Adobe mineralogy: Characterization of adobes from around the world
This article was downloaded by: [Hacettepe University]On: 23 January 2013, At: 22:41Publisher: Taylor & FrancisInforma Ltd Registered in England and Wales Registered Number: 1072954 Registeredoffice: Mortimer House, 37-41 Mortimer Street, London W1T 3JH, UK
Mineral Processing and ExtractiveMetallurgy Review: An InternationalJournalPublication details, including instructions for authors andsubscription information:http://www.tandfonline.com/loi/gmpr20
Mass Balance and QuantitativeMineralogy Studies for CircuitModificationN. Metin Can a , Ilkay B. Celik a , Ozlem Bicak a & Okan Altun aa Department of Mining Engineering, Hacettepe University, Beytepe,Ankara, TurkeyAccepted author version posted online: 18 Jan 2012.Version ofrecord first published: 22 Jan 2013.
To cite this article: N. Metin Can , Ilkay B. Celik , Ozlem Bicak & Okan Altun (2013): Mass Balance andQuantitative Mineralogy Studies for Circuit Modification, Mineral Processing and Extractive MetallurgyReview: An International Journal, 34:5, 348-365
To link to this article: http://dx.doi.org/10.1080/08827508.2012.656779
PLEASE SCROLL DOWN FOR ARTICLE
Full terms and conditions of use: http://www.tandfonline.com/page/terms-and-conditions
This article may be used for research, teaching, and private study purposes. Anysubstantial or systematic reproduction, redistribution, reselling, loan, sub-licensing,systematic supply, or distribution in any form to anyone is expressly forbidden.
The publisher does not give any warranty express or implied or make any representationthat the contents will be complete or accurate or up to date. The accuracy of anyinstructions, formulae, and drug doses should be independently verified with primarysources. The publisher shall not be liable for any loss, actions, claims, proceedings,demand, or costs or damages whatsoever or howsoever caused arising directly orindirectly in connection with or arising out of the use of this material.
MASS BALANCE AND QUANTITATIVE MINERALOGYSTUDIES FOR CIRCUIT MODIFICATION
N. Metin Can, Ilkay B. Celik, Ozlem Bicak, and Okan AltunDepartment of Mining Engineering, Hacettepe University, Beytepe,Ankara, Turkey
Two plant surveys were conducted at Lahanos Cu–Zn Concentrator under different operat-
ing conditions to assess the performance of the plant. In particular, an alternative process
flowsheet, which was based on metal balance and quantitative mineralogy, was evaluated.
First, a block survey was performed in the existing circuit. Next, cell-by-cell sampling was
performed in the Cu rougher bank after the circulation of the scavenger concentrate to the
feed was stopped. This allowed for the determination of the flotation kinetics of the minerals
in the fresh feed and the effect of the circulation on the stream. Mass balancing results
revealed that 14.3% and 12% of the copper was lost by the rougher and scavenger tails,
respectively. Mineralogical analysis of the first survey showed that the scavenger concentrate
primarily consisted of coarse/locked particles. According to the results, even the amounts of
minerals in the rougher concentrates were similar in both surveys; liberation has improved by
approximately 35–69% in the second survey particularly for copper minerals. It is concluded
that recirculating the stream to the feed would negatively affect plant performance. There-
fore, finer grinding was tested in the plant to assess the effect of decreasing feed tonnage on
the liberation. It was found that copper loss in the tails was significantly decreased. Finally,
possible flowsheet modifications based on these results are discussed.
Keywords: flotation, image analysis, liberation analysis, mass balance, sulphide minerals
INTRODUCTION
A comprehensive study involving mass balancing and quantitative mineralogywas found to be necessary to improve plant performance and to suggest appropriatemodifications in the plant flowsheet because it is well known that complicatedmineralogical associations can occur in complex sulphide ores.
The significance of process mineralogy, liberation analysis and their effects onmetallurgical performances of the plants has been very well documented in casestudies (Jones 1987, Frew and Davey 1993, Sutherland 1998, and Petruk 2000).However, mineral characterization is not sufficient anymore. Interpreting all datawith respect to the operational conditions is crucial to guide plant optimization.Olubambi et al. (2006) clearly showed the role played by applied mineralogy indetermining an optimal hydrometallurgical recovery process for base metals fromcomplex sulphide ores.
Address correspondence to N. Metin Can, Assistant Professor, Hacettepe University, Department
of Mining Engineering, Beytepe, 06800 Ankara, Turkey. E-mail: [email protected]
Mineral Processing & Extractive Metall. Rev., 34: 348–365, 2013
Copyright # Taylor & Francis Group, LLC
ISSN: 0882-7508 print=1547-7401 online
DOI: 10.1080/08827508.2012.656779
348
Dow
nloa
ded
by [
Hac
ette
pe U
nive
rsity
] at
22:
41 2
3 Ja
nuar
y 20
13
Process mineralogy can be used in different periods of the mine lifecycle, and itcan provide a better understanding of possible metallurgical performance of a newmineral source and make flowsheet development easier (Lotter et al. 2003).Additionally, it can provide useful data for modeling and predicting the performanceof a single piece of equipment (Donskoi et al. 2008). Studying the mineralogy of bulkand borehole samples is fundamental for understanding the behavior of an ore andfor developing an unusual physical concentration process (Tassinari, Kahn, andRatti 2001). Mineralogical features of the ores, such as texture, mineralization,and mineral associations, can be extremely important because they indicate the mostsuitable flowsheet for plant performance optimization. Xiao and Laplante (2004)studied the mineralogy of specific ores that are amenable to gravity and flotationseparations and the flowsheet for recovering platinum group minerals in several millsof interest. They found that for different ore types, the preconcentration methods aswell as the mineralogical features differ.
Performing size-by-size liberation analysis as part of the performanceevaluation studies is the key to understanding and addressing the real problem inthe circuit. This problem may sometimes be solved by changing the operational para-meters, such as the reagent suite (Lastra 2007), or by making modifications in thecircuit flowsheet (Young et al. 1997). Dobby, Kosick, and Matwijenko (1990) imple-mented a copper cleaner column flotation circuit. Although the final concentrate hada good grade, approximately 32% Cu, the recovery of chalcopyrite particles in differ-ent liberation classes indicated a recovery problem. Particles with 90% liberationshowed approximately 65% recovery, and only approximately 50% of the chalco-pyrite in particles with 70% liberation were recovered in the final concentrate. Theauthors concluded that particles with a low liberation value (of 70%) may be normalfor a cleaning circuit, but if the particles with a high liberation degree are recoveredby only 65%, then the situation should be investigated. In addition, the authorsfound that the recovery of free chalcopyrite decreased to 50% for particles coarserthan approximately 25 mm. This indicated the inefficient operating condition of thecolumn circuit for recovering coarse liberated chalcopyrite particles. This problemwas solved by adding a conventional flotation cell in front of the column circuitto recover these particles, thereby allowing the column circuit to recover the liberatedand fine particles.
Determining the elemental assay and=or particle size distribution is notsufficient for making critical decisions regarding the process route; attention shouldbe paid to the distribution of relevant minerals within the sizes of each processingstep.
Lahanos plant has been processing a typical volcanogenic sedimentary, finelydisseminated and massive complex copper and zinc sulphide ore, which was welldocumented in the literature (Bayraktar, Ipekoglu, and Tolun 1991). Revision stu-dies consisting of reagent schemes and flowsheet modifications have been conductedin the Lahanos Cu–Zn plant during the first 2 years of plant operation using metal-lurgical results and laboratory cycle tests (Bulatovic et al. 1996). Therefore, thisstudy aims to reveal the performance of the plant using a metal balance and detailedprocess mineralogy and to determine the required changes for improvement. Theinfluence of finer grinding and circulation of a cleaner scavenger concentrate oncopper recovery were investigated.
QUANTITATIVE MINERALOGY FOR CIRCUIT MODIFICATION 349
Dow
nloa
ded
by [
Hac
ette
pe U
nive
rsity
] at
22:
41 2
3 Ja
nuar
y 20
13
METHODOLOGY
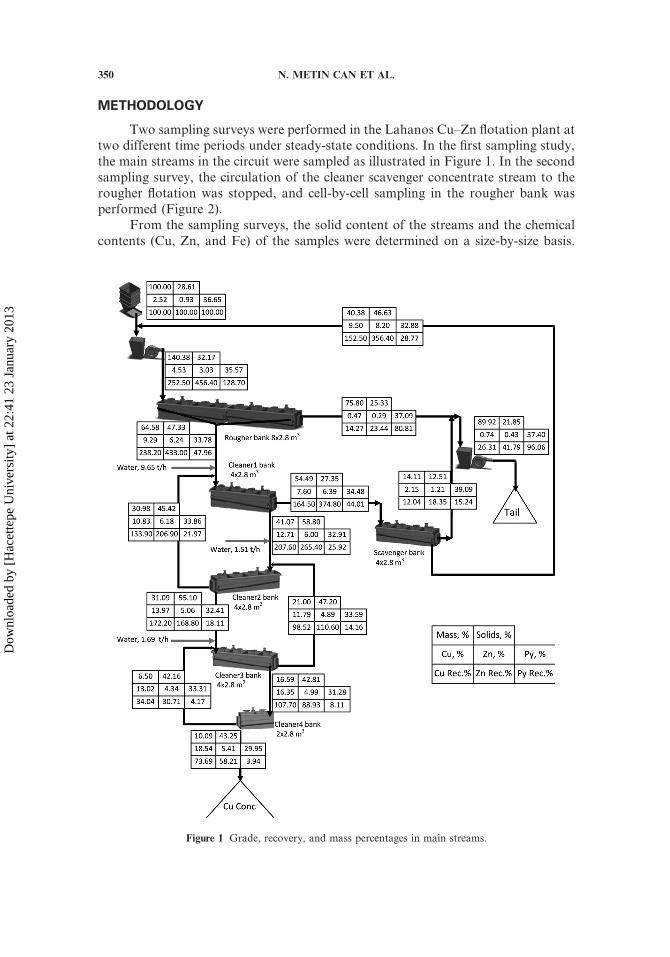
Two sampling surveys were performed in the Lahanos Cu–Zn flotation plant attwo different time periods under steady-state conditions. In the first sampling study,the main streams in the circuit were sampled as illustrated in Figure 1. In the secondsampling survey, the circulation of the cleaner scavenger concentrate stream to therougher flotation was stopped, and cell-by-cell sampling in the rougher bank wasperformed (Figure 2).
From the sampling surveys, the solid content of the streams and the chemicalcontents (Cu, Zn, and Fe) of the samples were determined on a size-by-size basis.
Figure 1 Grade, recovery, and mass percentages in main streams.
350 N. METIN CAN ET AL.
Dow
nloa
ded
by [
Hac
ette
pe U
nive
rsity
] at
22:
41 2
3 Ja
nuar
y 20
13

Sieving and cyclosizing were used to prepare the samples with narrow sizes, such asþ38 mm, �38þ 24 mm, �24þ 8 mm, and �8 mm fractions. A mass balancing studywas performed to determine the solid and volumetric flow rates of the streamsand to calculate the metal recoveries. Cu metal and mineral distributions in the
Figure 2 Sampling points in the second sampling study.
Figure 3 Comparison of the measured and calculated data obtained from the mass balance study of (a) the
first sampling survey and (b) the second sampling survey.
QUANTITATIVE MINERALOGY FOR CIRCUIT MODIFICATION 351
Dow
nloa
ded
by [
Hac
ette
pe U
nive
rsity
] at
22:
41 2
3 Ja
nuar
y 20
13
streams were evaluated on a size-by-size basis. A comparison of the measuredand calculated mass balancing data are shown in Figures 3a and 3b for the firstand the second sampling surveys, respectively. There is good agreement betweenthe measured and calculated values in both surveys.
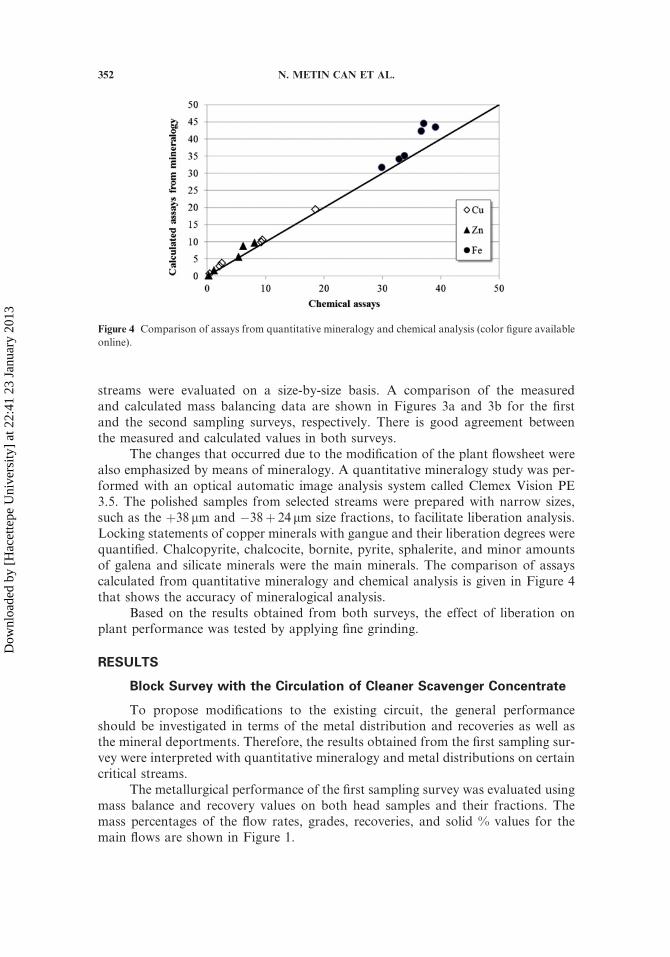
The changes that occurred due to the modification of the plant flowsheet werealso emphasized by means of mineralogy. A quantitative mineralogy study was per-formed with an optical automatic image analysis system called Clemex Vision PE3.5. The polished samples from selected streams were prepared with narrow sizes,such as the þ38 mm and �38þ 24 mm size fractions, to facilitate liberation analysis.Locking statements of copper minerals with gangue and their liberation degrees werequantified. Chalcopyrite, chalcocite, bornite, pyrite, sphalerite, and minor amountsof galena and silicate minerals were the main minerals. The comparison of assayscalculated from quantitative mineralogy and chemical analysis is given in Figure 4that shows the accuracy of mineralogical analysis.
Based on the results obtained from both surveys, the effect of liberation onplant performance was tested by applying fine grinding.
RESULTS
Block Survey with the Circulation of Cleaner Scavenger Concentrate
To propose modifications to the existing circuit, the general performanceshould be investigated in terms of the metal distribution and recoveries as well asthe mineral deportments. Therefore, the results obtained from the first sampling sur-vey were interpreted with quantitative mineralogy and metal distributions on certaincritical streams.
The metallurgical performance of the first sampling survey was evaluated usingmass balance and recovery values on both head samples and their fractions. Themass percentages of the flow rates, grades, recoveries, and solid % values for themain flows are shown in Figure 1.
Figure 4 Comparison of assays from quantitative mineralogy and chemical analysis (color figure available
online).
352 N. METIN CAN ET AL.
Dow
nloa
ded
by [
Hac
ette
pe U
nive
rsity
] at
22:
41 2
3 Ja
nuar
y 20
13
Quantitative mineralogical analysis. Quantitative mineralogical analysiswas performed using the samples taken from the cyclone overflow, the Cu rougherconcentrate, the cleaner scavenger concentrate, the final concentrate, the Cu roughertail, and the scavenger tail. The distributions of liberated, binary and ternary parti-cles were determined for two (þ38 mm and �38þ 24 mm) size fractions in which theliberation difference was much more pronounced. The results are given as modalanalysis graphs, which were formed by considering the weight percentage of each sizefraction within the entire stream flow rate.
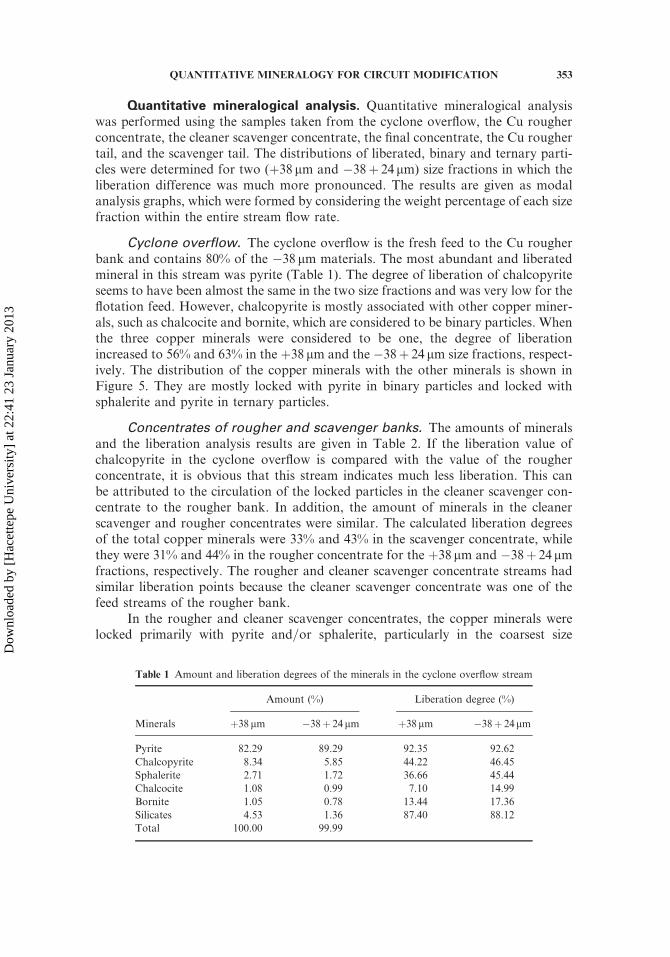
Cyclone overflow. The cyclone overflow is the fresh feed to the Cu rougherbank and contains 80% of the �38 mm materials. The most abundant and liberatedmineral in this stream was pyrite (Table 1). The degree of liberation of chalcopyriteseems to have been almost the same in the two size fractions and was very low for theflotation feed. However, chalcopyrite is mostly associated with other copper miner-als, such as chalcocite and bornite, which are considered to be binary particles. Whenthe three copper minerals were considered to be one, the degree of liberationincreased to 56% and 63% in the þ38 mm and the �38þ 24 mm size fractions, respect-ively. The distribution of the copper minerals with the other minerals is shown inFigure 5. They are mostly locked with pyrite in binary particles and locked withsphalerite and pyrite in ternary particles.
Concentrates of rougher and scavenger banks. The amounts of mineralsand the liberation analysis results are given in Table 2. If the liberation value ofchalcopyrite in the cyclone overflow is compared with the value of the rougherconcentrate, it is obvious that this stream indicates much less liberation. This canbe attributed to the circulation of the locked particles in the cleaner scavenger con-centrate to the rougher bank. In addition, the amount of minerals in the cleanerscavenger and rougher concentrates were similar. The calculated liberation degreesof the total copper minerals were 33% and 43% in the scavenger concentrate, whilethey were 31% and 44% in the rougher concentrate for the þ38 mm and �38þ 24 mmfractions, respectively. The rougher and cleaner scavenger concentrate streams hadsimilar liberation points because the cleaner scavenger concentrate was one of thefeed streams of the rougher bank.
In the rougher and cleaner scavenger concentrates, the copper minerals werelocked primarily with pyrite and=or sphalerite, particularly in the coarsest size
Table 1 Amount and liberation degrees of the minerals in the cyclone overflow stream
Minerals
Amount (%) Liberation degree (%)
þ38 mm �38þ 24 mm þ38mm �38þ 24mm
Pyrite 82.29 89.29 92.35 92.62
Chalcopyrite 8.34 5.85 44.22 46.45
Sphalerite 2.71 1.72 36.66 45.44
Chalcocite 1.08 0.99 7.10 14.99
Bornite 1.05 0.78 13.44 17.36
Silicates 4.53 1.36 87.40 88.12
Total 100.00 99.99
QUANTITATIVE MINERALOGY FOR CIRCUIT MODIFICATION 353
Dow
nloa
ded
by [
Hac
ette
pe U
nive
rsity
] at
22:
41 2
3 Ja
nuar
y 20
13
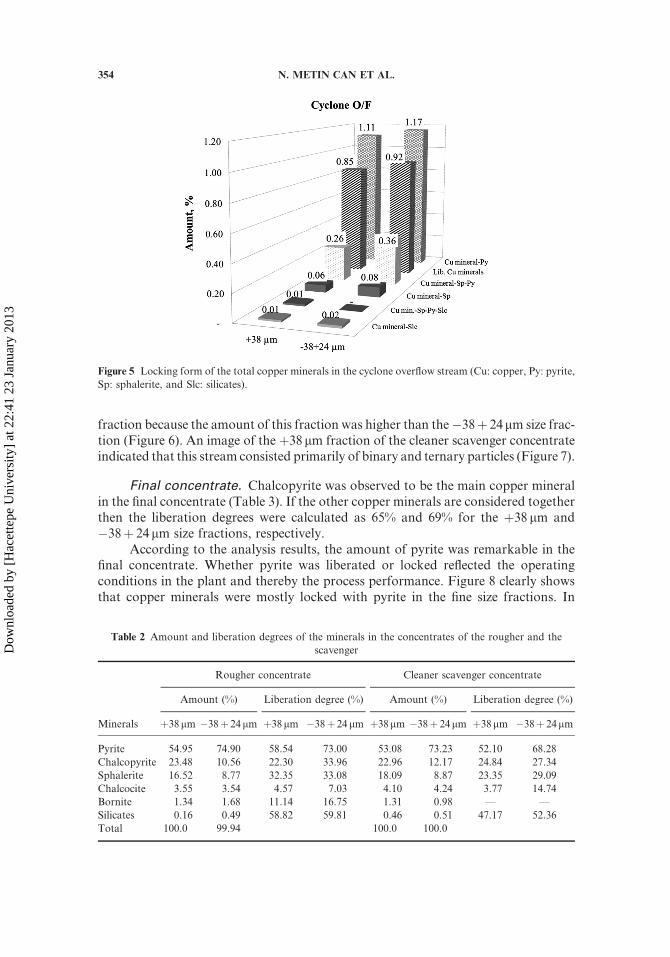
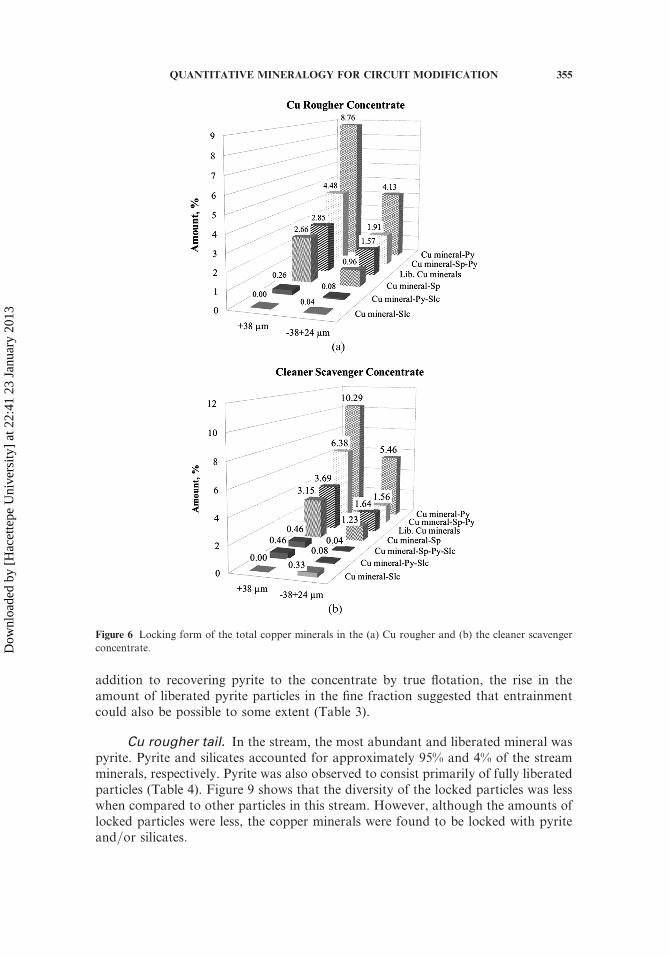
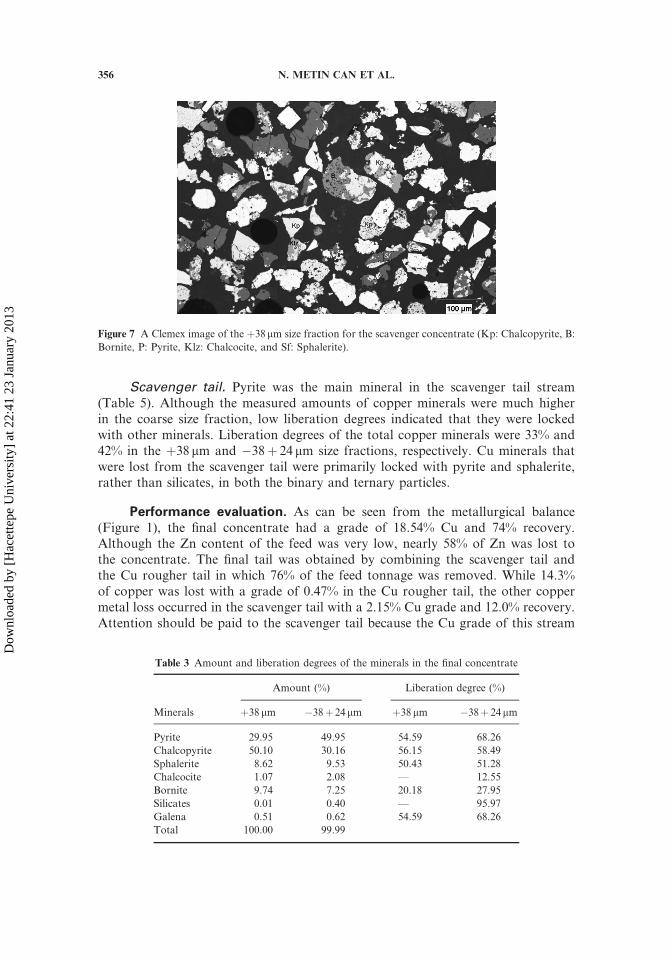
fraction because the amount of this fraction was higher than the�38þ 24mm size frac-tion (Figure 6). An image of the þ38mm fraction of the cleaner scavenger concentrateindicated that this stream consisted primarily of binary and ternary particles (Figure 7).
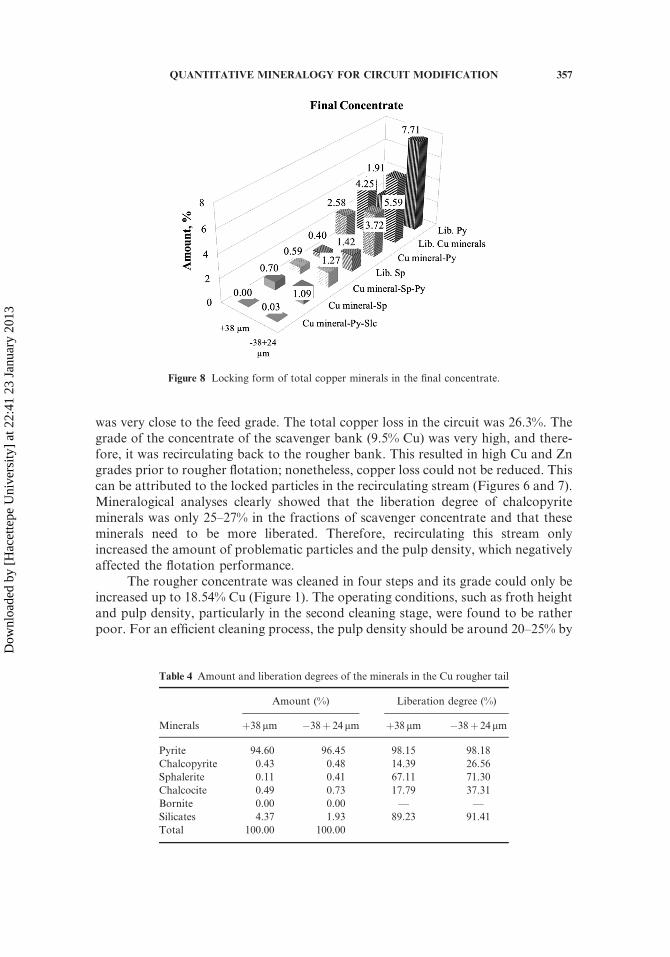
Final concentrate. Chalcopyrite was observed to be the main copper mineralin the final concentrate (Table 3). If the other copper minerals are considered togetherthen the liberation degrees were calculated as 65% and 69% for the þ38 mm and�38þ 24 mm size fractions, respectively.
According to the analysis results, the amount of pyrite was remarkable in thefinal concentrate. Whether pyrite was liberated or locked reflected the operatingconditions in the plant and thereby the process performance. Figure 8 clearly showsthat copper minerals were mostly locked with pyrite in the fine size fractions. In
Figure 5 Locking form of the total copper minerals in the cyclone overflow stream (Cu: copper, Py: pyrite,
Sp: sphalerite, and Slc: silicates).
Table 2 Amount and liberation degrees of the minerals in the concentrates of the rougher and the
scavenger
Rougher concentrate Cleaner scavenger concentrate
Minerals
Amount (%) Liberation degree (%) Amount (%) Liberation degree (%)
þ38mm �38þ 24 mm þ38mm �38þ 24 mm þ38mm �38þ 24mm þ38mm �38þ 24mm
Pyrite 54.95 74.90 58.54 73.00 53.08 73.23 52.10 68.28
Chalcopyrite 23.48 10.56 22.30 33.96 22.96 12.17 24.84 27.34
Sphalerite 16.52 8.77 32.35 33.08 18.09 8.87 23.35 29.09
Chalcocite 3.55 3.54 4.57 7.03 4.10 4.24 3.77 14.74
Bornite 1.34 1.68 11.14 16.75 1.31 0.98 — —
Silicates 0.16 0.49 58.82 59.81 0.46 0.51 47.17 52.36
Total 100.0 99.94 100.0 100.0
354 N. METIN CAN ET AL.
Dow
nloa
ded
by [
Hac
ette
pe U
nive
rsity
] at
22:
41 2
3 Ja
nuar
y 20
13
addition to recovering pyrite to the concentrate by true flotation, the rise in theamount of liberated pyrite particles in the fine fraction suggested that entrainmentcould also be possible to some extent (Table 3).
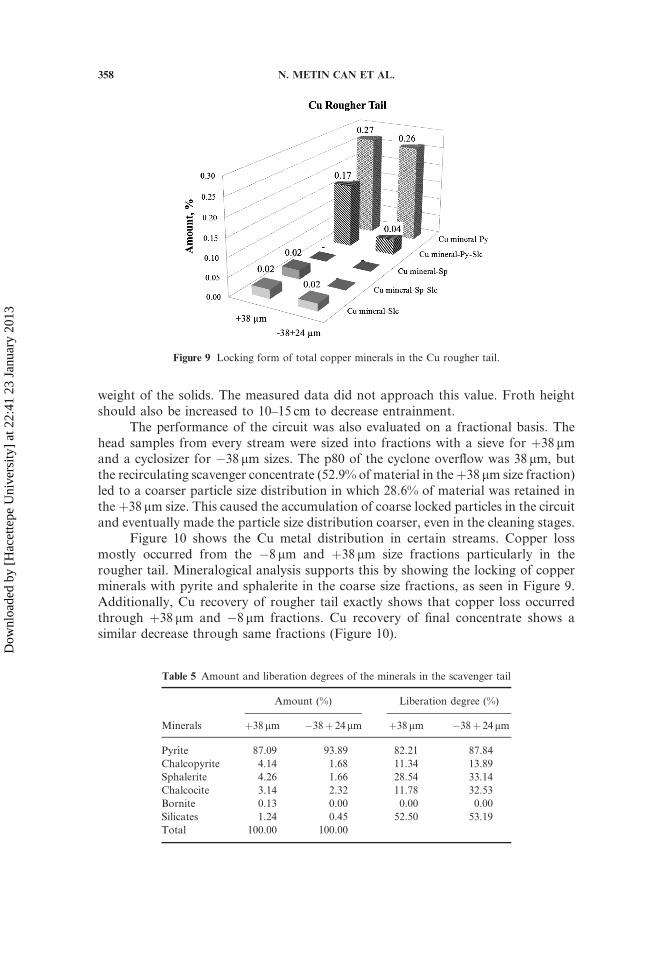
Cu rougher tail. In the stream, the most abundant and liberated mineral waspyrite. Pyrite and silicates accounted for approximately 95% and 4% of the streamminerals, respectively. Pyrite was also observed to consist primarily of fully liberatedparticles (Table 4). Figure 9 shows that the diversity of the locked particles was lesswhen compared to other particles in this stream. However, although the amounts oflocked particles were less, the copper minerals were found to be locked with pyriteand=or silicates.
Figure 6 Locking form of the total copper minerals in the (a) Cu rougher and (b) the cleaner scavenger
concentrate.
QUANTITATIVE MINERALOGY FOR CIRCUIT MODIFICATION 355
Dow
nloa
ded
by [
Hac
ette
pe U
nive
rsity
] at
22:
41 2
3 Ja
nuar
y 20
13
Scavenger tail. Pyrite was the main mineral in the scavenger tail stream(Table 5). Although the measured amounts of copper minerals were much higherin the coarse size fraction, low liberation degrees indicated that they were lockedwith other minerals. Liberation degrees of the total copper minerals were 33% and42% in the þ38 mm and �38þ 24 mm size fractions, respectively. Cu minerals thatwere lost from the scavenger tail were primarily locked with pyrite and sphalerite,rather than silicates, in both the binary and ternary particles.
Performance evaluation. As can be seen from the metallurgical balance(Figure 1), the final concentrate had a grade of 18.54% Cu and 74% recovery.Although the Zn content of the feed was very low, nearly 58% of Zn was lost tothe concentrate. The final tail was obtained by combining the scavenger tail andthe Cu rougher tail in which 76% of the feed tonnage was removed. While 14.3%of copper was lost with a grade of 0.47% in the Cu rougher tail, the other coppermetal loss occurred in the scavenger tail with a 2.15% Cu grade and 12.0% recovery.Attention should be paid to the scavenger tail because the Cu grade of this stream
Figure 7 A Clemex image of the þ38mm size fraction for the scavenger concentrate (Kp: Chalcopyrite, B:
Bornite, P: Pyrite, Klz: Chalcocite, and Sf: Sphalerite).
Table 3 Amount and liberation degrees of the minerals in the final concentrate
Minerals
Amount (%) Liberation degree (%)
þ38 mm �38þ 24 mm þ38 mm �38þ 24mm
Pyrite 29.95 49.95 54.59 68.26
Chalcopyrite 50.10 30.16 56.15 58.49
Sphalerite 8.62 9.53 50.43 51.28
Chalcocite 1.07 2.08 — 12.55
Bornite 9.74 7.25 20.18 27.95
Silicates 0.01 0.40 — 95.97
Galena 0.51 0.62 54.59 68.26
Total 100.00 99.99
356 N. METIN CAN ET AL.
Dow
nloa
ded
by [
Hac
ette
pe U
nive
rsity
] at
22:
41 2
3 Ja
nuar
y 20
13
was very close to the feed grade. The total copper loss in the circuit was 26.3%. Thegrade of the concentrate of the scavenger bank (9.5% Cu) was very high, and there-fore, it was recirculating back to the rougher bank. This resulted in high Cu and Zngrades prior to rougher flotation; nonetheless, copper loss could not be reduced. Thiscan be attributed to the locked particles in the recirculating stream (Figures 6 and 7).Mineralogical analyses clearly showed that the liberation degree of chalcopyriteminerals was only 25–27% in the fractions of scavenger concentrate and that theseminerals need to be more liberated. Therefore, recirculating this stream onlyincreased the amount of problematic particles and the pulp density, which negativelyaffected the flotation performance.
The rougher concentrate was cleaned in four steps and its grade could only beincreased up to 18.54% Cu (Figure 1). The operating conditions, such as froth heightand pulp density, particularly in the second cleaning stage, were found to be ratherpoor. For an efficient cleaning process, the pulp density should be around 20–25% by
Figure 8 Locking form of total copper minerals in the final concentrate.
Table 4 Amount and liberation degrees of the minerals in the Cu rougher tail
Minerals
Amount (%) Liberation degree (%)
þ38mm �38þ 24 mm þ38 mm �38þ 24 mm
Pyrite 94.60 96.45 98.15 98.18
Chalcopyrite 0.43 0.48 14.39 26.56
Sphalerite 0.11 0.41 67.11 71.30
Chalcocite 0.49 0.73 17.79 37.31
Bornite 0.00 0.00 — —
Silicates 4.37 1.93 89.23 91.41
Total 100.00 100.00
QUANTITATIVE MINERALOGY FOR CIRCUIT MODIFICATION 357
Dow
nloa
ded
by [
Hac
ette
pe U
nive
rsity
] at
22:
41 2
3 Ja
nuar
y 20
13
weight of the solids. The measured data did not approach this value. Froth heightshould also be increased to 10–15 cm to decrease entrainment.
The performance of the circuit was also evaluated on a fractional basis. Thehead samples from every stream were sized into fractions with a sieve for þ38 mmand a cyclosizer for �38 mm sizes. The p80 of the cyclone overflow was 38 mm, butthe recirculating scavenger concentrate (52.9% of material in theþ38 mm size fraction)led to a coarser particle size distribution in which 28.6% of material was retained inthe þ38 mm size. This caused the accumulation of coarse locked particles in the circuitand eventually made the particle size distribution coarser, even in the cleaning stages.
Figure 10 shows the Cu metal distribution in certain streams. Copper lossmostly occurred from the �8 mm and þ38 mm size fractions particularly in therougher tail. Mineralogical analysis supports this by showing the locking of copperminerals with pyrite and sphalerite in the coarse size fractions, as seen in Figure 9.Additionally, Cu recovery of rougher tail exactly shows that copper loss occurredthrough þ38 mm and �8 mm fractions. Cu recovery of final concentrate shows asimilar decrease through same fractions (Figure 10).
Figure 9 Locking form of total copper minerals in the Cu rougher tail.
Table 5 Amount and liberation degrees of the minerals in the scavenger tail
Minerals
Amount (%) Liberation degree (%)
þ38mm �38þ 24 mm þ38mm �38þ 24 mm
Pyrite 87.09 93.89 82.21 87.84
Chalcopyrite 4.14 1.68 11.34 13.89
Sphalerite 4.26 1.66 28.54 33.14
Chalcocite 3.14 2.32 11.78 32.53
Bornite 0.13 0.00 0.00 0.00
Silicates 1.24 0.45 52.50 53.19
Total 100.00 100.00
358 N. METIN CAN ET AL.
Dow
nloa
ded
by [
Hac
ette
pe U
nive
rsity
] at
22:
41 2
3 Ja
nuar
y 20
13
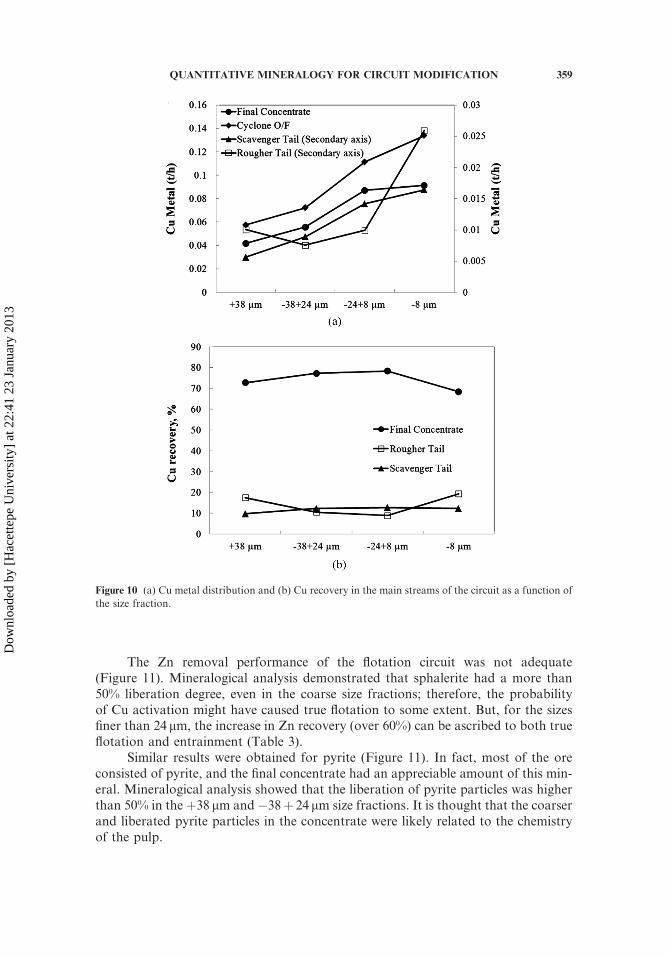
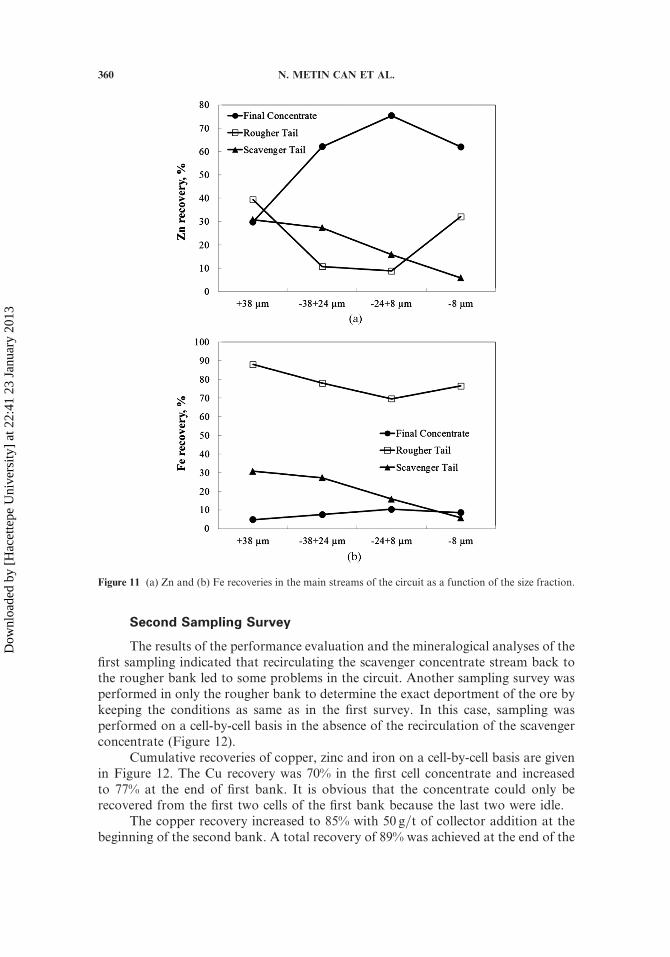
The Zn removal performance of the flotation circuit was not adequate(Figure 11). Mineralogical analysis demonstrated that sphalerite had a more than50% liberation degree, even in the coarse size fractions; therefore, the probabilityof Cu activation might have caused true flotation to some extent. But, for the sizesfiner than 24 mm, the increase in Zn recovery (over 60%) can be ascribed to both trueflotation and entrainment (Table 3).
Similar results were obtained for pyrite (Figure 11). In fact, most of the oreconsisted of pyrite, and the final concentrate had an appreciable amount of this min-eral. Mineralogical analysis showed that the liberation of pyrite particles was higherthan 50% in the þ38 mm and �38þ 24 mm size fractions. It is thought that the coarserand liberated pyrite particles in the concentrate were likely related to the chemistryof the pulp.
Figure 10 (a) Cu metal distribution and (b) Cu recovery in the main streams of the circuit as a function of
the size fraction.
QUANTITATIVE MINERALOGY FOR CIRCUIT MODIFICATION 359
Dow
nloa
ded
by [
Hac
ette
pe U
nive
rsity
] at
22:
41 2
3 Ja
nuar
y 20
13
Second Sampling Survey
The results of the performance evaluation and the mineralogical analyses of thefirst sampling indicated that recirculating the scavenger concentrate stream back tothe rougher bank led to some problems in the circuit. Another sampling survey wasperformed in only the rougher bank to determine the exact deportment of the ore bykeeping the conditions as same as in the first survey. In this case, sampling wasperformed on a cell-by-cell basis in the absence of the recirculation of the scavengerconcentrate (Figure 12).
Cumulative recoveries of copper, zinc and iron on a cell-by-cell basis are givenin Figure 12. The Cu recovery was 70% in the first cell concentrate and increasedto 77% at the end of first bank. It is obvious that the concentrate could only berecovered from the first two cells of the first bank because the last two were idle.
The copper recovery increased to 85% with 50 g=t of collector addition at thebeginning of the second bank. A total recovery of 89% was achieved at the end of the
Figure 11 (a) Zn and (b) Fe recoveries in the main streams of the circuit as a function of the size fraction.
360 N. METIN CAN ET AL.
Dow
nloa
ded
by [
Hac
ette
pe U
nive
rsity
] at
22:
41 2
3 Ja
nuar
y 20
13
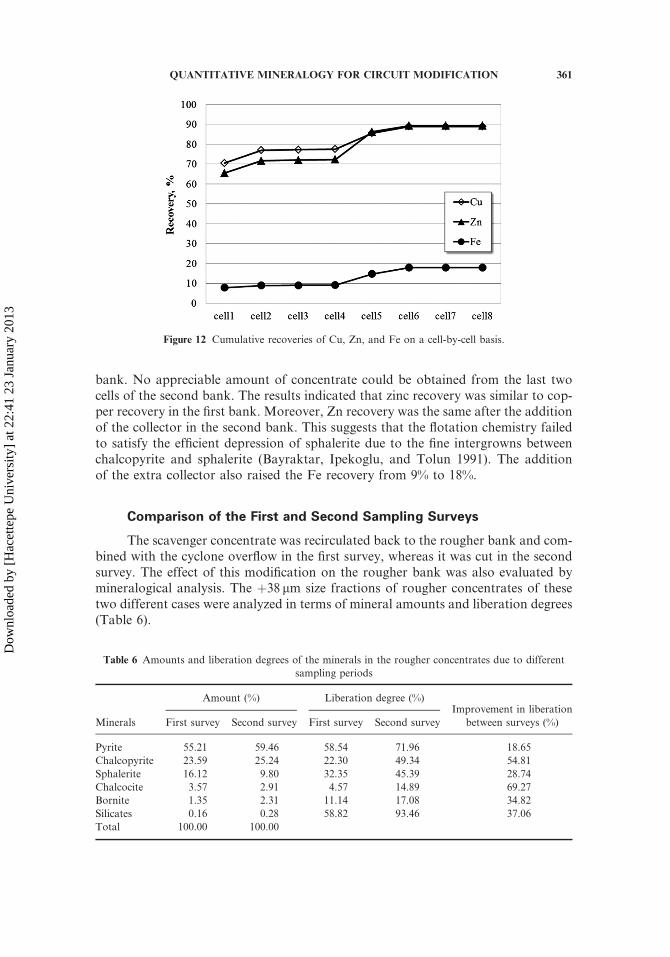
bank. No appreciable amount of concentrate could be obtained from the last twocells of the second bank. The results indicated that zinc recovery was similar to cop-per recovery in the first bank. Moreover, Zn recovery was the same after the additionof the collector in the second bank. This suggests that the flotation chemistry failedto satisfy the efficient depression of sphalerite due to the fine intergrowns betweenchalcopyrite and sphalerite (Bayraktar, Ipekoglu, and Tolun 1991). The additionof the extra collector also raised the Fe recovery from 9% to 18%.
Comparison of the First and Second Sampling Surveys
The scavenger concentrate was recirculated back to the rougher bank and com-bined with the cyclone overflow in the first survey, whereas it was cut in the secondsurvey. The effect of this modification on the rougher bank was also evaluated bymineralogical analysis. The þ38 mm size fractions of rougher concentrates of thesetwo different cases were analyzed in terms of mineral amounts and liberation degrees(Table 6).
Figure 12 Cumulative recoveries of Cu, Zn, and Fe on a cell-by-cell basis.
Table 6 Amounts and liberation degrees of the minerals in the rougher concentrates due to different
sampling periods
Minerals
Amount (%) Liberation degree (%)Improvement in liberation
between surveys (%)First survey Second survey First survey Second survey
Pyrite 55.21 59.46 58.54 71.96 18.65
Chalcopyrite 23.59 25.24 22.30 49.34 54.81
Sphalerite 16.12 9.80 32.35 45.39 28.74
Chalcocite 3.57 2.91 4.57 14.89 69.27
Bornite 1.35 2.31 11.14 17.08 34.82
Silicates 0.16 0.28 58.82 93.46 37.06
Total 100.00 100.00
QUANTITATIVE MINERALOGY FOR CIRCUIT MODIFICATION 361
Dow
nloa
ded
by [
Hac
ette
pe U
nive
rsity
] at
22:
41 2
3 Ja
nuar
y 20
13
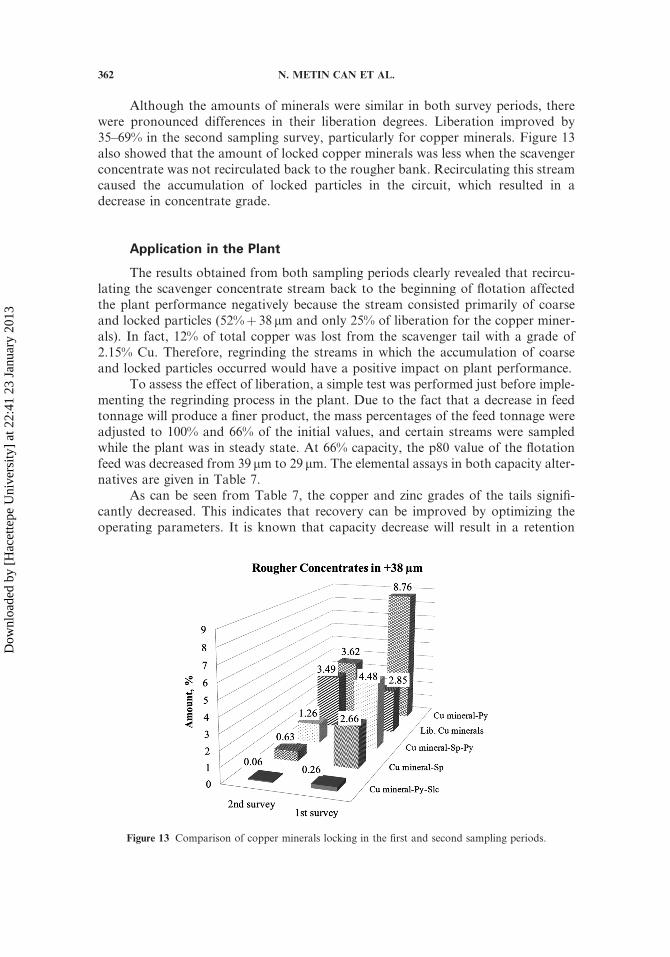
Although the amounts of minerals were similar in both survey periods, therewere pronounced differences in their liberation degrees. Liberation improved by35–69% in the second sampling survey, particularly for copper minerals. Figure 13also showed that the amount of locked copper minerals was less when the scavengerconcentrate was not recirculated back to the rougher bank. Recirculating this streamcaused the accumulation of locked particles in the circuit, which resulted in adecrease in concentrate grade.
Application in the Plant
The results obtained from both sampling periods clearly revealed that recircu-lating the scavenger concentrate stream back to the beginning of flotation affectedthe plant performance negatively because the stream consisted primarily of coarseand locked particles (52%þ 38 mm and only 25% of liberation for the copper miner-als). In fact, 12% of total copper was lost from the scavenger tail with a grade of2.15% Cu. Therefore, regrinding the streams in which the accumulation of coarseand locked particles occurred would have a positive impact on plant performance.
To assess the effect of liberation, a simple test was performed just before imple-menting the regrinding process in the plant. Due to the fact that a decrease in feedtonnage will produce a finer product, the mass percentages of the feed tonnage wereadjusted to 100% and 66% of the initial values, and certain streams were sampledwhile the plant was in steady state. At 66% capacity, the p80 value of the flotationfeed was decreased from 39 mm to 29 mm. The elemental assays in both capacity alter-natives are given in Table 7.
As can be seen from Table 7, the copper and zinc grades of the tails signifi-cantly decreased. This indicates that recovery can be improved by optimizing theoperating parameters. It is known that capacity decrease will result in a retention
Figure 13 Comparison of copper minerals locking in the first and second sampling periods.
362 N. METIN CAN ET AL.
Dow
nloa
ded
by [
Hac
ette
pe U
nive
rsity
] at
22:
41 2
3 Ja
nuar
y 20
13
time increase. In addition, the retention time in the cells were considered and foundto be sufficient. Therefore, it is concluded that the improvement was not due to aretention time increase but was related to the increase in fineness. It should be notedthat finer grinding will have more pronounced effect on coarse=locked particlesrather than finer size fractions.
DISCUSSION
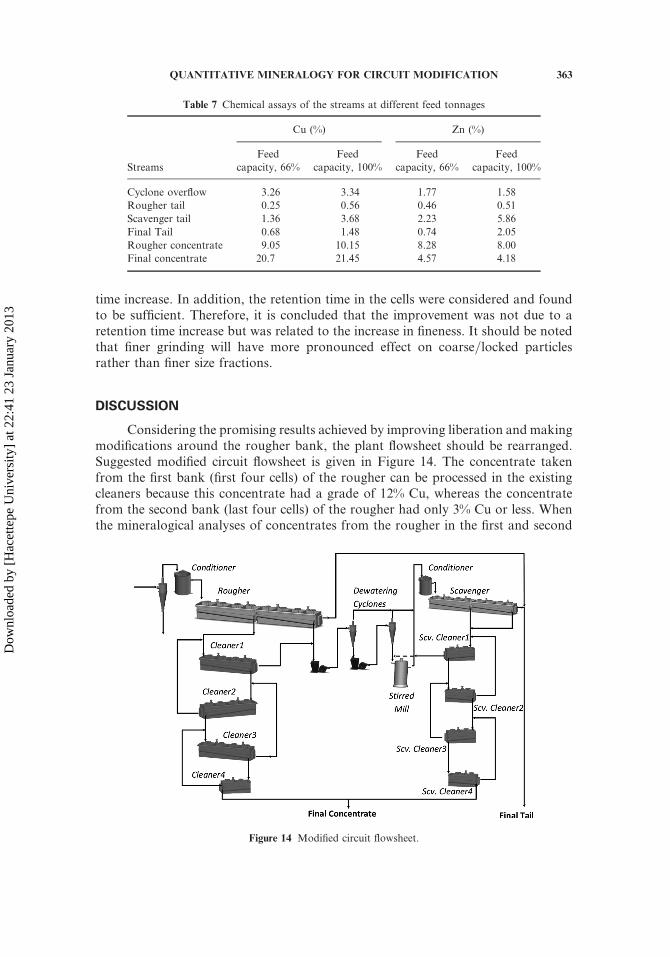
Considering the promising results achieved by improving liberation and makingmodifications around the rougher bank, the plant flowsheet should be rearranged.Suggested modified circuit flowsheet is given in Figure 14. The concentrate takenfrom the first bank (first four cells) of the rougher can be processed in the existingcleaners because this concentrate had a grade of 12% Cu, whereas the concentratefrom the second bank (last four cells) of the rougher had only 3% Cu or less. Whenthe mineralogical analyses of concentrates from the rougher in the first and second
Table 7 Chemical assays of the streams at different feed tonnages
Streams
Cu (%) Zn (%)
Feed
capacity, 66%
Feed
capacity, 100%
Feed
capacity, 66%
Feed
capacity, 100%
Cyclone overflow 3.26 3.34 1.77 1.58
Rougher tail 0.25 0.56 0.46 0.51
Scavenger tail 1.36 3.68 2.23 5.86
Final Tail 0.68 1.48 0.74 2.05
Rougher concentrate 9.05 10.15 8.28 8.00
Final concentrate 20.7 21.45 4.57 4.18
Figure 14 Modified circuit flowsheet.
QUANTITATIVE MINERALOGY FOR CIRCUIT MODIFICATION 363
Dow
nloa
ded
by [
Hac
ette
pe U
nive
rsity
] at
22:
41 2
3 Ja
nuar
y 20
13
sampling surveys are compared, it is obvious that more liberation could be providedfor the concentrate in the absence of scavenger concentrate recirculation. Conse-quently, there is no need to regrind the stream, which is more liberated and has ahigher grade. Therefore, a richer concentrate can be obtained if it is processed inthe existing cleaners. Under this condition, the copper recovery of the first bankwas 80%. It would be possible to make modifications to the operating parametersof the second bank to get the highest possible copper recovery. As a result, the con-centrate of the second bank and the tail of the first cleaner would be reground andprocessed in the Zn flotation circuit, which is currently not used in the plant due tolow Zn grades. According to the mineralogical analysis, the ore should be groundto a �25 mm size to provide sufficient liberation.
CONCLUSION
Applying quantitative mineralogy at the plant scale is of crucial importancebefore making any modifications to the process flowsheet. In this study, the realproblem in the Lahanos Cu-Zn Concentrator was addressed by applying the resultsof mineralogy and mass balancing studies applied in two different flowsheets. Min-eralogical analysis revealed that almost of the recirculating particles from scavengerconcentrate to the feed were locked. Liberation degree of chalcopyrite minerals wasonly 25–27% suggesting that finer grinding is necessary. It was also demonstratedthat the copper and zinc grades of the tails significantly decreased when the p80 valueof the flotation feed was decreased from 39 mm to 29 mm.
Sampling of the rougher bank on a cell-by-cell basis in the absence of recircula-tion showed that it was possible to get a high grade of concentrate from the firstbank of the rougher. If the concentrates of the first and second banks were processedseparately, then the grade of the concentrate would increase.
ACKNOWLEDGMENTS
The authors would like to acknowledge the staff at the Lahanos Plant for theircooperation and Demir Export for financial support.
REFERENCES
Bayraktar, I., Ipekoglu, U. A., and Tolun, R., 1991, ‘‘Features and flotation of complexCu-Pb-Zn sulphides.’’ In Innovations in Flotation Technology, (P. Mavros and K. A.Matis, Eds.), NATO ASI Series, 208, pp. 307–330.
Bulatovic, S., Bayraktar, I., Tecen, O., and Agyuz, M., 1996, ‘‘Lahanos copper-zinc concen-trator: An innovative way to improve plant performance.’’ Changing Scopes in MineralProcessing, Kusadasi, Turkey, pp. 307–313.
Dobby, G. S., Kosick, G. A., and Matwijenko, O., 1990, ‘‘Pilot plant testing for columnflotation circuit design.’’ Proceedings of the 22nd Meeting of the Canadian MineralProcessors, Ottawa, Ontario, Canada, pp. 198–217.
Donskoi, E., Suthers, S. P., Campbell, J. J., and Raynlyn, T., 2008, ‘‘Modelling and optimiza-tion of hydrocyclone for iron ore fines beneficiation-using optical image analysis and ironore texture classification.’’ International Journal of Mineral Processing, 87, pp. 106–119.
364 N. METIN CAN ET AL.
Dow
nloa
ded
by [
Hac
ette
pe U
nive
rsity
] at
22:
41 2
3 Ja
nuar
y 20
13
Frew, J. A. and Davey, K. J., 1993, Effect of liberation on flotation performance of a complexore. XVIII International Mineral Processing Congress, Sydney, pp. 905–911.
Jones, M. P., 1987, Applied Mineralogy-A Quantitative Approach, USA: Graham & Trotman,pp. 259.
Lastra, R., 2007, ‘‘Seven practical application cases of liberation analysis.’’ InternationalJournal of Mineral Processing, 84, pp. 337–347.
Lotter, N. O., Kowal, D. L., Tuzun, M. A., Whittaker, P. J., and Kormos, L., 2003, ‘‘Sam-pling and flotation testing of Sudbury Basin drill core for process mineralogy modelling.’’Minerals Engineering, 16, pp. 857–864.
Olubambi, P. A., Ndlovu, S., Potgieter, J. H., and Borode, J. O., 2006, ‘‘Influence of appliedmineralogy in developing an optimal hydrometallurgical processing route for complexsulphide ores.’’ Mineral Processing & Extractive Metallurgy Review, 27, pp. 143–158.
Petruk, W., 2000, Applied Mineralogy in the Mining Industry, The Netherlands: Elsevier,pp. 268.
Sutherland, D., 1998, ‘‘Applications of quantitative process mineralogy through the miningcycle.’’ AusIMM Annual Conference: The Mining Cycle, Mt. Isa, Queensland, Australia,pp. 333–337.
Tassinari, M. M. L., Kahn, H., and Ratti, G., 2001, ‘‘Process mineralogy studies of Corregodo Garimpo Ree ore, catalao-i alkaline complex, Goias, Brazil.’’ Minerals Engineering,14, pp. 1609–1617.
Xiao, Z. and Laplante, A. R., 2004, ‘‘Characterizing and recovering the platinum groupminerals–A review.’’ Minerals Engineering, 17, pp. 961–979.
Young, M. F., Pease, J. D., Johnson, N. W., and Munro, P. D., 1997, Developments in MillingPractice at the Lead=Zinc Concentrator of Mount Isa Mines Limited from 1990. http://www.isamill.com/downloads/Developments%20in%20Milling%20Practice%20at%20the%20LeadZinc%20Concentrator.pdf.
QUANTITATIVE MINERALOGY FOR CIRCUIT MODIFICATION 365
Dow
nloa
ded
by [
Hac
ette
pe U
nive
rsity
] at
22:
41 2
3 Ja
nuar
y 20
13
Copyright © 2022 FDOKUMEN