MASARYKOVA UNIVERZITA V BRNĚ Přírodovědecká fakulta ...
197
MASARYKOVA UNIVERZITA V BRNĚ Přírodovědecká fakulta DISERTAČNÍ PRÁCE Dominik HEGER Brno, 2005
-
Upload
khangminh22 -
Category
Documents
-
view
1 -
download
0
Transcript of MASARYKOVA UNIVERZITA V BRNĚ Přírodovědecká fakulta ...

MASARYKOVA UNIVERZITA V BRNĚ
Přírodovědecká fakulta
DISERTAČNÍ PRÁCE
Dominik HEGER Brno, 2005

m > 4 N A , ^ ^ V
M A S A R Y K O V A UNIVERZITA V BRNE Přírodovědecká fakulta
Dominik HEGER
AGREGACE ORGANICÝCH LÁTEK VE ZMRZLÝCH VODNÝCH ROZTOCÍCH
Disertační práce
Školitel: doc. RNDr. Petr Klán, Ph.D. Brno, 2005

Bibliografická identifikace
Jméno a příjmení autora: Dominik Heger
Název disertační práce: Agregace organických látek ve zmrzlých vodných roztocích
Název disertační práce anglicky:
Aggregation of Organic Compounds in Frozen Aqueous Solutions
Studijní program: DSP Chemie
Studijní obor (směr), kombinace oborů: Organická chemie
Školitel: doc. RNDr. Petr Klán, Ph.D.
Rok obhajoby: 2006
Klíčová slova v češtině: Led, Agregace, Spektroskopie, Acidobazické rovnováhy,
Solvatochromismus, Methylenová modř, Kresolová červeň, ETN
Klíčová slova v angličtině: Ice, Aggregation, Spectroscopy, Protonation, Acid-base equilibria,
Solvatochromism, Methylene blue, Cresol red, ETN

© Dominik Heger, Masarykova univerzita v Brně, 2005

Acknowledgements
I would like to thank first of all to Doc. RNDr. Petr Klán, Ph.D. for a great dissertation topic and guidance during my dissertaion work. I also thank to all collaborators and teachers: prof. Jakob Wirz, Dr. Jaromír Jirkovský, Doc. Libuše Trnková, Mgr. Jana Topinková, Mgr. Pavel Dvořák and all members of Klán's group and others in the department primarily to Jaromír Literák and Adriena Rokosová. Also thanks to Klokan and Koala for substantial help with ETgX and to Přemek Dohnal for language corrections. Last but not least, I thank to my wife Jana, my mother and sisters for supporting me in my studies.

Abstrakt
Při mrznutí vodných roztoků dochází ke vzniku čistého polykrystalického ledu a k vytesnení rozpuštěných látek na hranice krystalů ledu. V této práci jsme se zabývali spektroskopickou identifikací interakcí organických molekul vytlačených na hranice zrn krystalů ledu při zamrazení vodných roztoků. Použitím UV/vis absorpční spektroskopie jsme zjišťovali koncentrace organických a anorganických solutů a rozsah a způsob solvatace organických látek zamrzlých v ledu.
Míra agregace organických látek při vymrzání z ledu byla studována pomocí modelové látky (metylenové modře). Je známo, že se absorpční spektrum táto látky mění se stupněm agregace. S pomocí námi určených rovnovážných konstantant dimerizace a trimerizace ve vodě jsme stanovili lokální koncentrace indikátoru ve zmrzlých vzorcích. Rozhodující faktor určující stupeň agregace byla rychlost zamrazení, nikoli však teplota vzorku. Bylo např. zjištěno, že rychlým zamrazením roztoků při 77 K se koncentrace zvýšila třikrát, kdežto pomalým zamrazením při 243 K nejméně šestkrát, oproti výchozí koncentraci v roztoku.
Ve druhém projektu jsme sledovali stupeň protonace kresolové červeně ve zmrzlých vodných roztocích, které obsahovali různé kyseliny (HF, HCl, HNO3, H2SO4 a p-toluenesulfonovou kyselinu), hydroxid sodný, NaCl nebo NH4CI. Zvýšená koncentrace kyseliny na hranici krystalů ledu, způsobená zmrznutím kapalného vzorku, vyvolala protonaci kresolové červeně při koncentracích, která odpovídala koncentraci roztoku o dva až čtyři řády nižší. Tato změna nebyla příliš citlivá na rychlost zmražení ani na druh použité kyseliny. Usuzujeme proto na rychlé ustavení acidobazické rovnováhy před zmrznutím vzorku. Dále jsme zjistili, že přítomnost anorganických solí způsobí buď zvýšenou deprotonaci (např. NaCl) nebo protonaci (např. NH4CI) kresolové červeně po zamrazení. Toto pozorování je vysvětleno Bronshteynovou a Chernovovou teorií.
Dále jsme měřili absorpční spektra devíti solvatochromích látek ve zmrzlých vodných roztocích, abychom určili velikosti a rozsah různých typů interakcí na hranici krystalů ledu. Naše výsledky ukazují, že nejvýznamnější jsou interakce, při kterých prostředí poskytuje elektronové páry či působí jako akceptor vodíkové vazby. Dále jsou význame interakce, kdy prostředí působí jako donor vodíkové vazby. Oproti tomu, dipól-dipólové interakce se jeví jako nevýznamné.
Z výsledků měření UV/vis absorpčních spekter organických látek zmrzlých v ledu si můžeme představit hranice krystalů ledu v přítomnosti organických látek jako koncentrovanou směs organických molekul, které specificky interagují s molekulami vody v okolí a mezi sebou. Zmrznuti roztoků může následně ovlivnit případné chemické reakce. Výsledky naší práce mohou pomoci při předvídání osudu organických látek v přírodě a jsou relevantní také pro kosmochemii nebo geochemii.

Abstract
The pure polycrystaline ice is formed during freezing of aqueous solutions. Most of the solutes are expelled to the grain boundaries of ice crystals. The UV/vis absorption spectroscopy of the various organic compounds frozen in the aqueous solutions was used to elucidate the changes in absorption spectra and to characterize the amount of aggregation of organic compounds, H + and OH~ ions availabilities, as well as solvatochromic properties. Molecular aggregations in ice change the absorption characteristics of the organic molecules due to changed interactions with the host water molecules of the cavity as well as intermolecular interactions among the solute molecules themselves.
The extent of aggregation of organic compounds was studied on a model compound (methylene blue). The absorption spectra of this compound are known to change upon aggregation. The re-evaluated equilibrium constants of dimerization and trimerization in liquid water solution allowed us to estimate local concentrations in the frozen samples. The freezing rate, not the temperature of the sample, plays the central role in the degree of aggregation. While the local concentration of methylene blue at the grain boundaries of polycrystalline ice increased by approx. 3 orders of magnitude upon fast freezing at 77 K compared to the liquid phase, the concentration raised at least by 6 orders of magnitude upon slow freezing at 243 K.
The protonation degree of cresol red in frozen aqueous solutions at 253 or 77 K, containing various acids (HF, HCl, HN0 3 , H 2 S0 4 and p-toluenesulfonic acid), sodium hydroxide, NaCl, or NH4C1, was examined. The results showed that the extent of cresol red protonation, enhanced in the solid state by 2 - 4 orders of magnitude in contrast to the liquid solution, is principally connected to an increase in the local concentration of acids. It was found that this enhancement was not very sensitive to either the freezing rate or the type of acid used, and that cresol red apparently established an acid-base equilibrium prior to solidification. In addition, the presence of inorganic salts, such as NaCl or NH4CI, is reported to cause a more efficient deprotonation of CR in the former case and an enhanced protonation in the latter case, being well explained by the theory of Bronshteyn and Chernov.
In addition, absorption spectra of nine solvatochromic compounds were examined in the frozen aqueous solutions to obtain quantitative information about the solvation types on the grain boundaries of ice. According to our measurements, electron-pair donating and/or hydrogen-bond accepting interactions are the most prevailing at the grain boundaries of ice but the hydrogen-bond donating effect was significant too. In contrast, the polarity/dipolarity interactions were unimportant.
From the results of the UV/vis absorption measurements in the ice, we can envisage the grain boundary containing the probes as a complex concentrated mixture of more or less organized organic molecules that specifically interact with water molecules in the vicinity. Since changes caused by the freezing of aqueous solutions plays an important role in (photo)chemical transformations, this work helps to understand how the initial conditions control the course of the process. The results of our research are relevent in other interdisciplinary fields, such as environmental chemistry, cosmochemistry, or geochemistry.

Contents
1 Introduction 9
2 Review of the Literature 11 2.1 Ice 11
2.1.1 The importance of ice 11 2.1.2 Structure of ice 11 2.1.3 Electrical properties of ice 12 2.1.4 Protonic point defects 13 2.1.5 Point defects in ice 14 2.1.6 Chemical impurities 16 2.1.7 Freezing induced electric potentials 18 2.1.8 The surface of ice 20 2.1.9 Optical properties of ice 24 2.1.10 Ice with the contaminants in the nature 25 2.1.11 Photochemistry on the ice 26 2.1.12 Calculations of ice 28
2.2 Solvatochromis 29 2.2.1 Polarity on the Interfaces 35 2.2.2 Effective Polarity of Frozen Solvent Glasses 38
2.3 Methylene Blue 40 2.4 Cresol Red 46
3 The Summary of Results 48 3.1 Topic I - The Aggregation of Methylene Blue 48
3.1.1 The trimerization model 49 3.1.2 Finding the aggregation equilibrium constants 53 3.1.3 Solid Methylene Blue Solutions at 77 K 59 3.1.4 Solid Methylene Blue Solutions at 243 K 63
3.2 Topic II - Enhanced Protonation of Cresol Red 64 3.2.1 The Liquid Cresol Red Solutions at 293 K 64 3.2.2 Solid Cresol Red Solutions at 253 K 67 3.2.3 Solid Cresol Red Solutions at 77 K 72

3.2.4 The Effects of Salt Addition on Cresol Red Spectroscopic Behavior in Frozen Aqueous Solutions 76
3.3 Topic III - Solvatochromic Analysis of Ice Surface 77 3.3.1 ET(33) and ET(30) 79 3.3.2 The ir* parameter 83 3.3.3 The a parameter 83 3.3.4 The ß parameter 84 3.3.5 The AN, a and ß parameters 84 3.3.6 Solvatochromic probes in dichloromethane slurry 86
4 Conclusions 87
5 Experimental Part 94 5.1 Spectroscopic Measurements of Ice Samples 94 5.2 Determination of the Concentrations from the Absorption Spectra 95
5.2.1 The Gaussian Curve Fitting 95
5.2.2 Multivariate Curve Resolution 95
6 The Scripts Written to Process the Data 97
Bibliography 110
List of Figures 113
List of Schemes 113
List of Tables 114
List of Abbreviations 115
Appendices 116

Chapter 1
Introduction
The main objective of this work was to continue and extend the research of our photochemical group, which is discussed in Chapter 2.1.11 [1, 2, 3, 4, 5, 6, 7, 8]. Details about the fate of organic compounds in the frozen aqueous solutions under the UV irradiation have been established in these papers. However, to understand it well and to be able to predict rates of transformations in natural ice matrix, the study of UV/vis absorption spectra in the frozen aqueous solutions was necessary. During the time of measuring, processing, and sorting out the measured spectra, we recognized that besides the absorption characteristics as such, much more information can be obtained; this includes those about aggregation, protonation, and solvation of the probe molecules.
The absorption of light is the first precondition for any photochemical reaction. If the absorption characteristics of the species in the frozen aqueous solutions are altered, the number of excited molecules could be higher or lower compared to the solution. Also, the effect of internal light filter of the solutes should be considered.
My first task was to measure UV/vis absorption spectra of some representative compounds that can serve as models for environmental pollutants found in natural snow.
The photoproducts of irradiation of halobenzenes in the frozen aqueous solutions are predominantly coupling products [1, 2, 3, 7]. These observations imply the existence of aggregates of organic molecules in the frozen aqueous solutions. This phenomenon is also known as a freezing concentration enhancement [9, 10]. However, the measurement of the actual concentration at the ice boundary layer is demanding by an experiment. One possibility is to measure the absorption spectra of compounds, whose spectra are being changed with the concentration.
This became the second topic of my research: obtaining the information related to the concentration of organic compounds in the frozen aqueous solutions. Changes in the absorption spectra of methylene blue with the concentration, freezing rate, and temperature were examined.
The acids are common pollutants of the ice and snow [11, 12,13]. The localization [14, 15], ionization [16,17], and migration [18,19, 20] of acids molecules on the ice are all current topics of research. We contributed to this field by the search of the concentrations and availabilities of protons in the frozen aqueous solutions for various acids. We observed the absorption spectra
9

of different forms of cresol red in the frozen aqueous solutions; the spectra represent the proton availability at the boundary.
The frozen aqueous solutions with the probe molecules form unique microenvironment which can be characterized also by the solvatochromic parameters. By this approach, we can get fairly general picture of the interactions between the solute and the frozen ice and within the solute itself. Spectroscopic properties of some solvatochromic dyes were used to determine the Kamlet-Taft and Riechardt's solvatochromic parameters in the frozen aqueous solutions in this work.
The information relevant to the assigned topic is introduced in the Chapter 2. Attention is paid first to the properties of pure ice and to the ice with contaminants. The methods we use for investigation of the frozen aqueous solutions are introduced later; such as the concept of solvatochromism and the spectroscopic properties of methylene blue and cresol red. The Chapter 3 describes our results which have been published in two papers [21, 22]; the third one will be submitted for publication soon. All of them are attached to this dissertation in the Appendices. Finally, conclusions are presented in the Chapter 4.
10

Chapter 2
Review of the Literature
2.1 Ice 2.1.1 The importance of ice The whole character of the planet Earth depends on the abundance of water and on the temperature being such that all phases - ice, liquid, and vapour - are present in significant quantities. At the present time, the oceans cover 70% of the globe, and 10% of the land mass is covered with ice to depths of up to several kilometers [23]. The comfortable situation for mankind at the present time depends on two delicately balanced equilibria. The first is that between the radiation received from the Sun and that reflected or re-radiated from the Earth. The resulting global average temperature is highly sensitive to the amount of snow, ice, and cloud cover. The second equilibrium concerns the evaporation of water from the oceans, leading to snowfall over the polar regions and subsequent flow of the ice sheets back into the oceans.
Ice which we are familiar with is Ih crystalline phase. It is just one of at least 14 crystalline phases which have been observed under different conditions of pressure and temperature. The crystal structures of ice Ih and those of many of the other phases are unusual because, although the molecules lie on a regular crystal lattice, there is disorder in their orientations. This feature introduces a whole series of distinctive properties, of which the most significant are the electrical polarizability and conductivity. Ice can be described as a protonic semiconductor, and the theory of its electrical properties is now well developed.
Describing the pure ice we must recognize two stages. The crystallographic structure provides a link between individual molecules and the properties of single crystals, but on a large scale ice is polycrystalline and the mechanical properties in particular are dependent on this polycrystallinity. The property of ice changes significantly with the presence of a dopant.
2.1.2 Structure of ice Ice Ih is the normal form of ice obtained by freezing water at atmospheric pressure or by direct condensation from water vapor above about 100 °C. The number ' ľ was assigned by Tammann in 1900 following his discovery of the first of the high-pressure phases of ice, and the h is
11

commonly added to distinguish this normal hexagonal phase from a metastabe cubic variant called ice Ic [24].
When ice condenses from the vapour it usually forms single crystals [25]. These have a variety of shapes, including beautiful snow flakes, platelets and less commonly needles depending on the conditions. When liquid water freezes single crystals are nucleated initially, and these may be attached to the walls of the container or float on the surface. A few isolated nuclei form platelets lying on the surface with the oaxes vertical, and as these grow across the surface and then downward they form columnar grains with their oaxes parallel; this is called S1 ice. This form of ice is preferd in slow freezing condition. The fast freezing, on the other hand, produces S2 ice with their c- axes approximately horizontal. Polycrystalline ice with randomly oriented grains (Tl ice) can be produced in the laboratory by flooding compacted snow with water at 0 °C and then freezing. Single crystals are required for many experiments. In the laboratory they can be formed simply by cooling an open vessel containing water under controlled conditions, or much more quickly and stably if surface cooling is achieved by rapid evaporation from the surface under reduced pressure [26].
The crystal structure of ice was well determined by neutron beam scattering technique [27] and by NMR experiments [28]. The results can be summarized as follows: ice is built up of water molecules in such a way that each molecule is linked by hydrogen bonds to four others at the corners of a regular tetrahedron, offering protons to two neighbors and accepting hydrogen bonds from two others. The 0-0 distance is approximately 2.76 Á, and the proton lies about 0.985 Á from one of the oxygen atoms. The molecules are arranged in a hexagonal lattice. The lattice parameters at a typical temperature of 253 K are a = 4.519 Á and c = 7.357 Á, and there are four molecules per unit cell, giving a density of 3.074 x 1028 molecules per m3, which is equivalent to 0.9197 Mg M - 3 .
Subject to the above constraints there is no long-range order in the orientations of the molecules. For a specified arrangement of oxygen atoms the disorder amongst the hydrogens is described by the 'ice-rules' [29]:
1. there are two hydrogens adjacent to each oxygen
2. there is only one hydrogen per bond.
This disorder leads to the Pauling entropy approximately equal to fceZn(3/2) per molecule, and many properties of ice are a consequence of this disorder.
The H-O-H angle of 104.52° in the free water molecule does not exactly fit into the 0-0-O angle of 109.47° in the tetrahedral structure, and a complication arising from the disorder is that molecules are subject to small displacements off their average sites. These facts lead to difficulties in determining the actual structure and understanding it in detail in terms of the bonding between molecules.
2.1.3 Electrical properties of ice
When an electric field is applied to a specimen of ice three distinct processes occur [23]:
12

1. The individual molecules are polarized by the electric field. This involves displacements of the electrons relative to the nuclei and small distortions of the molecules under the restoring forces. These are processes which occur in any material. The response to a change in field is very rapid, so that the effects are independent of frequency up to microwave frequencies.
2. The ice is polarized by the reorientation of molecules or bonds. Put in another way, the energies of some of the proton configurations that are compatible with the ice rules are lowered relative to others, so that in thermal equilibrium there is a net polarization of the ice. The achievement of this equilibrium state is a comparatively slow process, requiring thermal activation and local violations of the ice rules.
3. With suitable electrodes a steady current flows in accordance with Ohm's law. There is no detectable electronic conduction in ice and the observed current arises from a flow of protons. Because the conduction process has features in common with electronic conduction in semiconductors ice is sometimes referred to as a 'protonic semiconductor'.
2.1.4 Protonic point defects
Bjerrum [30] recognized that for polarization or electrical conduction to be possible in ice there must be a number of places in the lattice at which the ice rules are locally violated. Once such defects are present, even in small numbers, their motion has the effect of reorienting the molecules along their path and so changing one Pauling configuration into another. The defects proposed by Bjerrum are specific to ice-like structures and are referred to as protonic point defects to distinguish them from more conventional point defects such as vacancies and interstitials. Figure 2.1 shows how the four types of protonic point defect can be formed from the perfect structure of ice. If the single molecule A is turned to a new orientation, it produces one bond with no protons and another in which two protons are pointing towards one another. This is clearly a very unstable situation but further turns of neighboring molecules can separate the defective bonds. Bjerrum called these incorrectly formed bonds orientation faults, but, following Gränicher [31], they are now known as Bjerrum defects. The empty bond is an L-defect (from the German leere = empty) and the bond with two protons is a D-defect (from doppeltbesetzte = doubly occupied). The other two defects in Figure 2.1 are the H 3 0 + and OH~ ionic defects, formed by the transfer of a proton from one molecule to a neighboring molecule, and separated by successive jumps of protons from one end of a hydrogen bond to the other. This ionization reaction
2H20 # H30+ + OFT
is a familiar process in liquid water, but in ice the ions do not move as complete entities. The oxygens cannot move from one site to another, and the motion of a proton along a bond transfers the state of ionization from one molecule to another.
The motion of an ion or Bjerrum defect through the crystal will follow a zig-zag path along appropriately oriented bonds, reorienting both molecules and bonds along its track. The propagation of the H 3 0 + ionic defect and D-defect is shown in Figure 2.2.
13
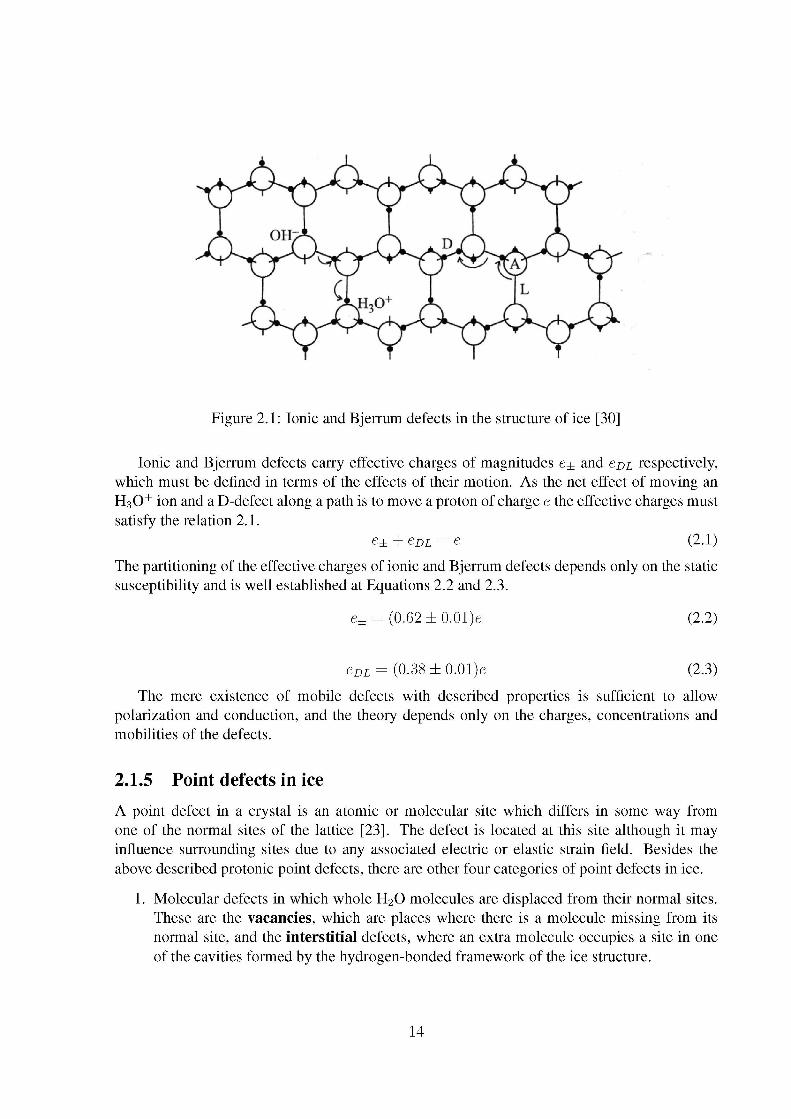
Figure 2.1: Ionic and Bjerrum defects in the structure of ice [30]
Ionic and Bjerrum defects carry effective charges of magnitudes e± and eoL respectively, which must be defined in terms of the effects of their motion. As the net effect of moving an H 3 0 + ion and a D-defect along a path is to move a proton of charge e the effective charges must satisfy the relation 2.1.
e± + eDL = e (2.1)
The partitioning of the effective charges of ionic and Bjerrum defects depends only on the static susceptibility and is well established at Equations 2.2 and 2.3.
e± = (0.62±0.01)e (2.2)
eDL = (0.38±0.01)e (2.3)
The mere existence of mobile defects with described properties is sufficient to allow polarization and conduction, and the theory depends only on the charges, concentrations and mobilities of the defects.
2.1.5 Point defects in ice
A point defect in a crystal is an atomic or molecular site which differs in some way from one of the normal sites of the lattice [23]. The defect is located at this site although it may influence surrounding sites due to any associated electric or elastic strain field. Besides the above described pro tonic point defects, there are other four categories of point defects in ice.
1. Molecular defects in which whole H20 molecules are displaced from their normal sites. These are the vacancies, which are places where there is a molecule missing from its normal site, and the interstitial defects, where an extra molecule occupies a site in one of the cavities formed by the hydrogen-bonded framework of the ice structure.
14
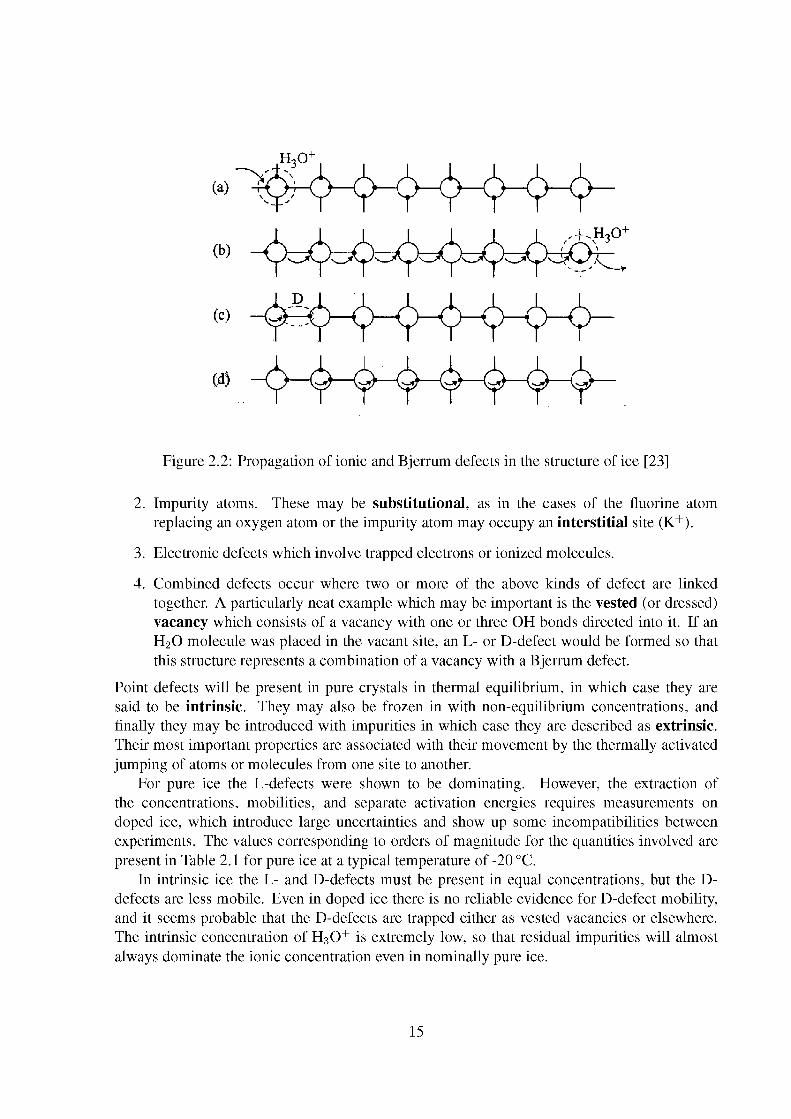
Figure 2.2: Propagation of ionic and Bjerrum defects in the structure of ice [23]
2. Impurity atoms. These may be substitutional, as in the cases of the fluorine atom replacing an oxygen atom or the impurity atom may occupy an interstitial site (K+).
3. Electronic defects which involve trapped electrons or ionized molecules.
4. Combined defects occur where two or more of the above kinds of defect are linked together. A particularly neat example which may be important is the vested (or dressed) vacancy which consists of a vacancy with one or three OH bonds directed into it. If an H20 molecule was placed in the vacant site, an L- or D-defect would be formed so that this structure represents a combination of a vacancy with a Bjerrum defect.
Point defects will be present in pure crystals in thermal equilibrium, in which case they are said to be intrinsic. They may also be frozen in with non-equilibrium concentrations, and finally they may be introduced with impurities in which case they are described as extrinsic. Their most important properties are associated with their movement by the thermally activated jumping of atoms or molecules from one site to another.
For pure ice the L-defects were shown to be dominating. However, the extraction of the concentrations, mobilities, and separate activation energies requires measurements on doped ice, which introduce large uncertainties and show up some incompatibilities between experiments. The values corresponding to orders of magnitude for the quantities involved are present in Table 2.1 for pure ice at a typical temperature of -20 °C.
In intrinsic ice the L- and D-defects must be present in equal concentrations, but the D-defects are less mobile. Even in doped ice there is no reliable evidence for D-defect mobility, and it seems probable that the D-defects are trapped either as vested vacancies or elsewhere. The intrinsic concentration of H 3 0 + is extremely low, so that residual impurities will almost always dominate the ionic concentration even in nominally pure ice.
15

Defect Effective Intrinsic Activation Mobility fii Activation charge e^/e concentration energy of pair [m2 V"1 s"1] energy of
rii/N formation E±,EDL[eV]
motionií^leV]
H3O+ +0.62 < 10"13 > 1-4 IO-7 « 0 OH- -0.62 3 x 10"8 « 0 D+ +0.38 IQ"7 0.66-0.79 ^C fi4 ? L" -0.38 2 x 10"8 0.2-0.3
Table 2.1: Parameters for intrinsic protonic point defects in ice at —20 °C
2.1.6 Chemical impurities
Impurity atoms at interstitial or substitutional sites constitute one kind of point defect, but although many materials are highly soluble in water, solubilities in ice are very small [23]. When aqueous solutions are frozen the solute is largely rejected into the liquid. These impurities may subsequently by incorporated into the ice as inclusions of concentrated solution (as in sea ice), or trapped in grain boundaries, but they are not then in solid solution at sites in the ice lattice. The electrical properties of ice are, however, very sensitive to small concentrations of certain impurities that can be incorporated in the hydrogen bonded network to generate protonic point defects. Therefore, the methods based on the measurements of conductivities are the methods of choice for the studies of impurities.
The HF and HCl are some of the most soluble and active dopants for ice, though doped samples are unstable with respect to loss of the dopant by out-diffusion. For HF in ice the diffusion parallel to the c-axis at -10 °C was found DHF = (1.08 ± 0.01) x 10"11 m V 1
with an activation energy of 0.200 ± 0.002 eV. The diffusion coefficient perpendicular to the c-axis was 20% higher and that in polycrystals 25% higher due to diffusion along boundaries. Such diffusion coefficients are ~ 5000 times larger than the coefficient of self-diffusion, which implies that molecules of HF move comparatively easily into and between interstitial sites. The halogen atom occupies the water place in the lattice and creates the L-defects and H 3 0 + ions (Figure 2.3). It seems that L-defects are fully dissociated from the halogen sites. HCl ionizes as a weak acid in the ice. The maximum solubility of HCl in ice at -10 °C is 3 x 10~6 mole fraction. The partition coefficient for crystal growth from very dilute solution was deduced to be 2.5 x IO-4 [12].
NH3 is soluble in ice at small concentrations (< 0.001 mol. dm -3), though subject to out-diffusion. The main effect of the doping is to the introduction of OH~ ions. It is an open question whether NH3 enters the lattice substitutionally or interstitially. But according to the below described experiments with NH4F it seems that NH^ sit in the substitutional positions.
Alkali hydroxides (KOH has been studied most extensively) have very low solid solubility in ice. To incorporate them, the ice must be frozen quickly from relatively concentrated (100-1000 mole p.p.m.) solution and then stored at a low temperature. Figure 2.4 suggests how KOH will
16

Figure 2.3: The introduction of an HF molecule in place of one of the H20 molecules with the subsequent release of an L-defect and an H 3 0 + ion. [32, 33]
be incorporated in the ice lattice to release both an L-defect and OH~ ion. The K+ is assumed to occupy an interstitial site, though there is no direct evidence for this. When an aqueous solution is frozen the anions and cations are not necessarily incorporated in the proportions originally present in the solution. In the case of sodium chloride, for example, the Cl~ enters the ice as HCl leaving the Na+ and OH~ in the liquid phase, and the electrical properties of ice formed in this way are indistinguishable from those of ice frozen from an HCl solution. This has unforeseeable effects which will be described in the next chapter.
A compound which is remarkable for its high solubility in ice is NH4F. For its concentration it has very much less effect on the electrical properties than HF. If both the NH^ and F~ ions occupy H20 sites in the lattice there is no surplus of deficit in the number of protons and so no extrinsic ionic or Bjerrum defects will be formed.
There is an evidence that all larger anions like SO J2 or NO ~ are present in liquid inclusions at grain boundaries or grain boundary junctions and do not incorporate much into the ice lattice (NO ~ solubility in ice ~ 1.2 x 10~7) [13]. The Scanning electron microscope and an energy-dispersive X-ray microanalyzer were used to determine the location of sulphur in the natural ice [11]. Sulphur is present as the SOJ2 species with the liquid concentration of 7.5 fjM. The analysis showed that sulphur was not present in the bulk of the ice nor along two grain boundaries. However, at the junctions where three grains met (triple-junctions), sulphur was found in concentrations greater than 1 M in areas of < \\irn2. Calculations suggest that between 40 and 100 % of sulphuric acid present in this ice was found at the triple-junctions and would be liquid to the eutectic temperature (-73 °C). At this temperature the sulphuric acid would have 4.9 M concentration and the area of triple-junction would be ~ 0.5/xm2.
Apart form these measurements and the effects of dopants in introducing protonic point defects, there is quite little information available about impurities in ice. This is because their concentrations are so low that they are very difficult to study. Even if the concentrations are
17

Figure 2.4: Proposed model for the incorporation of KOH in the ice structure. The K+ occupies an interstitial position and the OH~ is initially at A with no proton on the bond AB. Proton jumps as indicated can release either an OH~ ion or an L-defect or both. [34]
low, the role of ice is important to these impurities in catalyzing atmospheric reactions and in transporting and storing environmentally important materials.
2.1.7 Freezing induced electric potentials
It was found more than 55 years ago that, upon freezing of dilute aqueous salts solution (10~3 to 10~6 normal), relatively large potential differences develop between the water and the ice. These potential difference can be as large as 230 V with a weak solution of ammonium hydroxide [35]. The observed electric effect results from freezing. It starts when freezing starts, and stops when freezing stops. The potential barrier is at the water-ice interface; it persists during mechanical stirring of the liquid phase. A reverse potential was not observed during melting because of prior neutralization through the semiconducting ice. When random crystal orientation results from spontaneous freezing because of a high degree of supercooling, little or no electrical effect was observed. The sign and magnitude of the potential difference developed and the quantity of charge separated during freezing were functions of the kind and amount of contaminants in solution with the water.
The theory to qualitatively and quantitatively explain this phenomenon was developed by Bronshteyn and Chernov [9]. The freezing (crystallization) potential arises from the difference in distribution coefficients for impurity cations (K+) and anions (A -) between crystal and melt. Space charge layer parallel to the ice-water interface is formed in the ice by the predominantly trapped ions at the beginning of solidification. An excess of counterions accumulates in the water next to the interface. The impurity cations and anions in ice are then neutralized by highly mobile OH~ and H 3 0 + groups (ionization defects) supplied by thermal dissociation of H20 molecules in ice. Uncompensated ionization defects remaining after neutralization are moved
18
Substance Max. potential of liquid with respect
to ice [V]
Normality xlO"6
Max. charge separation [ellemental separeded units of charge/cubic
centimeter]
NaF +21 20 530000 NaCl +30 100 92000 NaBr +19 50 88000 Nal +2 10 Negligible NH4CI -105 70 104000 NH4OH -232 30 260000 NH4F +9 1000 82000 Pb(Ac)2 -100 ? 14000 CaC03 +20 50 9000
Table 2.2: Electrical characteristics of various solutions/ice systems [35]
by the electric field to the growing interface, encountering and neutralizing ions of solute. Thus the space charge layer of impurity follows the growth front. At the same time the oppositely charged layer of counterions is pushed ahead of the interface. The potential difference between the two layers considered as capacitor plates is the freezing potential. It is calculated taking into account a current of OH~ and H 3 0 + ions from water to ice. The theory predicts that the freezing potential arises only when the product of growth rate and impurity concentration at the front exceeds a critical value that depends on pH, at which point the potential increases with the growth rate up to tens and hundreds of volts. In the calculation of freezing potential they considered the crystal thickness, rate of crystal growth, initial solute concentration, and the pH of water. In the case of instability of the ice crystallization front the theory predicts a rapid neutralization of the electrical charge in ice, a decrease of the crystallization potential, and a substantial change in acidity of the water remaining unfrozen.
These theoretical calculations were found to be valid by experimental confinement [10]. They monitored the freezing potential and pH of the remaining unfrozen water of NaCl solutions as a function of freezing rate. They found high freezing potential with high freezing rate and high pH change with slow freezing rate. Also the freezing potential was diminished by added glycerine or DMSO. These findings should be considered when cryoprotection is used for biological materials [36]. Some examples of measured freezing potentials are in Table 2.2 [35].
Whenever the potential of liquid with respect to ice is positive it means, that cations does not incorporate into the ice as much as anions. An example is NaCl where the distribution coefficient for Cl~ incorporation is much higher than Na+. In the series of sodium fluoride, chloride, bromide and iodide, the measured charge separation decreases in going from fluorine to iodine. The small fluoride anion incorporates into the ice structure in large amount and cause
19
a high current to flow. On the other hand the iodide nearly does not incorporate into the ice lattice and so negligible charge separation is observed.
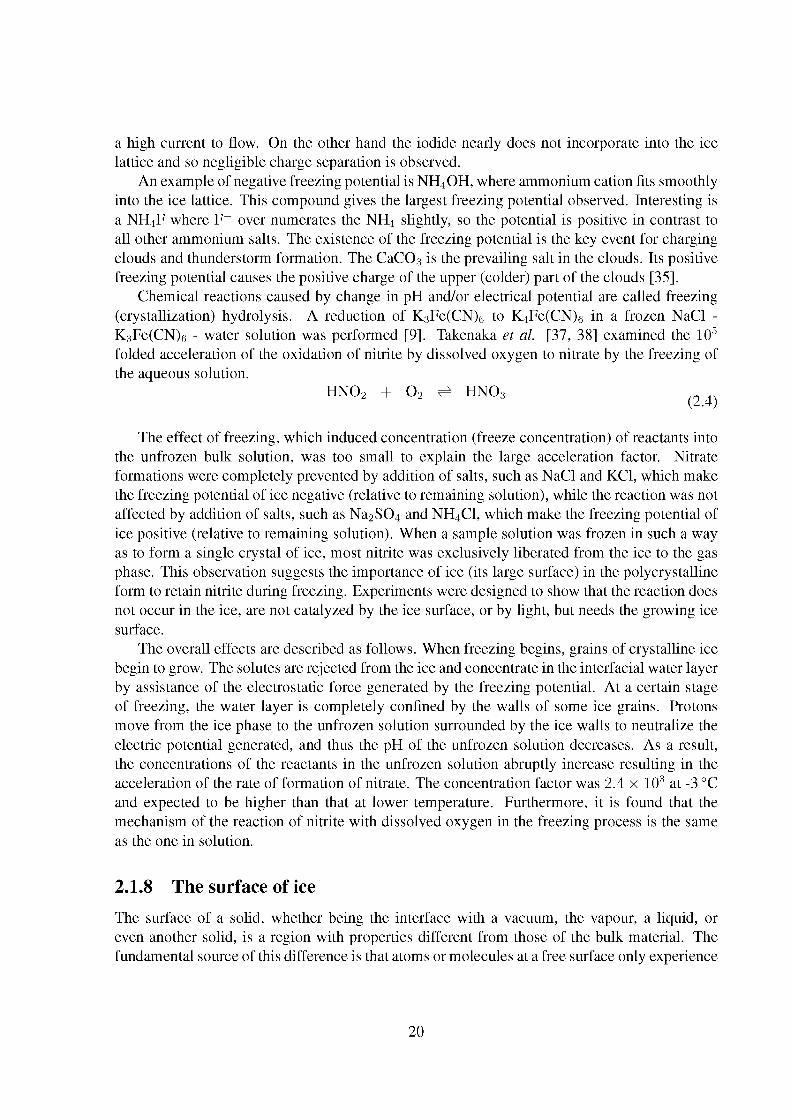
An example of negative freezing potential is NH4OH, where ammonium cation fits smoothly into the ice lattice. This compound gives the largest freezing potential observed. Interesting is a NH4F where F~ over numerates the NH4 slightly, so the potential is positive in contrast to all other ammonium salts. The existence of the freezing potential is the key event for charging clouds and thunderstorm formation. The CaC03 is the prevailing salt in the clouds. Its positive freezing potential causes the positive charge of the upper (colder) part of the clouds [35].
Chemical reactions caused by change in pH and/or electrical potential are called freezing (crystallization) hydrolysis. A reduction of K3Fe(CN)6 to K4Fe(CN)6 in a frozen NaCl -K3Fe(CN)6 - water solution was performed [9]. Takenaka et al. [37, 38] examined the 105
folded acceleration of the oxidation of nitrite by dissolved oxygen to nitrate by the freezing of the aqueous solution.
HN02 + 0 2 # HNO3
The effect of freezing, which induced concentration (freeze concentration) of reactants into the unfrozen bulk solution, was too small to explain the large acceleration factor. Nitrate formations were completely prevented by addition of salts, such as NaCl and KCl, which make the freezing potential of ice negative (relative to remaining solution), while the reaction was not affected by addition of salts, such as Na2S04 and NH4C1, which make the freezing potential of ice positive (relative to remaining solution). When a sample solution was frozen in such a way as to form a single crystal of ice, most nitrite was exclusively liberated from the ice to the gas phase. This observation suggests the importance of ice (its large surface) in the polycrystalline form to retain nitrite during freezing. Experiments were designed to show that the reaction does not occur in the ice, are not catalyzed by the ice surface, or by light, but needs the growing ice surface.
The overall effects are described as follows. When freezing begins, grains of crystalline ice begin to grow. The solutes are rejected from the ice and concentrate in the interracial water layer by assistance of the electrostatic force generated by the freezing potential. At a certain stage of freezing, the water layer is completely confined by the walls of some ice grains. Protons move from the ice phase to the unfrozen solution surrounded by the ice walls to neutralize the electric potential generated, and thus the pH of the unfrozen solution decreases. As a result, the concentrations of the reactants in the unfrozen solution abruptly increase resulting in the acceleration of the rate of formation of nitrate. The concentration factor was 2.4 x 10³ at -3 °C and expected to be higher than that at lower temperature. Furthermore, it is found that the mechanism of the reaction of nitrite with dissolved oxygen in the freezing process is the same as the one in solution.
2.1.8 The surface of ice
The surface of a solid, whether being the interface with a vacuum, the vapour, a liquid, or even another solid, is a region with properties different from those of the bulk material. The fundamental source of this difference is that atoms or molecules at a free surface only experience
20

bonding forces to other molecules from one side; and at other interfaces there is a similar imbalance. This results in displacements of atoms from their normal sites, changes in the energies and force constants, and consequent effects on the layers below.
The structure of ice surface is of uppermost interest, and has become the largest field of current research within ice physics. The most of the chemistry of dopants takes place on the surface of ice. The topic is relevant to such practical issues as frost heave, friction and adhesion, or surface catalysis by ice particles of chemical reactions.
Enhanced conductivity
Ellipsometry
Oxygen disorder (X-ray)
; Surface conductivity
Proton channelling
:••:•; n.m.r. * :
1 10
i i i i i i i
H Tm-T (K)
Figure 2.5: Chart showing on a logarithmic scale the temperature range below the melting point TTO over which different techniques reveal special properties characteristic of the surface layer on ice. [23]
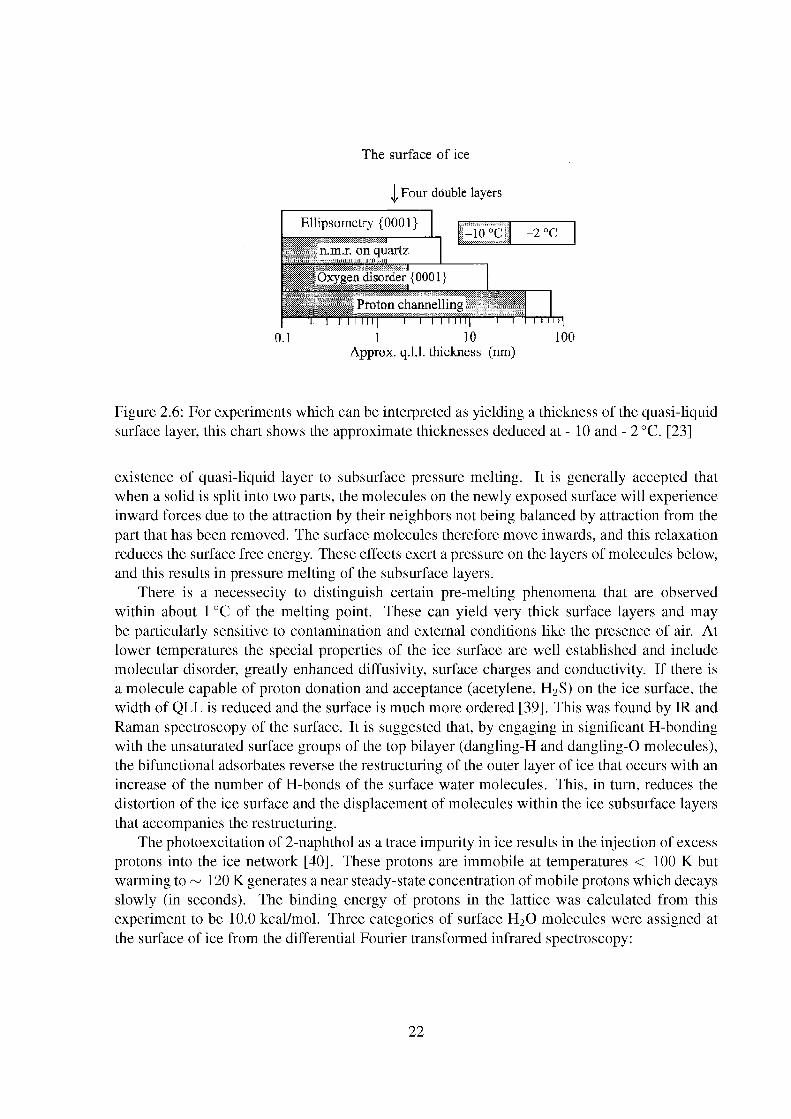
It is now well established that at high temperatures the surface of ice has properties that are very different from those of the bulk. Figure 2.5 indicates the temperature ranges over which such surface properties have been observed by different techniques. The differences may be largely determined by the nature and sensitivity of the techniques. In NMR, for example, one observes a new sharp line forming in the spectrum, whereas the surface electrical conductance has to be measured above the background arising from the bulk, and in X-ray diffraction one is looking for the diminution of an existing Bragg reflection. Nevertheless the temperature dependencies of some effects are certainly different. Where the techniques yield direct evidence of layer thickness, these are summarized in Figure 2.6 [23]. For the disordered layers of water molecules the term quasi-liquid has been accepted.
An important finding is, that one must by very cautious in interpreting these data because surface experiments are notoriously sensitive to surface contamination. It was, for example, found that optical observations of surface wetting were completely changed by exposure to air, and there is also the danger of accumulation of impurities from within the ice on a surface subjected to sublimation.
There is no complete satisfactory model for the special properties of the surface of ice observed at temperatures approaching the melting point. One of the models ascribes the
21
The surface of ice
I Four double layers
Ellipsometry {0001}
n.m.r. on quartz • ' -2°C
ä Oxygen disorder {0001}
I Proton channelling I ^ ^ ^ ™ ™ i h ™ , ™ ^ P » » . . r r | V . | r ^ i ľ 1 i i 11
0.1 1 10 Approx. q.1.1. thickness (nm)
100
Figure 2.6: For experiments which can be interpreted as yielding a thickness of the quasi-liquid surface layer, this chart shows the approximate thicknesses deduced at - 10 and - 2 °C. [23]
existence of quasi-liquid layer to subsurface pressure melting. It is generally accepted that when a solid is split into two parts, the molecules on the newly exposed surface will experience inward forces due to the attraction by their neighbors not being balanced by attraction from the part that has been removed. The surface molecules therefore move inwards, and this relaxation reduces the surface free energy. These effects exert a pressure on the layers of molecules below, and this results in pressure melting of the subsurface layers.
There is a necessecity to distinguish certain pre-melting phenomena that are observed within about 1 °C of the melting point. These can yield very thick surface layers and may be particularly sensitive to contamination and external conditions like the presence of air. At lower temperatures the special properties of the ice surface are well established and include molecular disorder, greatly enhanced diffusivity, surface charges and conductivity. If there is a molecule capable of proton donation and acceptance (acetylene, H2S) on the ice surface, the width of QLL is reduced and the surface is much more ordered [39]. This was found by IR and Raman spectroscopy of the surface. It is suggested that, by engaging in significant H-bonding with the unsaturated surface groups of the top bilayer (dangling-H and dangling-0 molecules), the bifunctional adsorbates reverse the restructuring of the outer layer of ice that occurs with an increase of the number of H-bonds of the surface water molecules. This, in turn, reduces the distortion of the ice surface and the displacement of molecules within the ice subsurface layers that accompanies the restructuring.
The photoexcitation of 2-naphthol as a trace impurity in ice results in the injection of excess protons into the ice network [40]. These protons are immobile at temperatures < 100 K but warming to ~ 120 K generates a near steady-state concentration of mobile protons which decays slowly (in seconds). The binding energy of protons in the lattice was calculated from this experiment to be 10.0 kcal/mol. Three categories of surface H20 molecules were assigned at the surface of ice from the differential Fourier transformed infrared spectroscopy:
22

1. three-coordinated molecules with dangling H
2. three-coordinated water molecules with dangling O
3. relaxed four coordinated molecules [41].
Comparison of calculations with the experiment suggests that unannealed ice nanocrystal surfaces are disordered and very rough and that the surfaces of annealed nanocrystals are relatively smooth but still laterally disordered [42]. The structural feature which is found to be the most significant for the CF4 adsorbate uptake on annealed icy surfaces is a ubiquitous presence of rings of water molecules in the surface, since such rings provide favorable binding sites for the CF4. There is found a broad ring size distribution in the annealed ice surface, including rings large enough to accommodate several CF4 molecules. Such large rings are likely to provide favorable sites for acid ionization on icy surfaces.
Speciation of HCl on the ice surface was examined by Cs+ ion scattering technique on the nonporous amorphous ice films [16]. The FTIR, Monte Carlo simulations and ab initio calculations were joined together to study HCl and HBr solvation and ionization on the cold ice particle surfaces [43]. The amount of ionization was shown to increase with temperature and to be concentration dependant. The transition point pHT of HCl at 20 % coverage of the ice surface lies around 80 K. Predominantly molecular HCl was detected below 70 K, whereas at 140 K the ionization was complete. With higher surface coverage (30 %) the temperature of transition point decresses to ~ 60 K. This was rationalized by the preferential self-ionization of the acid compared to the water. The molecular form of the acid on the ice surface is represented by two absorption bands. These originate from singly and doubly coordinated HCl molecules according to Monte Carlo simulation and ab initio calculation.
Also two forms of undissociated HCl molecules (named a and /3-states) were observed on the ice surface at 100 K by Cs+ reactive ion scattering, low energy sputtering, and temperature -programmed - desorption mass spectrometry [18]. The authors did not discuss whether they are the same as in the [43] or not. The acid molecules in these two states have distinct termal behaviour. The molecules in the a-state desorb at 135-150 K, whereas those in the /3-state first become ionized and then desorb via recombinative reaction at 170 K. When HCl is covered by a water overlayer at 100 K, its ionization efficiency is enhanced, but a substantial portion of HCl remains undissociated as molecules or contact ion pairs.
The ionization of HCl on the ice surfaces calculated by ab initio methods and was found to be a barrierless process [17] in contrast to the above-mentioned observations and calculations.
If the amount of HCl on the ice surface accedes monolayer, the ionic hydrates were recognized [19]. The kinetics of conversions of ice nanocrystal arrays to the amorphous acid dihydrate (for HBr), and amorphous monohydrate (for HCl) was followed at 110 ~ 125 K. The rate-determining step was identified to be the HX diffusion through the hydrate product crust toward the interracial reaction zone.
The diffusion coefficient of the HCl hydrate at 190 K was lowered from (5.1 ± 1.7) x 10~ncm2s~1 in the pure ice to the (1.2 ± 0.5) x 10~ncm2s~1 for the iniciál molar ratio of Na/Cl = 0.04 and further to less than 9.0 x 10_13cm2s_1 for the ratio 0.5 [20]. The effect is attributed to anion-cation trapping.
23

The liquidlike phase was found in dilute NaCl aqueous solutions frozen at temperatures below the liquid-to-solid phase transition temperatures of H20 and NaC1.2H20 [44]. The fractions and concentrations of water and NaCl in this subeutectic quasi-brine layer were measured by 1H and 23Na NMR spectroscopy, and the experimental results compared to predictions derived from an equilibrium thermodynamic analysis. The highly concentrated liquid brines, or technically, quasi brine layers, were found to coexist with ice and solid NaC1.2H20 at temperatures as low as 228 K. In parallel experiments with a pure water sample, a far smaller liquid fraction was measured, suggesting that the added NaCl and not the dissolved gases or impurities was the primary determinant of the volume of this liquid phase.
2.1.9 Optical properties of ice
Figure 2.7 displays a chart of the electromagnetic spectrum showing the regions of absorption of transparency of ice. At low frequencies the response of ice to an alternating electric field arises from the Debye dispersion. In the infrared region of the spectrum waves can couple to the modes of vibration of the molecules or the lattice, providing evidence about the spectrum of these modes. As in any material, ultraviolet radiation can excite electronic transitions. In these three regions of the spectrum there is strong absorption of radiation, but between them in the radio and visible parts of the spectrum there are windows in which the ice is almost transparent.
Debye relaxation
'''MŠk^-^-:"::k:^^::--'::^iif-'-/\r' Radio/microwave window
1 km 1 m i ! i i 1 i i
1 mm 1
1 mn 1
Wavelength
1 kHz 1 i
1 MHz 1 GHz i 1 , , 1
1 THz 1
1000 THz 1
Frequency
Wave number
Photon energy
1 cm ' 1
1000 cmr1
1 Wave number
Photon energy
Wave number
Photon energy i_
lmeV 1 i
1 eV i 1 i
Figure 2.7: Chart of the electromagnetic spectrum showing the regions of absorption and transparency of ice. [23]
Quickenden et al. investigated the luminescence of UV-excited ice at 77 K [45, 46, 47, 48, 49, 50]. They found that luminescent photoproducts are produced by photolysis of H20 in the ice lattice and by subsequent photolysis or reactions of these photoproducts. Photolysis occurs
Lattice and molecular § u.V.
modes 'S
24

at wavelengths greater than 200 nm, despite the fact that the peak absorption of the dissociative 1Ai state of H20 occurs below 150 nm, because of weak, broad absorption tail. A similar tail is observed for H20 in rare-gas matrixes. Thermodynamically, dissociation of H20 in ice can occur for wavelengths as long as ~ 270 nm, due to stable trapping of the OH photoproduct in the ice lattice. Hence, ice absorption increases with irradiation time since more strongly absorbing photoproducts, such as OH, accumulate in the ice lattice. They found an increase in luminescence quantum efficiency from crystalline hexagonal ice Ih, to polycrystalline ice Ih, to amorphous ice and a change in the relative intensities of the 340- and 420-nm emissions. Otherwise the pattern of luminescence is the same for all ices prepared. Small- to medium-sized water clusters of ice (or nanocrystals) show completely different luminescence behavior compared to the bulk forms of ice. Irradiation of water clusters containing up to ~ 1500 molecules with UV photons from a synchrotron source yielded fluorescence excitation spectra similar to those of the free water molecule, rather than bulk ice [45]. It is characterized by the excited OH emission. The absorption maxima of ice were found at 280, 260, 245, and 235 nm. These corresponds well to the excitation peaks of luminescence. These maxima are successively assigned to the OH radical, 0 3 molecule, O^ anion and H2 radical (the most intense transition) [47].
Upon excitation at 260 nm, there are two luminescent components. The first one is long lived (with the lifetime ~ 1.3 s) broad banded at 427.1 ± 0.4 nm. The second one is short lived (lifetime < 10//m) vibrationally resolved with maxima at 350.4 369.6, 386.1 and 417 nm. Assignment of the long lived component remains uncertain. Most probably, it originates in spin-forbidden transition of OH. The shorter component is assigned to the Herzberg I or III systems of 0 2 luminescence. The inter-band spacing corresponds to 0 2 vibrations. The excited 0 2 is formed chemically and not by optical excitation of ground-state 0 2 produced in the ice lattice. The most probable mechanism of formation of excited oxygen is by reaction of mobile O atoms with accumulated O atoms trapped in the ice lattice.
The luminescence emitted by amorphous H20 ice at 78 K and 420 nm was found to be biexponential [48]. This is explained by existence of OH radicals in two distinct environments within the ice lattice.
The UV/vis absorption spectra of o-nitrobezyl derivatives were measured to monitor the extend of photofragmentation reaction in the ice [51]. This demonstrates the optical transparency of ice and, to the best of our knowledge is the only published UV/vis absorption spectrum of organic molecule in the ice.
2.1.10 Ice with the contaminants in the nature
The environmental and cosmochemical consequences [52, 53, 54] of interactions and reactions upon freezing on the surface of ice are being intensively studied [55, 5, 56]. Persistent, bioaccu-mulative, and toxic substances (PCBs) are of local, regional and/or global concern, depending on their mobility in the environment [57]. Accumulation of PCBs in the remote polar regions is the result of long-range transport in the atmosphere, precipitation and 'cold condensation'-progressive volatilization in relatively warm locations and subsequent condensation in cooler environments. One report of the organochlorinated deposition in snow from the mountain
25

ranges of western Canada can be found for example in [58]. It was found that the concentration of more volatile compounds incerases with increasing altitude.
The process of uptake of chemicals into nascent snow crystals can take place either by adsorption onto the surface of a precipitating snow crystal or through co-deposition with water into the growing crystals [5].
The existence of quasi liquid or quasi brine layer and premelting phenomena allows the migration of molecules even at low temperatures. Realization of this fact can lead to the reevaluation of data from ice cores [58], because it can be expected that post-depositional migration exists.
2.1.11 Photochemistry on the ice
(Photo)chemical processes in/on ice and snow are still not fully understand, although of high importace. Surface and near-surface reactions that are promoted by water ice most likely play a key role in the formation of the Antarctic ozone hole or may mediate some other chemical transformations. The most of the works on the ice chemistry concerns small molecules HCl, HNO3, CIONO2, N2O2 or chlorine peroxide (ClOOCl) [5]. Among the larger molecules, the photochemistry of thymine [59, 60] and of 4-nitrophenol [61] was examined in ice. Thymine formed dimer on the ice surface. The photorectivity of 4-nitrophenol in ice pellets was found similar to the photolysis in aqueous solution. The founded photoproducts were: hydroquinone, benzquinone, and 4-nitrosophenol. This is explained by the occurence of the compound in the quasi-liquid water layer on the surface of ice which is reactive especialy at higher (sub-zero) temperatures.
Complex and systematic work on the reactivity of valerophenone [2] and halogenated aromatic compounds on ice was done in our working groupe [1, 3, 6, 7, 62].
First the photochemistry of chlorobenzene in ice was examined [1]. It was found that the photolysis at > 254 nm provided very different photoproducts from those observed in liquid water where phenol derivatives are almost exclusively isolated. Thus, biphenyl and terphenyl as well as their chlorinated isomers were formed in ice, possibly via a free-radical mechanism, thanks to aggregation of the starting molecules even in very dilute solid solutions. Also the triphenylene photoproduct was observed, whose formation can lead through multi-step reaction. No reaction with the ice was observed. The production of biphenyls and terphenyls is, moreover, an environmentaly interesting topic. Such reactions can be a secondary source of pollution in the polar regions as well as in tropospheric ice cloud particles.
The photolysis of 0,/7-dichlorobenzene, bromobenzene, and p-dibromobenzene in water ice [3] gave parallel results to these of chlorobenzene. All phototransformations appeared to be based on dehalogenation, coupling, and rearrangement reactions in ice cavities. Again no photosolvolysis products were found.
Photolysis of 2- and 4-chlorophenol samples in water ice of the initial concentration from 10"7 to 10"2 mol l"1 was performed at temperatures -15 °C, -10 °C and -5 °C [6]. At temperatures below -10 °C the radical dehalogenation and consequent reaction on the benzen ring of the second molecule in the ground state was prevailing (~ 90%). The main products, chlorobiphenyldiols, belong to the family of phenolic halogenated compounds that are known
26

xenobiotics found in nature. Their formation is based on the coupling reactions due to chlorophenol aggregation at the grain boundaries of the polycrystalline state. The major and detected minor products of photolysis are shown in the Figures 2.8 and 2.9.
Major products
OH CI
OH OH ci
Minor products
CI OH OH
OH
Figure 2.8: Photoproducts idnetified from the photochemistry of 2-chlorophenol in ice [6].
Major product
OH
CI
^
Minor products
^OH H ° ~ W - \ \ t™
OH
Figure 2.9: Photoproducts idnetified from the photochemistry of 4-chlorophenol in ice [6].
Raising the temperature to -5 °C caused a moderate photosolvolytic activity in the case of 4-chlorophenol (formation of hydroquinone), in contrast to 2-chlorophenol which was almost exclusively transformed into pyrocatechol. It is appearent that at these high temperatures the water molecules on the surfaces of ice are feasible to react with the radicals formed photochemicaly opposite to the lower temperatures.
The toxic effects of photoproducts formed upon the photolysis of 2- and 4-chlorophenol frozen solutions in polycrystalline ice phase were determined with a bacterial luminescence test and found to be more toxic than the products of the same photoreaction in aquatic phase [4]. This finding support a model according to which solar radiation can trigger the formation of new types of organic pollutants in polar ice or tropospheric ice cloud particles, presenting possibly greater risk to the environment than the parent compounds.
Several aromatic carbonyl, chloro, nitro or hydroxy compounds, frozen in the ice-matrix samples, underwent very efficient sunlight-induced chemical changes in the Spitsbergen Island
27

(Svalbard) [6]. The irradiation of identical samples by medium-pressure mercury lamp or by the sun produced the same photoproducs.
Recently, the cage effect study of 4-methyldibenzyl ketone reveled, that diffusion is important on the ice surface still at temperatures below -50 °C for the initial ketone concentration in the range of 10~6-10~4 mol 1_1 [8]. In addition, the study of trapping the benzyl radicals formed in situ by CuCl2 was used as a qualitative probe of heterogeneous bimolecular reactions in the frozen aqueous matrix and on its surface. Molecules of both solutes were found to be segregated from the ice phase to the same location and underwent chemical reactions within diffusion of intermediates lifetimes limits.
2.1.12 Calculations of ice
There is endeavour in molecular dynamics simulation of water freezing [63] and salt water freezing accompanied by brine rejection (Luboš Vrbka, Pavel Jungwirth and Victoria Buch -unpublished results) and the structure of ice. The field is quite complex and therefore will not be covered in here. Only some relevant calculations supporting the experimental results were already mentioned [42, 43, 18, 19, 17] or follow.
It is appropriate to mention here the extensive work of Vakarin et al. [14, 15]. They use a random binding lattice gas model and reproduced well the absorption isoterms of HCl on the ice surface. They take into account the presence of three binding sites: the OH-sites, O-sites and point-defect sites which differ in binding energy to the HCl.
28

2.2 Solvatochromis
The ability of surrounding medium to bring about a change in the position, intensity, and shape of absorption bands of chemical compounds in UV/vis/near-IR is called solvatochromism [64]. By the surrounding medium is meant not only the liquid environments, but also that of solids, glasses, and surfaces. This extension can be formulated by the term perichromism (from Greek peri = around).
A hypsochromic (or blue) shift of the UV/vis/near-IR absorption band, with increasing solvent polarity is called negative solvatochromism. The corresponding bathochromic (or red) shift, with increasing solvent polarity, is termed positive solvatochromism. Solvatochromism is caused by differential solvation of the ground and first excited state of the light-absorbing molecule (or its chromophore): if, with increasing solvent polarity, the ground-state molecule is better stabilized by solvation than the molecule in the excited state, negative solvatochromism will result. Or vice versa, better stabilization of the molecule in the first excited state relative to that in the ground state, with increasing solvent polarity, will lead to positive solvatochromism.
The relation between sign of solvatochromism and the structure of solvatochromic dyes can be in short expressed by these statements: If the solute dipóle moment increases during the electronic transition, a positive solvatochromism normally results. In the case of a decrease of the solute dipóle moment upon excitation, a negative solvatochromism is usually observed.
To list some representatives of solvatochromic compounds, let us consider one for each group. The 4,4'-bis(Af,A^dimethylamino)-benzophenone (Michlers ketone, IUPAC name: bis[4-(dimethylamino)phenyl]methanone) exhibits positive solvatochromic effect. The solvatochromic absorption band corresponds to charge-transfer (ir <— ir*) transition. The termochromic effect, on the other hand, shows blue shift with increasing temperature [65] for temperature range 20 — 60 °C, in cyclohexane, di-wopropyl ether, benzene, 1,4-dioxane, and THE
I I
o
Scheme 2.1: Michler's Ketone; 4,4'-bis(Af,Af-dimethylamino)-benzophenone
Representative of negatively solvatochromic compounds is 4-(2,4,6-triphenyl-l-pyridinio)-2,6-diphenylphenolate (so called Reichardt's dye or ET(30), IUPAC name: 2,6-diphenyl-4-(2,4,6-triphenylpyridinium-l-yl)benzenolate). As a matter of fact, it is one of the compounds with the largest solvatochromic shift known.
Its intramolecular CT absorption band is hypsochromically shifted by 357 nm on going from diphenyl ether (\max = 810 nm) to water (\max = 453 nm). Solutions of Reichardt's dye are red in methanol, violet in ethanol, blue in 3-methyl-l-butanol, green in acetone, and yellowish-green in ethyl acetate. The high negative solvatochromism of Reichardt's dye stems from the
29
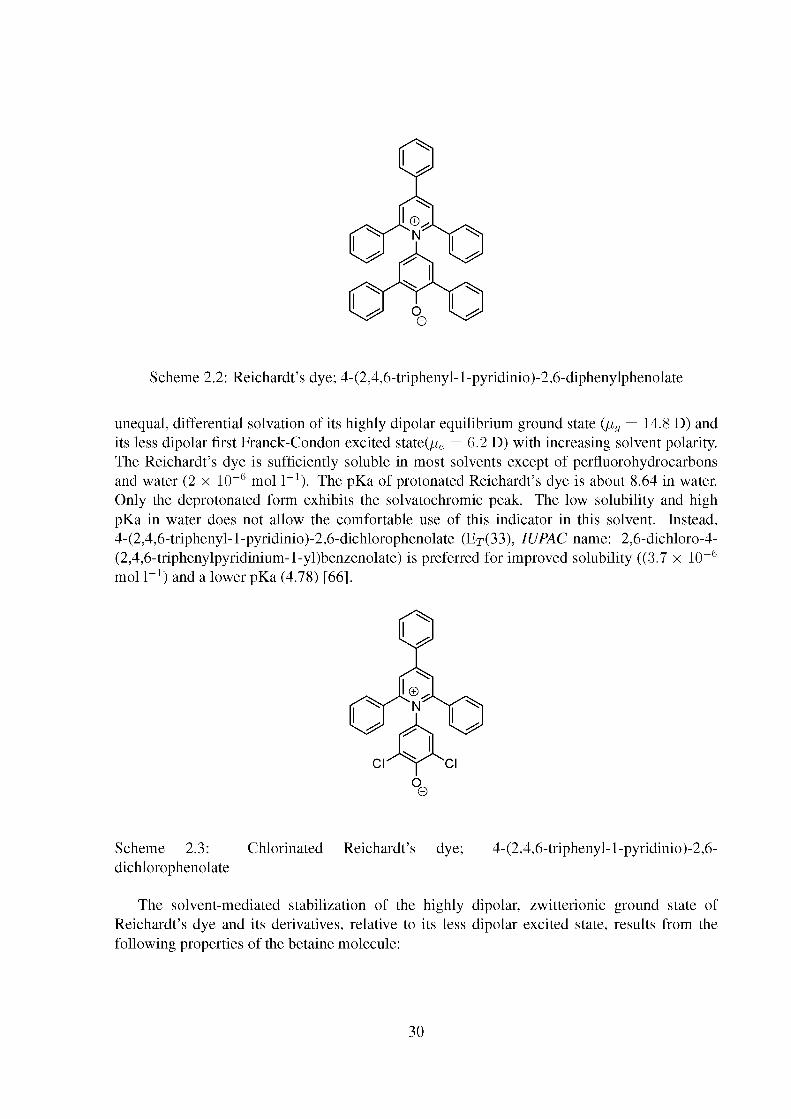
Scheme 2.2: Reichardt's dye; 4-(2,4,6-triphenyl-l-pyridinio)-2,6-diphenylphenolate
unequal, differential solvation of its highly dipolar equilibrium ground state (fig = 14.8 D) and its less dipolar first Franck-Condon excited state(//e = 6.2 D) with increasing solvent polarity. The Reichardt's dye is sufficiently soluble in most solvents except of perfluorohydrocarbons and water (2 x 10~6 mol 1_1). The pKa of protonated Reichardt's dye is about 8.64 in water. Only the deprotonated form exhibits the solvatochromic peak. The low solubility and high pKa in water does not allow the comfortable use of this indicator in this solvent. Instead, 4-(2,4,6-triphenyl-l-pyridinio)-2,6-dichlorophenolate (ET(33), IUPAC name: 2,6-dichloro-4-(2,4,6-triphenylpyridinium-l-yl)benzenolate) is preferred for improved solubility ((3.7 x 10~6
mol I -1) and a lower pKa (4.78) [66].
Scheme 2.3: Chlorinated Reichardt's dye; 4-(2,4,6-triphenyl-l-pyridinio)-2,6-dichlorophenolate
The solvent-mediated stabilization of the highly dipolar, zwitterionic ground state of Reichardt's dye and its derivatives, relative to its less dipolar excited state, results from the following properties of the betaine molecule:
30

1. It exhibits a large permanent dipóle moment, suitable for the registration of dipole/dipole and dipole/induced dipóle interactions.
2. It possesses a large polarizable ir electron system (with 42 ir electrons), suitable for the registration of dispersion interactions, which should be somewhat larger with the excited state than with the ground state, because excited states are always more polarizable than the corresponding ground states.
3. With the phenolate oxygen atom, it has a highly basic EPD center suitable for interactions with Brônsted acids (through H bonding) and Lewis acids (through EPD/EPA bonding).
The positive charge of the pyridinium moiety of Reichardt's dye is delocalized and sterically shielded, which minimizes the interaction with EPD solvents. Therefore, the CT absorption of Reichardt's dye depends also strongly on specific interactions with electrophilic solvents (HBD and EPA solvents), and only to a much lesser extent on specific interactions with nucleophilic solvents (i. e. EPD solvents).
Many different alternatives were proposed to measure solute-solvent interactions, resulting in a large variety of so-called solvent polarity scales based on diverse solvent-sensitive reference processes/empirical parameters (there are 184 parameters listed in a recent review [67]). Choosing a model system and recording the response of one of its parameters to the change of solvent have been the essence of the development of most of these scales. The model process must be chosen with care and represent properly the interactions of the system. Important is the understanding of the relationships between these various scales. While the early dream that a single parameter would somehow serve to describe a solvent has vanished, some still believes that there is a small number of identifiable classes of interactions between solvents and solutes [67].
The single parameter scales use just one parameter to describe the system. They are, therefore, of somewhat limited value in the correlation analysis of other solvent-dependent processes because they respond to a combination of nonspecific and specific solute/solvent interactions, which are typical for the chemical structure of the probe molecule. An example of single parameter empirical scale of solvent polarity is ET ' and E? scale (so called Dimroth-Reichardt scale).
ET [kcal mol-1] = hcvmaxNA = (2.8591 x 10_3)ž>rn,ox [cm-1] 28591/A^ [nm] (2.5)
ET ' values are based on the negatively solvatochromic Reichardt's dye as a probe molecule, and they are simply defined as the molar electronic transition energies (ET) of dissolved Reichardt's dye measured in kilocalories per mole at room temperature (25°C) and normal pressure (1 bar), according to Equation 2.5. vmax is the frequency and \max the wavelength of the maximum of the longest wavelength, intramolecular charge-transfer ir — ir* absorption band of Reichardt's dye. In the first publication, the betaine Reichardt's dye had, by accident, the formula number 30. Therefore, the number (30) was added in order to avoid confusion with ET, often used in photochemistry as abbreviation for triplet energy.
31

_ E^ (solvent) - E$0)(TMS) _ E^ (solvent) - 30.7 T E^ (water)-E^ (TMS) 3Ž4 ( 2 ' 6 )
In addition, so-called normalized E^ value has been introduced. They are defined according to Equation 2.6 as dimensionless figures, using water and tetramethylsilane (TMS) as extreme polar and nonpolar reference solvents, respectively. Hence, the E? scale ranges from 0.000 for TMS, the least polar solvent, to 1.000 for water, the most polar solvent. Ej, was measured for 360 solvents [64]. E{
T ' scale is defined in the same way as E{T ' only the 4-(2,4,6-triphenyl-l-
pyridinio)-2,6-dichlorophenolate is used. The correlation betweenEy and E{T ' is linear for
32 solvents [66] and can be expressed by Equation 2.7.
E{T0) = 0.979E{T3) - 7.461; N = 32; r = 0.9905 (2.7)
A temperature effect on the E^ in water is expressed by Equation 2.8.
193 4 1 ^ = 0 . 3 5 7 + ^ (2.8)
This linear relationship was determined from three points at temperatures 25, 50, 70 °C [68]. One of the most successful quantitative treatments of solvent effects by means of a multiparameter equation is that introduced by Kamlet and Taft in 1976 and called linear solvation energy relationship (LSER) [69]. They wrote an equation which describes any observable XYZ as a linear combination of individual components.
XYZ = (XYZ)o + S(TT* + do) + aa + bß + mö2H (2.9)
Using three UV/vis spectroscopically derived solvatochromic parameters, ir*, a, ß and 52H,
Equation 2.9 was established, where (XYZ)0, s, a, b, and m are solvent-independent coefficients characteristic of the process under study and indicative of its susceptibility to the solvent properties ir*, a, ß and 52
H. Their hope was that each of the parameters in Equation 2.9 described a truly fundamental aspect of solute solvent interactions. For any given process, the coefficients of these parameters would measure the relative importance of each type of interaction. The statistical methods were used to find out how many solvent parameters are essential to use and which are redundant. Marcus studied nine solvent parameters (a,ß,n*,E^ ', donor number, acceptor number, Z, acity, and basity) by linear correlation and found several to be highly interrelated. He concluded that there were four essentially independent solvent parameters: hydrogen-bond donation ability (described best by a), hydrogen-bond acceptor ability (ß), polarity/polarizability (ir*), and solvent stiffness (52
H) [70]. Principal component analysis applied on the 40 scales for 40 solvents revealed that most of the variation (>74%) in the data was described by just three principal components, whereas six components account for 90% of the variance. Also these mathematically derived scales seem not to be orthogonal (it means they are interdependent) [67]. These results of statistics on a large number of data justify the original simplification of Kamlet and Taft. So let us discus their parameters to some details.
The solvatochromic parameter ir* measures the exoergic effects of solute/solvent, dipole/dipole, and dipole/induced dipóle interactions. That is, it measures the ability of a solvent
32

to stabilize a neighboring charge or dipóle by virtue of nonspecific dielectric interactions. Therefore, ir* values represent a blend of dipolarity and polarizability of the solvent. The ir* is so named because it is derived from solvent effects on the ir — ir* absorptions of the seven nitroaromatics used as primary probe molecules [69]. Later it was proposed to measure the ir* scale using 4-nitroanisole as the primary probe [71]. When the absorption band of this probe is not well resolved, the absorption maxima of a secondary indicator JV,jV-dimethyl-4-nitroaniline is known to correlate with that of 4-nitroanisole by equation 2.10 for non-hydrogen-bond donors and equation 2.10 for primary and secondary amines.
^4-nitroanisole = °-7264i>N,N-dimethyl-4-nitroaniline + 1 3 8 4 0 cm~1 (2-10)
^4-nitroanisole = °-6089i>N,N-dimethyl-4-nitroaniline + 1 6 9 0 0 cm~1 (2Al">
The 7T* scale ranges form ir* = 0.00 for cyclohexane to ir* = 1.00 for dimethyl sulfoxide. The 7T* is defined by Equation 2.12. In correlating solvent effects a variable empirical polarizability parameter must be added to the first term of Equation 2.9. For aromatic solvents, 5 = 1.00, for polychlorinated aliphatic solvents, 5 = 0.50, and for all other aliphatic solvents, 5 = 0.00. This modification term is a less desirable, but necessary feature of the parameter ir*.
*(o\ v{S) - v [cyclohexane) = v{S) - 34120 71 [ } ~ v(DMSO) - v(cydohexane) ~ 31720 - 34120 l ' '
The solvatochromic parameter a is a quantitative, empirical measure of the ability of a bulk solvent to act as a hydrogen-bond donor (HBD) toward a solute. The solvatochromic comparison method for the determination of a values consists of the comparison of solvent-induced shifts of the longest wavelength ir — ir* absorption band of two similar (ideally homomorphic) probe molecules, one of which cannot act as hydrogen-bond acceptor toward HBD solvents, whereas the other can. An example of a pair of molecules used to determine an a scale is 4-nitroanisole (non hydrogen-bond accepting compound) and Reichardt's dye (hydrogen-bond accepting compound). According to the similarity (or homomorphism) of the two probe molecules, a plot of the absorption wavenumbers of Reichardt's dye against those of 4-nitroanisole gives, for non-HBD solvents, a straight reference line described by equation 2.13.
^ichardt's = az/4-nitroanisole + b (2.13)
HBD solvents fall off the line because of stronger hydrogen bonding of HBD solvents to the Reichardt's dye than to 4-nitroanisole. This supplementary enhanced band shift, induced in Reichardt's dye relative to 4-nitroanisole, is denoted AAi> and can be calculated from the deviation of HBD solvents from the reference line via Equation 2.14 for each HBD solvent.
^ r e i c h a r d t ' s - 4-nitroanisole = [az/4-nitroanisole + b] ~ ^ichardt's (2-14)
The a values can be also calculated from the ET(30) and ir* by the LSER (Eq. 2.15) because they can be, respectively, derived from the absorption maxima of Reichardt's dye and
33
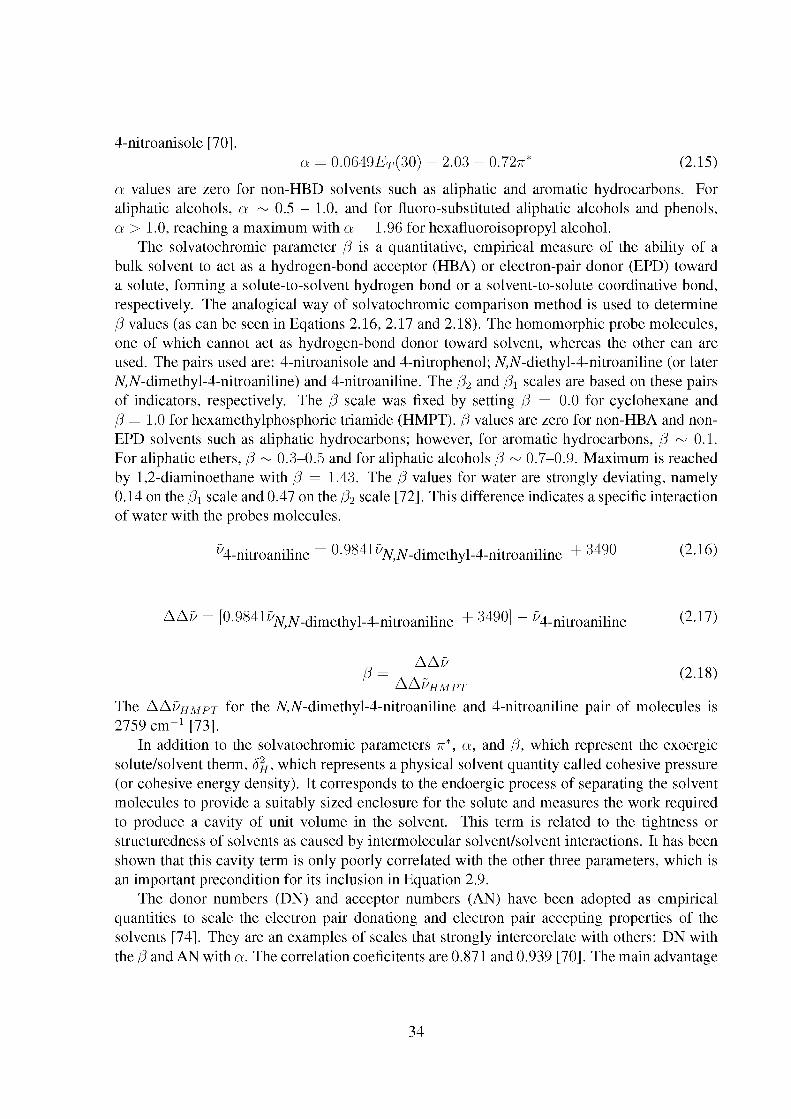
4-nitroanisole [70]. a = 0.0649^(30) - 2.03 - 0.72vr* (2.15)
a values are zero for non-HBD solvents such as aliphatic and aromatic hydrocarbons. For aliphatic alcohols, a ~ 0.5 - 1.0, and for fluoro-substituted aliphatic alcohols and phenols, a > 1.0, reaching a maximum with a = 1.96 for hexafluoroisopropyl alcohol.
The solvatochromic parameter ß is a quantitative, empirical measure of the ability of a bulk solvent to act as a hydrogen-bond acceptor (HBA) or electron-pair donor (EPD) toward a solute, forming a solute-to-solvent hydrogen bond or a solvent-to-solute coordinative bond, respectively. The analogical way of solvatochromic comparison method is used to determine ß values (as can be seen in Eqations 2.16, 2.17 and 2.18). The homomorphic probe molecules, one of which cannot act as hydrogen-bond donor toward solvent, whereas the other can are used. The pairs used are: 4-nitroanisole and 4-nitrophenol; jV,jV-diethyl-4-nitroaniline (or later jV,jV-dimethyl-4-nitroaniline) and 4-nitroaniline. The ß2 and ß\ scales are based on these pairs of indicators, respectively. The ß scale was fixed by setting ß = 0.0 for cyclohexane and ß = 1.0 for hexamethylphosphoric triamide (HMPT). ß values are zero for non-HBA and non-EPD solvents such as aliphatic hydrocarbons; however, for aromatic hydrocarbons, ß ~ 0.1. For aliphatic ethers, ß ~ 0.3-0.5 and for aliphatic alcohols ß ~ 0.7-0.9. Maximum is reached by 1,2-diaminoethane with ß = 1.43. The ß values for water are strongly deviating, namely 0.14 on the ß\ scale and 0.47 on the ß2 scale [72]. This difference indicates a specific interaction of water with the probes molecules.
^4-nitroaniline = 0-9841^,A^dimethyl-4-nitroaniline + 3 4 9 0 (2-16)
AAi> - [0.9841i>iV)iV_dimethyl_4_nitroaniline + 3490] - />4-nitroaniline (2-17)
AAi)HMpT
The AAvHMPT for the jV,jV-dimethyl-4-nitroaniline and 4-nitroaniline pair of molecules is 2759 cm"1 [73].
In addition to the solvatochromic parameters ir*, a, and ß, which represent the exoergic solute/solvent therm, 52
H, which represents a physical solvent quantity called cohesive pressure (or cohesive energy density). It corresponds to the endoergic process of separating the solvent molecules to provide a suitably sized enclosure for the solute and measures the work required to produce a cavity of unit volume in the solvent. This term is related to the tightness or structuredness of solvents as caused by intermolecular solvent/solvent interactions. It has been shown that this cavity term is only poorly correlated with the other three parameters, which is an important precondition for its inclusion in Equation 2.9.
The donor numbers (DN) and acceptor numbers (AN) have been adopted as empirical quantities to scale the electron pair donationg and electron pair accepting properties of the solvents [74]. They are an examples of scales that strongly intercorelate with others: DN with the ß and AN with a. The correlation coeficitents are 0.871 and 0.939 [70]. The main advantage
34

Pi silica wt TT* a ß
0.25 0.5 6
1.98 1.98 2.23
1.22 0.82 0.34
0.43 0.56 0.92
Table 2.3: Solvatochromic parametrs of silica surface
of using these parametrs is that it can be determined from the spectrum of one compound only. The AN parameter, for example is calculated from the absorption maximum of Fe(phen)2(CN)2, in which the solvatochromic shift of the charge transfer band corresponds to a hydrogen-bond donation ability of this compound as expressed in Equation 2.19 [75, 76].
AN = -133.8 + 0.00933z>maxFe(phen)2(CN)2 (2.19)
AN can also be calculated from the known values of a and ET(30) (see Eq. 2.20) [70].
AN = -30.0 + 15.3a + 1.01£T(30) (2.20)
2.2.1 Polarity on the Interfaces
ET(30) was used to probe the surface of x - type Alumina [77]. The dye was applied by mixing a standard dye acetonitrile solution with alumina slurry and removing the carrier solvent. The concentration dependent measurement reviled that from the coverage of about 400 mg of dye/kg of alumina (surface coverage ~ 0.0043 //mol m~2) the interactions between dyes molecules takes place (the peaks became broader and began shifting to longer wavelengths). The Ej, value for alumina ranges from 1.09 to 1.16, depending on the activation temperature and content of water. The higher is the content of water the lower the E? value.
The silica surfaces were probed by nine solvatochromic dyes [78]. The Kamlet-Taft solvatochromic parameters were evaluated, with following results: the dipolarity/polarizability (7T*) is the most important contributor to the polar properties of the surface, followed by hydrogen bond donation (a). The ir* value on the silica surfaces is greater than the largest values found for ordinary solvents. There is considerable dispersion of the ir* values of individual ir* indicators and of the ßi values of individual ß indicators. The greater dispersion means that interactions with silica are more specific for the structure of the adsorbate than are interactions between a liquid solvent and its solute. The dispersion of the ir* and ßi values may be due in part of the existence of more than one kind of adsorption site on the silica surfaces. The mean values of the solvatochromic parameters with the increasing coverage in wait percents are given in Table 2.3.
Spange et ai, in theirs extensive work, developed a method of characterizing a surfaces by three solvatochromic dye: Reichardt's dye, Michlers ketone, Fe(phen)2(CN)2 (ds-dicyano-bis(l,10-phenanthroline)iron(II)) [79, 80, 81].The last two dyes are sensitive to the ir* and a parameters by Equations 2.21 and 2.22.
35

a = -7.90 + (0.453ž>maxFe(phen)2(CN)2 x 1(T3) + (0.021i>maxMichler's ketone x 1(T3) (2.21)
vr* = 13.889 + (0.251í>maxFe(phen)2(CN)2 x 10"3) - (0.32ž>maxMichler's ketone x 1(T3) (2.22)
Scheme 2.4: Fe(phen)2(CN)2; d£-dicyano-bis(l,10-phenanthroline)iron(II)
By evaluation of these parameters, the correlation with E{T ' is possible. The LSER
Equation 2.23 for solvents was found not to be ideal. Instead, they found an Equation for functionalized silicas 2.24.
£ľ|P = 31.2 + 1 5 . 2 a + 11.57T*; n = 166, r = 0.979, sd = 1.1 (2.23)
Ef = 36.1 + 14.84a + 5.33vr*; n = 30, r = 0.964, sd = 1.12 (2.24)
The 35 silicas and alumina were found to be quite polar with the E? = 0.82-1.01, moderately strong dipolar/polarizable ir* = 0.38-1.04, and were fairly strong hydrogen-bond donors a =1.00-1.99. Spange et al. found, that the a - value for alkyl modified silicas decreases linearly with increasing the surface coverage since monolayer functionalization is accomplished. They draw a conclusion, that first the stronger acidic sites are occupied and only then the others. They did not consider any interactions between probes. The correlation between a and ir* parameters and the catalytic activities of solid acids were better than with £+(30) [82]. The same method of surface polarity indicators was applied on a amino acid crystals [83] , and dimethylsiloxane-grafted silica particles [84] . In order to get better soluble indicators in water Michlers ketone derivatives were prepared [85, 86, 87] and theirs solid state structures were correlated with theirs solvatochromic behavior. LSER of these compounds were found to hold. For example the LSER for MK and MK(OH)2 are expressed by Equations 2.25 2.26.
vy^ = 30.082 - 2.2367T* - 1.809a - 0.065/3 (2.25)
36

í>maxMK(OH)2 x 1(T3 = 29.912 - 2.005vr* - 1.661a - 0.343/3 (2.26)
The second harmonie spectroscopy, the surface sensitive technique, was used to probe the polarity of air/water, water/1,2-dichloroethane, water/chlorbenzene, water/n-heptane interfaces [88]. As a probes were used jV,jV-diethyl-/?-nitroaniline (DEPNA) and ET(30). The air/water interface were found to be non polar with E^ = 0.01 and ir* = —0.11. On both of these scales, these values corresponds to the narrow range of the bulk liquids like butyl ether, n-heptane, and carbon tetrachloride. The authors drew conclusion, based on their measurements that the polarity of the interface between two fluids is the arithmetic average of the polarities of the constituent bulk phases. This simple relationship of interface polarity with the polarities of the bulk phases suggests that the difference in excited- and ground-state interface solvation energies of the adsorbed solute molecules could be chiefly due to long-range interface solute-bulk solvent interactions and not to local (first shell) solute-solvent interface interactions. The E^ value in gas-phase was estimated from this hypothesis to be E? = —0.93 ± 0.02.
The time-resolved total internal reflection fluorometry studies have suggested that the average-polarity model breaks down when the adjacent organic solvent is polar (but aprotic) [89]. They employed sulforhodamine B as surface indicator; its nonradiative decay rate constant increase with an increase in a solvent polarity parameter Ej, in the bulk solutions. The average polarity model hold for water/cyclohexane, carbon tetrachloride, and toluene interfaces really well. But the measured polarity were lower than predicted for water/o-dichlorobenzene and 1,2-dichloroethane interfaces. They suggested, that the more polar solvents form thin but rough interfaces, which make the probe molecule experience less polar environment than would be predicted. Further complicating interpretation of the fluorescence results is the fact that the technique is not surface specific, meaning that even under total internal reflection conditions, experiments still sample up to tens of nanometers into the adjacent, low-index phase.
Zhang et al. examined how polar, solid surfaces alter the interracial polarity of adjacent solvents as evidenced by solvatochromic shifts in an adsorbed solutes electronic excitation energy [90]. Experiments use surface-specific, nonlinear optical methods to record effective excitation spectra of 4-aminobenzophenone (4ABP) adsorbed to different solid/liquid interfaces. Comparing the second harmonic excitation maxima of 4ABP adsorbed to solid/liquid interfaces to excitation maxima in corresponding bulk solvents enables them to infer how polar silica surface alter interracial solvent polarity from isotropic bulk limits. They found that interracial solvent polarity is controlled by a number of factors. Substrate-solvent interactions are the dominant influence. In systems where nonpolar solvents are only weakly attracted to hydrophilic silica surfaces, surface dipoles can interact strongly with adsorbed solutes, creating more polar environments than are found in bulk solutions. This effect was observed for silica/cyclohexane and silica/CCl4 systems as well as the silica/diisopropyl ether interface. However, when the substrate and solvent couple through hydrogen bonding, interracial dielectric properties depend quite sensitively on the solvents molecular structure. Spectra of 4ABP adsorbed to silica/n-alcohol boundaries show that the solute samples an environment that reflects neither the properties of the substrate nor the properties of the solvent. Such nonadditive interracial behavior can result from formation of oriented n-alcohol monolayers at the hydrophilic silica surface. Extensive hydrogen bonding between the substrate and solvent not only prevents
37

surface-solute interactions but also inhibits full solvation of the solute by the surrounding solvent, thus 4ABP will experiences a local, interracial environment that is significantly less polar than bulk solution. The longer the n-alcohol is the less polar the environment. If, however, the protic solvent cannot form such a well-ordered, long-range structure, surface dipoles can go unscreened and again interact with interracial solutes. This is a situation for 2-propanol.
A secondary effect of solvent structure on interracial polarity appears to be related to solvent size and packing ability. Solvatochromic results show the interracial region between a hydrophilic silica substrate and CC14 is disproportionately more polar than the equivalent hydrophilic silica/cyclohexane boundary. The dielectric properties of these two solvents are similar and thus cannot explain the different behavior. They proposed that differences between interracial CC14 and cyclohexane are due to the formers ability to pack efficiently next to a rigid, solid boundary, thereby increasing local solvent density over bulk solution limits. Enhance interracial density of the spherical CC14 solvent will lead to amplified solvent-solute dispersion interactions and a correspondingly more polar environment than in bulk solution. Cyclohexane simply cannot pack as efficiently and thus cannot create the same environment at the hydrophilic silica surface.
The comparison between liquid/liquid (heptane/water) and solid/liquid (silica/water) interfaces was obtained by in situ second harmonic generation spectroscopy of rhodamine dyes [91]. On the heptane/water interface only an in-plane associate could be recognized, although the sandwich dimer was dominant in a bulk heptane solution, contrary to the silica/water interface where two structures, the in-plane associate and the sandwich dimer, were detected. The hydrophobic property arising from heptane molecules at the heptane/water interface would be crucial for inhibition of the sandwich type dimerization. The adsorbate could be considered to be more easily mobilized at the liquid/liquid than solid/liquid, and this high mobility would function favorably for the growth of the in-plane associate while keeping the tilt angle of the monomer unit constant.
Petersen and Saykally et al. used second harmonic spectroscopy to probe the surface of liquid water's solutions of alkali iodide. They confirmed the reduced polarity of the liquid water surface [92]. They also observed that hydronium ions exists in much higher densities near the liquid surface than do the alkali ions [93]. These founding are in accord with the calculations and computer simulations [94, 95, 96, 97]
2.2.2 Effective Polarity of Frozen Solvent Glasses
The polarity of frozen organic solvent glasses is found to be substantially larger than that of liquid solvents at room temperature. This was shown for 2-methyltetrahydrofuran and toluene using the probe molecule Coumarin 153 [98] and for 2-methyltetrahydrofuran and methylcyklohexane using the probe molecule all-trans-retinal [99]. The same effect (increase in polarity upon freezing) was also observed for ethanol, 2-methyltetrahydrofurane, toluene and methylcyklohexane [100]. The Reichardt's dye or its tertbutyl derivative was used as a probe in this case. In all above mentioned cases the Stark electroabsorption spectroscopy and absorption spectroscopy was employed. The change in polarity, accompanying the solidification, is more pronounced for nonpolar solvents. To explain this behavior two actions
38
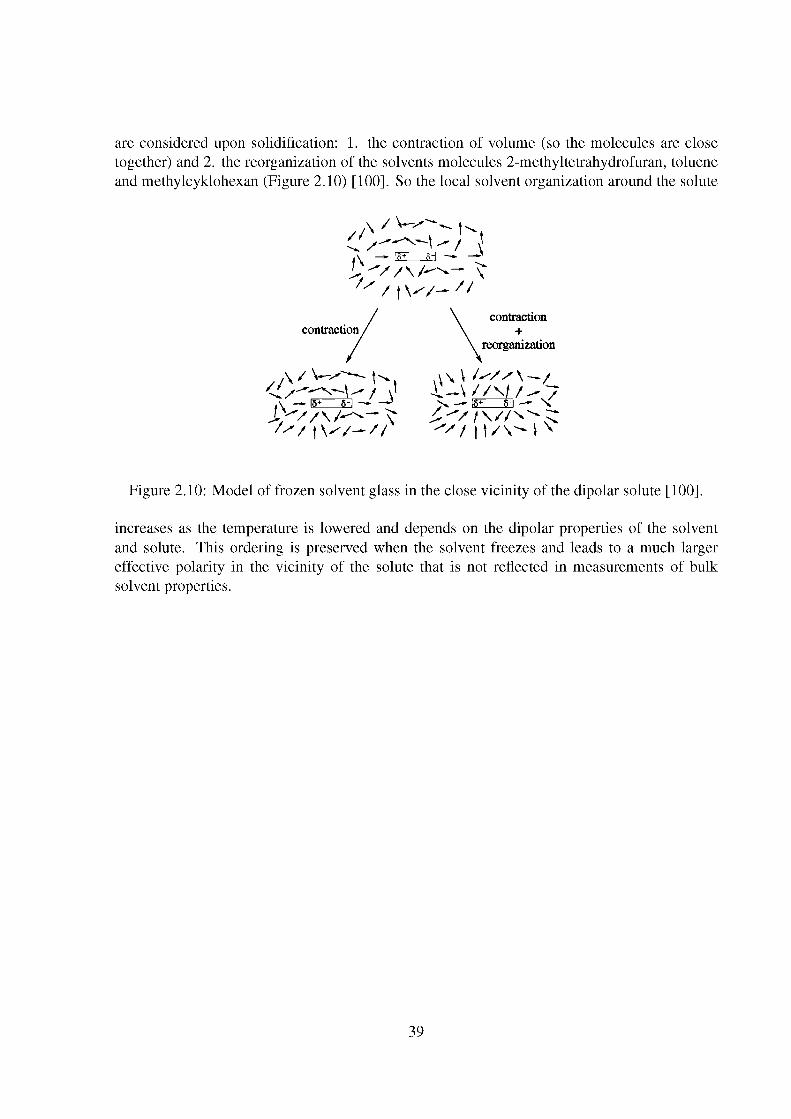
are considered upon solidification: 1. the contraction of volume (so the molecules are close together) and 2. the reorganization of the solvents molecules 2-methyltetrahydrofuran, toluene and methylcyklohexan (Figure 2.10) [100]. So the local solvent organization around the solute
A — IS* SI "y-^±^rj
contraction +
reorganization
? IS* f l — NÍ
Figure 2.10: Model of frozen solvent glass in the close vicinity of the dipolar solute [100].
increases as the temperature is lowered and depends on the dipolar properties of the solvent and solute. This ordering is preserved when the solvent freezes and leads to a much larger effective polarity in the vicinity of the solute that is not reflected in measurements of bulk solvent properties.
39

2.3 Methylene Blue
HhO+ >"l^
Figure 2.11: Methylene blue and its protonated form.
Methylene blue (IUPAC name: A^[7-(dimethylamino)-3r/-phenothiazin-3-ylidene]-N-methylmethanaminium) is a cationic dye. In its UV/vis spectrum of dilute aqueous solutions, there are two major bands: first one in the UV region (maximum at 293 nm) and the second in the visible region (maximum at 664 nm). The short wavelength band with high molecular absorption coefficient value is due to the ir* <— ir transition, while the visible absorption band results from the ir* <— n transition associated with the presence of a C=S+ chromophore group [101]. The second absorption band is a little solvatochromic (see Table 2.4).
The dipóle moment in the ground state was measured to be 4.19 ± 0.12 D and calculated to be 2.46 D with a charge on the ring sulphur atom (4) and 6.62 D with a charge on the exocyclic nitrogen atom (2 or 3). The average theoretical value 4.54 D is little higher than the experimental one [101]. This can indicate resonance equilibrium preferring the positive charge on the central ring. The authors did not consider the charge on the central ring nitrogen (1), but supposably the dipóle moment would not change much compared with the molecule having positive charge on the sulphur atom. The dipóle moment in the first excited state was measured to be about 4.56 D and calculated to be 0.20 with the charge on the ring sulphur atom or 4.68 with a charge on the exocyclic nitrogen atom. It indicates a change of distribution of charges in electronically excited states, predicting a migration of the positive charge from the ring sulphur atom to the exocyclic nitrogen atom in the excited singlet state of methylene blue.
The visible monomeric band has further structure: large peak (max. at 664 nm) and a shoulder at 610 nm corresponding to (0 - 1) vibronic transition [102] [103] [104]. The nature of the shoulder was deduced by fluorescence. The change in spectra of MB with the increasing
H,N
Figure 2.12: The structure of Thionine.
concentration was noticed already in 1941 by Rabinowitch and Epstein [105]. They wanted
40

Solvent Absorbtipn maximum Amax
loge Absorbtipn maximum Amax
Cloroform 652 4.11 1-Butanol 657 4.81 2-Propanol 657 4.51 Ethanol 654 4.61 Methanol 653 4.82 DMF 666 4.78 Acetonitrile 654 4.74 DMSO 670 4.95
Table 2.4: Solvatochromic shift of methylene blue
to rule out the possibility that the change in the spectra is caused by the association of cations with anions. They measured the spectra of thionine (Figure 2.12, IUPAC name: 7-amino-3íř-phenothiazin-3-iminium) in one molar solution of potassium chloride. Both the monomer and dimer bands were weakened, either by the formation of undissociated thionine CI molecules, or by an electrostatic interaction of thionine+ and Cl~ ions in pairs. The relative intensity of the two bands, however, were not affected by Cl~ ions; the effects thus must be due to the polymerization of the cations. They considered the dimerization equilibrium. They found the dimerization constant Kdim = 3.57 x 10³M_1 at t = 26.7°C. They got the molar extinctions of the monomer and dimer by extrapolation the experimental values of e to zero and infinite concentration, respectively. They also measured the temperature dependence for Kdissoc of thionine Equation 2.27 (from 10 to 70 °C, without specification of the concentration of the dye). With increasing temperature the monomer is preferred over dimer.
logwKdi880C = 1.9886 - (1492/T) (2.27)
Some of their conclusions were: no dimer formation in ethanol, dimeric ions do not fluoresce, and also no dimer could be formed from two doubly charged positive ions. They also stated that polymerization does not stop at the dimeric stage, and that colorless leucodyes dimerize, if at all, to a smaller extent than the corresponding colored forms.
The protonation of MB takes place at the central ring atoms (N(l) or S(4)) rather than at N(2) or N(3), and it causes red shift to 742 nm (MB1!!2-!-) (see Figure 2.11) [102]. It is predicted, that protonation of the atoms of peripheral nitrogens (N(2), N(3)) would cause blue shift, which is not observed experimentally. For capri blue (Figure 2.13, IUPAC name: A -[7-(dimethylamino)-8-methyl-3íř-phenothiazin-3-ylidene]-A^-methylmethanaminium), a compound that differs from MB only in having methyl in ortho position to dimethylamino, the N(CH3) group is forced to tilt out of the plane of aromatic rings by the methyl group. This increases its basicity and protonation goes on N (2) or N (3) (MB2H2+) (Figure 2.13). Therefore the absorption band is blue shifted to the \max = 514 nm.
41

HhO+
Figure 2.13: The structure of capri blue.
With increasing the H2S04 concentration to the 78% the band of MB (MB2H2+) disappear and three new broad bands at 710, 460, and 405 nm become visible. In this paper, they did not assign these bands to the species, they just assumed that these bands belong to three different substances.
Lewis et al. measured the temperature dependence of MB absorption at different concentrations. For high concentrations (> 9e-6 mol.dm-3) the monomer absorption coefficient increases with increasing temperature due to the lowering of dimer band [102]. But for low concentrations (< 1.9e-6 mol.dm-3) the monomer absorption coefficient decreases. They explained this behavior by formation of leuco form (IUPAC name: 7-(dimethylamino)-10-hydroxy-Af,A^dimethyl-10//-phenothiazin-3-aminium), which has the structure shown at Figure 2.14. In organic solvents the dimerization of MB appears at considerable higher concentrations
HaO
Figure 2.14: The proposed structure of leuco form of methylene blue.
than in water. But contrary to [105] they found dimer formation in ethanol in low temperatures (110 K).
The pyridine solution of MB was found red colored with absorption maximum at 523 nm [106].
The monomer-dimer equilibrium of MB was investigated by utilizing temperature-jump techniques [107]. For the Eqaution 2.30, the extinction coefficient of the monomer and dimer and equilibrium constant Kdim were determined spectrophotometrically at 610 and 660 nm at 20 °C by minimizing the Equation 2.28 for 610 nm,
A = (eM- "f) 1 + 8Kdtm[MB+]T ed[MB+]T
IK, dim (2.28)
42

where the total concentration of MB is [MB+]T = Cm + 2Cd. I believe, there is a misprint in this equation in this paper and it should be changed to Equation 2.29.
tD. A = (eM- -z-)
l + ^l + 8Kdim[MB+]T ed[MBH \T
2MB # MB2
(2.29)
(2.30)
The em,ed, and Kdim were found to be 3.87 x 10⁴ M - 1 cm"1, 9.05 x 10⁴ M - 1 cm"1, and 3.97 x 10³M-1, respectively. No effect of the [H+] on the measured relaxation times was observed. The overall AH of the reaction was calculated from a log Keq vs. 1/T plot and found to be -19.9 ± 2.5 kcal mol -1. AH was also determined from relaxation amplitude studies at 20 °C which yielded a value of -13.9 ± 0.8 kcal mol -1. The activation enthalpies in the forward and reverse directions were found to be -11.0 ± 1.1 and 8.9 ± 1.2 kcal mol -1, respectively.
Ruprecht et al. measured the absorption maxima of monomer and dimer (660 nm, 608 nm respectively), calculated the dimerization constant (4 710 1 mol-1) and thermodynamic parameters (A G = -20.3 kJ mol -1 at t = 25 °C,A H = -26.1 kJ mol-1,A S = -16.2 J mol -1 K - 1). The repulsive Coulombic interaction Ec = 5.1 kJ mol -1 and the attractive dispersion interaction ED = 25.8 kJ mol -1 were calculated for two molecules of MB placed at the distance of 3.35 Á in the water. This explains the favorable dimer formation in the water [108].
The equilibrium constant for the dimerization and trimerization are reported at 30 °C by Braswell (KD = 2000 1 mol -1, KT = 6 x 10⁶ l2 mol -2 ) [109]. Despite they wrote the Equation 2.34 in the abstract, they evaluated the equilibrium constants for two independent Equations 2.30, 2.32.
Kd =
3 MB
[MB2
[MBl
MB,
(2.31)
(2.32)
K,= [MB 3
3 MB
[MB]3
MB2 + MB MB?
(2.33)
(2.34)
The equilibrium constant of dimerization (2.30) can be used for low concentrations, whereas trimerization equilibrium constant (2.32) can operate at high concentrations. But joining them together was not right, as will be shown in the Experimental section of my disertation.
The molar absorption coefficients for monomer were obtained from the samples of the lowest concentrations, molar absorption coefficients for trimer by extrapolation to infinite concentration. The fitting to the strait line method was used to evaluate all five parameters ( tm, id, £t, and Kdim,Ktrim). From the vapor pressure osmometric studies it was found
43

that maximum degree of aggregation of MB in water is 3 in the concentration range studied (< 0.055 mol dm -3). The precondition for this calculation are complete dissociation of the dye even at highest concentrations and that the Debye-Hückel limiting law applies. Both of these conditions are questioned. The critical micellar concentration (CMC) of aqueous dye solution, i.e. the lowest concentration at which dye aggregation starts, is 2.5 x 10⁶ mol dm - 3 for MB in aqueous solutions.
The aggregation of methylene blue (MB) in water was studied by factor analysis (FA) of the visible spectra over a wide range of concentration from 1.0 x 10~7 to 1.6 x 10~2 M [110]. Abstract factor analysis of data with multiple sources of error (AFA-MSE) revealed three MB species. The concentration profiles and spectra of the species were extracted by window factor analysis (WFA). The profiles were interpreted to be due to MB monomer, dimer and a trimer containing one chlorine atom. The dissociation constants of the dimer and trimer were determined to be 1.5 x 10~4 M and 3.2 x 10~n M~3 respectively. They used the same dissociation constants as Braswell. This approach considers three molecular reaction for the trimer formation and four molecular reaction for the trimer with a chloride anion.
The visible spectra of MB in aqueous-methanol solutions were used to determine the extent of hydration of MB aggregates [111]. The investigation was carried out at MB concentrations of 1.0 x 10~3 M and 1.0 x 10~4 M. Abstract factor analysis was used to determine the number of chemical species responsible for the spectral data. The species were identified as aqueous MB monomer, dimer, and trimer, and a methanoic MB monomer with different degree of hydration.
The monomer/dimer equilibrium of MB and several other ionic dyes has been investigated by means of UV/vis spectroscopy [112]. From the calculated dimeric constant and monomer and dimer spectra, the structures of the dimeric forms of the studied dyes were estimated.
The reactivity of MB and its protonated form with ascorbic acid was examined [113]. The interactions of MB and some other dyes with acid polysaccharides were studied and
quantitative parameters of absorption bands determined [114]. The most important for our study is their determination of the wavelength of maxima of the main peak and its shoulder of MB in water solution: 664 and 620 nm, respectively. They also determined the oscillator strength, transition moment length, and center of gravity. They discussed the changes in absorption spectra upon bounding to the surface.
The dimerization and inclusion complexation equilibria of six phenothiazine dyes with cyclodextrins (a, ß, 7 CD) in aqueous media have been studied using absorption and fluorescence spectroscopy [115]. The dimerization constants (KD) of the dyes having two methyl substituents at the phenothiazine ring are much greater (one order of magnitude) than those of other dyes having unsubstituted rings, and the presence of methyl groups on the amine groups affects little the KD values in the water. This implies that the molecules are held together by hydrophobic interaction which is stronger for methylated compounds. The positions of the monomer/dimer equilibria do not change with the presence of CÜ-CD, while the addition of ß-CD suppresses and 7-CD enhances the dimerization of the dyes. The dye monomers fit better to ß-CD and the dimers fit snugly to 7-CD. The only exception is 1,9-methylene substituted methylene blue, which is larger, then the other compounds, and forms stable monomer complex with 7-CD while the interaction with ß-CD is minor. It appears that the inclusion complexes of the dye monomers and dimers are formed by deep insertion of the phenothiazine rings into
44

the cavities of the CDs, with the two methylene groups and the amine groups protruding from the cavities of the CDs. Fluorescence spectroscopic studies indicate that only monomers are fluorescent while the dye dimers are not [115].
Properties of the ground and excited states of MB were studied in negatively charged vesicles, normal and reverse micelles and sodium chloride solutions. In reverse micelles the dimerization constant is two-three orders of magnitude smaller than Kdimoi MB in the water [116].
MB tends to aggregate at increasing concentration. There are two possibilities of arrangements in the aggregate: the face-to-face parallel arrangement (sandwich-type, H-aggregates) and the head-to-tail (J-type) arrangement. For H-type of aggregates is characteristic blue shift of absorption spectrum, for J-type red shift, being supported by the exciton splitting theory[117]. The spectral characteristic of dimer, trimer as well as higher aggregates is distinct from each other, which indicates a strong interaction of the ir electrons of MB molecules. These aggregates are H-type in water. The MB cation dimers absorbs mainly at 605 nm. There is a second minor peak at approximately 697 nm. The MB trimers absorbs at 575 nm [103].
The MB is often used as a probe molecule for solid surfaces as clay minerals, inorganic oxides, and so on. The dye adsorption is always accompanied by color changes attributed to the formation of dye aggregates and acidification (protonation) at the clay surface. (The change in optical properties induced by the chromophore aggregation is called metachromasy.) The MB adsorbed on the montmorillonite has a maximum at 670 (monomer), 605 (H-dimer) and 575 nm (H-aggregates) [103]. A peak at 775 nm was also observed. Discrepancies exist about the assignment of this peak. Some think those are the J-aggregates (on montmorillonite) [118] and others that it is the protonated MBH2+ cation (on montmorillonite or vanadium pentoxide gel) [119, 120]. We can see that the dye absorption bands may change position by almost 100 nm with aggregation, whereas lesser changes are due to other effects, such as polarity of their environment.
The electronic structure and orientation of MB on muscovite mica was investigated with x-ray photoelectron spectroscopy and the near edge x-ray absorption fine structure spectroscopy. It was found that molecules do not lie flat on the surface, but are tilted with their largest face inclined at 65-70° with respect to the surface. The positive charge is present most on the N(2) and N(3) eventually on the S (4). The consequence of this charge distribution is that MB holds on the surface by the [2, 3, 4] edge. Resulting angle is given by sum of repulsing electrostatic and attractive van der Waals interactions. The apparent surface area for MB molecule is considered 66 Á2. This value is used to calculate available surface of materials [121].
Bujdak at al. experimentally proved, that the formation of MB dimers and higher aggregates reflects sensitively the layer charge density of smectites. Dye H-aggregates are formed predominantly on the surface of smectites with the highest charge density. In contrast, suppressed dye aggregation and J-aggregates formation on samples with lower-charge densities is caused by the greater distances between adsorbed neighboring dye cations [118, 122].
Turro et al. use the absorption and fluorescence characteristics of MB to monitor the distances between the ends of dendrimers [123, 124].
45

2.4 Cresol Red Three forms of aqueous cresol red (IUPAC name: 2-[bis(4-hydroxy-3-methylphenyl)-methyliumyľjbenzenesuľfonate) A, B, C have absorption bands in the visible region with \max at 518, 434, and 573 nm respectively (Scheme 2.5). The pKaws corresponding to the first and second deprotonation equilibria have been found to be 1.10 (in Glycine-NaCl-HCl buffer systems [125]) and 8.15 (in low ionic strength, I = 0.01, phosphate buffer systems [126]) respectively. The shift of absorption maximum of B form to 424 nm and of C form to 583 nm was observed in the presence of CTAB (hexadecyltrimethylammonium bromide) even below critical micellar concentration. Also the pKa2 value was lowered to 6.20 in the presence of CTAB. This observation was explained by formation of very closely packed ion-pair due to strong hydrophobicity of the oppositely charged dye and surfactant ions, which helped to a second deprotonation of the dye [127].
Scheme 2.5: Cresol red and it's forms
The shifts of absorption maximas for B and C are unsignificant for CR with CTAB in the sol-gel glass (in solution + CTAB maximas are at 418 and 584, in glass at 420 and 580 nm). Also the pKa value did not change upon incorporation the micelles in to the sol-gel matrix. As evident on Scheme 2.5, the increase in pH causes an increase in the number of negative charges 1, 2, and 3 for species A, B, and C, respectively, and all three species are hydrophilic. They reside, therefore, at the hydrophilic interracial zone of the silica/micellar phase, and as a consequence, the association strength between the indicator and the positively charged hydrophilic zone of the micelle increases with pH, causing an increase in the concentration of the competing protons needed to reach the pKai. As a result, CR transforms from an indicator for mild bases in solution to an indicator for mild acids in the sol-gel matrix. The next interaction to be considered is an electrostatic interaction between the positively charged N+ of CTAB and negative charge at
46

t[°C] T [K] pKa2
-20 0 20 50
253.15 273.15 293.15 323.15
8.7 8.477 8.288 8.052
Table 2.5: The temperature dependence of pKa2 of cresol red
CR. This interaction causes restriction of resonance and is known to cause blue shifts in \max. Also this ion pair competes with protonation of the indicator [128]. CR indicator was used to determine a freshwater pH [129]. It was also found that the molar absorptivity ratios are independent of the total indicator concentration used. Sulfonephthaleins molar absorptivities have very weak temperature dependence. A change in temperature from 4 to 20 °C would result in a 0.003-0.005 pH error for R from 0.1-1.5. The temperature-dependent pKa2 expression was found:
913 4 pKa = -—- + 2.049 + 1.266 logT (2.35)
T being in K. This means that with increasing temperature, the pKa2 would decrease. The pKa2
for some temperatures are shown in the Table 2.5. It was also noted that pKa2 decreases for increasing ionic strength. For thymol blue (another
sulfonephthalein indicator, similar structured as CR) pK„2 dropped from 9.20 at ionic strength ß = 0.00 M to ~ 8.9 at ß = 0.10 M [130].
pH indicators are inherently weak acids or bases and can therefore change the pH of the sample. The experimentally found decrease is 0.016 pH units for addition of 3.8 x 10⁶ M indicator.
The infra-red (IR) absorption spectra were measured in KBr matrix. The spectral patterns reveal that sulphonphthaleins display the quinone-like structure, while Phenolphthalein and its derivatives exist mainly in the lactone form [131].
Inclusion of phenolphthaliens and sulphonphthaleins in to the cyclodextrin was studied by UV/vis and NMR spectroscopy. It was found that the formation of a lactone ring is induced on inclusion [132].
47

Chapter 3
The Summary of Results
The results of the spectroscopic work have been published in two papers [21, 22]; the third one is ready to be submitted. During my doctoral studies, I also contributed by experimental work (irradiation of the samples at 77 K) to the paper comparing the UV and gamma irradiation of monochlorphenols in the frozen aqueous solutions [7]. All these papers are attached in the Appendices. Our previous work on the solid supports and water ice includes two more papers [133, 134].
The detailed description of the experimental procedures, results and related individual discussions can be found in the original papers and in the Chapter 5. Here I would like to build the overall picture of this study, add some details that did not have to be included in the papers and make a shared conclusion. To avoid duplication of some tables and pictures the above-mentioned publications will be referred to.
The UV/vis absorption spectroscopy of various organic compounds frozen in the aqueous solutions was used to elucidate the changes in absorption spectra and to characterize the amount of aggregation of organic compounds, H+ and OH~ availabilities, and solvatochromic properties in the frozen aqueous solutions.
3.1 Topic I - The Aggregation of Methylene Blue
The absorption and aggregation properties of methylene blue were utilized to find the aggregation of organic compounds upon freezing in aqueous solutions. The comprehensive literature review concerning the aggregation of methylene blue is provided in Chapter 2.3. In this Chapter, we concentrate first on the liquid solutions of methylene blue and on determination of the aggregation equilibria constants of dimerization and trimerization (Kd and Kt). Equiped with this knowledge, we examined the absorption spectra of quickly (77 K) and slowly (243 K) frozen aqueous samples of methylene blue. Our paper [21] discussing this theme can be found in the Appendix 1.
48

3.1.1 The trimerization model The absorption spectra of this dye changes with the increasing concentration i.e. with the increasing degree of aggregation. Normalized representative spectra of MB in liquid aqueous solutions at 293 K can be seen in Figure 3.1. Figure 3.2 shows all the measured spectra in the concentration range from 5.0 x 10~7 to 7.5 x 10~2 mol L_1 . Our aim was to utilize the MB behavior to proof the aggregation in the frozen aqueous solutions. We tried to reproduce the aggregation constants in the water solution first. Unfortunately, after the close examination of the methods used in the above cited papers to obtain the aggregation constants some inconsistencies and oversimplifications were found.
monomer dimer trimer
wavenumber [cm1]
Figure 3.1: Normalized representative spectra of MB in liquid aqueous solutions at 293 K.
The papers of Rabinowitch [105], Spencer [107] and Ruprecht [108] considered only the formation of dimer and did not include the trimer. This assumption can be questioned even for the lowest concentrations, based on the aggregation equilibria constants calculated by us and even on the base of a brief look at the absorption spectra measured by them or by us (Figure 3.2). The increase of absorption corresponding to the presence of trimer is apparent. The misprint in the Spencer's paper [107] is easy to uncover by going through the algebra. It is not clear whether this mistaken equation was used for the calculations of the equilibrium constants or it is just a misprint; the authors did not publish the raw data they used for minimalization.
Bras well [109] recognized the presence of three species: monomer, dimer, and trimer in the aqueous solutions in the concentration range from 6 x 10 -7 to 6 x 10 -2 mol L - 1 . He calculated the equilibrium constants from two equations: the one for dimerization (Equation 3.1), and the
49

14000 16000 18000 wavenumber [cm1]
20000
Figure 3.2: Normalized representative spectra of MB in liquid aqueous solutions at 293 K in the concentration range from 5.0 x 10~7 to 7.5 x 10~2 mol L_1 .
second for trimerization (Equation 3.2).
2MB initial concentration y concentration at equilibrium y — 2x
MB2
0 x
(3.1)
3 MB initial concentration y concentration at equilibrium y — 3 z
MB3
0 z
(3.2)
The trimerization was considered to occur by the aggregation of three monomers. This model can be mathematically described by Equations 3.3, 3.4, 3.5, 3.6. These equations which give two independent Equations 3.7 and 3.8 whose numerical solution reveals the concentrations of individual species as a function of the total MB concentration (A and B represent the dimerization and trimerization equilibrium constants, respectively).
KA
K,=
[MB2;
[MB]2
[MB3] [MBl3
(3.3)
(3.4)
50

A =
B =
x
{y - 2x)2
Z
(y - 3*)3
4Ax2 - xiAAy + 1) + Ay2 = O
By3 - z{Wy2 + 1) + 27Byz2 - 27Bz3 = O
(3.5)
(3.6)
(3.7)
(3.8)
Plot of Relative Concentrations 1.2 1.2
^ Ä monomer
§ 0.8 dimer trimer -
E sum u
S 0.6
o
-
I 0.4 -
o s 0.2
Q:
-o s 0.2
Q:
^z^^^ -0 -
-6 -5.5 -5 -4.5 -4 -3.5 Sum concentration [M]
Figure 3.3: Calculated relative concentration-dependent abundance profiles based on the solution of the Equations 3.7, 3.8 for Kd = 2 x 10³ L mol -1 and Kt = 6 x 10⁶ L2 mol -2
These concentration profiles are plotted in the Figure 3.3. We can see that the model somehow works for the dimerization at low concentrations and for trimerization at high concentrations, but altogether it does not give a meaningful picture. There are two unsatisfactory features: the negative concentration of the MB monomer and the increasing concentration of dimer at high concentrations. Generally, we can state, that this model does not describe satisfactorily the aggregation of MB.
Malinowski [110] used the same inadequate equations of dimerization and trimerization as Braswell did. Because of the better fit of the model to the experimental data, they introduced the Cl~ anion to incorporate in the trimer structure. As the model itself is not correct, this improvement could lower the unexplained residual of the fit, but cannot help the characterization of the aggregation.
We proposed the model for which the dimer is formed from two monomers and the trimer is formed from a dimer and a monomer (Equation 3.9). The aggregation equilibrium constants
51

3 MB # MB2 + MB # MB3
initial concentration y 0 y 0 concentration at equilibrium y -2x- z x — z y- -2x- - z z
„ [MB 2J M - [MB]2
K " [
[MB3] K " [ MB][MB2]
-~Y (x — z) J —
(y -2x- z)2
z
are expressed by the Equations 3.10 and 3.11. These can be represented by the Equations 3.12 and 3.13, where C and D represent the dimerization and trimerization equilibrium constants, respectively.
(3.9)
(3.10)
(3.11)
(3.12)
(x — z)(y — 2x — z)
Algebraic operations of Equations 3.12, 3.13 give Equations 3.14 and 3.15 which were numerically solved in MATLAB.
ACx2 - x{ACy - AC z + 1) + C z2 - 2Cyz + z + Cy2 = 0 (3.14)
Dz2 -2Dx2 + Dxy + Dxz- Dyx - z = 0 (3.15)
The plotted concentration profiles are pictured in the Figure 3.4. We can see that, this time, the plot is meaningful. The negative concentration of monomer is avoided, the concentration of dimer peaks at about log c = —3.2, and the concentration of trimer is raising all the time. In accord with the observed absorption spectra (Figure 3.2), the concentration of monomer in the highest observed overall concentrations is still not zero. Therefore the model seems to be capable of describing the aggregation of MB monomer to dimer and trimer.
The discrepancy between our model and reality lies most probably in the presence of higher aggregates (tetramers, pentamers and so on). The presence of these higher aggregates can be judged by the incessant shift of absorption peak of the 'trimer'. It means that our 'trimer' includes in fact the trimer and higher aggregates. As the spectra of these species are largely overlaying, we do not see any possibility separating them.
The above described model needs as input data just two aggregation equilibrium constants - one of dimerization and the other of trimerization. They can be arbitrarily chosen and the model can be used as a general trimerization model. The more difficult task, that follows, was the obtaining of the equilibrium constants (Kdim, Ktrim) from the measured spectra of MB at various concentration of MB.
52

1.2
1
CD
O Q.
S 0.8
o 0.6 o
CD
CD
QĹ
0.2
-7 -6.5 -6 -5.5 -5 -4.5 -4 -3.5 -3 -2.5 -2
Figure 3.4: Calculated relative concentration-dependent abundance profiles based on the solution of the Equations 3.14 and 3.15 for Kd = 282.4 L mol -1 and Kt = 9.056 x 10³ L mol -1
3.1.2 Finding the aggregation equilibrium constants In order to obtain the aggregation equilibrium constants (Kdim, Ktrim) from the spectra of MB, the concentrations of individual species at each total concentration of MB have to be known. These can be calculated if the molar absorption coefficients, actually integrated peak area of the molar absorption coefficients, of pure spectra of individual species are known
This problem gives a system of three equations with five unknowns (Kdim, Ktrim and molar peaks area of monomer, dimer and trimer), which, in principal at least, can be solved by minimization. We did not succeed in this, however. Possibly, more experimental data might allow for this evaluation. Instead, we utilized the molar peak area of each species obtained from the MCR-ALS (see below) to calculate the concentrations of individual species (Table 3.1).
The molar peaks area [L cm 2 mol ľ] Monomer
0.953 xlO8 Dimer
4.319 xlO8 Trimer
2.216 xlO8
Table 3.1: The integrated molar peaks area of individual methylene blue species
The equilibrium constants were found by the least square minimization of Equations 3.16 and 3.17. The function Pavlovamodr3b.m was written for the purpose of obtaining them (this function can be found on the attached CD). The plots of minimizations are shown in the Figures 3.5 and 3.6 and the concentration profiles calculated with the use of these constants are in the
Plot of Relative Concentrations
53

Figure 3.4. The founded values are K a = 282 ± 14 L mol x and Kt mol -1.
R + Kd[MB] =
P + Kt[MB] =
[MB2] [MB]
[MB3] [MB2]
(9.1 ± 4.2) x 103 L
(3.16)
(3.17)
0.2 0.4 0.6 0.8
Figure 3.5: The plot of least squares minimization to obtain Kd = 282 ± 14 L mol ľ based on the Equation 3.16
8..-"""
0.6 0.8
Figure 3.6: The plot of least squares minimization to obtain Kt = (9.1 ± 4.2) x 103 L mol ľ
based on the Equation 3.17
54

Determination of the concentrations from the absorption spectra
Technical details on the determination of the concentrations from the absorption spectra by Gaussian curve fitting and by Multivariate Curve Resolution can be found in Chapter 5. Here, the above-mentioned methods are utilized and their results compared.
The Gaussian Curve Fitting The Gaussian Curve Fitting method was used for liquid and also solid samples of aqueous methylene blue. First, the number of peaks and the maximum wavenumbers were found by the Step by step filter based program. The fitting minimization was carried out afterwards. This gave the areas of the peaks which could be recalculated to the concentrations. The absorption spectrum of MB monomer consists of two absorption bands (at 664 and 624 nm). The increase of each of these bands is linear for the increasing concentration in the range where the monomer dominates. The coefficients of the linear equations can be found out in the Table A of the Supporting Information for [21] (Appendix 1). A linear dependence of these two peaks was utilized to fit both of them by a single parameter. This technique proved to be appropriate in the circumstances, because the 624 nm peak was overlaid by the dimer peak (Xmax = 606 nm) at higher concentrations and the determination would be difficult.
1.0 -rw
J 0.8 H GQ 0) c 0 > 0.6-I
° 0.4 (/> C o
+•» o j? 0.2-I
0.0
-monomer •dimer - trimer and oligomers
^ + * >~ť£ -4
log c
Figure 3.7: The concentration-dependent abundance obtained by the Gaussian fitting analysis (solid points; monomer, black; dimer, blue; trimer and oligomers, red) in samples at 293 K as a function of the MB concentration c. The lines represent the calculated concentration profiles obtained from the estimated equilibrium constants (they are the same as in the Figure 3.4).
The concentration-dependent abundance of individual species obtained by the Gaussian fitting analysis to the spectra of MB in the Figure 3.2 can be found in the Figure 3.7. The
55

lines represent the calculated concentration profiles obtained from the estimated equilibrium constants (they are the same as in the Figure 3.4).
Multivariate Curve Resolution The alternative method to Gaussian Curve Fitting is the method of Multivariate Curve Resolution - Alternating Least Squares (MCR-ALS) [135, 136]. The spectra calculated by this method for the MB liquid solution can be seen in Figure 3.8 and the abundance profiles in the Figure 3.10. The spectrum of monomer (Figure 3.8; black line) is composed of two overlaying peaks, from which one apparently belongs to the known monomer absorption band (15040 cm-1; 665 nm), while that of 16328 cm-1 (612 nm) is associated with the 0-1 vibration and the dimer absorption band. The spectrum of dimer (blue line) consists only of one maximum. The dimer concentration in the concentration profile (Figure 3.10) is very low compared to the Gaussian analysis because of a large molar absorption coefficients of dimer calculated by this method.
monomer dimer trimer
t » 1
wavenumber [cm1]
Figure 3.8: Calculated normalized spectra of three MB species (black, monomer; blue, dimer; red, trimer) in liquid aqueous solutions at 293 K (Figure 3.2) obtained from MCR-ALS method. The arrows show the known wavenumber values [103, 109] corresponding to the absorption maxima of individual species.
As the next option we tried the hybrid method where the concentration profile from the Gaussian fitting analysis is used as the first estimate for MCR-ALS. The calculated spectra obtained by using this method are pictured in the Figure 3.9 and the abundance profiles in the Figure 3.10. They well resemble those in Figure 3.7 as well as data obtained from the estimated equilibrium constants. The spectrum of the monomer exhibits its maximum at 15050 cm-1
(664 nm) and a shoulder maximum at 16130 cm-1 (620 nm); that of dimer has a maximum
> Q. k. O (/) n (G O > o
56

at 16480 cm-1 (607 nm) with a second minor band at 14600 cm-1 (685 nm). Such findings correspond well to the observation of Bergmann and O'Konski [103]. The spectrum of the trimer is broader and consists of three peaks: 17319 cm-1 (577 nm), 15877 cm-1 (630 nm), and 14558 cm-1 (687 nm). Both minor maxima (at 15877 cm-1 and 14558 cm-1) are artifacts of the absorption bands corresponding to those of the monomer and the dimer.
monomer dimer trimer
\ \ I
> a k. o </> n (0 a> >
• j
14000 16000 18000 20000
wavenumber [cm1] 22000 24000
Figure 3.9: Calculated normalized spectra of three MB species (black, monomer; blue, dimer; red, trimer) in liquid aqueous solutions at 293 K (Figure 3.2) obtained from MCR-ALS method with the input data from the Gaussian fitting analysis. The arrows show the known wavenumber values [103, 109] corresponding to the absorption maxima of individual species.
The comparison of all calculated profiles is shown in Figure 3.10, providing a good agreement of the calculation methods applied. According to the methods, an efficient dimer and trimer formation occurs at the initial MB concentrations above ~ 10 - 3 mol L - 1 .
The same results are depicted in the different way in the Figure 3.11. This time the absolute concentrations in the logaritmic scale are used instead of the relative concentrations. The concentration value at which one species becomes more abundant than the other can be well found. Therefore, this way of plotting is a good alternative to the previously used one.
57

log c
Figure 3.10: Comparison of all calculated concentration profiles applied to the spectra in the Figure 3.2. The lines represent the profiles obtained from the estimated equilibrium constants. The solid symbols were taken from the Gaussian fitting analysis (Figure3.7), the empty symbols from MCR-ALS with EFA (Figure 3.8), and the half-filled ones from the MCR-ALS method using the Gaussian fitting analysis (Figure 3.9).
Plot of Absolute Concentrations
-6.5 -6 -5.5 -5 -4.5 -4 -3.5 -3 -2.5 -2 Log of Total Molar Concentration
Figure 3.11: Comparison of all calculated concentration profiles applied to the spectra in the Figure 3.2. The lines represent the profiles obtained from the estimated equilibrium constants. The cicles were taken from the Gaussian fitting analysis (Figure3.7), the crosses from MCR-ALS with EFA (Figure 3.8), and the asterisks from the MCR-ALS method using the Gaussian fitting analysis (Figure 3.9).
58

3.1.3 Solid Methylene Blue Solutions at 77 K The above described procedure establishes the aggregation of methylene blue in the aqueous liquid solution. It gave us the necessary starting knowledge of the methylene blue aggregation behavior which we later applied on the frozen samples. The absorption spectra of differently frozen MB solutions were analyzed by both the Gaussian fitting analysis, and MCR-ALS methods.
monomer dimer trimer
c[molL"1]
> a !*. O </>
•Q <0 0 > _5 0
14000 16000 18000 20000 22000
wavenumber [cm1]
Figure 3.12: Normalized representative spectra of MB in frozen aqueous solutions at 77 K. The arrows show the known wavenumber values [103, 109] corresponding to the absorption maxima of individual species.
Gaussian curve fitting
The representative absorption spectra of MB 77 K frozen solution are in the Figure 3.12 and the concentration profiles found by the Gaussian fitting analysis are in the Figure 3.13. Relatively fast freezing rate of the aqueous MB samples immersed to a liquid nitrogen bath (77 K) caused a significant change of the relative abundance of the MB species and new significant blue-shifted absorption bands (Figure 3.12) compared to liquid solutions. The lowest initial concentration, for which the signal had reproducible character, was 2.25 x 10~7 mol L_ 1 due to a lower signal-to-noise ratio. In this case, two Gaussian curves were readily fitted having
59

1.0-,
Figure 3.13: The calculated relative concentration-dependent abundance profiles obtained from the Gaussian fitting analysis in samples frozen at 77 K as a function of the MB concentration c based on spectra shown in Figure 3.12. The lines are visualized trends of the corresponding calculated values (solid points).
the maxima at 15383 cm~ľ (650 nm) and 16908 cm~ľ (591 nm) and they were assigned to the monomer and trimer absorption bands, shifted by ~ 10 nm compared to liquid samples. The highest concentration, where traces of monomer were still resolved, was found as low as 2.25 x 10 -6 mol L - 1 . Samples with higher concentrations exhibited absorption in the interval between 15823 cm~ľ (632 nm) and 16450 cm~ľ (608 nm) and it was assigned to dimer. From the concentration profiles in the Figure 3.13 we can see that the trimer prevailed already at the lowest MB concentrations, and the largest peak in the spectrum had the maximum between 18416 and 19305 cm~l (543 and 518 nm), which is considered to correspond to higher aggregates of MB, dominating at concentrations above ~ 5 x 10~6 mol L_1 .
Multivariate Curve Resolution
A similar MCR-ALS analysis as described above for liquid samples was applied to absorption spectra of the frozen MB solutions at 77 K. The spectra of the 'pure' MB species were not resolved in this case; instead, the absorption curves represent three mathematically resolved species that generally correspond to the individual aggregates or their mixtures (Figure 3.14).
o 3
GO O
o c o " Ü AJ
60

Since the results of the MCR-ALS analysis with the efa and Gaussian fitting analysis are very similar, only the latter is shown here. The former can be found in the Figure 6 in [22]. The concentration-dependent abundance profiles are depicted in the Figure 3.15. It is clearly established again that higher aggregates dominate in samples with concentrations above - 5 x lO^molL" 1 .
> o. i -o c/) n > J2
monomer dimer trimer
i 1 1
— i — 24000 14000 16000 18000 20000
wavenumber [cm1] 22000
Figure 3.14: Calculated spectra of three mathematically resolved species (generally corresponding to monomer + dimer, black; trimer, blue; trimer + higher aggregates, red) in frozen aqueous solutions at 77 K obtained from the MCR-ALS method using input data from the Gaussian fitting analysis. The arrows show the known wavenumber values [103, 109] corresponding to the absorption maxima of individual species.
61

- 1 • 1 • 1 • 1 • 1 • 1 -6.0 -5.5 -5.0 -4.5 -4.0 -3.5
log c
Figure 3.15: The calculated relative concentration-dependent abundance profiles obtained from the MCR-ALS analysis in samples frozen at 77 K as a function of the MB concentration c based on spectra shown in Figure 3.12. The lines are visualized trends of the corresponding calculated values (solid points).
62

3.1.4 Solid Methylene Blue Solutions at 243 K The absorption signal of MB samples frozen slowly in the refrigerator at 243 K was quite week and noisy. Slow freezing affected the relative abundance of the MB species noticeably more than fast freezing. There are only two significant broad blue-shifted absorption bands as portrayed in Figure 3.16. The spectra barely revealed the existence of dimer and trimer in samples with the lowest concentrations; however, the maxima at 19608 — 19881 cm'1 (510 -503 nm) and 20833 - 21368 cm'1 (480 - 468 nm) definitively belong to the most abundant species that must correspond to high-weight aggregates not observed in liquid or even quickly frozen aqueous samples. The attempts to apply MCR-ALS model analysis were not successful in this case, since the spectra were comparable in the whole concentration range.
monomer dimer trimer _1 I I I c [mol I ]
— i 1 1 1 1 1 — 14000 16000 18000 20000 22000 24000
wavenumber [cm"1]
Figure 3.16: Normalized representative spectra of MB in frozen aqueous solutions at 243 K. The arrows show the known wavenumber values [103, 109] corresponding to the absorption maxima of individual species.
63

3.2 Topic II - Enhanced Protonation of Cresol Red In order to find out what are the H+ and OH~ availabilities at the grain boundaries of ice the UV/vis absorption spectra of cresol red were measured for the samples frozen at 253 and 77 K, containing various acids (HF, HCl, HN03, H2SO4 and/7-toluenesulfonic acid), sodium hydroxide, NaCl, or NH4CI and covering broad range of pHs. As a weak organic diacid, CR has been selected as a model system to study the acid-base interactions at the grain boundaries of ice. Cresol red is a common acid-base indicator; its known properties were summarized in the Chapter 2.4. Our paper [22] covering this theme can be found in the Appendix II.
3.2.1 The Liquid Cresol Red Solutions at 293 K
As the first step to establish the validity of the proposed method, we determined the transition points of CR forms in aqueous solutions with a different pH using the corresponding concentrations of HCl or NaOH. In the absorption spectra of CR (c = 1.3 x ÍCT5 mol L_1) in the range of 350-650 nm (Figures 3.18, 3.17), three equilibrated forms (A, B, C) are well distinguished as shown in Scheme 2.5.
X [nm]
Figure 3.17: The 3D view to the absorption spectra of CR in aqueous liquid solution from Figure 3.18.
The absorption maxima (Xmax) of the doubly protonated (A), singly protonated (B), and deprotonated (C) forms were found at approximately 520, 434, and 573 nm respectively. The
64

400 450 500 X [nm]
550 600 650
Figure 3.18: Absorption spectra of three CR forms (A, B, C from Scheme 2.5) in aqueous liquid solution with different pH adjusted by HCl or NaOH measured at 293 K. The insert assigns the corresponding pH values to the spectra; the values with an asterisk (*) are the molar concentrations of HCl in the most acidic solutions.
existence of two isosbestic points in the overlaid spectra (A* = 474 and 486 nm), corresponding well to the literature values, [128] authenticated that the CR forms were in equilibrium.
The calculated spectra from the MCR-ALS analysis are shown in Figure 3.19 and the abundance of the CR forms in Figure 3.20. The form A was prevailing below pH = 1.1, B was observed in the pH range of 1.1 to 7.9, and C was the most abundant form in more basic solutions. The estimates of pKas found in these not buffered water solutions corresponds well to the literature values (pK* = 1.1 and pK^ = 8.0) [125, 126]. Also the maxima of the absorption bands (XmaxA = 520 nm, XmaxB = 434 nm, XmaxC = 573 nm) matches the literature values well.
65

400 450 500
X [nm] 550 600 650
Figure 3.19: Calculated spectra of three CR forms (A, blue; B, green; C, red) in liquid aqueous solutions at 293 K obtained from MCR-ALS method using the input data calculated by the evolving factor analysis.
10 11
Figure 3.20: The calculated relative concentration-dependent abundance profiles of three CR forms (A, blue; B, green; C, red) in liquid aqueous solutions at 293 K as a function of the pH obtained from the MCR-ALS method based on data shown in Figure 3.18. The lines are visualized trends of the corresponding calculated values (circles).
66

3.2.2 Solid Cresol Red Solutions at 253 K The frozen samples at 253 K did not show appreciable difference in the absorption bands maxima (see the Figure 3.21, 3.22). Only a new minor absorption maximum at the shoulder of band A appeared in the spectra of samples with the pH in the interval of ^ 2.8 — 5. The main difference lay in the shift of the transition point pH\ from 1.1 in liquid to 3.6 — 4.7 in frozen samples varying with the kind of acid considered (see Figures 3.23, 3.24, 3.25, 3.26, 3.27 and Table 3.2). The transition point pH\ is the pH at which two forms have the same molar concentrations. This indicates that the protonation of the B form of CR in the slowly frozen samples occurs at the acid concentration that, in comparison with the liquid samples, is lower by 2.5 — 3.6 orders of magnitude.The partitioning between the forms B and C, on the other hand, occurred at the same pH2 ~ 8.0 in both liquid (293 K) and solid (253 K) phases. The MCR-ALS analysis was again used with success.
350 400 450 500 550 600 650
A,[nm]
Figure 3.21: Representative absorption spectra of CR forms (A, B, C from Scheme 2.5) of frozen aqueous liquid solution with different pH adjusted by HCl or NaOH measured at 253 K. The insert assigns the corresponding pH values to the spectra; the values with an asterisk (*) are the molar concentrations of HCl in the most acidic solutions.
67

Acid VH\ (293 K) VH\ (253 K) pf/£ (77 K)
HF HCl H2S04
HNO3 p-toluenesulfonic acid
3.6 4.2 4.2 4.6 4.7
4.0 4.4 4.4 4.9 5.0
Table 3.2: Transition points of the first protonation step of CR by various acids in liquid and frozen aqueous solutions.
400 450 500 550
X [nm] 600 650
Figure 3.22: Calculated spectra of three CR forms (A, blue; B, green; C, red) in frozen aqueous solutions of HCl and NaOH at 253 K obtained from MCR-ALS method using the input data calculated by the evolving factor analysis.
68
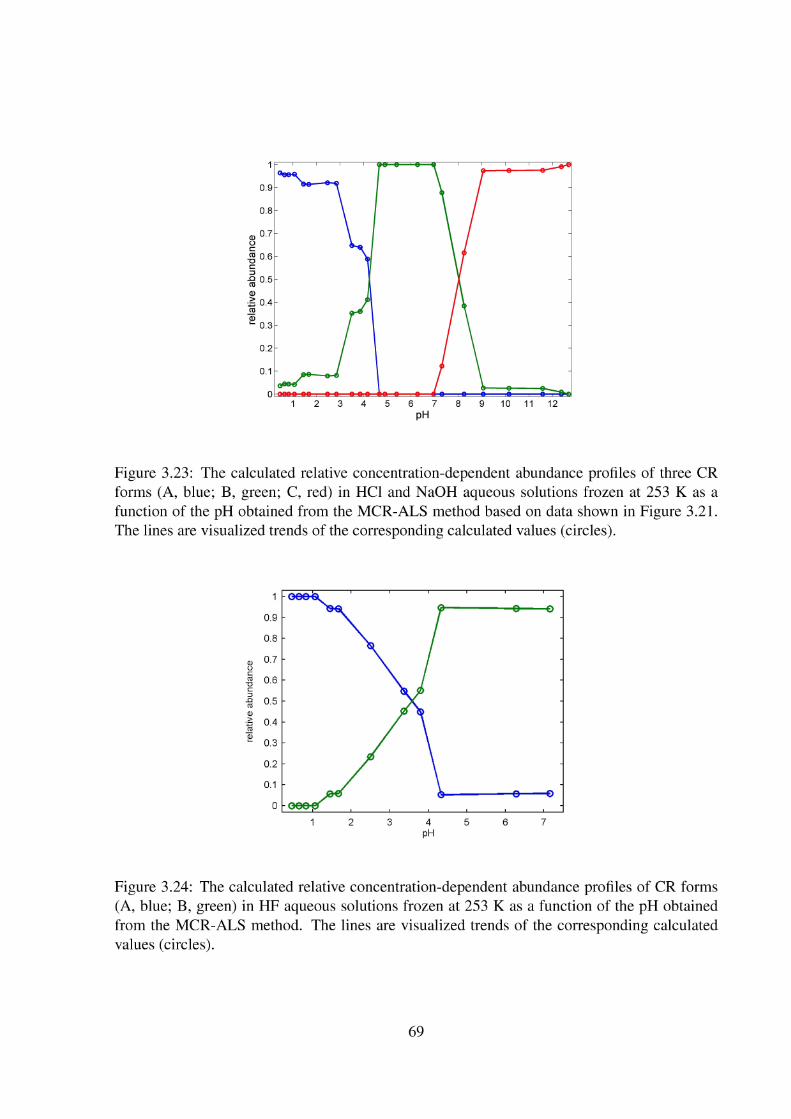
Figure 3.23: The calculated relative concentration-dependent abundance profiles of three CR forms (A, blue; B, green; C, red) in HCl and NaOH aqueous solutions frozen at 253 K as a function of the pH obtained from the MCR-ALS method based on data shown in Figure 3.21. The lines are visualized trends of the corresponding calculated values (circles).
1 öee^a — i — - \
—o 0.9 \ . / -\ 0.8
«t / \
o> 0.7 \ / J o £=
-g 0.6 \ / ^ £= V /k ^ S ü b X T
(D 0 © ž 0.4 / \ J CC / \ (D / \ - 0.3 y \ H
0.2 / \
\
0.1 / \ J a
0 oe&fT 4
pH
Figure 3.24: The calculated relative concentration-dependent abundance profiles of CR forms (A, blue; B, green) in HF aqueous solutions frozen at 253 K as a function of the pH obtained from the MCR-ALS method. The lines are visualized trends of the corresponding calculated values (circles).
69

1
0.9
<D ° - 8 •
O
a °7 •
•a S 0.6 . 3
XI ro os •
0) •^ 0.4 . (0 <U 0.3 . i—
0.2 •
0.1
0
4
pH
Figure 3.25: The calculated relative concentration-dependent abundance profiles of CR forms (A, blue; B, green) in H2S04 aqueous solutions frozen at 253 K as a function of the pH obtained from the MCR-ALS method. The lines are visualized trends of the corresponding calculated values (circles).
Figure 3.26: The calculated relative concentration-dependent abundance profiles of CR forms (A, blue; B, green) in HN03 aqueous solutions frozen at 253 K as a function of the pH obtained from the MCR-ALS method. The lines are visualized trends of the corresponding calculated values (circles).
70

1
0.9
i i i i i i 1
0.9 G 9 & N * . /
0.8 ^ ^ ^ » ^ / -
<D 0.7 ^ v / -ü c
0.6 \ / -c \ / ZJ .Q 0.5 x -(U / \ .> 0.4 / \ -ro / \ OJ IQ \
0.3 ^ s ^ \ " 0.2 ^ ^ \ -0.1
0 <***ŕ*ŕ^^ \ -0.1
0 • , o pH
Figure 3.27: The calculated relative concentration-dependent abundance profiles of CR forms (A, blue; B, green) in p-toluenesulfonic acid aqueous solutions frozen at 253 K as a function of the pH obtained from the MCR-ALS method. The lines are visualized trends of the corresponding calculated values (circles).
71

3.2.3 Solid Cresol Red Solutions at 77 K
The main difference between samples frozen at 77 K and 253 K can be seen by comparing the absorption spectra in Figure 3.28 and 3.21. Besides the already observed shoulder of A peak at ~ 560 nm the pronounced splitting of the A and C peaks into two peaks per each is observed. This change was found to be reversible with temperature. Increasing the temperature of the sample from 77 to 253 K caused the double peak to coalesce into one. And in the opposite way, two bands appeared again when the sample frozen at 253 K (one peak) was cooled to the 77 K.
400 450 500 550 600 650 X [nm]
Figure 3.28: Representative absorption spectra of CR forms (A, B, C from Scheme 2.5) of frozen aqueous liquid solution with different pH adjusted by HCl or NaOH measured at 77 K. The insert assigns the corresponding pH values to the spectra; the values with an asterisk (*) are the molar concentrations of HCl in the most acidic solutions.
The MCR-ALS procedure revealed again the spectra of three species (Figure 3.29) and their relative abundance profiles (Figure 3.30). The spectra of A and C consist of two forms which cannot be discriminated by MCR-ALS, because they occur always together at a given concentration. We assume that the absorption band splitting originates from the two different conformations of electronic isomers of only one protonated CR form. This assumption allowed for the pHT evaluation for HCl - NaOH (Figure 3.30) as well as for other acids (Figure 3.31, 3.32, 3.33, 3.34).
The p¥L\ still little increased for the samples frozen quickly at 77 K to 4.0 — 5.0 (see the Table 3.2) compared to those frozen at 253 K. pB.\ also increased to ^ 9.3 for the 77 K frozen samples compared to the p¥L\ = 8.0 in samples frozen at 253 K or in liquid samples.
72
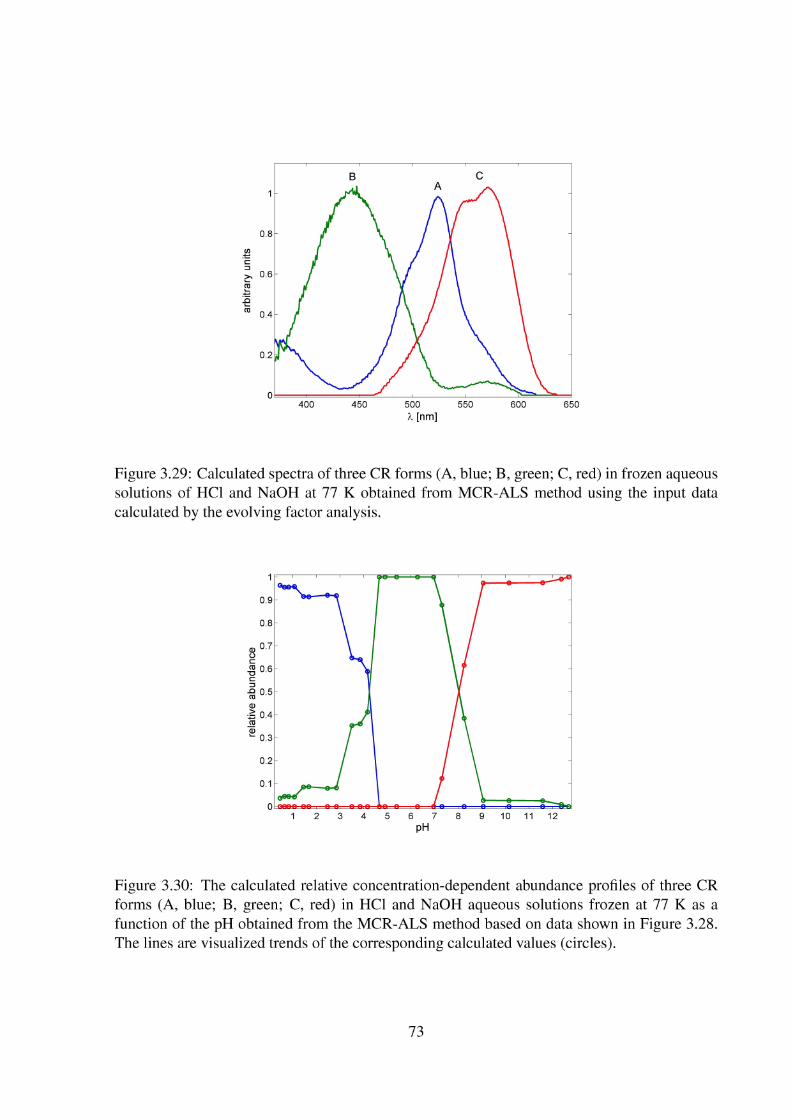
400 450 500 550
X [nm] 600 650
Figure 3.29: Calculated spectra of three CR forms (A, blue; B, green; C, red) in frozen aqueous solutions of HCl and NaOH at 77 K obtained from MCR-ALS method using the input data calculated by the evolving factor analysis.
Figure 3.30: The calculated relative concentration-dependent abundance profiles of three CR forms (A, blue; B, green; C, red) in HCl and NaOH aqueous solutions frozen at 77 K as a function of the pH obtained from the MCR-ALS method based on data shown in Figure 3.28. The lines are visualized trends of the corresponding calculated values (circles).
73

Figure 3.31: The calculated relative concentration-dependent abundance profiles of CR forms (A, blue; B, green) in HF aqueous solutions frozen at 77 K as a function of the pH obtained from the MCR-ALS method. The lines are visualized trends of the corresponding calculated values (circles).
Figure 3.32: The calculated relative concentration-dependent abundance profiles of CR forms (A, blue; B, green) in H2S04 aqueous solutions frozen at 77 K as a function of the pH obtained from the MCR-ALS method. The lines are visualized trends of the corresponding calculated values (circles).
74

1
0.9
Ô — : sk> -1
0.9 • 1 Ô — : sk> -
0.8 / 0.7 \ /
OJ
g 0.6 CO
§ 0.5 ' co / , g 0.4 / \ co ö 0.3 / \
0.2 / \ 0.1
0 „_J 0.1
0
4 pH
Figure 3.33: The calculated relative concentration-dependent abundance profiles of CR forms (A, blue; B, green) in HN03 aqueous solutions frozen at 77 K as a function of the pH obtained from the MCR-ALS method. The lines are visualized trends of the corresponding calculated values (circles).
1
0.9
Ô—' eöo -1
0.9
Ô—' eöo -
0.8 \ / 0.7 \ / 0.6
\ / 0.5
0.4 / \ 0.3 / \ 0.2 / \ 0.1
0
0.1
0
4 pH
Figure 3.34: The calculated relative concentration-dependent abundance profiles of CR forms (A, blue; B, green) in p-toluenesulfonic acid aqueous solutions frozen at 77 K as a function of the pH obtained from the MCR-ALS method. The lines are visualized trends of the corresponding calculated values (circles).
75

3.2.4 The Effects of Salt Addition on Cresol Red Spectroscopic Behavior in Frozen Aqueous Solutions
The absorption spectra of quickly frozen aqueous solutions (77 K) containing NaCl or NH4CI are shown in the Figure 3.35. The liquid solutions are plotted for comparison. The liquid solution of salts remained neutral; thus the B form with the absorption band at 434 nm is characteristic for its absorption spectrum. Upon freezing, the red shifted absorption band of B (^max ~ 450 nm) still remained the most intense. However, other peaks rose: at 578 nm for NaCl and at 538 nm for NH4CI. These peaks correspond to the deprotonated C and doubly protonated A forms of CR, respectively. We were unable to measure the spectra of samples frozen at 253 K, because a liquid phase containing salt was completely separated from the ice phase.
liquid solid (NaCl)
_ solid (NH4CI)
Oh
400 450 500
A,[nm]
550 600
Figure 3.35: Normalized representative spectra of CR in a liquid aqueous solution and those of frozen aqueous solutions containing NaCl (red; c = 0.0024 mol L - 1) or NH4CI (green; c = 0.0013 mol L"1) at 77 K.
76
3.3 Topic III - Solvatochromic Analysis of Ice Surface Besides the aggregation and the protonation/deprotonation of organic compounds at the grain boundaries of ice, we also proposed the possibilities of characterizing the ice crystal surface using the well established solvatochromic parameters. The draft of the paper [137] on this topic is attached in the Appendix 3. The extensive introduction to the idea of solvatochromism can be found in the Chapter 2.2. The solvatochromic parameters can be evaluated from the maxima of absorption bands of solvatochromic compounds.
In this work, we wanted to estimate the effective polarity [100] around various organic solutes in frozen aqueous solutions using the solvatochromic parameters. The concept was already extensively applied in studying the polarity of liquid solvents, [69, 138, 64] but also in examininig the solid surfaces of silica, [78, 86, 90] alumina, [77] and a-amino acid crystals [83]. For our purposes we utilized two independent ways of reaching the solvatochromic parameters:
1. using the ET(33), jV,jV-dimethyl-4-nitroaniline and 4-nitroaniline we were able to evaluate t h e £ f ,7r*,a,/?andAN,
2. using the MK(OH)2 and Fe(phen)2(CN)2 we found AN, vr*, a and E$.
The structures of solvatochromic compounds used are depicted in the Figure 3.36. The UV/vis absorption spectra of solvatochromic probes in liquid and frozen aqueous
solutions were measured. The representative spectra of the key compounds used to determine solvatochromic parameters are plotted in Figures 3.37 3.39 3.40 3.41. The spectra were measured on samples frozen relatively slowly at 253 K or quickly at 77 K, but also on already frozen samples which were warmed from 77 to 253 K or, on the contrary, cooled down from 253 to 77 K. The latter experiments were performed in order to find out if the spectral changes are reversible in this temperature range. The values of absorption maxima and the solvatochromic parameters calculated from them are summarized in the Tables 3.3 and 3.4 for the first and second method of calculation, respectively.
77

Figure 3.36: The structures of solvatochromic compounds used: 1. Reichardt's dye (ET(30) or (2,6-diphenyl-4-(2,4,6-triphenyl-l-pyridinio)-phenolate)), 2. ET(33) (2,6-dichloro-4-(2,4,6-triphenyl-l-pyridino)phenolate), 3. 4-nitroanisole, 4. Af,Af-dimethyl-4-nitroaniline, 5. 4 -nitroaniline, 6. Michler's ketone (4,4-bis(dimethylamino)benzophenone), 7. MK(OH)2
(4-(dimethylamino)-4-[di(2-hydroxyethyl)-amino]benzophenone), 8. Fe(phen)2(CN)2 (cis-dicyano-bis (1,10-phenanthroline)iron(II))
78

Figure 3.37: Normalized spectra of ET(33) in liquid aqueous solutions and in frozen samples.
3.3.1 ET(33) and ET(30) The ET(30) probe (2,6-diphenyl-4-(2,4,6-triphenyl-l-pyridinio)-phenolate) could not be used in aqueous solutions because it is protonated (/?Ka (ET(30)) = 8.64 [64]) at very low concentrations (2.0 x 10~6 mol L_1), the result being that the solvatochromic band disappears. Instead, the ET(30) parameter was calculated from the ET(33) values. The changes in the absorption spectra of 2,6-dichloro-4-(2,4,6-triphenyl-l-pyridino)phenolate (ET(33) probe) upon freezing (Figure 3.36) were easily observed visually: a yellow liquid turned to the red ice sample. In contrast to the spectra obtained at 298 K, those of the samples frozen at 253 or 77 K composed of two absorption bands with Xmax at 464 and 512 nm (253 K) or at 463 and 511 nm, respectively. This means that at least two different species were formed by freezing the aqueous solutions and their calculated abundance ratio (Table 3.3), determined by Gaussian fitting analysis, is based on the presumption that they have similar absorption properties. Such species can be formed by conformational or chemical changes caused only by lowering the temperature; apart from this, there may be two different kinds of interaction (different bounding sites) of the probe with the environment at the grain boundary of ice. Broad peaks can, furthermore, represent overlaid absorption bands of more than two species. An example of fitting the curves can be seen in the Figure 3.38.
The red shifts of both Xmax may suggest that hydrogen-bond donation ability (a) and polarity/polarizability (7r*) in the dye environment in the frozen state decreased compared to liquid solutions. The ET(33) and consequently ET(30) were calculated by the Eq. 2.5 and 2.7, respectively (Table 3.3). In addition, the dimensionless E^ was derived according to Eq. 2.6. Lower values of all ET parameters in frozen solutions could be compared to those of less
79

os ^3 OS ^H in cs os ^3 o in Tf 00
(N o rí TH ^H wi
(N X
^H (f) en ^H O ^H (N
O (N o r OŇ VO o
^H rn ON m £ Ä IT) Tt
ON O
m m OH OH
1 oo O ^H O (N s o oo o vo oo
^T en m m m m
m vo ^H •^, H » N \ e « ö ^ • - ^H m © - H o ©
in Eí in £2 <r> <=> o . o
(N 9 © 9 © (N (N
(N
(D
O o 8 o o o o O o 8 o o o o O o S m o t- -H
Ä o S Tt- Tt- Tt- Tt-OH z; m m m m OH
H . O VO oo »n g (N IT) IT) "<t IT)
Á?^ m m m m
O 00 OS CS n f o « » 5h *n 06 H h H 00 H t> rt
K r ^ v© l« v© in v© in v© in K r ^ o O O O o o o o o ^
g^i O IT) IT) rn ON (N vo in en i> cs' i> cs' i> cs' i>
t | S IT) |- IT) |- IT) |- IT) |-
O
t | S
O m —N ^h cn ^ OO (N (N O VO OO Tt CS
W v o ^H VO ^H" VO rH IT! rH VO
^ vo »n vo in vo »n vo »n
SR l/~) ,_ U~) ON ^ ON
^ m m ON ^H V l M H X H
1 vo m ON o ^H Tt- (N VO ON e o vo o vo ^H vo H vo o
^r^ •n- »n -n-m -<t m Tt m , K
U m m o o U IT) m o o U (N 7 T T en en en en
g Í-H
T 7 T T en en en en
£ O O O o m IT) IT) IT)
H £ O O O O CS CS CS CS
Table 3.3: Solvatochromic parametrs I
80
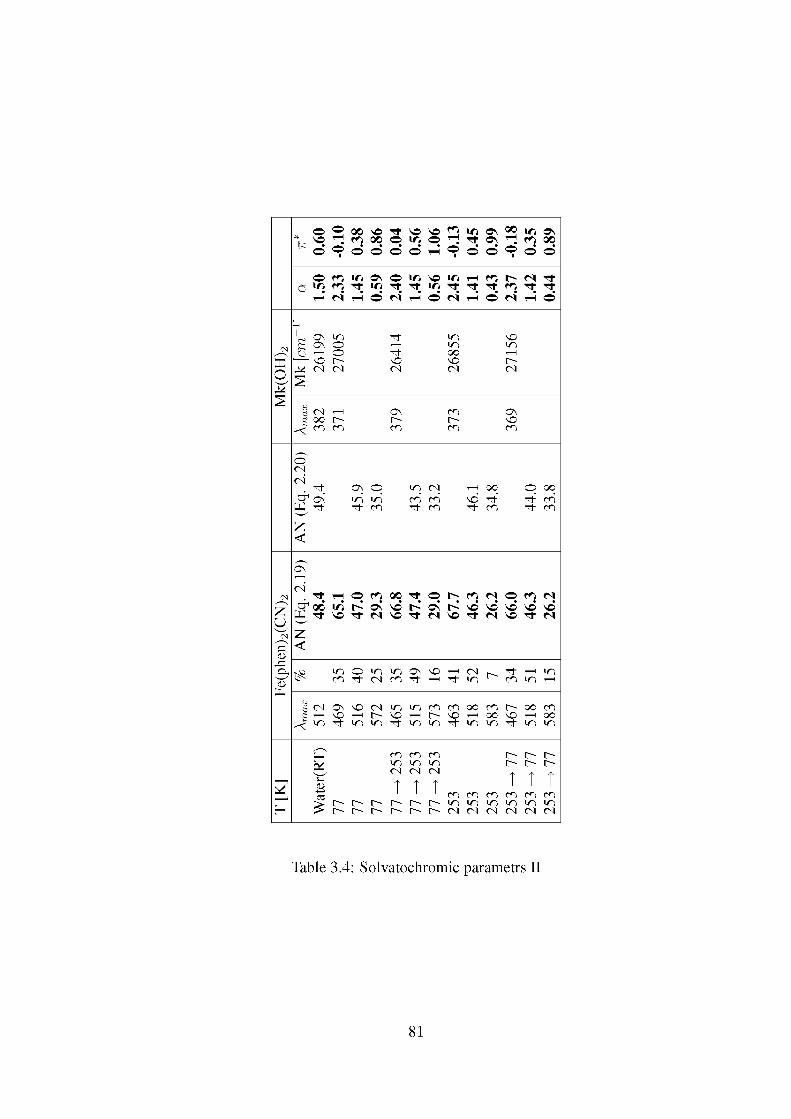
o o 00 o • r ř ^O ^O O I T ) OS 00 i n os * N
o T-H o 00 O i n o T-H T ř OS T-H m 00 * N o O
1 o o O o wi O
1 O O O
1 o o
o O in os o in \o i n ^ H m h> c* -rr ö i n m • f i n • r ř T ř i n T ř T ř T ř O •rř -rř ö
^ H r í ^ H o CJ ^ H o CJ ^ H o r í ^H O
i ON I T ) T ť I T ) o E ON O T—1 I T ) I T )
/-—N u ^ H o T ť OO ^ H
X o
^O o o o O X o
(N (N (N (N (N
s tí tí (N ^ H ON m ON OO O O o ^O
<< m m m m en
r K O (N (N T ť ON o I T ) (N ^ H OO o oo & OŇ i r i i r i en en d T ť Tť en © T ť T ť m Tt - m T ť en Tť en
£ <
r K ON "!
(N <N
• r ř ^ H O o 00 T ř O i > c> CJ O f^ r í
£ & OÓ iri l > OŇ o i > OŇ i > ^o o o O ^o £ w • r ř o • r ř CJ o T ř CJ o •rr CJ o •rř r í U -
<N £ "ô" < ,£3 ,£3 3 1
SR I T ) O I T ) I T ) ON o T—\ <N o T ť ^H IT) <D SR m T ť (N m T ť *—1 Tt - I T ) o en IT) ^H
IX, IX,
tí (N ON o (N I T ) I T ) m cn OO en o oo en ^ H ^ O ^ H O ^ O ^ H o o ^ H oo o ^H 0O
<< I T ) T ť I T ) I T ) T i I T ) I T ) T l I T ) I T ) T ť IT) IT)
Í eň m m O O O Í I T ) I T ) I T ) o O o Í (N (N (N T en
T T en en g
Í-H T T T en en en T
en T T
en en Ž o o O O O O I T ) I T ) I T ) I T ) IT) IT)
H Ž o o O O O O (N (N (N (N (N (N
Table 3.4: Solvatochromic parametrs II
81

o C/) - Q CD
0 _>
J9
15000 18000 21000 24000 27000 30000
wavenumber [cm"
Figure 3.38: Fitting of Gaussian curves into the absorption spectra of ET(33) aqueous sample frozen at 253 K and cooled downd to 77 K. The black line is the measured curve, green lines are the curves of individual peaks and red line is their envelope.
polar solvents than water. For example, E^ = 0.68 and 0.52 was measured for 1,3-butandiol [64] and 1-dodecanol [64], respectively. The freezing conditions had practically no effect on the ET parameter; however, they affected the abundance of the resolved species. Fast freezing moderately enhanced the population of a more polar species (E^ ~ 0.68) (Table 3.3).
82

3.3.2 The 7T* parameter
We tried to determine the 7r* parameter by measuring the absorption spectrum of 4-nitroanisole [71] but the corresponding solvatochromic band disappeared after the solution was frozen. As a result, an alternative probe - A^A/^-dimethyl-4-nitroaniline - was used for its determination using a linear correlation (Eq. 2.11); 7r* was obtained using Eq. 2.12. The absorption band (\max) of the frozen solutions was shifted hypsochromically by approximately 70 nm compared to liquid samples (Table 3.3), which provides the 7r* values close to zero in all cases. Thus, while the 7T* parameter for liquid samples (1.15) is in a good agreement with the tabulated value of 1.09 [139], the extremely low values found in ice can be compared, for example, to those obtained in cyclohexane [139]. This solvent does not exhibit any dipole-dipole interactions toward this probe. It is apparent from the Table 3.3 that temperature had no effect on the 7r* values.
I water (298 K) I
320 340 360 380 400 420 440 460 480 500 520
A,[nm]
Figure 3.39: Normalized spectra of PhN02NMe2 in liquid aqueous solutions and in frozen samples.
3.3.3 The a parameter
The a parameter was calculated from the preceding 7r* and ET(30) values by Eq. 2.15. It was not surprising that the values were found very high for ice samples (the corresponding 7r* parameters are negligible) compared to those of liquid solutions (Table 3.3). As a result, this parameter represents a principal interaction measured by ET(33), not affected by temperature again. The a = 1.4 value would correspond to the strong hydrogen-bond donating solvents such as trifluoroethanol (a = 1.51) [139].
83

3.3.4 The ß parameter This parameter was calculated from the absorption maxima of A^A/^-dimethyl-4-nitroaniline and 4-nitroaniline (Figures 3.39 and 3.40) according to Eq. 2.17 and 2.18, where the AAz>#MpT
for the used pair of molecules is 2759 cm - 1 [73]. 4-Nitroaniline is a molecule homomorphic to A^A/^-dimethyl-4-nitroaniline and able to donate a hydrogen to HBA solvents. The calculated values were found to be significantly higher in ice than in liquid solutions. Being somewhat different in samples frozen quickly or slowly, the average ß value of 1.7 is higher than that of any known solvent (the highest value is 1.43 for 1,2-diaminoethane [64]).
_ J i i i i i i i — ' — r —
320 340 360 380 400 420 440 460 480
X [nm]
Figure 3.40: Normalized spectra of PhN02NH2 in liquid aqueous solutions and in frozen samples.
3.3.5 The AN, a and ß parameters Now we wish to apply an independent procedure to evaluate AN, a and ß parameters using 4,4-bis(dimethylamino)benzophenone (Michlers ketone), 4-(dimethylamino)-4-[di(2-hydroxyethyl)-amino]benzophenone dyes (MK(OH)2), and c/s-dicyano-bis(l,10-phenanthro-line)iron(II) (Fe(phen)2(CN)2). This method was introduced by Spange et al. to estimate interactions of the probes with solid surfaces [81]. While the acceptor number (AN) was determined directly according to Eq. 2.19, a linear correlation of Xmax with those of by Eq. 3.18 enabled us to calculate the title parameters using Eq. 2.21 and 2.22 (Table 3.4). In addition, the AN values were calculated from ET(30) and 7r* (Eq. 2.20; Table 3.4) to compare the results. Fe(phen)2(CN)2 in the liquid solution gives a broad asymmetric absorption band with Xmax
= 512 nm (Figure 3.41). Upon freezing, the band was red-shifted and three distinct maxima approximately at 466, 517 and 580 nm appeared, relatively independently of temperature.
84

However a decrease in the intensity of the most red-shifted band (580 nm) was observed for the samples frozen at 253 K compared to those frozen at 77 K. If they represent three species their abundance are shown in Table 3.4, based again on the presumption that they have similar absorption properties. Since AN values characterize the electron pair acceptor ability of the medium, we could deduce that there are either three characteristic sites in the vicinity of the probe or that temperature and constraining environment affect its conformation. The existence of three species indicates that Fe(phen)2(CN)2 interacts differently at the grain boundary than ET(33) and A^A/^-dimethyl-4-nitroaniline. It is interesting that AN varied from very high values (65 - 68; AN = 83.6 and 52.3 were found for formic and acetic acid, respectively) [70], medium values (~ 47; comparable to that of water), and small values (26 29; AN = 23.1 was determined for chloroform) [70]. The highest value (AN = 66) determined by Fe(phen)2(CN)2 (Table 3.4) was not reached by the AN calculation based on the 7r* and ET(30) parameters (Table 3.3). This means that specific interactions of the probes must be considered.
water (298 K) — 77 K
253 K
350 400 450 500 550 600
X [nm]
Figure 3.41: Normalized spectra of Fe(phen)2(CN)2 in liquid aqueous solutions and in frozen samples.
The absorption bands of MK as well as MK(OH)2 shift hypsochromically upon freezing compared to water. The absorption spectra of MK were not well resolved at 253 K, perhaps because of its low solubility, and the absorption maximum could not be determined. In contrast, MK(OH)2 spectra provided Xmax at both 77 K and 253 K. No significant differences were found when the samples were frozen slowly or quickly. The parameters calculated from the MK and MK(OH)2 were essentially the same at 77 K. However, Table 3.4 shows the values obtained from the latter probe only.
85

Conditions ET(30) 7T* a ß CH2C12 slurry CH2CI2 solution
43.7 40.7
0.400 0.309
0.64 0.82
0.34 0.13
1.04 0.10
Table 3.5: The calculated solvatochromic parameters for CH2C12 slurry (the mixture of crystals with the solvent).
The linear dependence between the absorption maxima of MK and MK(OH)2 for 26 solvents [85] was found to obey Equation 3.18 and was therefore used.
/>maxMK = -0.96 + 1.038i>maxMK(OH)2 (3.18)
The 7T* and a values in water, measured for this work, do not correspond to those measured by independent procedures. To our knowledge, there is no correlation among these values available in the literature to this date. If those data are only relative, the same conclusion as above can be reached. There are three types of interactions, from which one is comparable and two are extreme (more or less dominant) in comparison with that observed in water. Since the calculation is based on the data measured with the probe Fe(phen)2(CN)2, such a result was expected.
3.3.6 Solvatochromic probes in dichloromethane slurry
In order to estimate the parameters of very concentrated solutions (aggregates) of the solvatochromic probes, the maxima in broad absorption spectra of the dyes (ET(30), N,N-dimethyl-4-nitroaniline, 4-nitroaniline) in a dichloromethane slurry were used. The calculated solvatochromic parameters obtained in the same way as those in the Table 3.3 are shown in the Table 3.5 together with the parameters for liquid dichloromethane.
86

Chapter 4
Conclusions
The absorption spectra of organic molecules frozen in the ice revealed new information that helps us to understand the ice surface and its interactions with organic molecules.
During the freezing process, the solutes in aqueous solutions are excluded from the ice-growing phase resulting in increased concentrations on the crystal surfaces [37, 38]. To avoid the formation of a liquid layer in the grain boundary due to the freezing point depression, all absorption spectra were measured below 253 K with all solutions solidified. Higher surface-layer concentration of the solutes shortens the average intermolecular distances and enhances the probability of aggregation processes. In addition, lower temperatures suppress diffusion and molecular dynamics. Molecular aggregations in ice may change the absorption characteristics of the organic molecules due to changed interactions with the host water molecules of the cavity as well as intermolecular interactions among the solute molecules themselves [7, 6]. Furthermore, gaseous solutes (air) can cause the scattering of light due to fine dispersed bubbles which, together with reflection, decrease the signal-to-noise ratio in the spectra [140].
Topic I The first sight at the MB spectra (liquid Figure 3.2, frozen at 77 K Figure 3.12 and at 243 K Figure 3.16) shows the shift of the absorption peaks to the higher wavenumbers. It corresponds with higher molecular aggregates for frozen samples compared to the liquid ones of the same concentration. Even at the lowest detected concentration (2 x 10~7 mol L - 1) at 77 K the trimer is prevailing and monomer and dimer occupy together only about 20 % overall. The monomer, dimer or trimer are barely detectable at the 243 K. Instead, the two peaks assigned to the higher aggregates dominate.
To compare the aggregation quantitatively, we determined the concentrations at which the ratio of a species (or their mixtures) reaches 1. These concentrations are summarized in the Table 1 in [21] for various freezing temperatures and all the analysis techniques. We can conclude that the local concentration of MB at the grain boundaries increased by ~ 3 orders of magnitude upon fast freezing at 77 K compared to the liquid phase, and at least by 6 orders of magnitude upon slow freezing at 243 K. Therefore the longer time of freezing allows the higher aggregation. The absorption spectra did not change when the sample frozen at 243 K was cooled down to the 77 K or when the sample frozen at 77 K was heated to 243 K. Therefore the aggregation quantity depends on the cooling rate and not on the final temperature.
87
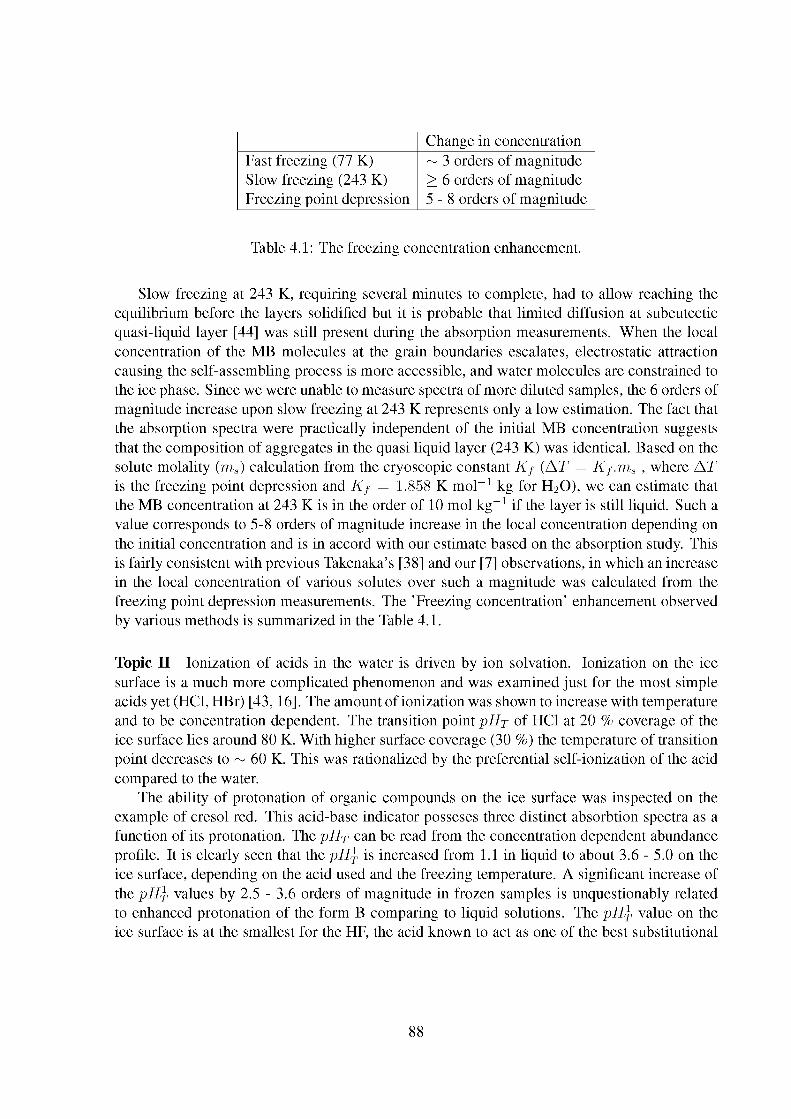
Change in concentration Fast freezing (77 K) Slow freezing (243 K) Freezing point depression
~ 3 orders of magnitude > 6 orders of magnitude 5 - 8 orders of magnitude
Table 4.1: The freezing concentration enhancement.
Slow freezing at 243 K, requiring several minutes to complete, had to allow reaching the equilibrium before the layers solidified but it is probable that limited diffusion at subeutectic quasi-liquid layer [44] was still present during the absorption measurements. When the local concentration of the MB molecules at the grain boundaries escalates, electrostatic attraction causing the self-assembling process is more accessible, and water molecules are constrained to the ice phase. Since we were unable to measure spectra of more diluted samples, the 6 orders of magnitude increase upon slow freezing at 243 K represents only a low estimation. The fact that the absorption spectra were practically independent of the initial MB concentration suggests that the composition of aggregates in the quasi liquid layer (243 K) was identical. Based on the solute molality (ms) calculation from the cryoscopic constant K f (AT = Kf.ms , where AT is the freezing point depression and K f = 1.858 K mol -1 kg for H20), we can estimate that the MB concentration at 243 K is in the order of 10 mol kg - 1 if the layer is still liquid. Such a value corresponds to 5-8 orders of magnitude increase in the local concentration depending on the initial concentration and is in accord with our estimate based on the absorption study. This is fairly consistent with previous Takenaka's [38] and our [7] observations, in which an increase in the local concentration of various solutes over such a magnitude was calculated from the freezing point depression measurements. The 'Freezing concentration' enhancement observed by various methods is summarized in the Table 4.1.
Topic II Ionization of acids in the water is driven by ion solvation. Ionization on the ice surface is a much more complicated phenomenon and was examined just for the most simple acids yet (HCl, HBr) [43,16]. The amount of ionization was shown to increase with temperature and to be concentration dependent. The transition point pHT of HCl at 20 % coverage of the ice surface lies around 80 K. With higher surface coverage (30 %) the temperature of transition point decreases to ~ 60 K. This was rationalized by the preferential self-ionization of the acid compared to the water.
The ability of protonation of organic compounds on the ice surface was inspected on the example of cresol red. This acid-base indicator posseses three distinct absorbtion spectra as a function of its protonation. The pHT can be read from the concentration dependent abundance profile. It is clearly seen that the pR\ is increased from 1.1 in liquid to about 3.6 - 5.0 on the ice surface, depending on the acid used and the freezing temperature. A significant increase of the p¥L\ values by 2.5 - 3.6 orders of magnitude in frozen samples is unquestionably related to enhanced protonation of the form B comparing to liquid solutions. The p¥L\ value on the ice surface is at the smallest for the HF, the acid known to act as one of the best substitutional
88

impurity in the ice lattice. The subsequent increase of p¥L\ for HCl, H2S04, HNO3 and p -toluenesulfonic acid corresponds to the presumable decreasing solubility of the acids in the ice. For the faster freezing at 77 K the pH^ is higher than for the slow freezing rate at 253 K.
We assume that CR forms at the grain boundaries at 253 K are in equilibrium, because protons efficiently migrate in ice[141] and diffusion of simple organic molecules is remarkably efficient at even lower temperatures [8]. The value of p¥L\ = 4.2 for HCl solutions at 253 K means that CR is protonated ~ 1000 more efficiently comparing to liquid solutions. The only explanation is based on the concentration-enhancing effect of the CR and acid molecules during the whole freezing process. The capabilities to protonate CR molecule logically depends on the amount of acid present on the ice surface. Freezing the aqueous solutions is known to be accompanied by the exclusion of most of the solutes from the growing ice phase resulting in increased concentrations at the grain boundaries of the polycrystalline state. It is found that the concentration of the less soluble acid is higher on the ice surface than those of the highly soluble acids by the factor of 10 only.
HNO3 is, for example, much less soluble [13] in ice than HCl, and H2S04 should be found essentially only at the grain boundaries of ice [11]. Additionally, p-toluenesulfonic acid is quite different system than the other acids. As an organic molecule it should be excluded from the ice phase, thus increasing the proton concentration at the grain boundary. This somewhat lower sensitivity of the p¥L\ values to the acid structure suggests that the proton concentration increased by freezing increases substantially as well in all cases studied. It is certain that the CR concentration at the grain boundaries becomes very high. The aggregation (self-organization) is promoted by electrostatic and dispersion forces in addition to hydrophobic effects. Such interactions may enhance a more efficient CR deprotonation due to the formation of closely packed intermolecular ion-pairs, as it was observed in the case of CTAB addition [127].
The higher freezing rate (at 77 K) has also the effect of increasing the acid concentration on the ice surface more than the lower rate at 253 K. The extent of the protonation enhancement was higher only by a factor of ~ 1.1 compared to that found at 253 K (Table 3.2). Immersing the samples in liquid nitrogen could be considered as fast freezing but an equilibrium prior to solidification was achieved quickly enough to allow this magnitude of protonation. The fact that all pR\ values obtained at 77 K are higher but the enhancement is modest compared to 253 K experiments means that the system in the liquid nitrogen was already equilibrated at relatively higher temperature, possibly reaching the maximum CR protonation. Such equilibrated mixtures can definitively co-exist with solidified solutions at the grain boundaries of ice. Several groups have showed that quasi-brine layer, the unfrozen NaCl solution phase on ice crystals, exists at temperatures below the eutectic point [142, 143, 144, 44]. Relaxation processes were also observed below liquid-glass transition temperatures in supercooled aqueous propylene glycol, glycerol or PEG solutions [145]. We do not know the eutectic point for CR solutions (the values for common organic molecules such as urea or citric acid [146], are close to 260 K), but CR molecules should have some additional time to establish the protonation equilibrium at temperatures below 253 K, being supported by probable fast proton migration [141] or motion of small organic molecules [8] through the solidified layer or aggregated dye molecules. When temperature drops further to 77 K, any molecular transport or motion is critically constrained and any intermolecular reactions can be nearly excluded. Of course, the
89

extent of acid dissociation is temperature dependent. While hydrogen chloride, a strong acid, dissociates completely in liquid solutions, ionization was found to be limited on the surface of ice at very low temperatures [43,16]. This will also have an effect on the acid - base interactions, therefore on the transition points measured.
The pH? ~ 8.0, corresponding to the second equilibrium step (B^C; Scheme 2.5), was found to have nearly the same value in the liquid phase and at 253 K, but a somewhat higher value (~ 9.3) at 77 K. The solubility of alkali hydroxides in ice is know to be low [23]. Ice prepared, for example, by freezing a KOH solution, contains inclusions of a concentrated KOH solution which freezes at 210 K to an eutectic mixture of almost pure ice and KOH.4H20 [147, 148]. An insignificant increase in CR deprotonation at 77 K might be explained by enhanced OH~ concentration during the freezing process, but it seems that the hydroxyl ions exhibit a more specific access to the OH group of CR than protons or we simply observe a temperature effect only as was demonstrated elsewhere [129].
When an aqueous solution of inorganic salt is frozen, the anions and cations are not necessarily incorporated in the proportion originally present in the solution (this behaviour was already dicsused in the Chapter 2.1.7). For NaCl, Cl~ incorporates into the ice lattice as HCl, whereas Na+ and OH~ remain in the liquid phase [35]. A decrease in the proton concentration on the surface of newly formed ice crystals corresponds well to the theory of Bronshteyn and Chernov [9, 10]. When the CR absorption spectra of the frozen (77 K) aqueous solutions containing NaCl were measured, two deprotonated CR forms (B and C) were exclusively found (Figure 3.35). As expected, the hydroxyl ions excluded from the ice phase deprotonated CR molecules before the layer at the grain boundaries froze. In contrast, when NH4C1 aqueous solutions is frozen, NH^ can occupy H20 sites in the lattice [23] in a greater extent than Cl~, thus the ice surface layer is more acidic. The absorption spectra of frozen aqueous CR solutions containing this salt at 77 K revealed only more protonated CR forms (A and B). CR thus served as an excellent acid-base indicator at the grain boundary. Since, in addition to the B form, either A (in the case of NH4C1) or C (in the case of NaCl) co-existed in frozen solutions, we tried to estimate the relative concentrations of the CR forms in each case to evaluate the corresponding pH of the frozen layer. The overlaid spectrum of the frozen NH4C1 solutions resembled that of HCl having pH ~ 4.8 frozen at 77 K (Figure 3.28). In contrast, the spectrum of the frozen NaCl solutions corresponded to that of NaOH having pH ~ 9.1. The corresponding pH at the brine layer in the case of NaCl are well in accord with the values measured by Sola and Corti (pKmax ~ 9) [10].
Topic III The solvatochromic parameters were used to evaluate interactions which can occur among various probes and water molecules at the grain boundaries. Table 4.2 surveys the most relevant information. Table 3.3 demonstrates the calculated values for differently frozen ice samples. The empirical solvent polarity functions, ET(30) or E^, were found to be generally lower than those of liquid water, and a detailed analysis revealed that only the a parameter evaluating the environment molecules as hydrogen donors contributes. Practically no dipole-dipole interaction (ir*) was found. The acceptor number (AN), calculated from the ET(30) and a parameters only supported this finding. In addition, the ß parameter obtained for frozen samples was exceptionally high. Three AN values were determined by Eq. 2.19 from each spectrum of
90

7T* a ß water 1 1.09 1.17 0.18 ice 0.68 0.51" 0 1.4 1.1° 1.5-2
Table 4.2: Solvatochromic parametrs - survey; a - the value derived from minor peak
the probe Fe(phen)2(CN)2 frozen in the aqueous liquid solutions because three absorption peaks emerged (Figure 3.41, Table 3.4). In addition, previously calculated ET(30) and a parameters allowed us to obtain AN independently (Eq. 2.20; Table 3.4); two absorption peaks in each spectrum meant 2 different AN values in this case. These two methods allow us to compare different types of interactions of the probes. For the frozen samples, the middle values obtained by Fe(phen)2(CN)2 correspond well to the higher values obtained by ET(33) and jV,jV-dimethyl-4-nitroaniline. Discrepancies (lower AN values in the case of Fe(phen)2(CN)2) can be caused by an offset in the LSER used or this change represents a different solvation type of the probes with the environment. The values of ir* and a calculated by the Eq. 2.21 and 2.22 (Table 3.4) differ substantially from those in Table 3.3. The Eq. 2.21 and 2.22 were derived for other solid surfaces and therefore it is possible that some correlations are necessary. It is obvious even for the 7T*, a and E^ values in liquid water, which differ from those shown in Table 3.3.
The organic as well as inorganic compounds are excluded from the bulk ice to the grain boundaries, causing a substantial increase of the local concentration of solutes [23, 38]. Considering the concentrations used in the present work (10~5 - 10~6 mol L - 1) , the following two kinds of interactions must be expected:
1. interactions of the probe molecules with the water molecules
2. interaction between the probe molecules themselves.
Thus, to estimate the latter interaction, the solvatochromic parameters based on the absorption spectra of probe molecules in the solid state would be necessary; however, they are, to our knowledge, unknown. Instead, we measured the absorption spectra of the crystals of some probe molecules (ET(30), jV,jV-dimethyl-4-nitroaniline, MK) in the dichloromethane slurry. The presence of medium-polar dichloromethane influences the spectra, but the intermolecular interactions were apparent when the probe concentrations increased (Table 3.5). The values of Ey and ir* slightly increased and decreased, respectively, whereas a and ß increased substantially. This behavior can be explained on the molecular level; while dipolar interactions of probe molecule with solvent and with itself do not differ much, the interactions which are responsible for the donation and acceptance of electron pairs became stronger upon the dye aggregation. The shifts of a, ß and ir* parameters upon aggregation in the dichloromethane slurry had the same trend (but a significantly smaller magnitude) than the changes observed upon freezing the aqueous solutions. The results indicate that the self-aggregated mixture with the remains of solvent is more polar than liquid dichloromethane but less polar than water.
The change of the solvatochromic parameters in the frozen aqueous samples can be explained by the pronounced inter-probe dipolar interactions as well as interactions between the
91

probes and water molecules at the grain boundaries. In contrast to the two peaks in the frozen aqueous solution the spectra of ET(30) in the dichloromethane slurry (not shown) did not reveal any structure. Therefore, it can be deduced that the interactions between the water molecules at the grain boundaries and the probe molecules are responsible for the appearance of two peaks in the case of compound ET(30) and three peaks in the case of compound Fe(phen)2(CN)2. The presence of three types of water interactions [41] and two energetically distinct bounding sites for HCl [43, 18] on the ice surface was reported in the temperature range of 50 to 140 K. These local surface patterns most probably interact with the probe molecules and influence its absorption spectrum. The probe molecules interact with more than one bounding site on the ice surface, causing the spectral broadening.
The temperature of the samples did not have any significant effect on the change of solvatochromic parameters. The minor shifts of the absorption band maxima can be caused by the drift in the spectrometer or a decreased S/N ratio. The absence of major change of solvatochromic parameters upon fast and slow freezing suggests strong interactions of the probe molecules in the beginning of the freezing process. In respect of our study on the methylene blue aggregation in ice [21], we can expect the three or six fold increase of the concentration of probe moleules upon fast (77 K) or slow (253 K) freezing, respectively. In the case that the inter-probe interactions and the probe - water interactions influence the absorption spectra of the probe differently, which is highly probable, we observe the same probe - water interactions in both quickly and slowly frozen samples. It means that - even at high concentrations (1-10 mol L - 1) that can be expected at the grain boundaries [11] - the interactions of probe molecules with water are present.
The minor temperature effects on the relative abundance of two peaks for ET(30) and three peaks of Fe(phen)2(CN)2 were found. The observation is contradictory for these two probes: for ET(30) the most red shifted peak (at 510 nm) intensified with higher temperature whereas the most red shifted peak (at 580 nm) of Fe(phen)2(CN)2 lowered its intensity. This means that specific interactions of the probes must be considered. The effect of decreasing E^ cannot be attributed to temperature, which should act in the opposite way - E^ raises with decreasing temperature [68]. This behavior was found to be a general feature for DMSO, acetonitrile, nitromethane, r-butanol, 2-propanol, methanol and water in the temperature range of 273 to 350 K.
According to our measurements, electron-pair donating and/or hydrogen-bond accepting interactions are the most prevailing at the grain boundaries of ice, but the hydrogen-bond donating effect was significant too. In contrast, the polarity/dipolarity interactions were unimportant. These properties make the surface of ice a unique reaction medium. It differs from the most solid supports (such as silicas, aluminas, Ti02) [81, 77, 78] because of a much lower 7T* value. This low ir* value corresponds to that measured on the air/water interface, for example [88]. The effects observed at the grain boundaries are quite opposite to those in the frozen organic solvents [100]. In such cases, the solvent molecules are more organized around the probe, which increases the polarity. An opposite trend is expected in ice, which is known to contract upon freezing.
In conclusions, the following points emphasize the results of our work:
92

1. The study of absorption spectra changes of methylene blue aqueous solutions upon freezing allowed us to characterize a concentration freezing effect of common organic molecules on the grain boundary of ice. The aggregation extent was found to be dependent on the cooling rate and not on the final temperature.
2. The acid-base equilibrium was studied on the grain boundaries on absorption spectra of cresol red as a model compound. Protonation extent of weak organic bases in the frozen water glasses was evaluated.
3. The solvation properties of organic molecules frozen in aqueous solution were determined. According to our measurements, electron-pair donating and/or hydrogen-bond accepting interactions are the most prevailing at the grain boundaries of ice but the hydrogen-bond donating effect was significant too. In contrast, the polarity/dipolarity interactions were found to be unimportant.
93

Chapter 5
Experimental Part
Details of experimental proccesses are given in this Chapter. It is written to make it easier to anybody willing to measure and interpret absorption spectra in non-transparent media.
5.1 Spectroscopic Measurements of Ice Samples
The reflection sphere had to be used because of the light scattering on the ice sample. In the normal UV/vis spectrometer, the amount of light transmitted through the ice sample and reaching the detector is not sufficient. Therefore we used 60-mm integrating sphere coated with BaS04. This allowed the transmission or the reflectance arrangement depending on whether the sample is placed in front of or behind the integrating sphere (relative to the incident light). Most of the examined samples were tested in both modes. The pattern of the absorption did not depend on the measuring mode, despite the signal to noise ratio. It revels that for the ice samples the transmission mode gave better spectra. For the highly nontransparent samples (as for example, KBr pallets or pure crystals of the compounds) the reflectance mode is better to use.
The plastic cuvettes (PLASTIBRAND) were used for the measurements. The solidified samples were prepared by fast freezing at 77 K (a liquid nitrogen bath) or slow freezing at 253 K (ethanol cooling bath) and measured immediately after removing the cuvettes from the cold media. Although the sample temperature was not controlled during the absorption measurements, no changes of the spectra were observed within the time period necessary for the duplicate consecutive experiments. Each reported spectrum is an average of at least four spectra. The independent measurements were conducted in the separate runs. This procedure should minimize any systematic error. The technique is capable of detecting the concentrations as low as 3 x 10~7 mol L - 1 , depending on the molar absorption coefficient of the compound.
94

5.2 Determination of the Concentrations from the Absorption Spectra
The quantity of the species can be calculated from the absorption at given wavelength on condition that the molar absorption coefficient at that wavelength is known and that the species of interest is the only absorbing species at given wavelength. This approach works well if the two conditions are fulfilled, which is most often not our case. Another approach uses not just the absorption at one given wavelength but the absorptions of the whole peak or the entire spectrum. We utilized both of these methods: by the Gaussian Curve Fitting and Multivariate Curve Resolution, respectively.
5.2.1 The Gaussian Curve Fitting
The spectra in the UV/vis region should consist of the peaks with Gaussian shape. Therefore, if we fit one Gaussian curve for each peak we can cover the whole spectrum. The peaks area is then proportional to the concentration of given species. This method is particularly good if the absorption maxima of the peaks are known. In this case, even the strongly overlapping absorption peaks can be fitted separately. The fitting program (Origin 7.0 for example) can do the optimization with some parameters fixed in the beginning; the constrained parameters can be relaxed later on and fine optimization can be accomplished. The peak's area can be calculated for the molar concentration to obtain the molar peaks area. This becomes the proportional constant that allows the calculation of concentration afterwards. The minimization by fitting the Gaussian curves does not necessarily give the unique solution [149]. Therefore the process of minimization should be a matter of routine for the samples in the same series. It is important to note that the spectroscopic peaks have the Gaussian shape if the x coordinate is directly proportional to the energy. The wavenumber suits this condition but the wavelength does not.
The number of peaks and their maxima can be found using the Step by step filter based program developed by Antonov [150].
5.2.2 Multivariate Curve Resolution
The alternative method to Gaussian Curve Fitting is the method of Multivariate Curve Resolution - Alternating Least Squares (MCR-ALS) [135, 136]. The objective of applying this method is the same as for Gaussian Curve Fitting: to extract the concentrations and the spectra of pure components of individual species from the concentration dependent set of measured spectra. The important difference between the methods is that the MCR-ALS is modeless. In our case of methylene blue for example it means that we cannot apply our knowledge of the absorption maxima of individual species. Instead, the mathematically estimated number of species presented in the spectra is calculated by singular value decomposition (SVD). An example of SVD analysis results of liquid MB spectra from Figure 3.2 is plotted in the Figure 5.1. It can be clearly seen that the importance of three species is overmastering. This number of species to be considered and the series of spectra are inputted into the evolving factor analysis (efa) program, which gives the first estimate of the concentration profiles of each species. This
95

Figure 5.1: Results of SVD analysis for liquid MB samples form the Figure 3.2.
is further used for the MCR-ALS program, which by using some constrains (neither spectra nor concentrations can be negative, the total concentrations of all species) calculates the spectra and concentration profiles of each species by least squares method.
96

Chapter 6
The Scripts Written to Process the Data
During the work on the topic of my dissertation hundreds of absorption spectra were analyzed. I quickly found out, that to process them in the Excel or Origin would take unbearable long time and that the process would be apt to mistakes. Therefore I wrote short scripts in unix, Python, or MATLAB which I used for data processing. They have they own comments in its body most often, but I will describe here the overall procedure that lead from the raw data from the spectrometer to the results of plotted spectra. The programs are placed on the attached CD and are ready to use for anybody who needs it.
On this place, I am happy to thanks once again to Pavel Dvorak, Jana Topinková, Petr Novak and Petr Klokan Pridal who help me substantially with the programming.
The first task is to get the spectrum in the form of two columns: in the first one should be wavelengths and in the second corresponding absorbances. This procedure is worked for three spectrophotometers I used.
1. The spectra collected on the Lambda 19 UV/VIS/NIR spectrophotometer (Perkin-Elmer) were exported to ACSII. The first 86 rows of each file contain only the instrument setting information. These can be cut off by the script maz in unix. This script should be placed in the same directory as the exported files and executed. All the files in the directory will be worked out and saved at once.
2. The inverted print edit (the exchange of commas to dots) which is needed from the files exported from Shimadzu UV-1601 can be done by the unix script shimadzu.bash. The procedure is the same as for the foregoing example.
3. The spectra collected on the Unicam UV4 (Cambridge, UK) were also exported to ASCII (Export as ASCII, Batch., command). The advantage of the software division into the 1.cycles l.samples and 3.batches was taken. The exactly same sample was let measured for at lest 2 cycles without removing the sample from the spectrometer. The Python program spectroMvg.py averages the spectra of the same sample and each averaged spectrum saves under the new name generated from the batch and the sample name and the running number.
97
Once the spectra were converted into the two column format the remaining operations were performed in the MATLAB.
The one spectrum or more spectra can be plotted by the function Graf.m. The functions GrafO.m and GrafOa.m plot spectra shifted horizontally to the zero by the average of the first or the last 25 values, respectively. The spectra can be normalized in its height (for example to 1) by the function GrafN.m or shifted to the zero and after normalized by the function GrafNa.m.
To make an average of two or more spectra the function AvrglEa.m is used. The pH or concentration value is expected to be inserted together with the two column spectrum. The function AvrgE.m does the same but the extra parameter of the width of the cuvette is needed. The function AvrgEnula.m is the same except the baseline is set to zero. All the Avrgxy.m functions has in the first or first two lines the values of concentration, pH and the width of the cuvette. These information are used by the functions EpsilonE.m, AbsorbE.m, or Spojxy.m to sort the spectra.
If the plain averaging of the spectra without saving the first row information is needed the prumbezHlavicky.m function can be used. This was commonly used for the averaging the spectra of pure ice considered to be later subtracted as a background.
If the spectrum of the background need to be subtracted together with the averaging of spectra and setting the baseline to the zero the function PRUmodec.m is suitable. The function PRUmodecHlav.m is similar in its function, just adds the informative first row of pH or concentration.
Now, the spectra formed by the above described functions are bunched up into one matrix by one of the listed functions. The Absorb.m calculates the absorbance for the samples of changing concentration as if the samples were in the cuvette 1 cm wide. The function AbsorbEl.m is proper if spectra of different pHs are plotted. The function EpsilonE.m calculates the molar absorption coefficients. All of these functions also plot the 2D and 3D graph of the spectra.
If two of these matrixes should be added together the function Spoja.m does it. The function Spojb.m can also set the baseline to zero. The Spojem is good for normalizing the spectra in the matrix and the function Spojd.m smoothes the spectra.
The outputs of all the functions creating the matrixes are also matrixes capable for singular value decomposition and for the als2004.m function of Romano Tauler [136, 135, 151]. This gives the spectral and concentration profiles which are austerely plotted by nakresli.m.
98
Bibliography
[1] P. Klan, A. Ansorgova, D. Del Favero, and I. Holoubek. Photochemistry of chloroben-zene in ice. Tetrahedron Letters, 41(40):7785-7789, 2000.
[2] P. Klan, J. Janošek, and Z. Kriz. Photochemistry of valerophenone in solid solutions. Journal of Photochemistry and Photobiology a-Chemistry, 134(l-2):37-44, 2000.
[3] P. Klan, D. Del Favero, A. Ansorgova, J. Klanová, and I. Holoubek. Photodegradation of halobenzenes in water ice. Environmental Science and Pollution Research, 8(3): 195-200, 2001.
[4] L. Blaha, J. Klanová, P. Klan, J. Janošek, M. Skarek, and R. Ruzicka. Toxicity increases in ice containing monochlorophenols upon photolysis: Environmental consequences. Environmental Science & Technology, 38(10):2873-2878, 2004.
[5] P. Klan and I. Holoubek. Ice (photo)chemistry. Ice as a medium for long-term (photo)chemical transformations - environmental implications. Chemosphere, 46:1201-1210, 2002.
[6] P. Klan, J. Klanová, I. Holoubek, and P. Cupr. Photochemical Activity of Organic Compounds in Ice Induced by Sunlight Irradiation: The Svalbard Project. Geophysical Research Letters, 30(4):art. no. 1313, 2003.
[7] J. Klanová, P. Klan, D. Heger, and I. Holoubek. Comparison of the effects of UV, H202/UV and gamma- irradiation processes on frozen and liquid water solutions of monochlorophenols. Photochemical & Photobiological Sciences, 2(10): 1023-1031, 2003.
[8] R. Ruzicka, L. Barákova, and P. Klan. Photodecarbonylation of dibenzyl ketones and trapping of radical intermediates by copper(II) chloride in frozen aqueous solutions. Journal of Physical Chemistry A, 2005 (jp044661k).
[9] V. L. Bronshteyn and A. A. Chernov. Freezing Potentials Arising on Solidification of Dilute Aqueous-Solutions of Electrolytes. Journal of Crystal Growth, 112(1): 129-145, 1991.
99

[10] M. I. Sola and H. R. Corti. Freezing Induced Electric Potentials and Ph Changes in Aqueous-Solutions of Electrolytes. Anales De La Asociacion Quimica Argentina, 81(6):483-498, 1993.
[11] R. Mulvaney, E. W. Wolff, and K. Oates. Sulfuric-acid at Grain-Boundaries in Antarctic Ice. Nature, 331(6153):247-249, 1988.
[12] E. Thibert and F Domine. Thermodynamics and kinetics of the solid solution of HCl in ice. Journal of Physical Chemistry B, 101(18):3554—3565, 1997.
[13] E. Thibert and F. Domine. Thermodynamics and kinetics of the solid solution of HN03 in ice. Journal of Physical Chemistry B, 102(22) :4432-4439, 1998.
[14] E. V. Vakarin and M. F. Holovko. Adsorption of HCl on ice. Effects of the surface heterogeneity. Chemical Physics Letters, 349(1-2): 13-18, 2001.
[15] E. V. Vakarin and J. P. Badiali. Influence of ice films morphology on HCl uptake. Surface Science, 513(3):431-436, 2002.
[16] H. Kang, T. H. Shin, S. C. Park, I. K. Kim, and S. J. Han. Acidity of hydrogen chloride on ice. Journal of the American Chemical Society, 122(40):9842-9843, 2000.
[17] K. Bolton and J. B. C. Pettersson. Ice-catalyzed ionization of hydrochloric acid. Journal of the American Chemical Society, 123(30):7360-7363, 2001.
[18] S. C. Park and H. Kang. Adsorption, ionization, and migration of hydrogen chloride on ice films at temperatures between 100 and 140 K. Journal of Physical Chemistry B, 109(11):5124-5132, 2005.
[19] J. P. Devlin, D. B. Gulluru, and V. Buch. Rates and mechanisms of conversion of ice nanocrystals to hydrates of HCl and HBr: Acid diffusion in the ionic hydrates. Journal of Physical Chemistry B, 109(8):3392-3401, 2005.
[20] F. E. Livingston and S. M. George. Effect of sodium on HCl hydrate diffusion in ice: Evidence for anion-cation trapping. Journal of Physical Chemistry A, 106(20):5114-5119,2002.
[21] D. Heger, J. Jirkovsky, and P. Klan. Aggregation of methylene blue in frozen aqueous solutions studied by absorption spectroscopy. Journal of Physical Chemistry A, 109(30):6702-6709, 2005.
[22] D. Heger, J. Klanová, and P. Klan. Enhanced protonation of cresol red in acidic aqueous solutions caused by freezing. Journal of Physical Chemistry A, accepted for publication.
[23] V. F. Petrenko and R. W. Whitworth. Physics of ice. Oxford University Press, Oxford, 1999.
100

[24] G. Tammann. Ueber die Grenzen des festen Zustandes IV. Annalen der Physik, 4(2): 1-31, 1900.
[25] U. Nakaya. Snow Crystals - Natural and Artificial. Harvard University Press, Cambridge, Massachusetts, 1954.
[26] N. N. Khusnatdinov and V. F. Petrenko. Fast-growth technique for ice single crystals. Journal of Crystal Growth, 163(4):420-425, 1996.
[27] S.W. Peterson and H.A. Levy. A single-crystal neutron diffraction study of heavy ice. Acta Crystallographice, 10:70-76, 1957.
[28] PJ. Hore. Nuclear magnetic resonance. Oxford University Press, Oxford, 1995.
[29] L. Pauling. The Structure and Entropy of Ice and Other Crystals with Some Randomness of Atomic Arrangement. Journal of the American Chemical Society, 57:2680-2684, 1935.
[30] N. Bjerrum. Kongelige Dánske Videnskabernes Selskab Matematisk-fysiske Meddelelser, 27:1-56, 1951.
[31] H. Gränicher. Gitterfehlordnung und physikalische eigenschaften hewagonaler und kubischer eiskristalle. Zeitschrift für Kristallographie, 110:432-471, 1958.
[32] H. Gränicher. Properties and lattice imperfections of ice crystals and the behaviour of h2o - hf solid solutions. Physik der Kondensierte Materie, 1:1-12, 1963.
[33] C. Jaccard. Etude theorieque et experimentale des proprietes de la glace. Helvetica PhysicaActa, 32:89-128, 1959.
[34] S. Kawada and R. Tutiya. Dielectric properties and annealing effects of as-grown koh-highly doped ice single crystals. Journal of Physics and Chemistry of Solids, 58:115-121, 1997.
[35] E. J. Workman and J. C. Reynolds. Electrical Phenomena Occurring during the Freezing of Dilute Aqueous Solutions and Their Possible Relationship to Thundrstorm Electricity. Physical Review, 78(3):254-259, 1950.
[36] P. Mazur and K. W Cole. Influence of Cell Concentration on the Contribution of Unfrozen Fraction and Salt Concentration to the Survival of Slowly Frozen Human-Erythrocytes. Cryobiology, 22(6):509-536, 1985.
[37] N. Takenaka, A. Ueda, and Y. Maeda. Acceleration of the Rate of Nitrite Oxidation by Freezing in Aqueous-Solution. Nature, 358(6389):736-738, 1992.
[38] N. Takenaka, A. Ueda, T. Daimon, H. Bandow, T. Dohmaru, and Y. Maeda. Acceleration mechanism of chemical reaction by freezing: The reaction of nitrous acid with dissolved oxygen. Journal of Physical Chemistry, 100(32): 13874-13884, 1996.
101

[39] L. Delzeit, M. S. Devlin, B. Rowland, J. P. Devlin, and V. Buch. Adsorbate-induced partial ordering of the irregular surface and subsurface of crystalline ice. Journal of Physical Chemistry, 100(24): 10076-10082, 1996.
[40] P. J. Wooldridge and J. P. Devlin. Proton Trapping and Defect Energetics in Ice from Ft-Ir Monitoring of Photoinduced Isotopic Exchange of Isolated D2o. Journal of Chemical Physics, 88(5):3086-3091, 1988.
[41] B. Rowland, N. S. Kadagathur, J. P. Devlin, V. Buch, T. Feldman, and M. J. Wojcik. Infrared-spectra of Ice Surfaces and Assignment of Surface- Localized Modes from Simulated Spectra of Cubic Ice. Journal of Chemical Physics, 102(21):8328—8341,1995.
[42] V. Buch, L. Delzeit, C. Blackledge, and J. P. Devlin. Structure of the ice nanocrystal surface from simulated versus experimental spectra of adsorbed CF4. Journal of Physical Chemistry, 100(9):3732-3744, 1996.
[43] V. Buch, J. Sadlej, N. Aytemiz-Uras, and J. P. Devlin. Solvation and ionization stages of HCl on ice nanocrystals. Journal of Physical Chemistry A, 106(41):9374-9389, 2002.
[44] H. Cho, P. B. Shepson, L. A. Barrie, J. P. Cowin, and R. Zaveri. NMR investigation of the quasi-brine layer in ice/brine mixtures. Journal of Physical Chemistry B, 106(43): 11226-11232,2002.
[45] V. S. Langford, A. J. McKinley, and T I. Quickenden. Luminescent photoproducts in UV-irradiated ice. Accounts of Chemical Research, 33(10):665—671, 2000.
[46] V. S. Langford, A. J. McKinley, and T. I. Quickenden. Temperature dependence of the visible-near-infrared absorption spectrum of liquid water. Journal of Physical Chemistry A, 105(39):8916-8921, 2001.
[47] A. J. Matich, M. G. Bakker, D. Lennon, T. I. Quiekenden, and C. G. Freeman. 02 Luminescence from UV-Excited H20 and D20 Ices. Journal of Physical Chemistry, 97(41):10539-10553, 1993.
[48] T. I. Quiekenden, T. A. Green, and D. Lennon. Luminescence from UV-irradiated amorphous H20 ice. Journal of Physical Chemistry, 100(42):16801-16807, 1996.
[49] M. G. Bakker, T. I. Quiekenden, C. F. Vernon, C. G. Freeman, and D. F. Sangster. The Effect of Crystal Fragmentation on the Luminescence from Pulse-Irradiated H2o Ice. Radiation Physics and Chemistry, 32(6):767-772, 1988.
[50] R. A. J. Litjens, T I. Quiekenden, C. G. Freeman, and D. F. Sangster. The Effect of Deposition Rate and Sample Thickness on the Luminescence Emitted by Electron-Irradiated Polycrystalline H2o Ice. Radiation Physics and Chemistry, 45(5):817-823, 1995.
102
[51] A. Specht, T. Ursby, M. Weik, L. Peng, J. Kroon, D. Bourgeois, and M. Goeldner. Cryophotolysis of ortho-nitrobenzyl derivatives of enzyme ligands for the potential kinetic crystallography of macromolecules. Chembiochem, 2(11):845-+, 2001.
[52] G. M. M. Caro, U. Meierhenrich, W. A. Schutte, W. H. P. Thiemann, and J. M. Greenberg. UV-photoprocessing of interstellar ice analogs: Detection of hexamethylenetetramine-based species. Astronomy & Astrophysics, 413(1):209-216, 2004.
[53] W. H. P. Thiemann and U. Meierhenrich. ESA mission ROSETTA will probe for chirality of cometary amino acids. Origins of Life and Evolution of the Biosphere, 31(1-2):199-210,2001.
[54] U. Meierhenrich and W. H. P. Thiemann. Determination of an enantiomeric bias in chiral organics for application in space exploration. Abstracts of Papers of the American Chemical Society, 219:U696-U696, 2000.
[55] F. Domine and P. B. Shepson. Air-snow interactions and atmospheric chemistry. Science, 297(5586): 1506-1510, 2002.
[56] G. L. Daly and F. Wania. Simulating the influence of snow on the fate of organic compounds. Environmental Science & Technology, 38(15):4176—4186, 2004.
[57] H. W. Vallack, D. J. Bakker, I. Brandt, E. Brostrom-Lunden, A. Brouwer, K. R. Bull, C. Gough, R. Guardans, I. Holoubek, B. Jansson, R. Koch, J. Kuylenstierna, A. Lecloux, D. Mackay, P. McCutcheon, P. Mocarelli, and R. D. F. Taalman. Controlling persistent organic pollutants - what next? Environmental Toxicology and Pharmacology, 6(3): 143-175, 1998.
[58] J. M. Blais, D. W. Schindler, D. C. G. Muir, L. E. Kimpe, D. B. Donald, and B. Rosenberg. Accumulation of persistent organochlorine compounds in mountains of western Canada. Nature, 395(6702):585-588, 1998.
[59] A. Wacker, D. Weinblum, L. Traeger, and Z. Moustafa. Photochemical reactions of uracil and uridine. Journal of Molecular Biology, 3:790-793, 1961.
[60] S. N. Bose, S. Kumar, R. J. H. Davies, S. K. Sethi, and J. A. McCloskey. The Photochemistry of D(T-a) in Aqueous-Solution and in Ice. Nucleic Acids Research, 12(20):7929-7947, 1984.
[61] Y. Dubowski and M. R. Hoffmann. Photochemical transformations in ice: Implications for the fate of chemical species. Geophysical Research Letters, 27(20):3321-3324, 2000.
[62] J. Klanová, P. Klan, J. Nosek, and I. Holoubek. Environmental ice photochemistry: monochlorophenols. Environmental Science & Technology, 37(8): 1568-1574, 2003.
[63] M. Matsumoto, S. Saito, and I. Ohmine. Molecular dynamics simulation of the ice nucleation and growth process leading to water freezing. Nature, 416(6879):409-413, 2002.
103

[64] C. Reichardt. Solvatochromic Dyes as Solvent Polarity Indicators. Chemical Reviews, 94(8):2319-2358, 1994.
[65] Paul Suppan and Chris Tsiamis. Temperature effects in solvatochromic shifts. Journal of the Chemical Society, Faraday Transactions 2: Molecular and Chemical Physics, 77(9):1553-1562, 1981.
[66] E. B. Tada, L. P. Novaki, and O. A. El Seoud. Solvatochromism in pure and binary solvent mixtures: effects of the molecular structure of the zwitterionic probe. Journal of Physical Organic Chemistry, 13(11):679—687, 2000.
[67] A. R. Katritzky, D. C. Fara, H. F. Yang, K. Tamm, T. Tamm, and M. Karelson. Quantitative measures of solvent polarity. Chemical Reviews, 104(1): 175-198, 2004.
[68] E. Bosch, M. Roses, K. Herodes, I. Koppel, I. Leito, and V. Taal. Solute-solvent and solvent-solvent interactions in binary solvent mixtures .2. Effect of temperature on the E(T)(30) polarity parameter of dipolar hydrogen bond acceptor-hydrogen bond donor mixtures. Journal of Physical Organic Chemistry, 9(6):403-410, 1996.
[69] M. J. Kamlet and R. W. Taft. Journal of the American Chemical Society, 98:377-383, 2886-2894, 1976.
[70] Y. Marcus. The Properties of Organic Liquids That Are Relevant to Their Use as Solvating Solvents. Chemical Society Reviews, 22(6):409^16, 1993.
[71] C. Laurence, P. Nicolet, M. T. Dalati, J. L. M. Abboud, and R. Notario. The Empirical-Treatment of Solvent Solute Interactions -15 Years of Pi. Journal of Physical Chemistry, 98(23):5807-5816, 1994.
[72] G. Gritzner. A critical view on the Lewis-donor (nucleophilic) properties of solvents. Journal of Molecular Liquids, 73-4:487-500, 1997.
[73] C. Laurence, P. Nicolet, and M. Helbert. Polarity and Basicity of Solvents .2. Solvatochromic Hydrogen-Bonding Shifts as Basicity Parameters. Journal of the Chemical Society-Perkin Transactions 2, (7):1081—1090, 1986.
[74] R. W. Soukup and R. Schmid. Metal-complexes as Color Indicators for Solvent Parameters. Journal of Chemical Education, 62(6):459-462, 1985.
[75] U. Mayer. Pure Appl. Chem., 51:1697, 1979.
[76] Y Mayer. Pure Appl. Chem., 41:291, 1975.
[77] J. J. Michels and J. G. Dorsey. Examination of the Surface Polarity of Chi-Type Alumina Using Et-30 Solvatochromism. Langmuir, 6(2):414^19, 1990.
104

[78] S. M. Lindley, G. C. Flowers, and J. E. Leffler. Analysis of the Polarity of Silica Surfaces as Reaction Media - Behavior of Adsorbed Solvatochromic Indicators. Journal of Organic Chemistry, 50(5):607-610, 1985.
[79] S. Spange and A. Reuter. Hydrogen-bond donating and dipolarity/polarizability properties of chemically functionalized silica particles. Langmuir, 15(1): 141-150, 1999.
[80] Y. Zimmermann, S. Anders, K. Hofmann, and S. Spange. Influence of chemical solvent properties on the external and internal surface polarity of silica particles in slurry. Langmuir, 18(24):9578-9586, 2002.
[81] S. Spange, E. Vilsmeier, and Y. Zimmermann. Probing the surface polarity of various silicas and other moderately strong solid acids by means of different genuine solvatochromic dyes. Journal of Physical Chemistry B, 104(27):6417-6428, 2000.
[82] S. Adolph, S. Spange, and Y. Zimmermann. Catalytic activities of various moderately strong solid acids and their correlation with surface polarity parameters. Journal of Physical Chemistry B, 104(27):6429-6438, 2000.
[83] S. Spange, C. Schmidt, and H. R. Kricheldorf. Probing the surface polarity of poly(alpha-amino acids) and alpha-amino acid crystals with genuine solvatochromic dyes. Langmuir, 17(3):856—865, 2001.
[84] S. Prause, S. Spange, and H. Barthel. Surface polarity of dimethylsiloxane-grafted silica particles. Macromolecular Chemistry and Physics, 206(3):364-371, 2005.
[85] Mohamed El-Sayed, Hardy Muller, Gerd Rheinwald, Heinrich Lang, and Stefan Spange. Linear solvation energy (LSE) correlations of the solvatochromic response and x-ray structure analysis of hydrophilically N-substituted Michler's ketone derivatives. Journal of Physical Organic Chemistry, 14(4): 247-25 5, 2001.
[86] S. Spange, M. El-Sayed, H. Muller, G. Rheinwald, H. Lang, and W. Poppitz. Solid-state structures of N-substituted Michler's ketones and their relation to solvatochromism. European Journal of Organic Chemistry, (24):4159-4168, 2002.
[87] M. El-Sayed, H. Müller, G. Rheinwald, H. Lang, and S. Spange. Uv/vis spectroscopic properties of n-(2 '-hydroxy-4 '-n,n-dimethylaminobenzylidene)-4-nitroaniline in various solvents and solid environments. Monatshefte Fur Chemie.
[88] H. F. Wang, E. Borguet, and K. B. Eisenthal. Generalized interface polarity scale based on second harmonic spectroscopy. Journal of Physical Chemistry B, 102(25):4927-4932, 1998.
[89] S. Ishizaka, H. B. Kim, and N. Kitamura. Time-resolved total internal reflection fluorom-etry study on polarity at a liquid/liquid interface. Analytical Chemistry, 73(11):2421-2428, 2001.
105

[90] X. Y. Zhang, M. M. Cunningham, and R. A. Walker. Solvent polarity at polar solid surfaces: The role of solvent structure. Journal of Physical Chemistry B, 107(14):3183-3195,2003.
[91] T. Uchida, A. Yamaguchi, T. Ina, and N. Teramae. Observation of molecular association at liquid/liquid and solid/liquid interfaces by second harmonic generation spectroscopy. Journal of Physical Chemistry B, 104(51): 12091-12094, 2000.
[92] P. B. Petersen, J. C. Johnson, K. P. Knutsen, and R. J. Saykally. Direct experimental validation of the Jones-Ray effect. Chemical Physics Letters, 397(l-3):46-50, 2004.
[93] P. B. Petersen and R. J. Saykally. Evidence for an enhanced hydronium concentration at the liquid water surface. Journal of Physical Chemistry B, 109(16):7976-7980, 2005.
[94] M. K. Petersen, S. S. Iyengar, T. J. F. Day, and G. A. Voth. The hydrated proton at the water liquid/vapor interface. Journal of Physical Chemistry B, 108(39): 14804-14806, 2004.
[95] P. B. Petersen and R. J. Saykally. Confirmation of enhanced anion concentration at the liquid water surface. Chemical Physics Letters, 397(l-3):51-55, 2004.
[96] E. C. Brown, M. Mucha, P. Jungwirth, and D. J. Tobias. Structure and vibrational spectroscopy of salt water/air interfaces: Predictions from classical molecular dynamics simulations. Journal of Physical Chemistry B, 109(16):7934-7940, 2005.
[97] S. Gopalakrishnan, P. Jungwirth, D. J. Tobias, and H. C. Allen. Air-liquid interfaces of aqueous solutions containing ammonium and sulfate: Spectroscopic and molecular dynamics studies. Journal of Physical Chemistry B, 109(18):8861—8872, 2005.
[98] A. Chowdhury, S. A. Locknar, L. L. Premvardhan, and L. A. Peteanu. Effects of matrix temperature and rigidity on the electronic properties of solvatochromic molecules: Electroabsorption of coumarin 153. Journal of Physical Chemistry A, 103(48):9614-9625, 1999.
[99] S. A. Locknar, A. Chowdhury, and L. A. Peteanu. Matrix and temperature effects on the electronic properties of conjugated molecules: An electroabsorption study of all-trans-retinal. Journal of Physical Chemistry B, 104(24):5816-5824, 2000.
[100] G. U. Bublitz and S. G. Boxer. Effective polarity of frozen solvent glasses in the vicinity of dipolar solutes. Journal of the American Chemical Society, 120(16):3988-3992, 1998.
[101] C. Parkanyi, C. Boniface, J. J. Aaron, and M. Maafi. A Quantitative Study of the Effect of Solvent on the Electronic Absorption and Fluorescence-Spectra of Substituted Phenothiazines - Evaluation of Their Ground and Excited Singlet-State Dipole-Moments. Spectrochimica Acta Part a-Molecular and Biomolecular Spectroscopy, 49(12): 1715-1725, 1993.
106

[102] Gilbert N. Lewis, O. Goldschmid, T. T. Magel, and Jacob Bigeleisen. Dimeric and Other Forms of Methylene Blue: Absorption and Fluorescence of the Pure Monomer. Journal of the American Chemical Society, 65:1150, 1943.
[103] K. Bergmann and C. T. OKonski. A Spectroscopic Study of Methylene Blue Monomer, Dimer, and Comlexes with Montmorillonite. Journal of Chemical Physics, 67:6169-2177,1963.
[104] J. Cenens and R. A. Schoonheydt. Visible Spectroscopy of Methylene-Blue on Hectorite, Laponite-B, and Barasym in Aqueous Suspension. Clays and Clay Minerals, 36(3):214-224, 1988.
[105] Eugene Rabinowitch and Leo F. Epstein. Polymerization of Dyestuffs in Solution. Thionine and Methylene Blue. Journal of the American Chemical Society, 63:69-78, 1941.
[106] Siegfried. Dahne and Helga Stanko. Die Darstellung der roten Methylenblau-Form in Losung. Die Naturwissenschaften, 50:328, 1962.
[107] W. Spencer and J. R. Sutter. Kinetic Study of the Monomer-Dimer Equilibrium of Methylene Blue in Aqueous Solution. The Journal of Physical Chemistry, 83(12): 1573-1576, 1979.
[108] J. Ruprecht and H. Baumgartel. The Influence of the Electronic-Structure on the Dimerization of Phenthiazonium Cations in Aqueous-Solution. Berichte Der Bunsen-Gesellschaft-Physical Chemistry Chemical Physics, 88(2): 145-150, 1984.
[109] Emory Braswell. Evidence for Trimerization in Aqueous Solution of Methylene Blue. Journal of Chemical Physics, 72:2477-2483, 1968.
[110] Z. M. Zhao and E. R. Malinowski. Determination of the hydration of methylene blue aggregates and their dissociation constants using visible spectroscopy. Applied Spectroscopy, 53(12): 1567-1574, 1999.
[ I l l ] Z. M. Zhao and E. R. Malinowski. Window factor analysis of methylene blue in water. Journal of Chemometrics, 13(2):83-94, 1999.
[112] L. Antonov, G. Gergov, V. Petrov, M. Kubista, and J. Nygren. UV-Vis spectroscopic and chemometric study on the aggregation of ionic dyes in water. Talanta, 49(1):99-106, 1999.
[113] A. Pietkiewicz-Graczyk, O. Impert, A. Katafias, and P. Kita. Reactivity of two protolytic forms of methylene blue in reaction with ascorbic acid. Polish Journal of Chemistry, 77(4):475-480, 2003.
[114] A.L. Stone. Aggregation of cationic dyes on acid polysacharides II. quantitative parameters of maetachromasy. Biochimica et biophysica acta, 148:193-206, 1967.
107
[115] C. Lee, Y. W. Sung, and J. W. Park. Multiple equilibria of phenothiazine dyes in aqueous cyclodextrin solutions. Journal ofPhysical Chemistry B, 103(5):893—898, 1999.
[116] D. Severino, H. C. Junqueira, M. Gugliotti, D. S. Gabrielli, and M. S. Baptista. Influence of negatively charged interfaces on the ground and excited state properties of methylene blue. Photochemistry and Photobiology, 77(5):459-468, 2003.
[117] K. Kemnitz, N. Tamai, I. Yamazaki, N. Nakashima, and K. Yoshihara. Fluorescence Decays and Spectral Properties of Rhodamine-B in Submonolayer, Monolayer, and Multilayer Systems. Journal of Physical Chemistry, 90(21):5094-5101, 1986.
[118] J. Bujdak, N. Iyi, and T. Fujita. The aggregation of methylene blue in montmorillonite dispersions. Clay Minerals, 37(1):121-133, 2002.
[119] F. Gessner, C. C. Schmitt, and M. G. Neumann. Time-dependent Spectrophotometric Study of the Interaction of Basic-Dyes with Clays .1. Methylene-Blue and Neutral Red on Montmorrillonite and Hectorite. Langmuir, 10(10):3749-3753, 1994.
[120] B. Ackermans, R. A. Schoonheydt, and E. RuizHitzky. Intercalation of methylene blue into vanadium pentoxide gels. Journal of the Chemical Society-Faraday Transactions, 92(22):4479-4484, 1996.
[121] G. Hahner, A. Marti, N. D. Spencer, and W. R. Caseri. Orientation and electronic structure of methylene blue on mica: A near edge x-ray absorption fine structure spectroscopy study. Journal of Chemical Physics, 104(19):7749-7757, 1996.
[122] J. Bujdak, M. Janek, J. Madejova, and P. Komadel. Methylene blue interactions with reduced-charge smectites. Clays and Clay Minerals, 49(3):244-254, 2001.
[123] S. Jockusch, N. J. Turro, and D. A. Tomalia. Aggregation of Methylene-Blue Adsorbed on Starburst Dendrimers. Macromolecules, 28(22):7416-7418, 1995.
[124] S. Jockusch, J. Ramirez, K. Sanghvi, R. Nociti, N. J. Turro, and D. A. Tomalia. Comparison of nitrogen core and ethylenediamine core starburst dendrimers through photochemical and spectroscopic probes. Macromolecules, 32(13):4419-4423, 1999.
[125] J. A. Dean. Lange 's Handbook of Chemistry. McGraw Hill, New York, 14th edn edition, 1992.
[126] D. D. Perrin. Aust. J Chem., 16:572, 1963.
[127] B. Gohain, P. M. Saikia, S. Sarma, S. N. Bhat, and R. K. Dutta. Hydrophobicity-induced deprotonation of dye in dye submicellar surfactant systems. Physical Chemistry Chemical Physics, 4(12):2617-2620, 2002.
[128] C. Rottman, G. Grader, Y. De Hazan, S. Melchior, and D. Avnir. Surfactant-induced modification of dopants reactivity in sol-gel matrixes. Journal of the American Chemical Society, 121(37):8533-8543, 1999.
108

[129] C. R. French, J. J. Carr, E. M. Dougherty, L. A. K. Eidson, J. C. Reynolds, and M. D. DeGrandpre. Spectrophotometric pH measurements of freshwater. Analytica Chimica Acta, 453(1): 13-20, 2002.
[130] H. Yamazaki, R. P. Sperline, and H. Freiser. Spectrophotometric Determination of Ph and Its Application to Determination of Thermodynamic-Equilibrium Constants. Analytical Chemistry, 64(22):2720-2725, 1992.
[131] M. M. Ghoneim, Y. M. Issa, and M. A. Ashy. Infrared Spectra of Some Derivatives of Phenolphthalein and Sulphonphthalein. Indian Journal of Chemistry, 18A:349-350, 1979.
[132] N. Yoshida, T. Shirai, and M. Fujimoto. Inclusion Reactions of Some Phthalein and Sulfophthalein Compounds with Cyclomalto-Hexaose and Cyclomalto-Heptaose. Carbohydrate Research, 192:291-304, 1989.
[133] P. Klan, R. Ružička, D. Heger, J. Literak, P. Kulhánek, and A. Loupy. Temperature-sensitive photochemical aromatic substitution on 4-nitroanisole. Photochemical & Photobiological Sciences, 1(12):1012-1016, 2002.
[134] J. Literak, P. Klan, D. Heger, and A. Loupy. Photochemistry of alkyl aryl ketones on alumina, silica-gel and water ice surfaces. Journal of Photochemistry and Photobiology a-Chemistry, 154(2-3): 155-159, 2003.
[135] R. Tauler, A. Izquierdoridorsa, and E. Casassas. Simultaneous Analysis of Several Spectroscopic Titrations with Self-Modeling Curve Resolution. Chemometrics and Intelligent Laboratory Systems, 18(3):293-300, 1993.
[136] R. Tauler and K. S. Booksh. Special issue: Process chemometrics - Preface. Chemometrics and Intelligent Laboratory Systems, 46(2):101—101, 1999.
[137] D. Heger and P. Klan. How organic molecules bind at grain boundaries in ice: a solvatochromic analysis. In preparation.
[138] M. S. Antonious, E. B. Tada, and O. A. El Seoud. Thermo-solvatochromism in aqueous alcohols: effects of the molecular structures of the alcohol and the solvatochromic probe. Journal of Physical Organic Chemistry, 15(7):403^12, 2002.
[139] M. J. Kamlet, J. L. M. Abboud, M. H. Abraham, and R. W. Taft. Linear Solvation Energy Relationships. 23. A Comprehensive Collection of the Solvatochromic Parameters. J. Org. Chem., (48):2877-2887, 1983.
[140] O. N. Mesquita, L. O. Ladeira, I. Gontijo, A. G. Oliveira, and G. A. Barbosa. Dynamic Light-Scattering at the Nonequilibrium Crystal-Melt Interface in Biphenyl and Naphthalene. Physical Review B, 38(2): 1550-1553, 1988.
109
[141] E. Poles, B. Cohen, and D. Huppert. Temperature dependence of excited-state proton transfer and geminate recombination processes in water and in glycerol-doped ice. Israel Journal of Chemistry, 39(3-4):347-360, 1999.
[142] T. Tang and J. C. McConnell. Autocatalytic release of bromine from Arctic snow pack during polar sunrise. Geophysical Research Letters, 23(19):2633-2636, 1996.
[143] G. A. Impey, P. B. Shepson, D. R. Hastie, and L. A. Barrie. Measurement technique for the determination of photolyzable chlorine and bromine in the atmosphere. Journal of Geophysical Research-Atmospheres, 102(D13): 15999-16004, 1997.
[144] G. A. Impey, P. B. Shepson, D. R. Hastie, and L. A. Barrie. Measurement technique for the determination of photolyzable chlorine and bromine in the atmosphere. Journal of Geophysical Research-Atmospheres, 102(D13): 15999-16004, 1997.
[145] S. S. N. Murthy. Experimental study of the dynamics of water and the phase behavior of the supercooled aqueous solutions of propylene glycol, glycerol, poly(ethylene glycol)s, and poly (viny lpyrrolidone). Journal of Physical Chemistry B, 104(29):6955-6962, 2000.
[146] C. G. Dekruif, J. C. Vanmiltenburg, A. J. J. Sprenkels, G. Stevens, W. Degraaf, and H. G. M. Dewit. Thermodynamic Properties of Citric-Acid and the System Citric-Acid Water. Thermochimica Acta, 58(3):341-354, 1982.
[147] Y. Tajima, T. Matsuo, and H. Suga. Calorimetric study of phase transition in hexagonal ice doped with alkali hydroxides. J. Phys. Chem. Solids, 45:1135-1144, 1984.
[148] R. Cohen-Adad and M. Michaud. Lew equilibres liquide-solide du systéme binaire eau-polasse. CRHebd. Acad. Sei, 242:2569-2571, 1956.
[149] L. Antonov and D. Nedeltcheva. Resolution of overlapping UV-Vis absorption bands and quantitative analysis. Chemical Society Reviews, 29(3):217-227, 2000.
[150] V. Petrov, L. Antonov, H. Ehara, and N. Harada. Step by step filter based program for calculations of highly informative derivative curves. Computers & Chemistry, 24(5):561-569, 2000.
[151] J. Jaumot, A. Avino, R. Eritja, R. Tauler, and R. Gargallo. Resolution of parallel and antiparallel oligonucleotide triple helices formation and melting processes by multivariate curve resolution. Journal of Biomolecular Structure & Dynamics, 21(2):267-278, 2003.
110
List of Figures
2.1 Ionic and Bjerrum defects in the structure of ice 14 2.2 Propagation of ionic and Bjerrum defects in the structure of ice 15 2.3 Ice dopped with HF 17 2.4 Ice dopped with KOH 18 2.5 The temperature of detection of QLL by various techniques 21 2.6 The thickness of QLL as detected by various techniques 22 2.7 Optical properties of ice 24 2.8 Photoproducts idnetified from the photochemistry of 2-chlorophenol in ice . . . 27 2.9 Photoproducts idnetified from the photochemistry of 4-chlorophenol in ice . . . 27 2.10 Two limiting models for the behavior of the solvent molecules immediately
surrounding the solute as the temperature is lowered 39 2.11 Methylene blue and its protonated form 40 2.12 The structure of Thionine 40 2.13 The structure of capri blue 42 2.14 The sturcture of leuco form of methylene blue 42
3.1 Normalized representative spectra of MB in liquid aqueous solutions at 293 K . 49 3.2 Normalized spectra of MB in liquid aqueous solutions at 293 K 50 3.3 The plot of relative concentrations of individual species of MB calculated by
Braswell 51 3.4 The plot of relative concentrations of individual species of MB calculated by us 53 3.5 The plot of least squares minimization to obtain Kd 54 3.6 The plot of least squares minimization to obtain Kt 54 3.7 The concentration-dependent abundance obtained by the Gaussian fitting anal
ysis to the spectra of MB at 293 K 55 3.8 Calculated normalized spectra of three MB species of liquid MB solution by
MCR-ALS method 56 3.9 Calculated normalized spectra of three MB species of liquid MB solution the
hybrid method 57 3.10 Comparison of all calculated concentration profiles applied to MB solution -
plot of relative concentrations 58 3.11 Comparison of all calculated concentration profiles applied to MB solution -
logaritminc plot 58 3.12 Normalized representative spectra of MB in frozen aqueous solutions at 77 K . 59
111

3.13 The calculated relative concentration-dependent abundance profiles in samples at 77 K as a function of the MB concentration obtained from the Gaussian fitting analysis 60
3.14 Calculated spectra of three mathematically resolved species of MB in frozen aqueous solutions at 77 K obtained from the MCR-ALS method 61
3.15 The calculated relative concentration-dependent abundance profiles in samples at 77 K as a function of the MB concentration obtained from the MCR-ALS analysis 62
3.16 Normalized representative spectra of MB in frozen aqueous solutions at 243 K . 63 3.17 3D view to the absorption spectra of CR in aqueous liquid solution 64 3.18 Absorption spectra of CR in aqueous liquid solution 65 3.19 Calculated absorption spectra of CR in aqueous liquid solution 66 3.20 Calculated relative abundance profiles of CR forms in aqueous liquid solution . 66 3.21 Absorption spectra of CR solutions frozen at 253 K 67 3.22 Calculated absorption spectra of CR solutions frozen at 253 K (HCl and NaOH) 68 3.23 Calculated relative abundance profiles of CR solutions frozen at 253 K (HCl
and NaOH) 69 3.24 Calculated relative abundance profiles of CR solutions frozen at 253 K (HF) . . 69 3.25 Calculated relative abundance profiles of CR solutions frozen at 253 K (H2S04) 70 3.26 Calculated relative abundance profiles of CR solutions frozen at 253 K (HN03) 70 3.27 Calculated relative abundance profiles of CR solutions frozen at 253 K (p-
toluenesulfonic acid) 71 3.28 Absorption spectra of CR solutions frozen at 77 K 72 3.29 Calculated absorption spectra of CR solutions frozen at 77 K (HCl and NaOH) 73 3.30 Calculated relative abundance profiles of CR solutions frozen at 77 K (HCl and
NaOH) 73 3.31 Calculated relative abundance profiles of CR solutions frozen at 77 K (HF) . . 74 3.32 Calculated relative abundance profiles of CR solutions frozen at 77 K (H2S04) 74 3.33 Calculated relative abundance profiles of CR solutions frozen at 77 K (HN03) . 75 3.34 Calculated relative abundance profiles of CR solutions frozen at 77 K (p-
toluenesulfonic acid) 75 3.35 Spectra of CR solutions frozen at 77 K in the presence of salts 76 3.36 The structures of solvatochromic compounds used 78 3.37 Normalized spectra of ET(33) in liquid aqueous solutions and in frozen samples 79 3.38 Fitting of Gaussian curves into the absorption spectra of ET(33) 82 3.39 Normalized spectra of PhN02NMe2 in liquid aqueous solutions and in frozen
samples 83 3.40 Normalized spectra of PhN02NH2 in liquid aqueous solutions and in frozen
samples 84 3.41 Normalized spectra of Fe(phen)2(CN)2 in liquid aqueous solutions and in frozen
samples 85
5.1 Results of SVD analysis for liquid MB 96
112

List of Schemes
2.1 Michler's Ketone 29 2.2 Reichardt's dye 30 2.3 Chlorinated Reichardt's dye 30 2.4 Fe(phen)2(CN)2 36 2.5 Cresolred 46
113
of Tables
Parameters for intrinsic protonic point defects in ice at—20 °C 16 Electrical characteristics of various solutions/ice systems [35] 19 Solvatochromic parametrs of silica surface 35 Solvatochromic shift of methylene blue 41 The temperature dependence of pKa2 of cresol red 47
The integrated molar peaks area of individual methylene blue species 53 Transition points of the first protonation step of CR by various acids in liquid and frozen aqueous solutions 68 Solvatochromic parametrs I 80 Solvatochromic parametrs II 81 The calculated solvatochromic parameters for CH2C12 slurry (the mixture of crystals with the solvent) 86
The freezing concentration enhancement 88 Solvatochromic parametrs - survey; a - the value derived from minor peak . . . 91
114

List of Abbreviations
4ABP 4-aminobenzophenone AFA-MSE Abstract factor analysis of data with multiple sources of error AN Acceptor numbers CMC Critical micellar concentration CD cyclodextrin CT Charge transfer DEPNA jV,jV-diethyl-/?-nitroaniline DN Donor numbers efa Evolving factor analysis EPA Electron pair acceptor EPD Electron pair donor ET Molar electronic transition energy FA Factor analysis FTIR Fourier transform infrared spectroscopy HBD Hydrogen bond donor HMPT Hexamethylphosphoric triamide LSER Linear solvation energy relationship MB Methylene Blue MCR-ALS Multivariate Curve Resolution - Alternating Least Squares PCB s Persistent Cumulative Biotoxic SVD Singular value decomposition THF Tetra hydro furane TMS tetramethylsilane UV/vis Ultraviolet - visible WFA Window factor analysis
115

Appendices
116

Appendix 1

6702 J. Phys. Chem. A 2005, 109, 6702-6709
Aggregat ion of Methy lene Blue in Frozen A q u e o u s Solutions Studied by Absorpt ion Spectroscopy
Dominik Hegery Jaromír Jirkovský,* and Petr Klán*'í
Department of Organic Chemistry, Faculty of Science, Masaryk University, Kotlářská 2, CZ-611 37 Brno, Czech Republic, and J. Heyrovsky Institute of Physical Chemistry, Academy of Sciences of the Czech Republic, Dolejskova 3, CZ-18223 Praha, Czech Republic
Received: January 25, 2005; In Final Form: June 7, 2005
The paper presents a qualitative as well as quantitative spectroscopic study of methylene blue (MB) aggregation that occurs upon freezing the aqueous solutions over a wide concentration range. The Gaussian curve analysis and the multivariate curve resolution—alternating least squares method were used to determine the number and concentration of chemical species responsible for the overlaying absorption visible spectra measured. The results show the extent of aggregation for the concentrations above 10~7 mol L -1 , being dependent on the freezing rate and the initial concentration. While the local concentration of MB at the grain boundaries of polycrystalline ice increased by approximately 3 orders of magnitude upon fast freezing at 77 K compared to the liquid phase, the concentration raised at least by 6 orders of magnitude upon slow freezing at 243 K. Since enhancement of the local concentration of solutes plays an important role in (photo)chemical transformations in solid aqueous media, this work helps to understand how the initial conditions control the course of the process. The results are relevant in other interdisciplinary fields, such as environmental chemistry, cosmochemistry, or geochemistry.
1. Introduction
Upon freezing aqueous solutions of organic compounds, most chemical and physical processes are slowed since the phase transition radically modifies the reaction microenvironment. The solute molecules accumulate in the unfrozen layer surrounding the crystal walls, at the grain boundaries, and are not incorporated much into the solid polycrystalline ice.1-5 Furthermore, fast nonequilibrium freezing can generate a substantial electrical potential difference between the solid ice and an unfrozen liquid layer.6,7 As temperature further decreases, the solute concentration becomes high7-9 and the layer eventually solidifies. Aggregated organic molecules in such a heterogeneous mixture undergo remarkable photochemistry9~n that can have large environmental consequences in polar regions,12-16 where chro-mophoric organic pollutants are common trace constituents of natural ice and snow.17-19
Methylene blue (MB) is a cationic dye which exhibits two major absorption bands at 293 (jt—jt*) and 664 (n—JT*) nm in dilute aqueous solutions,20 the latter having a shoulder at 610 nm corresponding to the 0—1 vibronic transition. 21~23 It is well-known that the aggregation of MB has a significant effect on its optical properties. The face-to-face (sandwich-type, H-aggregates) associations of this cationic dye (Scheme 1) show the blue shift of the spectral band of the JT—JT* transition, while the head-to-tail (J-type) arrangement shows the red shift.24 The H-type aggregates are typically observed in aqueous solutions. While the ~664-nm band is assigned to an isolated molecule (monomer), a shift to 605 nm, accompanied by a second maximum at 697 nm, is observed when dimer forms, and an
* Author to whom correspondence should be addressed. Phone: +420-549494856; fax: +420-549492688; e-mail: [email protected].
t Masaryk University. t J. Heyrovsky Institute of Physical Chemistry.
additional blue shift to 575 nm appears when trimer forms,22,25
being supported by the exciton splitting theory.24 The reported equilibrium constants for the dimerization22,26,27 and trimeriza-tion25 steps, 2 - 1 0 x 103 L mol"1 and 6 x ÍO6 L2 mol"2, respectively, suggest that the latter process is largely preferred at higher concentrations. In addition, Zhao and Malinowski determined the dissociation constant of trimer (3.2 x 10~n L3
mol -3) by a window factor analysis, suggesting that one chlorine anion is incorporated into the trimer structure.28 The molar absorption coefficients for monomer, dimer, and trimer were reported within 4—9 x 10⁴ M _ 1 cm -1.25 The spectral characteristics of higher aggregates are distinct from each other indicating the strong JT-interactions among MB molecules; the self-organization is promoted by electrostatic and dispersion forces as well as by hydrophobic effects.29 The association effect is strongly affected by dye surroundings, causing that higher MB concentrations are required to obtain the same level of aggregation in organic solvents compared to water. The dye has been frequently used to study molecular aggregations on solid surfaces.30 In this work, we benefited from this technique to probe the aggregation of MB in frozen aqueous solutions as an archetype for such a behavior of other organic molecules.
2. Experimental Section
Methylene blue (purum, Fluka) was used without further purification and each experiment was performed with a freshly prepared stock solution. Water was purified by the reverse osmosis process on an Aqua Osmotic 03 and its quality complied with U.S. Pharmacopeial Standards (USP). The solidified samples in Plastibrand cuvettes (transparent at >280 nm) containing MB solutions were prepared by freezing either quickly at 77 K (a liquid nitrogen bath) or slowly at 243 K (freezer). The spectra of liquid aqueous solutions were measured on a Unicam UV4 (Cambridge, U.K.) against a pure water
10.1021/jp050439j CCC: $30.25 © 2005 American Chemical Society Published on Web 07/12/2005
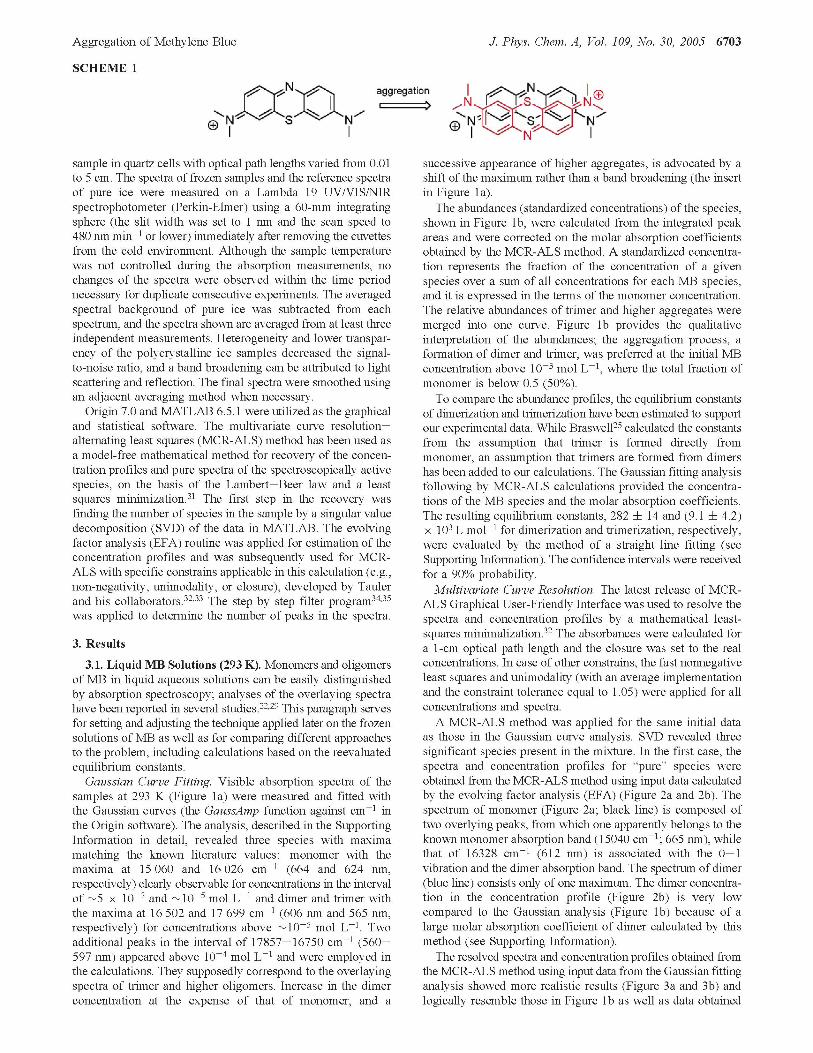
Aggregation of Methylene Blue J. Phys. Chem. A, Vol. 109, No. 30, 2005 6703
SCHEME 1
O jooa aggregation
• > i£is£i£ii>
sample in quartz cells with optical path lengths varied from 0.01 to 5 cm. The spectra of frozen samples and the reference spectra of pure ice were measured on a Lambda 19 UV/VIS/NIR spectrophotometer (Perkin-Elmer) using a 60-mm integrating sphere (the slit width was set to 1 nm and the scan speed to 480 nm min -1 or lower) immediately after removing the cuvettes from the cold environment. Although the sample temperature was not controlled during the absorption measurements, no changes of the spectra were observed within the time period necessary for duplicate consecutive experiments. The averaged spectral background of pure ice was subtracted from each spectrum, and the spectra shown are averaged from at least three independent measurements. Heterogeneity and lower transparency of the polycrystalline ice samples decreased the signal-to-noise ratio, and a band broadening can be attributed to light scattering and reflection. The final spectra were smoothed using an adjacent averaging method when necessary.
Origin 7.0 and MATLAB 6.5.1 were utilized as the graphical and statistical software. The multivariate curve resolution-alternating least squares (MCR-ALS) method has been used as a model-free mathematical method for recovery of the concentration profiles and pure spectra of the spectroscopically active species, on the basis of the Lambert—Beer law and a least squares minimization.31 The first step in the recovery was finding the number of species in the sample by a singular value decomposition (SVD) of the data in MATLAB. The evolving factor analysis (EFA) routine was applied for estimation of the concentration profiles and was subsequently used for MCR-ALS with specific constrains applicable in this calculation (e.g., non-negativity, unimodality, or closure), developed by Tauler and his collaborators.32,33 The step by step filter program34,35
was applied to determine the number of peaks in the spectra.
3. Results
3.1. Liquid MB Solutions (293 K). Monomers and oligomers of MB in liquid aqueous solutions can be easily distinguished by absorption spectroscopy; analyses of the overlaying spectra have been reported in several studies.22,29 This paragraph serves for setting and adjusting the technique applied later on the frozen solutions of MB as well as for comparing different approaches to the problem, including calculations based on the reevaluated equilibrium constants.
Gaussian Curve Fitting. Visible absorption spectra of the samples at 293 K (Figure la) were measured and fitted with the Gaussian curves (the GaussAmp function against cm - 1 in the Origin software). The analysis, described in the Supporting Information in detail, revealed three species with maxima matching the known literature values: monomer with the maxima at 15 060 and 16 026 cm - 1 (664 and 624 nm, respectively) clearly observable for concentrations in the interval of ~ 5 x 10~7 and ~10~5 mol L - 1 and dimer and trimer with the maxima at 16 502 and 17 699 cm - 1 (606 nm and 565 nm, respectively) for concentrations above ~10~5 mol L - 1 . Two additional peaks in the interval of 17857—16750 cm - 1 (560— 597 nm) appeared above 10~4 mol L - 1 and were employed in the calculations. They supposedly correspond to the overlaying spectra of trimer and higher oligomers. Increase in the dimer concentration at the expense of that of monomer, and a
successive appearance of higher aggregates, is advocated by a shift of the maximum rather than a band broadening (the insert in Figure la).
The abundances (standardized concentrations) of the species, shown in Figure lb, were calculated from the integrated peak areas and were corrected on the molar absorption coefficients obtained by the MCR-ALS method. A standardized concentration represents the fraction of the concentration of a given species over a sum of all concentrations for each MB species, and it is expressed in the terms of the monomer concentration. The relative abundances of trimer and higher aggregates were merged into one curve. Figure lb provides the qualitative interpretation of the abundances; the aggregation process, a formation of dimer and trimer, was preferred at the initial MB concentration above 10~3 mol L - 1 , where the total fraction of monomer is below 0.5 (50%).
To compare the abundance profiles, the equilibrium constants of dimerization and trimerization have been estimated to support our experimental data. While Braswell25 calculated the constants from the assumption that trimer is formed directly from monomer, an assumption that trimers are formed from dimers has been added to our calculations. The Gaussian fitting analysis following by MCR-ALS calculations provided the concentrations of the MB species and the molar absorption coefficients. The resulting equilibrium constants, 282 ± 14 and (9.1 ± 4.2) x 103 L mol - 1 for dimerization and trimerization, respectively, were evaluated by the method of a straight line fitting (see Supporting Information). The confidence intervals were received for a 90% probability.
Multivariate Curve Resolution. The latest release of MCR-ALS Graphical User-Friendly Interface was used to resolve the spectra and concentration profiles by a mathematical least-squares minimalization.32 The absorbances were calculated for a 1-cm optical path length and the closure was set to the real concentrations. In case of other constrains, the fast nonnegative least squares and unimodality (with an average implementation and the constraint tolerance equal to 1.05) were applied for all concentrations and spectra.
A MCR-ALS method was applied for the same initial data as those in the Gaussian curve analysis. SVD revealed three significant species present in the mixture. In the first case, the spectra and concentration profiles for "pure" species were obtained from the MCR-ALS method using input data calculated by the evolving factor analysis (EFA) (Figure 2a and 2b). The spectrum of monomer (Figure 2a; black line) is composed of two overlying peaks, from which one apparently belongs to the known monomer absorption band (15040 cm - 1 ; 665 nm), while that of 16328 cm - 1 (612 nm) is associated with the 0—1 vibration and the dimer absorption band. The spectrum of dimer (blue line) consists only of one maximum. The dimer concentration in the concentration profile (Figure 2b) is very low compared to the Gaussian analysis (Figure lb) because of a large molar absorption coefficient of dimer calculated by this method (see Supporting Information).
The resolved spectra and concentration profiles obtained from the MCR-ALS method using input data from the Gaussian fitting analysis showed more realistic results (Figure 3a and 3b) and logically resemble those in Figure lb as well as data obtained

6704 J. Phys. Chem. A, Vol. 109, No. 30, 2005 Heger et al.
(a) monomer dimer trimer
\ \
20000
(b)
1 14000
co
s •?. .e "5 3 U) c o
1
w;
0.8-
3.3-
0.4-
0.2.
1 ' 1 ' 1 1S0D0 18000 20000
ivenumber [cm'1]
f • X •
A '
co
s •?. .e "5 3 U) c o
1
w;
0.8-
3.3-
0.4-
0.2.
monomer \ dimer
f • X •
A '
co
s •?. .e "5 3 U) c o
1
w;
0.8-
3.3-
0.4-
0.2. y</
f • X •
A '
"-•
co
s •?. .e "5 3 U) c o
1
w;
0.8-
3.3-
0.4-
0.2. y</ —«- -•— "*"
co
s •?. .e "5 3 U) c o
1
w;
0.8-
3.3-
0.4-
0.2.
—«- -•— "*"
co
s •?. .e "5 3 U) c o
1
w;
0.8-
3.3-
0.4-
0.2.
-e -s -4 -3 -ľ
log c Figure 1. (a) Normalized representative spectra of MB in liquid aqueous solutions at 293 K. The arrows show the known wavenumber values22,25
corresponding to the absorption maxima of individual species. The insert displays the spectra of all samples at concentrations in the interval of 5.0 x 10~7—7.5 x 10~2 mol L-1, (b) The concentration-dependent abundances obtained by the Gaussian fitting analysis (solid points; monomer, black; dimer, blue; trimer and oligomers, red; the dotted lines are nonlinear regression fits) in samples at 293 K as a function of the MB concentration c. The solid lines represent the calculated concentration profiles obtained from the estimated equilibrium constants.
from the estimated equilibrium constants. The spectrum of monomer exhibits a maximum at 15 050 cm - 1 (664 nm) and a shoulder maximum at 16 130 cm - 1 (620 nm); that of dimer has a maximum at 16 480 cm - 1 (607 nm) with a second minor band at 14 600 cm - 1 (685 nm). Such findings correspond well to the observation of Bergmann and O'Konski.22 The spectrum of trimer is broader and consists of three peaks: 17 319 cm - 1 (577 nm), 15 877 cm"1 (630 nm), and 14 558 cm"1 (687 nm). Both minor maxima are artifacts of the absorption bands corresponding to those of monomer and dimer. A comparison of all calculated profiles is shown in Figure 4, providing a good agreement of the calculation methods applied, according to which an efficient dimer and trimer formation occurs at the initial MB concentrations above ~10~3 mol L - 1 .
3.2. Solid MB Solutions (77 K). The data obtained from the spectral analysis of differently frozen MB aqueous solutions were used to identify the aggregation species present in this constrained medium and to make qualitative estimation of their concentrations.
Gaussian Curve Fitting. A relatively fast freezing rate of the aqueous MB samples immersed in a liquid nitrogen bath (77 K) caused a significant change of the relative abundances of the MB species and new significant blue-shifted absorption
bands (Figure 5a) compared to liquid solutions. The lowest initial concentration, for which the signal had reproducible character, was 2.25 x 10~7 mol L - 1 because of a lower signal-to-noise ratio. In this case, two Gaussian curves were readily fitted having the maxima at 15 383 cm - 1 (650 nm) and 16 908 cm - 1 (591 nm), and they were assigned to the monomer and trimer absorption bands, shifted by ~ 10 nm compared to liquid samples. The highest concentration, where traces of monomer were still resolved, was found as low as 2.25 x 10~6 mol L - 1 . Samples with higher concentrations exhibited absorption in the interval between 15 823 cm"1 (632 nm) and 16 450 cm"1 (608 nm), and it was assigned to dimer. The concentration profile obtained by this analysis is shown in Figure 5b, where the monomer and dimer concentrations are summed up. Trimer prevailed already at the lowest MB concentrations, and the largest peak in the spectrum had the maximum between 18 416 and 19 305 cm"1 (543 and 518 nm), which is considered to correspond to higher aggregates of MB, dominating at concentrations above ~ 5 x 10"6 mol L - 1 .
Multivariate Curve Resolution. A similar MCR-AL S analysis as described in paragraph 3.1 was applied to absorption data of the frozen MB solutions at 77 K (in contrast, the spectra were normalized to the maximum height of peaks prior to the analysis

Aggregation of Methylene Blue J. Phys. Chem. A, Vol. 109, No. 30, 2005 6705
(a\ monomer dimer trimer U i l l
(a)
24000
log c Figure 2. (a) Calculated normalized spectra of three MB species (black, monomer; blue, dimer; red, trimer) in liquid aqueous solutions at 293 K obtained from MCR-ALS method using input data calculated by the evolving factor analysis (EFA). The arrows show the known wave-number values22,25 corresponding to the absorption maxima of individual species, (b) The calculated relative concentration-dependent abundance profiles in samples at 293 K as a function of the MB concentration c obtained from the MCR-ALS method on the basis of data from Figure 2a. The lines are visualized trends of the corresponding calculated values (solid points).
and the closure constant was set to 1). The sample with the lowest concentration (2.25 x 10~7 mol LT1) was not available because of an insufficient quality of the signal. Figure 6a and 6b shows data calculated by the evolving factor analysis while Figure 7a and 7b presents those received from the Gaussian fitting analysis. The spectra of the "pure" MB species were not resolved in this case; instead, the absorption curves represent three mathematically resolved species that generally correspond to the individual aggregates or to their mixtures (Figures 6a and 7a). Since the abundance of monomer and dimer was very low even at the lowest concentrations, the concentration profiles are simple and comparable in both cases. It is clearly established again that higher aggregates dominate in samples with concentrations above ~ 5 x 10~6 mol L - 1 .
3.3. Solid MB Solutions (243 K). The absorption signal of MB samples frozen slowly in the refrigerator at 243 K was quite weak and noisy (the samples were visually heterogeneous), however, precipitation of MB was never observed visually unless samples were frozen very slowly above 260 K. Slow
monomer dimer trimer
I I I
t
re
I
(b)
15000 18000 2000D
wavenumber [cm"1]
1.0.
0.3.
I o
I 0.6-
0.4.
0.2-
0.0 ~±-*=
-monomer dimer trimer and oligomers
-6 -5 —I—
-4 —r-
-3 log c
Figure 3. (a) Calculated normalized spectra of three MB species (black, monomer; blue, dimer; red, trimer) in liquid aqueous solutions at 293 K obtained from the MCR-ALS method using input data from the Gaussian fitting analysis. The arrows show the known wavenumber values22,25 corresponding to the absorption maxima of individual species, (b) The calculated relative concentration-dependent abundance profiles in samples at 293 K as a function of the MB concentration c obtained from the MCR-ALS method on the basis of data from Figure 3a. The lines are visualized trends of the corresponding calculated values (solid points).
freezing affected the relative abundances of the MB species noticeably more than fast freezing, and there are only two significant broad blue-shifted absorption bands as portrayed in Figure 8. The spectra obtained from the Gaussian fitting analysis barely revealed the existence of dimer and trimer in samples with the lowest concentrations, however, the maxima at 19 608— 19 881 cm"1 (510-503 nm) and 20 833-21 368 cm"1 (480-468 nm) belong definitively to the most abundant species that must correspond to high-weight aggregates not observed in liquid or even in quickly frozen aqueous samples. The attempts to apply MCR-ALS model analysis were not successful in this case since the spectra were comparable in the whole concentration range. For comparison, the samples containing MB in KBr tablets, measured at the mass ratios (MB/KBr) 5 x 10~4 and 5 x 10~5, provided spectra, the main peak of which was found at 18 520 cm"1 (540 nm) and shoulders at 15 015 and 16 390 cm - 1 (666 and 610 nm, respectively); thus, higher aggregates were present together with monomer and lower aggregates, in contrast to frozen solutions at 243 K.

6706 J. Phys. Chem. A, Vol. 109, No. 30, 2005 Heger et al.
TABLE 1: Changes in the Concentrations of the MB Species"
sample calculation method6 M/(D + T) (M + D)/T (M + D + T)/higher oligomers (mol L"1) (mol L"1) (mol L"1)
liquid (293 K)
solid (77 K)
solid (243 K)
GFA MCR-ALS/EFA MCR-ALS/GFA GFA MCR-ALS/EFA MCR-ALS/GFA GFA
6 x 10"4
3 x 1CT4
1 x 1CT3
n.a. n.a. n.a. n.a.
1 x 3 x 2 x <2 2 x 2 x n.a.
10-3
KT 3
io-3
x 1(T7
1CT6
KT6
5 x KT6
5 x 1CT6
6 x KT 6
only higher oligomers
" The concentrations presented correspond to the initial MB concentration, at which the fraction ratio of a species (or their mixtures) reaches 0.5 (data from Figures lb—3b and 5b—7b). M = monomer; D = dimer; T = trimer. b GFA, the Gaussian fitting analysis; MCR-ALS/EFA, the MCR-ALS method using input data calculated by evolving factor analysis; MCR-ALS/GFA, the MCR-ALS method using input data from the Gaussian fitting analysis.
log c
Figure 4. Comparison of all calculated concentration profiles applied for monomer (squares), dimer (circles), and trimer and oligomers (triangles). The lines represent the profiles obtained from the estimated equilibrium constants. The solid symbols were taken from the Gaussian fitting analysis (Figure lb), the empty symbols from MCR-ALS with EFA (Figure 2b), and the half-filled ones from the MCR-ALS method using the Gaussian fitting analysis (Figure 3b).
4. Discussion
Both the Gaussian curve analysis and the multivariate curve resolution—alternating least squares method provided excellent tools to evaluate qualitatively as well as quantitatively the distribution of the M B species in the liquid solutions with comparable results (Figures 1—4). The first part of this study confirmed the reported findings,22 '25 according to which monomer dominates in the lowest sample concentrations (in this work c > 5 x 1CT7 mol L - 1 ) , being replaced by dimer and trimer via an effective aggregation process already detectable at c > 1CT4 mol L - 1 . The concentration profiles calculated exclusively from the input data using EFA (Figure 2b) gave satisfactory, yet somewhat altered, results. While a lower dimer concentration is attributed to overlying (unresolved) peaks of both monomer and trimer in the calculated spectra as well as a high molar absorption coefficient of dimer (see Supplementary Information), the concentration ratios of the monomer and trimer formation profiles remained comparable in all computational methods used. Additionally, the MCR-ALS method using the Gaussian fitting analysis provided more satisfactory results, which provided data in a good agreement with those calculated using the equilibrium constants (Figure 4; Supplementary Information). Thus, all approaches described provided an authenticated and complex analysis, which advocated their use for the spectroscopy of the frozen M B solutions. Table 1 shows a summary of the quantitative analysis on the basis of the calculation methods applied. The initial concentrations of M B , at which the
monomer dimer trimer c[molL"1]
'.•'•/avertumber [cm" ]
-3.5
log c
Figure 5. (a) Normalized representative spectra of MB in frozen aqueous solutions at 77 K obtained from the Gaussian fitting analysis. The arrows show the known wavenumber values2225 corresponding to the absorption maxima of individual species, (b) The calculated relative concentration-dependent abundance profiles in samples at 77 K as a function of the MB concentration c on the basis of spectra shown in Figure 5a. The lines are visualized trends of the corresponding calculated values (solid points).
concentration fraction ratio of a species (or their mixtures) reaches 0.5 (50%), were deduced from in Figures lb—3b and 5b—7b. Such values represent the possibility to compare the mathematical approaches but most importantly to evaluate the aggregation processes that occur in different media.
During the freezing process, the solutes in aqueous solutions are excluded from the growing ice phase resulting in increased concentrations on the crystal surfaces.7,8 M B is relatively well

Aggregation of Methylene Blue J. Phys. Chem. A, Vol. 109, No. 30, 2005 6707
(a) monomer dimer trimer
(b) wavenumber [cm"1]
1.0-
o.a
1 0.6
O 0.4. n
I 0.2
0.0
monomer + dimer trimer higher aggregates
-5 —r—
•4
loge
Figure 6. (a) Calculated spectra of three mathematically resolved species (generally corresponding to monomer + dimer, black; trimer. blue; trimer + higher aggregates, red) in frozen aqueous solutions at 77 K obtained from the MCR-ALS method using input data calculated by the evolving factor analysis (EFA). The arrows show the known wavenumber values2225 corresponding to the absorption maxima of individual species, (b) The calculated relative concentration-dependent abundance profiles in samples at 77 K as a function of the MB concentration c obtained from the MCR-ALS method on the basis of data from Figure 6a. The lines are visualized trends of the corresponding calculated values (solid points).
soluble in water and to avoid the formation of a liquid layer in the grain boundary because of the freezing point depression, all absorption spectra were measured below 243 K when all solutions were solidified. Higher surface-layer concentration of the solutes shortens the average intermolecular distances and enhances the probability of aggregation processes. In addition, a lower temperature suppresses diffusion and molecular dynamics. Molecular aggregations in ice may change the absorption characteristics of the organic molecules because of changed interactions with the host water molecules of the cavity as well as intermolecular interactions among the solute molecules themself.9,10 Furthermore, gaseous solutes (air) can cause the scattering of light because of fine dispersed bubbles, which in addition to reflection decrease the signal-to-noise ratio in the spectra.36
The relatively fast freezing rate of the aqueous MB samples immersed in a liquid nitrogen bath (77 K) caused an occurrence of new significant blue-shifted absorption bands, suggesting a change of the relative abundances of the MB species. Figures
(a)
I i
monomer dimer trimer
I 1 1
(b)
I " J> 0.6
"5 04
a«.
14000 16000 18000 20000 22000
wavenumber [cm1]
- monomer + dimer •trimer • higher aggregates
24000
- I — -6 0
— I — -5.5
— I — -50
— I — -4.5
— I
-4 0
log c
Figure 7. (a) Calculated spectra of three mathematically resolved species (generally corresponding to monomer + dimer, black; trimer, blue; trimer + higher aggregates, red) in frozen aqueous solutions at 77 K obtained from the MCR-ALS method using input data from the Gaussian fitting analysis. The arrows show the known wavenumber values2225 corresponding to the absorption maxima of individual species, (b) The calculated relative concentration-dependent abundance profiles in samples at 77 K as a function of the MB concentration c obtained from the MCR-ALS method on the basis of the data from Figure 7a. The lines are visualized trends of the corresponding calculated values (solid points).
5—7 show the results from the Gaussian curve and the MCR-ALS analyses of absorption spectra. It is apparent that self-organization of the dye occurred at the lowest bulk concentrations used; trimer dominated already at c ~ 10 - 7 mol L - 1 (Table 1), while the concentrations of both monomer and dimer were negligible. This indicates that the local concentration of MB at the grain boundaries increased by ~3 orders of magnitude upon the freezing process compared to the liquid phase. When temperature is decreased, the solute concentration at the grain boundaries becomes gradually higher until the layer solidifies. There is only a limited time to establish an equilibrated distribution of the solute molecules in quickly frozen samples at 77 K, which can be, for example, connected to an acceleration of various chemical processes because of emerged interracial electrostatic forces.8,37 Such forces might inhibit or enhance the repulsion of the cationic MB from grain surface layers, but we currently have no evidence for such interactions. Once the solidification is accomplished at such a low temperature, molecular diffusion is practically prevented.38 Our recent cage effect studies on photodecarbonylation of dibenzyl ketones in frozen aqueous solutions have shown that diffusion of the benzyl

6708 J. Phys. Chem. A, Vol. 109, No. 30, 2005
monomer dimer trimer
14000 16000 18000 20000 22000 24000
waven umber [cm"1]
Figure 8. Normalized representative spectra of MB in frozen aqueous solutions at 243 K obtained from the Gaussian fitting analysis. The arrows show the known wavenumber values22,25 corresponding to the absorption maxima of individual species.
radicals within aggregates at the grain boundary is still remarkably efficient at 223 K but totally restricted at 193 K, independently of the initial ketone concentration in the range of 10~6 to 10~4 mol L - 1 .3 9 Thus, MB aggregations in quickly frozen samples at 77 K must be fixed in their positions and structure. In more concentrated MB samples, the new bands at > 18 000 cm - 1 most probably represent the transitions corresponding to higher aggregates as observed elsewhere.29 All analyses concurred that such oligomers dominated at e > 5 x 10~6 mol L - 1 . A minor shift due to the polarity or a different charge distribution at the phase boundary is possible, however, the MB absorption maxima are not very sensitive to the solvent polarity.20 Since no absorption bands at lower wavenumber appeared, the formation of the head-to-tail aggregates (J-aggregates) were not expected to occur under such experimental conditions.
Higher aggregates, exhibited as two broad absorption bands between 18 000 and 22 000 cm - 1 , were exclusively formed when the samples were frozen slowly at 243 K (Figure 8) and, furthermore, it was found that those spectra did not change upon additional cooling to 77 K. Only insignificant broad absorption in the region of 15 000— 18 000 cm - 1 advocates the existence of dimers or trimers. Such a slow freezing, requiring several minutes to complete, had to allow reaching the equilibrium before the layers solidified but it is probable that limited diffusion at subeutectic quasi-liquid layer4 was still present during the absorption measurements. When the local concentration of the MB molecules at the grain boundaries escalates, electrostatic attraction causing the self-assembling process is more accessible, and water molecules are constrained to the ice phase. Under such conditions, the local MB concentration was raised at least by a further 3 orders of magnitude (Table 1), but most likely more, compared to the quickly frozen samples, that is more than 6 orders of magnitude compared to a liquid solution. Since we were unable to measure spectra of more diluted samples to detect the absorption band of monomer, this number is only a low estimate. Furthermore, the aggregation process was found irreversible in the temperature range 243— 77 K once solidification occurred; thus, the intermolecular binding prevented the diffusion and the process was fully equilibrated. The fact that the absorption spectra were practically independent of the initial MB concentration suggests that the
Heger et al.
composition of aggregates in the quasi-liquid layer (243 K) was identical. On the basis of the solute molality (ms) calculation from the cryoscopic constant K{ (AT = K{ ms, where A r is the freezing point depression and K{ = 1.858 K mol - 1 kg for H2O), we can estimate that the MB concentration at 243 is about 10 mol kg - 1 if the layer is still liquid. Such a value corresponds to 5—8 orders of magnitude increase in the local concentration, depending on the initial concentration, and it is in accord with our estimate on the basis of the absorption study. This is fairly consistent with previous observations from Takenaka et al.8 and us9, in which an increase in the local concentration of various solutes over such a magnitude was calculated from the freezing point depression measurements. Furthermore, Cho and collaborators showed that subeutectic quasi-liquid (quasi-brine) phase can coexist with ice and solid NaCl*2H20 at temperatures as low as 228 K4 when the state of equilibrium is achieved, suggesting that there are many similarities in the behavior of inorganic and organic contaminants in ice.
The concentration-enhancing effect in the partially frozen aqueous solutions has been described since the 1960s in connection with the acceleration of some reactions.7.8.40~43 Such knowledge is extremely valuable also for the photochemical studies in ice or snow since most of the reactions already observed so far were bimolecular.10,15 On the basis of the above results, we present a quantitative as well as qualitative description of the aggregation process in the frozen aqueous solutions that may represent a general behavior of small organic molecules as ice contaminants. Further absorption and emission experiments, especially with realistic contaminant concentrations, will be required to explore in order to understand more the physical and chemical processes in terrestrial and atmospheric ices.
Acknowledgment. The project was supported by the Czech Ministry of Education, Youth and Sport (MSM 0021622412) and by the Grant Agency of the Czech Republic (205/05/0819). The authors express their thanks to P. Dvorak, J. Klanová, A. Rokosova, and J. Topinková for valuable discussions. We are grateful to anonymous reviewers who have contributed substantially by some constructive critical comments. This paper contributes to the Air-Ice Chemical Interactions (AICI) task of IGAC and SOLAS.
Supporting Information Available: The descriptions of the Gaussian curve fitting and equilibrium constants calculations are included in the supporting material. This material is available free of charge via the Internet at http://pubs.acs.org.
References and Notes
(1) Wang, S. Y. Nature 1961, 190, 690. (2) Petrenko, V. F.; Whitworth, R. W. Physics of ice; Oxford University
Press: Oxford, U.K., 1999. (3) Dash, J. G.; Fu, H. Y.; Wettlaufer, J. S. Rep. Prog. Phys. 1995.
58, 115. (4) Cho, H.; Shepson, P. B.; Barrie, L. A.; Cowin, J. P.; Zaveri, R. J.
Phys. Chem. B 2002, 106, 11226. (5) Doppenschmidt, A.; Butt, H. J. Langmuir 2000, 16, 6709. (6) Finnegan, W. G.; Pitter, R. L.; Hinsvark, B. A. J. Colloid Interface
Sei. 2001, 242, 373. (7) Takenaka, N.; Ueda, A.; Maeda, Y. Nature 1992, 358, 736. (8) Takenaka, N.; Ueda, A.; Daimon, T.; Bandow, H.; Dohmaru, T.:
Maeda, Y. J. Phys. Chem. 1996, 700, 13874. (9) Klanová, J.; Klan, P.; Heger, D.; Holoubek, I. Photochem. Photo-
biol. Sei. 2003, 2, 1023. (10) Klanová, J.; Klan, P.; Nosek, J.; Holoubek, I. Environ. Sei. Technol.
2003, 37, 1568. (11) Dubowski, Y.; Hoffmann, M. R. Geophys. Res. Lett. 2000, 27, 3321. (12) Hoffmann, M. R. Possible chemical transformations in snow and
ice induced by solar (UV photons) and cosmic irradiation (muons). In NATO ASI Series I, 1996; Wolff, W., Bales, R. C, Eds.; Vol. 43, p 353-377.

Aggregation of Methylene Blue J. Phys. Chem. A, Vol. 109, No. 30, 2005 6709
(13) Klan, P.; Holoubek, I. Chemosphere 2002, 46, 1201. (14) Blaha, L.; Klanová, J.; Klan, P.; Janošek, J.; Skarek, M.; Ružička,
R. Environ. Sei. Technol. 2004, 38, 2873. (15) Klan, P.; Klanová, J.; Holoubek, L; Cupr, P. Geophys. Res. Lett.
2003, 30, art. no. 1313. (16) Domine, F.; Shepson, P. B. Science 2002, 297, 1506. (17) Masclet, P.; Hoyau, V.; Jaffrezo, J.; Legrand, M. Analusis 1995.
23, 250. (18) Toom-Sauntry, D.; Barrie, L. A. Atmos. Environ. 2002, 36, 2683. (19) Wania, F. Environ. Sei. Pollut. Res. 1999, 6, 11. (20) Parkanyi, C; Boniface, C; Aaron, J. J.; Maafi, M. Spectrochim.
Acta, Part A 1993, 49, 1715. (21) Lewis, G. N.; Goldschmid, O.; Magel, T. T.; Bigeleisen, J. J. Am.
Chem. Soc. 1943, 65, 1150. (22) Bergmann, K.; O'Konski, C. T. J. Chem. Phys. 1963, 67, 6169. (23) Cenens, J.; Schoonheydt, R. A. Clays Clay Miner. 1988, 36, 214. (24) Kemnitz, K.; Tamai, N.; Yamazaki, L; Nakashima, N.; Yoshihara.
K. J. Phys. Chem. 1986, 90, 5094. (25) Braswell, E. J. Chem. Phys. 1968, 72, 2477. (26) Lee, C; Sung, Y. W.; Park, J. W. J. Phys. Chem. B 1999, 103.
893. (27) Ruprecht, J.; Baumgartel, H. Ber. Bunsen-Ges. Phys. Chem. Chem.
Phys. 1984, 88, 145. (28) Zhao, Z. M.; Malinowski, E. R. J. Chemom. 1999, 13, 83. (29) Jockusch, S.; Turro, N. J.; Tomalia, D. A. Macromolecules 1995.
28, 7416.
(30) Gessner, F.; Schmitt, C. C; Neumann, M. G. Langmuir 1994, 10. 3749.
(31) Jaumot, J.; Avino, A.; Eritja, R.; Tauler, R.; Gargallo, R. J. Biomol. Struct. Dyn. 2003, 21, 267.
(32) Multivariate Curve Resolution Homepage, http://www.ub.es/gesq/ mcr/mcr.htm (accessed Jan 2005).
(33) Tauler, R.; Izquierdoridorsa, A.; Casassas, E. Chemom. Intell. Lab. Syst. 1993, 18, 293.
(34) Petrov, V.; Antonov, L.; Ehara, H.; Harada, N. Comput. Chem. 2000, 24, 561.
(35) Antonov, L. TrAC, Trends Anal. Chem. 1997, 16, 536. (36) Mesquita, O. N.; Ladeira, L. O.; Gontijo, L; Oliveira, A. G.;
Barbosa, G. A. Phys. Rev. B 1988, 38, 1550. (37) Takenaka, N.; Furuya, S.; Sato, K.; Bandow, H.; Maeda, Y.;
Furukawa, Y. Int. J. Chem. Kinet. 2003, 35, 198. (38) Gudipati, M. S. J. Phys. Chem. A 2004, 108, 4412. (39) Ružička, R.; Baraková, L.; Klan, P. J. Phys. Chem. B 2005, 109,
9346. (40) Grant, N. H.; Clark, D. E.; Album, H. E. J. Am. Chem. Soc. 1961.
83, 4476. (41) Bruice, T. C; Butler, A. R. J. Am. Chem. Soc. 1964, 86, 4104. (42) Butler, A. R.; Bruice, T. C. J. Am. Chem. Soc. 1964, 86, 313. (43) Fennema, O. Reaction Kinetics in Partially Frozen Aqueous
Systems. In Water relations of foods; Duckworth, R. G., Ed.; Academic Press: London, 1975; p 539.

SUPPORTING INFORMATION for
Aggregation of Methylene Blue in Frozen Aqueous Solutions Studied by Absorption Spectroscopy
Dominik Heger, Jaromír Jirkovský, ? and Petr Klán ^
§ Department of Organic Chemistry, Faculty of Science, Masaryk University, Kotlářská 2, CZ - 611 37 Brno, Czech Republic
Ť J. Heyrovsky Institute of Physical Chemistry, Academy of Sciences of the Czech Republic, Dolejskova 3, CZ-18223 Praha, Czech Republic
in The Journal of Physical Chemistry A
1. Gaussian curve fitting
The concentration-dependence abundances for MB monomer were obtained by fitting two Gaussian curves corresponding to both vibration bands and one Gaussian curve for the baseline correction. The average of maxima (xc(i)) and the half-widths (w\) for each peak were calculated from six measurements. All dependences of the areas under the curves and the peak heights on the concentration were linear. The A and B coefficients were obtained from the linear regression in the equation y = A + Be (Table A), where y is a curve height in its maximum and c is the concentration.
Table A. Parameters characteristic for the monomer absorption (xc(i) - wavenumber of the peak maximum; wx - half-width at the maximum; A, B - coefficients in the linear regression of the concentration dependence). The interval corresponds to a 90% confidence of the standard deviation.
xc(i) [cm"1] Wi [cm"1] Ai Bi
0-0 vibration (664 nm)
0-1 vibration (624 nm)
15061±20
16024±34
334.1±6.6
767.0±30
-0.017±0.013
-0.014±0.013
43400±1600
29100±1600

Fitting two Gaussian curves for monomer can be expressed according to
(x xc(i)F (x xc(2)F
Y = a-e lwl + b-e 2wl (J)
where 7 is a simulated curve, a is an amplitude, x is a wavenumber, wc is a center of Gaussian curve, w is a half-height width, and
i = W a + a0168l-0.0136. ^ 43395
(2)
The value b (the height of a minor peak) was derived from the constants obtained by the solution of two linear equations corresponding to both maxima. This allowed us to fit two peaks of monomer by one parameter. Additionally, the expression could be used for fitting any other peak using the third term of this equation:
x(c(l)f (x-xcmf
Y = a-e + b-e •Z c„ -e
\x~xc(n)T 2wl
(3)
2. Equilibrium constant calculation
Previous calculations of the equilibrium constants of dimerization or trimerization, respectively, were based on the model proposed by Braswell.1 For two equilibria, the concentrations are expressed as:
2MB — — MB2 initial concentration y 0
concentration at equilibrium y - 2x X
3 MB — — MB3 initial concentration y 0
concentration at equilibrium y - 3z z
The equilibrium constants of dimerization (Kd) and trimerization (Kt),
K.
K.
[MB2]
[MB]
[MB,]
[MB]
and
(UAT> W
(4)
(5)
2

are represented by
( y -2x ) 2 '
B (y-^y
, respectively.
(6)
(7)
Finally, two independent equations (quadratic and cubic) are derived:
4Ax2 - x(4Ay + 1) + Ay2 = 0
By3 - z(9By2 + 1) + 21Byz2 - 27Bz3 = 0
(8)
(9)
These equations were numerically solved in MATLAB 6.5.1. The fractions of MB species calculated from the reported equilibrium constants for the dimerization2"4 and trimerization1
steps, 2xl03 L moľ1 and 6xl06 L2 moľ2, respectively, are shown in Figure A. To validate the calculation, the total concentration of the dye was expressed as a sum ([monomer] + 2x[dimer] + 3x[trimer]). The original assumptions, according to which only dimerization takes place at low MB concentrations as well as considering two independent equilibrium constants are certainly a simplification. As a result, the concentration of monomer is negative at higher MB concentrations and the profiles do not correspond well to the realistic concentration profiles measured.
-5.5 -5 -4.5 -4 -3.5 Log of Total Molar Concentration
Figure A. Calculated relative concentration-dependent abundance profiles based on the solution of the equations (8) and (9) for Kd = 2xl03 L moľ1 and Kt
: 6xl06L2moľ2.
3
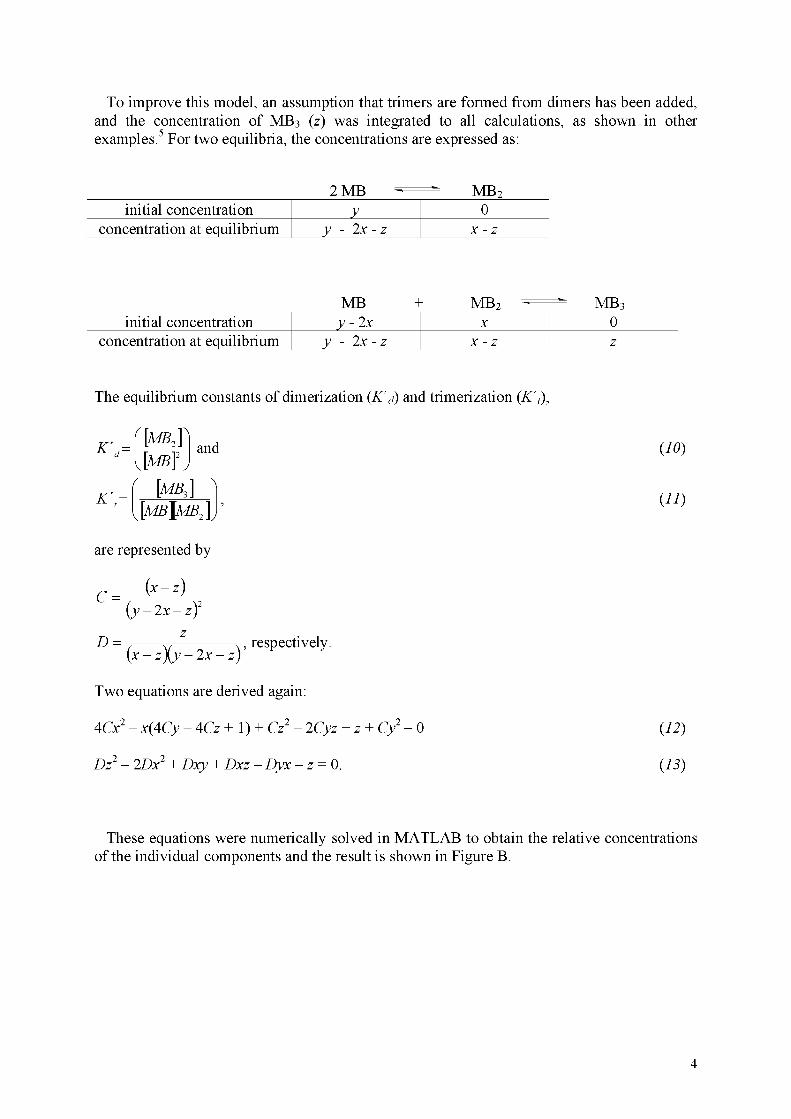
To improve this model, an assumption that trimers are formed from dimers has been added, and the concentration of MB3 (z) was integrated to all calculations, as shown in other examples.5 For two equilibria, the concentrations are expressed as:
2 MB MB2 initial concentration y 0
concentration at equilibrium y - 2x - z x -z
MB + MB2 MB3 initial concentration y-2x X 0
concentration at equilibrium y - 2x - z X - z z
The equilibrium constants of dimerization (K'd) and trimerization (K't),
K'
K
and to] [MB]\
' [MB,] ^
K[MB\MB2]
are represented by
C
D
(y-2x-zf
, respectively. (x - z\y - 2x - z)'
Two equations are derived again:
4Cx2 - x(4Cy - 4Cz + 1) + Cz2 - 2Cyz + z + Cy2=0
Dz2 - 2Dx2 + Dxy + Dxz - Dyx - z = 0.
(70)
(11)
(12)
(13)
These equations were numerically solved in MATLAB to obtain the relative concentrations of the individual components and the result is shown in Figure B.
4

Plot of Relative Concentrations 1.2
<n 4—1 £Z QJ £Z O Q . E o O
Z5 •g '> -a
0.8
o 0.6
I I I I I I I I I -
-
monomer
\
dirner \ — trimer \
-
sum
\ -- \ -
-
1 i i
^~1 -
1 i i i - i - ^ i i i
-6.5 -6 -5.5 -5 -4.5 -4 -3.5 -3 -2.5 -2 Loq of Total Molar Concentration
Figure B. Calculated relative concentration-dependent abundance profiles on the basis of the solution of the equations (12) and (73) for K'd = 282.4 L moľ1 and K't = 9.056x10³ L moľ1.
Re-evaluated equilibrium constants were obtained by the following procedure. The absorbances from the measured spectra were calculated for a 1-cm optical path length and the Gaussian fitting provided the areas under the curves for all species. Such values were used for a first estimate of the concentrations later applied in the MCR-ALS calculations (e.g., Figure 3b in the main text) and to obtain the molar absorption coefficients for all species at the corresponding wavelengths. The peak areas (in L cm"2 moľ1) were found and used as follows:
monomer 0.953 x 10⁸
dimer 4.319xl08
trimer 2.216 xlO8
As a result, the integrated peak areas were used to calculate the concentration profiles from the Gaussian fitting analysis (Figure lb in the main text) and the equilibrium constants were estimated by solving the linear equations:
R + K'd[MB] = [MB2] I [MB],
P + K t\MB] = [MB3] I [MB2I
(14)
(15)
where the symbols are same as those defined above, R and P are the intercepts, and the slopes are the equilibrium constants, K'd = 282 ± 14 L moľ1 and K't = (9.1 ± 4.2)xl03 L moľ1.
5

The error corresponds to a 90% confidence of the standard deviation of the slopes. Such a calculation depended largely on the oscillator strength used. Our model did not include the formation of higher aggregates which had to increase the error as well.
References
(1) Braswell, E. J. Chem. Phys. 1968, 72, 2477. (2) Bergmann, K.; O'Konski, C. T. J. Chem. Phys. 1963, 67, 6169. (3) Lee, C; Sung, Y. W.; Park, J. W. J. Phys. Chem. B 1999,103, 893. (4) Ruprecht, J.; Baumgartel, H. Ber. Bunsen-Ges. Phys. Chem. Chem. Phys. 1984, 88, 145. (5) Lueck, H. B.; Rice, B. L.; McHale, J. L. Spectroc. Acta Pt. A-Molec. Biomolec. Spectr. 1992, 48, 819.
6

Appendix 2
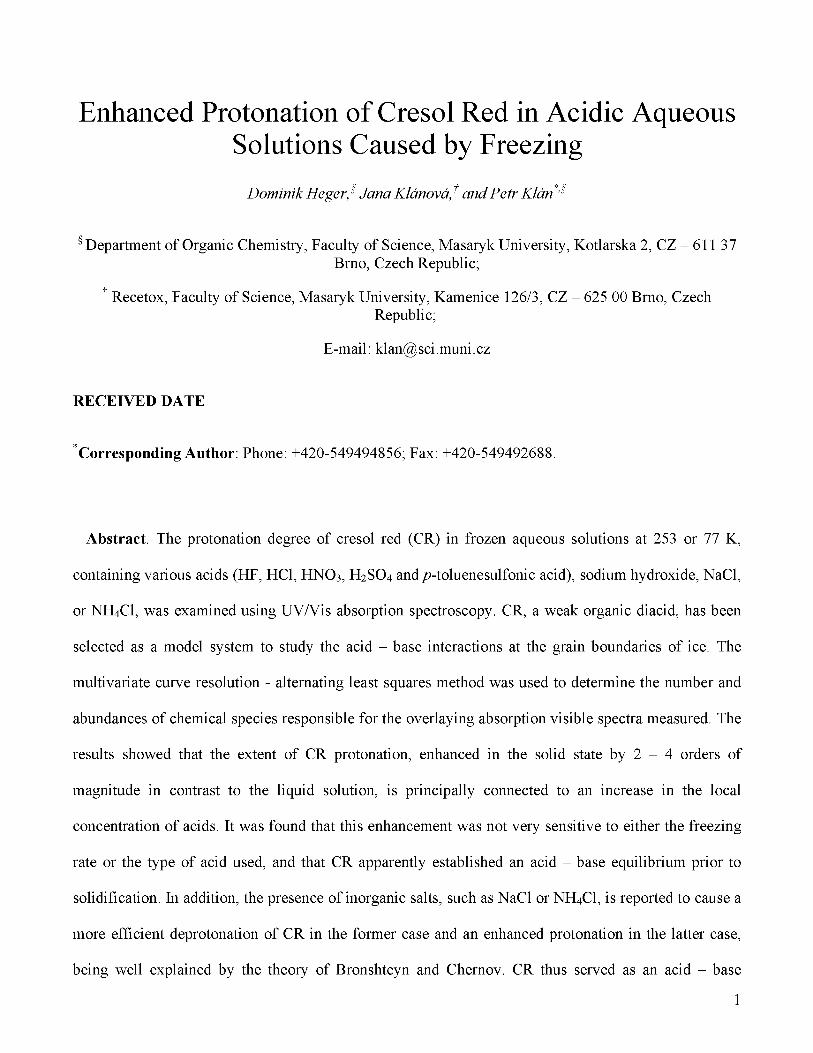
Enhanced Protonation of Cresol Red in Acidic Aqueous Solutions Caused by Freezing
Dominik Heger, Jana Klánová, and Petr Klán ^
§ Department of Organic Chemistry, Faculty of Science, Masaryk University, Kotlářská 2, CZ - 611 37 Brno, Czech Republic;
^ Recetox, Faculty of Science, Masaryk University, Kamenice 126/3, CZ - 625 00 Brno, Czech Republic;
E-mail: [email protected]
RECEIVED DATE
corresponding Author: Phone: +420-549494856; Fax: +420-549492688.
Abstract. The protonation degree of cresol red (CR) in frozen aqueous solutions at 253 or 77 K,
containing various acids (HF, HCl, FINO3, H2SO4 and^-toluenesulfonic acid), sodium hydroxide, NaCl,
or NH4CI, was examined using UV/Vis absorption spectroscopy. CR, a weak organic diacid, has been
selected as a model system to study the acid - base interactions at the grain boundaries of ice. The
multivariate curve resolution - alternating least squares method was used to determine the number and
abundances of chemical species responsible for the overlaying absorption visible spectra measured. The
results showed that the extent of CR protonation, enhanced in the solid state by 2 - 4 orders of
magnitude in contrast to the liquid solution, is principally connected to an increase in the local
concentration of acids. It was found that this enhancement was not very sensitive to either the freezing
rate or the type of acid used, and that CR apparently established an acid - base equilibrium prior to
solidification. In addition, the presence of inorganic salts, such as NaCl or NH4CI, is reported to cause a
more efficient deprotonation of CR in the former case and an enhanced protonation in the latter case,
being well explained by the theory of Bronshteyn and Chernov. CR thus served as an acid - base
1

indicator at the grain boundaries of ice samples. Structural changes in the CR molecule induced by
lowering the temperature and a presence of the constraining ice environment were studied by the
absorption and ^H NMR spectroscopies. Cryospheric and atmospheric implications concerning the
influence of acids and bases on composition and reactivity of ice or snow contaminants were examined.
Keywords: Ice; Cresol red; Acidity; Protonation; Aggregation; Spectroscopy; Grain boundaries; Environmental; Snow.
1. Introduction
Hydrophobic and hydrophilic compounds are known to become spontaneously segregated at grain
boundaries of ice at the phase transition when their aqueous solutions are frozen.1'2 Such a solute
concentration-enhancing effect is now well established, for example, in connection with the acceleration
of some heterogeneous reactions,3"5 or with specific intermolecular photoreactions of halogenated
aromatic compounds.6"8 Several investigations indicated that organic impurities in natural ice or snow
undergo heterogeneous reactions with various trace compounds,9"15 the reaction efficiency of which
unquestionably depends on the local concentrations of reactants. Recently, a UV-Vis spectroscopic
technique was shown to provide insight into the composition of frozen aqueous solutions of a model
organic compound - methylene blue.16 The extent of the dye aggregation at the grain boundaries of ice
matrix was found to be dependent on the freezing rate and temperature. While the local concentration
increased by approximately 3 orders of magnitude upon fast freezing at 77 K compared to the liquid
phase, it raised at least by 6 orders of magnitude upon slow freezing at 243 K. In addition, temperature-
dependent restrictions of the molecular motion have to be considered to evaluate any chemical
transformation in a constraining medium. Diffusion and surface transport of small particles, such as
protons or inorganic ions, is relatively effective in/on ice;17"20 moreover, diffusion of larger species,
such as benzyl radicals, was also found to be remarkably efficient at the grain boundaries above 223
K.21
2

Acid - base processes are of obvious importance in chemistry. Mineral acids and halogen molecules
play an important role in the heterogeneous chemistry on the surface of ice crystals in the
atmosphere ' or the snowpack. There has been extensive interest in characterizing HCl adsorption
and ionization on the ice surface, representing a key step in the heterogeneous chemical reactions in the
ozone destruction cycle because HCl degradation may lead to the production of the chlorine radicals.24"
26 Some organic monocarboxylic acids (such as formic and acetic acid)27 and various dicarboxylic acids
(C2 - Cg)28'29 were hypothesized to be photochemically produced in the snowpack. They contribute a
significant fraction of free acidity in precipitation in remote regions30 and their concentrations in the
Artie snowpack can reach 0.1-10 ug L"1.29 The presence of acids (protons) may play a significant role in
chemical processes in/on ice or snowpack, however, only limited information is available to date. FTIR
spectroscopy study has, for example, revealed that acid - base reaction between HCl and NH3 on
crystalline ice produces the ammonium ion (NH4) to a limited extent between 80 and 140 K, while its
formation is very efficient above 140 K.31 The major nitrate photolysis process in ice or snow,
producing NO2 and *OH,15'32 was found to be affected by pH.13
^max = 518nm B
^max = 434 n m
H
+ H
PKa2
^max = 573 nm
HO.- .OH
,SO?
Scheme 1

In this work we present a study of the protonation degree of cresol red (CR), a common acid - base
indicator, in frozen aqueous solutions in the presence of various acids (HF, HCl, HNO3, H2SO4 and p-
toluenesulfonic acid), NaOH, NaCl, or NH4CI. Three forms of aqueous CR (Scheme 1) are known to
have absorption bands in the visible region with ?Wx at 518 (A; orange-red), 434 (B; yellow), and 573
(C; red) nm,33 respectively, which can be easily distinguished by absorption spectroscopy. The structure
of CR has been well established by X-ray analysis,34 and unlike Phenolphthalein possessing a y-lactone
(colorless) ring system,35 all CR forms in aqueous solutions have zwitter-ion structures with the
prolonged conjugation system responsible for their color.36 This weak organic diacid has been selected
as a model system to study the acid - base interactions at the grain boundaries of ice because its proton
dissociation equilibria in water are generally well accepted. Our study focused on examining the extent
of CR protonation which can be affected by (a) sample temperature, (b) freezing rate, (c) acid
equilibrium and non-equilibrium solubility in ice, and (d) CR or acid accumulation (aggregation) in the
layer of liquid, quasi-liquid, or solid solution surrounding the ice crystal walls of the polycrystalline
state. The multivariate curve resolution - alternating least squares method37 was used to determine the
relative abundances of CR forms in ice samples from their overlaying visible absorption spectra.
2. Experimental Section
Cresol red (for analysis, J. Knittl Co.) was used without further purification and each experiment was
performed with a freshly prepared stock solution. Water was purified by the reverse osmosis process on
an Aqua Osmotic 03 and its quality complied with U.S. Pharmacopaial Standards (USP). Hydrofluoric
acid (38 - 40%, puriss; Spolek pro chemickou a hutni výrobu, Co.), hydrochloric acid (35%, purum;
ONEX), H2SO4 (96 %, p.a.; ML Chemica), nitric acid (65%, p.a.; ML Chemica),/»-toluenesulfomc acid
monohydrate (p.a.; MERCK), sodium hydroxide (p.a.; Lachema), NaCl (p.a.; Lachema), and NH4CI
(p.a.; Lachema) were used as received. The CR aqueous solutions of different pH were prepared by
4

dissolving concentrated (aq.) or pure chemicals, and subsequently by adding a corresponding amount of
the stock CR solution. The resulting concentration of CR used in this work was either -lxlO"5 or -3x10"
6 mol L"1. The pH of the solutions was measured after the addition of the dye using a SenTix 97 T pH-
combined electrode with an integrated temperature sensor of a pH 320 Microprocessor pH-meter
(WTW).
The solidified samples containing CR solutions in Plastibrand cuvettes (transparent at >280 nm) were
prepared by freezing either quickly at 77 K (a liquid nitrogen bath) or slowly at 253 K (ethanol cooling
bath). The spectra of liquid aqueous solutions were measured on a Unicam UV4 spectrometer
(Cambridge, UK) against a pure water sample in quartz cells with the optical path length of 1 cm. The
absorption spectra in methanol at low temperatures were recorded using Hellma optical fibers (Hellma,
041.002-UV) and an immersion quartz Suprasil probe (Hellma, 661.500-QX). The spectra of frozen
samples and the reference spectra of pure ice were measured on a Lambda 19 UV/VIS/NIR
spectrophotometer (Perkin-Elmer) using a 60-mm integrating sphere (the slit width was set to 1 nm and
the scan speed to 480 nm min"1 or lower) immediately after removing the cuvettes from the cold
environment. Although the sample temperature was not controlled during the absorption measurements,
no changes of the spectra were observed within the time period necessary for duplicate consecutive
experiments. The averaged spectral background of pure ice was subtracted from each spectrum and the
spectra shown are averaged from at least three independent measurements. The final spectra were
smoothed using an adjacent averaging method when necessary.
*H NMR spectra were obtained on a Bruker Avance spectrometer 500 (500 MHz for 1H). Chemical
shifts in the NMR spectra are reported in ppm (5) relative to an internal standard (tetramethylsilane) at
0.00 ppm. Cresol red (303 K). ltt NMR (CD3OD): ô = 8.18 - 8.16 (m, 1 H), 7.79 - 7.76 (m, 1 H), 7.70
- 7.66 (m, 1 H), 7.42 - 7.39 (m, 4 H), 7.25 - 7.23 (m, 1 H), 6.97 - 6.96 (m, 2 H), 2.25 (s, 6 H). Cresol
red (303 K; HCl (aq.) addition). ltt NMR (CD3OD): ô = 8.18 - 8.16 (m, 1 H), 7.85 - 7.81 (m, 1 H),
7.74 - 7.71 (m, 1 H), 7.484 - 7.479 (m, 1 H), 7.47 - 7.46 (m, 1 H), 7.45 - 7.44 (m, 2 H), 7.27 - 7.25 (m,
1 H), 7.23 - 7.11 (m, 2 H), 2.27 (s, 6 H).
5

MATLAB 6.5.1 was utilized as the graphical and statistical software. The multivariate curve
resolution - alternating least squares (MCR-ALS) has been used as a model-free mathematical method
for recovery of the concentration profiles and pure spectra of the spectroscopically active species, based
on the Lambert-Beer law and a least squares minimization, in the same way as it was described in our
preceding article.16 The first step in the spectra recovery was finding the number of species in the
sample by a singular value decomposition of the data in MATLAB. The evolving factor analysis (EFA)
routine was applied for estimation of the species concentrations, and subsequently used for MCR-ALS
with specific constrains applicable in this calculation (e.g., no-negativity, unimodality, or closure),
developed by Tauler and his collaborators. The step by step filter program ' was applied to
determine the number of peaks in the spectra.
3. Results
Cresol red: the study system. The pK& and pK2 of cresol red (Scheme 1), corresponding to the first
and second proton exchange equilibria (transition points) in aqueous solutions, have been reported to be
1.10 (in glycine-NaCl-HCl buffer systems40) or 1.11+0.Ol,41 and 8.15 (in phosphate buffer systems)42 or
7.87+0.Ol,43 respectively. Sulfonephthaleins, including CR, are inherently weak acids or bases and can
therefore somewhat change the pH of the sample in diluted solutions. The pK2 value of CR is known to
exhibit a weak temperature dependence (Eq. 1; temperature Tis in K).44
913 4 pK2
a = - + 2.049 + 1.2661ogr (1)
For example, increasing temperature from 253 to 323 K decreases the pK2 from 8.70 to 8.05.44 It was
also found that pK2 decreased with increasing ionic strength in some sulfonephthaleins. The pK2 for
thymol blue, for example, dropped from 9.20 at ionic strength of \x = 0.00 M to -8.9 at \x = 0.10 M.45
The shifts of the absorption maxima of all three forms have been observed under various conditions,
for example, in the presence of cetyltrimethylammonium bromide (CTAB) in aqueous solutions.46 Such
6

observations were explained, in addition to electrostatic interactions between the positively charged
nitrogen of CTAB and a negative charge at CR, by formation of very closely packed ion-pairs due to
strong hydrophobicity of the oppositely charged dye and surfactant ions enabling a more efficient
deprotonation.46 It was found by using the infra-red absorption spectroscopy that sulfonephthaleins in
the solid KBr matrix display the quinone-like structure,36 in contrast to a prevailing charge separated
moiety in solutions. Also, inclusion of sulfonephthaleins to cyclodextrins, studied by UV-VIS and NMR
spectroscopy, revealed that the formation of a lactone ring is induced in the cavity.47
X [nm]
Figure 1. Representative absorption spectra of three CR forms (A, B, C from Scheme 1) in liquid aqueous solutions of different pH adjusted by HCl or NaOH and measured at 293 K. The insert assigns the corresponding pH values to the spectra; the values with an asterisk (*) are the molar concentrations of HCl in the most acidic solutions.
7

Cresol red liquid solutions at 293 K. As a first step to establish the validity of the proposed method,
we determined the transition points of CR forms in aqueous solutions with a different pH using the
corresponding concentrations of HCl or NaOH. Absorption spectra of CR (c = 1.3x10"5 mol L"1) in the
range of 350-650 nm (Figure 1) distinguished well three equilibrated forms (A, B, C) shown in Scheme
1. The molar concentrations of HCl are depicted in the figure for most acidic solutions, when the
solution pH was outside the range of the pH meter performance. The absorption maxima (?Wx) of the
doubly protonated (A), singly protonated (B), and deprotonated (C) forms were found at approximately
520, 434, and 573 nm, respectively. The existence of two isosbestic points in the overlaid spectra (Xi =
Al A and 486 nm), corresponding well to the literature values,33 authenticated that the CR forms were in
equilibrium. The latest release of MCR-ALS user-friendly graphical interface was used to resolve
spectra and concentration profiles by a mathematical least-square minimalization.37 The closure was set
to 1 and the non-negative least-squares and unimodality (with an average implementation and the
constraint tolerance equal to 1.05) were applied to all spectra. Singular value decomposition revealed
the presence of 3 species as expected.
8

0.9 I I
A C
0.8 r \
0.7 / \
0.6 / \ s c CC 0.5 - \
- Q i _
O CO 0.4 \ CC
0.3 B \
0.2 \
0.1
0 •
400 450 500
X [nm] 550 600 650
Figure 2. Calculated spectra of three CR forms (A, blue; B, green; C, red) in liquid aqueous solutions at 293 K obtained from MCR-ALS method using the input data calculated by the evolving factor analysis (EFA).
The calculated spectra of the CR forms from the MCR-ALS analysis are shown in Figure 2 and their
abundances in Figure 3. The form A was prevailing below pH = 1.1, B was observed in the pH range of
1.1 to 7.9, and C was the most abundant form in more basic solutions. The pÄTa can be roughly estimated
from the transition point (pHT), which is the corresponding pH at which two forms have the same molar
concentrations. The obtained values, pH-/ -1.1 (p^a1 equivalent) and pHT2 -8.0 (pK2 equivalent),
corresponded accurately to the literature values.40"42
9

Figure 3. The calculated relative concentration-dependent abundance profiles of three CR forms (A, blue; B, green; C, red) in liquid aqueous solutions at 293 K as a function of the pH, obtained from the MCR-ALS method based on data shown in Figure 1. The lines are visualized trends of the corresponding calculated values (circles).
Frozen cresol red liquid solutions (HCl, NaOH) at 253 K. The data obtained from the spectral
analysis of the frozen aqueous CR solutions containing HCl or NaOH were used to identify all three
forms present in the constrained medium of ice, in order to determine the protonation degree of the dye
(Figure 4). A relatively slow freezing rate of the CR samples, the pH values of which were measured in
the liquid state, was achieved by immersing them to an ethanol bath at 253 K. The spectra were
measured immediately after removing from the cooling medium. The absorption maxima and isosbestic
points did not change their position significantly compared with those in the liquid (293 K) samples. A
new minor absorption maximum (560 nm) at the shoulder of a band A, however, appeared in the spectra
10

of samples with the corresponding pH in the interval of 2.8 and 5. Heterogeneity, lower transparency,
light scattering, and reflection of the poly crystalline ice samples decreased the signal-to-noise ratio.
350 400 450 500 550 600 650 X [nm]
Figure 4. Representative absorption spectra of CR (A, B, C from Scheme 1) frozen at 253 K. HCl or NaOH were used to adjust the pH. The insert assigns the corresponding pH values (liquid) to the spectra; the value with an asterisk (*) is the molar concentration of HCl in the most acidic solution.
11

i i
A
B C 1 f V
0.8 / \ co
E 3
£* 0.6 Hl H 1 -
n
0.4 \
0.2
0
\ \ 0.2
0 I i i 1 1
400 450 500
X [nm] 550 600 650
Figure 5. Calculated normalized spectra of three CR forms (A, blue; B, green; C, red) in frozen aqueous solutions at 253 K obtained from MCR-ALS method using input data calculated by the evolving factor analysis (EFA).
12

ö = ^
Ql-oooo oo i o o, o o o AQ O =a= 1 10 11 12
Figure 6. The calculated relative concentration-dependent abundance profiles of three CR forms (A, blue; B, green; C, red) in samples at 253 K as a function of the pH (liquid), obtained from the MCR-ALS method based on data shown in Figure 4. The lines are visualized trends of the corresponding calculated values (circles).
The singular value decomposition indicated the presence of three most abundant species again (Figure
5). The resolved spectra of the CR forms in frozen solutions at 253 K are comparable to those measured
in the liquid phase (Figure 2). While no shifts of the absorption maxima comparing to liquid samples
were observed, the transition point (pH-/), in this case the corresponding pH (liquid) value at which the
molar concentration ratio of A and B equals to 1, was found to be -4.2 (Figure 6). In contrast to data
shown in Figure 3, protonation of the form B in the slowly frozen samples occurs at an HCl
concentration lower by approximately 3.5 orders of magnitude. The partitioning between the forms B
and C, on the other hand, occurred at the same pHT2 -8.0 in both liquid (293 K) and solid (253 K)
phases.
13

I I I I I I I
350 400 450 500 550 600 650
X [nm]
Figure 7. Representative absorption spectra of CR frozen at 77 K. HCl or NaOH were used to adjust the pH. The insert assigns the corresponding pH values (liquid) to the spectra; the values with an asterisk (*) are the molar concentrations of HCl in the most acidic solutions.
Frozen cresol red liquid solutions (HCl, NaOH) at 77 K. The character of the absorption spectra
measured changed when the samples were prepared by fast freezing at 77 K (Figure 7). The absorption
maximum of the form A at the corresponding highest HCl concentration was red shifted by ~3 nm (523
nm). Furthermore, the absorption band split in two for the solution pH range of 1.2 to 1.7: one
maximum remained at ^max -523 nm, the second appeared at 498 nm. This change was found to be
reversible with temperature. Increasing the temperature of the sample from 77 to 253 K caused that the
bands coalesced into one with Xm!lx -523 nm, observed also in slowly frozen solutions (253 K), but two
bands re-appeared when the temperature dropped to 77 K. A new minor absorption maximum (560 nm)
14

at the shoulder of the band A, also observed at 253 K, was apparent at 77 K at the corresponding
solution pH of 2 - 4.85. In addition, an absorption enhancement at 375 nm was also observed. The form
B prevailed at pH = 4.9 - 9.0, having Xm!lx shifted to 447 nm. For pH >9.3, the band of the form C
appeared (?Wx -582 nm), and at pH >10.4, two apparent absorption maxima were observed (546 nm
and 574 nm). A reversible coalescence of these two bands after slow heating the samples to 253 K was
discerned as well. Two isosbestic points were observed at approximately same wavelengths as those at
293 K (Figure 7).
i 1 1 1 r
Figure 8. Calculated normalized spectra of three CR forms (A, blue; B, green; C, red) in frozen aqueous solutions at 77 K obtained from MCR-ALS method using input data calculated by the evolving factor analysis (EFA).
15

The singular value decomposition of all spectra revealed 3 important species present in the whole pH
range and the MCR-ALS analysis subsequently generated practically identical spectra of the main CR
forms (?Wx ~ 524 nm (A), 444 nm (B), 574 and 549 nm (C)), where two bands (A, C) are, however,
composed evidently of two closely overlying spectra (Figure 8). Due to the fact that appearance of the
double bands is temperature dependent and their coalescence is reversible (vide infra), only three
species A, B, and C were introduced to the minimalization procedure. The corresponding pH-/ value at
77 K was found to be -4.4, while pHT2 -9.3 (Figure 9); thus, the latter was somewhat higher than that
measured at 253 or 293 K.
1 D OOOXUÜÜ o Ü W » — v
0.9
0.8
-o °-6
"S 0.5 0)
•£ 0.4 Ü? QJ
"- 0.3
0.2h
0.1
0b
10 ' o
ocoocooo o oooi ft-Qr-e
1
i o ODO^g
o «PO o 10 11 12
Figure 9. The calculated relative concentration-dependent abundance profiles of three CR forms (A, blue; B, green; C, red) in samples at 77 K as a function of the pH (liquid), obtained from the MCR-ALS method based on data shown in Figure 7. The lines are visualized trends of the corresponding calculated values (circles).
16

Frozen cresol red liquid solutions in the presence of various acids. Protonation degree of CR has
also been studied in the presence of some other acids, such as HF, HNO3, H2SO4, or/?-toluenesulfonic
acid. Table 1 lists the pHj1 of various samples measured at 293, 253, and 77 K. The character of an acid
used had only minor effects on pH-/ and no effects on the band maxima, however, an overall increase of
the pHj1 values when temperature dropped from 253 to 77 K was apparent.
Table 1. Transition points of the first protonation step of CR in the presence of various acids in liquid and frozen aqueous solutionsa
acid pHx1 (293 K) pHx1 (253 K) pHx1 (77 K) HF 3.6 4.0 HCl 4.2 4.4 H2S04 1.1 4.2 4.4 HNO3 4.6 4.9 p-toluenesulfonic acid 4.7 5.0
The transition point pHT refers to the pH of the corresponding liquid CR solution, in which the concentrations of A and B forms (Scheme 1) are equal.
Temperature effects on CR spectroscopic behavior. Unexpected appearance of an absorption band
splitting in the spectra of frozen aqueous solutions in several cases and their reversible temperature
coalescence urged us to study temperature dependent structural changes of CR in detail. The absorption
spectra of CR methanol solutions containing HCl (c = 0.1 mol L"1) were measured in the temperature
interval of 176 and 303 K. CR in this methanol solution exists as a doubly protonated form (A) and the
absorption spectrum did not reveal any band splitting. Only a red shift of ^max from 521 to 526 nm was
observed when temperature dropped from 303 to 200 K. The same shift was observed in frozen aqueous
solutions. When the absorption spectrum was measured immediately after a sample frozen at 175 K was
thawed, a new minor absorption maximum at -560 nm appeared. In the case of CR methanol solutions
in the absence of HCl, the absorption maximum of a monoprotonated form (B) exhibited a larger red
shift from 419 to 440 nm, when temperature dropped from 303 to 200 K. The latter ?Wx value
corresponds to that found in ice at 77 K.
17

HO 10
OH
9, 13
form A
N»BwWW«wý|iiMi*i^ nmitm *t*M4im0mmimit>*vtit
303 K
\h#H**itß
18

Figure 10. Temperature dependence of *£! NMR spectra of an acidic CR solution in J-methanol. The corresponding hydrogen atoms are assigned in the figure.
In addition to the absorption measurements in methanol solutions, *£! NMR (CD3OD) spectra were
obtained for neutral and acidic samples (HCl (aq.) addition) in the temperature interval of 175 - 303 K.
Figure 10 shows NMR spectra of the form A. The aromatic hydrogen signals corresponding to the rings
Y, assigned by Yoshida et al.,47 exhibited a strong temperature dependence, in contrast to those of the
ring X. The line-broadening was visible already at 233 K and developed extensively at 175 K. The same
behavior was observed for the form B in pure methanol (not shown). The CHD2OD shifts, calibrated on
temperature,48 were used as a reference for measuring the *£! NMR spectra at low temperatures.
The effects of salt addition on CR spectroscopic behavior in frozen aqueous solutions. Figure 11
shows the absorption spectra of CR in aqueous frozen solutions containing NaCl or NH4CI at 77 K,
compared to that of a liquid CR solution. Addition of a salt caused that new absorption maxima
emerged: ?Wx = 578 and 538 nm in the presence of NaCl and NH4CI, respectively. The former is
consistent with a band of the deprotonated CR (form C), while the latter with a doubly protonated form
A. We were unable to measure the spectra of samples frozen at 253 K because the liquid phase
containing salt was completely separated from the ice phase.
19

Q . O y)
-Q
> U—i
CD
i i
B
^ A
[
1
i i
B
^ A
— liquid solid (NaCI) solid (NH4CI)
-
i i
B
^ A 0.8
0.6
0.4
Ě / \ C 0.6
0.4
0.2
0
- \ \ 0.2
0
i i i i I
400 450 500 X [nm]
550 600
Figure 11. Normalized representative spectra of CR in a liquid aqueous solution (black) and those of frozen aqueous solutions containing NaCI (red; c = 0.0024 mol L"1) and NH4C1 (green; c = 0.0013 mol L"1) at 77 K.
4. Discussion
In the first part of this study, UV/Vis absorption changes in aqueous cresol red solutions at various pH
(Figure 1) in the absence of buffers (buffers cannot be used in the subsequent low temperature
measurements) were followed to obtain the acid - base equilibrium constants. The evolving factor
analysis routine and MCR-ALS computational method16'37 proved to be an excellent tool for
determining three CR forms (Scheme 1) and their concentrations from the overlaying absorption spectra
measured (Figures 2). The pÄTas calculated from the abundance profiles (Figure 3) were found to be
20

identical with those known from the literature: pK^ -1.1 and pÄTa2 -8.0, respectively.40"42 As a result,
the same method was used in the analysis of the absorption spectra of frozen aqueous CR solutions. The
results are described in terms of the transition points (pHT) - the pH values of the corresponding liquid
solutions, at which the molar concentrations of two CR forms, being in equilibrium, are equal. Using the
pKn values has no meaning in the frozen solution.
Spectral characterization of CR forms in ice. The absorption bands corresponding to three CR
forms were still clearly observable upon freezing CR samples at 253 K (Figure 4) and their maxima had
practically the same wavelengths as those measured in the liquid phase. The acid form (A) had an
additional distinct shoulder absorption band at 560 nm in samples with the corresponding pH of 2.8 to
5. The subsequent evolving factor analysis then provided the absorption spectra of individual forms
(Figure 5) and the abundance profiles (Figure 6). This calculation was not able to separate the bands
corresponding to B and C forms completely; therefore that of B possesses a second (minor) maximum at
-580 nm.
The changes of absorption spectra were, however, significant in samples frozen at 77 K (Figure 7).
The band maxima (km!lx) shifted comparing to 253-K samples to some extent, and some new significant
absorption bands appeared. As in the previous case, a shoulder with ?imax = 560 nm appeared in most
acidic solutions. The peak corresponding to the form B was largely red shifted with a maximum at 447
nm. Moreover, a splitting of the C band was clearly evident in most alkaline samples. Interestingly, the
evolving factor analysis again provided relatively pure spectra of individual forms (Figure 8) and the
abundance profile (Figure 9), in spite of the fact that A and C were evidently composed of at least two
overlaying bands.
To explain the appearance of new absorption bands or shifts of their maxima, a further investigation
was necessary. To evaluate the temperature effect, the spectra of CR in methanol were measured at low
temperatures (293 - 175 K). All three forms exhibited comparable spectra to those obtained in aqueous
solutions. Only a shoulder absorption in the A band (km!lx = 560 nm) was observed at 175 K (methanol
21

is very viscous at this temperature). This absorption should not be related to the form C at such acid
concentrations. Despite the fact that no major band splitting was observed in methanol, we assumed that
spectral changes in ice at 77 K can be connected to a molecular confinement in the solid matrix and to
temperature. It is now well established, that heterogeneous environment often causes a remarkable
(cage) effects on chemistry due to restricted translational or conformational motion of molecules.49 For
example, we have recently shown that restrictions of an alkyl chain dynamics in alkyl phenyl ketones
can cause a decrease in the intramolecular photoreaction efficiency.50 Scheme 1 suggests that the
conjugation in the CR molecule is connected via a (partial) double bond between the central carbon,
bearing the positive charge, and the benzene rings. It is obvious that slowing down the rotation along
this bond, because of lower temperature or escalating dipolar interactions with other molecules, would
support the contribution of the quinone-like structure. This was, for example, demonstrated by the infra
red absorption spectroscopy measurement in the solid KBr matrix at 293 K, however, the absorption
bands and their maxima of solid CR silicate films were shown to be same as those in aqueous solutions
at 293 K.51 Absorption properties of such an electronic isomer should be different and unquestionably
affected by temperature. Indeed, the absorption band splitting at 77 K reversibly disappeared when
temperature reached 253 K, which suggests on a rather simple, least-motion transformation. Based on
the facts described above, we cannot fully exclude the possibility of very fast intermolecular reactions
(such as a proton exchange), however, we tentatively suggest that the appearance of new absorption
bands at 77 K is connected to a charge/electron redistribution in the CR molecule because of a restricted
conformational motion.
In this context, a specific signal broadening in a series of temperature ^H NMR measurements of CR
in methanol (Figure 10) clearly showed that only one part of the molecule, corresponding to
phenol/phenol ate rings, exhibited significant structural changes. Conformational restriction, because of
a partially developing double bond in the quinone-like form, is the most probable explanation again.
Other insignificant changes in the spectra and minor shifts of the absorption band maxima in samples at
77 K, including an enhancement of the band at ?Wx -375 nm, were considered to be an inherent
22
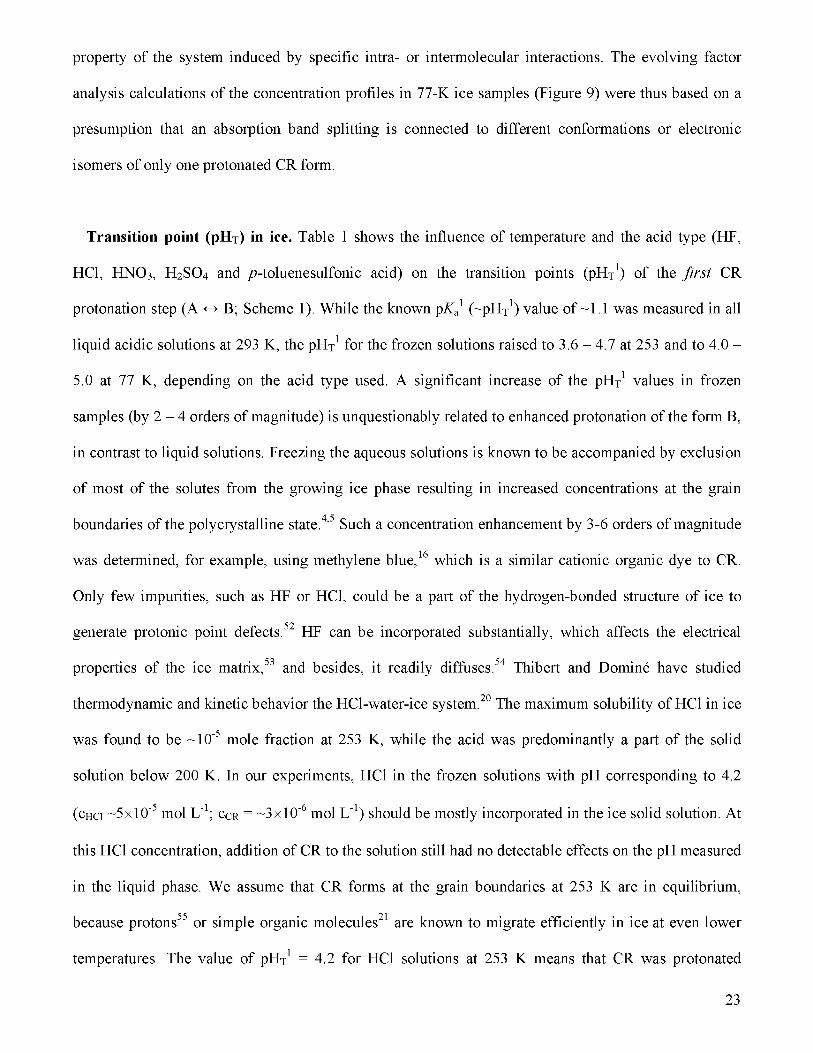
property of the system induced by specific intra- or intermolecular interactions. The evolving factor
analysis calculations of the concentration profiles in 77-K ice samples (Figure 9) were thus based on a
presumption that an absorption band splitting is connected to different conformations or electronic
isomers of only one protonated CR form.
Transition point (pHT) in ice. Table 1 shows the influence of temperature and the acid type (HF,
HCl, HNO3, H2SO4 and /»-toluenesulfonic acid) on the transition points (pHj1) of the first CR
protonation step (A <-+ B; Scheme 1). While the known pK^ (-pHj1) value of-1.1 was measured in all
liquid acidic solutions at 293 K, the pH-/ for the frozen solutions raised to 3.6 - 4.7 at 253 and to 4.0 -
5.0 at 77 K, depending on the acid type used. A significant increase of the pHj1 values in frozen
samples (by 2 - 4 orders of magnitude) is unquestionably related to enhanced protonation of the form B,
in contrast to liquid solutions. Freezing the aqueous solutions is known to be accompanied by exclusion
of most of the solutes from the growing ice phase resulting in increased concentrations at the grain
boundaries of the polycrystalline state.4'5 Such a concentration enhancement by 3-6 orders of magnitude
was determined, for example, using methylene blue,16 which is a similar cationic organic dye to CR.
Only few impurities, such as HF or HCl, could be a part of the hydrogen-bonded structure of ice to
generate protonic point defects.52 HF can be incorporated substantially, which affects the electrical
properties of the ice matrix,53 and besides, it readily diffuses.54 Thibert and Dominé have studied
thermodynamic and kinetic behavior the HCl-water-ice system.20 The maximum solubility of HCl in ice
was found to be ~10"5 mole fraction at 253 K, while the acid was predominantly a part of the solid
solution below 200 K. In our experiments, HCl in the frozen solutions with pH corresponding to 4.2
(CHCI ~5X10"5 mol L"1; CCR = ~3xl0"6 mol L"1) should be mostly incorporated in the ice solid solution. At
this HCl concentration, addition of CR to the solution still had no detectable effects on the pH measured
in the liquid phase. We assume that CR forms at the grain boundaries at 253 K are in equilibrium,
because protons55 or simple organic molecules21 are known to migrate efficiently in ice at even lower
temperatures. The value of pHx1 = 4.2 for HCl solutions at 253 K means that CR was protonated
23

approximately 1000 times more efficiently comparing to liquid solutions. To explain this, an increase in
the local concentration of acid (and CR) molecules during the freezing process must be considered.
Thus, while sample temperature decreased, a local concentration of the acid molecules dynamically
increased and protons preferentially interacted with CR. When HCl was replaced by other acids, pHT
changed only insignificantly (Table 1). A somewhat lower value of pH-/ = 3.6 in the case of HF could
be related to its better solubility in ice; the presence of other acids - HN03, H2S04, and p-
toluenesulfonic acid - caused only a negligible protonation enhancement, in contrast to our
expectations. HNO3 is, for example, much less soluble56 in ice than HCl, and H2S04 should be found
essentially only at the grain boundaries of ice.57 Additionally, /»-toluenesulfonic acid is quite different
system than the other acids. As an organic molecule it should be excluded from the ice phase
completely. Such a lower sensitivity of the pHx1 values to the acid structure shows that their
concentrations at grain boundaries increased significantly rather than being incorporated in the ice phase
in all cases. The affinity of CR toward protons as well as still efficient diffusion of the solutes was
apparently the main reason of the effect observed. The CR concentration at the grain boundaries
certainly became very high. The aggregation (self-organization) of such a molecule is promoted by
electrostatic and dispersion forces in addition to hydrophobic effects. These interactions might enhance
the CR deprotonation to some extent because of the formation of closely packed intermolecular ion-
pairs as it was observed in the case of CTAB addition.
Interestingly, very similar pH-/ values were obtained when the samples were frozen in a liquid
nitrogen bath (77 K). The extent of the protonation enhancement was higher only by a factor of-1.1,
compared to that found at 253 K (Table 1), possibly reaching the maximum value. Immersing the
samples in liquid nitrogen could be considered as fast freezing but an equilibrium prior to solidification
was obviously achieved quickly enough to allow this magnitude of protonation. The fact that all pHx1
values obtained at 77 K were higher while the enhancement was modest compared to 253 K
experiments means that the system in the liquid nitrogen was pre-equilibrated at a relatively higher
temperature, which still allows diffusion. This is, moreover, supported by the observation of two
24

isosbestic points in the spectra at nearly the same wavelengths as those at 293 K. Several groups have
showed that quasi-brine layer, the unfrozen NaCl solution phase on ice crystals, exists at temperatures
below the eutectic point.58"60 Some relaxation processes were also observed below liquid-glass transition
temperatures in supercooled aqueous propylene glycol, glycerol or PEG solutions.61 We do not know
the eutectic point for CR solutions (the values for common organic molecules such as urea or citric
acid62 are close to 260 K), but CR molecules should have some additional time to establish the
protonation equilibrium even at temperatures below 253 K. When temperature drops to 77 K, any
molecular transport or motion is critically constrained and intermolecular reactions can be almost
excluded. Furthermore, the extent of the acid dissociation is temperature dependent. While hydrogen
chloride, a strong acid, dissociates completely in liquid solutions, ionization was found to be limited on
the surface of ice at very low temperatures.63 This will also have a restrictive effect on the acid - base
interactions at very low temperatures.
The pHT2 -8.0, corresponding to the second equilibrium step (B<-»-C; Scheme 1), was found to have
nearly the same value in the liquid phase and at 253 K, but a somewhat higher value (-9.3) at 77 K. The
solubility of alkali hydroxides in ice is know to be low.52 Ice prepared, for example, by freezing a KOH
solution, contains inclusions of a concentrated KOH solution which freezes at 210 K to an eutectic
mixture of almost pure ice and KOH4H20.64'65 An insignificant increase in CR deprotonation at 77 K
might be explained by enhanced OH" concentration during the freezing process, but it seems that the
hydroxyl ions exhibit a more specific access to the OH group of CR than protons or we simply observe
a temperature effect only as was demonstrated elsewhere.44
Acid - base interactions in the presence of inorganic salts. When an aqueous solution of inorganic
salt is frozen, the anions and cations are not necessarily incorporated in the proportion originally present
in the solution.66'67 For NaCl, CI" incorporates more into the ice lattice as HCl, whereas Na+ and OH"
remain in the liquid phase.68 A decrease in the proton concentration on the surface of newly formed ice
crystals of the polycrystalline state corresponds well to the theory of Bronshteyn and Chernov.69'70
25

When CR absorption spectra of the frozen (77 K) aqueous solutions containing NaCl were measured,
two deprotonated CR forms (B and C) were exclusively found (Figure 11). As expected, the hydroxyl
ions excluded from the ice phase deprotonated CR molecules before the layer at the grain boundaries
froze. In contrast, when NH4CI aqueous solutions is frozen, NH4+ can occupy H20 sites in the lattice52
in a greater extent than Cľ, thus the layer excluded from the ice phase is more acidic. The absorption
spectra of frozen aqueous CR solutions containing this salt at 77 K revealed only more protonated CR
forms (A and B). CR thus served as an excellent acid - base indicator at the grain boundary. Since, in
addition to the B form, either A (in the case of NH4CI) or C (in the case of NaCl) co-existed in frozen
samples, we tried to estimate the relative concentrations of the CR forms in each case to evaluate the
corresponding pH of the frozen layer. The spectrum with two absorption bands of the frozen NH4CI
sample at 77 K resembled that containing HCl of the corresponding pH -4.8 (Figure 7). In contrast, the
spectrum of the frozen NaCl solution was similar to that of NaOH of the corresponding pH -9.1. Such a
finding is well in accord with the value measured in frozen NaCl solutions, where the corresponding
maximum pH of the brine layer was found to be close to 9.
Cryospheric and atmospheric implications. To consider any physical process or chemical reaction
that occurs within the natural snowpack or ice, we need information about the initial physical
conditions, physical and chemical properties of the contaminants, such as an extent and dynamics of
intermolecular interactions to the surrounding molecules, as well as about a chemical exchange between
the atmosphere and ice surfaces. The evaluation of acid - base reactions is thus extremely important in
order to know what are the forms of the species present in the snow or ice matrix. In general,
protonation of organic compounds may have large consequences on their physical and chemical
behavior, but it is not clear if an efficient protonation of organic impurities takes place in the
environment. Mineral acids in a surface coverage of cirrus cloud ice particles or the snowpack in the
cold environments were suggested to have a significant impact on atmospheric chemistry ' ' or
ground snowpack chemistry.9 Especially nitric acid has a very important role in photochemistry in the
26
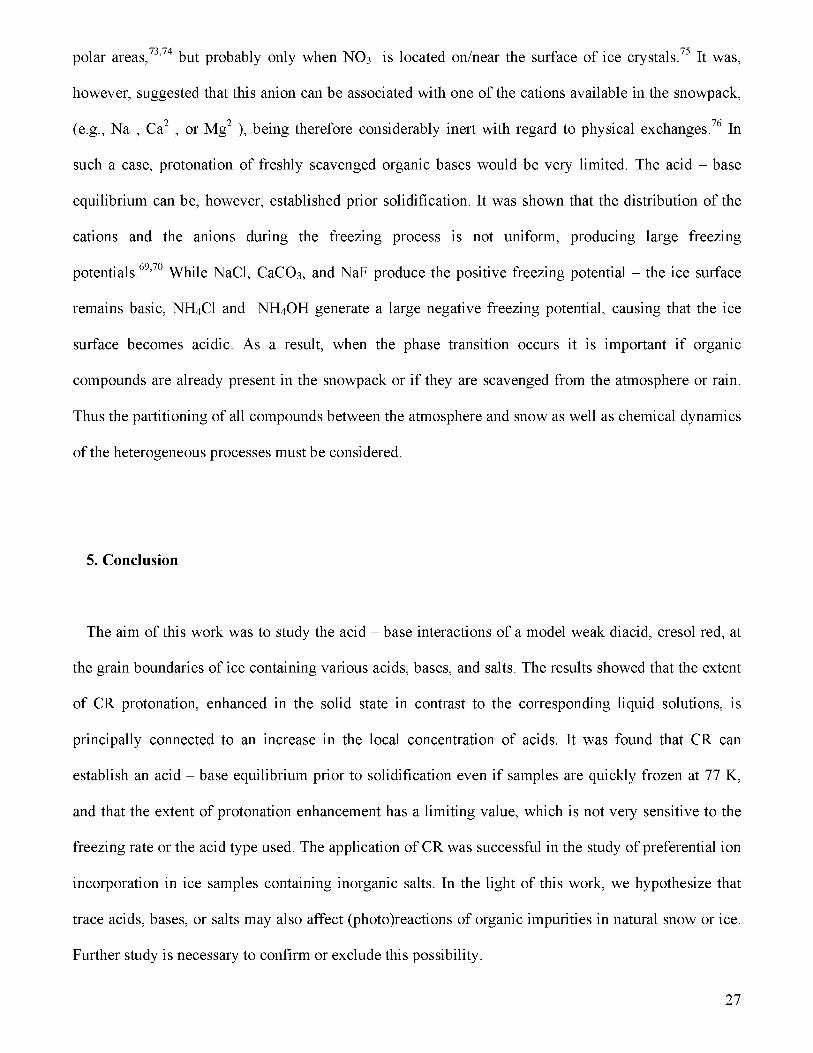
polar areas, ' but probably only when NO3 is located on/near the surface of ice crystals. It was,
however, suggested that this anion can be associated with one of the cations available in the snowpack,
(e.g., Na , Ca , or Mg ), being therefore considerably inert with regard to physical exchanges. In
such a case, protonation of freshly scavenged organic bases would be very limited. The acid - base
equilibrium can be, however, established prior solidification. It was shown that the distribution of the
cations and the anions during the freezing process is not uniform, producing large freezing
potentials.69'70 While NaCl, CaCC>3, and NaF produce the positive freezing potential - the ice surface
remains basic, NH4CI and NH4OH generate a large negative freezing potential, causing that the ice
surface becomes acidic. As a result, when the phase transition occurs it is important if organic
compounds are already present in the snowpack or if they are scavenged from the atmosphere or rain.
Thus the partitioning of all compounds between the atmosphere and snow as well as chemical dynamics
of the heterogeneous processes must be considered.
5. Conclusion
The aim of this work was to study the acid - base interactions of a model weak diacid, cresol red, at
the grain boundaries of ice containing various acids, bases, and salts. The results showed that the extent
of CR protonation, enhanced in the solid state in contrast to the corresponding liquid solutions, is
principally connected to an increase in the local concentration of acids. It was found that CR can
establish an acid - base equilibrium prior to solidification even if samples are quickly frozen at 77 K,
and that the extent of protonation enhancement has a limiting value, which is not very sensitive to the
freezing rate or the acid type used. The application of CR was successful in the study of preferential ion
incorporation in ice samples containing inorganic salts. In the light of this work, we hypothesize that
trace acids, bases, or salts may also affect (photo)reactions of organic impurities in natural snow or ice.
Further study is necessary to confirm or exclude this possibility.
27
Acknowledgments. The project was supported by the Czech Ministry of Education, Youth and Sport
(MSM 0021622412) and by the Grant Agency of the Czech Republic (205/05/0819). The authors
express their thanks to Jaromir Jirkovsky, Adriena Rokosova, and Jana Topinková for their help with
spectroscopy measurements. This paper contributes to the Air-Ice Chemical Interactions (AICI) task of
IGAC and SOLAS.
References
(1) Finnegan, W. G; Pitter, R. L. J. Colloid Interface Sei. 1997, 189, 322. (2) Cohen, S. R.; Weissbuch, L; PopovitzBiro, R.; Majewski, J.; Mauder, H. P.; Lavi, R.; Leiserowitz, L.; Lahav, M. Isr. J. Chem. 1996, 36, 97. (3) Fennema, O. Reaction Kinetics in Partially Frozen Aqueous Systems. In Water relations of foods; Duckworth, R. G., Ed.; Academic Press: London, 1975; pp 539. (4) Takenaka, N.; Ueda, A.; Maeda, Y. Nature 1992, 358, 736. (5) Takenaka, N.; Ueda, A.; Daimon, T.; Bandow, H.; Dohmaru, T.; Maeda, Y. J. Phys. Chem. 1996, 100, 13874. (6) Klan, P.; Klanová, J.; Holoubek, L; Cupr, P. Geophys. Res. Lett. 2003, 30, art. no. 1313. (7) Klanová, J.; Klan, P.; Nosek, J.; Holoubek, I. Environ. Sei. Technol. 2003, 37, 1568. (8) Klan, P.; Ansorgova, A.; Del Favero, D.; Holoubek, I. Tetrahedron Lett. 2000, 41, 7785. (9) Domine, F.; Shepson, P. B. Science 2002, 297, 1506. (10) Dassau, T. M.; Sumner, A. L.; Koeniger, S. L.; Shepson, P. B.; Yang, J.; Honrath, R. E.; Cullen, N. J.; Steffen, K.; Jacobi, H. W.; Frey, M.; Bales, R. C. J. Geophys. Res.-Atmos. 2002, 707, art. no. (11) Grannas, A. M.; Shepson, P. B.; Guimbaud, C; Sumner, A. L.; Albert, M.; Simpson, W.; Domine, F.; Boudries, H.; Bottenheim, J.; Beine, H. J.; Honrath, R.; Zhou, X. L. Atmos. Environ. 2002, 36,2733. (12) Klanová, J.; Klan, P.; Heger, D.; Holoubek, I. Photochem. Photobiol. Sei. 2003, 2, 1023. (13) Chu, L.; Anastasio, C. J. Phys. Chem. A 2005, 109, 6264. (14) Yang, J.; Honrath, R. E.; Peterson, M. C; Dibb, J. E.; Sumner, A. L.; Shepson, P. B.; Frey, M.; Jacobi, H. W.; Swanson, A.; Blake, N. Atmos. Environ. 2002, 36, 2523. (15) Honrath, R. E.; Peterson, M. C; Guo, S.; Dibb, J. E.; Shepson, P. B.; Campbell, B. Geophys. Res. Lett. 1999, 26, 695. (16) Heger, D.; Jirkovsky, J.; Klan, P. J. Phys. Chem. A 2005, 109, 6702. (17) Pines, E.; Huppert, D. Chem. Phys. Lett. 1985, 116, 295. (18) Foster, K. L.; Tolbert, M. A.; George, S. M. J. Phys. Chem. A 1997, 101, 4979. (19) Livingston, F. E.; George, S. M. J. Phys. Chem. B 1999, 103, 4366. (20) Thibert, E.; Domine, F. J. Phys. Chem. B 1997, 101, 3554. (21) Ružička, R.; Baraková, L.; Klan, P. J. Phys. Chem. B 2005, 109, 9346. (22) Abbatt, J. P. D. Chem. Rev. 2003, 103, 4783. (23) Faraudo, G.; Weibel, D. E. Prog. React. Kinet. 2001, 26, 179. (24) Molina, M. J.; Tso, T. L.; Molina, L. T.; Wang, F. C. Y. Science 1987, 238, 1253.
28

(25) Buch, V.; Sadlej, J.; Aytemiz-Uras, N.; Devlin, J. P. J. Phys. Chem. A 2002, 106, 9374. (26) Woittequand, S.; Toubin, C; Pouilly, B.; Monnerville, M.; Briquez, S.; Meyer, H. D. Chem. Phys. Lett. 2005, 406, 202. (27) Dibb, J. E.; Arsenault, M. Atmos. Environ. 2002, 36, 2513. (28) Kawamura, K.; Yokoyama, K.; Fujii, Y.; Watanabe, O. J. Geophys. Res.-Atmos. 2001, 106, 1331. (29) Narukawa, M.; Kawamura, K.; Li, S. M.; Bottenheim, J. W. Atmos. Environ. 2002, 36, 2491. (30) Galloway, J. N.; Likens, G. E.; Keene, W. C; Miller, J. M. J. Geophys. Res. - Ocean. Atmos. 1982,57,8771. (31) Pursell, C. J.; Zaidi, M.; Thompson, A.; Fraser-Gaston, C; Vela, E. J. Phys. Chem. A 2000, 104, 552. (32) Boxe, C. S.; Colussi, A. J.; Hoffmann, M. R.; Murphy, J. G; Wooldridge, P. J.; Bertram, T. H.; Cohen, R. C. J. Phys. Chem. A 2005, 109, 8520. (33) Rottman, C; Grader, G; De Hazan, Y.; Melchior, S.; Avnir, D. J. Am. Chem. Soc. 1999, 121, 8533. (34) Yamaguchi, K.; Tamura, Z.; Maeda, M. Anal. Sei. 1997, 13, 521. (35) Tamura, Z.; Abe, S.; Ito, K.; Maeda, M. Anal. Sei. 1996, 12, 927. (36) Ghoneim, M. M.; Issa, Y. M.; Ashy, M. A. Indian J. Chem. 1979, 18A, 349. (37) Tauler, R.; Izquierdoridorsa, A.; Casassas, E. Chemometr. Intell. Lab. 1993, 18, 293. (38) Petrov, V.; Antonov, L.; Ehara, H.; Harada, N. Comp. Chem. 2000, 24, 561. (39) Antonov, L. Trac-Trend. Anal. Chem. 1997, 16, 536. (40) Dean, J. A. Lange's Handbook of Chemistry, 14th edn ed.; McGraw Hill: New York, 1992. (41) Aragoni, M. C; Area, M.; Crisponi, G; Nurchi, V. M.; Silvagni, R. Talanta 1995, 42, 1157. (42) Perrin, D. D. Aust. J. Chem. 1963, 16, 572. (43) Casula, R.; Crisponi, G; Cristiani, F.; Nurchi, V.; Casu, M.; Lai, A. Talanta 1993, 40, 1781. (44) French, C. R.; Carr, J. J.; Dougherty, E. M.; Eidson, L. A. K.; Reynolds, J. C; DeGrandpre, M. D. Analyt. Chim. Acta 2002, 453, 13. (45) Yamazaki, H.; Sperline, R. P.; Freiser, H. Anal. Chem. 1992, 64, 2720. (46) Gohain, B.; Saikia, P. M.; Sarma, S.; Bhat, S. N.; Dutta, R. K. Phys.Chem. Chem. Phys. 2002, 4, 2617. (47) Yoshida, N.; Shirai, T.; Fujimoto, M. Carbohyd. Res. 1989, 192, 291. (48) Hoffman, R. E.; Becker, E. D. J. Magn. Reson. 2005, 176, 87. (49) Weiss, R. G.; Ramamurthy, V.; Hammond, G. S. Accounts Chem. Res. 1993, 26, 530. (50) Klan, P.; Janošek, J.; Kriz, Z. J. Photochem. Photobiol. A-Chem. 2000, 134, 37. (51) Makote, R.; Collinson, M. M. Anal. Chim. Acta 1999, 394, 195. (52) Petrenko, V. F.; Whitworth, R. W. Physics of ice; Oxford University Press: Oxford, 1999. (53) Camplin, G. C; Glen, J. W. The dielectric properties of HF-doped single crystals of ice. In Physics and chemistry of ice; Whalley, E., Jones, S. J., Eds.; Royal Society of Canada: Ottawa, 1973; pp 256. (54) Jaccard, C. Helv. Phys. Acta 1959, 32, 89. (55) Poles, E.; Cohen, B.; Huppert, D. Isr. J. Chem. 1999, 39, 347. (56) Thibert, E.; Domine, F. J. Phys. Chem. B 1998, 102, 4432. (57) Mulvaney, R.; Wolff, E. W.; Oates, K. Nature 1988, 331, 247. (58) Tang, T.; McConnell, J. C. Geophys. Res. Lett. 1996, 23, 2633. (59) Impey, G. A.; Shepson, P. B.; Hastie, D. R.; Barrie, L. A. J. Geophys. Res.-Atmos. 1997, 102, 15999. (60) Cho, H.; Shepson, P. B.; Barrie, L. A.; Cowin, J. P.; Zaveri, R. J. Phys. Chem. B 2002, 106, 11226. (61) Murthy, S. S. N. J. Phys. Chem. B 2000, 104, 6955. (62) Dekruif, C. G.; Vanmiltenburg, J. C; Sprenkels, A. J. J.; Stevens, G.; Degraaf, W.; Dewit, H. G. M. Thermochim. Acta 1982, 58, 341. (63) Kang, H.; Shin, T. H.; Park, S. C; Kim, I. K.; Han, S. J. J. Am. Chem. Soc. 2000, 122, 9842.
29

(64) Tajima, Y.; Matsuo, T.; Suga, H. J. Phys. Chem. Solids 1984, 45, 1135. (65) Cohen-Adad, R.; Michaud, M. CR Hebd. Acad. Sei. 1956, 242, 2569. (66) Workman, E. J.; Reynolds, S. E. Phys. Rev. 1950, 78, 254. (67) Gross, G. W.; Wong, P. M.; Humes, K. J. Chem. Phys. 1977, 67, 5264. (68) Workman, E. J.; Reynolds, J. C. Phys. Rev. 1950, 78, 254. (69) Bronshteyn, V. L.; Chernov, A. A. J. Cryst. Growth 1991, 112, 129. (70) Sola, M. L; Corti, H. R. An. Asoc. Quim. Argent. 1993, 81, 483. (71) Tolbert, M. A.; Rossi, M. J.; Golden, D. M. Science 1988, 240, 1018. (72) Domine, F.; Thibert, E. Geophys. Res. Lett. 1996, 23, 3627. (73) Honrath, R. E.; Guo, S.; Peterson, M. C; Dziobak, M. P.; Dibb, J. E.; Arsenault, M. A. J. Geophys. Res.-Atmos. 2000, 105, 24183. (74) Honrath, R. E.; Lu, Y.; Peterson, M. C; Dibb, J. E.; Arsenault, M. A.; Cullen, N. J.; Steffen, K. Atmos. Environ. 2002, 36, 2629. (75) Dubowski, Y.; Colussi, A. J.; Hoffmann, M. R. J. Phys. Chem. A 2001, 105, 4928. (76) Beine, H. J.; Domine, F.; Ianniello, A.; Nardino, M.; Allegrini, L; Teinila, K.; Hillamo, R. Atmos. Chem. Phys. 2003, 3, 335.
30

Appendix 3

How Organic Molecules Bind at Grain Boundaries in
Ice: A Solvatochromic Analysis
Dominik Heger and Petr Klán *
Department of Organic Chemistry, Faculty of Science, Masaryk University, Kotlářská 2, CZ - 611 37
Brno, Czech Republic
E-mail: [email protected]
RECEIVED DATE
Abstract, xxx
Keywords: Ice; Solvatochromism; Polarity; Spectroscopy; Grain boundaries; Aggregation.
1. Introduction
An understanding of the interracial interactions between ice and organic molecules is a convergence
of information from many different sources, including the studies of physical and chemical properties of
the ice surface1"9 or cryogenic behavior of ice contaminants.10"18 The surface of crystalline ice is a
complex disordered system with a greater molecular mobility than that of bulk ice, the magnitude of
which increases evidently when contaminant molecules are incorporated.1 It was shown that adsorption
of various organic molecules can be described well with a multi-parameter linear free energy
relationship, based on the van der Waals and the electron donor/acceptor interactions (such as H-
bonding).19 The surface of ice and its interaction with contaminants has been studied by infrared and
1

Raman spectroscopy, combined with computer modeling, finding three different important types of
surface water molecules, including those with dangling hydrogen or oxygen atoms.20'21 The adsorbed
states of some organic molecules, such as acetonitrile, chloroform,22, acetone,23 or benzene
derivatives,24 were investigated by various techniques, such as desorption mass spectroscopy or electron
spectroscopy, revealing the scope of hydrogen-bonding or dipolar interactions. Most importantly,
adsorption, desorption, interaction types, or diffusion of the molecules are known to be temperature and
phase-dependent variables.25"27
Hydrophobic or hydrophilic solute molecules are known to become spontaneously segregated at grain
boundaries of the polycrystalline ice during the freezing process.28'29 Such a solute concentration-of\ i n 11
enhancing effect ' ' causes that the solute molecules are aggregated and their local concentrations
increase by several orders of magnitude.27 There is, however, a lack of information available to evaluate
qualitatively the interactions of the solute molecules with water molecules at the grain boundaries in
frozen aqueous solutions.
In this work, we wish to estimate the effective polarity32 around various organic solutes in frozen
aqueous solutions using the solvatochromic parameters, the concept that was already extensively 11 IS Iŕí IS 1Q
applied to study the polarity of liquid solvents, " but also of the solid surfaces of silica, " alumina,
and a-amino acid crystals.40 Several different systems, exhibiting shifts of the UV-Vis absorption
maxima by changing the interaction forces between a solute and the surrounding water molecules of ice,
were employed. Ej{30) and ET(33) values were obtained, based on a solvatochromic behavior of 2,6-
diphenyl-4-(2,4,6-triphenyl-1 -pyridinio)-phenolate (l),35 and 2,6-dichloro-4-(2,4,6-triphenyl-1 -
pyridino)phenolate (2)41 dyes, respectively, and the %*, a, ß, and AN parameters were calculated using
4-nitroanisole (3), jV,jV-dimethyl-4-nitroaniline (4), 4-nitroaniline (5),42 4,4'-
bis(dimethylamino)benzophenone (Michler's ketone) (6),37 4-(dimethylamino)-4'-[di(2-hydroxyethyl)-
amino]benzophenone dyes (MK(OH)2) (7),43 and cz's-dicyano-bis(l,10-phenanthroline)iron(II)
(Fe(phen)2(CN)2) (8)37'44 (Chart 1).
2

Chart 1: Solvatochromic probes.
The study systems
Many different alternatives have been proposed to measure solute-liquid solvent interactions,
resulting in a large variety of "solvent polarity scales", but still no general definition has emerged.45
There are four reasonably independent parameters that can characterize the medium: hydrogen-bond
donation ability (acidity) (a), hydrogen-bond acceptor ability (ß), polarity/polarizability (TZ*), and
solvent stiffness (ô).46 The parameters were established by Kamlet and Taft in their simplified multi
parameter linear solvation energy (LSE) equation33 (XYZ = XYZ0 + s(7T* + dô) + aa + bß), where XYZ
is a property of the solvatochromic probe (such as the wavelength of an absorption maximum) in the
medium and XYZ0 is that of a reference system. The coefficients a, b, d, and s are solvent-independent
correlation coefficients.47 These three parameters were used to study interactions of organic solutes at
the grain boundary of ice in this work. In addition, the acceptor number (AN) parameter has been
obtained in order to determine the hydrogen-bond donation ability of the solvent independently on the
evaluations of a. 3

Empirical solvent polarity parameters ÍÍT(30) and ET(33). The molar electronic transition energies
of dissolved Reichardt's dye 1 (Eq. I)35 have been shown to correlate with a (-60%) and 7t* (-40%)
parameters (Eq. 2), while the ß term was found to contribute scarcely to the ET(30) values.35'46 This
observation is evidently connected to the probe structure: the presence of phenolate anion and
polarizable K electrons in the aromatic system imply large a and K* values, respectively. On the other
hand, the positive charge on the pyridinium nitrogen is too hindered to exhibit significant ß values as a
hydrogen acceptor. In addition to £T(30) , many other substitution derivatives were successfully
employed as solvatochromic probes.35'48"50 In this work, ET(33) (2), a dichloro derivative, was used
because of its better aqueous solubility (3.7xl0"6 mol L"1) and a lower pKa compared to ET(30) (pKa
(£T(30)) = 8.64, pKa (£T(33)) = 4.78).35 The £T(33) scale is defined in the same way as that of £T(30)
(Eq. 1) and both scales can be interconverted according to Eq. 3.41 Besides, a normalized ET(30)
parameter Ej* was defined as dimensionless quantity with water and TMS (tetramethylsilane) as
extreme polar and nonpolar reference solvents (Eq. 4), respectively, and its values range between 0 for
nonpolar TMS and 1 for highly polar water.35
£T(30 or 33) [kcal moľ1] = hcvmaxNA (1)
£T(30) = 31.2+ 15.2a +11. 5TT* (2)
£T(30) = 0.979£T(33) - 7.461 (3)
£TN = (ET(30) - 30.7)/32.4 (4)
The solvatochromic parameter 71*. This parameter measures the exoergic effects of dipole-dipole or
dipole-induced dipóle interactions among solute and solvent molecules, thus evaluates the dipolarity
and polarizability of the solvent.33A newly established and recommended probe is 4-nitroanisole (3).42
4

In case that its absorption band is not well resolved, the values of the absorption maxima of a secondary
indicator, 7V,jV-dimethyl-4-nitroaniline (4), are known to correlate with those of 4-nitroanisole by
Equation 5.42
v (3) = 0.6089 v (4) + 16900 [cm"1] (5)
The 7T* parameter is then calculated from the values of absorption maxima according to Equation 6.
*, . . _ v(solvent)-v(cyclohexane) _ v(solvent)-34120 - V(DMSO)_v(cyclohexane) ~ 31720-34120
where the corresponding v are maxima in cyclohexane, DMSO, and the solvent, respectively.42
The solvatochromic parameter a. This parameter is used to evaluate the solvent molecule as a
hydrogen-bond donor (HBD). The calculation is based on the comparison of the solvent-induced
absorption band maxima shifts of two similar probe molecules, from which one acts as a hydrogen bond
acceptor (in this work, the Reichardt's dye 1) whereas the other cannot (e.g. 4-nitroanisole (5)).35 The a
value is expressed by the Equation 7 from 7t* and Expo).46
a = 0.0649£T(30) - 2.03 - 0.72TT* (7)
The solvatochromic parameter ß. The ability of the solvent to act as a hydrogen-bond acceptor
(HBA) or electron-pair donor (EPD) to the solute is characterized by the ß parameter. Again, the
solvatochromic comparison method is based on absorption behavior of two similar molecules, where
one of them is capable of hydrogen bonding, whereas the other is not. For this work, iV,iV-dimethyl-4-
5

51,52 nitroaniline (4) and 4-nitroaniline (5) pair of the probes ' was applied. The ß parameter is calculated
by Equation 8.51 The ß value is normalized to for ß = 1 in hexamethylphosphoramide.33'53
ß = AAv(4,5)/2759 (8)
where AA v (4, 5) = 0.9841 v (4) + 3490 - v (5), and v is wavenumber in cm"1.
The acceptor number (AN). AN is an empirical parameter evaluating electron pair accepting
properties of the solvents that strongly correlates with the a parameter (r = 0.93146). The main
advantage is that it can be determined from the spectrum of one compound only. The parameter is
calculated from the absorption maximum of Fe(phen)2(CN)2 (8), in which the solvatochromic shift of
the charge transfer band corresponds to a hydrogen-bond donation ability of this compound (Eq. 9).54'55
AN [cm"1] = -133.8 + 0.00933 vmax(8) (9)
AN can be expressed as a function of the a and ET(30) parameters according to Equation 10.46
AN= -30.0 + 15.3a + 1.0LET(30) (10)
The 7i* and a parameters calculated using the probes 6, 7, and 8. These parameters were
calculated from the absorption maxima of MK (6), MK(OH)2 (7) and Fe(phen)2(CN)2 (8) by Equations
11 and 12 according to Spange and his coworkers.37 The resolution of the absorption bands in the
spectra of MK (6), which is not very well soluble in water, was very poor in samples frozen at 253 K.
6

Instead, MK(OH)2 (7) was used and the values of v max(6) were obtained by a linear correlation of the
values published for MK and MK(OH)2 in 26 solvents43 according to v max(6) = -0.96 + 1.038 v max(7).
a = -7.90 + (0.453 v max(8) x 10"3) + (0.021 v max(6) x 10"3) (11)
7T* = 13.889 + (0.251vmax(8)x 10"3) - (0.32vmax(6) x 10"3) (12)
2. Experimental Section
Chemicals. 2,6-Diphenyl-4-(2,4,6-triphenyl-l-pyridinio)-phenolate (Reichardt's dye £T(30) ; Aldrich;
90%), and 2,6-dichloro-4-(2,4,6-triphenyl-l-pyridino)phenolate (Reichardt's dye£T(33); Fluka; >99%),
4,4'-bis(dimethylamino)benzophenone (Michler's ketone (MK); Aldrich, 98%), 4-(dimethylamino)-4'-
[di(2-hydroxyethyl)-amino]benzophenone (MK(OH)2; kindly provided by Prof. S. Spange), 4-
nitroanisole (Acros organics; >99%), 4-nitrophenol (Lachema Co.; p. a.), 4-nitroaniline (Lachema Co.,
p. a.), iV,iV-dimethyl-4-nitroaniline (Acros organics; >99%), and czs-dicyano-bis(l,10-
phenanthroline)iron(II) (Fe(phen)2(CN)2; Pfaltz & Bauer; >99%) were used without further purification.
Each experiment was performed with a freshly prepared stock solution. Water was purified by the
reverse osmosis process on an Aqua Osmotic 03 and its quality complied with U.S. Pharmacopaial
Standards (USP). The dye aqueous solutions were prepared in volumetric flasks and their concentrations
are shown in the text.
Absorption measurements. The solidified samples containing probe solutions in Plastibrand cuvettes
(transparent at >280 nm) were prepared by freezing either quickly at 77 K (a liquid nitrogen bath) or
slowly at 253 K (ethanol cooling bath). The spectra of liquid aqueous solutions were measured on a
Unicam UV4 spectrometer (Cambridge, UK) against a pure water sample in quartz cells with the optical
path length of 1 cm. The absorption spectra of frozen samples and the reference spectra of pure ice were
measured on a Lambda 19 UV/VIS/NIR spectrophotometer (Perkin-Elmer) using a 60-mm integrating
sphere (the slit width was set to 1 nm and the scan speed to 480 nm min"1 or lower) immediately after
7

removing the cuvettes from the cold environment. Although the sample temperature was not controlled
during the absorption measurements, no changes of the spectra were observed within the time period
necessary for duplicate consecutive experiments. The averaged spectral background of pure ice was
subtracted from each spectrum and the spectra shown are averaged from at least three independent
measurements. The final spectra were smoothed using an adjacent averaging method when necessary.
MATLAB 6.5.1 and Origin 7.0 were utilized as the graphical and statistical software. The step by step
filter program56'57 was applied to determine the number of peaks in the spectra and ?wx-
3. Results and Discussion
The UV-Vis absorption spectra of solvatochromic probes in liquid and frozen aqueous solutions were
measured and the absorption maxima (?Wx) are listed in Table 1. Figures 1-5 then show the spectra of
all five probes (2, 4, 5, 7, and 8), which were used to determine solvatochromic parameters. The spectra
were measured on samples frozen relatively slowly at 253 K or quickly at 77 K, but also on already
frozen samples, which were warmed from 77 to 253 K or, on the contrary, cooled down from 253 to 77
K. The latter experiments were performed in order to find if the spectral changes are reversible in this
temperature range. The probes listed in Table 1 were selected on the basis of their properties, such as a
higher solubility in water, and the solvatochromic parameters were calculated using their absorption
maxima shifts directly or by the correlation to those of a corresponding probe, commonly used for such
a purpose. The concentrations of the dyes were adjusted carefully to obtain signals, which are well
resolved from the ice background. Heterogeneity and lower transparency of the polycrystalline ice
samples decreased the signal-to-noise ratio and a band broadening was attributed to light scattering and
reflection.
Table 1. The absorption maxima found in liquid (293 K) and frozen (253 and 77 K) aqueous solutions containing solvatochromic dyes.
8

solvatochromic concentration ^max (nm) ^max (nm) ?Wx (nm) ?Wx (nm) ?Wx (nm)
probe (mol L"1) 293 Ka 253 K 253 Kb 77 K 77 Kc
2 3.7xl0"6 406 (407)41 464,512 467,511 463, 509 466, 509
4 2.6xl0"6 421 (422)58 348 356 350 355
5 1.74xl0"5 378 (380)33 360 371 387 382
6 1.9xl0"6 379 n.d. n.d. 369 362
7 2.62xl0"5 382 (383)43 373 379 371 369
8 1.13xl0"6
1 a rr^1 1
512 (510)59 463,518, 583
465,515, 573
b
469,516, 572
467,515, 570
and warmed to 253 K (77 K -> 253 K). c The samples frozen at 253 K and warmed to 77 K (253 K -> 77 K).
Figure 1. The absorption spectra of the aqueous solution of 2,6-dichloro-4-(2,4,6-triphenyl-l-pyridino)phenolate (2) at 298, 253, and 77 K.
liquid (298 K) solid (253 K) solid (77 K)
Figure 2. The absorption spectra of the aqueous solution of jV,jV-dimethyl-4-nitroaniline (4) at 298, 253, and 77 K.
9

• ' " < • / \
' * '• / \ ' s ' 1 \ > s
1 \ . / \
. \ • •/ \
> . X / • . \
o o / \ \ </) / \ . \ ro ni ' ' , / - ' / N ' • - \
> / ^ • \ ro / v * • \ 2 / ** . \
/ v \ / ^ ' \
/ liquid (298 K) N x '•. \ / solid (253 K) " •. \
y / solid (77 K) \ " \ \
1 i i i i i i i i i i i i i i
325 350 375 400 425 450 475 X [nm]
Figure 3. The absorption spectra of the aqueous solution of 4-nitroaniline (5) at 298, 253, and 77 K.
> O </> -Q
" y *J Nv «• liquid (298 K) / -' '. \ \ solid (253 K)
- . . \ N solid (77 K)
s ' \ v / ' \ v
/ i \ ' v / ' y i \ "ľ
/ ' \ \ \ / / \ \ y i \ v / i \ \ . * i \ \ i •/ i
f
\ ^ v ^ ^ i \ i N
i S
• i ' i ' i ' i . 1 1 1 1 1 1 1 l"l
320 340 360 380 400 420 440 460 X [nm]
Figure 4. The absorption spectra of the aqueous solution 4,4'-bis(dimethylamino)benzophenone (Michler's ketone) (6) at 298, 253, and 77 K. 253 K —> 77 K means that the samples were frozen at 253 K and cooled down to 77 K.
10

> Q. O </>
-Q
liquid (298 K) solid (253 K -> 77 K) solid (77 K)
340 360 380 400 420 440
X [nm]
Figure 5. The absorption spectra of the aqueous solution of cz's-dicyano-bis(l,10-phenanthroline)iron(II) (Fe(phen)2(CN)2) (8) at 298, 253, and 77 K.
ro
" " > 1 —
550 X [nm]
liquid (298 K) - - solid (253 K)
solid (77 K)
450 500 600 650
ET(33) and ET(30). The £T(30) probe (2,6-diphenyl-4-(2,4,6-triphenyl-l-pyridinio)-phenolate (1))
could not be used in aqueous solutions because it is protonated (pKa (ExpO)) = 8.6435) at very low
concentrations (2.0xl0"6 mol L"1),35 causing that the solvatochromic band disappears. Instead, the
£T(30) parameter was calculated from the £r(33) values. The changes in the absorption spectra of 2,6-
11

dichloro-4-(2,4,6-triphenyl-l-pyridino)phenolate (£T(33) probe; 2) upon freezing (Figure 1) were easily
observed visually: a yellow liquid turned to the red ice sample. In contrast to the spectra obtained at 298
K, those of the samples frozen at 253 or 77 K composed of two absorption bands with ?Wx at 464 and
512 nm (253 K), or at 463 and 511 nm, respectively. This means that at least two different species were
formed by freezing the aqueous solutions and their calculated abundance ratio (Table 2), determined by
Gaussian fitting analysis, is based on the presumption that they have similar absorption properties. Such
species can be formed by conformational or chemical changes caused only by lowering the temperature,
or there are two different kinds of interaction (different bounding sites) of the probe with the
environment at the grain boundary of ice. Broad peaks can, furthermore, represent overlaid absorption
bands of more than two species.
The red shifts of both XmiiX may suggest that hydrogen-bond donation ability (a) and
polarity/polarizability (%*) in the dye environment in the frozen state decreased comparing to liquid
solutions. The ET(33) and consequently ET(30) were calculated by the Eq. 1 and 3, respectively (Table
2). In addition, the dimensionless £T N was derived according to Eq. 4. Lower values of all ET
parameters in frozen solutions could be compared to those of less polar solvents than water. For
example, £T N = 0.68 and 0.52 was measured for 1,3-butandiol35 and 1-dodecanol,35 respectively. This
simple comparison has, however, no meaning when we want to discuss the character of the interactions
at the grain boundary (see later the discussion). The freezing conditions had practically no effect on the
Ej parameter; however, it affected the abundance of the resolved species. The fast freezing moderately
enhanced population of a more polar species (£TN ~ 0.68) (Table 2).
Table 2. The calculated solvatochromic parameters for liquid (298 K) and frozen samples (253 and 77 K).
12

conditions a ?W2 (nm)b £T(33)C £T(30)d T7 N e
.Ľ/T f
Tí* a g ß h AN1
liquid (298 K) 406 70.4
70.241
61.5
63.135
0.95
(D3 5
1.15
(1.09)60
1.13
(1.17)60
0.15
(0.18)60
49.4
54.859
253 K 464 (85%)
512(15%)
61.6
55.8
52.9
47.2
0.68
0.51
-0.12 1.48
1.12
1.45 46.1
34.8
77 K -^253 K 467 (95%)
511(5%)
61.2
56.0
52.5
47.3
0.67
0.51
0.05 1.34
1.01
1.51 43.5
33.2
77 K 463 (95%)
509 (5%)
61.8
56.2
53.0
47.5
0.69
0.52
-0.07 1.46
1.11
2.09 45.9
35.0
253 K ^ 7 7 K 466 (89%)
509(11%)
61.4
56.2
52.6
47.5
0.68
0.52
0.03 1.36
1.03
1.82 44.0
33.8
a 77 K —> 253 K: the samples frozen at 77 K and warmed to 253 K; 253 K —» 77 K: the samples frozen at 253 K and warmed to 77 K. The parameter values for liquid solutions in the parentheses are from the literature. b ?Wx corresponding to the samples containing 2. The values in the parentheses are the abundances of both resolved species (bands) in the spectrum, determined by the Gaussian curve fitting. The parameters were calculated according to: c Eq. 1; d Eq. 3; e Eq. 4; f Eq. 6; g Eq. 7; h Eq. 8; ' Eq. 10. Two values for the a parameter were obtained from two different ?wx values of £T(33) .
The Ti* parameter. We tried to determine the TÍ* parameter by measuring the absorption spectrum of
4-nitroanisole (3)42 but the corresponding solvatochromic band disappeared after the solution was
frozen. As a result, an alternative probe, #, iV-dimethyl-4-nitroaniline (4), was used for its determination
using a linear correlation (Eq. 5) and %* was obtained using Eq. 6. The absorption band (km!lx) of the
frozen solutions was shifted hypsochromically by approximately 70 nm, comparing to liquid samples
(Table 1), which provides the %* values close to zero in all cases (Table 2). Thus, while the
n* parameter for liquid samples (1.15) is in a good agreement with the tabulated value of 1.09,60 the
extremely low values found in ice can be compared, for example, to those obtained in cyclohexane,60
which exhibits no dipole-dipole interactions toward this probe. It is apparent from the table that
temperature had no effect on the %* values.
13

The a parameter. The a parameter was calculated from the preceding %* and ET(30) values by Eq.
7. It was not surprising that the values were found very high for ice samples (the corresponding K*
parameters are negligible) compared to those of liquid solutions (Table 2). As a result, this parameter
represents a principal interaction measured by Ej(33), not affected by temperature again. The a = 1.4
value would correspond to the strong hydrogen-bond donating solvents such as trifluoroethanol (a =
1.51).60
The ß parameter. This parameter was calculated from the absorption maxima of iV,iV-dimethyl-4-
nitroaniline (4) and 4-nitroaniline (5) (Figures 2 and 3) according to Eq. 8.53 4-Nitroaniline (5) is a
homomorphic molecule to iV,iV-dimethyl-4-nitroaniline (4), being able to donate a hydrogen to HBA
solvents. The calculated values were found to be significantly higher in ice than those in liquid
solutions. Being somewhat different in samples frozen quickly or slowly, the average ß value of 1.7 is
higher than that of any known solvent (the highest value is 1.43 for 1,2-diaminoethane35).
The AN, a and 7T* parameters. Now we wish to apply an independent procedure to evaluate AN,
a and 7T* parameters, using 4,4'-bis(dimethylamino)benzophenone (Michler's ketone) (6), 4-
(dimethylamino)-4'-[di(2-hydroxyethyl)-amino]benzophenone dyes (MK(OH)2) (7), and cz's-dicyano-
bis(l,10-phenanthroline)iron(II) (Fe(phen)2(CN)2) (8). This method was introduced by Spange et al. to
estimate interactions of the probes with solid surfaces.37 While the acceptor number (AN) was
determined directly according to Eq. 9, a linear correlation of ^max (7) with those of 6 (see above)
enabled us to calculate the title parameters using Eq. 11 and 12 (Table 3). In addition, the AN values
were calculated from ET(30) and a (Eq. 10; Table 2) to compare the results. Fe(phen)2(CN)2 in the
liquid solution gives a broad asymmetric absorption band with Xm!lx = 512 nm (Figure 5). Upon freezing,
the band was red-shifted and three distinct maxima approximately at 466, 517 and 580 nm appeared,
relatively independently on temperature, but a decrease in the intensity of the most red-shifted band
14

(580 nm) was observed for the samples frozen at 253 K, compared to those frozen at 77 K. If they
represent three species, their abundances are shown in Table 3, based again on the presumption that they
have similar absorption properties. Since AN values characterize the electron pair acceptor ability of the
medium, we could deduce that there are either three characteristic sites in the vicinity of the probe or
that temperature and constraining environment affect its conformation. The existence of three species
indicates that Fe(phen)2(CN)2 interacts differently at the grain boundary than 2 and 4. It is interesting
that AN varied from very high values (65 - 68; AN = 83.6 and 52.3 were found for formic and acetic
acid, respectively),46 medium value (-47; comparable to that of water), and small values (26 - 29; AN =
23 A was determined for chloroform).46 The highest value (AN = 66) determined by Fe(phen)2(CN)2
(Table 3) was not reached by the AN calculation based on the a and ET(30) parameters (Table 2). This
means that specific interactions of the probes must be considered.
The absorption bands of MK as well as MK(OH)2 shifts hypsochromically upon freezing comparing
to water. The absorption spectra of MK (6) were not well resolved at 253 K, perhaps because of its low
solubility, and the absorption maximum could not be determined (Figure 4). In contrast, MK(OH)2 (7)
spectra provided ?Wx at both 77 K and 253 K. No significant differences were found when the samples
were frozen slowly or quickly. The parameters calculated from the MK and MK(OH)2 were essentially
the same at 77 K, however, Table 3 shows the values obtained from the latter probe only. The K* and a
values in water, measured for this work, do not correspond to those measured by independent
procedures. To our knowledge, there is no correlation among these values available in the literature to
this date. If those data are only relative, the same conclusion as above can be reached. There are three
types of interactions, from which one is comparable and two are extreme (more or less dominant) than
that observed in water. Since the calculation is based on the data measured with the probe 8, such a
result was expected.
Table 3. The calculated solvatochromic parameters for liquid (298 K) and frozen samples (253 and 77 K).
15

conditions a Amax8 (nm)b ANC Amax7 (nm)d 7 T * e a f
liquid (298 K) 512 48.4 382 0.60 1.50
253 K
463 (41%)
518(52%)
583 (7%)
67.7
46.3
26.2
373
-0.13
0.45
0.99
2.45
1.41
0.43
77 K -^253 K
465 (35%)
515(49%)
573 (16%)
66.8
47.4
29.0
379
0.04
0.56
1.06
2.40
1.45
0.56
77 K
469 (35%)
516(40%)
572 (25%)
65.1
47.0
29.3
371
-0.10
0.38
0.86
2.33
1.45
0.59
253 K ^ 7 7 K
467 (34%)
518(51%)
583 (15%)
66.0
46.3
26.2
369
-0.18
0.35
0.89
2.37
1.42
0.44
a 77 K —> 253 K: the samples frozen at 77 K and warmed to 253 K; 253 K —> 77 K: the samples frozen at 253 K and warmed to 77 K. The parameter values for liquid solutions in the parentheses are from the literature. b Ámax corresponding to the samples containing 8. The values in the parentheses are the abundances of both resolved species (bands) in the spectrum, determined by by the Gaussian curve fitting. The parameters were calculated according to: c Eq. 9; e Eq. 12; f Eq. 11. d Ámax corresponding to the samples containing 7.
Table 4. The solvatochromic parameters for a CH2C12 slurry (the mixture of crystals with the solvent) and in a CH2CI2 solutions
conditions £T(30) T7 N 7T* a ß
CH2C12 slurry
CH2C12
43.7
40.735
0.400
0.30935
0.64
0.8246
0.34
0.1346
1.04
0.1046
The Eq. 1, 4, 6, 7, and 8 were applied.
In order to estimate the parameters of very concentrated solutions (aggregates) of the solvatochromic
probes, the maxima in broad absorption spectra of the dyes (1, 4, 5) in a dichloromethane slurry were
used.
16

The solvatochromic probes at the grain boundaries of ice. Many different solvatochromic dyes
were utilized to estimate polarity of solid surfaces. For example, ET(30) was used to probe the surface of
X - type Alumina.39 The values in the interval of 1.09 to 1.16, depending on the activation temperature
and content of water, were obtained. In addition, the silica surfaces were investigated by nine
solvatochromic dyes.36 It was found that the dipolarity/polarizability (%*) is the most important
contributor to the polar properties of the surface, followed by hydrogen bond donation (a). The K* value
on the silica surfaces was found to be greater than the largest values found for ordinary solvents. There
was a considerable dispersion of the K* and ß values of individual indicators, which was interpreted by
the existence of more specific interactions. An acidic influence of the silica surface that may alter the
solvatochromic parameters, was later re-evaluated by Spange et al..37 They developed an alternative
way of determining solvatochromic parameters on the solid surfaces.37 It was found that 35 silicas and
alumina were quite polar with ETN = 0.82 - 1.01, moderately strong dipolar/polarizable (K* = 0.38 -
1.04), and fairly strong hydrogen-bond donors (a = 1.00 - 1.99).37 The a value for alkyl modified
silicas was found to decrease linearly with increasing the surface coverage since monolayer
functionalization is accomplished.61 The same method was additionally applied on a-amino acid
crystals 40, and dimethylsiloxane-grafted silica particles.62 Eisenthal et al. applied the second harmonic
spectroscopy to probe the polarity of air/water, water/1,2-dichloroethane, water/chlorbenzene, and
water/«-heptane interfaces using N,N-diethyl-4-nitroaniline and Expo).63 The air/water interface was
found to be non polar with Ej* = 0.01 and 7t* = -0.11. The authors drew conclusion that the polarity of
the interface between two fluids is the arithmetic average of the polarities of the constituent bulk phases.
The polarity of frozen organic solvent glasses was found to be substantially larger than that of liquid
solvents at room temperature for 2-methyltetrahydrofuran and toluene using Coumarin 153 as a probe
molecule,64 and for 2-methyltetrahydrofuran and methylcyklohexane using the probe all-trans-retinal.65
An increase in polarity upon freezing was also observed for ethanol, 2-methyltetrahydrofurane, toluene
and methylcyklohexane using the Reichardt's dyes as the probes.32 It was concluded that the change in
polarity, accompanying the solidification, is more pronounced for nonpolar solvents, because the 17

contraction of volume (the molecules are closer to each other) and the reorganization of the solvents
molecules.
In this work, the solvatochromic parameters were used to evaluate interactions which can occur
among various probes and water molecules at the grain boundaries. Table 2 demonstrates the calculated
values for differently frozen ice samples. The empirical solvent polarity functions, ET(30) or £TN , were
found to be generally lower than those of liquid water, and a detailed analysis revealed that only the a
parameter, evaluating the environment molecules as hydrogen donors, contributes. Practically no
dipole-dipole interaction (%*) was found. The acceptor number (AN), calculated from the ET(30) and a
parameters only supported this finding. In addition, the ß parameter obtained for frozen samples was
exceptionally high. Three AN vales were determined by Eq. 9 from each spectrum of the probe (8)
frozen in the aqueous liquid solutions because three absorption peaks emerged (Figure 5, Table 3). In
addition, previously calculated ET(30) and a parameters allowed us to obtain AN independently (Eq. 10;
Table 2); two absorption peaks in each spectrum meant 2 different AN values in this case. These two
methods allow us to compare different types of interactions of the probes. For the frozen samples, the
middle values obtained by 8 correspond well to the higher values obtained by 2 and 4. Discrepancies
(lower AN values in the case of 8) can be caused by an offset in the LSER used or this change
represents a different solvation type of the probes with the environment. The values of K* and a
calculated by the Eq. 11 and 12 (Table 3) differ substantially from these in Table 2. The Eq. 11 and 12
were derived for other solid surfaces and therefore it is possible that some correlations are necessary. It
is obvious even for the K* and a values in liquid water, which differ from those shown in Table 2.
The organic as well as inorganic compounds are excluded from the bulk ice to the grain boundaries,
causing a substantial increase of the local concentration of solutes.1'30 Considering the concentrations
used in the present work (10"5 - 10"6 mol L"1), the two kinds of interactions must be expected: (1)
interactions of the probe molecules with the water molecules; (2) interaction between the probe
molecules themselves.
18

Thus, to estimate the latter interaction, the solvatochromic parameters based on the absorption spectra
of probe molecules in the solid state was necessary; however, they are, to our knowledge, unknown.
Instead, we measured the absorption spectra of the crystals of some probe molecules (1, 4, 5) in the
dichloromethane slurry. The presence of medium-polar dichloromethane influences the spectra, but the
intermolecular interactions were apparent when the probe concentrations increased (Table 4). The
values of ETN and 7t* slightly increased and decreased, respectively, whereas a and ß increased
substantially. This behavior can be explained on the molecular level; while dipolar interactions of probe
molecule with solvent and with itself do not differ much, the interactions, which are responsible for the
donation and acceptance of electron pairs, became stronger upon the dye aggregation. The shifts of
a, ß and K* parameters upon aggregation in the dichloromethane slurry had the same trend (but a
significantly smaller magnitude) than the changes observed upon freezing the aqueous solutions. The
results indicate that the self-aggregated mixture with the remains of solvent is more polar than liquid
dichloromethane but less polar than water.
The change of the solvatochromic parameters in the frozen aqueous samples can be explained by the
pronounced inter-probe dipolar interactions as well as interactions between the probes and water
molecules at the grain boundaries. The spectra of 1 in the dichloromethane slurry (not shown) did not
reveal any structure, in contrast to the two peaks in the frozen aqueous solution. Therefore, it can be
deduced that the interactions between the water molecules at the grain boundaries and the probe
molecules are responsible for the appearance of two peaks in the case of compound 1 and three peaks in
the case of compound 8. The presence of three types of water ineractions66 and two energetically
distinct bounding sites for HCl67'68 on the ice surface were reported in the temperatures range of 50 to
140 K. These local surface patterns most probably interact with the probe molecules and influence its
absorption spectrum. The probe molecules interact with more than one bounding site on the ice surface,
causing the spectral broadening.
Temperature of the samples did not have any significant effect on the change of solvatochromic
parameters. The minor shifts of the absorption band maxima can be caused by the drift in the
19

spectrometer or a decreased S/N ratio. The absence of major change of solvatochromic parameters upon
fast and slow freezing suggests strong interactions of the probe molecules in the beginning of the
freezing process. From our recent study on the methylene blue aggregation in ice,27 we found that the
concentration of organic compounds increases by the three orders of magnitude upon fast freezing (77
K) and by at least six orders of magnitude upon slow freezing (243 K). The same behavior is expected
for the solvatochromic probe molecules. In the case that the inter-probe interactions and the probe -
water interactions would influence the absorption spectra of the probe differently, which is highly
probable, we observe the same probe - water interactions in both quickly and slowly frozen samples. It
means that even at high concentrations (1 -10 mol L"1) that can be expected at the grain boundaries,69
the interactions of probe molecules with water are present.
The minor temperature effects on the relative abundance of two peaks for 1 and three peaks in the
case of 8 were found. The observation is contradictory for these two probes: for 1 the most red shifted
peak (at 510 nm) intensified with higher temperature whereas the most red shifted peak (at 580 nm) of 8
lowered its intensity. This means that specific interactions of the probes must be considered. The effect
of decreasing Ej* cannot be attributed to temperature, which should act in the opposite way - £T N
raises with decreasing temperature.70 This behavior was found to be a general feature for DMSO,
acetonitrile, nitromethane, r-butanol, 2-propanol, methanol, and water in the temperature range of 273 to
350 K.
According to our measurements, electron-pair donating and/or hydrogen-bond accepting
interactions are the most prevailing at the grain boundaries of ice but the hydrogen-bond donating effect
was significant too. In contrast, the polarity/dipolarity interactions were unimportant. These properties
make the surface of ice a unique reaction medium. It differs from the most solid supports (such as
silicas, aluminas, TÍO2) ' ' because of a much lower 7t* value. This low 7t* value corresponds to that
measured on the air/water interface, for example.63 The effects observed at the grain boundaries are
quite opposite to those in the frozen organic solvents. 32 In such cases, the solvent molecules are more
20
organized around the probe, which increases the polarity. An opposite trend is expected in ice, which is
known to contract upon freezing.
From the interpretation of solvatochromic parameters in the ice measured, we can envisage the grain
boundary containing the probes as a complex mixture of more or less organized organic molecules that
interact with water molecules in the vicinity.
Acknowledgments. The project was supported by the Czech Ministry of Education, Youth and Sport
(MSM 0021622412) and by the Grant Agency of the Czech Republic (205/05/0819). The authors
express their thanks to Jaromir Jirkovsky for his help with spectroscopy measurements. This paper
contributes to the Air-Ice Chemical Interactions (AICI) task of IGAC and SOLAS. MK(OH)2 was
obtained from prof. Stefan Spange.
References.
(1) Petrenko, V. F.; Whitworth, R. W. Physics of ice; Oxford University Press: Oxford, 1999.
(2) Barone, S. B.; Zondlo, M. A.; Tolbert, M. A. Journal of Physical Chemistry A 1999, J03, 9717.
(3) Berland, B. S.; Tolbert, M. A.; George, S. M. Journal of Physical Chemistry A 1997, J0J, 9954.
(4) Girardet, C; Toubin, C. Surface Science Reports 2001, 44, 163. (5) Hoff, J. T.; Wania, F.; Mackay, D.; Gillham, R. Environmental Science & Technology
1995, 29, 1982. (6) Houdier, S.; Perrier, S.; Domine, F.; Cabanes, A.; Legagneux, L.; Grannas, A. M.;
Guimbaud, C; Shepson, P. B.; Boudries, H.; Bottenheim, J. W. Atmospheric Environment 2002, 36, 2609.
(7) Kroes, G. J.; Clary, D. C. Geophysical Research Letters 1992, 79, 1355. (8) Perrier, S.; Houdier, S.; Domine, F.; Cabanes, A.; Legagneux, L.; Sumner, A. L.;
Shepson, P. B. Atmospheric Environment 2002, 36, 2695.
21

(9) Guimbaud, C; Grannas, A. M.; Shepson, P. B.; Fuentes, J. D.; Boudries, H.; Bottenheim, J. W.; Domine, F.; Houdier, S.; Perrier, S.; Biesenthal, T. B.; Splawn, B. G. Atmospheric Environment 2002, 36,2743.
(10) Klan, P.; Holoubek, I. Chemosphere 2002, 46, 1201. (11) Hoffmann, M. R. Possible chemical transformations in snow and ice induced by solar
(UV photons) and cosmic irradiation (muons). In NATO ASI Series I, 1996; Vol. 43; pp 353. (12) Klan, P.; Klanová, J.; Holoubek, L; Cupr, P. Geophysical Research Letters 2003, 30, art.
no. 1313. (13) Klanová, J.; Klan, P.; Nosek, J.; Holoubek, I. Environmental Science & Technology
2003, 37, 1568. (14) Klan, P.; Del Favero, D.; Ansorgova, A.; Klanová, J.; Holoubek, I. Environmental
Science and Pollution Research 2001, 8, 195. (15) Grannas, A. M.; Shepson, P. B.; Filley, T. R. GlobalBiogeochemical Cycles 2004, 18. (16) Sumner, A. L.; Shepson, P. B. Nature 1999, 398, 230. (17) Zhou, X. L.; Beine, H. J.; Honrath, R. E.; Fuentes, J. D.; Simpson, W.; Shepson, P. B.;
Bottenheim, J. W. Geophysical Research Letters 2001, 28, 4087. (18) Dubowski, Y.; Hoffmann, M. R. Geophysical Research Letters 2000, 27, 3321. (19) Roth, C. M.; Goss, K. U.; Schwarzenbach, R. P. Environmental Science & Technology
2004, 38, 4078. (20) Devlin, J. P.; Buch, V. Journal of Physical Chemistry 1995, 99, 16534. (21) Devlin, J. P. Journal of Physical Chemistry 1992, 96, 6185. (22) Schaff, J. E.; Roberts, J. T. Langmuir 1999, 15, 7232. (23) Schaff, J. E.; Roberts, J. T. Langmuir 1998, 14, 1478. (24) Borodin, A.; Hofft, O.; Kahnert, U.; Kempter, V.; Krischok, S.; Abou-Helal, M. O.
Journal of Chemical Physics 2004, 120, 5407. (25) Abbatt, J. P. D. Chemical Reviews 2003, 103, 4783. (26) Cho, H.; Shepson, P. B.; Barrie, L. A.; Cowin, J. P.; Zaveri, R. Journal of Physical
Chemistry B 2002, 106, 11226. (27) Heger, D.; Jirkovsky, J.; Klan, P. Journal of Physical Chemistry A 2005, 109, 6702. (28) Finnegan, W. G.; Pitter, R. L. Journal of Colloid and Interface Science 1997, 189, 322. (29) Cohen, S. R.; Weissbuch, L; PopovitzBiro, R.; Majewski, J.; Mauder, H. P.; Lavi, R.;
Leiserowitz, L.; Lahav, M. Israel Journal of Chemistry 1996, 36, 97. (30) Takenaka, N.; Ueda, A.; Daimon, T.; Bandow, H.; Dohmaru, T.; Maeda, Y. Journal of
Physical Chemistry 1996, 100, 13874. (31) Dash, J. G.; Fu, H. Y.; Wettlaufer, J. S. Reports on Progress in Physics 1995, 58, 115. (32) Bublitz, G. U.; Boxer, S. G. Journal of the American Chemical Society 1998, 120, 3988. (33) Kamlet, M. J.; Taft, R. W. Journal of the American Chemical Society 1976, 98, 311. (34) Antonious, M. S.; Tada, E. B.; El Seoud, O. A. Journal of Physical Organic Chemistry
2002,75,403. (3 5) Reichardt, C. Chemical Reviews 1994, 94, 2319. (36) Lindley, S. M.; Flowers, G. C; Leffler, J. E. Journal of Organic Chemistry 1985, 50,
607. (37) Spange, S.; Vilsmeier, E.; Zimmermann, Y. Journal of Physical Chemistry B 2000, 104,
6417. (38) Zhang, X. Y.; Cunningham, M. M.; Walker, R. A. Journal of Physical Chemistry B
2003,707,3183. (39) Michels, J. J.; Dorsey, J. G. Langmuir 1990, 6, 414. (40) Spange, S.; Schmidt, C; Kricheldorf, H. R. Langmuir 2001, 17, 856. (41) Tada, E. B.; Novaki, L. P.; El Seoud, O. A. Journal of Physical Organic Chemistry 2000,
13, 679. (42) Laurence, C; Nicolet, P.; Dalati, M. T.; Abboud, J. L. M.; Notario, R. Journal of
Physical Chemistry 1994, 98, 5807. 22

(43) El-Sayed, M.; Muller, H.; Rheinwald, G.; Lang, H.; Spange, S. Journal of Physical Organic Chemistry 2001, 14, 247.
(44) Spange, S.; Keutel, D. Liebigs Annalen der Chemie 1992, 423. (45) Katritzky, A. R.; Fara, D. C; Yang, H. F.; Tamm, K.; Tamm, T.; Karelson, M. Chemical
Reviews 2004, 104, 175. (46) Marcus, Y. Chemical Society Reviews 1993, 22, 409. (47) Marcus, Y. Journal of Solution Chemistry 1991, 20, 929. (48) Reichardt, C. Pure Appl. Chem. 2004, 76, 1903. (49) Reichardt, C; Che, D. Q.; Heckenkemper, G.; Schafer, G. European Journal of Organic
Chemistry 2001, 2343. (50) Reichardt, C; Eschner, M.; Schafer, G. Journal of Physical Organic Chemistry 2001, 14,
131. (51) Nicolet, P.; Laurence, C. Journal of the Chemical Society-Perkin Transactions 2 1986,
1071. (52) Gritzner, G. Journal of Molecular Liquids 1997, 73-4, 487. (53) Laurence, C; Nicolet, P.; Heibert, M. Journal of the Chemical Society-Perkin
Transactions 2 1986, 1081. (54) Mayer, Y. Pure Appl. Chem. 1975, 41, 291. (55) Mayer, U. Pure Appl. Chem. 1979, 51, 1697. (56) Petrov, V.; Antonov, L.; Ehara, H.; Harada, N. Comp. Chem. 2000, 24, 561. (57) Antonov, L. Trac-Trend. Anal. Chem. 1997, 16, 536. (58) Morton, R. A.; A., M. J Chem. Soc. 1934, 907, 901. (59) Soukup, R. W.; Schmid, R. Journal of Chemical Education 1985, 62, 459. (60) Kamlet, M. J.; Abboud, J. L. M.; Abraham, M. H.; Taft, R. W. J Org. Chem. 1983,
2877. (61) Spange, S.; Simon, F.; Heublein, G.; Jacobasch, H.-J.; Borner, M. CoolidPolym. Sei.
1991, 173 (62) Prause, S.; Spange, S.; Barthel, H. Macromole cular Chemistry and Physics 2005, 206,
364. (63) Wang, H. F.; Borguet, E.; Eisenthal, K. B. Journal of Physical Chemistry B 1998, 102,
4927. (64) Chowdhury, A.; Locknar, S. A.; Premvardhan, L. L.; Peteanu, L. A. Journal of Physical
Chemistry A 1999, 103, 9614. (65) Locknar, S. A.; Chowdhury, A.; Peteanu, L. A. Journal of Physical Chemistry B 2000,
104, 5816. (66) Rowland, B.; Kadagathur, N. S.; Devlin, J. P.; Buch, V.; Feldman, T.; Wojcik, M. J.
Journal of Chemical Physics 1995, 102, 8328. (67) Buch, V.; Sadlej, J.; Aytemiz-Uras, N.; Devlin, J. P. Journal of Physical Chemistry A
2002, 106, 9374. (68) Park, S. C; Kang, H. Journal of Physical Chemistry B 2005, 109, 5124. (69) Mulvaney, R.; Wolff, E. W.; Oates, K. Nature 1988, 331, 247. (70) Bosch, E.; Roses, M.; Herodes, K.; Koppel, L; Leito, L; Taal, V. Journal of Physical
Organic Chemistry 1996, 9, 403.
23

Appendix 4

Comparison of the effects of UV, H202/UV and y-irradiation processes on frozen and liquid water solutions of monochlorophenols f
Jana Klánová," Petr Klán,* Dominik Heger and Ivan Holoubek"
a RECETOX-TOCOEN, Masaryk University, Kamenice 12613, 62500 Brno, Czech Republic. E-mail: [email protected], [email protected]
b Department of Organic Chemistry, Faculty of Science, Masaryk University, Kotlářská 2, 61137Brno, Czech Republic. E-mail: [email protected], [email protected]
Received 28th March 2003, Accepted 30th May 2003 First published as an Advance Article on the web 23rd June 2003
The effects of UV irradiation, both in the presence and absence of hydrogen peroxide, as well as of gamma irradiation on 2- and 4-chlorophenol in a solid water ice matrix have been studied and compared to those effects known to occur in aqueous solutions. While UV photolysis (>280 nm) of monochlorophenols leads to efficient coupling reactions in ice and photosolvolysis products in liquid water; hydroxylation to chlorobenzenediols is the main pathway in the presence of H 20 2 in both phases. The results show that the solute molecules accumulate in a layer surrounding the ice crystal walls during the freezing process, where they then react. The radiation chemistry of chlorophenol ice samples involves preferential coupling reactions at —78 °C rather than reactions with the OH radicals produced by cleavage of water molecules under the conditions employed (1 kGy fT1). The apparent similarities between the chemistry in the UV/H202-treated liquid and solid, and y-irradiated liquid and solid samples are discussed. It is suggested that the reactions of OH radicals within polycrystalline ice or snow are important natural processes that should be considered in environmental, ice-core or astrophysical research.
Introduction Water ice' is a poorly understood reaction medium. It is not completely transparent from 200 to 700 nm, and photoproducts identified within it include molecules of oxygen and hydrogen peroxide, atomic hydrogen, and hydroxyl radicals.2-8 Radiolysis (such as y-irradiation) of ice is known to produce relatively high concentrations of reactive species.9~" The first attempts to carry out photochemical reactions in an ice matrix (e.g. photo-dimerisation reactions of thymine or uracil derivatives) were conducted in order to understand the photodeactivation mechanism of DNA.12'13 In addition, studies of photo transformations occurring in ice under astrophysical conditions suggested a possible interstellar origin for some organic compounds found on Earth. 14~16 In the past decade, research results have provided a sufficient evidence that organic as well as inorganic compounds can undergo efficient solar light-induced chemical transformations in ice and snowpack.17-19 While laboratory experiments have shown that environmentally important organic compounds (such as chlorobenzenes,20,21 nitro-phenols,22 or chlorophenols23) are degradable in ice, it has also been proposed that some compounds may originate from matter dissolved in snow due to solar irradiation at polar sunrise,19 such as nitrogen oxides,24 bromine,25 formaldehyde,26'27
acetaldehyde or acetone,28,29 halogenated alkanes,30 or carb-oxylic acids.31 It was demonstrated by us that natural water ice or snow may be natural reaction media for sunlight-induced photochemical transformations of organic compounds.18 Our field experiment performed in Ny-Alesund, Spitsbergen Island (Svalbard, Norway) showed that organic pollutants may undergo very efficient photochemical changes, producing secondary pollutants.32 Some of them are completely different from those obtained in liquid solutions or the gas phase, and might pose a high environmental risk when they enter the environment.
f Dedicated to Professor Peter J. Wagner on the occasion of his 65th birthday.
Two exemplars of the chlorophenol family, 2- and 4-chlorophenol, belong to the most prevalent chloro-organic compounds in the environment because they are commonly used in the paper, herbicide, and pesticide industries. They have been identified in aquatic as well as soil environments. 33~35
Since the beginning of the 1970s, many research groups have focussed on the photochemical behaviour of chlorophenols, as well as on the development of a variety of destruction techniques.33'36'37 We have recently reported that the major photo-transformations of 2- and 4-chlorophenol in an ice matrix are based on coupling reactions within the ice cavities in the concentration range 10~2-10~7 mol T1.23 No photosolvolysis products, i.e. products from the intermolecular reactions between organic and water molecules, were observed at temperatures below —10 °C. It was also suggested that photosolvolysis can occur in a liquid or quasi-liquid layer above — 5 °C which covers the ice crystal surfaces and is composed of organic molecules in a partially melted aqueous solution.
In this work, we report a multi-disciplinary study of radiation effects on liquid and solid water solutions of 2- and 4-chlorophenol subjected to irradiation by UV light and by 60Co y-rays. The chemical changes are then compared to those occurring in the same samples containing hydrogen peroxide as a source of hydroxyl radicals.
Experimental
Instrumentation
Hewlett Packard HP 6890 gas chromatographs equipped with either a HP 5972 mass-selective detector or an FID detector were used for identification and quantification of the photo-products. A Hewlett Packard HP 1050 modular liquid Chromatograph equipped with a diode array photometric detector was used to obtain the LC spectra. UV spectra were obtained on a Shimadzu UV-1601 instrument with matched 1.0 cm quartz cells. Low temperature experiments were carried out in an MLW MK70 cryostat. The polycrystalline nature of
1023 Photochem. Photobiol. Set, 2003, 2, 1023-1031 This journal is © The Royal Society of Chemistry and Owner Societies 2003
DOI: 10.1039/b303483f

ice samples was checked using a Zeiss Jenapol polarising microscope.
Chemicals
2-Chlorophenol (99+%, Lachema Co.), 4-chlorophenol (99+%, Fluka), and hexadecane (99+%, Schuchardt) were used as received. Water was purified with Osmonics 2 and then Millipore Simplicity 185 apparatus. The following chemicals were purchased as the GC standards: pyrocatechol, hydro-quinone, benzoquinone (Lachema), floroglucinol, 1,2,4-benzenetriol, chlorohydroquinone, biphenyl-2,2'-diol, biphenyl-4,4'-diol, cyclopentanecarboxylic acid (Aldrich). Biphenyl-2,4'-diol, 3'-chlorobiphenyl-2,4'-diol, 3-chlorobiphenyl-2,2'-diol, and dibenzo[l,4]dioxin were synthesised according to our previous work.23
Sample preparation and irradiation procedures
Aqueous chlorophenol solutions were prepared by dilution of the stock solutions (the solubilities of 2-chlorophenol and 4-chlorophenol in water are -20 and -27 gl" 1 , respectively). Oxygen was removed from the samples by sonication for 15 min, where necessary. Aqueous solutions (10 ml) in 13 x 100 mm quartz tubes, sealed with septa, were solidified in the cryostat bath at - 2 0 °C. The homogeneity of frozen samples was tested randomly23 and was found to be acceptable in all cases. The polycrystalline nature of the ice was confirmed in randomly selected samples using a polarising microscope, however, the average crystal size was not evaluated. The samples, placed into a merry-go-round apparatus, were irradiated using a 125 W medium pressure mercury lamp (Teslamp Co., Praha, Czech Republic) in a cryostat box filled with ethanol, which was used as a cooling medium at the temperature of interest. Solutions were extracted with a dichloromethane solution (2 ml) of hexadecane (used as an internal standard) or used directly for the HPLC analyses. The methods for extraction with dichloro-methane (from both acidified and neutral aqueous solutions) were optimised in order to employ them for the quantitative measurements. Experiments at low temperature (-78 °C) were carried out in an isolated reactor, equipped with a double quartz window, which was filled with a mixture of methanol and dry ice. The samples in the cooling mixture were irradiated with an external UV source (a 200 W high pressure mercury lamp).
Irradiation at an isolated wavelength
The experiments were carried out on an optical bench consisting of a 200 W high pressure Hg lamp, an Oriel CornerStone 130 1/8 m monochromator with a 200-1600 nm grating set to a given wavelength (±5 nm), and a 1 cm quartz cell containing the sample solution (degassed by bubbling with argon). The light intensity was monitored with an Si photodiode detector (UV enhanced) and an Oriel OPM multifunction optical power meter controlled by TRACQ32 software.
Radiation chemistry experiments
Steady-state y-irradiation was carried out using a 60Co source (Bioster a.s., Veverska Bity ska, Czech Republic) with a dose rate of -1 kGy h"1. Degassed samples were irradiated in an isolated box containing dry ice (-78 °C) or at 20 °C.
Sample analysis
For GC-MS analyses, dichloromethane extracts were analysed on a GC-MS instrument equipped with a J&W Scientific DB-5MS fused silica column [60 m x 0.25 mm, with a 0.25 urn film of stationary phase, (5% phenyl-95% methyl)polysiloxane]. 1 ul of sample was introduced using the splitless technique with the temperature program 80 °C for 1 min, then 15 °C min"1 to
180 °C, 5 °C min"1 to 310 °C, and finally, 20 min at 310 °C. Injector and transfer line temperatures were kept at 280° C. The mass spectra were collected in the scan range mlz 50-550 for identification purposes. Measured spectra were compared with those in the Wiley 275 mass spectral library and the spectra of the standards. The actual compound concentrations were calculated using an internal standard method.
For GC-FID analyses, dichloromethane extracts were analysed on a GC instrument equipped with an HP-5 fused silica column (30 m x 0.32 mm, with a 0.25 urn film of stationary phase). The temperature program employed was 80 °C for 2 min, then 10 °C min"1 to 300 °C, and finally, 10 min at 300 °C. Injector and transfer line temperatures were kept at 220° C. For HPLC analyses, the thawed samples were sonicated for 5 min before any measurement, in order to guarantee uniform solutions. Special care was taken to verify that sonication did not cause any chemical change. A mobile phase of water-acetonitrile (95 : 5 w/w) of pH 2.5, acidified with H3P04, with a flow rate of 0.2 ml min"1 (30 min. gradient to 100% acetonitrile and then 100% acetonitrile for 10 min.) and a Polaris 3u C18-A column (150 x 2.0 mm) were used. The concentrations of the compounds analysed were calibrated using authentic samples.
Results In this work, liquid or frozen aqueous solutions of 2-chlorophenol (1) and 4-chlorophenol (2) in quartz or Pyrex vessels were irradiated with UV light or y-radiation. All the products from the chemical reactions were identified and the changes in their relative concentrations monitored as a function of the sample phase, temperature, wavelength, and conversion of the starting material. A series of samples containing hydrogen peroxide were UV-photolysed under the same conditions.
1 2
Photoproduct identification
All photoproducts were identified by HPLC, GC, and GC-MS techniques by comparison with authentic compounds and an MS spectral library. Some of the photoproducts were isolated from irradiated samples by column chromatography for analytical purposes. The structures of all the products identified [chlorobenzenediols (3-5), pyrocatechol (6), hydroquinone (7), phenol (8), chlorobiphenyldiols (9-11), and dichloro-biphenyldiols (12)] are shown below. Authentic analytical standards of 3-8 were purchased, compounds 9-11 were synthesised,23 and photosolvolysis products obtained by irradiation of liquid samples were analysed according to our previous work.23 Trace dichlorobiphenyldiol isomers were identified by mass spectrometry.
UV photolysis
Neutral aqueous solutions of chlorophenols absorb significantly in the region of 250-290 nm, with absorption maxima at 272 (s = 1920) and 278 nm (s = 1650 M"1 cm"1) for 2- and 4-chlorophenol, respectively38'39 In this work, liquid or solid samples (c = 10"2-10"7 mol l"1), were exposed to multiwave-length radiation filtered by Pyrex glass (>280 nm). Some of the data discussed later originate from our recent study of the ice photochemistry of chlorophenols,23 nevertheless, it was found to be necessary to carry out some additional experiments. The photoproducts obtained in liquid and solid samples differ significantly. While photosolvolysis products (such as pyrocatechol or hydroquinone) prevailed in the liquid-phase irradiation experiments, chlorobiphenyldiol coupling products (9 and
Photochem. Photobiol. Sei, 2003, 2, 1023-1031 1024

Table 1 Comparison of the chloro phenol photodegradation in the liquid and solid phasesa
[1] or [2] (phase) H 20 2 excess
10 2 M (1) lOOx 10 3 M (1) lOOx 10 4 M (1) lOOx 10 3 M (1) 30X 10 2 M (s) lOOx 10 3 M (s) lOOx 10 4 M (s) lOOx 10 3 M (s) 30X
Degradation of 1 in 5 min (%)
Degradation of 2 in 5 min (%)
Degradation of 1 in 30 min (%)
Degradation of 2 in 30 min (%)
17 43 90 33 2
13 20
5
19 45 92 42 3
18 25 10
34 36 >95 >95 >95 >95 >95 >95
8 11 28 35 30 48 12 20
a Irradiated at >280 nm and 20 °C (1) or -20 °C (s). b Molar excess compared to chlorophenol concentration. The decrease in concentration was linear for <20% conversions. The reproducibility from 3 experiments is ±10%.
Table 2 Initial photoproduct distributions from 2-chloro phenol (1) photolysis in the absence and presence of hydrogen peroxidea
Conditions* 10 12
10 3 M (0) (s) 10 2 M (30X) (s) 10 3 M (30X) (s) 10 3 M (lOOx) (s) 10 4 M (lOOx) (s) 10 3 M (30X) (1)
a Relative product concentrations (%) for conversions of 10-90%; irradiated at >280 nm; N.D.: not detected. The reproducibility from 4 experiments is given in the table.b Chlorophenol concentration and H202 molar excess, in the liquid phase at 25 °C (1) or in the solid phase, ice matrix, at -20 °C (s).
N.D. N.D. N.D. N.D. 60 ± 2 25 ± 1 N.D. 79 ± 5 10 ± 4 8 ± 2 ~1 2 ± 1 ~1 N.D. 57 ± 4 22 ± 3 9 ± 1 ~1 6 ± 1 2 ± 1 ~1 63 ± 4 29 ± 1 11 ± 2 ~1 N.D. N.D. N.D. 58 ± 3 23 ± 5 2 ± 1 ~1 3 ± 1 2 ± 1 ~1 48 ± 2 28 ± 3 13 ± 2 10 ± 2 N.D. N.D. N.D.
^Y 0 H fS /CI rr0H f*N>H V cr O H
CI OH
(3) (4)
OH
(5)
OH
OH
OH
(6) (8)
10 from 1; 11 from 2) are the major photoproducts isolated from solid-phase experiments. The quantum efficiencies of chlorophenol degradation strongly depend on the initial concentration. The product distribution in the conversion range 5-70% was found to be very similar and the dimeric products were always detected in high (75-95%) chemical yields. They were clearly identified at concentrations as low as 10"7 mol l"1.23
UV photolysis of samples in the presence of H202
Liquid or frozen sealed samples of aqueous solutions of a monochlorophenol (10~5-10~2 mol l"1) containing a 3- to 300-fold excess of H 20 2 were treated with either multiwave-length (>280 nm) or isolated-wavelength irradiation for
between 2 min and 24 h. Table 1 shows typical monochlorophenol photolytic consumptions as a function of the concentration of the starting material and hydrogen peroxide. Both chlorophenol isomers (1 and 2) exhibit nearly the same conversions for a given concentration ratio and it is readily apparent that the deterioration in liquid as well as solid samples, and the product distribution are strongly dependent on the relative concentration ratio [chlorophenol]/[H202], and on the starting concentration of chlorophenol.
Irradiation of liquid solutions of 1 in the presence of H 20 2 afforded two major products, 3-chlorocatechol (3) and 2-chlorohydroquinone (4), along with non-chlorinated benzene-diols 6 and 7, which were also isolated in relatively significant amounts (Table 2). Similar observations were made for the photolysis of 2, but as a result of the symmetry of the starting molecule, only one chlorobenzenediol (4-chlorocatechol, 5) was obtained (Table 3). The concentrations of chlorinated benzene-diols (3-5) in the liquid-phase samples initially increased linearly with the irradiation time, and then levelled off at higher conversion. This was not true for the relative amounts of catechol and hydroquinone, which continued to increase when the production of 3-5 stopped. Furthermore, the peroxide concentration did not greatly affect their absolute concentrations. The dimeric compound 11 was obtained from the photolysis of 2 only at low H 20 2 concentrations.
Irradiation of frozen (-20 °C) chlorophenol-H202 solutions afforded a somewhat different photoproduct distribution compared to that for the liquid-phase samples, which was nearly conversion independent. Formation of 6 and 7 from 1 was suppressed in favour of 3 and 4, and dimerisation products (the chlorobiphenyldiol coupling products 9 and 10, found in irradiation experiments23 in the absence of H202) were observable at low H 20 2 concentrations. Two other chlorobiphenyldiols (in addition to 9 and 10), one chlorohydroxydiphenyl ether, and 5 dichlorodihydroxybiphenyl isomers were identified by GC-MS in trace amounts (<5% total). The concentrations of dichlorodihydroxybiphenyls increased with irradiation time. Photolysis of 2 produced relatively higher amounts of the dimers (major product 11, plus one chlorohydroxydiphenyl, one chlorohydroxydiphenyl ether, and two dichlorodihydroxybiphenyls as minor products).
1025 Photochem. Photobiol Sei, 2003, 2, 1023-1031

Table 3 Initial photoproduct distributions from 4-chlorophenol (2) photolysis in the absence and presence of hydrogen peroxide"
Conditionsb 5 6 7 11 12
10" 3 M (0) (s) N.D. N.D. N.D. 90 ± 3 N.D. 10" 1 M (30x) (s) 93 ± 2 ~1 2 ± 1 2 ± 1 N.D. 10" 3 M (30x) (s) 80 ± 2 ~1 6 ± 1 9 ± 1 ~1 10" 3 M (100X) (s) 90 ± 4 ~1 4 ± 1 ~1 ~1 10" 4 M (100X) (s) 76 ± 4 ~1 ~1 17 ± 2 ~1 10~3 M (30x) (1) 56 ± 3 2 ± 1 28 ± 3 2 ± 1 N.D. " Relative product concentrations (%) for conversions of 10-90%; irradiated at >280 nm; N.D.: not detected. The reproducibility from 4 experiments is given in the table. b Chlorophenol concentration and H202 molar excess, in the liquid phase at 25 °C (1) or in the solid phase, ice matrix, at —20 °C (s).
Table 4 Wavelength-dependent transformations of 4-chlorophenol in ice in the presence of hydrogen peroxide"
Isolated wavelength/nm 5(%)ft 11 (%)"
366 295
99 90
" Irradiated at -20 °C; [2] = 10~3 mol T1, [H202] = 3 x 10~2 mol T1. Conversions 2-10%. 'Relative amounts. The reproducibility from 3 experiments is ±3%.
To distinguish the effects of direct photolysis of the organic molecules and the secondary reactions of the OH radicals, irradiation of 2 at two different isolated wavelengths (295 and 366 nm) was carried out (Table 4). 4-Chlorophenol does not absorb at 366 nm and was chosen for this experiment because it still forms dimeric products even at higher H 20 2 concentrations. No dimers were detected when samples were irradiated at 366 nm.
The photochemistry of chlorophenols in ice matrix in the presence of H 20 2 was also studied at low temperature (—78 °C; dry ice). It was found that the partitioning between the hydroxy-lated products and dimers changed significantly. While no dimers were formed from 1 with a 100-fold peroxide excess at —20 °C, lowering the temperature caused a significant increase in dimer production. The product distribution in all reactions carried out at —78 °C was found to be less sensitive to the peroxide concentration. Table 5 shows a comparison of the experiments accomplished at two different temperatures. Benzenediols (6-7) were not detected at —78 °C.
Radiation chemistry experiments
Both liquid (20 °C) and solid (—78 °C) samples containing chlorophenol were irradiated with a 60Co y-source (Tables 6 and 7), with an applied dose rate of ~1 kGy h_1. The half lives of 1 and 2 (10~3 mol l"1) in liquid solution were found to be ca. 400 and 300 min, respectively (the initial G value for monochlorophenols has been reported to be 2.840). The half lives of both chlorophenols (10~4 mol l"1) in the frozen state were estimated to be ~10 days. While the radiolysis of the liquid samples provided similar photoproduct distributions as the photolysis in the presence of H202 , irradiation of the solid solutions afforded the dimers almost exclusively. The reaction regioselectivity of dimer formation was found to be low compared to UV photolysis. In addition to compounds 9-11, 5 other chlorobiphenyldiols, 5 dichlorobiphenyldiols, and 1 chlorohydroxydiphenyl ether were obtained in approximately the same amounts from the radiolysis of both 1 and 2. When melted samples (>—5 °C) were y-irradiated, chlorobenzenediols (3-5) dominated.
Discussion
Chlorophenols are very common pollutants because of their importance in the production of fungicides and herbicides,41^13
and are photolabile when exposed to sunlight in an aqueous environment.44^7 A number of experiments on the photo-decomposition of monochlorophenols in the presence of hydrogen peroxide,48-52 and other advanced oxidation techniques have been reported.53~57 Natural hydrogen peroxide has attracted increasing attention from atmospheric chemists over the past two decades, because it acts as a reservoir species for OH radicals.58_63 It can play a key role in the oxidation of various compounds in clouds and, possibly, in polar snow and j c e 19,64-66 j n tjjjs w o r ] ^ a detailed investigation of the hydrogen peroxide-mediated photolysis of 2- and 4-chlorophenol in ice is reported and the results are compared to those obtained in the liquid phase. Radiation chemistry experiments with mono-chlorophenol samples have provided information about the system, in which OH radicals can be formed by direct y-irradiation of water molecules.
Comparison of UY7H202 photolysis in liquid water and ice
Table 1 compares the degradation efficiencies of 1 and 2 under steady-state UV irradiation with polychromatic light (>280 nm) in the presence of H202 . The apparent rates of decomposition
Table 5 Temperature-sensitive transformation of chlorophenols in ice in the presence of hydrogen peroxide"
Chlorophenol (77°C) H,0, excess Chlorobenzenediols (%) Dimers (%)
1 (-20) 1 (-20) 1 (-78) 1 (-78) 2 (-20) 2 (-20) 2 (-78) 2 (-78)
" Irradiated at >280 nm; [chlorophenol] = 10~ 3 experiments is ±4%.
8 0
45 38 12 1
40 32
mol T1. Relative amounts of photoproducts formed at conversions of -10%. The reproducibility from
30x 91 00x 99 30x 54 00x 61 30x 87 00x 98 30x 59 00x 67
Table 6 y-Radiolysis of 2-chlorophenol samples"
Phase Chlorobiphenyldiols Dichlorobiphenyldiols
Liquid 40 22 23 8 10 Solid -1 -1 0 0 40
Trace 40
" Relative concentration ranges (%). For concentrations of [1] between 10~2-10~4 mol T1; irradiated for several minutes (liquid phase, 25 °C; conversions 2-90%) or 24 h (solid phase, ice matrix, —78 °C; conversions 1-7%). The reproducibility from 3 experiments is ±7%.
Photochem. Photobiol. Set, 2003, 2, 1023-1031 1026

Table 7 y-Radiolysis of 4-chlorophenol samplesa
Phase Chlorobiphenyldiols + Dichlorobiphenyldiols
Liquid Solid
10 0
15 0
20 >95
a Relative concentration ranges (%). For concentrations of [2] between 10 2-10 4 mol 1 l; irradiated for several minutes (liquid phase, 25 °C; conversions 2-90%) or 24 h (solid phase, ice matrix, —78 °C; conversions 1-7%). The reproducibility from 3 experiments is ±7%.
are nearly the same for both derivatives. The photolysis efficiency in the solid state ( -20 °C) is generally lower than that in the liquid phase (20 °C). The decrease in the reaction efficiency is caused in part by the lower transparency of polycrystalline ice, however, the main reasons for the quantum efficiency reduction are suggested to be (i) the existence of different chemical pathways, (ii) restricted diffusion and conformational motion,67
and (iii) different microscopic molecular arrangements (aggregates) changing the absorption properties of the guest molecules in the ice matrix as well as their chemistry, i.e. local concentration of the reactants.
Photochemical aspects
The typical product distribution from the photolysis of mono-chlorophenol in an ice matrix (in the absence of H202) has been recently found to be dramatically different compared to that in liquid aqueous solution (Scheme l).23 The main products, chlorobiphenyldiols, are formed in ice within a broad initial chlorophenol concentration range, thus, the major photo-transformations appear to be based on coupling reactions within the ice cavities. Mechanistic considerations were offered in the same work. In contrast, photosolvolysis is a characteristic reaction pathway in aqueous solutions.23'38'68 The presence of hydrogen peroxide results in the same major products being obtained in both liquid and solid phases. Tables 2 and 3 show that chlorobenzenediols (3-5) are produced initially in a large excess in ice, with a similar regioselectivity to that observed in liquid water. Furthermore, the photochemistry in ice provides a larger amount of dimers (9-12). There is clear competition between the reaction of OH radicals created from H202 and other photoreactions in its absence (Scheme 2). The electro-philic OH radical, formed from H202 photolysis, preferentially added to the ortho position (with respect to the OH group) of 1 to form 3, while para substitution is less significant in ice. The minor product 4 was obtained accordingly; no meta substitution was observed. Such a regioselectivity, enhanced in the solid state ( -20 °C), must originate from the formation of thermodynamically favoured dihydroxychlorohexadienyl radicals, which means that the OH radical has enough opportunity to establish a proper orientation towards and distance from the chlorophenol molecule. Hydrogen bonding, stronger at lower temperature, between the OH radical and the OH group of chlorophenol may explain the enhanced regioselectivity in the solid state.
OH
1 i
hv
ice
hv
OH
liquid water
9,10
OH OH
6
Scheme 1 Major products from photolysis of 1 in ice and water.
Formation of 6 can be explained either by ipso substitution of the chlorine atom, or photochemical chlorine atom scission and subsequent reaction with an OH radical. Homolytic C-Cl
r #OH
1 -<
9, 10
Scheme 2 Pathways for the formation of products in the UV/H202 photolysis of 1.
bond cleavage, forming the free phenolic radical, also leads to dimer formation (9 and 10), due to radical electrophilic-like substitution (or electrophilic substitution after electron transfer between Cľ and Ph').23 A relatively small amount of dichlorobiphenyldiols 12 might originate from the abstraction of an aromatic hydrogen atom from 1 by a radical, such as a hydroxy-hexadienyl intermediate. The reactions of 4-chlorophenol (4) are analogous to those described in Scheme 2.
To exclude interference from the reactions of excited chlorophenol, experiments were carried out at 366 nm, where only H202 absorbs (e = -0.01 M"1 cm"1). Table 4 shows that only chlorobenzenediols form at this wavelength, due to the exclusive peroxide photolysis. The molar absorption coefficient of hydrogen peroxide at 280 nm is higher (e = 4.2 M"1 cm"1
at 280 nm), but still negligible when compared to those of the monochlorophenols. This, however, is still sufficient for reasonably efficient hydroxylation.
Physical aspects
While cooling the aqueous solutions usually slows down all chemical processes, freezing, resulting in a phase transition radically modifies the reaction environment. Migrations and conformational motions are suppressed, thus, most chemical transformations must be affected. Some reactions are known to be accelerated by the freezing process itself,69-73 however, for photoreactions that occur in the solid matrix under steady-state irradiation conditions, we may apply the "reaction cavity" model74 that has been used to describe reactions in other constraining media {e.g. zeolites). When grains of crystalline ice begin to grow, the solute molecules accumulate in the unfrozen solution surrounding the crystal walls and are not incorporated to any great extent into the solid ice.70'75'76 The solute (either a hydrophobic or hydrophilic compound) concentration rises significantly causing a considerable depression of the freezing point. As the temperature drops further, the solute concentration at the grain boundaries becomes extremely high and the layer eventually solidifies. In our previous work,23 the photosolvolysis of monochlorophenols (i. e. the reaction with water molecules in the liquid state) was still observed in visually solid samples of 10"2-10"3 mol l"1 initial concentrations at ca. — 5 °C.
1027 Photochem. Photobiol. Sei, 2003, 2, 1023-1031

This implies that the actual concentration, roughly estimated from this freezing point depression (the cryoscopic constant for water is 1.858 K kg mol"1), could be close to 3 mol l"1, which is in accord with Takenaka's similar calculations of nitrite concentrations at the grain boundaries, which was found as high as 1.5 mol I"1.70 We must keep in mind the high segregation ability of hydrophobic chlorophenol and its low solubility in water. A hypothetical 3 mol l"1 monochlorophenol solution can be then visualised as a mixture of differently sized aggregates surrounded by water molecules, rather than an ideal solution.
In this work, the photochemical formation of dimers provides clear proof that the starting molecules are highly concentrated (segregated) at grain boundaries of the polycrystalline matrix. The increased dimerisation in the presence of hydrogen peroxide at - 7 8 °C further supports this idea. Lowering the temperature raises the concentration and larger assemblies prevent the approach of the OH radicals to the inner molecules (Table 5). This is in agreement with the fact that increasing the H 20 2 concentration has only a slight effect on the product distribution in the studied concentration range. Such a change may result from a different partitioning of chlorophenol and peroxide molecules between the ice and the unfrozen layer at different temperatures. It seems logical that the escape of OH radicals from a solid cage is more complicated at lower temperatures. The restriction of the hydroxyl radical motion at low temperatures due to hydrogen bonding to the OH group of chlorophenol may enhance a substitution orientation.
Molecular aggregates in ice also somewhat change the absorption characteristics of the organic molecules due to different interactions with the host water molecules of the cavity as well as intermolecular interactions within the aggregate. While the absorption spectra of monochlorophenols in ice solid solutions ( -20 °C) exhibit practically no shifts in the absorption maxima, the absorption bands are broader.23
Radiation chemistry of monochlorophenols in ice
It is well known that paramagnetic species are formed at 77 K upon y-irradiation of glassy (frozen) water.9_11'77"80 Besides the OH radicals, comparable amounts of H 0 2 radicals were found in glassy water. Since the delivery of extraterrestrial organic molecules to Earth by meteorites may have been important for the origin and early evolution of life,14'15'81-83 generation of such reactive species in cometary ice containing simple organic molecules by ionising radiation may be an essential process. Furthermore, we could envisage some radiation chemistry on/in stratospheric84 ice particles. Irradiation with y-rays has been proven to be a powerful technique for degradation of environmentally important molecules such as chlorophenols,40'85-88 and it appears to be quite promising for future application. The main products from monochlorophenol radiolysis in aqueous solution were identified as phenol, quinones, polyhydroxy-benzenes, various aldehydes, and acids, depending on the extent of irradiation.40'87'89 The objective of this part of the work was to compare the effects of H202/UV photolysis to those of ionising radiation on monochlorophenol in solidified aqueous solutions.
The formation of OH radicals by y-irradiation and their subsequent reactions were expected to parallel UV-photochemical pathways using hydrogen peroxide, as has been observed previously in many homogeneous liquid systems.90'91 To our surprise, irradiation of frozen ice samples ( -78 °C) of chloro-phenols by a 60Co y-source with an applied dose rate of ~1 kGy h"1 led to totally different chemistry than that resulting from UV irradiation of samples containing H 20 2 (Tables 6 and 7). While radiolysis gives dimers 9-12 exclusively, chlorobenzene-diols (3-5) dominate in the UV/H202 process. The formation of chlorobenzenediols in the latter case strongly depends on the peroxide concentration, e.g. less than an equimolar amount of H 20 2 provided a large excess of dimers. This approximation
leads us to the conclusion that the dose of y-radiation applied was insufficient to generate a steady-state concentration of OH radicals at the grain boundaries comparable to that achieved in the UV/H202 experiments. Dimerisation is strongly enhanced by extremely high concentrations at the reaction site, due to the low temperature, as was discussed above. Instead of the hydroxyl-ation products, only dimeric isomers (5 chlorobiphenyldiol and 4 dichlorobiphenyldiol isomers, for radiolysis of both 1 and 2) were obtained with a low regioselectivity. The coupling reactions may occur by a variety of mechanisms. Scheme 3 suggests some of the possible pathways leading to chloro as well as dichloro derivatives. High energy y-photons interact only weakly with molecules in liquids and the principal energy-transfer process is Compton scattering, producing high energy electrons and, consequently, other reactive species. If the OH radicals are the major reactive species in ice, their absolute (steady-state) concentrations in the proximity of the chlorophenol molecules must have been too low to allow efficient hydroxylation, or the position in which they were formed (homogeneously in the whole sample bulk) was not favourable for efficient diffusion to the reaction cavity. As previously known from the literature mentioned above, y-radiolysis of aqueous (liquid) solutions of chlorophenols yielded comparable product distributions to those found when the UV/ H202 technique was applied.
Conclusion Fig. 1 and 2 compare the relative amounts of products obtained under the various reaction conditions in this work: photolysis of the liquid [UV(1)] or solid [UV(s)] phases; photolysis in the presence of H 20 2 in the liquid [per(l)] and solid phases [per(s) at
OH
Compton + CI — 9, 10
Scheme 3 Possible pathways for the formation of products in the y-radiolysis of 1.
60
% •1Ü
I benzeriediols chloro benzenediols
• (dichlorobiphenyldiol s
a B.J UV(I) UV(s) per{l) per(s} per(s*} gam{l) gam(s)
conditions
Fig. 1 Typical product distributions from the irradiation of 2-chlorophenol (c = 10 2 mol 1_1) under various conditions.
Photochem. Photobiol. Sei, 2003, 2, 1023-1031 1028

UV(I) UVts) per(l) per(s) per{s') gam(l)
conöilions
Fig. 2 Typical product distributions from the irradiation of 4-chloro-phenol (c = 1CT2 mol 1_1) under various conditions.
—20 °C and per(s*) at —78 °C]; y-radiolysis of liquid [gam(l)] or solid [gam(s)] phase samples (the total percentages do not necessarily total 100%, since the relative amounts of some other products are not shown). Apparent resemblances can be found in the following pairs: per(l) and per(s); per(l) and gam(l); UV(s) and gam(s). Similarities in the first case arise from the fact that the organic molecules are well mixed with the O H radicals (generated from H 2 0 2 ) in the liquid as well as the solid phase. While the reaction efficiency is limited by diffusion in water, segregation of both components to the grain boundaries of the polycrystalline ice is responsible for the reactions. The main reaction pathway in the second pair is diffusion-mediated hydroxylation originating from O H radical production, al though this occurs by different initialisation mechanisms. The third comparison is quite surprising, since high energy radiation was not expected to cause dimerisation to be the main reaction. Application of a higher dose of y-radiation should increase O H radical production and provide a more competitive reaction route to that which is observed. Our first results from the radiolysis of polycyclic aromatic hydrocarbons in ice showed that, in the absence of other reaction pathways, hydroxylation is the only process observed.
This work suggests that the reactions of organic molecules with the O H radicals, produced photochemically from naturally occurring hydrogen peroxide in polar or atmospheric ice, and eventually adsorbed on the surface of ice or snow from the atmosphere, may be quite efficient: it is known that hydrogen peroxide, and consequently O H radicals, in surface snow and ice can reach a relatively high concentration (up to several |imol j-i-j 60-62 significantly higher than that of the common organic pollutants (<1 nmol T1).92 '93 According to our previous work,23
photodimerisation is still efficient at concentrations of the starting chlorophenol as low as 10~7 mol l"1. Such a value is still 2-3 orders of magnitude higher than that of naturally occurring organic compounds in polar snow and ice, but is certainly low enough to advocate further experiments that would finally validate or invalidate our original presumptions that the photochemistry of organic pollutants in the environment is an important natural process.18 The production of new organic pollutants or ice-core record alterations are the apparent environmental consequences which may be evoked, along with the interesting issue of a high energy-mediated hydroxylation of organic matter in interplanetary ice particles. Our current research is now directed toward spectroscopic investigations of frozen aqueous solutions of organic molecules in order to understand better why ice is such a unique reaction medium.
Acknowledgements The project was supported by the Gran t Agency of the Czech Republic (205/02/0896). Special thanks are due to J. Dolinová for her help with sample analyses. We are grateful to the reviewers for a number of fruitful comments and suggestions.
References 1 V. F. Petrenko and R. W. Whitworth, Physics of Ice, Oxford
University Press, Oxford, 1999. 2 D. K. Perovich and J. W. Govoni, Absorption-coefficients of ice
from 250 to 400 nm, Geophys. Res. Lett, 1991,18, 1233-1235. 3 D. Lennon, T. I. Quiekenden and C. G. Freeman, UV-excited
luminescences from amorphous and polycrystalline H 2 0 ices, Chem. Phys Lett, 1993, 201, 120-126.
4 D. K. Perovich, A theoretical-model of ultraviolet-light transmission through Antarctic sea-ice, J. Geophys. Res, [Oceans], 1993, 98, 22 579-22 587.
5 R. E. Johnson and T. I. Quiekenden, Photolysis and radiolysis of water ice on outer solar system bodies, J. Geophys. Res, [Planets], 1997,102, 10985-10996.
6 T. Quiekenden and A. Hanlon, The colours of water and ice, Chem. Br., 2000, 36, 37-39.
7 H. A. Gillis and T. I. Quiekenden, Excess electrons in aqueous glasses and crystalline ice, Can. J. Chem.-Rev. Can. Chim., 2001, 79, 80-93.
8 C. G. Freeman, T. I. Quiekenden, R. A. J. Litjens and D. F. Sangster, Visible and ultraviolet emission from pulse irradiated amorphous and polycrystalline H 2 0 ice, J. Chem. Phys, 1984, 81, 5252-5254.
9 J. Bednarek, A. Plonka, A. Hallbrucker, E. Mayer and M. C. R. Symons, Hydroperoxyl radical generation by gamma-irradiation of glassy water at 77 K, J. Am. Chem. Soc, 1996, 118, 9387-9390.
10 H. Yoshioka and K. Hasegawa, Solid-state spin trapping of the hydroxyl radical formed by gamma-irradiation in ice and the scavenging effect of sodium L-ascorbate, Biosci, Biotechnol, Biochem., 1996, 60, 1971-1975.
11 J. Bednarek, A. Plonka, A. Hallbrucker and E. Mayer, Radical generation upon gamma-irradiation of two amorphous and two crystalline forms of water at 77 K, J. Phys. Chem. A, 1998, 102, 9091-9094.
12 S. Y. Wang, The mechanism for frozen aqueous solution irradiation of pyrimidines, Photochem. Photobiol, 1964, 3, 395-398.
13 A. Wacker, D. Weinblum, L. Traeger and Z. Moustafa, Photochemical reactions of uracil and uridine, J. Mol. Biol, 1961,3, 790-793.
14 M. P. Bernstein, J. P. Dworkin, S. A. Sandford, G. W. Cooper and L. J. Allamandola, Racemic amino acids from the ultraviolet photolysis of interstellar ice analogues, Nature, 2002, 416, 401-403.
15 M. P. Bernstein, J. P. Dworkin, S. A. Sandford and L. J. Allamandola, Ultraviolet irradiation of naphthalene in H 2 0 ice: Implications for meteorites and biogenesis, Meteoritics Planet. Sei, 2001,36,351-358.
16 G M. M. Čaro, U. J. Meierhenrich, W. A. Schutte, B. Barbier, A. A. Segovia, H. Rosenbauer, W. H. P. Thiemann, A. Brack and J. M. Greenberg, Amino acids from ultraviolet irradiation of interstellar ice analogues, Nature, 2002, 416, 403-406.
17 M. R. Hoffmann, Possible chemical transformations in snow and ice induced by solar (UV photons) and cosmic irradiation (muons)., NATO ASI Ser, Ser. I, 1996,43, 353-377.
18 P. Klán and I. Holoubek, Ice (photo)chemistry Ice as a medium for long-term (photo)chemical transformations - environmental implications, Chemosphere, 2002, 46, 1201-1210.
19 F. Dominé and P. B. Shepson, Air-snow interactions and atmospheric chemistry, Science, 2002, 297, 1506-1510.
20 P. Klán, D. Del Favero, A. Ansorgova, J. Klánová and I. Holoubek, Photodegradation of halobenzenes in water ice, Environ. Sei. Pollut. i to. ,2001,8, 195-200.
21 P. Klán, A. Ansorgova, D. Del Favero and I. Holoubek, Photochemistry of chlorobenzene in ice, Tetrahedron Lett., 2000,41, 7785-7789.
22 Y. Dubowski and M. R. Hoffmann, Photochemical transformations in ice: Implications for the fate of chemical species, Geophys. Res. Lett, 2000,27,3321-3324.
23 J. Klánová, P. Klán, J. Nosek and I. Holoubek, Environmental ice photochemistry: monochlorophenols, Environ. Sei. Technol, 2003, 37, 1568-1574.
24 R. E. Honrath, M. C. Peterson, M. P. Dziobak, J. E. Dibb, M. A. Arsenault and S. A. Green, Release of NOx from sunlight-irradiated midlatitude snow, Geophys. Res. Lett., 2000, 27, 2237-2240.
25 J. C. McConnell, G. S. Henderson, L. Barrie, J. Bottenheim, H. Niki, C. H. Langford and E. M. J. Templeton, Photochemical bromine production implicated in Arctic boundary-layer ozone depletion, Nature, 1992,355, 150-152.
26 A. L. Sumner and P. B. Shepson, Snowpack production of formaldehyde and its effect on the Arctic troposphere, Nature, 1999, 398, 230-233.
27 A. L. Sumner, P. B. Shepson, A. M. Grannas, J. W. Bottenheim, K. G Anlauf, D. Worthy, W. H. Schroeder, A. Steffen, F. Domine,
1029 Photochem. Photobiol. Sei., 2003, 2, 1023-1031

S. Perrier and S. Houdier, Atmospheric chemistry of formaldehyde in the Arctic troposphere at Polar Sunrise, and the influence of the snowpack, Atmos. Environ., 2002, 36, 2553-2562.
28 A. M. Grannas, P. B. Shepson, C. Guimbaud, A. L. Sumner, M. Albert, W. Simpson, F. Domine, H. Boudries, J. Bottenheim, H. J. Beine, R. Honrath and X. L. Zhou, A study of photochemical and physical processes affecting carbonyl compounds in the Arctic atmospheric boundary layer, Atmos. Environ., 2002, 36, 2733-2742.
29 C. Guimbaud, A. M. Grannas, P. B. Shepson, J. D. Fuentes, H. Boudries, J. W. Bottenheim, F. Domine, S. Houdier, S. Perrier, T. B. Biesenthal and B. G. Splawn, Snowpack processing of acetaldehyde and acetone in the Arctic atmospheric boundary layer, Atmos. Environ., 2002, 36, 2743-2752.
30 A. L. Swanson, N. J. Blake, J. E. Dibb, M. R. Albert, D. R. Blake and F. S. Rowland, Photochemically induced production of CH3Br, CHjI, C2H5I, ethene, and propene within surface snow at Summit, Greenland, Atmos. Environ, 2002, 36, 2671-2682.
31 J. E. Dibb and M. Arsenault, Shouldn't snowpacks be sources of monocarboxylic acids?, Atmos. Environ., 2002, 36, 2513-2522.
32 P. Klán, J. Klánová, I. Holoubek and P. Cupr, Photochemical activity of organic compounds in ice induced by sunlight irradiation: The Svalbard Project, Geophys. Res. Lett., 2003, 30, art. no. 1313.
33 U. G. Anlborg and T. M. Thunberg, CRC Crit. Rev. Toxicol, 1980, 7, 1-35.
34 L. R. Suntio, W. Y. Shiu and D. Mackay, A review of the nature and properties of chemicals present in pulp-mill effluents, Chemosphere, 1988,17, 1249-1290.
35 A. J. Beck, S. C. Wilson, R. E. Alcock and K. C. Jones, Kinetic constraints on the loss of organic-chemicals from contaminated soils - implications for soil-quality limits, Crit. Rev. Environ. Sei. Technol, 1995,25, 1^3.
36 S. Malato, J. Blanco, A. Vidal and C. Richter, Photocatalysis with solar energy at a pilot-plant scale: an overview, Appl. Catal, B, 2002, 37, 1-15.
37 U. Stafford, K. A. Gray and P. V. Kamat, Photocatalytic degradation of organic contaminants: Halophenols and related model compounds, Heterog. Chem. Rev, 1996, 3, 77-104.
38 P. Boule, C. Guyon and J. Lemaire, Photochemistry and environment .4. Photochemical behavior of monochlorophenols in dilute aqueous-solution, Chemosphere, 1982, 11, 1179-1188.
39 K. David-Oudjehani and P. Boule, Photolysis of halophenols in aqueous-solution sensitized by hydroquinone or phenol, New J. Chem., 1995,19, 199-206.
40 R. Zona, S. Schmid and S. Solar, Detoxification of aqueous chlorophenol solutions by ionizing radiation, Water Res, 1999, 33, 1314-1319.
41 P. Lampi, K. Tolonen, T. Vartiainen and J. Tuomisto, Chlorophenols in lake bottom sediments - a retrospective study of drinking-water contamination, Chemosphere, 1992, 24, 1805-1824.
42 V. I. Safarova, A. D. Fatyanova, G. F. Shaidulina, G. I. Teplova, Pilenkova, II and R. G. Yurkova, Study of environmental pollution from chlorine-containing organic industrial emissions, J. Anal. Chem., 1996,51, 1101-1105.
43 J. A. Vanleeuwen, B. C. Nicholson and K. P. Hayes, Distribution of chlorophenolic compounds, from a pulp-mill, in Lake Bonney, South Australia, Aust. J. Mar. Freshwater Res, 1993, 44, 825-834.
44 N. J. Bunce, J. S. Nakai and M. Yawching, Estimates of the tropospheric lifetimes of short-lived and long-lived atmospheric pollutants, J. Photochem. Photobiol, A, 1991, 57, 429-439.
45 J. Clarke, R. R. Hill and D. R. Roberts, Photohydrolysis of a halophenol in sunlight: Critical influence of substitution pattern, J. Chem. Res, 1998, (S)119-119.
46 T. Krutzler, H. Fallmann, P. Maletzky, R. Bauer, S. Malato and J. Blanco, Solar driven degradation of 4-chlorophenol, Catal. Today, 1999,54,321-327.
47 H. D. Burrows, L. S. Ernestova, T. J. Kemp, Y. I. Skurlatov, A. P. Purmal and A. N. Yermakov, Kinetics and mechanism of photodegradation of chlorophenols, Prog. React. Kinet., 1998, 23, 145-207.
48 Y. S. Li, Photolytic hydrogen peroxide oxidation of 2-chloro-phenol waste water, Arch. Environ. Contain. Toxicol, 1996, 31, 557-562.
49 E. Lipczynska-Kochany and J. R. Bolton, Flash-photolysis Hplc applications .2. Direct photolysis vs hydrogen-peroxide mediated photodegradation of 4-chlorophenol as studied by a flash-photolysis Hplc technique, Environ. Sei. Technol, 1992, 26, 259-262.
50 R. Apak and M. Hugul, Photooxidation of some mono-, di-, and tri-chlorophenols in aqueous solution by hydrogen peroxide UV combinations,/ Chem. Technol. Biotechnol, 1996,67,221-226.
51 F J. Benitez, J. Beltran-Heredia, J. L. Acero and F. J. Rubio, Contribution of free radicals to chlorophenols decomposition by several advanced oxidation processes, Chemosphere, 2000, 41, 1271-1277.
52 F. J. Benitez, J. Beltran-Heredia, J. L. Acero and F. J. Rubio, Oxidation of several chlorophenolic derivatives by UV irradiation and hydroxyl radicals, J. Chem. Technol. Biotechnol, 2001, 76, 312-320.
53 W. S. Kuo, Destruction of toxic organics in water by an injection-type downflow UV/O-3 oxidation reactor, Ozone: Sei. Eng, 1999, 21, 539-550.
54 R. Bauer, G. Waldner, H. Fallmann, S. Hager, M. Klare, T. Krutzler, S. Malato and P. Maletzky, The photo-Fenton reaction and the Ti02/UV process for waste water treatment - novel developments, Catal. Today, 1999,53, 131-144.
55 W. S. Kuo, Synergistic effects of combination of photolysis and ozonation on destruction of chlorophenols in water, Chemosphere, 1999,39, 1853-1860.
56 D. W Chen and A. K. Ray, Photodegradation kinetics of 4-nitro-phenol in Ti02 suspension, Water Res, 1998, 32, 3223-3234.
57 Y. Z. Wen, X. Z. Jiang and W P. Liu, Degradation of 4-chlorophenol by high-voltage pulse corona discharges combined with ozone, Plasma Chem. Plasma Process, 2002, 22, 175-185.
58 A. Sigg, T. Staffelbach and A. Neftel, Gas-phase measurements of hydrogen-peroxide in Greenland and their meaning for the interpretation of H 20 2 records in ice cores, J. Atmos. Chem., 1992, 14, 223-232.
59 A. Sigg and A. Neftel, Evidence for a 50-percent increase in H 20 2
over the past 200 years from a Greenland ice core, Nature, 1991, 351, 557-559.
60 D. Abele, G. A. Ferreyra and I. Schloss, H 20 2 accumulation from photochemical production and atmospheric wet deposition in Antarctic coastal and off-shore waters of Potter Cove, King George Island, South Shetland Islands, Antarct. Sei., 1999, 11, 131-139.
61 M. A. Hutterli, J. R. McConnell, R. W Stewart, H. W Jacobi and R. C. Bales, Impact of temperature-driven cycling of hydrogen peroxide (H202) between air and snow on the planetary boundary layer,/ Geophys. Res, [Atmos], 2001,106, 15395-15404.
62 H. W Jacobi, M. M. Frey, M. A. Hutterli, R. C. Bales, O. Schrems, N J. Cullen, K. Steffen and C. Koehler, Measurements of hydrogen peroxide and formaldehyde exchange between the atmosphere and surface snow at Summit, Greenland, Atmos. Environ., 2002, 36, 2619-2628.
63 J. R. McConnell, R. C. Bales and D. R. Davis, Recent intra-annual snow accumulation at South Pole: Implications for ice core interpretation, J. Geophys. Res, [Atmos], 1997, 102, 21947-21954.
64 J. Yang, R. E. Honrath, M. C. Peterson, J. E. Dibb, A. L. Sumner, P. B. Shepson, M. Frey, H. W Jacobi, A. Swanson and N. Blake, Impacts of snowpack emissions on deduced levels of OH and peroxy radicals at Summit, Greenland, Atmos. Environ., 2002, 36, 2523-2534.
65 S. Perrier, S. Houdier, F. Domine, A. Cabanes, L. Legagneux, A. L. Sumner and P. B. Shepson, Formaldehyde in Arctic snow. Incorporation into ice particles and evolution in the snowpack, Atmos. Environ., 2002, 36, 2695-2705.
66 P. J. Crutzen and M. G. Lawrence, The impact of precipitation scavenging on the transport of trace gases: A 3-dimensional model sensitivity study, J. Atmos. Chem., 2000, 37, 81-112.
67 P. Klán, J. Janošek and Z. Kriz, Photochemistry of valerophenone in solid solutions, J. Photochem. Photobiol, A, 2000,134, 37^44.
68 K. Oudiehani and P. Boule, Photoreactivity of 4-chlorophenol in aqueous-solution, J. Photochem. Photobiol, A, 1992, 68, 363-373.
69 N Takenaka, S. Furuya, K. Sato, H. Bandow, Y. Maeda and Y Furukawa, Rapid reaction of sulfide with hydrogen peroxide and formation of different final products by freezing compared to those in solution, Int. J. Chem. Kinet, 2003, 35, 198-205.
70 N Takenaka, A. Ueda, T. Daimon, H. Bandow, T. Dohmaru and Y Maeda, Acceleration mechanism of chemical reaction by freezing: The reaction of nitrous acid with dissolved oxygen, J. Phys Chem., 1996,100, 13874-13884.
71 N Takenaka, A. Ueda and Y. Maeda, Acceleration of the rate of nitrite oxidation by freezing in aqueous-solution, Nature, 1992, 358, 736-738.
72 R. H. M. Hatley, F. Franks and H. Day, Subzero-temperature preservation of reactive fluids in the undercooled state. 2. The effect on the oxidation of ascorbic-acid of freeze concentration and undercooling, Biophys Chem., 1986, 24, 187-192.
73 R. H. M. Hatley, F. Franks, H. Day and B. Byth, Subzero-temperature preservation of reactive fluids in the undercooled state. 1. The reduction of potassium ferricyanide by potassium cyanide, Biophys. Chem., 1986, 24, 41-46.
Photochem. Photobiol. Sei, 2003, 2, 1023-1031 1030

74 R. G. Weiss, V. Ramamurthy and G. S. Hammond, Photochemistry in organized and confining media - a model, Ace. Chem. Res., 1993, 26, 530-536.
75 J. G. Dash, H. Y. Fu and J. S. Wettlaufer, The premelting of ice and its environmental consequences, Rep. Prog. Phys, 1995,58, 115-167.
76 H. Cho, P. B. Shepson, L. A. Barrie, J. P. Cowin and R. Zaveri, NMR investigation of the quasi-brine layer in ice/brine mixtures, J. Phys. Chem. B, 2002, 106, 11226-11232.
77 L. Kevan, Radiation chemistry of frozen polar systems, Actions Chim. Biol. Radiat., 1969,13, 57-117.
78 P. L. Cooper and J. P. D. Abbatt, Heterogeneous interactions of OH and H 0 2 radicals with surfaces characteristic of atmospheric particulate matter, J. Phys. Chem., 1996,100, 2249-2254.
79 D. S. W Lim and E. M. Stuve, Solvation and ionization of hydroxyl groups in water-ice layers on silver (110), Surf. Sei, 1999, 425, 233-244.
80 E. J. Hart, Radiation chemistry of aqueous solutions, Radiat. Res. Rev., 1972,3,285-304.
81 L. J. Allamandola, M. P. Bernstein, S. A. Sandford and R. L. Walker, Evolution of interstellar ices, Space Sei. Rev., 1999, 90, 219— 232.
82 M. P. Bernstein, L. J. Allamandola and S. A. Sandford, Complex organics in laboratory simulations of interstellar/cometary ices, Adv. Space Res, 1997, 19, 991-998.
83 M. P. Bernstein, J. E. Elsila, J. P. Dworkin, S. A. Sandford, L. J. Allamandola and R. N. Zare, Side group addition to the polycyclic aromatic hydrocarbon coronene by ultraviolet photolysis in cosmic ice analogs, Astrophys J., 2002, 576, 1115-1120.
84 G. Reitz, Radiation Environment in the Stratosphere, Radiat. Prot. Dosim., 1993,48,5-20.
85 M. G. Bettoli, M. Ravanelli, L. Tositti, O. Tubertini, L. Guzzi, W Martinotti, G. Queirazza and M. Tamba, Radiation induced decomposition of halogenated organic compounds in water, Radiat. Phys. Chem., 1998, 52, 327-331.
86 K. A. Gray and U. Stafford, Probing photocatalytic reactions in semiconductor systems - study of the chemical intermediates in 4-chlorophenol degradation by a variety of methods, Res. Chem. Intermed, 1994, 20, 835-853.
87 S. Schmid, P. Krajnik, R. M. Quint and S. Solar, Degradation of monochlorophenols by gamma-irradiation, Radiat. Phys. Chem., 1997, 50, 493-502.
88 U. Stafford, K. A. Gray and P. V. Kamat, Radiolytic and Ti02-assisted photocatalytic degradation of 4-chlorophenol - a comparative-study,/ Phys. Chem., 1994, 98, 6343-6351.
89 N. Getoff and S. Solar, Radiation-induced decomposition of chlorinated phenols in water, Radiat. Phys. Chem., 1988, 31, 121-130.
90 A. Sugimori, K. Nakata and H. Hirai, Comparison of the radiation-induced reaction with photochemical and thermal reactions. I. The radiation-induced isomerization of o-nitrobenzaldehyde in the solid state, Bull. Chem. Soc. Jpn, 1966, 39, 2613-2615.
91 G. S. Hammond, R. A. Caldwell, J. M. King, H. Kristinsson and D. G. Whitten, Correlation between photochemistry and high-energy radiation chemistry, Photochem. Photobiol, 1968, 7, 695-703.
92 R. W MacDonald, L. A. Barrie, T. F. Bidleman, M. L. Diamond, D. J. Gregor, R. G. Semkin, W. M. J. Strachan, Y. F. Li, F. Wania, M. Alaee, L. B. Alexeeva, S. M. Backus, R. Bailey, J. M. Bewers, C. Gobeil, C. J. Halsall, T. Harner, J. T. Hoff, L. M. M. Jantunen, W. L. Lockhart, D. Mackay, D. C. G. Muir, J. Pudykiewicz, K. J. Reimer, J. N. Smith, G. A. Stern, W. H. Schroeder, R. Wagemann and M. B. Yunker, Contaminants in the Canadian Arctic: 5 years of progress in understanding sources, occurrence and pathways, Sei. Total Environ., 2000, 254, 93-234.
93 J. M. Blais, D. W Schindler, D. C. G. Muir, L. E. Kimpe, D. B. Donald and B. Rosenberg, Accumulation of persistent organochlorine compounds in mountains of western Canada, Nature, 1998, 395, 585-588.
1031 Photochem. Photobiol. Sei, 2003, 2, 1023-1031