Žurnalistika, médiá, spoločnosť 3 – 4 - Filozofická fakulta UK
Upload
khangminh22Category
view
1download
0
Comenius University in Bratislava Faculty of Physical Education and Sports
Slovak Scientific Society for Physical Education and Sports
International scientific conference SPORTS, PHYSICAL ACTIVITY AND HEALTH
PROCEEDINGS
BRATISLAVA 2014
International scientific conference
SPORTS, PHYSICAL ACTIVITY AND HEALTH
REVIEWERS: Prof. Šimonek Jaromír, PhD. Assoc. Prof. Paloma Filippo Gomez
EDITORS: Schickhofer Peter, PhD. Buzgó Gabriel, PhD.
SCIENTIFIC COMMITTEE:
Prof. Hamar Dušan, PhD., Bratislava, Slovakia Prof. Labudová Jela, PhD., Bratislava, Slovakia Prof. Kampmiller Tomáš, PhD., Bratislava, Slovakia Prof. Oborný Josef, PhD., Bratislava, Slovakia Prof. Šimonek Jaromír, PhD., Bratislava, Slovakia Prof. Laczo Eugen, PhD., Bratislava, Slovakia Prof. Zemková Erika, PhD., Bratislava, Slovakia Prof. Bunc Václav, PhD. Czech Republic Prof. Radak Zsolt, Hungary Assoc. Prof. Filippo Gomez Paloma, Italy ORGANIZING COMMITTEE:
Chair: Assoc. Prof. Kyselovičová Oľga, PhD. Secretary General: Nemček Dagmar, PhD. Members: Buzgó Gabriel, PhD. Chovanec Lukáš, PhD. Chren Matej, PhD. Kopúň Peter, PhD. Kraček Stanislav, PhD. Assoc. Prof. Labudová Jana, PhD. Assoc. Prof. Lednický Anton, PhD. Dr. Matoušek Rostislav, CSc. Sedliak Milan, PhD. Schickhofer Peter, PhD. Dr. Tirpáková Veronika, PhD. Edited by Slovak Scientific Society for Physical Education and Sports Bratislava 2014 ISBN 978-80-89075-44-7

Table of Contents
Keynote and invited speakers
DESIGNED TO MOVE – A PHYSICAL ACTIVITY ACTION AGENDA Wolfgang Baumann ……………………………………………………………………………………………...…... 8
ARE PREDISPOSITIONS FOR PHYSICAL EXERCISE INFLUENCED BY BODY MASS? Václav Bunc, Marie Skalská ........................................................................................................................ 15
REVISION OF PHYSICAL EDUCATION CURRICULUM IN SLOVAKIA – A POLITICAL OR PROFESSIONAL ISSUE? Dana Masaryková ...................................................................................................................................... 23
Full text presentations
THE IMPACT OF THE PROPOSED TRAINING PROGRAM FOR THE INTEROPERABILITY CAPABILITIES ON SOME BASIC SKILLS FOR JUNIOR FOOTBALL IN PRAIRIE Nasr Ali Hussein Agel, Aiad Elghadi ………………………………………………………………………...…. 30
MODELLING THE SYSTEM OF NATIONAL FIELD HOCKEY COMPETITIONS IN BULGARIA Antonio Antonov …………………………………………………………………………………………………….….. 37
THE IMPACT OF COACH – SOCCER PLAYERS INTERACTIONS ON THE GAME PERFORMANCE EFFICIENCY IN TERMS OF PSYCHOLOGICAL PREPARATION, AS ONE OF THE COMPONENTS OF SPORTS TRAINING Ľuboš Benkovský, Pavol Peráček, Janka Peráčková, Alžbeta Chovancová ..................................................... 46
RELATIONSHIP BETWEEN SHOT SPEED, MUSCLE POWER AND BAR SPEED DURING BENCH PRESS IN MEN’S ICE HOCKEY Juraj Bežák, Vladimír Přidal ……………………………………………………………………………………………. 54
BLOOD GLUCOSE AFTER ANAEROBIC LOADS OF DIFFERENT DURATION Ľubica Böhmerová, Matej Chalama, Dušan Hamar ........................................................................................... 60
THE QUALITY OF LIFE OF ADOLESCENTS IN RELATION TO PREFERRED TYPE OF SPORT Jaroslav Broďáni - Ľubomír Paška .................................................................................................................... 65
SPORTS EDUCATION PROGRAM FOR REINTEGRATION of POST-MILITARY SERVICE MEMBERS IN CIVILIAN LIFE Tamar Chachibaia, Helen Giorgadze, Irakli Kharjavanidze ……………...……...…………………………………. 76
SPINE CURVE OF DANCERS IN LATIN AMERICAN DANCING Matej Chren …………………………………………………………………………………………………………….. 81
PHYSICAL AND SPORT EDUCATION AS ASSESSMENT CONTEXT NATIONAL RESEARCH PROJECT OF INCLUSION Debora Di Iorio, Claudia Pagliuca, Filippo Gomez Paloma ............................................................................. 87
THE PROFILE OF THE ANIMATOR OF SPORT ACTIVITIES Aleksandar Ivanovski, Marija Zegnal Koretic …………………………………………..…………………….. 91

INFLUENCE OF MOTOR ACTIVITY OF YOUNG PEOPLE ON THEIR HEALTH Sergii Ivashchenko ………………..………………………………………………………………………………….... 98
HIGHER EDUCATION INSPIRING REGIONAL ACTIONS TO ENHANCE THE HEALTH OF UNEMPLOYED YOUTH Tarja Javanainen-Levonen, Annukka Mattinen, Vappu Salo, Päivi Laine …………..…..….………..………… 104
THE INFLUENCE OF SPORTS ACTIVITIES ON QUALITY OF LIFE OF ADOLESCENTS IN THE DISTRICT OF TOPOĽČANY Mária Kalinková, Ľubomír Paška, Jaroslav Broďáni, Vladimír Šutka, Marián Pargáč ……………….………… 115
INFLUENCE OF 12 MONTHS SWIMMING TRAININGS ON POSTURAL STATUS OF 6-14 YEAR OLD CHILDREN Sladjan Karaleic, Vladimir Puzovic, Marko Nikolic, Vesko Milenkovic, Zoran Savic, Ivana Andjelkovic ........... 123
COMPARISON OF THE CHANGES OF PERFORMANCE IN VERTICAL JUMPS IN WOMEN AND GIRLS OF THE SLOVAK NATIONAL TEAMS IN SOCCER Peter Kopúň, Pavol Peráček ..................................................................................................................... 126
ACUTE BONE TURNOVER AND EXERCISE Jana Kovárová, Dušan Hamar, Milan Sedliak ......................................................................................... 131
PHYSIOLOGICAL, MOTORIC AND ANTHROPOMETRICAL PROFILE OF YOUNG ELITE SLOVAK JUDOKAS Stanislav Kraček, Miloš Štefanovský, Žaneta Csáderová, Peter Lopata, Lukáš Lengvarský, Ladislav Kručanica ………………………………………………………………………………………….……. 137
A SUBJECTIVE AND OBJECTIVE VIEW OF OBESITY IN COLLEGE STUDENTS Zuzana Kuchelová, Alena Buková, Klaudia Zusková, Martina Hančová, Miroslava Barcalová ....................... 144
SOCIALISATION: DOMINANT ASPECT OF SPORT FOR PEOPLE WITH PHYSICAL DISABILITY Jela Labudová, Dagmar Nemček, Miloslav Bardiovský ........................................................................... 153
INDIVIDUALITY OF INTERNAL REACTION OF THE ORGANISM ON THE CHANGE OF OUTER ENVIRONMENT AND ON LOADING IN SHALLOW WATER Jana Labudová, Andrej Adamovič ..................................................................................................................... 161
CANCER EXERCISE REVIEW Eugen Laczo, Aurel Zelko ..............………………………………………………………………………….. 165
EFFECT OF PLYOMETRIC TRAINING ON MIDDLE DISTANCE RUNNERS’ PERFORMANCE Petronela Ladecká, Oľga Kyselovičová, Erika Zemková ........................................................................... 167
CHANGES IN MOTORIC PERFORMANCE OF YOUNG PEOPLE INVOLVED IN SPORT ACTIVITIES Anton Lednický, Ladislava Doležajová ………………………………………………………………………….. 175
ABOLISHMENT OF SPORTS IN BRATISLAVA CAPITAL – A COINCIDENCE OR INTENTION? Rostislav Matoušek, Ivana Krasňanová ……………………………………………………………………..…… 181
SATISFACTION WITH HEALTH STATUS IN PEOPLE WITH HEARING IMPAIRMENTS Dagmar Nemček, Ladislav Kručanica ………………………………………………………………………….. 184
EFFECTS OF A TEACHING GAMES FOR UNDERSTANDING APPROACH AND A TECHNICAL APPROACH TO TEACHING BASKETBALL ON DECLARATIVE AND PROCEDURAL KNOWLEDGE Gabriela Olosová, Ludmila Zapletalová ………………………………………………………………………..… 191
DIFFERENCES IN PUPILS’ KNOWLEDGE OF DEFFERENT AGE ABOUT CHOSEN HEALTH INDICATORS Natália Oršulová, Jela Labudová ..................................................................................................................... 195

THE SOMATIC PROFIL AND MOTOR PERFORMANCE OF THE STUDENTS OF THE FACULTY OF CHEMICAL AND FOOD TECHNOLOGY SLOVAK UNIVERSITY OF TECHNOLOGY IN BRATISLAVA IN THREE YEARS PERIOD Robin Pělucha, Adriana Koláriková, Miroslav Bobrík ........................................................................... 202
THE LEVEL OF AEROBIC PERFORMANCE IN ELITE WOMEN PLAYERS OF NATIONAL TEAMS IN SOCCER Peráček Pavol, Kopúň Peter, Benkovský Ľuboš ......................................................................................... 208
SINGLE – SUBJECT EXPERIMENTAL DESIGNS FOR IMPROVING PERFORMANCE OF AN INDIVIDUAL ATHLETE Mája Polakovičová, Eugen Laczo, Aurel Zelko ..……………………………………………………..………… 212
THE EFFECT OF SIX-WEEKS AEROBIC EXERCISES ON SOME PHYSIOLOGICAL AND BLOOD PARAMETERS OF SEDENTARY WOMEN Metin Polat, Nuray Aydoğan …………………………………………………………………………………….. 219
MOTOR AND FUNCTIONAL ABILITIES IN ELDERLY PEOPLE AFTER 8 WEEKS OF SUPERVISED TRAINING Vladimir Puzovic, Sladjan Karaleic, Ivana Andjelkovic, Zoran Savic, Vesko Milenkovic ................................ 226
HEART RATE RESPONSE TO EXERCISE PERFORMANCE IN ARTISTISC GYMNASTICS Ľuboš Rupčík ……………………………………………………………………………………………………….… 229
NATIONAL SPORT FEDERATIONS’ USE OF THE WEB FOR FULFILLING STRATEGIC GOALS Ivan Sandanski …………………………………………………………………………………………….…. 234
DEVELOPMENT OF THE CZECH AND SLOVAK VERSIONS OF THE YOUTH SPORT ENVIRONMENT QUESTIONNAIRE Pavol Siska, Alex J. Benson, Mark A. Eys, Silvia Priklerova, Pavel Slepicka .............................................. 241
OSTEOPOROSIS RISK SCORE EVALUATION IN POPULATION OF WOMEN OVER FIFTY Marek Smoleňák, Natália Oršulová ....................................................................................................... 250
APPEARANCE AND STRUCTURE OF INDIVIDUAL´S GAMEPLAY SKILLS AND COMBINATIONS IN THE GAMEPLAY TEAM SYSTEMS OF SENIORS´ TEAMS IN ICE HOCKEY Igor Tóth ………………………………………………………………………………………………...……….. 261
EXERCISE AND PSYCHOSOCIAL INTERVENTION IN PROSTATE CANCER PATIENTS Aurel Zelko, Eugen Laczo, Jana Potočníková, Tomáš Gregor ……………………………………….….. 267
THE INFLUENCE OF GENDER ON THE EFFECTIVENESS OF TGfU IN TEACHING FRISBEE ULTIMATE Zuzana Žuffová, Ludmila Zapletalová ....................................................................................................... 272
Slovak language section
ÚROVEŇ KOGNITÍVNYCH SCHOPNOSTÍ DETÍ S TELESNÝM POSTIHNUTÍM STREDNEJ ODBORNEJ ŠKOLY V BRATISLAVE Tibor Balga, Miloš Chromík ..................................................................................................................... 279
EFEKT DYNAMICKÉHO ROZCVIČENIA NA MAXIMÁLNY VÝKON V DREPE V SILOVOM TROJBOJI Iľja Číž, Michal Králik ................................................................................................................................... 287
MOTORICKÁ VÝKONNOSŤ DETÍ VO FUTBALOVEJ AKADÉMII LAFRANCONI FTVŠ UK Miroslav Holienka, Csaba Gábriš ..................................................................................................................... 293
AKTIVITY VOĽNÉHO ČASU MLÁDEŽE S TELESNÝM POSTIHNUTÍM

Miloš Chromík ................................................................................................................................................. 303
VÝVINOVÉ ZMENY FUNKČNÝCH PORÚCH POHYBOVÉHO SYSTÉMU 11 - AŽ 15 – ROČNÝCH ŽIAKOV A MOŽNOSTI ICH OVPLYVNENIA Janka Kanásová, Lenka Šimončičová ....................................................................................................... 311
OBEZITA Z POHĽADU SUBJEKTÍVNEHO A OBJEKTÍVNEHO HODNOTENIA VYSOKOŠKOLSKÝCH ŠTUDENTOV Zuzana Kuchelová, Alena Buková, Klaudia Zusková, Martina Hančová, Miroslava Barcalová .................. 319
ZMENY ÚROVNE PLÁVANIA ŠTUDENTOV FTVŠ UK Yvetta Macejková, Ľubomír Kalečík, Katarína Hrubiznová ........................................................................... 327
OPTIMÁLNY ČASOVÝ PROTOKOL TESTU LAKTÁTOVEJ KRIVKY VO VESLOVANÍ Peter Schickhofer, Michal Clementis ....................................................................................................... 333 ERRATA EFFECT OF THREE-POINT FIELD GOAL RULE CHANGE ON SHOOTING FREQUENCY IN TOP LEVEL BASKETBALL Richard Kucsa, Peter Mačura ……………………..……………………………………………………………… 342

KEYNOTE AND INVITED SPEAKERS

8
DESIGNED TO MOVE – A PHYSICAL ACTIVITY ACTION AGENDA
Wolfgang Baumann
TAFISA (The Association for International Sport for All) Secretary General
ABSTRACT The world has stopped moving. Just a few generations ago, physical activity was an integral part of daily life. In the name of progress, we've now chipped away at it so thoroughly that physical inactivity actually seems normal. In less than two generations, physical activity has dropped by 20% in the U.K. and 32% in the U.S. In China, the drop is 45% in less than one generation. Vehicles, machines and technology now do our moving for us. What we do in our leisure time doesn't come close to making up for what we've lost. The economic costs are unacceptable, the human costs are unforgiveable. Designed to move is a physical activity action agenda, focusing on children before the age of 10. More than 70 experts from a wide range of disciplines contributed to the development of the fact base and this framework, and TAFISA has recently adopted Designed To Move as its physical activity platform. No one can fix this alone. We must align strategies & combine resources. Urgent priority must be given to dramatically increase the world's commitment to physical activity. Designed To Move offers consensus on the path forward. It is a framework for action meant for ‘changemakers’ – people, companies, institutions and governments with the resources to turn this situation around. Designed To Move centers around a single vision - future generations running, jumping and kicking to reach their greatest potential – and two asks:
Ask 1 – Create early positive experiences for children. Ask 2 – Integrate physical activity into everyday life.
Today, the urgent priority is to break cycles of physical inactivity where they are already deeply entrenched, and prevent them in emerging economies where we still have time. While it’s essential for everyone to be physically active, focusing on children before the age of 10 could change the trajectory for the next generation. KEY WORDS: designed to move, physical activity, changemakers, children, next generation We live in a world where physical inactivity has become normal. It may seem like a bold statement — but consider…
Physical inactivity shows up and takes hold in a variety of different ways in modern lifestyles that we do not even question it anymore:

9
Everything at the press of a button, drive thru, signage that is actively discouraging play – all of this adds up to an extraordinary loss of human movement or physical activity loss.
The data shows we are in a race to slow down. Working with experts at the University of North Carolina, we can see the divestment of physical activity across key nations. The results are shocking…
In the US alone, in less than 2 generations, people became over 30% less active and as we extend out to 2030 they will be close to become 50% less active.
As you head over to see what is happening in the emerging economies, you can see that they are slowing down even faster.
• China, for example, in less than 1 generation is 45% less active. • Brazil is forecast to be 34% less active in 2030 compared to 2007.
At the end of the day, this is too significant in terms of a shift in behavior. We are witnessing significant material costs and consequences manifesting themselves disproportionately in today’s generation.

10
If you take a look at the research that is existing and lay it over the lifetime of a kid, what reflects back is a concerning deadly cycle. And we see that this starts to shape very early in a kid’s life.
Kids that are inactive:
• are 30% more likely to be obese, • will score lower on tests, • will be significantly more likely to be held back in school and • as they transition into the work place, they will have much lower productivity levels, • will cost their employer more, • will have more sick days, and then of course, • as an individual, really become a drain on the economy.
The most troubling thing is that the research shows that the behavior is passed on to the next generations: kids with 2 inactive parents are 6 times more likely to be inactive than kids with active parents.
Breaking the Cycle of physical inactivity
The Human Capital Model shows the manifold benefits of being physically active, as well as an incredibly powerful and holistic crosscutting solution to so many things.

11
If you lay those benefits over a lifetime of a kid, you can see that active kids have a much happier path of opportunity:
• they are less likely to be obese,
• they transition through school performing much higher, • as they go into the work force, they will be much higher performing and
potentially earn more, • They go on to be productive contributors to our economy and • of course to pass this behavior on inter-generationally.
This is the cycle we need to put in place – a positive, reinforcing cycle – for individuals, families, communities, and nations.
One of the things that is crucial in breaking or preventing the physical inactivity cycle is to identify what we have called a pivot population. The pivot population is that age or moment in a kid’s life where the cycle (deadly or positive) really locks in. We took a deeper look into the link between physical activity and certain developmental markers that occur in a person’s lifetime, particularly in the first 25 years. What we found is this moment between 7 and 12 (pre-adolescence) years old where as we understand it from the brain research, preferences in motivation really start to lock in. That means that if kids have a very positive experience during this time in their life, they are way more likely (because of what the brain will remember) to adopt that behavior through their adult hood. Conversely, if they are enjoying a ton of entertainment that is sedentary, and that becomes their positive experiences, then they are also likely to adopt those sedentary behaviors into adulthood.
So What?

12
This is a crucial time – we are in a position to make a difference and give kids 5 years back to live.
We firmly believe that the physical inactivity lever is a much bigger driver of the risk and opportunity than the world currently recognizes and is investing in today. The truth is that physical inactivity is a systemic issue – and no one can solve this alone.
The education sector nor the governments are going to be able to solve it themselves.
It is going to require all of us working within an ecosystem, together in a unified way, in order to really breakthrough on the issue. We will need to look at government policy to see which things are hurting us and which things are helping us. We will need to work with the education sector very differently because this is where our captive audience is for most of the day.
We will need to take a look at the sectors that have a very specific, vested interest in physical active populations, like the sporting goods industry and the healthcare/insurance sectors – how can we harness and harvest that for the benefit of the kids?
All sectors need to come together to create systemic solutions that can break the physical inactivity cycle: governments, healthcare, education, corporations, urban design, entertainment and gaming, communities, technology, the sport industry, etc.
In acknowledgement that no one is going to be able to fix this alone, the Designed to Move Report was set up. This is looks like another report, but it is so much more than that.
• It really sets out to do 2 things: 1) Raise the Stakes
2) Unite the Field
The third thing – what we call the multiplier effect – has exceeded expectations
On the Raise the Stakes piece, if you step back and think about the personality of the physical activity space, it is defined and shaped by 2 things:
• First, it is incredibly and directly attached to weight management and more specifically, the obesity issue. If you talk to anyone about operating in the physical activity space, the first place they go to typically these days is obesity.
• The second characteristic of the personality or the space right now is defined by this notion as parents seeing this as a distraction from more important things that are going to help their child succeed and compete in an uber-competitive world. It is extra-curricular and it is optional and it is something I cannot afford my child spending time on if they’re going to be successful in future life.

13
With that as the backdrop of the personality, what the Designed to Move report really does is consolidate the fact-base and insights in a definitive and powerful way. This work will play a very key role in shifting this issue from being in this “nice-to-have” misunderstood zone, to being a very critical, urgent and essential investment.
The second goal of the report is to unite the field.
Almost 70 organizations and individual experts contributed to the development and co-creation of the Designed to Move framework. Time was taken to substantively consider the views, opinions and validations of the organizations that have spent decades in this zone.
It is going to take a cross-section of all sorts of different types of players to solve this issue
With this aim in mind, 80 Champions were introduced to Designed to Move and joined the movement so far. If you take a look at the mix of these players, you will see that there are:
• government bodies, like the Ministry of Sport in Brazil, • research organisations, • sporting leagues like the Premier league and the NFL, • the sporting industry body itself: the WFSGI is represented here, • medical professionals • corporations like Kaiser and Nike.
All of this adding up to sends a very strong signal that it is going to take all of us to fix this.
The first thing to unite on through this work is a common framework, a single vision of future generations running, jumping and kicking to reach their greatest potential and then two asks that we think in combination create the greatest probability of breaking the cycle of physical inactivity:
• Creating early positive experiences for kids in sports and physical activity, • Integrating physical activity back into our daily life so that we encourage the world to
move more.
The second thing that we are uniting around and that we agreed on is what good looks like:
• About 60% or more of the DTM framework talks about how we implement against those two asks.
• 7 design filters were developed to create early positive experiences for children. What this represents is a point of view that has been validated by all these players – these are the key ingredients that need attention to increase the chances of a positive
• experience by a kid when they are intersecting with a physical education program in school or a sports program after school or in the community.

14
Finally, we have started something very unique: the multiplier effect. Many organisations not only co-created the work. They also carry its message and now lead its implementation.
What can YOU do?
Whether you are an individual, family member, or industry leader – everyone has a role to play in the change.
There are 3 things you can do immediately:
1) Go to designedtomove.org, download the information, and spread the message. In this day and age, we all know the power of social networking.
2) Align against the 1 Vision, 2 Asks Framework. In your work and experiences with children – leverage the 7 design filters. It is important that we get kids moving at an early age and in a fun way.
3) Make family time – active time. Kids love to move and, as adults, it is the signals we send by the choices we make that show kids physical activity is an essential part of everyday life. So go for a walk, ride a bike, kick a ball – dance! Opt for an active choice in each day.

15
ARE PREDISPOSITIONS FOR PHYSICAL EXERCISE
INFLUENCED BY BODY MASS? Václav Bunc, Marie Skalská
Faculty of P.E. and Sports Charles University, Prague, Czech Republic
ABSTRACT Poor nutrition, in addition to an overall lack of exercise, is one of the major issues of the current lifestyle. The basic question needed to be answered when designing exercise intervention: Are the physical assumptions affected by body mass (BM)? The exercise predispositions can be evaluated by the extracellular (ECM) and intracellular (BCM) mass ratio. To verify the dependence of the ECM/BCM on BM we calculated ECM/BCM for girls (normal BM, N=546, mean age=12.8±3.7yrs , BMI=19.5±0.2kg.m-2; overweight, 148, 12.6±3.2, 24.7±0.4; obese, 95, 12.9±3.4, 29.6±0.6), adult women (98, 42.3±4.6, 23.5±0.6; 84, 42.8±4.5, 28.4±0.8; 76, 42.9±4.7, 32.8±0.9) and female seniors (18, 69.4±2.6, 26.6±0.8; 15, 69.8±2.5, 29.6±1.0; 26, 68.9±2.3, 34.8±1.2). For the same age, we did not find significant differences in the ECM/BCM, and non-significant dependence on BM. In conclusion: 1.the morphological predispositions for exercise are not dependent on BM in females without regular physical exercise, 2.there do not exist any objective limitations for regular PA realized in the majority of the female population, 3.for successful management of an overweight populous and/or, in the case of individual obesity, it is necessary to influence both the energy intake (diet) and daily energy output (physical activity). KEY WORDS: physical exercise, females, body composition, diet, exercise predisposition, muscle morphology, bioimpedance
INTRODUCTION
Poor nutrition, in addition to an overall lack of exercise, is one of the major issues of the current modern lifestyle. In addition to decreasing fitness, and the reduction of everyday working conditions as well as a drop in leisure activities, the most common end result is the increase in instances of obesity and, coincidentally, a population that is generally overweight (Haskell et al. 2007). The energy content of current nutrition in majority western countries and of course in the Czech Republic has been practically stable over the last two decades. The average daily energy intake of Czech females without regular physical exercise is about 120% of BMR (Bunc 2012). In contrast, the energy content during general, daily function during the same period, decreased by about 30 % (Bunc 2000). The basis of regime interventions to influence obesity and actual fitness state is increasing the volume of PA regularly carried out.
When designing an exercise intervention should always respect previous movement experience, current physical fitness level and above current movement competence (Bunc 2012). By the assessing the movement competence should be assessed together the skill requirements and the state of muscles that insuring specific physical activity (Bunc 2000).
For assessment of physical fitness and physical competence, may be advantageously used the body composition (BC) that reflects on the one hand the imposed physical load and thus the actual level of physical fitness on the one hand and on the other hand, muscle morphology

16
(Bunc 2012).
Age related changes in body composition (BC) have implications for physical function and health (Karasik et l. 2005). The redistribution and increase of fat and the loss of muscle mass result in substantial decrease in functional capacity. Although BC, as well as the age-related changes in it, has a strong genetic component, it is also influenced by environmental factors. The primary influences are nutrition, disease, and physical activity (Roche et al.1996).
Clinically, BC is viewed in terms of two compartments: fat and fat-free mass (Blanchard et al.1990). Fat mass (FM) plus fat-free mass (FFM) that are make of proteins, water, and minerals, equals to the total body mass.
Beginning in middle adulthood, FFM begins to decline gradually both in men and women, primarily due to the wasting of muscle tissue (Blanchard et al. 1990). Similarly like FFM decreases with age the body cell mass (BCM) in subjects without of systematically physical training. This similarity is confirmed by a high significant positive correlation between these both variables that was found in women (Bunc et al. 2000). The BCM is the sum of oxygen-using, calcium rich, glucose-oxidising cells. This variable may indirectly characterize the ability of human to sustain a mechanical work. Because the BCM is related to FFM and this to body mass it is for standardization often used the relationship ECM/BCM. Extracellular body mass (ECM) is defined like ECM = FFM – BCM (Heyward and Wagner 2004).
The age related changes in ECM/BCM relationship are presented on the Figure 1. The ECM/BCM values are in the age range of 20-60 years practically constant (Bunc 2012). With the growing volume of musculoskeletal - movement load, the BCM volume increase at a significantly lower increase in ECM and therefore decreases the coefficient of ECM/BCM (Bunc 2012). Generally it is true, that the lower the ECM /BCM coefficient, the better are preconditions for muscular work (Bunc 2000).
Figure 1 Dependence of the relationship ECM/BCM on the increasing age.

17
Numerous tools and methodologies have been developed to measure various BC parameters. The bioelectrical impedance analysis (BIA) seems to be one of the most used methods in the field conditions (Roche et al. 1996). Regardless of which instrument is chosen to assess BC, the method is only as good as the measurement technique and prediction or conversion formula applied. The conversion formulas and prediction equations selected use must be restricted to the populations from which they were derived to remain valid (Bunc et al. 2000, Roche et al. 1996).
The proportion between the ECM and BCM ratio may be used to identify fluid imbalance or malnutrition and/or to assess the predispositions for muscular work. The term malnutrition refers to the loss of structural body components, which is most accurately reflected by the BCM and an increase of the ECM (Roche et al. 1996).
Lack of exercise regimen in people who are overweight or obese is often explained by lower movement assumptions for these people. It is true that many times these individuals have lower levels of motor skills as a result of completed mostly lower movement training, but an open question is whether they also have less muscle morphology, less quality of muscle mass, whether their muscle groups are less prepared to make the necessary physical activity (Brettschneider and Naul 2007).
Thus the most common questions needed to be answered when designing exercise intervention are thus: are the physical assumptions affected by an overweight nature or obese state?
METHODS
To verify the dependence of the coefficient ECM/BCM on body mass (BM) we used bioimpedance analysis; calculating this ratio for girls (normal BM, N=546, mean age=12.8±3.7 yrs , BMI=19.5±0.2 kg.m-2; overweight, 148, 12.6±3.2, 24.7±0.4; obese, 95, 12.9±3.4, 29.6±0.6), adult women (98, 42.3±4.6, 23.5±0.6; 84, 42.8±4.5, 28.4±0.8; 76, 42.9±4.7, 32.8±0.9) and female seniors (18, 69.4±2.6, 26.6±0.8; 15, 69.8±2.5, 29.6±1.0; 26, 68.9±2.3, 34.8±1.2) differing in BM.
The division into groups - normal weight, overweight and obesity was based on BMI and body fat content. For adults and seniors, we followed the WHO recommendations (Table 1), children according to data from Table 2.
Table 1WHO body mass state classification according to BMI and body fat content in adult and senior women.

18
Classification BMI
(kg.m-2)
%BF
(%)
Underweight <18.5 <18.0
Normal BM 18.5-24.9 18.1-26.0
Overweight 25.0-29.9 26.1-31.0
Obesity ≥ 30 ≥ 31.1
To assess the predispositions for PA using body composition, we can look at the ratio of extracellular (ECM) and intracellular (BCM) mass. The size of this coefficient depends on age. In the range of 20-60 year olds is practically constant. The body cell mass is calculated using the FFM and phase angle between whole impedance vector and resistance (Bunc et al. 2000). The extra cellular mass (ECM) is the difference between FFM and BCM - ECM = FFM - BCM. The FFM was calculated according to modified formula of Deurenberg et al. (1992). Resistance and reactance were measured at four frequencies - 1, 5, 50 and 100 kHz (B.I.A. 2000M, Data Input, Germany) on the right side of the body by tetrapolar electrode configuration in accordance with manufacturer’s specification. For the calculation of body fat content were used the prediction equation that were valid in senior women by DEXA method.
Table 2 Classification of body mass state according to BMI and %BF in children of age ranged from 6 to 14 years.
Classification BMI
(kg.m-2)
%BF
(%)
Underweight <15.5 <16.0
Normal BM 15.5-21.9 16.1-23.0
Overweight 22.0-26.9 23.1-28.0
Obesity ≥ 27 ≥ 28.1
The measurement itself was performed using the multi-frequency BIA analyzer BIA 2000 M, in a tetrapolar configuration of electrodes on the right side of the body in a lying position. The arrangement of the electrodes followed the manufacturer's recommendations. The apparatus measures total impedance, i.e. allows determining its capacity and resistance components. In The hydration state was controlled 8 hours before the laboratory evaluation in all subjects.

19
Means and standard deviations were calculated according to standard methods. The Pearson correlation was used for assessment of dependence in followed variables. The paired t-test was used to evaluate differences between means where appropriate. The level of statistical significance was set at p < 0.01.
The substantive significance is 1% in BF%, in coefficient ECM /BCM 0.03, and in BM, FFM, ECM and BCM 0.5 kg.
RESULTS
The mean values of %BF and ECM/BCM coefficient are presented in Table 3. In all groups of females we find significant positive dependence of ECM/BCM on age (p<0.01 in all cases). For groups of the same age, we did not find significant differences in the ECM/BCM and thus in predispositions for regularly exercise, and non-significant dependence on BM.
Table 3. Means and s of %BF and ECM/BCM coefficient in followed groups of subjects differing in body mass (nbm – normal body mass, ow – overweight, ob – obese).
%BF (%) ECM/BCM
Girlsob (n=95) 28.9±1.4 0.94±0.02
Girlsow (n=178) 24.6±1.2 0.92±0.03
Girlsnbm (n=546) 19.6±1.7 0.91±0.03
Femalesob (n=76) 32.9±1.7 0.91±0.02
Femalesow (n=84) 28.3±1.5 0.90±0.02
Femalesnbm (n=98) 23.8±1.6 0.89±0.02
Seniorsob (n =26) 35.9±1.8 1.09±0.04
Seniorsow (n =15) 29.2±1.4 1.11±0.03
Seniorsnbm (n =18) 23.9±1.0 1.10±0.02
In children we found the dependence of ECM/BCM on age in the form
ECM/BCM = -0.0243*age (years) + 1.259; r = 0.891, p<0.005, SEE = 0.04, TEE = 0.05

20
In females of middle age we found the dependence on age in the following form
ECM/BCM = 0.001*age (years) + 0.88; r = 0.891, p<0.005, SEE = 0.03, TEE = 0.04
The increase of ECM/BCM on increased age in adult females is not substantive.
The relationship ECM/BCM was increased significantly with the age in age higher than 60 years. This increase could be described by linear dependence in following form
ECM/BCM = 0.008*age (years) + 0.557; r = 0.874, p<0.005, SEE = 0.05, TEE = 0.06
DISCUSSION
The basic findings of this study, we consider the fact that the coefficients of ECM/BCM and thus the preconditions for movement load are not dependent on body mass. Thus, the conditions for regular physical training for people without regular training are independent of body mass. They are of course significantly influenced absolved training and genetically (Astrand and Rodahl 1986, Blancard et al. 1990, Bun et al. 2000). In the people with the same or similar movement regime are independent of the total body mass. Therefore, lower the volume of the implemented training for people with higher body mass or obese is largely the result of lower movement regime, their convenience. Therefore, the foundation of all movement interventions that aim to adjust body mass or increase physical fitness is always leading to clients education to change their behavior, to change their lifestyle.
The initially values of BC and aerobic fitness were slightly worse than are the Czech population standards of the similar age. Unfortunately we have not comparable data about BCM and ECM of Czech adult population and/or other European countries. These data are lacking in to our known literature.
The using of ECM/BCM for evaluation of physical exercise predispositions was confirmed by the significant dependence of VO2max on this variable. The relationship between VO2max and physical performance was often presented in literature (e.g. Astrand and Rodahl 1986). In our group of middle age men (N=67, age=44.8±3.4 years, VO2max.kg-1=38.7±4.8 ml.kg-1.min-1) we found the significant dependence between ECM/BCM and (r=0.796, p<0.005), and between ECM/BCM and physical performance (maximal speed of treadmill running) (r=0.807, p<0.005) (Bunc 2012). Similar results dependence of VO2max.kg-1 on ECM/BCM we found in females (N=84, age=43.1±3.8 years, VO2max.kg-1=32.4±4.1 ml.kg-1.min-1) (r=0.812, p<0.005), and on maximal speed of treadmill running (r=0.801, p<0.005).
The above presented dependency implies that the coefficient of ECM / BCM can be used as an important predictor for the expected load movement. In practice this means that the coefficient of ECM / BCM can be used not only to assess the applied movement regime, but also for evaluating the effectiveness of the applied motion program. Changes in the ECM/BCM coefficient are the fastest response to qualitative changes of the applied load

21
locomotive. Significant changes we found already after about 7 days changed the training load (Bunc 2012).
The significant positive ECM/BCM dependence on age could be used for assessment of actual development state – biological age in subjects (Bunc 2012, Karasik et al. 2005). In actual case we compare real value of ECM/BCM with value that was calculated according to general relationship that is true for adult men.
In normal subjects of middle age, ECM/BCM ratios are recorded between 0.75 and 1.00, in seniors and in children these values may be higher than 1.10 (Bunc et al. 2000, Roche et al. 1996, Spirduso 1995). Deviations from such figures toward higher values are due either to the erosion of BCM (catabolism) or to fluid expansion in extracellular spaces (edema). In the case of dehydration, we can observe the opposite phenomenon where the ECM/BCM ration is reduced.
With increasing volume of musculoskeletal load decreases the ratio ECM/BCM as a result of a growing amount of BCM. The default value is next to the completed locomotive load significantly genetically determined (Bunc 2000, Roche et al., 1996).
CONCLUSION
In conclusion: 1.the morphological predispositions for exercise are not dependent on BM in females without regular physical exercise, 2.there do not exist any objective limitations for regular PA realized in the majority of the female population, 3.for successful management of an overweight populous and/or, in the case of individual obesity, it is necessary to influence both the energy intake (diet) and daily energy output (PA).
The study was supported by grant of Czech Ministry of Education MSM 00216208 and grant of Charles University Prague P38.
REFERENCES
[1] ASTRAND PO, RODAHL K. Textbook of Work Physiology. New York: McGraw Hill, 1986.
[2] BLANCHARD J, CONRAD KA, HARRISON GG. J. GERONTOL. Biol. Sci. Med. Sci. 45, B119-B124, 1990.
[3] BRETTSCHNEIDER WD, NAUL R. Obesity in Europe. Frankfurt am Main: Peter Lang, 2007
[4] BUNC V et al. Acta Univ. Carol. Kinathropologica 36(1), 23-38, 2000.
[5] BUNC V. Antropomotoryka 57, 63-72, 2012.
[6] DEURENBERG P, SCHOUTEN FJM. Eur. J. Clin. Nutr. 4, 247-255, 1992.
[7] HASKELL W et al.Med. Sci. Sports Exercise 39, 1423-1434, 2007.

22
[8] HEYWARD VH, WAGNER DR. Applied body composition assessment. Champaign: Human Kinetics, 2004.
[9] KARASIK D et al. J. Geront. 60(5), 574-87, 2005.
[10] ROCHE AF, HEYMSFIELD SB, LOHMAN TG. Human body composition. Champaign: Human Kinetics, 1996.
[11] SPIRDUSO WW. Human Kinetics: Champaign; 1995.

23
REVISION OF PHYSICAL EDUCATION CURRICULUM IN SLOVAKIA – A POLITICAL OR PROFESSIONAL ISSUE?
Dana Masaryková
University of Trnava, Faculty of Education
ABSTRACT
The paper presents a case study of curricular revision in Slovakia specifically the curricular revision of physical education. It is based on author’s experience as a member of curricular committee and analysed in the context with worldwide surveys regarding curriculum development. The curriculum development is a complicated and very negotiating process that requires coordination of several groups involved, starting with national political institutions, academic professionals, teachers, school management etc. To be successful in this process means to meet conditions and requirements politically as well as professionally coherent. In conclusion the author suggests possible solutions for improving the process of curriculum development regarding the role of comparative physical education or FIEP.
KEY WORDS: physical education, curriculum, development, revision, Slovakia
INTRODUCTION
Development of curricular documents is usually an issue of political decision to improve the education system in a particular country and academic or professional discourse regarding education problems. However, the question is who sets the rules and decides what needs to be changed or revised. Therefore the concept of curriculum has recently evolved and gained in importance. Also the theorists of education like Bernstein (1974) understood the political component of the curriculum and that the curriculum development is dependent on ideological and political coherence.
Generally, curriculum defines educational foundations and contents taught at schools, sequencing the content in relation to the amount of time available for the learning experience, the characteristics of the teaching institutions, the characteristics of the learning experience, in particular from the point of view of methods to be used, the resources for learning and teaching (textbooks and new technologies), evaluation, standards and teachers’ profiles. The development of curriculum as a process is, however, less discussed in comparison with the curriculum as a result. The process itself shows certain indicators whether the curriculum implementation will be successful or not. We can basically use three approaches in curriculum development: the top down, the bottom-up and the mixed top-down and bottom-up process. As Fullan (1994) explains, neither of the two, the top-down (centralized approach) nor the bottom-up (decentralized approach) separately are good approaches for a successful school reform. The top-down process can be described through four basic phases and it is typical for centralized countries. The first phase is presenting the curriculum to teachers, this phase if followed by adopting the curriculum by teachers. As the next phase there is assimilation of the curriculum by teachers and the last phase is evaluation of the curriculum.

24
This approach usually fails in communication between the political institutions and teachers or schools. The problems of school practice are not always mirrored in this type of curricular reform. As Goodlad (1992) observed: "top-down, politically driven education reform movements are addressed primarily to restructuring. They have little to say about educating.“ The top-down strategies are questionable because it is simply difficult to change processes from the top. Senge (1990) calls it "the illusion of being in control”. The perception that someone "up there" is in control is based on an illusion – the illusion that anyone could master the dynamics and complexity of an organization from the top.
In contrary, the bottom-up process is based on teachers’ or society’s ideas of what needs to be revised or changed. There can be identified also four basic phases: what the society or the parents want, responses provided by teachers in the schools, the collection of these responses and the effort to identify some common aspects, and the development of common standards and their evaluation. However, the problems arise from the power given to schools and school management to make their own decisions regarding curricular changes. In general, schools are not likely to initiate any change in the absence of external stimuli, in particular they are not known for their innovativeness. The whole point of flexible structures and dispersed power is to enable those below to take action to deal with a large number of changes affecting an organization that operates in a certain environment. This is supposed to enable the organization to learn about society’s problems and necessities and so to adapt to it. However, studies have shown that widening participation and empowering people does not guarantee that organizational learning will improve.
The current trend is to promote networked curriculum development with several interactions (top-down and bottom-up), while trying to take into account the needs — not only the educational requirements — and to rebuild the way of conceptualizing reality and education systems, in order that political authorities are no longer found at the top, but in the centre of curriculum development dynamics. These authorities thus become stimulating bodies that promote multiple interactions between teaching institutions and society, jointly defining the meaning, the knowledge, the methods and the spaces of education (Braslavsky, 1999). From a strategy perspective, the question can be how to maximize the productive mixture of top-down pressure, incentives and responsiveness on the one hand, and bottom-up initiatives, development, and accountability on the other hand. According to Stacey (1992) the reason that simultaneous top-down/bottom-up strategies are essential is that dynamically complex societies are always full of surprises and only the negotiated capacity and strengths of the political institutions and schools/teachers, in combination, are capable of reaching improvement.
Physical education as part of curricula in many countries faces curricular strategies to the same extent as the other subjects at schools. It has gone through significant changes especially in the last decades. Its specific role that is defined also in the preamble to the European Parliament’s Resolution on the Role of Sport in Education (2007/2086NI), the physical education to be “the only school subject, which seeks to prepare children for a healthy lifestyle and focuses on their overall physical and mental development, as well as imparting important social values such as fairness, self-discipline, solidarity, team spirit, tolerance and fair play… (and is perceived to be) among the most important tools of social integration”, must be repeatedly defended in curricular documents. Hardman (2013) names some of the problems that physical education encounters these days: number of teaching hours, various contents, large gap between official policies and regulations and real practice, exemption

25
practice from physical education classes etc. Despite officially claimed changes in PE curricula where many countries present health oriented PE classes, the European Commission’s Eurydice Report (2013) presented that among the mandatory physical education activities in schools, games are most common and after ‘games’ come gymnastics and athletics. This information is in contrary with the ideas promoted, that physical education should be more health oriented and society friendly. Therefore also the importance of good curricular document in physical education is increasing especially because of health oriented society and growing awareness of physical inactivity consequences.
CURRICULAR REVISION OF PHYSICAL EDUCATION IN SLOVAKIA
The process of curricular revision in Slovakia started in autumn 2012. The reasons for revision were politically motivated and basically there were two main reasons: learners’ results (also high-stake testing) and teachers’ negative reactions regarding the previous national education programme that was launched in 20081. The process of curricular revision (or sometimes called innovation) has signs of modern “top-down and bottom-up” approach but with specific aspects. There were more actors (institutions) involved in the process, each with a specific role to play (Fig. 1).
Figure 1: Main actors of the curricular revision
1 In physical education there was no empirical evidence of unsatisfied teachers and it was presented in the work of Antala‐Labudová (2011)

26
The Ministry of Education, Science, Research and Sport of the Slovak Republic assigned the National Institute for Education (as an institution directly managed by the Ministry) with a task to innovate and revise curricular documents for pre-primary, primary and secondary education. The National Institute for Education called the Committee for Physical education and sport as advisory committee for executing the task. The revision of content and standards took approximately nine months. After this period the revised curriculum was made public on the Institute’s website and it was available for public discussion. Teachers, sport professionals, institutions or other individuals could raise comments to the curriculum. Public discussion took half a year and after that period all the comments were evaluated and categorized. During next two months the Committee included relevant comments in curriculum and prepared a report with explanations to accepted and declined comments. To this point this strategy could be described as a modern mixed top-down and bottom-up strategy of curriculum development. However, as we have already mentioned, the curricular revision in Slovakia had some specific aspects. After the public discussion the Ministry assigned other political institutions to participate in curricular revision and to raise comments on the prepared curriculum (Fig.2). Due to a large number of institutions with various recommendations, the process resulted in further negotiations.
Figure 2: Political institutions involved in curricular revision
RESULTS OF THE CURRICULAR DISCUSSIONS
During the public discussion various comments were collected from June to November 2013. Most of the comments were focused on the number of teaching hours and wanted to increase 2 hours per week to 3 or more hours per week. Slovakia as the only country reported in the Eurydice report (2013) decreased the number of teaching hours between the school years 2006/07 and 2011/12. Other comments were aimed at the education standards, a part of them

27
wanted to tighten up the criteria, the other part wanted to alleviate the criteria. An interesting discussion started among teachers about the period when to achieve the standards given in the curriculum. Especially teachers in primary education suggested achieving the standards after each school year, however, secondary teachers would prefer having more time for standard achievement e.g. after primary education or lower secondary education.
The discussion among the political institutions has not finished yet. Despite the fact that the revision started 2 years ago and the first announcement of the Ministry suggested implementing revised documents in practice in the school year 2015/16, there are still many questions to be answered and physical education as part of the curriculum also awaits the changes.
The curriculum development is a complicated and very negotiating process that requires coordination of several groups involved, starting with national political institutions, academic professionals, teachers, school management etc. To be successful in this process means to meet conditions and requirements politically as well as professionally coherent.
Presenting the curriculum development to teachers, academicians, school managers and other professionals means to open a discussion about the curriculum development and about the importance of being involved. However, their beliefs in development can be easily disappointed by political institutions and this will hopefully be not the case presented here.
CONCLUSION
The purpose of this paper was to present a difficult process of physical education curriculum development in Slovakia and analyse it in the context with worldwide curriculum problems.
The “comparative education“ or more specifically “comparative physical education“ as a scientific discipline can be helpful in the process of curriculum development. The comparison of particular curricula can show differences and issues on the international level.
However, until now the comparative education has mostly dealt with issues like the definition of educational policies, education system and its structures and trends in teaching techniques and methods. According to the International Bureau of Education (UNESCO), gathering and analyzing of information about the curriculum development (the process) should be more developed.
FIEP2 as an international organisation participates with its specific goals and activities in the process of comparing the national curricular documents as well as suggesting the ways of best practice in curriculum development. The Action plan of FIEP for 2013-2016 includes Network Partnerships, School PE and Sport Monitoring Clearing House, Publications, Conferences, Seminars, Meetings and Projects for promoting and developing ideas linked with physical education and sport.
2 FIEP – International Federation of Physical Education
28
REFERENCES
[1] ANTALA, B., LABUDOVÁ, J. Health and Healthy Life Style as a Part of Physical Education Curriculum on Slovak Schools. In Healthy Active Life Style and Physical Education. Bratislava: END, s.r.o, Topolčianky, 2011.
[2] BERNSTEIN, B., ed. Class, codes and control, vol. 2: Theoretical studies towards a sociology of language. London/Boston: Routledge & Kegan Paul, 1973.
[3] BRASLAVSKY, C. (1999). Rehaciendo escuelas: hacia un nuevo paradigma en la educación latinoamericana. Buenos Aires : Santillana, 1999.
[4] European Commission (2007). European Parliament Resolution on the Role of Sport in Education. Strasbourg, 13 November.
[5] European Commission/Eurydice (2013). Report. Physical Education and Sport at School in Europe. Brussels, Eurydice.
[6] FIEP – International federation of physical education, http://fiepeurope.eu/actionplannew.php
[7] FULLAN, M.G. (1994). Coordinating Top-Down and Bottom-Up Strategies for Educational Reform, In Anson, Ronald J., Ed. Systemic Reform: Perspectives on Personalizing Education. Office of Educational Research and Improvement (ED),Washington, DC. Office of Research. 1994.
[8] GOODLAD, J. (1992). On taking school reform seriously. Phi Delta Kappan,74(3), p.232-38
[9] HARDMAN, K. (2003). Worldwide survey on the state and status of physical education in schools: Foundations for deconstruction and reconstruction of physical education. In HARDMAN K., (Ed.), Physical Education : Deconstruction and reconstruction – Issues and directions (pp. 15-34). Schorndorf : Hofmann.
[10] International Bureau of Education, UNESCO, http://www.ibe.unesco.org/en.html
[11] National Institute for Education, http://www.statpedu.sk/
[12] SENGE, P. (1990). The fifth discipline. New York, NY: Double.ity.
[13] STACEY, R. (1992). Managing the. Unknowable. San Francisco, Jossey-Bass

29
FULL TEXTS
30
THE IMPACT OF THE PROPOSED TRAINING PROGRAM FOR THE INTEROPERABILITY CAPABILITIES ON SOME BASIC SKILLS FOR
JUNIOR FOOTBALL IN PRAIRIE
Dr. Nasr Ali Hussein Agel, Dr. Aiad Elghadi
University of Tripoli
Faculty of Physical Education and Sports Science
Office of Graduate Studies and Training
Training Department, Libya
ABSTRACT
The abstract has not been submitted by authors.
KEY WORDS: football players, junior class, basic skills, enhancement of performance
INTRODUCTION -
It has become scientific progress hallmark of the current era of what contributes to the creation of a lot of scientific solutions to many problems in all areas of life in general and the field of physical education and sports in particular, and it has advanced training methods athlete taking advantage of the principle of complementarity between science and knowledge of different and aimed to reach came to the level of Bmcnh achieve the best athletic achievements in competitive positions in the field of specialization within the limits allowed by the technical abilities.
Mentions Mr. Abdel-Maksoud (1985) that he has solved the concept of capacity harmonic replace the concept of agility old and does not show capacity harmonic Kqdarat individually, but are linked to other terms of sporting achievement, such as physical abilities and tactics also linked mostly to each other and serve capacity harmonic Turkish total traffic movements partial manner consistent and reflected on the interoperability capabilities: the quality of motor performance, the speed of motor learning, the effectiveness and the beauty of the movements, the ability to adapt programs kinetic mind with changing conditions (6: 224(
Problem of the study :-.
In the opinion of the student that the process of sports training are subject to the foundations of scientific codified by nine to raise and improve the performance of the players in general, and especially rookies are they construct properly as the student of gawkers to the game of football club promoter and being a former player in the junior team noted weakness in the level of performance of the players in some of the skills Basic (reception and ball control - Shuffle) during drills and games also noted the large number of technical errors when rookies

31
and when the largest category Sunan and when searching and inquiring about the reasons for this problem was found studies that drills used by coaches is codified moratorium scientific basis and the adoption of the trainers on their previous experience in Play The way they use the current Altksama is just this type of training is not enough to raise the level of performance of the players, which encouraged the student to conduct this study.
Importance of the study:
The importance of the study to identify the following :-
The harmonic capacity necessary and important for football players, especially at the junior class under (15) years where Tofferaha helps to achieve the best results and the best. We must therefore develop because of its great importance to the football players Faih beginners where you can not reach the highest levels without improving the capacity and the players who have the capabilities of a compromise to help them in agility and thinking and ease of performance and save a lot of time, effort and achieve the best results.
May contribute to the results of this study in planning for the development of training programs inhalers subject to the scientific basis for action to raise and improve the performance level of the player to ensure progress and raise its level, and to identify the criteria for the development of the training program appropriate for the Sunni stages.
As if this study will give add scientific scholars and researchers and coaches in football developed a new method to improve the capacity harmonic order effect on the performance of some of the basic skills of junior football where the focus is on the capacity harmonic which is working to improve the level of performance, rather than focusing on the traditional programs of experienced trainers The previous attempt to reach a practical recommendations to improve the business special training for junior football.
Objectives of the study :-
Aims to improve the level of student performance of some basic skills for junior football through:
1. The impact of the proposed training program for the interoperability capabilities of junior football.
2. Understand the impact of the proposed training program on capacity development for harmonic junior football.
Study hypotheses :-
1. There are significant differences between the measurement and tribal telemetric telemetric favor of the experimental group at the level of interoperability capabilities and some of the basic skills of football (the study sample).
2. There are significant differences between the two groups in the dimensional measurement for the experimental group at the level of interoperability capabilities and some basic skills for junior football (the study sample).

32
Terms of the study :-
Harmonic capacity
Are the terms of the kinetics and psychological general Anjazriadi enable the individual to control the motor performance in all sports activities as defined as being able recipes on the basis of athletic directing and organizing tool for the purpose of motor control in motor performance . )28 :176(
Reception and ball control :-
Possession means for disposition in an appropriate manner as required by the situation, and the receiver requires precise timing and control and highly sensitive parts of the body that are performance. (37:39)
Shuffle :-
Player points are passing up an opponent with the player and move on to another point of the stadium holding the ball with the user's performance technician fooled by his opponent's. (183:18)
The training program:
As a group of the organization and specific expertise in a scientific manner specified according to a deliberate plan and specific objectives of a particular work is to be achieved through a variety of methods and scientific methods in accordance with the specified time frame. (54: 105)
PROCEDURES OF THE STUDY :-
_1 Study methodology used student experimental approach using experimental design to measure (Pre - and post) to two groups, one experimental and the other officer.
_2 Study population:
The study population in the turf club players from the junior class (13-15) and the number (80) of the players who represent clubs Prairie - Alsyyoum - torch - meadows.
_3 Study sample:
The study sample core of players, club promoter for the junior class and numbered (20) are selected emerging and intentional way is to choose the number (5) of U study population outside the core sample to conduct a scoping study on them.
The study sample was chosen for the following reasons -
_My knowledge of the members of the club's management
_Cooperation of the administration and club coach to conduct the experiment
_Seen the sample in the same team and under the conditions of one
_Provides the tools and experience to conduct the pitch

33
_The desire of the players in the implementation of the proposed program modules in all seriousness.
Data Collection.
The tools used in the study :-
1 - hour stop.
2 - tape measure.
3 - scales to measure weight.
4 - footballs.
5 - Medical balls.
6 - mask visor to see.
7 - Flags.
8 - yolk.
9 - Gear.
10- 4 cubes 5 × 5 cm.
11 - chucked a small number (4.(
12 - football field.
13 - barriers.
14 - Swedish seats.
Physical and skill tests:
Physical tests.
1 - shuttle run test (agility) (448:38).
2 - Test the enemy 30 meters from the start low (speed transition) (17).
3 - Testing of running 400 meters (bearing speed) (17).
4 - Testing of the long jump of motion (force distinctive Baalsrah) (m) (283:38).
5 - test jump in Doaúrmnoh (total compatibility) (32:38).
6 - test correction Ali overlapping rectangles (res) (360:38-361).
7 - Achtbaralkrh paid (speed rad act) (276:46-275).

34
8 - test walk down the aisle (to realize the trend) (27:2)
1-9 Figure Eight test (dynamic balance)
Tests of skill:
First tests of the reception and control.
Test reception and control of the ball in a limited space. (191:41-190)
Second, tests Shuffle
1 - running between the flags and then scroll to the coach and then the correction (speed shuffle) (212:1).
2 - dribbling the ball against the defender (speed Shuffle) (213:1).
3 - dribbling inside the box side length of 10 meters (Srahalmraogh) (215:1).
Administrative Procedures:
Has to address' Club management meadows by the Director of the Office of Graduate Studies, Faculty of Physical Education and Sports Sciences in order to facilitate the task of the study in the application of the proposed training program. Facility (1(
Choice of Assistants
Was chosen student assistants coaches club promoter Faih rookies and numbered (3) and so forth in the annex (3)
Proposed training program:
The student prepare a proposed training program through the use of scientific references and students with the knowledge of previous training as well as expert opinion from specialists and Sport Sciences University of Tripoli and the program included the following proposed
- The program for 8 weeks.
- The number of training units per week (3) units trained.
- Total Training Modules (24) units.
- Module time (75-90 minutes).
It is divided as follows:
- Introductory section (warm-up). Facility (7)
- The main section (physical preparation - preparation Mehari).
- Concluding section (calm – relax).

35
CONCLUSIONS AND RECOMMENDATIONS:
Conclusions of the study:
In the light of the objectives of the study and within the sample and the methodology used and Mamcn obtained from the results of the student to reach the following conclusions:
1. has been reached between the percentage improvement of measurement for pre and post averages of measurements (variables) and is in the following order: For the capabilities of interoperability: Test octagonal 74% test ball paid 50% test correction Ali rectangles entered 50% test jumping in circles numbered 28% test long jump of movement 18% test run shuttle 11% test an enemy 30 meters from the start low 8% test Walking down the aisle 5% test run of 400 m 4%
2. was reached between the percentage of improvement of the control group and the experimental measurements of the mean (variables) and is in the following order: For the capabilities of interoperability: Test octagonal 62% test correction Ali rectangles entered 50% test ball paid 30% test jumping in circles numbered 23% test walk down the aisle 18% test run shuttle 13% test long jump of movement 9% test run of 400 m 7% test 30 m enemy to start a low of 6%.
3. was reached between the percentage improvement of measurement for pre and post averages of measurements (variables) and is in the following order: For the skills of reception and control: the absorption of the ball generally foot front 93% receiving the ball next to foot 88% absorption ball Bbatn foot 81% absorption of the ball thigh 80% absorption of the ball in the chest 80% mute the ball at the bottom of the foot 80% mute ball Bbatn foot 75% mute ball generally foot the outer 67% receiving the ball Bbatn foot 56%
4. was reached between the percentage of improvement of the control group and the experimental measurements of the mean (variables) and is in the following order: Skills for reception and control: mute the ball at the bottom of the foot 93% mute ball Bbatn foot 87% absorption front foot ball generally 81% absorption ball Bbatn foot 71% receiving the ball next to foot 67% Absorption ball chest 50% receiving the ball Bbatn foot 40% of the ball generally mute foot outer 39% absorption of the ball thigh 23%was reached between the percentage improvement of measurement for pre and post averages of measurements (variables) and is in the following order: For dribbling skills: dribbling test within a square the side 10 Meters 75% test dribbling the ball against the defender 28.64% test run Between the flags and then scroll to the coach and then the correction 27.11%
5. was reached between the rate of improvement of the control group and the experimental measurements of the mean (variables) and is in the following order:For dribbling skills: dribbling test within a square the side 10 Meters 47% test dribbling the ball against the defender 26% test run between Flags and then scroll to the coach and then the correction of 25%

36
Recommendations :-
In light of the results of the study showed was reached following recommendations:
1. conducting a similar study in the same age group on the impact of the harmonic capacity on all the basic skills in football.
2. must start in the development of interoperability capabilities at an early age of age.
3. Work on this study guide and training program proposed and implemented steps to working in the field of training Alnascin football.
4. The use of the proposed training program for capacity development on the harmonic Nation football.
5. to focus on training in the compatibility of the proposed program for juniors because of its great importance.
REFERENCES:
[1] AGNIENSZNAVJADACH. 2005. Connection between particular coordination motor and game efficiency of young female hand ball player-team games in physical education and sport, Poland
[2] Bryan raspon’s 1987. Soccer skills, the Hamlyn publishing comp London
[3] CHARLES B. CORBIN, RUTH LINDSEY, 1998. Concepts of physical fitness 6th wm.c. bvomn publishers, library of congress, u s a
[4] DAVID PONSANLEY, M.E.D. and ELINGTON DARDENM, D. 1987. Elington Dardenm, D: Soccer fitness Anna publishing inc., winter park florida u s a
[5] GORKIM M.J. 1953. Die frsgenderphysiologie des jugendalters, Tpkk
[6] MECHLING, H. 1999. Coordination abilities chapter (7) psychology for physical education, by Auwelleetal, Human rinetice.
[7] STANISLAW-ZAK, HENRIK DUDA. 2005. Level coordination ability but efficiency of game of young female hand ball player-team games in physical education and sport, Poland.
[8] TERESA ZWIERKO et al. 2005. Motor coordination Level of young makers on basketball player-team games in physical education and sport, Poland.
[9] VLADIMIR, LIAKH, VLADIMIR WALDSLAW ZUMDA, ZBIGNIEW WITOWSKI, H. 2001. Coordinative abilities chapter (7) psychology for physical education, by Auwelleetal, Human rinetive, Champaign.

37
MODELLING THE SYSTEM OF NATIONAL FIELD HOCKEY COMPETITIONS IN BULGARIA
Antonio Antonov
National Sports Academy, Sofia, Unit of Field Hockey, Bulgaria
ABSTRACT
The sport of hockey has various diversities (e.g. hockey, field hockey; grass hockey). It is a kind of collective game that has its origins in the Commonwealth and is most well known as a field hockey. In Bulgaria the game has been developing more intensively since 1991 with the establishment of a national governing body – the Bulgarian Field Hockey Federation (BFHF). After 2000 it is one of the most extensively developing sports in the country if gauged in terms of club network growth, number of youth players, and the establishment of a sustainable competition structure with national, regional and community championships and tournaments. The national system of competitions is run by an annual Hockey Competitions Regulations. Our study comprises a course of 23 years (1991-2013) that witnessed the conduct of 22 consecutive championships. Models used for the realization of the national hockey competitions calendar is based on two of the most popular three-cycle system of annual sporting preparation – ‘autumn-winter-spring’ and ‘winter-spring-autumn’. The former model is implemented within two calendar years while the latter within one calendar year. The study traces the impact of different models on the dynamics of a series of independent indicators: number of competitors across gender and age group, number of participating clubs and number of planned and conducted championships – rankings, age group and gender. The analysis of the results shows that the models used by the BFHF, based on two fundamentally different systems have had a mixed impact on the dynamics of examined indicators. In conclusion, it can be said that the dynamics of indicators, although diverse for separate competition years, reveals a positive trend. The largest growth in studied indicators is witnessed between 2000 and 2007. After that, with a few exceptions, a period of stagnation has occurred. This, however, is not due to the newly imposed by the BFHF model of national competition structure after 2011 when a transition from "fall-winter-spring" to "winter-spring-fall" model has been occurring. The peculiar ‘plateau’ that reflects the line of competition indicators’ dynamics serve to conclude that quantity development has probably been transformed in quality.
KEY WORDS: model, system, cycles, competitions, indicators, gender, age groups
INTRODUCTION
Hockey (field hockey; grass hockey) is a team game, more popular in the countries from the British Commonwealth as field hockey. It has been developing in Bulgaria since 1991, when the Bulgarian Hockey Federation (BHF) was founded. After 2000 it has become one of the fast-growing team sports, its growth indicators being the regional and club development, the number of practicing and registered players and officials, and also the well-developed system

38
of state, regional and club hockey championships and tournaments [3]. The system of hockey state championships and tournaments in the Republic of Bulgaria is controlled by an Act of regulation for the respective sport competition year, specifying their organization and conduct [1].
METHODOLOGY
Our study covers a period of twenty-three calendar years (1991-2013), during which the BHF has organized and conducted 22 sport competition years in succession. The models for the realization of the national sport calendar were specially selected after a study of normative acts. They are based on two of the most popular three-cycle systems for annual preparation in sport: “autumn-winter-spring”, realized in two calendar years, and “winter-spring-autumn”, realized in one calendar year [2]. Only the first sport calendar year 1991-1992 is an exception here, because the autumn season was not realized, it started from the winter season.
The aim of this research is to establish the influence of the different models for conducting hockey state championships on the dynamics of basic model indicators: number of practicing and registered players - in age groups, number of clubs – registered, members of the BHF and participating in the state championships (SCh), number of planned and conducted championships – in terms of ranking, age groups and professional staff providing for the organization of the sport events.
RESULTS
We have summarized the results from our research chronologically in tables 1, 2 and 3. The models used by the BHF to conduct the annual hockey state sport calendar, based on two different systems have had a positive influence on the dynamics of many of the studied indicators (fig.1-6). In the first ten years there has been a minor increase and no values for some indicators. In the second and third decade, however, there has been a significant increase in the rate of indicators – registered hockey clubs, members of the BHF, and participants in the state championships, with the exception of the last 22 season (2013) where a bigger decrease in the number of BHF members has been observed and, to a very small extent, in the participants in state championships. Table 1 Dynamics of hockey club development for the period 1991 -2013
№ на NC 1 2 3 4 5 6 7 8 9 10 11 12 13 14 15 16 17 18 19 20 21 22
SCY 91
92
92
93
93
94
94
95
95
96
96
97
97
98
98
99
99
00
00
01
01
02
02
03
03
04
04
05
05
06
06
07
07
08
08
09
09
10
2011
2012
2013
Registered HC
4 4 5 6 6 7 8 8 8 10 12 16 18 21 26 28 32 36 36 44 48 49
BHF members
4 4 5 6 6 7 8 8 8 10 12 16 18 21 26 28 32 36 35 36 35 30
NC participants
4 4 5 6 6 6 5 5 5 7 10 14 17 20 22 24 28 28 28 30 30 28
Notes: NC – state championships; SCY – sport competition year; BHF – Bulgarian Hockey Federation; HC – hockey club/s.

39
Table 2. Dynamics in the development of the number of players, officials and sport activities in hockey for the period 1991 -2013
№ SCY O Hockey players in age groups Conducted state championships and tournaments
U A C/M м/w 18 16 14 12 -10 ВО м/ж 18 16 14 12 КТ ВО
1 91-92 2 2 4 53 - - - - - 53 2 - - - - - 2
2 92-93 4 4 6 67 - - - - - 67 3 - - - - - 3
3 93-94 5 4 6 97 - - - - - 97 3 - - - - - 3
4 94-95 6 4 7 105 - - - - - 105 4 - - - - - 4
5 95-96 7 5 9 96 44 - - - - 140 4 1 - - - - 5
6 96-97 8 5 10 168 - - - - - 168 6 - - - - 1 7
7 97-98 10 6 15 177 - - - - - 177 7 - - - - 1 8
8 98-99 11 6 17 155 - 42 - 46 - 243 7 - 2 - 2 - 11
9 99-00 11 6 20 168 - 58 77 111 26 440 7 - 4 2 2 - 15
10 00-01 12 8 41 177 42 68 99 115 40 541 9 4 4 4 2 - 23
11 01-02 20 8 42 198 61 74 122 134 54 643 9 4 4 4 6 - 28
12 02-03 24 10 52 181 56 88 133 141 61 660 8 4 4 6 6 - 30
13 03-04 25 10 55 178 47 71 155 201 105 757 8 3 4 8 6 - 29
14 04-05 29 10 57 211 66 91 212 244 120 953 8 4 4 7 5 - 28
15 05-06 31 12 62 194 107 197 256 301 150 1205 5 6 3 7 7 1 28
16 06-07 45 21 65 237 98 205 298 355 188 1381 6 1 2 9 11 1 30
17 07-08 55 25 74 294 192 301 277 373 271 1717 7 - 6 10 10 2 35
18 08-09 49 35 79 202 180 250 340 300 - 1282 5 4 11 17 16 4 57
19 09-10 49 35 81 301 155 288 315 347 209 1625 8 4 11 17 17 4 61
20 2011 63 35 79 353 136 291 325 297 202 1654 10 2 4 7 7 5 35
21 2012 64 30 78 294 127 201 391 404 377 1794 12 3 9 12 12 11 59
22 2013 60 33 81 321 112 254 380 401 295 1753 15 2 9 12 12 11 61
AT 541 294 940 4227 1423
2479
3380
3770
2098 17455
153 42 81 122 121 41 562
AA 25 13 43 192 101 165 241 251 161 793 7,95 3,2 5,4 8,7 8,1 4,1 25,55
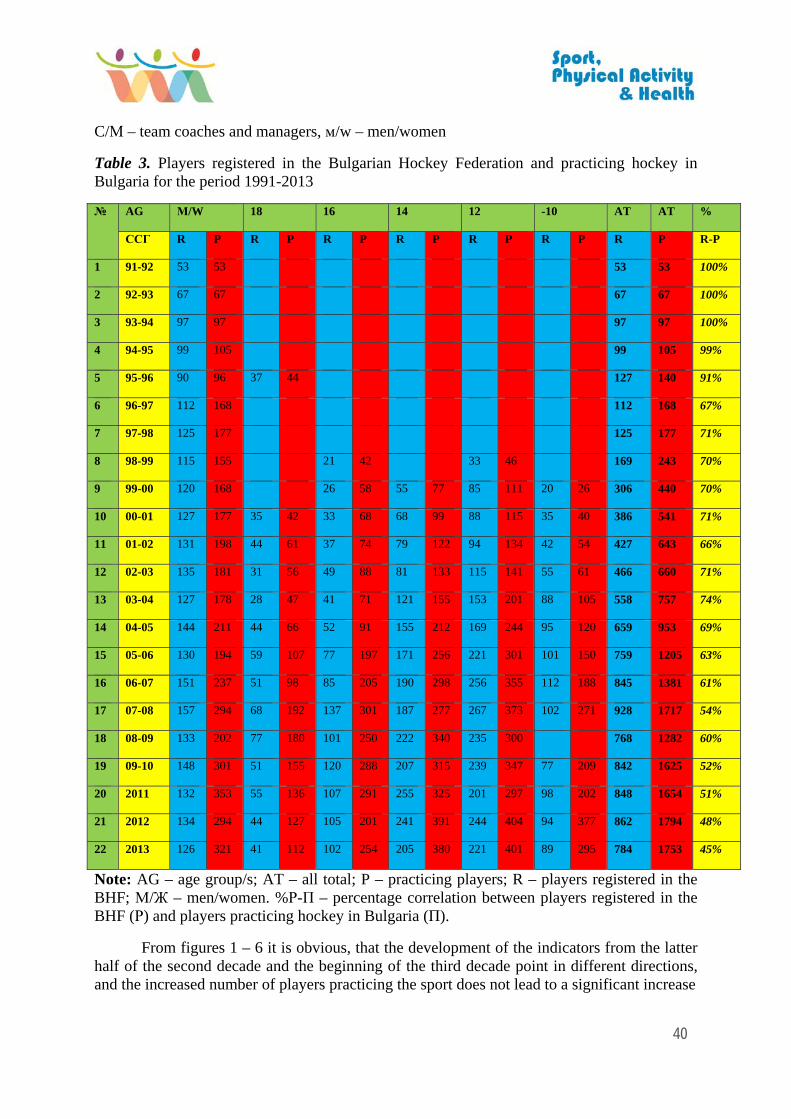
Note: AT –total all; O – officials; AA – annual average; SCY – sport competition year; U –umpires; А – administrative staff (tournament directors, technical officers and secretaries);
40
C/М – team coaches and managers, м/w – men/women
Table 3. Players registered in the Bulgarian Hockey Federation and practicing hockey in Bulgaria for the period 1991-2013
№ AG М/W 18 16 14 12 -10 AT AT %
ССГ R P R P R P R P R P R P R P R-P
1 91-92 53 53 53 53 100%
2 92-93 67 67 67 67 100%
3 93-94 97 97 97 97 100%
4 94-95 99 105 99 105 99%
5 95-96 90 96 37 44 127 140 91%
6 96-97 112 168 112 168 67%
7 97-98 125 177 125 177 71%
8 98-99 115 155 21 42 33 46 169 243 70%
9 99-00 120 168 26 58 55 77 85 111 20 26 306 440 70%
10 00-01 127 177 35 42 33 68 68 99 88 115 35 40 386 541 71%
11 01-02 131 198 44 61 37 74 79 122 94 134 42 54 427 643 66%
12 02-03 135 181 31 56 49 88 81 133 115 141 55 61 466 660 71%
13 03-04 127 178 28 47 41 71 121 155 153 201 88 105 558 757 74%
14 04-05 144 211 44 66 52 91 155 212 169 244 95 120 659 953 69%
15 05-06 130 194 59 107 77 197 171 256 221 301 101 150 759 1205 63%
16 06-07 151 237 51 98 85 205 190 298 256 355 112 188 845 1381 61%
17 07-08 157 294 68 192 137 301 187 277 267 373 102 271 928 1717 54%
18 08-09 133 202 77 180 101 250 222 340 235 300 768 1282 60%
19 09-10 148 301 51 155 120 288 207 315 239 347 77 209 842 1625 52%
20 2011 132 353 55 136 107 291 255 325 201 297 98 202 848 1654 51%
21 2012 134 294 44 127 105 201 241 391 244 404 94 377 862 1794 48%
22 2013 126 321 41 112 102 254 205 380 221 401 89 295 784 1753 45%
Note: AG – age group/s; AT – all total; P – practicing players; R – players registered in the BHF; М/Ж – men/women. %Р-П – percentage correlation between players registered in the BHF (Р) and players practicing hockey in Bulgaria (П).
From figures 1 – 6 it is obvious, that the development of the indicators from the latter half of the second decade and the beginning of the third decade point in different directions, and the increased number of players practicing the sport does not lead to a significant increase

41
in the number of players registered in the BHF.
DISCUSSION
The analysis of the acquired results gives reasons for discussion, comments and summarizing of the effect of the system models, applied by the BHF to organize the state championships, on the dynamics and growth of the main indicators characterizing the development of hockey in Bulgaria for the period 1991 – 2013.
Fig. 1 Dynamics of hockey club development for the period 1991 – 2013.
One of the important indicators of the system – club development shows an increase in development almost for the whole period, but the most prominent positive increase is observed for the period 2000 – 2008 and 2010 – 2013. (Fig. 1). From figure 1 it is also obvious, that no matter the dynamic increase in club development, after 2008 the number of BHF members and clubs participating in the state championships registers a five year standstill period, and after 2012 there is a slight decrease in numbers. It could be claimed that the competition model used until 2010 had a positive effect on club development, but by the end of its application the number of active clubs became almost a permanent value. The new model introduced in 2011 has preserved the rate of club development reached by 2010, but it has not managed to increase hockey club activity.
Similar to club development, figure 2 shows another important sport indicator on the increase – the development of training and management staff, the umpires and officials staff. Research values show that at the beginning of the period (1991) there was 1 coach per each club, 1 umpire and 1 official per two clubs, while in 2013 each active club used on average 3 coaches and managers, 2 umpires, and more than 1 official.

42
Fig. 2 Development of coaches, umpires, and BHF officials for the period 1991 - 2013
Fig. 3 Development of hockey players in age groups for the period 1991 - 2013

43
Fig. 4 Development of hockey state and club championships in age groups
The increased number of practicing players, registered players and conducted state championships are significant indicators for any sport. Figures 3 and 4 show that these indicators also have a positive development, no matter that in the course of years some multidirectional variations have been recorded, probably due to the uneven transition of players from one age group into another. This in its turn leads to the uneven number of teams participating in state championships as shown in figure 4. Although there are registered variations in the number of practicing hockey players and conducted state championships, the demographic crisis has not led to a negative development as a whole. This conclusion is confirmed by the values reflected in figure 5, where there is a marked increase in the number of staff registered in the BHF and the sport events organized during the period of the research.
We presume that the increased number of coaching, umpire and administrative staff is a factor of major importance for the positive development of the other indicators as a whole (fig. 5).

44
Fig. 5 Dynamics of the number of officials registered in the BHF and of the state championships conducted for the period 1991 – 2013
A careful examination of the dynamics of indicators reflected in figures 5 and 6 gives us reasons to claim that staff development has led to an increase in the number of the organized sport events, which has positively influenced hockey development in Bulgaria for the period 1991 – 2013.
Fig. 6 Dynamics of the number of practicing and registered hockey players in the BHF for the period 1991 - 2013
CONCLUSION
In conclusion the dynamics of indicator development as a whole is positive. The greatest increase of indicator dynamics is recorded in the period 2000-2008, followed by a period with

45
abrupt changes in the direction of development. However, this is not due to the new system
model of state sport calendar applied after 2010 (in 2011 there was a transition in the BHF from the “autumn-winter-spring” system to the “winter-spring-autumn” system). The change of the system model of BHF sport calendar in 2011 does not influence the basic indicators reflected in figures 1, 5 and 6, which characterize the potentials and general state of the sport. Positive dynamics in club development for the whole period has influenced the significant increase in three of the most important development indicators – staff provision, number of practicing players and number of organized sport events. The demographic crisis typical for the examined period does not have any influence on sport development, but the financial crisis and the increase of registration taxes in the last few years have led to a standstill in the number of registered players, whose percent constantly decreases compared to practicing players – 45% in 2013 (table 3), The “plateau” reflecting the dynamics line of some of the studied model indicators and the abrupt change in the direction of development with others are signals for transformations taking place in the model characteristics of the system from quantitative, to qualitative changes.
REFERENCES:
[1] Наредба за първенствата и турнирите по хокей в системата на БФХТ, БФХТ, София 1991-2012
[2] Отчети за дейността на БФХТ в периода 1992 – 2013 год., БФХТ, София
[3] Регистри на БФХТ за периода 1992 – 2013 год., БФХТ, София

46
THE IMPACT OF COACH – SOCCER PLAYERS INTERACTIONS ON THE GAME PERFORMANCE EFFICIENCY IN TERMS OF
PSYCHOLOGICAL PREPARATION, AS ONE OF THE COMPONENTS OF SPORTS TRAINING
Ľuboš Benkovský1, Pavol Peráček1, Janka Peráčková2, Alžbeta Chovancová2
1 Comenius University in Bratislava, Faculty of Physical Education and Sports, Department of Sport Games, Slovakia;
2 Comenius University in Bratislava, Faculty of Physical Education and Sports, Department of Sport Educology and Sport Humanistic, Slovakia
ABSTRACT
In the training process, as well as in any other social processes, the social interaction arises. It is characterized by a reversible action, where on the one hand the coach in the training process causes different reactions of their athletes on the other hand athletes with their behavior and activities foment and stimulate different responses of the coach. This interactive relationship forms one item of "puzzle" in the psychological preparation, which is inextricably linked with other components of sports training and preparation and thereby contribute to the growth and effectiveness of sport performance . The Questionnaire on Teacher Interaction was administered to 20 young soccer players of FC Spartak Trnava, who are in the stage of basic sports preparation in category of older pupils. We used questionnaire method. Standardized questionnaire on Teacher Interaction transformed to the Slovak version. Self-evaluation of the coach was very positive. He evaluated himself very highly in positive sections (behavior dimensions) and in addition in one of the negative sector "strict”. He was also highly evaluated in this section (behavior dimension - strict) by his athletes. The coach – athlete interaction is defined as a situation in which the coach, athletes, feelings, thoughts and behaviors are linked. The results support the idea that, if in this interaction is the emphasis given on cooperation, improvement and mutual approaching, then the coach – athlete interaction has an impact on the athletes’ motivation and their sports performance. Coaches and teachers and all, who are involved in pedagogical communication and social interaction, need good communication skills to provide tactical and technical guidance and also to provide psychological support to their athletes.
KEY WORDS: the coach – soccer players interaction, sport performance in soccer, psychological preparation
INTRODUCTION
In the training process, as in other social processes, there is social interaction. It is characterized by reversible actions, which on the one hand trainer in the training process

47
causes different reactions of his players and the other players with their behavior and actions,
encourage and motivate different reactions to the coach (Chovancová, Peráčková, 2013).
This interactive relationship forms one item "puzzle" in the psychological preparation, which is inextricably linked to other components of sports training and preparation, and thus contributes to the growth and effectiveness of sport performance (Moravec, 2007).
Social interaction affects the whole educational activity coach to players, which they characterized it as players perceive and describe the purposeful action, but also as a coach sees his players and himself in relation to the players. Method of communication prevalent in the coach, creating the typical behavior of the human personality and on that basis there is a particular kind of interaction style, which translates into relationships, in our case, a relationship coach - player. This relationship is influenced by many factors, but if you look at it in terms of the psychological component as one of the components of youth sports training, then it is in particular motivation, value orientation, emotional development, length and depth of the relationship with the coach, but also socialization, which increase level relationship coach - player in the training process.
The self-determination theory (SDT) (Deci and Ryan 1985, Ryan, 1995, Ryan, Deci, 2000) confirms that the athlete's social environment (motivational climate created by the coach) can affect the player's level of intrinsic motivation and pleasure. Reinbothe, Duda, and Ntoumanis (2004) argue that this very motivational climate created by the coach relates to players through motivation meet their basic psychological needs. Every human being is born with the basic psychological needs.
In our case, it is an important need for relatedness (feeling connected to others, feelings of affection for another, the other also himself), which is innate and essential for psychological growth of the player.
SDT (Deci and Ryan, 1985; Ryan, Deci, 2000) indicates the significance of the different kinds of motivation: internal, external and demotivation. Intrinsic motivation represents the highest level of self-determination. It occurs in situations in which the players devote activities training process and at the same time rewarding for them and offering the opportunity to develop their individual skills and abilities. Unlike extrinsic motivation occurs when people perform tasks because they value the results associated with them (public recognition) more than its own activity.
Finally disincentives that relates to the reluctance to perform tasks that may be because the person does not feel competent for the importance of the behavior carried out and the expected results do not appreciate or no activity (ibid). Although the motivation for better athletic performance necessary, we can say that every human being is born with some basic psychological needs such as:
1.Eligibility (feeling of reliability and efficiency in action) 2.Autonomy (feeling, which is seen as the origin or source of someone shares) 3.Closely related to (feelings associated with others, affection for each other and from the other)

48
These needs are innate, universal and necessary for psychological growth in the sport training. Participate in determining the various forms of motivation (Álvarez et al., 2009), which we mentioned above. Many foreign studies (Balaguer et al, 2005, Balaguer et al, 2008; Blanchard, Vallerand, 1996) deals with the legal relationship between the coach and the support of basic psychological needs players that are an important part of the training process of young people. Ntoumanis (2005) and Standage, Duda, Ntoumanis (2005) show that if the above merge us on psychological needs, there is satisfaction, which creates conditions to better meet its abortion if self-motivation.
METHODS
The goal was to improve understanding of the interaction style coach training process to his players and the perception of this interaction style players who coached two competition periods. As the coach-term effect on their players, we assume that the interactive relationship between them will influence their growth and effectiveness of sport performance. Research, we selected young footballers FC Spartak Trnava. Was a deliberate choice. Our group consisted of 20 footballers who are at the stage of basic sports training in the category of older students, keeping the same coach during the years of the contract. Their mean age was 14.02 ± 0.25 years.
To obtain the data we used a standardized questionnaire interaction style taken from T. Leary (1957), which Gavora, Mares, den Brok (2003) adapt the Slovak environment. The questionnaire was specifically prepared for play and especially for players. Consisted of 64 closed questions. Questions respondents on a scale of numbers 0 (never) to No. 4 (always). Even though the answers were clear and understandable, processing was difficult to evaluate individual properties trainer. These properties we called sectors and conduct them together was 8 (table. 1).
Table 1 Sectors interaction style

49
Evaluation of the sectors we applied to the octagon (pic. 1). These sectors are not octagon arranged randomly, but adjacent sectors together represent more akin to the behavior. We can say, for example, if the coach is a friendly against player, it is likely that to some extent, players can also listen (sector Conductive). If you can hear the players, it is likely that the player creates space for various design decisions (sector leads to responsibility) etc.. The smallest are related to each other opposites sectors. Coach who is hesitant (Uncertain sector) will well know to organize their training process (sector Organizer) (Amos, 2012). In interpreting, we used qualitative methods logical and responsible methods.
Picture 1 Eight sectors coach interaction model behavior
RESULTS
From observations of all players on all questions, we calculated the arithmetic means for the different sectors and at the same time, we calculated the arithmetic average terms on all issues at play. Numerical value of the players, along with coach numerical values are presented in Table 2.
We note that the players their coach not qualify higher than he is assessed in all sectors behavior. Positive sectors had higher ratings for coach and players compared to negative

50
sectors. The biggest difference in positive sectors can be seen in the sector leads to
responsibility (0.42) and in the organizer (0.36). The smallest difference in assessment is to aid in the sector conductive (0.09), where players recognize the quality and willingness to coach them to be helpful in the training process. The negative sectors players rated their coach in sectors Uncertain and Strict as well as he himself was evaluated against its players. The most striking deviation between the assessment of coach players in the sector dissatisfied (0.66). In the last sector criticizing (0.25) rated players lower their coach as he assessed.
Table 2 Values of views on the coach himself to the players and the players averages opinions on interaction style of play and comparison of these values
Based on these values, we can say that the players see their coach as more conductive and understandable, than as a coach who is a good organizer with larger doses lead them to liability. Deci and Ryan (1987) informs us that in the last decade have revealed the impact on motivation, which is a significant factor in interpersonal behavior. Are brought to the attention of just two interpersonal styles:
a. Management style is authoritarian way where others acting under duress b. Autonomous style in which it is important to promote freedom and the individual and which is involved in decision-making processes (Deci and Ryan, 1985, 1991).
This information gives us the direction that our coach is not studied in only one interaction style. On the one hand, does not act as a strong authoritarian man, because it that his players see more understandable and helpful decision we emerge on the other side that creates them a certain margin of freedom in decision making.
Picture 2 shows a comparison evaluation of players and coach self-evaluation, which shows

51
some differences. Positive in all sectors of the coach rated lower compared with self-
assessment and to evaluate the players it again below in all the bad sectors. We can say that is rated more positively than he is evaluated.
We want to say that no one in social interactions, whether a teacher or coach, will not be in only one sector, it responds to different situations and different, whether students or players. This means that rarely will get the same value in all sectors.
Legend Red = Coach Green = Players
Picture 2 Comparison of interaction style players and self coach
The study of self-determination SDT (Ryan, Deci, 2000), which we mentioned in the introduction, the authors found that if the coach provides support and autonomy of their player creates the better the condition of satisfying their basic psychological needs and also the player's satisfaction. In a relationship coach - player shows a strong bond where us authors Balaguer, Castillo and Duda (2008) confirm and highlight the same time, the higher the better support and the perception by the coach to the players, then the greater satisfaction of the needs for autonomy and relatedness player. Therefore, in our case we can say that the players and the coach's assessment of his self-evaluation does not show large differences. Points us to

52
the fact that among them there are more and relative relationship that affects them in their
training process. Players do not show any increased uncertainty, but what may be worse is that we are the biggest differences in the evaluations was found to be negative in the sector "Dissatisfied". Here we should look for the cause why they evaluated the trainer himself, but why him and evaluate his players.
The question is what creates incentives dissatisfaction in this relationship, which may further affect not only the players but the motivation and sports performance.
CONCLUSION
In our research, we tried to improve understanding of the interaction coach training process to his players and the perception of the interaction of players who train. Coach on the one hand evaluated as strict, dissatisfied and punishing, on the other hand as a coach who helps is a good organizer and understands players. In assessing whether or not a good coach or even ideal, can this developed model, according to the creators Mares, Gavora (2004) scientific nature, not prescriptive, which means that does not show how to coach in his profession messages, help, and even to which type of coach is better and which is worse. The authors (ibid) consider that trainers can be located anywhere in evaluating sectors and type of behavior may be a behavior that is acceptable in a given situation.
Behavior of the trainer as we mentioned above is not the only thing that affects the players. Also important is the climate, which creates a coach under it identifies and promotes self-motivation players. In addition, we can say that not only the climate but also emotional reactions affect the player's satisfaction needs of autonomy, competence and relatedness. Coach - player interaction is defined as a situation in which the coach, players, emotions, thoughts and behaviors are linked. The results support the idea that, if this interaction the emphasis is on cooperation, and improving relationships, then coach - player interaction affects the motivation of players and their athletic performance. Coaches, teachers and all who are involved in teaching communication and social interaction, must exhibit high quality communication skills, provide technical and tactical guidance and psychological support to its players (Jowett, Duda, 2008).
We can say this, that our research suggests a very important role coaches play in promoting and improving young players. Objective coaches are focused on developing players' competence, independence and good social relations. Support the coach is therefore important, not only in terms of motivation, but also addressing the basic psychological needs and quality gaming.
ACKNOWLEDGEMENT
This study is a part of Vega research grant No. 1/1252/12: “Improvement of identification and selection system of young male talented soccer players for junior national teams in the Slovak Republic and streamlining the content of their training and preparation.”

53
REFERENCES
[1] AMOS, G. 2012. Interakčný štýl učiteľov druhého stupňa ZŠ – porovnanie pohľadu žiakov a učiteľov. [online]. 2012, [cit. 2013–30-04]. Dostupné na internete: <http://www.e-metodologia.fedu.uniba.sk/kapitoly/volba-vyskumnej-temy/vyskumny-projekt.>.
[2] ÁLVAREZ et all. Coach Autonomy Support and Quality of Sport Engagement in Young Soccer Players, The Spanish Journal of Psychology ,2009, Vol. 12, No. 1, 138-148 ISSN 1138-7416
[3] BALAGUER. I. - CASTILLO, I. - ÁLVAREZ, M. S., DUDA, J. L. (2005).Importance of social context in the prediction of selfdetermination and well-being in athletes of different level. Paper presented at 9th European Congress of Psychology. Granada (Spain).
[4] BALAGUER, I. - CASTILLO, I. - DUDA, J. L. (2008). Apoyo a la autonomía, satisfacción de las necesidades, motivación y bienestar en deportistas de competición: un análisis de la teoría de la autodeterminación. Revista de Psicología del Deporte, 17, 123-139.
[5] BLANCHARD, C. - VALLERAND, R. J. (1996). Perceptions of competence, autonomy, and relatedness as psychological mediators of the social factors-contextual motivation relationship. Unpublished manuscript. Université du Québec à Montréal.
[6] DECI, E. L. - RYAN, R. M. (1985). Intrinsic motivation and selfdetermination in human behavior. New York: Plenum.
[7] DECI, E. L. - RYAN, R. M. (1987). The support of autonomy and the control of behavior. Journal of Personality and Social Psychology, 53, 1024-1037.
[8] DECI, E. L. - RYAN, R. M. (1991). A motivational approach to self: Integration in personality. In R. Dienstibier (Ed.), Nebraska Symposium on Motivation: Vol. 38. Perspectives on motivation (pp. 237-288). Lincoln, NE: University of Nebraska Press.
[9] GAVORA, P. – MAREŠ, J. – DEN BROK. Pedagogická revue, 55, 126-145, 2003.
[10] CHOVANCOVÁ, A. – PERÁČKOVÁ, J. Telesná výchova a šport, 23, 33-37, 2013.
[11] JOWETT, S. – DUDA, J.L. The Sport Psychologist, 22, 423-438, 2008.
[12] MORAVEC, R. Teória a didaktika výkonnostného a vrcholového športu,172-175, 2007
[13] NTOUMANIS, N. (2005). A prospective study of participation in optional school physical education using a self-determination theory framework. Journal of Educational Psychology, 97, 444-453.
[14] REINBOTH, M. - DUDA, J. L. - NTOUMANIS, N. (2004). Dimensions of coaching behavior, need satisfaction, and the psychological and physical welfare of young athletes. Motivation and Emotion, 28, 297-313.
[15] RYAN, R. M. (1995). Psychological needs and the facilitation of integrative processes. Journal of Personality, 63, 397-427.
[16] RYAN, R. M. - DECI, E. L. (2000). Self-determination theory and the facilitation of intrinsic motivation, social development, and well-being. American Psychologist, 55, 68-78.
[17] STANDAGE, M. - DUDA, J. L. - NTOUMANIS, N. (2005). A test of selfdetermination theory in school physical education. British Journal of Educational Psychology, 75, 411-433.

54
RELATIONSHIP BETWEEN SHOT SPEED, MUSCLE POWER AND BAR SPEED DURING BENCH PRESS IN MEN’S ICE HOCKEY
Juraj Bežák, Vladimír Přidal Comenius University in Bratislava, Faculty of Physical Education and Sports, Department of
Sport Kinantropology, Slovakia ABSTRACT
The aim of this study was to identify the relationship between maximal puck speed of two shot types (sweep shot and slap shot) and upper body strength and power represented by bench press characteristics. Thirteen male skilled senior ice hockey players (mean age 23.0 ± 2.7 years) participated in the sweep shot and the slap shot puck speed measuring and bench press testing. In bench press test each subject had (1) the maximal value of the mean power (Pmean) during the total concentric phase only with 30, 40, 50, 60 and 70 kg, respectively measured; (2) the maximal measured value of power output in the mean mode during concentric phase only (Pmax) measured; (3) the maximal value of the mean bar speed (BSmean) during total concentric phase only with 30 - 70 kg measured and (4) 1-repetition maximum (1RM) measured. FiTROdyne Premium (FiTRONiC s.r.o) device was used for power and bar speed assessing. Sweep shot and slap shot puck speeds were measured by sports radar PR1000 (Pocket Radar Inc). Sweep shot puck speed was statistically significantly related to Pmean and BSmean with every load. The highest correlations were found with Pmean (40 kg) (ρ = .71, p < 0.01); Pmean (50 kg) (ρ = .70, p < 0.01); Pmax (ρ = .70, p < 0.01); BSmean (40 kg) (ρ = .71, p < 0.01); BSmean (50 kg) (ρ = .71, p < 0.01). Sweep shot puck speed was also related to bench press 1RM (ρ = .64, p < 0.05). Slap shot puck speed significantly correlated with Pmean (50 kg) (ρ = .58, p < 0.05); Pmax (ρ = .57, p < 0.05); BSmean (40 kg) (ρ = .56, p < 0.05); BSmean (50 kg) (ρ = .58, p < 0.05). The results of this study suggested the strong relationship between sweep shot puck speed and upper body strength and power. Slap shot puck speed, compared with sweep shot, showed lower but significant correlation with muscular power. There was no significant relationship found between slap shot puck speed and upper body maximal strength. It is assumed that sweep shot puck speed in skilled players is mostly dependent on player’s strength and power abilities, while slap shot puck speed is influenced mostly by the shooting technique. Further similar studies need to be done to substantiate these assumptions. The study is a part of the research project: 1/0270/13 Identification of conditions for success of the realization of the final individual skills in sports games. KEY WORDS: ice hockey, slap shot, sweep shot, muscle power, bench press INTRODUCTION Teaching the shooting techniques in the game of ice hockey is one of the fundamental skills young players learn first. In general, there are four basic types of ice hockey shots: wrist shot, snap shot, backhand shot and slap shot [1, 2]. Other types of shots are: flip shot, tip-ins, deflections [1, 2]. Sometimes the wrist shot is also called a sweep shot and it is meant as the synonym [1-2]. According to Haché [3] there is a difference between sweep shot and the usual wrist shot. In the sweep shot a blade-puck contact is 1.2 - 1.5 m long against 0.3 - 0.6 m in the wrist shot. The longer sweeping motion produces higher puck

55
speed and accuracy, but it obviously takes more time [3]. Among all the types of shots the slap shot produces the highest puck velocities [4-7] and the sweep (wrist) shot is considered as the most accurate. According to the ice hockey shooting research done during the last two decades, there is no clarity what is the most significant factor affecting the puck speed. In fact, more factors have to be considered, such as: shooting technique, player skill, stick properties (construction, stiffness) and player strength. Blade-puck contact time, deflection angle deflection distance [8] and lower hand placement [5] are technique factors highly influencing puck speed of the slap shot. The comparison of elite and recreational ice hockey players slap shots revealed a significant difference in duration of the blade-puck contact. Longer blade-puck contact time during slap shot produces higher final velocity [4, 8]. A strong linear relationship was found between the distance of shaft deflection and peak velocity of puck. Elite players seem to be able to keep their sticks deflected for a longer distance with larger deflection angles and thus shoot pucks with higher velocities than recreational players [8]. Wu et al. [5] found difference in shooting technique between skilled and unskilled players in the slap shot in terms of lower hand placement. Skilled players grasped the shaft of the stick approximately 0.1 m lower in comparison to recreational players. Lomond et al. [9] using three dimensional analysis of blade contact in the slap shot observed differences in the blade kinematics (timing parameters, magnitude of linear variables, blade orientation) between skilled and recreational hockey players. The same factors of shooting technique during the blade-puck contact are responsible for the value of peak puck velocity in the wrist shot. Also body position determine the peak velocity of the sweep / wrist shot. Side stance (torso perpendicular to shooting direction) with a longer sweep produces higher puck velocities than the front stance (torso facing shooting direction) in sweep / wrist shot [10, 11]. The controversy in the recent research makes difficult to determine the role of ice hockey stick properties when considering its influence on the puck speed. Studies of Pearsall et al. [12], Wu et al. [5], Hannon et al. [4] described minimal or none effect of stick stiffness on slap shot puck speed. Likewise, there was no correlation found between stick stiffness and wrist shot puck speed [4, 5]. These findings are in contrast with other studies [7, 13], where significant correlations between stick stiffness and puck speed after slap shots and wrist shots were found. The results of Worobets’s at al. [6] study suggest that shaft stiffness has an influence on puck speed in wrist but not slap shots. There is an evidence of significant relationship between specific movement (ball throwing, bat swing, volleyball spike) and strength / power of upper body in handball [14] , baseball [15], volleyball [16]. In ice hockey, Wu et al. [5] detected minimal differences in hand grip and bench press strength between skilled and unskilled players, but significant difference in peak vertical force measured as an impact of stick during the contact with a shooting surface (force platform). Likewise, similar grip strength measures were also observed between high calibre and low calibre players in Hannon’s et al. study [4]. To our best knowledge, there is a lack of evidence about how strength and power characteristics of players are related to shooting speed of the puck. Therefore the purpose of this study was to identify the relationship between maximal puck speed of two shot types (slap shot - SLS, sweep shot - SWS) and upper body strength and power represented by bench press exercise characteristics: 1 repetition maximum - 1RM, maximal power Pmax, maximal values of mean Power with 30 to 70 kg - Pmean(30-70 kg) and maximal values of mean bar speed with 30 to 70 kg - BSmean(30-70 kg).
This study is a part of the research project: 1/0270/13 Identification of conditions for success of the realization of the final individual skills in sports games.

56
METHODS Thirteen senior male skilled ice hockey players (23 ± 2.7 years) participated in this study (Table 1). Twelve subjects had at least five years of competitive playing experience at junior or senior level, one subject played at these levels for three years. Every subject was informed prior to testing procedure and agreed to participate.
Table 1 General subject characteristicsCharacteristics Mean ± SDAge (years) 23.0 ± 2.7Sport age (years) 16.2 ± 3.2Body mass (kg) 84.1 ± 12.2Height (cm) 183.2 ± 5.4Elbow-to-elbow (cm) 98.0 ± 3.8
Each subject was tested in one session on the ice and in the weight room, respectively in the same day. Subjects had 10 - 15 minutes to warm up on the ice and other 10 minutes of warm up in the weight room. Subject were informed about proper realization of each test and also got a demonstration of proper and improper realization. The on ice testing procedure consisted of four trials of stationary sweep shot and four trials of stationary slap shot, respectively. There was a 30 s rest between each trial and at least a 3 min rest period after completing sweep shot testing. All shot trials were performed approximately 10 m from the goal line (Figure 1). Maximal puck speed was measured by sports radar - model PR1000 (Pocket Radar Inc) with measuring accuracy ± 2 km/h. A shot was considered a good trial if: (1) the puck went into the target area (a goal with IIHF official dimensions), (2) the puck speed was properly measured and (3) subject was satisfied with the trial and was sure about maximal effort. All of the shots were performed on the smooth ice with a new pucks with official IIHF dimensions. All players wore skates and hockey gloves and used their own sticks. No player broke or switched his stick during puck speed measuring. The intraclass correlation coefficient (ICC) for both types of shots (sweep shot puck speed and slap shot puck speed) was: ICC (1, 4) = .98. Standard error of measurement value for the sweep shot speed was 1.99 km/h and for the slap shot 2.81 km/h, respectively. These were the parameters assessed during bench press testing procedure: (1) the maximal value of the mean power (Pmean) during the total concentric phase only with 30, 40, 50, 60 and 70 kg, respectively; (2) the maximal value of power output in mean mode during concentric phase only (Pmax); (3) the maximal value of the mean bar speed (BSmean) during total concentric phase only with 30 - 70 kg; (4) 1-repetition maximum (1RM). The bench press grip width was set for each subject individually by means of elbow-to-elbow grip measurement [17]. After completing warm up each subject performed three sets of one maximal effort repetition with 30, 40, 50, 60, 70 kg, respectively. The subjects were instructed to use a countermovement during every repetition, but were not allowed to bounce the bar off the chest. The highest Pmean measured with every load was used for the further analysis. Once done with the third set with 70 kg, subjects continued with more sets with increased loads till reaching their bench press 1RM. Rest interval between sets was at least 2 min, but no more than 3 min. A computer based system FiTROdyne Premium (FiTRONiC s.r.o) was used for the Pmean Pmax and the BSmean assessment. To assess the relationship between puck speed and bench press performances Spearman’s rank order correlation coefficient was used. Statistical significance was accepted at p < 0.05 for all analysis.

57
Figure 1 Set up of the puck speed measuring experiment
RESULTS Main results are presented in Table 2 and Table 3. The stationary sweep shot puck speed produced by subjects of this study was 99.5 ± 8.5 km/h in average. For a stationary slap shot puck speed it was 117.2 ± 11.0 km/h in average. These results are within the range of puck speeds observed in Worobets’s et al. [6] study (wrist shot: 96.5 km/h in avg. and slap shot: 124.9 km/h in avg.) and [8], but they are higher than of other studies (considering male subjects marked as skilled / elite / high caliber only) [4, 5].
The results of this study showed significant relationship between sweep shot puck speed and bench press power output measured with every tested load (30 - 70 kg). The highest correlations were found with Pmean(40 kg), p < 0.01 and Pmean(50 kg), p < 0.01. The sweep shot puck speed also highly correlates with bench press Pmax, p < 0.01 (Table 2).
Table 2
30 kg 40 kg 50 kg 60 kg 70 kg Pmax
Sweep shot .66* .71† .70† .67* .66* .70†Slap shot .51 .53 .58* .53 .50 .57*
Significance: * p < 0.05; † p < 0.01
Correlations between sweep shot and slap shot puck speed, and bench press power output with different loads Pmean (30 - 70 kg) and maximal power output Pmax
Table 3 shows significant correlation between sweep shot puck speed and bench press
bar speed with each load. The highest correlations were found with BSmean(30 kg), p < 0.01 and BSmean(50 kg), p < 0.01. Sweep shot puck speed was also significantly related to bench press 1RM, p < 0.05.
Slap shot puck speed was found to be statistically significantly related only to: Pmean(50
kg), p < 0.05; Pmax, p < 0.05; BSmean(40 kg), p < 0.01 and BSmean(50 kg), p < 0.05 (Table 2 and Table 3).

58
Table 3
30 kg 40 kg 50 kg 60 kg 70 kg 1RMSweep shot .62* .71† .71† .69* .65* .64*Slap shot .48 .56* .58* .54 .47 .46
Correlations between sweep shot and slap shot puck speed, and bench press bar speed with different loads BSmean (30 - 70 kg) and bench press 1RM
Significance: * p < 0.05; † p < 0.01
Analysis of the results demonstrate evident relationship between sweep shot puck speed and upper body power and strength characteristics represented by bench press exercise. These findings might be helpful for adding a clarity to understanding of different puck speed production in the stationary sweep shot among skilled senior hockey players. The highest correlations between SWS puck speed and Pmean were detected with 40 kg and 50 kg, respectively. While relationship between SWS and Pmean(30 kg) is still significant, it is evident that some subjects with lower 1RM were able to outperform, in terms of power output with 30 kg, those with higher 1RM. This might be explained in this way: there were subjects who produced relatively high bar speeds and power outputs with lighter load (30 kg), but they were just not strong enough to press the heavier loads as fast as the stronger, but relatively, less powerful subjects could. As shown in Table 4, Pmean and BSmean significantly correlates with 1RM at every load, but it is evident that the heavier weight was bench-pressed, the higher correlation was detected. It is assumed that for higher SWS puck speed both muscular power and maximal strength are important.
Table 4
1-RM 1-RM 1-RMPmean(30 kg) .73† Pmax .89† BSmean(30 kg) .68*
Pmean(40 kg) .85† BSmean(40 kg) .82†
Pmean(50 kg) .87† BSmean(50 kg) .88†
Pmean(60 kg) .96† BSmean(60 kg) .95†
Pmean(70 kg) .94† BSmean(70 kg) .94†
Correlations between bench press 1-RM and Pmean; Pmax; BSmean with different loads
Significance: * p < 0.05; † p < 0.01
Generally, slap shot puck speed produced lower correlations with upper body strength and power in compare with those detected in sweep shot. SLS puck speed was significantly correlated with Pmax, but it wasn’t significantly related to 1RM. Considering these results, it seems like an upper body maximal strength is not as important factor for SLS puck speed production as muscular power is. While upper body strength and power certainly contribute to SLS puck speed production, probably other factor (mostly technique) seem to play more important role, which agrees with Villaseńor’s et al. [8] study. There are some experimental limitations which should be noted: (1) upper body strength and power were evaluated in one exercise only (bench press) - more tests and exercises could fortify or negate the significance of the puck speed and strength, power relationship; (2) relatively a small sample participated in this study; (3) subjects performed all of the shots in a stationary position, and hence it is unknown if results of this study might be

59
used for shots performed while skating; (4) since only men participated in this study, it is not possible to extend the same findings on women or youth hockey players. There were also advantages of this study: (1) results of this study might be considered as more sensitive and of higher value, because all subjects were skilled players (2) all shots were performed on the authentic ice in ice rink, which ensured game-play puck friction; (3) each subject used his own stick that he was used to play in real games with - there was no need for subjects to accommodate to any kind of experimental stick. CONCLUSION
The present study examined the relationship between two different types of ice hockey shots and upper body muscular power and maximal strength. Sweep shot and slap shot puck speeds of thirteen male senior skilled players were evaluated. The upper body maximal strength and the muscular power were assessed in a bench press exercise. The results of this study suggested the strong relationship between sweep shot puck speed and upper body strength and power. The slap shot puck speed compared with the sweep shot showed lower but significant correlation with muscular power. There was no significant relationship found between slap shot puck speed and upper body maximal strength. It is assumed that sweep shot puck speed in skilled players is mainly dependent on player’s strength and power abilities while slap shot puck speed is influenced mostly by the shooting technique. Further similar studies need to be done to substantiate these assumptions. REFERENCES [1] TABRUM. CEP Level 1 Manual, p. 114, 2012.
[2] TABRUM. CEP Level 2 Manual, p. 57, 2012.
[3] HACHÉ. The Physics of Hockey, p. 91, 2002.
[4] HANNON et al. Sports Eng J. 14, 57-65, 2011.
[5] WU et al. Sports Eng J. 6, 31-39, 2003.
[6] WOROBETS et al. Sports Eng J. 9, 191-200, 2006.
[7] KAYS - SMITH. Procedia Eng J. 72, 563-568, 2014.
[8] VILLASEŃOR et al. J Appl Biomech. 22, 200-209, 2006.
[9] LOMOND et al. Sports Eng J. 10, 87-100, 2007.
[10] BEŽÁK - Přidal. Phys Educ Sport. 24, 15-17, 2014, 2.
[11] GRICIUS. The Implications of leg position for Wrist Shot in Junior Ice hockey, p. 22, 2010.
[12] PEARSALL et al. Sports Eng J. 2, 3-11, 1999.
[13] GROVER et al. J Undergr Res in Alb. 3, 12, 2013, 1.
[14] MARQUES et al. Int J Sports Phys and Perf. 2, 414-422, 2007.
[15] MIYAGUCHI et al. J Strength and Con Res. 26, 1786-1791, 2012.
[16] FORTHOMME et al. Ame J Sports Med. 33, 1513-1519, 2005.
[17] EARLE - BAECHLE. Resistance Training and Spotting Techniques In Essentials of strength training and conditioning, p. 375, 2008.
60
BLOOD GLUCOSE AFTER ANAEROBIC LOADS OF DIFFERENT DURATION
Ľubica Böhmerová, Matej Chalama, Dušan Hamar
Faculty of Physical Education and Sports, Comenius University in Bratislava
ABSTRACT
The aim of the study was to investigate blood glucose response to anaerobic exercise loads of different duration. Ten physical education students (age 22.7 ± 1.64 years, height 183.8 ± 9.44 cm, weight 82.1 ± 9.42 kg) performed two all-out anaerobic exercises on cycle ergometer lasting 30 or 60 seconds. Blood glucose was analyzed prior to and in 5-minute intervals during 30 minutes of recovery. The highest increase of blood glucose was observed at 10th
minute (60 second load) and 15th minute (30 second load). Results showed significant increase from 3.92 to 5.03 mmol.l-1 after 60-second exercise. Only non-significant change from 4.83 to 5.4 mmol.l-1 was recorded after 30 second exercise. Higher increase of blood glucose after longer all-out anaerobic exercise can be due to a more pronounced phosphorylase mediated release of glucose from liver glycogen, resulting from a longer lasting stimulation of sympathetic nervous system. It can be concluded that short-term all-out exercise (less than 30 seconds) seems to be insufficient stimulus for significant increase of blood glucose. However, such an effect can be achieved if all-out exercise lasts longer than 60 seconds.
KEY WORDS: blood glucose, anaerobic exercise, recovery
INTRODUCTION
Glucose represents a substantial energy substrate for brain and muscle cells as well as for other tissues of human body. It is the only source of energy for the cells of central nervous system (GOODWIN, 2010). Glucose is stored in a form of glycogen in muscle fibers and liver cells. A small pool of glucose is contained in the blood. Muscle glycogen is used exclusively as a source of energy for muscle contractions. Glycogen in liver cells can (be converted into glucose units) and released into blood stream. This process plays a substantial role in regulation of blood glucose concentration. As there are no stores of glucose or glycogen in brain cells, a crucial role in their supply plays its concentration in the blood. This is the main reason why the body tends to keep glucose concentration stable. The process of its regulation involves several mechanisms.
The crucial role is played by two hormones produced by pancreatic gland, insulin and glucagon. Insulin tends to decrease blood glucose concentration by fostering its transport into cells. Glucagon, on the other hand, stimulates release of glucose from hepatic cells, what leads to an increase of its concentration in blood.

61
The insulin effect is stimulated by an increase of blood glucose concentration after
carbohydrate ingestion. Glucagon release is, on the other hand, activated by decrease of glycaemia due to starvation or excessive exercise. Under certain circumstances, when glycogen stores are depleted, glucose is synthetized from non-carbohydrate sources as glucoplastic aminoacids, glycerol, pyruvates and lactate. This process, known as gluconeogenesis, takes place in liver cells (McARDLE, et al., 2010).
During long term exercise, a part of energy demand is covered by combustion of glucose units released from muscle glycogen. Its share depends on exercise intensity and duration. As muscle glycogen stores are depleted, also liver glycogen, though primarily used by brain cells, tends to be mobilized. Glucose units are released to the blood stream to enter muscle cells as a fuel for oxidative phosphorylation. This process is associated with a mild increase of blood glucose level. Activation of liver phosphorylase is significantly stimulated by catecholamines.
Should intensive exercise last long enough, glycogen depletion occurs not only in muscles, but also in liver cells. Muscles have to “compete” with brain for valuable glucose in the blood stream (ALBRIGHT, et al., 2000). If exercise continues, normal values of blood glucose concentration (between 4.5 and 5.5 mmol.l-1), providing sufficient amount of glucose for brain cells, starts to decrease. First signs of hypoglycemia (pronounced hunger and fatigue) occur if the blood glucose drops below 3.6 mmol.l-1 (LOUCKS, 2005). Hypoglycemia intensifies adrenergic stimulation with the aim to stimulate gluconeogenesis and prevent the critical hypoglycemia.
Similar sympatoadrenergic stimulation, as due to hypoglycemia, occurs also during highly intensive short lasting exercise. So blood glucose concentration may increase up to 9 mmol (HERMANSEN et al., 1970).
The aim of our study was to investigate if and to which extent such sympatoadrenergic stimulation and subsequent hyperglycemia depend on the duration of an all-out anaerobic exercise.
METHODS
Ten recreational athletes (physical education students, age 22.7 ± 1.64 years, height 183.8 ± 9.44 cm, weight 82.1 ± 9.42 kg) participated in the study. Each of the subjects performed in random order 2 all-out anaerobic bouts of different duration (30 and 60 seconds). Both tests were performed on an isokinetic cycle ergometer (FITROcycle, Fitronic Slovakia) at a constant revolution rate of 100 rpm (HAMAR, 2006). Blood samples were collected from fingertip prior to, immediately after and then every 5 minutes of recovery. Samples were analyzed for glucose on Bayer Contor glucometer. In order to keep standard conditions, subjects were instructed to refrain from strenuous physical activity and meals prior to the testing 24 and 3 hours, respectively. Tests were separated by one week. Wilcoxon non parametric test was applied to compare the differences of blood glucose response to both exercise bouts.

62
RESULTS
Glucose concentration prior to and after two all-out exercise bouts are on the figure 1. Initial values prior to 30- and 60-second tests were identical, without any significant difference (4.83 and 3.92 mmol.l-1, respectively).
Blood glucose concentration dropped to 4.52 mmol.l-1 immediately after the 30-second lasting anaerobic bout. The concentration in minute 5 and 10 of the recovery period was increased (4.89 mmol.l-1 and 5.06 mmol.l-1, respectively). The peak value (5.38 mmol.l-1) occurred at minute 15, after which a steady decline towards to the lowest value of 4.79 mmol.l-1 followed.
A slight increase /to 4.23 mmol.l-1/ of blood glucose was found immediately after the longer-lasting anaerobic bout. Blood glucose concentration increased in further 5 minutes to 5.17 mmol.l-1 followed by slight, but steady decrease towards 4.74 mmol.l-1 in the 30th minute.
No significant differences of glucose concentration between the two tests were found at the end of recovery. As seen on the figure 1, the peak values of glycaemia were reached sooner during the longer-lasting than during the 30–second lasting bout (p ≤ 0.05).
Fig. 1. Blood glucose prior to and after all-out exercie bouts of different duration (30 vs 60 seconds).

63
Fig. 2. Delta increase of blood glucoe after all-out anaerobic bouts of different duration (30 vs 60 seconds).
Fig. 2 shows the delta values, i.e. an increase in glycaemia due to exercise bouts. A rise of glucose concentration after 30-second bout was not significant. Only 60-second exercise elicited a significant increase of glycaemia. In addition, despite lower maximal value in recovery, there was significantly more pronounced rise of glucose concentration after 60 second all-out bout.
An increase of blood glucose after anaerobic exercise is obviously a consequence of phosphorylase mediated release of glucose from liver glycogen as a consequence of stimulation of sympathetic nervous system during intensive muscle contractions. It can be concluded that short-term all-out exercise (less than 30 seconds) seems to be an insufficient stimulus for a significant increase of blood glucose
The effect of sympatoadrenergic stimulation has been well documented for aerobic exercise. There is no increase of blood glucose concentration as long as exercise remains under aerobic threshold. This is because cardiorespiratory and metabolic activity is stimulated by withdrawal of damping parasympatetic effects without any substantial activation of sympatoadrenergic system (MARLISS, et al., 2002). On the other hand, the exercise of higher intensity, e.g. close to VO2 max, requiring marked adrenergic stimulation elicits pronounced increase of glycaemia over 7 mmol.l-1 (MARLISS, et al., 2002).
During aerobic exercise of higher intensity, an increase of blood glucose takes place despite the fact that glucose units are partially used as a fuel for muscle work. However, as long as the exercise does not last long (e.g. no more than 60 minutes) these units are released from muscle glycogen, not from the blood. Hence, under such conditions carbohydrate combustion does not affect glycaemia.
One would expect that due to more pronounced sympatoadrenergic activation during intensive anaerobic exercise there will also be more increase of blood glucose. However, the effect of intensity is usually mitigated by shorter duration of such an exercise. However, if anaerobic exercise bouts are accumulated, more pronounced overall sympatoadrenergic

64
stimulation takes place leading to glycaemia values as high as 9.5 mmol.l-1 (HERMANSEN et
al., 1970).
In agreement with our findings, peak values of blood glucose in a similar study (HERMANSEN et al., 1970) were not recorded immediately after exercise but during 7th minute of recovery. It is very likely longer accumulated sympatoadrenergic stimulation, which was the main mechanism behind higher blood glucose increase in response to longer anaerobic exercise bout as compared with exercise of shorter duration.
CONCLUSIONS:
1. Short all-out exercise (less than 30 second) on cycle ergometer is an insufficient stimulus for significant increase of blood glucose.
2. Longer all-out exercise (more than 60 second) on cycle ergometer leads to significant increase of blood glucose. This effect can be ascribed to the more pronounced phosphorylase mediated release of glucose from liver glycogen, due to longer stimulation of sympathetic nervous system.
REFERENCES:
[1] ALBRIGHT et al. Med. Sci Sports Exerc. 32(7), 1345-1360, 2000.
[2] GOODWIN. Diabetes Sci Technol. 4(3), 694-705, 2010.
[3] HAMAR, In: Lipková. Fyziológia telesných cvičení. Praktické cvičenia. 20-21, 2006.
[4] LOUCKS. ACSM´s advanced exercise physiology. Lippincott Williams & Wilkins. 453-481, 2008.
[5] MARLISS et al. Diabetes. 51(1), 271-283, 2002.
[6] McARDLE et al. Exercise Physiology. 7 th ed. 7-18, 2010.
[7] HERMANSEN et al. Appl Physiol. 29(1), 13-16, 1970.

65
THE QUALITY OF LIFE OF ADOLESCENTS IN RELATION TO PREFERRED TYPE OF SPORT
Jaroslav Broďáni - Ľubomír Paška
Department of Physical Education and Sport, Education faculty, CPU in Nitra, Slovakia
ABSTRACT
The contribution points to relationship between the frequency of motor activity during the week and the quality of life of pupils of secondary schools in the middle adolescence who is dedicated to different kinds of sports.
There were involved 210 adolescents in the research dedicated to football, hockey, tennis and badminton, volleyball, contact indoor sports (basketball, handball and hockey) and athletics. Data on motor activity and quality of life were obtained through a modified questionnaire SQUALA. Data are presented by basic descriptive statistics. The differences and relationships between variables were assessed by parametric tests at the 5% level of significance.
The results presented differential relation between the types of sport is and the quality of life. The largest numbers of significant relationships with the quality of life from the perspective of satisfaction were found among football players, hockey players and athletes. Volleyball players do not show the areas of quality of life any significant relationships. In most sports we find a positive relationship with the physical well-being, material well-being, respectively their appearance and property affairs. Negative relationship with education we have seen in football players and contact indoor sports.
KEY WORDS: Quality of life, Motor activity, Sport, Adolescence
INTRODUCTION
Developmental period of adolescence lasts from about 13-15 to 20-22 years. This period is characterized by the beginning and finishing in particular physical and sexual maturation. Beginning of specific hormonal activity is accelerating the growth and development of secondary sexual characteristics. The boys are starting this period with first nocturnal emission begins around 15 years of age and girls turn menarche at age of 13. The completion of physical development at the age of about 25 years the adolescents become socially and emotionally mature personalities. By Vágnerová (2000) in foreign literature is adolescence divided into pubescencie period between 11th to 15th year and adolescence between 15 to 20 years of age. According to Macek (2003) adolescence is divided into three phases: early adolescence 10-13 years, 14-16 years middle adolescence and late adolescence 17-22 years.
The period of adolescence is characterized by the gradual release of relations with parents and preference of relations with peers. Intensively is developed emotional and sexual life. However the adolescent is social and moral at the beginning not matured he seeks security, do

66
not trust authority and has a tendency to take risks. This period is also characterized by rebellion, idealism and dramatic world of conflicting tendencies. Later there appear and extend the abilities of abstract thinking, consolidates the attitudes, beliefs, mental life, leads to the development of self-confidence, self-esteem, independence, integration of personality. At the end of adolescence reaches mature individual peak of intelligence and cognitive abilities (Macek, 2003).
The Quality of life is closely related to the different stages of development. Otherwise the quality of life is perceived in adolescence than in adulthood or retirement period. Some of the common features that affect satisfaction or dissatisfaction with life, however, we find in all stages of development (Sejčová, 2006). The evaluation of life satisfaction depends on personal comparisons of their own criteria and perceived life circumstances (Valois et al., 2002). As reported Sýkorová and Blatný (2008) overall life satisfaction in adolescents is associated with different variables, and environmental and demographic variables, socioeconomic status, temperament variables and personality. Life satisfaction is given more with positive orientation of mental health, which defines psychological wellbeing, as the absence of psychopathology symptoms (Valois et al., 2002).
The studies satisfaction with the quality of life in adolescents were monitored in relation to the frequency of leisure activities (Gilman 2001), gender (Hall-Lande, 2007), risky and violent behavior, risky sexual behavior, use of alcohol, tobacco, drugs, etc. (Züllig et al., 2001, Valois et al., 2002). The results point to a lack of work experience of adolescents in the areas of communication, stress management, decision making, problem solving and goal setting. The adolescents with poor experience can compensate own dissatisfaction in risky sexual behavior, and may occur at a higher rate and symptoms of depression. After age of 15, girls reported depressive symptoms and depression are two times higher than boys (Hall-Lande, 2007). It turns out that boys are more satisfied with life than girls Sýkorová and Blatný (2008).
Psychologists have found that people dedicated to physical exercise regularly at least three times a week as compared to individuals who do not perform any activities are satisfied with their lives. During motor activities the body releases certain substances such as endorphin (brings elation, a feeling of calm, pleasant feeling of relaxation, improves the quality of sleep and sexual desire) and serotonin (fabric hormone affecting blood coagulation, which raises the temperature of the hypothalamus and stimulates the - bottom part of the midbrain) which act as desired harmless "drug" enhancing a person's mood. With regular motor activity is shaped body, improves fitness, physical fitness of a man, while creating a habit of good body posture. Motor activity brings joy and enhances self-esteem of man is also an important means of disease prevention and stress relief. Especially air exercises works as active antidepressant because the body produces melatonin - a antidepressant hormone (Havranová, 2001).
The content assessment dimensions of quality of life are dependent on monitoring of specific sample population. Original questionnaire SQUALA the quality of life was originally created by Zannoti (1994) in France in 1992 and was designed for psychiatric patients but in the words of the author is also suitable for the general population. Skoda et al. (2007) in his research has highlighted the factors affecting the quality of life of adolescents 14-16 years. Among the most important factors of adolescents reported health and relationships with family and friends. The slightest importance is attributed to activities outside the home and
67
property affairs. By Sejčová (2006) maturing adolescents rate as the most important part of
the meaning of life the family, health and love. Interviewed adolescents are largely satisfied with the quality of life and most with the relationships and their performance at least with the social quality of life and quality of environment. Teens are mostly satisfied with their current life, they feel happy and are focused on values such as love, happiness, health, education, wisdom, peace, and less on money, success and prosperity. Ocetková (2007) is recommended in researches focus on areas of physical well-being, psychosocial well-being, spiritual well-being, material well-being, education, leisure, appearance and property affairs, respectively orientation to the future. Sýkorová and Blatný (2008) used a shortened version of the questionnaire by Ocetková for adults and adapting it for the pediatric and adolescent population.
Similar research methods were applied to specific groups of adolescents, university students, adults and teachers. In the works of Broďáni (2012); Broďáni and Bradáčová (2012); Broďáni and Špániková (2013), and Broďáni a Maťašová (2014), Broďáni a Žišková (2014), Pašková (2010) were demonstrated a positive relationships between frequency of motor activity during the week and different areas of quality of life in a group of adolescents, college students, kindergarten and primary schools teachers who realized motor activity 3-6 times a week. Motor activities with lower, respectively higher frequency during the week did not show significant relationships with different areas of quality of life.
In this paper, we focus on adolescents, where we try to look for a relationship between the frequency of motor activity during a week and quality of life. As one of important factors that should affect the mentioned causality in relation to the results is the preference of different kinds of sports.
GOAL
The aim of this work is to point out the differences and the relationship between the frequency of motor activity during the week and the quality of life for pupils of secondary schools in the middle adolescence, who are dedicated to different types of sport.
METHODS
A questionnaire survey was attended by 210 respondents. Respondents were then allocated to groups according to the preferred sports and frequencies: Soccer (N = 52, M = 15.31 years), Hockey (N = 36, M = 15.39 years), tennis and badminton (N = 23, M = 15.30 years), Volleyball (N = 22, M = 15.36 years), Contact indoor sports: basketball, handball and floorball (N = 36, M = 15.83 years) and Athletics (N = 28, M = 15.57 years).
In the first part of the questionnaire we investigated the basic information on respondents, preferred sport and frequency of motor activity during the week (N).
In the second part of the questionnaire were used modified items from a standardized questionnaire SQUALA (Zannotti - Pringuey, 1992 Dragomerická et all., 2006, Ocetková, 2007). Questionnaire shall be determined what importance people attach to certain areas of

68
life, and that they consider being important in life and then assessing the extent to which they are satisfied with these areas.
Modified questionnaire SQUALA according Sýkorová and Blatný (2008) includes a total of 58 indicators relating to external and internal factors of everyday life. Individual indicators were divided into eight areas:
1 area of physical well-being - health, sleep, solution of everyday activities, do not have problems 2 area of psychosocial well-being - family, personal relationships, intimate relationships, hobbies, safety 3 area of spiritual well-being - justice, freedom, beauty and art, truth 4 area of material well-being - money, good food 5 education - to be educated, to go to school 6 leisure time - possibility to spend your free time, have plenty of things for fun 7 appearance and ownership of things - look good, to dress nicely, have things that I like 8 orientation to the future - to have children and jobs in the future that will entertain me
The questionnaire SQUALA is divided into 2 parts. The first part defines areas from objective side "as it is important to you ..." and the second from the subjective view "how are you satisfied with ...". Both items are assessed on a 5-point scale (1 very important 2 important, 3something between, 4 unimportant, 5 completely unimportant) depending on the importance of each item in their life they attributed, respectively how was important in their life for them. and second part (1 very satisfied, 2 satisfied, 3something between, 4 dissatisfied, 5 very dissatisfied) according as with all items currently happy in your life. Satisfaction with a focus on the future of the monitored adolescents do not evaluate with respect to age.
For presentation of data were used basic descriptive statistics (frequency N, arithmetical mean M, standard deviation SD, difference in average d(M) ). Statistical significance of differences between related groups we assessed with paired t-test. Differences between independent groups were assessed by Fisher's LSD post hoc test. In identifying relationships between variables' quality of life and frequency of motor activity during the week "we used the Pearson correlation coefficient "r". To assess the statistical significance of differences and relationships was used at level of significance p<0.05. The data were processed in MS Excel and SPSS.
RESULTS
By comparing the frequency of motor activity during the week by Fisher LSD test, we recorded the same level of motor activity among football players and hockey players (p=0.829). Football players and hockey players showed statistically (p<0.01) higher frequency motor activity during the week as adolescents preferring other kinds of sports. Between groups of other sports (volleyball, athletics, tennis - badminton and basketball - handball - floorball), we also recorded statistically significant differences in the frequency of motor activities during the week. We do not present in resulting tables Fisher's LSD test because of extensiveness in our article.
Football players and hockey players participate in of motor activities on average M: 4.865 and

69
M: 4,917 times a week (Table 1). Lower frequency of motor activity during the week showed
adolescents preferring tennis - badminton (M: 3.565), volleyball (M: 3.50), basketball - handball - floorball (M: 3.829) and athletics (M: 3.50).
Table 1 Descriptive statistics of motor activity during the week and individual areas of quality of life from the perspective of importance and satisfaction of adolescents who prefer different kinds of sports
Comparing the quality of life from the perspective of the subjective assessment of the importance and satisfaction of adolescents we have recorded differences in physical well-being and spiritual well-being in all the sports (p<0.01). Adolescents attach a higher subjective importance of the physical and spiritual well-being as they are satisfied with it (table 2, figure 1-6). The most differences between importance and satisfaction in different areas of quality of life is found in hockey (6 areas), football (4 areas), contact indoor sports (field 4) and athletes (area 4). The highest proportionality between the importance and satisfaction was achieved group made up of badminton and tennis players.
To lower satisfaction with psychosocial wellbeing indicate hockey players, volleyball players and contact indoor sports (basketball, handball and floorball). Proportionality in subjective ratings of importance and satisfaction in material well-being and education is found in all

70
sports except for hockey players and athletes. Hockey players show a higher satisfaction with
the material well-being (p<0.05) and athletes turn to lower satisfaction with the field of education (p<0.01).
Higher frequency of motor activity during the week was reflected in lower satisfaction with leisure time in football players, hockey players and adolescents preferring contact indoor sports (p<0.01). Higher satisfactions with the importance are demonstrating hockey players and football players in the appearance and property affairs. Dissatisfaction with their appearance and to the property affairs indicate athletes (p<0.01).
Table 2 Differences between importance and satisfaction with the quality of life
(t-test, p<0,05)
Figure 1 Comparison of the individual areas of the quality of life in football players from the perspective of importance and satisfaction (t-test, p <0.05).

71
Figure 2 Comparison of the individual areas of the quality of life in hockey players from the perspective of importance and satisfaction (t-test, p <0.05).
Figure 3 Comparison of the individual areas of the quality of life in a group of tennis players and badminton players from the perspective of importance and satisfaction (t-test, p <0.05).
Figure 4 Comparison of the individual areas of the quality of life in volleyball players from the perspective of importance and satisfaction (t-test, p <0.05).

72
Figure 5 Comparison of the individual areas of the quality of life for a group of indoor sports (basketball, handball, hockey) from the perspective of importance and satisfaction (t-test, p <0.05).
Figure 6 Comparison of the individual areas of the quality of life in a group of athletes from the perspective of importance and satisfaction (t-test, p <0.05).
Correlation analysis of the frequency of motor activity during the week and the subjective assessment of satisfaction with individual areas of quality of life demonstrated the relationship differences between adolescents who prefer different kinds of sports (table 3). The most relationships between the frequency of motor activity during the week and the quality of life (in a positive or negative sense) were found in football players and athletes. No significant relationship between motor activity and the quality of life were observed in the group volleyball players.
Positive relationships (p<0.05) in motor activity during the week we find the physical well-being and the material well-being in football players, hockey players, tennis players in the group and badminton players, and athletes. The volleyball players and group of contact indoor sports (basketball, handball and hockey) have been demonstrated statistically significant relationships between physical activity during the week and physical well-being respectively material well-being.
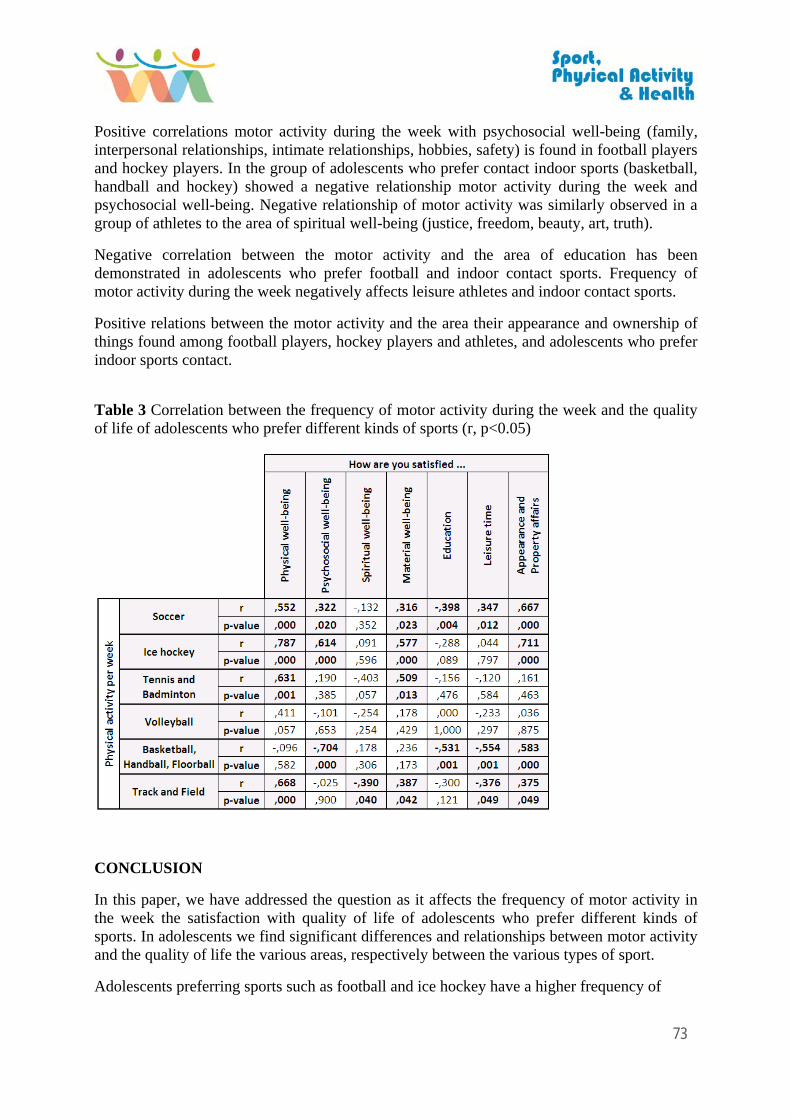
73
Positive correlations motor activity during the week with psychosocial well-being (family, interpersonal relationships, intimate relationships, hobbies, safety) is found in football players and hockey players. In the group of adolescents who prefer contact indoor sports (basketball, handball and hockey) showed a negative relationship motor activity during the week and psychosocial well-being. Negative relationship of motor activity was similarly observed in a group of athletes to the area of spiritual well-being (justice, freedom, beauty, art, truth).
Negative correlation between the motor activity and the area of education has been demonstrated in adolescents who prefer football and indoor contact sports. Frequency of motor activity during the week negatively affects leisure athletes and indoor contact sports.
Positive relations between the motor activity and the area their appearance and ownership of things found among football players, hockey players and athletes, and adolescents who prefer indoor sports contact.
Table 3 Correlation between the frequency of motor activity during the week and the quality of life of adolescents who prefer different kinds of sports (r, p<0.05)
CONCLUSION
In this paper, we have addressed the question as it affects the frequency of motor activity in the week the satisfaction with quality of life of adolescents who prefer different kinds of sports. In adolescents we find significant differences and relationships between motor activity and the quality of life the various areas, respectively between the various types of sport.
Adolescents preferring sports such as football and ice hockey have a higher frequency of

74
motor activity during the week as adolescents preferring volleyball, athletics, tennis – badminton and contact indoor sports (basketball - basketball - floorball).
All adolescents show lower satisfaction in the areas of physical and spiritual well-being. All adolescents evaluate proportional importance and satisfaction in material well-being and education. The highest proportionality between importance and satisfaction on areas of quality of life showed a group of tennis players and badminton players. The most differences between importance and satisfaction are reaching hockey players.
Motor activity during the week positively affects most areas of quality of life for most sports. The quality of life in volleyball players has not shown relationships with motor activity. The results highlight the importance of motor activity in the life of adolescents, the possibility of influencing the quality of life through physical activities, but also to create optimal conditions for the possibility of improving the quality of life (Vojtová, 2012).
REFERENCES
[1] BROĎÁNI J (2012) The Relationship of Physical Activity and Subjective Well-Being of Students on Constantine the Philosopher University in Nitra. In: Current Trends in Educational Science and Practice II. Ústí nad Labem : UJEP, 2012. pp 19-28.
[2] BROĎÁNI J, BRADÁČOVÁ N (2012) The Relationship Between the Activity and Quality of Students Lives at High Schools in Nitra. In: Aktuálne problémy telesnej výchovy a športu l. Ružomberok : VERBUM, 2012. pp 28-33.
[3] BROĎÁNI J, ŠPÁNIKOVÁ V (2012) Life quality in a relation to frequency of activity during a week by pre-school and elementary pedagogy and teacher training for the primary education on Faculty of education at CPU in Nitra. In Exercitatio Corpolis - Motus - Salus : Slovak journal of sports science. ISSN 1337-7310. 5( 1) pp 86-95.
[4] BROĎÁNI J, ŽIŠKOVÁ I (2014) Quality of life and physical activity of kindergarden teachers. In Kultura Fizyczna. ISSN 1505-424. 13(2).in press
[5] BROĎÁNI J, MAŤASOVÁ Z (2014) Frekvencia pohybovej aktivity v týždni vo vzťahu ku kvalite života učiteliek na prvom stupni ZŠ. In Aktuálne problémy telesnej výchovy a športu III.. Ružomberok : VERBUM, 2013. pp 31-40
[6] DRAGOMIRECKÁ E et al (2006) SQUALA : Příručka pro uživatele české verze dotazníku subjektivní kvality života. Praha, Psychiatrické Centrum, 2006.
[7] GILMAN R (2001) The relationship between life satisfaction, social interest, and frequency of extracurricular activities among adolescent students, Journal of youth and adolescence. 2001; 30 (6); ProQuest Social Science Journals, 749-767
[8] HALL-LANDE J, EISENBERG M, CHRISTENSON S, NEUMARK-SZTAINER D (2007) Social isolation, psychological health, and protective factors in adolescence, Adolescence, Summer 2007; 42 (166); ProQuest social science journals, pp 265-287
[9] HAVRANOVÁ, M. (2001) Krok k dokonalejšiemu vzhľadu a zdraviu. 1. vydanie. Bratislava: Právnická fakulta UK, 2001. 85 p.
[10] MACEK P (2003) Adolescence. Praha: Portál, 2003. 112 p.

75
[11] OCETKOVÁ I (2007) Úloha spirituality v životní pohodě a kvalite života mladých lidí. Dizertačná práca. Brno : KP FSS MU. 233 p.
[12] PAŠKOVÁ L (2010) Vzťah telesnej aktivity a subjektívnej pohody u vysokoškolských študentov. In Studia kinanthropologica, 9 (2) p.77-82
[13] SEJČOVÁ Ľ (2006) Pohľad na kvalitu života dospievajúcich. Bratislava: Album. 99 p.
[14] SÝKOROVÁ Z, BLATNÝ M (2008) Kvalita života u adolescentov: diplomová práca. Brno: KP FF MU. 99 p.
[15] VÁGNEROVÁ M (2000) Vývojová psychologie. Praha : Portál 522 p.
[16] VALOIS R, ZULLIG K, HUEBNER S, KAMMERMMANN S, DRANE W (2002) Association between life satisfaction and sexual risk - taking behaviors among adolescents, Journal of child and family studies, 11 (4), p. 427-440
[17] VOJTOVÁ Z (2012) Poradenské zručnosti pre prácu s adolescentmi. Bratislava: MPC, 2012. 76 s.
[18] ZANNOTTI M, PRINGUEY D (1992) A method for quality of life assessment in psychiatry: the S-QUA-L-A (Subjective Quality of life Analysis) Quality of life News Letter, 4, 6.
[19] ZULLIG K, VALOIS R, HUEBNER S, DRANE W (2005) Association among family structures, demographics, and adolescent perceived life satisfaction, Journal of child and Family studies, 14 (2), pp195-206
[20] The article is part of the Ministry of Education grant KEGA 014UKF-4/2013 Improving the quality and level of health of adolescents by means of motor activity in primary and secondary schools.

76
SPORTS EDUCATION PROGRAM FOR REINTEGRATION OF POST-
MILITARY SERVICE MEMBERS IN CIVILIAN LIFE
Tamar Chachibaia1,2, Helen Giorgadze2, Irakli Kharjavanidze3
1 Department of Behavior and Social Sciences, D.Tvildiani Medical University, Tbilisi, Georgia
2 Faculty of Medicine, Iv.Javakhishvlisi Tbilisi State University, Tbilisi, Georgia 3 Department of Sports and Art, Iv.Javakhishvlisi Tbilisi State University, Tbilisi, Georgia
Corresponding author: Tamar Chachibaia, Assistant Professor, D.Tvildiani Medical University, Tbilisi, Georgia
ABSTRACT
Diploma programs help many military service members earn their sports-related degrees or take sport education courses. The aim of the project is to involve retired military service veterans in sport education and coaching. To address veterans’ organizations to recruit veterans to sports education, coaching, risk and security management and Paralympics, to facilitate smooth transition of carrier from military to civil. We provide online course of distance education which is promoted at the university web-site as a diploma course of up to one year duration, teaching about rehabilitation and psychological aid, leadership, promoting sports education for involvement of retired veteran military service members to become sports educators trough coaching; to build sport safety management team. The program in forward looking perspective is dedicated to be available on many languages for demobilized army service members and wounded warriors. The university will work closely with the wounded warriors to deliver online sport education programs to military personnel, who are ill, wounded or disabled from post combat duty in Afghanistan. Earning a diploma can lead to jobs in the sport profession as a coach, athletic trainer or administrator in the future. It will be a vital asset in both civilian and military life.
KEY WORDS: sport education, management, military sports medicine, post-military service member reintegration.
The aim of the project is to involve retired military service veterans in sport education and coaching.
Diploma programs help many military service members earn their sports-related degrees or take education course.
The online courses are beneficial to anyone in the military who has the desire to learn and improve both mentally and physically.
Our initiative provides platform for the smooth transition of retired veterans to civil lifestyle and their integration in sports related activities, to stimulate active participation in university athletic team life, capacity building of leadership and performance enhancement. Program provides information related to performance education and legislation, risk management.

77
Earning a diploma can lead to jobs in the sport profession as a coach, athletic trainer or administrator in the future. It will be a vital asset in both civilian and military life.
METHODS:
1. Case study of curriculum design for the program in the “Legal Aspects of Athletes’ Performance” in the Tbilisi State University
2. Content analysis of curriculum. Comparative analysis of the related programs in the following universities: Uniform Services University, (Bethesda, USA), United States Sports Academy, (Alabama, USA), The Real Madrid Graduate School, European University of Madrid, (Spain).
1) The distance e-learning educational program “Legal Aspect of Athletes Performance” is innovative higher educational degree program, which is focusing on athletes’ performance improvement in sports activities, as well ethical and legal norms and regulations of human enhancement in professional sports.
New program “Legal Aspects of Athletes’ Performance” was designed in the Faculty of Medicine, Tbilisi State University to be integrated in the curriculum as a post-graduate diploma course. As a priority method for delivering of the innovative course was chosen distance e-learning approach.
Didactic teaching, as well practice and research project development is included in this program.
Program is relevant to US ACGME (Accreditation Council for Graduate Medical Education) and Georgian National Center of Education Accreditation standards.
The aim of the program is to introduce new paradigm in sports related disciplines by prioritization e-learning education, promoting teaching portfolio method, establishment of interdisciplinary connections between related disciplines; network formation in sports medicine in higher education institutions through dissemination of knowledge and expertise by formation of international network infrastructure.
This project group developed a network for e-learning providing web-site access to sports medicine education with the emphasis on athletes’ performance legislative aspects, which promotes and supports production and distribution of internet-based relevant educational materials.
The site contains tools for registering and retrieving information about available internet based e-learning resources.
All courses are offered online, and students can conveniently enroll and start their studies anytime and from anywhere. All courses are available for degree-seeking and non-degree-seeking students.
Teaching material can be distributed to large numbers of students and be made available

78
independent of time and place. Teaching materials can be used in different contexts and combinations.
The site also includes suggested guidelines for producing and using materials and offers advices on pedagogical and technological solutions. At a later stage a system for peer-review of materials will be introduced.
2) Key component of e-learning program is based on design and development of individual portfolio by student. Evaluations of studies are provided by assessment of students’ portfolio. The course portfolio is a relatively new method in professional development of university teachers. It was pioneered by a project of the American Association for Higher Education (AAHE) involving faculty of North American universities and has by now contributed to the development of the scholarship of teaching and learning [1].
Course portfolio is a method of focusing the teacher's attention on student learning and putting student-centered education into practice.
The e-portfolios owe much of their increasing popularity to their usefulness in documenting progress towards academic standards [2]. From a long-term perspective, the perceived value of e-portfolios lies in their potential as a space for lifelong learning [3].
Our program is designed with the analogy of United States Sports Academy, (Alabama, USA).
In our program student’s individual e-portfolio contains: personal professional development plan (PDP), mentorship report and project work paper.
Practice include: mass participation sports events practice, pre-participatory medical examination internship, round table meeting and discussions, and not limited to these. For theoretical learning is required annotated bibliography of selected readings, which will be part of course work. This might be represented by on-line presentations and publications.
One of the aims of this program is promoting establishment of interdisciplinary connections between specified fields and disciplines, network formation of physical activity professionals in public health versus family medicine doctors’ interest groups in sports medicine in higher education. This concept is adopted from the practice of Uniform Services University, Bethesda. Curriculum is composed of various materials related to military sports medicine issues and risk management in various extreme situations. Presentations are shared publicly and provide wealth of information specific for our current program. On-line platform allows us to use web-portals of USU for education purposes among students.
Risk management issues became more important since the attack on athletes during the Marathon in Chicago in 2013, which obviated the need for increased security measures surrounding sports events and the importance of comprehensive planning and security services for insuring the safety of athletes and spectators, care of the venues.
As sports medicine law is relatively new branch of sports medicine, it is important to increase awareness of some significant legal implications of sports medicine practices [4]. It will incorporate number of selective issues including negligence, confidentiality, and as well anti-

79
discrimination law. Important is knowing and understanding of the problems associated with the drugs on the World Anti-Doping Agency (WADA) [5], especially in the context of team sports, where responsibilities are divided between athlete and team.
When completed, the e-portfolios will be clear academic portraits of students’ interests, scholarly abilities, writing capabilities, independent and critical thinking, and research capabilities.
Students will choose the mentorship option and submit a final paper. The purpose of the mentorship final paper is to create a paper to provide an opportunity to explain how the students’ mentorship experience contributes to their career goals in the sport related discipline, e.g. risk management.
During the program initiation stage students are required to submit professional development plan, with personal statement including mandatory components: biographical, career plan component and goals in pursuing the degree program, which is updating during the whole course. At the end stage is submitted summative personal narrative. Students should provide an in-depth discussion on how the goals that were set prior to entering the program were met. This paper should show students’ professional evolution as it relates to the goals and the overall program.
In conclusion emphasize importance of this program with the regard of involvement of diverse groups of society and professionals with different specialties. In the program are involved sports management educators, as well representatives of medicine and law. Focus groups are schools’ sports groups, professional athletes’ teams in the universities and beyond. The priority issue remains involvement of retired military service members in teaching and learning for their reintegration in civilian life. The university will work closely with the wounded warriors to deliver online sport education programs to military personnel, who are ill, wounded or disabled from post combat duty in Afghanistan and Iraq; address veterans’ organizations to recruit them to sports activities and Paralympics.
The online program is beneficial to anyone to facilitate smooth transition of carrier from post-military services to civil, who has the desire to improve both mentally and physically, to learn about rehabilitation and psychological aid, leadership, promoting sports education for involvement of veteran service members to become sports educators trough coaching, to build sport safety management team. It will be a vital asset in both civilian and military life.
REFERENCES:
[1] HUTCHINGS H. (1998). The Course Portfolio: How Faculty Can Examine their Teaching to Advance Practice and Improve Student Learning, Washington DC: AAHE.
[2] SHROFF R., TRENT J., NG E. (2013). Using e-portfolios in a field experience placement: Examining student-teachers' attitudes towards learning in relationship to personal value, control and responsibility. Australasian J. of Educational Technology, 29(2). 143-160.
[3] GREENBERG, G. (2004). The digital convergence: extending the portfolio model, Educause Review, 39, 4. 28–36.
Available from: http://net.educause.edu/ir/library/pdf/ERM0441.pdf.

80
[4] GRAYSON, E. (1998). Ethics, Injuries and the Law in Sports Medicine. USA, Butterworth Heinemann.
[5] O'LEARY J (ed) (2001) Drugs and Doping in Sport: A Socio-Legal Perspective London: Cavendish Publishing.

81
SPINE CURVE OF DANCERS IN LATIN AMERICAN DANCING
Matej Chren
Faculty of Physical Education and Sports of Comenius University, Department of Gymnastics
ABSTRACT
Dance sport belongs to aesthetic sports along with figure skating, rock and roll, synchronised swimming, sports and rhythmic gymnastics. In these sports, the matter is in precisely managing intricate motion structures with predominant focus on purity of presentation, aesthetics of exercising and overall artistic impression. With such a performance, it is important to show a challenging motion configuration in a precise and aesthetically perfect way. Dance sport puts high requirements upon static and dynamic balance, sensomotory coordination in time and space, motion creativity as well as capability of expressivity (expression of idea by movement). The aim of our research was the comparison of spine curve parameters in free different tests in Latin-American dances. Research file consisted of six dance couples i.e. twelve dancers who specialize in Latin-American dances and achieve the highest performance class „S“. The main method in our research was measurement by Spinal Mouse. Spinal Mouse is a device that, combined with a computer program (PC), assesses the curvatures of the vertebral column without applying harmful radiation. The battery tests consisted of 6 tests. The research implementation and experimental group establishment was fairly problematic in the Slovak dance sport environment, considering the limited number of successfully performing dance couples. The results confirmed the interesting information about the spine curve of dancers.
KEY WORDS: dancesport, curvature of spine, Latin American dancing, Spinal mouse
INTRODUCTION
Dancesport is a competitive sport which developed from ballroom dancing. It blends the characteristics of sport and art. At the beginning of the 1990s dancesport joined the family of the so-called artistic sports, together with modern gymnastics, synchronised swimming and figure skating – which dancesport is most often compared to (Chren, 2008). On entering the realm of sport, a long period of self-reflection in dancesport as a competitive discipline was completed. In the 1970s and 1980s it oscillated on the border between art and sport, emotion and physical act. However, its bipolarity has endured, which might well be the reason for its attractiveness to viewers (Horáček, 2004). Both standard and Latin American dances are classified as dancesports. Standard dances include: waltz, tango, viennese waltz, foxtrot and quickstep. Latin American dances include: samba, cha-cha, rumba, pasodoble and jive.
Latin American dance, as well as the accompanying music, is characteristic for its rhythmical variegation, irrepressibleness, temperament, sensuality, animality and enormous emotional load. Despite efforts for its standardisation, it is not so much its form that is characteristic – it is its content. Latin American dances are significantly younger than standard dances. The

82
programme of this discipline only stabilised in the 1960s. The present form of Latin American dance is the result mainly of British dance teachers. The original forms of folk dances that originated in Afro-American culture cannot be seen in it anymore. Presently, it is the European, and mainly British approach to this group of dances. Opinions on their form developed in various curves. First there were only simple imitations of more attractive movements settled into Latin American rhythms – however, played by European orchestras. Gradually, while discovering the substance of African and jazz dances, there appeared a revision of the approach to Latin American competition forms of the dances. While in the 1960s there were mainly standardised movements with the many techniques of standard dances, the 1980s brought renovation and dancing with the whole body. Dancers started using the techniques of jazz dance. Choreographically, the solo performance dance or so-called dancing next to each other retreated and dancing in pairs returned. Latin American dances are now more relaxed in terms of the pairs’ posture, but also in terms of clothing, and movement is enabled not only in place but also into space.
The thesis focuses on the problems and possible solutions of curvature of the spine in the sagittal level in the case of Latin American dance dancers. Just the dance posture in Latin American dance itself is rather unnatural from the point of view of physiology and structure of the human body. Dance posture is however one of the main and decisive criteria in the evaluation of a dance couple in a competition and thus it cannot be avoided. Factors which can influence the development of verterbrogenic malfunctions and illnesses can be divided into two groups – governable and ungovernable. The first group includes weight, hypokinesis and one-sided activity – such as performing Latin American dances, type of employment, lifestyle and psychological state. The second group includes factors such as inheritability, sex and height (Preissová, 2008). Considering the repetition of rotary movements, various forward and backward bending, shakes and vibrations and one-side overload in Latin American dancers, the thesis focuses more distinctively on the diagnostics of changes in physiological curvature of the spine at the sagittal level (lordosis, kyphosis). It is assumed that the previously mentioned factors influencing the development of verterbrogenic malfunctions and illnesses are closely related to Latin American dance. The thesis focuses mainly on the influence of the prevalence of hyperlordosis of the lumbar spine and the influence of position in the distal third of the thoracic spine. A rather distinctive impact on the posture of pelvis, spine and head (axial system) is implied also by high-heel shoes. This has a negative effect on the development of movement patterns.
METHODS
The observed group contained six dance couples – six men and six women specialising in Latin American dance. All six dance couples are among the best in Slovakia and have successfully represented the country at various international competitions. The couples were classified in the main age category and according to their performance reached the highest performance category “S” – super advanced (international categorisation). The diagnostics of curvature of spine were accomplished in three positions – standing position (Fig.1), sitting position (Fig.2) and in the seated forward-bending position (Fig.3) with joined, straight lower limbs. The diagnostics were performed by use of Spinal Mouse.

83
Figure 1: standing position Figure 2: sitting position Figure 3: sit and reach position
It is a modern device for measuring the shape and mobility of the spine in sitting and standing positions as well as in movement at elementary levels. Measurements are fast, simple and reliable. The device is applied to the back and manually moved along. The measuring head of the mouse observes shape, curvature and angles of the spine. Prior to the measurement, the main researcher identified the spinal processes of the seventh cervical vertebra (C7) and the third sacral vertebra (S3) by palpation and marked them with a skin marker. In order to measure the thoracic curvature, the Spinal Mouse was guided along the length of the spinal process from C7 to S3 after the subject was guided into the measurement position. This system digitized the contour of the skin over the spine along the sagittal plane, giving information regarding the global angles of the spinal curvature. The Spinal Mouse has high validity and a consistent reliability in comparison to radiographic techniques (Guermazi, 2006). Additional software records clinically relevant data via Bluetooth. Numerical analyses of the measured results give information about deviations from reference values and calculate particular parameters of the segments of the whole spine. Highly sophisticated software immediately visualises possible problematic areas and marks them graphically. It highlights the hypo-mobile and hypermobile parts of the spine as well as all deviations from reference values. The data are transformed immediately into a graphical presentation of the spine together with a 3D image.
RESULTS
It is very important to admit that during the diagnostics the possibility of occurrence of hypermobility (which is often present in dancesport) was not taken into account (Bartolčičová, 2014). During the testing of the standing position (Fig.4), hyperkyphosis (or so-called flattening of the thoracic part of the spine) was confirmed in one of the female dancers. In the case of other subjects it was within the norms. In relation to lumbar lordosis, more distinctive deviation – deviation into hyperlordosis – from reference values was noticed only in the case of one female dancer.

84
Figure 4: Results - curvature of the thoracic and lumbar spine in standing position
In 33% of dancers the values remained within the range of the reference values. Initial phase kyphosis was confirmed in 42% of dancers and a more severe phase of kyphosis was noticed in 25% of (all) dancers. These results prove that it is hypermobility that could influence the position and extent of the thoracic part of the spine in the sitting position. Therefore it might be useful to research how many subjects with increased kyphosis in the sitting position also suffer from hypermobility. Regarding lumbar lordosis, 33% of dancers’ values were within the norms. In case of one of the tested female dancers, minus values of lumbar lordosis were identified. This means that in the sitting position increased trunk lordosis co-appeared together with increased thoracic kyphosis. In 33% of dancers subtle kyphotisation of trunk lordosis was diagnosed and in the case of 24% more severe kyphotisation was confirmed.
NAME THORACIC SPINE STANDING
LUMBAR SPINE STANDING
D.C. 40 º -32 º
T.A. 38 º -27 º
O.T. 38 º -30 º
T.U. 32 º -23 º
T.T. 42 º -25 º
M.C. 36 º -20 º
N.G. 28 º -30 º
L.K. 27 º -21 º
M.R. 27 º -32 º
P.M. 9 º -34 º
K.S. 32 º -46 º
D.F. 23 º -18 º
NAME THORACIC SPINE SITTING
LUMBAR SPINE SITTING
D.C. 56 º 20 º
T.A. 36 º 22 º
O.T. 55 º 20 º
T.U. 50 º 28 º
T.T. 33 º 11 º

85
Figure 5: Results - curvature of the thoracic and lumbar spine in sitting position
In the seated forward-bending position with joined, straight lower limbs the knee joint was diagnosed last. Regarding thoracic kyphosis, 67% of dancers displayed results within reference values. In less than 17%, mild worsening in hyperkyphosis was confirmed. More severe hyperkyphosis was noticed in the same percentage of dancers (16.66%). When examining lumbar lordosis in the same position, 33% of dancers were within the norm, but the same percentage suffered from mild lordosis. Also, the same percentage of dancers suffered from more severe kyphotisation of trunk lordosis. This demonstrates there were 67% of dancers with distinctively increased extent of movement in the sagittal level into the trunk flexion.
M.C. 45 º 20 º
N.G. 36 º 24 º
L.K. 41 º 16 º
M.R. 42 º 7 º
P.M. 55 º -11 º
K.S. 39 º 12 º
D.F. 47 º 7 º
NAME THORACIC SPINE SIT REACH
LUMBAR SPINE SIT AND REACH
D.C. 48 º 4 º
T.A. 53 º 31 º
O.T. 66 º 30 º
T.U. 63 º 16 º
T.T. 75 º 39 º
M.C. 84 º 34 º
N.G. 61 º 36 º
L.K. 51 º 23 º

86
Figure 6: Results - curvature of the thoracic and lumbar spine in sit and reach position
CONCLUSION
The highest risk-factors for verterbrogenic syndrome in the case of Latin American dance dancers are frequently repeated rotary movements, various types of forward and backward bending, shakes and vibrations and one-side overload. What is also important is the quality of floor surface (Preissová, 2008). Another substantial problem that can be observed in female partners with excessive lordosis is caused mainly by the height of the heels of special dance shoes. However, in the diagnostics of standing positions this assumption was not confirmed, considering that within the research there was only one subject with hyperlordosis of the lumbar spine. Latin American dance dancers can also have difficulties with flat-back syndrome – however, it was not diagnosed during the research in the standing position, but an increased thoracic kyphosis was present in 67% of dancers. This could be caused by the occurrence of hypermobility, a pathological position of the pelvis or erroneous position of the head. What was very interesting were our findings related to increased kyphosis of shank lordosis in the sitting position in the case 67% of dancers. This could be caused by the need for excessive pelvic thrusting in the fundamental positions of dancers. Based on our findings, it might be recommended to introduce specific exercises (deep-stabilisation system) aimed at the development and support of normal physiological spine curvature into the training process.
REFERENCES:
[1] BARTOLČIČOVÁ, B. Vplyv 6 mesačnej pohybovej aktivity a suplementácie antioxidantmi na vybrané faktory porúch plodnosti žien. Dizertačná práca. Bratislava: FTVŠ UK, 2014.
[2] GUERMAZI, M. et.al. Validity and reliability of Spinal Mouse to assess lumbar flexion,
M.R. 63 º 28 º
P.M. 84 º 32 º
K.S. 40 º 22 º
D.F. 70 º 15 º

87
Annales de Réadaptation et de Médecine Physique. 49 (4) (2006), 172 – 177.
[3] HORÁČEK, P. Umelecké aspekty tanečného športu. Prednáška pre kongres ČSTS, Praha, 2004.
[4] CHREN, M. Efektívnosť kondičnej prípravy na športový výkon v latinsko-amerických tancoch. Dizertačná práca. Bratislava: FTVŠ UK, 2008.
[5] MEJÍA, E.A. et.al. A prospective evaluation of idiophatic left thoracis scoliosis with MRI. Journal of Pediatric Orthopedic 16(3) (1996), 354 – 358.
[6] PREISSOVÁ, P.- VLASÁKOVÁ, D. Fyzioterapeutické postupyu vertebrogénních onemocnení LS páteře (studijní materiál pro kurz), 2008.
[7] RODRÍGUEZ-G. et.al. Comparison of hamstring criterion-related validity, sagittal spinal curvatures, pelvic tilt and score between sit-and-reach and toe-touch tests in athletes. Med Sport 61: 11-20, 2008.
[8] TÜZÜN C. et.al. Low back pain and posture. Clin Rheumatol.1999;18(4):308-12.

88
PHYSICAL AND SPORT EDUCATION AS ASSESSMENT CONTEXT
NATIONAL RESEARCH PROJECT OF INCLUSION
Debora Di Iorio1, Claudia Pagliuca1, Filippo Gomez Paloma1
1University of Salerno, Department of Human, Philosophical and Education Science, Italy
ABSTRACT Sports activities should increase people’s autonomy, going beyond the usual teaching to promote an inclusive context that values the role of body and movement to reach educational objectives (Embodied Cognitive Science).[ This work tries to understand how physical education could influence people’s skills and their personal factors, also identifying special educational needs. There is a strong connection with the ICF that is based on a biopsychosocial model and so allows you to understand better the real functioning of each person, considering body, personal and environmental factors, activity and participation. So we can advert to the National Research EDUFIBES that tries to combine the model of skills to the ICF model to identify special educational needs and to achieve a real inclusive approach. KEY WORDS: Physical Education, Sport, Inclusion, ICF, assessment
INTRODUCTION The promotion and the development of sports activities and the importance to highlight their real educational value is certainly one of the signs of innovation in our society. This issue could be introduced in many different contexts – social, cultural and educational context – to extend education provided in a general system that will be more able to meet the needs of our society. So people could increase their personal cultural baggage and could be more independent and more responsible thanks to playful, physical and sports activities that value people’s skills. If you consider body as a point of reference of playful, physical and sports activities, you can better understand a lot of our society’s phenomena. Physical and sport education teaches students to respect rules, not to overshoot, respecting rights and obligations and appreciating the importance of honesty and social skills. This could be a possible key to realize inclusion. For this reason is very important going beyond the usual teaching as a mere communication of knowledge to promote an inclusive context that considers not only knowledge but also skills and personal and environmental factors [1]. This is an educational context that values the role of body and movement to reach educational objectives through body experiences, as the new scientific paradigm of Embodied Cognitive Science has stated. You have to go beyond the classical cognitive psychology because body can no longer be seen as a mere instrument; it’s an essential resource that interacts with environment and produces learning and education. In fact, physical and sport education is recognised as a cognitive, social and expressive power that connects environment to each person. So people’s personality, emotions and thoughts can be expressed by body and you can better know yourself and interact with other people through it [2]. Body and movement are very important in the school because they help children to acquire

89
information about both own body and theirselves one and to develop the ability of communication, improving perceptual and spatial abilities, creative abilities and the knowledge of objects [3]. So in this educational context, physical and sport education could influence cognitive and personal factors of every students. This is certainly related to the ICF (International Classification Functioning, Disability and Health) that is based on a biopsychosocial model and so allows you to understand better the real functioning of each person, considering body, personal and environmental factors, activity and participation. For this reason this work tries to understand how physical education could influence people’s skills and their personal factors, also identifying special educational needs [4]. The ICF model introduces a different, original and multifactorial approach to disabled and able-bodied. It is important because it doesn’t consider the consequences of illness but it focuses on all the elements of health, considering the global functioning of each person, his possibilities and his restrictions [5]. Today, it is not very easy the identification of special educational needs and the realization of a possible project of inclusion. In fact, teachers often find difficulties identifying special educational needs, but they could make reference to the principles of ICF by handling these situations. So school should go beyond the biomedical model of the previous international classifications to promote a biopsychosocial model that allows the identification of special educational needs, by considering cultural and environmental context. The ICF model is composed by elements that allows to collect information about people’s biological functioning (body functions and body structures), social functioning (activity and participation) and psychological functioning (personal and environmental factors). Actually, personal factors have more influence on health and learning because contexts can influence the right or the filed functioning [4]. For this reason we can advert to the National Research EDUFIBES that tries to combine the model of skills to the ICF model to identify special educational needs and to achieve a real inclusive approach. METHODS The EDUFIBES research experimentation has been launched through ministerial projects for the employment of “Nuove Indicazioni Nazionali per il Primo Ciclo” (MIUR, 2012) but it has been also extended through useful tools for teachers who have to handle special educational needs and through the achievement of a clear communication with teachers, head teachers, students and parents. Furthermore, this research would give the chance of applying the ICF model in schools, according to students’ needs and the achievement of a teaching that values skills in a biopsychosocial and inclusive context. Some research forms has been realized for the observation and the identification of students’ personal factors, used during didactic works, especially during sports activities. These research forms could represent a try to consider the ICF model as a complex model that allows to obtain global information about people’s functioning. The research protocol is still ongoing among nine school networks in Campania, Sicily, Sardinia and Piedmont, making a total of 35 schools, 388 teachers and 4518 students. RESULTS The ICF model is a multifactorial tool that could be also used to identify and describe skills of

90
every students, using the context as a link between skills and ICF. The skills approach requires the ability to activate cognitive, emotional and social strategies for the achievement of good social behaviors and basic knowledge to perform meaningful tasks. This is all realized in a context that influence our behavior. The relationship between skills and ICF allows to go beyond the usual teaching based on a mere communication of knowledge, focusing on contents and ordinary activities, as the MIUR has stated. Furthermore, the conditions to increase differences between students could be created, by realizing an inclusive teaching in a cooperative context where every student is respected for his uniqueness. While Ianes had already talked about a relationship between the ICF model, disability and skills, the EDUFIBES research tries to extend the international classification to students with special educational needs, realizing an inclusive teaching [4]. The right functioning of people can be defined by their personal and environmental factors, relationships and experiences. For this reason the identification of special educational needs is not linked to the cause or the biological aspect of the disease, but it is linked to the biopsychosocial model and so to the right educational and learning functioning. Furthermore, physical and sport education has not well regarded in school for a long time, but still in some cases. In fact, usual teaching doesn’t consider the role of body in teaching and learning process and its great importance in education. Physical and motor development of students and their interaction with environment could be positively influenced by this new teaching method. Physical education is a great resource for all students, both disabled and able-bodied and it’s necessary to educate youths in disability and inclusion, increasing their own sense of responsibility, as the “Indicazioni Nazionali” of 2012 have said. However, only able-bodied play many sports activities in most cases, while disabled have few possibilities to play sport activities because they are more protected than able-bodied or teachers don’t take responsibility. But this can’t be defined an inclusive context. This research highlights teachers’ mistrust of inclusive teaching and a general change in school because most of teachers are too tied to school curriculum and their career. Moreover, they are often confused because of the real need to find a new key to identify special educational needs, going beyond disability. CONCLUSION Currently, results of EDUFIBES research are at the stage of publishing; nevertheless, some conclusions can be drawn from this research. The relationship between the ICF model and skills is also extended to special educational needs in EDUFIBES research. Moreover, this work tries to go beyond disability, valuing the biopsychosocial model of ICF, promoting a real inclusive teaching and identifying educational objects that are the same for all students, not considering restrictions and disabilities. We must take care however, to ensure that students with special educational needs don’t feel discriminated against. On the contrary, the identification of special educational needs should be a resource to improve students’ learning. Inclusion is not addressed only to students with special educational needs because it could be used as a tool to plan an inclusive education offering, considering students’ needs. So inclusive teaching requires a new teaching method. All teachers should be involved in projects about inclusion to use all the available resources, considering different perspectives and using different teaching tools and strategies. In fact, an inclusive teaching requires facilitating strategies, so nobody will discriminated against and

91
students’ needs will be respected. Inclusion should promote a dialogue between different situations; diversity should be considered as a chance or a resource that allows to analyse situations from different perspectives. So inclusion doesn’t influence completely the well-being both of disabled and able-bodied but it’s a real resource that allows them to give something to other people and to receive from them at the same time. This is a possible way to change usual teaching, considering all the activities that the “Indicazioni Nazionali” have launched to realize a new teaching and learning method [6]. This research tries to make teachers less confused and worried about change in school, giving them some useful models and tools. So teachers should change their usual teaching to promote an innovative one, considering students’ different learning models. Physical and sport education could be used as tool to promote a new teaching model: in fact, body is essential for students’ global education and for the development of all areas of their personality. Movement learning and learning trough movement means to use physical education as both a means and an end to educate students. Physical education surely requires specific motor abilities but it has also a strong educational value. For example the development of individual motor control, the ability to implement problem solving and develop life skills, the social, relational, cooperative and communicational value, improving intrapersonal and interpersonal relationships [7]. In particular, EDUFIBES research is based on the principles of Embodied Cognitive Science. It states that most of cognitive processes take place through body control systems and people’s experiences; that is why we talk about Embodied Cognition. From an educational point of view the research project proposes a new model of teaching and learning skills and operational protocols. There will be a different classroom management because teachers will more consider inclusive principles, respecting students’ uniqueness. So physical and sport education highlights the importance of body in teaching and learning too. Body and its abilities are at the hearth of education and they are necessary to achieve meaningful educational objectives and to increase cognitive processes through body experiences. REFERENCES [1] GOMEZ PALOMA F. ICF e Scuola. Dalla sinergia istituzionale al progetto di vita, 11-17, 2013. [2] GOMEZ PALOMA F. Embodied Cognitive Science. Atti incarnati della didattica, 68-75, 2013. [3] Indicazioni Nazionali per il curriculo della scuola dell’infanzia e del primo ciclo di istruzione (D.M. 254 del 16 novembre 2012 in G.U. n.30 del 5 febbraio 2013) [4] IANES D. E BIASIOLI U. L’ICF come strumento di classificazione, descrizione e comprensione delle competenze, “L’integrazione scolastica e sociale”, vol. 4, n. 5, 391-422, 2005. [5] Organizzazione Mondiale della Sanità. ICF versione breve. Classificazione Internazionale del Funzionamento della Disabilità e della Salute. 2004. [6] ALTAVILLA G. Inclusione. Paradigma pedagogico per una nuova cittadinanza libera, attiva e partecipata, 69-74, 2013. [7] COLELLA D. Competenze motorie e stili d’insegnamento in educazione fisica, 1-9, 2011

92
THE PROFILE OF THE ANIMATOR OF SPORT ACTIVITIES
Aleksandar Ivanovski, M.Sc.1, Marija Zegnal Koretic, M.A.2, educational kinesiology
1College of Sports and Health, Belgrade, Serbia 2Međimurje University of Applied Sciences in Čakovec , Croatia
ABSTRACT
This paper will analyze the Sports Animator's profile, tendencies, the potential, and the activities through kinesiology activities presented to tourists. The primary goal of the research is to determine the profile of a Sport Animator. Health and wellness have become the values that determine the contemporary person's life quality. How to decelerate the aging process from within is the question that has been turned into a movement and mission of millions of followers, whose life expectancy has been increasing year by year. Due to these radical changes in users' preferences and lifestyles, the profile of the Animator of Sport Activities has to adapt to these changes. The primary method of this research was a survey method, the empirical and non-experimental method. Survey sample in the research were adult respondents of both sexes working as sport animators. The aim of the research is to determine the animators' educational profile and their current level of competence. The Animators of Sport Activities is a person who creates, organizes, and promotes kinesiology activities in hotels and holiday resorts. The animation of sport activities represents the effective medium for encouraging people to participate in any kind of physical activity. Therefore, tourist destinations with professionally organized animation activities often are highly rated and more attractive to tourists. More research on this subject should improve the quality of Animators' activities and their education. KEY WORDS: Profile, animation, kinesiology, activities
INTRODUCTION
Times we are living in are characterized by technological optimism, scientific positivism, accentuated rationalization, as well as ever increasing eco-consciousness and entrepreneurial culture. Creativity represents one of the major elements while developing programs for clients. These programs have become essential element offered in every tourist destination. It has got a special place in hotel business, marketing, educational pedagogy, and andragogy, since it specifically targets the users' needs, their time and also improve their bonding and quality of communicating with each other, regardless of their age. The recent boom of many programs, courses, schools, and lectures is a definite proof that this vocation is more popular than ever. The overwhelming aim of decelerating the aging process from within has created the movement with ever increasing number of followers. The human life span has been extending year by year. The contemporary man has got many health problems connected with
93
hypokinesis, abnormally diminished muscular function and mobility. But the ways of living
and the priorities has been slowly changing. To personally excel professionally has become the prerequisite for existential prosperity. The animation essentially represents the comfortable quality and at the same time it integrates tourist, marketing and sports services.
Tourism animation aims at encouraging tourists to participate in different kind of activities, both those they are interested in and those that through research are recognized as important (Cetinski i sur., 1999.)
The word Animation has got its origin in Latin word anima-soul, animare-give, bring life, inspire, revive, refresh. Therefore, many authors use different words as; fun, entertainment, relaxation, active vacation, having fun, active workout, open communication etc. According to Mitic the animation is the action of stimulating people to actively spend their vacation time. It also represents recreation during a person's free time and his motivation to participate in offered animation programs as often as possible. The effects of the animation programs among many others, are economic and medical
Sport animation in tourism is executed by a professional animator, (Andrijašević, 2010.) whose tasks include motivating the vacationers to participate in sport activities, making the vacation time more humane. Sport animation has become the essential part of any modern tourist destination.
The animator is the first and foremost the initiator and creator of the program. He/she is also a worker in tourism. His/her activities start with the first contact with a customer. Therefore, every animator has to have specific psychophysical predispositions for the job. His/her physical appearance has to be agreeable, his/her age is not specifically defined but it has to be in accordance with demands of the program. The animator has to be a high spirited, outgoing person, informed about the current affairs in the city and country, especially if some grand sport and cultural event is locally on schedule (Olympic games, World football or basketball cup, Eurovision contest etc.). The animator is always on alert, ready to assist and help in every situation. Every animator has to, in his busy daily schedule, find time for himself/herself, his/her psychophysical condition and appearance.
The object, aim and tasks of the study
The object of the study is a sport animator profile. He/she has to be well informed about current sport, political, and cultural events (music trends). The animator creates a program on the basis of that knowledge and his/her own personal affinities. The aim of the research is to determine the animator's educational profile and current qualification for day and evening programs. It is essential to determine the correlation with the animator's abilities and the created programs. The key task of the study is to determine the animator’s educational profile, his/her specific knowledge, know-how and competence, which will be the foundation for creation and realization of recreational activities in hotel and other tourist destinations.
Research hypothesis:
H1 The animators are persons of both sexes usually under the age of 35. H2 The animators have acquired the basic training, and have got the knowledge and competence for creation and realization of recreational animation programs.

94
H3 The daily programs are constituted predominately of sport and recreational activities realized circularly by all the team members.
METHODS
The empirical and non-experimental method (survey method) was the primary method of this research. The chief reason for choosing this method was the nature of the research, especially their hypothesis. Furthermore, the research sample chosen for this study had a major influence on the choosing method. The research techniques were survey, scale analysis, and sstatistical analysis of the results.
Survey sample
The survey sample are the adults of both sexes who are actively performing some kind of sport animation in tourism. The number of examinees is 75, 40 women and 35 men. All of the examinees were working as sport animators during the summer season. The examinees originated from different social backgrounds. The survey was anonymous in order to avoid un objective and dishonest answers.
The results of the study with analysis
02468
101214161820
god.18
god.19
god.20
god.21
god.22
god.23
god.24
god.25
god.26
god.27
god.28
god.29
god.30
god.31
god.33
god.34
god.35
god.36
Frekvencija Procent
god. = age, Frekvencija = frequention, Procent = percent
Chart 1: examinees' age
The total number of examinees is 75, 40 of which are females, 35 males. The majority of examinees are between 23 and 25 years of age. With age (from 30 to 35) the interest in working as animator decreases proportionally.

95
Chart 2: examinees' gender
The conclusion drawn from the examinees’ answers was that the number of female animators (53.3%) prevail over the number of male animators (46.7%). The possible reason could be found in the fact that female animators tent to have better communicative skills, originate from different social backgrounds, and are more likely to accept a challenge.
Chart 3. Examinees' education level
The anonymous questionnaire analysis has shown that the majority of animators have got junior or university degree (Chart 3), which proves that the animator is the person with the broad spectrum of knowledge and insight, and is ready to meet the modern tourism high criteria.
male examinees 46,7%
female examinees 53,3%
Education for sport animator
21,3%
13,3% 45,3%
6,7%
22,7%
without any qualification
Self-educated
course organized by an agency
course organized by a hotel
junior or university degree

96
Activity Average value
Not preferable
Less preferable Preferable
Much preferable Enjoyable
Latino aerobics 2,40
30 40%
14 18,7%
10 13,3%
13 17,3%
8 10,7%
High and law aerobics 3,00
19 25,3%
9 12%
15 20%
17 22,7%
15 20%
Step aerobics 2,73
19 25,3%
19 25,3%
11 14,7%
15 20%
11 14,7%
Dance aerobics 2,67
22 29,3%
18 24%
8 10,7%
17 22,7%
10 13,3%
Stratching 3,75 9 12%
7 9,3%
12 16%
13 17,3%
34 45,3%
Easy excercise 3,52
16 21,3%
5 6,7%
11 14,7%
10 13,3%
33 44%
Water gymnast 4,25
6 8%
2 2,7%
5 6,7%
16 21,3%
46 61,3%
Tai Chi exercises 1,79
44 58,7%
14 18,7%
8 10,7%
7 9,3%
2 2,7%
Tae bo exercises 2,13
37 49,3%
12 16%
10 13,3%
11 14,7%
5 6,7%
Volleyball 4,29
3
4,9%
2
2,7%
5
6,7%
13
17,3%
50
65%
Bowling 3,59 14 18,7%
1 1,3%
13 17,3%
21 28%
26 34,7%
Table tennis 3,89
6 8%
3 4%
14 18,7%
22 29,3%
30 40%
Darts 4,13
4 5,3%
1 1,3%
10 13,3%
26 34,7%
34 45,3%
Archery 2,68 30 40%
5 6,7%
11 14,7%
17 22,7%
12 16%
Horse riding 1,69
44 58,7%
15 20%
13 17,3%
1 1,3%
2 2,7%
Table 1 Animator's interest for different kinesiology activities

97
Activity Average value Rank
Volleyball 4,29 1
Water gymnastics 4,25 2
Darts 4,13 3
Table tennis 3,89 4
Mini club 3,81 5
Water-polo 3,79 6
Olympic day 3,75 7
Stretching 3,75 8
Hiking 3,71 9
Fitness 3,68 10
Bowling 3,59 11
Aperitif games 3,55 12
Easy exercise 3,52 13
Football 3,52 14
Table 2 Preferred activities ranking
Through the preferred daily activity analysis (Table 2) we can conclude that the volleyball is the most preferable activity (89% of animators both prefer and practice volleyball). The next activity is aerobics/gymnastics and water gymnastics. These three activities are the most popular among the majority of animators.
The second group of preferable but not highly enjoyable activities are darts, table tennis and mini club. The next group is water-polo and the Olympic day. Stretching and hiking are the activities loved by the animators. The ranked programs show that the highest places are reserved for the most universal and commercial activities.
CONCLUSION
The animator is a person who works with vacationers while organizing and executing

98
kinesiology activities. The management in tourism, play-room managers, and marketing
agencies demand that that the programs like aerobics, swimming, dancing, as well as the basic sports games should be led by the qualified and experienced animators. Tourist destinations without an organized recreational activities regularly have shorter season and realize lesser profit (Zegnal, 2010). Therefore it is essential to provide as many research in this field as possible, in order to ensure high-quality staff recruiting and education. The adequate education of young animators will lead towards the ideally organized and executed animator activities in tourist destination.
REFERENCES
[1] ANDRIJAŠEVIĆ, M.: „ Kineziološka rekreacija“ (2010.) Zagreb
[2] IVANOVSKi.A.: „Profil animatora rekreacije” Master’s degree
[3] JOVIČIĆ.Z.:”Turistička propaganda”, NIP Turistička Štampa, Beograd, 1982.
[4] MITIĆ,D.:”Rekreacija”, Fakultet sporta i fizičkog vaspitanja, Beograd, 2001.
[5] NESTOROSKA, I.:” Animacii vo turizmot”, Fakultet za turizam i ugostitelstvo, Ohrid, 2005.
[6] VUČKOVIĆ, S. I MIKALAČKI, M.:”Teorija i metodika rekreacije”, Fakultet fizičke kulture, Niš
[7] ZEGNAL MARIJA, Significance of Management in Sports and Tourism in Croatia, 1. Međunarodna znanstveno stručna konferencija (2010) Sveti Martin

99
INFLUENCE OF MOTOR ACTIVITY OF YOUNG PEOPLE ON THEIR
HEALTH
Sergii Ivashchenko
National University of the Physical Education and Sport of Ukraine
ABSTRACT
This article describes the results of studies of the impact of individual modes and different levels of physical activity for children and adolescents of school age in Ukraine on their health. During the execution of the main part of this study were examined the most common and typical for the Ukrainian population modes of motor activity in young adults, which were applied in the course of their daily activities. The main purpose of the study was to find out which mode of physical activity for children and adolescents is the most favorable for the preservation and strengthening of their health. It was found that the most favorable in terms of their impact on the health status of young adults are those modes of motor activity, which are adequate to the individual capabilities of each. The results of this study confirmed that children and adolescents of school age in Ukraine, which were used corresponding to their individual abilities levels of motor activity, were in the better health status than those children and adolescents, who had excessive or insufficient level of their daily physical activity. KEY WORDS: impellent activity, individual capabilities, health status of young people, system of physical education, physical development. INTRODUCTION
Finding the new ways to further improving the system of physical education of children and adolescents is one of the main directions of the scientific activity in Ukraine. Therefore, in most of scientific-research institutions, which are engaged in solving the problem of further developing modern physical education system for different categories of population, many research investigations on this item are conducted [4].
Modern living conditions in most regions of Ukraine require for people rather high level of basic physical properties and good state of health. In this regard, it is extremely important the developing and application some special training methods for children and adolescents, that in fact contribute to the development of these physical qualities and are not hazardous to their health [7].
Results of the analysis of data obtained in the study of modern scientific and methodical literature shows that in our time finding ways to improve the system of physical training of children and adolescents of school age are one of the most important areas of research [1].
Sufficient development in childhood and adolescence some necessary physical qualities is very important for the future, because these working-age people will be able to perform some

100
complex and difficult motor actions when they will be performing different working tasks [6].
It is generally known that motor actions of increased complexity used in the course of professional activities require such physical qualities as strength, agility, endurance, and others. The development of these qualities begins in childhood and teenage years and reaches the required level as a result of prolonged exercise [3].
It should be noted, that the training for the development of such humans physical properties require considerable efforts and a long time. And this, in turn, may adversely affect the health of young people, whose bodies are still in a state of formation [8].
The results of research carried out in many countries in recent years, support the assumption that there is a need to improve the system of physical fitness of children and adolescents to ensure the development of their physical qualities and maintain good health [5].
The improved system of physical education for children and adolescents should be able to allow successfully develop main physical qualities, which are necessary for the producing activity in the future and contribute to the preservation and strengthening of their health [2].
METHODS
Subject matter
During the executing such research, particular attention was paid of the investigation the effect of different regimes of impellent activity on the state of schoolchildren’s health. There were used such methods as analysis of scientific information, sociological and pedagogical observation, methods to assess the health of schoolchildren, methods for studying the dynamics of schoolchildren’s emotional state and level of their impellent activity, statistical methods.
The general aim for this research was to investigate influence of different impellent stiles of modern schoolchildren in primary schools, secondary schools and other educational establishments in Ukraine on the state of their health.
Experimental design
This research was conducted in two phases and lasted from November 2012 till March 2014. To participation in this research were involved 248 schoolchildren from different schools of Ukraine. The first phase of the study was devoted to investigation of the state of schoolchildren’s health. During the second phase of the study was estimated the level of their impellent activity.
Statistical analysis
Statistical analysis of data, obtained in this research, was made by means of special computer programs, adapted to problems of physical education and sport.

101
RESULTS
In the course of the work there were obtained some data about the dynamic of changing the main indicators, which are characterizing the state of health of schoolchildren. For this reason all participants of investigation were undergone special medical examination.
Besides, each of pupils was examined by means the complex of special physical testes to evaluate the level of development his or her main physical qualities.
It worth to admit, that most of schoolchildren, who was involved in our investigation, in their childhood were engaged in different kinds of physical activity, such as participation in children’s sport competitions and so on. As a result, the level of their impellent activity was so high.
The results, obtained in these investigations are presented in the table 1.
Table 1.
The results of testing the physical fitness of schoolchildren
Test
Indicators of physical fitness
Before the training course After the training course
Boys Girls Boys Girls
S S S S
Run 30 m (sec) 7,4 0,6 7,7 0,5 7,0 0,6 7,1 0,4
Flexion and extension arms in emphasis lying
17,0 8,5 9,7 6,9 19,2 11,7 14,8 9,6
Lifting the body the supine 25,9 10,7 20,8 8,1 32,2 8,7 30,8 8,7
Shuttle run 10 x 4 (sec) 12,3 0,9 13,3 0,8 11,7 1,0 11,9 1,0
Leap's long (cm) 130,2 18,2 116,1 17,2 144,7 14,8 141,1 15,7
Torso forward from a seated position
9,1 4,8 9,3 5,0 11,6 4,4 13,2 5,1
The data in his table show the results of the physical tests by schoolchildren before application the special training program, based on innovating technologies, and after application of this program.
X X X X

102
It should be noted, that such a distinct positive dynamic the indicators of schoolchildren’s physical development was observed in cases, where the innovative technologies was used properly, wisely and under the medical control of the schoolchildren’s health.
As you can see from the data, presented in the table, there was increasing of all indicators, which are characterizing the level of physical development of schoolchildren, were observed in both cases: among boys and among girls contingents.
Moreover, in most cases after the application of progressive education-training program, based on the application of innovative technologies, main indicators of physical development such pupils have reached the level, that is corresponding to the level of normal physical development for pupils of the more older age group.
Thus, the results of this study show that the application of special educational and training programs, based on the using of innovative technologies lead to the progressive growth of physical indicators, which are characterizing the level of physical development of pupils.
It also confirms the important role of the school teacher of physical culture, and that, the final result fully depends of the quality of his work.
DISCUSSION
The results, obtained in this work, clearly show that the use of special educational and physical training programs, based on the innovative technologies, reliably provide the optimization of regime and style of impellent activity for children of school age.
The advantage of special physical training programs, based on innovative technologies, compared with standard programs, is clear and beyond doubt. However, the practical application of such special programs requires a high level of professional skill of the teacher of physical culture.
First of all, in order to achieve the desired result requires a high level of qualification and professional skill of the teacher of physical culture, as well as the using of special equipment required for the implementation of innovations in the lesson of physical culture.
Given the fact that in many countries there is an active process of modernization of educational technologies, it is expected that in the coming years will be the innovative technologies required attribute formal educational and training programs not only in secondary schools, but also in other types of educational institutions.
No need to prove, that the optimization of style, regime and character of impellent activity for children and adolescents has a positive effect on the state of their health.
Many scientific researches confirmed that the lack of physical inactivity and efficient propulsion mode of young people is an effective means of preventing such adverse events, such as overweight, diabetes, diseases of the cardiovascular system and metabolic disorders in the body.

103
In addition, scientific data, obtained in this study, can be successfully used to develop some
special programs of physical training, using such innovative technologies, that can help to prevent certain types of lesions in children and that can be successfully used in the organization of physical training lessons in the special medical groups.
That is the main direction of scientific activity can be regarded as the most promising for further development of the physical education of children and adolescents to address two main objectives: to achieve a high level of physical development of schoolchildren, as well as to protect and preserve their health.
CONCLUSION
Thus, on the basis of information, obtained as a result of such scientific research, we can draw the following conclusions:
1. In most cases the optimal character and level of impellent activity of people in their childhood contributes fairly well developing some of their physical qualities in older ages (first of all, such qualities, as strength, endurance, speed, agility and others).
2. Observance of the proper mode of motor activity of children and adolescents contributes to the preservation and strengthening of the state of their health.
3. The scientific information, obtained in the course of this study, can be successfully used to develop specific educational and training programs for children and adolescents, aimed at accelerating the development of their physical qualities and of serving and strengthening their health resource.
REFERENCES
[1] ANDERSEN K.L. Habitual physical activity and health / K.L. Andersen, J. Ruttenfrants // WHO regional publications. European series. – 1982 - № 6. – p. 12 – 19.
[2] CLIFFORD P. Muscular Christianity: Manhood and Sports in America at the end of nineteen’s century. – 2001. – Cambridge, Mass: Harvard U Press.
[3] HARDMAN K., MARSHALL J. The State and Status of Physical Education in Schools in International Context. European Physical Education Review. – 2001. – № 6 (3). – P. 203 – 229.
[4] MELICHER A. Physical education projects at primary and secondary schools. Methodology of the school physical education, Bratislava, 2001, p. 136 – 147.
[5] OPERAYLO C. Relevance and challenges of modernizing the system of physical education // Physical education in school. – 2006. – № 1. – P. 3 – 5.
[6] PENNEY D. Physical Education: What future? / D. Penney, T. Chandler // Sport, Education and Society. – 2000. – Vol. 5 (1). – P. 71 – 87.
[7] TRUDEAU F. Physical Education, School Physical activity, School Sports and Academic Performance / F. Trudeau, R. J. Shepherd // International Journal of Behavioral Nutrition and

104
Physical Activity. – 2008. – № 5. – P. 10 – 24.
[8] VYLCHKOVSKY J.E. Physical fitness of preschool children for the purpose of preparing to school / J. Vylchkovsky, A. Vylchkovskaya // Physical culture, sports and health / Collection of scientific papers. – Kiev, 2006. – 559 p.

105
HIGHER EDUCATION INSPIRING REGIONAL ACTIONS TO
ENHANCE THE HEALTH OF UNEMPLOYED YOUTH
Tarja Javanainen-Levonen1a, Annukka Mattinen2, Vappu Salo1b, Päivi Laine3
1Satakunta UAS (University of Applied Sciences), aFaculty of Welfare, bFaculty of Service Business; 2Turku UAS, Faculty of Health and Well-being;
3Public Employment and Business Services of Satakunta, Finland
ABSTRACT
The Finnish National Institute for Health and Welfare awarded a 3-year grant in 2013 for UAS consortium to develop an action model to promote health through physical activity and nutrition among the unemployed youth, aged 16-29 years. During the first year, separate pilots for physical activity and nutrition were carried out in two towns. Second year comprised exchange of the pilots. During the third year, the whole action model will be taken to a third municipality. In the pilot towns, Turku UAS and Satakunta UAS set up local networks. Within the project, local service providers were encouraged to create more affordable services for the target group. The aim of this article is to give an overview of how two Finnish higher education institutes implemented the first half of the project. This case example might inspire higher education experts to include this target group to their research, development and innovation activities.
KEY WORDS: health promotion, higher education, nutrition, physical activity, unemployment
INTRODUCTION
The Finnish higher education system consists of two complementary sectors: traditional universities and universities of applied sciences (UAS). UAS sector – occasionally referred to as polytechnics – is operating under the Finnish Ministry of Education and Culture. Currently, there are 20 universities and 26 universities of applied sciences operating in Finland. The two sectors complete each other with different kinds of missions and profiles. [1, 2.] According to the Finnish Ministry of Education and Culture, teaching in UAS should be carried out in close relationship with working life, and education should enhance regional development. Moreover, UAS education is supposed to response to the changes of society and has to collaborate with regional actors. [3, 4.]
One of the urgent needs regarding public health is diminishing inequality in health, a common concern all over Europe [5]. Physical activity and nutrition, two important health determinants and health indicators, are associated with unemployment [5, 6, 7, 8]. Furthermore, early unemployment might end up with social marginalisation [9] affecting health as well. In addition to physiological health effects, participation in physical activity offers options to socialise with peers, evidently preventing marginalisation. When developing health services for unemployed in Finland, young people have been considered as a specific challenge [10].

106
In the Finnish community, several professions work with the unemployed youth [10]. Public Employment and Business Services play the most important role in the case of unemployment. Currently, these services don’t necessarily include any face-to-face interaction with the client in the early stage of unemployment. However, these services – both their electronic tools and facial interaction – serve as a potential for activating and supporting the target group by disseminating information and motivating their clients.
Recently, several consortiums have been set up between various universities of applied sciences. One of those consortiums is CoastAL in south-west Finland. The members of CoastAL are Turku UAS and Satakunta UAS. The consortium has joint Master’s Programmes, for example in health promotion and joint research, development and innovation (RDI) activities. [11.] RDI activities are a natural way to fulfil UAS mission. Consequently, RDI activities are supposed to be carried out in close connection to teaching. These days, RDI projects are often implemented in co-funding with various kinds of external funding systems. Turku UAS and Satakunta UAS are both running several projects under the theme of health promotion. Recently, both members have set up research groups particularly focusing on health promotion and physical activity. The first author of this article is the leader of Well-being and Health through Physical Activity –research group in SAMK in the town of Pori.
The CoastAL members are in the focus of this article. Both of them train, among others, health professionals who will later on work with all age groups. Health promotion – including activation of clients to take care of their own health, and motivating them to the use of nutrition and physical activity services, will be one of the competencies needed from future health professionals.
Actions to reduce health inequalities would be relevant topics for RDI activities in UAS. Among youngsters and young adults, work placement or studies offer opportunities for participation in physical activity, as well as for healthy nutrition. Unfortunately, the unemployed either miss these services or need extra support for participation. Our presentation furthers the understanding of how UAS, as higher education institute can make its share in the community to promote the health of youngsters or young adults without study or work placement.
The aim of this paper is to describe and exemplify to an international audience how two Finnish higher education institutes started and run a developmental project dealing with health promotion of unemployed youth and young adults. Through our case example other European higher education experts have the opportunity to reflect their RDI actions, and even get inspired to expand their own RDI actions.
This article gives an overview of the implementation of the first half of a 3-year project. The methods section deals with the background information of the funding as well as the implementation plan of the project as presented in the project plan.
METHODS
In spring 2013, the Finnish National Institute for Health and Welfare awarded a health promotion grant for CoastAL members to develop an action model to promote health through physical activity and nutrition among unemployed youngsters and adults aged 16-29 years.

107
The National Institute for Health and Welfare is a research and development institute operating under the Finnish Ministry of Social Affairs and Health. The number of applications was 184. Only four new projects were selected for funding. In 2013, altogether 30 projects were operating with this national funding of 3 780 000 euros. [12.]
The name of the project is Catch! – eat and move for health (in Finnish: Ota Koppi! - syö ja liiku terveydeksi). The project runs in 2013-2015. The amount of external funding for the consortium was 180 000 €, which covers 85% of the total costs. Turku UAS is the coordinator of the project. The project manager for nutrition is senior lecturer, Ph. Lic. Annukka Mattinen from Turku UAS. Senior lecturer, Ph.D. Tarja Javanainen-Levonen from Satakunta UAS is the project manager for physical activity. [12.]
According to the grant proposal, the main aim is to develop an action model to promote healthy nutrition and physical activity among the target group. During the first year of the project, two pilots were implemented. The town of Salo was the location for the nutrition part of the project. Physical activity pilot was run in Pori. The pilots were run vice versa during the second year. The action model will be taken to a third municipality during the final year of the project. Later on, the model is supposed to spread out wider in Finland.
The steering group of the project meets twice a year. Due to the 175 kilometres distance between the pilot towns, every second meeting takes place virtually. Photo 1 illustrates the meeting with four members in Pori and five members in Salo. Naturally, the same means has been used for meetings with two UAS project members.
Photo 1. Virtual steering group meeting in Salo and in Pori
The aim of the project requires collaboration between various sectors working with the target group. Moreover, the project proposal calls for actions to enhance higher education students’ attitude and skills to work with the target group and with health promotional issues. The results section describes some of the efforts carried out in practice during the first one and a half years to reach the aims. Even though the project itself deals with nutrition and physical activity, the main focus of our article is on physical activity due to the theme of Sports,
Physical Activity and Health conference.

108
RESULTS
Brainstorming with the network members. The project pilots started with collecting local networks in Salo and in Pori. Depending on the theme of the pilot, the networks comprised public and private service providers, the municipal sports office, the local employment services, and health authorities among the others. Due to the huge number of private service providers in physical activity, the public sector was focused on in the beginning of the project in Pori. During the first year, the network members, project staff, and students were invited to the first workshop. First of all, the aim was to spread out the theme of the project among network members. Secondly, the workshop was supposed to come up with fresh ideas to be included into the project. Simultaneously, information about the existing health promotional actions related to either nutrition or physical activity could be gathered.
The workshop in Pori was run according to the idea of learning cafe with 30 participants. In Pori, the newest students in physiotherapy participated in the workshop. They got introduced with the project idea, got to know the collaborators of the project – in order to be better prepared to work within the project theme later on during their studies. Inspiring discussions were run led by experts from the project network (photos 2, 3). Five themes were discussed, mostly dealing with how to reach and motivate the target group for participation in physical activity. The content and maximum costs of organized activities were also dealt with. During the workshop it became evident, that several actions already exist to promote physical activity and nutrition, particularly within the activating employment services for unemployed youngsters. Moreover, the municipal sports office offers discounts for the unemployed persons. Members in the discussions stressed not only the importance of demonstrations of some organised activities (e.g., ultimate, Frisbee golf, canoeing), but also local nature facilities, other free-of-charge activities, and activation of daily life (e.g. walking and bicycling for commuting) were focused on.
Photos 2-3. Workshop discussions led by experts from local employment services
Active integration of the project to the teaching. Collaboration with UAS education was one of the requirements agreed in the project plan. Therefore, this chapter describes several examples how the project has been integrated to study courses.

109
During the first year, the municipal sports office and Satakunta UAS established a specific physical activity group for the target group. The two instructors, male and female, were mature students of physiotherapy, who did this way their 1,5 ECTS course in adapted physical activity. They were paid by the municipality. The weekly evening sessions were run in the sports facilities (hall 700 m2) of the faculty of welfare. All the sports equipment was in their use as well. In order to ensure the amount of participants, the students from the sixth term in physiotherapy education were supposed to participate in the sessions twice within their adapted physical activity course. In spite of marketing in local newspaper (in print-version and www-pages) and within the network, only two young men from labour market training programme “Youth Workshop (in Finnish: Nuorten Työpaja)” participated. Moreover, they needed their work coaches’ support and company to join the activities and to offer transportation. However, students got the possibility to plan a 9-week programme for this specific new target group. Moreover, they had to start analysing the ways how to do further marketing and how to reach the clients better.
Much more fruitful has been the “tailored” collaboration during the second year of the project with specific small groups of youngsters: with a work coaching –programme. The work coaching –collaboration included: a preliminary lecture by an expert from the work coaching program, familiarisation with the ten youngsters and 23 young students in physiotherapy by the means of bowling in small groups in a bowling alley. Later on, students had two weeks time to plan a 3-hour session with the theme of “Move for Health” for the youngsters. Twelve students planned the session, which covered some ice-breaking activities, the lead-up exercises of the game of indiaca, some balance training activities and stretching activities. Eight youngsters participated in the session. Students acted as peer group for the target group. All participants appreciated the session highly. Interaction was intensive and warm. The students in physiotherapy overcame with their fears and excitement to instruct the client group. Young clients from the training programme became very open even during the ice-breaking activities. Later on, they obviously enjoyed the flexible atmosphere of the session. To instructors’ astonishment, in the final evaluation after the session the young male clients told that they really needed and liked to do the stretching activities.
However, the youngest students in physiotherapy acting as instructors and peers had already participated in the first brainstorming event in the beginning of the project, and were well aware of the content and aims of the project. The bowling session worked well to let the students and the youngsters work together, discuss, and share their ideas. Moreover, students of physiotherapy could interview their future clients very informally while bowling. They could talk about their hobbies, wishes and experiences related to physical activity and sports. The fact that the expert from the work coaching programme happened to be a former student of physiotherapy in Satakunta UAS might have affected to the positive experience. Through her own studies, she was also very familiar with the education and the aims of the studies.

110
Photos 4-5. A preliminary lecture for physiotherapy students by the expert (Harriet Haavisto) from employment coaching programme
The local “Youth workshop” organises coaching for approximately 40 youngsters. One of their coaches, Satu Sirviö has been an active collaborator within the project. Six mature physiotherapy students organized sessions with Frisbee golf and boccia (photo 6) based on Satu Sirviö’s lecture in Satakunta UAS concerning experiences with the youth. Altogether 20 students acted as peer group during that collaboration. The project borrowed a Frisbee golf goal and four disc sets to be used in the leisure time in the surroundings of the youth workshop. Collaboration was organized within the course of adapted physical activity part2 – with the aim of instructing and modifying various activities.
Photo 6. Enjoying boccia together in the backyard of youth workshop
Regarding the theses, two bachelor’s theses and one master’s thesis have been started within

111
the project. They are carried out in the rehabilitation counsellor’s studies and in the master-level health promotion programme. They deal with physical activity services, the experiences and expectations of the unemployed youth, as well as health care professionals’ share in health promotion of the target group.
Establishing lower-cost service delivery within private sector. During the second year of the project, thirteen local service providers in physical activity were contacted by three bachelor level students in physiotherapy during their final course in adapted physical activity. The aim was to establish collaboration as well as survey developmental ideas related to the project aims with private service providers. Thus far, seven of them have presented their interest in the form of organizing physical activity sessions with demonstrations of their own services (e.g. spinning, canoeing, yoga, fitness dancing, bowling, bodypump etc.) for the target group. Three of them already had discounts for unemployed persons. Three service providers told their interest to start up with discounts for the target group. During autumn 2014, demonstrations will be organized integrated to the physical education courses of the newest students in physiotherapy.
Www-pages to disseminate the information. The final product of the project will be the www-pages for the use of the target group as well as for professionals working with them. The technical part is constructed by two students of Turku UAS. The information will cover the list of services for affordable (lower cost or free of charge) public or private services in nutrition and in physical activity. Links will be attached to each service provider’s www-pages. Furthermore, best practices will be shared with practical and motivational health information. One bachelor level student in physiotherapy did her clinical training of 6 ECTS to prepare material for www-pages. The material included general information related to health benefits of physical activity. Some video clips for easy home exercises were produced as well. The www-pages are still under construction.
The use of media for marketing. Within the physical activity pilot, services offered for youth have been marketed in the local newspaper (Satakunnan Kansa) in a specific, free-of-charge column under the title “Where to go today/this week?”. The newspaper spreads out the information in their www-pages as well. Moreover, the local newspaper was inspired by the project idea, and after a contact from the project manager, wrote an article about Frisbee golf (photo 7).

112
Photo 7. Local newspaper marketing cheap and easy options for physical activity
The front page had a huge photo with youngsters throwing the disc. The idea of the game itself was marketed as a cheap and easy activity, played in a group in near-by facilities in the nature. The project manager could make her comments also related to modification options of the game.
During the second half of the project, the collaboration within the network will continue. UAS education finds out new ways to include the students to the project. When www-pages are ready, the information will be spread out locally as widely as possible.
CONCLUSIONS
In general, the reduction of health inequalities seems to be a topic linear to the profile and mission of UAS education. Therefore, this topic should apply well to the European higher education level sector as well. Furthermore, this kind of a project can utilize several strengths of higher education. According to a former case study carried out in the degree programme of physiotherapy in Satakunta UAS [13], the curriculum, pedagogical resources and facilities of a higher education institute offer very good options to participate actively in regional efforts to promote physical activity of various age groups. A longitudinal analysis [14] of minor pedagogical projects and bachelor’s theses (N=39, N=57) showed, that Satakunta UAS has been active in promoting physical activity options for persons with extra need for support in their physical activity – mostly in the areas of recreation and rehabilitation [14]. Thus far, the pedagogical projects have favoured the elderly, working aged and children – with extra need for support to participate in physical activity. However, our Catch-project has given the opportunity to broaden the target population into youngsters and young adults without study or work placement.
Maassen and his colleagues [15] found out in their recent evaluation that the bachelor level students’ share is strongly focused on in the RDI activities of the Finnish UAS sector. This is also the case in our project. However, a few Master level theses have been started related to our project – both in physical activity and nutrition parts of the project. Based on earlier

113
experiences and findings in Satakunta UAS physiotherapy studies [13, 14], particularly the content and amount of study courses related to physical activity (for example the following courses: Physical activity and service delivery in physical activity, Didactic of physical education, Adapted Physical Activity) offer good prerequisites for integrating study courses to physical activity promotional projects [14]. The implementation of the physical activity part of our project has shown that the project efforts are easily integrated to the studies, particularly in the fields of welfare and health. Thus far, UAS students’ share as future health professionals and as a peer group has been vital. UAS education seems to offer a diverse tool to collaborate in a variety of ways with local service providers and thus to develop participation in physical activity in several populations and settings. Along with the project, the target group has been served with more options and will more easily find out affordable services in physical activity and nutrition. Consequently, more active social participation through increased use of physical activity and nutrition services is expected. Evidently, the action model serves as an example in the future: in Finland and even abroad.
Several challenges have been faced during the project. The target population is very heterogeneous. The diversity relates to the age, life phase, educational background, economical background, family support, length of unemployment etc. This heterogeneity makes the target group harder to be reached. Therefore, the project network has to cover several sectors. Moreover, the hectic nature of work and the huge number of on-going projects in the community has made the collaboration between all stakeholders much harder. Thus far, the collaboration has been easiest and most fruitful with the existing employment activation services, which offer their programme-based services for a group of clients. However, those services already have some on-going activities organized related to physical activity and nutrition.
Youth unemployment and health as global issues might interest several stakeholders. Therefore, our description with background information related to the project might interest other higher education members to start up with similar kinds of efforts. Simultaneously, new international cooperation and networks might be established. Higher education institutes have the possibility – via our experience – to reflect their own possibilities for such efforts. One of the most important prerequisites is that the stakeholders committed to these kinds of efforts have educational programmes, which have interests and competences both in health promotion, as well as in nutrition and physical activity.
REFERENCES
[1] WWW-pages of the Rectors’ Conference of Finnish Universities of Applied Sciences. www.arene.fi.
[2] WWW-pages of the Finnish Ministry of Education. www.minedu.fi.
[3] The Polytechnics Act 351/2003.
[4] Ministry of Education. (2008) Education and research 2007-2012. Development Plan. Publications 2008:11. Ministry of Education, p. 39.
[5] Commission of the European Communities. (2009) Solidarity in health: reducing health inequalities in the EU.

114
[6] Commission of the European Communities. (2005) Green paper. ”Promoting healthy diets and physical activity: a European dimension for the prevention of overweight, obesity and chronic diseases”.
[7] CABAN-MARTINEZ, A., LEE, D., GOODMAN, E., DAVILA, E., FLEMING, L., LEBLANC, W., ARHEART, K., MCCOLLISTER, K., CHRIST, S., ZIMMERMAN, F., MUNTANER, C. & HOLLENBECK, J. (2011) Health Indicators Among Unemployed and Employed Young Adults. Journal of Occupational and Environmental Medicine 53(2), 196-203.
[8] ROSENTHAL, L., CARROLL-SCOTT, A., EARNSHAW, V., SANTILLI, A. & ICKOVICS, J. (2012) The importance of full-time work for urban adults’ mental and physical health. Social Science and Medicine 75(9), 1692-1696.
[9] HAMMER, T. (2003) Youth unemployment and social exclusion in Europe: a comparative study. Bristol: Policy Press.
[10] NIIRANEN, K., HAKULINEN, H., MANNINEN, P. & RÄSÄNEN, K. (2014) Työttömien terveyspalveluiden kehittäminen – verkosto mahdollisuutena [in English: Development of health services for the unemployed – options offered through networking]. Työelämän tutkimus – Arbetslivsforskning 12(1), 3-22.
[11] KÄRKI, A. (2014) CoastAL – uutisia Lounais-Suomen ammattikorkeakoululiittoumasta. (in English: CoastAL – news from the consortium of south-west universities of applied sciences) AGORA. Satakunta University of Applied Science News. 2/2014, p. 12.
[12] WWW-pages of the Finnish Ministry of Social Affairs and Health. (2013) Terveyden edistämisen määrärahan käyttösuunnitelma vuodelle 2013 (in English: The plan for the use of health promotion funds for year 2013). The Ministry of Social Affairs and Health. http://www.stm.fi/vireilla/rahoitus_ja_avustukset/terveyden_edistamisen_maararahat .
[13] JAVANAINEN-LEVONEN, T. & KÄRKI, A. (2007) A Case Study from a Sport Pedagogical Perspective in the Bachelor-Level Training of Physiotherapists in Finland. In P. Heikinaro & Johansson, R. Telama ja E. McEvoy (Eds.), AIESEP World Congress 2006 Proceedings: The role of physical education and sport in promoting physical activity and health (pp. 234-243). Jyväskylä, Finland: University of Jyväskylä, Department of Sport Sciences Research Reports No. 4.
[14] JAVANAINEN-LEVONEN, T., KÄRKI, A. & MÄKITALO, E, (2013) Finnish physiotherapy education as a regional promoter of physical activity in populations with special needs (Case study 1997-2011). Selected full papers from the 5th European Conference on Public Health. Malta 2012. Medimond International Proceedings, pp. 1-6.
[15] MAASSEN, P., KALLIOINEN, O., KERÄNEN, P., PENTTINEN, M., SPAAPEN, J., WIEDENHOFER, R., KAJASTE, M. & MATTILA, J. (2012) From the bottom up. Evaluation of RDI activities of Finnish Universities of Applied Sciences. Publications of the Finnish Higher Education Evaluation Council 7:2012. Tampere: Tammerprint.
Tarja Javanainen-Levonen, PhD in Sport Sciences, is a senior lecturer at Satakunta University of Applied Sciences (in Finnish: SAMK) in Pori, Finland. She is the leader of the Well-being and Health through Physical Activity – research group in SAMK. Her main teaching duties are in the Finnish and English Degree Programmes in physiotherapy. SAMK has organized

115
Degree Programme in Physiotherapy in Finnish 30 years. Degree Programme in English has
been organized 20 years, since 1994. E-mail: tarja.javanainen-levonen(at)samk.fi. More information in the following pages: http://www.spectrumofteachingstyles.org/colleagues-profile.php?ind=23 and http://theinclusionclub.com/episodes/twin_sticks/. Study options without tuition fees in SAMK: http://www.samk.fi/apply.

116
THE INFLUENCE OF SPORTS ACTIVITIES ON QUALITY OF LIFE
OF ADOLESCENTS IN THE DISTRICT OF TOPOĽČANY
Mária Kalinková, Ľubomír Paška, Jaroslav Broďáni, Vladimír Šutka, Marián Pargáč
Department of PE, Faculty of Education, Constantine the Philosopher University, Nitra, Slovakia
ABSTRACT Current social problem becomes lifestyles of young people, because they do not spend enough time with physical activity, as it was the past. The absence of physical activity is substantially reflected in their dissatisfaction with the quality of life. The paper discusses the influence of sport activity on individual quality of life in adolescents in district of. The article is a part of the grant project KEGA no. 014UKF-4/2013 titled: "Improving the quality and level of health of adolescents by means of physical activity in primary and secondary schools." The aim of this paper is to point out the meaning of important place and role of physical activity in the life of the adolescent. The results of the current exploratory survey declare its irreplaceable role both for subjective well-being of interviewed pupils and also to other areas of their quality of life. In our research we used questionnaire according SQUALA, which monitored and evaluated 165 respondents, aged 15 to 16 years pupils of the grammar school in Topoľčany. We monitored the degree of influence of sports activities on their quality of life, respectively on its individual areas. We found that in active sportsmen there is a demonstrable relationship from the point of satisfaction to the quality of life the leisure time (p <0.10). The survey reveals the relationship of free time as a certain quality of life in terms of importance in organized sportsmen (p <0.05), and evaluation of satisfaction among active athletes (p <0.10). Another finding was that among active athletes, we found a statistically significant value in the five areas of quality of life - physical well-being (p <0.05), psychosocial well-being (p <0.10), spiritual well-being (p <0.05), material well-being (p <0.20) and leisure (p <0.10). Exploratory finding in organized sportsmen was a high degree of importance on quality of life as free time (p <0.04) and physical well-being (p <0.05). We had noticed the positive influence of physical and sport activity to the individual quality of life and overall satisfaction of the surveyed respondents. We also concluded that the sport activities quite significantly influence the subjective perception of quality of life of adolescents in the period of adolescence. It has a positive influence not only on their health and overall physical fitness, also affects their mental state and thinking. When playing sports an adolescent gets into the group of people, respectively peers, where he takes some positive values, norms, behavior patterns, acquires ethical and moral principles. Sport also acts as a regulator of anger, stress and frustration. KEY WORDS: quality of life, questionnaire Squalla, adolescents, well-being, sport activity INTRODUCTION The quality of life has become a modern collocation and it is a normal part of amateur and professional vocabulary. This means in particular collocation which recently appropriated board of science disciplines. It is a concept whose meaning is associated with several attributes, "the concept is relatively new, interdisciplinary, multidimensional, also matching very controversial and quite difficult to grip" [5].

117
In relation to the definition of this collocation should be noted that there is no adopted comprehensive definition. Although this concept, quality of life, acts as a comprehensive indicator it captures the complex reality in incomplete form. The parts of that concept are its different aspects. Regard to different areas of life that give us a complete picture of the quality of life, taking care to place great emphasis on the biological, social, cultural determinants of life and its temporal aspect, which brings changes and other more innovative view of the perception of life. It is therefore not possible to establish a universal definition of the mentioned concept [1], [8]. One of the oldest definitions which appeared in 1948 is associated with quality of life is the definition of health proposed and adopted by the World Health Organization (WHO). The content of this definition is characteristic of health as the absence of disease or disorder, and expresses the complex state of physical, mental and social well-being. In relation to health, the quality of life perceived as total, physical, spiritual, social, psychological state of man, through which achieves optimal quality of life [7] and [3] derived from the interpretation of the quality of life from overall satisfaction and happiness to the lives of individuals. Thus, the concept of quality of life takes place on many levels, affecting complex living being. Adolescence in translation refers to the temporal stages of human life period of adolescence. It is a transitional period between childhood and adolescence. If it is a specific time definition it includes a decade of human life a period from 11 to 20 years. In adolescence it almost completes personality, change in the social, psychological and somatic area. The period is accompanied mainly by biological transformations affected by social and psychological indicators that are interacting. Important factors in adolescence which significantly affects the direction the man in adolescence will take as culture and social conditions. These indicators include the requirements and expectations of society in relation to adolescents. It is a specific stage in the development of human life which is characterized by its distinctive characteristics in the life cycle and has its subjective and objective meaning. During this period, the individual is looking for and reviewed, must master his own transformation and achieve satisfaction in their adoption of more advanced forms of self-identity [9]. During adolescence according to [11] is usefully divided into two primary parts. The first stage is an early adolescence (a period from 11 to 15 year) otherwise known as pubescencia. Another 5 years of life characterizes as a late adolescence. Which lasts from 15 to 20 years, and we take into account some individual exceptions. The basic starting concept from which they rely is the motor activity. It brings together a variety of motor activities carried out deliberately by man. It also characterizes the fundamental nature of existence of all living systems and organs. Real form of motor activity is the implementation of some sport activity, which is an individual actively engaged for some time. Motor activity broadly applied to man and his quality of life, which depends on the individual quality of life. Motor activity is favorable to human behavior, health, work production, image, eating. Accompanying phenomenon of motor activity is a set of physical and mental changes. Changing the internal functions of the body organs occur improvement in thinking, perception and motor activity through individual achieves some results. If an individual regularly conducts one type of motor activity he also adapts to its effects. It is a set of physical exercises, a certain kind of movement. Health is an integral part of every person. According to several studies, motor activity has beneficial effects on overall whether physical or mental condition of a person. Sport represents a concept that every person is explained individually and everyone this term sees something different. Even in the absence of the word unambiguous definition. Otherwise perceived sports doctor, lawyer, bricklayer who see sport as entertainment, a kind of relaxation and other professional athletes who are actively engaged

118
in sport for many years. In general, we can define sport as a form of motor activity that significantly affects the physical and mental state of a person. It presents physical and mental activity of the individual, as well as its efforts to achieve maximum results. Sporting activity is representing a sport activity at the highest level. The individual performs highly specialized motor activity and try to achieve the highest possible results. They organize the competition, which is only open to the most talented individuals. Sports activities experts define as a certain type of gym activity, which is focused on achieving the highest result [2]. Sport is according to [6] an important element in the overall human development, particularly in a period of adolescence. Sport as a conscious activity represents in adolescents take full advantage of his free time, he becomes a member of a team, developing social awareness, learn to accept the established rules and comply with them. In addition to the mentioned features sport acts as a controller for controlling aggression. Adolescents at a certain age react to external stimuli often overreact or aggressive and sport is a suitable option how to work with this emotion. The lack of motor activity has a negative impact on the overall state of a person and weakening his health. METHODS The article is aimed to analyze the quality of life from the perspective of sports activity among adolescents in the district of Topoľčany. When obtaining the targets we used the questionnaire as a method for finding of sport activity and quality of life among young people. It is a modification of SQUALA, as reported by several authors [4], [12], [10]. Questionnaire method represented in our work research method through which we investigated the quality of life in adolescents in the district of Topoľčany. In the first part of the questionnaire which is labeled "Part A" were asked questions that we investigated the basic information about the respondent. These are questions relating to age, gender, visited grade level of sports activity, time limitation of a sport activity, including physical education classes, questions inspiration in a sport activity and emotional survival. The next section of the questionnaire, which is marked as "Part B", we study how individual selected respondents considered the quality of life. The questionnaire SQUALA focuses on importance the individuals attach to various areas of life that are important in their lives. They subsequently express the degree of satisfaction with these areas [10]. We have divided it into two interlinked items. The first section examines aspects of life on an objective site and respondents assessed various areas from the point of importance. The second section examines aspects of life from the subjective site and respondents evaluate indicated the area from the point of satisfaction. Adolescents assessed individual quality of life in both parts of the 5-point scale, according to the current survival. In the first part they evaluated 30 items according to how they are important to them and chose a possibility to completely unimportant, of little importance, moderately important, very important and absolutely essential. In the second part they evaluated 28 items by satisfaction and chose a possibility as very dissatisfied, dissatisfied, something in between, satisfied, very satisfied. Items of questionnaire SQUALA are divided into eight areas: 1 area of physical well-being - health, sleep, solution of everyday activities, do not have problems 2 area of psychosocial well-being - family, personal relationships, intimate relationships, hobbies, safety 3 area of spiritual well-being - justice, freedom, beauty and art, truth 4 area of material well-being - money, good food

119
5 education - to be educated, to go to school 6 leisure time - possibility to spend your free time, have plenty of things for fun 7 appearance and ownership of things - look good, to dress nicely, have things that I like 8 orientation to the future - to have children and jobs in the future that will entertain me (Ocetková, 2007) The research took place at the grammar school in Topoľčany where participated 165 students, of whom 78 were men and 87 women at the age of 15-16. The sample was divided into three groups according to the sports level of respondents. The first group consisted of 64 respondents there were "occasional athletes" who realized irregular, unorganized motor activity. The second group was "active sports" in the number of 42 respondents, performing regular motor activity, but not members of any sports organization. The third group was the "organized athletes" in the number of 59 respondents, performing an organized sport activity which included the top athletes. RESULTS The second part of the questionnaire research subjective assessment of individual areas of quality of life of all respondents. It focuses on what's important to respondents and subsequently with which areas the qualities of life are satisfied. The figure 1 shows evaluation of group - occasional athletes, where pupils emphasize the most on physical and spiritual well-being and to at least their look and ownership of things. In the area of satisfaction we find the highest value on appearance and ownership of money, leisure and education they were least satisfied with the spiritual well-being. The data presented by occasional athletes in terms of relevance surprised us because individuals in adolescence attach importance at this time just the way they look. They want to dress according to the latest fashion trends and in the process of socialization find new idols and want to like them. They attach the most importance to physical well-being. Students realize that health is the most important factor in people's lives and this factor affects the quality of life of an individual the most. In the area of satisfaction they are the least satisfied with the spiritual well-being which included a questionnaire justice, freedom, truth, beauty and art. This phenomenon is explained by the fact that adolescence adolescents undergoing many changes not only physically, mentally but also set behavioral changes. Individuals often react excessively, aggressive and defy authority. They often feel of grief and injustice and promote your truth. We believe that their dissatisfaction is derived from the fact that parents of adolescent still not perceive as adults, often control them, enjoin them and leave them enough freedom. For occasional athletes we find a statistically significant value from the point of the importance of spiritual well-being (p <0.20), which includes justice, freedom, beauty and art, truth; material well-being (p <0.20) - questions of money and good food, and in the appearance of the property and affairs (p <0.20) - questions of appearance, nice clothes and ownership of things that respondents like they crave. From the point of satisfaction we find statistically significant levels of psychosocial well-being (p <0.10), in the field of education (p <0.20), and material well-being (p <0.20).

120
Figure 1 Comparison of the areas „how you are satisfied" and "how important it is for you" to the individual areas the quality of life for occasional athletes Ratings of group - active athletes which shows Figure 2 most respondents from point of the importance placed on physical well-being, spiritual well-being and leisure on the other hand at least the appearance and ownership of money. From the results we can see similar assessments than occasional athletes. It is like occasional athletes as well as active athletes have the highest priority in physical well- being. Every individual wants to be healthy, happy not to be dependent on the help of others and to live in a nice environment. These are attributes of everyday human needs, without one cannot exist. They represent the primary conditions which determine the quality of life of each person. From the point of satisfaction is on the highest place the appearance and ownership of money and the lowest value has spiritual well-being. In the area of appearance and ownership of money we have recorded satisfaction for all respondents. This fact can explain the fact that some students have various kinds of part time jobs and with support from the side of parents they have sufficient economic means, which they most often spent on clothes, things those they like they crave, and thus are satisfied with its appearance. Since they are still economically dependent on their parents do not have the expenses such as housing expenditures, various bills and expenses for meals, they are spending money on things that they like. Active athletes attach the importance to the field of psycho-social well-being (p <0.05) and spiritual well-being (p <0.10). From the point of satisfaction we are talking about statistically significant levels of physical well-being (p <0.05), psychosocial well-being (p <0.10), spiritual well-being (p <0.05), material well-being (p <0.20) and free time (p <0.10).

121
Figure 2 Comparison of the areas "how you are satisfied" and "how it is important for you" to the individual areas of quality of life in active athletes The figure 3 represents an assessment of organized athletes of individual areas of quality of life. They attach the importance to physical well-being, leisure and spiritual well-being. Even in this group of respondents, we assumed that the most importance they reflect to physical well-being. So how do we describe this fact in the other groups of respondents, even in organized athletes we start from the conviction that every man in your life wants to be healthy, happy and self-sufficient to live in a pleasant environment. The organized athletes believe that the importance of this area attach also the reason that health and good sleep are also crucial for them in future issues. Organized athletes perform their specific sporting activity at a professional level, which makes their free time and it is assumed that they had to pay in the future, which will be the source of their livelihood, and the sporting activities they want to perform well at the top level. Whereas up sport devote most of the time is important to them and leisure which have less, due to the fact that in addition to sports duties they also have study and family responsibilities. The greatest satisfaction expressed in the "look and ownership of money" and "leisure". The appearance and ownership of money are areas which are satisfied all respondents at all levels of sport. This fact can be explained that the parents financially support the activities and its future interests of the respondents. Parents of organized athletes are paid all fees associated with the implementation of their sporting activities and support their future direction. By placing importance on enough free time then expressed the satisfaction with this area. Organized athletes must be able to adapt their obligations and allocate a time for rest and leisure.

122
Figure 3 Comparison of the areas "how you are satisfied" and "how important it is for you" to the individual areas of quality of life in organized athletes In organized athletes we find a statistically significant value from the point of the importance of quality of life in areas such as physical well-being (p <0.10), psychosocial well-being (p <0.10) and leisure (p <0.05). In the area of satisfaction we did not find any statistically significant values in relationship of sports activities and mentioned areas in quality of life. CONCLUSION In survey we realized we also confirmed the assumption that more than half of the people interviewed perform sport activity outside of physical education classes more than five hours a week. We have not confirmed the assumption that the respondents at all sport levels we find a significant relationship between the area of quality of life, leisure and sport activities. This relationship was found only in active athletes from the point of satisfaction and in organized athletes from the point of importance. Further we confirmed the assumption that active athletes are happier in different areas of quality of life than other respondents in other sports levels. In section of active athletes we found a statistically significant value to the five areas of quality of life - physical well-being, psychosocial well-being, spiritual well-being, material well-being and leisure. These facts could tell us that active athletes who are regularly engaged to motor activity, but not members of any sport organization are more satisfied with their lives, because they are doing something for their health, have enough free time for dedication to their favorite activities. The assumption that a group of organized athletes will put the greatest emphasis on physical well-being with by directing of their sports future was not confirmed because statistically significant results were found in the area of spare time. The result can be explained that the organized athletes in addition to their educational and sporting obligations should also be ensured plenty of free time for their private, individual needs, for

123
example: friends, girlfriends, etc. From our survey we can see positive impact of motor activity and sport to the individual areas of quality of life, which would be linked also our recommendations for practice. Whereas in this survey we has demonstrated the positive influence of motor activity on overall satisfaction with the quality of life of adolescents, decides to propose to enhance the subsidy to physical education classes at schools, increase the number of leisure time and extracurricular activities with and focus on team sports because on the score of our work to make findings that most respondents in adolescence would prefer to perform this team sports. We consider team sports as an appropriate form for adolescents from the point of motor activity, even of their socialization skills, communication, receiving moral values, patterns, developing the principle of fair play and etc. REFERENCES [1] BABINČÁK, P. 2008. Definície, teoretické modely a indikátory kvality života. In: Kvalita života a sociálny kapitál – psychologické dimenzie. Prešov: Filozofická fakulta Prešovskej univerzity v Prešove, 2008. ISBN 978-80-8068-747-2, s. 42-78.
[2] BARÁTH, L. – HALMOVÁ, N. – ŠIMONEK, J. 2004. Úvod do štúdia telesnej kultúry. 1.vyd. Nitra: doc. PaedDr. Jaromír Šimonek, PhD., 2004. 122 s. ISBN 80-969168-2-3.
[3] BENÁČEK, V. – REICHLOVÁ, N. 2007. Ekonomická dimenze kvality a udržitelnosti života. In: Česká republika v Evropské unii: proměny a inspirace. 1. vyd. Praha: CESES FSV UK, 2007. ISBN 978-80-239-9568-8. s. 7-15.
[4] DRAGOMIRECKÁ, E. – ŠKODA, C. 1995. QOL – CZ. Příručka pro uživatele české verze dotazníku kvality života SQUALA. IGA MZ ČR, č.313/1995/1084.
[5] HEŘMANOVÁ, E. 2012. Koncepty, teorie a měření kvality života. 1. vyd. Praha: Slon, 2012. 239 s. ISBN 978-80-7419-106-0.
[6] KANÁSOVÁ, J. - BROĎÁNI, J.: Držanie tela u chlapcov na 1. stupni ZŠ v Nitre. In: Telesná výchova a šport na univerzitách II: zborník vedeckých prác. - Nitra: SPU, 2007. - ISBN 978-80-8069-987-1. – S. 130-135.
[7] KŘIVOHLAVÝ, J. 2001. Psychologické pojetí a zpusoby zjišťování kvality života. [online]. 2001, [cit. 2014-03-15]. Dostupné na internete: < http://jaro.krivohlavy.cz/stare_stranky/clanky/c_kvalita.html>
[8] MAREŠ, J. 2006. Problémy spojetí pojmu „kvalita života“ a jeho definovaním. In: Kvalita života u detí a dospievajúcich I. Brno: MSD, 2006. ISBN 80-86633-65-9, s. 11-28.
[9] NIGUTOVÁ, M. – KIMÁKOVÁ, T. – KACHLÍK, P. 2011. Narušenie sociálnych väzieb akopríčina delikvencie adolescentov. [online] Škola a zdraví 21/2011. [cit. 2014-03-17]. Dostupné na internete: <http://www.ped.muni.cz/z21/knihy/2011/40/texty/cze/21_nigutova_kimakova_kachlik_CZE.pdf>
[10] OCETKOVÁ, I. 2007. Úloha spirituality v životní pohode a kvalite života mladých lidí. Dizertačná práca. Brno: KP FSS MU. 233 s.
[11] VÁGNEROVÁ, M. 2005. Vývojová psychologie I. Dětství a dospívání. 1. vyd. Praha: Univerzita Karlova v Praze, 2005. 467 s. ISBN 80-246-0956-8.
[12] ZANNOTTI, M. – PRINGUEY, D. 1992. A method for quality of life assessment in psychiatry: the S-QUA-L-A (Subjective QUAlity of Life Analysis). Quality of life News Letter, 4, 6.

124
INFLUENCE OF 12 MONTHS SWIMMING TRAININGS ON POSTURAL STATUS OF 6-14 YEAR OLD CHILDREN
Sladjan Karaleic1, Vladimir Puzovic2, Marko Nikolic1, Vesko Milenkovic1, Zoran Savic1, Ivana Andjelkovic1
1Faculty of Sport and Physical Education, University of Pristina, Leposavic, Serbia 2Faculty of Medical Sciences, University of Kragujevac, Kragujevac, Serbia
ABSTRACT
The aim of this study was to determine effect of the 12 months swimming trainings on lateral asymmetry of body posture and flat feet of children 6-14 years old. This study included 156 children (81 boy and 75 girls) from 4 swimming clubs in Serbia, examined at the beginning and after 12 months of swimming trainings. Including criteria in the study was that children train at least 3 times a week, with breaks no longer than 4 weeks during the summer and 2 weeks during the winter break. Postural status was assessed by visual assessment method from front and rear side of the body1. Children with verified structural scoliosis were excluded from the study. Statistical procedures were performed using PASW 18. At the initial examination 44 (28.21%) children had lateral asymmetry of the body and 34 (21.79%) had flat feet. After 12 months of swimming trainings those values were 31 (19.87%) and 28 (17.95%), respectively. In boys, at the first postural status assessment 23 (28.40%) had lateral asymmetry and 16 (19.75%) had flat feet, while on the final examination those values were 18 (22.22%) and 15 (18.52%), respectively. In the girls, first examination showed 21 (28.00%) with postural asymmetry and 18 (24.00%) with flat feet, those values were decreased on second assessment on 13 (17.33%) for both variables. It is already known that exercise have a little or no effect on postural status of children with confirmed scoliosis. However, as it shown in this study swimming can have positive effect on lateral asymmetry and scoliosis suspected postural status in children.
KEY WORDS: children, postural deformities, swimming
INTRODUCTION
Spine presents an axis of body and it has number of roles. Spine postural status in literature is defined by four curves. From lateral side of view, two of those curves are convex and two are concave. If the degree of spinal curvatures going out of normal physiological range it is considered as spine postural deformity. Deformities of the spine are the most common disorders in spine pathology1, and most common between them are hyperkyphosis of thoracic spine, hyperlordosis of lumbar spine and scoliosis. The possibilities of correcting spine posture are decreasing as one goes older2. Deformities of the spine, depending of their degree, cause reduced motor skills, especially range of motion and reduced possibilities of shock absorption. Also, they can cause esthetic problem, and decrease quality of life. High degree deformities significantly increase morbidity and mortality.
Flat feet (pes planus) is the most common feet deformity3, 4, it is characterized by the

125
lowering of the arches of the foot5. This deformity is often present in obese children, in children with big range of motion of the ankle and in children who used to wear closed and stiff footwear when they were younger and thereby inhibited the development of foot6, 7. Beside of lowered arches of the foot, this deformity can be recognized by valgus position of Achilles tendons.
Swimming is a sport in which the influence of the force of gravity on proximal-distal axis of the spinal cord is reduced to a minimum. Proper position in swimming requires regular spine posture without increased curvatures. Also, the increased curvatures of the spine, create more resistance and adversely affect the on the motion of body during the swimming. Human body during the swimming moves in all three planes – sagital, frontal and transversal. As swimming requires body movement in all three planes it increasing mobility of dominant joints involved in moving through water. In addition most of propulsive force in swimming is generated by arms, which in aquatic medium with horizontal body position enables additional stretching of the spine and thus directly make positive influence on prevention or correction of spine deformities. Also, swimming as sport require activities without footwear, with an exception of sports equipment which can be wear to increase or decrease propulsion during specific trainings, and that equipment have positive influence on muscles of the lower leg and foot.
The aim of this study was to determine effect of the 12 months swimming trainings on lateral asymmetry of body posture and flat feet of children 6-14 years old.
METHODS
This study included 156 children, 81 boys and 75 girls, from 4 swimming clubs in Serbia. They were 6-14 years old. Examination of spine postural status was part of regular medical check out, and it was performed at the beginning of the study, and after 12 months of swimming training in the end of the study. During those 12 months, children were included in swimming training at least 3 times a week, with breaks not longer than 4 weeks during the summer and 2 weeks during the winter break. Children who did not participate regularly on swimming training, or who had longer summer and/or winter break, were excluded from the study. Data of training participation were taken from training records that were written by coaches. Children with verified structural scoliosis were also excluded from the study. Postural status was assessed by visual assessment method from front, lateral and rear side of the body8.
Statistical procedures were performed using statistical package PASW 18.
RESULTS
Initial examination shown that 44 (28.21%) of children had lateral asymmetry of the body, while 34 (21.79%) had flat feet. After 12 months of swimming trainings those values were decreased, and they were 31 (19.87%) and 28 (17.95%), respectively. At the first postural status assessment, boys had slightly higher prevalence of lateral asymmetry of the body - 23 (28.40%) in comparing to girls who had 21 (28.00%). In the end of the study, at the second measurement those values were 18 (22.22%) and 13 (17.33%), respectively. At the beginning of the study, distribution of flat feet was 16 (19.75%) in boys and 18 (24.00%) in girls, in the

126
end of the study at the second postural status assessment those were decreased by 1 in boys and by 5 in girls, and they were 15 (18.52%) and 13 (17.33%), respectively.
DISCUSION
In this research we examined influence of 12 months swimming trainings on postural deformities. By the term of postural deformities, in this study, we considered lateral asymmetry of the body and flat feet. Lateral asymmetry of the body, may be reflected in leaning of the body on one side, unequal height of the shoulders and etc. As it is already known that exercise and physical treatment have no or have very little effect on correction of structural scoliosis deformity9, children with that deformity were excluded from the study. Swimming is cyclic and symmetric sport in which it is expected that both, left and right, sides of the body work the same movement, in the same time or alternatively – depending from style10. Besides its positive influence on spine by increasing its mobility and by decreasing an impact of gravitation force on longitudinal spine axis, swimming by requiring laterally symmetrical movements of left and right of the body may correct lateral asymmetries. In our study after 12 months of the swimming training, number of children with lateral deviations was decreased for 13 (8.33%), of which number of boys was decreased for 5 and number of girls was decreased for 8.
Important part of propulsion force in swimming come from leg and especially from feet workout, which, as a feedback, results with strengthening and increasing the flexibility of foot and lower leg muscles. In our study, number of children with flat feet after 12 months of the training was decreased by 6 (3.85%). Improving of feet posture was better in girls than in boys. Number of girls with flat feet was decreased by 5, while number of boys with flat feet was decreased just by 1 after 12 months of swimming.
CONCLUSON
It is already know that exercise have a little or no effect on postural status of children with confirmed scoliosis. However, as it shown in this study swimming can have positive effect on lateral asymmetry and scoliosis suspected postural status in children.
REFERENCES:
[1] PECINA M. Ortopedija 2000 [2] KOVAC V. Paediatr Croat, 44 (Supl 1), 199-204, 2000 [3] VUKAŠINOVIĆ Z et al. Srp Arh Celok Lek, 137 (5-6), 320-22, 2009 [4] ROSE CRE. Internet J Orthop Surg, 6 (1), 2007 [5] STAHELI LT. J Am Podiatr Med Assoc, 89 (2), 94-99, 1999 [6] RAO UB, JOSEPH B. J Bone Joint Surg Br 74: 525-527, 1992 [7] RADISAVLJEVIC M. Beograd: FSFV, 2001. [8] PINEDA S et al. Scoliosis, 1: 18, 2006 [9] WEISS HR. Scoliosis, 5 : 28, 2010 [10] MAGLISCHO EW. Human Kinetics, 2003

127
COMPARISON OF THE CHANGES OF PERFORMANCE IN
VERTICAL JUMPS IN WOMEN AND GIRLS OF THE SLOVAK NATIONAL TEAMS IN SOCCER
Peter Kopúň, Pavol Peráček
Comenius University, Faculty of Physical Education and Sport, Department of Sports Games ABSTRACT Power, strength are important abilities for elite soccer performance. One possibility of assessing the level of power of the lower extremities is vertical jump by jumper, consisting of the reflecting plate and interface. The aim of the study was to compare the significance of changes in performance parameters of the selected power between different categories of representative teams of women and girls in football. For data evaluation we applied a statistical method Anova. In the test of 10s repeated jumps, we found that there are between groups statistical significance at the 5% (F = 4.521). In the squat jump we did not find significant differences when comparing groups in studied (F =, 635, p> 0.05). In counter-movement We found that when comparing groups, there is a statistically significant difference at 5% level (F = 4.522). KEY WORDS: Soccer, Women National Teams, Power, Vertical Jumps, Counter- movement jump, Squat jump INTRODUCTION In most team sports and games is a long Endurance activity associated with frequent intense sequences of extraordinary dynamism and activities that have a significant impact on the physiological characteristics of the game and the training process, as well as convalescence and recovery (Peráček et al., 2013). Football is the intermittent load, which alternates higher intensity with lower intensity level (Bangsbo, Nørregaard, Thorsoe, 1991; Bangsbo, 1994; Mohr, Krustup, Bangsbo, 2003). Players perform a variety of cyclic, acyclic gaming activities with or without the ball, different speeds and different duration. According Iaia, Rampinini, Bangsbo (2009) players take 30 to 40 sprints, 1200 acyclic and unforeseen activities. Explosive power of the lower extremities is one of the important factors of performance in football. It not only determines the amount of force, but also the length of time for which the athlete reaches a certain percentage of their maximum strength. Is partly determined by the size of the maximum power and control intramuscular and intramuscular mechanisms (Kampmiller, Vanderka, In: Moravec, et al., 2007). Its level depends only on certain congenital available, a higher proportion of fast fibers (Bosco et al., 1983), as well as training contingent on improvements neuroregulačných mechanisms (Komi, 1986). The relationship between power and speed capability is undeniable, and it requires a high level of football both motor skills. Activation higher number of motor units, unlock the protective mechanism damping intensity contractions over time applied selective hypertrophy and coordination between synergistic and antagonistic muscles are active physiological mechanisms that can improve the training process (Wilmore, Costillo, 1999). One of the ways of assessing the level of explosive strength of the lower extremities is výskokový ergometer, consisting of the reflecting plate and interface. The device is capable of measuring to the nearest thousandth of a second duration of the flight and supporting phases and calculate the amount of them jump, rebound during acceleration, etc.. (Zemková Hamar,

128
2004). It is an orientation to assess the ability to use elastic energy, which can be highlighted jump after jump from higher situated place (in Hamar, 1991). Development and changes in performance and power skills in women, however, are subject to certain specificities. While the boys are highlighting the influence of adolescence - puberty hypertrophy of muscle fibers, the girls still share hypertrophy adaptation to changes despite intense workout due to persistent low androgen levels remained limited (Kampmiller, Hamar, 2009).
METHODS The group consisted of women and girls (n = 104) representative teams "A", U19 and U17 Slovakia Cup. The average age hráčok senior "A" team of women bol24,65 ± 2.75. The average age hráčok cooperative "U19" was 17.67 ± 1.82 and the mean age hráčok cooperative "U17" was 16.23 ± 1.04. Detection power skills we used Fitronic Jumper (Bratislava, Slovakia). We tested single jumps without offense, with counter-on impact with 10 cm height and repeated jumps for 10 seconds. Volunteer had performed all measurements with fixation arms at the sides. Reliability testing has proved to be reliable (r = 0.7). We tested four measurements in half-yearly intervals to control rallies representative teams. The aim of the study was to compare the significance of changes in performance parameters of the selected power between different categories of representative teams of women and girls in football. For data evaluation we applied a statistical method ANOVA.
RESULTS and DISSCUSION
As a result of large-scale data, we had to choose only selected parameters tested power skills to Jumper. Specifically, we worked with the height of a jump. Table 1 presents the results of the test repeated jump in the duration of 10 seconds. Statistical verification, we found that there are between groups in the selected test statistical significance at the 5% level of significance (F = 4.521, p <0.05). Significant difference can be seen in the performance of WA file with other groups, if the group WA reached average values of the four measurements (29.72 ± 3.55, 26.72 ± 3.18, 27.23 ± 3.81, 29.04 ± 4.18). WU19 reached the maximum value 26.39 ± 3.15 and 27.64 ± 3.66 and group WU17 even reached the maximum mean value of 26.31 ± 3.93 and 26.71 ± 4.13.
Tab.1 Test of 10s repeated jumps
Measurement WA WU19 WU17 1 29,72 26,39 26,31 2 26,72 24,65 23,54 3 27,23 25,91 26,72 4 29,04 27,64 25,34
F=4,251 (p<0,05)

129
Pic. 1 Significant differences in test of 10s repeated jumps between groups
Table 2 presents the results of averaging the four measurements, squat jump in the test, without countermovement with his hands fixed at the hips. We did not find significant differences when comparing groups in studied (F =, 635, p> 0.05). We can see the increase of the performance of the group WA 28.22 ± 6.30 to 29.74 ± 4.08, but in the course of the preparation of the long-term decline in performance can be seen. Groups WU19 and WU17 are almost identical.
Tab.2 Test of Squat jump Measurement WA WU19 WU17
1 28,22 27,40 27,36 2 25,21 25,54 27,24 3 25,84 25,76 23,80 4 29,74 26,80 25,52
F= ,635 (p>0,05)
Pic. 2 Significant differences in test of squat jump between groups
Table 3 presents the results of four measurements at test single jump after jump from a higher place with fixation hands at the hips and knees minimal shrug. We found that when comparing groups, there is a statistically significant difference at 5% level (F = 4.522, p <0.05). As in the test of repeated jumps for 10 seconds, and in this case one can see that the group has reached the maximum values WA 28.40 ± 4.04 and 28.74 ± 3.79. Another two sets achieved lower maximum values as follows: file WU19 - 26.51 ± 3.62 and 26.68 ± 3.95; WU17 - 25.50 ± 3.83 and 26.51 ± 3.76.

130
Tab.3 Test of Counter-movement jump
Pic. 3 Significant differences in test of counter-movement jump between groups
The same results were also found Castagna, Castellino (2013) when comparing senior team with the team to 17 years. The results confirm the theoretical knowledge of the power and performance capabilities of women in the force component. The WA team can follow the dynamics of a power performance, which is visible upward trend from the second measurement. Often encounter diagnostic phenomenon when the second measurement is the weakest. Attach a motivating factor.
CONCLUSIONS We found that significant changes in performance in the vertical jump between different categories occurred in the 10s repeated jump in and jump with countermovement. This, we believe that the principles of neuromuscular adaptation in long-term training of women and girls to play a major role. When we compare teams WU19 and WU17 see fluctuating dynamics of power output also. Players’ age difference was not significant and therefore we think that it is the developmental genesis of players plays an important role. For the selection of talented players to select for national team, we recommended tests for speed-force component.
ACKNOWLEDGEMENT Study is part of national program VEGA 1/1252/12
Measurement WA WU19 WU17 1 28,40 26,51 25,50 2 26,34 24,94 26,85 3 26,72 25,79 24,05 4 28,74 26,68 24,96
F= 4,522 (p<0,05)

131
REFERENCES
[1] BANGSBO, J. 1994. The physiology of soccer: with special reference to intense intermittent exercise. In Acta Physiologica Scandinavica Supplementum, :Wiley-Blackwell. 1994, roč. 619, č. 2, s. 1-155. ISSN 0302-2994
[2] BANGSBO, J., NORREGAARD, L., THORSOE, F. 1991. Activity profile of competition soccer. In Canadian Journal of Sports Sciences, Toronto: CASS, roč. 16, 110-116s. ISSN 0833-1235
[3] BOSCO, C. a kol. 1983. Mechanical power test and fiber composition of human leg extensor muscles. European Journal Applycation Physiology. 50, 129 – 136
[4] CASTAGNA, C., CASTELLINI, E. 2013. Vertical jump performance in Italian male and female national team soccer players. In Journal of Strenght Conditioning Research, 2013, 27(4), p. 1156 - 1161
[5] HAMAR, D. 1991. Výskokový ergometer – princíp a možnosti uplatnenia v diagnostike trénovanosti a tréningovej praxi. In Príspevok z pracovného seminára Diagnostika a rozvoj odrazových schopností. Austria: Salzburg – Riff
[6] IAIA, M., RAMPININI, E., BANGSBO, J. 2009. High-intensity training in football. In International journal of sport physiology and performance. Champaign: Human Kinetics. 2009, roč. 4, s. 291-306,
[7] KAMPMILLER, T., HAMAR, D. 2009. Mýty a fakty o silovom tréningu detí a adolescentov. In Telesná výchova a šport. r. 19, č. 2
[8] KOMI, P. V. 1986. Training muscles strenght and power: Interaction of neuromotoric, hypertrophic and mechanical factors. International Journal Sports Medicine, roč. 7, vyd. 1, 10 -15s.
[9] MOHR, M., KRUSTRUP, P., BANGSBO, J. 2003. Match performance of high - standard soccer players with special reference to development of fatigue. In Journal of Sports Sciences, London: Routlege . 2003, roč. 21, s. 519-528, ISSN 1746-1391
[10] MORAVEC, R. a kol. 2007. Teória a didaktika výkonnostného a vrcholového športu. Bratislava : FTVŠ UK, 2007. 240 s. ISBN 978-80-89075-31-7
[11] WILMORE, J. H., COSTILL, D. L. 1999, Physiology of Sport and Excercise. Champaign: Human Kinetics
[12] ZEMKOVÁ, E., HAMAR, D. 2004. Výskokový ergometer v diagnostike odrazových schopností dolných končatín. Bratislava: FTVŠ UK, 46str., ISBN 80-89197-11-6

132
ACUTE BONE TURNOVER AND EXERCISE
Jana Kovárová, Dušan Hamar, Milan Sedliak
Faculty of Physical Education and Sports, Comenius University in Bratislava ABSTRACT Various densitometrical techniques have been used for the assessment of the effectiveness of exercise interventions. The changes of bone tissue are manifested only after a long period of application of particular stimuli. Serum bone metabolism markers response to an exercise can be used as an alternative to these long term effect detecting densitometric techniques. The markers provide indirect information on the acute state of bone turnover. Based on this information a long term changes of bone metabolism can be assumed. Several molecules related to biological activities governing bone turnover in blood have been identified (for example bone alkaline phosphatase, osteocalcin, carboxy- and amino-terminal propeptide of type I procollagen, carboxy- and amino-terminal telopeptide of type I collagen, sclerostin, etc.) However, most of these markers show substantial intra-individual variability. Many factors need to be taken into account when analysing serum samples (age, menopause, diet, time of day, etc.). Bone turnover markers show different patterns depending on the type of exercise as well. The published studies show that impact activities are more osteogenic than non-impact ones and as such are more suitable for improving and maintaining proper state of bone tissue. KEY WORDS: bone turnover markers, bone mineral density, exercise INTRODUCTION Various densitometrical techniques have been used for the assessment of the effectiveness of exercise interventions that may influence bone density. As bone remodelling is a slow process, the changes are manifested only after a long (usually no less than 2-year) period of particular stimuli application. Such studies are not only time consuming, but also associated with problems related to maintaining the number of subjects studied. Proof of the effectiveness of different stimuli (e.g. different nature of load, intensity, volume or frequency of exercise intervention) under such circumstances is therefore a quite difficult task. Markers of bone metabolism Bone metabolism markers, though reflecting acute response to an exercise, can also be used as an alternative to the densitometric techniques. These markers provide information of the long time exercise effect on bones based on an assumption that a more pronounced acute effect represents a more intensive adaptation stimulus leading to more profound long term effects on the bone tissue. However it should be taken into account that the levels of biochemical markers reflect only overall bone turnover. That means that they do not provide distinct information on the remodeling of either trabecular or cortical bone. Based on their involvement in different phases of bone turnover, two categories, i.e. the markers of bone formation and resorption are classified, typically measured in plasma or serum. Bone formation markers Bone formation markers are produced during particular phases of osteoblast development and

133
extracellular matrix maturation. Most widely used bone formation markers are bone alkaline phosphatase (bALP), osteocalcin (OC) and carboxy-terminal and amino-terminal propeptides of type I procollagen (P1CP and P1NP, respectively). Bone resorption markers Bone resorption markers reflect the degradation process of the principle component of the bone matrix, i.e. type I collagen. The most widely used ones are carboxy-terminal telopeptide of type I collagen (CTx), amino-terminal telopeptide of type I collagen (NTx) and hydroxyproline. Though this widely used and accepted classification of the markers according to the metabolic involvement is not ideal. This is because some marker components reflect, to a certain degree, both, bone resorption and formation (e.g. certain osteocalcin fragments, hydroxyproline). Furthermore, their urinary or circulating levels can be influenced by non-skeletal processes, as the majority of the molecules are also present in tissues other than bone [28]. Although analytical pitfalls, biological variability and various confounding factors limit, to a certain degree, the use of biochemical markers of bone turnover, they still provide an acceptable tool for monitoring the actual metabolic status of the bone. This is a major advantage over traditional densitometric techniques, which can not be applied to detect the dynamics of bone turnover. Apart from that, their use is important in the study of athletes as well as of general population. Information obtained can enhance current knowledge on the application of various forms of physical activity in the treatment and prevention of bone metabolism disorders. Bone metabolism marker’s response to exercise Repetitive external loads are imposed on bone tissue during daily activities. Bones do not break or damage because the skeleton has adapted its micro-architecture during the development and growth according to altered loading environment [7]. The observation that bone responds positively to loading environment, generally attributed to German physician Wolff, is known for more than 100 years (1892). This concept, marked as Wolff’s law, has been subjected to several systemic experiments. Bone turnover markers show different patterns depending on the type of exercise [8, 27, 32]. The published studies show that impact activities are more osteogenic than non-impact ones and as such more suitable for improving and maintaining the state of bone tissue. It has been shown that athletes engaged in martial arts, as well as rugby and soccer players, had higher values of bone mineral density (BMD) than swimmers, rowers, or bodybuilders [14]. Similar trends have been found in a longitudinal study, which compared BMD between female gymnasts and athletes competing in running and swimming [31]. BMD measured at the lumbar spine and the femoral neck was greater in the gymnasts than in swimmers, runners, or controls. In the same line are the results published by a study [1], in which gymnasts showed higher values of BMD than cross-country runners. Another comparison of basketball and volleyball players with participants in non-impact sport events proved that athletes participating in impact sports have higher BMD and osteocalcin concentration than swimmers [3]. No differences in bone resorption (measured by NTx concentration) between the two types of activity evoke an assumption that the observed difference in BMD is due to more active processes of bone formation. Athletes who participate in non-weight-bearing sports have in general lower BMD than those

134
active in weight-bearing sports. Cycling, as a typical example of non-weight-bearing exercise, is associated with lower BMD than running [20]. The level of physical fitness also seems to have an impact on bone turnover. This has been documented by a study [17] in which university male students performed a 30-minute treadmill exercise at the intensity 50 % of their maximum capacity. The maximal osteocalcin level of non-athletic students was reached immediately after the run and it returned to baseline values within 1 hour of recovery. On the other hand, osteocalcin increase in athletes has been postponed, with the peak after 1 hour of recovery. Bone response to exercise largely depends on age and maturation [11]. The results of this study clearly demonstrate that exercise had more pronounce osteogenic effects in adolescents than in mature subjects. The biological mechanisms for this phenomenon are not yet fully understood. They are likely to be related to differences in bone surfaces. Prior to the maturation is the bone surface covered by a greater proportion of active osteoblast than in adulthood. It may be assumed that higher amount of active osteoblasts amplify the response to mechanical stimuli and leads to greater bone formation. There is a substantial body of evidence indicating that exercise prior to the pubertal growth spurt stimulates bone growth and skeletal muscle hypertrophy to a greater degree than observed during growth in non-physically active children [8]. This may explain why periosteal expansion occurs predominantly during growth, and consequently why the childhood and adolescent years represent a favourable period to significantly enhance periosteal growth with exercise. Such growth enhances the periosteal thickness, which is important in skeletal health as the addition of bone under the periosteal surface efficiently improves the bending and torsional strength of the bone. Consequently, vigorous exercise during growth and young adulthood may well reduce fracture risk in later decades of life [12]. The positive association between exercise and bone mass has prompted many physicians and public health officials to recommend the engagement in daily exercise not only in young, but also in advancing age. It is not clear which training method is superior for bone stimulation in adults, although scientific evidence points to a combination of high-impact and weight-lifting exercises. Studies performed in older adults show only mild increases, maintenance or just attenuation of BMD losses in postmenopausal women, but net changes in BMD relative to control subjects who are losing bone mass are beneficial in decreasing fracture risk. For those with osteoporosis, weight-bearing exercise in general, and resistance exercise in particular, as tolerated, along with exercise targeted to improve balance, mobility and posture, should be recommended to reduce the likelihood of falling and its associated morbidity and mortality [8]. The mechanical aspects of strain-adaptive response of bone The triggering input for bone adaptive processes are strains produced by external loading. The response of bone turnover depends mainly on the dynamic/static character of the external loading and its strain magnitude, which can be identified by their distribution and the rate of change. The possibility to attach strain gauges directly to bone surfaces in vivo allowed to measure not only the magnitude of strain, but also its distribution and the rate of change. This new method enriched the knowledge of bone metabolism and allowed a deeper insight into its mechanisms. A pioneer work [19] proving a correlation between maximum strain rate and

135
bone hypertrophy has been confirmed by several subsequent studies [16, 33]. Animal studies of different types of external loads show that bone tissue does not adapt to static strains [13]. On the other hand, exercise studies using human subjects prove that high strains changing at fast rates and presented in unusual directions result in greater bone adaptive responses than dynamic strains changing at slower rates. Researchers of another study [9] have specified the size of loads necessary to engender adaptive changes in bones. Bone tissue did not respond to none of the static loads applied, not even to those producing fairly large strains. They confirmed that bone adapts to intermittent and dynamic, but not static loadings. Thus high impact activities such as badminton, squash, triple jumping, etc. cause larger osteogenic responses than swimming or cycling [18]. It is therefore assumed that the character of the strain-related stimulus rather than particular strain intensity maintains and eventually improves the bone architecture. Another step forward in elucidation of factors influencing bone remodelling was an elaboration of functionally isolated avian ulna model [22]. This approach allowed the study of bone adaptation to strains imposed by experimental loads without the interference of strains originating from normal physical activities. It seems that not only the distribution and the rate of change, but also the number of external loading stimuli is also essential in the evaluation of strain adaptive response of bone tissue. The studies using this model [6, 23] found out that maximal level of bone adaptation to an osteogenic strain could be achieved with 36 loading cycles of per day. Rats exposed to repetitive jumping increased the mass of their femora and tibiae proportionately to the number of daily jumps. However, the anabolic response became saturated after about 40 loading cycles [35]. This finding corroborates another experiment, in which animals trained to jump 100 times a day did not improve their bone mass significantly over those trained to jump 40 times a day. These findings led to a conclusion that bone’s micro-architecture adapts to a subset of total mechanical stimuli to bone cells [29]. Another feature influencing the strain adaptation of bone is its duration. Studies on rodent cells [4, 5, 15, 16] showed that the periods of external loading need to be short in order to stimulate the adaptive processes in bone. Another issue about osteogenic response to loading relates to resting periods. It has been shown that bone loses logarithmically over 95 % of its mechanosensitivity after only 20 loading cycles [35]. However, it looks like bone cell mechanosensitivity recovers after a period of no loading. This concept results from an experiment [21] in which rats were subjected to mediolateral bending of the tibia. All six groups of rats received 360 cycles a day of the same loading stimulus, delivered as 90 continuous cycles, four times a day. The groups were allotted different resting periods between each of the daily bouts (8, 4, 2, 1, 0.5 or 0 hours of rest). No significant improvement occurred in a group without any rest period. However, as the rest periods were lengthened, bone formation was enhanced reaching almost double of baseline value when applying 4 hour resting interval. After 24 hours of rest, 98 % of bone mechanosensitivity returned. The study clearly indicated that the osteogenic response to short vigorous skeletal loading sessions is enhanced by regimens that incorporate periods of rest. Translating these laboratory data in terms of human exercise suggests that the osteogenic response of multiple loading bouts depends on the recovery time between sessions. This assumption has been corroborated by another study [34] showing that the osteogenic potential of exercise in human can be enhanced when the daily exercise is divided into two shorter

136
sessions separated by eight hours. Such an arrangement, i.e. dividing a daily contingent of 120 jumps into two sessions separated by 8 hours improves the osteogenic potential by almost 50 %. However, from a practical point of view is of interest that dividing the daily exercise volume into three sessions of 40 jumps each four hours apart does not elicit any additional improvement. Further studies also demonstrate that bone formation depends not only on duration of loading and periods of rest, but also on strain magnitude and frequency [10, 16, 30]. A 500 microstrain mechanical load applied at frequency 10 to 60 Hz is substantially more osteogenic than the same amount of load applied at the rate of 1 Hz [25]. Disuse bone loss may be prevented even by strains of extremely low magnitude (less than 10 microstrain) if applied at high frequency [26]. Furthermore, it looks like the primarily strains deviating from the habitually encountered ones lead to osteogenic response of bone cells [2, 24]. CONCLUSION As indicated by numerous studies, long term mechanical loading of bones is an important factor for keeping healthy bone structure and density. Bone tissue’s response to mechanical loading is more effective during adolescence, in athletes participating in impact sports and subjects with higher physical fitness. Though bone response to exercise in older and untrained people is less pronounced, systematic high impact physical activity is still an important factor also for this group of population. REFERENCES [1] BEMBEN et al. Journal of strength and conditioning research. 18(2), 220-226, 2004.
[2] BIEWENER et al. Journal of experimental biology. 185, 51-69, 1993.
[3] CREIGHTON, et al. Journal of applied physiology. 90(2), 565–570, 2001.
[4] FORWOOD et al. Bone. 15(6), 603-609, 1994.
[5] FORWOOD et al. The American journal of physiology – Endocrinology and metabolism. 270, 419-423, 1996.
[6] FROST. Bone and mineral. 19(3), 257-271, 1992.
[7] GOODSHIP et al. The Journal of joint and bone surgery. 61(4), 539-546, 1979.
[8] GUADALUPE-GRAU et al. Sports medicine. 39(6), 439-468, 2009.
[9] HERT et al. Folia morphologica. 19(3), 290-300, 1971.
[10] HSIEH et al. Journal of bone and mineral research. 16(5), 918-924, 2001.
[11] KANNUS et al. Annals of internal medicine. 123(1), 27–31, 1995.
[12] KARLSSON et al. Journal of bone and mineral research. 17(suppl. 1), 297, 2002.
[13] LANYON et al. Journal of Biomechanics. 17(12), 897-905, 1984.
[14] MOREL et al. Osteoporosis international. 12(2), 152-157, 2001.
[15] MOSLEY et al. Bone. 20(3), 191-198, 1997.
[16] MOSLEY et al. Bone. 23(4), 313-318, 1998.

137
[17] NISHIYAMA et al. Calcified tissue international. 43(3), 150-154, 1988.
[18] NORDSTROM et al. Journal of bone and mineral research. 13(7), 1141-1148, 1998.
[19] O’CONNOR et al. Journal of biomechanics. 15(10), 767-781, 1982.
[20] RECTOR et al. Metabolism. 57(2), 226–232, 2008.
[21] ROBLING et al. Journal of experimental biology. 204(Pt 19), 3389-3399, 2001.
[22] RUBIN et al. Journal of bone and joint surgery. 66(3), 397-402, 1984.
[23] RUBIN et al. Calcified tissue international. 37(4), 411-417, 1985.
[24] RUBIN et al. Journal of orthopaedic research. 5(2), 300-310, 1987.
[25] RUBIN et al. Nature. 412(6847), 603-604, 2001.
[26] RUBIN et al. FASEB journal. 15(12), 2225-2229, 2001.
[27] SCOTT et al. Journal of applied physiology. 10(2), 423–432, 2011.
[28] SEIBEL, M.J. The Clinical Biochemist. Reviews. 26(4), 97-122, 2005.
[29] SKERRY et al. Bone. 16(2), 269-274, 1995.
[30] SRINIVASAN et al. Journal of applied physiology. 102(5), 1945-1952, 2007.
[31] TAAFFE et al. Journal of bone and mineral research. 12(2), 255-260, 1997.
[32] THORSEN et al. Calcified tissue international. 60(1), 16-20, 1997.
[33] TURNEr et al. The American journal of physiology – Endocrinology and metabolism. 269, 438-442, 1995.
[34] TURNER et al. Exercise and sport sciences reviews. 31(1), 45-50, 2003.
[35] UMEMURA. Journal of bone and mineral research. 12(9), 1480-1485, 1997.

138
PHYSIOLOGICAL, MOTORIC AND ANTHROPOMETRICAL
PROFILE OF YOUNG ELITE SLOVAK JUDOKAS
Stanislav Kraček, PhD1, Miloš Štefanovský, PhD.1, Žaneta Csáderová, PhD.2, MA. Peter Lopata2, MA., Lukáš Lengvarský2, MA. Ladislav Kručanica3
1Faculty of Physical Education and Sport, Comenius University, Nábr. arm. g. L. Svobodu 9, Bratislava, Slovakia
2 National Sport Center, Trnavská cesta 39, Bratislava, Slovakia 3Faculty of Safety Management, Kukučínová 90/17, Košice, Slovakia
ABSTRACT
The aim of this study was to discovered and consequently identify physiological, motoric and anthropometrical profile of young elite Slovak judokas. For this purpose we select 8 male judokas, representing Slovakia this year at the age of 18 in different international competitions. The following tests and measurements were conducted: (a) Sterkowicz judo fitness test (SJFT); (b) test of maximal strength power by bench-press and Australian dumbbell pull; (c) skinfold thickness; (d) anaerobic power and capacity using of Wingate test for upper limbs; and (e) VO2max by running on treadmill. After the end of the SJFT, Wingate test and VO2 max test we executed blood lactate measurements. Moreover by these three tests we followed heart rate (HR). After finishing all this procedures we find out following results: SJFT 26,38 (± 1,30) throws and index 12,84 (± 0,71); maximal strength power in bench-press 5,5 (± 0,73) W / kg and maximal strength power by Australian dumbbell pull 6,61 (± 0,50) W / kg; skinfold thickness 12,19 (± 3,14) %; anaerobic power 7,15 (± 0,46) W/kg, anaerobic capacity 5,94 (± 0,28) W / kg and fatigue index 38 (± 11,15) by Wingate test; VO2 max 55,16 (± 3,3) ml / kg / min.
KEY WORDS: judo, SJFT, dynamic explosive power, skinfold thickness, anaerobic power and capacity, fatigue index, VO2 max.
INTRODUCTION
Judo is an Olympic sport that requires technical - tactical skills and high level of general physical preparedness (Pulkkinen, 2001). Fitness and anthropometric variables currently require high ranks already in cadet categories (15 – 18 years). Some authors state, that the top level judokas have very low values of subcutaneous fat (Claessens et al., 1987; Clarys et al., 2011). Although body composition varies significantly from heavier weight categories (higher percentage of fat) to lighter categories (Callister et al., 1991). From the physiological point of view the factors that limit the sport performance in judo are anaerobic power and capacity, explosive strength, reaction capabilities, dynamic balance, and aerobic performance (Thomas et al., 1989; Pulkkinen, 2001; Štefanovský, 2008). These parameters vary depending on the age of judokas and the weight category (Franchini et al., 2005). The assessment of fitness level of judokas is particularly difficult due to small number of standardized specific tests,

139
while laboratory tests do not simulate judo movements, typical for the match. Despite that, many judokas, especially in senior categories, are diagnosed primarily through non-specific tests (Sterkowicz, 1999; Pulkkinen, 2001; Franchini, 2005). Testing of judokas in male cadet categories are not known. The assessment of the fitness level in this category is becoming important due to the introduction of the Cadet World Judo Championships, as well as the Youth Olympic Games. Another reason for the need to diagnose cadets is the optimization of training plans and loads, as well as injury and overtraining preventions.
METHODS
Eight young judokas (V8), members of the Slovak Republic national team, with an average age of 16,13 (± 0,83) years, height 177,19 (± 8,33) cm and weight 66,84 (+ 5,89) kg participated in this study after written consent of their legal representative. The order of testing was as follows: 1st day: morning – Sterkowizc judo fitness test; afternoon – bench press and Australian dumbbell pull for maximum power (W); 2nd day: morning – anthropometric examination, Wingate test of upper limbs; afternoon – spiroergometric examination on a treadmill.
Sterkowicz special judo fitness test (SJFT): the test is divided into three periods of 15 s, 30 s and 30 s with intervals of 10 s rests. During each one of the periods the performer throw the partners, two judokas of similar stature and body mass, positioned at 6m of distance one of the other, using the ippon-seoi-nage technique as much as possible. The athlete's heart rate is verified immediately after the test (HR0), and 1 minute after the end of the test (HR1). The total of throws accomplished by period is added and an index (I) is calculated according to: I = HR0 + HR1. The smaller the value of the index, better the performance in the test. The heart rate was be obtained through the use of the POLAR monitor (Polar Electro Oy, Finland). Lactate was taken in the 5th min. after the test.
For testing of the strength capabilities parameters we used the device of corporate sign FITRO dyne Premium. This device registers position and speed of a movement of the known weight, the results are transformed to a computer connected via interface. The parameters of the strength capabilities are determined indirectly from the speed and weight. If the weight is known, it is sufficient to determine the acceleration, and from these two variables, using Newton´s law (F = m . a) we can calculate the force. In the upward movement, it is necessary to add the acceleration of gravity (g) to previously recorded acceleration, so that the formula for calculating actual force will be (F = m) . (g + a). By knowing the force and velocity we can calculate power (P = F . V), which can be also obtained from calculation of muscle work (W = F . s) carried out per unit of time (P = W / T). Power is expressed in watts (W). For maximal bench-press and Australian dumbbell pull we started at the lowest weight of 30 kg and we gradually added weight of 5 kg to achieve maximum power (W). Each judokas performed 3 repetitions with every single weight.
Anthropometric examination: after weight and height measurement the judokas underwent skinfold measurement using 10 different anatomical sites around the body: face, chin, chest I, II, triceps, below the shoulder blade, abdomen, hips, thighs and calves. We used a caliper brand Holtain LTD (Crymych U.K.) with a measurement accuracy of 0.2 mm. All anthropometric measurements were performed by experienced staff with years of experience.
Upper extremities Wingate test: we used an isokinetic crank ergometer EXIT + MD

140
Inclusive TECHNOGYM to generate the data. We measured peak power (P max W / kg), mean power in 30 sec. (P average W / kg) per kilogram of body weight and fatigue index. Before the testing, the judokas completed 4 min. warm up on the crank ergometer at submaximal level, followed by a rest. We collected blood samples in the 5th min. after the test had been finished and we evaluated lactate with BIOSEN C – LINE. Spiroergometric examination on a treadmill: is the technique to determine the functional response of the organism to the load using breath by breath method. We measured oxygen consumption and carbon dioxide output and other parameters such as respiratory quotient, etc. We monitored pulmonary ventilation and heart rate (POLAR). Examinations were carried out on a treadmill HP Cosmos and for analysis of exhaled gases we used spiroergometric unit from Schiller with gas analysis Ganshorn Power Cube. The judokas warmed up before undergoing the examination itself. The load in the test was gradually increasing to the max.
For processing of measured data, we used basic descriptive statistics methods (arithmetic mean and standard deviation). When interpreting the results, we used logical methods and comparison with the data of foreign scientific and professional studies.
RESULTS AND DISCUSSION
Chart 1 Average values of Sterkowicz special judo fitness test (SJFT)
Sterkowicz special judo fitness test
Number of throws [n]
Index Blood lactate
[mmol / l]
V8 26,38 ± 1,30 12,84 ± 0,71 14,83 ± 2,87
The average score of throws in our test group in all three segments altogether was 26,38 (± 1,30). The lowest score was 25, and the highest score was 29 throws. The average index representing special conditioning of cardiovascular system was 12,84 (± 0,71). In the Sterkowicz et al. (1999) study, the group of judokas of the average age 22,8 (± 3,95) reached better score 27,27 (±2 ,71) and better index 12,29 (± 1, 48). Even better values reached the group of elite Brazilian senior judokas (28,2 ± 2), with index of 12,53 (± 1,11) (Franchini et al., 2005). Similar study, realized 2 years later, recorded identical score in the number of throws even with lower index (11,83 ±1,16). Senior judokas, who showed lower levels of conditioning in Franchini et al. (2005) study, performed worse in the number of reached throws, as well as in the index, in comparison with our group of cadets. The average values of lactate in the 5th min. after the end of the test shows the dominancy of anaerobic glycolysis for energy covering (13,66 ± 2,62) mmol / l. Deggoute et al. (2003) took blood samples from 16 judokas of the average age 18,4 (± 1,6) during their competitive matches. The average values were 12,3 mmol/l. Based on the values of blood lactate we can conclude, that the load in the Sterkowitz judo fitness test is similar to load in competitive judo match.
Our group of cadets showed worse results in comparison with the studies mentioned above. According to us, the reason for that is probably lower age as well as smaller number of years in this sport specialization.

141
Chart 2 Average values strength performance measured with Fitro DYNE
Fitro DYNE Bench – press test [W / kg]
Australian dumbbell pull test [W / kg]
V8 5,5 ± 0,73 6,61 ± 0,50
Strength capabilities, especially explosive strength of upper extremities belongs to limiting factor in the structure of cadet judokas sport performance (Štefanovský, 2008). It influences especially acyclic movements’ structures of intermittent character such as throws techniques, which judokas repeat in the match several times. Unpublished results of junior and senior Slovak judokas of various conditioning from the year 2008 consisted of a bench press performance in average of 6,04 (± 1, 29) W / kg and 7,52 (± 1,12) W / kg in an Australian dumbbell pull. These results indicate that Slovak judokas from the older age categories (junior and senior) perform better in the explosive strength of upper extremities parameters in comparison to younger judokas. Reasons for this differences are probably the sensitive periods for single types of strength capabilities, the number of years in sport specialization as well as the influence of years of strength and specific training in judo.
Chart 3 Average values of anthropometric examination (skinfold thickness)
Skinfold thickness Subcutaneous fat [%]
V8 12,19 (± 3,14)
Brazilian anthropometric investigation of senior judokas found the average values of subcutaneous fat in elite A team 11,4 (± 8,4) % and 10,1 (± 5,7) % in B and C team (Franchini et al., 2007). Taylor et al. (1981) found in Canadian senior judokas averages 12,27 %. Similar values(12,3 %) was also recorded by Koutedakis and Sharp (1987) with British judokas. Callister (1991) found in the group of American judokas average valuesof subcutaneous fat percentage of 8,3 (± 1,0) % and the study also indicates that successful national athletes in the international field showed lower levels of subcutaneous fat. Thomas et al (1989) found that the valuesof subcutaneous fat of Canadian judokas vary in the range from 6,7 to 15,8 %.
The arithmetic mean of subcutaneous fat of our group was 12,19 (± 3,14) and is very similar to above studies except Callister (1991) research. Amount of fat largely depends primarily on competitive judo weight classes (Grasgruber - Cacek, 2008).
Relatively recently in the USA, the sport-governing bodies of wrestling at the intercollegiate and interscholastic levels have implemented programs to regulate the process used for selecting a weight class and reducing body weight (Oppliger et al., 1995). Using body fatness as the index, minimal weight is calculated at which the college male wrestler has 5% fat, the scholastic male wrestler has 7% fat, or the female wrestler has 12% fat. These levels of body fat are accepted as the leanest composition that sustains good health and performance (Horswill, 1992).

142
Chart 4 Average values of Wingate test of upper extremities
Wingate test Peak power [W / kg]
Mean power [W / kg]
Blood lactate [mmol / l]
Fatigue index
V8 7,15 ± 0,46 5,94 ± 0,28 11,12 ± 1,16 38 ± 11,15
Wingate test of upper extremities found in the group of young judokas, the peak anaerobic power 7,15 (± 0,46) W / kg and mean power 5,94 (± 0,28) W / kg at the average fatigue index 38 (± 11,15). After the 5th minute since the test had ended, blood lactate value 11,12 (± 1,16) mmol / l was detected. These values were surprisingly similar to those detected by Franchini et al. (2005) in the study of elite Brazilian judokas and they were even higher in comparison with the group of non-elite adult judokas. In the same time, the results are lower than the results of the adult British judokas (peak power 10,6 W / kg, mean power 8,5 W / kg in 30 sec.), and the Canadian judokas maximum power 11,3 W / kg (Pulkkinen, 2001). In another Franchini et al. (2005) study, senior judokas reached maximum power 8,13 (± 0,75) W / kg and the lactate took in the 3rd minute after the test was 13,0 (± 3,7) mmol / l.
Anaerobic peak performance of an athlete is genetically conditioned in a great extent. Depending on the training we can rather develop anaerobic capacity, which plays also important role in the structure of sport performance in judo (Štefanovský, 2008). We can conclude that cadets in our study reached values of anaerobic peak power similar to some top level judo players, and they have good genital presupposition for explosive performances.
Chart 5 Average values of spiroergometric examination on a treadmill.
Treadmill VO2 max
[ml / kg / min]
HR max
[b / min]
Lactate after 3rd min. [mmol / l]
V8 55,16 ± 3,3 191 ± 7,5 10,12 ± 4,32
The average values of maximal oxygen consumption (VO2 max) in our group, after a treadmill examination were 55,16 (± 3,3) and the maximum heart rate in a minute was 191 (± 7,5). The lactate taken after the 3rd minute after the test was 10,12 (± 4, 32) mmol / l. According to Pulkkinen (2001), average VO2 max values of the senior judokas are 57,5 ml / kg / min and they vary from 49,5 – to 65,2 ml / kg / min. Franchini et al. (2007) detected even lower values in comparison with our group (48,3 ± 8,1 ml / kg / min, resp. 49,6 ± 5,5 ml / kg / min) examining the judokas of various conditioning.
Gariod et al. (1995) suggested that judo players with a higher VO2 max presented a faster creatine phosphate (CP) resynthesis compared with judo players with a lower VO2 max. Together with the faster CP resynthesis, a faster lactate removal and pH recovery in individuals with higher aerobic power could benefit the recovery process between tournament matches or brakes during a match.

143
CONCLUSION
Up to this day, there is a lack of scientific studies in domestic and foreign literature, dealing with the level of motoric performance examined by laboratory and functional tests and by modern diagnostic devices, as well as studies dealing with anthropometric parameters of cadet judokas. Therefore, we only managed to compare our results with the studies of authors, who had been examining such parameters in the older age categories of judokas (19 years and more). Testing and diagnosing of conditioning in the younger age categories (15 – 18 years) is becoming more requested, due to greater emphasis on the peak performances even in an early period of a training process. Based on the results of our testing we can set the contemporary profile of a cadet judoka in Slovakia as follows: SJFT 26,38 (± 1,30) throws and index 12,84 (± 0,71); maximal strength power in bench-press 5,5 (± 0,73) W / kg and maximal strength power by Australian dumbbell pull 6,61 (± 0,50) W / kg; skinfold thickness 12,19 (± 3,14) %; anaerobic power 7,15 (± 0,46) W/kg, anaerobic capacity 5,94 (± 0,28) W / kg and fatigue index 38 (± 11,15) by Wingate test; VO2 max 55,16 (± 3,3) ml / kg / min. In the next studies, it is necessary to set the profiles of junior and senior Slovakian judokas and verify differences between diagnosed parameters in these age categories.
REFERENCES
[1] CALLISTER, R., CALLISTER, R.J., STARON, R.S., FLECK, S.J., TESCH, P., DUDLEY, G.A., 1991. Physiological characteristics of elite judo athletes. Int. J. Sports Med, 12, p. 196 – 203.
[2] CLAESSENS, A.L.M., BEUNEN, G.P., WELLNES, R. 1987. Somatotype and body structure of world top judoists. J.Sports Med., 27, p. 105 – 113.
[3] CLARYS, P., GEELEN, B., AERENHOUTS, D., DERIEMAEKER, P., ZINZEN, E. 2011. Estimation of body composition in adolescent judo athlets. Journal of Combat Sports and Martial Arts. Med sportpress, vol. 2, 2011, p. 73 – 77.
[4] DEGOUTTE, F., JOUANEL, P., FILAIRE, E. 2003. Energy demands during a judo match and recovery. Br J Sports Med. 2003. vol. 3, p. 245-249.
[5] DETANICO, D., PUPO, D. J., 2012. Relationship of aerobic and neuromuscular indexes with specific actions in judo. Science et Sports, 2012, 27, p. 16 – 22.
[6] FRANCHINI, E., TAKITO, M.Y., KISS, M.A.P.D.M., STERKOWICZ, S. 2005. Physical fitness and anthropometrical differences between elite and non-elite judo players. Biology of Sport, vol. 22 (4), 2005.
[7] FRANCHINI, E., TAKITO, M.Y., BERTUZZI, R.C.M., 2005. Morphological, physiological and technical variables in high-level college judoists. Archives of Budo, 2005, vol. 1, p. 1 – 7.
[8] FRANCHINI, E. et al. 2007. Physical fitness and anthropometrical profile of the Brazilian male judo team. Journal of physiological anthropology: 26(2), 2007, p. 59 – 67.
[9] GARIOD, L., FAVRE-JUVIN, A., NOVEL, V., MAJEAN, H., ROSSI, A. 1995. Évaluationdu profil énergétique des judokas par spectroscopie. Sci Sports. 1995; 10: 201-7.

144
[10] GRASGRUBER P., CACEK., J. 2008. Sportovní geny – antropometrie a fyziologie sportu, sport a rasa, doping. Brno: Computer Press, 2008. 480 s. ISBN 978-80-251-1873-3
[11] HORSWILL, C. 1992. When wrestlers slim to win. What’s a safe minimum weight ? Physician Sports Med 1992; 20: 91 – 104.
[12] KAMPMILLER. T. et. al. 2012. Teória športu a didaktika športového tréningu. Bratislava: ICM Agency, 2012. 353 s. ISBN 978-80-89257-48-5
[13] OPPLIGER, R., HARMS, R., HERRMANN, D., STREICH, C., CLARK, R. 1995. The Wisconsin wrestling minimum weight project: a model for weight control among high school wrestlers. Med Sci Sports Exerc 1995; 27: 1220 – 4.
[14] PULKKINEN, W. 2001. The sport science of elite judo athletes. Canada: Pulkinetics, Incorporated, 2001. ISBN 978-0968869307.
[15] SHARP, N.C., KOUTEDAKIS, Y., 1987. Anaerobic power and capacity measurements of the upper body in elite judo players, gymnasts and rowers. The Australian Journal of Science and Medicine in Sport, 19 (3), p. 9 – 13.
[16] STERKOWICZ, S., ŽUCHOWICZ, A., KUBICA, R. 1999. Levels of anaerobic and aerobic capacity indices and results for the special fitness test in judo competitors. Journal of Human Kinetics, 1999, vol. 2, p. 115 – 135.
[17] ŠTEFANOVSKÝ., M. 2008. Hierarchia motorických faktorov v štruktúre športového výkonu v dorasteneckom džude na Slovensku. Dizertačná práca. Bratislava: FTVŠ UK, 2008.
[18] TAYLOR, A.W., BRASSARD, L., 1981. A physiological profile of the Canadian judo team. Jornal of Sports Medicine and Physical Fitness, 21, p. 160 – 164.
[19] THOMAS, S.G., COX, M.H., LEGAL Y.M., VERDE, T.J., SMITH, H.K., 1989. Physiological profiles of the Canadian National Judo Team. Can. J. Sports Sci., 14, p 142 – 147.
[20] WOLSKA, B., SMULSKIJ, P., JAGIELLO, W., The level of aerobic and anaerobic capacity and the results of a special mobility fitness test of female Judo Contestants. Baltic J Health Phys Act, 2009; 1(2), p. 105 – 110.
Acknowledgement:
The authors would like to thank the Slovak cadet team head coach MA. Jozef Krnáč for enabling the cooperation between Faculty of Physical Education and Sport, Comenius University in Bratislava and National Sport Center, as well as for the selection of judokas for testing. We would like to thank Elena Sulovska for linguistic and stylistic corrections of the text.
This study was supported through a Scientific Grant Agency of the Ministry of Education of Slovak Republic VEGA No. 1/0503/11. The name of the project: Functional and motoric capabilities of the different age athletes and performance in correlation with selected parameters of cardiovascular system.

145
A SUBJECTIVE AND OBJECTIVE VIEW OF OBESITY IN COLLEGE
STUDENTS
Zuzana Kuchelová1, Alena Buková1, Klaudia Zusková1, Martina Hančová 2, Miroslava Barcalová3
1Pavol Jozef Šafárik University in Košice, Institute of Physical Education and Sport 2Pavol Jozef Šafárik University in Košice, Faculty of Science, Institute of Mathematics
3Technical University of Košice, Department of Physical Education and Sport ABSTRACT: Steady decline in habitual physical activity in children and the youth has resulted in an increase in body weight with age and a decline in their functional ability. The problem of overweight and obesity in the contemporary society has, besides its epidemiological, also a pandemic dimension. The imbalance between energy intake and expenditure is obviously one of the primary factors affecting this disease [7,17,26]. As confirmed by research, the psyche is another area where we may find the causes of such condition [34]. The subject of this partial research, which is part of the research grant VEGA No. 1/1343/12 "Selected risk factors of obesity and its physical prevention", is the subjective and objective view of obesity in college undergraduates. Comparison of the data obtained using the questionnaire method was carried out via calculating the Body Mass Index, following anthropometric measurements of body height and weight. The cohort comprised 2,453 students, of whom 926 were men and 1,527 women from two Slovak universities. A subjective self-perception of the occurence of obesity was reported only by 31.6% men and 45.8% women out of the set of probands diagnosed for obesity. KEYWORDS: Adolescents, Body Mass Index (BMI), physical activity, overweight, obesity, lifestyle, personal well-being INTRODUCTION The transition from high school to university is one of the major milestones within lifestyle change in adolescents. This period of late adolescence is characterized by building the individual's independence, who becomes responsible for his own daily routines and regimen [23]. Issues such as adapting to a new environment, coping with stress and various stressful situations connected with the study, and an increase in responsibility for oneself are all well reflected in the lifestyle of college students [21]. These changes may lead to a decline in hours spent on physical activity (hereinafter PA), and resolutely increase the proportion of adipose tissue on body composition, as well as to a decline in functional ability. The way people perceive themselves, has an impact on their mental health. It is also reflected in their behaviour and personal well-being [8,21,34]. The major cognitive component of personal well-being, defined by Blatný [4] as a conscious global evaluation of one's life as a whole, is life satisfaction. Social support, integration into social relationships and belonging to a community are the strongest predictors of personal well-being. Michalos [13] introduced the theory of multiple discrepancy satisfaction. According to this theory, people compare their lives to a number of standards, which are represented by social conditions, needs, goals, aspirations and ideas about the ideal level of satisfaction [39]. Self-perception, based on experience and interaction with the world gained by the individual become the basis for defining the image of himself [3,26]. Smékal (2002) states that the development of individual
146
is affected by both genetic and congenital disposition, as well as the social environment. The latter influences one's standards, principles and expectations. That is why there is often a conflict between the ideal and the real "I" [15,16,25]. Low rate of self- efficacy is often associated with stress, depression, anxiety and helplessness. It binds low self-esteem and pessimism in issues of personal success and development. Integration into social groups becomes harder and states of depression are associated. Consequently, it can lead to social isolation. On the other hand, high self-efficacy facilitates cognitive processes and behaviour in different situations [3,36]. At the turn of the millennium obesity became the most common metabolic disease as a result of positive energy balance. It is a multifactorial metabolic disorder characterized by an increase in body fat [1]. It is attributed to the interaction of genetic predisposition with environmental factors. These include the positive energy balance, attributable to changes in dietary habits, and a decrease in physical activity [1,12,17,27]. It is alarming that 60-85% of the world population is represented by people with insufficient physical activity [11,18,23,27]. The further the more we realize that a present realistic exercise regimen has difficulty meeting the biological necessity of musculoskeletal load of an individual [5,6,20]. One of the main negative lifestyle factors which influence our health is the lack of PA [5, 6]. An obese man may see himself fat and physically unattractive when comparing to people with normal weight, and this negatively affects one's personal well-being. On the other side, one's comparison with more obese, less mobile individuals suffering from multiple health problems, may increase his personal well-being [19]. For a certain period obesity does not cause health problems, and so it is often tolerated. We are facing extreme but not rare opinions stating that obesity is considered a sign of good health, not medical disqualification or any manifestation of the disease [10]. Fighting obesity has become in many developed countries one of the main priorities of their health systems [41,42]. The World Health Organization (WHO) declared obesity a global epidemic representing one of the most serious health problems of nowadays. Statistical evaluation of mortality ranks worldwide obesity and its complications among the three most common causes of death. Severe forms of obesity increase the risk of premature death almost tenfold, compared with life prognosis of non-obese people of the same age [7,14,29,30,31]. Unawareness, unknowingness, conscious or intentional disregard and their consequences for our life and health, are often the main characters that accompany the life of our population. Ignoring the facts leads to negative states and feelings of discomfort, poor aesthetic, physical and health conditions. Therefore, our research is there to increase awareness and education, which shall contribute to further reduction in the rise of pandemic obesity. RESEARCH METHODS The set of cross-section research consisted of first-year university students at Pavol Jozef Safarik University in Kosice and Technical University of Kosice, counting in total n = 2,453, the average age of whom was 20.3 years (sd = 2.46). Of these, 926 were men with an average age of 20.2 years (sd = 2.10) and 1,527 women with an average age of 20.4 years (sd = 2.66). The data were obtained within two cross-sectional studies in years 2012 and 2013 using the questionnaire method and somatometric examination of body weight and height. Based on the values we calculated BMI (BMI = bodyweight (kg) / height (m²)). Body weight was diagnosed using OMRON BF551 Body Composition Monitor. We categorized BMI values into different levels according to the values by WHO (<18.5 underweight, 18.5 to 24.99 optimum weight, from 25 to 29.99 overweight, 30 to 34.99 class 1 obesity, 35 to 39.99 class 2 obesity,> 40 class 3 obesity) The questionnaire was applied at the beginning of the winter semester. The question selected for this work, out of the research project questionnaire

147
battery, was the following: "Do you have any of the following health problems?" (closed question). When processing the results, we used basic descriptive mathematical statistics (characteristics of the mean and variability), the Chi Square Test for Independence in the contingency table and the Goodness-of-Fit Test. For correct use of the Chi-square test, we merged obesity classes I, II and III into one category of "obesity". For the results obtained, we adopted statistical significance at level p <0.05. This work is part of a more complex research grant VEGA No. 1/1343/12: " Selected risk factors of obesity and its physical prevention" dealt with at PJ Safarik University, Institute of Physical Education and Sport in Kosice. Statistical analyzes of data were carried out with the partial support of the project: TECHNICOM University Science Park using innovative applications supported by knowledge technologies, ITMS: 26220220182 and Centre of Excellence in Information Science and Knowledge Systems CAKS, ITMS: 26220120007, subsidized from the Research and Development Operational Programme, funded from ERDF. OBJECTIVE To detect the occurrence of obesity in terms of subjective self-reflection and objective assessment by first-year university undergraduates. HYPOTHESES 1.Subjective evaluation of the incidence of obesity is significantly lower than the data obtained by an objective method. 2.We expect a significantly lower percentage of women assessing themselves as obese, compared to men. RESULTS When analyzing the prevalence of obesity, we came to the following data regarding genders. The somatometric BMI results obtained demonstrate, or rather indicate than exactly state compared to other more exact methods, the risk of obesity in individuals. The set of female students n = 1,527 and male students n = 926 differed significantly in BMI values (Chi squared = 147,78 at p = 0.001) reporting higher BMI values in the group of men (see Table 1). The average BMI value in the group of men was 23.8 (sd = 3.77) compared to women 21.7 (sd = 3.57). Thus 72.6% of female students and 65.2% of male students fell within the standard, while as many as 24.8% men and 10.5% women reported overweight. On the contrary 244 people proved underweight, of whom 85.7% were women, and only 14.3% men. Another 4.3% of the subjects in the merged group fell within the obesity interval. The occurrence of optimal weight is closely comparable in both sets, whereas in the underweight and obesity categories the results varied widely. Table 1 Percentage of university students in particular BMI categories
BMI classification
Underweight Optimum weight Overweight
Class 1 obesity
Class 2 obesity
Class 3 obesity
n % n % n % n % n % n %
Gender
Male 35 3,8 604 65,2 230 24,8 44 4,8 13 1,4 0 0,0
Female 209 13,7 1109 72,6 161 10,5 35 2,3 12 0,8 1 0,1

148
When evaluating the incidence of overweight and class 1 obesity, we have to take into account the fact that this group often includes also athletic individuals with unusually well -developed musculature. Another variable we were monitoring was the incidence of college students' health problems reported in the questionnaire. The answer to the question "Do you have any of the following health problems?" was a subjective self-assessment of the individual's health problem perception (Table 2). Only 2.8% (n = 42) within the set of women and an equal 2.8% (n = 26) within the set of men reported obesity among the health problems. Thus, in terms of gender no significant difference was reflected in the percentage of subjects who listed obesity as an indicator of health problems. Table 2 Comparison of subjective assessment of obesity in women and men
BMI‐ based obesity Subjective assessment
n % n %
Gender male 57 6,2 yes 18 31,6
no 39 68,4
female 48 3,1 yes 22 45,8
no 26 54,2
BMI measurement-based obesity was observed in 105 people out of the 2,453 sample. In both sexes, we confirmed significant difference in the objective incidence of obesity via the BMI method compared to the subjective assessment (Chi squared = 30.03 at p = 0.001). This proves the fact that the probands tend to understate their real health condition (Fig.1).
FIG. 1 Comparison of subjective obesity assessment and BMI results The results show that only in 1.63% of the surveyed men and women does the subjectively reported obesity correspond with the BMI-based values. BMI-based obesity was diagnosed in 4.3% (n = 40) of the experimental group students.

149
DISCUSSION Significant differences in the assessment of obesity via BMI measurements versus self-assessment indicate a problem that needs to be addressed. This mainly concerns prevention. It includes the formation of an objective attitude to the individual's own health and a realistic assessment of physical self-concept. We confirmed the first hypothesis stating that subjective evaluation of the incidence of obesity would be significantly lower than the data obtained by an objective method, where the incidence was 2.5-times higher. The test of equality of proportions confirmed a statistically significant difference between the number of people who were objectively obese and those who listed their obesity subjectively in the questionnaire.. An interesting fact is that fewer men than women were subjectively right when assessing obesity, as shown by the objective evaluation based on BMI. Lack of objective self-esteem by the young people is related to the process of life education and learning. Therefore, we should have a positive impact on raising the level of knowledge in the students. We did not confirm the second hypothesis, according which significantly lower percentage of women would assess themselves obese compared to men. Women are often more influenced by a so-called egocentric cult, which emphasizes health, youth and physical aesthetics. It is paradoxical that men were those who admitted prevalence of obesity to a smaller extent in the subjective evaluation. If the same conditions were maintained, but the sample should be as much as 1.5-fold bigger (the number of obese would be156, instead of 105), it would prove that significantly less men are bound to admit obesity than women. Our results demonstrate the tendency to underestimate our own health, especially among men. One of the arguments to support such state may be that our society is still more lenient to the obesity in men than women. Low personal emotional well-being is linked not only to obesity but also to underweight [22]. In this research, women had their second most numerous representation in the group of the underweight. Women are probably more active in reducing their weight. [16,22]. As the authors [32] surveying the state of obesity and associated diseases in the Czech Republic stated, more than a quarter of girls aged 18 to 19 falls within underweight. From 20 to 29 years of age about every tenth woman reported a BMI below 18.5 kg /m2. It is at this age when most women take proper care of their weight, so they do not show disposition to weight gain. Great influence upon such trend is provided by the media and beauty contests. Strict diet and maintaining a critically low weight in adolescence at the age of about twenty years, are very risky. With aging, such behaviour can trigger various health problems, e.g. thinning of the bones or reproductive problems. Spontaneous PA declines significantly during adolescence [6,7], a period characterized by relatively good health and low mortality. PA in youth depends not only on the opportunities, but with age it is also influenced by their interests, knowledge and motivation. It is closely linked to lifestyle. It does not only affect the physical condition of man, but also has implications for the improvement of psychical symptoms [38]. Nevertheless, we realize that PA can only have a significant at a certain intensity, regularity, nature and duration [30]. The trend of reducing the number of Physical Education classes at colleges is one of the reasons behind the decrease in the hours spent by PA, the increase in proportion of adipose tissue and a decline in functional ability. Every child has a natural tendency towards PA, that is usually damped by lowering the number of hours of PE lessons and sports activities. This negative trend is further contributed to by disproportionately long time spent in front of televisions and computers at home. The form of obesity we meet today, and that is said to be a non-infectious epidemic, is a polygenical disease. Even as young as 5-year-old children have prejudice against obese children. Children suffering from obesity are often isolated, excluded from peer activities. Not only peers, but also teachers and other adults laugh at them,. Unlike children who suffer from

150
other health problems, obese children are blamed and punished for their condition. The way others respond to their appearance influences their perception and self-acceptance. They often suffer from feelings of inferiority. They show little activity, and rather avoid physical activity as such [7,14,17,27]. In terms of healthy somatic-mental development of the young organism, it is necessary to optimally balance all daily activities. Among the factors of a healthy lifestyle we may include sufficient physical activity, good eating habits, lifestyle, mental composure, enough sleep or stress resistance [11,24,28,30,35,37]. The difficulty of college studies, which is in its beginnings accompanied by excessive psychological stress in conjunction with a predominantly sedentary lifestyle, is possible to compensate for by physical exercises. The paradox remains that Physical Education as a subject of the curriculum in the past, and still now, struggles for its relevance and existence at several Slovak universities. Either it is absent, or is listed only as an elective or optional subject. CONCLUSION Overweight and obesity are now a huge problem almost all over the world. They bring along health complications that are life-threatening and to a large extent restrictive to the person who suffers from them. They also represent a problem for the society, which is unable to cope with them in the long term. Prevention programs that seek to restrict the development of obesity since its emergence, are not as successful as one would expect. That is why we recognize that treatment alone will be more difficult. It requires pointing to factors other than the biological and trying to implement them into individual treatment programs. Subjective assessment of obesity by the youth is alarmingly poor, a fact that confirmed also by our first hypothesis. , They are predominantly satisfied with themselves and even if they are fat. Hypothesis No.2 surprised us bz finding that men admit their obesity even less than women. We believe that college students are the intellectual group which has access to the latest information and knowledge. Influencing their lifestyle through Physical Education classes at universities is one of the starting points on preventing obesity and other defects associated with unhealthy lifestyle. Our results support the need for preventive measures in terms of increased representation of PA in the way of life, and an even greater public education about obesity. From this perspective, only an interdisciplinary approach can help to identify determining interactions between obesity, overweight, PA and bio-psycho-social factors among university students. Increasing the number of PA hours among students at universities and via increasing the range of information and knowledge we can prevent occurence of diseases, and applying secondary prevention may help to detect and prevent their development. REFERENCES: [1] ARNER P.: Obesity – a genetic disease of adipose tissue. Br J Nutr 2000; 83(1): 9-16.
[2] BAIER T. & NEUWIRTH E.; Excel: COM : R, Computational Statistics, 22/1, pp.91-108. 2007.
[3] BALCAR K.: Úvod do studia psychologie osobnosti. Chrudim: Mach. 1991.
[4] BLATNÝ M. & PLHÁKOVÁ A.: Temperament, inteligence, sebepojetí. Brno: Psychologický ústav Akademie věd ČR. 2003, s.87 – 141. ISBN 80-86620-05-0.
151
[5] BRAUNEROVÁ R, & HAINER V.: Obezita – diagnostika a léčba v praxi. [online]. In Med., Pro Praxi; 2010, 7 (1). Dostupné na internete: <http://www.solen.cz/pdfs/med/2010/01/05.pdf>.
[6] BUKOVÁ A, UHER I: Dynamika faktorov motivácie mladých ľudí k pohybovej aktivite. In: Pohybová aktivita v živote človeka: pohyb detí. Prešov: Prešovská univerzita, 2010. [7] BUNC V: Nadváha a obezita dětí – životní styl jako příčina a důsledek. Česká kinatropologie, 2008; 12 (3).
[8] BUNC V: Energetická náročnost pohybových aktivit a její využití pro ovlivňování tělesné hmotnosti. In VOBR R (ed): Disportare 2006. České Budějovice: Pedagogická fakulta Jihočeské university, 2006. http://theses.cz/id/1y8x9o/downloadPraceContent_adipIdno_6435 -dipl.pr.
[9] BURKE JD et al.: The University of New Hampsire´s Young Adult Health risk Screening Initiative. Journal of American Dietetic Association, 2009, vol. 109, No 10, 1751 – 1756
[10] BUNC V.: Nadváha a obezita dětí – životní styl jako příčina a důsledek. Česká kinatropologie, 2008; 12 (3).
[11] CARPENSEN CJ et al.: Physical activity, exercise, and physicalfitness: Definition and distinctions for health related research. Public Health Reports, 1985; 100(2).
[12] CUMMINGS DE. & SCHWARTZ MW.: Genetics and pathophysiology of human obesity. Annu Rev Med 2003; 54: 453-471. [13] DIENER, E., SUH, E. M., LUCAS, R. E. & SMITH, H. L. (1999). Subjective well- being: three decades of progress. Psychological Bulletin, 125(2), 276-302. [14] ĎATELOVÁ M.: Súčasný stav výživy a výskyt obezity u detí na Slovensku. In Zborník z medzinárodnej konferencie Rizikové faktory potravového reťazca. Nitra: FBP SPU v Nitre, 2007: 948-952. ISBN 978-80-8069-.
[15] FIALOVÁ L.: Body image jako součást sebepojetí člověka. Praha: Karolinum, 2001. ISBN 80-246-0173-7.
[16] FIALOVÁ L.: Body image. Jak se vyrovnat s kultem štíhlého těla. Praha: Grada Publishing, 2006. ISBN 80-247-1350-0.
[17] HAINER V.: Základy klinické obezitologie. 2. vyd. Praha: Grada Publishing, 2004. ISBN 80-247-0233-9. [18] HENDL J. &. DOBRÝ L a kol.: Zdravotní benefity pohybových aktivit. Monitorování, intervence, evaluace.UK, Praha: Karolínum, 2011.
[19] HRACHOVINOVÁ T. & CHUDOBOVÁ P.: Body image a možnosti jeho měření (se zaměřením na neklinickou populaci). Československá psychologie, 2004, 48, č. 6. [20] HU B et al.: Relations hipof PhysicalActivity and Body Mass Index to the Risk of Hypertension: A Prospective Study in Finland, 2005. Dostupné na http://hyper.ahajournals.org/content/43/1/25.full.pdf
[21] CHAMOUTOVA H.: K problematice stresu prožívaného studenty během vysokoškolského vzdělávaní.2004 [online], [cit. 2009-06-21]. Dostupné z: www.agris.cz/etc/text.forwarder.php
[22] JANSA P, KOCOUREK J, VOTRUBA J, DAŠKOVÁ B: Sport a pohybové aktivity v životě české populace. Praha: UK FTVS, 2005.

152
[22] JORM, A. F, KORTEN, A. E., CHRISTENSEN, H., JACOMB, P. A., RODGERS, B. & PARSLOW R. A. (2003). Association of obesity with anxiety, depression and emotional well-being: a community surfy. Australian and New Zealand journal of public health, 27(4), 434-440. [23] KAMENSKÝ J. & PELLA D.: Zdravý životný štýl – cesta k prevencii ochorení srdca a ciev. Bratislava: AEPress, s.r.o., 2010: 143. ISBN 978-80-8888O-88-2. [24] KOLLÁR J. Lipidy a lipoproteíny. Olympia, 1996: 312. ISBN 80-967388-7-9.
[25] LANGMAIER, J. & KREJČÍŘOVÁ D.: Vývojová psychologie. 2. aktualizované vydání. Praha: Grada, 2006. ISBN 80-247-1284-0.
[26] KŘIVOHLAVÝ J.: Psychologie zdraví. Portál, 2009.
[27] KUNEŠOVÁ M: Obezita – etiopatogeneze, diagnostika a léčba. Interní Med., 2004; 9.
[28] NEVORAL, J. a kol. 2003. Výživa v dětském věku. Nakladatelství H&H, Jinočany. 434 s. ISBN 80-86-022-93-5 [29] NIDDK: Statistics related to overweight and obesity, 1999: 1-14.
[30] PAŘÍZKOVÁ J. & LIDKA L. et al.: Obezita v dětství a dospívaní. Galen, 2007: 239. ISBN 978- 80- 7262-466-9. [31] PAUČO J. & Slovenská obezitologická spoločnosť. 2008 Fifo, http://wp.sos- obezita.sk/?page_id=1823.07.2014)
[32] PETEROVÁ K.: STEM/MARK průzkum stavu obezity a přidružených onemocnění v České republice 2013. Projekt Žij zdravě Všeobecné zdravotní pojišťovny (odborní garanti průzkumu a projektu Žij zdravě ; MUDr. Martin Matoulek s profesorem Svačinou z III. interní kliniky 1. LF UK a VFN v Praze). http://img.ct24.cz/multimedia/documents/46/4560/455923.pdf;
[33] RAABE H: Zdravie od A po Z. 1 vyd. Bratislava: Osveta, 1999.
[34] SHERMAN DL. & CEBULLA GL. & BALADY GJ.: Exercice and physical activity, In Textbook of cardiovascular medicine. Philadelphia: Wilkins, 2002: 2210. [35] SIGMUNDOVÁ D. et al.: Seculartrends:A ten year comparison of the amount and type of physical activity and inactivity of random samples of adolescent in the Czech Republic. BMC Public Health, 2011; 11(1): 731. [36] SMÉKAL V.: Pozvání do psychologie osobnosti. Brno: Barrister & Principal, 2002, s. 341-368. ISBN 80-85947-80-3. [37] ŠTEFKOVÁ G. & SHAFOUT R.: Fyzická aktivita študentov medicíny vo voľnom čase In Ošetrovateľstvo a zdravie. Zborník vedeckých prác. Trenčín: Trenčianska univerzita Alexandra Dubčeka, Fakulta zdravotníctva, 2012: 220-226. ISBN 9788080755317.
[38] UHER I: Health, well-being and exercise analysis of older population. In: Raporty i szkice o kulturze fizycznej i zdorowotnej w perspektywie Humanistycznej. Naukowy kwartalnik. Publisher: University of Rzeszów. Poland, 2009; 168-174.
[39] WILKINSON R. & MARMOT M.: Social determinants of health. The solid facts. Copenhagen: WHO, 1998. [40] WHO (World Health Organizations): Concepts of health behavior research, regular health paper No. 13. ND: SEARO, 1986.
[41] World Health Organization (WHO): Last accessed 25th August 2005. http://www.who.int/dietphysicalactivity/publications/facts/cvd/en/

153
[42] WHO: Cardiovascular Disease Fact sheet. Last accessed 25th August 2005. http://www.who.int/hpr/NPH/docs/gs_cvd.pdf
[43] WHO. (2004). BMI classification. Dostupné z: v http://apps.who.int/bmi /index.jsp?introPage =intro_3.html

154
SOCIALISATION: DOMINANT ASPECT OF SPORT FOR PEOPLE
WITH PHYSICAL DISABILITY
Jela Labudová ¹,Dagmar Nemček ¹,Miloslav Bardiovský²
1Comenius University in Bratislava, Faculty of Physical Education and Sports, Department of Sport Educology and Sport Humanities, Slovakia; 2Saint Elisabeth University of Medicine
and Social Work
ABSTRACT
The authors by questionnaire evaluated the opinion to social aspect of life and its place among other motives and sport activities. Answers were collected from 40 men and 20 women with physical disability in age category 19+. The aim of research was to extend the knowledge about self-realisation in life and sport situation in people with physical disability with focus to socialisation process by sport. We found out that the highest number of respondents selected aspect “having possibility for social contact” (32.7 % men and 34.8 % women). Women with physical disability are doing sport because of the „social contact”, but also for “personal example for the others” (30.4 %) and for “manage sport through by particular disability”. In these two motives were not found significant differences between men and women, but in motive “interest in sport” and in motive “personal example” were displayed significant differences between men’s and women’s opinions. Preferred reason of participating in sport in age category 19 – 25 years was finding new friends. Self-realisation and belief in his/her selves help to classify a man with disability into social relations. Efficient activity, individual effort and presence create internal values of human being and these make their self-realization easier.
KEY WORDS: socialisation, sport, physical disability, self-realisation, men, women, age categories
INTRODUCTION
European sport forum (EU Sport Forum, 2010) concerned to social function of sport specially paid attention not only on occasions but also on problems that are related to socialisation in sport. From this aspect is important to use potential of sport for support and identity development of individual and group, to coherence, integration and gender equality. Human with disability take sport as a challenge for get over a difficult situations. Novosad (2011) indicate that man involvement moving the value orientation to higher level, simultaneously offer stimulus for searching and finding it selves resources. Disability need not bother humans, but the challenge is how to cope with this load (Repková, Požár, Šoltés, 2003).
During interpersonal relationships in the social education are developing social skills and competences that enable the individual to participate effectively in a group of different nature. A person with a disability receives the opportunity to learn to explore, exploit learning opportunities throughout life, learning to do, to cope with different social and work situations,

155
to appreciate others, tolerate and respect and be authentic personality, myself and finding meaning in life. The process of development of the individual takes place gradually creating a social situation, the action of the social environment, shaping social behavior and action (Nemček, Labudová et al., 2008). Important is the willingness, interest and support for such a person and of creating an appropriate atmosphere socialization in educational, sport teams (Lebeer et al., 2006). Adverse social action deprivation can affect people cause further social isolation (Pančocha, 2008). On the other hand, cooperation, empathy, emotional intelligence and other conditions of social support lead to good support, cognitive orientation and social integration (Štěrbová, 2008).
Socialization of people with physical disabilities (PPD) and specifically people in a wheelchair has its own specifics. Evaluating the responses to the questionnaire from athletes with disabilities Piteková, Bardiovský, Labudová (2010) among others found that the motivation to participating in sports activities there is a marked difference between age and gender in sports such. How will run the processes of (re) socialization depend on the adoption of its rules, the fulfillment and the creation of a social position. Instead of an identity crisis, the loss of traditional certainties (Slovak, 2011) should come up by will of the sense of belonging, ambition, aspirations, anticipating and to his/her new life philosophy (Kozoň, 2009). Křivohlavý (2006) notes that the adoption of its own objective and activity behaviors is hope, which means that wheelchair becomes an integral part of man. It is a re-awareness of themselves in active social context, it is the fulfillment of the social objective, which is manifested in the ability of self-evaluation and evaluation of others, self-recognition and exposure to other.
One of the ways of socialization activity is an individual with a disability in sport, which is affected by various motives changing over time and depending on the stages of life. Hrouda, Rybová (2010) dealt with the conversion of the living situation of the sport-career path of living humans. For the task of socialization in sport and sport is by authors Labudová, Bardiovská (2011) needed to offer a wide variety of sport activities. Disability intense enters the individual's privacy and puts his behavior often demanding and unresolved situations. Klugerová (2009) argues that society should be the component of care, which should increase attention to the socialization of people.
AIM
The aim of the research was to enlarge the knowledge about opinion to socialisation throughout sport of people with physical disability.
HYPOTHESIS
Process of socialisation can be perceived like an occasion for self-realisation in which we assumed that:
H1: preferred motive for sport activity realisation of PPD will be “opportunity to social contact creation” in higher preference of women comparing men;
H2: decision to sport activity like a tool of socialisation will come out from opportunity for self-realisation creation in PPD and there won’t be difference in

156
a) gender neither
b) age of respondents.
TASKS
The aim fulfilment and verification of stand assumptions required solution of following tasks:
1) Analyse and compare motives between men and women with physical disability that lead to regular sport participation with orientation to socialisation aspect evaluation
2) Assess the socialisation through preferred indicators of self-realisation in PPD from gender and age point of view
METHODS
Sample consisted from 40 men and 20 women with physical disability participating in sport at the recreational and competitive level. From total number of respondents where 53.3 % wheelchair athletes and 46.7 % of PPD were mobile. 40 % of total number of respondents had inherited disability, 45 % became disabled by injury consequence and 15 % by illness consequence with other problems of structure and function of skeletal system.
We used the questionnaire as a main research method that was delivered personally during the training process and competitions in year 2013. Our evaluation was focused on assessment of 2 questions about:
Aspects of motivation for sport activity, The most serious reasons of decision to perform sport.
Achieved data were compared from gender and age point of view by using Chi-square test.
RESULTS AND DISCUSSION
We assumed that there will be a differentiated expression of different aspects motivation for sport activities for men and women, with a preference for women increased interest on the possibility of establishing social contact. The results indicated that there is no statistically significant difference in all studied motivational factors between men and women with disabilities (Fig. 1). Than women, as well as in men with the highest percentage of respondents was selected aspect "have the opportunity of social contact" (32.7% of men and 34, 8% of women), with a greater preference for women, so we can confirm the validity of the chosen hypothesis H1.

157
Figure 1 Motivation to sport activity based on gender differences
In the incidence motive "possibility to social contact" and the "perform sport in spite of my health status" we did not find significant difference between men and women. The motive continued interest in the sport and "personal example" were different views of men and women. It was confirmed that women participating in sports especially for social inclusion and in the second place we registered a personal motive example (30.4%). In men with physical disabilities motive of increased interest in the sport is the second most abundant motive. For several respondents as one of the motives mentioned for sports, in his cope with a given medical condition. One does not have to play sports right at competitive level, but can perform sports in leisure time within the sport for all, respectively in adapted physical education. We suggest that this fact has already been presented in the context of the school day, during treatment of injury and the early stages of post-traumatic condition of man, which would direct the victim to the sport.
Disability transforms and builds individual behavior often in difficult life situations. Raising awareness about the possibilities of action sports to individual development; improve the quality of his personal view of social and mentally demanding period of his life. Analysis of the reasons why the respondents do sports indicated that women dominated the aspect of self-realization (30.8%) and the possibility of improving the health status in 30.8% (Fig. 2). The responses of men belonged to improve the health status (29.8%) and the opportunity to make new friends (28, 1%). Unlike reasons for the decision, for sport between men and women was not statistically significant (Chi = 0.303). Given the differences in career opportunities between men and women cannot confirm the validity of the hypothesis H2a.

158
Figure 2 Decision for sport based on gender differences
Self-realization and action with faith in his/her self, it helps to rank as the person with disabilities in social relationships. Sport is a vital source of self-realization, along with improvements in health status (30.8% women). PPD need to gain confidence in his/her self. A man who finds himself in a social situation is unsatisfactory according Vanková (2009) used social assistance, as an expression of human solidarity. Sport is and will be the energizing means, leading to the attainment of competence independent life in the community. The answer to "find new friends" also belonged to important indicator, leading to a process of socialization (28.1% men). It suggests the need for communication and the creation of space for socializing. Although employment is the most important condition of human existence, with many respondents an opportunity to minimize its implementation and, therefore, can be a substitute for meaningful action in sport. It gives a sense of personal fulfillment, social usefulness, classifies individuals into social relations.
We hypothesized that there may be a reason for a differentiated for sport with dominated socializing opportunities regardless of age group (Fig. 3). Although there was no statistically significant difference between the observed reasons throughout the research group (Chi = 10, 91), we found a statistically significant difference at the 5% significance level between the age groups 19 to 25 years and 26 to 35 years of men and women (Chi = 7.986*). Differences in the other age groups were not statistically significant.

159
Figure 3 Decision for sport based on age differences
Legend: yellow:19-25 years; green: 26-35 years; red: 36-45 years; blue: 46+ age category
In the age group of 26-35 years dominated the annual self-realization (35.7%), similarly in 36-45 year old category, where hypothesis H2b was confirmed in particular age category. Respondents with physical disabilities expressed in an interview that sport is a chance, but also the duty, not only satisfaction to be part of a sports family, but the whole society. Following an evaluation of the proportion of sport at opportunities an individual’s socialization we can express that for 16, 6% of men and 21, 4% of women self-realization meant getting closer to sport victory. In the age group 46+ self-realization has the same representation as the reason to know para-athletes and finding new friends. They are also important factors necessary process of socialization of these people.
CONCLUSION
Analyses of achieved data in the group of PPD pointed out the need of the aim formulation their sport activity with dominance to socialisation. PPD need to achieve belief and confidence in their selves, find the substitutive goals of their life regime and settled position in society. As it was shown, sport and regular participation in sport can become an unforced tool to social task fulfilment and to self-realisation. We found out that dominant motive for sport is occasion of social contact creation even there are no significant differences between men and women neither between age categories. On the basis of our results we recommend:
Social contact should be intensively presented already in schools, during injury treatment and rehabilitation and in first periods of post-injury status.
Sport should become as a meaningful and regular compensation into life of PPD that contribute to self-realisation feeling, social usefulness and categorise the person into the social relations.

160
ACKNOWLEDGEMENT
This research has been realised within the VEGA grant project no. 1/0915/13 “Sport activity – a part of the quality of life of people with disabilities“.
REFERENCES
[1] EU SPORT FORUM. 2010. Priorites for the planned Commission initiatives in the field of Sport. Madrid, April 2010. http://ec.europa.eu/sport
[2] HROUDA, T., RYBOVÁ, L. 2010. Sport v životní dráze člověka s tělesným postižením. In Aplikované pohybové aktivity v teorii a praxi. 2010, roč. 1, č. 1, s. 56 – 61.
[3] KLUGEROVÁ, J. 2009. Globalizace-přímásouvislost se sociálními a ekonomickými problémy. In Hejdiš, M., Kozoň A. Sociálna a ekonomická núdza – bezpečnosť jedinca a spoločnosti. Zborník. Bratislava : VŠZD a SP, 2009, s. 72 – 80.
[4] KOZOŇ, A. 2009. Morálne aspekty bezpečnosti jedinca a spoločnosti v sociálnej a ekonomickej núdzi. In Hejdiš, M., Kozoň, A.: Sociálna a ekonomická núdza - bezpečnosť jedinca a spoločnosti. Zborník. Bratislava : VŠZd.a SP sv. Alžbety, 2009, s. 51 – 57. ISBN 978-80-89271-63-4.
[5] KŘIVOHLAVÝ, J. 2006. Psychologie smysluplnosti existence. Praha : Grada Publishing, 2006.
[6] LABUDOVÁ, J., BARDIOVSKÝ, M. 2011. Socializácia v telovýchovnom procese. In Labudová, J. a kol. Integrácia v telesnej výchove a športe. Bratislava : UK FTVŠ, 2011, s. 36 – 41.
[7] LEBEER, F. a kol. 2006. Programy pro rozvoj myšlení dětí s odchýlkami vývoje. Praha : Portál, 2006. In www.portal.cz.
[8] NEMČEK, D., LABUDOVÁ, J. a kol. 2008. Tvorba a manažovanie cvičebnej jednotky. Bratislava: SZ RTVŠ, 2008, 80 s. ISBN 978 – 80 – 89257 – 11 – 9.
[9] NOVOSAD, L. 2011.Tělesné postižení jako fenomén i životní realita. Praha : Portál, 2011. ISBN 978 – 80 – 7367 – 873 – 9.
[10] PANČOCHA, K. 2008. Sociální determinanty inkluzívního vzdělávaní. In Vzdělávaní žáků se speciálními vzdělávacími potřebami – s narušenou komunikační schopností. Brno : PdF MU, 2008, CD-rom.
[11] PITEKOVÁ, R., BARDIOVSKÝ, M., LABUDOVÁ, J. 2010. Osobná asistencia a šport osôb s telesným postihnutím In Mátel, A., Janechová, L., Roman, J. Patológia a sociálna intervencia sociálnej práce. Zborník z medzinárodnej vedeckej konferencie. Bratislava : VŠZaSP sv. Alžbety. 2010, s. 455- 464. ISBN 978-80-8132-018-7.
[12] REPKOVÁ, K., POŽÁR, L., ŠOLTÉS, L. 2003. Zdravotné postihnutie v kontexte novodobej sociálnej politiky. Informačná kancelária Rady Európy v Bratislave. 2003. ISBN 80 – 89141 -03 – X.
[13] SLOVÁK, P. 2011. Sociálna práca a znižovanie vplyvu sociálno-patologických javov u ohrozenej skupiny mladistvých. In Mátel, A., Janechová, L., Roman, L.: Patológia a sociálna intervencia sociálnej práce. Zborník. Bratislava : 2011, s. 437 – 447.
161
[14] ŠTĚRBOVÁ, D. 2008. Máme se obávat, že se dítěti s tělesným postižením „něco stane“ v hodině tělesné výchovy a při pohybových aktivitách? In Kudláček, M., Ješina, O.: Ontogeneze žáků s tělesným postižením do školní tělesné výchovy. Olomouc : UP FTK, 2008, s. 100 – 107.
[15] VANKOVÁ, K. 2009. Sociálna a ekonomická núdza a jej dopad na rodinný a spoločenský život. In Hejdiš, M., Kozoň A. Sociálna a ekonomická núdza – bezpečnosť jedinca a spoločnosti. Zborník. Bratislava : VŠZD a SP, 2009, s. 124 – 140.
162
INDIVIDUALITY OF INTERNAL REACTION OF THE ORGANISM ON THE CHANGE OF OUTER ENVIRONMENT AND ON LOADING
IN SHALLOW WATER
Jana Labudová, Andrej Adamovič
Faculty of Physical Education and Sports, Comenius University in Bratislava, Slovakia ABSTRACT
Immersion of human body into water causes heart rate lowering. When setting desired intensity of loading for physical activity in water in past there were used constant heart rate reduction for whole groups. These methods are not acurate due to individual variability of reaction of organism on immersion in water and on loading in water. This study pointed out the individuality of internal reaction of organism on change of outer environment by evaluating the changes of heart rate during immersion and on loading during stationary walking on land and in shallow water. Observed HRrest aquatic reduction in subjects was 6 – 27 bpm. Some of the subjects had lower heart rate during walk in water, others on land. The average values of heart rate during walk on land and in water didn`t show significant difference, but according to determined zones of intensity of loading, the subjects occured in higher zones during the tests in water than on land. These results promotes current knowledge about that for water exercises it is necessary to set the zones of intensity of loading for every participant individualy. KEY WORDS: heart rate, walk, water environment, intensity of loading
INTRODUCTION
The water environment has very complex efects on human organism. From the point of the influence on health, the swimming belongs to the most beneficial physical activities[9]. In the last decades physical activities in water in vertical body position, known as aquafitness became very popular[3, 7, 10]. There are several benefits in upgrading physical fitness dedicated to these programmes[2]. According to focus and content we know various kinds of programmes, like walking in water, running in water, water aerobics, strength exercises in water, stretching in water and more. The heart rate is reduced when body is immersed into water and also during physical activity in water because of several factors influencing it[1]: temperature, gravitation, compression, partial pressure, dive reflex and lowered body weight. The heart rate reductions of 17 beat per minute or of 13 %, which were used in the past to set the intensity of loading for training in water for whole groups are not acurate due to great individual differencies. It is necessary to find out the individual reaction of circulatory system on immersion in water and according to that assess appertaining zones of intensity of loading for training. Currently used way of setting zones of intensity of loading in water calculates with individual aquareduction of heart rate[5, 6, 8]. The aim of this study was to point out on the individuality of internal reaction of organism on change of outer environment by evaluating the changes of heart rate during immersion to the xiphoid process of os sternum and on loading during stationary walking at different cadencies on land and in shallow water.

163
METHODS
In this study the dynamics of heart rate was described in group of students of Faculty of Physical Education and Sports of Comenius University in Bratislava (n = 8). Age of tested subjects was 22,5 ± 2,3 years, body weight 81,63 ± 8,9 kg and body height 187 ± 6 cm. Cadencies of stationary walk during 3 minutes were 70, 90 a 110 steps per minute, water temperature was 29 ± 0,5° C. We loged up HRrest standing on land and in water with depth to the xiphoid process and physiological curve during 3 minute stationary walk on land and in water by sporttester POLAR RS 400. We set the zones of intensity of loading on land from HRmax derived from age[4] and the zones of intensity of loading in water by subtracting aquatic heart rate reduction from HRmax
[5, 6].
RESULTS
There were great individual differencies observed in heart rate reaction on change of the outer environment while standing still on land and in shallow water (Table 1). The values of heart rate were lower by 6 – 27 beats per minute in water than on land (8,6 – 31,8 % of HRmax). The average lowering of the heart rate by immersion in water was 14,75 ± 7,38 beats per minute. We also observed differencies in reaction on loading of subjects, marked blue and red in the Table 1. While some of the subjects had lower heart rate during walk in water, others on land. There was great width of span in the difference of heart rate reached during walk in different environments VR = 39. These results promotes current knowledge about that for physical activity in water it is necessary to set the zones of intensity of loading for every participant individualy[1]. Tab. 1 Reaction of heart rate on change of outer environment and on loading
HRrest [bpm] land
HRrest [bpm] water
HR aqua reduction [bpm]
HR aqua reduction
[%]
HRmax110
[bpm] land
HRmax110 [bpm] water
HRmax110 difference [bpm]
S1 85 58 27 31,76 120 145 -25 S2 80 56 24 30 132 136 -4 S3 86 72 14 16,28 153 152 1 S4 78 67 11 14,1 151 148 3 S5 74 62 12 16,22 147 169 -22 S6 70 64 6 8,57 142 128 14 S7 82 66 16 19,51 140 138 2 S8 66 58 8 12,12 147 136 11 average 77,63 62,88 14,75 18,57 141,5 144 -2,5 sd 7,13 5,44 7,38 8,26 10,94 12,68 14,17 Me 79 63 13 16,25 144,5 141,5 1,5 min 66 56 6 8,57 120 128 -25 max 86 72 27 31,76 153 169 14 VR 20 16 21 23,19 33 41 39
Legend: S1 – S8 – subjects, HR aquareduction = HRrest land – HRrest water, HRmax110 – maximal heart rate reached during 3 minute stationary walk at cadence of 110 steps per minute, HRmax110 difference = HRmax110 land – HRmax110 land

164
When increasing the cadence of stationary walk from very slow (70 steps per minute), through slow (90 steps per minute) to medium (110 steps per minute), the heart rate rised up significantly in both environments (p < 0,01). The average values of heart rate during walk on land and in shallow water at same cadencies didn`t show significant difference (Figure 1), HR [bpm]
Fig. 1 Heart rate during walk at cadence of 110 steps per minute in different environment According to determined zones of intensity of loading, the subjects occured in higher zones during the tests in water than on land at similar heart rate, what shows the greatist at cadence of 110 steps per minute (Figure 2).
HR [bpm]
Fig. 2 Comparsion of HRmax110 and zones of intensity of loading during walk in different environment Globally 5 of 8 subjects occured in higher zone of intensity of loading during stationary walk in shallow water than on land, whereby one was in the maximal intensity zone and two subjects in submaximal intensity zone. We concluded, that intensity of loading according to zones of heart rate during stationary walk at the same speed of movement and heart rate was higher in water environment.

165
CONCLUSION
The results of the study points out the need of knowing individual physiological reaction of each subject on water environment in creation and control of trainig in water. We think, that the changes of heart rate by change of outer environment are influenced by several factors, for example adptation of organism on water environment, level of fitness, body composition, actual health state and more. REFERENCES
[1] AQUATIC EXERCISE ASSOCIATION. Aquatic Fitness Professional Manual. 2010
[2] BARBOSA, T. M. et al. J Sports Sci Med. 8 (2), 179-189, 2009
[3] DARGATZ, T., KOCH, A. Bodytrainer Akvafitnes. 2003
[4] HOUDOVÁ, V., ČECHOVSKÁ, I. Česká kinantropologie. 16 (3), 11-25, 2012
[5] CHEWNING, J. M. Understanding Aquatic Heart Rate Deductions. [online] 2012
[6] KRUEL, L. F. et al. Fitness e Performance. 1 (6), 46-51, 2002
[7] LABUDOVÁ, J. Aquafitness. 2005
[8] LABUDOVÁ, J., PAVLOVOVÁ, J. Phys Edu Sport. 20 (2), 2-7, 2010
[9] MACEJKOVÁ, Y. et al. Didaktika plávania. 2005
[10] RODRIGUEZ-ADAMI, M. Akvafitness. 2005

166
CANCER EXERCISE REVIEW
Eugen Laczo, Aurel Zelko
Faculty of Physical Education and Sports, Comenius University in Bratislava Department of Track & Field
ABSTRACT
Advanced medical treatment such as surgery, chemotherapy, radiation and hormonal therapy promote 5 years survival expectation in cancer patients up to 68 % [1]. Further increase of survival rate is partially dependent on improvements of the multifactorial intensive care during and after the cancer therapy. The purpose of this review was to explore the existing exercise interventions studies that report health benefits and promotion of the quality of life in the cancer patients. A systematic research of two databases was conducted to identify randomized clinical trials realized from January 2000 to July 2014. For electronic search of articles we browsed combinations of these key words: „cancer“, „oncology“, „exercise“, „physical activity“, „quality of life“, and „health benefits“. 44 original articles were identified and included in this review. These interventions were classified on cancer type, type of intervention and type of primary outcome. Review findings strongly support exercise interventions in cancer patients during and after the cancer therapy and present benefits in the quality of life and health outcomes. For future research, individual methodology of exercise interventions and clinical therapy outcomes could be examined. KEY WORDS: oncology patients, cancer exercise, review INTRODUCTION Emerging evidence indicates that patients with cancer have considerable impairments in cardiorespiratory fitness and physical functions, which is likely to be a result of the direct toxic effects of anticancer therapy as well as the indirect consequences secondary to therapy. Structured exercise training is established as the cornerstone of primary and secondary disease prevention in multiple clinical settings (Warburton, 2006). In stark contrast, the role of exercise prior, during and following a cancer therapy, until recently, received comparably less attention. Significant progress has been made in the field of exercise-oncology research over the past two decades. We overview the extant literature and studies that examine the role of exercise therapy following a cancer diagnosis with a view towards identifying major types of oncologic diagnosis in Europe and North America. METHODS Based on estimated incidence and mortality rates by World Health Organization – Globocan project 2012), we concentrate review on breast and prostate cancer therapy side/adverse effects and their reduction by physiological effects of specialized exercise interventions (WHO – Globocan, 2012). For collection of relevant literature for review we overview the scientific electronic database (NCBI database). RESULTS Literature review confirmed high priority of aerobic exercise interventions for breast cancer

167
patients. Review confirmed high effectiveness during rehabilitation and during the oncology treatment. Pre-habilitation of breast cancer patients needs more scientific confirmations about effects and benefits. Positive effects of pre-habilitation, rehabilitation and interventions during the therapy are well described. For future research, scientific activities might to analyze and describe possible therapeutic and treatment-related benefits of exercise in combination with target cancer therapies (Jones et al., 2010; Szymlek-Gay et al., 2011; Lakoski et al., 2012; Jones et al., 2013). CONCLUSION Specialized exercise intervention has a potential to reduce/suppress side/adverse effects of oncology therapies. ACKNOWLEDGEMENT Project was supported by agency for support research and development under contract number APVV-0518-12.
REFERENCES [1] JONES LW, ALFANO CM. Exercise-oncology research: past, present, and future. Acta Oncol. 2013; 52(2):195-215.
[2] JONES LW, PEPPERCOM J, SCOTT JM, BATTAGLINI C. Exercise therapy in the management of solid tumors. Curr Treat Options Oncol. 2010; 11(1-2):45-58.
[3] LAKOSKI SG, EVES ND, DOUGLAS PS, JONES LW. Exercise rehabilitation in patients with cancer. Nat Rev Clin Oncol. 2012 Mar 6;9(5):288-96.
[4] SZYMLEK-GAY EA, RICHARDS R, EGAN R. Physical activity among cancer survivors: a literature review. N Z Med J. 2011; 124(1337):77-89.
[5] WARBURTON DE, NICOL CW, BREDIN SS. Prescribing exercise as preventative therapy. CMAJ. 2006; 174:961–974.

168
EFFECT OF PLYOMETRIC TRAINING ON MIDDLE DISTANCE
RUNNERS’ PERFORMANCE
Petronela Ladecká, Oľga Kyselovičová, Erika Zemková
Comenius University in Bratislava, Faculty of Physical Education and Sports, Department of Sport Educology , Slovakia
ABSTRACT Single pedagogical experiment, with duration of 16 weeks and training stimuli of 3-5 times a week. Monitoring was performed in season 2011-2012 and we made a subsequent comparison of competition performance with previous season, 2010-2011. The experimental group consisted of 8 athletes (4 boy, 4 girl), with different somatotypes (age 15.9±1.4 years; BW 58.3 ±8.1 kg; BH 174.5±7.1cm). Specific performance, i.e. best achieved running times we rated according IAAF scoring tables. Score increases observed in 2010-2011 and 2011-2012 were compared using the Mann-Whitney U test. The increase in the period 2011-2012 was significant at the significance level of 5% (p<0, 05) compared to the 2010-2011 period. Based on these findings, we come to the conclusion that plyometric training significantly influenced the specific performance of 400m – 1500m runners and is therefore necessary to practice explosive strength training for athletes – runners. KEY WORDS: plyometrics, plyometric training, athletics, running INTRODUCTION Interest in jump training increased during the early 1970s as East European athletes emerged as powers on the world sport scene. The actual term plyometrics was first coined in 1975 by Fred Wilt, one of America’s more forward-thinking track and field coaches. The term plyometrics has been derived from the Greek word pleythyein, meaning "to augment" or "to increase," and the shorter Greek words plio "more" and plyo "to move." Metrics means ''to measure" or "length." The spelling pliometric is also accepted in referring to eccentric contraction or muscle lengthening. Plyometric exercise merges the physical qualities of speed and strength to produce an athlete capable of running faster and jumping higher. The expansion of plyometrics to cover the multi-directional athlete provides greater variety and even more sport-specific options when designing training programs [3]. Plyometric training, specifically training of explosive power has specificities in any sports. This training is more or less applied in all sports and athletics (jumps, running) is not an exception [1]. The Merriam -Webster dictionary [8] defines plyometrics as: “exercise involving repeated rapid stretching and contracting of muscles (as by jumping and rebounding ) to increase muscle power”. Plyometrics is defined as exercises that enable a muscle to reach maximum strength in as short a time as possible [3]. The body of knowledge concerning the effects of plyometric training on performance has been expanded. The ability to get the “biggest bang for your buck” in sport training is now available. Not only do plyometrics fit into the complete training program, a training program is not complete without plyometrics [3]. Plyometrics rapidly became known to coaches and athletes as exercises or drills aimed at

169
linking strength with speed of movement to produce power. Plyometric training became essential to athletes who jumped, lifted, or threw. Chu [3] recommended that plyometric training should be considered in the context of the athlete´s age, skill level, injury history, and a myriad of other variables that comprise his or her athletic development. Plyometric training is the key to developing maximal explosive power and speed of movement. Plyometrics applies to the display of explosiveness after quick, intensive loading of the muscles [5]. When doing various forms of plyometrics, your muscles become loaded, or coiled, and then the energy accumulated from the loading is switched in direction so that your body becomes unloaded and in the process is propelled upward and forward. At this time, your muscles act as springs. They undergo compression, which builds up tension (force) and after being fully loaded (compressed), they expand to their original shape and in so doing release the force upward [5]. Absolute strength must also be increased if you want to increase your explosiveness. Key element in sports today is speed and explosiveness. Mechanisms involved in plyometrics to develop explosiveness: First, it is necessary to understand the different types of muscular contractions: Eccentric, isometric, and concentric. In the eccentric contraction, the length of the muscle increases as the muscle undergoes contraction. This type of contraction occurs when the outside force is greater than the force that is being generated by the muscle. Because of this, the outside force lengthens the muscles as the muscle maximally tries to reverse the movement but is unable. The eccentric contraction is sometimes known as a yielding type contraction, i.e. the muscle yield to the outside force and lengthens. Most athletes can eccentrically lower 40%-50% more weight than they can lift concentrically. For an exercise to be truly plyometric, it must be a movement proceeded by an eccentric contraction. This results not only in stimulating the proprioceptors sensitive to rapid stretch, but also in loading the serial elastic components (the tendons and cross-bridges between muscle fibres) with a tension force from which they can rebound. In the isometric contraction, the muscle contracts but there are no movement. There is some shortening of the muscle fibres but because the outside force is so great, it is not overcome and thus no movement occurs. The isometric contraction is also known as a static or holding type contraction. It should be noted that in this type of contraction the strength developed is 10-15% greater than can be generated in the concentric contraction. In the concentric contraction, the muscle shortens when it contracts. In this case, you overcome an outside resistance (weight) and move it a certain distance as the muscle contracts and shortens to produce the movement. This is known as an overcoming regime, i.e., you overcome the weight being used [3, 5].

170
Plyometrics are the exercises which involve stretch–shortening cycle (SSC). The SSC of muscle function comes from the observation that body segments are periodically subjected to impact or stretch forces. Running, walking and hopping are typical examples in human locomotion of how external forces (e.g. gravity) lengthen the muscle. In this lengthening phase the muscle is acting eccentrically, and then a concentric (shortening) action follows. The true definition of eccentric action indicates that the muscles must be active during stretch. This combination of eccentric and concentric actions forms a natural type of muscle function called the stretch–shortening cycle or SSC [6].
Fig.1 In human walking, hopping and running considerable impact loads occur when contact takes place with the ground. This requires preactivation from the lower limb extensor muscles before the ground contact to make them ready to resist the impact (a) and the active braking phase (b). The stretch phase is followed by a shortening (concentric) action (c) [7] Fig.2 In general, utilizing elastic energy is determined by the speed of the stretch shortening cycle and the level of muscle stretching. To properly use the elastic energy, the stretch phase should be:
1) Sufficiently rapid such that the coupling time (t) of the stretch shortening cycle will not be inferior to the half time of the actin and myosin cross-bridge cycling action (120-150ms circa)
2) Sufficiently ample (h) to cause the miotatic reflex to take place in the correct moment not anticipate the eccentric phase and not be inside the concentric phase
3) Combined to the active muscular contraction (external force impact – F) [9].
This specific type of strength training, known as explosive-strength training or plyometric training (PLY), has been reported to invoke specific neural adaptations such as increased activation of the motor units, with less muscle hypertrophy than typically observed after heavy-resistance strength training [12, 13, 14]. Both of these adaptations resulting from PLY could potentially improve RE by generating

171
greater force production from the muscles without a proportionate increase in the metabolic energy requirement. In this regard, Saunders [10] in his research confirmed that specific plyometric training program designed for runners, can improve running economy of elite distance runners. Runners improved RE at 18km/h by 4.1%. METHODS Experimental Approach to the Problem The study was a single pedagogical experiment with duration of 16 weeks and training stimuli was 3-times per week. Measures were conducted prior and after 8 weeks of strength and 8 weeks of plyometric training (PLYO) [table 1]. The experimental group consisted of young middle distance athletes. Subjects were matched based on performance level, middle distance run, and prior history of performance improvements. Prior to PLYO training intervention, athletes went through the strength training session. Strength preparation lasted 8 weeks and was aimed as preparation for PLYO training, to avoid injuries during jumping exercises. Subjects Eight highly-trained middle distance runners (4 girls, 4 boys), with different somatotypes (age 15.9±1.4 years; BW 58.3 ±8.1 kg; BH 174.5±7.1cm) volunteered for this study. All subjects competed at an international level. Subjects had minimal prior history of strength training. Subjects were informed of all experimental procedures and the possible risks involved in participation before their written consent was obtained. The study was approved by Department of Kinesiology, Faculty of Physical education and Sports, Comenius University in Bratislava and as well with Athletic Club Spartak Dubnica. Procedures Plyometric training. The first week of PLYO involved familiarization with the various exercises, with only 2 sessions undertaking during this week. Careful attention was given to each subject to ensure good technique for each exercise. The 30-minute sessions were conducted prior ordinary running training in track and field stadium. The session consisted of knee lifts, alternate leg bounding, ankle jumps, single leg ankle bound, scissor jumps, combination bounding( R,R,R- L,L,L), double leg hops, continuous hurdle jumps, agility ladder- feet in each, agility ladder - ickey shuffle and agility ladder- zig-zag drill [16]. Monitoring was performed in season 2011-2012 and we made a subsequent comparison of competition performance with previous season, 2010-2011. Every performance (time) was rated according IAAF scoring tables [table 3]. Specific performance, best achieved running times, we rated according IAAF scoring tables [4]. Score increases observed in 2010-2011 and 2011-2012 were compared using the Mann-Whitney U test, at the significance level of 5% (p<0, 05).

172
Table 1 Eight-week plyometric training program.
EXERCISE
WEEK
1-2 3-4 5-6 7-8
week session
1 2 1 2 3 1 2 3 1 2 3
knee lifts (technical) 1x20 1x20 1x20 2x20 2x20 2x20 2x20
alternate leg bounding 1x30m 1x30m 1x30m 1x30m 1x30m 1x30m 1x30m
ankle jumps 1x30m 1x30m 1x30m 1x30m 1x30m 1x30m 1x30m
single leg ankle bound 1x20m 1x20m 1x20m 2x20m 2x20m 2x20m 2x20m
scissor jumps 1x20m 1x20m 5x3 5x5
combination bounding ( R,R,R- L,L,L)
1x30m 1x30m 1x30m 1x30m 1x30m 1x30m 1x30m
double leg hops 1x10 1x10 1x10 3x5 3x5 3x10 3x10
continuous hurdle jumps 5x5 5x5 5x5
agility ladder- feet in each 3x10m 4x10m 3x10m 3x10m
agility ladder - ickey shuffle 3x10m 4x10m 3x10m 3x10m
agility ladder- zig-zag drill 3x10m 4x10m 3x10m 3x10m
RESULTS AND DISCUSSION Our research group were young athletes in age of 14-18 years old. It is obvious, that improvement of their performance will be effected by changes in training program, but also performance improvement given by biological age (BA) [table 4]. We accepted this fact and we decided to deduct our specific running performances in 4%. This value is based on publication, which compares these age groups of runners according 12-minutes run test [11]. Score increases observed in 2010-2011 and 2011-2012 were compared using the Mann-Whitney U test. The increase in the period 2011-2012 was significant at the significance level of 5% (p<0, 05) compared to the 2010-2011 period. Input values in period 2011-2012, in October 2011 – December 2011, reached point value of 607, which is higher than previous season in 11 points. Output points in December 2011 – February 2012 showed significant value of 665 points. It is 58 point higher than input value of 607 points [table2]. In this period of year specific plyometric training was included into standard running preparation. Prior to this plyometric training we conducted strength training as preparation for intensive parts of specific training. According to these findings we conclude that plyometric training significantly influenced specific running performance in middle distance runners and our hypothesis is confirmed. Although there is much evidence that plyometric training can improve jumping ability and performance of other movements that involve high power and the SSC (17, 18, 19, 20, 21, 22, 23), there has been little research on the mechanisms of such improvement. These mechanisms may include improved return of elastic energy stored during the eccentric phase of the SSC.
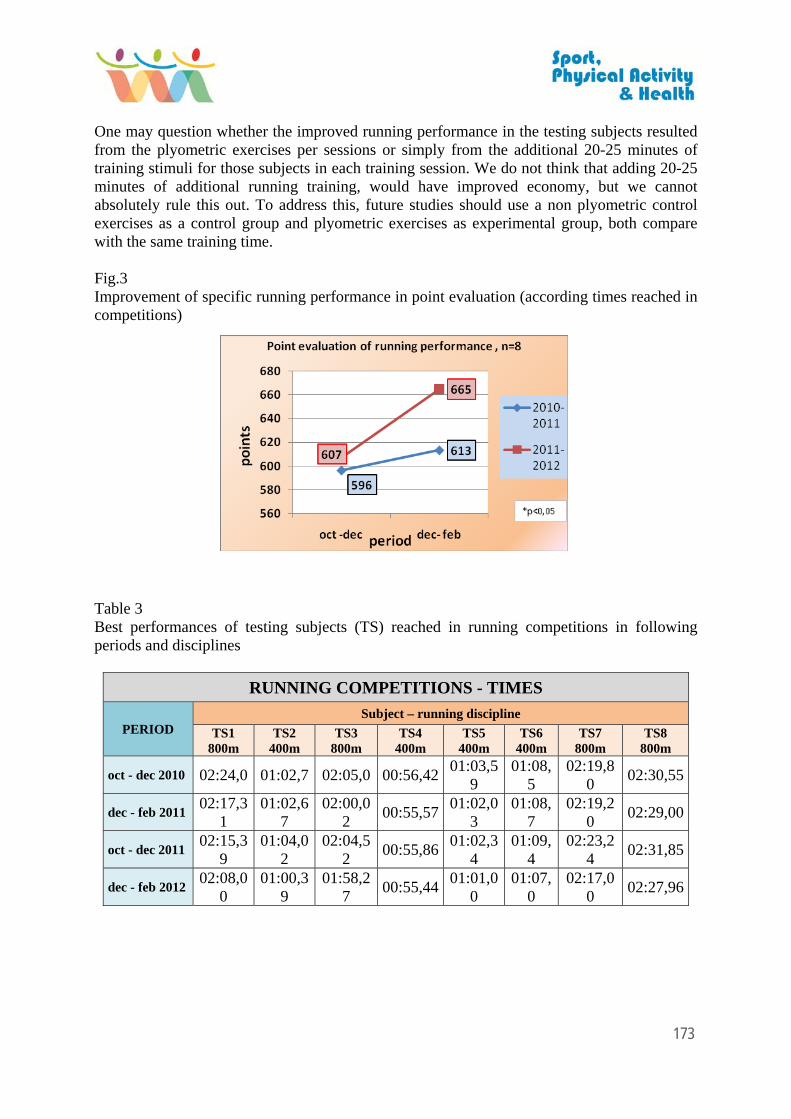
173
One may question whether the improved running performance in the testing subjects resulted from the plyometric exercises per sessions or simply from the additional 20-25 minutes of training stimuli for those subjects in each training session. We do not think that adding 20-25 minutes of additional running training, would have improved economy, but we cannot absolutely rule this out. To address this, future studies should use a non plyometric control exercises as a control group and plyometric exercises as experimental group, both compare with the same training time. Fig.3 Improvement of specific running performance in point evaluation (according times reached in competitions) Table 3 Best performances of testing subjects (TS) reached in running competitions in following periods and disciplines
RUNNING COMPETITIONS - TIMES
PERIOD Subject – running discipline
TS1 800m
TS2 400m
TS3 800m
TS4 400m
TS5 400m
TS6 400m
TS7 800m
TS8 800m
oct - dec 2010 02:24,0 01:02,7 02:05,0 00:56,4201:03,5
9 01:08,
5 02:19,8
0 02:30,55
dec - feb 2011 02:17,3
1 01:02,6
7 02:00,0
2 00:55,57
01:02,03
01:08,7
02:19,20
02:29,00
oct - dec 2011 02:15,3
9 01:04,0
2 02:04,5
2 00:55,86
01:02,34
01:09,4
02:23,24
02:31,85
dec - feb 2012 02:08,0
0 01:00,3
9 01:58,2
7 00:55,44
01:01,00
01:07,0
02:17,00
02:27,96

174
Table 4 Point evaluation of subjects reached in running competitions in following periods and disciplines
RUNNING COMPETITION - POINTS
PERIOD Subject – running discipline
TS1 800m
TS2 400m
TS3 800m
TS4 400m
TS5 400m
TS6 400m
TS7 800m
TS8 800m
average
oct - dec 2010 300,0 321,0 649,0 565,0 781,0 651,0 829,0 300,0 596
dec - feb 2011 - 4% BA 398,0 309,1 738,2 578,9 791,0 620,2 804,5 398,0 613
oct - dec 2011 444,0 279,0 664,0 590,0 815,0 628,0 778,0 444,0 607
dec - feb 2012 - 4% BA 565,0 386,9 778,6 586,6 819,8 661,4 836,2 565,0 665
*BA-biological age, TS-training subject
CONCLUSION Based on these findings, we come to the conclusion that plyometric training significantly influenced the specific performance of 400m – 1500m runners and is therefore necessary to practice explosive strength training for athletes – runners. Further research is required to determine whether trends we have demonstrated in improving running performance can be confirmed with PLYO of greater volume and intensity, and whether this in turn has a further impact on running. Our training methods could offer specific training interventions that coaches and athletes can implement to their training process. It is the responsibility of the coach and the athlete to upgrade this area of development before attempting plyometric training. The best coaches do not always win with their athletes, but they do make training an enjoyable, organized, and progressive activity that ultimately leads the athlete to higher levels of performance. The coach who understands the options and opportunities available through plyometric training will find new ways to train athletes. The point of good training is that you undertake the smart way versus the hard way to work and train. ACKNOWLEDGEMENT This study was supported by projects VEGA 1/0882/14 & VEGA 1/0373/14. REFERENCES
[1] ZEMKOVÁ, E , HAMAR, D. Výskokový ergometer v diagnostike odrazových schopností dolných končatín, p.4, 2004
[2] VANDERKA, M. Teoretické východiská a možnosti využitia plyometrie v kondičnej príprave športovcov. Zborník prednášok zo vzdelávacích aktivít NŠC, p. 140-151, 2004
[3] CHU,D.. Jumping into plyometrics, Human Kinetics, p.1-39, 1998
[4] SPIRIEV, B. 2008. IAAF Scoring Tables for Athletics,p.31-59, 211-239, 2008
[5] YESSIS, M, HATFIELD, F. Plyometric training, Human Kinetics, p. 9-15, 2003
[6] KOMI, P. Strength and power in sport. p.22-23, p. 184, 2003

175
[7] KOMI, P.V. (1984) Physiological and biomechanical correlates of muscle function: Effects of muscle structure and stretch–shortening cycle on force and speed. Exercise and Sport Sciences Reviews/American College of Sports Medicine12, 81–121
[8] http://www.merriam-webster.com/dictionary/plyometrics
[9] VERKHOSHANSKY, N. 2012. Shock method and plyometrics, http://www.verkhoshansky.com/Default.aspx
[10] SOUNDERS, P. Short-term plyometric training improves running economy in higly trained middle and long distance runners. Journal of Strength and Conditioning Research, 2006.
[11] ZAPLETALOVÁ, L. 2002. Ontogenéza motorickej výkonnosti 7-18 – ročných chlapcov a dievčat Slovenskej Republiky. Bratislava: Slovenská vedecká spoločnosť pre telesnú výchovu a šport, 2002. ISBN 80 – 89075-17-7
[12] HÄKKINEN, K. Neuromuscular adaptation during strengthtraining, aging, detraining, and immobilization.Crit. Rev. Phys.Rehabil. Med.6:161–198. 1994.
[13] HAKKINEN, K., P.V. KOMI, ALEN. Effect of explosive type strength training on isometric force- and relaxation-time, electromyographic and muscle fibre characteristics of leg extensor muscles. Acta Physiol.Scand.125:587–600. 1985
[14] SALE, D. Neural adaptation to strength training. In: The Encyclopedia of Sports Medicine. P.V. Komi, ed. Oxford: Blackwell, 1991. pp. 249–265
[15] RADCLIFFE, J. C.. High-powered Plyometrics. Human Kinetics, 1999. ISBN: 088011845.
[16] BROWN. L.E, FERRIGNO V.A. Training for speed, agility and quickness. Human Kinetics. 2005. ISBN: 978-0-7360-5873-5.
[17] BLATTNER, S.E., ANDL. NOBLE. Relative effects of isokinetic and plyometric training on vertical jumping performance.Res. Q.50:583–588. 1979.
[18] BROWN, M.E., J.L. MAYHEW, ANDL.W. BOLEACH. Effect of plyometric training on vertical jump performance in high school basketball players. J. Sports Med. 26:1–4. 1986.
[19] CORNU, C., M.A. SILVEIRA, ANDF. GOUBEL. Influence of plyometric training on the mechanical impedance of the human ankle joint.Eur. J. Appl. Physiol.76:282–288. 1997.
[20] FORD, H.T., J.R. PUCKETT,J.P.DRUMMOND, K.SAWYER, K.GANTT, ANDC. FUSSELL. Effects of three combinations of plyometric and weight training programs on selected physical fitness test items. Percept. Mot. Skills56:919–922. 1983.
[21] HEIDERSCHEIT, B.C., K.P. MCLEAN, ANDG.J. DAVIES. The effects of isokinetic vs. plyometric training on the shoulder internal rotators.J. Sport Phys. Ther. 23:125–133. 1996.
[22] KRAMER, J.F., A. MORROW, ANDA. LEGER. Changes in rowing ergometer, weight lifting, vertical jump and isokinetic performance in response to standard and standard plus plyometric training programs. Int. J. Sports Med. 14:449–454. 1983.
[23] WILSON, G.J., R.U. NEWTON, A.J. MURPHY,ANDB.J. HUMPHRIES. The optimal training load for the development of dynamic athletic performance. Med. Sci.Sports Exerc.25:1279–1286. 1993.
176
CHANGES IN MOTORIC PERFORMANCE OF YOUNG PEOPLE
INVOLVED IN SPORT ACTIVITIES
Anton Lednicky, Ladislava Dolezajova
Faculty of Physical Education and Sports, Comenius University in Bratislava, Department of Athletics, Slovakia
ABSTRACT The authors of this particular paper aimed to compare the general motoric performance of young sportsmen and sportswomen grouped over different sport centres in 1986 and 2010. The difference in performance in the group of junior boys (under 11 and 12) compared with particular results from previous years proved results on behalf of boys tested in 1986. This tendency was also confirmed in the category of senior boys (under 13 and 14). In the case of junior girls (under 11 and 12), the difference in performance was positive in the case of girls in 2010 and senior girls (under 13 and 14), girls from 1986 were at a higher performance level.
KEY WORDS: junior and senior boys and girls, general physical readiness, testing, period of 1986 and 2010, statistic comparison of results.
INTRODUCTION
Sport education is a science system of sport in which its aimed conception follows the connections with mass physical education lessons for children and youth and binds with professional sport. Thanks to this connection, the optimal association and relativity of development as well as the functionality of sport education of youth were established. According to Havlicek et al. (1979), the sport education of youth represents the core of top sportsmen/sportswomen preparation and education – representatives.
The way sport itself fulfils its function depends on several factors. The most important function is the level of children’s sport education and the preparation of top sportsmen/sportswomen. Both points are considered to be long term processes which can be characterized according to the continuity of physically gifted children’s education, according to the education of physically talented youngsters, and based on the education of top and national level sportsmen. The sport education of youngsters follows not only the tasks for perspective performance growth, but also the all-purpose and harmonic growth of children and young people.
The main task of physical education is to develop a comprehensive foundation and develop special physical abilities based on it and in accordance with the particular requirements of a particular type of sport (Moravec, 2004).
Particular tools of general physical education are aimed on strengthening health, development of cardio-pulmonary system, general stamina development and the improvement of joint mobility, as well as muscle elasticity and movement coordination.

177
Choutka – Dovalil (1991) noticed the importance of general and specialized uniformity particularly in the case of children and young people training, but also in the case of older beginners. First of all, it is comprehensive functional and locomotive development which is the most important assumption of dynamic sport performance growth.
Havlicek, Zapletalova (1989) presented particular standards of locomotive performance of sport-gifted young people at the age of 11 to 18. They studied the level of performance in six tests with the pool of sport-gifted children and young people.
Gallova (2010) believes that the present generation of children begins the sport education system with a lower level of physical ability compared to 20 - 30 years ago. This is caused mostly due to social lifestyle changes.
AIM
The aim of this work is to compare the level of physical performance of sport involving boys and girls, members of sport classes and clubs, within 25 years (1986 and 2010).
HYPOTESIS
We assume that we will notice a statistically significant difference in the performance of sportspersons trained in the past.
TASKS
1. To implement the testing of fitness abilities in groups of young sportspersons. 2. To provide a statistic comparison of particular results with available published data from the past.
PROCEDURE
Particular groups of studied subjects in the 1980s included athletes, swimmers, skiers, basketball players, handball players, volleyball players and football players. The studied group of sportspersons in 2009 to 2010 included ice-hockey players, football players, athletes, swimmers, canoeists, basketball players and volleyball players which were in several clubs for gifted young people (sport clubs, sport classes and eight years sport comprehensive schools) in Slovakia. Particular numbers of sportspersons are listed in the following charts.
Testing was performed using the group of tests which evaluated basic physical abilities. Particular fitness tests were applied on the following events: 50 m run - high start with sound signal (50m), run - 12 minutes (ER), long jump - from standing - splits over (LJSS), pull-ups on horizontal bar – overgrasp – boys and holding-time in pull-up for girls (holding-time in pull-up), 2 kg full ball throw (FBT), crunch in 1 minute (Crunch).
The following methods were used during the process of data collection and study results evaluation:

178
- method of locomotive performance testing,
- mathematical and statistical methods,
- logic methods.
Particular empiric data in our study were processed and evaluated using the following statistical tools and method:
- mean value
- standard deviation
- parametric t-test of substantive files
The statistic significance of particular differences was evaluated at 1% and 5% expectancy level.
RESULTS
In the group of junior boys (Table 1) four of the six tests showed statistically significant difference at the 1% level - particularly in the full ball throw test, pull-ups on horizontal bar, crunch, and endurance run of boys from 1986. The most significant difference was noticed in the case of pull-ups (4.5 and 1.8). No statistical significance was observed in the case of 50 m run and long jump, whereas the results were almost identical in the second test, but the homogeneity of the group was higher in 1986.
Table 1 Comparison of the performance of junior boys’ fitness tests in 1986 and 2010.
Test Years n X s t – test Sign.
50 m run [s] 1986 345 8.810 0.678
1.065 2010 278 8.753 0.643
Full ball throw [m]
1986 345 5.580 0.946 5.209** p<0.01
2010 278 5.169 1.015
Long jump [cm]
1986 345 171.3 16,92 0.064
2010 278 171.2 21,98
Pull-ups (total count)
1986 345 4.460 3.714 10.53** p<0.01
2010 278 1.831 2081
Crunch (total count)
1986 345 67.57 13.28 24.00** p<0.01
2010 278 44.02 10.59
12 min run [m]
1986 345 2501.9 304.9 7.886** p<0.01
2010 278 2303.8 318.6

179
A similar trend of performance was observed in a group of senior boys (Table 2). Three tests (pull-ups, crunch, 12 min. run) were statistically significant at 1% level, and the full ball throw was statistically significant at the 5% level. In the case of long jump from standing, boys achieved almost similar results when compared to the previous age group.
Table 2 Comparison of the performance of senior boys in fitness tests in 1986 and 2010.
Test Years n x s t – test Sign.
50 m run [s] 1986 345 7.890 0.480
1.857 2010 283 7.967 0.557
Full ball throw [m]
1986 345 7.980 1.402 2.332* p<0.05
2010 283 7.714 1.442
Long jump [cm]
1986 345 204.9 17.61 1.817
2010 283 202.0 22.31
Pull-ups (total count)
1986 345 7.770 4.330 15.01** p<0.01
2010 283 3.061 3.377
Crunch (total count)
1986 345 72.00 13.07 29.61** p<0.01
2010 283 46.02 7.507
12 min run [m]
1986 345 2719.4 250.6 13.28** p<0.01
2010 283 2430.8 293.0
In the group of junior girls (Table 3) results in accordance to the previously stated hypothesis were gained in crunch tests only and in 60 s (p<0,01). In the case of other tests (50 m run, full ball throw, long jump) performed at the same level of significance, girls achieved higher performance level in 2010. Significant difference of average achievements were observed in long jump from standing (+14.9 cm), whereas almost identical results were observed in pull-up holding time test and 12 minutes run.

180
Table 3 Comparison of the performance of junior girls in fitness tests in 1986 and 2011. Test Years n x s t – test Sign.
50 m run [s] 1986 170 9.160 0.671
8.938** p<0.01 2010 129 8.505 0.560
Full ball throw [m]
1986 170 4.850 0.864 4.638** p<0.01
2010 129 5.363 1.040
Long jump [cm]
1986 170 156.9 13.99 6.848** p<0.01
2010 129 171.8 23.27
Pull up holding time
[s]
1986 170 25.52 13.33 0.752
2010 129 24.04 20.51
Crunch (total count)
1986 170 60.16 12.65 12.94** p<0.01
2010 129 44.03 7.189
12 min run [m]
1986 170 2137.2 218.5 0.109
2010 129 2139.9 203.4
Table 4 Comparison of the performance of senior girls in fitness tests in 1986 and 2011.
Test Years n x s t – test Sign.
50 m run [s] 1986 170 7.890 0.422
2.502* p<0.05 2010 112 8.038 0.566
Full ball throw [m]
1986 170 6.920 0.984 0.159
2010 112 6.900 1.090
Long jump [cm]
1986 170 192.9 14.94 0.524
2010 112 191.9 16.61
Pull up holding time
[s]
1986 170 21.51 9.789 2.477* p<0.05
2010 112 26.78 24.87
Crunch (total count)
1986 170 58.54 9.650 10.53** p<0.01
2010 112 47.08 7.658
12 min run [m]
1986 170 2340.4 214.6 4.224* p<0.01
2010 112 2218.8 264.5

181
The comparison of performance in the group of senior girls (Table. 4) showed the lag of present young sportswomen compared to the same age group in 1986. The particular difference in the case of 50 m run is at lower level (p<0.05), but the situation is significantly different in the case of pull-ups test, crunch test and 12 minutes run where the observed difference is (p<0.01).
We are aware of the fact that particular results can be influenced by the actual structure of individual study pools of sportspersons in different sport categories, though it is possible to assume that in the listed age categories the specialization should not have such a major impact on the level of general physical performance. CONCLUSIONS
1. The results of performance comparison in the case of sport involved boys in junior and senior age categories in 1986 and 2010, and proved the negative trend of physical abilities development within young people. Both groups consist of boys regularly involved in a training process. Despite this, young sportsmen in 2010 were behind their peers from 1986 at statistically significant level. The comparison of performance in the group of junior girls did not prove the assumption of higher development in the case of fitness abilities within girls from 1986. The most significant difference was observed in the case of speed-strength type tests. In the case of senior girls group which were more influenced by the training process, the significant shift in performance on behalf of young sportswomen from 1986 was observed.
2. According to the listed data, it is necessary to assume lower initial level of sportspersons fitness status even in the case of higher age categories, which leads to the regression of our sport teams and individuals during international events. Success is considered to be an exception rather than the rule.
3. It is possible to assume that the proposed tendency of performance decrease in the case of present sportspersons will negatively influence their sport life growth.
4. The solution to this situation is complicated - most young people have neither the will to be involved in sport, nor the ability to cope with difficulties. Natural activity has disappeared, and its effective new onset via physical education lessons and the help of parents will be particularly difficult.
REFERENCES [1] GALLOVÁ, T. 2010. Efektivita ročného tréningového cyklu mladých basketbalistiek s akcentom na rozvoj vybraných pohybových schopností. Dizertačná práca. Bratislava, 2010. 186 s.
[2] HAVLÍČEK, I. et al. 1979. Stav športovej prípravy mládeže v oddieloch telovýchovných jednôt na Slovensku v roku 1975 v porovnaní s rokom 1970. In KUCHEN, A. Športová príprava mládeže. Zborník VMR SÚV ČSZTV VI. Bratislava : Šport, 1979, s. 217 – 244.
[3] HAVLÍČEK, I., ZAPLETALOVÁ, L. 1989. Normy všeobecnej motorickej výkonnosti športovo-talentovanej mládeže vo veku od 11 do 18 rokov (1986). In HAVLÍČEK, I. et al. Výsledky výskumu Výskumného ústavu telesnej kultúry FTVŠ UK v športovej príprave talentovanej mládeže v rokoch 1986 – 1988. Bratislava : Ministerstvo školstva, mládeže a telesnej výchovy SSR v Športe, 1989, s. 86 - 90.
[4] CHOUTKA, M., DOVALIL, J. 1991. Sportovní trénink. Praha : Olympia, 1991. 331 s. ISBN

182
ABOLISHMENT OF SPORTS IN BRATISLAVA CAPITAL – A
COINCIDENCE OR INTENTION?
PhDr. Rostislav Matoušek, CSc., Mgr. Ivana Krasňanová
Faculty of Physical Education and Sports, Comenius University in Bratislava, Slovakia
ABSTRACT
Our capital is supposed to be able to fulfill the metropolitan functions in all areas of human activities, and that means, also in the field of sport and physical education. In Bratislava, the capital of Slovakia, the sport facilities began to be systematically built up after the formation of Czechoslovakia, but most of them were constructed during the socialist period. After the change of the regime the liquidation phase arrived. In a short period of time the whole range of sport facilities have been destroyed, for example: the stadium of Slovan football club, ZTS Petržalka, the sport playground on Jegeho street, TJ Vinohrady sport complex, ice-ring, cycle track and many others. On the contrary, in the last 25 years only one ice-ring and the National Tennis Center have been built up. Most sports in Bratislava are missing an appropriate sport facilities for organizing international events. Is this abolishment a coincidence or intentional?
KEY WORDS: Bratislava, sport facilities and centers, conditions for sports, social and civic consciousness
INTRODUCTION
In 1919, Bratislava became the capital of Slovakia within the newly created State of Czechoslovakia. With the arrival of a new population of the Slovak and Czech nationality and increasing importance of sports, the need to build sports facilities originated Obec Sokolská played an important role in these activities. During the period of the first Czechoslovak Republic new venues were built on the right bank of the river Danube, in Petržalka. This part of Bratislava already featured as a recreational area during Austrian - Hungarian Empire (Sad Janka Kráľa, racing ovals, etc.). After the Vienna arbitration Czechoslovakia and subsequently Slovakia lost the right bank of the Danube, and thus the venues. Military Slovak State responded with great flexibility and built a complex of sports facilities – the resort at Tehelné pole which consisted of a football stadium, swimming pool, winter stadium, cycling tracks and a tennis resort. On these sports venues such Olympic champions have grown up as Nepela and Tkáč and some medallists of the World Championships as well.
The era of socialism from 1948 until 1989 was in terms of building sports facilities very favourable for Bratislava. The building of sports venues continued in the area of Tehelné pole in the direction towards the Lake of Kuchajda. 50 m long Olympic swimming pool in Pasienky and Spartakiádny Stadium were built, later came a football stadium of Inter Bratislava, where eight-track tartan area for athletes came into being, too. In the area of the stadium, tennis courts, gymnasium, multi-purpose hall called Mladosť, sports resort TJ Štart, resort of Pozemné stavby, sports hall of the school of Physical Education were included. Further were built such venues as a winter arena in Bratislava, Dubravka, and Central Spa with another 50 m long swimming pool and table tennis Hall in Rača.

183
At the end of 80-ties Bratislava had a comprehensive sports complex in which it was
possible to organize international sporting events. So, for example, in Bratislava World Cup Championships in ice-hockey, figure skating and women handball were held. Athletic meeting Pravda-Televízia-Slovnaft belonged to the most important athletic events on the European continent. In that period there were 3 teams in the National Football League based in Bratislava, as well as four teams both men and women in the national volleyball league.
In the late 1980-ies Bratislava noticeably lacked the sports halls in contrary with Prague, in which during each “spartakiáda” under the pretext of building of warehouses they built several new halls.
After the revolution in 1989 sports public expected the golden era of the sports and building amenities. Unfortunately, it was just the opposite. There has been a period of mass liquidation of sports. In the period of 25 years since the revolution and 21 years since separation the Slovak Republic, only two objects have been built:
- Athletic Hall Elán
- The National Tennis Center
There was one object redesigned:
- Ice Hockey Stadium of Andrej Nepela
In the period of socialism sports objects were dependent in particular, on the promotion of the manufacturing companies or organisation ČSZTV.
With the privatisation of these objects a few of them were demolished:
- Handball Hall in Jege's Street,
- Wrestling Hall - the port of Bratislava
- Spa Centre – Slovenské výrobné družstvo
The second method of sports disposal was more sophisticated. Investors in the robes of the Savior infiltrated the Club, or TJ. Then they brought the Club or TJ to the liquidation of sports facility, they demolished it and created space for commercial construction in such a way. The following campuses were destroyed:
The following campuses were destroyed:
- TJ Vinohrady (now there is a supermarket Billa)
- TJPozemné stavby (currently there is Slovenská sporiteľňa)
- Campus FC Artmedia Petržalka, which is now demolished
A similar fate waits for the resorts of TJ Inter Bratislava, TJ Nepočujúcich, TJ Štart and some of the other venues. The construction of the winter stadium of Ondrej Nepela where under the pretext of building a stadium for the ice-hockey WORLD CUP in 2011, there was confusion within the urban land and the Cycling Stadium of Vlastimil Ružička, where Olympic champion in sprint Anton Tkáč grew up, was destroyed. In the end, however, this

184
demolition was completely unnecessary. In order to avoid a public competition, the investors started to reconstruct the original stadium, for that purpose they maintained at least a piece of the eastern side of the grandstand. Instead of new ice rinks in Bratislava, the number of these areas has remained the same, however, the stadium, which was renovated in the 80-ties and 90-ties, was destroyed. Similar management was also used at the stadium of FC Artmedia Petržalka. After 12 years, unfortunately this stadium was demolished. At present, the unobstructed area serves as preparatory place for the construction of tramlines to Peržalka. Fortunately, some representatives have learned a lesson, and did not agree with the sale of a land on which stands the football stadium Slovan Bratislava, for a symbolic price or even for free, with regard that there would then grow a hotel, shopping center, etc. Liquidation of Sports Hall in Pasienky has been avoided as it had been declared a cultural monument.
How can the descent of this barbarism be prevented? One of the solutions is to learn from the experience of others. In Prague, in order to avoid liquidation, of the football stadium Bohemians a special party was set up which subsequently won the municipal elections in the city of Prague, which eventually saved the stadium. The sports public should develop more initiative for the conservation and restoration of sports in schools as well as building new sports sites, which Bratislava as the capital, needs badly.
THE CURRENT STATUS OF SPORTS BUILDINGS IN BRATISLAVA
Picture 1: Ice Hockey Arena of Ondrej Nepela
Picture 2: One of the few new buildings, National Tennis Center
Picture 3: Sport Hall of Pasienky has saved from demolition status of cultural monuments.
Picture 4: Football Stadium of Inter Bratislava
Picture 5: The remains of Cycling Stadium
Picture 6: The remains of Football Stadium Artmedia Petržalka
REFERENCES [1] MACHAJDÍK, I. 2011. Športové hry starej Bratislavy. Bratislava.2011.231 s. ISBN 978-80-
8046-493-6 [2] KOLEKTIV AUTOROV: Kapitoly z dejín Bratislavy. Bratislava 2006. [3] TKAČIKOVÁ, L. 2012. Na mieste bratislavskej športovej haly zaparkujú autá.Bratislava.
SME, Petit Press 2012. [4] TKAČIKOVÁ, L.2009. Hala chýba, hľadajú sa peniaze. Bratislava.SME.Petit Press 2009.

185
SATISFACTION WITH HEALTH STATUS IN PEOPLE
WITH HEARING IMPAIRMENTS
Dagmar Nemček¹, Ladislav Kručanica² 1Comenius University in Bratislava, Faculty of Physical Education and Sports, Department of
Sport Educology and Sport Humanities, Slovakia; 2University of Security Management in Kosice, Department of Physical Education and Sport, Slovakia
ABSTRACT In the article we use scientific observation to assess the subjective satisfaction with health of people with hearing impairment. The research sample consisted from 152 participants with hearing impairment where 28,3 % were physically active in their leisure time, while 71,7 % led sedentary behaviour. By SQUALA questionnaire we differentiated the results according to the participation on physical activity in leisure time and evaluated the significance of the difference. We found out, that physically active individuals with hearing impairment show significantly higher satisfaction with physical and mental health than sedentary living deaf individuals. It is obvious, that regular physical activity significantly participates on the increase of subjective satisfaction with health of people with hearing impairment. Therefore, the individuals, for whom sport is not the part of healthy lifestyle, should realise, that this phenomenon is important mean of health build up and overall satisfaction with it.
KEY WORDS: people with hearing impairments, physical and psychological health, active and sedentary population, subjective assessment INTRODUCTION
Majority of population use sound and speech as the main and most important way of communication. Our society is therefore very dependent on auditory perception. A man receives approximately 60% of all information by an acoustic channel. Hearing impairment has influence on the quality of speech of a man. It can lead to the communication breakdown, which can have a serious social and psychological impact. Hearing loss has a negative influence on the personal development of a child, social maturity and possibilities of integration in society.
It is well documented that individuals who are deaf and hard of hearing assert that they have a “special culture” [1, 18]. There are no outward signs that the person has a disability until the deaf individual engages in communication. Then the mannerisms and behaviors become obvious and are often confusing to those who can hear [20]. Some individuals who are deaf or hard of hearing choose exclusively to be part of the Deaf community. That’s why a person with hearing impairment is significantly socially deprived, excluded from society, there is a relationship breakdown and that lead to decrease in the quality of life [11]. [17] described this as a sociolinguistic community” where membership is gained through the acquitision of sign language and desire to embrace the values of Deaf culture.
We perceive the quality of life as individual and subjective living of reality, where the past, present, and future of the individual is reflected, his relationships towards other people, groups, culture, politics, ecosystem, etc. [7] define the quality of life as an expression of general well-being, degree of self-realisation and mental harmony, degree of life satisfaction and dissatisfaction. [4] implement the term: „health related quality of life„ as criteria The
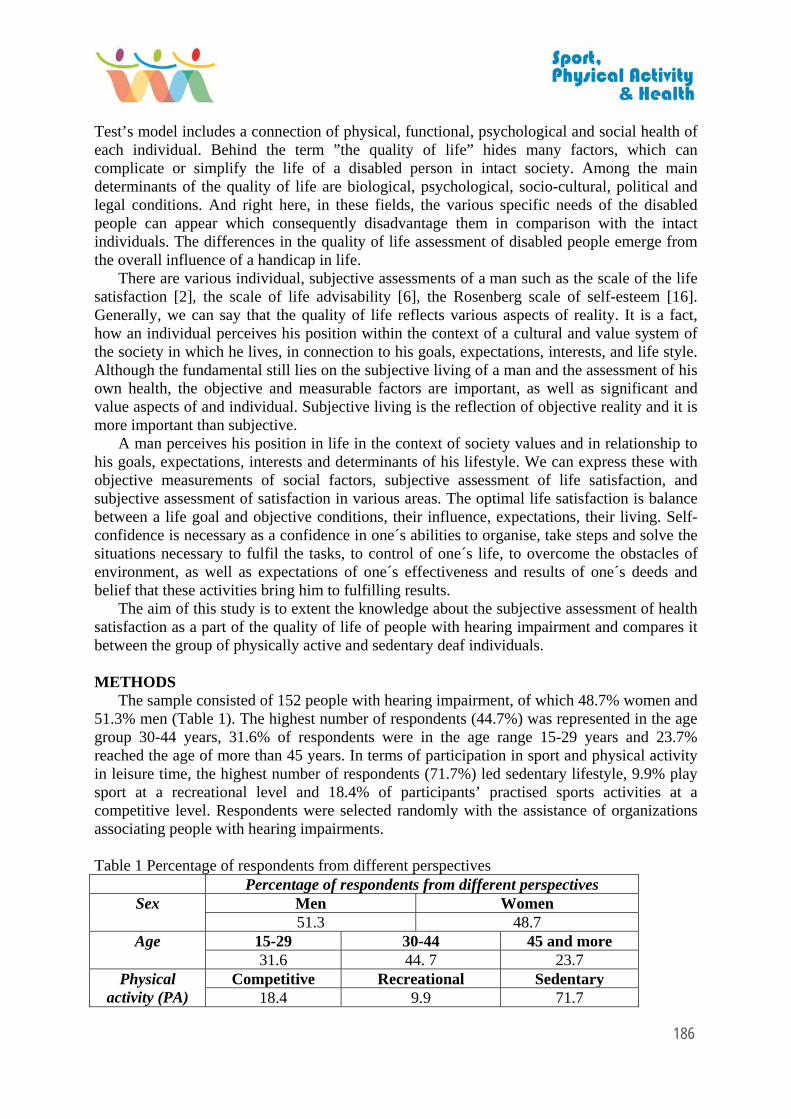
186
Test’s model includes a connection of physical, functional, psychological and social health of each individual. Behind the term ”the quality of life” hides many factors, which can complicate or simplify the life of a disabled person in intact society. Among the main determinants of the quality of life are biological, psychological, socio-cultural, political and legal conditions. And right here, in these fields, the various specific needs of the disabled people can appear which consequently disadvantage them in comparison with the intact individuals. The differences in the quality of life assessment of disabled people emerge from the overall influence of a handicap in life.
There are various individual, subjective assessments of a man such as the scale of the life satisfaction [2], the scale of life advisability [6], the Rosenberg scale of self-esteem [16]. Generally, we can say that the quality of life reflects various aspects of reality. It is a fact, how an individual perceives his position within the context of a cultural and value system of the society in which he lives, in connection to his goals, expectations, interests, and life style. Although the fundamental still lies on the subjective living of a man and the assessment of his own health, the objective and measurable factors are important, as well as significant and value aspects of and individual. Subjective living is the reflection of objective reality and it is more important than subjective.
A man perceives his position in life in the context of society values and in relationship to his goals, expectations, interests and determinants of his lifestyle. We can express these with objective measurements of social factors, subjective assessment of life satisfaction, and subjective assessment of satisfaction in various areas. The optimal life satisfaction is balance between a life goal and objective conditions, their influence, expectations, their living. Self-confidence is necessary as a confidence in one´s abilities to organise, take steps and solve the situations necessary to fulfil the tasks, to control of one´s life, to overcome the obstacles of environment, as well as expectations of one´s effectiveness and results of one´s deeds and belief that these activities bring him to fulfilling results.
The aim of this study is to extent the knowledge about the subjective assessment of health satisfaction as a part of the quality of life of people with hearing impairment and compares it between the group of physically active and sedentary deaf individuals.
METHODS
The sample consisted of 152 people with hearing impairment, of which 48.7% women and 51.3% men (Table 1). The highest number of respondents (44.7%) was represented in the age group 30-44 years, 31.6% of respondents were in the age range 15-29 years and 23.7% reached the age of more than 45 years. In terms of participation in sport and physical activity in leisure time, the highest number of respondents (71.7%) led sedentary lifestyle, 9.9% play sport at a recreational level and 18.4% of participants’ practised sports activities at a competitive level. Respondents were selected randomly with the assistance of organizations associating people with hearing impairments. Table 1 Percentage of respondents from different perspectives
Percentage of respondents from different perspectives Sex Men Women
51.3 48.7Age 15-29 30-44 45 and more
31.6 44. 7 23.7 Physical
activity (PA) Competitive Recreational Sedentary
18.4 9.9 71.7

187
Level of hearing loss
Severe Profound Total deaf 20 30.7 49.3
We used standardized questionnaire SQUALA (Subjective Quality of Life Analysis) to
obtain empirical data, especially its second part, which assesses the subjective satisfaction with the particular indicators of the quality of life of each individual. The questionnaire traces a subjective view of a man on his life situation in such way, that it assesses satisfaction and dissatisfaction with particular indicators of the quality of life. The questionnaire Subjective QUAlity of Life Analysis – SQUALA [21, 5] covers overall 22 indicators of outside and inside realities of everyday life: “the domains”. For our study we draw our attention to indicators concerning the domains: Physical health and the level of independence (PHLI) and Psychological health and spirituality (PHS).
In each indicator, the respondents rated a subjective satisfaction in the particular field on 5-point rating scale, specifying in what extent they are satisfied with the particular indicator. Point score 1 (high satisfaction) meant the highest satisfaction and in the same time the highest level and point score 5 (total disappointment) expressed the absolute insignificance of the particular factor in their life. We consider rating 1 – 2 to be positive, 3 to be neutral and 4-5 to be negative. We include personal data about respondents in the questionnaire SQUALA such as age, sex, the level of physical activity participation and the level of hearing impairment. For better presentation of the results we categorized the quality of life indicators in the questionnaire according to WHO [3] as follows:
1. Health (general health satisfaction); 2. Physical health and the level of independence (satisfaction with self-sufficiency, sleep,
rest in spare time, care about oneself, sex life, food); 3. Psychological health and spirituality (being satisfied with faith, justice, beauty and art,
truth, love, psychical well-being). For statistical evaluation of data, we used the average value of the responses expressed by
respondents and significance of the differences between the various indicators of the quality of life in sport and leisure by chi-square test (qualitative assessment values) at 1%, 5% and 10% level of statistical significance. We compare the indicators of the quality of live in terms of participation on physical activity in the leisure time, where one group consists of people who are physically active on recreational or competitive level and the second group consists of people with sedentary lifestyle. We present the results in figures. RESULTS AND DISCUSSION From the results of our research we conclude, people with hearing impairment (PHI) who actively participate in sport activities show higher subjective satisfaction with their general health (p<0.05) in comparison with deaf people with sedentary lifestyle. That confirms the average score of the responses, where the score of people who are involved in sport activities was 2.233 and the score of hearing impaired people, who do not participate on any sport activities, was 2.642. The difference between the scores was almost half a point (0.409). We compared our results with [11], who studied subjective satisfaction with health of people who have cochlear implant, and we found out that both of our groups showed higher satisfaction with health than her respondents, because the average score of responses was in scale between 3.0 and 3.5 points. This could be caused by the fact that [11] had higher number of respondents in older age than we had, because older people declare lower satisfaction with their health than the younger in disregard of disability [12, 14, 15].

188
Figure 1 Subjective satisfaction with PHLI from sport participation point of view
The results show, that in the domain PHLI, people involved in sport are most satisfied with food and least satisfied with physical self-support whereas people with sedentary lifestyle are mostly satisfied with sexual life and least satisfied with physical self-support (Fig. 1). In overall assessment we can say, that these domains are assessed more positively by health impaired people who do regular sport activities. The assessment of particular indicators of the quality of life, which are a part of these domains, suggest that as well, when higher satisfaction with all the indicators declared people participating on sport in comparison with people with sedentary lifestyle and moreover, the differences in three indicator showed the level of statistical significance. We recorded the greatest differences in the indicators “physical self-support” and a satisfaction with food on 1% level of statistical significance and the differences in satisfaction with self-care were on 5% level of statistical significance. The average score of the responses on the other three indicator in the physical health and the level of independence domain (sleep satisfaction, sex life, rest in leisure time) were in favour of PHI participating in sports, when we recorded the smallest differences in the indicator “sexual life” (0.058 points). We conclude, that PHI, who are actively involved in sports in their leisure time, are much happier with their health and the level of independence.
Also, it is recognized that participation in sport with hearing athletes plays an important role in the integration of deaf athletes into hearing society. Notably, if communication adaptation in these integrated settings can be made, the ability of deaf athletes to participate in such settings increases [10]. There is also well known that individuals who are deaf and hard hearing prefer to compete against other deaf individuals rather that against those who can hear [9, 19] and sensitive pedagogical access can be stimulated factor to create active motor regime and to lead to healthy life style [8, 9].

189
Figure 2 Subjective satisfaction with PHS from sport participation point of view
Having assessed the satisfaction with the quality of life domains PHS (Fig. 2) we found out, that PHI, who are actively involved in sports are most satisfied with love (1.762 points) and least satisfied with justice (2.605 points). We recorded the similar results in the group of people leading sedentary lifestyle, when they declared the highest satisfaction with the indicator “love” (1.963) and the lowest satisfaction with justice (3.704 points). Comparing the satisfaction differences of particular indicators of the quality of life between people actively involved in sports and people with sedentary life style we can say, that the overall satisfaction with these domain is higher in the group of people actively involved in sports. They declared he higher satisfaction in life in all six evaluated indicators and we recorded the most significant difference in the indicator justice (p<0.01). CONCLUSIONS From the analysis of our results we conclude as follows:
Actively living PHI show significantly higher satisfaction with: o physical health and the level of independence; o psychical health and spirituality; o general health in comparison with the individuals with hearing impairment who
lead sedentary lifestyle.
The individuals with hearing impairment are more satisfied with physical health and the level of independence than psychical health and spirituality.
In the physical health domain: o people involved in sport are most satisfied with food and people not involved
in sport are most satisfied with sexual life.

190
o people involved in sport as well as not involved are mostly unsatisfied with
self-sufficiency
In the domain psychological health: o people involved in sport and as well as those with sedentary life-style are
mostly satisfied with love; o people involved in sport and as well as not involved are mostly unsatisfied
with justice. Based on these findings we can conclude that regardless of impairment, a regular
physical activity becomes an important element of increasing subjective satisfaction with health [13]. Therefore, even the PHI who leads sedentary lifestyle should start to spend their free time by regular sport and exercising, because they greatly increase the quality of their life. ACKNOWLEDGEMENT This research has been realised within the VEGA grant project no. 1/0915/13 “Sport activity – a part of the quality of life of people with disabilities“. REFERENCES [1] AMMONS, D. K. Unique identity of the World Games for the Deaf. Palaestra, 6 (2), 1990, 40-43.
[2] DIENER, E., EMMONS, R.A., LARSEN, R.J. & GRIFFIIN, S. The satisfaction with life scale. Journal of Personality Assessment, 49, 1985, 71–75.
[3] DRAGOMERICKÁ, E., BARTOŇOVÁ, J. Příručka pro uživatele české verze dotazníků kvality života Světové zdravotnické organizace WHOQOL-BREF a WHOQOL-100. Psychiatrické centrum, Praha, 2006.
[4] DRAGOMERICKÁ, E. & ŠKODA, C. Kvalita života – vymezení, definice, historický vývoj pojmu v sociální psychiatrii. Česká a slovenská psychiatrie, 93, 2, 1997, 102-108.
[5] DRAGOMERICKÁ, E., et al. SQUALA. Príručka pre používateľov českej verzie Dotazníka subjektívnej kvality života SQUALA. Psychiatrické centrum, Praha, 2006.
[6] HALAMA, P. Vývin a konštrukcia škály životnej zmysluplnosti. Československá psychologia, 46, 3, 2002, 265 – 276.
[7] HARTL, P. & HARTLOVÁ, H. Velký psychologický slovník. Portál s.r.o., Praha, 2010.
[8] KURKOVÁ, P. Dimenze emočních reakcí v tělesné výchově u žáků se sluchovým postížením v prestředí běžné školy. Česká kinantropologie, 13(4), 2009, 40-49.
[9] KURKOVÁ, P., SCHEETZ, N. A. & STELZER, J. Health and Physical Education as an important part of school curricula: A comparison of schools for the deaf in the Czech Republic and the United States. American Annals of the Deaf, 155, 2010, 78-87.
[10] KURKOVÁ, P., VÁLKOVÁ, H., SCHEETZ, N. Factors impacting participation of European elite deaf athletes in sport. Journal of Sport Sciences, 29(6), 2011, 607-618.
[11] MARÁŠKOVÁ, I. Dospělí užívatelé kochleárního aparátu a kvalita jejich života. E-psychologie [online]. 2, 1, 2008, 9-22.

191
[12] NEMČEK, D. Účasť na pohybovej aktivite a cvičení vo voľnom čase : Indikátory kvality života seniorov. In Rekreačný šport, zdravie a kvalita života [CD ROM], UPJŠ, Košice, 2012, 211-218.
[13] NEMČEK, D. & Snopková, Z. Diferencie v sebahodnotení medzi športujúcou a nešportujúcou populáciou. In Pohyb a zdravie [CD ROM]. Trenčianska Univerzita A. Dubčeka, Fakulta zdravotníctva, Trenčín, 2012, 124-131.
[14] NEMČEK, D. & WITTMANNOVÁ, J. Indikátory a domény kvality života slovenských a českých seniorov žijúcich v domovoch dôchodcov. In Rekreačný šport, zdravie a kvalita života [CD ROM], UPJŠ, Košice, 2012, 219-227.
[15] NEMČEK, D. et al. Kvalita života seniorov a pohybová aktivita ako jej súčasť. Michal Vaško – Vydavateľstvo, Prešov, 2011, 6-74.
[16] ROSENBERG, M. Society and the Adolescent Self-Image. Princeton University Press, Princeton, 1965.
[17] SCHEETZ, N. A. Psychosocial aspects of deafness. Boston, MA: Pearson Education, 2004.
[18] STEWART, D. A. Deaf sport: The impact of sports within the Deaf community. Washington, DC: Gallaudet University Press, 1991.
[19] STEWART, D. A., ROBINSON, J. A. & MCCARTHY, D. Participation in Deaf sport: Characteristics of elite deaf athletes. Adapted Physical Activity Quarterly, 8, 1991, 136-145.
[20] STRNADOVÁ, V. Hádej co říkam, aneb odezírání je nejisté umění. Praha: ASNEP, 2001.
[21] ZANNOTTI, M. & PRINGUEY, D. A method for quality of life assessment in psychiatry: the S-QUA-L-A (Subjective QUAlity of Life Analysis). Quality of life News Letter, 4, 6, 1992, 21.

192
EFFECTS OF A TEACHING GAMES FOR UNDERSTANDING
APPROACH AND A TECHNICAL APPROACH TO TEACHING BASKETBALL ON DECLARATIVE AND PROCEDURAL
KNOWLEDGE
Gabriela Olosová, Ludmila Zapletalová
Comenius University in Bratislava, Faculty of Physical Education and Sports, Department of Sport Games, Slovakia
ABSTRACT This study investigates the effects of TGfU approach and the traditional teaching model on procedural and declarative knowledge in basketball. The experiment was conducted during PE classes at a primary school setting for 8 weeks. Four groups of boys in the age of 11 – 12 years participated in the study, two were taught by the technical approach (n=31) and another two by the TGfU (n=25). Procedural and declarative knowledge was assessed by a written test after an intervention. Man-Whitney’s U-test was used to evaluate the data. The group taught by TGfU showed better declarative knowledge of basketball in comparison to the group taught by technical approach (p<0.05). No significant difference between the groups was proved when procedural knowledge was evaluated however the group taught by TGfU achieved higher % score. We state that our results support several researches which proved better effects of the TGfU comparing to the technical approach on procedural or declarative knowledge in different sport games. KEY WORDS: Teaching games for understanding (TGfU), technical approach,
basketball, procedural and declarative knowledge, physical education
INTRODUCTION A typical format of a basketball lesson consists of a warm-up, skill introduction and review, skill development in a drill and at the end a game with the skill incorporated This technical games teaching approach is a traditional, generally accepted pattern. The Teaching Games for Understanding (TGfU) approach developed by Bunker and Thorpe (1982) places a whole different focus on the teaching ballgames during physical education. It focuses on developing pupils’ problem solving, critical thinking and decision making capability through integrating the cognitive and contextual dimensions of learning in physical education. TGfU is a games based pedagogical model aimed at generating greater understanding of all aspects of games, while increasing physical activity levels, engagement, motivation and enjoyment in physical education lessons (Forrest - Webb - Pearson, 2006). A cognitive psychology distinguishes declarative and procedural knowledge what was consequently implemented to sports. In sport games declarative knowledge (I know that) is concerned to the rules of the game and procedural knowledge (I know how) is considered to be a choice of a proper movement action in the game context (McPherson – French, 1991). Several authors (Turner – Martinek, 1992; 1999; Griffin et al., 1995; Turner, 1996; Blomqvist, 2001; Dalton, 2009; Popelka, 2012) already implemented a research in this area and compared effects of TGfU and the technical approach on procedural and declarative knowledge of different sport games. Although the results were not univocal, in majority of the cases students taught by TGfU achieved better procedural knowledge of the game than

193
students taught by the technical approach. The aim of this paper is to compare effects of TGfU and the technical approach to teaching basketball on procedural and declarative knowledge of primary school pupils. METHODS The experiment was conducted during PE classes at 2 primary schools for 8 weeks in duration of 45 minutes twice a week. Four male groups in the age of 11 – 12 years participated in the study. Two groups were taught by the technical approach (n=31) (Table 1) where a content of school lessons was built on the thematic plans inspired by Argaj - Rehák (2007). This experimental program focused on basketball skills like passing and catching the ball, asking for the ball, shooting, dribbling, rebound and defending players with and without a ball. Another two groups were taught by the TGfU approach (n=25) (Table 1) where the content was built on Mitchell‘s et al. thematic and lesson plans (2006; 2003). This experimental program focused on tactical problems like keeping possesion of the ball, penetrating the defence and attacking the goal, transitioning from defence to offence and vice versa, defending players with and without the ball, winning the ball and restarting play.
Average Standard deviation
TGfU group
Technical group
TGfU group
Technical group
Age (years) 11.63 11.58 0.49 0.5
Hight (cm) 152.96 150.28 6.15 14.46
Weight (kg) 41.83 45.42 10.05 10.98 Table 1 Groups’ elemental profile
Procedural and declarative knowledge was assessed by a written test after the intervention. The test was constructed on the basis of questions for physical education activities (McGee – Farrow, 1986). Seven out of 12 questions were concerned to rules (declarative knowledge) and five questions to tactics (procedural knowledge) of basketball. Both closed and open questions were applied. An example of a tactical question is shown in the picture below (Figure 1). Man-Whitney’s U-test was used to evaluate the data. Procedural and declarative knowledge was evaluated separately and also together as general (total) basketball knowledge. A level of significance was set on 5%.
What should the player with a ball do in this situation? Choose only one answer and explain WHY.
a) Dribble the ball b) Pass the ball to player A c) Pass the ball to player B d) Shoot the ball
Figure 1 An example of a tactical question in the written test constructed to measure basketball knowledge

194
RESULTS The group taught by the TGfU showed statistically better general knowledge of basketball (79.67%) in comparison to the group taught by the technical approach (72.04%) (p<0.05). Similarly, statistically better declarative knowledge was achieved in the group taught by the TGfU (75.43%) than by the technical approach (65.90%) (p<0.05). No significant differences between the groups were proved when procedural knowledge was evaluated however the TGfU group achieved visibly higher score (85.60%) than the technical group (80.65%), (Figure 2). Detailed results of both groups are shown in Table 2.
Figure 2 Basketball knowledge of TGfU and technical group
General knowledge (out of 12 questions)
Declarative knowledge (out of 7 questions)
Procedural knowledge (out of 5 questions)
TgfU group
Technical group
TgfU group
Technical group
TgfU group
Technical group
Average 9.56 8.65 5.28 4.61 4.28 4.03 Standard deviation
1.19 1.8 0.84 1.28 0.61 0.84
Median 10 9 5 5 4 4 Mode 10 9 6 5 4 4 Max 12 12 7 7 5 5 Min 7 5 4 1 3 2 % 79.67 72.04 75.43 65.90 85.60 80.65
Table 2 Statistics of groups’ basketball knowledge The results of our study show better declarative knowledge achieved by pupils taught by the TGfU approach. Although there was no significant difference in procedural knowledge between the groups, the TGfU group was more successful in %-score. Our results indicate the opposite phenomena as results of Popelka (2012) and Griffin et al. (1995) in volleyball, Dalton (2009) in basketball, Turner (1996) and Turner – Martinek (1999) in field hockey. These authors proved that pupils taught by TGfU achieved better procedural knowledge than students taught by the technical approach but there were no significant differences between declarative knowledge. Furthermore Turner – Martinek (1992) didn’t confirm any significant differences between the groups in neither procedural nor declarative knowledge of field

195
hockey of 6th and 7th graders. But the other way around Blomqvist (2001) proved significant differences in both types of knowledge of badminton between the groups. CONCLUSION According to results above we can see a tendency that TGfU seems to have a better effect mainly on procedural knowledge including the tactics in comparison to the technical approach. To conclude we can say that there is undoubtedly a need for a deeper investigation in this area. REFERENCES [1] ARGAJ, G., REHÁK, M. Teória a didaktika basketbalu 2, 137 p., 2007
[2] DALTON, W., Teaching teachers to play and teach games, <http://wiliandalton.blogspot.sk/2009/03/teaching-teachers-to-play-and-teach.html>, 2009
[3] FORREST,G. - WEBB,P. - PEARSON,P., Teaching games for understanding; a model for pre service teachers, www.penz.org.nz, 2006
[4] GRIFFIN, L., et al., Research Quarterly for Exercise and Sport, 66, A-64, 1995
[5] MCPHERSON, S. – FRENCH, K, Journal of Sport Exercise and Psychology, 13, 29-41, 1991
[6] MITCHELL, S. - OSLIN, J. - GRIFFIN, L., Teaching sport concepts and skills: A tactical games approach for ages 7 to 18. 2nd ed., 658 p., 2006
[7] MITCHELL, S. - OSLIN, J. - GRIFFIN, L., Sport Foundations for Elementary Physical education: A tactical games approach, 181 p., 2003
[8] POPELKA, J., Od výskumu k praxi v športe, 243-248, 2012
[9] RUISEL, I. et al., Kognitívny portrét človeka, 366 p, 2010
[10] TURNER, A. P., Journal of Physical Education, Recreation and Dance, 67(4), 46-48/55, 1996
[11] TURNER, A. P. – MARTINEK, T. J., Research Quarterly for Exercise and Sport, 70, 286-296, 1999
[12] TURNER, A. P. – MARTINEK, T. J., International Journal of Physical Education, 29, 131-152, 1992
The study is part of supporting grant of Comenius University UK/314/2014 “Effects of different approaches to teaching basketball of primary school pupils” and grant VEGA
10386/13 “Learning effects of different teaching approaches to sports games in relation to gender, age and game experience.”

196
DIFFERENCES IN PUPILS’ KNOWLEDGE OF DEFFERENT AGE
ABOUT CHOSEN HEALTH INDICATORS
Natália Oršulová, Jela Labudová
Comenius University in Bratislava, Faculty of Physical Education and Sports, Department of Sport Educology and Sport Humanisties
ABSTRACT Health status of the population of the country is a reflection of the level of several indicators, such as environmental, social, economic, biological and educational and intellectual aspects. In health care are highlighted particular concepts that emphasize primary prevention of diseases. It is not only about the offer of social health protection programs, but it is also important to change people's views on health, its determinants and the dissemination of knowledge. One of them is the improvement of pupils' knowledge of the components of health. The authors based on research using the questionnaire method followed the differences in knowledge level of 3 age groups of youth in Slovakia. They compared the knowledge of students in the field of the duration and frequency of health oriented physical activity, the most common health risk factors and sources of health oriented knowledge. Participants of our research were 118 college students, 48 primary school pupils and 65 secondary school pupils. It was found that only 17.1% of college students, 20.8% of primary school pupils and 18.5% of secondary school pupils knew that loco motor activity should be carried out daily. Similar results were observed for the knowledge of the duration of one exercise unit. 29.2% of primary school pupils 49.2% of high school students and only 35.9% of college students knew that the best duration of exercise per one unit is 60 minutes. As most common risks factors of health dominated in each age group smoking, drugs, alcohol, but the lack of exercise was expressed by only 18.9% of university and 14.9% of primary school pupils. As a most common source of knowledge was mentioned internet, except for college students who identified in 23.7% school as a source of knowledge about health. These results indicated generally low level of knowledge on selected indicators of health research in the study groups. KEY WORDS: health indicators, physical activity, knowledge, health risk factors INTRODUCTION
Health status of the population of the country is a reflection of the level of several indicators, such as environmental, social, economic, biological, educational and intellectual aspects. Emphasized concpets in healthcare are talking about primary prevention of disease. Among other, things like health protection society programs, it is important to change the meaning of pepople about heath, health determintants and dissemination of knowledge. Pupils' knowledge are the result of not only the acquisition of the curriculum of physical education and sport in schools (ISCED-3), but are also obtained through other sources of information. It is necessary to create incentives for individuals of various age groups to become wider range of knowledge for their healthy lifestyle.

197
Special Eurobarometer (2010) states that 86% of Europe's population learns, for example about the need for proper diet from a doctor. By Béderová (2006) exploring the principles of drinking regime and the risks of dehydration is one of the fundamental themes of education for pupils. One should have knowledge about how to spread evenly throughout the day drinking regime (Kovács, 2008) and how should it composition look like (Babinská et al., 2007). Novakova (2013) points out that some educational issues can be managed by teaching health education. The role of the school is to prepare students for future life and, therefore, there should be support for obtaining information and knowledge in the affinity to health values (Liba, 2007).
Evaluating the source of the knowledge about health of students Labudová (2012) reports that a group of female students in high schools and universities in Slovakia, as well as students dominate the internet, 2nd and 3rd place in group of girls is television and magazines, in group of boys from the mother and magazines. Labudová, Nemček (2009) recommend to provide informations about healthy lifestyle andiscuss regularly topics of theoretical instruction in the enviroment of physical education and sport as an addition to the active exercises, Horníková (2011) provided a research finding, that with such themes have met in physical education only 8.3% of boys and 15.4% girls. Similarly Nemček (2008a) points out, that the knowledge resources mainly include television and the internet, and the knowledge from teacher of physical education haven´t occurred.
METHODS
The aim of the study was to extend the knowledge of the sources and level of knowledge about health risks in 3 age groups of youth in Slovakia.
We assumed that there will be differences in knowledge between the groups, the most numerous incidence of correct answers among university versus primary and high schools students:
1) from the viewpoint of the required frequency and duration of daily physical activity,
2) risk preference of "lack of the movement" in day mode compared to the other risks
3) the dominance of the school as a source of knowledge about health.
Participants were 118 college students, 48 primary and 65 high school students. The basic research method was a questionnaire with four questions:
- To carry out physical activity beneficial to health:
a) how many times a week you should take part in it,
b) how much time per day is necessary for its implementation.
- Select the 3 most common risk factors for health disorders.
- Select the 3 most important sources of knowledge about health.

198
Responses were processed separately in three research groups and percentages are mutually compared.
RESULTS
Analysis of respondents from elementary school about health-enhancing physical activity indicated that the frequency was most numerous 1-2 times a week (31.3% of students), followed by determination of the frequency three times a week (27.1% of students) and the need to exercise every day indicated only 20.8% of pupils. Comparison of the knowledge about the frequency of high school students have reached similar results - 36.9% of students said they need the frequency of 3 times a week, but only 18.5% of pupils are aware of the need for daily physical activity. Very similar findings were presented results achieved by Nemček (2008b) and Nemček, Strnádová (2008) both researches done among high-school students. We detected better level of knowledge in this indicator neither in the group of university students, who identified in 17.1% the need for daily physical activity, which at the same time reject our first premise. Most numerous was also in this group of students 3 times a week (46.1%).
Similar negative results were recorded after assessing knowledge about the recommended duration of daily physical activity. University students with the highest percentage of correct answers expressed the daily duration of 60 minutes (35.9%), a further 23.9% submitted 30-minute duration of the exercise. Primary school pupils identified 60 minute duration in number of 29.2%, the need of 45 minutes indicated 18.8% of students. But 49.2% of high school students answered correctly within the scope of the required 60 minutes of daily physical activity. This means that the first assumption was not fulfilled and university students haven´t presented the most abundant knowledge of the correct answer, what was presented already in past research works investigated by Tóthová (2003, 2004, 2005).
Tab. 1 Frequency of physical activity of university respondents
Frequency University (%)
daily 17, 1
3-times a week 46, 1
4- times a week 24, 9
5- times a week 8, 5
6- times a week 3, 4

199
Tab. 2 Duration of physical activity of university students respondents
Minutes University (%)
15 1,7
30 23, 9
45 19, 6
60 35, 9
90 12, 1
120 & more 6, 8
We observed notable results and current differences by recovery of knowledge of the respondents about the risk factors of diseases. We didn´t observe the risk factor ‟lack of exercise either in one group, so we can not confirm the second assumption. In all age groups the most abundant factor designated was smoking (Figure 1). In the group of university students appeares hypokinesia at the 2nd place, in the group of elementary school students was at the 3rd place and high school students at the 4th place.
Fig. 1 Risk factors - individually types of schools

200
If we express together smoking, drug and alcohol as one indicator of addiction, this
factor would present the highest percentage in group of hugh school students (73%), primary school pupils (64.9%) and the smallest amount in group of university students (49.5%). However, highlighting of this risk and the necessary knowledge is important since primary school pupils, which also confirm some studies (HBSC-Slovakia, 2011).
We can also consider hypokinesis and sedentary lifestyle as one risk factor, which together may be indicated as a lack of exercise, then the risk factor was most numerous among university students (27.7%), primary school pupils was at level of 23% and the smallest number of high school students (15.5%). Overall, we can state that in all age groups, students have a basic understanding of the most important risk factor for human health disorders. This certainly also contributed to the current concept of educational health and sport modules with theoretical education about health and healthy lifestyles, as well as the subject of health promotion in higher education. The results may be an incentive for teaching physical education and sport, which should further increase daily physical activity as an important part of an optimal lifestyle.
Last of our investigation was the source of informations and knowledge acquisition of respondents. We assumed that the most numerous source of knowledge would be school (Fig. 2)
We have found that this assumption is valid only for university students who marked school as a source of knowledge in 23.7%, second was internet (23.0%). The school as a source of new knowledge is demonstrated by gradually precentage increasing from primary school (11.0%) pupils, through high school students (14.8%) up to the most numerous university students. Similar pattern was also reflected in the evaluation of books, school-books as a source of knowledge about health in the various age groups (from 3.9% through 5.8% to 18.3%). Conversely, with increasing age decreases the proportion of friend as a source of knowledge. For primary school pupils most abundant source of knowledge was the internet (26% of students), as well as in high school (22.9%). None of the respondents did not radio as a source of knowledge. In the case of primary and high schools play an important role in the family. Age differences did clearly demostrated in the case of tracking the source of knowledge.

201
CONCLUSION
Overall, we can state that students in all age groups have a basic understanding of the most important risk factors for human health and poor knowledge about the frequency and duration of health-enhancing physical activity. The increasing age is not proportional with the number of correct knowledge acquired by pupils. The results may be an incentive for teaching physical education and sport in schools, what should emphasize the need of more physical activity as an important part of daily optimal lifestyle. Highlighting the risk of lack of exercise, as well as other risks to health and to gain the necessary knowledge about health is important since primary school pupils.
REFERENCES
[1] BABINSKÁ, K. a kol. 2007. Stravovací režim školákov na Slovensku. In Pediatria pre prax. 2007, č. 4, s. 217 – 220.
[2] BÉDEROVÁ, A. 2006. Dostatok tekutín – nevyhnutnosť dobrého zdravia. In Výživa a zdravie, 50, 2006, č. 2, s. 6 – 7.
[3] ISCED 3. 2009. Štátny vzdelávací program Telesná a športová výchova. Bratislava : ÚPK, ŠPÚ, 2009, s. 15 s.
[14] HBSC–Slovensko. 2011. Sociálne determinanty zdravia školákov. Záverečná správa. 2011. HBCS_Internet_mensisubor_0910.pdf.
[5] HORNÍKOVÁ, M. 2011. Teoretické vzdelávanie v module zdravie a jeho poruchy. DP. Bratislava : UK FTVŠ, 2010, 68 s.
[6] KOVÁCS, L. 2008. Pitný režim u detí. In Pediatria pre prax, 2008, č. 2, s. 86 – 89.
[7] LABUDOVÁ, J., NEMČEK, D. 2009. Vedomosti žiakov základnej školy o pitnom režime ako východisko k tvorbe obsahu vzdelávacieho modulu. In Telesná výchova a šport. 2009, roč. 19, č. 1.
[8] LABUDOVÁ, J. 2012. Zdroj poznatkov mládeže k starostlivosti o zdravie a ich preferované druhy športu. In Pohyb a zdravie. Trenčín : TUAD, Fakulta zdravotníctva, 2012, s. 110 – 123 [CD-ROM].
[9] LIBA, J. 2007. Zdravie v kontexte edukácie. Prešov: Prešovská univerzita, 2007, 254 s.
[10] NEMČEK, D. 2008(a). Tvorba pohybového programu. In Nemček, D., Labudová, J. Tvorba a manažovanie cvičebnej jednotky. Bratislava : ICM Agency, 2008, s. 48 – 71.
[11] NEMČEK, D. 2008(b). Názory študentov stredných škôl na vplyv pohybovej aktivity na zdravie. In Peráčková, J. a kol. Telovýchovné a športové záujmy v rámci voľnočasových aktivít žiakov. Bratislava : UK FTVŠ, MŠ SR, 2008, s. 137 – 160.
[12] NEMČEK, D., STRNÁDOVÁ, K. 2008. Majú študenti gymnázií dostatočné vedomosti o zdravom životnom štýle? In Školská telesná výchovy z pohľadu výsledkov vedeckého výskumu. Bratislava : Medzinárodná federácia telesnej výchovy (FIEP), 2008, s. 45-52
[13] NOVÁKOVÁ, Z. 2013. Predmet výchova k zdraviu ako inovácia primárnej prevencie negatívnych civilizačných vplyvov na Slovensku. In Kopecký, M., Kikalová, K, Tomanová, J. Antropologicko-psychologicko-sociální aspekty podpory zdraví a výchovy ke zdraví.

202
Olomouc: UP, PgF, 2013, s. 329 – 340.
[14] TÓTHOVÁ, D. 2003. Úroveň vedomostí o účinku pohybovej aktivity na ľudský organizmus u žien. In Nové perspektivy výzkumu a praxe v kinantropologii. Praha : Univerzita Karlova, 2003, s. 122-123. ISBN 80-903285-1-2
[15] TÓTHOVÁ, D. 2004. Úroveň vedomostí v oblasti sebakontroly a vplyvu pohybovej aktivity na zdravý spôsob života žien. In EYES 2004. Bratislava : MŠ SR, 2004, s. [7 s]. [CD-ROM]
[16] TÓTHOVÁ, D. 2005. Knowledge of selected aspects of health-enhancing physical activities in women and ways of its influencing. In Acta Facultatis Educationis Physicae Universitatis Comenianae, 46. Bratislava : UK, 2005, s. 81-82. ISBN 80-223-2204-0.
[17] SPECIAL EUROBAROMETER 354. 2010. Food-related Risks. Brussel, European Commission, November 2010.

203
THE SOMATIC PROFIL AND MOTOR PERFORMANCE OF THE
STUDENTS OF THE FACULTY OF CHEMICAL AND FOOD TECHNOLOGY SLOVAK UNIVERSITY OF TECHNOLOGY IN
BRATISLAVA IN THREE YEARS PERIOD
Robin Pělucha, Adriana Koláriková, Miroslav Bobrík
Department of Physical education and sport of Faculty of chemical and food technology of Slovak university of technology in Bratislava, Slovak republic
ABSTRACT The aim of our work is to find out level of somatic development and motor perfomance of students of the 1.st year-class of FCHPT STU in Bratislava in three years period in years 2011 – 2013 (1180 women and 493 men). We used standardized test battery to recognize motor performance. Based on results from measurement of level of somatic development we observed in basic somatic characteristics stature has got stagnating trend in both men and women, though body weight has increased trend at 0.5 kg per year among women. We found a significant increase in values of BMI index in women category. From the results of testing motor performance we can review statistical significant increase level of running speed and statistical significant decrease level of aerobe abilities in both categories. We observed significant decrease of speed-power capability of arms and torso and increase of explosive strength of legs in category of men. We recognized stagnation in case of speed-power capabilty of arms and torso and explosive strength of legs in women category. In both categories we observed significant decrease in level of abdominal and hip muscles. KEY WORDS: college students, somatic development, motor performance, comparison of results INTRODUCTION One of the basic biological needs of man is physical activity. This is even true today, when almost the whole society changes extend to all areas of human life. Suitably chosen physical activity have a positive impact on enhancing your health, improve the physical ability of the adult population. Monitoring of somatic development and movement performance level of students FCHPT STU in Bratislava, builds on the results of the research study physical education at KTV CHTF in Bratislava which had been realized in year of 2000 (Bobrík et al., 2000). In the group of tests, which had been used for evaluation in year of 2000 we extended by tests EUROFIT 2002 already in year 2012, when we launched a new project to test students FCHPT, who became students at 1st year of study program. This group of tests which we are doing third year, we are modifying and adapting to our material, financial and personnel possibilities. Based on historical experiences we are adjusting group of tests to get higher efficienty and accurance of our processing of the data. The level of physical performance of college students is determined by either the "starting" state, ie performance of students which entry to study program, and then maintain their available potential, respectively to keep their motor performance, in conditions which our high school provides. Improve low level and help to maintain a good level of body disposal, while providing a wide range of relaxation options after high mental, intellectual workload, this is most wanted to the quality and quantity of physical education in FCHPT STU in Bratislava. For our educational work is necessary to constantly introduce new programs and forms of sports and recreational

204
activities, thereby achieve aim that students did not understand the hour of physical education in the curriculum as a duty, but as a starting base for broader physical activity with which they will absolutely internaly identified. The basis is the knowledge level of physical performance of students and understanding their interests based on different types of physical activities. Analysis of the state of somatic development of physical performance of students of the 1st year of study program on FCHPT STU in Bratislava for the years 2011, 2012 and 2013 are discussed in this report. METHODS The sample is made of the students from FCHPT STU in 2011/2012 with 524 members (142 males and 382 females), students from FCHPT STU in 2012/2013 with 553 members (164 males and 389 females) and students from FCHPT STU in 2013/2014 with 596 members (187 males and 409 females) that were able to go through the motion efficiency tests. The testing was taking place in sporting areal of Pavol Glesk at Mladá Garda in Bratislava. The testing was implemented in the first semester of 2011/2012, 2012/2013 and 2013/2014 respectively. The testing battery was determined by the historical experiences and also the ability to compare the data. The testing battery was made of :
50m run – start in high position sit-up in 60 sec long jump from standing position Beep test both hand throw with 2 kg ball
Comparison of the motion efficiency testing results we used the test of statistical significance of differences in mean values of the significance level p-value<0,05, in program Statgraphic (One – Way ANOVA, One – Variable Analysis, Two – Sample Comparisum). RESULTS Measurement results of somatic indicators Male In the case of measuring somatic indicators in men, we have not recorded statistically significant differences in either case.Body height was varied in subjects during the three years tests at an average of 181 cm of the population. These values correspond to the results of the rest of their authors, who have dealt with testing the 18-19 year old population, as well as the results of our research from year 2000. Body weight in subjects ranged at above 77 kg, representing up to 5 kg increase in average values over other authors. Body mass index in subjects achieved above average value of 23.5, which is 1 point more in comparison with other authors (fig. 1). Figure 1: Comparison results of somatic indicators male in years 2011, 2012 and 2013 Height [m] Weight [kg] BMI 2011 2012 2013 2011 2012 2013 2011 2012 2013
n 142 164 187 142 164 187 142 164 187 x 181,2 181,1 181,5 76,9 76,3 77,4 23,46 23,25 23,69 s 7,5 6,523 6,943 10,86 13,351 12,767 3,103 3,773 3,716
min 161 162 162 53 43 49,6 18,59 15,3 16,6 max 202 198 203 115 135,8 140,6 34,72 37,6 45,1
p-value<0,05

205
Female For the measurement of somatic characteristics in women, statistical important differences of mean values were reported in body weight and body mass index. Body height during the three years tests period ranged at an average of 168.2 cm. Body weight increased significantly in years 2012 (about 3.2 kg) and 2013 (about 3.8 kg) compared to 2011, when it was at an average of 18 to 19-year old school population of women. The measured values of body weight in 2011 are the same as we measured in year 2000. Similar to the body weight, body mass index increased significantly in 2012 (about 1) and 2013 (about 1.2) compared with the year 2011. Body mass index in 2011 is the same as the value measured by us in 2000 (fig 2). Figure 2: Comparison results of somatic indicators female in years 2011, 2012 and 2013 Height [m] Weight [kg] BMI 2011 2012 2013 2011 2012 2013 2011 2012 2013
n 382 389 409 382 389 409 382 389 409 x 167,9 168,2 168,7 58,5 61,7 62,3 20,74 21,78 21,96 s 5,855 6,193 6,334 8,191 11 10,51 2,62 3,37 3,25
min 151 150 150 40 41,9 39,6 14,69 15,8 14,7 max 186 187 191 100 117,5 116,7 33,66 38,8 43,4
p-value<0,05 2011-2012(0) 2011-2013(0)
2011-2012(0) 2011-2013(0)
Measurement results of motor performance Male In the test, sit-up for the 60s we found in all years a statistically significant difference in mean values. The highest relative values we measured in year 2012, when the average performance was around 48, which is 3 more than in 2011 and up to 6 more than in 2013. Compared to other authors, as well as our research in 2000 the relative values of 2012 were significantly higher and contrastly significantly lower in 2013 (fig. 3). In the long jump test, we observed a statistically significant increase in 2013 (about 7 cm, resp. about 6 cm) compared to 2011, resp. 2012. The tendency of mean values in the long jump test has the upward trend. Only in 2013 reached probands compared to the general population average performance. In years 2011 and 2012, their performances were below average (fig. 3). In the beep test, we found a significant decrease in mean values in 2012 (about 5 sections) and in 2013 (about 13 sections) compared to 2011. The tendency has important decreasing tendency from year to year. Compared to other authors mean values of FCHPT probands are each year significantly lower (fig. 3). Even in test 2 kg ball throw has the tendency from year to year degressive. In 2013, we recorded a statistically significant decrease in mean values compared to years 2011 and 2012 (about 0.46 m, resp. about 0.41 m). In comparison with the other authors values of FCHPT are below average in 2013, while in 2011 were above average (fig. 4). In the test 50 meters run we evaluated only the data from the years 2012 and 2013. In year 2013 we recorded a statistically significant decrease of 0.41 s (fig. 4).

206
Figure 3: Comparison results of sit-ups, long jump and beep test male in years 2011, 2012 and 2013 Sit-up Long jump [cm] Beep test 2011 2012 2013 2011 2012 2013 2011 2012 2013
n 142 164 187 142 164 187 142 164 187 x 44,99 48,39 42,25 2,17 2,18 2,24 57,84 52,93 45,11 s 10,21 10,02 9,38 0,29 0,26 0,25 23,49 20,03 19,34
min 18 20 20 1,3 1,4 1,65 6 12 12 max 70 80 65 2,86 2,85 3,1 138 104 103
p-value<0,05 2011-2012(0,036)
2011-2013(0,012)
2012-2013(0)
2011-2013(0,0315)
2012-2013(0,0303)
2011-2012(0,0499)
2011-2013(0)
2012-2013(0,0002) Figure 4: Comparison results of 2 kg ball throw and 50 m run test male in years 2011, 2012 and 2013 2 kg ball throw [m] 50 m run [s] 2011 2012 2013 2012 2013
n 142 164 187 164 187 x 9,74 9,69 9,28 7,62 7,21 s 1,956 1,852 1,809 0,956 0,659
min 4,5 2,86 5,6 5,52 5,89 max 14,6 13,9 17 10,97 9,4
p-value<0,05 2011-2013(0,0273)
2012-2013(0,0388) 2011-2012(0)
Female In the test sit up in the 60s, we observed significant difference in mean values in all years, similarly like the men category. The highest relative values we measured in year 2012, when the average performance was around 39, which is 2 more than in 2011 and 4 more than in 2013. Compared to other authors, as well as our research in 2000, the relative values of year 2012 were significantly higher and contrastly in year 2013 significantly lower (fig. 5). In the long jump test, we recorded statistically significant differences of mean values. The mean values were in the range of 164-168 cm, corresponding to the values found in our research from year 2000. However, in the comparison to other authors these values are significantly lower (up to 10 cm) (fig. 5). In the beep test, similarly like in men category we found a significant decrease in mean values in year 2012 (about 6 sections) and in year 2013 (about 10 sections) compared to 2011. The tendency has important decreasing character from year to year. Compared to other authors are mean values of FCHPT probands in 2012 and 2013 significantly lower (fig. 5). In test 2 kg ball throw in 2012 we experienced a statistically significant decrease in mean values compared to 2011 (about 0.2 m). In year 2013 we observed only a slight increase in values. Compared to other authors are mean values of FCHPT each year significantly lower (fig. 6). In the test 50 meters run we observed as well as for men only evaluated data from the years 2012 and 2013. In year 2013, we recorded a statistically significant decrease in the values about 0.53 s (fig. 6).

207
Figure 5: Comparison results of sit-ups, long jump and beep test female in years 2011, 2012 and 2013 Sit-up Long jump [cm] Beep test 2011 2012 2013 2011 2012 2013 2011 2012 2013
N 382 389 409 382 389 409 382 389 409 X 37,46 39,54 35,64 166,4 163,7 168 32,4 26,56 22,47 S 9,27 8,8 8,34 22,06 22,93 21,7 11,83 11,31 10,98
Min 12 17 12 100 62 100 11 9 6 Max 66 71 61 275 232 280 80 80 81
p-value<0,05 2011-2012(0,0019)
2011-2013(0,0037)
2012-2013(0)
2011-2012(0) 2011-2013(0)
2012-2013(0) Figure 6: Comparison results of 2 kg ball throw and 50 m run test female in years 2011, 2012 and 2013 2 kg ball throw [m] 50 m run [s] 2011 2012 2013 2012 2013
N 382 389 409 389 409 X 6,12 5,92 5,98 9,27 8,74 S 1,15 1,22 1,25 1,28 0,85
Min 1,5 3,1 1,3 6,79 5,9 Max 10,5 12,2 15 19 13,3
p-value<0,05 2011-2012(0,142) 2011-2012(0) CONCLUSION Based on the results of measuring the level of somatic development, we found that the basic parameters of the somatic body height has stagnating tendency for both men and women categories. Body weight has a stable level in men, but its value is about 5 kg higher than the population average. In women category is increasing, which is at 0.5 kg per year. Observing body mass index (BMI) we found a significant increase in values only for women category, men BMI values were at the same level throughout the three-year research, but these values are 1 point higher than in the population average. From the results of motor performance testing we can stated statistically significant increasing trend of running speed and statistically significant decreasing trend of aerobic endurance for both men and women categories. In men category we observed a significant decrease in the speed-power capabilities of the arms and torso and increase the explosive power of legs. In women category we observed stagnation in both speed-strength abilities of arms and torso as well as the explosive strength of the legs. By evaluating the dynamic force abdominal and hip muscles we reported significantly decreasing trend for both men and women category. From our research it is clear that aerobic endurance is the ability which has decreasing trend from year to year for both men and women category. One from the reasons for this fact can be the rising body weight, resp. overweight. Another reason also may be that students are less likely to devote activities in which would be endurance capability dominated. Our task as teaching staff is to provide students with a form of physical activity which combines both power capability but also endurance, speed and coordination skills.
REFERENCES
[1] BOBRÍK, M. et al. 2000. Stav telesného a pohybového rozvoja poslucháčov CHTF STU v Bratislave. In Telesná výchova a šport.č3, Bratislava, 2000.
[2] BOBRÍK, M. et al. 2012. Somatický profil a motorická výkonnosť študentov Fakulty

208
chemickej a potravinárskej technológie STU v Bratislave. In Telesná výchova a šport.č4, Bratislava, 2012.ISSN 1335-2245.
[3] KOLAŘ, V. 1988. Pohybová výkonnosť a telesný rozvoj študentov nastupujúcich na vysokú školu a jej zmeny po dvadsať ročnom intervale, Teorie a praxe tel.výchovy, roč.36, 1988, č.3.
[4] MORAVEC, R. 1990. Telesný, funkčný rozvoj a pohybová výkonnosť 7-18 ročnej mládeže v ČSFR. Bratislava, 1990. ISBN 80-89075-11-8.
[5] MORAVEC, R., KAMPMILLER, T., SEDLÁČEK, J. A KOL. 2002. EUROFIT. Telesný rozvoj a pohybová výkonnosť školskej populácie na Slovensku. Bratislava – SVSTVŠ 2002. ISBN 80-89075-11-8.
[6] ŠULC, I., RÁCZ, O., SERGIENKO, V., STAŠKO, I., TELEPKA, M. 2004. Porovnanie telesného rozvoja a pohybovej výkonnosti študentov vysokých škôl v stredoeurópskom regióne systémom Eurofit. TVŠ 14, 2004, 1, s. 15-18. ISSN 1335-2245.
[7] ZAPLETALOVÁ, L. A KOL. 2002. Ontogenéza motorickej výkonnosti 7 – 18-ročných chlapcov a dievčat Slovenskej republiky. Bratislava: SVSTVŠ, 2002. ISBN 80-89075-17-7.
[8] ZAPLETALOVÁ, L. A KOL. 2011. Sekulárny trend v ukazovateľoch telesného rozvoja a pohybovej výkonnosti 11- až 18-ročnej školskej

209
THE LEVEL OF AEROBIC PERFORMANCE IN ELITE WOMEN
PLAYERS OF NATIONAL TEAMS IN SOCCER
Peráček Pavol – Kopúň Peter – Benkovský Ľuboš
Comenius University, Faculty of Physical Educatio and Sport, Department of Sports Games ABSTRACT Soccer or football has intermittent load and aerobic performance can maintaned high loading for whole match. Also it is base for recovery. For assessment the level of endurance abilities, we used the shuttle YO-YO intermittent endurance test, level 1. For statistical verification we used Anova. We found statistical significance of differences in levels of endurance abilities between players of women and girls' national teams of Slovakia in covered distance (F =13,590; p<0,05), also in speed (F=7,201), KEY WORDS: Soccer, Women National Teams, Endurance, Aerobic Performance,
Intermittent Endurance Test Level 1 INTRODUCTION Soccer is an intermittent load, which alternates higher intensity with lower intensity [10, 11, 12]. Players perform different acyclic physical activity with or without the ball, different speeds and different duration. Endurance abilities in senior football are very important in relation to game performance in the match, but also in relation to the performance of the training process. In the first case it is necessary that the players were able to submit intermittent performance throughout the match without a significant change in intensity [4,5]. In relation to the training process is the quality (adequate aerobic power) required for completion of the intensive training program and quality [6]. This test is related to aerobic-anaerobic, soccer–specific field test [7].
METHODS The groups consisted of women and girls national teams WA, WU19 and WU17 of Slovakia. The average age of senior female players in "WA" team (n = 25) was 23±2,45. The average age of female players in team WU19 (n = 23) was 17,12±1,78 and the average age of female players in team WU17 (n = 25) was 16,25±1,23. For assessment the level of endurance abilities, we used the shuttle YO-YO intermittent endurance test, level 1 [1,2]. Testing we conducted 4 times in half-yearly intervals. RESULTS At picture no.1, we founnd statistical significance of differences in levels of endurance abilities between players of women and girls' national teams of Slovakia in covered distance (F =13,590; p<0,05), also in speed (F=7,201), using by ANOVA statistical method. Range of running metres was between 350 – 450 metres between groups. Range of speed was from 11,8 km/h to 13,2 km/h.

210
Pic. 1 Comparison of covered distance between national women teams
Pic. 2 Covered distance and speed in the women national team
At picture no.2 we found significant differences in speed at 1% (F=5,113), but in the covered distance we did not find significant (F=1,456). Maximum covered distance was 2013,11 meters, minimum was 1862 metres. The average of speed at begininig ot testing was approximatly 12,5 km per hour, but at the end was 13,3 km per hour.

211
Pic. 3 Covered distance and speed in the women national team under 19
In the national team WU19 we did not find significant differences also in speed (F=0,626) and covered distance (F=0,731) (pic.3). Range of the covered distance was from 1500 to 1660 metres and range of the speed was from 12 km per hour to 12,4 km/h.
Pic. 4 Covered distance and speed in the women national team under 17
At picture no.4, in the national team under 17 years, we found significant differences at 1%. This signicance was also in covered distance (F=6,966) and also in speed (F=6,619). How we could see, the incresing of speed, also volume is in the last two testing (3,4). The range of reached values is similar such as in the national team WU19.
We think, that result show us development of aerobic performance in longitudinal period and predict us, which parametres of endurance are important for each category. Aerobic performance of national teams is at top class, because they reached 1600 metres [8]. Danish elite female players reached 1,213±90 metres in YYETL2 [9]. In the average of speed they reached around 13,5 km/h. National team WA, in the last testing achieved similar result. It was about 0,3km/h less.
CONCLUSIONS We found that there were significant differences of changes in the level of aerobic

212
performance between teams WA, WU19 and WU17 in two-year cycle assessment by YO-YO Intermittent endurance test at 5%. Each assessed parameter show us, that in categories U17 and U19 is important to asset covered distance and in national team WA is important to asset running speed. ACKNOWLEDGEMENT Study is part of state program VEGA1/1252/12: REFERENCES [1] BANGSBO, J., Fitness Training in Football – A Scientific Approach, 2003.
[2] BANGSBo, J., YO-YO Test. Ancona: Kells, 1994.
[3] CARLING, Ch. Analysis of Physical Activity Profiles when Running with the Ball in a Professional Soccer Team, Journal of Sports Sciences. 2010, 38 (3), p. 319 -326.
[4] PERÁČEK, P. Analýza obsahového zamerania centrálnej prípravy reprezentantiek Slovenska vo futbale. Spoločnosť pre telesnú výchovu a šport, 1996, p.231 – 235.
[5] PERÁČEK et al. Analýza úrovne kondičných schopností slovenskej reprezentácie žien a ligových družstiev vo futbale. Výučba a tréning v športových hrách., 1997 p.21 – 27.
[6] WEINECK, J., Optimales Fussballtraining. 3. Aufl, 1999, p. 622
[7] CASTAGNA, C. et al. Aerobic fitness and YO-YO continous and inetermittent tests performances in soccer players: Acorrelation study. J of Strenght and Conditioning Research, 2006, 20(2), 320-325
[8] BANGSBO, J. et al. YO-YO Intermitent Recovery test. J Sport Medicine, 2008, 38 (1), p.37 – 51
[9] KRUSTRUP, P, et al. Game-induced fatigue patterns in elite female soccer. J Strength Cond Res 24(2): 437-441, 201
[10] BANGSBO, J., NORREGAARD, L., THORSOE, F. 1991. Activity profile of competition soccer. In Canadian Journal of Sports Sciences, Toronto: CASS, roč. 16, 110-116s. ISSN 0833-1235
[11] BANGSBO, J. 1994. The physiology of soccer: with special reference to intense intermittent exercise. In Acta Physiologica Scandinavica Supplementum, :Wiley-Blackwell. 1994, roč. 619, č. 2, s. 1-155. ISSN 0302-2994
[12] MOHR, M., KRUSTRUP, P., BANGSBO, J. 2003. Match performance of high - standard soccer players with special reference to development of fatigue. In Journal of Sports Sciences, London: Routlege . 2003, roč. 21, s. 519-528, ISSN 1746-1391

213
SINGLE – SUBJECT EXPERIMENTAL DESIGNS FOR IMPROVING
PERFORMANCE OF AN INDIVIDUAL ATHLETE
Mája Polakovičová 1, Eugen Laczo 2, Aurel Zelko 2
Comenius University in Bratislava, Faculty of Physical Education and Sports, Slovakia 1 Hamar Diagnostic Center, 2 Department of Track & Field
ABSTRACT The aim of the following overview is to outline the strategies and procedures of single-subject research that are used to optimize the training process for individual athletes. Traditional approaches have been using group research designs where multiple athletes are observed at one or more points in time and the training and control groups are compared. Statistical analysis of group-averaged data obscures individual differences and the effect of intervention on individual athlete may be masked. For applied training process research, which aims to establish the effect of a specific training program or intervention on individual athlete single-subject experimental designs allow to find out the extent to which a specific intervention works for a specific athlete. Single–subject designs, also known as time series designs consist of two or more phases – baseline or withdrawal phase (A) and phase of intervention (B). Single subject studies use individuals as their own controls, comparing no intervention and intervention time periods. The B Design is a single phase, intervention only design. It allows for measurement of change over the course of an intervention. In A-B Design the existence of a no intervention baseline allows for the establishment of a relationship between intervention and outcome. The A-B-A Withdrawal Design allows for evaluation of pre-intervention and intervention phase status and offers better controls for threats to internal validity. The Multiple Baseline Design allows evaluation across subjects or different settings. In Alternating Treatment Design the nature of the intervention changes over time. These designs are characterized by A-B-CD, with the B, C, and D phases representing different interventions. Single-subject design is widely used in evaluation of sport psychology interventions. Examples of results of single-subject research were published in field of biomechanics and elite sport performance in elite rowing, tennis, soccer, swimming, sprinting, and cycling. Inter-individual differences in response to training conditions and type of training loads should be considered in assessing changes in training process especially in elite athletes. Using the single-subject approaches, coaches and sports scientists can compare new training methods with traditional ones and make confident assertions about the effectiveness of a new strategy for improving the performance of an athlete. KEY WORDS: single-subject experimental designs, individual athlete INTRODUCTION
The aim of the following overview is to outline the strategies and procedures of single-subject research that are used to optimize the training process for individual athletes. Traditional approaches have been using group research designs where multiple athletes are observed at one or more points in time and the training and control groups are compared. Statistical analysis of group-averaged data obscures individual differences and the effect of intervention on individual athlete may be masked. For applied training process research, which aims to establish the effect of a specific training program or intervention on individual athlete single-

214
subject experimental designs allow to find out the extent to which a specific intervention works for a specific athlete [1]. BACKGROUND
Single subject experimental design and analysis has its roots in physiology and psychology, disciplines in which individual subject served as the basis for discoveries including principles of learning, memory, sensation and perception. Important outgrowth of studying individual subjects was the discovery of individual differences, that not all humans respond the same way under particular stimulus conditions. An English statistician, evolutionary biologist, and geneticist Sir Ronald Aylmer Fisher though most often associated with multiple-subject designs, first introduced a single-subject clinical trial of N-of-1 experimental paradigm in 1945 [2]. The aim of single-subject research is to observe one or a few subjects’ outcome as a dependent variable at many different time points and to compare the changes to assess the effect of an intervention. When compared with group research designs, single-subject research designs present several advantages. They allow rigorous objective experimental assessment of the effectiveness of an intervention for the individual. Group research designs assess the effect of a training method on the average athlete, single-subject research designs explore the effect of a training method on a specific athlete. Single subject designs are more appropriate for the study of small populations of athletes such as injured, over-trained or elite athletes, who are difficult to recruit in sufficiently large groups to meet the requirement of group research designs in the sample size be adequate to detect a practically significant effect of an intervention. Single-subject research designs are usually easier to incorporate into practical and clinical settings than group research designs because they are sufficiently flexible to accommodate the changing needs of the individual studied. Single-subject designs involve repeated measures of athletic behaviour for the same subject across several competitions or practices, therefore, they provide information on individual response to intervention strategies over a given time [3].

215
METHODOLOGY
The baseline phase A represents the period in which the intervention to be evaluated is not offered to the subject. During the baseline phase, repeated measurements of the dependent variable are taken (Fig.1). These measures reflect the status of an athlete on the dependent variable prior to the implementation of the intervention. In a group design, we expect the treatment group to have different scores than the control group after the intervention. In a single-subject design, the subject serves as the control as the repeated baseline measurements establish the pattern of scores that we expect the intervention to change. Without the intervention, researchers assume that the baseline pattern of scores would continue its course. In the baseline phase, measurements are taken until a pattern emerges. The three common types of patterns are a stable line, a trend line, and a cycle. A stable line is a line that is relatively flat, with little variability in the scores so that the scores fall in a narrow band. This kind of line is desirable because changes can easily be detected, and it is likely that there are few problems of testing, instrumentation, statistical regression, and maturation in the data. A trend occurs when the scores may be either increasing or decreasing during the baseline period. A cycle is a pattern in which there are increases and decreases in scores depending on the time of month or time of year [4]. The intervention phase B represents the time period during which the intervention is implemented (Fig.1). During the treatment phase, repeated measurements of the same dependent variable using the same measures are obtained.
Fig.1 Schematic graph of the A-B design data. [5] They are two aspects of evaluation when examining the effects of intervention:
• Has there been a change in the area of concern? • Is there a functional relationship between the intervention and the observed change?
The presence of change is a necessary for the establishment of causality. When a change occurs between phases, it is a change in level or a change in slope. While there is an upward trend in both phases of the following graph, the change between phases is a change in level while the slope remains constant in Fig.2. The following Fig.3 is an example of changes in both phase and slope [4].

216
Fig.2 Change between phases. [4]
Fig. 3 Change between the phase and the slope together. [4] Basic Design The A-B design is the basic single-subject design. It includes a baseline phase A with repeated measurements without the intervention and an intervention phase B continuing the same measures (Fig. 4). Withdrawal Designs There are two withdrawal designs: the A-B-A design and the A-B-A-B design. Withdrawal, design means that the intervention is concluded (A-B-A design) or is stopped for some period of time before it is begun again (A-B-A-B design). The premise is that if the intervention is effective, the target problem should be improved only during the course of intervention, and the target scores should worsen when the intervention is removed (Fig. 4).
Fig. 4 Basic A-B design (left) and withdrawal A-B-A design (right). [5]

217
The no intervention baseline and withdrawal phases allow for a more reliable establishment of a relationship between intervention and outcome than in the A-B design. This design offers better controls for threats to internal validity than the A-B design.
Multiple Baseline Designs In the withdrawal designs, the individual serves as the control for the impact of the intervention. Yet the withdrawal designs suffer from the problem that often the target behavior can not be reversed. A solution to these problems is to add additional subjects, target outcomes, or settings to the study. The basic format is a concurrent multiple baseline design, in which a series of A-B designs, although A-B-A or A-B-A-B designs could also be used, are implemented at the same time for at least three cases - subjects, target problems, or settings. Therefore, the data are collected at the same time. The unique feature of this design is that the length of the baseline phase is staggered to control for external events across the three cases. The baseline phase for the second case extends until the intervention data points for the first case become more or less stable (Fig. 5).
Fig. 6. Multiple baseline design. [5]
218
Alternating Treatment Designs This design involves the alternation of two or more types of treatments or conditions (e.g. treatments B1 and B2 are alternately implemented day by day) for a single subject within one intervention phase. One type of change that might occur is the intensity of the intervention and design is characterized by A-B1-B2. The main advantages of alternating treatment designs are that they do not require a withdrawal of intervention, the phases can be much shorter than in A-B designs, and a baseline phase is not an absolute requirement.
DATA ANALYSIS
Visual analysis Visual analysis refers to the interpretation of data that have been plotted on a graph without any additional statistical analyses. Despite the debates concerning validity, visual analysis is still commonly used for evaluating data generated from single subject designs. Statistical Analysis Statistical tests commonly used in group designs are not appropriate for single-case studies in cases in which observations are correlated. Correlation of data points over time is referred to as serial dependency or autocorrelation and violates the independence of error assumption of statistical tests such as the t and F tests. When serial dependency exists, test values can be biased, and the researcher is advised to use statistical alternatives to these tests. Some useful alternatives include nonparametric tests such as randomization tests, in which treatment conditions are randomly distributed over the course of the study in order to reduce serial dependency, and the magnitude (e.g. mean) of behavioral performance for each condition can be appropriately evaluated. Another popular alternative is time-series analysis, in which both the magnitude and trend of behavioral performance can be compared between conditions while accounting for serial dependency. Time-series analysis is an inferential statistic designed to analyse data collected repeatedly over time on the same subject. Unlike analysis of variance, time-series analysis controls for the serial dependency in the data series. Because of this control for serial dependency, time-series analysis has been recommended for use in applied research using single-subject designs. Autocorrelations and partial autocorrelations are performed to identify the structure of the serial dependency in the data series. An appropriate model that describes the serial dependency can then be identified. The most common model is the autoregressive integrated moving average model. Identification of the appropriate model allows for transformation to standard regression models. Revusky’s test of ranks has been proposed for examining the effect of an intervention in studies with a multiple baseline design in which data are collected across several outcomes, settings, or subjects. This statistics reflects whether the intervention had a significant effect on the various aspects of performance. One of the limitations of the test is that the performance must change dramatically across phases to be reflected in the ranks. The main limitations of conducting single subject research are issues concerning external validity and lack of generality of obtained effects. Interventions shown to be effective for a single individual may not be effective with other individuals [5]. RESULTS The most widely used are multiple baseline designs. They are used when the researchers want to examine the effect of an intervention across different outcomes, such as performance or performance readiness measures, settings – conditions and situations and subjects. To
219
illustrate in soccer conditioning, multiple baselines across three soccer skills (dribble, pass and shoot) can be used to examine the effects of a coach’s specific training program over 10 weeks. The researcher would take baseline measurements (no skill training) on at least three occasions for a soccer player before introducing each training program independently at three data points in the baseline phase. The coach and researcher would analyse each skill on a 10-point scale and show whether the specific training program had a positive effect on the soccer player’s skills [5]. Single-subject design is widely used in evaluation of sport psychology inteventions [3,6]. Methodology of single subject designs has been successfully applied in rehabilitation and physiotherapy [7,8]. Examples of results of single-subject research were published in field of biomechanics [9] and elite sport performance in elite rowing, tennis, soccer, water polo and swimming [1]. CONCLUSION
Single-subject experimental designs are rarely published in the sport science literature. Despite the problems associated with data analysis in single-subject research, serial dependency and generality of findings, it is recommended to use single-subject research experimental designs in applied conditioning research to assess the effect of an intervention and to predict performance for a particular athlete. Because single subject research uses each participant as his/her own control subject, researchers can get a better understanding of individual differences rather than the difference of the average between groups. When done correctly and carefully, single subject research can show a causal effect between the intervention and the outcome. Inter-individual differences in response to training conditions and type of training loads should be considered in assessing changes in training process especially in elite athletes. Using the single-subject approaches, coaches and sports scientists can compare new training methods with traditional ones and can make confident assertions about the effectiveness of a new strategy for improving the performance of an athlete. REFERENCES [1] KINUGASA T et al., Sports Med, 34, 1035-1050, 2004
[2] FISHER RA, Proc Int Inst Intel Coop, 19-31, 1945
[3] REBOUSSIN DM et al., Med Sci Sports Exerc, 28, 639–644, 1966
[4] JANOSKY JE et al., Single Subject Designs in Biomedicine. Springer, 2009
[5] BARLOW DH et al., Single-case experimental designs: strategies for studying behavior change. Pergamon Press, 1984
[6] BARKER JB et al., J Appl Sport Psychol, 25, 3-32, 2013
[7] SOO YK et al., J Sci Med Sport, in press, 2014
[8] SOUSA P et al., Phys Ther Sport, 8, 197-206, 2007
[9] SCHOLES CJ et al., J Biomech, 45, 2074 – 2078, 2012 Acknowledgement: This study was supported by the grant VEGA 1/0232/14

220
THE EFFECT OF SIX-WEEKS AEROBIC EXERCISES ON SOME PHYSIOLOGICAL AND BLOOD PARAMETERS OF SEDENTARY
WOMEN
Metin Polat1, Nuray Aydoğan2
1Erciyes University, School of Physical Education and Sport, Turkey 2Nigde University, Graduate School of Social Sciences, Turkey
ABSTRACT
It has been aimed to this study the effect of six weeks aerobic contented exercise programs on some physical, physiological and blood parameters of the women living as sedentary between the 30-55 ages. Twenty healthy volunteer women participated the study, 10 of whom were experimental group and the other 10 ones were in the control group and all of whom lived as sedentary between the ages of 30-55. While the control group continued normal life activities, experimental group has been applied aerobic contended exercises for 3 days a week throughout 6 weeks. All volunteers have been exposed to measurements twice both before and after the exercise program. The measurements of weight, height, body fat (%), body mass index (BMI), resting hearth rate, systolic blood pressure, diastolic pressure and flexibility values have been taken as physiological and physical parameters. The results have been taken of triglyceride, total cholesterol, HDL cholesterol, LDL cholesterol, glucose, and hemoglobin from the blood parameters. After the descriptive statistics of the volunteer groups, the non-parametric Wilcoxon Signed Ranks test was carried out to compare the values before and after the exercise program. The significance level was determined as p<0.05. As a result, the regular exercises of six weeks applied to the sedentary women has caused to significantly decrease in the values of weight, body fat (%), BMI, resting hearth rate, and significantly increase in the value of flexibility among the physical and physiological parameters. In addition, although there is no statistical significance in the blood parameters, there was an increase in HDL cholesterol, triglyceride, hemoglobin, and decrease in total cholesterol, LDL cholesterol, glucose values. It is thought that regular aerobic contented exercises give rise to positive changes in the physical, physiological and blood parameters, and contribute to more healthy and quality life of the individuals.
KEY WORDS: Physical activity, exercise, sedentary, blood parameters
INTRODUCTION
Technological advancements result in fewer requirements for physical activity in almost every aspect of life (Wilmore JH et al., 2008). Sedentary behaviors refers to activities that do not increase energy expenditure substantially above the resting level (1.0 –1.5 METs) and it includes activities such as sleeping, sitting, lying down, watching TV, and other forms of screen-based entertainment (Pate RR et al., 2008). The negative effects of a sedentary lifestyle on health have been reported in various studies. These effects primarily include high blood

221
pressure, postural defects, muscle weakness, obesity, metabolic syndrome, type 2 diabetes, and an increase in the risk factors for coronary artery disease (Healy GN et al., 2008; Hamilton MT et al., 2004). Humans are increasingly spending more time in sedentary behaviors, and this global trend is likely to continue (Church TS et al., 2011). Under these circumstances, it is very important that the individuals tend towards exercise in order to increase physical activity. On the other hand, different effects are reported in the literature according to the content and intensity of the exercise program and characteristics of the target group. Therefore, it is very important to define the content, duration, and intensity of an exercise program that is to be followed. Based on this, the present study was designed to determine the effects of an aerobics-based submaximal exercise program that was followed for three days a week for six weeks by women aged between 30-55 years and who had a sedentary lifestyle, on the physical, physiological, and specific blood parameters.
METHODS
Volunteer Groups
The study group included 20 healthy volunteer females with a sedentary lifestyle, who were aged between 30-55 years, ten of which formed the exercise group, while the rest constituted the control group. The volunteers were asked to obtain a medical report to confirm that they have no limitations to exercise and all volunteers signed the Volunteer Informed Consent Form. A specific diet program was not followed and the volunteers were asked to continue their routine daily activities. The volunteers in the exercise group exercised three days a week for six weeks. Two measurements were obtained from the volunteers, before and after the exercise program. Physical and physiological parameters, including the height, weight, body fat %, body mass index (BMI), resting heart rate, systolic blood pressure, diastolic blood pressure, and flexibility measurements were recorded. Blood parameters including triglycerides, HDL cholesterol, LDL cholesterol, glucose, hemoglobin, and total cholesterol analysis were obtained. Exercise Program
The control group continued their normal daily routine activity for six weeks, while the exercise group was asked to exercise for 1.5 hours three days a week. Before the exercise, they performed warm-up exercises for ten minutes and then walked on the treadmill for ten minutes. Then, they did step-aerobics for 30 minutes, followed by ground exercises targeting the legs, abdomen, thighs, and belly muscles for 30 minutes, and cool down and stretching for the last ten minutes. Exercise intensity was determined based on the Karvonen method (Powers SK et al., 2009) and heart rate was maintained between 40-60% of maximal heart rate during the exercises.
Physical and Physiological Measurements
The heights of the volunteers were measured by a measurement scale with 1 mm sensitivity. Weights and body fat (%) were measured by a Tanita BC-545 Body Mass Composition Monitor, while the hands and heels of the volunteers were placed on the electrodes. Special attention was paid to ensure the feet of the volunteers were not wet.
Body mass indexes of the volunteers were calculated by the following formula: BMI=Weight(kg) / Height (m2).

222
Resting heart rate, and systolic and diastolic blood pressure were measured after five minutes resting in a seated position, from the left elbow region using an Omron hem-712c automatic blood pressure monitor with arm cuff.
Flexibility measurements were performed with the sit and reach test using a sit and reach box.
Blood Parameters
Twelve cc venous blood samples were obtained by the health care staff at 9:30 am three days prior to the start and three days after the completion of the exercise program, under hygienic conditions from the antecubital region while the volunteers were fasting. Ten cc of each blood sample was transferred to tubes with yellow caps containing gel. In order to prevent hemolysis, the blood samples that were held at room temperature were centrifuged at 3000 g for 15 minutes and serums were separated. Lipemic, hemolyzed, and icteric samples were excluded from the analyses. Biochemistry parameters were analyzed by an Abbott Architect C.16000 device. Hemogram blood levels were measured by a CELL-BYN 3700 device after transferring 2 cc samples to the 3 cc purple tubes.
Statistical Analysis
Statistical analyses were performed using SPSS 18 package software. Descriptive statistics of the volunteer groups were presented and then the non-parametric Wilcoxon Signed Ranks test was used to compare the values before and after the exercise program. The significance level was determined as p<0.05.
RESULTS
Comparison of pre and post-exercise test values of volunteer groups are presented in table 1. According to these results, it was observed that significant decrease in the weight, body fat (%), BMI, resting heart rate and significant increase in flexibility values of exercise group (p < 0.05).

223
Blood parameter test results of volunteer groups are presented table 2. According to table 2, no statistical differences were observed between pre-exercise and post-exercise test values of both groups (p > 0.05). DISCUSSION AND CONCLUSIONS
Both due to the decrease in physical activity and the increase in calorie uptake, weight increase occurs between ages of 25 and 45 years. After 45 years, the weight remains stable for almost 10-15 years and begins to decrease after that (Wilmore JH et al., 2008). The weight can be kept within normal limits when the consumed and burned calories are equal. A sedentary lifestyle results in an increase in the weight (McArdle WD et al., 2009). It is known that regular exercises prevent this age-dependent weight gain and result in significant weight loss. In the present study, the weight of the exercise group was higher than the control group before the exercise program. Following the six-week exercise program, the weight of the exercise group had significantly decreased (p<0.05).
Fat mass continuously increases after the age of thirty. This is caused by the decrease in muscle mass and bone mineral loss. Both conditions are partially due to decreased physical activity (Wilmore JH et al., 2008). Exercise routines are expected to cause a decrease in the body fat percent of the individuals. Low body fat composition has very positive effects on life quality, especially in the elderly. In the present study, it has been observed that significant reduction in body fat percent of the exercise group after the exercise program (p<0.05).
Body mass index is associated with total fat in the body (Proper KI et al., 2011). High body mass index is an important risk factor for diabetes, coronary heart disease, and hypertension. Diabetes is more common among the elderly and the obese people. It has been shown in several studies that obesity is rather frequent among women. Body mass index can increase with age and as a result of a sedentary lifestyle (McArdle WD et al., 2009). Several serious health problems and decreased working capacity can be seen when the body mass index exceeds the normal limits (Proper KI et al., 2011). Individuals with normal body mass index are in better condition than those with a high body mass index, with respect to life expectancy and quality (McArdle WD et al., 2006). Regular exercises are expected to result in a reduction

224
in weight and accordingly, BMI. A comparison of the pre-exercise and post-exercise BMIs of the exercise group in the present study showed a significant reduction in the BMI values (p<0.05). Regularly performed submaximal exercises result in a reduction in the resting heart rate. Therefore, the resting heart rate is different between trained and untrained individuals (Powers SK., 2009). In addition, the increase in the heart rate during exercise is greater in individuals who do not exercise regularly. The heart rate of the individuals who exercise regularly reaches the maximum level at a later stage; therefore they have greater MaxVO2 consumption (McArdle WD et al., 2006). The effect of exercise on heart rate is related to the increased stroke volume that occurs as a result of exercise. Heart rate decreases when the amount of blood pumped per a beat increases. In other words, same level of cardiac output can be achieved by a lower heart rate (Powers SK., 2009). Due to the increase in contraction strength and venous return, individuals who regularly exercise have a higher stroke volume and cardiac output both during exercise and resting. While the heart rate after the exercise returns to the resting level in a few minutes in trained individuals, this duration becomes longer in sedentary individuals. Therefore, those who regularly exercise have high stroke volume and low heart rate also during resting (Wilmore JH et al., 2008). In the present study, resting heart rate of the exercise group were significantly lower compared to the control group after six weeks of exercise (p<0.05).
Regular physical exercise regulates blood pressure (Fagard RH & Cornelissen VA., 2007). The improvements observed in the heart as a result of exercising causes the blood pressure to decrease. While the heart functions more economically, the blood pressure decreases due to the decrease in the resistance to blood flow. After a specific exercise period, individuals with normal or even high blood pressure may achieve a decrease in their blood pressure levels. It is also known that aerobic exercises are more effective on blood pressure than the strength exercises. It is reported that the blood pressure may decrease by 5-10% as a result of endurance training performed for four to six weeks (Wilmore JH et al., 2008). The increase in the systolic and diastolic blood pressure caused by exercise is more pronounced in systolic blood pressure and a relatively smaller change is seen in the diastolic pressure (Powers SK., 2009). Moreover, the literature includes some studies in which the followed exercise programs did not result in any change in the blood pressure. In the present study, the researchers did not find any significant difference between the pre-exercise and post-exercise blood pressure values of the exercise and control groups (p>0.05). This finding can be explained by a few reasons. First, the duration of exercise performed by the volunteers in this study can be insufficient to demonstrate its effects on blood pressures. Additionally, this may be due to the content and intensity of the exercise itself. Increasing the duration of exercise may have positive effects on blood pressure.
In the present study, exercising resulted in a significant increase in the flexibility level of the exercise group (p<0.05). Several studies have reported that the flexibility level increases in the individuals who regularly exercise. By aging, the body fat increases and the ability to flexibility decreases in women. The leading cause of the acceleration in this process is limited physical activity (DiPietro L., 2001). A high level of flexibility allows us to move more freely and provides coordination, relaxes muscles, corrects posture, procures body symmetry, prevents back and muscle pains, increases movement area, develops physical and athletic abilities, regulates the blood circulation, and helps the body to relax mentally (Bushman B., 2011). In this respect, the positive changes observed in flexibility levels by regular exercising is considered to aid individuals in having a high quality of life, especially in older ages.
225
A sedentary lifestyle is accompanied by various severe health problems. Individuals performing submaximal exercises are expected to show some positive changes with both acute and chronic adaptation. It is known that regularly performed, long-term, and moderate aerobic exercise decreases the risk factors for coronary artery disease such as total cholesterol, LDL-C, and triglycerides while increasing the levels of high density lipoprotein (HDL-C). It is also indicated that diseases such as high blood pressure and obesity decrease with exercise (Bushman B., 2011). Several studies have demonstrated the positive effects of exercising with sufficient intensity, amount, and duration on the plasma lipids and lipoproteins. As the degree of exercise increases, the coronary problems decrease in parallel. In a study performed in Africa, a significant positive correlation was reported between BMI and triglycerides. Individuals who regularly exercise have lower levels of triglycerides, LDL, and higher levels of HDL-C compared to the sedentary individuals (Cameron N & Getz B., 1997). In the present study, a six-week exercise program resulted in a decrease in LDL-C, triglycerides, and total cholesterol, and an increase in HDL-C; however, these changes were not statistically significant (p>0.05).
When the hematocrit values and hemoglobin amount in every cell is normal, the amount of hemoglobin in the whole blood on the average is 14 g/dL in women (Guyton AC, Hall JE, 2006). The increase in the circulating hemoglobin concentration is associated with an increase in endurance capacity, proportional to the increase in the buffering capacity and the amount of oxygen that blood can transport (Calbet JA et al., 2006). In this way, the increase in hemoglobin levels contributes to individuals’ resistance to fatigue, thereby increasing their life quality. It is known that regular exercise increases the blood volume and hemoglobin level (Powers SK., 2009). Although the results of the present study demonstrated an increase in the hemoglobin levels after exercise program, this increase was not statistically significant (p>0.05).
A high level of blood glucose is one of the markers of metabolic syndrome. The other markers include the increase in waist to hip ratio, elevated blood pressure, and high cholesterol levels (Wilmore JH et al., 2008). Fasting blood glucose levels between 75-115 mg are considered to be normal (Alberti KGMM et al., 2006). In the present study, no significant difference was observed between the blood glucose levels measured before and after exercise (p>0.05); however, the mean blood glucose level that was 105.50 ± 40.15 before exercise decreased to 95.70 ± 12.9 after exercise. It is indicated that regular exercising helps to maintain the blood glucose levels within the normal range (Bushman B., 2011). Additionally, exercising regulates the other markers of metabolic syndrome which the increase in waist to hip ratio, increase blood pressure and high cholesterol levels (Wilmore JH et al., 2008). The results of this study also demonstrate that there were positive improvements in these parameters.
In conclusion, it was confirmed in the present study that a six-week regular exercise program compared to the results of sedentary women results in a significant decrease in the physical and physiological parameters including weight, body fat percent, BMI, resting heart rate, and a significant increase in flexibility values. Additionally, although a statistically significant change was not seen in blood parameters, the levels of triglycerides, HDL, and hemoglobin increased while the levels of total cholesterol, LDL, and glucose decreased. The authors consider that an aerobics-based moderate exercise program performed regularly three days a week for six weeks results in positive changes in the physical, physiological, and blood parameters of the individuals and contribute to a more healthy and high quality life.

226
REFERENCES
[1] ALBERTI KGMM, ZIMMET P, SHAW J. Metabolic syndrome—a new world-wide definition. A Consensus Statement from the International Diabetes Federation. Diabet. Med. 2006; 23, 469–480
[2] BUSHMAN B. ACSM’s Complete Guide to Fitness & Health, Human Kinetics, USA, 2011
[3] CALBET JA, LUNDBY C, KOSKOLOU M, et al. Importance of hemoglobin concentration to exercise: acute manipulations. Respir Physiol Neurobiol 2006; 151: 132–140
[4] CAMERON N, GETZ B. Sex Difference in the Prevalence of Obesity in Rural African Adolescents, Int J Obes Relat Metab Disard 1997; 21: 775 – 782
[5] CHURCH TS, THOMAS DM, TUDOR-LOCKE C, et al. Trends over 5 decades in U.S. occupation-related physical activity and their associations with obesity. PLoS 2011;6:e19657.
[6] DiPIETRO L. Physical Activity in Aging Changes in Patterns and Their Relationship to Health and Function, J Gerontol A Biol Sci Med Sci 2001; 56 (suppl 2): 13-22
[7] FAGARD RH, CORNELISSEN VA. Effect of Exercise on Blood Pressure Control in Hypertensive Patients, European Journal of Cardiovascular Prevention and Rehabilitation 2007, 14:12–17
[8] GUYTON AC, HALL JE. Textbook of Medical Physiology, Eleventh Edition, Elsevier Saunders, 2006
[9] HAMILTON MT, HAMILTON DG, ZDERIC TW. Exercise physiology versus inactivity physiology: an essential concept for understanding lipoprotein lipase regulation. Exerc Sport Sci Rev 2004;32:161–6.
[10] HEALY GN, DUNSTAN DW, SALMON J, SHAW JE, ZIMMET PZ, OWEN N. Television time and continuous metabolic risk in physically active adults. Med Sci Sports Exerc 2008;40:639–45.
[11] McARDLE WD, KATCH FI, KATCH VL. Essentials of Exercise Physiology, Third Edition, Lippincott Williams & Wilkins, Philadelphia, 2006
[12] McARDLE WD, KATCH FI, KATCH VL. Sports and Exercise Nutrition, Lippincott Williams & Wilkins, Philadelphia, 2009
[13] PATE RR, O’NEILL JR, LOBELO F. The evolving defınition of “sedentary.” Exerc Sport Sci Rev 2008;36(4):173– 8.
[14] POWERS SK, HOWLEY ET. Exercise Physiology, Theory and Application to Fitness and Performance, McGraw-Hill, New York, 2009
[15] PROPER KI, SINGH AS, MECHELEN W, CHINAPAW MJM. Sedentary Behaviors and Health Outcomes Among Adults A Systematic Review of Prospective Studies, Am J Prev Med 2011; 40 (2): 174 – 182
[16] WILMORE JH, COSTILL DL, KENNEY WL. Physiology of Sport and Exercise, Fourth Edition, Human Kinetics, 2008

227
MOTOR AND FUNCTIONAL ABILITIES IN ELDERLY PEOPLE
AFTER 8 WEEKS OF SUPERVISED TRAINING
Vladimir Puzovic1, Sladjan Karaleic2, Ivana Andjelkovic2, Zoran Savic2, Vesko Milenkovic2
1Faculty of Medical Sciences, University of Kragujevac, Kragujevac, Serbia 2Faculty of Sport and Physical Education, University of Pristina, Leposavic, Serbia
ABSTRACT
After the age of 20-25 most of motor and functional1 abilities start to decrease. In elderly people who generally spend sedentary lifestyle even minor activities can make problems with further consequences. The aim of this study was to estimate the difference in motor and functional abilities of elderly people after 8 weeks of supervised training. This study included 28 elderly people (average age 71.3 ± 2.8), divided in Training and Control group, both consisted of 14 subjects. Training group subjects were included in 8 weeks training program consisting of stretching, weight and aerobic exercises. Before and after 8 weeks of the study we conducted motor and functional testing. Battery test consisted of: flexibility – sit and reach test, trunk rotation test and shoulder flexibility test; balance – star excursion balance test (SEBT); strength – hand grip test, hand pinch test, chair stand up test for 30 sec, arm curl test with 4kg for 30 sec; agility – 8 foot up and go test; aerobic capacities – 6 min walking test; pulmonary functions – spirometry testing. Statistical procedures were performed using PASW 18, with p < 0.05. After 8 weeks of training, subjects from Training group had significantly better results in sit and reach test, SEBT test, hand grip test, chair stand up test for 30 sec and 6 min walking test (p < 0.05). In pulmonary function values we found improvements, but they were not statistically significant. In conclusion we can say that 8 weeks controlled training activities have positive effect on flexibility, balance, hand and legs strength and also on aerobic capacities of elderly people.
KEY WORDS: elderly people, functional abilities, motor abilities
INTRODUCTION
Gait stability present one of the major problems in health care of elderly people. With decreased gait stability risk of falling is higher which brings many problems and consequences. Risk of falling is important factor, with negative influence, on quality of life in elderly people and falls are one of the major causes of morbidity and mortality in the elderly. Because of their long-term consequences falls represent also an economic problem in term of health insurance and health care. Gait stability is closely related to the motor abilities of human beings. After the age of 20-25 most of motor and functional abilities start to decrease1. Therefore, elderly people often function at the limit of their motor abilities to fulfill their daily living activites2. Gait has been defined as complex motor ability, consisted of cyclic movements of the lower limbs, which generate body movements5 - 3. Gait speed, by some authors, has been shown to be associated with survival of elderly people3, 4 – 4, 5. In elderly people who generally spend sedentary lifestyle even minor activities can make problems with further consequences. Improving of motor abilities is mostly based on improving strength, flexibility, balance, agility and endurance. Those motor abilities are, by previous literature, in

228
correlation with gait stability and risk of fallings. Walking requires energy, movement control, balance, and support of multiple organs, including lungs, heart, circulatory, nervous and musculoskeletal system. In this paper motor and functional abilities will be tested by different motor and functional tests which can influence quality of gait ability.
The aim of this study was to estimate the difference in motor and functional abilities of elderly people after 8 weeks of supervised training.
METHODS
Subjects
This study included 28 elderly people, mean age 71.3 ± 2.8, and they were divided in two groups – Training and Control group. Both groups consisted of 14 subjects without statistically significant difference in mean age.
Training protocol
Training group subjects were included in 3 trainings per week, during 8 weeks of study. Control group subjects haven’t been included in any type of regular physical activity during 8 weeks of the study. Duration of training was 60 minutes, and it consisted of stretching, weight and aerobic exercises.
Test battery
Before and after 8 weeks of the study we conducted motor and functional testing. Test battery consisted of: flexibility tests – sit and reach test, trunk rotation test and shoulder flexibility test; balance test – star excursion balance test (SEBT); strength tests – hand grip test, hand pinch test, arm curl test with 4kg for 30 sec, chair stand up test for 30 sec; agility test – 8 foot up and go test; aerobic capacity test – 6 min walking test; pulmonary function tests – spirometry testing.
Statistical procedures were performed using PASW 18, p value was set on < 0.05.
RESULTS
After 8 weeks of training, subject from Training group had significantly better results in sit and reach test, SEBT test, hand grip test, chair stand up test for 30 sec and 6 min walking test (p < 0.05). In pulmonary function testing values we found improvements, but they were not statistically significant.
Table 1: Mean values of test with significant differences in the end of the study
Test Training group Control group p Sit and reach test (cm) -22.4 -16.3 < 0.05 SEBT (cm) 318,1 342.9 < 0.05 Hand grip test (kg) 21.1kg 26.5kg < 0.05 Chair stand up for 30s (n) 8.2 11.6 < 0.05 6 min Walking test (m) 366,7m 412,1m < 0.05

229
DISCUSSION
In previously published literature, hypokinesia or bradykinesia, gait disturbance, rigidity and tremor are stated as common motor signs of old age6. Both the severity of the gait disorder and its rate of progression are strongly associated with risk of death6. In our study, we conducted test battery, with an aim to estimate difference between elderly people who are included and those who are not included in regular training process. The goal of training process is to improve quality of life, maintain health and improve/maintain motor abilities of those people. Some studies have shown that survival is influenced by health and also by functional abilities7. In our battery of tests we had 10 tests with an aim to estimate flexibility, strength, balance and endurance, and beside that we also conducted spirometry testing to estimate lung functions. For flexibility we conducted three tests - sit and reach test, trunk rotation test and shoulder flexibility test. Those tests shows flexibility of hamstrings and lower back, torso and arm and shoulders and they correlate with length of the step, ability to rotate the body during walking and with ability of freely moving of arms with an aim to adhere on objects. In our study after 8 weeks of training, Training group had have significantly better results in sit and reach test (Table 1). Strength as motor ability is important in maintain quality of life in elderly people, but it is also decreasing with age. Often, in old age people it can be seen that, because of the lack of the strength in one part of the body, during movement they are helping with another parts of the body, e.g. they are helping with their arms when they are sitting down or staying up from the chair, they are also helping with their arms by pulling holder when they walk up stairs. For strength testing we used 4 tests adapted to testing of old age people. Three of them were with an aim to estimate the strength of the arms that are used during adhere on different object and one test is used to estimate strength of the legs. In Table 1 it can be seen, that after 8 weeks of training, Training group had better results in 2 of those tests, in hand grip and chair stand up for 30 second tests. For testing the balance we used Star Excursion Balance Test (SEBT), that test show an ability of making long step without losing the balance, and in the end of this study Training group had significantly better results (Table 1). In the end of our study we also had significantly better results in 6 min walking test (6MWT) (Table 1).
CONCLUSON
In conclusion we can say that 8 weeks controlled training activities have positive effect on flexibility, balance, hand and legs strength, and also on aerobic capacities of elderly people.
REFERENCES:
[1] KRUMPE P. E. et al. Clin Geriat Med. 1, 143-175, 1985
[2] HORTOBAGYI T. et al. J Gerontol A Biol Sci Med Sci. 58, M453-460, 2003
[3] PERRY J. São Paulo: Manole. 8-43, 2005
[4] ROLLAND Y. et al. Eur J Epidemiol. 21, 113-122, 2006
[5] ROSANO C. et al. J Am Geriatr Soc. 56, 1618-1625, 2008
[6] WILSON R. S. Neurology. 58, 1815-1819, 2002
[7] LUBITZ J. et al. N Engl J Med. 349, 1048-1055, 2003

230
HEART RATE RESPONSE TO EXERCISE PERFORMANCE IN ARTISTISC GYMNASTICS
Ľuboš Rupčík
Comenius University in Bratislava, Faculty of Physical Education and Sports, Department of Gymnastics
ABSTRACT
The heart rate level depends not only on the duration of the exercises and the D-score, but especially on the level of performance, exercise stabilization of individual shapes and the mental endurance. On the floor exercise was the highest measured value of heart rate per minute of 201, on the pommel horse 204, 192 on the still rings, on the parallel bars 182, and on the horizontal bar 204. The lowest heart rate values were measured at all gymnasts on the vault from 138 to 164 beats per minute. During analyzing the D-score on each apparatus, we recorded the highest score on the pommel horse 6.1 points and 5.3 points. When comparing the duration of the exercises, we recorded values from 4.71 sec. on the vault to the 78 sec. on floor exercise.
KEY WORDS: Heart rate, Exercise, D- score
INTRODUCTION
Artistic gymnastics is today characterised by its continually ascending difficulty of the exercises of the gymnasts. According to that the capacity and the scope of the training process increase and the requirements for the individual gymnasts during the training process increase as well. Even if the producers of the gymnastics apparatus in the last decade work on some improvements, mostly because of saving the motoric apparatus, majority of the artistic gymnasts specialize on individual apparatus, but the constituent part of the gymnasts complete the whole all-around. On the grounds of mentioned the training load in the training process of artistic gymnasts’ changes in the year training cycle, when the capacity and frequency of training load increase. Changing rules have also expressive effect in artistic gymnastics, which adjust for one Olympic cycle, thus 4 years. Therefore the requirements for sport exercise instantly increase and thus also for the structure of the training load (Rupčík, 2008).
Artistic gymnastics belongs to the most diversified sport branches due to its motoric structure. The individual apparatus of the men´s all-around are characterised mostly by its diversification of motoric content what depends highly on sport exercise structure on the individual apparatus. The level of the sport exercise in artistic gymnastics is given especially by the difficulty of the exercise on the apparatus. As rules of FIG for 2013 – 2016 declare, the exercise must contain 9 elements (in junior category 7) and dismount. According to the rules of the International Gymnastics Federation (FIG) for season 2013-2016, every element has assigned its difficulty from A to G (scheme 1).
Scheme.1 – Points of exercise elements element A B C D E F G
dificulty 0,1 b. 0,2 b. 0,3 b. 0,4 b. 0,5 b. 0,6 b. 0,7 b. Legend: CT – exercise element

231
The exercise can consist of maximally 4 exercise elements from the groups of exercise elements 1 to 4. Gymnast includes the exercise elements which he safely handles following his motoric ability and efficiency. The level of the D-score depends particularly on the number of the most difficult exercise elements (max. 9 exercise elements), connections between the individual elements and dismount. Duration of the exercise is given namely by number of the exercise elements and their difficulty. It is dependent also on the category of competitors and follows from 70 seconds on floor exercise to 5 seconds on vault.
It is appropriate to follow some of the physiological coefficients for evaluation of intensity of inner density. From the practical point of view is the most accessible following the pulse, or heart rate (HR), through the medium of which the inner reaction of organism on external density is measured. Monitoring of HR makes in artistic gymnastics for determination of general science which has to be on a high level at the gymnasts as a supposition of technical preparation and as a necessity of graduation of high-level daily training duties (Kremnický, 2007).
Kremnický (2007), who investigated the heart rate of artistic gymnasts on the floor exercise and on the pommel horse, indicates that the gymnasts entered at the end of the exercise the area of red line and the anaerobic threshold, what means anaerobic energy coverage of the human body. Gymnast whose exercised where composed of the most difficult exercise elements and bonds reached at the end of the exercises to his maximal values of HR and to the area of anaerobic energy coverage of the human body. We understand that the HR is not one of the coefficients which the most objectively reflect the special science of gymnasts because it is influenced by a lot of other factors (psychic-emotions, stress, anxiety, etc.) but on the other hand it plays a great role in the fitness training direction of the young gymnasts. During the local myasthenia the performance of the gymnast decreases, whilst the cardio-vascular system response is during the identical effort without distinguished changes. However, HR is a demonstration of general science, which has to be on a high-level at the gymnasts. Within the gymnastic sports where the sportsman achieves high levels of the heart rate up to the level of anaerobic threshold is sport aerobic. It is proved also by monitoring of Kyselovičová – Danielová (2012), who present maximal values of heart rate on the level of 180 P/min.
A lot of factors influence the heart rate level in artistic gymnastics:
‐ Level of science, ‐ Duration of the exercise, ‐ Difficulty of the exercise, ‐ Stress factor.
METHODS
The examined group consisted of 6 artistic gymnasts of junior and senior category. Average age was 17,83. Average stature was 172,4 cm and body weight 63,4 kg. Values and average values are mentioned in the scheme 2.

232
Scheme. 2. Somatometric measurements of the gymnasts.
Body height [cm]
body weight [kg] BMI
Max HR
P1 177 71 22,6 171
P2 173,5 67 22,39 176
P3 175 66 21,5 167
P4 172 62 20,96 181
P5 169 58 20,31 178
P6 168 56,5 19,84 185
172,417 63,41667 21,2667 176,333 Measuring of the heart rate was made using the sport tester Suunto t4c before the exercise, after exercise and 2 min. after exercise. The values of HR were measured during control competition lasting 2 hours. Before control competition the gymnasts could warm themselves up on each apparatus one hour. The warming-up lasting 3 min. was before each exercise, it means 30 sec. for each competitor. In the values max HR we followed the spiroergonometric examination. We recorded the duration of the exercise by hand using stopwatch and from the moment when the gymnast jumped on the apparatus to the dismount. We have used the judge´s protocols of three international judgesto analyze the competitive exercises. RESULTS
The scoring of the results is based on the knowledge of Kremnický (2007), who monitored the level of pulse rate during exercising on floor exercise and pommel horse, where he says that the gymnasts reached the anaerobic threshold area. When comparing the measured values of pulse rate after finishing exercises on individual apparatus of men´s all-around with the duration of exercise and its difficulty (sch.4) we found out that not only duration of the exercise and its difficulty influence the pulse rate. The highest values of pulse rate were measured on floor exercise, it means on the apparatus characterised by the fact that the duration of the exercise on this apparatus is the longest but also the number of exercises which is higher than on other apparatuses. In the exercise on floor there are various exercise elements which are not in the rules but the need of their performance in the exercise is important (round off, cartwel etc.). When comparing results with Kremnický (2007) we can agree on the similar measured values (sch.3) where he states general pulse rate value on floor exercise 181,6 and on the pommel horse 177,2. When comparing our results with the results of JemniI, Sands, Friemel (2000), who determinate average pulse rate while exercising on horizontal bar, we have determined similar values.

233
Scheme. 3. Values and average values of pulse rate on each apparatus.
floor pommel rings vault Pbars Hbar
P1 201 196 192 162 182 204
P2 186 168 173 138 138 172
P3 172 172 166 153 148 172
P4 197 204 174 164 169 181
P5 184 162 171 164 171 178
P6 167 154 169 158 165 167
184,5 176 174,167 156,5 162,167 179
Scheme. 4. HR values, duration of exercise and D-score on each apparatus.
P1 P2 P3 P4 P5 P6
floo
r
HR after 201 186 172 197 184 167 Exercise Time [s] 70 78 78 67 64 69 D-score 5 4,4 5,4 3,8 4 3,5
Pom
mel
ho
rse
HR after 196 168 172 204 162 154 Exercise Time [s] 23 23,58 34,52 39,96 25,24 22,18 D-score 4,3 4,4 6,1 5,3 4,3 2,8
ring
s
HR after 192 173 166 174 171 169 Exercise Time [s] 43,78 31,53 33,34 35,04 32,12 31,08 D-score 4,4 3,7 4,9 4,1 4,7 2,2
vaul
t
HR after 162 138 153 164 164 158 Exercise Time [s] 4,75 4,89 4,93 4,84 4,97 4,71 D-score 4,4 3,6 4,4 3,6 2,8 2,8
Pba
rs HR after 182 138 148 169 171 165
Exercise Time [s] 27,54 25,58 31,3 27,12 26,87 25,36 D-score 4,3 3,9 5,2 4,3 4,1 3
Hba
r
HR after 204 172 172 181 178 167 Exercise Time [s] 40,45 32,15 42,42 39,48 37,51 36,29 D-score 4 3,3 5,4 3,6 3,8 2,2
At the gymnast 1 on the floor exercise we have determined the highest measured heart rate level of 201 P/min., however duration of the exercise and its difficulty were not the highest. The new and more difficult exercise elements in the exercise on the floor exercise influenced the heart rate level and also the fact that he provided his exercise for the first time in the standard conditions. At the gymnast 4 we have found out the highest heart rate level of 204 P/min. on the pommel horse, whereby duration of the exercise was the longest from all

234
gymnasts. The number of all exercise elements on this apparatus is 30 – 40 (mainly circles). At the P4 we have noticed 32 exercise elements and at the P3 29 exercise elements. As we supposed, the lowest average HR was in regard of duration of exercise measured on the vault characterised by its dynamic but mainly by short lasting very intensive performance (Rupčík, 2009). The average duration of vault was 4,85 sec. At the gymnast 3, competitor of senior category, we have measured the heart rate values from 172 P/min. on floor exercise to 153 P/min. on vault and we have not noticed any outstanding variations in HR values of gymnasts 2, 5 and 6 as well. The reason was particularly the fact, that the sport level and level of science of P3 was the highest what prove also the D-scores on individual apparatuses. From the point of D-scores the sport level at the gymnasts 2, 5 and 6 was lower, especially because they had stable-based individual elements in their exercises.
CONCLUSION
The results of our research indicate comparison of heart rate, duration of exercises and D-scores. Taking into consideration that our group consisted of 6 gymnasts dared to generalize these results, but they can serve us for future monitoring. However, we can say that the level of heart rate depends not only on the duration of the exercises and D-scores, but especially on the level of gymnastics performance and coping with individual elements separately and also in the exercises.
REFERENCES
[1] JEMNI, M. – FRIEMEL, F. 2000. Heart Rate and Blood Lactate Concentration Analysis Duringa High-Level Men's Gymnastics Competition. In: The Journal of Strength and Conditioning Research. 2000. Vol. 14, No. 4, pp. 389–394 [2] KREMNICKÝ, J., 2007. Analýzy zaťaženia mladých gymnastov na koni s držadlami. In: Exercitatio Corpolis-Motus-Salus. Banská Bystrica: Univerzita Mateja Bela v Banskej Bystrici, Fakulta humanitných vied, Katedra telesnej výchovy a športu, ISBN 978-80-8083-541-5, s. 75 – 86. [3] KREMNICKÝ, J., 2007. Analýza zaťaženia mladých gymnastov v zostave na prostných pomocou fyziologickej krivky. In: Antropomotorika 2007. Banská Bystrica. ISBN 978-80-8083-446-3, s. 80-90. [4] KYSELOVIČOVÁ, O. – DANIELOVÁ, K. 2012. The functional response to training and competition load in aerobic gymnastics athletes.In: Acta facultatis educationis physicae universitatis Comenianae 2012. Bratislava. ISBN 978-80-223-3329-0, s.31-37. [5] RUPČÍK, Ľ., 2008. Objem a obťažnosť tréningového zaťaženia juniorov v športovej gymnastike v ročnom tréningovom cykle. In Sport a kvalita života 2008. Brno. [6] RUPČÍK, Ľ., 2009. Kinematic Characteristics of the Techniques for Vault Forward. In: Teoria i praktyka w nowoczesnych i tradycyjnych formach gimnastyki i tańca : gimnastyka-taniec-fitness, Kraków : EAS, 2010 s. 177-182.

235
NATIONAL SPORT FEDERATIONS’ USE OF THE WEB FOR
FULFILLING STRATEGIC GOALS
Ivan Sandanski
National Sports Academy, Sofia, Department of Sport Management, Bulgaria
ABSTRACT
Conceptually and methodologically this paper builds on studies of voluntary-sector, including sport, organisations’ presence on the Internet. Drawing on the ever increasing importance of the Web sites for the effective fulfillment of sport organisations’ activities, managerial, economic, and communication strategies, the paper trys to unfold how and to what extent national sport federations make strategic use of their own Web sites. For that aim 35 Bulgarian national sport federations administering both Olympic and non-Olympic sports (a response rate of 47%) out of 75 which have developed their own Web sites were surveyed by an online self-administering questionnaire. The results show that sport federations’ managers find the Web very effective and increasingly important platform in pursuing their mission and goals. Significant differences between sport governing bodies that run Olympic and non-Olympic sports respectively are observed with regard to the delivery of various interactive forms on their Web sites, with a strong predominance of those with Olympic status. Concerning the level of functionality of the Web site, the majority of federations can be qualified in the initial stage to provide basic information and promotion activities, and low to medium degree of interactivity in the provision of services for different users. Further research is needed to develop Internet-based strategies, forms and mechanisms for the development of federations running both collective and individual sports.
KEY WORDS: Internet, Web site, national sport federations
INTRODUCTION
Dynamic changes in the social and economic conditions, along with the new Web technological advances, force the national sport federations’ managers to rethink the conventional wisdom about the role and importance of their organisations’ websites. The impact of Internet-based technologies is becoming increasingly important for the activities of national sport federations (NSFs) in their capacity as voluntary and not-for-profit organisations committed to serve the interests of their member clubs and develop sport from the grassroots to an elite level [2].
Taking a lead by Cukier and Middleton (2003) [1] on the primary activities and services provided by the Internet, we propose that in the context of NSFs these relate to the following:
a) implementing a comprehensive marketing of the respective sport; b) promoting federation; c) providing services to clubs, sport participants, media, sponsors, institutions; d) strengthening the presence of the federation as an important source of information and
its credibility;

236
e) reducing the time and cost of communication with the key internal and external
stakeholders; f) securing additional fund-raising through sponsorship, advertising, and online shopping
(the website as an interactive marketing platform); g) obtaining public support on crucial sport-related issues and socially important causes; h) recruiting new volunteers.
In this regard, the paper sets out to unveil how and to what extent Bulgarian national sport federations (as a primary object of investigation) make use of their own websites perceived as a strategic resource for fulfilling managerial, economic, and communication strategies.
METHODS
Cukier and Middleton’s (2003) and LEVERUS’s (2004) studies [1, 3] of voluntary-sector organisations’ presence on the Internet were employed to identify the key methodological components of the study. 35 national sport federations (a response rate of 47%) out of 75 which have developed their own websites were surveyed by an online self-administering questionnaire. It was made available to and filled out by executive directors / secretaries general who are responsible for the federations’ daily operations. The survey was conducted between March and April 2012. 65% of the federations under scrutiny administer Olympic and the remaining 35% deal with non-Olympic sports which allowed for making a comparative analysis between the two groups and for unveiling some particularities.
RESULTS
Just as the poor quality of the content of information published on a Website site and poor design in terms of overall appearance, navigation, interactivity, and presentation of information alike, are factors that have the most negative impression on users. Figure 1 presents to what extent the people involved in the operational management of NSFs were satisfied with the overall design and navigation of their organisations’ Web sites.

237
As seen in the figure, totally 75% of Olympic federations and 60% of their counterparts with non-Olympic status display a high level of satisfaction with the design and ease of navigation on their УWeb sites. Another 25% and 40% of Olympic and non-Olympic federations respectively expressed certain reservations. In this respect the results of LEVERUS’ study (2004) [3] also confirm the importance of these two components to the overall satisfaction from the Web sites of public sector organisations.
As it becomes clear from figure 2, NSFs consider their presence on the Internet as a very important factor contributing to the achievement of their objectives. This is confirmed by the results according to which 75% of Olympic and 80% of non-Olympic federations indicated that their Web sites are very important for the fulfilment of their objectives, including 15% and 20% respectively which consider the Web essential. In addition, it can be said that while 35% of Olympic federations and 40% of non-Olympic governing bodies believe that their Web sites are extremely effective in achieving their objectives (50% and 47% for the two types of organizations respectively) other 15% of Olympic NSFs and 13% of their counterparts consider this true only to some extent.
NSFs understand and highly appreciate the opportunities that the Internet provides for the distribution of different in type, size, direction and content information, as exemplified by figures 3 and 4. High values are observed when using the Web site to promote the federation as an important source of information. Also, high importance has been attributed to the Websites’ potential to disseminate information to a wide audience in a fast and money and time-saving way. Those resources can be redirected to other activities (as opposed to the cost of using conventional means such as mail, fax, paper).
NSFs render significant importance to their Web site as a tool for providing services to different groups of current and potential users which leads to an increased credibility in the governing body. Among the main users of federations the following can be distinguished: clubs, athletes, coaches, administrative staff, fans, media, sponsors, officials, institutions, general public and other resource partners. In this regard, Web sites play a very important role in the development of sustainable and personalised relations between the federation and its stakeholders.

238

239
With the advance of new communications technologies the balance of power between market players has shifted significantly. The Web facilitates information access, which empowers sport customers and helps establish virtual communities (Internet users with common interests). Reach (people/locations) and range (variety) of information has also expanded dramatically [4]. Sport federations have been presented with enhanced opportunities due to the ability of the Internet to provide a direct access to new target groups of sport participants.
Without an effective technological support by the federation (in the form of investment in design, content, interactivity and functionality of the Web site), communication and maintaining sustainable relationships with different audiences is difficult and expensive [5].
If we, however, compare NSFs in terms of investing in the development of their Web sites (as a share of their annual budget) then it becomes clear that most often the amount is less than 1% (figure 5).
This is true for 65% of Olympic and 60% of non-Olympic federations, while only 5% and 7% respectively allocate some funds in the range of 4-5% of their budget. This suggests that the NSFs’ top managers have not yet formed the necessary understanding of the strategic role of their Web sites, by investing in better designs, navigation, functionality, interactivity, range and quality of services provided to different users.
Drawing on the results of the study we can summarise that all NSFs’ Web sites have passed the initial stage of functionality which relates to communicating background information about the federation and its activity. In this sense, it is important to establish the level of the each Web site’s interactivity as the second stage of the functionality spectrum (provision of information and services) [2]. For example, Web sites that do not provide any interactive forms can be qualified in the low level of interactivity and static. This applies to both types of federations, but especially for those with non-Olympic status (figure 6).

240
The most popular features emerge to be maintenance of calendar of past and upcoming events (it is the case with 90% of the federations), links to other files (90%), links to other Web sites (89%), section with archived documents such as news, Executive board and different committees’ decisions, and regulations (75%). Much less developed are interactive features, enabling for more active involvement of the users, such as maintaining a blog section (10%), chat forum (40%), updates by e-mails and mobile phones (20%), online shopping (20%), online polls and surveys (25%), job notices in different areas of the sport (20%). In the case of the non-Olympic NSFs these are completely absent or constitute only an insignificant share.
The Internet can help NSFs gather important information about different users. It can be socio-demographic background (e.g. gender, age, education, residence, occupation, life cycle); psychometrics (e.g. sport participation motives and attitudes, habits, leisure time structure), and economic (e.g. level of income, customer loyalty). Usually this happens during registration and as Girginov et al (2009, p. 176) put it in this regard ‘NSOs can then track the access, use, and length of time viewing particular Web pages’. From the data obtained it becomes clear that none of the federations’ Web sites has passed the stage of maturity (customers data processing). At the same time a high level of interactivity of the Web site is a prerequisite for building personalized relationships with users [2, 4].

241
CONCLUSION
The results show that NSFs’ managers find the Web very effective and increasingly important platform for achieving their mission and goals. Significant differences between sport governing bodies that run Olympic and non-Olympic sports respectively are observed with regard to the delivery of various interactive forms on their Web sites, with a strong predominance of those with Olympic status. Concerning the level of functionality, the majority of federations’ Web sites can be qualified in the initial stage to provide basic information and promotion activities, and low to medium degree of interactivity in the provision of services for different users. In all federations under scrutiny an overall satisfaction with the design and navigation of the Web site was expressed, which is very important for repeat visits but these are subjective assessments. The managers of NSFs can benefit significantly from a more strategic view of the role of their Web sites by investing in better designs, functionality, and interactivity. Further research is needed to develop Internet-based strategies, ffeatures and mechanisms for the development of federations running both collective and individual sports.
REFERENCES
[1] CUKIER, W., C. MIDDLETON. Evaluating the Web presence of voluntary sector organisations: As assessment of Canadian Web sites. IT & Society, 1 (3), 102–130, 2003.
[2] GIRGINOV, V., M. TAKS, B. BOUCHER, S. MARTYN, M. HOLMAN, J. DIXON. Canadian national sports organizations’ use of the Web for RM in promoting sport participation. International Journal of Sport Communication, 2, 164-184, 2009.
[3] LEVERUS. Annual Internet survey for associations and not-for profit organisations. Ottawa, 2004.
[4] WANG, F., M. HEAD, N. ARCHER. A relationship-building model for the Web retail marketplace. Internet Research: Electronic Networking Applications and Policy, 10 (5), 374-384, 2000.
[5] WANG, F., M. HEAD. Consumer Relationship Marketing on the Internet: An Overview and Clarification of Concepts, Innovative Marketing, (1), 55-68, 2005.

242
DEVELOPMENT OF THE CZECH AND SLOVAK VERSIONS OF THE
YOUTH SPORT ENVIRONMENT QUESTIONNAIRE
Pavol Siska,1 Alex J. Benson,2 Mark A. Eys,3 Silvia Priklerova,4 & Pavel Slepicka1
1Department of Pedagogy, Psychology and Didactics, Faculty of Physical Education and Sport, Charles University in Prague, Czech Republic
2Department of Psychology, Wilfrid Laurier University, Waterloo, ON, Canada 3Departments of Kinesiology/Physical Education and Psychology, Wilfrid Laurier University,
Waterloo, ON, Canada 4 Department of Sport Games, Faculty of Physical Education and Sport,
Comenius University in Bratislava, Slovak Republic
ABSTRACT The aim of this international study was to translate and analyze the psychometric properties of responses to the Czech and Slovak versions of the Youth Sport Environment Questionnaire (YSEQ; Eys, Loughead, Bray, & Carron, 2009) in a sample of elite youth handball and soccer players. First, the questionnaire was translated into the Czech and Slovak languages by method of parallel back-translation. In Phase 2, feedback was sought on the translated versions of each questionnaire from both researchers (n = 2) and athletes (n = 52) to ensure the clarity of the instructions and the readability of the items. Subsequent confirmatory analyses in the final phase provided an adequate fitting model for both Czech and Slovak versions with an independent sample (n = 352) from youth sport teams. These results offer further support to Eys et al.’s (2009) proposed two dimensional model underlying their measure of cohesion for youth sport groups. KEY WORDS: group cohesion, translation, confirmatory factor analysis INTRODUCTION
Cohesion is defined as “a dynamic process that is reflected in the tendency for a group to stick together and remain united in the pursuit of its instrumental objectives and/or for satisfaction of member affective needs” (Carron, Brawley, & Widmeyer, 1998, p. 213). Empirical examinations have found that cohesion is positively linked to a number of important variables including performance (e.g., Carron, Colman, Wheeler, & Stevens, 2002), passion (Paradis, Martin, & Carron, 2012), and return to sport rates (e.g., Spink, Wilson, & Odnokon, 2010). Given the importance of cohesion in sport, several efforts have been made to measure this construct (e.g., Martens, Landers, & Loy, 1972; Yukelson, Weinberg, & Jackson, 1984). The most widely accepted assessment of cohesion in the sport domain is the Group Environment Questionnaire (GEQ) developed by Carron, Widmeyer, and Brawley (1985). This questionnaire is based on a multidimensional conceptual model, which highlights that team members hold perceptions about their group’s unity (i.e., group integration) and their personal attractions to the group (i.e., individual attraction to the team). Further, Carron et al. (1985) proposed that these perceptions can be considered with respect to the task and social aspects of the group. Thus, the resultant four dimensional model includes (a) individual attraction to the group – task (ATG-T), (b) individual attraction to the group – social (ATG-S), (c) group integration – task (GI-T), and (d) group integration – social (GI-S). The GEQ is certainly the most widely used questionnaire for assessing team cohesion in sport. However, the authors of the questionnaire were clear that there are also limits to its

243
use. Generally speaking, the GEQ was developed for team sport athletes between the ages of 18 and 30 (Carron et al., 1985) and, not surprisingly, the majority of cohesion research has focused on adult athletes in interdependent sports. More recently, researchers have made efforts to understand cohesion in other populations (e.g., older adults or youth). Specific to the population of interest for the present study, researchers have attempted to use the GEQ with youth athlete samples despite potential issues with this approach (e.g., Høigaard, Safvenbom, & Tønnessen, 2006; Rovio, Eskola, Kozub, Duda, & Lintunen, 2009; Borrego, Cid, & Silva, 2012). Eys et al. (2009) discussed several limitations of the GEQ as a measure of cohesion with youth sport teams including language complexity and the use of mixed stems. In addition, they noted that the conceptual model underlying the GEQ may not be applicable for adolescents because of developmental differences. As such, Eys et al. (2009) developed the Youth Sport Environment Questionnaire (YSEQ) to assess cohesion in adolescent sport teams (approximately ages 13–17). The final version of the YSEQ contains 18 items rated on a 9-point Likert-type scale from 1 (strongly disagree) to 9 (strongly agree). The focal parts of the questionnaire are 16 items divided into two dimensions: task and social cohesion (8 items each). In addition to the 16 task and social items, two negative items are included in the questionnaire—but not analyzed—to aid in detecting invalidating response sets due to problems such as response acquiescence (e.g., answering 9 to all questions out of disinterest; Eys, Carron, Bray, & Brawley, 2007). Another alteration to the GEQ has been its translation into a number of different languages. In 2002, for example, Heuzé and Fontayne carried out the first translation of the GEQ for use in French-speaking populations. This was followed by translations into Spanish (Balaguer, Castillo, Moreno, Garrigues, & Soriano, 2004), German (Ohlert, 2012), Portuguese (Junior, Vieira, Rosado, & Serpa, 2012), and Italian (Steca, Pala, Greco, Monzani, & D'addario, 2013). Through subsequent investigations, the development and communication of these tools have resulted in a broader understanding of cohesion generally, as well as from an international perspective.
We contend that parallel translation practices with the youth version (i.e., YSEQ) could result in similar advances. For example, from a conceptual standpoint, the two dimension structure of the YSEQ (i.e., task and social dimensions) proposed and supported by Eys and colleagues (2009) is a substantive deviation from the original four dimension GEQ. Assessing questionnaire responses of youth from a variety of cultures will offer some evidence of the robustness of this proposed conceptual model, as well as allow for further examination of how cohesion is linked with other important variables. From an applied perspective, a greater understanding of the role that cohesion plays in youth sport teams will allow for positive group experiences to be fostered, which has broad implications for future sport choices (Spink et al., 2010). This is important as the issue of sport participation and physical inactivity is international in scope. Therefore, the purpose of the present study was to translate and assess the preliminary psychometric properties of responses to the Czech and Slovak versions of the Youth Sport Environment Questionnaire in a sample of elite adolescent handball and soccer players. The accomplishment of this general purpose involved three phases of research. In Phase 1, the YSEQ was translated into the Czech and Slovak languages via parallel back-translation (Brislin, 1970). In Phase 2, the questionnaires were examined by athletes and investigators who were tasked with assessing the clarity of the instructions and the items. In the final phase, confirmatory factor analyses were used to assess responses to the Czech and Slovak versions of the Youth Sport Environment Questionnaire provided by an independent sample.

244
METHODS AND RESULTS Phase 1: Translation of the YSEQ from English to Czech and Slovak The main objective of this phase was to translate the YSEQ into the Czech and Slovak languages. To achieve this, we used the well-established method of parallel back-translation (Brislin, 1970). Two individuals fluent in both languages translated their version of the questionnaire from English to Czech and another two translators carried out the Czech to English back translation without seeing the original version of the questionnaire. An identical process was employed for the Slovak translation. The translators’ primary language was Czech or Slovak, respectively, and seven worked previously as professional translators whereas the eighth was a professor of sport psychology. All translators worked independently and were instructed to aim for conceptual, rather than literal, translation and to keep the language compatible with a reading level of age 13. The translators were also asked to give two possible translations if they were unsure how to best express the original item. As a result, two translated options were created for two items in the Czech version (i.e., item 6: I do not get along with the members of my team; item 14: I am happy with my team´s level of desire to win) and one item in the Slovak version (item 3: As a team, we are all on the same page). Subsequently, we assessed all versions of the questionnaires with the principal objective of preserving the original meaning of each item. No items were deemed problematic, which resulted in the first iterations of the Czech and Slovak YSEQ including 20 and 19 items, respectively. Phase 2: Comprehension of the Items for the Target Population The purpose of Phase 2 was to evaluate the clarity of the items for both the Czech and Slovak versions and to resolve the problem with the selection of the translation for the three items in the previous phase. During this stage, two academic experts (i.e., university professors who have published in the field of sport psychology) assessed both the Czech and Slovak versions. Both agreed with the translations and the content-relevance of the items for assessing group cohesion with Czech and Slovak youth populations. Finally, elite youth soccer and handball athletes ranging in age from 13 to 18 years (Mage = 15.40, SD = 1.12) were asked to complete the questionnaire. The sample consisted of 52 male (n = 28) and female (n = 24) athletes, from both the Czech (n = 22) and Slovak (n = 30) Republics. Furthermore, participants were asked to give their perceptions of the meaning of each item. In particular, they were asked to give their thoughts on the meaning of the three items for which two translated options were created (items 3, 6, and 14) and to mark which one was easiest to understand. The end result of this phase was the creation of Czech/Slovak versions of the YSEQ, each consisting of 18 items. Phase 3: Confirmatory Factor Analysis The purpose of the final phase was to evaluate the proposed model fit of responses to the Czech and Slovak versions of the YSEQ through confirmatory factor analysis (CFA) procedures (using AMOS 17).
Participants. The sample consisted of 352 elite youth sport participants from the Czech (n = 225 participants) and Slovak (n = 127 participants) Republics, with an age range of 13 to 19 years (Mage = 15.56, SD = 1.36). This sample size is considered appropriate based on suggestions by Comrey and Lee (1992). The athletes from the Czech Republic were 193 males and 32 females (13 to 19 years; Mage = 15.67; SD = 1.35) whereas those from the Slovak Republic consisted of 108 males and 19 females (13 to 19 years; Mage = 15.36, SD = 1.36). Overall, they represented 22 elite youth teams from two team sports (soccer, k = 15; handball, k = 7), of which 13 teams were from the Czech Republic and 9 teams were from Slovakia. Procedure. Elite football and handball academies in the Czech and Slovak Republics were

245
contacted to ask if their youth coaches would be interested to participate with their teams in our research. Overall, we contacted 30 football and handball academies in the Czech Republic and 22 academies in Slovakia for permission to explain the purpose of our study to their team. Subsequently, 22 coaches agreed to allow us to speak to their team. The questionnaires were completed collectively under the supervision of the first author in meeting or changing room facilities before a training session and with the presence of coaches. The approximate time taken to complete the questionnaire was 15 minutes. The measurements were recorded approximately 2 or 3 weeks before the end of the first half of the 2012/2013 competitive season. RESULTS Table 1 presents descriptive statistics and standardized factor loadings of all items from the confirmatory factor analysis for the total sample and the separate Czech and Slovak samples. Parallel to Eys et al. (2009), we specified a two factor model of cohesion (i.e., social and task) that allowed both factors to correlate with one another, constrained the error variances to 1, and scaled the factor loadings to 1. Further, missing data were handled by using a maximum likelihood estimation approach (Enders & Bandalos, 2001). Model fit was evaluated by using multiples indices based on guidelines put forth by Hu and Bentler (1999): relative χ2 (< 3.00 for a good fit); comparative fit index (CFI; > .90 for an adequate fit and > .95 for an excellent fit); root mean square error of approximation (RMSEA; < .08 for an adequate fit and < .06 for an excellent fit). Although the initial CFA for the total sample demonstrated a near acceptable model fit, χ2 (103) = 398.861, p < .001, relative χ2 = 3.87, CFI = .899, RMSEA = .086, separate analyses for both the Czech version, χ2 (103) = 326.376, p < .001, relative χ2 = 3.17, CFI = .861, RMSEA = .096, and the Slovak version, χ2 (103) = 234.620, p < .001, relative χ2 = 2.28, CFI = .905, RMSEA = .092, showed inadequate fit indices. Examination of the standardized residual covariances indicated that social item 15 (i.e., we stick together outside of practice) had large absolute residual covariances with several other items (i.e., item 3 = 4.49, item 5 = 3.75, item 8 = 3.40, item 14 = 3.61, and item 16 = 4.68). We removed this item based on Jöreskog and Sörbom’s (1984) suggestion that a standardized residual covariance greater than two is problematic because it indicates a large difference between the sample covariance matrix and the population covariance matrix. We conducted a second confirmatory factor analysis without item 15, which demonstrated a near excellent model fit for the total sample, χ2 (89) = 244.270, p < .001, relative χ2 = 2.745, CFI = .940, RMSEA = .067. Moreover, an acceptable model fit was demonstrated for both the Czech version, χ2 (89) = 167.088, p < .001, relative χ2 = 1.87, CFI = .936, RMSEA = .076, and the Slovak version, χ2 (89) = 201.235, p < .001, relative χ2 = 2.261, CFI = .919, RMSEA = .073. This process resulted in the final versions of the YSEQ for Czech and Slovak Republic youth team sport athletes consisting of 17 items, such that there are 15 items across two dimensions of task (8 items) as well as social (7 items) cohesion, plus two negatively worded items used for similar purposes outlined by Eys et al. (2009; to detect invalidating response sets). DISCUSSION The aim of this study was to translate and analyze the psychometric properties of responses to the Czech and Slovak versions of the YSEQ in a sample of elite youth handball and soccer players. The results of the current study provide two translated versions of the YSEQ that allow future researchers to measure group cohesion in youth team sports in the Czech and Slovak Republics. Both final versions are presented in the Appendices. Overall, the results from our analyses support Eys et al.’s (2009) suggestion that a two factor model of group cohesion is appropriate for youth team sports. Although these findings are the first to

246
demonstrate additional support for the factorial validity of responses to the YSEQ, it was necessary to exclude one social cohesion item that demonstrated poor standardized residual covariances with several other items. Our results, however, are generally consistent with previous researchers who reported reasonable success with translated versions of the adult cohesion questionnaire (GEQ; e.g., Balaguer et al., 2004; Heuzé & Fontayne, 2002; Junior et al., 2012; Ohlert, 2012; Steca et al., 2013). Some of these aforementioned authors found a few items exhibiting lower factor loadings, which is comparable with our findings. Another point of the discussion relates to the sample used in the present study. First, we designed this international study with representation of young Czech and Slovak players because of the similarity between countries with respect to culture and language. For 75 years prior to 1993, the countries were considered as one state (i.e., Czechoslovakia) and jointly took part in sport competitions. In fact, several sport leagues are still organized across the border (e.g., women’s handball league). Second, the generalizability of the results are somewhat constrained given that the sample consisted only of youth elite handball and soccer players. As a result, detections from this investigation are particularly valid for task interdependent sport teams (Evans, Eys, & Bruner, 2012). Accordingly, researchers should focus on considering the validity and reliability of responses with heterogeneous samples of elite and recreational team sports. Nevertheless, the translation of the YSEQ offers several promising avenues for future research in the Czech and Slovak Republics. Understanding the role that cohesion plays within youth sport, with the aid of an appropriate measurement tool, as well as its associations with other important variables including satisfaction, performance, and adherence warrants considerable attention (e.g., Carron, Eys, & Burke, 2007).
ACKNOWLEDGEMENTS This study was supported by a grant from Charles University in Prague, Faculty of Physical Education and Sport (Project name: PRVOUK P -39 Social Scientific Aspects of Human Movement Studies). The first author would like to thank Dr. Mark Eys and his colleagues from the Wilfrid Laurier Group Dynamics and Physical Activity Laboratory for their help and cooperation on this study. REFERENCES [1] BALAGUER, I., CASTILLO, I., MORENO, Y., GARRIGUES, V., & SORIANO, L. (2004). El clima motivacional y la cohesión en equipos de fútbol. Encuentros en Psicología Social, 2, 152-156.
[2] BORREGO, C. C, CID, L., & SILVA, C. (2012). Relationship between group cohesion and anxiety in soccer. Journal of Human Kinetics, 34, 119-127.
[3] BRISLIN, R. W. 1970. Back-translation for cross-cultural research. Journal of Cross Cultural Psychology, 1, 185–216.
[4] CARRON, A. V., BRAWLEY, L. R., & WIDMEYER, W. N. (1998). The measurement of cohesiveness in sport groups. In J. L. Duda (Ed.), Advances in sport and exercise psychology measurement (pp. 213-226). Morgantown, WV: Fitness Information Technology.
[5] CARRON, A.V., COLMAN, M.M., WHEELER, J., & STEVENS, D. (2002). Cohesion and performance in sport: A meta-analysis. Journal of Sport & Exercise Psychology, 24, 168–188.

247
[6] CARRON, A.V., EYS, M.A., & BURKE, S.M. (2007). Team cohesion. In S. Jowett & D. Lavallee (Eds.), Social psychology in sport (pp. 91–102). Champaign, IL: Human Kinetics.
[7] CARRON, A.V., WIDMEYER, W.N., & BRAWLEY, L.R. (1985). The development of an instrument to assess cohesion in sport teams: The Group Environment Questionnaire. Journal of Sport Psychology, 7, 244–266.
[8] COMREY, A. L., & LEE, H. B. (1992). A first course in factor analysis. Hillsdale, NJ: Erlbaum.
[9] ENDERS, C. K., & BANDALOS, D. L. (2001). The relative performance of full information maximum likelihood estimation for missing data in structural equation models. Structural Equation Modeling, 8, 430-457.
[10] EYS, M. A., CARRON, A. V., BRAY, S. R., & BRAWLEY, L. R. (2007). Item wording and internal consistency of a measure of cohesion: The Group Environment Questionnaire. Journal of Sport and Exercise Psychology, 29, 395-402.
[11] EYS, M. A., LOUGHEAD, T. M., BRAY, S. R., & CARRON, A. V. (2009). Development of a cohesion questionnaire for youth: The Youth Sport Environment Questionnaire. Journal of Sport & Exercise Psychology, 31, 390-408.
[12] EVANS, M. B, EYS, M. A., & BRUNER, M. W. (2012). Seeing the “we” in “me” sports: The need to consider individual sport team environments. Canadian Psychology, 53, 301-308.
[13] HEUZÉ, J., & FONTAYNE, P. (2002). Questionnaire sur l’Ambiance du Groupe: A French language instrument for measuring group cohesion. Journal of Sport & Exercise Psychology, 24, 42–67.
[14] HØIGAARD, R., SAFVENBOM, R., & TØNNESSEN, F. E. (2006). The relationship between group cohesion, group norms, and perceived social loafing in soccer teams. Small Group Research, 37, 217-232.
[15] HU, L., & BENTLER, P.M. (1999). Cutoff criteria for fit indexes in covariance structure analysis: Conventional criteria versus new alternatives. Structural Equation Modeling, 6, 1–55.
[16] JUNIOR, N. A. R. J., VIEIRA, F. L., ROSADO, B. F. A., & SERPA, S. (2012). Validação do Questionário de Ambiente de Grupo (GEQ) para a língua portuguesa. Motriz, Rio Claro, 18, 770-782
[17] JÖRESKOG, K. G., & SÖRBOM, D. (1984). LISREL VI: Analysis of linear structural relationships by the method of maximum likelihood. Chicago: National Educational Resources
[18] MARTENS, R., LANDERS, D. M., & Loy, J. W. (1972). Sport cohesiveness questionnaire. Washington, DC: AAHPERD Publications.
[19] OHLERT, J. (2012). Kohäsionsfragebogen für Individual- und Teamsport - Leistungssport
[20] (KIT-L): A German-language instrument for measuring group cohesion in individual and team sports. International Journal of Sport and Exercise Psychology, 10, 39-51.
[21] PARADIS, K. F., MARTIN, L. J., & CARRON, A. V. (2012). Examining the relationship between passion and perceptions of cohesion in athletes. Sport & Exercise Psychology Review, 8, 22–31.

248
[22] ROVIO, E., ESKOLA, J., KOZUB, S. A., DUDA, J. L., & LINTUNEN, T. (2009). Can high group cohesion be harmful? A case study of a junior ice-hockey team. Small Group Research, 40, 421-435.
[23] SPINK, K. S., WILSON, K. S., & ODNOKON, P. (2010). Examining the relationship between cohesion and return to team in elite athletes. Psychology of Sport and Exercise, 11, 6–11.
[24] STECA, P., PALA, N. A., GRECO, A., MONZANI, D., & D'ADDARIO, M. (2013). A psychometric evaluation of the Group Environment Questionnaire in a sample of professional basketball and soccer players. Perceptual and Motor Skills, 116, 262-271.
[25] YUKELSON, D.P., WEINBERG, R.S., & JACKSON, A. (1984). A multidimensional group cohesion instrument for intercollegiate basketball teams. Journal of Sport Psychology, 6, 103-117. Table 1 Descriptive Statistics and Standardized Factor Loadings for Confirmatory Factor Analysis (N = 352; nCzech = 225; nSlovak = 127) Factor Item Factor Loading Mean SD Overall Czech Sample Slovak Sample Task 1 .66 .66 .65 7.07 1.45 3 .65 .65 .66 6.60 1.67 5 .78 .78 .79 6.85 1.74 8 .84 .94 .76 6.88 1.79 10 .67 .83 .52 7.80 1.58 14 .62 .78 .47 7.18 1.76 16 .63 .67 .60 6.54 2.04 18 .49 .58 .40 8.29 1.11Social 2 .77 .78 .77 6.34 2.12 4 .65 .74 .56 7.63 1.97 7 .71 .80 .65 5.63 2.16 9 .80 .78 .82 7.31 1.89 11 .80 .87 .74 6.95 1.94 13 .75 .79 .71 7.63 1.75 17 .82 .78 .86 7.33 1.87 Note. *Social Item 15 was removed from second CFA

249
Appendix A
Czech version Dotazník sportovního prostředí pro mládež Následující otázky se ptají na vaši zkušenost s týmem, do kterého patříte. Odpovězte prosím zakroužkováním čísla na škále od 1 do 9, do jaké míry souhlasíte s každým tvrzením. 1. Všichni jsme cílům našeho týmu stejně oddaní.¹ 2. Své spoluhráče zvu, aby se mnou podnikali různé věci.² 3. V týmu si všichni rozumíme.¹ 4. Někteří z mých nejlepších přátel jsou členy tohoto týmu.² 5. Líbí se mi, jak spolupracujeme jako tým.¹ 6. Se členy svého týmu příliš nevycházím.³ 7. Scházíme se při každé možné příležitosti.² 8. Jako tým jsme jednotní.¹ 9. Často kontaktuji své spoluhráče (telefonicky, prostřednictvím SMS či internetu).² 10. Tento tým mi poskytuje dostatek příležitostí pro zlepšení mého sportovního výkonu.¹ 11. Trávím čas se svými spoluhráči.² 12. V našem týmu spolu příliš nespolupracujeme.³ 13. Se svými spoluhráči zůstanu v kontaktu i po skončení sezóny.² 14. Jsem spokojený s tím, jak moc chce můj tým vyhrát.¹ 15. Můj přístup ke hře je stejný jako u mých spoluhráčů.¹ 16. Často jsme ve vzájemném kontaktu (telefon, SMS, internet).² 17. Líbí se nám, když spolupracujeme jako tým.¹
1 2 3 4 5 6 7 8 9 vůbec nesouhlasím naprosto souhlasím ¹Položka úkolové koheze ²Položka sociální koheze ³Reverzibilní negativná položka

250
Appendix B
Slovak version Dotazník športového prostredia pre mládež Nasledujúce otázky sa pýtajú na vašu skúsenosť s tímom, do ktorého patríte. Odpovedzte prosím zaškrtnutím čísla na škále od 1 do 9, do akej miery súhlasíte s každým tvrdením v dotazniku. 1. Všetci sme rovnako oddaní cieľom nášho tímu.¹ 2. Pozývam svojich spoluhráčov, aby so mnou podnikali rôzne veci.² 3. V tíme si všetci rozumieme.¹ 4. Niektorí z mojich najlepších priateľov sú členovia tohto tímu.² 5. Páči sa mi, jak spolupracujeme ako tím. ¹ 6. S členmi môjho tímu si príliš nerozumiem.³ 7. Stretávame sa navzájom pri každej možnej príležitosti.² 8. Ako tím sme jednotný.¹ 9. Často kontaktujem svojich spoluhráčov (telefonicky, prostredníctvom SMS či webu).² 10. Tento tím mi poskytuje dostatok príležitosti na zlepšovanie môjho športového výkonu.¹ 11. Trávim čas so svojimi spoluhráčmi.² 12. Náš tým nespolupracuje príliš dobre.³ 13. So svojimi spoluhráčmi zostanem v kontakte aj po skončení sezóny.² 14. Som spokojný s tým, ako moc chce môj tím vyhrať.¹ 15. Môj prístup k hre je rovnaký ako u mojich spoluhráčov. ¹ 16. Často sa vzájomne kontaktujeme (telefonicky, prostredníctvom SMS či internetu). ² 17. Pači sa nám, keď spolupracujeme ako tým. ¹ 1 2 3 4 5 6 7 8 9 absolútne nesúhlasím absolútne súhlasím ¹ Položka úlohovej kohézie ² Položka sociálnej kohézie ³ Reverzibilná negatívna položka

251
OSTEOPOROSIS RISK SCORE EVALUATION IN POPULATION OF
WOMEN OVER FIFTY
Marek Smoleňák1, Natália Oršulová2
1 II. Department of Pediatrics, Faculty of Medicine and Children University Teaching Hospital and Policlinic Bratislava
2 Department of Sport Educology and Sport Humanistic, Faculty of Physical Education and Sport, Comenius University Bratislava
ABSTRACT
Osteoporosis is a systemic disease characterized by structure bone disorders and low bone mass. Disorder leads to fragility and increased risk of osteoporotic fracture. Important in the osteoporosis management is a healthy lifestyle and lifelong physical activity, which increases the bone density level up to 50% recommends exercises focused on aerobic endurance, muscle strength development and flexibility. The aim of the study Athletics as a part of disabled people life quality was to evaluate the osteoporosis risk score in the population of women over fifty. We expected higher risk of osteoporosis in women section and higher manifestation of vices in men section. Using the questionnaire method we summarized answers of 38 respondents. Based on osteoporosis risk score analysis, we identified that 71.7% of women have slightly increased risk of osteoporosis development. We noticed higher percentage of more than 5 cm body height decrease in women section (13.2%). Most women (57.9%) certified calcium rich eating habits & adequate milk income from their childhood. Sport for all is a medium of health - enhancing physical activity. Women in monitored group attend sport activities only occasionally (34.2%). 28.9% of women attend sport activities rarely what is alarming in combination with a sedentary job they are working at. Based on the increasing risk of osteoporosis in our sample we recommend higher participation in physical activity and health risks elimination.
KEY WORDS: osteoporosis, healthy lifestyle, risk factors, physical activity
INTRODUCTION
Osteoporosis as a disease is well known for many years.The surge mainly occurs is caused by prolonging human life, improper diets, unhealthy lifestyle as well as other regional and civilizational factors. Estimated prevalention in the population of Caucas is 6-7% and it is significantly increasing. According to epidemiologists the mankind stands on the threshold of a new pandemic osteoporosis (Fig.1). The incidence of fractures resulting from an inadequately small traumas is alarming. Every second woman and every eighth man in the age group above 50 years suffer during their lifetime at least one osteoporotic fracture (Killinger et al., 2013).

252
Fig. 1 Projected number of osteoporosis fractures worldwide (http://www.iofbonehealth.org/epidemiology)
Osteoporosis is a systemic metabolic disease characterized by reduced bone mass and disruption of the bone microarchitecture. Bones are metabolically active organs which are being remodeled during the human life. Bone formation and amount of the bones is increasing in the childhood and adolescence. The ”Peak Bone Mass” achieved in the period from 20 to 30 years. Subsequent equilibration between osteoformation and osteoresobtion is maintained in women up to the menopause, when the deficiency of estrogen leads to bone loss of 1-3% per year. Failure leads to fragility and increased risk of osteporotic fracture. Osteoporotic fracture occurs at most in both bones of the forearm above the wrist called ”Colles fracture”, thoracic and lumbar vertebrae or in the femoral neck. Fractures occurring in elderly polymorbid patients have a serious impact on morbidity, mortality, and quality of life. Fracture is mainly in the elderly cause of secondary complications. Each prevalent fracture is a precondition of further. More than third of the patients after fracture of femoral neck has permanent restriction of movement and 20% of them die a year after the accident from various complications.. The risk of osteoporotic fracture is comparable to the risk of cardiovascular disease (Killinger, Payer, 1998; Killinger et al., 2013). The first step to identifying risk factors is explicit anamnesis. Most often risk factors of osteoporosis are (Fig. 2 (Řehořková, Špičková a Špičková, 2008).
Etiopathogenetically we describe the primary (postmenopausal, senile), secondary, idiopathic and idiopathic juvenile osteoporosis. In general, osteoporosis occurs asymptomatic but already the first signs may be obvious complication of the disease. Back pain can cause spontaneous vertebral compression fracture with subsequent decrease in body size and enlargement of thoracic kyphosis, leading to compensatory lordosis in the distal part of the spine with characteristic bulging abdomen (Fig. 3). Important role in the prevention and treatment of osteoporosis is lifetime physical activity and healthy lifestyle. Smoking, alcohol and hypokinesis are risk factors for the disease. Modification of lifestyle in the form of risk elimination, increasing physical activity and responsible patient is an important element in the treatment of osteoporosis. Physical activity is very important in the process of bone
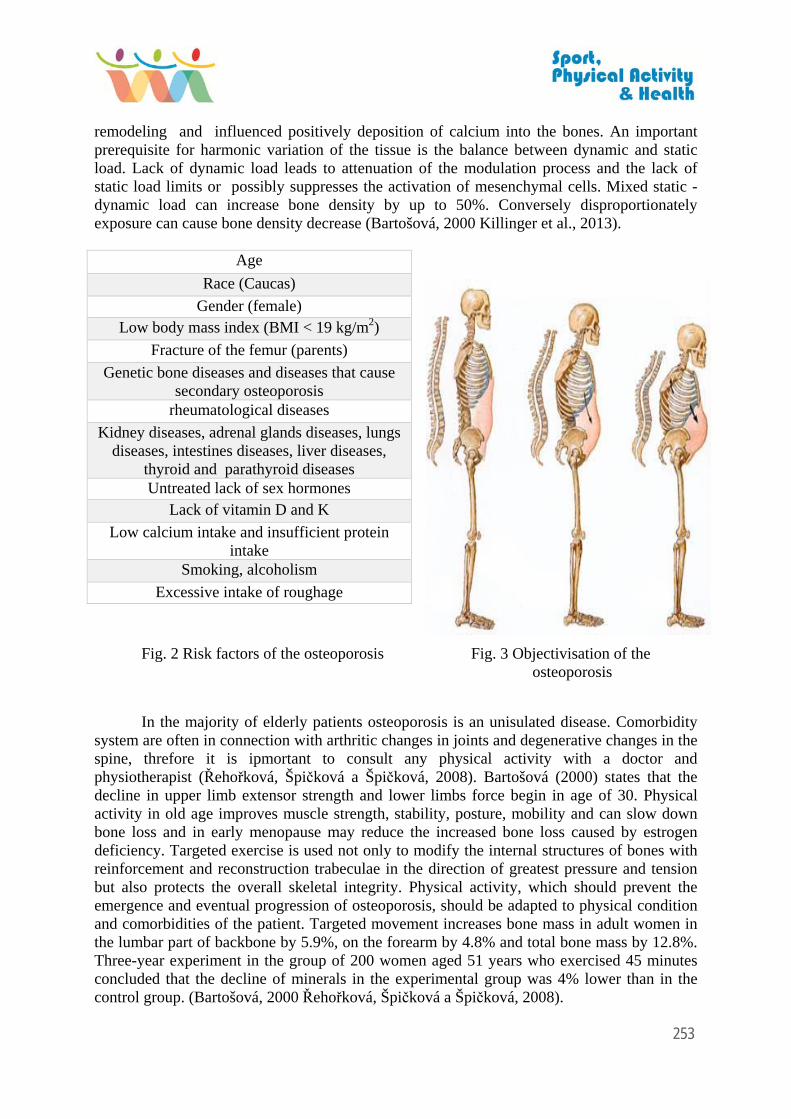
253
remodeling and influenced positively deposition of calcium into the bones. An important prerequisite for harmonic variation of the tissue is the balance between dynamic and static load. Lack of dynamic load leads to attenuation of the modulation process and the lack of static load limits or possibly suppresses the activation of mesenchymal cells. Mixed static - dynamic load can increase bone density by up to 50%. Conversely disproportionately exposure can cause bone density decrease (Bartošová, 2000 Killinger et al., 2013).
Fig. 2 Risk factors of the osteoporosis Fig. 3 Objectivisation of the osteoporosis
In the majority of elderly patients osteoporosis is an unisulated disease. Comorbidity system are often in connection with arthritic changes in joints and degenerative changes in the spine, threfore it is ipmortant to consult any physical activity with a doctor and physiotherapist (Řehořková, Špičková a Špičková, 2008). Bartošová (2000) states that the decline in upper limb extensor strength and lower limbs force begin in age of 30. Physical activity in old age improves muscle strength, stability, posture, mobility and can slow down bone loss and in early menopause may reduce the increased bone loss caused by estrogen deficiency. Targeted exercise is used not only to modify the internal structures of bones with reinforcement and reconstruction trabeculae in the direction of greatest pressure and tension but also protects the overall skeletal integrity. Physical activity, which should prevent the emergence and eventual progression of osteoporosis, should be adapted to physical condition and comorbidities of the patient. Targeted movement increases bone mass in adult women in the lumbar part of backbone by 5.9%, on the forearm by 4.8% and total bone mass by 12.8%. Three-year experiment in the group of 200 women aged 51 years who exercised 45 minutes concluded that the decline of minerals in the experimental group was 4% lower than in the control group. (Bartošová, 2000 Řehořková, Špičková a Špičková, 2008).
Age
Race (Caucas)
Gender (female) Low body mass index (BMI < 19 kg/m2)
Fracture of the femur (parents)
Genetic bone diseases and diseases that cause secondary osteoporosis
rheumatological diseases
Kidney diseases, adrenal glands diseases, lungs diseases, intestines diseases, liver diseases,
thyroid and parathyroid diseases Untreated lack of sex hormones
Lack of vitamin D and K
Low calcium intake and insufficient protein intake
Smoking, alcoholism
Excessive intake of roughage

254
By Zvarka (1998) is adequate physical activity along with diet, medicamentosa prevention and therapy, a crucial factor in comprehensive prevention and treatment of osteoporosis. The role of physical therapy is to
loose muscle hypertonus and get rid of pain sufferers, strain the bone so that there was an increase in the formation of bone matrix, strengthen the muscles in order to be burdened with more force and that in the area of
the spine are created more massive muscles, which help cushion the vertebrae abutting each other with intervertebral discs, which will reduce the pain,
increase the ability to reconcile the activities of daily nature. The general principle appears to favor tension excercise before swish exercise, endurance
over speed, prefer bipedal locomotion with submaximal intensity adhere to the adequacy of the content, form, intensity and time (30-60 min, maximum 180 min) (Bartošová, 2000).
Literature recommends exercising at least 3 times a week (Řehořková, Špičková a Špičková, 2008; Labudová, Nemček, 2007). Each exercise should be repeated 10 to 15 times in one serie, and gradually increasing the load during 3-4 weeks. Fundamentally we avoid spinal flexion exercises, because they increase the compressive pressure on the front of the body and the risk of vertebral wedge fractures and further deterioration of kyphosis. Inappropriate physical activity are those with risk of falls, steep swings, shocks and rebounds on a hard surface, intense dynamic exercise extreme rotation (watch out also for spinal exercises), big load, load lifting and contact sports (Sojáková, Gályová, 2000).
For lying patients with acute complications during their stay in the hospital and later at home we use breathing exercises with later training of abdominal and thoracic breathing, isometric exercises to strengthen abdominal, gluteal and quadriceps muscles, practicing passive joints of the lower and upper limbs, and strengthening using rubber devices. Whereas, bed rest can increase bone loss, it is necessary to mobilize the patient as soon as possible (Zvarka, 1998).
After the subsidence of the acute stage, patients generally manifested chronic pain caused by scoliotic or kyphotic spine changes and undue stress ligaments and muscle tone. Therefore, it is necessary to start with training proper posture and eliminate muscle imbalances (Vojtašák, 1998). Dominant role plays (Zvarka, 1998):
Strengthening the gluteal muscle in combination with pulling and paravertebral muscle relaxation training
Strengthening the back extensors to achieve muscle corset. Exercises are done in the lying on belly in case of a major pain sitting on a chair,
Hauling of musculi iliopsoas and pectoral muscles.
Complex changes occurring in osteoporosis require a special, comprehensive program-osteogymnastics - a targeted movement program that requires trainer (physiotherapist) to create a complete picture of the patient, about his medical condition and the consequences that occures it in connection with osteoporosis. The patient should assume a good supply of exercises that he is later able to train himself in domestic program, without professional guidance (Sojáková, Gályová, 2000). To achieve the objective, it is necessary to gain confidence of patient and be able to understand his pain and respond to questions in order to justify the need and importance of exercise to improve health. The program of osteogymanstics includes (Sojáková, Gályová, 2000):
stretching exercises,

255
breathing exercises, mobilization exercises, relaxation, strengthening of weakened muscles, shortened muscles hauling, training of posture and basic locomotion, dynamic stabilization.
Labudová (2000) and Tóthová (2006) recommend program focused on aerobic endurance
in order to improve the functional capacity of the respiratory and cardiovascular function, to develop the muscles of the shoulder girdle, pelvis and back, and flexibility. Aerobic activities
From aerobic activities patients start with short walks which cause muscle fatigue, but not muscle pain or chest pain. Good incentive to maintain adequate functional capacity of the cardiovascular system, respiratory system and an excellent way to develop endurance skills is walking. The impact of walking on the muscle strenght is influenced by properly engage of the leg muscles. The weight of the body while walking puts pressure on the long bones and leads to irritation of receptors at the site of muscle attachments, which comprehensively impact on improving bone strength. Walking with proper technique improves posture, balance and coordination. The untrained patients must start with walks in the length of 1 km, distance gradually extended to 3 - 4 km, then 5 - 7 km with simultaneous increase walking speed. In older individuals with lower physical fitness program start with a frequency of 70 steps / min for 10 min, then a rate of 100 steps / min for a period of 55-60 minutes (Sojáková, Gályová, 2000; Labudová, Tóthová, 2006).
Cycling is also suitable for osteoporotic patients who have a good posture while driving and avoiding the so-called ″roach backs″ (Zvarka, 1998 Řehořková, Špičková a Špičková, 2008). In cyclical movement are harmoniously working muscle groups performing movement in hip, knee and ankle joint. Static work of the muscles of the upper extremities and trunk posture strengthens and helps to maintain balance. Optimal speed for recreational cycling is 16 km / hour. In case of heart rate higher than 120 / min five minutes after the end of active work in sitting, it is necessary to reduce the driving speed. For walking as well as for cycling we choose flat terrain, so that we prevent the risk of falling or the possible need of dropping down from the bicycle. During breaks we choose balancing exercises to compensate bending during cycling. Movement in the countryside on a sunny day is also an excellent means to obtain necessary vitamin D (Zvarka, 1998 Sojáková, Gályová 2000).
Positive impact of antigravity movement in the aquatic environment on the health status of patients with osteoporosis is confirmed by many scientific studies. Training in water allows the perception of sensitivity of the body, strength and endurance exercises against the resistance of water, exercises and practicing of joint coordination in a relaxed state. Swimming strengthens the musculature of the spine. Spine must take the proper position while swimming, the movements are fluid, subtle enough carried out against the slight resistance of the water, so the muscles are getting stronger. Regular practice in aqueous environment requires the physical properties of the water environment a positive impact on the body of the patient with osteoporosis (Sojáková, Gályová, 2000). The effect is substantially conditioned by the temperature of water. Very low water temperature (below 20 °C) solidificates the muscles and causes lack of their involvement in the training (Kilinger, Payer, 1998 Řehořková, Špičková a Špičková, 2008). Zvarka states(1998) that swimming is in terms of improving bone density usually inefficient, it is important to maintain fitness and

256
muscle coordination. Its effect is shown on muscle and connective tissue component and on the functionality of the blood stream (Bartošová, 2000).
For patient it is important to understand the meaning and attenuated effect of exercise and not just accept exercise as a mechanical work. Practicing in osteoporosis means to exercise regularly and long term, because the positive effect of physical activity on bone mineral density is lost after ending (Sojáková, Gályová, 2000).
METHODS
The aim of the study was the incidence of osteoporosis prognosis in a selected sample of women over 50 years. We assumed higher risk of developing the disease in this sample of women. In the second hypothesis, we assumed a lower percentage of abuse - smoking and drinking alcohol as part of the risk factors based of nowadays knowledgement about influence of risk factors in developing of the osteoporosis. Research tasks were:
Assess the risk of osteoporosis score in the group of women Analyze risk factors showing the highest incidence rate
Using the questionnaire method was summarized responses from 38 respondents 68.2% of the respondents belong to the group of active workers, retirees group consisted of 12 respondents (31.6%). Characteristics of the reference group-average age, height, weight and Body Mass Index (BMI) are presented in the table (Tab.1).
Tab.1 Sample characteristics
age height mass BMI WOMEN 56,5 167,7 72,7 25,9
To obtain the data, we used a combination of two questionnaires. Dichotomous questions of forecasting increased risk of osteoporosis questionaire (Čápová, 2000) and questionnaire "Osteoporosis risk score" (Gályová, 2000). The obtained data were evaluated in percentage. We have to determine the significance of differences between the most frequent answer using the t-test.
RESULTS AND DISCUSSION Analysis of the results reached the following knowledge. The important factors in the prevention and treatment of osteoporosis include determining the risk profile of the patient. Analysing of osteoporosis risk score, we came to the finding that 13.2% of respondents belongs to a group with low risk of osteoporosis, 15.8% in the group with an increased risk of developing the disease, with the recommendation significant lifestyle changes. Not more than 71.7% of them belong to the group with a slightly increased risk and therefore the necessity of subsequent dispensing (Fig. 4).

257
Fig. 4 Classification of Osteoporosis Risk Score
The menopause started at the age of 48-52 years in 47.4% of women respondents, at the age of 45 to 47 years in 26.3% <T = 2.138, p <0.05>. Before the 45th year the menopause started in 15.8% of respondents <T = 5.965, p <0.01>. For reasons other than pregnancy missed menstrual cycle for more than a year 10.5% of the respondents <T = 6.882, p <0.01>. Based on the results of clinical trials is hormone replacement therapy nowadays indicated for the prevention and treatment of osteoporosis, but only for the purpose of influencing the climacteric syndrome. Positive effect on bone is therefore an additional positive aspect of this therapy (Killinger et al., 2013).
Experienced height loss of more than 5 cm (Fig. 5, question 4) occurred in the sample in 13.2%. The most important anthropometric determinant of bone mineral density is body weight (Ho - Pham, 2014). We appreciate that 63.2% of women have normal weight, 34.2% suffers from overweight <T = 2.557, p <0.05>.
Adequate intake of calcium and vitamin D is an absolute prerequisite for the prevention and treatment of osteoporosis (Fig.5). Most substantial step is to start with prevention during childhood. The preferred source of calcium in the first year of life breast milk of effective and proper nursed mother, in the case of failure initial and ongoing lactation milk fortified with adequate amount of calcium (Kapellerová, 2002). Kovács (2010) for children as well as for adults is recommended as the best source of calcium, milk, yogurts and cheese. Vitamin D is given regardless of the manner of nutrition from 3 weeks of age until at least the second year of life, with recommendation of re-administration during adolescence daily in drip form in case of premature infants at a dose of 800 IU/day (2 drops/day in a spoon of lukewarm milk). Recommended daily intake of vitamin D in adults is 100 IU/day and calcium 1000-1200 mg/day, ideally in the form of normal nutrition.

258
Fig.5 Vitamin D status in adults around the word when avalilable, vinter values were used to calculate the mean 25(OH) F levels (www.vitamindwiki.com)
Most respondents (57.9%) revenue diet rich in calcium, with sufficient intake of milk and milk products since childhood. 26.3% reported that their adult intake of calcium and milk products has decreased in general significantly <T = 2.559, p <0.05>. Respondents also commented on the issue of problems of stool and diarrhea incidence (Fig. 5, question 8), whose regular occurrence identified 7.9% of them. We believe that a possible reason of mentioned difficulties with the stool could from bloating, flatulence and borborigmi as a result of the income of milk products, which may be associated with a decrease in lactase and justify restrictions intake of milk products. If the patient is unable to receive the recommended amount of calcium in the diet caused by lactose intolerance supplementation using calcium preparations is indicated (Killinger et al., 2013).
Elimination of avoidable risk factors - excessive alcohol intake, smoking, low intake of vitamin D and calcium in the diet and hypokinetic way of life is an important element for prevention of the disease (Killinger et al., 2013). We appreciate that in our sample of women, decreased the number of active smokers. In the past smoked actively 39.5% currently smoke 15.8% of respondents. 78.9% of women drink alcohol occasionally, 18.4% are abstinents <T = 5.347, p <0.05>. As other risk factors respondents reported diabetes mellitus, liver diseases and osteoporosis in the mother anamnesis.
Only 1 respondent in the sample has hip fracture following a small fall or injury in a family history of (Fig. 6, question 1). Hip fracture had only one women respondent in personal history (Fig. 6, question 2). To reduce the incidence of osteoporotic fracture formation contributes according to Killinger et al. (2013) reducing the risk of falls in the form of removal of architectural barriers, choice of suitable shoes, correction of vision, dizziness and removing inappropriate antihypertensive therapy. Corticosteroid as a part of the drug therapyreported 10.5% women (Fig. 6, question 3).

259
Fig. 6 Osteoporosis Risk Factors of the respondents
1-femoral neck fracture in family history 2 - hip fractures in the personal history 3 -
corticosteroid therapy 4- a decrease in the amount of body height 8 - problems with stool.
Sport for All is a type of health-enhancing physical activity. Labudová (2011) states that men aged 51-64 years considered the most important motive for participation in sports health improvement. Women aged 51-60 years in the first place given relaxation after loading, orientation to improve health was only a secondary motive. Bendíková (2010) reported that in a sample of 211 elderly women as the primary motive of participation in sporting activity is improving their health and social factors, 89% of respondents, according to the author based on primary human needs in the senior age.
Daily participation in regular physical activity appropriate antigravity character (dance, skiing, gymnastics, brisk walking) has a positive impact not only on bone density but also for improving muscle coordination and movement as a crucial element in the prevention of falls. Alarming is that in the group of women most respondents attend sport activities occasionally (34.2%) and sporadically (28.9%), moreover those with sedentary job. CONCLUSION The prevention and treatment of osteoporosis use dominant regime recommendations, nonpharmacological and pharmacological intervention. Preventive recommendations are essential, particularly for individuals with increased risk of osteoporosis score (Killinger et al., 2013). We appreciate the reduction of the risk factor impact - smoking in our group of women, where the amount of active smokers was lowered what decreased the amount of oxygen radicals and also the negative oxidation phospholipid cell membranes were suppressed. Disappointing is the fact that regular sports activity attend only 3 of 38 (7.8%) respondents, despite the financial quirements of physical activities recommended as the prevention of osteoporosis. Physical activity is one of the best natural implements to maintain the bone strength. Most of our respondents (71.7%) belong to a group with a slightly increased risk of osteoporosis and therefore the necessity to subsequent dispensing. We suggest to reduce the impact of risk factors, increase the participation in sport and physical activity and adequate income of calcium and vitamin D through natural diet or through supplementation with dietary supplements in both groups of respondents.

260
ACKNOWLEDGEMENT This research has been realised within the VEGA grant project no. 1/0915/13 “Sport activity – a part of the quality of life of people with disabilities“. REFERENCES [1] BARTOŠOVÁ, M. (2000). Osteoporóza a jej vzťah k pohybovej aktivite. In: Gályová, I. Osteoporóza a pohybová aktivita. Šport pre všetkých Bulletin č.22. Bratislava: SZRTVŠ, s. 11-19. [2] BENDÍKOVÁ, E. (2010). Význam pohybových aktivít v spôsobe života senioriek. In: Telesná výchova a šport. XX, 4/2010, ISSN 1335-2245. s. 10-15 [3] ČÁPOVÁ, Ľ. (2000). Čo vieme o osteoporóze. In: Gályová, I. Osteoporóza a pohybová aktivita. Šport pre všetkých Bulletin č.22. Bratislava: SZRTVŠ, s. 5-11. [4] GÁLYOVÁ, I. (2000). Osteoporóza a pohybová aktivita. Šport pre všetkých Bulletin č.22. Bratislava: SZRTVŠ. [5] HO PHAM et al. Association between lean mass and bone mineral density: a meta analysis. [cit. 25.2.2014] Dostupné na http://www.ncbi.nlm.nih.gov/pubmed/24384013 [6] KAPELLEROVÁ, A & ZVOLENSKÝ M. (2002). Výživa. In: Kapellerová, Alica a kol. Propedeutika detského lekárstva. Bratislava: Univerzita Komenského v Bratislave, Lekárska fakulta, s.53-69. ISBN 80-223-1624-5. [7] KOVÁCS, L. (2010). Výživa a jej poruchy. In: Kovács, Lászlo a kol. Pediatria. Bratislava: Arete, s. 159-181. ISBN 978-80-970624-0-8. [8] KILINGER, Z.&PAYER J.& ŠTEŇOVÁ E. (2013). Metabolické osteopatie. In: Kiňová, Soňa, Hulín et al. Interná medicína. Bratislava: ProLitera, s.987-992. ISBN 978-80-970253-9-7. [9] KILINGER, Z., & PAYER, J. (1998). Patogenéza osteoporózy. In: Spustová, Viera. Osteoporóza. Bratislava: SAP, 116-122. ISBN 80 –88908–10-8. [10] LABUDOVÁ, J. (2000). Pohybová aktivita žien so zdravotnými poruchami. In: Šimonek, Jaromír. Pohybová aktivita žien. Bratislava: Slovenský olympijský výbor, s. 74-90. ISBN 80-88901-35-9. [11] LABUDOVÁ, J. (2011). Motívy športovania dospelých a ich názory na šport pre všetkých. In: Telesná výchova a šport, Ročník XXI, 1/2011, s. 11-16. ISSN 1335-2245. [12] LABUDOVÁ, J., NEMČEK, D. (2007). Pohybová aktivita starších žien s poruchou zdravia. In Aktivní v každém věku. Olomouc : Univerzita Palackého, 2007, s. 64-68. [13] LABUDOVÁ, J., TÓTHOVÁ, D. (2006). Motor activity in senior with diabetes and cardiovascular impairments. In Physical activity and successful aging. Book of Abstracts. Cologne : German Sport University, 2006, s. 111 [14] MUNTAU, A. C. et al. (2009) Vitaminy rozpusté v tucích. In: Muntau, Ania Carolina et al. Pediatrie. Praha: Grada Publishing, 62-67. ISBN 978-80-247-2525-3. [15] Projected number of osteoporosis fractures worldwide (http://www.iofbonehealth.org/epidemiology) [16] ŘEHOŘÍKOVÁ, P. & ŠPIČKOVÁ, M. & ŠPIČKOVÁ M (2008). Odvápnění kostí čili osteoporóza. Praha: Forsapi, s.r.o., 104 s. ISBN 978-80-87250-00-6 [17] SOJÁKOVÁ, M. & Gályová I. (2000) Osteo-fti program. In: Gályová, Iveta. Osteoporóza a pohybová aktivita. Šport pre všetkých Bulletin č.22. Bratislava: SZRTVŠ, s. 19-48. [18] TÓTHOVÁ, D. (2006). Názory na pohybovú aktivitu ako súčasť starostlivosti o zdravie u žien. In Sport a kvalita života 2006. Brno : Masarykova Univerzita, 2006. ISBN 80-210-4145-5 [CD-ROM]

261
[19] Vitamin D status in adults around the word when avalilable, vinter values were used to calculate the mean 25(OH) F levels (www.vitamindwiki.com) [20] ZVÁRKA, J. (1998) Zásady rehabilitácie pri osteoporóze. In: Spustová, Viera. Osteoporóza. Bratislava: SAP, s. 116-122. ISBN 80 –88908–10-8

262
APPEARANCE AND STRUCTURE OF INDIVIDUAL´S GAMEPLAY SKILLS AND COMBINATIONS IN THE GAMEPLAY TEAM SYSTEMS
OF SENIORS´ TEAMS IN ICE HOCKEY
Igor Tóth
Comenius University in Bratislava, Faculty of Physical Education and Sports, Department of Sports Games, Slovakia,
email: [email protected]
ABSTRACT The appearance of individual gameplay actions in a hockey match is determined by their particular type and kind. Various gameplay situations are solved by gameplay actions. Any defensive or offensive gameplay system, gameplay combinations. Gameplay combinations are formed by gameplay actions of an individual. We have carried out a four-year longitudinal research (169 international hockey players, 8 matches in the years 2011-2014). The results have shown that in the senior national hockey a standard structure of the appearance of gameplay combinations or gameplay actions of individuals exists within the same gameplay systems of the teams. Progress in gameplay rules, in coaches´ strategy in the game, the current tactics and concepts have also influenced the fact, that the presence of some team gameplay systems significantly declines (reorganized offense) at the expense of others (shot firing puck offense). Defense focuses on so-called: effective defending zones. The concepts of games are changing. Our outputs confirm reciprocal hierarchy and mutual arrangement in a system, their structure in the subsystem. Issuing from the assigned appearance and structure it is appropriate to determine the gameplay strategy, the concept of the team gameplay goals in the tournament, and thus to handle successfully the monitoring. KEY WORDS: gameplay team systems, gameplay combinations, gameplay skills of individuals, offense, defense, seniors, national teams, ice hockey INTRODUCTION The appearance of individual gameplay skills in a hockey match is determined by their particular type and kind. Various gameplay situations are solved by gameplay skills. Any defensive or offensive gameplay system of the team consists of gameplay combinations. Gameplay combinations are formed by gameplay skills of an individual. AIM OF STUDY To determine the incidence and structure of individual skills, game playing combinations and systems of the team game in international tournament matches of the Slovak team during the Slovakia Cup 2011-2014, their dominance in systems of team game and game play combination in offence and defense. METHODS We have carried out a four-year longitudinal research on a sample of 169 hockey players of Slovakia men national team (in 8 matches) on the international level. The research was conducted on a sample of senior national players and their teams (Slovakia vs. Germany, Latvia, Belarus, Norway) which played in a tournament system in the years 2011-2014; Slovakia Cup. The primary record of game play skills and their occurrence in individual matches has been made by a method of indirect observation.

263
RESULTS The results have shown that in the senior national hockey a standard structure of the appearance of gameplay combinations or gameplay actions of individuals exists within the same gameplay systems of the teams. Also a preference of dominant actions (combinations, gameplay actions of an individual) typical for gameplay systems both, in offense and defense has become evident (fig. 1-6.) In the table 1-4B is expressed the incidence and dominance of different individual skills in the subsystem. Legend: top – above the average incidence (over 81%), good – good incidence (61-80%), medium – average incidence (41-60%). This can determine the identity of gameplay intensions, gameplay systems of individual teams and their characteristics. Progress in gameplay rules, in coaches´ strategy in the game, the current tactics and concepts have also influenced the fact, that the of some team gameplay systems significantly declines (regroup) the expense of others (dump in zone).

264

265
Tab. 1: Offensive phase - dominant frequency gameplay combination in gameplay team
Tab. 1 give and go crossing breakaway
vertical passbackward
pass screening dump in
control breakout
TOP EXCELENT
GOOD
position control breakout
TOP EXCELENT
TOP EXCELENT
GOOD GOOD
counter attack
TOP
EXCELENT
breakaway play
MEDIUM TOP
EXCELENTTOP
EXCELENT
regroup
MEDIUM MEDIUM TOP
EXCELENT GOOD
dump in zone
GOOD MEDIUM TOP
EXCELENT
aggressive offensive play
GOOD GOOD GOOD GOOD

266
Tab. 2: Defensive phase - dominant frequency gameplay combination in gameplay game systems
Tab. 2 supporting sandwiching switching men
to men principle
withdraw from the zone
zone coverage
TOP EXCELENT
men to men coverage
combined men to men
MEDIUM GOOD TOP
EXCELENT TOP
EXCELENT zone pressing
MEDIUM GOOD TOP
EXCELENT Tab. 3A: Offensive phase - dominant frequency individual gameplay skills in gameplay combinations
Tab. 3B: Offensive phase - dominant frequency individual gameplay skills in gameplay combinations
Tab. 3A stick
handling (dribbling)
passing the puck
receiving the puck
faking without the
puck
faking with the
puck give and go
GOOD GOOD TOP
EXCELENT
Crossing TOP
EXCELENT
breakaway vertical pass
MEDIUM TOP
EXCELENT TOP
EXCELENT
backward pass
MEDIUM MEDIUM MEDIUM
screening
MEDIUM
dump in
MEDIUM
Tab. 3B shooting, scoring
tip in the puck
rebound the puck
breaking to net dumping the
puck in
give and go
Crossing
breakaway vertical pass
TOP EXCELENT
TOP
EXCELENT
backward pass
screening
MEDIUM GOOD TOP
EXCELENT
dump in
TOP EXCELENT
MEDIUM TOP
EXCELENT

267
Tab. 4A: Defensive phase - dominant frequency individual gameplay skills in gameplay combinations
Tab. 4B: Defensive phase - dominant frequency individual gameplay skills in gameplay combinations
Tab. 4B catching and
blocking shots covering the man
in zone back checking icing the puck
supporting
TOP
EXCELENT
sandwiching
switching men to men principle GOOD
withdraw from the zone
TOP EXCELENT
GOOD
RESUME The game as a whole can be devided into smaller units, into combinations and gameplay actions of an individual. The gameplay system of the team in hockey matches can be exactly determined by the occurrence of specific combinations and actions of individuals, as well as their structure, respectively, their dominance in the game. The result of the game is the special „hockey puzzle" of skills and actions (note: gameplay team systems from typical and characteristics gameplay combinations; gameplay combinations from typical and characteristics individuals skills). CONCLUSION We can state that our results have positively confirmed the expected changes in the balance of gameplay actions in the current game both, in a defense and offense on a representative level. Our outputs confirm their reciprocal hierarchy and their mutual arrangement in a system, their structure in the subsystem. Issuing from the assigned appearance and structure it is appropriate to determine the gameplay strategy, the concept of the team gameplay goals in the tournament, and thus to handle successfully the monitoring.
Tab. 4A fore checking stick checking body checking move blocking supporting
MEDIUM GOOD
sandwiching
TOP EXCELENT
GOOD GOOD GOOD
switching men to men principle MEDIUM GOOD
withdraw from the zone MEDIUM

268
EXERCISE AND PSYCHOSOCIAL INTERVENTION IN PROSTATE
CANCER PATIENTS
Aurel Zelko1, Eugen Laczo1, Jana Potočníková2, Tomáš Gregor2
Faculty of Physical Education and Sports, Comenius University in Bratislava 1Department of Track & Field, 2Department of Sport Educology and Sport Humanistic
ABSTRACT Prostate cancer is the second most common cancer worldwide for males, and the fifth most common cancer overall. Treatment of prostate cancer is mostly accompanied with androgen deprivation therapy (ADT), which fundamentally influences physiologic and metabolic regulations for long time and ADT prominently interfere into experience and behavior of patient´s personality – appear symptoms like anxiety, depression, stress and fatigue. Utilizing the specialized strength training and autogenic training could reduce the adverse effects of ADT and promote the quality of patients’ lives with prostate cancer. Patients, with locally advanced prostate cancer will be divided to experimental and control group. Experimental group will be trained in sixteen weeks specialized strength training program by American College of Sports Medicine. Control group will perform usual daily activities. Control group will be offered identical intervention, after finishing the whole study. Every subject of research will perform pre and post intervention diagnostics – bone mineral density, structure and function of muscle tissue, physical and motor performance. Separately, we will monitor psychical states of patients too (Scale of personal contentment, Differential questionnaire of depression, Questionnaire of anxiety and anxiozity and Questionnaire Supso). Secondary, we will apply in our research autogenic training. The results of this study will provide new knowledge on the effectiveness of the strength and autonomic training on the quality of life, physical and psychological functions, bone health and muscle cellular outcomes in prostate cancer patients. Information on beneficial effects of physical activity and psychological intervention has the potential to reduce ADT adverse effects and improve the quality of patients´ lives. KEY WORDS: oncological patients, strength training, autogenic training INTRODUCTION Prostate cancer is the second leading cause of cancer deaths in men. As the incidence of prostate cancer continue to rise, the number of men that need help and support to assist them in coping with disease and treatment-related symptoms and their psychosocial effects is likely to increase. The side effects of the treatments and the medications used for prostate cancer, such as hormonal therapy and pain medications, can cause distress as well. The side effects of hormonal therapies can be particularly distressing for otherwise asymptomatic men. These side effects include: muscle and bone mass decreases, pain, hot flashes, body image changes, osteoporosis, anemia, fatigue, sarcopenia, gynecomastia, loss of libido, erectile dysfunction, and risk of diabetes, risk of cardiovascular disease and fatal cardiac events as well as possible emotional distress (Holzbeierlein et al., 2004). Approximately one in six men will be diagnosed with prostate cancer in their lifetime, and the number of men living with, or after, the diagnosis will continue to rise. Some of them will have physical problems such as difficulty in passing urine, pain and sexual dysfunction, and these may cause distress, anxiety, uncertainty or depression. There are some men who begin

269
to shun social contact because of side effects. Quality of life those patients may therefore be affected. Health professionals often provide interventions to address some of these prostate cancer–related symptoms and the psychosocial problems that they may cause. However as yet, we do not know how effective, collectively, these interventions are (Parahoo et al., 2013).
Patients with prostate cancer are influenced by their illness and treatment process, which is reflected on their psychical personality. In this cases are appear symptoms like depression, anxiety, stress, fatigue and pain.
Confusion over choosing from various interventions often adds to anxiety and depression in these patients (De Sousa et al., 2012). Anxiety tends to be the most often experienced symptom for men with prostate cancer (Roth et al., 1998). Others Authors (Pirl et al., 2002) observed 45 men with prostate cancer receiving ADT. They surveyed oncology patients for depression with the Beck Depression Inventory. The results of this study were that major depressive disorder was prevalent in 12,8% of the men with prostate cancer receiving ADT, what is eight times the national rate of depression in men, and 32 times the rate in men over 65 years old. Major depression was not associated with worsening disease, medical response to ADT, receiving chemotherapy, or the type of ADT. Past history of depression was associated with current depression in this population. No first onset cases of depression occurred on ADT in their sample. Symptoms of fatigue are particularly upsetting to men who have led active and independent lives. They usually result in increased dependence on family or friends, which are further reminders of the contrast with how they were before the cancer. Fatigue and lack of motivation can be caused by the illness (Roth et al., 2009). Authors (Chipperfield et al., 2013) support the idea too, that depression, anxiety, and cognitive dysfunction are common complaints in men with prostate cancer receiving androgen deprivation therapy (ADT). Consequently, the quality of life of these men is negatively impacted. Their systematic review evaluated the effectiveness of physical activity as an intervention to improve depression and anxiety symptoms, cognitive function, and quality of life in patients receiving ADT for patients with prostate cancer. However, the existing evidence is not sufficiently robust to determine the adequacy of physical activity as an intervention to improve depression, anxiety, and cognitive function outcomes in this patient group. Many of researchers agree with mean, there is need except physical activity also psychosocial intervention too. Psychosocial strategies are commonly used to alleviate anxiety and depression in patients with prostate cancer. Authors (Chien et al., 2013) work with previous studies, which have shown inconsistent results. They refer that previous results indicate that psychosocial strategies were more effective in reducing anxiety and depression compared with routine care, although the effect was not sustainable. They recommended on importance of psychological strategy in work with oncology patients. In our research we will apply autogenic training and we will observe changes in patient´s behavior. Next review (Parahoo et al., 2013) assessed studies that compared the effectiveness of psychosocial interventions versus the usual care those participants received. They compared three studies which were carried out in the United States. The results show that psychosocial interventions resulted in small improvements in quality of life at end of intervention; however, the quality of the evidence was largely rated as very low. Reason can be that men were at various stages of prostate cancer and interventions also varied in terms of content. In the end authors emphasize that more and better research is needed to determine which types

270
of psychosocial interventions are effective for meeting the needs of men at different stages of prostate cancer. Psychological and psychiatric interventions provide avenues for decreased stress and improved quality of living. Avoidance of these issues leads to increased suffering, significant psychological distress and feelings of despair, isolation, hopelessness, and passive thoughts of wanting to die (Roth et al., 2009). METHODS Organization of the research Patients with prostate cancer who are treated by ADT will be get involved into our research. Next, patients will be divided to experimental and control group. Experimental group will be trained in sixteen weeks specialized movement program by American College of Sports Medicine (2010) and autogenic training could reduce the influence of ADT and raise the quality of patients’ lives with prostate cancer. Patients will be divided to experimental and control group. Experimental group will be trained in sixteen weeks specialized movement program by American College of Sports Medicine (Schmitz et al., 2010) and autogenic training. Control group will perform usual daily activities. Control group will be offered identical movement program, after finishing the whole study. Every subject of research will perform input and output diagnostic monitored measurements - mineral density of bone, structure and function of muscle tissue, physical and motor ability. Separately, we will monitor psychical states of patients too (Differential questionnaire of depression, Questionnaire of anxiety and anxiozity and Questionnaire of structure and dynamic subjective experiences and states - Supso). Trying to get better quality of life the main aim is health treatment, particularly in patients with chronic cancer. Experimental program Autogenic training (AT) is a relaxation technique, which involves the daily practice. It is a method for influencing each other of psychical tension, autonomic nervous system and tension of muscles (Kratochvíl, 2006). This save method is practiced three times in day and it consists of 7 standard autogenic training exercises, which patients are preceding. The basic AT exercises focus on various physical manifestations of relaxation in the body. AT starts with basic relieving/relaxation next is heaviness in the musculoskeletal system and warmth in the circulatory system. These are followed by awareness of the heartbeat, breathing, abdominal warmth and a coolness of the forehead. Between positive effects of autogenic training belongs for example the parasympathetic activity lowers the blood pressure, slows the heart rate, reduce or manage recurring stress-related symptoms, significantly improves sleep quality, reduces or eliminates anxiety, mild depression, fatigue, asthma, chronic pained, promotes the functions of the immune system and gives you health and emotional balance and promotes personal growth. Next positives could be improve performance in sport, and reduce the likelihood of serious illness in the future.
RESULTS Results of input tests confirm previous results about increased depression and anxiety. We used two standardized questionnaires. In first - Differential questionnaire of depression, results indicate depression in 46 % of actual respondents. Nevertheless 54% of respondents suffering from depression mentioned 46% records several kinds of depression. We recorded frequently hypochondriac, anankastic disorder of personality and in someone self-tormenting too. The second of using questionnaire was Questionnaire of anxiety and anxiozity. Results of patients in this dimension were same disturbing. There were 54% of patients, who suffer increased anxiety. Patients described subjective difficulties in input Questionnaire of structure

271
and dynamic subjective experiences and states - Supso, where patients described their problems in 5 level scale (0 - 4). The most appeared difficulties of patients were in all of cases (13) sleep disorders, which patients described in scale like mostly frequent (3). Such reasons of sleep disorders, 11 of patients reported Nocturia - need to get up and go to the bathroom to urinate at night. Next disorder was difficulty falling asleep in 7 cases and problem with sleep maintenance, so patients wake up during the sleep in 6 cases. The last of sleep disorders, what patients described was drowsiness during the day in 3 cases. Second common physical problem was excessive swearing, which 13 of tested patients evaluated in scale like slightly (1) to frequent (3). Next physical problem was the urge goes on the toilet. Twelve of patients evaluated this difficulty on scale slightly (1) to often (3) and only one of patient circled option frequently (4). After that followed difficulty with physical fatigue, this had 11 of patients. Physical fatigue was described from slightly (1) to often (3) and one of patients circled option frequently (4). Difficulty with psychical fatigue had 8 from respondents, which reported mostly like slightly (1) and in one case like average (2) and in one case like frequently. Seven of tested patients had stomach problems (1-3) and three of patients described slightly loss of appetite. Only 5 patients had problems with headache, which evaluated on scale 1 to often 3. CONCLUSION Many of the advances in treatments will not necessarily improve disease outcomes but will be implemented primarily to reduce the side effects of treatments, and institutions will push to “sell” these treatments based on the reduction of side effects. ACKNOWLEDGEMENT Project was supported by agency for support research and development under contract number APVV-0518-12 and Grant junior researches number UK/291/2014. REFERENCES [1] DE SOUSA A, SONAVANE S, MEHTA J. Psychological aspects of prostate cancer: a clinical review. Prostate Cancer Prostatic Dis. 2012; 15(2):120-7.
[2] HOLZBEIERLEIN JM, CASTLE E, THRASHER JB. Complications of androgen deprivation therapy: prevention and treatment. Oncology (Williston Park). 2004, Mar;18(3):303-9.
[3] CHIEN CH, LIU KL, CHIEN HT, LIU HE. The effects of psychosocial strategies on anxiety and depression of patients diagnosed with prostate cancer: a systematic review. Int J Nurs Stud. 2014; 51(1):28-38.
[4] CHIPPERFIELD K, BROOKER J, FLETCHER J, BURNEY S. The Impact of Physical Activity on Psychosocial Outcomes in Men Receiving Androgen Deprivation Therapy for Prostate Cancer: A Systematic Review. Health Psychol. 2013.
[5] KRATOCHVÍL, S. 2006. Základy psychoterapie, 5. Version. Praha: Avicenum. 108 p. ISBN 80-7367-122-0
[6] PARAHOO K, MCDONOUGH S, MCCAUGHAN E, NOYES J, SEMPLE C, HALSTEAD EJ, NEUBERGER MM, DAHM P. Psychosocial interventions for men with prostate cancer. Cochrane Database Syst Rev. 2013; 12:CD008529.

272
[7] PIRL WF, SIEGEL GI, GOODE MJ, SMITH MR. Depression in men receiving androgen deprivation therapy for prostate cancer: a pilot study. Psychooncology. 2002; 11(6):518-23. [8] ROTH AJ, WEINBERGER MI, NELSON CJ. 2008. Prostate Cancer: Quality of Life, Psychosocial Implications and Treatment Choices. Future Oncol. 2008; 4(4):561–568.
[9] ROTH AJ, KORNBLITH AB, BATEL-COPEL L, PEABODY E, SCHER HI, HOLLAND JC. Rapid screening for psychologic distress in men with prostate carcinoma: a pilot study. Cancer. 1998; 82(10):1904-8.

273
THE INFLUENCE OF GENDER ON THE EFFECTIVENESS OF TGfU
IN TEACHING FRISBEE ULTIMATE
Zuzana Žuffova, Ludmila Zapletalova
Comenius University in Bratislava, Faculty of Physical Education and Sports Department of Sports Games
Slovakia
ABSTRACT
The aim of article is to find out if there are differences in the effectiveness of TGfU in terms of gender. Effectiveness of TGfU was evaluated based on the level of game skills - passing and game performance. The research was performed at education at FTVŠ UK. Coeducational group consisted of 5 female students and 10 students, boys' group of 20 students, who did not previous experience with play. Differences between the co-educated and the boys group, between boys group and the boys from co-educated group, between boys group and the girls group from co-educated group and between the girls and the boys from co-educated group were compared. In terms of gender, we can conclude with caution that TGfU was slightly preferable for boys than for girls. It could be possible that the girls have to put more attention on technique of game skills than boys.
KEY WORDS: frisbee ultimate, game skill, game performance, TGfU, boys, girls, coeducational teaching
INTRODUCTION
Due to acceptance of the state educational programme in 2008 a change of aims in the subject physical and sport education was noticed. The subject is more focused on development of the competences and attitudes. The objective is to create a permanent relation to the physical activity as a part of the lifestyle and assumption for lifelong health care (Antala et al., 2012). The change of the objectives of the physical and sport education requires change of the routine educational approaches. At present, we can see some effort to use alternative, more efficient models, resp. approaches that could help teachers to reach the aims. The suitable one that could help to reach aims at nowadays physical and sport education seems to be didactical approach based on teaching for understanding (TGfU). This approach enables students to create a relation to the sport at first and then to adopt tactical knowledge and when they understand, why they do something in the game, why each game skill is important for game performance (Griffin et al., 1997). Besides this, the approach is based on constructivist and cognitive theory of teaching, teaching through problem solving (problem teaching), situational, cooperative and experience teaching (Olosová, Zapletalová, 2013). According to Butler, Griffin (2010) TGfU, can provide sustainable feeling of personal satisfaction to the students. The area, which would solve efficiency of TGfU from the point of view of gender, resp. co-educated teaching, is little examined. Establishment of co-education in the system of education was understood as a step towards

274
gender equality performed only less than fifty years ago in many countries. Repeated establishment of separated boys and girls classes seems like step back in the European states. Results of researches about positive influences of separation of the individual genders are not inconclusive. Hyde (2005) concludes that men and women are in fact quite similar in most psychological parameters; however it is different to compare men and women and boys and girls. Studies about mixed classes prove that boys receive more attention from their teachers (Epstein et al., 1998). Not mixed groups e.g. enable girls to answer the questions without worries and to be more involved in their classes, boys to work harder without being worried what impression they cause during teaching (Younger, Warrington, 2007). This statement can be also applied in physical and sport education. If the group consists of girls only, the girls do not have to be worried to try to fulfil their assigned tasks, they do not have to be shy with boys if they are not able to perform any movement activity and vice versa, the boys can focus on themselves while performing their movement activities and do not have to be worried what impression they will leave on girls. According to some opinions, separated education of boys and girls could improve motivation, behaviour and results (SEED, 2006). Concerning teaching sport games, it is generally believed that boys have better assumptions for sport games. They are more competitive; they like overcoming obstacles and prove their qualities. In this paper we tried to contribute to proving these theories. We focused on verification of efficiency of frisbee ultimate educational programme based on TGfU from the point of view of gender and co-educated education.
METHODS
The research group consisted of students of Faculty of Physical Education and Sports. The co-educated group consisted of 5 girls and 10 boys and the boys group of 20 students. Their age was between 18 - 24 years. All of them were amateur athletes without experience with Frisbee ultimate. The students had 10 lessons of 90 min. (20% warm-up and special warm-up, 20% drill exercises, 40% game, 20% minor games with frisbee disc).
Methods of data collection
To obtain the data motor test of game skill and expert evaluation of game performance was used.
Test of game skill
The target with the size 2x3 m divided into 9 parts with assigned values from 1 to 5 (Fig. 1). The task for the student is to hit a target from the distance of 10 m and to gets as many points as possible. Definition of point values: 5 – the most suitable height of the pass for easy catching in the area of the trunk 4 – acceptable height of the pass which is directed to the level of the head (its catching is not difficult) 3 – adequate height of the pass but out of the area of the trunk, it is possible to manage it 2 – high pass, out of the area of the trunk, more difficultly manageable 1 – low pass, out of the area of the trunk, hardly manageable The numbers of successful hits in the target and at the number of points are evaluated. Each student had two trials. Better performance is taken into account (Argaj, Žuffová, 2013).

275
Figure 1 Target for accuracy passing in frisbee ultimate
Expert evaluation of game performance
To evaluate game performance a 5-grade scale according to GPAI (Mitchell et al., 2006) was used: 5 = very efficient performance, 4 = efficient performance, 3 = average performance, 2 = poor performance, 1 = very poor performance
Methods of data processing and assessment
Mann-Whitneyho U-test. The level of the statistic significance 5%.
RESULTS AND DISCUSSION
Differences between the co-educated and the boys group, between boys group and the boys from co-educated group, between boys group and the girls group from co-educated group and between the girls and the boys from co-educated group were compared. In the accuracy passing test, in both alternatives, as well as in game performance the boys group reached statistically significantly better results than co-educated group (p<0.01). However, the factual difference in the evaluation of game performance was very small (Tab. 1). The group of boys was statistically better than the boys from co-educated group in number of points in test of game skill (p<0.01). There were not discovered differences in number of attempts in skill test and in the level of game performance between the mentioned groups. Comparing the boys form both groups and the girls, the boys were significantly better in both alternatives of the skill test (p<0.01). The boys from co-educated group scored statistically significantly better in the level of game performance than girls from co educated group (p<0.01) (Tab. 1 a 2).

276
Tab. 1 Result of test of game skill and game performance assessment
Co-
edu
cate
d g
rou
p
Boy
s´ g
rou
p
Gir
ls o
f co
-ed
uca
ted
grou
p
Boy
s of
co
ed
uca
ted
grou
p
Skill test - points min 20 13 20 23 max 36 43 28 36 VR 16 30 8 13 Me 30 37 26 32 x 29.3 34.8 25 31.5
Skill test - successful attempts min 6 4 7 6 max 10 10 8 10 VR 4 6 1 4 Me 9 10 8 9 x 8.5 9.6 7.6 8.9 Game performance min 1.5 3 1.5 3 max 5 5 4.5 5 VR 3.5 2 3 2 Me 4 4 3 4.25
x 3.8 4 3.1 4.2
Tab. 2 Comparison of the differences between all groups (U-test)
Co-
edu
cate
d g
rou
p v
s.
Boy
s gr
oup
Boy
s gr
oup
vs.
b
oys
from
co
-ed
uca
ted
grou
p
Boy
s gr
oup
vs.
gi
rls
from
co
-ed
uca
ted
grou
p
Boy
s fr
om
co-e
du
cate
dgr
oup
vs.
gi
rls
from
co
-ed
uca
ted
grou
p
Test - points 64** 46.5** 10.5** 4,5 **
Test-successful attempts
51.5** 58.5 11.5** 6,5**
Game performance
35.5** 70 34.5 10**

277
Based on the results it could be assumed that the boys from the co-educated group tried to accept the girls during the game and adjusted their performance to them. This can be noticed in older categories of boys in general. They do not need to prove their qualities like teenager boys. During the experiment it was noticed that the boys in the co-educated group were more patient, tolerant and respectful towards the girls. They adjusted tempo of the game, accuracy of passes and defended less active. The results show, that the boys group was statistically significantly better than the boys from co-educated group in the test of game skill (alternative - number of points). The performance in the test of game skill was higher in boys group but the range of results was much bigger than in boys from co-educated group, which indicates greater compactness of performance of boys from co-educational group. Comparing the boys group and the girls from the co-educated group it can be assumed that the boys were more successful in the test of game skill due to better development of strength at disc throwing. The technique of disc throwing in this research was not assessed but during the test we noticed that the boys used more power than the girls. Their disc overcame 10-meter distance with higher speed, and in contrast to girls it did not start to glide, and flew directly to the target. When comparing boys and girls from the co-educated group it was noticed the same as mentioned above. Regarding the game performance, from the tactical point of view, the boys did not have difficulties with the game, regardless the sport specialisation. However, decisive factor with the girls was the game experiences. The girls that were not performing sport games or performed individual sports achieved worse game performance.
CONCLUSIONS
In the paper, it was tried to determine whether gender has an impact on the effectiveness of TGfU. The results indicate that sex impact was higher in the test of game skill than in the game performance. The girls were in the test of game skill worse than boys in both groups, although they demonstrated externally higher compactness of performance. In terms of gender, we can conclude with caution that TGfU was slightly preferable for boys than for girls. It could be possible that the girls have to put more attention on technique of game skills than boys.
REFERENCES
[1] ANTALA, B. Legislatívna podpora rozvoja pohybových aktivít v školskom prostredí. In ANTALA, B. et. al. 2012. Telesná a športová výchova v názoroch žiakov základných a stredných škôl. Bratislava, 2012, s. 6-21. ISBN 978-80-89324-09-5.
[2] ARGAJ, G., ŽUFFOVÁ, Z. The possibilities of evaluation of game skills and game performance in frisbee ultimate. In: Physical education and sports perspective of children and youth in Europe - 8th. FIEP European Congress, Bratislava 2013 - Book of abstracts. Bratislava: END, spol. s. r. o., 2013b, s. 31. ISBN 978-80-89324-12-5.
[3] BUTLER, J. I., GRIFFIN, L. L. More teaching games for understanding: moving globaly. Champaing: Human Kinetics, 2010. ISBN 978-0-7360-8334-8.
[4] DOBRÝ, L. et. al. Integrovaná praxe ve sportovních hrách. Tělesná výchova a sport mládeže. 2011, 77(2), s.7-17.
[5] EPSTEIN, D. et. al. Failing boys? Issues in gender and achievement.
Buckingham: Open University Press. 1998

278
[6] GABBET, T. et. al. Game-based training for improving skill and physical fitness in team sport athletes. International Journal of Sports Science and Coaching. 2009, 4 (9).
[7] GRIFFIN, L. et. al. Teaching sport concepts and skills. A tactical game approach. Champaing: Human kinetics, 1997. ISBN 0-7360-5453-7.
[8] HOPPER, T. Teaching Games for Understanding. The Importance of Students Emphasis over Content Emphasis. JOPERD. 2002, 73 (7), s. 44-48.
[9] HYDE, J.S. The gender similarities hypothesis. American Psychologist. 2005, 60 (6), s. 581-592.
[10] MANDIGO, J. et. al.. What is Teaching Games for Understanding? A canadian perspective. Physical and Health Education. 2007, 73 (2), s. 14-12.
[11] MITCHELL et. al. Teaching Sport Concepts and Skill - a Tactical Games Approach. Champaign: Human Kinetics, 2006. ISBN 0-7360-5453-7.
[12] OLOSOVÁ, G., ZAPLETALOVÁ, L. Výučba športových hier s porozumením. Telesná výchova a šport. 2013, 23 (4), s. 14-17.
[13] SEED (Scottish Executive Education Department), 2006. Insight 31: Review of strategies to address gender inequalities in Scottish schools. [pdf] Edinburg: Scottish Executive Education Department. . [cit. 2014-09-01].
Dostupné na: <http://www.scotland.gov.uk/Resource/Doc/113682/0027627.pdf>
[14] YOUNGER, M., WARRIGTON, M. Single-sex classes in co-educational schools. In K. Myers, H. Taylor, S. Adler & D. Leonard, eds. Genderwatch: …still watching. Stoke-On-Trent: Trentham. 2007s., 144-147.

279
SLOVAK LANGUAGE SECTION

280
ÚROVEŇ KOGNITÍVNYCH SCHOPNOSTÍ DETÍ S TELESNÝM POSTIHNUTÍM STREDNEJ ODBORNEJ ŠKOLY V BRATISLAVE
Tibor Balga, Miloš Chromík
Univerzita Komenského v Bratislave, Fakulta telesnej výchovy a športu, Katedra športovej edukológie a športovej humanistiky
ABSTRAKT
Charakteristickým sprievodným javom žiakov, ktorí sú postihnutí vrodenou alebo získanou nervovou poruchou, sú rôzne špecifické poruchy učenia, nedôvera vo vlastné schopnosti, znížené sebavedomie. Problém učenia sa je v priamej súvislosti s druhom a stupňom telesného postihnutia. Aj napriek zdravotnému znevýhodneniu sebavedomie niektorých jednotlivcov v konkrétnych parametroch je porovnateľné so zdravou populáciou. Uplatnením opytovacích metód a štúdiom materiálov a porovnávaním v nich zistených údajov s našimi, sme zhromaždili výsledky uplatniteľné v školskej praxi. Žiaci sledovanej školy majú v istých parametroch zdravú úroveň sebadôvery a sebaúcta žiakov je porovnateľná so zdravými rovesníkmi. V rozvíjaní kognitívnych procesov u žiakov zameraných na šport sme tiež nenašli rozpor. U niektorých diagnóz je však proces učenia sa pohybom výrazne limitovaný. Kompenzačné pomôcky nie sú prekážkou pri športovaní pre 16 % opytovaných žiakov, teda aj napriek telesnému postihnutiu pravidelne športujú. Šport a aktívny spôsob života sú významnými prostriedkami, ktoré prispievajú k zvyšovaniu ich životnej spokojnosti.
KĽÚČOVÉ SLOVÁ: kognitívne schopností, úroveň motorického učenia, telesné postihnutie
ÚVOD
Život človeka je popretkávaný vzdelávacími aktmi, no sú obdobia v ľudskom živote, keď osvojovanie si poznatkov, získavanie vedomostí, praktických zručností je oveľa jednoduchšie, napr. u detí ako u seniorov. Takéto senzitívne a veľmi aktívne obdobie vývoja ľudskej motoriky je odpozorované aj objektívne potvrdené ku koncu mladšieho školského veku. Mladší školský vek sa člení na dve obdobia: 6-7 rokov obdobie pohybového nepokoja; 8-10 rokov „zlatý vek motoriky“.
Mladší školský vek je najvhodnejšie obdobie pre učenie sa pohybom. Deťom v ňom ide všetko akoby samo. Zámernej pohybovej aktivite by mal dominovať tzv. herný princíp, kedy zaraďujeme vo väčšej miere pohybové hry. Dôležitý je zážitok a radosť z pohybu. Dôraz kladieme na celkovú všestrannosť v športovej príprave. Samozrejme by sme mali už zaraďovať nácvik techniky jednotlivých prvkov techniky športového odvetvia a zatiaľ len na úrovni základného osvojenia zručností u konkrétneho jedinca. Už v tomto období vystupuje potreba rozvíjania rýchlostných schopností (4). Môžu sa už vyskytovať určité rozdiely v pohybových schopnostiach detí rovnakého veku. Mali by sme ich preto vedieť motivovať, aktivizovať a posilňovať ich vôľové procesy. Súčasne tiež rozvíjame veľmi dôležitú schopnosť koncentrácie. Uvedené predpoklady výrazne vstupujú do kognitívnych

281
(poznávacích) procesov detí tohto obdobia. Aj začiatkom stredného školského veku možno v poznávaní a teda i v učení úspešne napredovať. Do 12. roku veku sa aktívne rozvíja reakčná schopnosť, táto sa v neskoršom období utlmuje a výrazný regres nastupuje po 30. roku života jedinca. V období 8 – 18 rokov sa reakčný čas skráti zhruba o 100 ms. Kognitívne procesy majú svoju štruktúru a možno povedať, že táto je takmer zhodná u všetkých druhoch učenia.
TEORETICKÉ VÝCHODISKÁ PROBLEMATIKY
Kognitívne procesy umožňujú človeku vytvárať si obraz sveta, orientovať sa v ňom a vysvetľovať si ho. Ide o procesy prijímania a spracovávania informácií z vonkajšieho i vnútorného sveta. Zmyslové poznávanie prebieha ako pociťovanie a vnímanie (percepcia), no racionálne poznávanie prebieha ako myslenie – uvedomelá rozumová činnosť na najvyššej úrovni. V zásade rozlišujeme dve úrovne poznávania zmyslovú (senzorickú) a rozumovú (racionálnu). Základné informácie o vonkajšom svete ako i vlastnom organizme získavame pomocou analyzátorov. Najdôležitejšími sú zmyslové a rozumové poznávanie. Zmyslové analyzátory autori rozdeľujú:
a/ podľa charakteristiky podnetu ;
b/ podľa umiestnenia ;
c/ podľa charakteristiky pocitu.
Ďalej sa zmyslové analyzátory delia na:
A/ vonkajšie ( exteroanalyzátory) – sú umiestnené na povrchu tela:
- diaľkové (teleanalyzátory);
- dotykové (kontaktoanalyzátory).
B/ vnútorné (interoanalyzátory) – sú umiestnené pod povrchom tela:
- analyzátory pohybu a polohy (lokoanalyzátory);
- vnútornostné (visceroanalyzátory).
C/ podnetom pre zrakové videnie je svetelná energia vychádzajúca zo svetelného zdroja. Táto
energia pôsobí buď priamo alebo nepriamo (5).
Každý analyzátor sa skladá z:
receptora – nervové bunky špecializované na príjem určitého druhu energie);
dostredivej dráhy – nervové dráhy, ktoré vedú signály do centra);
príslušného centra v mozgu – oblasť mozgu, príp. miechy, jadra analyzátora).
Už sme uviedli, ľudské poznanie sa zvykne rozdeľovať na poznanie zmyslové a na poznanie sprostredkované, logické charakterizované funkciami intelektu. Pri charakterizovaní rozdielu medzi zmyslovým poznaním a myslením sa konštatuje, že výsledkom zmyslového poznania

282
sú pocity, vnemy a predstavy o rozličných javoch skutočnosti. Výsledkom myšlienkového poznania sú pojmy a všeobecné súdy (pravidlá, poučky, všeobecné zákonitosti). Zmyslový obraz sveta, ktorý utvárajú naše pocity a vnemy je síce potrebný, no nie je dostatočný na jeho dôkladné, hlboké a všestranné poznanie. V zmyslovom obraze sveta sa neodrážajú zložité vzájomné vzťahy rozličných predmetov, udalostí, javov, ich príčiny a následky, vzájomné ovplyvňovanie a premeny logických skutočnosti. Na to je potrebný prechod od pocitov a vnemov k mysleniu.
Cieľom myslenia je odhaliť podstatné, nevyhnutné súvislosti založené na reálnych vzťahoch. V procese myslenia sa uskutočňuje hlbšie poznanie vonkajšieho sveta. Výsledkom myslenia je „rozuzlenie“ najzložitejších vzájomných súvislostí medzi podnetmi, udalosťami, javmi,... . Myslenie umožňuje človeku predvídať a plánovať také skutočnosti, ktoré v danej situácii neexistujú, to znamená, že ich človek nemôže vnímať. Myslenie človeka začína vtedy, keď je zmyslové poznanie už nie dostačujúce, alebo tam, kde je zmyslové poznanie nemožné. Zmyslové poznanie a myslenie na seba nadväzujú a vzájomne sa ovplyvňujú. Nech by sa ľudské myslenie uskutočňovalo v akýchkoľvek formách, nie je možné bez jazyka. Kontinuálne organické spojenie myslenia s rečou svedčí o sociálnej, spoločensko-historickej podstate ľudského myslenia (4). Odborníci považujú myslenie za súčasť štruktúry intelektu, a ako hlavný prístup k riešeniu problému uvádzajú psychometrický prístup. K hlavným predstaviteľom tohto prístupu patrí J. P.Guilford. Od neho pochádza napr. aj rozdelenie myslenia na konvergentné, s ktorým sa stretávame pri probléme s jedným riešením a metódou riešenia jedným smerom, a divergentné, s ktorým sa stretávame pri riešení problému s viacerými alternatívami (2).
Kognitívne činitele a učenie. Tieto činitele, medzi ktoré zaraďujeme aj inteligenciu, nezaručujú zrelosť osobnosti. pokiaľ jej chýbajú skúsenosti, ktoré si učenie vyžaduje (Fontana, 2005). Kognitívna oblasť učenia podľa B. S. Blooma, ktorý určil kategórie v kognitívnej oblasti, je nasledovná:
znalosti – fakty, výrazy, teórie a podobne; požiadavky na žiakov na prvej úrovni taxonómie kognitívnych funkcií: povedať, vymenovať, vybaviť si, označiť;
porozumenie – pochopiť význam znalostí; požiadavky na žiakov na druhej úrovni taxonómie kognitívnych funkcií: vysvetliť, odlíšiť, odvodiť, dať príklady;
uplatnenie – uplatniť znalosti a porozumenie v nových konkrétnych situáciách; požiadavky na žiakov na tretej úrovni taxonómie kognitívnych funkcií: predviesť, vykonať, vyriešiť, použiť;
analýza – schopnosť rozdeliť látku na jej stavebné súčasti a rozpoznať vzťahy medzi nimi; požiadavky na žiakov na štvrtej úrovni taxonómie kognitívnych funkcií: popísať, rozčleniť, rozlíšiť, vybrať;
syntéza – schopnosť usporiadať tieto súčasti do nových a zmysluplných vzťahov a tým vytvoriť nový celok; požiadavky na žiakov na piatej úrovni taxonómie kognitívnych funkcií: skombinovať alebo zostaviť, navrhnúť, vytvoriť;
hodnotenie - schopnosť posúdiť hodnotu látky s použitím explicitných a súdržných kritérií buď vytvorených samostatne, alebo odvodených z práce iných; požiadavky na žiakov na šiestej úrovni taxonómie kognitívnych funkcií: zhodnotiť, porovnať,
283
skritizovať, zdôvodniť (Fontana, 2005).
Kognitívny prístup k učeniu – ak máme porozumieť učeniu, musíme sa zaoberať
schopnosťou jedinca reorganizovať svoje psychologické pole; jedinec nie je mechanický
výtvor okolitého prostredia, ale aktívny činiteľ v procese učenia (úmyselne sa snaží o
spracovávanie a triedenie toku informácií prijímaných z okolitého sveta); teória
kognitívneho prístupu k učeniu – inštrumentálny konceptualizmus (Fontana, 2005).
METODIKA
Výskumu sa zúčastnilo 115 žiakov Strednej odbornej školy so zdravotným postihnutím v Bratislave. Z celkového počtu žiakov bolo 73 chlapcov a 42 dievčat. Na zisťovanie kognitívnych úrovní a životnej spokojnosti sme použili štandardizovaný dotazník Rosenbergovu škálu sebahodnotenia a sebaúcty (Rosenberg, 1965), ktorá meria celkovú úroveň globálneho vzťahu k sebe. Rosenbergova škála sebahodnotenia (sebaúcty) je jednou z najrozšírenejších unidimenzionálnych metód s pomerne dobrou validitou. Škála obsahuje 10 položiek. Mieru súhlasu s jednotlivými položkami respondenti vyjadrujú na štvorstupňovej škále od úplne súhlasím po úplne nesúhlasím, pričom vysoké skóre naznačuje vysoké sebahodnotenie a nízke skóre nízke sebahodnotenie. Minimálne dosiahnuté skóre je 10, maximálne 40. Úroveň sebahodnotenia sme vyjadrili frekvenčným výskytom odpovedí a priemernou hodnotou.
VÝSLEDKY A DISKUSIA
Učenie sa pohybom, alebo motorické učenie je špecifický druh učenia, kde sa osvojuje pohyb na základe zmyslového vnímania za prispenia myšlienkových operácií. Je to učenie sa pohybovým úkonom, operáciám, návykom a zručnostiam, ktoré závisí od zložitosti osvojovanej techniky. Podstatou je osvojovanie pohybových štruktúr založených na vzájomnej koordinácii pohybov a koordinácii pohybov so senzorickými dojmami, pocitmi. Výsledkom sú motorické návyky, ktoré spočívajú na obratnosti (pohyby vlastného tela) a zručnosti (manuálne činnosti), a uplatňujú sa tu tiež i kognitívne procesy. V tejto súvislosti používame aj pojem motorická docilita, ktorá je definovaná ako schopnosť a zručnosť adekvátne rýchlo a presne osvojovať si nové pohyby a ich zostavy, spojenia. Pri realizácií náročných pohybových techník je potrebné momentálnu situáciu vnímať, myšlienkovo spracovať, motoricky zrealizovať. Kopúň (2014) cituje autorov, ktorí sa problematikou zaoberajú bližšie a tiež danú teoretickú koncepciu rozširujú o spätnú väzbu. Učenie sa pohybom nie je v celom rozsahu realizované len cez ľudské zmysly. Do procesu vstupuje aj intelektuálna činnosť učiaceho sa subjektu, ktorá poznávaciu a retenčnú činnosť efektivizuje. U detí a mládeže so zdravotným obmedzením je proces učenia sa pohybom výrazne sťažený a stupeň daného postihnutia osvojovanie si pohybu predlžuje. Neurovývojové syndrómy predstavujú funkčné obmedzenia spôsobené nervovou chorobou. Tieto začínajú pôsobiť v rannom veku a postihujú radu oblastí: kognitívne schopností, hybnosť, zrak, sluch, spôsob chovania (Kraus et al., 2005). Detská mozgová obrna (DMO) patrí medzi najpočetnejšie neurovývojové ochorenia. Postihuje motorický systém, descendentné (zostupné) nervové

284
vlákna z motorickej kôry a často sa spája s neurokognitívnymi, senzorickými a senzitívnymi léziami (poruchami zdravia). Významná porucha osvojovania, plánovania a vykonávania vôľových pohybov sa nazýva dyspraxia. Predpona „dys“ znamená rozpor, deformáciu. Súhrnný názov pre všetky „dys...“ je – špecifické vývojové poruchy učenia. Zelinková (2003) uvádza, že rôzne poruchy detského vývoja sa vyskytujú vo vzájomných kombináciách. Portwood 2001(Zelinková, 2003) na základe dlhodobého výskumu uvádza, že 40 – 45 % deti s dyspraxiou trpí zároveň ďalšou vývojovou poruchou: dyslexiou, ADHD (Attention Deficit Hyperactivity Disorder) – porucha pozornosti spojená s hyperaktivitou, autizmom. Dospievajúci a dospelý jedinec s dyspraxiou trpí nasledujúcimi problémami: vplyvom nedostatočne rozvinutej percepcie a pohybovej koordinácie je neobratný (nemotorný), nie je šikovný na manuálne činnosti, športové aktivity, reč môže byť menej zrozumiteľná. Potrebuje dlhšiu dobu na splnenie pohybovej úlohy, nie je schopný plniť súbežne viac úloh. Žiaci a študenti Strednej odbornej školy so zdravotným postihnutím v Bratislave sú rozdelení do skupín podľa druhu a stupňa zdravotného postihnutia. Podľa zaradenia sa zúčastňujú rehabilitačných procedúr (vozičkári, používatelia barly) , alebo navštevujú telesnú a športovú výchovu (TŠV). Na škole je momentálne 11 vozičkárov a 6 žiakov používajúcich barle. Zaujímavý je fakt, že 50 (43,5 %) mladých ľudí zo 115 je oslobodených od TŠV. Štyridsať žiakov (34,8 %) vo voľnom čase športuje a z celkového počtu žiakov školy 16 % športuje s kompenzačnou pomôckou. Teda aj vozičkári vo voľnom čase športujú. Mládež s kompenzačnými pomôckami okrem športovania vykonáva aj iné pohybové úlohy. Návštevu športových podujatí deklarovalo 3 % opýtaných a ten istý počet vykonáva aj domáce práce. Myslíme si, že v tejto oblasti by mali viac motivačne pôsobiť rodičia postihnutých žiakov. 8,7 % žiakov používajúcich kompenzačné pomôcky navštevuje kultúrne podujatia, naproti tomu len niečo vyše 7 % tých, čo nepoužívajú dané pomôcky navštevuje „kultúru“. Čo sa týka kognitívnych procesov v oblasti umeleckej tvorivosti, tieto sú blízke 11-tim % žiakov školy. Sebavzdelávaniu vo voľnom čase a teda poznávaniu všeobecne sa venuje 5,8 % žiakov uplatňujúcich kompenzačné pomôcky a 7,6 % ostatných účastníkov prieskumu. Menšia účasť respondentov v poznávacích činnostiach vo voľnom čase je spôsobená aj skutočnosťou, že niektorí žiaci majú viacnásobné postihnutia a títo si vyžadujú špeciálne edukačné potreby (Vančová, 2010 ). Častá pridružená vývinová anomália sa označuje ako špecifická vývinová porucha motorickej funkcie. Prívlastok „vývinová“ znamená, že hoci je porucha prítomná od narodenia, prejaví sa až na určitom stupni vývinu, obvykle po nástupe dieťaťa do školy (Harčaríková, 2010). Jednotlivec má problém s koordináciou jemnej a hrubej motoriky. Jeho pohyby vyznievajú nešikovne, nie sú ladné, plynulé, má problém s orientáciou na tele, má problém s pravo ľavou orientáciou. Postihnutý často odmieta telesné cvičenia v dôsledku celkovej motorickej nešikovnosti, jeho pohyby sú nepresné, nedokáže odhadnúť aký pohyb môže vykonať v danom priestore, nedokáže cvičiť do rytmu, pohybovať sa podľa istých pravidiel s ostatnými (pochodovanie, tanec, tlieskanie). Potrebuje veľa času na zvládnutie sebaobslužných úkonov, má problémy v manipulácii s malými predmetmi, napr. nedokáže sa naučiť vyšívať, krájať nožom, presne strihať, navliekať koráliky, triediť malé predmety podľa veľkosti. Má problémy napríklad aj v hre so stavebnicou, problémová je aj manipulácia s nástrojmi (Michalová, 2004). Špecifické poruchy učenia výrazne negatívne ovplyvňujú proces učenia sa. Ich samostatný výskyt je však v praxi veľmi vzácny. Ich dôsledky sú ďalekosiahle: ovplyvňujú emočné prejavy jedinca, oblasť jeho pracovných a študijných zručností, výrazne ovplyvňujú proces komunikácie. Podľa Borkowského (in Harčaríková, 2010) má v USA 15 – 20 % žiakov poruchu učenia. Špecifické poruchy učenia je potrebné „liečiť“ skôr, ako sa v plnom rozsahu prejavia a začnú v plnej miere dezintegrovať život a osobnosť dieťaťa. Komplexnú osobnosť tvoria tieto roviny: rovina motoriky, senzoriky, sebaobsluhy, kognície, komunikácie, emocionality, sociability, autoregulácie (samostatného
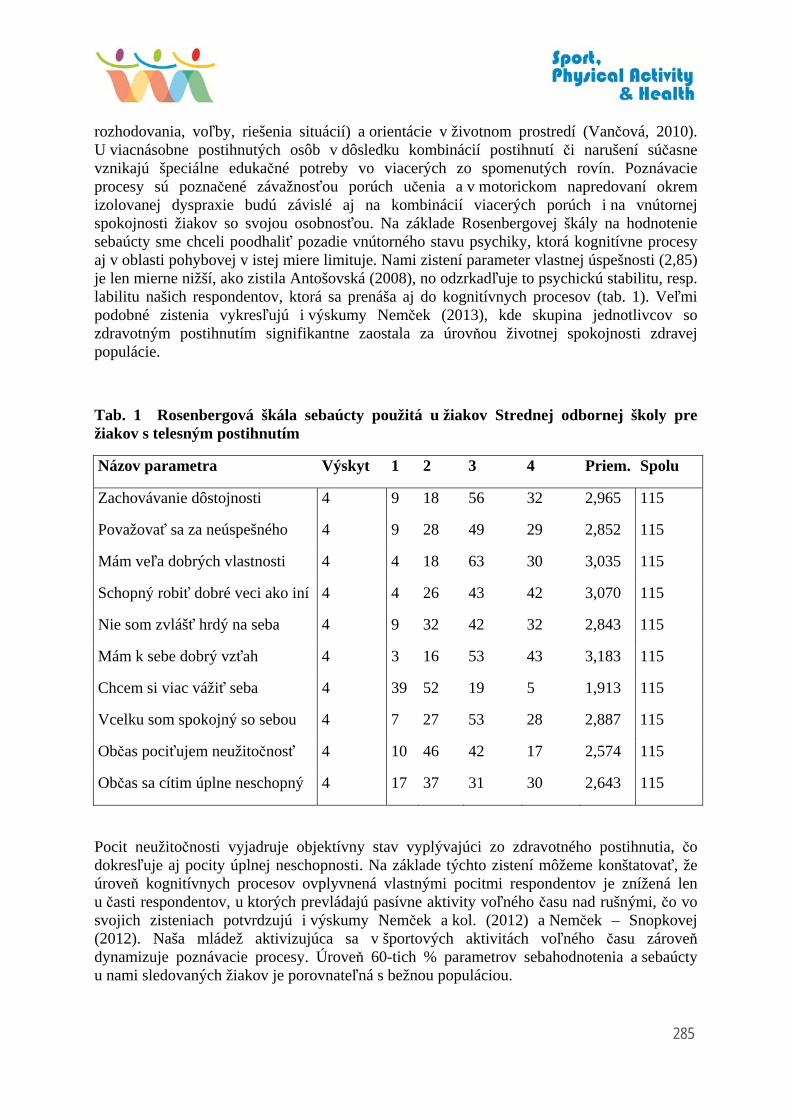
285
rozhodovania, voľby, riešenia situácií) a orientácie v životnom prostredí (Vančová, 2010). U viacnásobne postihnutých osôb v dôsledku kombinácií postihnutí či narušení súčasne vznikajú špeciálne edukačné potreby vo viacerých zo spomenutých rovín. Poznávacie procesy sú poznačené závažnosťou porúch učenia a v motorickom napredovaní okrem izolovanej dyspraxie budú závislé aj na kombinácií viacerých porúch i na vnútornej spokojnosti žiakov so svojou osobnosťou. Na základe Rosenbergovej škály na hodnotenie sebaúcty sme chceli poodhaliť pozadie vnútorného stavu psychiky, ktorá kognitívne procesy aj v oblasti pohybovej v istej miere limituje. Nami zistení parameter vlastnej úspešnosti (2,85) je len mierne nižší, ako zistila Antošovská (2008), no odzrkadľuje to psychickú stabilitu, resp. labilitu našich respondentov, ktorá sa prenáša aj do kognitívnych procesov (tab. 1). Veľmi podobné zistenia vykresľujú i výskumy Nemček (2013), kde skupina jednotlivcov so zdravotným postihnutím signifikantne zaostala za úrovňou životnej spokojnosti zdravej populácie.
Tab. 1 Rosenbergová škála sebaúcty použitá u žiakov Strednej odbornej školy pre žiakov s telesným postihnutím
Názov parametra Výskyt 1 2 3 4 Priem. Spolu
Zachovávanie dôstojnosti 4 9 18 56 32 2,965 115
Považovať sa za neúspešného 4 9 28 49 29 2,852 115
Mám veľa dobrých vlastnosti 4 4 18 63 30 3,035 115
Schopný robiť dobré veci ako iní 4 4 26 43 42 3,070 115
Nie som zvlášť hrdý na seba 4 9 32 42 32 2,843 115
Mám k sebe dobrý vzťah 4 3 16 53 43 3,183 115
Chcem si viac vážiť seba 4 39 52 19 5 1,913 115
Vcelku som spokojný so sebou 4 7 27 53 28 2,887 115
Občas pociťujem neužitočnosť 4 10 46 42 17 2,574 115
Občas sa cítim úplne neschopný 4 17 37 31 30 2,643 115
Pocit neužitočnosti vyjadruje objektívny stav vyplývajúci zo zdravotného postihnutia, čo dokresľuje aj pocity úplnej neschopnosti. Na základe týchto zistení môžeme konštatovať, že úroveň kognitívnych procesov ovplyvnená vlastnými pocitmi respondentov je znížená len u časti respondentov, u ktorých prevládajú pasívne aktivity voľného času nad rušnými, čo vo svojich zisteniach potvrdzujú i výskumy Nemček a kol. (2012) a Nemček – Snopkovej (2012). Naša mládež aktivizujúca sa v športových aktivitách voľného času zároveň dynamizuje poznávacie procesy. Úroveň 60-tich % parametrov sebahodnotenia a sebaúcty u nami sledovaných žiakov je porovnateľná s bežnou populáciou.

286
ZÁVER
Deti a mládež so špecifickým zdravotným postihnutím možno edukovať (vychovávať a vzdelávať) dvoma základnými spôsobmi: ľahko i viacnásobne postihnutých v systéme bežných škôl, kde sa teraz rieši problematika asistenta učiteľa, alebo v systéme špeciálnych škôl pri veľmi ťažkých a hlbokých stupňoch postihnutí a je lepšie ich edukovať individuálne. Nezaradiť ich do triedy, ale individuálne ich usmerňovať v domácom prostredí, alebo v prostredí liečebnej inštitúcie, či zariadení sociálnej starostlivosti. Týmto dvom modelom edukácie sa hovorí segregačný a integračný (Vančová, 2010). Súbor žiakov Strednej odbornej školy so zdravotným postihnutím v Bratislave vykazuje znaky zdravej sebakritiky. V parametri sebahodnotenia vlastných pozitívnych vlastností sa náš súbor javí suverénnejšie ako bežná populácia. Na druhej strane sa vyskytuje deficit vlastnej sebaúcty, kde sme zistili výrazný prepad oproti bežnej populácie a skóre 1,91 je najnižšie zo všetkých sledovaných parametrov (tieto sú prehľadne predložené v tabuľke 1). Čo sa týka športových aktivít vo voľnom čase, je treba výraznejšie motivačne pracovať so žiakmi, na čo upozorňovali autori aj v predošlých výskumoch (Nemček, 2014, Nemček – Bergendiová, 2013a). Chce to nové prístupy vo vzťahu k žiakom, ktoré 70-ročný pedagóg bude zvládať a uplatňovať asi obtiažnejšie. Novými didaktickými prostriedkami, ich realizáciou v procese TŠV by pravdepodobne došlo aj výraznejšiemu rozvoju kognitívnych schopností žiakov. Výraznejšie by sa mala rozšíriť aj ponuka záujmových telovýchovných a športových aktivít a to aj v čase víkendových dní, na čo poukázali už v minulosti riešené výskumy (Nemček – Bergendiová, 2013b; Nemček – Bergendiová, 2013c), keď prevažná časť žiakov s telesným postihnutím ostáva na internáte. Materiálne zázemie špeciálnej školy je na dobrej úrovni, treba doriešiť personálne otázky, konkrétne v osobe zodpovednej za realizáciu telovýchovného procesu na škole.
Žiaci školy svoj zdravotný hendikep v prevažnej väčšine prípadov zvládajú optimistický. Často ho ani nevnímajú a to až do doby, keď im vonkajšie prostredie vytvorí ťažko prekonateľnú prekážku, bariéru. Sršia humorom ako zdraví mladí ľudia a život berú ako nevyhnutnú realitu. Je na spoločnosti aj na nás pedagógov, aby sme im spoločne život čo najviac uľahčovali a spríjemňovali a tým im ho robili znesiteľnejším.
LITERATÚRA
[1] ANTOŠOVSKÁ, D. Účinnosť Feldenkraisovej metódy na zmenu vo vybraných komponentoch welless u žien. Univerzita Komenského v Bratislave, Bratislava: Fakulta telesnej výchovy a športu, 2008, s. 58 – 66.
[2] FONTANA, D. Transpersonal Psychology: Meaning and Developments. Transpersonal Psychology Review Special Issue. Leicester: British Psychological Society, 2005, p. 160 -162.
[3] GUILFORD, J. P. Cognitive psychology's ambiguities: Some suggested remedies. Psychological Review, 1982, 89, p. 48-59.
[4] www.karatekriz.cz/karate/vychova.htm
[5] https://www.google.sk/#q=kognit%C3%ADvne+procesy
[6] HARČARÍKOVÁ, T. Základy pedagogiky jednotlivcov so špecifickými poruchami učenia. Bratislava: Iris, 2010, s. 9 – 13, ISBN 978-80-89238-31-6.
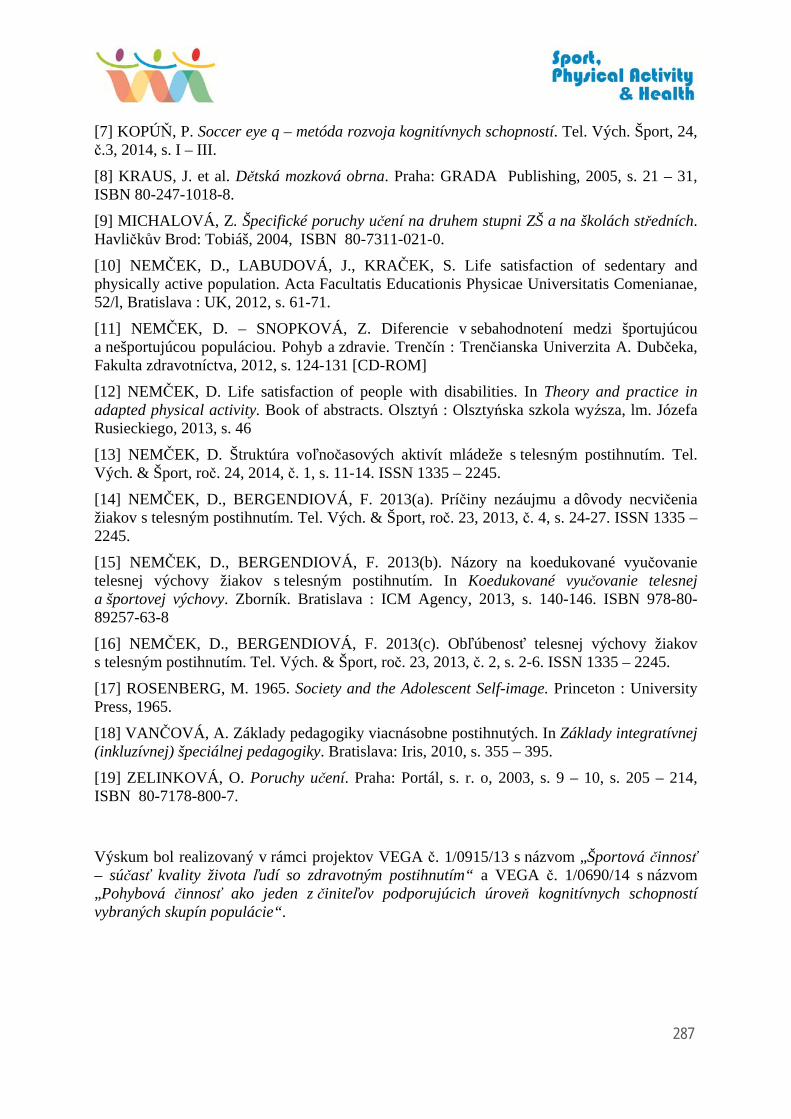
287
[7] KOPÚŇ, P. Soccer eye q – metóda rozvoja kognitívnych schopností. Tel. Vých. Šport, 24, č.3, 2014, s. I – III.
[8] KRAUS, J. et al. Dětská mozková obrna. Praha: GRADA Publishing, 2005, s. 21 – 31, ISBN 80-247-1018-8.
[9] MICHALOVÁ, Z. Špecifické poruchy učení na druhem stupni ZŠ a na školách středních. Havličkův Brod: Tobiáš, 2004, ISBN 80-7311-021-0.
[10] NEMČEK, D., LABUDOVÁ, J., KRAČEK, S. Life satisfaction of sedentary and physically active population. Acta Facultatis Educationis Physicae Universitatis Comenianae, 52/l, Bratislava : UK, 2012, s. 61-71.
[11] NEMČEK, D. – SNOPKOVÁ, Z. Diferencie v sebahodnotení medzi športujúcou a nešportujúcou populáciou. Pohyb a zdravie. Trenčín : Trenčianska Univerzita A. Dubčeka, Fakulta zdravotníctva, 2012, s. 124-131 [CD-ROM]
[12] NEMČEK, D. Life satisfaction of people with disabilities. In Theory and practice in adapted physical activity. Book of abstracts. Olsztyń : Olsztyńska szkola wyźsza, lm. Józefa Rusieckiego, 2013, s. 46
[13] NEMČEK, D. Štruktúra voľnočasových aktivít mládeže s telesným postihnutím. Tel. Vých. & Šport, roč. 24, 2014, č. 1, s. 11-14. ISSN 1335 – 2245.
[14] NEMČEK, D., BERGENDIOVÁ, F. 2013(a). Príčiny nezáujmu a dôvody necvičenia žiakov s telesným postihnutím. Tel. Vých. & Šport, roč. 23, 2013, č. 4, s. 24-27. ISSN 1335 – 2245.
[15] NEMČEK, D., BERGENDIOVÁ, F. 2013(b). Názory na koedukované vyučovanie telesnej výchovy žiakov s telesným postihnutím. In Koedukované vyučovanie telesnej a športovej výchovy. Zborník. Bratislava : ICM Agency, 2013, s. 140-146. ISBN 978-80-89257-63-8
[16] NEMČEK, D., BERGENDIOVÁ, F. 2013(c). Obľúbenosť telesnej výchovy žiakov s telesným postihnutím. Tel. Vých. & Šport, roč. 23, 2013, č. 2, s. 2-6. ISSN 1335 – 2245.
[17] ROSENBERG, M. 1965. Society and the Adolescent Self-image. Princeton : University Press, 1965.
[18] VANČOVÁ, A. Základy pedagogiky viacnásobne postihnutých. In Základy integratívnej (inkluzívnej) špeciálnej pedagogiky. Bratislava: Iris, 2010, s. 355 – 395.
[19] ZELINKOVÁ, O. Poruchy učení. Praha: Portál, s. r. o, 2003, s. 9 – 10, s. 205 – 214, ISBN 80-7178-800-7.
Výskum bol realizovaný v rámci projektov VEGA č. 1/0915/13 s názvom „Športová činnosť – súčasť kvality života ľudí so zdravotným postihnutím“ a VEGA č. 1/0690/14 s názvom „Pohybová činnosť ako jeden z činiteľov podporujúcich úroveň kognitívnych schopností vybraných skupín populácie“.

288
EFEKT DYNAMICKÉHO ROZCVIČENIA NA MAXIMÁLNY VÝKON
V DREPE V SILOVOM TROJBOJI
Mgr. Iľja Číž, PhD., Bc. Michal Králik
Fakulta telesnej výchovy a športu, Univerzita Komenského
Katedra gymnastiky
ABSTRAKT
Silový trojboj ako individuálny silový šport využíva ako kritérium hodnotenia jednorázový maximálny vykon v jednotlivých disciplínach. V našej štúdii sme sa rozhodli overiť zvýšenie výkonu v drepe, zaradením dynamického strečingu do rozcvičenia. Použité strečingové cvičenia pomáhajú rozvoju rozsahu pohybu v drepe, ktorý sa nielen v silovom trojboji využíva ako cvičenie na testovanie maximálnej sily a výkonu. Je to tiež prvé cvičenie v súťaži, čo je veľmi dôležité. Takto by mali byť lifteri pripravený súťažiť s využitím najlepšej techniky a čo najefektívnejším spôsobom, ako je to možné. Predpokladali sme, že aplikácia dynamického rozcvičenia bude mať pozitívny vplyv na zlepšenie maximálnej sily. Po šiestich týždňoch v kontrolnom období, kde sme používali všeobecné rozcvičenie, sme po dobu 6 týždňov do rozcvičenia zaradili dynamické naťahovacie cvičenia. V oboch obdobiach sme v tréningu využívali metódu maximálneho úsilia. Testovali sme jednorázový výkon v drepe. Testovanie sme vykonali pred a po oboch obdobiach tréningu. Na základe rozdielu medzi vstupných a výstupných meraní 1RM drepu, sme zaznamenali nárast o 11,3% výkonu probanda s použitím rozcvičenia s dynamickými cvičeniami. V kontrolnej skupine, kde proband vykonával len všeobecné zahrievanie, po 6 týždňoch tréningu obdobia, sme zaznamenali nárast len 6,9%, čo predstavuje rozdiel 4,4% v prospech probanda, ktorý využíval dynamický spôsob rozcvičenia. Na základe preukázaného rozdielu dosiahnutého výkonu v prípravnom období, sme dospeli k záveru, že dynamické rozcvičenie pred silovým tréningom efektívne napomohlo zvyšiť výkon pri tréningu zameranom na rozvoj maximálnej sily, v porovnaní s ostatnými spôsobmi strečingu.
KĽÚČOVÉ SLOVÁ: Silový trojboj, drep, dynamické rozvičenie, strečing , maximálna sila, 1RM.
ÚVOD
Dynamické rozcvičenie je veľmi dôležitou súčasťou športového tréningu. Správne rozcvičenie Vás pripravuje fyziologicky, psychicky aj emocionálne. Rozcvičenie pripravuje svaly na tréning, pomáha zvýšiť tepovú frekvenciu a teplotu svalovej hmoty. Zahriate svaly, väzy a šľachy sú limitujúcim faktorom pre optimálnu kĺbovú mobilitu a flexibilitu , ktorá je potrebná na zlepšenie rýchlosti , obratnosti a sily (COOK 2003, BOYLE 2004, RADCLIFFE 2007, VERSTEGEN 2007, KOVACS 2010, IVEY - STONER 2012, ŠTEFANOVSKÝ et al . 2012). Dynamické rozcvičenie pomáha aktivovať centrálny nervový systém, zlepšuje

289
komunikáciu a spoluprácu svalov pre cvičenie, kde môžu produkovať svoje najlepšie úsilie. Je to najlepší spôsob prevencie, ako zabrániť poranenia svalov, väzov a šliach. Rozcvičenie môžeme meniť denne , čo pomáha rozvíjať atletickosti športovcov.
METÓDY
Nosnou metódou bolo intraindividuálne sledovanie a porovnávanie úrovne zmien silových schopností vplyvom cvičení dynamického rozcvičenia pred zaťažením. Empirické údaje sme získali pomocou testovania drepu na jedno opakovanie, ako súčasti metódy rozvoja silových schopností a to metódou s využitím maximálneho úsilia. Počas sledovania sme využívali metódu priameho ako aj nepriameho pozorovania. Merania boli zhotovené pred začiatkom silového mezocyklu a po jeho ukončení. Keďže sme v tréningových mezocykloch využívali na rozvoj maximálnej sily metódu maximálnych úsilí, dostali sme aj ďalšie čiastkové hodnoty, ktoré ukazovali postupný rozvoj maximálnej sily. Do experimentálneho mezocyklu sme pridali pred každý tréning špeciálnu batériu dynamického rozcvičenia - strečingových cvičení dynamického charakteru. Dynamické rozcvičenie predchádzala krátka aeróbna aktivita, tak ako stanovujú predchádzajúce teoretické východiská. Sme si vedomí, že experiment na jednom probandovi nemôže jednoznačne určiť či práve strečingové cvičenia boli príčinou zmeny rozvoja silových schopností, a to z dôvodov malého počtu nameraných údajov. Avšak intraindividuálne pozorovanie zmien silových parametrov nám môže pomôcť pochopiť procesy, ktoré sa u probanda prebiehali.
Výskum
Výskumný súbor tvoril proband narodený v roku 1990, vek 22 rokov. Telesná výška bola 174,6 cm a telesná hmotnosť sa v dobe merania pohybovala od 73,5 kg do 75 kg v dôsledku fyziologických zmien spôsobených tréningovým zaťaženým, ako aj stravou a následnou zmenou hmotnosti. Proband je aktívny pretekár v silovom trojboji, súťažiaci v dorasteneckých a juniorských súťažných kategóriách. Súťažil na úrovni M-SR vo federácii IPF v rokoch 2006 - 2010 v kategórii do 67,5kg z toho v roku 2010 túto juniorskú kategóriu vyhral. Z hľadiska jeho športovej výkonnosti ho môžeme charakterizovať ako silového trojbojára na vrcholovej úrovni v rámci Slovenska.
Homogenita merania bola zaručená tým, že merania sme vykonávali v rovnaký deň v týždni, na rovnakom mieste, v rovnakom čase a za rovnakých podmienok. Testovanie a všetky tréningy prebiehali vo fitness centre Golem Centrál Bratislava. Počas testovania boli splnené všetky bezpečnostné aj technické podmienky, ktoré vyplývajú z popisu testu. Počas každého testovania aj tréningovej jednotky bol prítomný sparing partner, ktorý vykonával dopomoc pri cvičení a kontroloval hĺbku drepu pri meraniach. Proband počas tohto obdobia nebol chorý ani ho nepostihli žiadne vážnejšie zdravotné ťažkosti, počas týchto období nevynechal ani jeden tréning. Tréningové dni sme určili na pondelok, utorok, štvrtok a piatok. Tréningy sme vykonávali v poobedňajších hodinách v čase 16:00 až 18:00.
Vstupné meranie kontrolného mezoycklu bez aplikácie strečingových cvičení sme vykonali 07.01.2013 a výstupné meranie sme vykonali 18.02.2013. Tréningy sa konali 4-krát do týždňa, s priemerným časom 90 minút, čo je celkovo 2160 minút (36h) počas 6-týždnového obdobia. Počas tohto obdobia proband nevyužíval žiadne strečingových cvičení, nechali sme

290
ho vykonať vlastnú prípravu na tréningovú jednotku. Jej obsah bol zvyčajne do 5 minút.
Vstupné meranie experimentálneho mezocyklu s aplikáciou strečingových cvičení pred tréningom sme vykonali 04.03.2013 a výstupné meranie vykonali 15.04.2013. Tréningy sa konali rovnako 4-krát do týždňa, s priemerným časom 105 minút, čo je celkovo 18 tréningových jednotiek s celkovým časom 2520 minút (42h) počas 6-týždnového obdobia. Priemerný čas „warm-up“ bol 15 minút. Experimentálny činiteľ tvoril súbor špeciálnych dynamických strečingových cvičení, zaradený do tréningového cyklu. Strečingové cvičenia sme pridali na začiatok hlavnej časti tréningovej jednotky do časti rozohriatia - „warm-up“. Cvičenia sme vybrali na základe osobných poznatkov, po konzultácii s inými súťažiacimi a trénermi s dlhoročnou praxou, ktorí trénujú elitu silového trojboja na Slovensku. Celú batériu cvičení sme zostavili pre špeciálne potreby tohto výskumu a aplikovali pred každou tréningovou jednotkou v 6-týždnovom tréningom období. Každá strečingová jednotka začínala 5 - 10 minútami aeróbnej aktivity nízkej intenzity, na rozohriatie a prekrvenie svalstva, po ktorej nasledovalo 7 – 12 minút pre šport špecifických dynamického strečingových cvičenia. Prvých 5 - 10 minút nám slúžilo na zahriatie tela, zvýšenie telesnej teploty. Vonkajším prejavom zvýšenia telesnej teploty bolo mierne spotenie. Každé cvičenie sme vykonávali po dobu 30 sekúnd s 30 sekundovou prestávkou medzi cvičeniami. Preto sme zostavili 7 cvičení dynamického strečingu, ktorých organizáciu sme používali na každý tréning.
VÝSLEDKY
Výskum prebiehal podľa očakávaní. Z priameho pozorovania proband javil pozitívne pocity z pridanej strečingovej časti počas experimentálne obdobia, čo sa odrážalo aj na kvalite jeho tréningov. Zmeny sa dostavovali postupne a pri konci experimentálneho obdobia prišlo ku zmenám, ktoré sme očakávali. Počas oboch mezocyklov experimentu sa probandovi darilo postupné rozvíjanie maximálnej sily, i keď v kontrolnom mezocykle sme videli viac týždňov za sebou, kde nastala stagnácia v hmotnosti odporu. Nato v experimentálnom mezocykle mal proband pomerne stály progres v dosahovaní maximálnych silových výkonov. Podľa priameho pozorovania bolo vidno, že sa proband po aplikácii experimentálneho činiteľa javil viac nabudený na nasledovnú tréningovú jednotku. Už len z použitia logických metód spracovania môžeme vidieť, že úroveň meraných silových schopností sa na tomto probandovi zlepšovala viac ako v kontrolnom období. Podľa toho môžeme usudzovať, že mal dynamický strečing vo fáze „warm-up“ pozitívny účinok na rozvoj silových schopností daného jedinca. Avšak kvôli malému množstvu čiastkových údajov nie je tieto údaje možné štatisticky potvrdiť. V teste dvoch relatívnych hodnôt sa nám štatistickej významnosti nepodarilo preukázať. Ak by sme sa bližšie pozreli na percentuálny rozvoj drepu, uvidíme že rozvoj v experimentálnom období bol viac ako 11% a v kontrolnom iba necelých 7%. Tento rozdiel „efektívnosti“ mezocyklov činí zhruba 4%. Pri vrcholovej úrovni, zvažujeme každé percento. Ak by sme dokázali v každej disciplíne zlepšiť svoj rozvoj o už „len“ štyri percentá, mohlo by to znamenať lepšie umiestnenie, a v niektorých prípadoch aj prekonanie rekordov. Nanešťastie výsledky, ktoré sme dosiahli, môžu byť skreslené vplyvom rôznych vonkajších a vnútorných faktov. Jedným z nich môže byť neskoršia svalová reakcia na tréningový podnet v kontrolnom období, ktoré sa mohlo prejaviť v experimentálnom období ako časť superkompenzácie. Ďalším faktorom mohli byť mimotréningové podmienky, v ktorých sa proband nachádzal. Keďže to bol študent, bolo by potrebné brať do úvahy možnosti únavy v

291
rámci štúdia. Ako ďalším faktorom mohla byť čiastočná náhodnosť cieľových výsledkov aj kvôli nedostatočnému vôľovému nasadeniu probanda. Tejto odchýlke sme sa snažili vyhnúť a preto bol vybraný bývalý súťažiaci, ktorý nemá tendenciu vynechávať tréningové jednotky a vkladá do tréningových jednotiek maximálne vôľové úsilie. O toto sme ho žiadali počas testovania, aj počas tréningových jednotiek.
Obrázok 1: Výsledky testu - drep s činkou na ramenách 1RM
Ako ukazuje graf rozvoj maximálnej silových nastal v oboch mezocykloch, aj keď nie v rovnakej miere a časom. Výsledky z kontrolného obdobia mohli byť teda ovplyvnené nedostatočným zahriatím organizmu, spôsobené nedostatočným rozcvičením a prekrvením potrebných svalov a nie maximálnym zapojením a koordináciou neuromuskulárneho systému. Stagnácia, ktorá nastala počas začiatku experimentálneho obdobia, mohla byť spôsobená zmenou tréningového stereotypu a preto naň telo nevedelo zareagovať adekvátne. Po ďalšom týždni však nastal vyšší progres a tento efekt pretrvával až do konca sledovaného obdobia. Môžeme tvrdiť že zo začiatku si muselo telo probanda adaptovať na nové metódy využívané pred samotným tréningom. Po primeranom zohriatí organizmu sa zlepšilo aj prekrvenie svalov a mohlo byť jednou z príčin tohto progresu. V kontrolnom období bol progres pravidelný a postupný, i keď bola viditeľná stagnácia v niektorých týždňoch za sebou. Nepretrvávala dlhšie obdobie ale ani sa výkon v žiadnom týždni kontrolného obdobia rapídne nezvýšil. To mohlo byť spôsobené aj horšou odozvou organizmu na klasický tréningový štýl. Avšak pre štatisticky významné hodnoty by bolo potrebné merania týchto mezocyklov aplikovať na väčšej skupine probandov.
ZÁVER
Cieľom práce bolo zistiť efekt strečingových cvičení. Z teoretickej časti sme dospeli k názoru, že dynamický strečing bol najvhodnejšou možnou metódou, ktorá má význam na rozvoj maximálnej sily. Pri porovnaní výsledkov sa nám potvrdila hypotéza , že sa rozvoj maximálnej sily zvýšil viac, ako v kontrolnom mezocykle. V experimentálnom mezocykle sa

292
proband cítil mierne unavený, ale viac nabudený na tréning. Jeho odhodlanie sa zvýšilo a pocitové stavy počas tréningov boli podľa pozorovania kladnejšie. Vďaka tomuto môžeme usudzovať, že ak by sme aplikovali kombinované strečingové cvičenia na všetky partie tela, mohli by byť lepšie výsledky dosahované vo všetkých súťažných disciplínach. Potvrdilo sa nám, že strečingové cvičenia majú svoje podstatné a nezameniteľné miesto počas každej tréningovej jednotky v príprave športovca na maximálny športový výkon. Z iných štúdií bol zjavný aj akútny pozitívny účinok dynamického strečingu. Sme spokojní s vykonaniami úloh práce, ktoré by mohli poskytnúť aj širšej verejnosti aj náhľad, ako by mali jednotlivé strečingové cvičenia vyzerať. Štúdiom odbornej literatúry sme zistili, že zahraničná literatúra sa zhoduje s našimi výsledkami, alebo chýbajú preklady týchto štúdií, čo by pomohlo všeobecnej osvete v rámci silových športov a silového výkonu celkovo. Týmto sme vytvorili batériu cvičení, ktorá poskytli východiská v slovenskom jazyku na pokračovanie využívania náležitého dynamického strečingu v prípravných častiach tréningových jednotiek. Odporúčania pre prax Podľa získaných a nameraných výsledkov môžeme odporúčiť, aby boli strečingové metódy do rozohriatia zapojené v každom tréningu a pred každou súťažou. Odporúčame hlavne dynamické strečingové cvičenia spolu s predchádzajúcim zahriatím organizmu miernou aeróbnou aktivitou, ktorou môže byť beh alebo aj skákanie na švihadle alebo iné formy aeróbnej aktivity s nízkou intenzitou. Dynamické rozcvičenie by mal začať až po tom, ako je na probandovi možno pozorovať známky spotenia, čo nám signalizuje dosiahnutie potrebného zahriatia organizmu pre bezpečné a účinné vykonanie dynamického strečingu. Neodporúčame využívať iné strečingové metódy, hlavne statického typu, pokiaľ je zámerom tréningovej jednotky alebo súťaženia maximálne silové výkony. Tieto strečingové cvičenia môžu mať podstatne negatívne účinky na nabudenie organizmu, a tým zhoršiť súťažné výsledky alebo výsledky tréningových jednotiek. Statický strečing sa podľa väčšiny štúdií javí ako najmenej vhodnou metódou rozcvičenia pred tréningom, aj keď môže mať pozitívne účinky na celkovú kĺbovú pohyblivosť a rozsah pohybu. Balistický strečing sa javí neutrálnou metódou, ale o potvrdenie týchto záverov by bolo potrebné vykonať dlhodobejšie výskumy. Sme presvedčení, že strečingové cvičenia počas fázy rozohriatia by nemali presahovať 10-15 minút, aby boli svaly stále dostatočne mobilizované, ale aby neboli ani unavené kvôli dlhému vykonávaniu dynamických cvičení. Podľa štúdií je vhodné, aby boli použité aj iné cvičenia ako len tie, ktoré v práci popisujeme. Podstatnou informáciou je štruktúra športového výkonu a vybranie ideálnych cvičení, ktoré sú k danému športu najbližšie. Obsah strečingovej jednotky by mal byť špecifický pre každý šport a disciplínu. Ak by sme sa sústredili na inú disciplínu silového trojboja, mali by byť vybrané iné, pre výkon špecifické dynamické cvičenia. Prvú časť zahriatia nie je potrebné meniť, aj keď nevylučujeme jej modulovanie pre špeciálne športové podmienky. Odporúčame ďalšie skúmanie účinku strečingových cvičení po tréningovej jednotke, ktoré by mohlo taktiež do určitej miery ovplyvniť prácu svalov. Myslíme si, že by bolo vhodné ďalej sa zaoberať longitudiálnym výskumom strečingových cvičení a ich vplyv na organizmus v jednotlivých obdobiach športovej prípravy súťažiacich silových športov. Ďalej by bola vhodná súborná literatúra, ktorá by poukazovala na výhody spojené s využívaním strečingových cvičení. Potom by sme mohli skvalitniť dosahovanie maximálnych športových výkonov a formou osvety apelovať na trénerov v jednotlivých kluboch silového trojboja.

293
LITERATÚRA:
[1] ANDERSON, B. 1981. Stretching, exercise for everyday fitness and for twentyfive individual sports. London : Pelham Book. 1981. ISBN 9780720713510.
[2] BACURAU, R.F.P., et al, 2009. Acute Effect of a Ballistic and a Static Stretching Exercise Bout on Flexibility and Maximal Strength. Journal of Strength and Conditioning Research, vol. 23, no. 1, pp. 304-8 ProQuest Central. ISSN 10648011.
[3] CACEK, J., BUBNÍKOVÁ, H. 2009. Statický versus dynamický strečink. Praha, In: Atletika. 6/2009. Česká atletika s.r.o. 32 s. ISSN 0323-1364.
[4] CRAMER, J.T., et al, 2005. The Acute Effects of Static Stretching on Peak Torque, Mean Power Output, Electromyography, and Mechanomyography. European Journal of Applied Physiology, vol. 93, no. 5-6, pp. 530-9 ProQuest Central. ISSN 1439-6319. DOI http://dx.doi.org/10.1007/s00421-004-1199-x.
[5] NELSON, A. G., KOKKONEN, J. 2009. Strečink na anatomických základech. 1. vyd. Praha: Grada publishing. 2009. 144 s. ISBN 247-80-247-2784-4.
[6] NELSON, A. G., et al. 2007. Acute effects of passive muscle stretching on sprint performance. In : Journal of Sports Sciences, Volume 23, Issue 5. Abington : Routledge, ISSN 0264-0414.
[7] POWER, K., et al. 2004. An acute bout of static stretching: effects on force and jumping performance. Med Sci Sports Exerc, 2004; 36 (8). 1389-96.
[8] TORRES, J., CONCEIÇÃO, M., DEOLIVEIRA, A.S. and DANTAS, E., 2009. Acute Effects of Static Stretching on Muscle Strength. Biomedical Human Kinetics, vol. 1, pp. 52 ProQuest Central. DOI http://dx.doi.org/10.2478/v10101-009-0013-y.

294
MOTORICKÁ VÝKONNOSŤ DETÍ VO FUTBALOVEJ AKADÉMII
LAFRANCONI FTVŠ UK
Miroslav Holienka1, Csaba Gábriš2
1Fakulta telesnej výchovy a športu, Univerzita Komenského Katedra športových hier
2Fakulta telesnej výchovy a športu, Univerzita Komenského Katedra atletiky
ABSTRAKT
V súčasnosti sa problematike výberu talentovanej športovej mládeže venuje stále väčšia pozornosť. Napriek tomu sa danej oblasti týka stále veľa nejasností, ako napríklad stanovenie najvhodnejšieho veku pre výber, ako aj kritérií výberu pre danú športovú disciplínu. Na rozdiel od atletických disciplín sa výkon v športových hrách nedá presne kvantifikovať, čo sa premieta aj do nejasností premenných na základe ktorých by sa mal výber realizovať. Neskorší úspech vo futbale je navyše podmienený mnohými ďalšími vonkajšími faktormi, akými sú možnosti trénovania, frekvencia zranení, vplyv osobnosti a odbornosti trénera vedúceho tréningový proces, ako aj ďalšie sociálne a kultúrne faktory. Z uvedeného vyplýva, že proces výberu, najmä ak má prebiehať čo najúspešnejšie a najefektívnejšie by mal mať multidisciplinárny charakter. V našej práci sme sa na základe dlhoročnej trénerskej praxi a dostupnej domácej aj zahraničnej literatúry pokúsili vybrať testy a zostaviť z nich testovú batériu mapujúcu pohybové schopnosti a taktiež vhodnú na identifikáciu talentovaných 8-ročných futbalistov pre novootvorenú futbalovú akadémiu. Pomocou vybraných matematicko-štatistických metód sme sa pokúsili vyjadriť k vzťahom medzi jednotlivými testovými položkami, porovnať dosiahnuté výsledky s dostupnými prácami a následne formulovať odporúčania pre športovú prax. Výsledky našich meraní ukázali, že náš testovaný súbor dosiahol porovnateľné výsledky v testoch beh na 10 a 20 m s ich rovesníkmi (U9)z práce, Hulse (2012). V samotnom teste beh na 20 m si pri porovnaní aritmetického priemeru počínali dokonca o takmer 0,3 s lepšie, ako ich futbaloví rovesníci, a o 0,4s ako kontrolná skupina (nevenujúca sa pravidelnému futbalového tréningu) z práce Erceg et al. (2008).V rovnakej práci dospeli k záverom, že tri futbalové tréningy týždenne nad rámec hodín školskej telesnej výchovy mali za následok signifikantné prírastky predovšetkým v aeróbnej vytrvalosti a v rýchlosti, resp. v rýchlosti zo zmenou smeru (agility). Prostredníctvom vzťahovej analýzy sme zistili štatistický významné vzťahy (p<0,01) medzi výkonnosťou v behu na 10 m a 20 m, ako aj časom 10 m behu s prebehnutím cez koordinačný rebrík. Signifikantný vzťah (p<0,05) bol zistený aj medzi agility T-testom a prebehnutím cez koordinačný rebrík, ako aj medzi behom na 10 m a agility T-testom (p<0,10). Z uvedených výsledkov vyplýva, že mladí hráči predstavujúci kategóriu U9 si počínajú lepšie v koordinačne menej náročných testoch (ako napr. beh na 10 a 20 m), čo je podporené aj pomerne vysokým korelačným koeficientom medzi výkonmi v týchto testoch. Koordinačne náročnejšie cvičenia (Agility T-test, hod plnou loptou) sa zdajú byť pre túto vekovú kategóriu neprimerané, avšak z hľadiska dlhodobého sledovania prírastkov má ich zaradenie opodstatnenie. KĽÚČOVÉ SLOVÁ: futbal, futbalová akadémia, pohybové schopnosti, testová batéria pre U7 - U8.

295
ÚVOD
Futbal je najpopulárnejšou športovou hrou sveta, dôkazom čoho sú desiatky miliónov registrovaných hráčov bez ohľadu na vek, či pohlavie, ako aj milióny fanúšikov po celom svete. Globálnou a nevyhnutnou súčasťou takto masového športu sú aj obrovské finančné náklady súvisiace s jeho realizáciu, a to najmä na vrcholovej úrovni. Nemalé percento finančného majetku elitného svetového klubu predstavujú jeho hráči, pri transfere ktorých sa v súčasnosti takmer vždy hýbu milióny eur. Je potom celkom logické, že sa v súčasnosti stále väčšia pozornosť sústreďuje na včasnú identifikáciu (a neskorší rozvoj) talentovaných hráčov, keďže finančné náklady spojené s výberom a následným zabezpečením ich ďalšieho rozvoja sú popri ich potencionálnej budúcej trhovej cene minimálne.
Samotný výber talentov pritom chápeme, ako dlhodobý vedecky zdôvodnený proces zameraný na vyhľadávanie vhodných jedincov, ktorí majú predpoklady uplatniť sa vo vrcholovom športe. O športovom talente hovoríme, ako o mimoriadne priaznivej štruktúre aktuálne sa prejavujúcich vlastností (morfologických, psychologických, sociologických, fyziologických, funkčných), schopností a zručností, umožňujúcich dosiahnuť vysokú úroveň športovej výkonnosti vo vybranom športe alebo v disciplíne (Kampmiller, 2012). Popri tejto zaužívanej definícii talentu (športového) sa v súčasnosti čoraz častejšie hovorí aj o tzv. výchove talentu (z angl. nurturing talented players). Základom tejto myšlienky je, že talent, alebo miera talentu hrá pri dosahovaní športového majstrovstva iba limitovanú úlohu (Ericcson, Krampe,Tesch-Römer, 1993; Ericsson-Charness, 1994; Ericsson-Lehmann, 1996). Uvedení autori predpokladajú, že úroveň výkonnosti je priamo spojená s kumuláciou množstva absolvovaného cvičenia, a že bez ohľadu na mieru prirodzeného nadania a vlôh, najmenej 10 rokov intenzívneho tréningu je nevyhnutných pre osvojenie zručností požadovaných pre dosiahnutie športového majstrovstva.
Proces výberu by tak mal byť veľmi komplexný a okrem hodnotenia pohybovej a zručnostnej stránky by sa mal klásť minimálne rovnaký dôraz aj na mapovanie osobnostnej stránky (psychologický profil) hráča, jeho schopnosti zapadnúť do kolektívu a pracovať preň, či na kvalitu rodinných vzťahov (Comolli, D., 2014).
Pri samotnom posudzovaní talentovanosti vychádzame z tzv. Gausovho rozloženia početnosti vo veľkých súboroch. Opierame sa o porovnanie sledovaných znakov jednotlivca s priemernými hodnotami základného štatistického súboru a hodnotami variancie (Kampmiller, 2012).
Premenných, ktoré ovplyvňujú ďalšie etapy úspešného výberu resp. úspešného rozvoja hráča je však o mnoho viac. Tréneri a odborní pracovníci musia okrem kalendárneho veku počítať aj faktormi ako biologický vek hráča, odchýlky od štandardných kriviek rýchlosti rastu, rešpektovanie fyziologických osobitostí mladého organizmu (prevaha aeróbneho spôsobu získavania energie / menšia možnosť opierania sa o anaeróbnu glykolýzu), a popritom sa snažiť, vyhnúť sa predčasnej špecializácii, resp. udržať, alebo vytvoriť trvalý záujem o šport. Medzi základné zásady správne organizovaného výberu patrí etapovitosť, ktorá predstavuje zásadu permanentného posudzovania výberu. Podľa Kampmiller (2012) môžeme hovoriť o nasledujúcich etapách výberu:

296
Tabuľka 1. Etapy výberu športového talentu podľa Kampmiller, 2012
Začiatok, resp. dĺžka jednotlivých etáp športového tréningu tak bude závislá jednak od nárokov danej športovej špecializácie (prevaha technickej, či kondičnej zložky – zručností, alebo schopností), ako aj od aktuálneho veku športovca. V Anglicku má štruktúra výberu talentovaných športovcov podobný charakter, funguje pod názvom LTADM (Long-Term Athlete Development Model). Tento model má dva varianty v závislosti od stupňa potrebnej špecializácie danej disciplíny (skorší a neskorší model). Skorší model, ktorý je vhodný pre disciplíny ako gymnastika, stolný tenis, potápanie pozostáva zo štyroch etáp, kým neskorší model, vhodný pre atletiku, bojové športy, veslovanie, či kolektívne športy, pozostáva zo šiestich etáp.
Tabuľka 2. Etapy LTADM podľa Balyi, Way, Higgs, 2013.
1. Základná etapa (6-9 rokov)
2. Učiť sa trénovať (9-12 rokov)
3. Trénovať pre tréning (12-16 rokov)
4. Trénovať pre súťaž (16-18 rokov)
5. Tréning pre víťazstvo (18 roční a viac)
6. Tréning po ukončení kariéry
Tento program bol v Anglicku ďalej prepracovaný Futbalovou Asociáciou do špecifickejšej podoby pre futbal. Ponúka 8 etáp, ktoré sú úspešne využívané futbalovými akadémiami po celej krajine.
Každá z vyššie uvedených etáp má svoje veľmi podrobne špecifikované úlohy a ciele, dodržanie ktorých patrí medzi kritériá, na základe ktorých sú činnosti futbalových akadémií hodnotené, a podľa ktorých sú rozdelené do kategórií typu 1 až 4. Kritérií na základe ktorých sa akadémie rozdeľujú je však samozrejme omnoho viac, ako napr. finančný kapitál, množstvo zamestnancov (pomer počtu hráč: tréner), počet tréningových jednotiek v týždni atď.
1. Etapa náboru
2. Etapa základného výberu
3. Etapa špecializovaného výberu
4. Etapa výberu na vrcholový šport
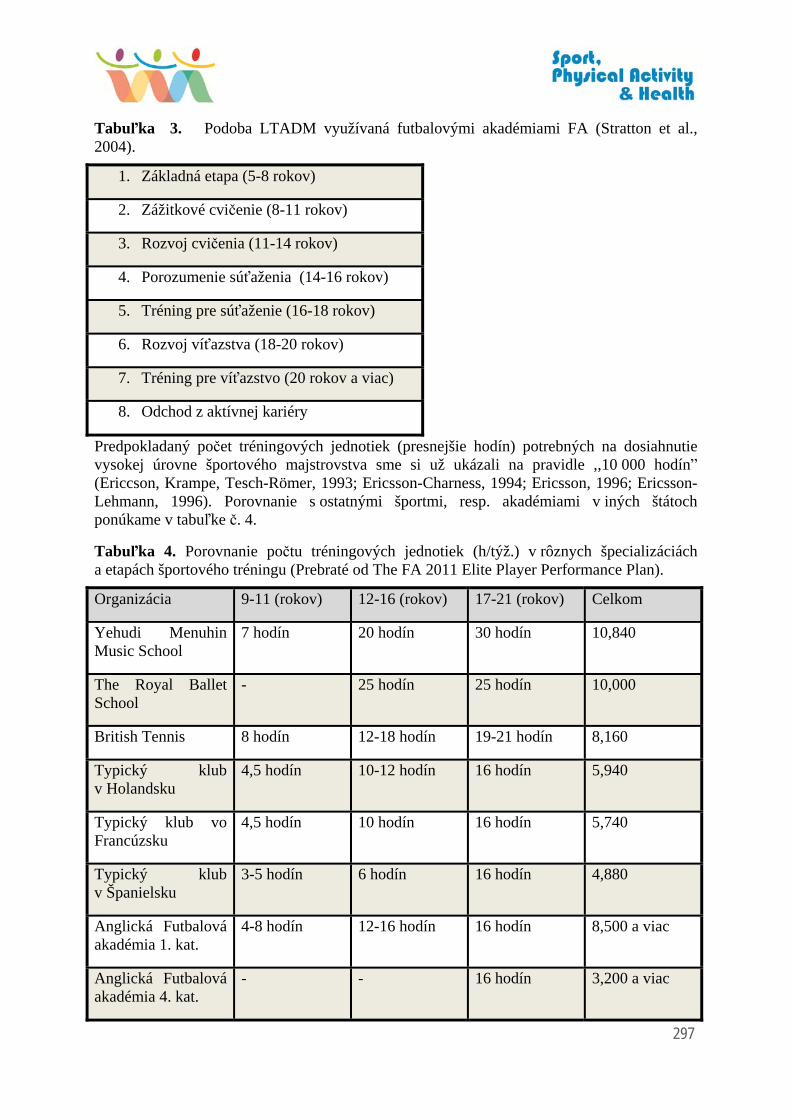
297
Tabuľka 3. Podoba LTADM využívaná futbalovými akadémiami FA (Stratton et al., 2004).
1. Základná etapa (5-8 rokov)
2. Zážitkové cvičenie (8-11 rokov)
3. Rozvoj cvičenia (11-14 rokov)
4. Porozumenie súťaženia (14-16 rokov)
5. Tréning pre súťaženie (16-18 rokov)
6. Rozvoj víťazstva (18-20 rokov)
7. Tréning pre víťazstvo (20 rokov a viac)
8. Odchod z aktívnej kariéry
Predpokladaný počet tréningových jednotiek (presnejšie hodín) potrebných na dosiahnutie vysokej úrovne športového majstrovstva sme si už ukázali na pravidle ,,10 000 hodínˮ (Ericcson, Krampe, Tesch-Römer, 1993; Ericsson-Charness, 1994; Ericsson, 1996; Ericsson-Lehmann, 1996). Porovnanie s ostatnými športmi, resp. akadémiami v iných štátoch ponúkame v tabuľke č. 4.
Tabuľka 4. Porovnanie počtu tréningových jednotiek (h/týž.) v rôznych špecializáciách a etapách športového tréningu (Prebraté od The FA 2011 Elite Player Performance Plan).
Organizácia 9-11 (rokov) 12-16 (rokov) 17-21 (rokov) Celkom
Yehudi Menuhin Music School
7 hodín 20 hodín 30 hodín 10,840
The Royal Ballet School
- 25 hodín 25 hodín 10,000
British Tennis 8 hodín 12-18 hodín 19-21 hodín 8,160
Typický klub v Holandsku
4,5 hodín 10-12 hodín 16 hodín 5,940
Typický klub vo Francúzsku
4,5 hodín 10 hodín 16 hodín 5,740
Typický klub v Španielsku
3-5 hodín 6 hodín 16 hodín 4,880
Anglická Futbalová akadémia 1. kat.
4-8 hodín 12-16 hodín 16 hodín 8,500 a viac
Anglická Futbalová akadémia 4. kat.
- - 16 hodín 3,200 a viac

298
Správne zostavenie výberových kritérií predstavuje základ dobre organizovaného procesu výberu. Pri výbere kritérií by sa mali zohľadniť osobitosti mladého organizmu, ako aj požiadavky danej športovej disciplíny samozrejme s rešpektovaním aktuálnej etapy výberu. Zohľadniť by sa mal predovšetkým vplyv rastu, dozrievania a vývoja na biologické charakteristiky mladých hráčov. V súčasnosti je už jasné, že počas rastu a vývoja, kedy sa mladý hráč stáva silnejším, rýchlejším a vytrvalejším rastie aj jeho futbalová výkonnosť, a to tak využitím špeciálnych, ako aj všeobecných prostriedkov (všeobecný adaptačný syndróm). Či je tento spozorovaný nárast vo výkonnosti viac spojený so systematickým tréningom, alebo s uvedeným prirodzeným vývojom jedinca je nateraz nejasné. Naopak z mnohých zahraničných prác je už dnes jasné, ktoré fyziologické požiadavky (pohybové schopnosti) sú pre futbal dôležité, a samozrejme aj to, na ktoré by sme sa mali v rámci jednotlivých etáp výberu sústrediť.
Z týchto východísk sme sa snažili vychádzať aj pri zostavovaní testovej batérie, ktorú sme použili pri vstupných meraniach našich mladých hráčov futbalovej akadémie.
METODIKA PRÁCE
Súbor pozostával zo 17 hráčov spadajúcich pod kategóriu U8, pričom ich priemerný kalendárny vek sa pohybuje okolo 8± rokov. Hráči sa pravidelnému futbalovému tréningu venujú 1 rok, ktorý môžeme považovať za ich športový vek. Tréningu sa venujú 3-krát do týždňa, zatiaľ bez súťažných futbalových zápasov. Uvedenú batériu testov hráči absolvovali počas jednej tréningovej jednotky s dostatočnými intervalmi odpočinkov medzi jednotlivými testami, umožňujúcimi ich takmer plné zotavenie.
Nami vybrané testové položky boli nasledovné:
- beh na 10 m
- beh na 20 m
- prebehnutie koordinačným rebríkom
- hod plnou loptou (1kg)
- Agility T-test
Časy všetkých testov boli merané dvojlúčovými fotobunkami. Štartová čiara bola takisto v prípade každého testu posunutá 50 cm za úrovňou fotobuniek.
Aby sme si vytvorili určitý základný obraz o úrovni vybraných pohybových schopností nášho výberu, namerané výkony sme sa snažili porovnať s prácami zaoberajúcimi sa podobnou problematikou. Relevantné zdroje sme hľadali vo svetových elektronických databázach ako Pubmed, Proquest, Wiley online library, Scopus. Napriek narastajúcemu záujmu o mládežnícky futbal, testovaním, resp. hodnotením pohybovej výkonnosti mladých futbalistov v tejto vekovej kategórii sa zaoberá pomerne málo štúdií.
Získané výsledky sme vyhodnotili a spracovali zodpovedajúcimi matematicko-štatistickými metódami.

299
VÝSLEDKY A DISKUSIA
Z existujúcich prác skúmajúcich podobnú problematiku sme sa dopátrali, že náš testovaný súbor dosiahol napríklad horšie výsledky, ako ich rovesníci (U9, avšak o 3 roky dlhší športový vek) z elitných anglických futbalových akadémií v teste beh na 20 m (Hulse,2012). Pri porovnaní aritmetického priemeru si naši hráči počínali horšie o takmer 0,6 s, a takisto o 0,3 s horšie, ako , ako skupina venujúca sa pravidelnému futbalovému tréningu, avšak o 0,4s lepšie ako kontrolná skupina (nevenujúca sa pravidelnému futbalového tréningu, len pravidelným hodinám školskej telesnej výchovy a športu) z práce Erceg et al., 2008, (obrázok č. 1.).V rovnakej práci dospeli k záverom, že tri systematické futbalové tréningy týždenne nad rámec hodín školskej telesnej výchovy mali za následok signifikantné prírastky predovšetkým v aeróbnej vytrvalosti a v rýchlosti, resp. rýchlosti zo zmenou smeru.
0
0,5
1
1,5
2
2,5
3
3,5
4
4,5
5
FA Lafranconi FTVSUK
U9 Premier League(Hulse, 2012)
U9 FT(Erceg et al, 2008)
U9 STV(Erceg et al, 2008)
čas (s)
Beh na 20 m
Obrázok 1. Porovnanie nášho súboru s výsledkami zahraničných prác v teste beh na 20 m.
V teste beh na 10 m dosiahli naši hráči priemerný čas 2,38 s, čo je v porovnaní s časmi kategórie U9 z anglickej futbalovej akadémie horšie o 0,34 s (Goto, 2012). Ďalšie výsledky zo všetkých testov našej skupiny prezentujeme v tabuľke č. 5.
Tabuľka 5. Výsledky našej skupiny v jednotlivých testoch
Priemerné výkony najlepší výkon najhorší výkon
Beh na 10 m 2,38 2,19 s 2,69 s
Beh na 20 m 4,35 3,9 s 4,93 s
Prebehnutie koordinačného r.
2,25 s 1,61 s 2,93 s
hod plnou loptou (1kg) 3,55 m 5,00 m 2,30

300
Na základe týchto údajov, ako aj výsledkov mnohých zahraničných prác je dôležité zdôrazniť a nezabudnúť na významné zdravotné benefity systematického futbalového tréningu, a to v každom veku (de Sousa, et al., 2014; Randers, 2014). Medzi najvýznamnejšie patria zvýšená maximálna spotreba kyslíka, zlepšenie lipidového profilu, inzulínovej rezistencie, pokles percentuálneho podielu telesného tuku, zvýšenie kostnej a svalovej hmoty.
Prostredníctvom vzťahovej analýzy sme sa zároveň snažili objasniť vzťahy medzi jednotlivými testami a do určitej miery aj vhodnosť vybraných testov. Štatisticky významné vzťahy sme zistili (p<0,01) medzi výkonnosťou v behu na 10 m a 20 m, ako aj časom 10 m behu s prebehnutím cez koordinačný rebrík. Signifikantný vzťah (p<0,05) bol zistený aj medzi agility T-testom a prebehnutím cez koordinačný rebrík, ako aj medzi behom na 10 m a agility T-testom (p<0,10). Uvedené výsledky naznačujú, že mladí hráči predstavujúci kategóriu U9 si počínajú pravdepodobne lepšie v koordinačne menej náročných testoch (ako napr. beh na 10 a 20 m), čo je podporené aj pomerne vysokým korelačným koeficientom medzi výkonmi v týchto testoch. Koordinačne náročnejšie cvičenia (Agility T-test, HPL) sa zdajú byť pre túto vekovú kategóriu neprimerané, avšak z hľadiska dlhodobého sledovania prírastkov má ich zaradenie opodstatnenie.
V ideálnom prípade sa pri výbere správnych testov, resp. testových kritérií vychádza z nárokov samotných futbalových zápasov. V zahraničí takéto práce nie sú žiadnou raritou, čiže je možné sa dopátrať k pomerne veľkému množstvu údajov týkajúcich sa kvantifikácii (fyziologické a časovo-priestorové parametre) zápasového zaťaženia v mládežníckom futbale. Drust-Rielly (1997) pomocou monitorovania srdcovej frekvencie počas zápasov 10 ročných futbalistov zistili priemerné hodnoty pohybujúce sa okolo 170±18 úderov/min. Počas druhého polčasu bola táto hodnota ešte o ďalších 10 úderov vyššia. Tieto pomerne vysoké priemerné hodnoty srdcovej frekvencie spolu s pozorovanými nízkymi hodnotami (40-60 úderov za minútu) na jednej strane poukazujú na vysokú fyzickú náročnosť futbalového zápasu, a na strane druhej na intermitentný charakter takéhoto zaťaženia, ktorý je charakteristický aj/hlavne pre mužské kategórie. Pomerne nízke hodnoty krvného laktátu (3-4 mmol.l) spozorované počas zápasov v práci Klimt et al. (1992) sú dôkazom už spomínanej nízkej anaeróbnej (laktátovej) kapacity mladých hráčov, čo naznačuje, že počas prevažnej časti hry sa energia získava aeróbnym spôsobom (Felci et al., 1995). Pre ucelený obraz o veľkosti zápasového zaťaženia je k vyššie uvedeným parametrom potrebné samozrejme prirátať rôzne druhy lokomócie (beh vzad, bokom), početné zmeny smeru, odrazy a súboje.
V súvislosti s problematikou výberu a zabezpečením ďalšieho rozvoja talentovanej mládeže sa často hovorí aj o možností využitia tzv. senzitívnych období, t.j. obdobia, alebo veku dieťaťa, v ktorom je rozvoj jeho niektorých pohybových schopností výraznejší. Do akej miery sa však tieto prírastky viažu k tréningovému zaťaženiu, a nakoľko k prirodzenému biologickému vývinu je nejasné, a v súčasnosti ťažko preukázateľné. Toto podporujú aj štúdie Weber et al. (1976), ktorí možnosti senzitívneho obdobia so zameraním na aeróbnu vytrvalosť (vo2max) skúmali na 10, 13 a 16 ročných dvojičkách (chlapci). Výsledky práce ukázali 13 a 15% nárast vo2max pri 10 a 16 ročných probandoch, kým iba 10% prírastky v prípade 13 ročných (optimálnym vekom sa pritom podľa literatúry javí 12-18 mesiacov po PHV, peak height velocity). K podobným kontrastným (nevýznamné zmeny vo vo2max v senzitívnom období aeróbnej vytrvalosti) záverom dospeli Sjodin-Svedenhag (1992). Určitý obraz o dôležitosti a prirodzenej akcelerácii v jednotlivých komponentoch športového tréningu v závislosti od chronologického veku a rýchlosti rastu telesnej výšky si môžeme vytvoriť
Agility T-test 17,72 15,23 s 21,48

301
pomocou obrázku č. 2.
Obrázok 2. Dôležitosť jednotlivých tréningových komponentov podľa chronologického veku a rýchlosti rastu telesnej výšky (údaje prebraté od Mero et al., 1990).
ZÁVERY
V príspevku sme snažili objasniť a priniesť nové poznatky do oblasti procesu výberu športového talentu pre futbal. Tak ako pre každý šport aj v tomto prípade by sa malo jednať o komplexný proces, hodnotiaci nielen pohybovú (zručnostnú) stránku hráča, ale rovnako aj psychologické parametre, motivačné a emočné faktory, ako aj osobnostné vlastnosti. Napriek tomu, že sa tejto oblasti venuje stále väčšia pozornosť, v súčasnosti stále nie je známy žiadny unikátny parameter, ktorý by zaručil budúci úspech, resp. vysokú úroveň športového majstrovstva vo futbale. Nevyhnutnou požiadavkou úspešného výberu je teda jeho stále výraznejší multidisciplinárny charakter, čo len podporuje potrebu práce a zaangažovania vedeckých pracovníkov z oblasti športu. Poznatky práce sa budeme snažiť využiť aj v našej novootvorenej futbalovej akadémii, samozrejme v rámci súčasných možností.
Zhrnutie a odporúčania pre prax
‐ Pri výbere je potrebné pracovať nielen s motorickými, ale aj psychologickými a sociálnymi parametrami
‐ Pri hodnotení pohybovej výkonnosti je potrebné okrem biologického veku zohľadniť aj parametre ako sú biologický a športový vek (hráči narodení skoršie v tom istom kalendárnom roku dosahujú v týchto úvodných mládežníckych kategóriách významne lepšie výsledky ako ich neskoršie narodení spoluhráči, ktorí však tento deficit môžu dobehnúť v neskoršom veku, Helsen, Winckel, Williams 2004)
‐ Táto výhoda sa navyše premieta aj do veľkosti absolvovaného zaťaženia počas zápasu (Buccheit Mendez-Villanueva, 2014)
‐ Rešpektovanie zásad výberu, pričom za najdôležitejšie považujeme zásady dobrovoľnosti, systematickej kontroly a predovšetkým etapovitosti (neúspešné zaradenie športovca do vybranej športovej disciplíny, špecializácie, t.j. jeho nepresadenie sa ešte nemusí byť automaticky považované za neúspech, keďže osvojené zručnosti a dosiahnutá úroveň pohybových schopností môže byť využitá v inej špecializácii)
‐ Sledovanie najnovších trendov a východísk pri uplatňovaní vyššie uvedených

302
odporúčaní.
LITERATÚRA
[1] BALYI, I., WAY, R., HIGGS, C. 2013. Human Kinetics. Long-Term Athlete Development. 2013.p. 296. ISBN 9780736092.
[2] BUCCHEIT, M.-MENDEZ-VILLANUEVA, A., 2014. Effect of age, maturity and body dimensions on match running performance in highly trained U15 soccer players. Journal of Sports Science. Issue 32, vol. 13, pp. 1271-1278. ISSN 0264-0414.
[3] DE SOUSA, M.V. et al. 2014. Positive effects of football on fitness, lipid profile, and insulin resistance in Brazilian patients with type 2 diabetes. Scandinavian Journal of Medicine in Science and Sports. 2014. Vol. 24. pp. 57-65. ISSN 1600-0838.
[4] DRUST, B. - REILLY, T. 1997. Heart rate responses of children during soccer play. In T. Reilly, J. Bangsbo, M. Hughes. Science and Football III. London: E. & F.N. Spon, pp. 196–200. ISBN 978-0419221609.
[5] COMOLLI, D. 2014. Talent identification and recruitment. Football and Science. Conference, London. 2014.
[6] ERCEG M., ZAGORAC, N., KATIČ, R. 2008. The impact of football training on motor development in male children. Collegium antropologicum. Issue 32, vol. 1, pp 241-247.2008. ISSN 1848-9486
[7] ERICSSON, K.A., KRAMPE, R.T., TESCH-RÖMER, C. 1993. The role of deliberate practice in the acquisition of expert performance. Psychological Review. 1993. Vol. 100, pp. 363-406. ISSN 1939-1471.
[8] ERICSSON-CHARNESS. 1994. Expert performance: its structure and Acquisition. American Psychologist. 1994. vol. 49, pp. 725-747. ISSN 1935-990X.
[9] ERICSSON – LEHMANN. 1996. Expert and exceptional performance: evidence of maximal adaptation to task constraints. Annual Review of Psychology. 1996. vol. 47, pp. 273-305. ISSN 0066-4308.
[10] FELCI, U., DE VITO, G., MACALUSO, A., MARCHETTONI, P., SPROVIERO, E. 1995. Functional evaluation of soccer players during childhood. Medicina Dello Sport. 1995. vol. 48, pp. 221–225. ISSN 1827-1863.
[11] GOTO, H. 2012. Physical development and match analysis of elite youth soccer players. Doctoral thesis, LJMU.2012.
[12] HELSEN, W.F., WINCKEL, J., WILLIAMS, M. 2004. The relative age effect in youth soccer across Europe. Journal of Sports Science. Issue 23, vol. 6, pp. 629-639.2005. ISSN 0264-0414
[13] HULSE, MA., et al. 2012. A field test battery or elite, young soccer players. International Jornal of Sports medicine. 2013. vol.34, issue 4, pp. 302-11. ISSN1439-3964 Felci, U., et al. 1995. Functional evaluation of soccer players during childhood. Medicina Dello Sport. vol. 48. pp. 221-225. ISSN 0025-7826.
[14] KAMPMILLER, T. 2012. Výber talentov na šport. In Kampmiller, T. et al. et al. Teória a didaktika športového tréningu. Bratislava : ICM Agency. 2012. ISBN 978-80-89257-48-5.
[15] KLIMT, F., BETZ, M., SEITZ, V. 1992. Metabolism and circulation of children playing

303
soccer. In: Coudert-Praagh. Children and Exercise XVI: Pediatric work physiology. Paris: Masson.
[16] MERO, A., VUORIMAA, T., HAKKINEN, K. 1990. Training in children and adolescents. Jyvaskyla, Finland: Gummurus Kirjapaino Oy, 1990.
[17] RANDERS, M.B. et al. 2014. Exercise performance and cardiovascular health variables in 70-year-old male soccer players compared to endurance-trained, strength-trained and untrained age-matched men. Journal of Sport Science. 2014. Vol. 32, issue 13. Pp. 1300-8. ISSN 1466-447X.
[18] SJODIN, B. – SVEDENHAG, J. 1992. Oxygen uptake during running as related to body mass in circumpubertal boys: a longitudinal study. European journal of applied physiology and occupational physiology. 1992. Vol. 65. Issue 2, ISSN 0301-5548.
[19] STRATTON, G., RIELLY, T., WILLIAMS, M., RICHARDSON, D. 2004. Youth soccer from science to performance. 2004. New York-London: Routledge. P. 216. ISBN 0203644131.
[20] WEBER, G., KARTODIHARDJO, W., KLISSOURAS, V. 1976. Growth and physical training with reference to heredity. Journal of applied physiology. 1976. Vol. 40, issue 2. Pp. 211-5. ISSN 0021-8987.

304
AKTIVITY VOĽNÉHO ČASU MLÁDEŽE S TELESNÝM
POSTIHNUTÍM
Miloš Chromík
Univerzita Komenského v Bratislave, Fakulta telesnej výchovy a športu, Katedra športovej edukológie a športovej humanistiky
ABSTRAKT
Pohybové aktivity majú úzku súvislosť s tvorbou adaptačných mechanizmov na rôzne formy zaťaženia, teda nielen fyzického. Vo výskumnom sledovaní sme sa zamerali na zmapovanie aktivít voľného času mládeže na Strednej odbornej škole pre žiakov s telesným postihnutím. Zistili sme, že zastúpenie športovo-rekreačných aktivít pri trávení voľného času u sledovanej mládeže nie je na porovnateľnej úrovni so zdravou populáciou tej istej vekovej skupiny. Fakt, že až 16 % žiakov aj napriek používaniu kompenzačnej pomôcky športuje, je na zváženie, no len 31,5 % žiakov školy bez používania rôznych kompenzačných pomôcok športuje pravidelne. Zaujímavé je zistenie, že vo voľnom čase športuje 26 % žiakov, ktorí sú od povinnej telesnej a športovej výchovy (TŠV) oslobodení. V aktivitách voľného času a to hlavne u dievčat prevládajú statické činnosti: počúvanie hudby, práca s počítačom, posedenia s priateľmi, čítanie kníh a časopisov a návšteva kultúrnych podujatí. Chlapci dominujú v športovaní, sledovaní TV, sebavzdelávaní (13,7 %), v domácich prácach a takmer 10 % z nich aj v umeleckých aktivitách (ide pravdepodobne o prípravu na profesiu zlatníka). Vo výchovnom usmerňovaní žiakov školy sú výrazné rezervy. Využitím niektorých z nich (napr. nástupom mladého, najnovšími poznatkami vyzbrojeného telovýchovného pedagóga, namiesto 70-ročného učiteľa) sa môže dosiahnuť výrazný posun v postojoch žiakov k športu a utváraní pozitívneho vzťahu k športovaniu vôbec.
KĽÚČOVÉ SLOVÁ: voľný čas mládeže s telesným postihnutím, pohybové aktivity voľného času
ÚVOD
Veľkým umením a šťastím učiteľa zároveň je schopnosť, podľa možnosti, upútať každého žiaka. Rozloženie vlastností, javu, schopností v populácií je neúprosné. Nie všetci môžeme byť vedci, lekári, virtuózi, básnici, no mnohí z nás sa môžu o to pokúsiť. Aby šanca človeka na spokojný život stúpla, je tu pedagóg s predpokladmi odhaľovať nepoznané zákutia ľudskej duše, intelektu, i stupňa nadania. Takémuto stavu konsolidácie zanietenia učiteľa môžeme smelo hovoriť „vysnívané pedagogické Eldorádo“. V oblasti športu, ktorého základy deťom sprístupňujeme už v počiatkoch školskej dochádzky (v niektorých druhoch športu ešte skôr – plávanie, korčuľovanie), je pre deti so špeciálnymi výchovno-vzdelávacími potrebami nevyhnutné uplatňovať špeciálne vyučovacie postupy, didakticko-interakčné formy, ale hlavne efektívne metódy osvojovania si pohybu. Pedagóg je pre žiaka model správania a zároveň pokladnica múdrosti. Takéto výsadné postavenie sa buduje v každodennej a zo strany učiteľa nanajvýš korektnej interakcii.

305
Učiteľovo taktné správanie sa vyznačuje týmito zásadami:
žiaka rešpektuje v celej jeho jedinečnosti;
v žiadnom prípade ho nezosmiešňuje;
rešpektuje špecifiká jeho fyzickej aj psychickej stránky, je mu starším skúsenejším poradcom, partnerom;
kladie pred žiaka výzvy podnecujúce jeho životné ašpirácie, v logickej postupnosti mu otvára svet poznania;
usiluje o jeho mravno-citový a senzorický rozvoj;
v staršom období prevádza žiaka do sveta dospelých, je mu prirodzeným vzorom a osobou, ktorá v žiakovi zanechá hlbokú brázdu ako prípravu pre „budúcu úrodu“.
Dobrý učiteľ udáva „prím“- smerovanie nálady žiakov v kolektíve počas vyučovania, jeho usmerňovanie je zrozumiteľné a dobre mienené – prevláda v ňom pedagogický optimizmus a prirodzený entuziazmus. Organizácia žiakov pri klasickom vyučovaní v triedach je v podstate udaná využívaním pracovného miesta v triede, na ktorom plnia zadané úlohy individuálne, vo dvojiciach, prípadne v skupinách no spravidla na statickom stanovišti. Vyučovať telesnú a športovú výchovu (ďalej TŠV) s maximálnou efektivitou je nesmierne náročná a hlavne zodpovedná a záslužná práca vyvstávajúca hlavne z nehomogenity triedy. Nehomogenita triedy môže byť spôsobená:
1. rozdielnou všeobecnou pohybovou výkonnosťou a telesnou zdatnosťou;
2. rozdielmi vo výškových a hmotnostných parametroch;
3. rozdielnou motorickou docilitou;
4. rozdielnosťou v osobnom nasadení (vložení sa žiaka do problému), averziou voči obsahu;
5. niekde koedukovaným vyučovaním TŠV, to vyžaduje od učiteľa vysoké nasadenie pedagogického majstrovstva vo viacerých smeroch.
Pedagóg by mal uplatňovať čo najefektívnejšie spôsoby riadenia procesu:
širokospektrálnu motiváciu (ako vnútorné pohnútky ku konaniu) a stimuláciu ako vonkajšie podnety, určenie vhodnej miery ašpirácií;
rozložiť vlastnú pozornosť na množstvo detailných činností jednotlivcov;
vytvoriť bezpečné podmienky práce pre každého cvičenca;
poskytovať spätno-väzbové informácie o kvalite vykonávaného pohybu, v prípade otázok jasne ozrejmiť opytovanú vec;
individuálne stanoviť primerané pohybové, senzomotorické i mentálne úlohy;
zadeliť špeciálne úlohy pre jednotlivcov, ktorí nejakým spôsobom v skupine „vyčnievajú“;

306
zabezpečiť kooperáciu medzi všetkými členmi kolektívov (skupín) v rámci športových
a pohybových hier, no nielen pri nich;
vytvárať emocionálne situácie pre všetkých žiakov na vyučovaní (podľa možností aj pre necvičiacich).
Celková organizácia takto rozdiferencovaného kolektívu (a to sme ešte nespomenuli rozdielnosti prostredia, v ktorom telovýchovný proces prebieha), kladie hlavne na psychiku pedagóga záťaž, ktorá sa môže niekedy prejaviť neadekvátnou reakciou. Na druhej strane zo skúseností (aj vlastných – pocity po záťaži) vieme, že fyzická záťaž u širokej obce učiteľov TŠV vedie skôr k psychickému relaxu a uchovaniu telesnej sviežosti.
Pojem efektivita sa v pedagogickej teórii môže stotožniť s pojmom účinnosť. Tá hovorí o miere úžitku, teda toho, čo sme pri svojom širokospektrálnom pôsobení na žiakov u nich zafixovali a čo pri konkrétnej forme opakovania naučeného spätne získavame. Už na prvý pohľad je to zložitá slovná konštrukcia a to isté sa dá povedať o samotnej pedagogike. Veľa odborníkov v tejto oblasti prišlo s prevratnými myšlienkami, lenže ich realizácia na rôznorodosť sociálneho prostredia i neopakovateľnosť ľudských indivíduí v ňom, robí túto vedu stále živú, neustále sa vyvíjajúcu. Vyučovanie má okrem vzdelávacej a výchovnej stránky napĺňať tak často preferovaný aspekt zdravia. Je dobré, keď pedagóg fundovane a pritom jednoducho a logicky vysvetlí „tvorbu zdravia“ v súvislosti s telesným a pohybovým zaťažovaním. Tvorba adaptačných mechanizmov je základná téma, ktorá má byť žiakom (študentom) vysvetlená podľa možnosti v rámci teoretickej lekcie vo vyučovaní TŠV. Som presvedčený, že teoretické vzdelávanie v predmete TŠV v stredných školách sa dočká učebnice, v ktorej budú obsiahnuté podstatné témy zdravotvorby pohybom v súčinnosti s ďalšími zložkami zdravého životného štýlu.
Aj jednoduchou dedukciou dospejeme k záveru, že nie všetky vyučovacie hodiny sa môžu „vydariť“, splniť účel, na ktorý boli pripravované, zamerané. Pedagóg je na vyučovaní aj „od toho“, aby nešetril slovami a nezdar žiaka v napredovaní vždy okomentoval – našiel príčinu neúspechu. Učiteľ je pre žiaka idol, nie strašiak a tiež nie, ako sa vyslovil jeden už zaslúžili dôchodca a kolega: „Študent je triedny nepriateľ“. Áno, žiak alebo študent môže byť oponentom v diskusii, no mal by náležite svoje argumenty zdôvodniť. Systém výberu adeptov na učiteľské povolanie by mal byť nastavený tak, že na štúdium budú prijatí vhodní uchádzači, prípadne sa počas bakalárskeho stupňa vyselektujú nevhodné typy a na magisterské štúdium nepostúpia A on sa podľa toho aj k študentom správal, čo hraničilo s „ makarenkovskou tendenciou“ uplatňovanou vo výchove po vzore sovietskych pedagógov istého vývojového obdobia. Nevdojak sme sa v polemike o pôsobení učiteľa v procese dostali k telesným trestom. Telesné tresty ponižujú trestaného a trestajúci dehonestuje svoj odborno-morálny fortieľ a znižuje svoj osobný odborný kredit. Dieťaťu je možné dať najavo jeho neprístojné konanie humanistickými spôsobmi výchovného usmerňovania. Výslovne nepraktizujeme telesné tresty a zaužívané „odmeny“ – kľuky, drepy „pre prehraté“ družstvo sú diskutabilné. Príjemne trestať môžeme všetky cvičiace deti spoločným cvičením, ktoré môže napomáhať napr. správnemu držaniu tela v ľahu s takýmto slovným sprievodom. „Za to, že ste bojovali, súťažili v duchu fair-play a na úrovni svojich možností, urobili ste radosť mne a sebe úžitok pre vlastnú telesnú schránku. Športovanie je o budovaní adaptačných mechanizmov, ktoré robia vaše telo ale aj ducha odolnejšími. Preto každú pohybovú aktivitu navyše neberte ako telesný trest, ale naopak“. Keď sme pri zdôvodňovaní činností, učiteľ nemá šetriť slovami. Mentorovanie má vo výrazových prostriedkoch učiteľa svoje pevné miesto. Prílišné prerušovanie deja (napr. hier) deti irituje. Treba poznať správnu mieru dobre

307
mienených rád, a tieto môže pedagóg realizovať individuálne, bez prerušenia činnosti celého kolektívu. Len pri výrazných nedostatkoch učiteľ proces preruší a čo najnázornejšie utvorí predstavu správnej činnosti, zvýrazní uzlové body - fázy osvojovanej techniky. Venovať sa optimálnej činnosti učiteľa vo vyučovaní, je vec nadmieru zaujímavá a zároveň potrebná, no našou úlohou je presondovať možnosti ovplyvňovania voľného času žiakov s telesným postihnutím a orientovať ho podľa možnosti na jemu vhodný a príťažlivý šport. Problematiku taktného správania a konania pedagóga sme do úvodu zaradili z dôvodu jej dôležitosti pri formovaní záujmov, ktoré majú svoj prapôvod v jednotlivých oblastiach vzdelávania v školskom edukačnom procese. Taktné správanie pedagóga v telovýchovnom procese výrazne vstupuje do formovania vzťahu k telovýchovným a športovým aktivitám detí a mládeže školského veku. Pozitívny vzťah je základom pre budovanie zdravého životného štýlu najmladšej generácie, v ktorom pohybové aktivity majú svoje nezastupiteľné miesto.
CIEĽ
Získať prehľad o záujmových aktivitách mládeže s telesným postihnutím. Porovnať záujmy mládeže s telesným postihnutím so záujmami zdravej populácie aj v oblasti telovýchovných a športových aktivít. Na základe komparácie navrhnúť vhodné pohybové aktivity pre nami sledovanú mládež.
PREDPOKLAD PEDAGOGICKÉHO SLEDOVANIA
Sme toho názoru, že žiaci so špeciálnymi výchovno-vzdelávacími potrebami budú preferovať málo dynamické záujmové aktivity. V oblasti záujmu o šport predpokladáme výrazne nižší záujem u dievčat, na druhej strane ich zvýšený záujem o kultúrne a v rámci nich o umelecké aktivity praktizované vo voľnom čase.
METODIKA
Súbor tvorili žiaci Strednej odbornej školy pre žiakov s telesným postihnutím v Bratislave (n=115) a súbory populácie sledované Klimtovou et al. (2012), Nemček (2014), Medekovou (2013), Majerským (2002).
Metódy získavania údajov predstavovali výsledky sledovaní záujmových aktivít v „súbore“ uvedených autorov a časť údajov z dotazníka vypracovaného na tento účel.
Metódami spracovania výsledkov sledovaní boli štatistické metódy uplatnené pri vyhodnocovaní dotazníka a prioritnou metódou bola komparácia nami získaných údajov so zisteniami niektorých obdobných sledovaní.
VÝSLEDKY A DISKUSIA
Zistili sme, že aktivity voľného času žiakov so špeciálnymi výchovno-vzdelávacími potrebami majú obdobnú štruktúru akou sa vyznačuje zdravá mládež. No aká je ich preferencia u zdravej a telesne postihnutej populácie, bol náš odborný zámer. Na obr. 1

308
uvádzame štruktúru možných záľub (záujmov) mládeže s telesným postihnutím. Výrazne v nich dominujú aktivity s nízkym energetickým výdajom, čo má v mnohých prípadoch výrazný vplyv na somatickú stránku osobnosti žiaka. Takéto zistenia korešpondujú so zisteniami vo výskumnom sledovaní Nemček (2014) a Wittmannová a kol. (2013), ktoré zistili veľmi nízku preferenciu športovania vo svojom voľnom čase u detí a mládeže s telesným postihnutím. Nadváha, ale hlavne obezita sú sprievodným znakom hypokinézy telesne oslabenej mládeže. Počúvanie hudby je dominantné ako u dievčat, tak i u chlapcov a miera záujmu „našej“ mládeže je porovnateľná so zisteniami Klimtovej, et al. (2012), ktorá uvádza strednú hodnotu záujmu 75 % sledovanej populácie. Práca na počítači je preferovaná 47 % bratislavských žiakov s telesným obmedzením. Klimtovej, et al. (2012) stredná hodnota tohto parametru záujmových aktivít je 45 %. Podľa zistení Medekovej (2013) relaxáciu pri počítači uplatňuje len 20 % mužov a niečo vyše dvoch percent žien ňou sledovaného súboru. Treba však uviesť, že súbor tvorili respondenti so sedavým charakterom zamestnania. Športové aktivity našej skupiny mládeže sú akceptované 45 % opýtaných chlapcov a len 17 % dievčat. Medeková uvádza záujem o športovanie u 57 % mužov a 34 % žien. Klimtová, et al. (2013) prezentuje strednú hodnotu záujmu o šport na úrovni 70 %.
V našich úvahách sme sčasti mylne predpokladali záujem dievčat v kultúrnej oblasti. Umelecké aktivity proklamuje skoro 10 % chlapcov a len 7 % dievčat. Avšak pri návšteve kultúrnych podujatí výrazne dominujú dievčatá s 24 %-ami, a chlapci len na úrovni štyroch percent. Klimtová uvádza strednú hodnotu kultúrnych aktivít až na úrovni 40 %, Medeková u dievčat 24 % u mužov 12,3 %. Záujem o športovanie v našom súbore je nízky hlavne u dievčat – už uvádzaných 17 %, no príčinu môžeme hľadať aj v zdravotnom hendikepe. Nemček, Bergendiová (2013) uvádzajú ako príčinu nezáujmu o šport vlastnú pohodlnosť respondentov. Takto sa vyjadrilo 26 % dievčat a 22 % chlapcov. Naši respondenti medzi aktivity voľného času zaradili „sladké ničnerobenie“ (5,5 % chlapcov, 5 % dievčat).
Keď by sme šli pri skúmaní záujmov detí a mládeže pár rokov dozadu, štruktúra by bola celkom odlišná a celkom jednoznačne môžeme povedať, že záujmy a postoje by v najväčšej miere kopírovali technickú úroveň spoločnosti, čo vždy bolo a aj bude (Labudová, Nemček, 2011). Samozrejme, záujem o cyklistiku dnes a v počiatkoch 20.stor. je ťažko zrovnateľný. Dnes udáva smer záujmov populácie mobilná komunikácia a informatizácia celého života (Nemček, 2012). Aj situácia v spoločenstve ľudí rozhoduje o aktivitách jednotlivcov. Ako krutú spomienku na vojnu, pri pohľade na percento rozhlas počúvajúcich ľudí dnes a počas čakania na koniec vojny je tento počet neporovnateľný. Medeková (2013) zistila počúvanosť na úrovni 11 % populácie.
K nami získaným výsledkom sa dá vo všeobecnosti povedať toľko, že prevažujú záujmy statického charakteru a dobre je to vidieť i na športovej činnosti dievčat (Chromík, 2006). Prvých šesť aktivít mimo už spomínaného športovania, je trendovou záležitosťou hypokinetickej doby dneška (Nemček a kol., 2011). Náš súbor respondentov (hlavne chlapci) prekvapil aj nízkym záujmom o návštevu športových podujatí - 8 % chlapcov, dievčatá necelých 5 %. Klimtová, et al. (2013) udáva strednú hodnotu 37,5 %. Majerský (2002) zistil v športových aktivitách, proklamovaných aj praktizovaných, výrazne vyššiu zainteresovanosť chlapcov ako dievčat a zistil aj obľúbenosť jednotlivých športov v populácii mládeže západoslovenského regiónu. Na tému voľnočasových aktivít detí a mládeže bolo publikovaných množstvo (neodvážim sa ani odhadnúť číslovku, akiste štvormiestnu) príspevkov, no články sondujúce záujmové aktivity zdravotne postihnutej populácie sú vzácne. Na Slovensku problematiku sledujú najmä Labudová Jela a Nemček Dagmar

309
a skupiny diplomantov okolo nich. Samozrejme aj na ostatných pedagogických fakultách sa vyprofilovali zanietenci pre túto zaujímavú oblasť na pedagogické sledovania.
Obr. 1 Aktivity voľného času mládeže v SOŠ pre žiakov s telesným postihnutím
ZÁVER
Predpokladané skutočnosti sa nám podarilo naplniť, no nie v plnej miere a ako sa občas konštatuje „človek mieni, život mení“, sa v našom prípade tiež potvrdilo. Naši respondenti sú menej sebavedomí ako ich zdraví rovesníci, no aj toto konštatovanie treba

310
považovať za relatívne. Sú medzi nimi výnimky, ktoré však potvrdzujú pravidlo. V statických aktivitách (počúvanie hudby, sledovanie televízie, posedenia s priateľmi) sú isté diferencie medzi zdravou a zdravotne oslabenou mládežou. Napr. posedenia s priateľmi preferuje zhruba 35 % našich probandov naproti 55 % zdravej mládeže. Je to možno spôsobené nižším stupňom sebaúcty a sebadôvery hendikepovaných, ktorí svoj „údel“ neradi prezentujú na verejnosti (Chromík, 2014). Potešila nás „kultúrna aktivita“ chlapcov nášho súboru, ktorú sme predpokladali skôr u dievčat. Hudbu má v obľube na porovnateľnej úrovni tak bežná ako aj telesne postihnutá mládež. V praktizovaných športových aktivitách naši respondenti výrazne zaostávajú, čo okrem zníženej pohyblivosti až imobility spôsobuje špeciálnu zameranosť v praktickom živote. Týmto zistením nechceme „objaviť Ameriku“, len chceme poukázať na fakt, že športové aktivity postihnutej mládeži chýbajú a nemali by. Práve aktívnym športovaním môžu telesne postihnuté osoby stabilizovať svoj zdravotný problém, ba dokonca v mnohých prípadoch ho aj z časti odstrániť. Naše odporúčania smerujú hlavne k telovýchovným pedagógom pracujúcimi so zdravotne postihnutou populáciou, aby prezentovali čo najviac cvičení prospievajúcich ich zdraviu, t. j. cvičenia vo vhodných polohách pre konkrétne zdravotné postihnutie. Pri takomto „zápase“ o získanie dôvery žiakov by mal pedagóg neustále mentorovať a memorovať zásady správneho cvičenia. Ako sme už v úvode naznačili, pedagóg má byť motorom – spúšťačom aktivity svojich žiakov. Má vedieť zvládnuť aj náročnejšie pedagogické situácie uplatnením vhodných výchovných metód (Chromík, 2006). Odmena vo forme pochvaly, hodnotenie najvyšším klasifikačným stupňom a niekedy len úsmev a dobré slovo, to by v pôsobení učiteľa TŠV nemalo chýbať. Pedagóg hlavne v súčasnej dobe potrebuje enormnú dávku trpezlivosti a sviežosti v uvažovaní, aby jeho konanie bolo nápadité, tvorivé a zároveň zmysluplné. Urobiť život deťom s telesným postihnutím príjemnejším a zároveň zážitkovým by malo byť krédom každého „dospeláka“, ktorý do interakcie s nimi prichádza.
Výskum bol realizovaný v rámci grantovej úlohy č. 1/0915/13 s názvom „Športová činnosť – súčasť kvality života ľudí so zdravotným postihnutím“.
LITERATÚRA
[1] CHROMÍK, M. Uplatňovanie metódy požiadaviek v školskej telesnej výchove. Telesná výchova šport, roč.16, č. 2, 2006, s. 43-44, ISSN 1335-2245.
[2] CHROMÍK, M. Výsledky zisťovania sebahodnotenia žiakov na Strednej odbornej škole pre žiakov s telesným postihnutím, (rukopis v tlači) 2014
[3] KLIMTOVÁ, H. FOJTÍK, I., VALA, R., VALOVÁ, M. Volnočasové aktivity žáků základní školy. In Pedagogická kinantropológie. Ostrava: Ostravská univerzita v Ostravě, Tribun EU, 2012, s. 49 – 54. ISBN 978-80-263-0248-3.
[4] LABUDOVÁ, J., NEMČEK, D. Diferenciácia cieľov a podmienok na šport v rámci životného štýlu dospelých a starších ľudí. In Ošetrovateľstvo – pohyb – zdravie [elektronický dokument]. Trenčín : Trenčianska Univerzita A. Dubčeka, 2011, s. 350-357 [CD-ROM]. ISBN 978-80-8075-487-7.
[5] MAJERSKÝ, O. Športové záujmy žiakov základných a stredných škôl v západoslovenskom regióne. Acta Facultatis Educationis physicae Universitatis Comenianae, roč. 43, 2002, s. 63 – 103.

311
[6] MEDEKOVÁ, H. Vybrané aspekty životného štýlu pracovníkov so sedavým charakterom zamestnania. In Športové pohybové aktivity a životný štýl (vybrané problémy). Monografický zborník vedeckých štúdií. Bratislava: Univerzita Komenského v Bratislave, FTVŠ UK, Katedra športovej edukológie a športovej humanistiky, 2013, s. 43 – 50. ISBN 978-80-89075-41-6.
[7] NEMČEK, D. Aktívny životný štýl. In Labudová J., Nemček, D., Antala, B. Pohyb pre zdravie. Bratislava : SZ RTVŠ, 2012, s. 12 – 30.
[8] NEMČEK, D. Štruktúra voľnočasových aktivít mládeže s telesným postihnutím. Tel. Vých. & Šport, roč. 24, 2014, č. 1, s. 11-14. ISSN 1335 – 2245.
[9] NEMČEK, D. – BERGENDIOVÁ, F. Príčiny nezáujmu a dôvody necvičenia žiakov s telesným postihnutím. Telesná výchova šport, roč. 23, č. 4, 2013, s. 24 – 27, ISSN 1335-2245.
[10] NEMČEK, D. a kol. Kvalita života seniorov a pohybová aktivita ako jej súčasť. Bratislava : Michal Vaško – Vydavateľstvo, Prešov, 2011, 6-74.
[11] WITTMANNOVÁ, J., NEMČEK, D., BERGENDIOVÁ, F. Structure of leisure time activities in youth with physical disability. In Acta Universitatis Palackianae Olomucensis. Vol. 43, Suppl. 1, Olomouc : Palacký University, 2013, s. 53, ISSN 1212-1185.

312
VÝVINOVÉ ZMENY FUNKČNÝCH PORÚCH POHYBOVÉHO
SYSTÉMU 11 - AŽ 15 – ROČNÝCH ŽIAKOV A MOŽNOSTI ICH OVPLYVNENIA
Janka Kanásová, Lenka Šimončičová [email protected], [email protected]
Katedra telesnej výchovy a športu, PF UKF v Nitre (Slovensko) ABSTRAKT
Práca je výsledkom nášho pedagogického výskumu, ktorého cieľom bolo získať a rozšíriť poznatky o zmenách svalovej nerovnováhy 11 - až 15 – ročných žiakov a možnosti ich ovplyvnenia kompenzačnými cvičeniami v rámci hodín telesnej a športovej výchovy. Objektom sledovania bolo 32 žiakov základnej školy v Nitre, ktorých sme sledovali v 6., 7., 8. a 9. ročníku, uskutočnili sme celkove päť meraní svalovej nerovnováhy. Medzi 2. a 3. meraním bol počas štyroch mesiacov realizovaný experimentálny činiteľ, zameraný na tri najčastejšie skrátené svaly, oslabené svaly a porušené pohybové stereotypy. Svalovú nerovnováhu sme vyšetrovali metódou podľa Jandu (1982) modifikovanú pre účely telovýchovnej praxe Thurzovou (1992). Zistili sme vysoký výskyt svalovej nerovnováhy u všetkých 11 - až 15- ročných probandov. Výsledky experimentu ukázali pozitívny efekt aplikácie cielených cvičení v rámci hodín povinnej telesnej a športovej výchovy, zameraných na ovplyvnenie svalovej nerovnováhy. Po ukončení pôsobenia experimentu, bez adekvátnych kompenzačných postupov, pohybový systém sledovaných žiakov reagoval nástupom reverzibilných zmien - zvyšovaním výskytu celkovej svalovej nerovnováhy. Z výsledkov nášho výskumu dedukujeme, že včasným a vhodným pôsobením cielených cvičení v rámci hodín telesnej a športovej výchovy možno u 11 - až 15 - ročných žiakov vplývať pozitívne na výskyt svalovej nerovnováhy.
Príspevok je súčasťou grantovej úlohy VEGA 1/0310/13 „Prevencia funkčných porúch pohybového systému u detí a možnosti ich ovplyvnenia“. KĽÚČOVÉ SLOVÁ: Svalová nerovnováha – (dysbalancia). Skrátené svaly. Oslabené svaly. Pohybové stereotypy. Držanie tela. ÚVOD
Vo vedách o športe (v športovej edukológii) sa v súčasnosti venuje čoraz väčšia pozornosť otázkam funkčného stavu pohybového aparátu detí a mládeže. Na trend v náraste funkčných porúch pohybového systému u detí upozorňuje rad autorov (Thurzová, 1991; Thurzová et al., 1993; Kováčová, 2003; Riegerová, 2004; Kanásová, 2005, 2008; Medeková - Bekö, 2009).
Za bezprostrednú príčinu svalovej nerovnováhy možno označiť nevhodné, neprimerané funkčné zaťaženie – nadmerné alebo nedostatočné, alebo kvalitatívne nevhodné - jednostranné, dlhodobé, nerovnomerné. Dôležitú úlohu zohrávajú negatívne emócie (u pubescentov prebieha okrem fyziologických a anatomických zmien aj myšlienkový a citový vývin, hormonálne procesy a labilita vyššej nervovej činnosti). Podľa najnovších poznatkov ovplyvňuje svalovú nerovnováhu aj kvalita posturálneho správania (Kolář et al. 2009).
Životný štýl prevažnej väčšiny detí stredného a staršieho veku je charakterizovaný hypokinézou a psychickým napätím. Nevhodný pohybový režim s výrazným nepomerom medzi pohybovou a posturálnou aktivitou, s úbytkom dynamického a nárastom statického zaťaženia zaznamenávajú mnohí autori a to už u detí v predškolskom veku (Vařeková -

313
Vařeka, 2001; Kanásová, 2005; Thurzová, 2008; Bekö, 2010; Bendíková, 2011).
Tieto skutočnosti vyvolávajú potrebu cielenej intervencie (Hamade et al., 2009). Za závažné treba považovať poznatky, ktoré poukazujú na potrebu včasnej diagnostiky funkčných porúch pohybového systému (Thurzová, 2003; Kobzová, 2000; Riegerová, 2004; Bekö, 2010 a iné). Nekorigovaná narušená svalová rovnováha sa prehlbuje, premieta sa do utvárania nesprávnych pohybových stereotypov, čo v konečnom dôsledku znižuje odolnosť pohybového systému na zaťaženie a vytvára zvýšené riziko jeho poškodenia (Medeková, 2009). Tieto poznatky podporujú výzvy zakladateľov koncepcie funkčnej patológie pohybového systému Lewita (1990) a Jandu (1982) venovať pozornosť prevencii vzniku svalovej nerovnováhy v rámci povinných foriem školskej telesnej a športovej výchovy.
CIEĽ
Cieľom práce bolo získať poznatky o vývinových zmenách svalovej nerovnováhy 11 až 15 – ročných žiakov a možnosti ich ovplyvnenia kompenzačnými cvičeniami v rámci školskej telesnej a športovej výchovy. METÓDY
Objektom sledovania bolo 15 dievčat, s decimálnym vekom 11,72 až 14,71 a 17 chlapcov s decimálnym vekom 11,80 až 14,78, ktorých sme sledovali v 6., 7., 8. a 9. ročníku v školskom roku 2006/2007 až 2009/2010 na ZŠ v Nitre. Uskutočnili sme celkove päť vyšetrení svalovej nerovnováhy. Všetci probandi tvorili jednoskupinový postupný experiment. Svalovú nerovnováhu sme vyšetrovali metódou podľa Jandu (1982) modifikovanú pre účely telovýchovnej praxe Thurzovou (1992). Pri popise metodiky testovania sme postupovali podľa Kanásovej (2005). Testovali sme 11 svalov a svalových skupín s tendenciou ku skráteniu, 5 svalových skupín s tendenciou k oslabeniu a 7 pohybových stereotypov. Podľa počtu skrátených svalov, oslabených svalov a porušených pohybových stereotypov sme u probandov vyvodzovali kvalitatívny stupeň svalovej nerovnováhy: I. stupeň – svalová rovnováha, II. stupeň - ľahký stupeň svalovej nerovnováhy, III. stupeň - stredný stupeň svalovej nerovnováhy, IV. stupeň – generalizovaná svalová rovnováha.
Experimentálny činiteľ bol realizovaný v druhom roku nášho sledovania, t.j. v siedmom ročníku. Experimentálnym činiteľom boli cielené cvičenia, zamerané na tri najrizikovejšie svalové skupiny (v zmysle svalov skrátených a oslabených a na pohybové stereotypy). Pri skrátených svaloch sme zaradili cvičenia na skrátené flexory kolena, na štvoruhlý driekový sval a na priamy sval stehna. Z oslabených svalov sme zaradili cvičenie na extenzory bedrového kĺbu, dolné fixátory lopatky a na brušné svaly. Z pohybových stereotypov sme zaradili cvičenia na najčastejšie porušenú extenziu v bedrovom kĺbe, stoj na jednej dolnej končatine a kľuk. Telesná a športová výchova sa vyučovala v rozsahu 2 hodiny do týždňa po dobu 4 mesiacov s upraveným obsahom učiva. Probandi absolvovali v rámci záveru každej vyučovacej hodiny telesnej a športovej výchovy 10 minútové cvičenia zamerané cielene na prevenciu a odstraňovanie oslabených svalových skupín.
Pre ukazovatele funkčného stavu pohybového systému sme použili percentuálnu analýzu a frekvenčnú analýzu. Štatistickú významnosť zmien ukazovateľov svalovej nerovnováhy podľa distribúcie probandov v kvalitatívnych pásmach pri jednotlivých meraniach sme vyhodnotili chí – kvadrátom (χ2) na 1%, 5% a 10% hladine významnosti. Štatistickú, vecnú, praktickú ale aj klinickú významnosť štatistického testu chí (χ2) – kvadrátu sme posudzovali prostredníctvom koeficientu veľkosti účinku Cramerovo ES "phi" (Effect Size), vychádzajúceho z jeho odhadu: 0,10 – Malý efekt; 0,30 – Stredný efekt; 0,50 – Veľký efekt (Fan, 2001).

314
VÝSLEDKY Zmeny vo výskyte celkovej svalovej nerovnováhy podľa kvalitatívnych stupňov
Zmeny celkovej svalovej nerovnováhy sme posudzovali v sledovanej skupine probandov podľa ich distribúcie do kvalitatívnych stupňov a hodnotili medzi jednotlivými meraniami (obr. 3, 4), (tab. 1, 2). Prvý kvalitatívny stupeň – svalovú rovnováhu nedosiahol počas piatich meraní ani jeden proband. Vo štvrtom stupni (generalizovaná svalová nerovnováha) sa pri piatom meraní nachádzalo 26,7% dievčat a 47% chlapcov. Tento kvalitatívny stupeň sme u chlapcov zaznamenali pri všetkých vyšetreniach od 11,8% - 47%, u dievčat iba pri poslednom piatom meraní.
Pri prvom vyšetrení v novembri šiesteho ročníka sme diagnostikovali svalovú nerovnováhu rozdielne u chlapcov i dievčat. Zaznamenali sme najvyšší frekvenčný výskyt v II. a III. kvalitatívnom stupni u dievčat a v III. a IV. kvalitatívnom stupni u chlapcov. Svalovú nerovnováhu v II. kvalitatívnom stupni sme diagnostikovali u 5,9% chlapcov a u 33,3% dievčat (obr. 29 a 30), v III. kvalitatívnom stupni u 82,4% chlapcov a u 66,7% dievčat. 11,8% chlapcov sa nachádzalo v IV. kvalitatívnom stupni, v generalizovanej svalovej nerovnováhe. Zaznamenali sme signifikantné rozdiely (p < 0,10) z hľadiska pohlavia vo výskyte celkovej svalovej nerovnováhy podľa kvalitatívnych stupňov (tab.3) v neprospech chlapcov.
Pri druhom vyšetrení, realizovanom po roku, sme nezistili štatisticky významné zhoršenie stavu. Zaznamenali sme však zhoršenie u chlapcov – nárast počtu probandov v IV. kvalitatívnom stupni – generalizovanej svalovej nerovnováhe. V treťom kvalitatívnom pásme sa nachádzalo 76,5% chlapcov a 66,7% dievčat, v štvrtom kvalitatívnom pásme sa nachádzalo 23,5% chlapcov a žiadne dievča. Ani tu sme do prvého kvalitatívneho pásma nemohli zaradiť žiadneho probanda. Zaznamenali sme štatisticky významné (p< 0,01) intersexuálne rozdiely vo výskyte celkovej svalovej nerovnováhy podľa kvalitatívnych stupňov (tab. 3) v neprospech chlapcov, nakoľko ani jeden sa nenachádzal v prvom a ani v druhom kvalitatívnom pásme svalovej nerovnováhy. V druhom kvalitatívnom pásme sa nachádzalo 33% dievčat.
Tretie vyšetrenie sme uskutočnili po štvormesačnom ovplyvňovaní žiakov cieleným pohybovým programom počas experimentu. Zistili sme zlepšenie vo výskyte celkovej svalovej nerovnováhy (medzi 2. a 3. meraním), zhodne u dievčat aj u chlapcov (obr. 1, 2). Tieto výsledky poukazujú na účinný vplyv cieleného pôsobenia cvičebného programu, kedy došlo k nevýznamnému zníženiu celkovej svalovej nerovnováhy - nárastu distribúcie probandov do II. kvalitatívneho pásma zo strednej svalovej nerovnováhy do pásma ľahkej svalovej nerovnováhy. U dievčat z 33,3% na 60 %. U chlapcov sme zaznamenali nárast distribúcie probandov do III. kvalitatívneho pásma z generalizovanej svalovej nerovnováhy zo 76,5% na 88,2 % a pokles v IV. kvalitatívnom pásme o 12 %. Pri tomto meraní sme zaznamenali štatisticky významné (p< 0,01) intersexuálne rozdiely vo výskyte celkovej svalovej nerovnováhy podľa kvalitatívnych stupňov (tab. 3) v prospech dievčat.
Medzi 3. a 4. meraním, ktoré sme realizovali po 8 mesiacoch od odoznenia experimentálneho činiteľa, v novembri šk. roku 2008/2009 u žiakov v 8. ročníku ZŠ sme nezaznamenali zmeny vo výskyte svalovej nerovnováhy u chlapcov.
Môžeme konštatovať, že zistená celková svalová nerovnováha sa počas tohto obdobia u dievčat signifikantne (p < 0,05) zhoršila. Zaznamenali sme nárast distribúcie probandov z II. kvalitatívneho pásma, ľahkej svalovej nerovnováhy do pásma strednej svalovej nerovnováhy takmer o 47% (obr. 2).
Pri štvrtom meraní sme nezaznamenali signifikantné rozdiely vo výskyte celkovej svalovej nerovnováhy z hľadiska pohlavia podľa kvalitatívnych stupňov (tab. 3).
Pri piatom vyšetrení, realizovanom v 9. ročníku v novembri šk. roku 2009/2010 sme

315
zistili štatisticky významné (p < 0,05) zhoršenie stavu (obr. 1, 2) u oboch pohlaví. Až 52,9% chlapcov sa nachádzalo v treťom kvalitatívnom pásme a 47,1% v štvrtom kvalitatívnom pásme. 73,3% dievčat sa nachádzalo v treťom kvalitatívnom stupni a 26,7 % v IV. kvalitatívnom stupni.
U dievčat aj u chlapcov došlo pri piatom vyšetrení v porovnaní s prvým k zvýšeniu výskytu svalovej nerovnováhy na hladine významnosti p < 0,05 u dievčat a p < 0,10 u chlapcov. V prvom kvalitatívnom stupni s výskytom svalovej rovnováhy sa nenachádzal žiadny chlapec ani dievča. Oproti prvému vyšetreniu na začiatku šiesteho ročníka sa zvýšila distribúcia probandov s výskytom svalovej nerovnováhy za tri školské roky v štvrtom kvalitatívnom stupni u chlapcov o 35% a u dievčat o 27%, i napriek tomu, že počas zaradenia experimentálneho činiteľa sa stav nevýznamne zlepšil (obr. 1, 2), (tab. 1, 2). Analýza výsledkov z hľadiska pohlavia poukazuje na významnejšie zvýšenie výskytu svalovej nerovnováhy u dievčat. Obrázok 1. Zmeny vo výskyte celkovej svalovej nerovnováhy podľa kvalitatívnych stupňov >> Chlapci <<
Stupne (%) I. stupeň II. stupeň III. stupeň IV. stupeň
1. meranie 0,0 5,9 82,4 11,8
2. meranie 0,0 0,0 76,5 23,5
3. meranie 0,0 0,0 88,2 11,8
4. meranie 0,0 0,0 88,2 11,8
5. meranie 0,0 0,0 52,9 47,1
LEGENDA:
I. stupeň – svalová rovnováha III. stupeň - stredná svalová nerovnováha
II. stupeň - prípustná (ľahká) svalová nerovnováha IV. stupeň - generalizovaná SN

316
Tabuľka 1. Štatistická a vecne praktická významnosť zmien vo výskyte celkovej SN podľa kvalitatívnych stupňov u chlapcov
Meranie 1.-2.m. 2.-3.m. 3.-4.m. 4.-5.m. 1.-5.m
Chi-kvadrát 1,704 0,809 0,0 5,100* 5,687(*)
Effekt size 0,224ME 0,154ME 0,0 0,387SE 0,409SE
LEGENDA:
Hladina významnosti: p<0,10(*) p<0,05* p<0,01** Malý efekt ME, Stredný efekt SE, Veľký efekt VE
Obrázok 2. Zmeny vo výskyte celkovej svalovej nerovnováhy podľa kvalitatívnych stupňov >> Dievčatá <<
Stupne (%) I. stupeň II. stupeň III. stupeň IV. stupeň
1. meranie 0,0 33,3 66,7 0,0
2. meranie 0,0 33,3 66,7 0,0
3. meranie 0,0 60,0 40,0 0,0
4. meranie 0,0 13,3 86,7 0,0
5. meranie 0,0 0,0 73,3 26,7
Tabuľka 2. Štatistická a vecne praktická významnosť zmien vo výskyte celkovej SN podľa kvalitatívnych stupňov u dievčat
Meranie 1.-2.m. 2.-3.m. 3.-4.m. 4.-5.m. 1. -5.m
Chi-kvadrát 0,000 2,143 7,033* 6,167* 9,048*
Effekt size 0,000 0,267ME 0,484SE 0,453SE 0,549VE
LEGENDA:
Hladina významnosti: p<0,10(*) p<0,05* p<0,01** Malý efekt ME, Stredný efekt SE, Veľký efekt VE
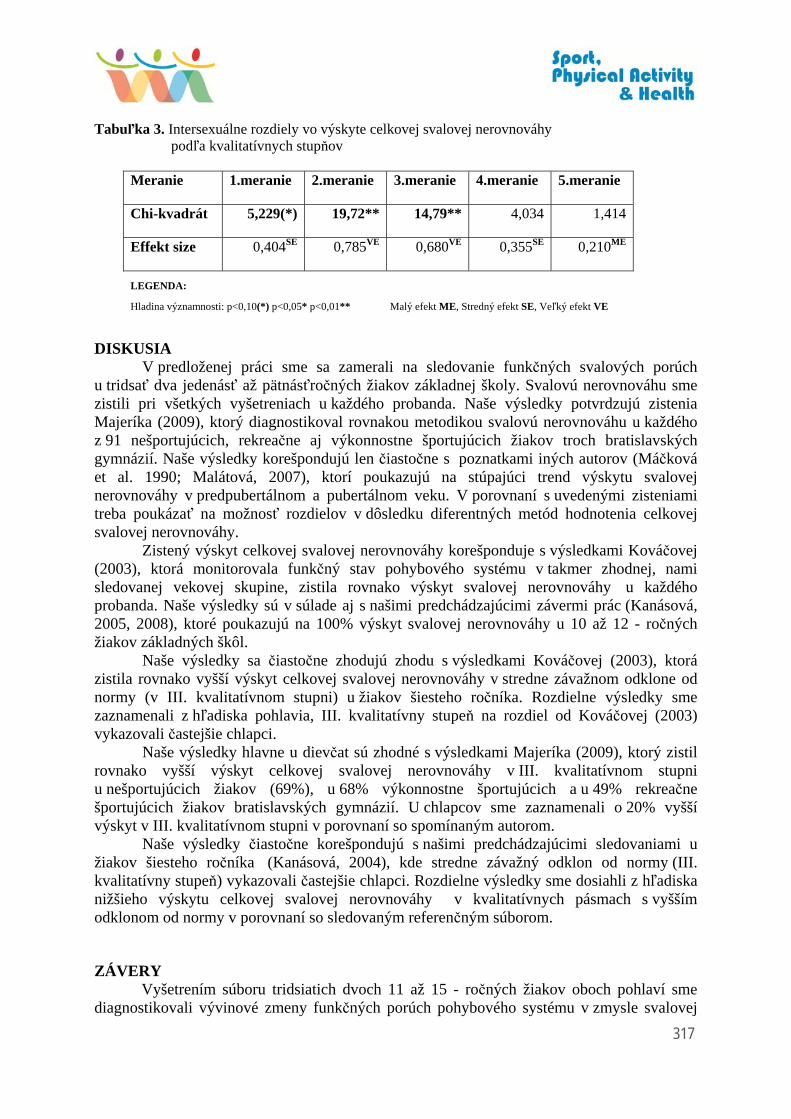
317
Tabuľka 3. Intersexuálne rozdiely vo výskyte celkovej svalovej nerovnováhy podľa kvalitatívnych stupňov
Meranie 1.meranie 2.meranie 3.meranie 4.meranie 5.meranie
Chi-kvadrát 5,229(*) 19,72** 14,79** 4,034 1,414
Effekt size 0,404SE 0,785VE 0,680VE 0,355SE 0,210ME
LEGENDA:
Hladina významnosti: p<0,10(*) p<0,05* p<0,01** Malý efekt ME, Stredný efekt SE, Veľký efekt VE
DISKUSIA
V predloženej práci sme sa zamerali na sledovanie funkčných svalových porúch u tridsať dva jedenásť až pätnásťročných žiakov základnej školy. Svalovú nerovnováhu sme zistili pri všetkých vyšetreniach u každého probanda. Naše výsledky potvrdzujú zistenia Majeríka (2009), ktorý diagnostikoval rovnakou metodikou svalovú nerovnováhu u každého z 91 nešportujúcich, rekreačne aj výkonnostne športujúcich žiakov troch bratislavských gymnázií. Naše výsledky korešpondujú len čiastočne s poznatkami iných autorov (Máčková et al. 1990; Malátová, 2007), ktorí poukazujú na stúpajúci trend výskytu svalovej nerovnováhy v predpubertálnom a pubertálnom veku. V porovnaní s uvedenými zisteniami treba poukázať na možnosť rozdielov v dôsledku diferentných metód hodnotenia celkovej svalovej nerovnováhy.
Zistený výskyt celkovej svalovej nerovnováhy korešponduje s výsledkami Kováčovej (2003), ktorá monitorovala funkčný stav pohybového systému v takmer zhodnej, nami sledovanej vekovej skupine, zistila rovnako výskyt svalovej nerovnováhy u každého probanda. Naše výsledky sú v súlade aj s našimi predchádzajúcimi závermi prác (Kanásová, 2005, 2008), ktoré poukazujú na 100% výskyt svalovej nerovnováhy u 10 až 12 - ročných žiakov základných škôl.
Naše výsledky sa čiastočne zhodujú zhodu s výsledkami Kováčovej (2003), ktorá zistila rovnako vyšší výskyt celkovej svalovej nerovnováhy v stredne závažnom odklone od normy (v III. kvalitatívnom stupni) u žiakov šiesteho ročníka. Rozdielne výsledky sme zaznamenali z hľadiska pohlavia, III. kvalitatívny stupeň na rozdiel od Kováčovej (2003) vykazovali častejšie chlapci.
Naše výsledky hlavne u dievčat sú zhodné s výsledkami Majeríka (2009), ktorý zistil rovnako vyšší výskyt celkovej svalovej nerovnováhy v III. kvalitatívnom stupni u nešportujúcich žiakov (69%), u 68% výkonnostne športujúcich a u 49% rekreačne športujúcich žiakov bratislavských gymnázií. U chlapcov sme zaznamenali o 20% vyšší výskyt v III. kvalitatívnom stupni v porovnaní so spomínaným autorom.
Naše výsledky čiastočne korešpondujú s našimi predchádzajúcimi sledovaniami u žiakov šiesteho ročníka (Kanásová, 2004), kde stredne závažný odklon od normy (III. kvalitatívny stupeň) vykazovali častejšie chlapci. Rozdielne výsledky sme dosiahli z hľadiska nižšieho výskytu celkovej svalovej nerovnováhy v kvalitatívnych pásmach s vyšším odklonom od normy v porovnaní so sledovaným referenčným súborom. ZÁVERY
Vyšetrením súboru tridsiatich dvoch 11 až 15 - ročných žiakov oboch pohlaví sme diagnostikovali vývinové zmeny funkčných porúch pohybového systému v zmysle svalovej

318
nerovnováhy. V jednoskupinovom postupnom experimente sme preukázali vysoký výskyt funkčných porúch pohybového systému už od vstupného hodnotenia.
Súhrnne možno konštatovať, že pre spontánny vývoj svalovej nerovnováhy je charakteristický nárast s vekom v období, kedy sme funkčný stav pohybového systému cielene neovplyvňovali. Zistené výsledky dokumentujú nepriaznivý trend vývoja funkčného stavu pohybového systému u detí. Poukazujú na rezervy v pohybovom režime detí, na nedostatok voľnej pohybovej aktivity pri zvýšenej statickej záťaži a na absenciu cielených kompenzačných cvičení. Pri hodnotení uvedených funkčných porúch pohybového systému z hľadiska pohlavia sme zaznamenali signifikantné rozdiely podľa kvalitatívnych pásiem pri svalovej nerovnováhe v neprospech chlapcov.
Pri vynechaní kompenzačných cvičení v rámci povinného obsahu hodín telesnej a športovej výchovy a návrate k zaužívaným výchovno-vzdelávacím postupom sme v ôsmom a deviatom ročníku zaznamenali významné zhoršenie výskytu svalovej nerovnováhy u chlapcov.
LITERATÚRA
[1] BENDÍKOVÁ, E. (2011). Aktuálny zdravotný stav a dôvody neúčasti žiačok na hodinách telesnej a športovej výchovy. In: Telesná výchova a šport. 2011, roč. 21, č. 1, s. 6-10.ISSN 1335-2245.
[2] FAN, X. (2001). Statistical signifikance and effect size in education research: Two sides of a coin. The Journal of Educational Research, 94 (5), 275-282.
[3] JANDA, V. (1982). Základy kliniky funkčních (neparetických) hybných porúch. Brno: 139.
[4] KANÁSOVÁ, J. (2004). Sledovanie stavu držania tela a svalovej dysbalancie u 12-13 ročných žiakov ZŠ z hľadiska sexuálneho dimorfizmu. In: Sborník s příspěvkú mezinárodního semináře Pedagogické kinantropologie 9.-11.dubna 2003, KTV PF OU, Ostrava 2004, str.63-68, ISBN 80-7042-382-X.
[5] KANÁSOVÁ, J. (2005). Svalová nerovnováha u 10 až 12 - ročných žiakov a jej ovplyvnenie v rámci školskej telesnej výchovy. 1.vyd. Bratislava: Peter Mačura – PEEM, 84 s.
[6] KANÁSOVÁ, J. (2008). Reducing shortened muscles in 10-12-year-old boys through a physical exercise programme. In: Medicina Sportiva, Vol. 12, no. 4, 115-123.
[7] KOBZOVÁ, J. 2000. Rozbor funkčního stavu posturálních svalů u českobudějovických sportujících a nesportujících chlapců ve věku 11 – 14 let. In: Diagnostika pohybového systému. Sborník IV. mezinárodní konference v oboru funkční antropologie a zdravotní tělesné výchovy, Olomouc : FTK UP Olomouc, 2000, s. 82 – 85
[8] KOLÁŘ, P. et al. (2009). Rehabilitace v klinické praxi. Praha: Galén. s. 650. ISBN 978‐80‐7262‐657‐1.
[9] KOVÁČOVÁ, E. (2003). Stav svalovej nerovnováhy a chybného držania tela u školskej populácie a možnosti ich ovplyvňovania u mladších žiakov. (Kandidátska dizertačná práca). Bratislava: FTVŠ UK, 2003. 120 s.
[10] LEWIT, K. (1990). Manipulační léčba v rámci léčebné rahabilitace. Praha: Nakladatelství dopravy a spojů, 1990. 428 s. ISBN 80-7030-096-5. (2003).
319
[11] MÁČKOVÁ, J. et al. 1990. Vývoj funkčních poruch svalstva u dětí a dospívajících. Lékař a tělesná výchova. 18,1990. č.3, s. 53-59.
[12] MAJERÍK, J. (2009). Svalová nerovnováha a držanie tela 16 až 17 – ročných gymnazistov z hľadiska športovania. In: Telesná výchova a šport., 2009, roč. 19, č. 1, s. 14-18. ISSN 1335- 2245.
[13] MALÁTOVÁ, R. (2007). Význam hlubokého stabilizačního systému páteře. Studia Kinanthropologica. 2007; 2: 89-96. ISSN 1213 – 2101
[14] MEDEKOVÁ, H. - BEKÖ, R. (2009). Funkčné svalové poruchy a držanie tela detí z hľadiska pohybovej aktivity po prvom roku ZŠ. In: Pohybová aktivita a jej súvislosti s vybranými ukazovateľmi somatického, funkčného a motorického rozvoja. Zborník prác VEGA 1/4508/07. FTVŠ UK v Bratislave. - ICM Agency: Bratislava, 2009, s. 56-63. ISBN 978-80-89257-18-8, 2011.
[15] RIEGEROVÁ, J. (2004). Hodnocení posturálních funkcí a pohybových stereotypů u dětské populace nesportovců a dětí zabývajících se různými druhy sportovní činnosti. In: Česká kinantropologie, č. 54. s. 169-171. ISSN 0862-5085.Thurzová, E. (1991). Funkčné svalové poruchy u detskej populácie. Telesná výchova a šport, 1, 1991. č. 1. s. 23-28.
[16] THURZOVÁ, E. (1992). Svalová nerovnováha. In: Labudová, J. a Thurzová, E. 1992. Teória a didaktika telesnej výchovy oslabených (vybrané kapitoly). Bratislava: FTVŠ UK, 7 - 46.
[17] THURZOVÁ, E. (2003). Bolesť pohybového aparátu u mladých športovcov. Telesná výchova a šport, 13, 2003. č.2. s. 31 – 35.
[18] VAŘEKOVÁ, R. - VAŘEKA, I. (2001). The Comparison of Muscle Dysbalance between Boys and girls of School Age. Sborník 2. Mezinárodní konference „Pohyb a zdraví“ 15. – 19.9.2001. Olomouc: FTK UP, 494 – 496.
320
OBEZITA Z POHĽADU SUBJEKTÍVNEHO A OBJEKTÍVNEHO
HODNOTENIA VYSOKOŠKOLSKÝCH ŠTUDENTOV
Zuzana Kuchelová1, Alena Buková1, Klaudia Zusková1, Martina Hančová 2, Miroslava Barcalová3
1Univerzita P.J. Šafárika v Košiciach, Ústav telesnej výchovy a športu 2Univerzita P.J. Šafárika v Košiciach, Prírodovedecká fakulta
3Technická univerzita v Košiciach, Katedra telesnej výchovy a športu ABSTRAKT: Stály pokles habituálnej pohybovej aktivity u detí a mládeže má za následok vzostup telesnej hmotnosti s vekom a pokles funkčnej zdatnosti. Problém nadváhy a obezity má v súčasnej spoločnosti nie len epidemiologický, ale až pandemický rozmer. Disbalancia medzi príjmom a výdajom energie ako jedného z primárnych činiteľov tohto ochorenia je zrejmá [7,17,26]. Ako potvrdzujú výskumy, príčiny tohto stavu môžeme hľadať aj v oblasti psychiky [34]. Predmetom sledovania tohto čiastkového výskumu, ktorý je súčasťou výskumného grantu VEGA č. 1/1343/12 „Vybrané rizikové faktory obezity a pohybová prevencia“, sme sa zamerali na obezitu z pohľadu subjektívneho a objektívneho hodnotenia vysokoškolských študentov. Komparáciu údajov výskytu obezity z hľadiska sebareflexie študentov sme zrealizovali dotazníkovou metódou a metódou Body Mass Index, na základe antropometrických meraní telesnej hmotnosti a výšky. Súbor tvorilo 2453 študentov, z toho 1527 žien a 926 mužov z dvoch vybraných slovenských univerzít. Výsledky poukázali na fakt, že len 31,6% mužov a 45,8% žien zo súboru probandov diagnostikovaných na obezitu pomocou BMI, ju uviedlo aj v subjektívnom hodnotení. KĽÚČOVÉ SLOVÁ: Adolescenti, Body mass index (BMI), pohybová aktivita, nadváha, obezita, životný štýl, osobná pohoda ÚVOD Prechod zo strednej školy na vysokú školu, je jedným z výrazných medzníkov zmeny životného štýlu dospievajúcej mládeže. Toto obdobie neskoršej adolescencie sa vyznačuje osamostatnením jedinca, ktorý už sám zodpovedá za svoj denný režim činností a životosprávu [23]. Adaptácia na nové prostredie, zvládanie rôznych záťažových a stresových situácií spojených so štúdiom, zvýšenie zodpovednosti za seba samého sa prejavuje i v životnom štýle vysokoškolákov [21]. Tieto zmeny môžu viesť k poklesu hodín venovaných pohybovej aktivite (ďalej len PA) a konsekventne nárastu podielu tukového tkaniva na zložení tela a poklesu funkčnej zdatnosti. To ako ľudia vnímajú sami seba, má vplyv na ich duševné zdravie. Odráža sa to aj v ich správaní a osobnej pohode [8,21,34]. Hlavný kognitívny komponent osobnej pohody, ktorý Blatný [4] definuje ako vedomé globálne hodnotenie vlastného života ako celku, je životná spokojnosť. Sociálna opora, začlenenie do sociálnych vzťahov a príslušnosť k určitej komunite patrí k najsilnejším prediktorom osobnej pohody. Michalos [13] predstavil multinásobnú teóriu diskrepančnej spokojnosti. Podľa nej ľudia porovnávajú svoj život s viacerými štandardmi, ktoré sú tvorené sociálnym porovnávaním, potrebami, cieľmi, ašpiráciami a predstavami o ideálnej miere spokojnosti [39]. Sebaponímanie (selfperception) na základe skúseností a interakcii so svetom, ktoré človek nadobúda, sa stáva základom pre vymedzenie obrazu seba [3,26]. Smékal (2002) uvádza, že na vývin jedinca majú vplyv tak

321
genetické a vrodené dispozície, ako aj sociálne okolie. To ho ovplyvňuje svojimi normami, zásadami a očakávaním. Práve preto často dochádza k rozporu medzi ideálnym a reálnym „ja“ [15,16,25]. Nízka miera vedomia self-efficacy (vlastnej účinnosti) je často asociovaná so stresom, depresiou, anxietou a bezmocnosťou. Na to sa viaže nízke sebavedomie a pesimiszmus v otázkach osobnostného rozvoja a úspechu. Sťažujú sa možnosti začleniť sa do sociálnej skupiny a pridružujú sa depresívne stavy. Ich dôsledkom môže byť sociálna izolácia. Vysoká miera self-efficacy facilituje kognitívne procesy a správanie v rôznych situáciách [3,36]. Výsledkom pozitívnej energetickej bilancie sa na prelome tisícročia stala obezita najčastejším metabolickým ochorením. Je to multifaktoriálne podmienená metabolická porucha charakterizovaná zmnožením telesného tuku [1]. Vzniká dôsledkom interakcie genetických dispozícii s faktormi vonkajšieho prostredia. Medzi ne radíme pozitívnu energetickú bilanciu, ktorá je daná zmenami dietetických zvyklostí a poklesom pohybovej aktivity [1,12,17,27]. Je alarmujúce, že 60-85% svetovej populácie tvorí nedostatočne fyzicky aktívnych ľudí [11,18,23,27]. Čím ďalej, tým viac si uvedomujeme, že v súčasnosti reálny pohybový režim len s ťažkosťou spĺňa biologickú nutnosť pohybového zaťaženia jednotlivca [5,6,20]. Jedným z hlavných negatívnych civilizačných faktorov, ktorý ovplyvňuje zdravie je nedostatok PA [5, 6]. Obézny človek sa pri porovnávaní s ľuďmi s normálnou váhou môže vnímať ako tučný, fyzicky neatraktívny a to negatívne ovplyvňuje osobnú pohodu. Opakom môže byť porovnávanie s obéznejšími, menej mobilnými, trpiacimi viacerými zdravotnými problémami, čo zvýši osobnú pohodu [19]. Obezita, určité obdobie nespôsobuje zdravotné problémy, preto ju často tolerujeme. Stretávame sa s krajne vyhrotenými a nie ojedinelými názormi, v rámci ktorých sa obezita považuje za znak pevného zdravia, nie zdravotnej diskvalifikácie a nie za prejav choroby [10]. Boj s obezitou sa stal v mnohých vyspelých krajinách jednou z hlavných priorít zdravotníckych systémov [41,42]. Svetová zdravotnícka organizácia (WHO) ju vyhlásila za globálnu epidémiu, ktorá predstavuje jeden z najzávažnejších zdravotných problémov súčasnosti. Štatistické hodnotenie úmrtnosti radí celosvetovo obezitu a jej komplikácie medzi tri najčastejšie príčiny smrti. Závažné formy obezity takmer desaťnásobne zvyšujú riziko predčasného úmrtia v porovnaní so životnou prognózou rovnako starých neobéznych ľudí [7,14,29,30,31]. Nevedomosť, neznalosť, vedomé prehliadanie či úmyselná nevšímavosť a ich dôsledky, ktoré z toho vyplývajú pre náš život a zdravie, to sú často hlavné znaky, ktoré našu populáciu sprevádzajú životom. Ignorovanie skutočnosti vedie k negatívnym stavom a nepríjemným pocitom, zlej estetickej, kondičnej a zdravotnej stránke. A preto aj my svojim výskumom chceme prispieť k zvýšeniu informovanosti a k osvete, ktorá by tiež prispela k zníženiu nárastu pandémie obezity. METODIKA VÝSKUMU Súbor prierezového výskumu tvorili vysokoškolskí študenti prvých ročníkov Univerzity Pavla Jozefa Šafárika v Košiciach a Technickej Univerzity v Košiciach v počte n = 2453 s vekovým priemerom 20,4 rokov (sd = 2,46 ). Z toho bolo 926 mužov, s vekovým priemerom 20,2 rokov (sd = 2,10) a 1527 žien s vekovým priemerom 20,4 rokov (sd = 2,66). Údaje sme získali v rámci dvoch prierezových sledovaní v rokoch 2012 a 2013 pomocou dotazníkovej metódy a somatometrickým vyšetrením telesnej hmotnosti a výšky. Na základe získaných hodnôt sme vypočítali BMI (BMI = kg / m²). Telesná hmotnosť bola diagnostikovaná pomocou OMRON Body Composition Monitor BF551. Hodnoty BMI sme kategorizovali do jednotlivých úrovní podľa WHO (< 18,5 podváha, 18,5 - 24,99 optimálna váha, 25 - 29,99 nadváha, 30 - 34,99 obezita prvého stupňa, 35 - 39,99 obezita druhého stupňa, > 40 obezita

322
tretieho stupňa). Dotazník sme aplikovali vždy na začiatku zimného semestra. Z dotazníkovej batérie výskumného projektu sme vybrali pre túto prácu otázku: „Prejavujú sa u Vás niektoré z nasledujúcich zdravotných problémov?“(uzavretá otázka). Pri spracovaní výsledkov sme použili základnú popisnú matematickú štatistiku (charakteristiky miery stredu, smerodajnú odchýlku), Chí kvadrát a logistickú regresiu (Sheather, 2009). Pre korektné použitie chí-kvadrát testu sme zlúčili obezitu I., II. a III. stupňa do jednej kategórie "obezita". Štatistickú významnosť získaných výsledkov sme prijali na hladine p < 0,05 a p < 0,01. Táto čiastková práca je súčasťou výskumného grantu VEGA č 1/1343/12: "„Vybrané rizikové faktory obezity a pohybová prevencia" riešeného na Univerzite P. J. Šafárika, Ústave telesnej výchovy a športu v Košiciach. Štatistické analýzy dát boli vykonané s čiastočnou podporou realizácie projektu: University Science Park Technicom, v inovatívnych aplikáciách podporovaných znalostnými technológiami, ITMS: 26220220182 a Centre of Excellence v informačných systémoch CAKS, ITMS: 26220120007, ktorý je podporovaný z Operačného programu Výskum a vývoj, financovaný z ERDF. CIEĽ PRÁCE Odhaliť výskyt obezity z hľadiska subjektívnej sebareflexie študentov a objektívneho hodnotenia u študentov prvých ročníkov vysokoškolského štúdia. HYPOTÉZY 1.Subjektívne hodnotenie výskytu obezity bude významne nižšie, ako údaje získané objektívnou metódou. 2.Predpokladáme významne nižšie percento žien, ktoré sa hodnotia ako obézne, v porovnaní s mužmi. VÝSLEDKY Pri analýze výskytu obezity sme prišli k nasledujúcim údajom vzhľadom k pohlaviu. Hodnoty BMI zisťované somatometriou nám oproti exaktnejším metódam skôr orientačne poukazujú na rizikovosť osôb vzhľadom k obezite. Súbor n=1527 študentiek a n=926 študentov sa významne líšil v dosiahnutých hodnotách BMI (Chi squerd = 14,8 p < 0,01) v prospech vyšších hodnôt v súbore mužov (viď tab.1). Priemerná hodnota BMI v súbore mužov bola 23.8 (sd =3.77) a u žien 21.7(sd = 3.57). V norme sa nachádzalo 72,6% študentiek a 65,2% študentov, pričom nadváhu malo 24,8% mužov a 10,5% žien. Podváhu malo 244 osôb, pričom z tohto počtu 85,7% tvorili ženy, a len 14,3% muži. V pásme obezity sa vyskytlo 4,3% probandov v zlúčenom súbore. Výskyt optimálnej hmotnosti je v obidvoch súboroch skoro zrovnateľný, zatiaľ čo v súbore podváha a obezita sa výsledky značne líšia. Tab.1 Percentuálne zastúpenie študentov VŠ v jednotlivých kategóriách BMI
BMI klasifikácia
podváha optimálna hmotnosť nadváha
obezita I. stupňa
obezita II. stupňa
obezita III. stupňa
n % n % n % n % n % n %
Pohlavie
muž 35 3,8 604 65,2 230 24,8 44 4,8 13 1,4 0 0,0
žena 209 13,7 1109 72,6 161 10,5 35 2,3 12 0,8 1 0,1

323
Pri hodnotení výskytu nadváhy a obezity I. stupňa musíme zobrať do úvahy fakt, že v tejto skupine sú často zaradení športujúci jedinci s nadpriemerne vyvinutou muskulatúrou. Ďalšou sledovanou premennou bol výskyt zdravotných problémov vysokoškolákov, ktoré študenti uviedli v dotazníku. V otázke „Prejavujú sa u Vás niektoré z nasledujúcich zdravotných problémov?“ išlo o subjektívne sebahodnotenie zdravotného problému (Tab.2). Len 2,8 % (n = 42) v rámci súboru žien a identické percento 2,8 % (n = 26) v rámci súboru mužov uviedlo v zdravotných problémoch položku obezita. Z hľadiska pohlavia sa neprejavil významný rozdiel v percentuálnom zastúpení probandov, ktorí v dotazníku uviedli položku obezita. Tab.2 Porovnanie subjektívneho hodnotenia obezity u žien a mužov
obezita podľa BMI subjektívne hodnotenie
n % n %
pohlavie
muž 57 6,2 áno 18 31,6
nie 39 68,4
žena 48 3,1 áno 22 45,8
nie 26 54,2
Obezitu na základe meraní BMI má 105 ľudí zo vzorky 2453. U oboch pohlaví sa nám potvrdil významný rozdiel výskytu obezity uvádzanej subjektívne a metódou BMI (Chi squerd = 30,03 na p = 0,01). To nám potvrdzuje fakt, že probandi majú tendenciu podhodnocovať reálnu skutočnosť svojho zdravotného stavu (Obr.1).
Obr. 1 Porovnanie subjektívneho hodnotenia obezity a výsledkov BMI Z výsledkov vyplýva, že iba 1,63% opýtaných respondentov mužov a žien sa zhoduje subjektívne uvedená obezita s nameranými hodnotami BMI. Obezitu pomocou BMI sme diagnostikovali u 4,3% (n = 40) študentov z výskumného súboru. DISKUSIA Významné rozdiely v hodnotení obezity metódou BMI a sebahodnotením poukazujú na

324
problém, ktorý je potrebné riešiť. Týka sa to hlavne prevencie. Jedná sa o formovanie objektívneho postoja k vlastnému zdraviu a reálneho hodnotenia telesného self-conceptu. Prijali sme prvú hypotézu, že subjektívne obezitu prizná významne nižšie percento študentov v porovnaní so zistením metódou BMI, ktorou výskyt bol 2,5krát vyšší. Test zhody pomerov (test of equality of proportions) potvrdil, že je štatisticky významný rozdiel medzi pomerom ľudí, ktorí naozaj majú obezitu a pomerom tých, ktorí to uviedli v dotazníku. Zaujímavá je skutočnosť, že obezitu subjektívne posúdilo menej mužov ako žien, čo sa ukázalo pri objektívnom vyhodnotení na základe BMI. Neobjektívnosť reálneho sebahodnotenia mladých ľudí súvisí s procesom výchovy a vzdelania. Aj preto by sme mali pozitívne vplývať na zvyšovanie vedomostnej úrovne študentov. Nepotvrdili sme druhú hypotézu, že bude významne nižšie percento žien, ktoré priznajú obezitu ako mužov. Ženy sú často pod väčším egocentrickým kultom, ktorý zdôrazňuje zdravie, mladosť a telesnú estetičnosť. Je paradoxné, že práve muži v nižšom počte priznali výskyt obezity v subjektívnom hodnotení. Ak by sa pomery zachovali, ale vzorka by bola napr. 1,5-krát väčšia (obéznych by bolo nie 105, ale 156), potvrdilo by sa, že muži si pripúšťajú obezitu významne menej ako ženy. Naše výsledky poukazujú na podhodnocovanie vlastného zdravotného stavu , hlavne u mužov. Jeden argument može byť aj ten, že naša spoločnosť je ešte stále zhovievavejšia k obezite mužov ako žien. S nízkou emočnou osobnou pohodou nesúvisí len obezita, ale i podváha [22]. Ženy mali druhé najpočetnejšie zastúpenie v skupine podváhy v tomto výskume. U žien je zrejme viac rozšírená aktívna modifikácia hmotnosti. [16,22]. Ako uvádzajú autori [32] v prieskume stavu obezity a pridružených ochorení v Českej republike, viac ako štvrtina dievčat vo veku 18 až 19 rokov sa pohybuje v oblasti podváhy. Od 20 do 29 rokov približne každej desiatej žene kleslo BMI pod 18,5 kg/m2. Práve v tomto veku ženy dbajú najviac na svoju hmotnosť, a tak sa ich dispozície k priberaniu neprejavujú. Veľký vplyv v tom majú médiá a súťaže krásy. Prísne diéty a udržovanie kriticky nízkej hmotnosti v adolescencii a veku okolo dvadsiatich rokov, sú veľmi rizikové. S pribúdajúcim vekom môžu byť spúšťačom rôznych zdravotných problémov napr. rednutie kostí, reprodukčné problém . Spontánna PA klesá výrazne v období adolescencie [6,7], ktoré je charakterizované ako obdobie relatívne dobrého zdravia a nízkej mortality. PA mládeže závisí nie len od možností, ale s postupujúcim vekom aj od ich záujmov, vedomostí a motivácie. Je úzko spätá so životným štýlom. Ovplyvňuje nie len fyzickú stránku človeka, ale má vplyv aj na zlepšenie mnohých psychických prejavov [38]. Uvedomujeme si, že PA pôsobí signifikantne len pri určitej intenzite, pravidelnosti, charaktere a dĺžke trvania [30]. Trend redukcie počtu hodín telesnej výchovy vysokoškolákov je jedným z dôvodov poklesu hodín venovaných PA, nárastu podielu tukového tkaniva na zložení tela a poklesu funkčnej zdatnosti. Každé dieťa má prirodzený vzťah k PA, ktorý býva utlmený nízkym počtom hodín telesnej výchovy a športovej činnosti. Prispieva tomu aj neúmerne dlhý čas strávený pri televízií a počítačoch doma. Obezita, s akou sa dnes stretávame, a o ktorej sa hovorí ako o neinfekčnej epidémii, je ochorenie polygénne. Už 5 ročné deti majú predsudky voči obéznym deťom. Deti trpiace obezitou sú často izolované, vylúčené z peer-aktivít. Vysmievajú sa im nie len rovesníci, ale aj učitelia a iní dospelý. Na rozdiel od detí, ktoré trpia inými zdravotnými problémami, obézne deti sú obviňované a trestané za svoj stav. To, ako ostatní reagujú na ich vonkajší vzhľad, ovplyvňuje ich vnímanie a sebaakceptáciu. Často trpia pocitmi menejcennosti. Sú málo aktívne, fyzickej aktivite sa radšej vyhýbajú [7,14,17,27]. Z hľadiska zdravého somato-mentálneho vývinu mladého organizmu, je nevyhnutné optimálne vyváženie všetkých denných aktivít. Medzi činitele zdravého spôsobu života patria napríklad dostatok fyzickej aktivity, správne stravovacie návyky, životospráva, psychická

325
vyrovnanosť, dostatok spánku, odolnosť voči stresu [11,24,28,30,35,37]. Náročnosť vysokoškolského štúdia, ktoré je v začiatkoch sprevádzané nadmernou psychickou záťažou v spojení s prevažne sedavým spôsobom života, je možné kompenzovať telesnými cvičeniami. Paradoxom je, že telesná výchova ako študijný predmet v minulosti aj v súčasnosti na viacerých slovenských vysokých školách zápasí o svoje opodstatnenie a existenciu. Buď absentuje, alebo je zaradená len ako povinne voliteľný alebo nepovinný predmet. ZÁVER Nadváha a obezita sú v súčasnosti obrovským problémom takmer celého sveta. Súvisí so zdravotnými komplikáciami, ktoré sú život ohrozujúce a v nemalej miere obmedzujú človeka, ktorý ňou trpí. Je problémom i pre spoločnosť, ktorá si s ňou dlhodobo nevie poradiť. Preventívne programy, ktoré sa snažia podchytiť rozvoj obezity už v jej začiatkoch, nie sú tak úspešné, ako by sa očakávalo. A preto si uvedomujeme, že samotná liečba bude náročnejšia. Vyžaduje si poukazovať na faktory iné ako biologické a snažiť sa ich implementovať do jednotlivých liečebných programov. Subjektívne hodnotenie obezity je u mladých ľudí alarmujúco neobjektívne, čo sa potvrdilo aj na základe našej hypotézy 1. Sú v prevahe spokojní sami so sebou i napriek tomu, že sú tučný. V hypotéze č.2 nás prekvapilo, že u muži si pripúšťajú svoju obezitu ešte menej ako ženy. Domnievame sa, že vysokoškolskí študenti predstavujú intelektuálnu skupinu, ktorá má prístup k najmodernejším informáciám a poznatkom. Vplývanie na ich životný štýl prostredníctvom hodín telesnej výchovy na vysokých školách je jedným z východísk, ako riešiť prevenciu obezity a iných nedostatkov súvisiacich so zdravým životným štýlom. Naše výsledky podporujú potrebu preventívnych opatrení v zmysle zvýšeného zastúpenia PA, v spôsobe života a ešte väčšej osvete o obezite. Z tohto pohľadu jedine interdisciplinárny prístup môže pomôcť identifikovať určujúce interakcie medzi obezitou, nadváhou, PA a biopsychosociálnymi faktormi u vysokoškolákov. Zvyšovaním počtu hodín PA študentov na vysokých školách a zvyšovaním spektra informácií i poznatkov môžeme zabrániť vzniku ochorení a vďaka sekundárnej prevencii ich odhaliť a zabrániť ich rozvoju. LITERATÚRA [1] ARNER P.: Obesity – a genetic disease of adipose tissue. Br J Nutr 2000; 83(1): 9-16. [2] BAIER T. & NEUWIRTH E.; Excel: COM : R, Computational Statistics, 22/1, pp.91-108. 2007. [3] BALCAR K.: Úvod do studia psychologie osobnosti. Chrudim: Mach. 1991. [4] BLATNÝ M. & PLHÁKOVÁ A.: Temperament, inteligence, sebepojetí. Brno: Psychologický ústav Akademie věd ČR. 2003, s.87 – 141. ISBN 80-86620-05-0. [5] BRAUNEROVÁ R, & HAINER V.: Obezita – diagnostika a léčba v praxi. [online]. In Med., Pro Praxi; 2010, 7 (1). Dostupné na internete: <http://www.solen.cz/pdfs/med/2010/01/05.pdf>. [6] BUKOVÁ A, UHER I: Dynamika faktorov motivácie mladých ľudí k pohybovej aktivite. In: Pohybová aktivita v živote človeka: pohyb detí. Prešov: Prešovská univerzita, 2010. [7] BUNC V: Nadváha a obezita dětí – životní styl jako příčina a důsledek. Česká kinatropologie, 2008; 12 (3). [8] BUNC V: Energetická náročnost pohybových aktivit a její využití pro ovlivňování tělesné hmotnosti. In VOBR R (ed): Disportare 2006. České Budějovice: Pedagogická fakulta Jihočeské university, 2006. http://theses.cz/id/1y8x9o/downloadPraceContent_adipIdno_6435 -dipl.pr.
326
[9] BURKE JD et al.: The University of New Hampsire´s Young Adult Health risk Screening Initiative. Journal of American Dietetic Association, 2009, vol. 109, No 10, 1751 – 1756 [10] BUNC V.: Nadváha a obezita dětí – životní styl jako příčina a důsledek. Česká kinatropologie, 2008; 12 (3). [11] CARPENSEN CJ et al.: Physical activity, exercise, and physicalfitness: Definition and distinctions for health related research. Public Health Reports, 1985; 100(2). [12] CUMMINGS DE. & SCHWARTZ MW.: Genetics and pathophysiology of human obesity. Annu Rev Med 2003; 54: 453-471. [13] DIENER, E., SUH, E. M., LUCAS, R. E. & SMITH, H. L. (1999). Subjective well-being: three decades of progress. Psychological Bulletin, 125(2), 276-302. [14] ĎATELOVÁ M.: Súčasný stav výživy a výskyt obezity u detí na Slovensku. In Zborník z medzinárodnej konferencie Rizikové faktory potravového reťazca. Nitra: FBP SPU v Nitre, 2007: 948-952. ISBN 978-80-8069-. [15] FIALOVÁ L.: Body image jako součást sebepojetí člověka. Praha: Karolinum, 2001. ISBN 80-246-0173-7. [16] FIALOVÁ L.: Body image. Jak se vyrovnat s kultem štíhlého těla. Praha: Grada Publishing, 2006. ISBN 80-247-1350-0. [17] HAINER V.: Základy klinické obezitologie. 2. vyd. Praha: Grada Publishing, 2004. ISBN 80-247-0233-9. [18] HENDL J. &. DOBRÝ L a kol.: Zdravotní benefity pohybových aktivit. Monitorování, intervence, evaluace.UK, Praha: Karolínum, 2011. [19] HRACHOVINOVÁ T. & CHUDOBOVÁ P.: Body image a možnosti jeho měření (se zaměřením na neklinickou populaci). Československá psychologie, 2004, 48, č. 6. [20] HU B et al.: Relations hipof PhysicalActivity and Body Mass Index to the Risk of Hypertension: A Prospective Study in Finland, 2005. Dostupné na http://hyper.ahajournals.org/content/43/1/25.full.pdf [21] CHAMOUTOVA H.: K problematice stresu prožívaného studenty během vysokoškolského vzdělávaní.2004 [online], [cit. 2009-06-21]. Dostupné z: www.agris.cz/etc/text.forwarder.php [22] JANSA P, KOCOUREK J, VOTRUBA J, DAŠKOVÁ B: Sport a pohybové aktivity v životě české populace. Praha: UK FTVS, 2005. [22] JORM, A. F, KORTEN, A. E., CHRISTENSEN, H., JACOMB, P. A., RODGERS, B. & PARSLOW R. A. (2003). Association of obesity with anxiety, depression and emotional well-being: a community surfy. Australian and New Zealand journal of public health, 27(4), 434-440. [23] KAMENSKÝ J. & PELLA D.: Zdravý životný štýl – cesta k prevencii ochorení srdca a ciev. Bratislava: AEPress, s.r.o., 2010: 143. ISBN 978-80-8888O-88-2. [24] KOLLÁR J. Lipidy a lipoproteíny. Olympia, 1996: 312. ISBN 80-967388-7-9. [25] LANGMAIER, J. & KREJČÍŘOVÁ D.: Vývojová psychologie. 2. aktualizované vydání. Praha: Grada, 2006. ISBN 80-247-1284-0. [26] KŘIVOHLAVÝ J.: Psychologie zdraví. Portál, 2009. [27] KUNEŠOVÁ M: Obezita – etiopatogeneze, diagnostika a léčba. Interní Med., 2004; 9. [28] NEVORAL, J. a kol. 2003. Výživa v dětském věku. Nakladatelství H&H, Jinočany. 434 s. ISBN 80-86-022-93-5 [29] NIDDK: Statistics related to overweight and obesity, 1999: 1-14. [30] PAŘÍZKOVÁ J. & LIDKA L. et al.: Obezita v dětství a dospívaní. Galen, 2007: 239. ISBN 978- 80- 7262-466-9. [31] PAUČO J. & Slovenská obezitologická spoločnosť. 2008 Fifo, http://wp.sos-obezita.sk/?page_id=1823.07.2014)

327
[32] PETEROVÁ K.: STEM/MARK průzkum stavu obezity a přidružených onemocnění v České republice 2013. Projekt Žij zdravě Všeobecné zdravotní pojišťovny ( odborní garanti průzkumu a projektu Žij zdravě ; MUDr. Martin Matoulek s profesorem Svačinou z III. interní kliniky 1. LF UK a VFN v Praze. http://img.ct24.cz/multimedia/documents/46/4560/455923.pdf; [33] RAABE H: Zdravie od A po Z. 1 vyd. Bratislava: Osveta, 1999. [34] SHERMAN DL. & CEBULLA GL. & BALADY GJ.: Exercice and physical activity, In Textbook of cardiovascular medicine. Philadelphia: Wilkins, 2002: 2210. [35] SIGMUNDOVÁ D. et al.: Seculartrends:A ten year comparison of the amount and type of physical activity and inactivity of random samples of adolescent in the Czech Republic. BMC Public Health, 2011; 11(1): 731. [36] SMÉKAL V.: Pozvání do psychologie osobnosti. Brno: Barrister & Principal, 2002, s. 341-368. ISBN 80-85947-80-3. [37] ŠTEFKOVÁ G. & SHAFOUT R.: Fyzická aktivita študentov medicíny vo voľnom čase In Ošetrovateľstvo a zdravie. Zborník vedeckých prác. Trenčín: Trenčianska univerzita Alexandra Dubčeka, Fakulta zdravotníctva, 2012: 220-226. ISBN 9788080755317. [38] UHER I: Health, well-being and exercise analysis of older population. In: Raporty i szkice o kulturze fizycznej i zdorowotnej w perspektywie Humanistycznej. Naukowy kwartalnik. Publisher: University of Rzeszów. Poland, 2009; 168-174. [39] WILKINSON R. & MARMOT M.: Social determinants of health. The solid facts. Copenhagen: WHO, 1998. [40]WHO (World Health Organizations): Concepts of health behavior research, regular health paper No. 13. ND: SEARO, 1986. [41] World Health Organization (WHO): Last accessed 25th August 2005. http://www.who.int/dietphysicalactivity/publications/facts/cvd/en/ [42] WHO: Cardiovascular Disease Fact sheet. Last accessed 25th August 2005. http://www.who.int/hpr/NPH/docs/gs_cvd.pdf
[43] WHO. (2004). BMI classification. Dostupné z: http://apps.who.int/bmi/index.jsp?introPage =intro_3.html

328
ZMENY ÚROVNE PLÁVANIA ŠTUDENTOV FTVŠ UK
Yvetta Macejková– Ľubomír Kalečík– Katarína Hrubiznová*
Comenius University in Bratislava Faculty of Physical Education and Sport
Department of outdoor sport and swimming * student Faculty of Physical Education and Sport
ABSTRAKT Teória a didaktika plávania má dlhodobo významné postavenie v didaktickej časti obsahu štúdia na FTVŠ UK. Technické zručnosti sumované v kvalite výkonu sú preverované na prijímacích skúškach a sú vstupnou orientáciou úrovne plávania uchádzačov o štúdium. Táto sa dlhodobo sleduje na všetkých úrovniach vzdelávania na vysokých školách s telovýchovným zameraním. Z dlhodobého hľadiska možno konštatovať jej klesajúcu úroveň z hľadiska kvality výkonov na 100 m (Bence –Chebeň, 2002, Kalečík, 2009, Kalečík-Benčurikova, 2011). Z hľadiska profilácie absolventa FTVŠ UK je v praktickej časti štúdia nutné zvládnuť komplex špeciálnych didakticko-praktických zručností a návykov. Obsah výučby tvorí nadstavbu individuálnej úrovne technických zručností. Cieľ príspevku má dve úlohy. Prvá hodnotí úroveň plaveckej výkonnosti uchádzačov o štúdium na FTVŠ UK v r. 2012 – 2014. Druhá hodnotí zmeny plaveckej výkonnosti prijatých študentov po ukončení 1. ročníka štúdia. Hodnotenie úrovne plaveckej výkonnosti na prijímacích skúškach v plávaní má charakter deskripcie. V r. 2012 plávalo100 m 580 uchádzačov, v r. 2013 bolo 577 študentov, v r. 2014 najmenej 473 uchádzačov. Základnými štatistickými charakteristikami sme vyhodnocovali zvlášť mužov, ženy podľa plaveckých spôsobov (prsia, kraul) a 10 bodovej stupnice. V dvoch akademických rokoch 2012/2013 a 2013/2014 sme hodnotili plaveckú výkonnosť po ukončení výučby plávania v 1. ročníku štúdia. T-testom sme porovnávali zmeny výkonnosti rovnakých študentov (mužov) v tej istej disciplíne na prijímacích skúškach a po ukončení prvého semestra výučby plávania. Dominancia zastúpenia plaveckých spôsobov z hľadiska pohlavia je dlhodobo rovnaká. Muži preferujú plavecký spôsob kraul (80%), ženy prsia (90%). Plavecká výkonnosť v sledovaných rokoch je výrazne sústredená do stredných a nižších výkonnostných pásiem. Viac ako 60 % uchádzačov sa úrovňou plaveckej výkonnosti pohybuje v bodovej hranici 3 – 7 bodov. Na zhoršujúcu úroveň plaveckej výkonnosti poukazuje vysoké percento (15%) uchádzačov, ktorí nesplnili základné výkonnostné požiadavky. Štatisticky významné zmeny plaveckej výkonnosti vplyvom obsahu výučby plávania v 1.ročníku štúdia sme zistili v r. 2012/2013. Aktuálne zmeny plaveckej výkonnosti uchádzačov o štúdium na FTVŠ UK sú nepriamym prejavom životného štýlu mladej generácie a poukazujú na dôležitosť špeciálnej pohybovej prípravy. KĽÚČOVÉ SLOVÁ: plavecká výkonnosť, prsia, voľný spôsob, vysokoškoláci, prijímacie konanie
ÚVOD Od vzniku vysokých škôl s telovýchovným zameraním majú výskumy úrovne plaveckej výkonnosti študentov dlhodobú výskumnú genézu. Cieľ výskumov má svoje opodstatnenie z dôvodu neustálej inovácie učebných osnov didaktických predmetov a s tým súvisiacou inováciou didaktických požiadaviek na študentov počas štúdia. Z dlhodobého

329
hľadiska výsledky tiež nepriamo poukazujú na meniaci sa výkonnostný profil v plávaní vysokoškolskej populácie. Pozitívne zmeny plaveckej výkonnosti uchádzačov o štúdium na FTVŠ UK v Bratislave v dlhšom časovom diapazóne r. 1987-1993 tvorili základ pre vypracovanie nových bodovacích tabuliek pre prijímacie konanie (Macejková,1994) Od začiatku nového milénia výskumy prezentujú rozdielnu tendenciu. Poukazujú na pozvoľný, ale systematický pokles plaveckej výkonnosti v 100 m disciplíne uchádzačov o štúdium na fakultách s telovýchovným zameraním (Bence et al. 2010, Bence –Chebeň, 2002, Kalečík, 2009, Kalečík - Benčurikova, 2011). Z hľadiska profilácie absolventa FTVŠ UK je v praktickej časti štúdia nutné zvládnuť komplex špeciálnych didakticko-praktických zručností a návykov. Obsah výučby tvorí nadstavbu individuálnej úrovne špeciálnych plaveckých zručností. Kondično-technické zručnosti sumované v kvalite výkonu sú preverované na prijímacích skúškach a sú vstupnou informáciou úrovne plávania uchádzačov o štúdium. Cieľom príspevku je analyzovať úroveň plaveckej výkonnosti na pohybových prijímacích skúškach a následne zistiť jej zmeny vplyvom obsahu výučby plávania po ukončení 1. ročníka štúdia. METÓDY Hodnotenie úrovne plaveckej výkonnosti na prijímacích pohybových skúškach v plávaní má charakter deskripcie. Za 3 roky prijímacieho konania sme hodnotili 1651 študentov z toho 310 žien. V r. 2011/2012 plávalo100 m 580 uchádzačov, v r. 2012/13 577 študentov, v r. 2014 najmenej 494. Základnými štatistickými charakteristikami sme vyhodnocovali zvlášť mužov, ženy podľa plaveckých spôsobov (prsia, kraul) a 10 bodovej hodnotiacej škály. V dvoch akademických rokoch 2012/2013 (n 131 z toho 32 žien) a 2013/2014 (n 165 z toho 27 žien) sme hodnotili plaveckú výkonnosť po ukončení výučby plávania v 1. ročníku štúdia. T-testom sme porovnávali zmeny výkonnosti tých istých študentov (mužov, ženy), v tej istej disciplíne na prijímacom konaní a po ukončení prvého semestra výučby plávania. VÝSLEDKY Dominancia zastúpenia plaveckých spôsobov z hľadiska pohlavia je dlhodobo rovnaká. Muži preferujú voľný spôsob, ženy prsia. Plavecká výkonnosť v sledovaných rokoch je výrazne diferencovaná z hľadiska pohlavia a plaveckého spôsobu. Koncentruje sa do stredných a nižších výkonnostných pásiem. Preferencie prsiarskeho spôsobu v súbore žien sú vysoké 71% v r. 2014, 61,5% v r. 2013, 69,8% v r. 2012. Priemerná výkonnostná úroveň súborov v jednotlivých rokoch sledovania mala úroveň kreditu D (123 s).Najvyššia koncentrácia výkonnosti na úrovni 7-3 body bola v r. 2013 (56,3%, obr.1). Väčšinové zastúpenie spôsobu prsia v súbore žien potvrdzuje jeho masovosť u bežnej populácie. Vyššiu výkonnosť preukázal súbor žien vo voľnom spôsobe. V strednom pásme 7-3 body plávalo 100 m 49,9% (r.2012), 67,5% (r. 2013), 41,7% (r. 2014)(obr. 2). V tejto súvislosti treba zdôrazniť, že voľný spôsob v r. 2012 plávalo 24 žien z 85, v r. 2013 40 z počtu 104, v r. 2014 26 z 86 zúčastnených. Malá početnosť súborov neumožňuje objektívne porovnať zmeny plaveckej výkonnosti. Priemerný výkon súboru 90,7s v r. 2013 by umožnil splniť čiastkový obsah kreditu na úrovni B. V súbore mužov si prsia zvolilo 42,3% v r. 2013 a 37,1% v r. 2012. Najvyššia koncentrácia výkonnosti v bodovom rozmedzí 7-3 body bola v r. 2013 (67,3%)(obr. 3). Výkonnostný priemer súborov v r. 2012 bol 108 s a v r. 2014 110 s. Študenti by zvládli čiastkové výkonnostné plnenie kreditu v 1. ročníku na úrovni kreditu D.

330
Voľný spôsob plávalo vo výkonnostnom rozmedzí 7-3 body 72,1% (r.2013) a 55,8% mužov (r. 2014) (obr. 4). Aritmetický priemer súboru sa pohyboval v rozmedzí 93 s – 94 s. Uchádzači by čiastkový obsah kreditu splnili na úrovni kreditu C, čo je lepšie ako v prsiarskom spôsobe. Naše výsledky korešpondujú s výsledkami z obdobia 2008 až 2010 (Kalečík, 2010). Plavecká výkonnosť v oboch plaveckých spôsoboch a oboch pohlaví sa koncentrovala v strednom výkonnostnom pásme. Štatisticky významné zmeny plaveckej výkonnosti z hľadiska pohlavia a plaveckých spôsoboch boli nevýznamné, okrem súboru žien voľný spôsob. Priemerný čas v r. 2012 bol 100,8 s a v r. 2013 bol 90,7 s, o 10 s lepší (p<0,05). Pre objektívnosť posúdenia zmien výkonnosti v jednotlivých rokoch sledovania navrhujeme hodnotiť počet študentov v jednotlivých pásmach výkonnosti, a nie priemerné hodnoty celých súborov, ako je to vo väčšine výskumov na Slovensku.
Obr. 1 Plavecká výkonnosť na prijímacom konaní (ženy, prsia)
Obr. 2 Plavecká výkonnosť na prijímacom konaní (ženy, voľný spôsob)

331
Dôkazom znižujúcej sa úrovne plávania sú aj počty študentov, ktorí nesplnili štandard. Najvyšší počet sme zaznamenali v r. 2013, kedy 104 študentov z 577 (18%) nezaplávalo najnižší výkonnostný limit. V r. 2012 to bolo 15,9%, čo predstavuje 92 uchádzačov z počtu zúčastnených 580 a v r. 2014 16,4%, čo predstavuje 81 študentov z počtu 494.
Obr.3 Plavecká výkonnosť na prijímacom konaní
(muži, prsia)
Obr.4 Plavecká výkonnosť na prijímacom konaní (muži, voľný spôsob)
Dôvodom hodnotenia úrovne plávania na pohybových prijímacích skúškach v sledovaných rokoch, bolo porovnať zmeny plaveckej výkonnosti vplyvom obsahu semestrálnej výučby plávania v 1. ročníku štúdia na FTVŠ UK. Jadro obsahu tvorí zdokonaľovanie techniky plaveckých spôsob prsia, znak, kraul včítane štartov a obrátok a v základoch je spoločné na všetkých fakultách s telovýchovným zameraním na Slovensku. Štatisticky významné zmeny plaveckej výkonnosti sme zistili v súbore mužov v r. 2012-2013 (obr.5,6). Objektivita porovnávania je otvorená, nakoľko výsledky sú ovplyvňované mnohými premennými, ako vstupná úroveň plaveckej výkonnosti, športová špecializácia, veľkosť súborov, individuálny prístup študentov k výučbe atď. Jasnejšiu informáciu o zmenách výkonnosti prezentujú

332
hraničné údaje v konkrétnych súboroch. V r. 2013 súbor študentov (n 75) prijatých na štúdium mal na prijímacích skúškach najlepší výkon voľným spôsobom 58 s a najhorší 155 s. V r. 2014 po semestrálnej výučbe plávania ten istý súbor mal najlepší výkon 55 s a najslabší 113 s. Tendencie môžu byť rozdielne. Súbor žien v spôsobe prsia (n 21) v r.2012 na prijímacích pohovoroch mal najpomalší čas 139s a najrýchlejší 99 s. O rok neskôr ten istý súbor plával najrýchlejšie za 105 s a najpomalší za 133 s.
Obr. 5 Porovnanie úrovne plávania na prijímacích pohybových skúškach a v 1.ročníku štúdia (2012-13)
Obr. 6 Porovnanie úrovne plávania na prijímacích pohybových skúškach a v 1.ročníku štúdia (2013-14)
ZÁVERY Diferencovaná úroveň plaveckej výkonnosti uchádzačov o štúdium na FTVŠ UK z hľadiska pohlavia a plaveckých spôsobov neumožňuje zvyšovať kvalitu obsahu predmetu Plávanie s akcentom na plaveckú výkonnosť. V súlade so súčasným trendom zmien vo výkonnostnej úrovni to nepovažujeme za prioritu. Z dlhodobého hľadiska a zdravotného vplyvu plávania doporučujeme v obsahu predmetu Plávanie akcentovať zvyšovanie kvality špeciálnych plaveckých zručností, ktoré nepriamo súvisia s kvalitou kondično-technickej vyspelosti študentov FTVŠ UK a vytvárajú pevnejší zručnostný základ pre záchranu topiaceho sa.

333
LITERATÚRA
[1] BENCE –CHEBEŇ. UKF. 58-62, 2002.
[2] BENCE et al. 2010. UKF. 14-19, 2010.
[3] KALEČÍK. STU. 150-159, 2009.
[4] KALEČÍK.TVS. 20, 31 – 35, 2010.
[5] KALEČÍK-BENČURIKOVÁ. TVS. 21, 23-26, 2011.
[6] MACEJKOVÁ. Acta Fac. Educ. Phys. Univ. Comeniae. 34, 43-49, 1994.

334
OPTIMÁLNY ČASOVÝ PROTOKOL TESTU LAKTÁTOVEJ KRIVKY
VO VESLOVANÍ
Peter Schickhofer, Michal Clementis
Univerzita Komenského v Bratislave, Fakulta telesnej výchovy a športu, Katedra športovej kinantropológie
ABSTRAKT Cieľom našej práce bolo vybrať optimálny diagnostický protokol pre hodnotenie testu laktátovej krivky a čo najpresnejšie určiť individuálny anaeróbny prah (IANP). Šesť veslárov absolvovalo 4 testy (3 testy laktátovej krivky a jeden kontrolný test). Testy lakátovej krivky mali rôzne časové protokoly. Prvý 3 minútový so 6 stupňami zaťaženia, druhý 5 minútový s 5 stupňami zaťaženia a tretí experimentálny protokol s 5 stupňami zaťaženia, ale rôznej dĺžky (I. 20 minút, II. 15 minút, III. 10 minút, IV. a V. 5 minút). Kontrolný test mal trvanie 20 minút a pri intenzite na úrovni IANP určenou experimentálnym časovým protokolom testu laktátovej krivky. Výsledky ukázali, že priemerná úroveň výkonu na IANP určená z experimentálneho časového protokolu testu laktátovej krivky (228,91 W) vykazovala štatisticky významne (p≤0,01) nižšiu hodnotu výkonu na IANP, ako zaužívané časové protokoly testu laktátovej krivky (3 min protokol – 254,53 W, 5 min protokol - 246,40 W). Hodnota laktátu (5,80 mmol.l-1) a srdcovej frekvencie (186,5 úder/min) na úrovni IANP v kontrolnom teste zodpovedá hodnote vypočítanej z experimentálneho protokolu (LACT- 5,40 mmol.l-1, SF – 183 úder/min). Rozdiel medzi jednotlivými hodnotami probandov nebol štatisticky významný. Rozdiel medzi hodnotami vypočítanými z 3 min a 5 min časového protokolu a hodnotami kontrolného testu bol štatisticky významný (p≤0,05). Čím sme potvrdili obä hypotézy. Na základe získaných výsledkov odporúčame pri diagnostickom teste laktátovej krivky vo veslovaní používať navrhnutý časový protokol. KĽÚČOVÉ SLOVÁ: veslovanie, individuálny anaeróbny prah, laktát, pulzová frekvencia, laktátová krivka, časový protokol. ÚVOD
Neustále zvyšovanie tréningového a pretekového zaťaženia so sebou prináša potrebu poznania mechanizmov a podstaty adaptačných zmien organizmu športovca na tréningové zaťaženie. V posledných rokoch sme boli svedkami zvyšovania objemu tréningového zaťaženia. Táto cesta je však prirodzene limitovaná možnosťami ľudského organizmu a preto upriamujeme pozornosť na zefektívňovanie tréningového procesu. Optimalizácia a efektívnosť tréningu nie je možná bez poznania aktuálneho stavu športovca a jeho zmien. Veslovanie sa radí medzi silovo – vytrvalostné športy. Veslári vykonávajú cyklický pohyb zložitejšej štruktúry na 2000 m súťažnej trati. Dĺžka trvania súťažného zaťaženia sa mení v závislosti od veku, pohlavia a disciplíny. Je všeobecne známe, že tento šport vyvíja enormné zaťaženie na organizmus športovca. V priebehu pretekov sú zapájané všetky systémy energetického krytia potrieb organizmu a až 80% energie sa získava aeróbnym spôsobom preto je dôležité sa v príprave zameriavať na rozvoj aeróbnej vytrvalosti.
Vo veslárskom preteku ktorý trvá približne 6 min (rozmedzie je 5`30``- 7` v závislosti na disciplíne), priemerný mechanicky výkon veslára je medzi 470 a 520 wattmi (merané na veslárskom trenažéri Concept 2 model D) a srdcová frekvencia je približne 190 úderov za

335
minútu, spotreba kyslíka sa pohybuje medzi 6000 až 6500 mililitrov za minútu, VO2MAX 65-70 mililitrov na kilogram telesnej hmotnosti (Mader, 1996). Úroveň laktátu po skončení preteku na 2000 metrov je v rozmedzí 10 až 21 mmol.l-1 a pH krvi je 7.0 - 6.85, čo je tiež hranica fyziologickej tolerancie acidózy (Hartmann, 2005).
Na základe spomenutej charakteristiky zaťaženia pretekára sa ďalší autori (Hagerman 1971, Jackson 1975, Mader 1977, Hartmann 1996, Janssen 2001, Nolte 2001) zhodujú na tom, že až 80% energie je počas športového výkonu vo veslovaní získavaná aeróbnym spôsobom a len 15% energie získavame anaeróbnym laktátovým systémom. Anaeróbno alaktátový systém teda zabezpečuje iba 5% z energetických potrieb organizmu.
Vo veslovaní teda, tak ako v iných silovo vytrvalostných športoch, hrá veľkú úlohu aeróbna vytrvalosť. Na monitorovanie vytrvalostných schopností vo veslovaní a ich zmien je najčastejšie využívaný test laktátovej krivky. Spomínaným testom okrem iného získame hodnotu zaťaženia na individuálnom anaeróbnom prahu (IANP).
Kľudová hodnota laktátu je podľa Jannsena (2001) 1-2mmol.l-1. Približne rovnaké hodnoty sú uvádzané aj Kucerom a Truksom (2000) 1.3-2.0 mmol.l-1.
Koncentrácia laktátu v krvi odráža určitým spôsobom rozsah anaeróbneho energetického metabolizmu pri zaťažení maximálnej a submaximálnej intenzity (Heller, 1996) a prináša tak informácie o intenzite zaťaženia a o jeho priebehu (Ozturk et al., 1998).
Úroveň laktátu v krvi sa progresívne zvyšuje so zvyšovaním intenzity záťaže a rýchlosti. Čím rýchlejšie sa pohybuje loď, tým vyššia je produkcia laktátu.
Zaznamenávaním zvyšovania úrovne laktátu počas progresívneho zvyšovania zaťaženia získame laktátovú krivku. Na získanie potrebných údajov pre vytvorenie laktátovej krivky by mal veslár vykonať sériu úsekov, trvajúcich rovnaký čas, minimálne o dĺžke aspoň 5 minút (Janssen 2001) a každý úsek by mal mat väčšiu intenzitu než predchádzajúci úsek.
Vzostup koncentrácie laktátu v krvi pomerne presne zodpovedá zmenám laktátu priamo vo svaloch. Jednou z možností ako zistiť aktuálny funkčný stav, je hodnotenie priebehu závislosti koncentrácie laktátu na stúpajúcom zaťažení, t.j. hodnotenie tzv. laktátovou krivkou, ktorou je možné stanoviť anaeróbny prah (ANP). Laktátovou krivkou je možné hodnotiť efektivitu tréningového zaťaženia a stanoviť najúčinnejšie intenzity tréningového zaťaženia pre rozvoj aeróbnych a anaeróbnych schopností (Paugschová 2006).
Pojem ANP je široko diskutovaný vo vedeckých kruhoch. Mnoho fyziológov tvrdí, že neexistuje presný prahový bod (Yehet al., 1983, Brooks, 1985), iní sú presvedčení, že úroveň ANP je možné presne stanoviť (Antonutto, DiPramperro, 1995). Dôvodom týchto debát je skutočnosť, že existuje mnoho metód, ako stanoviť prahovú hodnotu (Panuška, 2001). Hamar (1997) opísal ANP ako dynamickú rovnováhu medzi laktátom tvoriacim sa vo svaloch a jeho odbúravaním v srdci a odpočívajúcich svaloch. Po prekonaní tejto hranice dochádza k hromadeniu laktátu a dochádza k narušeniu vnútornej rovnováhy organizmu. Bunc et al. (1984) zadefinovali ANP ako bod zlomu krivky závislosti laktátu na zaťažení. Ide teda o bod pokiaľ mala krivka lineárny charakter a od tohto bodu prechádza do inej krivky zväčša exponenciálneho charakteru. Bielik et al. (2006) považujú ANP za jednu z najsignifikantnejších premenných vzhľadom k predikcii výkonu vo vytrvalostných druhoch športu.
336
Štandardnou metódou stanovenia ANP je posudzovanie aeróbnych schopností
pomocou ventilačných parametrov (Wasserman et al., 1973). Pri tejto metóde sa však stretávame s veľkou finančnou, organizačnou a technickou náročnosťou diagnostických prístrojov. V dnešnej dobe je dostupnejšia metóda merania hladiny krvného laktátu. Pri zachovaní vhodne zvolenej metodiky je táto metóda určenia ANP považovaná za dostatočne presnú (Bielik et al., 2006). Podľa Bielika (2010) test laktátovej krivky predstavuje optimálny spôsob na hodnotenie trénovanosti a tvorbu tréningového plánu. Hlavným cieľom spomínanej diagnostiky je určiť individuálny anaeróbny prah (IANP).
Test laktátovej krivky prebieha priamo na športovisku alebo v laboratórnych podmienkach na veslárskom trenažéri. Laktátová krivka je v podstate matematický model, ktorý výborne slúži k pochopeniu jednotlivých metabolických zón a ich významu v športe a to najmä vytrvalostnom (Kučera, 2006). Podľa autorov (Buncet al., 1984; Kučera – Truksa, 2000; Vilikus et al., 2004) sa ako optimálna metodika určenia IANP z testu laktátovej krivky ukazuje graficko – matematická metóda. Metóda lineárnej regresie s priesečníkom dvoch priamok si vyžaduje najmenej 4 stupne zaťaženia. Spočíva v zostrojení dotyčníc na krivku v jej začiatočnom a koncovom bode, ktorá sa predtým aproximuje, aby mala exponenciálny charakter.
V praxi sa stretávame s javom, že po druhom úseku zaťaženia je hodnota krvného laktátu rovnaká, alebo dokonca nižšia, ako po prvom úseku. Práve tento jav podľa nás spôsoboval posun aproximatívnej krivky a vo finálnej časti spôsobil nepresnosť určenia IANP. Pri vyhodnocovaní sa z priesečníku spomínaných dotyčníc vedie spojnica k najbližšiemu bodu aproximatívnej krivky. Zo zisteného bodu sa následne vedie vodorovná spojnica k pôvodnej krivke. Tento bod na krivke zodpovedá IANP. Pri spomínanom teste sa najčastejšie používa 3 až 5 minútový časový (stupňovaný) protokol. Každý stupeň zaťaženia trvá určitý čas. Medzi jednotlivými úsekmi je 1 min, alebo 2 min interval oddychu, počas ktorého sa odoberá kapilárna krv. Pritom sa sleduje ďalší vnútorný ukazovateľ zaťaženia – srdcová frekvencia (SF).
Na základe skúseností z praxe vieme o probléme nepresnej resp. nadhodnotenej úrovne zaťaženia na IANP. Spätná väzba, ktorú sme mali od športovcov bola rovnaká. Pri vyrovnanosti výkonov svetovej špičky rozhodujú často krát detaily. Pre nás je týmto detailom presnejšie určenie prahovej hodnoty. Našim cieľom bolo v tomto prípade pozmeniť metodiku testovania. V prípade získania presnejšej hodnoty IANP by nám to umožnilo presnejšie dávkovať zaťaženie v tréningu a vo finále tým zefektívniť tréningový proces.
METÓDY
Sledovaný súbor tvorilo 6 veslárov s priemerným kalendárnym vekom 22,5±7,5 rokov. Ich športový vek je v priemere 6,5±5,5 rokov, priemerná telesná hmotnosť 79±8kg a priemerná telesná výška 180,5±6,5cm.Všetci sú aktívni športovci a súťažia v juniorských alebo seniorských kategóriách. Každý z nich trénuje minimálne 6-krát do týždňa v rozsahu minimálne 2 hodiny denne. Ročne najazdia na vode priemerne 1900±300 km.
Všetci probandi absolvovali 3 tesovania s rozličnými protokolmi na posúdenie IANP.
V 1. protokole probandi absolvovali 6 úsekov 3 min zaťaženia, v 2. protokole 5 úsekov 5min zaťaženia. S3 experimentálny protokol laktátovej krivky mal predĺžené trvanie prvých 3-och úsekov a to 20 min, 15 min a 10 min. Ostatné 2 úseky ostali bez zmeny. Stupne zaťaženie

337
boli stanovené individuálne podľa výkonnosti každého pretekára tak aby bol prvý stupeň pod úrovňou aeróbneho prahu a posledný na úrovni osobného maxima na trenažéri (napr.: I. 160W, II.200W, III. 240W, IV. 280W, V. 320W). Medzi jednotlivými úsekmi zaťaženia nasledoval minútový interval odpočinku, počas ktorého sme uskutočnili odber kapilárnej krvi. Zo zistených hodnôt laktátu pri jednotlivých stupňoch zaťaženia sme vypočítali hodnotu laktátu pri IANP.
Srdcovú frekvenciu sme sledovali sporttesterom značky Polar . Pri vyhodnocovaní sme odpočítali priemernú hodnotu poslednej pol minúty úseku.
Hodnotu IANP sme priradili k úrovni výkonu na veslárskom trenažéri Concept 2 Model D.
Pred každým meraním probandi absolvovali 20 min rozcvičku. Odpor na trenažéri si probandi nastavili individuálne. Aby sme predišli ovplyvneniu výsledkov, 48 hodín pred začiatkom a rovnako aj po každom testovaní absolvovali probandi ľahké aeróbne tréningy. Tiež stravovanie probandov bolo upravené tak, aby sa minimalizoval vplyv tohto činiteľa na priebeh testovania. Výskum prebehol počas zimnej prípravy v mesiaci december v prípravnom období, kedy forma pretekárov už nejavila veľké výkyvy. Výskum prebiehal vždy v ranných hodinách medzi 9:00 až 11:00. Pri testovaní sme spolupracovali s Národným športovým centrom (NŠC), kde sa aj testovanie uskutočnilo. Na analýzu vzoriek krvi sme využívali prístroj Biosen C-Line.
Spracovanie nameraných hodnôt (laktát, srdcová frekvencia, výkon) prebieha vo viacerých krokoch. Prvým je preloženie exponenciálnej krivky cez namerané hodnoty (Wat, laktát). Ďalším krokom je výpočet súradníc priesečníka dotyčníc vychádzajúcich z koncov exponenciálnej krivky. Nasleduje určenie bodu na exponenciálnej krivke, ktorý zodpovedá kritériu najmenšej vzdialenosti priesečníka priamok a samotnej exponenciálnej krivky. Z tohto bodu sa nakoniec vynáša horizontálou bod na spojnici nameraných hodnôt. Takto získame hodnoty výkonu a laktátu zodpovedajúce IANP. Pomocou hodnoty laktátu pri ANP je možné na spojnici nameraných hodnôt odčítať aj hodnotu srdcovej frekvencie pri ANP.
Pri vyhodnocovaní výsledkov sme sa opierali o matematicko – štatistické metódy t.j. Wilcoxonov T – test pre neparametrické porovnanie dvoch závislých súborov a základné štatistické charakteristiky (smerodajnú odchýlku a aritmetický priemer), metódy porovnávania a tiež aj metódy vecne – logické, ktoré uvádzame v tabuľkách výsledkovej časti.
VÝSLEDKY Na základe získaných údajov sme vytvorili laktatové krivky pre jednotlivých
probandov na ktoré sme preniesli aj hodnotu zaťaženia na IANP. Priemerné hodnoty sledovaných parametrov spolu s hodnotami pri kontrolnom teste môžeme vidieť v tabuľke 1.

338
Tabuľka 1. Priemerné hodnoty výkonu, laktátu a srdcovej frekvencie na IANP podľa jednotlivých časových protokolov a kontrolného testu u probandov.
Obrázok 1. Priemerná hodnota kontrolného testu, IANP a laktátová krivka podľa jednotlivých protokolov u probandov.
Na základe obrázka 1 a tabuľky 1 môžeme konštatovať, že hodnota laktátu na úrovni zaťaženia IANP pri experimentálnom časovom protokole laktátovej krivky je vyššia ako u bežne používaných časových protokolov. Naopak hodnota výkonu pri našom protokole je najnižšia. Tým sa potvrdila prvá hypotéza nielen u jednotlivcov ale aj vo výskumnom súbore.
Tiež sme pozorovali krivku srdcovej frekvencie (obr. 2) a dospeli sme k záveru, že úroveň srdcovej frekvencie na úrovni IANP určená experimentálnym časovým protokolom je väčšia ako u zaužívaných časových protokolov testu laktátovej krivky.
Priemerné hodnoty Výkon [W] Laktát [mmol/l] Srdcová frekvencia [1/min]
IANP 3 min 254,5+0,00 4,17+0,88 177,3+10,5 IANP 5 min 246,4+0,00 4,99+0,56 180,7+9,3 IANP Exp. 228,9+0,00 5,40+0,77 183,0+10,1 Kontrola 20 min 230,8+0,00 5,80+1,15 186,5+6,8

339
Obrázok 2. Priemerné priebehy kriviek srdcovej frekvencie, kontrolný test a IANP podľa časových protokolov na krivke srdcovej frekvencie.
Obrázok 3. Priemerné hodnoty výkonu na úrovni IANP podľa jednotlivých protokolov.
Rozdiel výkonu na úrovni IANP podľa rôznych časových protokolov testu laktátovej krivky (obr. 3) resp. nižšia hodnota ktorú predikuje experimentálny časový protokol je štatisticky významná na 1% hladine významnosti. Tým sme potvrdili prvú hypotézu.

340
Tabuľka 2. Hodnoty SF na úrovni IANP určenej na základe rôznych časových protokolov a hodnota SF z kontrolného testu u jednotlivých probandov resp. priemerná hodnota.
SF 3 min [1/min]
SF 5 min [1/min]
SF exp [1/min]
SF Kontrola [1/min]
A.Š. 188 189 191 193 D.P. 179 171 179 180 J.P. 186 194 190 190 J.Z. 167 174 180 177 P.K. 182 174 166 186 M.Š. 162 182 192 193
Priemer 177,3 180,7 183,0 186,5 Smer. odch. 10,5 9,3 10,1 6,8
Tabuľka 3. Hodnoty laktátu na úrovni IANP určenej na základe rôznych časových protokolov a hodnota laktátu z kontrolného testu u jednotlivých probandov resp. priemerná hodnota.
Laktát 3 min
[mmol/l] Laktát 5 min
[mmol/l] Laktát Exp.
[mmol/l]
Laktát Kontrola [mmol/l]
A.Š. 4,82 4,91 5,44 5,51 D.P. 4,49 5,51 6,3 6,45 J.P. 5,19 5,65 4,97 6,21 J.Z. 3,62 4,36 4,46 4,05 P.K. 4,12 5,18 6,31 7,4 M.Š. 2,77 4,34 4,91 5,19
Priemer 4,17 4,99 5,40 5,80 Smer. odch. 0,88 0,56 0,77 1,15
V tabuľkách 2 a 3 môžeme vidieť hodnoty laktátu a srdcovej frekvencie vypočítaného na základe jednotlivých protokolov testu laktátovej krivky a hodnotu získanú z kontrolného testu. Po štatistických výpočtoch môžeme konštatovať že:
1. Rozdiel v hodnote krvného laktátu vypočítaného na základe experimentálneho časového protokolu testu laktátovej krivky a hodnote krvného laktátu zisťovaného po kontrolnom teste nie je štatisticky významný.
2. Rozdiel v hodnote krvného laktátu vypočítaného na základe 3 min časového protokolu testu laktátovej krivky a hodnote krvného laktátu zisťovaného po kontrolnom teste je štatisticky významný (p≤0,01).
3. Rozdiel v hodnote krvného laktátu vypočítaného na základe 5 min časového protokolu testu laktátovej krivky a hodnote krvného laktátu zisťovaného po kontrolnom teste je štatisticky významný (p≤0,05).
4. Rozdiel v hodnote srdcovej frekvencie vypočítanej na základe experimentálneho časového protokolu testu laktátovej krivky a hodnote srdcovej frekvencie zisťovanej v kontrolnom teste nie je štatisticky významný.

341
5. Rozdiel v hodnote srdcovej frekvencie vypočítanej na základe 3 min časového
protokolu testu laktátovej krivky a hodnote srdcovej frekvencie zisťovanej v kontrolnom teste je štatisticky významný (p≤0,05).
6. Rozdiel v hodnote srdcovej frekvencie vypočítanej na základe 5 min časového protokolu testu laktátovej krivky a hodnote srdcovej frekvencie zisťovanej v kontrolnom teste je štatisticky významný (p≤0,05).
Na základe týchto zistení môžeme konštatovať, že hodnota laktátu a srdcovej frekvencie na úrovni IANP v kontrolnom teste je najbližšia k hodnote vypočítanej z experimentálneho protokolu.
ZÁVERY Cieľ práce, vybrať optimálny protokol diagnostiky aeróbnej vytrvalosti pre tréningovú
prax hodnotením laktátovej krivky sme splnili. Na základe našich výsledkov sme preukázali že bežne používané časove protokoly testu laktátovej krivky vo veslovaní nadhodnocujú úroveň zaťaženia na IANP.
Na základe získaných výsledkov odporúčame pri diagnostickom teste laktátovej krivky vo veslovaní používať navrhnutý časový protokol.
Nepresná diagnostika nám neumožňuje, riadiť tréning podľa našich predstáv, nemôžeme presne určiť tréningové zóny čím nedochádza v tréningu k požadovanému efektu, ktorý nám napr. tréning podľa zón umožňuje.
Potvrdili sme, že metodika testovania sa až na zmenu trvania prvých troch úsekov zaťaženia nemení. Táto skutočnosť však môže byť považovaná aj za nevýhodu, z dôvodu celkového predĺženia času diagnostického testu, ale tento argument môžeme považovať za neopodstatnený. Samotná diagnostika testu laktátovej krivky, je aj pri zaužívaných časových protokoloch pre športovcov náročný test, v ktorom dosahujú maximálne úsilie. Tak isto aj na test laktátovej krivky zaužívanými časovými protokolmi treba prísť pripravený resp. oddýchnutý, správne najedený atd. V našom výskume bola potreba presnejšej diagnostiky stavu športovca podstatnejšia. V dnešnej dobe kedy rozhodujú často milimetre a stotiny a fyziologické možnosti atlétov sú hnané na maximum, rozhoduje v športovej príprave každý detail. Našou prácou ponúkame nový pohľad na test laktátovej krivky. Rozšírením nášho časového protokolu chceme prispieť k spresneniu tejto diagnostickej metódy.
LITERATÚRA
[1] ANTONUTTO G., DIPRAMPERO P. 1995. The concept of lactate treshold, The Journal of sports medicine and physical fitness (Impact Factor: 0.73). 04/1995; 35(1):6-12.
[2] BIELIK, V. 2010. Neležme, bežme. Bratislava: Sportdiag, 2010.s.167 ISBN 9788097034207
[3] BIELIK, V. – ANEŠTÍK, M. – PETROVIČ, J. – PELIKÁNOVÁ, J. – JAMRICHOVÁ, E. 2006. Laktátová krivka – Teória a prax. In Vedecký zborník Atletika 2006: s.6-12 ISBN 80-89257-01-1

342
[4] BROOKS, G. A. 1985. Anaerobic threshold: Review of the concepts and directions for future research. Medicine and Science in Sports and Exercise,1985 17, 22-34.
[5] BUNC, V., et al. 1984. Possibilities of application of anaerobic threshold in work physiology. II. Methods of determining anaerobic threshold. Prac Lek, 1984, 36: 127-133.
[6] HAGERMAN, FREDRICK C.; LEE, W. DAVID. 1971. Measurement of oxygen consumption, heart rate, and work output during rowing. Medicine and science in sports, 1971, 3.4: 155.
[7] HAMAR, D. 1997. Anaeróbny prah, s. 25. In: KOMADEL, Ľ. a kol: Telovýchovnolekárske vademecum. Bratislava: Slov. spol. telových. Lekárstva, Berlin – Chemie, Menarini Group, 1997, 237 s.
[8] HARTMANN, U.; MADER, A. 1996. Oxygen Uptake, Heart Rate and Lactate During Endurance Training in Top Class Rowers 744. Medicine & Science in Sports & Exercise, 1996, 28.5: 125.
[9] HELLER, J. et al. 1996. Fysiologie tělesné zátěže II. – Speciální část – 2. díl. Praha: Karolinum, 1996.
[10] JACKSON, ROGER C.; SECHER, NIELS H. 1975. The aerobic demands of rowing in two Olympic rowers. Medicine and science in sports, 1975, 8.3: 168-170.
[11] JANSSEN, Peter GJM. 2001. Lactate threshold training. Human Kinetics, 2001.
[12] KUČERA, V. 2006. Laktátová křivka. In : Atletika 2/2006, Praha: ČAS, s. 1-2.
[13] KUČERA, V.; TRUKSA, Z. 2000.Běhy na střední a dlouhé tratě. Olympia, 2000.
[14] MADER, A.; HOLLMANN, W. 1977. The importance of the elite rowers metabolic capacity in training and competition. Beiheft zu Leistungssport, 1977, 9: 9-59.
[15] OZTURK, M – OZER, K. – GOCKE, E. 1998. Evaluation of blood lactate in young men after wingate anaerobic power test. In: Eastern Journal of Medicine 3, 1998. s.13 -16.
[16] PANŮŠKA, P. 2001. Veslařský trénink. Praha: Český veslařský svaz, 2001.
[17] PAUGSCHOVÁ B.,PUPIŠ M., 2006. Laktátová krivka ako indikátor rôznych foriem zaťaženia v príprave biatlonistky. Banská Bystrica 2006
[18] VILIKUS, Z. – BRANDEJSKÝ, P. – NOVOTNÝ, V. 2004. Tělovýchovné lékařství. Praha: Karolinum UK,s.126-127ISBN 80-246-0821-9
[19] WASSERMAN, K. - WHIPP, B. J. – KOYAL, S. – BEAVER, W. L. 1973. Anaerobic threshold and respiratory gas Exchange during exercise. J App.Physiology; 35:s.236-243.
[20] YEH M.P., GARNER R.M., ADAMS T.D., YANOWITZ F.G., CRAPO R.O. 1983. ,,Anaerobic treshold“ : problems of determinations and validations. J Appl Physiol.1983. 55:1178 -1186.

343
ERRATA
EFFECT OF THREE-POINT FIELD GOAL RULE CHANGE ON SHOOTING FREQUENCY IN TOP LEVEL BASKETBALL
Richard Kucsa, Peter Mačura
Comenius University in Bratislava, Faculty of Physical Education and Sports, Department of Sport Games, Slovakia
ABSTRACT
In 2010 FIBA changed the international basketball rules. These changes had an impact on the distance of shots beyond the three-point line. We expected that the number of three-point shooting frequency will significantly decrease after the application of this rule. The aim of the study is to compare the three-point shooting frequency between two periods, tournaments played until 2010 (including World Championship 2010, October), when the distance of three-point line was 6.25 meters and tournaments played after this term, when the three-point line was extended to 6.75 meters. We were selected 16843 three-point shots in 390 games in high level men´s basketball tournaments. We performed Student T-test to monitor significant differences of three-point shooting frequency in compared periods. The difference in the compared periods was -2.58 attempts. Based on these results we can conclude that the effects of applying new rule of the three-point area significantly decreased the three-point shooting frequency (p <.05) on top level men´s basketball.
KEY WORDS: Basketball. Three-point field goal area rule. Three-point shooting frequency.
INTRODUCTION
Basketball is a team sport in which the team with the most points at the end of the game wins. According to the authors (Trninić, 2002; Krause, 2008; Mačura, 2008; Tománek, 2010; Wissel, 2011) we agree with the statement that basketball shooting is the most decisive action in basketball, with the score depending directly on it. The characteristics of this important game performance indicator are often analyzed by number of authors (Csataljay et al. 2012; Kucsa et al. 2014). The 1st October 2010 is the date when the International basketball federation (FIBA) has changed the international basketball rules touching the three-point field goal rule. This chang had an impact on the distance of shots beyond the three-point line. This research compares three-point shooting frequency between two periods, tournaments played until 2010 (including World Championship 2010, October), when the distance of three-point line was 6.25 meters and tournaments played after this term, when the three-point line was extended to 6.75 meters (Picture 1.). We expected that the number of three-point shooting frequency will significantly decrease after the application of the rule.

344
Picture 1. FIBA three-point line distances
METHODS
Data for this study were obtained from the official website of FIBA (www.archive.fiba.com). The data included all three-point shots of the players who participated in selected top level men´s basketball tournaments: Olympic Games 2008 (OG 2008) 38 games, European championship 2009 (ECH 2009) 54 games, World championship 2010 (WCH 2010) 80 games, European championship 2011 (ECH 2010) 90, Olympic Games 2012 (OG 2012) 38 games and European championship 2013 (ECH 2013) 90 games. These players shoot a 16843 three-point shots in 390 games totally. Comparison were made between tournaments played until October 2010 (OG 2008, ECH 2009, WCH 2010) and tournaments played after October 2010 (ECH 2011, OG 2012, ECH 2013). Ex post facto research methodology was used. The equality of variance was verified using F-test before using the parametric test. We performed Student T-test (Hendl, 2009; O´Donoghue 2012) to monitor significant differences of three-point shooting frequency in compared periods.
RESULTS
As shown in Picture 2, the average number of three-point attempts when the distance of three-point line was 6.25 meters was 45.29 ± 4.8 in OG 2008, 41.2 ± 5 in ECH 2009 and 46.6 ± 5.3 in WCH 2010. When the distance of three-point line was 6.75 meters the average number of three-point attempts was 40.30 ± 5, in ECH 2011, 44.5 ± 7.5 in OG 2012 and 42.72 ± 7.4 in ECH 2013. The descriptive trend of the average number of three-point attempts taken per game at selected tournaments shows that the biggest difference was between the tournaments played in 2010 and 2011. In Picture 3 is the three-point shooting frequency difference (2.58 attempts) from all played games in the compared periods (before October 2010 and after

345
October 2010). The average number of three-point attempts taken per game in all games after the rule has been changed decreased (p <.05 *).
Picture 2. Three-point shooting frequency
Picture 3. Comparison of three-point shooting frequency

346
CONSLUSIONS
Based on these results we can conclude that the effects of applying new rule of the three-point area significantly decreased the three-point shooting frequency (p <.05) on top level men´s basketball. In future, it would be useful to take into consideration other factors and explanations such as the kind of defense being played, different offensive style played by teams, etc.
REFERENCES
[1] CSATALJAY G., Journal of Human Sport & Exercise, p. 356-364, 7, 2, 2012
[2] HENDL, J., Přehled statistických metod. (Overview of statistical methods), p. 213-244, 2009
[3] KRAUSE, J. et al., Basketball skills and drills, p. 15, 2008
[4] KUCSA, R. et al., Research papers DPP and PA 2014, p. 203-208, 2014
[5] MAČURA, P., Biomechanika basketbalovej streľby. (Biomechanics of basketball shooting), p. 23, 2008
[6] O´DONOGHUE P., Statistics for Sport and Exercise Studies, p.176-190, 2012
[7] TOMÁNEK, Ľ. 2010. Teória a didaktika basketbalu, (Theory and didactics of basketball), p.120, 2010
[8] TRNINIĆ S. et.al., Collegium Antropologicum, 26, 2, p. 521-523, 2002
[9] WISSEL, H., Step to success, p. 18, 2011
Článok je súčasťou výskumnej úlohy VEGA Identifikácia predpokladov úspešnosti realizácie
finálnych herných činností jednotlivca v športových hrách 1/0270/13(2013-2015).
Zodpovedný riešiteľ doc. PaedDr. Vladimír Přidal, PhD.

347
Copyright © 2022 FDOKUMEN