market access and constraints in . goat ... - DSpace@GIPE
331
MARKET ACCESS AND CONSTRAINTS IN . GOAT MARKETING AND THEIR PRODUCTS IN MAHARASHTRASTATE KAlLAS -THAW ARE Agro-Economic Research Center (AERC) Gokhale Institute of Politics and Economics (Deemed to be University under section 3 of the UGC ACT. 1956) GIPE-RP 003 Pune- 411 004 (MS), INDIA - .. February- 2010
-
Upload
khangminh22 -
Category
Documents
-
view
0 -
download
0
Transcript of market access and constraints in . goat ... - DSpace@GIPE
MARKET ACCESS AND CONSTRAINTS IN . GOAT MARKETING AND THEIR PRODUCTS IN
MAHARASHTRASTATE
KAlLAS -THAW ARE
Agro-Economic Research Center (AERC) Gokhale Institute of Politics and Economics
(Deemed to be University under section 3 of the UGC ACT. 1956)
GIPE-RP 003
Pune- 411 004 (MS), INDIA - ..
February- 2010
MARI{ET ACCESS AND CONSTRAINTS IN GOAT MARKETING AND THEIR PRODUCTS IN
MAHARASHTRASTATE
KAlLAS THAWARE
Agro-Economic Research Center (AERC) Golthale Institute of Politics and Economics
(Deemed to be University under section 3 of the UGC ACT. 1956) Pune - 411 004 (MS), INDIA
February - 2010

FOREWORD
Economic activities in the rural India are very complex. About 20 percent
households are 'landless families' and about 80 percent of the landholders are
categorized as 'small and marginal farmers'. Under these circumstances, the animal
husbandry sector (livestock) plays an .important role to generate sizeable additional
income as well employment for the agriculture sector. With social commitment of the
Government, special provisions have been made in most o( the five-year development
plans to assist the rural poor and socially backward classes to get rid of poverty. To
achieve the. defined goals, the Government of India had included 'livestock
development strategy' in 1971 as a major intervention for rural development.
The different Livestock censuses reported that livestock population in the
country has been increasing since, 1951. In 2003, it has been reported that the country
has 485 millions livestock population. It increased by 65.64% over 1951. In 2003, the
share of cattle and buffaloes is 57.96% in the total livestock population in the country
and the share of goat population is 25.64 o/o in the total livestock. It has been observed
that the growth rate of cattle population is reported negative over 1992 to 2003. The
buffalo population indicates positive growth with average 1.37% over 1992 to 2003.
The goat population has 0.22% growth rate, which is found in 2003 livestock census
and average 0.74% growth rate has been measured during 1992 to 2003.
In the world, India occupies important place in the livestock sector. This is
shown by ranking of the countries in terms of number of animals. India ranks first in
respect of buffalo, 2nd in cattle and goats, 3rd in sheep, 4th in ducks, 5th in chicken
and 6th in camel population in the world. Regarding the importance of this sector in
economy, every Agriculture Policy of the Central government clearly mentions that
India must achieve at least 4 %growth rate per annum. To achieve this growth rate
about 6 percent to 8 percent needs to be Achieved in Animal Husbandry sector.
Without contribution of animal husbandry sector, the targeted growth rate of 4% in
Agriculture sector is impossible.
The study found that mostly poor, small and marginalized people are engaged
m of goat rearing activities. They are less educated, use traditional way of goat
rearing practices, are unaware about goat breeds, and government policy for goats.
The majority of the goat keepers sell their goats at various places like organized
markets, unorganized markets, along roads, and at the door. Butchers mostly prefer to
buy animal on the way and at door as they want to pay lower prices and obtain high
profit margin. There are no exclusive markets for goats, which are presently sold at
general livestock markets. Presently, the state has only two skin markets, which are
inadequate.
The present study has been carried out by Dr. Kailas Thaware of our Institute
in the Agro-Economic Research Center (l\1inistry of Agriculture, Govt. of India) of
the Institute under ministry's guidance. The study brought out various facts into light
and made suggestions to strengthen the activity of goat rearing in the state. Some of
suggestions are valuable for the policy makers. These include:
1. The Goat breeding policy of state needs to be reframed by the state government.
Special goat development strategy must be framed as goats are the most preferable
animal for poor households as they generate income. 'It is found that goats are
really poo~ man's cow as 4-5 goats support livelihood of 4 family members.
2. The livestock markets in the state are inadequate. There is no exclusive goat
market in the state. The government should initiate strategy for development of
goat markets and markets for their by-products.
3. The market information system is poorly maintained at APMC level, it needs to be
updated every day and should be available to the goat keepers, buyers, sellers,
butchers at free of cost, whenever they require. Though APMCs are providing
infrastructure facilities, they must be properly maintained.
4. The credit and delivery its delivery is found unsuitable, it must be rejuvenated for
poor goat keepers.
5. Skin markets in state are found inadequate and underdeveloped; they need state
government intervention for further development.
6. Services of veterinary clinics are not delivered to beneficiaries properly;
awareness must be created among the poor goat keepers so that they will benefit
from the veterinary services, and will have higher production, income, etc. from
goat rearing.
7. The policy for slaughtering animals requires to be reframed as number of
registered slaughter houses decreased though number of slaughtering animals and
non-vegetarian population increased. The state government must ban slaughtering
animals at unauthorized and unhygienic. places and sanitary inspectors must
inspect them from time to time.
8. Even today, the price of goats is fixed on traditional practice of weight estimation
lifting goat by 'hands; it must be changed at scientific line based on the weighing
machine, so that illiterate goat keepers must get benefits without any cheating.
Undoubtedly, the research results of study will be useful to state and central
government as well as researchers in the field.
Gokhale Institute of Politics and Economics (Deemed to be university under section 3 ofthe UGC ACT. 1956)
Pune-411 004 (MS), INDIA February, 2010
.. 11
Rajas Purchure (Professor and Offig.Director)
ACKNOWDGEMENTS
The Present research work is &n outcome of guidance, suggestion and help of
various people. At the outset, I record my sincere thanks for the cooperation extended
by all sample goalkeeper households, buyers, butchers, wholesalers, skin traders,
sellers, who have given valuable time for filling the schedules and questionnaires, and
supplied valuable information for survey. I am very much thankful to District
Livestock Officers, personnel of APMCs, veterinary doctors of Yavatmal and
Ahemadnag~ district, Commissioner of Animal Husbandry Department, Officers of
Punyashloak Ahilaya Devi Sheli va Mendhi Vikas Mahamandal, Pune, Officers and
other staff of APEDA, and all others, who have provided valuable information
supports to this study. I also acknowledge all sources that incorporated for further
interpretation and analysis.
I am very much thankful to Prof. P.N. Mehrotra, Honorary Director, AERC,
Allahabad, who extended his cooperation to complete the study. I acknowledge with
thanks his valuable comments, co-operation, and contribution on the draft report of
this study. Because of his comments, all suggestions have been appropriately
incorporated while finalizing this study.
Research Investigators Mr. S.S. Dete, Mr S.B. Kate, Mr. V.G. Kasbe are
source persons for collecting primary and secondary information from various places
and research assistants Swetal Wankhede, Priyanka Gaikawad, and Anil Memane,
who entered data and prepare-d tables particularly for this study. They all have done
very commendable jobs and I acknowledge their valuable participation in the study.
I express my gratitude for past Officiating Director Prof. Arup Maharatna,
who allotted me this study and initial cooperation and also for the present Officiating
Director Prof. Rajas Purchure, who extended his cooperation in all respects at the last
moment under pleasant environment.
Lastly, I am very much thankful to Dr. Sangeeta Shroff, In-charge, AERC,
Pune, for her co-operation and contribution. I acknowledge the support of library
staff, who provided reference materials, whenever I required for this study and my
colleague Prof. S.N. Tripahty, who encouraged me all the time.
KAlLAS THAW ARE
!11
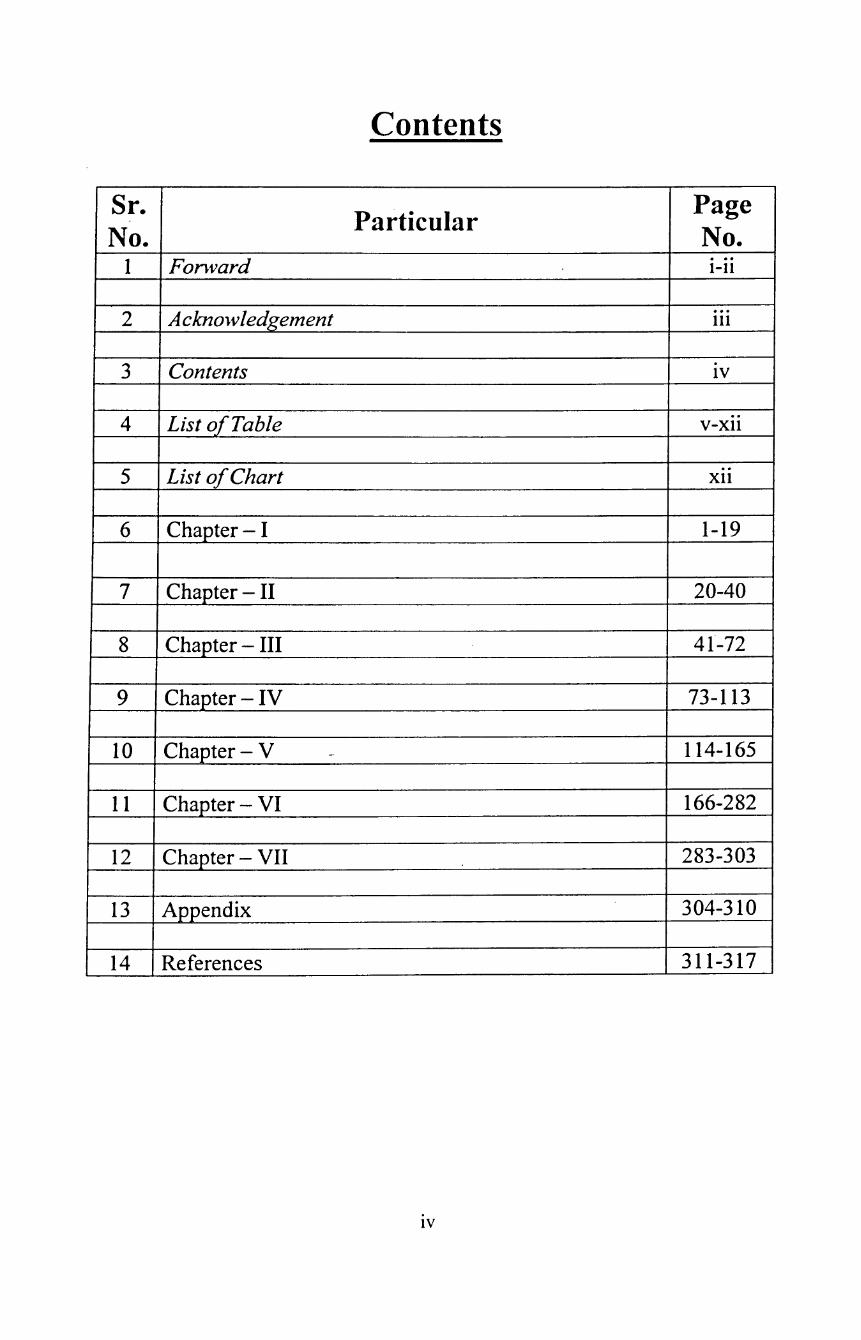
Contents
Sr. Particular
Page No. No.
1 Fonvard . . . I-ll
2 Acknolvledgement ... Ill
3 Contents . IV
4 List of Table ..
V-Xll
5 List of Chart ..
Xll
6 Chapter- I 1-19
7 Chapter- II 20-40
8 Chapter - III 41-72
9 Chapter-IV 73-113
10 Chapter- V - 114-165
1 1 Chapter- VI 166-282
12 Chapter - VII 283-303
13 Appendix 304-310
14 References 311-317
IV

List ofTahles and Names
Sr. No. Table No. Chapter- I Page No.
I IA General Picture of Livestock in India 2 2 1B Livestock Population Gro\\th Rate in India 2 3 2 Comparative Nutrient 4
Chapter- II
I 01 Sheep and Wool Development 27 2 02 Locations of the Government Run Goat and Sheep 28
Farms 3 03 Livestock Population in Maharashtra 29 4 04 Goats Population in the State 30 5 05 Milk Production in the State 31 6 06 Production of Meat at Registered Slaughter Houses 33 7 07 District wise Number of Slaughter Houses 34 8 08 Export of Meat (value) in India 35 9 09 Share of Goat based Leather in Leathers Products 36
Exports from the State 10 10 Cattle Markets in State 37 I I I I Number of Exclusively Skin rv1arkets in State 37 13 12 Production of Leather from Various Species in State 38 14 13 District wise Veterinary Institution in State 39 15 14 Total Veterinary Hospitals and Center of Rearing of 40
Livestock in State
Chapter- III
I 01 Are~ Village, Households and Population in 42 Yavatmal District
2 02 Livestock Population in Yavatmal District 45 3 03 Tahshil- Wise Livestock Population in Yavatmal 46
District (2003) 4 04 Arrivals, Sales, and l\1arket Fees Collected by Darvha 47
APMC (2006-07) · 5 05 (A) Arrivals, Sales, and Market Fees Collected by Pusad 48
APMC (2006-07) 6 05 (B) Arrivals, Sales, and Market Fees Collected by Pusad 48
APMC 7 06 Veterinary Dispensary, Clinics, Primary Health 49
Center and Mobile Clinics (2006-07) 8 07 Number of Recognized Slaughterhouses and 50
Slaughtered Animal in Yavatmal (2006-07) 9 08 Are~ Village, Households and Population In 51
Ahemadnagar District 10 09 Livestock Population in Ahemadnagar District in 54
Year I 987 to 2003 11 10 Tahshil- \Vise Li,,.estock Population in 55
v
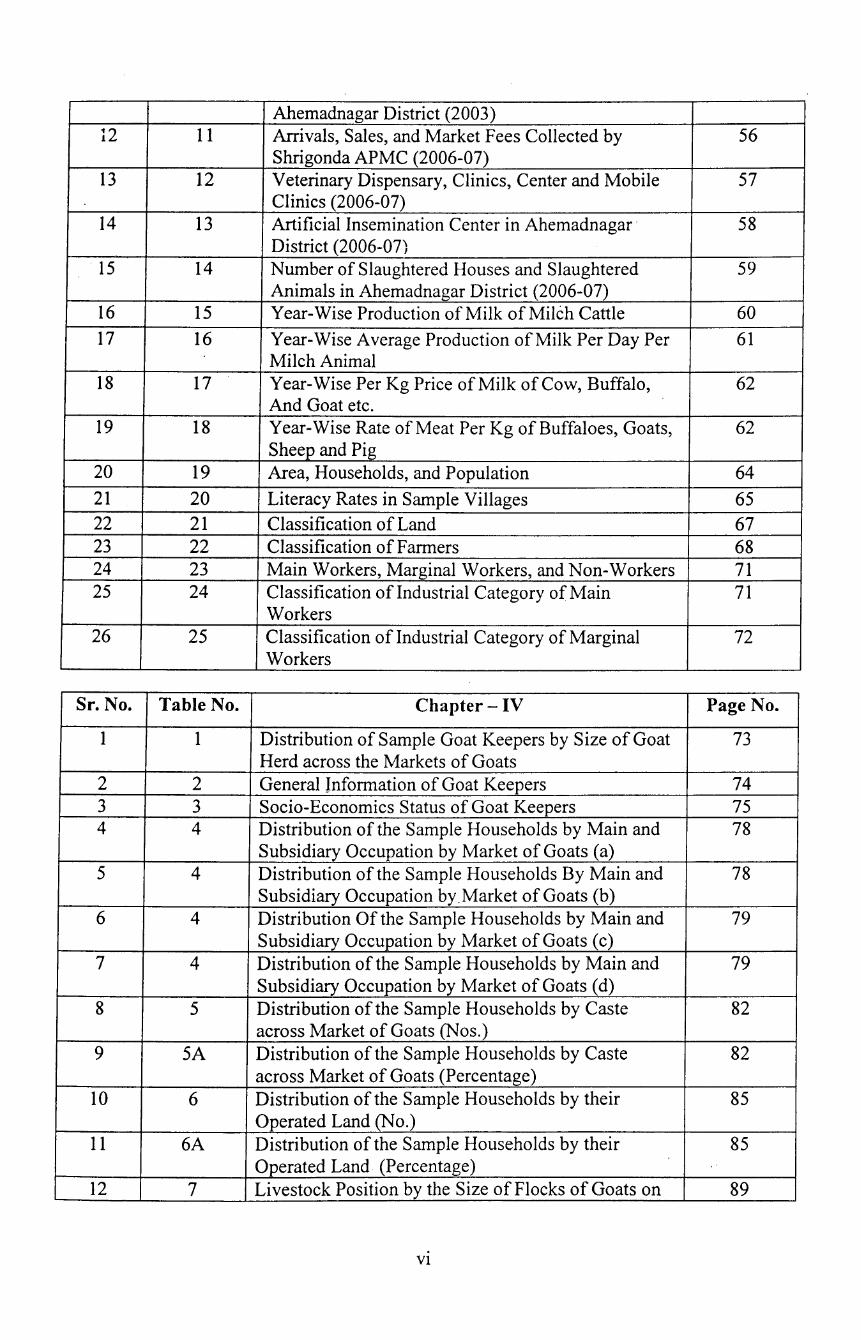
Ahemadnagar District (2003) 12 II Arrivals, Sales, and Market Fees Collected by 56
Shrigonda APMC (2006-07) I3 I2 Veterinary Dispensary, Clinics, Center and Mobile 57
Clinics (2006-07) 14 I3 Artificial Insemination Center in Ahemadnagar · 58
District (2006-07) 15 I4 Number of Slaughtered Houses and Slaughtered 59
Animals in Ahemadnagar District (2006-07) 16 IS Year-Wise Production of Milk of MilCh Cattle 60 17 I6 Year-Wise Average Production of Milk Per Day Per 6I
Milch Animal 18 I7 Year-Wise Per Kg Price of Milk of Cow, Buffalo, 62
And Goat etc. 19 I8 Year-Wise Rate of Meat Per Kg of Buffaloes, Goats, 62
Sheep and Pig 20 I9 Area, Households, and Population 64 2I 20 Literacy Rates in Sample Villages 65 22 2I Classification of Land 67 23 22 Classification of Farmers 68 24 23 Main Workers, Marginal Workers, and Non-Workers 71 25 24 Classification of Industrial Category of Main 7I
Workers 26 25 Classification of Industrial Category of Marginal 72
Workers
Sr. No. Table No. Chapter- IV Page No.
I I Distribution of Sample Goat Keepers by Size of Goat 73 Herd across the Markets of Goats
2 2 General Information of Goat Keepers 74 3 3 Socio-Economics Status of Goat Keepers 75 4 4 Distribution of the Sample Households by Main and 78
Subsidiary Occupation by Market of Goats (a) 5 4 Distribution of the Sample Households By Main and 78
Subsidiary Occupation by.Market of Goats (b) 6 4 Distribution Of the Sample Households by Main and 79
Subsidiary Occupation by Market of Goats (c) 7 4 Distribution of the Sample Households by Main and 79
Subsidiary Occupation by Market of Goats (d) 8 5 Distribution of the Sample Households by Caste 82
across Market of Goats (Nos.) 9 SA Distribution ofthe Sample Households by Caste 82
across Market of Goats (Percentage) 10 6 Distribution of the Sample Households by their 85
Operated Land (No.) II 6A Distribution of the Sample Households by their 85
Operated Land (Percentage) 12 7 Livestock Position by the Size of Flocks of Goats on 89
VI
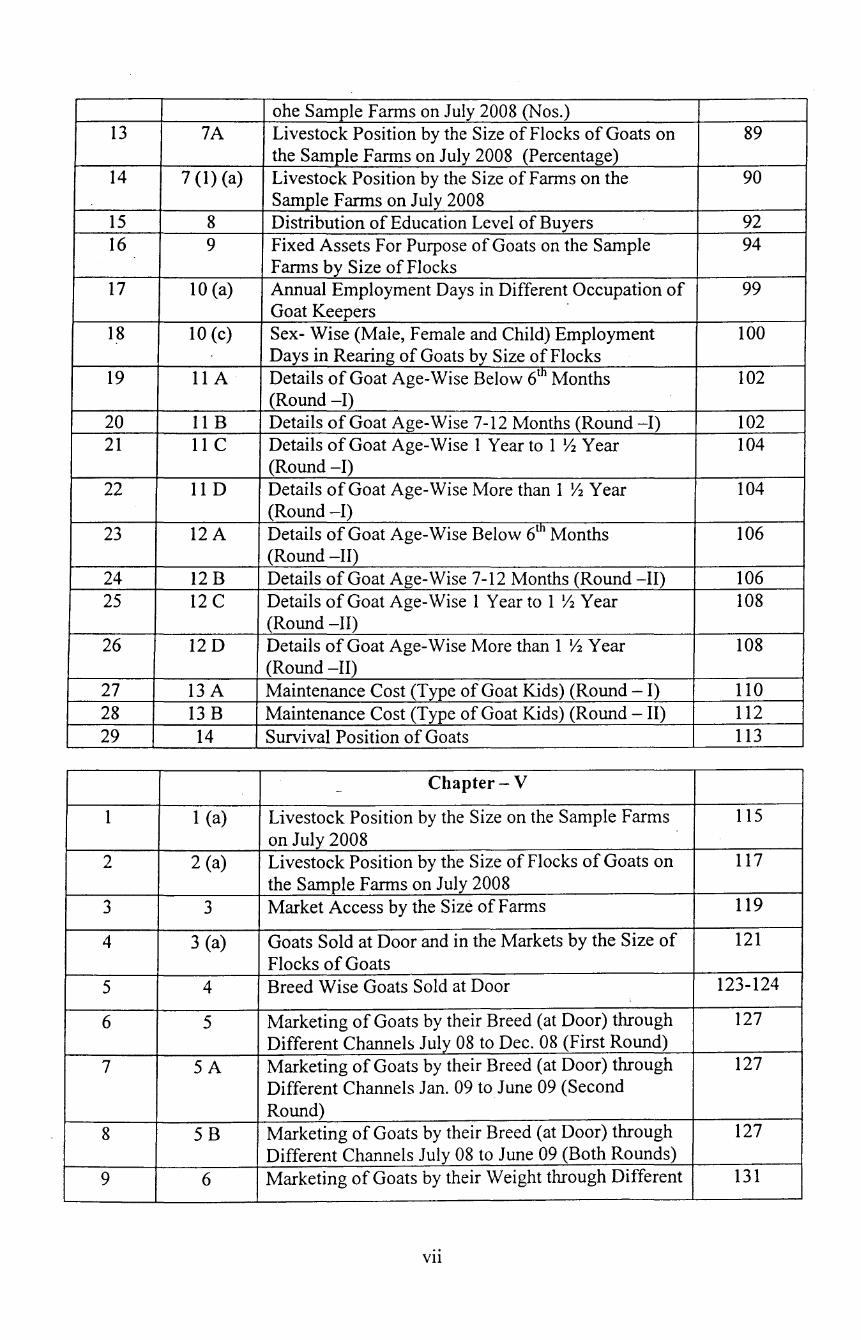
ohe Sample Farms on July 2008 (Nos.) I3 7A Livestock Position by the Size of Flocks of Goats on 89
the Sample Farms on July 2008 (Percentage) I4 7 (I) (a) Livestock Position by the Size of Farms on the 90
Sample Farms on July 2008 I5 8 Distribution of Education Level of Buyers 92 I6 9 Fixed Assets For Purpose of Goats on the Sample 94
Farms by Size of Flocks I7 IO (a) Annual Employment Days in Different Occupation of 99
Goat Keepers I8 IO (c) Sex- Wise (Male, Female and Child) Employment 100
Days in Rearing of Goats by Size of Flocks I9 llA Details of Goat Age-Wise Below 6th Months I02
(Round -I) 20 II B Details of Goat Age-Wise 7-12 Months (Round -I) 102 21 1I c Details of Goat Age-Wise 1 Year to 1 ~ Year I04
(Round -I) 22 II D Details of Goat Age-Wise More than 1 ~ Year 104
(Round -I) 23 12A Details of Goat Age-Wise Below 6th Months 106
(Round -II) 24 I2 B Details of Goat Age-Wise 7-12 Months (Round -II) 106 25 12 c Details of Goat Age-Wise 1 Year to 1 ~ Year 108
(Round -II) 26 12 D Details of Goat Age-Wise More than 1 ~ Year 108
(Round -II) 27 13 A Maintenance Cost (Type of Goat Kids) (Round- I) 110 28 13 B Maintenance Cost (Type of Goat Kids) (Round - II) 112 29 14 Survival Position of Goats 113
- Chapter- V
1 1 (a) Livestock Position by the Size on the Sample Farms 115 on July 2008
2 2 (a) Livestock Position by the Size of Flocks of Goats on 117 the Sample Farms on July 2008
3 3 Market Access by the Size of Farms 119
4 3 (a) Goats Sold at Door and in the Markets by the Size of 121 Flocks of Goats
5 4 Breed Wise Goats Sold at Door 123-124
6 5 Marketing of Goats by their Breed (at Door) through 127 Different Channels July 08 to Dec. 08 (First Round)
7 5A Marketing of Goats by their Breed (at Door) through 127 Different Channels Jan. 09 to June 09 (Second Round)
8 5B Marketing of Goats by their Breed (at Door) through 127 Different Channels July 08 to June 09 (Both Rounds)
9 6 Marketing of Goats by their Weight through Different 131
Vll
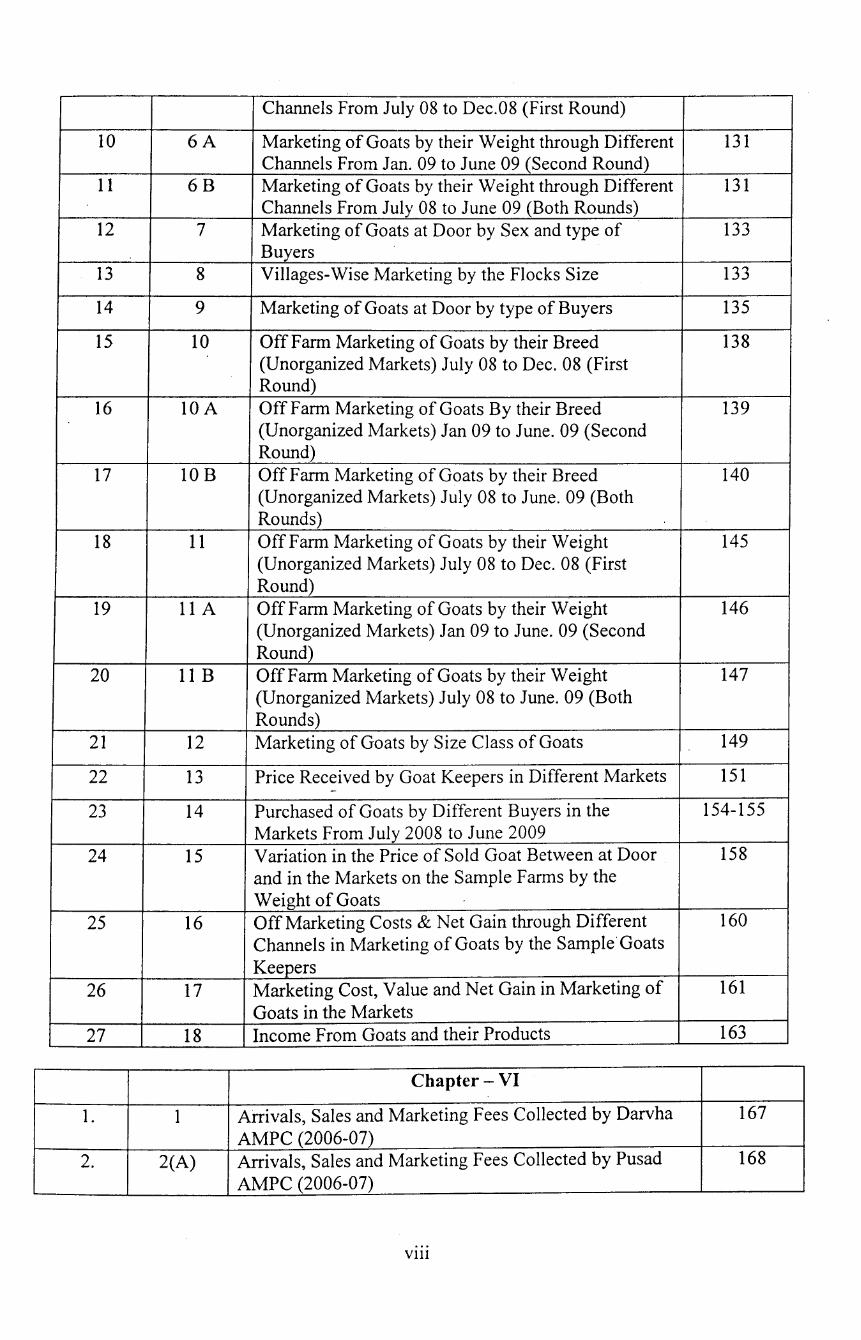
Channels From July 08 to Dec.08 (First Round)
10 6A Marketing of Goats by their Weight through Different 131 Channels From Jan. 09 to June 09 (Second Round)
11 6B Marketing of Goats by their Weight through Different 131 Channels From July 08 to June 09 (Both Rounds)
12 7 Marketing of Goats at Door by Sex and type of 133 Buyers
13 8 Villages-Wise Marketing by the Flocks Size 133
14 9 Marketing of Goats at Door by type of Buyers 135
15 10 OffFarm Marketing of Goats by their Breed 138 (Unorganized Markets) July 08 to Dec. 08 (First Round)
16 lOA Off Farm Marketing of Goats By their Breed 139 (Unorganized Markets) Jan 09 to June. 09 (Second Round)
17 10 B Off Farm Marketing of Goats by their Breed 140 (Unorganized Markets) July 08 to June. 09 (Both Rounds)
18 11 Off Farm Marketing of Goats by their Weight 145 (Unorganized Markets) July 08 to Dec. 08 (First Round)
19 11 A Off Farm Marketing of Goats by their Weight 146 (Unorganized Markets) Jan 09 to June. 09 (Second Round)
20 11 B Off Farm Marketing of Goats by their Weight 147 (Unorganized Markets) July 08 to June. 09 (Both Rounds)
21 12 Marketing of Goats by Size Class of Goats 149
22 13 Price Received by Goat Keepers in Different Markets 151 -
23 14 Purchased of Goats by Different Buyers in the 154-155 Markets From July 2008 to June 2009
24 15 Variation in the Price of Sold Goat Between at Door 158 and in the Markets on the Sample Farms by the Weight of Goats
25 16 Off Marketing Costs & Net Gain through Different 160 Channels in Marketing of Goats by the Sample Goats Keepers
26 17 Marketing Cost, Value and Net Gain in Marketing of 161 Goats in the Markets
27 18 Income From Goats and their Products 163
Chapter- VI
I. 1 Arrivals, Sales and Marketing Fees Collected by Darvha 167 AMPC (2006-07)
2. 2(A) Arrivals, Sales and Marketing Fees Collected by Pusad 168 AMPC (2006-07)
Vlll
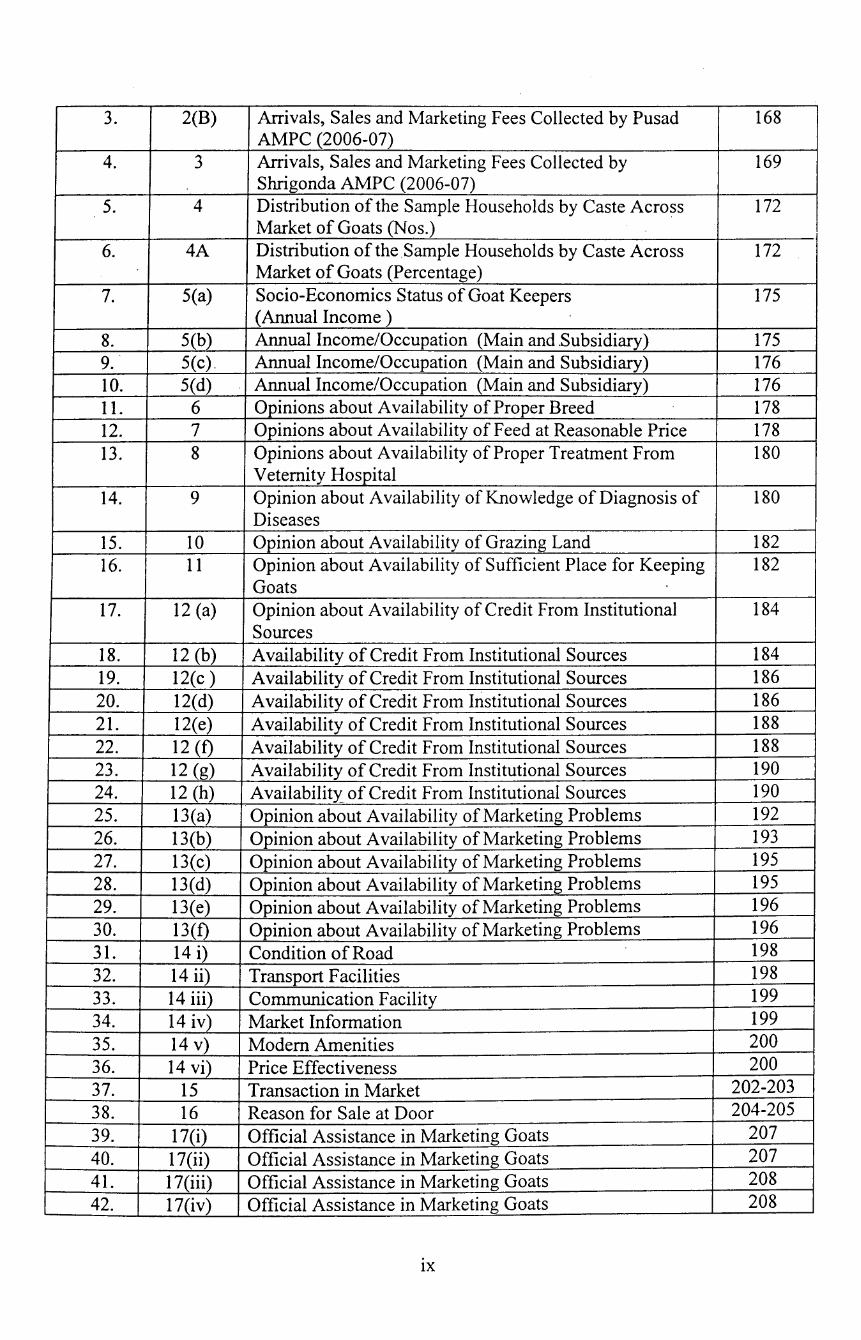
3. 2(B) Arrivals, Sales and Marketing Fees Collected by Pusad 168 AMPC (2006-07)
4. 3 Arrivals, Sales and Marketing Fees Collected by 169 Shrigonda AMPC (2006-07)
5. 4 Distribution of the Sample Households by Caste Across 172 Market of Goats (Nos.) I
6. 4A Distribution of the Sample Households by Caste Across 172 Market of Goats (Percentage)
7. 5(a) Socio-Economics Status of Goat Keepers 175 (Annual Income)
8. 5(b) Annual Income/Occupation (Main and .Subsidiary) 175 9. 5(c). Annual Income/Occupation (Main and Subsidiary) 176 10. 5(d) Annual Income/Occupation (Main and Subsidiary) 176 11. 6 Opinions about Availability of Proper Breed 178 12. 7 Opinions about Availability of Feed at Reasonable Price 178 13. 8 Opinions about Availability of Proper Treatment From 180
Vetemity Hospital 14. 9 Opinion about Availability of Knowledge of Diagnosis of 180
Diseases 15. 10 Opinion about Availability of Grazing Land 182 16. 11 Opinion about Availability of Sufficient Place for Keeping 182
Goats 17. 12 (a) Opinion about Availability of Credit From Institutional 184
Sources 18. 12 (b) Availability of Credit From Institutional Sources 184 19. 12(c) Availability of Credit From Institutional Sources 186 20. 12(d) Availability of Credit From Institutional Sources 186 21. 12(e) Availability of Credit From Institutional Sources 188 22. 12 (f) Availability of Credit From Institutional Sources 188 23. 12 (g) Availability of Credit From Institutional Sources 190 24. 12 (h) A vailabilitx of Credit From Institutional Sources 190 25. 13(a) Opinion about Availability of Marketing Problems 192 26. 13(b) Opinion about Availability of Marketing Problems 193 27. 13(c) Opinion about Availability of Marketing Problems 195 28. 13(d) Opinion about Availability of Marketing Problems 195 29. 13(e) Opinion about Availability of Marketing Problems 196
30. 13(f) Opinion about Availability of Marketing Problems 196
31. 14 i) Condition of Road 198
32. 14 ii) Transport Facilities 198
33. 14 iii) Communication Facility 199
34. 14 iv) Market Information 199
35. 14 v) Modem Amenities 200
36. 14 vi) Price Effectiveness 200
37. 15 Transaction in Market 202-203
38. 16 Reason for Sale at Door 204-205
39. 17(i) Official Assistance in Marketing Goats 207
40. 17(ii) Official Assistance in Marketing Goats 207
41. 17(iii) Official Assistance in Marketing Goats 208
42. 17(iv) Official Assistance in Marketing Goats 208
IX
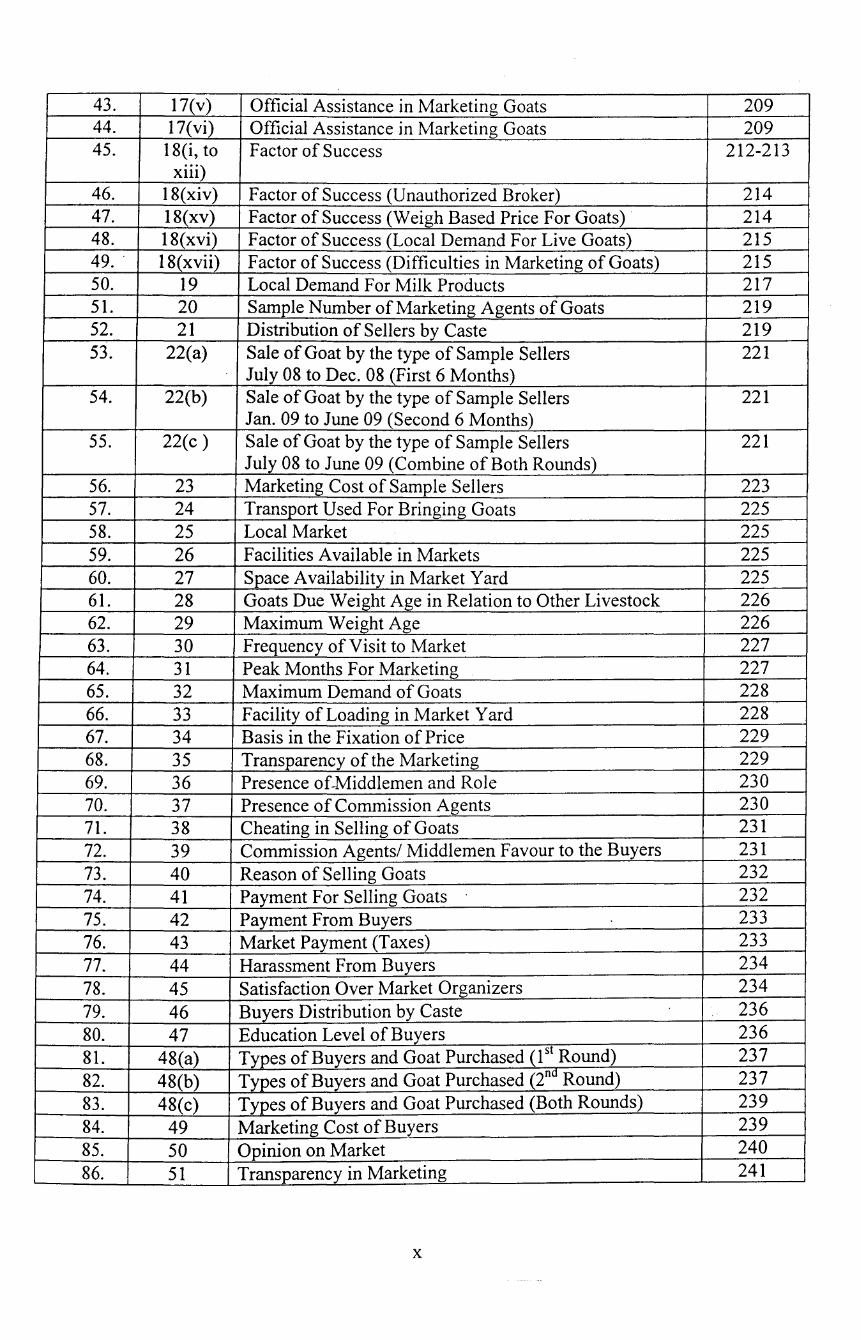
43. 17(v) Official Assistance in Marketing Goats 209 44. 17(vi) Official Assistance in Marketing Goats 209 45. 18(i, to Factor of Success 212-213
xiii) 46. 18(xiv) Factor of Success (Unauthorized Broker) 214 47. 18(xv) Factor of Success (Weigh Based Price For Goats)· 214 48. 18(xvi) Factor of Success (Local Demand For Live Goats) 215 49 .. 18(xvii) Factor of Success (Difficulties in Marketing of Goats) 215 50. 19 Local Demand For Milk Products 217 51. 20 Sample Number of Marketing Agents of Goats 219 52. 21 Distribution of Sellers by Caste 219 53. 22(a) Sale of Goat by the type of Sample Sellers 221
July 08 to Dec. 08 (First 6 Months) 54. 22(b) Sale of Goat by the type of Sample Sellers 221
Jan. 09 to June 09 (Second 6 Months) 55. 22(c) Sale of Goat by the type of Sample Sellers 221
July 08 to June 09 (Combine of Both Rounds) 56. 23 Marketing Cost of Sample Sellers 223 57. 24 Transport Used For Bringing Goats 225 58. 25 Local Market 225 59. 26 Facilities Available in Markets 225 60. 27 Space Availability in Market Yard 225 61. 28 Goats Due Weight Age in Relation to Other Livestock 226 62. 29 Maximum Weight Age 226 63. 30 Frequency of Visit to Market 227 64. 31 Peak Months For Marketing 227 65. 32 Maximum Demand of Goats 228 66. 33 Facility of Loading in Market Yard 228 67. 34 Basis in the Fixation of Price 229 68. 35 Transparency of the Marketing 229 69. 36 Presence of-Middlemen and Role 230 70. 37 Presence of Commission Agents 230 71. 38 Cheating in Selling of Goats 231 72. 39 Commission Agents/ Middlemen Favour to the Buyers 231 73. 40 Reason of Selling Goats 232 74. 41 Payment For Selling Goats 232 75. 42 Payment From Buyers 233 76. 43 Market Payment (Taxes) 233 77. 44 Harassment From Buyers 234 78. 45 Satisfaction Over Market Organizers 234
79. 46 Buyers Distribution by Caste 236 80. 47 Education Level of Buyers 236 81. 48(a) Types of Buyers and Goat Purchased (I st Round) 237 82. 48(b) Types of Buyers and Goat Purchased (2na Round) 237 83. 48(c) Types of Buyers and Goat Purchased (Both Rounds) 239 84. 49 Marketing Cost of Buyers 239 85. 50 Opinion on Market 240
86. 51 Transparency in Marketing 241
X
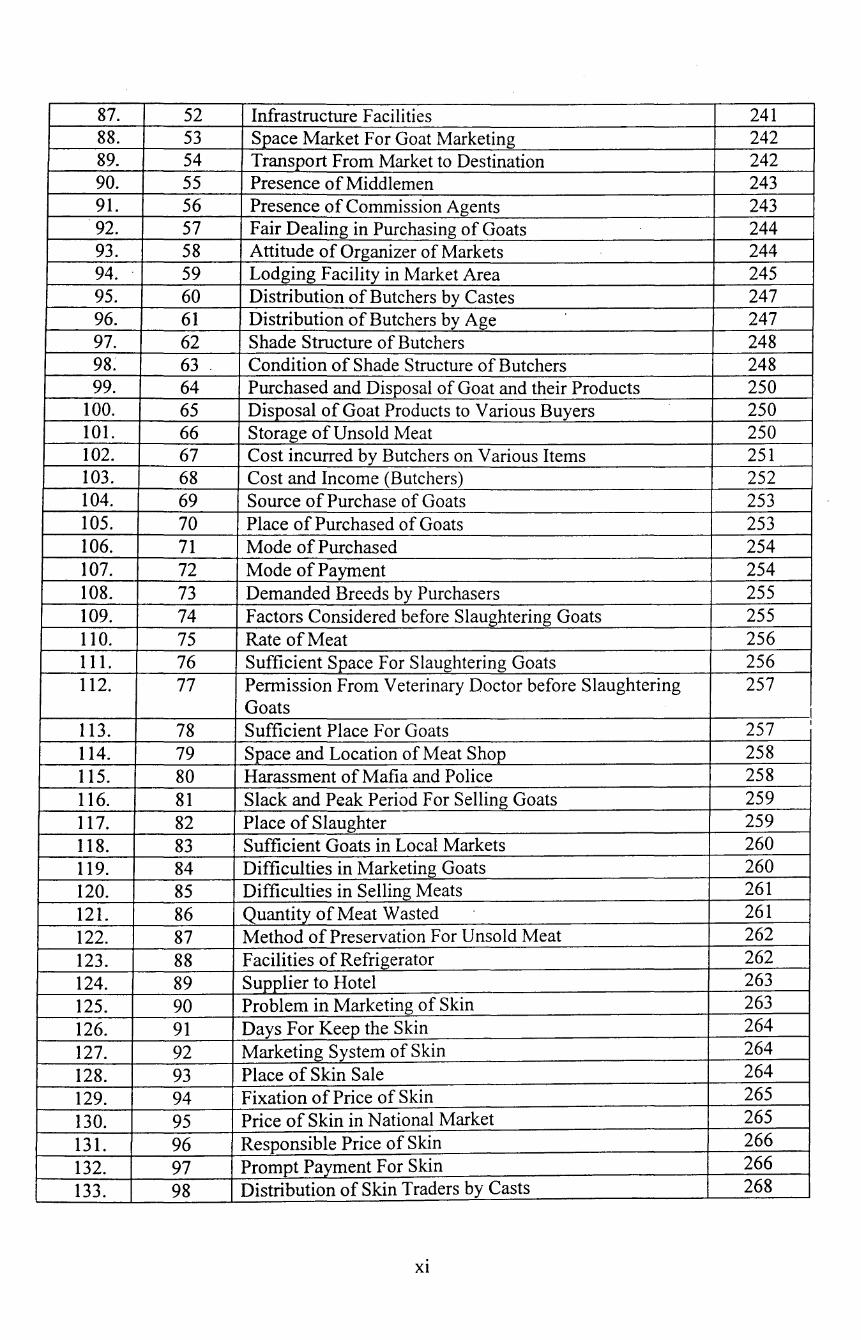
87. 52 Infrastructure Facilities 241 88. 53 Space Market For Goat Marketing 242 89. 54 Transport From Market to Destination 242 90. 55 Presence of Middlemen 243 91. 56 Presence of Commission Agents 243 92. 57 Fair Dealing in Purchasing of Goats 244 93. 58 Attitude of Organizer of Markets 244 94. 59 Lodging Facility in Market Area 245 95. 60 Distribution of Butchers by Castes 247 96. 61 Distribution of Butchers by Age 247 97. 62 Shade Structure of Butchers 248 98; 63 Condition of Shade Structure of Butchers 248 99. 64 Purchased and Disposal of Goat and their Products 250
100. 65 Disposal of Goat Products to Various Buyers 250 101. 66 Storage of Unsold Meat 250 102. 67 Cost incurred by Butchers on Various Items 251 103. 68 Cost and Income (Butchers) 252 104. 69 Source of Purchase of Goats 253 105. 70 Place of Purchased of Goats 253 106. 71 Mode of Purchased 254 107. 72 Mode of Payment 254 108. 73 Demanded Breeds by Purchasers 255 109. 74 Factors Considered before Slaughtering Goats 255 110. 75 Rate of Meat 256 111. 76 Sufficient Space For Slaughtering Goats 256 112. 77 Permission From Veterinary Doctor before Slaughtering 257
Goats I 113. 78 Sufficient Place For Goats 257 I
114. 79 Space and Location of Meat Shop 258 115. 80 Harassment of Mafia and Police 258 116. 81 Slack and Peak Period For Selling Goats 259 117. 82 Place of Slaughter 259 118. 83 Sufficient Goats in Local Markets 260 119. 84 Difficulties in Marketing Goats 260 120. 85 Difficulties in Selling Meats 261 121. 86 Quantity of Meat Wasted 261 122. 87 Method of Preservation For Unsold Meat 262 123. 88 Facilities of Refrigerator 262 124. 89 Supplier to Hotel 263 125. 90 Problem in Marketing of Skin 263 126. 91 Days For Keep the Skin 264 127. 92 Marketing System of Skin 264 128. 93 Place of Skin Sale 264 129. 94 Fixation of Price of Skin 265 130. 95 Price of Skin in National Market 265 131. 96 Responsible Price of Skin 266 132. 97 Prompt Payment For Skin 266 133. 98 Distribution of Skin Traders by Casts 268
Xl

134. 99 Distribution of Family Members Involved in Skin Trade . 268
135. 100 Transaction For Skin and Marketing Cost Involved 269 136. 101 Sufficient Raw Materials 270 137. 102 Quality of Skin From Butchers 270 138. 103 Demand of Skin 271 139. 104 Space of Storage of Skin 271 140. 105 Problem of Processing of Skin 272 141. 106 Financial Problem 272 142. 107 Marketing Problems 273 143. 108 Sell Skin to Local Dealers 273 144. 109 Sell Skin in Major Market 274 145. 110 Criteria For Grading Skin 274 146. I 1 1 Infrastructure Facilities in Marketing of Skin 275 147. 112 Difficulties in Marketing of Goats Skin 275 148. 113 Distribution of Wholesaler Skin Traders by Caste 277 149. 114 Transaction Cost Involved 278 150. 115 Collection of Skin From Different Sources 279 151. 116 Sold to Various Skin Buyers 279 152. 117 Sufficient Number of Skin 280 153. 118 Quality of Skin 280 154. 119 Place to Store Skin 281 155. 120 Place to Processing Skin 281 156. 121 Adequate of Marketing of Skin 282 157. 122 Availability of Infrastructure Facility 282
N arne of Charts
Sr. No. Figure No Chapter- I Page No.
1 Chart I Steps for Sample Households Selection 18
2 Chart II Sample Selection of Sellers and Buyers 19
- Chapter- V
3 Common Market Channels 165
Xll
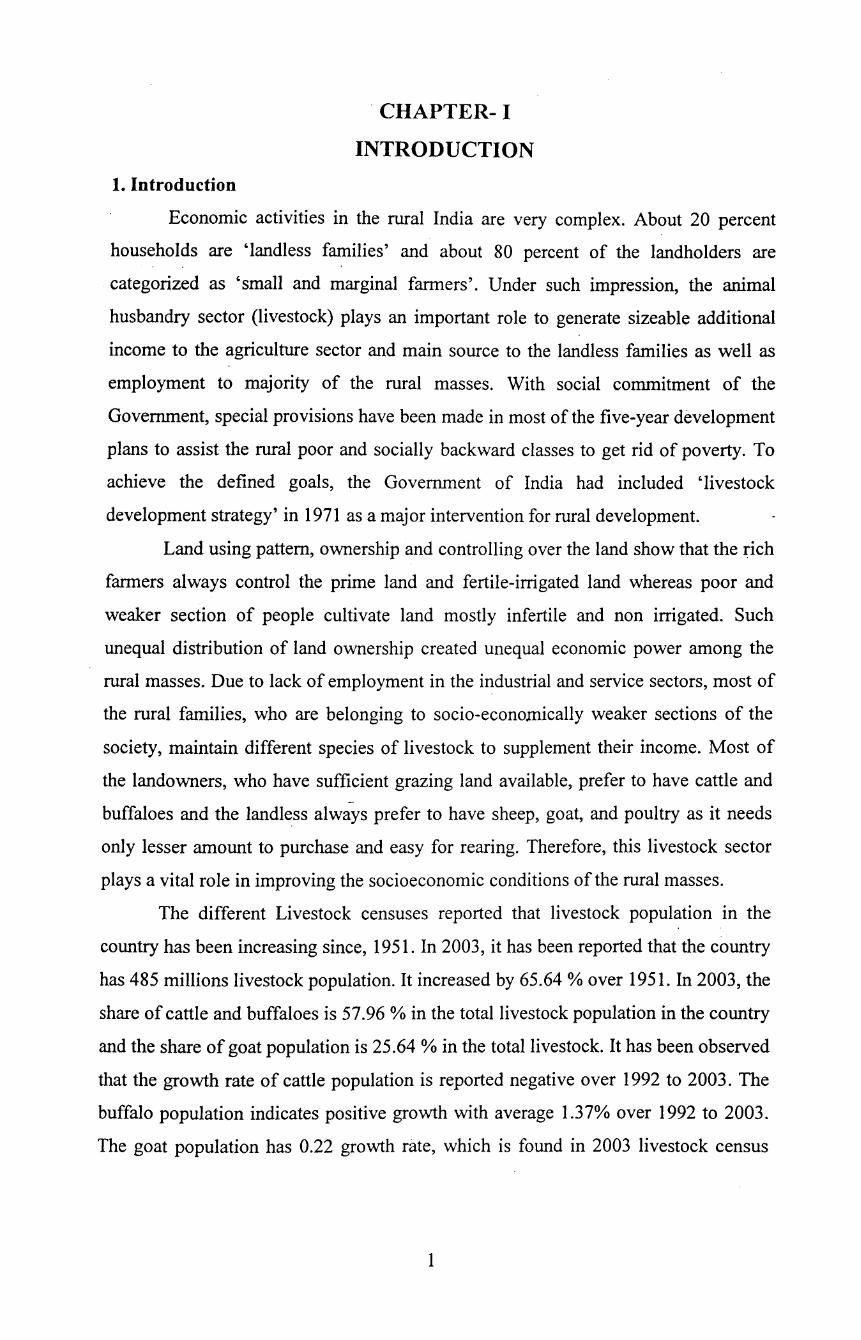
1. Introduction
. CHAPTER- I
INTRODUCTION
Economic activities in the rural India are very complex. About 20 percent
households are 'landless families' and about 80 percent of the landholders are
categorized as 'small and marginal farmers'. Under such impression, the animal
husbandry sector (livestock) plays an important role to generate sizeable additional
income to the agriculture sector and main source to the landless families as well as
employment to majority of the rural masses. With social commitment of the
Government, special provisions have been made in most of the five-year development
plans to assist the rural poor and socially backward classes to get rid of poverty. To
achieve the defined goals, the Government of India had included 'livestock
development strategy' in 1971 as a major intervention for rural development.
Land using pattern, ownership and controlling over the land show that the rich
farmers always control the prime land and fertile-irrigated land whereas poor and
weaker section of people cultivate land mostly infertile and non irrigated. Such
unequal distribution of land ownership created unequal economic power among the
rural masses. Due to lack of employment in the industrial and service sectors, most of
the rural families, who are belonging to socio-economically weaker sections of the
society, maintain different species of livestock to supplement their income. Most of
the landowners, who have sufficient grazing land available, prefer to have cattle and
buffaloes and the landless always prefer to have sheep, goat, and poultry as it needs
only lesser amount to purchase and easy for rearing. Therefore, this livestock sector
plays a vital role in improving the socioeconomic conditions of the rural masses.
The different Livestock censuses reported that livestock population in the
country has been increasing since, 1951. In 2003, it has been reported that the country
has 485 millions livestock population. It increased by 65.64 % over 1951. In 2003, the
share of cattle and buffaloes is 57.96% in the total livestock population in the country
and the share of goat population is 25.64% in the total livestock. It has been observed
that the growth rate of cattle population is reported negative over 1992 to 2003. The
buffalo population indicates positive growth with average 1.37% over 1992 to 2003.
The goat population has 0.22 growth rate, which is found in 2003 livestock census
1
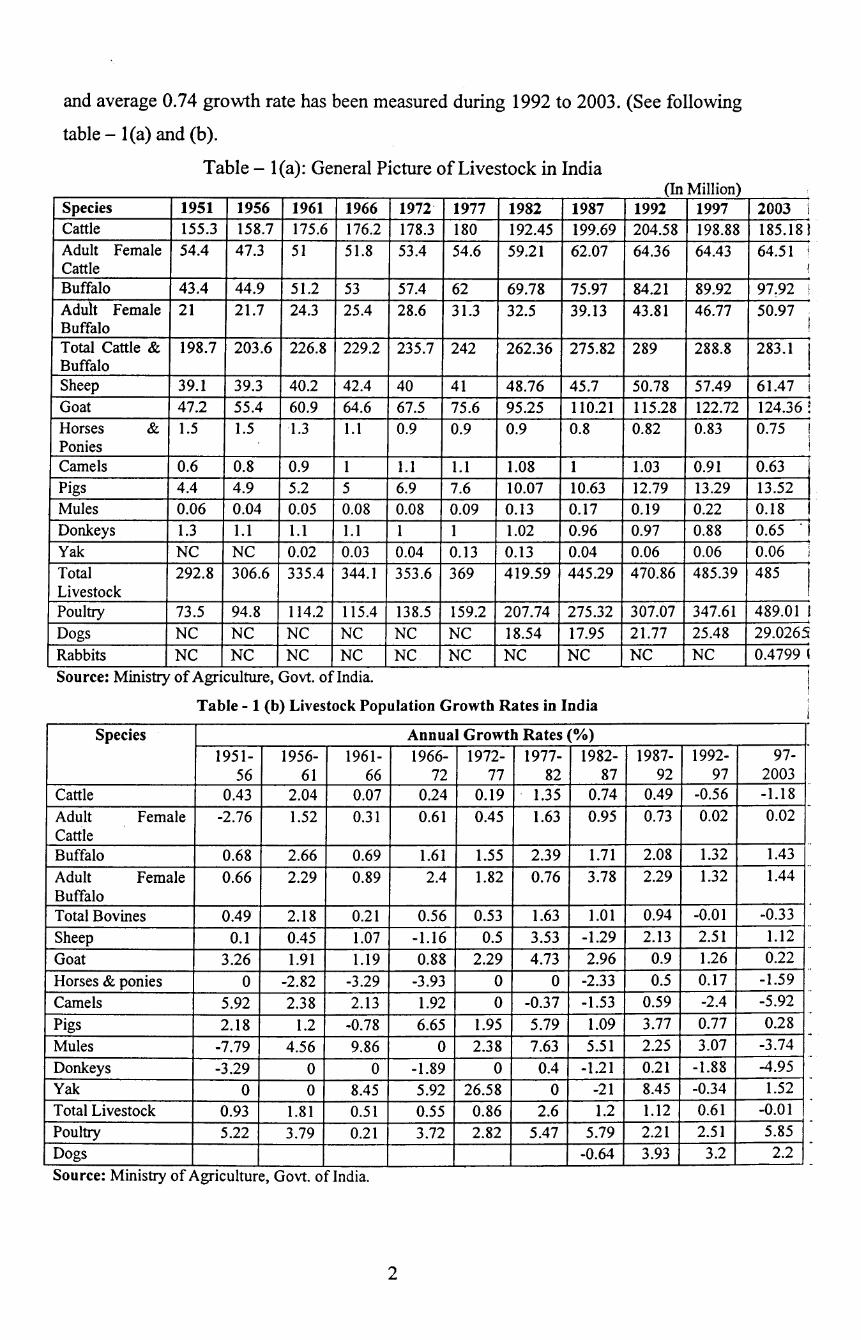
and average 0.74 growth rate has been measured during 1992 to 2003. (See following
table- l(a) and (b).
Table- l(a): General Picture of Livestock in India (In Million)
Species 1951 1956 1961 1966 1972• 1977 1982 1987 1992 1997 Cattle 155.3 158.7 175.6 176.2 178.3 180 192.45 199.69 204.58 198.88 Adult Female 54.4 47.3 51 51.8 53.4 54.6 59.21 62.07 64.36 64.43 Cattle Buffalo 43.4 44.9 51.2 53 57.4 62 69.78 75.97 84.21 89.92 Adult Female 21 21.7 24.3 25.4 28.6 31.3 32.5 39.13 43.81 46.77 Buffalo Total Cattle & 198.7 203.6 226.8 229.2 235.7 242 262.36 275.82 289 288.8 Buffalo Sheep 39.1 39.3 40.2 42.4 40 41 48.76 45.7 50.78 57.49 Goat 47.2 55.4 60.9 64.6 67.5 75.6 95.25 110.21 115.28 122.72 Horses & 1.5 1.5 1.3 1.1 0.9 0.9 0.9 0.8 0.82 0.83 Ponies Camels 0.6 0.8 0.9 I 1.1 1.1 1.08 1 1.03 0.91 Pigs 4.4 4.9 5.2 5 6.9 7.6 I0.07 10.63 12.79 13.29 Mules 0.06 0.04 0.05 0.08 0.08 0.09 0.13 O.I7 0.19 0.22 Donkeys 1.3 1.1 1.1 I. I I I 1.02 0.96 0.97 0.88 Yak NC NC 0.02 0.03 0.04 0.13 0.13 0.04 0.06 0.06 Total 292.8 306.6 335.4 344.1 353.6 369 419.59 445.29 470.86 485.39 Livestock Poultry 73.5 94.8 114.2 115.4 138.5 159.2 207.74 275.32 307.07 347.61
Dogs NC NC NC NC NC NC 18.54 17.95 21.77 25.48
Rabbits NC NC NC NC NC NC NC NC NC NC Source: Ministry of Agriculture, Govt. of India.
Table- 1 (b) Livestock Population Growth Rates in India
Species Annual Growth Rates(%) 195I- 1956- 1961- 1966- 1972- 1977- 1982- 1987- 1992-
56 61 66 72 77 82 87 92 97 Cattle 0.43 2.04 0.07 0.24 0.19 1.35 0.74 0.49 -0.56
Adult Female -2.76 1.52 0.3I 0.61 0.45 1.63 0.95 0.73 0.02 Cattle Buffalo 0.68 2.66 0.69 1.6I 1.55 2.39 1.71 2.08 1.32
Adult Female 0.66 2.29 0.89 2.4 1.82 0.76 3.78 2.29 1.32 Buffalo Total Bovines 0.49 2.18 0.2I 0.56 0.53 1.63 1.01 0.94 -0.01
Sheep O.I 0.45 1.07 -1.16 0.5 3.53 -1.29 2.13 2.51
Goat 3.26 1.91 1.19 0.88 2.29 4.73 2.96 0.9 1.26
Horses & ponies 0 -2.82 -3.29 -3.93 0 0 -2.33 0.5 0.17
Camels 5.92 2.38 2.13 1.92 0 -0.37 -1.53 0.59 -2.4
Pigs 2.18 1.2 -0.78 6.65 1.95 5.79 1.09 3.77 0.77
Mules -7.79 4.56 9.86 0 2.38 7.63 5.51 2.25 3.07
Donkeys -3.29 0 0 -1.89 0 0.4 -1.21 0.21 -1.88
Yak 0 0 8.45 5.92 26.58 0 -21 8.45 -0.34
Total Livestock 0.93 1.8I 0.51 0.55 0.86 2.6 1.2 1.12 0.61
Poultry 5.22 3.79 0.21 3.72 2.82 5.47 5.79 2.21 2.51 Dogs -0.64 3.93 3.2
.. Source: Mmistry of Agriculture, Govt. of India.
2
2003 l 185.18 I 64.51 j
I
97.92 i
50.97 I !
283.1 I l
61.47 i ' 1
124.36: 0.75 I
I !
0.63 l 13.52 J 0.18 I 0.65 ., 0.06 i
I
485 I 489.01 l 29.0265
0.4799 '
.
. 97-
2003 -1.18
0.02
1.43 1.44
-0.33 1.12 0.22
-1.59 -5.92
0.28 -3.74
-4.95 1.52
-0.01
5.85 2.2
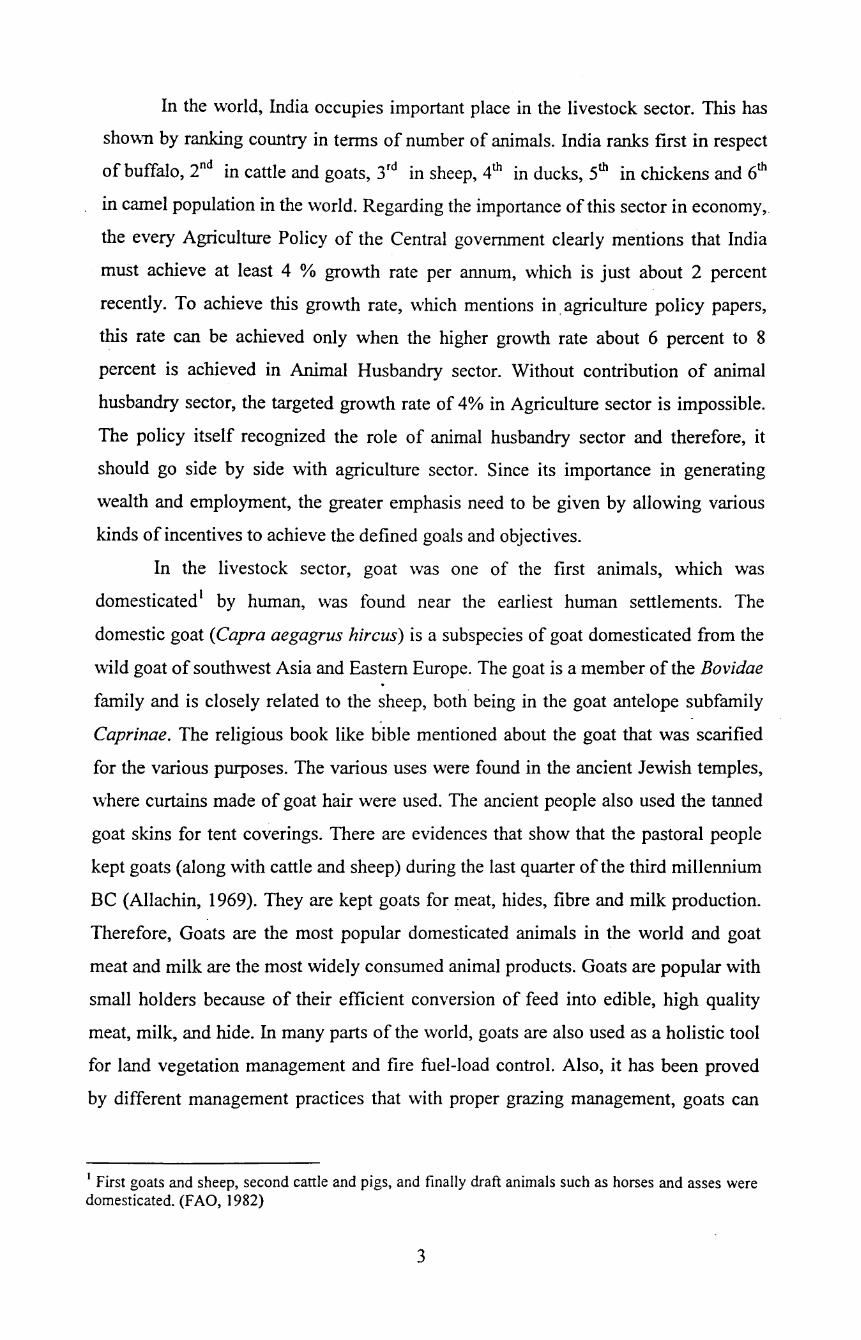
In the world, India occupies important place in the livestock sector. This has
shown by ranking country in terms of number of animals. India ranks first in respect
of buffalo, 2nd in cattle and goats, 3rd in sheep, 4th in ducks, 5th in chickens and 6th
in camel population in the world. Regarding the importance of this sector in economy,
the every Agriculture Policy of the Central government clearly mentions that India
must achieve at least 4 % growth rate per annum, which is just about 2 percent
recently. To achieve this growth rate, which mentions in. agriculture policy papers,
this rate can be achieved only when the higher growth rate about 6 percent to 8
percent is achieved in Animal Husbandry sector. Without contribution of animal
husbandry sector, the targeted growth rate of 4% in Agriculture sector is impossible.
The policy itself recognized the role of animal husbandry sector and therefore, it
should go side by side with agriculture sector. Since its importance in generating
wealth and employment, the greater emphasis need to be given by allowing various
kinds of incentives to achieve the defined goals and objectives.
In the livestock sector, goat was one of the first animals, which was
domesticated 1 by human, was found near the earliest human settlements. The
domestic goat (Capra aegagrus hi reus) is a subspecies of goat domesticated from the
wild goat of southwest Asia and Eastern Europe. The goat is a member of the Bovidae . family and is closely related to the sheep, both being in the goat antelope subfamily
Caprinae. The religious book like bible mentioned about the goat that was scarified
for the various purposes. The various uses were found in the ancient Jewish temples,
where curtains made of goat hair were used. The ancient people also used the tanned
goat skins for tent coverings. There are evidences that show that the pastoral people
kept goats (along with cattle and sheep) during the last quarter of the third millennium
BC (Allachin, 1969). They are kept goats for ~eat, hides, fibre and milk production.
Therefore, Goats are the most popular domesticated animals in the world and goat
meat and milk are the most widely consumed animal products. Goats are popular with
small holders because of their efficient conversion of feed into edible, high quality
meat, milk, and hide. In many parts of the world, goats are also used as a holistic tool
for land vegetation management and fire fuel-load control. Also, it has been proved
by different management practices that with proper grazing management, goats can
1 First goats and sheep, second cattle and pigs, and finally draft animals such as horses and asses were domesticated. (F AO, 1982)
3
eliminate noxious weeds, restore native grasses, and prevent fire through fuel-load
reduction.
2. Economy of Goats:
The economic of goat is very simple but its value in income and employment
is great importance for poor households. Goats require small amount for purchase.
Even they can be purchased on the 'credit' or borrowing from the relatives. Due to
short gestation period with normal breeding ratio2 and higher maturity, goats generate
reasonable returns in a short period. Such returns cannot be generated from other such
rearing activities. In addition, animal needs no special attention in case of 4-5 goats
and very comfortable in any atmosphere, and they themselves search the forages
except stall-feeding. Therefore, it undoubtedly becomes very popular and profitable
activity, which is second to poultry.
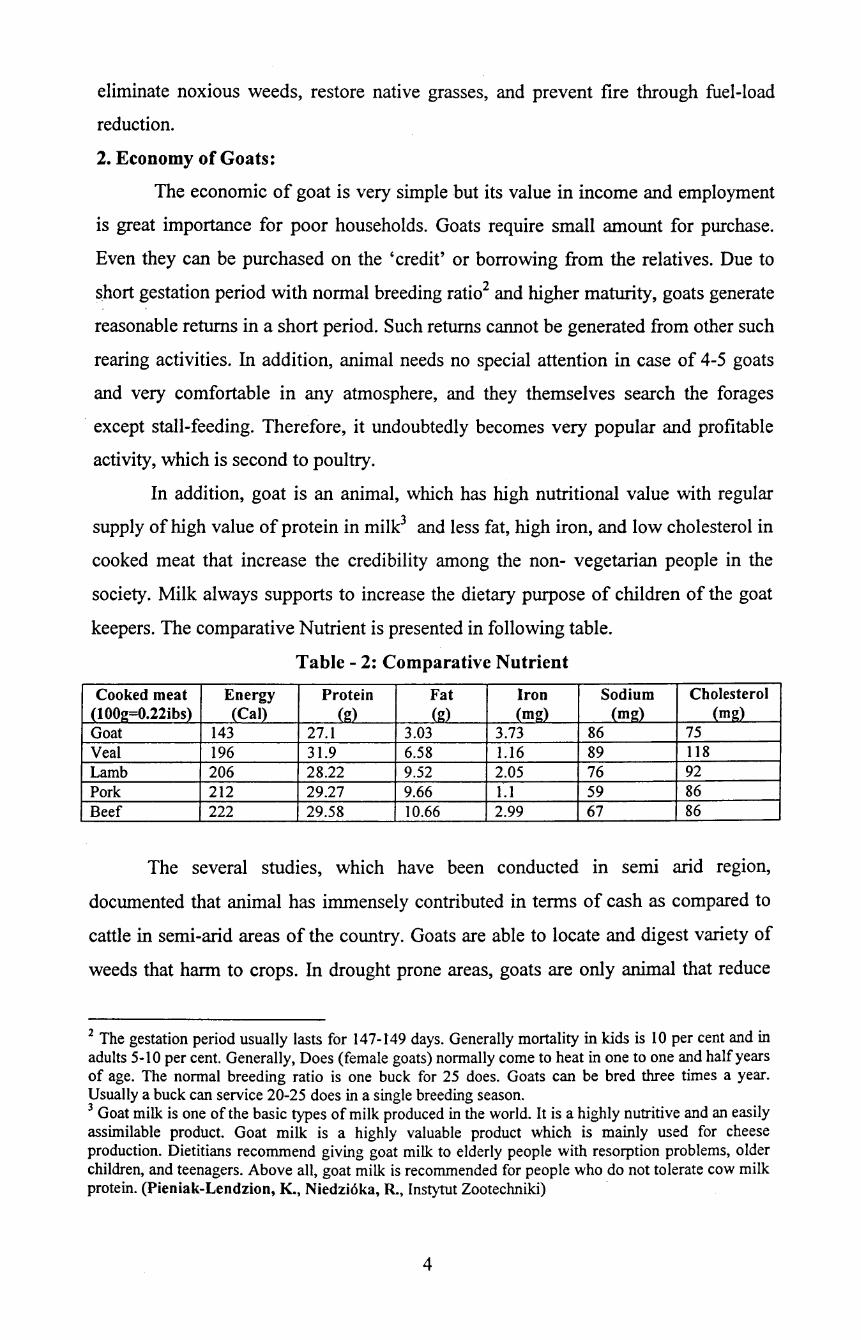
In addition, goat is an animal, which has high nutritional value with regular
supply of high value of protein in milk3 and less fat, high iron, and low cholesterol in
cooked meat that increase the credibility among the non- vegetarian people in the
society. Milk always supports to increase the dietary purpose of children of the goat
keepers. The comparative Nutrient is presented in following table.
Table- 2: Comparative Nutrient
Cooked meat Energy Protein Fat Iron Sodium Cholesterol (I 00g=0.22ibs) (Cal) (g) (g) (mg) _{mg) (mg) Goat 143 27.1 3.03 3.73 86 75 Veal 196 31.9 6.58 1.16 89 118 Lamb 206 28.22 9.52 2.05 76 92 Pork 212 29.27 9.66 1.1 59 86 Beef 222 29.58 10.66 2.99 67 86
The several studies, which have been conducted in semi arid regwn,
documented that animal has immensely contributed in terms of cash as compared to
cattle in semi-arid areas of the country. Goats are able to locate and digest variety of
weeds that harm to crops. In drought prone areas, goats are only animal that reduce
2 The gestation period usually lasts for 147-149 days. Generally mortality in kids is 10 per cent and in adults 5-10 per cent. Generally, Does (female goats) normally come to heat in one to one and half years of age. The normal breeding ratio is one buck for 25 does. Goats can be bred three times a year. Usually a buck can service 20-25 does in a single breeding season. 3 Goat milk is one of the basic types of milk produced in the world. It is a highly nutritive and an easily assimilable product. Goat milk is a highly valuable product which is mainly used for cheese production. Dietitians recommend giving goat milk to elderly people with resorption problems, older children, and teenagers. Above all, goat milk is recommended for people who do not tolerate cow milk protein. (Pieniak-Lendzion, K., Niedzi6ka, R., Instytut Zootechniki)
4
the risks than other animals and empower the vulnerable group of people. Goats are
highly adaptable animals and thus are suitable for many different environments. They
can be raised on a variety of forages grown on marginal land and with feedstuffs.(crop
residues) that would not be consumed by other animals (Huss, 1985). Since they are
more resistant to droughts, they utilize a wider diversity of plants and their higher
reproductive rate allows populations to recover quickly. (Devendra, 1992; Kumar and
Singh; 1992; Kumar et al., 1992; N aidu et al., 1991; Sing~ and Ram, 1987). Few
studies revealed that goat meat production is higher than meat production from cattle
or hogs in worldwide (Holcomb, 1994). It exhibits the changing habits of people for
eating goat meat. The recent trend of consumer habits exhibit that the consumers have
been changing their eating habits in favour of 'low fat milk' and 'low sodium meat'.
Some studies and reports have scientifically mentioned that goat products are good
sources of protein, iron, and phosphorus, and are low in fat and sodium. The fat
content of goat meat is lower than that of beef, pork, or mutton, which makes goat
meat more desirable for human consumption (smith et al., 1978; Haenlein, 1981). The
low fat content of goat meat is a potentially valuable merchandising asset considering
the current health consciousness of the consumers (Ospina et al., 1987). Goats, as
providers of meat and milk, serve a useful function in fulfilling nutritional
requirements for the consumers, especially for low-income farm families, who are
unable to get those products by raising cattle, hogs, or poultry (Devendra, 1980;
Haenlein, 1981 ). Other special advantages of goat production over larger animals
include higher reproductive rates, lower initial investment and operating costs per
animal, lower risk of loss from death, and greater ease of transport to the market
because of their small size. Finally, it can be concluded from above paragraphs that
economically goat is ideally suited for poor rur~l masses including marginal farmers,
landless laborers and others due to low cost maintenance, short-term return with low
risk. The entire family members can be engaged without any problem.
3. Goats' Dietary Requirement: Many studies4 documented that goats require a
more nutritious diet than other ruminants. It happens due to having shorter digestive
4 There are many studies that mentioned the systematic grazing habits of goats like (Luginbuhl et al., 1996a), at www.cals.ncsu.edu/an_sci/extension/animaVmeatgoat/MGVeget.htm>. Also, see the Ohio State University Bulletin 857, "Multiflora Rose Control," at <http://ohioline.osu.edu/b857/b857_8.html>. and see "Controlling Leafy Spurge using Goats and Sheep" (Sedivic et al., 1995), at <www.ext.nodak.edu/extpubs/plantsci/hay/rl093w. htm#goats>.
5

system that does not retain food for long. Such digestive system allows them to eat
larger quantities of food to fulfill the their needs. However, unique grazing behavior
of goats enables them to search the require quantity and quality. Each goat is able to
consume up to 3 percent to 5 percent of its body weight in dry matter daily (perhaps
more if the forage is highly digestible). However, various factors influence intake viz
age, size, stage, and level of production of the animal; animal's health; animal's
fomge preferences (which are influenced by its mother and peers); weather;
palatability of food; digestibility (fiber content); and maturity of forage
Generally, goats prefer browsing area for the likable species of plants that meet the
requirement mostly leaves of plants and weeds. By grazing habits of goats controls
weeds and such like plants. Goats will eat such weeds as leafy spurge, multi-flora
rose, and brambles, decreasing the need for commercial herbicides or mowing.
4. Mortality Constraints:
While rearing the goats, some studies found that the goat mortality is the most
important constraint. It is revealed that farmers with few goats are unable to sustain
their flocks, whereas those with larger flocks do not realize the potential benefits from
goats due to high mortality rates, which contribute further to the misery. Some of the
factors like poor access to animal health support, dry season feed shortages and
inadequate housing are the most important immediate factors, which are contributing
to high mortalities.
5. Marketing:
While selling the goats in the market there are lot of problems that goat
keepers have to face. Although many goat keepers attempt to sell goats, however, they
do not get adequate market information and infrastructure so that they can sell goats at
competitive prices. The Report of the Working Group on Animal Husbandry, set up
by the Planning Commission for the Tenth Plan Proposals, mentioned that India has
over 2000 markets, where livestock are traded. Further, livestock markets are under
the jurisdiction of the state governments although the direct operation and supervision
would generally fall within the purview of the local bodies. The report further said
that the market for live animals in the country unfortunately has not developed on
scientific lines. There are no separate markets for different species of animals. There >
are no separate enclosures for different species/animals. Brokers facilitate most of the
trade. Vertical linkages between the processors/butchers and livestock producers are
rare. Market facilities are generally inadequate and if available are poorly maintained.
6
Weighbridges, ramp facilities for loading and unloading, feeding and watering and
veterinary facilities are not available.
Regarding the development of live animals market information system, the
report submitted that data is a key input to informed planning and decision-making.
However, no such effort was made in the previous plans. The report on· Improvement
of Slaughterhouses, the group pointed out that though there are 2702 slaughterhouses
in the country, which are recognized or authorized by local bodies, a considerable
number of animals are slaughtered in unauthorized places. According to one rough
estimate, about 50 percent animals are slaughtered at unauthorized slaughter places in
urban area of the country. Many of them are dirty, unclean, and unhygienic for
slaughter and selling goat meat.
6. Breeds:
Many studies documented and revealed that few important breeds are being
used for various purposes such as milk and meat (dual purpose), exclusive for meat
and wool. The breeds like Osmanabadi, Barberi, Jarnnapari (U.P.) Sangamneri,
Mehasa and Zalwadi (Gujarat), Beetal (Punjab), Ajmeri & Kachhi (Rajasthan) serve
the dual purpose i.e. Milk and Meat. The breeds like Assam, Kali Bengali, Brown
Bengali and Marwari are exclusively used for meat and breeds like Angora, Gaddhi
(HP) and Pashmina (Kashmir) are especially used for the wool.
7. Life-span
The exclusive study on goat rearing practices has documented the details life
span and the normal economic -characters of goats. The age of maturity has been
considered from 9 to 12 months. The first pregnancy is expected in 15 to 18 months
and pregnancy period continues 145 to 150 days. It is documented that the Inter -
kidding period is ranging from 8 to 9 months. _During the life-span, many studies
found that chances of twinning are about. 30 to 40% and chances of triplets are 10 to
15%. It has also been documented that the productive life is ended in 6 to 7 years. The
mortality of kids as recorded by many studies is 8 to 1 0 % and in adult is 5%. The
cycles of kidding in two years are documented as three and male-female ratio is found
1:1.
8. Weights of Kids:
Many studies documented that the weights of kids at different ages that
indicate the growth of the kids. At the birth, the weights among the males and females
are measured around 2 kg. In 3 months, male kid reaches to 6 kg and female reaches
7
5.5 kg. In 6 months, male gains 12 kg and female gains around 10.25 kg. In 12
months, _males reach to around 19 to 22 kg depending upon the normal growth and
availability of forages.
9. Stall Feeding:
The studies documented that if the goats are completely stall-feed, the
different quantities of forages and other fodder are required for normal growth. In
case -of green fodder, the quantity requires 3 to 4 kg and in case of dry fodder, the
quantity requires I to 2 kg all these are given in normal course. The readymade feeds,
which are available in the markets, are given as 200 to 250 gms. (Concentrates)
10. Diseases:
Many studies in different parts of the world observed and documented
different types of diseases among the goats. The major diseases, which are found in
goats, are: pneumonia, diphtheria, goat pox, entrotoxemia, dysentery, mastitis, foot
and mouth, blue tongue, brucellosis
11. Literatures:
The literatures on goat had reported that about 570 breeds are found around
the world of which, about 146 breeds of goats are found in Asia and about 20 breeds
are found in India (F AO, 1982). The largest population of goats are found in India
(35.2 percent), China (29.3 percent) and Pakistan (12.0 percent). These three countries
together accounted for about 84 percent of the population of goats in Asia (FAO). The
goats, which is one of the ruminant animals and popularly known as poor man's cow,
are found across all agro-ecological environments through out the world with
different species (Winrock International, 1983). Some studies recorded that the goats
are suitable for all categories of the system right from very extensive rearing practices
to highly mechanized production system (Wilson, 1982; F AO, 1987). The goat is one
of the important species of livestock that contributes greatly to the agrarian economy,
especially in areas where crop and dairy farming are not economical, and play an
important role in the livelihood of a large proportion of small and marginal farmers
and landless labourers (F AO, 1982). They contribute a significant amount to the daily
welfare of the very poor, even for million landless poor of India (Devendra 1992a).
Shalander Kumar and Deoghare (2003) found that the goat rearing provided an
opportunity for efficient utilization of family labour. Their study revealed that about
57 percent income from selling of goats was spent in procuring food for the family. It
clearly indicates that goat-rearing activity supports the family and livelihood for the
8

poor families (Shalander Kumar and Deoghare, 2003). Singh and Rai found in their
study in eastern states of India that goat rearing as a small scale enterprise has
tremendous potential in the north-eastern states in terms of nutritional security,
gainful self-employment and economic upliftment. As most of the population in the
north-eastern states is non-vegetarian and so, they prefer to eat meat and goats are
among other animals that have been on the high preferential scale. Goat rearing has
tremendous potential in this region among poor families because it needs low initial
investment and adequate financial returns. The study found that goat rearing practices
improved the s·ocio-economic indicators of the poor families by providing a ready
cash without dependence on high cost private credit. The most of families own
bicycles due to this business (Braj Mohan, Ramji Lal Sagar and Khushyal Singh,
2008). In fact, a goat is often called and also now recognized as a poor man's cow;
because two does bred at alternative, intervals can provide families with a year-round
supply of milk and meat (Huss, 1985).
In the recent past, the goat development activities have been undertaken by the states
however, it has not made sturdy impact on the goat keepers as they follow this
practice traditionally. Some studies even today remarked that the rearing of goat
continues to be a backward profession, primarily in the hands of poor, landiess or
small and marginal farmers who own either an uneconomical holding or no land at all,
and thus graze their sheep on natural vegetation and crop stubbles supplemented by
tree loppings (F AO). The study on commercialization of goat farming in India
revealed that several large and- progressive farmers, businessman and industrialists
have adopted commercial goat farmings, which are more capital intensive and
mechanized, successfully continue. Out of them, majority of farms have been found
operating with positive net returns. This has been found equally rewarding under both
intensive and semi-intensive systems of management (KumarShalander, 2007).
Though, the commercialization of goat farming is successful in some in some parts of
the country, it is found that it is not popular among the poor people, as it requires
huge investment to sustain the enterprises. Due to non-availability of grazing land,
some goat owners migrate from one place to another over extensive areas in the same
State or even neighbouring States, sometimes including goats within their sheep
flocks. In the northern hilly region, where goat flocks are generally large, owners
migrate and practice the same. One of the studies found that they may be mainly kept
9
for meat production, but higher-yielding goats may be milked as the opportunity
arises on a seasonal basis (Matthewman, 1985). In US, by integrating livestock sector
into a farm system can increase its economic and environmental health and diversity,
thereby making important contributions to the farm's sustainability and animals
proved that can fit well into a farm under existing grazing operations with sheep and
cattle. Further, while studying economy of goats in US, it has been found that erosion
on 'land used for row crops declines when the land is converted to pasture. Rotating
row crops and pasture every year or two offers both fertility and pest control
advantages. Goats eat the forages, the goats' manure replaces some purchased
fertilizers, and the life cycles of various crop and animal pests are interrupted. Like
other ruminant animals, goats convert plant material that is unsuitable for human
consumption into high-quality animal products. 5 Leather production from goats has
become a major industry in India and other Asian countries in recent years (Saithanoo
& Naidu, 1996). Cashmere production is a significant contributor to small-farmer
income, particularly in China (Youzhang, 1996). Mohair production is important for
commercial fanners (Laker, 1996), especially in South Afri"\ (van der Westhuysen et
a/. 1988). However, most production from goats is utilized in 'lbe small farm context,
where its impact and value is often not measurable (Devendra, 1996). Variability in
body size and in geographic distribution among breeds of goats exceeds that of any
other farm animal (Shkolnik, 1992). Goats are particularly well adapted to hot
climates (Singh & Singh, 1992). They are often unfairly accused of causing
environmental deterioration and even desertification (Singh, 1992); but they can form
an important part in the ecology of rural areas (Acharya & Singh, 1992), and can even
be used to control bush encroachment (Allan & Holst, 1996; Woldeghebriel et a/.
1992). Goats are usually not of specific breeds in the formal sense, although many
types can be distinguished. Some have a greater potential for milk production and are
known to be kept primarily for this purpose (Gall, 1975). Goats are usually kept
extensively and this may mean that there are severe nutritional constraints on their
ability to produce milk. Such constrai~ts may also apply in urban or peri-urban areas
where "town goats" are kept under circumstances that are most unfavourable,
especially in terms of the adequacy of nutrition. Many different systems of keeping
5 By Linda Coffey, Margo Hale, and Ann Wells NCAT Agriculture Specialists August 2004 © NCAT
2004, www.attra.ncat.org).
10
goats occur in different parts of the world, and they may be both appropriate and
efficient. However, improvements in productivity may be achieved by simple changes
in methods of management, nutrition, disease prevention and health care (Mavrogenis
. & Nrujisse, 1992). Small holder goat production systems in Africa have been
reviewed (Wilson et a!. 1992). Milk production from goats is substantial in many
countries of Europe such as France (Sigwald & Lequenne, 1985; Sopexa, 1986),
Germany (Geissler, 1987), Great Britain (Mowlem 1988), Greece (Hatziminaoglu et
a!. 1982; Katsaounes, 1986) the Netherlands (Boogaert, 1982), Norway (Nygaard,
1986), Spain (Ballester, 1986), and Yugoslavia (Antic et a!. 1986). However even in
these countries most people who keep dairy goats keep a few for household use; and
the commercial producers, while they may have large numbers of goats in their herds,
are relatively few in number. Goats are also kept for milk production in developed
countries elsewhere, such as Australia (Rayner, 1985), New Zealand (Horton &
Dawson 1987) and the United States of America (Haenlein, 1986). They have been
reported to be a significant source of milk in many developing countries as well,
including Brazil (Neto & Baker, 1987), Central America (Stanton 1982), India (Saini
& Khan, 1986), Israel (Laor, 1982), Mexico (Peraza, 1986) and Thailand (Sarabol,
1985). The difficulties commercial goat producers face include the need to manage
successfully the whole spectrum of production, processing and marketing. This is
because there may be no co-operative ventures or State controls over goat milk
production, comparable to those that apply to the cow milk industry. Commercial
ventures are also faced with problems of organization, inadequate facilities, and in
particular, labour requirements, as a result of the large number of goats required to
ensure economic viability. In few cases are the dairy goats the sole source of income
(Mowlem, 1988). It is apparent that most peop~e who keep dairy goats do so for a
household supply of milk, with perhaps a surplus sold locally as 'milk or cheese. In
France there are more than 80 recognised varieties of goat cheese (Le Jaouen, 1982).
Meat is usually the most important product of goat farming, and can also be a
significant source of income for fibre and milk production enterprises (Smith, G.C.,
1992). It is an important source of protein in many developing countries of the world
(Casey, 1992), especially in Asia (Saithanoo & Huq, 1992); but is less important in
the USA (Smith, G.C., 1992) and in Europe (Morand-Fehr et a!. 1992). Marketing
systems are either non-existent or poorly developed and managed (Wilson 1992;
Mandebvu, 1991). Meat hygiene is often poor (Gill & Joshi, 1992). The efficiency of
11
goat meat production will depend on the reproductive rate achieved, and on the
survival and growth rates of the kids, as well as the availablity of suitable feed
sources. Goat meat production development programmes have been attempted, but
with varying success on natural vegetation (Carles & Schwartz 1992; Riviere 1991);
and also with intensive feeding (Mandebvu & Prasad 1991). Research has been
carried out on the effects on carcasses of breed (Hogg et a/. 1992; Ruvuna, Taylor,
Ok~yo, Wanyoike & Ahuya, 1992); of rearing and feeding systems (Morand-Fehr et
a/. 1991); and of castration (Anous & Shahin, 1993). Aspects of carcass evaluation
include conformation (Prasad & Kirton 1992); by-products (Kumar & Issani 1992);
minerals (Wahid eta/. 1992); fatty acids (Zygoyiannis eta/. 1992); and palatability
(Griffin et a/. 1992). While the primary aim may be to ensure self sufficiency in a
subsistence economy, even the basic household economy has a need for some cash
income (Low, 1986). Local selling of animal products such as milk may generate
some income, but it will be the rare entrepreneur that will develop a commercial
enterprise. A marketing opportunity must be available, and sufficient resources at
hand, such as feed supplies for the animals (Donkin, 1991 ). Government supported
development of marketing opportunities may have a substantial effect in improving
income for small-scale farmers, and also in developing secondary industries, as
exemplified in the great progress made in the leather industry in India in the last few
years (Rao & Rao, 1992). The majority of goats in India are raised on a 'zero input'
basis, with farmers selling their goats at any price, making this highly attractive for
middle-men. Goats are either maintained in large flocks under a free ranging system
with migration or in small flocks on a stationary basis. Our experiences indicate that
when goats from these rural farming systems are purchased and put in confinement
under intensive and semi-intensive system of management they tend to suffer from
contagious and communicable diseases. There is a lack of skilled labour to manage
goats under intensive management systems (SK Singh, at e/). Dr F .R. Sheriff found
that goat farming is a viable income-generating sector, especially for marginal
farmers. Studies on cross breeding of the Kanni variety and other local varieties with
6 "Integrating goat farming with cropping systems like agro forestry models such as, agrisilviculture, hortipasture, boundary plantations, wind belts and silvipasture models with trees and grasses can be established in wastelands to supplement farm income," Dr F.R. Sheriff, Director of Extension Education, Tamil Nadu Veterinary and Animal Sciences University (TANUVAS).
12
the Boer goat and the economics of integrating them in dry land farming have shown
promising results.
Though the Goats are very popular and helpful to supplement the income and
. employment to the poor people, the environmentalists have been blaming goats
rearing activity as the threat to environment. However, the researchers have
scientifically studied this issue and came to conclusion with some evidences that goats
are no more threat to environment what concern groups had ~hought and supported to
rearing activity of goats (Acharya and Singh, 1992). After studying the comparative
destructive behavior of goat, sheep, and other livestock, Shankamarayana and others
( 1985) had categorically declined the blames, which · are leveled by the
environmentalists on the goat rearing. Further, they came to conclusion that most of
the world's deteriorated rangelands have been caused by overgrazing by cattle and
sheep and not by goats as they use scrub vegetation whatever left behind. Further, the
role of goat in regeneration of vegetation has been well documented in various studies
and declined the ill fit look out for the goat (Sharma and Ogra, 1987; Harsh and
Shankar Narayana, 1992). There are other studies that proved that goats are
controlling the weeds and prevention of forest fire (Holgate, 1980; Edward , 1981;
Holga, 1984; Mitchel ,1984; Kolars, 1966.). Prof. K.H. Rao (Chairman oftask force,
1987) observed that there was no definite evidence to prove that goat posed threat to
the ecology as was generally believed. They further recommended that sheep and goat
should not be categorized as animals responsible for the destruction of ecology. In
spite of above evidence in favour of goat farming, the forest officials and others do
not agree with and believe that goat is still a threat to ecology. Sanjay Kumar and
Mahesh Chander studied the environment issue with rearing goats and came to
conclusion that goat rearing was a profitable enterprise and earning a good amount of
cash and it acted as a security. The surplus family labor was engaged for this purpose
along with the kitchen waste. The study found that the goat is not a threat to ecology.
Therefore, the blame on goat for the vast destruction of the world's pasture and forest
resources may be unrealistic.
Above all literatures have gtven importance to variOus Issues right from
important number of breeds in the world and Asia, life span, economy, different uses,
and nature of animal and behaviour. It is also observed from the literatures that
though many economists and livestock experts give weightage to goats as economical
animal for poor people that term as "poor man's cow", some environmentalists are
13
unhappy with rearing of goats and business as goats have destructive behaviour of
environment. However, some studies proved that benefits are more than cost. on some
aspects. Most of the studies neglected marketing of goats aspect in the whole system
and its importance, which give the employment and income to the poor.
12. Need and Importance the Study
Several studies noted the importance of goats in economy and to what extent
goats contribute for poor people. As it has been seen the importance of goats and their
contributions, actually, the goats play an important role in terms of income, and
employment that supplement to income of the poor marginal farmers, landless and
others in rural India. Due to short gestation period with normal breeding ratio and
higher maturity, goats generate reasonable returns from selling during a short period.
Such returns cannot get from any other rearing activity. In addition, animal is very
comfortable in any atmosphere, and they themselves search the forages except stall
feeding. This poor man's business robustly supports to about 67 percent small and
marginal farmers, and landless population in the country. Mostly women take the care
of goats other than agriculture and labour works. It is categorically found that more
than 90 percent womenfolk care the animals. Also, goats are known to produce
varieties of products like meat, skin, milk, fleece and manure. All these indicate that
goats contribute a lot for rural masses in terms of income and employment. Generally,
goat keepers mostly rear animals by following traditional way of practice with some
other occupations. Though goats give high returns, it is observed that the actual
benefits do not reach to the goat keepers due to inadequate market information,
middlemen's role, and urgency of selling. Therefore, it is needed to have thorough
investigations as to what are the lacunae in the marketing· channels, who are the
beneficiaries, what is role of middlemen, how goats sell in the markets, whether goat
sellers get proper rates or not, infrastructural facilities, and how by products are sold
etc. and existing market channels all these aspects are important and to be needed to
assess the whole process of buying and selling mechanisms of goats and constraints of
goat marketing and their products.
14
13. Objectives of the Study:
The followings are the objectives of the study. They are:
I. To study the goat marketing system and marketing access to goat farmers
2. To ascertain the constraints in marketing of farmers goat
3. To identify leverage points for developing a system ensuring fair marketing
·access and prices of goats
4. To suggest suitable development strategies for the efficient marketing of the
goats
14. Research Methodology:
For this study, data have been collected from both secondary and primary
sources (field survey). The secondary data have been collected from the various
sources like offices and publication of the Government of Maharashtra, Central
Government and Mahamandal etc. As per methodology, sample villages have been
identified by using step by step selection procedure. While selecting the final markets
and villages, the Maharashtra State is divided into four regions viz; Vidarbha,
Marathawada, Western Maharashtra and Konkon. From these four regions, two
regions are identified based on the highest goat population. (See Appendix-!, table-1)
After selecting two highest populated goat population regions, the highest goat
population district from each region has been identified and selected. Under this
identification and selection method, Yavatmal district from Vidarbha region and
Ahemadnagar district from Western Maharashtra have finally been selected.(See
Appendix-!, Table-2(a) & (b)[ The next step was to identify Tahshils and then
markets. The same procedures of the highest population goats are adopted. From
each district, the highest concentration of goat population in each tahshil was taken
into account and two tahshils from each district a:re finally identified and selected.
In Ahemadnagar district, Pamer and Srigonda these two tahshils have been
identified and two markets i..e. Supa and Kasti markets, which are most famous and
large number of goats are being sold and brought, have been selected. After selection
of two markets, two villages i.e. Jamgaon (vicinity to Supa Market) and Dhavalpuri
(Far-off to Supa Market) in Pamer Tahshil, and Vangdari (Vicinity to Kasti market)
and Belwandi (Far-off to Kasti market) in tahshil Srigonda have been identified and
selected for field survey. Similarly, in Yavatmal district, Darahwa and Pusad tahshils,
and same markets have been selected respectively. Two villages Bori-arab Bk.
(Vicinity to Darhwa market), Ladkhed (Far-off to Darhwa market), Jambazar
15
(Vicinity to Pusad market) and Shilona (Far-off to Pusad market) have been selected
for the final goat keeper households sample. After identification and selection of eight
villages in two districts, 4 groups of goat keepers are classified in each sample village
viz; 1-5,6-15, 16-30, >30 and then, the primary data have been collected. However,
sample households are equally distributed to fair selection and result, therefore, from
each village, 13 goat keepers are finally identified. So, total 104 goat keepers have
been selected for this study. AERC Allahabad informed to AERC, Pune to select 100
samples, but it was found some odd, therefore, 4 samples are additionally selected for
equal distribution. In addition, 5 sellers and 5 buyers from each market, and 5
butchers, 5 petty skin merchants, 2 whole merchants from each market. Thus, 20
butchers, 20 petty skin traders and 8 whole sellers from 4 markets have been
identified and selected. The details presentation of the sample selection has been
presented in the following pages (chart No. I and II).
15. Reference Year:
The secondary data for livestock are taken from the 1985 to 2005. While
collecting secondary data, it is found that some data in those particular years were
missing and therefore, those particular years had to be dropped. These will reflect in
some tables. The primary data have been collected in two rounds in gap of six
months. Both rounds data are processed and analyzed. The field surveys have been
conducted during July 2008-Dec 2008(I st around) and January 2009-June 2009 (II nd
round).
16. Constraints:
There various constraints are found while collecting the data. As mentioned in
above paragraphs, while collecting secondary data, it is found that some data in those
particular years were missing and therefore, those particular years had to be dropped.
The primary data have been collected in two rounds in gap of six months. Both rounds
data are processed and analyzed. The field surveys have been conducted during July
2008-Dec 2008 (I st around) and January ?009-June 2009 (II nd round). The primary
observation of this study is that the required information on the markets and their
channels are not well documented. It was found very difficult to obtain even
secondary information regarding markets and channels from the offices of the
Government. The lists of "organized markets", "unorganized markets" and "private
markets" are not properly documented maintained. Therefore, in some cases, data are
16

missing and care has been taken to document the various constraints for the market
access for this study.
17
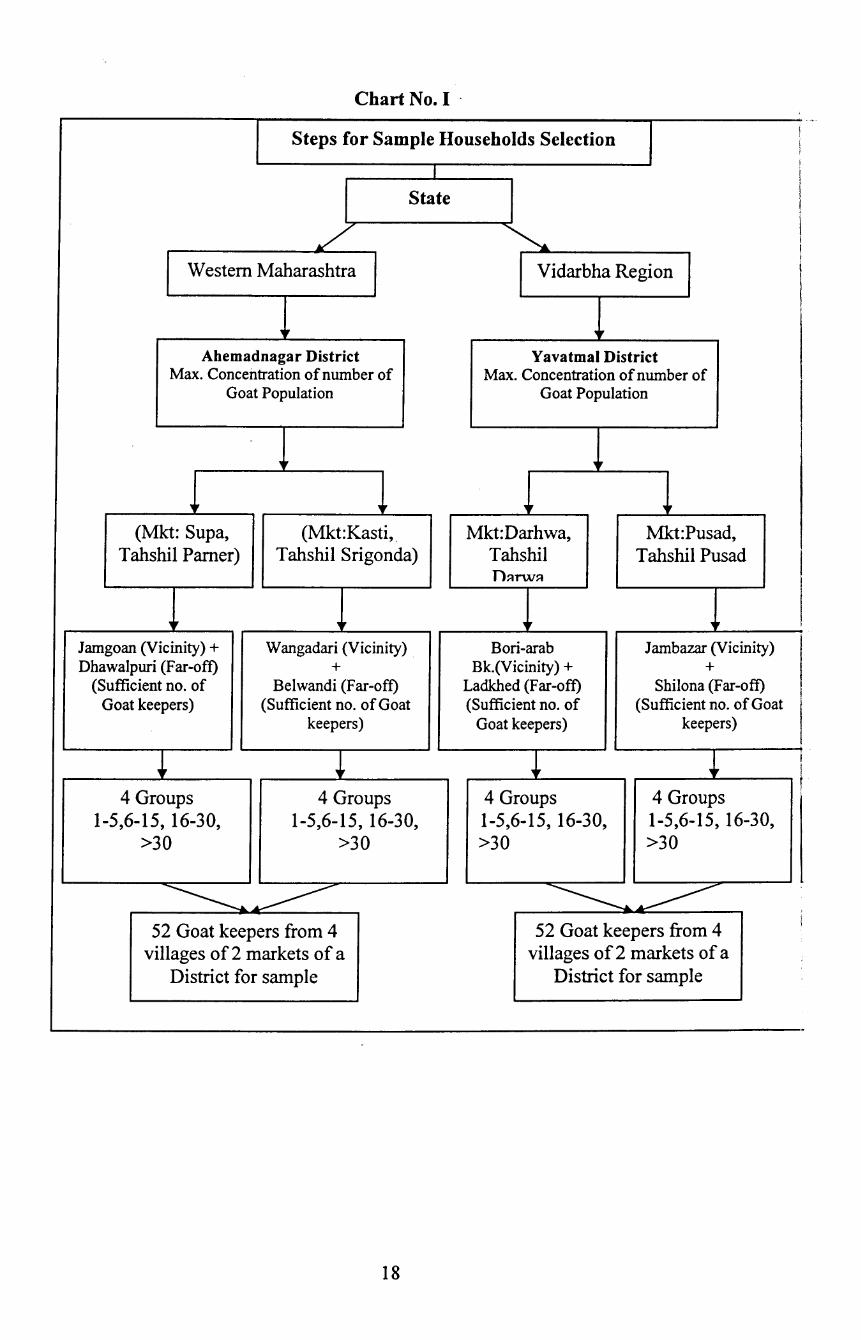
Chart No. I ·
Steps for Sample Households Selection ! l
I I
I
I State
I / ~ I I !
Western Maharashtra Vidarbha Region I
I lr lr
Ahemadnagar District Yavatmal District Max. Concentration of number of Max. Concentration of number of
Goat Population Goat Population
lr ~,
, , (Mkt: Supa, (Mkt:Kasti,. Mkt:Darhwa, Mkt:Pusad,
Tahshil Pamer) Tahshil Srigonda) Tahshil T ahshil Pusad
I n~rw~
, , lr ,,. I j
Jamgoan (Vicinity)+ Wangadari (Vicinity) Bori-arab Jambazar (Vicinity) Dhawalpuri (Far-off) + Bk.(Vicinity) + +
(Sufficient no. of Belwandi (Far-off) Ladkhed (Far-off) Shilona (Far-oft) Goat keepers) (Sufficient no. of Goat (Sufficient no. of (Sufficient no. of Goat '
keepers) Goat keepers) keepers)
~ ~ .~. i I
4 Groups 4 Groups 4 Groups 4 Groups t
1-5,6-15, 16-30, 1-5 6-15 16-30 ' ' ' 1-5 6-15 16-3 0 ' ' ' 1-5,6-15, 16-30,
>30 >30 >30 >30
~~ ~~ 52 Goat keepers from 4 52 Goat keepers from 4
l
villages of 2 markets of a villages of 2 markets of a District for sample District for sample
-
18
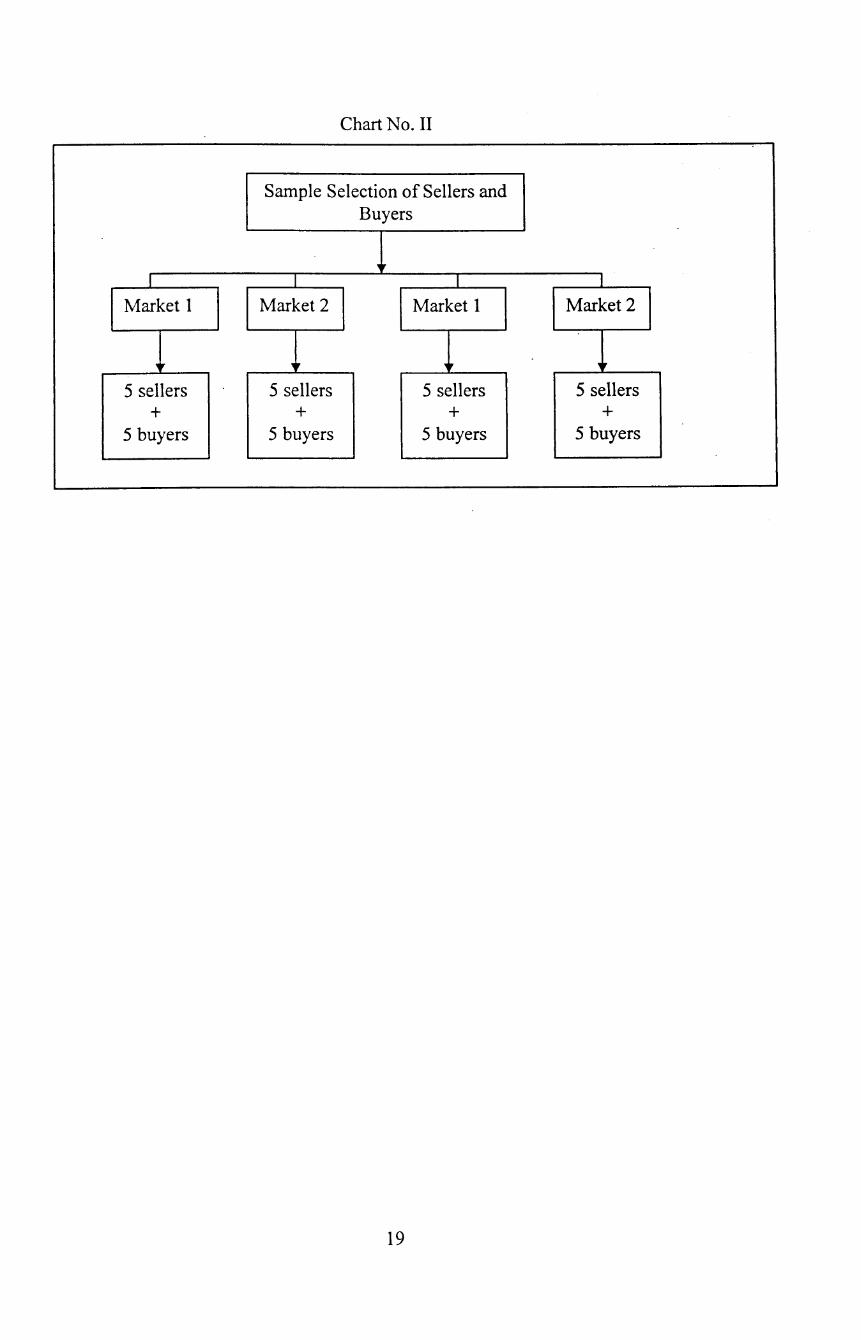
Chart No. II
Sample Selection of Sellers and Buyers
~,.
I I
Market I Market 2 Market I Market 2
~, ~, , ,, 5 sellers 5 sellers 5 sellers 5 sellers
+ + + + 5 buyers 5 buyers 5 buyers 5 buyers
I9

CHAPTER-II
BACKGROUND, LIVESTOCK, AND INSTITUTIONS
1. Background of State
Maharashtra state came into existence on 1st May 1960 as a result of the
bifurcation of the then composite Bombay state into Maharashtra and Gujarat states.
The state is located on the western coast of India and it spreads between 15° 45' and
22° 00' north latitude and from 72° 45' to 80° 45' east longitude and its boundary
connected to Gujarat, and Dadra and Nagar Haveli in the north-west, Madhya Pradesh
to its north, Chhatisgarh in the east, Andhra Pradesh in the south, Kamataka and Goa
in the south-west, and the Arabian Sea to its west. The Survey of India recorded about
the state that the state occupied 307, 713 km2 land mass area that accounts 9.36 per
cent of the total geographical area of the country. Out of total area of the state, the
rural area occupies 300,357 km2 land mass and urban segment occupies 7,355.80 km2
land, of which it is found that more than 97 percent area has been in rural segment of
the state. In addition, state has a 720 kms long coastline, which is stretching from
Thane district in the north part to Sindhudurg district in the southern part of the state.
As per the census 2001, the total households are 19,576,736, of which
11,173,512 households are located in the rural part of the state and remaining
8,403,224 households are urban areas of the state. In percentage term, it indicates that
about 57 percent households are located in rural part of the state. The population of
the state is 968,78,627 of which -s57,77,647 resides in the rural areas and 411,00,980
resides in the urban areas. The percentage of rural population is 57.58 in the state. The
state is the second largest State in India both in terms of population and geographical
area. The State is highly urbanized with 42 per cent people residing in urban areas
whereas at national level it was around 28 per cent. The total population of the
Scheduled Castes (SCs) in the state is 98,81,656 of which 60,93,829 population
reside in the rural areas that accounts 61.67 percent and remaining reside in the urban
areas of the state. The population of Scheduled Tribes (STs) is 85,77,27~ of which
74,86,537 resides in the rural area that accounts 87.28 percentage. The general
literacy rate in the state is 52.07 percent and among the SC and ST communities are
71.9 and 55.2 respectively. Total workers in the state are 411,73,351 of which, 66.21
percent lives in the rural area of the state. The main workers are 34,748,053 out of
20
that 62.89 percent resides in the rural areas. The marginal workers are 64,25,298 out
of this, 84.16 percent resides in rural areas. Non-workers are 55,705,276 and 51.19
percent resides in rural areas. Among the main workers, there are cultivators,
agricultural labourers, household industry workers and other workers. Out of main
workers, 29.31 percent are cultivators, 21.99 percent are agricultural labourers, 2.33
percent are household industry workers, and 46.37 percent are workers, who are
working in other categories work. Among the marginal workers, 25.3 9 percent are
cultivators, 49.39 percent are agricultural labourers, 4.34 percent are household
industry workers, and 0.20 percent are other workers. It is found that the rural
population, which resides in rural areas, spread in 40,412 inhabited villages and
remaining population 30,~41,586 (38.69%) live in 336 urban centres including urban
agglomerations. Maharashtra state, which is the most urbanized state, ranks first
among the bigger states in the country. The area of Pune to Kolhapur through Sa tara
has a high density of population. High densities of population are also found in the
fertile river valleys and the coastal plains. Greater Bombay (entirely urban district),
which is the biggest centre for trade, commerce, industry and transportation, provides
immense opportunities to the people of the state as well as other states. Therefore,
these locations have the highest concentration of population (16,461 persons per
square kilometer) and also influence the high concentration in the surrounding areas
of Thane and Raigarh districts of the state. It is found that the distribution of
population is generally very sparse in the remotely located forest areas, hilly tracts,
and backward area of the state. It has been recorded that the lowest concentration (55
persons/km2) is found in Gadchiroli district, whic4 is the most backward district and
remotely located tribal region in the state (home of Madia primitive tribe). It has been
noticed that the physical condition of area and development of infrastru~ture in
particular locations greatly affect the distribution of population through out the state.
Generally, it is observed that the hilly tracts like Sahyadri, Satpuda, Gawilgarh hills
and the remote forest parts of Chandrapur and Gadchiroli districts are thinly populated
while agricultural development with multiple cropping, and industrialization have
jointly caused clustering of population in certain areas of the state. For example two
well-known regions Kolhapur-Sangali-Satara region, which is well-known for sugar
belt and Bombay-Thane region, which is famous for industrial belt are clustering the
population. In addition, other some clusters are found around Jalgaon, along the Tapi
valley, Shrirampur, Nagpur, Pune, and around Gondia.
21
The state has six administrative divisions namely Konkan, Nashik, Pune,
Aurangabad, Amaravati, and Nagpur. The Konkan revenue division controls six
districts namely Gr. Bombay, Mumbai sub-urban, Thane, Raigarh, Ratnagiri, and
Sindhudurg. The Nashik revenue division controls five district administrations that
are Nashik, Dhule, Jalgaon, and Ahamadnagar, Nandurbar. The Pune revenue division
controls five district administration namely Pune, Satara, Sangali, Solapur and
Kolhapur districts. The Aurangabad revenue division controls Auragabad, Jalna,
Parbhani, Beed, Nanded, Usmanabad, Latur, and Hingoli districts. The Amaravati
revenue division controls Buldhana, Akola, Amravati, Yavatmal, and Washim
district's administration and the Nagpur revenue division controls Wardha, Nagpur,
Bhandara, Chandrapur, Gadchiroli, and Gondiya districts. Further, these divisions
have been divided into 35 districts and 353 tahsils. According to the Census 2001,
there were 3 78 urban centres in the state (251 Municipal towns and 127 Census
towns). There were 43,711 villages of which 41,095 were inhabited and 2616
uninhabited villages. The number of districts were increased from 30 in 1991 to 35 in
the 2001 Census. The newly created districts were Nandurbar, Washim, Gondia,
Hingoli and Mumbai (Suburban). The Number of tahsils increased from 300 in the
1991 to 353 in the 2001 Census.
The Gross State Domestic Product (GSDP) at current prices for 2007-08 is
estimated at Rs. 5,90,995 crore and contributes about 13 per cent of the National
Income. The GSDP has been growing at a rapid pace over the last few years. The
State boasts of a very vibrant industrial sector and a rapidly growing services sector.
Both these sectors presently contribute about 86 per cent of the state's domestic
product. The agriculture & allied activities sector contributes just 14 per cent of the
state's income though about 55 per cent of the population is dependent on income
from this sector. Mumbai, the capital of Maharashtra and the financial capital of India
houses the headquarters of almost all major financial institutions, insurance
companies and mutual funds. India's premier stock exchanges i.e. the Bombay Stock
Exchange as well as the National Stock Exchange and the Commodity Exchanges are
located in Mumbai.
The State has 225.6 lakh hectares of land under cultivation where cereals,
pulses and other major foodgrains are grown. Forests cover another 52.1 lakh
hectares. The extreme weather conditions, coupled with low quality soils and rain fed
22
cropping results in lower agriculture productivity. Numbers of irrigation projects are
being implemented to improve irrigation. A watershed mission has been launched to
ensure that soil and water conservation measures are implemented speedily in the . '
unirrigated area.
The State has made rapid strides in the production of commercial crops like
sugarcane, soyabean, cotton, oilseeds and onions. The last few years have seen a
healthy shift towards horticulture crops. The State is well known for its Alphonso
mangoes, grapes, bananas, pomegranates and oranges.
Animal husbandry is one of the important allied activities and has 24 per cent
share in agriculture sector. The State's share of milk, livestock and poultry population
in India is 7.7, 7.6 and 7.0 per cent respectively. The long costal line is a boon to the
State's economy. The State contributes to 25 per cent in India's total export offish.
The State has been recognised as the country's industrial powerhouse and
maintains the position of being the most industrialized state. The State is pioneer in
SSI. The State continues to attract industrial investment from both, domestic as well
as foreign institutions. It has become a leading automobile production hub and a
major IT growth centre. It boasts of the largest number of special export promotion
zones being set up in the country. During the year 2007-08, about 27 percent of the
exports from the country are from the State. The State is becoming one of the leading
wine producing areas in the country. At present, 35 wineries are functioning with an
investment of Rs. 109 crore and export of 22.49 lakh liters of wine.
2. Physiography of State:
The state can be divided physiographically into two parts viz; Konkan Low
Land and the Deccan Plateau. The Konkan Low Land (KLL), which is the narrow
strip of land situated between the Arabian Sea in the west and the Sahyadri Range in
the east, lies in the extreme west of the state. It stretches in a north- south direction
for about 720 Kms and its width ranges between 40 and 95 Kms in the east-west
direction. Throughout its length, the KLL is dominated by the tremendous scraps of
the ghats that are rising to a height of about 900 meters. The drainage system of the
KLL is a group of small drainage systems. All the rivers, which originate from the
Sahyandry range, are short and swift without forming deltas. These rivers normally
flow westwards to the Arabian Sea. The Deccan Plateau, as per the relief and
topography of the state, can be classified into four parts, which are: Sahyadri Range,
23
?\1aharashtra Plateau, Tapi-Purna Valley, and \Vardha-Wainganga Plain. The Sahyadri
Range runs parallel to the coast in a north-south direction. The range forms the
watershed bet\veen the east flovving reverse and the west-flowing streams. Also, the
range slopes gently eastwards .The height of the range varies between 800 and 1200
meters. The maximum height is observed at Kalsubai that has been measured 1638
meters; which is the highest point of in the state. There are two main passes known as
Thalghat and Bhorghat in the range, which connect the coastal land and the
?\1aharashtra plateau. The Maharashtra plateau is made up of horizontally bedded
basaltic lava called Traps. There are three visible crests between Tapi-Godavari,
Godavari-Bhima and between Bhima-Krishana rivers. In the valleys the lava
through tropical weathering and erosion has produced a black soil known as'Regur'.
The plateau,in general,has a height of between 350 and 900 meters and slopes gently
in a southeast direction. The Tapi-Purna valley is located between the Satpuda and the
Satmala-Ajanta ranges. It is rift with an altitude between 150 and 300 mtrs. Soils
around the range are fertile. Due to this, agricultural activities are well developed. The
Wardha-Wainganga Plain is located in eastern Maharashtra and slops towards the
south and southeast. The plain mainly flat except for a few remnant hillocks scattered
over the plain. The average height ranges between 150 and 300 mtrs. The rivers made
this plain more fertile that conducive to grow cotton and other important crops in this
region. The river Wainganga, which rises near Seoni in Madhaya Pradesh and flow
towards the south, is the main river of the plain.
The distributions of forest depend on many factors like rainfall, temperature,
physiography and soils. Snowfall, humidity, frost, elevation, number of rainy days
etc. also play a significant roll in the distribution of tree species and forest types. The
forests of Maharashtra can broadly be grouped as tropical forests, sub- tropical
forests, and littoral and swamp forests.· Tropical forests can be further classified as;
tropical evergreen forests, tropical moist deciduous forests, tropical dry deciduous
forests, and tropical thorn forests. Tropical evergreen forests are found in a narrow
strip on the Western Ghats and in south and southeast Gadchiroli district where the
annual rainfall is over 1500 nun. Tropical moist deciduous forest are found in the
western part of the state in the Konkan and the western Ghats. They are mostly found
in Thane, Raigarh, Western, Pune, Rannagiriand Sindhudurga districts. These forests
occur in areas having a rainfall of between 1500 mm. and 2500 nun. with about six
24
month's dry season. Economically, the trees of this forests are of great importance
and used as building and households materials and in industries. Tropical dry
deciduous forests are found in many parts of the state. These are mainly in the foot
hills of the Satpuda range, Satmala-Ajanta range, eastern slopes of the Western Ghats,
uploads of Solapur, Yavatmal Wardha, Nagpur, eastern hill of Bhandara and on the
uplands and hills of Chandrapur and Gadchiroli districts. Sal, Teak, Bamboo, Hirda,
Anjan, Tembhumi etc are the main species found in this region. These forests are
subjected to over cutting and overgrazing. Tropical thorn forests are found in the rain
shadow area of the Western Ghats. This area receives an annual rainfall of less than
750 nun. Babu/, Khair and other acacias are common species of this forest. Babul is
useful for domestic purposes· while Khair has certain chemical and industrial uses. It
is also used in betal, which is chewed by many in India. The sub -tropical forests in
Maharashtra are known as sub- tropical broad leafed hill forests and are found at high
altitudes in the Western Ghats in the districts of Kolhapur, Sangli, Satara, northern
Pune and southern Nashik. Littoral and swamp forests are found only in Thane
district. The state is a unique in varieties of biodiversity species in all parts of the
state. The total forest area reported in the state is 6193 9 sq. km.
3. Rainfalls:
The India receives rainfall by two seasonal currents of the south-west
monsoon and south-east monsoon. Maharashtra receives about 85 per cent of it's
rainfall by the south-west monsoon. It has been found that there is considerable
variation in rainfall among the different parts of the state. Greater Bombay, Thane,
Raigarh, Ratnagiri and Sidhudurga receive rainfall between 2,000 and 3,000 mm. The
places like Mahabaleshwar in Satara district and Bavda in Kolhapur district receive
heavy rainfall i.e. 6,226 mm and 6,212 mm respectively. This region receives heavy
rainfall due to the obstruction of the southwest monsoon by the Sahyadri range, which
lie in a north-south direction in the state. On the eastern slope of the Sahyadri range
the intensity of rainfall drops sharply and a major part of the state lies in the rain
shadow area of the Sahyadri range and receives rainfall below 750 mm. This area
includes parts of Dhule, Jalgaon, Nasik, Aurangabad, Jalna, Ahmadnagar, Pune,
Satara, Sangali, Solapur and Bid district. The trend of intensity of rainfall is
interesting near Mahabaleshwar. Mahabaleshwar receives about 6,000 mm. while Wai
at a distance of about only 32 kms in the east receives only 710 mm. By the middle of
25
Jalgaon, Jalna, Bid and eastern part of Solapur district the intensity of rainfall again
increase gradually towards the east and features up to 1,500 nun. in the extreme east
of the state. The extreme eastern part of the state which includes the districts of
Bhandara, Nagpur, Wardha, northeast, Nanded, Yawatmal, Chandrapur and
Gadchiroli are reached by climatic influence from the Bay of Bengal and hence this
region receives higher rainfall (more than 1,000 mm.). The hills and forested areas of
Chandrapur, Gadchiroli and Bhandara district receives more the 1,500 mm. of
rainfall. In this region the rainiest month is late August or September while in the
western part of the state it is July or August.
4. Breeding Policy:
The Government of Maharashtra had framed 'breeding policy' for sheep and
goat to improve the breed quality in terms of meat and wool production. Under this
policy, the Government of Maharashtra primarily aimed to increase the meat and
wool production for meeting local demand of wool. The second objective of policy
was to improve the quality up- gradation of goat and sheep, therefore, the state
government also tried to have experimental breeding efforts with germplasm found in
other parts of India and also in foreign countries. For this venture, Osmanabadi and
Sangamneri breeds of goat and Deccani breeds of sheep are identified as germplasm
for genetic up-gradation of non-descript breeds in respective species. Besides, Kanyal
breed of goat, and Madgyal breed of sheep may be used for up-gradation of local non
descript goats and sheep in their breeding home tracts. At the same time, cross
breeding among sheep and goat was strictly prevented except for research purposes.
Natural service will continue to be the strategy for genetic up-gradation in sheep and
goat. The State government established Punyashloak Ahilaya Devi Sheli va Mendhi
Vikas Mahamandal, Pune in 1978 under the Agric_ulture and Cooperation Department
of the State Government, which shall be responsible to maintain farms for production
of nucleus flocks of selected breeds; organize Breeder-Farmers and Breeder's
Association for production of stock to be distributed under its programs and under its
plan schemes by suitable strategy of buy back. It may act as supplier of nucleus flocks
to such Breeder-Farmers and Breeder's Associations for multiplication. Also,
Punyashloak Ahilaya Devi Sheli va Mendhi Vikas Mahamandal, Pune; MAFSU
Nagpur and Animal Science Division of State Agriculture Universities shall be the
designated agencies responsible for conservation of native breeds of sheep and goat
26
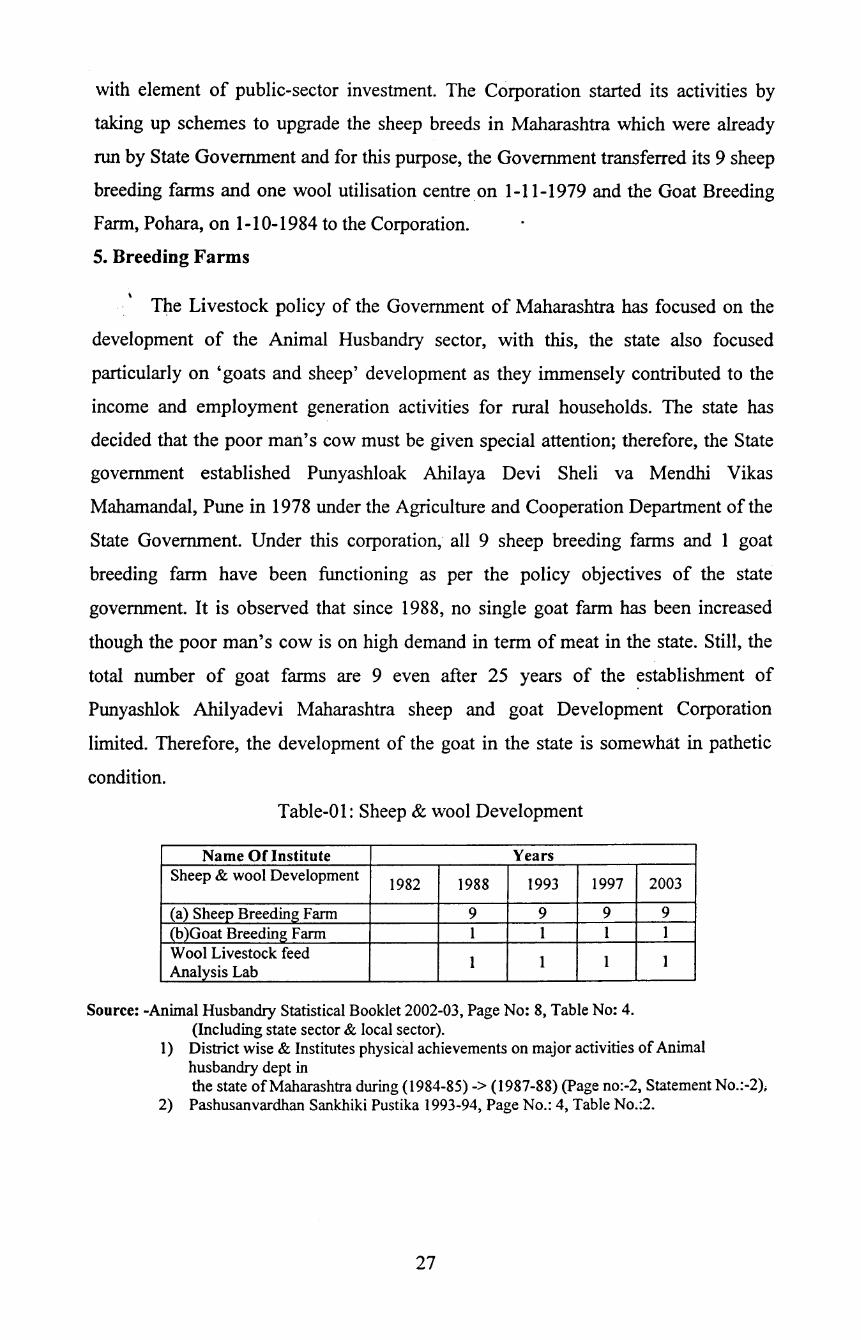
with element of public-sector investment. The Corporation started its activities by
taking up schemes to upgrade the sheep breeds in Maharashtra which were already
run by State Government and for this purpose, the Government transferred its 9 sheep
breeding farms and one wool utilisation centre . on 1-11-1979 and the Goat Breeding
Farm, Pohara, on 1-10-1984 to the Corporation.
5. Breeding Farms
·. ' The Livestock policy of the Government of Maharashtra has focused on the
development of the Animal Husbandry sector, with this, the state also focused
particularly on 'goats and sheep' development as they immensely contributed to the
income and employment generation activities for rural households. The state has
decided that the poor man's cow must be given special attention; therefore, the State
government established Punyashloak Ahilaya Devi Sheli va Mendhi Vikas
Mahamandal, Pune in 1978 under the Agriculture and Cooperation Department of the
State Government. Under this corporation, all 9 sheep breeding farms and 1 goat
breeding farm have been functioning as per the policy objectives of the state
government. It is observed that since 1988, no single goat farm has been increased
though the poor man's cow is on high demand in term of meat in the state. Still, the
total number of goat farms are 9 even after 25 years of the establishment of
Punyashlok Ahilyadevi Maharashtra sheep and goat Development Corporation
limited. Therefore, the development of the goat in the state is somewhat in pathetic
condition.
Tab le-O 1: Sheep & wool Development
Name Of Institute Years Sheep & wool Development
1982 1988 1993 1997
(a) Sheep Breeding Farm 9 9 9 (b )Goat Breeding Farm 1 1 1 Wool Livestock feed
1 1 1 Analysis Lab
Source: -Animal Husbandry Statistical Booklet 2002-03, Page No: 8, Table No: 4. (Including state sector & local sector).
2003
9 1
1
1) District wise & Institutes physical achievements on major activities of Animal husbandry dept in the state ofMaharashtra during (1984-85) -> (1987-88) (Page no:-2, Statement No.:-2);
2) Pashusanvardhan Sankhiki Pustika 1993-94, Page No.: 4, Table No.:2.
27
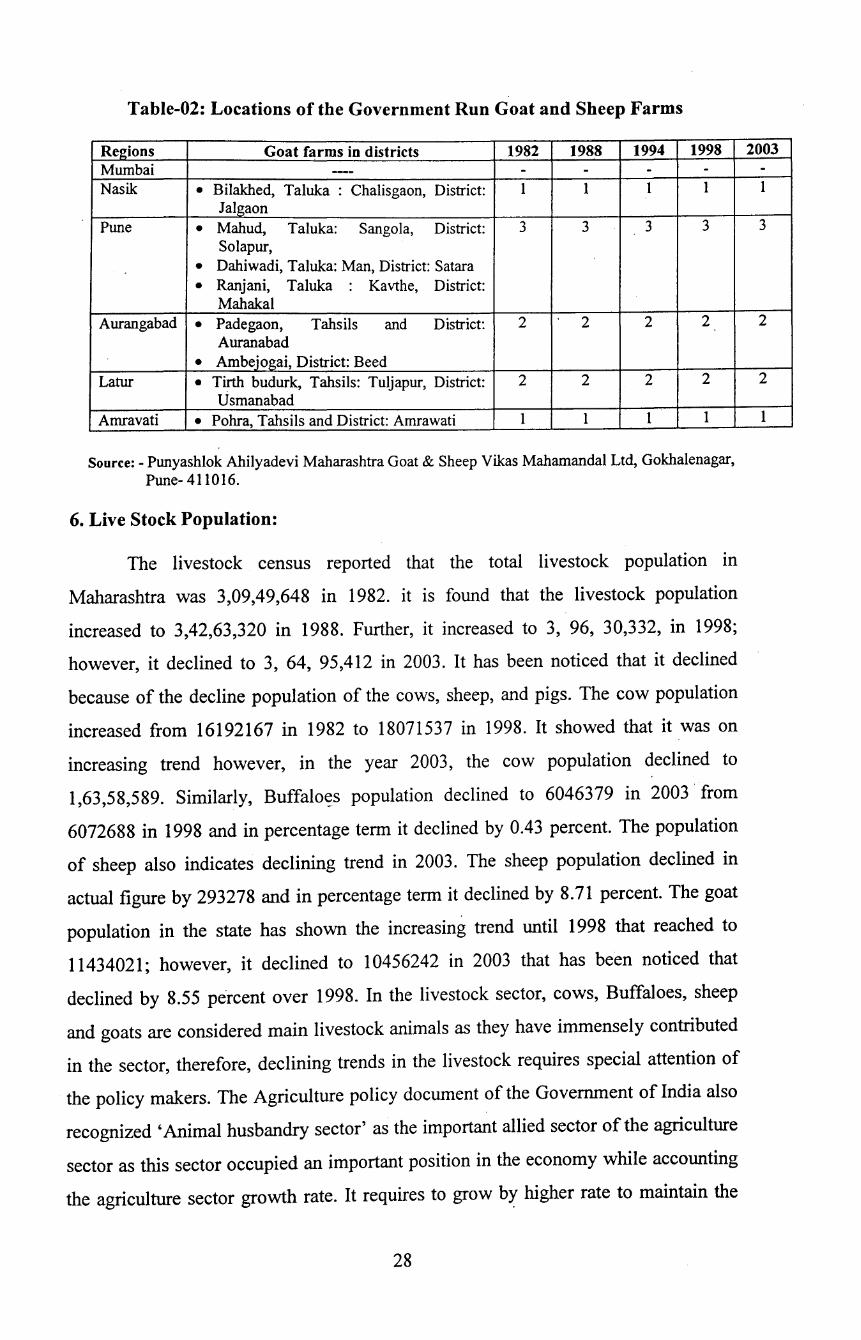
Table-02: Locations of the Government Run Goat and Sheep Farms
Re2ions Goat farms in districts 1982 1988 1994 1998 Mumbai -- - - - -Nasik • Bilakhed, Taluka : Chalisgaon, District: I 1 1 1
Jalgaon Pune • Mahud, Taluka: Sangola, District: 3 3 3 3
Solapur,
• Dahiwadi, Taluka: Man, District: Satara
• Ranjani, Taluka Kavthe, District: Mahakal
Aurangabad • Padegaon, Tahsils and District: 2 2 2 2 Auranabad
• Ambeiogai, District: Beed Latur • Tirth budurk, Tahsils: Tuljapur, District: 2 2 2 2
Usmanabad Amravati • Pohra, Tahsils and District: Amrawati 1 1 1 1
Source: - Punyashlok Ahilyadevi Maharashtra Goat & Sheep Vikas Mahamandal Ltd, Gokhalenagar, Pune- 411016.
6. Live Stock Population:
The livestock census reported that the total livestock population in
Maharashtra was 3,09,49,648 in 1982. it is found that the livestock population
increased to 3,42,63,320 in 1988. Further, it increased to 3, 96, 30,332, in 1998;
however, it declined to 3, 64, 95,412 in 2003. It has been noticed that it declined
because of the decline population of the cows, sheep, and pigs. The cow population
increased from 16192167 in 1982 to 18071537 in 1998. It showed that it was on
increasing trend however, in the year 2003, the cow population declined to
1,63,58,589. Similarly, Buffalo~s population declined to 6046379 in 2003 ·from
6072688 in 1998 and in percentage term it declined by 0.43 percent. The population
of sheep also indicates declining trend in 2003. The sheep population declined in
actual figure by 293278 and in percentage term it declined by 8.71 percent. The goat
population in the state has shown the increasing trend until 1998 that reached to
11434021; however, it declined to 10456242 in 2003 that has been noticed that
declined by 8.55 percent over 1998. In the livestock sector, cows, Buffaloes, sheep
and goats are considered main livestock animals as they have immensely contributed
in the sector, therefore, declining trends in the livestock requires special attention of
the policy makers. The Agriculture policy document of the Government of India also
recognized 'Animal husbandry sector' as the important allied sector of the agriculture
sector as this sector occupied an important position in the economy while accounting
the agriculture sector growth rate. It requires to grow b~ higher rate to maintain the
28
2003 -1
3
2
2
1
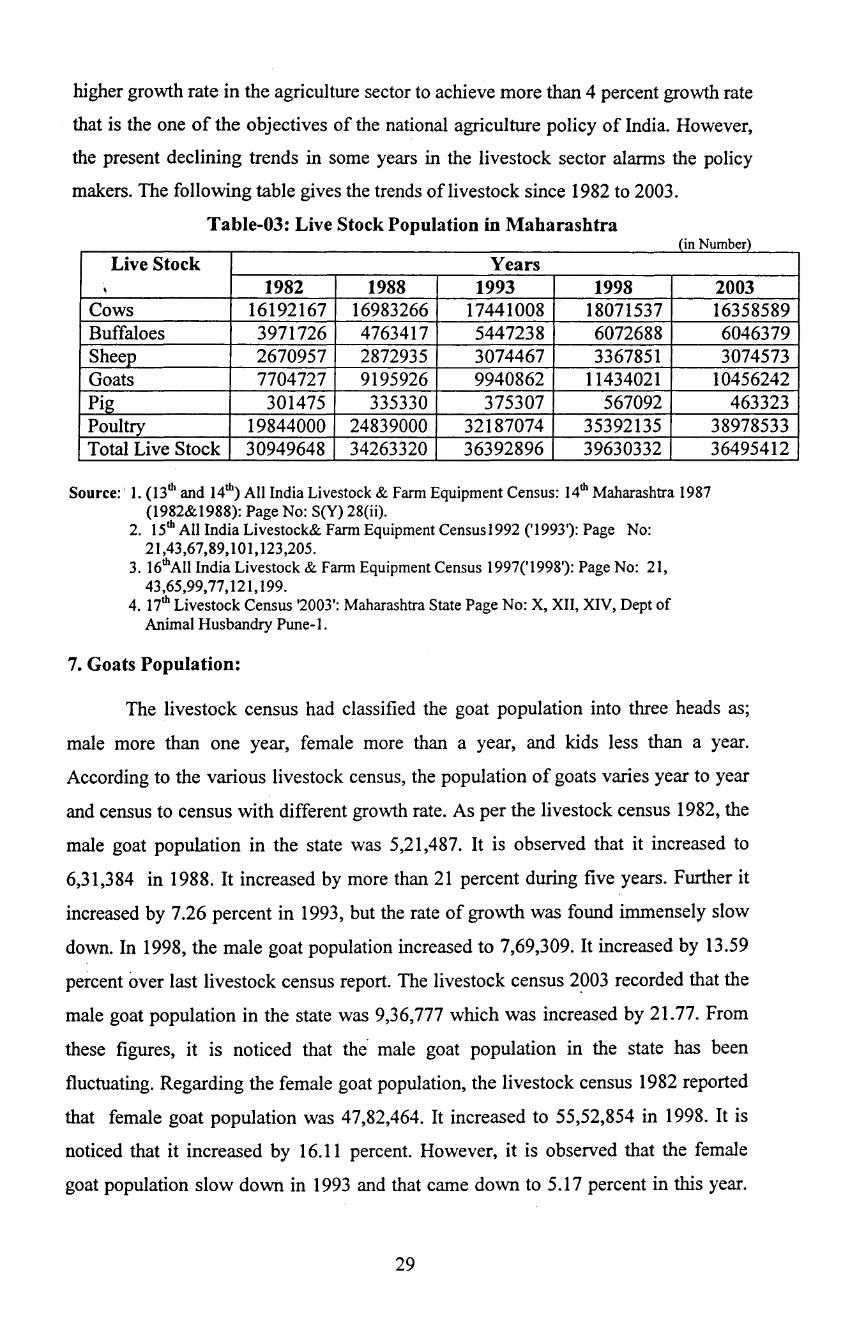
higher growth rate in the agriculture sector to achieve more than 4 percent growth rate
that is the one of the objectives of the national agriculture policy of India. However,
the present declining trends in some years in the livestock sector alarms the policy
makers. The following table gives the trends of livestock since 1982 to 2003.
Table-03: Live Stock Population in Maharashtra (in Number)
Live Stock Years I 1982 1988 1993 1998
Cows 16192167 16983266 17441008 18071537 Buffaloes 3971726 4763417 5447238 6072688 Sheep 2670957 2872935 3074467 3367851 Goats 7704727 9195926 9940862 11434021 Pig 301475 335330 375307 567092 Poultry 19844000 24839000 32187074 35392135 Total Live Stock 30949648 34263320 36392896 39630332
Source: I. (13th and 14th) All India Livestock & Farm Equipment Census: 14th Maharashtra 1987 (1982&1988): Page No: S(Y) 28(ii).
2. 15th All India Livestock& Farm Equipment Census1992 ('1993'): Page No: 21 ,43,67,89, 101,123,205.
3. 16th All India Livestock & Farm Equipment Census 1997('1998'): Page No: 21, 43,65,99,77, 121,199.
4. 17th Livestock Census '2003': Maharashtra State Page No: X, XII, XIV, Dept of Animal Husbandry Pune-1.
7. Goats Population:
2003 16358589 6046379 3074573
10456242 463323
38978533 36495412
The livestock census had classified the goat population into three heads as;
male more than one year, female more than a year, and kids less than a year.
According to the various livestock census, the population of goats varies year to year
and census to census with different growth rate. As per the livestock census 1982, the
male goat population in the state was 5,21,487. It is observed that it increased to
6,31,384 in 1988. It increased by more than 21 percent during five years. Further it
increased by 7.26 percent in 1993, but the rate of growth was found immensely slow
down. In 1998, the male goat population increased to 7,69,309. It increased by 13.59
percent over last livestock census report. The livestock census 2903 recorded that the
male goat population in the state was 9,36,777 which was increased by 21.77. From
these figures, it is noticed that the. male goat population in the state has been
fluctuating. Regarding the female goat population, the livestock census 1982 reported
that female goat population was 4 7 ,82,464. It increased to 55,52,854 in 1998. It is
noticed that it increased by 16.11 percent. However, it is observed that the female
goat population slow down in 1993 and that came down to 5.17 percent in this year.
29
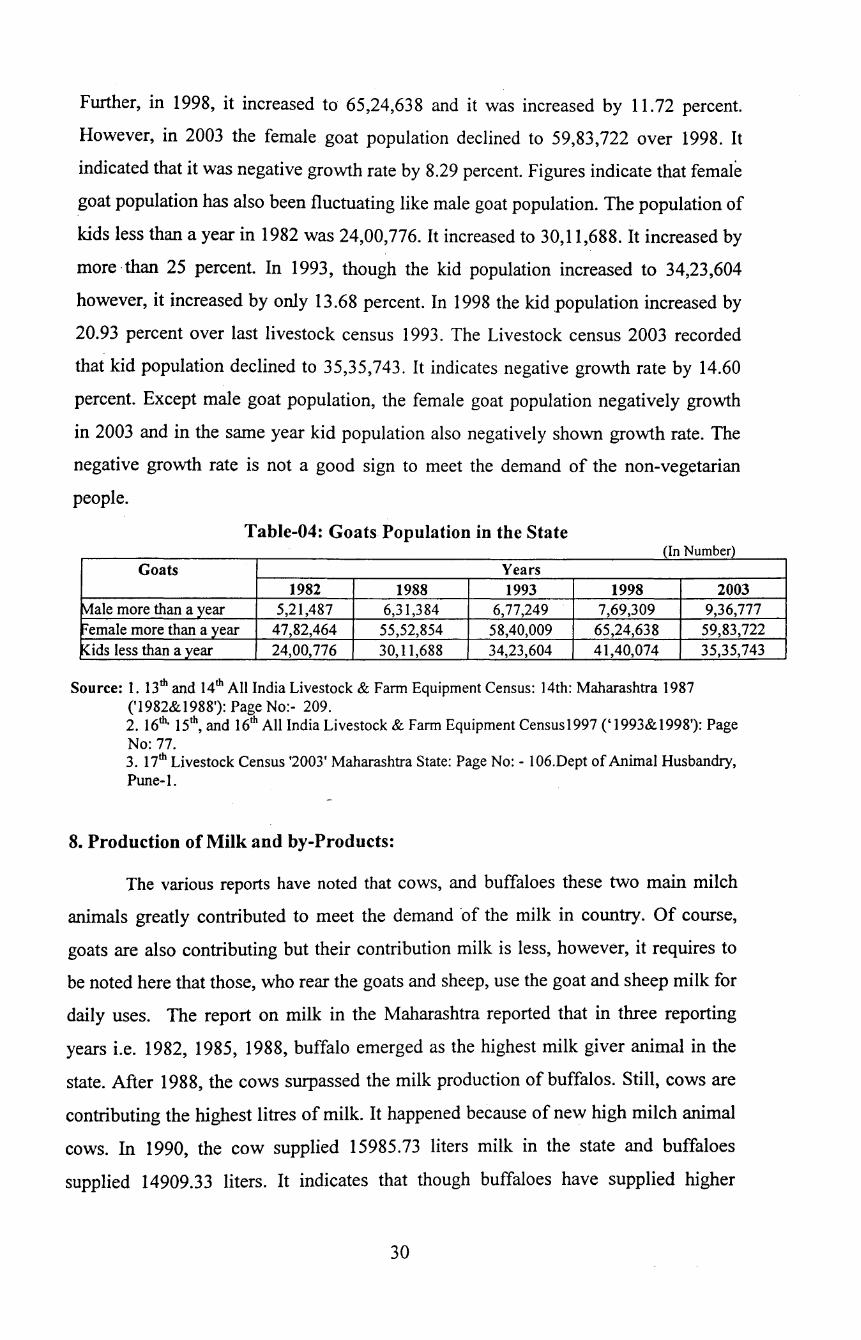
Further, in 1998, it increased to 65,24,638 and it was increased by 11.72 percent.
However, in 2003 the female goat population declined to 59,83,722 over 1998. It
indicated that it was negative growth rate by 8.29 percent. Figures indicate that female
goat population has also been fluctuating like male goat population. The population of
kids less than a year in 1982 was 24,00,776. It increased to 30,11,688. It increased by
more ·than 25 percent. In 1993, though the kid population increased to 34,23,604
however, it increased by only 13.68 percent. In 1998 the kid population increased by
20.93 percent over last livestock census 1993. The Livestock census 2003 recorded
that kid population declined to 35,35,743. It indicates negative growth rate by 14.60
percent. Except male goat population, the female goat population negatively growth
in 2003 and in the same year kid population also negatively shown growth rate. The
negative growth rate is not a good sign to meet the demand of the non-vegetarian
people.
Table-04: Goats Population in the State (In Number)
Goats Years 1982 1988 1993 1998
Male more than a year 5,21,487 6,31,384 6,77,249 7,69,309 Female more than a year 47,82,464 55,52,854 58,40,009 65,24,638 Kids less than a year 24,00,776 30,11,688 34,23,604 41,40,074
Source: 1. 13th and 14th All India Livestock & Farm Equipment Census: 14th: Maharashtra 1987 ('1982&1988'): Page No:- 209.
2003 9,36,777
59,83,722 35,35,743
2. 16th. 15th, and 16th Ali India Livestock & Farm Equipment Census 1997 (' 1993& 1998'): Page No: 77. 3. 17th Livestock Census '2003' Maharashtra State: Page No: - 1 06.Dept of Animal Husbandry, Pune-1.
8. Production of Milk and by-Products:
The various reports have noted that cows, and buffaloes these two main milch
animals greatly contributed to meet the demand ·of the milk in country. Of course,
goats are also contributing but their contribution milk is less, however, it requires to
be noted here that those, who rear the goats and sheep, use the goat and sheep milk for
daily uses. The report on milk in the Maharashtra reported that in three reporting
years i.e. 1982, 1985, 1988, buffalo emerged as the highest milk giver animal in the
state. After 1988, the cows surpassed the milk production of buffalos. Still, cows are
contributing the highest litres of milk. It happened because of new high milch animal
cows. In 1990, the cow supplied 15985.73 liters milk in the state and buffaloes
supplied 14909.33 liters. It indicates that though buffaloes have supplied higher
30
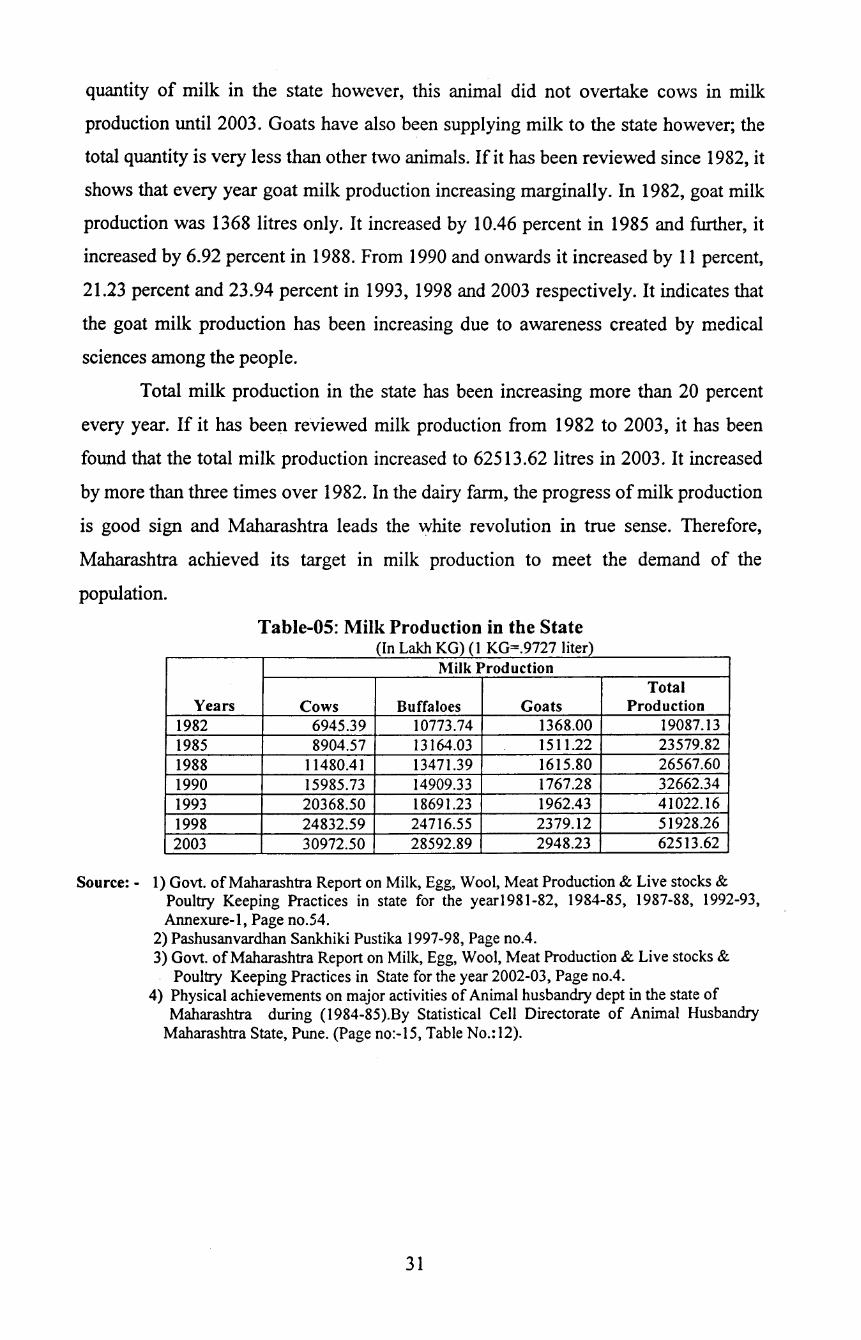
quantity of milk in the state however, this animal did not overtake cows in milk
production until 2003. Goats have also been supplying milk to the state however; the
total quantity is very less than other two animals. If it has been reviewed since 1982, it
shows that every year goat milk production increasing marginally. In 1982, goat milk
production was 1368 litres only. It increased by 10.46 percent in 1985 and further, it
increased by 6.92 percent in 1988. From I990 and onwards it increased by II percent,
21.23 percent and 23.94 percent in I993, I998 and 2003 respectively. It indicates that
the goat milk production has been increasing due to awareness created by medical
sciences among the people.
Total milk production in the state has been increasing more than 20 percent
every year. If it has been reviewed milk production from I982 to 2003, it has been
found that the total milk production increased to 625I3.62 litres in 2003. It increased
by more than three times over I982. In the dairy farm, the progress of milk production
is good sign and Maharashtra leads the white revolution in true sense. Therefore,
Maharashtra achieved its target in milk production to meet the demand of the
population.
Years 1982 1985 1988 1990 1993 1998 2003
Table-05: Milk Production in the State (In Lakh KG) (1 KG=.9727 liter)
Milk Production
Cows Buffaloes Goats 6945.39 10773.74 1368.00 8904.57 13164.03 1511.22
11480.41 13471.39 1615.80 15985.73 14909.33 1767.28 20368.50 18691.23 1962.43 24832.59 24716.55 2379.12 30972.50 28592.89 2948.23
Total Production
19087.13 23579.82 26567.60 32662.34 41022.16 51928.26 62513.62
Source:- 1) Govt. ofMaharashtra Report on Milk, Egg, Wool, Meat Production & Live stocks & Poultry Keeping Practices in state for the year1981-82, 1984-85, 1987-88, 1992-93, Annexure- I, Page no.54.
2) Pashusanvardhan Sankhiki Pustika 1997-98, Page no.4. 3) Govt. ofMaharashtra Report on Milk, Egg, Wool, Meat Production & Live stocks &
Poultry Keeping Practices in State for the year 2002-03, Page no.4. 4) Physical achievements on major activities of Animal husbandry dept in the state of
Maharashtra during (1984-85).By Statistical Cell Directorate of Animal Husbandry Maharashtra State, Pune. (Page no:-15, Table No.:12).
3I
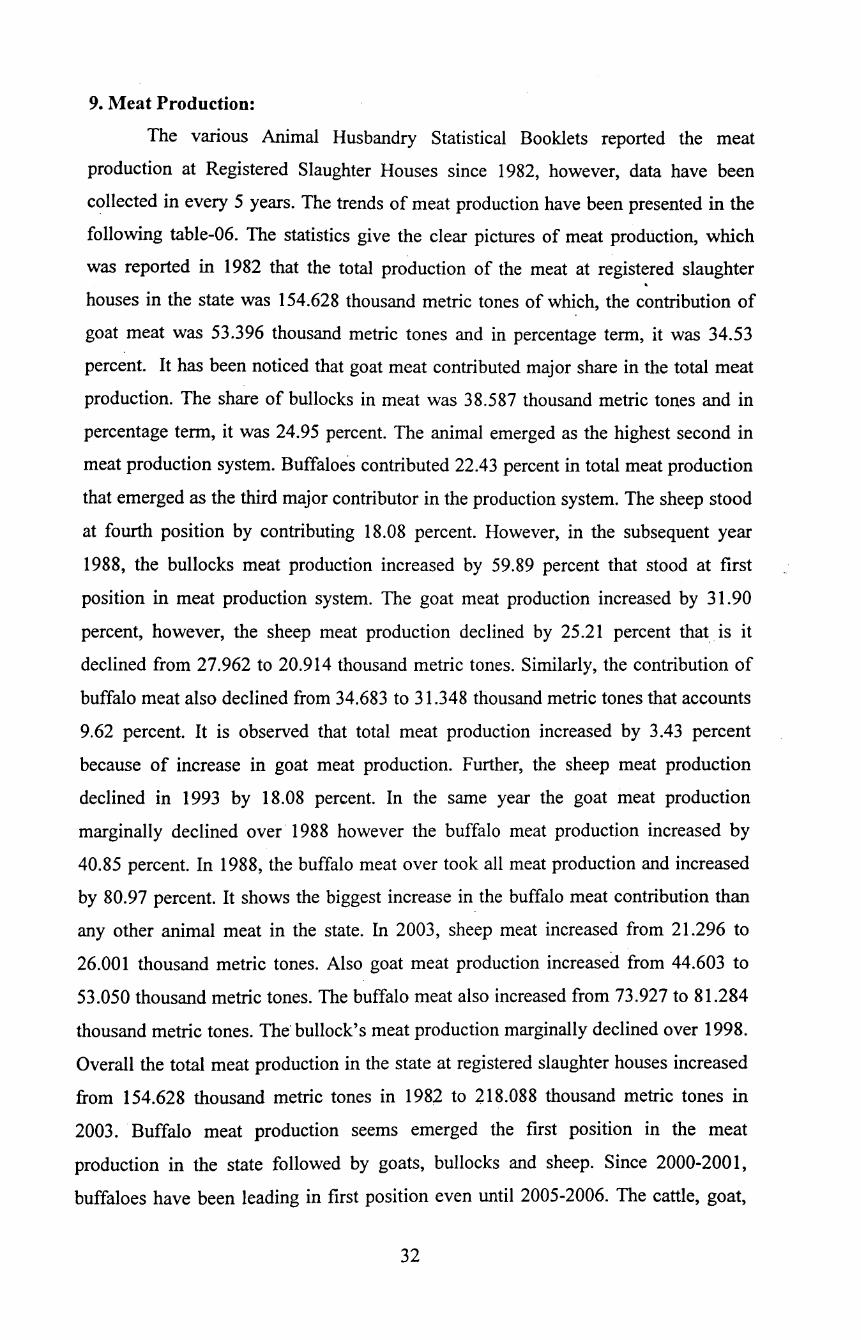
9. Meat Production:
The various Animal Husbandry Statistical Booklets reported the meat
production at Registered Slaughter Houses since 1982, however, data have been
collected in every 5 years. The trends of meat production have been presented in the
following table-06. The statistics give the clear pictures of meat production, which
was reported in 1982 that the total production of the meat at registered slaughter . houses in the state was 154.628 thousand metric tones of which, the contribution of
goat meat was 53.396 thousand metric tones and in percentage term, it was 34.53
percent. It has been noticed that goat meat contributed major share in the total meat
production. The share of bullocks in meat was 38.587 thousand metric tones and in
percentage term, it was 24.95 percent. The animal emerged as the highest second in
meat production system. Buffaloes contributed 22.43 percent in total meat production
that emerged as the third major contributor in the production system. The sheep stood
at fourth position by contributing 18.08 percent. However, in the subsequent year
1988, the bullocks meat production increased by 59.89 percent that stood at first
position in meat production system. The goat meat production increased by 31.90
percent, however, the sheep meat production declined by 25.21 percent that is it
declined from 27.962 to 20.914 thousand metric tones. Similarly, the contribution of
buffalo meat also declined from 34.683 to 31.348 thousand metric tones that accounts
9.62 percent. It is observed that total meat production increased by 3.43 percent
because of increase in goat meat production. Further, the sheep meat production
declined in 1993 by 18.08 percent. In the same year the goat meat production
marginally declined over· 1988 however the buffalo meat production increased by
40.85 percent. In 1988, the buffalo meat over took all meat production and increased
by 80.97 percent. It shows the biggest increase in the buffalo meat contribution than
any other animal meat in the state. In 2003, sheep meat increased from 21.296 to
26.001 thousand metric tones. Also goat meat production increased from 44.603 to
53.050 thousand metric tones. The buffalo meat also increased from 73.927 to 81.284
thousand metric tones. The· bullock's meat production marginally declined over 1998.
Overall the total meat production in the state at registered slaughter houses increased
from 154.628 thousand metric tones in 1982 to 218.088 thousand metric tones in
2003. Buffalo meat production seems emerged the first position in the meat
production in the state followed by goats, bullocks and sheep. Since 2000-2001,
buffaloes have been leading in first position even until 2005-2006. The cattle, goat,
32
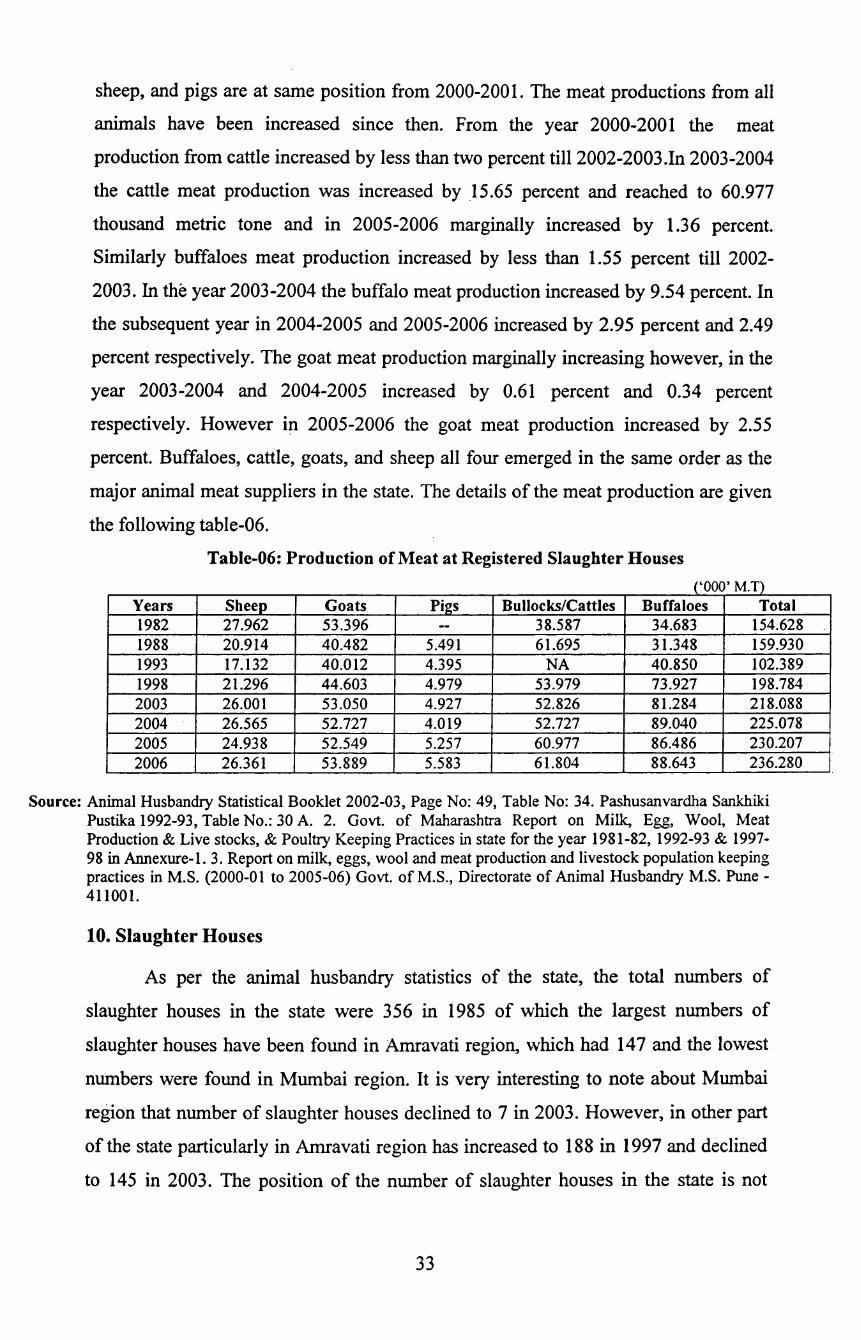
sheep, and pigs are at same position from 2000-2001. The meat productions from all
animals have been increased since then. From the year 2000-2001 the meat
production from cattle increased by less than two percent till2002-2003.In 2003-2004
the cattle meat production was increased by 15.65 percent and reached to 60.977
thousand metric tone and in 2005-2006 marginally increased by 1.36 percent.
Similarly buffaloes meat production increased by less than 1.55 percent till 2002-
2003. In the year 2003-2004 the buffalo meat production increased by 9.54 percent. In
the subsequent year in 2004-2005 and 2005-2006 increased by 2.95 percent and 2.49
percent respectively. The goat meat production marginally increasing however, in the
year 2003-2004 and 2004-2005 increased by 0.61 percent and 0.34 percent
respectively. However in 2005-2006 the goat meat production increased by 2.55
percent. Buffaloes, cattle, goats, and sheep all four emerged in the same order as the
major animal meat suppliers in the state. The details of the meat production are given
the following table-06.
Table-06: Production of Meat at Registered Slaughter Houses
('000' M.T) Years Sheep Goats Pi2S Bullocks/Cattles Buffaloes Total 1982 27.962 53.396 -- 38.587 34.683 154.628 1988 20.914 40.482 5.491 61.695 31.348 159.930 1993 17.132 40.012 4.395 NA 40.850 102.389 1998 21.296 44.603 4.979 53.979 73.927 198.784 2003 26.001 53.050 4.927 52.826 81.284 218.088 2004 26.565 52.727 4.019 52.727 89.040 225.078 2005 24.938 52.549 5.257 60.977 86.486 230.207 2006 26.361 53.889 5.583 61.804 88.643 236.280
Source: Animal Husbandry Statistical Booklet 2002-03, Page No: 49, Table No: 34. Pashusanvardha Sankhiki Pustika 1992-93, Table No.: 30 A. 2. Govt. of Maharashtra Report on Milk, Egg, Wool, Meat Production & Live stocks, & Poultry Keeping Practices in state for the year 1981-82, 1992-93 & 1997-98 in Annexure- I. 3. Report on milk, eggs, wool and meat production and livestock population keeping practices in M.S. (2000-0 I to 2005-06) Govt. of M.S., Directorate of Animal Husbandry M.S. Pune -411001.
10. Slaughter Houses
As per the animal husbandry statistics of the state, the total numbers of
slaughter houses in the state were 356 in 1985 of which the largest numbers of
slaughter houses have been found in Amravati region, which had 14 7 and the lowest
numbers were found in Mumbai region. It is very interesting to note about Mumbai
region that number of slaughter houses declined to 7 in 2003. However, in other part
of the state particularly in Amravati region has increased to 188 in 1997 and declined
to 145 in 2003. The position of the number of slaughter houses in the state is not
33

increasing though the total meat production increased from 154.628 thousand metric
tones in 1982 to 236.280 thousand metric tones in 2006.
Table-07: District-wise Number of Slaughter Houses (in Number)
R~ions 1985 1988 1993 1997 Mumbai 21 26 15 23 Nashik 35 40 44 44 Pune 47 44 44 44 Aurangabad 71 83 85 85 Latur -- -- -- --Amravati 147 159 188 188 Nagpur 35 35 37 37 Maharashtra State 356 387 413 421
Source: 1. Ammal Husbandry Statistical Booklet 1988-89 to 2003-04, Page No: 43, Table No: 3. ·
2. Pashusanvardhan Sankhiki Pustika 1996-97, Page no.36, Table No: 29.
11. Export of Live Goats and Their Products Export of Meat (Value) In India
2003 7
45 39 33 38
145 31
338
According to the report of APEDA on Agro Exports Statistics, in 2001-2002,
India had exported meat of values Rs. 1307.56 Cr of which the contribution of the
buffalo meat was Rs. 1144.42 Cr. It is observed that the buffalo meat emerged as
major export component in terms of rupees in total export of meat. Its export value
has been increased by 14.07 percent in 2002-2003. It is noticed that the export
contribution of buffaloes more than doubled in terms of export value in 2005-2006.
Trends continue in case of sheep and goat meat, which value was Rs. 33.07 in 2001-
2002 that increased by 20.80 percent in subsequent year. In 2003-2004, the export
value of sheep and goat meat -was Rs. 110.39 Cr, which is noticed in term of
percentage that it increased by 176.32 percent in a single year. In subsequent year,
2004-05 and 2005-06 the export value were 81.27 Cr. and 80.37 Cr. respectively. The
value of processed meat was Rs. 130.07 in 2001-2002 that increased to 156.47 Cr,
which increased by 20.30 percent. It has been noticed in the subsequent year that it
increased by more than 29 percent, which was actually Rs. 167.58 in 2005-2006. No
doubt that the processed meat component is one of major head, which has been
contributing in export value of meat. Overall, the export value of meat increased from
Rs. 1307.56 Cr. in 2001-2002 to 2877.52 Cr. in 2005-2006 that accounted 120.07
percent. (See table-08)
34
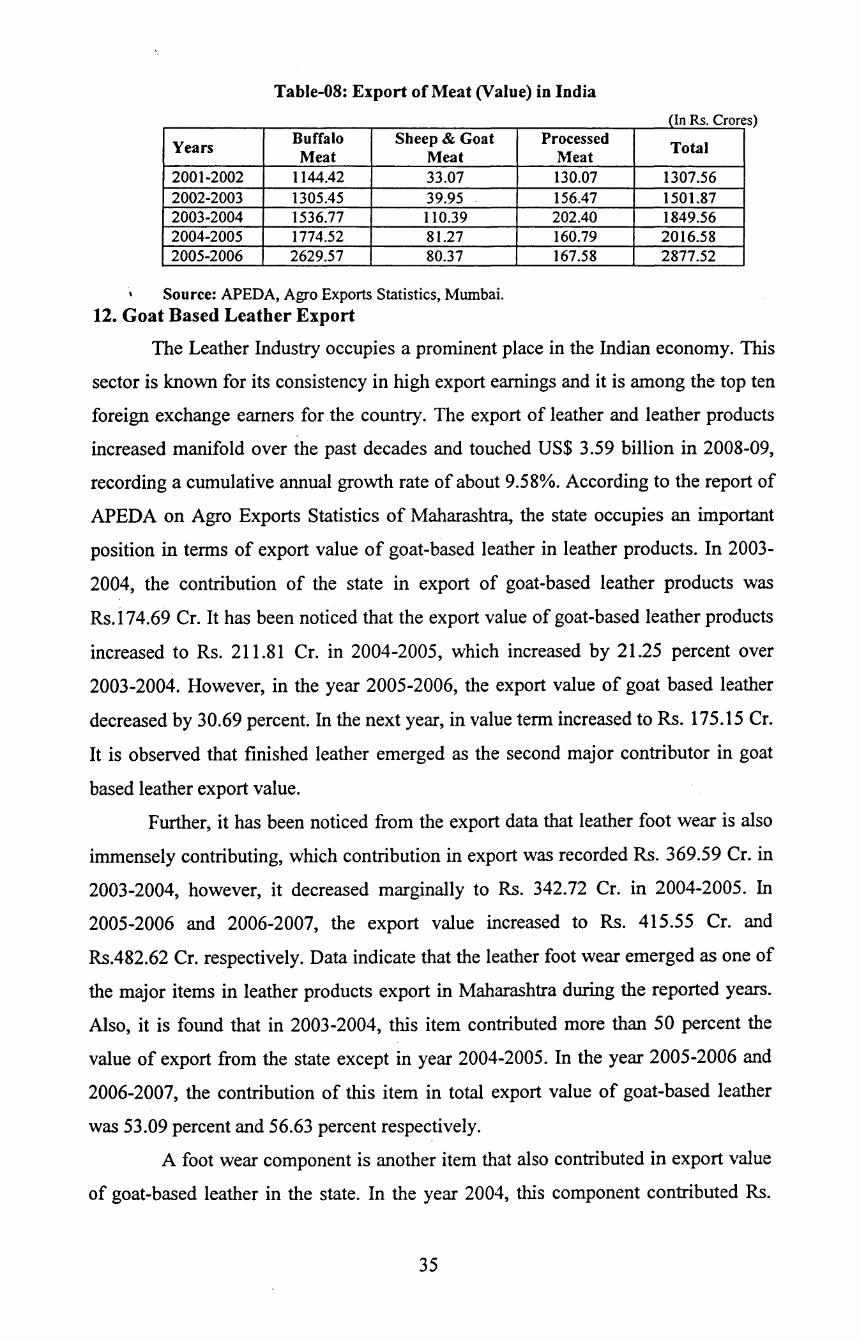
Table-08: Export of Meat (Value) in India
Years Buffalo Sheep & Goat Meat Meat
2001-2002 1144.42 33.07 2002-2003 1305.45 39.95 2003-2004 1536.77 110.39 2004-2005 1774.52 81.27 2005-2006 2629.57 80.37
Source: APEDA, Agro Exports Statistics, Mumbai.
12. Goat Based Leather Export
Processed Meat 130.07 156.47 202.40 160.79 167.58
(In Rs. Crore s)
Total
1307.56 1501.87 1849.56 2016.58 2877.52
The Leather Industry occupies a prominent place in the Indian economy. This
sector is known for its consistency in high export earnings and it is among the top ten
foreign exchange earners for.the country. The export of leather and leather products
increased manifold over the past decades and touched US$ 3.59 billion in 2008-09,
recording a cumulative annual growth rate of about 9.58%. According to the report of
APED A on Agro Exports Statistics of Maharashtra, the state occupies an important
position in terms of export value of goat-based leather in leather products. In 2003-
2004, the contribution of the state in export of goat-based leather products was
Rs. i 74.69 Cr. It has been noticed that the export value of goat-based leather products
increased to Rs. 211.81 Cr. in 2004-2005, which increased by 21.25 percent over
2003-2004. However, in the year 2005-2006, the export value of goat based leather
decreased by 30.69 percent. In the next year, in value term increased toRs. 175.15 Cr.
It is observed that finished leather emerged as the second major contributor in goat
based leather export value.
Further, it has been noticed from the export data that leather foot wear is also
immensely contributing, which contribution in export was recorded Rs. 369.59 Cr. in
2003-2004, however, it decreased marginally to Rs. 342.72 Cr. in 2004-2005. In
2005-2006 and 2006-2007, the export value increased to Rs. 415.55 Cr. and
Rs.482.62 Cr. respectively. Data indicate that the leather foot wear emerged as one of
the major items in leather products export in Maharashtra during the reported years.
Also, it is found that in 2003-2004, this item contributed more than 50 percent the
value of export from the state except in year 2004-2005. In the year 2005-2006 and
2006-2007, the contribution of this item in total export value of goat-based leather
was 53.09 percent and 56.63 percent respectively.
A foot wear component is another item that also contributed in export value
of goat-based leather in the state. In the year 2004, this component contributed Rs.
35
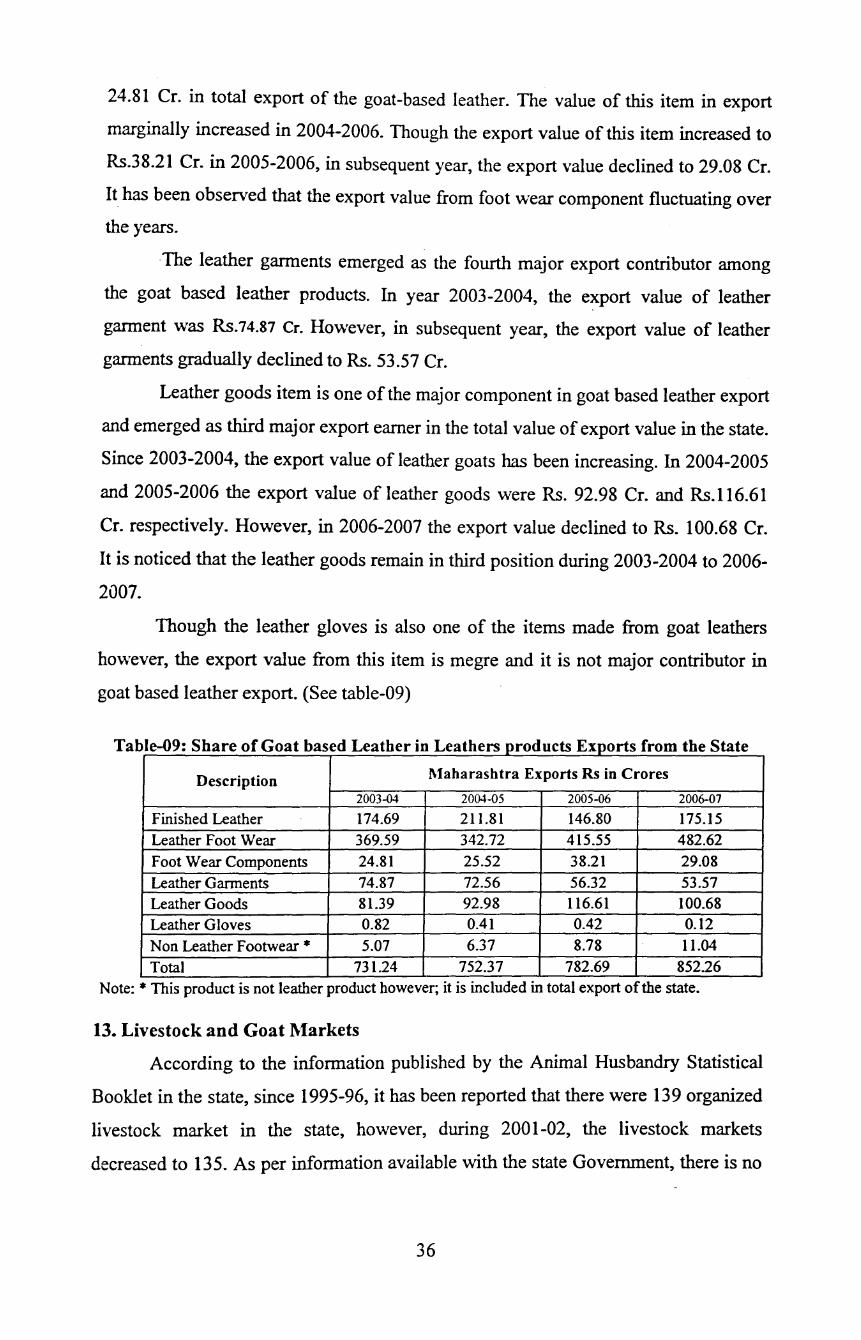
24.81 Cr. in total export of the goat-based leather. The value of this item in export
marginally increased in 2004-2006. Though the export value of this item increased to
Rs.38.21 Cr. in 2005-2006, in subsequent year, the export value declined to 29.08 Cr.
It has been observed that the export value from foot wear component fluctuating over
the years.
The leather garments emerged as the fourth major export contributor among
the goat based leather products. In year 2003-2004, the export value of leather
garment was Rs.74.87 Cr. However, in subsequent year, the export value of leather
garments gradually declined toRs. 53.57 Cr.
Leather goods item is one of the major component in goat based leather export
and emerged as third major export earner in the total value of export value in the state.
Since 2003-2004, the export value of leather goats has been increasing. In 2004-2005
and 2005-2006 the export value of leather goods were Rs. 92.98 Cr. and Rs.ll6.61
Cr. respectively. However, in 2006-2007 the export value declined to Rs. I 00.68 Cr.
It is noticed that the leather goods remain in third position during 2003-2004 to 2006-
2007.
Though the leather gloves is also one of the items made from goat leathers
however, the export value from this item is megre and it is not major contributor in
goat based leather export. (See table-09)
Table-09 Sh . areo oat ase at er m eat ers pro nets xports rom e e . fG b d Le h L h d E f th Stat
Description .Maharashtra Exports Rs in Crores
2003-04 2004-05 2005-06 2006-07
Finished Leather 174.69 211.81 146.80 175.15 Leather Foot Wear 369.59 342.72 415.55 482.62 Foot Wear Components 24.81 25.52 38.21 29.08 Leather Garments 74.87 72.56 56.32 53.57 Leather Goods 81.39 92.98 116.61 100.68 Leather Gloves 0.82 0.41 0.42 0.12 Non Leather Footwear* 5.07 6.37 8.78 11.04 Total 731.24 752.37 782.69 852.26
Note: *This product is not leather product however; it is included in total export of the state.
13. Livestock and Goat 1\larkets
According to the information published by the Animal Husbandry Statistical
Booklet in the state, since 1995-96, it has been reported that there were 139 organized
livestock market in the state, however, during 2001-02, the livestock markets
decreased to 135. As per information available with the state Government, there is no
36
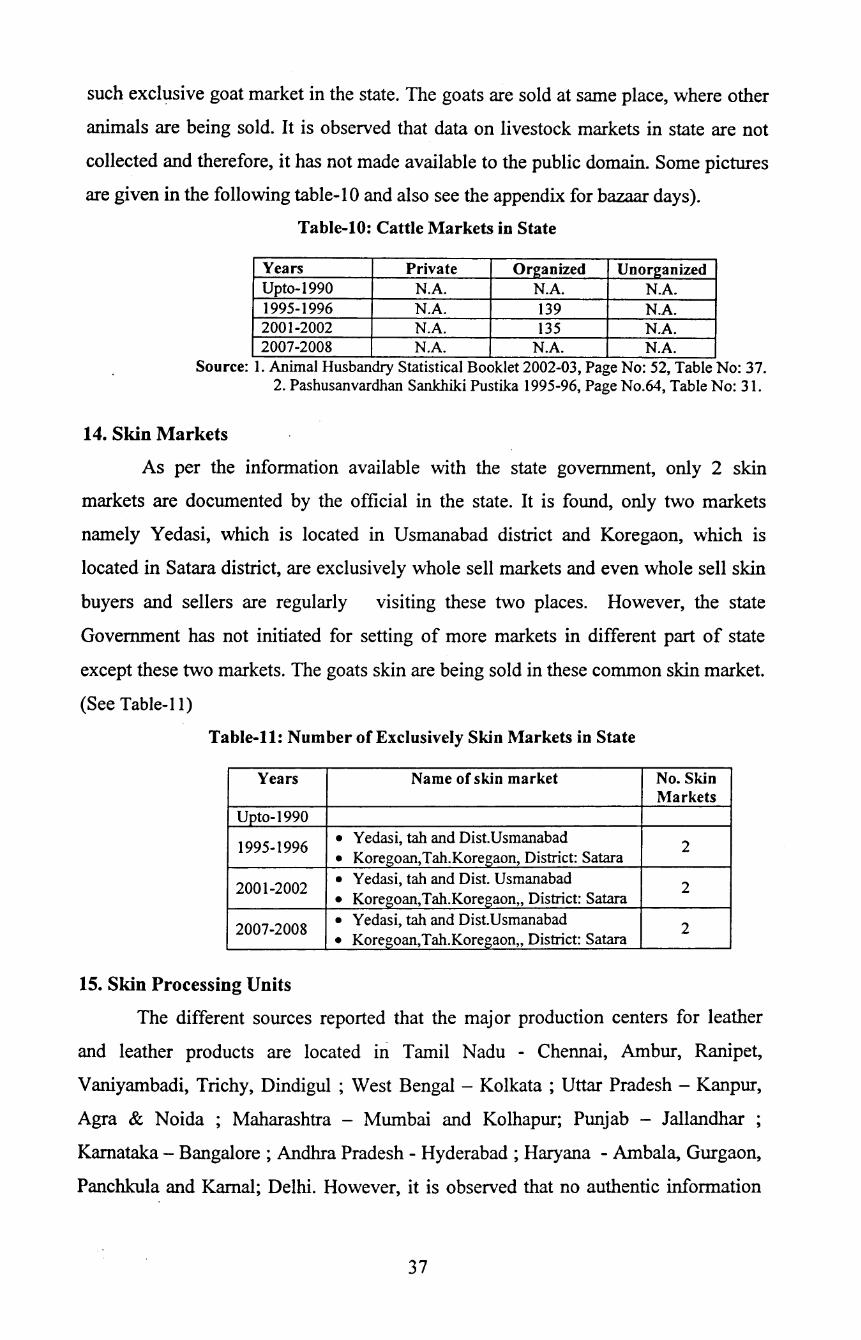
such exclusive goat market in the state. The goats are sold at same place, where other
animals are being sold. It is observed that data on livestock markets in state are not
collected and therefore, it has not made available to the public domain. Some pictures
are given in the following table-t 0 and also see the appendix for bazaar days).
Table-10: Cattle Markets in State
Years Private 0.-g_anized Unor2anized Upto-1990 N.A. N.A. N.A. 1995-1996 N.A. 139 N.A. 2001-2002 N.A. 135 N.A. 2007-2008 N.A. N.A. N.A.
Source: 1. Animal Husbandry Statistical Booklet 2002-03, Page No: 52, Table No: 37. 2. Pashusanvardhan Sankhiki Pustika 1995-96, Page No.64, Table No: 31.
14. Skin Markets
As per the information available with the state government, only 2 skin
markets are documented by the official in the state. It is found, only two markets
namely Yedasi, which is located in Usmanabad district and Koregaon, which is
located in Satara district, are exclusively whole sell markets and even whole sell skin
buyers and sellers are regularly visiting these two places. However, the state
Government has not initiated for setting of more markets in different part of state
except these two markets. The goats skin are being sold in these common skin market.
(See Table-11)
Table-11: Number of Exclusively Skin Markets in State
Years Name of skin market No. Skin Markets
Upto-1990
1995-1996 • Yedasi, tab and Dist.Usmanabad
2 • Koregoan, Tah.Koregaon, District: Satara
2001-2002 • Yedasi, tab and Dist. Usmanabad
2 • Koregoan, Tah.Koregaon, District: Satara
2007-2008 • Yedasi, tab and Dist.Usmanabad
2 • Koregoan, Tah.Koregaon, District: Satara
15. Skin Processing Units
The different sources reported that the major production centers for leather
and leather products are located iri Tamil Nadu - Chennai, Ambur, Ranipet,
Vaniyambadi, Trichy, Dindigul ; West Bengal- Kolkata; Uttar Pradesh- Kanpur,
Agra & Noida ; Maharashtra - Mumbai and Kolhapur; Punjab - Jallandhar ;
Karnataka - Bangalore ; Andhra Pradesh - Hyderabad ; Haryana - Ambala, Gurgaon,
Panchkula and Kamal; Delhi. However, it is observed that no authentic information
37
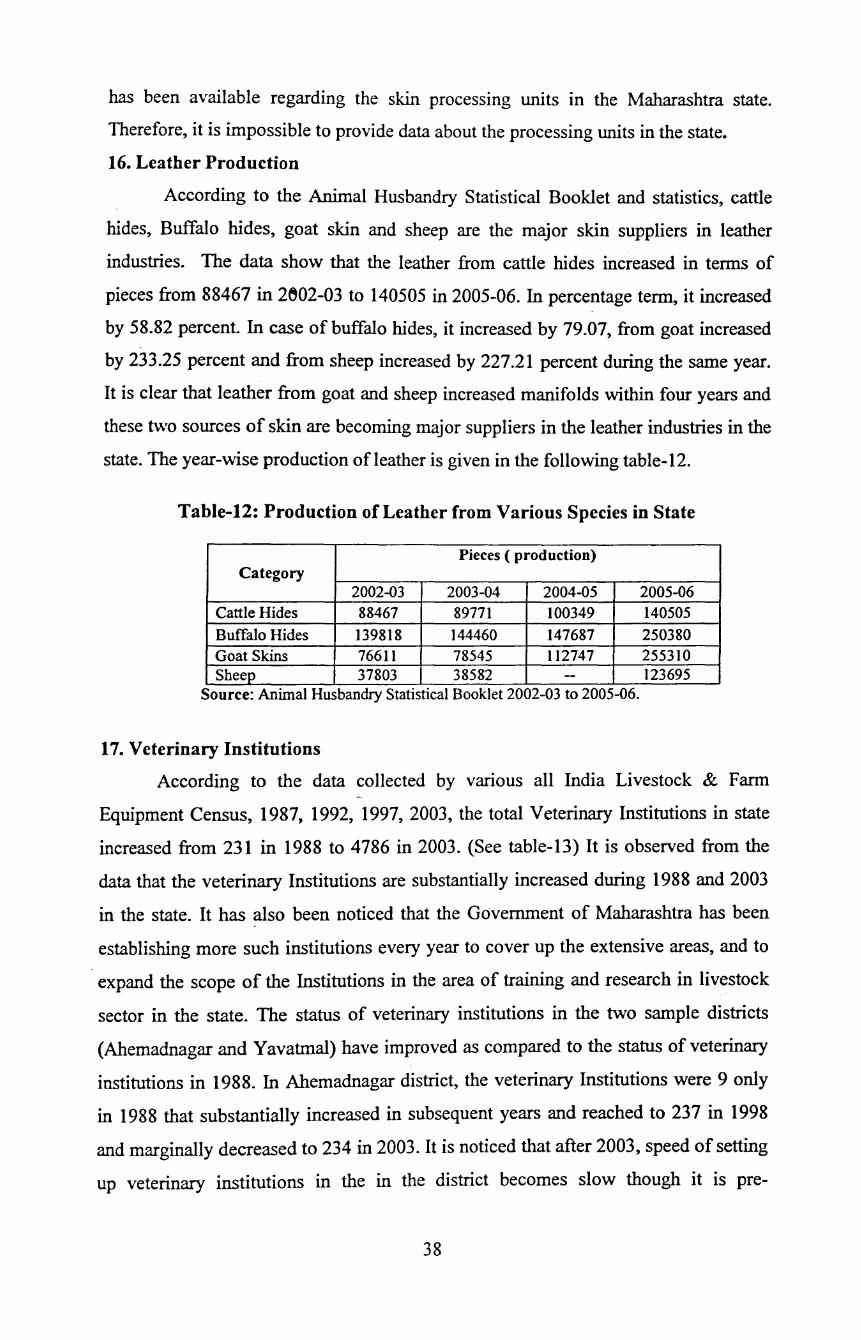
has been available regarding the skin processing units in the Maharashtra state.
Therefore, it is impossible to provide data about the processing units in the state.
16. Leather Production
According to the Animal Husbandry Statistical Booklet and statistics, cattle
hides, Buffalo hides, goat skin and sheep are the major skin suppliers in leather
industries. The data show that the leather from cattle hides increased in terms of
pieces from 88467 in 2~W2-03 to 140505 in 2005-06. In percentage term, it increased
by 58.82 percent. In case of buffalo hides, it increased by 79.07, from goat increased
by 233.25 percent and from sheep increased by 227.21 percent during the same year.
It is clear that leather from goat and sheep increased manifolds within fouryears and
these two sources of skin are becoming major suppliers in the leather industries in the
state. The year-wise production of leather is given in the following table-12.
Table-12: Production of Leather from Various Species in State
Pieces (production) Category
2002-03 2003-04 2004-05 2005-06 Cattle Hides 88467 89771 100349 140505
Buffalo Hides 139818 144460 147687 250380 Goat Skins 76611 78545 112747 255310 Sheep 37803 38582 -- 123695
.. Source: Animal Husbandry Statistical Booklet 2002-03 to 2005-06.
17. Veterinary Institutions
According to the data collected by vanous all India Livestock & Farm
Equipment Census, 1987, 1992, 1997, 2003, the total Veterinary Institutions in state
increased from 231 in 1988 to 4786 in 2003. (See table-13) It is observed from the
data that the veterinary Institutions are substantially increased during 1988 and 2003
in the state. It has also been noticed that the Government of Maharashtra has been
establishing more such institutions every year to cover up the extensive areas, and to
expand the scope of the Institutions in the area of training and research in livestock
sector in the state. The status of veterinary institutions in the two sample districts
(Ahemadnagar and Yavatmal) have improved as compared to the status of veterinary
institutions in 1988. In Ahemadnagar district, the veterinary Institutions were 9 only
in 1988 that substantially increased in subsequent years and reached to 237 in 1998
and marginally decreased to 234 in 2003. It is noticed that after 2003, speed of setting
up veterinary institutions in the in the district becomes slow though it is pre-
38

requirement for the development of livestock sector. Similarly, in Yavatmal district
the veterinary Institutions were 11 only in 1988 that substantially increased to 202 in
1998 and 203 in 2003. Since then, in this district too, the speed of setting up
veterinary institutions becomes slow.
Table-13: District wise Veterinary Institutions in state
Name of Districts Veterinary Institutions (In Number)
1988 1993 1998 2003 Bombay 5 9 I4 9 Thane II I24 139 I 57 Raigad 11 96 IIO I2I Ratnagiri I9 I44 I 57 I 56 Sindhudurg I2 65 96 IOI Nashik 9 I97 226 254 Dhuie 11 I6I 197 115
Nandurbar --- --- - I06 Jalgaon IO I 52 I80 I79 Ahemadnagar 9 216 237 234 Pune 11 215 287 280 Sa tara 9 I40 I86 I9I Sangli II 132 I60 I 59 Solapur 8 134 172 I74 Kolhapur 13 I44 I72 176 Aurangabad 9 113 128 124 Jalna . 10 89 101 101 Parbhani 10 138 154 85 Beed 9 131 153 158 Nanded 10 147 173 131 Osmanabad 10 78 100 99 Latur 13 113 135 182 Hingoli --- -- - 69 Buldhana 11 127 131 174 Akola 12 135 142 77 Washim --- --- - 67 Amravati 15 165 174 134 Yavatmal 11 185 202 203 Wardha 12 82 108 190 Nagpur 15 174 197 109 Bhandara 12 151 172 83 Gondiya --- -- - 90 Chandrapur 11 137 150 156 Gadchiroli 9 93 101 142 Maharashtra State 231 3987 4654 4786
.th ·tn -tn Source: 14 , 15 , 16 All India Livestock & Farm Eqmpment Census, 1987, 1992, 1997, 2003 Animal Husbandry Maharashtra State, Pune-1.
18. Veterinary Hospitals and Rearing Centers
According to the information made available by the State Government and
local authorities (Zilha Parishad), both the authorities play important role for setting
up the hospitals for the timely treatment, vaccination, medication, artificial
39
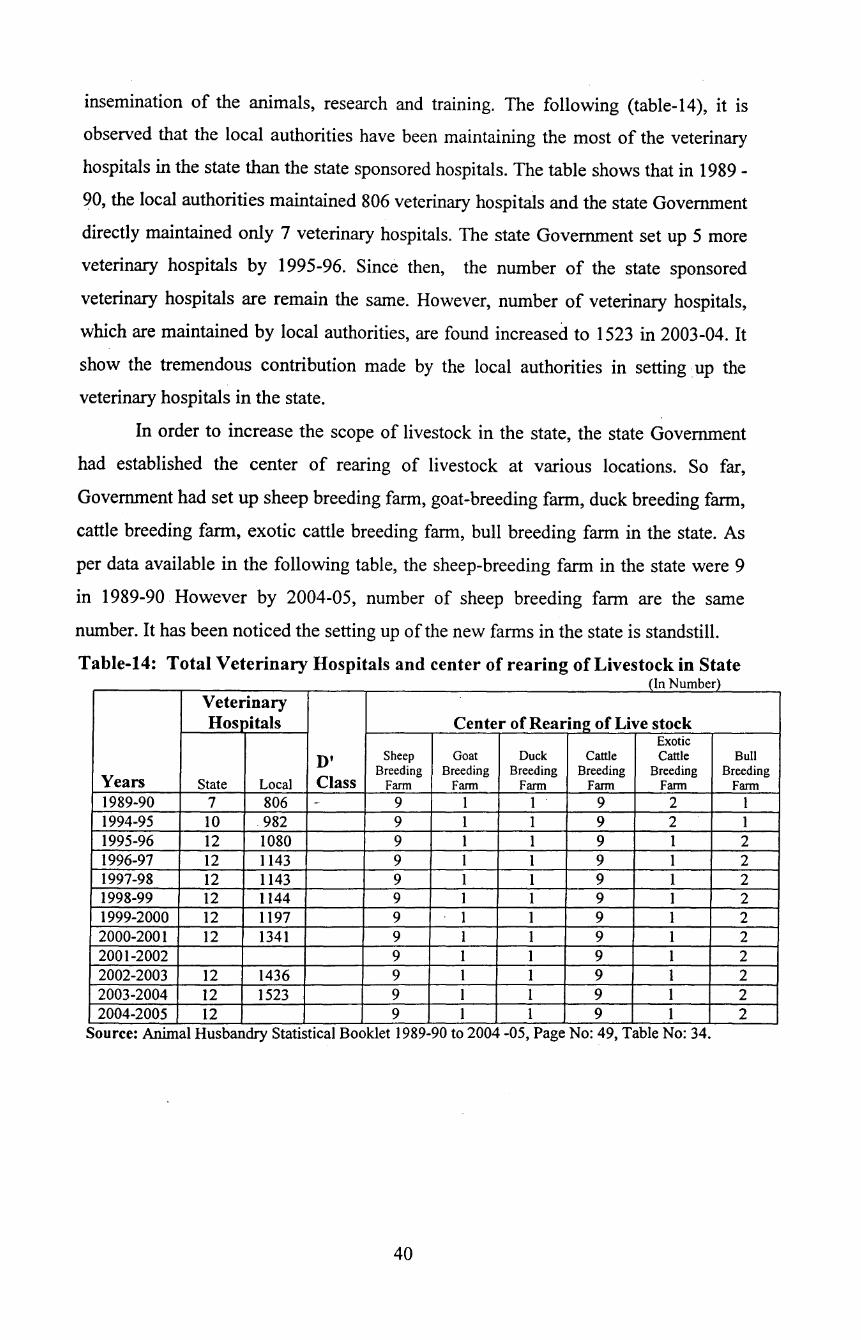
insemination of the animals, research and training. The following (table-14), it is
observed that the local authorities have been maintaining the most of the veterinary
hospitals in the state than the state sponsored hospitals. The table shows that in 1989 -
90, the local authorities maintained 806 veterinary hospitals and the state Government
directly maintained only 7 veterinary hospitals. The state Government set up 5 more
veterinary hospitals by 1995-96. Since then, the number of the state sponsored
veterinary hospitals are remain the same. However, number of veterinary hospitals,
which are maintained by local authorities, are found increased to 1523 in 2003-04. It
show the tremendous contribution made by the local authorities in setting . up the
veterinary hospitals in the state.
In order to increase the scope of livestock in the state, the state Government
had established the center of rearing of livestock at various locations. So far,
Government had set up sheep breeding farm, goat-breeding farm, duck breeding farm,
cattle breeding farm, exotic cattle breeding farm, bull breeding farm in the state. As
per data available in the following table, the sheep-breeding farm in the state were 9
in 1989-90 However by 2004-05, number of sheep breeding farm are the same
number. It has been noticed the setting up of the new farms in the state is standstill.
Table-14: Total Veterinary Hospitals and center of rearing of Livestock in State (In Number)
Veterinary Hospitals Center of Rearing of Live stock
Exotic
D' Sheep Goat Duck Cattle Cattle Bull Breeding Breeding Breeding Breeding Breeding Breeding
Years State Local Class Farm Farm Farm Farm Farm Farm I989-90 7 806 - 9 I I 9 2 I I994-95 10 982 9 I I 9 2 I I995-96 12 1080 9 I I 9 1 2 1996-97 12 1143 9 I 1 9 I 2 I997-98 12 1143 9 I 1 9 1 2 1998-99 12 1144 9 I I 9 1 2 1999-2000 12 1197 9 I I 9 I 2 2000-2001 I2 1341 9 I I 9 I 2 200I-2002 9 I I 9 I 2 2002-2003 12 I436 9 I I 9 I 2 2003-2004 12 I523 9 I I 9 I 2 2004-2005 12 9 I I 9 I 2
Source: Animal Husbandry Statistical Booklet 1989-90 to 2004 -05, Page No: 49, Table No: 34.
40

CHAPTER-III
PROFILE OF SAMPLE DISTRICTS, VILLAGE, AND MARKETING SYSTEM
1. Profile of Yavatmal District
· Yavatmal district lies between I9° 26' and 20° 42' north latitudes and between
77° I8' and 79° 09' east longitude. With the re-organization of State in 1956, the
district. was transferred from Madhya Pradesh to Bombay State, which was renamed
as Maharashtra state and was created on 1st May 1960. Since then, the district had
become a part ofMaharashtra State. The district has an area of 13,582 sq. kms., which
constitutes 4.4 percent area of the State and is surrounded by Amaravati and Wardha
districts in the north, Chandrapur in the east, Nanded in the south, and Hingoli and
Washim in the west. Andhra Pradesh surrounds in the south. Its greatest length, from
east to west, is about 120 miles, and its greatest breadth, from north to south, nearly
100 miles. It occupies the south eastern quarter of berar on the west are Washim and
Akola District. On the north is the Amravati to the east where the Wardha river forms
the boundary, lie two Districts of the Central Provinces Wardha and Chandrapur
along the south lie the Nanded District and Andhra Pradesh. The Penganga River,
which flows in great curves and loop, marks the whole of the southern boundary and
unites at the southeastern extremity with the Wardha River.
According to Census 200 I, the total population of the district is 2,45 8,27I that -
comprising 1,265,681 males and I, I92,590 females. It has been noticed in the census
2001 that the district population in 2001 is higher by 18.3 percent over previous
census 199I. The census 2001 reported that Yavatmal tahshil is most populous with a
population of 335,967 and as much as I3.7 percent of the population is concentrated
in tahshil Yavatmal only. Other tahshils in order of population size are Yavatmal
(335,967), Pusad (285,458), Umarkhed (222,818), Wani (193,713), Darwha
(173,480), Mahagaon (I58,230), Kelapur (140,907), Ami (139,861), Digras
(134,928), Ghatanji (125,214), Ner (110,762), Ralegaon (104,832), Kalamb (95,830),
Babulgaon (89,153), Maregaon (74,879) and Zari-Jamani (72,239). The districts
population constitutes 2.5 percent of the total population of the State. The density of
population is 181 persons per sq. km. Among the 35 districts of the State, the district
ranks 6th in terms of area, 16th in terms of population and 32nd in terms of density. The
4I
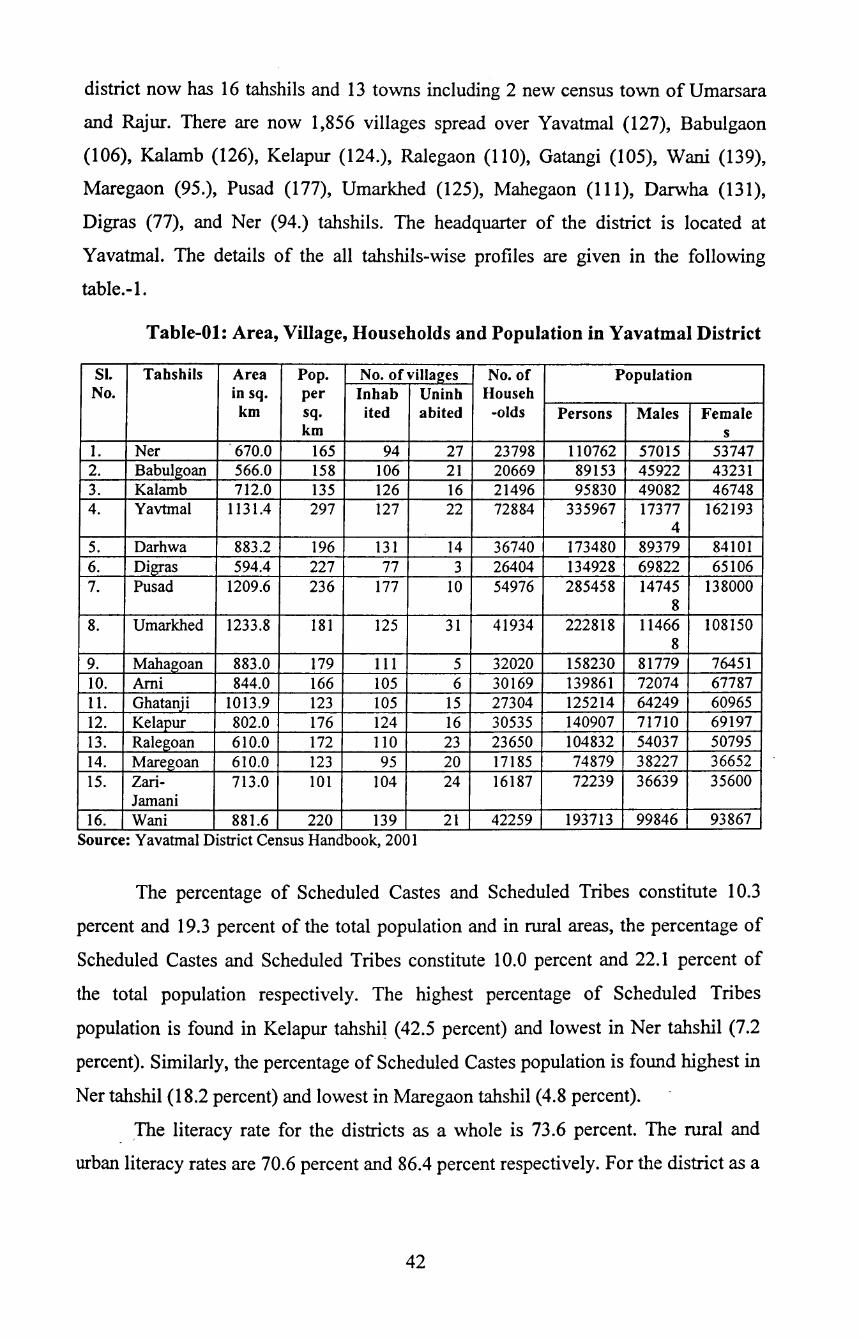
district now has 16 tahshils and 13 towns including 2 new census town of Umarsara
and Rajur. There are now 1,856 villages spread over Yavatmal (127), Babulgaon
(106), Kalamb (126), Kelapur (124.), Ralegaon (110), Gatangi (105), Wani (139),
Maregaon (95.), Pusad (177), Umarkhed (125), Mahegaon (111), Darwha (131),
Digras (77), and Ner (94.) tahshils. The headquarter of the district is located at
Yavatmal. The details of the all tahshils-wise profiles are given in the following
table.-1.
Table-01: Area, Village, Households and Population in Yavatmal District
Sl. Tahshils Area Pop. No. ofvillages No. of Population No. in sq. per Inhab Uninh Househ
km sq. ited abited -olds Persons Males Female km s
1. Ner 670.0 165 94 27 23798 110762 57015 53747 2. Babulgoan 566.0 158 106 21 20669 89153 45922 43231 3. Kalamb 712.0 135 126 16 21496 95830 49082 46748 4. Yavtmal 1131.4 297 127 22 72884 335967 17377 162193
4 5. Darhwa 883.2 196 131 14 36740 173480 89379 84101 6. Digras 594.4 227 77 3 26404 134928 69822 65106 7. Pus ad 1209.6 236 177 10 54976 285458 14745 138000
8 8. Umarkhed 1233.8 181 125 31 41934 222818 11466 108150
8 9. Mahagoan 883.0 179 Ill 5 32020 158230 81779 76451 10. Ami 844.0 166 105 6 30169 139861 72074 67787 11. Ghatanji 1013.9 123 105 15 27304 125214 64249 60965 12. Kelapur 802.0 176 124 16 30535 140907 71710 69197 13. Ralegoan 610.0 172 110 23 23650 104832 54037 50795 14. Maregoan 610.0 123 95 20 17185 74879 38227 36652 15. Zari- 713.0 101 104 24 16187 72239 36639 35600
Jamani 16. Wani 881.6 220 139 21 42259 193713 99846 93867
Source: Yavatmal D1stnct Census Handbook, 2001
The percentage of Scheduled Castes and Scheduled Tribes constitute 1 0.3
percent and 19.3 percent of the total population and in rural areas, the percentage of
Scheduled Castes and Scheduled Tribes constitute 10.0 percent and 22.1 percent of
the total population respectively. The highest percentage of Scheduled Tribes
population is found in Kelapur tahshil (42.5 percent) and lowest inNer tahshil (7.2
percent). Similarly, the percentage of Scheduled Castes population is found highest in
Ner tahshil (18.2 percent) and lowest in Maregaon tahshil (4.8 percent).
The literacy rate for the districts as a whole is 73.6 percent. The rural and
urban literacy rates are 70.6 percent and 86.4 percent respectively. For the district as a
42
whole, the literacy rate for males is much higher than females 84.1 percent of the
males are literates while females account only 62.5 percent.
Geographical Regions
The district consists of valley, hilly regions and partially surrounded by the
plains _and occupied by a number of east west ranges. The central portion is a plateau
with very steep sides and attains an elevation of between 300 and 600 meters above
the mean sea level. Here and there, it rises into ridges or into flat-topped or pointed
hills. The distric~ may be broadly divided into six geographical regions as; the Bernia
basin in the northern parts of new and Babulgoan tahshils; the Wardha plain that
spreads along the Wardha river through Kalamb, Ralegaon, Maregaon and Wani
tahshils; the Yavatmal plateau that covers major part of Yavatmal, Kalamb, Kelapur
and Ghatanji tahshils and small part of Babhulgaon Ralegaon and Maregaon tahshils;
the Darwha plateau, which covers the entire tahshil of Darwha, major part of Digras
Tahshil, and parts of Ner, Yavatmal, and Ghatanji tahsi; the Pusad hills that covers
Pusad, Mahagaon and Umarkhed tahshils and the Penganga valley along the southern
district boundary and consisting of small part of Pusad, Umarkhed, Mahagaon
Darwha, Ghatanji, Kelapur, Maregaon and Wani tahshils.
Tribal Villages
The district Yavatmal is recognized as tribal belt area and therefore the
Government of Maharashtra notified about 334 villages as under Tribal Sun-plan
(TSP) area, and another 122 villages are included under the Additional Tribal Sub
plan{ATSP).To carry the smooth develop metal work in remaining tribal concentrated
villages, the state government, as per the direction of the Central Government, formed
a group of cluster that is known as Modified Area Development Area (MADA)
villages that numbers in the district are 160 villages. Also, smaller population, which
live in villages, form a group and called as Mini- Modified Area Development Area
(Mini-MADA) villages that numbers are 22 Villages.
Rainfall and Climate
The average rainfall of Yavatmal District is 964.7 MM. In Rabi, cultivation is
said to have decreased partly because of the uncertainty of the rainfall in recent years.
On the other hand, it is said that a heavy rainfall would injure or even ruin cultivation
in some parts of the District, and that some villages in Pusad taluka formerly went out
of cultivation from this cause. The rainfall of the last 12 years has certainly been
43

enough when it has come at favorable times. The 25 years average gives 6 inches in
June 12 in July 8 in August 7 in September 2 in October and less than 1 in each of the
other months. There is no observatory in the District. Yavatmal us higher and cooler
than Amravati or Akola, but is not as cool as Buldhana. There is generally a breeze in
the hot weather, so that the nights are cool. The District has rather a bad name for
fever.
The climate of the district is, in general, hot and dry with moderately cold
winters. The year may be divided into four seasons. The hot season begins in March
and extends up to the first week of June. This is followed by the south west monsoon
season which last up till the end of September, October and November constitute the
post monsoon season and is followed by the cold season which last up till February.
The summer season from March to May is one of continuous rise in both day and
night temperature. May is generally the hottest month of the year with the mean daily
maximum temperature at about 42° C with the on set of the south west monsoons
there is an appreciable fall in temperatures and the weather becomes pleasant. During
the South-west monsoon season the air is humid and the skies are heavily clouded to
overcast. During the rest of the year, the air is generally dry and the skies are clear or
lightly clouded. Winds are generally light to moderate with some increase in force in
the latter part of the summer season and the monsoon months.
Crops
The district is known to produce main crops like Jowar, cotton, groundnut and
rice, which also known as kharifCrops of the District. Thejowar is grown in taluka of
Pusad, Ner, Mahagaon, Umarkhed, Maregaon, Ghatnaji, Wani, and Zari-Jamn. The
tahshils like Ghatanji, Wani, Pusad, Umarkhed, Mahagaon, and Ner are famous for
cotton crop as large-scale farmers grow this crop in the these region. Groundnut is
grown in the talukas of Pusad, Digras, Darwha, Arni, Ghtanji etc. Rices is Grown in
all the talukas in varying quantities. Wheat and gram are the important crops grown
in the Rabbi season. Sesame and linseed (Jaw as) are also grown besides these. These
crops are grown in the talukas like, which are lying in river basins of the Wardha and
the Penganga, are Umarkhed, Pusad, Wani, Digras, Maregaon, and Zari-jamni. \Vheat
is grown in Ami, ·ahtanji, and Yavatmal , too .Gram is grown in the talukas of
Umarkhed , Wani, Ralegaon,Maregaon ,Pusad, Digras, Ghatanji and Babhulgaon
etc. Other export items are cotton bales, lime, ice candy, wooden furniture, and
44
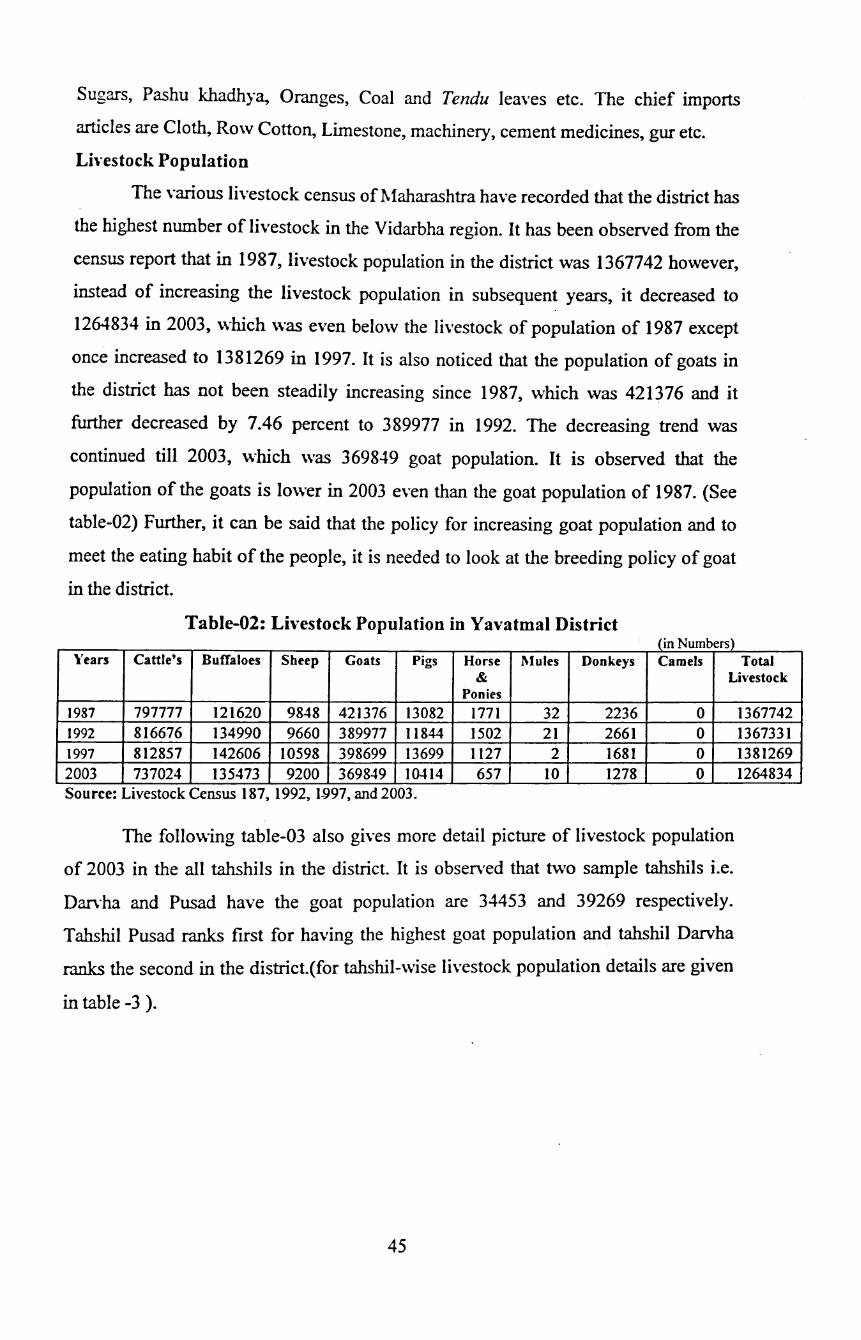
Sugars, Pashu khadhy~ Oranges, Coal and Tendu leaves etc. The chief imports
articles are Cloth, Row Cotton, Limestone, machinery, cement medicines, gur etc.
LiYestock Population
The various livestock census of l\1aharashtra have recorded that the district has
the highest number of livestock in the Vidarbha region. It has been observed from the
census report that in 1987, livestock population in the district was 1367742 however,
instead of increasing the livestock population in subsequent years, it decreased to
1264834 in 2003, which was even below the livestock of population of 1987 except
once increased to 1381269 in 1997. It is also noticed that the population of goats in
the district has not been steadily increasing since 1987, which was 421376 and it
further decreased by 7.46 percent to 3 89977 in 1992. The decreasing trend was
continued till 2003, which was 369849 goat population. It is observed that the
population of the goats is lower in 2003 even than the goat population of 1987. (See
table-02) Further, it can be said that the policy for increasing goat population and to
meet the eating habit of the people, it is needed to look at the breeding policy of goat
in the district.
Table-02: LiYestock Population in Yavatmal District (in Numbers)
\'ears Cattle's Buffaloes Sheep Goats Pigs Horse Mules Donkeys Camels Total & Livestock
Ponies 1987 797777 121620 9848 421376 13082 1771 32 2236 0 1992 816676 134990 9660 389977 11844 1502 21 2661 0 1997 812857 142606 10598 398699 13699 1127 2 1681 0 2003 737024 135473 9200 369849 10414 657 10 1278 0 Source: Livestock Census 187,1992, l-997,and2003.
The follo\\ing table-03 also gives more detail picture of livestock population
of 2003 in the all tahshils in the district. It is observed that two sample tahshils i.e.
Darvha and Pusad have the goat population are 34453 and 39269 respectively.
Tahshil Pusad ranks frrst for having the highest goat population and tahshil Darvha
ranks the second in the district.(for tahshil-wise livestock population details are given
in table -3 ).
45
1367742 1367331 1381269 1264834
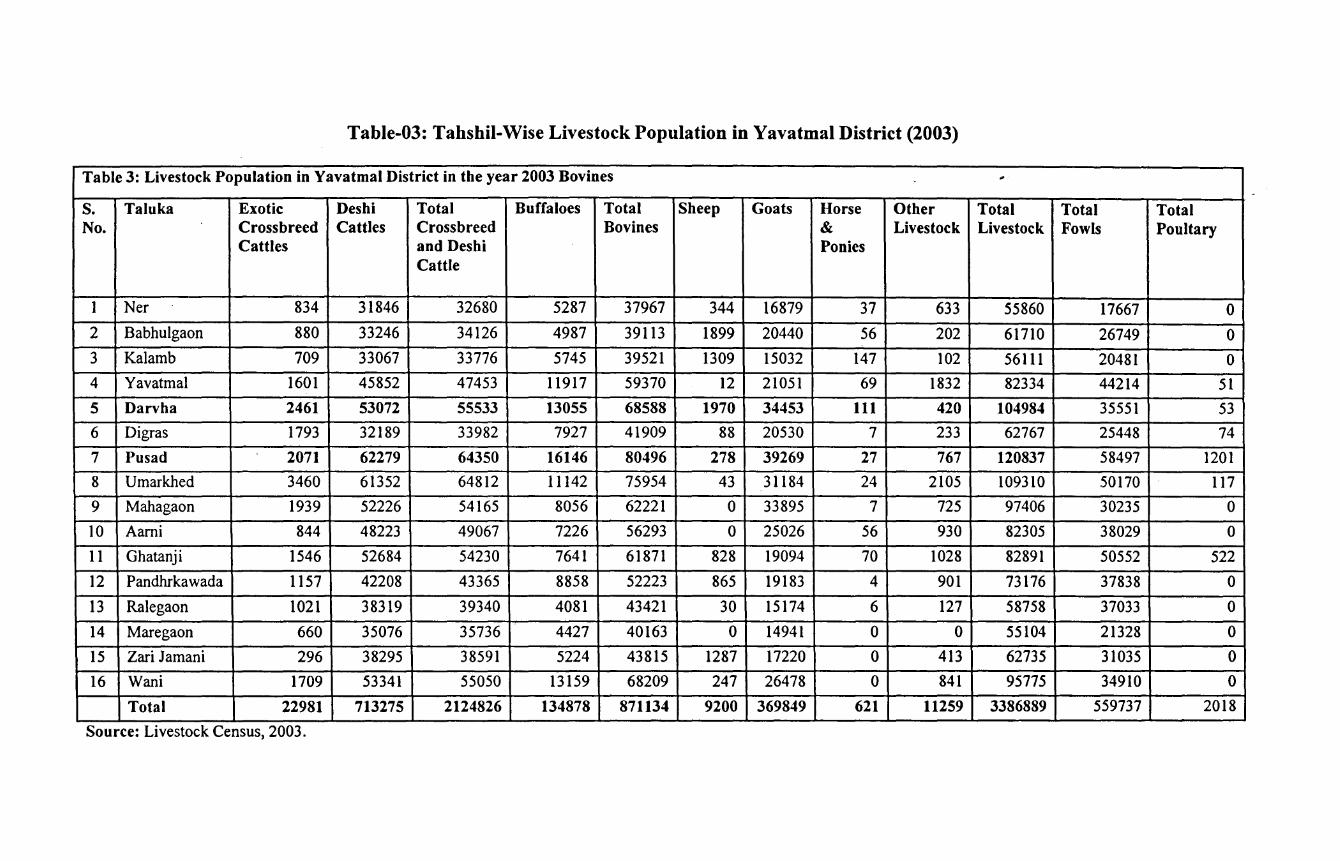
Table-03: Tahshil-Wise Livestock Population in Yavatmal District (2003)
Table 3: Livestock Population in Yavatmal District in the year 2003 Bovines .,
s. Taluka Exotic Des hi Total Buffaloes Total Sheep Goats Horse Other Total Total Total No. Crossbreed Cattles Crossbreed Bovines & Livestock Livestock Fowls Poultary
Cattles and Deshi Ponies Cattle
1 Ner 834 31846 32680 5287 37967 344 16879 37 633 55860 17667 0 2 Babhulgaon 880 33246 34126 4987 39113 1899 20440 56 202 61710 26749 0 3 Kalamb 709 33067 33776 5745 39521 1309 15032 147 102 56111 20481 0 4 Yavatmal 1601 45852 47453 11917 59370 12 21051 69 1832 82334 44214 51 5 Darvha 2461 53072 55533 13055 68588 1970 34453 111 420 104984 35551 53 6 Digras 1793 32189 33982 7927 41909 88 20530 7 233 62767 25448 74 7 Pus ad 2071 62279 64350 16146 80496 278 39269 27 767 120837 58497 1201 8 Umarkhed 3460 61352 64812 11142 75954 43 31184 24 2105 109310 50170 117 9 Mahagaon 1939 52226 54165 8056 62221 0 33895 7 725 97406 30235 0
10 A ami 844 48223 49067 7226 56293 0 25026 56 930 82305 38029 0
11 Ghatanji 1546 52684 54230 7641 61871 828 19094 70 1028 82891 50552 522
12 Pandhrkawada 1157 42208 43365 8858 52223 865 19183 4 901 73176 37838 0
13 Ralegaon 1021 38319 39340 4081 43421 30 15174 6 127 58758 37033 0
14 Maregaon 660 35076 35736 4427 40163 0 14941 0 0 55104 21328 0
15 Zari Jamani 296 38295 38591 5224 43815 1287 17220 0 413 62735 31035 0
16 Wani 1709 53341 55050 13159 68209 247 26478 0 841 95775 34910 0
Total 22981 713275 2124826 134878 871134 9200 369849 621 11259 3386889 559737 2018
Source: Livestock Census, 2003.
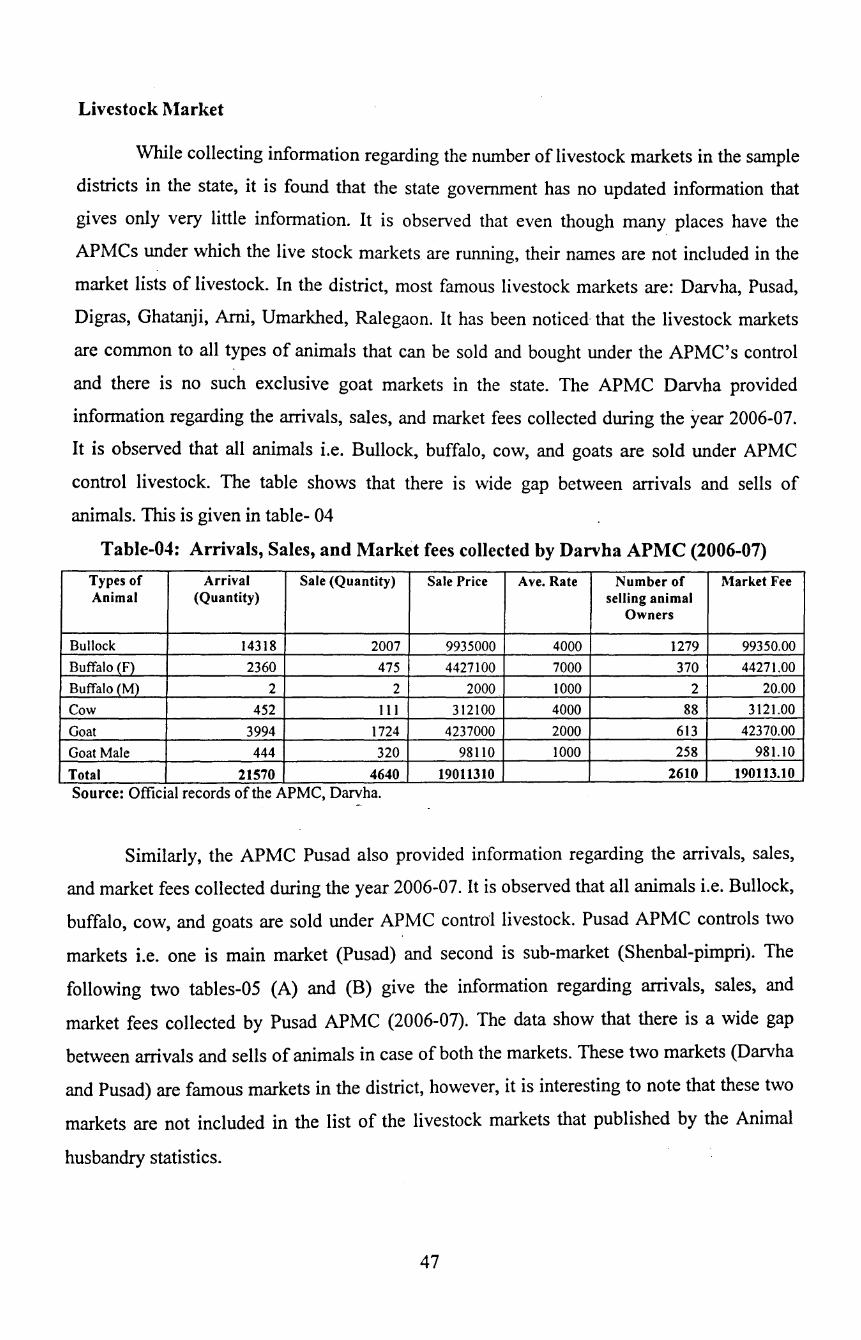
Livestock l\larket
While collecting information regarding the number of livestock markets in the sample
districts in the state, it is found that the state government has no updated information that
gives only very little information. It is observed that even though many places have the
APMCs under which the live stock markets are running, their names are not included in the
market lists of livestock. In the district, most famous livestock markets are: Darvha, Pusad,
Digras, Ghatanji, Ami, Umarkhed, Ralegaon. It has been noticed that the livestock markets
are common to all types of animals that can be sold and bought under the APMC's control
and there is no such exclusive goat markets in the state. The APMC Darvha provided
information regarding the arrivals, sales, and market fees collected during the year 2006-07.
It is observed that all animals i.e. Bullock, buffalo, cow, and goats are sold under APMC
control livestock. The table shows that there is wide gap between arrivals and sells of
animals. This is given in table- 04
Table-04: Arrivals, Sales, and Market fees collected by Darvha APMC (2006-07)
Types of Arrival Sale (Quantity) Sale Price Ave. Rate Number of Market Fee Animal (Quantity) selling animal
Owners
Bullock 14318 2007 9935000 4000 1279 99350.00 Buffalo (F) 2360 475 4427100 7000 370 44271.00 Buffalo _(M) 2 2 2000 1000 2 20.00 Cow 452 111 312100 4000 88 3121.00 Goat 3994 1724 4237000 2000 613 42370.00 Goat Male 444 320 98110 1000 258 981.10
Total 21570 4640 19011310 2610 190113.10 Source: Official records of the APMC, Darvha.
Similarly, the APMC Pusad also provided information regarding the arrivals, sales,
and market fees collected during the year 2006-07. It is observed that all animals i.e. Bullock,
buffalo, cow, and goats are sold under APMC control livestock. Pusad APMC controls two
markets i.e. one is main market (Pusad) and second is sub-market (Shenbal-pimpri). The
following two tables-05 (A) and (B) give the information regarding arrivals, sales, and
market fees collected by Pusad APMC (2006-07). The data show that there is a wide gap
between arrivals and sells of animals in case of both the markets. These two markets (Darvha
and Pusad) are famous markets in the district, however, it is interesting to note that these two
markets are not included in the list of the livestock markets that published by the Animal
husbandry statistics.
47
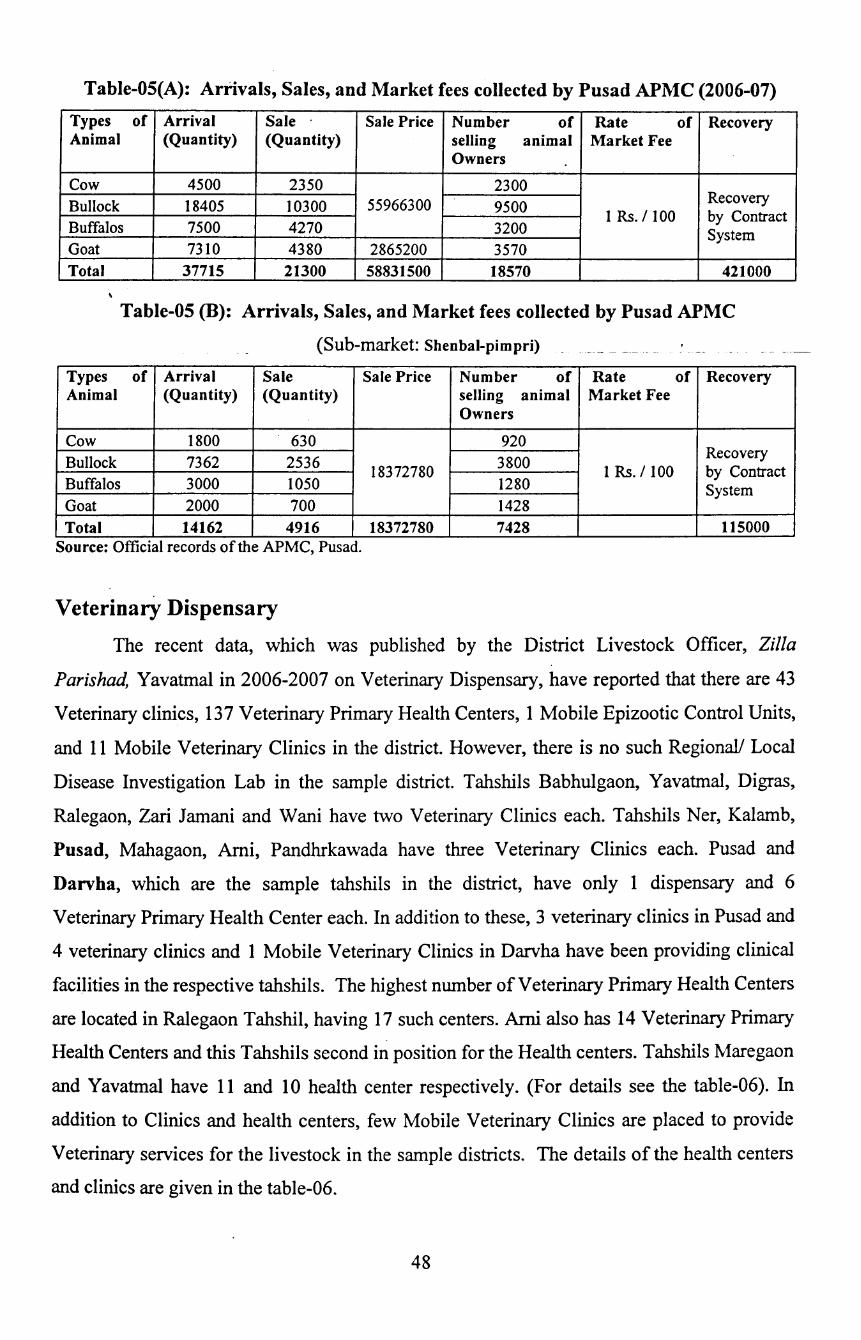
Table-OS(A): Arrivals, Sales, and Market fees collected by Pusad APMC (2006-07)
Types of Arrival Sale Sale Price Number of Rate of Recovery Animal (Quantity) (Quantity) selling animal Market Fee
Owners
Cow 4500 2350 2300 Bullock I8405 I0300 55966300 9500 Recovery
Buffalos 7500 4270 IRs. I IOO by Contract
3200 System Goat 73IO 4380 2865200 3570 Total 37715 21300 58831500 18570 421000
Table-05 (B): Arrivals, Sales, and Market fees collected by Pusad APMC
(Sub-market: Shenbal-pimpri)
Types of Arrival Sale Sale Price Number of Rate of Recovery Animal (Quantity) (Quantity) selling animal Market Fee
Owners
Cow I800 630 920 Bullock 7362 2536 3800
Recovery
Buffalos I8372780 IRs. I 100 by Contract
3000 I050 I280 System Goat 2000 700 I428 Total 14162 4916 18372780 7428 115000
Source: Official records of the APMC, Pusad.
Veterinary Dispensary
The recent data, which was published by the District Livestock Officer, Zilla
Parishad, Yavatmal in 2006-2007 on Veterinary Dispensary, have reported that there are 43
Veterinary clinics, 137 Veterinary Primary Health Centers, 1 Mobile Epizootic Control Units,
and 11 Mobile Veterinary Clinics in the district. However, there is no such Regional/ Local
Disease Investigation Lab in the sample district. Tahshils Babhulgaon, Yavatmal, Digras,
Ralegaon, Zari Jamani and Wani have two Veterinary Clinics each. Tahshils Ner, Kalamb,
Pusad, Mahagaon, Ami, Pandhrkawada have three Veterinary Clinics each. Pusad and
Darvha, which are the sample tahshils in the district, have only 1 dispensary and 6
Veterinary Primary Health Center each. In addition to these, 3 veterinary clinics in Pusad and
4 veterinary clinics and 1 Mobile Veterinary Clinics in Darvha have been providing clinical
facilities in the respective tahshils. The highest number of Veterinary Primary Health Centers
are located in Ralegaon Tahshil, having 17 such centers. Ami also has 14 Veterinary Primary
Health Centers and this Tahshils second in position for the Health centers. Tahshils Maregaon
and Yavatmal have 11 and 10 health center respectively. (For details see the table-06). In
addition to Clinics and health centers, few Mobile Veterinary Clinics are placed to provide
Veterinary services for the livestock in the sample districts. The details of the health centers
and clinics are given in the table-06.
48
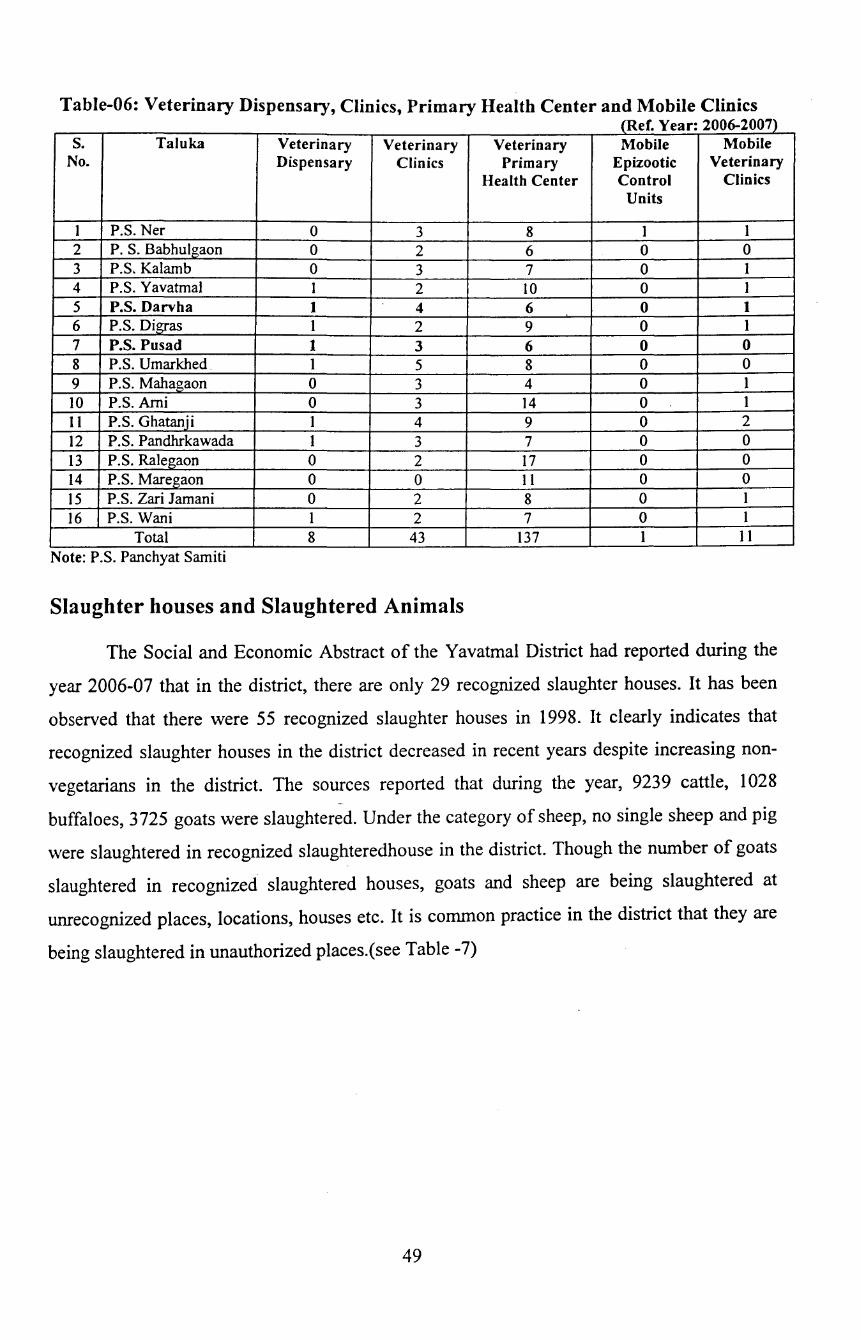
Table-06: Veterinary Dispensary, Clinics, Primary Health Center and Mobile Clinics (Ref. Year: 2006-2007)
s. Taluka Veterinary Veterinary Veterinary Mobile Mobile No. Dispensary Clinics Primary Epizootic Veterinary
Health Center Control Clinics Units
I P.S. Ner 0 3 8 I I 2 P. S. Babhulgaon 0 2 6 0 0 3 P.S. Kalamb 0 3 7 0 I 4 P.S. Yavatmal I 2 IO 0 I 5 P.S. Darvha 1 4 6 0 1 6 P.S. Digras I 2 9 0 1 7 P.S. Pusad 1 3 6 0 0 8 P.S. Umarkhed. 1 5 8 0 0 9 P.S. Mahagaon 0 3 4 0 1 10 P.S. Ami 0 3 I4 0 1 II P.S. Ghatanji I 4 9 0 2 12 P.S. Pandhrkawada 1 3 7 0 0 13 P.S. Ralegaon 0 2 I7 0 0 14 P.S. Maregaon 0 0 I1 0 0 15 P.S. Zari Jamani 0 2 8 0 I 16 P.S. Wani 1 2 7 0 1
Total 8 43 137 1 II ..
Note: P.S. Panchyat Sam1t1
Slaughter houses and Slaughtered Animals
The Social and Economic Abstract of the Yavatmal District had reported during the
year 2006-07 that in the district, there are only 29 recognized slaughter houses. It has been
observed that there were 55 recognized slaughter houses in 1998. It clearly indicates that
recognized slaughter houses in the district decreased in recent years despite increasing non
vegetarians in the district. The sources reported that during the year, 9239 cattle, 1028 -
buffaloes, 3725 goats were slaughtered. Under the category of sheep, no single sheep and pig
were slaughtered in recognized slaughteredhouse in the district. Though the number of goats
slaughtered in recognized slaughtered houses, goats and sheep are being slaughtered at
unrecognized places, locations, houses etc. It is common practice in the district that they are
being slaughtered in unauthorized places.(see Table -7)
49
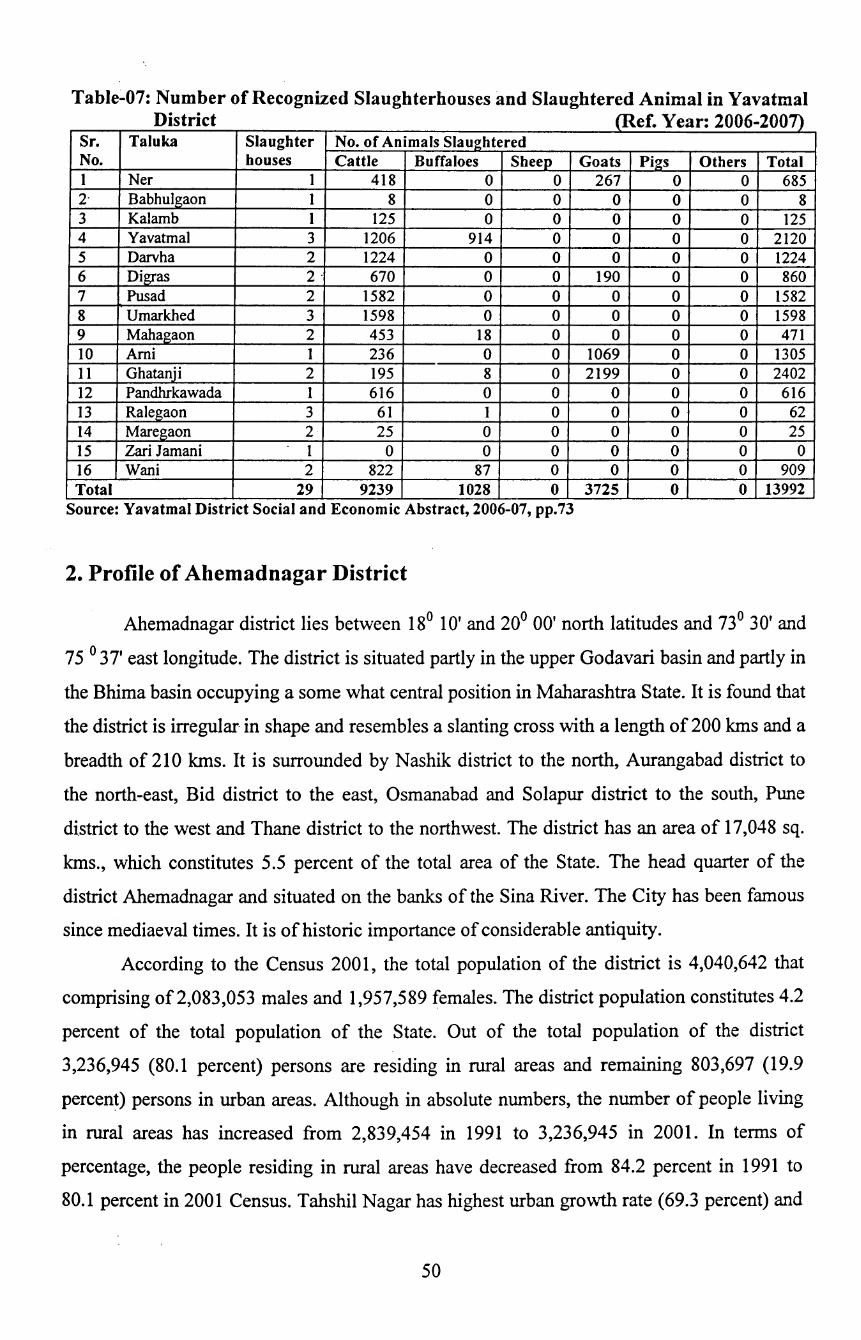
Table-07: Number of Recognized Slaughterhouses and Slaughtered Animal in Yavatmal District (Ref. Year: 2006-2007)
Sr. Taluka Slaughter No. of Animals Slau2;htered No. houses Cattle Buffaloes Sheep Goats Pi2:S Others Total I Ner I 4I8 0 0 267 0 0 685 2· Babhulgaon I 8 0 0 0 0 0 8 3 Kalamb I I25 0 0 0 0 0 125 4 Yavatmal 3 1206 914 0 0 0 0 2120 5 Darvha 2 I224 0 0 0 0 0 1224 6 Digras 2· 670 0 0 I90 0 0 860 7 Pus ad 2 I582 0 0 0 0 0 I582 8 Umarkhed 3 1598 0 0 0 0 0 1598 9 Mahagaon 2 453 18 0 0 0 0 47I IO Ami 1 236 0 0 I069 0 0 1305 11 Ghatanji 2 195 8 0 2I99 0 0 2402 I2 Pandhrkawada I 616 0 0 0 0 0 6I6 13 Ralegaon 3 6I I 0 0 0 0 62 14 Maregaon 2 25 0 0 0 0 0 25 I5 Zari Jamani I 0 0 0 0 0 0 0 16 Wani 2 822 87 0 0 0 0 909 Total 29 9239 1028 0 3725 0 0 13992
Source: Yavatmal District Social and Economic Abstract, 2006-07, pp.73
2. Profile of Ahemadnagar District
Ahemadnagar district lies between 18° 10' and 20° 00' north latitudes and 73° 30' and
75 ° 37' east longitude. The district is situated partly in the upper Godavari basin and partly in
the Bhima basin occupying a some what central position in Maharashtra State. It is found that
the district is irregular· in shape and resembles a slanting cross with a length of 200 kms and a
breadth of 210 kms. It is surrounded by Nashik district to the north, Aurangabad district to
the north-east, Bid district to the east, Osmanabad and Solapur district to the south, Pune
district to the west and Thane district to the northwest. The district has an area of 17,048 sq.
kms., which constitutes 5.5 percent of the total area of the State. The head quarter of the
district Ahemadnagar and situated on the banks of the Sina River. The City has been famous
since mediaeval times. It is of historic importance of considerable antiquity.
According to the Census 200 I, the total population of the district is 4,040,642 that
comprising of2,083,053 males and 1,957,589 females. The district population constitutes 4.2
percent of the total population of the State. Out of the total population of the district
3,236,945 (80.1 percent) persons are residing in rural areas and remaining 803,697 (19.9
percent) persons in urban areas. Although in absolute numbers, the number of people living
in rural areas has increased from 2,839,454 in 1991 to 3,236,945 in 2001. In terms of
percentage, the people residing in rural areas have decreased from 84.2 percent in 1991 to
80.1 percent in 2001 Census. Tahshil Nagar has highest urban growth rate (69.3 percent) and
50
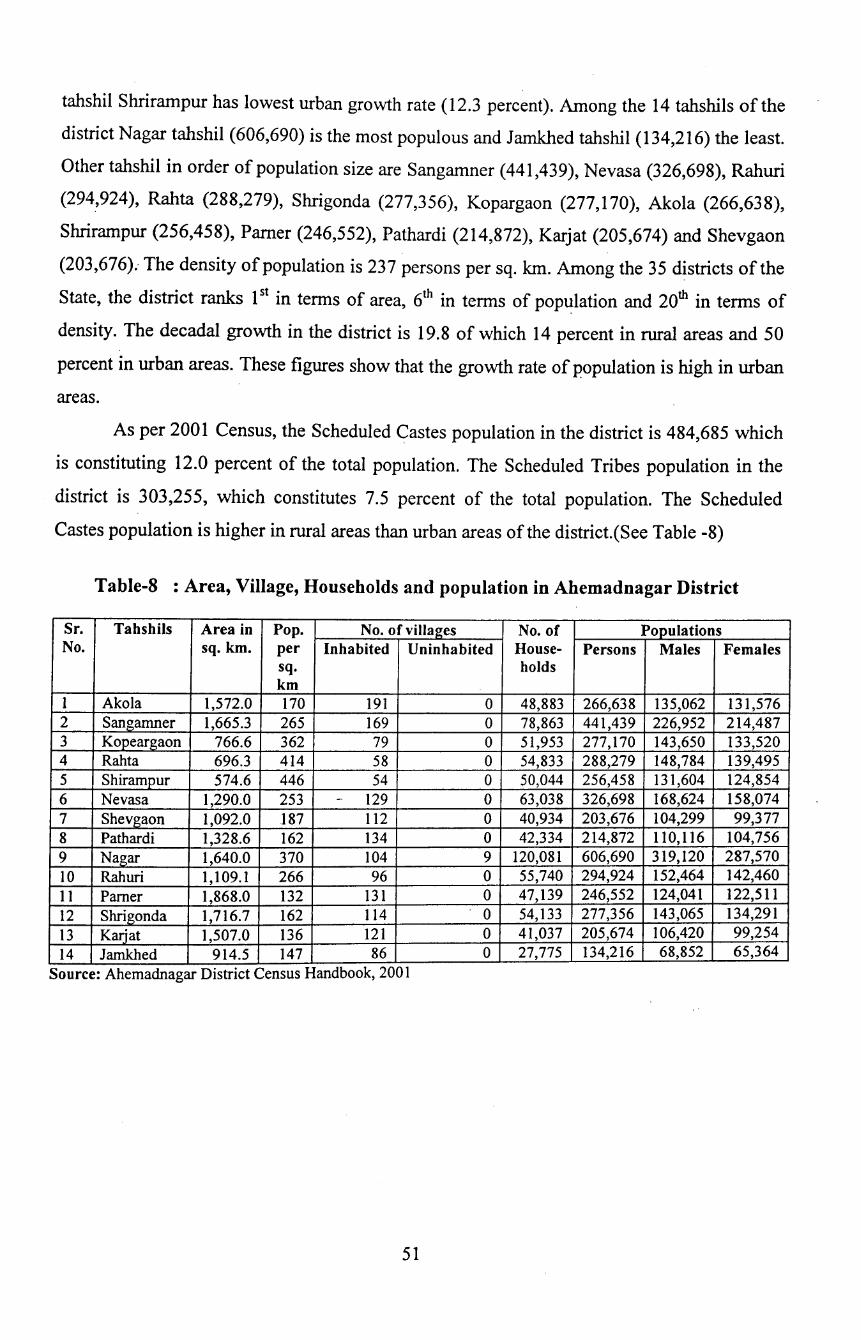
tahshil Shrirampur has lowest urban growth rate (12.3 percent). Among the I4 tahshils of the
district Nagar tahshil (606,690) is the most populous and Jamkhed tahshil (I34,2I6) the least.
Other tahshil in order of population size are Sangamner (44I,439), Nevasa (326,698), Rahuri
(294,924), Rahta (288,279), Shrigonda (277,356), Kopargaon (277,I70), Akola (266,638),
Shrirampur (256,458), Pamer (246,552), Pathardi (2I4,872), Karjat (205,674) and Shevgaon
(203,676).- The density of population is 237 persons per sq. km. Among the 35 districts of the
State, the district ranks I st in terms of area, 6th in terms of pop~lation and 20th in terms of
density. The decadal growth in the district is I9.8 of which I4 percent in rural areas and 50
percent in urban areas. These figures show that the growth rate of population is high in urban
areas.
As per 200 I Census, the Scheduled Castes population in the district is 484,685 which
is constituting 12.0 percent of the total population. The Scheduled Tribes population in the
district is 303,255, which constitutes 7.5 percent of the total population. The Scheduled
Castes population is higher in rural areas than urban areas of the district.(See Table -8)
Table-8 : Area, Village, Households and population in Ahemadnagar District
Sr. Tahshils Area in Pop. No. of villages No. of Populations No. sq. krn. per Inhabited Uninhabited House- Persons Males Females
sq. holds km
1 A kola 1,572.0 170 191 0 48,883 266,638 135,062 131,576 2 Sangamner 1,665.3 265 169 0 78,863 441,439 226,952 214,487 3 Kogeargaon 766.6 362 79 0 51,953 277,170 143,650 133,520 4 Rahta 696.3 414 58 0 54,833 288,279 148,784 139,495 5 Shirampur 574.6 446 54 0 50,044 256,458 131,604 124,854 6 Nevasa 1,290.0 253 - 129 0 63,038 326,698 168,624 158,074 7 Shevgaon 1,092.0 187 112 0 40,934 203,676 104,299 99,377 8 Pathardi 1,328.6 162 134 0 42,334 214,872 110,116 104,756 9 Nagar 1,640.0 370 104 9 120,081 606,690 319,120 287,570 10 Rahuri 1,109.1 266 96 0 55,740 294,924 152,464 142,460 11 Pamer 1,868.0 132 131 0 47,139 246,552 124,041 122,511 12 Shrigonda 1,716.7 162 114 0 54,133 277,356 143,065 134,291 13 K_!Ij_at 1,507.0 136 121 0 41,037 205,674 106,420 99,254
14 Jamkhed 914.5 147 86 0 27,775 134,216 68,852 65,364
Source: Ahemadnagar Dtstnct Census Handbook, 200 1
51
Ahemadnagar district reported 2,598,597 persons as literates in 2001 Census. They
constitute 75.3 percent of the total population (excluding 0-6 age group) of the district. For
the district as a whole the literacy rates for males are substantially higher compared to
females in both rural and urban areas. The tahshilwise breakup shows that Nagar tahshil has
the higher literacy rate of 84.6 percent and Jamkhed tahshil has the lowest literacy rate of
67.8 percent. It is observed that the tahshils having urban centres have literacy rates higher
than other, confirming the fact that urban have better infrastructure as far as educational
facilities are concerned male as well as females literacy rate highest in Nagar tahshil i.e. 91.8
percent and 76.8 percent respectively and male as well as female literacy is lowest in
Jamkhed tahshil i.e. 80.7 percent and 54.3 percent respectively. In rural areas of the district
literacy rate is 72.9 percent with male literate~ having 84.2 percent and female literates accounting for
61.1 percent. Nagar tahshil has the highest literacy rate of 78.9 percent.
Geographical Region
The district is a part of western plateau with protruded hills, the micro level division
of Deccan plateau. The district as a whole is an elevated tableland which has been denuded
by the Godavari and Bhima rivers. On the basis of local variation in relief and other
characteristics the district may be grouped into four parts i.e., (i) The Sahyadri Range, (ii)
The Plateaux, (iii) Godavari Basin and (iv) Ghod Valley and Bhima Basin (i) Sahyadri hills
cover the exteame north-western part of the district including part of Akola and Sangamner
tahshils. From the main hills of Sahyadri, three spurs, viz., Kalsubai-Adula range, Baleshwar
range and Harishchandragad range stretch towards the east. The Kalsubai-Adula stretches out
eastwards along the northern boundary of the district, forming watershed between Darna and
Pravara rivers, the tributaries of Godavari and ends in Sangamner tahshils near Dudheshwar
hills. The highest peak of Sahyadri as well as the state, the Kalsubai (1646 mts.) is located in
this area. Forming the watershed between the pravara and Mula river, the Harishchandragad
spur extends about sixty miles in the district. The Baleshwar range is the longest spur forming
the boundary between Pune and Ahmadnagar districts upto Pamer tahshil and then it forms a
plateau which is named as Ahmadnagar plateau, which stretches upto Karjat tahshil. The hills
of Sahyadri within the district is badly dissected by the Adula, Pravara and Mula rivers, the
tributaries of Godavari. It is partly covered with forests.
Godavari basin spreading over the entire tahshils of Kopergaon, Rahata, Shrirampur,
Rahuri, Nevasa, Shegaon and parts of Pathardi and Sangamner tahshils, occupies the north
and northeastern parts of the district. In general this basin has an elevation of benveen 500
52
and 600 metres from mean sea level and gradually slopes towards south-east. Surface is
almost smooth in nature having a thick layer of black cotton soil, in which Jowar, Bajra,
Sugarcane, Groundnut, wheat and cotton are grown. The Pravara irrigation system has
converted to the northern portion of the basin into one of the most prosperous and productive
tracts in the state, which comprises of Kopargaon, Rahata, Shrirampur, Rahuri tahshils and
parts of Nevasa and Sangamner tahshils It is an area of intensive sugarcane cultivation and
many sugar factories are located in this area.
Climate The climate. of the district is characterized by a hot summer and . general dryness
except during the South-west monsoon season. The year can be divided into four seasons.
The cold season from December to February is followed by the hot season from March to the
first week of June. The South-west monsoon season is from the second week of June till the
end of September while October and November constitute the post monsoon or retreating
monsoon season. The average annual rainfall in the district is 583.5 mm. The distribution of
rainfall is very uneven. About 75 percent of the annual rainfall is received during the South
west monsoon season. The variation in rainfall from year to year is large. Seasonal variation
in temperature is quite large. From March onwards is a period of continuous increase in day
temperatures, the nights remaining compantively cool. May is the hottest month of the year
with the mean daily maximum temperature at 38.9o C on individual days temperatures
occasionally rise to 43o or 44o C. December is the coldest month of the year with the mean
daily minimum temperature at 11.7° C.
Livestock Population
The various livestock censuses of Maharashtra have recorded that the district has the
highest number of livestock population in the Western Maharashtra region. It has been
observed that the total livestock population was 2208264 in 1987 that increased by 433570 in
1992. In percentage term, it increased by 19.64 percent. In 1997 further, livestock population
increased to 3192795 and in percentage term it increased by 20.86 percent. Increasing trend
was continued however, in 2003, livestock population decreased to 2811404. It has been
noticed that livestock population decreased because of decreased population of Cattle, sheep
and goats in the district. The Cattle population in the district has continuously been increasing
since 1987 except decreasing in 2003. The Buffaloes population have also been increasing
since 1987, as it was 124273 and reached to 192196 in 2003. Sheep population has also been
increasing from 309586 in 1987 to 56854Q in 1997. However, in 2003, it decreased by 35.98
percent. It was the highest decreased in percentage term in 2003. The goat population in the
53
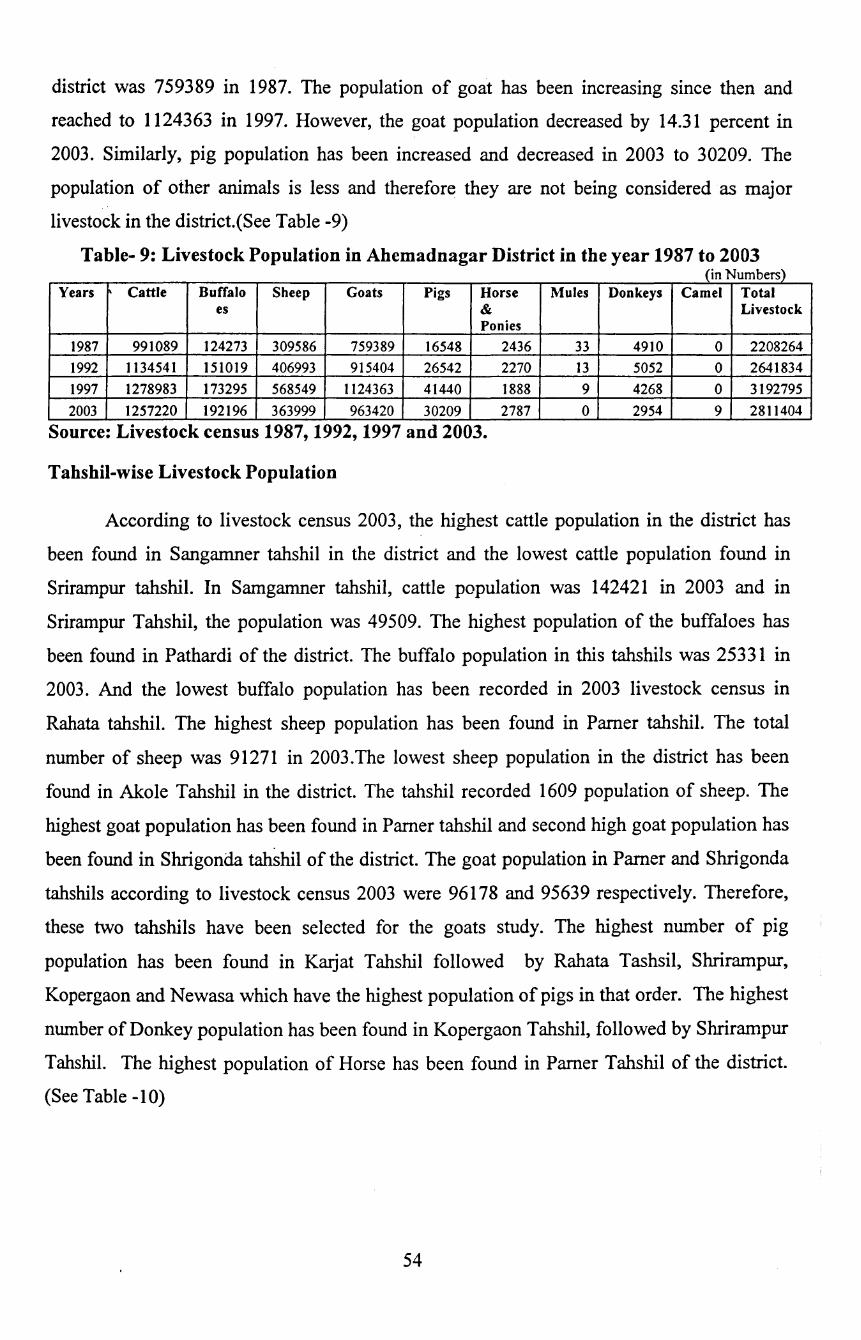
district was 759389 in 1987. The population of goat has been increasing since then and
reached to 1124363 in 1997. However, the goat population decreased by 14.31 percent in
2003. Similarly, pig population has been increased and decreased in 2003 to 30209. The
population of other animals is less and therefore they are not being considered as major
livestock in the district.(See Table -9)
Table- 9: Livestock Population in Ahemadnagar District in the year 1987 to 2003 (in Numbers)
Years Cattle Buffalo Sheep Goats Pigs Horse Mules Donkeys Camel Total es & Livestock
Ponies
1987 991089 124273 309586 759389 16548 2436 33 4910 0 2208264 1992 1134541 151019 406993 915404 26542 2270 13 5052 0 2641834 1997 1278983 173295 568549 1124363 41440 1888 9 4268 0 3192795 2003 1257220 192196 363999 963420 30209 2787 0 2954 9 2811404
Source: Livestock census 1987, 1992, 1997 and 2003.
Tahshil-wise Livestock Population
According to livestock census 2003, the highest cattle population in the district has
been found in Sangamner tahshil in the district and the lowest cattle population found in
Srirampur tahshil. In Samgamner tahshil, cattle population was 142421 in 2003 and in
Srirampur Tahshil, the population was 49509. The highest population of the buffaloes has
been found in Pathardi of the district. The buffalo population in this tahshils was 25331 in
2003. And the lowest buffalo population has been recorded in 2003 livestock census in
Rahata tahshil. The highest sheep population has been found in Pamer tahshil. The total
number of sheep was 91271 in 2003. The lowest sheep population in the district has been
found in Akole Tahshil in the district. The tahshil recorded 1609 population of sheep. The
highest goat population has been found in Pamer tahshil and second high goat population has
been found in Shrigonda tahshil of the district. The goat population in Pamer and Shrigonda
tahshils according to livestock census 2003 were 96178 and 95639 respectively. Therefore,
these two tahshils have been selected for the goats study. The highest number of pig
population has been found in Karjat Tahshil followed by Rahata Tashsil, Shrirampur,
Kopergaon and Newasa which have the highest population of pigs in that order. The highest
number of Donkey population has been found in Kopergaon Tahshil, followed by Shrirampur
Tahshil. The highest population of Horse has been found in Pamer Tahshil of the district.
(See Table -1 0)
54

Table- 10: Tahshil-wise Lh·estock Population in Ahemadnagar District (2003) (In Numbers)
Sr. Taluka Cattle's Buffaloes Sheep Total Total
No. Goats Horses Donkeys Pigs Livestock Poultry
1 Na£ar 79613 23158 22848 74674 243 95 1466 202097 200723 2 Rahuri. 112802 8243 27073 86232 262 64 2446 237122 128516 3 Shrirampur 49509 7196 5665 35657 51 420 . 3369 101867 94668 4 Rahata 64149 5009 14480 49690 130 236 3374 137068 136478 5 Kopargaon 65943 11148 6701 49597 139 702 2847 137077 131843 6 San£amner 142421 5507 66017 83264 229 188 575 298201 184951 7 Akole 95271 14529 1609 50199 53 60 1181 162902 86431 8 Parner 116778 14020 91271 96178 743 58 1053 320101 309863 9 Shrigonda 119559 21459 33123 95639 90 178 548 270596 178420 10 Karjat 65500 6840 39088 52409 119 304 6604 170864 119201 I 1 Jamkhed 56208 10234 4134 36322 65 21 726 107710 75736 12 Pathardi 99746 25331 20200 90461 133 II 295 236177 125659 13 Shevgaon 72850 15263 11836 67017 141 37 1949 169093 130911
14 Newasa 116871 24259 19954 93396 388 115 2736 257719 151186
Total 1257220 192196 363999 960735 2786 2489 29169 2808594 2054586
Source: Lh·estock census 2003.
Li\'estock market
Similarly in Ahemadnagar district~ it is observed that no updated published
information regarding number of livestock markets in the district is available. In the disctric4
most famous livestock markets are: Kasti~ Supa~ Valki, Ghodegaon, Rajur, Newasa, Pathardi
and Kopargaon. Like Y avatmal district~ it has also been noticed in the Ahemadnagar district
that livestock markets are common to all types of animals that can be sold bought under
AP~1C's control and in this district too, there is no such exclusive goat markets. Kasti
livestock sub-market is being controlled by Shrigonda AMPC market, however, Kasti
livestock sub-market is more developed than the Shrigonda (Tahshil place) livestock market.
It can be noticed from the arrivals and sell of animals in both the livestock markets.
(See table-11)
55
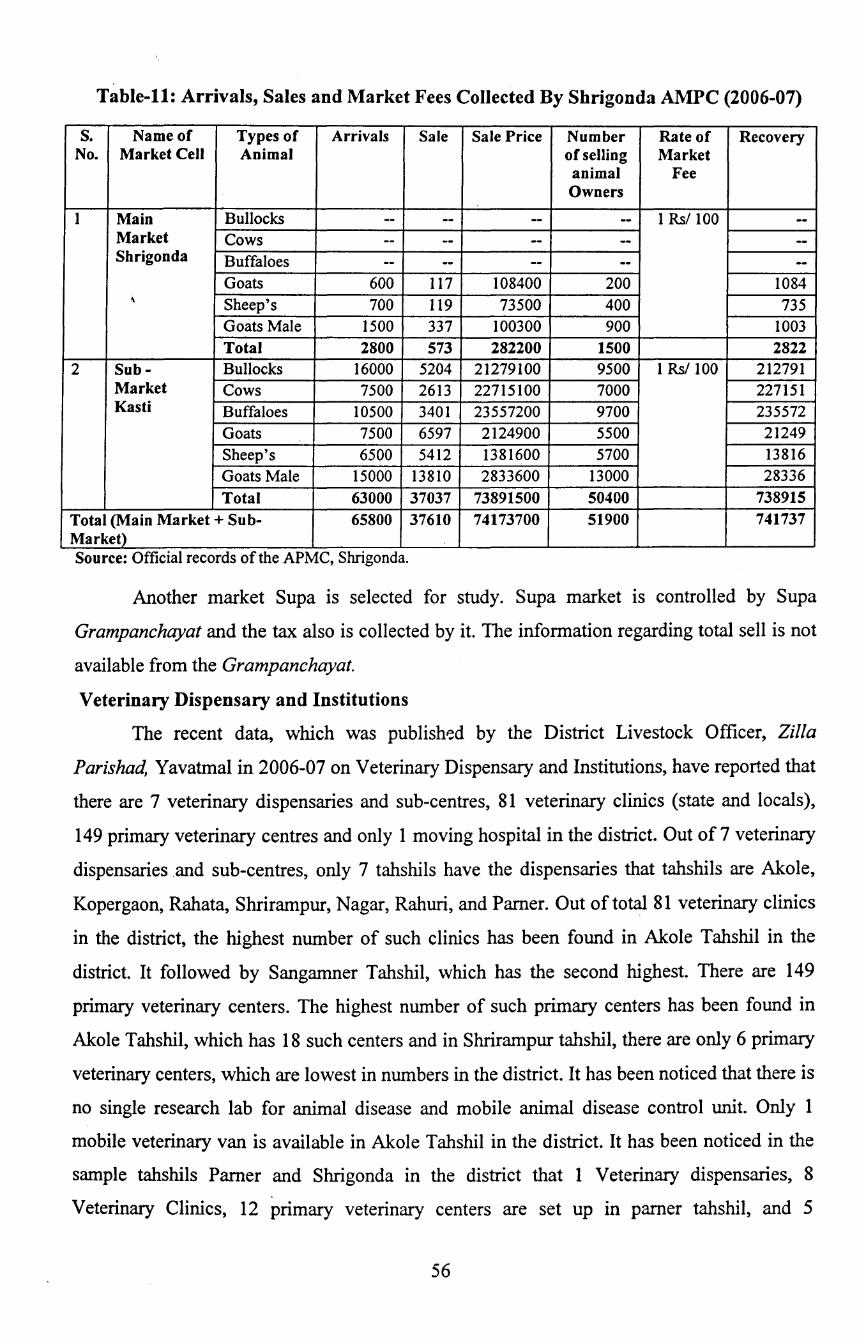
Table-11: Arrivals, Sales and Market Fees Collected By Shrigonda AMPC (2006-07)
s. Name of Types of Arrivals Sale Sale Price Number Rate of Recovery No. Market Cell Animal of selling Market
animal Fee Owners
I Main Bullocks -- -- -- -- IRs/ IOO --Market Cows -- -- -- - --Shrigonda Buffaloes -- -- -- -- --
Goats 600 117 I08400 200 1084 \ Sheep's 700 119 73500 400 735
Goats Male 1500 337 100300 900 1003 Total 2800 573 282200 1500 2822
2 Sub- Bullocks 16000 5204 2I279100 9500 I Rs/ 100 21279I Market Cows 7500 2613 22715100 7000 227I51 Kasti Buffaloes 10500 3401 23557200 9700 235572
Goats 7500 6597 2124900 5500 21249 Sheep's 6500 5412 138I600 5700 13816 Goats Male 15000 13810 2833600 13000 28336 Total 63000 37037 73891500 50400 738915
Total (Main Market+ Sub- 65800 37610 74173700 51900 741737 Market) Source: Official records of the APMC, Shrigonda.
Another market Supa is selected for study. Supa market is controlled by Supa
Grampanchayat and the tax also is collected by it. The information regarding total sell is not
available from the Grampanchayat.
Veterinary Dispensary and Institutions
The recent data, which was publish~d by the District Livestock Officer, Zilla
Parishad, Yavatmal in 2006-07 on Veterinary Dispensary and Institutions, have reported that
there are 7 veterinary dispensaries and sub-centres, 81 veterinary clinics (state and locals),
149 primary veterinary centres and only 1 moving hospital in the district. Out of 7 veterinary
dispensaries .and sub-centres, only 7 tahshils have the dispensaries that tahshils are Akole,
Kopergaon, Rahata, Shrirampur, Nagar, Rahuri, and Pamer. Out of total 81 veterinary clinics
in the district, the highest number of such clinics has been found in Akole Tahshil in the
district. It followed by Sangamner Tahshil, which has the second highest. There are 149
primary veterinary centers. The highest number of such primary centers has been found in
Akole Tahshil, which has 18 such centers and in Shrirampur tahshil, there are only 6 primary
veterinary centers, which are lowest in numbers in the district. It has been noticed that there is
no single research lab for animal disease and mobile animal disease control unit. Only 1
mobile veterinary van is available in Akole Tahshil in the district. It has been noticed in the
sample tahshils Pamer and Shrigonda in the district that 1 Veterinary dispensaries, 8
Veterinary Clinics, 12 primary veterinary centers are set up in pamer tahshil, and 5
56

Veterinary Clinics and 12 primary · veterinary centers are set up In Shrigonda tahshil.
(Tahshil-wise dispensaries and clinics are given in the table-12)
Table- 12: Veterinary Dispensary, Clinics, Centers and Mobile Clinics (Ref. Year: 2006-2007)
Sr. Taluka Veterinary Veterinary primary Beast Moving Moving No. dispensaries Clinics veterinary disease disease hospital
and sub (state & local) centers investigatio control centers n Ambulance
laboratory 1 Akole I 10 18 0 0 1 2 Sangamner 0 9 I5 () 0 0 3 Kopargaon I 4 8 0 0 0 4 Rahta I 8 7 0 0 0 5 Shrirampur I 4 6 0 0 0 6 Nevasa 0 6 9 0 0 0 7 Shevgaon 0 4 11 0 0 0 8 Pathardi 0 5 11 0 0 0 9 Nagar I 5 15 0 0 0 10 Rahuri I 7 8 0 0 0 II Parner 1 8 12 0 0 0 12 Shrigonda 0 5 12 0 0 0 13 Karjat 0 3 9 0 0 0 14 Jamkhed 0 3 8 0 0 0
Total 7 81 149 0 0 1
Source: Ahemadnagar District social and Economic Abstract, 2006-07.
Artificial Insemination Centers:
In the Ahemadnagar district, there are 231 Artificial insemination centers. In all
Tahshils of the district, have these centers to make artificial fertilization of livestock animals.
In Akole Tahshil, the highest numbers of artificial insemination center have been set up. The
total numbers of such centers in these Tahshils are 29. The Sangamner Tahshil has the second
highest insemination centers. In Shrirampur Tahshil there are 10 insemination centers, is the
lowest in the district. (See Table -13)
57
I
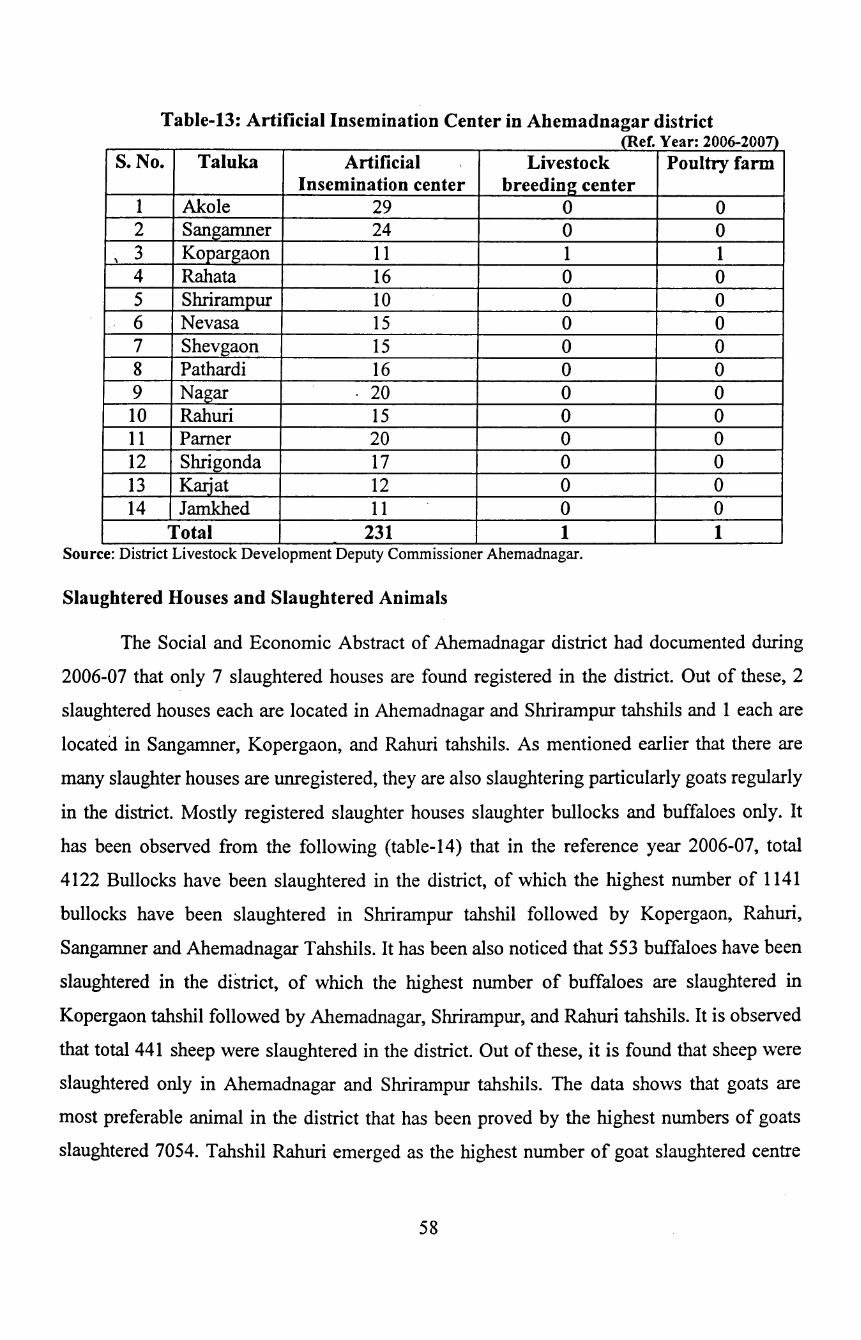
Table-13: Artificial Insemination Center in Ahemadnagar district {Ref. Year: 2006-2007)
S. No. Taluka Artificial Livestock Poultry farm Insemination center breeding center
1 Akole 29 0 0 2 Sangamner 24 0 0
' 3 Kopargaon I I 1 1 4 Rahata 16 0 0 5 Shrirampur IO 0 0 6 Nevasa I5 0 0 7 Shevgaon I5 0 0 8 Pathardi 16 0 0 9 Nagar 20 0 0 IO Rahuri I5 0 0 II Pamer 20 0 0 I2 Shrigonda I7 0 0 I3 Krujat I2 0 0 I4 Jamkhed II 0 0
Total 231 1 1 Source: District Livestock Development Deputy Commissioner Ahemadnagar.
Slaughtered Houses and Slaughtered Animals
The Social and Economic Abstract of Ahemadnagar district had documented during
2006-07 that only 7 slaughtered houses are found registered in the district. Out of these, 2
slaughtered houses each are located in Ahemadnagar and Shrirampur tahshils and I each are
located in Sangamner, Kopergaon, and Rahuri tahshils. As mentioned earlier that there are
many slaughter houses are unregistered, they are also slaughtering particularly goats regularly
in the district. Mostly registered slaughter houses slaughter bullocks and buffaloes only. It
has been observed from the following (table-I4) that in the reference year 2006-07, total
4I22 Bullocks have been slaughtered in the district, of which the highest number of II4I
bullocks have been slaughtered in Shrirampur tahshil followed by Kopergaon, Rahuri,
Sangamner and Ahemadnagar Tahshils. It has been also noticed that 553 buffaloes have been
slaughtered in the district, of which the highest number of buffaloes are slaughtered in
Kopergaon tahshil followed by Ahemadnagar, Shrirampur, and Rahuri tahshils. It is observed
that total 44I sheep were slaughtered in the district. Out of these, it is found that sheep were
slaughtered only in Ahemadnagar and Shrirampur tahshils. The data shows that goats are
most preferable animal in the district that has been proved by the highest numbers of goats
slaughtered 7054. Tahshil Rahuri emerged as the highest number of goat slaughtered centre
58
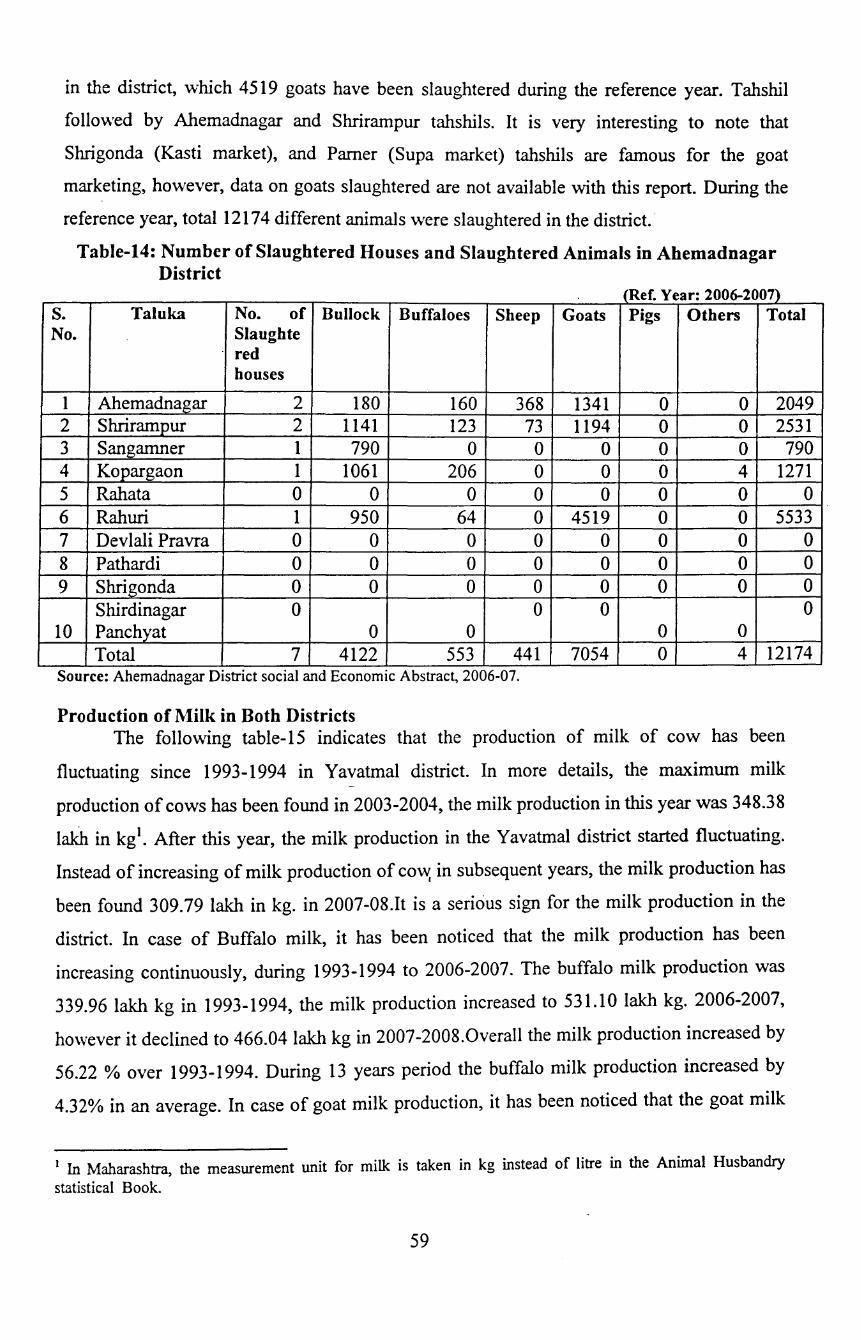
in the district, which 4519 goats have been slaughtered during the reference year. Tahshil
followed by Ahemadnagar and Shrirampur tahshils. It is very interesting to note that
Shrigonda (Kasti market), and Pamer (Supa market) tahshils are famous for the goat
marketing, however, data on goats slaughtered are not available with this report. During the
reference year, total 1217 4 different animals were slaughtered in the district.
Table-14: Number of Slaughtered Houses and Slaughtered Animals in Ahemadnagar District
(Ref. Year: 2006-2007) s. Taluka No. of Bullock Buffaloes Sheep Goats Pigs Others Total No. Slaughte
red houses
1 Ahemadnagar 2 180 160 368 1341 0 0 2049 2 Shrirampur 2 1141 123 73 1194 0 0 2531 3 Sangamner 1 790 0 0 0 0 0 790 4 Kopargaon 1 1061 206 0 0 0 4 1271 5 Rahata 0 0 0 0 0 0 0 0 6 Rahuri 1 950 64 0 4519 0 0 5533 7 Devlali Pravra 0 0 0 0 0 0 0 0 8 Pathardi 0 0 0 0 0 0 0 0 9 Shrigonda 0 0 0 0 0 0 0 0
Shirdinagar 0 0 0 0 10 Panchyat 0 0 0 0
Total 7 4122 553 441 7054 0 4 12174 Source: Ahemadnagar Distnct social and Economic Abstract, 2006-07.
Production of Milk in Both Districts The following table-15 indicates that the production of milk of cow has been
fluctuating since 1993-1994 in Yavatmal district. In more details, the maximum milk
production of cows has been found in 2003-2004, the milk production in this year was 348.38
lakh in kg1• After this year, the milk production in the Yavatmal district started fluctuating.
Instead of increasing of milk production of co~ in subsequent years, the milk production has
been found 309.79 lakh in kg. in 2007-08.It is a serious sign for the milk production in the
district. In case of Buffalo milk, it has been noticed that the milk production has been
increasing continuously, during 1993-1994 to 2006-2007. The buffalo milk production was
339.96 lakh kg in 1993-1994, the milk production increased to 531.10 lakh kg. 2006-2007,
however it declined to 466.04lakh kg in 2007-2008.0verall the milk production increased by
56.22 % over 1993-1994. During 13 years period the buffalo milk production increased by
4.32% in an average. In case of goat milk production, it has been noticed that the goat milk
1 In Maharashtra, the measurement unit for milk is taken in kg instead of litre in the Animal Husbandry
statistical Book.
59

production has been fluctuating. The goat milk production was 48.38 lakh kg in 1993-1994; it
could increase to 62.73 lakh kg in the district. However, it needs to be a proper policy to
increase the milk production of goat and if necessary the good species of goats, which give
the maximum quantity of milk, are to be introduced in the district as well as in other part of
the state.
In Ahemadnagar district, the production of milk is much better than Yavatmal
district. The table indicates that the production of milk of cow in the district is found
increasing trend initially till 2000-2001 and then the production of milk started fluctuating. In
more details, the maximum milk production of cows has been found in 2000-2001, the milk
production in this year was 857.44 lakh kg. Instead of increasing of milk production of cow
in subsequent years, the milk production has been found 690.72 lakh kg. in 2007-08. It is
indicated that the milk production in the district is declining. In case of Buffalo milk, it has
been noticed that the milk production has been steadily increasing during 1993-1994 to 2007-
2008. It is a good sign in terms of milk production in the district. The buffalo milk production
was 484.12lakh kg in 1993-1994, the milk production increased to 1056.73 lakh kg. in 2007-
2008. Overall the milk production increased by 118.27 % over 1993-1994. During 13 years
period, the buffalo milk production increased by 9.09% in an average. In case of goat milk
production, it has been noticed that the goat milk production has been increasing steadily till
2003-2004. After this year, the goat milk production decreased to 268.86-lakh kg in 2004-
2005 and then it started increasing. However, it needs to be a proper policy to increase the
milk production of goat and if necessary the good species of goats, which give the maximum
quantity of milk, are to be introduced in the district.
Table- 15: Year-Wise Production of Milk of Milch Cattle Unit- lakhs in kg
Years Yavatmal Ahemadnagar Live -stock . Live -stock
Cows Buffaloes Goats Total Cows Buffaloes Goats Total 1993-94 285.08 339.96 48.34 673.38 692.59 484.12 180.12 692.59 1998-99 212.22 429.89 48.93 691.04 821.81 715.82 246.37 1784 1999-00 218.18 434.32 51.14 703.64 829.11 724.18 258.98 1812.27 2000-01 229.49 440.12 52.16 721.77 857.44 776.83 264.08 1898.35 2001-02 318.29 465.76 60.10 844.15 793.50 840.38 276.82 1910.7 2002-03 331.35 477.54 61.49 870.38 811.66 863.32 283.42 1958.4 2003-04 348.38 486.13 62.56 897.07 808.49 892.24 289.05 1989.78 2004-05 285.43 498.38 57.92 841.73 685.70 902.17 268.86 1856.73 2005-06 291.69 505.48 58.78 855.95 714.52 913.81 270.91 1899.24 2006-07 289.10 531.10 58.70 878.9 717.70 944.20 276.10 1938 2007-08 309.75 466.04 62.73 838.52 690.72 1056.73 282.10 2029.55
Source: Animal Husbandry Statistical Booklets and records of Anunal Husbandry Department, Maharashtra State, Pune.
60

Average Production of 1\-filk
The table-16 shows that the average production of milk per cow is ranging from 0.55
litres to 1.96 litres in Yavatmal district whereas in Ahemadnagar district, it is ranging from
0.55. to 2.99 litres. It is noticed that the cows, which are domesticated in Ahemadnagar
district, are better breads than domesticated in Yavatmal district. In case of buffalos too, the
average production of milk per day per animal is higher in Ahemadnagar district that reported
ranging from 2.40 litres to 3.29 litres during 1993 to 2008. No. doubt, high milk yielding
species of cows and buffalos always influence the production of milk per day. However, data
about per day per goat are not available.
Table -16: Year-Wise Average Production of Milk Per Day Per Milch Animal
Years Yavatmal Ahemadnagar Live -stock Live -stock
Ave. Buffaloes Ave. Goats Ave. Of Buffaloes OfDeshi and Milk Deshi and Ave. Milk
Cross Breed cows Cross Breed cows.
1993-94 0.55 2.40 - 0.55 2.40 1998-99 0.55 2.40 - 1.40 3.12 1999-00 0.56 2.41 - 1.42 3.13 2000-01 0.6 2.44 - 1.46 3.25 2001-02 0.60 2.32 - 1.35 3.18 2002-03 0.62 2.34 - 1.37 3.21 2003-04 0.651 2.33 - 1.34 3.25 2004-05 0.60 2.35 - 1.27 3.26 2005-06 0.60 2.34 - 1.30 3.25 2006-07 0.60 0.87 - 1.28 3.29 2007-08 1.96 0.91 - 2.99 1.77
Source: Animal Husbandry Statistical Booklets and records of Ammal Husbandry Department, Maharashtra State, Pune.
Price of Milk in the State
K ~2
Goats
-----------
The following table-17 shows that the price per kg in the state since 1998-99. The
table shows that the price per kg is gradually increa~ing from Rs. 12 per kg in 1999-00 to
17.32 per kg in 20007-08, whereas, the price per kg for buffalos is also increasing. It
increased from Rs 14 per kg to Rs. 21.41 kg in 2007-08. In case of goat milk, the price per kg
increased from Rs. 9.17 toRs. 15.29 in 2007-08. If all rates are compared, it has been noticed
that Buffaloes receives higher rate per kg, followed by cows and goats milk rates.
61

Table -17: Year-Wise Per Kg Price Of Milk Of Cow, Buffalo, Goat Etc. . er .g. Rs P K
Live -stock
Years Cows Buffaloes Goats Average
Rs. In Rs. In Rs.In Rs. In Per Rs.In Rs. In Per Rs.In M.T. Per Ke. M.T. Kg. M.T. Kg. M.T.
1993-94 - - - -. - - -1998-99 12630 13 14870 15 10000 10 37500 1999-00 12000 12 14150 14.15 9170 9.17 35320 2000-01 12871 13 14752 15 10140 10.14 37763 2001-02 12991 13 14860 15 10183 10.18 38034 2002-03 12752 13 15416 15.41 10245 10.24 38413 2003-04 14342 14.34 16874 17 11315 11.31 42531 2004-05 13412.21 13.41 17624.78 18 12985.11 13 44022.1 2005-06 14005 14 18453 18.45 13028 13.02 45486 2006-07 15826 16 19742 20 13908 14 49476 2007-08 17320.15 17.32 21417.34 21.41 15293.76 15.29 54031.25 Source: Anunal Husbandry Statistical Booklets and records of Anunal Husbandry Department,
Maharashtra State, Pune.
Rate of Meat in State
Rs. In Per Kg.
-38
35.32 38.14 38.18 38.65 42.65 44.41 45.47
50 54.02
The following table-18 shows that in 1998-99, the buffalo meat per kg was ranging
from Rs.32 toRs 37 in the state, rates gradually increased from Rs. 40 toRs 45 in 2007-2008.
In percentage term, it increased by 21.66 percent in ten years span. The price of goat meat.per
kg increased ranging from 96 to 102 per kg in 1998-99 to Rs 130 to Rs. 140 per kg. It
increased by 3 7.25 percent. The price of goat meat is increasing at faster rate than other
animal meat. It is probably because of eating preference of people towards the goat meat.
These rates are wholesale; however, the retail rates are higher than these rates. In the state, it
has been noticed that in 2010, the retail rate for the goat meat per kg for consumer is being
charged ranging from Rs. 180 per kg to Rs. 240 kg depending upon the place of sale. The pig
meat is being sold ranging from Rs 36 toRs 43 per kg
Table- 18: Year-Wise Rate Of Meat Per Kg Of Buffaloes, Goats, Sheep And Pig Rs. Per Kg.
Live -stock Buffaloes Goats Sheep Pi2S
Years Min. Max. Min. Max. Min. Max. Min. meat meat meat meat meat meat meat price price price price price price price
1993-94 - - - - - - -1998-99 32 37 96 102 - - 36 1999-00 29 34 99 105 - - 35.48 2000-01 31.04 36 102 108 - - 37.21 2001-02 32 38 97.28 103 - - 37.06 2002-03 31 41 80 90 - - -2003-04 30 35 95 105 - - -2004-05 28 34 104 115 - - -2005-06 35 40 100 II 0 - - -2006-07 37 42 120 130 - - -2007-08 40 45 130 140 - - -
Source: Animal Husbandry Statistical Booklets and records of Animal Husbandry Department, Maharashtra State, Pune.
62
Max. meat price
-41.10 40.12 43.07 42.17
------
3. Profile of Sample Villages
A per methodology, two villages Ladkhed and Bori kh from Darhva tahshil, and two
villages Jambazar and Shilona from Pusad tahshil have been selected in Yavatmal district.
The area of ladkhed, Bori, Jambazar, and Shilona are 1831, 424, 903, and 2422 ha
respectively. As per the Census 2001, the population of Ladkhed village is 6308, of which
10.35 percent is population of SC and 4.76 of ST. The population of Bori kh. is 6698 of
which the population of SC is 16.81 percent and that of ST is 9 .8~ percent. The population of
Jambazar is 3752 of which SC population is 9.12 percent and that of ST is 3.01 percent.
Village· Shilona has- 2974 population of which 13.45 percent is population of SC and 23.54
percent is of ST. The area-wise Shilona village is bigger, however, it has been noticed that
this village has 580 households and the largest ST population village among the sample
villages in the district.
Similarly in Ahemadnagar district, four villages Dhavalpuri and Jamgoan (from
Pamer tahshil and Supa market area), and Belvandi and Vangdari (from Shrigonda tahshil
and Kasti market area) have been selected and the area of these four villages are 10362, 2834,
3111, 949 respectively. As per the Census 2001, the population ofDhavalpuri village is 5234,
of which 7.91 percent is population ofSC and 7.59 of ST. The population of Jamgaon is 3533
of which the population of SC is 7.53 percent and that of ST is 3.11 percent. The population
ofBelvandi is 10836 of which SC population is 8.01 percent and that of ST is 2.91 percent.
Village Vangdari has 2743 population of which 11.92 percent is population of SC and 8.97
percent is of ST. (See table-19)
It is found that the literacy rate in Ladkhed village is 70.56 % .It is noticed that 76.20
%is male literacy rate and 64.73 %is female literacy rate. In Bori the overall literacy rate is
69.60% and female and male literacy rate are 61.08 and 77.64% respectively. In Jambazar
village it is found that the literacy rate is 62.34 % and male female literacy rate are 72.29 %
and 51.78% respectively. Shilona village has 52.12% literacy rate and among the male and
female are 64.49 % and 3S.73 %respectively. In Dhavalpuri village the overall literacy rate
found is 58.18 %. The literacy rate among male and female are 68.10 and 48.05 %
respectively. In Jamgaon has 60.88 % overall literacy rate and male and female literacy rate
are 70.75 % and 49.91 % respectively. In Belwandi village, it is noticed that 64.09 % is
literacy rate and among the male and female, the literacy rate are 72.67 % and 54.86 %
respectively. The village Wangadari has~ 60.81 % literacy rate and among the male and
female, the literacy rate are 69.27% and 52.Q4 o/o respectively. (See Table -20)
63
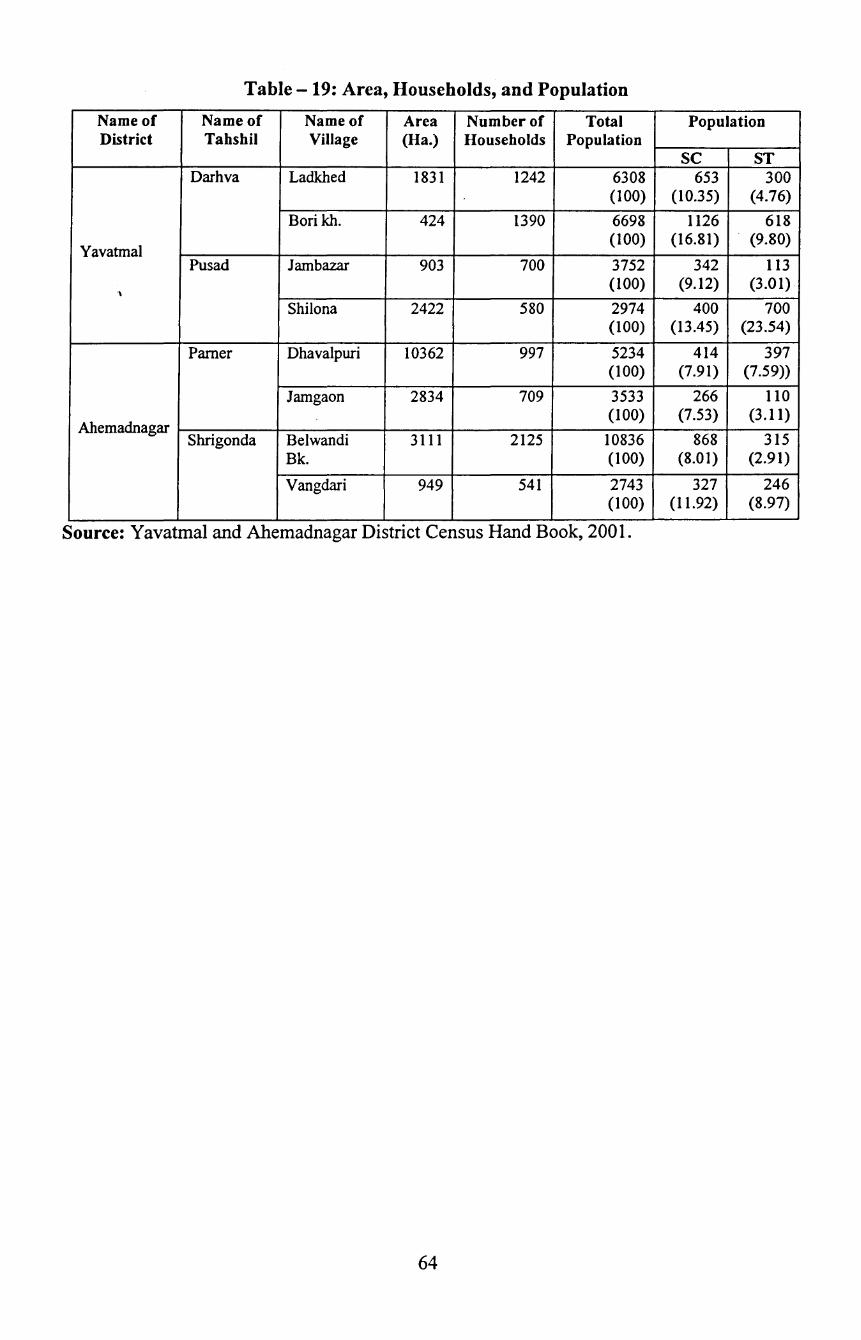
Table- 19: Area, Households, and Population
Name of Name of Name of Area Number of Total Population District Tahshil Village (Ha.) Households Population
sc ST Darhva Lad.khed 1831 1242 6308 653 300
(100) (10.35) (4.76)
Bori kh. 424 1390 6698 1126 618
Yavatmal (100) (16.81) (9.80)
Pus ad Jarnbazar 903 700 3752 342 113
'\ (100) (9.12) (3.01)
Shilona 2422 580 2974 400 700 (100) (13.45) (23.54)
Pamer Dhavalpuri 10362 997 5234 414 397 (100) (7.91) (7.59))
Jarngaon 2834 709 3533 266 110
Ahemadnagar (100) (7.53) (3.11)
Shrigonda Belwandi 3111 2125 10836 868 315 Bk. (100) (8.01) (2.91)
Vangdari 949 541 2743 327 246 (100) (11.92) (8.97)
Source: Yavatmal and Ahemadnagar District Census Hand Book, 2001.
64
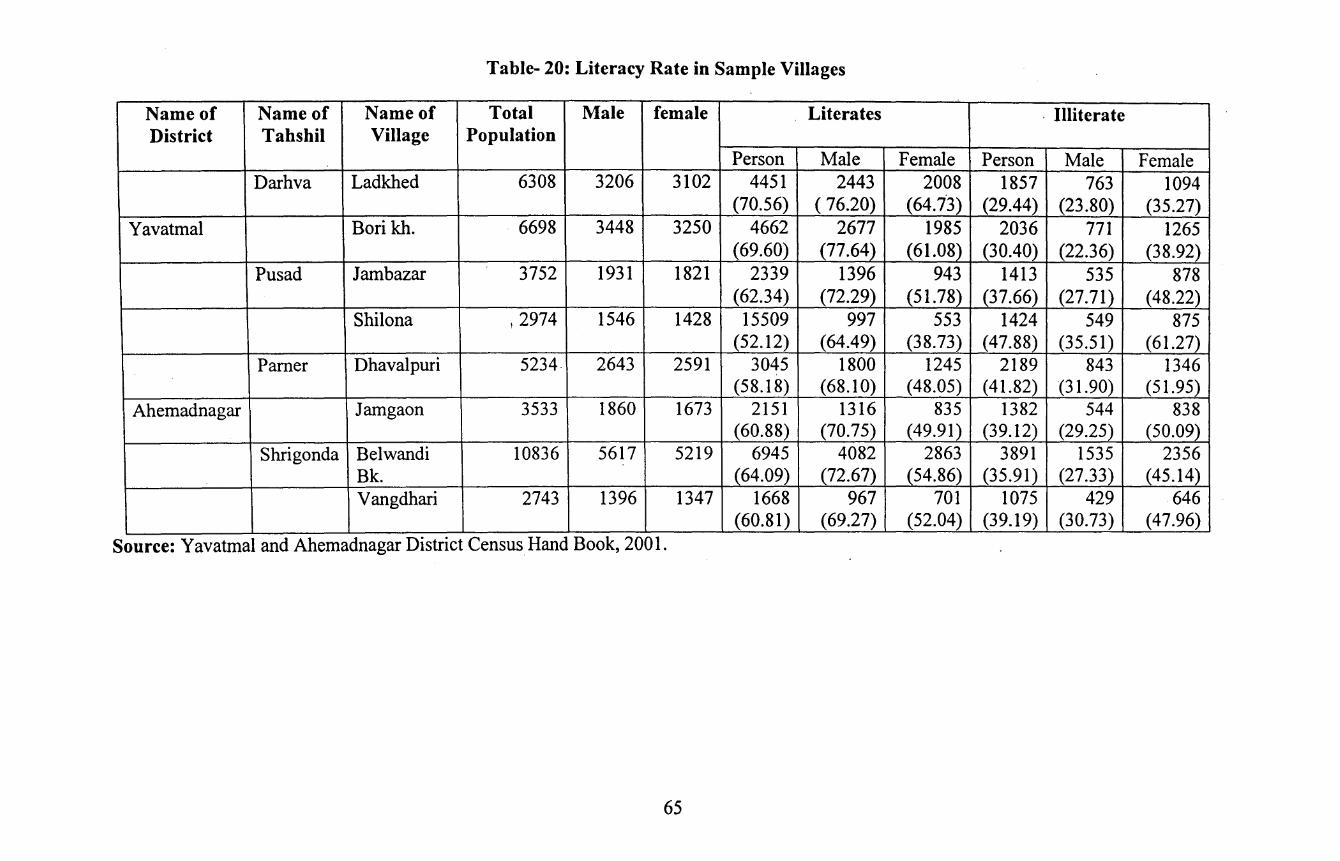
Table- 20: Literacy Rate in Sample Villages
Name of Name of Name of Total Male female . Literates . Illiterate District Tahshil Village Population
Person Male Female Person Male Female Darhva Ladkhed 6308 3206 3102 4451 2443 2008 1857 763 1094
(70.56) ( 76.20) (64.7.3) (29.44) (23.80) (35.27) Yavatmal Bori kh. 6698 3448 3250 4662 2677 1985 2036 771 1265
(69.60) (77.64) (61.08) (30.40) (22.36) (38.92) Pus ad Jambazar 3752 1931 1821 2339 1396 943 1413 535 878
(62.34) (72.29) (51.78) (37.66) (27.71) (48.22) Shilona 12974 1546 1428 15509 997 553 1424 549 875
(52.12) (64.49) (38.73) (47.88) (35.51) (61.27) Pamer Dhavalpuri 5234. 2643 2591 3045 1800 1245 2189 843 1346
(58.18) (68.1 0) (48.05) (41.82) (31.90) (51.95) Ahemadnagar Jamgaon 3533 1860 1673 2151 1316 835 1382 544 838
(60.88) (70.75) ( 49.91) (39.12) (29.25) (50.09) Shrigonda Belwandi 10836 5617 5219 6945 4082 2863 3891 1535 2356
Bk. {64.09) (72.67) (54.86) (35.91) (27.33) ( 45.14) Vangdhari 2743 1396 1347 1668 967 701 1075 429 646
(60.81) (69.27) (52.04) (39.19) (30.73) (47.96) Source: Yavatmal and Ahemadnagar District Census Hand Book, 2001.
65
Classification of Land Area
The census 2001, revealed the different uses and nonuse of land in the sample
villages. It is observed that in village Ladkhed, the cultivable land is 1402.73 ha. It is found
in this village that only 1.04 ha area is available for Grazing and 317.98 ha. is covered by the
forest. Only 60 ha. land is found irrigated. In Bori kh. out of total area of village, 323.69 ha.
land area is cultivable area, 28.15 ha is irrigated land, 9.74 ha. land is available for grazing
purpose. The village Jambazar has 800 ha land as cultivable, 61 ha. land is irrigated, and
remaining areas are classified as government and unutilized area. Another sample village
Shilona has 1079.89 ha. cultivable area, 1252.98 ha. area is covered by forest, and 61 ha land
is found irrigated land. The village Dhavalpuri has 7399 ha. land is covered by cultivable
area, 296 ha. land is found irrigated, and large land area i.e. 2527.34 ha. is classified under
unutilized area category. In village Jamgaon, it is noticed that 2451 ha. land is classified as
cultivable land, 250 ha.land is irrigated land, and 236 ha area is classified as unutilized area.
Belwandi village has 3111 ha. as cultivable area, 114 ha. land is classified as forest area, and
148 ha. land area is classified as government fallow land. It is found that most of the area in
this village is found under irrigation. Similarly in village V angdari, out of cultivable, most of
the land area is brought under irrigation. These two sample villages in Ahemadnagar district
are found that the most of land areas are irrigated. The details of areas are given in the
following table-21
66

Table-21: Classification of Land
Name of Name of Name of Area of Cultivable Non- Government Irrigated Grazing Forest Unutilized District Tahshils Village Village Area in Cultivable Fallow Area in Area in Area in Area in
in Hectares Area in Area in Hectares Hectares Hectares Hectares Hectares Hectares Hectares
IR Darhva Ladkhed 1831.0 1402.73 6.09 3.83 60 1.04 317.98 43.24
Bori kh. 424.0 323.69 23.11 33.63 28.15 9.74 - 23.87
Yavatmal Pus ad Jambazar 903.0 800 7 22 61 - - 35
Shilona 2422.1
3 1079.89 - 38.84 35.85 - 1252.98 44.86
Pamer Dhavalpuri 10362.0 7399 - 65.05 296 . - - 2527.34
Jamgaon 2834.0 2451 60R 17.45 250 - - 236.66
Ahemadnagar Shrigonda Belwandi 3111.0 3132 6 148 3132 - 114 212.69 Bk. Vangdari 949.0 764 142 R 100 554 - 28 77
Source: Yavatmal and Ahemadnagar D1stnct Census Hand Book, 200 I.
67
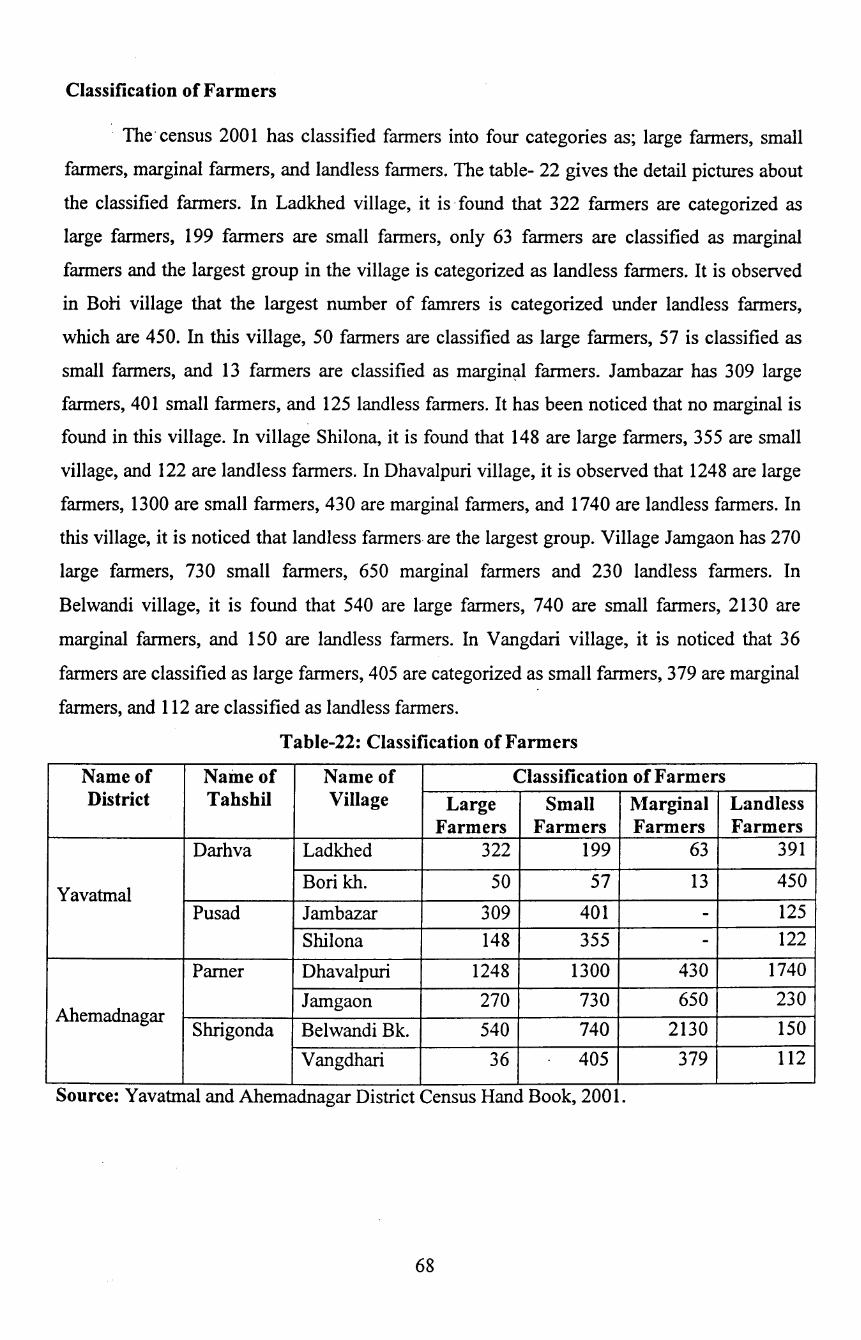
Classification of Farmers
The· census 2001 has classified farmers into four categories as; large farmers, small
farmers, marginal farmers, and landless farmers. The table- 22 gives the detail pictures about
the classified farmers. In Ladkhed village, it is· found that 322 farmers are categorized as
large farmers, 199 farmers are small farmers, only 63 farmers are classified as marginal
farmers and the largest group in the village is categorized as landless farmers. It is observed
in BoH village that the largest number of famrers is categorized under landless farmers,
which are 450. In this village, 50 farmers are classified as large farmers, 57 is classified as
small farmers, and 13 farmers are classified as margin~.! farmers. Jambazar has 309 large
farmers, 401 small farmers, and 125 landless farmers. It has been noticed that no marginal is
found in this village. In village Shilona, it is found that 148 are large farmers, 355 are small
village, and 122 are landless farmers. In Dhavalpuri village, it is observed that 1248 are large
farmers, 1300 are small farmers, 430 are marginal farmers, and 1740 are landless farmers. In
this village, it is noticed that landless farmers are the largest group. Village Jamgaon has 270
large farmers, 730 small farmers, 650 marginal farmers and 230 landless farmers. In
Belwandi village, it is found that 540 are large farmers, 740 are small farmers, 2130 are
marginal farmers, and 150 are landless farmers. In Vangdari village, it is noticed that 36
farmers are classified as large farmers, 405 are categorized as small farmers, 3 79 are marginal
farmers, and 112 are classified as landless farmers.
Table-22: Classification of Farmers
Name of Naine of Name of Classification of Farmers District Tahshil Village Large Small Marginal Landless
Farmers Farmers Farmers Farmers Darhva Ladkhed 322 199 63 391
Yavatmal Bori kh. 50 57 13 450
Pus ad Jambazar 309 401 - 125
Shilona 148 355 - 122
Pamer Dhavalpuri 1248 1300 430 1740
Jamgaon 270 730 650 230 Ahemadnagar
Shrigonda Belwandi Bk. 540 740 2130 150
Vangdhari 36 405 379 112
Source: Yavatmal and Ahemadnagar District Census Hand Book, 2001.
68
Different Category of Workers:
According to the Census 2001, (See table -23, 24, 25) it has been observed in
Yavatmal district in Ladkhed village that out of total population, 39.36 percent are total
workers and 60.64 percent workers are classified as non-workers in the village. Out of total
workers, 81.55 percent workers are classified as main workers and remaining workers are
classified as marginal workers. Out of total main workers, it is observed that 26.47 percent
workers are cultivators, 55.31 percent are Agricultural Labourers, 1.19 percent workers are
engaged in Household Industry, and 17.04 percent is classified as other workers. Out of total
marginal workers, it is noticed that 3.71 percent workers are cultivators, 88.21 percent are
Agricultural Labourers, 0.87 percent workers are engaged in Household Industry, and 7.21
percent is classified as other workers.
In village Bori kh, 41.92 percent workers are classified as workers and remaining
58.08 percent workers are classified as non-workers. Out of total workers, 87.07 percent
workers are classified as main workers and remaining workers are classified as marginal
workers. Out of total main workers, it-is observed that 11.86 percent workers are cultivators,
60.53 percent are Agricultural Labourers, 1.60 percent workers are engaged in Household
Industry, and 26.01 percent is classified as other workers. Out of total marginal workers, it is
noticed that 7.99 percent workers are cultivators, 73.00 percent are Agricultural Labourers,
4.96 percent workers are engaged in Household Industry, and 14.5 percent is classified as
other workers.
In village Jambazar, 37.74 percent workers are classified as workers and remaining
workers are classified as non-work~rs. Out of total workers, 91.60 percent workers are
classified as main workers and remaining workers are classified as marginal workers. Out of
total main workers, it is observed that 19.66 percent workers are cultivators, 58.29 percent are
Agricultural Labourers, 0. 93 percent workers are engaged in Household Industry, and 21.13
percent is classified as other workers. Out of total marginal workers, it is noticed that 2.52
percent workers are cultivators, 90.75 percent are Agricultural Labourers, and 6.72 percent is
classified as other workers.
In village Shilona, 49.53 percent population is classified workers and remaining as
non-workers. Out of total workers, 80.52 percent workers are classified as main workers and
remaining workers are classified as marginal workers. Out of total main workers, it is
observed that 39.97percent workers are cultivators, 51.69 percent are Agricultural Labourers,
0.67 percent workers are engaged in Household Industry, and 7.67 percent is classified as
other workers. Out of total marginal workers, it is noticed that 22.30 percent workers are
69
cultivators, 74.22 percent are Agricultural Labourers, 1.05 percent workers are engaged in
Household Industry, and 2.44 percent is classified as other workers.
Similarly in Ahemadnagar district, in Dhavalpuri village, 49.79 percent population is
classified as workers and remaining population . is classified as non-workers. Out of total
workers, 82.89 percent workers are classified as main workers and remaining workers are
classified as marginal workers. Out of total main workers, it is observed that 59.77 percent
worket:s are cultivators, 22.12 percent are Agricultural Labourers, 1.20 percent workers are
engaged in Household Industry, and 16.90 percent is classified as other workers. Out of total
marginal workers, it is noticed that 68.83 percent workers are cultivators, 20.85 percent are
Agricultural Labourers, 0.90 percent workers are engaged in Household Industry, and 9.42
percent is classified as other workers.
In village Jamgaon, 55.68 percent population is classified as workers and remaining is
classified as non-workers. Out of total workers, 83.58 percent workers are classified as main
workers and remaining workers are classified as marginal workers. Out of total main
workers, it is observed that 63.32 percent workers are cultivators, 16.61 percent are
Agricultural Labourers, 2.01 percent workers are engaged in Household Industry, and 18.7
percent is classified as other workers. Out of total marginal workers, it is noticed that 52.32
percent workers are cultivators, 29.41 percent are Agricultural Labourers, 4.64 percent
workers are engaged in Household Industry, and 13.62 percent is classified as other workers.
In village Belvandi 48.73 percent population is classified as workers and remaining is
classified as non-workers. Out of total workers, 94.32 percent workers are classified as main
workers and remaining workers are classified as marginal workers. Out of total main
workers, it is observed that 56.35 percent workers are cultivators, 28.09 percent are
Agricultural Labourers, 1.27 percent workers are engaged in Household Industry, and 14.30
percent is classified as other workers. Out of total marginal workers, it is noticed that 46.33
percent workers are cultivators, 40 percent are Agricultural Labourers, 0.67 percent workers
are engaged in Household Industry, and 13 percent is classified as other workers.
In village Vangdari, 48.52 percent population is classified as workers and remaining
is classified as non-workers. Out of total workers, 86.25 percent workers are classified as
main workers and remaining workers are classified as marginal workers. Out of total main
workers, it is observed that 46.69 percent workers are cultivators, 36.50 percent are
Agricultural Labourers, 1.22 percent workers are engaged in Household Industry, and 15.59
percent is classified as other workers. Out of total marginal workers, it is noticed that 15.30
70
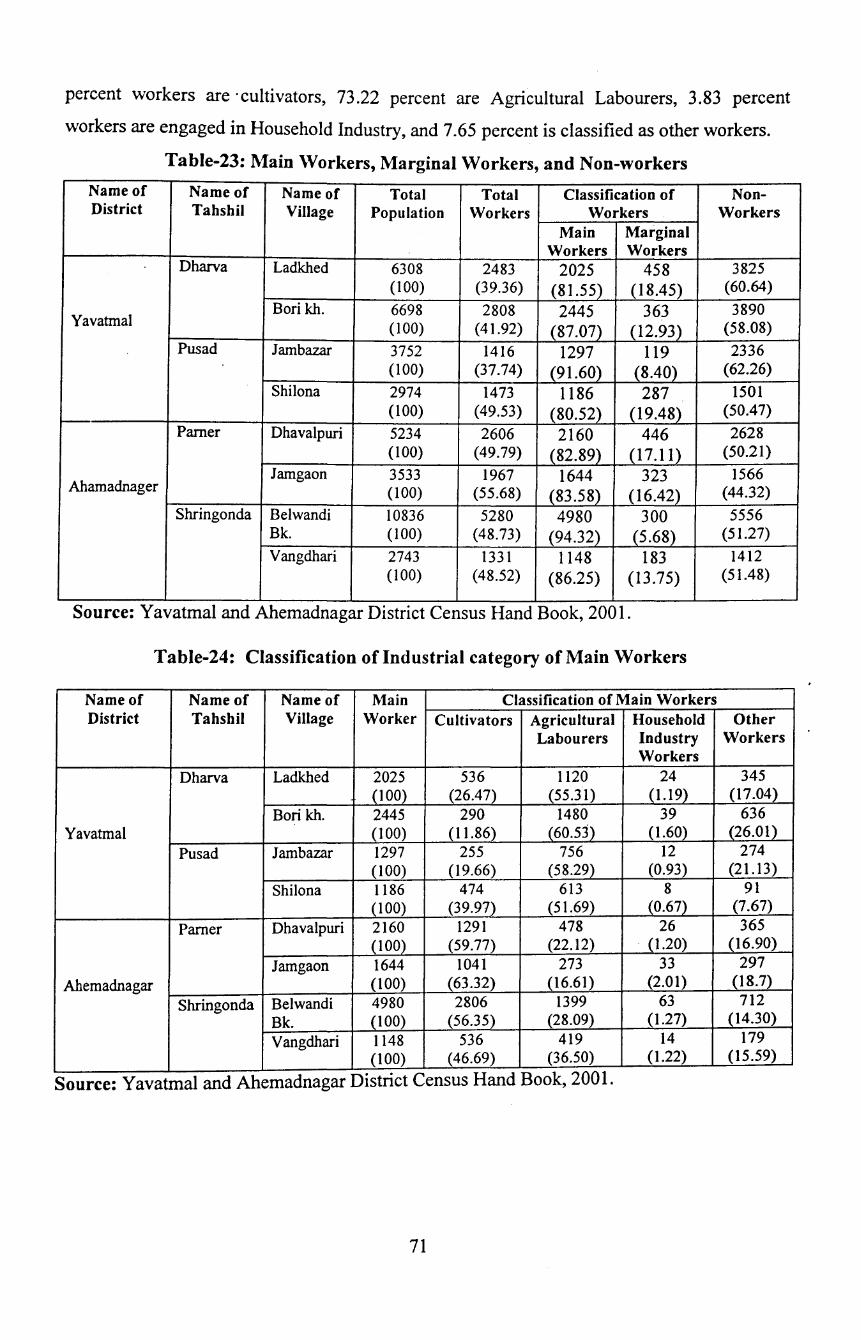
percent workers are ·cultivators, 73.22 percent are Agricultural Labourers, 3.83 percent
workers are engaged in Household Industry, and 7.65 percent is classified as other workers.
Table-23: Main \Vorkers, Marginal Workers, and Non-workers
Name of Name of Name of Total Total Classification of Non-District Tahshil Village Population Workers Workers Workers
Main Marginal Workers Workers
Dharva Ladkhed 6308 2483 2025 458 3825 (100) (39.36) (81.55) (18.45) (60.64)
Bori kh. 6698 2808 2445 363 3890 Yavatmal (100) (41.92) (87.07) (12.93) (58.08)
Pus ad Jambazar 3752 1416 1297 119 2336 (100) (37.74) (91.60) (8.40) (62.26)
Shilona 2974 1473 1186 287 1501 (100) (49.53) (80.52) (19.48) (50.47)
Pamer Dhavalpuri 5234 2606 2160 446 2628 (100) (49.79) (82.89) (17.11) (50.21)
Jamgaon 3533 1967 1644 323 1566 Ahamadnager (100) (55.68) (83.58) (16.42) (44.32)
Shringonda Belwandi 10836 5280 4980 300 5556 Bk. (100) (48.73) (94.32) (5.68) (51.27)
Vangdhari 2743 1331 1148 183 1412 (100) (48.52) (86.25) (13.75) (51.48)
Source: Y avatmal and Ahemadnagar District Census Hand Book, 2001.
Table-24: Classification of Industrial category of Main Workers
Name of Name of Name of Main Classification of Main Workers District Tahshil Village Worker Cultivators Agricultural Household Other
Labourers Industry Workers Workers
Dharva Ladkhed 2025 536 ll20 24 345 (100) (26.47) (55.31) (1.19} (17.04)
Bori kh. 2445 290 1480 39 636 Yavatmal (100) (11.86) (60.53) (1.60) (26.01}
Pus ad Jambazar 1297 255 756 12 274 (100) (19.66) (58.29) (0.93) (21.13)
Shilona 1186 474 613 8 91 (100) (39.97) (51.69) (0.67) (7.67)
Pamer Dhavalpuri 2160 1291 478 26 365 (100) (59.77) (22.12) . (1.20) (16.90)
Jamgaon 1644 1041 273 33 297
Ahemadnagar (100) (63.32) (16.61) (2.01) (18.7)
Shringonda Belwandi 4980 2806 1399 63 712
Bk. (100) (56.35) (28.09) (I .27) (14.30)
Vangdhari 1148 536 419 14 179 (100) (46.69) (36.50) (1.22) (15.59) . .
Source: Yavatmal and Ahemadnagar Dtstnct Census Hand Book, 2001 .
71

Table-25: Classification of Industrial category of Marginal Workers
Name of Name of Name of Marginal Classification ofMarginal \Yorkers District Tahshil Village Workers Cultivators Agricultural Household Other
Labourers Industry \Yorkers Workers
Darhva Ladkhed 458 17 404 4 33 (100) (3.71) (88.21) (0.87) (7.21)
Bori kh. 363 29 265 18 51 Yavatmal (100) (7.99) (73.00) (4.96) (14.5)
\
Pus ad 108 8 Jambazar 119 3 -(100) (2.52) _(90.75) (00.00) (6.72)
Shilona 287 64 213 3 7 (100) (22.3Ql (74.22) (1.05) (2.44)
Pamer Dhavalpuri 446 307 93 4 42 (100) (68.83) (20.85) (0.90) (9.42)
Jamgaon 323 169 95 15 44 Ahemadnagar (100) (52.32) (29.41) (4.64) (13.62)
Shrigonda Belwandi 300 139 120 2 39 Bk. (100) (46.33) (40.00) (0.67) (13.00) Vangdari 183 28 134 7 14
(100) (15.30) (73.22) (3.83) (7.65)
Source: Yavatmal and Ahemadnagar District Census Hand Book, 2001.
72

CHAPTER-IV
STATUS OF GOAT KEEPERS IN SAMPLE VILLAGES
Distribution of Sample Goat Keepers
According to methodology adopted for the study, the total 104-goat
keepers households have been selected for the sample. The four-goat keepers
households have additionally been taken over I 00 sample size to divide equally in the
four. markets. The distribution of samples and the information of the sample goat
keepers regarding sample size in each market, each village and each district have been
given in table- 1. Therefore, in Yavatmal District, 13 sample households have been
selected from each sample villages Bori kh, Ladkhed, Jambazar, and Shilona.
Similarly, in Ahemadnagar district, 14 sample households are identified from
Jamgaon village, 12 sample households are identified in Dhavalpuri, and 13 sample
households are identified from each village Belwandi and Vangdari.
Table-1: Distribution of Sample Goat Keepers by Size of Goat Herd across the Markets of Goats
Category Yavatmal Ahemadnagar Total of Goat
Market- I Market- II Sub Market- I Market- II Sub-Keepers (Darhva) (Pusad) total (Supa_l (Kasti) total Bori Lad- Jam- Shilona Jam- Dhaval- Bel- Vang-(kh) khed Bazar gaon puri wandi dari
Group I 3 3 3 3 12 3 4 3 2 12 24
Group H 3 3 3 3 12 3 2 2 4 II 23 Group III 5 4 4 4 17 5 3 5 4 17 34 Group IV 2 3 3 3 II 3 3 3 3 12 23 Total 13 13 13 13 52 14 12 13 l3 52 104
While collecting information from the goat keepers households, the
information has been classified caste wise. Among them, 22 goat keepers households
are from general category, 15 households have been from OBC category, 31
households from NT category, 7 households from ST, and 29 households from SC
category. In all four groups of goat keepers, among the sample goat keepers, the
highest goat keepers are found in NT category, followed by SC category, general
category, and OBC category. (See Table-2)
As it has been mentioned in above paragraph about total number of sample
goat keepers, the total numbers of goats in two sample districts are 1782, of which in-
73
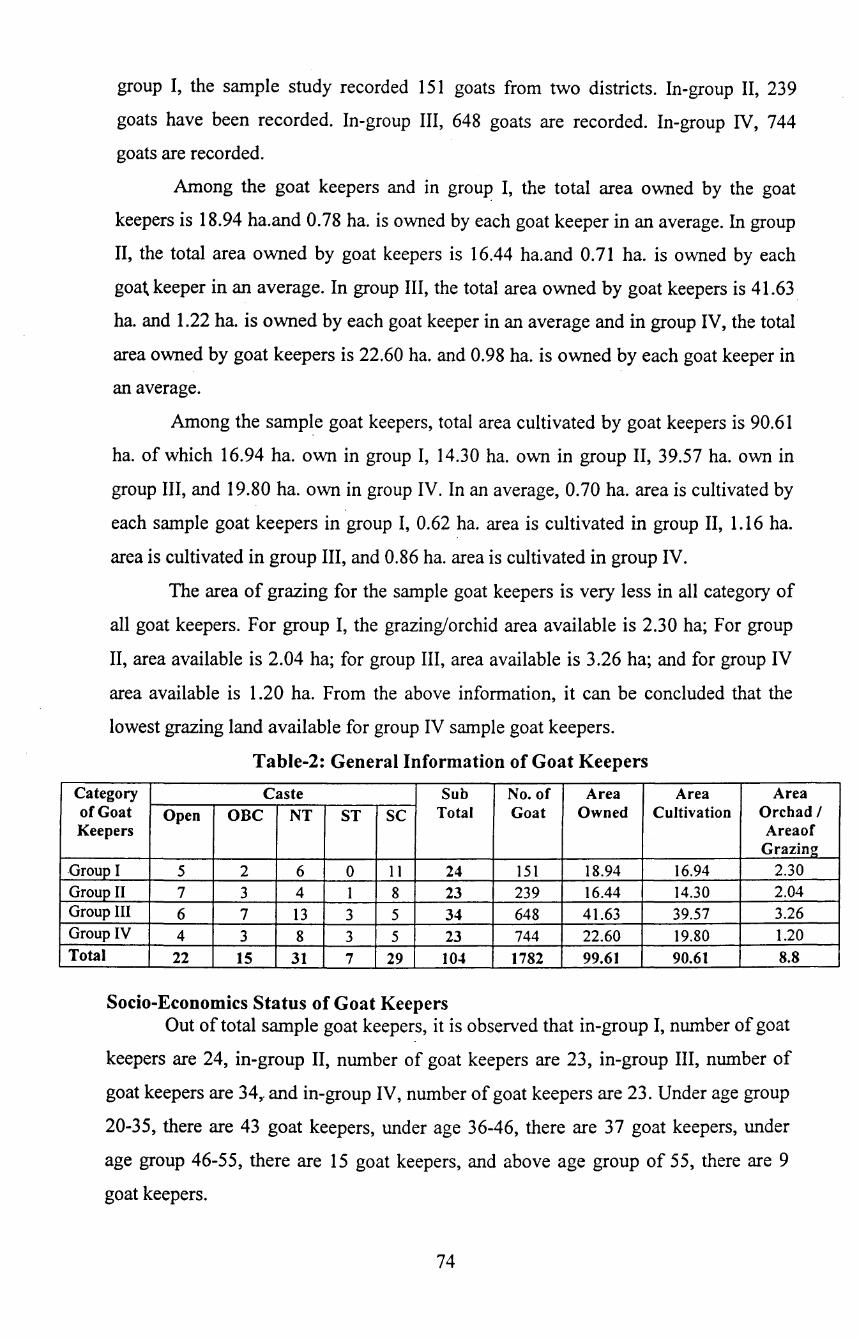
group I, the sample study recorded 151 goats from two districts. In-group II, 239
goats have been recorded. In-group III, 648 goats are recorded. In-group IV, 744
goats are recorded.
Among the goat keepers and in group I, the total area owned by the goat
keepers is 18.94 ha.and 0. 78 ha. is owned by each goat keeper in an average. In group
II, the total area owned by goat keepers is 16.44 ha.and 0.71 ha. is owned by each
goat keeper in an average. In group III, the total area owned by goat keepers is 41.63
ha. and 1.22 ha. is owned by each goat keeper in an average and in group IV, the total
area owned by goat keepers is 22.60 ha. and 0.98 ha. is owned by each goat keeper in
an average.
Among the sample goat keepers, total area cultivated by goat keepers is 90.61
ha. of which 16.94 ha. own in group I, 14.30 ha. own in group II, 39.57 ha. own in
group III, and 19.80 ha. own in group IV. In an average, 0.70 ha. area is cultivated by
each sample goat keepers in group I, 0.62 ha. area is cultivated in group II, 1.16 ha.
area is cultivated in group III, and 0.86 ha. area is cultivated in group IV.
The area of grazing for the sample goat keepers is very less in all category of
all goat keepers. For group I, the grazing/orchid area available is 2.30 ha; For group
II, area available is 2.04 ha; for group III, area available is 3.26 ha; and for group IV
area available is 1.20 ha. From the above information, it can be concluded that the
lowest grazing land available for group IV sample goat keepers.
Table-2: General Information of Goat Keepers
Category Caste Sub No. of Area Area Area of Goat Open OBC NT ST sc Total Goat Owned Cultivation Orchad I Keepers Area of
Grazing -Group I 5 2 6 0 11 24 151 18.94 16.94 2.30 Group II 7 3 4 1 8 23 239 16.44 14.30 2.04 Group III 6 7 13 3 5 34 648 41.63 39.57 3.26 Group IV 4 3 8 3 5 23 744 22.60 19.80 1.20 Total 22 15 31 7 29 104 1782 99.61 90.61 8.8
Socio-Economics Status of Goat Keepers Out of total sample goat keepers, it is observed that in-group I, number of goat
keepers are 24, in-group II, number of goat keepers are 23, in-group III, number of
goat keepers are 34,. and in-group IV, number of goat keepers are 23. Under age group
20-35, there are 43 goat keepers, under age 36-46, there are 37 goat keepers, under
age group 46-55, there are 15 goat keepers, and above age group of 55, there are 9
goat keepers.
74
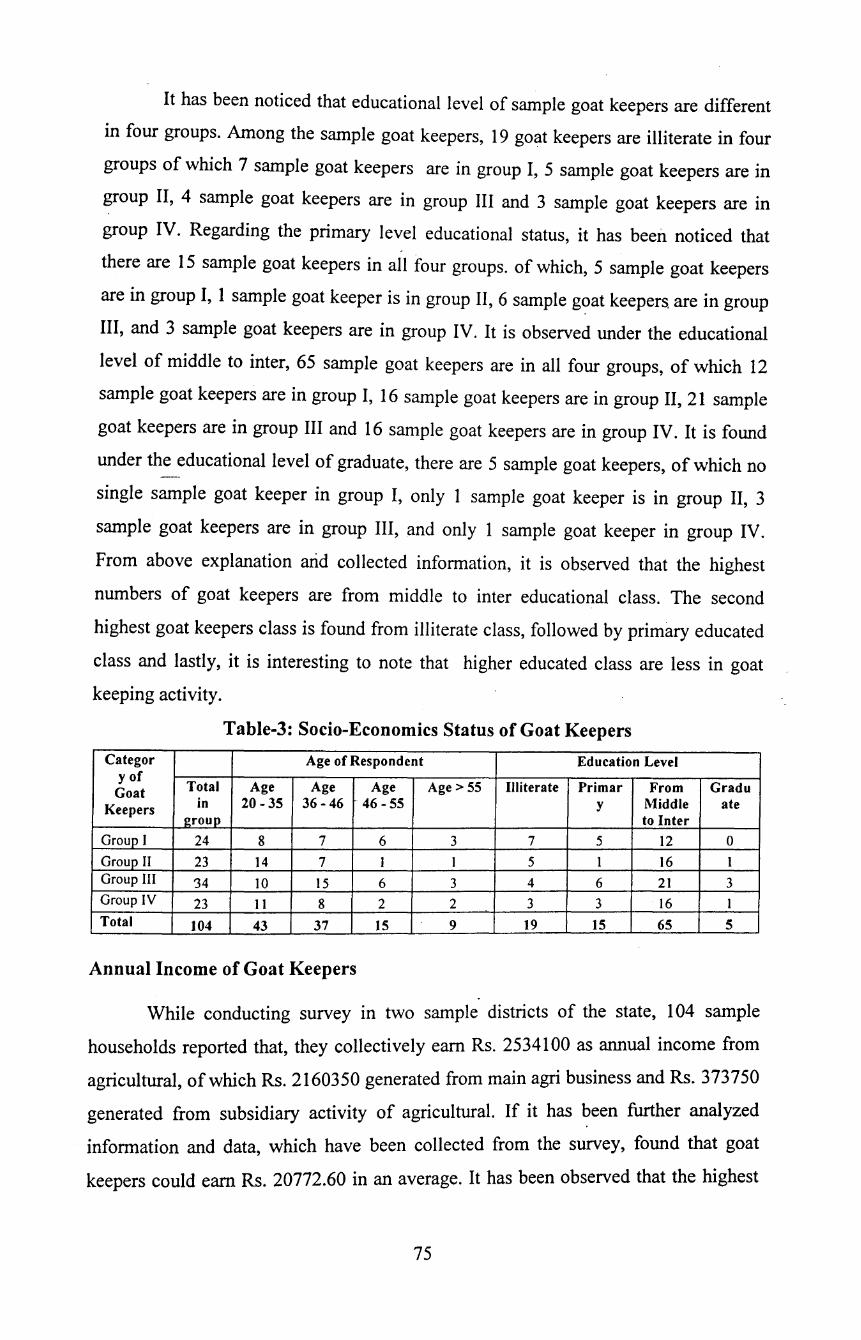
It has been noticed that educational level of sample goat keepers are different
in four groups. Among the sample goat keepers, 19 goat keepers are illiterate in four
groups of which 7 sample goat keepers are in group I, 5 sample goat keepers are in
group II, 4 sample goat keepers are in group III and 3 sample goat keepers are in
group IV. Regarding the primary level educational status, it has been noticed that
there are 15 sample goat keepers in all four groups. of which, 5 sample goat keepers
are in group I, I sample goat keeper is in group II, 6 sample goat keepers are in group
III, and 3 sample goat keepers are in group IV. It is observed under the educational
level of middle to inter, 65 sample goat keepers are in all four groups, of which 12
sample goat keepers are in group I, 16 sample goat keepers are in group II, 21 sample
goat keepers are in group III and 16 sample goat keepers are in group IV. It is found
under the educational level of graduate, there are 5 sample goat keepers, of which no
single sample goat keeper in group I, only 1 sample goat keeper is in group II, 3
sample goat keepers are in group III, and only 1 sample goat keeper in group IV.
From above explanation arid collected information, it is observed that the highest
numbers of goat keepers are from middle to inter educational class. The second
highest goat keepers class is found from illiterate class, followed by primary educated
class and lastly, it is interesting to note that higher educated class are less in goat
keeping activity.
Table-3: Socio-Economics Status of Goat Keepers
Categor Age of Respondent Education Level y of
Total Age Age Age Age> 55 Illiterate Primar From Gradu Goat in 20-35 36-46 46-55 y Middle ate Keepers
group to Inter
Group I 24 8 7 6 3 7 5 12 0 GroUQII 23 14 7 1 1 5 1 16 1 Group III '34 10 15 6 3 4 6 21 3 Group IV 23 11 8 2 2 3 3 16 I Total 104 43 37 15 9 19 15 65 5
Annual Income of Goat Keepers
While conducting survey in two sample districts of the state, 104 sample
households reported that, they collectively earn Rs. 2534100 as annual income from
agricultural, of which Rs. 2160350 generated from main agribusiness and Rs. 373750
generated from subsidiary activity of agricultural. If it has ~een further analyzed
information and data, which have been collected from the survey, found that goat
keepers could earn Rs. 20772.60 in an average. It has been observed that the highest
75
annual income has been earned by in group IV goat keepers. It is found that the
annual income of this category of households, in an average, is Rs. 22173.91. Further,
the lowest per household income from agricultural has been found in group I, which is
Rs.15379.17. The average annual income sample households from subsidiary activity
of agricultural is found Rs. 373750 and average of per household annual income is Rs.
3593.75. It is found that the group IV household earned the highest annual income
among four groups from agricultural, which is Rs. 5347.83. The group-! households
earned average annual income Rs. 1158.33, which is the lowest income per household
among four groups of goat keepers.
The average animal income from dairy business of total sample households is
Rs.5936.91, of which Rs. 3418.46 annual income is from main occupation and
Rs.2518.45 from subsidiary income. The highest per household income found in
group IV households, which is Rs. 8226.7 4 and lowest per households income has
been found in group I household, which is Rs. 4929.17. It has been noticed that the
average annual income of sample households is Rs. 92000.5 from goat rearing
activity, of which Rs.5733.13 is generated from main activity and Rs. 3466.92 has
been generated from subsidiary activity. The lowest annual income from goat rearing
activity has been found in group-I households and the highest annual income has been
found in group IV households, which is Rs. 20925.
Like other sectors, it is found that services sector also plays important role to
provide annual income source to the goat keepers. From this activity, while
conducting survey in two districts of the state, it has been found that sample
households could generate average annual income Rs. 2925, of which Rs. 2561.46 has
been generated from main business and Rs. 363.46 has been generate from subsidiary
business.
The average annual income from labour work of all sample households is Rs.
6152.88 of which Rs. 3208.41 has been generated from main activity and Rs. 2944.47
has been generated from subsidiary. The lowest average annual income from this
activity has been reported in group I households and the highest average annual
income has been reported in group II of sample household, which is Rs. 9726.09.
The average annual income from other profession has been reported Rs. 400,
in an average, of which Rs. 209.62 has been generated from main activity and Rs.
190.38 has been generated from subsidiary. The group I and group II sample
households could not report any income from this profession however, the group IV
76
sample households reported to have earned Rs. 1721.7 4 from this profession, which is
highest annual income among the sample households and groups. Group III reported
very meager amount from this activity.
From the business activity, the goat keepers added a small amount to the
annual incorre. While conducting field survey and after available data, it has been
reported that Rs. 807.69 could add to the goat keepers income in an average, of which
Rs. 430.77 has been generated from the main activity and Rs .. 376.92 has been added
from subsidiary.
From other sources of income, goat keepers could add Rs. 230.77 to the main
income in an average, which is also small amount, only group III households could
add some income to the annual income and others 'sample households, which are in
group I, group II and group IV added nothing to the annual income. (See table-4 (a),
(b), (c), and (4)
77

Table 4: Distribution of Sample Households by Main and Subsidiary Occupation by Market of Goats (a) I
'
Category Total in group Annual Income I Occupations (Main and Subsidiary) of Goat Agri i Dairy Keepers
I Average II Average Total Average I Average II Average Total Average Group I 24 369100 15379.17 27800 1158.33 396900 16537.5 65900 2745.83 52400 2183.33 118300 4929.17 Group II 23 393000 17086.96 46000 1352.94 439000 19086.96 53785 2338.65 60219 2618.22 114004 4956.70 Group III 34 888250 26125 176950 5204.41 1065200 31329.41 133600 3929.41 62320 1832.94 195920 5762.35 Group IV 23 510000 22173.91 123000 5347.83 633000 27521.74 102235 4445 86980 3781.74 189215 8226.74 Total 104 2160350 20772.60 373750 3593.75 2534100 24366.35 355520 3418.46 261919 2518.45 617439 5936.91
Table continued ...•••..•
Table 4 Distribution of Sample Households by Main and Subsidiary Occupation by Market of Goats (b)
Category Total Goat rearing Service of Goat in I
Keepers group I Average II Average Total Average I Average II Average Total Average Group I 24 26370 1098.75 2710 112.92 29080 1211.67 60200 2508.33 11200 466.67 71400 2975 . Group II 23 68650 2984.78 26000 1130.43 94650 4115.22 156000 6782.61 8000 347.83 164000 7130.43 Group III 34 225480 6631.76 126320 3715.29 351800 10347.06 24600 723.53 13000 382.35 37600 1105.88 Group IV 23 275745 11988.91 205530 8936.09 481275 20925 25600 1113.04 5600 243.48 31200 1356.52 Total 104 596245 5733.13 360560 3466.92 956805 9200.05 266400 2561.54 37800 363.46 304200 2925
Table continued ••.••••••

Table-4: Distribution of Sample Households by 1\Iain and Subsidiary Occupation by Market of Goats (c)
Category Labour Profession of Goat Total in Keepers group I Average II Average Total Average I Average II Average Total Averag_e Group I 24 51650 2152.08 48600 . 2025 100250 4177.08 0 0 0 0 0 0 Group II 23 119850 5210.87 103850 4515.22 223700 9726.09 0 0 0 0 0 0 Group III 34 82075 2413.97 77675 2284.56 159750 4698.53 2000 58.82 0 0 2000 58.82 Group IV 23 80100 3482.61 76100 3308.70 156200 6791.30 19800 860.87 19800 860.87 39600 1721.74 Total 104 333675 3208.41 306225 2944.47 639900 6152.88 21800 209.62 19800 190.38 41600 400
Table continued •..•••...
Table 4 Distribution of Sample Households by Main and Subsidiary Occupation by Market of Goats (d)
Category of Total in Business Others Goat group I Average II Average Total Average I Average II Average Total Average
Keepers Group I 24 0 0 0 0 0 0 0 0 0 0 0 0 Group II 23 18300 795.65 14700 639.13 33000 1434.78 0 0 0 0 0 0 Group III 34 24500 720.59 22500 661.76 47000 1382.35 12000 352.94 12000 352.94 24000 705.88 Group IV 23 2000 86.96 2000 86.96 4000 173.91 0 0 0 0 0 0 Total 104 . 44800 430.77 39200 376.92 84000 807.69 12000 115.38 12000 115.38 24000 230.77
79
Distribution of Sample Goats Keepers
The distribution of sample Goat keepers are given in the following table- 5 and table
SA. It is found in tables that in Yavatmal district, two markets have been selected based on
concentration of goat population and their selling. The two markets are Dharvha and Pusad in
the district. From each market, two villages have been selected for samples. In Darhva tahsil,
two villages BoriArab (kh) and Ladkhed, and in Pusad tahsil, Jambazar and Shilona have
been selected for the study. Similarly, in Ahemadnagar district, two markets Supa and Kasti
have been selected and two villages from each market area have been finalized for the
sample. Two villages Jamgaon and Dhavalpuri have been selected from Supa market area
(Pamer Tahsil) and two villages Belwandi and V angdari have been selected from Kasti
market area in Shrigonda tahsil of the Ahemadnagar district.
From two samples districts Yavatmal and Ahemadnagar, out of 104 samples, 29
samples are from SC category, 7 samples are from ST category, 31 samples are from NT
category, 15 samples are from OBC category and 22 samples are from Open category. In
percentage terms, 27.88 percent are SC samples households, 6.73 percent are ST samples
households, 29.81 percent are NT samples households, 14.42 percent are OBC samples
households and 21.15 percent are Open category households.
In BoriArab (kh) village of Dharvha in Yavatmal district, out of 13 samples, 6
samples are from SC category (46.15 percent), 3 sample are from ST category (23.08
percent), 1 sample from OBC category (7.69 percent) and 3 from Open category (23.08
percent) of total sample in the village. In Ladkhed village of same market, out of 13 samples,
5 samples are from SC category (38.46 percent), 4 samples are from OBC category (30.77
percent), and 4 samples are from Open category (30.77 percent).
In Jambazar village in Pusad market, out of 13 samples, 1 sample is from SC category
(7.69 percent), 1 sample is from ST category (7.69 percent), 5 samples are from NT category
(38.46 percent), 6 samples are from Open category (46.15 percent). In Shilona village of
same market, out of 13 samples, 1 sample is from SC category (7 .69 percent), 1 sample is . from ST category (7.69 percent), I 0 samples are from NT category (76.92 percent) and 1
sample is from Open category (7.69 percent).
In Jamgaon village of Supa market (Tahsil Pamer), out of 13 samples, 6 samples are
from SC category (46.15 percent), I sample is from ST category (7.69 percent), 1 sample is
from NT category (7.69 percent), and 5 samples are from OBC category (38.46 percent). In
Dhavalpuri village, out of 13 samples 7 samples are from SC category (53.85 percent), 3
80
samples are fro~ NT category (23.08 percent), 1 sample is from OBC category (7.69 percent)
and 2 samples are from Open category (15.38 percent).
In Belwandi village of Kasti market (Tahsil Shrigonda) in Ahemadnagar district, out
of 13 samples, 1 sample is from SC category (7 .69 percent), 8 samples are from NT category
(61.54 percent), and 4 samples are from OBC category (30.77 percent). In Vangadari village,
out of 13 .samples, 2 samples are from SC category (15.38 percent), 1 sample is from SC
category (7.69 percent), 4 samples are from NT category (30.77 percent) and 6 samples are
from Open category (46.15 percent).
81
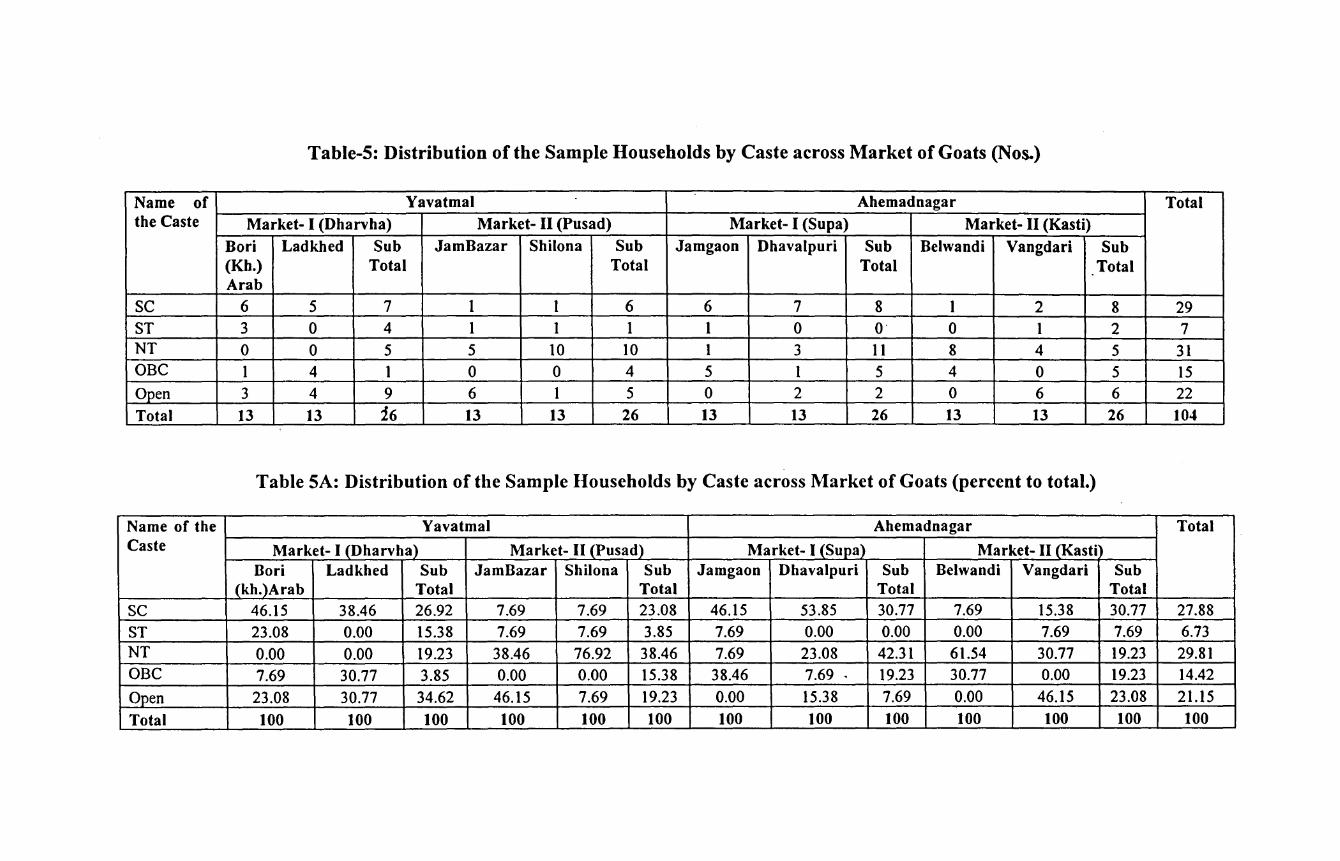
Table-S: Distribution of the Sample Households by Caste across Market of Goats (Nos.)
Name of Yavatmal Ahemadnagar Total the Caste Market- I (Dharvha) Market- II (Pusad) Market- I (Supa) Market- II (Kasti)
Bori Ladkhed Sub JamBazar Shilona Sub Jamgaon Dhavalpuri Sub Belwandi Vangdari Sub (Kh.) Total Total Total Total Arab
sc 6 5 7 I I 6 6 7 8 I 2 8 29 ST 3 0 4 I I I I 0 0 0 I 2 7 NT 0 0 5 5 10 10 1 3 11 8 4 5 31 OBC I 4 1 0 0 4 5 1 5 4 0 5 15 Open 3 4 9 6 1 5 0 2 2 0 6 6 22
Total 13 13 26 13 13 26 13 13 26 13 13 26 104
Table SA: Distribution of the Sample llouseholds by Caste across Market of Goats (percent to total.)
Name of the Yavatmal Ahemadnagar Total Caste Market- I (Dharvha) Market- II (Pusad) Market- I _(SupaJ Market- II (Kasti)
Bori Ladkhed Sub JamBazar Shilona Sub Jamgaon Dhavalpuri Sub Belwandi Vangdari Sub (kh.)Arab Total Total Total Total
sc 46.15 38.46 26.92 7.69 7.69 23.08 46.15 53.85 30.77 7.69 15.38 30.77 27.88 ST 23.08 0.00 15.38 7.69 7.69 3.85 7.69 0.00 0.00 0.00 7.69 7.69 6.73 NT 0.00 0.00 I9.23 38.46 76.92 38.46 7.69 23.08 42.3I 61.54 30.77 19.23 29.81 OBC 7.69 30.77 3.85 0.00 0.00 15.38 38.46 7.69 . 19.23 30.77 0.00 19.23 14.42
Open 23.08 30.77 34.62 46.15 7.69 19.23 0.00 I5.38 7.69 0.00 46.15 23.08 2l.I5
Total 100 100 100 100 100 100 100 100 100 100 100 100 100

Distribution of the Sample Households by their Operated Land
The distribution of Sample Households by their Operated Land and area are given in
the following table-6 and table-6A. It is observed from the tables that in two samples
districts, out of 104 sample households, 41 sample households are from land less category
(39.42 percent), 30 households having less than 1 ha.(28.85 percent), 15 households having
land area 1 to 2 ha. (14.42 percent), 15 households having land area 2 to 4 ha.(14.42 percent),
and 3 households having land area above 4 ha. (2.88 percent).
In BoriArab (kh) village of Dharvha market in Yavatmal district, out of 13 sample
households, 8 sample households are from land less category ( 61.54 percent), 2 sample
households (15.38 percent) having less than 1 ha. land, 2 households (15.38 percent) having
land area 1 to 2 ha. and 1 household has land area 2 to 4 ha. category. From these data,
majority of sample households are from land less category. In Ladkhed village of Darhva
market, it is noticed that out of 13 sample households 9 sample households are from land less
category (69.23 percent), 2 households (15.38 percent) have land area less than 1 ha; and 2
households (15.38 percent) having land area 1 to 2 ha. category. In Jambazar village (Tahsil
Pusad), out of 13 sample households 7 sample households (53.85 percent) having less than 1
ha. land, 4 sample households (30.77 percent) having land area 1 to 2 ha; and 2 households
(15.38 percent) having land area 2 to 4 ha. In Shilona village (Tahsil Pusad), out of 13 sample
households, 5 households (38.46 percent), 4 households (30.77 percent) have land less than 1
ha., 1 household (7.69 percent), having land area under Ito 2 ha. category, 3 households
(23.08 percent), having land area above 4 ha., So, the highest number of samples are from
land less category of households.
In Ahemadnagar district, it is found in the sample village Jamgaon of Supa market
(Tahsil Pamer) that out of 13 sample households, 3 sample households (23.08 percent) are
from land less category, 4 sample households (30.77 p.ercent) having less than 1 ha. land area,
1 sample households (7 .69 percent) has been classifieds under 1 to 2 ha. land area category
and 5 sample households (38.46 percent) classifieds under 2 to 4 ha. land area. In Dhavalpuri
village, 7 sample households (53.85 percent) are from land less category, 2 sample
households (15.38 percent) having less than 1 ha. land, and 4 sample households (30.77
percent) have been classifieds under 2 to 4 ha. category. So, in this village, 53.85 percent
households are from land less category, which is the highest in percentage. In Belwandi
village of Kasti market in Shrigonda Tahsil, out of 13 sample households, 2 samples
households ( 15.3 8 percent) have no land area, 8 households ( 61.54 percent) having land area
83

less than 1 ha. and 3 sample households (23.08 percent) having land area under category of 1
to 2 ha. So, the highest numbers of sample households are from the category of those, who
having less than 1 ha. land area. In Vangdari village, 7 households (53.85 percent) are from
land less category, 1 household (7.69 percent) having less than 1 ha. land areas, 2 sample
households ( 15.3 8 percent) have been classifieds under 1 to 2 ha. land area category and 3
sample households (23.08 percent) classifieds under 2 to 4 ha. land area. So, in Jamgaon, the
highe~t numbers of sample households are from those, who have land area 2 to 4 ha. category
and in Vangadari village, 53.85 per.cent sample households are from landless category, which
is the highest number of sample households in village.
8.4
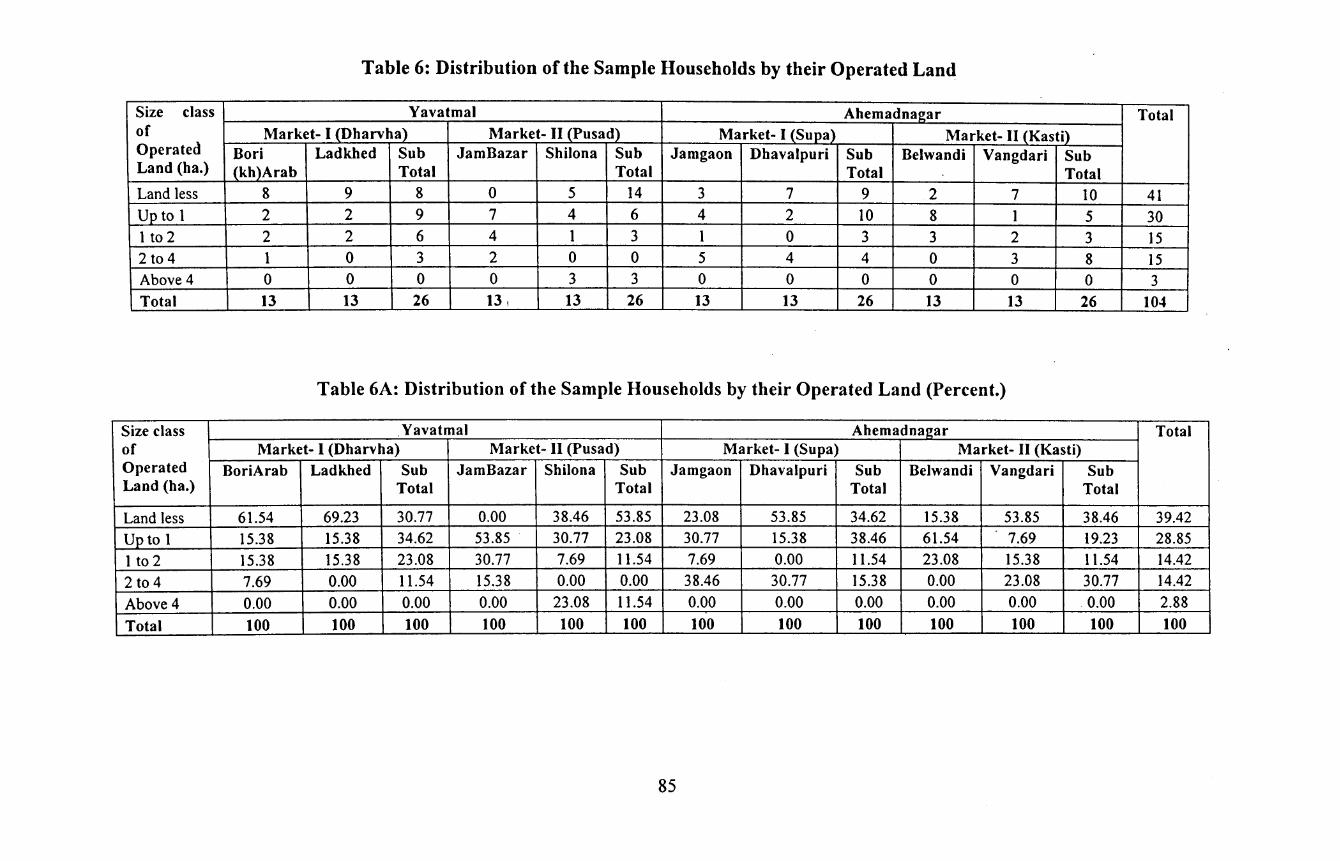
Table 6: Distribution of the Sample Households by their Operated Land
Size class Yavatmal Ahemadnagar Total of Market- I (Dharvha) Market- II (Pusad) Market- I (Supa) Market- II (Kasti) Operated Bori Ladkhed Sub JamBazar Shilona Sub Jamgaon Dhavalpuri Sub Belwandi Vangdari Sub Land (ha.) (kh)Arab Total Total Total Total Land less 8 9 8 0 5 14 3 7 9 2 7 10 41 Up to 1 2 2 9 7 4 6 4 2 10 8 1 5 30 1 to 2 2 2 6 4 1 3 1 0 3 3 2 3 15 2 to 4 1 0 3 2 0 0 5 4 4 0 3 8 15 Above 4 0 0 0 0 3 3 0 0 0 0 0 0 3 Total 13 13 26 13, 13 26 13 13 26 13 13 26 104
Table 6A: Distribution of the Sample Households by their Operated Land (Percent.)
Size class Yavatmal Ahemadna~ar Total of Market- I (Dharvha) Market- II (Pusad) Market- I (Supa) Market- II (Kasti) Operated BoriArab Ladkhed Sub JamBazar Shilona Sub Jamgaon Dhavalpuri Sub Belwandi Vangdari Sub Land (ha.) Total Total Total Total
Land less 61.54 69.23 30.77 0.00 38.46 53.85 23.08 53.85 34.62 15.38 53.85 38.46 39.42
Up to 1 15.38 15.38 34.62 53.85 30.77 23.08 30.77 15.38 38.46 61.54 7.69 19.23 28.85
1 to 2 15.38 15.38 23.08 30.77 7.69 11.54 7.69 0.00 11.54 23.08 15.38 11.54 14.42
2 to 4 7.69 0.00 11.54 15.38 0.00 0.00 38.46 30.77 15.38 0.00 23.08 30.77 14.42
Above 4 0.00 0.00 0.00 0.00 23.08 11.54 0.00 0.00 0.00 0.00 0.00 0.00 2.88
Total 100 100 100 100 100 100 100 100 100 100 100 100 100
85
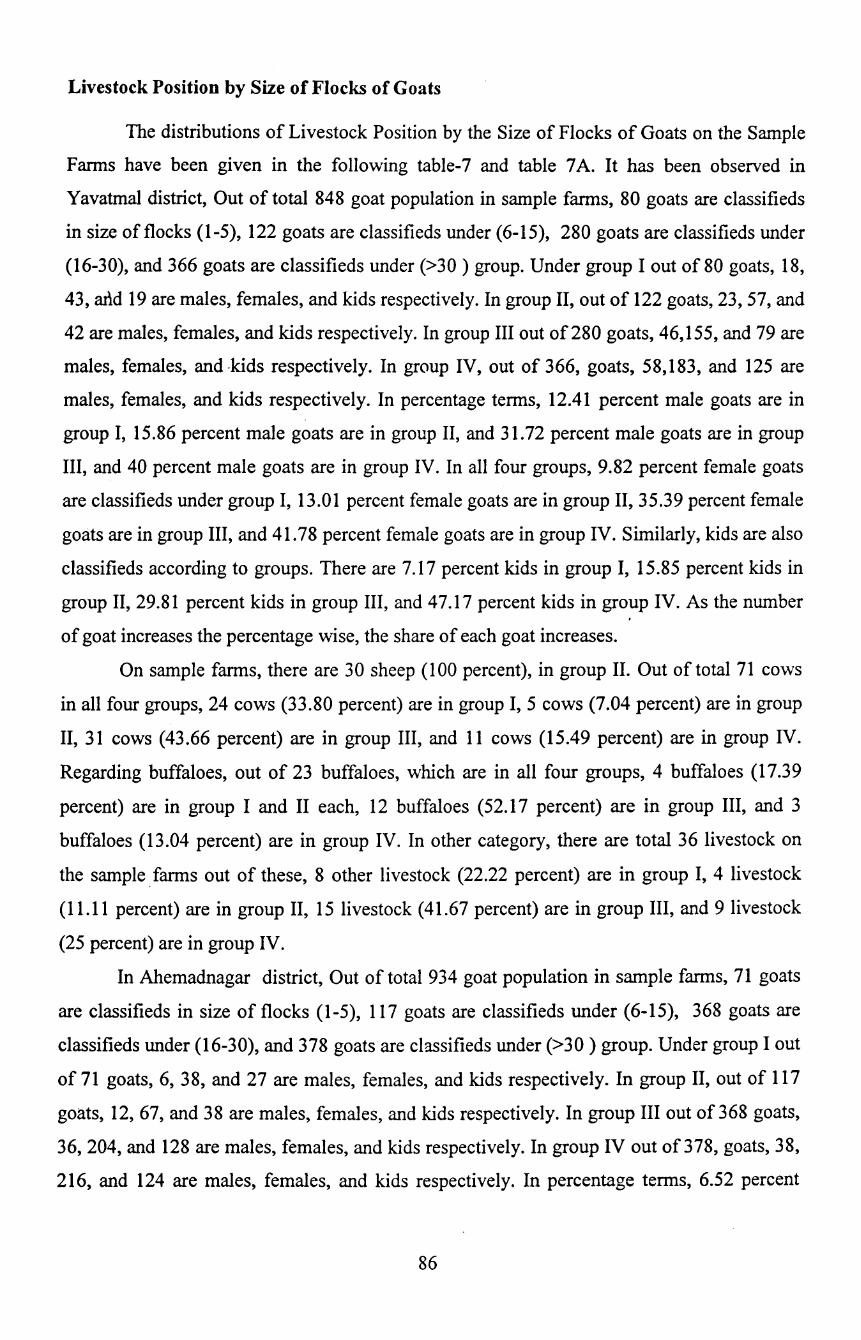
Livestock Position by Size of Flocks of Goats
The distributions of Livestock Position by the Size of Flocks of Goats on the Sample
Farms have been given in the following table-7 and table 7 A. It has been observed in
Yavatmal district, Out of total 848 goat population in sample farms, 80 goats are classifieds
in size of flocks ( 1-5), 122 goats are classifieds under ( 6-15), 280 goats are classifieds under
(16-30), and 366 goats are classifieds under (>30) group. Under group I out of 80 goats, 18,
43, add 19 are males, females, and kids respectively. In group II, out of 122 goats, 23, 57, and
42 are males, females, and kids respectively. In group III out of280 goats, 46,155, and 79 are
males, females, and ·kids respectively. In group IV, out of 366, goats, 58,183, and 125 are
males, females, and kids respectively. In percentage terms, 12.41 percent male goats are in
group I, 15.86 percent male goats are in group II, and 31.72 percent male goats are in group
III, and 40 percent male goats are in group IV. In all four groups, 9.82 percent female goats
are classifieds under group I, 13.01 percent female goats are in group II, 35.39 percent female
goats are in group III, and 41.78 percent female goats are in group IV. Similarly, kids are also
classifieds according to groups. There are 7.17 percent kids in group I, I5.85 percent kids in
group II, 29.81 percent kids in group III, and 47.17 percent kids in group IV. As the number . of goat increases the percentage wise, the share of each goat increases.
On sample farms, there are 30 sheep (1 00 percent), in group II. Out of total 7I cows
in all four groups, 24 cows (33.80 percent) are in group I, 5 cows (7.04 percent) are in group
II, 31 cows (43.66 percent) are in group III, and II cows (I5.49 percent) are in group IV.
Regarding buffaloes, out of 23 buffaloes, which are in all four groups, 4 buffaloes (I7.39
percent) are in group I and II each, 12 buffaloes (52.17 percent) are in group III, and 3
buffaloes (I3.04 percent) are in group IV. In other category, there are total 36 livestock on
the sample. farms out of these, 8 other livestock (22.22 percent) are in group I, 4 livestock
(1l.I1 percent) are in group II, 15 livestock ( 41.67 percent) are in group III, and 9 livestock
(25 percent) are in group IV.
In Ahemadnagar district, Out of total 934 goat population in sample farms, 7I goats
are classifieds in size of flocks (I-5), 117 goats are classifieds under (6-IS), 368 goats are
classifieds under (I6-30), and 378 goats are classifieds under (>30) group. Under group I out
of 7I goats, 6, 38, and 27 are males, females, and kids respectively. In group II, out of I17
goats, I2, 67, and 38 are males, females, and kids respectively. In group III out of 368 goats,
36, 204, and 128 are males, females, and kids respectively. In group IV out of 378, goats, 38,
2I6, and I24 are males, females, and kids respectively. In percentage terms, 6.52 percent
86

male goats are in group I, 13.04 percent male goats are in group II, and 39.13 percent male
goats are in group III, and 41.30 percent male goats are in group IV. In all four groups, 7.24
percent female goats are classifieds under group I, 12.76 percent female goats are in group II,
3 8.86 percent female goats are in group III, and 41.14 percent female goats are in group IV.
Similarly, kids are also classifieds according to groups. There are 8.52 percent kids in group
I, 11.99 percent kids in group II, 40.38 percent kids in group III, and39.12 percent kids in
group IV. As the number of goat increases the percentage wise, the share of each goat . . . mcreases.
On sample farms, out of 193 sheep in all four groups, 101 sheep (52.33 percent) are in
group II, 12 sheep (6.22 percent) in group III and 80 sheep (41.45 percent) are in group IV.
Out oftotal 52 cows in all four groups, 7 cows(13.46 percent) are in group I, 14 cows (26.92
percent) are in group II, 21 cows ( 40.38 percent) are in group III, and 10 cows (19.23
percent) are in group IV. Regarding buffaloes, out of 39 buffaloes, which are in all four
groups, 10 buffaloes (25.64 percent) are in group I, 2 buffaloes (5.13 percent) are in group II,
18 buffaloes (46.15 percent) are in group III, and 9 buffaloes (23.08 percent) are in group IV.
In other category, there are total 57 livestock on the sample farms out of these, 11 other
livestock (19.30 percent) are in group I, 7 other livestock (12.28 percent) are in group II, 24
other livestock ( 42.11 percent) are in group III, and 15 other livestock (26.32 percent) are in
group IV.
In both districts, in all four groups, out of237 male goats, 24 goats (10.13 percent) are
in (1- 5) size of flocks, 35 male goats (14.77 percent) are in (6-15) group, 82 male goats
(34.60 percent) are in (16-30) group,_and 96 male goats (40.51 percent) are in group (greater
than 30). Out of 963 female goats, 81 female goats (8.41 percent) are in group (1-5), 124
female goats (12.88 percent) are in group (6-15), 359 female goats (37.28 percent) are in
group (16-30), and 399 female goats (41.43 percent) are in group (greater than 30). Out of
582 kids 46 kids (7.90 percent) are in group (1-5), 80 kids (13.75 percent) are in group (6-
15), 207 kids (35.57 percent) are in group (16-30), and 249 kids (42.78 percent) are in group
(greater than 30). Out of 223 sheep in both districts on sample farms, 131 sheep (58.74
percent) are in group (6-15), 12 sheep (5.38 percent) are in group (16-30), and 80 sheep
(35.87 percent) are in group (greater than 30). Out of 123 cows in both district 31 cows
(25.20 percent) are in group (1-5), 19 cows (15.45 percent) are in group (6-15), 52 cows
(42.28 percent) are in group (16-30), and. 21 cows (17.07percent) are in group (greater than
30). Out of 62 buffaloes in both districts on sample farms, 14 buffaloes (22.58 percent) are in
group (1-5), 6 buffaloes (9.68 percent) are in group (6-15), 30 buffaloes (48.39 percent) are
87
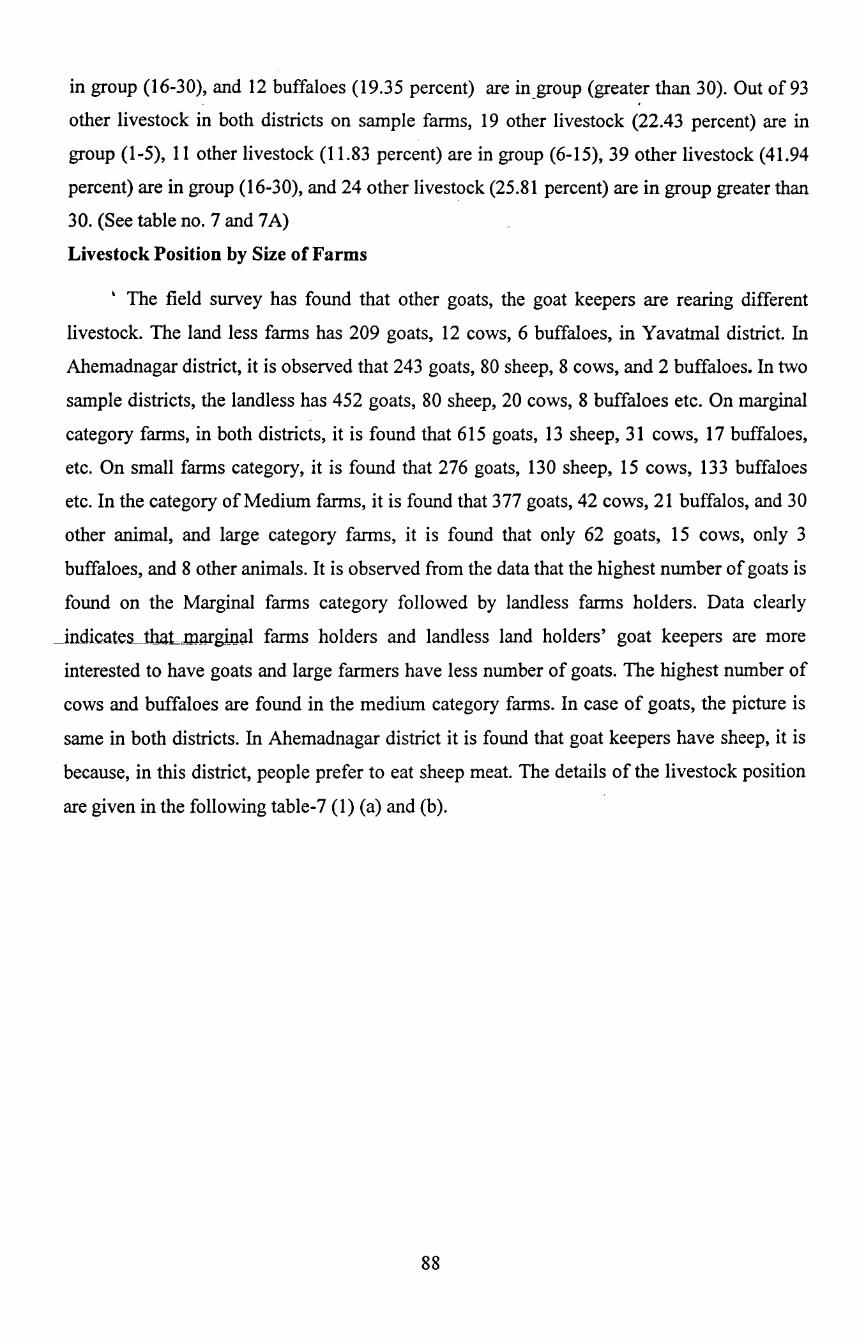
in group (16-30), and 12 buffaloes (19.35 percent) are in _group (greater than 30). Out of 93 . other livestock in both districts on sample farms, 19 other livestock (22.43 percent) are in
group (1-5), 11 other livestock (11.83 percent) are in group (6-15), 39 other livestock (41.94
percent) are in group (16-30), and 24 other livestock (25.81 percent) are in group greater than
30. (See table no. 7 and 7 A)
Livestock Position by Size of Farms
' The field survey has found that other goats, the goat keepers are rearing different
livestock. The land less fanns has 209 goats, 12 cows, 6 buffaloes, in Yavatmal district. In
Ahemadnagar district, it is observed that 243 goats, 80 sheep, 8 cows, and 2 buffaloes. In two
sample districts, the landless has 452 goats, 80 sheep, 20 cows, 8 buffaloes etc. On marginal
category fanns, in both districts, it is found that 615 goats, 13 sheep, 31 cows, 17 buffaloes,
etc. On small fanns category, it is found that 276 goats, 130 sheep, 15 cows, 133 buffaloes
etc. In the category of Medium fanns, it is found that 377 goats, 42 cows, 21 buffalos, and 30
other animal, and large category fanns, it is found that only 62 goats, 15 cows, only 3
buffaloes, and 8 other animals. It is observed from the data that the highest number of goats is
found on the Marginal fanns category followed by landless fanns holders. Data clearly
_in_dicates_JhaL~marginal fanns holders and landless land holders' goat keepers are more
interested to have goats and large fanners have less number of goats. The highest number of
cows and buffaloes are found in the medium category fanns. In case of goats, the picture is
same in both districts. In Ahemadnagar district it is found that goat keepers have sheep, it is
because, in this district, people prefer to eat sheep meat. The details of the livestock position
are given in the following table-7 (1) (a) and (b).
88
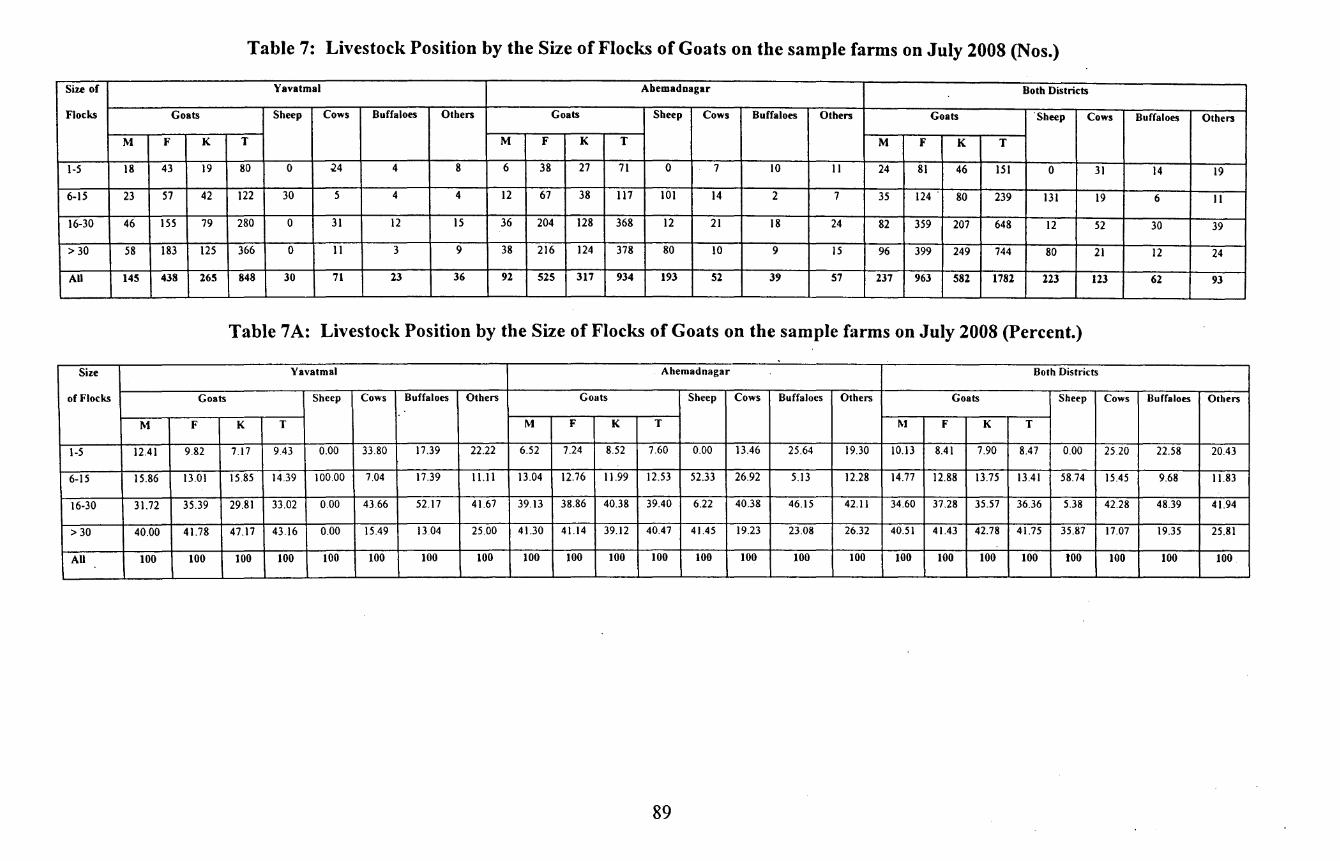
Table 7: Livestock Position by the Size of Flocks of Goats on the sample farms on July 2008 (Nos.)
Size of Yavatmal Abemadoagar Both Districts
Flocks Goats Sheep Cows Buffaloes Others Goats Sheep Cows Buffaloes Others Goats Sheep Cows Buffaloes Others
M F K T M F K T M F K T
1-5 18 43 19 80 0 ~4 4 8 6 38 27 71 0 7 10 11 24 81 46 151 0 31 14 19
6-15 23 57 42 122 30 5 4 4 12 67 38 117 101 14 2 7 35 124 ' 80 239 131 19 6 II
16-30 46 155 79 280 0 31 12 15 36 204 128 368 12 21 18 24 82 359 207 648 12 52 30 39
> 30 58 183 125 366 0 11 3 9 38 216 124 378 80 10 9 15 96 399 249 744 80 21 12 24
All 145 438 265 848 30 71 23 36 92 525 317 934 193 52 39 57 237 963 582 1782 223 123 62 93
Table 7 A: Livestock Position by the Size of Flocks of Goats on the sample farms on July 2008 (Percent.)
Size Yavatmal Ahemadnagar Both Districts
of Flocks Goats Sheep Cows Buffaloes Others Goats Sheep Cows Buffaloes Others Goats Sheep Cows Buffaloes Others
M F K T M F K T M F K T
1-5 12.41 9.82 7.17 9.43 0.00 33.80 17.39 22.22 6.52 7.24 8.52 7.60 0.00 13.46 25.64 19.30 10.13 8.41 7.90 8.47 0.00 25.20 22.58 20.43
6-15 15.86 13.01 15.85 14.39 100.00 7.04 17.39 11.11 13.04 12.76 11.99 12.53 52.33 26.92 5.13 12.28 14.77 12.88 13.75 13.41 58.74 15.45 9.68 11.83
16-30 31.72 35.39 29.81 33.02 0.00 43.66 52.17 41.67 39.13 38.86 40.38 39.40 6.22 40.38 46.15 42.11 34.60 37.28 35.57 36.36 5.38 42.28 48.39 41.94
>30 40.00 41.78 47.17 43.16 0.00 15.49 13 04 25.00 41.30 41.14 39.12 40.47 41.45 19.23 23.08 26.32 40.51 41.43 42.78 41.75 35.87 17.07 19.35 25.81
AU 100 100 100 100 100 100 100 100 100 100 100 100 100 100 100 100 100 100 100 100 tOO 100 100 100
89
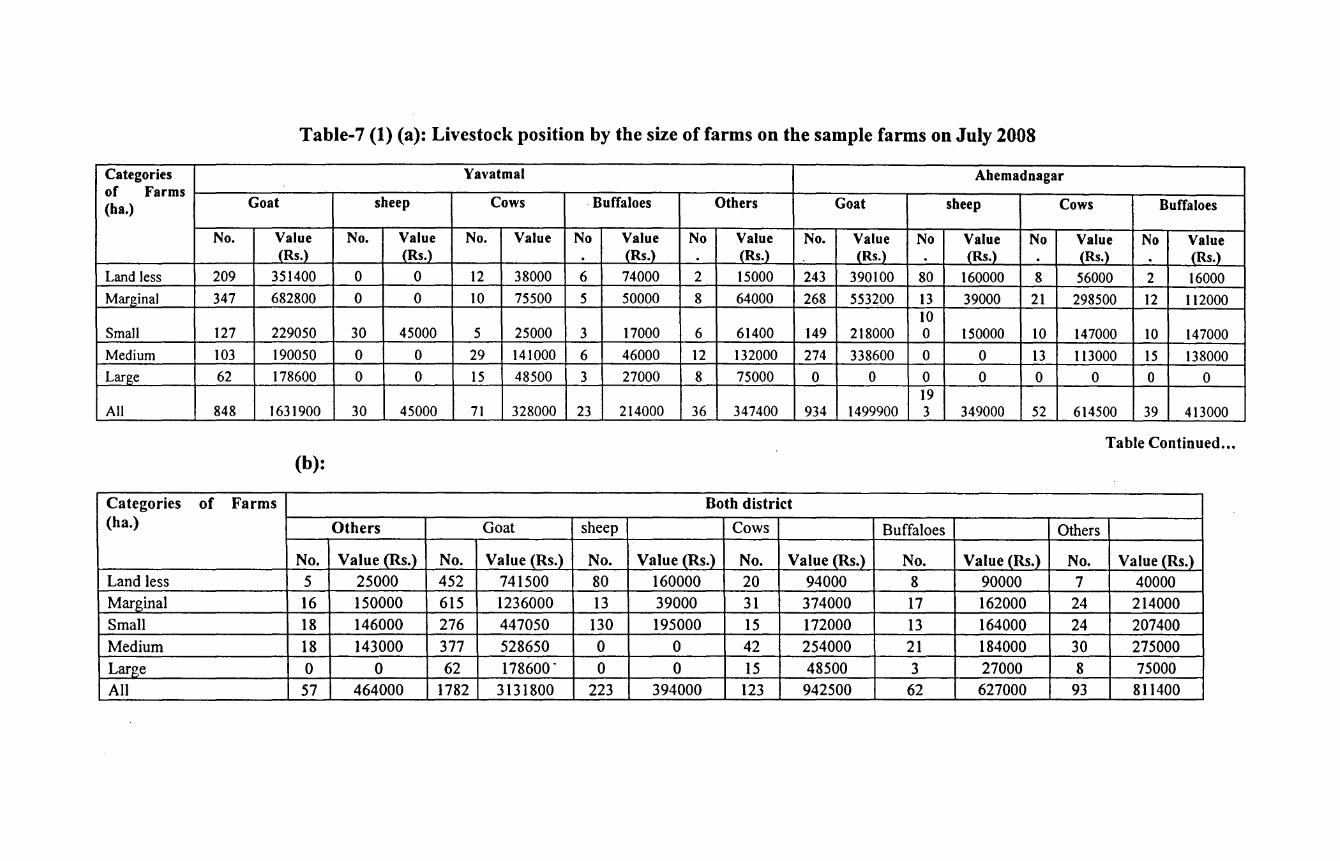
Table-7 (1) (a): Livestock position by the size of farms on the sample farms on July 2008
Categories Yavatmal Ahemadnagar of Farms (ha.) Goat sheep Cows Buffaloes Others Goat sheep Cows Buffaloes
No. Value No. Value No. Value No Value No Value No. Value No Value No Value No Value (Rs.) (Rs.) . (Rs.l . (Rs.) (Rs.) . (Rs.) . (Rs.) . (Rs.)
Land less 209 351400 0 0 12 38000 6 74000 2 15000 243 390100 80 160000 8 56000 2 16000 Marginal 347 682800 0 0 10 75500 5 50000 8 64000 268 553200 13 39000 21 298500 12 112000
10 Small 127 229050 30 45000 5 25000 3 17000 6 61400 149 218000 0 150000 10 147000 10 147000 Medium 103 190050 0 0 29 141000 6 46000 12 132000 274 338600 0 0 13 113000 15 138000 Large 62 178600 0 0 15 48500 3 27000 8 75000 0 0 0 0 0 0 0 0
19 All 848 1631900 30 45000 71 328000 23 214000 36 347400 934 1499900 3 349000 52 614500 39 413000
Table Continued .•• (b):
Categories of Farms Both district (ha.) Others Goat sheep Cows Buffaloes Others
No. Value (Rs.) No. Value (Rs.) No. Value (Rs.) No. Value (Rs.) No. Value_(Rs.}_ No. Value (Rs.) Land less 5 25000 452 741500 80 160000 20 94000 8 90000 7 40000 Marginal 16 150000 615 1236000 13 39000 31 374000 17 162000 24 214000 Small 18 146000 276 447050 130 195000 15 172000 13 164000 24 207400 Medium 18 143000 377 528650 0 0 42 254000 21 184000 30 275000 Large 0 0 62 178600" 0 0 15 48500 3 27000 8 75000 All 57 464000 1782 3131800 223 394000 123 942500 62 627000 93 811400
Educational Status of Buyers
Distributions of Education Level of Buyers are given in the following table - 8. It is
observed from the table that in Yavatmal district, out of total 10 buyers in two markets
(Darvha and Pusad) and 4 sample villages (BoriArab, Ladkhed, Jambazar, and Shilona) in
more details, 2 buyers are from Bori (Arab) village, 4 buyers are from Ladkhed village, 2
buyers are· from Jambazar, and 2 buyers are from Shilona village. Out of I 0 buyers, I buyer is
illiterate and is from Bori (Arab) village of Darvha market. Out. of total 7 buyers, who are
educated up to s~condary (9th std.), I buyer is from Bori Arab, 3 buyers are from Ladkhed, I
buyer is from Jambazar, and 2 buyers are from Shilona. Out of 2 buyers, who are educated of
higher secondary, I is from Jambazar and I is from Ladkhed village. In the category of up to
primary education, there is no such buyer for interview of the study. In addition to this, there
is no single buyer, who is educated more than higher secondary in all four villages in 2
markets area of Yavatmal district.
In Ahemadnagar district, out of total I 0 buyers in two markets (Supa and Kasti) and 4
sample villages (Jamgaon, Dhavalpuri, Belwandi, and Vangdari) in.more details, 4 buyers are
from Jamgaon village, 2 buyers are from Dhavalpuri, 2 buyers are from Belwandi village,
and 2 buyers are from V angdari village. Out of I 0 buyers in four markets, 3 buyers are
illiterate and I is from Belwandi village of Kasti market, and 2 buyers are from Jamgaon
village (Supa market). Only 1 buyer, who is educated up to primary, is from Vangdari
(Kasti). Out of 2 buyers, who are educated up to secondary (9th std.), I is from Dhavalpuri
village (Supa Market) and I is from Jamgaon. Out of 4 buyers, who are educated higher
secondary school, each buyer is from 4 villages.
In this way, as have been discussed in above paragraphs, 4 buyers are illiterate, 1
buyer has completed primary education, 9 buyers studied up to secondary school education,
and 6 buyers are educated up to higher secondary school education. (See table no.8)
9I
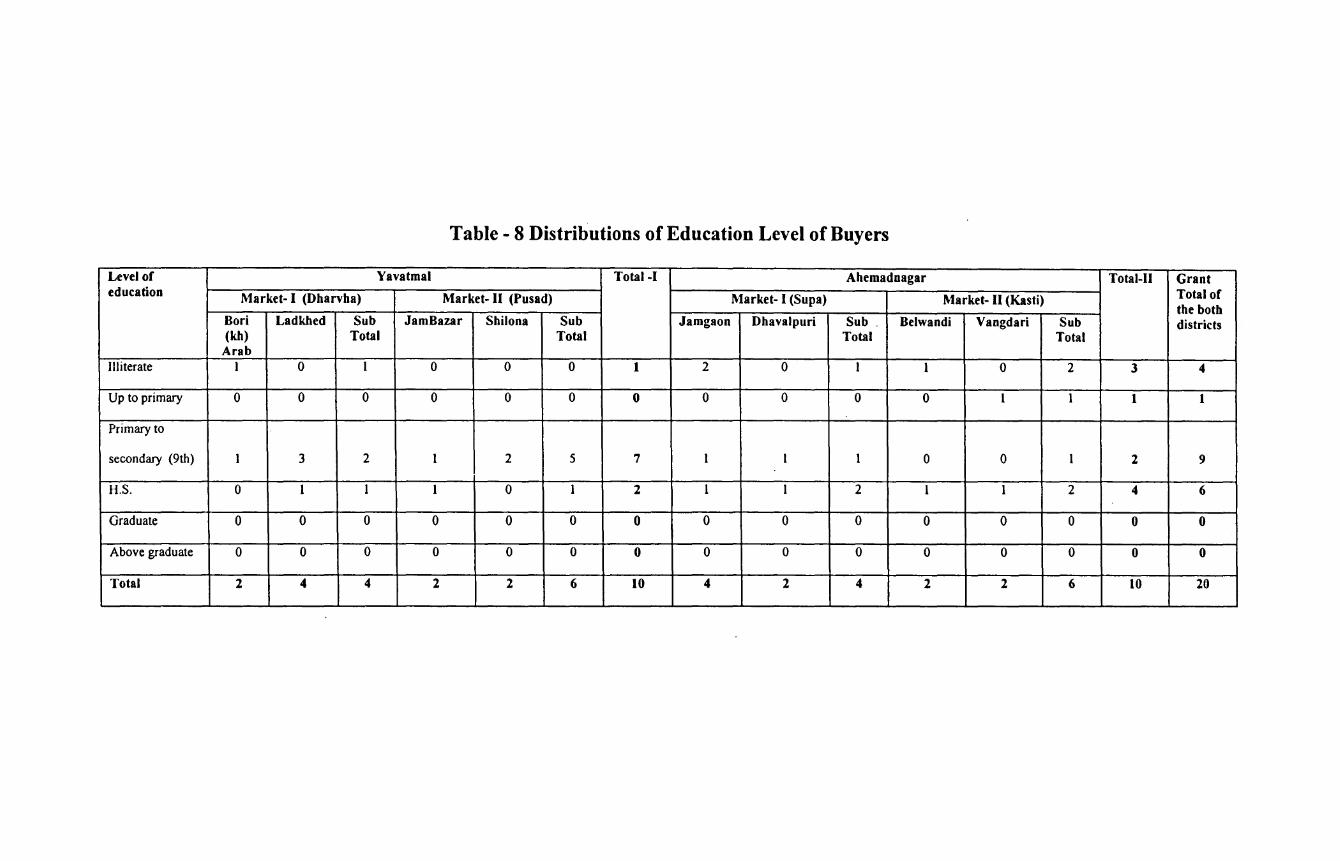
Table - 8 Distributions of Education Level of Buyers
Level of Yavatmal Total-1 Ahemadnagar Total-II Grant education Market- I (Dharvha) Market- II (Pusad) Market- I (Supa) Market- II (Kasti) Total of
the both Bori Ladkhed Sub Jam Bazar Shilona Sub Jamgaon Dhavalpuri Sub . Belwandi Vangdari Sub districts (kh) Total Total Total Total
Arab Illiterate I 0 I 0 0 0 I 2 0 1 1 0 2 3 4
Up to primary 0 0 0 0 0 0 0 0 0 0 0 1 1 I I
Primary to
secondary (9th) 1 3 2 1 2 5 7 1 1 1 0 0 1 2 9
H.S. 0 1 I 1 0 1 2 1 1 2 1 1 2 4 6
Graduate 0 0 0 0 0 0 0 0 0 0 0 0 0 0 0
Above graduate 0 0 0 0 0 0 0 0 0 0 0 0 0 0 0
Total 2 4 4 2 2 6 10 4 2 4 2 2 6 10 20
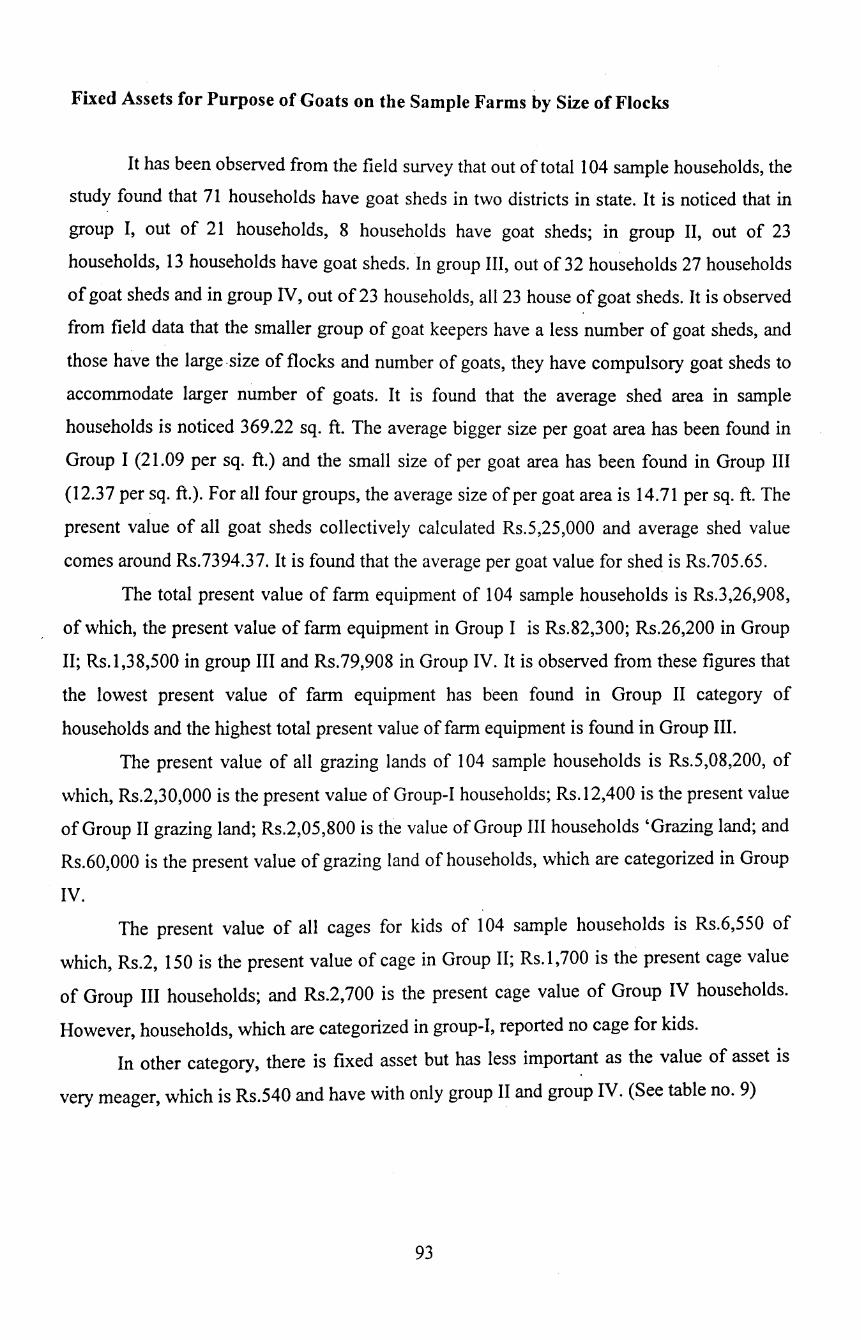
Fixed Assets for Purpose of Goats on the Sample Farms by Size of Flocks
It has been observed from the field survey that out of total I 04 sample households, the
study found that 7I households have goat sheds in two districts in state. It is noticed that in
group I, out of 2I households, 8 households have goat sheds; in group II, out of 23
households, I3 households have goat sheds. In group III, out of 32 households 27 households
of goat sheds and in group IV, out of 23 households, all 23 house of goat sheds. It is observed
from field data that the smaller group of goat keepers have a less number of goat sheds, and
those have the large -size of flocks and number of goats, they have compulsory goat sheds to
accommodate larger number of goats. It is found that the average shed area in sample
households is noticed 369.22 sq. ft. The average bigger size per goat area has been found in
Group I (2I.09 per sq. ft.) and the small size of per goat area has been found in Group III
(12.37 per sq. ft.). For all four groups, the average size of per goat area is 14.71 per sq. ft. The
present value of all goat sheds collectively calculated Rs.5,25,000 and average shed value
comes around Rs.7394.37. It is found that the average per goat value for shed is Rs.705.65.
The total present value of fann equipment of I 04 sample households is Rs.3,26,908,
of which, the present value of fann equipment in Group I is Rs.82,300; Rs.26,200 in Group
II; Rs.1,38,500 in group III and Rs.79,908 in Group IV. It is observed from these figures that
the lowest present value of fann equipment has been found in Group II category of
households and the highest total present value of farm equipment is found in Group III.
The present value of all grazing lands of 104 sample households is Rs.5,08,200, of
which, Rs.2,30,000 is the present value of Group-I households; Rs.12,400 is the present value
of Group II grazing land; Rs.2,05,800 is the value of Group III households 'Grazing land; and
Rs.60,000 is the present value of grazing land of households, which are categorized in Group
IV.
The present value of all cages for kids of 104 sample households is Rs.6,550 of
which, Rs.2, 150 is the present value of cage in Group II; Rs.I, 700 is the present cage value
of Group III households; and Rs.2, 700 is the present cage value of Group IV households.
However, households, which are categorized in group-I, reported no cage for kids.
In other category, there is fixed asset but has less import~t as the value of asset is
very meager, which is Rs.540 and have with only group II and group IV. (See table no. 9)
93
Table No. 9: Fixed Assets for Purpose of Goats on the Sample Farms by Size of Flocks ,
Category Sample Group Goat Shed of flocks size population No. of Total Area Average Average area Total Present Average Average per
goat shed (Sq. ft.) Area of goat per goat shed Value (Rs.) shade goat shed value shed (per Sq. ft.) (Sq. ft.) value (Rs.) (Rs.)
Group I 24 151 8 3185 398.12 21.09 79900 9987.5 529.14
Group II 23 239 13 3510 270.00 14.69 80600 6200 337.24
Group III 34 648 27 8015 296.85 12.37 234000 8666.67 361.11
Group IV 23 744 23 11505 500.22 15.46 130500 5673.91 175.40
Total 104 1782 71 26215 369.22 14.71 525000 7394.37 705.65
Table continued ...•..
Category Sample Farm Equipment Grazing Land Cage for Kids Others of flocks size No. Area Year Present No. Area Year Present No. Area Year Present No. Area Year Prese
value value value nt (Rs) (Rs) (Rs) value
(Rs) Group I 24 0 - 0 82300 0 1.8 0 230000 0 0 0 0 0 400 0 0
Group II 23 0 - 0 26200 0 0.4 0 12400 0 0 0 2150 0 0 0 60
Group III 34 0 - 0 138500 .0 2.46 0 205800 0 100 0 1700 0 0 0 0
Group IV 23 0 - 0 79908 0 0.9 0 60000 0 4 0 2700 0 0 0 480 .
Total 104 0 - 0 326908 0 5.56 0 508200 0 104 0 6550 0 400 0 540
Annual Employment Days in different Occupation
Annual Employment Days in Different Occupation of Goat Keepers has been given
in the following ~able-10 (a), (b), (c) and (d) It is observed from the table that the first round
survey disclosed that total 8920 employment days have been generated. Out of total
employment days generated in agricultural in group I, 1450 employment days have been
generated by 24 households and the average employment days of these households comes
60.41 employment days. In group II, there are 23 households, and generated 2390
employment days, which comes in an average 103.91 employment days. In group III,
households generated total 2350 employment days and it has been reported in an average
69.11 days and 2730 employment days have been generated by 23 households, which are
categorized in group IV and the average of the employment days has been 118.69 days. It has
been noticed that households, which are in group IV category, generated maximum
employment days in an average in agricultural. Out of total employment days generated in
group I, 725 employment days generated by male, 483 employment days are generated by
female and 242 employment days generated by children. In group II, the male family
members generated 1195 employment days, 797 employment days generated by female and
398 employment days generated by children. In group III the male family members generated
1175 employment days, female family generated 783 employment days and children
generated 392. In group IV the male family members generated 1365 employment days, 918
employment days generated by female and 44 7 employment days generated by children.
While conducting second round stirvey, it is found that the interesting information came to
light that the average employment days for all sample households collectively came down to
69.80 days. The highest fall is found in group II households, followed by group IV
households.
Out of total employment days generated in group I, 600 employment days generated
by male, 360 employment days are generated by female and 240 employment days generated
by children. In group II, the male family members generated 910 employment days, 607
employment days generated by female and 303 employment days generated by children. In
group III the male family members generated 990 employment days, female family generated
-660 employment days and children generated 330. In group IV the male family members
generated 1130 employment days, 753 employment days generated by female and 377
employment days generated by children. If the employment days of first round and second
round survey combined together, it is observed that in agricultural, in an average 155.57
95
employment days have been generated in two districts of the state. The employment
generation rate has been found highest in those households, which are categorized in group
IV. The average employment days for group IV households are 216.95 employment days and
the lowest employment days generated in group I households, which are 110.41 days. In first
round, it has been noticed that the highest male, female and children employment days are
generated by group IV category and lowest in group I. It is natural that the employment days
generfl.tion depends on the size of flocks bigger the size of flocks, the larger employment days
can be generated.
In dairy business, while conducting first and second round survey in two districts of
the state different pictures of employment days came to light. In fir~t round survey in an
average 20 employment days were reported whereas in second ·round survey, only 14.75
employment days are reported. It is noticed that the group I households generated in an
average 30 days, which is the highest among the sample households. The group IV
households generated about 7 employment days, which is the lowest among the sample
households. In second round survey group, III households reported to have highest
employment days, which is 19.11 whereas group IV households generated 9.13 employment
days in an average, which is the lowest among the sample households.
In first round survey, out of total employment days generated in group I, 360
employment days generated by male, 240 employment days are generated by female and 120
employment days generated by children. In group II, the male family members· generated 215
employment days, 143 employment days generated by female and 72 employment days
generated by children. In group III, the male family members generated 300 employment
days, female family generated 253 employment days, and children generated 207. In group
IV the male family members generated 85 employment days, 57 employment days generated
by female and 28 employment days generated by children.
In second round survey, out of total employment days generated in group I, 188
employment days generated by male, 125 employment days are generated by female and 62
employment days generated by children. In group II, the male family members generated 150
employment days, 100 employment days generated by female and 50 employment days
generated by children. In group III the male family members generated 325 employment
days, female family generated 217 employment days and children generated 108. In group IV
the male family members generated 105 employment days, 70 employment days generated
by female and 35 employment days generated by children.
96
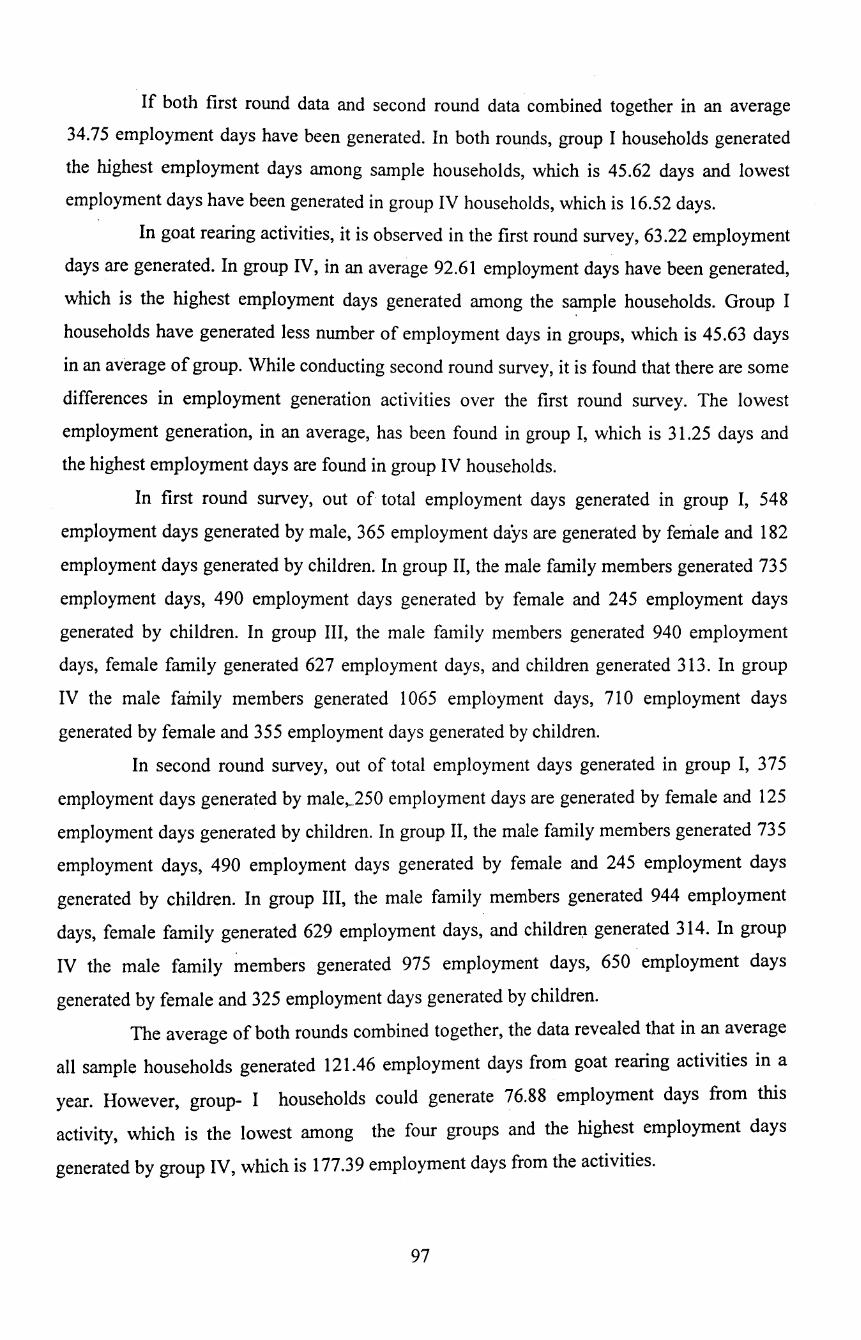
If both first round data and second round data combined together in an average
34.75 employment days have been generated. In both rounds, group I households generated
the highest employment days among sample households, which is 45.62 days and lowest
employment days have been generated in group IV households, which is 16.52 days.
In goat rearing activities, it is observed in the first round survey, 63.22 employment
days are generated. In group IV, in an average 92.61 employment days have been generated,
which is the highest employment days generated among the sample households. Group I
households have generated less number of employment days in groups, which is 45.63 days
in an average of group. While conducting second round survey, it is found that there are some
differences in employment generation activities over the first round survey. The lowest
employment generation, in an average, has been found in group I, which is 31.25 days and
the highest employment days are found in group IV households.
In first round survey, out of total employment days generated in group I, 548
employment days generated by male, 365 employment days are generated by female and 182
employment days generated by children. In group II, the male family members generated 73 5
employment days, 490 employment days generated by female and 245 employment days
generated by children. In group III, the male family members generated 940 employment
days, female family generated 627 employment days, and children generated 313. In group
IV the male fainily members generated 1 065 employment days, 710 employment days
generated by female and 355 employment days generated by children.
In second round survey, out of total employment days generated in group I, 375
employment days generated by male,_250 employment days are generated by female and 125
employment days generated by children. In group II, the male family members generated 73 5
employment days, 490 employment days generated by female and 245 employment days
generated by children. In group III, the male family members generated 944 employment
days, female family generated 629 employment days, and children generated 314. In group
IV the male family ~embers generated 975 employment days, 650 employment days
generated by female and 325 employment days generated by children.
The average of both rounds combined together, the data revealed that in an average
all sample households generated 121.46 employment days from goat rearing activities in a
year. However, group- I households could generate 76.88 employment days from this
activity, which is the lowest among the four groups and the highest employment days
generated by group IV, which is 177.39 employment days from the activities.
97
The employment days generated through various activities viz. agricultural, dairy
and goat rearing activities by sample households in two districts of the states in an average
are 311.80 employment days in a year. The group-IV households could generate the highest
employment days in a year from all activities throughout year, which is the highest
employment days generation days in four groups. Similarly, group-1 households, which is
small,households group of goat keepers, generated 232.92 employment days in a year for all
members of family. Remaining two categories of households i.e. group II and group III have
generated 342.61 and 279.62 employment days respectively. (See table-10 (a), (b),(c) and (d).
98
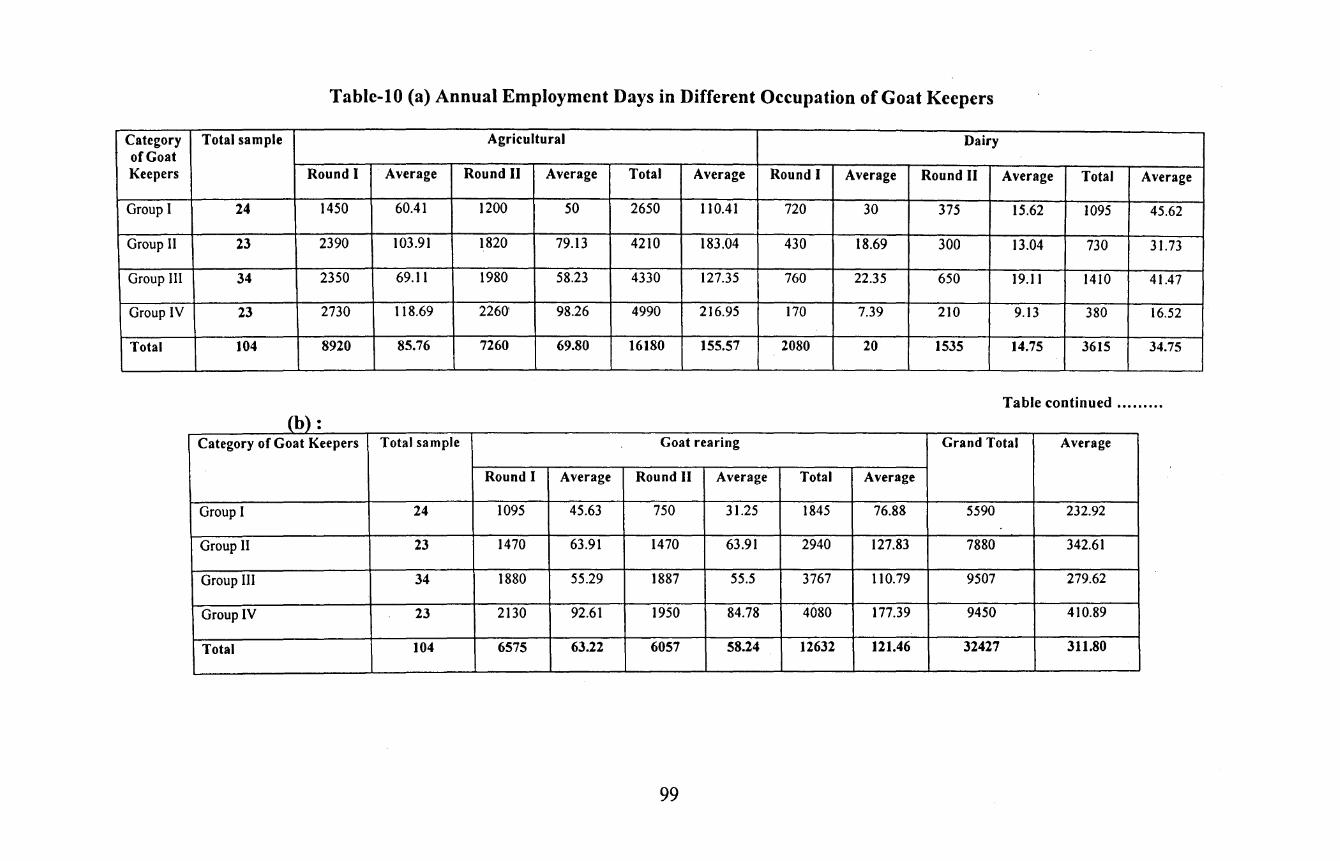
Table-10 (a) Annual Employment Days in Different Occupation of Goat Keepers
Category Total sample Agricultural Dairy of Goat Keepers Round I Average Round II Average Total Average Round I Average Round II Average Total Average
Group I 24 1450 60.41 1200 50 2650 110.41 720 30 375 15.62 1095 45.62
Group II 23 2390 103.91 1820 79.13 4210 183.04 430 18.69 300 13.04 730 31.73
Group Ill 34 2350 69.11 1980 58.23 4330 127.35 760 22.35 650 19.11 1410 41.47
Group IV 23 2730 118.69 22601 98.26 4990 216.95 170 7.39 210 9.13 380 16.52
Total 104 8920 85.76 7260 69.80 16180 155.57 2080 20 1535 14.75 3615 34.75
Table continued •••••....
(b): Category of Goat Keepers Total sample Goat rearing Grand Total Average
Round I Average Round II Average Total Average
Group I 24 1095 45.63 750 31.25 1845 76.88 5590 232.92
Group II 23 1470 63.91 1470 63.91 2940 127.83 7880 342.61
Group III 34 1880 55.29 1887 55.5 3767 110.79 9507 279.62
Group IV 23 2130 92.61 1950 84.78 4080 177.39 9450 410.89
Total 104 6575 63.22 6057 58.24 12632 121.46 32427 311.80
99
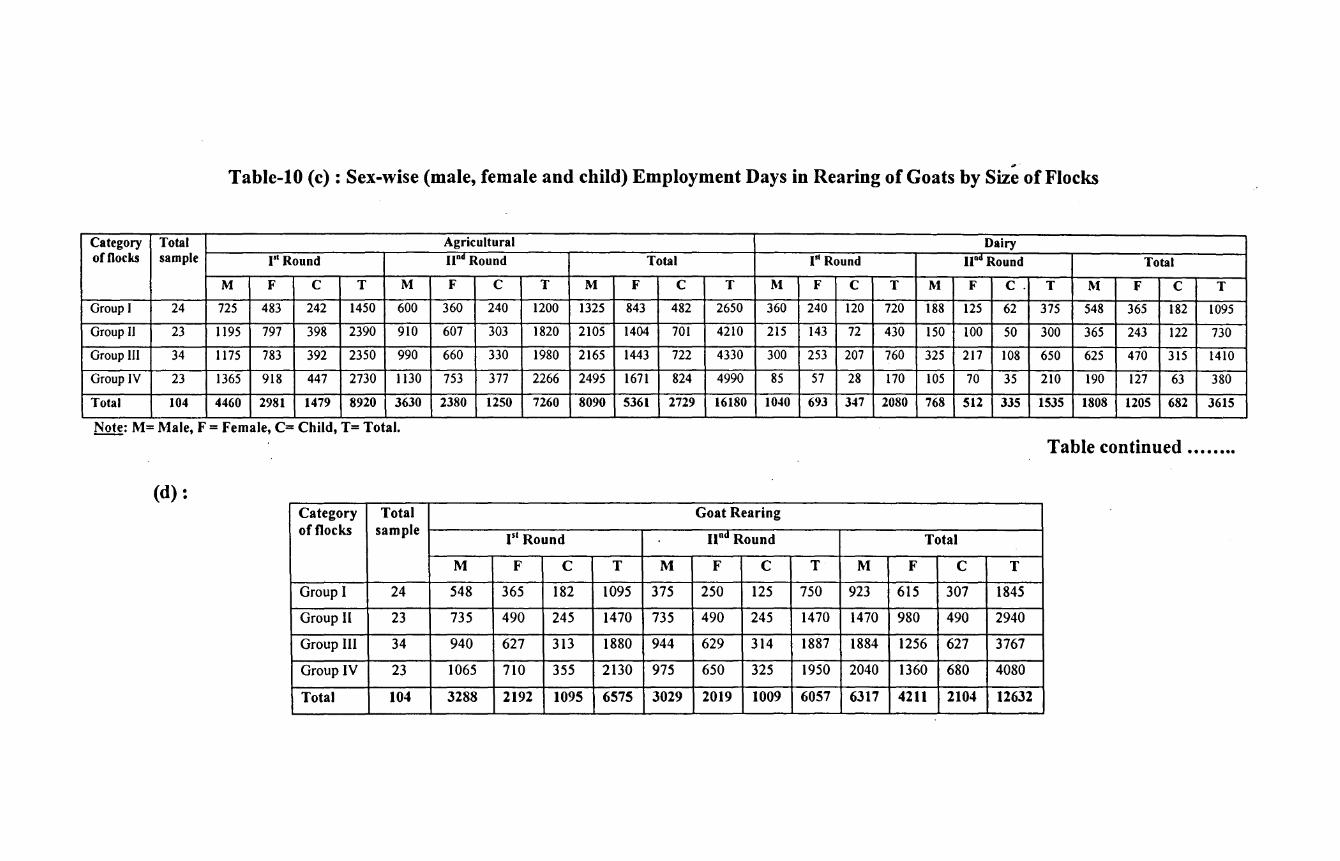
... -
Table-10 (c): Sex-wise (male, female and child) Employment Days in Rearing of Goats by Size of Flocks
Category Total Agricultural Dairy of Docks sample 1"1 Round una Round Total I" Round nod Round Total
M F c T M F c T M F c T M F c T M F c. T M F c T
Group I 24 725 483 242 1450 600 360 240 1200 1325 843 482 2650 360 240 120 720 188 125 62 375 548 365 182 1095
Group II 23 1195 797 398 2390 910 607 303 1820 2105 1404 701 4210 215 143 72 430 150 100 50 300 365 243 122 730
Group III 34 1175 783 392 2350 990 660 330 1980 2165 1443 722 4330 300 253 207 760 325 217 108 650 625 470 315 1410
Group IV 23 1365 918 447 2730 I 130 753 377 2266 2495 1671 824 4990 85 57 28 170 105 70 35 210 190 127 63 380
Total 104 4460 2981 1479 8920 3630 2380 1250 7260 8090 5361 2729 16180 1040 693 347 2080 768 512 335 1535 1808 1205 682 3615
Note: M= Male, F = Female, C= Child, T= Total.
Table continued •••...•.
(d): Category Total Goat Rearing of flocks sample
I'' Round und Round Total
M F c T M F c T M F c T
Group I 24 548 365 182 1095 375 250 125 750 923 615 307 1845
Group II 23 735 490 245 1470 735 490 245 1470 1470 980 490 2940
Group III 34 940 627 313 1880 944 629 314 1887 1884 1256 627 3767
Group IV 23 1065 710 355 2130 975 650 325 1950 2040 1360 680 4080
Total 104 3288 2192 1095 6575 3029 2019 1009 6057 6317 4211 2104 12632
Goats Age-wise B~low 6th Months (Round- I)
While conducting survey in sample villages in two districts of states, total 286 male
goats have been reported in 104 sample households under age 6 months in round I. The
present value of these males is calculated as per the values suggested by sample goat keeper
households and that arrived to Rs. 201900. The average price of per goat under age 6 months
comes arotind Rs.706.94 and average weight per goat comes around 5.70 kg. All the breeds
of the goats are home product and are local breeds (deshi). The .female goats are 296 that
reported during survey, which are under age 6 months. The average weight of female goat is
6.10 kg. and the average present value of per goat is Rs. 845.6. Out of total number 296, 294
are home product goats and only 2 goats are reported to purchase from outside. It is noticed
that the local households also preferred to have local breed only. The total male and female
goats, which are below 6 months, and are in the sample households, are 582. The average
weight of the goats, which are below 6 months, is 5.90 kg. and the average present value of
male and female .is 776.49. As mentioned earlier, except 2 female breed, all are home product
goats and also local breeds (deshi). (See table no. llA)
Goats Age-wise 7 -12 Months
It is observed from the survey in sample village in two districts of states that total 67
male goats have been reported in 104 sample households under age 7-12 months in round I.
The present value of these males is calculated as per the values suggested by sample goat
keeper households and that arrived to Rs.160300. The average price of per goat under age 7-
12 months comes around Rs.2392.53 and average weight per goat comes around 19.01 kg.
All the breeds of the male goats are-home product and are local breeds (deshi). The female
goats are 276 that reported during survey, which are under age 7-12 months. The average
weight of female goat is 11.04 kg. and the average present value of per goat is Rs. 1451.81.
Out of total number 276, 275 are home product goats and only 1 female goat is reported to
purchase from outside. It has also noticed that the local households also preferred to have
local breed only. The total male and female goats, which are below 7-12 months, and are in
the sample households, are 343. The average weight of the goats, which are below 7-12
months, is 12.60 kg. and the average present value of male and female is Rs.l635.56. As
mentioned earlier, except 1 female breed, all are home product goats and also local breeds
(deshi). (See table-liB)
101
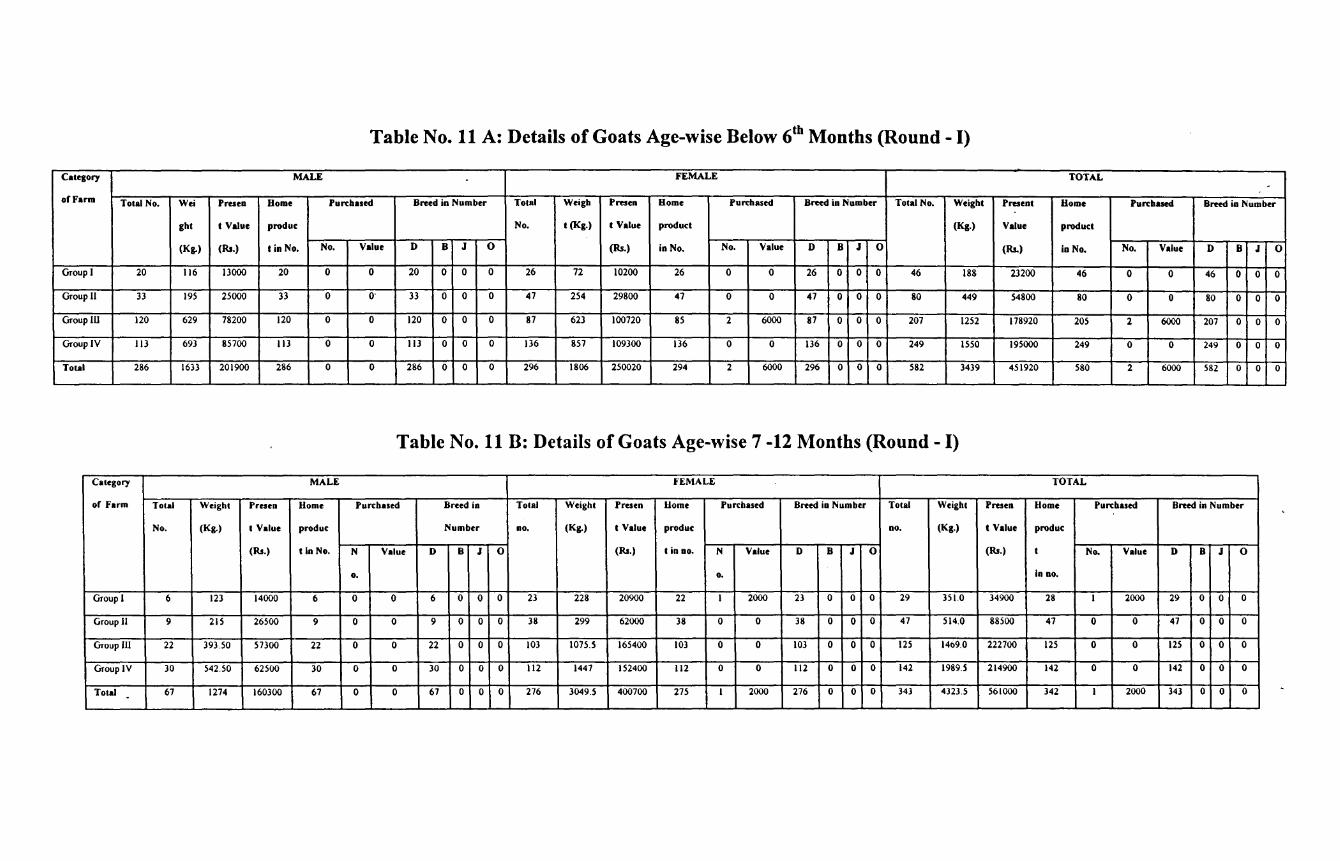
Table No. 11 A: Details of Goats Age-wise Below 6th Months (Round- I)
Category MALE FEMALE TOTAL -
of Farm Total No. Wei Presen Home Pun:hased Breed in Number Total Weigh Presen Home Pun:hased Breed in Number Total No. Weight Present Home Pun:hased Breed in Number
ght t Value produc No. t (Kg.) t Value product (Kg.) Value product
(Kg.) (Rs.) tin No. No. Value D B J 0 (Rs.) in No. No. Value D B J 0 (Rs.) in No. No. Value D B J 0
Group I 20 116 13000 20 0 0 20 0 0 0 26 72 10200 26 0 0 26 0 0 0 46 188 23200 46 0 0 46 0 0 0
Group II 33 195 25000 33 0 o· 33 0 0 0 47 254 29800 47 0 0 47 0 0 0 80 449 54800 80 0 0 80 0 0 0
Group Ill 120 629 78200 120 0 0 120 0 0 0 87 623 100720 85 2 6000 87 0 0 0 207 1252 178920 205 2 6000 207 0 0 0
Group IV Ill 693 85700 113 0 0 113 0 0 0 136 857 109300 136 0 0 136 0 0 0 249 1550 195000 249 0 0 249 0 0 0
Total 286 1633 201900 286 0 0 286 0 0 0 296 1806 250020 294 2 6000 296 0 0 0 582 3439 451920 580 2 6000 582 0 0 0
Table No. 11 B: Details of Goats Age-wise 7 -12 Months (Round- I)
Category MALE FEMALE TOTAL
of Farm Total Weight Pres en Home Pun:hased Breed in Total Weight Presen Uome Purchased Breed in Number Total Weight Presen Home Pun: based Breed in Number
No. (Kg.) t Value produc Number no. (Kg.) t Value produc no. (Kg.) t Value produc
(Rs.) tin No. N Value D B J 0 (Rs.) tin no. N Value D B J 0 (Rs.) t No. Value D B J 0
o. o. In no.
Group I 6 123 14000 6 0 0 6 0 0 0 23 228 20900 22 I 2000 23 0 0 0 29 351.0 34900 28 I 2000 29 0 0 0
Group II 9 215 26500 9 0 0 9 0 0 0 38 299 62000 38 0 0 38 0 0 0 47 514.0 88500 47 0 0 47 0 0 0
Group Ill 22 393.50 57300 22 0 0 22 0 0 0 103 1075.5 165400 103 0 0 103 0 0 0 125 1469.0 222700 125 0 0 125 0 0 0
Group IV 30 542.50 62500 30 0 0 30 0 0 0 112 1447 152400 112 0 0 112 0 0 0 142 1989.5 214900 142 0 0 142 0 0 0
Total 67 1274 160300 67 0 0 67 0 0 0 276 3049.5 400700 275 I 2000 276 0 0 0 343 4323.5 561000 342 I 2000 343 0 0 0 .

Goats Age-wise 1 Year to 1 Yz Year
It has been observed from the survey in sample village in two districts of state that
total 78 male goats have been reported in 104 sample households age 1- 1 Y2 year in round I.
The present value of these males is calculated as per the values suggested by sample goat
keepers households and that arrived to Rs. 231850. The average price of per goat under age
1- 1 ~year comes around Rs.2972.43 and average weight per goat comes around 20.12 kg.
All the breeds of the male goats are home product and are local breeds ( deshi). The female
goats are 327 that reported during survey, which are age 1- 1 ~year. The average weight of
female goat is 13.70.kg. and the average present value of per goat is Rs. 1798.77. Out of total
number 405, 398 are home product goats. and 7 female goats are reported to purchase from
outside. The local households also preferred to have local breed only. The total male and
female goats, which are below 1- 1 ~year, and are in the sample households, are 405. The
average weight of the goats, which are 1- 1 ~ year, is 14.94 kg, and the average present value
of male and female is Rs.2024.81. As mentioned earlier, except 7 female breed, all are home
product goats and also local breeds ( deshi). (See table no. 11 C)
It is noticed that total 92 male goats have been reported in 104 sample households age
more than 1 ~ year in round I. The present value of these males is calculated as per the
values suggested by sample goat keepers households and that arrived to Rs.257498. The
average price of per goat age more than 1 ~ year comes around Rs.2798.89 and average
weight per goat comes around 19.30 kg. All the breeds of the male goats are home product
and are local breeds (deshi). The female goats are 360 that reported during survey, which are
age more than 1 ~ year. The average weight of female goat is 21.02 kg. and the average
present of per goat is Rs. 2530.41. Out oftotal number 360, 341 are home product goats and
19 female goat is reported to purchase from outside. The local households also preferred to
have local breed only. The total male and female goats, which are more than 1 ~year, and
are in the sample households, are 452. The average weight of the goats, which are more than
1 ~ year, is 20.67 kg. and the average present value of male and female is Rs.2585.06. As
mentioned earlier, except 19 female breed, all are home product goats and also local breeds
( deshi). (See table no. 11 D)
103
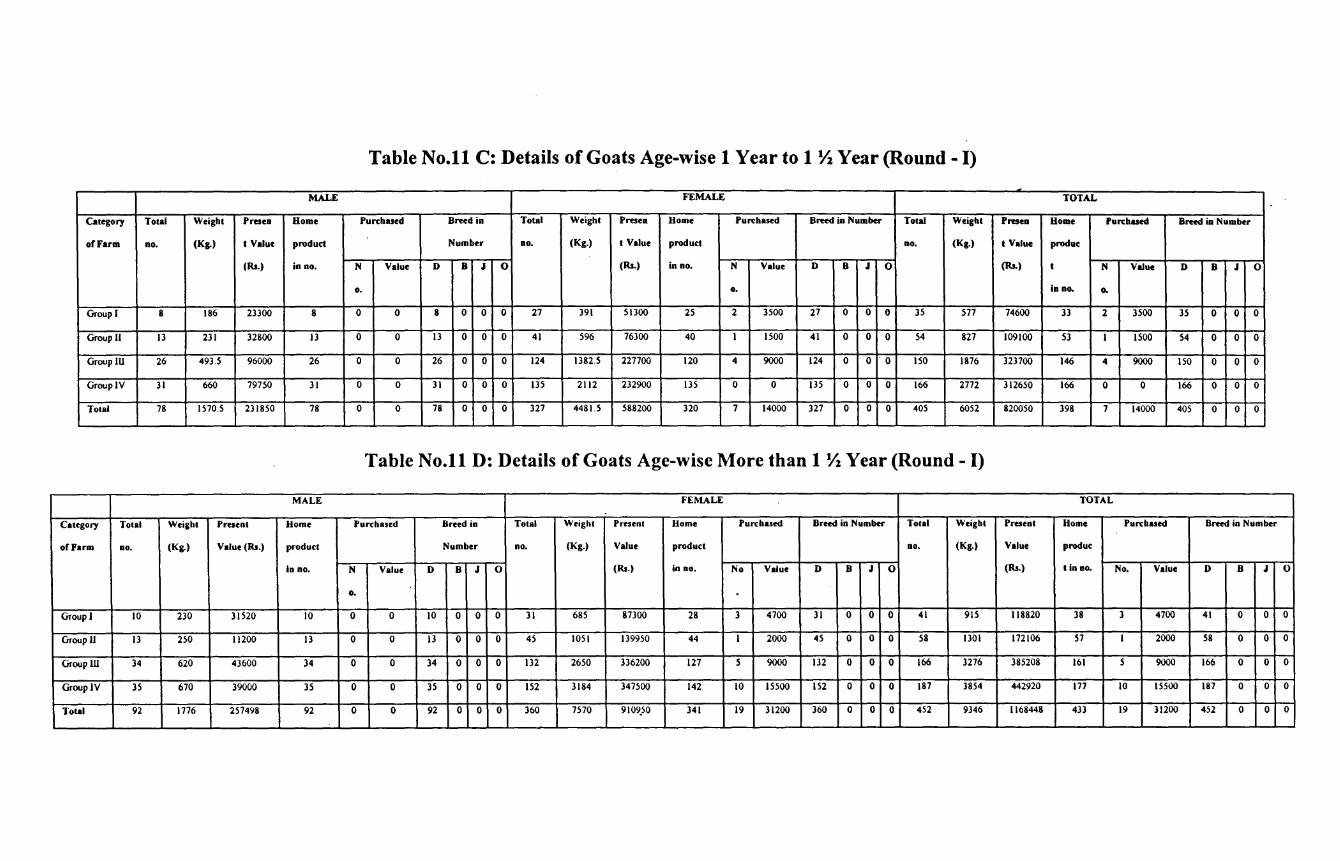
Table No.11 C: Details of Goats Age-wise 1 Year to 1 Yz Year (Round- I)
MALE FEMALE TOTAL
Category Total Weight Presen Home Purchased Breed in Total Weight Presen Home Purchased Breed in Number Total Weight Presen Home Purchased Breed in Number
of Farm no. (Kg.) 1 Value product Number no. (Kg.) I Value product no. (Kg.) 1 Value produc
(Rs.) in no. N Value D B J 0 (Rs.) in no. N Value D B J 0 (Rs.) I N Value D B J 0
o. o. in no. 0.
Group I 8 186 23300 8 0 0 8 0 0 0 27 391 51300 25 2 3500 27 0 0 0 35 577 74600 33 2 3500 3.S 0 0 0
Group II 13 231 32800 13 0 0 13 0 0 0 41 596 76300 40 I 1500 41 0 0 0 54 827 109100 53 I 1500 54 0 0 0
Group Ill 26 493.5 96000 26 0 0 26 0 0 0 124 1382.5 227700 120 4 9000 124 0 0 ·o 150 1876 323700 146 4 9000 150 0 0 0
Group IV 31 660 79750 31 0 0 31 0 0 0 135 2112 232900 135 0 0 135 0 0 0 166 2772 312650 166 0 0 166 0 0 0
Total 78 1570.5 231850 78 0 0 78 0 0 0 327 4481.5 588200 320 7 14000 327 0 0 0 405 6052 820050 398 7 14000 405 0 0 0
Table No.ll D: Details of Goats Age-wise More than 1 Yz Year (Round- I)
MALE FEMALE TOTAL
Category Total Weight Present Home Purchased Breed in Total Weight Present Home Purchased Breed in Number Total Weight Present Home Purchased Breed in Number
of Farm no. (Kg.) Value (Rs.) product Number no. (Kg.) Value product no. (Kg.) Value produc
in no. N Value D B J 0 (Rs.) in no. No Value D B J 0 (Rs.) 1 in no. No. Value D B J 0
o.
Group I 10 230 31520 10 0 0 10 0 0 0 31 685 87300 28 3 4700 31 0 0 0 41 915 118820 38 3 4700 41 0 0 0
Group lJ 13 250 11200 13 0 0 13 0 0 0 45 1051 139950 44 I 2000 45 0 0 0 58 1301 172106 57 I 2000 58 0 0 0
Group lll 34 620 43600 34 0 0 34 0 0 0 132 2650 336200 127 5 9000 132 0 0 0 166 3276 385208 161 5 9000 166 0 0 0
Group IV 35 670 39000 35 0 0 35 0 0 0 152 3184 347500 142 10 15500 152 0 0 0 187 3854 442920 177 10 15500 187 0 0 0
Total 92 1776 257498 92 0 0 92 0 0 0 360 7570 9109.50 341 19 31200 360 0 0 0 452 9346 1168448 433 19 31200 452 0 0 0
Goats Age-wise Below 6 th Months (Round - II)
The second round survey found that total 268 male goats have been reported in 1 04
sample households under age 6 months in round II. The present value of these males is
calculated as per the values suggested by sample goat keeper households and that arrived to
Rs.217250. The average price of per goat under age 6 months comes around Rs.810.63 and
average weight per goat comes around 5.87 kg. All the breeds of the goats are home product
and are local breeds (deshi). The female goats are 322 that reported during survey, which are
under age 6 months. The average weight of female goat is 4.59 kg, and the average present of
per goat is Rs.724.84. Out of total number 322, 321 are home product goats and only 1 goat is
reported to purchase from outside. It is also noticed in the second round that the local
households also preferred to have local breed only. The average weight of the goats, which
are below 6 months, is 8.68 kg, and the average present value of male and female is 1270.50.
As mentioned earlier, except 1 female breed, all are home product goats and also local breeds
( deshi). (See table no. 12A)
Goats Age-wise 7 -12 Months
It is found that total 65 male goats have been reported in 104 sample households
under age 7-12 months in round II. The present value of these males is calculated as per the
values suggested by sample goat keepers households and that arrived to Rs. 209465. The
average price of per goat under age 7-12 months comes around Rs.3222.53 and average
weight per goat comes around 19.41 kg. All the breeds of the male goats are home product
and are local breeds (deshi). The female goats are 278 that reported during survey, which are -
under age 7-12 months. It is noticed that the average weight of female goat is 16.70 kg. and
the average present of per goat is Rs. 2489.12 Out of total number 278, 273 are home product
goats and only 5 female goat is reported to purchase from outside. No doubt that the local
households also preferred to have local breed only. The total male and female goats, which
are below 7-12 months, and are in the sample households, are 343. The average weight of the
goats, which are below 7-12 months, is 19.07 kg. and the average present value of male and
female is Rs.3213.66. As mentioned earlier, except 5 female breed, all are home product
goats and also local breeds (deshi). (See table no. 12B)
105
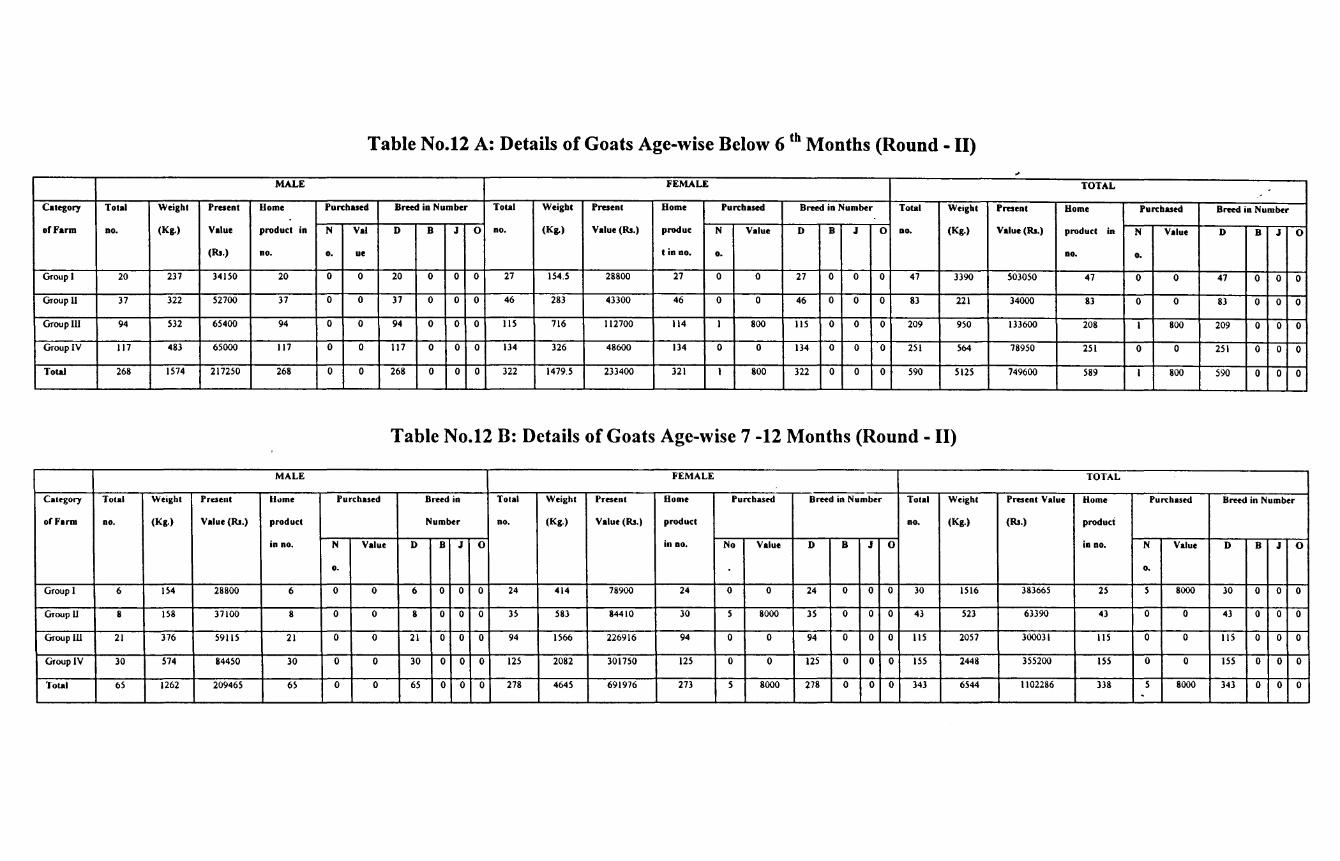
Table No.12 A: Details of Goats Age-wise Below 6th Months (Round- II)
MALE FEMALE TOTAL -Category Total Weight Present Home Purchued Breed in Number Total Weight Present Home Purchased Breed in Number Total Weight Present Home Purchued Breed in Number
of Farm no. (Kg.) Value product in N Val D B J 0 no. (Kg.) Value (Rs.) produc N Value D B J 0 no. (Kg.) Value(Rs.) product in N Value D B J 0
(Rs.) no. o. ue tin no. o. no. o.
Group I 20 237 34150 20 0 0 20 0 0 0 27 154.5 28800 27 0 0 27 0 0 0 47 3390 503050 47 0 0 47 0 0 0
Group II 37 322 52700 37 0 0 37 0 0 0 46 283 43300 46 0 0 46 0 0 0 83 221 34000 83 0 0 83 0 0 0
Group Ill 94 532 65400 94 0 0 94 0 0 0 115 716 112700 114 I 800 115 0 0 0 209 950 133600 208 I 800 209 0 0 0
Group IV I 17 483 65000 117 0 0 117 0 0 0 134 326 48600 134 0 0 134 0 0 0 251 564 78950 251 0 0 251 0 0 0
Total 268 1574 217250 268 0 0 268 0 0 0 322 1479.5 233400 321 I 800 322 0 0 0 590 5125 749600 589 I 800 590 0 0 0
Table No.12 B: Details of Goats Age-wise 7 -12 Months (Round- II)
MALE FEMALE TOTAL
Category Total Weight Present Holme Purchased Breed in Total Weight Present Home Purchased Breed in Number Total Weight Present Value Home Purchased Breed in Number
of Farm no. (Kg.) Value (Rs.) product Number no. (Kg.) Value (Rs.) product no. (Kg.) (Rs.) produci
in no. N Value D B J 0 in no. No Value D B J 0 in no. N Value D B J 0
o. 0.
Group I 6 154 28800 6 0 0 6 0 0 0 24 414 78900 24 0 0 24 0 0 0 30 1516 383665 25 5 8000 30 0 0 0
Group II 8 158 37100 8 0 0 8 0 0 0 35 583 84410 30 5 8000 35 0 0 0 43 523 63390 43 0 0 43 0 0 0
Group Ill 21 376 59115 21 0 0 21 0 0 0 94 1566 226916 94 0 0 94 0 0 0 115 2057 300031 115 0 0 I 15 0 0 0
Group IV 30 574 84450 30 0 0 30 0 0 0 125 2082 301750 125 0 0 125 0 0 0 155 2448 355200 155 0 0 155 0 0 0
Total 65 1262 209465 65 0 0 65 0 0 0 278 4645 691976 273 5 8000 278 0 0 0 343 6544 1102286 338 5 8000 343 0 0 0 .
Goats Age-wise 1 Year to 1 Yl Year (Round - II)
It is observed from the survey in sample villages that total 81 male goats have been
reported in 104 sample households age 1- 1 12 year in round II. The present value of these
males is calculated as per the values suggested by sample goat keepers households and that
arrived to Rs. 214301. The average price of per goat under age 1- 1 12 year comes around
Rs.2645.69- and average weight per goat comes around 22.87 kg. All the breeds of the male
goats are home product and are local breeds (deshi).
It is noticed that the female goats are 319 that reported during survey, which are age
1- 1 12 year. The average weight of female goat is 22.53 kg. and the average present of per
goat is Rs. 3120.39. Out of total number 319, 307 are home product goats and 12 female goat
is reported to purchase from outside. No doubt, it is usual practice that the local households
also prefer to have local breed only. The total male and female goats, which are below 1-1 'l2
year, and are in the sample households, are 400. The average weight of the goats, which are
1- 112 year, is 20.01 kg. and the average present value of male and female is Rs.2652.25. As
mentioned earlier, except 17 female breed, all are home product goats and also local breeds
( deshi). (See table no. 12C)
It is noticed that total 98 male goats have been reported in 104 sample households that
have age more than 1 'l2 year in round II. The present value of these males is calculated as per
the values suggested by sample goat keeper households and that arrived toRs. 288420. The
average price of per goat age more than 1 'l2 year comes around Rs. 2943.06 and average
weight per goat comes around 18.79 kg. The female goats are 374 that reported during
survey, which are age more than 1 Y2- year. The average weight of female goat is 17.91 kg.
and the average present value of per goat is Rs. 2431.55. The total male and female goats,
which are more than 1 'l2 year, and are in the sample households, are 472. The average weight
ofthe goats, whic.h are more than 1 Yz year, is 16.33 kg._ and the average present value of male
and female is Rs.2471.44. (See table no. 12D)
107

Table No.12 C: Details of Goats Age-wise 1 Year to 1 Yz Year (Round- II)
MALE FEMALE TOTAL
category Total Weigh Present Home Purchased Breed in Number Total Weigh Present Home Purchased Breed in Number Total Weigh Present Home Purchased Breed in Number
of Farm no. t (Kg.) Value Product N Valu D B J 0 no. I (Kg.) Value produc No. Value D B J 0 no. I (Kg.) Value product N Value D 8 J 0
(Rs.) in no. o. e (Rs..) I in no. (Rs.) in no. o.
Group I 9 241 47200 9 0 0 9 0 0 0 27 3613.5 566000 21 6 8800 27 0 0 0 36 4389 684102 27 9 10451 36 0 0 0
Group 11 13 404 84700 13 0 0 13 0 0 0 41 762 117900 36 5 2451 41 0 0 0 54 372 63300 49 s 0 54 0 0 0
Group Ill 26 359 44901 24 2 4000 26 0 0 0 117 2140 209106 116 I 1500 117 0 0 0 143 2638 206300 140 3 0 143 0 0 0
Group IV 33 849 37500 33 0 0 33 0 0 0 134 673 102400 134 0 0 134 0 0 0 167 641 107200 167 0 0 167 0 0 0
106090
Total 81 1853 214301 79 2 4000 81 0 0 0 319 71885 995406 307 12 12751 319 0 0 0 400 8040 2 383 17 10451 400 0 0 0
Table No.12 D: Details of Goats Age-wise More than 1 Yz Year (Round- II)
MALE FEMALE TOTAL
Category Total Weight Present Home Purchased Breed in Total Weight Praent Home Purchased Breed in Number Total Weight Present Home Purchased Breed in Number
of Farm No. (Kg.) Value product Number no. (Kg.) Value product no. (Kg.) Value (Rs.) produc
(Rs.) in no. N Value D B J 0 (Rs.) in no. N Value D B J 0 I in no. N Value D B J 0
o. o. o.
Group I 10 261 40100 10 0 0 10 0 0 0 32 1432 182800 21 II 15700 32 0 0 0 42 2788 501200 31 II 15800 42 0 0 0
Group 11 IS 267 41000 IS 0 0 15 0 0 0 51 1349 179300 45 6 8300 51 0 0 0 66 694 80900 60 6 3000 66 0 0 0
Group 111 38 736 107920 38 0 0 38 0 0 0 149 2486 326600 131 18 26500 149 0 0 0 187 2311 311320 169 18 22300 187 0 0 0 . Group IV 35 577 99400 35 0 0 35 0 0 0 142 1434 220700 131 II ISSOO 142 0 0 0 177 1919 273100 166 II 18500 177 0 0 0
Total 98 1841 288420 98 0 0 98 0 0 0 374 6701 909400 328 46 66000 374 0 0 0 472 7712 1166520 426 46 59600 472 0 0 0
Maintenance Cost I
The field survey recorded that the sample households spent money on the various
items and requirements, which are given in details in the following table-13 A. It is observed
that the goat keepers spent as maintenance cost on various items. It is noticed that feed gains,
fodder, salt, medicines are the main items to spend. It is found that the maintenance cost on
male goats is Rs. 9221.51, which was spent by all sample households and similarly,
maintenance cost on female goats and kids are Rs. 31853.08, and Rs. 11911.91 respectively.
It is noted that the total expenditure on 1782 goats, as reported by all sample households that
calculated after adding all types of goats, is Rs.52986.5. It is observed that the average per
goat expenditure incurred by sample households in first round survey is Rs.29.73. It is found
that the sample households have spent maximum amount on medicine for male, female and
kids goat. The second highest expenditure incurred by sample households is on 'feed grains'
in case of male goats, under other expenditure on female goats, and feed grains in case of
kids goats. It is noticed that very meager amount was spent on the· fodders, and salts as it is
know fact that fodder is freely available in village area and salt is not considered as necessity
item for spending on the goats. (See table no. 13A)
109
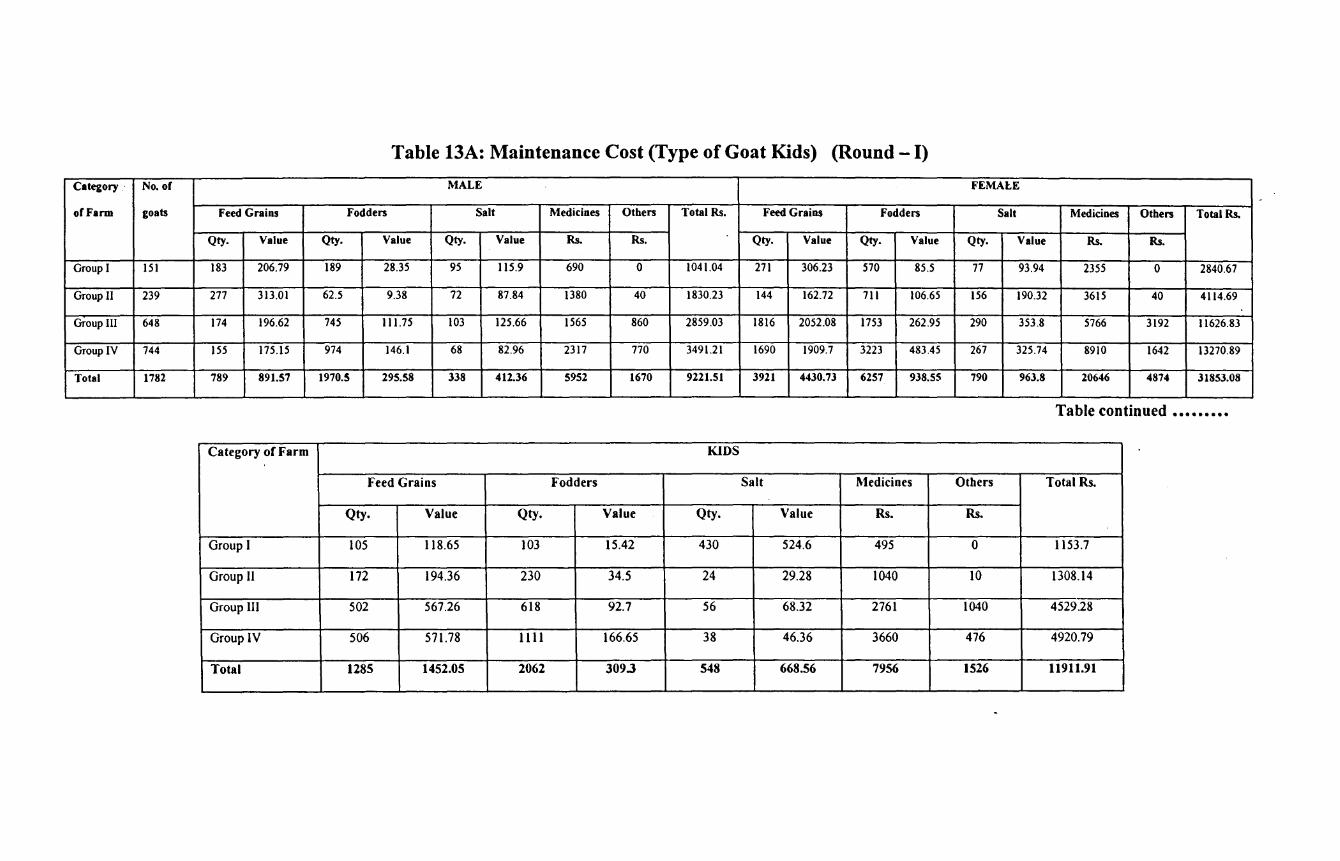
Table 13A: Maintenance Cost (Type of Goat Kids) (Round- I)
Category · No. of MALE FEMAlE
of Farm goats Feed Grains Fodden Salt Medicines Othen Total Rs. Feed Grains Fodden Salt Medicines Othen TotalRs.
Qty. Value Qty. Value Qty. Value Rs. Rs. Qty. Value Qty. Value Qty. Value Rs. Rs.
Group I 151 183 206.79 189 28.35 95 115.9 690 0 1041.04 271 306.23 570 85.5 77 93.94 2355 0 2840.67
Group II 239 277 313.01 62.5 9.38 72 87.84 1380 40 1830.23 144 162.72 711 106.65 156 190.32 3615 40 4114.69
Group lli 648 174 196.62 745 111.75 103 125.66 1565 860 2859.03 1816 2052.08 1753 262.95 290 353.8 5766 3192 11626.83
Group IV 744 155 175.15 974 146.1 68 82.96 2317 770 3491.21 1690 1909.7 3223 483.45 267 325.74 8910 1642 13270.89
Total 1782 789 891.57 1970.5 295.58 338 412.36 5952 1670 9221.51 3921 4430.73 6257 938.55 790 963.8 20646 4874 31853.08
Table continued •••••••••
Category of Farm KIDS
Feed Grains Fodders Salt .Medicines Others Total Rs.
Qty. Value Qty. Value Qty. Value Rs. Rs.
Group I 105 118.65 103 15.42 430 524.6 495 0 1153.7
Group II 172 194.36 230 34.5 24 29.28 1040 10 1308.14
Group III 502 567.26 618 92.7 56 68.32 2761 1040 4529.28
Group IV 506 571.78 1111 166.65 38 46.36 3660 476 4920.79
Total 1285 1452.05 2062 309.3 548 668.56 7956 1526 11911.91
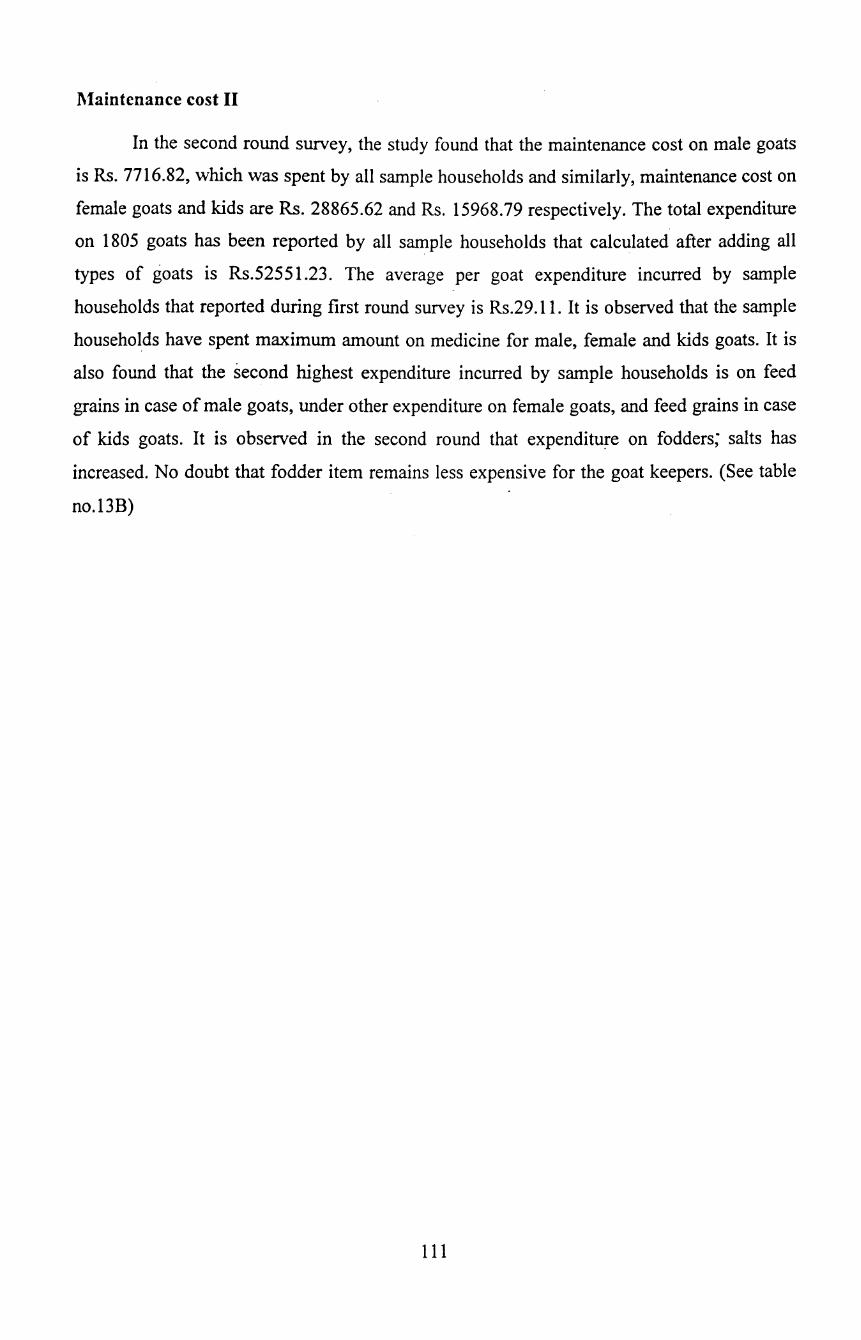
l\Iaintenance cost II
In the second round survey, the study found that the maintenance cost on male goats
is Rs. 7716.82, which was spent by all sample households and similarly, maintenance cost on
female goats and kids are Rs. 28865.62 and Rs. 15968.79 respectively. The total expenditure
on 1805 goats has been reported by all sample households that calculated after adding all
types of goats is Rs.52551.23. The average per goat expenditure incurred by sample
households that reported during first round survey is Rs.29.11. It is observed that the sample
households have spent maximum amount on medicine for male, female and kids goats. It is
also found that the second highest expenditure incurred by sample households is on feed
grains in case of male goats, under other expenditure on female goats, and feed grains in case
of kids goats. It is observed in the second round that expenditll!e on fodders; salts has
increased. No doubt that fodder item remains less expensive for the goat keepers. (See table
no.l3B)
1 1 1
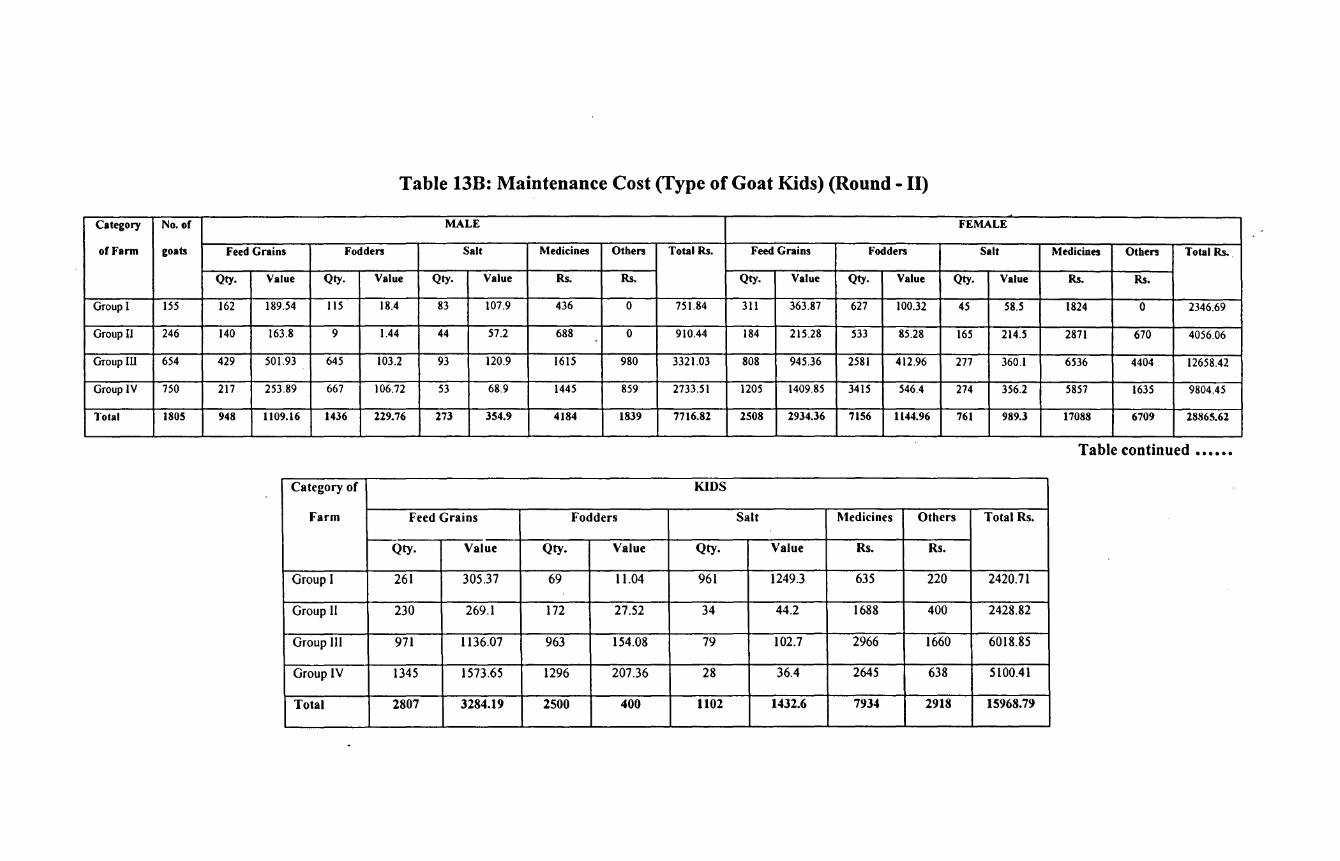
Table 13B: Maintenance Cost (Type of Goat Kids) (Round- II)
Category No. of MALE FEMALE
of Farm goats Feed Grains Fodders Salt Medicines Others Total Rs. Feed Grains Fodders Salt Medicines Others Total Rs.
Qty. Value Qty. Value Qty. Value Rs. Rs. Qty. Value Qty. Value Qty. Value Rs. Rs.
Group I ISS 162 189.54 115 18.4 83 107.9 436 0 751.84 311 363.87 627 100.32 45 58.5 1824 0 2346.69
Group II 246 140 163.8 9 1.44 44 57.2 688 0 910.44 184 215.28 533 85.28 165 214.5 2871 670 4056.06
Group III 654 429 501.93 645 103.2 93 120.9 1615 980 3321.03 808 945.36 2581 412.96 277 360.1 6536 4404 12658.42
Group IV 750 217 253.89 667 106.72 53 68.9 1445 859 2733.51 1205 1409.85 3415 546.4 274 356.2 5857 1635 9804.45
Total 1805 948 1109.16 1436 229.76 273 354.9 4184 1839 7716.82 2508 2934.36 7156 1144.96 761 989.3 17088 6709 28865.62
Table continued ••••••
Category of KIDS
Farm Feed Grains Fodders Salt Medicines Others Total Rs.
--Qty. Value Qty. Value Qty. Value Rs. Rs.
Group I 261 305.37 69 11.04 961 1249.3 635 220 2420.71
Group II 230 269.1 172 27.52 34 44.2 1688 400 2428.82
Group lil 971 1136.07 963 154.08 79 102.7 2966 1660 6018.85
Group IV 1345 1573.65 1296 207.36 28 36.4 2645 638 5100.41
Total 2807 3284.19 2500 400 1102 1432.6 7934 2918 15968.79
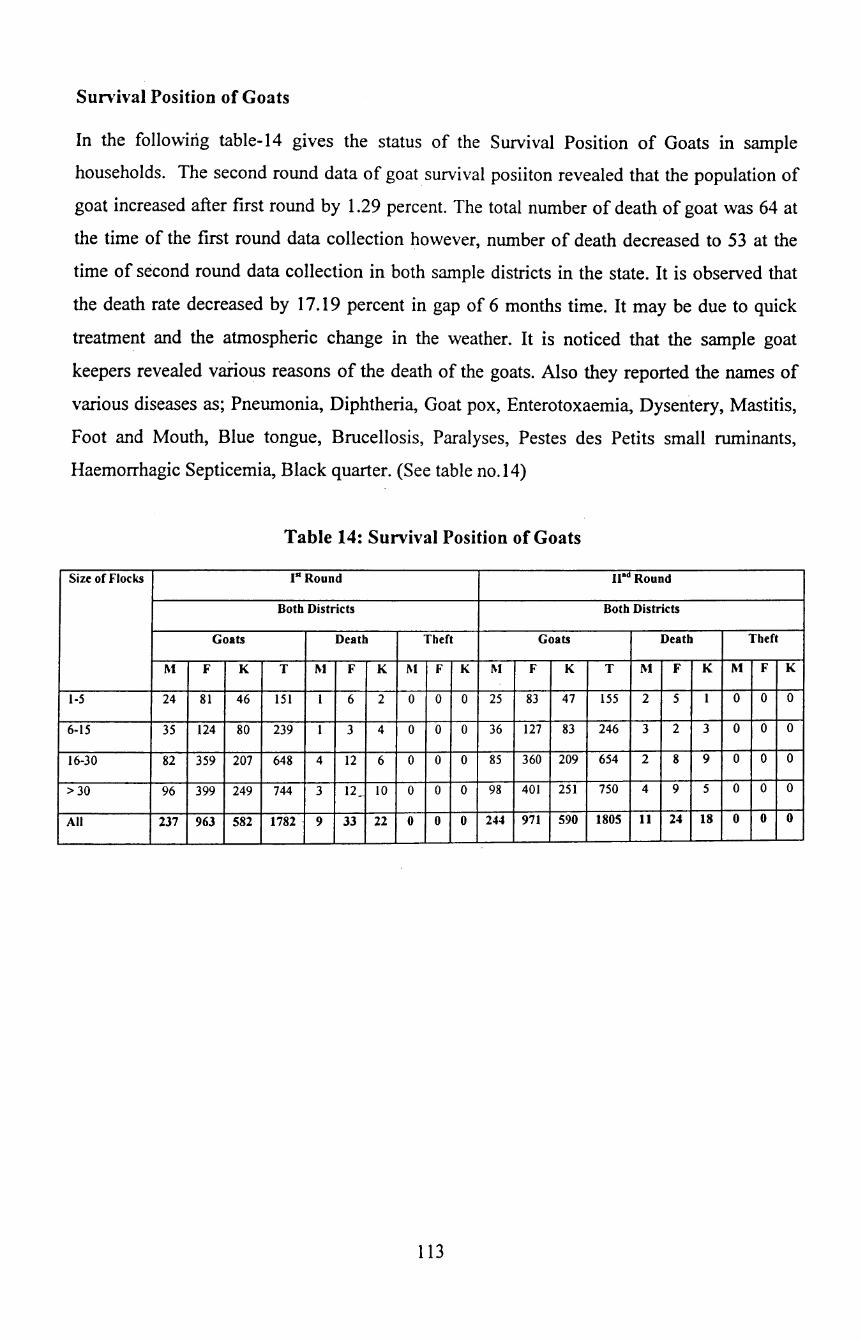
Sunrival Position of Goats
In the following table-14 gives the status of the Survival Position of Goats in sample
households. The second round data of goat survival posiiton revealed that the population of
goat increased after first round by 1.29 percent. The total number of death of goat was 64 at
the time of the first round data collection however, number of death decreased to 53 at the
time of second round data collection in both sample districts in the state. It is observed that
the death rate decreased by 17.19 percent in gap of 6 months time. It may be due to quick
treatment and the atmospheric change in the weather. It is noticed that the sample goat
keepers revealed various reasons of the death of the goats. Also they reported the names of
various diseases as; Pneumonia, Diphtheria, Goat pox, Enterotoxaemia, Dysentery, Mastitis,
Foot and Mouth, Blue tongue, Brucellosis, Paralyses, Pestes des Petits small ruminants,
Haemorrhagic Septicemia, Black quarter. (See table no.14)
Table 14: Survival Position of Goats
Size of Flocks I" Round lind Round
Both Districts Both Districts
Goats Death Theft Goats Death Theft
M F K T M F K l\1 F K l\1 F K T M F K M F K
1-5 24 81 46 151 I 6 2 0 0 0 25 83 47 155 2 5 I 0 0 0
6-15 35 124 80 239 I 3 4 0 0 0 36 127 83 246 3 2 3 0 0 0
16-30 82 359 207 648 4 12 6 0 0 0 85 360 209 654 2 8 9 0 0 0
>30 96 399 249 744 3 12_ 10 0 0 0 98 401 251 750 4 9 5 0 0 0
All 237 963 582 1782 . 9 33 22 0 0 0 244 971 590 1805 11 24 18 0 0 0
113
CHAPTER-V
LIVE STOCK POSITION ON SAMPLE FARMS AND GOAT MARKETING SYSTEM
Livestock Position on the Sample Farms
The field survey has found that other goats, the goat keepers are rearing
different livestock. The land less farms has 209 goats, 12 cows, 6 buffaloes, in
Yavatmal district. In Ahemadnagar district, it is observed that 243 goats, 80 sheep, 8
cows, and 2 buffaloes. In two sample districts, the landless has 452 goats," 80 sheep,
20 cows, 8 buffaloes etc. On marginal category farms, in both districts, it is found that
615 goats, 1 ~ sheep, 31 cows, 17 buffaloes, etc. On small farms category, it is found
that 276 goats, 130 sheep, 15 cows, 133 buffaloes etc. In the category of Medium
farms, it is found that 3 77 goats, 42 cows, 21 buffalos, and 30 other animal, and large
category farms, it is found that only 62 goats, 15 cows, only 3 buffaloes, and 8 other
animals. It is observed from the data that the highest number of goats is found on the
Marginal farms category followed by landless farms holders. Data clearly indicates
that marginal farms holders and landless land holders and goat keepers are more
interested to have goats and large farmers have less number of goats. The highest
number of cows and buffaloes are found in the medium category farms. In case of
goats, the picture is same in both districts. In Ahemadnagar district it is found that
goat keepers have sheep, it is because, in this district, people prefer to eat sheep meat.
The details of the livestock position are given in the following table-1 (a) and (b).
114
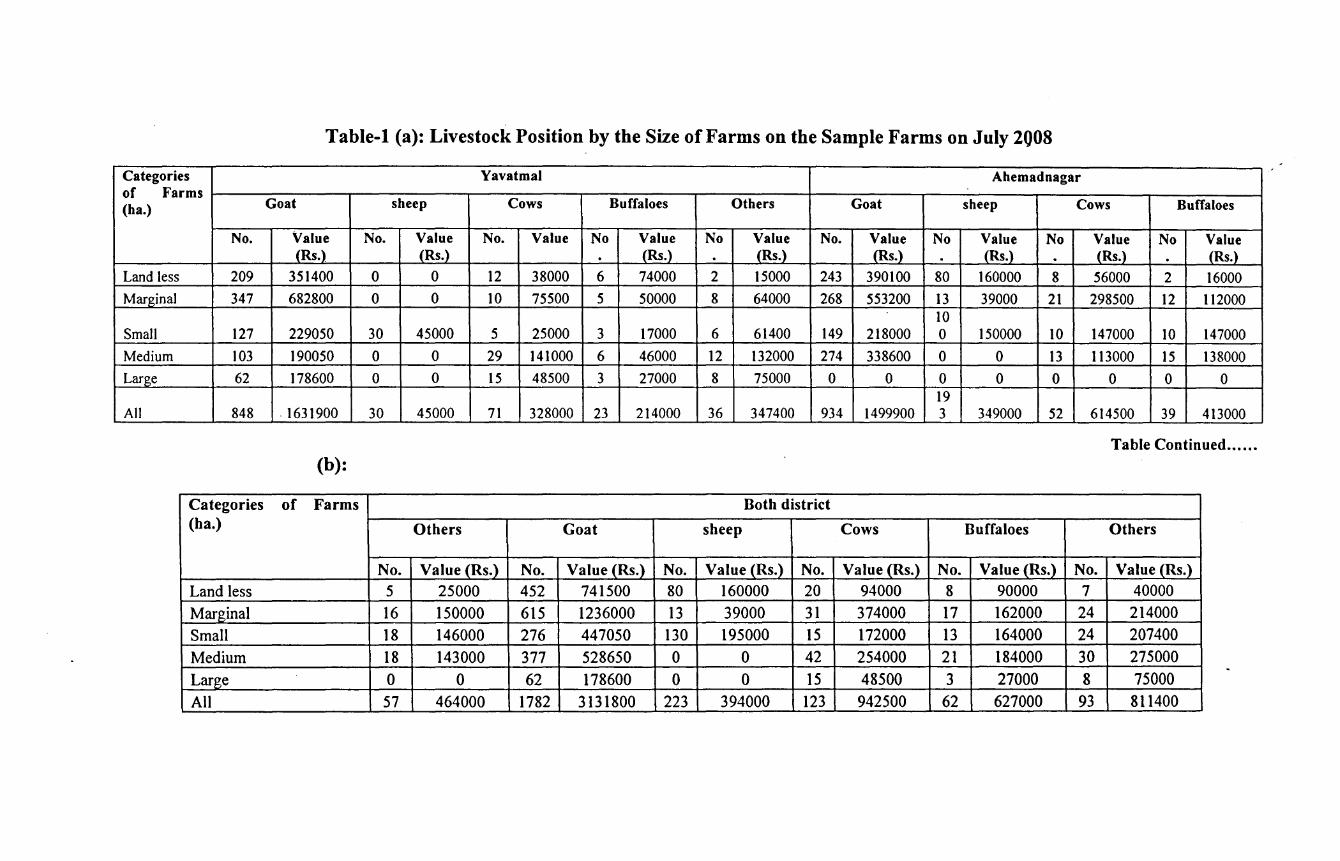
Table-t (a): Livestock Position by the Size of Farms on the Sample Farms on July 2Q08
Categories Yavatmal Ahemadnagar of Farms (ha.) Goat sheep Cows Buffaloes Others Goat sheep Cows Buffaloes
No. Value No. Value No. Value No Value No Value No. Value No Value No Value No Value (Rs.) (Rs.) . (Rs.) . (Rs.) (Rs.) . (Rs.) . (Rs.) . _{Rs.)
Land less 209 351400 0 0 12 38000 6 74000 2 15000 243 390100 80 160000 8 56000 2 16000 Marginal 347 682800 0 0 10 75500 5 50000 8 64000 268 553200 13 39000 21 298500 12 112000
10 Small 127 229050 30 45000 5 25000 3 17000 6 61400 149 218000 0 150000 10 147000 10 147000 Medium 103 190050 0 0 29 141000 6 46000 12 132000 274 338600 0 0 13 113000 15 138000 Large 62 178600 0 0 15 48500 3 27000 8 75000 0 0 0 0 0 0 0 0
19 All 848 . 1631900 30 45000 71 328000 23 214000 36 347400 934 1499900 3 349000 52 614500 39 413000
Table Continued .•...• (b):
Categories of Farms Both district (ha.) Others Goat sheep Cows Buffaloes Others
No. Value (Rs.) No. Value (Rs.) No. Value{Rs.) No. Value (Rs.) No. Value (Rs.) No. Value (Rs.) Land less 5 25000 452 741500 80 160000 20 94000 8 90000 7 40000 Marginal 16 150000 615 1236000 13 39000 31 374000 17 162000 24 214000 Small 18 146000 276 447050 130 195000 15 172000 13 164000 24 207400 Medium 18 143000 377 528650 0 0 42 254000 21 184000 30 275000 Large 0 0 62 178600 0 0 15 48500 3 27000 8 75000 All 57 464000 1782 3131800 223 394000 123 942500 62 627000 93 811400

Size of Flocks of Goats
The following table-2 gtves more clear pictures of the male, female, kids. In
Yavatamal district, it is observed from the data that out oftotal male goats 145, 18 male goats
classified in group-!, 23 goats in group-II, 46 goats in group-III, and 58 goats in group-IV. It
is found that the highest number of goats own by group -IV category goat keepers. It is
noticed that female goats are largest number among goat population. Similarly, in
Ahemadnagar district, same pictures are found. The largest population of goats is found
Ahemadnagar district. It is noticed that total 1782 goat population is recorded among the
sample goat keepers; out of which, 237 are reported male goat population, 963 are reported
female goat population, and 582 are reported kid population. The share of female goats is
54.04 %. The sheep population also recorded from same sample houses but the population of
other livestock is very less.
116

Table-2 (a): Livestock Position by the Size of FlockS of Goats on the sample farms on July 2008 I
Size of Flocks Yavatmal Ahemadnagar Goats Sheep Cows Buffaloes Others Goats Sheep Cows Buffaloes Others
M F K T M F K T
Group I 18 43 19 80 0 24 4 8 6 38 27 71 0 7 10 II Group II 23 57 42 122 30 5 4 4 12 67 38 117 101 14 2 7 Group III 46 155 79 280 0 31 12 15 36 204 128 368 12 21 18 24 Group IV 58 183 125 366 0 II 3 9 38 216 124 378 80 10 9 15 Total 145 438 265 848 30 71 23 36 92 525 317 934 193 52 39 57
Table Continued ...
(b)
Size of Flocks Both Districts Goats Sheep Cows Buffaloes Others
M F K T Group I 24 81 46 151 0 31 14 19 Group II 35 124 80 239 131 19 6 11 Group III 82 359 207 648 12 52 30 39 Group IV 96 399 249 744 80 21 12 24 Total 237 963 582 1782 223 123 62 93
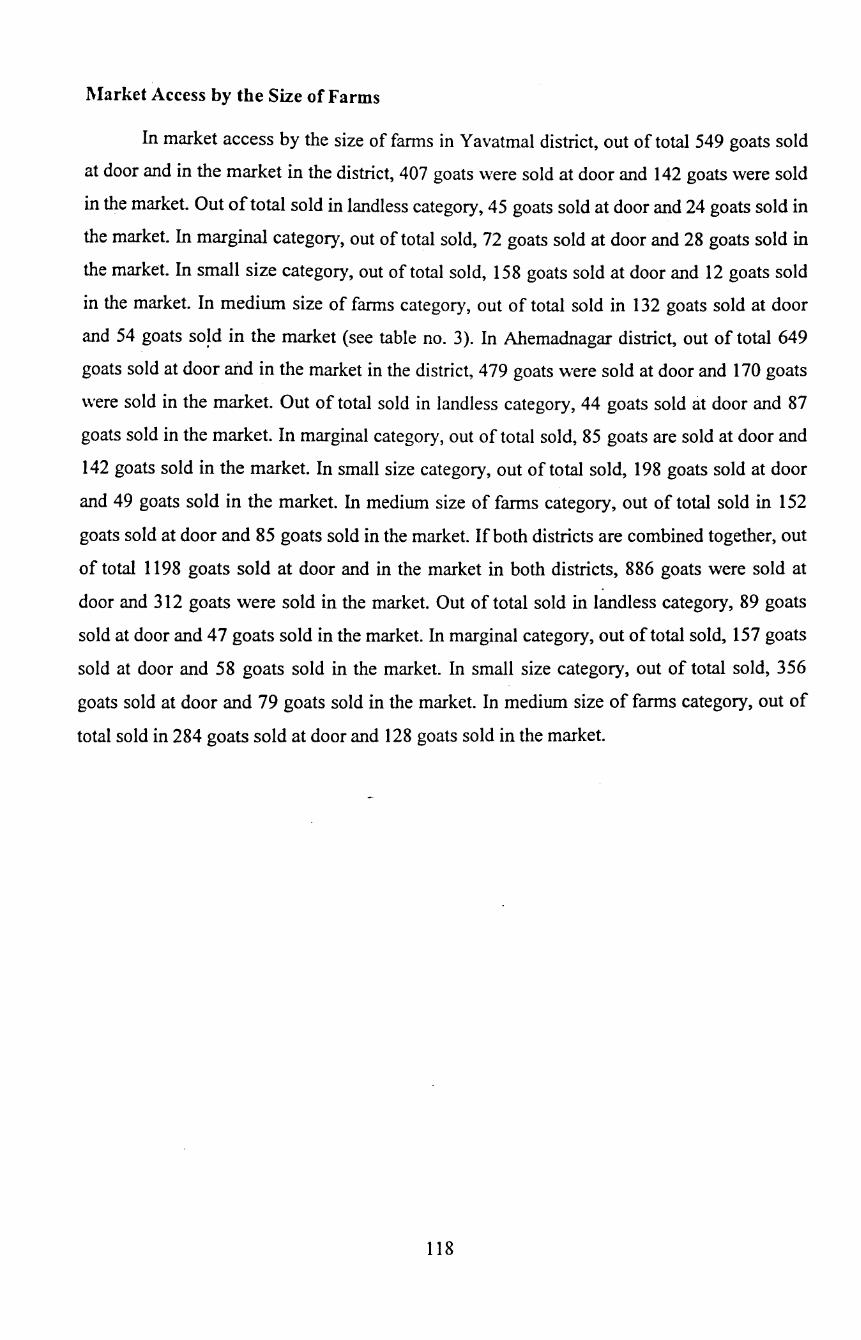
l\larket Access by the Size of Farms
In market access by the size of fanns in Yavatmal district, out of total 549 goats sold
at door and in the market in the district, 407 goats were sold at door and 142 goats were sold
in the market. Out of total sold in landless category, 45 goats sold at door and 24 goats sold in
the market. In marginal category, out of total sold, 72 goats sold at door and 28 goats sold in
the market. In small size category, out of total sold, 158 goats sold at door and 12 goats sold
in the market. In medium size of fanns category, out of total sold in 132 goats sold at door
and 54 goats so~d in the market (see table no. 3). In Ahemadnagar district, out of total 649
goats sold at door and in the market in the district, 4 79 goats were sold at door and 170 goats
were sold in the market. Out of total sold in landless category, 44 goats sold at door and 87
goats sold in the market. In marginal category, out of total sold, 85 goats are sold at door and
142 goats sold in the market. In small size category, out of total sold, 198 goats sold at door
and 49 goats sold in the market. In medium size of farms category, out of total sold in 152
goats sold at door and 85 goats sold in the market. If both districts are combined together, out
of total 1198 goats sold at door and in the market in both districts, 886 goats were sold at
door and 312 goats were sold in the market. Out of total sold in landless category, 89 goats
sold at door and 47 goats sold in the market. In marginal category, out of total sold, 157 goats
sold at door and 58 goats sold in the market. In small size category, out of total sold, 356
goats sold at door and 79 goats sold in the market. In medium size of farms category, out of
total sold in 284 goats sold at door and 128 goats sold in the market.
118
Table- 3: Market Access by the Size of Farms
Size of farms District - I Yavatmal District -II Ahemadnagar Population of Goats Sold at door Sold in the market Population of Goats Sold at door Sold in the market M F K T M F K T M F K T M F K T M F K T M F K T
Landless 18 43 19 80 14 18 13 45 6 16 2 24 6 38 27 71 4 21 19 44 2 13 8 23 Marginal 23 57 42 122 18 21 33 72 5 14 9 28 12 67 38 117 9 47 29 85 3 18 9 30 Small 46 155 79 280 41 55 62 158 5 19 12 36 36 204 128 368 29 57 112 198 9 20 14 43 Medium 58 183 125 366 35 31 66 132 13 5 36 54 38 216 124 378 33 45 74 152 6 18 50 74 Large - - - - - - - - - - - - - - - - - - - - - - - -Total 145 438 265 848 108 125 174 407 29 54 59 142 92 525 317 934 75 170 234 479 20 69 81 170 Note: M= Male, F = Female, K= Kids, T= Total.
Table continued ............. . Size of Both district farms Population of Goats Sold at door Sold in the market
M F K T M F K T M F K T Landless 24 81 46 151 18 39 32 89 8 29 10 47 Marginal 35 124 80 239 27 68 62 157 8 32 18 58 Small 82 359 207 648 70 112 174 356 14 39 26 79 Medium 96 399 249 744 68 76 140 284 19 23 86 . 128 Large - - - - - - - - - - - -Total 237 963 582 1782 183 295 408 886 49 123 140 312
Goats Sold at Door and In the Markets By the Size of Flocks of Goats
In Yavatmal district, out of total 549 goats sold at door and in the market in the
district, 407 goats were sold at door and 142 goats were sold in the market. Out of total sold
in 1-5 flock size category, 39 goats sold at door and 22 goats sold in the market. In 6-15 flock
size category, out of total sold, 64 goats sold at door and 17 goats sold in the market. In 16-30
flock size category, out of total sold, 123 goats sold at door and 59 goats sold in the market.
In above 30 flock size category, out oftotal sold in 18lgoats sold·at door and 44 goats sold in
the market.( see table no. 3 a ). In Ahemadnagar district, out of total 649 goats sold at door
and in the market in the district, 4 79 goats were sold at door and 1 70 goats were sold in the
market. Out of total sold in 1-5 flock size category, 35 goats sold at door, and 24 goats sold in
the market. In 6-15 flock, size category, out of total sold, 59 goats sold at door and 29 goats
sold in the market. In 16-30 flock, size category, out of total sold, 188 goats sold at door and
81 goats sold in the market. In above 30 flock size of farms category, out of total sold in 197
goats sold at door and 36 goats sold in the market. If both districts are combined together, out
of total 1198 goats sold at door and in the market in both districts, 886 goats were sold at
door and 312 goats were sold in the market. Out of total sold in 1-5 flock size category, 7 4
goats sold at door, and 46 goats sold in the market. In 6-15 flock, size category, out of total
sold, 123 goats sold at door and 46 goats sold in the market. In 16-30 flock, size category, out
of total sold, 311 goats sold at door and 140 goats sold in the market. In above 30 flock size
of farms category, out of total sold in 3 78 goats sold at door and 80 goats sold in the market.
120
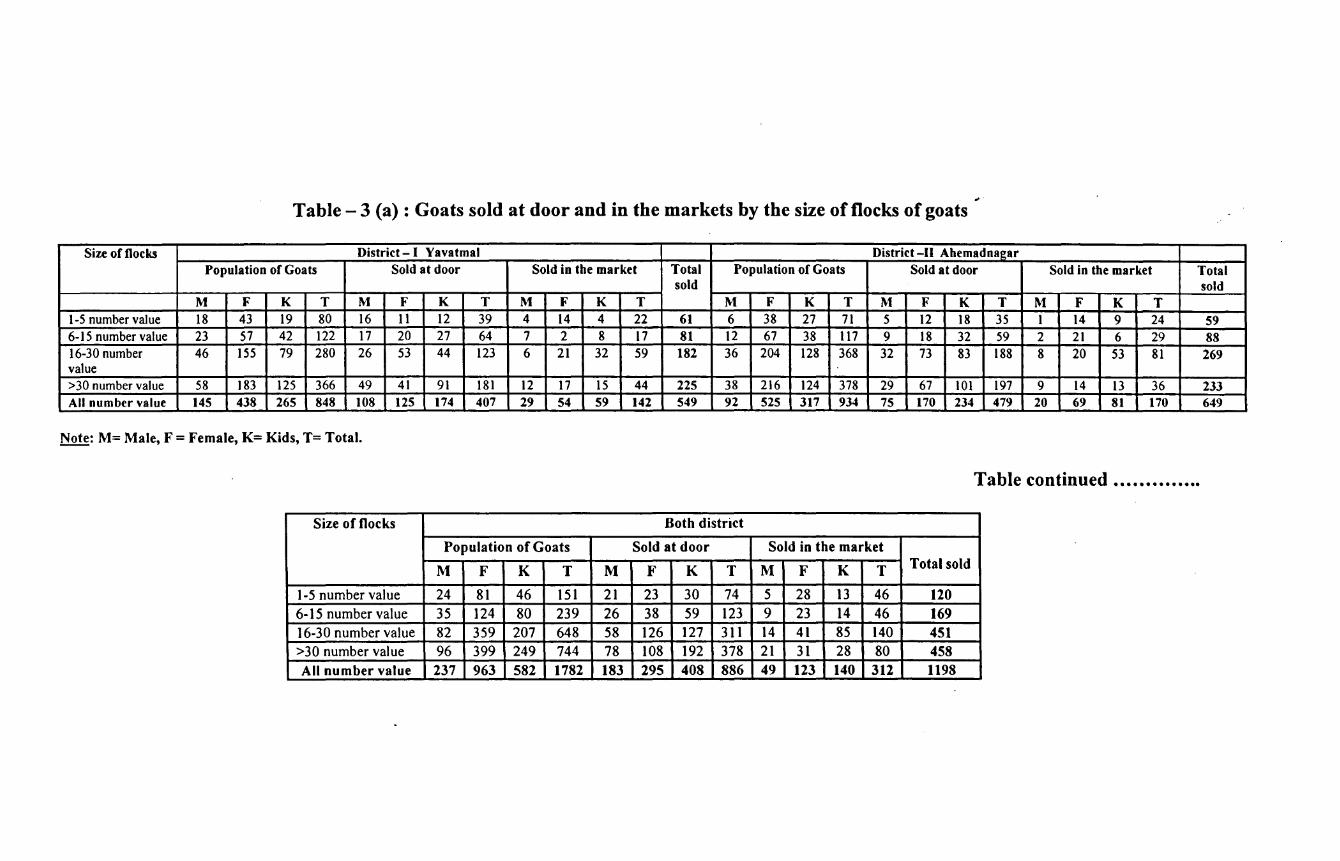
Table- 3 (a): Goats sold at door and in the markets by the size of flocks of goats
Size of Docks District -I Yavatmal District -II A hemad nagar Population of Goats Sold at door Sold in the market Total Population of Goats Sold at door Sold in the market Total
sold sold M F K T M F K T M F K T M F K T M F K T M F K T
I-5 number value I8 43 I9 80 I6 II I2 39 4 I4 4 22 61 6 38 27 7I 5 12 18 35 I 14 9 24 59 6-15 number value 23 57 42 122 17 20 27 64 7 2 8 17 81 12 67 38 117 9 18 32 59 2 21 6 29 88 16-30 number 46 155 79 280 26 53 44 I23 6 2I 32 59 182 36 204 128 368 32 73 83 I88 8 20 53 8I 269 value >30 number value 58 183 I25 366 49 41 91 181 12 17 15 44 225 38 216 124 378 29 67 101 197 9 14 13 36 233 All number value 145 438 265 848 108 125 174 407 29 54 59 142 549 92 525 317 934 75 170 234 479 20 69 81 170 649
Note: M= Male, F = Female, K= Kids, T= Total.
Table continued •....•••...•..
Size of flocks Both district
Population of Goats Sold at door Sold in the market
M F K T M F K T M F K T Total sold
1-5 number value 24 81 46 151 21 23 30 74 5 28 13 46 120 6-15 number value 35 124 80 239 26 38 59 123 9 23 14 46 169 16-30 number value 82 359 207 648 58 126 127 311 14 41 85 140 451 >30 number value 96 399 249 744 78 108 192 378 21 31 28 80 458 All number value 237 963 582 1782 183 295 408 886 49 123 140 312 1198
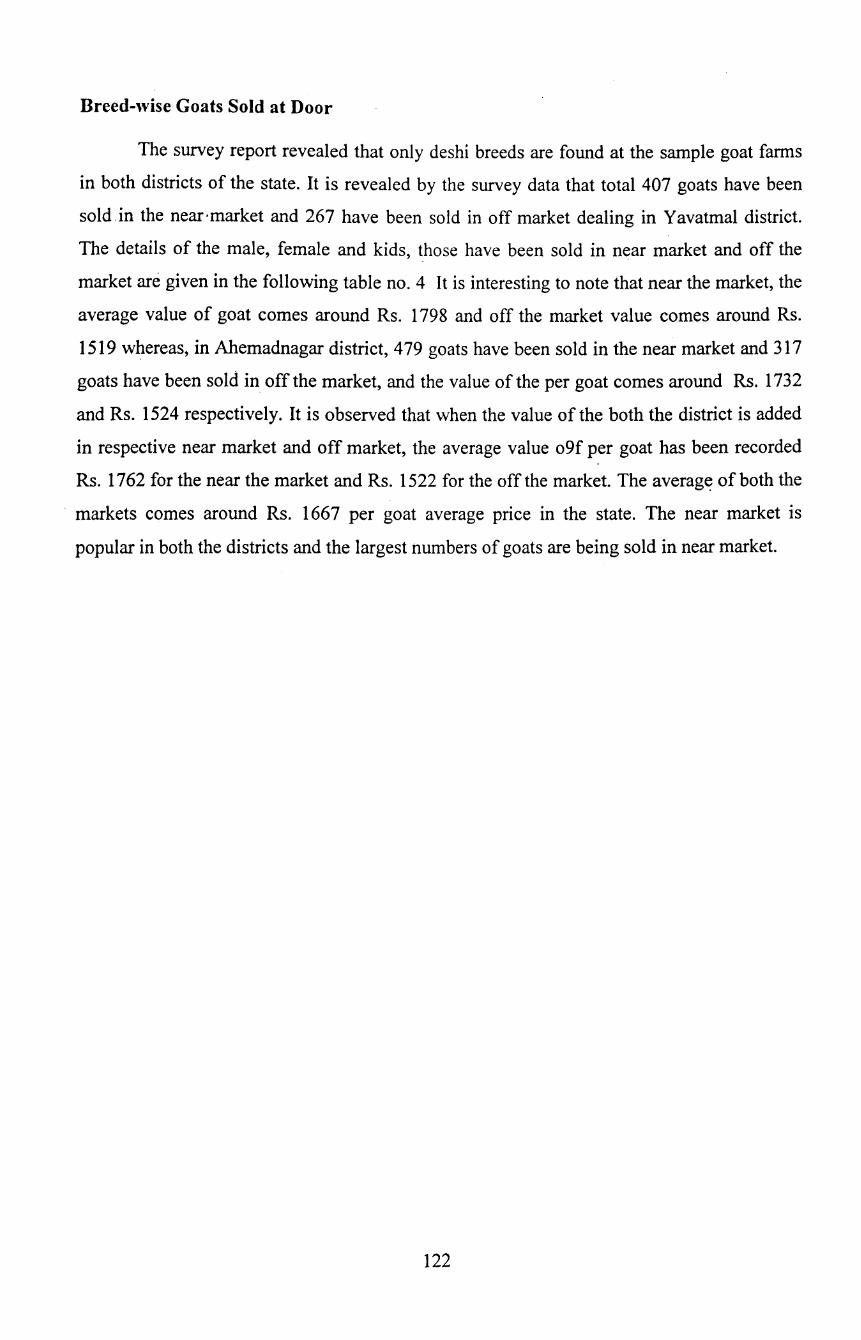
Breed-wise Goats Sold at Door
The survey report revealed that only deshi breeds are found at the sample goat farms
in both districts of the state. It is revealed by the survey data that total 407 goats have been
sold.in the near·market and 267 have been sold in off market dealing in Yavatmal district.
The details of the male, female and kids, those have been sold in near market and off the
market are given in the following table no. 4 It is interesting to note that near the market, the
average value of goat comes around Rs. 1798 and off the market value comes around Rs.
1519 whereas, in Ahemadnagar district, 4 79 goats have been sold in the near market and 317
goats have been sold in off the market, and the value of the per goat comes around Rs. 1732
and Rs. 1524 respectively. It is observed that when the value of the both the district is added
in respective near market and off market, the average value o9f per goat has been recorded
Rs. 1762 for the near the market and Rs. 1522 for the off the market. The averag~ of both the
markets comes around Rs. 1667 per goat average price in the state. The near market is
popular in both the districts and the largest numbers of goats are being sold in near market.
122
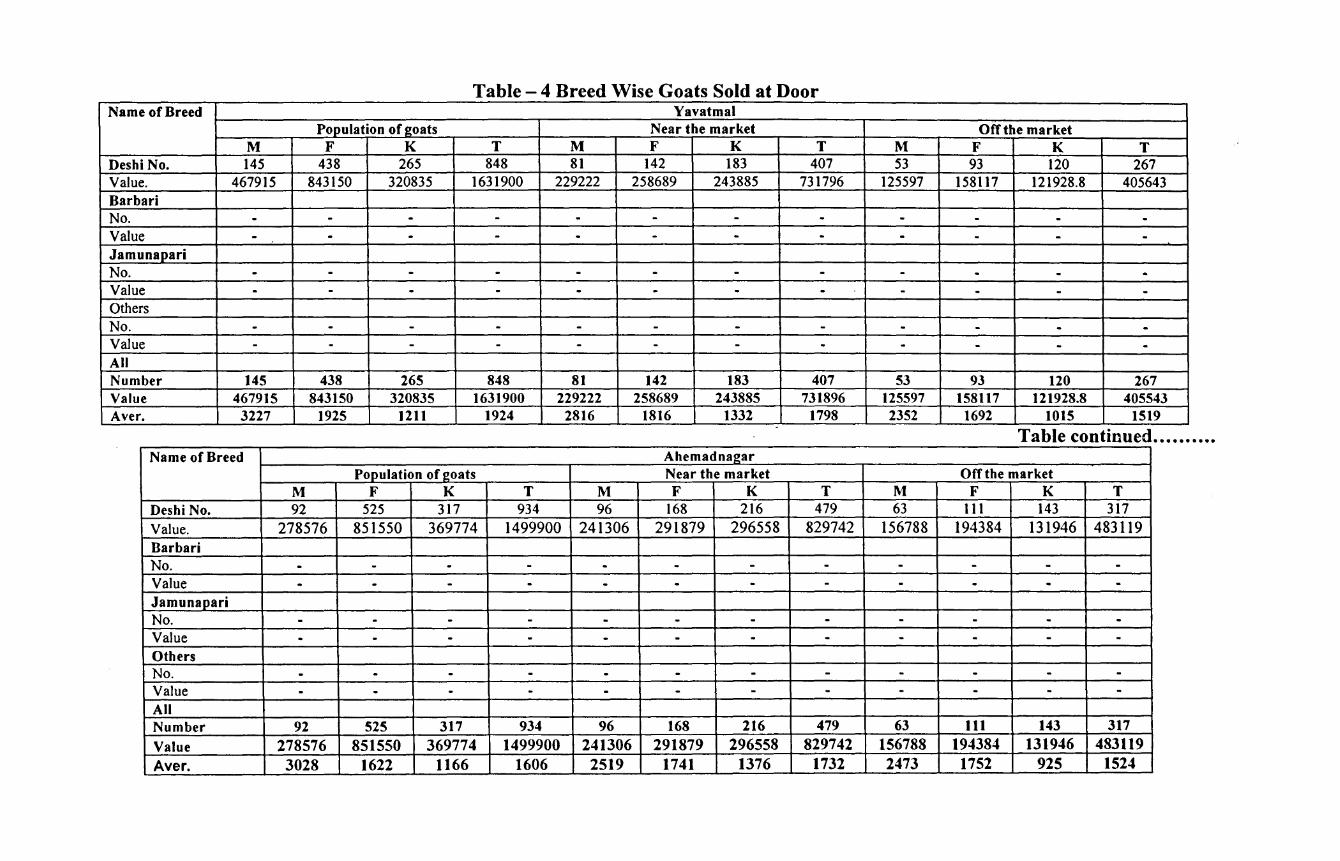
Table - 4 Breed Wise Goats Sold at Door Name of Breed Yavatmal
Population of 2oats Near the market Off the market M F K T M F K T M F K T
Deshi No. 145 438 265 848 81 142 183 407 53 93 120 267 Value. 467915 843150 320835 1631900 229222 258689 243885 731796 125597 158117 121928.8 405643 Barbari No. - - - - - - - - - - - -Value - - - - - - - - - - - -Jamunapari No. - - - - - - - - - - - -Value - - - - - - - - - - - -Others No. - - - - - - - - - - - -Value - - - - - - - - - - - -All Number 145 438 265 848 81 142 183 407 53 93 120 267 Value 467915 843150 320835 1631900 229222 258689 243885 731896 125597 158117 121928.8 405543 Aver. 3227 1925 1211 1924 2816 1816 1332 1798 2352 1692 1015 1519
Table continued .....•.••. Name of Breed Ahemadnagar
Population of eoats Near the market Offthe market M F K T M F K T M F K T
Deshi No. 92 525 317 934 96 168 216 479 63 Ill 143 317 Value. 278576 851550 369774 1499900 241306 291879 296558 829742 156788 194384 131946 483119 Barbari No. - - - - - - - - - - - -Value - - - - - - - - - - - -Jamunapari No. - - - - - - - - - - - -Value - - - - - - - - - - - -Others No. - - - - - - - - - - - -Value - - - - - - - - - - - -All Number 92 525 317 934 96 168 216 479 63 111 143 317 Value 278576 851550 369774 1499900 241306 291879 296558 829742 156788 194384 131946 483119 Aver. 3028 1622 1166 1606 2519 1741 1376 1732 2473 1752 925 1524
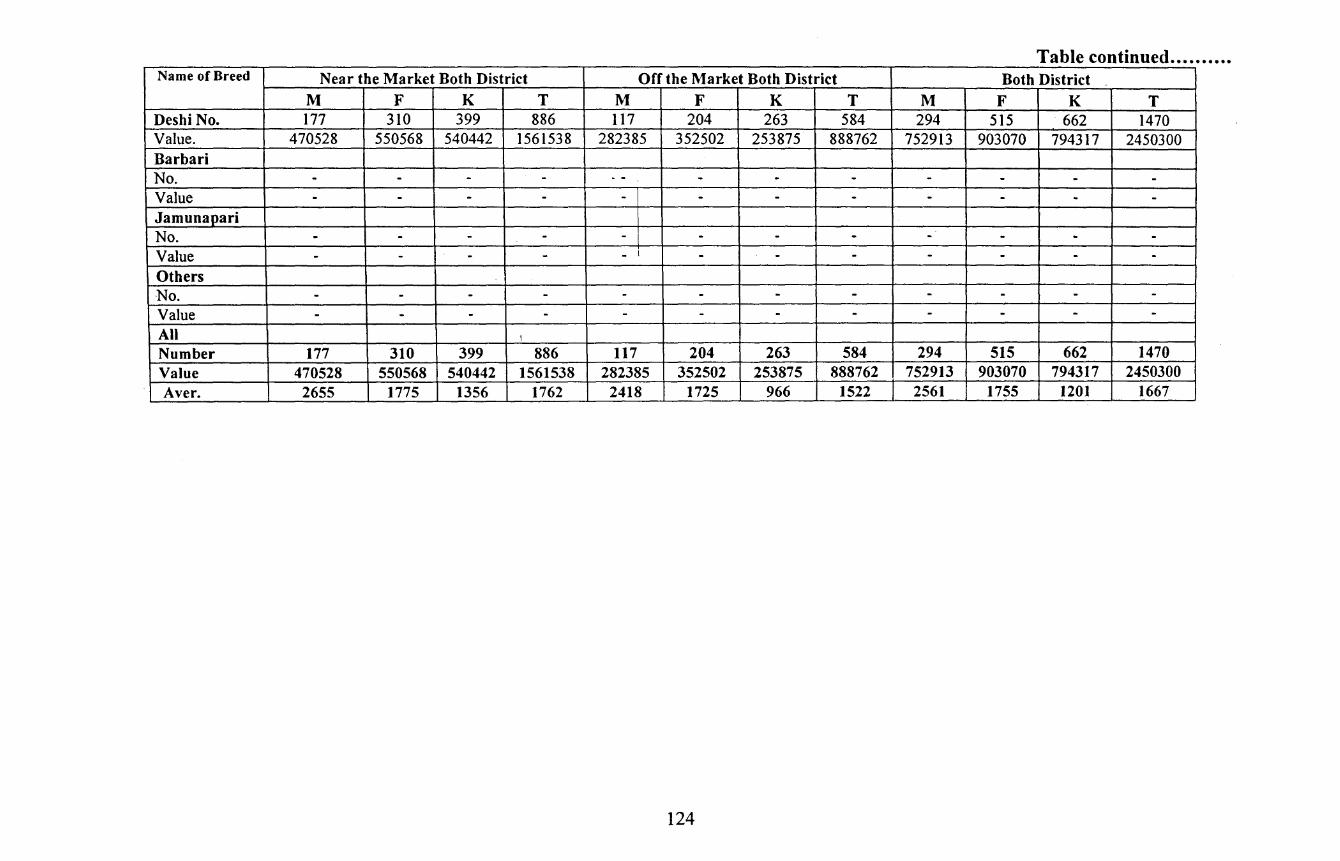
Table continued .••.•••••• Name of Breed Near the Market Both District Off the Market Both District Both District
M F K T M F K T M F K T Deshi No. 177 310 399 886 117 204 263 584 294 515 662 1470 Value. 470528 550568 540442 1561538 282385 352502 253875 888762 752913 903070 794317 2450300 Barbari No. - - - - . - - - - - - - -Value - - - - - - - - - - - -Jam una pari No. - - - - - - - - - - - -Value - - - - - I - - - - - - -Others No. - - - - - - - - - - - -Value - - - - - - - - - - - -All I
Number 177 310 399 886 117 204 263 584 294 515 662 1470 Value 470528 550568 540442 1561538 282385 352502 253875 888762 752913 903070 794317 2450300 Aver. 2655 1775 1356 1762 2418 1725 966 1522 2561 1755 1201 1667
124
Marketing of Goats by their Breed (At door)
In the first round survey, the study revealed that goats have been sold the different
categories of the buyers that are goat keepers, local butchers, professional traders, local
consumers etc. As it has been discussed earlier,. only deshi breeds are popular in the sample
district. The study revealed that the goat keepers are found to prefer mostly female and kids.
It is observed that goat keepers paid average price Rs. 1735 for a female and Rs. 1319 for a
kid. It is also noticed that the local butchers prefer to buy kids than male and female goats.
Male goats also prefer by them. The first round study noticed that the butchers purchased
highest number of kids and they are followed by male goats and female goats. It is observed
that butchers paid average price Rs. 2711 for a male goat, Rs. 1821 for a female, and Rs.
1332 for a kid. The professional traders are preferring female and kids mostly. It is observed
that traders paid average price Rs. 2829 for a male goat, Rs. 1792 for a female and Rs. 1315
for a kid. Local consumers prefer to buy female, kids and male goats in this order. It is
observed that consumers paid average price Rs. 2692 for a male goat, Rs. 1793 for a female
and Rs. 1297 for a kid. It is noticed that the all types of buyers paid different values for a goat
depending upon the place of purchased situation of purchased and the urgency of purchase of
goat. And therefore, it is observed that different price has been paid in an average to the
sellers by the buyers. The details of the values and number of goats given in the following
table no. 5
In the second round survey, the study revealed that it is observed that goat keepers
paid average price Rs. 2755 for a male goat Rs. 1770 for a female and Rs. 1340 for a kid. It is
also noticed that the local butchers prefer to buy kids than male and female goats. Male goats
also prefer by them. The second round study noticed that the butchers purchased highest
number of kids and they are followed by male goats and female goats. It is observed that
butchers paid average price Rs. 2737 for a male goat, Rs. 1837 for a female, and Rs. 1340 for
a kid. The professional traders are preferring female and kids mostly. It is observed that
traders paid average price Rs. 2833 for a male goat, Rs. 1795 for a female and Rs. 1320 for a
kid. Local consumers prefer to buy female, kids and male goats in thi~ order. It is observed
that consumers paid average price Rs. 2695 for a male goat, Rs. 1796 for a female and Rs.
1299 for a kid. It is noticed that even in the second round the all types of buyers paid different
values for a goat depending upon the place of purchased situation of purchased and the
urgency of purchase of goat. And therefore, it is observed that different price has been paid in
125
an average to the sellers by the buyers. The details of the values and number of goats given in
the following table no. 5 A
When both the rounds combined together, it is observed that goat keepers paid
average price Rs. 2755 for a male goat Rs. 1757 for a female and Rs. 1328 for a kid. It is also
noticed that the local butchers prefer to buy kids than male and female goats. Male goats also
prefer by them. The both round study noticed that the butchers purchased highest number of
kids and they are followed by male goats and female goats. It is observed that butchers paid
average price Rs. 2724 for a male goat, Rs. 1832 for a female, and. Rs. 1336 for a kid. The
professional traders are preferring female and kids mostly. It is observed that traders paid
average price Rs. 2831 for a male goat, Rs. 1793 for a female and Rs. 1316 for a kid. Local
consumers prefer to buy female, kids and male goats in this order. It is observed that
consumers paid average price Rs. 2694 for a male goat, Rs. 1794 for a female and Rs. 1298
for a kid. It is noticed that even in the second round the all types of buyers paid different
values for a goat depending upon the place of purchased situation of purchased and the
urgency of purchase of goat. And therefore, it is observed that different price has been paid in
an average to the sellers by the buyers. The details of the values and number of goats given in
the following table no. 5 B
126

Table- 5 Marketing of Goats by their Breed (At Door) Through Different Channels July 08 to Dec. 08 (First Round) Marketing Items Type of Buyers
No. Sold to goat keeper for No. Sold to local Butcher for No. Sold to professional No. Sold to local consumers & ' No. Sold to all buyers for July 08 July 08 to Dec. 08 July 08 to Dec. 08 traders for July 08 to Dec. 08 others for July 08 to Dec. 08 to Dec. 08
Male Female Kids Male Female Kids Male Female Kids Male Female Kids Male Female Kids Breed- Deshi 0 18 40 59 16 92 3 10 9 21 77 25 83 121 166 Barbari - - - - - - - - - - - - - - -Jamunapari - - - - - - - - - - - - - - -Others - - - - - - - - - - - - - - -Total No. sold 0 18 40 59 16 92 3 10 9 21 77 25 83. 121 166 Total value (Rs.) 0 31230 52760 159949 29147.36 122608 8489.70 17920 11835 56532 138061 32425 224970.7 216358.36 219628 Value/No. of ~oat 0 1735 1319 2711 1821.71 1332 2829 1792 1315 2692 1793 1297 2710 1788 1323
Table- 5 A Marketing of Goats by Their Breed (At Door) Throu_gh Different Channels Jan 09 to June 09 (Second Round) Marketing Type of Buyers
Items No. Sold to goat keeper for No. Sold to local Butcher for No. Sold to professional traders No. Sold to local consumers & No. Sold to all buyers for Jan 09 Jan 09 to June 09 Jan 09 to June 09 for Jan 09 to June 09 others for Jan 09 to June 09 to June 09
Male Female Kids Male Female Kids Male Female Kids Male Female Kids Male Female Kids Breed- Deshi 4 33 31 64 33 99 3 8 5 51 134 54 122 208 189 Barbari - . - - - - - - - - - - - - - -Jamunapari - - - - - - - - - - - - - - -Others - - - - - - - - - - - - - - -Total No. sold 4 33 31 64 33 99 3 8 5 51 134 54 122 208 189 Total value 11020 58410 41540 175168 60621 132660 8499 14360 6600 137445 240664 70146 332132 374055 250946 (Rs.) Value/No. of 2755 1770 1340 2737 1837 1340 2833 1795 1320 2695 1796 1299 2722 1798 1327 goat
Table- 5 B Marketing of Goats by Their Breed (At Door) Through Different Channels July 08 to June 09 (Both Rounds) Marketing Type of Buyers
Items No. Sold to goat keeper for No. Sold to local Butcher for No. Sold to professional traders for No. Sold to local consumers & No. Sold to all buyers for July July 08 to June 09 July 08 to June 09 July 08 to June 09 others for July 08 to June 09 08 to June 09
Male Female Kids Male Female Kids Male Female Kids Male Female Kids Male Female Kids Breed- Deshi 4 51 71 123 49 191 6 18 14 72 211 79 205 329 355 Barbari - - - - - - - - - - - - - - -Jamunapari - - - - - - - - - . - - - - - -Others - - - - - - - - - - - - - - -Total No. 4 51 71 123 49 191 6 18 14 72 211 79 205 329 355 sold Total value 11020 89640 94300 335117 89768.36 255268 16988.7 32280 18435 193977 378725 102571 557102 590413.36 470574 _(Rs.) .7 Value/No. of 2755 1757.64 1328.16 2724.52 1832.00 1336.48 2831.45 1793.33 1316.78 2694.12 1794.90 1298.36 2717.5 1794.56 1325.5 goat 7 6

1\Iarketing of Goats at Door by their Weight
The first round field study revealed (table no. 6 ) that the goat keepers purchased 18
female and 40 kids goats. It is observed from the data that out of 18 female goats purchased
by the goat keepers, 8 female goats are ranging from 5-10 kg weight and 10 female goats are
ranging from 10-15 kg weight. Average price paid by goat keepers is Rs. 1735. Out of 40
kids purchased by goat keepers 19 kids are 5 kg and around weights and remaining are
ranging from 5-10 kg weight and the average price of kid comes around Rs. 1319. The
butchers purchased 59 males, 16 female and 92 kid goats. It is observed from the data that out
of 59 male goats, 37 male goats are ranging from 10-15 kg weight and 22 male goats have
weight more than 15 kg. Average price paid by butchers is Rs.271l.Out of 16 female goats
purchased by the butchers, 7 female goats are ranging from 10-15 kg weight and 9 female
goats have weight more than 15 kg weight. Average price paid by butchers is Rs. 1821.0ut of
92 kids purchased by butchers 92 kids are ranging from 5-l 0 kg and around weights and the
average price of kid comes around Rs. 1332.The professional traders purchased 3 males, 10
female and 9 kids goats. It is observed from the data that out of 3 male goats, 2 male goats are
ranging from 10-15 kg weight and 1 male goat have weight more than 15 kg. Average price
paid by professional traders is Rs.2829.0ut of 10 female goats purchased by the professional
traders, 6 female goats are ranging from 1 0-15 kg weight and 4 female goats have weight
more than 15 kg weight. Average price paid by professional traders is Rs. 1792. Out of 9 kids
purchased by professional traders 3 kids are ranging around 5 kg and around weights and
remaining ate ranging from 5-1 0 kg weight and the average price of kid comes around Rs.
1315.The local consumer purchased-21males, 77 female and 25 kids goats. It is observed
from the data that out of 21 male goats, 15 male goats are ranging from 10-15 kg weight. and
6 male goat have weight more than 15 kg. Average price paid by local consumer is
Rs.2692.0ut of 77 female goats purchased by the local consumer, 61 female goats are
ranging from 10-15 kg weight and 16 female goats have weight more than 15 kg weight.
Average price paid by professional traders is Rs. 1793.0ut of 25 kids purchased by local
consumer 4 kids are ra:nging around 5 kg and around weights and remaining are ranging from
5-10 kg weight. And the average price of kid comes around Rs. 1297. When all types of
buyers combined together, the average price for male goat comes around Rs. 2710, Rs. 1788
for female goats and Rs. 1323 for kids. The second round field study revealed (table no. 6 A)
that the goat keepers purchased 4 male, 33 female and 31 kids goats. It is observed from the
data that out of 4 male, 2 are ranging from 1 0-15 kg weight and 2 male goats have weight
128

more than 15 kg. and the average price per male goat paid by goat keepers comes around Rs.
2755.0ut of 33 female goats purchased by the goat keepers, II female goats are ranging from
5-l 0 kg weight, 13 female goats are ranging from I 0-15 kg weight and 9 female goats have
weight more than 15 kg. Average price paid by goat keepers is Rs.l770. Out of 31 kids
purchased by goat keepers, 6 kids are 5 kg and around weights and remaining are ranging
from 5-l 0 ·kg weight. The average price of kid comes around Rs. 1340. The butchers
purchased 64 males, 33 female and 99 kid goats. It is observed from the data that out of 64
male goats, 30 male goats are ranging from I 0-15 kg weight and 34 male goats have weight
more than 15 kg. Average price paid by butchers is Rs.2737.0ut of 33 female goats
purchased by the butchers, 13 female goats are ranging from I 0-15 kg weight and 20 female
goats have weight more than 15 kg weight. Average price paid by butchers is Rs. 1837.0ut of
99 kids purchased by butchers 12 kids are around 5 kg weight and 87 kids are ranging from
5-10 kg and around weights. The average price of kid comes around Rs. 1340.The
professional traders purchased 3 males, 8 female and 5 kids goats. It is observed from the
data that out of 3 male goats, 1 male goats are ranging from I 0-15 kg weight. and 2 male goat
have weight more than 15 kg. Average price paid by professional traders is Rs.2833.0ut of8
female goats purchased by the professional traders, 6 female goats are ranging from I 0-15 kg
weight and 2 female goats have weight more than 15 kg weight. Average price paid by
professional traders is Rs. 1795.0ut of 5 kids purchased by professional traders 2 kids are
ranging around 3 kg and around weights and remaining are ranging from 5-l 0 kg weight. and
the average price of kid comes around Rs. 1320.The local consumer purchased 51males, 134
female and 54 kids goats. It is observed from the data that out of 51 male goats, 12 male
goats are ranging from 10-15 kg weight and 39 male goat have weight more than 15 kg.
Average price paid by local consumer is Rs.2695.0ut of 134 female goats purchased by the
local consumer, 70 female goats are ranging from 10-15 kg weight and 64 female goats have
weight more than 15 kg weight. Average price paid by professional traders is Rs. 1796.0ut of
54 kids purchased by local consumers 24. kids are ranging around 5 kg and around weights
and remaining are ranging from 5-l 0 kg weight. And the average price of kid comes around
Rs. 1299. When all types of buyers combined together, the average price for male goat comes
around Rs. 2722, Rs. 1798 for female goats and Rs. 1327 for kids.
The both rounds field study revealed (table no. 6 B) that the goat keepers purchased 4
male, 51 female and 71 kids goats. It is observed from the data that. out of 4 male, 2 are
ranging from 10-15 kg weight and 2 male goats have weight more than 15 kg. and the
average price per male goat paid by goat keepers comes around Rs. 2755.0ut of 51 female
129
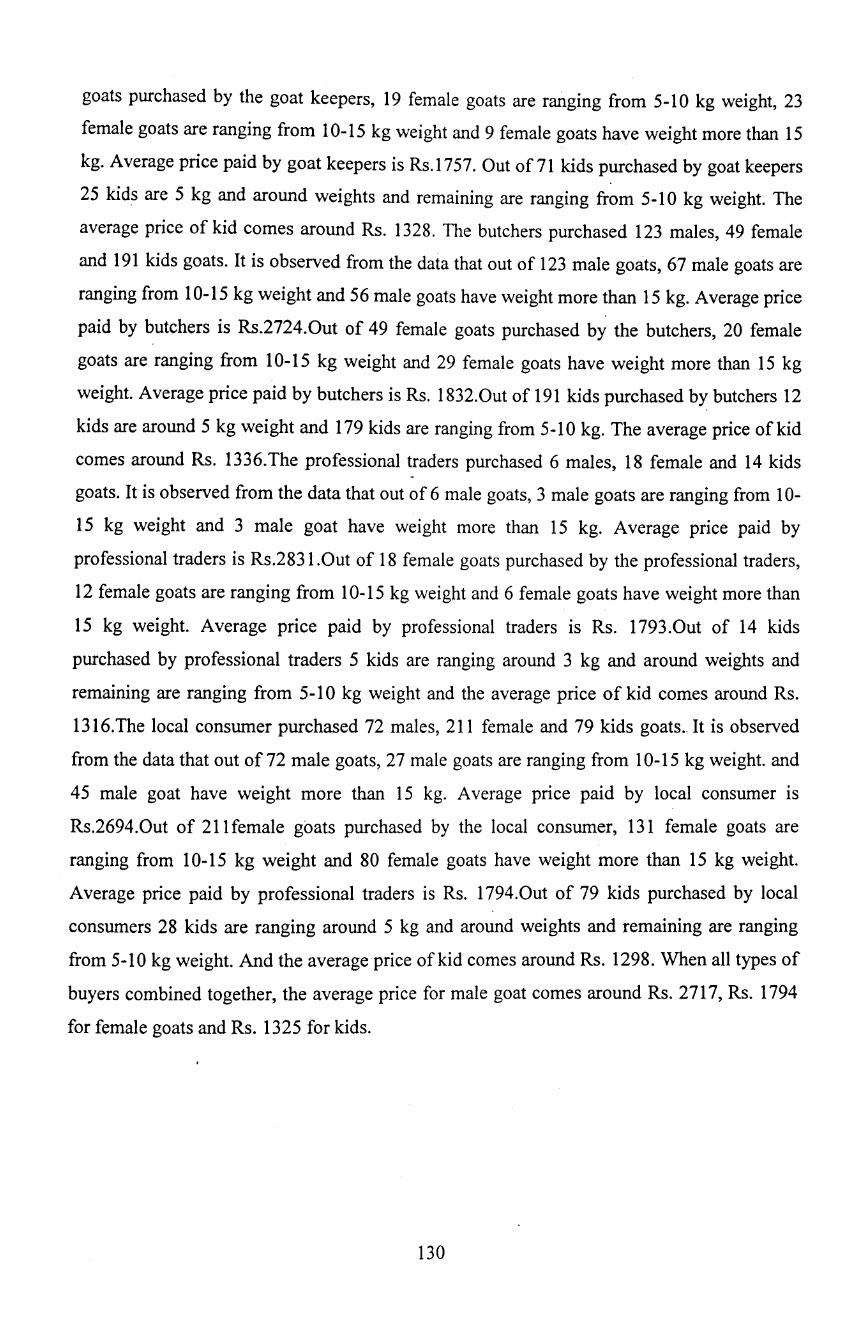
goats purchased by the goat keepers, 19 female goats are ranging from 5-10 kg weight, 23
female goats are ranging from 1 0-15 kg weight and 9 female goats have weight more than 15
kg. Average price paid by goat keepers is Rs.l757. Out of71 kids purchased by goat keepers
25 kids are 5 kg and around weights and remaining are ranging from 5-10 kg weight. The
average price of kid comes around Rs. 1328. The butchers purchased 123 males, 49 female
and 191 kids goats. It is observed from the data that out of 123 male goats, 67 male goats are
ranging from 10-15 kg weight and 56 male goats have weight more than 15 kg. Average price
paid by butchers is Rs.2724.0ut of 49 female goats purchased by the butchers, 20 female
goats are ranging from 10-15 kg weight and 29 female goats have weight more than 15 kg
weight. Average price paid by butchers is Rs. 1832.0ut of 191 kids purchased by butchers 12
kids are around 5 kg weight and 179 kids are ranging from 5-10 kg. The average price of kid
comes around Rs. 1336.The professional traders purchased 6 males, 18 female and 14 kids
goats. It is observed from the data that out of 6 male goats, 3 male goats are ranging from 10-
15 kg weight and 3 male goat have weight more than 15 kg. Average price paid by
professional traders is Rs.2831.0ut of 18 female goats purchased by the professional traders,
12 female goats are ranging from 10-15 kg weight and 6 female goats have weight more than
15 kg weight. Average price paid by professional traders is Rs. 1793.0ut of 14 kids
purchased by professional traders 5 kids are ranging around 3 kg and around weights and
remaining are ranging from 5-10 kg weight and the average price of kid comes around Rs.
1316.The local consumer purchased 72 males, 211 female and 79 kids goats. It is observed
from the data that out of 72 male goats, 27 male goats are ranging from 10-15 kg weight. and
45 male goat have weight more than 15 kg. Average price paid by local consumer is
Rs.2694.0ut of 211 female goats purchased by the local consumer, 131 female goats are
ranging from 10-15 kg weight and 80 female goats have weight more than 15 kg weight.
Average price paid by professional traders is Rs. 1794.0ut of 79 kids purchased by local
consumers 28 kids are ranging around 5 kg and around weights and remaining are ranging
from 5-10 kg weight. And the average price of kid comes around Rs. 1298. When all types of
buyers combined together, the average price for male goat comes around Rs. 2717, Rs. 1794
for female goats and Rs. 1325 for kids.
130
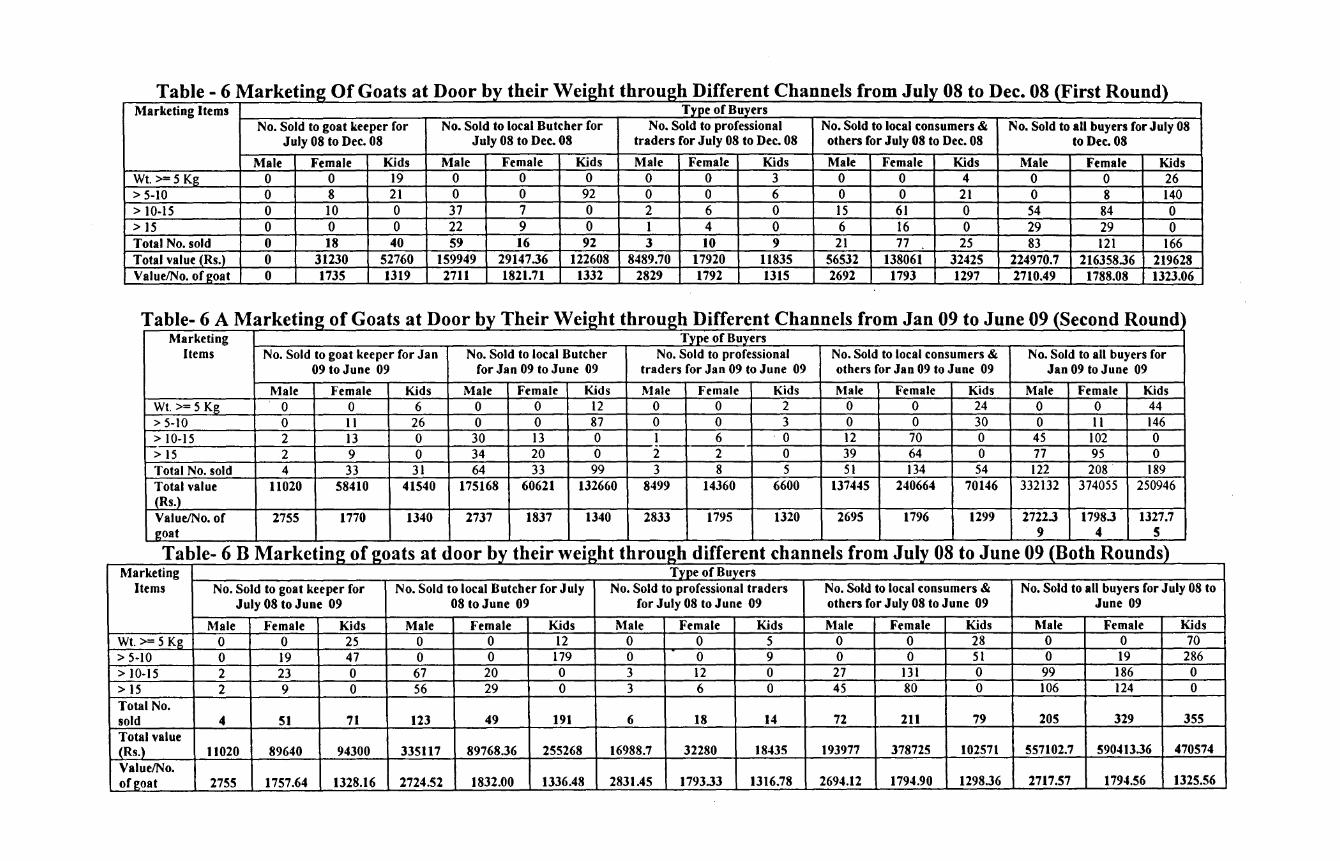
Table- 6 Marketing_ Of Goats at Door by their Weight through Different Channels from July 08 to Dec. 08 _(First Round) Marketing Items Type of Buyers
No. Sold to goat keeper for No. Sold to local Butcher for No. Sold to professional No. Sold to local consumers & No. Sold to all buyers for July 08 July 08 to Dec. 08 July 08 to Dec. 08 traders for July 08 to Dec. 08 others for July 08 to Dec. 08 to Dec. 08
Male Female Kids Male Female Kids Male Female Kids Male Female Kids Male Female Kids Wt. >= 5 Kg 0 0 19 0 0 0 0 0 3 0 0 4 0 0 26 > 5-10 0 8 21 0 0 92 0 0 6 0 0 21 0 8 140 > I 0-15 0 10 0 37 7 0 2 6 0 15 61 0 54 84 0 > 15 0 0 0 22 9 0 1 4 0 6 16 0 29 29 0 Total No. sold 0 18 40 59 16 92 3 10 9 21 77 25 83 121 166 Total value (Rs.) 0 31230 52760 159949 29147.36 122608 8489.70 17920 11835 56532 138061 32425 224970.7 216358.36 219628 Value/No. of goat 0 1735 1319 2711 1821.71 1332 2829 1792 1315 2692 1793 1297 2710.49 1788.08 1323.06
Table- 6 A Marketing of Goats at Door by Their Weight through Different Channels from Jan 09 to June 09 (Second Round Marketing Type of Buyers
Items No. Sold to goat keeper for Jan No. Sold to local Butcher No. Sold to professional No. Sold to local consumers & No. Sold to all buyers for 09 to June 09 for Jan 09 to June 09 traders for Jan 09 to June 09 others for Jan 09 to June 09 Jan 09 to June 09
Male Female Kids Male Female Kids Male Female Kids Male Female Kids Male Female Kids Wt. >= 5 Kg 0 0 6 0 0 12 0 0 2 0 0 24 0 0 44 > 5-10 0 II 26 0 0 87 0 0 3 0 0 30 0 II 146 > 10-15 2 13 0 30 13 0 I 6 . 0 12 70 0 45 102 0
-> 15 2 9 0 34 20 0 2 2 0 39 64 0 77 95 0 Total No. sold 4 33 31 64 33 99 3 8 5 51 134 54 122 208 189 Total value 11020 58410 41540 175168 60621 132660 8499 14360 6600 137445 240664 70146 332132 374055 250946 (Rs.) Value/No. of 2755 1770 1340 2737 1837 1340 2833 1795 1320 2695 1796 1299 2722.3 1798.3 1327.7 20at 9 4 5
Table- 6 B Marketing of goats at door by their weight through different channels from July 08 to June 09 (Both Rounds) Marketing Type of Buyers
Items No. Sold to goat keeper for No. Sold to local Butcher for July No. Sold to professional traders No. Sold to local consumers & No. Sold to all buyers for July 08 to July 08 to June 09 08 to June 09 for July 08 to June 09 others for July 08 to June 09 June 09
Male Female Kids Male Female Kids Male Female Kids Male Female Kids Male Female Kids Wt. >= 5 Kg 0 0 25 0 0 12 0 0 5 0 0 28 0 0 70 > 5-10 0 19 47 0 0 179 0 0 9 0 0 51 0 19 286 > 10-15 2 23 0 67 20 0 3 12 0 27 131 0 99 186 0 > 15 2 9 0 56 29 0 3 6 0 45 80 0 106 124 0 Total No. sold 4 51 71 123 49 191 6 18 14 72 211 79 205 329 355 Total value
1Rs.) 11020 89640 94300 335117 89768.36 255268 16988.7 32280 18435 193977 378725 102571 557102.7 590413.36 470574 Value/No. of goat 2755 1757.64 1328.16 2724.52 1832.00 1336.48 2831.45 1793.33 1316.78 2694.12 1794.90 1298.36 2717.57 1794.56 1325.56
Marketing Of Goats at Door by Sex and Type of Buyers
The field study revealed that 889 goats are sold in both district. The details of
marketing of goats are given in the following table no. 7. Out of 889 goats sold, 470 goat sold
in Yavatmal district and 419 goat sold in Ahemadm;1gar district. In Y avatmal district, out of
4 70 goats, goat keepers purchased 2 male goats, 19 female goats and 41 kids. Butchers
purchased 77 male goats, 27 female goats and 88 kids. Traders purchased 2 male goats, 9
female goats and 6 kids. Local consumers purchased 41 male, 127 females and 31 kids. Out
of total sell of goats, total males are 122, 182 are females and 166 are kids. The average price
paid by. all for a male goat is Rs. 2686. The average price is paid Rs.1748 for a female goat,
and the average price paid for a kids is Rs.1285. In Ahemadnagar district, out of 419 goats,
goat keepers purchased 2 male goats, 32 female goats and 30 kids. Butchers purchased 46
male goats, 22 female goats and 103 kids. Traders purchased 4 male goats, 9 female goats
and 8 kids. Local consumers purchased 31 male, 84 females and 48 kids. Out of total sell of
goats, total males are 83, 14 7 are females and 189 are kids. The average price paid by all for
a male goat is Rs. 2763. The average price is paid Rs.1851 for a female goat, and the average
price paid for a kids is Rs.1360. The average price for all purchased and both the districts is
recorded Rs.1820 per goat in the state.
Villages- Wise Marketing by the Flocks Size
It has been noticed that out of total sold under 1-5 flock size in Yavatmal district, 39
goats were sold in near market and 22 in off market. Under 6-15 flock size out of total sold,
64 goats were sold in near market and 32 were sold in off market. In 16-30 flock size, 123
goats were sold in near market and 101 were sold in off market. Under the flock size of above
30 goats, out of total sold, 181 goats were sold in near market and 122 were sold in off
market. Out of total sold in all markets, 407 goats are reported to sell in near market and 267
goats are sold in off market in Yavatmal district. Also, it has been noticed that out of total
sold under 1-5 flock size in Ahemadnagar district, 35 goats were sold in near market and 28
in off market. Under 6-15 flock size out of total sold, 59 goats were sold in near market and
39 were sold in off market. In 16-30 flock size, 188 goats were sold in near market and 124
were sold in off market. Under the flock size of above 30 goats, out of total sold, 197 goats
were sold in near market and 126 were sold in off market. Out of total sold in all markets,
4 79 goats are reported to sell in near market and 317 goats are sold in off market in Yavatmal
district. Out of total goat sold, 886 goats were sold in near market and 584 goats were sold in
off market. (See table no. 8)
132
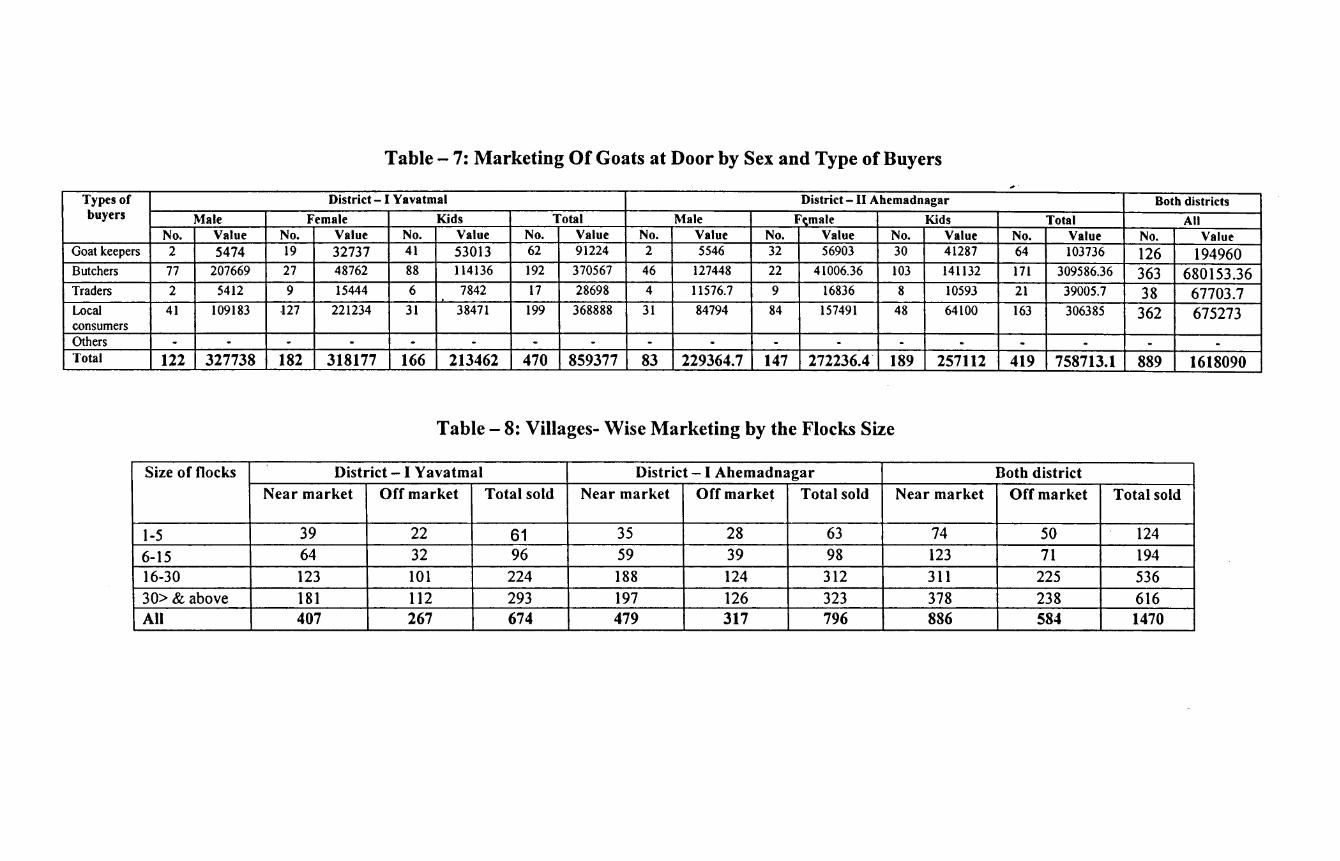
Table- 7: Marketing Of Goats at Door by Sex and Type of Buyers
Types of District- I Yavatmal District- II Ahemadnagar Both districts buyers Male Female )(jds Total Male F~male )(jds Total All
No. Value No. Value No. Value No. Value No. Value No. Value No. Value No. Value No. Value Goat keepers 2 5474 19 32737 41 53013 62 91224 2 5546 32 56903 30 41287 64 103736 126 194960 Butchers 77 207669 27 48762 88 114136 192 370567 46 127448 22 41006.36 103 141132 171 309586.36 363 680153.36 Traders 2 5412 9 15444 6 7842 17 28698 4 11576.7 9 16836 8 10593 21 39005.7 38 67703.7 Local 41 109183 -127 221234 31 38471 199 368888 31 84794 84 157491 48 64100 163 306385 362 675273 consumers Others - - - - - - - - - - - - - - - - - -Total 122 327738 182 318177 166 213462 470 859377 83 229364.7 147 272236.4" 189 257112 419 758713.1 889 1618090
Table- 8: Villages- Wise Marketing by the Flocks Size
Size of flocks District- I Yavatmal District- I Ahemadnagar Both district Near market Off market Total sold Near market Off market Total sold Near market Off market Total sold
1-5 39 22 61 35 28 63 74 50 124 6-15 64 32 96 59 39 98 123 71 194 16-30 123 101 224 188 124 312 311 225 536 30> & above 181 112 293 197 126 323 378 238 616 All 407 267 674 479 317 796 886 584 1470
Marketing of Goats at Door by Type of Buyers It has been noticed that out of total sold under category of goat keeper in Yavatmal
district, 57 goats were sold in near market with valueRs. 92737 and 18 goats in off market
with valueRs. 29664. Under category of butcher out of total sold, 177 goats were sold in near
market with value Rs. 298599 and 29 goats were sold in off market with value Rs. 48459.
Under the ~ate gory of professional traders, 15 goats were sold in near market with value Rs.
25065 and 97 goats were sold in off market with value Rs. 162087. Under category of the
local consumers, out of total sold, 158 goats were sold in near market with value Rs. 270496
and 123 goats were s~ld in off market with valueRs. 210084. Out of total sold in all markets,
407 goats are reported to sell in near market with value Rs. 686897 and 267 goats are sold in
off market with value Rs. 450294 in Yavatmal district. Also, it has been noticed that out of
total sold under category of goat keeper in Ahemadnagar district, 54 goats were sold in near
market with value Rs. 89316 and 23 goats in off market with value Rs. 38019. Under
category of butcher out of total sold, 227 goats were sold in near market with value Rs.
380679 and 156 goats were sold in off market. with valueRs. 259427. Under the category of
professional traders, 39 goats were sold in near market with value Rs. 65052 and 31 goats
were sold in off market with valueRs. 52101. Under category of the local consumers, out of
total sold, 159 goats were sold in near market with value Rs. 273003 and 107 goats were sold
in off market with value Rs. 185512. Out of total sold in two markets, in the district, 479
goats are reported to sell in near market with value Rs. 808050 and 317 goats are sold in off
market with value Rs. 535059. Out of total sold in all markets, 674 goats are reported to sell
in near market with valueRs. 1137191 and 796 goats are sold in off market with valueRs.
1343109 in Ahemadnagar district. (See table no. 9 )
134

Table- 9: Marketing Of Goats at Door By Type Of Buyers
Types of Buyers District- I Yavatmal District- II Ahemadnagar Both districts Near market Off market Total sold Near market Off market Total sold Total sold
No. Value No. Value No. Value No. Value No. Value No. Value No. Value Goat keepers 57 92737 18 29664 75 122401 54 89316 23 38019 77 127335 152 249736 Butchers 177 298599 29 48459 206 347058 227 380679 156 259427 383 640106 589 987164 Professional traders 15 25065 97 162087 112 187152 39 65052 31 52101 70 117153 182 304305 Local consumers 158 270496 123 210084 281 480580 159 273003 107 185512 266 458515 547 939095.07 Others - - - - - - - - - - - - - -All 407 686897 267 450294 674 1137191 479 808050 317 535059 796 1343109 1470 2480300
Off Marketing of Goats by their Breeds
In first round survey, report revealed that only .deshi breeds are found at the sample
goat fanns in both districts of the state. It is revealed by the survey data that total 352 goats
have been sold in the off market. The details of the male, female and kids, those have been
sold in off the market are given in the following table no. 10. It is interesting to note that off
the market, the average value of a goat comes around Rs. 1692.1n off the market, the average
value for the go,at keepers and for male goat comes around Rs. 2415, for female, it comes
around Rs. 1918, and for kid it comes around Rs. 987. The average value for the butchers and
for male goat comes around Rs. 2352, for female it comes around Rs. 1870, and for kid it
comes around Rs. 836.The average value for the professional traders and for male goat comes
around Rs. 2109, for female, it comes around Rs. 1971, and for kid it comes around Rs.
866.The average value for the local consumers and for male goat comes around Rs. 2235, for
female it comes around Rs. 1943, and for kid it comes around Rs. 973. In addition to this,
there are various cost that incurred by the sellers that include marketing cost, loading
unloading cost, transport cost, family labours and others cost. After deducting all the cost
(See the table no. 1 0). The net return per goats for the different types of buyers and for the
male, female and kid wise are calculated. As per the calculations, the average per goat net
return for goat keepers and for male, female and kid wise are Rs. 2378, Rs. 1884, and Rs. 953
respectively. The average per goat net return for butcher and for male, female, and kid wise
are Rs. 2313, Rs. 1834, and Rs. 805 respectively. The average per goat net return for
professional trader and for male, female, and kid wise are Rs. 2070, Rs. 1935, and Rs. 837
respectively. The average per goat net return for local consumer and for male, female, and kid
wise are Rs. 2199, Rs. 1908, and Rs. 940 respectively. In second round survey, report
revealed that only deshi breeds are found at the sample goat fanns in both districts of the
state. It is revealed by the survey data that total 232 goats have been sold in the off market.
The details of the male, female and kids, those have been sold in off the market are given in
the following table no. 10 A. It is interesting to note that off the market, the average value of
a goat comes around Rs. 1739.In off the market, the average value for the goat keepers and
for male goat comes around Rs. 2624, for female, it comes around Rs. 2044, and for kid it
comes around Rs. 959. The average value for the butchers and for male goat comes around
Rs. 2407, for female it comes around Rs. 1829, and for kid it comes around Rs. 925.The
average value for the professional traders and for male goat comes around Rs. 2122, for
female, it comes around Rs. 1982, and for kid it comes around Rs. 965. The average value for
136

the local consumers and for male goat comes around Rs. 2150, for female it comes around
Rs. 1972, and for kid it comes around Rs. 902. In addition to this, there are various cost that
incurred by the sellers that include marketing cost, loading unloading cost, transport cost,
family labours and others cost. After deducting all the cost (See the table no. I 0 A ) The net
return per goats for the different types of buyers and for the male, female and kid wise are
calculated. As per the calculations, the average per goat net return for goat keepers and for . male, female and kid wise are Rs. 2586, Rs. 2008, and Rs. 929 respectively. The average per
goat net return for butcher and for male, female, and kid wise are Rs. 2371, Rs. 1795, and Rs.
894 respectively. The average per goat net return for professional trader and for male, female,
and kid wise are Rs. 2088, Rs. 1949, and Rs. 934 respectively. The average per goat net
return for local consumer and for male, female, and kid wise are Rs. 2115, Rs. 1939, and Rs.
871 respectively. In both rounds survey, report revealed that only deshi breeds are found at
the sample goat farms in both districts of the state. It is revealed by the survey data that total
584 goats have been sold in the off market. The details of the male, female and kids, those
have been sold in off the market are given in the following table no. 10 B. It is interesting to
note that off the market, the average value of a goat comes around Rs. 17ll.In off the market,
the average value for the goat keepers and for male goat comes around Rs. 2467, for female,
it comes around Rs. 1961, and for kid it comes around Rs. 973. The average value for the
butchers and for male goat comes around Rs. 2379, for female it comes around Rs. 1853, and
for kid it comes around Rs. 859.The average value for the professional traders and for male
goat comes around Rs. 2114, for female, it comes around Rs. 1976, and for kid it comes
around Rs. 90l.The average value for the local consumers and for male goat comes around
Rs. 2189, for female it comes around Rs. 1957, and for kid it comes around Rs. 942. In
addition to this, there are various cost that incurred by the sellers that include marketing cost,
loading unloading cost, transport cost, family labours and others cost. After deducting all the
cost (See the table no. 10 B) The net r~turn per goats for the different types of buyers and for
the male, female and kid wise are calculated. As per the calculations, the average per goat net
return for goat keepers and for male, female and kid wise are Rs. 2430, Rs. 1927, and Rs. 941
respectively. The average per goat net return for butcher and for male, female, and kid wise
are Rs. 2342, Rs. 1818, and Rs. 828 respectively. The average per goat net return for
professional trader and for male, female, and kid wise are Rs. 2077, Rs. 1941, and Rs. 872
respectively. The average per goat net return for local consumer and for male, female, and kid
wise are Rs. 2154, R~. 1923, and Rs. 910 respectively.
137
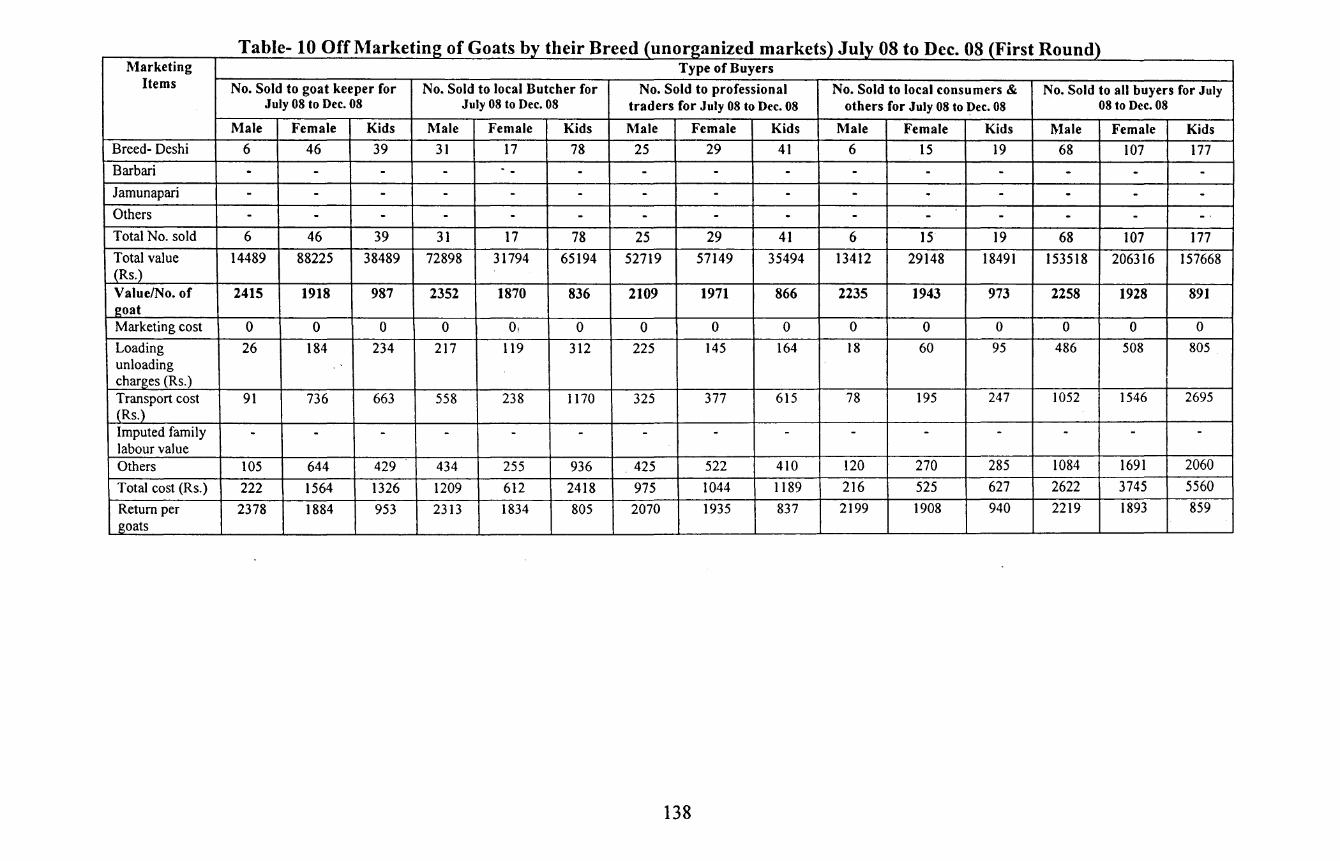
Table- 10 Off Marketing of Goats by their Breed (unorganized markets) July 08 to Dec. 08 (First Round) Marketing Type of Buyers
Items No. Sold to goat keeper for No. Sold to local Butcher for No. Sold to professional No. Sold to local consumers & No. Sold to all buyers for July July 08 to Dec. 08 July 08 to Dec. 08 traders for July 08 to Dec. 08 others for July 08 to Dec. 08 08 to Dec. 08
Male Female Kids Male Female Kids Male Female Kids Male Female Kids Male Female Kids
Breed- Deshi 6 46 39 31 17 78 25 29 41 6 15 19 68 107 177 Barbari - - - - -- - - - - - - - - - -Jamunapari - - - - - - - - - - - - - - -Others - - - - - - - - - - - - - - - .
Total No. sold 6 46 39 31 17 78 25 29 41 6 15 19 68 107 177 Total value 14489 88225 38489 72898 31794 65194 52719 57149 35494 13412 29148 18491 153518 206316 157668 (Rs.) Value/No. of 2415 1918 987 2352 1870 836 2109 1971 866 2235 1943 973 2258 1928 891 goat Marketing cost 0 0 0 0 o, 0 0 0 0 0 0 0 0 0 0 Loading 26 184 234 217 119 312 225 145 164 18 60 95 486 508 805 unloading charges (Rs.) Transport cost 91 736 663 558 238 1170 325 377 615 78 195 247 1052 1546 2695 (Rs.) Imputed family - - - - - - - - - - - - - - -labour value Others 105 644 429 434 255 936 425 522 410 120 270 285 1084 1691 2060
Total cost (Rs.) 222 1564 1326 1209 612 2418 975 1044 1189 216 525 627 2622 3745 5560
Return per 2378 1884 953 2313 1834 805 2070 1935 837 2199 1908 940 2219 1893 859 goats
138
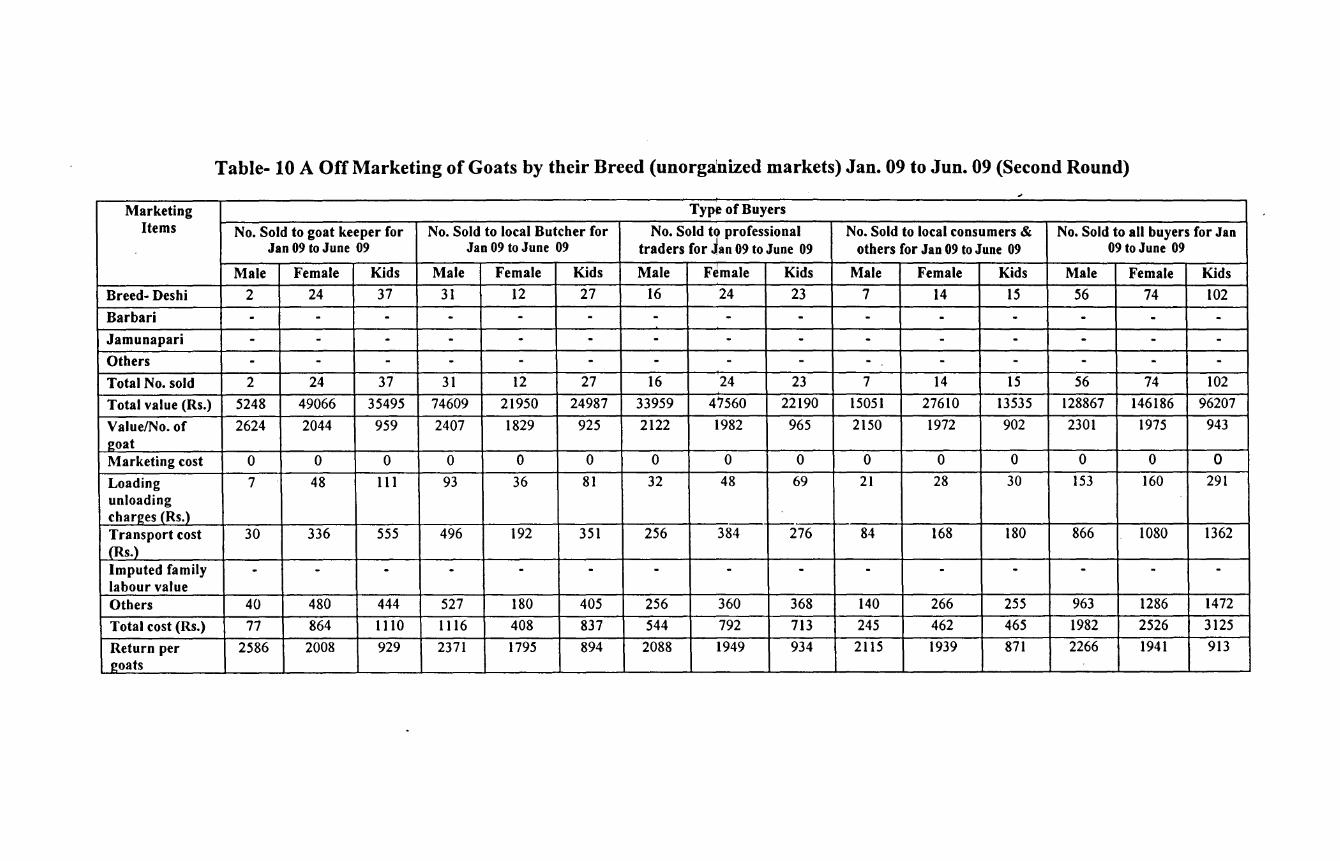
Table- 10 A Off Marketing of Goats by their Breed (unorganized markets) Jan. 09 to Jun. 09 (Second Round)
Marketing Type of Buyers Items No. Sold to goat keeper for No. Sold to local Butcher for No. Sold l professional No. Sold to local consumers & No. Sold to all buyers for Jan
Jan 09 to June 09 Jan 09 to June 09 traders for an 09 to June 09 others for Jan 09 to June 09 09 to June 09
Male Female Kids Male Female Kids Male Female Kids Male Female Kids Male Female Kids
Breed- Deshi 2 24 37 31 12 27 16 24 23 7 14 15 56 74 102
Barbari - - - - - - - - - - - - - - -Jamunapari - - - - - - - - - - - - - - -Others - - - - - - - - - - - - - - -Total No. sold 2 24 37 31 12 27 16 24 23 7 14 15 56 74 102
Total value (Rs.) 5248 49066 35495 74609 21950 24987 33959 47560 22190 15051 27610 13535 128867 146186 96207
Value/No. of 2624 2044 959 2407 1829 925 2122 1982 965 2150 1972 902 2301 1975 943 eo at Marketing cost 0 0 0 0 0 0 0 0 0 0 0 0 0 0 0
Loading 7 48 111 93 36 81 32 48 69 21 28 30 153 160 291 unloading charges {Rs.)
276 Transport cost 30 336 555 496 192 351 256 384 84 168 180 866 1080 1362 (Rs.) Imputed family - - - - - - - - - - - - - - -labour value Others 40 480 444 527 180 405 256 360 368 140 266 255 963 1286 1472
Total cost (Rs.) 77 864 1110 1116 408 837 544 792 713 245 462 465 1982 2526 3125
Return per 2586 2008 929 2371 1795 894 2088 1949 934 2115 1939 871 2266 1941 913 goats
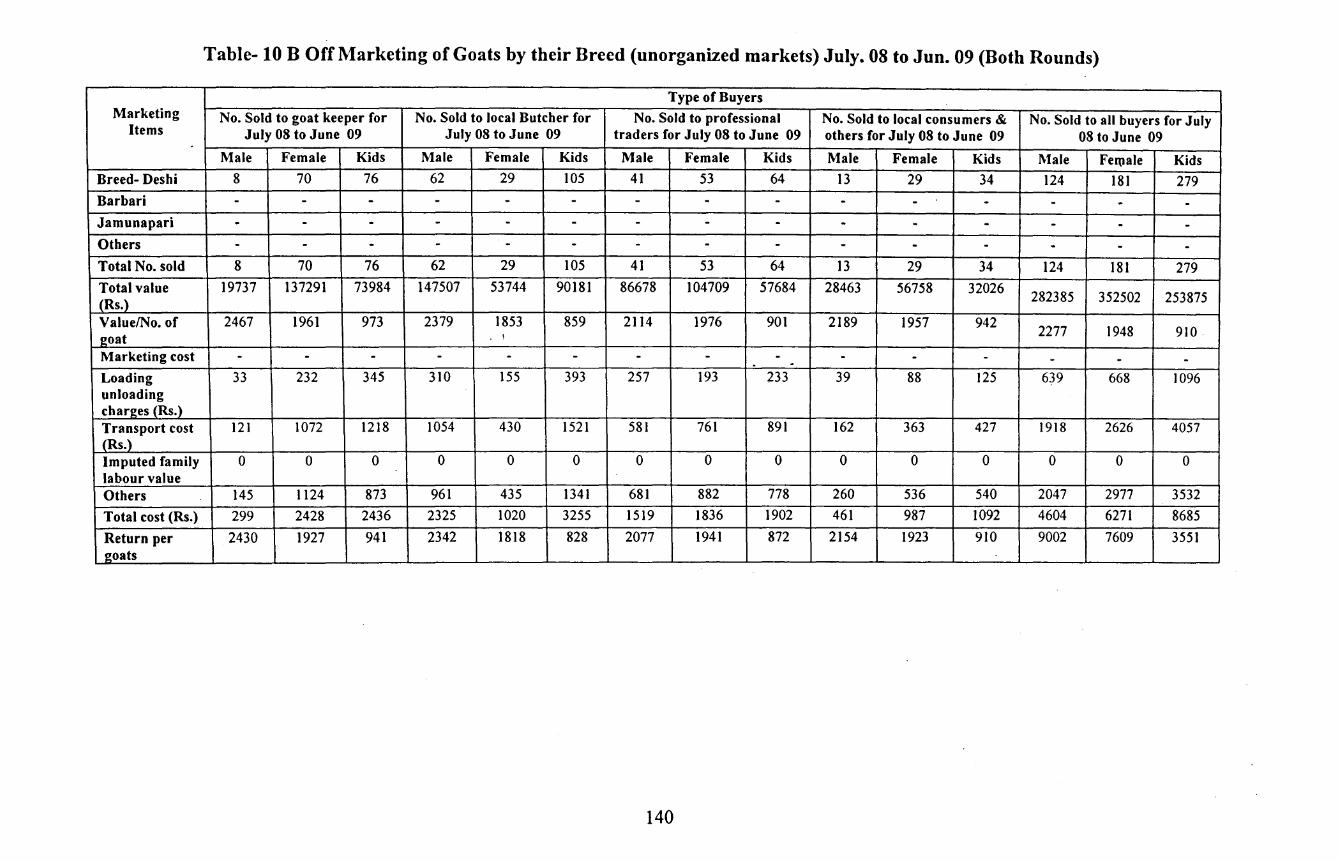
Table- 10 B Off Marketing of Goats by their Breed (unorganized markets) July. 08 to Jun. 09 (Both Rounds)
Type of Buyers Marketing No. Sold to goat keeper for No. Sold to local Butcher for No. Sold to professional No. Sold to local consumers & No. Sold to all buyers for July
Items July 08 to June 09 July 08 to June 09 traders for July 08 to June 09 others for July 08 to June 09 08 to June 09 -Male Female Kids Male Female Kids Male Female Kids Male Female Kids Male Fel\lale Kids
Breed- Deshi 8 70 76 62 29 105 41 53 64 13 29 34 124 181 279 Barbari - - - - - - - - - - - - - - -Jam una pari - - - - - - - - - - - - - - -Others - - - - - - - - - - - - - - -Total No. sold 8 70 76 62 29 105 41 53 64 13 29 34 124 181 279 Total value 19737 137291 73984 147507 53744 90181 86678 104709 57684 28463 56758 32026 282385 352502 253875 (Rs.) Value/No. of 2467 1961 973 2379 1853 859 2114 1976 901 2189 1957 942 2277 1948 910 20at . I
Marketing cost - - - - - - - - - - - - - - -. . Loading 33 232 345 310 155 393 257 193 233 39 88 125 639 668 1096 unloading charges (Rs.) Transport cost 121 1072 1218 1054 430 1521 581 761 891 162 363 427 1918 2626 4057 (Rs.) Imputed family 0 0 0 0 0 0 0 0 0 0 0 0 0 0 0 labour value Others 145 1124 873 961 435 1341 681 882 778 260 536 540 2047 2977 3532 Total cost (Rs.) 299 2428 2436 2325 1020 3255 1519 1836 1902 461 987 1092 4604 6271 8685
Return per 2430 1927 941 2342 1818 828 2077 1941 872 2154 1923 910 9002 7609 3551 20ats
140
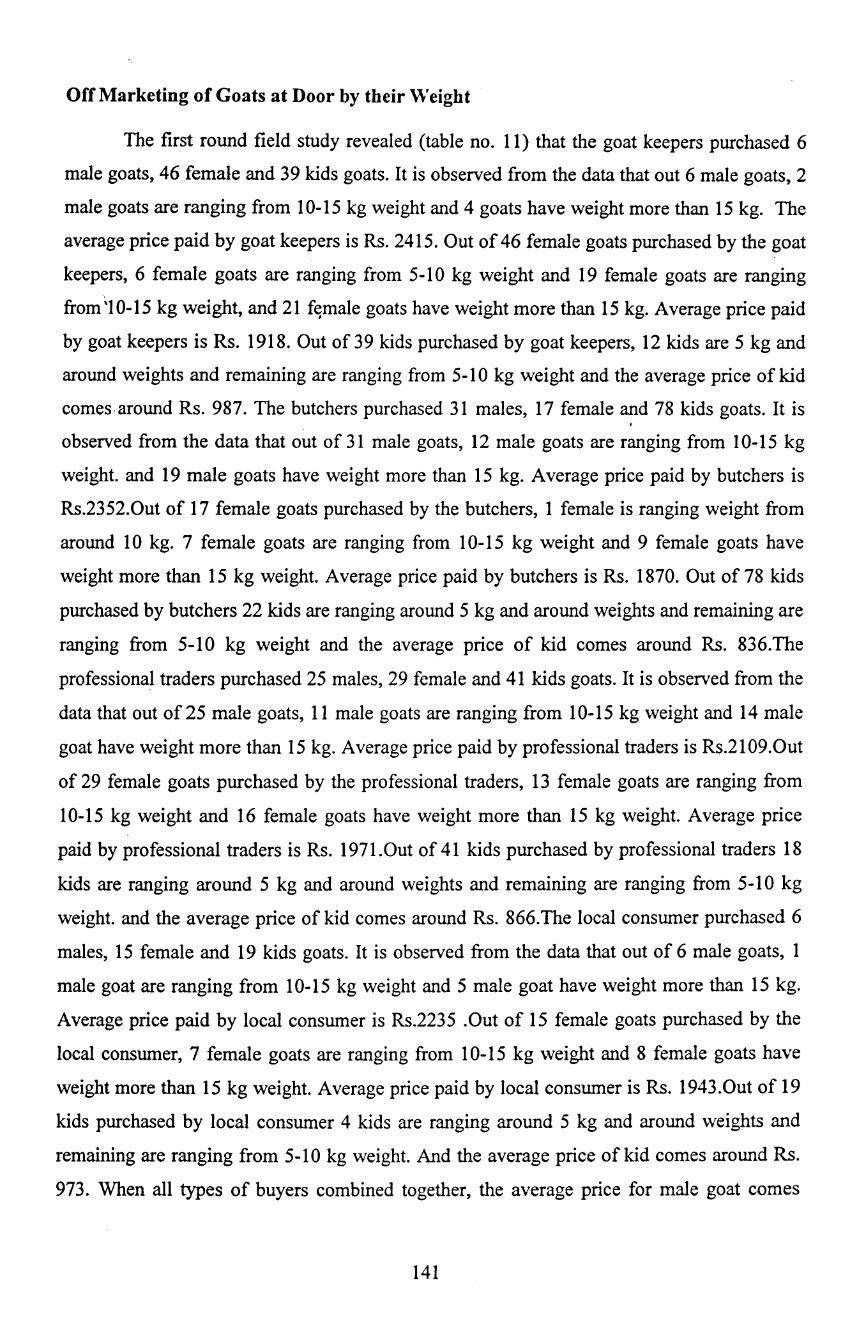
Off Marketing of Goats at Door by their \Veight
The first round field study revealed (table no. 11) that the goat keepers purchased 6
male goats, 46 female and 39 kids goats. It is observed from the data that out 6 male goats, 2
male goats are ranging from 10-15 kg weight and 4 goats have weight more than 15 kg. The
average price paid by goat keepers is Rs. 2415. Out of 46 female goats purchased by the goat
keepers, 6 female goats are ranging from 5-l 0 kg weight and 19 female goats are ranging
from 'I 0-15 kg weight, and 21 f~male goats have weight more than 15 kg. Average price paid
by goat keepers is Rs. 1918. Out of 39 kids purchased by goat keepers, 12 kids are 5 kg and
around weights and remaining are ranging from 5-l 0 kg weight and the average price of kid
comes around Rs. 987. The butchers purchased 31 males, 17 female and 78 kids goats. It is . observed from the data that out of 31 male goats, 12 male goats are ranging from 10-15 kg
weight. and 19 male goats have weight more than 15 kg. Average price paid by butchers is
Rs.2352.0ut of 17 female goats purchased by the butchers, 1 female is ranging weight from
around 10 kg. 7 female goats are ranging from 10-15 kg weight and 9 female goats have
weight more than 15 kg weight. Average price paid by butchers is Rs. 1870. Out of 78 kids
purchased by butchers 22 kids are ranging around 5 kg and around weights and remaining are
ranging from 5-10 kg weight and the average price of kid comes around Rs. 836.The
professional traders purchased 25 males, 29 female and 41 kids goats. It is observed from the
data that out of 25 male goats, 11 male goats are ranging from 10-15 kg weight and 14 male
goat have weight more than 15 kg. Average price paid by professional traders is Rs.2109.0ut
of 29 female goats purchased by the professional traders, 13 female goats are ranging from
10-15 kg weight and 16 female goats have weight more than 15 kg weight. Average price
paid by professional traders is Rs. 1971. Out of 41 kids purchased by professional traders 18
kids are ranging around 5 kg and around weights and remaining are ranging from 5-10 kg
weight. and the average price of kid comes around Rs. 866.The local consumer purchased 6
males, 15 female and 19 kids goats. It is observed from the data that out of 6 male goats, 1
male goat are ranging from 10-15 kg weight and 5 male goat have weight more than 15 kg.
Average price paid by local consumer is Rs.2235 .Out of 15 female goats purchased by the
local consumer, 7 female goats are ranging from 1 0-15 kg weight and 8 female goats have
weight more than 15 kg weight. Average price paid by local consumer is Rs. 1943.0ut of 19
kids purchased by local consumer 4 kids are ranging around 5 kg and around weights and
remaining are ranging from 5-10 kg weight. And the average price of kid comes around Rs.
973. When all types of buyers combined together, the average price for male goat comes
141
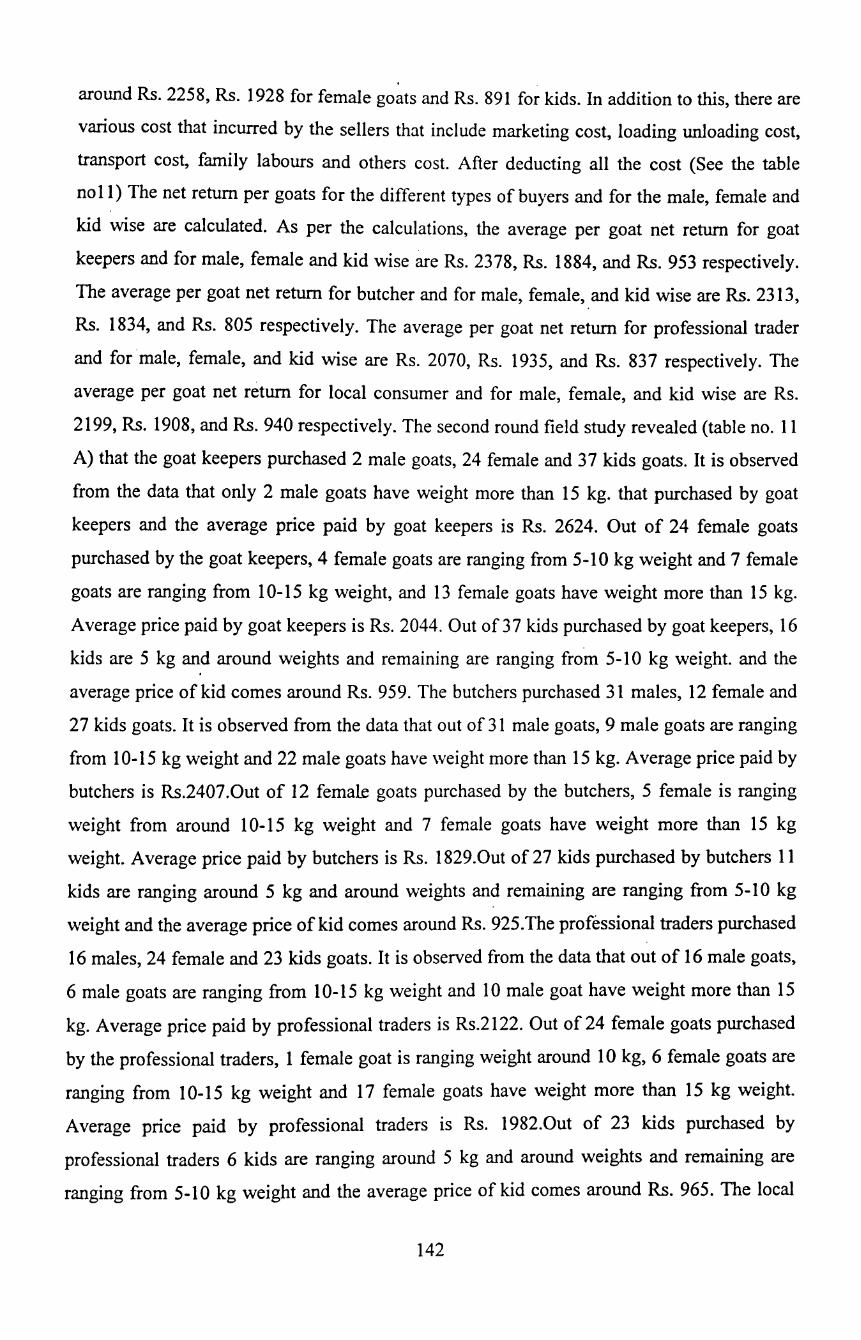
around Rs. 2258, Rs. 1928 for female goats and Rs. 891 for kids. In addition to this, there are
various cost that incurred by the sellers that include marketing cost, loading unloading cost,
transport cost, family labours and others cost. After deducting all the cost (See the table
no 11) The net return per goats for the different types of buyers and for the male, female and
kid wise are calculated. As per the calculations, the average per goat net return for goat
keepers and for male, female and kid wise are Rs. 2378, Rs. 1884, and Rs. 953 respectively.
The average per goat net return for butcher and for male, female, and kid wise are Rs. 2313,
Rs. 1834, and Rs. 805 respectively. The average per goat net return for professional trader
and for male, female, and kid wise are Rs. 2070, Rs. 1935, and Rs. 837 respectively. The
average per goat net return for local consumer and for male, female, and kid wise are Rs.
2199, Rs. 1908, and Rs. 940 respectively. The second round field study revealed (table no. 11
A) that the goat keepers purchased 2 male goats, 24 female and 37 kids goats. It is observed
from the data that only 2 male goats have weight more than 15 kg. that purchased by goat
keepers and the average price paid by goat keepers is Rs. 2624. Out of 24 female goats
purchased by the goat keepers, 4 female goats are ranging from 5-10 kg weight and 7 female
goats are ranging from 10-15 kg weight, and 13 female goats have weight more than 15 kg.
Average price paid by goat keepers is Rs. 2044. Out of 3 7 kids purchased by goat keepers, 16
kids are 5 kg and around weights and remaining are ranging from 5-10 kg weight. and the
average price of kid comes around Rs. 959. The butchers purchased 31 males, 12 female and
27 kids goats. It is observed from the data that out of 31 male goats, 9 male goats are ranging
from 10-15 kg weight and 22 male goats have weight more than 15 kg. Average price paid by
butchers is Rs.2407 .Out of 12 female goats purchased by the butchers, 5 female is ranging
weight from around 10-15 kg weight and 7 female goats have weight more than 15 kg
weight. Average price paid by butchers is Rs. 1829.0ut of27 kids purchased by butchers 11
kids are ranging around 5 kg and around weights and remaining are ranging from 5-10 kg
weight and the average price of kid comes around Rs. 925.The professional traders purchased
16 males, 24 female and 23 kids goats. It is observed from the data that out of 16 male goats,
6 male goats are ranging from 10-15 kg weight and I 0 male goat have weight more than 15
kg. Average price paid by professional traders is Rs.2122. Out of 24 female goats purchased
by the professional traders, 1 female goat is ranging weight around 10 kg, 6 female goats are
ranging from 10-15 kg weight and 17 female goats have weight more than 15 kg weight.
Average price paid by professional traders is Rs. 1982.0ut of 23 kids purchased by
professional traders 6 kids are ranging around 5 kg and around weights and remaining are
ranging from 5-10 kg weight and the average price of kid comes around Rs. 965. The local
142
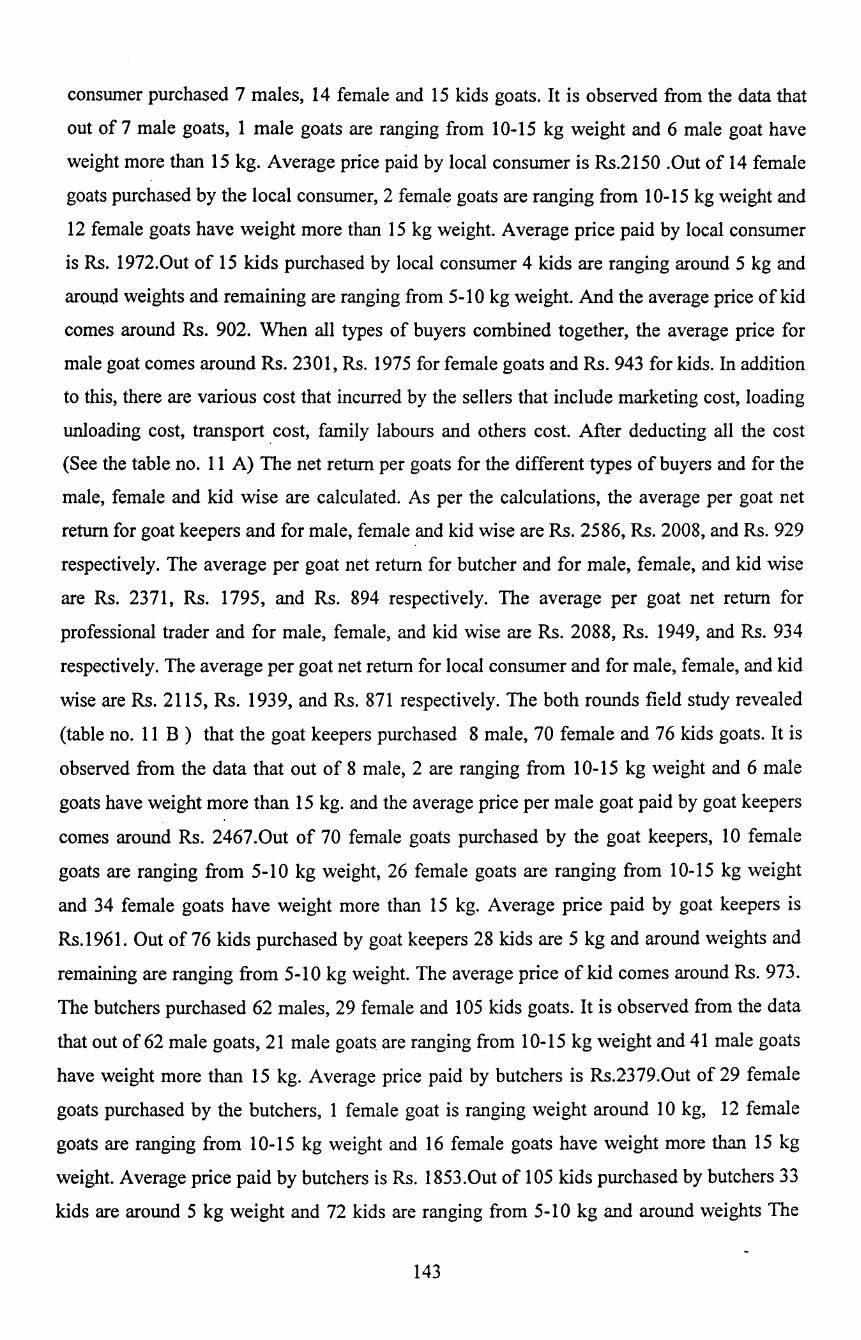
consumer purchased 7 males, 14 female and 15 kids goats. It is observed from the data that
out of 7 male goats, 1 male goats are ranging from 1 0-15 kg weight and 6 male goat have
weight more than 15 kg. Average price paid by local consumer is Rs.2150 .Out of 14 female
goats purchased by the local consumer, 2 female goats are ranging from 10-15 kg weight and
12 female goats have weight more than 15 kg weight. Average price paid by local consumer
is Rs. 1972.0ut of 15 kids purchased by local consumer 4 kids are ranging around 5 kg and
around weights and remaining are ranging from 5-10 kg weight. And the average price of kid
comes around Rs. 902. When all types of buyers combined together, the average price for
male goat comes around Rs. 2301, Rs. 1975 for female goats and Rs. 943 for kids. In addition
to this, there are various cost that incurred by the sellers that include marketing cost, loading
unloading cost, transport cost, family labours and others cost. After deducting all the cost
(See the table no. 11 A) The net return per goats for the different types of buyers and for the
male, female and kid wise are calculated. As per the calculations, the average per goat net
return for goat keepers and for male, female and kid wise are Rs. 2586, Rs. 2008, and Rs. 929
respectively. The average per goat net return for butcher and for male, female, and kid wise
are Rs. 2371, Rs. 1795, and Rs. 894 respectively. The average per goat net return for
professional trader and for male, female, and kid wise are Rs. 2088, Rs. 1949, and Rs. 934
respectively. The average per goat net return for local consumer and for male, female, and kid
wise are Rs. 2115, Rs. 1939, and Rs. 871 respectively. The both rounds field study revealed
(table no. 11 B ) that the goat keepers purchased 8 male, 70 female and 76 kids goats. It is
observed from the data that out of 8 male, 2 are ranging from 1 0-15 kg weight and 6 male
goats have weight more than 15 kg. and the average price per male goat paid by goat keepers
comes around Rs. 2467.0ut of 70 female goats purchased by the goat keepers, 10 female
goats are ranging from 5-10 kg weight, 26 female goats are ranging from 10-15 kg weight
and 34 female goats have weight more than 15 kg. Average price paid by goat keepers is
Rs.1961. Out of 7 6 kids purchased by goat keepers 28 kids are 5 kg and around weights and
remaining are ranging from 5-10 kg weight. The average price of kid comes around Rs. 973.
The butchers purchased 62 males, 29 female and 105 kids goats. It is observed from the data
that out of 62 male goats, 21 male goats are ranging from 10-15 kg weight and 41 male goats
have weight more than 15 kg. Average price paid by butchers is Rs.2379.0ut of 29 female
goats purchased by the butchers, 1 female goat is ranging weight around 10 kg, 12 female
goats are ranging from 1 0-15 kg weight and 16 female goats have weight more than 15 kg
weight. Average price paid by butchers is Rs. 1853.0ut of 105 kids purchased by butchers 33
kids are around 5 kg weight and 72 kids are ranging from 5-10 kg and around weights The
143
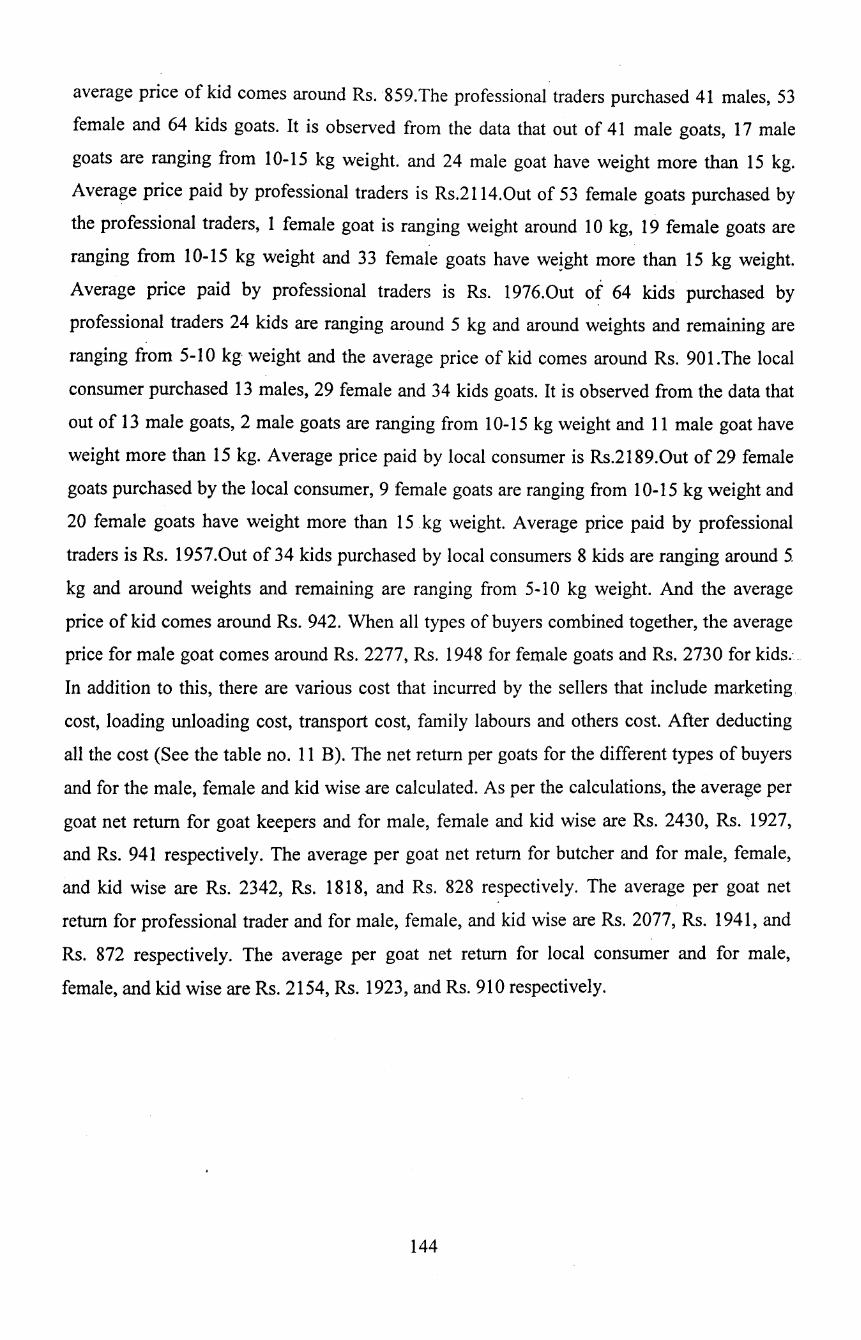
average price of kid comes around Rs. 859.The professional traders purchased 41 males, 53
female and 64 kids goats. It is observed from the data that out of 41 male goats, 17 male
goats are ranging from 10-15 kg weight. and 24 male goat have weight more than 15 kg.
Average price paid by professional traders is Rs.2114.0ut of 53 female goats purchased by
the professional traders, 1 female goat is ranging weight around 1 0 kg, 19 female goats are
ranging from 10-15 kg weight and 33 female goats have we!ght more than 15 kg weight.
Average price paid by professional traders is Rs. 1976.0ut of 64 kids purchased by
professional traders 24 kids are ranging around 5 kg and around weights and remaining are
ranging from 5-1 0 kg- weight and the average price of kid comes around Rs. 901. The local
consumer purchased 13 males, 29 female and 34 kids goats. It is observed from the data that
out of I 3 male goats, 2 male goats are ranging from 1 0-15 kg weight and 11 male goat have
weight more than 15 kg. Average price paid by local consumer is Rs.2189.0ut of29 female
goats purchased by the local consumer, 9 female goats are ranging from 10-15 kg weight and
20 female goats have weight more than I 5 . kg weight. Average price paid by professional
traders is Rs. 1957.0ut of 34 kids purchased by local consumers 8 kids are ranging around 5.
kg and around weights and remaining are ranging from 5-10 kg weight. And the average
price of kid comes around Rs. 942. When all types of buyers combined together, the average
price for male goat comes around Rs. 2277, Rs. 1948 for female goats and Rs. 2730 for kids.- ..
In addition to this, there are various cost that incurred by the sellers that include marketing
cost, loading unloading cost, transport cost, family labours and others cost. After deducting
all the cost (See the table no. 11 B). The net return per goats for the different types of buyers
and for the male, female and kid wise are calculated. As per the calculations, the average per
goat net return for goat keepers and for male, female and kid wise are Rs. 2430, Rs. 1927,
and Rs. 941 respectively. The average per goat net return for butcher and for male, female,
and kid wise are Rs. 2342, Rs. 1818, and Rs. 828 respectively. The average per goat net
return for professional trader and for male, female, and kid wise are Rs. 2077, Rs. 1941, and
Rs. 872 respectively. The average per goat net return for local consumer and for male,
female, and kid wise are Rs. 2154, Rs. 1923, and Rs. 910 respectively.
144
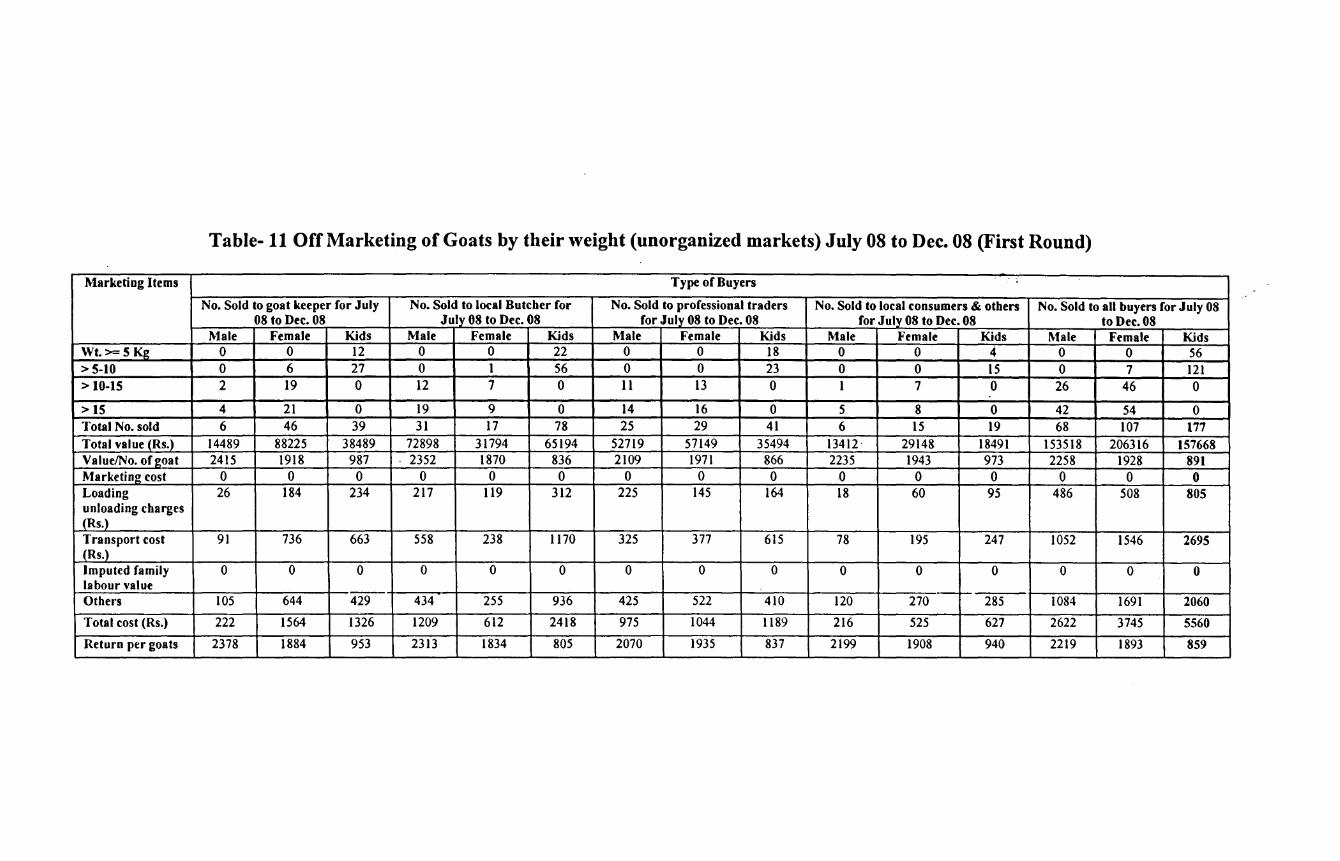
Table-11 Off Marketing of Goats by their weight (unorganized markets) July 08 to Dec. 08 (First Round)
Marketing Items Type of Buyers
No. Sold to goat keeper for July No. Sold to local Butcher for No. Sold to professional traders No. Sold to local consumers & others No. Sold to all buyers for July 08 08 to Dec. 08 July 08 to Dec. 08 for July 08 to Dec. 08 for July08 to Dec. 08 to Dec.08
Male Female Kids Male Female Kids Male Female Kids Male Female Kids Male Female Kids Wt.>=5 Kg 0 0 12 0 0 22 0 0 18 0 0 4 0 0 56 >S-10 0 6 27 0 1 56 0 0 23 0 0 15 0 7 121 > 10-15 2 19 0 12 7 0 11 13 0 1 7 0 26 46 0
> 15 4 21 0 19 9 0 14 16 0 5 8 0 42 54 0 Total No. sold 6 46 39 31 17 78 25 29 41 6 15 19 68 107 177 Total value _{Rs.) 14489 88225 38489 72898 31794 65194 52719 57149 35494 13412. 29148 18491 153518 206316 157668 Value/No. of~oat 2415 1918 987 2352 1870 836 2109 1971 866 2235 1943 973 2258 1928 891 Marketing cost 0 0 0 0 0 0 0 0 0 0 0 0 0 0 0 Loading 26 184 234 217 119 312 225 145 164 18 60 95 486 508 805 unloading charges (Rs.) Transport cost 91 736 663 558 238 1170 325 377 615 78 195 247 1052 1546 2695 (Rs.) Imputed family 0 0 0 0 0 0 0 0 0 0 0 0 0 0 0 labour value Others 105 644 429 434 255 936 425 522 410 120 270 --- 285 1084 1691 2060
Total cost (Rs.) 222 1564 1326 1209 612 2418 975 1044 1189 216 525 627 2622 3745 5560
Return per goats 2378 1884 953 2313 1834 805 2070 1935 837 2199 1908 940 2219 1893 859
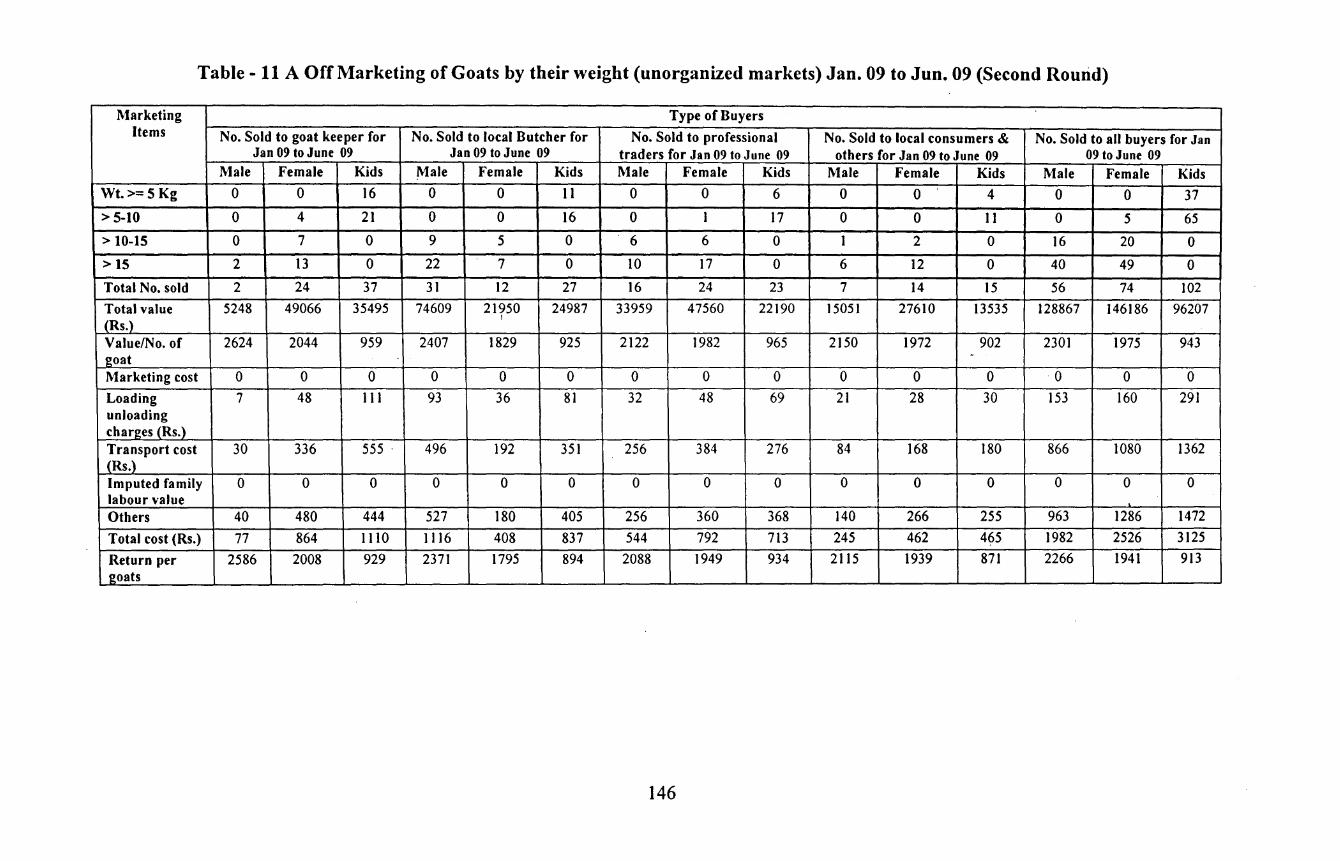
Table- 11 A Off Marketing of Goats by their weight (unorganized markets) Jan. 09 to Jun. 09 (Second Rourid)
Marketing Type of Buyers Items No. Sold to goat keeper for No. Sold to local Butcher for No. Sold to professional No. Sold to local consumers & No. Sold to all buyers for Jan
Jan 09 to June 09 Jan 09 to June 09 traders for Jan 09 to June 09 others for Jan 09 to June 09 09 to June 09 Male Female Kids Male Female Kids Male Female Kids Male Female Kids Male Female Kids
Wt.>=5 Kg 0 0 16 0 0 II 0 0 6 0 0 4 0 0 37 > 5-10 0 4 21 0 0 16 0 I 17 0 0 11 0 5 65
> 10-15 0 7 0 9 5 0 6 6 0 1 2 0 16 20 0
> 15 2 13 0 22 7 0 10 17 0 6 12 0 40 49 0
Total No. sold 2 24 37 31 12 27 16 24 23 7 14 15 56 74 102 Total value 5248 49066 35495 74609 21950 24987 33959 47560 22190 15051 27610 13535 128867 146186 96207 (Rs.)_
I
Value/No. of 2624 2044 959 2407 1829 925 2122 1982 965 2150 1972 902 2301 1975 943 goat
.
Marketing cost 0 0 0 0 0 0 0 0 0 0 0 0 0 0 0 Loading 7 48 Ill 93 36 81 32 48 69 21 28 30 153 160 291 unloading charges (Rs.) Transport cost 30 336 555 . 496 192 351 256 384 276 84 168 180 866 1080 1362 {Rs.) Imputed family 0 0 0 0 0 0 0 0 0 0 0 0 0 0 0 labour value Others 40 480 444 527 180 405 256 360 368 140 266 255 963 1286 1472
Total cost (Rs.) 77 864 1110 1116 408 837 544 792 713 245 462 465 1982 2526 3125
Return per 2586 2008 929 2371 1795 894 2088 1949 934 2115 1939 871 2266 1941 913 goats
146

Table- 11 B Off Marketing of Goats by their weigbt(unor_ganized market~ July. 08 to Jun. 09 (Both Rounds) Marketing Type of Buyers
Items No. Sold to goat keeper for No. Sold to local Butcher for No. Sold to professional No. Sold to local consumers & No. Sold to all buyers for July Julv 08 to June 09 Jut) 08 to June 09 traders for July 08 to June 09 others for July 08 to June 09 08 to June 09
Male Female Kids Male Female Kids Male Female Kids Male Female Kids Male Female Kids
Wt.>=5Kg 0 0 28 0 0 33 0 0 24 0 0 8 0 0 93
>5-10 0 10 48 0 I 72 0 I 40 0 0 26 0 12 186
> 10-15 2 26 0 21 12 0 17 19 0 2 9 0 42 66 0
> 15 6 34 0 41 16 0 24 33 0 11 20 0 82 103 0
Total No. sold 8 70 76 62 29 105 41 53 64 1.3 29 34 124 181 279 Total value 19737 137291 73984 147507 53744 90181 86678 104709 57684 28463 56758 32026 282385 352502 253875 (Rs.) Value/No. of 2467 1961 973 2379 1853 859 2114 1976 901 2189 1957 942 2277 1948 2730 goat Marketing 0 0 0 0 0 0 0 0 0 0 0 0 0 0 0 cost Loading 33 232 345 310 155 393 257 193 233 39 88 125 639 668 1096 unloading charges (Rs.) Transport cost 121 1072 1218 1054 430 1521 581 761 891 162 363 427 1918 2626 4057 (Rs.) Imputed 0 0 0 0 0 0 0 0 0 0 0 0 0 0 0 family labour value Others 145 1124 873 961 435 1341 681 882 778 260 536 540 2047 2977 3532 Total cost 299 2428 2436 2325 1020 3255 1519 1836 1902 461 987 1092 4604 6271 8685 (Rs.) Return per 2430 1927 941 2342 1818 828 2077 1941 872 2154 1923 910 9002 7609 3551 goats
i\Iarketing of goats by size class of goats
It has been observed from the data that total 1198 goats were sold at various locations
mainly at door and in the markets. Out of total sold, 226 were male goats, 539 female goats
and 539 were kids. The details of the marketing of the goats are given in the follov.ing table
no. 12.The table shows that 886 goats were sold at door and 312 were sold in the market. Out
of total sold at door, 177 were male goats, 310 were female goats and 399 were kids. Out of
sold in the market, 49 were male goats, 123 were female goats, and 140 were kids. Out of
total sold at various locations, 120 goats were sold by goat keepers with 1-5 flock size, 169
goats were sold by goat keepers with 6-15 flock size, 451 goats were sold by goat keepers
\vith 16-30 flock size, and 458 goats were sold by goat keepers with flock size more than 30
goats.
148

Table - 12 Marketing Of Goats by Size Class of Goats
Size of flocks Total Number of Goats Sold at door Sold in the market Total sold Male Female Kids Total Male Female Kids Total Male Female Kids Total Male Female Kids Total
1-5 24 81 46 151 16 27 31 74 5 28 13 46 21 55 44 120 6-15 35 124 80 239 22 36 65 123 9 23 14 46 31 59 79 169 16-30 82 359 207 648 65 153 93 311 14 41 85 140 79 194 178 451
30> & above 96 399 249 744 74 94 210 378 21 31 28 80 95 125 238 458 All 237 963 582 1782 177 310 399 886 49 123 140 312 226 433 539 1198

Price Received by Goat Keepers in Different Markets
Table no. 13 gives the details value about the goat in different size of flock that sold at
door and in the market. The average value for the male goat comes around Rs. 2658. for
goats, which are sold at door and in the market the average price come around Rs. 2050 for
the same. The average price for the female is calculated around Rs. 1776. For the door sell
and for the female, the average price is calculated Rs.1670. for the selling in the market.
Similarly, for the kids the average price is calculated Rs.13 54 and. in the market, the average
price come around Rs. 921. It has been observed from the table that the difference prices in
both markets are visible. In category of 1-5 flock size of goat keepers, the average value
difference is found Rs. 630 for male, Rs 135 for female, and 444 for kid. In category 6-15
flock size, Rs 543 is price difference for male, Rs. 35 for female, and Rs 438 for kid are
found. In 16-30 flock size, it is observed that Rs. 725 for male, Rs 144 for female, and Rs.
171 for kid are observed from the data. Under the 30 and above flock size, the price
differences are Rs. 556 for male, Rs. 80 for female and Rs. 417 for the kid are noticed. The
difference prices in the market depend on the various reasons like urgency of sale and
traditional way of selling without technical weighing. It is also noticed that values of goats
vary with expected weight and quantity of goats may not give the approximate value of goats.
The traditional way of selling without weighing influences the value of goats.
150
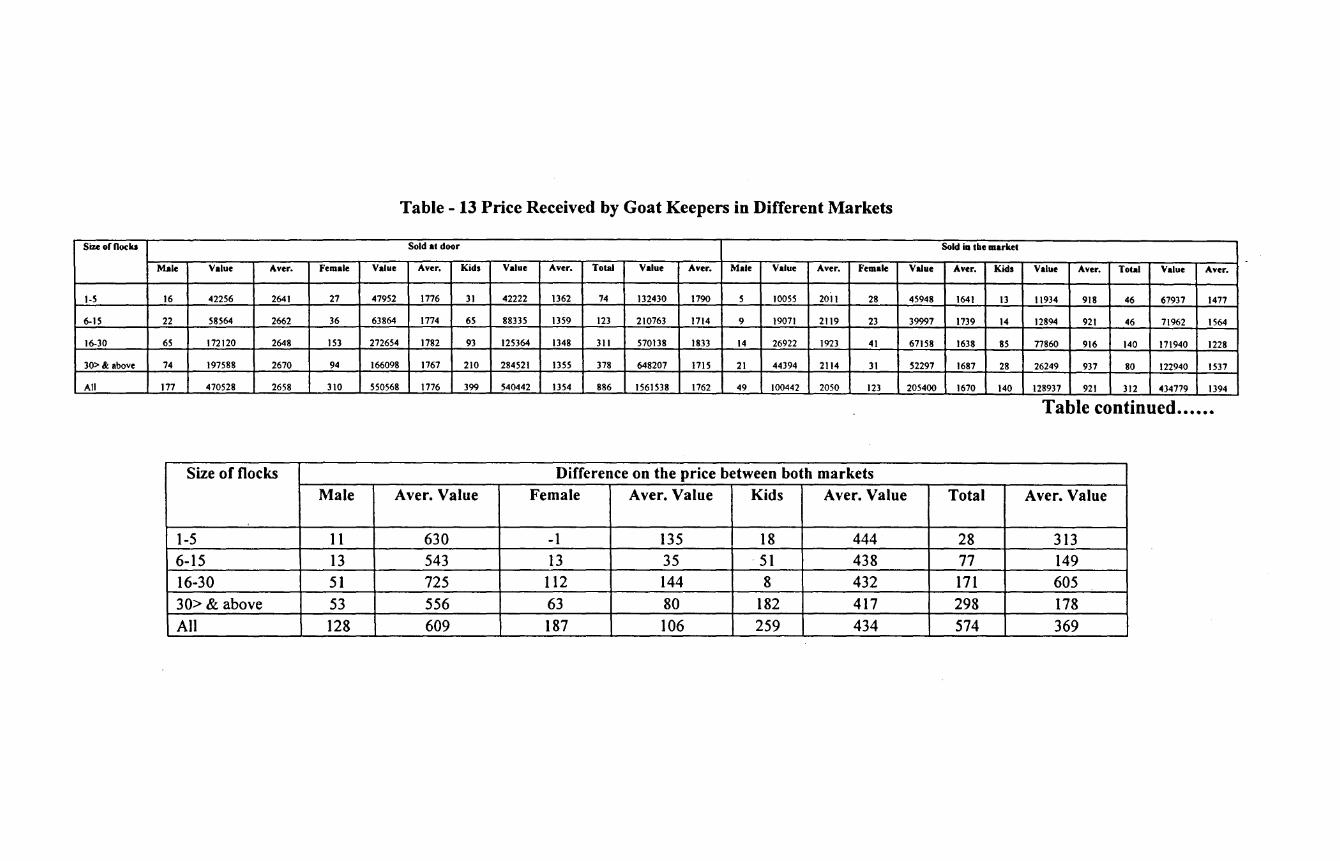
Table - 13 Price Received by Goat Keepers in Different Markets
Size of Docks Sold at door Sold ia the market
Male Value Aver. Female Value Aver. Kids Value Aver. Total Value Aver. Male Value Aver. Female Value Aver. Kids Value Aver. Total Value Aver.
1-S 16 42256 2641 27 47952 1776 31 42222 1362 74 132430 1790 5 10055 2011 28 45948 1641 13 11934 918 46 67937 1477
6-15 22 58564 2662 36 63864 1774 65 88335 1359 123 210763 1714 9 19071 2119 23 39997 1739 14 12894 921 46 71962 1564
16-30 65 172120 2648 153 272654 1782 93 125364 1348 311 570138 1833 14 26922 1923 41 67158 1638 85 77860 916 140 171940 1228
30> & above 74 197588 2670 94 166098 1767 210 284521 1355 378 648207 1715 21 44394 2114 31 52297 1687 28 26249 937 80 122940 1537
All 177 470528 2658 310 550568 1776 399 540442 1354 886 1561538 1762 49 100442 2050 123 205400 1670 140 128937 921 312 434779 1394
Table continued ...•.•
Size of flocks Difference on the price between both markets
Male Aver. Value Female Aver. Value Kids Aver. Value Total Aver. Value
1-5 11 630 -1 135 18 444 28 313 6-15 13 543 13 35 51 438 77 149
16-30 51 725 112 144 8 432 171 605
30> & above 53 556 63 80 182 417 298 178
All 128 609 187 106 259 434 574 369
Purchased of Goats by Different Buyers in the Markets
In Yavatmal district, out of total goats sold in near market and off the market, 407
goats were sold in near market and 267 goats were sold in the off market. Out of goats, which
are sold in near market, 81 are male goats, 142 are female goats, and 183 are kids. Similarly,
in off the market, 53 are male goats, 94 are female goats, and 120 are kids. The details of the
distribution are given in the following table no.l4. In the district, goat keepers purchased 75
goats, of which 5 are male goats, 42 are female goats, and 28 are kids from both near market
and off the market with average price Rs. 2656, Rs. 1832 and Rs. 1149 respectively. Out of
total purchase, 57 goats are purchased from near market with average price per goat Rs. 1627
and 18 goats are purchased from off the market with average price Rs. 1648. The butchers
purchased total 206 goats, of which 54 are male goats, 69 are female goats, and 83 are kids
from both near market and off the market, with average price Rs. 2488, Rs. 1711 and Rs.
1140 for male, female and kids respectively. Out of total purchased by butchers, 177 goats
are purchased from near market and 29 goats are purchased from off the market with average
price Rs. 1687 and Rs. 1671 respectively. The Local consumers purchased total280 goats, of
which 39 are male goats, 110 are female goats, and 131 are kids from both near market and
off the market with average price Rs. 2576, Rs. 2015, and Rs. 1210 respectively. Out oftotal
purchased, by local consumers 15 8 goats are purchased from near market and 123 goats are
purchased from off the market with average price Rs. 1712 and Rs. 1708 respectively. The
Traders purchased total 112 goats, of which 36 are male goats, 15 are female goats, and 61
are kids from both near market and off the market with average price Rs. 2594, Rs. 1860 and
Rs. 1080 respectively. Out of total purchased, by traders 15 goats are purchased from near
market and 97 goats are purchased from off the market with average price Rs. 1671 for the
both markets. In Ahemadnagar district, out of total goats sold in near market and off the
market, 4 79 goats were sold in near market and 317 goats were sold in the off market. Out of
goats, which are sold in near market, 96 are male goats, 168 are female goats, and 216 are
kids. Similarly, in off the market, 63 are male goats, Ill are female goats, and 143 are kids.
The details of the distribution are given in the following table no.l4. In the district, goat
keepers purchased 77 goats, of which 19 are male goats, 18 are female goats, and 40 are kids
from both near market and off the market with average price Rs. 2656, Rs. 1727 and Rs.
1194 respectively. Out of total purchase, 54 goats are purchased from near market with
average price per goat Rs. 1691 and 23 goats are purchased from off the market with average
price Rs. 1653. The butchers purchased total 383 goats, of which 58 are male goats, 146 are
152
female goats, and 179 are kids from both near market and off the market, with average price
Rs. 2902, Rs. 1852 and Rs. 1125 for male, female and kids respectively. Out of total
purchased by butchers, 227 goats are purchased from near market and 156 goats are
purchased from off the market with average pric_e Rs. 1677 and Rs. 1663 respectively. The
Local consumers purchased total 70 goats, of which 3 7 are male goats, 16 are female goats,
and 17 are kids from both near market and off the market with average price Rs. 2156, Rs.
1414, ,and Rs. 867 respectively. Out of total purchased by local consumers, 39 goats are
purchased from near market and 31 goats are purchased from off the market with average
price Rs. 1668 and Rs. 1681 respectively. The Traders purchased total267 goats, of which 45
are male goats, 99 are female goats, and 123 are kids from both near market and off the
market with average price Rs. 2911, Rs. 1873 and Rs. 1155 respectively. Out of total
purchased by traders, 15 9 goats are purchased from near market and 1 07 goats are purchased
from off the market with average price Rs. 1717 and Rs. 1734 respectively.
153
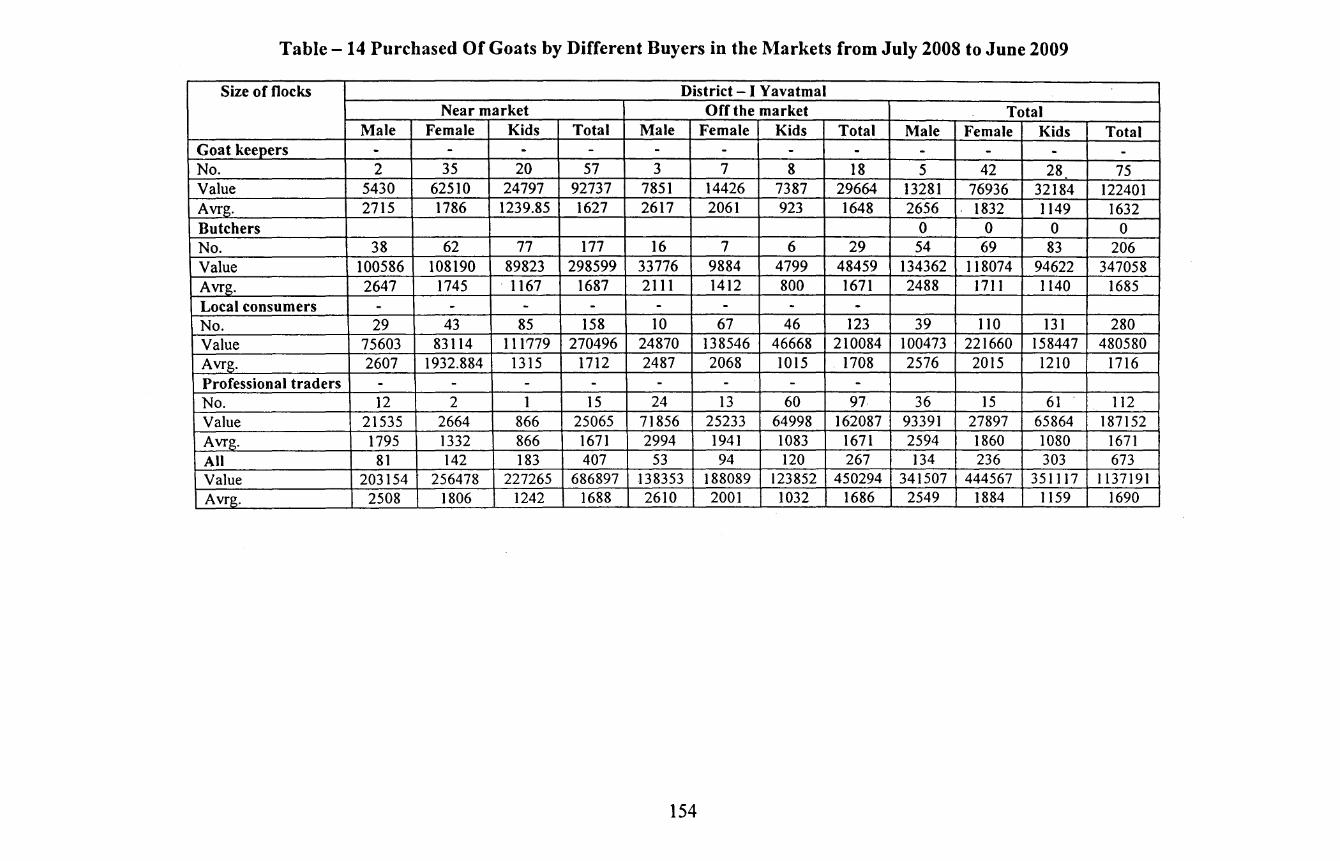
Table -14 Purchased Of Goats by Different Buyers in the Markets from July 2008 to June 2009
Size of flocks District- I Yavatmal Near market Off the market Total
Male Female Kids Total Male Female Kids Total Male Female Kids Total Goat keepers - - - - - - - - - - - -No. 2 35 20 57 3 7 8 18 5 42 28 75 -Value 5430 62510 24797 92737 7851 14426 7387 29664 13281 76936 32184 122401 Avrg. 2715 1786 1239.85 1627 2617 2061 923 1648 2656 1832 1149 1632 Butchers 0 0 0 0 No. 38 62 77 177 16 7 6 29 54 69 83 206 Value 100586 108190 89823 298599 33776 9884 4799 48459 134362 118074 94622 347058 Avrg. 2647 1745 . 1167 1687 2111 1412 800 1671 2488 1711 1140 1685 Local consumers - - - - - - - -No. 29 43 85 158 10 67 46 123 39 110 131 280 Value 75603 83114 111779 270496 24870 138546 46668 210084 100473 221660 158447 480580 Avrg. 2607 1932.884 1315 1712 2487 2068 1015 1708 2576 2015 1210 1716 Professional traders - - - - - - - -No. 12 2 1 15 24 13 60 97 36 15 61 112 Value 21535 2664 866 25065 71856 25233 64998 162087 93391 27897 65864 187152 Avrg. 1795 1332 866 1671 2994 1941 1083 1671 2594 1860 1080 1671 All 81 142 183 407 53 94 120 267 134 236 303 673 Value 203154 256478 227265 686897 138353 188089 123852 450294 341507 444567 351117 1137191 Avrg. 2508 1806 1242 1688 2610 2001 1032 1686 2549 1884 1159 1690
154
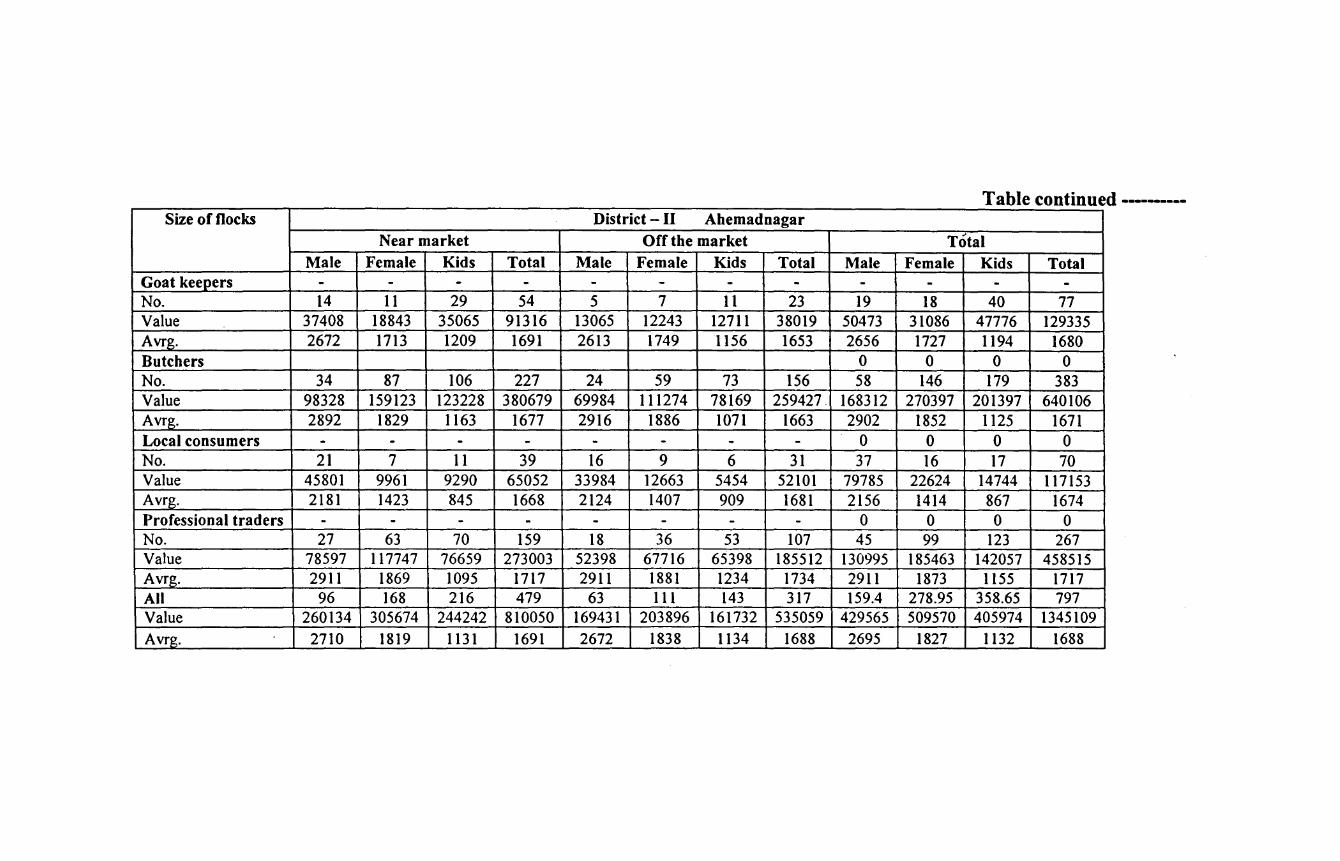
Table continued -------Size of flocks District - II Ahemadnagar
Near market Off the market Total Male Female Kids Total Male Female Kids Total Male Female Kids Total
Goat keepers - - - - - - - - - - - -No. 14 11 29 54 5 7 11 23 19 18 40 77 Value 37408 18843 35065 91316 13065 12243 12711 38019 50473 31086 47776 129335 Avrg. 2672 1713 1209 1691 2613 1749 1156 1653 2656 1727 1194 1680 Butchers 0 0 0 0 No. 34 87 106 227 24 59 73 156 58 146 179 383 Value 98328 159123 123228 380679 69984 111274 78169 259427. 168312 270397 201397 640106 Avrg. 2892 1829 1163 1677 2916 1886 1071 1663 2902 1852 1125 1671 Local consumers - - - - - - - - 0 0 0 0 No. 21 7 11 39 16 9 6 31 37 16 17 70 Value 45801 9961 9290 65052 33984 12663 5454 52101 79785 22624 14744 117153 Avr_g. 2181 1423 845 1668 2124 1407 909 1681 2156 1414 867 1674 Professional traders - - - - - - - - 0 0 0 0 No. 27 63 70 159 18 36 53 107 45 99 123 267 Value 78597 117747 76659 273003 52398 67716 65398 185512 130995 185463 142057 458515 Avrg. 2911 1869 1095 1717 2911 1881 1234 1734 2911 1873 1155 1717 All 96 168 216 479 63 Ill 143 317 159.4 278.95 358.65 797 Value 260134 305674 244242 810050 169431 203896 161732 535059 429565 509570 405974 1345109 Avrg. 2710 1819 1131 1691 2672 1838 1134 1688 2695 1827 1132 1688
Variation in the price of sold goat
It is observed in Yavatmal district at door sold that under the category of weight range
around 5 kg, the average price is calculated Rs. 821. It is given in the following table no 15.
In category of weight 5-10 kg, the average price is calculated Rs. 1029, in category 10-15 kg
weight the average price is calculated Rs. 2011 and in category of weight above 15 kg, the
average price is Rs. 2319. In market sold category, it is observed that under the category of
weight range around 5 kg, the average price is calculated Rs. 829. In category of weight 5-1 0
kg, the average price is calculated Rs. 1046, in category 1 0-15 kg weight the average price is
calculated Rs. 2029 and in category of weight above 15 kg, the average price is Rs. 2337. The
average percentage difference in price is noticed in the market selling of goat in ·weight wise
category. In 5 kg and around weight, it is observed that about 0.97 % price difference is
noticed higher in market sold. In 5-10 kg weight category, it is observed that 1.65 o/o is
noticed higher price. In category 10-15 kg weight 0.90 % price higher is noticed in the market
and in category of 15 kg and above about 0.78 % price is noticed higher in the market.
Overall, in market sold, it is observed that around 1.07 % for all category of weight is found
higher price in an average in the market. It is observed in Ahemadnagar district at door sold
that under the category of weight range around 5 kg, the average price is calculated Rs. 807.
In category of weight 5-10 kg., the average price is calculated Rs. 1052, in category 10-15 kg
weight the average price is calculated Rs. 2043 and in category of weight above 15 kg, the
average price is Rs. 2321. In market sold category it is observed that under the category of . weight range around 5 kg, the average price is calculated Rs. 814. In category of weight 5-10
kg, the average price is calculated Rs. -1089, in category 10-15 kg weight the average price is
calculated Rs. 2107 and in category of weight above 15 kg, the average price is Rs. 2294. The
average percentage difference in price is noticed in the market selling of goat in weight wise
category. In 5 kg and around weight, it is observed that about 0.87 % price difference is
noticed higher in market sold. In 5-10 kg weight category, it is observed that 3.52 % is
noticed higher price. In category 10-15 kg weight 3.13 o/o price higher is noticed in the market
and in category of 15 kg and above about 1.16 % price is noticed less in the market. Overall,
in market sold, it is observed that around 1.6 % for all category of weight is found higher
price in an average in the market. If both districts are combined for the average price
difference at the door sold and in the market sold it is observed in both districts at door sold
that under the category of weight range around 5 kg, the average price is calculated Rs. 814.
In category of weight 5-10 kg, the average price is calculated Rs. 1042, in category 10-15 kg
156
weight the. average price is calculated Rs. 2028 and in category of weight above 15 kg, the
average price is Rs. 2317. In market sold category it is observed that under the category of
weight range around 5 kg, the average price is calculated Rs. 822. In category of weight 5-10
kg, the average price is calculated Rs. 1 066, in category 10-15 kg weight the average price is
calculated Rs. 2071 and in category of weight above 15 kg, the average price is Rs. 2308. The
average percentage difference in price is noticed in the market selling of goat in weight wise
categQry. In 5 kg and around weight, it is observed that about 1.07 % price difference is
noticed higher in market sold. In 5-10 kg weight category, it is observed that 2.32 % is
noticed higher price. In category, 10-15 kg weight 2.12 % price higher is noticed in the
market and in category of 15 kg and above about 0.38% price is noticed less in the market.
Overall, in market sold, it is observed that around 1.14 % for all category of weight is found
higher price in an average in the market.
157
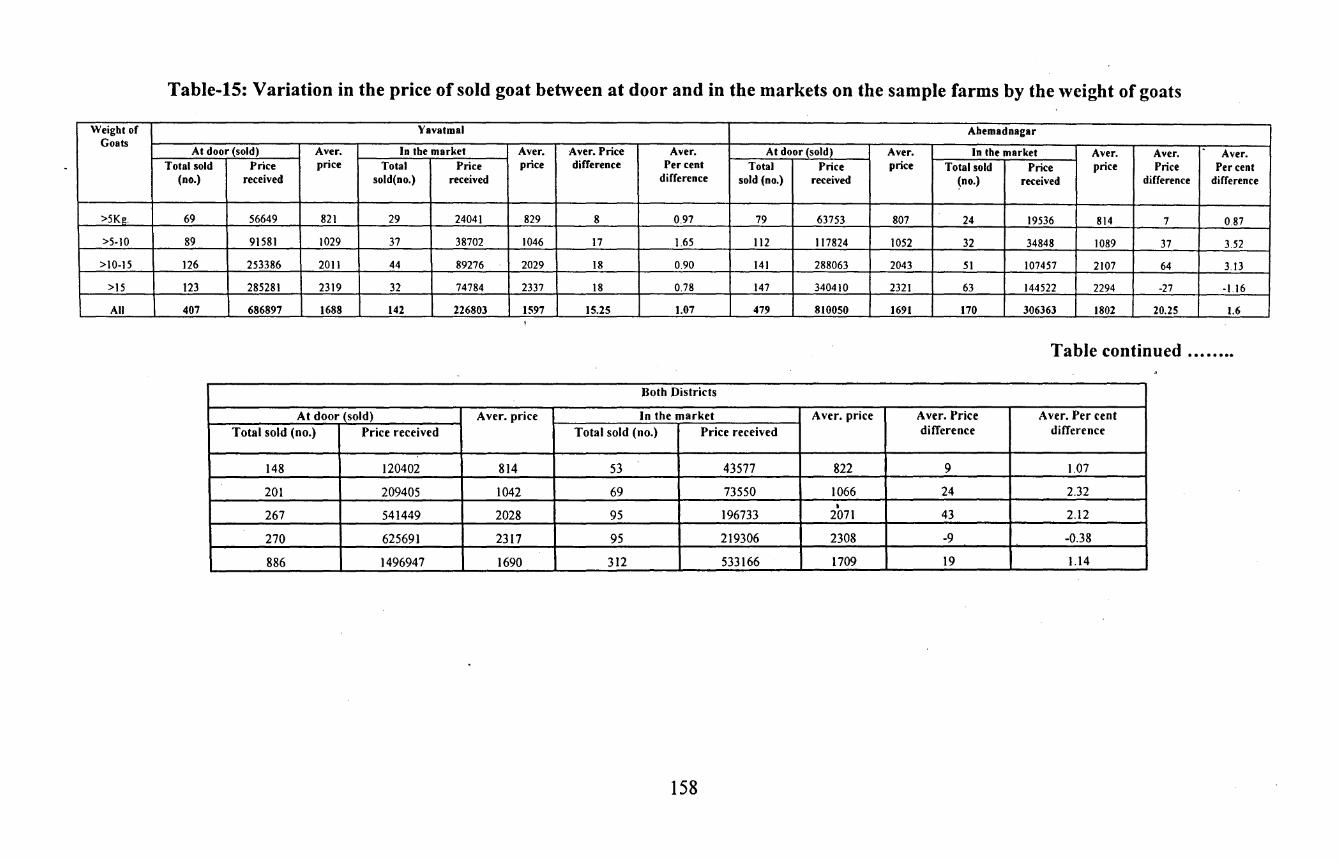
Table-15: Variation in the price of sold goat between at door and in the markets on the sample farms by the weight of goats
Weight of Yavatmal Ahemadnagar Goats
At door (sold) Aver. In the market Aver. Aver. Price Aver. At door (sold) Aver. In the market Aver. Aver. .
Aver. Total sold Price price Total Price price difference Per cent Total Price price Total sold Price price Price Per cent
(no.) received sold(no.) received difference sold (no.) received (no.) received difference difference
>5Kg. 69 56649 821 29 24041 829 8 0.97 79 63753 807 24 19536 814 7 0.87
>5-10 89 91581 1029 37 38702 1046 17 1.65 112 117824 1052 32 34848 1089 37 3.52
>10-15 126 253386 2011 44 89276 2029 18 0.90 141 288063 2043 51 107457 2107 64 3.13
>15 123 285281 2319 32 74784 2337 18 0.78 147 340410 2321 63 144522 2294 -27 -1.16
All 407 686897 1688 142 226803 1597 15.25 1.07 479 810050 1691 170 306363 1802 20.25 1.6
Table continued ....... .
Both Districts
At door (sold) Aver. price In the market Aver. price Aver. Price Aver. Per cent Total sold (no.) Price received Total sold (no.) Price received difference difference
148 120402 814 53 43577 822 9 1.07
201 209405 1042 69 73550 1066 24 2.32 • 267 541449 2028 95 196733 2071 43 2.12
270 625691 2317 95 219306 2308 -9 -0.38
886 1496947 1690 312 533166 1709 19 1.14
158
Off Marketing costs &net gain through different channels
The following table shows that total 584 goats are sold in off marketing. It has . (
been noticed from the table that the average cost are calculated per goat Rs.l467 for
goat rearers, Rs.l453 for butchers, Rs.l543 for traders and Rs.l509 for local
consumers after deducting market costs incurred by the goat sellers The details of the
costs are given in table no.l6 \
Marketing cost, Value and net gain in marketing of goats
It has been observed from the following table that in Yavatmal district, total
406 goats are sold, out these, 81 are male goats, 142 are female goats, and 183 are
kids. It is found in the table that Rs.203154 has been received as net get in near
market for total male with average per goat price Rs.2508, Rs.256478 for female
goats with average price per goat Rs.l806, and Rs.227265 for kids with average price
per kid Rs. 1241. Also in off the market,- total 267 goats are sold, out these, 53 are
male goats with average· price goat Rs. 2571, 94 are female goats with average price
per female Rs. 1965, and 120 are kids with average price per kid Rs. I 001. In off
market, it is found that respondents mentioned the various marketing costs and but, in
case of near market, the respondents were unable to give the marketing costs. (See
table no. 17). In Ahemadnagar district, it is found in near market that Rs.260134 has
been received as net gain for male goat with average price per male goat Rs. 2709, Rs.
305674 for female goat with average price per female goat Rs.l819, and Rs. 244242
for kid with average price per kid Rs.l130.75. In off the market, Rs.167201 has been
received as net gain for male goat with average price per male goat Rs. 263 7, Rs.
200214 for female goat with average price per female goat Rs.1804, and Rs.l57142
for kid with average price per kid Rs.11 01.
If both districts are combined together, it is observed in near market that
Rs.463288 has been received as net gain for male goat with average price per male
goat Rs. 2617, Rs.562152 for female goat with average price per female goat
Rs.l813.39, and Rs.471507 for kid with average price per kid Rs.l181. In off the
market, Rs.303480 has been received as net gain for male goat with average price per
male goat Rs.2607, Rs.384947 for female goat with average price per female goat
Rs.l878, and Rs.277366 for kid with average price per kid Rs.1 056.
159
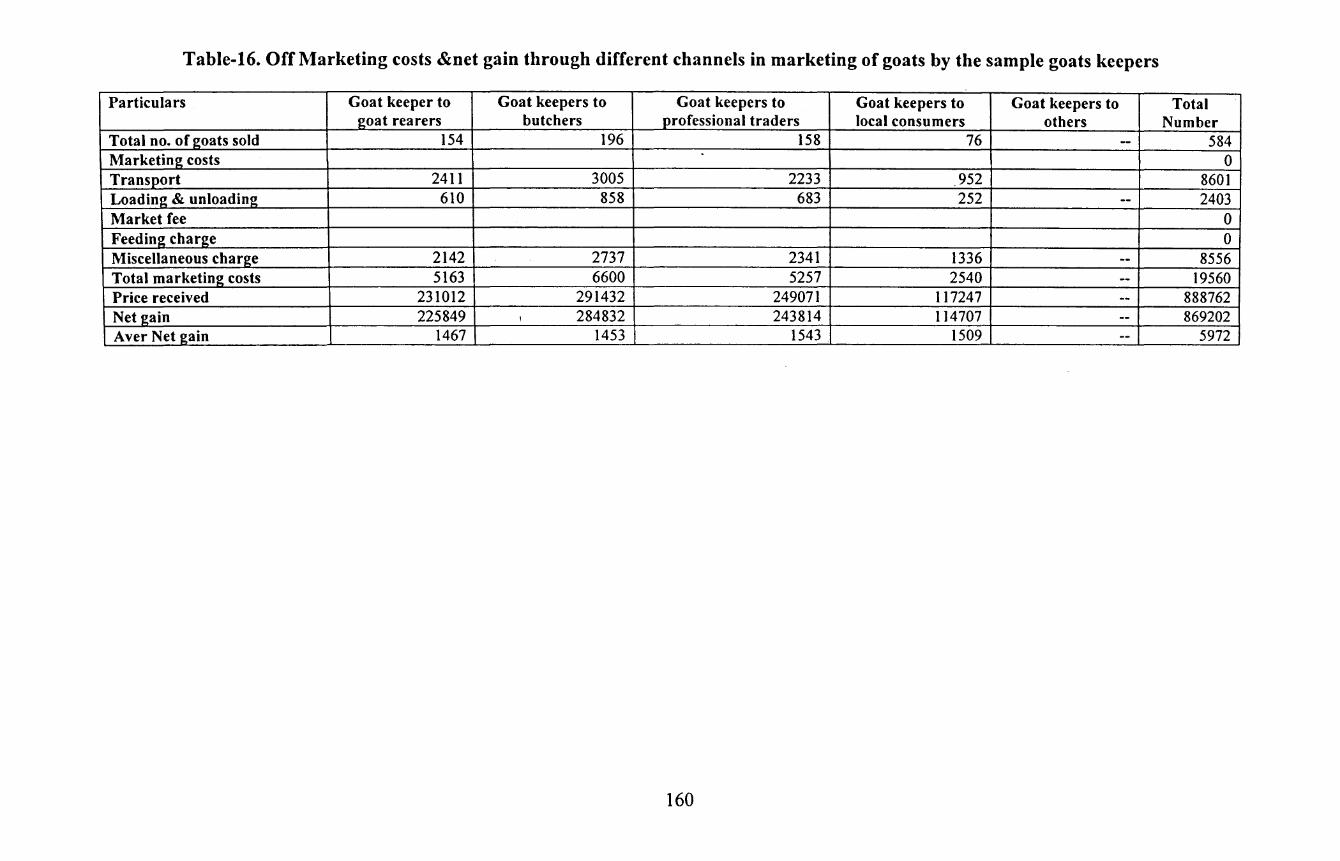
Table-16. Off Marketing costs &net gain through different channels in marketing of goats by the sample goats keepers
Particulars Goat keeper to Goat keepers to Goat keepers to Goat keepers to Goat keepers to Total goat rearers butchers professional traders local consumers others Number
Total no. of goats sold 154 196 158 76 -- 584 Marketing costs
. 0
Transport 2411 3005 2233 952 8601 Loading & unloading 610 858 683 252 -- 2403 Market fee 0 Feeding charge 0 Miscellaneous charge 2142 2737 2341 1336 -- 8556 Total marketing costs 5163 6600 5257 2540 -- 19560 Price received 231012 291432 249071 117247 -- 888762 Net gain 225849 I 284832 243814 114707 -- 869202 Aver Net gain 1467 1453 1543 1509 -- 5972
160
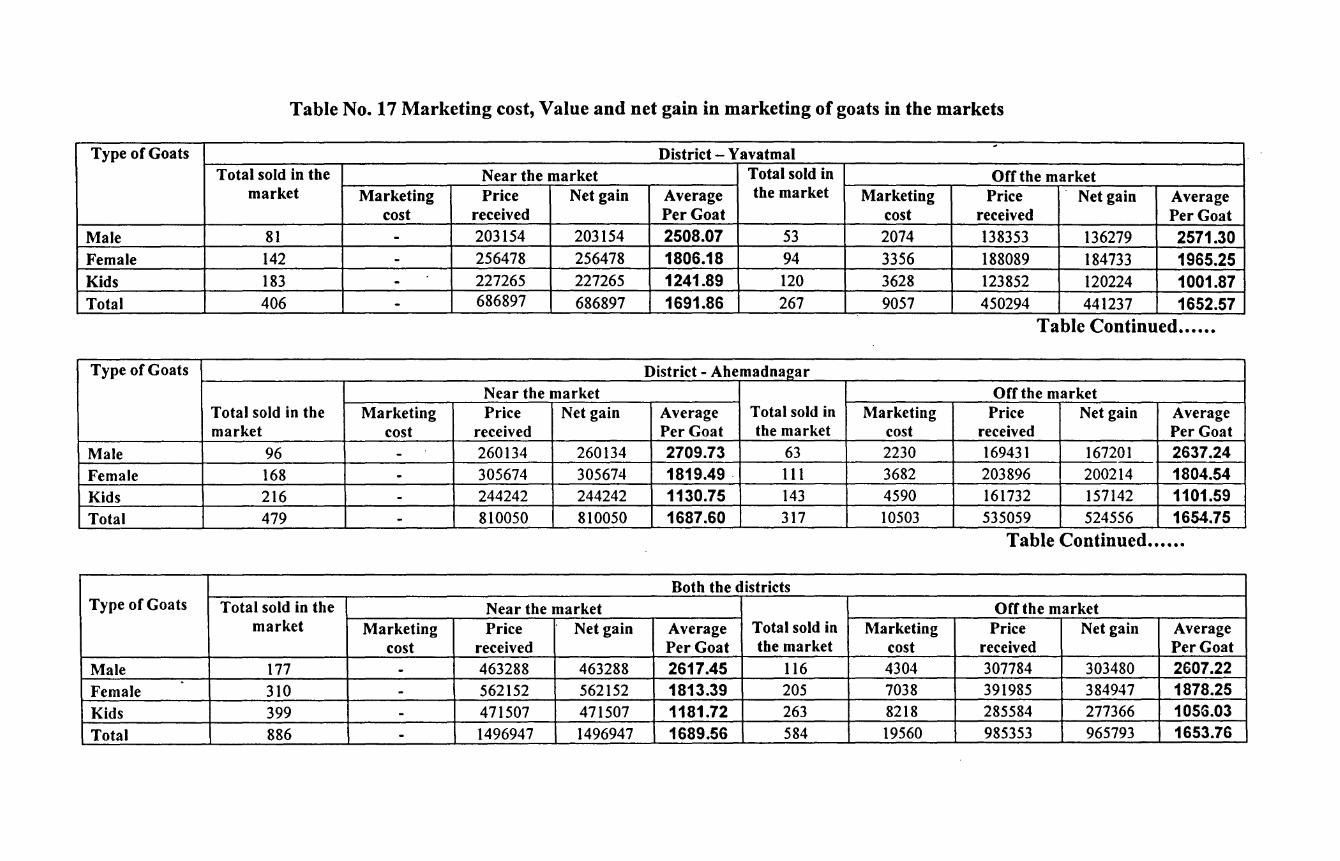
Table No. 17 Marketing cost, Value and net gain in marketing of goats in the markets
.. Type of Goats District - Yavatmal
Total sold in the Near the market Total sold in Off the market market Marketing Price Net gain Average the market Marketing Price Net gain Average
cost received Per Goat cost received Per Goat Male 81 - 203154 203154 2508.07 53 2074 138353 136279 2571.30 Female 142 - 256478 256478 1806.18 94 3356 188089 184733 1965.25 Kids 183 - 227265 227265 1241.89 120 3628 123852 120224 1001.87 Total 406 - 686897 686897 1691.86 267 9057 450294 441237 1652.57
Table Continued ••••••
Type of Goats District- Ahemadnagar Near the market orr the market
Total sold in the Marketing Price Net gain Average Total sold in Marketing Price Net gain Average market cost received Per Goat the market cost received Per Goat
Male 96 - 260134 260134 2709.73 63 2230 169431 167201 2637.24 Female 168 - 305674 305674 1819.49 . 111 3682 203896 200214 1804.54 Kids 216 - 244242 244242 1130.75 143 4590 161732 157142 1101.59 Total 479 - 810050 810050 1687.60 317 10503 535059 524556 1654.75
Table Continued •••••.
Both the districts Type of Goats Total sold in the Near the market Off the market
market Marketing Price Net gain Average Total sold in Marketing Price Net gain Average cost received Per Goat the market cost received Per Goat
Male 177 - 463288 463288 2617.45 116 4304 307784 303480 2607.22 .
Female 310 - 562152 562152 1813.39 205 7038 391985 384947 1878.25 Kids 399 - 471507 471507 1181.72 263 8218 285584 277366 1056.03 Total 886 - 1496947 1496947 1689.56 584 19560 985353 965793 1653.76
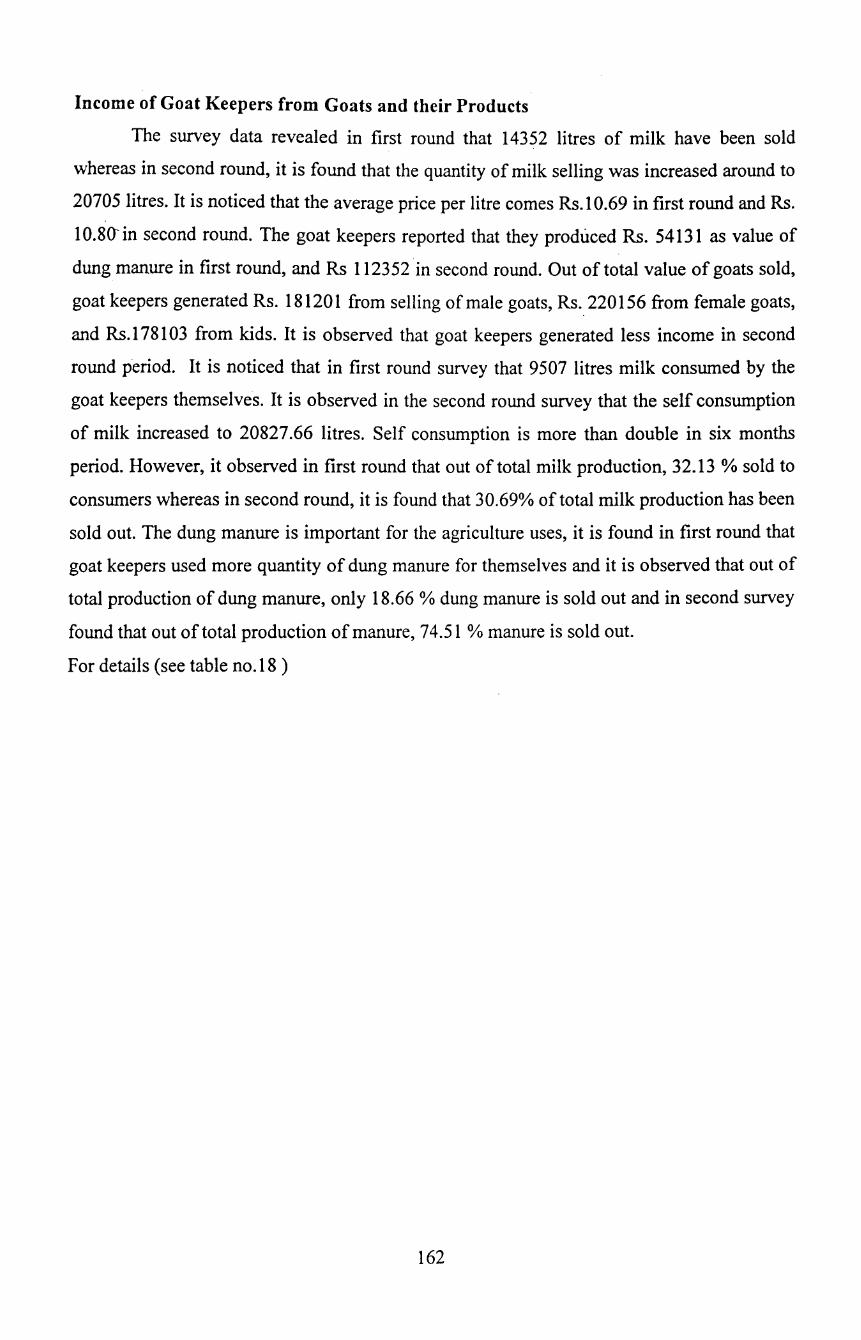
Income of Goat Keepers from Goats and their Products
The survey data revealed in first round that 14352 litres of milk have been sold
whereas in second round, it is found that the quantity of milk selling was increased around to
20705 litres. It is noticed that the average price per litre comes Rs.l 0.69 in first round and Rs.
10.80' in second round. The goat keepers reported that they produced Rs. 54131 as value of
dung manure in first round, and Rs 112352 in second round. Out of total value of goats sold,
goat keepers generated Rs. 18120 I from selling of male goats, Rs. 220156 from female goats,
and Rs.l781 03 from kids. It is observed that goat keepers generated less income in second
round period. It is noticed that in first round survey that 9507 litres milk consumed by the
goat keepers themselves. It is observed in the second round survey that the self consumption
of milk increased to 20827.66 litres. Self consumption is more than double in six months
period. However, it observed in first round that out of total milk production, 32.13 % sold to
consumers whereas in second round, it is found that 30.69% of total milk production has been
sold out. The dung manure is important for the agriculture uses, it is found in first round that
goat keepers used more quantity of dung manure for themselves and it is observed that out of
total production of dung manure, only 18.66 % dung manure is sold out and in second survey
found that out oftotal production of manure, 74.51% manure is sold out.
For details (see table no.18)
162
Table-18: Income from Goats and their Products
Period Production of Product Milk Value of dung manure Value of goat sold
®~> (Rs.) Qty.(lit) Value (Rs.) Avg. Value Male Female Kids Total
Rs.) I- Round 14352 153435 10.69 54131 181201 220156 178103 579460 II- Round 20705.66 223710 10.80 112352 158102 131304 196650 486056 Total 35057.66 377145 10.76 166483 339303 351460 374753 1065516 A vg. Of Two rounds 2921.47 31428.75 - 13873.58 28275.25 29288.33 31229.42 532758
Table continued .••.
Period Disposal Self consumed Sold
Milk Dung manure Milk Dung manure Qty. Value Avg. Qty. Value Avg. Qty. Value Avg. To whom sold Qty. Value Avg. To
Value Value Value Value whom sold
I- Round 9507 93130 9.80 20161.50 40389 2.00 4500 44696 9.93 Hotel, Labour, 4626 10780 2.33 Village Farmer Farmer
II- Round 20827.66 87332 4.19 8886 31976 3.60 9224 45295 4.91 Hotel, Labour, 5946.50 25980 4.37 Village Farmer Farmer
Total 30334.66 180462 5.95 29047.50 72365 2.49 13724 89991 6.56 - 10572.50 36760 3.48 -Avg. ofboth 2527.89 15038.50 - 2420.63 6030.42 - 1143.67 7499.25 - 881.04 3063.33 - -rounds
Goat Marketing System
The field study observed that there are different channels for goat marketing and through
these channels the goats are being sold. It is found that mostly four channels are available to
goat keepers to sell their live goats i.e. organized markets (control by under APMC Act or by
Grampanchayat), unorganized markets, on the way selling, and at door. The buyers
approaches all the places, however, it ·is found that at door, on the way to markets,
unorganized markets, and organized are popular in this sequence. Because, buyers always
hope that they will get higher profit margin. Marketing channels is present in the following
chart.
Constraints in Channels
The study observed that the present marketing channels, which are existed in the state,
is still underdeveloped as most of goat keepers are illiterate or less educated. As reported by
the goat keepers, there is high demand for goats meat from consumers therefore, the butchers
and traders always approach to goat keepers at door and try to settle dealings at the door only.
Due to illiteracy and unawareness, the goat sellers sell their goats at roughly estimated price
and weight. It is highly unpredictable dealings of goats and more chances of undervalued
goat price.
164
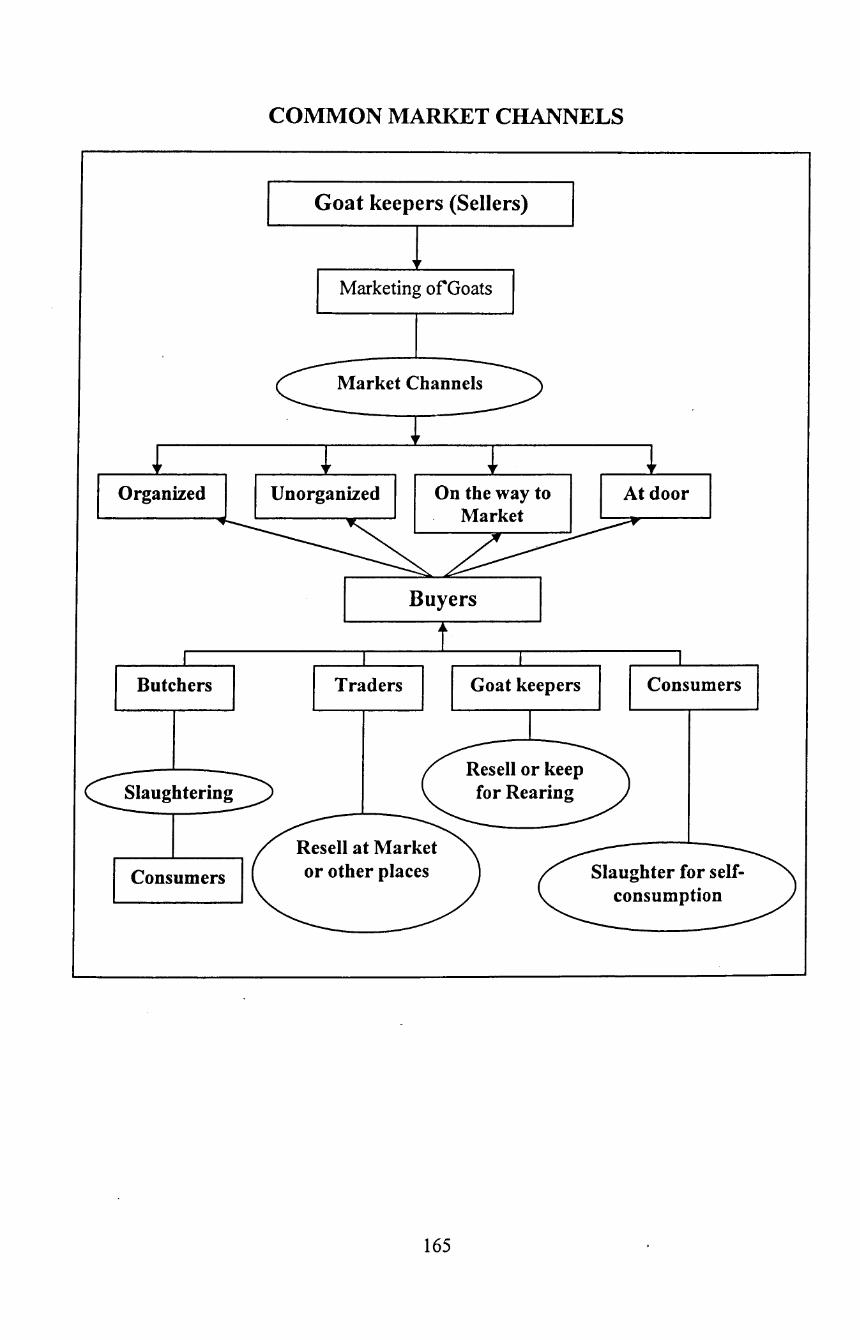
Organized
Butchers
Slaughtering
Consumers
COMMON MARKET CHANNELS
Goat keepers (Sellers)
Marketing ofGoats
Unorganized
Traders
On the way to Market
Buyers
Goat keepers
or other places
165
At door
Consumers
CHAPTER- VI
MARiffiTING SYSTEM AND FINDINGS OF THE FIELD STUDY
The chapter VI deals with market systems, which exist in four selected market
areas of the sample district. Their establishment, staff, market areas, submarkets, and
facilities provided by respective APMCs have been discussed. In addition to these
informations, the socio-economic status of sample sellers, buyers, butchers, . .
wholesalers etc are discussed with their opinions on the various aspects of the
dealings, activities, and business.
Darvha Market
Darvha is one of tahshils of Yavatmal district. Livestock of Darvha is famous
in this locality. It is found from the record that Darvha APMC is one of the oldest
APMC in the state, which came into existence by the notification of dated
27/0511921. Since then, APMC has been providing services to grain market as well as
livestock market. The APMC also operates Lobi and Bodegaon submarkets, which
came into existence by notification of dated 15/04/1982 and 28112/1982 respectively.
APMC has 1.40 ha own area to organize the marketin Darvha and in two submarkets
Lohi and Bodegaon, which have 1.87 and 1.21 ha. areas respectively. It is found that
total staff working under this APMC is 8 and market day is Tuesday. As per
Maharashtra APMC Act 1963, this APMC also collects Re 1.05 per Rs 100 dealing -
out of which 0.05 paisa goes to State Government as the cess. The APMC provides
infrastructure facilities to the sellers, buyers, and traders.
The APMC Darvha provided information regarding the arrivals, sales, and
market fees collected during the year 2006-07. It is observed that all animals i.e.
Bullock, buffalo, cow, and goats are sold under APMC control livestock. The table
shows that there is wide gap between arrivals and sells of animals. This is given in
table- 01
166
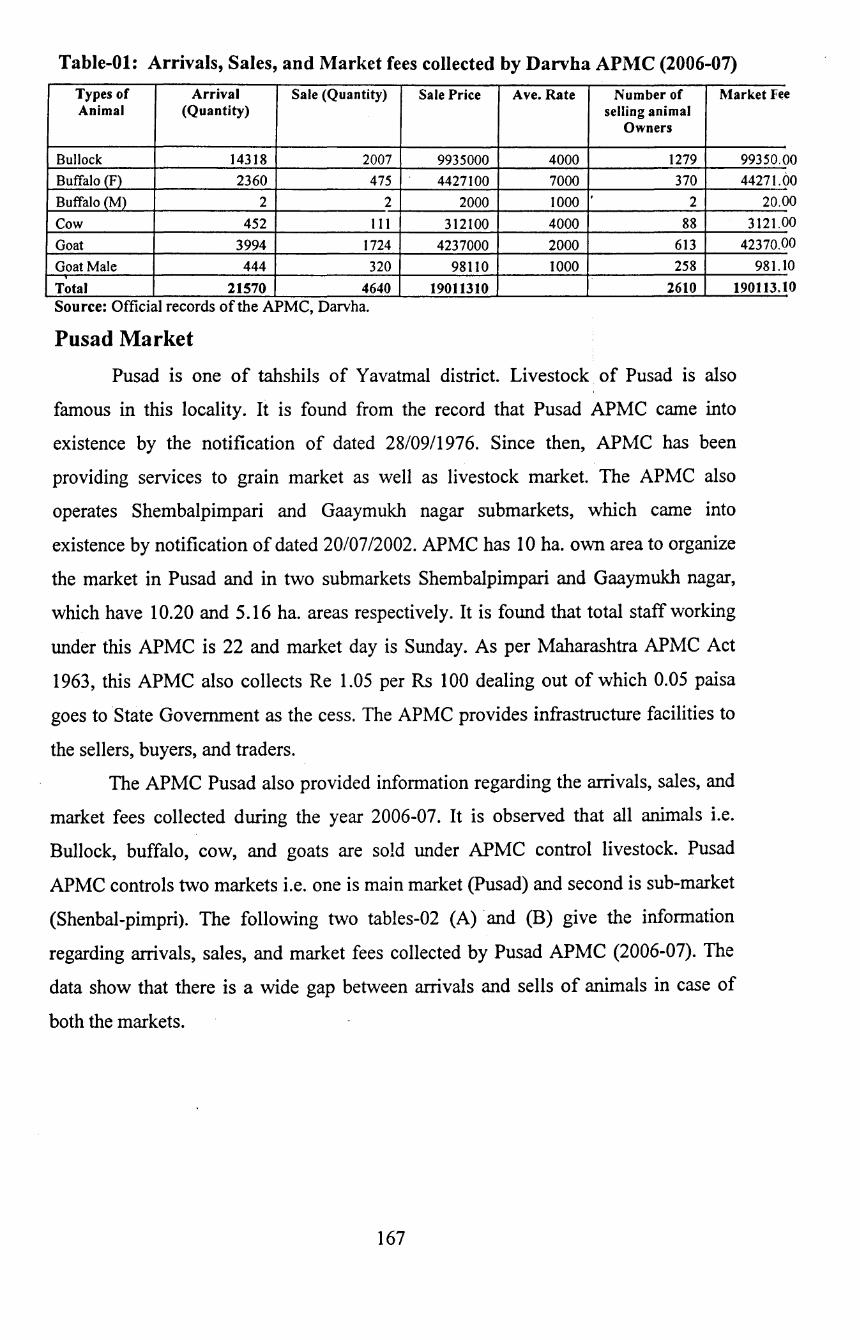
Table-01: Arrivals, Sales, and Market fees collected by Darvha APMC (2006-07)
Types of Arrival Sale (Quantity) Sale Price Ave. Rate Number of Market Fe e Animal (Quantity) selling animal
Owners
Bullock 14318 2007 9935000 4000 1279 99350. Buffalo (F) 2360 475 4427100 7000 370 44271.0 Buffalo (M) 2 2 2000 1000 . 2 20.0 Cow 452 Ill 312100 4000 88 3121.0 Goat 3994 1724 4237000 2000 613 42370.0 Goat Male 444 320 98110 1000 258 981.1
Total 21570 4640 19011310 2610
00 0
0
0
0
0
0 190113.1 Source: Official records of the APMC, Darvha.
Pusad Market
Pusad is one of tahshils of Y avatmal district. Livestock of Pusad is also
famous in this locality. It is found from the record that Pusad APMC came into
existence by the notification of dated 28/09/1976. Since then, APMC has been
providing services to grain market as well as livestock market. The APMC also
operates Shembalpimpari and Gaaymukh nagar submarkets, which came into
existence by notification of dated 20/07/2002. APMC has 10 ha. own area to organize
the market in Pusad and in two submarkets Shembalpimpari and Gaaymukh nagar,
which have 10.20 and 5.16 ha. areas respectively. It is found that total staff working
under this APMC is 22 and market day is Sunday. As per Maharashtra APMC Act
1963, this APMC also collects Re 1.05 per Rs 100 dealing out of which 0.05 paisa
goes to 'State Government as the cess. The APMC provides infrastructure facilities to
the sellers, buyers, and traders.
The APMC Pusad also provided information regarding the arrivals, sales, and
market fees collected during the year 2006-07. It is observed that all animals i.e.
Bullock, buffalo, cow, and goats are sold under APMC control livestock. Pusad
APMC controls two markets i.e. one is main market (Pusad) and second is sub-market
(Shenbal-pimpri). The following two tables-02 (A) ·and (B) give the information
regarding arrivals, sales, and market fees collected by Pusad APMC (2006-07). The
data show that there is a wide gap between arrivals and sells of animals in case of
both the markets.
167

Table-02(A): Arrivals, Sales, and Market fees collected by Pusad APMC Year: (2006-07)
Types of Arrival Sale Sale Price Number of Rate of Recovery Animal (Quantity) (Quantity) selling animal Market Fee
Owners
Cow 4500 2350 2300 Bul1ock 18405 10300 55966300 9500
Recovery
Buffalos 7500 4270 1 Rs. / 100 by Contract
3200 Goat 7310 4380 2865200 3570
System
Total 37715 21300 58831500 18570 421000
Table-02 (B): Arrivals, Sales, and Market fees collected by Pusad APMC (Sub-market· Shenbal-pimpri) .
Types of Arrival Sale Sale Price Number of Rate of Recovery Animal (Quantity) (Quantity) selling animal Market Fee
Owners
Cow 1800 630 920 Bu11ock 7362 2536 3800
Recovery
Buffalos 3000 1050 18372780 1 Rs. I 100 by Contract
1280 System Goat 2000 700 1428 Total 14162 4916 18372780 7428 115000
Source: Official records of the APMC, Pusad.
These two markets (Darvha and Pusad) are famous markets in the district, however, it
is interesting to note that these two markets are not included in the list of the livestock
markets that published by the Animal husbandry statistics.
Kashti Market
Kashti is one of the submarkets of Shrigonda APMC, which also tahshil of
Ahemadnagar district. Livestock of Kashti is famous in this locality particularly for
livestock. It is found from the record that Shrigonda APMC came into existence by
the notification of dated 13/08/1960 and Kashti submarket came to existence by
notification of dated 27/04/1970. Another submarket Ghogargaon came into existence
by notificatio'n of dated 21/11/1998. Since establishment of Shrigonda APMC and
submarkets, they have been providing services to grain market as well as livestock
market. APMC has 6.27 ha. own area to organize the market in Shrigonda and in two
submarkets Kashti and Ghogargaon, which have 4.00 and 3.19 ha. areas respectively.
It is found that total staff working under this APMC is 16 and Kashti market day is
Saturday. As per Maharashtra APMC Act 1963, this APMC also collects Re 1.05 per
Rs 100 dealing out of which 0.05 paisa goes to State Government as the cess. The
APMC provides infrastructure facilities to the sellers, buyers, and traders.
168
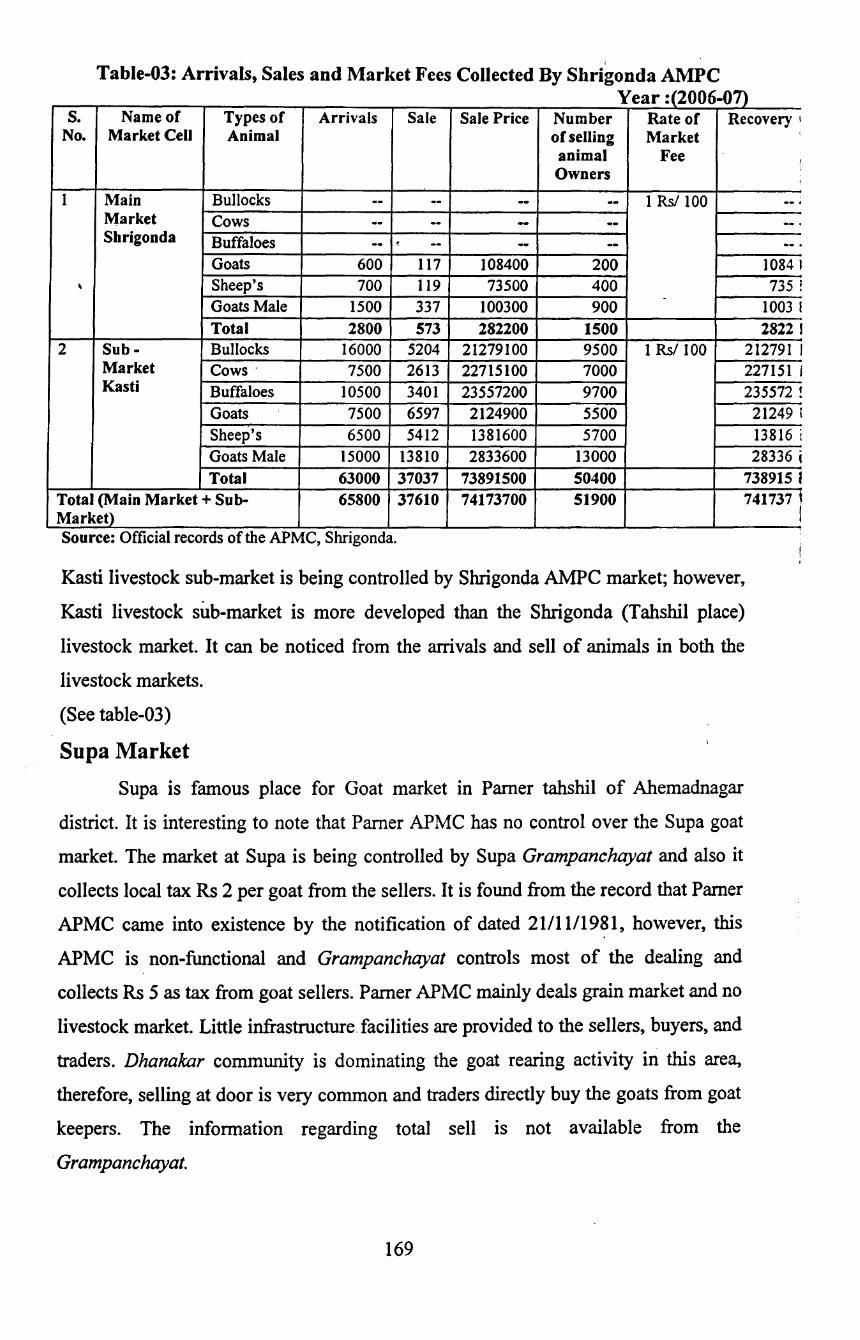
Table-03: Arrivals, Sales and Market Fees Collected By Shrigonda AMPC Year :(2006-07)
s. Name of Types of Arrivals Sale Sale Price Number Rate of Recovery 1
No. Market Cell Animal of selling Market animal Fee ;
Owners
I Main Bullocks -- -- -- -- IRs/ IOO -- . Market Cows -- -- -- -- --. Shrigonda Buffaloes -- ' -- -- -- --.
Goats 600 117 I08400 200 1084 I \ Sheep's 700 119 73500 400 735!
-
Goats Male I500 337 I00300 900 I003 I Total 2800 573 282200 1500 28221
2 Sub- Bullocks I6000 5204 2I279IOO 9500 I Rs/ 100 212791 l Market Cows · 7500 2613 22715IOO 7000 227I51 j Kasti Buffaloes 10500 3401 23557200 9700 235572 !
Goats 7500 6597 2124900 5500 21249 i
Sheep's 6500 5412 1381600 5700 13816 i Goats Male 15000 13810 2833600 13000 28336 • Total 63000 37037 73891500 50400 738915 I
Total (Main Market+ Sub- 65800 37610 74173700 51900 741737 t Market) I Source: Offictal records of the APMC, Shngonda.
Kasti livestock sub-market is being controlled by Shrigonda AMPC market; however,
Kasti livestock sub-market is more developed than the Shrigonda (Tahshil place)
livestock market. It can be noticed from the arrivals and sell of animals in both the
livestock markets.
(See table-03)
Supa Market
Supa is famous place for Goat market in Pamer tahshil of Ahemadnagar
district. It is interesting to note that Pamer APMC has no control over the Supa goat
market. The market at Supa is being controlled by Supa Grampanchayat and also it
collects local tax Rs 2 per goat from the sellers. It is found from the record that Pamer
APMC came into existence by the notification of dated 2111111981, however, this
APMC is non-functional and Grampanchayat controls most of the dealing and
collects Rs 5 as tax from goat sellers. Pamer APMC mainly deals grain market and no
livestock market. Little infrastructure. facilities are provided to the sellers, buyers, and
traders. Dhanakar community is dominating the goat rearing activity in this area,
therefore, selling at door is very common and traders directly buy the goats from goat
keepers. The information regarding total sell is not available from the
· Grampanchayat.
169
Distribution of Sample Goats Keepers
The d.istribution of sample Goat keepers are given in the following table- 04
and table-4A. It is found in tables that in Yavatmal district two markets have been '
selected based on concentration of goat population and their selling. The two markets
are Dharvha 'and Pusad in the district. From each market, two villages have been
selected for samples. In· Darhva tahsil, two villages BoriArab (kh) and Ladkhed, and
in Pusad tahsil, Jambazar and Shilona have been selected for the study. Similarly, in
Ahemadnagar district, two markets Supa and Kasti have been selected and two
villages from each market area have been finalized for the sample. Two villages
Jamgaon and Dhavalpuri have been selected from Supa market area (Pamer Tahsil)
and two villages Belwandi and Vangdari have been selected from Kasti market area in
Shrigonda tahsil of the Ahemadnagar district.
From two samples districts Y avatmal and Ahemadnagar, out of 104 samples,
29 samples are from SC category, 7 samples are from ST category, 31 samples are
from NT category, 15 samples are from OBC category and 22 samples are from Open
category. In percentage terms, 27.88 percent are SC samples households, 6.73 percent
are ST samples households, 29.81 percent are NT samples households, 14.42 percent
are 0 BC samples households and 21.15 percent are Open category households.
In BoriArab (kh) village of Dharvha in Yavatmal district, out of 13 samples, 6
samples are from SC category (46.15 percent), 3 sample are from ST category (23.08
percent), 1 sample from OBC category (7.69 percent) and 3 from Open category
(23.08 percent) of total sample in t_he village. In Ladkhed village of same market, out
of 13 samples, 5 samples are from SC category (38.46 percent), 4 samples are from
OBC category (30.77 percent), and 4 samples are from Open category (30.77
percent).
In Jambazar village in Pusad market, out of 13 samples, 1 sample is from SC
category (7.69 percent), 1 sample is from ST category (7.69 percent), 5 samples are
from NT category (38.46 percent), 6 samples are from Open category ( 46.15 percent).
In Shilona village of same m~ket, out of 13 samples, 1 sample is from SC category
(7.69 percent), 1 sample is from ST category (7.69 percent), 10 samples are from NT
category (76.92 percent) and 1 sample is from Open category (7.69 percent).
In Jamgaon village of Supa market (Tahsil Pamer), out of 13 samples, 6
samples are from SC category (46.15 percent), 1 sample is from ST category (7.69
percent), 1 sample is from NT category (7.69 percent), and 5 samples are from OBC
170
category (38.46 percent). In Dhavalpuri village, out of 13 samples 7 samples are from
SC category (53 .. 85 percent), 3 samples are from NT category (23.08 percent), 1
sample is from OBC category (7.69 percent) and 2 samples are from Open category
(15.38 percent).
In Belwandi village of Kasti market (Tahsil Shrigonda) in Ahemadnagar
district, out of 13 samples, 1 sample is from SC category (7.69 percent), 8 samples are
from NT category (61.54 percent), and 4 samples are from OBC category (30.77 \
percent). In Vangadari village, out of 13 samples, 2 samples are from SC category
(15.38 percent), 1 sample is from SC category (7.69 percent), 4 samples are from NT . category (30.77 percent) and 6 samples are from Open category (46.15 percent).
171

Table-04: Distribution of the Sample Households by Caste across Market of Goats (Nos.)
Name of Yavatmal Ahemadnagar Total the Caste Market- I (Dharvha) Market- II (Pusad) Market- I (Supa) Market- II (Kasti)
Bori Ladkhed Sub JamBazar Shilona Sub Jamgaon Dhavalpuri Sub Belwandi Vangdari Sub (Kh.) Total . Total Total Total Arab
sc 6 5 7 1 1 6 6 7 8 1. 2 8 29 ST 3 0 4 1 I I I 0 0 0 I 2 7 NT 0 0 5 5 10 10 I 3 II 8 4 5 31 OBC I 4 I 0 0 4 5 I 5 4 0 5 15 Open 3 4 9 6 I 5 0 2 2 0 6 6 22 Total 13 13 26 13 13 26 13 13 26 13 13 26 104
Table 4A: Distribution of the Sample Households by Caste across Market of Goats (percent to total.)
Name of the Yavatmal Ahemadnagar Total Caste Market- I _(Dharvha_l Market- II_(Pusad_l Market- I (Supa) Market- II_(Kasti)
Bori Ladkhed Sub Jam Bazar Shilona Sub Jamgaon Dhavalpuri Sub Belwandi Vangdari Sub (kh.)Arab Total Total Total Total
sc 46.15 38.46 26.92 7.69 7.69 23.08 46.15 53.85 30.77 7.69 15.38 30.77 27.88
ST 23.08 0.00 15.38 7.69 7.69 3.85 7.69 0.00 0.00 0.00 7.69 7.69 6.73 NT 0.00 0.00 19.23 38.46 76.92 38.46 7.69 23.08 42.31 61.54 30.77 19.23 29.81 OBC 7.69 30.77 3.85 0.00 0.00 15.38 38.46 7.69 19.23 30.77 0.00 19.23 14.42 Open 23.08 30.77 34.62 46.15 7.69 19.23 0.00 15.38 7.69 0.00 46.15 23.08 21.15
Total 100 100 100 100 100 100 100 100 100 100 100 100 100
172
Annual Income of Goat Keepers
While conducting survey in two sample districts of the state, 104 sample households
reported that, they collectively earn Rs. 2534100 as annual income from agricultural, of
which Rs. 2160350 generated from main agri. business and Rs. 373750 generated from
subsidiary activity of agricultural. If it has been further analyzed information and data, which
have been collected from the survey, found that goat keepers could earn Rs. 20772.60 in an
average. It has been observed that the highest annual income has been earned by in group IV
goat keepers. It is found that the annual income of this category of households, in an average,
is Rs. 22173.91. Further, the lowest per household income from agricultural has been found
in group I, which is Rs.l5379.17. The average annual income sample households from
subsidiary activity of agricultural is found Rs. 373750 and average of per household annual
income is Rs. 3593.75. It is found that the group IV household earned the highest annual
income among four groups from agricultural, which is Rs. 5347.83. The group-! households
earned average annual income Rs. 1158.33, which is the lowest income per household among
four groups of goat keepers.
The average animal Income from dairy business of total sample households is
Rs.5936.91, of which Rs. 3418.46 annual income is from main occupation and Rs.2518.45
from subsidiary income. The highest per household income found in group IV households,
which is Rs. 8226.74 and lowest per households income has been found in group I household,
which is Rs. 4929.17. It has been noticed that the average annual income of sample
households is Rs. 92000.5 from goat rearing activity, of which Rs.5733.13 is generated from
main activity and Rs. 3466.92 has been generated from subsidiary activity. The lowest annual
income from goat rearing activity has been found in group-! households and the highest
annual income has been found in group IV households, which is Rs. 20925.
Like other sectors, it is found that services sector also plays important role to provide
annual income source to the goat keepers. From this activity, while conducting survey in two
districts of the state, it has been found that sample households could generate average annual
income Rs. 2925, of which Rs. 2561.46 has been generated from main business and Rs . . 363.46 has been generate from subsidiary business.
The average annual income from labour work of all sample households is Rs. 6152.88
of which Rs. 3208.41 has been generated from main activity and Rs. 2944.47 has been
generated from subsidiary. The lowest average annual income from this activity has been
173
. reported in group I households and the highest average annual income has been reported in
group II of sample household, which is Rs. 9726.09.
The average annual income from other profession has been reported Rs. 400, in an
average, of which Rs. 209.62 has been generated from. main activity and Rs. 190.3 8 has been
generated from subsidiary. The group I and group II sample households could not report any
income from this profession however, the group IV sample households reported to have
earned Rs. 1721.74 from this profession, which is highest annual income among the sample
households and groups. Group III reported very meager amount from this activity.
From the business activity, the goat keepers added a small amount to the annual
income. While conducting field survey and after available data, it has been reported that Rs.
807.69 could add to the goat keepers income in an average, of which Rs. 430.77 has been
generated from the main activity and Rs. 376.92 has been added from subsidiary.
From other sources of income, goat keepers could add Rs. 230.77 to the main income
in an average, which is also small amount, only group III households could add some income
to the annual income and others sample households, which are in group I, group II and group
IV added nothing to the annual income. (See table-05 (a), (b), (c), and (4)
174

Table OS (a): Socio-Economics Status of Goat Keepers (annual income)
Category Total in group Annual Income I Occupations ( Main and Subsidiary) of Goat Agri Dairy Keepers
I Average II Average Total Average I Average II Average Total Average Group I 24 369100 15379.17 27800 1158.33 396900 16537.5 65900 2745.83 52400 2183.33 118300 4929.17 Group II 23 393000 17086.96 46000 1352.94 439000 19086.96 53785 2338.65 60219 2618.22 114004 4956.70 Group III 34 888250 26125 176950 5204.41 1065200 31329.41 133600 3929.41 62320 1832.94 195920 5762.35 Group IV 23 510000 22173.91 123000 5347.83 633000 27521.74 102235 4445 86980 3781.74 189215 8226.74 Total 104 2160350 20772.60 373750 3593.75 2534100 24366.35 355520 3418.46 261919 2518.45 617439 5936.91
Table continued ..•...•.•
Table OS (b): Annual Income I Occupations (Main and Subsidiary)
Category Total Goat rearing Service of Goat in Keepers group I Average II Average Total Average I Average II Average Total Average Group I 24 26370 1098.75 2710 112.92 29080 1211.67 60200 2508.33 11200 466.67 71400 2975 Group II 23 68650 2984.78 26000 1130.43 94650 4115.22 156000 6782.61 8000 347.83 164000 7130.43 Group III 34 225480 6631.76 126320 3715.29 351800 10347.06 24600 723.53 13000 382.35 37600 1105.88 Group IV 23 275745 11988.91 205530 8936.09 481275 20925 25600 1113.04 5600 243.48 31200 1356.52 Total 104 596245 5733.13 360560 3466.92 956805 9200.05 266400 2561.54 37800 363.46 304200 2925
Table continued ••.•••..•
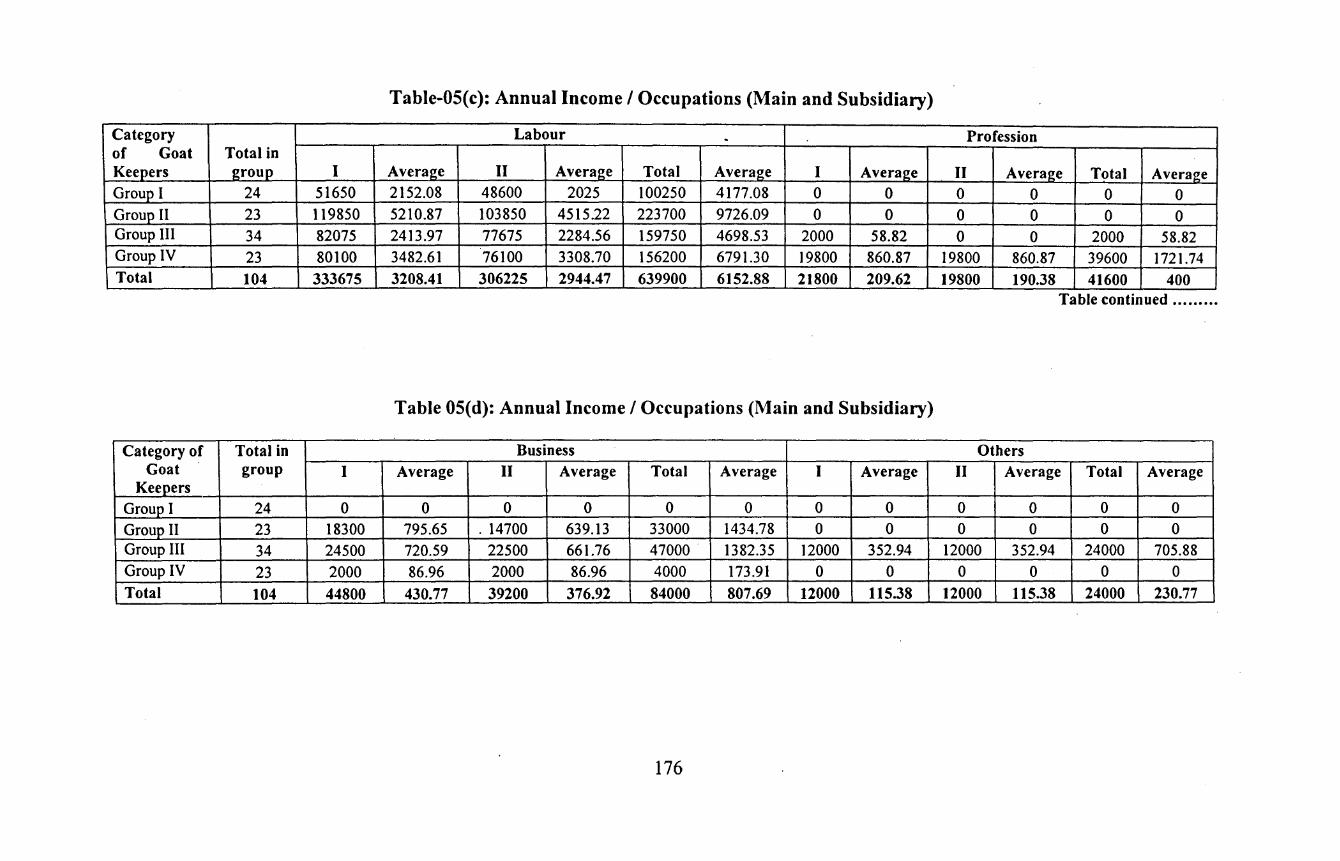
Table-OS(c): Annual Income I Occupations (Main and Subsidiary)
Category Labour . Profession of Goat Total in Keepers group I Average II Average Total Average I Average II Average Total Average Group I 24 51650 2152.08 48600 2025 100250 4177.08 0 0 0 0 0 0 Group II 23 119850 5210.87 103850 4515.22 223700 9726.09 0 0 0 0 0 0 Group III 34 82075 2413.97 77675 2284.56 159750 4698.53 2000 58.82 0 0 2000 58.82 Group IV 23 80100 3482.61 76100 3308.70 156200 6791.30 19800 860.87 19800 860.87 39600 1721.74 Total 104 333675 3208.41 306225 2944.47 639900 6152.88 21800 209.62 19800 190.38 41600 400
Table continued •••..•...
Table OS( d): Annual Income I Occupations (Main and Subsidiary)
Category of Total in Business Others Goat group I Average II Average Total Average I Average II Average Total Average
Keepers Group I 24 0 0 0 0 0 0 0 0 0 0 0 0 Group II 23 18300 795.65 . 14700 639.13 33000 1434.78 0 0 0 0 0 0 Group III 34 24500 720.59 22500 661.76 47000 1382.35 12000 352.94 12000 352.94 24000 705.88 Group IV 23 2000 86.96 2000 86.96 4000 173.91 0 0 0 0 0 0 Total 104 44800 430.77 39200 376.92 84000 807.69 12000 115.38 12000 115.38 24000 230.77
176
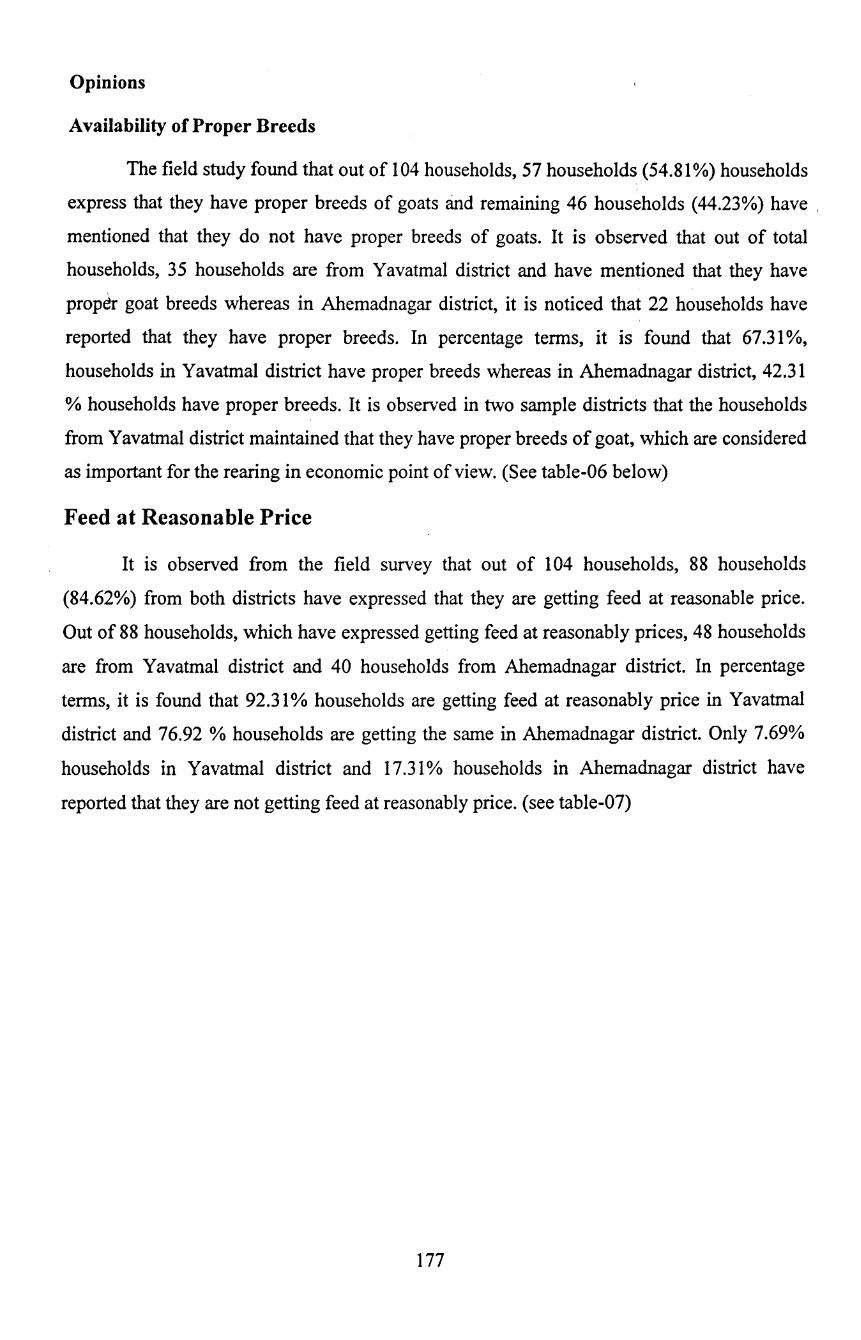
Opinions
Availability of Proper Breeds
The field study found that out of 104 households, 57 households (54.81%) households
express that they have proper breeds of goats and remaining 46 households (44.23%) have '
mentioned that they do not have proper breeds of goats. It is observed that out of total
households, 35 households are from Yavatmal district and have mentioned that they have
prop~ goat breeds whereas in Ahemadnagar district, it is noticed that 22 households have
reported that they have proper breeds. In percentage terms, it is found that 67.31 %,
households in Yavatmal district have proper breeds whereas in Ahemadnagar district, 42.31
%households have proper breeds. It is observed in two sample districts that the households
from Yavatmal district maintained that they have proper breeds of goat, which are considered
as important for the rearing in economic point of view. (See table-06 below)
Feed at Reasonable Price
It is observed from the field survey that out of 104 households, 88 households
(84.62%) from both districts have expressed that they are getting feed at reasonable price.
Out of 88 households, which have expressed getting feed at reasonably prices, 48 households
are from Yavatmal district and 40 households from Ahemadnagar district. In percentage
terms, it is found that 92.31% households are getting feed at reasonably price in Yavatmal
district and 76.92 %households are getting the same in Ahemadnagar district. Only 7.69%
households in Y avatmal district and 17.31% households in Ahemadnagar district have
reported that they are not getting feed at reasonably price. (see table-07)
177
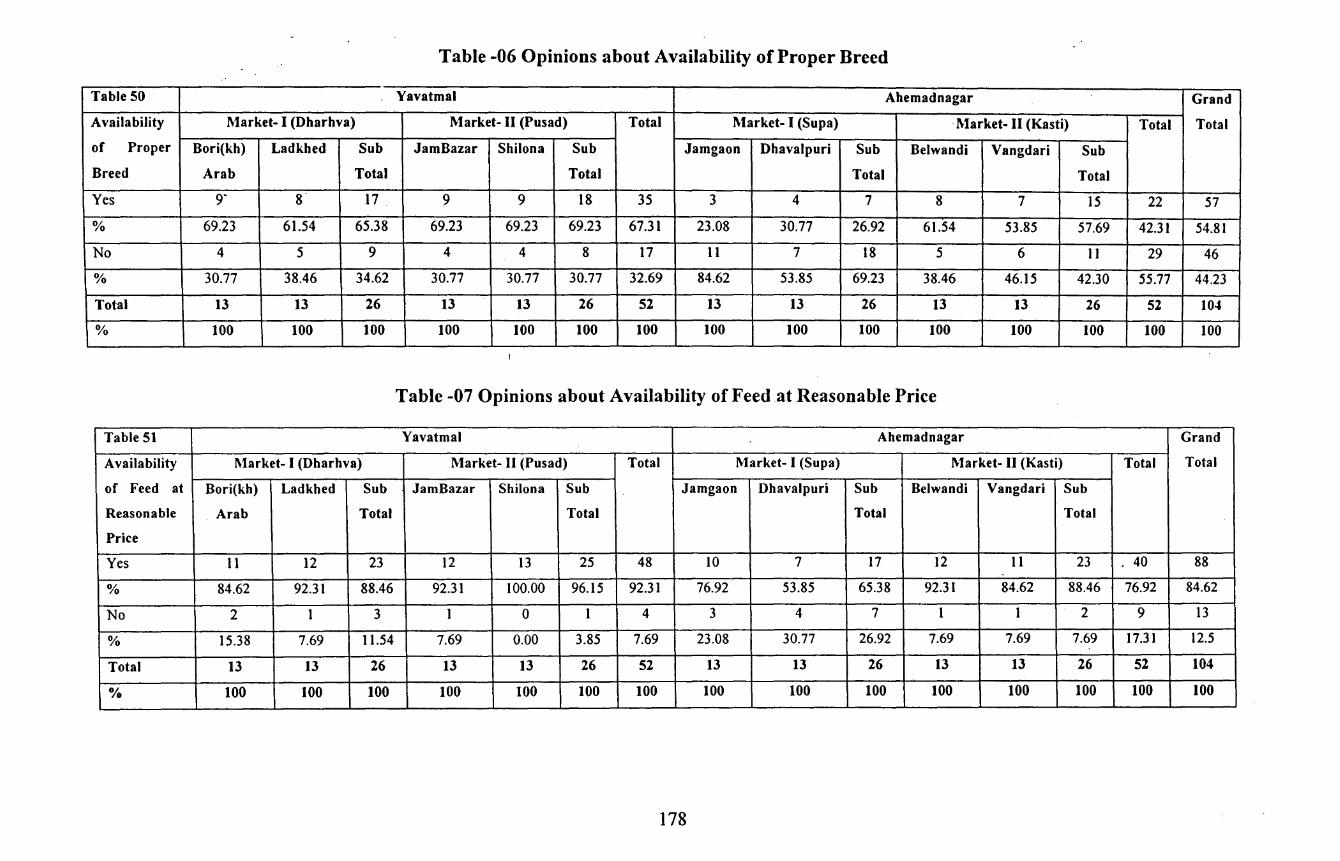
Table -06 Opinions about Availability of Proper Breed
Table 50 Yavatmal Ahemadnagar Grand
Availability Market- I (Dharhva) Market- II (Pusad) Total Market- I (Supa) ·Market- II (Kasti) Total Total
of Proper Bori(kh) Ladkhed Sub JamBazar Shilona Sub Jamgaon Dhavalpuri Sub Belwandi Vangdari Sub
Breed Arab Total Total Total Total
Yes 9" 8 17 9 9 18 35 3 4 7 8 7 15 22 57
% 69.23 61.54 65.38 69.23 69.23 69.23 67.31 23.08 30.77 26.92 61.54 53.85 57.69 42.31 54.81
No 4 5 9 4 4 8 17 11 7 18 5 6 11 29 46
% 30.77 38.46 34.62 30.77 30.77 30.77 32.69 84.62 53.85 69.23 38.46 46.15 42.30 55.77 44.23
Total 13 13 26 13 13 26 52 13 13 26 13 13 26 52 104
% 100 100 100 100 100 100 100 100 100 100 100 100 100 100 100
Table -07 Opinions about Availability of Feed at Reasonable Price
Table 51 Yavatmal A hemad nagar Grand
Availability Market- I (Dharhva) Market- II (Pusad) Total Market- I (Supa) Market- II (Kasti) Total Total
of Feed at Bori(kh) Ladkhed Sub JamBazar Shilona Sub Jamgaon Dhavalpuri Sub Belwandi Vangdari Sub
Reasonable Arab Total Total Total Total
Price
Yes 11 12 23 12 13 25 48 10 7 17 12 11 23 . 40 88
% 84.62 92.31 88.46 92.3I IOO.OO 96.15 92.3I 76.92 53.85 65.38 92.31 84.62 88.46 76.92 84.62
No 2 1 3 1 0 I 4 3 4 7 1 I 2 9 13
% 15.38 7.69 U.54 7.69 0.00 3.85 7.69 23.08 30.77 26.92 7.69 7.69 7.69 I7.3I 12.5
Total 13 13 26 13 13 26 52 13 13 26 13 13 26 52 104
% 100 100 100 100 100 100 100 100 100 100 100 100 100 100 100
178
Proper Treatment from Veterinary Hospitals
Out of 104 sample households, it is observed that 91 households (87.5%) have
reported that they availed the treatment facility from the veternity hospitals in both sample
districts of the state. Out of which those avail facility of veternity hospitals, 49 households
are identified from Yavatmal district (out of total 52 sample households). In percentage term,
it is found that 94.23% households availed the veterinary services whereas in Ahemadnagar
district, 80.77% households out of 52 households availed veterinary services. The field study
found that the maximum sample households from Yavatmal district are aware about the
veterinary services than other sample district Ahemadnagar. It is noticed that a very few
households are found that they are not taking advantage of veterinary services and hospitals.
(See table-08)
Knowledge of Diagnosis of Diseases
Out of sample households, it is observed that 93 households (89.42%) have reported
that doctors are frequently visiting to the goat keepers' houses. However, 9 households
(8.65%) have shown unawareness and knowledge of diagnosis of diseases and 2 households
(1.92%) have not responded to this question.
It is found that when question asked about availability of medicine from hospitals, 90
households (86.54%) have reported that they get medicine from hospitals and 13 households
(12.5%) have reported that they have not received any medicine from hospitals. Only 1
household has not mentioned any response about question.
It is found that 91 households (87.5%) have reported that they got free medicine
whereas 11 households (10.58%) have reported nothing about free medicine. 2 households
have not recorded their response on free medicine.
It is noticed that 31.73% households have reported prices of medicine were high
whereas 38.46% households have mentioned prices of medicine were low and 29.80%
households have reported nothing about the prices of the medicine.
It is observed that 7 households reported mortality is high, 64 households (61.54%)
have reported mortality is low, and 33 households (31.73%) have not recorded any response
for mortality. It is found that 85.58% households have reported that the intensity of disease
of goat is high, 11 households have reported that the intensity of goat is low, and 4
households have reported nothing about the diseases. (see Table-09)
179
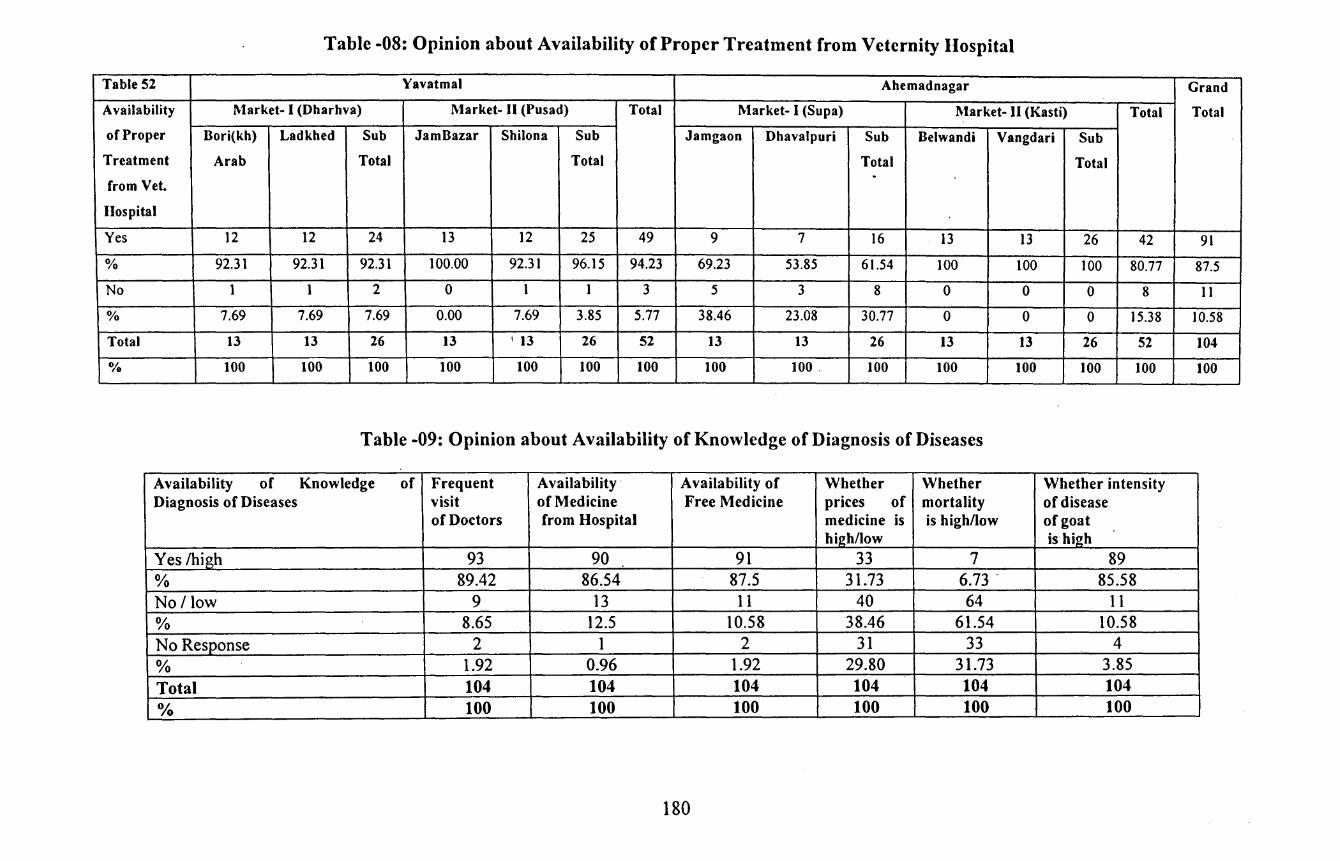
Table -08: Opinion about Availability of Proper Treatment from Veternity Hospital
Table 52 Yavatmal Ahemadnagar Grand
Availability Market- I (Dharhva) Market- II (Pusad) Total Market- I (Supa) Market- II (Kasti) Total Total
of Proper Bori(kh) Ladkhed Sub JamBazar Shilona Sub Jamgaon Dhavalpuri Sub Belwandi Vangdari Sub
Treatment Arab Total Total Total Total . from Vet.
Hospital
Yes 12 12 24 13 12 25 49 9 7 16 13 13 26 42 91
% 92.31 92.31 92.31 100.00 92.31 96.15 94.23 69.23 53.85 61.54 100 100 100 80.77 87.5
No 1 1 2 0 1 1 3 5 3 8 0 0 0 8 II
% 7.69 7.69 7.69 0.00 7.69 3.85 5.77 38.46 23.08 30.77 0 0 0 15.38 10.58
Total 13 13 26 13 I 13 26 52 13 13 26 13 13 26 52 104
o;o 100 100 100 100 100 100 100 100 100 . 100 100 100 100 100 100
Table -09: Opinion about Availability of Knowledge of Diagnosis of Diseases
Availability of Knowledge of Frequent Availability· Availability of Whether Whether Whether intensity Diagnosis of Diseases visit of Medicine Free Medicine prices of mortality of disease
of Doctors from Hospital medicine is is high/low of goat high/low is high
Yes /high 93 90 91 33 7 89 % 89.42 86.54 87.5 31.73 6.73. 85.58 No I low 9 13 11 40 64 11 % 8.65 12.5 10.58 38.46 61.54 10.58 No Response 2 1 2 31 33 4
% 1.92 0.96 1.92 29.80 31.73 3.85
Total 104 104 104 104 104 104 0/o 100 100 100 100 100 100
180
Availability of Grazing Land
The field study observed that 85 households (81.73%) have reported that they have . grazing land for their goats, whereas 14 households (13.46%) have reported that they have no
grazing land available for their goats. It is noticed that 44 households (84.61 %) from
Y avatmal district have reported that they have available grazing land and 5 households
(9 .61%) have reported that they do not have grazing land and in Ahemadnagar district 41
hous((holds have reported they have grazing land and 9 households have reported that no
grazing land available for them. It is found that the majority households from both the
districts have reported that they have grazing land available. (See table-1 0)
Sufficient Place for Keeping Goats
The field survey revealed that 88 sample households (84.62%) from both districts
have expressed that they have sufficient place for goat keepings. It is found that in Yavatmal
district, out of 52 sample households, 45 households (86.54%) have the sufficient place for
goat keepers. Remaining households 13.46% in Yavatmal district and 17.31% in
Ahemadnagar district have revealed that they have no sufficient place for goat keepings. If
the data is analyzed village-wise, it is found that in Yavatmal district, 2 households each in
Bori Arab (kh), Ladkhed (both in Darvha market area) and Shilona (Pusad market area) have
revealed that they have no sufficient place for goat keeping. Similarly, in Ahemadnagar
district, it is found that 2 households each in Jamgaon (Supa market), Belwandi and
V angdari, and 3 households in Dhavalpuri have revealed that they have no place for goat
keeping. However, it is noticed from the field study that majority households have reserve
space for goat keeping in both district of the state. (See table-11)
181

Table -10: Opinion about Availability of Grazing Land
Table 54 Yavatmal Ahemadnagar Grand
A vail ability Market- I (Dharhva) Market- II (Pusad) Total Market- I (Supa) Market- II (Kasti) Total Total
of Grazing Bori(kh) Ladkhed Sub Jamllazar Shilona Sub Jamgaon Dhavalpuri Sub llelwandi Vangdari Sub
Land Arab Total Total Total Total . Yes 10 9 19 13 12 25 44 11 6 17 12 12 24 41 85
% 76.92 69.23 73.07 100 92.30 96.15 84.61 84.62 46.15 65.38 92J1 92.31 92.30 78.84 81.73
No 3 2 5 0 0 0 5 2 5 7 1 1 2 9 14
% 23.08 15.38 19.23 0 0 0 9.61 15.38 38.46 26.92 7.69 7.69 7.69 17.31 13.46
Total 13 13 26 13 13 26 52 13 13 26 13 13 26 52 104
o;o 100 100 100 100 190 100 100 100 100 100 100 100 100 100 100
Table -11: Opinion about Availability of Sufficient Place for Keeping Goats
Table 55 Yavatmal A hemad nagar Grand
Availability of Market- I (Dharhva) Market- II (Pusad) Total Market- I (Supa) Market- II (Kasti) Total Total
Sufficient Bori(kh) Ladkhed Sub JamBazar Shilona Sub Jamgaon Dhavalpuri Sub Belwandi Vangdari Sub
Place for keeping Goats Arab
Total Total Total Total
Yes II II 22 12 II 23 45 II 10 21 II II 22 43 88
% 84.62 84.62 84.62 92.31 84.62 88.46 86.54 84.62 76.92 80.77 84.62 84.62 84.62 82.69 84.62
No 2 2 4 1 2 3 7 2 3 5 2 2 4 9 16
% 15.38 15.38 15.38 7.69 15.38 11.54 13.46 15.38 23.08 19.23 15.38 15.38 15.38 17.31 15.38
Total 13 l3 26 13 13 26 52 l3 13 26 13 13 26 52 104
% 100 100 100 100 100 100 100 100 100 100 100 100 100 100 100
182
Availability of Institutional Credit:
a) Availability of Timely Credit
The field study found that 38.46 households have expressed their positive response to
have timely credit availability from institutional source whereas 35.58% have responded that
they have no such credit availability from institutional sources. It is interesting to note that
25.96% households have not responded anything for the credit availability from institutional \
sources. Further, when field data analyzed district-wise, out of total sample households in
districts, 18 households (34.62%) in Yavatmal district, and 14 households (53.85%) in
Ahemadnagar district have responded positively to have credit availability from institutional
sources. Similarly, same numbers of households in Yavatmal district and 19 households
(36.54%) in Ahemadnagar district have said that they have not availed the credit facility from
institutional sources. (See table-12 (a))
b) Availability of Adequately Credit
It is observed from the field study that out of total sample households, 36.54%
households have opined that they get credit from institutional source adequately. It is noticed
that out of 34 households, 18 households are identified from Yavatmal district and remaining
households are from Ahemadnagar district. It is found that same number of households have
responded negative about the adequately credit from institutional source in Yavatmal district
whereas 21 households have expressed inadequate credit available from institutional sources
in Ahemadnagar district. It is found that many households have not given their responses to
this question in Yavatmal district and in Ahemadnagar district. The majot finding is that most
of the households are not satisfied with credit availability channels, which are available at
gross root level mostly from institutional sources. The field result is given in Table-12 (b)
183
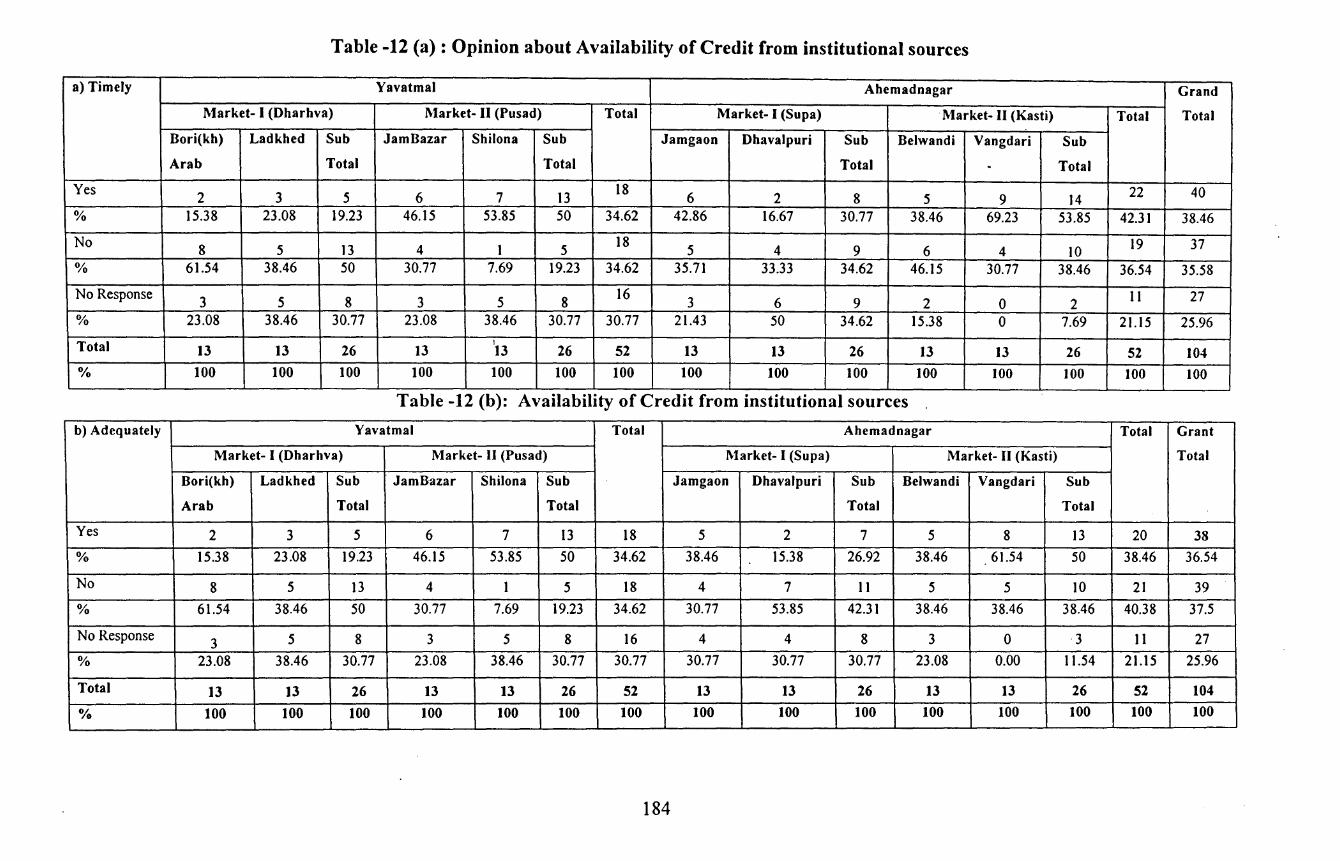
Table -12 (a): Opinion about Availability of Credit from institutional sources
a) Timely Yavatmal Ahem ad nagar Grand
Market- I (Dharhva) Market- II (Pusad) Total Market- I (Supa) Market- II (Kasti) Total Total
Bori(kh) Ladkhed Sub Jam Bazar Shilona Sub Jamgaon Dhavalpuri Sub Belwandi Vangdari Sub
Arab Total Total Total . Total
Yes 2 3 5 6 7 13
18 6 2 8 5 9 14 22 40
% 15.38 23.08 19.23 46.15 53.85 50 34.62 42.86 16.67 30.77 38.46 69.23 53.85 42.31 38.46
No 8 5 13 4 1 5 18 5 4 9 6 4 10 19 37
% 61.54 38.46 50 30.77 7.69 19.23 34.62 35.71 33.33 34.62 46.15 30.77 38.46 36.54 35.58
No Response 3 5 8 3 5 8
16 3 6 9 2 0 2
II 27
% 23.08 38.46 30.77 23.08 38.46 30.77 30.77 21.43 50 34.62 15.38 0 7.69 21.15 25.96
Total 13 13 26 13 I 13 26 52 13 13 26 13 13 26 52 104
% 100 100 100 100 100 100 100 100 100 100 100 100 100 100 100 . Table -12 (b): Availability of Credit from institutional sources .
b) Adequately Yavatmal Total Ahemadnagar Total Grant
Market- I (Dharhva) Market- II (Pusad) Market- I (Supa) Market- II (Kasti) Total
Bori(kh) Ladkhed Sub · JamBazar Shilona Sub Jamgaon Dhavalpuri Sub Belwandi Vangdari Sub
Arab Total Total Total Total
Yes 2 3 5 6 7 13 18 5 2 7 5 8 13 20 38 % 15.38 23.08 19.23 46.15 53.85 50 34.62 38.46 15.38 26.92 38.46 61.54 50 38.46 36.54
No 8 5 13 4 I 5 18 4 7 II 5 5 10 21 39
% 61.54 38.46 50 30.77 7.69 19.23 34.62 30.77 53.85 42.31 38.46 38.46 38.46 40.38 37.5
No Response 3 5 8 3 5 8 16 4 4 8 3 0 3 II 27
% 23.08 38.46 30.77 23.08 38.46 30.77 30.77 30.77 30.77 30.77 23.08 0.00 11.54 21.15 25.96
Total 13 13 26 13 13 26 52 13 13 26 13 13 26 52 104 0/o 100 100 100 100 100 100 100 100 100 100 100 100 100 100 100
184
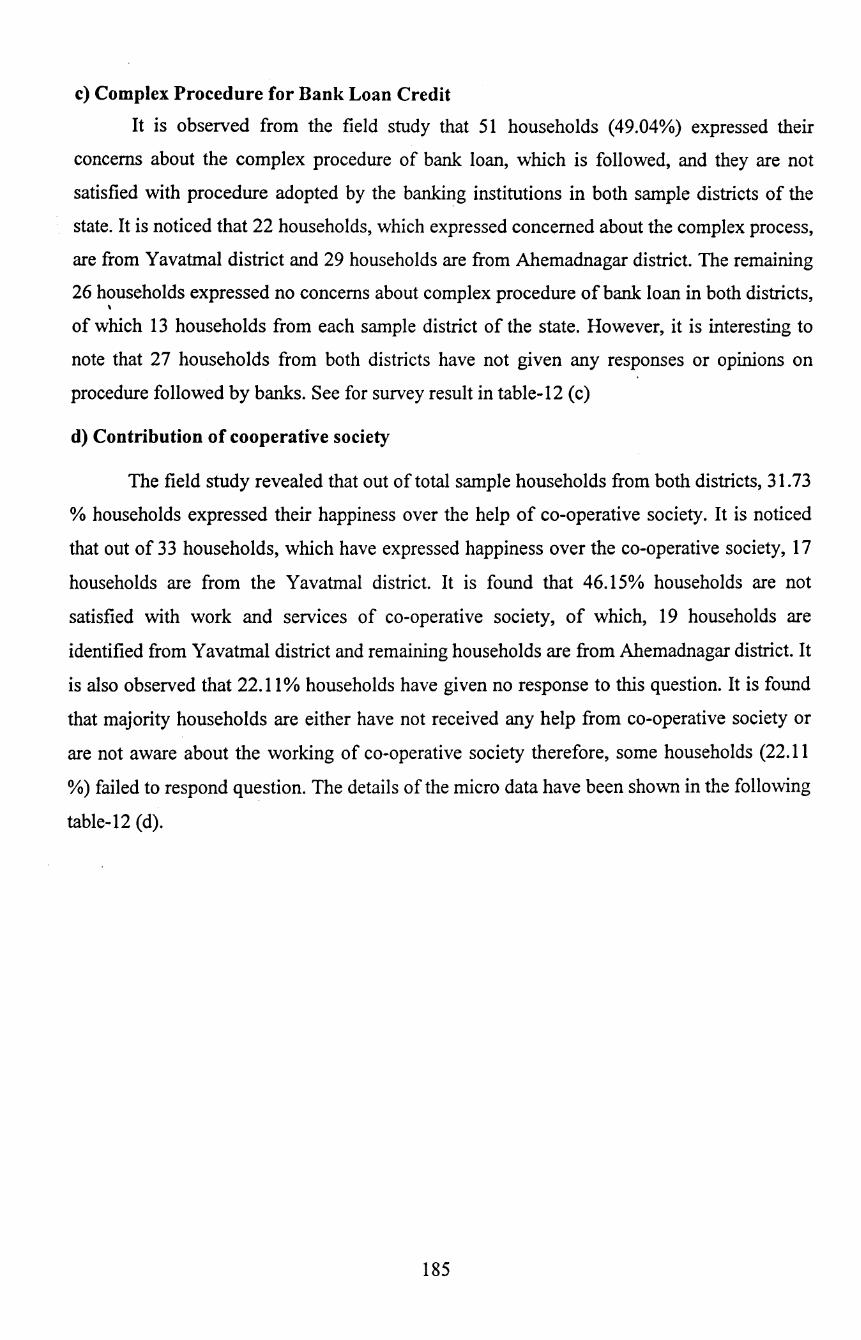
c) Complex Procedure for Bank Loan Credit
It is observed from the field study that 51 households (49.04%) expressed their
concerns about the complex procedure of bank loan, which is followed, and they are not
satisfied with procedure adopted by the banking institutions in both sample districts of the
state. It is noticed that 22 households, which expressed concerned about the complex process,
are from Yavatmal district and 29 households are from Ahemadnagar district. The remaining
26 households expressed no concerns about complex procedure of bank loan in both districts, \
of which 13 households from each sample district of the state. However, it is interesting to
note that 27 households from both districts have not given any responses or opinions on
procedure followed by banks. See for survey result in table-12 (c)
d) Contribution of cooperative society
The field study revealed that out of total sample households from both districts, 31.73
% households expressed their happiness over the help of co-operative society. It is noticed
that out of 33 households, which have expressed happiness over the co-operative society, 17
households are from the Y avatmal district. It is found that 46.15% households are not
satisfied with work and services of co-operative society, of which, 19 households are
identified from Y avatmal district and remaining households are from Ahemadnagar district. It
is also observed that 22.11% households have given no response to this question. It is found
that majority households are either have not received any help from co-operative society or
are not aware about the working of co-operative society therefore, some households (22.11
%) failed to respond question. The details of the micro data have been shown in the following
table-12 (d).
185
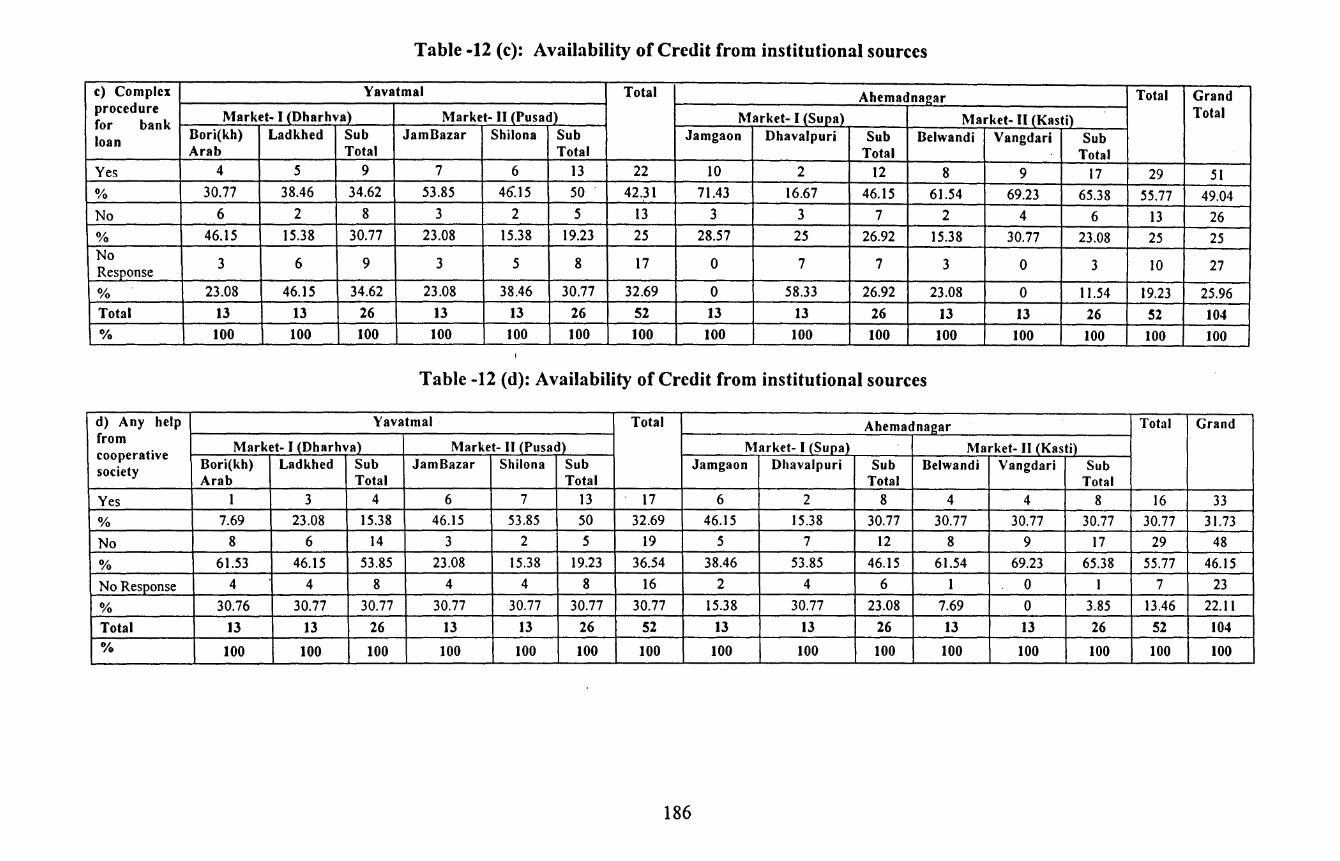
Table -12 (c): Availability of Credit from institutional sources
c) Complex Yavatmal Total Ahemadnaf!ar Total Grand procedure
Market- I (Dharhva) Market- IIJPusadl Market- I (Sups) Market- II (Kasti) Total for bank loan Bori(kh) Ladkhed Sub Jam Bazar Shilona Sub Jamgaon Dhavalpuri Sub Belwandi Vangdari Sub
Arab Total Total Total Total Yes 4 5 9 7 6 13 22 10 2 12 8 9 17 29 51 % 30.77 38.46 34.62 53.85 46.15 50 . 42.31 71.43 16.67 46.15 61.54 69.23 65.38 55.77 49.04 No 6 2 8 3 2 5 13 3 3 7 2 4 6 13 26 % 46.15 15.38 30.77 23.08 15.38 19.23 25 28.57 25 26.92 15.38 30.77 23.08 25 25 No
3 6 9 3 5 8 17 Response 0 7 7 3 0 3 10 27
% 23.08 46.15 34.62 23.08 38.46 30.77 32.69 0 58.33 26.92 23.08 0 11.54 19.23 25.96 Total 13 13 26 13 13 26 52 13 13 26 13 13 26 52 104 o;o 100 100 100 100 100 100 100 100 100 100 100 100 100 100 100
Table -12 (d): Availability of Credit from institutional sources
d) Any help Yavatmal Total Ahemadnagar Total Grand from
Market- I (Dharhval Market- II JPusadl Market- I (Supa) Market- II_(Kasti)_ cooperative Bori(kh) Ladkhed Sub Jam Bazar Shilona Sub Jamgaon Dhavalpuri Sub Belwandi Vangdari Sub society Arab Total Total Total Total
Yes 1 3 4 6 7 13 17 6 2 8 4 4 8 16 33
% 7.69 23.08 15.38 46.15 53.85 50 32.69 46.15 15.38 30.77 30.77 30.77 30.77 30.77 31.73
No 8 6 14 3 2 5 19 5 7 12 8 9 17 29 48
% 61.53 46.15 53.85 23.08 15.38 19.23 36.54 38.46 53.85 46.15 61.54 69.23 65.38 55.77 46.15
No Response 4 4 8 4 4 8 16 2 4 6 1 0 I 7 23
% 30.76 30.77 30.77 30.77 30.77 30.77 30.77 15.38 30.77 23.08 7.69 0 3.85 13.46 22.1 I
Total 13 13 26 13 13 26 52 13 13 26 13 13 26 52 104 o;o 100 100 100 100 100 100 100 100 100 100 100 100 100 100 100
186
e) Membership of SHGs
The field survey revealed that 33.65% households are a part of SHG for goat keepers.
However, it is noticed that 45.19% households have no membership and 'are not part of SHGs
venture. In addition, it is interesting that 21.15 % households have not ~iven any response to
this question. Those who are the part of SHGs, in both districts, 51.43 % households are
identified from the Yavatmal district and remaining households are from Ahemadnagar
distric~. It is noticed that those who are not part of the SHGs, 44.68 % households are
identified from Yavatmal district and remaining households are from Ahemadnagar district.
Those who have not responded for this question, 59.09 % households are from Yavatmal
district and remaining are from the Ahemadnagar district. The data category revealed that the
SHGs have not helped to the sample households for the goat keeping activities as the number
of households, which availed the facility from the SHGs, are even less than 34 %. The details
of the survey result are given in table- 12 (e).
f) Interest Rate
The field survey revealed that out of total sample households, 53.85% households
have expressed that the interest rate charge by the institutional sources, are high. Out of those
responded by saying the credits rates are high, 42.86% households are identified from the
Yavatmal district and remaining households are from Ahemadnagar district. It is also found
that 13.46% households have responded that the institutional credit rates are not high and it is
observed that they are satisfied with the present rate of interest, which are offered by the
institutional sources. If it is analyzed district-wise data, it is noticed that those, who are
satisfied with present rate of interest, 78.57% households are from Yavatmal district and
remaining households are from Ahemadnagar district. However, it is found that 34
households have not responded to this question and 50% households are from Y avatmal
district and the same percentage households are also from Ahemadnagar district. It is clear
that majority of households are not satisfied with the present structure of· the rate of interest,
which are consider as high for them. See table No. 12 (f) for detail survey result.
187
Table -12 (e): Availability of Credit from institutional sources
e) Are you Yavatmal Total Ahemadnagar Total Grand part of
Market- I (Dharhval Market- II 1Pusad) Market- I (Supa) Market- II (Kastll_ Total SIIGs for goat Bori(kh) Ladkhed Sub Jam Bazar Shilona Sub Jamgaon Dhavalpuri Sub Belwandi Vangdari Sub keepers Arab Total Total Total Total . Yes 2 3 5 6 7 13 18 7 3 10 4 3 7 17 35 % 15.38 23.08 19.23 46.15 53.85 50 34.62 53.84 23.08 38.46 15.38 23.08 26.92 32.69 33.65 No 8 7 15 4 2 6 21 5 7 12 ·5 9 14 26 47 % 61.54 53.85 57.69 30.77 15.38 23.08 40.38 38.46 53.85 46.15 38.46 69.23 53.85 50 45.19 No
3 3 6 3 4 7 13 Response 1 3 4 4 1 5 9 22
% 23.08 23.08 23.08 23.08 30.77 26.92 25 7.69 23.08 15.38 30.76 7.69 19.23 17.30 21.15
Total 13 13 26 13 1~ 26 52 13 13 26 13 13 26 52 104 0/o 100 100 100 100 100 100 100 100 100 100 100 100 100 100 100
Table -12 (f): Availability of Credit from institutional sources
f) Whether Yavatmal Total Ahemadna2ar Total Grand the Interest
Market- I (Dharhva) Market- II (Pusad) Market- I (Supa) Market- II (Kasti) Total Rate is
Bori(kh) Ladkhed Sub Jam Bazar Shilona Sub Jamgaon Dhavalpuri Sub Belwandi Vangdari Sub High Arab Total Total Total Total
Yes 7 5 12 8 4 12 24 9 4 13 8 11 19 32 56
% 53.85 38.46 46.15 61.54 30.77 46.15 46.15 64.29 33.33 50 61.54 84.62 73.08 61.54 53.85
No 1 4 5 2 4 6 11 0 1 1 2 0 2 3 14
% 7.69 30.77 19.23 15.38 30.77 23.08 21.15 0 8.33 3.85 15.38 0 7.69 5.77 13.46
No 5 4 9 3 5 8 17 5 7 12 3 2 5 17 34 Response
% 38.46 30.77 34.62 23.08 38.46 30.77 32.69 35.71 58.33 46.15 . 23.08 15.38 19.23 32.69 32.69
Total 13 13 26 13 13 26 52 13 13 26 13 13 26 52 104 0/o 100 100 100 100 100 100 100 100 100 100 100 100 100 100 100
188
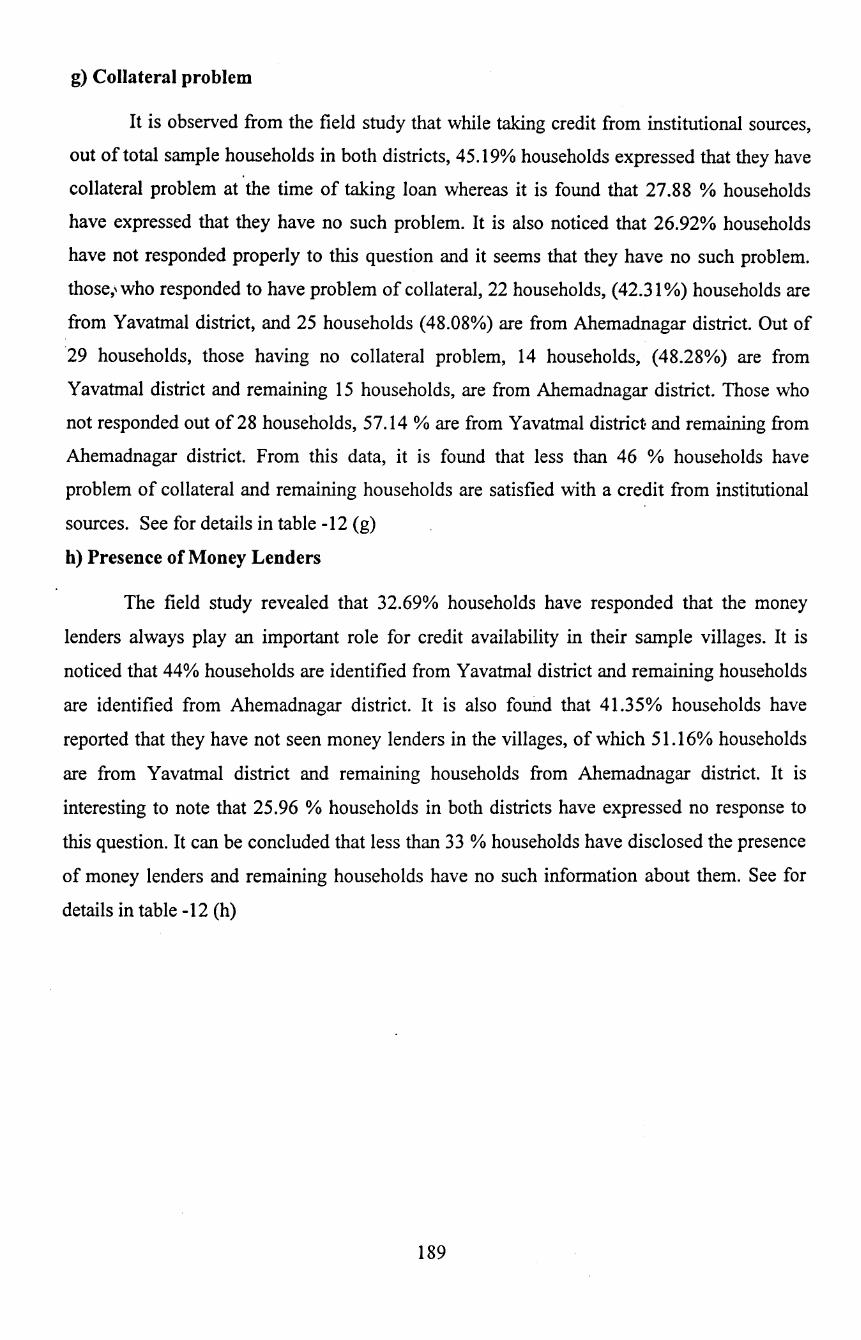
g) Collateral problem
It is observed from the field study that while taking credit from institutional sources,
out of total sample households in both districts, 45.19% households expressed that they have
collateral problem at the time of taking loan whereas it is found that 27.88 % households
have expressed that they have no such problem. It is also noticed that 26.92% households
have not responded properly to this question and it seems that they have no such problem.
those,' who responded to have problem of collateral, 22 households, ( 42.31%) households are
from Yavatmal district, and 25 households (48.08%) are from Ahemadnagar district. Out of
29 households, those having no collateral problem, 14 households, (48.28%) are from
Yavatmal district and remaining 15 households, are from Ahemadnagar district. Those who
not responded out of 28 households, 57.14% are from Yavatmal district and remaining from
Ahemadnagar district. From this data, it is found that less than 46 % households have
problem of collateral and remaining households are satisfied with a credit from institutional
sources. See for details in table -12 (g)
h) Presence of Money Lenders
The field study revealed that 32.69% households have responded that the money
lenders always play an important role for credit availability in their sample villages. It is
noticed that 44% households are identified from Yavatmal district and remaining households
are identified from Ahemadnagar district. It is also found that 41.35% households have
reported that they have not seen money lenders in the villages, of which 51.16% households
are from Yavatmal district and remaining households from Ahemadnagar district. It is
interesting to note that 25.96 % households in both districts have expressed no response to
this question. It can be concluded that less than 33% households have disclosed the presence
of money lenders and remaining households have no such information about them. See for
details in table -12 (h)
189
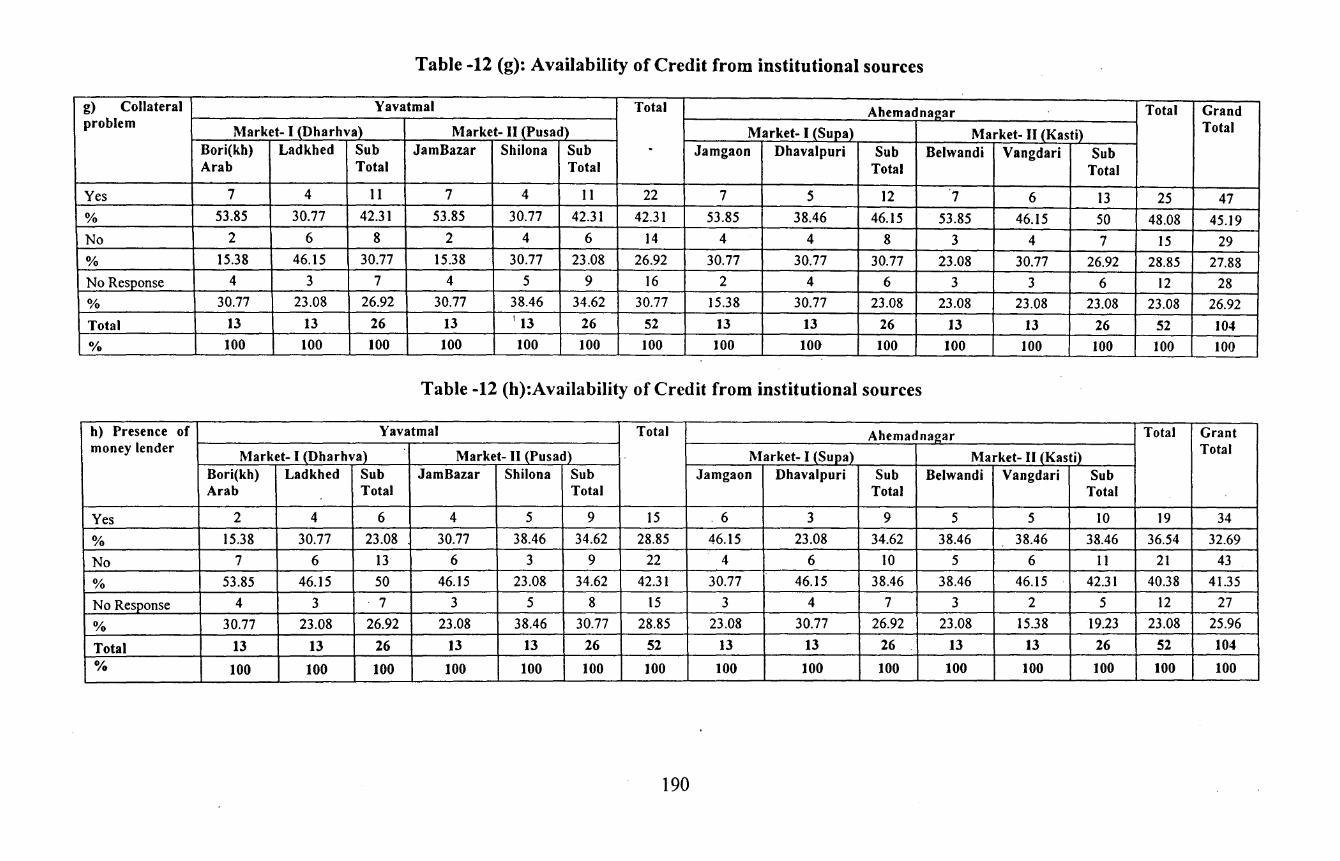
Table -12 (g): Availability of Credit from institutional sources
g) Collateral Yavatmal Total Ahemadna2ar Total Grand problem
Market- I (Dharhva) Market- II (Pusad) Market- I (Supa) Market- II j_Kasti}_ Total
Bori(kh) Ladkhed Sub Jam Bazar Shilona Sub . Jamgaon Dhavalpuri Sub Belwandi Vangdari Sub Arab Total Total Total Total
Yes 7 4 11 7 4 11 22 7 5 12 7 6 13 25 47 % 53.85 30.77 42.31 53.85 30.77 42.31 42.31 53.85 38.46 46.15 53.85 46.15 50 48.08 45.19
No 2 6 8 2 4 6 14 4 4 8 3 4 7 15 29
% 15.38 46.15 30.77 15.38 30.77 23.08 26.92 30.77 30.77 30.77 23.08 30.77 26.92 28.85 27.88
No Response 4 3 7 4 5 9 16 2 4 6 3 3 6 12 28
% 30.77 23.08 26.92 30.77 38.46 34.62 30.77 15.38 30.77 23.08 23.08 23.08 23.08 23.08 26.92
Total 13 13 26 13 I 13 26 52 13 13 26 13 13 26 52 104 o;o 100 100 100 100 100 100 100 100 100 100 100 100 100 100 100
Table -12 (h):Availability of Credit from institutional sources
h) Presence of Yavatmal Total Ahemadnagar Total Grant money lender
Market- I (Dharhva) Market- II (Pusad) Market- I (Supa) Market- II (Kasti) Total
Bori(kh) Ladkhed Sub Jam Bazar Shilona Sub Jamgaon Dhavalpuri Sub Belwandi Vangdari Sub Arab Total Total Total Total
Yes 2 4 6 4 5 9 15 .6 3 9 5 5 10 19 34
% 15.38 30.77 23.08 30.77 38.46 34.62 28.85 46.15 23.08 34.62 38.46 38.46 38.46 36.54 32.69
No 7 6 13 6 3 9 22 4 6 10 5 6 II 21 43
% 53.85 46.15 50 46.15 23.08 34.62 42.31 30.77 46.15 38.46 38.46 46.15 42.31 40.38 41.35
No Response 4 3 7 3 5 8 15 3 4 7 3 2 5 12 27
% 30.77 23.08 26.92 23.08 38.46 30.77 28.85 23.08 30.77 26.92 23.08 15.38 19.23 23.08 25.96
Total 13 13 26 13 13 26 52 13 13 26 13 13 26 52 104
% 100 100 100 100 100 100 100 100 100 100 100 100 100 100 100
190
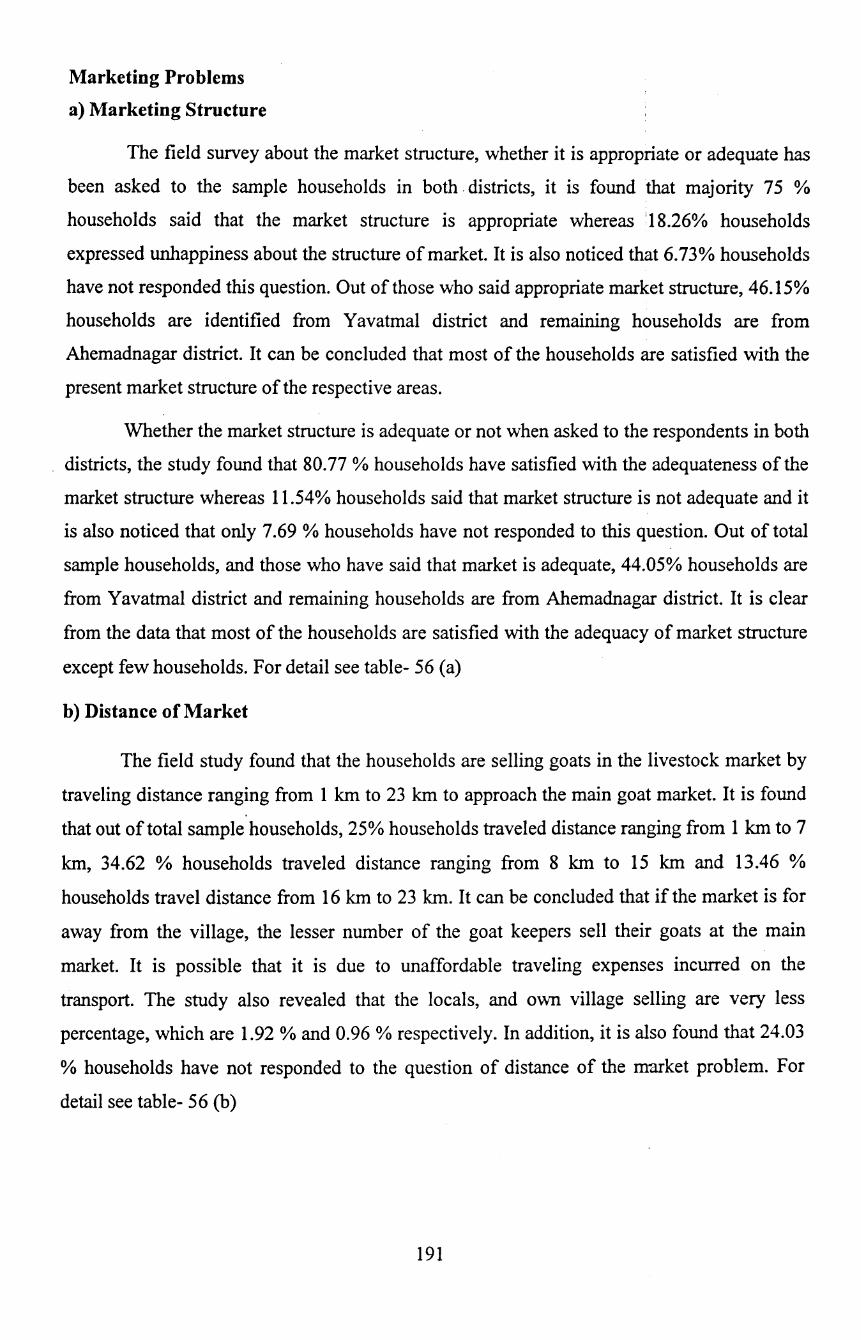
Marketing Problems
a) Marketing Structure
The field survey about the market structure, whether it is appropriate or adequate has
been asked to the sample households in both. districts, it is found that majority 75 %
households said that the market structure is appropriate whereas 118.26% households
expressed unhappiness about the structure of market. It is also noticed that 6. 73% households
have not responded this question. Out of those who said appropriate market structure, 46.15%
households are identified from Y avatmal district and remaining households are from
Ahemadnagar district. It can be concluded that most of the households are satisfied with the
present market structure of the respective areas.
Whether the market structure is adequate or not when asked to the respondents in both
districts, the study found that 80.77 % households have satisfied with the adequateness of the
market structure whereas 11.54% households said that market structure is not adequate and it
is also noticed that only 7.69 % households have not responded to this question. Out of total
sample households, and those who have said that market is adequate, 44.05% households are
from Yavatmal district and remaining households are from Ahemadnagar district. It is clear
from the data that most of the households are satisfied with the adequacy of market structure
except few households. For detail see table- 56 (a)
b) Distance of Market
The field study found that the households are selling goats in the livestock market by
traveling distance ranging from 1 km to 23 km to approach the main goat market. It is found
that out of total sample households, 25% households traveled distance ranging from 1 km to 7
km, 34.62 % households traveled distance ranging from 8 km to 15 km and 13.46 %
households travel distance from 16 km to 23 km. It can be concluded that if the market is for
away from the village, the lesser number of the goat keepers sell their goats at the main
market. It is possible that it is due to unaffordable traveling expenses incurred on the
transport. The study also revealed that the locals, and own village selling are very less
percentage, which are 1.92 % and 0.96 % respectively. In addition, it is also found that 24.03
% households have not responded to the question of distance of the market problem. For
detail see table- 56 (b)
191
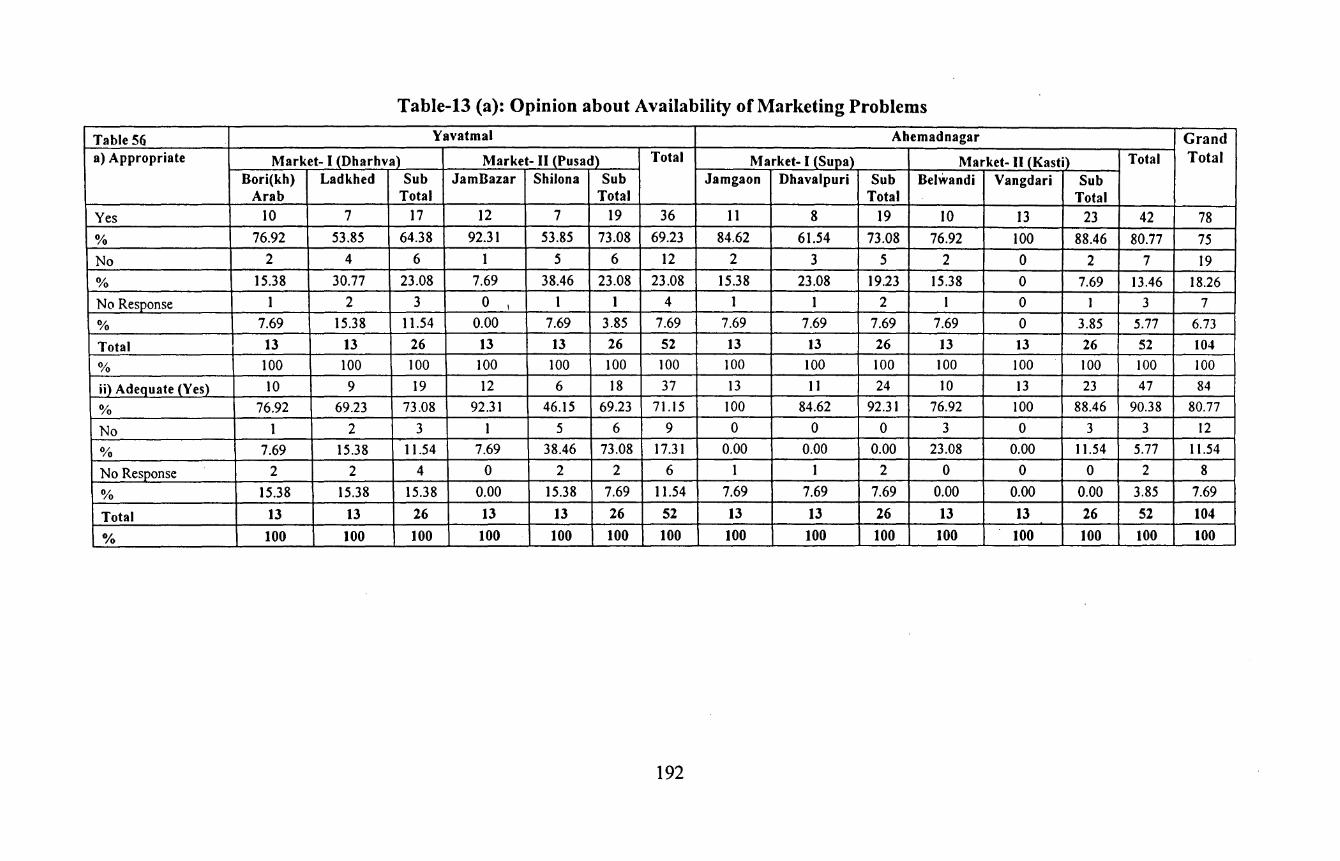
Table-13 (a): Opinion about Availability of Marketing Problems
Table 56 Yavatmal Ahemadnagar Grand a) Appropriate Market- I (Dharhva) Market- II (Pusad) Total Market- I (Supa) Market- II (Kasti) Total Total
Bori(kh) Ladkhed Sub JamBazar Shilona Sub Jamgaon Dhavalpuri Sub Belwandi Vangdari Sub Arab Total Total Total Total
Yes 10 7 17 12 7 19 36 11 8 19 10 13 23 42 78
% 76.92 53.85 64.38 92.31 53.85 73.08 69.23 84.62 61.54 73.08 76.92 100 88.46 80.77 75
No 2 4 6 1 5 6 12 2 3 5 2 0 2 7 19
% 15.38 30.77 23.08 7.69 38.46 23.08 23.08 15.38 23.08 19.23 15.38 0 7.69 13.46 18.26
No Response 1 2 3 0 I 1 1 4 1 1 2 1 0 1 3 7
% 7.69 15.38 11.54 0.00 7.69 3.85 7.69 7.69 7.69 7.69 7.69 0 3.85 5.77 6.73
Total 13 13 26 13 13 26 52 13 13 26 13 13 26 52 104
% tOO 100 100 100 100 100 100 100 100 100 100 100 100 100 100
ii) Ade_quate (Yes) 10 9 19 12 6 18 37 13 11 24 10 13 23 47 84
% 76.92 69.23 73.08 92.31 46.15 69.23 7].]5 100 84.62 92.31 76.92 100 88.46 90.38 80.77
No 1 2 3 1 5 6 9 0 0 0 3 0 3 3 12
% 7.69 15.38 11.54 7.69 38.46 73.08 17.31 0.00 0.00 0.00 23.08 0.00 11.54 5.77 11.54
No Response 2 2 4 0 2 2 6 1 1 2 0 0 0 2 8
% 15.38 15.38 15.38 0.00 15.38 7.69 11.54 7.69 7.69 7.69 0.00 0.00 0.00 3.85 7.69
Total 13 13 26 13 13 26 52 13 13 26 13 13 26 52 104
o;o 100 100 100 100 100 100 100 100 100 100 100 100 100 100 100
192
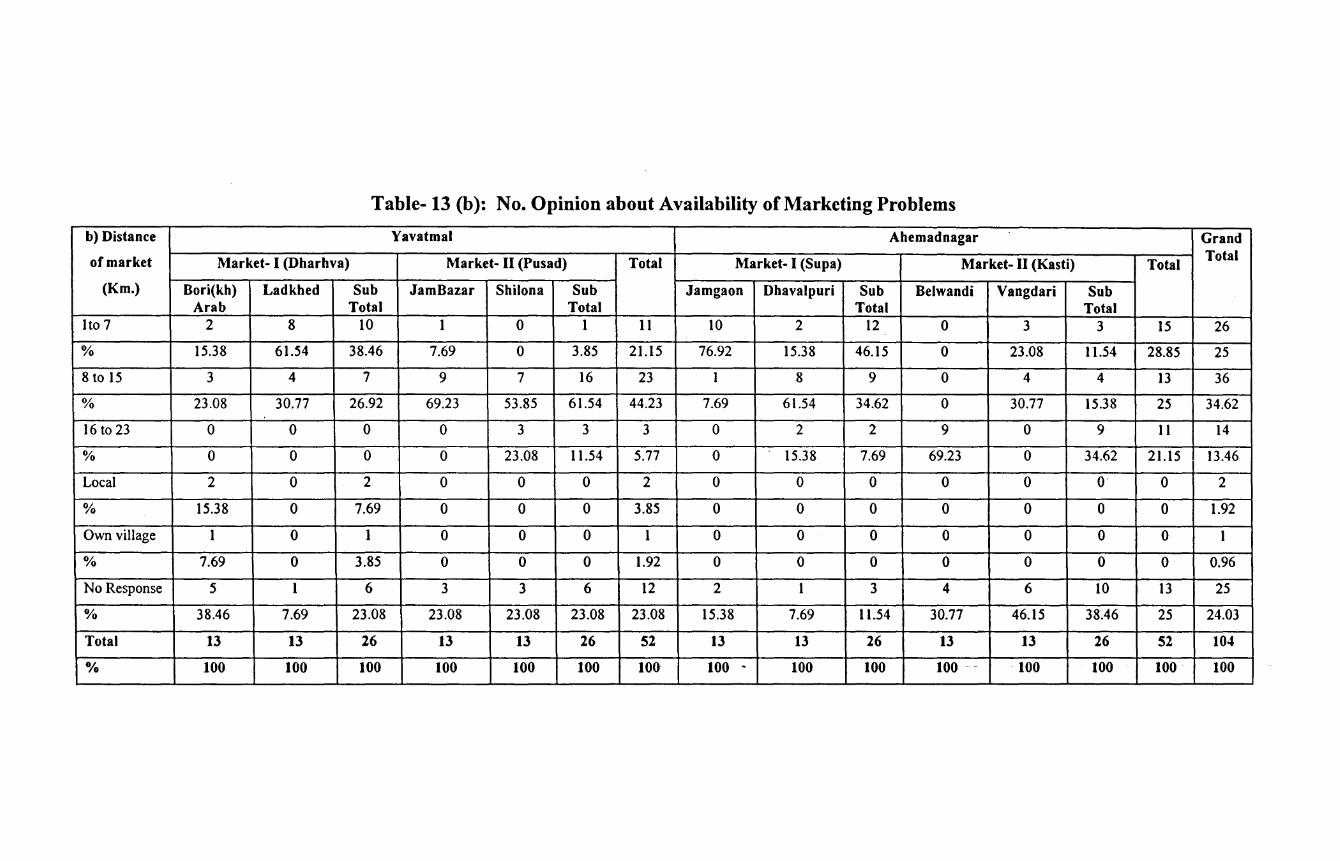
Table-13 (b): No. Opinion about Availability of Marketing Problems
b) Distance Yavatmal Ahemadnagar Grand
of market Market- I (Dharhva) Market- II (Pusad) Total Market- I (Supa) Market- II (Kasti) Total Total
(Km.) Bori(kh) Ladkhed Sub Jam Bazar Shilona Sub Jamgaon Dhavalpuri Sub Belwandi Vangdari Sub Arab Total Total Total Total
Ito 7 2 8 10 I 0 1 11 10 2 12 0 3 3 15 26
% 15.38 61.54 38.46 7.69 0 3.85 21.15 76.92 15.38 46.15 0 23.08 11.54 28.85 25
8 to 15 3 4 7 9 7 16 23 I 8 9 0 4 4 13 36
% 23.08 30.77 26.92 69.23 53.85 61.54 44.23 7.69 61.54 34.62 0 30.77 15.38 25 34.62
16 to 23 0 0 0 0 3 3 3 0 2 2 9 0 9 11 14
% 0 0 0 0 23.08 11.54 5.77 0 15.38 7.69 69.23 0 34.62 21.15 13.46
Local 2 0 2 0 0 0 2 0 0 0 0 0 0 0 2
% 15.38 0 7.69 0 0 0 3.85 0 0 0 0 0 0 0 1.92
Own village I 0 1 0 0 0 1 0 0 0 0 0 0 0 1
% 7.69 0 3.85 0 0 0 1.92 0 0 0 0 0 0 0 0.96
No Response 5 1 6 3 3 6 12 2 1 3 4 6 10 13 25
% 38.46 7.69 23.08 23.08 23.08 23.08 23.08 15.38 7.69 11.54 30.77 46.15 38.46 25 24.03
Total 13 13 26 13 13 26 52 13 13 26 13 13 26 52 104
o/o 100 100 100 100 100 100 100 100 . 100 100 100 .. 100 100 100 100
c) Type of Market
The field study found result in Table- 13 (c) that out of total sample households,
97.12% households have reported that they are selling their goats in the organized market
only and only 2.88 % households have reported that they are selling their goats in the
unorganized market. It is noticed that in both districts, most of the sample villages and
households are selling their goats in organized market rather than unorganized market and
private market.
d) Frequency of Visit of Goat Traders
It is found that while collecting the information about the frequency of visit of goat
traders to the sample households, 35.58 %households have disclosed that the traders visit to
households weekly sometimes, 7.73 %households reported that they are visiting on market
days, 7.63% households reported that they are visiting monthly sometimes and 4.92 %
households repoqed that they are visiting everyday. It is observed that goat traders are keen
to visit directly to the goat keepers households as they expect more profit margin and
depending on the demand of the goat. (See table- 13 (d)
e) Mode of payment of buyers
The field survey study found that the most of the buyers make payment in cash that
has been the opinion of the sample households. Out of total sample households, 92.33 %
households have accepted cash payment against the selling of goats, only 0.96 households
responded that they sell goats on credit. However, it is found that 6.~3% households have not
responded to this question. It is obseryed that from this data that most of the goat keepers,
while selling goats, take a payment in cash, except very few households. (See table- 13 (e)
f) Availability of Market Infrastructure
The field study revealed that 96.15 % households are satisfied with the availability of
market infrastructure in both sample districts of the state, and remaining households have not
responded to this question, so from this data it can be concluded that except few households,
majority households are satisfied with the existing market infrastructure. See table- 13 (f)
194
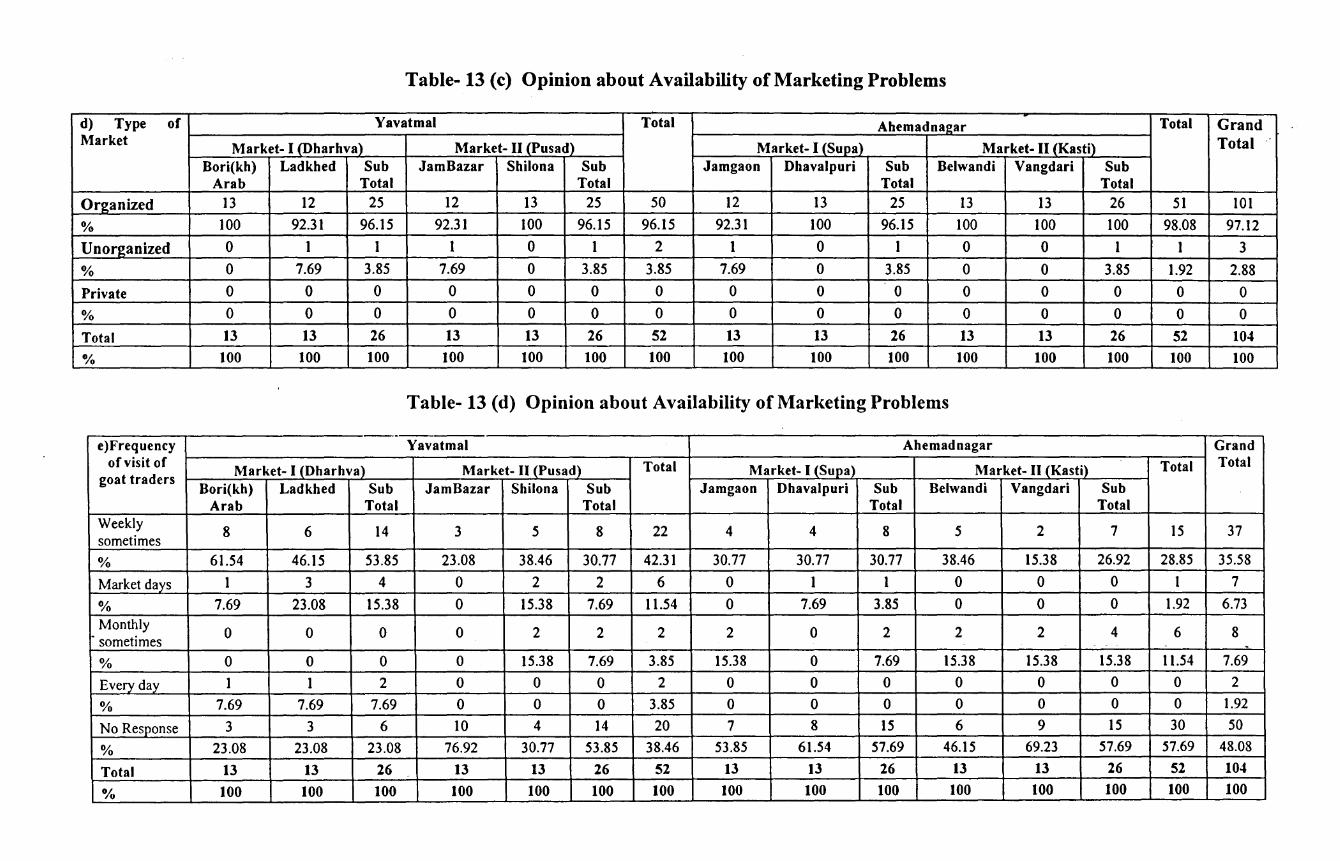
Table-13 (c) Opinion about Availability of Marketing Problems
d) Type of Yavatmal Total Ahemadna2ar Total Grand Market
Market- I (Dharhva) Market- II (Pusad) Market- I (Supa) Market- II (Kasti) Total ·
Bori(kh) Ladkhed Sub Jam Bazar Shilona Sub Jamgaon Dhavalpuri Sub Belwandi Vangdari Sub Arab Total Total Total Total
Organized 13 12 25 12 13 25 50 12 13 25 13 13 26 51 101
% 100 92.31 96.15 92.31 100 96.15 96.15 92.31 100 96.15 100 100 100 98.08 97.12
Unorj:!anized 0 I I I 0 I 2 1 0 I 0 0 I I 3
% 0 7.69 3.85 7.69 0 3.85 3.85 7.69 0 3.85 0 0 3.85 1.92 2.88
Private 0 0 0 0 0 0 0 0 0 0 0 0 0 0 0
% 0 0 0 0 0 0 0 0 0 0 0 0 0 0 0
Total 13 13 26 13 13 26 52 13 13 26 13 13 26 52 104
% 100 100 100 100 100 100 100 100 100 100 100 100 100 100 100
Table- 13 (d) Opinion about Availability of Marketing Problems
·-e)Frequency Yavatmal Ahemadnagar Grand
of visit of Market- I (Dharhva) Market- H{_Pusad) Total Market- I (Supa) Market- II (Kasti) Total Total
goat traders Bori(kh) Ladkhed Sub Jam Bazar Shilona Sub Jamgaon Dhavalpuri Sub Belwandi Vangdari Sub
Arab Total Total Total Total Weekly
8 6 14 3 5 8 22 4 4 8 5 2 7 15 37 sometimes
% 61.54 46.15 53.85 23.08 38.46 30.77 42.31 30.77 30.77 30.77 38.46 15.38 26.92 28.85 35.58
Market days I 3 4 0 2 2 6 0 I 1 0 0 0 I 7
% 7.69 23.08 15.38 0 15.38 7.69 11.54 0 7.69 3.85 0 0 0 1.92 6.73
Monthly 0 0 0 0 2 2 2 2 0 2 2 2 4 6 8
·sometimes -% 0 0 0 0 15.38 7.69 3.85 15.38 0 7.69 15.38 15.38 15.38 11.54 7.69
Every day I I 2 0 0 0 2 0 0 0 0 0 0 0 2
% 7.69 7.69 7.69 0 0 0 3.85 0 0 0 0 0 0 0 1.92
No Response 3 3 6 10 4 14 20 7 8 15 6 9 15 30 50
% 23.08 23.08 23.08 76.92 30.77 53.85 38.46 53.85 61.54 57.69 46.15 69.23 57.69 57.69 48.08
Total 13 13 26 13 13 26 52 13 13 26 13 13 26 52 104
% 100 100 100 100 100 100 100 100 100 100 100 100 100 100 100
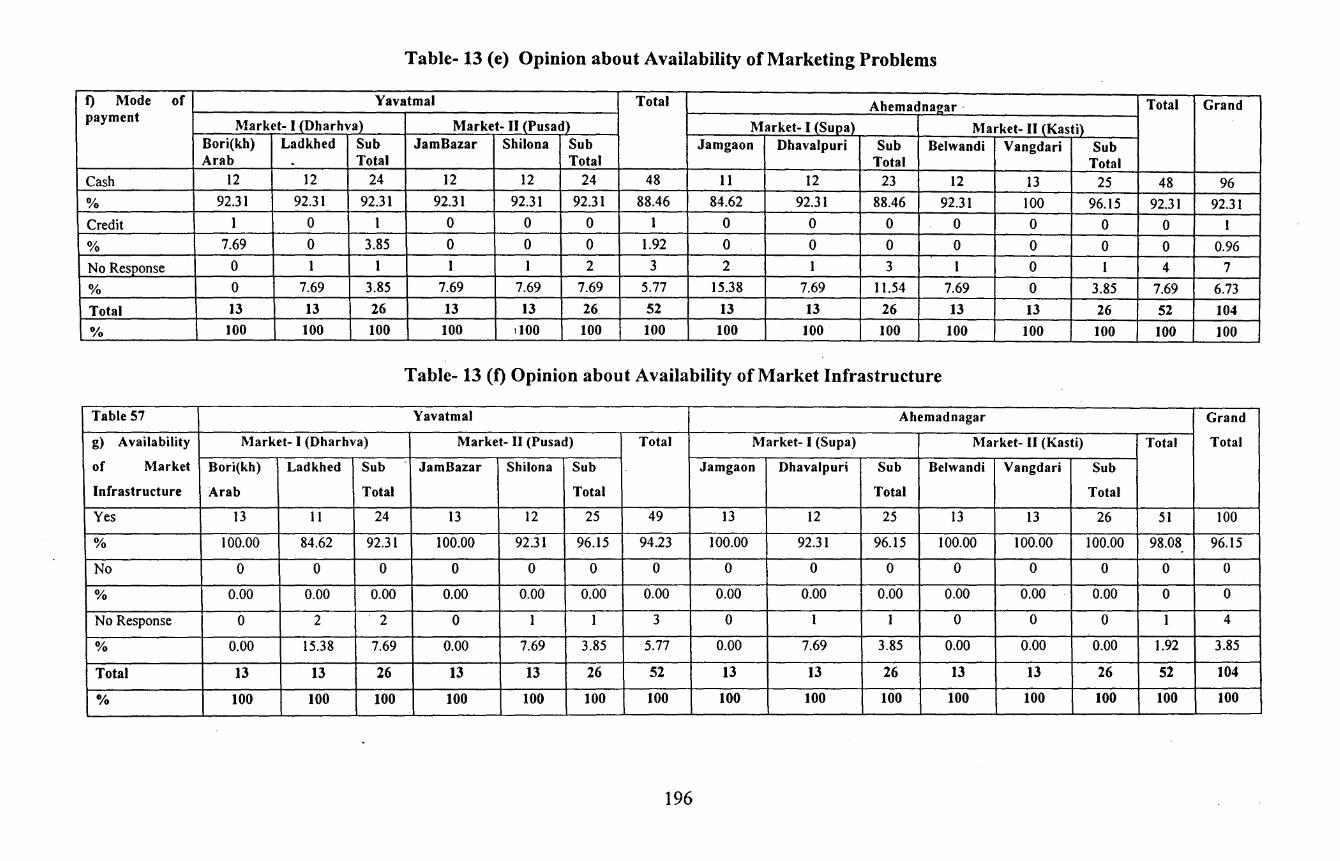
Table-13 (e) Opinion about Availability of Marketing Problems
f) Mode of Yavatmal Total Ahemadna2ar · Total Grand payment
Market- I (Dharhva) Market-II_(Pusad) Market- I 1_Sup_a) Market- II (Kasti) Bori(kh) Ladkhed Sub JamBazar Shilona Sub Jamgaon Dhavalpuri Sub Belwandi Vangdari Sub Arab . Total Total Total Total
Cash 12 12 24 12 12 24 48 II 12 23 12 13 25 48 96
% 92.31 92.31 92.31 92.31 92.31 92.31 88.46 84.62 92.31 88.46 92.31 100 96.15 92.31 92.31
Credit I 0 I 0 0 0 I 0 0 0 0 0 0 0 I
% 7.69 0 3.85 0 0 0 1.92 0 0 0 0 0 0 0 0.96
No Response 0 I I I I 2 3 2 I 3 I 0 I 4 7
% 0 7.69 3.85 7.69 7.69 7.69 5.77 15.38 7.69 11.54 7.69 0 3.85 7.69 6.73
Total 13 13 26 13 13 26 52 13 13 26 13 13 26 52 104 o;o 100 100 100 100 tlOO 100 100 100 100 100 100 100 100 100 100
Table- 13 (f) Opinion about Availability of Market Infrastructure
Table 57 Yavatmal A hemad nagar Grand
g) Availability Market- I (Dharhva) Market- II (Pusad) Total Market- I (Supa) Market- II (Kasti) Total Total
of Market Bori(kh) Ladkhed Sub JamBazar Shilona Sub Jamgaon Dhavalpuri Sub Belwandi Vangdari Sub
Infrastructure Arab Total Total Total Total
Yes 13 II 24 13 12 25 49 13 12 25 13 13 26 51 100
% 100.00 84.62 92.31 100.00 92.31 96.15 94.23 100.00 92.31 96.15 100.00 100.00 100.00 98.08 96.15
No 0 0 0 0 0 0 0 0 0 0 0 0 0 0 0
% 0.00 0.00 0.00 0.00 0.00 0.00 0.00 0.00 0.00 0.00 0.00 0.00 0.00 0 0
No Response 0 2 2 0 I I 3 0 I I 0 0 0 I 4
% 0.00 15.38 7.69 0.00 7.69 3.85 5.77 0.00 7.69 3.85 0.00 0.00 0.00 1.92 3.85
Total 13 13 26 13 13 26 52 13 13 26 13 13 26 52 104
o;o 100 100 100 100 100 100 100 100 100 100 100 100 100 100 100
196
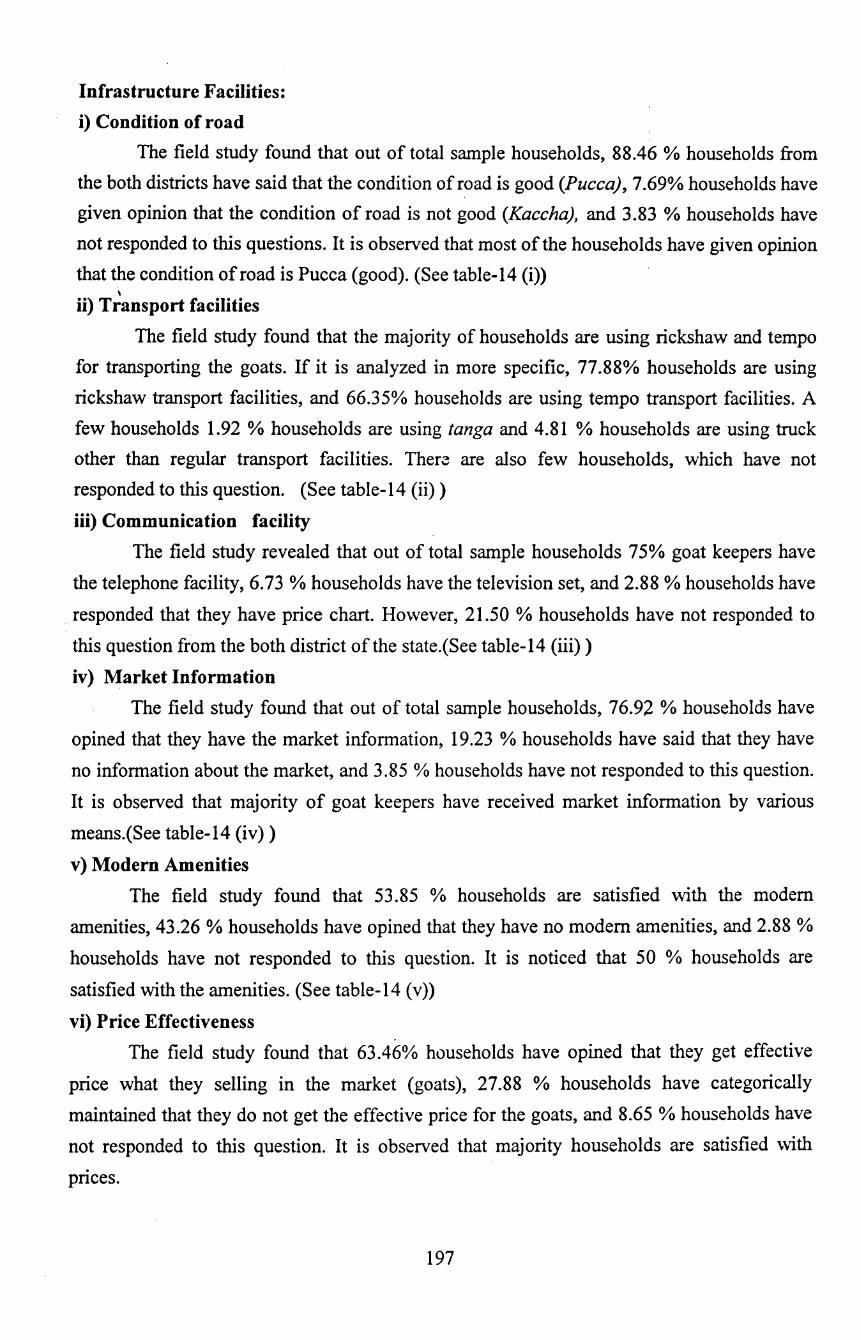
Infrastructure Facilities:
i) Condition of road
The field study found that out of total sample households, 88.46 % households from
the both districts have said that the condition of road is good (Pucca}, 7.69% households have
given opinion that the condition of road is not good (Kaccha), and 3.83 %households have
not responded to this questions. It is observed that most of the households have given opinion
that the condition of road is Pucca (good). (See table-14 (i)) \
ii) Transport facilities
The field study found that the majority of households are using rickshaw and tempo
for transporting the goats. If it is analyzed in more specific, 77.88% households are using
rickshaw transport facilities, and 66.35% households are using tempo transport facilities. A
few households 1.92 % households are using tanga and 4.81 % households are using truck
other than regular transport facilities. Ther\! are also few households, which have not
responded to this question. (See table-14 (ii) )
iii) Communication facility
The field study revealed that out of total sample households 75% goat keepers have
the telephone facility, 6.73% households have the television set, and 2.88% households have
responded that they have price chart. However, 21.50 % households have not responded to
this question from the both district of the state.(See table-14 (iii) )
iv) Market Information
The field study found that out of total sample households, 76.92 %households have
opined that they have the market information, 19.23 % households have said that they have
no information about the market, and 3.85% households have not responded to this question.
It is observed that majority of goat keepers have received market information by various
means.(See table-14 (iv))
v) Modern Amenities
The field study found that 53.85 % households are satisfied with the modem
amenities, 43.26% households have opined that they have no modem amenities, and 2.88%
households have not responded to this que~tion. It is noticed that 50 o/o households are
satisfied with the amenities. (See table-14 (v))
vi) Price Effectiveness
The field study found that 63.46% households have opined that they get effective
price what they selling in the market (goats), 27.88 % households have categorically
maintained that they do not get the effective price for the goats, and 8.65 % households have
not responded to this question. It is observed that majority households are satisfied \vith .
pnces.
197
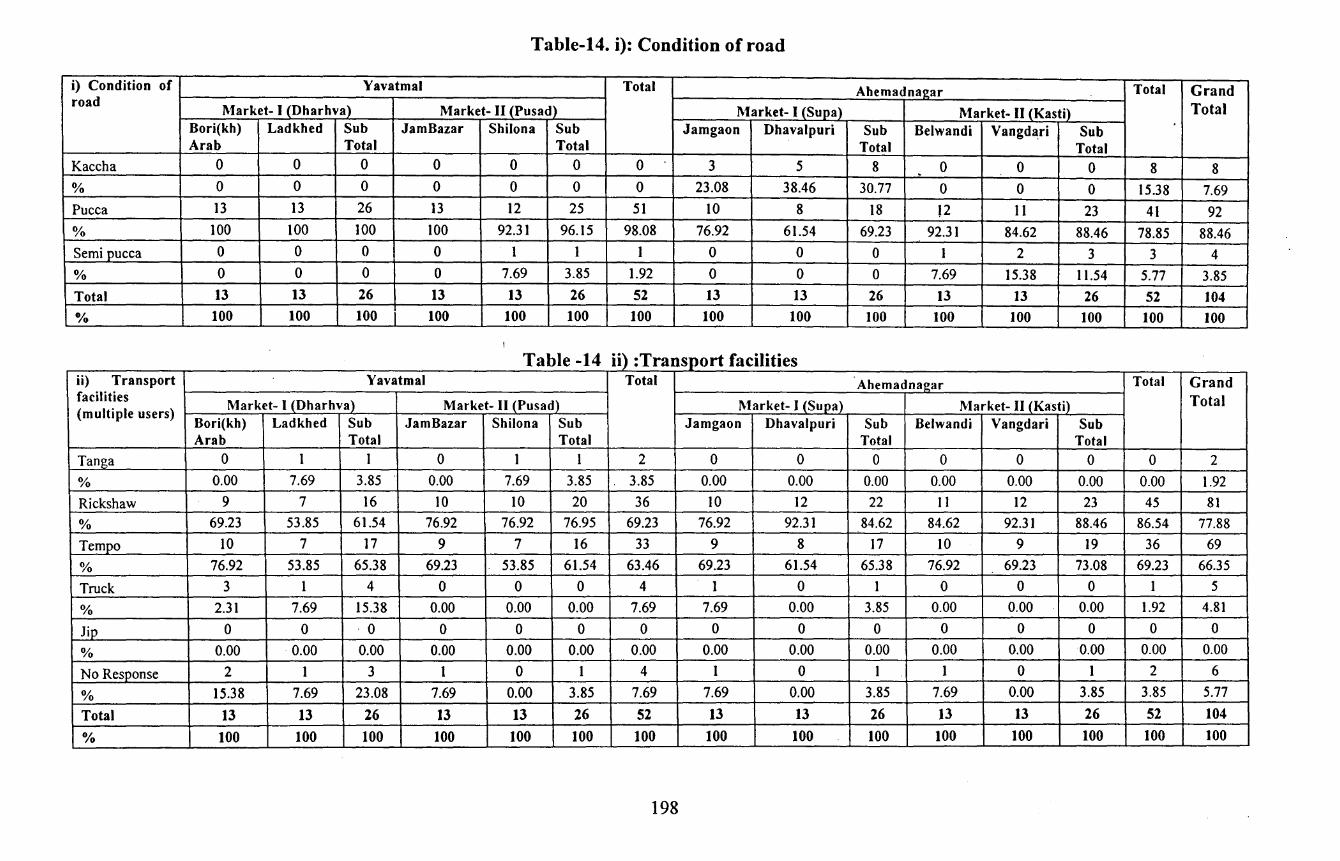
Table-14. i): Condition of road
i) Condition of Yavatmal Total Ahemadnagar Total Grand road
Market- I (Dharhva) Market- II (Pusad) Market- I (Supa) Market- II (Kasti) Total Bori(kh) Ladkhed Sub JamBazar Shilona Sub Jamgaon Dhavalpuri Sub Belwandi Vangdari Sub Arab Total Total Total Total
Kaccha 0 0 0 0 0 0 0 3 5 8 0 . 0 0 8 8 % 0 0 0 0 0 0 0 23.08 38.46 30.77 0 0 0 15.38 7.69 Puce a 13 13 26 13 12 25 51 10 8 18 l2 II 23 41 92 % 100 100 100 100 92.31 96.15 98.08 76.92 61.54 69.23 92.31 84.62 88.46 78.85 88.46 Semi_pucca 0 0 0 0 1 1 1 0 0 0 1 2 3 3 4
% 0 0 0 0 7.69 3.85 1.92 0 0 0 7.69 15.38 11.54 5.77 3.85
Total 13 13 26 13 13 26 52 13 13 26 13 13 26 52 104 o;o 100 100 100 100 100 100 100 100 100 100 100 100 100 100 100
Table -14 ii) :Transport facilities ii) Transport Yavatmal Total Ahemadnagar Total Grand facilities
Market- I (Dharhva) Market- II (Pusadl Market- I (Supa) Market- II (Kasti) Total (multiple users)
Bori(kh) Ladkhed Sub Jam Bazar Shilona Sub Jamgaon Dhavalpuri Sub Belwandi Vangdari Sub Arab Total Total Total Total
Tanga 0 1 1 0 1 1 2 0 0 0 0 0 0 0 2
% 0.00 7.69 3.85 0.00 7.69 3.85 3.85 0.00 0.00 0.00 0.00 0.00 0.00 0.00 1.92
Rickshaw 9 7 16 10 10 20 36 10 12 22 )) 12 23 45 81
% 69.23 53.85 61.54 76.92 76.92 76.95 69.23 76.92 92.31 84.62 84.62 92.31 88.46 86.54 77.88
Tempo 10 7 17 9 7 16 33 9 8 17 10 9 19 36 69
% 76.92 53.85 65.38 69.23 53.85 61.54 63.46 69.23 61.54 65.38 76.92 69.23 73.08 69.23 66.35
Truck 3 1 4 0 0 0 4 1 0 1 0 0 0 1 5
% 2.31 7.69 15.38 0.00 0.00 0.00 7.69 7.69 0.00 3.85 0.00 0.00 0.00 1.92 4.81
Jip 0 0 ·0 0 0 0 0 0 0 0 0 0 0 0 0
% 0.00 0.00 0.00 0.00 0.00 0.00 0.00 0.00 0.00 0.00 0.00 0.00 0.00 0.00 0.00
No Response 2 1 3 1 0 1 4 1 0 1 1 0 1 2 6
% 15.38 7.69 23.08 7.69 0.00 3.85 7.69 7.69 0.00 3.85 7.69 0.00 3.85 3.85 5.77
Total 13 13 26 13 13 26 52 13 13 26 13 13 26 52 104
% 100 100 100 100 100 100 100 100 100 100 100 100 100 100 100
198

Table -14. iii): Communication Facility iii) Yavatmal Total
~-
Total Grant Ahemadnagar communication
Market- I (Dharhva) Market- II (Pusad) Market- I (Supa) Market- II (Kasti) Total ·
facility Bori(kh) Ladkhed Sub Jam Bazar Shilona Sub Jamgaon Dhavalpuri Sub Belwandi Vangdari Sub Arab Total Total Total Total
Telephone 11 10 21 8 9 17 38 12 10 22 8 10 18 40 78
% 84.62 76.92 80.77 61.54 69.23 65.38 73.08 92.31 76.92 84.62 61.54 76.92 69.23 38.46 75
Television 0 0 0 1 1 2 2 1 1 2 2 1 3 5 7
% 0.00 0.00 0.00 7.69 7.69 7.69 3.85 7.69 7.69 . 7.69 15.38 7.69 11.54 9.62 6.73
Price of chart 0 1 1 0 1 1 2 0 0 0 0 1 1 1 3
% 0.00 7.69 3.85 0.00 7.69 3.85 3.85 0.00 0.00 0.00 0.00 7.69 3.85 . 1.92 2.88
No Res2_onse 3 2 5 5 3 8 13 2 2 4 3 2 5 9 22
% 23.08 15.38 19.30 19.30 23.08 15.38 25 15.38 15.38 15.38 23.08 15.38 19.23 17.31 21.15
Total 13 13 26 13 13 26 52 13 13 26 13 13 26 52 104
% 100 100 100 100 100 100 100 100 100 100 100 100 100 100 100
Table-14 (iv): Market Information
iv)Market Yavatmal Total Ahemadna_gar Total Grand Information
Market- I (Darhva) Market- II (Pusad) Market- I (Supa) Market- II (Kasti) Total
BoriArab Ladkhed Sub JamBazar Shilona Sub Jamgaon Dhavalpuri Sub Belwandi Vangdari Sub Total Total Total Total
Yes 11 10 21 13 12 25 46 10 5 15 9 10 19 34 80
% 84.61 76.92 80.77 100 92.31 96.15 88.46 76.92 38.46 57.69 69.23 76.92 73.08 65.38 76.92 .
No 2 2 4 0 1 1 5 2 6 8 4 3 7 15 20
% 15.38 15.38 15.38 0 7.69 4 9.61 15.38 46.15 30.77 30.77 23.08 26.92 28.85 19.23
No Response 0 1 1 0 0 0 1 1 2 3 0 0 0 3 4
% 0 7.69 3.85 0 0 0 1.92 1.92 15.38 11.53 0 0 0 5.77 3.85
Grand Total 13 13 26 13 13 26 52 13 13 26 13 13 26 51 104
o;o 100 100 100 100 100 100 100 100 100 100 100 100 100 100 100
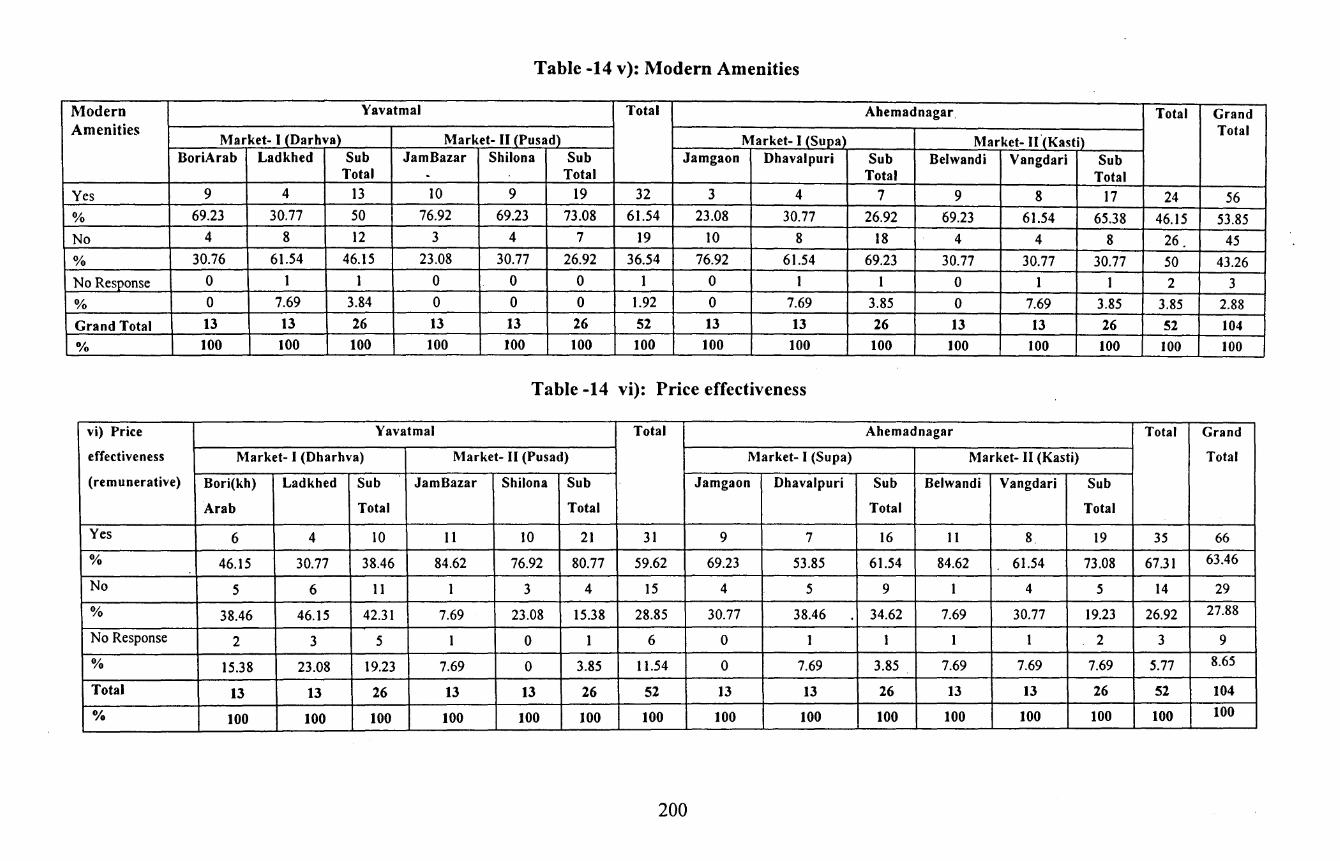
Table -14 v): Modern Amenities
Modern Yavatmal Total Ahemadnagar Total Grand Amenities
~arket- I (Darhva) ~arket- II (Pusad) ~arket-1 (Supal ~arket- lf(Kasti) Total
BoriArab Ladkhed Sub Jam Bazar Shilona Sub Jamgaon Dhavalpuri Sub Belwandi Vangdari Sub Total . Total Total Total
Yes 9 4 13 10 9 19 32 3 4 7 9 8 17 24 56
% 69.23 30.77 50 76.92 69.23 73.08 61.54 23.08 30.77 26.92 69.23 61.54 65.38 46.15 53.85
No 4 8 12 3 4 7 19 10 8 18 4 4 8 26 45
% 30.76 61.54 46.15 23.08 30.77 26.92 36.54 76.92 61.54 69.23 30.77 30.77 30.77 50 43.26
No Response 0 1 1 0 0 0 1 0 1 1 0 1 1 2 3
% 0 7.69 3.84 0 0 0 1.92 0 7.69 3.85 0 7.69 3.85 3.85 2.88
Grand Total 13 13 26 13 13 26 52 13 13 26 13 13 26 52 104 o/o 100 100 100 100 100 100 100 100 100 100 100 100 100 100 100
Table -14 vi): Price effectiveness
vi) Price Yavatmal Total Ahemadnagar Total Grand
effectiveness ~arket- I (Dharhva) Market- II (Pusad) Market- I (Supa) Market- II (Kasti) Total
(remunerative) Bori(kh) Ladkhed Sub JamBazar Shilona Sub Jamgaon Dhavalpuri Sub Belwandi Vangdari Sub
Arab Total Total Total Total
Yes 6 4 10 11 10 21 31 9 7 16 11 8. 19 35 66
% 46.15 30.77 38.46 84.62 76.92 80.77 59.62 69.23 53.85 61.54 84.62 61.54 73.08 67.31 63.46
No 5 6 11 1 3 4 15 4 5 9 I 4 5 14 29
% 38.46 46.15 42.31 7.69 23.08 15.38 28.85 30.77 38.46 34.62 7.69 30.77 19.23 26.92 27.88
No Response 2 3 5 1 0 1 6 0 I I I 1 2 3 9
% 15.38 23.08 19.23 7.69 0 3.85 11.54 0 7.69 3.85 7.69 7.69 7.69 5.77 8.65
Total 13 13 26 13 13 26 52 13 13 26 13 13 26 52 104
o/o 100 100 100 100 100 100 100 100 100 100 100 100 100 100 100
200
Transaction in Market
The field study found that the transaction of the goat in the market is being carried out
by applying various criteria and methods. It is observed that the fixation of price of goats also
is influenced by factors like, weight, age, general appearances, breed and colour. It is noticed
that the opinion of the sample households have thrown light on the issue, which is considered
as inputs for fixing the prices of goats. Out of total sample households, it is found that 68.27
%households sell their goats by mutual negotiation method, 58.65 %households sell their
goats in open market, 26.92 % households sell their goats in auction, and few households
(5.77 %) sell their goats under cloth system. As mentioned earlier that the fixation of price of
goats is being largely influenced by various factors, 75 % households have opined that the
price is being fixed by considering the weight of the goat, 69.23 % households opined that the
price of goat also affected by age factor, 25 %households have opined that the price can be
affected by general appearance of the goat, 19.23 % households have said that the price of
goat influenced by breed, 7.69 % households opined that colour also contributed for the price.
Only 1.92% households not responded to this question. (See table-15)
Reason for Sale at Door
The study found that the sample households have disclosed various reasons for
selling goats at door. It is noticed that out of total sample households, 27.88 % households
have expressed that because of distance of the market they are selling at door, 22.12 %
households have said that because of less bargaining power with them, therefore they are
selling goat at door, 13.46 % households have disclosed that because of lack of transport
facility available to them they sell at door. 13.46 % households have expressed that due to
some reason they have no time to take goats to the market. It is also observed that 11.54 %
households have expressed that the butchers are dominating the market and created monopoly
like situation, therefore they do not like to sell goat in the market. Further, 14.42 %
households have opined that their transport cost is very high, and 9.62 % households opined
that it is not logical to sell few numbers of goats in the market because of uneconomic and
impractical expenses incurred on the goats_ for selling in the market instead of selling at door.
8.65 % households are selling at doorstep because of lack of transport facility. 31.73 %
households sell their goat other than doorstep, 17.31 % households not specifically mentioned
the reason. Lastly, 23.08 % households have not responded to this question. It is observed
from data that the situation of goat selling at door step is common in both districts and sample
villages as mentioned above by quoting various reasons. (See table-16)
201
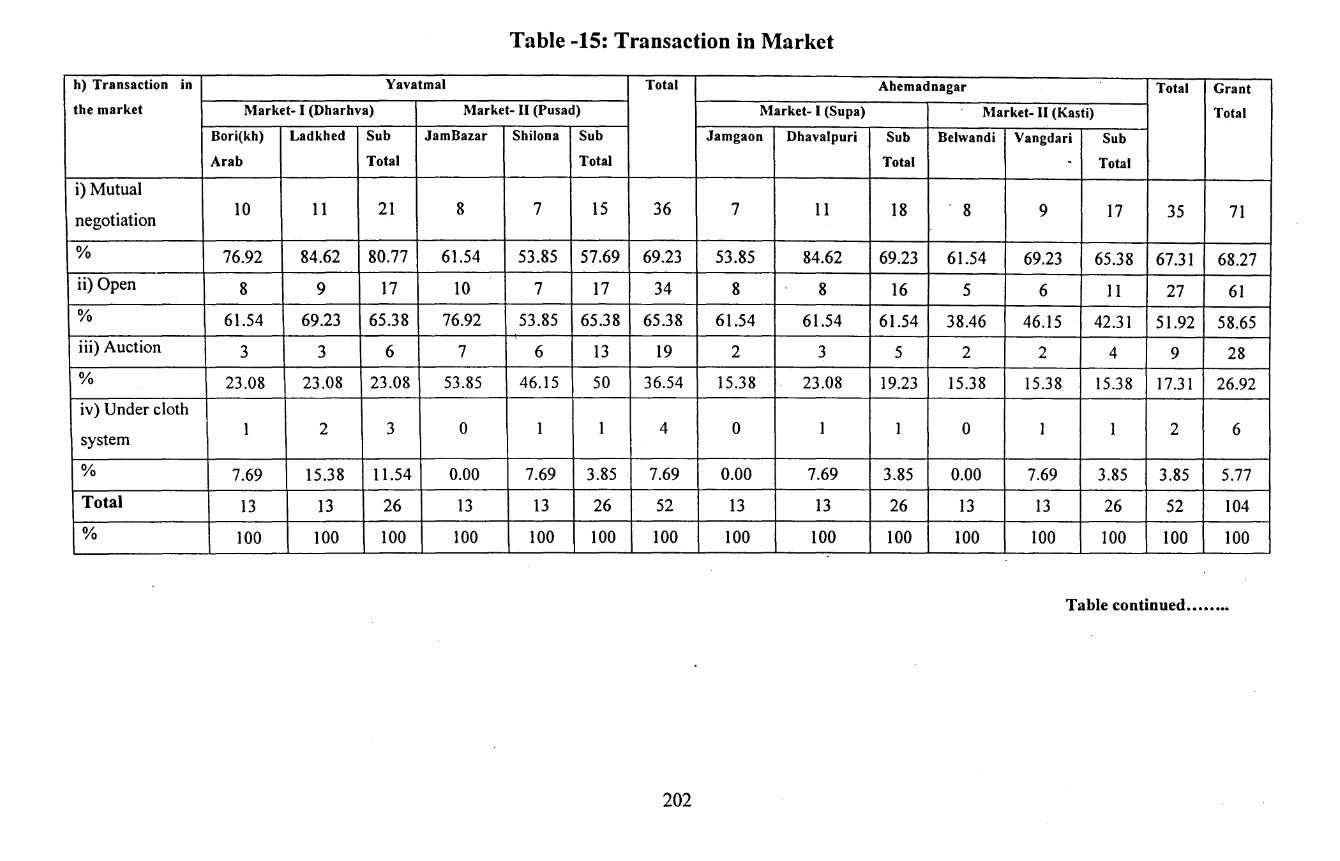
Table -15: Transaction in Market
h) Transaction in Yavatmal Total Ahemadnagar Total Grant
the market Market- I (Dharhva) Market- II (Pusad) Market- I (Supa) Market- II (Kasti) Total
Bori(kh) Ladkhed Sub JamBazar Shilona Sub Jamgaon Dhavalpuri Sub Belwandi Vangdari Sub
Arab Total Total Total - Total
i) Mutual
negotiation 10 11 21 8 7 15 36 7 11 18 . 8 9 17 35 71
% 76.92 84.62 80.77 61.54 53.85 57.69 69.23 53.85 84.62 69.23 61.54 69.23 65.38 67.31 68.27
ii) Open 8 9 17 10 7 17 34 8 8 16 5 6 II 27 61
% 61.54 69.23 65.38 76.92 53.85 65.38 65.38 61.54 61.54 61.54 38.46 46.15 42.31 51.92 58.65
iii) Auction 3 3 6 7 6 13 19 2 3 5 2 2 4 9 28
% 23.08 23.08 23.08 53.85 46.15 50 36.54 15.38 23.08 19.23 15.38 15.38 15.38 17.31 26.92
iv) Under cloth
system 1 2 3 0 1 1 4 0 1 1 0 1 1 2 6
% 7.69 15.38 11.54 0.00 7.69 3.85 . 7.69 0.00 7.69 3.85 0.00 7.69 3.85 3.85 5.77
Total 13 13 26 13 13 26 52 13 13 26 13 13 26 52 104
% 100 100 100 100 100 100 100 100 100 100 100 100 100 100 100
Table continued ••••••••
202
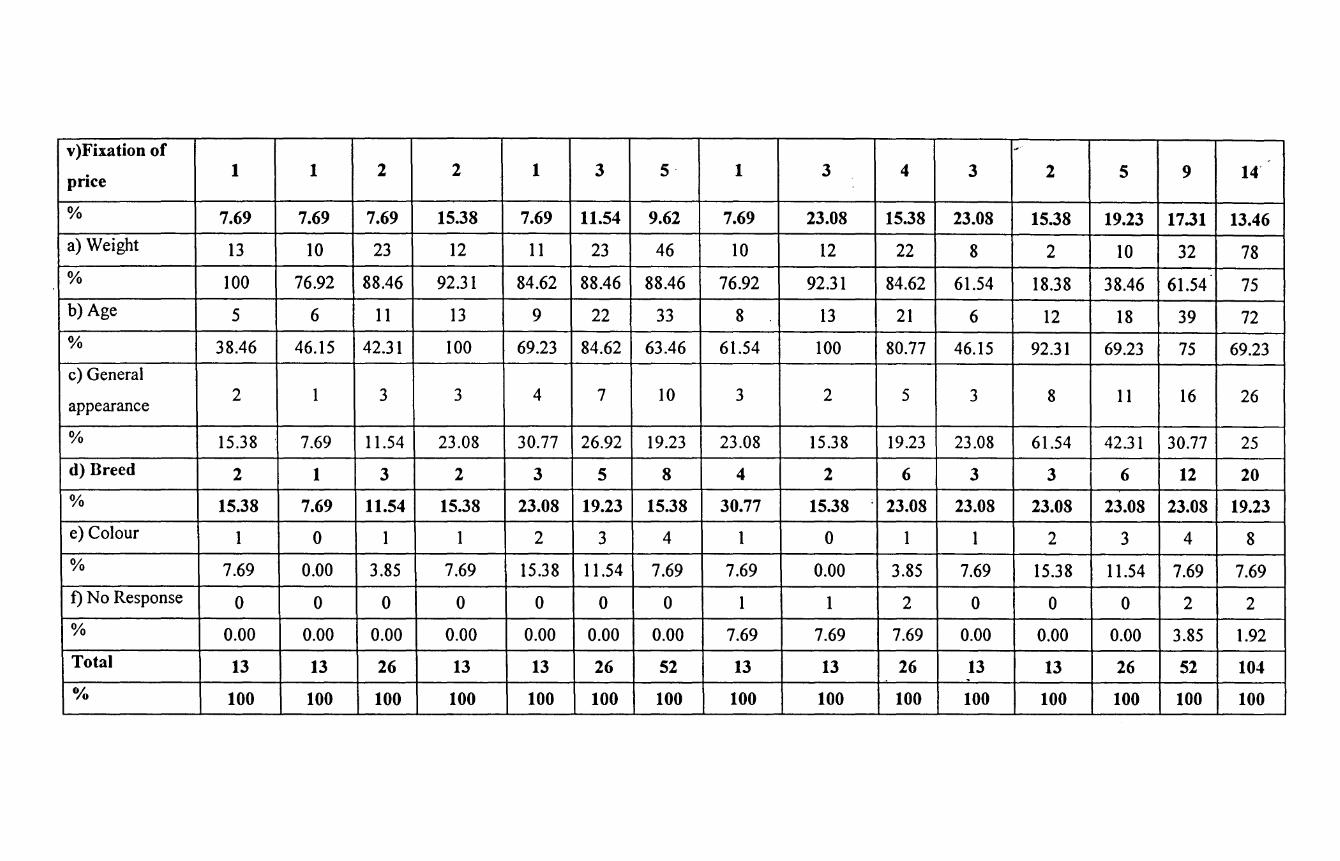
v)Fixation of #
-price
1 1 2 2 1 3 5· 1 3 4 3 2 5 9 14"
% 7.69 7.69 7.69 15.38 7.69 11.54 9.62 7.69 23.08 15.38 23.08 15.38 19.23 17.31 13.46
a) Weight 13 IO 23 I2 II 23 46 IO I2 22 8 2 IO 32 78
% IOO 76.92 88.46 92.3I 84.62 88.46 88.46 76.92 92.3I 84.62 6I.54 I8.38 38.46 61.54 75
b) Age 5 6 11 I3 9 22 33 8 13 2I 6 I2 I8 39 72
% 38.46 46.I5 42.3I IOO 69.23 84.62 63.46 6I.54 IOO 80.77 46.15 92.3I 69.23 75 69.23
c) General 2 I 3 3 4 7 10
appearance 3 2 5 3 8 11 16 26
% 15.38 7.69 11.54 23.08 30.77 26.92 19.23 23.08 15.38 19.23 23.08 61.54 42.31 30.77 25
d) Breed 2 1 3 2 3 5 8 4 2 6 3 3 6 12 20
% 15.38 7.69 11.54 15.38 23.08 19.23 15.38 30.77 15.38 23.08 23.08 23.08 23.08 23.08 19.23
e) Colour I 0 I 1 2 3 4 1 0 I I 2 3 4 8
% 7.69 0.00 3.85 7.69 I5.38 II.54 7.69 7.69 0.00 3.85 7.69 I5.38 II.54 7.69 7.69
f) No Response 0 0 0 0 0 0 0 1 I 2 0 0 0 2 2
% 0.00 0.00 0.00 0.00 0.00 0.00 0.00 7.69 7.69 7.69 0.00 0.00 0.00 3.85 1.92
Total 13 13 26 13 13 26 52 13 13 26 13 13 26 52 104 . o;o 100 100 100 100 100 100 100 100 100 100 100 100 100 100 100
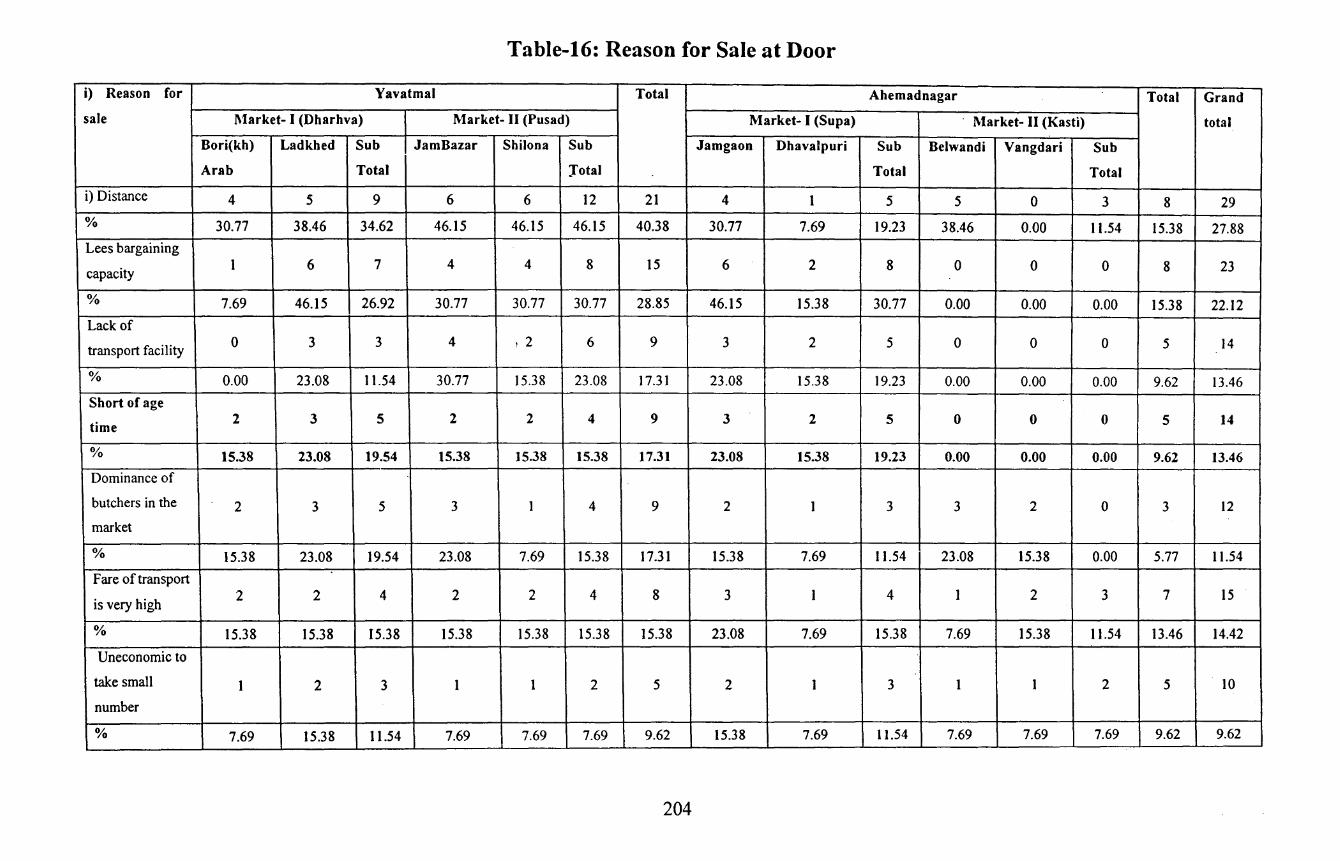
Table-16: Reason for Sale at Door
i) Reason for Yavatmal Total Ahemadnagar Total Grand
sale Market- I (Dharhva) Market- II (Pusad) Market- I (Supa) Market- II (Kasti) total
Bori(kh) Ladkhed Sub JamBazar Shilona Sub Jamgaon Dhavalpuri Sub Belwandi Vangdari Sub
Arab Total Jotal Total Total
i) Distance 4 5 9 6 6 I2 2I 4 1 5 5 0 3 8 29
% 30.77 38.46 34.62 46.I5 46.I5 46.15 40.38 30.77 7.69 I9.23 38.46 0.00 II.54 I5.38 27.88 Lees bargaining
capacity I 6 7 4 4 8 I5 6 2 8 0 0 0 8 23
% 7.69 46.I5 26.92 30.77 30.77 30.77 28.85 46.I5 I5.38 30.77 0.00 0.00 0.00 I5.38 22.12
Lack of
transport facility 0 3 3 4 ,2 6 9 3 2 5 0 0 0 5 14
% 0.00 23.08 11.54 30.77 15.38 23.08 17.31 23.08 I5.38 I9.23 0.00 0.00 0.00 9.62 13.46
Short of age
time 2 3 5 2 2 4 9 3 2 5 0 0 0 5 14
% 15.38 23.08 19.54 15.38 15.38 15.38 17.31 23.08 15.38 19.23 0.00 0.00 0.00 9.62 13.46
Dominance of
butchers in the 2 3 5 3 I 4 9 2 I 3 3 2 0 3 I2
market
% 15.38 23.08 I9.54 23.08 7.69 I5.38 17.31 15.38 7.69 11.54 23.08 15.38 0.00 5.77 11.54
Fare of transport
is very high 2 2 4 2 2 4 8 3 I 4 I 2 3 7 I5
% I5.38 I5.38 15.38 I5.38 I5.38 15.38 I5.38 23.08 7.69 I5.38 7.69 I5.38 I I .54 I3.46 14.42
Uneconomic to
take small I 2 3 I I 2 5 2 1 3 I I 2 5 IO
number
% 7.69 15.38 Il.54 7.69 7.69 7.69 9.62 15.38 7.69 11.54 7.69 7.69 7.69 9.62 9.62
204
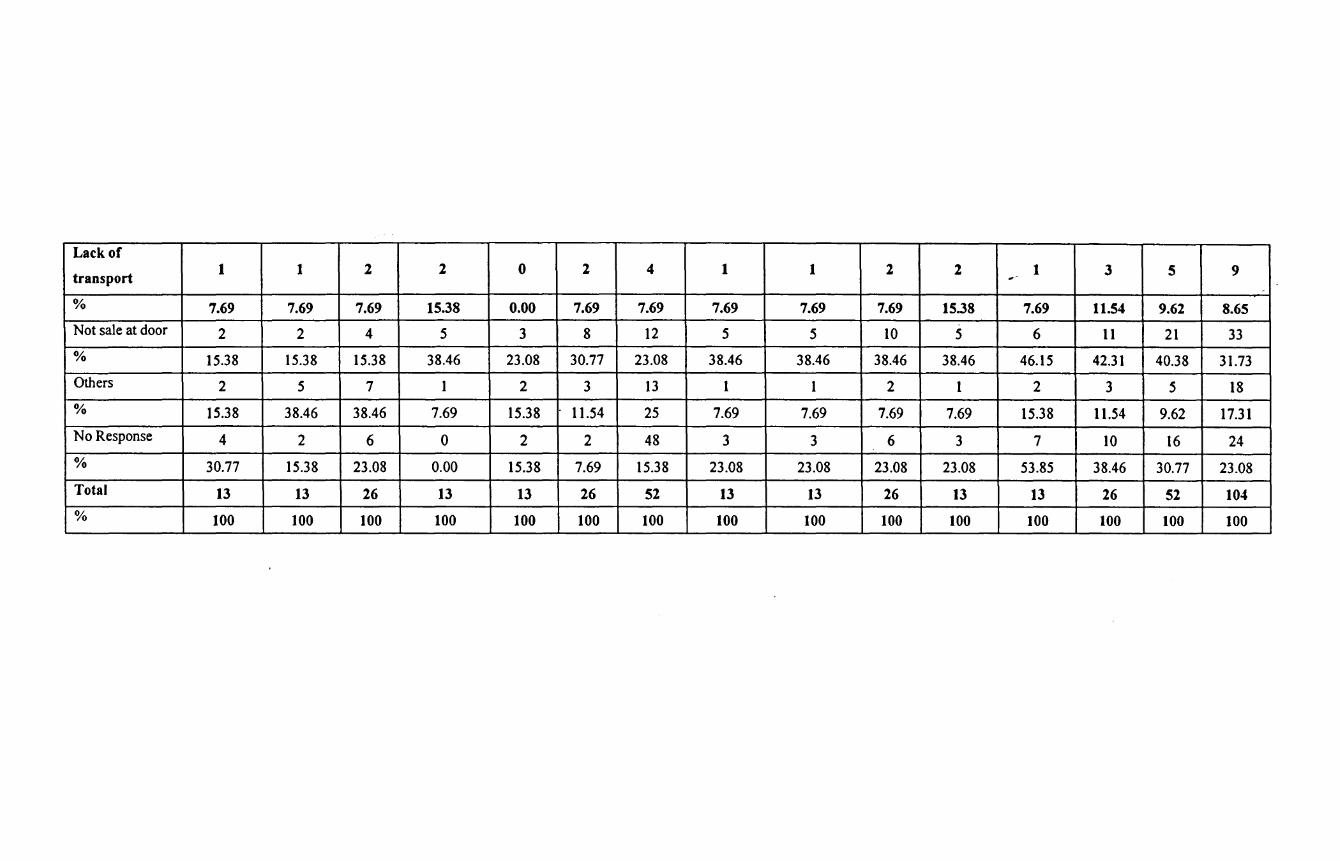
Lack of 1 1 2 2 0 2 4 1 1 2 2 1 3 5 9 transport ,
% 7.69 7.69 7.69 15.38 0.00 7.69 7.69 7.69 7.69 7.69 15.38 7.69 11.54 9.62 8.65
Not sale at door 2 2 4 5 3 8 12 5 5 10 5 6 11 21 33 % 15.38 15.38 15.38 38.46 23.08 30.77 23.08 38.46 38.46 38.46 38.46 46.15 42.31 40.38 31.73 Others 2 5 7 1 2 3 13 1 1 2 1 2 3 5 18 % 15.38 38.46 38.46 7.69 15.38 11.54 25 7.69 7.69 7.69 7.69 15.38 11.54 9.62 17.31 No Response 4 2 6 0 2 2 48 3 3 6 3 7 10 16 24 % 30.77 15.38 23.08 0.00 15.38 7.69 15.38 23.08 23.08 23.08 23.08 53.85 38.46 30.77 23.08 Total 13 13 26 13 13 26 52 13 13 26 13 13 26 52 104
% tOO 100 100 100 100 100 100 100 100 100 100 100 100 100 100

Official Assistapce in Marketing Goats
The field study found that various official and non-official agencies have been helping
to the goat keepers by officering services at the time of goat selling in the markets in both
districts of the state. It is observed that particularly the agencies of central and state
government, gram panchayat, local community body, rural development of programmer,
Bank I institution, and veterinary department. It is found that 4 7.12 % households disclosed
that they received central and state government assistance, 50% households said that they
received panchayat assistance, 46.15 % households accepted that .community body extends
assistance to them, 27.88 % households revealed that rural development programmer
assistance helps them, 31.73 % households found bank and institution assistance valuable and
18.27 % households also give credit to the veterinary department for timely assistance. It is
also noticed that the panchayat body emerged at the first position for valuable support than
other agencies and institutions. Their supports and contribution for the marketing of the goats
encourage the goat keepers to have the larger herds for rearing. It is also found that there are
some households, which have not received any official assistance. Such households revealed
their opinions by giving preferences. It is observed that 38.46 % households disclosed that
they did not receive central and state government assistance, 37.5 % households panchayat
support, 38.46 % households community body assistance, 56.73 % households, rural
development programmer assistance and 50% households bank and institutions support, and
15.38 % households veterinary departments help. Most of the households disclosed various
assistance but local body always is at top for the any kind of supports. The details of opinions
have given in tables -17-i, ii, iii, iv, v, and vi)
206
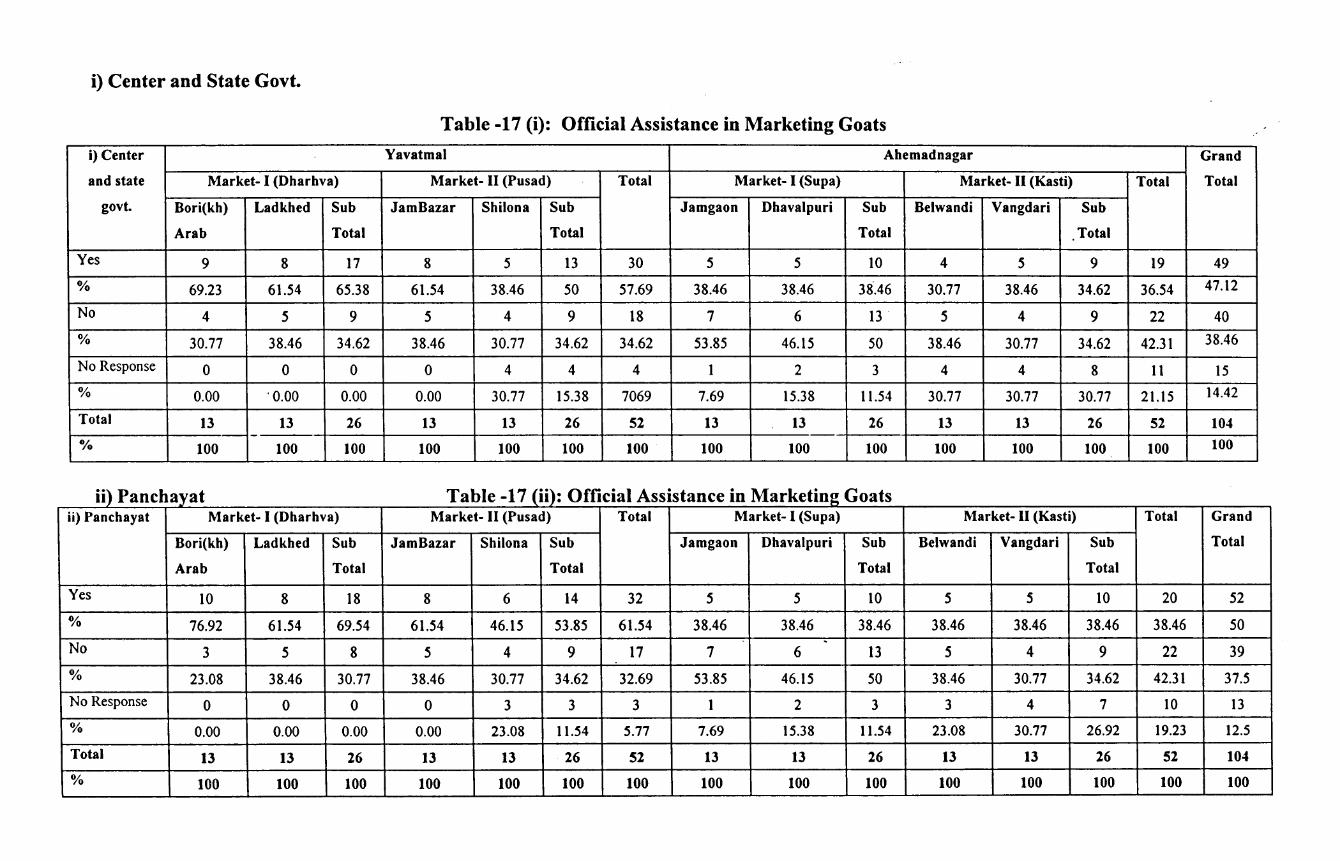
i) Center and State Govt.
Table -17 (i): Official Assistance in Marketing Goats
i) Center Yavatmal Ahemadnagar Grand
and state Market- I (Dharhva) Market- II (Pusad) Total Market- I (Supa) Market- II (Kasti) Total Total
govt. Bori(kh) Ladkhed Sub Jam Bazar Shilona Sub Jamgaon Dhavalpuri Sub Belwandi Vangdari Sub
Arab Total Total Total Total
Yes 9 8 17 8 5 13 30 5 5 10 4 5 9 19 49
% 69.23 61.54 65.38 61.54 38.46 50 57.69 38.46 38.46 38".46 30.77 38.46 34.62 36.54 47.12
No 4 5 9 5 4 9 18 7 6 13 5 4 9 22 40
% 30.77 38.46 34.62 38.46 30.77 34.62 34.62 53.85 46.15 50 38.46 30.77 34.62 42.31 38.46
No Response 0 0 0 0 4 4 4 1 2 3 4 4 8 11 15 % 0.00 ·o.oo 0.00 0.00 30.77 15.38 7069 7.69 15.38 11.54 30.77 30.77 30.77 21.15 14.42
Total 13 13 26 13 13 26 52 13 13 26 13 13 26 52 104 % 100 100 100 100 100 100 100 100 100 100 100 100 100 100 100
ii) Panchayat Table -17 (ii): Official Assistance in Marketing Goats ii) Panchayat Market- I (Dharhva) Market- II (Pusad) Total Market- I (Supa) Market- II (Kasti) Total Grand
Bori(kh) Ladkhed Sub JamBazar Shilona Sub Jamgaon Dhavalpuri Sub Belwandi Vangdari Sub Total
Arab Total Total Total Total
Yes 10 8 18 8 6 14 32 5 5 10 5 5 10 20 52
% 76.92 61.54 69.54 61.54 46.15 53.85 61.54 38.46 38.46 38.46 38.46 38.46 38.46 38.46 50
No .
3 5 8 5 4 9 17 7 6 13 5 4 9 22 39
% 23.08 38.46 30.77 38.46 30.77 34.62 32.69 53.85 46.15 50 38.46 30.77 34.62 42.31 37.5
No Response 0 0 0 0 3 3 3 1 2 3 3 4 7 10 13
% 0.00 0.00 0.00 0.00 23.08 11.54 5.77 7.69 15.38 11.54 23.08 30.77 26.92 19.23 12.5
Total 13 13 26 13 13 26 52 13 13 26 13 13 26 52 104
% 100 100 100 100 100 100 100 100 100 100 100 100 100 100 100
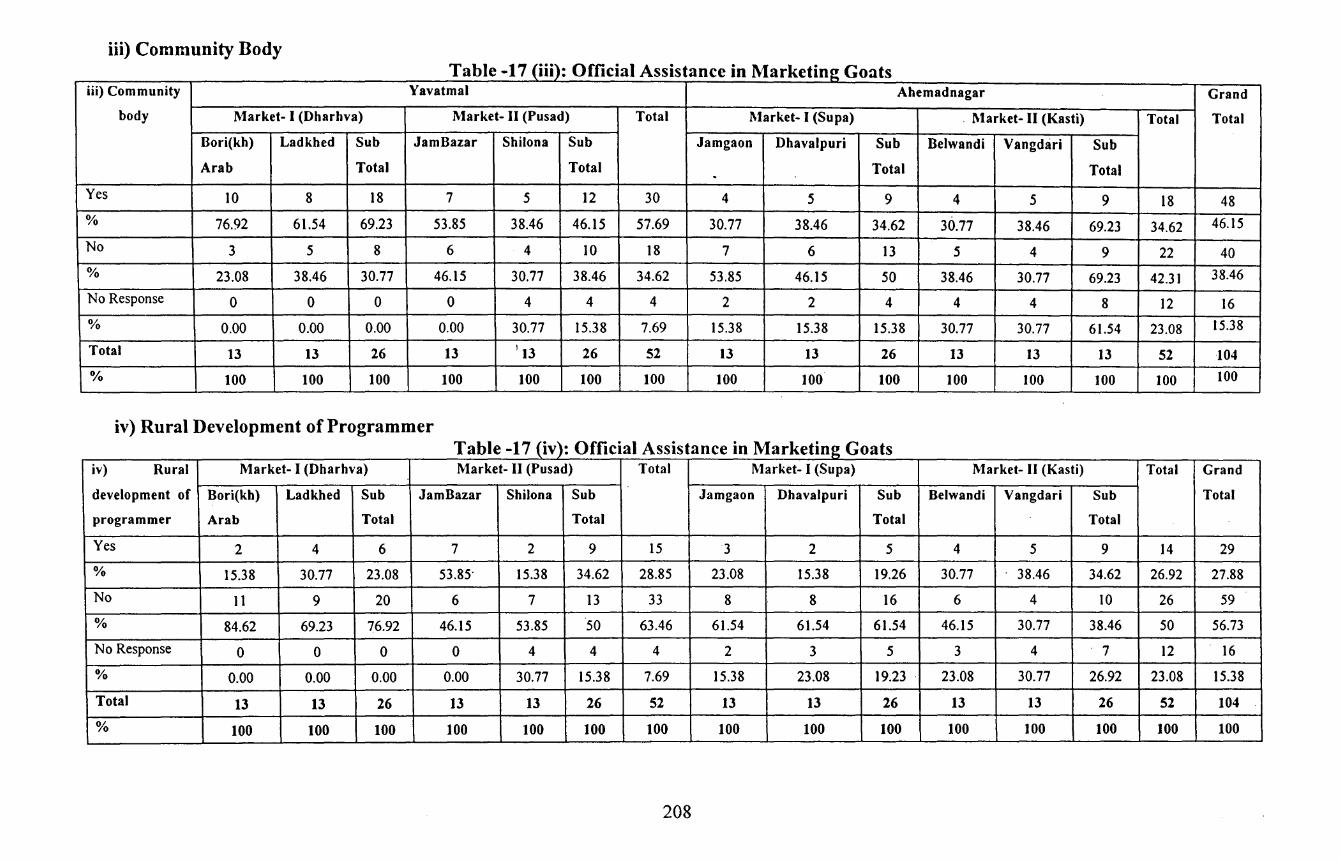
iii) Community Body Table -17 (iii): Official Assistance in Marketing Goats
iii) Community Yavatmal Ahemadnagar Grand
body Market- I (Dharhva) Market- II (Pusad) Total Market- I (Supa) . Market- II (Kasti) Total Total
Bori(kh) Ladkhed Sub JamBazar Shilona Sub Jamgaon Dhavalpuri Sub Belwandi Vangdari Sub
Arab Total Total Total Total . Yes 10 8 18 7 5 12 30 4 5 9 4 5 9 18 48 % 76.92 61.54 69.23 53.85 38.46 46.15 57.69 30.77 38.46 34.62 30.77 38.46 69.23 34.62 46.15
No 3 5 8 6 4 10 18 7 6 13 5 4 9 22 40 % 23.08 38.46 30.77 46.15 30.77 38.46 34.62 53.85 46.15 50 38.46 30.77 69.23 42.31 38.46
No Response 0 0 0 0 4 4 4 2 2 4 4 4 8 12 16
% 0.00 0.00 0.00 0.00 30.77 15.38 7.69 15.38 15.38 15.38 30.77 30.77 61.54 23.08 15.38
Total 13 13 26 13 '13 26 52 13 13 26 13 13 13 52 104
% 100 100 100 100 100 100 100 100 100 100 100 100 100 100 100
iv) Rural Development of Programmer Table -17 (iv): Official Assistance in Marketing Goats
iv) Rural Market- I (Dharhva) Market- II (Pusad) Total Market- I (Supa) Market- II (Kasti) Total Grand
development of Bori(kh) Ladkhed Sub Jam Bazar Shilona Sub Jamgaon Dhavalpuri Sub Belwandi Vangdari Sub Total
programmer Arab Total Total Total Total
Yes 2 4 6 7 2 9 15 3 2 5 4 5 9 14 29
% 15.38 30.77 23.08 53.85• 15.38 34.62 28.85 23.08 15.38 19.26 30.77 38.46 34.62 26.92 27.88
No 11 9 20 6 7 13 33 8 8 16 6 4 10 26 59
% 84.62 69.23 76.92 46.15 53.85 50 63.46 61.54 61.54 61.54 46.15 30.77 38.46 50 56.73
No Response 0 0 0 0 4 4 4 2 3 5 3 4 7 12 16
% 0.00 0.00 0.00 0.00 30.77 15.38 7.69 15.38 23.08 19.23 . 23.08 30.77 26.92 23.08 15.38
Total 13 13 26 13 13 26 52 13 13 26 13 13 26 52 104
% 100 100 100 100 100 100 100 100 100 100 100 100 100 100 100
208
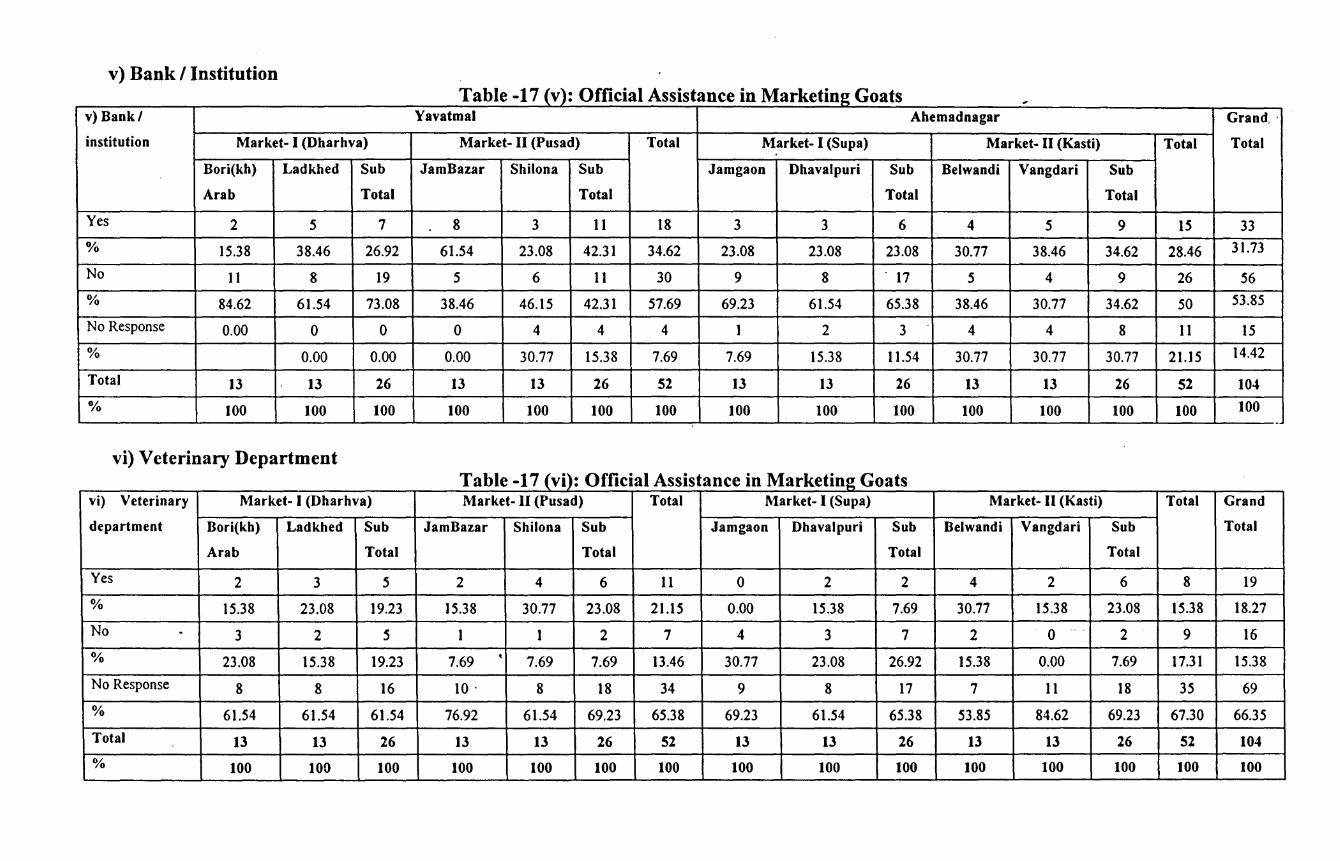
v) Bank I Institution Table -17 (v): Official Assistance in Marketing Goats ,
v) Bank/ Yavatmal Ahemadnagar Grand_-
institution Market- I (Dharhva) Market- II (Pusad) Total Market- I (Supa) Market- II (Kasti) Total Total
Bori(kh) Ladkhed Sub JamBazar Shilona Sub Jamgaon Dhavalpuri Sub Belwandi Vangdari Sub
Arab Total Total Total Total
Yes 2 5 7 8 3 11 18 3 3 6 4 5 9 15 33
% 15.38 38.46 26.92 61.54 23.08 42.31 34.62 23.08 23.08 23.08 30.77 38.46 34.62 28.46 31.73
No 11 8 19 5 6 11 30 9 8 ' 17 5 4 9 26 56
% 84.62 61.54 73.08 38.46 46.15 42.31 57.69 69.23 61.54 65.38 38.46 30.77 34.62 50 53.85
No Response 0.00 0 0 0 4 4 4 1 2 3 4 4 8 11 15
% 0.00 0.00 0.00 30.77 15.38 7.69 7.69 15.38 11.54 30.77 30.77 30.77 21.15 14.42
Total 13 13 26 13 13 26 52 13 13 26 13 13 26 52 104 o;o 100 100 100 100 100 100 100 100 100 100 100 100 100 100 100
-
vi) Veterinary Department Table -17 (vi): Official Assistance in Marketing Goats
vi) Veterinary Market- I (Dharhva) Market- II (Pusad) Total Market- I (Supa) Market- II (Kasti) Total Grand
department Bori(kh) Ladkhed Sub JamBazar Shilona Sub Jamgaon Dhavalpuri Sub Belwandi Vangdari Sub Total
Arab Total Total Total Total
Yes 2 3 5 2 4 6 11 0 2 2 4 2 6 8 19
% 15.38 23.08 19.23 15.38 30.77 23.08 21.15 0.00 15.38 7.69 30.77 15.38 23.08 15.38 18.27
No . 3 2 5 1 1 2 7 4 3 7 2 0 ---
2 9 16
% 23.08 15.38 19.23 7.69 • 7.69 7.69 13.46 30.77 23.08 26.92 15.38 0.00 7.69 17.31 15.38
No Response 8 8 16 10 . 8 18 34 9 8 17 7 11 18 35 69
% 61.54 61.54 61.54 76.92 61.54 69.23 65.38 69.23 61.54 65.38 53.85 84.62 69.23 67.30 66.35
Total 13 13 26 13 13 26 52 13 13 26 13 13 26 52 104 % 100 100 100 100 100 100 100 100 100 100 100 100 100 100 100

Factor of success of Goat 1\farketing
The field survey found that there are various factors, which always influence the
dealing and selling of the goats markets, impact positive or negative on the goat sellers. Some
of them are supply of goat breed, availability of loan on low rate of interest, veterinary
support, implementation of insurance scheme for goats, formation of SHGs, development of
infrastructure~ organized market intervention of govt. in market yard to avoid the influence of
butchers, eradication of malpractices from markets, formation of cooperative marketing
society, provision of regulation of live stock market, expansion of market with modem
amenities, less marketing channels, formation of animal breeder cooperative society,
however, some factors are more dominant to influence the marketing of goats and the profit
margin of the goat keepers while selling the goats in the market. It is also found that other
than these factors, they also influence the profit margin if the unauthorized brokers are
allowed; selling of goats without weighing, live goat selling give the negative income to the
goat keepers.
It is observed from the total sample households in both districts ofthe state that 51.92
%households said that the supply of breed influences the value and profit while rearing the
goats, 68.27 % households expressed the non availability of loan on low rate of interest is one
of the hurdles in goat business, 67.31 % households revealed that the veterinary department is
responsible for growing goat activities because of lacking support of veterinary, households
feel insecure, 43.27 % households disclosed that the insurance scheme is not encouraging
them, 62.50 % households held responsible to lack of cooperation among the community like
SHGs, 27.88 % households revealed that lack of development in infrastructure is responsible
for development of goat enterprises, 25 o/o households held responsible to the market
structure, which discourage the goat keepers, 14.42 % households are in favour of in
eradication of the malpractices from the market, 23.08 % households disclosed that the
cooperative marketing society is non functional, therefore households have to depend on
other alternatives, 21.15 % households held responsible provision of regulation of livestock
market. It is also noticed that 21.15 % households expressed their views on the modem
amenities that are lacking and 25 % households mentioned that less marketing channels are
reconcilable for the marketing of goats. It is also observed that 15.36 o/o households expressed
their views on the ·formation of the cooperative society. It is interesting to note that out of
total sample households, 21.15 % households have not responded to the 13 factors of success,
which have been discussed in above paragraph.
210
(see table-18,i,ii,ii,iv, v, vi, vii, viii,ix,x,xi,xii,xii)
In addition to these factors, to success of goat marketing, households give some
reasons as to why goat enterprises need attention and what are their requirements. It is found
that 48.08% households have not allowed to the unauthorized brokers, 38.46% households
clearly said that 13.46 % households are favour to unauthorized brokers and 13.46 %
households have not responded to this question. (See table-18 (xiv)
.. The field study revealed that 77.88% households are in favour to weigh based selling \
price of goat whereas 15.38 % households are not favour to the weighing based selling of
goats, and 6. 73 % households not responded to this question. (see table-18 ( xv)
It is observed that 65.38 %households expressed that there are lo~al demand for live
goats, whereas 32.69% households responded that there is no local demand for live goats and
very few households that not responded to the question. (Table-18 xvi) Majority of
households are in favour of live goat selling. It is found that 38.46 % households disclosed
that they are facing some difficulties in marketing of goats however majority households that
is 55.77% households responded that they have no such difficulties in marketing of goats and
5.77% households not responded to the question. (Table-18,. xvii)
211

Table -18 i,ii,ii,iv,v,vi,vii, viii,ix,x,xi,xii,xiii): Factor of success
Factor of Yavatmal Total Ahemadnagar Total Grand success
Market- I (Dharhva) Market- II Jrusad} Market- I (Supa) Market- II (Kasti) Total
Bori(kh) Ladkhed Sub Jam Bazar Shilona Sub Jamgaon Dhavalpuri Sub Belwandi Vangdari Sub Arab Total Total Total Total
i)Supply of goat .
7 8 15 6 6 12 27 8 9 17 5 5 10 27 54 breed
% 53.85 61.54 57.69 46.15 46.15. 46.15 51.92 61.54 69.23 65.38 38.46 38.46 38.46 51.92 51.92 ii)Availability of loan on low rate 9 9 18 10 10 20 38 9 9 18 6 9 15 33 71 of interest
% 69.23 69.23 69.23 76.92 76.92 76.92 73.08 69.23 69.23 69.23 46.15 69.23 57.69 63.46 68.27 iii) Veterinary support
11 11 22 9 9 18 40 7 9 16 6 8 14 30 70
% 84.62 84.62 84.62 69.23 69.23 69.23 76.92 53.85 69.23 61.54 46.15 61.54 53.85 57.69 67.31 iv)lmplimantatio n on insurance 6 7 13 8 I 9 22 4 6 10 9 4 13 23 45 scheme for goats
% 46.15 53.85 50 61.54 7.69 34.62 42.31 30.77 46.15 38.46 69.23 30.77 50 44.23 43.27
v)Formation of 6 II 17 10 10 20 37
SHGs 7 9 16 5 7 12 28 65
% 46.15 84.62 65.38 76.92 76.92 76.92 71.15 53.85 69.23 61.54 38.46 53.85 46.15 53.85 62.50
vi)Development 2 6 8 4 2 6 14 4 4 8 4 3 7 15 29 of infrastructure
% 15.38 46.15 30.77 30.77 15.38 23.08 26.92 30.77 30.77 30.77 30.77 23.08 26.92 28.85 27.88
vii)Organized mark. Intervention of govt. in mark. 3 4 7 5 0 5 12 4 4 8 3 3 6 14 26
Yard to avoid the influence of butchers
% 23.08 30.77 26.92 38.46 0.00 19.23 23.08 30.77 30.77 30.77 23.08 23.08 23.08 26.92 25
Table continued
212
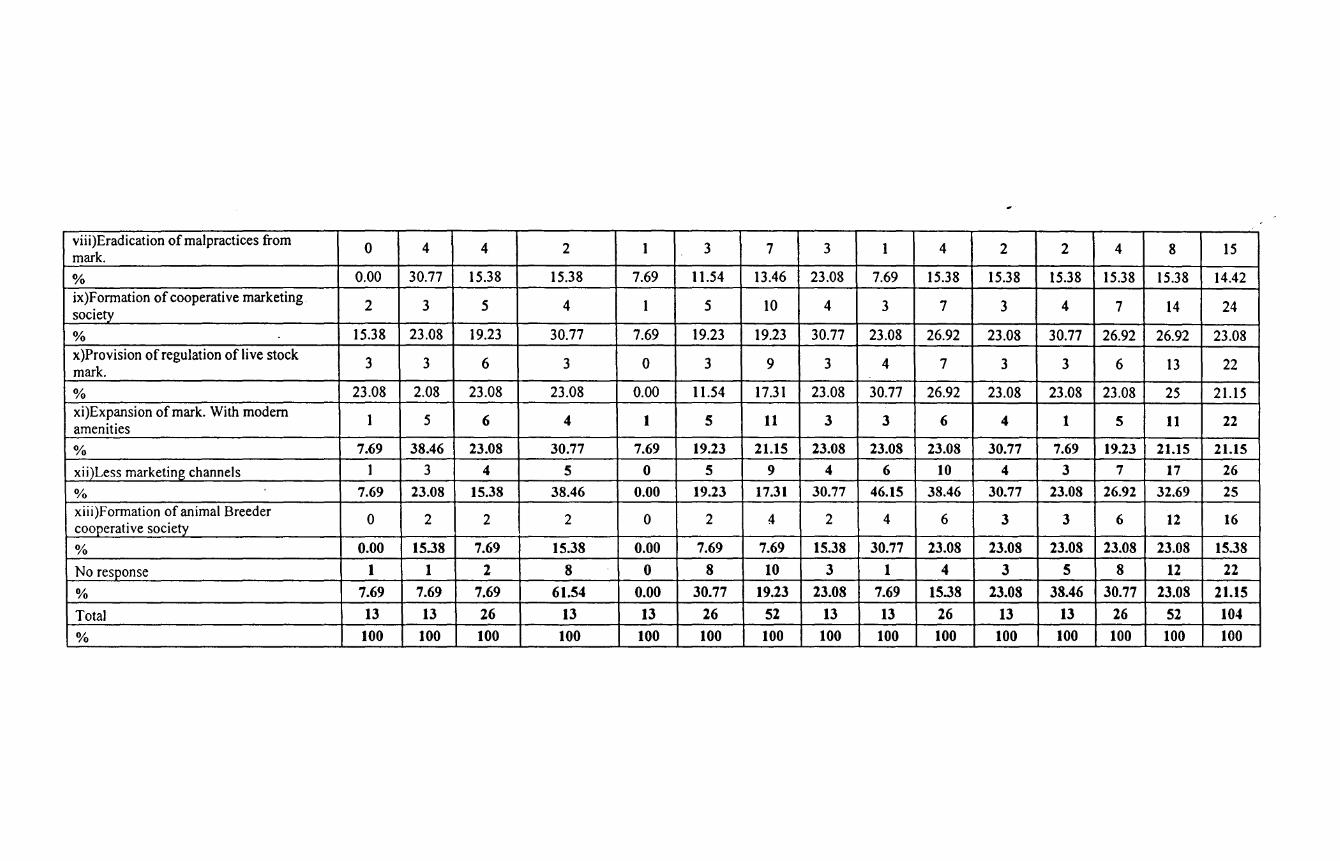
viii)Eradication of malpractices from 0 4 4 2 1 3 7 3 1 4 2 2 4 8 15
mark.
% 0.00 30.77 15.38 15.38 7.69 11.54 13.46 23.08 7.69 15.38 15.38 15.38 15.38 15.38 14.42 ix)Fonnation of cooperative marketing.
2 3 5 4 1 5 10 4 3 7 3 4 7 14 24 society
% 15.38 23.08 19.23 30.77 7.69 19.23 19.23 30.77 23.08 26.92 23.08 30.77 26.92 26.92 23.08 x)Provision of regulation of live stock
3 3 6 3 0 3 9 3 4 7 3 3 6 13 22 mark.
% 23.08 2.08 23.08 23.08 0.00 11.54 17.31 23.08 30.77 26.92 23.08 23.08 23.08 25 21.15 xi)Expansion of mark. With modem
1 5 6 4 1 5 11 3 3 6 4 1 5 11 22 amenities
% 7.69 38.46 23.08 30.77 7.69 19.23 21.15 23.08 23.08 23.08 30.77 7.69 19.23 21.15 21.15
xii)Less marketing channels 1 3 4 5 0 5 9 4 6 10 4 3 7 17 26
% 7.69 23.08 15.38 38.46 0.00 19.23 17.31 30.77 46.15 38.46 30.77 23.08 26.92 32.69 25 xiii)Formation of animal Breeder
0 2 2 2 0 2 4 2 4 6 3 3 6 12 16 cooperative society
% 0.00 15.38 7.69 15.38 0.00 7.69 7.69 15.38 30.77 23.08 23.08 23.08 23.08 23.08 15.38
No response 1 1 2 8 0 8 10 3 1 4 3 5 8 12 22
% 7.69 7.69 7.69 61.54 0.00 30.77 19.23 23.08 7.69 15.38 23.08 38.46 30.77 23.08 21.15
Total 13 13 26 13 13 26 52 13 13 26 13 13 26 52 104
% 100 100 100 100 100 100 100 100 100 100 100 100 100 100 100

Table No-18 _(xiv).- Factor of success (unauthorized broker 1 xiv) Not Yavatmal Ahemadnagar Grand
allowed Market- I (Dharhva) Market- II (Pusad) Total Market- I (Supa) · Market- II (Kasti) Total Total
unauthorized llori(kh) Ladkhed Sub Jamllazar Shilona Sub Jamgaon Dhavalpuri Sub llelwandi Vangdari Sub
broker Arab Total . Total Total Total
Yes 3 8 11 7 6 13 24 4 6 10 8 8 16 26 50 % 23.08 61.54 42.31 53.85 46.15 50 46.15 30.77 46.15 38.46 61.54 61.54 61.54 50 48.08
No 8 3 11 3 3 6 17 9 6 15 3 5 8 23 40 % 61.54 23.08 42.31 23.08 23.08 23.08 32.69 69.23 46.15 57.69 23.08 38.46 30.77 44.23 38.46
No Response 2 2 4 3 4 7 11 0 1 I 2 0 2 3 14 % 15.38 15.38 15.38 23.08 30.77 26.92 21.15 0.00 7.69 3.85 15.38 0.00 7.69 5.77 13.46
Total 13 13 26 13 13 26 52 13 13 26 13 13 26 52 104
% 100 100 100 100 100 100 100 100 100 100 100 100 100 100 100
Table -18 (xv): Factor of success (weigh based price of goats xv) Price of Market- I (Dharhva) Market- II (Pusad) Total Market- I (Supa) Market- II (Kasti) Total Grand
goats should be llori(kh) Ladkhed Sub Jamllazar Shilona Sub Jamgaon Dhavalpuri Sub llelwandi Vangdari Sub Total decided on Arab Total Total Total Total
weight basic
Yes 9 11 20 9 10 19 39 7 12 19 11 12 23 42 81
%· 69.23 84.62 76.92 69.23 76.92 73.08 75 53.85 92.31 73.08 84.62 92.31 88.46 80.77 77.88
No 3 1 4 1 1 2 6 6 1 7 2 1 3 10 16
% 23.08 7.69 15.38 7.69 7.69 7.69 11.54 46.15 7.69 26.92 15.38 7.69 11.54 19.23 15.38
No Response 1 1 2 3 2 5 7 0 0 0 0 0 0 0 7
% 7.69 7.69 7.69 23.08 15.38 19.23 13.46 0.00 0.00 0.00 0.00 0.00 0.00 0.00 6.73
Total 13 13 26 13 13 26 52 13 13 26 13 13 26 52 104
% 100 100 100 100 100 100 100 100 100 100 100 100 100 100 100
214
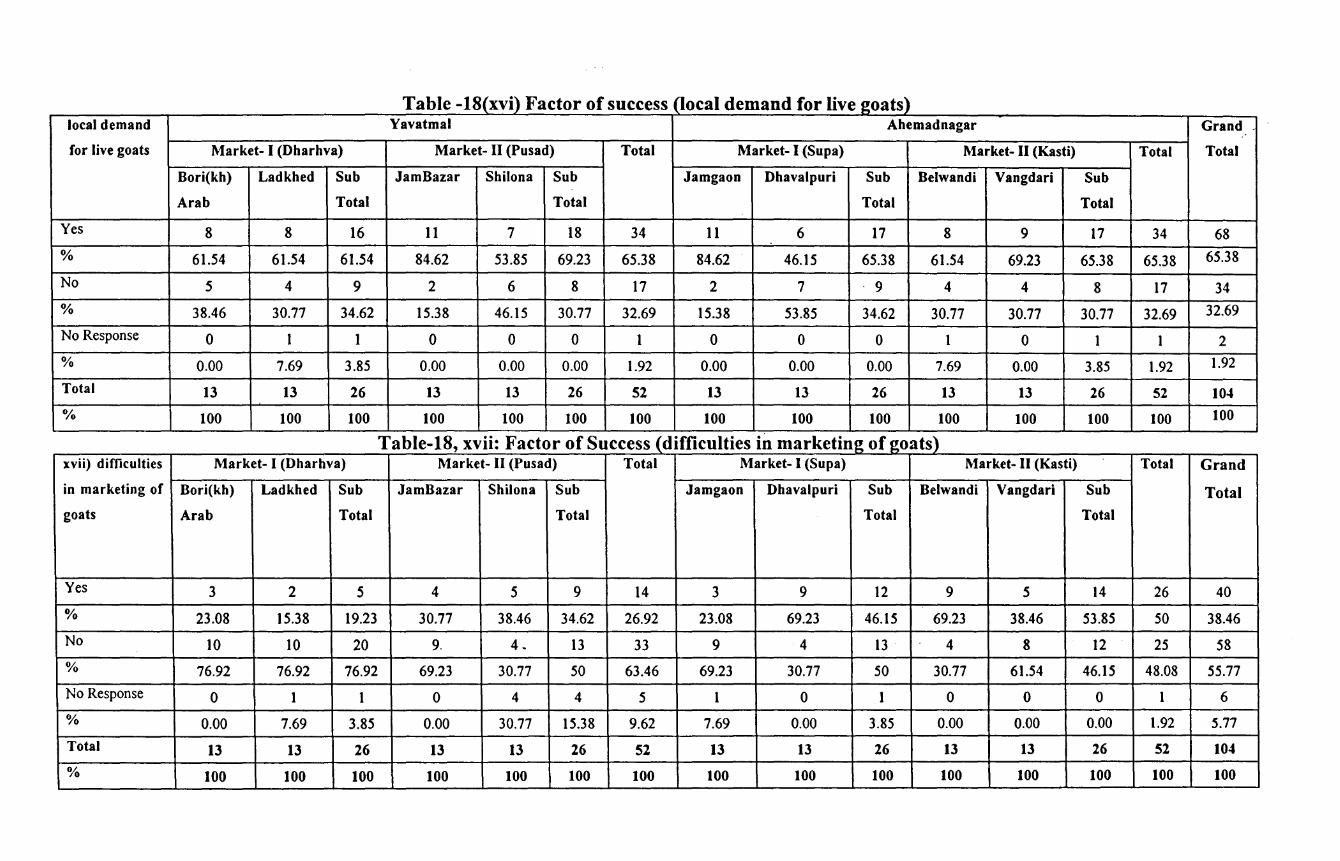
Table -18(xvi) Factor of success (local demand for live _goats) local demand Yavatmal Ahemadnagar Grand
for live goats Market- I (Dharhva) Market- II (Pusad) Total Market- I (Supa) Market- II (Kasti) Total Total
Bori(kh) Ladkhed Sub JamBazar Shilona Sub Jamgaon Dhavalpuri Sub Belwandi Vangdari Sub
Arab Total Total Total Total
Yes 8 8 16 11 7 18 34 11 6 17 8 9 17 34 68
% 61.54 61.54 61.54 84.62 53.85 69.23 65.38 84.62 46.15 65.38 61.54 69.23 65.38 65.38 65.38
No 5 4 9 2 6 8 17 2 7 . 9 4 4 8 17 34
% 38.46 30.77 34.62 15.38 46.15 30.77 32.69 15.38 53.85 34.62 30.77 30.77 30.77 32.69 32.69
No Response 0 I 1 0 0 0 1 0 0 0 1 0 I 1 2
% 0.00 7.69 3.85 0.00 0.00 0.00 1.92 0.00 0.00 0.00 7.69 0.00 3.85 1.92 1.92
Total 13 13 26 13 13 26 52 13 13 26 13 13 26 52 104 o;o 100 100 100 100 100 100 100 100 100 100 100 100 100 100 100
Table-18, xvii: Factor of Success (difficulties in marketing of goats) xvii) difficulties Market- I (Dharhva) Market- II (Pusad) Total Market- I (Supa) Market- II (Kasti) Total Grand
in marketing of Bori(kh) Ladkhed Sub JamBazar Shilona Sub Jamgaon Dhavalpuri Sub Belwandi Vangdari Sub Total goats Arab Total Total Total Total
Yes 3 2 5 4 5 9 14 3 9 12 9 5 14 26 40
% 23.08 15.38 19.23 30.77 38.46 34.62 26.92 23.08 69.23 46.15 69.23 38.46 53.85 50 38.46
No 10 10 20 9. 4- 13 33 9 4 13 4 8 12 25 58
% 76.92 76.92 76.92 69.23 30.77 50 63.46 69.23 30.77 50 30.77 61.54 46.15 48.08 55.77
No Response 0 I 1 0 4 4 5 I 0 I 0 0 0 I 6
% 0.00 7.69 3.85 0.00 30.77 15.38 9.62 7.69 0.00 3.85 0.00 0.00 0.00 1.92 5.77
Total 13 13 26 13 13 26 52 13 13 26 13 13 26 52 104
% 100 100 100 100 100 100 100 100 100 100 100 100 100 100 100
Local Demand for Milk Products
There are various products, which are produced by the goat, like, milk and their
byproducts generate important income source to the goat keepers. While conducting field
survey in the sample districts, the study found that 32.69% households said that there is local
demand for the milk products, whereas 65.3 8 % households said that there is no such demand
for the milk products locally. However, there are some households, which have not responded
this question, are 1.92 % households. The data indicates that. majority of households . expressed that milk product cannot be sold locally except few households. (Table-19 )
216
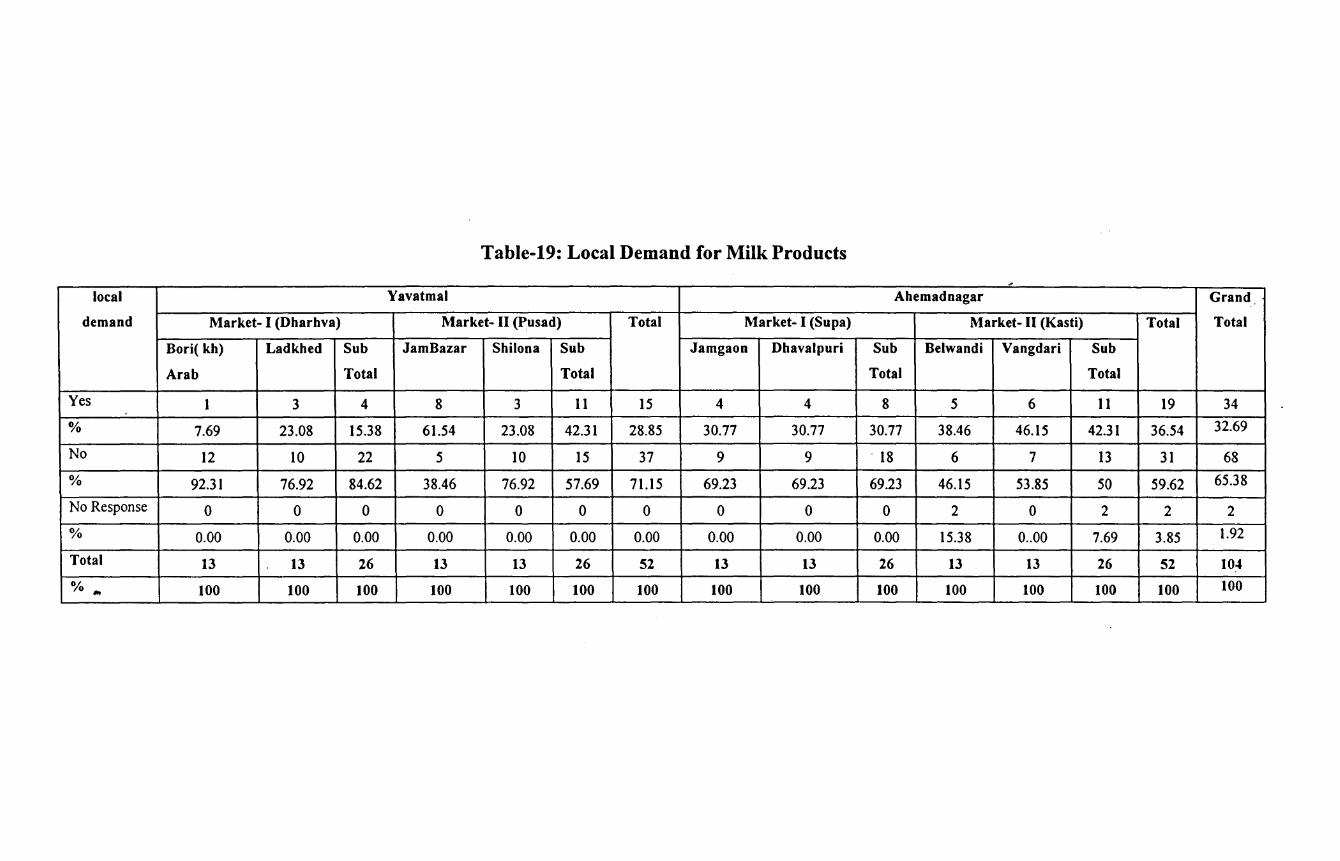
Table-19: Local Demand for Milk Products J
local Yavatmal Abe mad nagar Grand
demand Market- I (Dharhva) Market- II (Pusad) Total Market- I (Supa) Market- II (Kasti) Total Total
Bori( kh) Ladkhed Sub JamBazar Shilona Sub Jamgaon Dhavalpuri Sub Belwandi Vangdari Sub
Arab Total Total Total Total
Yes I 3 4 8 3 11 15 4 4 8 5 6 11 19 34
% 7.69 23.08 15.38 61.54 23.08 42.31 28.85 30.77 30.77 30.77 38.46 46.15 42.31 36.54 32.69
No 12 10 22 5 10 15 37 9 9 . 18 6 7 13 31 68
% 92.31 76.92 84.62 38.46 76.92 57.69 71.15 69.23 69.23 69.23 46.15 53.85 50 59.62 65.38
No Response 0 0 0 0 0 0 0 0 0 0 2 0 2 2 2
% 0.00 0.00 0.00 0.00 0.00 0.00 0.00 0.00 0.00 0.00 15.38 0 .. 00 7.69 3.85 1.92
Total 13 13 26 13 13 26 52 13 13 26 13 13 26 52 104
o/o "' 100 100 100 100 100 100 100 100 100 100 100 100 100 100 100
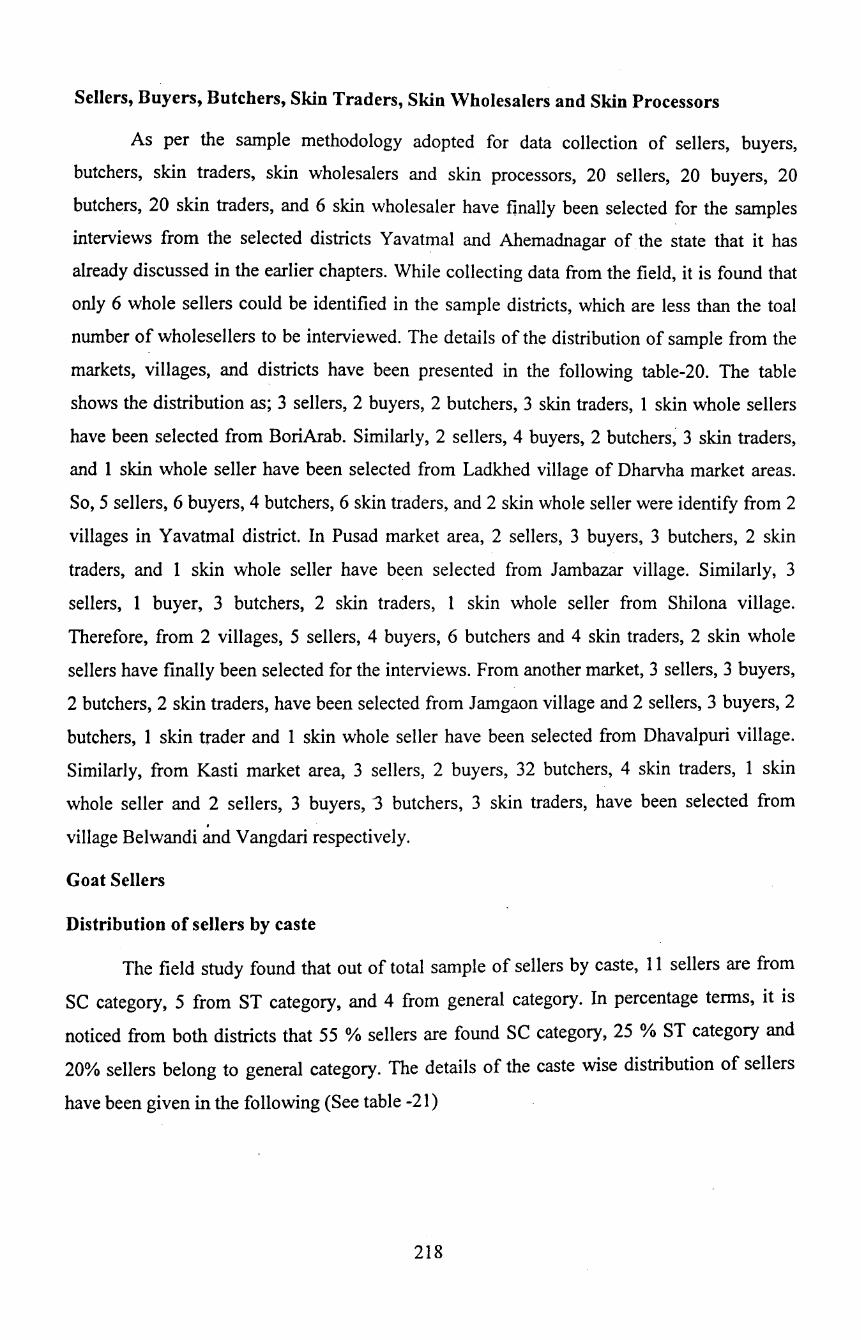
Sellers, Buyers, Butchers, Skin Traders, Skin Wholesalers and Skin Processors
As per the sample methodology adopted for data collection of sellers, buyers,
butchers, skin traders, skin wholesalers and skin processors, 20 sellers, 20 buyers, 20
butchers, 20 skin traders, and 6 skin wholesaler have finally been selected for the samples
interviews from the selected districts Yavatmal and Ahemadnagar of the state that it has
already discussed in the earlier chapters. While collecting data from the field, it is found that
only 6 whole sellers could be identified in the sample districts, which are less than the toal
number of wholesellers to be interviewed. The details of the distribution of sample from the
markets, villages, and districts have been presented in the following table-20. The table
shows the distribution as; 3 sellers, 2 buyers, 2 butchers, 3 skin traders, 1 skin whole sellers
have been selected from BoriArab. Similarly, 2 sellers, 4 buyers, 2 butchers~ 3 skin traders,
and 1 skin whole seller have been selected from Ladkhed village of Dharvha market areas.
So, 5 sellers, 6 buyers, 4 butchers, 6 skin traders, and 2 skin whole seller were identify from 2
villages in Yavatmal district. In Pusad market area, 2 sellers, 3 buyers, 3 butchers, 2 skin
traders, and 1 skin whole seller have been selected from Jambazar village. Similarly, 3
sellers, 1 buyer, 3 butchers, 2 skin traders, 1 skin whole seller from Shilona village.
Therefore, from 2 villages, 5 sellers, 4 buyers, 6 butchers and 4 skin traders, 2 skin whole
sellers have finally been selected for the interviews. From another market, 3 sellers, 3 buyers,
2 butchers, 2 skin traders, have been selected from J amgaon village and 2 sellers, 3 buyers, 2
butchers, 1 skin trader and 1 skin whole seller have been selected from Dhavalpuri village.
Similarly, from Kasti market area, 3 sellers, 2 buyers, 32 butchers, 4 skin traders, 1 skin
whole seller and 2 sellers, 3 buyers, 3 butchers, 3 skin traders, have been selected from .
village Belwandi and Vangdari respectively.
Goat Sellers
Distribution of sellers by caste
The field study found that out of total sample of sellers by caste, 11 sellers are from
SC category, 5 from ST category, and 4 from general category. In percentage terms, it is
noticed from both districts that 55 %sellers are found SC category, 25 % ST category and
20% sellers belong to general category. The details of the caste wise distribution of sellers
have been given in the following (See table -21)
218
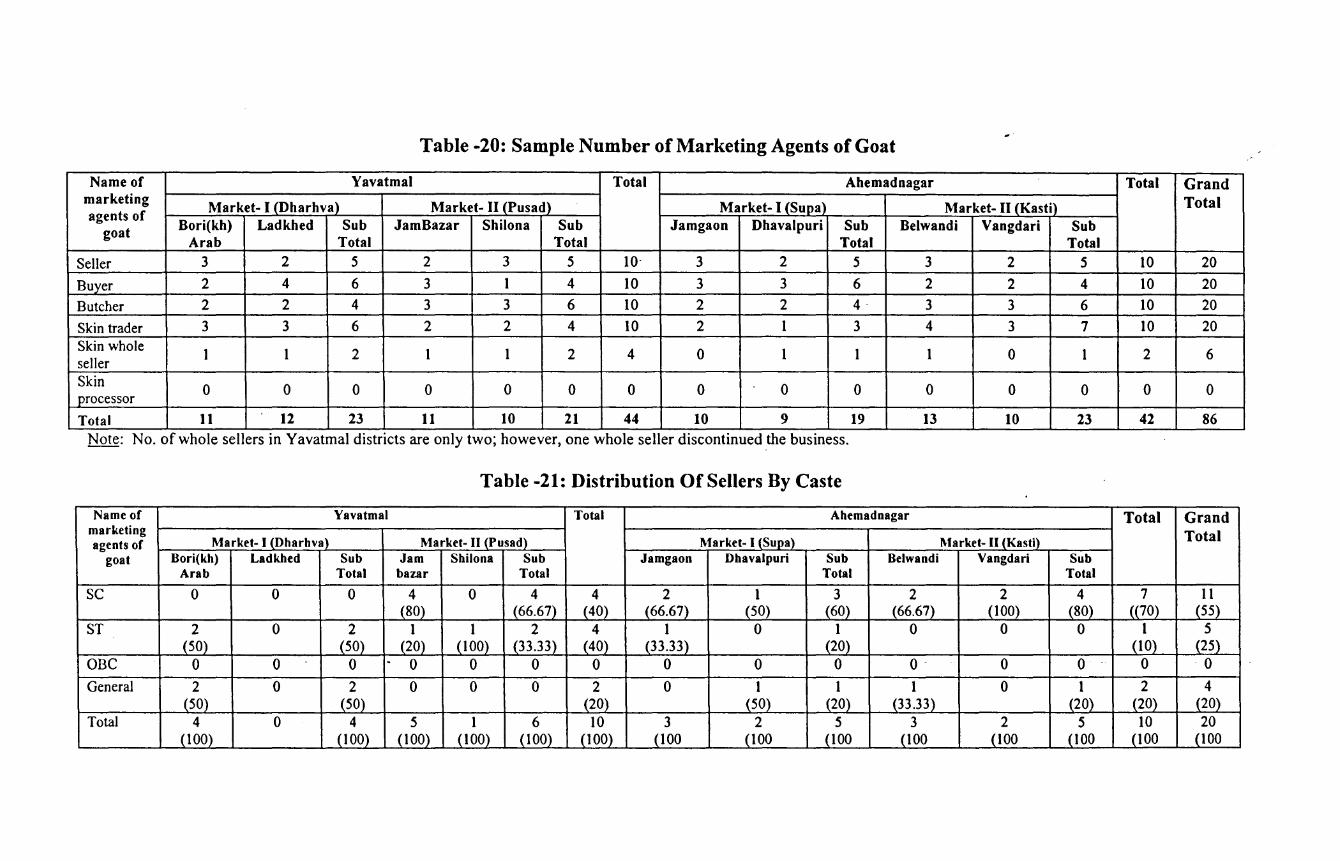
Table -20: Sample Number of Marketing Agents of Goat
Name of Yavatmal Total Ahemadnagar Total Grand marketing
Market- I (Dharhva) Market- II (Pusad) Market- I (Supa' Market- II (Kasti) Total agents of
Bori(kh) Ladkhed Sub JamBazar Shilona Sub Jamgaon Dhavalpuri Sub Belwandi Vangdari Sub goat Arab Total Total Total Total
Seller 3 2 5 2 3 5 10· 3 2 5 3 2 5 10 20
Buyer 2 4 6 3 1 4 10 3 3 6 2 2 4 10 20
Butcher 2 2 4 3 3 6 10 2 2 4· 3 3 6 10 20
Skin trader 3 3 6 2 2 4 10 2 1 3 4 3 7 10 20 Skin whole
1 1 2 1 1 2 4 0 1 1 1 0 1 2 6 seller Skin
0 0 0 0 0 0 0 0 0 0 0 0 0 0 0 processor
Total 11 12 23 11 10 21 44 10 9 19 13 10 23 42 86 Note: No. of whole sellers in Yavatmal districts are only two; however, one whole seller discontinued the business.
Table -21: Distribution Of Sellers By Caste
Name of Yavatmal Total Ahemadoagar Total Grand marketing agents of Market- I (Dharhva) Market- II (Pusad) Market- I (Supa) Market- II (Kasti) Total
goat Bori(kh) Ladkhed Sub Jam Shilona Sub Jamgaon Dhavalpuri Sub Belwaodi Vangdari Sub Arab Total bazar Total Total Total
sc 0 0 0 4 0 4 4 2 1 3 2 2 4 7 11 (80) (66.67} (40) (66.67) (50) (60) _(66.671 (100) (80) ((70) (55)
ST 2 0 2 1 1 2 4 1 0 1 0 0 0 1 5 (50) (50) (20) (100) (33.33) (40) (33.33) (20) (10) (25)
OBC 0 0 0 . 0 0 0 0 0 0 0 o· 0 0 0 0
General 2 0 2 0 0 0 2 0 1 1 1 0 1 2 4 (50) (50) (20) (50) (20) (33.33) (20) (20) (20)
Total 4 0 4 5 1 6 10 3 2 5 3 2 5 10 20 (100) (100) (tOO) (tOO) (tOO) (100) (100 (100 (tOO (100 (100 (tOO (tOO (100
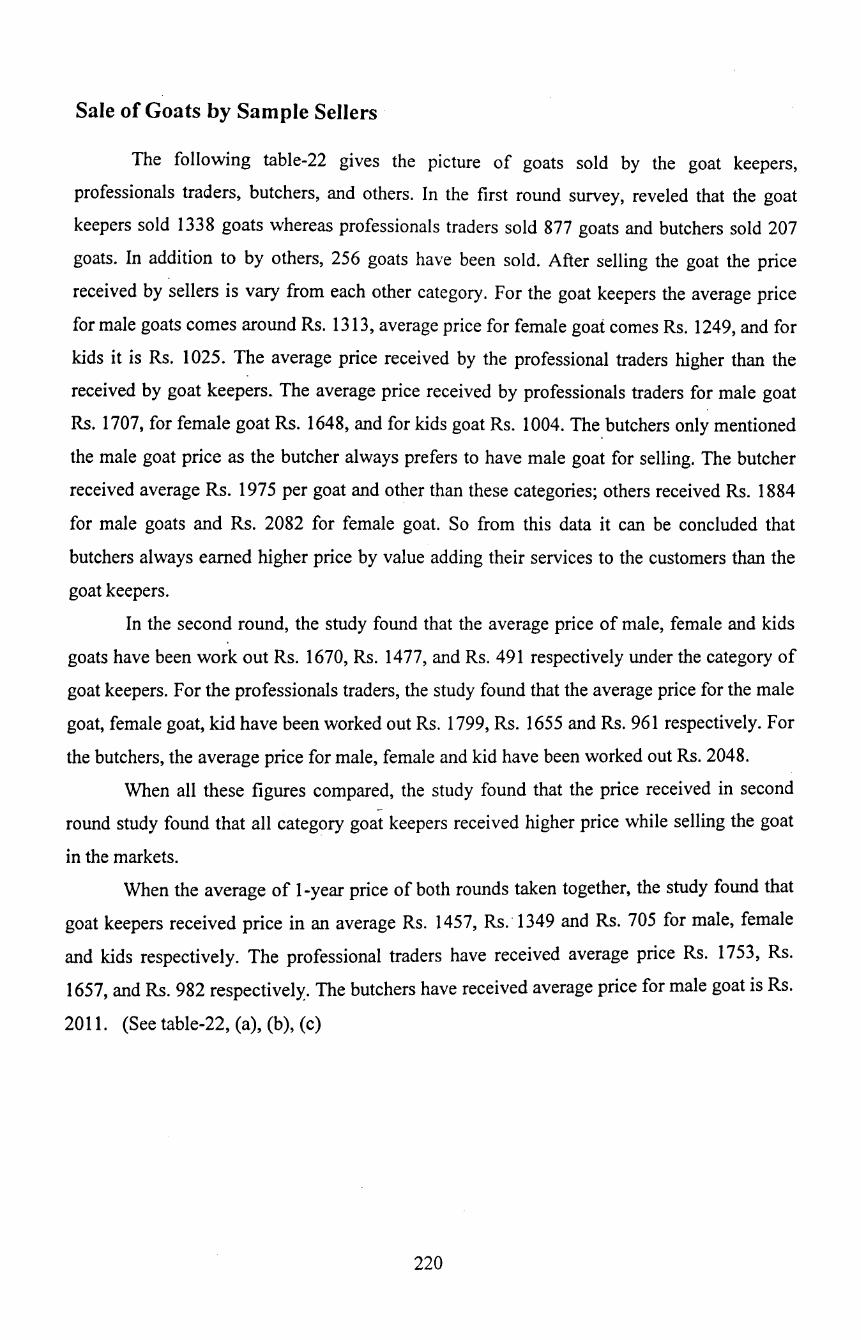
Sale of Goats by Sample Sellers
The following table-22 gives the picture of goats sold by the goat keepers,
professionals traders, butchers, and others. In the first round survey, reveled that the goat
keepers sold 1338 goats whereas professionals traders sold 877 goats and butchers sold 207
goats. In addition to by others, 256 goats have been sold. After selling the goat the price
received by sellers is vary from each other category. For the goat keepers the average price
for male goats comes around Rs. 1313, average price for female goat comes Rs. 1249, and for
kids it is Rs. 1025. The average price received by the professional traders higher than the
received by goat keepers. The average price received by professionals traders for male goat
Rs. 1707, for female goat Rs. 1648, and for kids goat Rs. 1004. The. butchers only mentioned
the male goat price as the butcher always prefers to have male goat for selling. The butcher
received average Rs. 1975 per goat and other than these categories; others received Rs. 1884
for male goats and Rs. 2082 for female goat. So from this data it can be concluded that
butchers always earned higher price by value adding their services to the customers than the
goat keepers.
In the second round, the study found that the average price of male, female and kids
goats have been work out Rs. 1670, Rs. 14 77, and Rs. 491 respectively under the category of
goat keepers. For the professionals traders, the study found that the average price for the male
goat, female goat, kid have been worked out Rs. 1799, Rs. 1655 and Rs. 961 respectively. For
the butchers, the average price for male, female and kid have been worked out Rs. 2048.
When all these figures compared, the study found that the price received in second
round study found that all category goat keepers received higher price while selling the goat
in the markets.
When the average of 1-year price of both rounds taken together, the study found that
goat keepers received price in an average Rs. 1457, Rs. · 1349 and Rs. 705 for male, female
and kids respectively. The professional traders have received average price Rs. 1753, Rs.
1657, and Rs. 982 respectively. The butchers have received average price for male goat is Rs.
2011. (See table-22, (a), (b), (c)
220
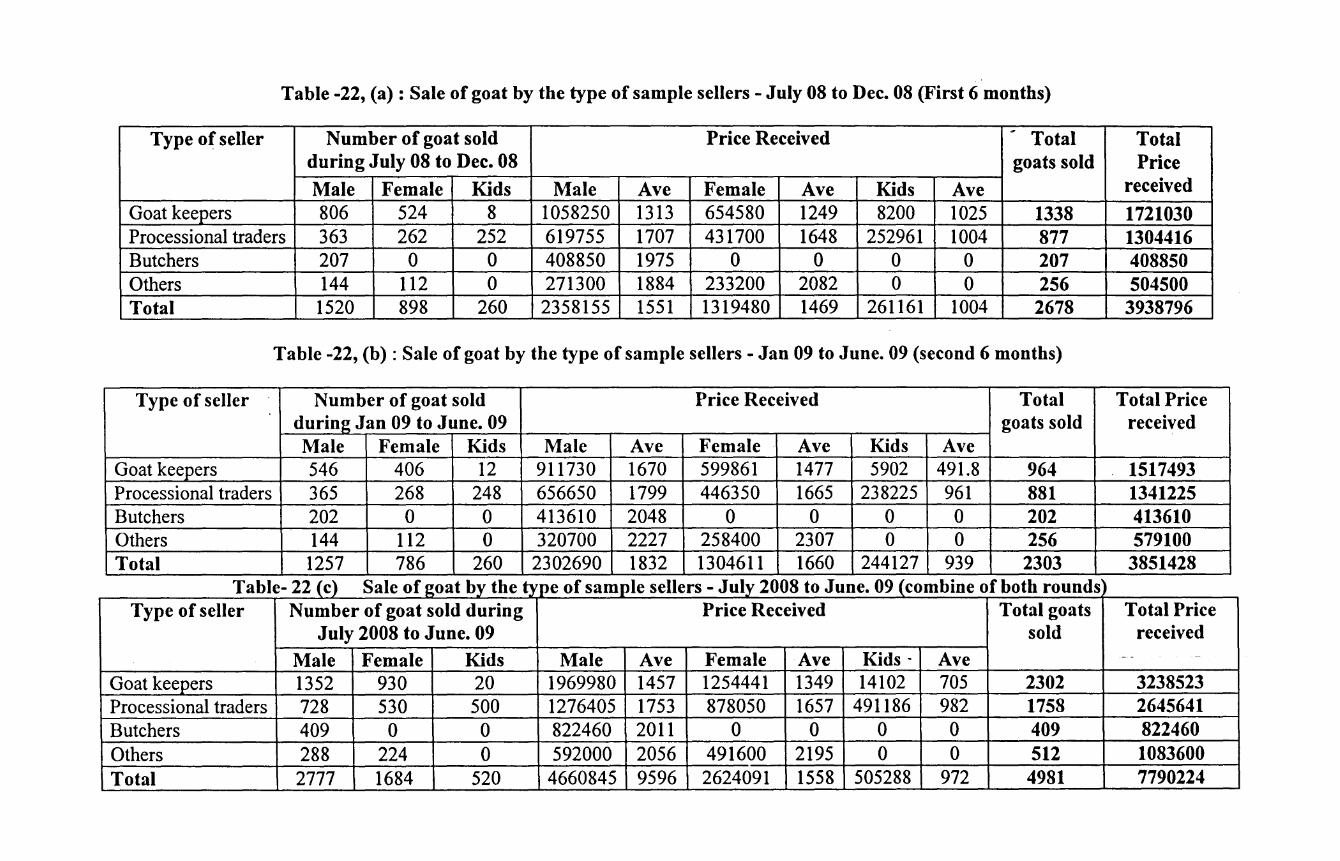
Table -22, (a) : Sale of goat by the type of sample sellers- July 08 to Dec. 08 (First 6 months)
Type of seller Number of goat sold Price Received # Total Total during July 08 to Dec. 08 goats sold Price Male Female Kids Male Ave Female Ave Kids Ave received
Goat keepers 806 524 8 1058250 1313 654580 1249 8200 1025 1338 1721030 Processional traders 363 262 252 619755 1707 431700 1648 252961 1004 877 1304416 Butchers 207 0 0 408850 1975 0 0 0 0 207 408850 Others 144 112 0 271300 1884 233200 2082 0 0 256 504500 Total 1520 898 260 2358155 1551 1319480 1469 261161 1004 2678 3938796
Table -22, (b) :Sale of goat by the type of sample sellers- Jan 09 to June. 09 (second 6 months)
Type of seller Number of goat sold Price Received Total Total Price during Jan 09 to June. 09 goats sold received Male Female Kids Male Ave Female Ave Kids Ave
Goat keepers 546 406 12 911730 1670 599861 1477 5902 491.8 964 1517493 Processional traders 365 268 248 656650 1799 446350 1665 238225 961 881 1341225 Butchers 202 0 0 413610 2048 0 0 0 0 202 413610 Others 144 112 0 320700 2227 258400 2307 0 0 256 579100 Total 1257 786 260 2302690 1832 1304611 1660 244127 939 2303 3851428
Table- 22 (c) Sale of goat by the type of sample sellers- Ju!Y_ 2008 to June. 09 (combine of both rounds Type of seller Number of goat sold during Price Received Total goats Total Price
July 2008 to June. 09 sold received
Male Female Kids Male Ave Female Ave Kids- Ave - - -
Goat keepers 1352 930 20 1969980 1457 1254441 1349 14102 705 2302 3238523 Processional traders 728 530 500 1276405 1753 878050 1657 491186 982 1758 2645641 Butchers 409 0 0 822460 2011 0 0 0 0 409 822460 Others 288 224 0 592000 2056 491600 2195 0 0 512 1083600 Total 2777 1684 520 4660845 9596 2624091 1558 505288 972 4981 7790224
l\Iarketing Cost of Sample Sellers
The study found that the average expenses for the seller incurred on the various items
have been presented in the following table-23. During the first round survey, the study found
that the average cost incurred on the transport by the seller is Rs. 1095.75 The other costs like
loading/ unloading (Rs. 456.90), feeding cost (Rs. 279.70), Mandi fees ( Rs. 570.95), family
labour value (Rs. 176.4), hired labour charges (Rs.450) and others charges (Rs.l77.90). The
average of all items has been worked pout per seller Rs. 3297.60
The second round study found that the sellers incurred on various items as transport
charge (Rs.916), loadirig/ unloading (Rs. 436.25), feeding cost (Rs. 236.40), Mandi fees
(Rs. 467.70), family labour value (Rs. 181.65), hired labour charges (Rs.450) and other
charges (Rs. 186.10). The average of all items has been worked pout per seller Rs. 3297.60
·When the average of the both rounds taken together the average price for each items
has been work out as transport charge (Rs.1 005), loading/ unloading ( Rs. 491.50), feeding
cost (Rs. 258.05), Mandi fees ( Rs. 519.30), family labour value (Rs. 179.02), hired labour
charges (Rs.450) and other charges (Rs. 182). The average of all items has been worked pout
per seller Rs. 3085.8
222
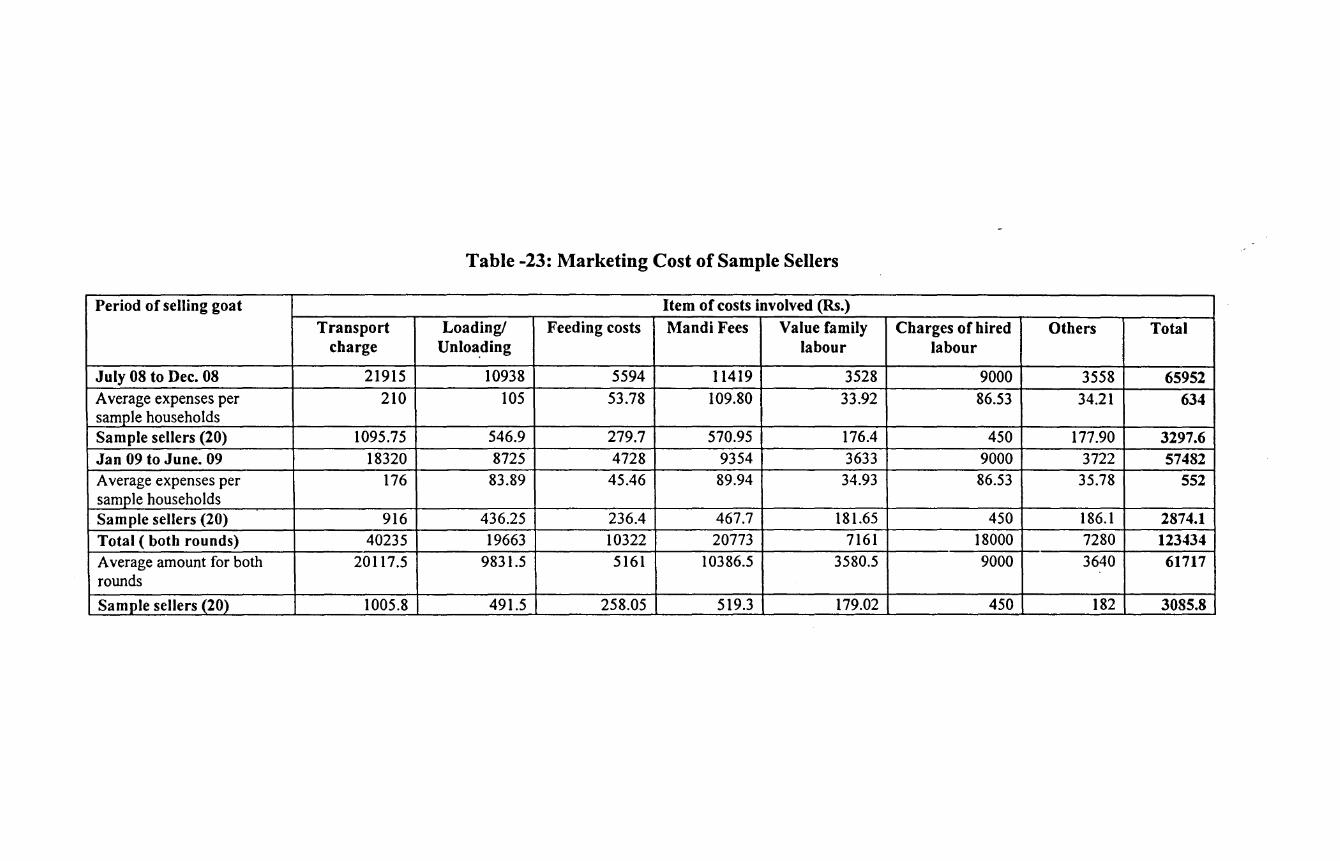
Table -23: Marketing Cost of Sample Sellers
Period of selling goat Item of costs involved (Rs.)
Transport Loading! Feeding costs Mandi Fees Value family Charges of hired Others Total charge Unloa_ding labour labour
July 08 to Dec. 08 21915 10938 5594 11419 3528 9000 3558 65952 Average expenses per 210 105 53.78 109.80 33.92 86.53 34.21 634 sample households Sample sellers (20) 1095.75 546.9 279.7 570.95 176.4 450 177.90 3297.6 Jan 09 to June. 09 18320 8725 4728 9354 3633 9000 3722 57482 Average expenses per 176 83.89 45.46 89.94 34.93 86.53 35.78 552 sample households Sample sellers (20) 916 436.25 236.4 467.7 181.65 450 186.1 2874.1 Total ( both rounds) 40235 19663 10322 20773 7161 18000 7280 123434 Average amount for both 20117.5 9831.5 5161 10386.5 3580.5 9000 3640 61717 rounds
Sample sellers (20) 1005.8 491.5 258.05 519.3 179.02 450 182 3085.8
Transport Used for Bringing Goats
The field study found that the goat sellers have been using different means of
transports for bringing goats to the market places. It is observed that at different point of
times,_ the goat sellers used available transports like cycles, autos, trucks and tempos. That
means that the single seller also uses multiple transport facilities at different times and places
according to availability and urgency. However, the study found that most goat sellers have
been using tempo facility frequently than other transport means in ·~ll sample villages of the
both districts of the state. (See table -24).
Local Market
It is observed from the study that out of total sample goat seller opinions about local
market, 75 % goat keepers have opined that they are selling goats locally, and 25 % goat
sellers opined that the markets are not locals. Only 5% goat sellers have not responded to this
question. Overall, the majority goat sellers prefer to sell goats at local markets. (See table -
25)
Facilities Available in Markets
It is observed from the field data that out of total 20 samples goat sellers, all sellers
have positively opined that water, electricity, shade, telephone, price board facilities are
available to them in the market locations particularly in Darvha market. The goat sellers in
Pusad market areas, it is found that out of 5 goat sellers, 4 goat sellers are satisfied with water
facility, Shade and telephone facility. It is also noticed that all sellers are satisfied with
electricity and price board facility. In Ahemadnagar district in the Supa market, 3 goat sellers
are satisfied with water facility and telephone, 4 goat sellers are satisfied with electricity, 1
goat seller is satisfied with shade and price board. In Kasti market area, only 1 goat seller is
satisfied with shade facility and price board, 3 goat sellers are satisfied with water facility, 2
goat sellers are satisfied with the telephone facility. However, all goat sellers are satisfied
with the only 1 amenity and that is electricity. (See table -26)
Space Availability in Market Yard
The field study found that out of total sample goat sellers, 25 % goat sellers agreed
that they are provided sufficient space for goat marketing in the market places whereas it is
observed that 75 % goat sellers have opined that no sufficient space for marketing of goats
are provided in the market yard. It indicates that majority of goat sellers feel that sufficient
market space for the marketing of the ~oats must be provided. (See table -27)
224
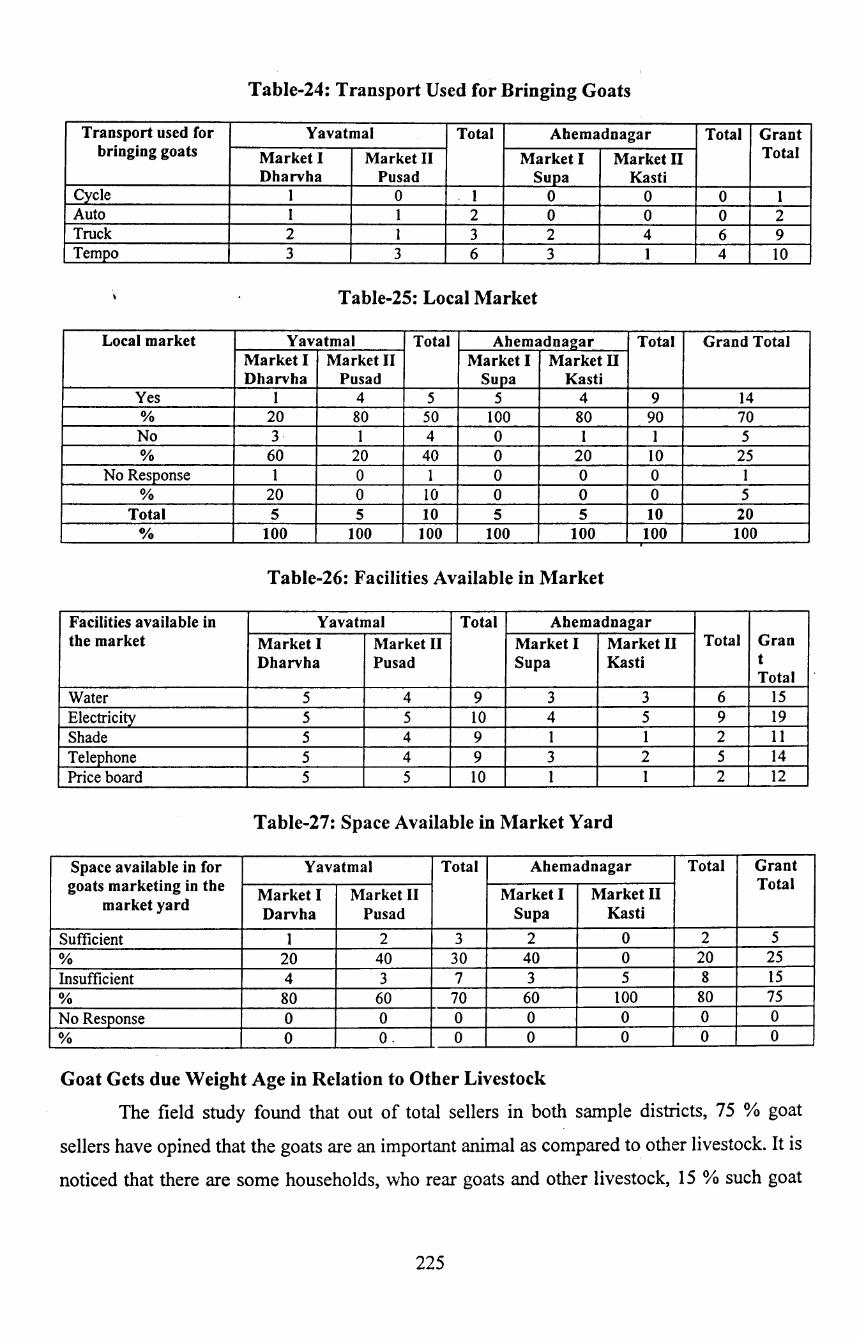
Table-24: Transport Used for Bringing Goats
Transport used for Yavatmal Total Abemadnagar Total Grant bringing goats Market I Market II Market I Marketll Total
Dharvha Pusad Sup a Kasti C_ycle I 0 I 0 0 0 I Auto I I 2 0 0 0 2 Truck 2 1 3 2 4 6 9 Tempo 3 3 6 3 I 4 IO
Table-25: Local Market
Local market Yavatmal Total Abemadnagar Total Grand Total Market I Market II Market I Market ll Dharvha Pusad Supa Kasti
Yes I 4 5 5 4 9 14 % 20 80 50 IOO 80 90 70 No 3· I 4 0 I I 5 % 60 20 40 0 20 10 25
No Response I 0 1 0 0 0 I % 20 0 10 0 0 0 5
Total 5 5 10 5 5 10 20 % 100 100 100 100 100 100 100
Table-26: Facilities Available in Market
Facilities available in Yavatmal Total Ahemadnagar the market Market I Market II Market I Market II Total Gran
Dharvha Pusad Sup a Kasti t Total
Water 5 4 9 3 3 6 15 Electricity 5 5 10 4 5 9 19 Shade 5 4 9 I 1 2 11 Telephone 5 4 9 3 2 5 14 Price board 5 5 10 1 1 2 12
Table-27: Space Available in Market Yard
Space available in for Yavatmal Total Ahemadnagar Total Grant goats marketing in the
Market I Market II Market I Market II Total
market yard Darvha Pus ad Supa Kasti
Sufficient 1 2 3 2 0 2 5 % 20 40 30 40 0 20 25 Insufficient 4 3 7 3 5 8 I5 % 80 60 70 60 100 80 75 No Response 0 0 0 0 0 0 0 % 0 Q_ 0 0 0 0 0
Goat Gets due Weight Age in Relation to Other Livestock
The field study found that out of total sellers in both sample districts, 75 % goat
sellers have opined that the goats are an important animal as compared to other livestock. It is
noticed that there are some households, who rear goats and other livestock, 15 % such goat
225
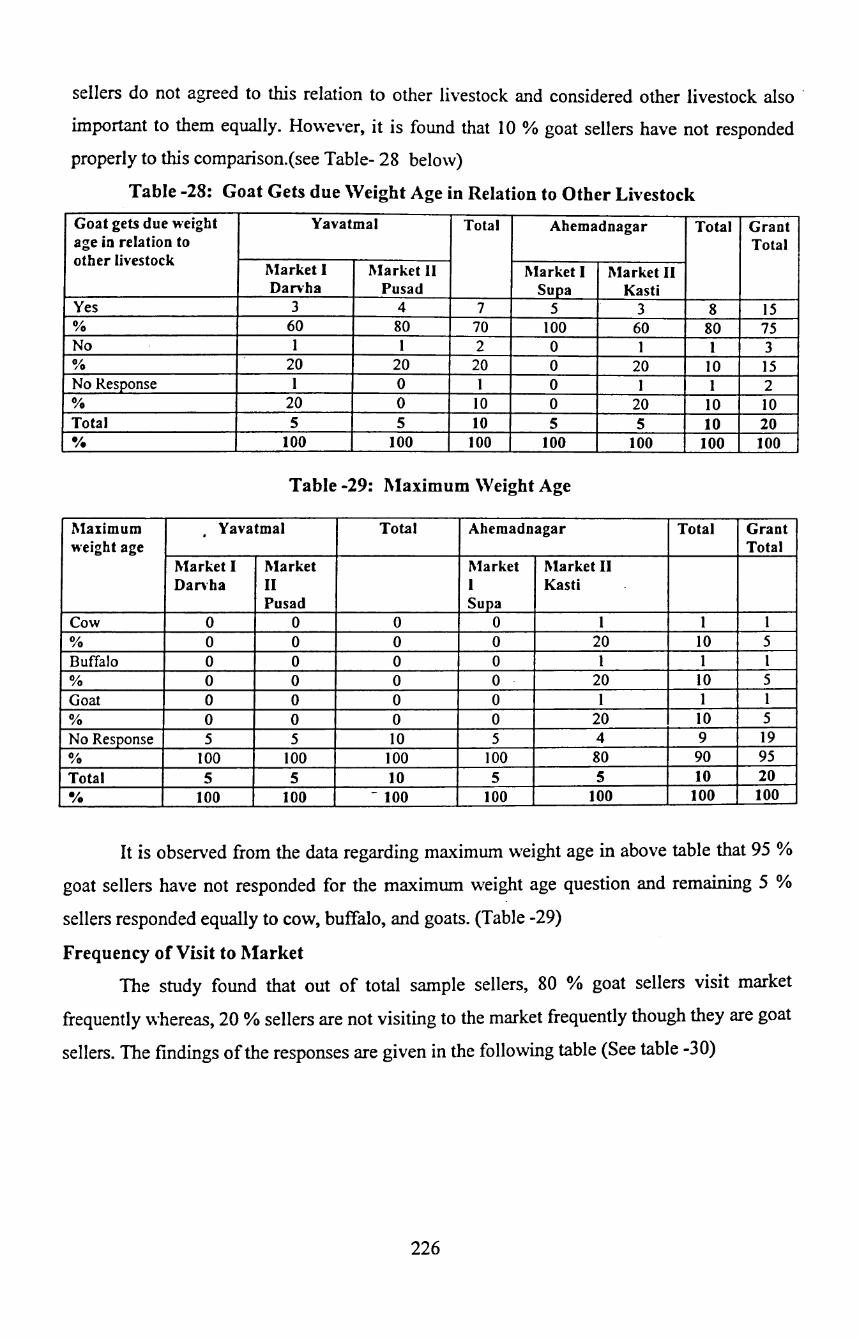
sellers do not agreed to this relation to other livestock and considered other livestock also ·
important to them equally. However, it is found that I 0 % goat sellers have not responded
properly to this comparison.( see Table- 28 below)
Table -28: Goat Gets due \Veight Age in Relation to Other Livestock
Goat gets due weight Yavatmal Total Ahemadnagar Total Grant age in relation to Total other livestock
Market I Market II Market I Market II Dan·ha Pusad Supa Kasti
Yes 3 4 7 5 3 8 15 % 60 80 70 100 60 80 75 No I I 2 0 I 1 3 % 20 20 20 0 20 10 I5 No Response I 0 I 0 I I 2 % 20 0 10 0 20 IO IO Total 5 5 10 5 5 10 20 •;. 100 100 100 100 100 100 100
Table -29: l\laximum \Veight Age
Maximum . Yavatmal Total Ahemadnagar Total Grant weight age Total
Market I Market Market Market II Dan-ha II I Kasti
Pusad Sup a Cow 0 0 0 0 I I I % 0 0 0 0 20 10 5 Buffalo 0 0 0 0 I I I % 0 0 0 0 20 IO 5 Goat 0 0 0 0 I 1 I % 0 0 0 0 20 10 5 No Response 5 5 10 5 4 9 I9 % 100 100 100 100 80 90 95 Total 5 5 10 5 5 10 20 •;. 100 100 - 100 100 100 100 100
It is observed from the data regarding maximum weight age in above table that 95 %
goat sellers have not responded for the maximum weight age question and remaining 5 %
sellers responded equally to cow, buffalo, and goats. (Table -29)
Frequency of Visit to l\larket
The study found that out of total sample sellers, 80 % goat sellers visit market
frequently whereas, 20 % sellers are not visiting to the market frequently though they are goat
sellers. The findings of the responses are given in the following table (See table -30)
226
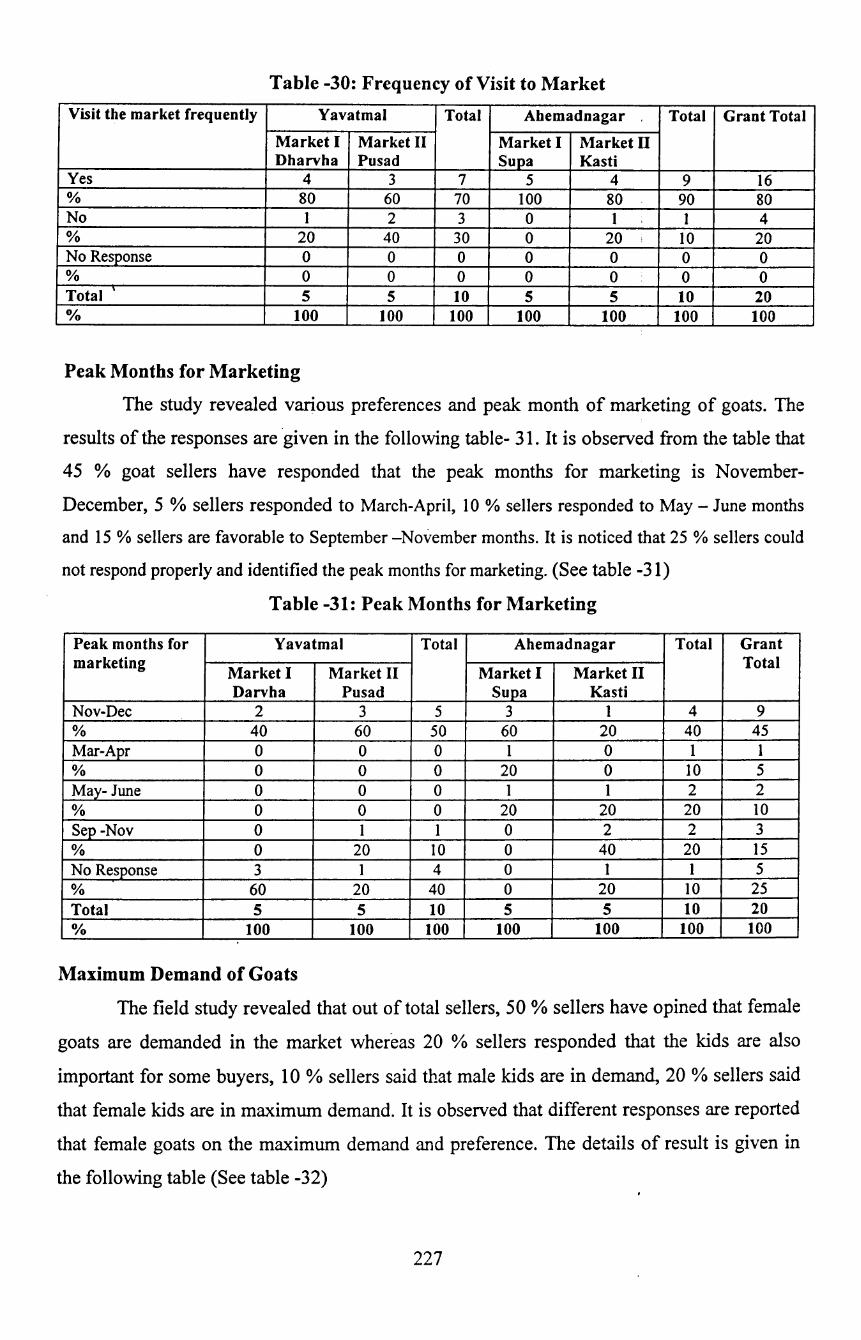
Table -30: Frequency of Visit to Market
Visit the market frequently Yavatmal Total Ahemadnagar Total Grant Total
Market I Market II Market I Market II Dharvha Pus ad Supa Kasti
Yes 4 3 7 5 4 9 I6 % 80 60 70 IOO 80 90 80 No I 2 3 0 I I 4 % 20 40 30 0 20 IO 20 No Response 0 0 0 0 0 0 0 % 0 0 0 0 0 0 0 Total 5 5 10 5 5 10 20 0/o 100 100 100 100 100 100 100
Peak Months for Marketing
The study revealed various preferences and peak month of marketing of goats. The
results of the responses are ·given in the following table- 31. It is observed from the table that
45 % goat sellers have responded that the peak months for marketing is November
December, 5 %sellers responded to March-April, 10% sellers responded to May- June months
and 15% sellers are favorable to September -November months. It is noticed that 25 %sellers could
not respond properly and identified the peak months for marketing. (See table -31)
Table -31: Peak Months for Marketing
Peak months for Yavatmal Total Ahemadnagar Total Grant marketing
Market I Market II Market I Market II Total
Darvha Pusad Sup a Kasti Nov-Dec 2 3 5 3 I 4 9 % 40 60 50 60 20 40 45 Mar-Apr 0 0 0 1 0 I I % 0 0 0 20 0 IO 5 May-June 0 0 0 I I 2 2 % 0 0 0 20 20 20 IO Sep -Nov 0 I 1 0 2 2 3 % 0 20 10 0 40 20 15 No Response 3 1 4 0 I 1 5 % 60 20 40 0 20 IO 25 Total 5 5 10 5 5 10 20 0/o 100 100 100 100 100 100 100
Maximum Demand of Goats
The field study revealed that out of total sellers, 50 % sellers have opined that female
goats are demanded in the market whereas 20 % sellers responded that the kids are also
important for some buyers, 10 % sellers said that male kids are in demand, 20 % sellers said
that female kids are in maximum demand. It is observed that different responses are reported
that female goats on the maximum demand and preference. The details of result is given in
the following table (See table -32)
227
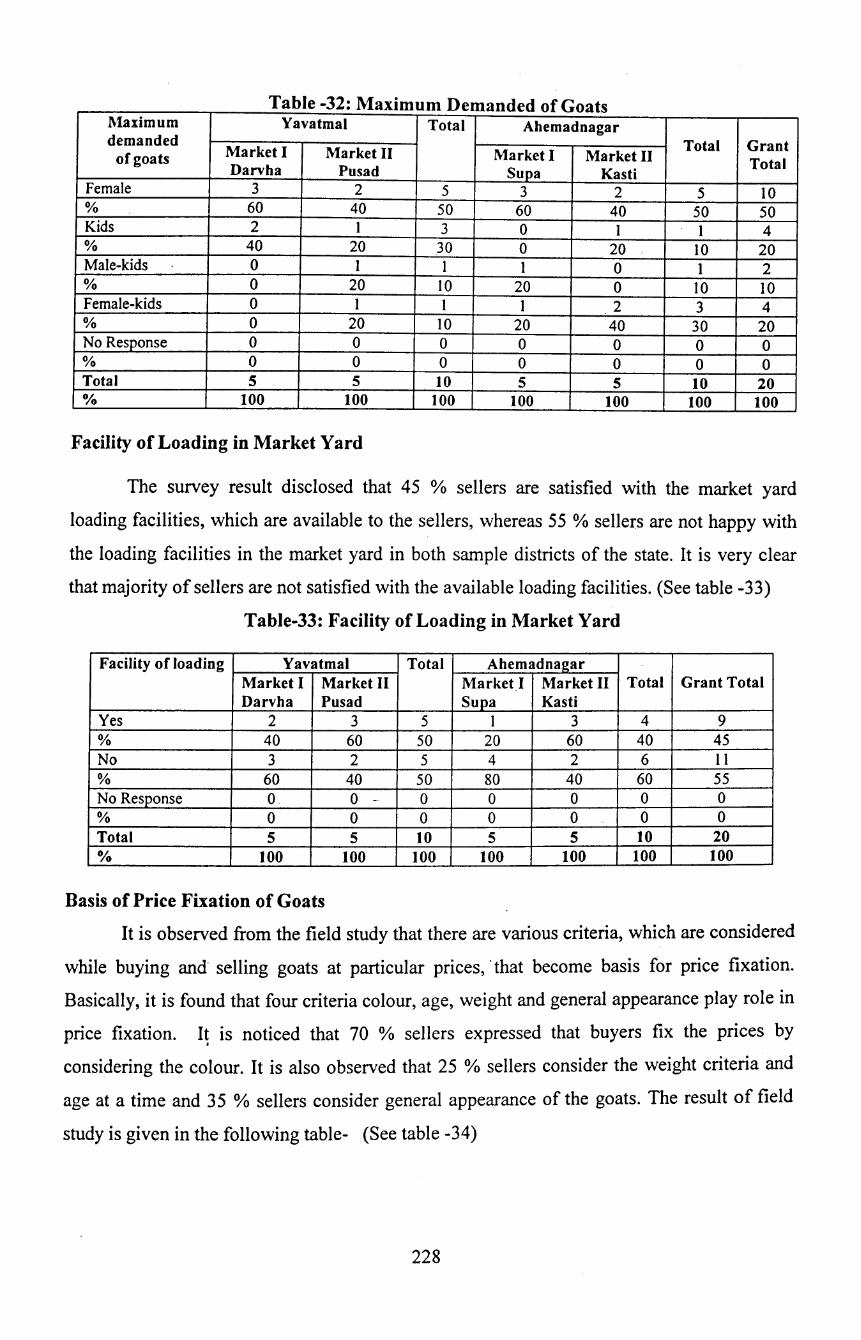
Table -32: Maximum Demanded of Goats .Maximum Yavatmal Total Ahemadnagar demanded Total Grant
of goats .Market I .Market II .Market I .Market II Darvha Pusad Supa Kasti
Total
Female 3 2 5 3 2 5 10 % 60 40 50 60 40 50 50 Kids 2 1 3 0 1 1 4 % 40 20 30 0 20 10 20 Male-kids 0 1 I 1 0 1 2 % 0 20 IO 20 0 10 10 Female-kids 0 1 I I 2 3 4 % 0 20 10 20 40 30 20 No Response 0 0 0 0 0 0 0 % 0 0 0 0 0 0 0 Total 5 5 10 5 5 10 20 o;o 100 100 100 100 100 100 100
Facility of Loading in Market Yard
The survey result disclosed that 45 o/o sellers are satisfied with the market yard
loading facilities, which are available to the sellers, whereas 55 % sellers are not happy with
the loading facilities in the market yard in both sample districts of the state. It is very clear
that majority of sellers are not satisfied with the available loading facilities. (See table -33)
Table-33: Facility of Loading in Market Yard
Facility of loading Yavatmal Total Ahemadnagar .Market I Market II .Market I Market II Total Grant Total Darvha Pusad Sup a Kasti
Yes 2 3 5 1 3 4 9 % 40 60 50 20 60 40 45 No 3 2 5 4 2 6 11 % 60 40 50 80 40 60 55 No Response 0 0 - 0 0 0 0 0 % 0 0 0 0 0 0 0 Total 5 5 10 5 5 10 20 % 100 100 100 100 100 100 100
Basis of Price Fixation of Goats
It is observed from the field study that there are various criteria, which are considered
while buying and· selling goats at particular prices, ·that become basis for price fixation.
Basically, it is found that four criteria colour, age, weight and general appearance play role in
price fixation. I~ is noticed that 70 % sellers expressed that buyers fix the prices by
considering the colour. It is also observed that 25 % sellers consider the weight criteria and
age at a time and 35 % sellers consider general appearance of the goats. The result of field
study is given in the following table- (See table -34)
228
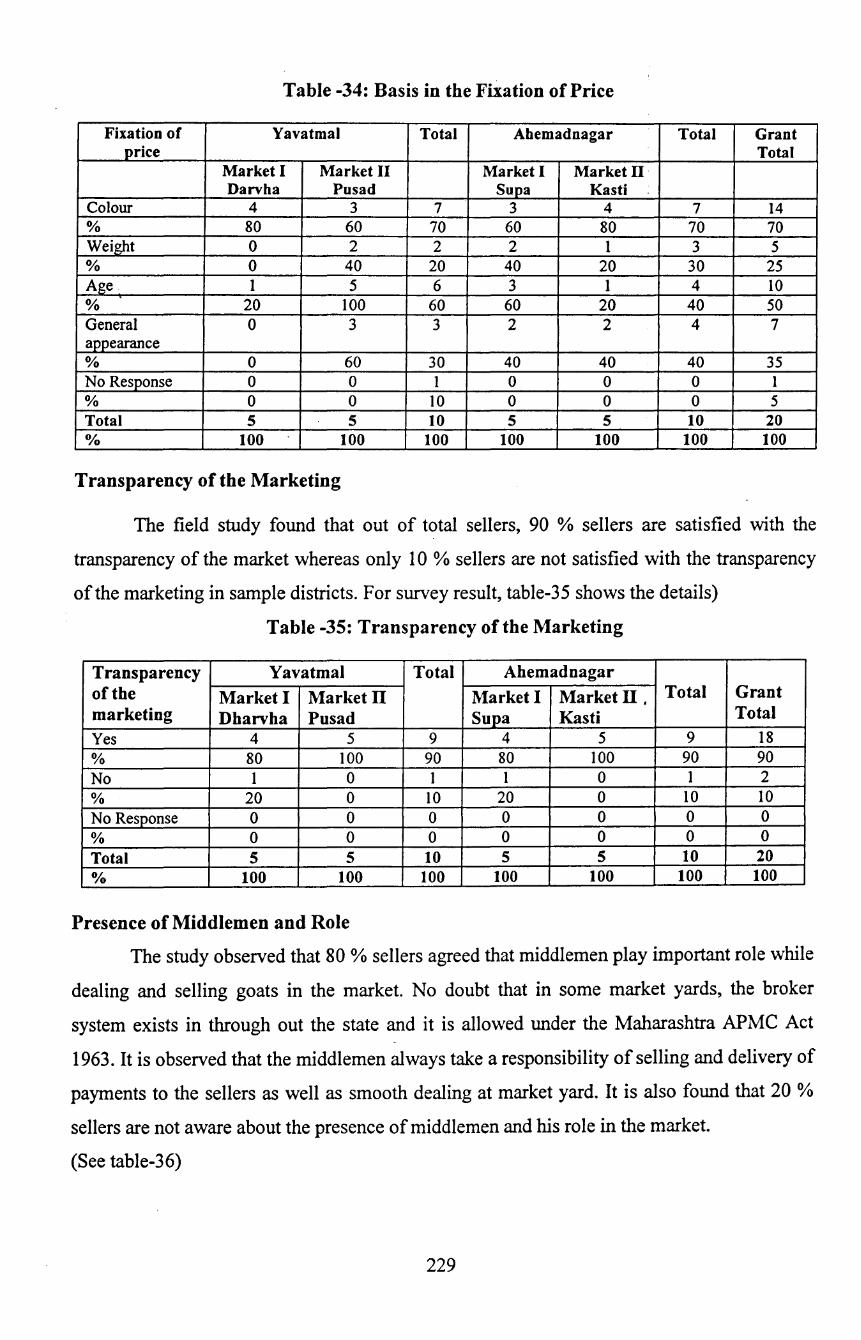
Table -34: Basis in the Fixation of Price
Fixation of Yavatmal Total Ahemadnagar Total Grant price Total
Market I Market II Market I Marketll Darvha Pus ad Supa Kasti
Colour 4 3 7 3 4 7 14 % 80 60 70 60 80 70 70 Weight 0 2 2 2 1 3 5 % 0 40 20 40 20 30 25 Age 1 5 6 3 1 4 10 % 20 100 60 60 20 40 50 General 0 3 3 2 2 4 7 appearance % 0 60 30 40 40 40 35 No Response 0 0 I 0 0 0 1 % 0 0 10 0 0 0 5 Total 5 5 10 5 5 10 20 0/o 100 100 100 100 100 100 100
Transparency of the Marketing
The field study found that out of total sellers, 90 % sellers are satisfied with the
transparency of the market whereas only 1 0 % sellers are not satisfied with the transparency
of the marketing in sample districts. For survey result, table-35 shows the details)
Table -35: Transparency of the Marketing
Transparency Yavatmal Total Ahemadnagar of the Market I Market II Market I Market II. Total Grant marketing Dharvha Pusad Supa Kasti Total
Yes 4 5 9 4 5 9 18 % 80 100 90 80 100 90 90 No 1 0 I 1 0 1 2 % 20 0 10 20 0 10 10 No Response 0 0 0 0 0 0 0 % 0 0 0 0 0 0 0 Total 5 5 10 5 5 10 20 0/o 100 100 100 100 100 100 100
Presence of Middlemen and Role
The study observed that 80 % sellers agreed that middlemen play important role while
dealing and selling goats in the market. No doubt that in some market yards, the broker
system exists in through out the state and it is allowed under the Maharashtra APMC Act
1963. It is observed that the middlemen always take a responsibility of selling and delivery of
payments to the sellers as well as smooth dealing at market yard. It is also found that 20 %
sellers are not aware about the presence of middlemen and his role in the market.
(See table-36)
229
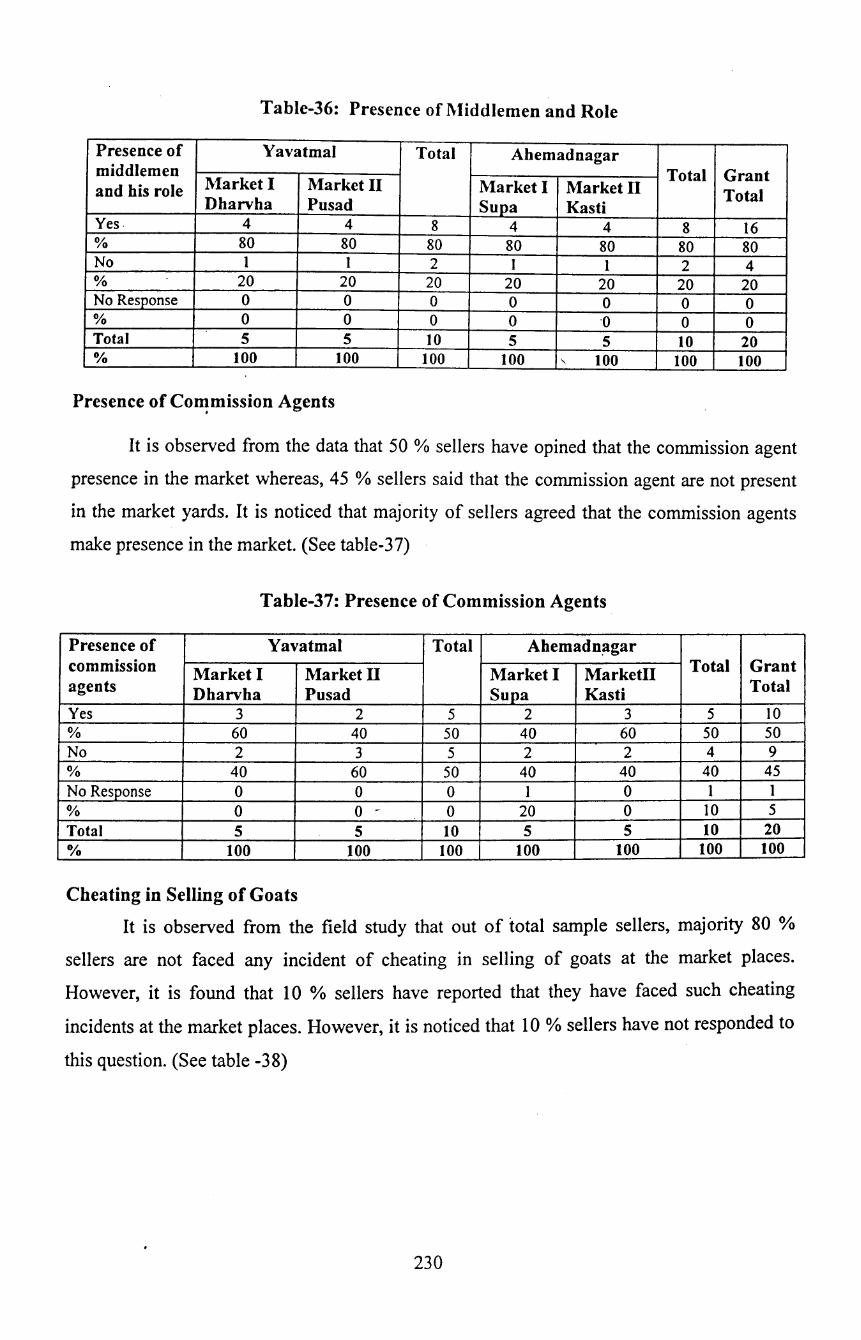
Table-36: Presence of l\liddlemen and Role
Presence of Yavatmal Total Abe mad nagar middlemen Total Grant and his role Market I Market II Market I Market II Total Dharvha Pusad Supa Kasti Yes. 4 4 8 4 4 8 16 % 80 80 80 80 80 80 80 No 1 1 2 1 1 2 4 % 20 20 20 20 20 20 20 No Response 0 0 0 0 0 0 0 % 0 0 0 0 ·o 0 0 Total 5 5 10 5 5 10 20 % 100 100 100 100 ' 100 100 100
Presence of Co~mission Agents
It is observed from the data that 50 % sellers have opined that the commission agent
presence in the market whereas, 45 % sellers said that the commission agent are not present
in the market yards. It is noticed that majority of sellers agreed that the commission agents
make presence in the market. (See table-37)
Table-37: Presence of Commission Agents
Presence of Yavatmal Total Ahemadn~gar commission Market I Market II Market I Marketii Total Grant agents Dharvha Pusad Sup a Kasti Total
Yes 3 2 5 2 3 5 10 % 60 40 50 40 60 50 50 No 2 3 5 2 2 4 9 % 40 60 50 40 40 40 45 No Response 0 0 0 1 0 1 1 % 0 0 - 0 20 0 10 5 Total 5 5 10 5 5 10 20 % 100 100 100 100 100 100 100
Cheating in Selling of Goats
It is observed from the field study that out of total sample sellers, majority 80 %
sellers are not faced any incident of cheating in selling of goats at the market places.
However, it is found that 10 % sellers have reported that they have faced such cheating
incidents at the market places. However, it is noticed that 10 % sellers have not responded to
this question. (See table -38)
230
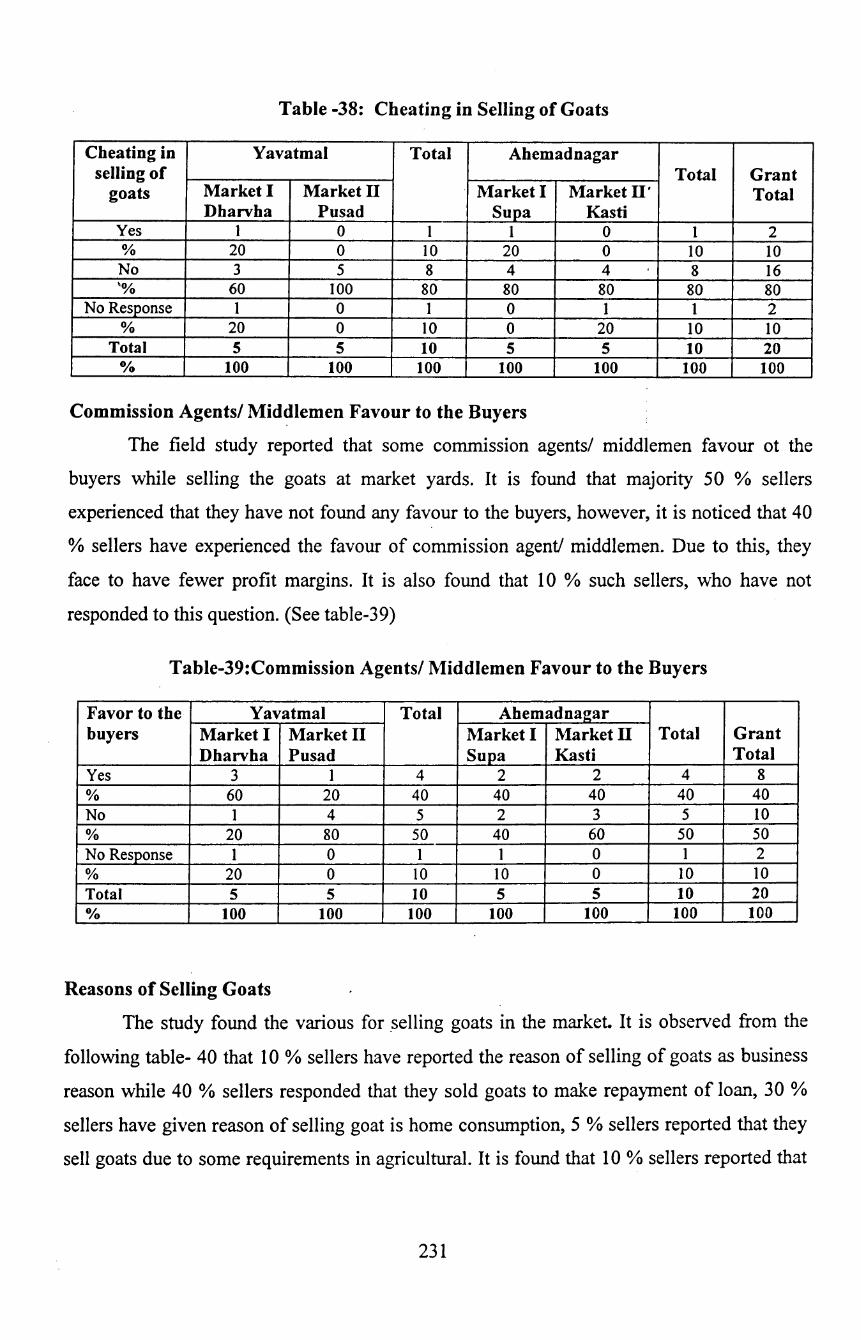
Table -38: Cheating in Selling of Goats
Cheating in Yavatmal Total Ahemadnagar selling of Total Grant
goats Market I Market II Market I Market II' Total Dharvha Pusad Sup a Kasti
Yes 1 0 1 1 0 1 2 % 20 0 10 20 0 10 10 No 3 5 8 4 4 8 16 '% 60 100 80 80 80 80 80
No Response 1 0 1 0 1 1 2 % 20 0 10 0 20 10 10
Total 5 5 10 5 5 10 20 0/o 100 100 100 100 100 100 100
Commission Agents/ Middlemen Favour to the Buyers
The field study reported that some commission agents/ middlemen favour ot the
buyers while selling the goats at market yards. It is found that majority 50 % sellers
experienced that they have not found any favour to the buyers, however, it is noticed that 40
% sellers have experienced the favour of commission agent/ middlemen. Due to this, they
face to have fewer profit margins. It is also found that 10 % such sellers, who have not
responded to this question. (See table-39)
Table-39:Commission Agents/ Middlemen Favour to the Buyers
Favor to the Yavatmal Total Ahemadnagar buyers Market I Market II Market I Market II Total Grant
Dharvha Pusad Supa Kasti Total Yes 3 1 4 2 2 4 8 % 60 20 40 40 40 40 40 No 1 4 5 2 3 5 10 % 20 80 50 40 60 50 50 No Response 1 0 1 1 0 1 2 % 20 0 10 10 0 10 10 Total 5 5 10 5 5 10 20 0/o 100 100 100 100 100 100 100
Reasons of Selling Goats
The study found the various for selling goats in the market. It is observed from the
following table- 40 that 10 % sellers have reported the reason of selling of goats as business
reason while 40 % sellers responded that they sold goats to make repayment of loan, 30 %
sellers have given reason of selling goat is home consumption, 5 % sellers reported that they
sell goats due to some requirements in agricultural. It is found that 10 % sellers reported that
231

at time illness, they have the only alternatives for purchasing of medicine. The majority of
sellers have reported that repayment of loan and home consumption are two major reasons,
which compel them to sell goats. It is observed that goats became important animal at time of
difficulties. (See table -40)
Table -40: Reason of Selling Goats
Reason of selling goats Yavatmal Total Ahemadnagar Total Grant Total
Market I Market II Market I Market II Dharvha Pusad Sup a Kasti
Business 1 0 I 0 I I 2 % 20 0 IO 0 20 IO IO Payment of loan 2 2 4 2 2 4 8 % 40 40 40 40 40 40 40 Home consumption I 2 3 2 I 3 6 % 20 40 30 40 20 30 30 Agriculture 0 0 0 1 0 1 I % 0 0 0 20 0 IO 5 Medicines I 1 2 0 0 0 2 % 20 20 20 0 0 0 IO No Response 0 0 0 0 I I I % 0 0 0 0 20 10 5 Total 5 5 10 5 5 10 20 % 100 100 100 100 100 100 100
Payment for Selling Goats
The study found that all 100 % sellers have reported that they cash payment
immediate after the selling of goats. They are happy with dealing. (See table-41)
Table -41: Payment for Selling Goats
Payment Yavatmal Total Ahmadnagar
Market I Market II Market I Market II Total Grant Total
Dharvha Pusad Sup a Kasti Yes 5 5 10 5 5 IO 20
% 100 IOO IOO IOO 100 IOO 100
No 0 0 0 0 0 0 0
% . 0 0 0 0 0 0 0
No Response 0 0 0 0 0 0 0
% 0 0 0 0 0 0 0
Total 5 5 10 5 5 10 20 o;o 100 100 100 100 100 100 100
Payment from Buyers
The sellers are very positive about the buyers dealing and promptness of payment. It
is found that 100% sellers are satisfied with the payment from buyers. It is noticed that there
is no such complaints about the buyers. (See table-42)
232
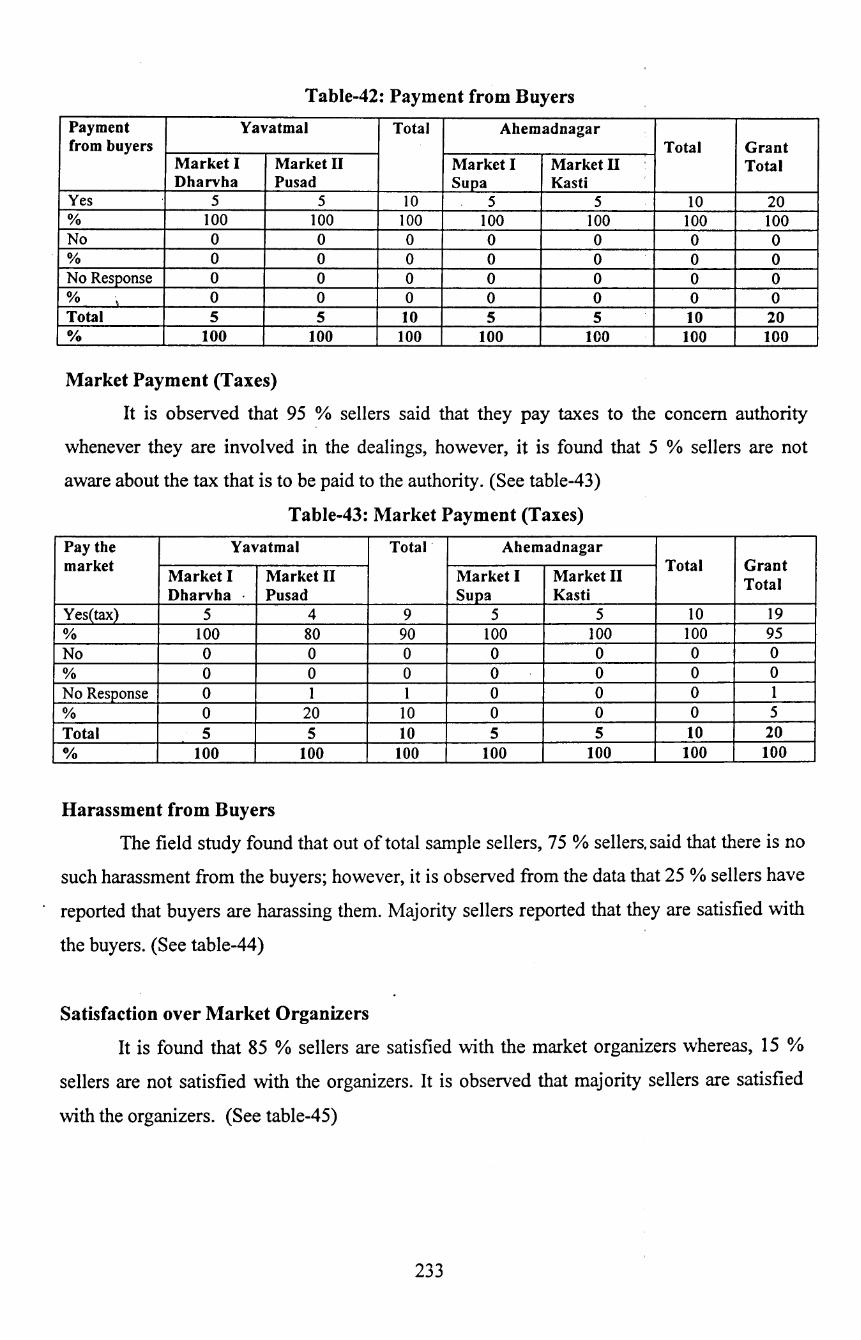
Table-42: Payment from Buyers
Payment Yavatmal Total Ahemadnagar from buyers Total Grant
Market I Market D Market I Market II Total Dharvha Pusad Sup a Kasti
Yes 5 5 10 5 5 10 20 % 100 100 100 100 100 100 100 No 0 0 0 0 0 0 0 % 0 0 0 0 0 0 0 No Response 0 0 0 0 0 0 0 % '\ 0 0 0 0 0 0 0 Total 5 5 10 5 5 10 20 0/o 100 100 100 100 100 100 100
Market Payment (Taxes)
It is observed that 95 % sellers said that they pay taxes to the concern authority
whenever they are involved in the dealings, however, it is found that 5 % sellers are not
aware about the tax that is to be paid to the authority. (See table-43)
Table-43: Market Payment (Taxes)
Pay the Yavatmal Total, Ahemadnagar market
Market I Market II Market I Market II Total Grant
Dharvha Pusad Sup a Kasti Total
Yes( tax) 5 4 9 5 5 10 19 % 100 80 90 100 100 100 95 No 0 0 0 0 0 0 0 % 0 0 0 0 0 0 0 No Response 0 1 1 0 0 0 1 % 0 20 10 0 0 0 5 Total 5 5 10 5 5 10 20 % 100 100 100 100 100 100 100
Harassment from Buyers
The field study found that out of total sample sellers, 7 5 % sellers. said that there is no
such harassment from the buyers; however, it is observed from the data that 25% sellers have
reported that buyers are harassing them. Majority sellers reported that they are satisfied with
the buyers. (See table-44)
Satisfaction over Market Organizers
It is found that 85 % sellers are satisfied with the market organizers whereas, 15 %
sellers are not satisfied with the organizers. It is observed that majority sellers are satisfied
with the organizers. (See table-45)
233
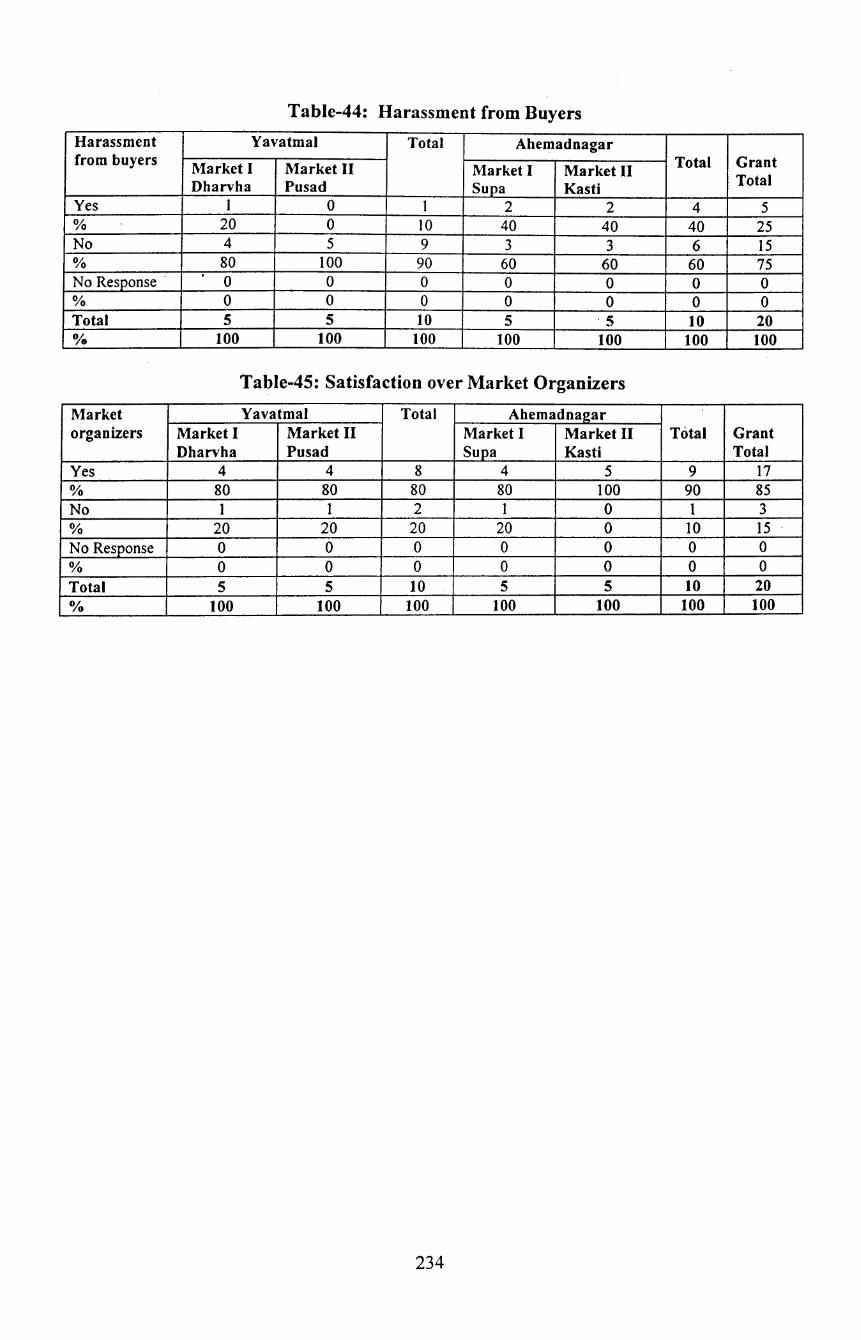
Table-44: Harassment from Buyers
Harassment Yavatmal Total Ahemadnagar from buyers Market I Market II Market I Market II Total Grant
Dharvha Pusad Supa Kasti Total
Yes I 0 I 2 2 4 5 % 20 0 10 40 40 40 25 No 4 5 9 3 3 6 15 % 80 100 90 60 60 60 75 No Response
. 0 0 0 0 0 0 0
% 0 0 0 0 0 0 0 Total 5 5 10 5 ·5 10 20 0/o 100 100 100 100 100 100 100
Table-45: Satisfaction over Market Organizers
Market Yavatmal Total Ahem ad nagar organizers Market I Market II Market I Market II Total Grant
Dharvha Pusad Sup a Kasti Total Yes 4 4 8 4 5 9 17 % 80 80 80 80 100 90 85 No 1 1 2 I 0 1 3 % 20 20 20 20 0 10 15 No Response 0 0 0 0 0 0 0 % 0 0 0 0 0 0 0 Total 5 5 10 5 5 10 20 0/o 100 100 100 100 100 100 100
234
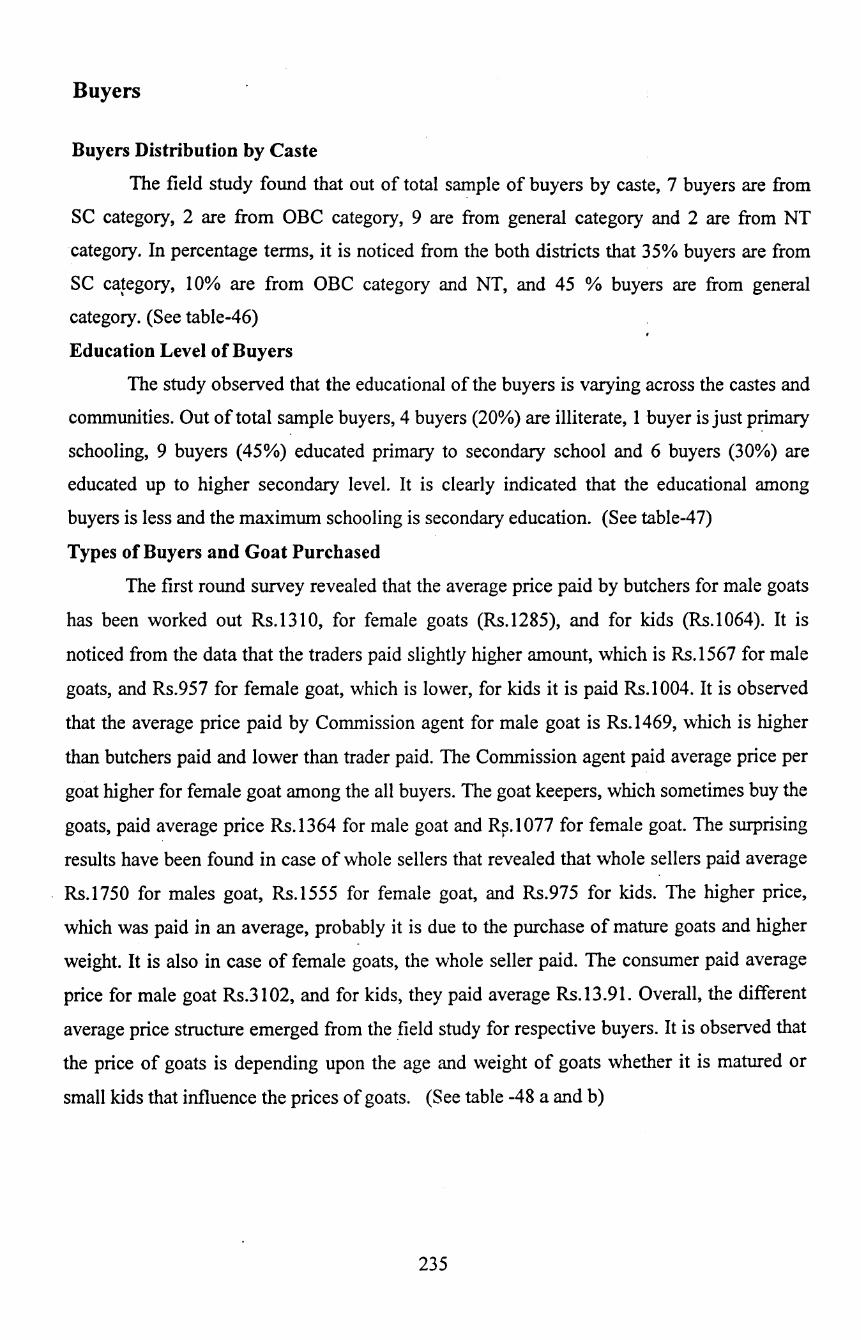
Buyers
Buyers Distribution by Caste
The field study found that out of total sample of buyers by caste, 7 buyers are from
SC category, 2 are from OBC category, 9 are from general category and 2 are from NT
category. In percentage terms, it is noticed from the both districts that 35% buyers are from
SC category, I 0% are from OBC category and NT, and 45 % buyers are from general
category. (See table-46)
Education Level of Buyers
The study observed that the educational of the buyers is varying across the castes and
communities. Out of total sample buyers, 4 buyers (20%) are illiterate, I buyer is just primary
schooling, 9 buyers (45%) educated primary to secondary school and 6 buyers (30%) are
educated up to higher secondary level. It is clearly indicated that the educational among
buyers is less and the maximum schooling is secondary education. (See table-4 7)
Types of Buyers and Goat Purchased
The first round survey revealed that the average price paid by butchers for male goats
has been worked out Rs.l31 0, for female goats (Rs.l285), and for kids (Rs.l 064 ). It is
noticed from the data that the traders paid slightly higher amount, which is Rs.1567 for male
goats, and Rs.957 for female goat, which is lower, for kids it is paid Rs.l 004. It is observed
that the average price paid by Commission agent for male goat is Rs.l469, which is higher
than butchers paid and lower than trader paid. The Commission agent paid average price per
goat higher for female goat among the all buyers. The goat keepers, which sometimes buy the
goats, paid average price Rs.l364 for male goat and R~.l077 for female goat. The surprising
results have been found in case of whole sellers that revealed that whole sellers paid average
Rs.l750 for males goat, Rs.l555 for female goat, and Rs.975 for kids. The higher price,
which was paid in an average, probably it is due to the purchase of mature goats and higher
weight. It is also in case of female goats, the whole seller paid. The consumer paid average
price for male goat Rs.31 02, and for kids, they paid average Rs.13 .91. Overall, the different
average price structure emerged from the _field study for respective buyers. It is observed that
the price of goats is depending upon the age and weight of goats whether it is matured or
small kids that influence the prices of goats. (See table -48 a and b)
235
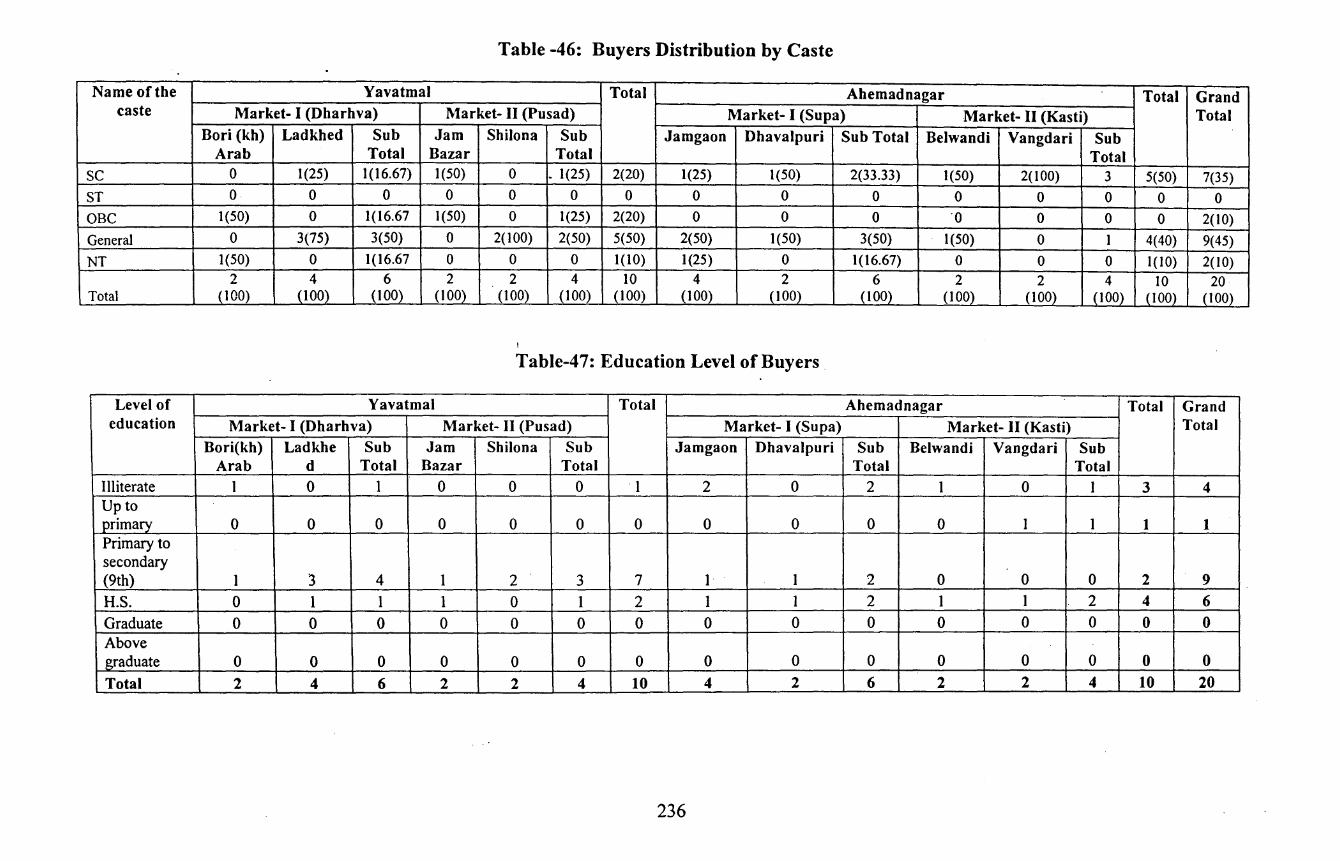
Table -46: Buyers Distribution by Caste
Name of the Yavatmal Total Ahemadnagar Total Grand caste Market- I (Dharhva) Market- II (Pusad) Market- I (Supa) Market- II (Kasti) Total
Bori (kh) Ladkhed Sub Jam Shilona Sub Jamgaon Dhavalpuri Sub Total Belwandi Vangdari Sub Arab Total Bazar Total Total
sc 0 1(25) 1(16.67) 1(50) 0 . I (25) 2(20) 1(25) 1(50) 2(33.33) 1(50) 2(100) 3 5(50) 7(35)
ST 0 0 0 0 0 0 0 0 0 0 0 0 0 0 0
OBC 1(50) 0 1(16.67 1(50) 0 1(25) 2(20) 0 0 0 ·o 0 0 0 2(10)
General 0 3(75) 3(50) 0 2(100) 2(50) 5(50) 2(50) 1(50) 3(50) 1(50) 0 I 4(40) 9(45)
NT 1(50) 0 1(16.67 0 0 0 1(10) 1(25) 0 1(16.67) 0 0 0 1(10) 2(10) 2 4 6 2 2 4 10 4 2 6 2 2 4 10 20
Total (100) (100} JlOOl (lOQl (10Ql (100) (100) (100) (100) (100) (100) (100J (100) (100) J.IOOl
Table-47: Education Level of Buyers
Level of Yavatmal Total Ahemadnagar Total Grand education Market- I (Dharhva) Market- II (Pusad) Market- I (Supa) Market- II (Kasti) Total
Bori(kh) Ladkhe Sub Jam Shilona Sub Jamgaon Dhavalpuri Sub Belwandi Vangdari Sub Arab d Total Bazar Total Total Total
Illiterate I 0 1 0 0 0 . 1 2 0 2 1 0 I 3 4 Up to primary 0 0 0 0 0 0 0 0 0 0 0 1 1 1 1 Primary to secondary (9th) 1 3 4 I 2 3 7 1 1 2 0 0 0 2 9
H.S. 0 1 1 1 0 1 2 1 1 2 1 I 2 4 6
Graduate 0 0 0 0 0 0 0 0 0 0 0 0 0 0 0 Above graduate 0 0 0 0 0 0 0 0 0 0 0 0 0 0 0
Total 2 4 6 2 2 4 10 4 2 6 2 2 4 10 20
236
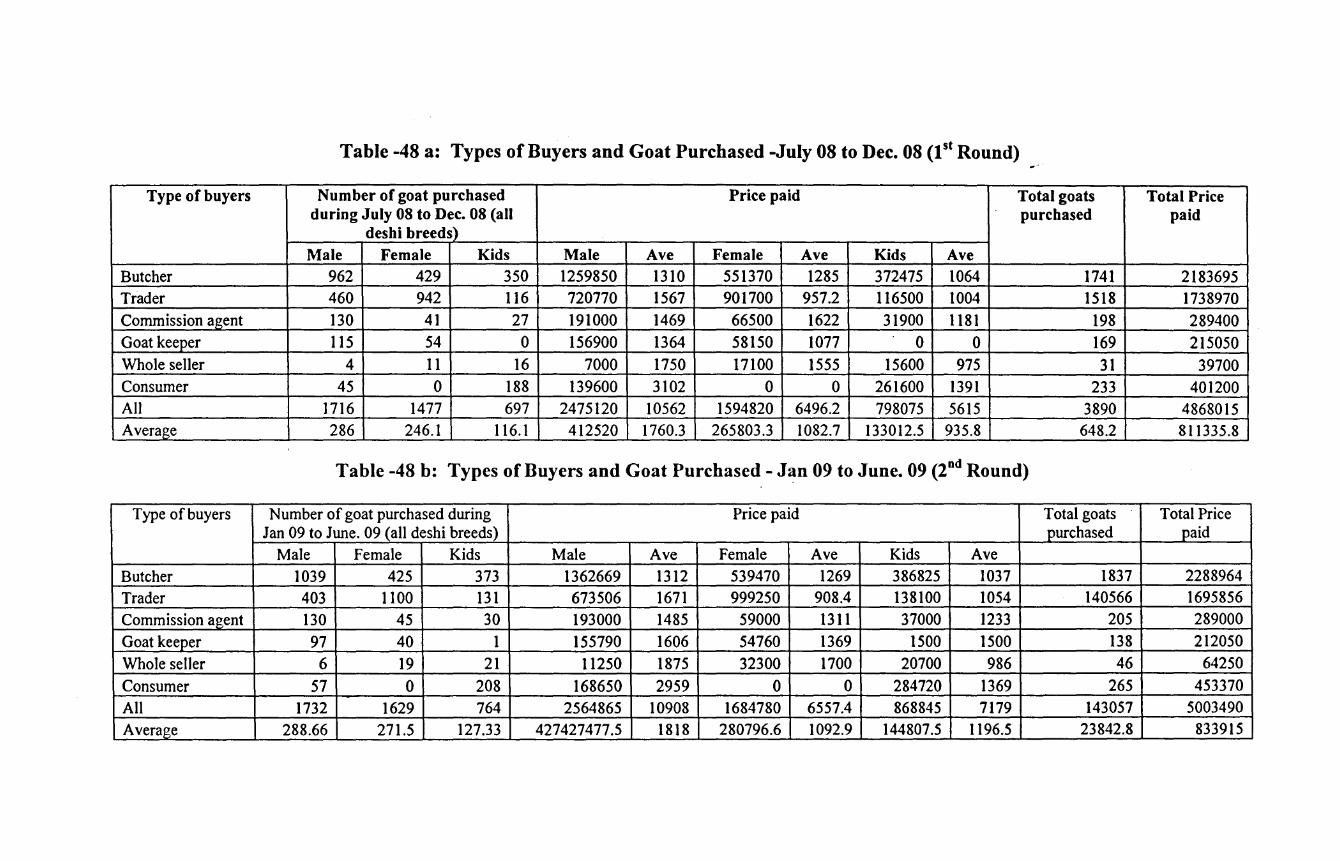
Table -48 a: Types of Buyers and Goat Purchased -July 08 to Dec. 08 (1st Round)
Type of buyers Number of goat purchased Price paid Total goats Total Price during July 08 to Dec. 08 (all purchased paid
deshi breeds) Male Female Kids Male Ave Female Ave Kids Ave
Butcher 962 429 350 1259850 1310 551370 1285 372475 1064 1741 2183695 Trader 460 942 116 720770 1567 901700 957.2 116500 1004 1518 1738970 Commission agent 130 41 27 191000 1469 66500 1622 31900 1181 198 289400 Goat keeper 115 54 0 156900 1364 58150 1077 0 0 169 215050 Whole seller 4 11 16 7000 1750 17100 1555 15600 975 31 39700 Consumer 45 0 188 139600 3102 0 0 261600 1391 233 401200 All 1716 1477 697 2475120 10562 1594820 6496.2 798075 5615 3890 4868015 Average 286 246.1 116.1 412520 1760.3 265803.3 1082.7 133012.5 935.8 648.2 811335.8
Table -48 b: Types of Buyers and Goat Purchased- Jan 09 to June. 09 (2nd Round)
Type of buyers Number of goat purchased during Price paid Total goats Total Price Jan 09 to June. 09 (all deshi breeds) purchased paid
Male Female Kids Male Ave Female Ave Kids Ave
Butcher 1039 425 373 1362669 1312 539470 1269 386825 1037 1837 2288964
Trader 403 1100 131 673506 1671 999250 908.4 138100 1054 140566 1695856
Commission agent 130 45 30 193000 1485 59000 1311 37000 1233 205 289000
Goat keeper 97 40 1 155790 1606 54760 1369 1500 1500 138 212050
Whole seller 6 19 21 11250 1875 32300 1700 20700 986 46 64250
Consumer 57 0 208 168650 2959 0 0 284720 1369 265 453370
All 1732 1629 764 2564865 10908 1684780 6557.4 868845 7179 143057 5003490
Average 288.66 271.5 127.33 427427477.5 1818 280796.6 1092.9 144807.5 1196.5 23842.8 833915

The second round survey also revealed the different price structure for all buyers. It is
observed that tlie average price of male goats, female goats and kid goats are varies.
However, it is found that all buyers have paid higher price for the goats in next sixth month
period. It is clearly indicated that the prices of goats are arising particularly for male goats. It
is also noticed that the prices for female goats have slightly fallen for butchers, traders,
commission· agent, but the prices rose in case of goat keepers and whole sellers. In case of
kids, it is found that butchers and consumers paid lower price, and traders, commission agent
and goat keepers paid higher prices for the same; More or less same scenario has been found
when both rounds are taken together. The details of the average prices for all buyers are given
in the following table- 48 b and c.
Marketing Cost of Buyers
The result of the field survey on marketing cost of the sample buyers is given in the
following table-49. It is observed from the data that buyers have reported that they have spent
on various charges like transport, loading and unloading, feeding, mandi and market fees, and
others. It is found in the first round survey that buyers spent in an average highest amount on
the transport (Rs.3093.45), which emerged as the main head for marketing cost and in second
survey, it is noticed that they spent slightly higher amount on this head. The second most
head of spending is feeding costs. It is observed that mandi and market fees, and loading
/unloading are the nest major expenses of the buyers. In the second round survey, it is found
that the same expenses are leading in that sequence only and no major changes are reported in
head-wise costs. The details of the items-wise costs are given in the following table-49.
238
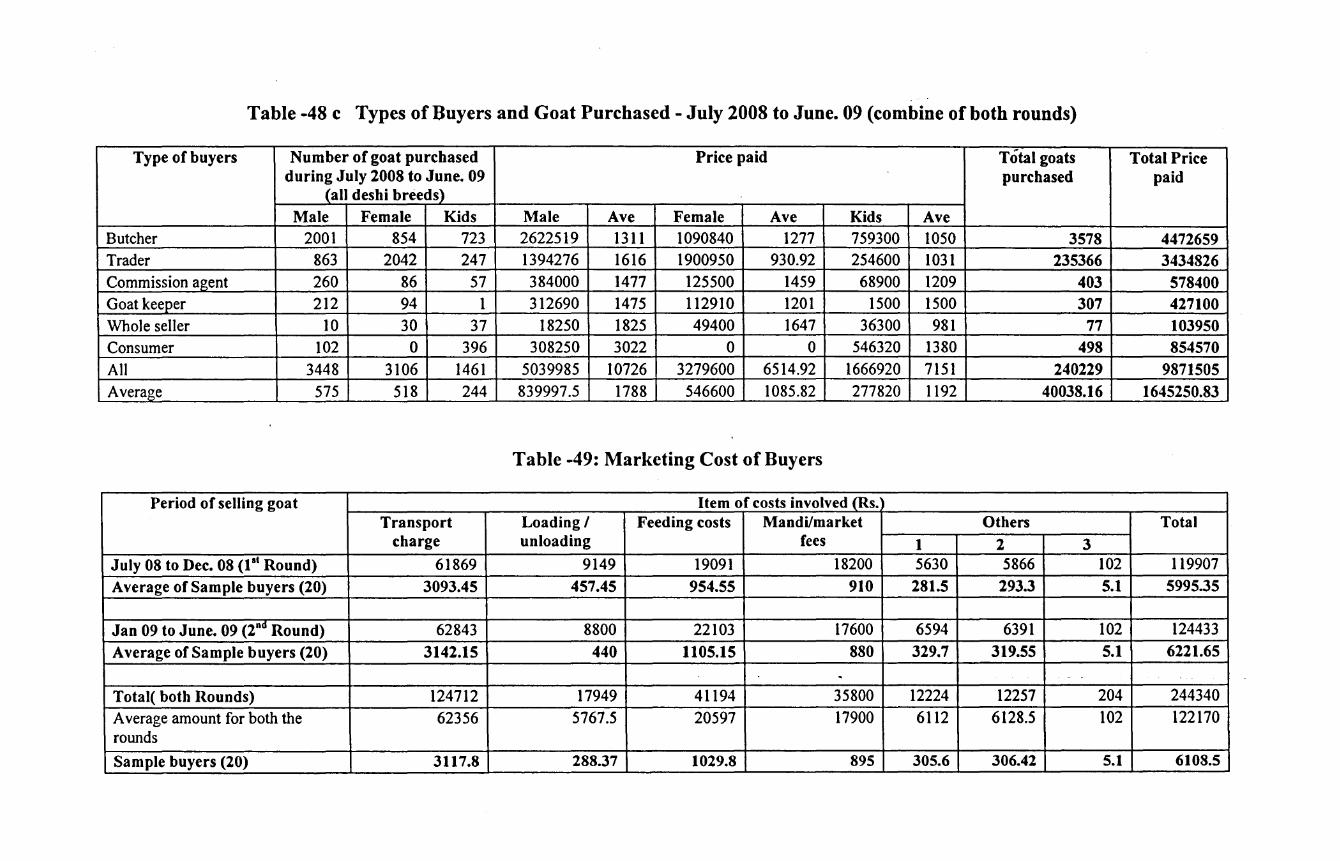
Table -48 c Types of Buyers and Goat Purchased- July 2008 to June. 09 (combine of both rounds)
Type of buyers Number of goat purchased Price paid Total goats Total Price during July 2008 to June. 09 purchased paid
(all deshi breeds) Male Female Kids Male Ave Female Ave Kids Ave
Butcher 2001 854 723 2622519 1311 1090840 1277 759300 1050 3578 4472659 Trader 863 2042 247 1394276 1616 1900950 930.92 254600 1031 235366 3434826 Commission agent 260 86 57 384000 1477 125500 1459 68900 1209 403 578400 Goat keeper 212 94 1 312690 1475 112910 1201 1500 1500 307 427100 Whole seller 10 30 37 18250 1825 49400 1647 36300 981 77 103950 Consumer 102 0 396 308250 3022 0 0 546320 1380 498 854570 All 3448 3106 1461 5039985 10726 3279600 6514.92 1666920 7151 240229 9871505 Average 575 518 244 839997.5 1788 546600 1085.82 277820 1192 40038.16 1645250.83
Table -49: Marketing Cost of Buyers
Period of selling goat Item of costs involved (Rs. Transport Loading I Feeding costs Mandi/market Others Total
charge unloading fees 1 2 3 July 08 to Dec. 08 (1 1
' Round) 61869 9149 19091 18200 5630 5866 102 119907 Average of Sample buyers (20) 3093.45 457.45 954.55 910 281.5 293.3 5.1 5995.35
Jan 09 to June. 09 (2nd Round) 62843 8800 22103 17600 6594 6391 102 124433 Average of Sample buyers (20) 3142.15 440 1105.15 880 329.7 319.55 5.1 6221.65
. - -
Total( both Rounds) 124712 17949 41194 35800 12224 12257 204 244340 Average amount for both the 62356 5767.5 20597 17900 6112 6128.5 102 122170 rounds
Sample buyers (20) 3117.8 288.37 1029.8 895 305.6 306.42 5.1 6108.5
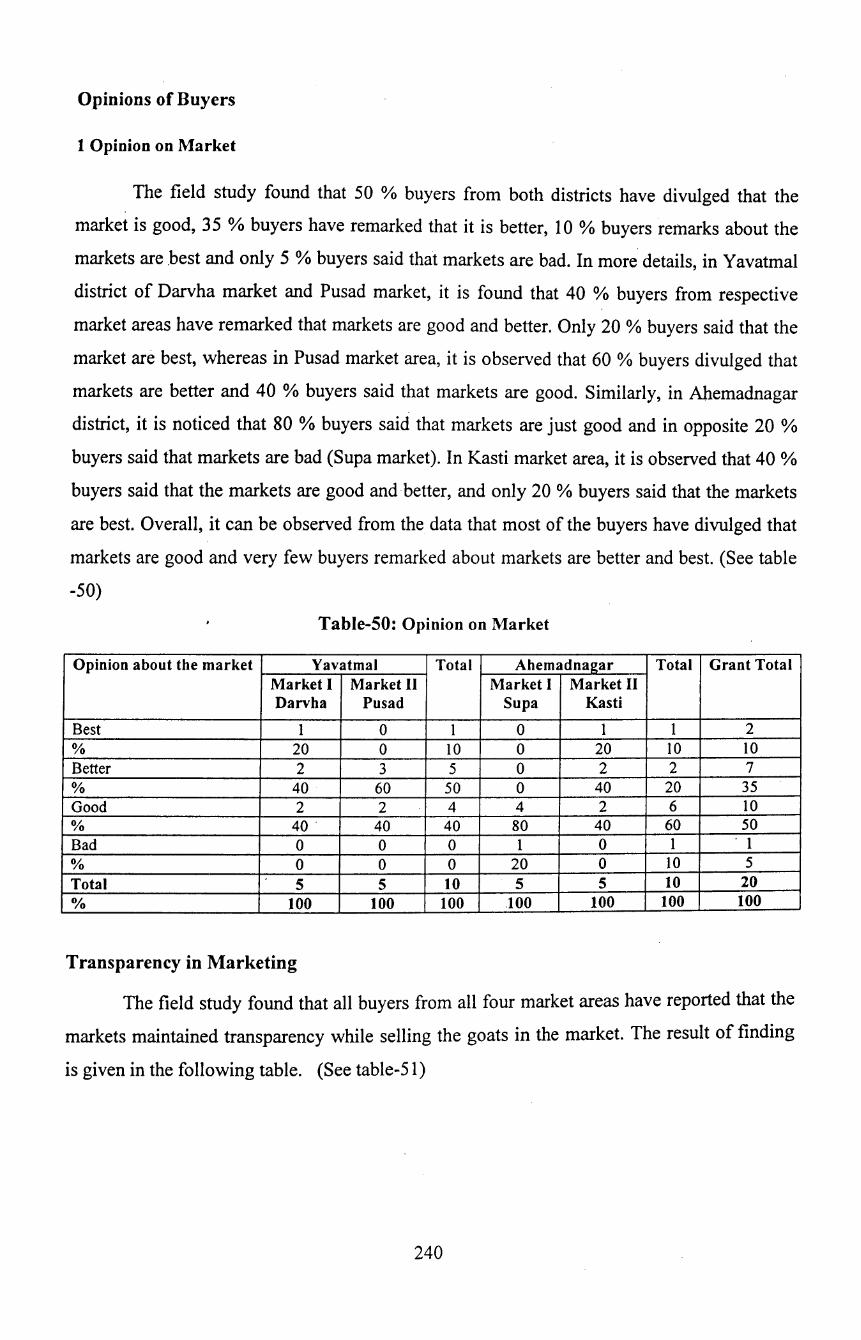
Opinions of Buyers
1 Opinion on Market
The field study found that 50 % buyers from both districts have divulged that the
market is good, 35 % buyers have remarked that it is better, 10 %buyers remarks about the
markets are best and only 5 % buyers said that markets are bad. In more details, in Yavatmal
district of Darvha market and Pusad market, it is found that 40 % buyers from respective
market areas have remarked that markets are good and better. Only 20 % buyers said that the
market are best, whereas in Pusad market area, it is observed that 60 %buyers divulged that
markets are better and 40 % buyers said that markets are good. Similarly, in Ahemadnagar
district, it is noticed that 80 % buyers said that markets are just good and in opposite 20 %
buyers said that markets are bad (Supa market). In Kasti market area, it is observed that 40%
buyers said that the markets are good and better, and only 20% buyers said that the markets
are best. Overall, it can be observed from the data that most of the buyers have divulged that
markets are good and very few buyers remarked about markets are better and best. (See table
-50)
Table-50: Opinion on Market
Opinion about the market Yavatmal Total Ahemadnagar Total Grant Total Market I Market II Market I Market II Darvha Pusad Supa Kasti
Best I 0 I 0 I 1 2 % 20 0 IO 0 20 10 10
Better 2 3 5 0 2 2 7 % 40 60 50 0 40 20 35 Good 2 2 4 4 2 6 IO % 40. 40 40 80 40 60 50 Bad 0 0 0 I 0 1 . I
% 0 0 0 20 0 10 5 Total 5 5 10 5 5 10 20 % 100 100 100 .100 100 100 100
Transparency in Marketing
The field study found that all buyers from all four market areas have reported that the
markets maintained transparency while selling the goats in the market. The result of finding
is given in the following table. (See table-51)
240

Table-51: Transparency in Marketing
Transparency in Yavatmal Total Ahemadna2:ar Total Grant marketing Market Market Market I Market II Total
I II Supa Kasti Darvha Pus ad
Yes 5 5 10 . 5 5 10 20 % 100 100 100 100 100 100 IOO No 0 0 0 0 0 0 0 % 0 0 0 0 0 0 0 No Response 0 0 0 0 0 0 0 % \ 0 0 0 0 0 0 0 Total 5 5 10 5 5 10 20 % 100 100 100 100 100 100 100
Infrastructure Facilities
It is observed from the study that buyers have disclosed their op1ruons about
infrastructures facilities, which are available in the market areas. It is found that overall,
majority of buyers (70%) said that the facilities are good, 20% buyers said that facilities are
. bad and only 10% buyers said that the facilities are better. In more details, in Darvha market
of Yavatmal district, all sample buyers (100%) and 80% buyers in Pusad market area said
that the provided market infrastructure facilities are good, however, it is noticed that only
20% buyers in Pusad market area said that the market facilities are bad. Similarly, in
Ahemadnagar district, it is found that 60 o/o buyers from Supa market and 40% buyers from
Kasti market said that facilities are good and 20 % buyers from respective market areas of the
district said that facilities are better. However, it is observed that 20% buyers in Supa market
and 40% buyers in Kasti market have remarked that facilities provide by the APMC are bad.
Though, there are various remarks about market infrastructure, most of the buyers are
satisfied with the facilities. (See table-52)
Table-52: Infrastructure Facilities
Infrastructure facilities Yavatmal Total Ahemadnagar Total Grant Market I Market II Market I Market II Total Darvha Pusad Sup a Kasti
Better 0 0 0 I 1 2 2 % 0 0 0 20 20 20 10 Good 5 4 9 3 2 5 14 % 100 80 90 60 40 50 70 Bad 0 1 I I 2 3 4 % 0 20 10 20 40 30 20 Total 5 5 10 5 5 10 20 0/o 100 100 100 100 100 ' 100 100
241
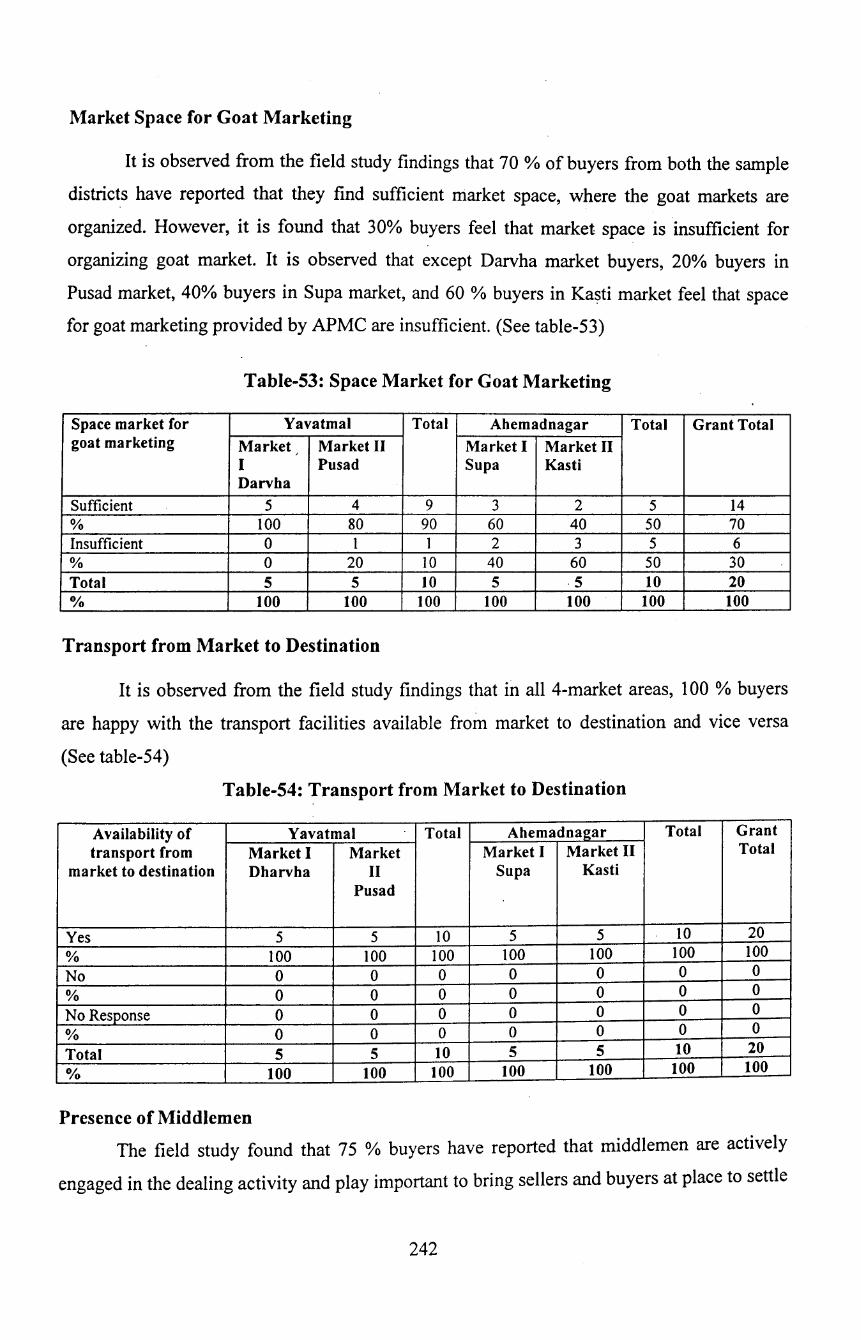
Market Space for Goat Marketing
It is observed from the field study findings that 70 % of buyers from both the sample
districts have reported that they find sufficient market space, where the goat markets are
organized. However, it is found that 30% buyers feel that market space is insufficient for
organizing goat market. It is observed that except Darvha market buyers, 20% buyers in
Pusad market, 40% buyers in Supa market, and 60% buyers in Ka~ti market feel that space
for goat marketing provided by APMC are insufficient. (See table-53)
Table-53: Space Market for Goat Marketing
Space market for Yavatmal Total Ahemadnagar Total Grant Total goat marketing Market Market II Market I Market II
' I Pusad Supa Kasti Darvha
Sufficient 5 4 9 3 2 5 14 % 100 80 90 60 40 50 70 Insufficient 0 1 1 2 3 5 6 % 0 20 10 40 60 50 30 Total 5 5 10 5 ·5 10 20 % 100 100 100 100 100 100 100
Transport from Market to Destination
It is observed from the field study findings that in all 4-market areas, 100 % buyers
are happy with the transport facilities available from market to destination and vice versa
(See table-54)
Table-54: Transport from Market to Destination
Availability of Yavatmal Total Ahemadnagar Total Grant
transport from Market I Market Market I Market II Total
market to destination Dharvha II Sup a Kasti Pusad
Yes 5 5 10 5 5 10 20
% 100 100 100 100 100 100 100
No 0 0 0 0 0 0 0
% 0 0 0 0 0 0 0
No Response 0 0 0 0 0 0 0
% 0 0 0 0 0 0 0
Total 5 5 10 5 5 10 20 o;o 100 100 tOO 100 tOO tOO 100
Presence of Middlemen
The field study found that 75 % buyers have reported that middlemen are actively
engaged in the dealing activity and play important to bring sellers and buyers at place to settle
242
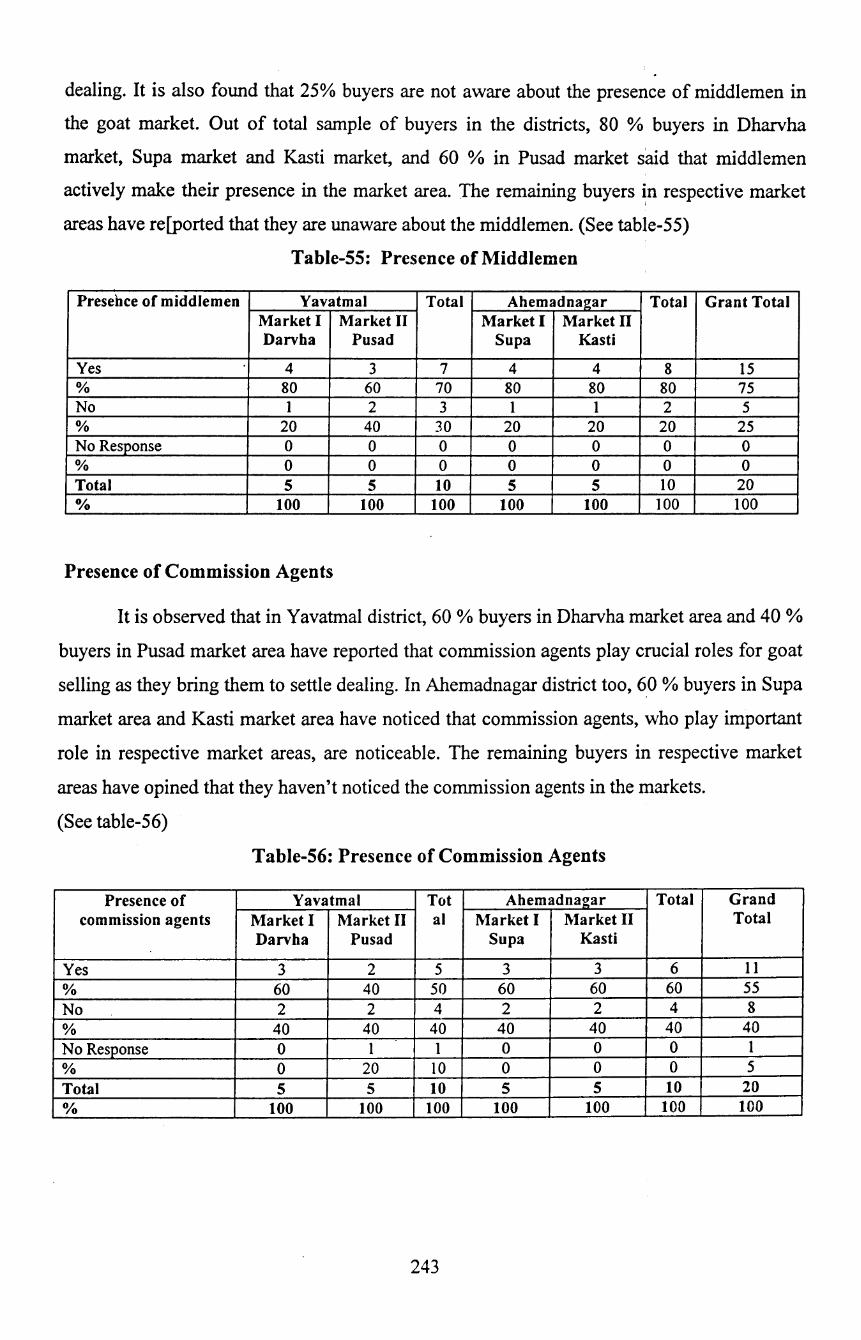
dealing. It is also found that 25% buyers are not aware about the presence of middlemen in
the goat market. Out of total sample of buyers in the districts, 80 % buyers in Dharvha
market, Supa market and Kasti market, and 60 % in Pusad market smd that middlemen
actively make their presence in the market area. The remaining buyers ~n respective market
areas have re[ported that they are unaware about the middlemen. (See table-55)
Table-55: Presence of Middlemen
Presence of middlemen Yavatmal Total Ahemadnagar Total Grant Total Market I Market II Market I Market II Darvha Pus ad Supa Kasti
Yes 4 3 7 4 4 8 15 % 80 60 70 80 80 80 75 No 1 2 3 1 1 2 5 % 20 40 30 20 20 20 25 No Response 0 0 0 0 0 0 0 % 0 0 0 0 0 0 0 Total 5 5 10 5 5 10 20 0/o 100 100 100 100 100 100 100
Presence of Commission Agents
It is observed that in Yavatmal district, 60% buyers in Dharvha market area and 40%
buyers in Pusad market area have reported that commission agents play crucial roles for goat
selling as they bring them to settle dealing. In Ahemadnagar district too, 60 % buyers in Supa
market area and Kasti market area have noticed that commission agents, who play important
role in respective market areas, are noticeable. The remaining buyers in respective market
areas have opined that they haven't noticed the commission agents in the markets.
(See table-56)
Table-56: Presence of Commission Agents
Presence of Yavatmal Tot Abemadna2ar Total Grand commission agents Market I Market II al Market I :Market II Total
Darvha Pusad Supa Kasti
Yes 3 2 5 3 3 6 11
% 60 40 50 60 60 60 55 No 2 2 4 2 2 4 8 % 40 40 40 40 40 40 40 No Response 0 1 1 0 0 0 1 % 0 20 10 0 0 0 5 Total 5 5 10 5 5 10 20 % 100 100 100 100 100 100 100
243
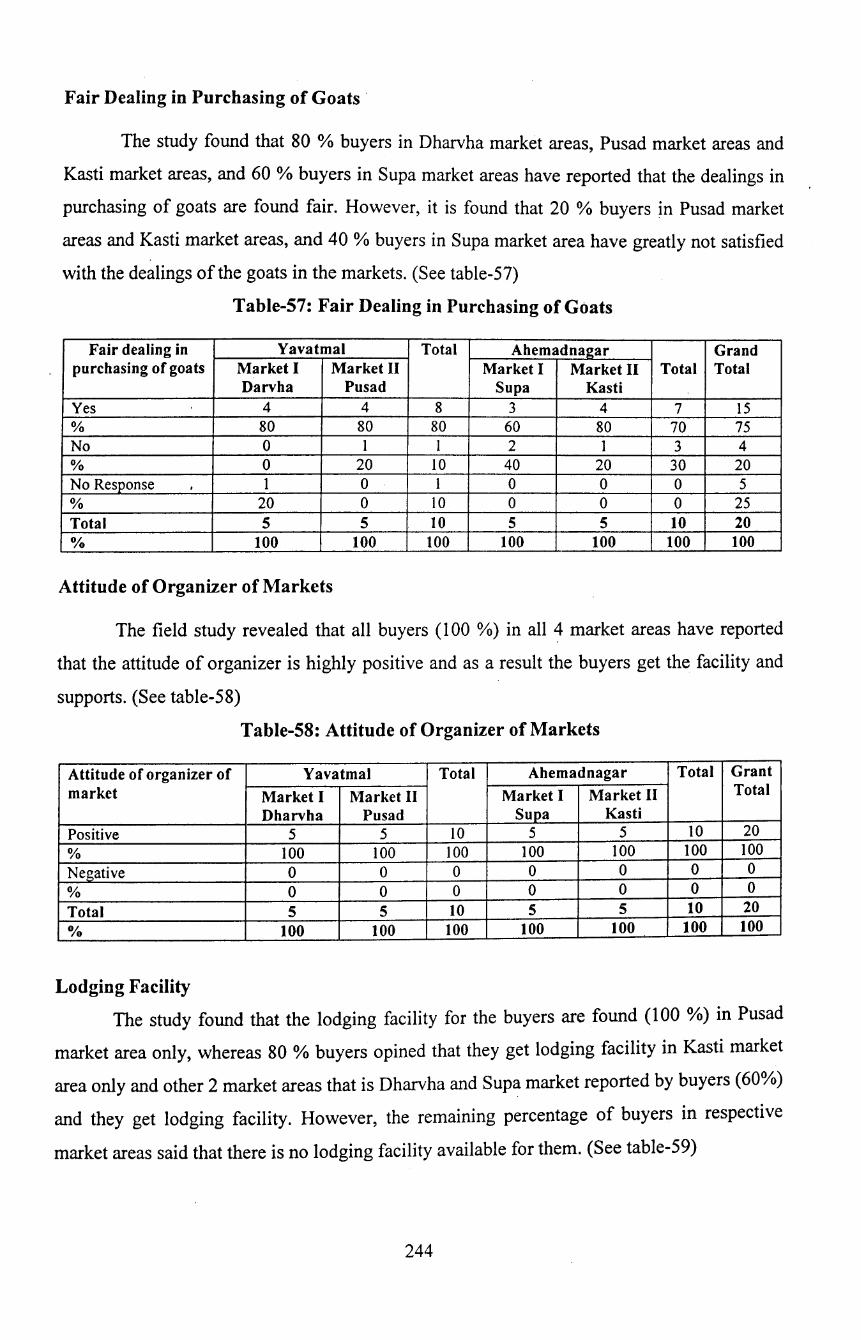
Fair Dealing in Purchasing of Goats ·
The study found that 80 %buyers in Dharvha market areas, Pusad market areas and
Kasti market areas, and 60% buyers in Supa market areas have reported that the dealings in
purchasing of goats are found fair. However, it is found that 20 % buyers in Pusad market
areas and Kasti market areas, and 40% buyers in Supa market area have greatly not satisfied
with the dealings of the goats in the markets. (See table-57)
Table-57: Fair Dealing in Purchasing of Goats
Fair dealing in Yavatmal Total Ahemadnagar Grand purchasing of goats Market I Market II Market I Market II Total Total
Darvha Pus ad Sup a Kasti Yes 4 4 8 3 4 7 I5 % 80 80 80 60 80 70 75 No 0 I 1 2 1 3 4 % 0 20 10 40 20 30 20 No Response . I 0 I 0 0 0 5 % 20 0 10 0 0 0 25 Total 5 5 10 5 5 10 20 0/o 100 100 100 100 100 100 100
Attitude of Organizer of Markets
The field study revealed that all buyers ( 1 00 o/o) in all 4 market areas have reported
that the attitude of organizer is highly positive and as a result the buyers get the facility and
supports. (See table-58)
Table-58: Attitude of Organizer of Markets
Attitude of organizer of Yavatmal Total Ahemadnagar Total Grant
market Market I Market II Market I Market II Total
Dharvha Pusad Sup a Kasti Positive 5 5 10 5 5 IO 20 % 100 100 100 100 100 100 100 Negative 0 0 0 0 0 0 0 % 0 0 0 0 0 0 0
Total 5 5 10 5 5 10 20 0/o 100 100 100 100 100 100 100
Lodging Facility
The study found that the lodging facility for the buyers are found (100 %) in Pusad
market area only, whereas 80 %buyers opined that they get lodging facility in Kasti market
area only and other 2 market areas that is Dharvha and Supa market reported by buyers (60%)
and they get lodging facility. However, the remaining percentage of buyers in respective
market areas said that there is no lodging facility available for them. (See table-59)
244
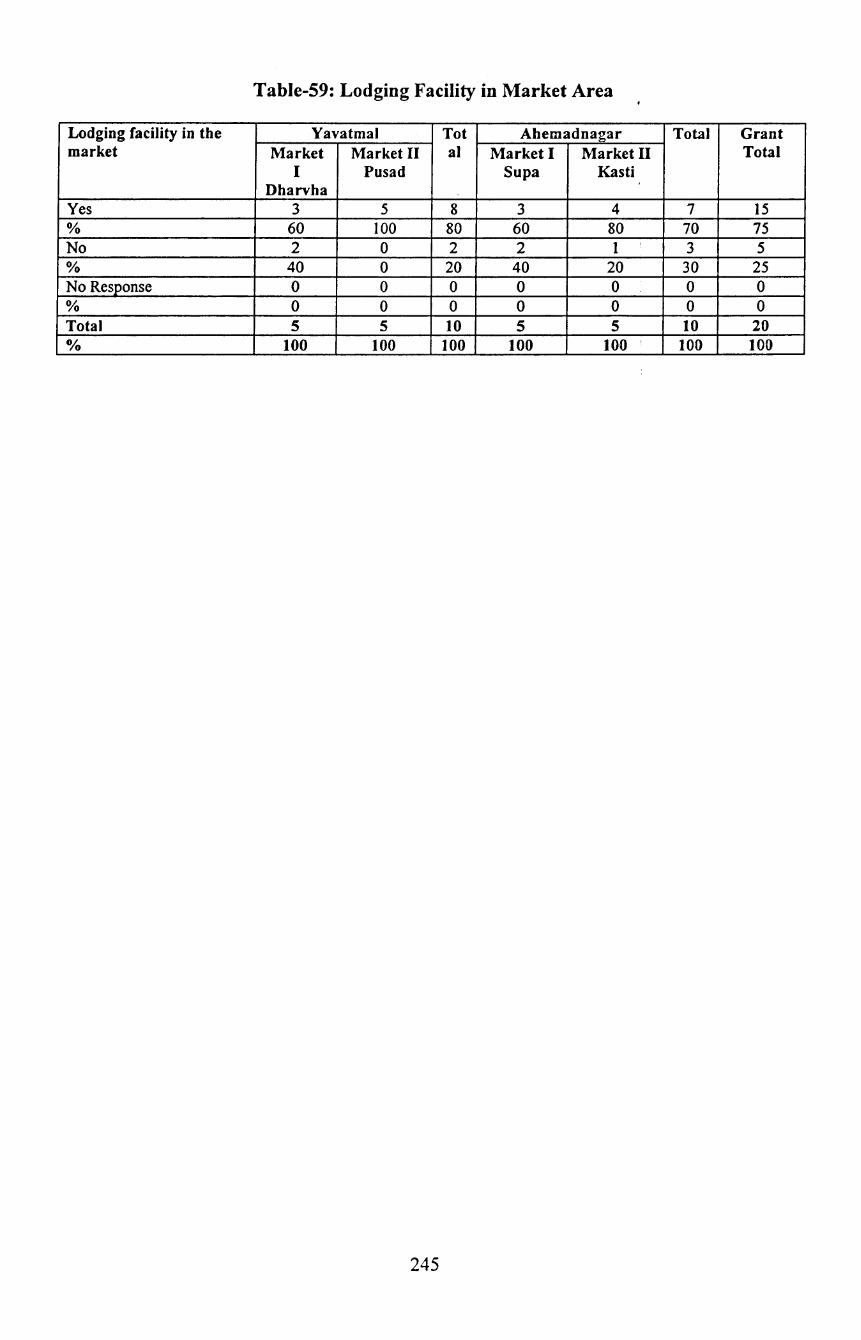
Table-59: Lodging Facility in Market Area
Lodging facility in the Yavatmal Tot Ahemadnagar Total Grant market Market Market II al Market I Market II Total
I Pusad Supa Kasti Dharvha
Yes 3 5 8 3 4 7 15 % 60 100 80 60 80 70 75 No 2 0 2 2 I 3 5 % 40 0 20 40 20 30 25 No Response 0 0 0 0 0 0 0 % 0 0 0 0 0 0 0 Total 5 5 10 5 5 10 20 0/o 100 100 100 100 100 ' 100 100
245
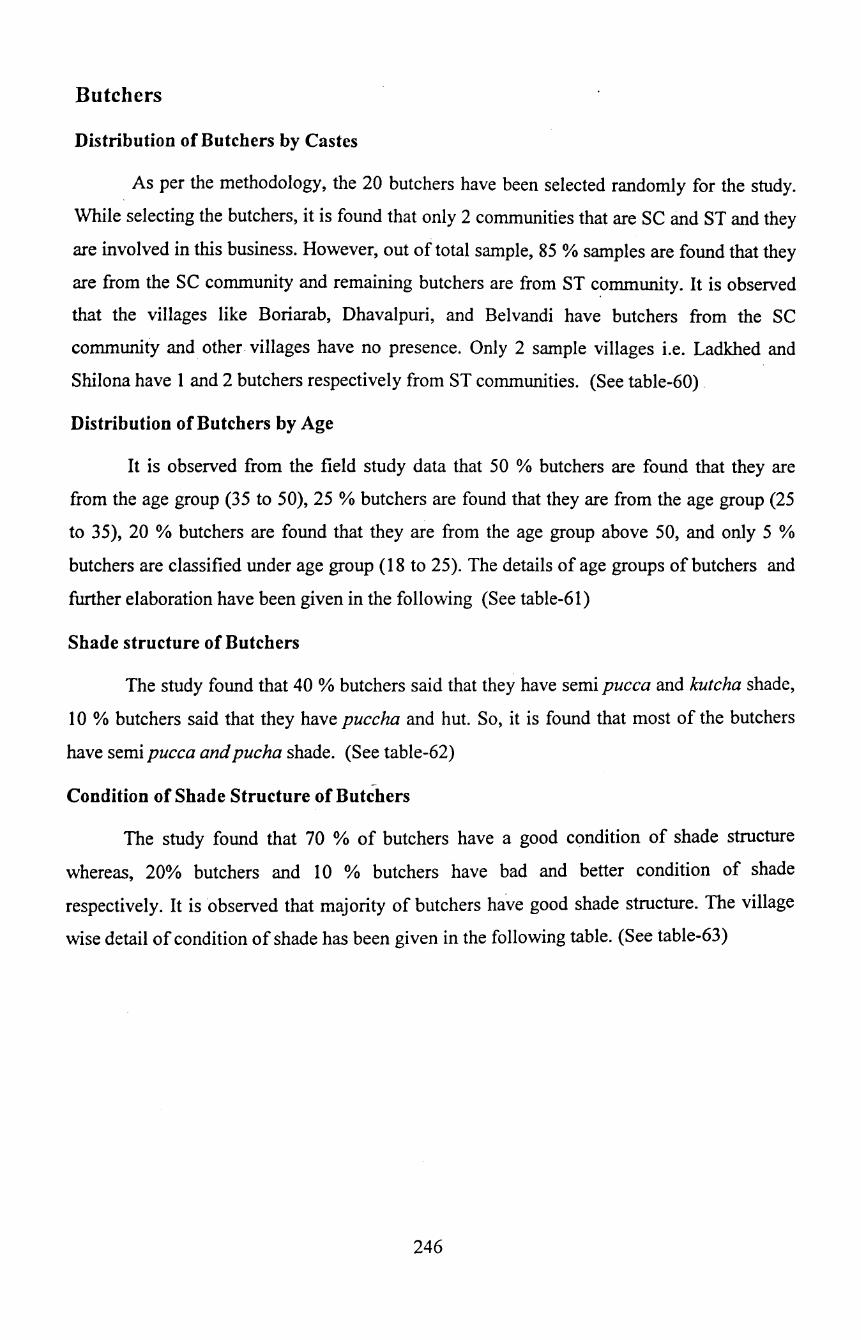
Butchers
Distribution of Butchers by Castes
As per the methodology, the 20 butchers have been selected randomly for the study.
While selecting the butchers, it is found that only 2 communities that are SC and ST and they
are involved in this business. However, out of total sample, 85 % samples are found that they
are from the SC community and remaining butchers are from ST c~mmunity. It is observed
that the villages like Boriarab, Dhavalpuri, and Belvandi have butchers from the SC
community and other. villages have no presence. Only 2 sample villages i.e. Ladkhed and
Shilona have 1 and 2 butchers respectively from ST communities. (See table-60) .
Distribution of Butchers by Age
It is observed from the field study data that 50 % butchers are found that they are
from the age group (35 to 50), 25% butchers are found that they are from the age group (25
to 35), 20 % butchers are found that they are from the age group above 50, and only 5 %
butchers are classified under age group (18 to 25). The details of age groups of butchers and
further elaboration have been given in the following (See table-61)
Shade structure of Butchers
The study found that 40 % butchers said that they have semi puce a and kutcha shade,
10 % butchers said that they have puccha and hut. So, it is found that most of the butchers
have semi pucca and pucha shade. (See table-62)
Condition of Shade Structure of Butchers
The study found that 70 % of butchers have a good condition of shade structure
whereas, 20o/o butchers and 10 % butchers have bad and better condition of shade
respectively. It is observed that majority of butchers have good shade structure. The village
wise detail of condition of shade has been given in the following table. (See table-63)
246
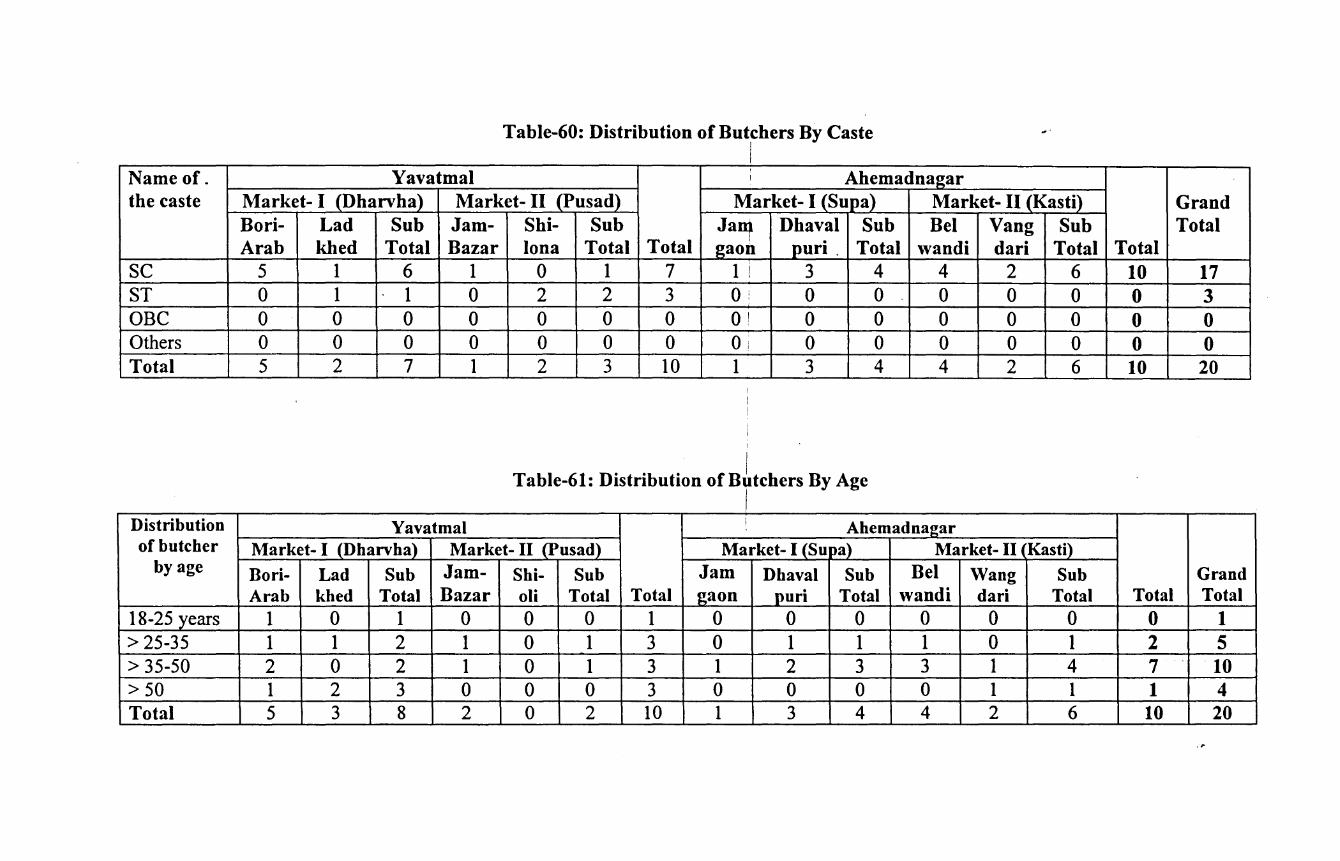
Table-60: Distribution of Butchers By Caste I
Name of. Yavatmal ' Ahemadnagar !
the caste Market- I (Dharvha) Market- II (PusadJ Market- I (Supa) Market- II (Kasti) Grand Bori- Lad Sub Jam- Shi- Sub Jant Dhaval Sub Bel Vang Sub Total Arab khed Total Bazar lona Total Total gaon pori. Total wandi dari Total Total
sc 5 1 6 1 0 1 7 1 i 3 4 4 2 6 10 17 ST 0 1 1 0 2 2 3 0: 0 0 0 0 0 0 3 OBC 0 0 0 0 0 0 0 Q! 0 0 0 0 0 0 0 Others 0 0 0 0 0 0 0 0: 0 0 0 0 0 0 0 Total 5 2 7 1 2 3 10 1 3 4 4 2 6 10 20
I
Table-61: Distribution of B~tchers By Age I
Distribution Yavatmal i Ahemadna~ar
of butcher Market- I (Dharvha) Market- II (Pusad) Market- I (Supa) Market- II ~ Kasti) by age Bori- Lad Sub Jam- Shi- Sub Jam Dhaval Sub Bel Wang Sub Grand
Arab khed Total Bazar oli Total Total gaon puri Total wandi dari Total Total Total 18-25 years 1 0 1 0 0 0 1 0 0 0 0 0 0 0 1 > 25-35 1 1 2 1 0 1 3 0 1 1 1 0 1 2 5 > 35-50 2 0 2 1 0 1 3 1 2 3 3 1 4 7 10 >50 1 2 3 0 0 0 3 0 0 0 0 1 1 1 4 Total 5 3 8 2 0 2 10 1 3 4 4 2 6 10 20

Table-62: Shade Structure of Butchers
Type of Yawatmal Total Ahemadnagar . Total Grand shade Market- I 1 Dharvha) Market- II _(Pusad) Market- I (Supa) Market- II (Kasti) Total
Bori-Arab Lad Sub Jam- Shi Sub Jam Dhaval Sub Bel ·Wang Sub khed Total Bazar roli Total gaon puri Total wandi dari Total
Puce a 0 0 0 I 0 I I 0 I I 0 0 0 1 2 Semipucca 5 0 5 0 0 0 5 0 I I 2 0 2 3 8 Kutcha 0 I I 2 0 2 3 I I 2 2 I 3 5 8 Hut 0 I I 0 0 0 I 0 0 0 0 I I 1 2 Total 5 2 7 3 0 3 IO I 3 4 4 2 6 10 20
Table-63: Condition of shade structure of the butcher
Yawatmal Ahemadnagar Market- I (Supa) Market- II (Kasti) Market- I (Dharvha) Market- II (Pusad)
Bor Gra Condit i- nd ion of Ara Ladk Sub Jam- Shilo Sub Tot Jam g. Dhaval Sub Belwa Vanga Sub Tot Tota shade b bed Total Bazar na Total al a on puri Total ndi dari Total al I
Better 0 0 0 1 0 I I 0 1 I 0 0 0 1 2 Good 4 1 5 2 0 2 7 I 2 3 3 I 4 7 14 Bad I I 2 0 0 0 2 0 0 0 I I 2' 2 4 N. A. 0 0 0 0 0 0 0 0 0 0 0 0 0 0 0
Total 5 2 7 3 0 3 10 1 3 4 4 2 6 10 20
248
Purchased and Disposal of Goat and Their Products
The study found in the first round survey that the butchers purchased 2178 male goats
ofRs. 3136565, 771 female goats ofRs. 999950 and 885 kids ofRs. 1140300, however, it is
noticed that butchers slaughtered 2096 male. goats, 748 female goats, and 868 kids
respectively. In second round survey, it is found that the butchers purchased slightly higher
number of goats and also, slaughtered more number of male and female goats except kids.
So, during the 1 year of the both round survey recorded that 7541 goats were purchased of
which 7490 goats were slaughtered. It is also noted that the males goats are preferred to .
slaughter than the females and kids. The details of the survey have been given in the
following table. (See table-64)
Disposals of Goat Products to Various Buyers
The study found that the butchers supplied meats and various parts of the goats to the
consumers, hotels and others. As per first round survey and information collected from the
butchers, it is noticed that 3 713 8 kg meat has been provided to the consumers, hotels and
others. In value term, it was Rs. 4797877. Out of total meat sold, 45 %meat was sold to the
consumers. 31% meat was sold to the hotels, and remaining to the others. However, the
second round study revealed that the selling of meat goats is decreased by 14 %. Probably it
is because of decreased demands from others and hotels; however it is observed that the
demands of meat increased by 2118 kg in case of consumers. (See table-65)
Storage of Unsold Meat
The field study found that the butchers use various facilities for storage of meat. It is
noticed that the butchers kept unsold meat in icebox, air condition and refrigerator and the
like. It is found in both round survey that the highest number of kg meat were kept in
refrigerator followed by ice box and others. (See table-66)
Cost Incurred By Butchers on Various Items
The field study found in the first round survey that the average cost incurred by per
butcher on various items is Rs. 3109.80. It is found in the second round survey that the cost
incurred on various items is increased by 38.23 %. Cost incurred on family labours in the
highest among the all heads and the lowest on the license fees. (Table-67 )
249
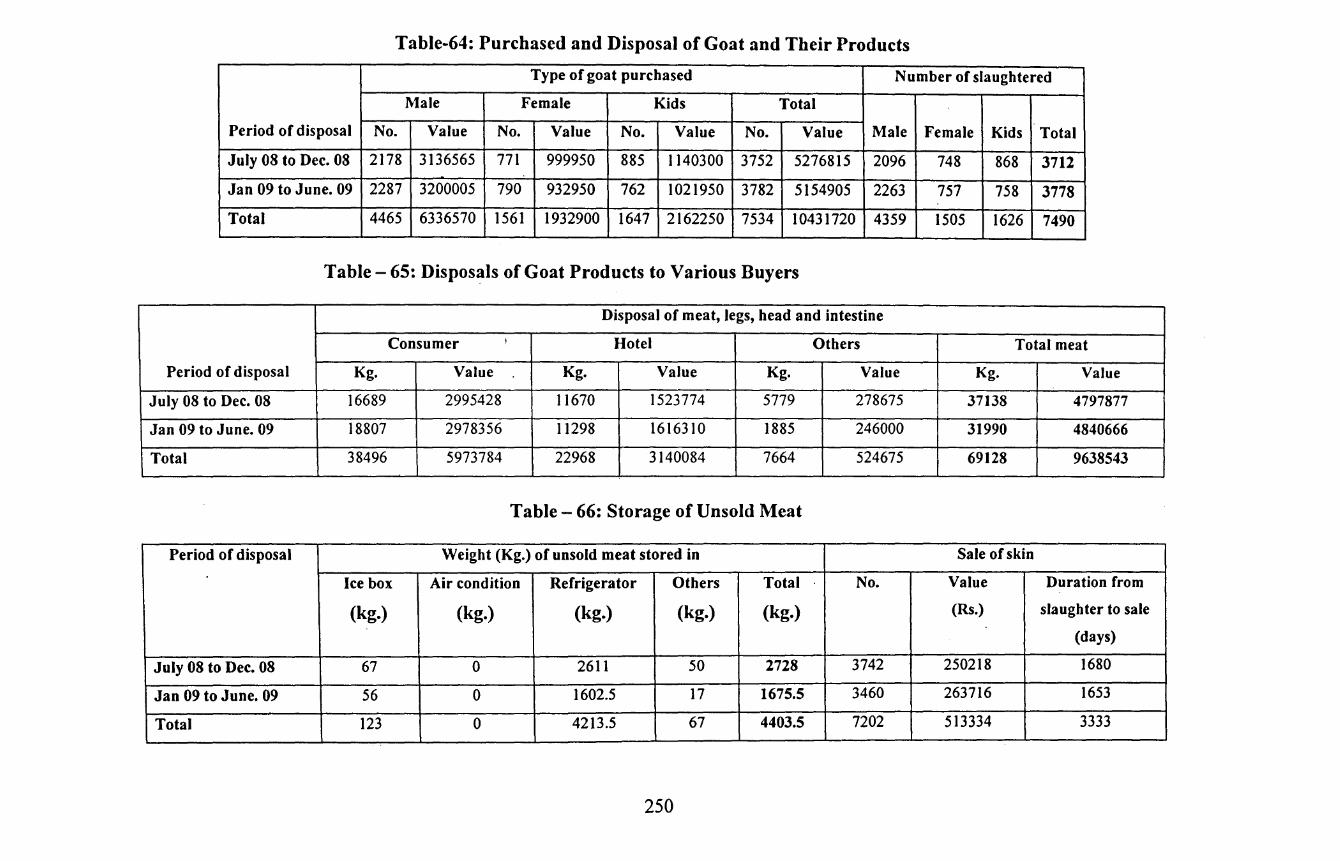
Table-64: Purchased and Disposal of Goat and Their Products
Type of goat purchased Number of slaughtered
Male Female Kids Total
Period of disposal No. Value No. Value No. Value No. Value Male Female Kids Total
July 08 to Dec. 08 2178 3136565 771 999950 885 1140300 3752 5276815 2096 748 868 3712
Jan 09 to June. 09 2287 3200005 790 932950 762 1021950 3782 5154905 2263 757 758 3778
Total 4465 6336570 1561 1932900 1647 2162250 7534 10431720 4359 1505 1626 7490
Table- 65: Disposals of Goat Products to Various Buyers
Disposal of meat, legs, head and intestine
Consumer I Hotel Others Total meat
Period of disposal Kg. Value Kg. Value Kg. Value Kg. Value
July 08 to Dec. 08 16689 2995428 11670 1523774 5779 278675 37138 4797877
Jan 09 to June. 09 18807 2978356 11298 1616310 1885 246000 31990 4840666
Total 38496 5973784 22968 3140084 7664 524675 69128 9638543
Table- 66: Storage of Unsold Meat
Period of disposal Weight (Kg.) of unsold meat stored in Sale of skin
Ice box Air condition Refrigerator Others Total No. Value Duration from
(kg.) (kg.) (kg.) (kg.) (kg.) (Rs.) slaughter to sale
(days)
July 08 to Dec. 08 67 0 2611 50 2728 3742 250218 1680
Jan 09 to June. 09 56 0 1602.5 17 1675.5 3460 263716 1653
Total 123 0 4213.5 67 4403.5 7202 513334 3333
250
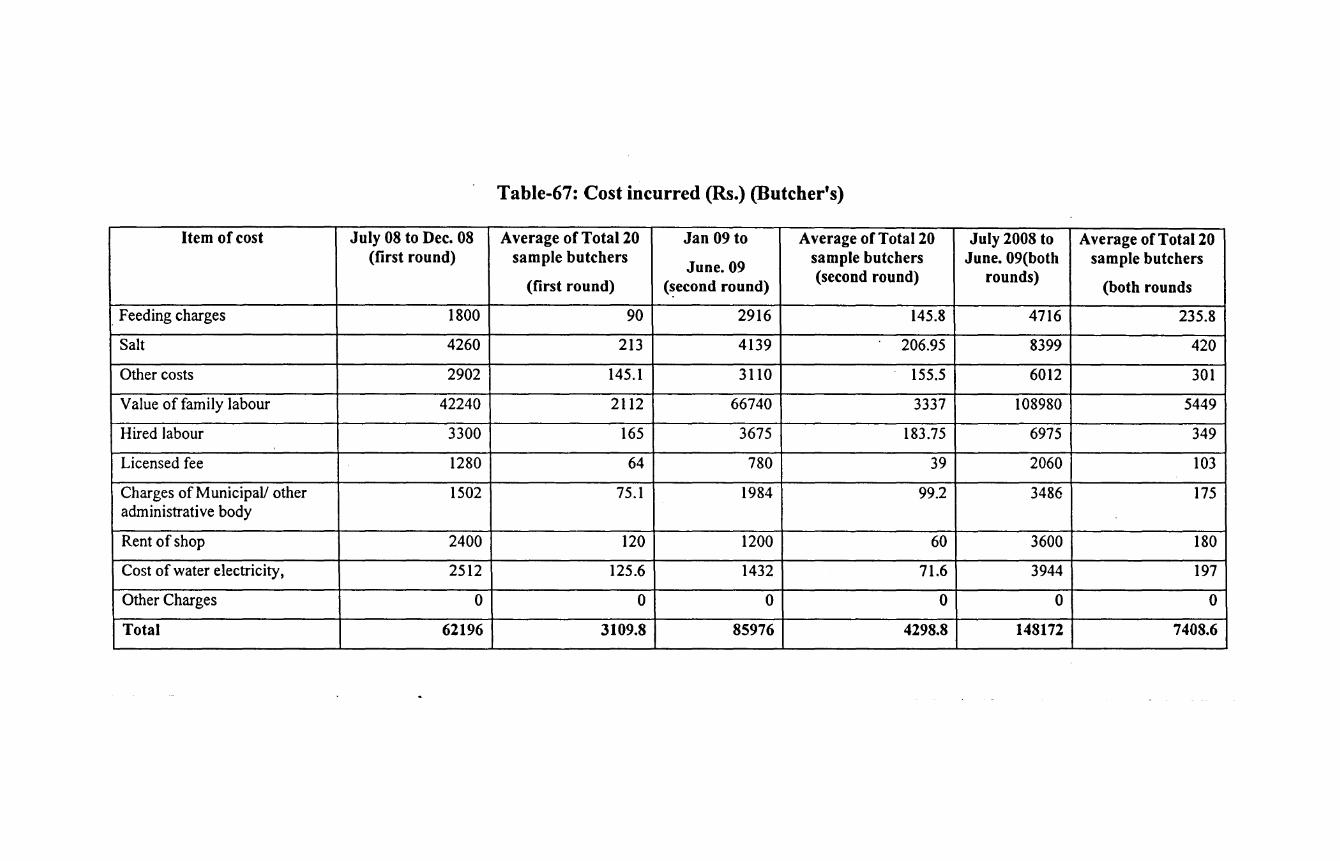
Table-67: Cost incurred (Rs.) (Butcher's)
Item of cost July 08 to Dec. 08 Average of Total 20 Jan 09 to Average ofTotal20 July 2008 to Average ofTotal20 (first round) sample butchers
June.09 sample butchers June. 09(both sample butchers
(first round) (~econd round) (second round) rounds)
(both rounds
Feeding charges 1800 90 2916 145.8 4716 235.8
Salt 4260 213 4139 206.95 8399 420
Other costs 2902 145.1 3110 155.5 6012 301
Value of family labour 42240 2112 66740 3337 108980 5449
Hired labour 3300 165 3675 183.75 6975 349
Licensed fee 1280 64 780 39 2060 103
Charges of MunicipaV other 1502 75.1 1984 99.2 3486 175 administrative body
Rent of shop 2400 120 1200 60 3600 180
Cost of water electricity, 2512 125.6 1432 71.6 3944 197
Other Charges 0 0 0 0 0 0
Total 62196 3109.8 85976 4298.8 148172 7408.6
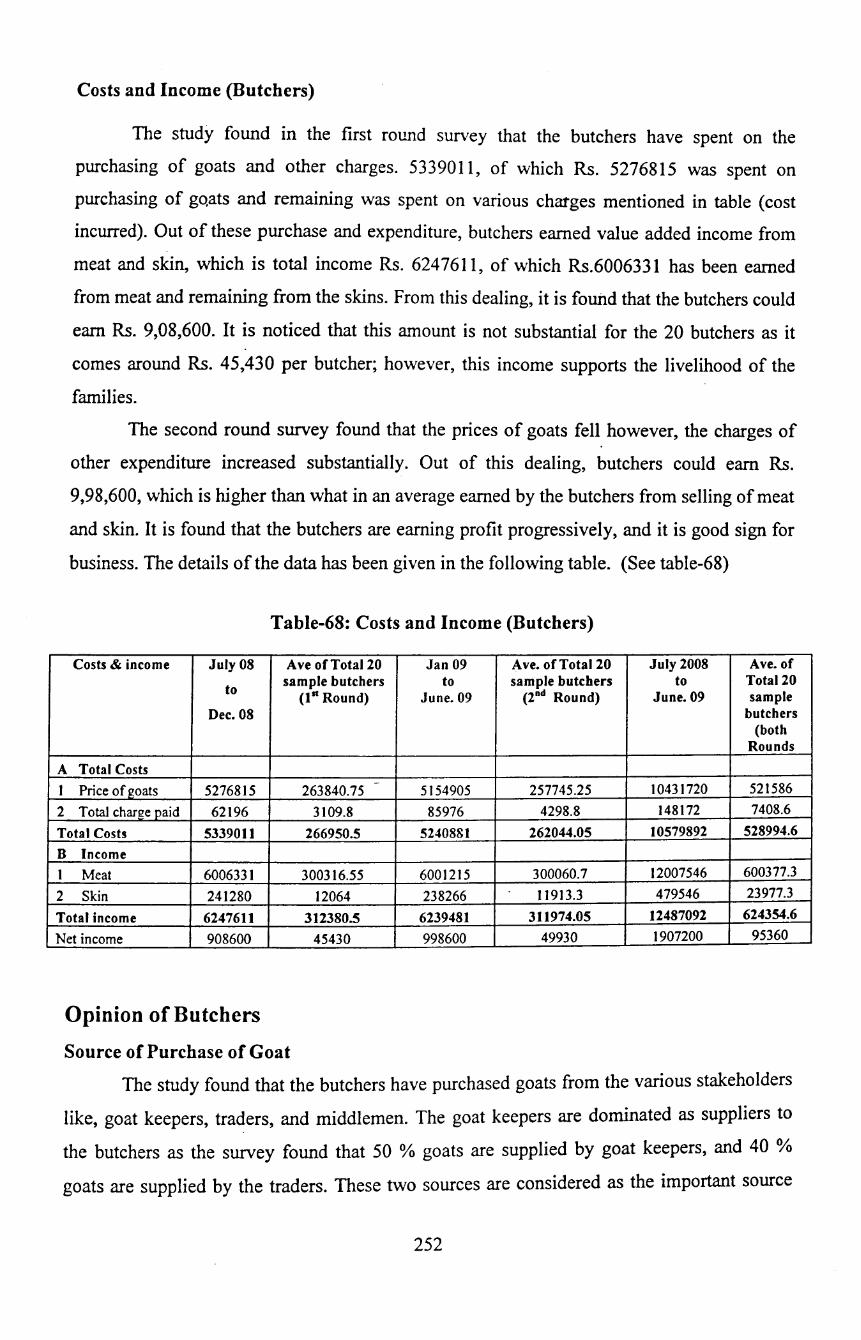
Costs and Income (Butchers)
The study found in the first round survey that the butchers have spent on the
purchasing of goats and other charges. 5339011, of which Rs. 5276815 was spent on
purchasing of gqats and remaining was spent on various charges mentioned in table (cost
incurred). Out of these purchase and expenditure, butchers earned value added income from
meat and skin, which is total income Rs. 6247611, of which Rs.6006331 has been earned
from meat and remaining from the skins. From this dealing, it is found that the butchers could
earn Rs. 9,08,600. It is noticed that this amount is not substantial for the 20 butchers as it
comes around Rs. 45,430 per butcher; however, this income supports the livelihood of the
families.
The second round survey found that the prices of goats fell however, the charges of
other expenditure increased substantially. Out of this dealing, butchers could earn Rs.
9,98,600, which is higher than what in an average earned by the butchers from selling of meat
and skin. It is found that the butchers are earning profit progressively, and it is good sign for
business. The details of the data has been given in the following table. (See table-68)
Table-68: Costs and Income (Butchers)
Costs & income July 08 Ave ofTotal20 Jan 09 Ave. ofTota120 July 2008 Ave. of sample butchers to sample butchers to Tota120
to (1 11 Round) June. 09 (rd Round) June. 09 sample
Dec. 08 butchers (both
Rounds
A Total Costs
I Price of goats 5276815 2 Total charl!e paid 62196 Total Costs 5339011
B Income
I Meat 6006331 2 Skin 241280 Total income 6247611
Net income 908600
Opinion of Butchers
Source of Purchase of Goat
263840.75 3109.8
266950.5
300316.55 12064
312380.5
45430
5154905 257745.25 10431720 521586
85976 4298.8 148172 7408.6
5240881 262044.05 10579892 528994.6
6001215 300060.7 12007546 600377.3
238266 11913.3 479546 23977.3
6239481 311974.05 12487092 624354.6
998600 49930 1907200 95360
The study found that the butchers have purchased goats from the various stakeholders
like, goat keepers, traders, and middlemen. The goat keepers are dominated as suppliers to
the butchers as the survey found that 50 % goats are supplied by goat keepers, and 40 %
goats are supplied by the traders. These two sources are considered as the important source
252
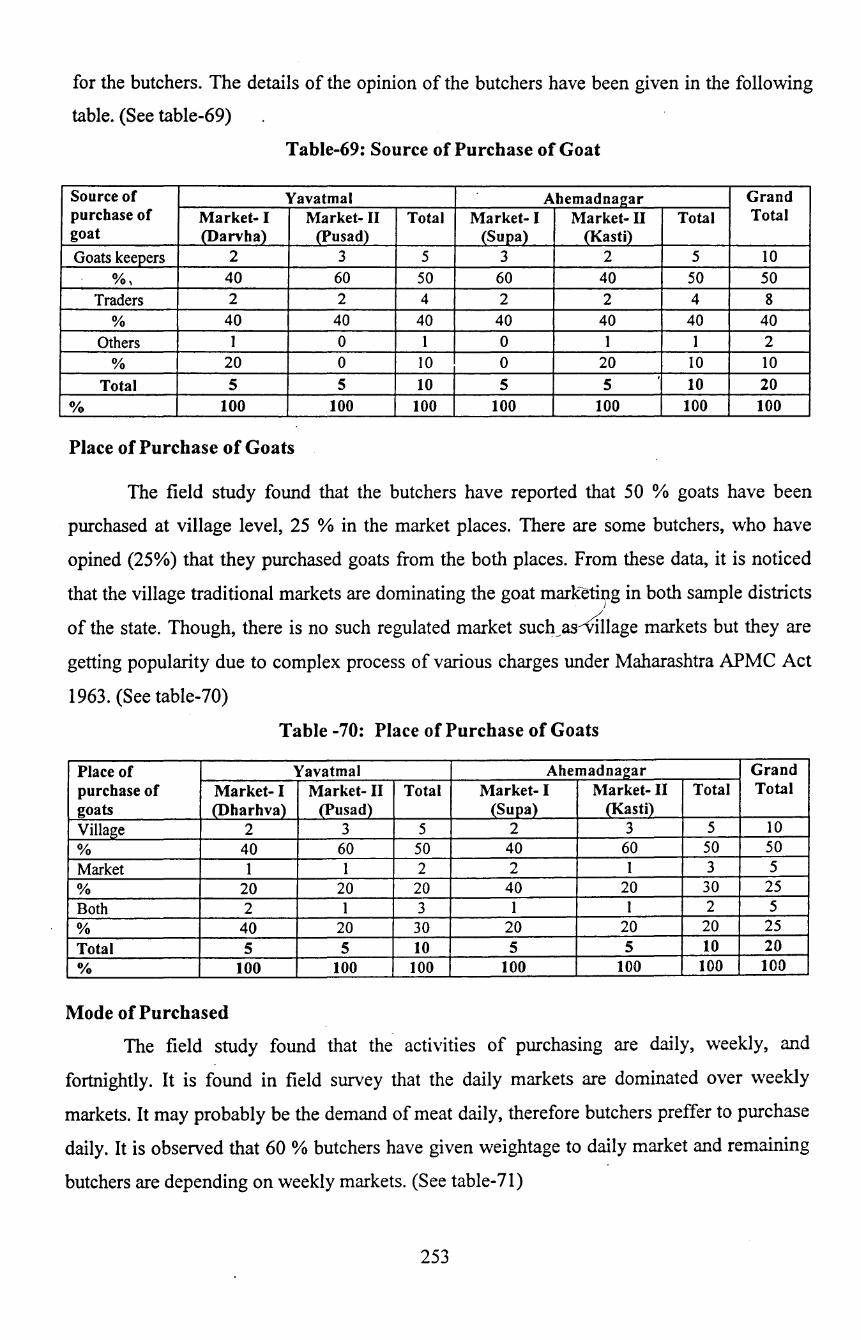
for the butchers. The details of the opinion of the butchers have been given in the following
table. (See table-69)
Table-69: Source of Purchase of Goat
Source of Yavatmal Ahemadnagar Grand purchase of Market- I Market- II Total Market- I Market- II Total Total goat (Darvha) (Pusad} (Supa) (Kasti) Goats keepers 2 3 5 3 2 5 10
%\ 40 60 50 60 40 50 50 Traders 2 2 4 2 2 4 8
% 40 40 40 40 40 40 40 Others I 0 I 0 I I 2
% 20 0 10 0 20 10 10 Total 5 5 10 5 5
. 10 20
Ofo 100 100 100 100 100 100 100
Place of Purchase of Goats
The field study found that the butchers have reported that 50 % goats have been
purchased at village level, 25 % in the market places. There are some butchers, who have
opined (25%) that they purchased goats from the both places. From these data, it is noticed
that the village traditional markets are dominating the goat marketing in both sample districts )
of the state. Though, there is no such regulated market such~rilage markets but they are
getting popularity due to complex process of various charges under Maharashtra APMC Act
1963. (See table-70)
Table -70: Place of Purchase of Goats
Place of Yavatmal Ahemadna2ar Grand purchase of Market- I Market- II Total Market- I Market- II Total Total goats (Dharhva) (Pusad) (Supa) (Kasti) Village 2 3 5 2 3 5 10 % 40 60 50 40 60 50 50 Market 1 I 2 2 I 3 5 % 20 20 20 40 20 30 25 Both 2 1 3 1 I 2 5 % 40 20 30 20 20 20 25 Total 5 5 10 5 5 10 20 o;o 100 100 100 100 100 100 100
Mode of Purchased
The field study found that the activities of purchasing are daily, weekly, and
fortnightly. It is found in field survey that the daily markets are dominated over weekly
markets. It may probably be the demand of meat daily, therefore butchers preffer to purchase
daily. It is observed that 60% butchers have given weightage to daily market and remaining
butchers are depending on weekly markets. (See table-71)
253

Table-71: I\ lode of Purchased
.Mode of Yavatmal Ahemadna2ar Grand purchased Market- I 1\larket- II Total Market- I Market- II Total Total
(Dharhva) (Pusad) (Supa) (Kasti) Daily 2 4 6 2 4 6 I2
% 40 80 60 40 80 60 60 Weekly 3 I 4 3 I 4 8
% 60 20 40 60 20 40 40 Fortnightly 0 0 0 0 0 0 0
% 0 0 0 0 ·o 0 0 Total 5 5 10 5 5 10 20
•;. 100 100 100 100 100 100 100
I\ lode of Payment
The study found that 80% butchers have opined that they have made prompt payment
immediately. Only 10 % butchers opined that they made payment to the sellers in later days
depending upon the mutual understanding and oral agreements. Generally, the dealings of the
goats in the market or at door are traditional base, where free entry and free exit are allowed
like perfect competition. The prices of goats depend upon the demand and supply of the goats
particularly for male goats, as most meat eaters prefer meat of male goats in two sample
districts of the state. (See table-72)
Table -72: l\lode of Payment
Mode of . Yavatmal Ahemadnagar Grand payment Market- I Market- II Total Market- I Market- II Total Total
(Dharhva) (Pusad)_ (Supa) (Kasti) Immediately 5 4 9 4 3 7 I6
% 100 80 - 90 80 60 70 80 Latter 0 0 0 0 2 2 2
% 0.00 0.00 0.00 0.00 40 20 10 Partial 0 0 0 0 0 0 0
% 0.00 0.00 0.00 0.00 0.00 0.00 0.00
Full 0 I I I 0 I 2
% 0.00 20 IO 20 0.00 IO IO
Total 5 5 10 5 5 10 20 •;. 100 100 100 100 100 100 100
Demanded Breeds by Purchasers
The study found that mostly local breeds are available for selling. Therefore,
according to local availability and prices of goats, the butchers proceed with this principles
by hoping that they will get higher profit margin. It is observed that 55% butchers of both
districts of the state are purchasing local breeds only, and 15 % butchers said that they
purchased other goats breeds too. It is very interesting to note that 30 % butchers failed to
254
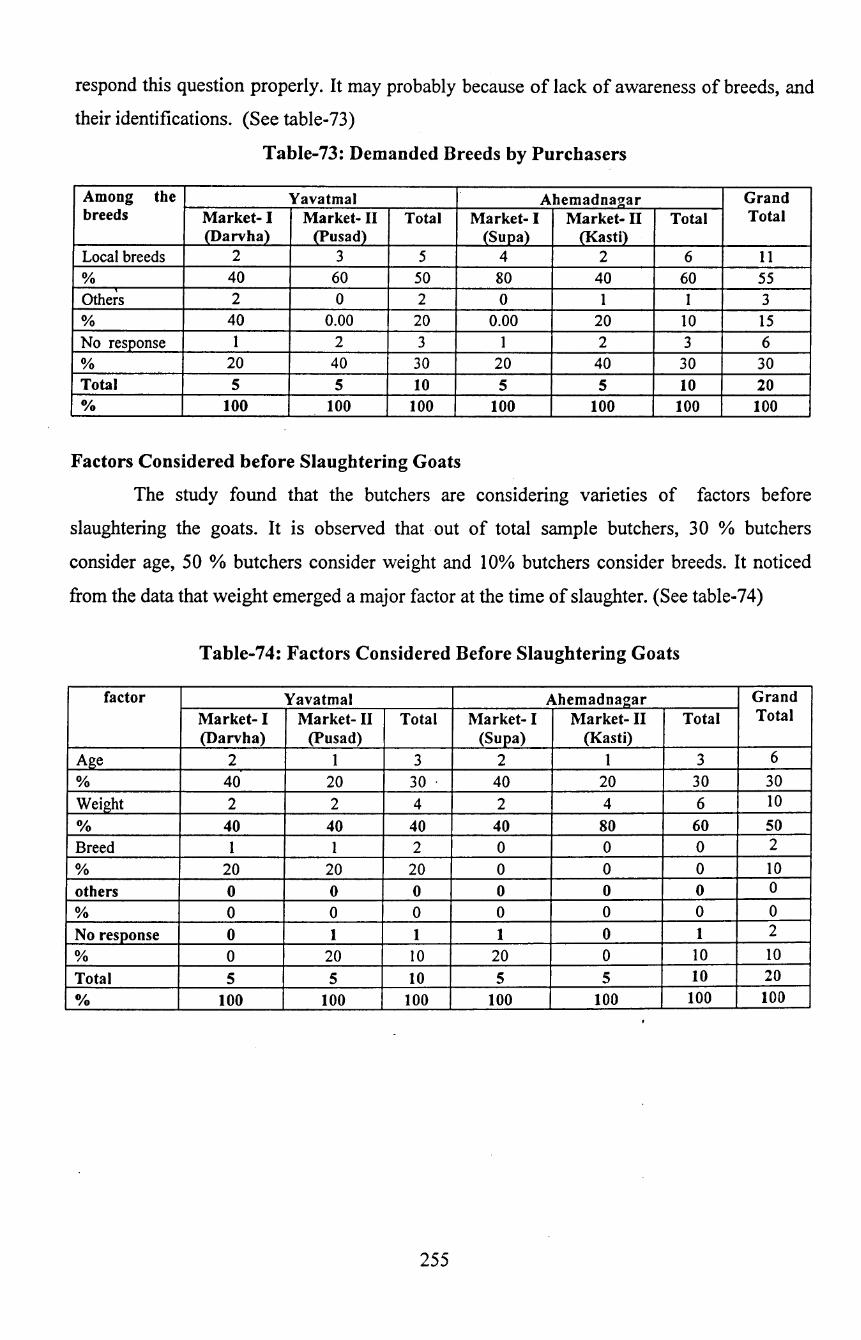
respond this question properly. It may probably because of lack of awareness of breeds, and
their identifications. (See table-73)
Table-73: Demanded Breeds by Purchasers
Among the Yavatmal Ahemadnagar Grand breeds Market- I Market- II Total Market- I Market- IT Total Total
(Darvha) (Po sad) (Supa) (Kasti) Local breeds 2 3 5 4 2 6 11 % 40 60 50 80 40 60 55 Others 2 0 2 0 1 1 3 % 40 0.00 20 0.00 20 10 15 No response 1 2 3 1 2 3 6 % 20 40 30 20 40 30 30 Total 5 5 10 5 5 10 20 0/o 100 100 100 100 100 100 100
Factors Considered before Slaughtering Goats
The study found that the butchers are considering varieties of factors before
slaughtering the goats. It is observed that. out of total sample butchers, 30 % butchers
consider age, 50 % butchers consider weight and 10% butchers consider breeds. It noticed
from the data that weight emerged a major factor at the time of slaughter. (See table-74)
Table-74: Factors Considered Before Slaughtering Goats
factor Yavatmal Ahemadnagar Grand
Market- I Market- II Total Market- I Market- II Total Total
(Darvha) (Pusad) (Supa) (Kasti)
Age 2 1 3 2 1 3 6
% 40 20 30 . 40 20 30 30 Weight 2 2 4 2 4 6 10 0/o 40 40 40 40 80 60 50 Breed 1 1 2 0 0 0 2
% 20 20 20 0 0 0 10 others 0 0 0 0 0 0 0
% 0 0 0 0 0 0 0 No response 0 1 1 1 0 1 2
% 0 20 10 20 0 10 10 Total 5 5 10 5 5 10 20 0/o 100 100 100 100 100 100 100
255
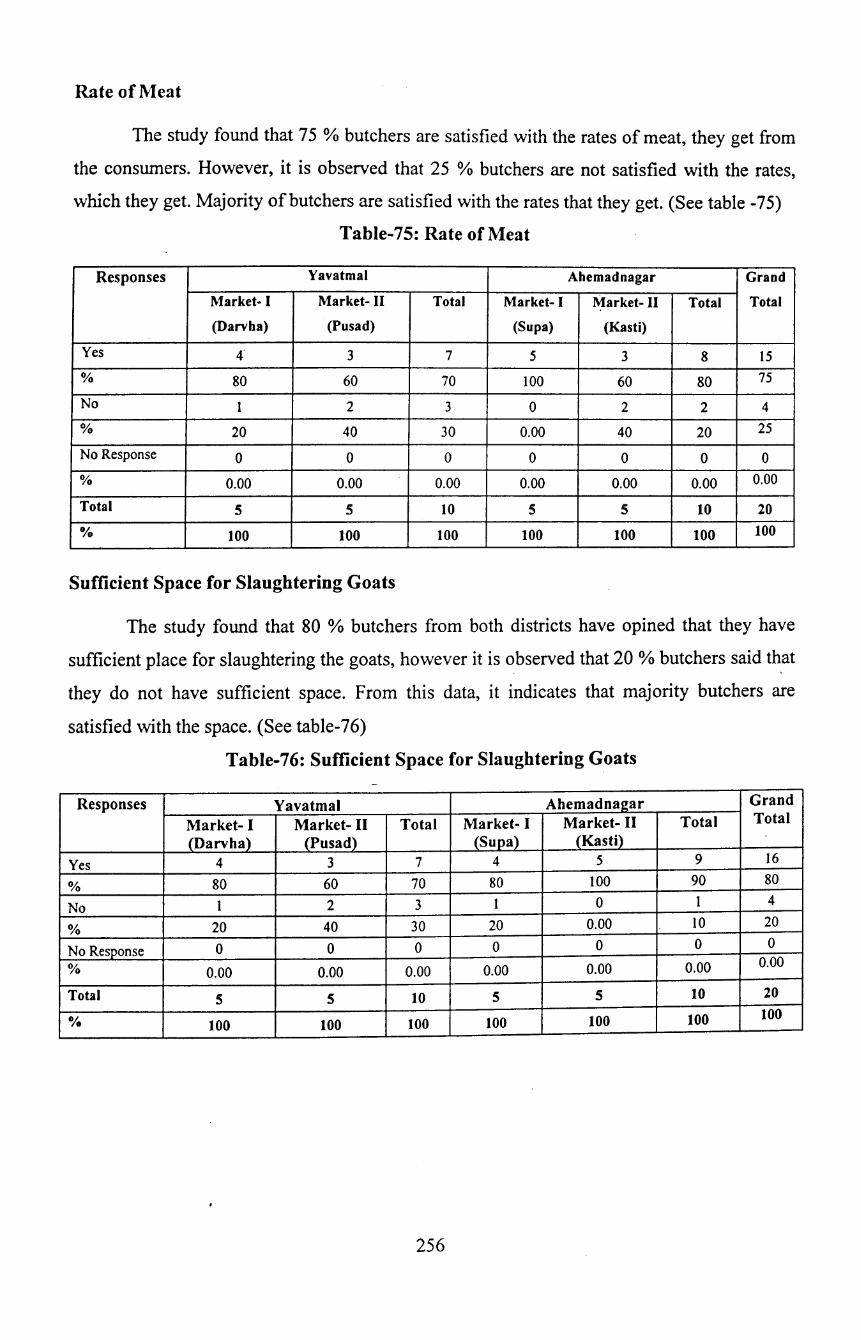
Rate of l'\'leat
The study found that 75 %butchers are satisfied with the rates of meat, they get from
the consumers. However, it is observed that 25 % butchers are not satisfied with the rates,
whichthey get. Majority ofbutchers are satisfied with the rates that they get. (See table -75)
Table-75: Rate of Meat
Responses Yavatmal Ahemadnagar Grand
Market- I Market- II Total Market- I Market- II Total Total
(Darvha) (Pusad) (Supa) (Kasti)
Yes 4" 3 7 5 3 8 15
% 80 60 70 100 60 80 75
No 1 2 3 0 2 2 4
% 20 40 30 0.00 40 20 25
No Response 0 0 0 0 0 0 0
% 0.00 0.00 0.00 0.00 0.00 0.00 0.00
Total 5 5 10 5 5 10 20
% 100 100 100 100 100 100 100
Sufficient Space for Slaughtering Goats
The study found that 80 % butchers from both districts have opined that they have
sufficient place for slaughtering the goats, however it is observed that 20 % butchers said that
they do not have sufficient space. From this data, it indicates that majority butchers are
satisfied with the space. (See table-76)
Table-76: Sufficient Space for Slaughtering Goats
Responses Yavatmal Ahemadnagar Grand
Market- I Market- II Total Market- I Market- II Total Total
(Darvha) (Pusad) (Supa) (Kasti)
Yes 4 3 7 4 5 9 16
% 80 60 70 80 100 90 80
No 1 2 3 1 0 1 4
% 20 40 30 20 0.00 10 20
No Response 0 0 0 0 0 0 0
% 0.00 0.00 0.00 0.00 0.00 0.00 0.00
Total 5 5 10 5 5 10 20
% 100 100 100 100 100 100 100
256
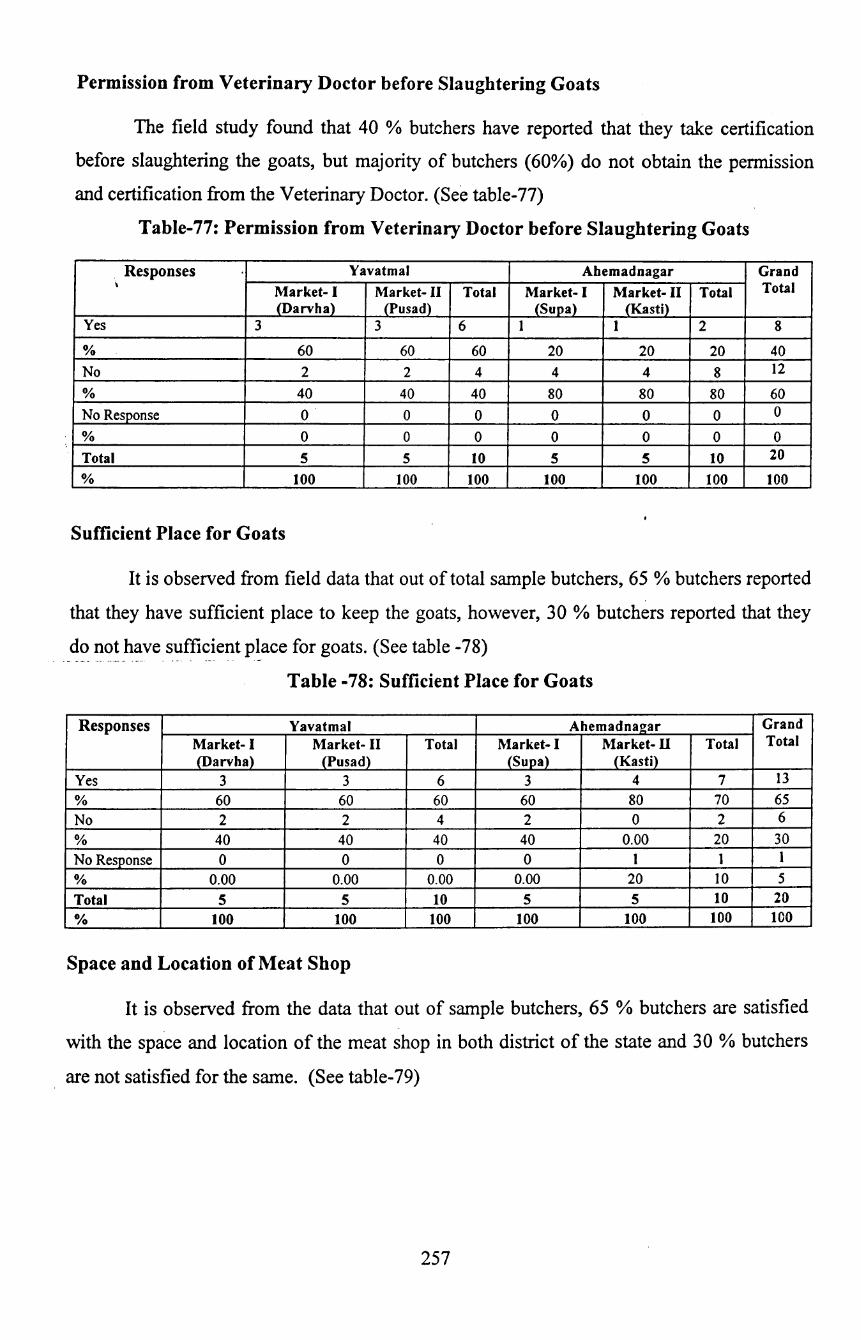
Permission from Veterinary Doctor before Slaughtering Goats
The field study found that 40 % butchers have reported that they take certification
before slaughtering the goats, but majority of butchers (60%) do not obtain the permission
and certification from the Veterinary Doctor. (See table-77)
Table-77: Permission from Veterinary Doctor before Slaughtering Goats
Responses Yavatmal Ahemadnagar Grand \
Market- I Market- II Total Market- I Market- II Total Total (Darvha) (Pusad) (Supa) (Kasti)
Yes 3 3 6 I I 2 8
% 60 60 60 20 20 20 40 No 2 2 4 4 4 8 12
% 40 40 40 80 80 80 60 No Response 0 0 0 0 0 0 0
% 0 0 0 0 0 0 0
Total 5 5 10 5 5 10 20
% 100 100 100 100 100 100 tOO
Sufficient Place for Goats
It is observed from field data that out of total sample butchers, 65 % butchers reported
that they have sufficient place to keep the goats, however, 30% butchers reported that they
do not have sufficient place for goats. (See table -78) . ---------------- . -- --- -
Table -78: Sufficient Place for Goats
Responses Yavatmal Ahem ad nagar Grand
Market- I Market- II Total Market- I Market- II Total Total (Darvha) (Pusad) (Supa) (Kasti)
Yes 3 3 6 3 4 7 13
% 60 60 60 60 80 70 65 No 2 2 4 2 0 2 6 % 40 40 40 40 0.00 20 30
No Response 0 0 0 0 1 1 1
% 0.00 0.00 0.00 0.00 20 10 5 Total 5 5 10 5 5 10 20 % 100 100 100 100 100 100 100
Space and Location of Meat Shop
It is observed from the data that out of sample butchers, 65 % butchers are satisfied
with the space and location of the meat shop in both district of the state and 30 % butchers
are not satisfied for the same. (See table-79)
257
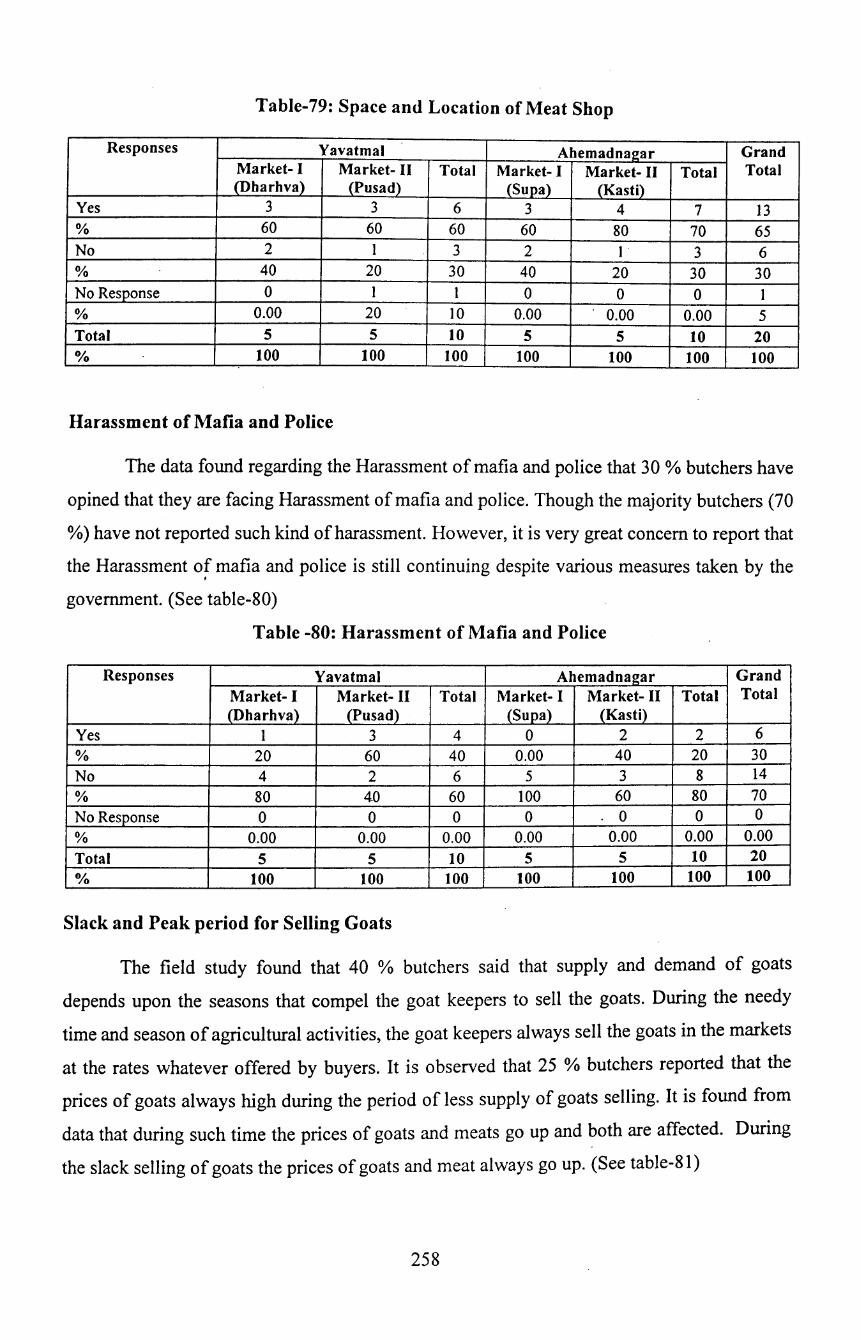
Table-79: Space and Location of Meat Shop
Responses Yavatmal Ahemadnagar Grand Market- I Market- II Total Market- I Market- II Total Total (Dharhva) (Pusad) (Supa) (Kasti)
Yes 3 3 6 3 4 7 13 % 60 60 60 60 80 70 65 No 2 I 3 2 I 3 6 % 40 20 30 40 20 30 30 No Response 0 I I 0 0 0 I % 0.00 20 IO 0.00 0.00 0.00 5 Total 5 5 10 5 5 10 20 0/o 100 100 100 100 100 100 100
Harassment of Mafia and Police
The data found regarding the Harassment of mafia and police that 30 o/o butchers have
opined that they are facing Harassment of mafia and police. Though the majority butchers (70
%) have not reported such kind of harassment. However, it is very great concern to report that
the Harassment of mafia and police is still continuing despite various measures taken by the
government. (See table-80)
Table -80: Harassment of Mafia and Police
Responses Yavatmal Ahemadnagar Grand Market- I Market- II Total Market- I Market- II Total Total (Dharhva) (Pusad) (Supa) (Kasti)
Yes 1 3 4 0 2 2 6
% 20 60 40 0.00 40 20 30 No 4 2 6 5 3 8 14
% 80 40 60 100 60 80 70 No Response 0 0 0 0 0 0 0
% 0.00 0.00 0.00 0.00 0.00 0.00 0.00
Total 5 5 10 5 5 10 20 0/o 100 100 100 100 100 100 100
Slack and Peak period for Selling Goats
The field study found that 40 o/o butchers said that supply and demand of goats
depends upon the seasons that compel the goat keepers to sell the goats. During the needy
time and season of agricultural activities, the goat keepers always sell the goats in the markets
at the rates whatever offered by buyers. It is observed that 25 % butchers reported that the
prices of goats always high during the period of less supply of goats selling. It is found from
data that during such time the prices of goats and meats go up and both are affected. During
the slack selling of goats the prices of goats and meat always go up. (See table-81)
258
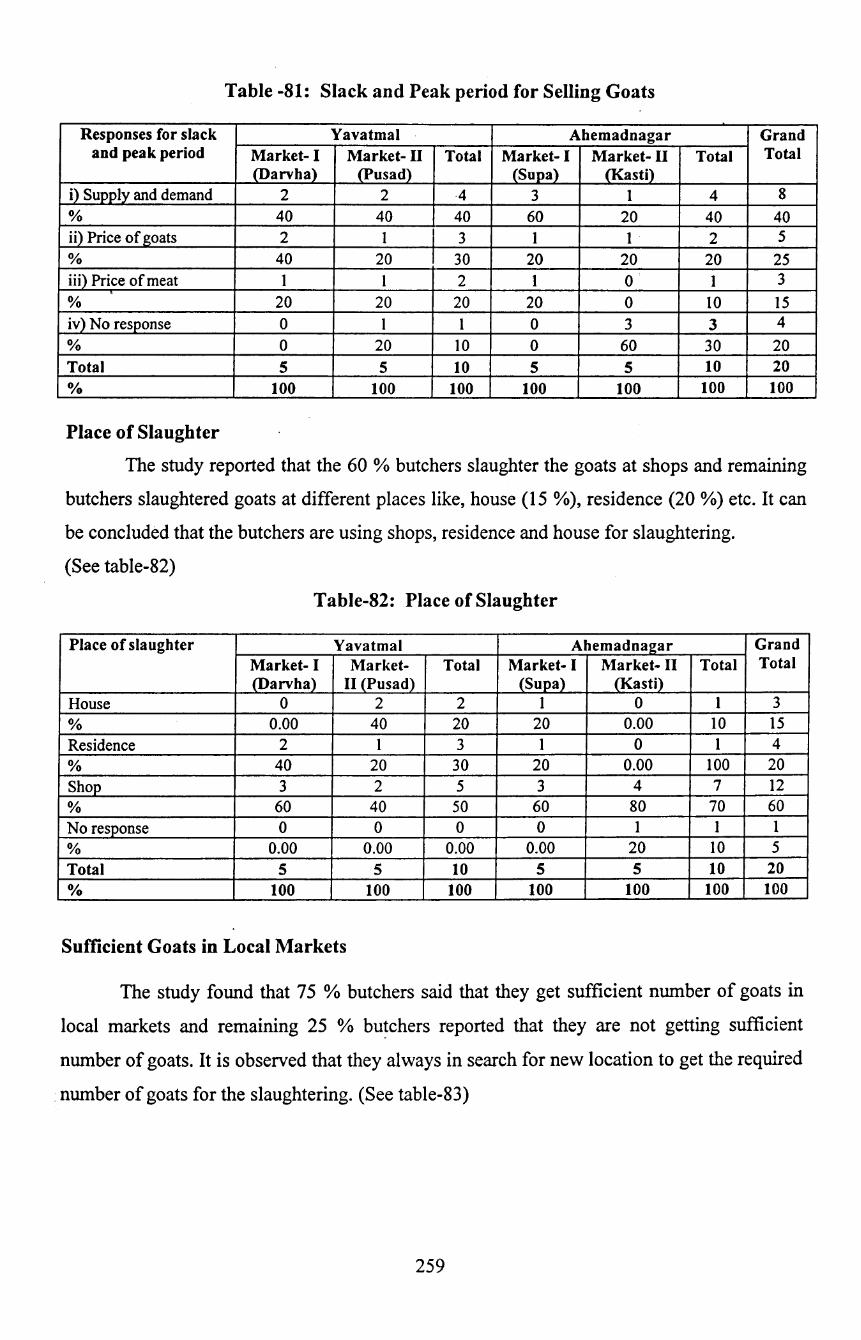
Table -81: Slack and Peak period for Selling Goats
Responses for slack Yavatmal Ahemadnagar Grand and peak period Market- I Market- II Total Market- I Market- II Total Total
(Darvha) {Pusad) (Supa) (Kasti} !}_ Supp_!y_ and demand 2 2 4 3 1 4 8 % 40 40 40 60 20 40 40 ii) Price of goats 2 I I 3 I 1 2 5 % 40 20 30 20 20 20 25 iii) Price of meat I I 2 I 0 1 3 % 20 20 20 20 0 10 15 iv) No response 0 I I 0 3 3 4 % 0 20 IO 0 60 30 20 Total 5 5 10 5 5 10 20 Ofo 100 100 100 100 100 100 100
Place of Slaughter
The study reported that the 60 % butchers slaughter the goats at shops and remaining
butchers slaughtered goats at different places like, house (15 %), residence (20 %) etc. It can
be concluded that the butchers are using shops, residence and house for slaughtering.
(See table-82)
Table-82: Place of Slaughter
Place of slaughter Yavatmal Ahemadnagar Grand Market- I Market- Total Market- I Market- II Total Total (Darvha) II (Pusad) (Supa) (Kasti)
House 0 2 2 1 0 1 3 % 0.00 40 20 20 0.00 IO I5 Residence 2 I 3 I 0 1 4 % 40 20 30 20 0.00 100 20 Shop 3 2 5 3 4 7 I2 % 60 40 50 60 80 70 60 No response 0 0 0 0 1 1 1 % 0.00 0.00 0.00 0.00 20 10 5 Total 5 5 10 5 5 10 20 o;o 100 100 100 100 100 100 100
Sufficient Goats in Local Markets
The study found that 75 % butchers said that they get sufficient number of goats in
local markets and remaining 25 % bu~chers reported that they are not getting sufficient
number of goats. It is observed that they always in search for new location to get the required
. number of goats for the slaughtering. (See table-83)
259
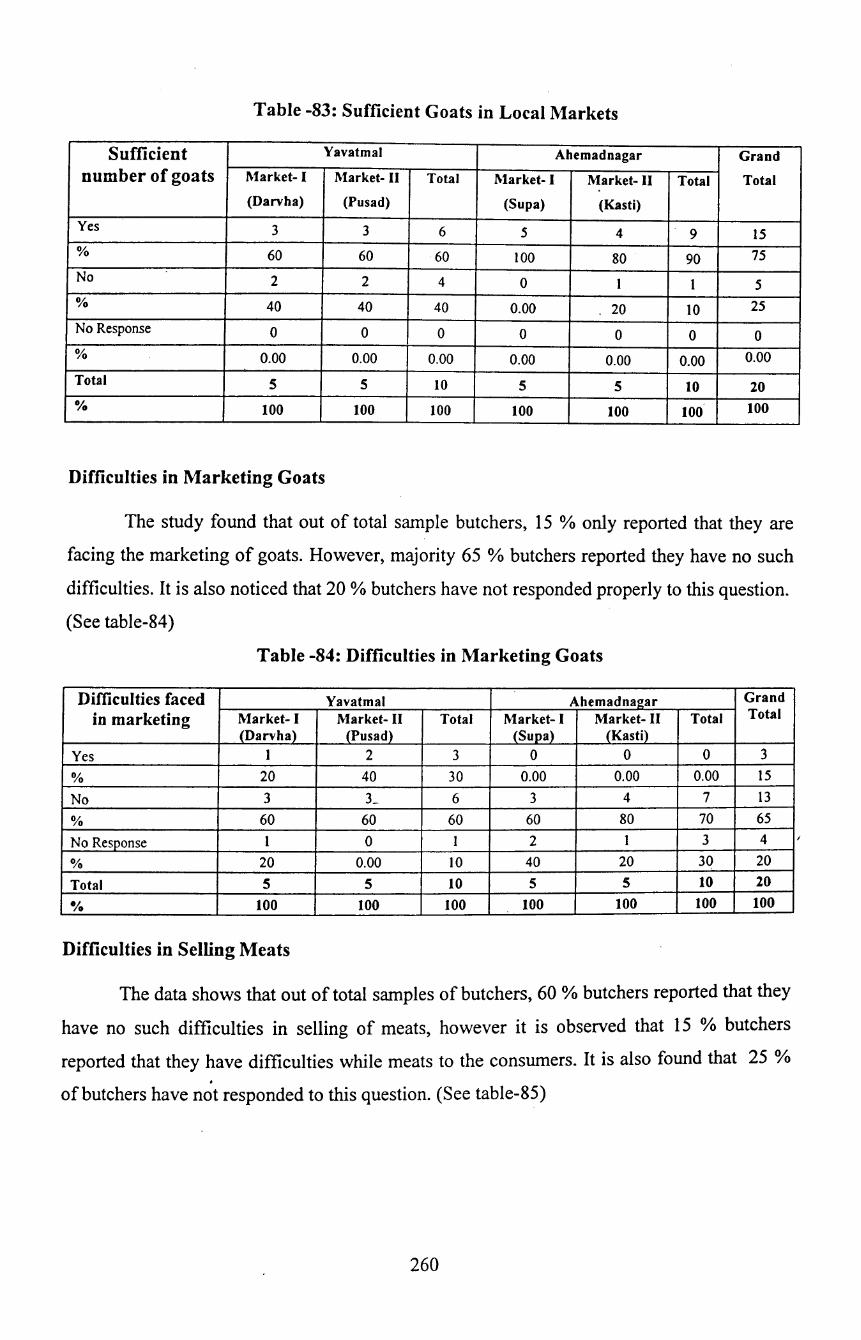
Table -83: Sufficient Goats in Local Markets
Sufficient Yavatmal Ahemadnagar Grand
number of goats Market- I Market- II Total Market- I Market- II Total Total
(Darvha) (Pusad) (Supa) (Kasti)
Yes 3 3 6 5 4 9 15 % 60 60 60 100 80 90 15
No 2 2 4 0 1 1 5 % 40 40 40 0.00 20 10 25
No Response 0 0 0 0 0 0 0 % 0.00 0.00 0.00 0.00 0.00 0.00 0.00
Total 5 5 10 5 5 10 20 % 100 100 100 100 100 100 100
Difficulties in Marketing Goats
The study found that out of total sample butchers, 15 % only reported that they are
facing the marketing of goats. However, majority 65 %butchers reported they have no such
difficulties. It is also noticed that 20 % butchers have not responded properly to this question.
(See table-84)
Table -84: Difficulties in Marketing Goats
Difficulties faced Yavatmal Ahem ad nagar Grand
in marketing Market- I Market- II Total Market- I Market- II Total Total
(Darvha) (Pusad) (Supa) (Kasti)
Yes 1 2 3 0 0 0 3
% 20 40 30 0.00 0.00 0.00 15
No 3 3_ 6 3 4 7 13
% 60 60 60 60 80 70 65
No Response 1 0 I 2 1 3 4
% 20 0.00 10 40 20 30 20
Total 5 5 10 5 5 10 20
•;. 100 100 100 100 100 tOO 100
Difficulties in Selling Meats
The data shows that out of total samples of butchers, 60 % butchers reported that they
have no such difficulties in selling of meats, however it is observed that 15 % butchers
reported that they have difficulties while meats to the consumers. It is also found that 25 % . of butchers have not responded to this question. (See table-85)
260
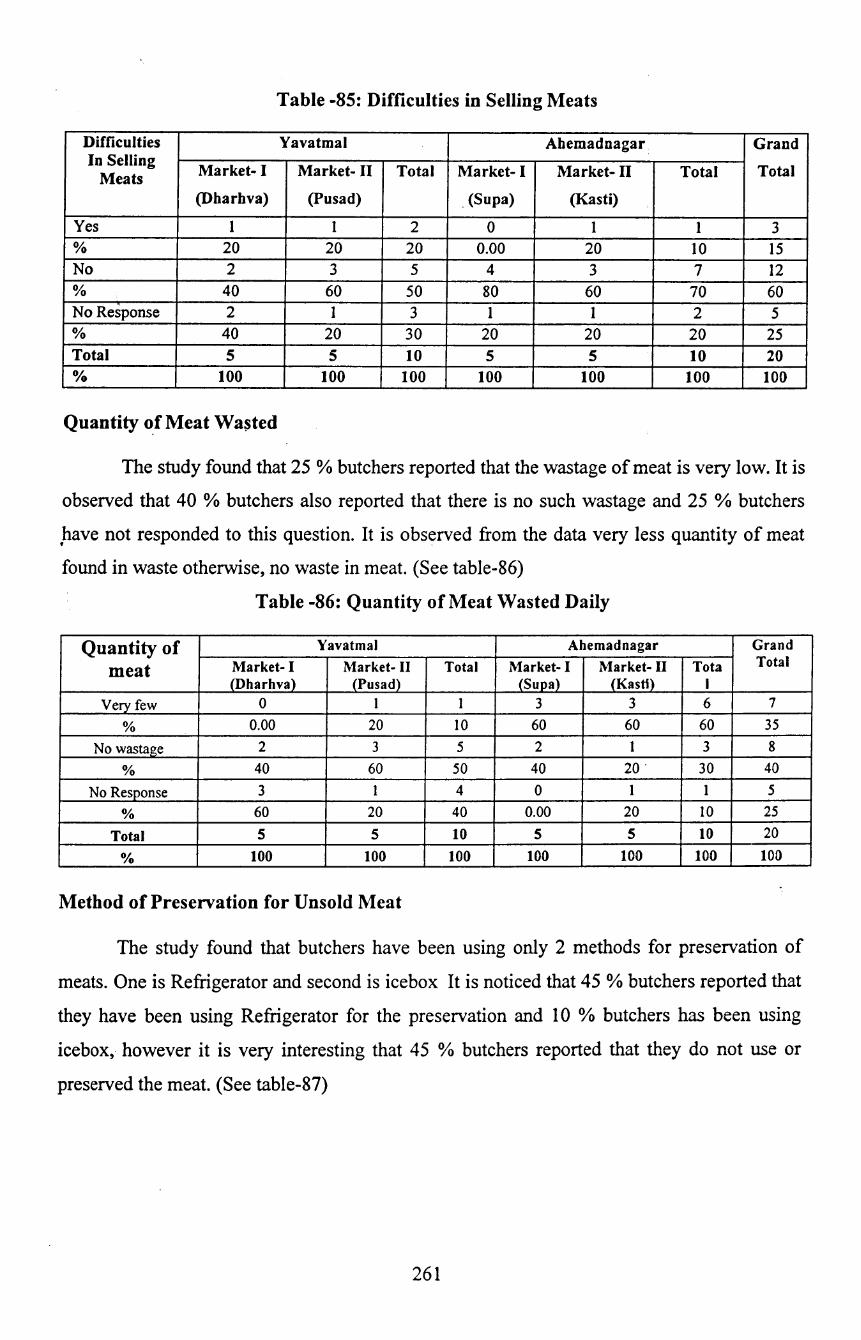
Table -85: Difficulties in Selling Meats
Difficulties Yavatmal Ahemadnagar Grand In Selling
Market- I Market- II Total Market- I Market- II Total Total Meats (Dharhva) (Pusad) . (Supa) (Kasti)
Yes I I 2 0 I I 3 % 20 20 20 0.00 20 IO I5 No 2 3 5 4 3 7 I2 % 40 60 50 80 60 70 60 No Response 2 I 3 I I 2 5 % 40 20 30 20 20 20 25 Total 5 5 10 5 5 10 20 0/o 100 100 100 100 100 100 100
Quantity o_f Meat Wasted
The study found that 25 % butchers reported that the wastage of meat is very low. It is
observed that 40 % butchers also reported that there is no such wastage and 25 % butchers
.have not responded to this question. It is observed from the data very less quantity of meat
found in waste otherwise, no waste in meat. (See table-86)
Table -86: Quantity of Meat Wasted Daily
Quantity of Yavatmal Ahemadnagar Grand
meat Market- I Market- II Total Market- I Market- II Tota Total
(Dharhva) (Pusad) (Supa) (Kastl) I
Very few 0 I 1 3 3 6 7
% 0.00 20 10 60 60 60 35
No wastage 2 3 5 2 1 3 8
% 40 60 50 40 20. 30 40
No Response 3 1 4 0 1 1 5
% 60 20 40 0.00 20 10 25
Total 5 5 10 5 5 10 20
% 100 100 100 100 100 100 100
Method of Preservation for Unsold Meat
The study found that butchers have been using only 2 methods for preservation of
meats. One is Refrigerator and second is icebox It is noticed that 45 % butchers reported that
they have been using Refrigerator for the preservation and 10 % butchers has been using
icebox, however it is very interesting that 45 % butchers reported that they do not use or
preserved the meat. (See table-87)
261

Table-87: Method of Preservation for Unsold Meat
20) Method of Yavatmal Ahemadnagar Grand preserve the unsold Market- I Market- II Total Market- I Market- II Total Total
meat (Dharhva) (Pusad) (Supa) (Kasti)
Refrigerator 2 4 6 3 0 3 9 % 40 80 60 60 0.00 30 45
Ice box 1 0 I 0 I I 2 % 20 0.00 IO 0.00 20 10 10
No preserve 2 I 3 2 4 6 9 % 40 20 30 40 80 60 45
Total 5 5 10 5 5 10 20 o;o 100 100 100 100 100 100 100
Facilities of Ref~igerator
The study found that only 35 % butchers have the refrigerator facilities, majority of
butchers (50%) have no such facility, and remaining butchers have not responded to this
question. The detail of market wise responses has been given in the following table. (See
table-88)
Table-88: Facilities of Refrigerator
Facilities of refrigerator Yavatmal Ahemadnagar Grand for keeping the unsold Market- I Market- II Total Market- I Market- II Total Total meat (Dharhva) (Pusad) (Supa)' (Kasti)
Yes 2 2 4 3 0 3 7
% 40 40 40 60 0.00 30 35
No 3 2 5 1 4 5 10
% 60 40 50 20 80 50 50
No Response 0 1 1 1 1 2 3
% 0.00 20 10 20 20 20 15
Total 5 5 10 5 5 10 20
% 100 100 100 100 100 100 100
Supplier to Hotel
The field study found that 50 % of butchers are supplying meat to the hotels and
remaining butchers responded that they have no business to supply meat to the hotels. (See
table-89)
262
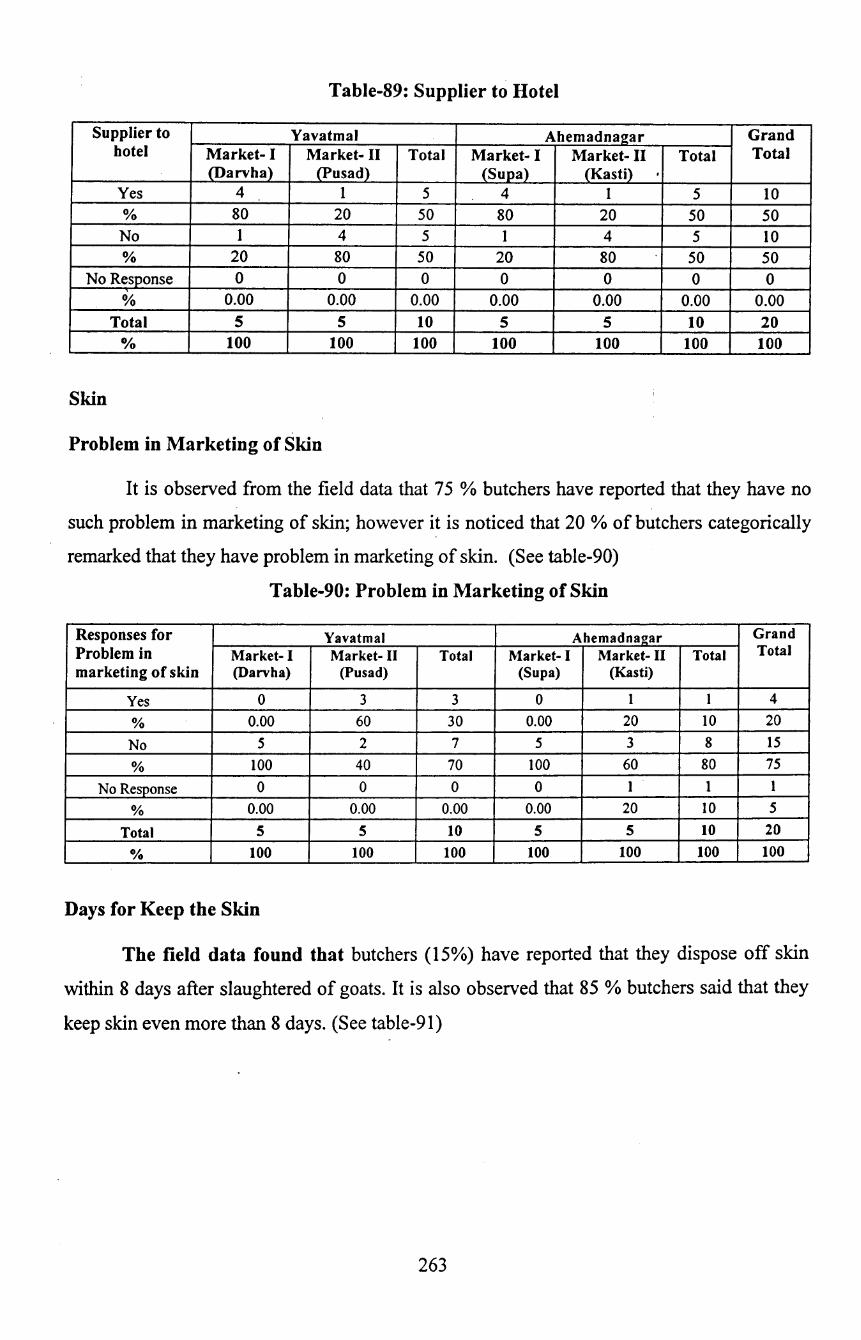
Table-89: Supplier to Hotel
Supplier to Yavatmal Ahemadnagar Grand hotel Market- I Market- II Total Market- I Market- II Total Total
(Darvha) (Pusad) (Supa) (Kasti) . Yes 4 I 5 4 I 5 IO % 80 20 50 80 20 50 50 No I 4 5 I 4 5 IO % 20 80 50 20 80 50 50
No Response 0 0 0 0 0 0 0 % 0.00 0.00 0.00 0.00 0.00 0.00 0.00
Total 5 5 10 5 5 10 20 % 100 100 100 100 100 100 100
Skin
Problem in Marketing of Skin
It is observed from the field data that 75 %butchers have reported that they have no
such problem in marketing of skin; however it is noticed that 20 % of butchers categorically
remarked that they have problem in marketing of skin. (See table-90)
Table-90: Problem in Marketing of Skin
Responses for Yavatmal Ahemadnag_ar Grand
Problem in Market- I Market- II Total Market- I Market- II Total Total
marketing of skin (Darvha) (Pusad) (Supa) (Kasti)
Yes 0 3 3 0 1 I 4
% 0.00 60 30 0.00 20 10 20
No 5 2 7 5 3 8 15
% 100 40 70 100 60 80 75
No Response 0 0 0 0 I 1 I
% 0.00 0.00 0.00 0.00 20 10 5
Total 5 5 10 5 5 10 20
% 100 100 100 100 100 100 100
Days for Keep the Skin
The field data found that butchers (15%) have reported that they dispose off skin
within 8 days after slaughtered of goats. It is also observed that 85 % butchers said that they
keep skin even more than 8 days. (See table-91)
263
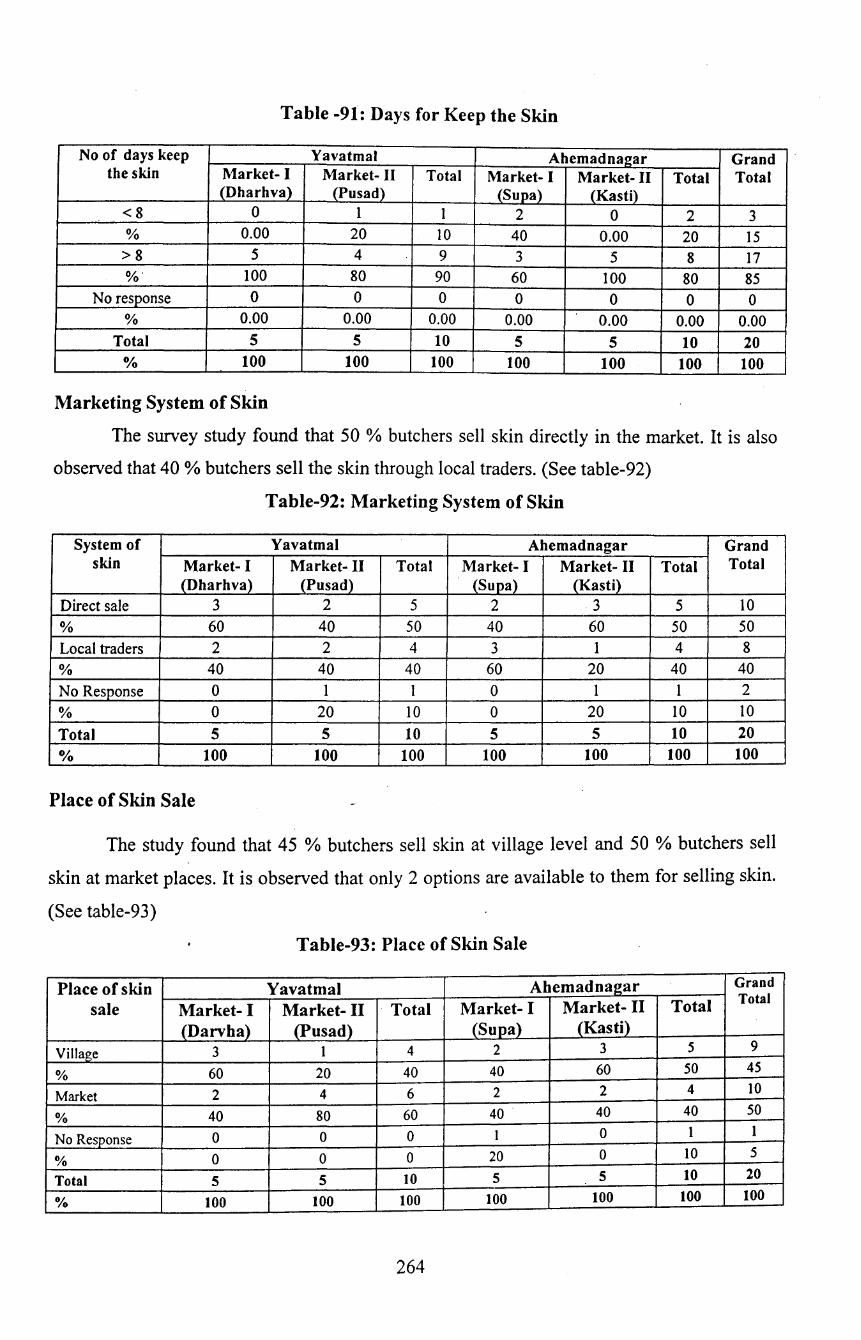
Table -91: Days for Keep the Skin
No of days keep Yavatmal Ahemadna~ar Grand the skin Market- I Market- II Total Market- I Market- II Total Total
(Dharhva) (Pusad) (Supa) (Kasti) <8 0 1 1 2 0 2 3 % 0.00 20 10 40 0.00 20 15 >8 5 4 9 3 5 8 17 %' 100 80 90 60 100 80 85
No response 0 0 0 0 0 0 0 % 0.00 0.00 0.00 0.00 0.00 0.00 0.00
Total 5 5 10 5 5 10 20 % 100 100 100 100 100 100 100
Marketing System of Skin
The survey study found that 50 % butchers sell skin directly in the market. It is also
observed that 40% butchers sell the skin through local traders. (See table-92)
Table-92: Marketing System of Skin
System of Yavatmal Ahemadnagar Grand skin Market- I Market- II Total Market- I Market- II Total Total
(Dharhva) (Pusad) (Supa) (Kasti) Direct sale 3 2 5 2 3 5 10 % 60 40 50 40 60 50 50
Local traders 2 2 4 3 1 4 8
% 40 40 40 60 20 40 40
No Resp_onse 0 1 1 0 1 1 2
% 0 20 10 0 20 10 10
Total 5 5 10 5 5 10 20 o;o 100 100 100 100 100 100 100
Place of Skin Sale
The study found that 45 % butchers sell skin at village level and 50 %butchers sell
skin at market places. It is observed that only 2 options are available to them for selling skin.
(See table-93)
Table-93: Place of Skin Sale
Place of skin Yavatmal Ahemadnagar Grand
sale Market- II Total Market- I Market- II Total Total Market- I (Darvha) (Pusad) (Supa) (Kasti)
Village 3 I 4 2 3 5 9
% 60 20 40 40 60 50 45
Market 2 4 6 2 2 4 10
% 40 80 60 40 40 40 50
No Response 0 0 0 1 0 I I
% 0 0 0 20 0 10 5
Total 5 5 10 5 5 10 20
% 100 100 100 100 100 100 100
264
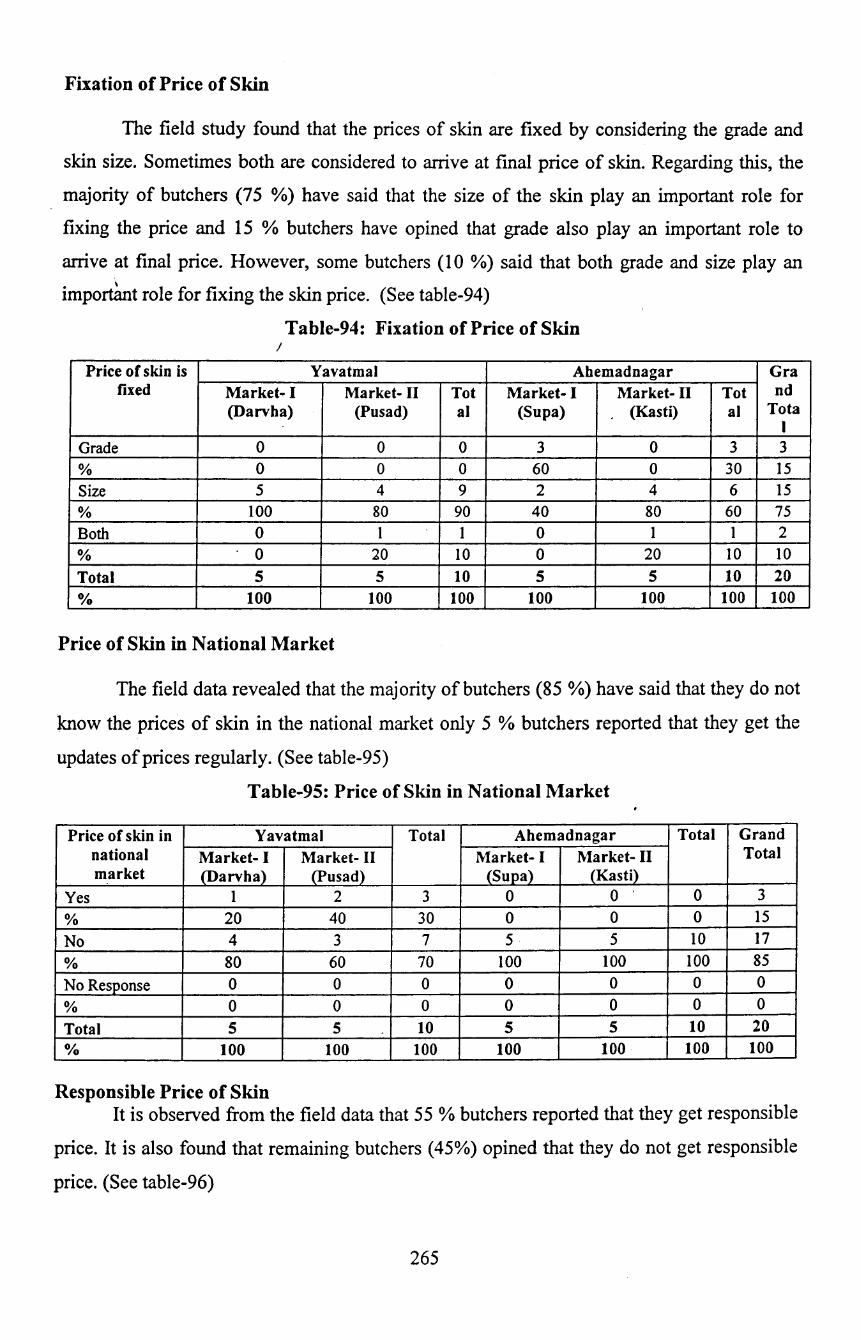
Fixation of Price of Skin
The field study found that the prices of skin are fixed by considering the grade and
skin size. Sometimes both are considered to arrive at final price of skin. Regarding this, the
majority of butchers (75 %) have said that the size of the skin play an important role for
fixing the price and 15 % butchers have opined that grade also play an important role to
arrive at final price. However, some butchers (1 0 %) said that both grade and size play an \
important role for fixing the skin price. (See table-94)
Table-94: Fixation of Price of Skin /
Price of skin is Yavatmal Ahemadnagar Gra fixed Market- I Market- ll Tot Market- I Market- ll Tot nd
(Darvha) (Pusad) al (Supa) (Kasti) al Tota I
Grade 0 0 0 3 0 3 3 % 0 0 0 60 0 30 15 Size 5 4 9 2 4 6 15 % 100 80 90 40 80 60 75 Both 0 I I 0 I I 2 % 0 20 10 0 20 10 10 Total 5 5 10 5 5 10 20 0/o 100 100 100 100 100 100 100
Price of Skin in National Market
The field data revealed that the majority of butchers (85 %) have said that they do not
know the prices of skin in the national market only 5 % butchers reported that they get the
updates of prices regularly. (See table-95)
Table-95: Price of Skin in National Market
Price of skin in Yavatmal Total Ahemadnagar Total Grand national Market- I Market- II Market- I Market- ll Total market (Darvha) (Pusad) (Supa) (Kasti)
Yes I 2 3 0 0 0 3 % 20 40 30 0 0 0 15
No 4 3 7 5 5 10 17
% 80 60 70 100 100 100 85 No Response 0 0 0 0 0 0 0 % 0 0 0 0 0 0 0
Total 5 5 10 5 5 10 20 % 100 100 100 100 100 100 100
Responsible Price of Skin It is observed from the field data that 55 % butchers reported that they get responsible
price. It is also found that remaining butchers (45%) opined that they do not get responsible
price. (See table-96)
265

Table -96: Responsible Price of Skin
Responsible Yavatmal Total Ahemadnagar Total Grand price of skin Market- I Market- II Market- I Market- II Total
(Darvha) (Pusad) (Supa) (Kasti) Yes· 3 2 5 4 2 6 11 % 60 40 50 80 40 60 55 No 2 3 5 I 3 4 9 % 40 60 50 20 60 40 45 No Response . 0 0 0 0 0 0 0 % 0 0 0 0 0 0 0 Total 5 5 10 5 5 10 20 o;o 100 100 100 100 100 100 100
Prompt Payment for Skin
The study found that all butchers (I 00%) have agreed that they get prompt payment
for selling of skin. It is observed that they are satisfied with the payment and system.
(See table-97)
Table -97: Prompt Payment for Skin
Prompt Yavatmal Total Ahemadnagar Total Grand payment of skin Market- I Market- II Market- I Market- II Total
(Darvha) (Pusad) (Supa) (Kasti)
Yes 5 5 10 5 5 10 20 % 100 100 100 100 100 100 100 No 0 0 0 0 0 0 0 % 0 0 0 0 0 0 0 No Response 0 0 0 0 0 0 0 % 0 0 0 0 0 0 0 Total 5 5 10 5 5 10 20 % 100 100 100 100 100 100 100
266
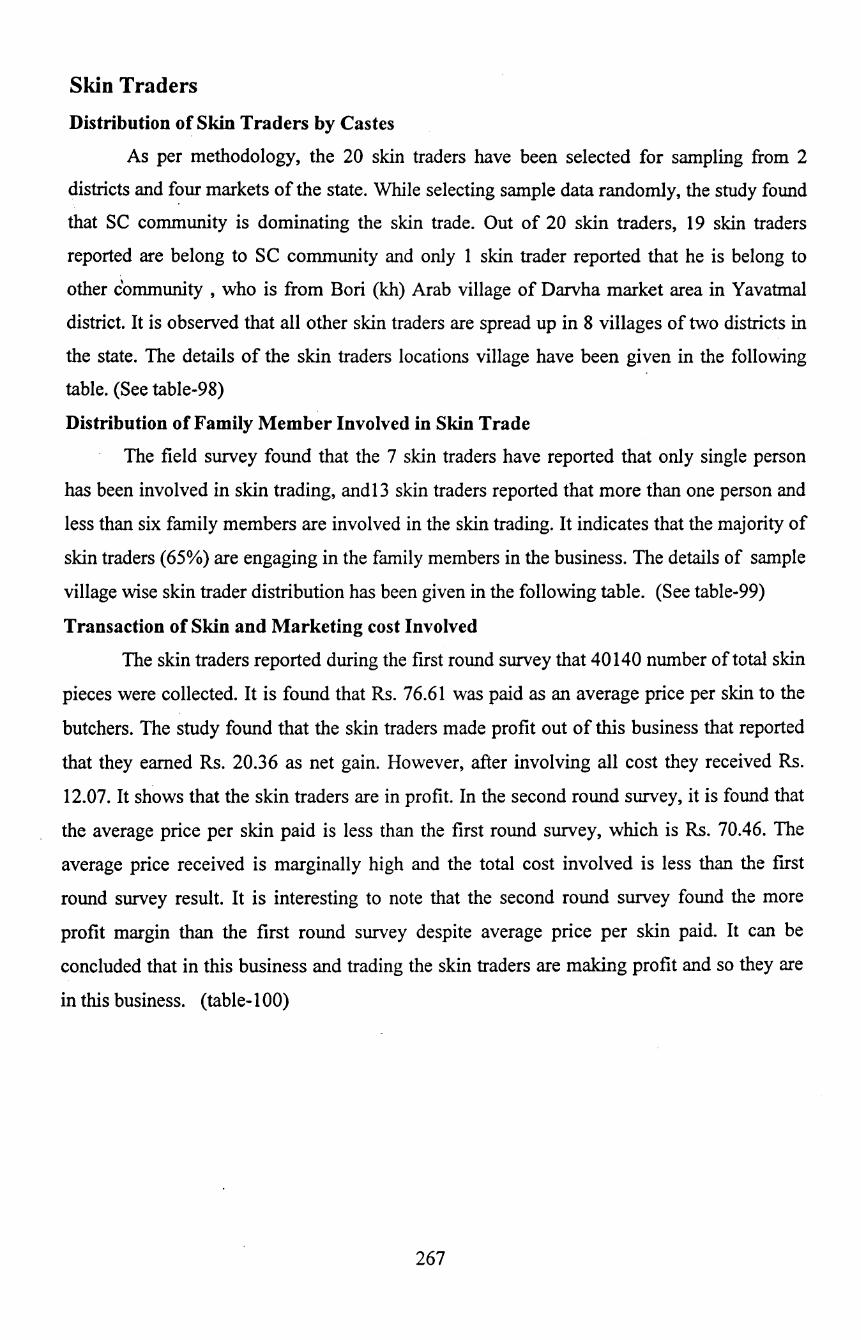
Skin Traders
Distribution of Skin Traders by Castes
As per methodology, the 20 skin traders have been selected for sampling from 2
districts and four markets of the state. While selecting sample data randomly, the study found
that SC community is dominating the skin trade. Out of 20 skin traders, 19 skin traders
reported are belong to SC community and only 1 skin trader reported that he is belong to
other community , who is from Bori (kh) Arab village of Darvha market area in Yavatmal
district. It is observed that all other skin traders are spread up in 8 villages of two districts in
the state. The details of the skin traders locations village have been given in the following
table. (See table-98)
Distribution of Family Member Involved in Skin Trade
The field survey found that the 7 skin traders have reported that only single person
has been involved in skin trading, and13 skin traders reported that more than one person and
less than six family members are involved in the skin trading. It indicates that the majority of
skin traders (65%) are engaging in the family members in the business. The details of sample
village wise skin trader distribution has been given in the following table. (See table-99)
Transaction of Skin and Marketing cost Involved
The skin traders reported during the first round survey that 40140 number of total skin
pieces were collected. It is found that Rs. 76.61 was paid as an average price per skin to the
butchers. The study found that the skin traders made profit out of this business that reported
that they earned Rs. 20.36 as net gain. However, after involving all cost they received Rs.
12.07. It shows that the skin traders are in profit. In the second round survey, it is found that
the average price per skin paid is less than the first round survey, which is Rs. 70.46. The
average price received is marginally high and the total cost involved is less than the first
round survey result. It is interesting to note that the second round survey found the more
profit margin than the first round survey despite average price per skin paid. It can be
concluded that in this business and trading the skin traders are making profit and so they are
in this business. (table-1 00)
267
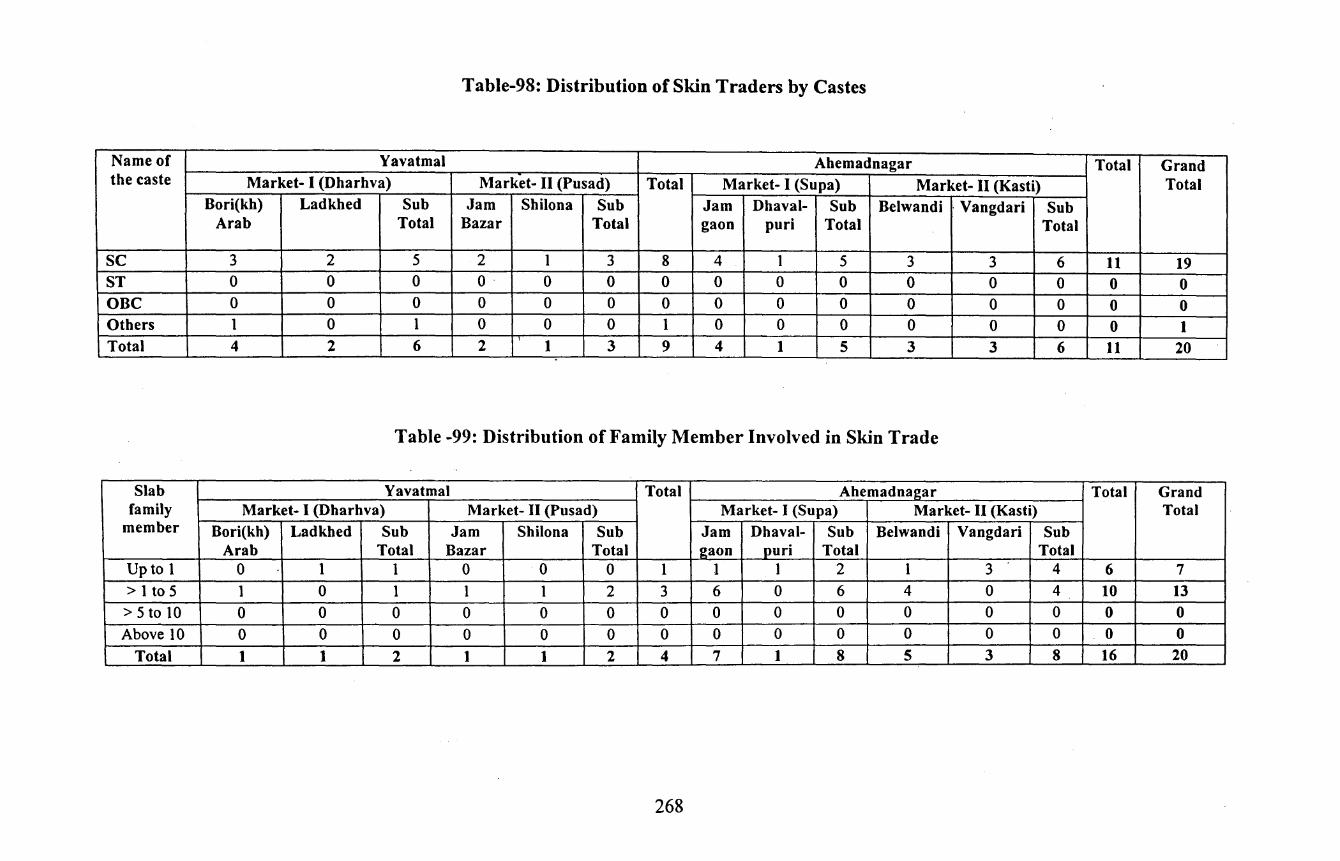
Table-98: Distribution of Skin Traders by Castes
Name of Yavatmal Ahemadnagar Total Grand the caste Market- I (Dharhva) Market- II (Pusad) Total Market- I (Supa) Market- II (Kasti) Total
Bori(kh) Ladkhed Sub Jam Shilona Sub Jam Dhaval- Sub Belwandi · Vangdari Sub Arab Total Bazar Total gaon puri Total Total
sc 3 2 5 2 1 3 8 4 1 5 3 3 6 11 19 ST 0 0 0 0· 0 0 0 0 0 0 0 0 0 0 0 OBC 0 0 0 0 0 0 0 0 0 0 0 0 0 0 0 Others 1 0 1 0 0 0 1 0 0 0 0 0 0 0 1 Total 4 2 6 2 1 3 9 4 1 5 3 3 6 11 20
Table -99: Distribution of Family Member Involved in Skin Trade
Slab Yavatmal Total Ahemadnagar Total Grand family Market- I (Dharhva) Market- II (Pusad) Market- I (Supa) Market- II (Kasti) Total
member Bori(kh) Ladkhed Sub Jam Shilona Sub Jam Dhaval- Sub Belwandi Vangdari Sub Arab Total Bazar Total ~a on puri Total Total
Up to 1 0 1 1 0 0 0 1 1 1 2 1 3 4 6 7
> 1 to 5 1 0 1 1 1 2 3 6 0 6 4 0 4 10 13 > 5 to 10 0 0 0 0 0 0 0 0 0 0 0 0 0 0 0
Above 10 0 0 0 0 0 0 0 0 0 0 0 0 0 0 0
Total 1 1 2 1 1 2 4 7 1 8 5 3 8 16 20
268
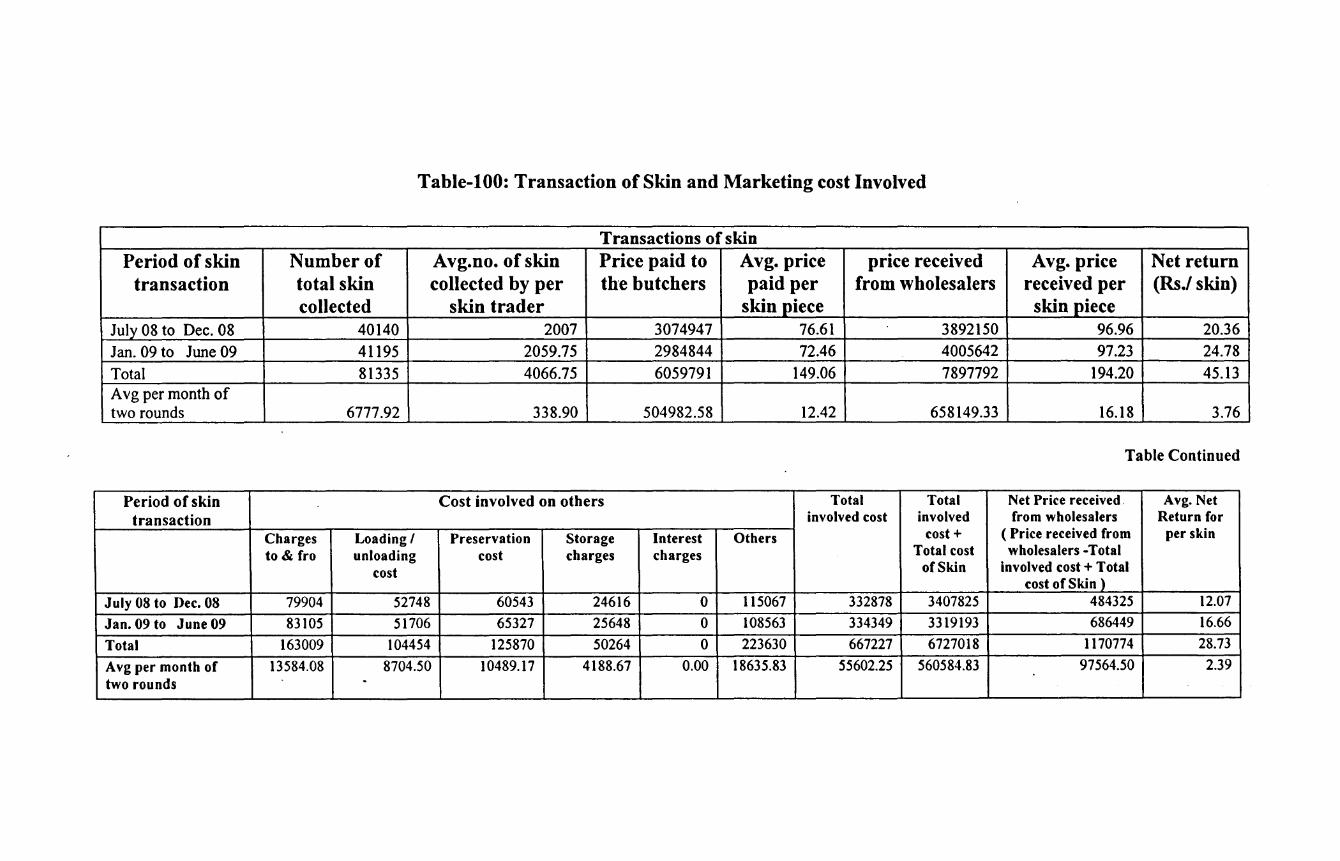
Table-100: Transaction of Skin and Marketing cost Involved
Transactions of skin Period of skin Number of Avg.no. of skin Price paid to Avg. price price received Avg. price Net return
transaction total skin collected by per tbe butchers paid per from wholesalers received per (Rs./ skin) collected skin trader skin piece skin piece
July 08 to Dec. 08 40140 2007 3074947 76.61 3892150 96.96 20.36
Jan. 09 to June 09 41195 2059.75 2984844 72.46 4005642 97.23 24.78
Total 81335 4066.75 6059791 149.06 7897792 194.20 45.13 A vg per month of two rounds 6777.92 338.90 504982.58 12.42 658149.33 16.18 3.76
Table Continued
Period of skin Cost involved on others Total Total Net Price received. Avg. Net
transaction involved cost involved from wholesalers Return for
Charges Loading I Preservation Storage Interest Others cost+ ( Price received from per skin
to & fro unloading cost charges charges Total cost wholesalers -Total
cost of Skin involved cost+ Total cost of Skin )
July 08 to Dec. 08 79904 52748 60543 24616 0 115067 332878 3407825 484325 12.07
Jan. 09 to June 09 83105 51706 65327 25648 0 108563 334349 3319193 686449 16.66
Total 163009 104454 125870 50264 0 223630 667227 6727018 1170774 28.73
A vg per month of 13584.08 8704.50 10489.17 4188.67 0.00 18635.83 55602.25 560584.83 97564.50 2.39 two rounds .
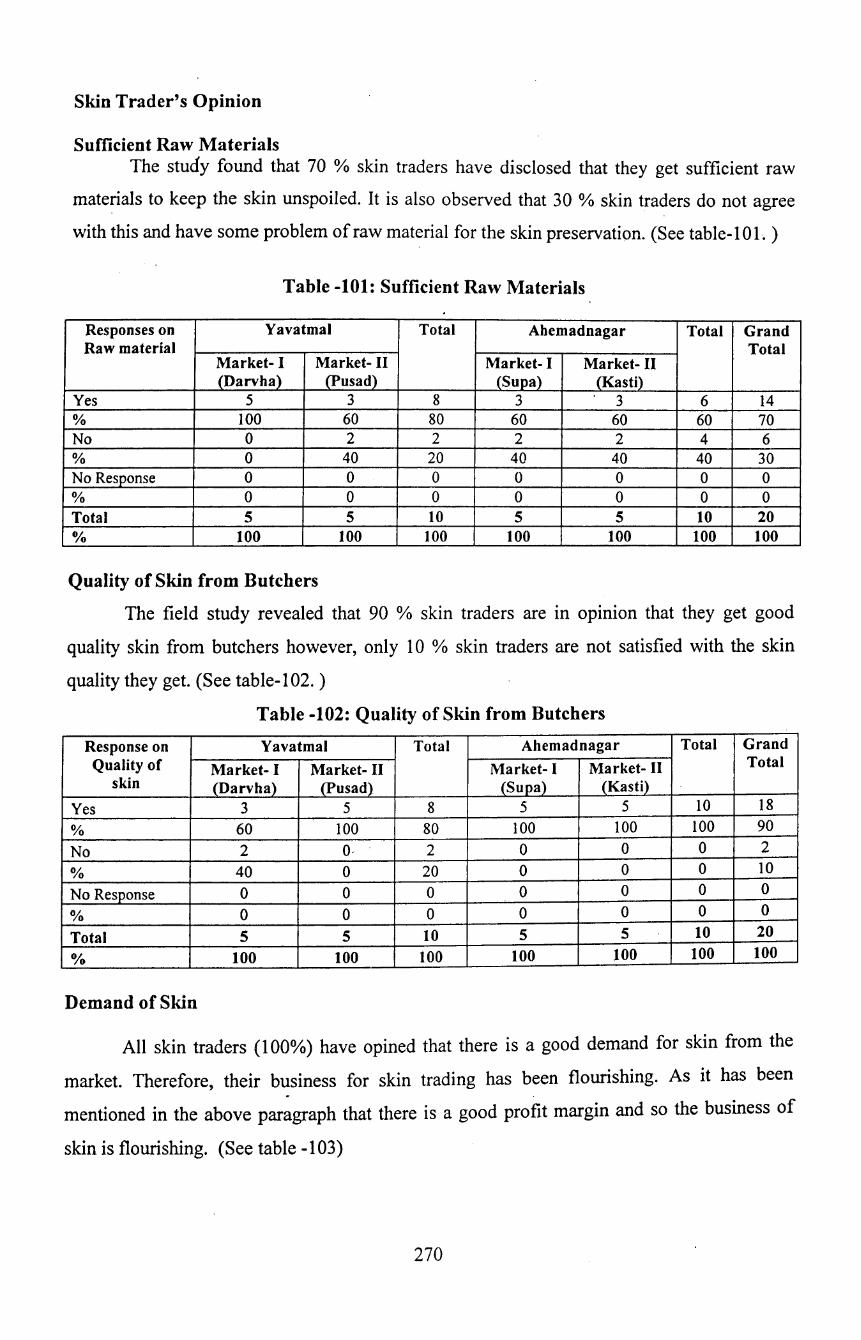
Skin Trader's Opinion
Sufficient Raw Materials The study found that 70 % skin traders have disclosed that they get sufficient raw
materials to keep the skin unspoiled. It is also observed that 30 % skin traders do not agree
with this and have some problem of raw material for the skin preservation. (See table-1 01. )
Table -101: Sufficient Raw Materials
Responses on Yavatmal Total Ahemadnagar Total Grand Raw material Total
Market- I Market- II Market- I Market- II (Darvha) (Pusad) (Supa) (Kasti)
Yes 5 3 8 3 3 6 14 % 100 60 80 60 60 60 70 No 0 2 2 2 2 4 6 % 0 40 20 40 40 40 30 No Response 0 0 0 0 0 0 0 % 0 0 0 0 0 0 0 Total 5 5 10 5 5 10 20 o;o 100 100 100 100 100 100 100
Quality of Skin from Butchers
The field study revealed that 90 % skin traders are in opinion that they get good
quality skin from butchers however, only 10 % skin traders are not satisfied with the skin
quality they get. (See table-1 02. )
Table -102: Quality of Skin from Butchers
Response on Yavatmal Total Ahemadnagar Total Grand Quality of Market- I Market- II Market- I Market- II Total
skin (Darvha) (Pusad) (Supa) (Kasti)
Yes 3 5 8 5 5 10 18
% 60 100 80 100 100 100 90
No 2 0- 2 0 0 0 2
% 40 0 20 0 0 0 10
No Response 0 0 0 0 0 0 0
% 0 0 0 0 0 0 0
Total 5 5 10 5 5 10 20
o;o 100 100 100 100 100 100 100
Demand of Skin
All skin traders ( 1 00%) have opined that there is a good demand for skin from the
market. Therefore, their business for skin trading has been flourishing. As it has been
mentioned in the above paragraph that there is a good profit margin and so the business of
skin is flourishing. (See table -1 03)
270
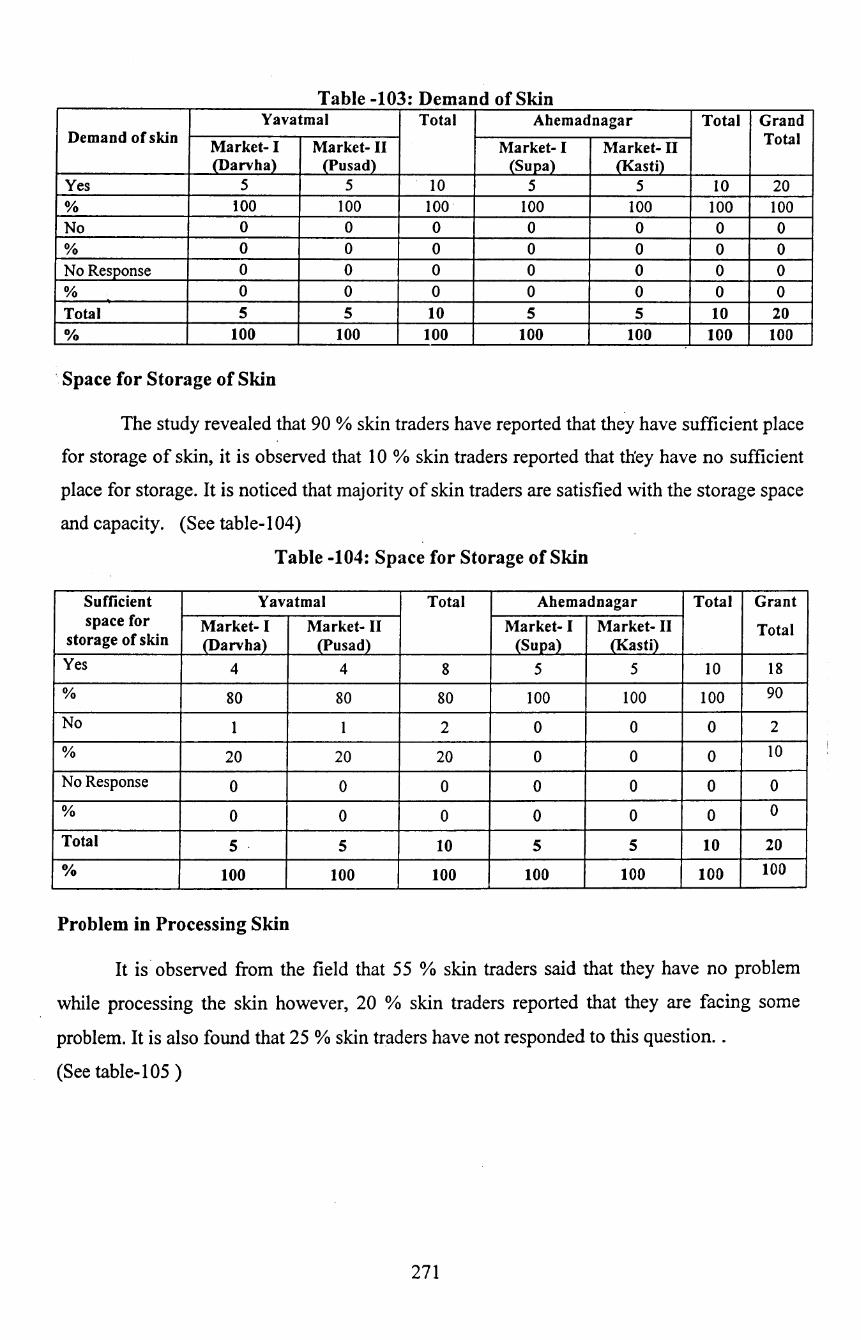
Table -103: Demand of Skin Yavatmal Total Ahemadnagar Total Grand
Demand of skin Market- I Market- II Market- I Market- II Total
(Darvha) (Pusad) (Supa) (Kasti) Yes 5 5 10 5 5 10 20 % iOO 100 100 100 100 100 100 No 0 0 0 0 0 0 0 % 0 0 0 0 0 0 0 No Response 0 0 0 0 0 0 0 % 0 0 0 0 0 0 0 Total 5 5 10 5 5 10 20 % 100 100 100 100 100 100 100
·. Space for Storage of Skin
The study revealed that 90 % skin traders have reported that they have sufficient place
for storage of skin, it is observed that I 0 % skin traders reported that th'ey have no sufficient
place for storage. It is noticed that majority of skin traders are satisfied with the storage space
and capacity. (See table-104)
Table -104: Space for Storage of Skin
Sufficient Yavatmal Total Ahemadnagar Total Grant space for Market- I Market- II Market- I Market- II Total
storage of skin (Darvha) (Pusad) (Supa) (Kasti) Yes 4 4 8 5 5 10 18 % 80 80 80 100 100 100 90
No 1 1 2 0 0 0 2
% 20 20 20 0 0 0 10
No Response 0 0 0 0 0 0 0
% 0 0 0 0 0 0 0
Total 5 5 10 5 5 10 20
% 100 100 100 100 100 100 100
Problem in Processing Skin
It isobserved from the field that 55 % skin traders said that they have no problem
while processing the skin however, 20 % skin traders reported that they are facing some
problem. It is also found that 25 % skin traders have not responded to this question ..
(See table- I 05 )
271
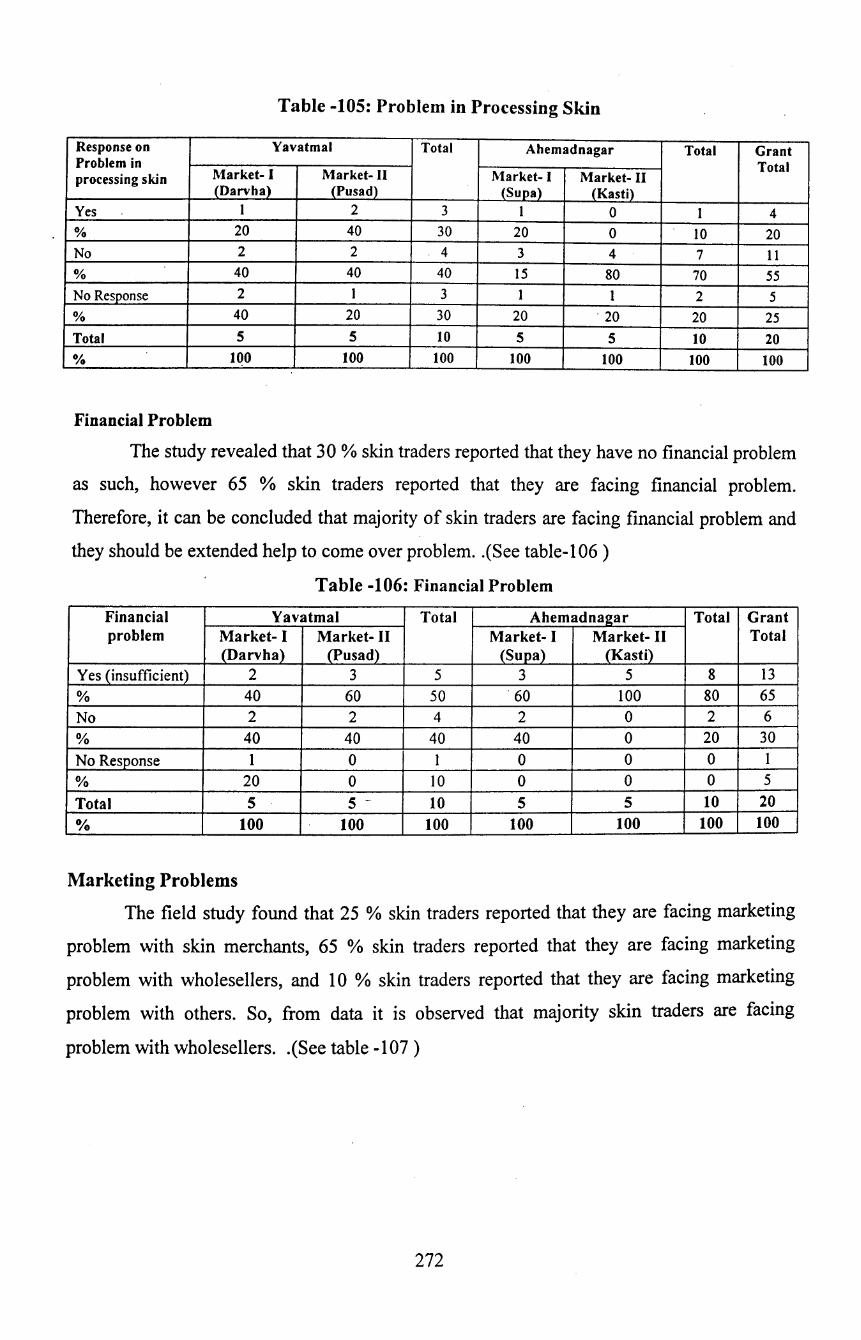
Table -105: Problem in Processing Skin
Response on Yavatmal Total Ahemadnagar Total Grant Problem in Total processing skin Market- I Market- II Market- I Market- II
(Darvha) .(Pusad) (Supa) (Kasti) Yes I 2 3 I 0 I 4 % 20 40 30 20 0 10 20 No 2 2 4 3 4 7 II % 40 40 40 15 80 70 55 No Response 2 I 3 I I 2 5 % 40 20 30 20 '20 20 25 Total 5 5 10 5 5 10 20 % 100 100 100 100 100 100 100
Financial Problem
The study revealed that 30% skin traders reported that they have no financial problem
as such, however 65 % skin traders reported that they are facing financial problem.
Therefore, it can be concluded that majority of skin traders are facing financial problem and
they should be extended help to come over problem .. (See table-t 06 )
Table -106: Financial Problem
Financial Yavatmal Total Ahemadnagar Total Grant problem Market- I Market- II Market- I Market- II Total
(Darvha) (Pusad) (Supa) (Kasti) Yes (insufficient) 2 3 5 3 5 8 13
% 40 60 50 60 100 80 65 No 2 2 4 2 0 2 6 % 40 40 40 40 0 20 30 No Response 1 0 1 0 0 0 1
% 20 0 10 0 0 0 5 Total 5 5 - 10 5 5 10 20 % 100 100 100 100 100 100 100
Marketing Problems
The field study found that 25 % skin traders reported that they are facing marketing
problem with skin merchants, 65 % skin traders reported that they are facing marketing
problem with wholesellers, and 10 % skin traders reported that they are facing marketing
problem with others. So, from data it is observed that majority skin traders are facing
problem with wholesellers. .(See table -107 )
272
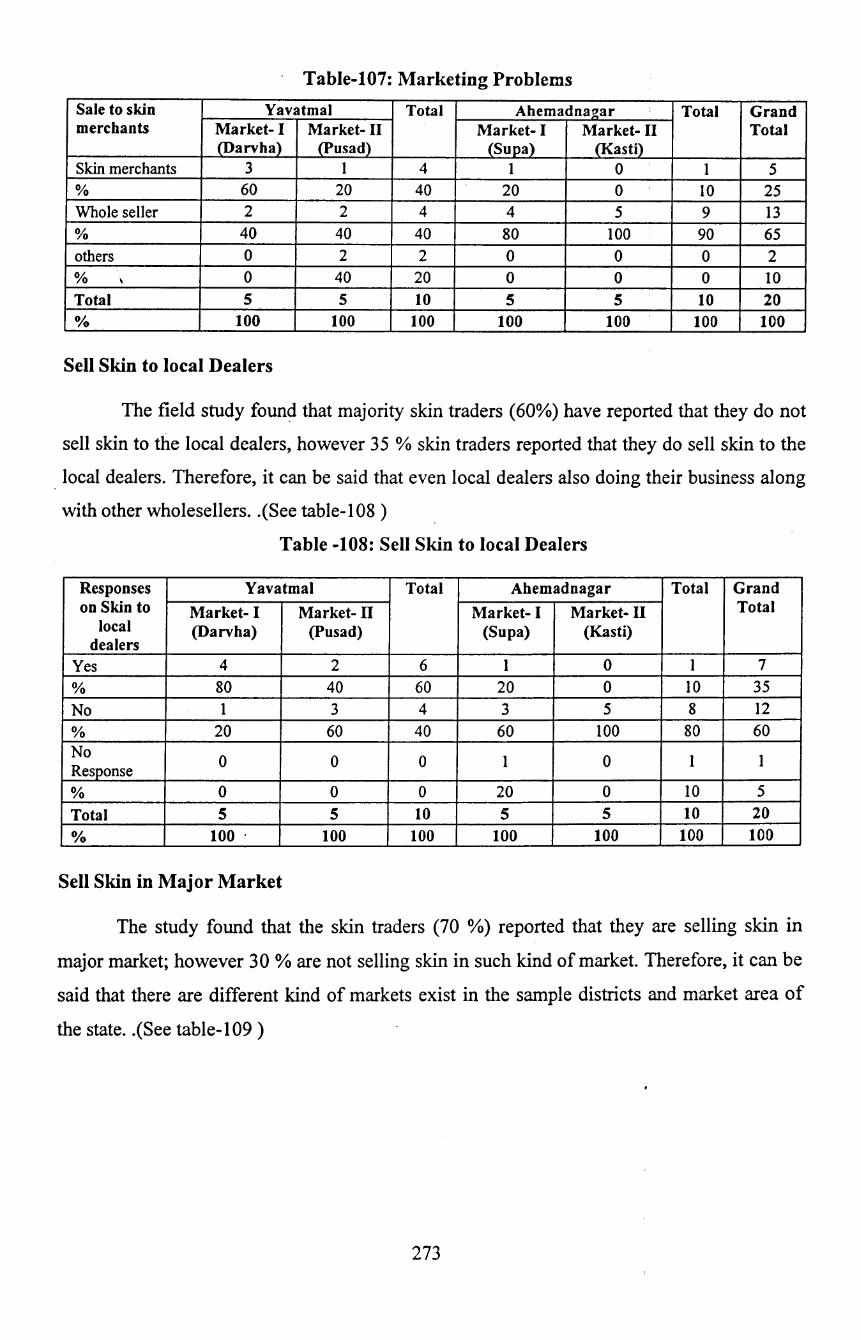
· Table-107: Marketing Problems
Sale to skin Yavatmal Total Ahemadnagar Total Grand merchants Market- I Market- II Market- I Market- II Total
(Darvha} (Pusad) (Supa) (Kasti) Skin merchants 3 I 4 I 0 I 5 % 60 20 40 20 0 10 25 Whole seller 2 2 4 4 5 9 I3 % 40 40 40 80 100 90 65 others 0 2 2 0 0 0 2 % \ 0 40 20 0 0 0 IO Total 5 5 10 5 5 10 20 •;. 100 100 100 100 100 100 100
Sell Skin to local Dealers
The field study found that majority skin traders (60%) have reported that they do not
sell skin to the local dealers, however 35 % skin traders reported that they do sell skin to the
local dealers. Therefore, it can be said that even local dealers also doing their business along
with other wholesellers .. (See table- I 08 )
Table -108: Sell Skin to local Dealers
Responses Yavatmal Total Ahemadnagar Total Grand on Skin to Market- I Market- II Market- I Market- II Total
local (Darvha) (Po sad) (Supa) (Kasti) dealers
Yes 4 2 6 I 0 I 7
% 80 40 60 20 0 IO 35 No 1 3 4 3 5 8 I2 % 20 60 40 60 IOO 80 60 No 0 0 0 I 0 I I Response % 0 0 0 20 0 IO 5
Total 5 5 10 5 5 10 20 •;. 100 . 100 100 100 100 100 100
Sell Skin in Major Market
The study found that the skin traders (70 %) reported that they are selling skin in
major market; however 30 % are not selling skin in such kind of market. Therefore, it can be
said that there are different kind of markets exist in the sample districts and market area of
the state .. (See table-1 09 )
273
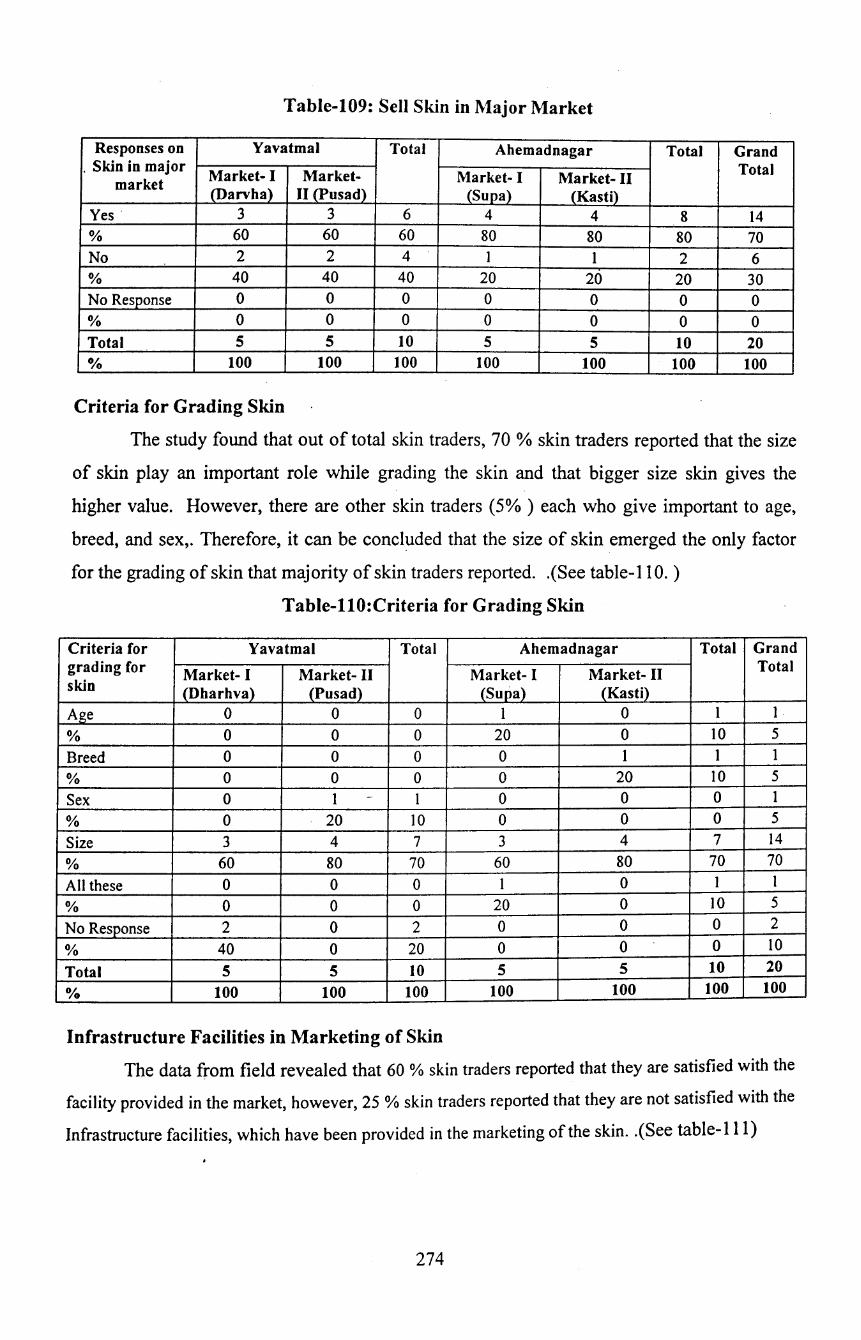
Table-109: Sell Skin in l\1ajor Market
Responses on Yavatmal Total Ahemadnagar Total Grand . Skin in major
Market- I Market- Market- I Market- II Total market
(Darvha) II (Pusad) .(Supa) (Kasti) Yes· 3 3 6 4 4 8 14 % 60 60 60 80 80 80 70 No 2 2 4 I I 2 6 % 40 40 40 20 20 20 30 No Response 0 0 0 0 0 0 0 % 0 0 0 0 0 0 0 Total 5 5 10 5 5 10 20 % 100 100 100 100 100 100 100
Criteria for Grading Skin
The study found that out of total skin traders, 70 % skin traders reported that the size
of skin play an important role while grading the skin and that bigger size skin gives the
higher value. However, there are other skin traders (5%) each who give important to age,
breed, and sex,. Therefore, it can be concluded that the size of skin emerged the only factor
for the grading of skin that majority of skin traders reported. .(See table-11 0. )
Table-llO:Criteria for Grading Skin
Criteria for Yavatmal Total Ahemadnagar Total Grand grading for Market- I Market- II Market- I Market- II Total skin (Dharhva) (Pusad) (Supa) (Kasti)
Age 0 0 0 I 0 I I
% 0 0 0 20 0 10 5
Breed 0 0 0 0 1 1 1
% 0 0 0 0 20 IO 5
Sex 0 1 - I 0 0 0 I
% 0 20 10 0 0 0 5
Size 3 4 7 3 4 7 I4
% 60 80 70 60 80 70 70
All these 0 0 0 I 0 I I
% 0 0 0 20 0 IO 5
No Response 2 0 2 0 0 0 2
% 40 0 20 0 0 0 10
Total 5 5 10 5 5 10 20
o;o 100 100 100 100 100 100 100
Infrastructure Facilities in Marketing of Skin
The data from field revealed that 60 % skin traders reported that they are satisfied with the
facility provided in the market, however, 25 % skin traders reported that they are not satisfied with the
Infrastructure facilities, which have been provided in the marketing of the skin .. (See table-Ill)
274
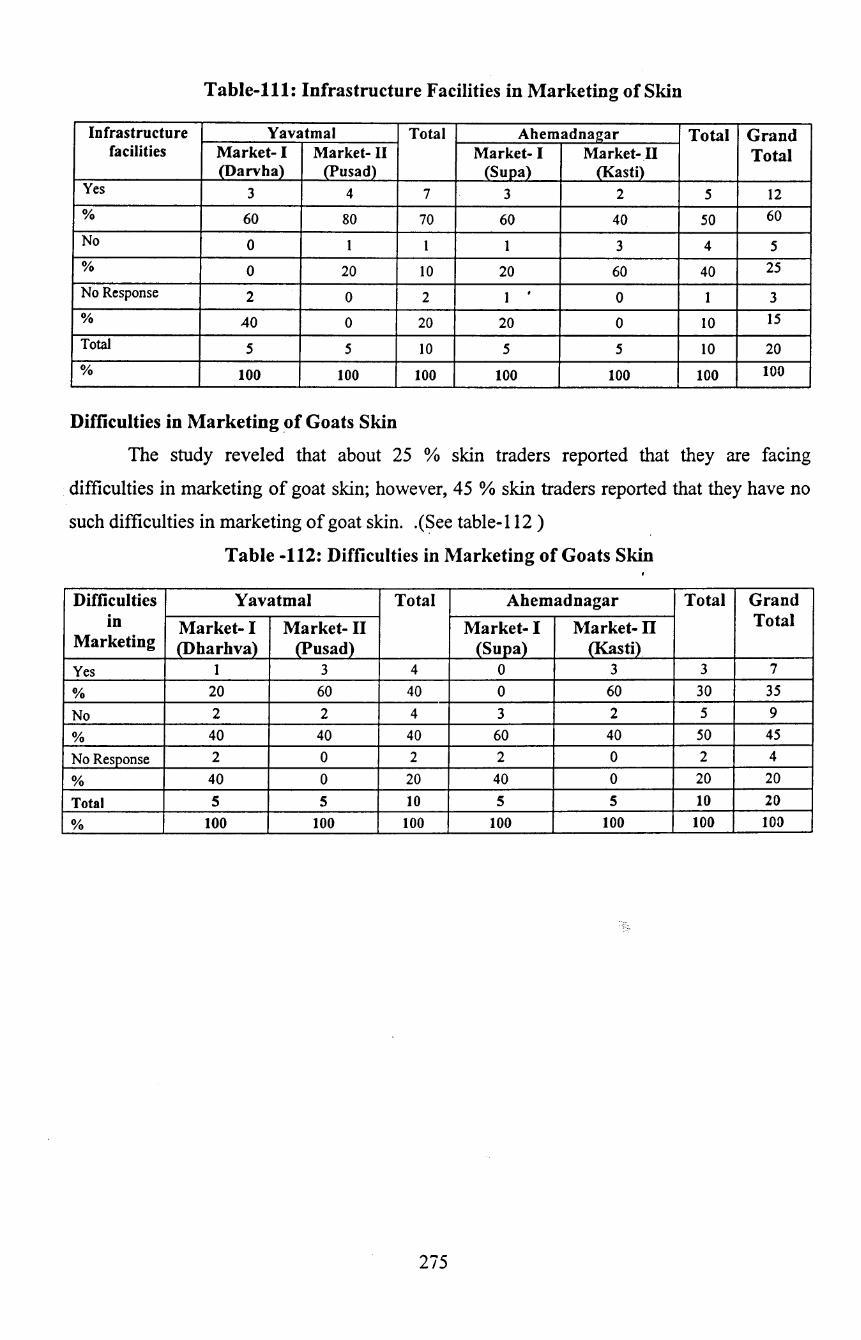
Table-111: Infrastructure Facilities in Marketing of Skin
Infrastructure Yavatmal Total Ahemadnagar Total Grand facilities Market- I Market- II Market- I Market-11 Total
(Darvha) (Pusad) (Supa) (Kasti) Yes 3 4 7 3 2 5 12 % 60 80 70 60 40 50 60
No 0 1 I I 3 4 5 % 0 20 10 20 60 40 25
No Response 2 0 2 I ' 0 1 3 % 40 0 20 20 0 10 15
Total 5 5 10 5 5 10 20 % 100 100 100 100 100 100 100
Difficulties in Marketing of Goats Skin
The study reveled that about 25 % skin traders reported that they are facing
difficulties in marketing of goat skin; however, 45 %skin traders reported that they have no
such difficulties in marketing of goat skin. .(See table-112 )
Table -112: Difficulties in Marketing of Goats Skin
Difficulties Yavatmal Total Ahemadnagar Total Grand in Market- I Market- II Market- I Market-ll Total
Marketing (Dharhva) (Pusad) (Supa) (Kasti) Yes I 3 4 0 3 3 7
% 20 60 40 0 60 30 35
No 2 2 4 3 2 5 9
% 40 40 40 60 40 50 45
No Response 2 0 2 2 0 2 4
% 40 0 20 40 0 20 20
Total 5 5 10 5 5 10 20
% 100 100 100 100 100 100 100
275
Skin Wholesalers
Distribution of Wholesale Skin Traders by Caste
According to research methodology adopted for this study, the skin wholesellers
requited to be taken, however, only 2 whole sellers are found in Yavatamal district and 4
whole sellers are found in Ahemadnagar ·district. Therefore, only 6 whole sellers are
interviewed. Out of 6 skin wholesellers, it is noticed that 5 whole sellers are identified from
SC category and only 1 whole seller is from OBC category. The OBC category person was
identified and locate~ in Yavatmal district of Pusad market in Jambazar village and SC
category whole sellers are located 5 villages (one from each village) i.e. in Bori (kh. arab),
Jamgaon, Dhavalpuri, Belwandi and Vangdari. (See table-113)
Transaction Cost involved
The field data revealed various cost involved on different heads. It is observed fromt
he data that the average amount spent on loading and unloading by per wholesaler is Rs.
4595.86 during first sixth month, on preservation Rs.l6883.33, on godown charges Rs. 3560
, on processing 15263.33, on water 2864 etc. During second round survey found that cost on
loading and unloading, and transport decreased and other cost involved increased (table-114)
Collection of Skin from Different Sources and sold
The data disclosed from the following table-115 and table-116 that the wholesalers
collected skin from different sources like butchers, and traders etc. It is observed that
wholesaler spent Rs. 81.61 for per skin, which is purchased from the butchers and paid Rs.
71.76 to traders. In an average, wholesalers spent Rs. 76.82 for per skin. In second survey, it
is observed that the wholesaler paid less amount to butchers and higher amount to the traders.
It is very apparent that when wholesalers sold to processors, they sold on higher price. It is
found from the data that wholesalers earn good profit margin from the dealings.
276

Table-113: Distribution of Wholesale Skin Traders by Caste
Yawatmal Total Ahemadnagar Grand Name of Market- I (Dharvha) Market- II (Pusad) Market- II (Supa) Market- II (Kasti) Total Total the caste
Bori-Arab Lad- Sub- Jam-Bazar Shi- Sub- Jam- Dhaval- Sub- Total Bel- Wang- Sub- Total khed Total roli Total gaon puri wandi dari
sc 1 0 1 0 0 0 1 1 1 2 1 1 2 4 5 ST 0 0 0 0 0 0 0 0 0 0 0 0 0 0 0 OBC 0 0 0 1 0 1 1 0 0 0 0 0 0 0 1 Others 0 0 0 0 0 0 0 0 0 0 0 0 0 0 0 Total I 0 1 1 0 1 2 I 1 2 1 1 2 4 6
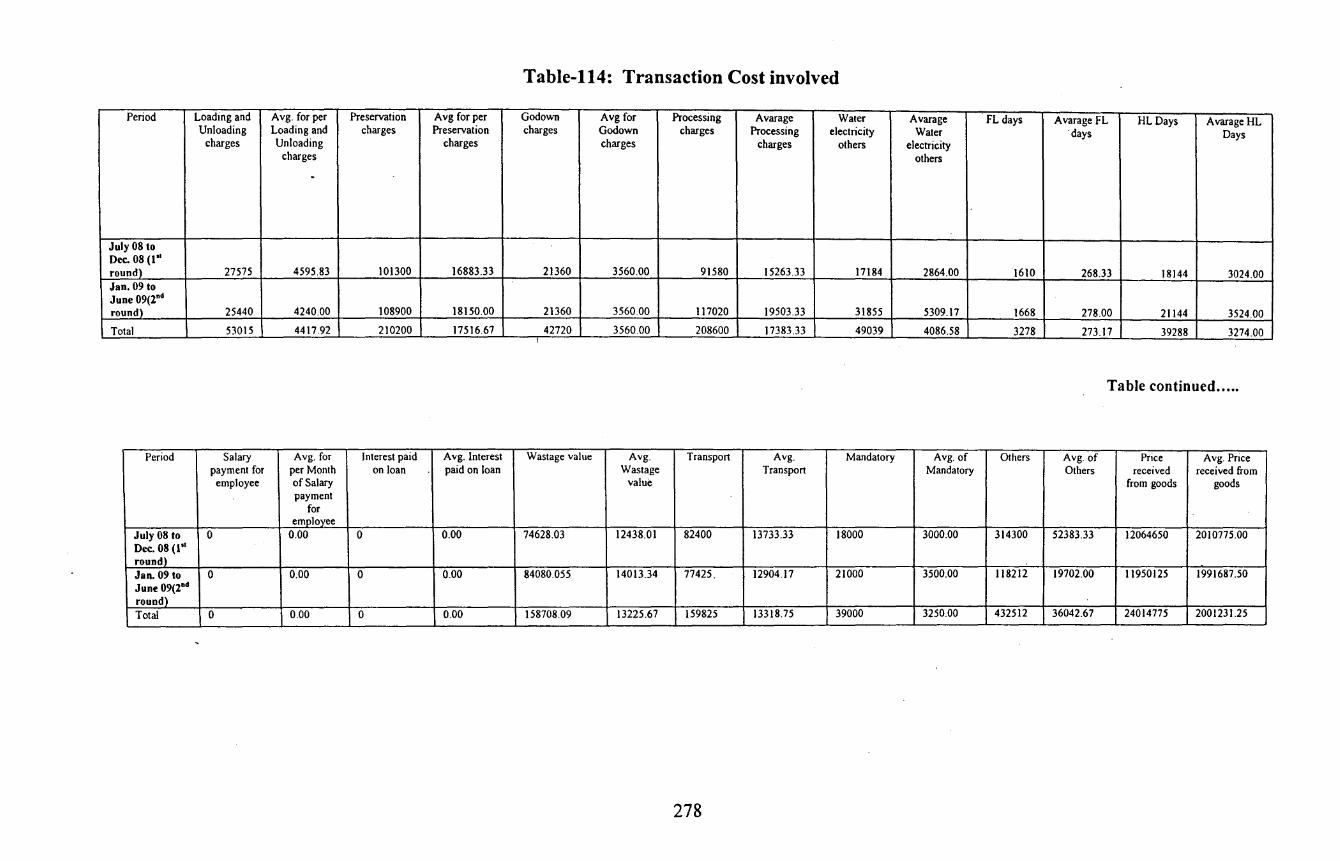
Table-114: Transaction Cost involved
Period Loading and Avg. for per Preservation Avg for per Godown Avg for Processing Avarage Water Avarage FL days Avarage FL HLDays Avarage HL Unloading Loading and charges Preservation charges Godown charges Processing electricity Water ·days Days
charges Unloading charges charges charges others electricity charges others
-
July08 to Dec. 08 (1'' round) 27575 4595.83 101300 16883.33 21360 3560.00 91580 15263.33 17184 2864.00 1610 268.33 18144 3024.00 Jan. 09 to June 09(2"d round) 25440 4240.00 108900 18150.00 21360 3560.00 117020 19503.33 31855 5309.17 1668 278.00 21144 3524.00
Total 53015 4417.92 210200 17516.67 42720 3560.00 208600 17383.33 49039 4086.58 3278 273.17 39288 3274.00
Table continued .....
Period Salary Avg. for Interest paid A vg. Interest Wastage value Avg. Transpon Avg. Mandatory Avg. of Others Avg. of Price Avg. Price payment for per Month on loan paid on loan Wastage Transport Mandatory Others received received from employee of Salary value from goods goods
payment for
employee July 08 to 0 0.00 0 0.00 74628.03 12438.01 82400 13733.33 18000 3000.00 314300 52383.33 12064650 2010775.00 Dec. 08 (1'' round) Jan. 09 to 0 0.00 0 0.00 84080.055 14013.34 77425. 12904.17 21000 3500.00 118212 19702.00 11950125 1991687.50 June 09(2Dd round} Total 0 0.00 0 0.00 158708.09 13225.67 159825 13318.75 39000 3250.00 432512 36042.67 24014775 2001231.25
278
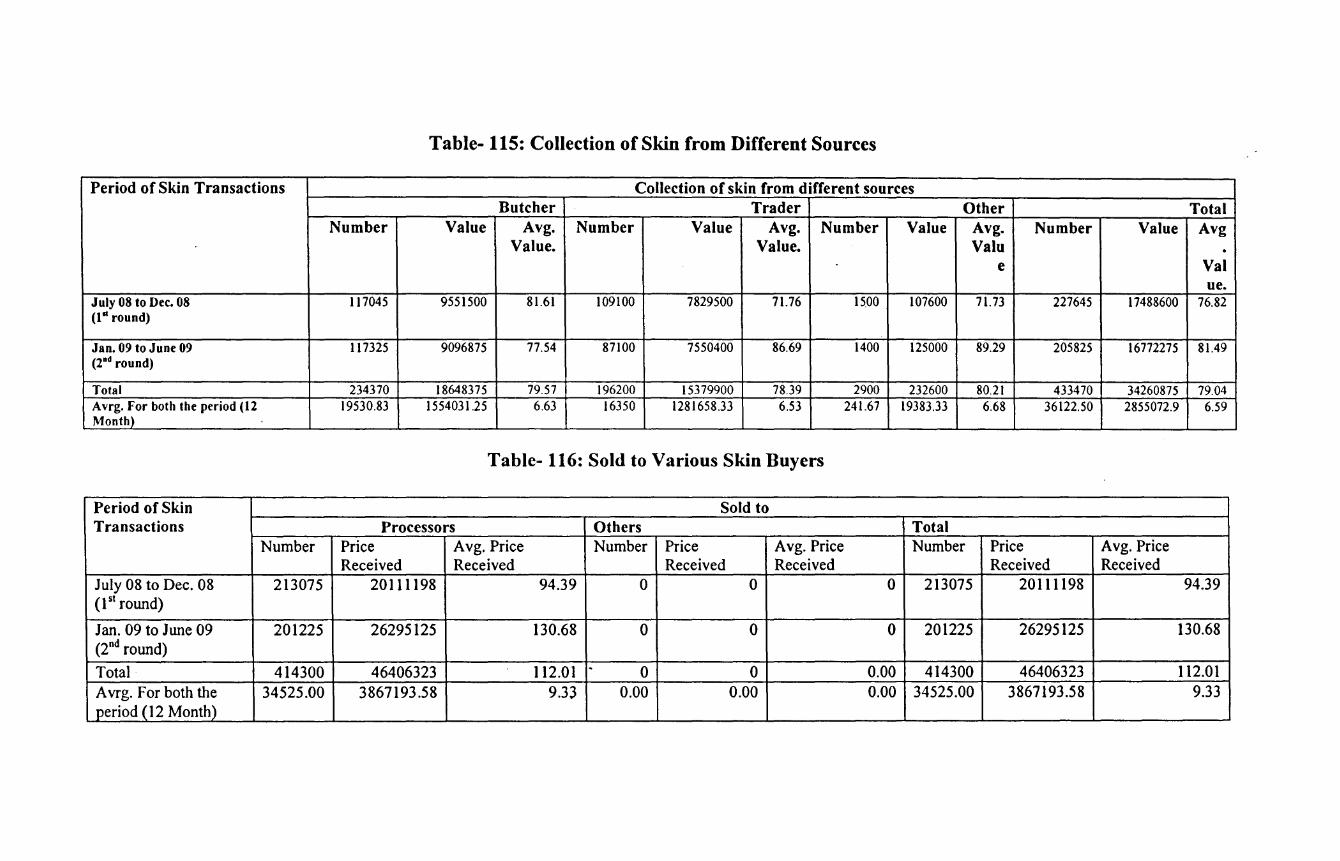
Table- 115: Collection of Skin from Different Sources
Period of Skin Transactions Collection of skin from different sources Butcher Trader Other Total
Number Value Avg. Number Value Avg. Number Value Avg. Number Value Avg Value. Value. Valu .
e Val ue.
July 08 to Dec. 08 117045 9551500 81.61 109100 7829500 71.76 15.00 107600 71.73 227645 17488600 76.82 (1 11 round)
Jan. 09 to June 09 117325 9096875 77.54 87100 7550400 86.69 1400 125000 89.29 205825 16772275 81.49 (rd round)
Total 234370 18648375 79.57 196200 15379900 78.39 2900 232600 80.21 433470 34260875 79.04 Avrg. For both the period (12 19530.83 1554031.25 6.63 16350 1281658.33 6.53 241.67 19383.33 6.68 36122.50 2855072.9 6.59 Month)
Table- 116: Sold to Various Skin Buyers
Period of Skin Sold to Transactions Processors Others Total
Number Price Avg. Price Number Price Avg. Price Number Price Avg. Price Received Received Received Received Received Received
July 08 to Dec. 08 213075 20111198 94.39 0 0 0 213075 20111198 94.39 (1 51 round)
Jan. 09 to June 09 201225 26295125 130.68 0 0 0 201225 26295125 130.68 (2"d round)
Total 414300 46406323 112.01 . 0 0 0.00 414300 46406323 112.01 A vrg. For both the 34525.00 3867193.58 9.33 0.00 0.00 0.00 34525.00 3867193.58 9.33 period (12 Monthl

Opinion of Skin Whole Sellers
Sufficient Number of Skin
The study revealed that 66.46 % skin wholesellers have reported that they. get
sufficient number of skin however, 16.67 % wholesellers have reported that they are not
getting sufficient number of skin. In addition to this 16.67 % wholesellers have not responded
to this question. It is observed that majority whole sellers are satisfied with skin
business.(table-117)
Table-117: Sufficient Number of Skin?
Number of Skin Yavatmal Ahem ad nagar Total
Yes 2 2 4 % 100 50 66.67 No 0 1 1 % 0 25 16.67 No Response 0 1 1 % 0 25 16.67 Total 2 4 6 % 100 100 100
Quality of Skin
The study found that 83.33 % wholesellers are satisfied with the quality
of the skin; however, 16.67 % wholesellers are not satisfied with equality that provided while
selling the skin. (table-118)
Table -118: Quality of Skin
Quality of skin Yavatmal Ahemadnag_ar Total
Yes 1 4 5 % 50 100 83.33
No 1 0 1
% 50 0 16.67
No Response 0 0 0
% 0 0 0
Total 2 4 6
o/o 100 100 100
280
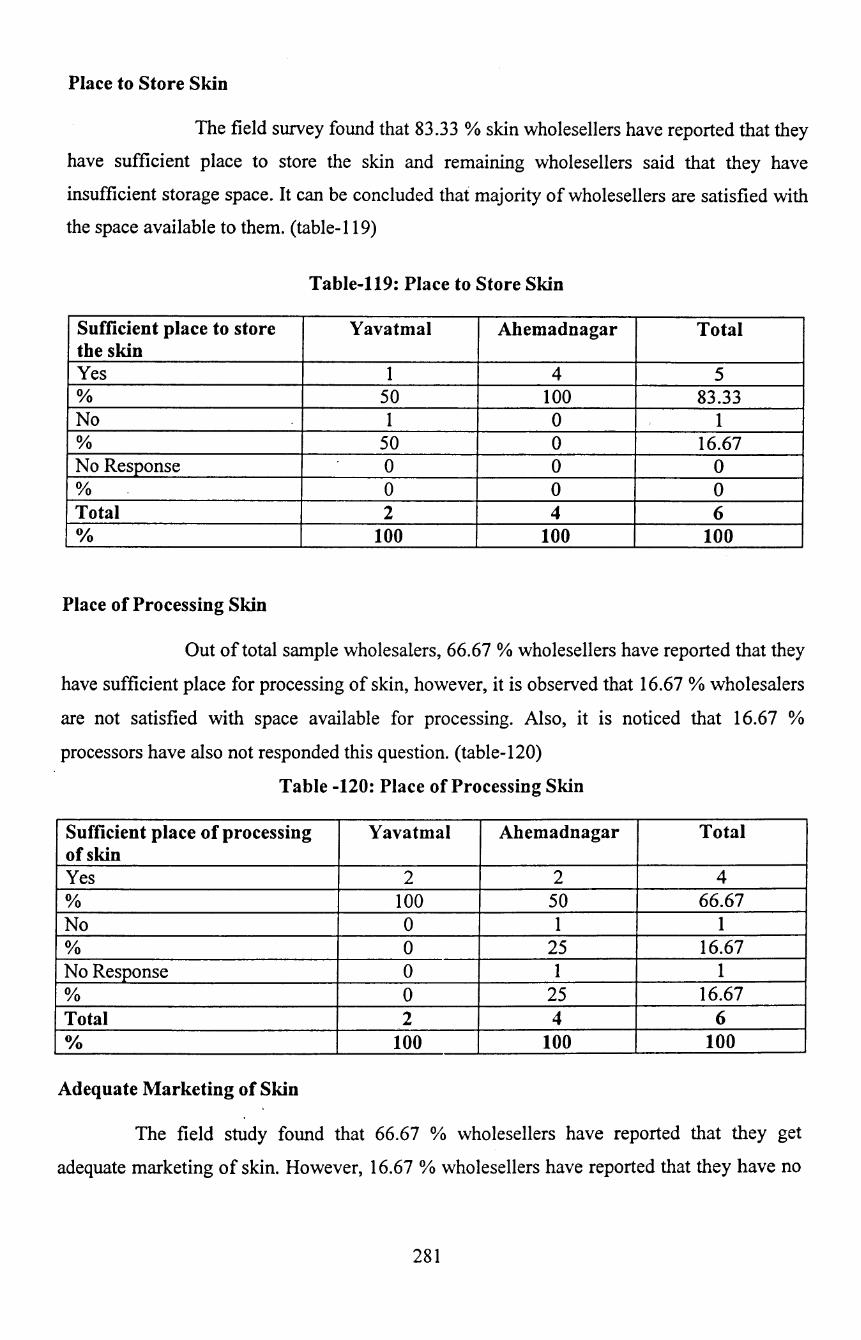
Place to Store Skin
The field survey found that 83.33% skin wholesellers have reported that they
have sufficient place to store the skin and remaining wholesellers said that they have
insufficient storage space. It can be concluded that majority of wholesellers are satisfied with
the space available to them. (table-119)
Table-119: Place to Store Skin
Sufficient place to store Yavatmal Ahemadnagar Total the skin Yes 1 4 5 % 50 100 83.33 No 1 0 1 % 50 0 16.67 No Response 0 0 0 % 0 0 0 Total 2 4 6 Ofo 100 100 100
Place of Processing Skin
Out of total sample wholesalers, 66.67 % wholesellers have reported that they
have sufficient place for processing of skin, however, it is observed that 16.67 % wholesalers
are not satisfied with space available for processing. Also, it is noticed that 16.67 %
processors have also not responded this question. (table-120)
Table -120: Place of Processing Skin
Sufficient place of processing Yavatmal Ahemadnagar Total of skin Yes 2 2 4 % 100 50 66.67 No 0 1 1 % 0 25 16.67 No Response 0 1 1 % 0 25 16.67 Total 2 4 6 Ofo 100 100 100
Adequate Marketing of Skin
The field study found that 66.67 % wholesellers have reported that they get
adequate marketing of skin. However, 16.67 o/o wholesellers have reported that they have no
281
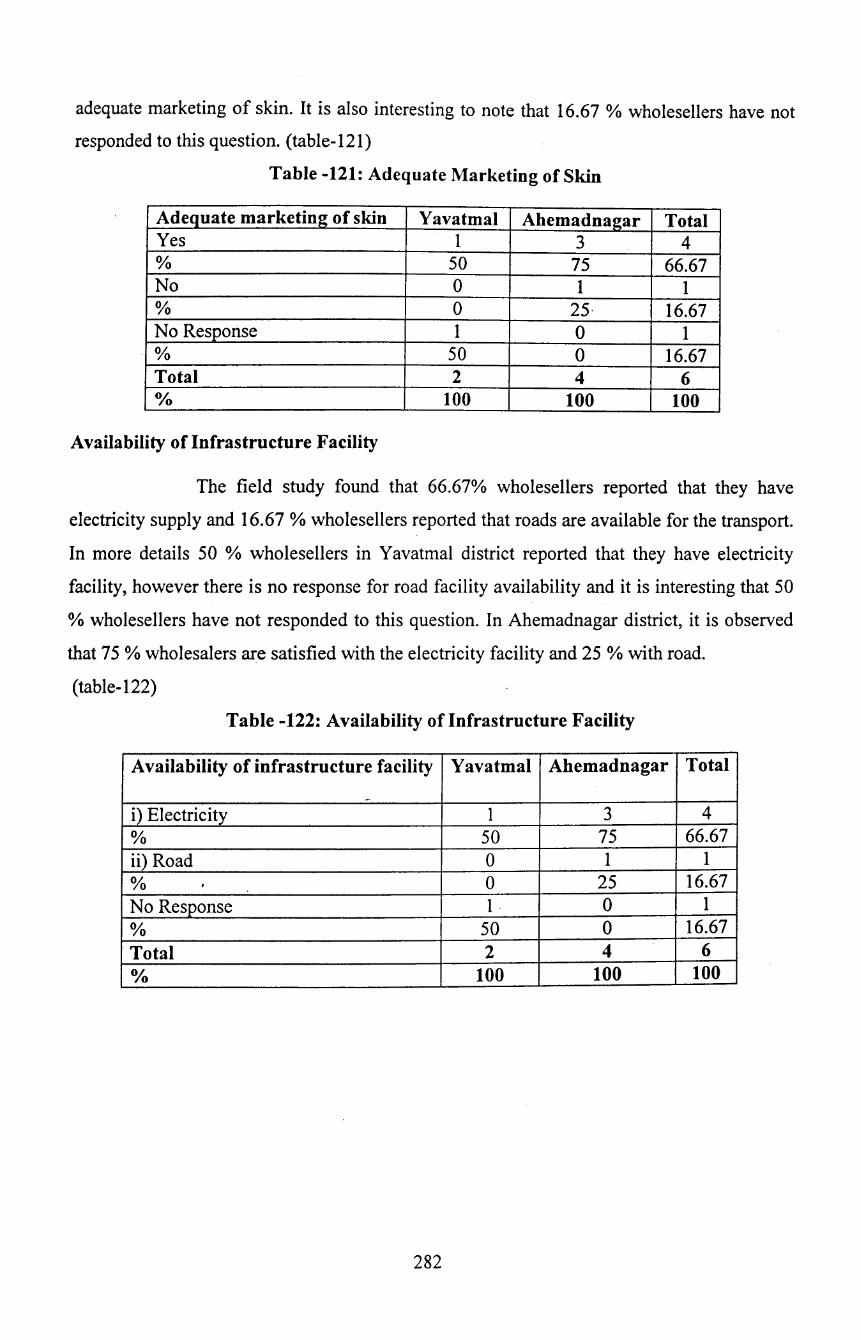
adequate marketing of skin. It is also interesting to note that 16.67 % wholesellers have not
responded to this question. (table-121)
Table -121: Adequate Marketing of Skin
Adequate marketing of skin Yavatmal Ahemadnagar Total Yes 1 3 4 % 50 75 66.67 No 0 1 1 % 0 25· 16.67 No Response 1 0 1 % 50 0 16.67 Total 2 4 6 0/o 100 100 100
Availability of Infrastructure Facility
The field study found that 66.67% wholesellers reported that they have
electricity supply and 16.67 % wholesellers reported that roads are available for the transport.
In more details 50 % wholesellers in Yavatmal district reported that they have electricity
facility, however there is no response for road facility availability and it is interesting that 50
% wholesellers have not responded to this question. In Ahemadnagar district, it is observed
that 75 %wholesalers are satisfied with the electricity facility and 25 %with road.
(table-122)
Table -122: Availability of Infrastructure Facility
Availability of infrastructure facility Yavatmal Ahemadnagar Total
i) Electricity 1 3 4 % 50 75 66.67 ii) Road 0 1 1 % . 0 25 16.67 No Response 1 . 0 1
% 50 0 16.67
Total 2 4 6 0/o 100 100 100
282
CHAPTER-VII
SUMMARY AND CONCLUSIONS
1. India is ~omplex country where one can find diversified culture, religions, and
beliefs. The country is home of 20 percent 'landless families', 80 percent 'small and
marginal farmers', 32 percent below poverty line population. In rural sector, it is
observed that the animal husbandry sector (livestock) plays an important role to
generate sizeable additional income to the agriculture sector and main source to the
landless families as well as generate employment for majority of the rural masses.
With social commitment Government made special provisions in most of the five
year development plans to assist the rural poor and socially backward classes to get
rid of poverty. The Government also included in plan in 1971 'livestock
development strategy' as a major intervention for rural development.
2. The livestock population in the country has been increasing since, 1951 and has 485
millions livestock population in 2003 that increased by 65.64 % over 1951. Out of
total livestock population, 57.96% is population of cattle and Buffalo, and 25.64 %
population of goat in the country. The growth rate of cattle population is found
negative over 1992 to 2003. The buffalo population indicates positive growth with
average 1.37% over 1992 to 2003. The goat population has 0.22 % growth rate in
2003 and average 0.74% growth rate has been measured during 1992 to 2003.
3. In the world, India occupies important place in the livestock sector. This has shown
by ranking country in terms of number of animals. India ranks first in respect of
buffalo, 2"d in cattle and goats, 3rd in sheep, 4th in ducks, 5th in chickens and 6th in ·
camel population in the world.
4. The Animal Husbandry Sector is one of the allied sectors of Agriculture sector. If
this sector grows by the rate of 8 % to 9 %, then agriculture sector can achieve about
4% growth rate. The policy itself recognized the role of animal husbandry sector
and therefore, it should go side by side with steady growth.
5. The economic of goat is very simple but its value in income and employment is
great importance for poor households. Goats require small amount for purchase.
Even they can be purchased on the 'credit' or borrowing from the relatives. Due to
short gestation period with normal breeding ratio and higher maturity, goats
283
generate reasonable returns in a short period. In addition, animal needs no special
attention in case of 4-5 goats and very comfortable in any atmosphere, and they
themselves search the forages except stall-feeding. Therefore, it undoubtedly
becomes very popular and profitable activity, which is second to poultry.
6. Goats are animal which have high nutritional value with regular supply of high
value of protein in milk and less fat, high iron, and low cholesterol in cooked meat
that increase the credibility among the non- vegetarian people in the society. Milk . always supports to increase the dietary purpose of children of the goat keepers. It is
revealed that farmers with few goats are unable to sustain their flocks, whereas
those with larger flocks do not realize the potential benefits from goats due to high
mortality rates, which contribute further to the misery. Some of the factors like poor
access to animal health support, dry season feed shortages and inadequate housing is
the most important immediate factors; which are contributing to high mortalities.
7. The country has about 2000 livestock markets, but there are few markets, where
goats are sold. Further, livestock markets are under the jurisdiction of the state
governments although the direct operation and supervision would generally fall
within the purview of the Agriculture Produce Marketing Committee (APMC),
which is a local body that set up under APMC Act of states. In Maharashtra state,
APMC is set up under Maharashtra Agriculture Produce Marketing Committee
(Control &Regulation) Act 1963. Though, APMCs control livestock markets, they
are still underdeveloped and facilities are poorly provided. The market information
system is poorly maintained and inaccessible to common man.
8. Registered slaughter houses in the country are 2702 only. It is noticed that
considerable animals particularly goats are slaughtered at unauthorized places and
these are dirty, unclean, and unhygienic for slaughtering and selling goat meat.
9. The breeds like Osmanabadi, Barberi, Jamnapari (U.P.) Sangamneri, Mehasa and
Zalwadi (Gujarat), Beetal (Punjab), Ajmeri & Kachhi (Rajasthan) serve the dual
purpose i.e. Milk and Meat. The breeds like Assam, Kali Bengali, Brown Bengali
and Marwari are exclusively used for meat and breeds like Angora, Gaddhi (HP)
and Pashmina (Kashmir) are especially used for the wool.
284
I 0. This poor man's business robustly supports to about 67 percent small and marginal
fanners, and landless population in the country. Mostly women take the care of
goats other than agriculture and labour works. It is categorically found that more
tha~ 90 percent womenfolk care the animals. Also, goats are known to produce
varieties of products like meat, skin, milk, fleece and manure.
II. The Maharashtra government established Punyashloak Ahilaya Devi Sheli va
Mendhi Vikas Mahamandal, Pune in I978 under the Agriculture and Cooperation
Department of the State Government. Under this corporation, all 9 sheep breeding . farms and I goat breeding farm have been functioning as per the policy objectives
of the state government. Since 1988, no single goat farm has been increased though
the poor man's cow is on high demand in term of meat in the state. Still, the total
numbers of goat farm are 9 even after 25 years of the establishment of
Mahamandal. But, the development of the goat breeding programme in the state is
somewhat in pathetic condition.
I2. The goat population in the state has shown the increasing trend until 1998 that
reached to 1I434021; however, it declined to 10456242 in 2003 that has been
noticed that declined by 8.55 percent over 1998.
13. In 1980's, buffalo emerged as the highest milk giver animal in Maharashtra state.
Though buffaloes have supplied higher quantity of milk in the state, now cows
overtake in milk production. Nevertheless, goats have been supplying milk but total
quantity is very less than Cows and Buffaloes. The production of goat mill is
increasing marginally. It is observed that the goat milk production has been
increasing due to awareness created by medical sciences among the people that goat
'milk has medicinal value.
I4. The goat meat production is marginally increasing however, in the year 2003-2004
and 2004-2005 increased by 0.61 percent and 0.34 percent respectively. However in
2005-2006, the goat meat production increased by 2.55 percent. Buffaloes, cattle,
goats, and sheep all four emerged in the same order as the major animal meat
suppliers in the state.
15. The slaughter houses in the state are not increasing though the total meat production
increased from 154.628 thousand metric tones in 1982 to 236.280 thousand metric
285
tones in 2006. The highest numbers of slaughter houses have been found in
Amravati division, which had 14 7 and the lowest numbers were found in Mumbai
division It is very interesting to note about Mumbai region that number of slaughter
houses declined to 7 in 2003.
16. The value of processed meat was Rs. 130.07 in 2001-2002 that increased to 156.47
Cr, which increased by 20.30 percent. It has been noticed in the subsequent year that
it increased by more than 29 percent, which was actually Rs. 167.58 in 2005-2006.
No doubt that the processed meat component is one of major head, which has been . contributing in export value of meat. Overall, the export value of meat increased
from Rs. 1307.56 Cr. in 2001-2002 to 2877.52 Cr. in 2005-2006 that accounted
120.07 percent.
17. Leather Industry occupies a prominent place in the Indian economy. This sector is
known for its consistency in high export earnings and it is among the top ten foreign
exchange earners for the country. The state occupies an important position in terms
of export value of goat-based leather in leather products. Finished leather emerged
as the second major head goat based leather export value. Leather foot wear is also
immensely contributing. Data indicate that the leather foot wear emerged as one of
the major items in leather products export in Maharashtra during the reported years.
A foot wear component is another item that also contributes in export value of goat
based leather in the state. The export value from foot wear component is fluctuating
over the years. The leather garments emerged as the fourth major export head
among the goat based leather products. Leather goods item is one of the major
component in goat based leather export and emerged as third major export earner in
the total value of export value in the state.
18. In the state, in 1990's, there were 139 organized livestock market in the state instead
of increasing, they found decreased to 135. Also, no such exclusive goat market is
found set up in the state. The goats are sold at same markets, where other animals
are being sold. It is noticed that data on livestock markets are poorly maintained and
collected at state level.
19. The state has only 2 skin markets namely Yedasi (Osmanabad district) and
Koregaon (Satara district) are exclusively whole sell markets for skin.
286

20. The major production centers for leather and leather products in Maharashtra are
Mumbai and Kolhapur; however, it is observed that no authentic information has
been available regarding the skin processing units in the state.
21. Cattle hides, Buffalo hides, goat skin and sheep are the major skin suppliers in
leather industries. Leather from goats and sheep increased manifolds within four
years and these two sources of skin are becoming major suppliers in the leather
industries in the state.
22. In Yavatmal district (sample district) the veterinary Institutions were 11 in 1988 that
substantialJy increased to 203 in 2003. Since then, no new veterinary institution in
state is coming up ..
23. The Yavatmal district has the highest number of livestock population in the
Vidarbha region. It is also noticed that the population of goats has not been steadily
increasing since 1987. Instead of increasing, it is found that it decreased to 369849
in 2003 from 421376 in 1987.
24. In the district, most famous livestock markets are: Darvha, Pusad, Digras, Ghatanji,
Ami, Umarkhed, Ralegaon. It has been noticed that the livestock markets are
common to all types of animals that can be sold and bought under the APMC's
control and there is no such exclusive goat markets.
25. Insufficient veterinary clinics are found in sample tahshils Pusad and .Darvha as
well as registered slaughtered houses decreased from 55 to 29. Yet, goats and sheep
are being slaughtered at unrecognized places, locations, houses etc.
26. In Ahemadnagar district has the highest number of livestock population as well as
goat population in the Western Maharashtra region. The highest goat population has
been found in Pamer tahshil and Shrigonda . tahshil has second highest goat
population, which are 96178 and 95639 respectively.
27. In the Ahemadnagar district, there are 231 Artificial insemination centers. In all
Tahshils of the district, have these centers to make artificial fertilization of livestock
animals. In Akole Tahshil, the highest numbers of artificial insemination center
have been set up. The total numbers of such centers in these Tahshils are 29. The
Sangamner Tahshil has the second highest insemination centers. In Shrirampur
Tahshil there are I 0 insemination centers, is the lowest in the district.
287
28. In Ahemadnagar district, only 7 slaughtered houses are found registered. Out of
these, 2 slaughtered houses each are located in Ahemadnagar and Shrirampur
tahshils and I each are located in Sangamner, Kopergaon, and Rahuri tahshils.
29. In all four groups of goat keepers, among the sample goat keepers, the highest goat
keepers are found in NT category, followed by SC category, general category, and
OBC category.
30. The study found that in an average, 0.70 ha. area is cultivated by each sample goat
keepers in group I, 0.62 ha. area is cultivated in group II, 1.16 ha. area is cultivated
in group III, and 0.86 ha. area is cultivated in group IV.
31. The area of grazing for the sample goat keepers is very less in all categories of all
goat keepers. The lowest grazing land available for group IV sample goat keepers. ,
32. Educational level of sample goat keepers is found different in four groups. it is
observed that the highest numbers of goat keepers are from middle to inter
educational class. The second highest goat keepers class is found from illiterate
class, followed by primary educated class. Higher educated class are less in goat
keeping activity.
33. Goat keepers could earn Rs. 20772.60 in an average. It has been observed that the
highest annual income has been earned by in group IV goat keepers. It is found that
the annual income of this category of households, in an average, is Rs. 22173.91.
Further, the lowest per household income from agricultural has been found in group
I, which is Rs.l5379.17. The average annual income sample households from
subsidiary activity of agricultural is found Rs. 373750 and average of per household
annual income is Rs. 3593.75. It is found that the group IV households earned the
highest annual income among four groups from agricultural,-which is Rs. 5347.83.
The group-I households earned average annual income Rs. 1158.33, which is the
lowest income per household among four groups of goat keepers.
34. The average animal income from dairy business of total sample households IS
Rs.5936.91, of which Rs. 3418.46 annual income is from main occupation and
Rs.2518.45 from subsidiary income. The highest per household income found in
group IV households, which is Rs. 8226.74 and lowest per households income has
been found in group I household, which is Rs. 4929.17. It has been noticed that the
288
average annual income of sample households is Rs. 92000.5 from goat rearing
activity, of which Rs.5733.13 is generated from main activity and Rs. 3466.92 has
been generated from subsidiary activity. The lowest annual income from goat
rearing activity has been found in group-1 households and the highest annual income
has been found in group IV households, which is Rs. 20925.
35. It is found that out of I 04 sample households, 41 sample households are from land
less category_ (39.42 percent), 30 households having less than 1 ha.(28.85 percent),
15 households having land area I to 2 ha. ( 14.42 percent), 15 households having
land area 2 to 4 ha.(14.42 percent), and 3 households having land area above 4 ha.
(2.88 percent). So, the highest samples are from land less category.
36. There is no single buyer, who is educated more than higher secondary in sample
villages. In market access by the size of farms, the largest numbers of goats are sold
in Ahemadnagar district than Yavatmal district at door sold and in the market. There
is a wide variation in both sample districts \vhile selling goats at door and in the
market in all categories of farms. It is observed that goat sold at door is more
preferable than the sold in the market. Also, it is because the high demand of goats
meat daily (table-3 in Chapter-V).
37. In both sample districts and in four flock sizes, the door sell is predominant;
therefore, the larger sell figure has been recorded in the survey. Out of total 1198
goats sold at door and in the market in both districts, 886 goats were sold at door
and 312 goats were sold in the market. Out of total sold in 1-5 flock size category,
74 goats sold at door, and 46 goats sold in the market. In 6-~5 flock, size category,
out of total sold, 123 goats sold at door and 46 goats sold in the market. In 16-30
flock, size category, out of total sold, 311 goats sold at door and 140 goats sold in
the market. In above 30 flock size of farms category, out of total sold, 378 goats
sold at door and 80 goats sold in the market. (Table no. 3 a Chapter -V).
38. It is interesting to note that the survey report revealed that only Deshi breeds are
found at the sample goat farms in both districts of the state. Non-local goat breeds
are not found popular among the goat breeders. It is probably that local breeds are
more suitable in local atmospheres and less expensive than other non-local goat
breeds.
289
39. It is interesting to note that in Yavatmal district and in near the market, the average
value of goat comes around Rs. 1798 and in off the market value comes around Rs.
1519 whereas, in Ahemadnagar district, 479 goats have been sold in the near market
and 317 goats have been sold in off the market, and the value of the per goat comes
around Rs. 1732 and Rs. 1524 respectively. It is observed that when the value of
the both the district is added in respective near market and off market, the average
value of per goat has been recorded Rs. 1762 for the near the market and Rs. 1522
for the off the market. The average of both the markets comes around Rs. 1667 per
goat average price in the state. The near market is popular in both the districts and
the largest numbers ·of goats are being sold in near market.
40. The study revealed for marketing of Goats by their Breed (At door) that the different
buyers paid different average price per male, female, and kid goats. The Goat
keepers always prefer to have more female and kids, butchers prefer to buy kids,
male and female in this preference order. The professional traders are preferring
female and kids mostly. Local consumers prefer to buy female, kids and male goats
in this order. However, the preference order may differ from place to place in both
districts. (Table no. 5, Chapter-V).
41. It is observed in sample districts for Marketing of Goats at Door by their Weight
from the data that Average price paid by goat keepers is Rs. 1735 for female and the
average price of kid comes around Rs. 1319. Average price paid by butchers is
Rs.2711. Average price paid by butchers is Rs. 1821. The average price of kid
comes around Rs. 1332. Average price paid by professional traders is Rs.2829.
Average price paid by professional traders is Rs. 1792. The average price of kid
comes around Rs. 1315. Average price paid by local consumer is Rs.2692. Average
price paid by professional traders is Rs. 1793. The average price of kid comes
around Rs. 1297. When all types of buyers combined together, the average price for
male goat comes around Rs. 2710, Rs. 1788 for female goats and Rs. 1323 for kids.
In the second round survey found that the average price for goats is found slightly
higher than the first round survey. (table 6, 6A,6 B, chapter-5).
290
42. The study found that goat keepers are interested to purchase female and kids more,
the butchers are interested to kids, male and female goats, traders prefer mixed sex,
and local consumers also prefer to purchase mixed sex of goats (table-7, chapter-S).
43. Under Marketing by the Flocks Size 1-5 flock size in Yavatmal district, 39 goats
were sold in near market and 22 in off market. Under 6-15 flock size out of total
sold, 64 goats were sold in near market and 32 were sold in off market. In 16-30
flock size, 12_3 goats were sold in near market and 101 were sold in off market.
Under the flock size of above 30 goats, out of total sold, 181 goats were sold in near
market and I22 were sold in off market. Out of total sold in all markets, 407 goats
are reported to sell in near market and 267 goats are sold in off market in Yavatmal
district. Also, it has been noticed that out of total sold under I -5 flock size in
Ahemadnagar district, 35 goats were sold in near market and 28 in off market.
Under 6-15 flock size out of total sold, 59 goats were sold in near market and 39
were sold in off market. In 16-30 flock size, 188 goats were sold in near market and
I24 were sold in off market. Under the flock size of above 30 goats, out of total
sold, 197 goats were sold in near market and 126 were sold in off market. Out of
total sold in all markets, 479 goats are reported to sell in near market and 317 goats
are sold in off market in Yavatmal district. Out of total goat sold, 886 goats were
sold in near market and 584 goats were sold in off market. (table no. 8, Chapter-S)
44. For Off Marketing of Goats by their Breeds, the average per goat net return for goat
keepers and for male, female and kid wise are Rs. 2378, Rs. I 884, and Rs. 953
respectively. The average per goat net return for butcher and for male, female, and
kid wise are Rs. 23I3, Rs. I834, and Rs. 805 respectively. The average per goat net
return for professional trader and for male, female, and kid wise are Rs. 2070, Rs.
1935, and Rs. 837 respectively. The average per goat net return for local consumer
and for male, female, and kid wise are Rs. 2199, Rs. 1908, and Rs. 940 respectively.
However, in second round prices for goats differ and higher than the first round.
45. Under the different weight slab in Off Marketing of Goats at Door by their Weight,
the average price paid by goat keepers is Rs. 2415. Average price paid by goat
keepers is .Rs. 1918. Average price paid by butchers is Rs.2352. Average price paid
by butchers is Rs. 1870. The average price of kid comes around Rs. 836. Average
291
price paid by professional traders is Rs.2109. Average price paid by professional
traders is Rs. 1971. the average price of kid comes around Rs. 866. Average price
paid by local consumer is Rs.223S. Average price paid by local consumer is Rs.
1943. The average price of kid comes around Rs. 973. When all types of buyers
combined together, the average price for male goat comes around Rs. 22S8, Rs.
1928 for female goats and Rs. 89I for kids. As per the calculations, the average per
goat net return for goat keepers and for male, female and kid wise are Rs. 2378, Rs.
1884, and Rs~ 953 respectively. The average per goat net return for butcher and for
male, female, and kid wise are Rs. 23I3, Rs. I834, and Rs. 805 respectively. The
average per goat net return for professional trader and for male, female, and kid
wise are Rs. 2070, Rs. I93S, and Rs. 837 respectively. The average per goat net
return for local consumer and for male, female, and kid wise are Rs. 2I99, Rs. I908,
and Rs. 940 respectively. In second round the prices differ and higher than the first
round (table- II, II A, II B, Chapter-S).
46. The survey study found for Marketing of goats by size class of goats that 886 goats
were sold at door and 312 were sold in the market. Out of total' sold at door, I77
were male goats, 3I 0 were female goats and 399 were kids. Out of sold in the
market, 49 were male goats, I23 were female goats, and I40 were kids. Out of total
sold at various locations, I20 goats were sold by goat keepers with I-S flock size,
I69 goats were sold by goat keepers with 6-IS flock size, 4SI goats were sold by
goat keepers with I6-30 flock size, and 4S8 goats were sold by goat keepers with
flock size more than 30 goats (Table-I2, Chapter-S).
47. The difference prices in both markets are visible. In category of I-S flock size of
goat keepers, the average value difference is found Rs. 630 for male, Rs I3S for
female, and 444 for kid. In category 6-IS flock size, Rs 543 is price difference for
male, Rs. 3S for female, and Rs 438 for kid are found. In I6-30 flock size, it is
observed that Rs. 72S for male, Rs 144 for female, and Rs. I71 for kid are observed
from the data. Under the 30 and above flock size, the price differences are Rs. SS6
for male, Rs. 80 for female and Rs. 4I7 for the kid are noticed. The difference prices
in the market depend on the various reasons like urgency of sale and traditional way
of selling without technical weighing. It is also noticed that values of goats vary
292
with expected weight and quantity of goats may not give the approximate value of
goats. The traditional way of selling without weighing influences the value of goats.
48. The average percentage difference in price in Yavatmal district is noticed in the
market selling of goat in weight wise category. In 5 kg and around weight, it is
observed that about 0.97 % price difference is noticed higher in market sold. In 5-10
kg weight category, it is observed that 1.65 % is noticed higher price. In category
I 0- I 5 kg weight 0.90 % price higher is noticed in the market and in category of 15
kg and above about 0. 78 % price is noticed higher in the market. Overall, in market
sold, it is observed that around 1.07 % for all category of weight is found higher
price in an average in the market. In Ahemadnagar district, the average percentage '
difference in price is noticed in the market selling of goat in weight wise category.
In 5 kg and around weight, it is observed that about 0.87 % price difference is
noticed higher in market sold. In 5-1 Okg weight category, it is observed that 3.52%
is noticed higher price. In category 10-15 kg weight 3.13 % price higher is noticed
in the market and in category of 15 kg and a.bove about 1.16 o/o price is noticed less
in the market. Overall, in market sold, it is observed that around 1.6 % for all
category of weight is found higher price in an average in the market.
49. For marketing cost, Value and net gain in marketing of goats in both districts it is
observed in near market that Rs.463288 has been received as net gain for male goat
with average price per male goat Rs. 2617, Rs.562152 for female goat with average
price per female goat Rs.1813.39, and Rs.471507 for kid with average price per kid
Rs.1181. In off the market, Rs.303480 has been received as net gain for male goat
with average price per male goat Rs.2607, Rs.384947 for female goat with average
price per female goat Rs.1878, and Rs.277366 for kid with average price per kid
Rs.1056.
50. It is observed that the goat keepers spent as maintenance cost on various items. It is
noticed that feed gains, fodder, salt, medicines are the main items to spend. It is
observed that the average per goat expenditure incurred by sample households in
first round survey is Rs.29.73. It is found that the sample households have spent
maximum amount on medicine for male, female and kids goat. The second highest
expenditure incurred by sample households is on 'feed grains' in case of male goats,
293
, under other expenditure on female goats, and feed grains in case of kids goats. It is
noticed that very meager amount was spent on the fodders, and salts as it is known
fact that fodder is freely available in village area
51. In both data found that butchers prefer more male and kids for buying. It is noticed
that goat keepers sold mostly male and kids to the butchers and share of kids is more
than 50 percent in total selling to butchers. The goat keepers must have purchased
goats in keeping view of income. Mostly traders purchased goa~s male, female and
kids. All dealings it is found that local consumers and butchers are dominating the
market at door.
52. Mostly four cham'iels are available to goat keepers to sell their live goats i.e.
organized markets (control by under APMC Act or by Grampanchayat),
unorganized markets, On the way selling, and at door. The buyers approaches all the
places, however, it is found that at door, on the way to markets, unorganized
markets, and organized are popular in this sequence. Because, buyers always hope
that they will get higher profit margin.
53. The present marketing chaimels, which are existed in the state, is still
underdeveloped as most of goat keepers are illiterate or less educated. As reported
by the goat keepers, there is high demand for goats meat from consumers therefore,
the butchers and traders always approach to goat keepers at door and try to settle
dealings at the door only. Due to illiteracy and unawareness, the goat sellers sell
their goats at roughly estimated price and weight. It is highly unpredictable dealings
of goats and more chances of undervalued goat price.
54. Both sample districts have proper local breeds of goats. Majority households
92.31% are getting feed at reasonably price. The maximum sample households from
Yavatmal district are aware about the veterinary services than district Ahemadnagar
and a very few households are found that they are not taking advantage of veterinary
services and hospitals.
55. Majority hous~holds from both the districts have reported that they have grazing
lands are available and have reserve space for goat keeping in both district of the
state.
294
56. Few households have availed credit facilities and most of the households are not
satisfied with credit availability channels, which are available at gross root level
mostly from institutional sources. 49.0-lo/o households expressed their concerns
about the complex procedure of bank loan, which is followed, and they are not
satisfied with procedure adopted by the banking institutions in both sample districts
of the state. Only 31.73 % households expressed their happiness over the help of co
operative soci~ty. Few households are a part of SHG and majority of them are out of
SHG folds. ~fajority of 53.85% households have expressed that the interest rate
charged by the institutional sources, are high. Out of those responded by saying the
credits rates are high. ~1ajority households have expressed that they have collateral
problem at the time of taking loan. The money lenders always play an important
role for credit availability in their sample villages. Majority of sample households
said that market structures are appropriate
57. Households are selling goats in the livestock market by traveling distance ranging
from I km to 23 km to approach the main goat markets. If the market is far away
from the villages, the lesser number of the goat keepers sell their goats at the main
market instead they prefer to sell at door. Unaffordable traveling expenses incurred
on the transport are reason.
58. 97.12% households have reported that they are selling their goats in the organized
market only however, it is also found that they are selling their goats in the
unorganized market too. The frequency of visiting markets are _varies. Few visit
markets regularly and majority are satisfied with the availability of market
infrastructure and roads. ~fajority using rickshaw, tempo etc for transporting the
goats and telephone facilities in both sample districts of the state.
59. ~1ajority have the market information, satisfied with the modem amenities, get
effective price. The fixation of price of goats also is influenced by factors like,
weight, age, general appearances, breed and colour, however, weight and age are
considered as major factors.
60. There are multiple reasons to sell goats at door because of distance of the market,
less bargaining power with them, lack of transport facility, no time to take goats to
the market etc. Some have expressed that the butchers are dominating the market
295
and created monopoly like situation, therefore they do not like to sell goat in the
market and few goats at long distance markets that is not uneconomic and
impractical.
61. The agencies of central and state government, gram panchayat, local community
body, rural development of programmer, Bank I institution, and veterinary
department are extending helps but panchayat assistance and local body and
community body extend assistance at top level. The panchayat body emerged at the
first position for valuable support than other agencies and institutions. Their
supports and contribution for the marketing of the goats encourage the goat keepers
to have the larger herds for rearing.
62. Various factors always influence the dealing and selling of the goats markets and
impact positive or negative on the goat sellers. Some of them are supply of goat
breed, availability of loan on low rate of interest, veterinary support, implementation
of insurance scheme for goats, formation of SHGs, development of infrastructure,
organized market intervention of govt. in market yard to avoid the influence of
butchers, eradication of malpractices from markets, formation of cooperative
marketing society, provision of regulation of live stock market, expansion of market
with modem amenities, less marketing channels, formation of animal breeder
cooperative society, however, some factors are more dominant to influence the
marketing of goats and the profit margin of the goat keepers while selling the goats . in the market.
63. There are various products, which are produced by the goat, like, milk and their
byproducts generate important income source to the goat keepers. Majority goat
keepers said that there is no such demand for the milk products locally.
64. The study found that 55 % sellers are found SC category, 25 % ST category and
20% sellers belong to general category. The butchers always earned higher price by
value adding their services to the customers than the goat keepers.
65. The goat sellers have been using different means of transports for bringing goats to
the market places. It is observ~d that at different point of times, the goat sellers used
available transports like cycles, autos, trucks and tempos. Mostly, goat keepers sell
goats in local markets only.
296
66. All goat sellers have positively opined that water, electricity, shade, telephone, price
board facilities are available to them in the markets however, all goat sellers are
satisfied with the only 1 amenity and that is electricity. Majority of goat sellers feel
that sufficient market space for the marketing of the goats must be provided.
67. It is observed from the table that 45 % goat sellers have responded that the peak
months for marketing is November- December, 5 % sellers responded to March
April, 10 % sellers responded to May - June months and 15 % sellers are favorable to
September -November months.
68. The field study revealed that out of total sellers, 50 % sellers have opined that
female goats are demanded in the market whereas 20 % sellers responded that the
kids are also important for some buyers, I 0 %> sellers said that male kids are in
demand, 20% sellers said that female kids are in maximum demand. It is observed
that different responses are reported that female goats on the maximum demand and
preference.
69. The survey result disclosed that 45 % sellers are satisfied with the market yard
loading facilities, whereas 55 % sellers are not happy with the loading facilities in
the market yard in both sample districts of the state. It is very clear that majority of
sellers are not satisfied with the available loading facilities.
70. Various criteria are considered for buying and selling goats at particular prices, four
criteria colour, age, weight and general appearance play role in price fixation. 90 %
sellers are satisfied with the transparency of the market whereas only I 0 % sellers
are not satisfied with the transparency of the marketing. 80 % sellers agreed that
middlemen play important role while dealing and selling goats in the market, and
the commission agent presence in the market. Except few sellers, majority sellers
are not cheated and favours.
71. 10 % sellers have reported the reason of selling of goats as business reason· while 40
% sellers responded that they sold goats to make repayment of loan, 30 % sellers
have given reason of selling goat is home consumption, 5 % sellers reported that
they sell goats due to some requirements in agricultural. All sellers are happy cash
payment immediate after the selling of goats and are aware about tax system that
297
they pay. Majority sellers reported that they are satisfied with the buyers, and the .
orgamzers ..
72. It is noticed from the both districts that 35% buyers are from SC category, 10% are
from OBC category and NT, and 45 % buyers are from general category and the
educational level among buyers is less and the maximum scho'oling is secondary
education.
73. Buyers spend on various charges like transport, loading and unloading, feeding,
mandi and market fees, and others. Mandi and market fees, and loading /unloading
are the next major expenses of the buyers.
74. The field study found that 50 % buyers from both districts have divulged that the
market is good, 35 %buyers have remarked that it is better, 10% buyers remarks
about the markets are best and only 5 % buyers said that markets are bad. In more
details, in Y avatmal district of Darvha market and Pusad market, it is found that 40
% buyers from respective market areas have remarked that markets are good and
better. The markets maintained transparency while selling the goats in the market.
75. The study found that buyers have disclosed their opinions about infrastructures
facilities, which are available in the market areas. It is found that overall, majority
of buyers (70%) said that the facilities are good, 20% buyers said that facilities are
bad and only 10% buyers said that the facilities are better. Majority reported that
they find sufficient market space, where the goat markets are organized. However, it
is found that 30% buyers feel that market space is insufficient for organizing goat
market. 100 % buyers are happy with the transport facilities available from market
to destination and vice versa. 75 % buyers have reported that middlemen are
actively engaged in the dealing activity and play important to bring sellers and
buyers at place to settle dealing however, dealings are fair. The attitude of organizer
is highly positive and as a result the buyers get the facility and supports and have
lodging facilities.
76. Only 2 communities SC and ST are in involved in butchers business and mostly SC
community is dominating the business. They have semi pucca and kutcha shade,
and majority of butchers have good shade structure. It is also noted that the male
goats are preferred to slaughter than the females and kids. It is found in both round
298
survey that the highest number of kg meat were kept in refrigerator followed by ice
box and others. Cost incurred on family labours is the highest among the all heads
and the lowest on the license fees .. The average income from meat selling is found
Rs~ 45,430 per butcher.
77. The goat keepers are dominated as suppliers to the butchers as the survey found that
50 % goats are supplied by goat keepers, and 40 o/o goats are supplied by the traders.
These two sources are considered as the important source for the butchers. The
village traditional markets are dominating the goat marketing in both sample
districts of the state. Though, there is no such regulated market such as village
markets but they are getting popularity due to complex process of various charges
under Maharashtra APMC Act 1963.
78. 80% butchers have opined that they have made prompt payment immediately.
Generally, the dealings of the goats in the market or at door are traditional base,
where free entry and free exit are allowed like perfect competition. The prices of
goats depend upon the demand and supply of the goats particularly for male goats,
as most meat eaters prefer meat of male goats in two sample districts of the state.
79. The study found that 75 % butchers are satisfied with the rates of meat, they get
from the consumers. However, it is observed that 25 % butchers are not satisfied
with the rates, which they get. Majority of butchers are satisfied with the rates that
they get and are satisfied with the space, place and location for shop and goats. Few
butchers reported about harassment of mafia and police. Most of butchers have no . such difficulties in selling of meats and have no waste. Few are using Refrigerator
for the preservation. No problem is found in marketing of skin and even can be sold
off after eight days. It is sold through market- and traders at village aw well as
market place. The size of the skin plays an important role for fixing the price and
get prompt payment and butchers are unaware about the prices of skin in the
national market
80. The study found that SC community is dominating the skin trade. Majority of skin
traders (65%) are engaging in the family members in the business. It is found that
Rs. 76.61 was paid as an average price per skin to the butchers. Skin traders have
disclosed that they get sufficient raw materials to keep the skin unspoiled and that
299

they get good quality skin from butchers and there is a good demand for skin from
the market. It is noticed that majority of skin traders are satisfied with the storage
space and capacity, processing, selling skin in major markets, and facilities. No such
difficulties are for marketing of skin.
81. The study revealed about wholesalers that 66.46 % skin wholesellers have reported
that they get sufficient number of skin. The study found that 83.33 % wholesellers
are satisfied with the quality of the skin, sufficient place to store, sufficient place for
processing of skin, and marketing. Skin wholesalers are satisfied with infrastructure
facilities and activity of skin selling is daily business.
300

Suggestions:
The rearing of goat becomes a major allied activity for landless, marginal, and
small farmers in rural area in the state. This activity provides additional employment and
cash income to the rural families. It is observed that economy of goat is very simple but
value addition in income and employment is very high. Therefore, it is needed to take
positive steps for increasing goat population as well as meat and milk production. It is
found that if goats are reared as allied activity to agriculture and in case, agriculture crops
fail due to unforeseen reasons, the goats can support by providing income and
employment to the poor families. As stated by various experts, and concluded by this
study, employment and income are major issues in rural area of the state. If goat-rearing
activity links to agriculture, it will certainly benefit to the poor families.
The study found that mostly goat keepers rear the local breads (Deshi), and other
breads, which are reared only for the meat and milk purposes in other part of the country,
rarely are noticed in both sample districts. Therefore, it is suggested that the government
should take initiatives to increase the breeding capacity of goats by introducing the good
crossbreeds goats found in other part of the country and provide them to the goat keepers'
families and to those, who are interested in goat rearing activity at subsidized price. There
are some specific goat breeds, which are reared for specific purposes like meat, milk, and
wool, should be introduced larger scale in the state and should be made available to the
goat keepers. Then, it will possible to increase meat, and milk production in the state. The
policy about is found insufficient.
It is found that goats are really poor man's cow as 4-5 goats support to a
livelihood of 4 family members. If the suitable breeds are provided to the families, which
are poor and prone to various problems like suicide etc., certainly goats will provide good
regular income source to such families. In suicide prone district like Yavatmal, some
poor families are starving and cases of suicide farmers continue, therefore, it is suggested
that increasing goat rearing activity among such families will be one of the solutions for
sustainable income. No doubt that the poor families cannot afford the high cost of such
goats; therefore, the government must provide such goats at subsidized prices.
301
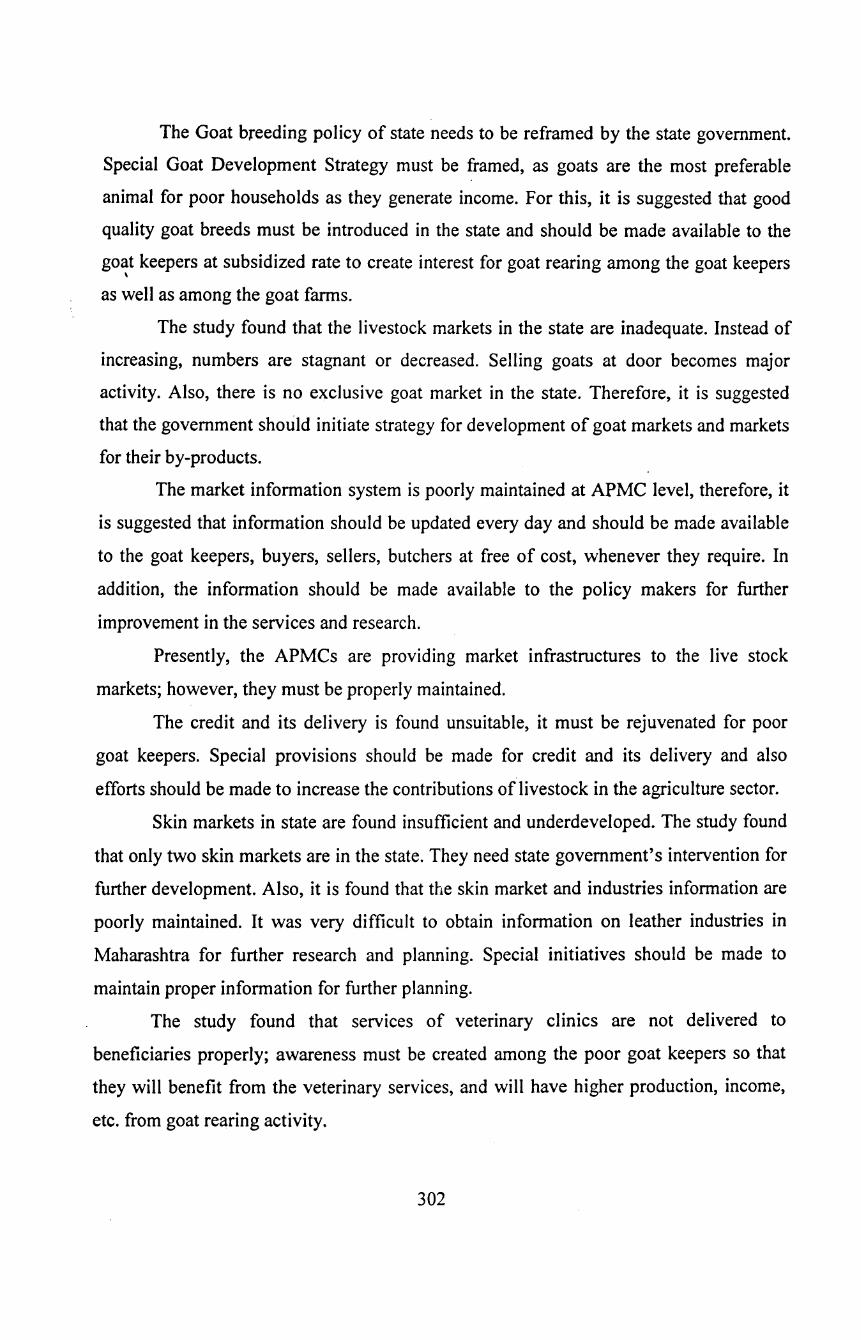
The Goat breeding policy of state needs to be reframed by the state government.
Special Goat Development Strategy must be framed, as goats are the most preferable
animal for poor households as they generate income. For this, it is suggested that good
quality goat breeds must be introduced in the state and should be made available to the
goat keepers at subsidized rate to create interest for goat rearing among the goat keepers \
as well as among the goat farms.
The study found that the livestock markets in the state are inadequate. Instead of
increasing, numbers are stagnant or decreased. Selling goats at door becomes major
activity. Also, there is no exclusive goat market in the state. Therefore, it is suggested
that the government should initiate strategy for development of goat markets and markets
for their by-products.
The market information system is poorly maintained at APMC level, therefore, it
is suggested that information should be updated every day and should be made available
to the goat keepers, buyers, sellers, butchers at free of cost, whenever they require. In
addition, the information should be made available to the policy makers for further
improvement in the services and research.
Presently, the APMCs are providing market infrastructures to the live stock
markets; however, they must be properly maintained.
The credit and its delivery is found unsuitable, it must be rejuvenated for poor
goat keepers. Special provisions should be made for credit and its delivery and also
efforts should be made to increase the contributions of livestock in the agriculture sector.
Skin markets in state are found insufficient and underdeveloped. The study found
that only two skin markets are in the state. They need state government's intervention for
further development. Also, it is found that the skin market and industries information are
poorly maintained. It was very difficult to obtain information on leather industries in
Maharashtra for further research and planning. Special initiatives should be made to
maintain proper information for further planning.
The study found that services of veterinary clinics are not delivered to
beneficiaries properly; awareness must be created among the poor goat keepers so that
they will benefit from the veterinary services, and will have higher production, income,
etc. from goat rearing activity.
302
The policy for slaughtering animals requires to be reframed as number of
registered slaughter houses decreased though number of slaughtering animals and non
vegetarian population increased. The state government must ban slaughtering animals at
unauthorized and unhygienic places and sanitary inspectors must inspect them from time
to time.
Still, the price of goats is fixed on traditional practice o'r weight estimation by
'hand lifting; it must be changed at scientific line based on the weighing machine, so that
illiterate goat keepers must get benefits and value of the goats without any cheating.
303
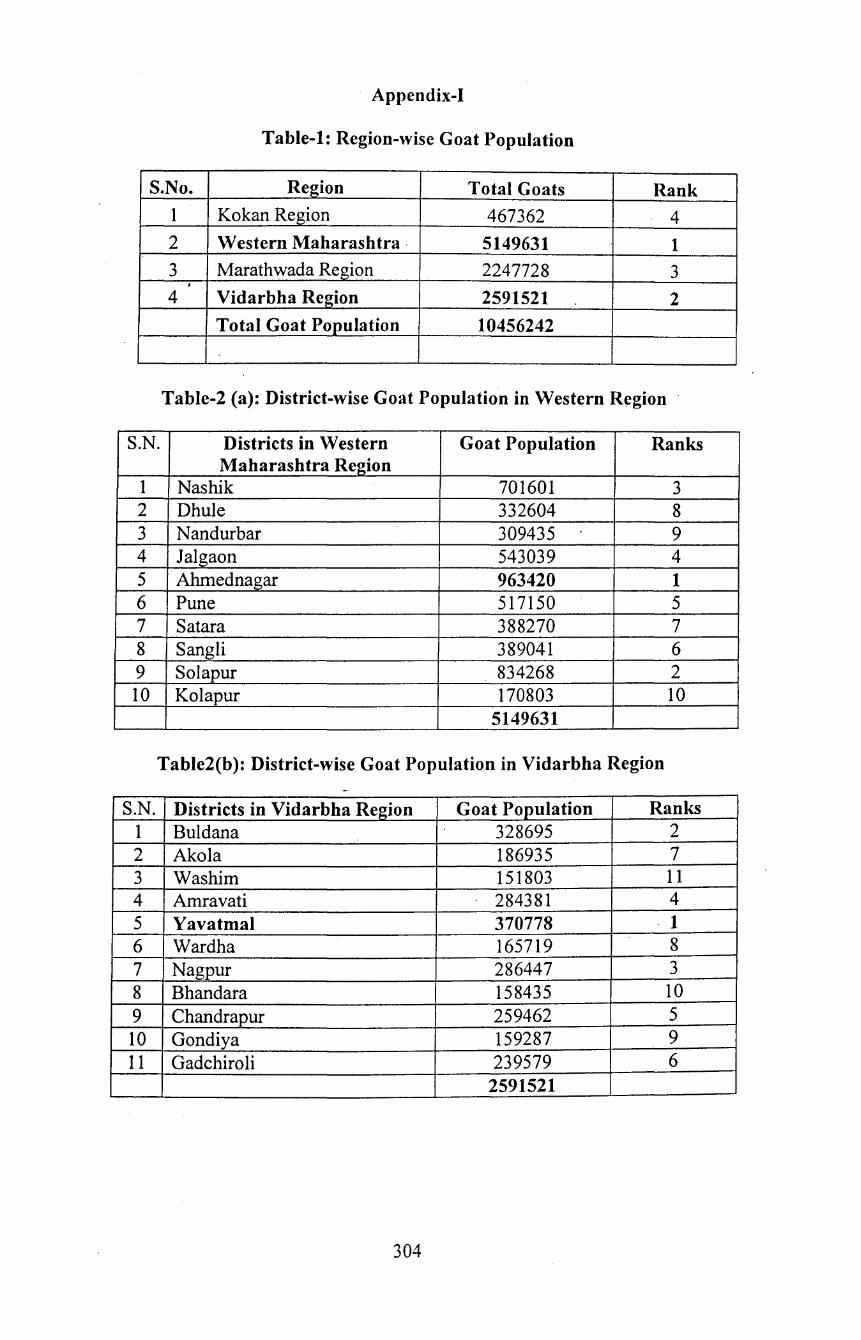
Appendix-I
Table-1: Region-wise Goat Population
S.No. Region Total Goats Rank 1 Kokan Region 467362 4 2 Western Maharashtra. 5149631 1 3 Marathwada Region 2247728 3 . 4 Vidarbha Region 2591521 2
Total Goat Population 10456242
Table-2 (a): District-wise Goat Population in Western R~gion ·
S.N. Districts in Western Goat Population Ranks Maharashtra Region
1 Nashik 701601 3 2 Dhule 332604 8 3 Nandurbar 309435 9 4 Jalgaon 543039 4 5 Ahmednagar 963420 1 6 Pune 517150 5 7 Sa tara 388270 7 8 Sangli 389041 6 9 Solapur 834268 2 10 Kola pur 170803 10
5149631
Table2(b ): District-wise Goat Population in Vidarbha Region
S.N. Districts in Vidarbha Region Goat Population Ranks 1 Buldana 328695 2 2 Akola 186935 7 3 Washim 151803 1 1 4 Amravati 284381 4 5 Yavatmal 370778 . 1
6 Wardha 165719 8 7 Nagpur 286447 3 8 Bhandara 158435 10 9 Chandrapur 259462 5 10 Gondiya 159287 9 1 1 Gadchiroli 239579 6
2591521
304
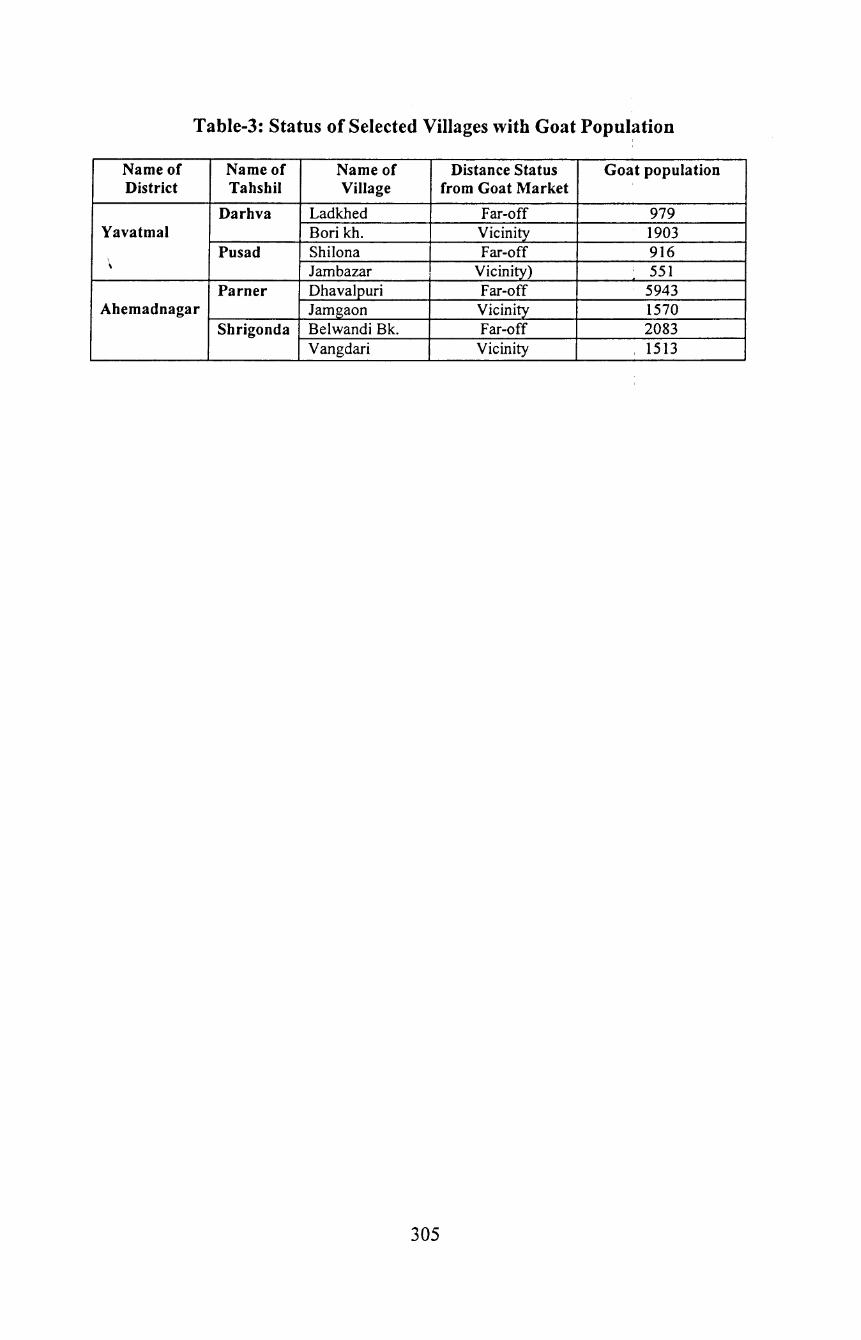
Table-3: Status of Selected Villages with Goat Population
Name of Name of Name of Distance Status Goat population District Tahshil Village from Goat Market
Darhva Ladkhed Far-off 979 Yavatmal Bori kh. Vicinity 1903
Pusad Shilona Far-off 916 \ Jambazar Vicinity) 551
Parner Dhavalpuri Far-off 5943 Ahemadnagar Jamgaon Vicinity_ 1570
Shrigonda Belwandi Bk. Far-off 2083 Vangdari Vicinity 1513
305
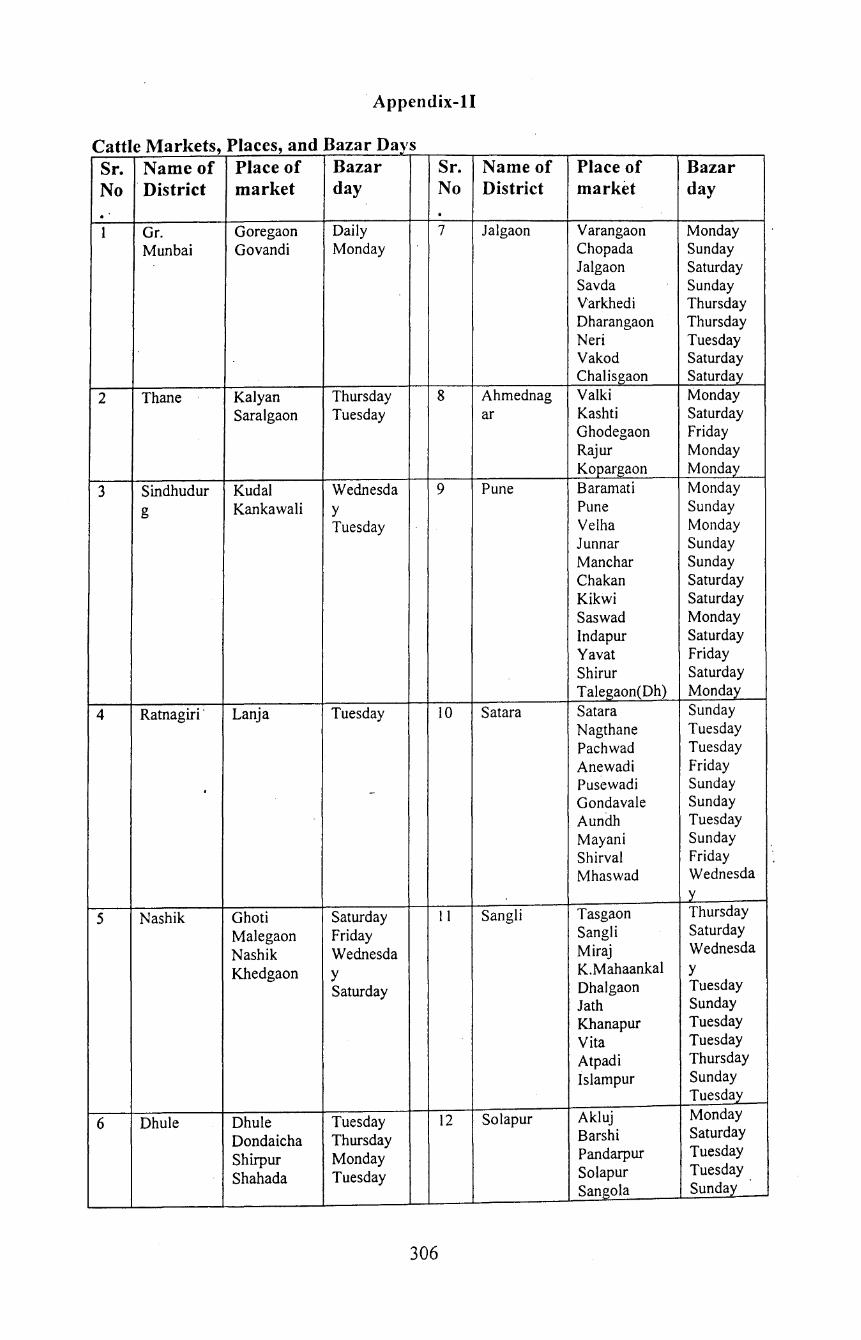
· Appendix-11
C ttl M k t PI a e ar e s, aces, an dB azar D ays Sr. Name of Place of Bazar Sr. Name of Place of Bazar No District market day No District market day . . 1 Gr. Goregaon Daily 7 Jalgaon Varangaon Monday
Munbai Govandi Monday Chopada Sunday Jalgaon Saturday Savda Sunday Varkhedi Thursday Dharangaon Thursday Neri Tuesday Vakod Saturday Chalisgaon Saturday
2 Thane Kalyan Thursday 8 Ahmednag Valki Monday Saralgaon Tuesday ar Kashti Saturday
Ghodegaon Friday Rajur Monday Kopargaon Monday
3 Sindhudur Kudal Wednesda 9 Pune Baramati Monday g Kankawali y Pune Sunday
Tuesday Velha Monday Junnar Sunday Man char Sunday Chakan Saturday Kikwi Saturday Saswad Monday lndapur Saturday Yavat Friday Shirur Saturday Talegaon(Dh) Monday
4 Ratnagiri · Lanja Tuesday 10 Sa tara Sa tara Sunday Nagthane Tuesday Pachwad Tuesday Anewadi Friday
. - Pusewadi Sunday Gonda vale Sunday Aundh Tuesday Mayani Sunday Shirval Friday Mhaswad Wednesda
y
5 Nashik Ghoti Saturday I 1 Sangli Tasgaon Thursday
Malegaon Friday Sangli Saturday
Nashik Wednesda Miraj Wednesda
Khedgaon y K.Mahaankal y
Saturday Dhalgaon Tuesday Jath Sunday Khanapur Tuesday Vita Tuesday Atpadi Thursday Islam pur Sunday
Tuesday
6 Dhule Dhule Tuesday 12 Sola pur Akluj Monday
Dondaicha Thursday Barshi Saturday
Shirpur Monday Pandarpur Tuesday
Shahada Tuesday Solapur Tuesday Sangola Sunday
306

Natepute Wednesda Kurduwadi y Modnimb Tuesday Akkalkot Saturday
! Monday 13 Nandurbar Nandurbar Tuesday 24 Akola Akola I Sunday
Chouhatta Friday Malegaon Tuesday Damdi (shed) Tuesday
14 Kolhapur Vadgaon Sunday 25 Amravati Bednera, Friday Kolhapur Sunday Rajura(Ba) Thursday
\ Ichalkarnji Friday Paratvada Thursday Murgud Tuesday Shendurjana Tuesday
Chandur Sunday Bazar Tuesday Talegaon Thursday Daryapur
15 Aurangaba Paithan Tuesday 26 Yeotmal Digras ' Saturday d Aurangabad Thursday Ghatanji Wednesda
Pachod Sunday Ami y Umarkhed Thursday Ralegaon Wednesda
y Wednesda y
16 Jalna Jalna Tuesday 27 Vardha De vii Saturday Gevrai Thursday Arvi Thursday Mantha Friday Samudrapur Sunday
17 Parbhani Balapur(Ma Thursday 28 Nagpur Kotol Tuesday .) Tuesday Nagpur Thursday Parbhani Sunday Mahipa Wednesda Javla Ramtek y
Sunday 18 Beed Renapur Friday 29 Bhandara Kondha/Kosar Wednesda
Neknur Sunday a y Bhandara Sunday Amgaon Friday Lalchandur Tuesday
19 Nanded Loha Thursday 30 Chandrapur Chimur Friday Naigaon Thursday Chandrapur Wednesda
Madheli y Jamul ghat Monday Ganga! wadi Tuesday
Saturday 20 Osmanaba Bhoom Thursday 31 Gadchiroli Gadchiroli Sunday
d Osmanabad Thursday Brahamapuri Sunday Khasgi Tuesday . Yenegur Monday Devni Friday_
21 Latur Murud Tuesday Halli Sunday _
22 Hingoli Hingoli Monday 23 Buldhana Khamgaon Thursday
Maika pur Thursday Janephal Saturday Chikhli Monday
Total markets in Maharashtra state :- 135 Source: Annual report of Animal Husbandry booklet, Govt. of Maharashtra
307

Appendix-Ill
COMMENTS ON DRAFT STUDY REPORT
General Comments:
(I) Title of project has been slightly changed from "Market Access and
Constraints in Marketing of Goats and their Products". to Market Access and
Constraints of Goat Marketing and their Products". This is a common study,
so the titl~ of the study should be same for all the participating Centers. Please
correct the Title as had been decided Officers-in-Charge meeting at Bangalore.
(2) The reference year of the study was given from July 2007 to June 2008 but
you have taken the reference year from July 2008 to June 2009.
(3) Most of data of tables of differ chapters have not been processed in terms of
percentage, per farm, per goat etc.
Chapter-wise Comments:
Chapter- 1: No need for comments. It has been well analysed and drafted.
Chapter- II: This chapter is quite satisfactory. Almost all the required aspects
have been fully covered.
Chapter - III: Most of required data have been adequately covered and fully
analysed. However, few tables of both districts are also required for the analysis in
this chapter, such as:
(1) Year-wise production of milk of milch cattle.
(2) Year-wise average production of milk per day per milch animal.
(3) Year-wise per liter price of milk of cow, buffalo, goat etc.
( 4) Year-wise rate of meat per Kg of buffaloes, goats, sheep and pig.
These above tables have not been covered in this chapter (both districts).
Chapter- IV: This chapter has been broadly analysed and discussed. However
few important tables have not been mentioned in the chapter, such as :
(I) Distribution of sample goat keepers by size of goat herd across the markets of
goats.
(2) Distribution of sample households by main and subsidiary occupation by the
markets of goats.
(3) Sex-wise (male, female and child) employment days in rearing of goats by
size of flocks.
308

(4) Livestock position by size of farms.
(5) Fixed assets for purpose of goats on the sample farms by the size of flocks.
( 6) It also is surprising to note that all the sample goat keepers had reared only
Deshi/ Local breed on their farms.
These above mentioned tables are essential for the preparation of consolidated
report.
Chapter- V: This chapter has not been adequately covered as for as marketing of
goats by different required parameters. Most of tables related to marketing of goats
have not been mentioned such as, marketing of goats through different channels by
size of farms flocks, breeds etc. at door and in the markets.
Please analyse, all tables which have been already provided to you fqr this chapter to
make common format for the consolidated report.
Chapter- VI: This chapter has been excellently analysed and drafted.
Chapter- VII: This chapter is satisfactory but some improvements 'are also needed
such as:
(1) Please clarify the policy implication section.
(2) Few important tables should also be inserted at appropriate places in the chapter.
The report is acceptable after incorporation of above comments.
Prof. P.N. Mehrotra Prof. & Hon. Director
Agro Economic Research Centre Chatham Lines Campus, University of Allahabad
Allahabad-211 002
309
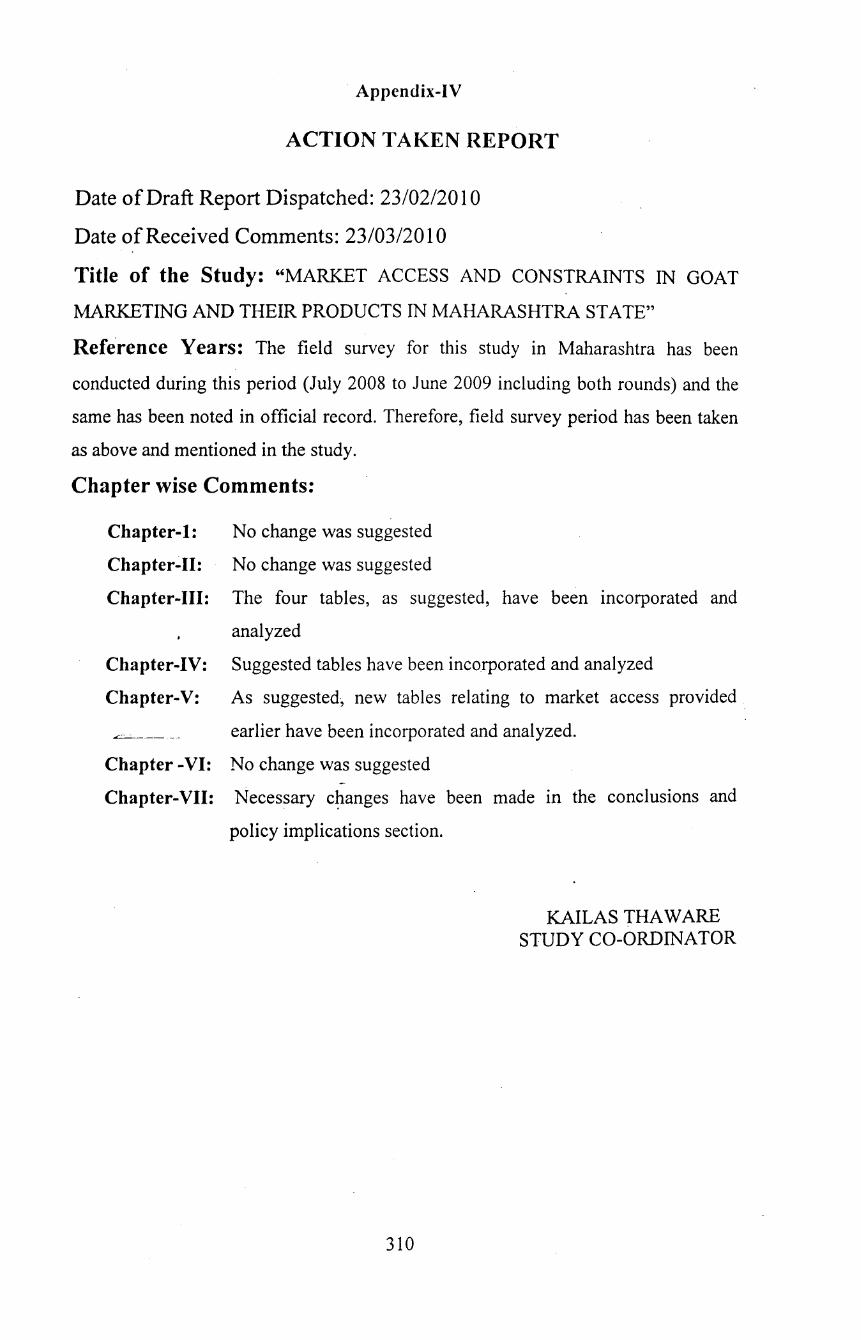
Appendix-IV
ACTION TAKEN REPORT
Date of Draft Report Dispatched: 23/02/2010
Date of Received Comments: 23/03/2010
Title of the Study: "MARKET ACCESS AND CONSTRAINTS IN GOAT
MARKETING AND THEIR PRODUCTS IN MAHARASHTRA STATE"
Reference Years: The field survey for this study in Maharashtra has been
conducted during this period (July 2008 to June 2009 including both rounds) and the
same has been noted in official record. Therefore, field survey period has been taken
as above and mentioned in the study.
Chapter wise Comments:
Chapter-1: No change was suggested
Chapter~II: No change was suggested
Chapter-III: The four tables, as suggested, have been incorporated and
analyzed
Chapter-IV:
Chapter-V:
~------·
Suggested tables have been incorporated and analyzed
As suggested, new tables relating to market access provided .
earlier have been incorporated and analyzed.
Chapter-VI: No change was suggested
Chapter-VII: Necessary c~anges have been made In the conclusions and
policy implications section.
310
KAlLAS THAW ARE STUDY CO-ORDINATOR
References
Acharya, R.M. and Singh, N.P., 1992. Pre-conference proceedings and plenary papers and invited lectures. 5th International Conference on Goats; March 1992. pp 81-99.
Allachin, F. R. 1969, Early domestic animals in India and Pakistan, "the Domistication and exploitation of plants and animals" eds peter J. Ucko and G.W. Dimbleby proceeding of a meeting of the research seminar in Archaelogy and releted subject held at the institute of Archaelogy, London university, Gerald Duckworth and co Ltd. London pp.58.1.
Allan, C.J. and Holst, P.J.l996, The ecological role of the goat in maintaining pasture and range .. In: Proc. VI Inti. Conf. on Goats, 6-11 May 1996, Beijing, China: 427-435.
Anous, M.R. & Shahin, K.A., 1993, Genetic and castration influence on crosssectional areas and composition of the gigot in goats. Small Rumin. Res. 10:165-173.
Antic et.al.1986, Characteristics of goats and development of goat husbandry in the world, individual continents and individual countries, with particular regard to the current situation and the need and potential for development in Serbia. [Dairy .Sci.Abstr.49:3288(1987)].
Ballester, P. 1986, Production and use of sheep and goat milk in Spain. Bull. Int. Dairy Fed. No. 202:212-214. [Dairy Sci. Abstr.49:2686(1987)].
Boogart, D.H.van A., 1982, Goat husbandry in the Netherlands. In: Proc.3rd Int. . Conf. Goat Production and Disease. Univ.Arizona, Tucson: 506.
Braj Mohan, Ramji Lal Sagar and Khushyal Singh), Indian Res. J. Ext. Edu. 8 (1), January 2008).
Carles, A.B. & Schwartz, H. J., 1992, Factors affecting flock productivity of small East African goats on a Kenyan rangeland. In: Pre-Conf.Proc., V Inti. Conf. on Goats, New Delhi, March 1992. Abstr. Contrib. Papers: 1 o,.
Casey, N. H., 1992, Goat meat in human nutrition. In: Pre-Conf. Proc., V Inti. Conf. on Goats, New Delhi, March 1992. Invited Papers, 2(2):581-598.
Devendra, C. 1980 goat production in Asia region: current status Available genetic resources and potential prospect. Int. Goat Sheep Ress.1 :55.
Devendra, C., 1992. Goats and rural prosperity. Pre-conference proceedings and plenary papers and invited lectures. 5th International Conference on Goats; March 1992. pp6-25.
Devendra, C. 1992a, Goats and rural prosperity. In: Pre-Conf. Proc., V Inti. Conf on Goats, New Delhi, March 1992. Plenary Papers: 6-25.
Donkin, E.F. 1991, Small-scale milk production. Paper presented at the Annual Symposium, Developing Areas Branch, South African Society of Animal Science, Golden Gate National Park, South Africa, October 1991.
Edwards, A.E., 1981. Weed control by the forestry commission ofNew South Wales. Proceedings of the First Biennial Noxious plants Confrence, Wagga, Australia.
311

FAO (Food and Agriculture Organization of the United Nations), 1987, small reminants in the near east selected paper prepared for expert consultation on small reminants research and development. Animal and health paper no. 54, Vol no. 1 Food and Agriculture Organization of the United Nations, Rome, Italy.
Gall, C. 1975, Milk production from sheep and goats. World Anim. Rev. 13:1-8.
Geissler, B., 1987, Jahresbericht 1985-1986. Landesverband Bayerischer Ziegenzuchter e.V.: 17pp.
Gill, J.P.S. & Joshi, D. V., 1992, Microbiological assay of goat meat with special reference to pathogenic organisms. In: Pre-Conf. Proc. V Inti. Conf. on Goats, New Delhi, March 1992. Abstr. Contrib. Papers: 536.
GOI, 1982-88(13th and 14th) All India Livestock & Farm Equipment Census: 14th Maharashtra 1987 ,Page No: S(Y) 28(ii), Page No:- 209,
GOI, 1993, 15th All India Livestock& Farm Equipment Census1992: Page No: 21 ,43,67,89,1 01,123,205,
GOI, 1998, 16thAll India Livestock & Farm Equipment Census 1997: Page No: 21, 43,65,99,77, 121,199,77.
GOM, 2002-03, Animal Husbandry Statistical Booklet, Page No: 8, Table No: 4, Page No: 49, Table No: 34. (Including state sector & local sector).
GOM, 1984-85 to 1987-88, District wise & Institutes physical achievements on major activities of (Page no:-2, Statement No.:-2), Page No: 43, Table No: 3.
GOM, 1989-90 to 2004 -05, Animal Husbandry Statistical Booklet, Page No: 49, Table No: 34.
GOM, 1993-94, Pashusanvardhan Sankhiki Pustika, Page No.: 4, Table No.:2.
GOM, Punyashlok Ahilyadevi Maharashtra Goat & Sheep Vikas Mahamandal Ltd, Gokhalenagar, Pune- 411 016
GOM, 2003, 1 ih Livestock Census: Maharashtra State Page No: X, XII, XIV,106 Dept of Animal Husbandry Pune-1.
GOM, 1981-82 to 1997-98, Report on Milk, Egg, Wool, Meat Production & Liye stocks & Poultry Keeping Practices in state, Annexure-1.3, Page no.54.
GOM, 2000-01 to 2005-06, Report on milk, eggs, wool and meat production and livestock population keeping practices in M.S. Govt. of M.S., Directorate of Animal Husbandry M.S. Pune -411001.
GOM, 1997-98, Pashusanvardhan Sankhiki Pustika, Page no.4.
GOM, 1992-93, Pashusanvardha Sankhiki Pustika, Table No.: 30 A.2.
GOM, 1996-97, Pashusanvardhan Sankhiki Pustika, Page no.36, Table No: 29.
GOM, 1984-85, Physical achievements on major activities of Animal husbandry dept by statistical Cell Directorate of Animal Husbandry Maharashtra State, Pune. (Page no:-15, Table No.: 12).
GOM, 2006-07, Official records of the APMC, Darvha, Pusad,, Shrigonda
GOM, 2006-07, P.S. Panchyat Samiti.
312
GOM, 2006-07, Yavatmal, Ahemadnagar District Social and Economic Abstract, pp.73
GOM, 2001, Yavatmal and Ahemadnagar District Census Hand.Book.
Grrifm et.al.1992 Griffin, C. L., M. W. Orcutt, R. R. Riley, G. C. Smith, J. W. Savell, and M. Shelton. 1992, Evaluation of palatability of lamb, mutton and chevon by sensory panels of various cultural backgrounds. Small Ruminant Res. Vol. 8:67.
Haenlien, G.F.W. 1981, Dairy Goat industry of the United States. J. Dairy Sci. 64:1288.
Haenlien, G .F. W ., 1986, Dimensions of the goat milk industry in the USA. Bull .Inti. Dairy Fed~ No.202:215-217. [Dairy Sci.Abstr. 49:2648].
Harsh, L.N. and Shankar Narayana, K.A., 1982. Performance of sheep and goats under different intensities of grazing on Cechurs pasture dominated by Zizyphus numularia. Paper presented in the Seminar on Problema and Prospects of Livestock Development, held at CAZRI, Jodhpur, November 26-30, 1982.
Haziminaglu et.al. 1982, A note on goat production in Greece. In: Proc. 3rd Inti. Conf. Goat Prod. and Disease, Univ. Arizona, Tucson: 506.
Hogg, B. W., G. J. K. Mercer, B.J. Mortimer, A. H. Kirton and D.M. Dugarizich, 1992, Carcass and meat quality attributes of commercial goats in New Zealand. Small Rum. Res., 8: 243-256.
Holgate, L. N. 1984, Arole for goat in range utilization and srub wood control on New Zeland's pastoral lands proceedings of the Second International Rangeland Cogress, Adelaid, Australia.
Horton, C.T. and dawson, J. E., 1987, Livestock diversification in New Zealand involving goats for meat and dairy production. Proc. New Zealand Soc. Anim. Prod. 47:125-126. [Dairy Sci. Abstr. 51:4061].
Huss, D.L. 1985. Small Animals for small farms in Latin America and the caribean. In: baker, F.H. and M. E. Miller (Eds). Emergency Technology and Management for Ruminants. Winlock International, West Press, Inc., Boulder, Co., pp.429.
India present address: 1 scientist (SS), Agriculture Economics ARIS- Cell, IVRI Izatnagar - 243122 2 senior Scientist Division of Extension Education, IVRI Izatnagar. 243122.
Katasaounes, N. 1986, Milk production in Greece. The present situation and ways to improve it. Deltion tes Ellenikes Kteniatrikes Etaireias 3 7:197-205. [Dairy Sci. Abstr. 49:4801(1987)].
Kolars, J.196q Location aspects ot cultural ecology: the case of goat in non western agriculture. Geogrl Rev. 56:577-84.
Kumar and Issani, G.B. 1992, Utilization of edible and non-edible by-products from slaughter of goats. In: Pre-Conf. Pro c. V Inti. Conf. on Goats, New Delhi, . March 1992. Invited Papers, Vol. 2(2), pp. 487-493.
313
Kumar Shalender, 2007, commercial goat farming in India: An emerging agribussines opportunity, Agriculture Economics Research Review Year :2007, Vol. 20, issue conference.
Laker,J.P., 1996, Production systems for goat fibre in Europe, Africa and theAmericas. In: Proc. VI Inti. Conf. on Goats, 6-11 May 1996, Beijing, China: 16- 24.
Laor, M., 1982, The dairy goat industry of Israel (semi-arid conditions).In: Proc. 3rd Inti. Conf. Goat Prod. and Disease, Univ. Arizona, Tucson: 505.
Le Jaouen, J. C. 1982, La fabrication du fromage de chevre fermier. Institut Technique de l'Elevage Ovin et Caprin, ITOVIC, Paris.
Low, A., 1986, Agricultural Development in Southern Africa: Farm household economics and the food crisis. James Currey, London.
Mandebvu, F.G., 1991, C.S.C. goat marketing policy and constraints. In: Goat Development in Zimbabwe: Prospects and Constraints. Ed: L.R. Ndlovu, Matopos Research Station, November 1991: 152-154.
Mandebvu, P. and Prasad, V. L. 1991, Fattening systems for goats. In: Goat Development in Zimbabwe: Prospects and Constraints. Ed: L.R.Ndlovu, Matopos Research Station, November, 191: 28-38.
Mavrogenis , A.P. & Narjisse, H., 1992, Efficiency of intensive systems of goat milk and meat production. In: Pre-Conf. Proc. V Inti. Conf. on Goats, New Delhi, March 1992. Invited Papers 2(1): 31-35.
Mitchell, T.D., 1984 Australia's feral goats-A valuable genetic resource . Proceeding of the Second International Rangeland Congress, A de laid, Australia. ,
Morand -Fehr,P., Haverevol, 0., Bas,P., Coromer-Rocher, A., Falagan,A., Sanz Sampeayo,M.R., Sauvant,D. & Treacher,T.T., 1991, Influence of feeding and rearing methods on the quality of young goat carcasses. In: Goat Nutrition Ed: P.Morand-Fehr, EAAP Publ. No.46, Pudoc, Wageningen: 292-303.
Mowlem, A., 1988, Goat Farming. Farming Press Books, Ipswich, England.
Naidu, A.S., Rao, K.S., Chandra Mouli, D and Seshagri Rao, K., 1991. Marketing of goats. Workshop on Meat and Slaughtrhouse Byproducts Handling System. Central Leather Research Institute, Madras India (Mimeograph, 33pp).
Neto, J.S. & Banker, G., 1987, Dairy goat production in northeast Brazil: Production characteristics and research needs. In: Proc. 4th Inti. Conf. Goats, EMBRAPA-DDT, Brasilia: 1534.
Nygaard, 1.1986, [Dairying in Norway during 1985]. Nordisk Mejeriindustri 13:6-8 .. [Dairy Sci. Abstr.49:6380(1987)].
Ospina,E.J., Gilp.J. Yazman and F.H. Baker. 1987 Goat Meat production and Marketing in the Southern Eastern United States: option for expansion. The Prof. Annial Science 3:5.
Peraza, C. C., 1986, Preliminary notes on the marketing of goat's milk and goat's milk products in Mexico. Bull. Int. Dairy Fed. No.202:197-200. [Dairy Sci. Abstr. 49:2647(1987)].
314
Peraza, C. C., I 986, Preliminary notes on the marketing of goat's milk and goat's milk products in Mexico. Bull. Int. Dairy Fed. No.202: I 97-200. [Dairy Sci. Abstr. 49:2647(1987)].
Prasad,V.S.S. & Kirton,A.H. I992, Evaluation and classification of live goats, their carcasses and cuts. In: Pre-Conf. Proc. V Inti. Conf. on Goats, New Delhi, March 1992. Invited Papers, pp. 440-450.
Rao, K.S. & Rao,G.G. I 992, Production, processing and export of goat skins. PreConference Proceedings, V Inti. Conf. on Goats, Delhi, March I 992. Invited l>fipers, Volume II, Part II, pp. 526-533.
Rayner, I. H., I 985, Milk production from the goat. In: Goat Production and research in the tropics. Proceedings of a workshop held at the University of Queensland, Brisbane, Australia, 6-8 February, I 984. [Dairy Sci. Abstr. 48: I 727(I 986)].
Redfern, J.M.;J.A. Yazman, a. Z. DeBoer, p.J. Howard, and M.D. Norman. I985. The goat milk industry of northen Arkansas and southern Missouri, Winrock International, Morrilton, AR.
Riviere, J. I99I, Development of goat production in communal areas. In: Goat Development in Zimbabwe: Prospects and Constraints. Workshop, Matopos Research Station, November I991. Ed: L.Ndlovu: 136-144.
Ruvuna, F., J. F. Taylor, M. Okeyo, M. Wanyoike, and C. Ahuya. I992, Effects of breed and castration on slaughter weight and carcass composition of goats. Small Ruminant Res. 7: 17 5.
Saini, A.L. & Khan, B. U., 1986, Production and processing of goat milk in India. Livestock Adviser 11:30-33. [Dairy Sci. Abstr. 49:5900(1987)].
Saithanoo, S. & Hoq, M.A., I 992, Goat meat production and processing in Asia. In: Pre-Conf. Proc. V Inti. Conf. on Goats, Invited Papers 2(2):451-457.
Sanjay Kumar and Mahesh Chander ( ? ) IS GOAT FARMING A THREAT TO ECOLOGY?, Indian Veterinary Research Institute, Campus Mukteswar, Kumaon, Nanital - 263138 (Uttaranchal) India Present address: I Scientist (SS), Agricultural Economics, ARIS-Cell, IVRI, lzatnagar-243 I22 2Senior Scientist, Division of Extension Education, IVRI, Izatnagar- 243122)
Sankamarayan, K.A., Bhohara., Ghosh, P.K. 1985, the Gaot: An Appropriate Animal For Arid and Semi Arid Regina!, EPW, Vol. XX, No. 45, 46 and 47. special Number November I 985.
Sarabol, S. 1985, Goat research and development in Thailand. In: Goat production and research in the tropics. Proceedings of a workshop held at the University ofQueensland, Brisbane, Australia, 6-8 February, 1984:22-23. [Dairy Sci. Abstr. 48: 1726(I 986)].
Shalander Kumar and P.R., Deoghare (2003): Goat production system and livelihood security of rural landless households, Indian Journal of Small Ruminants, Indian Society for Sheep and Goat Production and Utilization, 2003, Volume: 9, Issue: 1.
Sharma, K. and Ogra, J.L., 1987. Reaction of component plant species of synthesized pausture under three-tire system to high intensity of grazing by goats and
315
sheep in semi-arid zone. Proceedings of 4th International Confrence on goats, Brazil.
Shkolnik, A., 1992, Digestive efficiency: significance of body size and of adaptations to a stressful environment. In: Pre-Conf. Proc. V Inti. Corif. on Goats, New Delhi, March 1992. Invited Papers, 2(1):253-260.
Singh, M. K., and Rai, B., Goat production status in the eastern region of India, Indian Herbs Research and Supply, Livestock International.
Singh, S. K., Singh M. K. and Singh N .P ., role of goats in sustainable rural livelihood in India, Thailand Conference.
Singh,K and Ram K. 1987. Economic analysis of goats keeping in the goats breeding tract ofPanjab. Indian J. of Anim.Sci. 57:317 -23.
Singh,M. and Singh, K., 1992, Adaptability to hot climates for growth and reproductive performance. In: Pre-Conf. Proc. V Intl. Conf. on Goats, New Delhi, March 1992. Invited Papers 2(1):244-252.
Singwald, J.P. & Lequenned, D.1985, Resultats de controle laitier en elevage caprin, campagne, ITOVIC, Institut Technique de l'Elevage Ovin et Caprin, Paris.
SK Singh, MK Singh and NP Singh, ( ? )Role of goats in sustainable rural livelihoods in India, Thailand Conference.
Smith, G. C., Carpenter, Z. L. and M Shelton 1978, Effect of ge and quality level on the palatability of goat meat. J. Animal. Sci. 46: 1229.
Smith, G. C., Riley, R. R., Savell, J. W., and M. Shelton. 1982, Yields of dress-off items and carcass quality-quantity measures for Angora and Spanish goats. Proc. 3rd Int. Goat Conf., Tucson, M. pp. 469.
Sopexa, 1986, Goat Farming in France. In: Bulletin de l'Elevage francais: 2-43
Stanton, T.1982, Introduction and acceptance of goats and their socio-economic importance in the Caribbean and Central America. In: Proc. 3rd Inti. Conf. Goat Prod. and Disease,Univ. Arizona, Tucson:182-185.
Vander Westhuysen, J.M., Wentzel, D. & Grobler, M.C., 1988, Angora Goats and Mohair in South Africa, 3rd Edition, The Mohair Board, Port Elizabeth, South Africa.
Wahid et.al. 1992, Status of minerals in bones and soft tissues of four breed groups of goats. In: Pre-Conf. Proc. V Inti. Conf on Goats, New Delhi, March 1992. Abstr. Contrib. Papers: 217.
Wilson, R.T. 1982, Small ruminant breed productivity in Africa. Ed. R.M. Gatemby and J.C.M. Trail ILCA, Addis Ababa, Ethiopia.
Wilson, R. T., 1988.Small ruminant production systems in tropical Africa.Small Ruminant Research, Vol. 1, pp. 305-325.
Wilson, R.T., 1992~ Goat meat production and research in Africa and Latin America in: Pre-Conf. Proc. V Inti. Conf. on Goats, New Delhi, March 1992. Invited Papers 2(2), pp. 458-472.
Winrock International, 1983. Sheep and Goats in developing countries Their present and potential rate, A world Bank technical paper, Washington D.C. U.S.A.
316

Woldeghebriel et al. 1992, A microcomputer model simulating biological control of kudzu-infested timberland by angora goats. In: Pre-Conf. Proc. V Inti. Conf. on Goats, New Delhi, March 1992. Abstr. Contrib. Papers: 137.
Youzhang, Z. 1996, Goat industry and its significance in Chinese economy. In:Proc. VI Inti. Conf. on Goats, 6-11 May 1996, Beijing, China: 1-8.
Zygoyiannis, D., Kufidis, D., Katsaounis, N. & Phillips,P ., 1992, Fatty acid composition of carcass fat of indigenous (Capra prisca) suckled Greek kids and milk of their does. Small Rumin. Res. Vol. 8, pp. 83-95.
317