MARKAL Modeling in Myanmar - IEA-ETSAP
40
1
-
Upload
khangminh22 -
Category
Documents
-
view
2 -
download
0
Transcript of MARKAL Modeling in Myanmar - IEA-ETSAP

1

2
CURRENT ENERGY SITUATION IN MYANMARCURRENT ENERGY SITUATION IN MYANMAR

3
LOCATION OF MYANMAR IN ASEAN , GMS AND BIMSTEC REGIONS
4
UNION OF MYANMARUNION OF MYANMAR
UNION OF MYANMARUNION OF MYANMAR
-- TOTAL LAND AREA = 676,577 KMTOTAL LAND AREA = 676,577 KM2 2
-- SHARING BORDERS WITH ;SHARING BORDERS WITH ;
BANGLADESH & INDIA = NORTHBANGLADESH & INDIA = NORTH--WESTWESTCHINA CHINA = NORTH= NORTH--EASTEASTLAOS = EASTLAOS = EASTTHAILAND = SOUTHTHAILAND = SOUTH--EASTEAST
-- COASTAL STRIP = 2832 KM FACING TO COASTAL STRIP = 2832 KM FACING TO THE BAY OF BENGAL AND ANDAMAN SEA.THE BAY OF BENGAL AND ANDAMAN SEA.
-- ABOUT 52 MILLION PEOPLE ABOUT 52 MILLION PEOPLE WITH AN AVERAGE GROWTH RATE OF 2.0 %WITH AN AVERAGE GROWTH RATE OF 2.0 %PER ANNUM.PER ANNUM.

5
39,720 MW108,000 MWHydro Power310711 mmtonsCoal
207.179 mmbbls3206.388 mmbblsCrude Oil12.617 TCF93.698 TCFNatural Gas
land area covered (344,234 km2)
50.8% of total with forest
Biomass
-93 hot springsGeothermal-5850 mmbblsOil Shale
Identified ReservePotentialSector
Energy Resources of Myanmar

6
CURRENT ENERGY SITURATIONCURRENT ENERGY SITURATION
PRIMERY ENERGY CONSUMPTION
Gas11.09%
Oil14.94%
Hydro6.12%
Coal0.96%
Biomass66.9%
Oil Gas Hydro Coal Biomass

7
STATUS OF EXPLORATIONA. Thoroughly Explored
Basins1. Central Myanmar2. Pyay Embayment3. Ayeyarwady Delta(Only Part of the
Basin)
B. Explored to Some Extent1. Chindwin2. Rakhine Coastal
C. Very Little Explored1. Hukaung2. Shwebo-Monywa3. Bago Yoma
D. Not Explored Yet1. Hsipaw-Lashio2. Namyau3. Kalaw4. Sittaung Valley5. Mawlamyine6. Mepale
SEDIMENTARY BASINSSEDIMENTARY BASINS
ONSHOREONSHORE1.1. RakhineRakhine CoastalCoastal2.2. HukaungHukaung3.3. ChindwinChindwin4.4. ShweboShwebo--MonywaMonywa5.5. Central MyanmarCentral Myanmar6.6. PyayPyay EmbaymentEmbayment7.7. AyeyarwadyAyeyarwady DeltaDelta8.8. BagoBago YomaYoma BasinBasin9.9. SittaungSittaung ValleyValley10.10. MepaleMepale11.11. MawlamyineMawlamyine12.12. NamyauNamyau13.13. HsipawHsipaw--LashioLashio14.14. KalawKalaw
OFFSHOREOFFSHORE1.1. RakhineRakhine offshoreoffshore2.2. MoattamaMoattama offshoreoffshore3.3. TanintharyiTanintharyi offshoreoffshore
Shwe-1
Sedimentary Basins in Myanmar

8
OFFSHORE BLOCKSOFFSHORE BLOCKSIN MYANMARIN MYANMAR

9
Myanmar Offshore Gas Export ProjectsMyanmar Offshore Gas Export Projects
Export Gas Pipeline (Offshore)Export Gas Pipeline (Offshore)
Size Length (mile)36" 216 Yadana offshore36" 39 Yadana land24" 126 Yetagun offshore24" 42 Yetagun land
------------------------------Total 423
------------------------------

10
Gas Export to Thailand from MyanmarGas Export to Thailand from Myanmar(BSCF)
1283.897298.018985.879TOTAL282.73092.339190.3912003 / 046.
273.55481.929191.6252002 / 035.
267.98875.830192.1582001 / 024.
281.17147.920233.2512000 / 013.
148.455-148.4551999 / 20002.29.999-29.9991998 / 991.
TOTALYETAGUNYADANAYEARSr.No.
Third Asia Gas Buyers Summit - 2005, New Delhi, India, 14-15 February 2005

11
Natural Gas Export by Pipeline
3.74Indonesia134.90Bolivia12.4.92Turkmenistan11.6.46Argentina10.6.87Myanmar9.10.34Germany8.15.20U.K7.16.82U.S.A6.33.08Algeria5.
42.17Netherlands4.68.37Norway3.98.60Canada2.
131.77Russia1.Export Volume(BCM)CountrySr.No.
Ref: BP’s Statiscal Review of World Energy 2004.

12
Shwe Discovery in Block A-1 by Daewoo (in 2004)
Location - Rakhine Offshore of Myanmar
Type of contract - Production Sharing Contract
Date of contract - August 4, 2000
Max Gas Flow Rate - 32 mmcfd (Shwe Well 1A – 2004 Jan)
Estimated Gas Reserves - 4.2 TCF – 5.8 TCF
AA--11
AA--33
The partners in A-1 and their interests- Daewoo (Operator, Korea) 60 %
- ONGC Videsh (India) 20 %
- Gas Authority of India Ltd. (GAIL) 10 %
- Korea Gas Corporation (Korea) 10 %
Partner in Block A-3 and its interest- Daewoo (Korea) 100%
Third Asia Gas Buyers Summit - 2005, New Delhi, India, 14-15 February 2005

13
Development Options for A-1 Natural Gas Reserves
• Liquefied Natural Gas (LNG) Plant (Size Options)
• Pipeline Gas to India (Route Options)
• Special Economic zone in Rakhine Region (Myanmar)
Third Asia Gas Buyers Summit - 2005, New Delhi, India, 14-15 February 2005

14
46.36Lignite
15.18Sub-bit (other)
18.19Sub-bit (Kyethee)
20.2Sub-bit (Pinluang)
87.78Sub-bit (Kalewa)
89.0Sub-bit (Mawleik)
33.91Sub-bit (Tamu)
RecoverableRecoverableReservesReservesCoal ResourcesCoal Resources
771.82198.19962.152003-04
439.87120.40550.202002-03
531.25113.00631.932001-02
401.88132.71571.142000-01
90.3650.35184.501999-00
-64.3053.611998-99
ExportExportCons.Cons.Prod.Prod.YearYear
COAL RESOURCES,COAL RESOURCES,PRODUCTION & CONSUMPTIONPRODUCTION & CONSUMPTION
( Million Tons ) ( Thousand Tons )

15
ELECTRIC POWER
Total ( Grid system + Isolated ) PercentageHydroelectric 712.80 39.6 %Gas Turbines 698.60 38.8 %Steam Turbines 323.00 18.0 %Diesel 65.39 3.6 %
1799.79 100.0 %
Hydroelectric39.6%
Steam Turbines18.0%
Diesel3.6%
Gas Turbines38.8%
Gas Turbines Hydroelectric Steam Turbines Diesel
Installed Capacity (MW)ELECTRIC POWER SECTORELECTRIC POWER SECTOR
16
CURRENT MARKAL ACTIVITIES IN MYANMARCURRENT MARKAL ACTIVITIES IN MYANMAR

17
CLMCLM
ENERGY POLICY AND SYSTEM ANALYSIS ENERGY POLICY AND SYSTEM ANALYSIS PROJECTPROJECT
UNDERUNDER
THE REGIONAL PARTNERSHIP SCHEMETHE REGIONAL PARTNERSHIP SCHEME’’S S ASEAN AUSTRALIAN DEVELOPMENT ASEAN AUSTRALIAN DEVELOPMENT
COOPERATION PROGRAMCOOPERATION PROGRAM
(RPS(RPS--AADCP)AADCP)
18
PROJECT OBJECTIVESPROJECT OBJECTIVES
•• to enhance the capacity of CLM energy to enhance the capacity of CLM energy policy analysis and energy planning to policy analysis and energy planning to assess the impacts and costassess the impacts and cost--effectiveness of effectiveness of alternative energy and technology options alternative energy and technology options which could assist the CLM countries to which could assist the CLM countries to formulate sustainable energy policy and formulate sustainable energy policy and programs to help meet the energy demand programs to help meet the energy demand at least cost at least cost

19
PROJECT BACKGROUNDPROJECT BACKGROUND•• Australian Managing Contractor Australian Managing Contractor --SMEC invited SMEC invited
Myanmar to participate in EPSAP Project under Myanmar to participate in EPSAP Project under the AADCPthe AADCP--RPS in September 2003.RPS in September 2003.
•• MYANMAR joined the Project with the MYANMAR joined the Project with the shorthenshorthentime frame commenced late in September 2003. time frame commenced late in September 2003.
•• Letter of Agreement between Energy Planning Letter of Agreement between Energy Planning Department ,Ministry of Energy , Myanmar and Department ,Ministry of Energy , Myanmar and ETSAPETSAP Primary System Coordinator Primary System Coordinator -- Decision Decision Ware Inc in January 2004.Ware Inc in January 2004.
•• ANSWER End User License Agreement signed ANSWER End User License Agreement signed between Energy Planning Department,Ministry of between Energy Planning Department,Ministry of Energy,Myanmar and NOBLEEnergy,Myanmar and NOBLE--SOFT SYSTEM SOFT SYSTEM PTY,LTD ,Australia in January 2004.PTY,LTD ,Australia in January 2004.

20
PROJECT ACTIVITIESPROJECT ACTIVITIES•• The National Coordinating Committee and The National Coordinating Committee and
National Project Team were established in National Project Team were established in October 2003 comprising the members from the October 2003 comprising the members from the major energy sector in Myanmar (Oil & Gas major energy sector in Myanmar (Oil & Gas Sector,Electric Power Sector, and Coal sector).Sector,Electric Power Sector, and Coal sector).
•• The Project was commenced in late 2003 when The Project was commenced in late 2003 when Australian Coordinating Partner (ACP) conducted Australian Coordinating Partner (ACP) conducted MARKAL training MARKAL training progeamprogeam for all CLM National for all CLM National Project Team members in Project Team members in PhenomPhenom Penh , Penh , CambodiaCambodia ..

21
PROJECT ACTIVITIESPROJECT ACTIVITIES(Contd(Contd))•• The main activities of program are listed below The main activities of program are listed below
chronologically:chronologically: , ,
Basic MARKAL training conducted by the Australian Basic MARKAL training conducted by the Australian Coordinating Partner(ACP).(November to Coordinating Partner(ACP).(November to decemberdecember2003).2003).
MARKAL Database design,data collection , database MARKAL Database design,data collection , database development and enhancement (January to April 2004).development and enhancement (January to April 2004).

22
PROJECT ACTIVITIESPROJECT ACTIVITIES(contd(contd))
Discussion and finalizing of the topic for national Discussion and finalizing of the topic for national energy policy and report planning (June to July 2004).energy policy and report planning (June to July 2004).
Further training over the period of Myanmar team Further training over the period of Myanmar team member work attachment to the ASEAN Centre for member work attachment to the ASEAN Centre for Energy (ACE) during July 2004.Energy (ACE) during July 2004.
23
PROJECT ACTIVITIESPROJECT ACTIVITIES(contd(contd))
Formulate scenarios and cases for the policy analysis Formulate scenarios and cases for the policy analysis over the period from November through December 2004. over the period from November through December 2004.
Completion of model runs and draft report by January Completion of model runs and draft report by January followed by report editing by ACE,ACP and reviewing followed by report editing by ACE,ACP and reviewing by ABARE.by ABARE.

24
PROJECT ACTIVITIESPROJECT ACTIVITIES(contd(contd))NATIONAL POLICY STUDY TOPICSNATIONAL POLICY STUDY TOPICS
The Topic chosen for the national policy study is:The Topic chosen for the national policy study is:
““Self Sufficiency in Liquid FuelsSelf Sufficiency in Liquid Fuels--Option and StrategiesOption and Strategies””
The study was largely performed over a period ofThe study was largely performed over a period ofabout 2 months from November through December 2004.about 2 months from November through December 2004.
The topic is considerable interest to Myanmar whichThe topic is considerable interest to Myanmar whichis endowed with substantial primary energy resourceis endowed with substantial primary energy resourcein the petroleum and gas sector,but however is forcedin the petroleum and gas sector,but however is forcedto import certain petroleum products.to import certain petroleum products.

25
IMPORTED CRUDE OIL AND IMPORTED CRUDE OIL AND PETROLEUM PRODUCTSPETROLEUM PRODUCTS
YearYear Crude OilCrude Oil DieselDiesel GasolineGasoline1988 1988 -- 8989 0.9020.902 -- --1989 1989 -- 9090 -- 0.1450.145 --1990 1990 -- 9191 0.7740.774 0.1970.197 --1991 1991 -- 9292 1.0131.013 0.2490.249 --1992 1992 -- 9393 0.7990.799 0.8190.819 --1993 1993 -- 9494 1.5931.593 1.1061.106 --1994 1994 -- 9595 2.4372.437 1.3901.390 0.0430.0431995 1995 -- 9696 3.5523.552 1.7781.778 0.0260.0261996 1996 -- 9797 2.7032.703 2.6742.674 0.2750.2751997 1997 -- 9898 4.7944.794 2.5642.564 0.0320.0321998 1998 -- 9999 5.0775.077 3.7423.742 0.3410.3411999 1999 -- 0000 5.0035.003 5.4045.404 0.3740.3742000 2000 -- 0101 4.7244.724 6.3026.302 0.7560.7562001 2001 -- 0202 3.9293.929 6.8716.871 0.7610.7612002 2002 -- 0303 3.4333.433 6.1056.105 0.4510.4512003 2003 -- 0404 -- 6.8026.802 0.1670.167
( Million barrels )

26
PROJECT ACTIVITIESPROJECT ACTIVITIES(contd(contd))
NATIONAL POLICY STUDY TOPICSNATIONAL POLICY STUDY TOPICS““Self Sufficiency in Liquid FuelsSelf Sufficiency in Liquid Fuels--Option and Option and
StrategiesStrategies””The index of self sufficiency is defined as:The index of self sufficiency is defined as:
SS = SS = ( Net domestic production )( Net domestic production )( Total domestic consumption )( Total domestic consumption )
ororSS SS = = ( Net domestic production ( Net domestic production -- Export)Export)
( Total domestic consumption )( Total domestic consumption )

27
PROJECT ACTIVITIESPROJECT ACTIVITIES(contd(contd))
NATIONAL POLICY STUDY NATIONAL POLICY STUDY ––OBJECTIVEOBJECTIVE
To achieve the SS = 100 % in the liquid Fuel byTo achieve the SS = 100 % in the liquid Fuel by
2020.2020.
This Study attempts to find the options andThis Study attempts to find the options and
strategies available for achieving this objective.strategies available for achieving this objective.

28
MARKAL MODEL AND DATABASE
• Cooking and lighting in the residential sector;• Process heat (boilers) and electric drive (motors) in
the industrial sector;• Lighting and air-conditioning in the commercial
sector; and• Private car transportation, taxis and buses in the
transport sector.

29
MARKAL DATABASE TECHNOLOGY
• Resource technologies covering primary energy supply, imports and exports;
• Conversion technologies, which for the ASEAN countries provide electricity generation, but can also include district heat;
• Process technologies where fuels are transformed into different products such as processing crude oil to produce refined petroleum products in an oil refinery;
• Demand technologies that are used by consumers to provide useful energy services such as an LPG or kerosene stove used in cooking.

30
SUPPLY OPTIONS FORLIQUID FUELS
Sr. Name of Plant Capacity Process PlantsNo. ( BOPD )1. Thanlyin Refinery 26,000 Crude Oil Distillation
Unit A,B,C; SBP Plant; LPG Terminal; Lube Blending Plant; Delayed Coker Plant; Candle Factory; Drum Manufacturing Plant.
2. Chauk Refinery 6,000 Wax Extraction Plant; Candle Factory.
3. Thanbayakan Refinery 25,000 Topper; Reformer; Delayed Coker Plant; Naphtha HDS; Kerosene Smoke Point Improving & LPG Recovery Units.
EXISTING REFINERIES

31
SCENARIOS AND CASES
Allow fuel substitution in transportTRSUB
High discount rate of 15%PESSDIS
Low discount rate of 7%OPTDIS
Low crude oil prices (30$/bbl)LOWOIL
High crude oil prices (55$/bbl)HIGHOIL
Govt energy policyGPOLICY
Myanmar Base Data (Crude 40$/bbl)BASE
DescriptionScenario
SCENARIOS
32
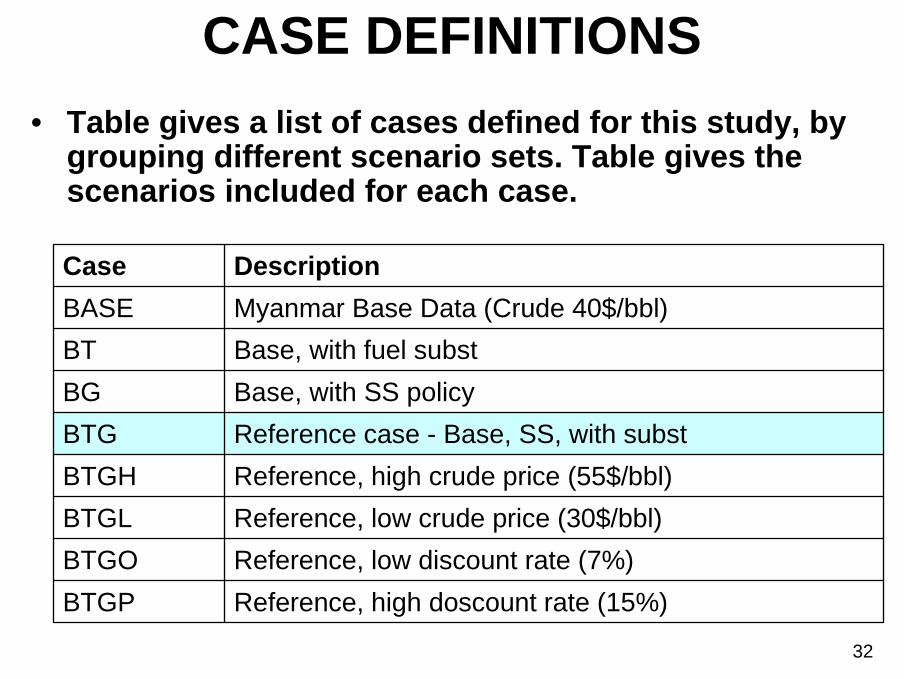
CASE DEFINITIONS• Table gives a list of cases defined for this study, by
grouping different scenario sets. Table gives the scenarios included for each case.
Reference, high doscount rate (15%)BTGPReference, low discount rate (7%)BTGOReference, low crude price (30$/bbl)BTGLReference, high crude price (55$/bbl)BTGHReference case - Base, SS, with substBTGBase, with SS policyBGBase, with fuel substBTMyanmar Base Data (Crude 40$/bbl)BASEDescriptionCase

33
STATIC ANALYSIS
( c )9.567.280.836.45Light crudeNew refinery( a )5.307.510.277.24Heavy crude( b )6.456.720.276.45Light crudeThanlyin
(expansion)
( c )7.163.590.742.85Condensate( a )6.337.190.746.45Light crudeThanbayakan
(existing)
( c)6.743.710.862.85Condensate( c)7.437.310.866.45Light crudeThanlyin
(existing)
Cost($/GJ)Fuel
CategoryOutput value($/GJ)
Total cost($/GJ)
Refinery cost($/GJ)
FeedstockName of Refinery
THE REFINERY SECTORthe operation of a refinery can be classified under three categories:a) Uneconomical to operate or expandb) Economical to operate but not expandc) Economical to operate and expand.

34
STATIC ANALYSIS
• THE TRANSPORT SECTORCar transport (diesel, gasoline, LPG and CNG)Bus transport (diesel, gasoline and CNG)Truck transport (diesel and gasoline)Taxi transport (diesel, gasoline, LPG and CNG)

352,40524,01126,4163,7253,5129,496BTGP2,39624,01126,4073,7323,51213,833BTGO2,32924,01126,3403,7253,51117,219BTGL2,40424,01126,4153,7323,6292,960BTGH2,39624,01126,4073,7323,51211,546BTG
2,35124,01126,3623,7323,51212,523BG2,39624,01126,4073,7253,51211,355BT1,89924,01125,910
34,541
3,725
3,850
3,508
3,629
12,540BASE
ActualLimitActualLimitActualLimit
Nat. Gas (PJ)
Nat. Gas (PJ)
Natural Gas (PJ)
Condensate (PJ)
Crude Oil (PJ)
UseExportExtraction
Discounted Cost (M$)Case
Primary Fuel Balance
ANALYSIS OF RESULTSPRIMARY FUEL BALANCE

36
ACHIEVEMENT OF POLICY OBJECTIVE BY DIFFERENT
CASES IN 2020
100%5,5555,5556266,1819,496BTGP
100%5,5765,5766136,18913,833BTGO
100%5,6215,6215596,18017,219BTGL
100%5,5405,5395446,0832,960BTGH
100%5,5695,5696196,18911,546BTG
100%5,5465,5466436,18912,523BG
84%5,5944,6971,4846,18111,355BT
57%5,8383,3092,8676,17612,540BASE
SelfSufficiency
TotalConsumption
(PJ)
NetDom. Supply
(PJ)
TotalExport
(PJ)
TotalDom.Supply
(PJ)
DiscountedCost(M$)
Case
Achievement of Policy Objective (from 2020)

37
PETROLEUM PRODUCTS USED IN TRANSPORT SECTOR
Consumption of (substitutable) Petroleum Products in the Transport Sector (PJ)-Case-BTG-Reference case - Base, SS, with subst
0.00
50.00
100.00
150.00
200.00
250.00
300.00
2000 2005 2010 2015 2020 2025 2030 2035Gasoline Diesel (ADO and IDO) Compressed Natural Gas LPG

38
CONCLUSIONS AND RECOMMENDATIONS
• Self sufficiency of liquid fuels starting from 2020 can only be achieved by allowing fuel substitution in the transport sector.
• Fuels in the order of the lowest to highest cost in the transport sector:1. CNG2. Gasoline3. LPG4. Diesel(car, taxi, bus and truck are transport sub-sectors)

39
CONCLUSIONS AND RECOMMENDATIONS
• It is highly desirable to implement the CNG conversion program to the maximum technical limit from 2010 and a LPG conversion program from 2020if more condensate reserves cannot be utilized.
• The new refinery commissioned in 2020 has only the facility to process domestic crude oil.This can be concluded as a major limitation as it runs only at approx 50% capacity factor, exhausting practically all domestic crude oil reserves by 2035.An added flexibility of refining condensate in this refinery would be a definite advantage.

40