Marital Fertility Control in a Kerala Village - ANU Open Research
263
Marital Fertility Control in a Kerala Village: A Microdemographic Study Thesis submitted for the degree of doctor of philosophy of the Australian National University Pilakudi Narayan Sushama June 1989
-
Upload
khangminh22 -
Category
Documents
-
view
1 -
download
0
Transcript of Marital Fertility Control in a Kerala Village - ANU Open Research
Marital Fertility Control in a Kerala Village: A Microdemographic Study
Thesis submitted for the degree of doctor of philosophy
of the Australian National University
Pilakudi Narayan Sushama
June 1989

Except Where Otherwise Indicated, this thesis is my own work
P.N.Sushama
iii
ACKNOWLEDGEMENTS
It is a great pleasure to acknowledge all the people who have helped me during the various stages of this thesis, although not all names can be mentioned here.
Thanks are due to the Department of Demography, for accepting me as a research scholar, and to the Australian National University and the Population Council for theirfinancial assistance. I am thankful to my principalsupervisor, Professor J.C. Caldwell for his constantsupport and guidance and my other supervisors Dr. Gavin Jones and Dr. K. Srinivasan, for their advice and comments which were of great help.
I have also benefited from the advice and suggestions given by Professor Helmut Mühsam, and Drs. Caroline Ifeka, Gigi Santow, K.N.S. Yadava, Sheila Macrae and Terry Hull. Special thanks also go to Pat Caldwell who took active interest by reading and commenting on several draft chapters. Discussions with Bruce Caldwell and Dr. M. Guruswamy were of immense help. I also owe thanks to Jenny Widdowson and Di Cook, former programmers in the department, for helping me with computer Programms.
I am extremely thankful to Wendy Cosford who took the trouble to read all my draft chapters and made valuable suggestions to improve the presentation.
ivI owe my greatest debt to the people of Palankara, who
were patient and tolerant of my frequent visits to their homes and my questions on many personal matters. I also thank Umadevi who gave me shelter during the fieldwork and I cannot forget the field assistance I received from Ambika, Narayan, Lata, Satish and Ravi.
I also thank my colleagues and friends, particularly, Indrani, Ramanee, Roberto, Ahmet, Rapin, Michael and Sandhya who kept me going on all those gloomy days and without whom my stay in Canberra would have been very lonely.
I am also grateful to my mother Devaki, my brother Babu and my uncle Damodaran for their emotional support and I am indebted to my late father P.N. Bhattathiri, who without gender bias encouraged me in whatever I did.

V
ABSTRACT
Rapid fertility decline in Kerala did not conform with demographic transition theory, as the decline occurred in a still predominantly rural setting.
This thesis employed a combination of qualitative and quantitative methods to examine rhe motivation and processes of rapid fertility decline in a Kerala village.
Fertility has declined in the village during the 1970s and 1980s and current fertility has reached replacement level. Though the proximate determinants are postponement of marriage and extensive use of contraceptives, the changes in these factors were the result of changing socioeconomic conditions.
At the time of study the singulate mean age at marriage was 29 years for males and 23 years for females, higher than elsewhere in India. Postponement of marriage was a combined effect of favourable attitudes towards higher marriage age, the expansion of education, and economic changes.
Higher use of contraceptives is attributed to their availability, but seems to reflect changes in attitude that in turn reflect social and economic changes, as a result of these changes smaller families became advantageous. The factors influencing fertility decline are decreasing agricultural opportunities, expanded education and mortality decline. These changes were taking place in

viKerala at the beginning of the century, but when the family planning program was implemented, there were favourable conditions for a rapid fertility decline.
vii
TABLE OF CONTENTS
ACKNOWLEDGEMENTS iiiABSTRACT vLIST OF TABLES xiLIST OF FIGURES xii
CHAPTER 1 Kerala - A Unique Phenomenon in IndianDemographic Transition 1
1.1 Introduction 11.1.1 Threshold Hypothesis to Explain
Fertility Transition 31.1.2 Sociological Theories to Explain
Fertility Transition 41.1.3. Economic Theories to Explain
Fertility Transition 61.1.4. Wealth Flows Theory 91.1.5 Value of Children 11
1.2 Fertility Decline in Kerala State -its Uniqueness 15
1.3 Explanations for Fertility Decline 181.4 Objectives Of The Study 22
CHAPTER 2 Methods of Data Collection 262.1 Choice of Micro-approach 282.2 Selection of the Study Village 332.3 Organization of Field Work 382.4 Data Collection 41
2.4.1 Household Census 422.4.2 In-depth Interviews 452.4.3 Observation 47
2.5 Summary 49
51CHAPTER 3 Palankara - The Village, its Economic
and Social Transformation3.1 The Village 51
3.1.1 Age Structure 543.2 Economic Changes 56
3.2.1 Land Distribution. 563.2.2 Occupational Structure 59
3.3 Social Change 633.3.1 Changes in Education 643.3.2 Utilization of Health Services. 703.3.3. Religion in Palankara 753.3.4. Changes in The Hindu Caste System 77
3.3.4.1 Nambuthiris 793.3.4.2 Nayars 803.3.4.3 Velathedth Nayars 823.3.4.4 Asaris 833.3.4.5 Kollans 843.3.4.6 Velans 853.3.4.7 Ganakans 853.3.4.8 Panditar 863.3.4.9 Izhavas 863.3.4.10 Pulayas and Parayas 883.3.4.11 Tulu Brahmins, Shaiva
Vellalas and Konkanis 903.4 Summary 91
CHAPTER 4 Age at Marriage 924.1 Changes in the Institution of Marriage 924.2 Age at Marriage 954.3 Trends in Age at Marriage 964.4 Age at Marriage and Socio-Economic
Conditions 1014.4.1 Religion and A.ge at Marriage 1014.4.2 Schooling and Age at Marriage 1074.4.3 Occupation and Age at Marriage 113
4.5 Attitudes on Age at Marriage 1184.6 Conclusion 123
CHAPTER 5 Fertility and Family Planning in Palankara 1265.1 Introduction 1265.2 Current Fertility Rates 1275.3 Fertility Trends 129
5.3.1 Religion and Fertility levels. 1335.3.2 Schooling and Fertility Levels 1365.3.3 Employment and Fertility Levels. 140

ix5.4 Family Planning 143
5.4.1 Family Planning Program in Kerala 1435.4.2 Family Planning Program in the
Village 1465.5 Pattern of Contraceptive Use 147
5.5.1 Current Family Planning Use 147' 5.5.2 Current Family Planning Use
by Age of Women. 1535.5.3 Current Family Planning Use
by Parity 1555.5.4 Current Family Planning Use by
Surviving Children 1585.6 Selected Characteristics of Family
Planning Users 1605.6.1 Current Family Planning
Use and Religion 1605.6.2 Current Family Planning Use
by Number of Years in Schoolby Husbands and Wives. 162
5.6.3 Family Planning Use and Occupationof Wife 164
5.6.4 Family Planning Use by Husband'sOccupation. 165
5.7 Non-users of Family Planning 1665.8 Summary 168
CHAPTER 6 Preference for Small Families: Motivationsand Processes 1706.1 Reproductive Decision Making 170
6.1.1 Pre-Transition Period 1716.1.2 Fertility Transition Period 173
6.1.2.1 Timing of ReproductiveDecision Making 174
6.1.2.2 Timing of ContraceptiveUse 180
6.1.2.3. The Decision Makers 1836.2 Why Small Families Are Desired 191
6.2.1 Perceived Cost of Living 1916.2.2 Perceived Cost of Education 1946.2.3 Perceived Cost of Medical
Treatment 1986.2.4 Non-Availability of Land
and Desire for Small Family 2006.2.5 Why Women Desire Small Families. 201
6.3 Why Couples Desire Children 2036.4 Societal Changes and Preference
for Small Family 2066.4.1 Societal Changes. 2066.4.2 Changes in Mortality 2106.4.3 Family Planning Programme 213
6.5 Summary and Conclusion 214

CHAPTER 7 Summary and Conclusion 2167.1 Summary 2167.2 Conclusion 2227.3 Future Trends in Fertility t 228
REFERENCES 229
APPENDIX 242
xi
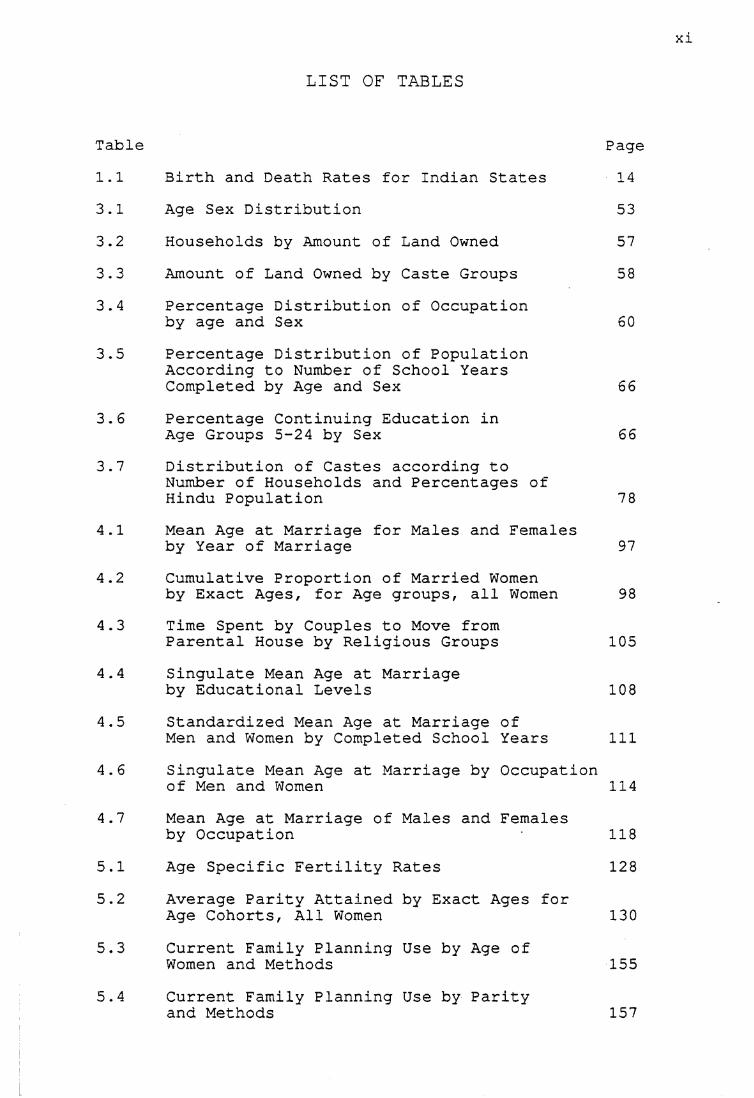
LIST OF TABLES
Table Page1.1 Birth and Death Rates for Indian States 143.1 Age Sex Distribution 533.2 Households by Amount of Land Owned 573.3 Amount of Land Owned by Caste Groups 583.4 Percentage Distribution of Occupation
by age and Sex 603.5 Percentage Distribution of Population
According to Number of School Years Completed by Age and Sex 66
3.6 Percentage Continuing Education inAge Groups 5-24 by Sex 66
3.7 Distribution of Castes according to Number of Households and Percentages ofHindu Population 78
4.1 Mean Age at Marriage for Males and Femalesby Year of Marriage 97
4.2 Cumulative Proportion of Married Womenby Exact Ages, for Age groups, all Women 98
4.3 Time Spent by Couples to Move fromParental House by Religious Groups 105
4.4 Singulate Mean Age at Marriageby Educational Levels 108
4.5 Standardized Mean Age at Marriage ofMen and Women by Completed School Years 111
4.6 Singulate Mean Age at Marriage by Occupationof Men and Women 114
4.7 Mean Age at Marriage of Males and Femalesby Occupation 118
5.1 Age Specific Fertility Rates 1285.2 Average Parity Attained by Exact Ages for
Age Cohorts, All Women 1305.3 Current Family Planning Use by Age of
Women and Methods 1555.4 Current Family Planning Use by Parity
and Methods 157
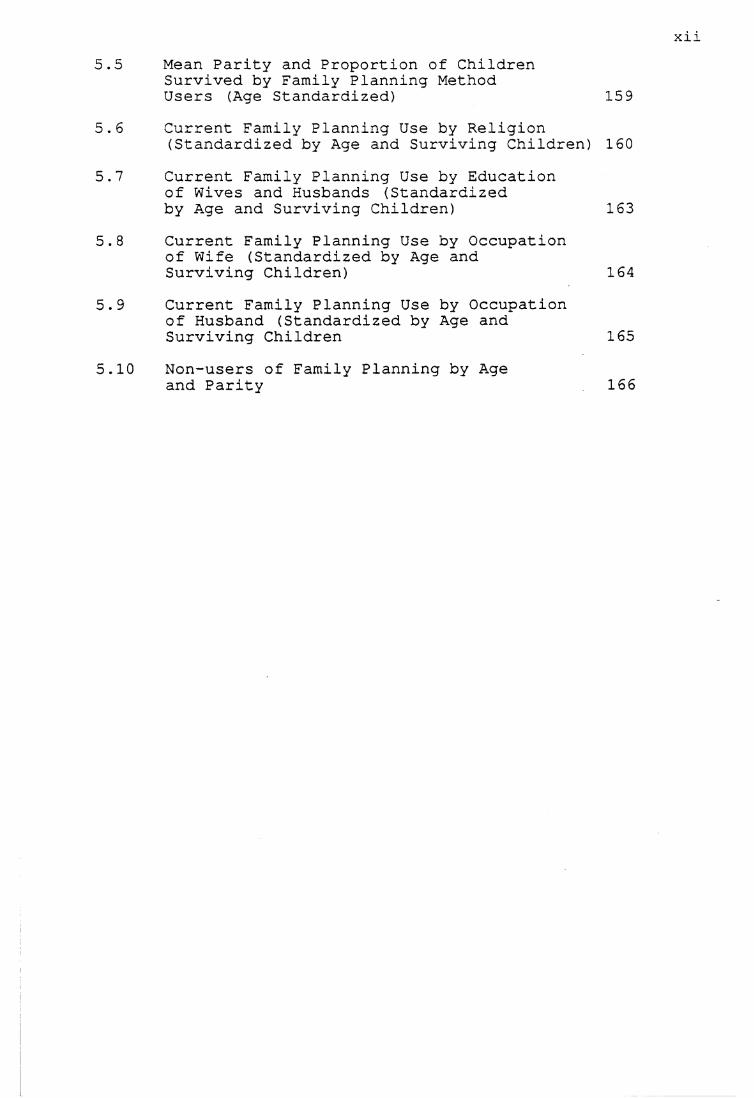
xii5.5 Mean Parity and Proportion of Children
Survived by Family Planning MethodUsers (Age Standardized) 159
5.6 Current Family Planning Use by Religion(Standardized by Age and Surviving Children) 160
5.7 Current Family Planning Use by Education of Wives and Husbands (Standardizedby Age and Surviving Children) 163
5.8 Current Family Planning Use by Occupation of Wife (Standardized by Age andSurviving Children) 164
5.9 Current Family Planning Use by Occupationof Husband (Standardized by Age and Surviving Children 165
5.10 Non-users of Family Planning by Ageand Parity 166
xiii
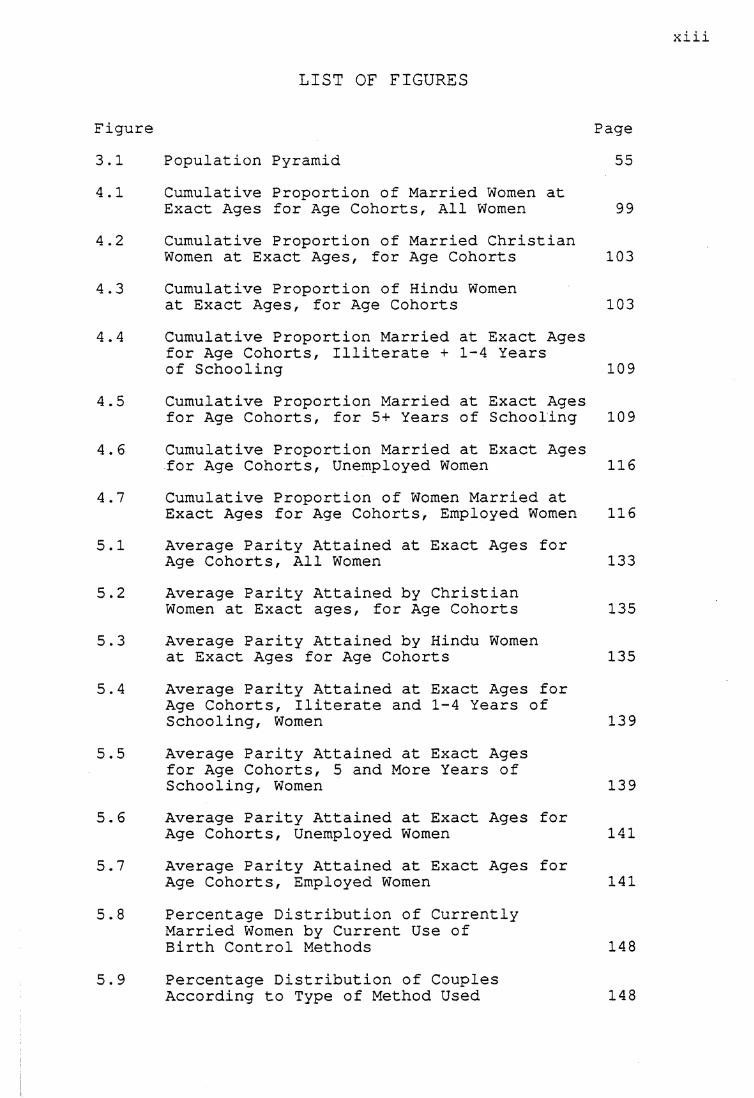
LIST OF FIGURES
Figure Page3.1 Population Pyramid 554.1 Cumulative Proportion of Married Women at
Exact Ages for Age Cohorts, All Women 994.2 Cumulative Proportion of Married Christian
Women at Exact Ages, for Age Cohorts 1034.3 Cumulative Proportion of Hindu Women
at Exact Ages, for Age Cohorts 1034.4 Cumulative Proportion Married at Exact Ages
for Age Cohorts, Illiterate + 1-4 Yearsof Schooling 109
4.5 Cumulative Proportion Married at Exact Agesfor Age Cohorts, for 5+ Years of Schooling 109
4.6 Cumulative Proportion Married at Exact Agesfor Age Cohorts, Unemployed Women 116
4.7 Cumulative Proportion of Women Married at Exact Ages for Age Cohorts, Employed Women 116
5.1 Average Parity Attained at Exact Ages forAge Cohorts, All Women 133
5.2 Average Parity Attained by ChristianWomen at Exact ages, for Age Cohorts 135
5.3 Average Parity Attained by Hindu Womenat Exact Ages for Age Cohorts 135
5.4 Average Parity Attained at Exact Ages forAge Cohorts, Iliterate and 1-4 Years of Schooling, Women 139
5.5 Average Parity Attained at Exact Agesfor Age Cohorts, 5 and More Years of Schooling, Women 139
5.6 Average Parity Attained at Exact Ages forAge Cohorts, Unemployed Women 141
5.7 Average Parity Attained at Exact Ages forAge Cohorts, Employed Women 141
5.8 Percentage Distribution of CurrentlyMarried Women by Current Use ofBirth Control Methods 148
5.9 Percentage Distribution of CouplesAccording to Type of Method Used 148

xiv5.10 Percent Sterilized of all Sterilization
by Year 1505.11 Percentage Distribution of Births by
Place of Births 1505.12 Current Use of Family Planning Methods
by Age 1545.13 Current Use of Family Planning Methods by
Parity 1565.14 Current Family Planning Use by Surviving
Children 158
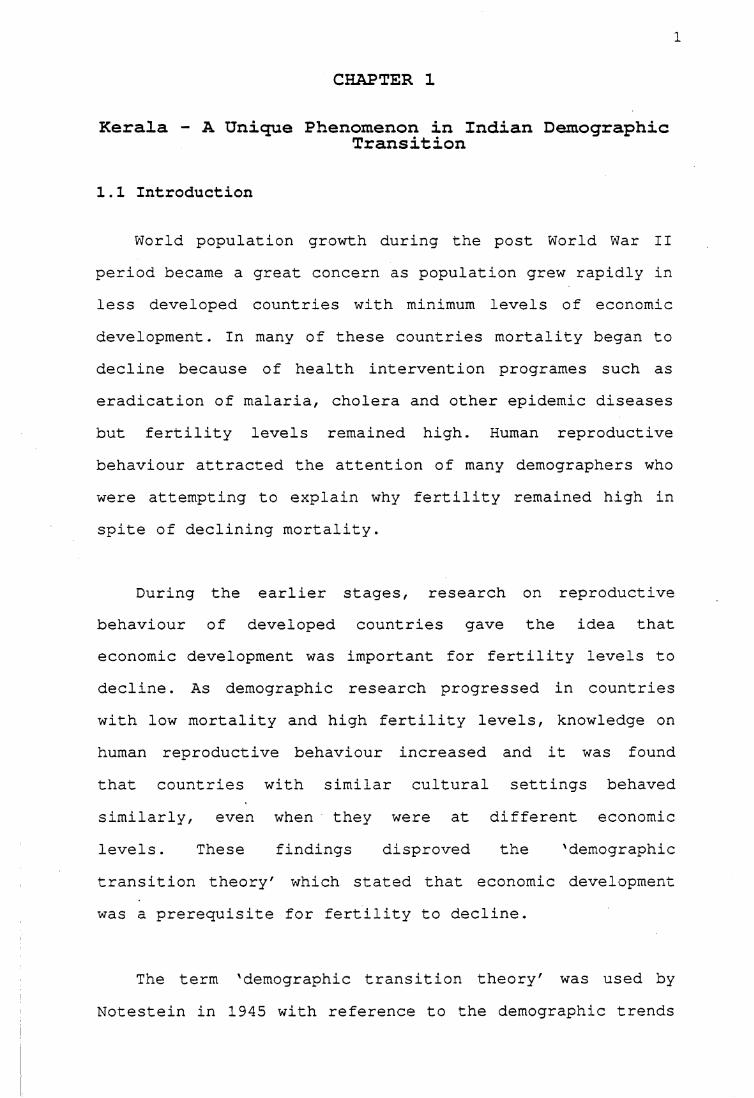
CHAPTER 1
Kerala - A Unique Phenomenon in Indian DemographicTransition
1.1 Introduction
World population growth during the post World War II period became a great concern as population grew rapidly in less developed countries with minimum levels of economic development. In many of these countries mortality began to decline because of health intervention programes such as eradication of malaria, cholera and other epidemic diseases but fertility levels remained high. Human reproductive behaviour attracted the attention of many demographers who were attempting to explain why fertility remained high in spite of declining mortality.
During the earlier stages, research on reproductive behaviour of developed countries gave the idea that economic development was important for fertility levels to decline. As demographic research progressed in countries with low mortality and high fertility levels, knowledge on human reproductive behaviour increased and it was found that countries with similar cultural settings behaved similarly, even when they were at different economic levels. These findings disproved the 'demographic transition theory' which stated that economic development was a prerequisite for fertility to decline.
The term 'demographic transition theory' was used by Notestein in 1945 with reference to the demographic trends
2observed in many developed countries- The theory states that fertility decline is caused by a 'preceding decline of mortality' as a result of economic development and the higher levels of living connected with it. This explanation was based mainly on two observations. First; that fertility and mortality are high in traditional societies and low in modern societies. The traditional societies were characterized by high mortality levels, an agrarian economy, low literacy levels, low economic development and an extended family system as opposed to modern societies which were industrialized, had low levels of mortality, high educational levels and nuclear families. Second; every modern society had passed from high to low mortality and fertility rates. This phenomenon was thought to have occurred in three stages; a balanced stage of high potential growth when both birth rates and death rates were high; a transitional stage of rapid growth when death rates fell but birth rates remained high, and a third stage when both birth rates and death rates were low with a potential for dwindling population.
However, detailed empirical work has shown that this theory cannot be applied universally to all the countries. Demographers have found that in some European communities fertility fell simultaneously with or before mortality. Moreover, difficulties arose in relating the transition in different areas to any consistent set of social or economic factors. Countries that differed widely with respect to industrialization and urbanization experienced a decline at about the same time. Also, researchers have uncovered
examples in which decline began in less advanced countries (Coale, 1973, Teitelbaum, 1975). Indeed, according to Freedman (1975:2),
the diversity of the historical record may require several different theories for different circumstances or a revised general theory quite different from that which has been accepted for many years'.
The classical demographic transition theory also failed to explain the type or degree of modernization necessary to induce fertility decline and it could not reliabily identify a population in which fertility would fall at a specified time. Ever since scholars started questioning the 'demographic transition theory', a number of other theories have been put forth.
1.1.1 Threshold Hypothesis to Explain Fertility Transition.
The 'threshold hypothesis' emphasized the role of socio-economic development in initiating a strong downward trend in fertility. According to this hypothesis,
in a developing country where fertility is initially high, improving economic and social conditions are likely to have little if any effect on fertility until a certain economic and social level is reached; but once that level is achieved, fertility is likely to enter a decided decline and to continue downward until it is again stabilised on a much lower plane (United Nations, 1965:143) .
Kirk (1971:146), supporting the 'threshold hypothesis', emphasized the role of cultural factors in identifying the threshold levels for initiating fertility reductions in developing countries and argued that the threshold levels are different within the major cultural regions.Empirically investigating the threshold hypothesis theory,
4Srikantan (1977:231) applied 'threshold hypothesis' to explain fertility decline in selected states in India and found that lower fertility was associated with certain aspects of modernization and structural change.
However, the threshold hypothesis failed to identify a precise threshold of modernization that would reliably identify a population in which fertility is ready to fall (Coale, 1973:64). Another limitation- of its predictive power is that 'threshold' levels are changing over time in any given country or cultural area (Jones, 1976:5).
1.1.2 Sociological Theories to Explain Fertility Transition
The sociologists' framework to explain fertility decline emphasized the importance of cultural factors in the determination of fertility decline. In 1954 Lorimer, while reviewing the demographic transition theory, emphasized the importance of cultural factors in fertility decline because reproductive practices of particular societies operate within total social structures (Lorimer, 1954:20) .
The importance of cultural and social norms in fertility studies was also implicit in the classical analytical framework devised by Davis and Blake, which has proved very useful in facilitating the systematic study of fertility. As Davis and Blake (1956:211) stated, 'such factors would be those through which, and only through which cultural conditions can effect fertility'. These factors referred to as 'intermediate variables' were also
5proximate determinants through which any change in fertility must take effect. This framework helped in systematizing the study of fertility. Freedman (1975: ISIS) constructed a model for the sociological analysis of fertility levels where environmental factors and social and economic structure (including family planning program activity) act on fertility via the Davis and Blake series of intermediate variables which are said to operate through their effect on norms.
Later, Bongaarts (1978:125) identified four important proximate determinants: marriage, postpartum infecundability, contraception and induced abortion, through which social and cultural norms act and noted that any changes in these four factors have a significant effect on fertility. Freedman (1979:14) reviewing fertility decline in developing countries, concluded that there are multiple pathways to fertility decline.
Reviewing the 'demographic transiton theory', Coale (1973:65) concluded that marital fertility declined under diverse circumstances and three preconditions must be fulfilled for the sustained decline of marital fertility: fertility must be within the calculus of conscious choice; reduced fertility must be advantageous; and effective techniques of fertility reduction must be available.
Modernization can produce the first two conditions and the third may be latent. Then again societies differ widely in their socio-economic and cultural characteristics.
6Societies may respond differently to fertility control even when these three preconditions exist. Experience of less developed countries has shown that prevalence of these preconditions produces marital fertility decline even in the absence of 'extensive modernization' .
1.1.3. Economic Theories to Explain Fertility Transition.
The basis for economic theories of fertility decline is that people make decisions either by going through a maximization calculation or by doing things which result in the maximization of utility and profits. The economic framework or demand theory or 'new home economics' of the 'Chicago school' (Becker, 1960, 1965, Easterlin, 1975, Schultz, 1971, 1974) conceptualizes the family as a decision-making unit, maximizing both its production resources and activities and its consumption utility. Since parenting demands significant time, couples who choose to do so must have weighed rewards from bearing and rearing children against those from alternatives. Here children are durable goods, giving satisfaction over time and comparable with alternatives such as stereo systems and cars. Moreover, the 'opportunity costs' of having children, along with the 'quality of life of children' (operationally defined as how much time, money and effort the parent has and is willing to spend on the offspring), will vary among families.
Blake (1968) questioned the idea of treating children as consumer goods and explained that a theory of reproduction is also a theory of family and society. Becker
7failed to explain the important elements in the sociology of family and he did not take into consideration cultural factors affecting fertility behaviour. Jones (1976), presenting a number of key reasons, suggested that the demand theory of fertility is not readily applicable to developing countries, as it is heavily influenced by a Western and, even more, American world view. In some cultures women have little access to employment outside the home, so the opportunity cost of motherhood is irrelevant. Further, child care help without opportunity costs to the care-giving parent is often readily available from other kin. Even then, children's role as 'consumer durables' is outweighed by their role as productive agents and as a source of security. One weakness of the economic theory according to Jones (1976:20), lies in its inapplicability to a population where 'natural fertility' is below 'desired fertility' . Finally, the theory does not take into consideration the availability and accessibility of birth control methods that are sufficiently reliable.

8Easterlin (1975) developed an economic framework for
fertility analysis and incorporated some of the views expressed by non-economists. According to Easterlin the determinants of fertility work through one or more of the following:
1. the demand for children (desired family size), that is the number of surviving children parents would want if fertility regulation were costless,
2 the 'potential output' of children (natural fertility), the number of surviving children parents would have if they did not deliberately limit fertility and3 the costs of fertility regulation which included both subjective (psychic) costs and objective costs, the time and money required to learn about and use specific techniques.
The first of the three emphasizes the survival of children. Parents may desire a certain number of children depending on the survival prospects of children, even though tastes, prices and income remain unchanged.
The second statement refers to 'natural fertility' if there is no fertility regulation. The natural fertility of a society depends partly on physiological or biological factors and partly on cultural practices. The potential output of and demand for children jointly determine the motivation for fertility regulation. If the potential output falls short of demand, there is no desire to limit fertility. On the contrary, an 'excess demand' situation of this type would result in a demand for ways to enhance fertility regulation and for the adoption of contraception.
In an 'excess supply' situation parents would be faced with the prospect of having unwanted children and would be
motivated to regulate their fertility. But motivation is not a sufficient condition and there are costs incurred in fertility regulation, costs of time and money in use of specific techniques. There are also psychic costs of displeasure associated with the idea or practice which depends on societal attitudes and the degree of access to fertility control methods. This theory stresses more the biological aspects of fertility than the sociological aspects.
After reviewing the European fertility transition, Knodel and van de Walle rephrased the framework developed by Easterlin:
1 European transition suggests the relative lack of importance of income and prices and determining the demand for children prior to or during early stages of the fertility decline
2 decline of fertility occurred among countries with very different supply functions, both in terms of overall fertility and in terms of childhood survival3 cost of fertility regulation is an extremely important component of an explanation of fertility decline. This also includes diffusion of attitudes towards knowledge of contraception and of contraceptive techniques and implements themselves may trigger or accelerate the decline of fertility (1982:275).
They also stressed the importance of cultural factors among those that appeared to influence the onset and spread of fertility decline in European countries.
1.1.4. Wealth Flows Theory
Caldwell (1982:152) used the concept of 'wealth flows' to explain both stable high fertility and the onset of sustained fertility decline. In this context 'wealth flows'
is defined as 'ail the money, goods, services and guarantees that the person provides to another' (Caldwell, 1982:333). According to this theory,
10
In general, in societies of every type and stage of development, fertility behaviour is rational, and fertility is high or low as a result of economic benefit to individuals, couples, or families in its being so. Whether high or low fertility is economically rational is determined by social conditions: primarily by thedirection of the intergenerational wealth flow. This flow has been from younger to older generations in all traditional societies; and it is apparently impossible (or at least, examples are unknown) for a reversal of flow-at the great divide-to occur before the family is largely nucleated both emotionally and economically. A fair degree of emotional nucleation is needed for economic nucleation; and considerable amounts of both are required before parents are free to indulge in ever greater expenditures on their children (Caldwell, 1982:152).
The 'wealth flows' theory of fertility is basically about the changes in the nature of family relationships as a result of changes in the family's internal economic structure. Caldwell theorizes that changes in economic relationships are brought about by a change in the emotional balance within the family.
.... the rules about who can get what from whom (and how much) and who can tell whom to do what fundamentally alter, thus rendering high fertility • (indeed any fertility) disadvantageous. Very subtle shifts in emotional relationships within the family, usually reflecting changes in society's attitudes towards male- female and parent-child relationships, can dramatically alter the direction of the wealth flow. A strengthening of spousal relationships can both weaken extended family relationships and can alter intergenerational relationships (partly because the wife's influence in parental decisions becomes more important (Caldwell, 1982:338) .
The point to be noted here is that once the older generation of parents hand over decision making powers to the younger generation, there is very little motivation to sustain high fertility: social and economic change will
11eventually render high fertility uneconomic, and this process is accelerated by an 'import of ideas, ideologies and educational systems'. In a developing country such a change can occur before industrialization or urbanization through the import of ideas from the Western countries.
Caldwell (1982:350) further argued that the introduction of mass education in a society triggers the onset of fertility decline.
the direction of the wealth flow between generations is changed with the introduction of mass education, at least partly because the relationships between members of the family are transformed as the morality governing those relationships changes (Caldwell, 1982:301).
Mass education does not merely change the cost of schooling or time lost from work but also changes children's attitude towards parents; children become more aware of their rights and proceed to demand and consume a greater share of the family resources.
Caldwell's theory considers both socio-economic and cultural factors influencing demographic behaviour in a society. The theory states that separating the economic from the sociological aspects would not adequately explain fertility decline in a society.
1.1.5 Value of Children
The 'value of children' in explaining fertility levels and trends has received due recognition in demographic research. The major research conducted in this area was the Value of Children (VOC) project undertaken by the East-West
Population Institute. Comparable interview data were collected from men and women in six countries and the
12
project tried to combine the economic value, social value and psychological values of children (Arnold et al., 1975). Analysis from both structured and open ended questions yielded 15 dimensions of the value of children to parents which were subsequently grouped into four categories; positive general values, negative general values, large- family values and small-family values. These values influence the fertility decisions. In some cultures having a son is important, so people may continue childbearing until they have a son.
Answering Berelson's (1976:231) question on the policy relevance of research on the value of children, Fawcett (1976: 111) stated that policies should be directed to improved family and child welfare. He also stressed the need for further research in this project which is more directed to the cross-cultural context. However, based on the cross-cultural study, the VOC project made certain policy recommendations specific to countries such as Philippines and Taiwan (Bulatao, 1975:204-206; Wu, 1977:118-122) .
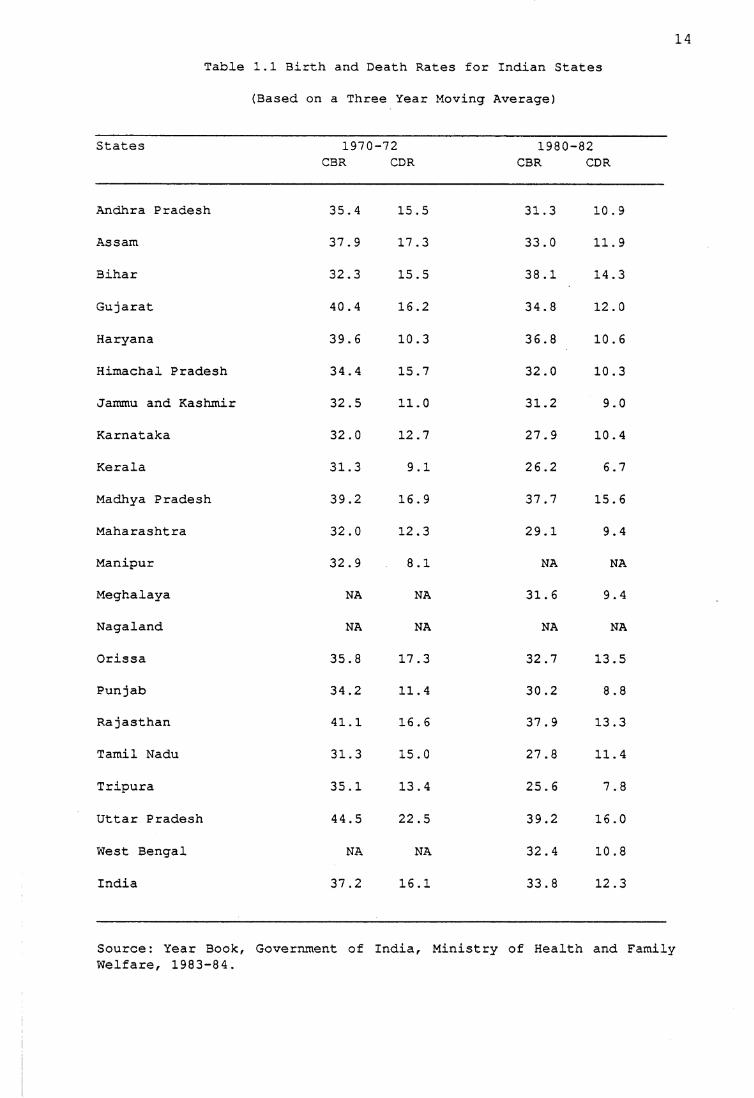
In the light of all these theories, researchers studying demographic transition in India found that even as late as 1981 the classical theory was applicable to the extent that mortality levels had been successfully brought down while fertility levels remained high (Government of India, 1984) . Table 1.1 indicates that birth and death
rates are declining in India. Although, there is debate about the exactness of the levels and trends estimated
13
through different sources of data, there is clear indication that India as a whole has experienced a significant decline in its birth rates during the 1970s (Dyson and Somawat, 1983:152).
However, one state stood out as an exception: this was Kerala in south India where both fertility and mortality were much lower than elsewhere in the country (Table 1.1).
14Table 1.1 3irth and Death Rates for Indian States
(Based on a Three Year Moving Average)
States 1970CBR
-72CDR
1980CBR
-82CDR
Andhra Pradesh 35.4 15.5 31.3 10.9
Assam 37.9 17.3 33.0 11.9
Bihar 32.3 15.5 38.1 14.3
Gujarat 40.4 16.2 34.8 12.0
Haryana 39.6 10.3 36.8 10.6
Himachal Pradesh 34.4 15.7 32.0 10.3
Jammu and Kashmir 32.5 11.0 31.2 9.0
Karnataka 32.0 12.7 27.9 10.4
Kerala 31.3 9.1 26.2 6.7
Madhya Pradesh 39.2 16.9 37.7 15.6
Maharashtra 32.0 12.3 29.1 9.4
Manipur 32.9 8.1 NA NA
Meghalaya NA NA 31.6 9.4
Nagaland NA NA NA NA
Orissa 35.8 17.3 32.7 13.5
Punjab 34.2 11.4 30.2 8.8
Rajasthan 41.1 16.6 37.9 13.3
Tamil Nadu 31.3 15.0 27.8 11.4
Tripura 35.1 13.4 25.6 7.8
Uttar Pradesh 44.5 22.5 39.2 16.0
West Bengal NA NA 32.4 10.8
India 37.2 16.1 33.8 12.3
Source: Year Book, Government of India, Ministry of Health and FamilyWelfare, 1983-84.
151.2 Fertility Decline in Kerala State - its Uniqueness
In 1952 India became the first country to initiate an official family planning program in an attempt to arrest unchecked population growth. Since the inception of the family planning program, fertility has been declining in India with differences in the rate of decline among the states. Kerala state in South India has differed markedly from all other states in India in terms of fertility levels. Declining fertility in Kerala is often considered an anomaly in relation to demographic transition theory, which holds that fertility decline occurs only at a higher level of percapita income, industrialization and urbanization (Zachariah, 1983:2). In demographic terms, Kerala has achieved a later stage of transition than might have been predicted on the basis of percapita income, percentage of labour force employed in the agricultural sector and the level of industrialization.
Use of family planning methods in Kerala increased from 27 per cent in 1970 to 61 per cent in 1980 (Khan et al., 1985:317); this is reflected in its birth rates and fertility levels. The estimation of crude birth rates for Kerala before 1941 was almost 45 births per thousand population and during the period 1941-61, a slight decline in the birth rate might have taken place; but it is unlikely that the rate had gone below 40 per thousand by 1961 (Namboodiri, 1968:58). Since 1961 birth rates showed a steady decline and from 1966 onwards there was a rapid decline in the crude birth rate from 38 per thousand in
161966 (Government of Kerala, Fact Book, 1978:83) to 26 in 1981 (Government of India, Year Book, 1984:61).
In the rural areas of Kerala the total fertility rate declined from 4.2 in 1972 to 2.8 in 1978 and in urban areas it declined from 3.6 in 1972 to 2.3 in 1978. The total marital fertility rate declined from 6.9 in 1972 to 4.8 in 1978 in rural areas of Kerala and for the same period the decline in the urban areas was from 6.8 to 4.7 (Government of India, Year Book, 1984:78-79). According to the 1981 census, the total fertility rate for the state was 2.07, the rural and urban rates being 2.12 and 1.84 respectively (Census of India, 1981:21). The total marital fertility rate also reached a level of 4.1 in 1981 in the rural areas, while in the urban areas it was 3.8 in 1981. Both in rural and urban areas the decline in fertility has been highest among Christians followed by Hindus and Muslims.
Such a decline has occurred without any accompanying signs of major economic development. Percapita income, urbanization and the level of industrialization as indicators of economic modernization remained relativelylow in Kerala. Fertility decline in the state did notconform to the United Nation's 'threshold' range ofpercapita income at which fertility of a population is about to fall (United Nations, 1965:145). The 1981 census count showed that the proportion of urban population in Kerala was 18 per cent which was much less than that of India (23 per cent).
17Although there has been an increase in percapita income
levels in the state as well as in the country as whole, the percapita income of Kerala has always been below the all- India level from 1970-71 to 1983-84 (Institute of Public Opinion, 1985). The percapita income in the state increased from 594 rupees in 1970-71 to 1,761 rupees in 1983-84 and for the same period the percapita income of the country rose from 633 rupees to 2,201 rupees.
Even though fertility decline in Kerala preceded mortality decline, it disproved the classical demographic transition theory proposed by Notestein (1945) that economic development is a precondition for fertility of a population to fall. The magnitude and rapidity of fertility falls in other countries (Sri Lanka, Indonesia and Thailand) have also exposed the deficiencies of the demographic transition theory in not being able to predict a precise level of economic development required for fertility of a population to fall. These countries have shown that a combination of minimal changes in life conditions may be sufficient for motivating lower fertility.
Thus, in demographic terms, Kerala stands out as a unique place. Researchers in the past have produced explanations for fertility decline in quantitative terms: the extent of decline has been well researched and documented. But it is necessary to know how this fertility decline has come about, and hence it would be worthwhile to explain in qualitative terms the nature of fertility
13decline in Kerala. Before attempting any such explanation, it is fitting to review various explanations put forth by other social scientists to explain the recent and rapid fertility decline in the state.
1.3 Explanations for Fertility Decline
In explaining fertility decline in Kerala, Nair (1974:325) stated that education and public health facilities brought down the birth rate in Kerala. He also suggested that it is important to look at the extent to which the rise in age at marriage reflects a decline in the birth rate. Krishnan (1976:1223) identified four elements which could have contributed to a decline in the birth rate in Kerala: the nuptiality rate, the mortality rate, percapita income, and the voluntary limitation of family size. He also stated that the major causes of reduction in the birth rate in Kerala have been a rise in age at marriage and a decline in mortality rate; and that a rise in age at marriage was due to improvements in the level of female education in Kerala.
Gulati (1976:1233) argued that the reduction in infant mortality rates owed more to an improvement in medical and public health facilities which increased child survivorship than to a shift in the age at marriage. This in turn seemed to have influenced the number of surviving children a woman wanted to have. Gulati added that it was the high age of female marriage in a combination of all the above-mentioned factors which seemed to have brought down the birth rate in Kerala. Kurup and Cecil (1976) were of the opinion that the
19decline in the birth rate was due to a well-organizedfamily planning program. Ratcliffe (1978) applied thesocial justice theory to explain fertility decline inKerala. According to this theory,
more equitable income distribution is strongly associated with lower fertility rates and that this is an impact net of the association of more equitable income distribution with the broader distribution of social welfare, as indicated by literacy, increased life expectancy and so on (Repetto, 1974:1).
Ratcliffe stated that, because of the Communistgovernments in Kerala, a considerable degree of economic and social equity had been achieved. The Communist government introduced land reforms, minimum wage legislation, mass education, and extended health facilities and other reforms which to some extent have generated economic and social equity in the state. In his view, family planning has not contributed significantly as Kerala stands only fifth among the Indian states in family planning acceptance.
Mencher (1980) stated that agricultural labourers in Kerala were now having fewer children than before, not because their quality of life had improved, but because the decline in employment opportunities had made it economically disadvantageous for them to have more children. Basu (1986:266), supporting the idea, said that fertility decline in Kerala was poverty-induced. Zachariah (1983: 177-178) stated that the principal determinants offertility decline in Kerala were socio-economic factors: increasing average age at marriage, low infant mortality, education, particularly female education, and other
20developmental policies such as agrarian reforms, land reforms and minimum wage policies. About 60 per cent of the fertility decline could be attributed to socio-economic factors, that is, even if Kerala did not have an official family planning program, its fertility rate would have declined by 60 per cent.
Comparing Kerala with West Bengal, as both have left- oriented governments and are highly politicized, Nag (1983:29) showed that greater fertility decline in Kerala was associated more with greater equity in education and health facilities than with greater equity in income and assets. He also stated that equity in educational and health services could perhaps be attained with less political opposition, but with more significant demographic consequences which in turn were favourable for economic and social development. The low mortality level in Kerala could be attributed mostly to higher social development and to its favourable environmental and hygienic conditions (1983:895)
Nayar (1986:166) pointed out that the success of massive programs of education and health care promotion (including the family planning program) was mainly because of ecology and culture produced a unique social structure which in turn supplied the necessary infrastructure for quick absorption of the educational and health care inputs. According to Radhadevi (1988:128) the reduction in birth rates in Kerala was due to population pressure and the failure to meet the basic needs of the growing numbers.
21Thus, the major issues identified to explain fertility
decline in the state are mass education, delayed age at marriage and a decline in mortality, particularly infant mortality. But these studies do not fully explain the nature of fertility decline as they are only thestatistical associations of selected factors derived from macro-level surveys and secondary data. The importance of cultural or behavioural aspects of the community to explain rising age at marriage and changing values from a large family size to a small family size has not been adequately emphasized.
In finding explanations for the recent and rapidfertility decline in Kerala, it is important to understandthe socio-economic change which induced fertility declinein the state. As Jeffrey (1976:xiv) points out:
in every region of India the period from about 1850 to1910 was one of striking change.....Perhaps nowhere inIndia, however, were the changes of these years so dramatic or so little known as in the Malayalam-speaking region of Kerala in the southwestern coast.
The changes that occurred over one hundred years have transformed society in Kerala and have certainly induced demographic transition in the state. To list the major changes: patriliny has replaced matriliny; Sambandham
marriages which in most cases were an unstable relationship between a man and a woman were abolished and spousal relationships became more stable; tarvads (Nayar joint families) which consisted of matrilineal kin broke into families which consisted of married couples and their children; the commercialization of agriculture gave an opportunity for Izhavas (traditionally low-caste toddy
22tappers) to improve their economic conditions; social reformers fought for equality among castes and demanded the rights of education for the lower castes. This movement increased the emphasis on literacy among the lower castes.
The effects of these changes were an improvement in literacy levels, a spread of egalitarian ideas, a higher age at marriage, change in family structure and increased political awareness: for instance, in 1957 Kerala was the first state in the world to freely vote a Communist party to power in the state assembly.
During the post-Independence period India on the whole has been moving towards modernization. A number of policies have been introduced at the national and state levels to improve the socio-economic conditions of the people. The government has introduced land reforms, a minimum wage policy for labourers, free education, a family planning program and improved medical facilities. As a result, there has been fragmentation of land, improvement in literacy levels, abolition of bonded labour leading to improved working conditions; increased use of contraception and a decline in mortality.
1.4 Objectives Of The Study
In view of the above, the general objective of this thesis is to examine how socio-economic factors have influenced a shift in values from a large family to a small family norm. Emphasis is laid on the following aspects to
study the change from a natural fertility regime to a controlled fertility regime.
23
To some extent a rise in age at marriage has influenced fertility decline in the state. As age at marriage is influenced by social and cultural norms existing in society, the factors responsible for a rise in age at marriage are studied.
The use of contraceptives means a deliberate attempt by couples to control fertility; hence, the circumstances under which such decisions were made are studied in order to understand the nature of fertility decline in Kerala.
With these objectives in mind the following hypotheses are tested.
1. Fragmentation of land due to the Land Reforms Act and inheritance laws resulted in small holdings of land. Hence, there was pressure created to acquire non-farming jobs.
2. Commercialization of agriculture has brought changes in the life of people. This has also changed consumption patterns and the life style of the rural people resulting in increased living costs .
3. Social pressure to educate children coupled with a need to acquire non-farming jobs has forced couples to send their children to school and this in turn has increased the cost of bearing and rearing children.
4 Improved health facilities have reduced mortality levels, particularly child mortality. This has ensured the survival of children and couples can have the number of children they desire.
5 Fertility decline in the state is largely due to marital fertility control through the use of contraceptives.
6 The free availability of birth control methods has facilitated their use by couples desiring to limit the number of children they want to have.
To attain the objectives mentioned earlier and to test the hypotheses formulated, an anthropological investigation was conducted. This thesis is organized in the following manner.
In Chapter 2 the methods used to collect data and the relevance of the micro approach to' this study are discussed. Chapter 3 contains a description of the study area and deals with the location of the study area, caste structure, age structure, vital events, literacy levels, occuptional patterns and other information relevant to the study. Social and economic changes in the area which have
25significantly affected fertility levels are also discussed in this chapter. The Chapter 4 focuses on age at marriage and discusses the social and cultural factors responsible for a delay in marriage. Following this, the fertility levels and trends in the study area in the context of the prevailing educational and occupational structure are examined in Chapter 5, which also deals with the level of family planning acceptance and non-acceptance as well as the type of methods used to regulate fertility. Chapter 6 contains an analysis of fertility decision making and the reasons for changes in reproductive behaviour. To conclude this thesis, the relevance to Kerala as a whole of fertility decline in the study area'6discussed#
26
CHAPTER 2
Methods of Data Collection
This chapter describes the methods used in data collection in a Kerala Village during the field work which lasted for ten months from November 1984 to August 1985. As the choice of methods of data collection and analysis should fulfil the objectives of the study, it seemed appropriate to employ a micro-approach to explain fertility transition in a Kerala village.
In the recent past there has been considerable emphasis on qualitative analysis in demographic research because survey methods have failed to explain the nature of association between the macro-variables. Macro-variables 'did not evidence the expected consistent explanatory power' (Freedman, 1986:30). Macro-surveys based on large data sets often explained the statistical association, but not the nature of linkage between the variables (Srinivas, 1988:455). McNicoll (1988:10) noted that surveys have said the same kind of things about more and more societies, while they failed to answer questions on the theoretical front. However, there are studies which have emphasized that living in a community did help in understanding the demographic behaviour of the society.
The micro-approach in demography has been developed in the anthropological tradition of living in a community for long periods so that the real-life environment of the
27people is understood. In contrast to the tradition of large surveys in demography, the micro-approach focuses on small communities, a single village or a cluster of small villages. Often the focus is on small groups so that intensive field studies may be undertaken and the principal researcher, even if assisted by a team of researchers, is able to have face-to-face contact with the community. Though the size of the community can be debated because of its importance in estimating demographic indices, the qualitative researcher can always make use of secondary data (censuses, earlier surveys if any or vital registration) to understand the prevailing demographic trend.
Realising the weaknesses of survey methods, demographers have tried various methods to understand demographic behaviour in many societies. Caldwell, Reddy and Caldwell (1988:32) employed quasi-anthropological methods to explain demographic transition in South India. They found that social, political, economic and educational forces are interrelated and eventually produce demographic changes. Knodel, Pramulratana and Havanon (1988) used focus group discussions and interviews to show that fertility transition in Thailand is a product of both social and economic change, while the organized family planning programme hastened fertility decline by facilitating birth control. Hull, Hull and Singarimbun could explain Indonesian demographic transition better by combining research techniques: surveys, intensive interviews and observation. They also pointed out that 'one justification
28for a micro-approach is that it provides qualitatively different information than can normally be expected from survey or census data' (Hull, et al., 1988:58) . While doing field work in India Vlassoff (1988) found that a combination of micro-study and survey was useful to explain the relationships between cultural factors and fertility and family planning among rural Indian women.
Oppong (1982:38) has shown from her African data that allocations of resources and costs are important in fertility-related expectations and behaviour. She argues that such studies need an understanding of cultural and social phenomena and both quantitative and qualitative data are required.
However, the micro-approach has been criticized on the ground that it does not provide any generalizations because the area studied is not usually statistically representative. The strengths and weaknesses of the microapproach were debated during an IUSSP seminar on Microapproaches to Demographic Research held at the Australian National University, Canberra in 1984 and the participants arrived at a consensus that survey and micro-studies should be complementary to each other (Caldwell, 1988; Srinivas, 1988) .
2.1. Choice of Micro-approach
The strengths of the micro-approach noted above and a dearth of qualitative analysis were the primary reasons for employing such an approach to find an explanation for the
29demographic transition in Kerala. The censuses and large surveys have shown that demographic transition is taking place in the state and the rate of fertility decline has been rapid during recent years. The surveys have identified the macro-variables associated with fertility decline, but have failed to explain the nature of the linkage between the variables. For instance, while many surveys have established that there is a statistical association between education and fertility, they do not explain the nature of the relationship.
Qualitative data can be effectively used to provide insight into the processes of change or the contexts in which demographic decisions are taken. Face-to-face contact and observations along with structured and unstructured interviews support statistical data, avoiding problems of attaching too much meaning to the occurrence of chance, generally found in large samples of data (Oppong, 1985:285).
One advantage of living in a community is that the researcher becomes well acquainted with its people: as Hull et al. (1988:65) wrote, 'by living for a time in a community researchers begin to "feel" ' . In contrast to surveys, in- depth interviews become informal two-way conversations where respondents do not feel that they are answering questions in a formal manner. The absence of formality helps the researcher to obtain important information whichcould not have otherwise been done.
30These informal interviews and observations open up new
ideas sometimes unexpected by researchers. Often during the informal interviews women talk about their children, in particular, children's activities, their health and schooling, which often gives greater insight into such behaviour as the bearing and rearing of children. Such information can be of immense help in understanding fertility behaviour.
To give an example, two months after I started my field work, I met Rugmini one morning on the road and she started talking to me: she began telling me about her plans for cooking lunch. During this chat she said 'I discontinued working in the fields because of my son. I do not know where to leave him when I go to work' (Her son was two and a half years old). This led me to ask a few more questions on family size and the answers explained the fertility behaviour of the couple. Rugmini and her husband decided to have two children: she was six months pregnant at the time of the interview. Both the husband and the wife wanted to educate their children, but her husband's income was not sufficient to educate them. Rugmini could contribute to the family income but the son was very young and leaving him at home would have affected his health because of irregular feeding and so on. She would have to wait until he started attending school. This information made me probe into this matter and I found that there were many women who discontinued working in order to care for their children. Such a pattern clearly might have implications for both child survival and desired fertility.
31Another advantage of the qualitative method is that the
principal researcher lives in the community to collect data and also personally analyses the data and writes the report. In other words, the researcher who employs the micro-approach participates in the research project at every stage from planning to finalizing the report. Often in survey research, the researchers who plan, analyse and write reports may not participate in the collection of data, which can lead to a lack of comprehensive understanding of the situation in the study area.
There is little doubt that living in the village helped me in gaining insights in understanding the fertility behaviour of the people. As I started living in the community I got to know the villagers and they in turn came to know and accept me. They greeted me whenever they met me. The villagers would stop me on the road to have a chat and make jokes too; often these chats revealed some information which helped me understand people better. Nevertheless, it should be noted that acceptance came only after they were satisfied about my background and my intentions and that my questions would in no way harm them. The first two months of my fieldwork were mainly a process of familiarization. Eventually I was accepted as a part of the village and not only was I invited to attend social events but more importantly, the respondents began to confide in me.
Once the villagers became acquainted with me, they felt free to confide in me about many sensitive issues. Couples
32who were initially reluctant to reveal information on the practices of withdrawal and abstinence started talking about them freely. Their earlier reluctance was due to embarrassment in discussing methods as these would also reveal their sexual behaviour. People may not feel free to inform a researcher about sensitive issues during the first visit but do so after they have gained a certain amount of confidence. The following are a few examples which illustrate how close acquaintance with the researcher prompts many respondents to talk about sensitive issues. Although each household was visited at least three times during the study period, meeting most of the villagers informally increased the degree of familiarity.
H .H.No.190: We have two daughters aged three years andfour months. I want a son but my husband does not agree with me. My husband argues that there is no guarantee that the third child would be a male and he does not want to continue having children until a male child is born. We argue every day. My husband wants to use birth control methods but I refuse. He refuses to have sex to avoid pregnancy. It always bothered me because he was never interested in sex and now he finds an excuse to avoid sex. We generally have sex once a month.
H . H . No. 320 : We have only one daughter. We want to educate her so that she can get a job. My husband works in a granite quarry. He is a daily wage earner who earns wages only on the days he works. Because of this we decided to have only one child and my husband is vasectomized. Before he got himself vasectomized we practised the withdrawal method. We delayed sterilisation until our daughter was five years old. Even in the past we had sex only on those days when my husband did not work. The days he worked, he was too physically tired to have sex.
There were a number of instances where women talked about sensitive issues. Such information can be gathered only when one has lived in the community for a reasonable period of time, say not less than a month. The fact that women talk about such sensitive issues is of great
importance, since this information helps in understanding the demographic behaviour of the community.
33
As my field work progressed the villagers also knew the questions I would ask and also the areas of my interest. Often the villagers volunteered information without being asked. One morning a villager came to see me at the rented house in which I lived and told me that his wife had delivered a baby and she had had herself tubectomized. He said that his wife insisted that I should be told as she thought that it was important for my studies. I then remembered having inter viewed his wife, who had told me that she would employ sterilization after the childbirth to limit family size. There were other instances where people volunteered information. Some people would tell the story of their lives and many times I had to focus the interview to meet my requirements. The many advantages of the microapproach confirmed the appropriateness my decision to study a village to understand the process of fertility decline.
2. 2 Selection of the Study Village
The purpose of the study being to understand the process of fertility decline in a village, I wanted to select a village which had experienced a decline in fertility. As the information on fertility rates is often available for larger areas than for individual villages, selecting a village which had experienced fertility decline was a difficult task. However, the findings of a fertility survey carried out during 1980, as part of a larger World Bank research project entitled 'Determinants of Fertility
Decline in Sri Lanka and South India' (Zacharia, 1981:ix) provided information on the recent levels of fertility in three districts of the State. I then decided to select a district which had experienced a substantial fertility decline anticipating that a village chosen from these districts might have also experienced a significant decline in fertility. Of these three districts, from the period 1965-70 to 1975-80, Alleppy and Ernakulam experienced a decline in their total marital fertility rate of the order of 30 percent while in Palghat it was 21 per cent (World Bank, 1983 : 148) .
I selected Ernakulam district in preference to Alleppy district because my greater familiarity with the area would help in my field work and also provide a better understanding of the society. This is contrary to the anthropological tradition of studying an alien society. This argument is mainly put forward because studying one's own culture is influenced by one's own position in society and an insider researcher might take things for granted in his own society (Cornelius, 1955:6, Levine, 1973:390). However, studying one's own society has become acceptable in anthropological research. As Messerschmidt (1981:8) stated, one advantage of anthropology at home is that the anthropologist need not' go native'. Srinivas wrote:
the examination of one's ideas and interests, and relating them to one's social background and intellectual history, are, however, necessary in order to make one's work more objective. For the very awareness of subjectivity - and the areas and the forms in which it is most likely to occur - is a step towards achieving greater objectivity (Srinivas, 1966:154).
35The advantages in studying one's own society are
evident when one considers the time available. In my case, prior knowledge of the language was of immense help as I could talk to the people freely in the local dialect without the help of an interpreter. Prior knowledge of the society, particularly Ernakulam district, reduced the time I would have otherwise needed to spend in understanding cultural values associated with demographic behaviour. Being part of the culture it was easy to gain theconfidence of the people. This was of great importancebecause a study of fertility behaviour involved asking many sensitive questions.
Having selected the district, the next task was to select a village. In 1961, the Census of India studiedthree villages in each district and the findings were published in a Village Monograph series. Initially, I thought of selecting one of the villages chosen for theVillage Monograph Series. In Ernakulam District, three villages were selected by the Census of India to study in depth specific aspects of the population. Ankamali was selected to study the life of the people who are engaged in reed mat weaving as they were concentrated in this particular area. Mulavacad was selected to study the life of an Anglo-Indian community and Latin Christians who are concentrated there. Tekkunbhagam was selected to study the castes such as Kudumbis and Kammalans. Though there ismention of other aspects of the villages, such specificfocuses did not serve the purposes of my investigations. Hence, selecting one of these villages would not have
36served the purposes of my study. Moreover, Ankamali had developed into a town and the other two villages were very close to towns and the degree of exposure to urbanization was high.
Further, there was another problem of a personal nature. As a never-married woman it was difficult for me to live alone in a village. Field experiences of many anthropologists and sociologists (Srinivas et al., 1379, Beteille et al., 1975) reveal that community acceptance is an important and hard task. This problem is aggravated when a woman has to do field work in a society where the status of woman is low (vis-a- vis man) and one happens to be part of that society.
Dube (1975:159), an Indian anthropologist, describing her experiences in Indian villages, wrote that she selected a village where her father-in-law was known, because a strange woman travelling alone in these areas was inconceivable to the people. Adding to her experiences from another village Dube (1975:165) related that she had to behave in a certain manner being part of the culture whereas her colleagues from a western country were tolerated for their different behaviour. Similarly, Sivakumar (1979:216), on her teacher's advice, decided to study a group of college students in a town instead of a village because it was considered difficult and dangerous for a never-married woman to live alone in a village.
37This is still largely true: a never-married woman
living alone in an Indian village has to face many problems such as sexual harassment. While I was doing field work in rural Karnataka in 1981-82, I met young and unmarried female health workers working in rural areas who often living alone in the village encountered these problems.
However, this was not the first time I had lived alone in a village to carry out field work. In the earlier times, as I was a part of an institution, there was always its support which greatly helped; often senior colleagues would accompany me on the first visit and their frequent subsequent visits were helpful. However, this time the situation was different; first, I belonged to an institution of which the people were unaware and institutional support was limited to field visits by my supervisors. Second, the information to be collected required good rapport because of its very personal nature. Hence, I had to think of a place where I could establish good rapport.
Believing that personal acquaintance would help in establishing rapport, I initially thought of selecting my ancestral village* 1. I had doubts, however, about whether my familiarity would help me elicit information because I was part of that social structure and the people might hide
1 I had not lived for any substantial period in that village because my father had a job outside the state. My visits to the village occurred only once every two years. However, as my ancestors were landowners in the past and belonged to the Nambuthiri caste, I thoughtI could establish rapport.
38certain facts from me. In the end, I had to drop the idea of selecting my ancestral village because the village happened to be large with more than 2000 households (according to the panchayat records) which would have been difficult to study in a single year. I was against choosing a sample of households from a large village as I feared that missing some households would put me at thedisadvantage of not understanding the village in its totality.
I selected Palankara2 which fulfilled my purpose as it was large enough to quantify certain demographic indices such as fertility rates and also small enough to carry out an in-depth study. Selection of this village also solved the problem of my residence; one of the families in Palankara had contacts with my family and this helped me enter the community. This particular family, which is respected and considered important by the rest of the community belonged to the Nambuthiri caste, at the top of the caste hierarchy. People felt confident to talk to me because I had the support of this family. Moreover, one of the sons of the family assisted me in data collection and during the initial stages of my fieldwork his presence helped in gaining the confidence of the people.
2.3 Organization of Field Work
Having selected the village it was important to organize the actual field study. The time at my disposal
o A fictitious name is used for the village to protect the privacy of the inhabitants.
was a year and it was not enough to personally gather all the required data, so I had to employ research assistants to do some of the data collection. There were two main problems in finding research assistants because I was looking for persons who had university education (important for accurately recording responses) and could live in my study village. To an extent my problem was solved as the son of the Nambuthiri family was an unemployed graduate and was ready to work with me. The real problem was to find female research assistants who were willing to live and work in the village. This problem persisted for a few days, and the only solution was that I had to employ two girls with two years of university education who lived in the same village and were willing to work.
To start with I had three investigators (two female and one male) to help me in data collection. As the investigators had very little knowledge of demography they had to be trained to collect data. I accompanied them to the households and conducted demonstration interviews. However, the interviews conducted by the investigators were checked every day and each interview was discussed in detail. Whenever required, a household would be revisited for collecting additional information on matters of interest. Although the others did gather the data from some of the households, I visited all the households at different stages of the fieldwork either to interview or to revisit them to probe for additional information.
Two months after the beginning of the study, one of the female research assistants left the team as she found more
40
permanent employment. This created a problem of finding a replacement. A month later with the help of a family in the village I found a female research assistant and a male research assistant who were graduates. There were in all four research assistants, two female and two male, of whom a male and a female research assistant belonged to Palankara and the other two were from two different villages about seven kilometres from the study village.
There were advantages in having research assistants from the same village. Being part of the village they could clarify certain matters. For example, a widow had a child because of an extramarital relationship; when I interviewed her I could not understand why she had such a long birth interval between her two sons without use of any contraceptives. Moreover, there was inconsistency in the information on the birth of the child and the death of her husband. It was very awkward to ask whether she had a child after her husband's death because it was not socially acceptable. My doubts were clarified by one of my research assistants from the same village, who told me that the woman had a sexual relationship with another man even when her husband was alive; in fact her husband was killed and people suspected that her lover killed her husband. The child was born when she was a widow. Three years later the lover was nowhere to be seen. The local investigators were not merely collectors of data but also important sources of verification.
41Another instance was when a woman told me that her
adopted child was her own child; I was confused as her answers to many questions were inconsistent. This again was clarified by a research assistant who belonged to the village.
A woman who had a child outside marriage told me that she was separated from her husband, but the fact that she had a child outside marriage was confirmed later during my stay in the village.
A 29-year-old woman's marriage was dissolved because her husband's family discovered that she had a premarital sexual relationship (the pregnancy was aborted). The girl's family reported her marital status as 'never married' and gave dowry as the reason for the delay in getting her married. I learnt the truth on discussing the matter with one of the female investigators who was a local and knew what had happened to the family.
However, one disadvantage of having research assistants from the same village was that they could not visit some of the households in the village, because of the strained relationship between families. There was also the danger that respondents would not reveal all the facts to a researcher who was part of the village. Often they might confide more readily in an outsider because he or she would leave the village once the work was over. On such occasions either I or one of the research assistants from outside the village visited those households. However, I visited all

the households to ensure collection of the required information.
42
2.4 Data Collection
Considering the fact that different types of data were required to understand fertility behaviour, it was decided to use a combination of research techniques. Warwick (1973:190) pointed out that 'Every method of datacollection is only an approximation of knowledge. Each provides a different and usually valid glimpse of reality, and all are limited when used alone' . Actual data collection included a household census, structuredinterviews, unstructured in-depth interviews and observation, both direct and participant.
2.4.1 Household Census
As the first step of the fieldwork, a village census was conducted and an interview schedule was used to collect basic information from each household in the village. Every household was listed and information was noted on age, sex, relationship of members to the head of the household, marital status, number of years spent in school and the occupation of each member of the household. The information thus collected provided basic data on age and sex composition, religious and caste composition, literacy rate, occupational pattern, marital status and income levels of the households, in the village.
Usually the head of the household was interviewed on the assumption that he/she was well informed about all the
43details of the household. In households where the head of the household was not available an adult member of the household was interviewed. However, it was ensured that the information which could not be obtained during the first stage of the listing was collected during the subsequent visits to the household. The information on every member of the household helped in identifying the ever-married men and women in the households because they had to be interviewed to understand fertility decline in the village.
Along with the collection of basic data from each household, a map of the village was prepared identifying the location of each household (see Chapter 3) . The listing of the households posed problems of identification as the households were hidden among dense trees and gardens and created problems in the proper location of the households, so the map was modified when I became familiar with the location of each household.
The ecological conditions have influenced the formation of linear, continuous and loosely organized villages in Kerala (Mencher, 1966). This posed problems in deciding the borders of the study village. I had to make sure that I neither omitted any household which belonged to the study village nor included a household which belonged to a neighbouring village. One way of ensuring that a household belonged to the village was by asking the respondents. However, I had an interesting encounter. One of the Nayar families from a neighbouring village identified itself with the study village, mainly because the head of the household
took an interest in the affairs of the local temple in the study village. He had retired from the army, was never- married and lived with his sister's son; it was like a traditional Nayar family. Because of his experience in the army he considered himself a knowledgeable man and acted as an informal leader. During my fieldwork he was the mediator and negotiater in a land dispute which took place between a Christian family and a Nambuthiri family. He insisted that his household be listed in my study village. Nevertheless,I interviewed him because he could give some information on traditional Nayar tarvads (extended families). He was a key informant who accurately described the changes in the Nayar tarvads (this household has been excluded from the analysis as it fell outside the study village).
The second stage of the fieldwork involved interviewing all ever-married women to collect information on reproductive histories. A structured schedule was used to gather information from all ever-married women on details of each pregnancy and its outcome; also on past and current use of birth control methods. Data on antenatal care, postnatal care and the place of delivery of each birth, weaning, supplementary feeding and immunization of the children were noted.
Reliable and accurate information on age is important in estimating demographic indices, but collecting reliable information on age is very difficult in many societies. In societies where there is no method of recording date of
birth, one has to employ different probing techniques to collect accurate data on age.
45
In Palankara, birth records were available with most of the families. Upper caste Hindus kept horoscopes which enabled me to record exact ages and Christian families could also provide relatively good age data as they kept records on date of birth, marriage and death of their family members. However, in families where no records were available the month and year of birth could be obtained in terms of the local calendar.
2.4.2 In-depth Interviews
Once the basic information was gathered, in-depth interviews were conducted; these focused mainly on fertility planning, changes in marriage, schooling of children, value of children, and health care in the family. All currently married couples were interviewed. Although husbands and wives were interviewed separately, there were occasions when both were present at the time of interview and they were interviewed together. However, interviewing husband and wife separately was better when sensitive matters had to discussed.
An interview guide was prepared on the above issues and the respondents were interviewed until a satisfactory answer was obtained. This differed from a survey schedule in which the possible answers to questions are often formulated by the researcher, thus restricting the respondent and the investigator in the choice of answers.
46As Goode and Hatt (1952, 185-186) rightly pointed out, the greatest limitation of a structured instrument of data collection is that it restricts the scope of the investigation. The unstructured in-depth interviews gave more flexibility in asking questions and in recording responses. To give an example, Kartyani had six live births and only three surviving children. She told me that she and her husband had decided not to have any more children, but she denied use of any birth control methods. This answer was hard to accept because she had not conceived after her last live birth ten years ago and she had an average birth interval of two years and three months. Initially she kept insisting that her horoscope said that she would have only six live births. I then changed the topic of the interview to other matters such as education of the children and details of her marriage. Later when I asked about the services rendered by the health worker she revealed that she and her husband had decided to abstain from sex because they did not like any program methods. She also said that her husband and her three sons slept in one room while she slept in the kitchen. Kartyani and her husband were agricultural labourers and lived in a hut with a kitchen and a room used as bedroom and living room. She also argued that it was not good to have sex once the children were grown up, as was her situation. I spent almost four hours interviewing her before receiving a satisfactory answer.
The unstructured in-depth interviews also helped in understanding the process of fertility decision making. To get a clear picture of fertility decision making each
couple was asked a number of probing questions. As the main focus of the thesis is to understand the nature of
47
fertility decline, the questions were focused on fertility decision making. The questions on fertility behaviour differed for those who had employed birth control methods at any time and for those who had never used any birth control method. The questions for those couples who employed birth control were related to the timing of initiating the idea of limiting family size, when to use, who initiated the idea of limiting family size, the persons involved in the decision and also the reasons for such a decision. The couples who never used any birth control methods were asked whether they ever thought of limiting family size, the persons involved in decision making and also reasons for non-acceptance. Thus, there were many advantages in using unstructured interviews to collect data. Nevertheless, the use of in-depth interviews produced one problem which did not previously exist, that of nonresponse. There were four families in the study area where respondents refused to provide answers to detailed questions although they had done so during the conduct of the household census. This was because they felt that such matters as fertility regulation were purely personal and should not be asked about. While it was possible to overcome this non-response through revisits and persuasion in three of the households, the respondent in the fourth remained firm and could not be interviewed. However, this single case of non-response did not in any significant manner affect the findings of my study.
482.4.3 Observation
Household census and in-depth interviews were not adequate to explain the fertility decline in the village, because knowledge and examination of complex social relationships and intricate patterns of interaction were necessary to understand the nature of fertility decline. The values and attitudes which cannot be elicited by direct questions are better understood from observing social behaviour (Piddington, 1957:544).
Observation was both direct and participant and lasted for the whole period of the fieldwork. Participant observation has been interpreted as a method of data collection wherein the investigator deliberately participates in the activities of the study population to observe and understand the phenomena in which he/she is interested (Kluckhohn, 1940:43). However, when I started living in the village I was observing as well as participating in the day-to-day life of the village and it was difficult to draw a line between the two.
Observation and participating in day-to-day life helped me to understand how people live, their struggle, their aspirations and how they react when certain social and political events occur. Fertility studies have noted the relationships between fertility and husband-wife relationships, parent-child relationships, old age security and value of children. Often interviews may mislead about actual behaviour because people may give the answers which reflect the ideal rather than the actual behaviour. The
49ideal in Indian societies is to respect the old and care for the old parents but the actual practice may be different. These concepts were understood better in real life situations. Observation of infant and child care, in particular the treatment of sickness of the children, gave me a better idea of declining child mortality and infant mortality. But observation was vital when it came to understanding how certain community level variables such as schools, local bodies and government health and family planning program affected demographic behaviour.
2.5 Summary
The micro-approach was chosen to collect data because of its inherent strength in helping to understand the qualitative aspects of fertility change. Use of this approach provided insights into the processes of change and the context in which demographic behaviour is altered. Living in the study village enabled me to understand the people better and gain their confidence which made them provide (and many times volunteer) detailed information without inhibition. In this context, selecting a village in an area with which I was familiar was helpful as I could understand the society better.
An interview schedule was first used to enumerate the study population and collect basic demographic data. Following this, another interview schedule was used to collect retrospective data on fertility histories. Care was taken to enhance the accuracy of age data through the use of horoscopes, church records and the local calendar.
50Finally, highly focused in-depth interviews were conducted to collect data on sensitive matters such as contraceptive behaviour, the pattern of decision making and the reasons for acceptance and non-acceptance of family planning methods.
Thus, a combination of methods such as observation, household census, structured interview schedules and unstructured in-depth interviews was used to gather information in a comprehensive and effective manner as the weaknesses of one method were offset by the advantages of the others. Observation, whether direct or participant, helped in understanding social behaviour such as family relations, caste relations and the functioning of institutions such as schools and health clinics. But observation alone was not sufficient to gather information on basic demographic characteristics such as number of members in a household, age, sex, educational and occupational status and the level of income. Similarly, retrospective data on reproductive histories of women could be collected only by interviewing the women. Unstructured in-depth interviews which provided considerable flexibility helped to collect data which could not be done with a structured schedule as the structured questions would have restricted collection of details about the nature of fertility decision making. Finally, the use of the anthropological approach was most appropriate in view of the prevailing socio-economic and cultural conditions in the study area, details of which are discussed in Chapter3 .
51
CHAPTER 3
Palankara - The Village, its Economic and SocialTransformation
3.1 The Village
The village, Palankara, is situated approximately 25 kilometres south-east of Ernakulam, the district headquarters town. A well organized transport system in the state has helped the villagers to keep close contact with the nearest town, Ernakulam. Although there is nogovernment road transport service to this village, in 1974, for the first time, a private bus service was started to Ernakulam. Two more private buses were introduced in 1982 and 1983, providing transport between the village and the twin cities of Cochin and Ernakulam. Before theintroduction of the buses, people had to walk about ten kilometres to find any type of transport. People often pointed out to me how these three buses had helped them to reach Ernakulam for health services, employment, and entertainment. Apart from these buses, autorickshaws (motorized three-wheelers) and taxis are available, but they are relatively expensive and are used only in emergencies, which are usually health emergencies.
The villagers are well-informed about current events by newspapers which are delivered every day. Twenty per cent of the households subscribe to newspapers every day, and even those who do not buy newspapers have access to them in the tea shops and other common places of meeting. There are
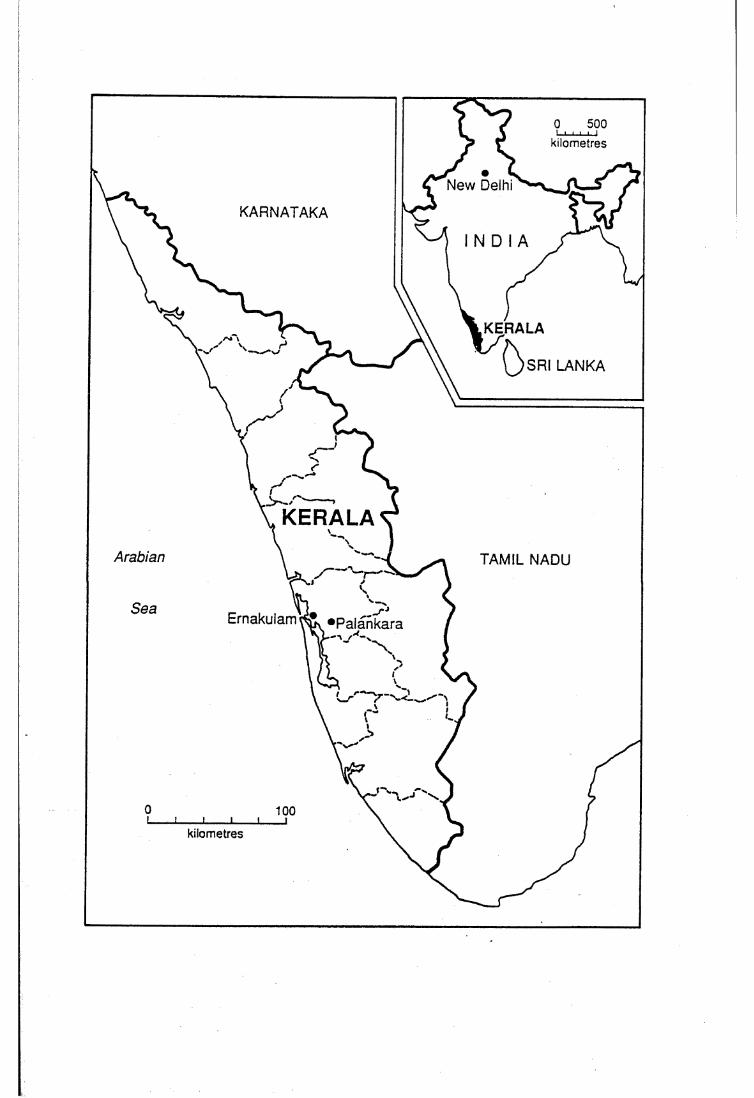
kilometres
New Delhi
KARNATAKA
I N D I A
KERALA
SRI LANKA
KERALAArabian TAMIL NADU
Ernakulam «Palankara
kilometres
52more newspapers published in the vernacular language every day in Kerala than in any other Indian state, and men and women generally read at least one newspaper every day. By the end of 1983, 112 daily newspapers were published in the vernacular Malayalam, in the state (Government of India, 1985) . This is a reflection of the high literacy levels in Kerala, which was also true of the village. It is clear that the widespread reading of newspapers has contributed to imparting new types of knowledge and generating greater political awareness.
The villagers depend mainly on the local fair price shop for their food grains: fair-price shops are those where once a week food grains are sold at a subsidized price by the government and the items commonly available in them are rice, wheat, sugar, cooking oil and kerosene. This has enabled many poor people to buy basic necessities at a reduced price. It has been documented that the public distribution system of food grains has been unusually effective in Kerala and has largely solved the problem of food scarcities (Centre for Development Studies, 1977, George, 1979) . Though the nearest post office is five kilometres away, mail is delivered every day by a postman who visits the village. The village also has a government aided primary school. Drinking water is procured from wells and the village is electrified with 21 per cent of the houses connected. There are three Hindu temples, one of which is exclusively used by the Harijans, and twochurches.
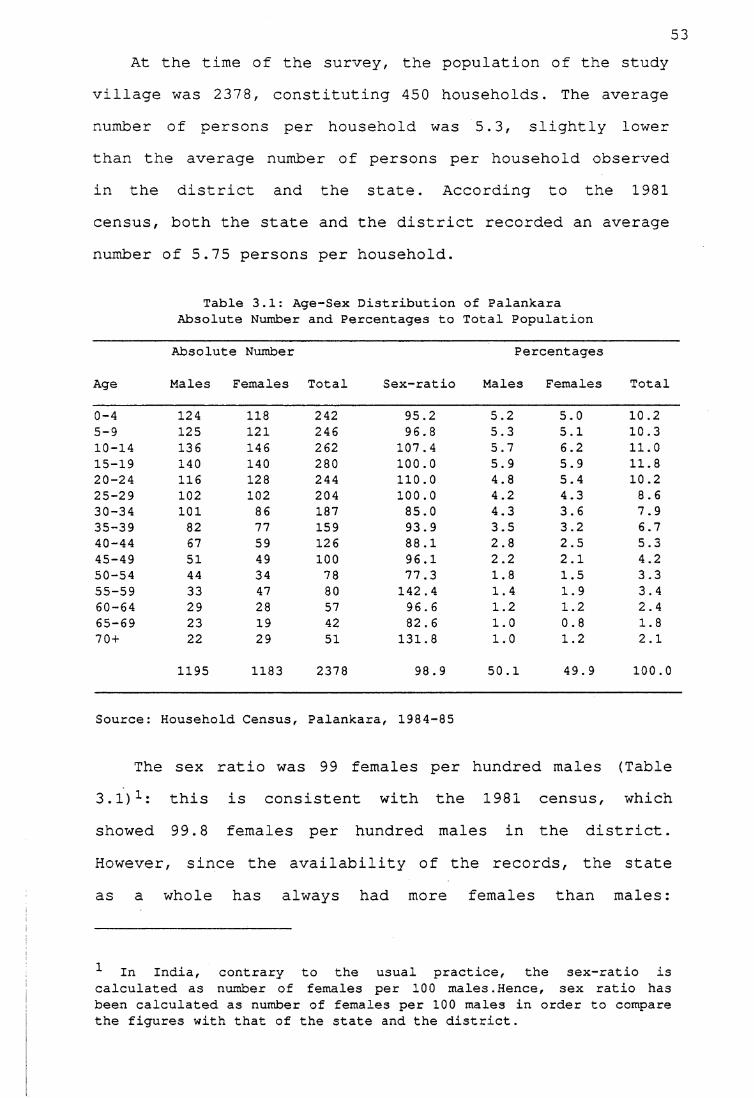
53At the time of the survey, the population of the study
village was 2378, constituting 450 households. The average number of persons per household was 5.3, slightly lower than the average number of persons per household observed in the district and the state. According to the 1981 census, both the state and the district recorded an average number of 5.75 persons per household.
Table 3.1: Age-Sex Distribution of Palankara Absolute Number and Percentages to Total Population
Age
Absolute Number
Males Females Total Sex-ratioPercentages
Males Females Total
0-4 124 118 242 95.2 5.2 5.0 10.25-9 125 121 246 96.8 5.3 5.1 10.310-14 136 146 262 107.4 5.7 6.2 11.015-19 140 140 280 100.0 5.9 5.9 11.820-24 116 128 244 110.0 4.8 5.4 10.225-29 102 102 204 100.0 4.2 4.3 8.630-34 101 86 187 85.0 4.3 3.6 7.935-39 82 77 159 93.9 3.5 3.2 6.740-44 67 59 126 88.1 2.8 2.5 5.345-49 51 49 100 96.1 2.2 2.1 4.250-54 44 34 78 77.3 1.8 1.5 3.355-59 33 47 80 142.4 1.4 1.9 3.460-64 29 28 57 96.6 1.2 1.2 2.465-69 23 19 42 82.6 1.0 0.8 1.870 + 22 29 51 131.8 1.0 1.2 2.1
1195 1183 2378 98.9 50.1 49.9 100.0
Source: Household Census, Palankara, 1984-85
The sex ratio was 99 females per hundred males (Table3.1)1: this is consistent with the 1981 census, whichshowed 99.8 females per hundred males in the district.However , since the availability of the records, the stateas a whole has always had more females than males:
1 In India, contrary to the usual practice, the sex-ratio is calculated as number of females per 100 males.Hence, sex ratio has been calculated as number of females per 100 males in order to compare the figures with that of the state and the district.
according to the 1981 census, there were 103.2 females per hundred males.
54
3.1.1 Age Structure
The age structure of a population also indicates the changes in fertility, mortality and migration of that population. This can be a good indicator if the data on age are accurate. Myers's blended method (Shryock and Siegel, 1976:117) is applied to measure the extent of accuracy in reporting ages. The digit preference index obtained covering the age range 10 to 89 is 4.6 indicating that there is a relatively low level of digit preference: reporting on age is fairly accurate.
The under-cutting of the base of the pyramid indicates a fertility decline which seems to have been accelerating in the recent past. The low percentage of population in the age group 0-9 is more a consequence of declining fertility than high mortality (see Chapter 5) . The relatively low percentage of male population in the age group 20-24 may be due to the emigration of males in search of employment. The hollow in the age group 50-54 among women may be due to age misreporting or due to random chance. As the study population is small, even a small shift from one group to another can lead to fluctuations in percentages.
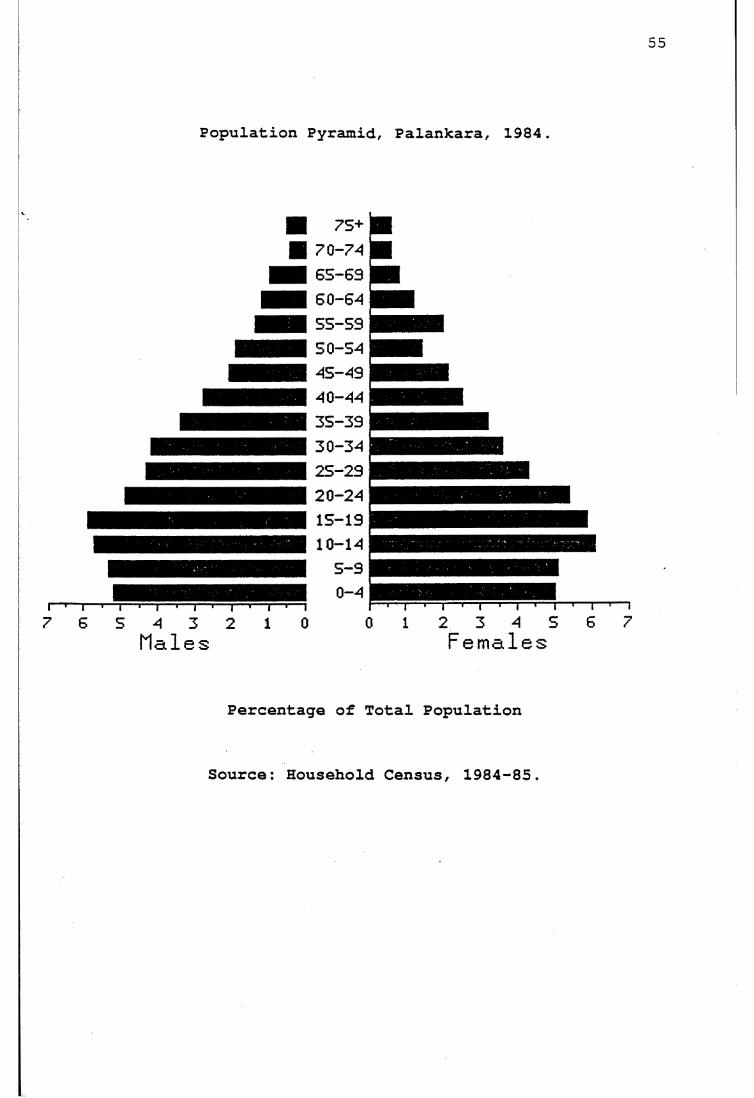
55
Population Pyramid, Palankara, 1984.
r7 6 S 4 3 2 1 0
Males
75+7 0 -7 46 5 -6 96 0 -645 5 -5 95 0 -5 44S-494 0 -443 5 -3 93 0 -3 42 5 -2 92 0 -2 415-1910-14
5 -90-4
0 1 2 3 4 5 6Females
1- j i
Percentage of Total Population
Source: Household Census, 1984-85.
56Another feature of the Palankara age-sex distribution
is that the population is not 'young'; that is, only 32.4 per cent of the total population is under age 15, indicating ageing of the population. The dependency ratio, defined as the number of persons under 15 and 65 and over, in relation to the number of those between the ages of 15 and 64, is 57. The 'median age' of the population is 26.6 years which falls in the category of 'intermediate age' (Shryock and Siegel, 1976:134).
3.2 Economic Changes
There have been a number of economic changes which have made a far reaching impact on the lives of the people. The most notable of these changes have been the introduction of land reforms and the implementation of a minimum wage policy which have in turn led to changes in economic conditions.
3.2.1 Land Distribution.
There were a number of land laws enacted in all the regions of Kerala, Travancore, Cochin and Malabar from the nineteenth century onwards (Menon, 1976:80, Centre for Development Studies, 1977:54-55, Varghese, 1970); but the first comprehensive and radical land reform legislation in the state was the 'Kerala Agrarian Relations Act' proposed by the first Communist government of the state in 1960. The Act was not enacted as there was political opposition by the land owners. Since then a series of Acts and amendments
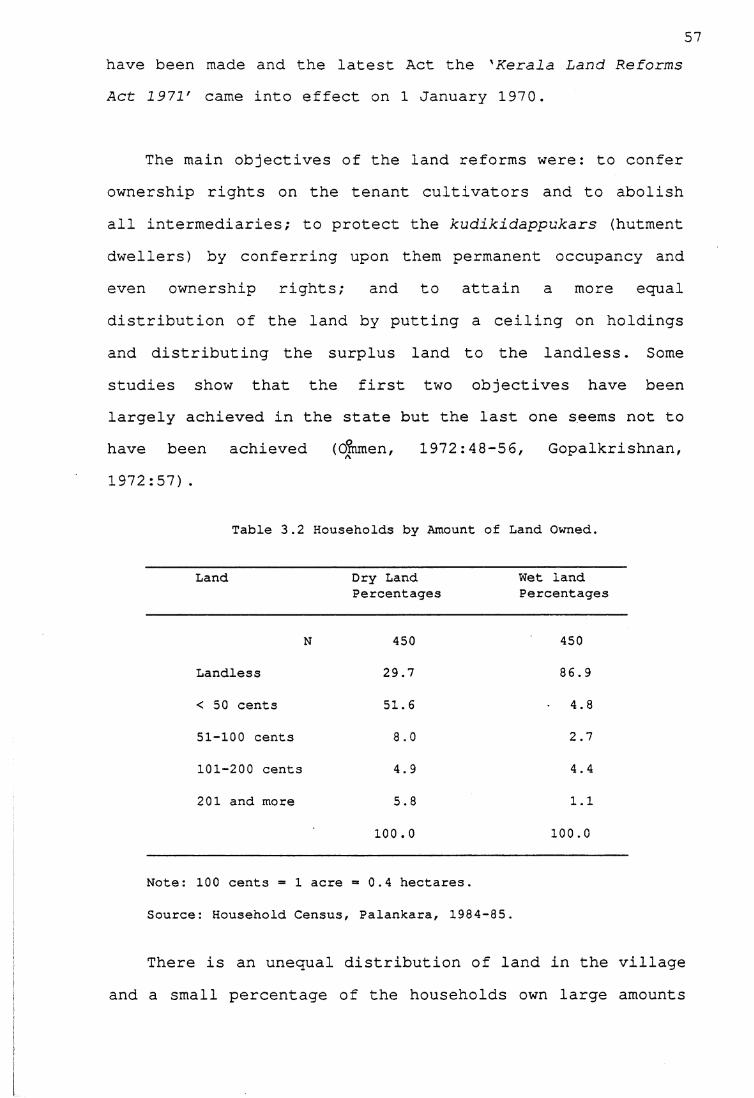
57have been made and the latest Act the 'Kerala Land Reforms Act 1971' came into effect on 1 January 1970.
The main objectives of the land reforms were: to confer ownership rights on the tenant cultivators and to abolish all intermediaries; to protect the kudikidappukars (hutment dwellers) by conferring upon them permanent occupancy and even ownership rights; and to attain a more equal distribution of the land by putting a ceiling on holdings and distributing the surplus land to the landless. Some studies show that the first two objectives have been largely achieved in the state but the last one seems not to have been achieved (dmmen, 1972:48-56, Gopalkrishnan, 1972:57).
Table 3.2 Households by Amount of Land Owned.
Land Dry Land Percentages
Wet land Percentages
N 450 450
Landless 29.7 86.9
< 50 cents 51.6 • 4.8
51-100 cents OO o 2.7
101-200 cents 4.9 4.4
201 and more 5.8 1.1
100 . 0 100.0
Note: 100 cents = 1 acre = 0.4 hectares.
Source: Household Census, Palankara, 1984-85.
There is an unequal distribution of land in the village and a small percentage of the households own large amounts
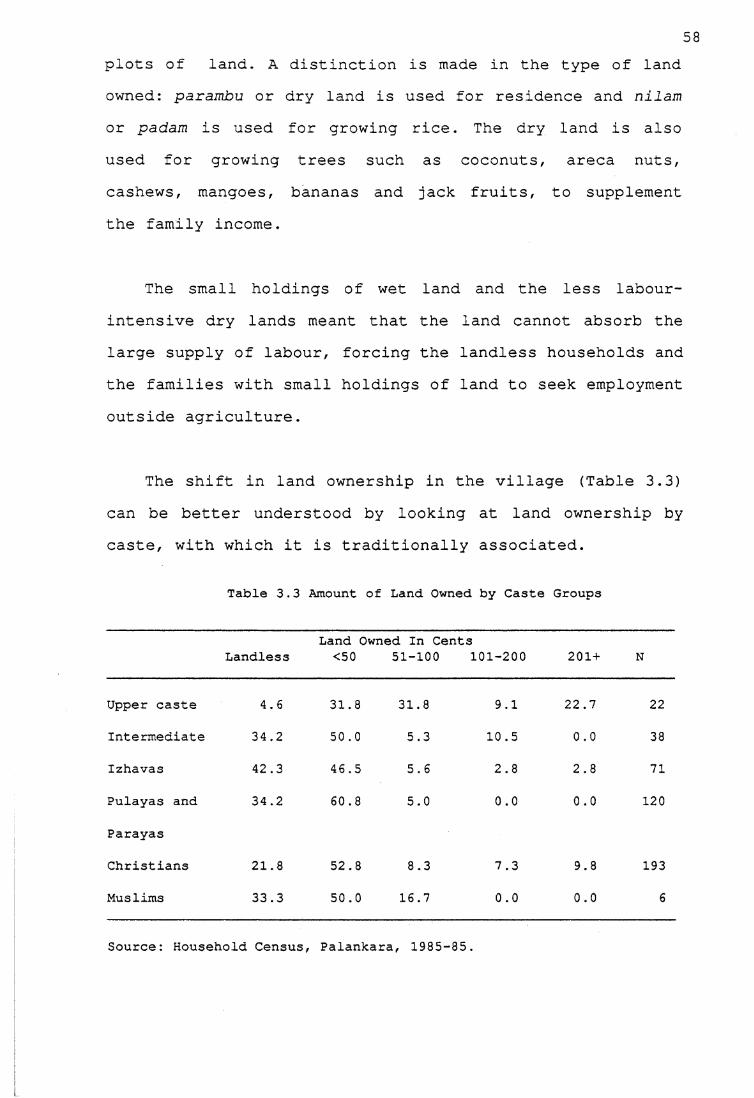
58plots of land. A distinction is made in the type of land owned: parambu or dry land is used for residence and nilam or padam is used for growing rice. The dry land is also used for growing trees such as coconuts, areca nuts, cashews, mangoes, bananas and jack fruits, to supplement the family income.
The small holdings of wet land and the less labour- intensive dry lands meant that the land cannot absorb the large supply of labour, forcing the landless households and the families with small holdings of land to seek employment outside agriculture.
The shift in land ownership in the village (Table 3.3) can be better understood by looking at land ownership by caste, with which it is traditionally associated.
Table 3.3 Amount of Land Owned by Caste Groups
LandlessLand Owned In Cents<50 51-100 101-200 201 + N
Upper caste 4.6 31.8 31.8 9.1 22.7 22
Intermediate 34.2 50.0 5.3 10.5 0.0 38
Izhavas 42.3 46.5 5.6 2.8 2.8 71
Pulayas and 34.2 60.8 5.0 0.0 0.0 120
Parayas
Christians 21.8 52.8 8.3 7.3 9.8 193
Muslims 33.3 50.0 16.7 0.0 0.0 6
Source: Household Census, Palankara, 1985-35.
59Although the upper caste and Christians own the large
blocks of land, the significant change is that 65 per cent of the Pulayas own some land; traditionally, these people were landless labourers and lived on the land of their masters. These kudikidappukkars or hutment dwellers acquired land as a result of the Act, and even if it is a small amount they own it and need not fear eviction by their landlords; their life has improved in that they are not slaves any more.
It is clear that some upper caste families have lost land through land reforms and inheritance laws, by which the landless upper caste families belonging to the Nayar caste lost all their land. The lancMLess families live on poramboke or government land, and must vacate the land at the request of the government, which compensates them with cash, enabling them to build a house. Often the government suggests the land to which they can move.
However, the implementation of these reforms has led to fewer employment opportunities on the land and changes in occupational pattern in the village.
3.2.2 Occupational Structure
The occupational pattern in Palankara according to age and sex is presented in Table 3.4. The occupations have been categorized into eight groups and age into broad intervals. The important feature is the higher proportion of boys and girls in age groups 10-14 and 15-19 who are students, indicating an absence of child labour. The
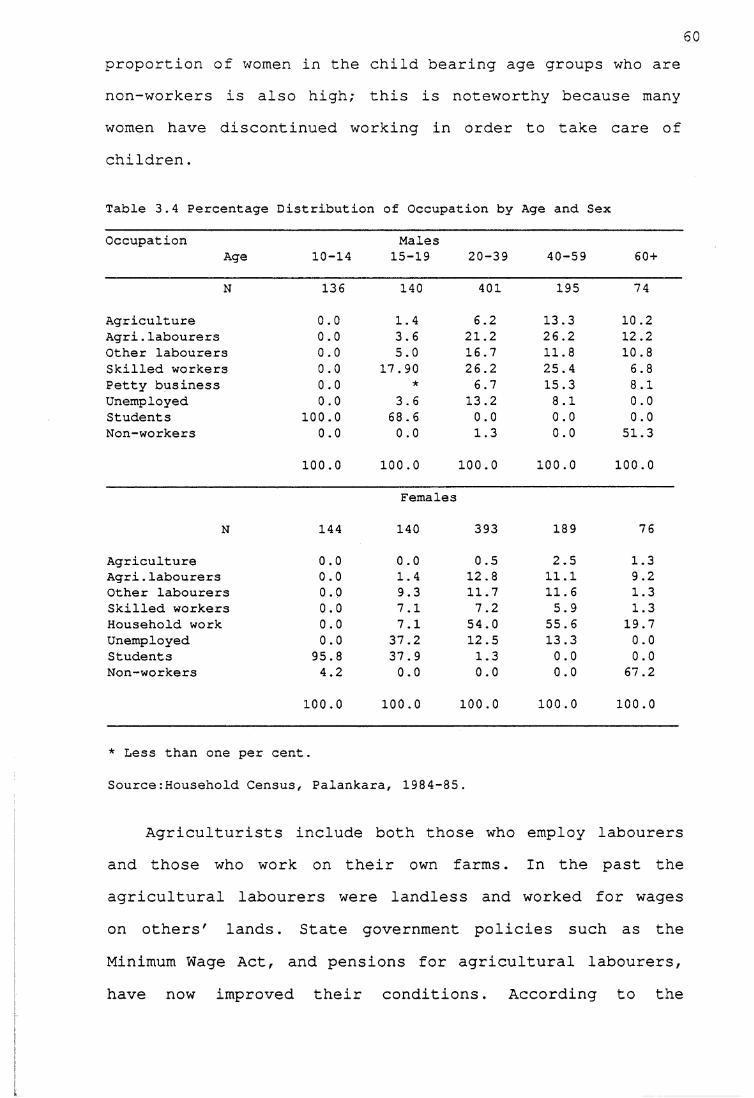
60proportion of women in the child bearing age groups who are non-workers is also high; this is noteworthy because many women have discontinued working in order to take care of children.
Table 3.4 Percentage Distribution of Occupation by Age and Sex
OccupationAge 10-14
Males15-19 20-39 40-59 60 +
N 136 140 401 195 74
Agriculture 0.0 1.4 6.2 13.3 10.2Agri.labourers 0.0 3.6 21.2 26.2 12.2Other labourers 0.0 5.0 16.7 11.8 10.8Skilled workers 0.0 17.90 26.2 25.4 6.8Petty business 0.0 ★ 6.7 15.3 8.1Unemployed 0.0 3.6 13.2 8.1 0.0Students 100.0 68 . 6 0.0 0.0 0.0Non-workers 0.0 0.0 1.3 0.0 51.3
100.0 100.0 100.0 100.0 100.0
Females
N 144 140 393 189 76
Agriculture 0.0 0.0 0.5 2.5 1.3Agri.labourers 0.0 1.4 12.8 11.1 9.2Other labourers 0.0 9.3 11.7 11.6 1.3Skilled workers 0.0 7.1 7.2 5.9 1.3Household work 0.0 7.1 54.0 55.6 19.7Unemployed 0.0 37.2 12.5 13.3 0.0Students 95.8 37.9 1.3 0.0 0.0Non-workers 4.2 0.0 0.0 0.0 67.2
100.0 100.0 100.0 100.0 100.0
* Less than one per cent.
Source:Household Census, Palankara, 1984-85.
Agriculturists include both those who employ labourers and those who work on their own farms. In the past the agricultural labourers were landless and worked for wages on others' lands. State government policies such as the Minimum Wage Act, and pensions for agricultural labourers, have now improved their conditions. According to the
61pension scheme the agricultural labourer (both male and female) who is over 65 years is entitled to a pension of 65 rupees a month. In the study village agricultural labourers over 65 years did receive this pension. Apart from the state government policies, the agricultural labourers' organizations also work for the welfare of their members. While there is no adequate evidence in the extant literature on the strength of the unions in fixing wages, discussions in the village suggested that these organizations might have acted as catalysts in fixing wages. Tharamangalam (1981:73) stated that in his study area there were instances of women workers refusing to transplant and harvest until the landlords agreed to pay higher wages. At present, a male agricultural labourer earns Rs.20 and a female agricultural labourer earns Rs.12 per day. Wages for agricultural labourers in Kerala are higher than in any state except Punjab (Centre for Development Studies, 1977:88). As most rural labourers belong to the backward castes, the government has provided special privileges for them in fields such as education and employment; this has created a situation where children of agricultural labourers can get not only education but also employment outside agriculture.
The other labourers are those who work in a granite quarry, in building and road construction, loading and unloading material, and in making grindstones. With the introduction of electrically operated grinding equipment, the market for traditional grindstones has to some extent fallen. However, as Electrical equipment is more
expensive, making grinding stones continues to be a household industry and many of the rural population still use them.
62
The quarry workers work in a quarry close to the village while others work wherever employment is available. Quarrying has been a local industry in the village for the last 40 years. There are three types of quarry labourers: the people who bore holes in the rocks to fill with explosives, those who cut the blasted rocks into pieces and those who carry them from the pit. Men are usually engaged in blasting rocks and women usually carry them from the pit. Men cut rocks into large sizes after blasting and women cut them into smaller sizes.
Working in the quarry is hard and risky; often accidents occur and some result in death and severe injuries. I was told that on average one death occurs every two years and two to three persons meet with severe injuries every year. Generally, when an accident occurs the contractor has to meet a part of the medical expenses. During my field work I met a woman who had fractured her ankle while carrying rocks from the pit and the contractor had met the expenses during her hospitalization. To some extent the labour unions and the government labour welfare policies protect the interests of these labourers. The men who blast the rocks earn Rs. 20-22 a day; the men and women who carry the rocks from the pit earn Rs.18 to 20 a day; and women who cut these rocks into smaller sizes are paid according to the amount of work they do. Generally the
63measure is a wooden box of one cubic foot: a person gets 90 paise for every cubic foot of rocks cut into pieces. A woman earns about Rs. 2 to 3 a day by cutting rocks into pieces.
The skilled workers category includes all those occupations which need some kind of skill such as those who work as carpenters, barbers, blacksmiths, teachers and washermen. Household work comprises those persons who are engaged in cooking, collecting firewood, bringing water and other domestic work. Non-workers include those who are not working due to sickness or physical incapacitation.
ICThere have been signifant changes in the economic conditions of the people in the study area. There has been a clear shift in the pattern of landownership, and landless labourers are now assured of a minimum wage. However, what is most significant is that agriculture can no longer sustain an expanding labour force and consequently, more importance is attached to employment in the non- agricultural sector. This emphasis on non-agricultural jobs has in turn made the people realize the necessity to provide their children with education as is discussed in the next section.
3.3 Social Change
The village has been experiencing changes due to social reform movements in the state; important changes have been in education and the health services. Changes in education have improved the literacy levels which in turn has created
political awareness and also changes in attitudes such as emphasis on female education and employment, and less fatalism towards sickness which has resulted in low mortality levels.
Apart from these, the village has experienced certain important changes especially with regard to the Hindu caste system. Also, the family structure has changed and the village has witnessed a shift from a matrilineal system to a patrilineal system. Attitudes towards marriage have changed and this has resulted in increased age at marriage for males as well as females; this is examined in next Chapter 4.
3.3.1 Changes in Education
The village has a primary school, which was a village school before it became a government-aided school. It is managed by the Latin church authorities. After completing primary education students have to travel four kilometres north of the village or cross the river and attend schools in neighbouring villages. In 1985 a pre-school was started by the Syrian church, which also has a convent for the nuns who run the school.
According to the census, the literacy rate in ehe village increased from 42.5 per cent in 1961 to 51.5 per cent in 1971 (this includes the population aged 0-5). For the same period male literacy levels increased from 51.7 per cent to 56.8 per cent and female literacy levels increased from 32.9 per cent to 46 per cent, a significant
65change in education in the village. At the time of the study, the proportion of population who were literate was 78 per cent, with 80 per cent of males and 75 per cent of females literate (this includes the population aged 0-5).
Another important factor is that although the village has only a primary school, the percentage of people who have attained higher levels of education is increasing (Table:3.5). The children are sent to nearby schools for continuing education. Another striking feature is the narrowing gap between the proportions of males and females educated among the younger age groups. It is obvious that female education is given importance in the village. The proportion of literate women in the child-bearing age groups is important because it is well established that literacy of women and fertility decline are positivelycorrelated.
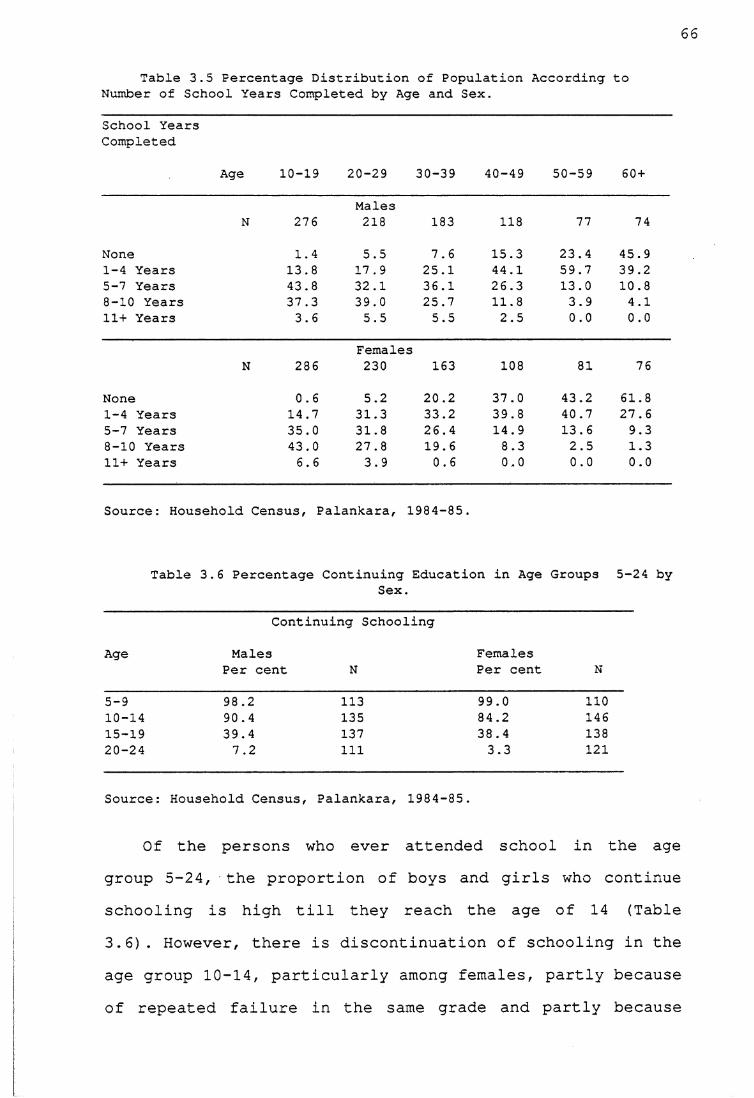
66
Table 3.5 Percentage Distribution of Population According to Number of School Years Completed by Age and Sex.
School Years Completed
Age 10-19 20-29 30-39 40-49 50-59 60 +
MalesN 276 218 183 118 77 74
None 1.4 5.5 7.6 15.3 23.4 45.91-4 Years 13.8 17.9 25.1 44.1 59.7 39.25-7 Years 43.8 32.1 36.1 26.3 13.0 10.88-10 Years 37.3 39.0 25.7 11.8 3.9 4.111+ Years 3.6 5.5 5.5 2.5 0.0 0.0
FemalesN 286 230 163 108 81 76
None 0.6 5.2 20.2 37.0 43.2 61.81-4 Years 14.7 31.3 33.2 39.8 40.7 27.65-7 Years 35.0 31.8 26.4 14.9 13.6 9.38-10 Years 43.0 27.8 19.6 8.3 2.5 1.311+ Years 6.6 3.9 0.6 0.0 0.0 0.0
Source: Household Census, Palankara, 1984-85.
Table 3.6 Percentage Continuing Education in Age Groups 5-24 bySex.
Age
Continuing Schooling
MalesPer cent N
Females Per cent N
5-9 98.2 113 99.0 11010-14 90.4 135 84.2 14615-19 39.4 137 38.4 13820-24 7.2 111 3.3 121
Source: Household Census, Palankara, 1984-85.
Of the persons who ever attended school in the age group 5-24, the proportion of boys and girls who continue schooling is high till they reach the age of 14 (Table 3.6). However, there is discontinuation of schooling in the age group 10-14, particularly among females, partly because of repeated failure in the same grade and partly because
67the children showed a lack of interest in studies. However, the number of children who discontinue in age groups 5-14 is negligible in the village. This phenomenon is not peculiar to the village, but has been observed in the state as a whole (Centre for Development Studies, 1977). The higher percentage of persons in age group 15-24 who discontinue schooling is because those of this age have to continue education by going to university which is relatively expensive.
Tables 3.5 and 3.6 show that the education of daughters is considered as important as the education of sons. Daughters are not withdrawn from school when they reach puberty in order to get married as observed in rural Karnataka by Caldwell, Reddy and Caldwell (1985:41), and by myself when working in a village2 in Karnataka. Girls were withdrawn from school mainly because of the fear that there might be scandalous gossip about them which would make it difficult for parents to get them married. This kind of fear did not stop the parents in the Kerala study village from sending their daughters to school. While some argued that one need not go to school to get into any scandal, others said it is the duty of mothers to keep a watch on their daughters. Although a few girls in the past (according to women aged 30-40) were withdrawn from school to take care of their siblings, this does not happen any
2 I conducted field work for 18 months in a Karnataka village as part of the research project on the Origins of Demographic Change in South India, which was a joint undertaking of the Population Centre, Bangalore, India, and Department of Demography, Research School of Social Sciences, Australian National University, Canberra. For details see Caldwell et al.(1982)
more, because couples now have only two or three children and do not require such childminding assistance by the time an older daughter reaches upper primary levels.
It was also observed that in a few families daughters had a higher level of education than sons. This was mainly because of the daughters' interest in studying and the sons' lack of interest, indicating that daughters are not discriminated against in comparison with sons in providing education. Education of daughters is encouraged in the village primarily to acquire knowledge of reading and writing. Moreover, it is likely that an educated daughter has an opportunity to marry an educated man with urban employment. Education also provides an opportunity for women to get jobs ; an employed woman can save money for her marriage and it is likely that employed women need not pay a dowry. Parents were not apprehensive that educated children would be less obedient or not suitable for farm work, a feeling often reported elsewhere in India (Vlassoff and Vlassoff, 1980:494, Caldwell, et al., 1985:46, Sushama, 1982) .
As in many other villages in Kerala, it was normal in this village in the past for men and women of the upper castes to attend school while the lower castes were prevented from doing so. The struggle for the right to learn during the early part of the century provided an opportunity for people of all castes to attend school and this in turn improved literacy levels in the village and in the state. In the past, education was important as a means
of acquiring knowledge of reading and writing. Discussions with some people of the older generation revaled that while literacy did not help them in their jobs, it provided the psychological satisfaction. The following examples illustrate the increasing emphasis laid on education by the lower castes, reflecting the result of the social reform movement:
Kuttappan, aged 82 years, is a blacksmith who lives with his youngest married son. Three older sons live separately in the same village. As a child he spent three years in the village school learning to read and write. In those days children from his caste rarely attended school.Though Kuttappan does not know why his parents decided to send him to school, he is happy that he can read and write. He feels very proud of himself when his friends ask him to read letters or documents. After dropping out of school at the age of twelve, Kuttappan started helping his father in his smithy. He reported that while his education did not in any way help him in his job as a blacksmith, he was happy that he could read and write and therefore decided to send his sons to school with the primary intention of making them knowledgeable. He did not aspire that his sons should be employed outside the family occupation. His first two sons, now aged 55 and 49, could complete only primary level schooling as they were not interested in studies, but his third and fourth sons, aged 46 and 33, completed high school (Sushama, Field Notes,1985) .The case of a barber aged 7 6 years was different. He had lost both his parents by the age of 12 and was brought up by his uncle who put him to work as an assistant in the barber shop. At the age of 20 he set up his own shop and his profession b&ught him into contact with many people whom he served. His customers used to talk about many things and the freedom struggle was a favourite topic of conversation. The barber was curious to know more about the freedom struggle but felt sad as he could neither read nor write and had to rely on his customers to provide information. So he decided to learn to read and his friends assisted him. He also decided to send his children to school as he felt that they should not suffer the same fate as he did (Sushama, Field Notes:1985)
Schooling has become an integral part of village life and it is no longer a matter of whether a child should be sent to school or not but a matter of how far parents canafford to educate the child.
70Recently the emphasis on education has been mainly on
acquiring non-farming jobs. All couples with wives in the age group 15-49 reported that educating children was important to acquire a job. Though they were not certain about university education, they said that basic education was essential for any job their children could hope to get in future. Non-farming jobs included white collar jobs as well as carpentry, tailoring, driving or electrical repair.
Parents also realize that white collar jobs are hard to acquire without a higher level of education. As university education is more expensive, there is increasing emphasis on acquiring skills such as carpentry and electrical work. This is partly because it is cheaper than university education and it is also possible to establish an independent firm with a modest investment.
A strong demand for jobs such as carpentry, masonry, electrical work, and painting in Gulf countries was another reason to emphasize such training for children in the study area. In recent years migration from Kerala state to the Gulf countries has been significant. In 1979, workers from Kerala formed half of all the Indian workers in these countries and the migrants were largely unskilled and semiskilled workers from rural areas wishing to supplement family income derived from agriculture or low production rural occupations (Gulati and Mody, 1983;7-11). Nair (1983, cited in Madhavan, 1985:473) reports that this affected the wages for carpenters and masons in areas in the state where emigration was concentrated.
713.3.2 Utilization of Health Services.
Traditionally, the villagers used the Ayurvedic system, home-made herbal medicines and magico-religious practices to cure the sick. The Ayurvedic system is the traditional medical system used in India for more than 3000 years and according to this system, sickness is caused by the imbalance in bodily humours. Extracts of plants are used to treat the sick and this type of treatment is widespread in the state. The government has given some support to this system and both Western and Ayurvedic systems coexist in the state. By 1965, Ernakulam district had seven Ayurvedic hospitals and 24 dispensaries maintained by the Department of Indigenous Medicine (Gazetteer, 1965:769).
Until 1974, the village had a private Ayurvedic clinic but then the doctor moved his clinic to another place for personal reasons. Even when the Ayurvedic clinic existed in the village, the villagers sought modern medicine from the government health clinic seven kilometres away, and also from other private clinics in neighbouring villages as well as major hospitals in Ernakulam.
There is an auxiliary-nurse-midwife (ANM) centre in the neighbouring village a kilometre away. The male and female health workers attached to this centre are expected to visit the village once a week to provide health and family planning services but do not do so on a regular basis. During my field work I gathered that villagers were displeased with their irregular visits and I had an
72opportunity to watch their displeasure. The day I visited the subcentre3 in the neighbouring village an old man in his sixties (who was an informal leader) came to see the ANM. He was complaining about her irregular visits and said that if she did not come to live in the village, he would inform the higher authorities. He made it clear to her that the villagers did not want her if she continued as in the past, as she was of no help to the community. The villagers had given the land to build the subcentre, and they had every right to demand her services. The man told me that his daughter had developed labour pains the previous night and they could not take her to the hospital whereas, if the ANM had lived in the village, she could have helped his daughter. The ANM was very much embarrassed because I was present when the man was complaining and after he left she told me of her problems in carrying out her duties properly. But the point is that people demand services, particularly from those who are paid by the government. Such incidents have been noted elsewhere in the state (Mencher, 1980:1782). This shows that people are aware of these services partly through higher literacy levels and partly through radical and egalitarian political movements in the state as a whole which teach them their rights. Such demands are made not only for health, but also in the fields of education and transport.
3 Each ANM is provided with a building, a part of which is used as clinic and the other part as residence for the ANM. The rationale is that if the ANM lives in the village it enables her to provide maternal and child health care to the villagers. Generally, the land is donated by the villagers to build subcentres.
73At the time of the study there were three private
health clinics in the village, one established in 1983, and the other two in 1985; two are Ayurvedic and one homoeopathic. Even though the doctors are primarily trained in Ayurveda and homoeopathy, they also dispense modern medicines, so, ever since these clinics were established, the villagers have not needed to go far for health services. Nevertheless, the existence of these clinics has not prevented the villagers from using health services in Ernakulam and nearby towns; distance has not been a deterrent. If the service was not available in the village they would not hesitate to travel to wherever it was available. This has been made possible by a well organized transport system. However, 20 per cent of the families preferred to visit the same physicians for all complaints because they believed that in this way the physicians would be familiar with their constitutions and they would be in a better position to treat the sick.
To depend on fate to recover from ill-health was very common in the past. This was more so among the lower castes because they could not visit Ayurvedic clinics, often owned by upper castes. During the interview, Kali, an 80-year-old Pulaya (Untouchable) woman told me that only five children out of her eleven had survived. Whenever her children were sick she used herbs and magico-religious treatment. Because she was an Untouchable she could not go to a doctor and had to depend on fate. She believed that children would survive if they had ayassa or were destined to live longer (the god of death decides each person's life span) . The condition of
Untouchable castes used to be very bad because of strict caste rigidity, and most of them depended on herbs and magico-religious practices to cure the sick, or just left it to fate. However, nowadays there is no discrimination in the use of health services according to caste or social class and this has led to a very significant change in the use of health services in the village.
Of the people reported sick, 56 per cent used Western medicines, 18 per cent used Ayurveda and 16 per cent used homoepathic medicines as the first step to cure their sickness. The rest used magico-religious means (one per cent) and self-medication (9 per cent) as the first step to cure illness. It is true that Ayurvedic medicines are still used for certain illnesses such as skin diseases, rheumatic pains and chronic gastric complaints. But self-medication and magico-religious treatments are disappearing. It is also true that along with treating the sick with medicines, people offer vows to temples and churches in cases of serious illnesses. Nevertheless, there has been a remarkable increase in the utilization of modern medicine. Not only do people in the area seek modern health services but what is notable is the promptness with which they seek such services. This is more so when young children fall ill. There is no delay in getting a sick person treated and people do not hestitate to spend money on such services. Knowledge and awareness about the health services available has made the people more concerned about their health. Pregnant women are periodically taken to the hospital for ante natal visits and the proportion of deliveries taking
75place in hospitals is increasing (see Chapter 5) . Immunization of children is also considered very important. For instance, when a child needs to be immunized, the mother visits the subcentre to find out when immunization will be available there. If the date is too far away, she promptly takes the child to a hospital where such services are available on a regular basis. Thus, there is less fatalism towards sickness and people no longer associate sickness with religion as they previously used to do.3.3.3.Religion in Palankara
The village is a heterogeneous society dominated by Hindus and Christians. Of the total population in the village, Hindus formed 55.2 percent, Christians 43.4 per cent and Muslims 1.4 percent.
This pattern of religious composition is not unique to the village, but is similar to that found in the whole district (except for the low Muslim figure, explained by Muslim concentrations in the towns rather than villages) . According to the 1971 census, while the proportions of Hindus, Christians and Muslims in the district were 46 per cent, 41.5 per cent and 12.3 per cent respectively, for the whole state the proportions were 59.4 per cent Hindus, 21.05 per cent Christians and 19.50 Muslims. The difference in the pattern of religious composition in the state and the district is due to the concentration of differnt religious groups in different districts of the state. Ernakulam District has always had a greater concentrationof Christians.
76The Christians in the village belonged to three sects:
the Latin Christians who formed 76 per cent of the Christian population, the Syrian Christians 23 per cent and the Jacobites one per cent. The Syrian Christians are considered superior to other sects because of the belief that converts to this sect originally belonged to the upper Hindu castes, while the Latin Christians are believed to be converts from the fisherman caste (Fuller, 1976:55) . Even though this belief still persists, the Christians in my village did not know the caste from which they came, and have been following Christianity for five to six generations. However, it was interesting to observe that marriages between these sects are still very rare. In my study village only three such marriages had occurred and the couples explained that their parents had opposed the marriage and had severed all contact.
One important fact about Christianity in the state in general and the village in particular is its contribution in improving literacy levels and health status. The missionaries, whose main interest was the conversion of the natives to Christianity, also established schools and hospitals (Nair,1981:26). Until 1930 the village had two primary schools, one Christian and the other Hindu, teaching mainly customs and religious ideas. The two merged as one school when the then government gave grants to promote vernacular schools. The Indian Christians who tried to imitate European customs favoured female education leading to an improvement in female literacy in the state (Jeffrey, 1987:465). This eventually improved the status of
77the Christian women. The influence of Christian ideologies during the colonial period might have contributed to raising the status of women in the state as a whole compared with elsewhere in India.3.3.4.Changes in The Hindu Caste System
There have been changes in the caste system in the village, the most important of which have been in the weakening of economic interdependence, in concepts of purity and pollution and in marriage forms, family structure and inheritance laws. Table 3.7 shows that there are 14 castes in Palankara. Although they are listed according to the ranking in the past, neither the ritual purity of the higher castes nor the large numbers of lower castes such as Izhvas and Pulayas make them dominant. It be said that the village is moving towards an egalitarian society, because caste rigidity has reduced to a largeextent.
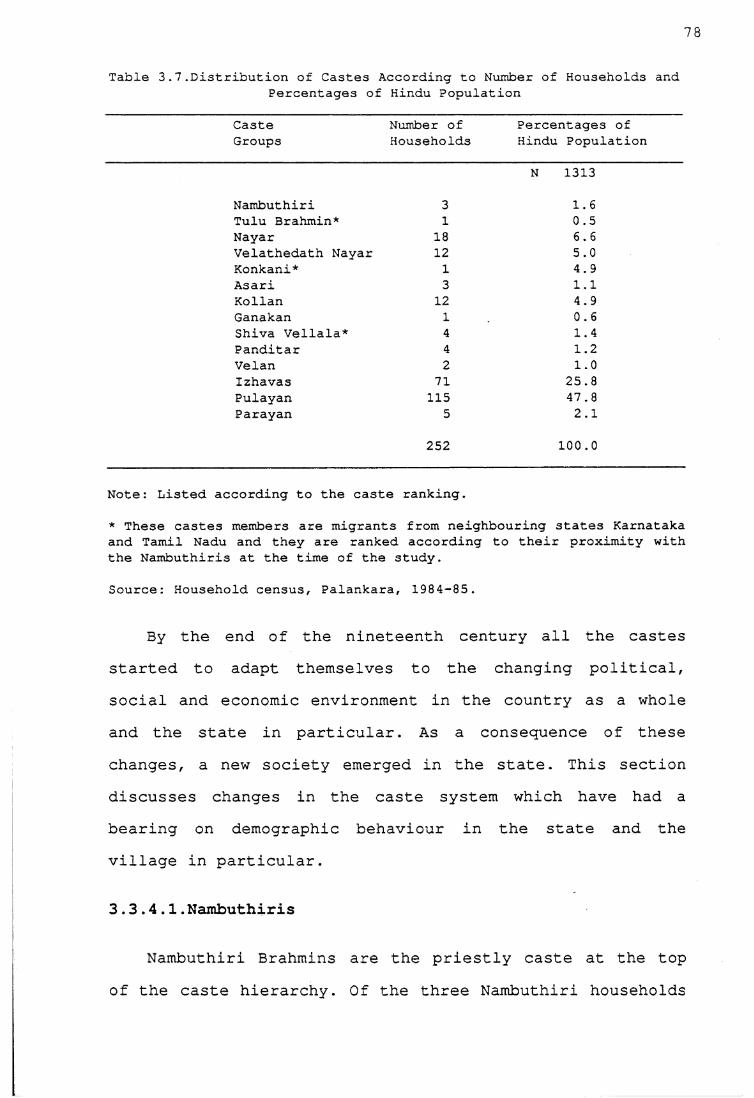
78
Table 3.7.Distribution of Castes According to Number of Households andPercentages of Hindu Population
CasteGroups
Number of Households
Percentages of Hindu Population
Nambuthiri 3
N 1313
1.6Tulu Brahmin* 1 0.5Nayar 18 6.6Velathedath Nayar 12 oin
Konkani* 1 4.9Asari 3 1.1Kollan 12 4.9Ganakan 1 0.6Shiva Vellala* 4 1.4Panditar 4 1.2Velan 2 1.0Izhavas 71 25.8Pulayan 115 47.8Parayan 5 2.1
252 100.0
Note: Listed according to the caste ranking.
* These castes members are migrants from neighbouring states Karnataka and Tamil Nadu and they are ranked according to their proximity with the Nambuthiris at the time of the study.
Source: Household census, Palankara, 1984-85.
By the end of the nineteenth century all the castes started to adapt themselves to the changing political, social and economic environment in the country as a whole and the state in particular. As a consequence of these changes, a new society emerged in the state. This section discusses changes in the caste system which have had a bearing on demographic behaviour in the state and the village in particular.
3.3.4.1.Nambuthiris
Nambuthiri Brahmins are the priestly caste at the top of the caste hierarchy. Of the three Nambuthiri households
in the village, two belong to the same lineage. The household was divided in 1964 as a result of the Land
79
Reform Act. The members of the third household migrated to the study village because the wife of the head of the household is a teacher in a nearby school, five kilometres from the village. Two of the Nambuthiri families once owned two-thirds of the land in the village and enjoyed ritual, social and economic power. Though they have since lost ownership of the land, they still perform priestly functions and command social respect.
They followed patrilineal descent and patrilocal residence. The major change in this caste since 1933 has been in the form of marriage. Among Nambuthiris, only the eldest son was permitted to marry into his own caste; other sons had Sambandham marriages with the women from the Nayar and Kshatriya castes. In this system of marriage, the junior sons had sexual relations with women belonging to the Nayars or Kshatriyas and children born to such unions belonged to the women's families. Nambuthiri women could marry only Nambuthiri men; this meant often that Nambuthiri girls married an old Nambuthiri or delayed their marriages.
Nambuthiris at that time felt that this unique system of marriage had certain advantages. First, it prohibited the division of land so that they remained wealthy; secondly, the sambandham relationships with Kshatriya women who belonged to the ruling community and Nayar women who belonged to the warrior community gave them unique political power. This system of marriage helped them to
have both economic and political power in the state along with ritual power. Mencher (1966:189) observed,
80
these wealthy landlords had far more influence and power than they would have had if their property had been split every generation or two, as was the case with the Brahmins of other parts of India.
By the early twentieth century the situation was changing rapidly. Many junior members of the Nambuthiri families who were influenced by the changes in the society started revolting against the system. They wanted to learn English and also to marry within their caste. Partly as a result of this revolt and partly because of changes in the society, the Madras Nambuthiri Act was passed in 1933; it conferred on all the Nambuthiris the right to marry within their own caste and the children of all such marriages became legal heirs to property. The division of property was also allowed under the new Act. In the village, the Nambuthiri families do not now follow the concepts of purity and pollution as in the past and they have lost their past economic status. However they still enjoy ritual status because people still expect them to perform the rituals in temples and places of worship.3.3.4.2 Nayars
Among the 18 Nayar households, 14 belong to the same matrilineal lineage ; the other four households migrated to the village for various reasons. Because of thismatrilineal lineage, the Nayars enjoyed political and economic power in the village.
Of all the castes in the village, perhaps the greatest changes were experienced by the Nayars. They had to change
their family structure, marriage forms and also inheritance laws to adapt themselves to the changing social and political situation.
In the past they practised matriliny and matrilocal residence. The eldest male became the head of the household (called karanavan) and all his maternal relatives lived under the same roof. Ideally, a Nayar family was an extended family (generally called a tarvad) consisting of all the relatives traced through the female line. The property and assets of the tarvad belonged to all the members and no individual could claim his share of the joint property.
Among Nayars, the women had sexual relations with men from higher castes or from their own castes. The children born to the women inherited the mother's family name and property. The bond between husband and wife was not strong, partly because they did not live under the same roof, and the man only visited his wife at her residence. Moreover, a man did not have the responsibility of bringing up his children, but had more responsibility towards his sisters' children. A woman from this caste had the freedom to choose her husband and also could break the alliance very easily. Generally, women in this caste enjoyed more freedom than the women in patrilineal castes (Gough, 1968:151).
Along with the external pressures, there was also a great amount of unrest within the tarvads (Jeffrey, 1976:177). At the same time many educated Nayars who were
82exposed to western ideas, rebelled against the marriage practices. From 1891, many laws were passed, recognizing sambandham as legal marriage and allowing the wife and children of a Nayar male to inherit half of his self- acquired property. In 1925, the Second Nayar Act was passed in Travancore allowing almost unrestricted partition of joint family property. Similar laws were passed in 1933 and 1938 in the Cochin and Malabar regions of the state. Eventually every marriage in the state was legal and the wife and children could inherit the property of a deceased man.
By the second half of the twentieth century, Nayars on the whole adopted patrilineal descent and patrilocal residence. However, inheritance is often bilateral. The result of the laws in 1933 and 1938 was that tarvads were divided and nuclear families replaced them.3.3.4.3.Velathedth Nayars
Velathedth Nayars are the traditional washermen. The 12 households of this caste belong to two different tarvads. Though they are the village washermen, they washed clothes only of Nambuthiri and royal families but not the clothes of upper caste Nayars and other lower castes. The Velathedth Nayars had jajmani4 relationships with the Nambuthiri caste. Of the 12 households only two now serve as washermen and the others are engaged in other occupations such as casual labouring. With the introduction
4 Traditionally the landowners and the peasants made periodic payments in kind to the service castes such as blacksmiths, washermen and barbers in return for their services.
83of the cash economy wages are now paid in cash; respondents of this caste reported that they have been paid in cash for the last 30 years. Even today the washerman family does not wash the clothes of other castes. The only change is that they wash the clothes of those people who go on an annual pilgrimage to the Sabarimala temple5.
This caste followed matrilineal inheritance and matrilocal residence like the Nayars. When the Nayars changed their marriage forms, family structure and inheritance, this caste followed them.
3.3.4.4. Asaris
Asaris are the village carpenters. Traditionally they provided agricultural implements needed by the villagers. Since they were also engaged in construction of houses, they did not pollute the upper caste by approaching them (Thurston, 1909; 61). Asaris were the traditional architects in the village. Presently, apart from being engaged in traditional occupations the Asaris in the village are also engaged in making furniture and other wood-work. Nevertheless, since the establishment of training schools in the state, carpentry has ceased to be an occupation of Asaris exclusively.
5 The Sabarimala temple is situated on a hill top in Kottayam district; only men are permitted to visit the it. The temple festival falls during the month of January. The people who go for a pilgrimage are supposed to follow certain rules of purity and pollution for 41 days before the festival. During this period they have to eat vegetarian food and abstain from alcohol and sex. Because of the strict rules of pollution the clothes of the men who visit these temples are washed by the washerman caste. The reason for such a change might be because the lower castes were not permitted to enter these temples in the past.
84The Asaris always followed patrilineal and patrilocal
residence. Iyer (1909:345) noted that in the past girls of this caste could be married before or after puberty and there was no social degradation if a woman remained unmarried. Cross-cousin marriages were prevalent. They followed the Nayars in marriage forms. In the past they practised polyandry, but now there is no such case.
3.3.4.5. Kollans
Kollans are the blacksmiths of the village. All 12 families belong to the same lineage. In the past, they were engaged in making or repairing ploughs or other tools needed for agricultural purposes. Unlike in the past the carpenters receive their wages or payments for goods in cash. At present the families in the village are engaged in different occupations. Of the 12 households only four are engaged in their traditional occupation. Others are employed as welders, tinkers, and labourers.
The Kollans followed the Asaris in marriage customs, inheritance and residence. The fraternal type of polyandry where several brothers shared one wife was most prevalent among Kollans in the past (Thurston, 1909;129) . However, this practice no longer exists.
3.3.4.6. Velans
The traditional occupation of the Velans was the giving of mattu to Brahmans, Kshatriyas, Nairs and Izhavas (Iyer,1909;169). Mattu is a custom where the Velans provide clothes for the people of this caste before they bathe on
85the days they were freed from pollution. These days were the fourth day of menstruation of a woman, a woman after confinement on the fifth, ninth, eleventh and sixteenth days and of all the members of a family under birth and death pollution. However, such practices have died out in the village.
They were also climbers of coconut trees. Except for one person, the Velans in the village are now engaged in different occupations depending on their skill and ability. They practice patrilineal and patriiocal residence.
3.3.4.7. Ganakans
Ganakans are the village astrologers; in the past they also acted as village teachers. The father of the present head of the Ganakan family was the village teacher and astrologer. The present head of the household is an astrologer and casts horoscopes. They have always practiced patrilineal and patriiocal residence.
3.3.4.8. Panditar
The Panditars are the village barbers. There are four households and all of them belong to the same family. They still continue their traditional occupation except for one person who does work related to electrical wiring. Iyer (1912:366) noted that a barber's wife acted as a birth attendant in the past, but a shift of deliveries from home to hospitals has changed this situation and even the village barber's wife went to hospital to deliver herchild.

86
3.3.4.9 Izhavas
Izhavas are the traditional toddy tappers engaged in occupations related to coconut farming; now they are engaged in different occupations. The Izhavas are a very good example of a caste which has achieved upward social mobility through economic improvement followed by educational improvement and political power. There are three main reasons for the improved conditions of the Izhavas. First, towards the end of the 19th century, the demand for coconut products in Europe and America increased and many Izhavas experienced an improvement in their economic condition (Jeffrey, 1976).
Another factor which improved their status eventually was education. Traditionally, the lower castes were denied the rights to own property, to wear costly ornaments or elaborate clothing (women belonging to lower castes could not cover their breasts), attend village schools, enter a temple, or use a public road. They had to keep at a stipulated distance when they had to converse with members of the upper castes. When the British introduced English- medium education in order to recruit some people for the government services, many upper caste Hindus were apprehensive that English education was a means to convert Hindus to Christianity. The rulers of Travancore and Cochin feared that missionary activity might jeopardize the Hindu religion, so they introduced vernacular education and encouraged village schools by giving them grants. In 1904, the government met the cost of primary education and
87education was given to everyone irrespective of caste and creed. This does not mean that every member of the lower castes attended school, but the system created an opportunity, denied in the past, for everyone to attend school. Izhavas who were directly or indirectly involved in trade made use of this opportunity, because literacy proved important for their trade.
Thirdly, there were several social reformers among the Izhavas who fought for the improvement of the caste. The caste organization was formed under the leadership of Sri Narayan Guru. It was named Sri Narayan Dharma Pratipalana (SNDP) yogam and every Izhava family became a member of this organization by paying an amount which it could afford. The SNDP was founded in 1903 and every Izhava is a member of this organization whose objective is to fight for Izhava rights, in particular to get admission to schools and government jobs and entry into temples and the abolition of matriliny. This organization increasingly protected the interests of the caste, which eventually achieved considerable economic, political and ritual power. Here, ritual power means not that their caste ranking has improved, but that they can study Sanskrit and Hindu religious scriptures, which were the domain of Brahmins in the past. Unlike the situation in the past they do not keep to the stipulated distance when they talk to the members of the upper castes.
During my fieldwork I met an Izhava who studied tantram, the knowledge of temple rituals. Though he was
88respected for his knowledge on the subject, he could not enter the inner parts of the Brahmin household. This means that his ranking in the caste hierarchy has not improved though he is respected for his knowledge.
3.3.4.10 Pulayas and Parayas
Other lower castes like Pulayas (landless agricultural labourers) and Parayas (basket weavers) in Kerala did not achieve an improvement in their status as did the Izhavas. They were the landless labourers who occupied the lowest status in caste ranking, and their occupation did not provide them with opportunities similar to those of Izhavas. Even though Ayankali, a Pulaya leader who was inspired by the Izhava leader Sri Naravan Guru founded an organization called Sadhu Paripalana Yogam in 1909 (later known as Kerala Pulaya Maha Sabha) to improve the status of the Pulayas, the caste did not achieve the same social mobility as the Izhavas (Woodcock, 1967;231). Jeffrey (1976:25) observed,
Conversion to Christianity was their only road to improvement; but they had so little to offer- their resources both of status and of material things were nonexistent-that some missionaries were reluctant to accept them. They saw that slave castes converts would lower the prestige of the mission and make it more difficult for them to retain Syrian Christians or to convert members of higher castes.
Izhavas who considered themselves superior to Pulayas did not mix with them. They could not attend Christian missionary schools maintained by Pulayas (Jeffrey, 1976:145). The position of the Pulayas was bad in the fight for equality because Izhavas who were fighting to raise their own status, considered Pulayas ritually impure.
89During my field work one of the old women from an Izhava family told me that she would not drink water from a Pulaya house. This kind of behaviour was found less among the younger generation than among the older generation.
However, the position of the Pulayas and the Parayas has improved in independent India, because the constitution of India aims at a secular nation. It protects the rights of the lower castes (Untouchables) by abolishing untouchability, promoting educational and job opportunities and use of public places. Nevertheless, many Pulayas in my village are engaged as labourers, with the exception of a few families where the sons living in towns have in jobs such as factory workers and peons in offices. However, marriage between a Pulaya and an upper caste Hindu is very rare. In Palankara, the family of a girl from the Washerman caste has severed all contacts with her since the day she married a Pulaya.
Alexander (1968:232) in his study of Pulayas observed that the position of Pulayas improved by attaining better education and employment in white collar jobs and by improvimg their standard of living. He also found that the elite Pulayas were treated better by the higher castes, but the gap still remains when one considers the very few marriages between Pulayas and higher castes. His study shows that there is less degradation of people on the basisof caste.
90
3.3.4.11. Tulu Brahmins, Shaiva Vellalas and Konkanis.
Three castes Tulu Brahmins, Shaiva Vellalas and Konkanis migrated to the village long ago; the Shaiva Vellalas from Tamil Nadu, the Tulu Brahmins and Konkanis from the South Canara District of the neighbouring state of Karnataka. Although they are not really part of the local caste system, they have been accepted as such. Shaiva Vellalas and Konkanis enjoy the same ranking as Nayars in the caste system and Tulu Brahmins act as assistants to Nambuthiris in temples and enjoy higher status than the Nayars in ritual purity.
Caste relations have changed to a great extent and the significant changes have been in the weakening of economic interdependence and in the concepts of purity and pollution. One example of this can be observed with reference to the Krishna Temple: in the past, the temple was exclusively the domain of Nambuthiris and Nayars. Till the Temple Entry Act was passed in 1936, lower castes could not enter ehe temple and worship, but now the temple is open to the public and has a temple administration committee to manage its activities, consisting of representatives from all the castes.
3.4 Summary
The village has experienced significant changes in its social, economic and cultural structure. It is also changing from a rigid caste system to a more egalitarian society. Because of social changes and some government
91policies the literacy level in the village has risen. The equal emphasis on education for boys and girls is a reflection of a better status for women, than elsewhere in India. My field work experience in villages in Karnataka state also supports the assertion that women in Kerala enjoyed a better status than the women in Karnataka villages. The women in matrilineal communities enjoyed high status and the missionary work of the Christians also helped in improving the status of women. In general, ideas such as encouraging female literacy and female employment have contributed towards raising the status of women in Kerala. This is an important change in the village because women now play a major role in fertility control decisions (discussed in Chapter 6) . Moreover, changes in the occupational structure, literacy levels and in the caste system have contributed towards a rise in age at marriage. As age at marriage is considered to be a proximate determinant of fertility, it would be appropriate to discuss changes in age at marriage before proceeding to examine fertility levels, trends and the use of contraception in the study area.
92
CHAPTER 4
Age at Marriage
One of the factors contributing to a declining fertility rate in Palankara is the rising age of marriage. Age at marriage has been defined as a proximate determinant of fertility because it determines the length of the reproductive period. This is more so in a traditional south Indian society where childbearing is socially accepted only within marriage. It also affects infant mortality, for the mother's age is important in pregnancy outcome. Childbearing in the age interval 20-34 ensures the minimum risk of maternal mortality, foetal loss and infant and child mortality in any socio-economic conditions (Nortman, 1974:7). The survival of children is important in fertility decision making because the desired family size of couples depends on the number of surviving children (see Chapter 6). Age at marriage however, can only be explained in terms of the cultural and social values held with regard to marriage. In other words, a comprehensive understanding of the way in which marriages are arranged, the choice of partners and the traditions and customs governing marriages is necessary to explain how age at marriage affects demographic behaviour.
4.1 Changes in the Institution of Marriage
With the abolition of the sambandham system, the institution of marriage underwent certain changes in Kerala. First, monogamy replaced polygamy. Instead of a
husband visiting his wife at her residence, they lived under the same roof and in most cases a wife moved to her
93
husband's residence as in many patrilocal societies. Secondly, as in rest of India, marriages came to be arranged by parents and the principle of caste endogamy was followed to the extent that parents tried to get their children married within the same caste: for example, in the study village, we observed that only one per cent of the marriages were inter-caste. Thirdly, the dowry system which was previously prevalent only among the Brahmins and the Christians (Iyer, 1912:446) was adopted by the other castes. It should however be noted that in Kerala, dowry is taken to mean the daughter's claim to a share of her father's property. This claim has been strengthened by the fact that in the past women in matrilineal families inherited all the property. However, with a change in the family structure and inheritance laws, daughters no longer inherit all the property but are entitled to an equal share with the sons. This practice is also followed by the other religious and caste groups in the area.
Nevertheless, Kerala remained unique in that the age at marriage remained high and did not fall just because marriages were arranged by parents. In the study village, 90 per cent of marriages were arranged by the parents; but usually the consent of the boy and the girl was obtained and marriages were not arranged against their wishes. MacDorman (1987, 115) oberved in her study area in Uttar Pradesh that the decision makers in marriage were not the girl and boy to be married. In the Karnataka village which
94I earlier studied, certain marriages were conducted in a hurried manner because the parents believed that if the girl did not get married during that particular year, she would forever remain unmarried. This was not the situation in my study village in Kerala where parents did not hesitate to postpone the marriage of their daughter until the right partner was found. In Kerala there is no social stigma attached to a girl remaining unmarried and parents are genuinely concerned about the future of their daughters and not merely interested in fulfilling their own social obligations.
The anthropological literature also documents that in many matrilineal communities in Kerala, marriages of girls were not performed before puberty (Iyer, 1912). As mentioned in Chapter 3, the sambandham system of marriage practised by the matrilineal castes permitted women to have sexual relations with men either from the same caste or from the upper castes and children born to such women were considered legitimate. Because of such practices in earlier times there was less concern about the modesty and purity of women. Elsewhere in India, often the rationale behind pre-pubertal marriage was to protect female modesty and purity, but among the matrilineal castes in Kerala such marriages were rare as the people were not concerned about such matters. Among Nambuthiris the girls were often married after puberty because of their unique marriage customs (Chapter 3) . The Nayar Regulation Act of 1937-38 which abolished the sambandham system of marriage also prohibited the marriage of females under 16 and of males
95under 21 (Gazetteer of India, 1965:281) . Interestingly, these ages are higher than those stipulated by the Government of India in the Sarda Act of 1931, which stated the minimum age at marriage for girls as 14 and for boys as 18. Apparently, because of its marriage customs, society in Kerala in the first half of the present century favoured a higher age at marriage for females than elsewhere in India and was less in favour of child marriages. This can be seen from the next section.
4.2 Age at Marriage
An accurate estimation of age at marriage is difficult in the absence of marriage registration. However, the data obtained through interviews in Palankara yielded a mean age at marriage of 27.3 years for males and 20.5 years for females. The mean age at marriage suffers from a truncation effect leading to bias because it relates only to ever married women; it does not take into consideration the proportion of never-married women in the population, which can have an effect on fertility.
To avoid such a bias the singulate mean age at marriage has been calculated on the basis of proportions never married in the population. The singulate mean age at marriage (SMAM) calculated from proportions single in the study village provided an age at marriage of 29.2 years for males and 23 years for females (See UN Manual X for calculation of SMAM). The age at marriage thus computed can be considered reasonable partly because it is consistent with the trend toward rising age at marriage for the state
96and the district (Table 4.1A in appendix) . Moreover, the rise in the median age at marriage for females from 20.7 years in 1961 to 23.9 years in 1980 for Ernakulam District (Zacharia, 1984:97) confirms that the district's age at marriage is rising.
4.3 Trends in Age at Marriage
To understand past marriage trends, the mean age at marriage was calculated according to the year of marriage. Table 4.1 shows that the mean age at marriage for both males and females is rising in Palankara. The age at marriage for males has risen by four years from 23.7 years for the period 1917-39 to 27.6 years in 1980-84. The female age at marriage has also risen by four years from 17.6 during 1917-39 to 22.4 during the period 1980-84. The male age at marriage rose from 26.3 years in 1940-44 to 27.3 years in 1950-54. The slight difference of one year could have been either due to the mean age at marriage being calculated only for those still living or due to random statistical fluctuations because of small numbers. Nevertheless, one can safely say that the male age at marriage in the village is relatively high and this has been the case for a good part of this century. The figures for Cochin (Table 4.1A in appendix) also show a high age at marriage for males in the past.
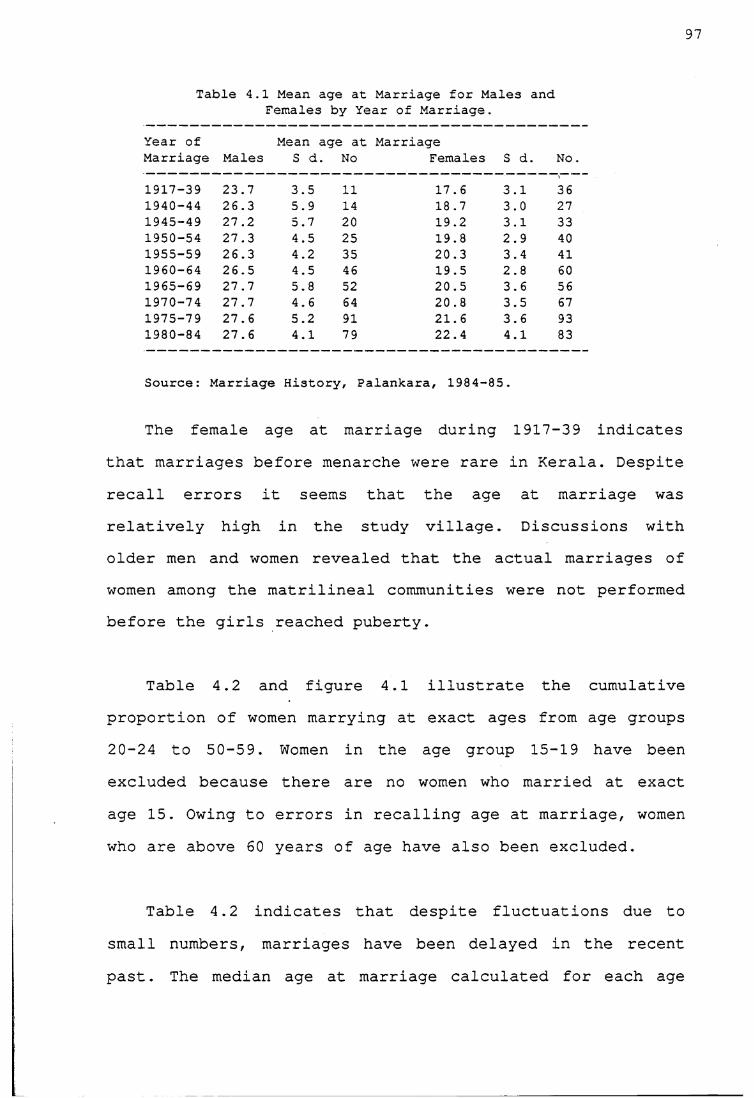
97
Table 4.1 Mean age at Marriage for Males and Females by Year of Marriage.
Year of Marriage Males
Mean S d
age at . No
MarriageFemales S d. No.
1917-39 23.7 3.5 11 17.6 3.1 361940-44 26.3 5.9 14 18.7 3.0 271945-49 27.2 5.7 20 19.2 3.1 331950-54 27.3 4.5 25 19.8 2.9 401955-59 26.3 4.2 35 20.3 3.4 411960-64 26.5 4.5 46 19.5 2.8 601965-69 27.7 5.8 52 20.5 3.6 561970-74 27.7 4.6 64 20.8 3.5 671975-79 27.6 5.2 91 21.6 3.6 931980-84 27.6 4.1 79 22.4 4.1 83
Source: Marriage History, Palankara, 1984-85.
The female age at marriage during 1917-39 indicates that marriages before menarche were rare in Kerala. Despite recall errors it seems that the age at marriage was relatively high in the study village. Discussions with older men and women revealed that the actual marriages of women among the matrilineal communities were not performed before the girls reached puberty.
Table 4.2 and figure 4.1 illustrate the cumulative proportion of women marrying at exact ages from age groups 20-24 to 50-59. Women in the age group 15-19 have been excluded because there are no women who married at exact age 15. Owing to errors in recalling age at marriage, women who are above 60 years of age have also been excluded.
Table 4.2 indicates that despite fluctuations due to small numbers, marriages have been delayed in the recent past. The median age at marriage calculated for each age
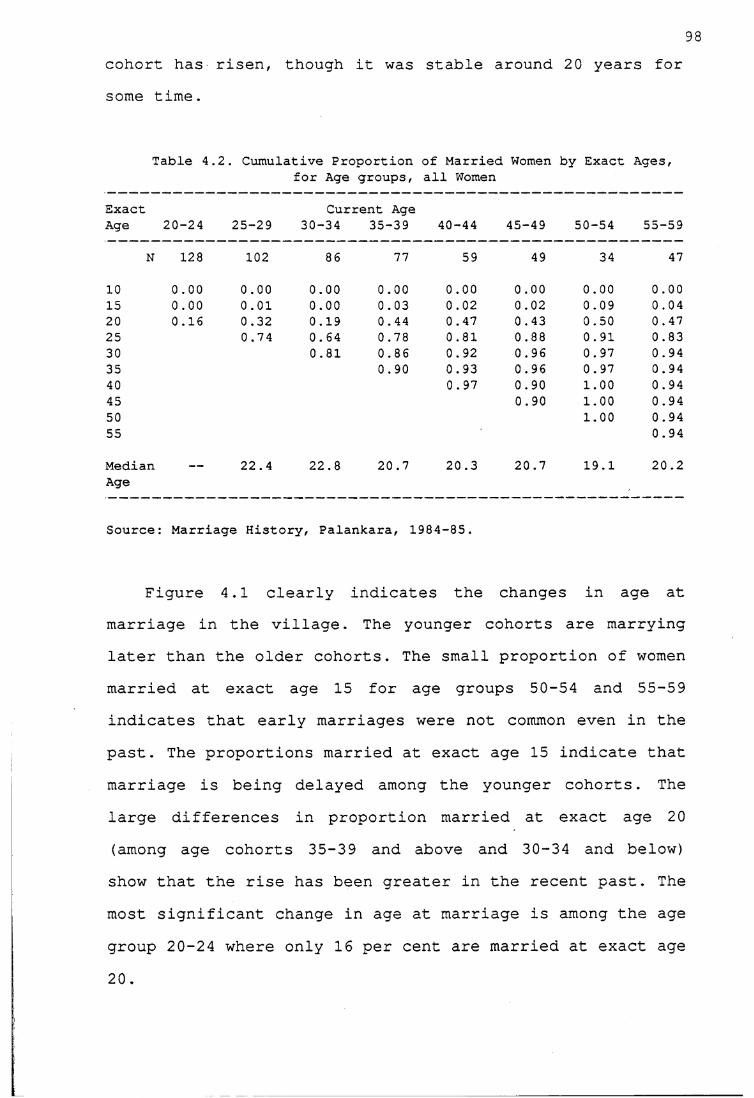
cohort has risen, though it was stable around 20 years for some time.
98
Table 4.2. Cumulative Proportion of Married Women by Exact Ages,for Age groups, all Women
Exact Current AgeAge 20-24 25-29 30-34 35-39 40-44 45-49 50-54 55-59
N 128 102 86 77 59 49 34 47
10 0.00 0.00 0.00 0.00 0.00 0.00 0.00 0.0015 0.00 0.01 0.00 0.03 0.02 0.02 0.09 0.0420 0.16 0.32 0.19 0.44 0.47 0.43 0.50 0.4725 0.74 0.64 0.78 0.81 0.88 0.91 0.8330 0.81 0.86 0.92 0.96 0.97 0.9435 0.90 0.93 0.96 0.97 0 . 9440 0 . 97 0.90 1.00 0 . 9445 0.90 1.00 0.9450 1.00 0.9455 0.94
MedianAge
— 22.4 22.8 20.7 20.3 20.7 19.1 20.2
Source: Marriage History, Palankara, 1984-85.
Figure 4.1 clearly indicates the changes in age at marriage in the village. The younger cohorts are marrying later than the older cohorts. The small proportion of women married at exact age 15 for age groups 50-54 and 55-59 indicates that early marriages were not common even in the past. The proportions married at exact age 15 indicate that marriage is being delayed among the younger cohorts. The large differences in proportion married at exact age 20 (among age cohorts 35-39 and above and 30-34 and below) show that the rise has been greater in the recent past. The most significant change in age at marriage is among the age group 20-24 where only 16 per cent are married at exact age20.
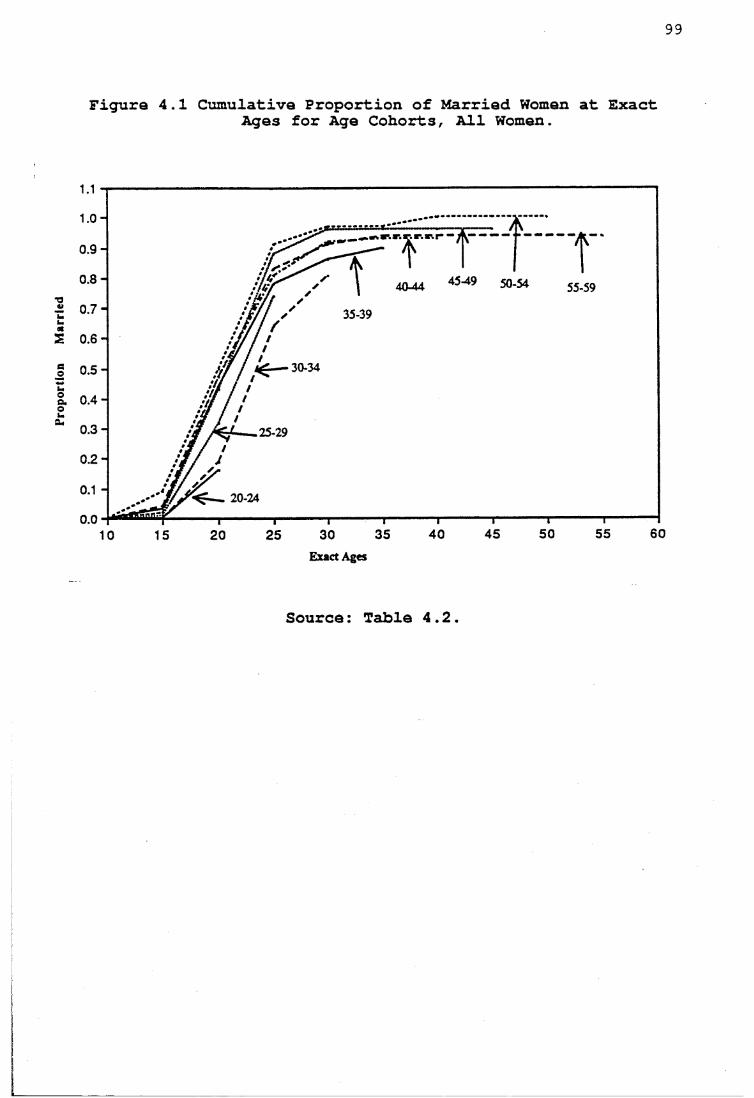
opor
tion
Mar
99
Figura 4.1 Cumulative Proportion of Married Women at ExactAges for Age Cohorts, All Women.
50-54 55-59
35-39
30-34
25-29
20-24
Exact Ages
Source: Table 4.2.
100Table 4.2 and Figure 4.1 also show that 90 per cent of
women marry by age 35 and that only a negligible proportion of women have not married by age 45. Thus, while marriage remains universal, most women do get married, the age at marriage is nevertheless high.
The cumulative proportion of women married at exact age 20 for the age cohort 25-29 is 32 per cent, while it is 19 per cent for women in the 30-34 cohort. The median age at marriage for the age group 25-29 is 22.4 years, which is lower than the 22.8 years for the age cohort 30-34 . This indicates that women in the age cohort 30-34 might have delayed their marriage.
What were the possible reasons for such a delay in marriage among women in this age group? The study was conducted in 1984 and women in the age group 30-34 were born during the fifties. Considering the mean age at marriage as 20, the women in the 30-34 age group would have mostly married during the early seventies. Because of the political developments in Kerala it was only in the early 1970 that the Land Reform Act could be effectively implemented abolishing tenancy and allowing tenants the right to purchase the land. Similarly, agricultural labourers who lived on the owners' lands had the right to purchase the piece of land on which they lived. This meant that they had to raise extra money to purchase the land. The labourers and tenants who used to generally borrow money from the landlords could not do so, because with the abolition of bonded labour there was no way of repaying it.
101Previously they paid back the debt in the form of labour. People felt they should purchase the land, as it would be an economic asset. Hence raising money for marriage was delayed.
Secondly, the inheritance laws led to land division often resulting in land holdings too small to be viable for agriculture, and forcing men to seek non-farming jobs. Education also gave opportunities for people to get nonfarming jobs. As in a non-agricultural economy earnings became a prerequisite for a man to marry, men delayed their marriage, which in turn delayed the age at marriage ofwomen.
4.4 Age at Marriage and Socio-Economic Conditions
The age at marriage for both males and females ishigher in the study village than in India as a whole. As marriage is a social institution, the age at which people marry depends on the social attitudes towards marriage and this attitude might change according to their socioeconomic conditions. So this section examines the age at marriges according to different occupational, educational and religious groups.
4.4.1 Religion and Age at Marriage
The singulate mean age at marriage obtained for Christian males is 29.9 years, while that for Hindu malesis 28.8 years, indicating a higher age at marriage forChristian males. However, no significant differences are observed in singulate mean age at marriage of Hindu and
102Christian females. The singulate mean age at marriage obtained for Christian females is 23.6 years, while for Hindu females it is 23.4 years.
The SMAM calculated for males and females is estimates at the time of the study. To understand the past trends of marriages among Christian and Hindu females, the cumulative proportion of women aged 15-59 who were married at exact ages by religion were calculated, Muslim women were excluded because of small numbers.
Figures 4.2 and 4.3 show the cumulative proportion of women married at exact ages for both Christians and Hindus respectively. It is clear from both figures that despite differences between the two groups, the age at marriage has been rising for females among the two religious groups in the recent past.
Although there is a rise in the age at marriage, Christian women marry later than Hindu women. Looking at exact age 15 for the older cohorts, it is clear that no Christian woman was married under age 15, while a few Hindu women were married, indicating occasional early marriage among Hindus. Though marriage is delayed for Christian women, 80 per cent of them were married by exact age 25.
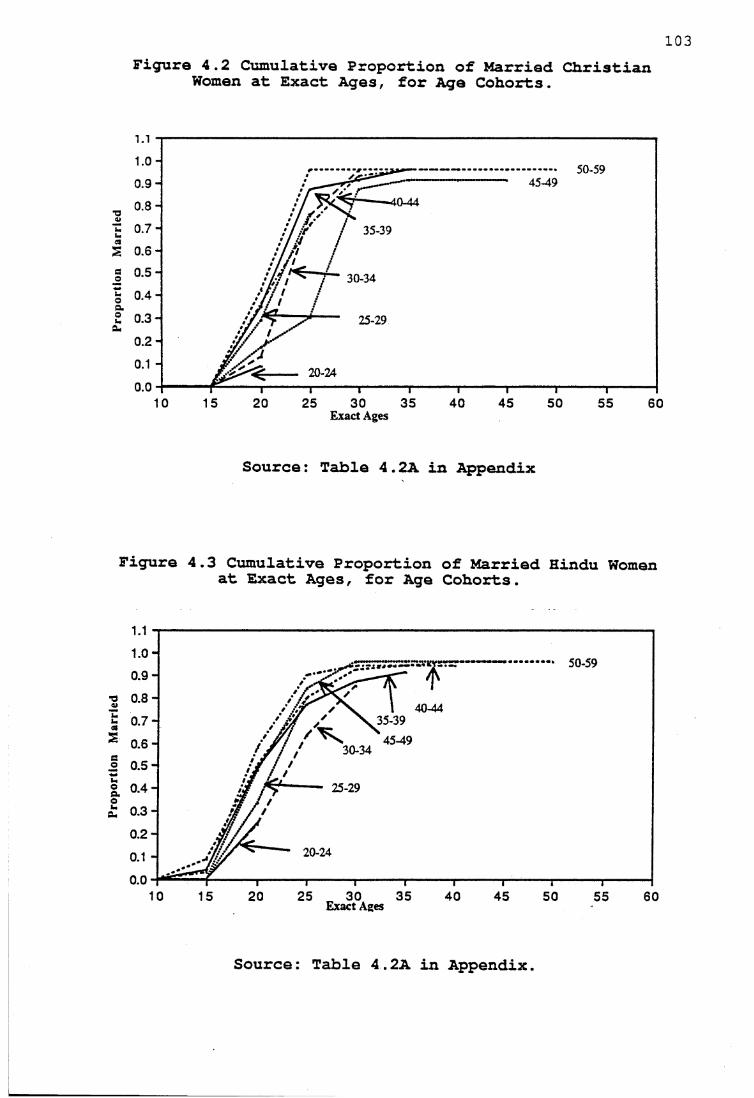
Figure 4.2 Cumulative Proportion of Married Christian Women at Exact Ages, for Age Cohorts.
50-5945-490 . 9 -
0.8 -
u 0 . 7 -
S 0.6-5 0 . 5 - 30-34
,*// /
t 0 . 3 -
20-24
Exact Ages
Source: Table 4.2A in Appendix
Figure 4.3 Cumulative Proportion of Married Hindu Women at Exact Ages, for Age Cohorts.
rr-~vinrrrrr———
T9 0.8 -40-44
£ 0 . 7 - 35-3945-49
30-343 0 . 5 -
2 0 . 4 -
20-24
Exact Ages
Source: Table 4.2A in Appendix.
104Delay during early ages among Christians may be due to the Church's influence. According to the Indian Christian religious law on marriage (The Indian Christian Marriage Act, 1872, 1972:13; Beri, 1982:27) the minimum age at marriage of females is 18 years and that of males is 21 years (similar to the Government of India's minimum legal age at marriage). The Christian Church believed in adhering to the law to a greater extent than the Hindus did and usually insisted on the couple attaining the specified minimum age before marriage. On the other hand, the Hindu religious code always supported early marriage and was lax when it came to observing the legal age at marriage. However, under special circumstances, the Church gave special permission for girls to marry before they completed 18 years. For instance, the parents of a Christian girl in the village who became pregnant before marriage obtained special permission from the Archbishop of Ernakulam, to get her married although she was only 17 years.
One reason for the high age at marriage for males in the area is that the timing of marriage is affected by financial conditions as the men need to establish an independent household after marriage. To understand this phenomenon it is important to know the nature of household division in the village: the property is divided equally among all sons and daughters, and the daughter's share is given to her at the time of her marriage in the form of dowry. Although property is shared equally by all the sons, the older sons establish separate households after marriage and the youngest of all inherits the parental house.
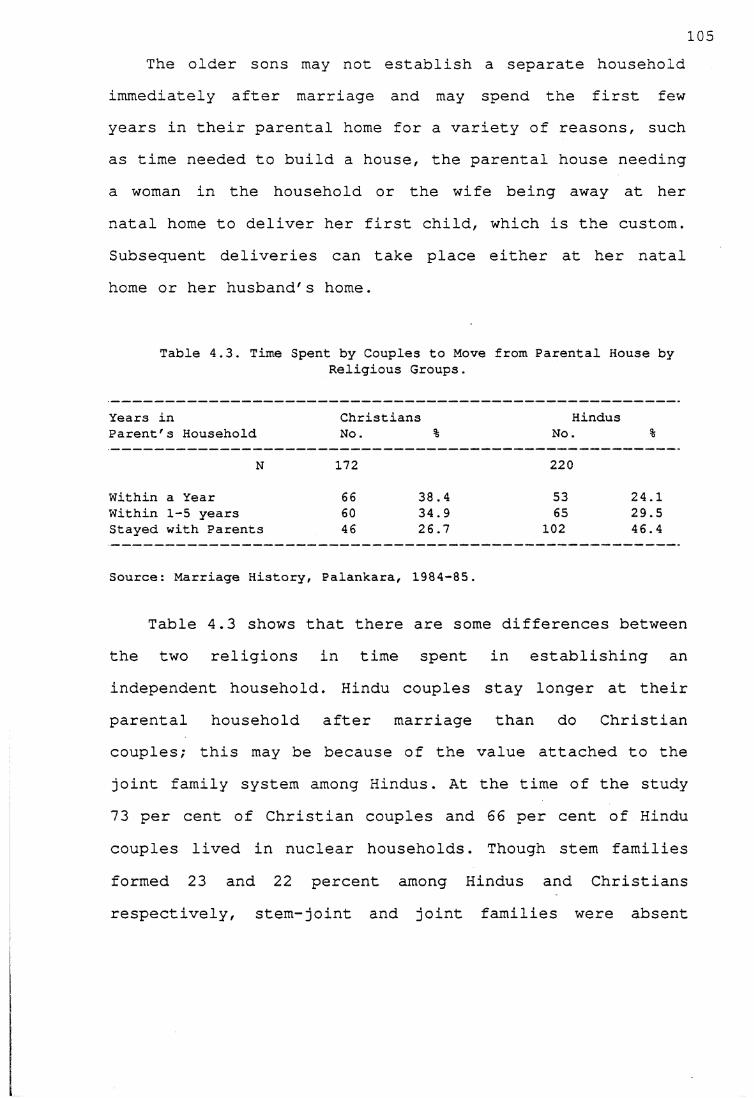
105The older sons may not establish a separate household
immediately after marriage and may spend the first few years in their parental home for a variety of reasons, such as time needed to build a house, the parental house needing a woman in the household or the wife being away at her natal home to deliver her first child, which is the custom. Subsequent deliveries can take place either at her natal home or her husband's home.
Table 4.3. Time Spent by Couples to Move from Parental House byReligious Groups.
Years in Christians HindusParent's Household No. % No. %
N 172 220Within a Year 66 38.4 53 24.1Within 1-5 years 60 34.9 65 29.5Stayed with Parents 46 26.7 102 46.4
Source: Marriage History, Palankara, 1984-85.
Table 4.3 shows that there are some differences betweenthe two religions in time spent in establishing anindependent household . Hindu couples stay longer at theirparental household after marriage than do Christiancouples; this may be because of the value attached to thejoint family system among Hindus. At the time of the study 73 per cent of Christian couples and 66 per cent of Hindu couples lived in nuclear households. Though stem families formed 23 and 22 percent among Hindus and Christians respectively, stem-joint and joint families were absent
106among Christians1. The emphasis on establishing a separate household among Christians may be another reason for men to delay marriage. Hajnal (1982:452) points out that establishment of a separate household is a feature of late marriages among males and females.
One factor in delaying marriage is the time spent by the family in selecting a proper match, the meaning of which depends very much on the family. I observed during field-work in a village in Karnataka that age at marriage was lower for those couples who married their close blood relatives than for those who married non-relatives. A similar phenomenon was observed by Caldwell and colleagues (1983:348) in a different region of Karnataka. Traditionally, in many castes in South India the preferred marriage was that of a man to his sisters'daughter and the next preference was that of a man to his cross-cousin (either his mother's brother's daughter or his father's sister's daughter). In Kerala the preferred marriage of the Hindus (other than Nambuthiris) was of a man to his mother's brother's daughter (cross-cousins), while the marriage of a man to his sister's daughter was tabooed. The reason for lower age at marriage for couples who marry blood relatives is that these marriages are decided by the family when the couples are very young. In such marriages, as the decision is already made in the selection of
1 Stem families are those where two couples of two different generations live together. Joint families are those where two or more couples of the same generation live together. Stem-joint families are those where couples of the same generation and also two different generations live together.
107spouses, the marriage takes place when the bride and bridegroom attain marriageable age, which depends on the existing norms in the society. For example, for a long time pre-pubertal marriages for girls were a norm in many societies. In the case of uncle-niece marriages an early marriage may be preferred if there is a large age difference between the uncle and his niece.
Eighty-nine per cent of all the marriages in Palankara occurred between non-relatives. The 11 percent of couples who married their cross-cousins belonged to the Hindu religion while among Christians uncle-niece and crosscousin marriages were tabooed. The large number of marriages among non-relatives may be a factor influencing age at marriage as in the absence of previous understanding among relatives, parents may have to spend time searching for suitable husbands for their daughters. Evidence from Karnataka, where marriage among relatives is most common and the female age at marriage is relatively low, supports such an interpretation
4.4.2 Schooling and Age at Marriage
Table 4.4 shows the singulate mean age at marriage for males and females by educational levels. The illiterates have been included among persons with one to four years of schooling as they form a small group. The singulate mean age at marriage for males rose with higher levels of schooling, while that for females showed a different pattern. Though the female age at marriage was higher for
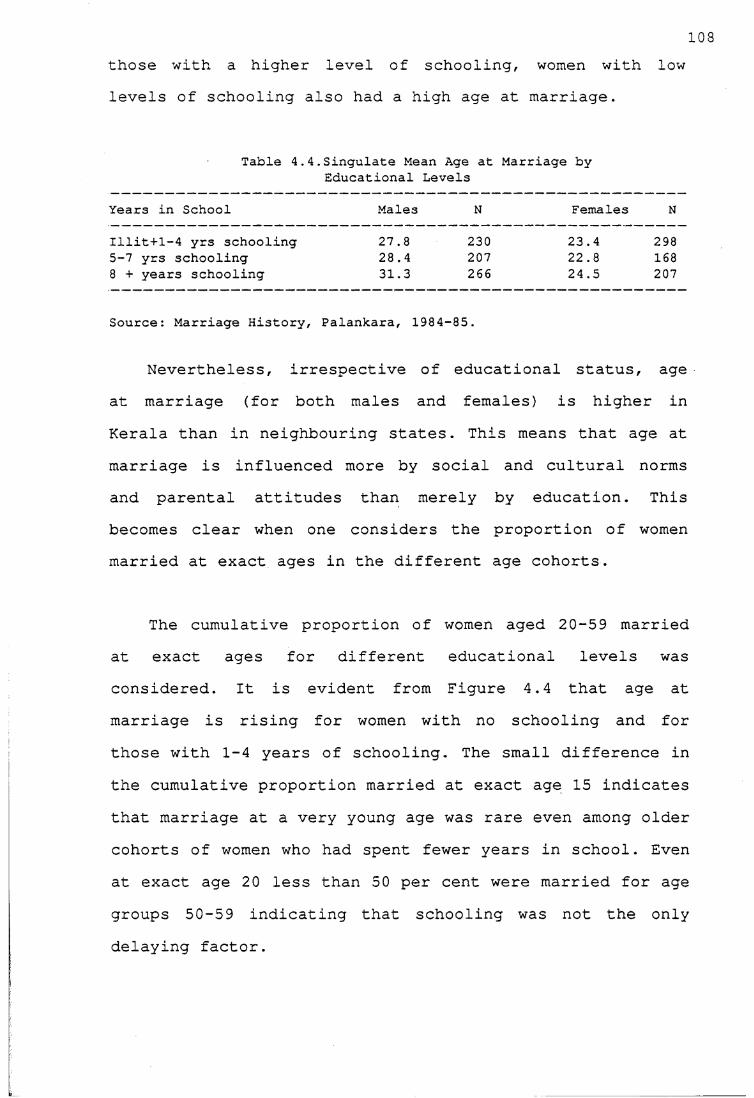
those with a higher level of schooling, women with low levels of schooling also had a high age at marriage.
103
Table 4.4.Singulate Mean Age at Marriage by Educational Levels
Years in School Males N Females N
Illit+1-4 yrs schooling 27.8 230 23.4 2985-7 yrs schooling 28.4 207 22.8 1688 + years schooling 31.3 266 24.5 207
Source: Marriage History, Palankara, 1984-85.
Nevertheless, irrespective of educational status, age at marriage (for both males and females) is higher in Kerala than in neighbouring states. This means that age at marriage is influenced more by social and cultural norms and parental attitudes than merely by education. This becomes clear when one considers the proportion of women married at exact ages in the different age cohorts.
The cumulative proportion of women aged 20-59 marriedat exact ages for different educational levels wasconsidered. It is evident from Figure 4.4 that age atmarriage is rising for women with no schooling and forthose with 1-4 years of schooling. The small difference in the cumulative proportion married at exact age 15 indicates that marriage at a very young age was rare even among older cohorts of women who had spent fewer years in school. Even at exact age 20 less than 50 per cent were married for age groups 50-59 indicating that schooling was not the only delaying factor.
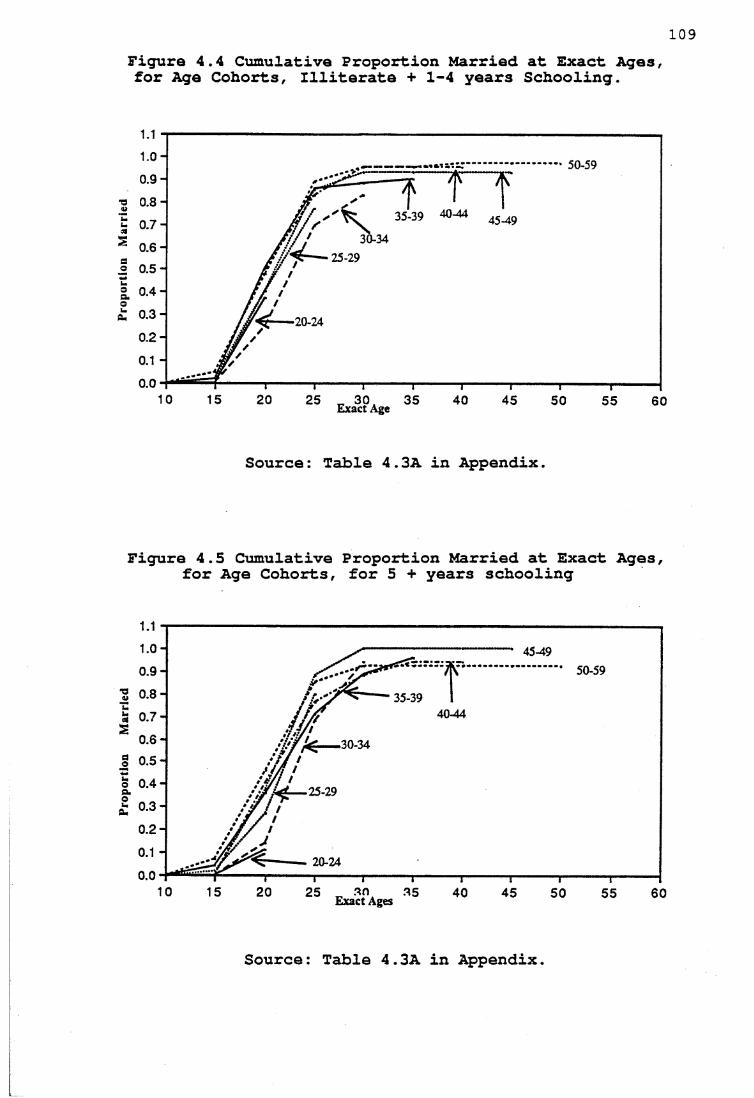
Figure 4.4 Cumulative Proportion Married at Exact Ages, for Age Cohorts, Illiterate + 1-4 years Schooling.
109
• 50-59
■a 0.8-35-39 40-44
£ 0 .7 -30-34
3 0 .5 -
2. 0 .4 -
20-24
Exact Age
Source: Table 4.3A in Appendix.
Figure 4.5 Cumulative Proportion Married at Exact Ages, for Age Cohorts, for 5 + years schooling
--------- 45-49
■2 0.8 -40-44
,30-34
o 0.4 -— 25-29
20-24
Exact Ages
Source: Table 4.3A in Appendix.
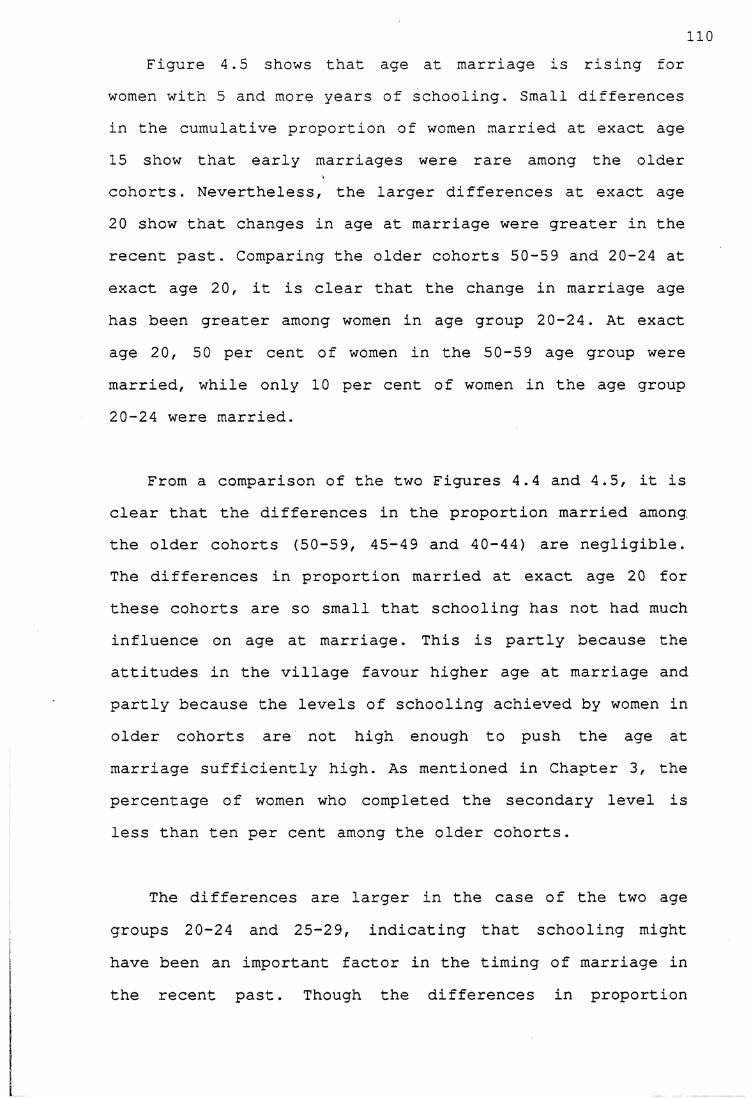
110Figure 4.5 shows that age at marriage is rising for
women with 5 and more years of schooling. Small differences in the cumulative proportion of women married at exact age 15 show that early marriages were rare among the older cohorts. Nevertheless, the larger differences at exact age 20 show that changes in age at marriage were greater in the recent past. Comparing the older cohorts 50-59 and 20-24 at exact age 20, it is clear that the change in marriage age has been greater among women in age group 20-24. At exact age 20, 50 per cent of women in the 50-59 age group were married, while only 10 per cent of women in the age group 20-24 were married.
From a comparison of the two Figures 4.4 and 4.5, it is clear that the differences in the proportion married among the older cohorts (50-59, 45-49 and 40-44) are negligible. The differences in proportion married at exact age 20 for these cohorts are so small that schooling has not had much influence on age at marriage. This is partly because the attitudes in the village favour higher age at marriage and partly because the levels of schooling achieved by women in older cohorts are not high enough to push the age at marriage sufficiently high. As mentioned in Chapter 3, the percentage of women who completed the secondary level is less than ten per cent among the older cohorts.
The differences are larger in the case of the two age groups 20-24 and 25-29, indicating that schooling might have been an important factor in the timing of marriage in the recent past. Though the differences in proportion
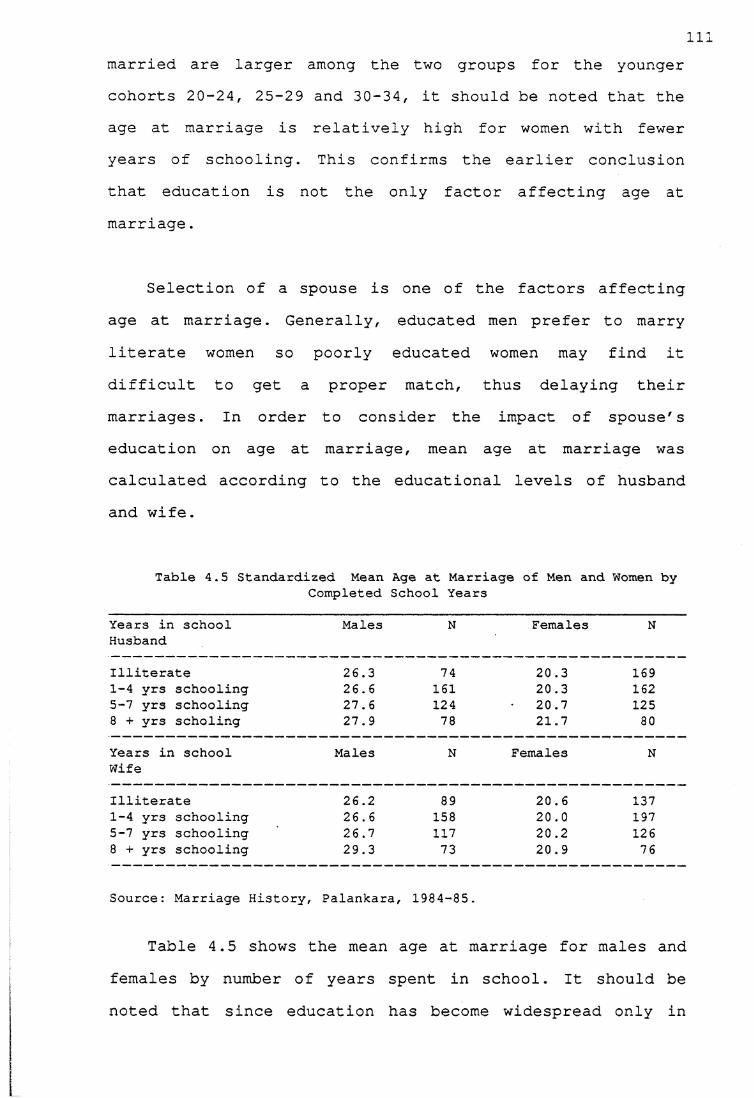
Illmarried are larger among the two groups for the younger cohorts 20-24, 25-29 and 30-34, it should be noted that the age at marriage is relatively high for women with fewer years of schooling. This confirms the earlier conclusion that education is not the only factor affecting age at marriage.
Selection of a spouse is one of the factors affecting age at marriage. Generally, educated men prefer to marry literate women so poorly educated women may find it difficult to get a proper match, thus delaying their marriages. In order to consider the impact of spouse's education on age at marriage, mean age at marriage was calculated according to the educational levels of husband and wife.
Table 4.5 Standardized Mean Age at Marriage of Men and Women byCompleted School Years
Years in school Males N Females NHusband
Illiterate 26.3 74 20.3 1691-4 yrs schooling 26.6 161 20.3 1625-7 yrs schooling 27.6 124 20.7 1258 + yrs scholing 27.9 78 21.7 80
Years in school Males N Females NWife
Illiterate 26.2 89 20.6 1371-4 yrs schooling 26.6 158 20.0 1975-7 yrs schooling 26.7 117 20.2 1268 + yrs schooling 29.3 73 20.9 76
Source: Marriage History, Palankara, 1984-85.
Table 4.5 shows the mean age at marriage for males and females by number of years spent in school. It should be noted that since education has become widespread only in
112the recent past, the men and women with higher education are likely to be younger and those who are not literate are likely to be older. To avoid the effect of age, the mean age at marriage is calculated by standardizing the present age of men and women. Though with higher educational levels of the husband, the differences in mean age at marriage are small, there is a rising trend in age at marriage for both males and females. With regard to the educational levels of the husband, the mean age at marriage for males rose from 26.3 years for illiterate males to 27.9 years for men with eight and more years of schooling. Similarly, the mean age at marriage for females rose from 20.3 years for those whose husbands were illiterate to 21.7 years for those whose husbands attained a higher level of schooling. Although the differences are small, there is a positive correlation between age at marriage and husband's education.
The mean age at marriage of men rose from 26.2 years for those whose wives were illiterate to 29.3 years for those whose wives had eight or more years of schooling, while the female age at marriage rose from 20.6 years for women with no schooling to 20.9 years for women with eight and more years of schooling. It appears that the educational level of the spouse has a greater effect on mean age at marriage of men and women. This is partly because the men with a higher level of schooling are likely to seek wives among the better educated and similarly, the better educated women are likely to marry more educatedmen.

113Another observation in the study village is that only
one per cent of women had discontinued schooling to get married and these women were relatively old. The reasons normally cited for discontinuation of schooling were financial problems, need to care for siblings or sickness. In contrast, in the village I studied in Karnataka parents were generally apprehensive about keeping a daughter in school after menarche, and often began arrangements for the marriage of daughters immediately after menarche. The reason for this was the fear of girls becoming pregnant, a fear which was greater in the case of girls in school. Parents in the study village in Kerala also expressed the fear that girls might become pregnant before marriage but went on to add that one need not go to school for such an incident to happen, and that girls should not be kept away from school because of one or two such incidents. Probably there is less fear because there are more girls in school now and few become pregnant. Greater emphasis was placed on the education of Kerala girls because women enjoyed a better status overall than that of village women in Karnataka.
4.4.3 Occupation and Age at Marriage
Table 4.6 shows the singulate mean age at marriage of males and females by occupation. For convenience of analysis, occupation for men is grouped into four broad categories because of the small numbers in some categories. Agriculturists are those who own land and are engaged in cultivation and agricultural labourers are those who work on others' land for wages. Casual labourers include
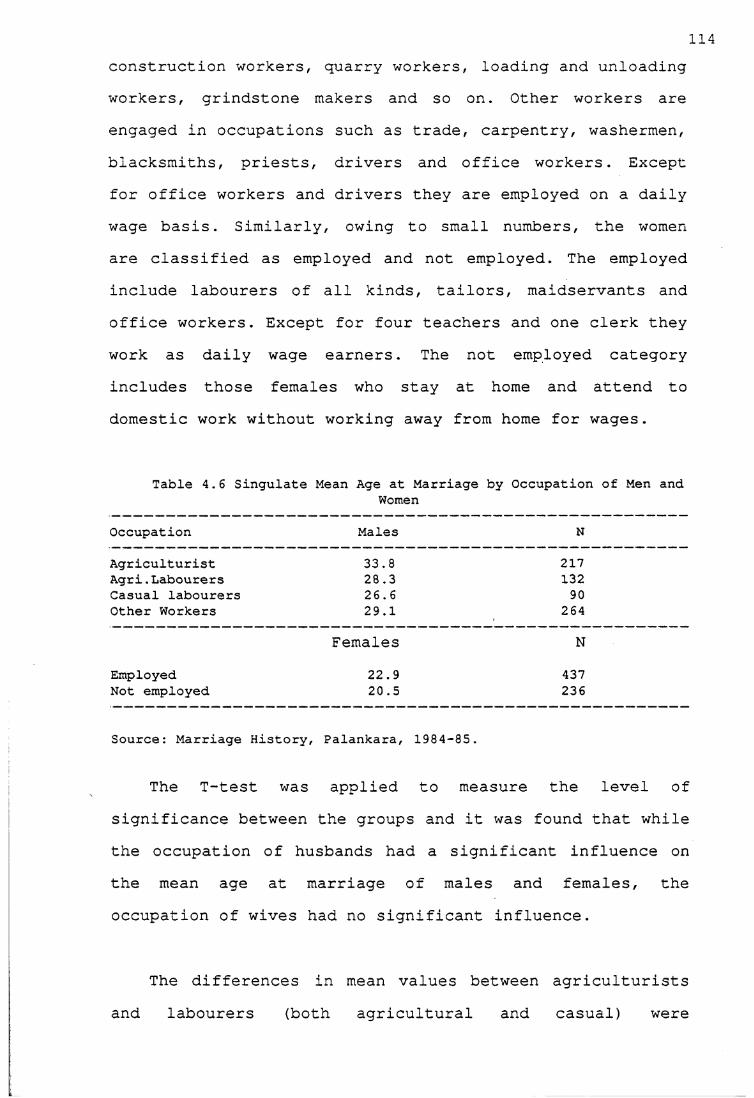
114construction workers, quarry workers, loading and unloading workers, grindstone makers and so on. Other workers are engaged in occupations such as trade, carpentry, washermen, blacksmiths, priests, drivers and office workers. Except for office workers and drivers they are employed on a daily wage basis. Similarly, owing to small numbers, the women are classified as employed and not employed. The employed include labourers of all kinds, tailors, maidservants and office workers. Except for four teachers and one clerk they work as daily wage earners. The not employed category includes those females who stay at home and attend to domestic work without working away from home for wages.
Table 4.6 Singulate Mean Age at Marriage by Occupation of Men andWomen
Occupation Males N
Agriculturist 33.8 217Agri.Labourers 28.3 132Casual labourers 26.6 90Other Workers 29.1
Females264
NEmployed 22.9 437Not employed 20.5 236
Source: Marriage History, Palankara, 1984-85.
The T-test was applied to measure the level of significance between the groups and it was found that while the occupation of husbands had a significant influence on the mean age at marriage of males and females, the occupation of wives had no significant influence.
The differences in mean values between agriculturists and labourers (both agricultural and casual) were
115significant at the five per cent level. The difference in mean values between skilled occupations and officials was not significant at the five per cent level. For female age at marriage by husband's occupation, the difference between the mean values of women whose husbands were engaged in skilled occupations and those whose husbands were labourers was significant at the five per cent level. Other groups were not significant at the five per cent level. The differences between the groups according to wife's occupation was not statistically significant.
Employing singulate mean age at marriage for males, the agriculturists had the highest age at marriage, while the casual labourers had the lowest (Table 4.5). Among females as expected the employed females had a higher age at marriage than unemployed females.
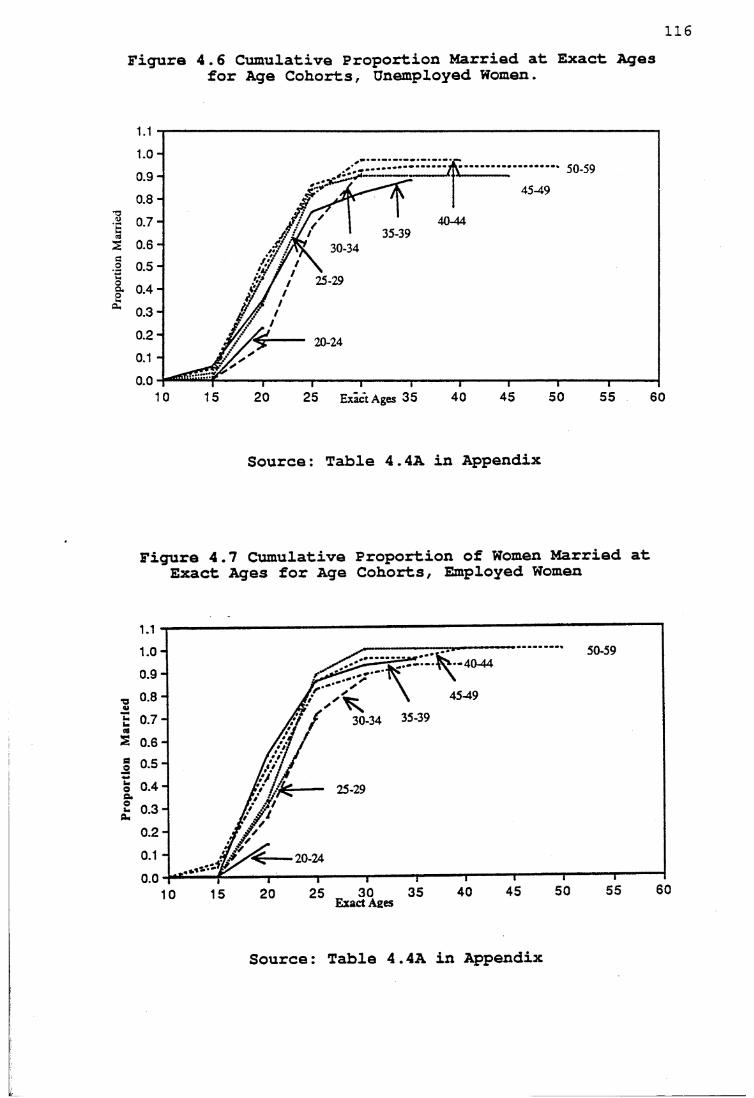
opor
t
116Figura 4.6 Cumulative Proportion Married at Exact Ages
for Age Cohorts, Unemployed Women.
50-59
45-49
40-44
0.6 - 30-34
25-290 . 4 -
20-24
2 5 Exact Ages 35
Source: Table 4.4A in Appendix
Figure 4.7 Cumulative Proportion of Women Married at Exact Ages for Age Cohorts, Employed Women
50-591.0 -• -40-44
fit / 30-34 35-39W f
t 0.7-S 0.6-
0.5-
2 0.3-
20-24
Exact Ages
Source: Table 4.4A in Appendix
117Figure 4.6 shows the cumulative proportion of women
married in the age groups 20-59 according to employment status. The large difference at exact age 20 shows that the age at marriage is rising among the not employed women. However, differences tend to be smaller at exact age 25. Looking at exact age 20, the differences between the older cohorts (50-59, 45-49 and 40-44) and the younger cohorts (30-34,25-29 and 20-24) show that the change in marriage behaviour has occurred recently.
Figure 4.7 also shows that age at marriage is rising for women who are employed. The difference is greatest for the age group 20-24 showing that the changes in marriage behaviour are recent.
Figures 4.6 and 4.7 show that the differences between employed and not employed women are negligible for the older cohorts. The small differences in proportion married at exact age 20 for cohorts 20-24, 25-29 and 30-34 among the two groups indicate that employment may not be the only factor influencing the timing of marriage.
Since age at marriage is relatively high in the village, the not employed also tend to marry late. The attitudes regarding age at marriage showed that after 20 years of age there is more pressure on parents to arrange the marriage of their daughters. Irrespective of employment status, the arrangements to perform the daughter's marriage begin by the time they are in their late twenties.
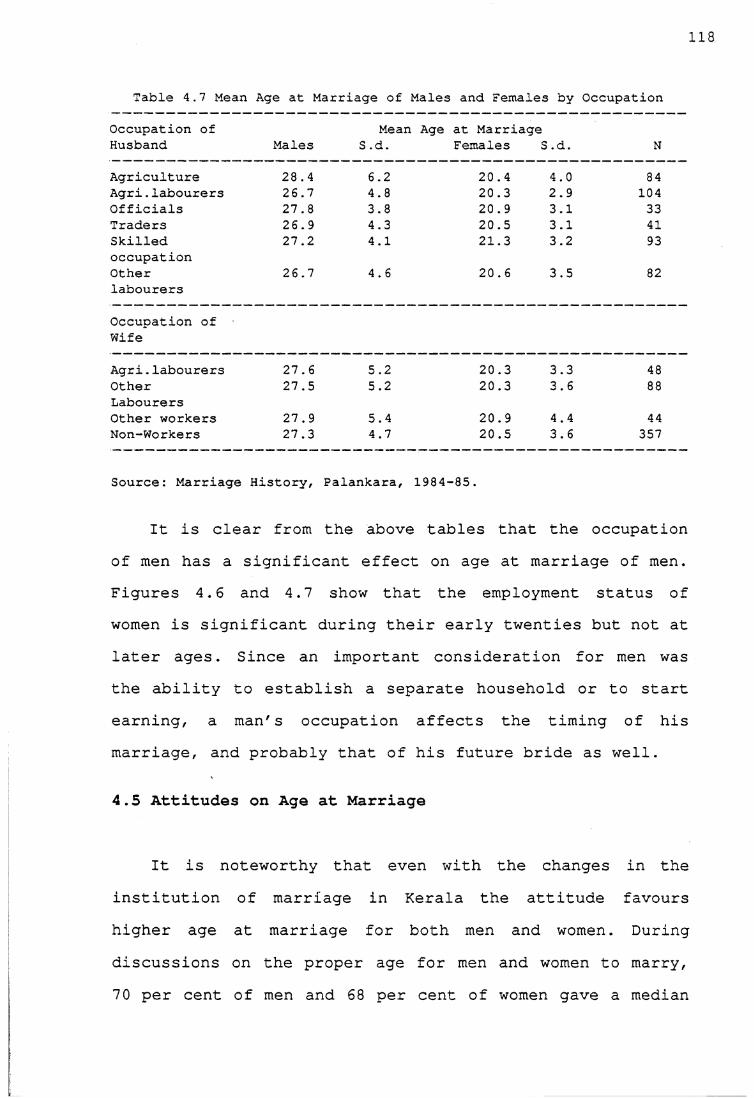
118
Table 4.7 Mean Age at Marriage of Males and Females by Occupation
Occupation of Mean Age at MarriageHusband Males S .d. Females S; .d. N
Agriculture 28.4 6.2 20.4 4.0 84Agri.labourers 26.7 4.8 20.3 2.9 104Officials 27.8 3.8 20.9 3.1 33Traders 26.9 4.3 20.5 3.1 41Skilledoccupation
27.2 4.1 21.3 3.2 93
Otherlabourers
Occupation of Wife
26.7 4.6 20.6 3.5 82
Agri.labourers 27.6 5.2 20.3 3.3 48OtherLabourers
27.5 5.2 20.3 3.6 88
Other workers 27.9 5.4 20.9 4.4 44Non-Workers
Source: Marriage
27.3
History,
4.7
Palankara,
20.5
1984-85.
3.6 357
It is clear from the above tables that the occupationof men has a significant effect on age at marriage of men. Figures 4.6 and 4.7 show that the employment status of women is significant during their early twenties but not at later ages. Since an important consideration for men was the ability to establish a separate household or to start earning, a man's occupation affects the timing of his marriage, and probably that of his future bride as well.
4.5 Attitudes on Age at Marriage
It is noteworthy that even with the changes in the institution of marriage in Kerala the attitude favours higher age at marriage for both men and women. During discussions on the proper age for men and women to marry, 7 0 per cent of men and 68 per cent of women gave a median
119age of 27 for men and 20 for women. The reasons most often cited for choosing these ages were concern over women's health in early marriages. For instance, in the case of Leelamma, her husband's family proposed the marriage when she was 17 years old, but her parents did not perform the marriage because they thought she was still young. However, in this case her husband's family waited for three years for the marriage to take place. But there were instances where the bridegroom's family did not wait for the bride's family's decisions, a./\cL he married somebody else. Nevertheless, the bride's family were not upset with such occurrences.
It is also believed that men should be mature enough to assume family responsibility before the marriage is arranged. Early sex is also deemed bad for a man's health. Men often preferred to marry women in their twenties who would be mature enough to take care of the home properly.
The age for marriage preferred in Palankara is high compared to that favoured by people in the village in Karnataka state where I conducted a similar kind of study. Caldwell and others found elsewhere in Karnataka that median ages of 25 for men and 18 for women were considered the proper ages to marry (Caldwell et al., 1983:350). Furthermore, in the Karnataka villages parents started the arrangement of a daughter's marriage soon after or at times even before the girl had attained menarche.
120The ages at which attempts are made by parents to
arrange marriages have risen in the study village to relatively high levels. The average age at first attempt at marriage of girls rose from 18 years for those who were married during 1950-69 to 20 years for those who were married during the period 1970-84. The first attempt at marriage means the age at which the parents earnestly start considering the marriage of their sons and daughters. Parents generally start the arrangements for their children keeping in mind the time spent in negotiating the marriages. This is influenced by the existing values on proper age at marriage and also social and economic conditions of the family.
Similarly, for men the average age at first attempt at marriage rose from 26 years for those who were married in 1950-69 to 28 years for those who were married in 1970-84. These figures are clearly similar to the perceived 'proper' age at marriage mentioned by people.
The favourable attitude to a relatively higher age at marriage is mainly because the women in matrilineal communities enjoyed a better status. The marriage practices which existed in the past favoured higher age at marriage and the same attitude continued and was strengthened by social changes in the country as a whole. Furthermore, Chrstianity also favoured higher age at marriage and Chrstian women also enjoyed better status in the state than elsewhere in India.
121Apart from the cultural factors, other socio-economic
factors also influenced the age at marriage. Some of these factors were similar to what is found in other parts of India, for instance, dowry, matching horoscopes, socioeconomic status, and, arrangement of the marriage of the oldest children first (although preference is given to a daughter's marriage if the family has both sons and daughters of marriageable age) . However, the age at marriage is rising faster in Palankara and in Kerala than elsewhere in India, despite some similarities, because of culturally favourable attitude towards higher age at marriage.
A family's economic condition was an important factor in arranging a marriage in a particular year. A family has to raise money for a daughter's dowry and for the expenses of the marriage ceremony. The following example shows how marriages are delayed through financial constraints.
When Ramani was 16 years old a family proposed the marriage of their son to her. Her elder brother ignored the proposal as she was in school and he thought she was still young. The next serious attempt at marriage occurred when she was 21 years old. Although everything else was agreed, the marriage alliance broke off because the bridegroom's family wanted the marriage to take place in April but her family wanted it in August so that her brother would raise money to pay the dowry. When her family did not agree the bridegroom's family demanded more than Rs. 3500 (which was her share in the property) . Soher brother did not agree to their demands. Only when she was 2 6 years old, she found a partner who agreed to all the demands of both her family and his own family (Sushama, Field notes, 1985).
Similarly, in the case of Sajini her mother had to raise money for the dowry, some gold jewellery and marriage expenses as her father died when she was 17 years. Not only were finances a problem but there was no one who could make arrangements such as finding a proper match.Since her mother was a labourer she could not give a huge sum as dowry. Only when she was 2 6 years she got a
122proposal from a man who demanded very little dowry (Sushama, Field notes, 1985).
These examples also show that parents wait until they find a person who agrees to their demands rather than agreeing to all the demands of the bridegroom's family. They do not really hurry to get rid of their daughters through marriage. Though a daughter's share of theinheritance is treated as dowry, the land owned is usually retained by the family and the daughter is given an equivalent amount in cash. Sometimes if the family is forced to sell land, marriage arrangements can again be delayed. Moreover, parents have to wait until they find someone to accept an amount which they can afford to give, often delaying the marriage.
One factor affecting a boy's marriage in a particular year was the need for a female in the family.
H.H.No. 17: My husband's family proposed the marriage when I was 20. Husband' family wanted the marriage to be performed in that year as his mother was getting old and they needed a female in the household. My family liked the proposal because my husband did not have sisters whichmeant less responsibility and my husband's family agreed to the dowry my father gave.
Although the arrangements of marriage of men and women start at these ages, the actual time spent in negotiating marriages was longer for women than for men. The parents of daughters had to consider on average four proposals and spend three years before choosing the proper spouse for their daughters. Often proposals failed because of disagreement over the amount of dowry or mismatched horoscopes. The parents of sons spent on average 1.5 years
123and considered two proposals in choosing brides. These negotiations delay the age at marriage of both men and women, but particularly of women as decisions depend mainly on the men's families. It is true that economic conditions and the process of negotiations often delay marriages elsewhere in India; but in Kerala, the first attempt at negotiations starts at a later age, thereby pushing up the age at marriage even further.
The important aspect of marriages in the village is that parents did not hurry in getting their daughters and sons married. They waited for a proper match, consulted their sons and daughters and more importantly the never- married people were not looked down upon. For instance, 35- year- old Sarojini decided not to get married and her parents could not force her to do so. She is a labourer in the quarry and is involved in the industrial activities there; she is also a member of Communist Party. It is noteworthy that the villagers have accepted her never- married status. However, only a small proportion of men and women remain unmarried in older age groups. In the study village, the proportion of never married men in the age groups 40 and above was 3 per cent, while 2 per cent of the women in the same age group remained never married.
4.6. Conclusion
Age at marriage for men and women is rising in the village because of social and cultural factors in choosing a proper spouse and attitudes favouring a higher age at marriage, partly due to a tradition of high age at marriage
124among the matrilineal communities and partly due to social reform movements encouraging the emancipation of women in the country as a whole.
The rise in age at marriage, particularly for females implies a decline in fertility. As pointed out at the beginning of the chapter, marriage during the age interval 20-34 ensures the minimum risk of maternal mortality, foetal loss, infant and child mortality. It is likely that women in the village will give birth in the age interval 20-34 because the estimated SMAM for the village is 23 years for females. This may have been one of the reasons for falling infant mortality, whose influence on fertility decisions is discussed in Chapter 6.
Much of the fertility decline in the past was due to delayed age at marriage, influenced by such things as education, and urban jobs made possible by changing attitudes to morality: much stress is no longer laid on a girl's 'purity' and in fact such attitudes have always been weaker in Kerala than elsewhere in India, perhaps because of matrilineality. This has been a 'secular' one-off change from the past regime to the present, and once it has happened, age at marriage is not likely to keep on rising, though it may fluctuate with changing economic conditions. Indeed remittances from the towns elsewhere in India and from the Gulf countries have been fairly unimportant so far, unlike in some areas in Kerala, but their influence may act to bring age at marriage down in the near future. Future falls in fertility are likely to be within marriage.

In view of this, the fertility levels, trends and the use of contraceptives in the study area are examined in thenext chapter.
126
CHAPTER 5Fertility and Family Planning in Palankara
5.1 Introduction
A basic indicator of the prevailing fertility levels in any given population is the crude birth rate; hence his ̂ chapter provides a brief description of the vital rates in the study population before proceeding to examine fertility levels and trends.
The village registered a crude birth rate of 18.2 per thousand population and a crude death rate of 4.5 per thousand. It can be argued that the relatively low birth and death rates result from the small size of the study population, but this is not the case as there is evidence of extensive use of birth control in the village, details of which are provided in the sections that follow. It could also be argued that these low rates are the result of underenumeration. However, in the study village, this problem was minimized. Many women, in particular younger women, could state the dates of birth of their children with certainty. Secondly, as mentioned in chapter 2, a few women could express the dates of birth in terms of the local calendar, which were matched with the Gregorian calendar to get exact dates. Thirdly, as detailed information on reproductive history was collected for each woman, the probability of missing births was minimized. Fourthly, as each birth during the study period, which lasted for ten months, could be cross-checked, accuracy was ensured. Care was taken to keep track of each pregnancy in
127the village and the outcome was verified and noted as soon as the pregnancy was terminated.
The birth rate for the whole state fell from 26.8 per thousand population in 1980 to 24.6 per thousand in 1983.The death rate for the same period fell from 7.0 to 6.7 per thousand (Sample Registration Scheme, 1984) . The crude birth rate for the district as a whole fell from 36.9 for 1965-70 to 26.2 for 1970-75 and to 21.8 for 1975-80 (Zacharia, 1983:43). Considering the fall in birth and death rates for the state as well as for the district, it can be reasonably concluded that the falling birth and death rates in the village are in conformity with the pattern elsewhere in the state and not isolated phenomena peculiar to the study village. The low birth rate in the village is a reflection of the fertility levels and trends which are discussed in the sections that follow.
5.2 Current Fertility Rates
The total fertility rate at the time of the study was estimated to be 2.0 (Table 5.1). The age specific fertility rate was found to be the highest in the age groups 20-24 and 25-29 while it was lowest among the age groups 30-34 and 35-39. The absence of births during the reference period among women aged between 15 and 19 was due more to the high age at marriage as discussed in Chapter 4 than to fertility control. On the other hand, the low number of births among women of the higher age groups was due to the use of birth control methods.
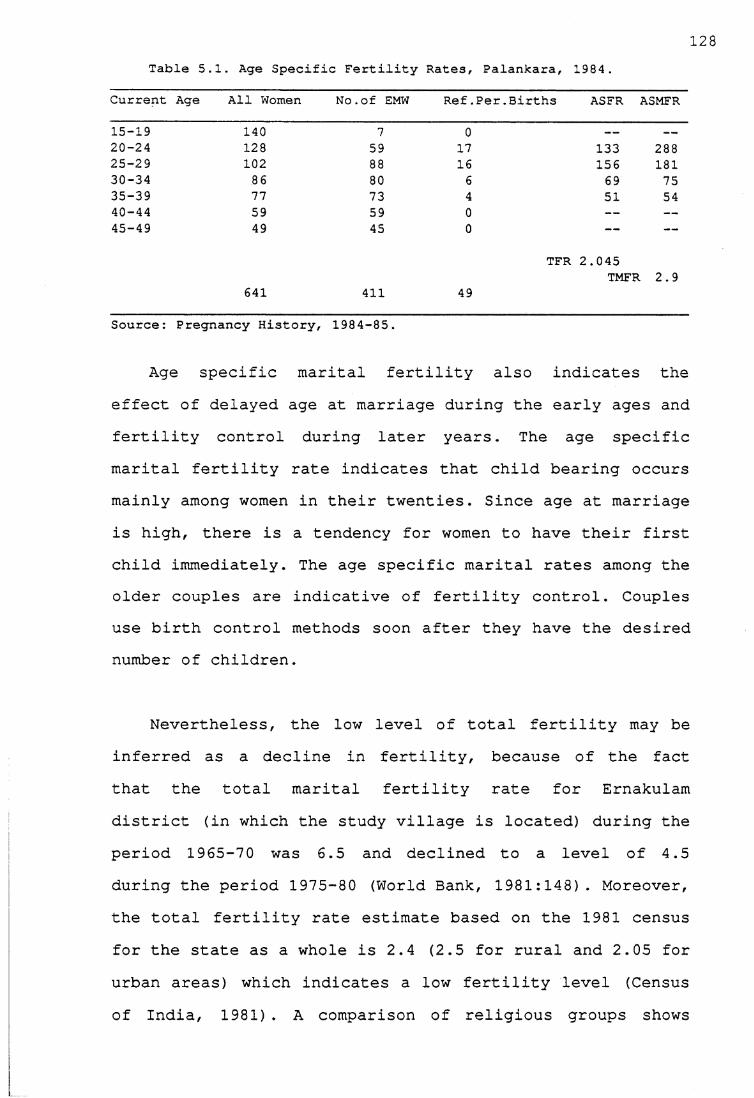
128Table 5,.1. Age Specific Fertility Rates, Palankara, 1984 .
Current Age All Women No.of EMW Ref .Per.Births ASFR ASMFR
15-19 140 7 0 — —
20-24 128 59 17 133 28825-29 102 88 16 156 18130-34 86 80 6 69 7535-39 77 73 4 51 5440-44 59 59 0 — —45-49 49 45 0 — —
TFR 2.045TMFR 2.9
641 411 49
Source: Pregnancy History, 1984-85.
Age specific marital fertility also indicates the effect of delayed age at marriage during the early ages and fertility control during later years. The age specific marital fertility rate indicates that child bearing occurs mainly among women in their twenties. Since age at marriage is high, there is a tendency for women to have their first child immediately. The age specific marital rates among the older couples are indicative of fertility control. Couples use birth control methods soon after they have the desired number of children.
Nevertheless, the low level of total fertility may be inferred as a decline in fertility, because of the fact that the total marital fertility rate for Ernakulam district (in which the study village is located) during the period 1965-70 was 6.5 and declined to a level of 4.5 during the period 1975-80 (World Bank, 1981:148). Moreover, the total fertility rate estimate based on the 1981 census for the state as a whole is 2.4 (2.5 for rural and 2.05 for urban areas) which indicates a low fertility level (Census of India, 1981). A comparison of religious groups shows
129that Hindus and Christians have lower fertility than Muslims: the total fertility rates for Hindus, Muslims and Christians for the state as a whole are 2.16, 3.64 and 2.07 respectively. Hence, the total fertility rate of 2.0 for the village is reasonable because the village has a predominantly Hindu and Christian population.
5.3 Fertility Trends
Owing to the absence of proper records of vital statistics for the village, the pregnancy histories recorded for each woman were used to estimate the fertility levels in the past by calculating from them the average parity at exact ages within the age cohorts. This method clearly shows that if fertility were constant the differences in the average parity at the same ages for women in all age cohorts would be negligible. On the other hand, if fertility were declining the differences in parity values at exact ages for women in different age cohorts would be significant.
Although pregnancy histories were recorded for all women, only the women in the age range 15-59 were considered in order to calculate the average parity, on the assumption that women in this age range could recall their pregnancies. On the other hand, a few women aged 60 years and above had problems in recalling pregnancies. Of the 47 women in the age group 60-69, the complete pregnancy histories could be recorded for only 21 women. Thus, the number of older women for whom the data on pregnancies were
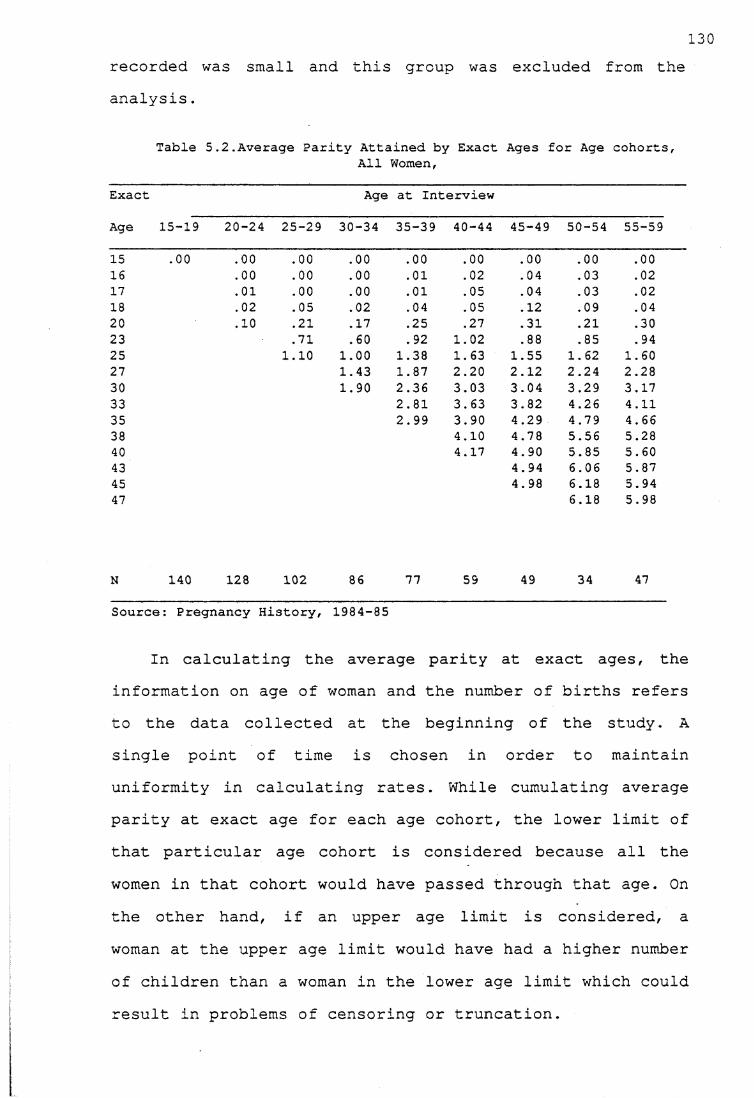
recorded was small and this group was excluded from the analysis.
120
Table 5.2.Average Parity Attained by Exact Ages for Age cohorts,All Women,
Exact Age at Interview
Age 15-19 20-24 25-29 30-34 35-39 40-44 45-49 50-54 55-59
15 .00 .00 .00 .00 .00 .00 .00 .00 .0016 .00 .00 .00 .01 .02 .04 .03 .0217 .01 .00 .00 .01 .05 .04 .03 .0218 .02 .05 .02 .04 .05 . 12 .09 .0420 .10 .21 .17 .25 .27 .31 .21 .3023 .71 .60 .92 1.02 .88 .85 . 9425 1.10 1.00 1.38 1.63 1.55 1.62 1.6027 1.43 1.87 2.20 2.12 2.24 2.2830 1.90 2.36 3.03 3.04 3.29 3.1733 2.81 3.63 3.82 4.26 4.1135 2.99 3.90 4.29 4.79 4.6638 4.10 4.78 5.56 5.2840 4.17 4.90 5.85 5.6043 4.94 6.06 5.8745 4.98 6.18 5.9447 6.18 5.98
N 140 128 102 86 77 59 49 34 47
Source: Pregnancy History, 1984-85
In calculating the average parity at exact ages, the information on age of woman and the number of births refers to the data collected at the beginning of the study. A single point of time is chosen in order to maintain uniformity in calculating rates. While cumulating average parity at exact age for each age cohort, the lower limit of that particular age cohort is considered because all the women in that cohort would have passed through that age. On the other hand, if an upper age limit is considered, a woman at the upper age limit would have had a higher number of children than a woman in the lower age limit which could result in problems of censoring or truncation.
131Although there are a few fluctuations, the average
parity at exact ages indicates a declining trend in fertility levels (Table 5.2) . The following inferences can be made from this table. First, the zero parity at exact age 15 and also lower parity values during the early reproductive period suggest that even in the past, childbearing started in late adolescence because of delayed age at marriage. The zero parity at exact ages 16 and 17 for women in age groups 15-19, 20-24, 25-29 and 30-34 also suggests that fertility is controlled at early ages because of a rising age at marriage. Secondly, the small differences in parity values at exact age 25 for all cohorts suggest that though marriage is delayed among the age groups 25-29 and 30-34, there is no delay in having the first child. Thirdly, the large differences in parity values at later ages suggest that fertility is increasingly controlled once couples have smaller desired numbers of children. For example, by exact age 30, women in age cohort 30-34 had had 1.9 live births while women over 40 years had had over 3 live births by the same age. Similarly, by exact age 40, the current age cohorts 40-44 and 45-49 had had lower parity values than age cohorts 50-54 and 55-59. It is highly unlikely that the women in age cohort 30-34 could attain the parity of over 4 children that was reached by women in age cohorts 40-44 and older. These trends indicate a marked decline in fertility.
Women in age cohort 35-39 will not achieve an average parity of 5 or 6 as in the case of women in age groups 50- 54 or 55-59, because the average parity at exact age 35 is
1323 for women in age group 35-39, which is lower considering the parity values of 4.3, 4.8 and 4.7 at exact age 35 for age cohorts 45-49, 50-54 and 55-59 respectively. This suggests that fertility is declining and that it is being controlled once couples have the desired number of children.
The decline in fertility can be seen very clearly in Figure 5.1. The larger differences in parity values for each age cohort after exact age 30 indicate that fertility is controlled at a later period of the reproductive cycle. Until age 35, the age cohorts 50-54 and 55-59 show similar fertility behaviour, and age cohort 50-54 deviates to achieve higher fertility. This may be due to chance because of small numbers of women in the age group. Age cohorts 40- 44 and 45-49 exhibit similar fertility behaviour, but at exact age 30, the age cohort 40-44 deviated from the 45-49 cohort and achieved lower parity at exact age 40, indicating use of fertility control measures.
A large difference in parity values for the age cohorts 40-44 and 35-39 at exact age 35 indicates rapid fertility decline during the 1960s, 1970s and early 1980s. Furthermore, the age cohort 30-34 also shows a relatively large difference in parity values when compared with the age cohort 35-39. The age cohorts 25-29 and 30-34 show a similar pattern and indicate that fertility might stabilize at the level of 2 children per woman. The lower parity values for the age cohort 20-24 indicate delayed age at marriage. Thus, from Table 5.2 and Figure 5.1 there is
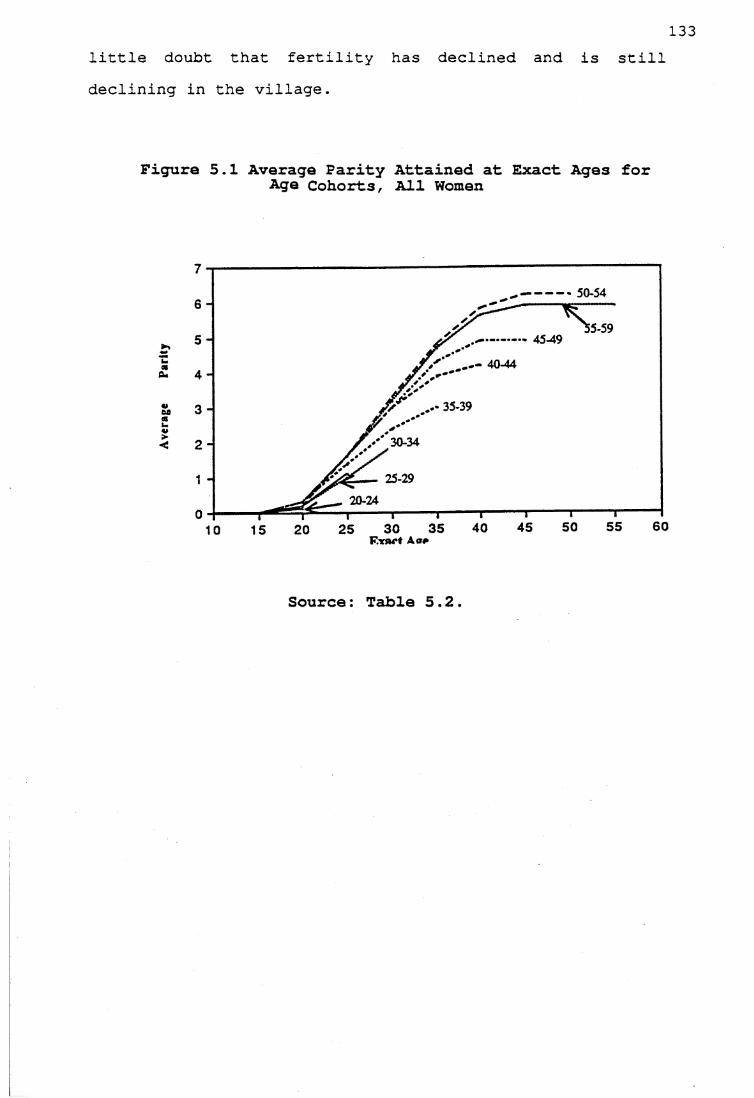
Par
little doubt that fertility has declined and is still declining in the village.
Figure 5.1 Average Farity Attained at Exact Ages for Age Cohorts, All Women
50-54
30-34
25-2920-24
Source: Table 5.2.
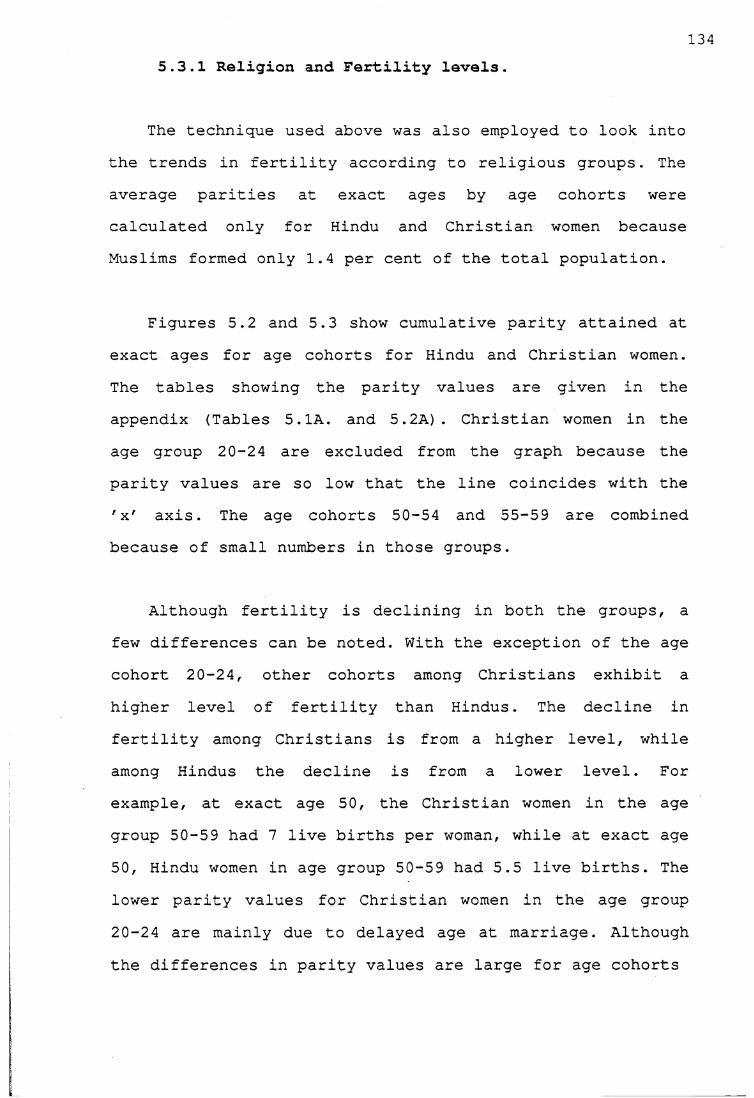
1345.3.1 Religion and Fertility levels.
The technique used above was also employed to look into the trends in fertility according to religious groups. The average parities at exact ages by age cohorts were calculated only for Hindu and Christian women because Muslims formed only 1.4 per cent of the total population.
Figures 5.2 and 5.3 show cumulative parity attained at exact ages for age cohorts for Hindu and Christian women. The tables showing the parity values are given in the appendix (Tables 5.1A. and 5.2A). Christian women in the age group 20-24 are excluded from the graph because the parity values are so low that the line coincides with the 'x' axis. The age cohorts 50-54 and 55-59 are combined because of small numbers in those groups.
Although fertility is declining in both the groups, a few differences can be noted. With the exception of the age cohort 20-24, other cohorts among Christians exhibit a higher level of fertility than Hindus. The decline in fertility among Christians is from a higher level, while among Hindus the decline is from a lower level. For example, at exact age 50, the Christian women in the age group 50-59 had 7 live births per woman, while at exact age 50, Hindu women in age group 50-59 had 5.5 live births. The lower parity values for Christian women in the age group 20-24 are mainly due to delayed age at marriage. Although the differences in parity values are large for age cohorts
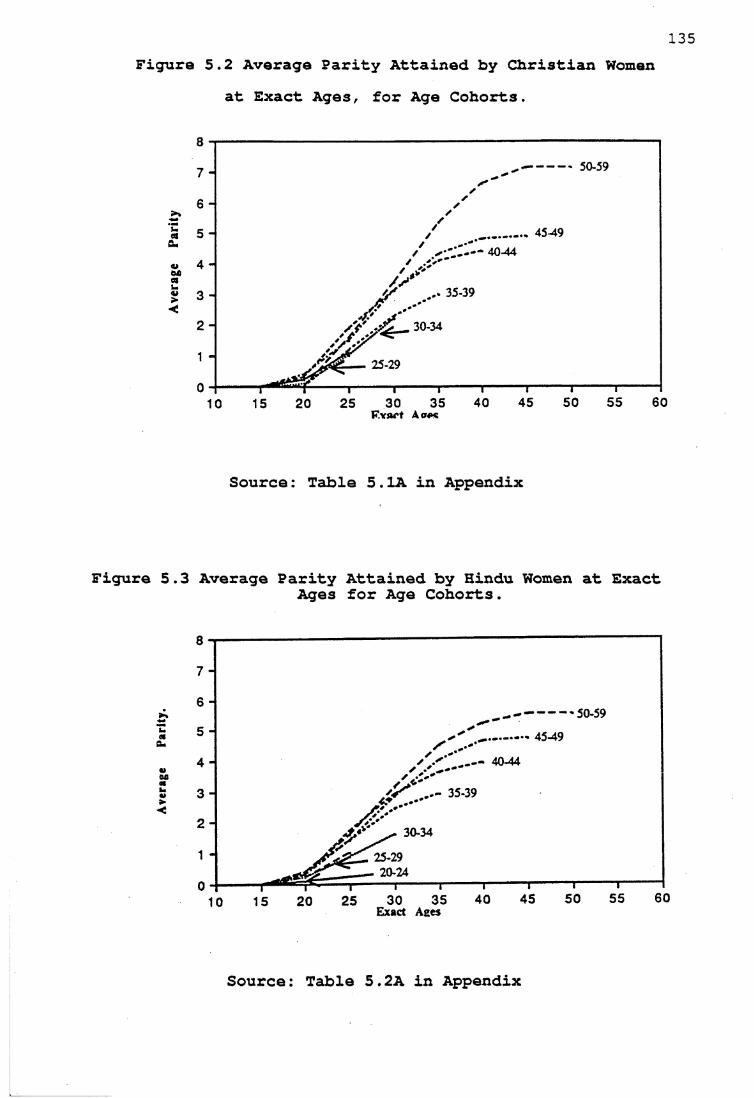
Figure 5.2 Average Parity Attained by Christian Womenat Exact Ages, for Age Cohorts.
50-59
35-39
30-34
25-29
F.vart A ape
Source: Table 5.1A in Appendix
Figure 5.3 Average Parity Attained by Hindu Women at ExactAges for Age Cohorts.
50-59
30-34
Exact Ages
Source: Table 5.2A in Appendix
13650-59 and 40-49, the differences narrow for younger cohorts indicating fertility decline in both groups.
5.3.2 Schooling and Fertility Levels
Figures 5.4 and 5.5 show cumulative parity attained at exact ages for age cohorts according to the number of years women spent in school; tables 5.3A and 5.4A are given in the appendix. Owing to the small numbers in some of the cells two broad groups were formed, one consisting of illiterate women and women who spent 1-4 years in school and the other women who spent 5 or more years in school. Among the women who spent 5 or more years in school, the maximum level achieved was 10 years of schooling.
The age cohort 20-24 is excluded from graphs 5.5 and 5.6 because the parity values were so small that they were in line with the 'x' axis. Similarly, the age cohorts 50-54 and 55-59 were combined because of small numbers in these groups.
Figure 5.4 shows that fertility has declined even among the age cohorts of women with fewer years in school. The large differences at later ages indicate that couples control their fertility when they attain their desired family size. At exact age 20, the parity values are low for all the age cohorts showing that perhaps the age at marriage was almost the same for all the cohorts for women with low levels of schooling.
137Figure 5.5 also shows a decline in fertility for the
women with 5 or more years of schooling. The large differences in parity values for the age cohorts 45-49 and 50-59 indicate a decline in fertility. For example, at exact age 45, women in age cohort 50-59 had 5.6 live births per woman, whereas women in age cohort 45-49 had 5.2 live births, indicating fertility decline. It is noteworthy that age cohorts 40-44 and 45-49 had similar patterns and the younger cohorts 35-39, 30-34 and 25-29 exhibited a similar pattern.
Although both groups exhibit a decline in fertility, a comparison of the two groups shows that at all exact ages, parity values are lower for all the age cohorts, for the women who spent 5 or more years in school. However, the differences between the two groups tend to narrow among the younger cohorts.
Two explanations can be reasonably given for such behaviour: first, the proportion of women who spent 5 or more years in school is higher among younger cohorts and lower among older cohorts and the small numbers might lead to some fluctuations; second, it is likely that at very high levels of parity values such as 6 or more live births per woman, and at very low levels such as 2 live births, the influence of schooling may be minimal. This behaviour may be due more to societal values regarding fertility than to individual level of schooling.

138Since the literacy levels are also high for the village
as a whole it is likely that the illiterates are influenced by the change. The inverse relationship of education and fertility decreases when the aggregate levels of literacy are high. Cochrane (1979:43) reviewing the findings of studies related to education and fertility, writes that the individual level and aggregate level of literacy interact and with a higher aggregate level of literacy, the inverse relationship between literacy and education may not exist.
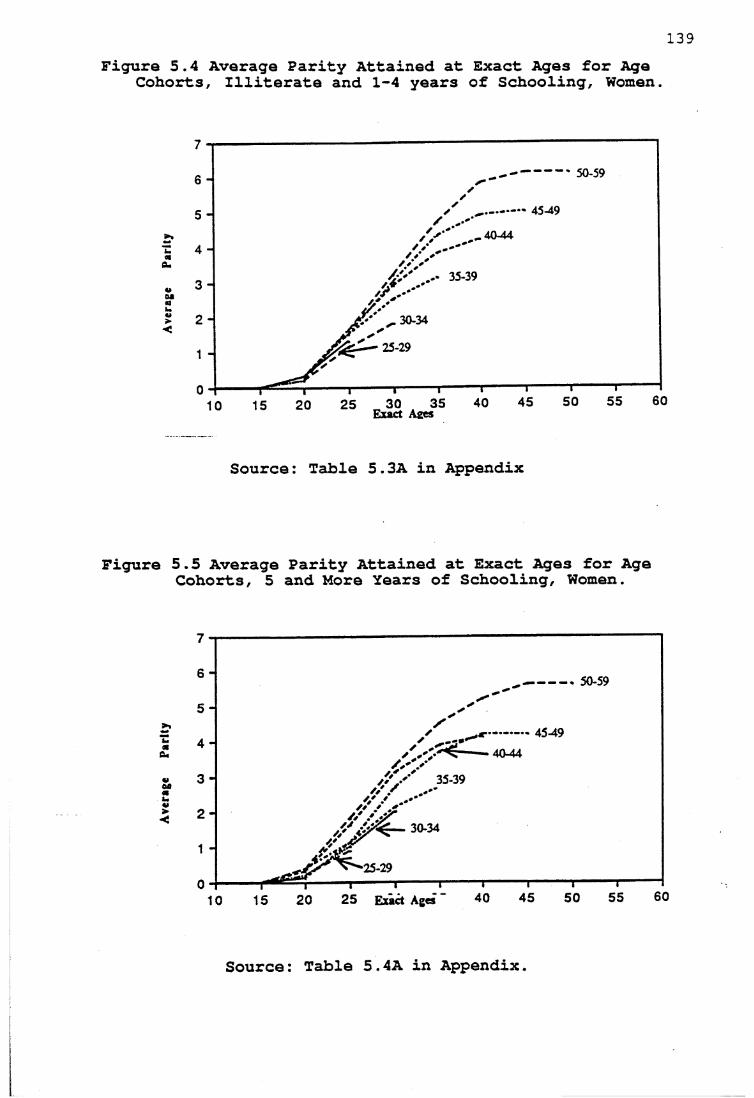
P*r^
y A
vera
ge
Par
Figure 5.4 Average Parity Attained at Exact Ages for Age Cohorts, Illiterate and 1-4 years of Schooling, Women.
139
50-59
40-44
30-34
Source: Table 5.3A in Appendix
5.5 Average Parity Attained at Exact Ages for Age Cohorts, 5 and More Years of Schooling, Women.
40-44
30-34
■25-29
2 5 E xact Ages
Source: Table 5.4A in Appendix.
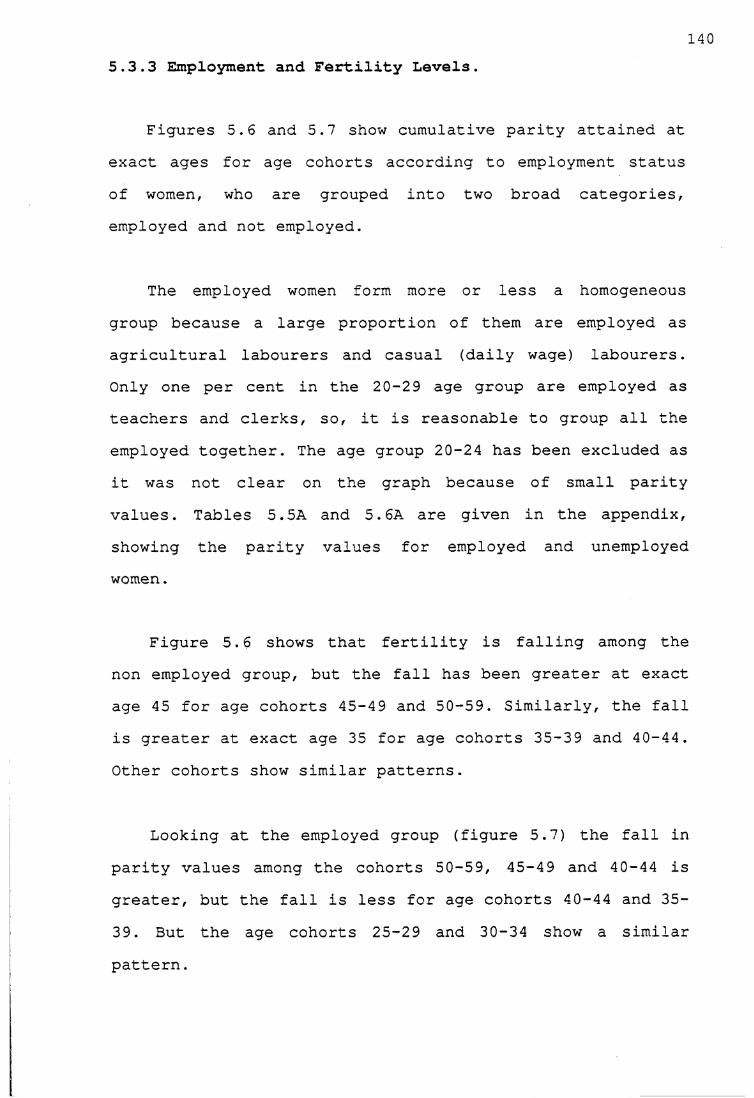
1405.3.3 Employment and Fertility Levels.
Figures 5.6 and 5.7 show cumulative parity attained at exact ages for age cohorts according to employment status of women, who are grouped into two broad categories, employed and not employed.
The employed women form more or less a homogeneous group because a large proportion of them are employed as agricultural labourers and casual (daily wage) labourers. Only one per cent in the 20-29 age group are employed as teachers and clerks, so, it is reasonable to group all the employed together. The age group 20-24 has been excluded as it was not clear on the graph because of small parity values. Tables 5.5A and 5.6A are given in the appendix, showing the parity values for employed and unemployed women.
Figure 5.6 shows that fertility is falling among the non employed group, but the fall has been greater at exact age 45 for age cohorts 45-49 and 50-59. Similarly, the fall is greater at exact age 35 for age cohorts 35-39 and 40-44. Other cohorts show similar patterns.
Looking at the employed group (figure 5.7) the fall in parity values among the cohorts 50-59, 45-49 and 40-44 is greater, but the fall is less for age cohorts 40-44 and 35- 39. But the age cohorts 25-29 and 30-34 show a similarpattern.
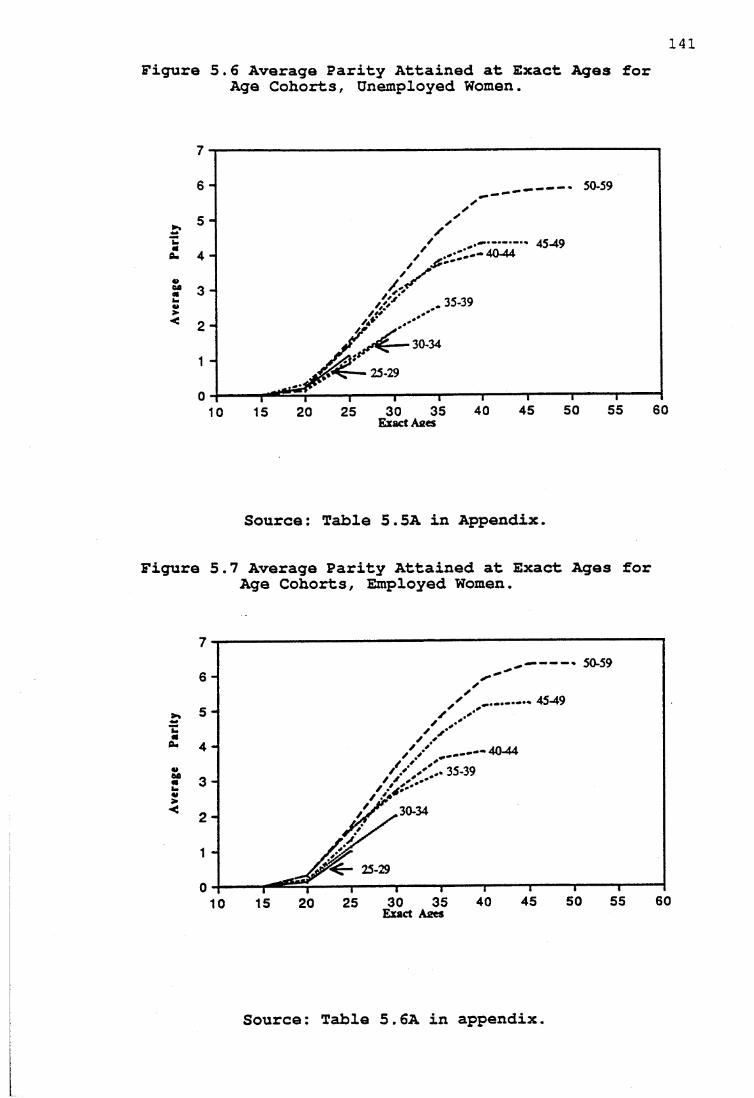
141Figure 5.6 Average Parity Attained at Exact Ages for
Age Cohorts, Unemployed Women.
50-59
....... 45-4940-44
30-34
25-29
Exact Aees
Source: Table 5.5A in Appendix.
Figure 5.7 Average Parity Attained at Exact Ages for Age Cohorts, Employed Women.
— 50-59
40-44
30-34
25-29
Exact Aaes
Source: Table 5.6A in appendix.
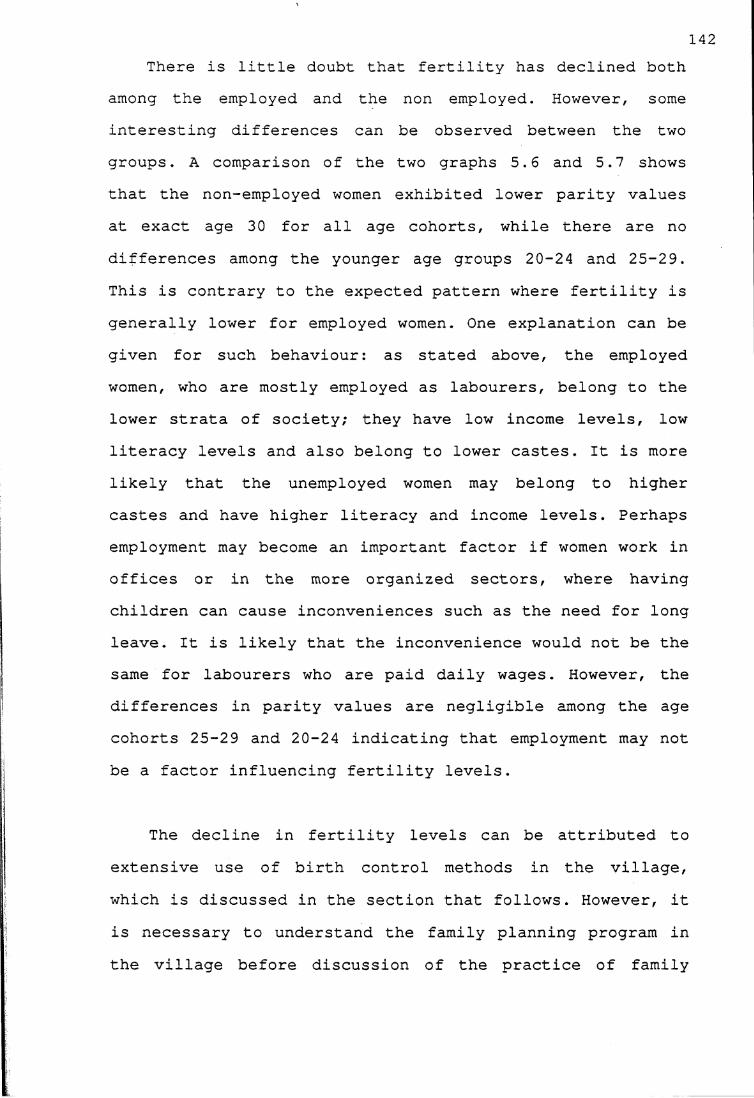
142There is little doubt that fertility has declined both
among the employed and the non employed. However, some interesting differences can be observed between the two groups. A comparison of the two graphs 5.6 and 5.7 shows that the non-employed women exhibited lower parity values at exact age 30 for all age cohorts, while there are no differences among the younger age groups 20-24 and 25-29. This is contrary to the expected pattern where fertility is generally lower for employed women. One explanation can be given for such behaviour: as stated above, the employed women, who are mostly employed as labourers, belong to the lower strata of society; they have low income levels, low literacy levels and also belong to lower castes. It is more likely that the unemployed women may belong to higher castes and have higher literacy and income levels. Perhaps employment may become an important factor if women work in offices or in the more organized sectors, where having children can cause inconveniences such as the need for long leave. It is likely that the inconvenience would not be the same for labourers who are paid daily wages. However, the differences in parity values are negligible among the age cohorts 25-29 and 20-24 indicating that employment may not be a factor influencing fertility levels.
The decline in fertility levels can be attributed to extensive use of birth control methods in the village, which is discussed in the section that follows. However, it is necessary to understand the family planning program in the village before discussion of the practice of family
143planning with reference to the extent of family planning use, the methods used, the type of users and non-users.
5.4 Family Planning
5.4.1 Family Planning Program in Kerala
Since policy decisions are made by the government of India, the State family planning program has developed more or less on the same pattern as in other states in India, although with a few variations in its implementation (Soni, 1984:144). While the state governments are responsible for the administration and implementation of family planning programs, the central government is responsible for the planning and financial control of the program. When the official family planning program started in 1955, the number of family planning clinics were only 11. In 1958, Family Planning Boards were set up at the State as well as at the District level. The clinics provided advice on family planning methods and services were made available; but the clinical approach was limited to providing information and services at the government hospitals to those who voluntarily sought them, thus only a small proportion of the population received information, education on family planning methods and supply of contraceptives.
In the 1960s the family planning program gained momentum with the introduction of an 'extension' approach, where information and education on birth control methods and supply of contrceptives were offered in both rural and
144urban areas, at the door steps of couples, who were offered a free choice from among sterilization and various mechanical and chemical contraceptives. This was made possible through strengthening the family planning infrastructure by establishing Primary Health Centres in rural areas and Urban Family Planning Centres in urban areas.
With the aim of reducing the birth rate to 25 per thousand population by 1975-76 (Visaria and Jain, 1976:26), the program became time-bound and target-oriented. In addition to this, sterilization was intensified and the IUD was introduced as a contraceptive and nirodh (condoms) were commercially marketed.
It was in 1970 that the 'mass camp' approach was adopted to intensify the program; all the resources at the district level were mobilized and a large number of men were vasectomized. In this direction the mass vasectomy camp organized in Ernakulam district of Kerala was the first of its kind. The important camps were those held in 1970, 1971 and 1972, and the numbers of male sterilizations conducted in those years were 15,005, 63,148 and 15,576 respectively. This success was attributed to the leadership of the District Commissioner, improvement in services, efficient functioning of staff, effective supervision and guidance of workers, intensive propaganda and educational effort, prompt attention in cases of complaints, and the active involvement of other departments (Krishnakumar, 1972:177-185, Valsan, 1978:155). Though the achievement of the mass camps was praised in terms of number of persons
145sterilized, criticisms were raised against the 'mass camp' approach. The main criticisms included lack of individual attention, incentives attracting non-eligible persons to use the facilities, lack of post-surgical care and surgical failures (Pillai, 1983:103); so mini-camps were organized at Primary Health Centres and hospitals.
In the late 1970s, the emphasis shifted to female sterilization, mainly because of the integration of the Maternal and Child Health Care program with the family planning program. Medical officers were therefore trained to conduct female sterilizations, and regular camps were held in rural areas so that people could have easy access.
The family planning program can be said to have gone through four distinct phases. During the first phase a clinical approach was used and the efforts were limited to providing family planning advice and services to those who voluntarily sought the services. In the second phase the program effort was intensified and there was a systematic motivation along with incentives for the people who used birth control methods. Mass camps became the main feature of the third phase, where the help of all governmental departments and local leaders was mobilized to motivate people to adopt sterilization. In the fourth phase, the accent was on female sterilization and the emphasis was on achieving sterilization targets.
1465.4.2 Family Planning Program in the Village
The official family planning program in the village can be traced as far back as the 1960s when the 'extension' approach replaced the 'clinical' approach. Though there is a subcentre in a neighbouring village, my interviews and observations showed that the villagers depended on the Government General Hospital and other major hospitals in Ernakulam for family planning services, partly because the women visited these hospitals for maternal and child health services, and partly because the services rendered by health workers were irregular. During the investigation of this matter, it became clear that the ANM could not carry out most of her work properly, partly because her services were needed in Primary Health Centres during the sterilization camps, and in surveys for updating the target-couple register. In addition to this, she could not carry out her duties properly as she lived with her family elsewhere in the district. However, this has had little effect on the in extensive use of family planning methods in the village because poeple use the services wherever they are available, as discussed in the following sections.
At the time of the study all the couples in the village knew about family planning methods, having been informed through hospitals, health staff, radios and the literature available on family planning methods. As the literacy levels are high in the village, the couples could read the information about family planning methods; visits to hospitals and talking to doctors proved positive factors in acquiring contraceptive knowledge. Whenever I asked the
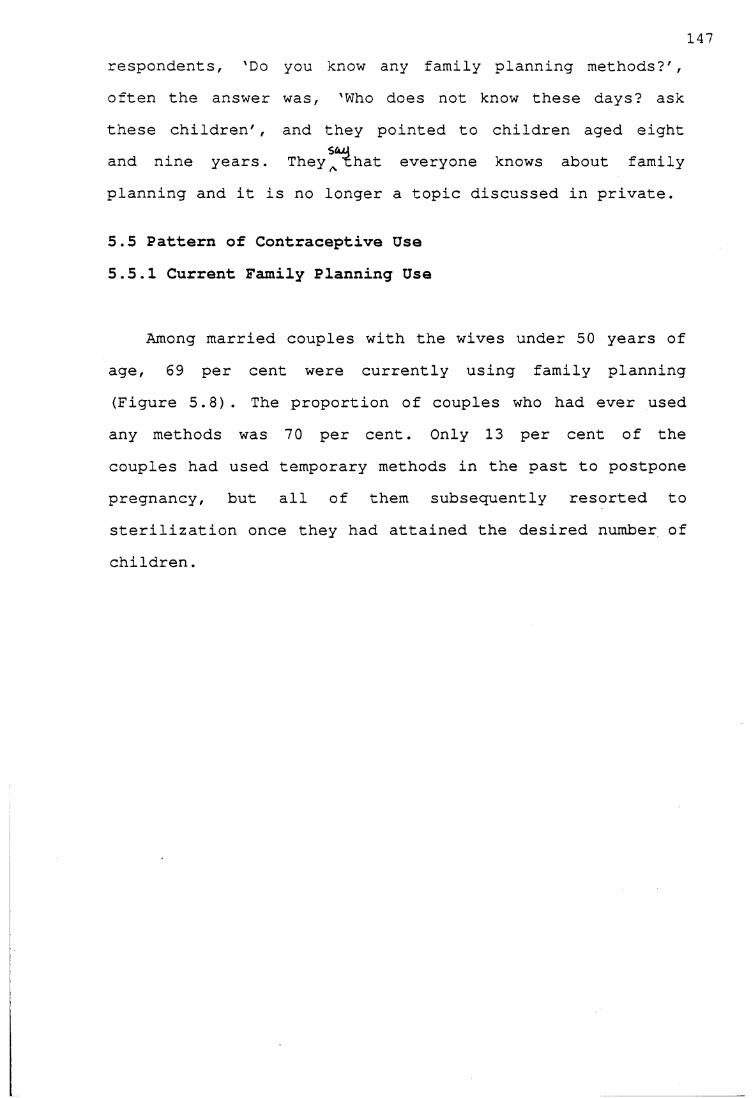
respondents, 'Do you know any family planning methods?' , often the answer was, 'Who does not know these days? ask these children' , and they pointed to children aged eight
SOuXand nine years. They s that everyone knows about family planning and it is no longer a topic discussed in private.
5.5 Pattern of Contraceptive Use 5.5.1 Current Family Planning Use
Among married couples with the wives under 50 years of age, 69 per cent were currently using family planning (Figure 5.8). The proportion of couples who had ever used any methods was 70 per cent. Only 13 per cent of the couples had used temporary methods in the past to postpone pregnancy, but all of them subsequently resorted to sterilization once they had attained the desired number of
147
children.
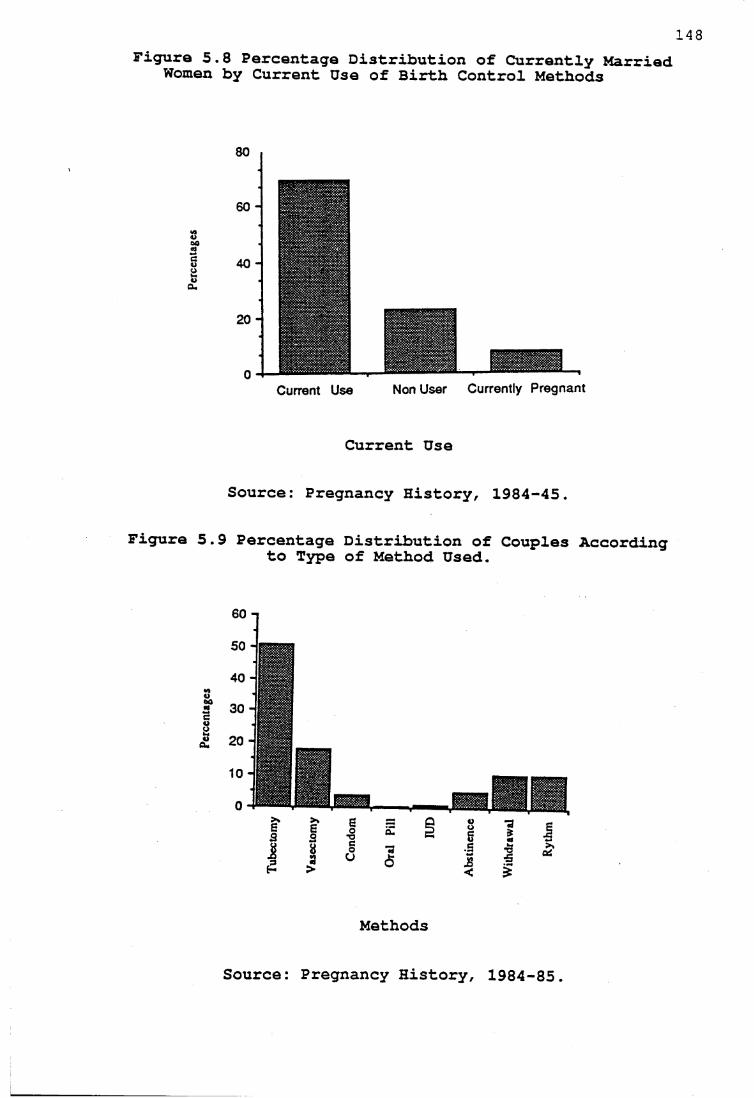
Figure 5.8 Percentage Distribution of Currently Married Women by Current Use of Birth Control Methods
3002oua*
80
60 -
40 -
20 -
0 -Current Use Non User Currently Pregnant
Current Use
Source: Pregnancy History, 1984-45.
Figure 5.9 Percentage Distribution of Couples According to Type of Method Used.
Methods
Source: Pregnancy History, 1984-85.
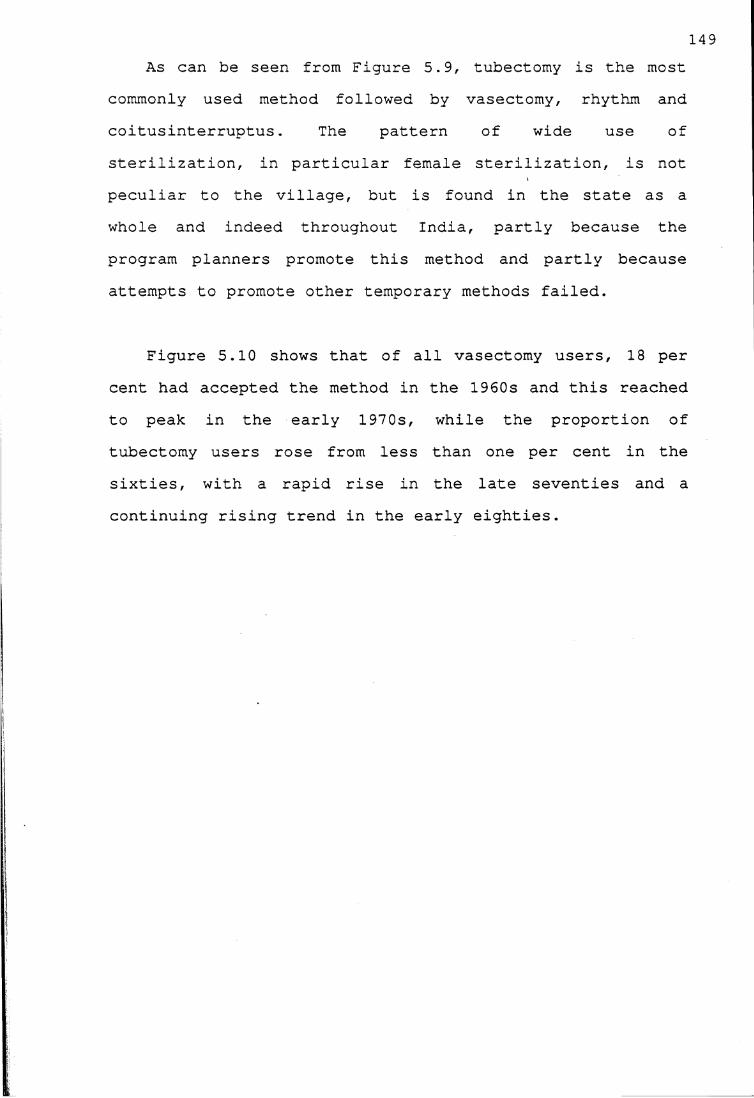
As can be seen from Figure 5.9, tubectomy is the most commonly used method followed by vasectomy, rhythm and coitusinterruptus. The pattern of wide use of sterilization, in particular female sterilization, is not peculiar to the village, but is found in the state as a whole and indeed throughout India, partly because the program planners promote this method and partly because attempts to promote other temporary methods failed.
Figure 5.10 shows that of all vasectomy users, 18 per cent had accepted the method in the 1960s and this reached to peak in the early 1970s, while the proportion of tubectomy users rose from less than one per cent in the sixties, with a rapid rise in the late seventies continuing rising trend in the early eighties.
149
and a
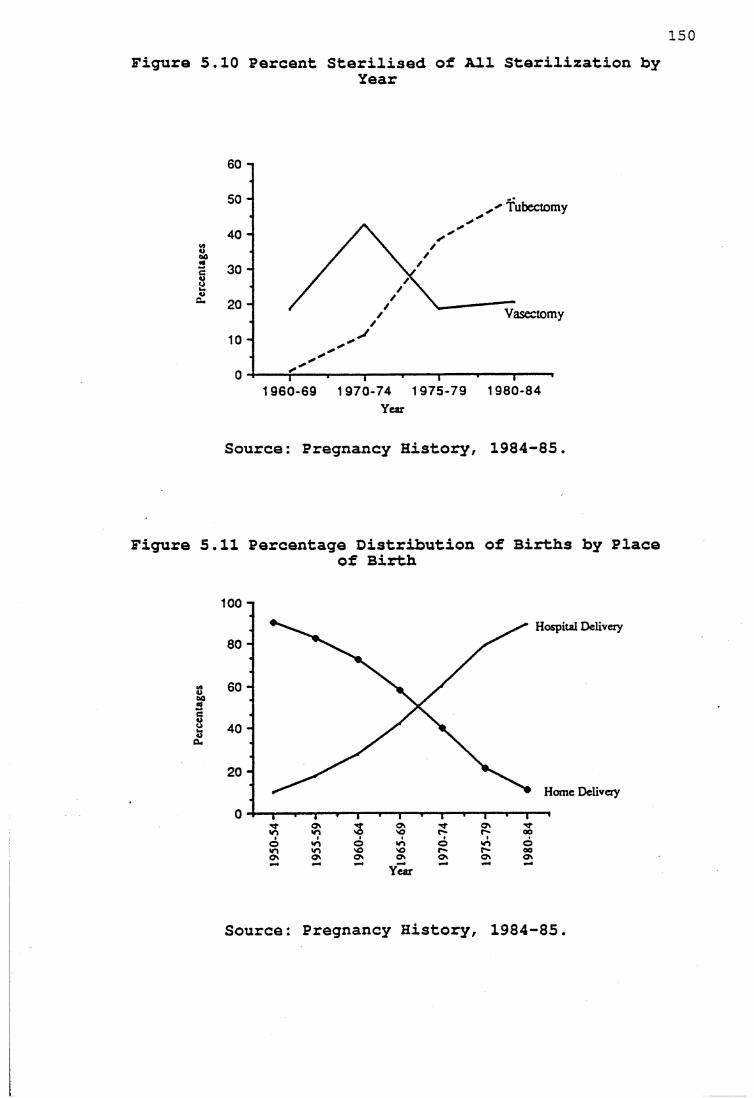
Figure 5.10 Percent Sterilised of All Sterilization byYear
Tubectomy
Vasectomy
1960-69 1970-74 1975-79 1980-84Year
Source: Pregnancy History, 1984-85.
Figure 5.11 Percentage Distribution of Births by Placeof Birth
100 nHospital Delivery
Home Delivery
Year
Source Pregnancy History, 1984-85.
151The peak observed among vasectomy users occurred mainly
because mass vasectomy camps were held in Ernakulam city during the early 1970s. Though only 11 men from the village were vasectomized during these camps, this reduced the stigma attached to the use of family planning in the village. During the field work I met two men one Christian and one from Shaiva Vellala caste who had been vasectomized before marriage because of high incentives paid during one of the camps; their families did not know about it and they arranged their marriages. When their wives did not become pregnant after two years of marriage, the families were concerned about it and insisted that they should consult the doctor; when the pressure from the families increased the men had to reveal the truth. The Christian woman left her husband and lives in the study village which is also her natal village. She said that her religion does not permit her to remarry while her husband is still alive. The Hindu woman is still with her husband because she believes that it is not proper for her to leave her husband.
In the late seventies the emphasis shifted to female sterilization. The program planners integrated the maternal and child health program with the family planning program, while medical officers were trained to conduct tubectomies and also introduce postpartum tubectomies. The program planners also convinced the women about postpartum sterilization, arguing that women need not spend any additional period of rest after sterilization because it is customary for women to convalesce for three months after child-birth. In addition to this, often there was fear of
152surgery, so that female sterilization was preferred to male sterilization on the grounds that men were the breadwinners of the family and had to be safe.
The number of family planning users increased in many Indian states during the 'Emergency' period from June 1975 to March 1977, when family planning was given priority and couples with three or more children were coerced to accept sterilization. Villagers in Karnataka felt bitter about forced sterilization (Caldwell, 1984:117), while in contrast the people in Palankara maintained that they volunteered to accept sterilization. It is likely that politicians and program planners hesitated to force sterilization on people in Kerala because of the strong trade union movements in the state and the higher awareness among people about the socio-economic and political situation.
However, the real breakthrough in the increase in tubectomy in the village came through the increase in the proportion of hospital deliveries. It is evident from Figure 5.11 that the proportion of ever-married women in the age group 15-59 who delivered their babies in the hospital rose from nine per cent during 1950-54 to 27 per cent during 1960-64, to 60 per cent during 1970-74 and to 90 per cent in 1980-84. Of all the female sterilizations,80 per cent were done during the postpartum period, suggesting that the increase in hospital deliveries might have boosted female sterilizations in the village. These suggestions supported by Gulati's observation (1979:332-
153336) in a semirural squatter settlement in Kerala that the shift of deliveries from the home to the hospital had played an important role in favour of female sterilization.
This high level of use of tubectomy in the village does not mean that people are totally satisfied with the method. There are couples who complained about after effects of sterilization, but they maintain that it is the only method available for them. Some couples felt that using condoms and oral pills was expensive because they had to be purchased from the chemists in the absence of a regular supply from the family planning workers. An oral pill user in the village said that, the cost of the oral pill was Rs.5.80 (approximately As$ 0.72) per month and the prices of condoms marketed varied with the brands; condom users spent on an average Rs. 2 to 3 for a packet of three condoms. The reasons given by many couples for not using condoms were sexual dissatisfaction, insufficient privacy for their satisfactory use and difficulty in disposing of them after use.
5.5.2 Current Family Planning Use by Age of Women.
Figure 5.12 indicates a rapid rise in current use of family planning methods from the 15-19 year age group to the 20-24 and 25-29 age groups; the level rises to a peak of 80 per cent in the late thirties and levels off around 70 per cent for women in their forties.
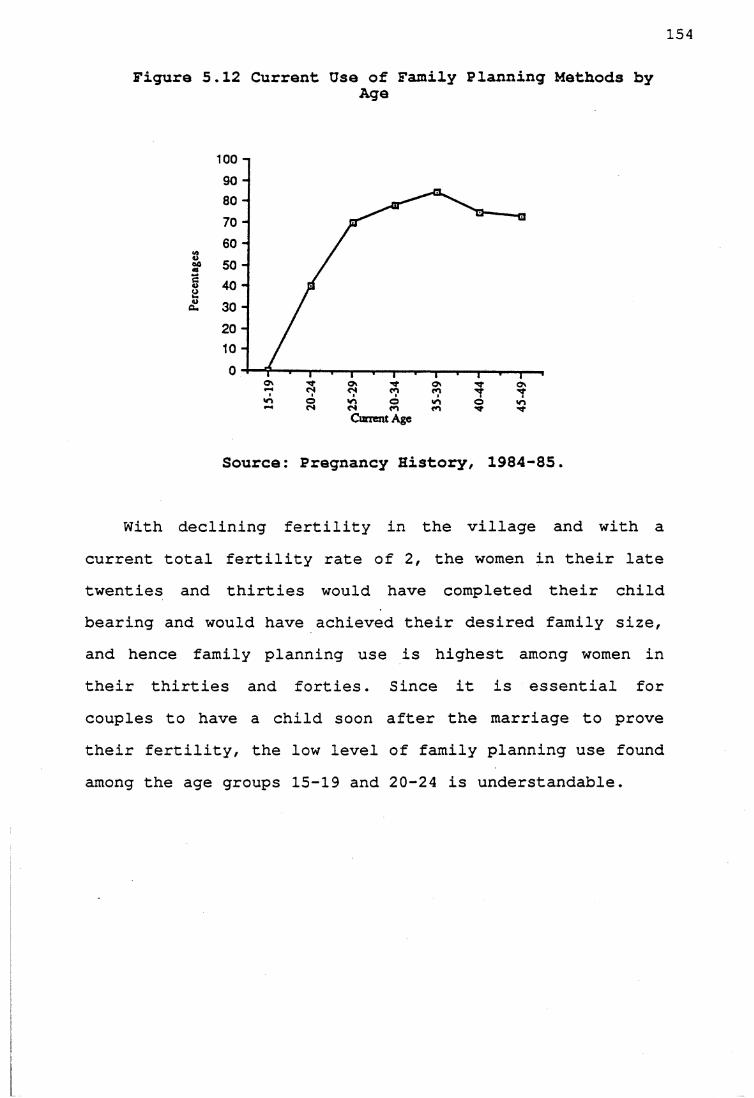
154
Figure 5.12 Current Use of Family Planning Methods byAge
100 n
Current Age
Source: Pregnancy History, 1984-85.
With declining fertility in the village and with a current total fertility rate of 2, the women in their late twenties and thirties would have completed their child bearing and would have achieved their desired family size, and hence family planning use is highest among women in their thirties and forties. Since it is essential for couples to have a child soon after the marriage to prove their fertility, the low level of family planning use found among the age groups 15-19 and 20-24 is understandable.
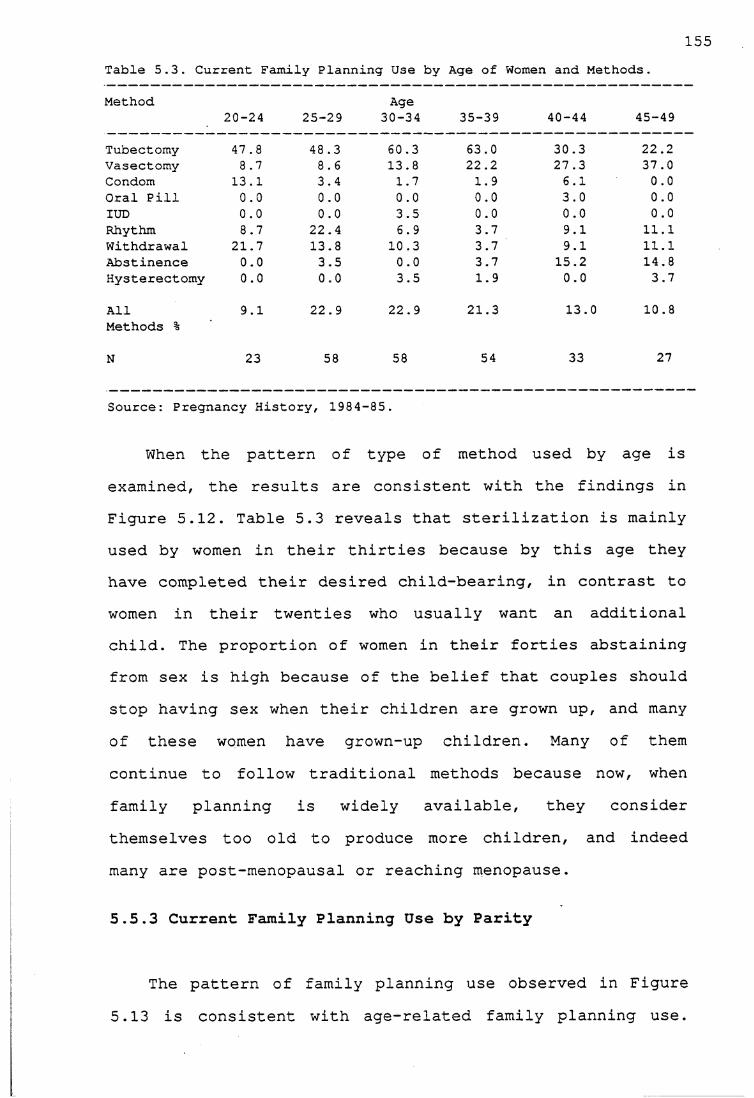
155Table 5.3. Current Family Planning Use by Age of Women and Methods.
Method Age20-24 25-29 30-34 35-39 40-44 45-49
Tubectomy 47.8 48.3 60.3 63.0 30.3 22.2Vasectomy 8.7 8.6 13.8 22.2 27.3 37.0Condom 13.1 3.4 1.7 1.9 6.1 0.0Oral Pill 0.0 0.0 0.0 0.0 3.0 0.0IUD 0.0 0.0 3.5 0.0 0.0 0.0Rhythm 8.7 22.4 6.9 3.7 9.1 11.1Withdrawal 21.7 13.8 10.3 3.7 9.1 11.1Abstinence 0.0 3.5 0.0 3.7 15.2 14.8Hysterectomy 0.0 0.0 3.5 1.9 0.0 3.7
All 9.1 22.9 22.9 21.3 13.0 10.8Methods %
N 23 58 58 54 33 27
Source: Pregnancy History, 1984-85.
When the pattern of type of method used by age is examined, the results are consistent with the findings in Figure 5.12. Table 5.3 reveals that sterilization is mainly used by women in their thirties because by this age they have completed their desired child-bearing, in contrast to women in their twenties who usually want an additional child. The proportion of women in their forties abstaining from sex is high because of the belief that couples should stop having sex when their children are grown up, and many of these women have grown-up children. Many of them continue to follow traditional methods because now, when family planning is widely available, they considerthemselves too old to produce more children, and indeed many are post-menopausal or reaching menopause.
5.5.3 Current Family Planning Use by Parity
The pattern of family planning use observed in Figure 5.13 is consistent with age-related family planning use.
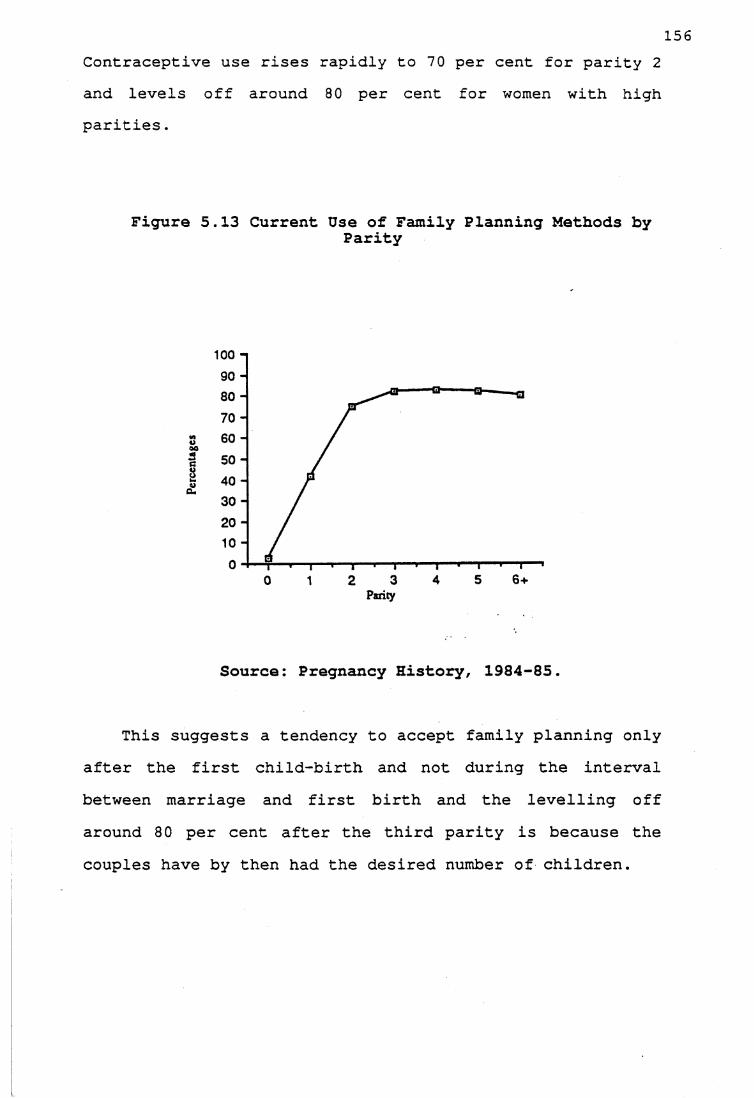
156Contraceptive use rises rapidly to 70 per cent for parity 2 and levels off around 80 per cent for women with high parities.
Figure 5.13 Current Use of Family Planning Methods byParity
100 - |
Source: Pregnancy History, 1984-85.
This suggests a tendency to accept family planning only after the first child-birth and not during the interval between marriage and first birth and the levelling off around 80 per cent after the third parity is because the couples have by then had the desired number of children.
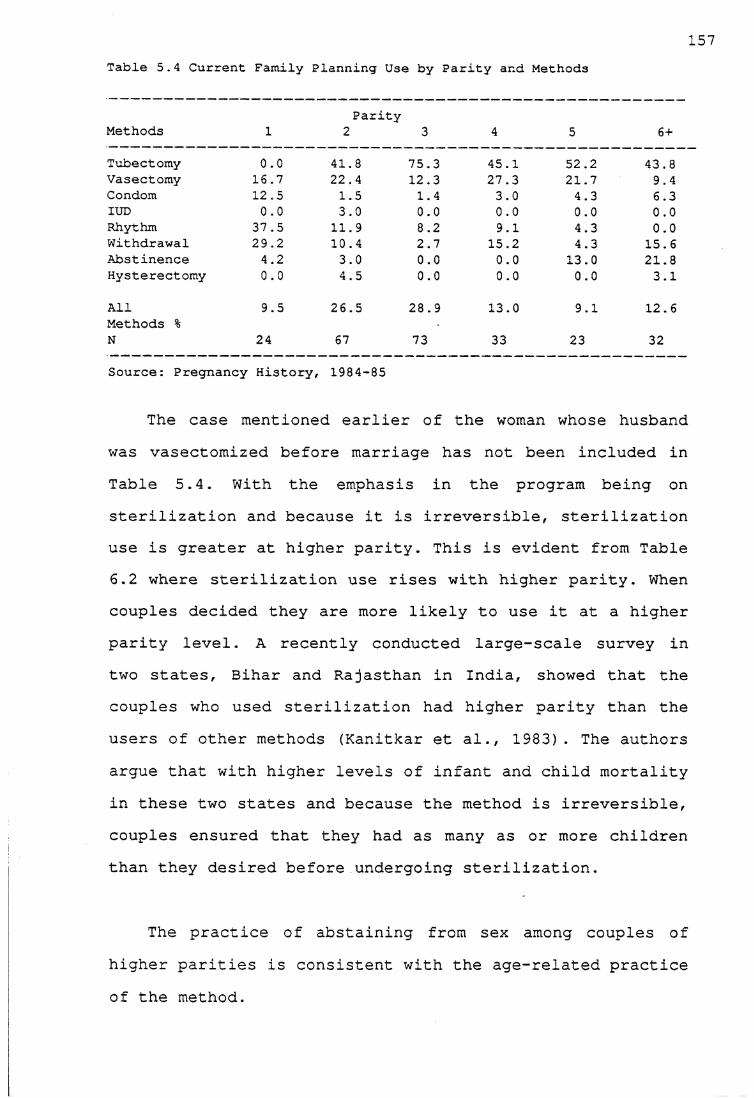
157Table 5.4 Current Family Planning Use by Parity and Methods
Methods 1Parity
2 3 4 5 6 +Tubectomy 0.0 41.8 75.3 45.1 52.2 43.8Vasectomy 16.7 22.4 12.3 27.3 21.7 9.4Condom 12.5 1.5 1.4 3.0 4.3 6.3IUD 0.0 3.0 0.0 0.0 0.0 0.0Rhythm 37.5 11.9 8.2 9.1 4.3 0.0Withdrawal 29.2 10.4 2.7 15.2 4.3 15.6Abstinence 4.2 3.0 0.0 0.0 13.0 21.8Hysterectomy 0.0 4.5 0.0 0.0 0.0 3.1All 9.5 26.5 28.9 13.0 9.1 12.6Methods % N 24 67 73 33 23 32Source: Pregnancy History, 1984-85
The case mentioned earlier of the woman whose husband was vasectomized before marriage has not been included in Table 5.4. With the emphasis in the program being on sterilization and because it is irreversible, sterilization use is greater at higher parity. This is evident from Table 6.2 where sterilization use rises with higher parity. When couples decided they are more likely to use it at a higher parity level. A recently conducted large-scale survey in two states, Bihar and Rajasthan in India, showed that the couples who used sterilization had higher parity than the users of other methods (Kanitkar et al., 1983). The authors argue that with higher levels of infant and child mortality in these two states and because the method is irreversible, couples ensured that they had as many as or more children than they desired before undergoing sterilization.
The practice of abstaining from sex among couples of higher parities is consistent with the age-related practiceof the method.
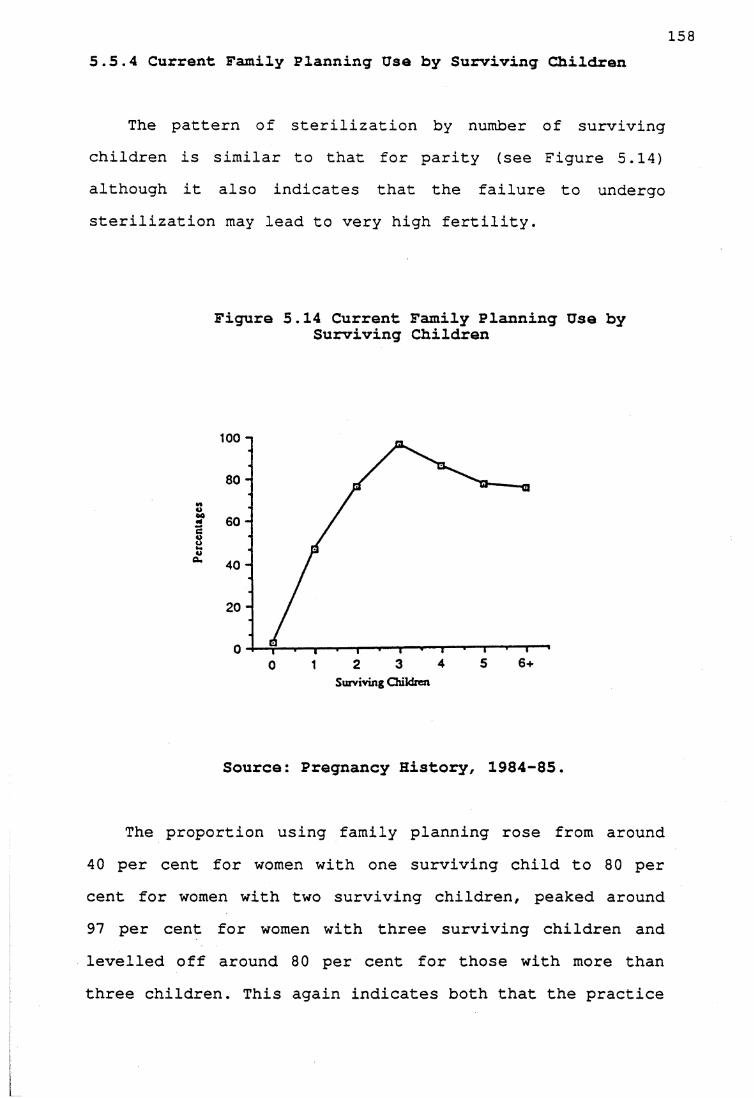
1585.5.4 Current Family Planning Use by Surviving Children
The pattern of sterilization by number of surviving children is similar to that for parity (see Figure 5.14) although it also indicates that the failure to undergo sterilization may lead to very high fertility.
Figure 5.14 Current Family Planning Use by Surviving Children
100 n
Surviving Children
Source: Pregnancy History, 1984-85.
The proportion using family planning rose from around 40 per cent for women with one surviving child to 80 per cent for women with two surviving children, peaked around 97 per cent for women with three surviving children and levelled off around 80 per cent for those with more than three children. This again indicates both that the practice
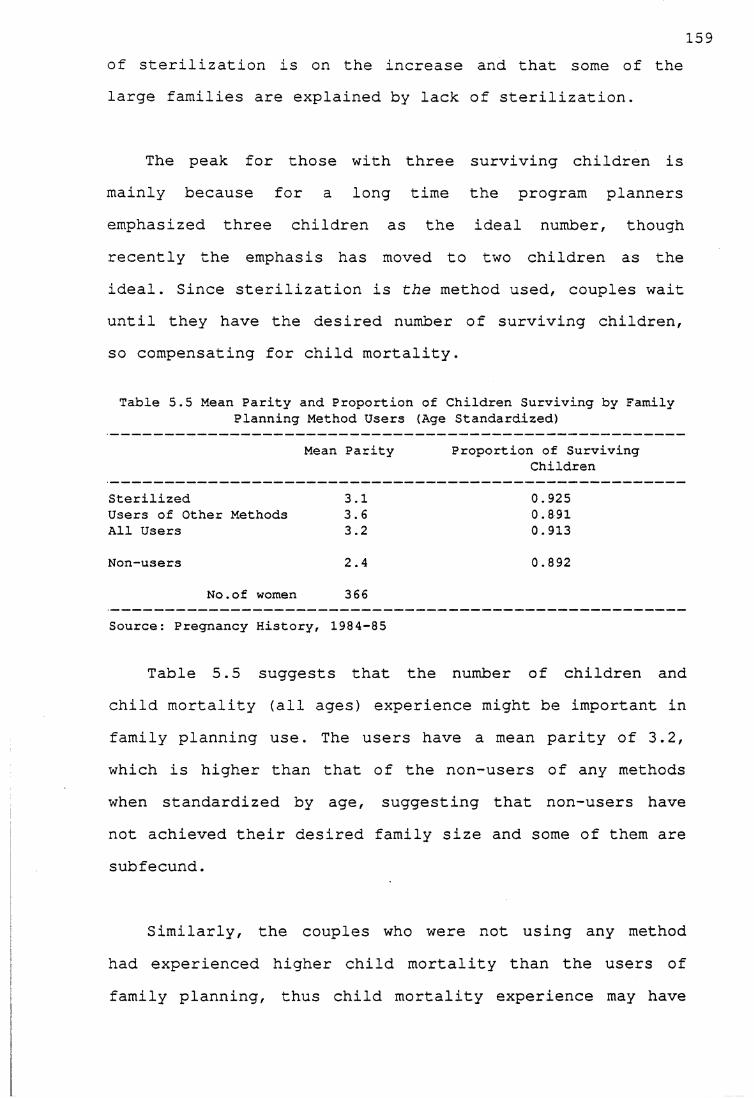
159of sterilization is on the increase and that some of the large families are explained by lack of sterilization.
The peak for those with three surviving children is mainly because for a long time the program planners emphasized three children as the ideal number, though recently the emphasis has moved to two children as the ideal. Since sterilization is the method used, couples wait until they have the desired number of surviving children, so compensating for child mortality.
Table 5.5 Mean Parity and Proportion of Children Surviving by Family Planning Method Users (Age Standardized)
Mean Parity Proportion of SurvivingChildren
Sterilized 3.1 0.925Users of Other Methods 3.6 0.891All Users 3.2 0.913
Non-users 2.4 0.892No.of women 366
Source: Pregnancy History, 1984-85
Table 5.5 suggests that the number of children and child mortality (all ages) experience might be important in family planning use. The users have a mean parity of 3.2, which is higher than that of the non-users of any methods when standardized by age, suggesting that non-users have not achieved their desired family size and some of them are subfecund.
Similarly, the couples who were not using any method had experienced higher child mortality than the users of family planning, thus child mortality experience may have

160kept the surviving family small and stopped the couples from using family planning. It is noteworthy that sterilization users have experienced lower child mortality than the users of other methods, suggesting that couples who experienced child mortality preferred methods which are reversible. Since the family planning program emphasizes sterilization, the couples with low child mortality experience tend to use sterilization.
5.6 Selected Characteristics of Family Planning Users 5.6.1. Current Family Planning Use and Religion
Table 5.6 reveals that, among Hindus and Christians, family planning methods are used extensively and religious beliefs do not hinder family planning use. Though the differences are small the contraceptive prevalence is higher among Christians than among Hindus when standardized by age and surviving children. It should be noted that, even though the Catholic church does not approve of family planning methods, family planning use is high among Christians.
Table 5.6 Current Family Planning Use by Religion (Standardized by Age and Surviving Children)
Religion Percentages N
Muslims (4) (6)Christians 66.7 154Hindus 62.3 206
Source: Pregnancy History, 1984-85
It w a s c l e a r f r o m c o n v e r s a t i o n s w i t h t h e C h r i s t i a n
f a m i l i e s in t h e v i l l a g e t h a t t h e C h r i s t i a n r e l i g i o u s
i n s t i t u t i o n s o p p o s e d f a m i l y p l a n n i n g m e t h o d s s u c h as
161sterilization, IUD and condom, but, rather than opposing the idea of the small family, they encouraged couples to practise rhythm and withdrawal.
A respondent reported that apart from training girls to become nuns, one of the seminaries in Ernakulam town trains women in tailoring and handicrafts. The authorities in the seminary also have courses on child health and nutrition and traditional family planning methods such as rhythm and withdrawal for those girls who opt for marriage. However, many Christian couples preferred sterilization to traditional methods since the chance of failure is higher for traditional methods which were used mainly to postpone pregnancy. The Christian women who generally went to a missionary hospital to deliver children opted for government hospitals when they decided to use postpartum tubectomy. The attitude of Christian couples showed that they desired a small family size and their religious beliefs did not stop them from using family planning methods such as sterilization. Thus, it is evident that the religious institutions cannot effectively prevent Christian couples from undergoing sterilization.
While Hindus do not have any religious beliefs against using family planning methods, the relatively low level of family planning use among Hindus may be because they experienced higher child mortality than the Christians. The proportion of children surviving among Hindus was 0.863, while among the Christians it was 0.949. Higher child mortality among Hindus may occur because the Hindu
162population contains scheduled castes who are likely to be poor and illiterate. These estimates are compounded over time and also reflect differences in education between the two religions; however, educational differences do not exist in the younger population.
5.6.2.Current Family Planning Use by Number of Years in School by Husbands and Wives.
Although family planning use is more than 60 per cent in every educational group, an unexpected pattern emerged showing that family planning use is higher among those with fewer years of schooling, even when standardized by age and surviving children. (Table 5.7) . Two broad educational groups, those with no schooling and those with a university level of education, have been employed for analysis owing to small numbers.
Family planning use shows a similar pattern according to wife's and husband's educational levels, but the only variation is that the differences in percentage use of family planning is larger among husbands in the two educational groups .

163Table 5.7 Current Family Planning Use by Education of Wives and Husbands (Standardized by Age and Surviving Children)
No.of School Years
Wife's Education
Percentages N
No schooling + 1-4 years 68.1 1845 + years of Schooling 65.3 182
Husband's education
No schooling + 1-4 years 70.5 1745 + years of schooling 64.2 192
Source: Pregnancy History, 1984-85
However, when the chi square test is applied to see the degree of dependence between the two variables, family planning use and number of years in school, the levels of significance are only 0.0693 and 0.3853 for wife's and husband's education respectively, which shows that contraceptive use is independent of the number of years in school.
This negates the view that family planning use rises consistently with a rise in educational levels. The in- depth interviews gave insight into the reasons for using family planning, the details of which are discussed in Chapter 6. However, it was observed that, among the vasectomy users, often the motivating factor was peer group pressure and the attraction of incentive money, and most of the decisions were made on the spur of the moment. It is possible that persons with low levels of education are more likely to be labourers and likely to be vulnerable to peer group pressure and incentive money, So, there is some plausibility in family planning use being higher among persons with fewer years in school.
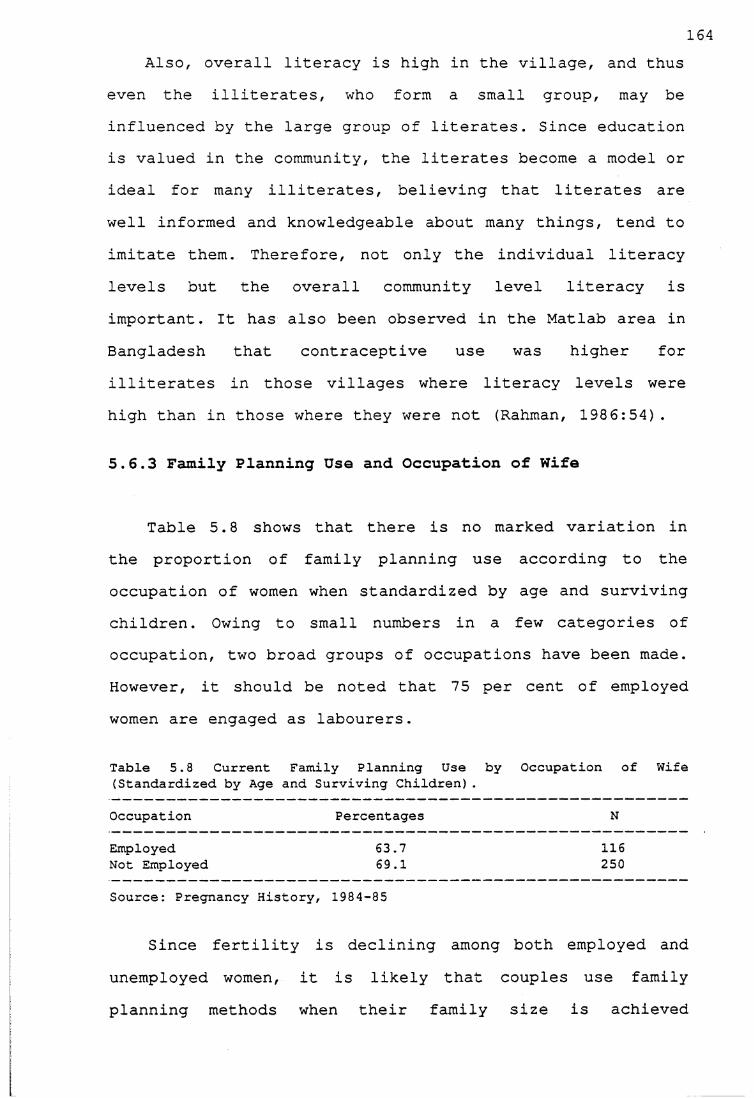
164Also, overall literacy is high in the village, and thus
even the illiterates, who form a small group, may be influenced by the large group of literates. Since education is valued in the community, the literates become a model or ideal for many illiterates, believing that literates are well informed and knowledgeable about many things, tend to imitate them. Therefore, not only the individual literacy levels but the overall community level literacy is important. It has also been observed in the Matlab area in Bangladesh that contraceptive use was higher for illiterates in those villages where literacy levels were high than in those where they were not (Rahman, 1986:54).
5.6.3 Family Planning Use and Occupation of Wife
Table 5.8 shows that there is no marked variation in the proportion of family planning use according to the occupation of women when standardized by age and surviving children. Owing to small numbers in a few categories of occupation, two broad groups of occupations have been made. However, it should be noted that 75 per cent of employed women are engaged as labourers.
Table 5.8 Current Family Planning Use by Occupation of Wife (Standardized by Age and Surviving Children).
Occupation Percentages N
Employed 63.7 116Not Employed 69.1 250
Source: Pregnancy History, 1984-85
Since fertility is declining among both employed and unemployed women, it is likely that couples use family planning methods when their family size is achieved
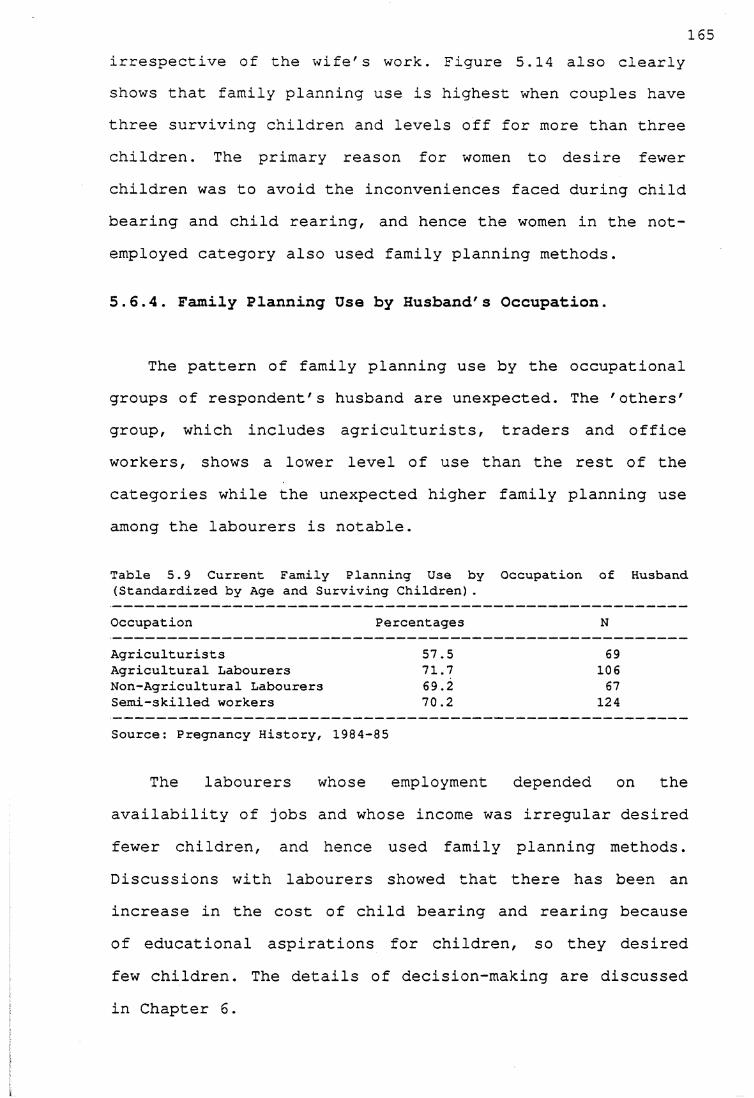
165irrespective of the wife's work. Figure 5.14 also clearly shows that family planning use is highest when couples have three surviving children and levels off for more than three children. The primary reason for women to desire fewer children was to avoid the inconveniences faced during child bearing and child rearing, and hence the women in the not- employed category also used family planning methods.
5.6.4. Family Planning Use by Husband's Occupation.
The pattern of family planning use by the occupational groups of respondent's husband are unexpected. The 'others' group, which includes agriculturists, traders and office workers, shows a lower level of use than the rest of the categories while the unexpected higher family planning use among the labourers is notable.
Table 5.9 Current Family Planning Use by Occupation of Husband (Standardized by Age and Surviving Children).
Occupation Percentages N
Agriculturists 57.5 69Agricultural Labourers 71.7 106Non-Agricultural Labourers 69.2 67Semi-skilled workers 70.2 124
Source: Pregnancy History, 1984-85
The labourers whose employment depended on the availability of jobs and whose income was irregular desired fewer children, and hence used family planning methods. Discussions with labourers showed that there has been an increase in the cost of child bearing and rearing because of educational aspirations for children, so they desired few children. The details of decision-making are discussed in Chapter 6.
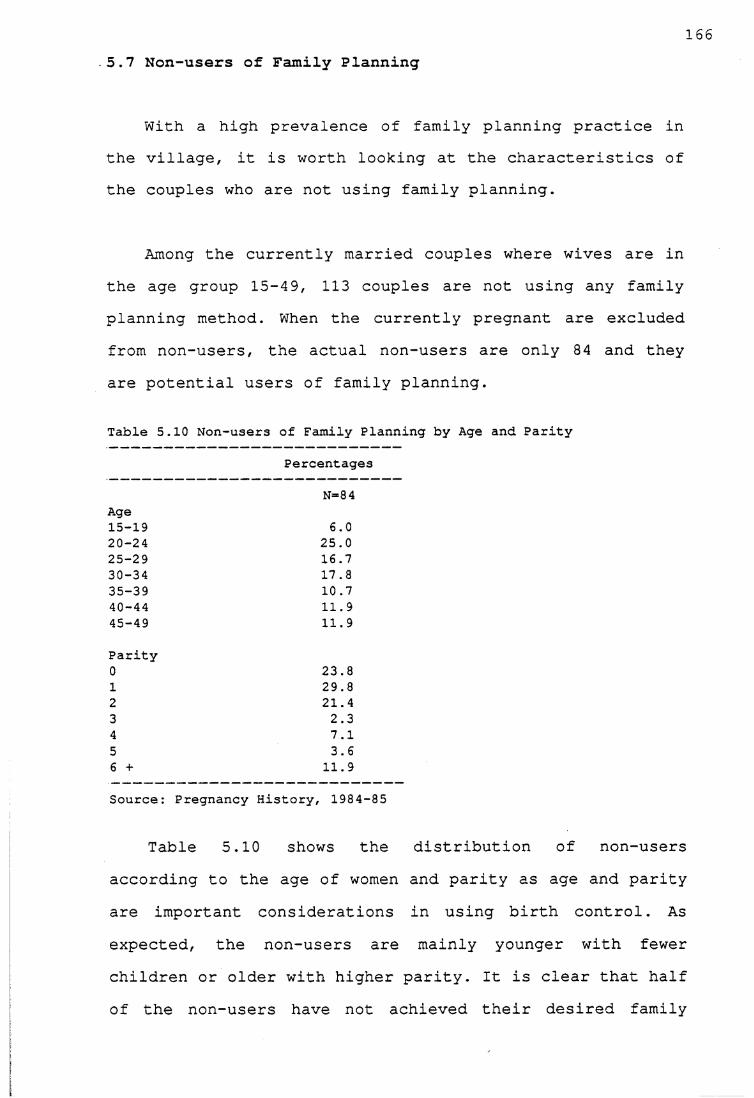
1665.7 Non-users of Family Planning
With a high prevalence of family planning practice in the village, it is worth looking at the characteristics of the couples who are not using family planning.
Among the currently married couples where wives are in the age group 15-49, 113 couples are not using any familyplanning method. When the currently pregnant are excluded from non-users, the actual non-users are only 84 and they are potential users of family planning.
Table 5.10 Non-users of Family Planning by Age and Parity
Percentages
N=8 4Age15-19 6.020-24 25.025-29 16.730-34 17.835-39 10.740-44 11.945-49 11.9
Parity0 23.81 29.82 21.43 2.34 7.15 3.66 + 11.9
Source: Pregnancy History, 1984-85
Table 5.10 shows the distribution of non-users according to the age of women and parity as age and parity are important considerations in using birth control. As expected, the non-users are mainly younger with fewer children or older with higher parity. It is clear that half of the non-users have not achieved their desired family
167size and as sterilization is the method used, the couples with lower parity wait until they achieved the desired family size. I met a woman who had only one child and had not conceived at all for more than 12 years; as her natural fertility was below the desired fertility she did not use any birth control method. One of the couples in the village lost a child after sterilization; as they wanted two children and the wife got herself tubectomized after they had the second child, they were very upset about losing their only daughter, and being unable have another child. So there was a fear of child mortality among couples and it made them wait for the children to grow up before seeking sterilization. However, couples were not very happy about it because they felt that there were no proper temporary methods available to be used during the waiting period or to postpone the pregnancies. There was fear of using IUD because of complications, condoms were considered inconvenient and the traditional methods were regarded as ineffective: people felt the only choice was sterilization. These factors influenced the decisions regarding the use of birth control methods in the village.
Since the women with higher parity are usually older, they believe that they will not bear any more children as they are approaching menopause. As is shown in Chapter 6, the fear of surgery and fear of child mortality stop many older couples from using family planning methods.
1635.8 Summary
The data indicate a rapid fertility decline and the current level of fertility has reached replacement level (TFR 2.0) . Fertility has declined among all the socioeconomic groups and the differences in fertility levels are also negligible for younger age cohorts, indicating that socio-economic factors have little influence on fertility levels. The days when women had four or five live births each are certainly past.
Female sterilization has been the method to control fertility. The use of traditional methods is higher than that of contraceptives; people were aware of these traditional methods and preferred them to IUD and condoms because of the problems associated with using modern methods. As there is no choice people resort to sterilization. The extensive use of family planning methods in all the socio-economic groups reflects a change in attitude.
Although delay in marriage has been important for fertility decline, the main reason is the control of marital fertility through extensive use of family planning. Any future fertility decline will be due to marital fertility control and the family planning program can help in this fertility regulation. Though efforts to promote temporary methods are poor, people are seeking theavailable methods to control fertility. The increase in voluntary acceptance of family planning suggests that there
169is a felt need for a small family and now it is important for the government to meet the needs. But as Dyson and Crook (1984:8) correctly point out, 'the program is currently failing to completely meet the need largely because of defects in its design'.
Marital fertility control also means that couples make a deliberate attempt to have the number of children they desire. So who makes these decisions? When do the couples decide about the number of children they want? What are the motivations for such a desire? Is the change in attitude mainly due to the family planning program or are there any other factors? These aspects of the use of family planning methods are discussed in the next chapter.
170
CHAPTER 6Preference for Small Families: Motivations andProcesses
In view of the fact that the shift in reproductive behaviour is largely due to extensive use of birth control, this chapter examines the motivations and processes involved in use of these methods. It examines who makes the reproductive decisions, and how and the perceived socioeconomic and demographic forces underlying the increased use of birth control and emerging preference for small families.6.1 Reproductive Decision Making
The smallness of the differences in fertility regulation among all the socio-economic groups in thevillage has been an important factor in fertility decline. One way to explain this shift in reproductive behaviour among all the groups is gain an understanding of theindividual perceptions, motivations and decision processes, which may have some predictive power (Höllerbach, 1983:340).
The study village provided sufficient data to understand the change in reproductive behaviour, becausethere were sufficient currently married couples who hadexperienced each of the three stages of fertility transition. The currently married couples where the wives were aged 60 and above were classified as those belonging to the pre-transition fertility period; most of these
171couples had not been exposed to the family planning program.
The currently married couples where wives were aged 40- 59 and who were exposed to the initial stages of the family planning program were classified as having experienced the initial stages of fertility decline. The currently married couples with wives under 40 were grouped as those who had experienced recent and rapid fertility decline.6.1.1 Pre-Transition Period
Currently married couples with wives aged 60 and over were interviewed on their perception of the social and economic changes in the village, in general, and reproductive behaviour in particular. The old couples who belonged to the pre-transition period were mainly asked whether they had ever thought of the number of children they would prefer, and their perceptions of changing family size norms among the younger generation.
The pre-transition couples were aware of the fact that their children lived differently and that society had changed. It was clear from the interviews that in the past, the attitude to life was more fatalistic: events such as birth and death were natural processes and there was no control over them, and similarly in the pre-transition period, couples had minimal control over family size. For
172most of them, children continued to be born till the end of the reproductive span:
H.H.No.12 : We never thought about the number of children we wanted. We accepted the children as they came along. We never thought it posible to have the desired number of children. Three of our children died and four children survived. We accepted it (Choti, aged 66, Pulaya, Agricultural Labourer).
H.H.No.139 : Many children were born; a few survived and a few died. Those days nobody thought about the number of children one should have (Madhavi, aged 64, Izhava Agricultural labourer)
Many old couples heard about family planning programs in the later years of their child-bearing and many of them approved the idea of 'small family' ; some old couples who felt that they would have limited the number of children if they had known about birth control methods, by which they always meant sterilization, partly because sterilization is widespread. For instance,
H.H.No. 167 : We felt the burden of children as they were born. But we did not know what to do. If the operation (sterilization) were done in those days we would have limited the number of children (Anippa, aged 61, Pulaya and Agricultural labourer)H.H.No. 59 : I had frequent child birth. I lost three children. I would have limited the number if I had known how to postpone the pregnancy. (Lakshmi, aged 64, Izhava, Agricultural Labourer)
However, a few old couples still did not approve of the younger generation limiting the number of children. Most of them considered the younger generation to be incapable of bearing the responsibilities of a family, and some old women felt that the younger women had to limit the number of children they had because they were physically and mentally weak.
173
H.H.No. 162: Those days children were born and we never thought it difficult to rear them. These days young people think children are a burden (Elikutty, aged 60, Catholic, Agriculturist) .H.H.No. 141: Those days many children were considered as good. We never thought of the number of children. Nowadays everyone wants few children (Tresia, aged 61, Catholic, Agriculturist).
Nevertheless, most older couples were now positive about the small family norm, as was evident from the number of cases where parents encouraged their sons and daughters to have a small family. They felt that the cost of living was higher now than in the past and that it was not easy to rear children under present conditions.
6.1.2. Fertility Transition Period
Among the couples who belonged to the fertility transition period, in-depth interviews were phrased differently for users and non-users of family planning.
For those who used family planning methods, the discussions centred mainly on the following issues :
1) When did the couples initiate the decision to use family planning?2) Who initiated the idea of using family planning?3) Who were consulted and what kind of debate took place?4) Who made the final decision?5) When did they use family planning?6) Why was such a decision made ?
174For those couples who were not users of family planning
methods, the in-depth interviews focused on the following areas:
1) Did any one in the family ever think about birthcontrol?2) When did the first thought occur?3) What was the nature of debate?4) Who made the final decision?5) Why was it decided not to accept?
The findings of the in-depth interviews are organized around a series of topics which are related to fertility decision making.
6.1.2.1.Timing of Reproductive Decision Making
One approach to understanding the process of decision making is to know the timing of reproductive decisions. At what stage of child-bearing are the family size decisions made? It is assumed that if family size goals are formed at an early stage of child bearing, the couples are more likely to regulate fertility early. A difference was observed in the timing of fertility decision-making among couples of different age groups.
It was found that family size goals were formed later among the couples where wives were in the age group 40-59 than among the younger group. While 40 per cent of the couples with wives between 40 and 59 thought about limiting their family size only when they had more than four children, 20 per cent had thought about it when they had
175three children. The rest in this group had not thought about the number of children at any time.
H.H.No. 2 : We never thought of the number of children we were going to have. Children came along as a result of natural behaviour. When the number of children increased we felt the economic burden, but did not know what to do.When we had the eighth child a doctor suggested vasectomy and we agreed (George, aged 56, Catholic, Vasectomized).H.H.No. 153: Never thought about the number of childrenwhen I got married. When I had the fourth child I started feeling the burden. I was not sure although sterilization camps were held. When I had the fifth child I talked to a friend of mine who was vasectomized. He assured me the safety of the method (Joseph, aged 44, Catholic, Vasectomised).
H.H.No.49: I came to know about the methods when I had 10 children (only 7 survived) . I always felt the burden of children every time I had one, but did not know what to do. Once I heard about the family planning propaganda in a nearby town. I went to this camp and got myself sterilized (Ayyappan, aged 65, Pulaya, Vasectomized).H.H.No. 60: I saw the posters in a hospital one day inErnakulam. That time I had 3 children. I was feeling the burden of taking care of these children. I thought if I have more children than this, it will be difficult to look after them (Paramu, aged 59, Izhava, Vasectomized).
These couples felt the economic burden of having children as the family size grew. The immediate costs of rearing the child outweighed the economic benefits from the children in the future.
The non-users of birth control methods also thought about family size only later in their reproductive period, but the fear of side effects in using birth control methods stopped them from doing so.
176
H.H.No. 75: I came to know about the operation (sterilization) when I had five children. I was afraid of operation hence decided to have children (Anipa, aged 44, Pulaya, Non-user) .
H.H.No. Ill: We came to know about the methods when we had 4 children. But we feared complication. Hence, we decided not to limit the number of children (Varky, aged 47, Catholic, Non-user).
The fear was partly because of misinformation and partly because some couples experienced side effects. Of couples whose wives were in the age group 40-59, 50 percent feared complications due to surgery.
Another factor which influenced the decision making was fear of child mortality, which was felt by 47 per cent of these couples.
H.H.No. 118: I came to know about the operation when I had 6 children. But I had already lost two and I feared complications. Hence, I decided not to use any method (Pankajakshy, aged 52, Nair, Non-user).H.H.NO. 003: Neither my husband nor I thought of limiting the number of children. I had four children. One died. I had a miscariage too. We were prepared to have any number of children (Kunjupenna, aged 44, Pulaya, Non-user).
This fear of child mortality was mainly due to two factors: first, some women had experienced child mortality during their child-bearing period; second, women who had not experienced child mortality were influenced by the past experience of older women and women of their own age cohort. However, even though there were fears of after effects of sterilization and child mortality, there was a latent demand for small families among these couples.
177Of the younger couples with wives in the age group 30-
39, 70 per cent of the couples had thought about usingbirth control by the time they had two children. The remaining 25 per cent thought about controlling family size when they had their third child.
H.H.No.33 : I decided to have two children and when mywife delivered the second child I got myself sterilized. I told my wife later and she was happy that I did it (Sebastin, aged 33, Catholic, Vasectomized).
H.H.No. 2 6 : I thought of limiting the number of childrenafter the third child. But no one in the family approved.So I kept quiet. During the fourth pregnancy I fell sick.I requested the doctor to use my sickness as a reason to get tubectomized and it worked (Kunjukali, aged 37, Pulaya, Tubectomized)H.H.No.61 : During my second child birth I decided to get operated. I consulted my husband and husband' parents.They agreed (Parvati, aged 33, Pulaya, Tubectomized).H.H.No. 107 : We both decided to have only two children.Hence I got tubectomized after the second delivery. We consulted our parents. They all agreed (Baby, aged 39, Izhavas, Tubectomized)
It is clear that family size goals were formed at an early stage of the child-bearing period, thus motivating the couples to use birth control methods. There was fear of child mortality and of after-effects of sterilization. Among these couples 39 per cent feared complications and 30 per cent feared child mortality. Jhis suggests, that younger couples had fewer fears because of widespread use of sterilization and the decline in child mortality in the village.
Of couples with wives in the age group 15-29 and who were using birth control methods, 90 per cent made their fertility decisions after the first birth, and the rest had already decided soon after marriage.
178
H.H.No. 15 : We have one male child aged three years. We want to have another child when this child starts schooling. We are following the safe period method to postpone the pregnancy (Reeta, aged 27, Catholic, Safe- period) .
H.H.No. 4 6 : We both decided to have two children when we got the first child. We got tubectomized after the second child (Vasu, aged 28, Pulaya, Tubectomized).
H.H.No. 57: Both of us decided to have only two children when we got our first child. My mother- in -law was not very happy about it. But because my husband also wanted it so she had to agree (Vinisha, aged 20, Velan, Tubectomized).
H.H.No. 47 : Both of us decided to have only two children when we got the first child. After the second child I consulted my mother and she did not agree saying that I should have another child. But when I had my third child I fell sick and the doctor refused to do surgery on me. So my husband got himself vasectomized (Julie, aged 27, Catholic, husband vasectomized)H.H.No.54: We decided to have only two children, but the doctor asked us to wait to get tubectomized till the children are grown up. The second child did not survive. We had another child and now we follow the safe-period method. We will think about tubectomy when our children are grown up (Supran, aged 27, Pulaya, safe-period)
It is also noteworthy that the couples who were young and were not currently using birth control methods had already decided about their family size. The reason for not using birth control methods was either that the wives were pregnant or that they had not yet reached their desired family size.
H.H.No. 8 8 : My wife is at her mother's house. She wentthere for her delivery. The child is five months old. We want to have two children. We want to postpone the next pregnancy too. We have not yet decided the method we want to use. I have to talk to my wife when she comes here (Chandran, aged 33, Izhava, Non-user).
H.H.No. 51 : We decided to have only two children, butwant to wait for the child to grow up a little bit before I am sterilized (Ayyappan, aged 34, Pulaya, Non-user)
179
H . H . No .3 93 : Both of us have already decided to have only two children. I am pregnant now. After this child birth we have decided to use Nirodh (Condom) to postpone the second child and than get tubectomized (Shoba, aged 20, Pulaya, Non-User).
The younger couples thought about family size during the earlier period of their child-bearing years and discussed family size when they had their first child; only a few discussed this issue soon after marriage. Since marriages are arranged by the parents there is little interaction between the couples and they do not feel free to discuss these matters immediately after marriage. Couples did not discuss whether or not to have a first child, because culturally it is important for every couple to prove their fertility. These couples feared neither complications of surgery nor child mortality because there is widespread familiarity with birth control methods and child mortality has declined in the village.
To summarize, timing of reproductive decisions has changed over time. While during the initial stages of fertility transition family size goals were formed at a later stage of the reproductive period, during the recent and rapid fertility transition period family size goals were formed at an early stage of the reproductive period. Moreover, the immediate costs of child bearing and rearing outweighed the fear of after-effects of surgery.
1806.1.2.2. Timing of Contraceptive Use
Of the currently married couples with wives in the age group 15-4 9, 44 per cent wanted two children and 31 per cent wanted three. This differed with age of the couples and the methods the couples used.
Among the younger couples with wives in the age group 15-29, 67 per cent wanted only two children and 26 per cent wanted three. Of the older couples with wives in the age group 40-59, 54 per cent had not thought about the number of children they wanted, while the remainder first thought about the number of children only as the family grew in size.
Among the currently married couples with wives in the age group 15-49, and sterilized, 43 per cent had the number of children that they wanted, while 32 per cent had more than they wanted. Only nine per cent had fewer than the desired number, while 14 per cent never thought about family size, but regulated their fertility because every one in the village did it.
Among the couples who were not using family planning, 2 6 per cent had fewer children than they wanted, 33 per cent had the desired number and 20 per cent had never thought about any specific number of children.
However, it was observed that family size decisions were influenced by external forces. For instance, in some cases disapproval by family members because of the fear of
181complications, or preference for sex of the child delayed the use of birth control methods. The in-depth interviews were helpful in finding details of such external influences:
H.H.No. 129 : I suggested tubectomy after two children. My husband and my parents didn't agree because I didn't have a male child. When the third child happened to be a male they didn't agree because they feared complications. But I thought we can't afford to have more than three children. So I went to the hospital alone and my parents didn't speak to me for a few months. My husband came to see me after two days (Achama, aged 30, Catholic, tubectomized).
There were instances where the failure of temporary methods resulted in a larger family size than the couples desired.
H.H.No.251:I thought of limiting the number of children after the third child-birth. Hence I used the loop (IUD) . But I conceived (She thinks it might have been expelled) . After the fourth delivery I fell sick. Hence I could not get sterilized. Hence I had to wait till the fifth child birth to employ tubectomy. (Selina, aged 46, Catholic, tubectomized).
Misinformation about birth control methods such as the belief that tubectomy can be done only immediately after delivery also led to some couples having more than the desired number of children.
H.H.No. 5: I thought of having only three children and wanted to get tubectomized. The doctor refused to operate on medical grounds. So I requested my husband to get vasectomized. He refused fearing complications. I did not force my husband to get vasectomized, because I did not want him to be sick. Hence, I had to wait till I had another child to get tubectomized (Wilsy, aged 34, Syrian Christian, Labourer, tubectomized).
182
H.H.No.34 After the second child-birth we thought of having three children (I did not think of it till then) . After the third child-birth my husband fell sick. So I had to work to feed the family. Because I would not be able to rest after tubectomy, I decided to use the IUD. But my mother did not agree as it results in bleeding. After the fourth child one of my children fell sick, and I still did not go for tubectomy. Ultimately I went after the fifth child (Kartiaini, aged 33, Izhava, tubectomized).
Though mortality levels were low, the fear of child mortality resulted in wanting on additional number of children.
H.H.No. 35 : I always wanted only one child. But my husband and my mother did not agree because I have only one child and they argued that, if the child died I woudn't be able to have another child. My second child was male. Again they did not agree because both were males. I decided that I could not have more than two whether boys or girls (Sudhama, aged 25, Velan, tubectomized).H.H.No. 13 : My husband and I desired only two children. But, when we had two children, we decided to have one more in case a child died (Rosy, aged 30, Catholic, tubectomized).
Even though in some cases sex of the children influenced family size decisions, the maximum number desired was three children, generally through influence of the family planning program.
H.H.No. 43: We desired only two children. But both were daughters. Hence, we had one more child. But, if the third child were a female we would not have tried for another child. Three children were the maximum we wanted (Savitri, aged 30, Pulaya, Quarry labourer, tubectomised).
However, such factors as the disapproval of relatives, preference for the sex of the children and fear of complications and child mortality were less important factors influencing the child-bearing decisions of younger couples. They were less apprehensive about complications of surgery and child mortality. The younger couples had more
control over their child-bearing decisions and they accepted the small family norm.6.1.2.3. The Decision Makers
One factor which emerged during the discussions and in- depth interviews is the participation of women in fertility decision-making. Among the currently married couples in the age group 15-45, 35 per cent of fertility control decisions were initiated by wives only, while 33 per cent of decisions were initiated jointly by husbands and wives.
This behaviour differed with the age of the couples. Among the older couples with wives in the age group 40-59,60 per cent of the fertility decisions were initiated by the women. This was mainly for two reasons: first, womenwere more easily motivated to have few children because of the inconveniences of child-birth. Secondly, women's decision-making power in the family Generally increases with age and number of children (Höllerbach, 1980:146-173, Epstein, 1982:156, Sushama, 1982). Since the timing of decisions among these couples was at a later stage of child-bearing most women were fairly old and of high parity when they made their decisions.
Among younger couples, with wives below the age of 40, the fertility decisions were more often initiated jointly by the husband and the wife. There was increasedcommunication between the younger couples. The spread of education and a weakening of traditional values regarding
183
husband-wife relationships have led to a greaterindependence among couples. With the rise in age at
184marriage and education, the wife is no longer a shy young bride in her teens, but older and mature. Old couples often noted that their daughters and daughters-in-law were very free to talk to their husbands, while the older women claimed that they still did not talk freely with their husbands. They believed that this change was due to the movies and reading romantic novels. The strengthening of the husband-wife relationship is one of the factors in weakening extended family relationships (Caldwell, 1982:338, Poffenberger, 1975:105).
Initiating the idea of fertility control also differed according to the fertility control methods the couples used. In the case of couples where the wives were sterilized, 64 per cent of the wives had initiated the idea of using fertility control, while 52 per cent of husbands initiated the idea of using male sterilization among those couples in which husbands were sterilized. Sincesterilization required surgery, the spouses were hesitant to suggest such methods to each other.
H .H .No.16: I wanted three children and then decided to use tubectomy. I had previously used oral pills to postpone the pregnancy. No one disagreed (Kartiyayini, aged 27, Izhava, tubectomized).H.H.No.19 : I wanted two children but my husband and mymother wanted me to have a female child as my two children happened to be males. The third child was also a male and they insisted that I should have one more child but I decided that three children were the maximum I could have (Cicily, aged 26, Catholic, tubectomized).
H.H.No 30: I decided to have two children as I used tofeel very sick during pregnancy. My family members did not agree but I insisted (Kalikutty, aged 30, Pulaya, tubectomized).
185
H.H.No 164: We feared complications due to operation but wanted to have only two children hence husband decided that we use condoms (Mary, aged 33, Catholic, Condom user) .
H.H.No.194 : I wanted two children but doctors refused to do tubectomy due to my ill-health. Then my husband decided that he would get vasectomized (Cicily, aged 45, Catholic husband vasectomized).
However, there were instances of wives persuading husbands to undergo vasectomy:
H.H.No. 37 : I asked my husband to get sterilized when we had two children. Those days female sterilization was not widespread. So I was not sure about the safety of female sterilization. Hence, I insisted on male sterilization. My husband refused the idea on the grounds that he wanted a female child. I tried to persuade him once again when the fourth child happened to be a female. This time he refused, arguing that sterilization might lead to complications. But he agreed only when I assured him that I would take up the family burden if he became an invalid.(Lily, aged 40, Catholic, petty business,husband vasectomized)H.H.No. 21: When I got my sixth child (four children survived), I felt that I should stop having children. My husband was a very irresponsible person. He used to spend his earnings on gambling. We lost a bit of land also. I had to work and feed the children. I could not manage child birth and work. So I asked my husband to get vasectomized (tubectomies were very rare) He and my mother did not agree fearing complications. I had another child.This time I had to promise him that I would take care of him and the children. Now he always uses his vasectomy as an excuse for not working. (Mariam, aged 40, Catholic,labourer, husabnd vasectomised)
Often in the case of male sterilization the decisions were sudden because of peer pressure and the attraction of monetary incentives.
H.H.No. 212 : One day I went to Ernakulam city with myfriends. One of my friends suggested getting sterilized when he saw the vasectomy camp. All of us decided together. Our wives came to know about it later. (Choti, aged 55, Pulaya, labourer, Vasectomized)
186
H.H.No.53 : I went to Ernakulam one day with my friendsand all of them decided to undergo vasectomy as soon as they saw the camp. I was not sure because I had only two children. My friends said that it was an ideal number. I agreed. I do not regret it at all (Raghavan, aged 45, Pulaya, agri. labourer, vasectomized)
H.H.No. 269 : I used to hear about the vasectomy camps. In one of the camps (in 1972 in a nearby town) the incentive was high. So I got vasectomized (Padmanabha, aged 51, Izhava, labourer, vasectomized)
H.H.No. 132 : I went to Ernakulam city to see a movie. Isaw the camp and they were giving money. So I thought it is a good idea. I told my wife later (Tampilla, aged 49, Saiva-Vellala, quarry labourer, vasectomy).
H.H.No.270: I decided suddenly when I saw the vasectomycamp at one of the hospitals at a nearby town. (Krishnan 54 years, Vasectomy)
In most of these cases, instead of showing any dissatisfaction, women accepted their husbands employing sterilization without their knowledge as they were relieved of child-bearing tasks.
The use of temporary birth control methods was almost always initiated jointly by husband and wife.
H.H.No.147 : We came to know about birth control methods when we had four children. We decided not to use sterilization as we feared complications. Hence my husband suggested we use the Nirodh (condom) . He came to know about it from a friend of his (Chakappan, aged 49, Catholic, Nirodh user).
H.H.No. 10: We both decided to have only two children but our first child fell sick and he is mentally retarded. Hence we decided to use the Nirodh instead of a permanent method (Shantamma, aged 33, Nair, husband Field Supervisor, Nirodh user).
H.H.No.77: The health staff told us to use sterilization but we did not like the idea due to fear. Hence both of us decided to abstain from sex. We had six children. Because we lost three children, we decided against sterilization (Ammini, aged 42, Pulaya, Withdrawal)
187In most of the cases one made the suggestion and
persuaded the other.
H.H.No.149 : I knew about the safe period method through adoctor. I suggested the method to my husband. He agreed (Mary, aged 35, Catholic, casual labourer, Safe-period).
H.H.No.428 : I was doing a course in handicrafts at one of the nunneries. They also had a course in maternal and child health. That is how I came to know about birth control methods such as withdrawal and rhythm. I suggested this method to my husband so that we could postpone the pregnancy. We want to continue the method. We have two daughters and we do not want any more children. If the method fails we want to abort the pregnancy and get sterilized (Mary, aged 28, Catholic, labourer, Withdrawal)
In some cases it was hard to identify which spouse initiated and who persuaded whom, because using temporary contraceptives, such as condoms, rhythm, withdrawal and abstinence, requires easy communication and understanding between husbands and wives. However, there were instances where wives suggested the method and husbands agreed.
H.H.No.18: Auxiliary-Nurse-Midwife asked me to get sterilized after my last child's birth (I lost three children and three survived) . I did not like the idea of sterilization because I feared complications. Hence, I suggested to my husband that we should employ withdrawal. He agreed. My friends suggested this method (Kalikutty, aged 49, Pulaya, agri. labourer, Withdrawal).
Once the thought of using fertility control was initiated the couples generally discussed it with others. In the case of couples where one of the spouses initiated the idea, the first person to be consulted was the spouse. When spouses agreed there was less consultation with other members of the family. There was less argument by the wives when the husbands suggested the use of birth control, than by husbands when the first suggestion came from the wife. When wives made the first suggestion it was because women
188felt the immediate problems connected with child-bearing and child rearing. Husbands often seemed to be very apprehensive when wives suggested female sterilization because they feared complications and the consequent possibility of having to spend money.
H.H.No.100 : I suggested my idea of using condoms to delay the second and third delivery. Husband agreed. But when I suggested female sterilization after we had our third child, my huband and my parents disagreed. I insisted and got myself sterilized. My husband and my parents did not visit me at the hospital for two days (Gracy, aged 36, Catholic, labourer, tubectomized).H.H.No.320. : After the third child birth, I suggested to my husband that I would get tubectomized. He did not agree fearing complications. I could not go on with child-birth. During the sixth pregnancy I requested my husband's sister to talk to my husband. She talked to him and he agreed (Eliamma, aged 42, agriculturist, Catholic, tubectomized).
H.H.No. 6 : When I got my third child, I thought of accepting tubectomy. My husband and my mother did not allow me to do it. But when I got my sixth child I decided to get sterilized even when my husband and my mother disapproved. They were unhappy with me for a long time (Savitri, aged 35, Izhava, tubectomized) .
As discussed in Chapter 5, the choice of the method was primarily influenced by the program. When male sterilization was widespread the choice was mainly vasectomy, and when female sterilization was widespread the choice was mainly tubectomy. Most couples felt that permanent methods were the only methods really available. The IUD was usually considered to be a very complicated method because of its side-effects.
H.H.No. 98 : I wanted to have a tubectomy after my second child. Since my mother was busy I could not get her help during the post-natal period. So I thought of using an IUD. But my mother did not agree as it might lead to heavy bleeding. Hence, I waited till I had another child (Sumati, aged 25, Panditaru, labourer, tubectomized).
189Partly because of program propaganda and partly because
of the permanence of the method, the great majority of couples prefer sterilization. Many couples opined that, if they chose sterilization, they need not fear the failure of the method.
When couples chose sterilization, the main argument was about its safety; they wanted to be sure that there would not be any complications after the operation. They generally consulted those who were already sterilized, and also doctors.
Two-thirds of couples among whom the husbands had been sterilized had not consulted anyone because these decisions were made spontaneously because of either peer group pressure or monetary incentives.
On the other hand, among the couples where wives had been sterilized, all of them had consulted doctors, mothers and mothers-in-law as well as women who were already tubectomized. The approval of either mothers or mothers-in- law was considered important as they depended on them during post-operative, which often is also the post-partum period, to take care of the domestic chores. Often the mothers and mothers-in-law refused help after the poststerilization if they disapproved of it.
H.H.No. 11 : I thought of tubectomy after the second child. My husband agreed, but not my mother-in-law. Hence my mother-in-law refused to take care of me and my child during my post-natal period. After the third child I requested my husband and my husband's sister to persuade my mother-in-law and she finally agreed (Fransis, aged 37, catholic, labourer, tubectomized).
190The increase in hospital visits for maternal and child
care has provided an opportunity for the women to talk to doctors, mainly about the safety of the methods. Although fertility control decisions were influenced by other family members, the ultimate decision lay with the couple. The level of female participation in decision making was high among those couples where the wives had been sterilized, and the level of male participation was high where husbands were sterilized.
In short, the fertility decisions were ultimately made by the conjugal pair, though a number of factors influenced the decision. Women played a major role in deciding the family size and also the birth control methods to be used. This was mainly because women could communicate and also enforce their desires. With a tradition of better position of women and spread of literacy among women in Kerala, they had a say in matters of child-bearing. According to Dyson and Moore, one of the reasons for greater acceptance of family planning in southern states of India is that
women there are less likely to be constrained by the influence of senior wives in a joint family situation, and that interspouse communication, which is clearly important in the adoption of methods of fertility control, is easier (1983;49) .
Similarly, Shorter (1973:632) noted that the combined effect of the female emancipation and birth control movements were important factors in European fertility decline in the late nineteenth century. A study by Rainwater and Weinstein (1960) showed that poor
191communication among conjugal couples, relatively deficient sexual relationships resulted in poor contraception.
The influence of kin on fertility is becoming less important mainly because of the changing nature of family relationships. Moreover, when both husbands and wives had the same fertility intentions they could enforce their fertility desires even in an extended family situation.
On the whole, small family size has become a norm in the village. Although decisions were influenced by external factors such as gender, child mortality and side effects of birth control methods, the actual number of children was influenced by the family planning program. For instance, many couples expressed the number of children desired as 'three' because the family planning program carried the message that couples should 'have two children, but stop at three children' . However, it was not only the family planning program which created the demand for a small family, but also the changing socio-economic conditions, which are discussed in the following section.
6.2 Why Small Families Are Desired
The small family has become a norm in the village, and the main reason was the perceived economic cost of childbearing and rearing. There was a general feeling among the couples that children cost more now than in the past because living costs have increased and they have to spend so much on children's education and medical expenses. There were also other issues such as decreasing opportunities in
192agriculture and the inconveniences caused to women by child-birth. Discussions with old and young couples revealed one main aspect of social and economic change, the nature of child bearing and rearing has been transformed in the village, with a resultant rise in costs.
6.2.1.Perceived Cost of Living
Time and time again the old and younger couples said that living costs were higher now than in the past. This perceived rise in the cost of living is due partly to changing consumer aspirations and partly to the increased penetration of the cash economy. In the past, villagers consumed whatever they grew on the farm, and bought a few additional things such as salt, kerosene and matches. Moreover, the economic interdependence of castes made villages self-sufficient to a greater extent and many basic needs of the people were met at the village level.
In the past we ate whatever we grew. We use to get fish from the nearby river. Now we have to buy many things. It is not sufficient whatever I grow. I buy rice every year (Patrose, aged 60, Catholic, Agriculturist).Whatever we grow is not sufficient to feed the family for the whole year. Two of my sons are working in Bombay. They send some money. And another son works here. That is how I am able to survive. Nowadays everything is very expensive (Eswariamma, aged 59, Nair, Agriculturist).
Now it has been difficult to live. We had a lot of land. I lost land at the time of the land reforms. I sold two acres at the time of my daughter's marriage. My son has just started working. I spent money on his education, because living on land is not lucrative any more (Krishanan Nambutiri, 64 years, Nambuthiri, Land owner).
There have also been changes in food and clothing habits among the villagers. The concept of breakfast was alien to the villagers 25 years ago; they ate only two
193meals a day consisting mainly of rice and a curry for those who could afford it. Many labourers ate kanji (a semiliquid dish consisting of a little rice and a large quantity of water) in the morning and dinner was generally rice. Drinking tea and coffee was unknown to many people. It is now a common sight in the morning that, while a group of men are having tea, one of them reads the newspaper aloud and others listen to him and discuss the news.
The pattern of clothing has also changed in the village. In the past, both men and women were semi-clothed, with only a piece of cloth around the waist. Menon (1979:111) observes that Nayar women and those belonging to the lower castes were prohibited from covering the upper part of the body. Though the position of Nayar women improved during the late nineteenth century, the prohibition continued for women from other low castes for a much longer time. With external influences the concept of proper clothing has continued to change, increasing the expenses in the family.
The lifestyle of the landless labourers has also changed over time. They could, in the past, acquire leftover food, old clothing, and a few things from the land- owners for whom they worked. Ever since wages have been
194paid in cash the labourers have had to buy everything from the shop1 .
As a child I always liked to accompany my parents to work because of the food we use to get from the landowner's house. In those days lunch was served to the labourers who worked for them regularly. We used to get vegetables from the landowner's farm and we used to fish in the nearby river (Kalukurumban, aged 79, Pulaya, Agricultural labourer).I worked for the Nambutiri family. The land we are living on belonged to them. We acquired it through the land reform act. We were paid in kind and we bought only salt and oil. from the shop. Now we buy everything from the shop. Often the the cash we get is not sufficient to buy everything we need. Now life is difficult to live. One needs money to live comfortably (Choti 70 years, Pulaya and agricultural labourer).
Now we have to buy everything from the shop. We always need cash to feed the children and educate them. In the past we got everything from the landowner's farm and cash was not important (Kunjan, 44 years, Pulaya and agricultural labourer).
With the growth of the trade union movement in the state the labourers feel that they are no longer slaves of the landlords; they are proud to buy their own food and clothes and happy to spend because it makes them independent. Agricultural labourers also spend on soaps and detergents to keep themselves and their clothes clean. It is now common to see labourers going to work in clean clothes and changing into work clothes (generally a cloth tied around the waist) , and at the end of the day once
1 The responses from the agricultural labourers on the time when wages began to be paid in cash were not clear. The wages differ for different agricultural operations and even to-day are paid in kind for threshing paddy. However, it appeared that, in the study village, the payment of wages in cash (except threshing) started during the late 1950s and early 1960s. It may have been related to the passing of the Minimum Wage Act in 1948 for different classes of employees of agricultural operations (Gazetteer: 1965 :545) . Even then it may have taken a few years to make a complete change from wage payment in kind to cash.
again putting on clean clothes. Their needs have also changed in terms of proper clothing.
It is not only food and clothing habits which have changed, but also there are increasing aspirations to possess radios and watches and other material goods. Tharamangalam (1981:65) noted that the agricultural labourers in Kuttanad in Kerala had developed new aspirations: this had an impact on their consumerexpenditure and made demands on the meagre incomes. Guruswamy (1986:117) also noted changes in consumer aspirations of villagers in Tamil Nadu.
6.2.2 Perceived Cost of Education
Educating children is considered a substantial cost by the parents. Though government-aided schools provide free education, parents argue that there are additional expenses other than the tuition fees. They argue that the schoolgoing child requires better clothing and also more clothing than children needed when they did not go to school or when they went for a shorter time. There are additional expenses on books, notebooks, pens and pencils. Many activities in school also require extra money. Since transport has become available, many children insist on taking a bus to school2.
toOften parents have to give in̂ the demands of their children such as for candies and toys. Because of the small number of children it is likely that each child gets more attention from its parents and that the parents are more
195
o The village has only a primary school. Children go to a nearby town to attend high school.
196anxious to satisfy their children. In contrast, in a large family the children get less attention and often the older siblings take care of the younger ones.
The expenses of schooling varied for children at different socio-economic levels. Data on expenses on schooling are not reliable partly because parents do not keep accounts of these expenses; however, some could give a rough estimate of the amount they spent on. From the available data, the expenses on each child's education in a year varied from Rs.50 to Rs.500, depending on the economic status of the families. The rich always liked to send their children to nearby private schools, which are considered best and are expensive, and they also employ private tutors to improve the skills of the children.
H.H.No.318 : I have eight children. I wanted to give them university education so that they have good jobs. I have only two-and-a-half acres of land which will be very little for each child when divided. None of my children studied well. I spent Rs.500 for each child every year. I also employed a tutor to help them in their education (Paili, aged 50, Catholic, Agriculturist).H.H.No.354 : This year we spent Rs.50 on each child's schooling. Education is the only thing I can give them. Otherwise they will be idle staying at home. They have nothing to do at home (Kunjappan, aged 35, Pulaya, agri. labourer).
H.H.No.320 : We spent Rs.2000 in the last two years on our daughter's university education. This year we spent Rs.200 for other children who are in school (Manuel, aged 49, Catholic, agriculturist).
The couples were asked the cost of educating a male and a female child; generally they felt the cost was the same. While a few parents said that they spent more on their sons because sons demand money to buy candies and toys, others felt they spent more on daughters because of their clothing
197and other accessories such as face powder and bangles. However, education of daughters was considered equally important.
H.H.No. 329: I have three acres of land and four children.If I do not educate them they cannot live on land alone.We spent more on our female children because of their dress and the face powder, ribbons and so on (Joseph, aged 51, Catholic, agriculturist).H.H.No. 302: If our daughter is educated and has a job wehope that we need not pay dowry for her marriage. Education is the only thing we can give to our sons and daughters. The expenses varies with the grade in which they are studying. Sons demand too much and they do not study properly but daughters are always kind and they listen to their parents (Ayyappan, aged 40, Pulaya, labourer).
H.H.No.354 : We spent about Rs.250 this year for our children's education. If we educate them at least they can get jobs and they also know how to read and write (Achutan, aged 35, Pulaya, agricultural labourer).
The recent emphasis on education has arisen because of the determination to acquire non-farming jobs. Every couple where the wives are in the age group 15-49 said that educating children is important to acquire a job. Though they are not certain about the university education of their children, they said that basic education is essential for any job they might wish to do in future.
H.H.No.120 : Now education is important because one cannot live only on land. I got an acre of land and if divided among the children they get very little. If daughters are educated they need not pay too much dowry on her marriage (Kamalam, aged 41, Nayar, agriculturist).
H.H.No.333: My son is in fourth grade. We spend Rs.300 a year on his education. I want him to be a doctor or engineer. Then he would be respected by society. Perhaps he would take care of us (Pushkaran, aged 38, Izhava, agricultural labourer).
198
H.H.N0.327: I want to give technical education to my son,so that he can get a job in Dubai or other foreign country. I want to educate my daughter so that she will marry an educated men with urban employment. I do not want her to work like me on the farm, milking the cow and so on. (Mary, aged 27, Jacobite, agriculturist).H.H.NO. 332: I want my children to be educated and to geta job in an office. I do not want them to be agricultural labourers like me. If they have education they will have a better life (Narayanan, aged 38, Pulaya, peon).
H.H.No. 307: My daughter has completed S.S.L.C (tenthgrade in school) and she can get a job or at least she would get an educated husband with a job in town (Xavier, aged 49, Catholic, labourer).
Non-farming jobs include white-collar jobs as well as carpentry, tailoring, driving or electrical wiring. Parents realize that white collar jobs are difficult to get unless a person has a higher level of education.
6.2.3. Perceived Cost of Medical Treatment
People increasingly realize the cost of medical treatment largely because there has been a change in the nature of treatment of illness, particularly in the less fatalistic attitude to treatment. As mentioned earlier, the proportion of the population who use Western medicines is high in the village.
As a rule, government hospitals are free but, in practice, the visits to these hospitals involve costs such as transport and the purchase of medicines. Whenever the child had to be taken to a nearby hospital in town, both husband and wife went together; this often means that the husband loses a day's wages. In addition to this, government hospitals are crowded and one has to wait a long
199time to get services, so people visit private clinics and hospitals which increases expenses.
There is also a belief that the government health services are poor and one has to bribe the authorities to get good services. This forces people to visit private clinincs.
The rise in the number of hospital visits for antenatal check-ups, deliveries and postnatal care has increased medical costs. Now, each child-birth is considered more expensive than in the past when the births were attended by traditional birth attendants at home.
Although health interventions are important in mortality decline, the utilization of health services depends to a great extent on the traditional beliefs. In the study village people used Western medicines to treat those illnesses which can be fatal and used self-medication for those which were not life-threatening.
Plurality of treating illnesses is observed partly because people were concerned over their health and partly because of certain beliefs associated with the type of medicines used. The belief is that people have different body constitutions and, depending on their constitutions, certain medicines are effective. Promptness in seeking proper medical service can influence the mortality levels as intervention may be in time to stop a person from dying. There were no significant differences in the pattern of
treating the sick according to socio-economic status. Most labourers went to government hospitals for treatment as they were cheaper than the private clinics.
200
The plurality in seeking cures has been observed in other parts of India (Gould, 1959, Minocha, 1980, Caldwell et al, 1983) , but this Kerala village differed from those accounts because of the promptness in seeking treatment and also the narrowing gap in pattern of seeking treatment between different socio-economic levels.
6.2.4. Non-Availability of Land and Desire for Small Family
There is a strong feeling among the people that land holdings are becoming small and that the income from land is not sufficient to support the family. Villagers had a fair idea that population is growing and felt that land is becoming scarce.
H.H.No.193: When I came to this village after my marriage, this village was like a forest. There were few houses and few people. Now there are many houses and people (Maria, aged 64, Christian, agriculturist).
H.H.No.348 When I was a Panchayat Chairman 20 years ago there were around 200 houses. Now houses have almost doubled (Vasudevan Nambuthiri, 69 years).
Couples also felt that they did not have enough land to pass on to their children, so that the children could make their living.
H.H.No. 312: I am a casual labourer. I have 5 cents of land. What do I give to my children? I can only give education to them. Two of my children are in primary school and I have already spent Rs.200 for their education (Joseph, aged 28, Catholic).
201
H.H.No. 33 9: We do not have any land to give my children.So we have to educate our children. Hence we have decided to have only two children (Anthony, aged 29, Catholic, labourer).H.H.No. 38 4 : We have only one acre of land and when wedivide our land among our children each of them would get only little which is not sufficient for them to live. We are educating them so that they can get jobs (Kunjukuttan, aged 49, blacksmith).
Thus it is evident that the non-availability of land has a definite bearing on preferred family size and fertility control decisions.
6.2.5 Why Women Desire Small Families.
Though cost was an important issue for desiring a small family, women also desired small families to overcome such practical inconveniences as performing day-to-day chores during the antenatal and postnatal periods. The absence of anyone to care for the older children at the time of their mother's delivery and postnatal period has become a problem since nuclear families have become a common residential pattern. There are other costs. For the delivery of the first and to some extent the second child, women generally visit their mother's house; subsequent births take place at the husband's house. This means that the husband or a member of the husband's family has to help the women at the time of child-bearing; the husband's helping on such occasions means that he must forgo his wages.
In the study village, 60 per cent of the women who stated they were currently 'housewives' said that they discontinued working after marriage in order to take care
202of the children. Half of them expressed the view that they would resume working once the children were at school and 30 per cent were concerned that their going to work could disrupt the systematic care of their children or would affect the children's health.
H.H.No.195: I got a job in a hospital as a sweeper and they paid me Rs.200, but I quit the job after three months because it affected my children. I could not feed them properly and could not keep an eye on their homework (Mary, aged 37, Catholic).H.H.No.346: I discontinued working after my child's death. The oldest son died of respiratory problem and I could not care for him properly because those days I worked in a granite quarry. Now we have two children and I am tubectomized so I stay at home caring for the children (Kanakamma, aged 29, Pulaya, agri. labourer).
H.H.No.79 I stopped working two months before I delivered. I can't go to work because my daughter is eight months old and I do not know where to leave her when I am working. I will continue to work when she starts schooling. We need money to treat my husband's sister who is in the hospital. So we have decided to have only one child (Karmili, aged 33, Pulaya, agri labourer).
The mothers in nuclear families are likely to spend more time in child care than those in joint families, where child rearing is shared by other family members, particularly grandparents whose time is least valued, so that the mothers can devote more time in an economically fruitful way, in activities such as food processing, farming and farm related work. Since nuclear families have become widespread in the village, the women are spending more time on child care and this may have helped in reducing child mortality in the village.
With changes in education in the village, the older children are still at school when their younger siblings require minding, and child care becomes a problem when the
203women have to attend work outside the house. With changes in family structure and in education, women are spending more time on each child's care, so they want smallfamilies.6.3 Why Couples Desire Children
It was observed that, though the cost of bearing and rearing children was the reason for desiring fewer children, there were no couples who deliberately decided not to have children and everyone wanted children because of the pleasures of having children, continuity of family lineage and for old age security. Everyone believed that sons are needed to continue the family name and daughters are needed to nurse their parents in old age.
H.H.No.123: Children give pleasure. We need them in oldage. Both sons and daughters are equally important (Vimala, aged 29, Nayar).H .H .No.130 Children bring pleasure. They calm down parents when they have a fight. Sons protect parents in old age and continue the family name. Daughters nurse their parents in old age (Joseph, aged 43, Latin Christian).
H.H.No 136: Children give pleasure. Sons would be there to help parents. They also continue their family name. Daughters to nurse the parents and they do help in domestic work (Krishnankutty, aged 48, Pulaya).H.H.No 209. Children give pleasure and they are the motive to live. They are pleasant and lovable. They protect parents in old age. Daughters nurse parents when they are sick (Usha, aged 35, Pulaya, agri.labourer).
Though old age security is one of the motives for couples desiring children, it does not influence the number of children they desire and was not the reason for having large family. For many parents it was only a hope that children would take care of them. Moreover, the changing social and economic conditions leave the parents wondering
204about the future economic benefits from children. In some cases parents argued that, if they provide a better life for the children (which they can do more easily with fewer children), there is a greater chance that the children will take care of them. Though old age security was the motive for having children, it did not affect the number of children the couples desired.
It was observed that some cultural and social factors in the village gave some security to the old parents. There are strong cultural norms that old parents should be cared for and since there are no social taboos preventing parents from living with married daughters, both sons and daughters are equally valued. This situation is different from that in patrilineal societies found elsewhere in India3, where strong social taboos prevent parents from living with their married daughters, and so they prefer more sons which often results in large families (Mamdani, 1972:132-133, Karve, 1953:131).
Chakrapani is a village astrologer and he has three daughters, one of whom is blind; the other is lame and they are not married. Since they do not have any sons, their married daughter and her husband live with him. There is no stigma attached to it (Sushama, 1985, Field notes) .Tresia lives with her married daughter and son-in-law. Her married sons live in the same village but she preferred to live with her daughter as she could not live with her daughters-in-law (Sushama, 1985 Field notes).
3 The preference for sons is not as strong as I have observed in a village in Karnataka. The villagers in Karnataka had many sayings which showed their preference for more sons than daughters. Such as having one son is like having only one eye.
205The nature of the division of the property in the
village also gives some security to parents in old age. The property is divided equally among all members of the family and the parental share of the property is inherited by the youngest son (generally daughters live at their husband's house) after a parent's death, thus parents live with their youngest son during old age.
Land reforms also allowed the landless labourers some security: the hutment dwellers could own the piece of land on which they had lived for a long time. Landless people can also build a house on government land but have to vacate it if the government needs it, and compensation is paid at the time of vacation; this has given some security to the landless people who can build a hut on a small piece of land.
The agricultural labourer over 65 years of age now gets a pension of Rs.65 a month which gives him some support in old age. However, at the time of the study, the old parents in the village generally lived with one of their sons or daughters. Of the 450 households, in the village eight were single-member households. Of these three were priests (two in churches and one in a Pulaya temple), and they had never been married. Four separated childless women in their thirties (working as labourers) lived alone and a man aged .48 years who had never married lived alone. The four women, although separated from their husbands, lived very close to their brother's families and they received support from their brothers whenever needed.
206It was a norm in the village that the married daughters
lived with their sick parents to nurse them.
Johny, 77 year old man was bed-ridden with arthritis. His three married daughters took turns to treat him until his death in June 85 (Sushama, Field notes, 1985) .Kausalya was bed-ridden due to back pain and her daughter stayed with her until she was able to walk, although she lived with her married son and daughter-in-law. (Sushama,1985, Field notes).
At present people still adhere to norms such as daughters nursing and sons providing for their old parents,
<rbutAhard to predict the future because the couples who are getting some old age security have fairly high fertility. The couples whose fertility is low are still young and still have children in school. Wanting old-age security did not affect the number of children the younger couples desired, because old-age security was a thing parents could hope for, whereas child-rearing costs were immediate.
6.4. Societal Changes and Preference for Small Family
It is clear from the in-depth interviews that parents in Palankara desire small families and this desire is because of the increasing cost of child bearing and rearing due to changing lifestyles in the village. The major changes in the village have been a reduction in the man- land ratio, the increased monetization of the economy, educational changes, mortality changes and introduction of family planning.
2076.4.1. Societal Changes.
Because of population growth and inheritance, land holdings became small and in most cases were not viable for agriculture. In addition to this, many peasants found agriculture not very productive because of the monetization of the economy. The peasants needed cash to carry out agricultural operations such as wage payments and buying better seeds and fertilizers, and often had to seek jobs outside agriculture partly to supplement the family income and partly to earn the cash needed for farming. The small size of holdings also caused a decline in demand for agricultural labourers. The Land Reform Act also bought changes in the agricultural sector. Although land reforms conferred tenancy rights upon the agricultural workers, those who did not have cash could not buy land; they suffered partly because the Kerala Land Reforms Act of 1963 also banned the creation of new tenancies (Gazetteer, 1965:609) and because land owners were apprehensive about giving land for tenancy for fear of losing it. Those who acquired land did not benefit either because of fragmentation; this forced peasants to seek jobs outside agriculture.
This change forced many people to seek non-farming jobs. Education was the only means to acquire special skills needed for non-farming jobs, forcing parents to send their children to school, and educating children increased the cost of child rearing and decreased the work contribution of children to the family economy.
208However, the need for non-farming jobs is not the only
factor which created a need for schooling and reduced child labour in the village. First, the cropping pattern (growing coconuts, pepper, cardamom and cashew) in the village is far from labour-intensive and there is always a surplus of adult labour. When adult labour was available, children seldom worked on the land and parents sent them to school rather than allow them to idle at home.
The Minimum Wage Act also reduced the demand for child labour and created a situation where children could easily be sent to school. The wage rate of agricultural labourers has been high in the village thus helping them to buy enough food grains distributed through fair price shops at subsidised rates. The involvement of government and trade unions in fixing wages meant that wages for children were not fixed because of child labour legislation; thus an employer of children does not wish to pay a higher wage to a child, as the work done by a child would be less, and he would not be able to pay less, because the strong trade union movement. Ideas like 'exploitation' are very powerful perhaps because of active Communist movement in the state. Since the children are prevented from working on the farms, parents send them to school. In fact many mothers were happy when children were in school, as they could find time to attend to other activities.
Apart from these changes in the village, the ability to read and write is greatly valued, particularly among the lower castes who were previously denied education. Literacy
209developed in Kerala State because of better rainfall and the growing of cash crops (Gough, 1968:153), overseas trade, government policies, the commercialization of the economy (Nair, 1983:23, Tharakan, 1984:1913) and the position of women coupled with government policies (Caldwell, 1986:208; Jeffrey, 1987:447-472).
The result of these changes was the spread of mass schooling. After a thorough examination of the relationship between fertility and education, Cochrane (1979) showed that the initial stage of mass schooling is associated with high fertility, but, as the process continues, mass schooling decreases fertility. Caldwell (1980:225) argued that, with mass education the family economy changes and affects the direction of the wealth flow between generations and ultimately results in low fertility.
One direct influence of mass schooling on fertility is that the children cost more as parents spend more on schooling and because as the children spend long hours in school their contribution to the family income declines. The work contributions and cost of children and the net value of children as a component of fertility decisions have been well established (Arnold, 1975; Bulatao, 1975, 1979, 1981; Fawcett, 1974; Hoffman and Hoffman, 1973; Hull, 1975; Mueller, 1976; Nag, 1978).
To an extent, mass schooling has produced an egalitarian society in the study village, where the lower castes have been able to improve their status through
210schooling and the jobs associated with education. Thus, a person born in a Pulaya caste does not have to remain an agricultural labourer but can improve his status through education.
Schooling also helps the people to have access to more sources of information. Although knowledge of birth control and child health care is spread by door-to-door service, the ability to read the literature on family planning and health care does provide more information than is given by the health staff during their house visits.6.4.2 Changes in Mortality
Mortality decline, particularly the decline in infant mortality in the village, has indirectly contributed to the fertility decline. The estimation of infant mortality from the retrospective birth histories in the village showed that infant mortality had declined from 102 per thousand live births for the period 1950-54 to 68 per thousand livebirths during 1970-74 and to 20 per thousand in 1980- 84. The decline was sharp, particularly during the 1970s. This decline in infant mortality has assured many couples of the likely survival of their children, thus affecting their fertility decisions.
Infant mortality decline in the village is a combined effect of government policies and the community response to these policies. At the governmental level, health services are free, maternal and child health programs provide free antenatal care and postnatal care, and immunization of children against diseases. At the time of the study, every
211child below the age of five was immunized against illnesses such as polio, tuberculosis, diphtheria, pertussis and tetanus. Mothers used their initiative to find out the place and time of the immunization program organized by the government health departments or by the missionary hospitals.
Apart from the government health services there are hospitals run by Christian missions which provide health services at a reasonable price; one of the missionary hospital in Ernakulam gives free treatment to poor people.
The decline in infant mortality can also be attributed to the role women played in seeking health services. In the study village it was observed that when they were both present, husbands and wives made decisions jointly regarding where to go for treatment or what type of medicines to use; but a striking feature of decision making was that women were free to decide about treating the children in the absence of their husbands. The freedom for women to decide about children's health is a significant factor because mothers were usually the first to notice the sickness of the children and they took immediate action to treat the illness.
The women could make decisions because Kerala women enjoyed higher status than women elsewhere in India. Cultural factors contributed to the higher level of decision making power among women in the village. They were not restricted to the four walls of the house like women in
212other states in India (particularly North India). This kind of freedom was enjoyed by the women because of the tradition of matriliny and the spread of Christianity. Women were used to making decisions about their children when matriliny existed in the state. They made most decisions regarding the children as the fathers had very little responsibility towards their children and they did not live under the same roof.
To quote Mateer on his observation on women in Kerala,
Unlike their sisters in North India, the restraints imposed on them are few. They are not restricted to their own apartments, and the mother of each household occupies a dignified and honourable position. In the families of the Nayars she governs the whole house, ...Her duties are not light, for, besides buying, storing up and giving out food for many mouths, she regulates the lives of the children, decides what schools they shall attend, how they shall dress, and what medicines they shall take when they are ill, their own mothers having no choice in anything that concerns them (Mateer: 1883: 209-210).
This quote illustrates the extent to which the women enjoyed freedom and status in Kerala even a hundred years ago. Women had great freedom of movement and decisionmaking power even the in the past, with the exception of the women in Nambuthiri caste. Many castes who followed Nayars showed similar behaviour. Apart from matriliny, Christianity also contributed to improving the status of women.
The freedom of movement and the better status of women has contributed to higher literacy levels over the decades. It has been well established that the chances of child survival increase with higher level of female literacy
213(Caldwell and McDonald, 1981) . The reason for this is that literate women are more likely to know where the services are available and what type of medicines are effective and are in a better position to convince their immediate family members. Since community-level female literacy is high, the illiterate women are likely to observe literate women in the neighbourhood and to be influenced by them.
Now, with education and employment, women's status has further improved. The freedom of movement has also allowed them to visit clinics without depending on male members of the family. When a child is sick she need not wait for her husband to return from work or to ask the permission of inlaws to visit a doctor.
The major factors in declining mortality are health intervention programmes, greater utilization of these services by all socio-economic groups and the organised transport system which helps in reaching these facilities.
The in-depth interviews in the village showed that child survival played an important role in fertility decisions. However, it was also found that the couples with a few children provided enough health care to the children to stop them from dying. The greater chance of survival of the children motivated couples to limit the number of children, and the motivation to regulate fertility stopped children from dying by providing them with proper health care. Thus a two way relationship was found between the fertility and infant mortality levels.
2146.4.3. Family Planning Programme
Largely because of socio-economic change the small family has become a norm in the village. The official family planning program has helped in regulating the number of children desired by the couples, but because a demand for a small family has emerged because societal changes, it is hard to single out the impact of family planning alone on fertility decline in the village.
One argument put forward in explaining fertility decline in Kerala is a well organized family planning program (Kurup et al., 1976), but can the programme succeed without a demand for a small family? Panandikar, Bishnoi and Sharma (1983) have shown that the success of the family planning program depends on community acceptance. However, the availability of family planning services cannot be ignored in explaining fertility decline.
There is little doubt that the family planning program has succeeded in promoting knowledge and awareness; two other important components are the free availability of family planning methods and payment of incentive money to users which contributed in improving the acceptance of family planning. Given the socio-economic changes in the village, fertility would have declined, but with the existence of family planning program the rate of declinehas been faster.
2156.5 Summary and Conclusion
The transition from high to low fertility in thevillage is mainly because there has been a shift inmotivations and processes in reproductive behaviour. During the pre-transition period family size was generally thought of as a natural process over which couples had minimal control. During the transition period couples had more control over their family size because of the family planning program. However, the motivation to use birth control methods was because of the socio-economic change which produced desire for small families.
From the above we can reasonably conclude that fertility decline in the village can be attributed to the emergence of the small family norm due to socio-economic changes. The official family planning program has hastened the fertility decline. Since the social changes are continuing and the family planning program will also continue to be available to the people, fertility is likely to become low and remain low in the village.

216
CHAPTER 7
Summary and Conclusion
7.1 Summary
Fertility has been declining in India since the inception of the family planning program in 1952, but the rate of decline was faster in Kerala state without major economic development predicted on the basis of per-capita income, percentage of labour force employed in the agricultural sector and the level of industrialization. The explanations put forward so far for this phenomenon were statistical associations of selected factors derived from macro-level surveys and secondary data, and do not fully explain how this change has come about. Moreover there has not been adequate emphasis on cultural and behavioural aspects of the community to explain the change from large family values to small family values. To understand this change, an anthropological investigation was carried out in a Kerala village.
A combination of qualitative and quantitative methods helped in understanding the motivations and processes involved in fertility decline in the village. Observation, direct and indirect, provided insight into both the processes of change and the contexts in which demographic decisions were made. However, this method did not lend itself to gathering basic demographic information such as age, sex and educational and occupational pattern, so acensus of the households was carried out. In the absence of
217complete data on vital events retrospective data on birth histories were important in understanding the fertility levels and trends in the village, while unstructured in- depth interviews provided considerable flexibility in understanding the nature of fertility decisions. Thus employing a combination of methods contributed to a more comprehensive analysis of fertility decline in the village.
The study village has experienced significant social, economic and cultural changes. It has changed from a rigid caste system to a more egalitarian society. Land ownership and occupation are not based on caste, but on the individual capacity to acquire land. A person born in a lower caste can improve his economic condition by education and by acquiring better paid employment. As agriculture is not able to sustain the expanding labour force and also because of recent land reform laws, more importance is attached to employment in the non-agricultural sector. Thus emphasis on education has increased. Education of girls among all socio-economic groups has been a significant change in the village, leading to an improvement in the status of women.
The institution of marriage has changed from a Sambandham system to more stable unions. Although factors common throughout India such as caste endogamy, payment of dowry and parent-arranged marriages were observed, the age at marriage was higher in the village than in India as a whole. The favourable attitude to a higher age at marriage was partly due to a tradition of high age at marriage among matrilineal communities and partly due to social reform
218movements encouraging the emancipation of women in the country as a whole. There was less stigma attached to a never-married person in Kerala than elsewhere in India, though only a small proportion of women in the village remained never-married in their forties. Apart from the favourable attitude towards a higher age at marriage, economic changes such as land reform, and need for non- agricultural employment have been important in delaying male age at marriage, which is also a contributing factor in pushing up the female age at marriage.
Fertility has declined in the study area: the currentlevel of fertility has reached replacement level and the differences in fertility levels among the socio-economic groups are small. Though fertility decline in the village has to some extent been achieved by postponement of marriage, the decline has been largely a result of effective contraception. As elsewhere in India, female sterilization is employed to limit the number of children. There has been a considerable use of birth control among younger couples. Traditional methods are used to delay pregnancies because the government has been ineffective in promoting modern methods such as IUD, condoms and oral pills. The role of PHC personnel is becoming minimal in providing maternal and child health care, because people visit maternity homes and major hospitals in nearby towns for antenatal care, deliveries and postnatal care. This has also led to an increase in the number of postpartumtubectomies.
219The increased use of birth control among all socio
economic groups reflects not only a change in attitude, but also the need for a smaller family. There has been a shift in reproductive behaviour between older couples and younger couples in the village. During the pre-transition period family size was a product of biological processes, while during the transition period deliberate attempts were made by the couples to limit the number of children to the number desired. Family sizes were affected by the timing of decision making. The couples who made decisions only at a later stage of child-bearing had large families, and the couples who made fertility decisions at an early stage of the child-bearing period had small families. Though the decisions were influenced by external factors such as fear of surgery, child mortality, kin influence and misinformation about methods, the ultimate decision regarding family size was made by the conjugal couple reflecting better communication between husbands and wives than in the past.
A considerable degree of female autonomy was an important factor in fertility decline because most decisions depended on women's initiative in using contraceptives. Women enjoyed this autonomy because of the tradition of matrilineality and Christianity.
Though the family planning program provided information and free services, the motivation to use birth control methods to limit family size was the perceived cost of child bearing and rearing. The villagers perceived that living costs have increased and that opportunities on the land
220have decreased. The cost of educating and providing health care to children has increased.
Not only population growth but also land reforms and inheritance laws have created a land shortage. The unavailability of sufficient land for cultivation has reduced opportunities in agriculture, forcing people to seek non-agricultural employment.
The need to educate children has increased, because of the additional skills required to acquire non-farming employment. Thus the cost of bearing and rearing children has increased. Education had two direct impacts. First, the cost of child rearing increased because schooling entailed additional expenses. Secondly, child labour was reduced because children spent most of their time in school, thus reducing the contribution of children to the family economy. Thus schooling reduced the economic benefits and increased the economic cost of children.
Other effects of literacy have been to impart new types of knowledge to the people and to generate greater political awareness, forcing governments to provide social welfare services such as educational facilities, health services, transport and better working conditions.
The decline in infant and child mortality has been significant in fertility decline in the village. The proper utilization of preventive and curative measures reduced infant and child mortality, this affected fertility as family size decisions depended on the number of surviving children. A two-way relationship was observed between

221fertility and child survival. During the initial fertility transition, it appeared that improvement in child survival was necessary for fertility to decline, but as fertility started declining, child survival also improved because the couples with small families provided better health care to their children.
Though economic cost was a consideration for preferring a small family, the decisions were not based merely on maximizing the family's production resources, activities and consumption utility, but also on other factors such as proving one's parenthood, emotional satisfactions, continuity of family lineage and need for old age security. But these factors did not lead couples to have a large family because even with a small family size one could prove one's parenthood, could achieve emotional satisfactions and continue the family lineage. Old age security could be gained more effectively from rearing fewer, but better educated children able to get nonfarming jobs than from having more less educated ones. So the immediate costs of child bearing and rearing seemed more important than the future benefits of having a large
A
family. Moreover, the decline in infant mortality also ensured the survival of children, thus parents desired fewer children who would survive and care for them in old age.7.2 Conclusion
The main proximate determinants affecting fertility have been the postponement of marriage and the extensive use of contraception to limit the number of children. This
222has come about as a result of socio-economic changes in the village. Agriculture has not been able to sustain the existing labour force because of land reforms, monetization and inheritance laws. Consequently a need for non-farming employment has developed. Literacy has become an integral part of the life of people because education is needed to acquire non-farming employment. There is also social pressure on parents to educate their children as the ability to read and write is important. This has reduced the economic value of children and increased their economic cost.
Age at marriage has increased partly through favourable attitudes towards higher age at marriage and partly through increasing literacy levels and availability of non-farming employment. The rise in age at marriage has contributed to a decline in fertility as child-bearing started at a later stage.
The women's position has improved in the village with the spread in literacy among females, the right to an equal share in the property and freedom to take up urban employment. Because of the improved status, women played a major role in fertility decisions and this has been an important factor in fertility decline.
As a result of schooling and the awareness of the importance of child care there is now a less fatalistic attitude towards sickness. Improving health care has been a major factor in ensuring survival of children, which in turn has influenced the fertility decisions.
223Thus a number of inter-related factors have contributed
to socio-economic changes in the village. These in turn have created a situation conducive to fertility decline, and the family planning program has helped in speeding the process.
Socio-economic changes have also been crucial for a slow fertility transition elsewhere in India. Caldwell and his colleagues (1982) identified three crucial factors in fertility transition; fragmentation of land, availability of non-farming employment and recent increases in educational facilities. According to Nag and Kak (1984), the fertility decline in Punjab has been due to the introduction of modern technology, institutional innovations and the expansion of formal education. Factors such as land fragmentation, a market economy and educational changes have been common features of fertility decline in these three states, because they reduced the economic value and increased the economic cost of children.
But the question arises why Kerala's fertility decline has been the fastest in India. The answer appears to be that the factors promoting lower fertility came into effect much earlier in Kerala. The state has been experiencing changes from the beginning of this century. As a result of the changing political and economic situation during the second half of the nineteenth century and the first half of the twentieth century, agriculture became commercialized very early in Kerala. Literacy levels improved over the decades partly because of overseas trade and partly because the lower castes demanded the right to education. The
224combined effect of matrilineality and Christianity improved the status of women, which is reflected in improved female literacy levels and high female age at marriage. Mortality decline began very early in Kerala owing to the health care programs introduced by the Travancore and Cochingovernments (Panikar, 1975:46). Thus, the state of Kerala underwent a number of socio-economic changes during the earlier part of the twentieth century.
In 1955, when the family planning programme was implemented in the state, half the population in Kerala was literate, female age at marriage was around 20, the crude death rate was 16 per thousand population and the infant mortality rate was around 70 per thousand live births (Varghese, 1983), all rates which were unparalleled in India. Agriculture was commercialized, women enjoyed better status than elsewhere. Thus favourable condition existed in the state for a rapid fertility decline.
As Zachariah (1983:177) wrote fertility would have declined in Kerala withoout an official family planning program, because the socio-economic changes created a need for smaller families. A considerable degree of knowledge and practice of traditional methods exists in the state and couples would probably have employed traditional birth- control methods in the absence of modern methods, because as a result of the changing economic and social conditions, the small family became advantageous.
Ratcliffe's (1978) 'social justice' theory raises the question of the economic equity in the state. I found that even though land reforms have been successful in reducing
225feudalism to a great extent, land distribution still remains unequal and agriculture is not able to absorb the existing labour force, thus there is a need for non-farming jobs. Mencher (1980) also pointed out that the economic conditions of agricultural labourers have not improved because the amount of work available for agricultural labourers has been steadily decreasing, as a result of the gradual increase in the labour force and a decline in employment opportunities in agriculture and other sectors. The outmigration of Kerala people to other parts of the country and also recently to the Gulf countries is a response to the decreasing opportunities in agriculture and the nonavailability of alternative employment in the state. This kind of change creates a demand for education and the educational policies in the state have been responsible for expansion in education. The implications of mass education for fertility have been manifold and well documented (Caldwell, 1982; Cochrane, 1979) and this study also shows that schooling had an impact on fertility decisions. At present, remittances from overseas are having an impact on the economy of the state and need further investigation.
However, another question which follows is whether the socio-economic changes that occurred in Kerala are necessary preconditions for fertility decline. There is no simple answer to this, for societies not only differ in their cultural and social settings, but are also subject to socio-economic changes specific to particular regions. For instance, the geographical location of Kerala has long been favourable to overseas trade: as a result, agriculture was commercialized and literacy levels improved. Matrilineality
226contributed to raising the status of women which is important in fertility decline. All these factors were specific to the region. So when the family planning program was introduced, Kerala had the most favourable conditions for fertility to decline.
Apart from these factors, observations and some historical facts suggests that the people of Kerala adapt easily to changing social, political and economic situations. During the later half of the nineteenth century, the previously rigid society, changed from matriliny to patriliny, and from polyandry to monogamy and tarvads disintegrated in adaption to the changing political and economic situations. So it is reasonable to say that a society which could change its fundamental institutions to its advantage, could also very easily adapt to small family value because small families became advantageous, and that fertility declined as a result of shift in these values.
There is also evidence from other countries that cultural and social values are more crucial to fertility decline than economic development. Streatfield (1986:153) showed that fertility decline in Bali was largely due to factors specific to Balinese society, and argued that the economic, political and social circumstances in the late 1960s were 'unusually favourable' for acceptance of the small family norm. Hugo et al.(1987), pointing out a number of factors influencing fertility levels in Indonesia, identified three 'crucial' transitions occurring in Indonesia and probably mutually reinforcing: the demographic transition, educational transition and the

227transition in the structure of employment. Fertility decline in Thailand was a product of socio-economic changes some of which were culture specific (Knodel et al., 1984:325). Similarly, the fertility decline in Sri Lanka has been a combined effect of delayed age at marriage and marital fertility control, the explanation of which is to be largely found in the favourable cultural and social conditions of Sri Lankan society (Alam and Cleland, 1981:42; Fernando, 1980; and Gajanayake, 1987). Though family planning seems to have played an important role in the fertility decline in all these countries the nature of decline seems to differed according to their cultural and social setting.
In view of these multiple pathways to fertility decline, future research should be directed towards understanding the mechanisms through which fertility has declined in countries where fertility levels are low. Equal emphasis should also be given to understanding why in some countries fertility levels have declined slowly.7.3 Future Trends in Fertility
Societies are always in the process of change. While we cannot predict in advance the exact nature of change, we can make some projections on the basis of existing trends. Given the fact that the fertility decline in Kerala is the combined effect of postponement of marriage and marital fertility control, any change in these areas will bring changes in fertility. On the basis of this study, we can speculate that the fertility levels are likely to stabilize at current levels and are less likely to increase
228considerably or go below replacement level immediately. The following reasons can be given for this speculation;
1. Although age at marriage is high, marriage is still universal. The age at marriage is already high at around 23 and a further rise is unlikely to be large enough to bring much decline in fertility. The factors which have delayed age at marriage such as the need to acquire education and a non-agricultural job have already had their effect and are unlikely to delay marriage still further.
2. Values such as proving one's parenthood and need for children as old age security still ensure that couples do not deliberately have no children. With existing economic conditions it is unlikely that old people will get any kind of social welfare from the government and they have to depend on their children to take care of them.
Because fertility and mortality are fairly low Imhof (1986) argues that Kerala will be the first Indian state to experience the problems faced by Western countries as a result of demographic transition. He cautions that a country such as India should learn a lesson from the West and prepare for the future.
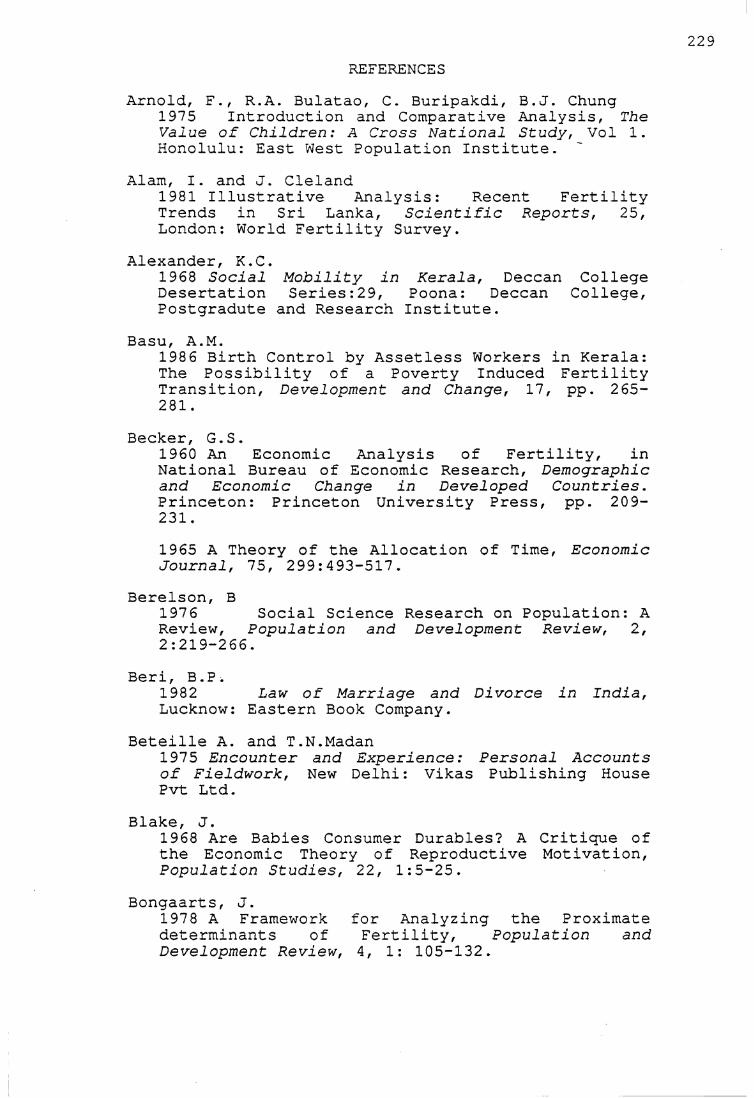
229REFERENCES
Arnold, F., R.A. Bulatao, C. Buripakdi, B.J. Chung1975 Introduction and Comparative Analysis, The Value of Children: A Cross National Study, Vol 1. Honolulu: East West Population Institute.
Alam, I. and J. Cleland1981 Illustrative Analysis: Recent FertilityTrends in Sri Lanka, Scientific Reports, 25, London: World Fertility Survey.
Alexander, K.C.1968 Social Mobility in Kerala, Deccan College Desertation Series:29, Poona: Deccan College,Postgradute and Research Institute.
Basu, A.M.1986 Birth Control by Assetless Workers in Kerala: The Possibility of a Poverty Induced Fertility Transition, Development and Change, 17, pp. 265-281.
Becker, G.S.1960 An Economic Analysis of Fertility, in National Bureau of Economic Research, Demographic and Economic Change in Developed Countries. Princeton: Princeton University Press, pp. 209-231.1965 A Theory of the Allocation of Time, Economic Journal, 15, 299:493-517.
Berelson, B1976 Social Science Research on Population: A Review, Population and Development Review, 2, 2:219-266.
Beri, B.P.1982 Law of Marriage and Divorce in India, Lucknow: Eastern Book Company.
Beteille A. and T.N.Madan1975 Encounter and Experience: Personal Accountsof Fieldwork, New Delhi: Vikas Publishing HousePvt Ltd.
Blake, J.1968 Are Babies Consumer Durables? A Critique of the Economic Theory of Reproductive Motivation, Population Studies, 22, 1:5-25.
Bongaarts, J.1978 A Framework for Analyzing the Proximate determinants of Fertility, Population and Development Review, 4, 1: 105-132.
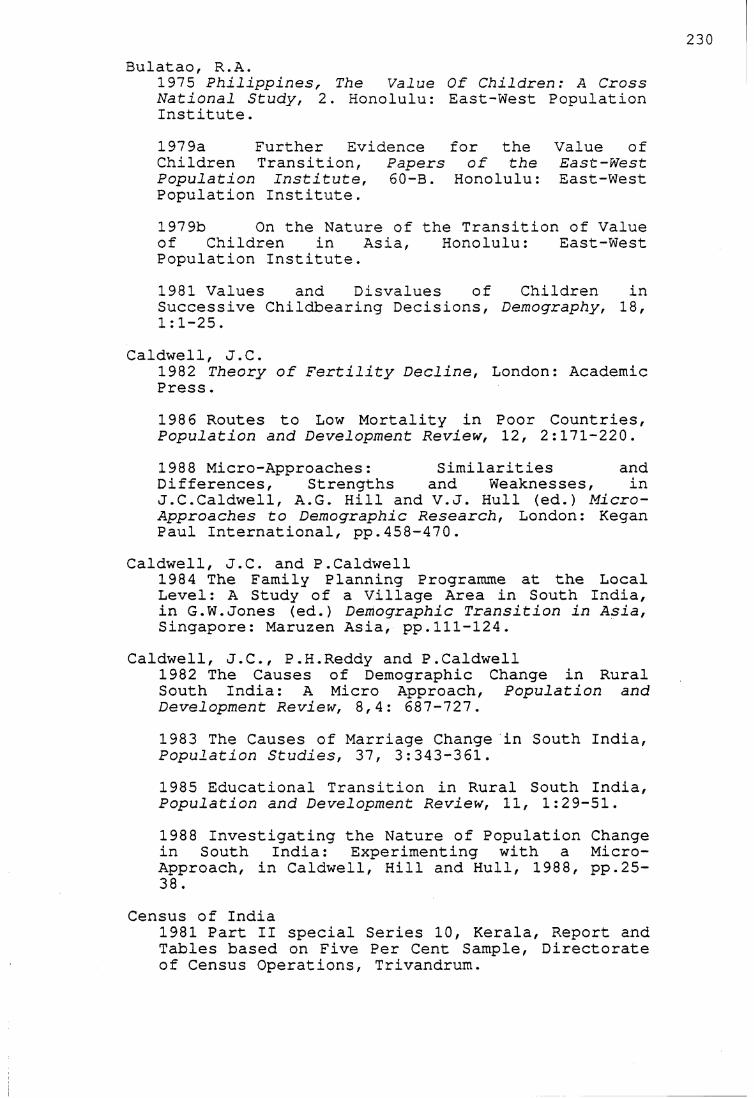
Bulatao, R . A .1975 Philippines, The Value Of Children: A Cross National Study, 2. Honolulu: East-West Population Institute.1979a Further Evidence for the Value of Children Transition, Papers of the East-West Population Institute, 60-B. Honolulu: East-West Population Institute.1979b On the Nature of the Transition of Value of Children in Asia, Honolulu: East-West Population Institute.1981 Values and Disvalues of Children in Successive Childbearing Decisions, Demography, 18, 1:1-25.
Caldwell, J.C.1982 Theory of Fertility Decline, London: Academic Press.1986 Routes to Low Mortality in Poor Countries, Population and Development Review, 12, 2:171-220.1988 Micro-Approaches: Similarities and Differences, Strengths and Weaknesses, in J.C.Caldwell, A.G. Hill and V.J. Hull (ed.) Micro- Approaches to Demographic Research, London: Kegan Paul International, pp.458-470.
Caldwell, J.C. and P.Caldwell1984 The Family Planning Programme at the Local Level: A Study of a Village Area in South India, in G.W.Jones (ed.) Demographic Transition in Asia, Singapore: Maruzen Asia, pp.111-124.
Caldwell, J.C., P.H.Reddy and P.Caldwell1982 The Causes of Demographic Change in Rural South India: A Micro Approach, Population and Development Review, 8,4: 687-727.1983 The Causes of Marriage Change in South India, Population Studies, 37, 3:343-361.1985 Educational Transition in Rural South India, Population and Development Review, 11, 1:29-51.1988 Investigating the Nature of Population Change in South India: Experimenting with a Micro- Approach, in Caldwell, Hill and Hull, 1988, pp.25- 38.
Census of India1981 Part II special Series 10, Kerala, Report and Tables based on Five Per Cent Sample, Directorate of Census Operations, Trivandrum.
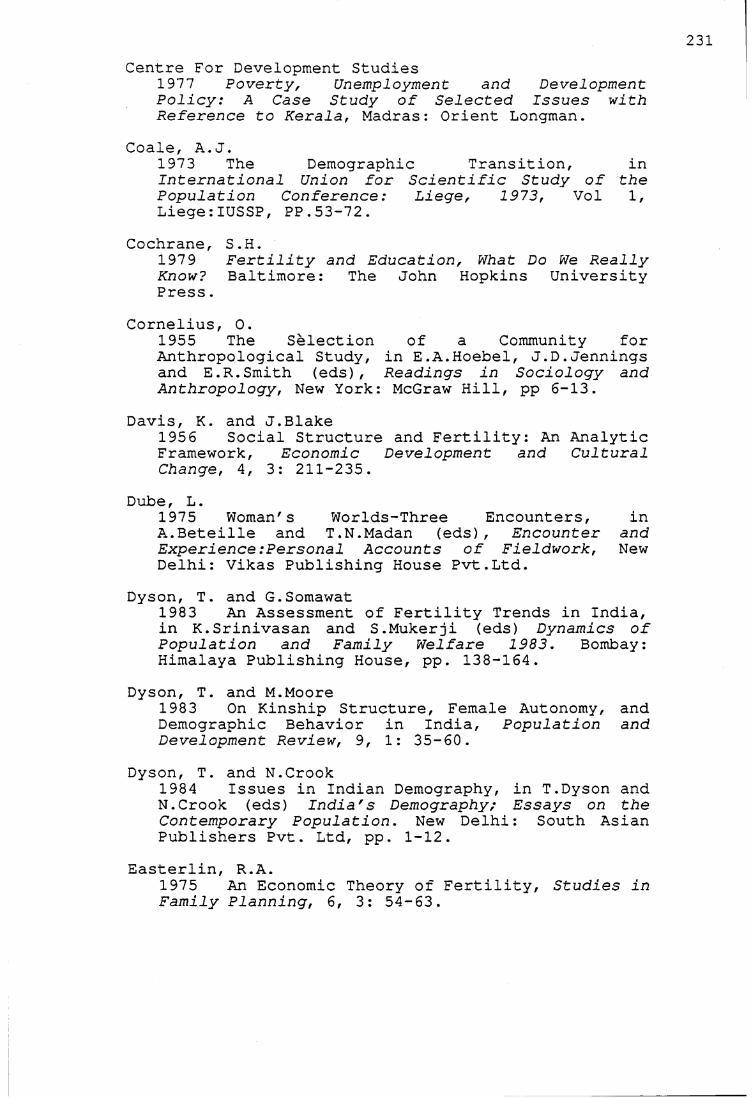
Centre For Development Studies1977 Poverty, Unemployment and DevelopmentPolicy: A Case Study of Selected Issues withReference to Kerala, Madras: Orient Longman.
Coale, A .J.1973 The Demographic Transition, inInternational Union for Scientific Study of the Population Conference: Liege, 1973, Vol 1,Liege:IUSSP, PP.53-72.
Cochrane, S.H.1979 Fertility and Education, What Do We Really Know? Baltimore: The John Hopkins University Press.
Cornelius, 0.1955 The Selection of a Community forAnthropological Study, in E.A.Hoebel, J.D.Jennings and E.R.Smith (eds), Readings in Sociology and Anthropology, New York: McGraw Hill, pp 6-13.
Davis, K. and J.Blake1956 Social Structure and Fertility: An Analytic Framework, Economic Development and Cultural Change, 4, 3: 211-235.
Dube, L.1975 Woman's Worlds-Three Encounters, in A.Beteille and T.N.Madan (eds), Encounter and Experience:Personal Accounts of Fieldwork, New Delhi: Vikas Publishing House Pvt.Ltd.
Dyson, T. and G.Somawat1983 An Assessment of Fertility Trends in India, in K.Srinivasan and S.Mukerji (eds) Dynamics of Population and Family Welfare 1983. Bombay: Himalaya Publishing House, pp. 138-164.
Dyson, T. and M.Moore1983 On Kinship Structure, Female Autonomy, and Demographic Behavior in India, Population and Development Review, 9, 1: 35-60.
Dyson, T. and N.Crook1984 Issues in Indian Demography, in T.Dyson andN.Crook (eds) India's Demography; Essays on the Contemporary Population. New Delhi: South AsianPublishers Pvt. Ltd, pp. 1-12.
Easterlin, R.A.1975 An Economic Theory of Fertility, Studies in Family Planning, 6, 3: 54-63.
Epstein, T.S.1982 A Social Anthropological Approach to Women's Roles and Status in Developing Countries: TheDomestic Cycle, in R. Anker, M. Buvinic and N.H.Youssef (eds) Women's Roles and Population Trends in the Third World, London: Croom Helm, pp. 151-170.
Fawcett, J.T.1976 The Value and Cost of Children: ConvergingTheory and Research, in L.T.Ruzicka (ed.), The Economic and Social Supports of High Fertility, Canberra: The Australian National University, po. 91-117.
Fernando, D.F.S.1980 The Continuing Fertility Decline in Sri Lanka, Journal of Biosocial Science, 12, 1: 51-60.
Freedman, R.1975 The Sociology of Fertility: An AnnotatedBibliography: A Population Council Book. NewYork: Irvington Publishers, Inc. pp. 1-21.1979 Theories of Fertility Decline: a Reappraisal, Social Forces, 58, 1:1-17.1986 Theories of Fertility Decline, in K.Mahadevan and A.Naidu (ed.) Fertility and Mortality: Theory, Methodology and Empirical Issues, New Delhi: Sage Publications, pp. 30-36.
Fuller, C.J.1976 Kerala Christians and the Caste System, Man, New Series, 2: 53-70.
Gazetteer of India.1965 Kerala, Ernakulam, Government of Kerala.
Gajanayake, I.1987 Cessation of Childbearing in the Absence of Contraception in Sri Lanka, Journal of Biosocial Science, 19, 1: 65-71.
George, P.S.1979 Public Distribution of Foodgrains In Kerala, Income Distribution Implications AndEffectiveness, Research Report 7. Washington: International Food Policy Research Institute.
Goode, W.J. and P.K. Hatt1952 Methods in Social Research. New York: McGraw- Hill.
Gopalakrishnan, P.K.1972 Tenancy Relations, Land Reform and Agricultural Production, in P.K.B. Nayar (ed.) Development of Kerala: Problems and Promises,Trivandrum: University of Kerala, pp. 57-67.
Gough, K.1968 Literacy in Kerala, in J. Goody (ed.), Literacy in Traditional Societies, Cambridge: Cambridge University Press, pp. 132-160.
Government of Kerala197 8 Fact Book On Population and Family Welfare Programme. Trivandrum: Directorate of Economicsand Statistics.
Government of India1984 Year Book, New Delhi: Ministry of Health and Family Welfare.1985 India 1985, Annual Number, New Delhi:Publications Division, Ministry of Information and Broadcasting.1979 Indian Christian Marriage Act, 1872, New Delhi: Ministry of Law, Justice and Company Acts.
Gulati, I.S and A. Mody1983 Remittances of Indian Migrants to the Middle East: An Assessment with Special Reference toMigrants from Kerala state, Working Paper No. 182, Trivandrum: Centre for Development Studies.
Gulati, L.1976 Age of Marriage of Women and Population Growth-The Kerala Experience, Economic and Political Weekly, Special Number, 11, 31/33: 1225- 1234 .1979 Marked Preference for Female Sterilisation in a Semirural Squatter Settlement, Studies in Family Planning, 10, 11/12: 416-417.
Hajnal, J.1982 Two Kinds of Preindustrial Household Formation System, Population and Development Review, 8, 3:449-494.
Hoffman, L.W., and M.L.Hoffman1973 The Value of Children to Parents, in J.T.Fawcett (ed.), Psychological Perspectives on Population, New York: Basic Books, pp. 19-76.
Hollerbach, E.P.1980 Power in Families, Communication and Fertility Decision Making, Population and Environment, 3, 2: 146-173.1983 Fertility Decision-Making Processes: ACritical Essay, in R.A. Bulatao and R.D. Lee (ed.) Determinants of Fertility in Developing Countries, New York: Academic Press, pp. 340-380.
Hugo, G.J., T.H. Hull, V.J. Hull, and G.W. Jones1987 The Demographic Dimension in Indonesian Development. Singapore: Oxford University Press.
Hull, T.H.1975 Each Child Brings its Own Fortune: an Inquiry into the Value of Children in a Javanese Village. Unpubl. Ph.D. thesis, Canberra: AustralianNational University.
Hull T.H., V .J .Hull and M.Singarimbun1988 Combining Research Techniques in the Study of Fertility and Family Planning in Java: Theory and Practice, in Caldwell, Hill and Hull, 1988, pp. 56-73.
Imhof, A.E.1986 Can India Learn Lessons from Europe's Demographic and Epidemiological Transition?, Indian Journal of Community Medicine, 11, 2:63-80.
Indian Institute of Public Opinion1985 Disparities in Per Capita Income Growth of Indian States and Union Territories 1970-71 to 1983-84, Supplement to the Monthly Commentary on Indian Economic Conditions, Annual Number, 27, 5:I-IX.
Iyer, L.K.A.1909 The Cochin Higginbotham and
TribesCo.
and Castes, Vol 1 . Madras:
1912 The Cochin Higginbotham and
Tribes Co.
and Castes, Vol 2. Madras:
Jeffrey, R.1976 The Decline of Nayar Dominance: Society and Politics in Travancore, 1847-1908, London:SussexUniversity Press.1987 Governments and Culture: How Women MadeKerala Literate, Pacific Affairs, 60, 3:447-472.
Jones, G.W.1976 Economic and Social Supports of High Fertility: Conceptual Framework, in L.T. Ruzicka(ed.) The Economic and Social Supports for High Fertility, Family and Fertility Change: ChangingAfrican Family Series, No.2. Canberra: Australian National University, pp. 3-47.
Kanitkar, T. and B.N. Murthy1983 Factors Associated with Contraception in Bihar and Rajasthan : Findings from Recent Sample Surveys, in K. Srinivasan and S. Mukerji (ed.) Dynamics of Population and Family Welfare 1983, Bombay: Himalaya Publishing House, pp. 165-198.
Karve, I1953 Kinship Organisation in India, Deccan College Monograph Series, Poona.
Khan, M.E and C.V.S.Prasad1985 A Comparison of 1970 and 1980 Survey Findings on Family Planning in India, Studies in Family- Planning, 16, 6: 312-320.
Kirk, D.1971 A New Demographic Transition, in National Academy of Sciences, Rapid Population Growth: Consequences and Policy Implications. Baltimore: The John Hopkins Press, pp. 123-147.
Kluckhohn, F.R.1940 The Participant Observation Technique in Small Communities, The American Journal of Sociology, 46, 3: 331-343.
Knödel, J. and E. van de Walle1982 European Transition, in J.A.Ross (ed.), International Encyclopedia of Population. New York: Free Press, pp. 268-275.
Knödel, J., N.Havanon and A.Pramualratana1984 Fertility Transition in Thailand: AQualitative Analysis, Population and Development Review, 10, 2: pp. 297-3281988 Focus Group Research on Fertility Decline in Thailand: Methodology and Findings, in Caldwell,Hill and Hull, 1988, pp. 41-55.
Krishnakumar, S.1972 Kerala's Pioneering Experiment in Massive Vasectomy Camps, Studies in Family Planning, 3, 8:177-185.
Krishnan, T.N.1976 Demographic Transition in Kerala- Facts and Factors, Economic and Political Weekly, 11:1203- 1224 .
Kurup, R.S.and Cecil1976 A Note on Birth and Death Rates In Kerala, Sample Registration Report Series No. 11,Demographic Research Centre, Trivandrum: Bureau of Economics and Statistics, Mimeo.
Leibenstein, H.1958 Economic Backwardness and Economic Growth, New York: John Wiley and Sons.
Levine, R.1973 Outsider's Judgements: An EthnographicApproach to Group Differences in Personality, in R.Naroll and R.Cohen (ed.) A Handbook of Method in Cultural Anthropology. New York: ColumbiaUniversity Press, pp. 388-397.
Lorimer, F.1954 Culture and Human Fertility. Paris: UNESCO.
236MacDorman, M.
1987 Contemporary Marriage Practices in NorthIndia: Evidence from Three Uttar Pradesh Villages. Unpubl. Ph.D. thesis, Canberra: AustralianNational University
Madhavan M.C.1985 Indian Emigrants: Numbers, Characteristics,and Economic Impact, Population Developmnet Review, 11, 3: 457-481.
Mamdani, M.1972 The Myth of Population Control, New York: Monthly Review Press.
Mateer, S.1883 Native Life in Travancore, London: W.H.Allen.
McNicoll, G.1988 On the Local Context of Demographic Change, in Caldwell, Hill and Hull, 1988, pp. 10-24.
Mencher, J.P.1966a Kerala and Madras: A Comparative Studyof Ecology and Social Structure, Ethnology, 5,1: 135-171. '1966b Namboodiri Brahmins: An Analysis of aTraditional Elite in Kerala, Journal of Asian and African Studies, 1: 183-196.1980 The Lessons and Non-lessons of Kerala: Agricultural Labourers and Poverty, Economic and Political Weekly, 15: 1781-1802.
Menon, A. S.1979 Social and Cultural History of Kerala. New Delhi: Sterling Publishers Pvt. Ltd.
Messerschmidt, D.A.1981 Preface, in D.A.Messerschmidt (ed.), Anthropologists at Home in North America: Methods and Issues in the Study of One's Own Society. Cambridge: Cambridge University Press, pp. 4-14.
Mueller, E.1976 The Economic Value of Children in Peasant Agriculture, in R.G.Ridker (ed.), Population and Development: The Search for SelectiveInterventions. Baltimore: John Hopkins UniversityPress, pp. 98-153.
MacDorman, M.1987 Contemporary Marriage Practices in North India: Evidence from Three Uttar Pradesh Villages. Unpubl. Ph.D. thesis, Canberra: Australian National University
Madhavan M.C.1985 Indian Emigrants: Numbers, Characteristics,and Economic Impact, Population Developmnet Review, 11, 3: 457-481.
Mamdani, M.1972 The Myth of Population Control, New York: Monthly Review Press.
Mateer, S.1883 Native Life in Travancore, London: W.H.Allen.
McNicoll, G.1988 On the Local Context of Demographic Change, in Caldwell, Hill and Hull, 1988, pp. 10-24.
Mencher, J.P.1966a Kerala and Madras: A Comparative Studyof Ecology and Social Structure, Ethnology, 5,1: 135-171. '1966b Namboodiri Brahmins: An Analysis of aTraditional Elite in Kerala, Journal of Asian and African Studies, 1: 183-196.1980 The Lessons and Non-lessons of Kerala: Agricultural Labourers and Poverty, Economic and Political Weekly, 15: 1781-1802.
Menon, A. S.1979 Social and Cultural History of Kerala. New Delhi: Sterling Publishers Pvt. Ltd.
Messerschmidt, D.A.1981 Preface, in D.A.Messerschmidt (ed.), Anthropologists at Home in North America: Methods and Issues in the Study of One's Own Society. Cambridge: Cambridge University Press, pp. 4-14.
Mueller, E.1976 The Economic Value of Children in Peasant Agriculture, in R.G.Ridker (ed.), Population and Development: The Search for SelectiveInterventions. Baltimore: John Hopkins UniversityPress, pp. 98-153.
Nag, M.1983 The Equity and Fertility Hypothesis as an Explanation of the Fertility Differential between Kerala and West Bengal, Working Papers, No.96, Center for Policy Studies. New York: Population Council.1983 Impact of Social and Economic Development on Mortality: A Comparative Study of Kerala and West Bengal, Economic and Political Weekly, 18, 19/21: 877-900.
Nag, M. and N. Kak.1984 Demographic Transition in a Punjab Village, Population and Development Review, 10, 4:661-678.
Nag, M., B.N.F.White and R.C.Peet1978 An Anthropological Approach to the Study of the Economic Value of Children in Java and Nepal, Current Anthropology, 19, 2: 293-306.
Nair G.1981 Primary Education, Population Growth and Socio-Economic Change. New Delhi: Allied Publishers.
Nair, P.R.G.1974 Decline in Birth Rate in Kerala- A Hypothesis about the Inter-relationship between Demographic Variables, Health Services and Education, Economic and Political Weekly, 9:323-336.1983 Educational Reforms in India: Universalisation of Primary Education in Kerala, Working Paper No. 181. Trivandrum: Centre For Development Studies.
Namboodiri K.N.1968 The Changing Population Of Kerala, Monograph Series, Census of India 1961, New Delhi: Ministry of Home Affairs, Government of India.
Nayar, P.K.B.1986 Factors in Fertility Decline in Kerala, in K.Mahadevan and A.Naidu (ed.) Fertility and Mortality, Theory, Methodology and Empirical Issues, New Delhi: Sage Publications, pp. 155-167.
Nortman, D.1974 Parental Age as a Factor in Pregnancy Outcome and Child Development, Reports on Population/ Family Planning. New York: The Population Council.
Notestein, F.W1945 Population: The Long View, in T.W. Shultz (ed.) Food For the World. Chicago: University of Chicago Press, pp. 36-57.
Ratcliffe J.1978 Social Justice and the DemographicTransition: Lessons from India's Kerala State,International Journal of Health Services, 8, 1:123-144
Repetto, R.C.1974 The Relationship of the Size Distribution of Income to Fertility, and the Implications for Development Policy, Research Paper Series, No. 3, Harvard Center for Population Studies, Cambridge Mass.: Harvard University Press.
Schultz, T.W.1971 Investment in Human Capital: The Role ofEducation and of Research. New York: Free Press.1974 Economics of the Family: Marriage, Children, and Human Capital. Chicago: University of Chicago Press.
Shryock, H.S. and J.S.Siegel197 6 The Methods and Materials of Demography. Florida: Academic Press.
Shorter, E.1973 Female Emancipation, Birth control, and Fertility in European History, American Anthropologist, 78, 3: 605-640.
Sivakumar C.1979 An Apprenticeship Marked by Frustrations:College Students in Mysore, in M.N.Srinivas, A.M.Shah and E .A.Ramaswamy (eds), The Field Worker and the Field, Bombay: Oxford University Press,pp. 216-227.
Soni, V.1984 The Development and Current Organisation of the Family Planning Programme, in Dyson and Crook, 1984, pp. 141-157.
Srinivas M.N.1966 Social Change in Modern India. Berkeley: University of California Press.1979 Introduction, in Srinivas et al., 1979, pp.1-15.1988 Notes on the Use of the Method of Participant Observation in the Study of Demographic Phenomena, in Caldwell, Hill, and Hull, 1988, pp. 451-457.
Srikantan K.1977 The Family Planning Program in Socio-Economic Context, New York: The Population Council.
Streatfield, K.1986 Fertility Decline in a Traditional Society: The Case of Bali, Indonesia Population Monograph Series, no 4. Canberra: Australian NationalUniversity.
Sushama, P.N.1982 Micro-demographic Study: Experiences ofFieldwork in a Developed Indian Village. Paper presented at International Seminar on the Social Context of Demographic Change, Bangalore.
Teitelbaum, M.S1975 Relevance of Demographic Transition Theory for Developing Countries, Science, 188:420-425.
Tharakan, P.K.M.1984 Socio-Economic Factors in Educational Development: The Case of Nineteenth CenturyTravancore, Economic and Political Weekly, 19, 45: 1913-1928.
Tharamangalam J.1981 Agrarian Class Conflict: PoliticalMobilisation of Agricultural Labourers in Kuttanad, South India. Vancouver: University ofBritish Columbia Press.
Thurston E.1909 Castes and Tribes of Southern India, Vols. 1 and 3. Madras: Government Press.
United Nations1965 Economic and Social Factors Related to Differences in Levels of Fertility, Population Bulletin, No.7. New York: United Nations.1983 Manual X, Indirect Techniques for Demographic Estimation, New York: United Nations.
Valsan B.N.1977 Successes and Problems in F.P.Administration: Experiences in Two Districts ofKerala, India, Studies in Family Planning, 8, 6:148-156.
Varghese T.C.197 0 Agrarian Change and Economic Consequences, Land Tenures in Kerala 1850-1960. Bombay: AlliedPublishers.
Varghese, M.M.1983 Population of Kerala, in Studies in Population and Family Welafre Programme, Vol. 2. Trivandrum: Directorate of Economics andStatistics, pp. 1-13.
Visaria, P. and A.K. Jain1976 India, Country Profiles. New York: The Population Council.
Vlassoff C.1988 A Micro-Study of Culture and Fertility in Rural Maharashtra, in Caldwell, Hill and Hull, 1988, pp. 74-87.
Vlassoff, M. and Vlassoff, C.1980 Old Age Security and the Utility of Children in Rural India, Population Studies, 34: 487-499.
Warwick, D. and Osherson S.1973 Comparative Research Methods. New Jersey: Prentice-Hall, Inc.
Woodcock, G.1967 Kerala: A Portrait of the Malabar Coast. London: Faber and Faber.
World Bank1983 Determinants of Fertility Decline in Kerala Draft Report, Trivandrum: Directorate of Economics and Statistics.
Wu, T.S.1977 Taiwan, the Value of Children: A CrossNational Study, 5, Honolulu: East West Population Institute.
Zachariah, K.C.1981 Anomaly of Fertility Decline in Kerala-Social Change, Agrarian Reform, or The Family Planning Programme? Discussion Paper No.81, Population and Human Resources Division, World Bank.1983 Anomaly of Fertility Decline in Kerala, Report No. 1 from RPO 671-70, World Bank.
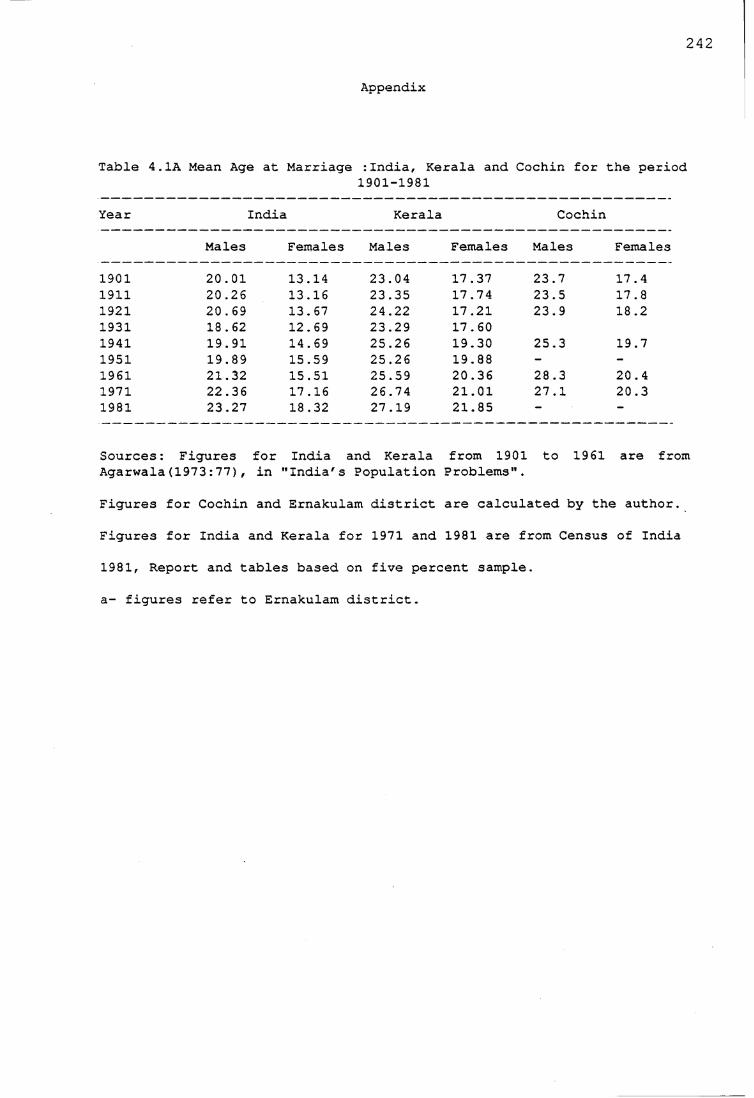
242
Appendix
Table 4. 1A Mean Ag<s at Marriage :India, Kerala and Cochin for t:he period1901-1981
Year India Kerala Cochin
Males Females Males Females Males Females
1901 20.01 13.14 23.04 17.37 23.7 17.41911 20.26 13.16 23.35 17.74 23.5 17.81921 20.69 13.67 24.22 17.21 23.9 18.21931 18.62 12.69 23.29 17.601941 19.91 14.69 25.26 19.30 25.3 19.71951 19.89 15.59 25.26 19.88 - -1961 21.32 15.51 25.59 20.36 28.3 20.41971 22.36 17.16 26.74 21.01 27.1 20.31981 23.27 18.32 27.19 21.85 —
Sources:: Figures for India and Kerala from 1901 to 1961 are fromAgarwala(1973:77) , in "India's Population Problems 1«
Figures for Cochin and Ernakulam district are calculated by the author.
Figures for India and Kerala for 1971 and 1981 are from Census of India
1981, Report and tables based on five percent sample.
a- figures refer to Ernakulam district.
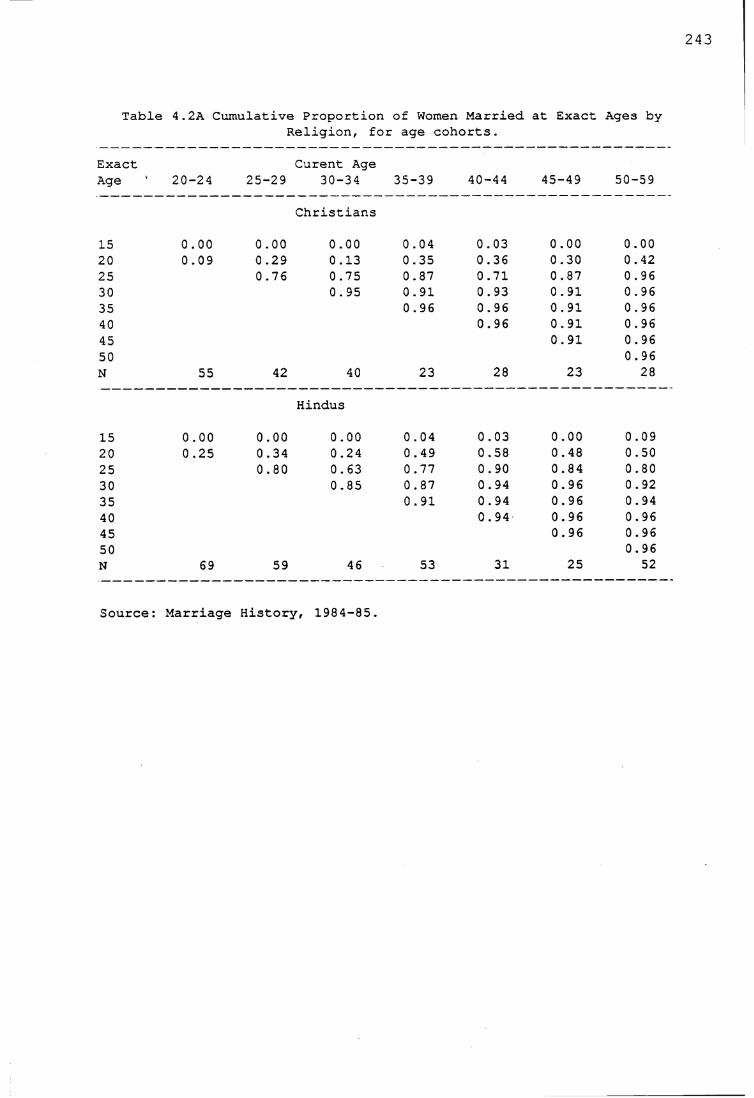
243
Table 4.2A Cumulative Proportion of Women Married at Exact Ages byReligion, for age cohorts.
Exact Curent AgeAge 20-24 25-29 30-34 35-39 40-44 45-49 50-59
Christians
15 0.00 0.00 0.00 0.04 0.03 0.00 0.0020 0.09 0.29 0.13 0.35 0.36 0.30 0.4225 0.76 0.75 0.87 0.71 0.87 0 . 9630 0.95 0.91 0.93 0.91 0.9635 0.96 0.96 0.91 0 . 9640 0.96 0.91 0.9645 0.91 0.9650 0.96N 55 42 40 23 28 23 28
Hindus
15 0.00 0.00 0.00 0.04 0.03 0.00 0.0920 0.25 0.34 0.24 0.49 0.58 0.48 0.5025 0.80 0.63 0.77 0.90 0.84 0.8030 0.85 0.87 0.94 0.96 0.9235 0.91 0.94 0.96 0.9440 0.94 0.96 0.9645 0.96 0.9650 0.96N 69 59 46 53 31 25 52
Source: Marriage History, 1984-85.
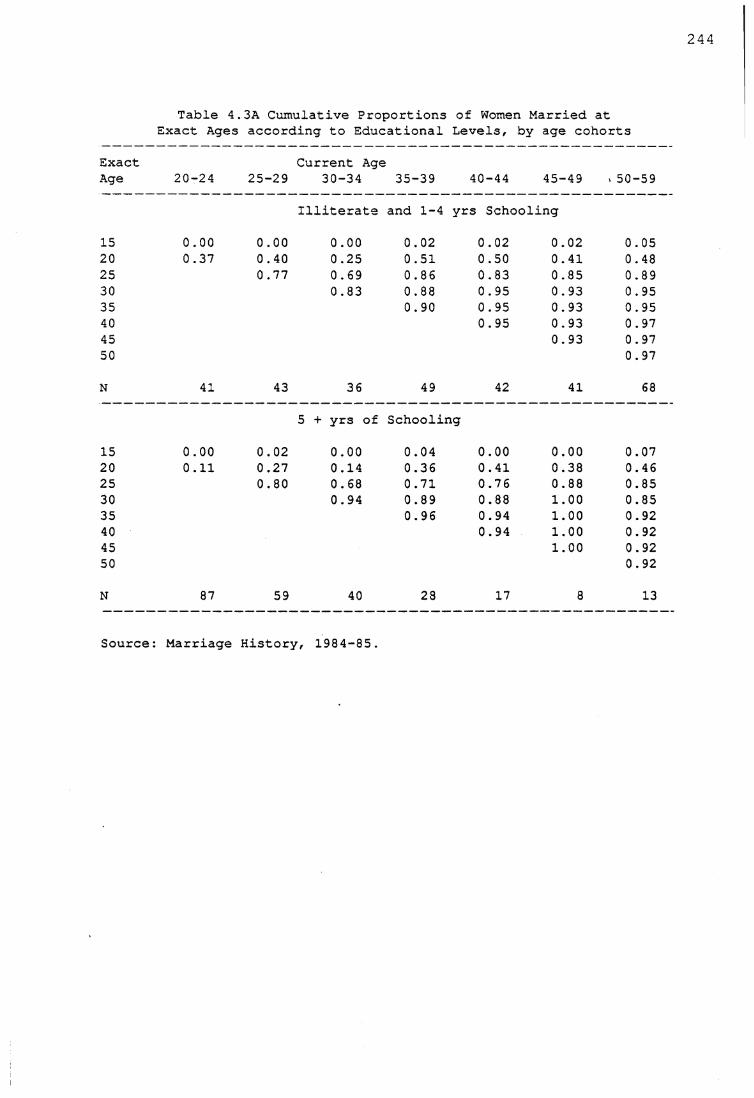
Table 4.3A Cumulative Proportions of Women Married at Exact Ages according to Educational Levels, by age cohorts
Exact Current AgeAge 20-24 25-29 30-34 35-39 40-44 45-49 v 50-59
Illiterate and 1-4 yrs Schooling
15 0.00 0.00 0.00 0.02 0.02 0.02 0.0520 0.37 0.40 0.25 0.51 0.50 0.41 0.4825 0.77 0.69 0.86 0.83 0.85 0.8930 0.83 0.88 0.95 0.93 0 . 9535 0.90 0.95 0.93 0.9540 0.95 0.93 0.9745 0.93 0.9750 0.97
N 41 43 36 49 42 41 68
5 + yrs of Schooling
15 0.00 0.02 0.00 0.04 0.00 0.00 0.0720 0.11 0.27 0.14 0.36 0.41 0.38 0.4625 0.80 0.68 0.71 0.76 0.88 0.8530 0.94 0.89 0.88 1.00 0.8535 0.96 0.94 1.00 0.9240 0.94 1.00 0.9245 1.00 0.9250 0.92
N 87 59 40 28 17 8 13
Source: Marriage History, 1984-85.
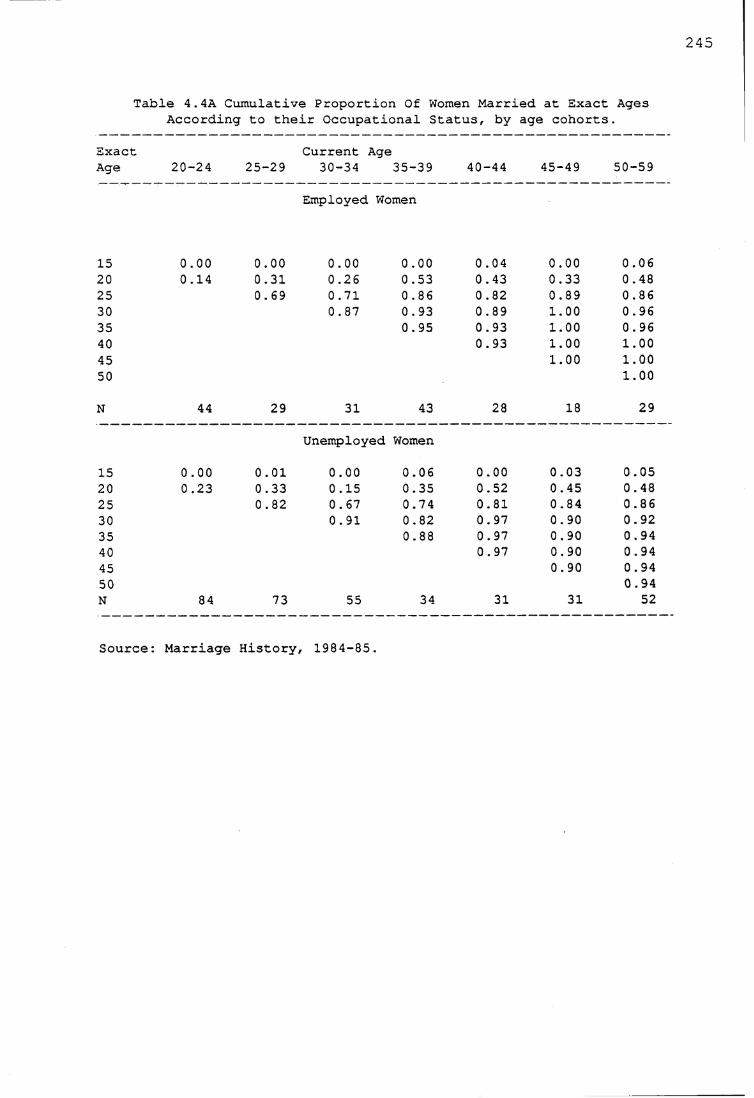
245
Table 4.4A Cumulative Proportion Of Women Married at Exact Ages According to their Occupational Status, by age cohorts.
ExactAge 20-24
Current Age25-29 30-34 35-39 40-44 45-49 50-59
Employed Women
15 0.00 0.00 0.00 0.00 0.04 0.00 0.0620 0.14 0.31 0.26 0.53 0.43 0.33 0.4825 0.69 0.71 0.86 0 . 82 0.89 0.8630 0.87 0.93 0.89 1.00 0.9635 0.95 0.93 1.00 0.9640 0.93 1.00 1.0045 1.00 1.0050 1.00
N 44 29 31 43 28 18 29
Unemployed Women
15 0.00 0.01 0.00 0.06 0.00 0.03 0.0520 0.23 0.33 0.15 0.35 0.52 0.45 0.4825 0.82 0.67 0.74 0.81 0.84 0.8630 0.91 0.82 0.97 0.90 0.9235 0.88 0.97 0.90 0.9440 0.97 0.90 0.9445 0.90 0.9450 0.94N 84 73 55 34 31 31 52
Source: Marriage History, 1984-85.
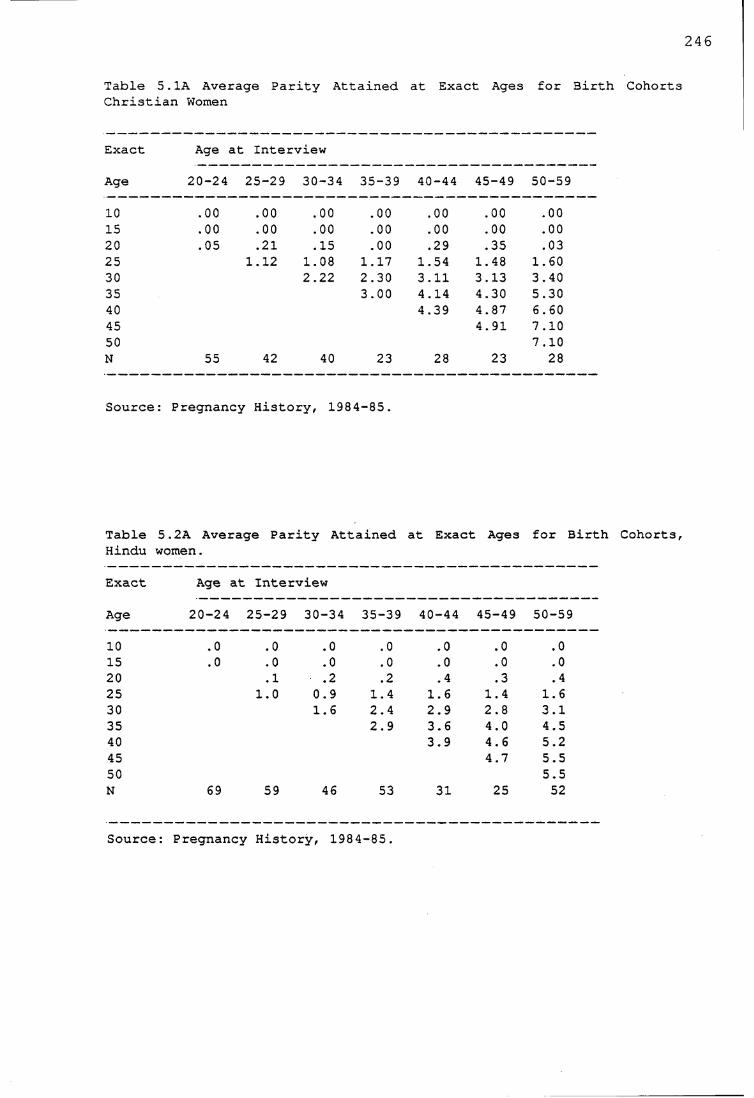
246
Table 5.1A Average Parity Attained at Exact Ages for 3irth Cohorts Christian Women
Exact Age at Interview
Age 20-24 25-29 30-34 35-39 40-44 45-49 50-59
10 .00 .00 .00 .00 .00 .00 .0015 .00 .00 .00 .00 .00 .00 .0020 .05 .21 .15 .00 .29 .35 .0325 1.12 1.08 1.17 1.54 1.48 1.6030 2.22 2.30 3.11 3.13 3.4035 3.00 4.14 4.30 5.3040 4.39 4.87 6.6045 4.91 7.1050 7.10N 55 42 40 23 28 23 28
Source: Pregnancy History, 1984 -85 .
Table 5.2A Average Parity Attained at Exact Ages for BirthHindu women.
Exact Age at Interview
Age 20-24 25-29 30-34 35-39 40-44 45-49 50-59
10 .0 .0 .0 .0 .0 .0 .015 .0 .0 .0 .0 .0 .0 .020 .1 .2 .2 . 4 .3 . 425 1.0 0.9 1.4 1.6 1.4 1.630 1.6 2.4 2.9 2.8 3.135 2.9 3.6 4.0 4.540 3.9 4.6 5.245 4.7 5.550 5.5N 69 59 46 53 31 25 52
Source: Pregnancy History, 1984-85.
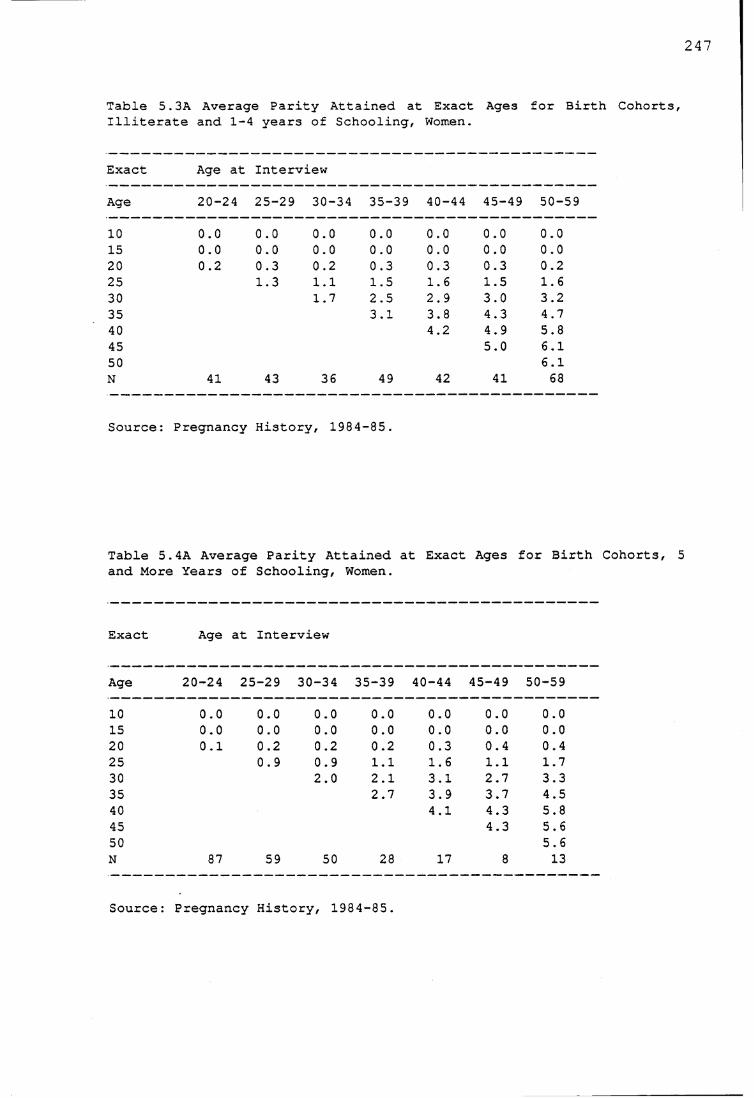
247
Table 5.3A Average Parity Attained at Exact Ages for Birth Cohorts, Illiterate and 1-4 years of Schooling, Women.
Exact Age at Interview
Age 20-24 25-29 30-34 35-39 40-44 45-49 50-59
10 0.0 0.0 0.0 0.0 0.0 0.0 0.015 0.0 0.0 0.0 0.0 0.0 0.0 0.020 0.2 0.3 0.2 0.3 0.3 0.3 0.225 1.3 1.1 1.5 1.6 1.5 1.630 1.7 2.5 2.9 3.0 3.235 3.1 3.8 4.3 4.740 4.2 4.9 5.845 5.0 6.150 6.1N 41 43 36 49 42 41 68
Source: Pregnancy History, 1984 -85.
Table 5. 4A Average Parity Attained at Exact Ages for Birthand More Years of Schooling, Women.
Exact Age at Interview
Age 20-24 25-29 30-34 35-39 40-44 45-49 50-59
10 0.0 0.0 0.0 0.0 0.0 0.0 0.015 0.0 0.0 0.0 0.0 0.0 0.0 0.020 0.1 0.2 0.2 0.2 0.3 0.4 0.425 0.9 0.9 1.1 1.6 1.1 1.730 2.0 2.1 3.1 2.7 3.335 2.7 3.9 3.7 4.540 4.1 4.3 5.845 4.3 5.650 5.6N 87 59 50 28 17 8 13
Source: Pregnancy History, 1984-85.
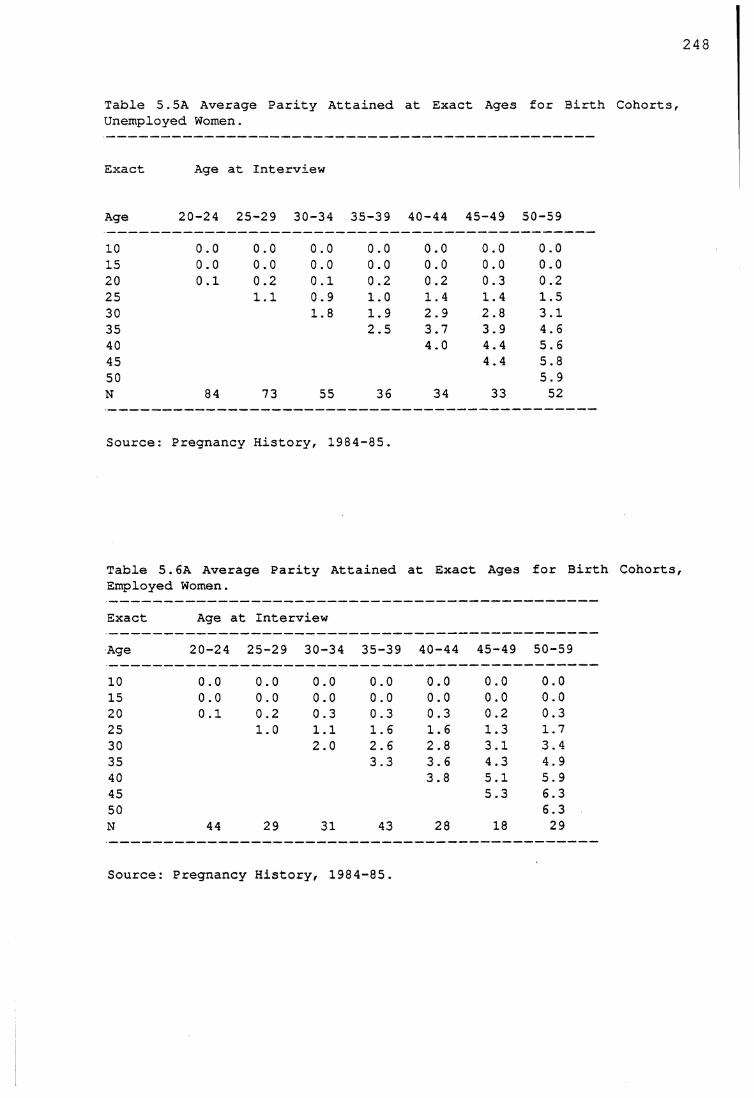
243
Table 5.5A Average Parity Attained at Exact Ages for Birth Cohorts, Unemployed Women.
Exact Age at Interview
Age 20-24 25-29 30-34 35-39 40-44 45-49 50-59
10 oo oo 0.0 oo o o Oo 0.015 0.0 0.0 0.0 0.0 0.0 0.0 0.020 0.1 0.2 0.1 0.2 0.2 0.3 0.225 1.1 0.9 1.0 1 .4 1.4 1.530 1.8 1.9 2.9 2.8 3.135 2.5 3.7 3.9 4.640 4.0 4 .4 5.645 4 .4 5.850 5.9N 84 73 55 36 34 33 52
Source: Pregnancy History, 1984-85.
Table 5.6A Average Parity Attained at Exact Ages for 3irth Cohorts, Employed Women.Exact Age at InterviewAge 20-24 25-29 30-34 35-39 40-44 45-49 50-5910 0.0 oo oo 0.0 oo oo oo
15 0.0 0.0 0.0 0.0 0.0 0.0 0.020 0.1 0.2 0.3 0.3 0.3 0.2 0.325 1.0 1.1 1 .6 1 .6 1.3 1.730 2.0 2 .6 2.8 3.1 3.435 3.3 3.6 4.3 4.940 3.8 5.1 5.945 5.3 6.350 6.3N 44 29 31 43 28 18 29
Source: Pregnancy History, 1984-85.