Science, Medicine and Arbitration: Pieter Eijkman’s World Capital in The Hague

Religious differentials in marital fertility in The Hague(Netherlands) 1860�/1909
Jona Schellekens1 and Frans van Poppel21Hebrew University, Jerusalem, 2Netherlands Interdisciplinary Demographic Institute, The Hague
Previous studies of the marital fertility transition in Europe have found religious differentials. Using data
collected from the population registers of The Hague, our aim in this study is to search for answers to the
following questions: whether religious differentials result from socio-economic characteristics; to what
extent religious ideology explains the behaviour of religious groups; which proximate determinants account
for the religious differentials; and whether the Jews were forerunners in the marital fertility transition in
Europe. The results provide some evidence of relatively low levels of parity-dependent fertility control
among Jews before the transition and among Catholics during the transition. Religious ideology probably
accounts for the low level of fertility control among Catholics. The ultimate reason for the relatively high
marital fertility among Jews before the transition remains unclear. Our findings do not support the
hypothesis that Jews were forerunners in the marital fertility transition.
Keywords: marital fertility; religious differentials; minority-group status; parity-dependent fertility
control; population registers; discrete-time repeated-events history model
[Submitted December 2004; Final version accepted July 2005]
Introduction
The spread of fertility control differs from religion to
religion. For instance, the decline in marital fertility
among Catholics in countries including Germany
and the Netherlands was delayed compared with
that in other religious groups (Knodel 1974; van
Poppel 1985), while Jews are thought to have led the
rest of the population in achieving lower levels of
reproduction in countries like Germany and Italy
(Knodel 1974; Livi-Bacci 1986). As yet, much needs
to be learned about the proximate and ultimate
determinants of religious differentials in fertility. In
this paper, these determinants are investigated in a
Dutch setting, using birth-history data from the
population registers of The Hague, which are avail-
able from 1850. Our questions are, first, whether
religious differentials can be explained by socio-
economic characteristics; second, to what extent
religious values explain the behaviour of religious
groups; third, which proximate determinants ac-
count for the religious differentials; and fourth,
whether Jews were ‘forerunners’ in the fertility
transition. Since religious differentials and their
determinants may change over time, we examine
the first three questions for two different periods*/
before and during the transition.
Religion and fertility
There are three kinds of hypotheses about the
relationship of religion to fertility: the characteristics
hypothesis, the religious-values hypothesis, and the
minority-group-status hypothesis (Goldscheider
1971). The first type contends that religious differ-
entials will disappear once the proper socio-eco-
nomic and demographic variables are taken into
account. ‘Suppose that on average Catholics have
both higher fertility and lower socio-economic status
than Protestants. If Protestants and Catholics with
the same socio-economic status did not differ in
fertility, then the higher fertility of Catholics as a
group would be presumed to result from the
compositional effect of a higher proportion of
Catholics than of Protestants having low socio-
economic status’ (Anderson 1986, p. 299). Schrover’s
(1997) study is a Dutch example of the character-
istics hypothesis. She associates the relatively high
fertility among Catholics in rural areas of the south
Population Studies, Vol. 60, No. 1, 2006, pp. 23�/38

of the Netherlands in the second half of the nine-
teenth century with the contemporary reduction in
women’s tasks on farms. Petersen (1961, p. 223),
discussing the results of the 1941 Indianapolis study,
provides an additional example when he argues that
‘the small family size of Jews derives from their
concentration in cities, especially in those urban
occupations that are always associated with low
fertility’.
Religious ideology may influence fertility not only
directly through proximate variables, such as the use
of contraceptives or breastfeeding, but also indir-
ectly by increasing the number of children that
couples desire, or by teachings on the appropriate
roles for men and women without specifying a
particular proximate determinant (McQuillan 2004,
p. 31). During the nineteenth century, the policy of
the Catholic Church and other denominations was to
say as little as possible in public about contraception,
and, in private situations, where necessary, to reiter-
ate the traditional condemnation by the Church
(Campbell 1960, pp. 131�/2). In the twentieth cen-
tury, the Catholic Church placed more severe sanc-
tions than the Protestant churches or Judaism on the
use of contraception (Feldman 1968, pp. 104�/105).
Marital fertility may also be influenced through
religious attitudes to breastfeeding. In the Nether-
lands, the Catholic Church did not start a vigorous
campaign against the use of birth control until after
1900 (Westhoff 1986, pp. 26�/42; Roling 1987, pp.
135�/41 and 218�/25). Hence Meurkens (1989, p. 129)
has argued that marital fertility among Catholics was
high in the nineteenth century because of a decline
in breastfeeding (see also Lesthaeghe 1983). In the
second half of the nineteenth century, Catholic
priests in the Netherlands started to oppose the
baring of any part of the female body, in particular
breasts, to prevent sexual stimulation of men. The
Catholic politician P. J. M. Aalberse (1871�/1948)
explained that ‘Catholics . . . do not breastfeed be-
cause of a misplaced sense of shame [when bearing
their breasts] or, even worse, because of the tradition
of binding young girls’ breasts so they won’t develop
[making breastfeeding difficult] . . .This terrible ha-
bit is probably the result of prudishness which is
wrongly equated with morality . . .’ (translated from
Aalberse 1917, p. 354).
Writing in the first half of the nineteenth century,
the Polish Rabbi Abraham Zvi Hirsch Eisenstadt
(1966) advised parents not to wean infants before
the age of 2. Nineteenth-century observers in
Amsterdam and Rotterdam reported that Jewish
mothers breastfed their infants more than Catholics
and Protestants (van Poppel 1992), but it is not clear
whether this was for religious reasons. A local health
commission in The Hague reported relatively small
religious differentials in breastfeeding patterns in
1908. Forty per cent of Jewish mothers breastfed for
more than 10 months, compared with 35�/36 per cent
among Protestants and Catholics (Gezondheidscom-
missie 1912).
A number of religions have elaborate rules about
the timing and frequency of sexual intercourse. The
concept of ‘marital debt’*/the obligation of spouses
not to deny sexual gratification to their partner*/
may be one of the few elements of Catholic theology
to have promoted coital frequency (Hull 1996, p. 12;
McQuillan 2004, p. 29). Jewish marital law stipulates
that a woman is entitled to a minimum coital
frequency, depending on the husband’s occupation,
as part of her marital rights (Feldman 1968).
If differences in neither characteristics nor reli-
gious ideology explain religious differentials in
marital fertility, there remains the minority-group-
status hypothesis, which relates the fertility beha-
viour of a given group to the social context in which
the group exists. Explanations of reproductive be-
haviour among Jews during the transition are often
of this kind. For instance, Goldscheider (1967, p.
207) contends that Jews, as members of a minority
group that is conscious of discrimination, feel
insecure and believe they lack full acceptance in
the non-Jewish world, and that their aspiration to
social mobility and desire for acceptance in society,
has tended to encourage small family size. While
Goldscheider stresses the desire for integration as a
decisive force, Knodel argues that it was rather
segregation that favoured the adoption of practices
of family limitation among Jews. He attributes (1974,
pp. 140�/1) the early fertility decline among German
Jews to ‘the close cultural and social ties between
them which resulted in their being a more self-
contained, closed cultural entity than Protestants or
Catholics and provided a situation in which changing
norms regarding family size and family limitation
could spread rapidly and relatively independently of
the rest of German society’.
Of course, it would be wrong to associate the
minority-group-status hypothesis with Jews only.
During the overall period described in the present
study, Catholics in The Hague also constituted a
minority, albeit a much larger one. This is likely to
have affected their compliance with the require-
ments of Church authorities, and hence their repro-
ductive behaviour.
Religious ideologies seem to play a pivotal role in
some settings but not in others. McQuillan (2004,
p. 32) argues that religious values are most likely to
24 Jona Schellekens and Frans van Poppel

matter when religious institutions have the means to
communicate values to their members and to
institute mechanisms to promote compliance and
punish nonconformity. The Netherlands seems to
have provided such a setting for Catholics. Dutch
Catholics have held a minority position for several
centuries. In their opposition to the Protestant
majority, they developed strong religious institu-
tions, and these dominated their group in the
Netherlands to such an extent that the Church’s
moral objection to family planning could be main-
tained (van Poppel 1985, p. 368).
In the nineteenth century, religion deeply divided
Dutch society. It played an important role in
determining the choice between the three main
types of school: public, Protestant, or Roman
Catholic. Thus, by the age of 6, society was already
split along religious lines. In Dutch, this phenom-
enon is known as verzuiling (the ‘pillarization’) of
society. Typically, a Dutch child played with children
of his or her own faith only. When a Dutch male
grew up, his circle of friends would consist of people
of the same faith and he would marry someone of
that faith. He would join the party and trade union,
and read newspapers and periodicals associated with
his faith (van Poppel 1985, pp. 352�/3).
Data and variables
Because of the unbalanced regional distribution of
Catholics in the Netherlands, a national study of this
group may confuse the effect of religion with that of
region. We therefore decided to focus on a city in the
western part of the country, where the numbers of
Protestants, Catholics, and Jews were large enough
for our purpose. Because, for practical reasons, our
choice fell on The Hague, the results presented here
relate mainly to the urban sector, though rural
migrants may to some extent have mitigated the
differences between urban and rural settings.
Although the choice of The Hague may affect the
size of any effect of religion, we do not expect this to
affect its direction .
In the second half of the nineteenth century, The
Hague evolved from a provincial capital and a quiet
place to live into a big, modern city. In 1850, the city
had about 72,000 inhabitants. After 1870, when
prosperity increased, the population grew steadily,
reaching 206,000 at the turn of the century. More
than half of this growth was due to migration. The
presence of the Royal Court, Parliament, and
government offices attracted large numbers into
the service sector. In 1850 this sector made up 42
per cent of the labour force. Another 34 per cent
were employed in industry, mostly in the construc-
tion sector and in the clothing and shoe industries.
By 1900 the service sector had declined to less than
37 per cent, while almost 36 per cent were employed
in industry (Stokvis 1987, pp. 88 and 149).
In 1850 about 60 per cent of the population of The
Hague was Dutch Reformed. After 1880 their
numbers declined, reaching about 40 per cent in
1920. The percentage of Roman Catholics remained
more or less stable at about 30 per cent for most of
the period, while the percentage of Jews slowly
declined from about 5 to 3 per cent in 1920. Before
the twentieth century, few people in The Hague
were unaffiliated to a particular religion.
It should be noted that the Dutch Reformed in
The Hague, as elsewhere, included both fundamen-
talists and liberals, the former being much more
outspoken in their opposition to neo-Malthusianism.
At the end of the 1880s members of the Dutch
Reformed congregation in the city received the right
to vote for new clergymen. This led to the domina-
tion of more orthodox clergy, and after a while
liberal clergy were no longer appointed in The
Hague (Stokvis 1987).
At the restoration of the Catholic episcopal
hierarchy in 1853, The Hague became a deanery in
the diocese of Haarlem. Stations (congregations
having neither a church nor a resident priest) were
replaced by parishes with defined territories, and
from then on the faithful were instructed to keep to
their own local parish. This removal of choice is
thought to have increased the hold of local priests
over the faithful in their parishes (Voets 1981,
p. 19). Between 1853 and 1900 the number of
Catholic parishes and churches in The Hague
doubled, enabling the faithful in new neighbour-
hoods to go to church. The growing Catholic self-
confidence expressed itself in the neo-Gothic style
of churches, the Maria cult, and the foundation of
religious brotherhoods (Dumas 1983).
Most Jews lived in four neighbouring streets
known as De Buurt*/literally ‘the neighbourhood’*/
and in a few streets nearby. Although this was not an
exclusively Jewish neighbourhood (many non-Jews
lived there) in the middle of the nineteenth century,
there was still a certain degree of cultural isolation
because of the Yiddish still spoken by many inhabi-
tants. In the second half of the nineteenth century
those who could afford it started to move out to
streets around De Buurt . The Jewish community in
The Hague had its own hospital, orphanage, and
home for the aged. Towards the end of the century
Religious differentials in fertility 25
complaints about the decline of religious commit-
ment became more common (van Creveld 1989).
For the present study, marriage registration was
used as a sampling frame. A degree of oversampling
was necessary to ensure that a sufficient number of
Jews were included in the study. The marriage
registers do not contain information on religion. To
identify Jewish couples, we first compiled a list of
surnames common among Dutch Jews, drawing on
four different sources: a list of names of Jewish
families living in the Jewish quarter of The Hague in
the years 1811�/1942 (van Creveld 1989, pp. 214�/22);
an index of surnames of Jews marrying in the period
1811�/52 (Veldhuijzen 1996); a list of surnames in the
archives of the Sephardic Jewish community of The
Hague; and the registers of rabbinical marriages in
The Hague for the period 1873�/1902. Because only
a very few Jews were not registered members of the
Jewish community in the nineteenth century, the
registers of rabbinical marriages cover the vast
majority of the growing secular Jewish population.
Using the list of surnames, we searched the marriage
registers for couples who married in The Hague
during the years 1859�/1902, and consulted the
population registers of The Hague to verify whether
the bride or groom or both were indeed Jewish. For
all other religious groups, a random sample was
drawn from the records of civil marriages contracted
between 1859 and 1902. The sample fraction ranges
from 4.6 per cent (1902) to 8.2 per cent (1885), and
the initial number of cases was 3,966 couples.
However, many couples who married in The Hague
did not settle there after their marriage. Other
couples simply could not be located in the popula-
tion registers for technical reasons. Second mar-
riages were excluded from the study, and a few more
cases were lost because of data inconsistencies and
missing values. The final sample, on which the data
are based, comprised 2,145 women, giving 24,943
years of exposure. Note that there are women who
contributed years to the analyses of both periods.
Next, socio-economic and demographic informa-
tion on the couples was extracted from the popula-
tion registers. Continuous population registers*/
bound documents with non-removable pages*/
were prescribed in the Netherlands by a royal decree
of 22 December 1849, to record the population
residing within each municipality. The returns from
the census of 1849 were copied into the population
register, and from then on all changes occurring in
the population during the following decades were
recorded there. For each individual, the following
details appear in the record: date and place of birth,
relation to the head of the household, sex, marital
status, occupation, and religion. Births after 1909 are
not included in the study.
For the town of Tilburg, Janssens (1994) checked
the accuracy of the population register’s recording of
demographic events by comparing the registration of
births there against the birth registers. At most 0.2
per cent of births were not entered in the population
register, all such cases being children dying soon
after birth. The omission of less than 1 per cent of
births should not significantly affect the conclusions
of the present paper.
Couples are divided into four religious groups
according to the denomination of the husband. The
Dutch Reformed constitute the largest group, with
924 couples. There are 494 Roman Catholic and 613
Jewish couples, the latter mostly Ashkenazim . The
residual category (114 couples) consists of different
groups of Calvinists, such as the Christelijk Gerefor-
meerde Kerken and the Gereformeerde Kerken in
Nederland, small liberal Protestant groups such as the
Evangelisch Luthers Kerkgenootschap, the Remon-
strantse Broederschap, and people without religion.
We used the first occupation listed in the popula-
tion registers. Occupational categories are a far from
perfect basis for a socio-economic stratification of the
population. For example, in the early years of the
population registers they do not indicate whether a
person is an employer, self-employed, or an em-
ployee. In particular, occupations in the trade sector
pose a problem: it is usually impossible to tell whether
a person is a great merchant or just a street trader.
The study used a slightly adapted version of the
socio-economic classification by occupational cate-
gory designed by Giele and van Oenen (1976). This
is based on the relationship of the individual to the
means of production and on the ideas of contem-
poraries about the class structure. The categories
are:
1 Upper class (employers in industry, profes-
sionals, higher civil servants, higher military
personnel);
2 Petite bourgeoisie (shopkeepers, small entre-
preneurs and merchants, self-employed arti-
sans);
3 Lower white-collar (lower-level professionals
and lower-level civil servants, foremen and
supervisors of various kinds);
4 Gardeners and fishermen;
5 Skilled manual workers (craftsmen, skilled
labourers, construction workers, service em-
ployees, lower-level military personnel);
6 Unskilled labourers;
7 Without occupation, and unknown.
26 Jona Schellekens and Frans van Poppel

The different religious groups have different
socio-economic profiles. Jews are over-represented
in the trade and retailing sector (‘petite bourgeoi-
sie’) of The Hague, whereas Catholics and the Dutch
Reformed are more likely than Jews to have work-
ing-class occupations (see Table 1). This does not
mean that Jews were on average better off than
others. Indeed many Jews in the trade and retailing
sector were just street traders living in one of the
poorest neighbourhoods of The Hague (van Creveld
1989). Almost all fishermen were Dutch Reformed,
all living in the coastal village of Scheveningen,
which belongs to the municipality of The Hague.
The following demographic variables are included
in the study: age of the woman; marital duration; a
dummy variable indicating the first year of marriage;
age difference between the woman and her husband;
infant mortality; the number of births, or crude
parity; and the number of surviving children, or net
parity. A set of dummy variables is used to model
the effect of a woman’s age. The dummy variable
indicating the first year of marriage is added to take
into account the fact that some women were
exposed to sexual intercourse and may have con-
ceived before marriage.
In the absence of parity-dependent marital ferti-
lity control, the age pattern of marital fertility
closely follows a standard schedule, a fact which
led Coale and Trussell (1974) to propose to use the
deviation of the age pattern of marital fertility from
such a schedule as a measure of parity-dependent
fertility control. However, fertility control is a
function not only of age but also of marital duration.
For this reason, Page (1977) proposed a model of
marital fertility incorporating both age and marital
duration. Later van Bavel (2003) introduced parity
into the model in order to determine whether the
effect of marital duration on marital fertility is
primarily attributable to parity-dependent fertility
control or to declining coital frequency. The present
study makes use of his method to uncover evidence
for parity-dependent control. Van Bavel’s model
includes both net and crude parity. Net parity equals
crude parity minus the number of children who died.
Thus, after controlling for crude parity, the effect of
net parity is exactly the opposite of the effect of the
number of children who died. Although parity-
dependent fertility control is a function of net rather
than crude parity, the inclusion of crude parity is
essential in order to control for fecundability and
secondary sterility. There is a positive correlation
between crude parity and fecundability, while there
is a negative correlation between crude parity and
secondary sterility. Fecundability and secondary
sterility will also influence net parity, but less so
than they do crude parity.
Crude parity is modelled as a count variable, and
net parity by three dummy variables indicating two,
three, and four or more children being alive in the
previous year, one child or none being the reference
category. The death of an infant to a breastfeeding
mother would be expected to shorten the post-
partum infecundable period. To control for this
physiological effect, the study includes a variable
indicating whether an infant death occurred in the
previous year.
When family limitation is practised, the reproduc-
tive behaviour of couples will depend on net parity.
However, net parity is also a function of past levels
of breastfeeding, coital frequency, and contraceptive
use, just as crude parity is. Hence, after controlling
for crude parity and infant mortality, a negative
correlation between net parity and subsequent
fertility suggests the presence of family limitation
in the broadest sense, including parity-dependent
abstinence and reductions in coital frequency. In this
study, crude and net parity are lagged by 1 year (see
the next section, ‘Statistical methods’).
Because the individual’s view of the ideal family
usually encompasses preferences about both number
Table 1 Occupational distribution of male heads of household by religion, The Hague 1860�/1909
Occupational group Dutch Reformed Catholics Jews
Upper class 6.8 3.2 7.4Petty bourgeoisie 17.0 24.5 57.8Lower white collar 6.6 6.1 8.1Horticulture and fishing 7.5 2.4 0.1Skilled labourers 36.3 35.3 13.1Unskilled labourers (reference category) 9.3 9.7 3.7Without occupation and unknown 16.4 18.8 9.8Total 100.0 100.0 100.0Number of cases 1,114 621 727
Source : Population registers of The Hague.
Religious differentials in fertility 27
of children and their distribution by sex, this latter
preference may affect the reproductive behaviour of
couples when family limitation is practised. Pollard
and Morgan (2002) have shown that among Amer-
ican cohorts born between 1915 and 1954 a child of
each sex was often required before parents stopped
childbearing. For the present study, we constructed
two variables, one indicating that the only children
alive in the previous year were boys and the other
that girls were the only children alive. Both same-sex
variables produced similar results. To prevent multi-
collinearity with net parity we excluded the ‘only
boys’ variable from the model.
The study comprises women who married in The
Hague only. Thus, all the women went through at
least a partial process of socialization in an urban
area before marriage. It is not possible to differ-
entiate between migrants and locally born mothers,
which is a shortcoming in our analysis since it has
been shown that migrant status is related to fertility
control in urban settings (Alter 1988, p. 193).
However, if the omission of this variable does not
affect the coefficients of the other variables in the
analysis, it should not affect our conclusions.
Statistical methods
A discrete-time multi-level hazard model is used to
assess the effects of the independent variables on the
probability of giving birth (Barber et al. 2000). On
the first level we have years and on the second
women. It is now an accepted procedure to estimate
discrete-time hazard models using logistic regression
(Efron 1988). A logistic regression can easily accom-
modate two common features of event histories:
censored data and time-varying variables such as
crude and net parity (Allison 1982).
Event-history models were initially developed in
the health sciences, where the canonical study is one
of mortality. By contrast, the nature of fertility is
that births are repeatable events. Because the focus
of the present study is not any specific interval but
rather fertility levels in general, intervals were
pooled, turning the model into a repeated-events
duration model (Box-Steffensmeier and Zorn 2002).
The use of logistic regression to estimate the
repeated-events history model effectively turns this
analysis into a binary time-series cross-section ana-
lysis, in which binary time series for women are
pooled. Researchers typically analyse time-series
cross-section data with a binary dependent variable
assuming temporal independence. However, obser-
vations in a time series are likely to be temporally
dependent, and ignoring this may lead to misleading
results (Beck et al. 1998). The simple solution used
here is to add a lagged dependent variable. A
random effect was added to the model in order to
control for unobserved heterogeneity between wo-
men (Amemiya 1985, pp. 348�/52; Yamaguchi 1986).
MIXNO, a computer program for mixed-effects
logistic regression, was used to estimate the coeffi-
cients (Hedeker 1999).
Since we do not censor intervals (after 5 years, for
example) but follow all married women, including
infertile ones, until the end of their marriages, or
until age 50, or, depending on the period, until 1880
or 1910*/whichever comes first*/last intervals can
be quite long. Moreover, unlike deaths, births cannot
occur every month. Hence, we opted for annual
rather than monthly intervals. The model, therefore,
assumes that the hazard for a birth is constant within
annual intervals, but is otherwise unconstrained.
There is some chance that a woman will have two
births in a calendar year. However, we found that
less than 0.5 per cent of second and higher-order
births occurred during the same calendar year as the
previous birth. The dependent variable in the model
is the log odds of a woman giving birth in a specific
calendar year.
Results
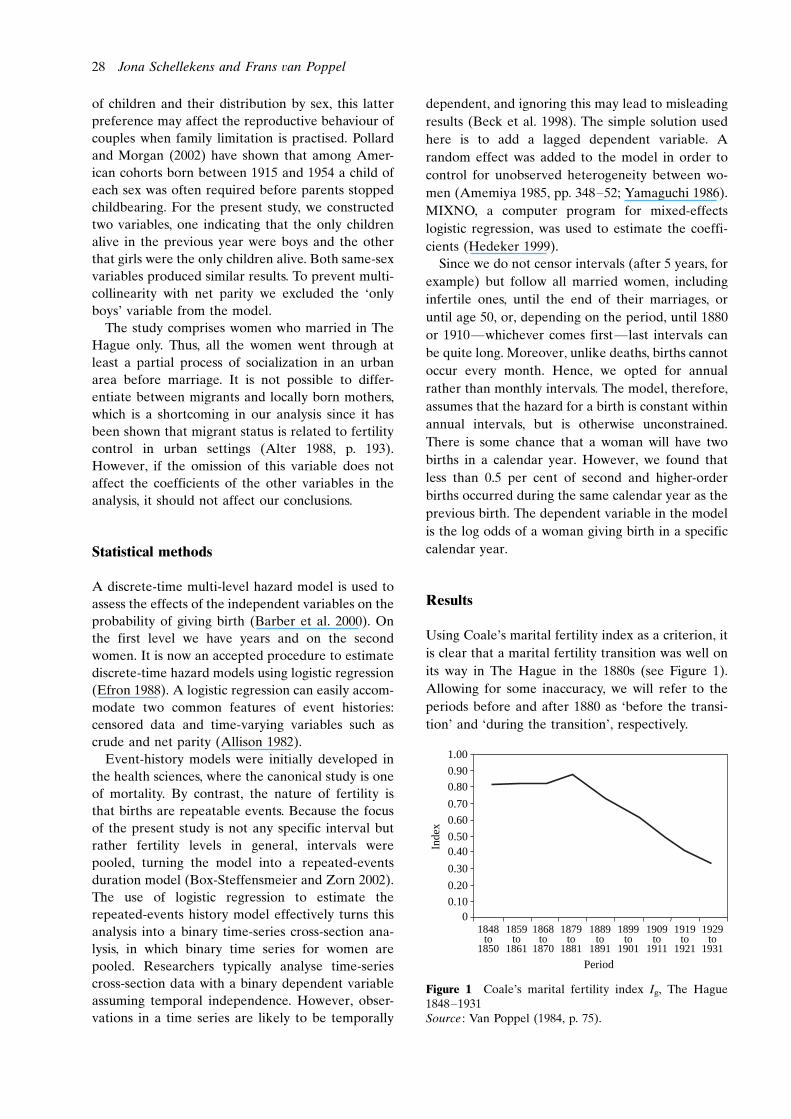
Using Coale’s marital fertility index as a criterion, it
is clear that a marital fertility transition was well on
its way in The Hague in the 1880s (see Figure 1).
Allowing for some inaccuracy, we will refer to the
periods before and after 1880 as ‘before the transi-
tion’ and ‘during the transition’, respectively.
Inde
x
1.00
0.900.80
0.70
0.60
0.500.40
0.30
0.20
0.100
1848to
1850
1859to
1861
1868to
1870
1879to
1881
1889to
1891
1899to
1901
1909to
1911
1919to
1921
1929to
1931
Period
Figure 1 Coale’s marital fertility index Ig, The Hague1848�/1931Source : Van Poppel (1984, p. 75).
28 Jona Schellekens and Frans van Poppel

Table 2 presents age-specific marital fertility by
religion before and during the transition in The
Hague. Before 1880 total marital fertility was high-
est among Jews. In the second period, marital
fertility was highest among Catholics. An analysis
of the shape of the marital fertility function by age
may indicate whether parity-dependent fertility
control accounts for any of these observations. The
age pattern becomes more apparent when the value
for the 20�/24 age group in each schedule is taken as
100, as is done in Figure 2(a) and (b). For compar-
ison, a population with ‘natural fertility’*/the
Hutterites*/has been added to the figures. In the
pre-transition period, the age pattern of Jewish
fertility shows a close resemblance to that of the
Hutterites, suggesting a very low level of parity-
dependent fertility control. Like that of the Hutter-
ites, Jewish fertility shows a pattern of a slow decline
up to the age of 35�/39, falling rapidly thereafter.
This pattern is less clear among the other two
groups, who diverge slightly from the Hutterites,
but not enough to show with any certainty whether
family planning was being practised. Marital fertility
tends to be higher among women who have recently
married, because the first birth interval does not
include a period of post-partum non-susceptibility.
This may explain part of the deviation from the
Hutterite pattern in Figure 2(a) and (b). In the first
period, when Jewish women married earlier than
others on average, such deviations are more likely
among Catholics and the Dutch Reformed, while in
the second period, when Jewish women married
later than others, deviations are more likely to occur
among Jews (see Table 3). For this and other reasons
Table 2 Age-specific marital fertility rates and total marital fertility by religion and period, The Hague 1860�/1909
1860�/79 1880�/1909
Age group Dutch Reformed Catholics Jews Dutch Reformed Catholics Jews
20�/24 0.524 0.547 0.557 0.502 0.507 0.48825�/29 0.455 0.462 0.525 0.423 0.471 0.39430�/34 0.487 0.361 0.442 0.302 0.355 0.31435�/39 0.315 0.338 0.391 0.210 0.261 0.27240�/44 0.161 0.200 0.248 0.137 0.154 0.18245�/49 �/ �/ �/ 0.019 0.026 0.021Total marital fertility 9.5 9.5 10.8 8.0 8.9 8.3Years of exposure 1,477 775 1,562 9,912 5,262 4,942
Source : As for Table 1.
Bir
ths
per
1000
wom
en
1.20
0.80
0.60
0.40
0.20
020–24
Age group
1.00
25–29 30–34 35–39 40–44 45–49
Bir
ths
per
1000
wom
en-y
ears
1.20
0.80
0.60
0.40
0.20
020–24
Age group
1.00
25–29 30–34 35–39 40–44 45–49
Jews Protestants Catholics Hutterites
(a) (b)
Figure 2(a) Indexed age-specific marital fertility rates by religion, The Hague 1860�/1879Note : There are not enough cases in the last age group to estimate marital fertility rates; instead estimates for 1880�/1909are usedSource : Computations based on Table 2.(b) Indexed age-specific marital fertility rates by religion, The Hague 1880�/1909Source : As for Figure 2(a).
Religious differentials in fertility 29

the graphical method may not be sensitive enough to
measure low levels of parity-dependent fertility
control. Below, we will use regression analysis to
show that the Dutch Reformed already practised
this type of fertility control before the transition.
When couples can use some method of family
limitation, they make efforts to reduce or cease
further childbearing and thus lower fertility when
they reach their desired family size. For this reason,
fertility falls more rapidly as age, and thus parity,
increases (Wilson 1984, p. 229). Figure 2(b) shows
that marital fertility among the Dutch Reformed
declined at a similar speed both before and after the
age of 35�/39. This is clear evidence of the practise of
family limitation after 1880 among the Dutch
Reformed. Figure 2(b) suggests that family limita-
tion was also practised among Catholics and Jews
but may have been less widespread among them.
Table 4 presents descriptive statistics by period for
the variables used in the discrete-time event-history
analysis. Note that many women who married in the
first period continue to contribute years of exposure
to the second. This and its longer duration explain
the second period’s relatively high mean values of
crude and net parity and marital duration.
Table 5 presents three models of a discrete-time
event-history analysis of births before the transition.
The first model shows that there is no significant
difference between Catholics and Protestants during
the pre-transition period, while the odds of a birth
among Jews are significantly higher than among
Protestants. The effect of being Jewish does not
change, and remains significant in the second model
after occupational categories are added. Upper-class
and lower-white-collar families have lower fertility
than the families of unskilled labourers. This finding
is consistent with the theory that high fertility is a
strategy adopted by working-class families to cope
with life-cycle poverty (see Schellekens 1993). The
third model adds infant mortality and crude and net
parity. All three have a significant effect. Note that
the inclusion of these variables reduces heterogene-
ity, as well as the effects of the occupational
categories. Yet the effect of being Jewish does not
diminish.
Table 6 shows evidence for parity-dependent
fertility control among the Dutch Reformed before
1880. In a one-sided test, having two children in the
previous year has an effect that is significant at the 5-
per-cent level. No evidence of parity-dependent
fertility control among Catholics or Jews is revealed.
If anything may be inferred from the shape of the
marital fertility function in Figure 2(a), it may be
that the relatively high fertility of Jews before the
transition was due to a low level of parity-dependent
fertility control. But we cannot exclude other
explanations, except for one*/late marriage among
Jews that may be associated with a slower decline in
coital frequency or level of contraceptive use as
women age. First, age at marriage is controlled for
indirectly by including marital duration and age.
Second, Jewish women married relatively early in
the pre-transition period compared with non-Jews
(see Table 3).
In any case, the analysis does not provide any
evidence of Jews having a higher level of parity-
dependent fertility control before the transition than
other groups. Without such evidence, the hypothesis
that Jews were forerunners in the transition cannot
be supported in the case of nineteenth-century The
Hague.
The first model in Table 7 shows that there is no
significant difference between Protestants and Jews
during the transition, while the odds of a birth
among Catholics are significantly higher than among
Protestants. The effect of being Catholic does not
change, and remains significant in the second model
after the inclusion of dummy variables for the
occupational categories. Again, upper-class and
lower-white-collar families have lower fertility than
those of unskilled labourers. Differences in infant
mortality, crude and net parity, and sex composition
Table 3 Mean age at first marriage of women by religion and period, and age at last birth by religion, The Hague1860�/1902
Age at first marriage Age at last birth
1860�/79 1880�/1902
Religion Mean n Mean n Mean n
Dutch Reformed 26.0 254 25.1 670 38.3 195Roman Catholic 26.3 136 25.3 358 39.7 90Jewish 25.5 212 25.7 401 40.9 69Others 27.0 26 25.6 88 37.5 25
Source : As for Table 1.
30 Jona Schellekens and Frans van Poppel

account for some of the difference between Catho-
lics and Protestants, because the effect of being
Catholic is smaller in the third model. The decline in
this effect is mostly due to the inclusion of net parity
and sex composition rather than infant mortality
(results not shown). Part of the effect of being
Catholic seems therefore to be due to differences in
parity-specific fertility control. Note that about half
of the heterogeneity is explained by infant mortality
and crude and net parity.
While differences in socio-economic characteris-
tics do not seem to account for much of the effect of
religion in either period, there may be religious
differentials in the coefficients of occupational
categories. Hence, the religious groups are analysed
separately. Table 8 presents three models of discrete-
time event-history analyses of births for each of the
three major religious groups during the transition.
The effects of the occupational categories vary
among religious groups, with no significant effect
among Catholics. Differences among the occupa-
tional categories in this period are thought to be due
to differences in fertility control (Schellekens 1993).
Thus, the absence of any significant effect among
Catholics suggests a low level of fertility control
during the transition (see also Figure 2(b)), as well
Table 4 Descriptive statistics for all variables used in a study of religious differentials in marital fertility in The Hague1860�/1909, by period
Variable 1860�/79 1880�/1909
Mean1 SD Mean1 SD
Birth 0.377 0.485 0.277 0.447
Religion
Dutch Reformed (ref.) 0.388 �/ 0.471 �/
Roman Catholic 0.200 0.400 0.249 0.433Jewish 0.384 0.486 0.236 0.425Others 0.028 0.165 0.044 0.205
Demographic variablesAge of woman:
B/25 0.160 �/ 0.099 �/
25�/29 0.313 0.464 0.222 0.41630�/34 0.267 0.443 0.249 0.43335�/39 0.158 0.365 0.202 0.40240�/44 0.102 0.303 0.142 0.34945�/ �/ �/ 0.086 0.280
Marital duration 5.105 4.519 8.842 6.463Age difference 1.557 4.480 1.444 4.092First year of marriage 0.145 0.352 0.068 0.252Birth in t�/1 0.305 0.460 0.260 0.439Infant death in t�/1 0.048 0.214 0.035 0.185Crude parity in t�/1 2.059 2.134 3.181 2.700Net parity in t�/1:
0�/1 0.572 �/ 0.367 �/
2 0.184 0.388 0.206 0.4053 0.119 0.324 0.144 0.3514�/ 0.125 0.331 0.283 0.450
Daughters only in t�/1 �/ �/ 0.330 0.470
Occupational groupUpper class 0.110 0.313 0.064 0.245Petite bourgeoisie 0.337 0.473 0.298 0.457Lower white collar 0.095 0.293 0.065 0.247Gardeners and fishermen 0.030 0.170 0.057 0.232Skilled manual workers 0.334 0.472 0.348 0.476Unskilled labourers (reference category) 0.059 �/ 0.081 �/
Without occupation and unknown 0.035 0.185 0.087 0.282Number of women 584 1,778Woman-years 4,584 22,645
1Means of woman-years; the averages for the two periods are not comparable owing to differences in marital duration.Source : As for Table 1.
Religious differentials in fertility 31

as a strong religious influence touching all parts of
the community. The strongest effects are seen
among Jews. This could be a result of relatively
large social inequalities and not necessarily a higher
level of fertility control. However, caution is neces-
sary when comparing logistic regression coefficients
across groups. Differences in the degree of residual
variation across groups can produce apparent differ-
ences in coefficients that are not indicative of true
differences in causal effects (Allison 1999).
Those among the Dutch Reformed and Catholics
who use parity-dependent control seem to do so
usually after having had two children, while Jews
seem to do so after reaching a net parity of either
two or three. Note the relatively high likelihood of
births among Dutch Reformed families with four or
more children; we suspect that most of these are
fundamentalist families. The effect of sex composi-
tion is significant only among the Dutch Reformed.
Conclusion and discussion
Coale’s marital fertility index cannot be used for
reliable dating of the early stages of a marital
fertility transition (Guinnane et al. 1994). The
Table 5 Discrete-time event-history analysis of births, The Hague 1860�/79
Variable Model 1 Model 2 Model 3
eb p-value eb p-value eb p-value
ReligionDutch Reformed 1.000 �/ 1.000 �/ 1.000 �/
Roman Catholic 0.929 0.568 0.878 0.322 0.937 0.525Jewish 1.262 0.031 1.256 0.055 1.238 0.020Others 0.864 0.607 0.943 0.822 1.139 0.517
Demographic variables
Age of woman:B/25 1.000 �/ 1.000 �/ 1.000 �/
25�/29 0.852 0.212 0.868 0.271 0.896 0.36630�/34 0.792 0.133 0.835 0.246 0.855 0.25335�/39 0.669 0.035 0.722 0.091 0.724 0.04840�/ 0.226 0.000 0.247 0.000 0.266 0.000
Marital duration 0.922 0.000 0.918 0.000 0.795 0.000Age difference 1.000 0.968 1.005 0.688 0.999 0.911First year of marriage 0.104 0.000 0.104 0.000 0.121 0.000Birth in t�/1 0.244 0.000 0.243 0.000 0.204 0.000Infant death in t�/1 3.940 0.000Crude parity in t�/1 1.433 0.000Net parity in t�/1:
0�/1 1.000 �/
2 0.892 0.2763 0.918 0.5864�/ 1.082 0.692
Occupational groupUpper class 0.518 0.005 0.625 0.013Petite bourgeoisie 0.896 0.620 0.943 0.731Lower white collar 0.552 0.014 0.665 0.030Gardeners and fishermen 0.702 0.302 0.760 0.287Skilled manual workers 0.877 0.546 0.940 0.712Unskilled labourers 1.000 �/ 1.000 �/
Without occupation and unknown 0.844 0.624 0.852 0.555Intercept 2.260 0.000 2.786 0.000 2.450 0.000
SD random effect 0.655 0.000 0.630 0.000 0.093 0.404Number of births 1,730 1,730 1,730Woman-years 4,584 4,584 4,584
�/2 Log likelihoodInitial 6,076.337 6,076.337 6,076.337Final 5,407.976 5,387.788 5,260.277
Source : As for Table 1.
32 Jona Schellekens and Frans van Poppel

regression analyses presented here provide addi-
tional evidence for this, since some degree of parity-
dependent fertility control can be seen before 1880
among the largest of the three major religious
groups in The Hague. Although our characterization
of the periods before and after 1880 as, respectively,
‘before the transition’ and ‘during the transition’ is
not entirely accurate, we have kept 1880 as a
dividing point, because religious differentials in
marital fertility in The Hague show a divide around
this time.
There are no significant differences between
Catholics and Protestants for the period before the
transition. Marital fertility for these two groups only
started to diverge in the 1880s, Catholics lagging
behind other religious groups. After controlling for
occupational categories, the coefficient of being
Catholic remains almost unaffected. This lends
support to the argument that the characteristics
hypothesis does not explain the relatively high
fertility of Catholics. Perhaps there are socio-eco-
nomic variables not included in our analysis that are
not correlated at all with the occupational-category
variables and account for some of the differentials.
However, if this is not the case, then two possible
explanations remain: the religious-values hypothesis
and the minority-group-status hypothesis. The pre-
sent analysis does not enable us to differentiate
between them. Although the low level of parity-
specific fertility control among Catholics during this
period seems at least partly to explain their rela-
tively high marital fertility, the study does not enable
us to test Meurkens’ breastfeeding hypothesis.
However, judging by the 1908 report of the local
Table 6 Discrete-time event-history analysis of births by religion, The Hague 1860�/79
Variable Roman Catholic Dutch Reformed Jewish
eb p-value eb p-value eb p-value
Demographic variablesAge of woman:
B/25 1.000 �/ 1.000 �/ 1.000 �/
25�/29 0.703 0.128 0.859 0.367 1.045 0.81030�/34 0.509 0.012 1.083 0.683 0.887 0.56035�/39 0.542 0.063 0.678 0.105 0.866 0.57640�/ 0.257 0.005 0.275 0.000 0.280 0.000
Marital duration 0.878 0.001 0.786 0.000 0.737 0.000Age difference 0.975 0.199 1.002 0.903 0.997 0.819First year of marriage 0.141 0.000 0.172 0.000 0.055 0.000Birth in t�/1 0.297 0.000 0.259 0.000 0.132 0.000Infant death in t�/1 3.941 0.000 3.007 0.000 5.314 0.000Crude parity in t�/1 1.212 0.062 1.443 0.000 1.624 0.000Net parity in t�/1:
0�/1 1.000 �/ 1.000 �/ 1.000 �/
2 1.029 0.908 0.740 0.083 0.948 0.7703 1.043 0.910 0.759 0.271 0.956 0.8484�/ 0.988 0.983 0.959 0.897 1.098 0.770
Occupational group
Upper class 0.369 0.085 0.722 0.175 0.456 0.013Petit bourgeoisie 0.757 0.547 1.045 0.835 0.758 0.315Lower white collar 0.593 0.338 0.785 0.332 0.508 0.033Gardeners and fishermen 0.621 0.417 0.829 0.510 �/ �/
Skilled manual workers 0.728 0.476 1.058 0.771 0.756 0.357Unskilled labourers 1.000 �/ 1.000 �/ 1.000 �/
Without occupation and unknown 0.892 0.845 0.929 0.826 0.530 0.145Intercept 2.931 0.025 2.127 0.001 4.698 0.000
Number of births 328 651 708Woman-years 919 1,777 1,759
�/2 Log likelihood
Initial 1,197.676 2,334.918 2,371.177Final 1,071.727 2,056.261 1,932.929
Note : The random-effect variance cannot be reliably estimated as being different from zero.Source : As for Table 1.
Religious differentials in fertility 33

health commission (Gezondheidscommissie 1912),
low levels of breastfeeding are a less likely explana-
tion of the relatively high level of marital fertility
among Catholics in The Hague.
If the present results may be taken at face value,
The Hague’s Jews had above-average marital ferti-
lity before the transition. As far as we can tell, this
was not due to their occupational characteristics, but
our analysis is inconclusive about the proximate
reason. A graphical analysis of the shape of the
marital fertility function suggests a low level of
parity-dependent fertility control, as do our regres-
sion results. However, differences in parity-depen-
dent fertility control are unlikely to have been large
before 1880. This leaves low levels of non-parity-
specific fertility control (spacing) or breastfeeding or
both as the most likely proximate explanations. The
1908 health commission’s report indicated relatively
small religious differentials in breastfeeding patterns
(Gezondheidscommissie 1912). Breastfeeding pat-
terns, however, probably changed during the transi-
tion, and religious differentials may therefore have
Table 7 Discrete-time event-history analysis of births, The Hague 1880�/1909
Variable Model 1 Model 2 Model 3
eb p-value eb p-value eb p-value
ReligionDutch Reformed 1.000 �/ 1.000 �/ 1.000 �/
Roman Catholic 1.276 0.001 1.292 0.000 1.176 0.001Jewish 1.026 0.718 1.097 0.231 1.069 0.215Others 0.807 0.185 0.876 0.406 0.912 0.407
Demographic variables
Age of woman:B/25 1.000 �/ 1.000 �/ 1.000 �/
25�/29 0.863 0.054 0.880 0.093 0.918 0.22030�/34 0.612 0.000 0.636 0.000 0.690 0.00035�/39 0.495 0.000 0.525 0.000 0.578 0.00040�/44 0.329 0.000 0.354 0.000 0.405 0.00045�/ 0.044 0.000 0.048 0.000 0.070 0.000
Marital duration 0.889 0.000 0.886 0.000 0.789 0.000Age difference 0.967 0.000 0.973 0.001 0.979 0.000First year of marriage 0.112 0.000 0.112 0.000 0.127 0.000Birth in t�/1 0.262 0.000 0.262 0.000 0.249 0.000Infant death in t�/1 2.608 0.000Crude parity in t�/1 1.428 0.000Net parity in t�/1:
0�/1 1.000 �/
2 0.743 0.0003 0.912 0.1744�/ 1.079 0.389
Daughters only in t�/1 1.259 0.000
Occupational group
Upper class 0.571 0.001 0.724 0.006Petite bourgeoisie 0.798 0.063 0.872 0.114Lower white collar 0.639 0.004 0.790 0.033Gardeners and fishing 1.227 0.263 1.137 0.304Skilled manual workers 0.866 0.225 0.899 0.210Unskilled labourers 1.000 �/ 1.000 �/
Without occupation and unknown 0.668 0.006 0.768 0.009Intercept 2.359 0.000 2.782 0.000 2.027 0.000
SD random effect 0.927 0.000 0.913 0.000 0.420 0.000Number of births 6,268 6,268 6,268Woman-years 22,645 22,645 22,645
�/2 Log likelihoodInitial 26,716.563 26,716.563 26,716.563Final 22,830.025 22,797.334 22,275.705
Source : As for Table 1.
34 Jona Schellekens and Frans van Poppel

been larger before 1880. To what extent the rela-
tively high fertility of Jews before the transition was
due to their being a minority group we cannot tell. In
any case, the absence of evidence of a relatively high
level of parity-dependent fertility control means that
the Jews in The Hague in the nineteenth century are
unlikely to have been ‘forerunners’ in the marital
fertility transition.
Before and during the transition, Jewish infant
and child mortality in Europe as well as The Hague
was lower than that of most other religious groups
(van Poppel et al. 2002). Demographic transition
theory would predict an early fertility decline among
Jews in such a case, all else being equal. This is
indeed what several authors claim happened. Livi-
Bacci (1986) describes Jews as forerunners in the
fertility decline in Italy. An early fertility decline has
also been ascribed to German Jews (Knodel 1974).
However, Derosas (2003, p. 114) finds no evidence
of an early fertility decline among Venetian Jews.
Furthermore, one of the few German family-recon-
stitution studies to compare Jews with other reli-
gious groups does not fit this characterization. For
couples who married before 1830, the marital
fertility of Protestants in the village of Nonnenweier
already shows a large deviation from the Hutterite
age pattern, while the first signs of family planning
among local Jews only become visible among
couples who married in the 1840s (Goldstein 1981,
p. 132, Table 8). The results shown in the present
study raise further doubts about the special
characteristics of Jews during the marital fertility
Table 8 Discrete-time event-history analysis of births by religion, The Hague 1880�/1909
Variable Roman Catholic Dutch Reformed Jewish
eb p-value eb p-value eb p-value
Demographic variablesAge of woman:
B/25 1.000 �/ 1.000 �/ 1.000 �/
25�/29 1.040 0.743 0.830 0.036 0.943 0.62530�/34 0.743 0.025 0.603 0.000 0.850 0.22635�/39 0.612 0.002 0.498 0.000 0.829 0.23640�/44 0.405 0.000 0.416 0.000 0.546 0.00245�/ 0.094 0.000 0.077 0.000 0.073 0.000
Marital duration 0.779 0.000 0.777 0.000 0.760 0.000Age difference 0.993 0.408 0.966 0.000 0.991 0.335First year of marriage 0.145 0.000 0.145 0.000 0.149 0.000Birth in t�/1 0.281 0.000 0.253 0.000 0.256 0.000Infant death in t�/1 2.553 0.000 2.790 0.000 2.580 0.000Crude parity in t�/1 1.489 0.000 1.469 0.000 1.606 0.000Net parity in t�/1:
0�/1 1.000 �/ 1.000 �/ 1.000 �/
2 0.788 0.024 0.776 0.002 0.643 0.0003 0.878 0.311 1.060 0.563 0.789 0.0854�/ 0.979 0.900 1.430 0.006 0.926 0.683
Daughters only in t�/1 1.016 0.673 1.229 0.002 0.973 0.532
Occupational groupUpper class 1.014 0.951 0.856 0.224 0.491 0.000Petite bourgeoisie 1.046 0.705 0.870 0.162 0.674 0.011Lower white collar 0.953 0.800 0.698 0.006 0.695 0.057Gardeners and fishermen 1.287 0.234 1.096 0.395 �/ �/
Skilled manual workers 1.148 0.218 0.858 0.085 0.600 0.003Unskilled labourers 1.000 �/ 1.000 �/ 1.000 �/
Without occupation and unknown 0.983 0.903 0.785 0.035 0.607 0.045Intercept 1.862 0.000 2.218 0.000 2.719 0.000
Number of births 1,685 2,823 1,519Woman-years 5,642 10,669 5,342
�/2 Log likelihoodInitial 6,880.065 12,329.351 6,378.512Final 5,731.261 10,159.953 5,463.959
Note : The random-effect variance cannot be reliably estimated as being different from zero.Source : As for Table 1.
Religious differentials in fertility 35

transition. We did not find any evidence of higher
levels of parity-dependent fertility control among
Jews than among the rest of the population before or
during the transition. In some places Jews may have
been forerunners, but this was not a general Eur-
opean phenomenon.
Previous research assembled data on forerunners
in the hope that this would increase our under-
standing of the complex transition of the populations
of Western Europe from high to low marital fertility
(Livi-Bacci 1986, p. 183). However, when religious
groups such as Jews are forerunners in one place but
not in another, religion is unlikely to contribute
much to our understanding of the origins of fertility
declines. Instead, it is more likely to explain leads
and lags in the speed of these declines (Lesthaeghe
and Wilson 1986).
The pace of fertility decline is a relatively un-
explored topic. ‘The classic statements about the
determinants of fertility decline are addressed much
more to the question of why fertility declines than to
how rapidly it declines’ (Casterline 2001, p. 18).
Religion can be a major determinant of the pace of
fertility declines, as the results of this and previous
papers suggest. Whether a particular religion has
any influence depends not only on its values, but also
on the level of commitment of its members. Hence,
future research should try to estimate the pace of
secularization by religion and relate this to the pace
of fertility decline.
Notes
1 Jona Schellekens is at the Hebrew University of
Jerusalem, Department of Sociology and Anthropology,
Mount Scopus, Jerusalem 91905, Israel. E-mail: jona@
vms.huji.ac.il. Frans van Poppel is at the Netherlands
Interdisciplinary Demographic Institute (NIDI), The
Hague, the Netherlands.
2 An earlier version of this paper was presented at the
Annual Meeting of the Social Science History Associa-
tion, November 2003. The authors thank Zvi Eisenbach,
Barbara Okun, and three anonymous referees for their
helpful comments. The research for this paper was
supported by a grant from the Israel Science Founda-
tion, administered by the Israel Academy of Sciences
and Humanities, for a research project entitled ‘Ex-
plaining religious differences during the demographic
transition in Holland: how different were the Jews
and why?’ The data on which this research is based
were collected for a research project entitled ‘Religion
and child mortality in Holland 1860�/1920’. Financial
assistance from the Wellcome Trust is gratefully
acknowledged.
References
Aalberse, P. J. M. 1917. Kindergeboorten en kindersterfte
VI [Births and child deaths, Part VI], Katholiek Sociaal
Weekblad [Catholic Social Weekly] 15(35): 353�/356.
Allison, Paul D. 1982. Discrete-time methods for the
analysis of event histories, Sociological Methodology
13: 61�/98.
Allison, Paul D. 1999. Comparing logit and probit coeffi-
cients across groups, Sociological Methods & Research
28(2): 186�/208.
Alter, George. 1988. Family and the Female Life Course:
The Women of Verviers, Belgium, 1849�/1880 . Madison:
University of Wisconsin Press.
Amemiya, Takeshi. 1985. Advanced Econometrics. Cam-
bridge, MA: Harvard University Press.
Anderson, Barbara. 1986. Regional and cultural factors in
the decline of marital fertility in Europe, in Ansley J.
Coale and Susan Cotts Watkins (eds.), The Decline of
Fertility in Europe . Princeton, NJ: Princeton University
Press, pp. 293�/313.
Barber, Jennifer S., Susan A. Murphy, William G. Axinn,
and Jerry Maples. 2000. Discrete-time multilevel hazard
analysis, Sociological Methodology 30: 201�/235.
Beck, Nathaniel, Jonathan N. Katz, and Richard Tucker.
1998. Taking time seriously: time-series-cross-section
analysis with a binary dependent variable, American
Journal of Political Science 42(4): 1260�/1288.
Box-Steffensmeier, Janet M. and Christopher Zorn. 2002.
Duration models for repeated events, The Journal of
Politics 64(4): 1069�/1094.
Campbell, Flann. 1960. Birth control and the Christian
churches, Population Studies 14(2): 131�/147.
Casterline, John B. 2001. The pace of fertility transition:
national patterns in the second half of the twentieth
century, Population and Development Review 27(Sup-
plement: Global Fertility Transition): 17�/52.
Coale, Ansley J. and T. James Trussell. 1974. Model
fertility schedules: variations in the age structure of
childbearing in human populations, Population Index
40(2): 185�/258.
Derosas, Renzo. 2003. Watch out for the children!
Differential infant mortality of Jews and Catholics in
nineteenth-century Venice, Historical Methods 36(3):
109�/130.
Dumas, Charles (ed.). 1983. Waar Hagenaars Kerkten:
Geschiedenis van de Haagse Kerken Gebouwd voor
1900 [Where People Went to Church in The Hague:
History of Churches in The Hague Built Before 1900] .
Den Haag: Uitgeverij Boekencentrum.
36 Jona Schellekens and Frans van Poppel

Efron, Bradley. 1988. Logistic regression, survival analysis,
and the Kaplan�/Meier curve, Journal of the American
Statistical Association 83(402): 414�/425.
Eisenstadt, Abraham Zvi Hirsch. 1966 (1836). Pitkhei
Teshuvah [a commentary on the Jewish law codex
Shulkhan Arukh], Volume Yoreh De’ah . Jerusalem:
Makhon Khatam Sofer (in Hebrew).
Feldman, David M. 1968. Marital Relations, Birth Control,
and Abortion in Jewish Law. New York: Schocken.
Gezondheidscommissie. 1912. Sterfte in Verband met
Voedingswijze en Sociale Omstandigheden onder de
Kinderen beneden het Jaar in 1908 Geboren te ’s-
Gravenhage en Scheveningen, Deel I, Aflevering I.
Vervolg [Mortality Related to Method of Feeding and
Social Circumstances among Children Below Age One
Year in 1908 Born in The Hague and Scheveningen,
Volume I, Issue I. Continued] . The Hague: Gezond-
heidscommissie.
Giele, J. and G. J. van Oenen. 1976. Theorie en praktijk
van het onderzoek naar de sociale struktuur [Theory
and practice in research on social structure], Tijdschrift
voor Sociale Geschiedenis 5(2): 167�/186.
Goldscheider, Calvin. 1967. Fertility of the Jews, Demo-
graphy 4(1): 196�/209.
Goldscheider, Calvin. 1971. Population, Modernization,
and Social Structure . Boston: Little, Brown.
Goldstein, Alice. 1981. Some demographic characteristics
of village Jews in Germany: Nonnenweier, 1800�/1931,
in Paul Ritterband (ed.), Modern Jewish Fertility.
Leiden: E. J. Brill, pp. 112�/143.
Guinnane, Timothy W., Barbara S. Okun, and James
Trussell. 1994. What do we know about the timing of
fertility transitions in Europe?, Demography 31(1): 1�/
20.
Hedeker, Donald. 1999. MIXNO: a computer program for
mixed-effects nominal logistic regression, Journal of
Statistical Software 4(5): 1�/92.
Hull, Isabel V. 1996. Sexuality, State, and Civil Society in
Germany, 1700�/1815 . Ithaca, NY: Cornell University
Press.
Janssens, Jacqueline. 1994. Family and Social Change: The
Household as a Process in an Industrializing Commu-
nity. Cambridge: Cambridge University Press.
Knodel, John E. 1974. The Decline of Fertility in Germany,
1871�/1939 . Princeton, NJ: Princeton University Press.
Lesthaeghe, Ron. 1983. The breast-feeding hypothesis and
regional differentials in infant mortality and marital
fertility: Belgium and the Netherlands during the 19th
Century, Bevolking en Gezin 12(3): 61�/84 (in Dutch
with English abstract).
Lesthaeghe, Ron and Chris Wilson. 1986. Modes of
production, secularization, and the pace of the fertility
decline in Western Europe, 1870�/1930, in Ansley J.
Coale and Susan Cotts Watkins (eds.), The Decline of
Fertility in Europe . Princeton, NJ: Princeton University
Press, pp. 261�/292.
Livi-Bacci, Massimo. 1986. Social-group forerunners of
fertility control in Europe, in Ansley J. Coale and Susan
Cotts Watkins (eds.), The Decline of Fertility in
Europe . Princeton, NJ: Princeton University Press, pp.
182�/200.
McQuillan, Kevin. 2004. When does religion influence
fertility?, Population and Development Review 30(1):
25�/56.
Meurkens, P. C. G. 1989. Kinderrijk en katholiek: De
stijging van de huwelijksvruchtbaarheid in het Kem-
penland, 1840�/1920 [Many children and Catholic: the
increase in marital fertility in Kempenland, 1840�/
1920], in G. J. M. van den Brink, A. M. D. van der
Veen, and A. M. van der Woude (eds.), Werk, Kerk en
Bed in Brabant: Demografische Ontwikkelingen in
Oostelijk Noord-Brabant 1700�/1920 [Work, Church
and Bed in Brabant: Demographic Developments in
Eastern North Brabant 1700�/1920] . ’s-Hertogenbosch:
Stichting Brabantse Regionale Geschiedbeoefening,
pp. 117�/130.
Page, Hillary J. 1977. Patterns underlying fertility sche-
dules: a decomposition by both age and marriage
duration, Population Studies 31(1): 85�/106.
Petersen, William. 1961. Population . New York: Macmil-
lan.
Pollard, Michael S. and S. Philip Morgan. 2002. Emerging
parental gender indifference? Sex composition of
children and the third birth, American Sociological
Review 67(4): 600�/613.
Roling, Hugo Q. 1987. ‘De Tragedie van het Geslacht-
sleven’: Dr. J. Rutgers (1850�/1924) en de Nieuw-Mal-
thusiaansche Bond (Opgericht 1881) [‘The Tragedy of
Sex’: Dr. J. Rutgers (1850�/1924) and the Neo-Malthu-
sian League (Founded 1881)] . Amsterdam: Van Gen-
nep.
Schellekens, Jona. 1993. Wages, secondary workers, and
fertility: a working-class perspective of the fertility
transition in England and Wales, Journal of Family
History 18(1): 1�/17.
Schrover, Marlou. 1997. The demographic consequences
of changing employment opportunities: women in the
Dutch Meierij in the nineteenth century, The History of
the Family 2(4): 451�/480.
Stokvis, P. R. D. 1987. De Wording van Modern Den Haag:
De Stad en Haar Bevolking van de Franse Tijd tot de
Eerste Wereldoorlog [The Birth of Modern The Hague:
The City and its Population from the French Period until
the First World War] . Zwolle: Uitgeverij Waanders.
van Bavel, Jan. 2003. Does an effect of marriage duration
on pre-transition fertility signal parity-dependent con-
trol? An empirical test in nineteenth-century Leuven,
Belgium, Population Studies 57(1): 55�/62.
Religious differentials in fertility 37

van Creveld, I. B. 1989. De Verdwenen Buurt: Drie Eeuwen
Centrum van Joods Den Haag [The Neighborhood We
Have Lost: Three Centuries of Jewish The Hague] .
Zutphen: Walburg Pers.
van Poppel, Frans. 1984. Stad en platteland in demogra-
fisch perspectief: De Nederlandse situatie in de periode
1850�/1960 [Town and countryside in demographic
perspective: the situation in the Netherlands in the
period 1850�/1960], Intern Rapport 29 . The Hague:
Netherlands Interuniversity Demographic Institute.
van Poppel, Frans. 1985. Late fertility decline in the
Netherlands: the influence of religious denomination,
socio-economic group and region, European Journal of
Population 1(4): 347�/373.
van Poppel, Frans. 1992. Religion and health: Catholicism
and regional mortality differences in nineteenth-cen-
tury Netherlands, Social History of Medicine 5(2): 229�/
253.
van Poppel, Frans, Jona Schellekens, and Aart Liefbroer.
2002. Religious differentials in infant and child mortal-
ity in Holland, 1855�/1912, Population Studies 56(3):
277�/289.
Veldhuijzen, E. 1996. Index op het register van besnijde-
nissen [Index of the register of circumcision]. Unpub-
lished manuscript, Municipal Archives, The Hague.
Voets, B. 1981. Bewaar het Vertrouwde Pand: Het Verhaal
van het Bisdom Haarlem [Preserve the Familiar Pre-
mises: The Story of the Diocese of Haarlem] . Hilver-
sum: Gooi en Sticht.
Westhoff, Hanneke. 1986. Natuurlijk Geboortenregelen in
de Twintigste Eeuw: De Ontwikkeling van de Periodieke
Onthouding door de Nederlandse Arts J. N. J. Smulders
in de Jaren Dertig [Natural Fertility Control in the
Twentieth Century: The Development of Periodical
Abstinence by the Dutch Physician J. N. J. Smulders in
the Thirties] . Baarn: Ambo.
Wilson, Chris. 1984. Natural fertility in pre-industrial
England, 1600�/1799, Population Studies 38(2): 225�/
240.
Yamaguchi, Kazuo. 1986. Alternative approaches to un-
observed heterogeneity in the analysis of repeatable
events, Sociological Methodology 16: 213�/249.
38 Jona Schellekens and Frans van Poppel
Copyright © 2022 FDOKUMEN