Anu Rajasthan LULC YJARE 2013
13
(This is a sample cover image for this issue. The actual cover is not yet available at this time.) This article appeared in a journal published by Elsevier. The attached copy is furnished to the author for internal non-commercial research and education use, including for instruction at the authors institution and sharing with colleagues. Other uses, including reproduction and distribution, or selling or licensing copies, or posting to personal, institutional or third party websites are prohibited. In most cases authors are permitted to post their version of the article (e.g. in Word or Tex form) to their personal website or institutional repository. Authors requiring further information regarding Elsevier’s archiving and manuscript policies are encouraged to visit: http://www.elsevier.com/copyright
-
Upload
teriuniversity -
Category
Documents
-
view
2 -
download
0
Transcript of Anu Rajasthan LULC YJARE 2013

(This is a sample cover image for this issue. The actual cover is not yet available at this time.)
This article appeared in a journal published by Elsevier. The attachedcopy is furnished to the author for internal non-commercial researchand education use, including for instruction at the authors institution
and sharing with colleagues.
Other uses, including reproduction and distribution, or selling orlicensing copies, or posting to personal, institutional or third party
websites are prohibited.
In most cases authors are permitted to post their version of thearticle (e.g. in Word or Tex form) to their personal website orinstitutional repository. Authors requiring further information
regarding Elsevier’s archiving and manuscript policies areencouraged to visit:
http://www.elsevier.com/copyright

Author's personal copy
Influence of land use/land cover (LULC) changes on atmospheric dynamics overthe arid region of Rajasthan state, India
Shailesh Kumar Kharol a,b,*, D.G. Kaskaoutis c, K.V.S. Badarinath a,1, Anu Rani Sharma d, R.P. Singh e
aAtmospheric Science Section, National Remote Sensing Centre, Department of Space-Govt. of India, Balanagar, Hyderabad 500 625, IndiabDepartment of Physics and Atmospheric Science, Dalhousie University, Halifax, CanadacResearch and Technology Development Centre, Sharda University, Greater Noida, NCR 201306, Indiad TERI University, 10 Vasant Kunj Institutional Area, New Delhi 110070, Indiae School of Earth and Environmental Sciences, Schmid College of Science and Technology, Chapman University, Orange, CA 92866, USA
a r t i c l e i n f o
Article history:Received 9 March 2012Received in revised form15 August 2012Accepted 3 September 2012Available online
Keywords:Atmospheric fluxesIndiaLand use/land cover (LULC) changesPrecipitationRajasthanRemote sensing
a b s t r a c t
The present study examines the long-term effects of land use/land cover (LULC) changes in Rajasthanstate, India on land-atmosphere fluxes and, possibly in precipitation and aerosol loading. By comparingthe satellite observations from Landsat MSS (1972e73) and IRS-P6 AWiFS (2006e07) considerable LULCchanges are observed, an increase in crop-land and vegetated areas of w57% in the eastern and w68% inthe western Rajasthan. The increase in agriculture intensification from irrigation activities after theconstruction of the Indira Gandhi canal (IGC) seems to affect the land-atmosphere fluxes, i.e. increase inatmospheric humidity and latent heat and reduction in sensible heat. On the other hand, the multi-decadal variability (1951e2007) in annual rainfall amount and total number of rainy days revealssignificant year-to-year fluctuations, exhibiting a slight increasing trend over arid western Rajasthan.However, the overall analysis shows that the variability in precipitation is much more influenced by thegeneral monsoonal circulation (i.e. meteorological dynamics and intensity of the monsoon) and partlycan be associated with local phenomena, such as LULC changes and modifications in land-atmospherefluxes. Similarly to precipitation, the long-term (1979e2008) aerosol index (AI) variations over theregion seem to be affected by atmospheric and meteorological dynamics and not by LULC changes.
� 2012 Elsevier Ltd. All rights reserved.
1. Introduction
Land use and land cover changes (LULC) are linked to globalclimate change and several other environmental issues concerningland-atmosphere interactions, such as thermal and latent heatfluxes, evapotranspiration and the exchange of greenhouse gasesfrom plants and soil into the atmosphere (IPCC, 2007). The landsurface is an important component of the Earth’s climate system asa source of moisture and energy for the atmosphere and, therefore,any perturbation in land-surface properties can cause significantchanges in the boundary-layer dynamics (Baidya Roy et al., 2003).On the other hand, changes in LC and crop type may affect theprecipitation and hydrological cycle through the partitioning of theincoming solar radiation into turbulent sensible and latent heatfluxes (Bookhagen and Burbank, 2006; Prasad et al., 2007; Sarkaret al., 2007a). Therefore, numerous studies have focused on the
effects of LULC changes in atmospheric properties and processes,such as boundary layer dynamics (Niyogi et al., 1999), convection(Pielke, 2001), mesoscale circulations (Baidya Roy and Avissar,2002), cloudiness and cloud properties (Ray et al., 2003) andprecipitation (Douglas et al., 2009; Marshall et al., 2004; Pielkeet al., 2007; Ray et al., 2006). Thus, on the one hand globalclimate change affects terrestrial ecosystems and, from the other,these ecosystems can also affect the regional climate by impactingnet radiation and surface heat fluxes (Chase et al., 2000; Foley et al.,2003; Pielke et al., 2002).
As a consequence, the linkage between LULC changes andperturbation in atmospheric processes has attracted the attentionof the scientific community. Fall et al. (2010) suggested that LULCchanges produced a significant cooling effect over parts of theUnited States and anthropogenic activities were responsible for themodification in the urban precipitation, primarily due to re-distribution of the local energy budget by expansion of the urbanareas. Baidya Roy et al. (2003) studied the impact of LULC change inUnited States and found reduction in precipitation mainly due tochanges in the large-scale moisture advection patterns. Kaufmanet al. (2007) also established the impact of urbanization in the
* Corresponding author. Department of Physics and Atmospheric Science, Dal-housie University, 6310 Coburg Road, Halifax B3H 3J5, Canada. Tel.: þ1 9024897867.
E-mail address: [email protected] (S.K. Kharol).1 Deceased.
Contents lists available at SciVerse ScienceDirect
Journal of Arid Environments
journal homepage: www.elsevier .com/locate/ jar idenv
0140-1963/$ e see front matter � 2012 Elsevier Ltd. All rights reserved.http://dx.doi.org/10.1016/j.jaridenv.2012.09.006
Journal of Arid Environments 88 (2013) 90e101

Author's personal copy
Pearl River Delta, China and found decrease in rainfall due toincrease in urban areas, primarily affected by changes in surfacehydrology that extend beyond the urban heat island effect andenergy-related emissions (Arnfield, 2003). Moreover, the irrigationimpacts on land-surface fluxes, atmospheric circulation and climatehave been examined (e.g. Kueppers and Snyder, 2012; Zhu et al.,2011).
Furthermore, several modeling studies have been carried out tostudy the impact of LULC changes on regional climate over Indiansub-continent (De Rosnay et al., 2003; Douglas et al., 2006; Loharand Pal, 1995; Subash et al., 2011) suggesting that irrigation alterswater-vapor and energy fluxes on regional and sub-continentalscales. Sarkar and Kafatos (2004) using monthly NormalizedDifference Vegetation Index (NDVI) data for 18 years (1982e2000)over India found a significant linkage between rainfall amount andland-surface temperature with spatial and temporal variations ofvegetation. Recent modeling investigations suggested that majormodifications of the biosphere in the Indian sub-continent influ-ence monsoon circulation and rainfall by altering the surfaceenergy balance, the planetary boundary layer motion fields, themoisture convergence and the hydrological cycle (Douglas et al.,2009), also suggesting that the Indian monsoon was significantlyweakened by both an increase in surface albedo and by a reductionin surface roughness.
India’s economy is strongly related to agriculture, and the crop-land areas over the country feed up to one billion of population.Thus, an effort has been made by Indian planners to use irrigationfor reducing the dependence of agriculture on an erratic andunreliable southwest monsoon, which may be weak in some years,like 2002. Despite various problems faced in the harnessing ofwater resources and management of water, irrigation has emergedas themost effectivemeasure to guard against the adverse effects ofdroughts and dry spells on crop products. The construction of canalirrigation in an area aims essentially at increasing both cropproduction and subsequent economic development. Simulta-neously, it also brings out considerable changes in the environmentand local ecosystems by the way of increased vegetation cover withimproved vigor that affects the microclimate, especially in the aridand semi-arid regions where evapotranspiration exceeds precipi-tation (Douglas et al., 2006).
In the present study, we investigate the influence of LULCchanges caused by the intensification and extensification of canalirrigation on surface heat and moisture fluxes in the arid and semi-arid regions of northwestern India (Rajasthan state), using long-term ground datasets, satellite observations and re-analysis. Inaddition, the present study examines the changes in number ofrainy days, rainfall amount and aerosol loading and their possibleassociation with the LULC changes.
2. Study area
Rajasthan (23�40e30�110 N, 69�290e78�170 E) is the largest statein India with a geographical area of 34.22 million ha (Fig. 1). Theregional climate varies from semi-arid to arid with average annualrainfall ranging from w480 mm to 750 mm with low values(w150 mm) in the western arid region and w1000 mm in south-eastern plateau. Pre-monsoon (AprileJune) is the hottest season ofthe year with temperature varying from 32 �C to 45 �C. In westernRajasthan the air temperature often rises up to 48 �C and theprevailing westerly winds cause dust storms locally known as“Andhi”. During monsoon season (JulyeSeptember), the areareceives w90% of the annual rainfall; however, it often suffersfrom frequent drought due to poor and delayed monsoon rainfall,abnormally high summer-temperature and insufficient waterresources. As a consequence, the arid environment of Rajasthan has
been the subject of studies dealing with remote sensing andGeographic Information System (GIS) monitoring of the quantita-tive modeling of ground water recharge (Bhuiyan et al., 2009a),vegetation indexes and drought dynamics (Bhuiyan et al., 2006)and water stress (Bhuiyan et al., 2009b). The major part of the stateis an arid region comprising 12 districts located in western andnorth-western parts accounting for 61% of the total hot Indian aridzone. The forest area accounts for 7.44% of the state with the majorforest types to be the tropical dry deciduous forest and tropicalthorn forest. The Indira Gandhi canal (IGC) project is one of thebiggest canal projects in India, initiated on 31 March, 1958 with theaim to convert 0.15 million ha of semi-arid and arid desert waste-lands to agriculturally productive areas. IGC covers seven districtsof western Rajasthan namely, Barmer, Bikaner, Churu, Hanu-mangarh, Jaisalmer, Jodhpur and Sriganganagar. The project hasresulted in the improvement in agricultural production andregional development transforming the barren deserts of westernRajasthan into rich and lush fields.
3. Datasets and methodology
3.1. Rainfall data
Information on spatial and temporal variation of rainfall isessential in understanding the hydrological balance on a global/regional scale. Daily gridded rainfall data with a 1� � 1� spatialresolution obtained from the Indian Meteorological Department(IMD) (Rajeevan et al., 2006) were used over the Rajasthan state.The IMD product uses gauge data from 1803 stations to estimateaccumulated rainfall in the 24 h ending 08:30 IST (03:00 UTC)
Fig. 1. Location map of the study area.
S.K. Kharol et al. / Journal of Arid Environments 88 (2013) 90e101 91
Author's personal copy
during the period 1951e2007. IMD uses the Shepard (1968) inter-polation technique for gridding data from individual stations overthe Indian sub-continent. In this method, the interpolated valuesare computed from a weighted sum of the observations. Morespecifically, for a given grid point, the search distance is defined asthe distance from this point to a given station, while the interpo-lation is restricted to the radius of influence. For search distancesequal to or greater than the radius of influence, the grid point valueis assigned a missing code when there is no station located withinthis distance. More details about IMD gridded rainfall datasets hasbeen described elsewhere (Rajeevan et al., 2006). Furthermore, thegridded daily rainfall data over Rajasthan for each year wereanalyzed to identify the number of rainy days. The rainy days weredetected by noting the rainfall values corresponding to each dayand the days with rainfall above “0” were considered as rainy days.The Student’s t-test was used to determine the significance in therainfall trends over eastern and western Rajasthan.
3.2. Satellite data
3.2.1. Landsat-MSSLandsat-1, the first satellite of the United States Landsat
program, was launched in July 1972 and was in operation untilJanuary 1978. Landsat-1 carried two sensor systems: (i) a fourchannel multi-spectral scanner (MSS) system and (ii) a threecamera return beam vidicon (RBV) system. Landsat-MSS sensormakes observations at four spectral bands in the visible and near-IRwavelengths ranging from 0.5 to 1.1 mm (band 4: 0.5e0.6 mm; band5: 0.6e0.7 mm; band 6: 0.7e0.8 mm; band 7: 0.8e1.1 mm). Thespatial resolution is 80 m at nadir covering a swath width of185 � 185 km (Booth and Oldileld, 1988). Landsat MSS data of1972e73 available from (http://glovis.usgs.gov/) website was usedfor the present analysis.
3.2.2. IRS-P6 (RESOURCESAT-1)The Indian Research Satellite (IRS-P6), also known as
Resourcesat-1, was launched in October 2003 and has threesensors, viz., LISS-IV, LISS-III and AWiFS (Gyanesh et al., 2008).AWiFS sensor provides observations in four spectral bands of theelectromagnetic spectrum, i.e. green (0.52e0.59 mm), red (0.62e0.68 mm), NIR (0.77e0.86 mm) and SWIR (1.55e1.70 mm) witha spatial resolution of 56 m and swath width of 740 km.
In the present study, we used a combined analysis of the Landsat-MSS and IRS-P6 AWiFS observations for the periods 1972e73 and2006e07, respectively for the retrieval of the LULC changes overeastern and western Rajasthan. The changes in LULC are criticallylinked to natural and human influences on environment and suchchanges can be observed using current and archived remote sensingdatasets. The maximum likelihood classifier was chosen to allocateeach pixel to its nearest class. The separability and contingencyanalysis of the training sites indicated that all classes werecompletely distinct and about more than 97% of the pixels in thetraining sites were correctly classified. In order to estimate separa-bility between various land-use features the Transformed Diver-gence (TD) distancewas calculated using the relation given in Eq. (1).
TDði; jÞ ¼ 2��1� exp
��Dði; jÞ8
��(1)
where TD (i, j)¼ Transformed Divergence between classes i and j; D(i, j) ¼ divergence between classes i and j
Dði; jÞ ¼ 0:5*T ½MðiÞ�MðjÞ�*½InvSðiÞþ InvSðjÞ*½MðiÞ�MðjÞ��þ0:5*Trace½InvSðiÞ*SðjÞþ InvSðjÞ*SðiÞ�2*I� (2)
where M(i) ¼ mean vector of class i, where the vector has N-channel elements (N-channel is the number of channels used);S(i) ¼ Covariance matrix for class i, which has N-channel by N-channel elements; InvS(i) ¼ inverse of matrix S(i); Trace [] ¼ traceof matrix (sum of diagonal elements); T [] ¼ transpose of matrix;I ¼ identity matrix.
TD is an empirical measure for separability analysis, whichmeasures real values between 0 and 2, where ‘0’ indicates completeoverlap between the signatures of two classes, and ‘2’ indicatesa complete separation between the two classes (Swain and Davis,1978). These measures are monotonically related to classificationaccuracies. TD is calculated from the means and covariancematrices of each training class and is a measure of the statisticaldistance between training group pairs of interest providing infor-mation on their separability (Metternicht and Zinck, 1998).Furthermore, it can be considered as an apriori estimate of thelikelihood of correct classification between groups of differentfeature combinations.
3.2.3. Aerosol index (AI)The UV-absorbing AI is the longest aerosol record since 1978
(Torres et al., 1998) and is suitable for detecting the absorbingaerosols above high reflecting surfaces, such as desert and snow/iceareas (Torres et al., 2007). AI is sensitive to elevated absorbinglayers such as dust and biomass-burning aerosols due to theirstrong dependence on the imaginary part of the refractive index inthe UV (De Graaf et al., 2005). In the present study, the Total OzoneMapping Spectrometer (TOMS) AI values onboard Nimbus 7 (1979e1992) and Earth Probe (1997e2005) as well as the Aura-OMI(Ozone Monitoring Instrument) AI values (Curier et al., 2008)(2006e2008) were obtained over Rajasthan (24�e29�N, 69�e77�E)using the version 8 of TOMS AI algorithm. The spatial resolution forTOMS-AI is 1� � 1.25�, while OMI-AI resolution is 0.25� � 0.25�.
3.3. MERRA re-analysis
Furthermore, the new long-term Modern Era Retrospective-analysis for Research and Applications (MERRA 2D) dataset wasused to obtain some parameters (latent heat, sensible heat, specifichumidity) related to land-atmosphere fluxes. The MERRA 2Ddataset is based on satellite observations and re-analysis allowinga climatological analysis (above 30 years) of several parametersrelated to land, biosphere, hydrosphere and atmosphere over theglobe (Bosilovich et al., 2008). The MERRA is a NASA re-analysis forthe satellite era using a new version (V5) of the Goddard EarthObserving System - Data Assimilation System (GEOS-DAS)(Rienecker et al., 2007; http://gmao.gsfc.nasa.gov/research/merra/intro.php). The MERRA dataset used in the present study includesthe specific humidity at 2 m above surface, the latent and sensibleheat fluxes over Rajasthan during the period 1979e2007 withhorizontal resolution of 2/3 � 1/2� at 72 levels extended from thesurface to the stratosphere. The system employs an incrementalanalysis update (IAU) procedure (Bloom et al., 1996) to eliminatethe shocks that are otherwise associated with the observations.Satisfactory agreement betweenMERRA products and observationsfrom ground-based instruments or satellites has been observedover India (Badarinath et al., 2010; Gautam et al., 2011).
4. Results and discussion
4.1. LULC changes over Rajasthan
LULC studies provide critical inputs to large-scale biomass andforest cover assessments, climate change and other human andenvironmental components (Kaskaoutis et al., 2011a). Fig. 2 shows
S.K. Kharol et al. / Journal of Arid Environments 88 (2013) 90e10192

Author's personal copy
the LULC maps of Rajasthan state during 1972e73 and 2006e07obtained from Landsat-MSS and IRS-P6 AWiFS observations,respectively; the small blank area in Landsat image represents gapin satellite dataset. Significant changes are observed in LULCpattern over Rajasthan during the 34-years time period, especiallyin the desert regions encompassing IGC command area in westernRajasthan. The main differences between the two images areemphasized in the pronounced decrease of the scrubland areas(magenta) in the central-west part of the state and their limitationinto far western regions towards the boarder of Pakistan. Thescrubland and arid areas have been transformed in to crop areas(yellow), which present a considerable increase over central-western Rajasthan, due to irrigation facility provided by the IGCtransforming the barren deserts to green land.
Since the agriculture is the main economic activity in Rajasthan,we emphasized the analysis on the variations in crop-land areas. Tothis respect, we have compared the images of Landsat-MSS and IRS-P6 AWiFS satellites in order to estimate the changes in agriculturearea over the state. The changes in the cover of crop areas arequalitatively presented in Fig. 3, with the largest changes to bedetected over central-west and northwest Rajasthan. The analysisrevealed an increase in crop areas of w57% and w68% over easternandwestern Rajasthan, respectively from 1972e73 to 2006e07. Theanalysis is performed after registering two images and takingdifference of two images to map the agricultural changes usingERDAS IMAGINE software.
Furthermore, we have compared the changes in crop areas overfour different regions of Rajasthan namely A, B, C and D, as shown inFig. 4a. These regions cover different places (Sriganganagar, Churuand Hanumangarh in region A, Jaisalmer, Barmer and Jodhpur inregion B, Jaipur, Dausa, Dhaulpur, Alwar, Bharatpur, Karauli andSwai Madhopur in region C and Rajasmand, Udaipur, Banswara,Dungarpur and Chittaurgarh in region D). Fig. 4b shows the totalcrop areas (in ha) during the periods 1972e73 and 2006e07 as wellas the % increase in crop areas. A large increase is shown for theregions A (w54%) and B (w60%) in western Rajasthan while, theregions C and D in eastern Rajasthan show w14% and w4%,respectively increase in crop areas. The drastic increase of crop
Fig. 2. Land use/land cover map of Rajasthan by means of Landsat-MSS during 1972e73 (left panel) and IRS-P6 AWiFS during 2006e07 (right panel).
Fig. 3. Agriculture crop change image of Rajasthan showing crop increase from 1972e73 to 2006e07.
S.K. Kharol et al. / Journal of Arid Environments 88 (2013) 90e101 93

Author's personal copy
areas in regions A and B is mainly attributed to change in irrigationactivities through IGC canal. Similar to our results, Pandya et al.(2004) also found increase in agriculture activity during the pasttwo decades over the arid regions of western Rajasthan associatedto irrigation by IGC. However, in the 34-years period between thetwo satellite images other parameters, like changes in precipitation,population density, etc may affect the coverage of the crop areas.However, the regions A and B are the driest of Rajasthan with verylow population density and, therefore, the LULC changes are asso-ciated mainly to IGC irrigation project. At any case, for a firmconclusion, more systematic research is needed over areas close toIGC by looking at the land cover before and after irrigation startedthrough IGC.
4.2. Variations in land-atmosphere fluxes
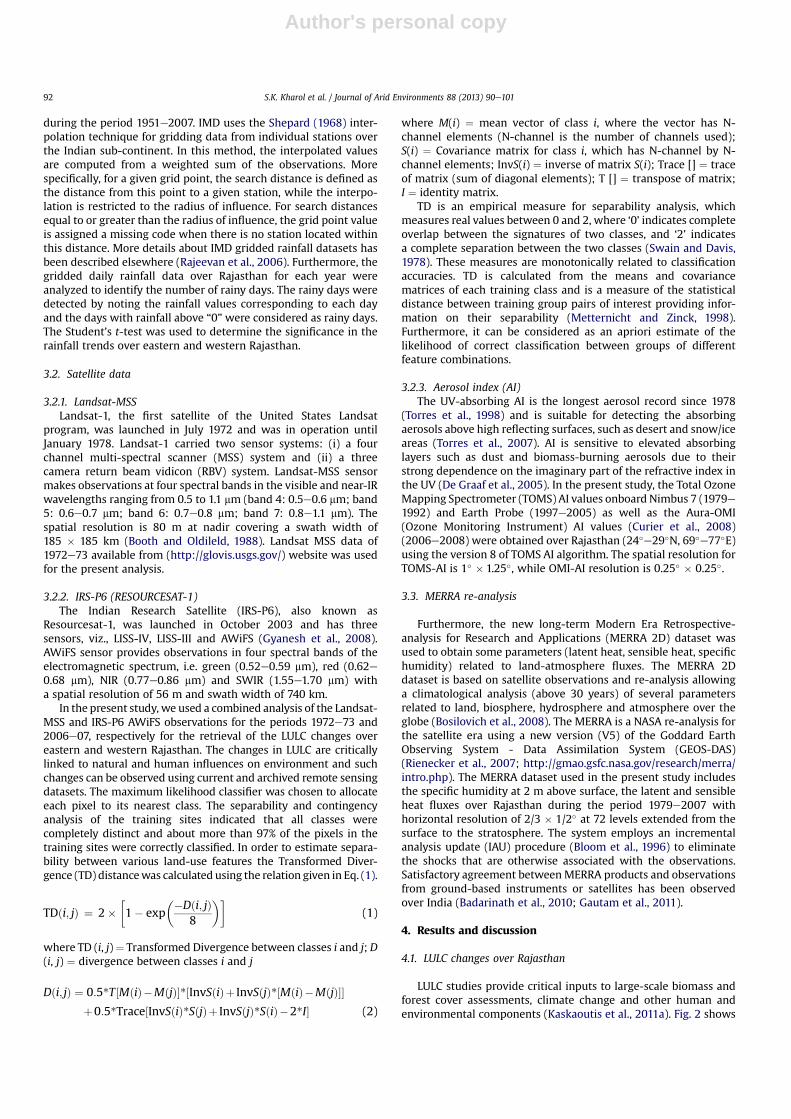
Irrigation in Rajasthan introduces increase in latent heat flux ofw56% over the region (24�e29�N, 69�e77�) as obtained fromregression analysis of the MERRA dataset during the period 1979e2007 (Fig. 5a). The annual variation of the latent heat shows a clearpattern with large values (w70e90 Wm�2) during the wet period(JuneeOctober) and very low (w10 Wm�2) during dry period(DeceMay) (Fig. 5b). In contrast, the percentage (%) differences(% ¼ a*N/x * 100, where a is the slope of the linear regression, N thenumber of years and x the mean of the variable) in the latent heatvalues for the two periods 1979e1993 and 1994e2007 are largerduring the dry season. The increase in latent heat suggests largeravailability of water vapor into the atmosphere, which can beassociated with the expansion of the vegetated areas. On the otherhand, the sensible heat, which is mainly determined by the landtemperature, shows a decreasing trend (w�27%) over the period1979e2007, which may be likely associated with decrease in soiltemperature due to increase in vegetation areas (Fig. 6a). Oppositeto latent heat, the annual variation of the sensible heat flux showslarge values (w80e90 Wm�2) in AprileJune, which are graduallydecreasing towards winter, with a small exception in September(Fig. 6b). The sensible heat flux values over Rajasthan are found tobe much lower during the period 1994e2007 compared to theperiod 1979e1993, with larger differences during monsoon andpost-monsoon (OcteNov) seasons (decrease of �20 to �45%).
Douglas et al. (2006) analyzed the impact of agriculture activityon land-atmosphere interactions through irrigation over India bycomparing estimated evaporation and transpiration from a pre-agricultural and a contemporary land cover. More specifically,they reported an increase of 17% in mean annual water-vapor
0
10
20
30
40
50
60
A B C D0
500000
1000000
1500000
2000000
2500000
3000000
3500000
% I
ncre
ase
Cro
p A
rea
(ha)
Region
LANDSAT MSS (1972-73) IRS-P6 AWiFS (2006-07)
a
b
Fig. 4. Location map of the different regions over east and west Rajasthan consideredfor estimates on variations in crop areas (a). Absolute (in ha) and percent variations intotal crop area between 1972e73 and 2006e07 over the different regions (b).
1980 1984 1988 1992 1996 2000 2004 200810
15
20
25
30
35
40
45
50
Lat
ent H
eat (
W m
)
Year
Y=0.58( .13) x + 22.14( .25)
R =0.42, P=1.48E-4
a b
Jan Feb Mar Apr May Jun Jul Aug Sep Oct Nov Dec0
10
20
30
40
50
60
70
80
90
100
1979-1993 1994-2007 % difference
Month
Lat
ent H
eat (
W m
)
0
5
10
15
20
25
30
35
40
45
50
55
Dif
fere
nce
(%)
±0 ±2
Fig. 5. Multiyear (1979e2007) variation and trend of the latent heat over Rajasthan (24e29�N, 69e77�E) as obtained from MERRA-2D dataset (a) and, mean annual variation and %difference in latent heat for 1979e1993 and 1994e2007 (b).
S.K. Kharol et al. / Journal of Arid Environments 88 (2013) 90e10194
Author's personal copy
fluxes, with 7% increase during JulyeDecember and 55% increaseduring JanuaryeMay, indicating a considerable influence of agri-culture on atmospheric moisture and energy fluxes. Similarly, DeRosnay et al. (2003) found that irrigation plays a vital role in theregional hydrological cycle over the Indian sub-continent affectingthe partitioning of net radiation into latent heat; they found anincrease in latent heat flux up to 9.5% due to irrigated agriculture.Mesoscale circulations that developed over the large irrigated areasassociated with boundary layer wind convergence, can also impactthe rainfall pattern over the region (Douglas et al., 2009; Lee et al.,2009). In addition to variations in surface energy fluxes due tochanges in LULC, the spatial heterogeneity associated with thechanges also influences the rainfall patterns (Lohar and Pal, 1995;Pielke, 2001).
4.3. Variations in humidity
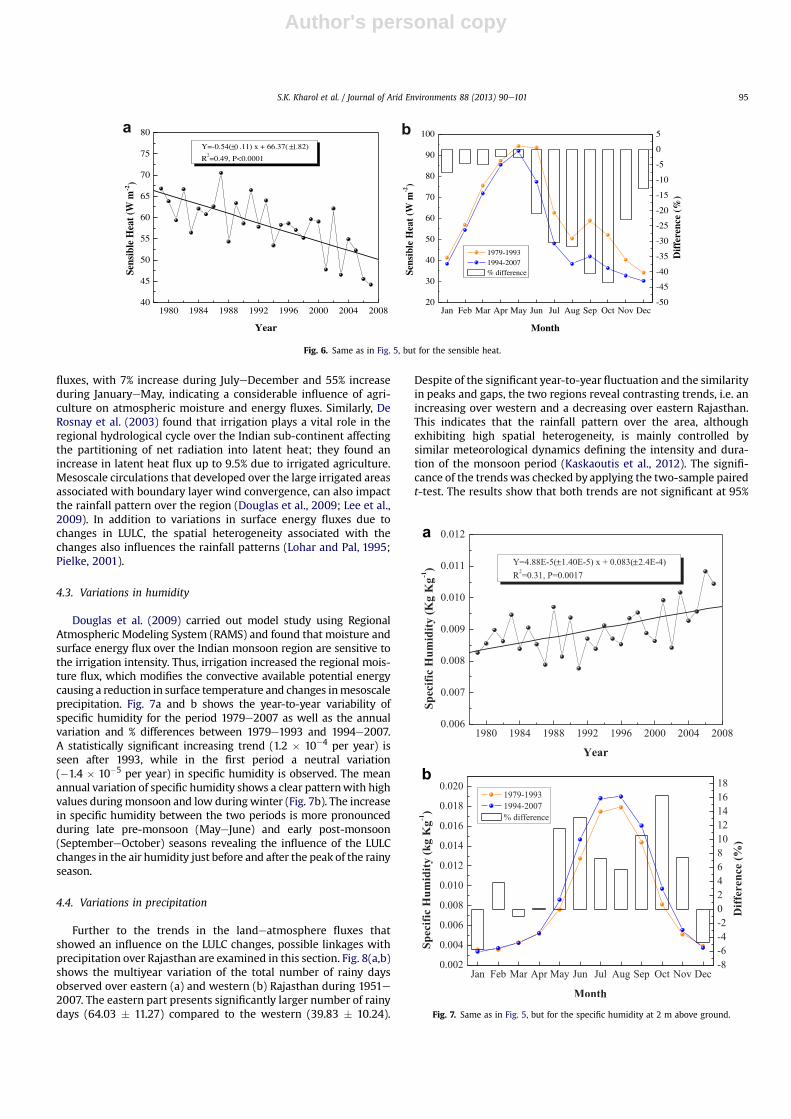
Douglas et al. (2009) carried out model study using RegionalAtmospheric Modeling System (RAMS) and found that moisture andsurface energy flux over the Indian monsoon region are sensitive tothe irrigation intensity. Thus, irrigation increased the regional mois-ture flux, which modifies the convective available potential energycausing a reduction in surface temperature and changes inmesoscaleprecipitation. Fig. 7a and b shows the year-to-year variability ofspecific humidity for the period 1979e2007 as well as the annualvariation and % differences between 1979e1993 and 1994e2007.A statistically significant increasing trend (1.2 � 10�4 per year) isseen after 1993, while in the first period a neutral variation(�1.4 � 10�5 per year) in specific humidity is observed. The meanannual variation of specific humidity shows a clear patternwith highvalues duringmonsoon and low during winter (Fig. 7b). The increasein specific humidity between the two periods is more pronouncedduring late pre-monsoon (MayeJune) and early post-monsoon(SeptembereOctober) seasons revealing the influence of the LULCchanges in the air humidity just before and after the peak of the rainyseason.
4.4. Variations in precipitation
Further to the trends in the landeatmosphere fluxes thatshowed an influence on the LULC changes, possible linkages withprecipitation over Rajasthan are examined in this section. Fig. 8(a,b)shows the multiyear variation of the total number of rainy daysobserved over eastern (a) and western (b) Rajasthan during 1951e2007. The eastern part presents significantly larger number of rainydays (64.03 � 11.27) compared to the western (39.83 � 10.24).
Despite of the significant year-to-year fluctuation and the similarityin peaks and gaps, the two regions reveal contrasting trends, i.e. anincreasing over western and a decreasing over eastern Rajasthan.This indicates that the rainfall pattern over the area, althoughexhibiting high spatial heterogeneity, is mainly controlled bysimilar meteorological dynamics defining the intensity and dura-tion of the monsoon period (Kaskaoutis et al., 2012). The signifi-cance of the trendswas checked by applying the two-sample pairedt-test. The results show that both trends are not significant at 95%
1980 1984 1988 1992 1996 2000 2004 200840
45
50
55
60
65
70
75
80Se
nsib
le H
eat (
W m
)
Year
Y=-0.54( .11) x + 66.37( .82)
R =0.49, P<0.0001
Jan Feb Mar Apr May Jun Jul Aug Sep Oct Nov Dec20
30
40
50
60
70
80
90
100
1979-1993 1994-2007 % difference
Month
Sens
ible
Hea
t (W
m)
-50
-45
-40
-35
-30
-25
-20
-15
-10
-5
0
5
Dif
fere
nce
(%)
±0 ±1
a b
Fig. 6. Same as in Fig. 5, but for the sensible heat.
a
b
± ±
Fig. 7. Same as in Fig. 5, but for the specific humidity at 2 m above ground.
S.K. Kharol et al. / Journal of Arid Environments 88 (2013) 90e101 95

Author's personal copy
confidence level and are influenced by extreme values (high andlow) in specific years like 1997, 2002, 2006, etc. Except of this,a pronounced increasing trend in number of rainy days is observedover both regions from mid-1980s and, more specifically, after thedrought years in the beginning of 2000s. Earlier studies (Basisthaet al., 2007; Gupta, 1996; Pant and Hingane, 1988; Rao et al.,1997) also reported increasing precipitation trends over aridwestern Rajasthan with a remarkable reduction in wind erosionand frequency of dust storms probably attributed to the LULCchanges and increased moisture due to extensive irrigation by IGC(Jaglan and Qureshi, 1996). The increase in soil moisture throughirrigation substantially transforms the existing environmentalconditions, particularly in the moisture-deficient regions of veryfragile ecosystems, helping in improvement of soil structure andraises the soil fertility.
Fig. 9(a and b) shows the multi-decadal variation of the numberof rainy days having rainfall amount <10, 10e25 and >25 mm overeastern and western Rajasthan during the period 1951e2007. Thefrequency for rainfall <10 mm is higher over both regions, whiledays with 10e25 and >25 mm rainfall are rather rare. Similarly toFig. 8, the number of rainy days for all the three rainfall amountsshows slight decreasing trends over eastern Rajasthan, without anystatistical significance. On the other hand, western Rajasthanexhibits increasing trend for days with <10 mm rainfall, whichbecomes neutral for 10e25 and >25 mm amounts. However, alltrends in both regions are not considered as statistically significantat 95% confidence level.
The Indian Summer Monsoon Rainfall (ISMR) has vital impor-tance for the economic development and hydrological planning ofthe country and crop failure, drought or famine due to deficientmonsoon lead to adverse socio-economic effects. A recent study(Guhathakurta and Rajeevan, 2009) has shown that ISMR does notexhibit any significant trend over the country as a whole, but largeanomalies may exist in regional scale (Gautam et al., 2009a;Kaskaoutis et al., 2012; Prasad et al., 2007). Fig. 10(a,b) shows thetrends in annual rainfall amount over eastern and western Rajas-than, respectively during the period 1951e2007. The annual rainfallover eastern Rajasthan varies from aminimum ofw380mm during2002 to amaximum ofw1000mmduring 1961, while overwesternRajasthan, the rainfall varies from w130 mm during 2002 to
w540mmduring 2006. Themonsoon season of 2002was 19% driercompared to normal (Samra, 2004; Waple and Lawrimore, 2003)over India, and as much as 60e70% below normal in Rajasthanstate. More specifically, the deviation from the normal rainfall wasas high as�49% in Rajsamand,�67% in Sirohi, and�33% in Udaipurdistricts of Rajasthan state (UNDP, 2002). The variability in themonsoon rainfall over Rajasthan controls fluctuations in the soilmoisture, water resources and reservoir storage over the region aspointed out by Bhuiyan et al. (2006, 2009a) based on a long termdata analysis. The linear regression analysis reveals a decliningtrend in annual rainfall over eastern Rajasthan, in contrast to theincreasing trend observed over the western part, although bothtrends are not statistically significant at 95% confidence level. Theresults obtained for the rainfall trends are in line to those of therainy days and can be partly explained from the same reasons. Themost interesting finding is a pronounced increasing trend in rainfallafter the drought monsoon year of 2002, especially over the aridwestern Rajasthan. This finding, as well as the extreme of precipi-tation in specific years, suggests that the fluctuation and trends inprecipitation are more likely associated with large-scale atmo-spheric dynamics controlling the ISMR, such as El-Nino Southern
1950 1955 1960 1965 1970 1975 1980 1985 1990 1995 2000 2005 201010
20
30
40
50
60
70
Y=0.076X + 37.61, P=0.36West Rajasthan
No
of r
ainy
day
s
Year
1950 1955 1960 1965 1970 1975 1980 1985 1990 1995 2000 2005 201040
50
60
70
80
90Y=-0.049X + 65.46, P=0.59
East Rajasthana
b
No
of r
ainy
day
s
Year
Fig. 8. Multiyear (1951e2007) variation and trend in the number of rainy daysobserved over (a) Eastern and (b) Western Rajasthan.
Fig. 9. Multiyear variation (1951e2007) and trend in the number of rainy days having<10, 15e25 and >25 mm rainfall over (a) Eastern and (b) Western Rajasthan.
S.K. Kharol et al. / Journal of Arid Environments 88 (2013) 90e10196
Author's personal copy
Oscillation (ENSO) (Patra et al., 2005), and not to local phenomena,such as LULC changes and land-atmosphere fluxes.
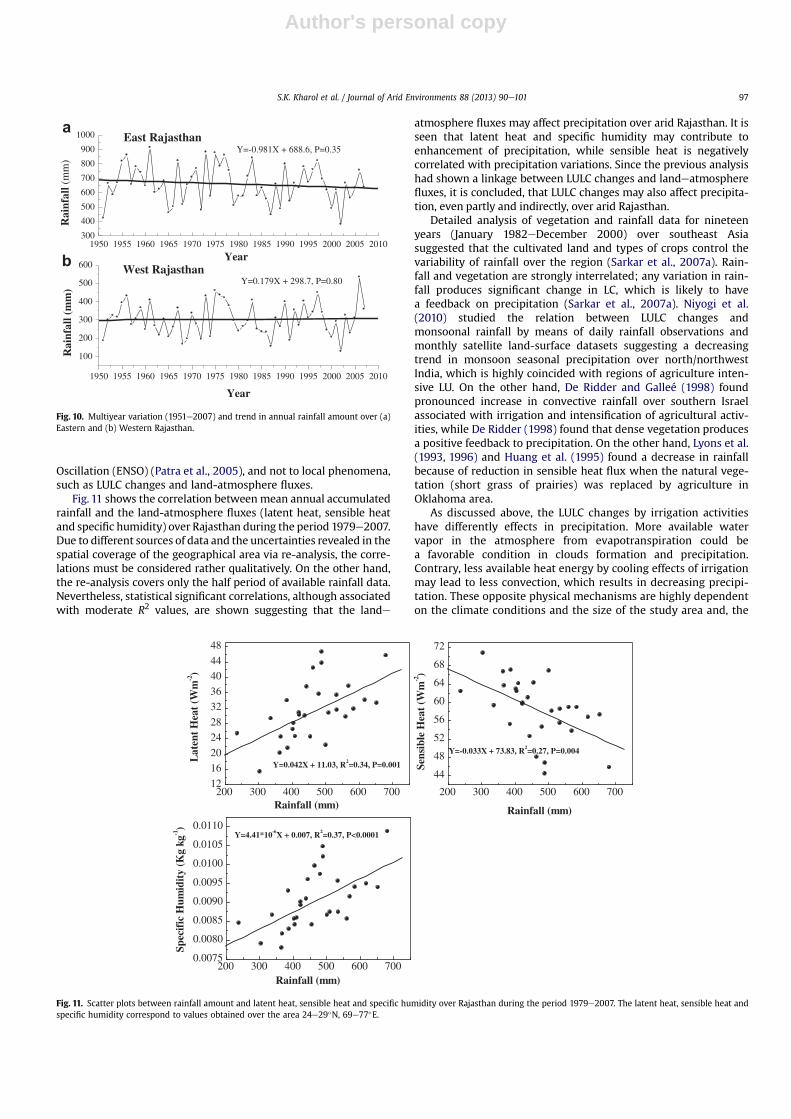
Fig. 11 shows the correlation betweenmean annual accumulatedrainfall and the land-atmosphere fluxes (latent heat, sensible heatand specific humidity) over Rajasthan during the period 1979e2007.Due to different sources of data and the uncertainties revealed in thespatial coverage of the geographical area via re-analysis, the corre-lations must be considered rather qualitatively. On the other hand,the re-analysis covers only the half period of available rainfall data.Nevertheless, statistical significant correlations, although associatedwith moderate R2 values, are shown suggesting that the lande
atmosphere fluxes may affect precipitation over arid Rajasthan. It isseen that latent heat and specific humidity may contribute toenhancement of precipitation, while sensible heat is negativelycorrelated with precipitation variations. Since the previous analysishad shown a linkage between LULC changes and landeatmospherefluxes, it is concluded, that LULC changes may also affect precipita-tion, even partly and indirectly, over arid Rajasthan.
Detailed analysis of vegetation and rainfall data for nineteenyears (January 1982eDecember 2000) over southeast Asiasuggested that the cultivated land and types of crops control thevariability of rainfall over the region (Sarkar et al., 2007a). Rain-fall and vegetation are strongly interrelated; any variation in rain-fall produces significant change in LC, which is likely to havea feedback on precipitation (Sarkar et al., 2007a). Niyogi et al.(2010) studied the relation between LULC changes andmonsoonal rainfall by means of daily rainfall observations andmonthly satellite land-surface datasets suggesting a decreasingtrend in monsoon seasonal precipitation over north/northwestIndia, which is highly coincided with regions of agriculture inten-sive LU. On the other hand, De Ridder and Galleé (1998) foundpronounced increase in convective rainfall over southern Israelassociated with irrigation and intensification of agricultural activ-ities, while De Ridder (1998) found that dense vegetation producesa positive feedback to precipitation. On the other hand, Lyons et al.(1993, 1996) and Huang et al. (1995) found a decrease in rainfallbecause of reduction in sensible heat flux when the natural vege-tation (short grass of prairies) was replaced by agriculture inOklahoma area.
As discussed above, the LULC changes by irrigation activitieshave differently effects in precipitation. More available watervapor in the atmosphere from evapotranspiration could bea favorable condition in clouds formation and precipitation.Contrary, less available heat energy by cooling effects of irrigationmay lead to less convection, which results in decreasing precipi-tation. These opposite physical mechanisms are highly dependenton the climate conditions and the size of the study area and, the
1950 1955 1960 1965 1970 1975 1980 1985 1990 1995 2000 2005 2010
100
200
300
400
500
600
Y=0.179X + 298.7, P=0.80West Rajasthan
Rai
nfal
l (m
m)
Year
1950 1955 1960 1965 1970 1975 1980 1985 1990 1995 2000 2005 2010300
400
500
600
700
800
900
1000
Y=-0.981X + 688.6, P=0.35East Rajasthan
a
b
Rai
nfal
l (m
m)
Year
Fig. 10. Multiyear variation (1951e2007) and trend in annual rainfall amount over (a)Eastern and (b) Western Rajasthan.
200 300 400 500 600 70012
16
20
24
28
32
36
40
44
48
Y=0.042X + 11.03, R =0.34, P=0.001
Lat
ent
Hea
t (W
m-2)
Rainfall (mm)200 300 400 500 600 700
44
48
52
56
60
64
68
72
Y=-0.033X + 73.83, R =0.27, P=0.004
Sens
ible
Hea
t (W
m-2)
Rainfall (mm)
200 300 400 500 600 7000.0075
0.0080
0.0085
0.0090
0.0095
0.0100
0.0105
0.0110Y=4.41*10 X + 0.007, R =0.37, P<0.0001
Spec
ific
Hum
idit
y (K
g kg
-1)
Rainfall (mm)
Fig. 11. Scatter plots between rainfall amount and latent heat, sensible heat and specific humidity over Rajasthan during the period 1979e2007. The latent heat, sensible heat andspecific humidity correspond to values obtained over the area 24e29�N, 69e77�E.
S.K. Kharol et al. / Journal of Arid Environments 88 (2013) 90e101 97

Author's personal copy
identification of which mechanism is dominant over the aridenvironment of Rajasthan constitutes a real challenge. However,such an investigation is beyond the scope of the present work anddemands more systematic in situ measurements and modelsimulations of the landeatmosphere fluxes and boundary-layerdynamics.
4.5. Variation in aerosol field
Aerosols have been widely recognized as a major source ofuncertainty in climate change studies through their interactionwith solar radiation, clouds and precipitation (e.g. Andreae et al.,2004; Lohmann and Feichter, 2005; Ramanathan et al., 2001;Rosenfeld et al., 2001). Smaller cloud-droplet size distributions andsuppressed rainfall have been linked to increased anthropogenicaerosol concentrations over the downwind directions of urbanareas (Givati and Rosenfeld, 2004; Lensky and Drori, 2007; Menon,2004; Rosenfeld and Woodley, 2003).
Northwestern India is the main source of desert dust aerosolsover the country, which under mixing with anthropogenic ones,cause thick aerosol layers transported at w3e5 km over the foot-hills of Himalayas, able to affect the mid-tropospheric temperature(Gautam et al., 2009b, 2010) and rainfall pattern (Gautam et al.,2009a). Recent studies have shown a strong linkage betweenaerosols and precipitation, but whether the increasing aerosolsincrease or decrease rainfall is not well established. Choi et al.(2008) observed decreasing trend in summer rainfall frequencyover China due to increased aerosol pollution. Rotstayn et al. (2007)found increase in rainfall and cloudiness over Australia due totransport of Asian anthropogenic aerosols. Except from theincreased anthropogenic emissions and aerosol optical depth(AOD) levels over India (e.g. Dey and Di Girolamo, 2011; Kaskaoutiset al., 2011b), the LULC changes in Rajasthan may also affect theemissions of natural aerosols. This fact may be linked to theincreasing crop land and changes in atmospheric and meteoro-logical parameters (humidity, number of rainy days and rainfallamount), all corresponding to negative feedbacks in dust outflowand intensity.
Detailed analysis of 30 years AI data (Nimbus-7 TOMS, 1979e1993, Earth-Probe TOMS, 1997e2005 and Aura OMI, 2006e2008)over Rajasthan (24�e29�N, 69�e77�E) may reveal the potentialeffects of the changes in LULC and precipitation (Fig. 12). Themulti-decadal variation in AI shows an increasing trend over theregion, which seems to lie in the limits of the statistical signifi-cance at 95% confidence level (P ¼ 0.043). The linear regressionshows a mean increase in AI of 0.005 � 0.003 per year indicatinghighly sensitivity on the very high annual AI > 1.6 during 2002e2004. It was found that excluding these years from the analysis,the overall trend remains positive, but without being statisticallysignificant. The (%) departure graph shows that the positiveanomalies are defined mainly in the period 2000e2004, reachingto 50% in 2002. After 2004 the yearly-mean AI is close to theclimatological mean value. Limiting the linear regression till 2001,as suggested by TOMS scientists (see Gautam et al., 2009a), theresults show a statistically significant increasing trend (P ¼ 0.01)with a yearly increase of 0.01. Some uncertainties in the linearregressions may occur due to inconsistencies in the wavelengthrange for AI retrievals between Nimbus 7 and Earth Probe (Habibet al., 2006; Hsu et al., 1999) and evidence for underestimation ofthe OMI AI over the northwestern India as found by Gautam et al.(2009a). AI presents considerable spatial distribution (not pre-sented) with higher values over the arid western Rajasthan, whilethe dust aerosols over eastern Rajasthan may be mixed withanthropogenic emissions from the densely populated neighboringregions.
5. Discussion
The overall analysis revealed that the intensive irrigation via theconstruction of IGC over arid Rajasthan had a direct effect on theextension of the crop land and vegetation areas, which in turn,influences the specific humidity, latent and sensible fluxes. On theother hand, the multi-decadal variations in rainfall and number ofrainy days showed that, except of the considerable increase duringthe last years (after drought 2002), they are mostly associated withthe regional meteorology and local monsoon system and partly canbe explained by the changes in LULC. Several studies have showncontrasting mechanisms for increasing or decreasing precipitationdue to changes in crop land areas, which are difficult to be quan-tified over the arid environment of Rajasthan.
The increasing AI over Rajasthan during the 30-years period1979e2008 is similar to earlier observations over India and Indo-Gangetic Plains (Bollasina et al., 2008; Habib et al., 2006; Massieet al., 2004; Sarkar et al., 2007b). The analysis showed that the AItrend is sensitive to the enhanced values in the beginning of 2000s.Focusing on the last decade, a significant decreasing AI trend wasobserved, mainly in the pre-monsoon andmonsoon seasons, whichis in agreement with MISR (Dey and Di Girolamo, 2011), MODIS andGOCART (Kaskaoutis et al., 2011b) decreasing AODs over northernIndia during the same periods. The decreasing trend in AI and AODduring 2000s is attributed to extreme aerosol loading in monsoonof 2002 and pre-monsoon of 2003 when prolonged dry anddrought conditions dominated over northwestern India. In thesame periods the precipitation was the lowest over Rajasthan(Figs. 8e10) and a recent study by Kaskaoutis et al. (2012) revealeda strong linkage between drought conditions and enhancement indust-aerosol loading over the region. Therefore, changes inprecipitation may influence the natural aerosol emissions over thearid Rajasthan, mainly during the dust-dominated periods (pre-monsoon and monsoon). Although several studies over south Asia(Balakrishnaiah et al., 2012; Gautam et al., 2009a; Ghude et al.,2011; Manoj et al., 2011) have shown some linkages betweenaerosol trends, tropospheric-temperature anomalies and rainfallre-distribution, the present analysis revealed that the inverseassociation may be also active. Thus, intense or weak monsoon
1980 1985 1990 1995 2000 20050.0
0.4
0.8
1.2
1.6
2.0
2.4
2.8
3.2
AI=0.011x + 1.09P=0.043
Aer
osol
Ind
ex
Year
Fig. 12. Yearly variation and trend in annual mean AI over Rajasthan during the period1979e2008. The vertical bars express one standard deviation of the annual mean,while the insect graph presents the % anomaly from the mean AI value for the wholeperiod.
S.K. Kharol et al. / Journal of Arid Environments 88 (2013) 90e10198

Author's personal copy
years strongly affect the emissions of natural aerosols, mainly dustover northwestern India.
Thus, opposite to the considerable influence in the land-atmosphere fluxes, the overall analysis did not reveal a clearassociation between LULC changes and aerosol load over Rajasthanand surrounding regions. On the other hand, the precipitationpattern seems to have better associationwith the land-atmospherefluxes and specific humidity trends, especially after 1986, andseems to affect the aerosol loading during specific years of extremeconditions (surplus or deficit of rainfall). These phenomena are ableto control the variability and trends of natural aerosol emissionsover northwestern India and examining their periodicity it must bea real challenge for future predictions of aerosol trends.
6. Conclusions
In the present study, the impact of the human-induced agri-cultural LULC changes on variations in landeatmosphere fluxes andpossibly in rainfall and aerosol loading were investigated overRajasthan state, northwestern India by the synergistic use ofground data, multi-platform satellite observations and re-analysis.The main results can be summarized as follows:
� The comparison of high spatial resolution satellite observationsfrom Landsat-MSS (1972e73) and IRS-P6 (2006e07) showeda considerable decrease of the desert and semi-arid regions,especially over the western part of Rajasthan and a concurrentsignificant increase in crop areas. This was considered asa consequence of the IGC irrigation bringingwater over the aridwestern Rajasthan, thus leading to increase of the vegetationareas.
� The agriculture intensification resulted in modification ofseveral parameters related with land cover and land-atmosphere interactions thus, causing an increase in latentheat and specific humidity and a concurrent decrease insensible heat. The trends of these parameters over a period ofseveral years seemed to be statistically significant. The increasein specific humidity and latent heat are positive feedbacks forrainfall, although an opposite feedback is caused by the lessconvection caused by cooling effects of irrigation. The investi-gation of the dominantmechanism constitutes a real challenge,but the overall analysis showed that the precipitation varia-tions and trends were much more influenced by the generalcirculation and intensity of the monsoon and only partly can beexplained by LULC changes. However, it was found that theland-atmosphere fluxes may be related to precipitation, sincestatistical significant correlations were found between rainfalland latent heat, sensible heat and specific humidity overRajasthan.
� The multi-year variation of the number of rainy days andrainfall amount exhibited a pronounced year-to-year fluctua-tion with several peaks and gaps over Rajasthan. On the otherhand, the rainfall amount and number of rainy days exhibitedan increasing trend during the last decade, after the droughtmonsoon of 2002.
� The analysis showed that the natural aerosol trends overRajasthan were much more influenced by other phenomena(i.e. rainfall variations) rather than LULC changes. The variationin rainfall amount and number of rainy days might havesignificant linkage to aerosol loading and dust outflow from theThar desert. On the other hand, the larger vegetation cover andthe limitation of the desert and arid surfaces due to intensifi-cation of irrigation activities, especially over western Rajas-than, constitute negative feedbacks to frequency and intensityof dust outflows.
Acknowledgements
The authors thank Director, NRSC and Dy. Director (RS&GIS-AA)for necessary help at various stages and ISRO-GBP for funding theproject. Many thanks to IMD, Landsat and IRS-P6 research groupsfor providing the rainfall data and satellite images, respectively.Analyses and visualizations used in this study were produced withthe Giovanni online data system, developed and maintained by theNASA GES DISC. We also acknowledge the TOMS and OMI missionscientists and associated NASA personnel for the production of thedata used in this research effort. We really appreciate the valuablecomments from both reviewers helping us in improving themanuscript.
References
Andreae, M.O., Rosenfeld, D., Artaxo, P., Costa, A.A., Frank, G.P., Longo, K.M., Silva-Dias, M.A.F., 2004. Smoking rain clouds over the Amazon. Science 303 (5662),1337e1342.
Arnfield, A.J., 2003. Two decades of urban climate research: a review of turbulence,exchanges of energy and water, and the urban heat island. International Journalof Climatology 23, 1e26.
Badarinath, K.V.S., Sharma, A.R., Kaskaoutis, D.G., Kharol, S.K., Kambezidis, H.D.,2010. Solar dimming over the tropical urban region of Hyderabad, India: effectof increased cloudiness and increased anthropogenic aerosols. Journal ofGeophysical Research 115, D21208. http://dx.doi.org/10.1029/2009JD013694.
Baidya Roy, S., Avissar, R., 2002. Impact of land use/land cover change on regionalhydrometeorology in Amazonia. Journal of Geophysical Research 107, D20.http://dx.doi.org/10.1029/2000JD000266.
Baidya Roy, S., Hurtt, G.C., Weaver, C.P., Pacala, S.W., 2003. Impact of historical landcovers change on the July climate of the United States. Journal of GeophysicalResearch 108 (D24), 4793. http://dx.doi.org/10.1029/2003JD003565.
Balakrishnaiah, G., Raghavendra Kumar, K., Suresh Kumar Reddy, B., Rama Gopal, K.,Reddy, R.R., Reddy, L.S.S., Swamulu, C., Nazeer Ahammed, Y., Narasimhulu, K.,KrishnaMoorthy, K., Suresh Babu, S., 2012. Spatio-temporal variations in aerosoloptical and cloud parameters over Southern India retrieved from MODISsatellite data. Atmospheric Environment 47, 435e445. http://dx.doi.org/10.1016/j.atmosenv.2011.10.032.
Basistha, A., Goel, N.K., Arya, D.S., Gangwar, S.K., 2007. Spatial pattern of trends inIndian sub divisional rainfall. Jalvigyan Sameeksha 22, 47e57.
Bhuiyan, C., Singh, R.P., Kogan, F.N., 2006. Monitoring drought dynamics in theAravalli region (India) using different indices based on ground and remotesensing data. International Journal of Applied Earth Observation and Geo-information 8, 289e302.
Bhuiyan, C., Singh, R.P., Flügel, W.A., 2009a. Modelling of ground water recharge-potential in the hard-rock Aravalli terrain, India: a GIS approach. EnvironmentalEarth Sciences 59 (4), 929e938. http://dx.doi.org/10.1007/s12665-009-0087-4.
Bhuiyan, C., Flügel, W.A., Singh, R.P., 2009b. Erratic monsoon, growing waterdemand, and declining water table. Journal of Spatial Hydrology 9, 1e19.
Bloom, S., Takacs, L., Da Silva, A., Ledvina, D., 1996. Data assimilation using incre-mental analysis updates. Monthly Weather Review 124, 1256e1271.
Bookhagen, B., Burbank, D.W., 2006. Topography, relief, and TRMM-derived rainfallvariations along the Himalaya. Geophysical Research Letters 33, L08405. http://dx.doi.org/10.1029/2006GL026037.
Booth, D.J., Oldileld, R.B., 1988. Estimation of the area of lake Kariba, Zimbabwe,using Landsat MSS Imagery. Geoscience and remote sensing Symposium,IGARSS’88. Remote Sensing: Moving Toward the 21st Century, International 3(12e16), 1564e1566.
Bollasina, M., Nigam, S., Lau, K.-M., 2008. Absorbing aerosols and summer monsoonevolution over South Asia: an observational portrayal. Journal of Climate 21,3221e3239.
Bosilovich, M., Chen, J., Robertson, F.R., Adler, R.F., 2008. Evaluation of globalprecipitation in reanalyses. Journal of Applied Meteorology and Climatology 47(9), 2279e2299.
Chase, T.N., Pielke Sr., R.A., Kittel, T.G.F., Nemani, R.R., Running, S.W., 2000. Simu-lated impacts of historical land cover changes on global climate in northernwinter. Climate Dynamics 16, 93e105.
Choi, Y.S., Ho, C.H., Kim, J., Gong, D.Y., Park, R.J., 2008. The impact of Aerosols on thesummer rainfall frequency in China. Journal of Applied Meteorology andClimatology 47 (6), 1802e1813.
Curier, R.L., Veefkind, J.P., Braak, R., Veihelmann, B., Torres, O., de Leeuw, G., 2008.Retrieval of aerosol optical properties from OMI radiances using a multi-wavlength algorithm: application to western Europe. Journal of GeophysicalResearch 113, D17S90. http://dx.doi.org/10.1029/2007JD008738.
De Graaf, M., Stammes, P., Torres, O., Koelemeijer, R.B.A., 2005. Absorbing aerosolindex: sensitivity analysis, application to GOME and comparison with TOMS.Journal of Geophysical Research 110, D01201. http://dx.doi.org/10.1029/2004JD005178.
De Ridder, K., 1998. The impact of vegetation cover on Sahelian drought persistence.Boundary Layer Meteorology 88, 307e321.
S.K. Kharol et al. / Journal of Arid Environments 88 (2013) 90e101 99

Author's personal copy
De Ridder, K., Galleé, H., 1998. Land surface-induced regional climate change insouthern Israel. Journal of Applied Meteorology and Climatology 37, 1470e1485.
De Rosnay, P., Polcher, J., Laval, K., Sabre, M., 2003. Integrated parameterization ofirrigation in the land surface model ORCHIDEE. Validation over Indian Penin-sula. Geophysical Research Letters 30 (19). http://dx.doi.org/10.1029/2003GL018024.
Dey, S., Di Girolamo, L., 2011. A decade of change in aerosol properties over theIndian subcontinent. Geophysical Research Letters 38, L14811. http://dx.doi.org/10.1029/2011GL048153.
Douglas, E.M., Niyogi, D., Frolking, S., Yeluripati, J.B., Pielke Sr., R.A., Niyogi, N.,Vorosmarty, C.J., Mohanty, U.C., 2006. Changes in moisture and energy fluxesdue to agricultural land use and irrigation in the Indian Monsoon Belt.Geophysical Research Letters 33, L14403. http://dx.doi.org/10.1029/2006GL026550.
Douglas, E.M., Beltrán-Przekurat, A., Niyogi, D., Pielke Sr., R.A., Vorosmarty, C.J.,2009. The impact of agricultural intensification and irrigation on landeatmo-sphere interactions and Indian monsoon precipitation e a mesoscale modelingperspective. Global and Planetary Change 67 (1e2), 117e128. http://dx.doi.org/10.1016/j.gloplacha.2008.12.007.
Foley, J.A., Costa, M.H., Delire, C., Ramankutty, N., Snyder, P., 2003. Green Surprise?How terrestrial ecosystems could affect earth’s climate. Frontiers in Ecology andthe Environment 1, 38e44.
Fall, S., Niyogi, D., Pielke Sr., R.A., Gluhovsky, A., Kalnay, E., Rochon, G., 2010. Impactsof land use land cover on temperature trends over the continental UnitedStates: assessment using the North American Regional Reanalysis. InternationalJournal of Climatology 30, 1980e1993. http://dx.doi.org/10.1002/joc.1996.
Gautam, R., Hsu, N.C., Lau, K.-M., Kafatos, M., 2009a. Aerosol and rainfall variabilityover the Indian monsoon region: distributions, trends and coupling. AnnalesGeophysicae 27, 3691e3703.
Gautam, R., Hsu, N.C., Lau, K.-M., Kafatos, M., 2009b. Enhanced pre-monsoonwarming over the Himalayan-Gangetic region from 1979 to 2007. GeophysicalResearch Letters 36, L07704. http://dx.doi.org/10.1029/2009GL037641.
Gautam, R., Hsu, N.C., Lau, K.-M., 2010. Premonsoon aerosol characterization andradiative effects over the Indo-Gangetic Plains: implications for regional climatewarming. Journal of Geophysical Research 115, D17208. http://dx.doi.org/10.1029/2010JD013819.
Gautam, R., Hsu, N.C., Tsay, S.C., Lau, K.M., Holben, B., Bell, S., Smirnov, A., Li, C.,Hansell, R., Ji, Q., Payra, S., Aryal, D., Kayastha, R., Kim, K.M., 2011. Accumulationof aerosols over the Indo-Gangetic plains and southern slopes of the Himalayas:distribution, properties and radiative effects during the 2009 pre-monsoonSeason. Atmospheric Chemistry and Physics 11, 12841e12863.
Ghude, S.D., Kulkarni, S.H., Kulkarni, P.S., Kanawade, V.P., Fadnavis, S., Pokhrel, S.,Jena, C., Beig, G., Bortoli, D., 2011. Anomalous low tropospheric column ozoneover Eastern India during the severe drought event of monsoon 2002: a casestudy. Environmental Science and Pollution Research 18, 1442e1455. http://dx.doi.org/10.1007/s11356-011-0506-4.
Givati, A., Rosenfeld, D., 2004. Quantifying precipitation suppression due to airpollution. Journal of Applied Meteorology and Climatology 43, 1038e1056.
Guhathakurta, P., Rajeevan, M., 2009. Trends in the rainfall pattern over India.International Journal of Climatology 28, 1453e1469.
Gupta, R., 1996. Correlation of rainfall with upsurge of malaria in Rajasthan. Journalof the Association of Physicians of India 44 (6), 385e389.
Gyanesh, C., Michael, C.J., Pasquale, L.S., 2008. Evaluation and comparison of theIRS-P6 and the Landsat sensors. IEEE Transactions on Geoscience and RemoteSensing 46 (1), 209e221.
Habib, G., Venkataraman, C., Chiapello, I., Ramachandran, S., Boucher, O.,Reddy, M.S., 2006. Seasonal and interannual variability in absorbing aerosolsover India derived from TOMS: relationship to regional meteorology andemissions. Atmospheric Environment 40 (11), 1909e1921.
Hsu, N.C., Herman, J.R., Torres, O., Holben, B.N., Tanre, D., Eck, T.F., Smirnov, A.,Chatenet, B., Lavenu, F., 1999. Comparisons of the TOMS aerosol index with sunphotometer aerosol optical thickness: results and applications. Journal ofGeophysical Research 104, 6269e6279.
Huang, X., Lyons, T.J., Smith, R.C.G., 1995. Meteorological impact of replacing nativeperennial vegetation with annual agricultural species. In: Kalma, J.D.,Sivapalan, M. (Eds.), Scale Issues in Hydrological Modelling. Advanstar Com-mun., Chichester, England, pp. 401e410.
Intergovernmental Panel on Climate Change (IPCC), 2007. Climate change 2007: thescientific basis. In: Solomon, S. (Ed.), Contribution of Working Group I to theFourth Assessment Report of the IPCC on Climate Change. Cambridge UniversityPress, New York.
Jaglan, M.S., Qureshi, M.H., 1996. Irrigation development and its environmentalconsequences in arid regions of India. Environmental Management 20 (3), 323e336.
Kaskaoutis, D.G., Kharol, S.K., Sifakis, N., Nastos, P.T., Sharma, A.R., Badarinath, K.V.S.,Kambezidis, H.D., 2011a. Satellite monitoring of the biomass burning aerosolsduring the wildfires of August 2007 in Greece: climate implications. Atmo-spheric Environment 45 (3), 716e726.
Kaskaoutis, D.G., Kharol, S.K., Sinha, P.R., Singh, R.P., Badarinath, K.V.S., Mehdi, W.,Sharma, M., 2011b. Contrasting aerosol trends over South Asia during the lastdecade based on MODIS observations. Atmospheric Measurement TechniquesDiscussions 4, 5275e5323. http://dx.doi.org/10.5194/amtd-4-5275-2011.
Kaskaoutis, D.G., Gautam, R., Singh, R.P., Houssos, E.E., Goto, D., Singh, S.,Bartzokas, A., Kosmopoulos, P.G., Sharma, M., Hsu, N.C., Holben, B.N.,Takemura, T., 2012. Influence of anomalous dry conditions on aerosols over
India: transport, distribution and properties. Journal of Geophysical Research117, D09106. http://dx.doi.org/10.1029/2011JD017314.
Kaufman, R.K., Seto, K.C., Schneider, A., Liu, Z., Zhou, L., Wang, W., 2007. Climateresponse to rapid urban growth: evidence of a human-induced precipitationdeficit. Journal of Climate 20 (10), 2299e2306.
Kueppers, L.M., Snyder, M.A., 2012. Influence of irrigated agriculture on diurnalsurface energy and water fluxes, surface climate, and atmospheric circulation inCalifornia. Climate Dynamics 38 (5e6), 1017e1029.
Lee, E., Thomas, N. Chase, Rajagopalan, B., Berry, R.G., Biggs, T.W., Lawrence, P.J.,2009. Effects of irrigation and vegetation activity on early Indian summermonsoon variability. International Journal of Climatology 29, 573e581. http://dx.doi.org/10.1002/joc.1721.
Lensky, I.M., Drori, R., 2007. A satellite-based parameter to monitor the aerosolimpact on convective clouds. Journal of Applied Meteorology and Climatology46, 660e666.
Lohar, D., Pal, B., 1995. The effect of irrigation on premonsoon season precipitationover South West Bengal, India. Journal of Climate 8, 2567e2570.
Lohmann, U., Feichter, J., 2005. Global indirect aerosol effects: a review. Atmo-spheric Chemistry and Physics 5, 715e737.
Lyons, T.J., Schwerdtfeger, P., Hacker, J.M., Foster, I.J., Smith, R.C.G., Xinmei, H., 1993.Land-atmosphere interaction in a semiarid region: the bunny fence experiment.Bulletin e American Meteorological Society 74 (7), 1327e1334.
Lyons, T.J., Smith, R.C.G., Xinmei, H., 1996. The impact of clearing for agriculture onthe surface energy budget. International Journal of Climatology 16, 551e558.
Manoj, M.G., Devara, P.C.S., Safai, P.D., Goswami, B.N., 2011. Absorbing aerosolsfacilitate transition of Indian monsoon breaks to active spells. ClimateDynamics 37, 2181e2198. http://dx.doi.org/10.1007/s00382-010-0971-3.
Marshall Jr., C.H., Pielke Sr., R.A., Steyaert, L.T., Willard, D.A., 2004. The impact ofanthropogenic land-cover change on the Florida peninsula sea breezes andwarm season sensible weather. Monthly Weather Review 132, 28e52.
Massie, S.T., Torres, O., Smith, S.J., 2004. Total ozone Mapping Spectrometer (TOMS)observations of increases in Asian aerosol in winter from 1979 to 2000. Journalof Geophysical Research 109, D18211. http://dx.doi.org/10.1029/2004JD004620.
Menon, S., 2004. Current uncertainties in assessing aerosol effects on climate.Annual Review of Environment and Resources 29, 1e30.
Metternicht, G.I., Zinck, J.A., 1998. Evaluating the information content of JERS-1 SARand Landsat TM data for discrimination of soil erosion features. ISPRS Journal ofPhotogrammetry and Remote Sensing 53 (3), 143e153.
Niyogi, D., Raman, S., Alapaty, K., 1999. Uncertainty in specification of surfacecharacteristics, Part 2: Hierarchy of interaction explicit statistical analysis.Boundary Layer Meteorology 91, 341e366.
Niyogi, D., Kishtawal, C., Tripathi, S., Govindaraju, R.S., 2010. Observational evidencethat agricultural intensification and land use change may be reducing theIndian summer monsoon rainfall. Water Resources Research 46, W03533.http://dx.doi.org/10.1029/2008WR007082.
Pandya,M.R., Singh, R.P., Dadhwal, V.K., 2004. A signal of increased vegetation activityof India from 1981 to 2001 observed using satellite-derived fraction of absorbedphotosynthetically active radiation. Current Science 87 (8), 1122e1126.
Pant, G.B., Hingane, L.S., 1988. Climate changes in and around the Rajasthan desertduring the twentieth century. International Journal of Climatology 8 (4), 391e401.
Patra, P.K., Behera, S.K., Herman, J.R., Maksyutov, S., Akimoto, H., Yamagata, T., 2005.The Indian summer monsoon rainfall: interplay of coupled dynamics, radiationand cloud microphysics. Atmospheric Chemistry and Physics 5, 2181e2188.
Pielke Sr., R.A., 2001. Influence of the spatial distribution of vegetation and soils onthe prediction of cumulus convective rainfall. Review of Geophysics 39 (2), 151e177.
Pielke Sr., R.A., Marland, G., Betts, R.A., Chase, T.N., Eastman, J.L., Niles, J.O.,Niyogi, D., Running, S., 2002. The influence of land-use change and landscapedynamics on the climate system: relevance to climate change policy beyond theradiative effect of Greenhouse Gases. Philosophical Transactions of The RoyalSociety (London) A. Special Theme Issue 360, 1705e1719.
Pielke Sr., R.A., Davey, C., Niyogi, D., Fall, S., Steinweg-Woods, J., Hubbard, K., Lin, X.,Cai, M., Lim, Y.K., Li, H., Nielsen-Gammon, J., Gallo, K., Hale, R., Mahmood, R.,Foster, S., McNider, R.T., Blanken, P., 2007. Unresolved issues with the assess-ment of multi-decadal global land surface temperature trends. Journal ofGeophysical Research 112, D24S08. http://dx.doi.org/10.1029/2006JD008229.
Prasad, A.K., Sarkar, S., Singh, R.P., Kafatos, M., 2007. Inter-annual variability ofvegetation cover and rainfall over India. Advances in Space Research 39, 79e87.
Rajeevan, M., Bhate, B., Kale, J.D., Lal, B., 2006. High resolution daily gridded rainfalldata for the Indian region: analysis of break and active monsoon spells. CurrentScience 91 (3), 296e306.
Ramanathan, V., Crutzen, P.J., Kiehl, J.T., Rosenfeld, D., 2001. Aerosols, climate, andthe hydrological cycle. Science 294 (5549), 2119e2124. http://dx.doi.org/10.1126/science.1064034.
Rao, A.S., Gupta, J.P., Faroda, A.S., 1997. Changing climatic scenarios and Strategiesfor drought management in the Indian arid region. Drought Network News 9(1), 8e11.
Ray, D.K., et al., 2003. Effects of land use in Southwest Australia: 1. Observations ofcumulus cloudiness and energy fluxes. Journal of Geophysical Research 108(D14), 4414. http://dx.doi.org/10.1029/2002JD002654.
Ray, D.K., Nair, U.S., Lawton, R.O., Welch, R.M., Pielke Sr, R.A., 2006. Impact of landuse on Costa Rican tropical montane cloud forests: sensitivity of orographiccloud formation to deforestation in the plains. Journal of Geophysical Research111, D02108. http://dx.doi.org/10.1029/2005JD006096.
S.K. Kharol et al. / Journal of Arid Environments 88 (2013) 90e101100

Author's personal copy
Rienecker, M.M., Suarez, M.J., Todling, R., Bacmeister, J., Takacs, L., Liu, H.-C.,Gu, W., Sienkiewicz, M., Koster, R.D., Gelaro, R., Stajner, I., Nielsen, J.E., 2007.The GEOS-5 data assimilation system e Documentation of versions 5.0.1,5.1.0, and 5.2.0. In: Suarez, M.J. (Ed.), NASA Technical Memo 2007-104606,vol. 27.
Rosenfeld, D., Rudich, Y., Lahav, R., 2001. Desert dust suppressing precipitation e
a possible desertification feedback loop. Proceedings of the National Academyof Sciences of the United States of America 98 (11), 5975e5980.
Rosenfeld, D., Woodley, W.L., 2003. Closing the 50-year circle: from cloud seeding tospace and back to climate change through precipitation physics. MeteorologicalMonographs 51, 59e80.
Rotstayn, L.D., Cai, W., Martin, R.D., Farquhar, G.D., Feng, Y., Ginoux, P., Herzog, M.,Ito, A., Penner, J.E., Roderick, M.L., Wang, M., 2007. Have Australian rainfall andcloudiness increased due to the remote effects of Asian anthropogenic aerosols?Journal of Geophysical Research 112, D09202. http://dx.doi.org/10.1029/2006JD007712.
Samra, J.S., 2004. Review and Analysis of Drought Monitoring, Declaration andManagement in India. Working Paper 84. International Water ManagementInstitute, Colombo, Sri Lanka, pp. 1e31.
Sarkar, S., Kafatos, M., 2004. Interannual variability of vegetation over the Indiansub-continent and its relation to the different meteorological parameters.Remote Sensing of Environment 90, 268e280.
Sarkar, S., Chiu, L., Kafatos, M., Singh, R., 2007a. Sensitivity of rainfall on land coverchange over South East Asia: some observational results. Advances in SpaceResearch 39 (1), 73e78.
Sarkar, S., Chokngamwong, R., Cervone, G., Singh, R.P., Kafatos, M., 2007b. Variabilityof aerosol optical depth and aerosol forcing over India. Advances in SpaceResearch 37, 2153e2159.
Shepard, D., 1968. A two-dimensional interpolation function for irregularly spaceddata. Proc. ACM National Conference, 517e524.
Subash, N., Ram Mohan, H.S., Banukumar, K., 2011. Comparing water-vegetativeindices for rice (Oryza sativa L.)ewheat (Triticum aestivum L.) droughtassessment. Computers and Electronics in Agriculture 77 (2), 175e187.
Swain, P.H., Davis, S.M. (Eds.), 1978. Remote Sensing: The Quantitative Approach.McGraw-Hill, New York.
Torres, O., Bhartia, P.K., Herman, J.R., Ahmad, Z., Gleason, J.,1998. Derivation of aerosolproperties from satellite measurements of backscattered ultraviolet radiation:theoretical basis. Journal of Geophysical Research 103 (D14), 17099e17110.
Torres, O., Tanskanen, A., Veiheiman, B., Ahn, C., Braak, R., Bhartia, P.K., Veefkind, P.,Levelt, P., 2007. Aerosols and surface UV products from Ozone MonitoringInstrument observations: an overview. Journal of Geophysical Research 112,D24S47. http://dx.doi.org/10.1029/2007JD008809.
UNDP, 2002. Drought damage assessment and agricultural rehabilitation fordrought affected districts of Rajasthan. UNDP Mission Report, August 2002.
Waple, A.M., Lawrimore, J.H., 2003. State of the climate in 2002. Bulletin of theAmerican Meteorological Society 86 (6), S1eS68.
Zhu, X., Liang, S., Pan, Y., Zhang, X., 2011. Agricultural irrigation impacts on landsurface characteristics detected from satellite data products in Jilin Province,China. IEEE Journal of Selected Topics in Applied Earth Observations in RemoteSensing 4 (3), 721e729.
S.K. Kharol et al. / Journal of Arid Environments 88 (2013) 90e101 101