MARCH 2014 - Tharisa
458
MARCH 2014 Pre-Listing Statement
-
Upload
khangminh22 -
Category
Documents
-
view
0 -
download
0
Transcript of MARCH 2014 - Tharisa

MARCH 2014Pre-Listing Statement

1
Tharisa plc(Incorporated in the Republic of Cyprus with limited liability)
(Registration number HE223412)
Share code: THA ISIN: CY0103562118
(“Tharisa” or “the Company” or together with its subsidiaries “the Group”)
PRE-LISTING STATEMENT
The definitions and interpretations commencing on page 16 of this Pre-listing Statement shall apply, mutatis mutandis, throughout this Pre-listing Statement.
This Pre-listing Statement, prepared and issued in accordance with the Listings Requirements, relates to the Listing and Private Placement by way of subscription for up to 23,393,971 Shares. The Bookrunner has been granted an option by the Company, from the Listing Date, to allot additional Shares of up to 15% of the number of Shares issued pursuant to the Private Placement. Such action, if commenced at the discretion of the Bookrunner, may be discontinued at any time, but may under no circumstances continue beyond the 30th calendar day after the Listing Date.
Tharisa and the Board reserves the right, at any time during the Offer and, at their sole and absolute discretion, in compliance with the Listings Requirements, to amend, deviate from or modify the Offer in the manner deemed fit or to postpone, discontinue or terminate the Offer. The Offer, as set out in this Pre-listing Statement, is open for acceptance by Qualifying Investors only.
It is currently estimated that the Offer Price pursuant to this Pre-listing Statement will be between R42.75 and R55.21 per Share. The Offer Price may however be outside of the aforementioned range.
Opening date of the Offer (09:00) Monday, 24 March 2014
Last date for Applicants to submit their Application Forms to the Bookrunner in order to be
considered for the book build and qualify for participation in the Offer (12:00)
Wednesday, 2 April 2014
Date on which Applicants will be notified of the number of Shares which they have been
allocated in terms of the Offer (12:00)
Thursday, 3 April 2014
Offer Price and results of the Offer announced on SENS Friday, 4 April 2014
Last date for Applicants to make payment for their allocated Shares (12:00) Friday, 4 April 2014
Shares listed on the JSE (09:00) Tuesday, 8 April 2014
The dates and times in this Pre-listing Statement are subject to change and any such change will be released on SENS.
For a single addressee acting as principal, offers can only be made at an aggregate purchase price of not less than R1,000,000.
The JSE has, subject to the Shareholder spread obligations in terms of the Listings Requirements being obtained, granted Tharisa the Listing of up to 257,333,677 Shares in the “General Mining” sector of the Main Board of the JSE, under the abbreviated name “Tharisa”, share code “THA” and ISIN CY0103562118. At the Listing Date, Tharisa will have authorised share capital of 10,000,000,000 par value shares of US$0.001 each; and issued share capital and share premium of between US$235,450 to US$257,334 and US$206,347,144 to US$206,341,862, respectively (converted at a ZAR/US$ exchange rate of 10.75:1 on the Last Practicable Date) comprising 235,449,533 to 257,333,677 fully paid par value Shares at the Offer Price of R55.21 to R42.75, assuming the Offer is fully subscribed and the Convertible Preference Shares, in accordance with their terms, are converted into Shares.
The authorised capital of the Convertible Preference Shares is US$1,051 divided into 1,051 shares of US$1.00 each. The Convertible Preference Shares were issued on 14 April 2011, at a price of US$142,857 per share and are fully paid. On the Listing Date, the Convertible Preference Shares shall convert into Shares based on the higher of:
(i) 1,420 Shares for every 1 Convertible Preference Share; or

2
(ii) that number of Shares calculated by dividing the notional return amount (details below) of US$292,352,456, converted to ZAR at such ZAR/US$ exchange rate as shall be determined by an independent investment bank, by the Offer Price.
The notional return amount is the amount calculated by applying an IRR of 25% to the subscription price for each Convertible Preference Share from the issue date to the Listing Date.
All Shares (including Shares issued on conversion of the Convertible Preference Shares and the Bonus Issue) rank pari passu in all respects. Accordingly, no Share has any special rights to distributions, capital or profits of the Company and there are no Shares held in treasury. Fractions of Shares will not be issued and the Company will round up or down to the nearest whole number.
This Pre-listing Statement is not an invitation to the public to purchase or subscribe for Shares, and is issued in terms of the Listings Requirements for the purpose of providing information on Tharisa in relation to the Listing and the Offer.
Shares will only be traded on the JSE as Dematerialised Shares. Accordingly, all Shareholders who elect to receive Certificated Shares will have to dematerialise their Certificated Shares should they wish to trade their shares on the JSE.
The Directors, whose names are provided on page 4 of this Pre-listing Statement, collectively, and individually, accept full responsibility for the accuracy of the information contained herein and certify that, to the best of their knowledge and belief, there are no facts that have been omitted which would make any statement false or misleading and that all reasonable enquiries to ascertain such facts have been made and that this Pre-listing Statement contains all information required in terms of the Listings Requirements. Tharisa undertakes to comply fully with the Listings Requirements.
The Reporting Accountants, whose reports are contained in this Pre-listing Statement, have given their consent and have not withdrawn their consent to the inclusion of their reports in the form and context in which they appear herein.
Each of the Investment Bank, Bookrunner, Sponsor, Financial Advisor, Legal Advisors, Technical Advisor, Auditors, Reporting Accountants, Communication Advisor and Transfer Secretaries whose names are included in the “Corporate Information and Advisors” section of this Pre-listing Statement, have consented in writing to act in the capacities stated herein and to their names being included in this Pre-listing Statement and have not withdrawn their consents prior to the publication of this Pre-listing Statement.
Investment Bank, Bookrunner
and Sponsor
South African Legal Advisor Transfer Secretaries
Financial Advisor South African Legal Advisor to the
Investment Bank, Bookrunner
and Sponsor
Transfer Secretaries
Reporting Accountants Legal Advisor to the Board Communication Advisor
Auditors Cyprus Legal Advisor Technical Advisor
UK Legal Advisor to the
Investment Bank, Bookrunner
and Sponsor
Date of issue: Tuesday, 25 March 2014

3
Offers in South Africa and the United Kingdom only
This Pre-listing Statement constitutes a Private Placement to Qualifying Investors in South Africa only and certain other jurisdictions to whom the Private Placement will specifically be addressed, and is only addressed to persons to whom it may lawfully be made. The distribution of this Pre-listing Statement and the Private Placement in jurisdictions other than South Africa may be restricted by law and a failure to comply with any of those restrictions may constitute a violation of the securities laws of any such jurisdiction. Persons into whose possession this Pre-listing Statement comes must inform themselves about and observe any such restrictions. This Pre-listing Statement does not constitute a Private Placement in any
jurisdiction in which such Private Placement would be unlawful.
Investors should make their investment decision in relation to the Shares based solely on the information contained in this
Pre-listing Statement and should disregard any other information either published by the Company or in respect of the
Company.
To the extent that this Pre-listing Statement is provided to persons in the UK, the following is noted:
This Pre-listing Statement does not contain an offer of transferable securities to the public within the meaning of section 85
of the UK FSMA and will not be a prospectus for the purposes of the Prospectus Rules made under section 73A of FSMA.
Accordingly, this Pre-listing Statement has not been prepared in accordance with the Prospectus Rules, nor has it been
approved by the Financial Conduct Authority pursuant to section 85 of FSMA and a copy has not been and will not be
delivered to the FCA under regulation 3.2 of the Prospectus Rules. No application has been made, or is being made, for any
of the Shares to be admitted to the official list of the UK Listing Authority or to trading on any market of the London Stock
Exchange plc or any other recognised investment exchange in the UK.
In relation to each Relevant Member State of the European Economic Area which has implemented the Prospectus Directive
(Directive 2003/71/EC, as amended by the 2010 PD Amending Directive (Directive 2010/73/EU)), no Shares will be offered
pursuant to the Offer in that Relevant Member State, except that offers of Shares to the public may be made under an
exemption under the Prospectus Directive, if such an exemption is implemented in that Relevant Member State, and
provided that no such offer of Shares shall result in a requirement for the publication of a prospectus pursuant to Article 3
of the Prospectus Directive or any measure implementing the Prospectus Directive in a Relevant Member State.
This Pre-listing Statement is only addressed to and directed Relevant Persons. Any investment or investment activity to
which this Pre-listing Statement relates is only available to Relevant Persons and will be engaged in only with Relevant
Persons. Any person in the European Economic Area or the UK who receives this Pre-listing Statement will be deemed to
have represented and agreed that it is a Relevant Person. Any such recipient will also be deemed to have represented and
agreed that it has not received this Pre-listing Statement on behalf of persons in the European Economic Area other than
Qualified Investors or persons in the UK and other member states (where equivalent legislation exists) for whom the
investor has authority to make decisions on a wholly discretionary basis. The Company will rely on the truth and accuracy of
the foregoing representations and agreements. Any person in the European Economic Area or the UK who is not a Relevant
Person should not act or rely on this Pre-listing Statement or any of its contents. Failure to comply with this restriction may
constitute a violation of applicable securities laws.
Neither this Pre-listing Statement nor any part or copy of it may be taken or transmitted, directly or indirectly, into the US,
Australia, Canada or Japan, or distributed directly or indirectly in the US, Australia, Canada or Japan or to any resident thereof.
Any failure to comply with the above restrictions may constitute a violation of US, Australian, Canadian or Japanese securities
laws. The distribution of this Pre-listing Statement in other jurisdictions may be restricted by law, and persons into whose
possession this Pre-listing Statement comes should inform themselves about, and observe, any such restrictions. The Shares
have not been and will not be registered under the securities laws of the US, Canada, Australia or Japan and, subject to
certain exceptions, may not be offered or sold within US, Canada, Australia or Japan. This Pre-listing Statement does not
constitute an offer of securities to the public in the US, the United Kingdom or in any other jurisdiction.
This Pre-listing Statement encompasses the information required in parts I and II of the 4th schedule of the Cyprus Companies
Law, subject to the provisions of part III of the 4th schedule.
As the Offer is not an offer to the public as contemplated under the Companies Act, a copy of this Pre-listing Statement is
not required to be registered with CIPC pursuant to the Companies Act.
An abridged version of this Pre-listing Statement will be released on SENS on Tuesday, 25 March 2014 and published in the
press on Wednesday, 26 March 2014.
Electronic copies of this Pre-listing Statement (in English only) may be obtained from Tharisa’s website, www.tharisa.com at
any time from Tuesday, 25 March 2014. Hard copies of this Pre-listing Statement are available (in English only), and may be
obtained during normal business hours from Eland House, The Braes, 3 Eaton Avenue, Bryanston, Johannesburg, South Africa,
2021; Office 108 – 110, S. Pittokopitis Business Centre, 17 Neophytou Nicolaides and Kilkis Streets, 8011 Paphos, Cyprus;
the Investment Bank, Bookrunner and Sponsor and the Transfer Secretaries whose addresses are set out in the “Corporate
Information and Advisors” section of this Pre-listing Statement from Tuesday, 25 March 2014 until Tuesday, 8 April 2014
(both days inclusive).

4
CORPORATE INFORMATION AND ADVISORS
Directors of Tharisa
Loucas Christos Pouroulis (Executive Chairman)Phoevos Pouroulis (Chief Executive Officer)Michael Gifford Jones (Chief Finance Officer)John David Salter (Lead Independent non-Executive Director)Ioannis Drapaniotis (Independent non-Executive Director)Antonios Djakouris (Independent non-Executive Director)
Company Secretaries
Lysandros Lysandrides26 Vyronos Avenue1096 NicosiaCyprus
Sanet de WittEland House, The Braes3 Eaton AvenueBryanstonJohannsburg, 2021South Africa
Investment Bank, Bookrunner and Sponsor
Investec Bank Limited(Registration number 1969/004763/06)100 Grayston DriveSandownSandton, 2196(PO Box 785700, Sandton, 2146)South Africa
South African Legal Advisor
Baker & McKenzie South Africa (Du Plessis, Van der Merwe Incorporated)(Registration number 2012/047447/21)4 Sandown Valley CrescentSandownSandton, 2196South Africa
Cyprus Legal Advisor
Lysandrides Lysandros LLC(Registration number HE317683)26 Vyronos Avenue1096 NicosiaCyprus
UK Legal Advisor to the Investment Bank, Bookrunner and Sponsor
Hogan Lovells International LLP(Registration number OC323639)Atlantic HouseHolborn ViaductLondon, ECIA2FGUK
Principal place of business of the Company
Office 108 – 110S. Pittokopitis Business Centre17 Neophytou Nicolaides and Kilkis Streets8011PaphosCyprus
Registered Office of the Company
Office 108 – 110S. Pittokopitis Business Centre17 Neophytou Nicolaides and Kilkis Streets8011PaphosCyprus
Financial Advisor
HSBC Bank plc Johannesburg Branch(Registration number 2003/004613/10)2 Exchange Square85 Maude StreetSandownSandton, 2196South Africa
Legal Advisor to the Board
Terry Mahon AttorneysFirst Floor108 Albertyn AvenueCorner Albertyn and Katherine StreetsSandton, 2196South Africa
South African Legal Advisor to the Investment Bank, Bookrunner and Sponsor
Edward Nathan Sonnenbergs Inc.(Registration number 2006/018200/21)150 West Street Sandton, 2196South Africa
5
Technical Advisor
Coffey Mining (South Africa) Proprietary Limited(Registration number 2006/030152/07)Block D, Somerset Office Estate604 Kudu StreetAllen’s NekRoodepoort, 1737South Africa
Communication Advisor
Brunswick South Africa Limited(Registration number 1995/011507/10)23 Fricker RoadIllovo BoulevardIllovo, 2196(PO Box 2603, Saxonwold, 2136)South Africa
Auditors
KPMG Limited (Cyprus)(Registration number HE132527)14 Esperidon Street1087 NicosiaCyprus
Reporting Accountants
KPMG Inc.(Registration number 1999/021543/21)KPMG Forum1226 Schoeman StreetHatfieldPretoria, 0028South Africa
Transfer Secretaries
Computershare Investor Services Proprietary Limited(Registration number 2004/003647/07)Ground Floor70 Marshall StreetJohannesburg,2001(PO Box 61051, Marshalltown, 2107)South Africa
Cymain Registrars Limited(Registration number HE174490)26 Vyronos Avenue1096 NicosiaCyprus
Date of incorporation
20 February 2008
Place of incorporation
Cyprus

6
DISCLAIMER
The release, publication or distribution of this Pre-listing Statement in certain jurisdictions may be restricted by law and
therefore persons in any such jurisdiction into which this Pre-listing Statement is released, published or distributed should
inform themselves about and observe such restrictions. Any failure to comply with the applicable restrictions may constitute
a violation of the securities laws of any such jurisdiction. This Pre-listing Statement does not constitute an offer to sell or issue,
or the solicitation of an offer to purchase or to subscribe for Shares or other securities or a solicitation of any vote in any
jurisdiction in which such offer or solicitation would be unlawful.
FORWARD-LOOKING STATEMENTS
The following cautionary statements identify important factors that could cause the Group’s actual results to differ materially
from those projected in the forward-looking statements made in this Pre-listing Statement. Any statements about the
Group’s expectations, beliefs, plans, strategy, objectives, assumptions or future events or performance are not historical facts
and may be forward-looking. These statements are often, but not always, made through the use of words or phrases such as
“will”, “will likely result”, “are expected to”, “will continue”, “believe”, “is anticipated”, “estimated”, “intends”, “expects”, “plans”,
“seek”, “projection”, and “outlook”. These statements involve estimates, assumptions and uncertainties that could cause actual
results to differ materially from those expressed in them. Any forward-looking statements are qualified in their entirety with
reference to the factors discussed throughout this Pre-listing Statement, including the risk factors set out in Section 16
(“Risk Factors”) of this Pre-listing Statement.
By their nature, forward-looking statements are inherently predictive and/or speculative. New factors will emerge in the
future, and it is not possible for the Group to predict such factors. Such factors, as well as the Risk Factors set out in
Section 16 of this Pre-listing Statement, could cause actual results, performance or outcomes to differ materially from those
expressed in the forward-looking statements made in this Pre-listing Statement by the Group or on behalf of the Group. No
undue reliance should be placed on any of these forward-looking statements. Furthermore, any forward-looking statement
speaks only as at the date on which it is made, and the Company undertakes no obligation to update any forward-looking
statement to reflect events or circumstances after the date on which the statement is made or to reflect the occurrence of
unanticipated events. In addition, the Company cannot assess the effect of each factor on the Company’s business or the
extent to which any factor, or combination of factors, may cause actual results to differ materially from those described in
any forward-looking statements.

7
TABLE OF CONTENTS
Page
PRE-LISTING STATEMENT
CORPORATE INFORMATION AND ADVISORS 4
DISCLAIMER 6
FORWARD-LOOKING STATEMENTS 6
SALIENT FEATURES 9
DEFINITIONS AND INTERPRETATIONS 16
THE OFFER AND INSTRUCTIONS TO APPLICANTS 25
1. Rationale and purpose 25
2. Particulars of the Offer and the Listing 25
The business
1. Introduction to Tharisa 29
2. Business overview 31
3. Competitive strengths 36
4. Strategy 39
5. Beneficiation and value addition 41
6. Labour relations 41
7. Directors 42
8. Related party transactions 47
9. Shareholders and Lock-up Undertakings 47
10. Details of subsidiary companies 49
11. Overview of South African laws and regulations 49
12. Financial information 49
13. Dividend policy 50
14. Incorporation, share capital, options and preferential rights in respect of Shares 50
15. Share Award Plan 52
16. Risk factors applicable to Tharisa 52
17. Corporate governance practices of Tharisa 58
18. Corporate relationships and material contracts 58
19. Material borrowings and loans receivable 59
20. South African Exchange Control 60
21. Interests of Directors and promoters 61
22. Advisors’ interests 61
23. Preliminary expenses incurred 61
24. Litigation statement 61
25. Expenses relating to the Listing 61
26. Material changes 61
27. Working capital statement 62
28. Consents 62
29. Documents available for inspection 62

8
Page
Annexure 1 Historical financial information 63
Annexure 2 Independent Reporting Accountants’ report on the historical financial information 108
Annexure 3 Pro forma financial information 111
Annexure 4 Independent Reporting Accountants’ reasonable assurance report on
the pro forma financial information 114
Annexure 5 Quarterly historical financial information 116
Annexure 6 Salient features of the Articles of Association 129
Annexure 7 Corporate governance 135
Annexure 8 Share Award Plan 138
Annexure 9 Curriculum vitae of the Directors, senior management and Company secretaries 144
Annexure 10 Other directorships 151
Annexure 11 Issues and offers of securities 154
Annexure 12 Details of subsidiary companies 156
Annexure 13 Owned and leased properties 158
Annexure 14 Material contracts 162
Annexure 15 Competent Person’s Report 169
Annexure 16 Overview of South African laws and regulations 443
Application Form (blue) Attached

9
SALIENT FEATURES
This summary contains the salient features of Tharisa, the Listing and the Offer set out in this Pre-listing Statement, which should be read in its entirety for a complete understanding thereof.
1. MISSION STATEMENT
To maximise shareholder returns through innovative exploitation of mineral resources in a responsible manner.
2. NATURE OF BUSINESS AND PROSPECTS
2.1 Introduction to the Group
Tharisa is domiciled, incorporated and registered in the Republic of Cyprus as a public company limited by shares. Tharisa is an integrated resources group incorporating mining, processing, beneficiation, marketing, sales and logistics of PGMs and Chrome Concentrate through its 74% interest in Tharisa Minerals (mining and processing) and its wholly-owned subsidiaries including Arxo Metals (processing and beneficiation), Arxo Logistics (logistics) and Arxo Resources and Dinami (collectively, marketing and sales).
Tharisa’s objective is to become a leading natural resources company focused on originating, developing and operating mines in the PGM, chrome and steel raw material sectors to service growing global demand through integrated mining, processing, marketing, sales and logistics operations. The Company’s strategy is to focus on growth through value accretive acquisition, development and operation of large-scale and low cost projects that are in or close to production.
Tharisa is led by a strong management team with significant sector expertise and a track record in the successful origination, development and operation of mining projects.
2.2 Key investment highlights
Tharisa provides direct access to a PGM and Chrome Concentrate open pit co-producer with an integrated marketing, sales and logistics platform:
• shallow and large (835Mt resource) PGM and Chrome Concentrate co-producer;
• mechanised open pit operations with over 23 years LoM and a 36 year LoM underground extension;
• located in the lowest cost quartile of the PGM and Chrome Concentrate cost curves;
• operationally de-risked:
– Tharisa Mine is cash generative in FY2014 and is currently at c.87% (for the 5 months ending 28 February 2014) of steady state production of 4,800,000tpa RoM ore;
– capital investment programme completed (mine and infrastructure development for the Tharisa Mine and processing plants);
– mining, environmental and water use permits and licenses have been granted and are valid;
– processing, marketing, sales and logistics platform is fully operational;
– processing flexibility provided through the Voyager and Genesis standalone concentrator plants which are independently operated by Tharisa Minerals;
– PGM concentrate off-take agreement with Impala Platinum; and
– 25,000tpm Chrome Concentrate off-take agreement with Noble;
• global marketing and sales of Chrome Concentrate to an established customer base;
• established marketing and sales platform with direct access to market and price discovery which provides a channel for future growth;
• in-house, cost effective mine to customer logistics solution;
• stable labour and community relations;
• mechanised open pit mining with a comparatively small and skilled contractor labour force; and
• capital appreciation through value accretive growth and dividend policy of 10% of net profit after tax.
The Group is well positioned to benefit from projected growth in demand for both PGMs and Chrome Concentrate. Rising income per capita in emerging markets will drive commodity demand as consumers purchase more goods. As income per capita increases, the structure of the economy moves away from agriculture towards industry, which increases commodity demand. Supply is likely to be constrained due to rising costs and capacity reductions at underground mines in South Africa.
10
2.3 Competitive strengths
Tharisa is uniquely positioned through:
• commitment to health, safety and environmental management;
• stable labour and community relations;
• shallow and large scale PGM and chrome resource, one of the world’s single largest chrome resources,
enabling Tharisa to be a large scale supplier of consistent products over several decades;
• mining of all 6 MG Chromite Layers which allows for the co-production of PGMs and Chrome Concentrate;
• located in the lowest cost quartile of the PGM and Chrome Concentrate cost curves underpinned by low
risk mining and beneficiation processes;
• mechanised and skilled labour force;
• independent processing plants providing operational flexibility;
• capacity to produce Metallurgical, Chemical and Foundry Grade Concentrates for different markets;
• direct relationships with its South African and international customers;
• integrated marketing, sales and logistics platform;
• extensive industry and management experience with a successful track record of identifying, developing and
operating open pit and underground mining operations; and
• pioneering, innovative and unique approach to viable mineral extraction and beneficiation.
2.4 Strategy
Tharisa’s strategy for future growth through:
• becoming a leading natural resources company focused on originating, developing and operating mines in
the PGM, chrome and steel raw material sectors to service growing global demand through integrated
mining, processing, marketing, sales and logistics operations. The strategy is to focus on growth through value
accretive acquisition, development and operation of large-scale and low cost projects that are in or close to
production;
• growth through innovative research and development projects;
• implementation of the optimisation initiatives to maximise value extraction;
• leveraging off the established marketing, sales and logistics platform for expansion into multi-commodities
with geographic diversity; and
• capital discipline through the return of dividends to Shareholders, through a dividend policy of 10% of net
profit after tax, and growth driven by capital allocation to low risk projects and opportunities.
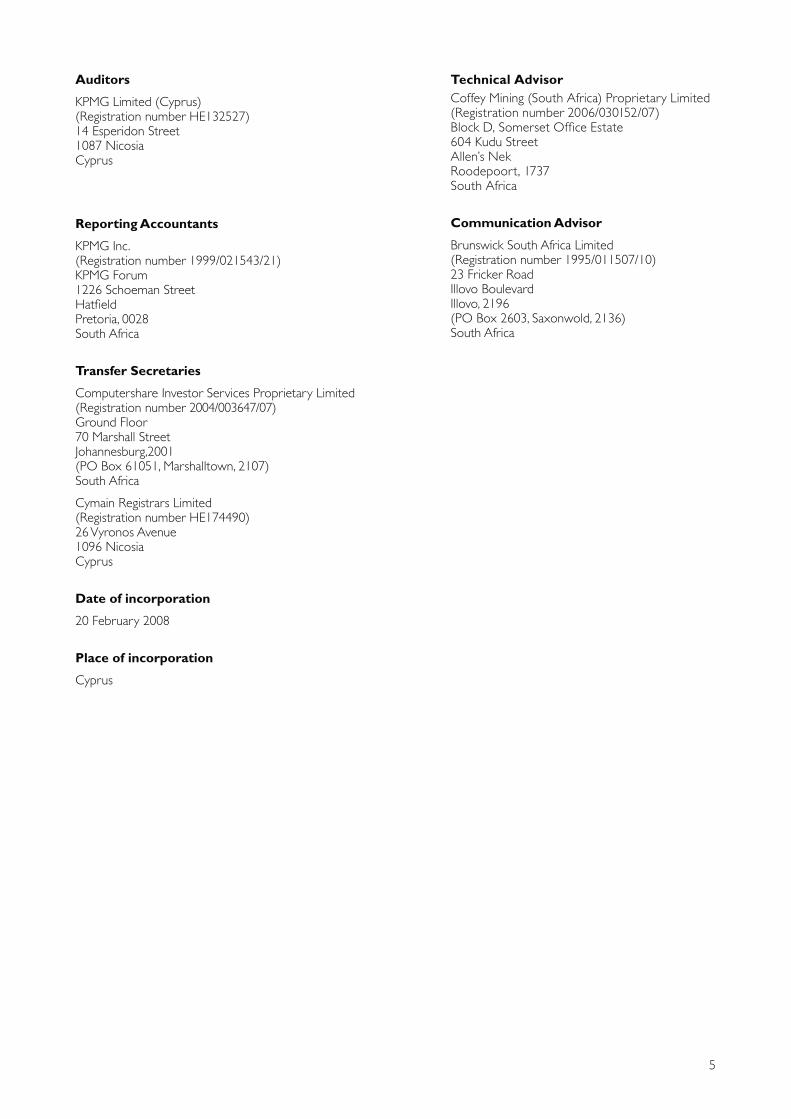
2.5 Business overview
The Group structure is shown in the diagram below:
Source: Tharisa

11
Tharisa Minerals
Tharisa Minerals, a 74% subsidiary of the Company, owns and operates the Tharisa Mine, located 95km north
west of Johannesburg in the south western region of the Bushveld Complex, the world’s leading source of
platinum and chrome, and within close proximity to the town of Rustenburg, South Africa:
Source: Tharisa
Salient features of the Tharisa Mine
• shallow and large scale PGM and chrome resource:
• producing and operationally cash generative in FY2014;
– large-scale open pit PGM and chrome mid-tier operation;
– over 23 years LoM open pit and a 36-year LoM underground extension (commencing in year 19);
– 8.5 average LoM stripping ratio (m3 to m3 basis);
– co-production of PGM and Chrome Concentrates through the mining and processing of all
6 MG Chromitite Layers;
– commenced production in March 2009;
– currently at c.87% of steady state production of 4,800,000tpa RoM ore (for the 5 months ending
28 February 2014);
– average steady state production of 144,000ozpa of 5PGE + Au and 1,850,000tpa of Chrome Concentrate
in FY2016; and
– monthly run of mine ore processing capacity of 400,000tpm at its independent and standalone Voyager
and Genesis concentrator Plants;
• processing flexibility to produce Metallurgical, Chemical and Foundry Grade Chrome Concentrate;
• off take agreement with Impala Platinum for PGM Concentrate;
• off take, agency and global marketing and sales of Chrome Concentrate through Arxo Resources to an
established customer base; and
• dedicated research team focused on enhancing operating efficiencies through initiatives including:
– increasing the RoM stock pile to provide mining and processing flexibility;
– a magnetic separation circuit for additional Chrome Concentrate yield; and
– ultra fine grinding with high energy flotation for additional PGM recovery.
Black Economic Empowerment
Tharisa Minerals complies with the BEE ownership criteria in the Mining Charter through the broad-based
Community Trust and Thari Resources, holding 6% and 20% interests in Tharisa Minerals, respectively. As at
31 December 2013, Tharisa Minerals has a BEE compliance score of 93.0% and achieves an “excellent” rating in
compliance with the Mining Charter.

12
Tharisa places a priority on community relations and initiatives. In this context, Tharisa Minerals has set up an
engagement forum for the local community surrounding the Tharisa Mine and has implemented initiatives for
job creation, permanent housing, poverty alleviation, basic infrastructure and community development, which
projects are and will continue to be funded from future dividends from the Tharisa Mine.
Arxo Metals
Arxo Metals, an indirectly wholly-owned subsidiary of Tharisa, is the producing, beneficiation, research and
development company of the Group.
Arxo Metals conducts research and development into further downstream beneficiation opportunities to expand
and optimise the Group’s operations, including:
• magnetic separation circuits to enhance chrome yields;
• ultra fine grinding with high energy flotation to increase PGM recoveries;
• DC PGM smelting and hydrometallurgical feasibility studies;
• development and feasibility of producing Chrome Alloys as a high value feed material for the stainless steel
industry; and
• further recovery of chrome ore from tailings produced at the Tharisa Mine and other mines.
In addition to research and development, Arxo Metals produces higher value Chemical and Foundry Grade
Concentrates at its Challenger Plant, which is capable of producing a minimum of ~8,000tpm of Foundry and
Chemical Grade Concentrate, for which it has an off-take agreement with Rand York.
Arxo Resources
Arxo Resources, a wholly-owned subsidiary of Tharisa, provides direct access to the international Chrome
Concentrate customer base, in particular in the PRC, and provides an established marketing and sales platform
with direct access to market and price discovery which provides a channel for future growth through:
• an integrated marketing and sales operation for Chrome Concentrate; and
• direct channels with international customer base of third party sales revenue.
Tharisa accounted for ˜9% of South African Chrome Concentrate production and ˜4% of global Chrome
Concentrate production for the 2013 financial year.
Arxo Logistics
Arxo Logistics, a wholly-owned subsidiary of Tharisa, provides:
• an integrated logistics platform to mitigate logistics risks and providing a competitive advantage;
• road transportation of PGM Concentrate to Impala Platinum;
• road and rail transport capacity, warehousing facilities and port facilities at the RBDBT and the Durban port
to handle the full steady state production levels of 155,000tpm of Chrome Concentrate;
• transportation of Chrome Concentrate from the Tharisa Mine to either : the RBDBT by rail and then loaded
onto bulk vessels; or by road to warehouses and then packed into containers and transported by either road
or rail to the Durban stacks for shipment by container vessels;
• shipment of Chrome Concentrate production from the RBDBT and the Durban port to customers in Asia
and other international markets through bulk and container vessels; and
• a platform to service third party customers in the future.
During the 2013 Financial Year, Arxo Logistics shipped 488,000t in containers and 545,000t in bulk shipments of
Chrome Concentrate.
Dinami
Dinami, a wholly-owned subsidiary of Tharisa, provides marketing, sales and agency services in relation to Arxo
Metals’ Foundry and Chemical Grade Concentrates as well as third party products.

13
3. DETAILS OF THE OFFER
Offer Price range per Share R42.75 to R55.21
Number of Shares to be offered 23,393,971 to 18,111,503
Amount to be raised in terms of the Offer R1,000,000,000
The Offer comprises an offer for subscription of up to 23,393,971 Shares, subject to Qualifying Investor demand to
whom the Offer will be specifically addressed. The Bookrunner has been granted an option by the Company, from the
Listing Date, to allot additional Shares of up to 15% of the number of Shares issued pursuant to the Private Placement.
Such action, if commenced at the discretion of the Bookrunner, may be discontinued at any time, but may under no
circumstances continue beyond the 30th calendar day after the Listing Date.
The Listing and the Offer are conditional on obtaining the minimum spread of Shareholders required in terms of the
Listings Requirements, which provide that, unless the JSE determines otherwise, the number of public shareholders, as
defined in the Listings Requirements, must be at least 300 who will hold a minimum of 20% of the Shares. The Listing
may not proceed if these shareholder spread requirements are not met, and in such event the Private Placement and
any acceptance thereof will not be of any force or effect and no person shall have any claim whatsoever against the
Company or any other person.
The Bookrunner is seeking applications from Qualifying Investors to acquire Shares as part of a book-building process.
Applicants will only be permitted to apply for Shares with a minimum total purchase price per single addressee
acting as principal, of greater than or equal to R1,000,000 unless the Applicant is a person, acting as principal, whose
ordinary business, or part of whose ordinary business, is to deal in securities, whether as principal or agent (in reliance
on sections 96(1)(a)(i) and 96(1)(b) of the Companies Act) or such Applicant falls within one of the other specified
categories of persons listed in section 96(1) of the Companies Act. Following the book-building process, the Offer Price
will be determined by the Bookrunner in consultation with Tharisa prior to or on the Closing Date of the Offer and will
be released on SENS on Friday, 4 April 2014. Any change to this date will be released on SENS.
Qualifying Investors who wish to participate in the Offer are required to complete the Application Form (blue) which
is attached to this Pre-listing Statement setting out the number of Shares and the Offer Price at which they wish to
subscribe. Applicants allocated Shares will be advised of the number of Shares which they have been allocated once the
Offer Price has been determined. Subsequent to payment on the Payment Date, the Shares so allocated will be issued
on the Listing Date at the Offer Price.
Tharisa and the Board reserves the right, at any time during the Offer, at their sole and absolute discretion, in compliance
with the Listings Requirements, to amend, deviate from or modify the Offer in the manner they deem fit or to postpone,
discontinue or terminate the Offer.
4. USE OF PROCEEDS
The proceeds from the Private Placement will be applied to optimisation initiatives, for working capital funding of the
product pipeline, purchase of long-lead items, strategic spares, further de-risking of the operation by building a RoM
stockpile and to settle unsecured debt funders of Tharisa Minerals.
The detail of the use of proceeds from the Private Placement is set out below:
Optimisation initiatives
Description Amount
Magnetic separation R200 million
Ultra-fine grind R100 million
High energy flotation R12 million
Siding on mine R100 million
Silos R30 million
Genesis RoM feed arrangement R10 million
Total R452 million

14
Working capital
Description Amount
RoM stockpile R80 million
Strategic spares R43 million
General purposes R120 million
Total R243 million
Capital projects
Description Amount
Second tailings storage facility R38 million
Infrastructure projects R32 million
Land purchases R30 million
Total R100 million
Capital structure
Description Amount
Redemption of B class preference shares and repayment of Langa Trust loan R165 million
Listing and Private Placement fees and costs R40 million
Total R205 million
Grand total R1 billion 1
1 Assuming R1 billion is raised in the Private Placement
Where capital costs for a project are scheduled to be carried over to FY2016, such costs will be internally funded and
are not included in the use of proceeds amount.
The optimisation initiatives to enhance mineral recoveries, thereby increasing production volumes of PGM and Chrome
Concentrate, include a magnetic separation circuit for increased Chrome Concentrate yields and ultra fine grinding with
high energy flotation for increased PGM Concentrate recoveries, and are outlined below:
Magnetic separation
After crushing and milling the RoM material is fed into the chrome spirals. Coarse, dense chrome particles are then
recovered utilising gravity separation. A magnetic separation circuit, located after the chrome spirals, will remove some
of the finer chrome particles, increasing the yield from an estimated 34% to over 39%.
As the PGMs are associated with the silicates, which are significantly less dense and remain in the tailings material, less
than 5% of PGMs are lost in the final Chrome Concentrate.
The tailings from the spiral circuit become the feed material for the PGM flotation circuit.
Ultra-fine grind
After the first stage Chrome Concentrate separation, the feed material goes through a secondary milling circuit before
being fed into a flotation circuit to recover PGMs. A proportion of PGMs occur as small particles encased within a silica
matrix and are not recovered in this circuit. The ultra-fine grinding liberates these encased PGM particles which are then
recovered in the high energy flotation circuit, thereby increasing PGM recoveries.
High-energy flotation
Due to the lower mass of the particles as a result of ultra-fine grinding, the finer liberated PGM particles would not
be collected by the flotation bubbles. To mitigate this problem, more energy is added to the flotation process, which is
achieved by adding more velocity to the flotation liquids, hence, high-energy flotation. This changes the proportion of
smaller PGM particles are thereby recovered by flotation.
The benefit from the implementation of the ultra-fine grind and high-energy flotation is an expected increase in
concentrate recoveries from 61% to over 70%.
15
5. FURTHER COPIES OF THIS PRE-LISTING STATEMENT
Further copies of this Pre-listing Statement may be obtained during normal business hours from Tuesday, 25 March 2014
until Tuesday, 8 April 2014 from:
• Tharisa Minerals, Eland House, The Braes, 3 Eaton Avenue, Bryanston, Johannesburg, 2021, South Africa;
• Tharisa, Office 108 – 110, S. Pittokopitis Business Centre, 17 Neophytou Nicolaides and Kilkis Streets, 8011 Paphos,
Cyprus;
• Computershare Investor Services Proprietary Limited, Ground Floor, 70 Marshall Street, Johannesburg, 2001,
South Africa; and
• Investec Corporate Finance, a division of Investec Bank, 2nd Floor, 100 Grayston Drive, Sandown, Sandton, 2196,
South Africa.

16
DEFINITIONS AND INTERPRETATIONS
In this Pre-listing Statement and the Annexures hereto, unless otherwise indicated, the words in the first column have the
meanings stated opposite them in the second column, words in the singular include the plural and vice versa, words denoting
one gender includes the others, and words denoting natural persons include juristic persons and associations of persons and
vice versa. All times in this Pre-listing Statement refer to Central African Time and all acts referred to are South African acts
unless expressly stated.
“5PGE” platinum group metals comprising platinum, palladium, rhodium, ruthenium and
iridium;
“6PGE” 5PGE plus osmium;
“Applicants” Qualifying Investors who have applied for Offer Shares;
“Application Form” the Application Form (blue), attached to and forming part of this Pre-listing
Statement, which Applicants are required to complete and return in accordance
with the instructions contained therein in order to be considered for allocation
of Shares in the Private Placement;
“Articles of Association” the Articles of Association of Tharisa, the salient details of which are set out in
Annexure 6;
“Arxo Logistics” Arxo Logistics Proprietary Limited (Registration number 2009/006720/07),
a private company duly registered and incorporated in South Africa,
a wholly-owned subsdiary of Tharisa and a member of the Group;
“Arxo Metals” Arxo Metals Proprietary Limited (Registration number 2011/143342/07),
a private company duly registered and incorporated in South Africa, an indirect
wholly-owned subsdiary of Tharisa and a member of the Group;
“Arxo Resources” Arxo Resources Limited (Registration number HE221459), a company duly
registered and incorporated in Cyprus, a wholly-owned subsdiary of Tharisa and
a member of the Group;
“Au” gold;
“Auditors” KPMG Limited (Cyprus), full details of which are set out in the “Corporate
Information and Advisors” section to this Pre-listing Statement;
“Authorised Dealer” a South African bank licensed to deal in foreign exchange;
“Baker & McKenzie” or
“South African Legal Advisor”
Baker & McKenzie South Africa (Du Plessis, Van der Merwe Incorporated),
full details of which are set out in the “Corporate Information and Advisors”
section to this Pre-listing Statement;
“BEE” Black Economic Empowerment, as defined in the MPRDA and “Broad-based
Socio Economic Empowerment” as defined in the Mining Charter ;
“Bonus Issue” the allotment and issue to each Shareholder of 25 new Shares for each Share
held, which issued Shares shall be credited as fully paid up Shares and shall rank
pari passu in all respects with the issued Shares of the Company, which issue will
occur immediately upon conversion of the Convertible Preference Shares to
Shares on the day immediately preceding the Listing Date and prior to the
issuance of Shares pursuant to the Offer ;
“ Braeston Corporate Consulting
Services”
Braeston Corporate Consulting Services Proprietary Limited (Registration
number 2007/022755/07), a private company duly registered and incorporated
in South Africa, an indirect wholly-owned subsdiary and a member of the Group;
“ Brunswick” or “Communication
Advisor”
Brunswick South Africa Limited, full details of which are set out in the “Corporate
Information and Advisors” section to this Pre-listing Statement;

17
“Bushveld Complex” a major intrusive igneous body in the northern part of South Africa, that has
undergone remarkable magmatic differentiation and the leading source of PGMs
and Chromium;
“Central African Time” time zone used in central and southern Africa and is 2 hours ahead of Coordinated
Universal Time;
“Certificated Shares” Shares which are held and represented by a share certificate or other tangible
document of title, which Shares have not been Dematerialised in terms of the
requirements of Strate;
“Challenger” or “Challenger Plant” the integrated beneficiation plant adjacent to the Genesis Plant for the production
of Chemical and Foundry Grade Concentrate owned by Arxo Metals;
“Charter Scorecard” the Scorecard for the Mining Charter published pursuant to section 100(2)(a) of
the MPRDA under Government Gazette No. 26661 of 13 August 2004,
as amended by General Notice 838 of 20 September 2010;
“Chemical Grade Concentrate” the main ingredient in the production of chrome chemicals. The critical
specifications are a minimum of 45% Cr2O
3,and a maximum of 1.28% SiO
2;
“chrome” used to reference any form of Chromium, Cr or Chrome Concentrate;
“Chrome Concentrate” any combination of Chemical, Foundry and/or Metallurgical Grade Concentrate
with a predominance of Metallurgical Grade Concentrate;
“Chrome Alloys” a chrome alloy produced directly through smelting using carbon as a reducing
agent in the presence of fluxes, which alloy is used as primary raw material in the
production of stainless steel;
“Chromite” a hard, black, refractory chromium-spinel mineral consisting of varying
proportions of the oxides of iron chromium, aluminium and magnesium;
“Chromitite” a rock composed essentially of Chromite, that typically occurs as layers or
irregular masses exclusively associated with magmatic complexes. The bulk of the
world’s exploitable chromitite occurs almost exclusively in layered complexes;
“Chromitite Layers” thick accumulations of Chromite grains to form monomineralic bands or layers,
which Chromitite Layers are typically greater than 30cm thick;
“Chromium” or “Cr” the element chromium (Cr) is classified as a metal and is situated between other
metals such as vanadium (V), manganese (Mn) and molybdenum (Mo) in the
Periodic Table of Elements;
“CIF” cost, insurance and freight as defined in Incoterms 2010;
“CIPC” Companies and Intellectual Property Commision, established in terms of
section 185 of the Companies Act;
“cm” centimetres;
“Closing Date” 12:00 on Wednesday, 2 April 2014, being the closing date for the receipt of the
Application Forms by the Applicants under the terms of the Offer ;
“Coffey” or “Technical Advisor” Coffey Mining (South Africa) Proprietary Limited (Registration number
2006/030152/07), a private company duly registered and incorporated in
South Africa;
“Common Monetary Area” South Africa, the Republic of Namibia and the Kingdoms of Lesotho and
Swaziland;
“Community Trust” Tharisa Community Trust (Master reference number IT1866/2011), being a trust
established by the Company for the benefit of the communities residing in the
vicinity of the Tharisa Mine and which holds 6% of the issued ordinary share
capital of Tharisa Minerals;
“Companies Act” the South African Companies Act, 71 of 2008, as amended;

18
“Company” or “Tharisa” Tharisa plc (Registration number HE223412), a public company duly registered
and incorporated in Cyprus;
“Competent Person’s Report” or
“CPR”
a techno-economic report representing the opinions on the deposit of a
registered professional, independent of the client and its subsidiaries;
“Computershare” or
“Transfer Secretaries”
Computershare Investor Services Proprietary Limited full details of which are set
out in the “Corporate Information and Advisors” section to this Pre-listing
Statement;
“ Convertible Preference
Shareholders”
holders of the Company’s Convertible Preference Shares;
“Convertible Preference Shares” the convertible redeemable preference shares of the Company, consisting of
1,051 shares of US$1.00 each, all of which were issued on 14 April 2011 at a
price of US$142,857 each and are fully paid;
“Coordinated Universal Time” the time as measured on the prime meridian running through the UK and used
as a standard of calculation;
“Cornèr Bank” Cornèr Bank Limited (Registration number CH-514.3.000.263-8), a company
duly registered and incorporated in Switzerland;
“Cr2O
3” chromium (III) oxide;
“CSDP” a Central Securities Depository Participant as defined in section 1 of the Financial
Markets Act;
“Cymain” or “Transfer Secretaries” Cymain Registrars Limited full details of which are set out in the “Corporate
Information and Advisors” section to this Pre-listing Statement;
“Cyprus” the Republic of Cyprus;
“Cyprus Companies Law” companies law, chapter 113 of the laws of Cyprus, as amended, supplemented or
otherwise modified from time to time;
“DC” direct current, the direct flow of electric charge;
“Dematerialise”, “Dematerialised”
or “Dematerialisation”
the process by which physical share certificates are replaced with electronic
records of ownership in accordance with the rules of Strate;
“Dematerialised Shares” Shares which are held in electronic form as uncertificated securities in accordance
with the requirements of Strate;
“Dinami” Dinami Limited (Registration number 56730), a company duly registered and
incorporated in Guernsey, a wholly-owned subsidiary of Tharisa and a member
of the Group;
“Directors” or “the Board” any Executive or non-Executive Director or the Board of Directors of the
Company, the full details of which are set out in Annexure 9 to this Pre-listing
Statement;
“DMR” the South African Department of Mineral Resources;
“EMP” the environmental management plan in term of the MPRDA;
“ ENS” or “South African Legal
Advisor to the Investment Bank,
Bookrunner and Sponsor”
Edward Nathan Sonnenbergs Inc., full details of which are set out in the
“Corporate Information and Advisors” section to this Pre-listing Statement;
“Equator Principles” the set of voluntary guidelines adopted and interpreted in accordance with
International Finance Corporate Performance Standards and the World Banks
EHS guidelines, adopted by Equator Principle Financial Institutions, as updated
from time to time;
“Eskom” Eskom Holdings Limited (Registration number 2002/015527/06), a public
company duly registered and incorporated in South Africa and a South African
utility company;

19
“Exchange Control” the Financial Surveillance Department of the SARB;
“Exchange Control Regulations” Exchange Control Regulations, 1961, as amended, promulgated in terms of
section 9 of the Currency and Exchanges Act, 9 of 1933, as amended;
“Facility Lenders” HSBC Bank plc (Johannesburg Branch), Nedbank Limited and ABSA Bank
Limited;
“Financial Markets Act” the Financial Markets Act, 19 of 2012 of South Africa;
“ Financial Services and Markets
Act” or “FSMA”
the Financial Services and Markets Act 2000 (as amended);
“Financial Year” or “FY” the financial year of Tharisa which commences on 1 October of each year and
ends on 30 September of the following year ;
“Foundry Grade Concentrate” saleable Chromium rich product typically more than 45% Cr2O
3, less than 1%
SiO2 and a specific particle size distribution;
“Fujian Wuhang” Fujian Wuhang Stainless Steel Products Co., Limited (Registration number
350100400015672), a company duly registered and incorporated in accordance
with the laws of the PRC;
“Further Allotment” an option has been granted by the Company to the Bookrunner pursuant to
which the Bookrunner may (for a 30 calendar day period commencing on the
date of the Listing) require the Company to implement the allotment and issue
of Shares in excess of the number of Shares subscribed for in the Offer, but
which Shares, in aggregate, may not exceed 15% of the number of Shares placed
by Tharisa pursuant to the Offer ;
“g/t” grams per ton;
“General Meeting” a meeting of Shareholders to consider and, if deemed fit, approve necessary
Shareholder resolutions;
“Genesis” or “Genesis Plant” the 100,000tpm RoM processing plant for the production of PGM and Chrome
Concentrate, owned by Tharisa Minerals;
“Group” the Company and its subsidiary companies as set out in paragraph 1.3 of this
Pre-listing Statement;
“HDSA” Historically Disadvantaged South Africans as defined in the MPRDA and the
Mining Charter ;
“HeYi Mining” Hong Kong HeYi Mining Resource Co., Limited (Registration number 750563),
a company duly registered and incorporated in Hong Kong;
“ Hogan Lovells” or “UK Legal
Advisor to the Investment Bank,
Bookrunner and Sponsor”
Hogan Lovells International LLP, full details of which are set out in the “Corporate
Information and Advisors” section to this Pre-listing Statement;
“HSBC” or “Financial Advisor” HSBC Bank plc (Johannesburg Branch) (Registration number 2003/004613/10),
incorporated in the UK and registered as an external company in South Africa,
full details of which are set out in the “Corporate Information and Advisors”
section to this Pre-listing Statement;
“IFRS” International Financial Reporting Standards;
“Impala Platinum” Impala Refining Services Limited, a 100% owned subsidiary of Impala Platinum
Holdings Limited;
“Incoterms 2010” the Incoterms rules are a series of pre-defined commercial terms published by
the International Chamber of Commerce that are widely used in international
commercial transactions or procurement processes;
“Investec Bank” Investec Bank Limited (Registration number 1969/004763/06), a public company
duly registered and incorporated in South Africa;

20
“ Investment Bank” or “Bookrunner”
or “Sponsor”
Investec Corporate Finance, a division of Investec Bank, full details of which are
set out in the “Corporate Information and Advisors” section to this Pre-listing
Statement;
“IRR” the internal rate of return applied to an investment amount;
“JIBAR” the Johannesburg Interbank Agreed Rate;
“JSE” JSE Limited (Registration number 2005/022939/06), a public company duly
registered and incorporated in South Africa and licensed in terms of the Financial
Markets Act, 19 of 2012;
“Kameni” Kameni Limited (Registration number 2006/028498/06), a company duly
registered and incorporated in South Africa;
“King III” the King Code of Governance Principles for South Africa, 2009 (“King Code”)
and the King Report on Governance for South Africa, 2009 (“King Report”)
as amended from time to time;
“km” 1 000 metres;
“Last Practicable Date” Monday, 10 March 2014, being the last practicable date prior to the finalisation
of this Pre-listing Statement on which information could be included in this
Pre-listing Statement;
“LIBOR” London Interbank Offered Rate;
“Listing” the primary listing of Tharisa, a foreign registered company, in the “General
Mining” sector of the Main Board of the JSE under the abbreviated name
“Tharisa”, JSE code “THA” and ISIN CY0103562118;
“Listing Date” on or about Tuesday, 8 April 2014, being the date of the Listing;
“Listings Requirements” the Listings Requirements of the JSE, as amended from time to time;
“Lock-up Undertaking” deed of lock-up by Medway and the existing Convertible Preference Shareholders
pursuant to the Listing on the terms set out in paragraph 9 of this Pre-listing
Statement;
“LoM” life of mine, being the expected remaining years of production based on
production rates and ore Mineral Reserves;
“LTIFR” Lost Time Injury Frequency Rate, the number of lost time injuries within a given
accounting period relative to the number of hours worked;
“Lysandrides Lysandios LLC ” or
“Cyprus legal advisor”
full details of which are set out in the “Corporate Information and Advisors”
section to this Pre-listing Statement;
“Maaden Invest” Maaden Invest Limited (Registration number CF-137212), a company duly
registered and incorporated in Cayman Islands;
“MCC” MCC Contracts Proprietary Limited (Registration number 1983/008084),
a subsidiary of EQSTRA Holdings Limited, a company duly registered and
incorporated in South Africa;
“Medway” Medway Developments Limited (Registration number HE34472), a company
duly registered and incorporated in Cyprus;
“Metallurgical Grade Concentrate” saleable Chromium rich product typically of 42% Cr2 O
3;
“MG0” Chromitite Layer that consists of Chromitite dissemination with more Chromitite
Layers and stringers, that are developed in the footwall pyroxenite of the MG1
Chromitite Layer;
“MG1” Chromitite Layer that typically has a massive Chromitite content with minor
feldspathic pyroxenite partings or layering. In some areas the MG1 Chromitite
Layer has developed into 2 Chromitite Layers separated by a feldspathic
pyroxenite;

21
“MG2” Chromitite Layer that consists of 3 groupings of Chromitite Layers which from
the base are the MG2A Chromitite Layer, MG2B Chromitite Layer and the
MG2C Chromitite Layer. The partings are typically feldspathic pyroxenite. The
parting between the MG2B Chromitite Layer and MG2C Chromitite Layer
includes a platiniferous Chromitite stringer ;
“MG3” Chromitite Layer that is occasionally a massive Chromitite Layer but more often
a very irregular, assemblage of Chromitite Layers and stringers within a norite
and/or anorthosite. The top of the package typically consists of thin Chromitite
stringers and dissemination of Chromite in norite which develops into a massive
layer at the base;
“MG Chromitite Layers” middle group with reference to Chromitite Layers, being thick accumulations of
Chromite grains to form monomineralic bands or layers, which Chromitite
Layers are typically greater than 30cm thick;
“Mineral Reserve” the economically mineable material derived from a measured or indicated
Mineral Resource or both, which includes diluting and contaminating materials
and allows for losses that are expected to occur when the material is mined.
Appropriate assessments to a minimum of a pre-feasibility study for a project
and a LoM plan for an operation must have been completed, including
consideration of, and modification by, realistically assumed mining, metallurgical,
economic, marketing, legal, environmental, social and governmental factors (the
modifying factors) (SAMREC Code, 2009);
“Mineral Resource” a concentration or occurrence of material of economic interest in or on the
earth’s crust in such form, quality and quantity that there are reasonable and
realistic prospects for eventual economic extraction. The location, quantity, grade,
continuity and other geological characteristics of a Mineral Resource are known,
or estimated from specific geological evidence, sampling and knowledge
interpreted from an appropriately constrained and portrayed geological model.
Mineral Resources are subdivided, and must be so reported, in order of increasing
confidence in respect of geoscientific evidence, into Inferred, Indicated or
Measured categories (SAMREC Code, 2009);
“Mining Charter” the Broad-Based Socio-Economic Empowerment Charter for the South African
Mining Industry (together with the Charter Scorecard), published pursuant
to section 100(2)(a) of the MPRDA under Government Gazette No. 26661
of 13 August 2004 and thereafter amended by General Notice 838 of
20 September 2010;
“Mining Right” a new order mining right, granted by the DMR in terms of the MPRDA, which
provides the holder thereof the required legal title to mine;
“MPRDA” the South African Mineral and Petroleum Resources Development Act, 28 of
2002, as amended;
“Mt” million tonnes;
“NEMA” the National Environmental Management Act, 107 of 1998, as amended;
“Noble” Noble Resources International PTE Limited, (Registration number 201115304N),
a company duly registered and incorporated in Singapore;
“NUM” the National Union of Mineworkers;
“NWA” the National Water Act, 36 of 1998, as amended;
“Offer” or “Private Placement” the private placement of the Offer Shares to Applicants at the Offer Price, post
conversion of the Convertible Preference Shares and Bonus Issue;
“Offer Price” the price of R42.75 to R55.21, at which each Offer Share is to be issued under
the Offer ;
22
“Offer Shares” up to 23,393,971 Shares in the issued ordinary share capital of the Company for
subscription under the Offer ;
“oz” a troy ounce which is exactly 31.1034768 grams;
“ozpa” oz per annum;
“pa” per annum;
“Payment Date” 12:00 on Friday, 4 April 2014, being the closing date for the receipt of payment
by Applicants under the terms of the Offer ;
“PGMs” platinum group metals being platinum, palladium, rhodium, ruthenium, iridium,
and osmium;
“PGM Concentrate” the commercially acceptable flotation concentrate containing PGMs;
“PRC” or “China” the People’s Republic of China;
“Pre-listing Statement” all documents contained in this bound document, including the Annexures
hereto and the Application Form (blue) dated Tuesday, 25 March 2014;
“Prospecting Right” a prospecting right granted by the DMR in terms of the MPRDA;
“Qualified Investors” persons in member states of the European Economic Area who are “Qualified
Iinvestors” within the meaning of Article 2(1)(e) of the Prospectus Directive
(Directive 2003/71/EC, as amended by the 2010, PD Amending Directive
(Directive 2010/73/EU));
“Qualifying Investors” selected institutional investors, invited investors and private clients of selected
stockbroking companies to whom the Offer will be addressed and made;
“Rance Holdings” Rance Holdings Limited (Registration number 1617356), a company duly
registered and incorporated in the British Virgin Islands;
“Rand York” Rand York Minerals Proprietary Limited (Registration number 1985/004951/07),
a private company duly registered and incorporated in South Africa;
“RBDBT” Richards Bay Dry Bulk Terminal;
“Registered Office” the registered office of Tharisa, Office 108 – 110, S. Pittokopitis Business Centre,
17 Neophytou Nicolaides and Kilkis Streets, 8011 Paphos, Cyprus;
“Relevant Member State” each member state of the EEA (the “EEA”) which has implemented the
Prospectus Directive (Directive 2003/71/EC, as amended by the 2010 PD
Amending Directive (Directive 2010/73/EU));
“Relevant Persons” persons in member states of the European Economic Area who are Qualified
Investors and, where addressed to and directed to persons in the UK, to persons
who are also those: (i) who have professional experience in matters relating to
investments falling within Article 19(5) of the Financial Services and Markets Act,
2000 (Financial Promotion) Order 2005, as amended (the “FPO”); or (ii) who
are high net worth entities as described in Article 49(2) of the FPO; or (iii) to
whom it may otherwise be lawful to distribute it and in all cases are capable of
being categorised as a Professional Client or an Eligible Counterparty for the
purposes of the Financial Conduct Authority Conduct of Business Rules;
“Reporting Accountants” KPMG Inc, full details of which are set out in the “Corporate Information and
Advisors” section to this Pre-listing Statement;
“RoM” run of mine, being the ore tonnage extracted to be processed;
“SAMREC Code” the South African Code for Reporting of Exploration Results, Mineral Resources
and Reserves (prepared by the South African Mineral Resource Committee
(SAMREC) Working Group) (2007 and as amended in 2009);
23
“SAMVAL Code” the South African Code for the Reporting of Mineral Asset Valuation (2008)
(as amended in July 2009) prepared by the South African Mineral Asset Valuation
Committee (SAMVAL) Working Group;
“SARB” the South African Reserve Bank;
“SENS” the Stock Exchange News Service of the JSE;
“Share Award Plan” the share award plan conditionally approved and adopted by Shareholders on
Thursday, 13 March 2014, the principal terms of which are summarised
in Annexure 8;
“Shareholders” the ordinary shareholders of the Company from time to time;
“Shares” ordinary shares with a par value of US$0.001 each in the issued share capital of
the Company;
“Short-Term Bonus Scheme” a short-term bonus scheme whereby employees of the Group are eligible to
receive either a quarterly or annual cash bonus based on the performance of the
Group against budget, the individual performances of such persons and the
safety record of all Group companies;
“Sirius Resources” Sirius Resources Fund 1 Limited (Registration number CT182193), a company
duly registered and incorporated in Cayman Islands;
“SiO2” silicon dioxide;
“South Africa” the Republic of South Africa;
“Strate” Strate Limited (Registration number 1998/022242/06), a limited liability public
company duly registered and incorporated in South Africa, which is a registered
central securities depository and which is responsible for the electronic
settlement system used by the JSE;
“STT” Securities Transfer Tax, as determined in the South African Securities Transfer Tax
Act, 25 of 2007;
“t” tonnes;
“Terry Mahon Attorneys” or
“Legal Advisor to the Board”
Terry Mahon Attorneys, a sole proprietorship, full details of which are set out in
the “Corporate Information and Advisors” section to this Pre-listing Statement;
“Thari Resources” Thari Resources Proprietary Limited (Registration number 2005/001270/07),
a private company duly registered and incorporated in South Africa and a BEE
shareholder in the issued capital of Tharisa Minerals;
“Tharisa Administration Services” Tharisa Administration Services Limited (Registration number HE287964),
a company duly registered and incorporated in Cyprus and a wholly-owned
subsidiary of the Company;
“Tharisa Fujian Industrial” or “TFI” Tharisa Fujian Industrial Co., Limited (Registration number 350000400003725),
a company duly registered and incorporated in the PRC, an indirect wholly-
owned subsidiary of Tharisa and a member of the Group;
“Tharisa Investments” Tharisa Investments Limited (Registration number HE276151), a company duly
registered and incorporated in Cyprus and a wholly-owned subsidiary of the
Company;
“Tharisa Investments (Hong Kong)” Tharisa Investments (Hong Kong) Limited (Registration number 1497193),
a company duly registered and incorporated in Hong Kong and a wholly-owned
subsidiary of the Company;
“Tharisa Mine” Tharisa Minerals’ wholly-owned PGM and chrome mining and processing
operations located in the Magisterial District of Rustenburg (North West region),
South Africa, situated in the Bushveld Complex;

24
“Tharisa Investments (Hong Kong)” Tharisa Investments (Hong Kong) Limited (Registration number 1497193),
a company duly registered and incorporated in Hong Kong, an indirect wholly-
owned subsidiary of the Company;
“tpa” tonnes per annum;
“tpm” tonnes per month;
“UG1” a well developed and consistent marker in the critical zone of the Bushveld
Complex that consists of a massive Chromitite, chromitiferous pyroxenite, bands
of anorthosite, Chromitite and norites and stringers of Chromitites;
“UG2” the upper group 2 Chromitite Layer of the Bushveld Complex that is well known
and typically contains PGMs in a concentration that is sufficient for economic
extraction;
“UK” the United Kingdom;
“US” the United States of America;
“US$” United States Dollars, the lawful currency of the US;
“VAT” South African value added tax, legislated through the VAT Act, 89 of 1991;
“Voyager” or “Voyager Plant” a 300,000tpm RoM processing plant for the production of PGM and Chrome
Concentrate, owned by Tharisa Minerals;
“YUAN” or “RMB” Chinese Yuan Renminbi, the lawful currency of the PRC; and
“ZAR” or “R” or “Rand” South African Rand, the lawful currency of South Africa.

25
THE OFFER AND INSTRUCTIONS TO APPLICANTS
1. RATIONALE AND PURPOSE
1.1 Rationale for the Listing and the Offer
• provide a platform and currency for further expansion and diversification;
• increase the Company’s public presence and profile on a leading mineral and resouces exchange;
• fulfill commitments to existing Shareholders and Convertible Preference Shareholders;
• raise the requisite capital for the accelerated implementation of the optimisation initiatives, working capital, purchase of long-lead items, strategic spares, and settlement of unsecured debt funders of Tharisa Minerals;
• augment Tharisa’s continued commitment to South Africa through foreign direct investment; and
• provide direct access to the South African mining investor base.
1.2 Purpose of this Pre-listing Statement
• provide Qualifying Investors with the relevant information relating to the Group in accordance with the Listings Requirements;
• communicate the strategy and vision of the Company;
• set out the salient details of the Offer and the procedure for participating therein; and
• undertake the Private Placement of up to 23,393,971 Shares with Applicants.
2. PARTICULARS OF THE OFFER AND LISTING
2.1 Details of the Offer
Offer Price range per Share R42.75 to R55.21
Number of Shares to be offered 23,393,971 to 18,111,503
Amount to be raised in terms of the Offer R1,000,000,000
The Offer comprises an offer for subscription of up to 23,393,971 Shares, subject to Qualifying Investor demand
to whom the Offer will be specifically addressed. The Bookrunner has been granted an option by the Company,
from the Listing Date, to allot additional Shares of up to 15% of the number of Shares issued pursuant to the
Private Placement. Such action, if commenced at the discretion of the Bookrunner, may be discontinued at any
time, but may under no circumstances continue beyond the 30th calendar day after the Listing Date.
The Listing and the Offer are conditional on obtaining the minimum spread of Shareholders required in terms
of the Listings Requirements, which provide that, unless the JSE determines otherwise, the number of public
shareholders, as defined in the Listings Requirements, must be at least 300 who will hold a minimum of 20% of
the Shares. The Listing may not proceed if these shareholder spread requirements are not met, and in such event
the Private Placement and any acceptance thereof will not be of any force or effect and no person shall have any
claim whatsoever against the Company or any other person.
The Bookrunner is seeking applications from Qualifying Investors to acquire Shares as part of a book-building process. Applicants will only be permitted to apply for Shares with a minimum total purchase price per single addressee acting as principal, of greater than or equal to R1,000,000, unless the Applicant is a person, acting as principal, whose ordinary business, or part of whose ordinary business, is to deal in securities, whether as principal or agent (in reliance on sections 96(1)(a)(i) and 96(1)(b) of the Companies Act) or such Applicant falls within
one of the other specified categories of persons listed in section 96(1) of the Companies Act. Following the book-building process, the Offer Price will be determined by the Bookrunner in consultation with Tharisa prior to or on the Closing Date of the Offer and will be released on SENS on Friday, 4 April 2014. Any change to this date will be released on SENS.

26
Qualifying Investors who wish to participate in the Offer are required to complete the Application Form (blue) which is attached to this Pre-listing Statement setting out the number of Shares and the Offer Price at which they wish to subscribe. Applicants allocated Shares will be advised of the number of Shares which they have been allocated once the Offer Price has been determined. Subsequent to payment on the Payment Date, the Shares so allocated will be issued on the Listing Date at the Offer Price.
Tharisa and the Board reserves the right, at any time during the Offer, at their sole and absolute discretion, in compliance with the Listings Requirements, to amend, deviate from or modify the Offer in the manner they deem fit or to postpone, discontinue or terminate the Offer.
2.2 Times and dates of the opening and closing of the Offer
Opening date of the Offer (09:00) Monday, 24 March 2014
Last date for Applicants to submit their Application Forms for purposes of the
book-build (12:00)
Wednesday, 2 April 2014
Date on which Applicants will be notified of the number of Shares which they
have been allocated in terms of the Offer (12:00)
Thursday, 3 April 2014
Offer Price and results of the Offer released on SENS Friday, 4 April 2014
Last date for Applicants to make payment for their allocated Shares (12:00) Friday, 4 April 2014
Shares listed on the JSE (09:00) Tuesday, 8 April 2014
The above dates and times are subject to change, and any changes will be released on SENS.
2.3 Offer Price
It is estimated that the Offer Price of the Shares being offered for subscription in terms of the Offer shall be between R42.75 and R55.21 per Share. The Offer Price may however be outside of the price range. The Offer Price will be exclusive of STT and will be payable in full in Rands without deduction or set-off.
The Bookrunner is seeking applications from Qualifying Investors to subscribe for Shares in terms of the Offer as part of a book-building process. Following the book-building process, the Offer Price will be determined by the Bookrunner after consultation with Tharisa, prior to, or on the Closing date of the Offer and will be released on SENS on Friday, 4 April 2014. Any change to this date will be released on SENS.
2.4 Participation in the Offer
Only Qualifying Investors may participate in the Offer. Qualifying Investors wishing to participate in the Offer should contact the Bookrunner prior to the cut-off time and date for submitting Application Forms referred to in paragraph headed “Times and dates of the opening and closing of the Offer”.
The following procedures apply to participation in the Offer :
• Application Forms will not be accepted after 12:00 on Wednesday, 2 April 2014;
• Applications Forms submitted by Applicants are irrevocable until the Listing Date and may not be withdrawn once received by the Transfer Secretaries, CSDPs or brokers, as the case may be;
• no person acquiring Shares by virtue of section 96(1)(b) of the Companies Act shall be permitted to use an agent;
• Application Forms must be completed in accordance with the provisions of this Pre-listing Statement and the instructions contained in the Application Form;
• copies or reproductions of the Application Form will be accepted at the discretion of the Board;
• any alterations on the Application Form must be authenticated by full signature;
• receipts will not be issued for applications, application monies or supporting documents received;
• each application will be regarded as a single application;
• applications must be for a minimum of R1,000,000;
• Shares may not be applied for in the name of a minor or a deceased estate;
• no documentary evidence of capacity need accompany the Application Form, but Tharisa reserves the right to call upon any selected Applicant to submit such evidence for noting, which evidence will be returned at the risk of the Applicant; and
• the Directors reserve the right to accept or refuse any applications, either in whole or in part, or to abate any
or all applications (whether or not received timeously) in such manner as they deem fit.

27
2.5 Representation
Any Applicant applying for or accepting Shares in terms of the Offer shall be deemed to have represented to Tharisa that such Applicant was in possession of a copy of this Pre-listing Statement at that time. Any party applying for or accepting Shares on behalf of another Applicant shall be deemed to have represented to Tharisa that it is duly authorised to do so and warrants that it and the Applicant for whom it is acting as agent is duly authorised to do so in accordance with all relevant laws and such investor guarantees the payment of the Offer Price and that a copy of this Pre-listing Statement was in the possession of such Applicant for whom it is acting as agent.
2.6 Allocation
The basis of allocation of the Offer Shares will be determined by the Bookrunner in consultation with the Board. It is intended that notice of allocation will be provided on Friday, 4 April 2014. Subject to the level of demand and, at the discretion of the Bookrunner, Applicants may receive zero Shares or fewer than the number of Shares applied for, subject to a minimum monetary allocation of R1,000,000. Any dealing in Shares prior to delivery of such Shares is entirely at the Applicant’s own risk. No preference of allotment will be given to any particular company or group.
In the event of an over subscription, Shares may be allocated and issued by the Bookrunner, in consultation with the Board. Factors to be considered in allocating Shares include:
• allocation will be calculated in such a way that an Applicant will not, in respect of their application, receive an allocation of a lesser number of Shares than any other Applicant applying for the same number or a lesser number of Shares; and
• achieving the requisite spread of Shareholders that is acceptable to the JSE.
2.7 Further Allotment
The Bookrunner has been granted an option by the Company, from the Listing Date, to allot additional Shares of up to 15% of the number of Shares issued pursuant to the Private Placement.
Such action, if commenced at the discretion of the Bookrunner, may be discontinued at any time, but may under no circumstances continue beyond the 30th calendar day after the Listing Date.
In the event of a subscription in respect of the Further Allotment, no preference on allotment will be given to any company or group.
Tharisa will release the results of the Further Allotment at the end of the 30-day period on SENS.
2.8 Dematerialisation of the issued Shares
Shares will be issued by Tharisa to successful Applicants in Dematerialised form only. Accordingly, all successful Applicants must appoint a CSDP, directly or through a broker, to receive and hold the Dematerialised Shares on their behalf. Should a Shareholder require a physical certificate for his/her Shares, such Shareholder will have to materialise their Shares following the Listing, for which a fee will be charged, and should therefore contact its CSDP to do so. It is noted that there are risks associated with holding Shares in certificated form, including the risk of loss or tainted script, which are no longer covered by the JSE Guarantee Fund. All Shareholders who elect to convert their Dematerialised Shares into Certificated Shares will have to Dematerialise their Shares should they wish to trade them under the terms of Strate (refer to paragraph 2.10 in this Pre-listing Statement).
Each Applicant’s duly appointed CSDP or broker will receive the Dematerialised Shares on their behalf which is expected to occur on the Listing Date during the Strate settlement runs.
2.9 Payment and delivery of Shares
Each successful Applicant must, after being notified of an allocation of Shares, forward to:
• its CSDP, all information required by the Applicant’s CSDP and instruct its CSDP to pay, against delivery of the Applicant’s allocation of Offer Shares, at the Offer Price for such Shares to the designated account of Tharisa. Such information and instructions must be confirmed to the Applicant’s CSDP by no later than 12:00 , 2 business days (expected to be on or about Friday, 4 April 2014) prior to the Listing Date; and
• the Bookrunner, details of its CSDP, the name of the account holder and number of Shares and such other information as is required by Tharisa’s CSDP in order to effect delivery of the relevant Shares. Such information must be confirmed to the Bookrunner by no later than 12:00, 2 business days (expected to be on or about
Friday, 4 April 2014) prior to the Listing Date.

28
Applicants are advised to consult their CSDP with regards to the date by which they are required to transfer their
funds to the CSDP. Each Applicant must place its funds with its CSDP or make other necessary arrangements
to enable its CSDP to make payment for the allocated Shares on Friday, 4 April 2014, in accordance with each
Applicant’s agreement with its CSDP. The above is required in order to ensure that funds are received and Shares
issued prior to Listing.
The Applicant’s CSDP must commit to Strate to the receipt of the Applicant’s allocation of Shares against
payment by no later than 12:00, on Friday, 4 April 2014.
On the Listing Date, the Applicant’s allocation of Shares will be credited to the Applicant’s CSDP or broker during
the Strate settlement runs which occur throughout the day.
2.10 Strate
Dematerialised Shares may only be traded on the JSE and will be traded for electronic settlement in terms of
Strate immediately following the Listing.
Strate is a system of “paperless” transfer of securities. If you have any doubt as to the mechanics of Strate please
consult your CSDP, broker or other appropriate independent advisor, as the case may be, and you are referred
to the Strate website (http://www.strate.co.za).
The principal features of Strate are:
• electronic records of ownership replace certificates and physical delivery of certificates;
• trades executed on the JSE must be settled within 5 business days;
• all investors owning Dematerialised Shares or wishing to trade their securities on the JSE are required to
appoint either a CSDP or broker to act on their behalf and to handle their settlement requirements; and
• unless investors owning Dematerialised Shares specifically request their CSDP to register them as an
“own name” holder (which entails a fee), their respective CSDP’s or broker’s nominee company holding
Shares on their behalf, will be the holder (member) of the relevant company and not the investor. Subject
to the agreement between the investor and the CSDP or broker (or the CSDP’s or broker’s nominee
company), generally in terms of the rules of Strate, the investor is entitled to instruct the CSDP or broker (or
the CSDP’s or broker’s nominee company), as to how it wishes to exercise the rights attaching to the Shares
and/or to attend and vote at Shareholder meetings.
2.11 Applicable law
The Offer, applications, allocations and acceptances will be exclusively governed by the laws of South Africa and
each Applicant will be deemed, by applying for Shares, to have consented and submitted to the jurisdiction of the
courts of South Africa in relation to all matters arising out of or in connection with the Offer.
2.12 Resolutions, authorisations and approvals of the securities
Tharisa has sufficient authorised Shares and Shares have been placed under the control of the Directors.
Applicants are advised to consult their CSDP with regards to the date by which they are required to transfer
their funds to the CSDP. Each Applicant must then place its funds with its CSDP or make other necessary
arrangements to enable its CSDP to make payment for the allocated Shares on Friday, 4 April 2014, in accordance
with each Applicant’s agreement with its CSDP. The above is required in order to ensure that funds are received
and Shares issued prior to Listing.

29
THE BUSINESS
1. INTRODUCTION TO THARISA
1.1 Overview of Tharisa
Tharisa is domiciled, incorporated and registered in Cyprus as a public company limited by shares. Tharisa is
an integrated resources group incorporating mining, processing, beneficiation, marketing, sales and logistics of
PGM and Chrome Concentrate through its 74% interest in Tharisa Minerals (mining and processing) and its
wholly-owned subsidiaries including Arxo Metals (processing and beneficiation), Arxo Logistics (logistics) and
Arxo Resources and Dinami (collectively, marketing and sales).
Tharisa’s objective is to become a leading natural resources company focused on originating, developing and
operating mines in the PGM, chrome and steel raw material sectors to service growing global demand through
integrated mining, processing, marketing, sales and logistics operations. The strategy is to focus on growth through
value accretive acquisition, development and operation of large-scale and low cost projects that are in or close
to production.
The Company is led by a strong management team with significant sector expertise and a successful track record
in the origination, development and operation of mining projects.
The Tharisa Mine commenced production in 2009 and, in the Financial Year ended 30 September 2013, produced
57,421oz of contained PGMs in PGM Concentrate and 1,192,807t of Chrome Concentrate. The Tharisa Mine
is currently at c.87% of steady state production (for the 5 months ending 28 February 2014) of 4,800,000tpa
RoM ore, with steady state forecasted production at an average of ˜144,000ozpa of contained PGMs in PGM
Concentrate and ˜1,850,000tpa of Chrome Concentrate.
The development of the Tharisa Mine has been partially funded through the issue of preference shares by Tharisa
Minerals to Tharisa. The preference shares confer the right to Tharisa to receive, out of distributable profits of
Tharisa Minerals, a cumulative preferential cash dividend. The applicable dividend rate, which is calculated annually
in arrears, is LIBOR plus 1%. The balance of the preference shares as at 30 September 2013 was US$248,214,545.
PGM Concentrate is sold to Impala Platinum in terms of a concentrate off take agreement with Tharisa Minerals.
Metallurgical and Chemical Grade Concentrate is marketed and sold, mainly to customers in China, by Arxo
Resources and Foundry and Chemical Grade Concentrates are sold by Arxo Metals to Rand York. The delivery
of Chrome Concentrate sold by Arxo Resources is managed by Arxo Logistics.
1.2 Development and history
Key milestones in the development of the Group are set out below:
Date Event
Feb-06 and Mar-07 Prospecting Rights for minerals, including PGM and chrome, over various portions of the
farm Kafferskraal 342 JQ and the whole of the farm Rooikoppies 297 JQ are granted to
Thari Resources by the DMR.
Mar-06 Tharisa Minerals is incorporated as a wholly-owned subsidiary of Thari Resources.
Mar-07 Coffey commences a drilling and exploration study for the Tharisa Mine.
Nov-07 Thari Resources sells its Prospecting Rights for minerals, including PGMs and chrome, to
Tharisa Minerals.
Feb-08 The Company is incorporated.
Mar-08 A Mining Right for chrome over portions 96 and 183 of Kafferskraal 342 JQ is purchased
by Tharisa Minerals from South African Producers and Beneficiators of Chrome Ore
Proprietary Limited.
Apr-08 Consent for the Company to acquire a 74% stake in Tharisa Minerals is obtained from
the DMR.

30
Date Event
Sep-08 A Mining Right for certain minerals, including PGM and chrome, over various portions of
Kafferskraal 342 JQ and the whole of Rooikoppies 297 JQ is granted to Tharisa Minerals
by the DMR.
Oct-08 Trial mining commences at the Tharisa Mine.
Dec-08 Seed capital raising of US$65 million.
Feb-09 and Mar-09 The Company acquires a 74% stake in Tharisa Minerals.
A trial plant is established at the Tharisa Mine and trial production of Chrome Concentrate
commences.
Nov-09 The pilot-scale Genesis Plant with a RoM processing capacity of 38,000tpm is commissioned
and production of Chrome Concentrate commences on a commercial basis.
Jan-11 US$95 million raised through the issue of Shares to Fujian Wuhang and HeYi Mining.
Apr-11 Capital raising of US$150 million from the issue of Convertible Preference Shares.
Aug-11 The Community Trust is registered.
The processing capacity of the Genesis Plant is increased to 100,000tpm.
Nov-11 Steady state mining at a rate of 100,000tpm RoM ore is achieved at the Tharisa Mine.
Nov-11 The Community Trust acquires 6% of Tharisa Minerals from Thari Resources funded by a
donation from the Company.
Dec-11 The PGM concentrator at the Genesis Plant is commissioned.
Feb-12 Tharisa Minerals enters into the ZAR1 billion senior debt facility with the Facility Lenders.
May-12 First bulk rail shipment to RBDBT.
Jul-12 Revised PGM Concentrate off-take agreement entered into with Impala Platinum (first
agreement dated September 2011).
Tharisa Minerals integrated water use license is granted.
Sept-12 Decision to suspend the development of the ferrochrome smelter in the PRC. The
project was evaluated by the Company, but was suspended as it was not feasible and did
not meet the Company’s investment criteria.
Dec-12 The Voyager Plant is commissioned.
Mar-13 Arxo Resources enters into a 25,000tpm Chrome Concentrate off-take agreement
with Noble.
Jul-13 Challenger Plant is commissioned for the production of Foundry and Chemical Grade
Concentrates.
Sept-13 Selective blasting and mining method implemented.
Dec-13 Coffey updates the CPR increasing the open pit to over 23 years with the inclusion of
MG0 Chromitite Layer and the MG2 disseminated layers (immediately below and above
the MG3 Chromitite Layer).

31
1.3 Group structure
Source: Tharisa
2. BUSINESS OVERVIEW
2.1 Tharisa Mine
The Company holds a 74% shareholding in Tharisa Minerals which owns and operates the Tharisa Mine, a shallow
and large-scale open pit PGM and chrome mine located on the south-western limb of the Bushveld Complex. The
mine is located approximately 95 kilometres north-west of Johannesburg and 35 kilometres east of Rustenburg,
and is supported by well-developed infrastructure. Tharisa Minerals holds a Mining Right, granted by the DMR
on 19 September 2008 for a period of 30 years, renewable for successive periods in terms of the MPRDA, over
various portions of the farm Kafferskraal 342 JQ and over the whole of the farm Rooikoppies 297 JQ in respect
of PGMs, gold, nickel, copper, silver and chrome contained within the 6 MG Chromitite Layers and the UG1
Chromitite Layer. The Mining Right in respect of the Tharisa Mine covers an area of approximately 5,590 hectares
and the MG Chromitite Layers outcrop on the property over a strike length of approximately 5 kilometres.
The processing facilities at the Tharisa Mine consist of the Genesis Plant, a PGM and chrome concentrator
capable of processing 100,000tpm of RoM ore that was commissioned in February 2012, the Voyager Plant,
a PGM and chrome concentrator capable of processing 300,000tpm of RoM ore that was commissioned in
December 2012 and the Challenger Plant that was commissioned in July 2013 which is capable of producing a
minimum of ~8,000tpm of Foundry and Chemical Grade Concentrates.
MCC, established in 1972, provides services covering all open pit mining requirements, including drilling, blasting,
loading, hauling, rehabilitation and the rental of heavy earth moving equipment. MCC has one of the largest fleets
of mining equipment in Southern Africa and provides contract mining services at a number of other coal, nickel
and PGM mines in South Africa.
Tharisa Minerals has had a business relationship with MCC since 2008. MCC was appointed as an independent
contractor for the open pit mining operations at the Tharisa Mine for an initial period of 6 years with effect
from 21 May 2011. The contract is renewable for successive 6-year periods unless terminated by either party by
providing 12 months’ notice prior to the end of the applicable 6-year period. In terms of the agreement, MCC is
required to provide all necessary plant, materials, diesel, temporary works, labour and transport that are required
for the mining operations and is paid on a monthly basis by reference to the volume of material mined and
transported from the open pit. MCC currently employs 786 employees and 43 sub-contractors.
Tharisa Minerals determines the contractual programme, which outlines MCC’s daily responsibilities, as described
in the paragraph above, in consultation with MCC. Tharisa Minerals manages the fufilment of the overall mining
programme by MCC. The average mining cost of the MCC mining contract has been budgeted at R222.90 per
tonne mined.
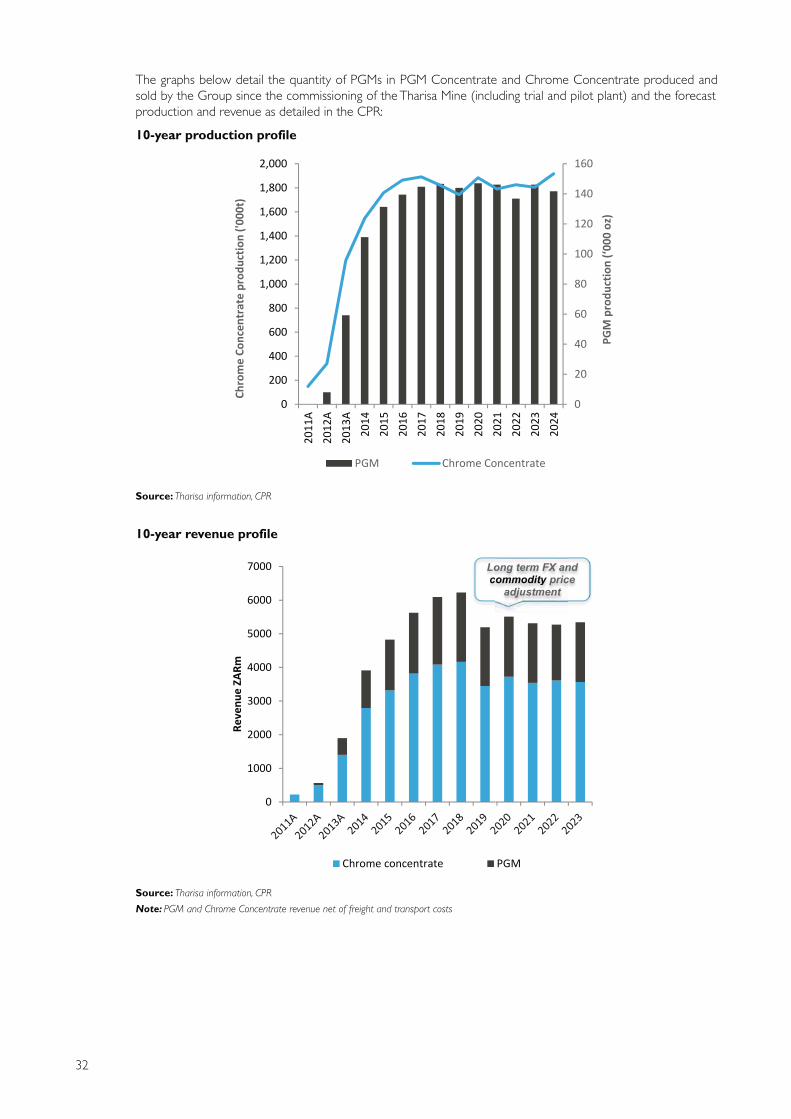
32
The graphs below detail the quantity of PGMs in PGM Concentrate and Chrome Concentrate produced and
sold by the Group since the commissioning of the Tharisa Mine (including trial and pilot plant) and the forecast
production and revenue as detailed in the CPR:
10-year production profile
Source: Tharisa information, CPR
10-year revenue profile
Source: Tharisa information, CPR
Note: PGM and Chrome Concentrate revenue net of freight and transport costs

33
Revenue % per product sold (steady state and long term)
Source: CPR (FY14 projections), revenue excludes freight and transport costs
2.2 Arxo Metals
Arxo Metals, an indirectly wholly-owned subsidiary of Tharisa, is the producing, beneficiation, research and
development company of the Group.
Arxo Metals conducts research and development into further downstream beneficiation opportunities to expand
and optimise the Group’s operations, including:
• magnetic separation circuits to enhance Chrome Concentrate yields;
• ultra fine grinding with high energy flotation to increase PGM Concentrate recoveries;
• DC PGM smelting and hydrometallurgical feasibility studies;
• development and feasibility of producing Chrome Alloys as a high value feed material for the stainless steel
industry; and
• further recovery of chrome ore from tailings produced at the Tharisa Mine and other mines.
In addition to research and development, Arxo Metals produces higher value Chemical and Foundry Grade
Chrome Concentrates at its Challenger Plant, which is capable of producing a minimum of ~8,000tpm of Foundry
and Chemical Grade Concentrate, for which it has an off-take agreement with Rand York.
2.3 Arxo Resources
Sales and marketing of the Group’s chrome products are carried out through Arxo Resources, which acts as the
exclusive agent and/or off-taker for Tharisa Minerals for the sale of Chrome Concentrate to customers in China
and other international markets, receiving a 5% commission on the Chrome Concentrate and a handling fee of
US$2 per tonne. Through the Beijing office of TFI, Arxo Resources has built and established a strong platform
with global customers in the PRC including stainless steel, ferrochrome and global commodity traders and has
secured supply commitments from these customers. Scale of operations allows for direct access to market and
price discovery. It opens channels with customers, thus providing for an excellent platform for generating revenue
through the sales of third party products in the future.
2.4 Arxo Logistics
Arxo Logistics, a wholly-owned subsidiary of Tharisa, provides:
• an integrated logistics platform to mitigate logistics risks;
• road transportation of PGM Concentrate to Impala Platinum;
• favourable road and rail transport capacity, warehousing facilities and port facilities at RBDBT and the Durban
port to handle the full steady state production levels of 155,000tpm of Chrome Concentrate;

34
• transportation of Chrome Concentrate from the Tharisa Mine to either the RBDBT by rail and then loaded
onto bulk vessels or by road to warehouses and then packed into containers and transported by either road
or rail to the Durban stacks for shipment by container vessels;
• shipment of Chrome Concentrate production from the RBDBT and the Durban port to customers in Asia
and other international markets through bulk and container vessels; and
• a platform to service third party customers in the future.
During FY2013 Arxo Logistics shipped 488,000t in containers and 545,000t in bulk shipments of Chrome
Concentrate. Arxo Logistics receives a fee of 5% of the costs of transporting the PGM Concentrate and Chrome
Concentrate produced by Tharisa Minerals.
2.5 Dinami
On 30 May 2013, the Company incorporated Dinami in Guernsey. The principal activities of Dinami is to provide
marketing, sales and agency services in relation to Arxo Metals’ Foundry and Chemical Grade Concentrates as
well as third party products.
2.6 Tharisa Investments
On 2 November 2010, the Company incorporated Tharisa Investments, a company established in Cyprus.
The principal activity of Tharisa Investments Limited is that of an investment holding company.
2.7 Tharisa Fujian Industrial
On 15 February 2011, Tharisa Investments incorporated Tharisa Fujian Industrial, a company established in
the PRC. Tharisa Fujian Industrial’s principal activity is that of ferrochrome smelting. However this project has
currently been suspended as it was not feasible and did not meet the investment criteria of the Company. Tharisa
Investments has subscribed for US$4,600,000 equity capital in Tharisa Fujian Industrial, to fund Tharsia Fujian
Industrial working capital requirements.
2.8 Tharisa Investments (Hong Kong)
On 24 August 2011, Tharisa Investments incorporated Tharisa Investments (Hong Kong), a company established
in Hong Kong. Tharisa Investments (Hong Kong) is a dormant company and has not commenced operations.
2.9 Tharisa Administration Services
On 31 May 2011, the Company incorporated Tharisa Administration Services, a company established in Cyprus.
Tharisa Administration Services provides management and administration services to the Group.
2.10 Braeston Corporate Consulting Services
On 1 April 2013, Tharisa Administration Services, acquired Braeston Corporate Consulting Services, a company
established in South Africa. The principal activity of Braeston Corporate Consulting Services is the provision of
management services to the Group.
2.11 Mineral Resource and Mineral Reserve statements
The CPR, compiled by the Technical Advisor, has been compiled in compliance with the Listings Requirements
and in accordance with the guidelines of the SAMREC and SAMVAL Codes.
Mineral Resource statement for the Tharisa Mine (31 December 2013) (SAMREC Code):
Tonnes
(’000)
6PGE + Au
g/t
Cr2O
3
%
Measured 55,079 1.53 21.39
Indicated 129,864 1.68 22.24
Inferred 650,045 1.54 19.93
Total 834,989 1.56 20.38
Notes:
Mineral Resources include Mineral Reserves.
The full CPR is attached as Annexure 15 to this Pre-listing Statement.
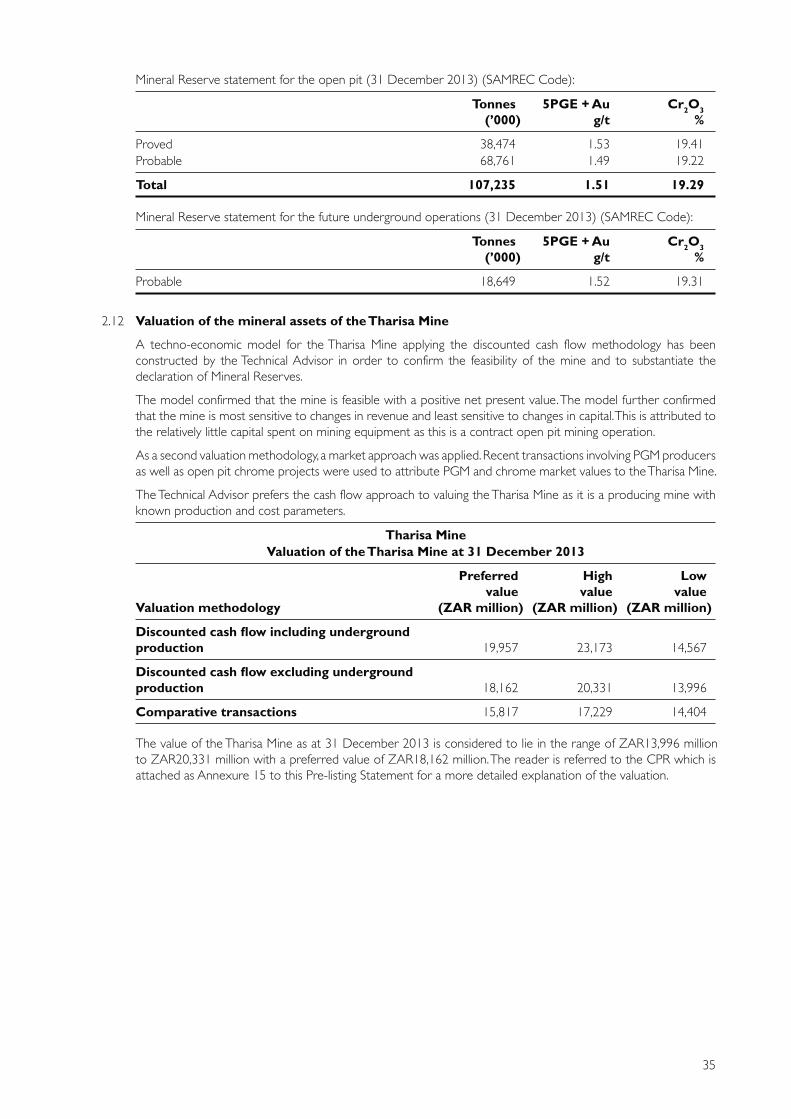
35
Mineral Reserve statement for the open pit (31 December 2013) (SAMREC Code):
Tonnes
(’000)
5PGE + Au
g/t
Cr2O
3
%
Proved 38,474 1.53 19.41
Probable 68,761 1.49 19.22
Total 107,235 1.51 19.29
Mineral Reserve statement for the future underground operations (31 December 2013) (SAMREC Code):
Tonnes
(’000)
5PGE + Au
g/t
Cr2O
3
%
Probable 18,649 1.52 19.31
2.12 Valuation of the mineral assets of the Tharisa Mine
A techno-economic model for the Tharisa Mine applying the discounted cash flow methodology has been
constructed by the Technical Advisor in order to confirm the feasibility of the mine and to substantiate the
declaration of Mineral Reserves.
The model confirmed that the mine is feasible with a positive net present value. The model further confirmed
that the mine is most sensitive to changes in revenue and least sensitive to changes in capital. This is attributed to
the relatively little capital spent on mining equipment as this is a contract open pit mining operation.
As a second valuation methodology, a market approach was applied. Recent transactions involving PGM producers
as well as open pit chrome projects were used to attribute PGM and chrome market values to the Tharisa Mine.
The Technical Advisor prefers the cash flow approach to valuing the Tharisa Mine as it is a producing mine with
known production and cost parameters.
Tharisa Mine
Valuation of the Tharisa Mine at 31 December 2013
Valuation methodology
Preferred
value
(ZAR million)
High
value
(ZAR million)
Low
value
(ZAR million)
Discounted cash flow including underground
production 19,957 23,173 14,567
Discounted cash flow excluding underground
production 18,162 20,331 13,996
Comparative transactions 15,817 17,229 14,404
The value of the Tharisa Mine as at 31 December 2013 is considered to lie in the range of ZAR13,996 million
to ZAR20,331 million with a preferred value of ZAR18,162 million. The reader is referred to the CPR which is
attached as Annexure 15 to this Pre-listing Statement for a more detailed explanation of the valuation.

36
2.13 Salient financial information
The following salient financial information has been extracted from the consolidated financial statements of the
Group. For a full appreciation of the financial results and position of the Group, the annual financial statements
and the results for the quarter ended 31 December 2013, set out in Annexure 1 and Annexure 5, respectively,
should be read in full.
12 months to
30 September (audited)
3 months to
31 December
FY2011 FY2012 FY2013 Q1 FY2014
US$’000 US$’000 US$’000 US$’000
Revenue 28,128 53,889 215,455 65,674
Gross (loss)/profit (1,247) (8,225) 25,885 11,107
Results from operating activities (36,871) (33,518) (663) 5,532
Loss for the year (88,548) (29,971) (47,443) (10,571)
Loss per share (US$) (12.76) (3.40) (6.31) (1.47)
Net cash used in operating activities (49,257) (9,195) (2,956) (2,459)
Cash and cash equivalents at the end of the year 134,783 52,805 28,017 13,326
3. COMPETITIVE STRENGTHS
3.1 Commitment to health, safety and environmental management
The Group safety management system is implemented under the guidance of a safety expert with over 35 years
of experience and has adopted a zero tolerance policy with regard to unsafe conditions and as a result Tharisa
Mine has amongst the lowest LTIFR in its peer group. As at 30 September 2013 the Group has a LTIFR of 0.14
per 200,000 man hours worked which represents amongst the lowest LTIFR’s in the PGM and chrome industries
in South Africa.
The Group is committed to the health of its employees and has implemented a number of programmes to
facilitate the same, including a wellness programme, awareness days, HIV and peer counselling.
The Group has obtained the environmental approvals and authorisations required for the operation of the
Tharisa Mine, including an integrated water use license issued under the Water Act, an Environmental Impact
Assessment and an Environmental Management Programme as required in terms of the MPRDA. Moreover, the
Group employs a system of continuous monitoring of the impact of its operations on the environment and is
committed to the implementation of the Equator Principles.
3.2 Stable labour and community relations
The Group pro-actively engages with its employees in order to maintain good relations, and holds discussions
frequently, at times on a daily basis, during the recent industrial action within the platinum sector. This approach
has helped the Group to avoid industrial action by its labour force and to date has not lost any days of production
due to the labour disputes or strike action in the industry. In February 2013, the Group entered into a recognition
agreement with the NUM under which the NUM has the right to negotiate on behalf of its members, who
represent a majority of the workforce at the Tharisa Mine. As a result of strike action of the MCC employees
in August 2013, only 3 days were lost to Tharisa Minerals’ mining operations in comparison to the Building and
Construction sector nationwide 2 week strike. During this period the processing facilities were unaffected.
The Group is committed to corporate social responsibility and sustainable development within the community
in which it operates. Approximately one-third of the Group’s employees and 40% of the workers employed by
MCC at the Tharisa Mine are from the local community. The Group has established an engagement forum which
liaises with the steering committee for the local community neighbouring the Tharisa Mine and will continue
its commitment to community initiatives through its social and labour plan, to address job creation, poverty
alleviation, basic infrastructure and education and development needs. The Group has also engaged with the
Rustenburg Local Municipality for the proclamation of a formal township under which the families comprising the
community will be granted legal ownership of the properties on which they live and utilities such as electricity,
water and sewerage will be provided. Consistent with its corporate and social responsibility, the Group established
the Community Trust, which holds an unencumbered 6% equity interest in Tharisa Minerals, for the benefit of
members of the local community in which the Tharisa Mine is located. The Directors believe that the Group’s
good relationships with the local community have helped it to avoid similar disruption to its operations as that

37
experienced by certain neighbouring mines during the unrest which occurred in 2012, 2013 and the start of
2014. Finally, the Group conducts its operations in an environmentally sound manner.
The Group has demonstrated a pro-active approach towards the community residing in the vicinity of the Tharisa
Mine and has undertaken, at its sole cost, the relocation of informal settlers comprising approximately 850 families
who were previously residing in the mining footprint to an area of land owned by Tharisa Minerals and identified
by management for this purpose. Following such relocation, the living conditions of such communities have been
considerably improved via the construction of permanent housing and the provision of water, sewerage facilities
and roads.
3.3 Shallow and large scale PGM and chrome resource, one of the world’s single largest chrome
resources, enabling Tharisa to be a large scale supplier of consistent products over several
decades
The large resource size and strike length of approximately 5 kilometres allows for bulk mining and positions the
Tharisa Mine amongst the world’s largest single chrome resource. The multiple MG Chromitite Layers provides
process flexibility and through blending allows Tharisa Minerals to maintain consistency in product quality and
stable supply over several decades.
3.4 Mining of all 6 MG Chromite Layers which allows for the co-production of PGMs and Chrome
Concentrate
The average PGM grade for the open pit mine is 1.51g/t on a 5PGE+Au basis which allows the Group to pursue
a co-product development strategy and to derive revenues from both PGM and Chrome Concentrate, thereby
increasing total revenues derived from every tonne of ore mined. The ability to co-produce PGM and Chrome
Concentrate differentiates the Tharisa Mine from other PGM and chrome mines in South Africa and enhances its
cost efficiency through the sharing of common mining, production and overhead costs, which the Group currently
allocates 40% as to PGM Concentrate production and 60% as to Chrome Concentrate production.
3.5 Located in the lowest cost quartile of the PGM and Chrome Concentrate cost curves
underpinned by low risk mining and beneficiation processes
The mining of all the 6 MG Chromitite Layers allows for optimum extraction of PGMs and chrome as opposed
to mining a single reef for either PGM or chrome. Extracting and recovering both PGMs and chrome reduces the
unit costs of production of each, positioning Tharisa in the lowest cost quar tile of operating costs in South Africa
for both. Based on current revenues, Tharisa assigns 40% to PGM Concentrate production and 60% to Chrome
Concentrate production in accordance with IFRS.
Cash cost margin of ˜44% over 23 years LoM
Source: CPR, Tharisa financial results
38
3.6 Mechanised and skilled labour force
As a result of the mechanised mining and processing operations at the Tharisa Mine, the Company has a
comparatively small and skilled labour force comprising of 488 direct employees and 935 contractors. The
mechanised nature of the mining and processing activities at the Tharisa Mine necessitate skilled labour and Tharisa
has embarked on training and development programmes, apprenticeships, internships, artisan programmes,
mentorships and bursaries to procure and sustain the required skills.
3.7 Independent processing plants providing operational flexibility
The 2 independent processing plants provide processing flexibility and production stability.
3.8 Capacity to produce Metallurgical, Chemical and Foundry Grade Concentrates for different
markets
The Group has the flexibility to produce diversified chrome products, Metallurgical Chemical and Foundry
Grade Concentrates, through its Voyager, Genesis and Challenger Plants and as circumstances demand, is able
to produce larger quantities of Chemical Grade Concentrate should market demand and prices warrant. The
production of the diversified products lends towards a geographically diversified customer base which the Group
has been able to establish.
3.9 Direct relationships with its South African and international customers
The Group has secured long-term off-take agreements for all of its current PGM Concentrate production with
Impala Platinum and for all of its Foundry and Chemical Grade Concentrates production from the Challenger
Plant with Rand York. The Group has also entered into an off-take agreement with Noble for a total of 25,000tpm
of Metallurgical Grade Concentrate, with the balance of its Chrome Concentrate being sold in the spot market.
All PGM Concentrate and Chrome Concentrate is sold by reference to prevailing market prices. The Directors
believe that the Group’s off-take arrangements will help to secure long-term demand for its PGM Concentrate
and Chrome Concentrate products from high quality and creditworthy customers. These agreements provide
comfort on a stable revenue stream over the medium to long term, whilst allowing the Group to retain flexibility
of benefiting from favourable market and pricing developments. In terms of its spot market sales of Chrome
Concentrate, the Group markets such product to global stainless steel and ferrochrome producers located
mainly in the PRC. The Group envisages concluding medium-term off-take agreements with a number of such
customers.
3.10 Integrated marketing, sales and logistics platform
The Company benefits from an integrated marketing, sales and logistics platform that ensures direct contact with
the local and international customer base. The direct access to the market ensures that the Company has access
to current information, enables direct price discovery and mitigates the costs that an intermediary or trader
would introduce in the value chain. The information flow from customers and potential customers can also be
used in the research and development that the Company undertakes. The integrated platform also provides a
basis to service third party customers in the future.
3.11 Extensive industry and management experience with a successful track record of identifying,
developing and operating open pit and underground mining operations and
The Directors and senior management team have a track record of identifying, developing and operating open pit
and underground mining projects together with broad commercial expertise and extensive industry experience
in metallurgy, PGM and chrome mining. Certain of the Directors and management have realised a number of
business successes, the most recent of which is the development of Eland Platinum, a South African mining
company, which was listed in 2006 with a market value of approximately US$90 million and sold to Xstrata plc
in 2007 for approximately US$1 billion.
The senior management team has supplemented its core competencies and further consolidated its technical
know-how with recruited expertise, including specialists experienced in PGM and chrome mining, extraction and
processing, marketing, sales and logistics. The culture of the management team is entrepreneurial, and the Group
has implemented a flat management structure which allows for flexible and efficient decision-making within each
of the Group’s primary business areas, recognising the skills and experience of the senior managers who head
those business areas.

39
3.12 Pioneering, innovative and unique approach to viable mineral extraction and beneficiation
Tharisa Minerals is the first company to economically extract both PGMs and chrome from all 6 MG Chromitite
Layers on a co-product basis. The Group identified, consolidated and obtained a Mining Right over more than
100 properties, comprising approximately 5,590 hectares to create one of the world’s largest single chrome
resource mines with significant PGM production.
The Group has constructed and commissioned the Voyager, Genesis and Challenger Plants which are now fully
operational and comprise fully integrated PGM and chrome processing circuits.
The Group is also committed to research and development through Arxo Metals.
4. STRATEGY
Becoming a leading natural resources company focused on originating, developing and operating mines in the PGM,
chrome and steel raw material sectors to service growing global demand through integrated mining, processing, marketing,
sales and logistics operations. The strategy is to focus on growth through value accretive acquisition, development and
operation of large-scale, low cost projects that are in or close to production. This will be achieved through:
4.1 Growth through innovative research and development projects
The Group seeks to grow and expand its business by investing in new projects which demonstrate opportunities
for value accretion. The Group will proactively seek out investment or acquisition opportunities in the PGM and
chrome industries and the steel supply chain that meet the Company’s stringent investment criteria, and in which
management can employ its core skills in addition to commercial considerations.
The Group’s experience in evaluating mining opportunities, and taking them through development to operation,
provides the ability to move quickly with a high degree of familiarity to take advantage of favourable opportunities
that may arise, whilst discounting opportunities that do not meet the Company’s investment criteria. The Group’s
focus will be on large-scale, low cost investment opportunities that are in or close to production with particular
emphasis on the PGM industry and the steel raw material supply sector, including chrome, manganese, iron ore
and coking coal, as it believes these sectors provide exposure to attractive market fundamentals whilst taking
advantage of the Group’s core competencies.
4.2 Implementation of the optimisation initiatives to maximise value extraction
The Directors expect that the Group’s implementation of its mining, processing and optimisation initiatives will
result in increased efficiencies, optimised mineral recoveries and significantly greater production volumes of PGM
Concentrate and Chrome Concentrate.
Such optimisation initiatives include:
• increasing the RoM stockpile to 30 days. This will provide greater mining flexibility and a buffer against
unforeseen disruption such as heavy rainfall. Importantly the RoM stockpile will also allow optimal blending
of the different MG Chromitite Layers, providing a consistent feed to the Voyager and Genesis Plants; and
• process optimisation strategies for both PGM Concentrate recoveries and Chrome Concentrate yields.
A high intensity magnetic separation circuit is to be added after the main spiral plant to recover additional
Chrome Concentrate from 34% to over 39% (FY16). To recover additional PGMs, an ultra-fine grind and high
energy flotation circuit will treat the tailings to increase recoveries from 61% to over 70% (FY17). In-house
research on recovering additional Chrome Concentrate from the tailings at the Tharisa Mine is ongoing and
opportunities to use the technology on third party tailings is being evaluated.
4.3 Leveraging off the established marketing, sales and logistics platform for expansion into multi-
commodities with geographic diversity
Expansion of the Group’s marketing and sales capabilities will allow the Group to capture additional margins by
leveraging its existing know-how, experience and relationships through third party sales. It will also provide the
Group with increased scalability to secure more efficient logistics arrangements and deliver a greater quantity
and range of products to customers. Moreover, such in-house capabilities will enable the Group to strengthen its
management of commodity and logistics risks, while increasing the Group’s interface with customers and other
participants in the market. The Group believes that it can effectively compete with other commodity traders on
the basis of its tailored and high-quality service offering, local market knowledge and competitive pricing. Through
Arxo Resources, the Group is increasingly exploring opportunities to act as an off-taker or agent for third parties
allowing it to benefit from scalability, and to broaden its contact base with the market.

40
The Group intends to pursue additional strategic partnerships with third parties including established commodities
trading houses and Chinese ferrochrome producers to secure off-take and sale agency arrangements for the
Group’s Chrome Concentrate, diversify the Group’s customer base and broaden the Group’s exposure to the
Chinese and other Asian markets. The Group’s target strategic partners are established commodities trading
houses and stainless steel and ferrochrome producers.
The Group’s in-house logistics capabilities will support its marketing and sales functions, leveraging its expertise
in procuring optimal transportation arrangements from a diverse range of third party operators. The Group has
positioned itself to service third parties in providing logistics arrangements primarily between South Africa and
China. In addition to generating revenue for the Group, expansion of the Group’s logistics capabilities will allow
it to capitalise on volumes and reduce its own transportation costs.
4.4 Capital discipline through the return of dividends to Shareholders, through a dividend policy
of 10% of net profit after tax, and growth driven by capital allocation to low risk projects and
opportunities
The Company’s policy is to pay an annual dividend of 10% of consolidated net profit after tax. The dividend policy
will be reviewed by the Directors from time to time in light of the prevailing business circumstances, investment
decisions to be taken, working capital requirements and available cash for distribution.
The Company will follow a disciplined approach to capital allocation, focusing on low risk projects similar to the
Tharisa Mine. The projected capital profile of the Tharisa Mine is shown in the graph below:
Tharisa Mine forecast capital spend (ZAR)
Source: CPR

41
5. BENEFICIATION AND VALUE ADDITION
Arxo Metals was established specifically to develop, implement and commercialise the Group’s strategy of value addition
and beneficiation through extensive research and development.
Arxo Metals successfully designed, developed, constructed and commissioned the Challenger Plant in July 2013.
This facility produces Foundry and Chemical Grade Concentrates, which are higher grade chrome products with more
stringent quality specifications, greater market value and higher margins than Metallurgical Grade Concentrate. This has
not only created additional value, but has also increased the range of chrome products offered by the Group.
Arxo Metals has carried out extensive research, development and testing of various technologies in order to create
greater value PGM and chrome products. Different energy efficient technologies are currently being tested with the
objective of producing cost effective PGM and Chrome Alloys.
Arxo Metals is evaluating low capital expenditure, low energy intensity, value add beneficiation opportunities, through
in-house research and in partnership with international companies. These initiatives include the DC smelting of PGM
Concentrate and hydrometallurgical processing of the resulting alloy to refine the PGMs. A feasibility study of the
viability of this project is underway.
Also under evaluation is the production of Chrome Alloys through direct reduction of the Chrome Concentrate,
avoiding energy intensive production of ferrochrome and producing a high value direct feed material for stainless steel
producers. During 2013 Arxo Metals acquired a pilot scale 250KVA DC furnace in order to conduct PGM and Chrome
Alloy smelting test work at the Tharisa Minerals laboratory. The PGM alloy that is currently being produced is further
used to conduct hydrometallurgical test work in order to commercialise the PGM refining process.
The Group will continue its research into other ways to maximise its performance by optimising its product range
through beneficiation and the use of advanced technology, and the Group’s engineering and metallurgy teams will
continue to use their specialised expertise to further optimise mineral recovery processes and yields.
6. LABOUR RELATIONS
The Group recognises the importance of good relationships with its employees. The Group continues to provide
training for its staff to enhance technical and product knowledge as well as knowledge of industry quality standards.
More than 51% of the workforce eligble for union membership employed by the Tharisa Mine are members of NUM.
On 18 February 2013, Tharisa Minerals entered into a recognition agreement with NUM under which NUM is entitled
to appoint shop stewards at the Tharisa Mine and negotiate collectively on behalf of its members in relation to wages
and substantive conditions of employment. Tharisa Minerals considers its relations with its employees and the NUM to
be good and will strive to maintain this good relationship in the future.
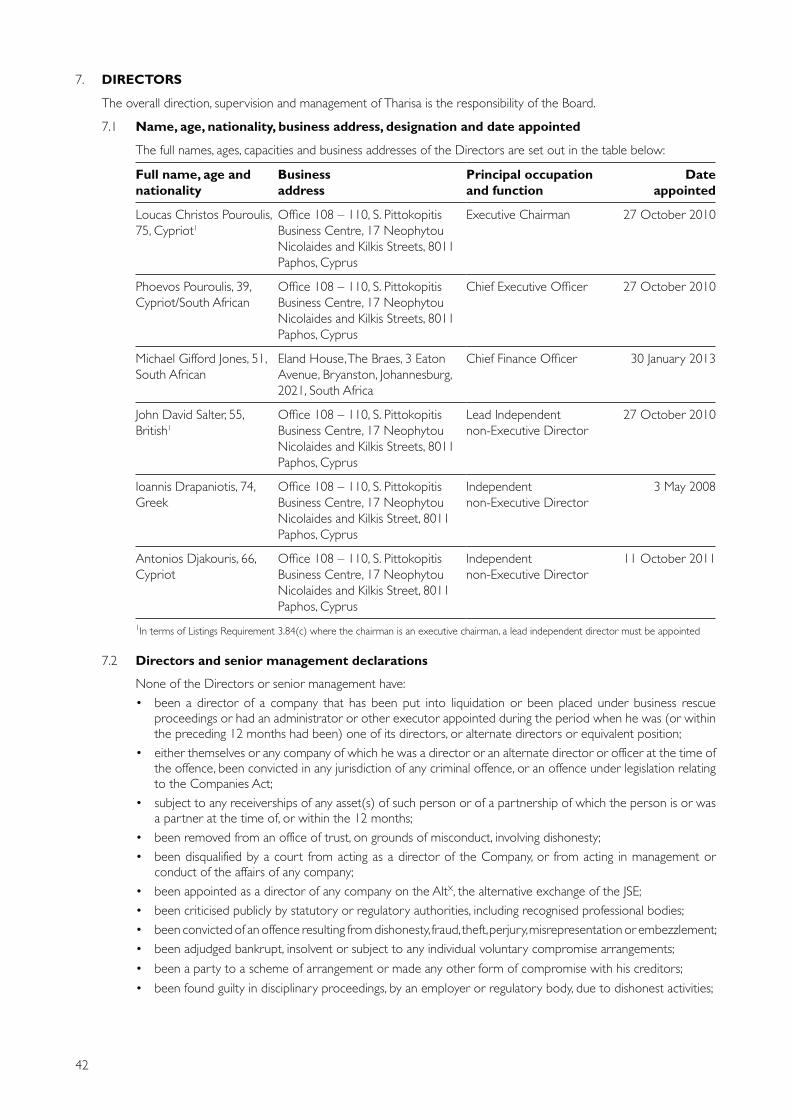
42
7. DIRECTORS
The overall direction, supervision and management of Tharisa is the responsibility of the Board.
7.1 Name, age, nationality, business address, designation and date appointed
The full names, ages, capacities and business addresses of the Directors are set out in the table below:
Full name, age and
nationality
Business
address
Principal occupation
and function
Date
appointed
Loucas Christos Pouroulis,
75, Cypriot1
Office 108 – 110, S. Pittokopitis
Business Centre, 17 Neophytou
Nicolaides and Kilkis Streets, 8011
Paphos, Cyprus
Executive Chairman 27 October 2010
Phoevos Pouroulis, 39,
Cypriot/South African
Office 108 – 110, S. Pittokopitis
Business Centre, 17 Neophytou
Nicolaides and Kilkis Streets, 8011
Paphos, Cyprus
Chief Executive Officer 27 October 2010
Michael Gifford Jones, 51,
South African
Eland House, The Braes, 3 Eaton
Avenue, Bryanston, Johannesburg,
2021, South Africa
Chief Finance Officer 30 January 2013
John David Salter, 55,
British1
Office 108 – 110, S. Pittokopitis
Business Centre, 17 Neophytou
Nicolaides and Kilkis Streets, 8011
Paphos, Cyprus
Lead Independent
non-Executive Director
27 October 2010
Ioannis Drapaniotis, 74,
Greek
Office 108 – 110, S. Pittokopitis
Business Centre, 17 Neophytou
Nicolaides and Kilkis Street, 8011
Paphos, Cyprus
Independent
non-Executive Director
3 May 2008
Antonios Djakouris, 66,
Cypriot
Office 108 – 110, S. Pittokopitis
Business Centre, 17 Neophytou
Nicolaides and Kilkis Street, 8011
Paphos, Cyprus
Independent
non-Executive Director
11 October 2011
1In terms of Listings Requirement 3.84(c) where the chairman is an executive chairman, a lead independent director must be appointed
7.2 Directors and senior management declarations
None of the Directors or senior management have:
• been a director of a company that has been put into liquidation or been placed under business rescue proceedings or had an administrator or other executor appointed during the period when he was (or within the preceding 12 months had been) one of its directors, or alternate directors or equivalent position;
• either themselves or any company of which he was a director or an alternate director or officer at the time of the offence, been convicted in any jurisdiction of any criminal offence, or an offence under legislation relating to the Companies Act;
• subject to any receiverships of any asset(s) of such person or of a partnership of which the person is or was a partner at the time of, or within the 12 months;
• been removed from an office of trust, on grounds of misconduct, involving dishonesty;
• been disqualified by a court from acting as a director of the Company, or from acting in management or conduct of the affairs of any company;
• been appointed as a director of any company on the AltX, the alternative exchange of the JSE;
• been criticised publicly by statutory or regulatory authorities, including recognised professional bodies;
• been convicted of an offence resulting from dishonesty, fraud, theft, perjury, misrepresentation or embezzlement;
• been adjudged bankrupt, insolvent or subject to any individual voluntary compromise arrangements;
• been a party to a scheme of arrangement or made any other form of compromise with his creditors;
• been found guilty in disciplinary proceedings, by an employer or regulatory body, due to dishonest activities;

43
• had any court grant an order declaring him to be a delinquent or placed such director under probation in
terms of section 162 of the Companies Act;
• been barred from entry into any profession or occupation; and
• been convicted in any jurisdiction of any criminal offence, or an offence under legislation relating to the
Companies Act.
7.3 Directors’ terms of appointment
No remuneration receivable by any of the Directors of the Company will be varied in consequence of the Listing.
7.3.1 Executive Directors
Each of the Executive Directors have entered into a letter of appointment with the Company whereby
they are appointed indefinitely until terminated. The Executive Directors’ appointments may be terminated
by the Company at any time without notice in accordance with the Articles of Association and Cyprus
Companies Law or upon certain specified events (including breach of the appointment letter without
remedying the same; incompetence; gross, serious or persistent negligence or misconduct; conduct
which prejudices the reputation or interests of the Group; failure to carry out duties; disqualification
from acting as a director or conviction of a criminal offence involving dishonesty, fraud or theft) or upon
the Director’s resignation. Under the terms of their appointment letters, the Executive Directors are not
entitled to any compensation upon termination of their appointment as Director.
All of the Executive Directors are covered by the Company’s Directors’ and officers’ liability insurance
and by an indemnity agreement.
Loucas Pouroulis, Phoevos Pouroulis and Michael Jones have employment contracts with Braeston
Corporate Consultancy Services.
7.3.2 Independent non-Executive Directors
Each of the independent non-Executive Directors has entered into a letter of appointment with the
Company whereby one third of the non-Executive Directors retire each year by rotation, but are eligible
for re-election. The appointments of each of the independent non-Executive Directors are subject to
the Articles of Association, satisfactory performance and retirement and re-election at annual General
Meetings in accordance with the Articles Association.
Each of the independent non-Executive Directors is paid an annual fee of US$42,500, plus an additional
US$29,750 per annum for each Board committee of which he is a member or US$42,500 per annum
for each Board committee of which he is chairman provided that no fees are payable in relation to the
Risk Committee of the Board. In addition, the independent non-Executive Directors are entitled to
reimbursement of reasonable expenses incurred in performing his role as Director.
The independent non-Executive Directors’ appointments are terminable by the Company at any time
without notice in accordance with the Articles and Cyprus Companies Law, upon certain specified
events (including breach of the terms of the appointment letter without remedying the same;
incompetence; gross, serious or persistent negligence or misconduct; conduct which prejudices the
reputation or interests of the Group; failure to carry out his duties; disqualification from acting as a
director or conviction of a criminal offence involving dishonesty, fraud or theft) or upon the Director’s
resignation. The Directors are not entitled to any compensation upon termination of their appointment.
The independent non-Executive Directors are not entitled to participate in the Company’s Share Award
Plan or other share, bonus or pension schemes.
The independent non-Executive Directors are subject to confidentiality undertakings without limitation
in time and are subject to a general restriction from being engaged or interested in any business that
competes with the Group (except as a shareholder of up to 3% of any listed company) for the duration
of their respective appointments.
All of the independent non-Executive Directors are covered by the Company’s Directors’ and officers’
liability insurance and by an indemnity agreement.
Save as set out in the paragraphs above, there are no existing or proposed employment contracts,
service agreements or letters of appointment between the Directors and any member of the Group.
44
7.4 Qualifications of Directors
The qualifications of the respective Directors can be found in Annexure 9 of this Pre-listing Statement.
7.5 Borrowing Powers of Tharisa and its subsidiaries exercisable by Directors
Tharisa
The Directors may exercise all the powers of the Company to borrow or raise money, to guarantee, to indemnify,
to charge or mortgage its undertaking, property and uncalled capital, or any part thereof, and to issue debentures,
debenture stock, and other securities as security for any debt, loss or obligation of the company or of any third
party. If and for so long as the Shares are listed on the JSE, no special privileges relating to attending and voting
at General Meetings and to the appointment of Directors shall be granted to the holders of debt instruments
issued by the Company. The Directors’ borrowing powers have not been exceeded during the past 3 years and
may only be varied by way of a special resolution passed by the Shareholders of Tharisa in General Meeting.
Tharisa Minerals
Section 34 of the Memorandum of Incorporation of Tharisa Minerals provides that Directors may from time to
time borrow for the purposes of the Company such sums as they deem fit and secure the payment or repayment
of any such sums, or any sum, as they may think fit whether by the creation or issue of securities, mortgage or
charge upon all or any of the property or assets of the Company.
The restrictions contained In the Articles of Association of Tharisa, insofar as they apply to Group companies,
are applicable to Tharisa Minerals. The borrowing powers of Tharisa Minerals, as restricted in terms of the Articles
of Association of Tharisa, have not been exceeded.
Arxo Logistics and Braeston Corporate Consulting Services
Article 61 of the Articles of Association of Arxo Logistics and Braeston Corporate Consulting Services provide
that their directors may exercise all powers of the company to borrow money and to mortgage or bind its
undertaking and property or any part thereof, and to issue debentures, debenture stock and other securities
whether outright or as security for any debt, liability or obligation of the Company or of any third party.
The restrictions contained in the Articles of Association of Tharisa, insofar as they apply to Group companies,
are applicable to Arxo Logistics and Braeston Corporate Consulting Services. The borrowing powers of Arxo
Logistics and Braeston Corporate Consulting Services, as restricted in terms of the Articles of Association of
Tharisa, have not been exceeded.
Arxo Metals
The Memorandum of Incorporation of Arxo Metals does not have any specific provisions in respect of the
borrowing powers of the company. The Companies Act provides in section 19 that a company has all the legal
powers and capacity of an individual except to the extent that it is incapable of exercising such power or having
such capacity or if the company’s Memorandum of Incorporation provides otherwise. Arxo Metals is capable
of exercising all legal powers of an individual to borrow money, and thus, subject to the restrictions contained
in the Articles of Association of Tharisa insofar as Arxo Metals is a Group company, Arxo Metals has full power
and capacity to borrow monies as so determined by its Board Its borrowing powers have not been exceeded.
The restrictions contained in the Articles of Association of Tharisa, insofar as they apply to Group companies,
are applicable to Arxo Metals. The borrowing powers of Arxo Metals, as restricted in terms of the Articles of
Association of Tharisa, have not been exceeded.
Tharisa Investments, Tharisa Administration Services and Arxo Resources
The Articles of Association of Tharisa Investments, Tharisa Administration Services and Arxo Resources provide
that the directors may raise and borrow money without any limit as to the amount borrowed or secure other
credit or financial facilities and mortgage or charge all or any part of all the undertaking and property of the
company, present or future, including its uncalled capital or any part thereof and issue debentures, floating
debentures, mortgage debentures, fixed charges, bonds, promissory notes or other securities payable to the
bearer or otherwise and whether permanent or redeemable and either outright or as security for any loan, debt,
liability or obligation of the company or any third person. Such debentures, mortgage debentures, debentures
stock, promissory notes, bonds or other securities may be issued at a discount, at a premium or otherwise and
with such powers as to redemption, surrender, drawings, issue of shares or otherwise as the directors may think
fit or proper.

45
The provisions of Regulation 79 of Table A in the first schedule to the Cyprus Companies Law limiting the
powers of directors to borrow money beyond the authorised capital of the company are not applicable.
The restrictions contained in the Articles of Association of Tharisa, insofar as they apply to Group companies, are
applicable to Tharisa Investments, Tharisa Administration Services and Arxo Resources. The borrowing powers of
Tharisa Investments, Tharisa Administration Services and Arxo Resources, as restricted in terms of the Articles of
Association of Tharisa, have not been exceeded.
Dinami
Dinami has corporate capacity through its directors to borrow without limitation and their directors have the
power to bind the company into any agreement that involves borrowings being made by the company.
The restrictions contained in the Articles of Association of Tharisa, insofar as they apply to Group companies,
are applicable to Dinami. The borrowing powers of Dinami, as restricted in terms of the Articles of Association
of Tharisa, have not been exceeded.
7.6 Remuneration of Directors
The remuneration of Directors for the year ended 30 September 2013 is set out below:
Director Directors’ fees
(US$)
Salary (US$)
Expense allowance
(US$)
Other material benefits received
(US$)
Pension scheme
(US$)
Total (US$)
L Pouroulis – 714,611 – – – 714,611
P Pouroulis – 538,487 12,719 16,791 16,155 584,152
M Jones – 438,875 – 21,031 65,831 525,737
J D Salter 251,953 – – – – 251,953
A Djakouris 235,000 – – – – 235,000
I Drapaniotis 155,000 – – – – 155,000
E Papacleovoulou* 50,000 – – – – 50,000
C Chan* 40,000 – – – – 40,000
Total 731,953 1,691,973 12,719 37,822 81,986 2,556,453
* Resigned as a director on 30 January 2013.
Notes:
1. With effect from 1 October 2013, the non-Executive and Executive Directors agreed to a 15% reduction in their fees and remuneration.
For FY2014, the Executive Directors’ remuneration, applying the ZAR:US$ spot exchange rate at 1 October 2013 will be as follows:
Director
Directors’ fees
Annual
(US$)
L Pouroulis 606,806
P Pouroulis 505,671
M Jones 455,104
Total 1,567,581
2. No payments are proposed to be made, either directly or indirectly, in cash or securities or otherwise to the Directors in respect of
management, consulting, technical or secretarial fees, performance related bonuses and any commission, gain or profit-sharing arrangement;
3. No share options will have been granted at the Listing Date;
4. Directors’ remuneration above includes remuneration from the Company and subsidiaries;
5. There will be no variation of the Directors’ remuneration as a result of the Listing; and
6. No fees have been paid or accrued to a third party in lieu of Directors’ fees.
7.7 Contracts of employment relating to Directors’ and senior management
All Executive Directors and senior management of the Company are bound by substantially the same terms and
conditions of service. The salient features of the service agreements are as follows:
• Executive Directors and senior management are eligible to participate in both the Short-Term Bonus Scheme
as well as the Share Award Plan, details of which are set out in Annexure 8;

46
• Executive Directors and senior management are entitled to 30 working days annual leave per annum,
together with 30 working days sick leave during each period of 36 months;
• service agreements are terminable on 6 months’ prior notice, save in the case of termination as a result
of cause in which event the agreement is terminable either on a summary basis or on 1 month’s notice,
depending on the severity of the cause;
• at the election of the Company, the Executive Directors and senior management will be required to serve a
garden leave period, equal to all or part of the notice period; and
• at the election of the Company, Executive Directors and senior management will be subject to a non-
compete in favour of the Group equal to a maximum of 12 months (as determined by the employer) post-
termination of employment. In the event that the employer elects to impose a non-compete, the Executive
Director would be entitled to a restraint payment equal to his/her monthly cost-to-company remuneration
package multiplied by the number of months of the non-compete.
7.8 Directors’ interest in Shares
No Directors have a direct beneficial shareholding in the Company including a Director who has resigned during
the last 18 months.
Associates of Loucas Pouroulis and Phoevos Pouroulis set out below have an indirect beneficial interest in the
Company as follows:
• Medway, prior to the issuance of Shares pursuant to conversion of the Convertible Preference Shares and
the Bonus Issue, currently holds 4,578,080 (74.20%) Shares; and
• Medway is held 96.74% by the Leto Settlement of which the trustees are Artemis Trustees Limited and
the beneficiaries are Adonis Pouroulis, his spouse and his children, who are related to Loucas Pouroulis and
Phoevos Pouroulis.
There has been no change to the direct and indirect beneficial holding of Directors from the end of the preceding
Financial Year to the date of this Pre-listing Statement, including any Director who has resigned during the last
18 months.
7.9 Directors’ interest in transactions
The Directors of the Company, including any Director who has resigned during the last 18 months, do not hold
any material beneficial interests, whether direct or indirect, in transactions that were effected by the Company
during the current or immediately preceding Financial Year or during an earlier Financial Year and remain in any
respect outstanding or unperformed.
7.10 Other directorships held by Directors
Details of all companies to which the Directors are, or have been, appointed as directors in the 5 years preceding
the Last Practicable Date are set out in Annexure 10 to this Pre-listing Statement.
7.11 Loans granted to Directors
No loans had been granted by Tharisa or its subsidiaries to the Directors or managers, or any associate of any
Director or manager as at the Last Practicable Date.
7.12 Sums paid to Directors
No sums have been paid or agreed to be paid within the 3 years preceding the date of this Pre-listing Statement
to any Director or to any company in which he is beneficially interested, directly or indirectly, or of which he
is a Director (“the associate company”), or to any partnership, syndicate or other association of which he is
a member (“the associate entity”), in cash or securities or otherwise, by any person either to induce him to
become or to qualify him as a Director, or otherwise for services rendered by him or by the associate company
or the associate entity in connection with the promotion or formation of the Company.
7.13 Directors’ responsibility statement
The Directors, whose names are set out in paragraph 7.1 on page 42 of this Pre-listing Statement, collectively
and individually, accept full responsibility for the accuracy of the information given and certify that, to the best
of their knowledge and belief, there are no facts that have been omitted which would make any statement false
or misleading, and that all reasonable enquiries to ascertain such facts have been made and that this Pre-listing

47
Statement contains all information required by the Listings Requirements. The Directors are not aware of any
legal proceedings that may have an influence on the rights to explore or mine.
The Directors also accept full responsibility for the historic financial information as set out in Annexure 1 to this
Pre-listing Statement.
8. RELATED PARTY TRANSACTIONS
Save as described above and in the Company’s Consolidated Financial Information as set out in Annexure 1 of this
Pre-listing Statement, there are no other related party transactions between the Company or members of the Group
that were entered into during the Financial Years ended 30 September 2011, 2012 and 2013, and during the period
between 1 October 2013 up to the Last Practicable Date.
9. SHAREHOLDERS AND LOCK-UP UNDERTAKINGS
9.1 Effect on Shareholders prior to the Offer and post the conversion of the Convertible Preference
Shares and Bonus Issue
The table below sets out information with respect to the controlling Shareholder, Medway, and other Shareholders
before and after the conversion of the Convertible Preference Shares into Shares and after the Bonus Issue:
Shares owned before
the conversion of
Convertible
Preference Shares
Shares owned after
the conversion of
Convertible
Preference Shares
Shares owned after
the Bonus Issue
Number % Number % Number %
Medway1 4,578,080 74.20 4,578,080 54.8 119,030,080 54.8
Rance Holdings – 0.00 1,093,586 13.1 28,433,236 13.1
Fujian Wuhang 746,920 12.11 980,218 11.7 25,485,668 11.7
Maaden Invest 397,600 6.44 397,600 4.8 10,337,600 4.8
HeYi Mining 198,800 3.22 198,800 2.4 5,168,800 2.4
Cornèr Bank 149,100 2.42 149,100 1.8 3,876,600 1.8
Sirius Resources 99,400 1.61 99,400 1.2 2,584,400 1.2
Other Convertible
Preference Shareholders – 0.00 862,371 10.2 22,421,646 10.2
6,169,900 100.00 8,359,155 100.0 217,338,030 100.0
1. Registered office at Office 108 – 110, S. Pittokopitis Business Centre, 17 Neophytou Nicolaides and Kilkis Street, 8011 Paphos, Cyprus.
2. No Directors have a direct beneficial shareholding in the Company.
3. There has been no change in controlling Shareholder of Tharisa or any of its subsidiaries during the previous 5 years. There have been
no new trading objects and the Group has not carried out widely differing operations. There has been no change in name.
4. The table above assumes that the Offer is based on a price of R55.21 per Share for illustrative purposes.
The authorised capital of the Convertible Preference Share is US$1,051 divided into 1,051 shares of US$1.00
each. The Convertible Preference Shares were issued on 14 April 2011, at a price of US$142,857 per share and
are fully paid. On the Listing Date and prior to the issue of Shares under the Private Placement, the Convertible
Preference Shares shall convert into Shares based on the higher of:
(i) 1,420 Shares for every 1 Convertible Preference Share; or
(ii) that number of Shares calculated by dividing the notional return amount of US$292,352,456, converted to
ZAR at such ZAR/US$ exchange rate as shall be determined by an independent investment bank, by the
Offer Price.
The table above assumes that Shares are issued based on the calculation set out in point (ii) above.
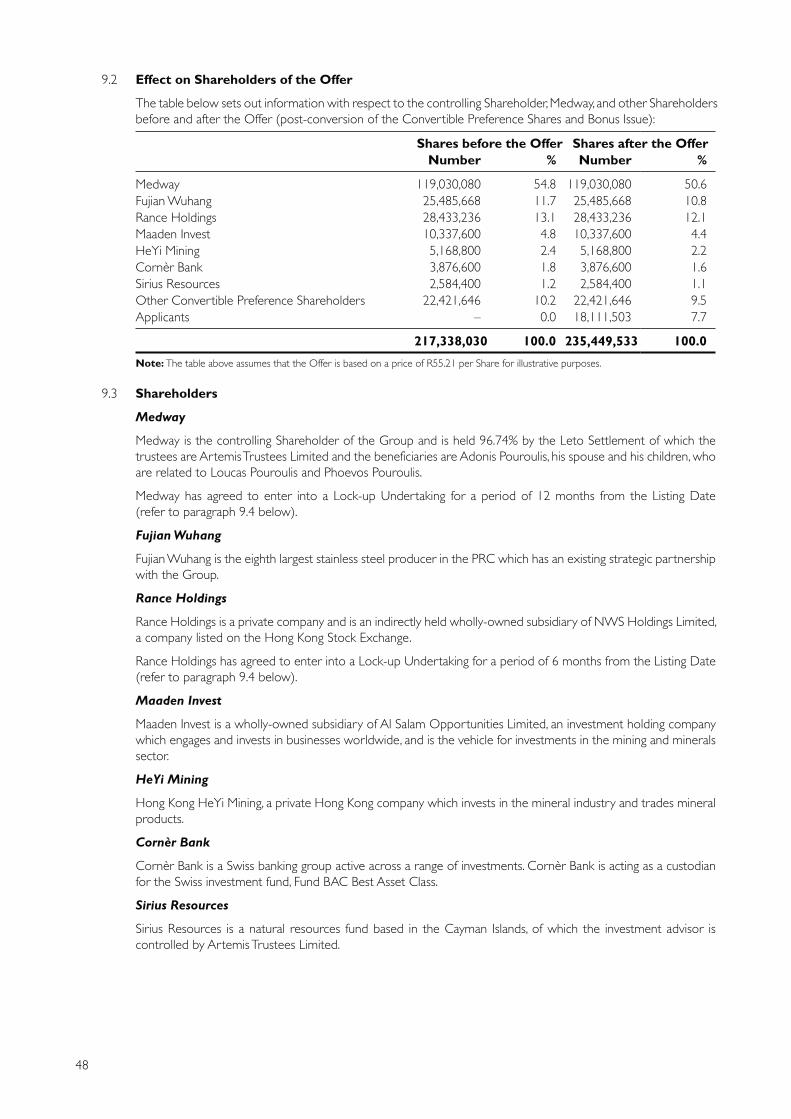
48
9.2 Effect on Shareholders of the Offer
The table below sets out information with respect to the controlling Shareholder, Medway, and other Shareholders
before and after the Offer (post-conversion of the Convertible Preference Shares and Bonus Issue):
Shares before the Offer Shares after the Offer
Number % Number %
Medway 119,030,080 54.8 119,030,080 50.6
Fujian Wuhang 25,485,668 11.7 25,485,668 10.8
Rance Holdings 28,433,236 13.1 28,433,236 12.1
Maaden Invest 10,337,600 4.8 10,337,600 4.4
HeYi Mining 5,168,800 2.4 5,168,800 2.2
Cornèr Bank 3,876,600 1.8 3,876,600 1.6
Sirius Resources 2,584,400 1.2 2,584,400 1.1
Other Convertible Preference Shareholders 22,421,646 10.2 22,421,646 9.5
Applicants – 0.0 18,111,503 7.7
217,338,030 100.0 235,449,533 100.0
Note: The table above assumes that the Offer is based on a price of R55.21 per Share for illustrative purposes.
9.3 Shareholders
Medway
Medway is the controlling Shareholder of the Group and is held 96.74% by the Leto Settlement of which the
trustees are Artemis Trustees Limited and the beneficiaries are Adonis Pouroulis, his spouse and his children, who
are related to Loucas Pouroulis and Phoevos Pouroulis.
Medway has agreed to enter into a Lock-up Undertaking for a period of 12 months from the Listing Date
(refer to paragraph 9.4 below).
Fujian Wuhang
Fujian Wuhang is the eighth largest stainless steel producer in the PRC which has an existing strategic partnership
with the Group.
Rance Holdings
Rance Holdings is a private company and is an indirectly held wholly-owned subsidiary of NWS Holdings Limited,
a company listed on the Hong Kong Stock Exchange.
Rance Holdings has agreed to enter into a Lock-up Undertaking for a period of 6 months from the Listing Date
(refer to paragraph 9.4 below).
Maaden Invest
Maaden Invest is a wholly-owned subsidiary of Al Salam Opportunities Limited, an investment holding company
which engages and invests in businesses worldwide, and is the vehicle for investments in the mining and minerals
sector.
HeYi Mining
Hong Kong HeYi Mining, a private Hong Kong company which invests in the mineral industry and trades mineral
products.
Cornèr Bank
Cornèr Bank is a Swiss banking group active across a range of investments. Cornèr Bank is acting as a custodian
for the Swiss investment fund, Fund BAC Best Asset Class.
Sirius Resources
Sirius Resources is a natural resources fund based in the Cayman Islands, of which the investment advisor is
controlled by Artemis Trustees Limited.

49
9.4 Lock-up Undertaking
The Company, Medway (for a period of 12 months from the Listing Date) and the Convertible Preference
Shareholders (for a period of 6 months from the Listing Date) (“Lock-up Period”) have entered into agreements
such that Medway and the Convertibale Preference Shareholders shall not, without the prior written consent of
the Company directly or indirectly dispose of any of their Shares and will observe such further restrictions as are
reasonably requested by the Bookrunner.
The lock-ups referred to in the preceding paragraphs shall not preclude any person who acquires Offer Shares
in connection with the Offer from trading in, and transferring, any such Shares.
The table below sets out the various Lock-up Undertakings entered into by the Company and various
Shareholders:
Shareholder Period of Lock-up
Medway 12 months
Rance Holdings 6 months
Other Convertible Preference Shareholders 6 months
10. DETAILS OF SUBSIDIARY COMPANIES
Details of the subsidiary companies of Tharisa are set out in Annexure 12 to this Pre-listing Statement.
11. OVERVIEW OF SOUTH AFRICAN LAWS AND REGULATIONS
Annexure 16 to this Pre-listing Statement provides an overview of the applicable laws and regulations of the South African mining sector.
12. FINANCIAL INFORMATION
The audited annual consolidated financial statements of the Group for the 3 years ended 30 September 2011, 30 September 2012 and 30 September 2013 are set out in Annexure 1 to this Pre-listing Statement.
The reporting currency for Tharisa is the US$. The consolidated financial information of the Group presented in this Pre-listing Statement has been reviewed by the Reporting Accountants, as stated in their report appearing in Annexure 2.
Financial results and position
For the Financial Year ended 30 September 2013, there was a significant increase in revenue from US$53.9 million to US$215.5 million following the commissioning of the Voyager Plant and the Arxo Metals Foundry and Chemical Grade Concentrate plant and consequent increase in production. The Chrome Concentrate sales are mainly on a CIF basis. If the insurance and freight costs costs are excluded to enable a “like for like” comparison to be made, the contribution to revenue from Chrome Concentrate sales amounted to US$140.8 million (2012: US$43.4 million) and PGM sales amounted to US$54.3 million (2012: US$5.3 million). The respective contributions to gross profit/(loss) from Chrome Concentrate sales and PGM sales amounted to US$22.1 million (2012: US$4.6 million) and US$3.8 million (2012: US$(12.8 million)). Gross profit/(loss) totalled US$25.6 million (2012: US$(8.2 million)).
In terms of finance costs, the net charge to the income statement was US$62.3 million (2012: US$5.1 million) and relates primarily to the fair value adjustments in respect of the IRR calculation on the Convertible Preference Shares of US$48.4 million (2012: US$5.7 million), with US$14.7 million (2012: US$1.6 million) relating primarily the interest on third party borrowings including (for the 2013 Financial Year) the B class preference dividend. The net loss (before tax) after providing for the financing charges amounted to US$63.0 million (2012: US$38.7 million).
The Company has provided funding to Tharisa Minerals by way of preference shares. The preference shares are US$ denominated while Tharisa Minerals reports in ZAR. The foreign currency translation differences relating primarily to this inter Group funding for the Financial Year amounted to US$38.8 million (2012: US$7.9 million) following the weakening of the ZAR against the US$.
The basic and diluted earnings per share increased from a loss of US$3.40 per Share to a loss of US$6.31 per Share. The diluted earnings per share is calculated based on the conversion of the Convertible Preference Shares assuming a 1:1 conversion ratio of the Convertible Preference Shares to Shares.
The Group has a negative total equity of US$53.6 million (2012: US$32.6 million positive) with the Convertible Preference Shares being classified as a current liability.

50
Cash flows from operating activities before changes in working capital amounted to US$13.9 million (2012: US$(23.8 million)) and after taking into account working capital changes has reduced cash from operating activities to US$3.0 million (2012: US$9.2 million).
The results for the quarter ended 31 December 2013 are set out in Annexure 5 to this Pre-listing Statement. These
quarterly results have been reviewed by the Auditors but not audited.
For the 2 months ended 28 February 2014, on reef mining was substantially as planned for the period with the
pre-stripping being advanced ahead of schedule. The Voyager Plant throughput was adversely affected due to a gearbox
failure of the first primary mill. Production continued at approximately 60% of budgeted throughput for a 4 week period.
The downtime was minimised as a spare gearbox had already been manufactured and could be shipped immediately.
During the downtime in the first primary mill section, certain planned maintenance was brought forward including the
relining of the mills. Management intends to build a strategic inventory of critical spares, for which a portion of the
proceeds from the Offer have been allocated, which would minimise the impact of future breakdowns. The maintenance
that was brought forward reduces the number of days required for planned maintenance for the balance of the
Financial Year. Management estimates that the impact on production, attributed to this breakdown, for the full year will
be approximately 5%. Unprocessed ore has been stockpiled and provided an additional buffer and will be processed
over the coming months. All contracted sales of Chrome Concentrate were fulfilled during this period and PGM
Concentrate deliveries to Impala Platinum continued in the normal course.
The pro forma statement of financial postion and statement of comprehensive income of the Group as at 30 September
2013, before and after the Listing and Offer is presented in Annexure 3 of this Pre-listing Statement. The Reporting
Accountants’ reasonable assurance report on the pro forma financial information is contained in Annexure 4 of this
Pre-listing Statement.
There were no material inter-company balances as at 30 September 2013 and 31 December 2013, other than the
Company’s subscription of redeemable cumulative preference shares in the capital of Tharisa Minerals as disclosed in
Annexure 11 and no material acquisitions or disposals have been made, by Tharisa or any of Tharisa’s subsidiaries, within
the last 3 years as at the date of this Pre-lisiting Statement.
Tharisa Minerals pays a Mineral Petroleum and Resource Royalty in terms of the Mineral and Petroleum Resources
Royalty Act, 2008. Royalty payments made by Tharisa in respect of the Financial Year ended 30 September 2013
amounted to R6.2 million.
13. DIVIDEND POLICY
The Company’s policy is to pay an annual dividend of 10% of consolidated net profit after tax. The dividend policy will
be reviewed by the Directors from time to time in light of the prevailing business circumstances, investment decisions
to be taken, working capital requirements and available cash for distribution.
As per the Articles of Association of Tharisa Article 187, all dividends unclaimed for a period of 12 years after having
become due for payment shall (if the Board so resolves) be forfeited and shall revert to the Company.
14. INCORPORATION, SHARE CAPITAL, OPTIONS AND PREFERENTIAL RIGHTS IN RESPECT OF
SHARES
14.1 Incorporation
The Company was incorporated and registered in Cyprus on 20 February 2008 as a private company limited by
shares under the Cyprus Companies Law with the name Jamphorina Investments Limited and with the registered
number HE223412.
On 21 May 2008, the Company changed its name to Tharisa Limited and on 11 November 2011 the Company
was converted to a public limited company with the name Tharisa plc.
The principal laws and legislation under which the Company operates and the ordinary shares have been created
are the Cyprus Companies Law and regulations made thereunder.
The share capital history of the Company is as follows:
• on incorporation the share capital of the Company was €1,000 divided into 1,000 ordinary shares of
€1.00 each;
• on 2 May 2008 Medway became the sole shareholder of the Company by acquiring the entire issued share
capital of the Company from Truetec (Nominees) Services Limited;

51
• on 3 May 2008 the Company increased its share capital to €10,000 divided into 10,000 ordinary shares of
€1.00 each and issued a total of 2,250 ordinary shares of €1.00 each to Medway at a price of €1.00 per share
credited as fully paid for a total consideration of €2,250, thereby increasing Medway’s shareholding to 3,250
ordinary shares of €1.00 each in the capital of the Company;
• on 6 December 2008 the Company issued a total of 455 ordinary shares of €1.00 each to the seed capital
subscribers all credited as fully paid for a total consideration of US$18.2 million;
• the seed capital subscribers subscribed for preference shares (A Class) in Tharisa Minerals for a total
consideration of US$46.8 million, which shares were transferred to Tharisa for a nominal consideration in
2009 once the acquisition of 74% of Tharisa Minerals became unconditional;
• as a result of an administrative error, a court order was issued on 10 November 2008 for the Company to
forfeit 26 Shares of €1.00 each that had been allotted to Medway. The forfeiture took place on 19 November
2008 and reduced Medway’s shareholding to 3,224 Shares of €1.00 each in the capital of the Company. On
25 November 2010 the Company passed a special resolution to reduce the share capital of the Company by
€26.00 representing 26 Shares held by the Company. This reduction of capital was confirmed by an order of
the District Court of Paphos (Civil Division) on 11 March 2011 and the Shares were cancelled on 24 March
2011. On the same day, the Company passed a special resolution to increase the authorised share capital of
the Company by €26.00 divided into 26 Shares of €1.00 each, reinstating the authorised share capital of the
Company to €10,000 comprising 10,000 Shares of €1.00 each;
• on 27 November 2010 the Company issued 210 Shares of €1.00 each to Fujian Wuhang all credited as fully
paid for a total consideration of US$30 million;
• on 5 January 2011 the Company issued 316 Shares of €1.00 each to Fujian Wuhang at a price of US$142,857
per share and 140 Shares of €1.00 each to HeYi Mining all credited as fully paid for a total consideration of
US$65.1 million;
• on 4 April 2011, the authorised share capital of the Company was converted into the US$ equivalent of
€10,000 calculated at the exchange rate of US$1.42 to €1.00, resulting in the share capital being divided
into 10,000 Shares of US$1.42 each. The effect of this conversion was that the authorised share capital was
redenominated into US$14,200 divided into 10,000 Shares. On the same day, the authorised share capital of
the Company was increased with the approved addition of 1,156 Convertible Preference Shares of US$1.00
each resulting in the authorised share capital of the Company being US$15,356 divided into 10,000 Shares
of US$1.42 each and 1,156 Convertible Preference Shares of US$1.00 each;
• on 14 April 2011 the Company issued a total of 1,051 Convertible Preference Shares of US$1.00 each to
investors, all credited as fully paid for a total consideration of US$150.1 million;
• on 14 April 2011, Medway pledged all of its Shares to and in favour of the holders of the Convertible
Preference Shares;
• on 4 June 2011, HeYi Mining pledged 140 Shares it held in the Company in favour of RB International Finance
(Hong Kong) Limited;
• on 11 November 2011 the Company subdivided each Share of US$1.42 in the capital of the Company
into 1,420 Shares and increased its authorised share capital to US$10,001,051 divided into 10,000,000,000
Shares of US$0.001 each and 1,051 Convertible Preference Shares of US$1.00 each through the creation of
9,985,800,000 new Shares and the cancellation of 105 unissued Convertible Preference Shares;
• on 8 October 2013, 75% of Medway’s Shares were or are eligible for release from pledge. The remaining 25%
will be eligible for release on the Listing Date;
• immediately prior to the publication of this document, the issued share capital of the Company consisted
of 6,169,900 Shares and 1,051 Convertible Preference Shares (all of which were fully paid or credited as
fully paid);
• on the Listing Date, the Convertible Preference Shares convert into Shares based on the higher of:
– 1,420 Shares for every 1 Convertible Preference Share; or
– that number of Shares calculated by dividing the notional return amount of US$292,352,456, converted
to ZAR at such ZAR/US$ exchange rate as shall be determined by an independent investment bank, by
the Offer Price;
• immediately after the conversion of the Convertible Preference Shares into Shares, the Company will issue
25 bonus Shares for every Share held by existing Shareholders prior to the issuance of Shares pursuant to
the Private Placement; and
• all Shares represent capital in the Company. No Shares are held by or on behalf of the Company or by any
subsidiary of the Company.

52
14.2 Share capital
All Shares (including Shares issued on conversion of the Convertible Preference Shares and the Bonus Issue)
rank pari passu in all respects. Accordingly, no Share has any special rights to distributions, capital or profits of the
Company and there are no Shares held in treasury. The Company has not repurchased any of its Shares in the
3 years preceding the Last Practicable Date. All unissued Shares are under the control of the Directors.
At the Listing Date, Tharisa will have authorised share capital of 10,000,000,000 par value Shares of US$0.001
each; and issued share capital and share premium of between US$235,450 to US$257,334 and US$206,347,144
to US$206,341,862, respectively (converted at a ZAR/US$ exchange rate of 10.75:1) comprising 235,449,533
to 257,333,677 fully paid par value Shares at the Offer Price of R55.21 to R42.75, assuming the Offer is fully
subscribed and the Convertible Preference Shares, in accordance with their terms, are converted into Shares.
14.3 Options and preferential rights in respect of shares
On 22 November 2011, the Company and Fujian Wuhang signed an agreement, according to which Fujian
Wuhang transferred its 15% equity interests in Tharisa Investments to the Company. The consideration for this
transfer was the par value of the shares transferred of US$22.5 and a call option written by the Company which
conferred to Fujian Wuhang a right to purchase 15% of the equity capital of Tharisa Fujian Industrial at YUAN
100 any time after 31 December 2012 (European in nature).
The Convertible Preference Shares will convert to Shares of the Company on Listing as detailed in paragraph 9.1
on page 47.
The Bookrunner has been granted an option by the Company, from the Listing Date, to allot additional Shares
of up to 15% of the number of Shares issued pursuant to the Private Placement.
15. SHARE AWARD PLAN
The Directors believe that the success of the Group will depend to a high degree upon the retention and future
performance of the management team. The Company has a Share Award Plan in place, which was established to
provide incentives to qualified parties to increase their proprietary interest in the Company and thereby encourage
their continuing association with the Company.
The salient details of the Share Award Plan have been included in Annexure 8 to this Pre-listing Statement.
16. RISK FACTORS APPLICABLE TO THARISA
Any reader of this Pre-listing Statement should carefully consider all the information in this Pre-listing Statement,
including the following risk factors, as well as any risk factors identified in the CPR which the Directors consider to be
all of the material risks specific to the Group and/or industry in which it operates. Additional risks not presently known
to the Company may also impair business operations.
16.1 Mineral resource and reserve estimates risk
Tharisa Minerals reports its Mineral Resources and Mineral Reserves in accordance with the guidelines of the
SAMREC Code. Mineral Resource estimates are uncertain and subject to change due to a variety of factors.
The estimation of Mineral Resources is a subjective process and the accuracy of Mineral Resource estimates
are a function of the quantity and quality of data available, the assumptions used and judgements made in
interpreting engineering and geological data. Mineral Resource estimates are expressions of judgement based
on knowledge, experience and industry practice. Estimates which were valid when originally estimated may alter
significantly when new information or techniques become available. As further information becomes available
through additional fieldwork and analysis, the estimates are likely to change.
Assumptions used in determining the economic viability of Mineral Resource estimates include geological and
mining conditions, commodity prices foreign currency exchange rates, operating costs, taxation, regulatory
requirements, mining technology, development costs and rehabilitation costs. Changes in any of these assumptions
may adversely impact the Mineral Resource estimate and may render them economically uneconomical or
unprofitable to develop.
This may result in alterations to development and mining plans which may, in turn affect the Company’s business
plan or operations.

53
16.2 Operating risk
The operations of the Group are subject to risks normally associated with the conduct of business in South
Africa. Risks may include problems relating to labour disputes, delays or invalidation of governmental orders and
permits, uncertain political and economic environments, opposition to mining from environmental or other non-
governmental organisations or changes in the political attitude towards mining.
The establishment and operation of a commercial mine is complex and the mining operations of the Group may
be affected by various factors, including:
• adverse mining conditions, including unanticipated variations in grade, quality, ore and other geological
problems;
• adverse open pit mining conditions, including failure of the high wall, flooding, excess waste material and
unexpected geological conditions;
• equipment failure or under performance;
• disruption to transportation systems;
• labour problems including lack of skilled personnel, strikes or poor performance;
• government or other regulatory action that could impact production, or operating costs or result in the
suspension or revocation of licences;
• unanticipated rehabilitation or remediation costs; and
• community relations including access to land, relocation of people and compensation.
Further, the Tharisa Mine is located 95km north west of Johannesburg in the south western region of the
Bushveld Complex. Since the Group’s operations are geographically concentrated to one location, any adverse
economic, political or social conditions affecting this region, as well as natural disaster, strikes, work stoppages and/
or any other disruptions could have a material adverse effect on the business operations.
16.3 Production risk
The Company cannot guarantee that it will achieve its production estimates or that production will be economically
viable. Production estimates are dependent on, among other things, the accuracy of the Mineral Resource
estimates, the accuracy of assumptions on grade, quality, extraction rates, ground conditions and production
costs. Actual production may vary from estimates due to a number of factors including adverse operating
conditions (such as unexpected geological conditions, fire, weather), compliance with government regulation,
labour and safety issues, equipment availability, mining rights and permits, relations with local communities and the
availability of capital for investment.
16.4 Force majeure
The Groups operations may now or in future be adversely affected by risks outside the control of Group,
including without limitation, acts of God, industrial action, theft, floods, fire, explosion, riot, insurrection or other
civil disorder, war (whether declared or not), military operations, sabotage, international restrictions, strikes, lock-
outs, labour unrests, work stoppages, equipment failure, transportation constraints, technical failures, the cutting
off of electrical power supply, scheduled and unexpected blackouts or electrical power cuts, any requirement
or action of any international authority, any requirement or action of any government or other competent local
authority, any court order and export control.
These risks could result in damage to, or destruction of, property or production facilities, decease in production,
decease in quality of products, personal injury or death, environmental damage, business interruption and legal
liability.
16.5 Competition risk
The Group operates in a highly competitive market. Many of the Group’s competitors have greater financial and
technical resources and, as a result may be better placed for the acquisition of mineral licences as well as the
recruitment and retention of qualified employees. This competition could have a material adverse effect on the
Group’s financial condition, operations and ability to compete for potential opportunities.

54
16.6 Liquidity and financing risks
Liquidity, or ready access to funds, is essential for the Group’s business. A lack of liquidity may mean that the Group will not have funds available to maintain or increase its activities and operations. Large amounts of capital are required to implement projects and long-term production and processing requires both significant capital expenditure and ongoing maintenance expenditure.
Future funding may be required by the Group from time to time to support its ongoing activities and operations. There can be no assurance that such funding will be available on satisfactory terms or at all. Any inability to finance will adversely affect the business and financial condition of the Group and its performance. If the Group is unable to raise any additional capital it requires, it may be required to consider alternative funding arrangements. In addition, it may be necessary for the Group to issue additional Shares in the future, which would result in a dilution of the interests held by Shareholders should they not acquire such additional Shares.
16.7 Commodity price volatility risk
The Group’s revenues are currently, and expected in the longer term, to be derived from the sale of its products to both South African companies and the international market. The global supply and demand dynamic for its products are beyond the control of the Group. The Group is exposed to fluctuations in commodity prices. Sustained lower than anticipated PGM and Chrome Concentrate product prices could render less economic, or uneconomic, some or all of the Group’s operations. This could have a material adverse effect on the Group’s business and profitability and may require the Group to write down its Mineral Reserves and Mineral Resources.
16.8 Exchange rate risks
The Group’s mining and logistics operations are located in South Africa, and costs relating to construction, services and materials, are predominantly in South African Rand. Certain input costs, including some machinery and equipment, diesel, freight, and other inputs may be imported or linked to international prices. The prices for the PGM Concentrate and Chrome Concentrate produced by the Group are determined in US$. The Company’s accounts are maintained in US$ and therefore may be partly affected by fluctuations in the ZAR/US$ exchange rate. The Group may from time to time hedge against its currency exposure.
16.9 Interest rate risk
Interest rate risk is the Group’s exposure to adverse movements in interest rates. It arises as a result of timing differences on the repricing of assets and liabilities. The Group may from time to time hedge against adverse interest rate movements.
16.10 Environmental risks
Mining operations have an impact on the environment and environmental hazards may arise during the extraction, processing, storage or transportation of minerals. Mining companies may be liable for losses associated with environmental hazards or pollution which could result in legal claims, the suspension or withdrawal of licences, remedial clean up action and rehabilitation. In certain circumstance, mining companies may be liable for environmental hazards caused by previous owners or retain liability after the sale or relinquishment of a property. Any losses, licence suspensions or withdrawals, costs or other obligations may have a material adverse effect on the Group.
The Group’s operations are subject to South African environmental legislation and regulations, specifically the MPRDA and NEMA.
Under the MPRDA, companies that undertake mining activities must make financial provision for rehabilitation liabilities to the satisfaction of the DMR, and directors of companies may be held jointly and severally liable for any unacceptable negative impact on the environment, including damages caused by the company which they represent.
Under the NEMA, every person who causes, has caused or may cause significant pollution or degradation of the environment must take reasonable steps to prevent pollution or degradation from occurring, continuing or recurring, or insofar as such harm to the environment is authorised by law or cannot reasonably be avoided or stopped to minimise and rectify such pollution or degradation of the environment.
Under the NWA, the owner of land and controllers or occupiers of land on which any activity or process is or was performed or undertaken or on which any situation exists that causes, has caused or is likely to cause the pollution of a water resource, must take all reasonable measures to prevent such pollution from occurring,
continuing or recurring.

55
The Department of Environmental Affairs and Tourism and the Department of Water Affairs may issue administrative directives to enforce the provisions of NEMA and the NWA to take specific anti-pollution measures, continue with those measures and/or to complete those measures.
In addition, mining companies operating in South Africa are subject to extensive environmental laws and regulations with respect to environmental matters such as:
• limitations on land use;
• mine permitting and authorisation requirements;
• reclamation and restoration of mining properties after mining is completed;
• management of materials generated by mining operations;
• the storage, treatment and disposal of wastes;
• air quality standards;
• water pollution;
• protection of human health, plant life and wildlife, including endangered or threatened species;
• protection of wetlands;
• the discharge of materials into the environment;
• the effects of mining on surface water and groundwater quality and availability; and
• the management of structures and equipment containing polychlorinated biphenyls.
The costs associated with compliance with these laws and regulations are substantial, and possible future changes to laws and regulations could cause additional expense. Failure to comply with the laws and regulations could result in substantial fines, penalties or other civil or criminal sanctions which could have a materially adverse effect on the Group. In addition, the failure to comply with the laws and regulations could result in the Group being liable for environmental hazards or having its licenses and permits withdrawn or suspended.
If the Group’s environmental compliance obligations in South Africa were to vary as a result of changes to the legislation; if certain assumptions it makes to estimate liabilities are incorrect; or if unanticipated conditions were to arise in its operations, the Group’s expenses and provisions would increase, which could adversely affect operating results and financial condition.
The Group’s exposure to environmental liability in South Africa is determined in the first place by reference to the approved EMP’s, which the Group was obliged to develop for its operations. The process in place requires mining companies, as a prerequisite for applications for mining rights and prospecting (exploration) rights, to submit EMP’s to the regulator for approval. Once so approved, the mining company is obliged to comply with the approved EMP when prospecting or mining. Further, under South African mining legislation, funding for environmental rehabilitation at mine closure has to be provided as a prerequisite for the granting of mining rights. The quantum of this funding is reviewed each year. The funding is placed at the disposal of the regulator if a mining company goes insolvent, so that environmental rehabilitation can take place notwithstanding such insolvency. The mining company’s liability is however not limited to the amount of funding that has been set aside. Environmental and health and safety legislation is evolving in a manner requiring stricter standards and these higher standards are taken into account when compiling EMP’s. The DMR is the lead government agency when it comes to enforcement of compliance with EMP’s. The Group incurs substantial costs to ensure compliance with the legislation discussed above, which, if such costs were to escalate, could have an adverse effect on the Group’s financial condition and results of operations.
16.11 Management and personnel risk
The Group’s business depends in significant part on a number of key personnel.
The Group cannot guarantee the retention of key personnel. The Company’s future success and growth will also depend on its ability to attract and retain additional suitably qualified and experienced personnel. There is no guarantee that the Group will be able to continue to attract and retain such employees, and failure to do so could have an adverse material impact on the financial condition, results or operating performance of the Group.
16.12 Mine design risk
The underground design was not constrained within the extents of the current surface rights and Mining Right. Small portions exist within the mine design for which Tharisa Mine does not currently hold the Mining Right and/or where the surface rights have yet to be acquired. These areas have been included in the mine design based on the reasonable expectation that exists that the necessary permitting and ownership would be in place
by the time mining is undertaken in these areas.

56
16.13 Infrastructure risk
Exploration, development and mining activities depend, to a significant extent, on adequate infrastructure. Reliable mining equipment, power supply, water supply, roads, rails and port facilities are important determinants which affect capital and operating costs as well as the ability to deliver product to customers. Tharisa Minerals depends on Eskom for electricity supply at its operations and any disruption to supply, usage constraints or electricity cost increases could have an adverse impact on production. The lack of, or interruption to key infrastructure could materially and adversely affect the Group’s operations and financial condition.
16.14 BEE risk
The Group is required to comply with local procurement, employment equity, ownership and other regulations which are designed to address social and economic transformation issues, redress historical social and economic inequalities and ensure socio-economic stability. In South Africa, new order mining rights are linked to meeting various obligations including compliance with the Mining Charter which, inter alia, requires targeted level of participation by HDSA’s in various levels of management. Failure to achieve the targets may result in financial penalties and/or the suspension or revocation of new order mining rights and may affect the ability to acquire new new order mining rights in the future.
16.15 Regulatory oversight risk
The Group’s exploration, development and operating activities are subject to various laws governing prospecting, mining, development, production, taxes, labour standards and occupational health, mine, safety, toxic substances, land use, water use, land claims of local people and other matters. Although the Group’s exploration and development activities are currently carried out in accordance with all applicable rules and regulations, no assurance can be given that new rules and regulations will not be enacted or that existing rules and regulations will not be applied in a manner which could limit or curtail development.
Failure to comply with applicable laws, regulations and permitting requirements may result in enforcement actions thereunder, including orders issued by regulatory or judicial authorities causing operations to cease or be delayed or curtailed, and may include corrective measures requiring capital expenditures, installation of additional equipment, or remedial actions. Parties engaged in the exploration or development of mineral properties may be required to compensate those suffering loss or damage by reason of the activities and may have civil or criminal fines or penalties imposed for violations of applicable laws or regulations.
16.16 Regulatory approvals and title right risks
The operations of the Group require compliance with the MPRDA and other regulatory approvals. Any non-compliance or failure by the Group to renew a licence or the failure to obtain the required government consents could have a material adverse effect on the Group’s financial performance, may result in a reduction in the carrying value of assets and may materially impact the viability of the Group’s projects.
Mining Rights may carry contractual obligations regarding work programmes, expenditure, social and environmental development. Failure to comply with these obligations may result in a reduction in the carrying value of assets and may materially impact the viability of the Group’s projects.
Certain of the Group’s Mining Rights may from time to time have technical defects, errors or breaches, have not been registered with the applicable authority or may have consents or approvals outstanding.
16.17 Insurance risk
In the course of exploration, development and production of mineral properties, the Group is exposed to a variety of risks including adverse weather conditions, environmental risks, fire, unexpected or unusual geological or operating conditions. These risks can result in injury to persons as well as damage to plant, Group property, equipment, the sterilisation or reduction in mineral resources, pollution or damage to third party property.
While the Group will exercise due care in the conduct of its business, and will maintain what it believes to be customary insurance coverage for companies engaged in similar operations, the Group is not fully insured for all possible risk in its business. The occurrence of an event that is not covered, in whole or in part, by insurance could have a material adverse effect on the business.
There is a risk that insurance premiums may increase to a level where the Group considers it unreasonable or not in its interests to maintain insurance cover or not to a level of coverage customary for companies engaged in similar operations. In addition, the Group may, following a cost-benefit analysis, elect not to insure certain risks on the grounds that the amount of premium payable for that risk is excessive when compared to the potential benefits for the Group.

57
16.18 Litigation risk
Legal proceedings, with or without merit, may arise from time to time in the course of the Group’s business. The Directors cannot preclude litigation being brought against the Group and any litigation brought against the Group could have a material adverse effect on the financial condition, results or operations. The Group’s business may be materially adversely affected if the Group and/or its employees or agents are found not to have met the appropriate standard of care or exercised their discretion or authority in a prudent or appropriate manner in
accordance with accepted standards.
16.19 Community risks
The Group’s operations will require the support of communities in areas where it operates. The Group may also need to acquire surface rights on community land. If expectations are not met at a local level in relation to employment and benefits, which may include share ownership, support may be withdrawn. Amendments to the MPRDA may specify the degree of involvement of the community which could have a materially adverse effect on the viability of projects and render them economically unviable to develop.
16.20 Exchange Control risk
The ability of the Group, and its South African subsidiaries and their operations, to transfer funds out of South Africa and to enter into agreements which require or potentially require the transfer of funds out of South Africa is subject to South African Exchange Control Regulations. Exchange Control has been delegated the authority to administer the South African Exchange Control system, which in turn has delegated certain powers to Authorised Dealers. If the Group makes an application to an Authorised Dealer or the SARB through an Authorised Dealer for a transfer of funds out of South Africa or to enter into an agreement which will involve such a transfer, there can be no such assurance that such a transfer will be approved. Any failure to obtain the necessary approval or the imposition of any restrictions on the Group in respect of any transfer or agreement may have a material adverse effect on the Group’s business, operations, financial condition or growth prospects.
16.21 Health and safety risks
South Africa has a high incidence of HIV and tuberculosis infection. The operations of the Group may be negatively impacted by the loss of productivity and the costs arising from any effects of these and other infectious diseases. Accidents and fatalities in the workplace, should they occur, could result in additional costs, the temporary or permanent closure of operations and legal proceedings against the Group.
16.22 Climate change risk
The government of South Africa is considering proposals to levy a carbon tax and other measures to mitigate the impact of climate change. The introduction of a carbon tax and other measures could result in increased costs for the Group.
16.23 Sovereign risk
The Group is domiciled in Cyprus and has operations and interests in South Africa and the PRC. These risks may include economic, political or social instability or change, change in foreign exchange regulations, changes in legislation, changes to dual taxation agreements, foreign ownership rules, import and export duties, repatriation of income or capital, environmental protection and requirements for the employment of local labour or contractors. Any such changes may materially impact the viability of the Group and the value of its assets.
16.24 Share price volatility
The market price of the Shares could be subject to significant fluctuations some of which do not relate to the Group’s performance, including changes in general market conditions, regulatory changes affecting the Group’s operations, changes in the economic, social or economic conditions in South Africa or changes in the global commodity markets and the pricing of commodities the Group produces. Variations in the Group’s operating results, business plans or prospects, or failure to meet the expectations of market analysts and investors may also result in fluctuations in the market price of the Shares. Any of the events above could result in a decline in the market price of the Shares.

58
16.25 Investing in emerging markets
South Africa is generally considered by international investors to be an emerging market. Emerging markets are typically thought to have certain characteristics and be subject to many risks, including:
• adverse changes in economic and governmental policy;
• relatively low levels of disposable consumer income;
• relatively high levels of crime;
• relatively unstable institutions;
• unpredictable changes in the legal and regulatory environment;
• inconsistent application of existing laws and regulations; and
• slow or insufficient legal remedies.
The Group cannot assure investors that political, economic, social and other developments in South Africa or other emerging markets will not have a material adverse effect on its business, prospects, financial condition or results of operations.
16.26 Taxation risk
Any change in the Group’s tax status or in taxation legislation could affect the Company’s ability to provide returns to Shareholders and could have a materially adverse effect on the Group.
16.27 Contractual risk
The Group is unable to predict the risk of:
• financial failure or default of the contractor or any other third party to a contract to which the Group is a party; or
• insolvency or other managerial failure by any of the operators and contractors used by the Group in its mining activities; or
• insolvency or other managerial failure by any of the other service providers used by the Group or operators
for any activity.
17. CORPORATE GOVERNANCE PRACTICES OF THARISA
The Board is fully committed to the principles of the Code of Corporate Practices and Conduct as set out in King III. The Board recognises that it is ultimately responsible for conducting the affairs of the Company with integrity and in accordance with the generally accepted corporate practices. Tharisa’s corporate governance statement is set out in Annexure 7 of this Pre-listing Statement.
The Audit Committee of Tharisa has considered and satisfied itself as to the appropriateness of the expertise and experience of the financial Director. In terms of the Listings Requirements all Directors will retire at the first annual General Meeting of Tharisa but will make themselves available for re-election by the Shareholders.
The full curriculum vitae of the Directors are set out in Annexure 9 of this Pre-listing Statement and a list of their other directorships are set out in Annexure 10 to this Pre-listing Statement.
The Company secretaries will be subject to an annual evaluation by the Board.
18. CORPORATE RELATIONSHIPS AND MATERIAL CONTRACTS
Save for the contracts listed below, the Group has not entered into any other material contract, being a contract entered into otherwise than in the ordinary course of business, within the 2 years preceding the Last Practicable Date or a contract entered into at any time containing an obligation or settlement that is material to the Group as at the Last Practicable Date:
• investment agreements;
• Tharisa Minerals B class preference share subscription agreements;
• Fujian Wuhang Subscription Agreement;
• senior debt loan facility agreement;
• trade finance facilities;
• limited recourse disclosed receivables discounting agreement;

59
• opencast mining works agreement;
• PGM Concentrate off-take agreement;
• chromite ore concentrate off-take agreement;
• electricity supply agreement;
• memorandum of agreement for the supply of water ;
• agreement for the provision of rail transport services;
• agreement of lease;
• logistical services agreement; and
• agency and off-take agreement.
The abovementioned agreements have been summarised in Annexure 14 of this Pre-listing Statement and are available
for inspection as set out in paragraph 29.
19. MATERIAL BORROWINGS AND LOANS RECEIVABLE
The Company has not exceeded its borrowing powers as set out in the Articles of Association during the past 3 years
prior to the Last Practicable Date and details of material borrowings are as follows:
30 September 2013
US$’000
Non-current
Secured bank borrowing 82,876
Current
Secured bank borrowing 27,811
Details of the material borrowings are as follows:
Senior debt loan facility agreement
During the Financial Year ended 30 September 2012 the Group obtained financing of ZAR 1 billion from the Facility Lenders, primarily to finance the construction of the Voyager Plant at the Tharisa Mine. The financing is for a period of 7 years and is repayable in 22 equal quarterly installments, with the first repayment date on 31 December 2013. The financing bears interest at 3-month JIBAR plus 3.4% to 3.9% per annum. The financing was obtained by Tharisa Minerals, and is secured by the assets of Tharisa Minerals and by the shares of the Company in Tharisa Minerals and is also guaranteed by the Company. There are no conversion or redemption rights and payments are to be paid out of profits and cash flows. There is no loan capital outstanding.
The loan contains financial covenants, which the borrower needs to maintain at levels in excess of:
• Debt service cover ratio at a level greater than 1.4 times;
• Loan life cover ratio at a level greater than 1.6 times; and
• Reserve tail ratio at a level of 30% or greater.
Further details of the this agreement can be found in Annexure 14 of this Pre-listing Statement.
Trade finance facilities
Trade finance facilities were provided for the purposes of partially funding working capital requirements pending payment from customers on credit terms. With this facility, Arxo Resources created a charge over a US$2.5 million cash deposit and created an assignment of documentary credit proceeds. In addition Tharisa was required to provide a letter of undertaking and guarantee limited to US$12.5 million. Further details of the this agreement can be found in Annexure 14 of this Pre-listing Statement.
Limited recourse disclosed receivables discounting agreement
Tharisa Minerals is entitled to discount its platinum, palladium and gold receivables under the PGM Concentrate off-take agreement with Impala Platinum up to a maximum revolving facility amount of R300 million. The receivables to be discounted will require the prior approval of the facility agent under the agreement and if approved, the amount payable will be based on the quality and quantum as per the final assay under the off-take agreement of platinum, palladium and gold concentrate. The receivables will be discounted on a limited recourse basis and recourse to Tharisa Minerals will occur only as a result of the occurrence of a limited recourse event. Further details of this agreement can be found in Annexure 14 of this Pre-listing Statement.

60
Material commitments, lease payments and contingent liabilities
There are no material commitments, lease payments and contingent liabilities. Material loan capital outstanding is as
indicated above and in note 20 to the financial statements as disclosed in Annexure 1 of this Pre-listing Statement.
Material loans receivable
There are no material loans made by the Company or by any of its subsidiaries.
20. SOUTH AFRICAN EXCHANGE CONTROL
Following the successful application to Exchange Control, Tharisa has been granted approval to effect the Listing.
Accordingly, upon commencement of the Listing, the Exchange Control Regulations as set out below will apply to the
purchase and sale of Shares by South African residents.
This summary is intended as a guide and is therefore not comprehensive. If you are in any doubt in regards hereto, you
should consult an appropriate professional advisor before purchasing Shares.
South African individuals
South African individuals will be able to acquire Shares on the JSE, without restriction. Consequently, the purchase
of Shares by a South African individual will not affect such person’s offshore investment allowance of R4 million per
calendar year.
South African institutional investors
South African retirement funds, long-term insurers, collective investment scheme management companies as well as
investment managers who have registered with Exchange Control as “institutional investors” for Exchange Control
purposes are entitled to a foreign portfolio investment allowance. Institutional investors are allowed to invest in inward
listed shares, being shares which are listed on the JSE and settled in Rand, without affecting their permissible foreign
portfolio investment allowance and will be able to acquire Shares on the JSE, without restriction.
South African corporate entities
An acquisition of Shares on the JSE by a South African corporate entity, partnership or trust is allowed without
restriction.
Authorised Dealers
Authorised Dealers may invest in approved inward listed instruments subject to the macro-prudential limit as defined in
section B.2(B)(iv) of the Exchange Control Regulations. Authorised Dealers are allowed to invest in inward listed shares,
being shares which are listed on the JSE and settled in Rand, without affecting their macro-prudential limit and will be
able to acquire Shares on the JSE, without restriction.
Non-residents of the Common Monetary Area
Non-residents of the Common Monetary Area may acquire Shares on the JSE, provided that payment is received in
foreign currency or Rands from a non-resident account. However, former residents of the Common Monetary Area
who have emigrated may use emigrant blocked funds to acquire Shares only if Exchange Control approval has been
obtained.
Applicants resident outside the Common Monetary Area
A person who is not resident in the Common Monetary Area should obtain advice as to whether any government
and/or other legal consent is required and/or whether any other formality must be observed to enable a subscription
for Shares in terms of the Offer. This Pre-listing Statement is not an offer in any area or jurisdiction in which it is illegal
to make the Offer. In such circumstances, this Pre-listing Statement and the Application Form should be read for
information purposes only. All Share certificates issued to non-residents of South Africa will be endorsed “non-resident”
in accordance with the Exchange Control Regulations.
Dividends and proceeds on sale
Dividends declared to non-resident shareholders and proceeds on sale of shares are not subject to approval by the
SARB and are freely transferable to non-resident shareholders by publicly listed companies. The transfer of funds abroad
in respect of the declaration of a dividend in specie or special dividend by a publicly listed company requires prior SARB
approval.
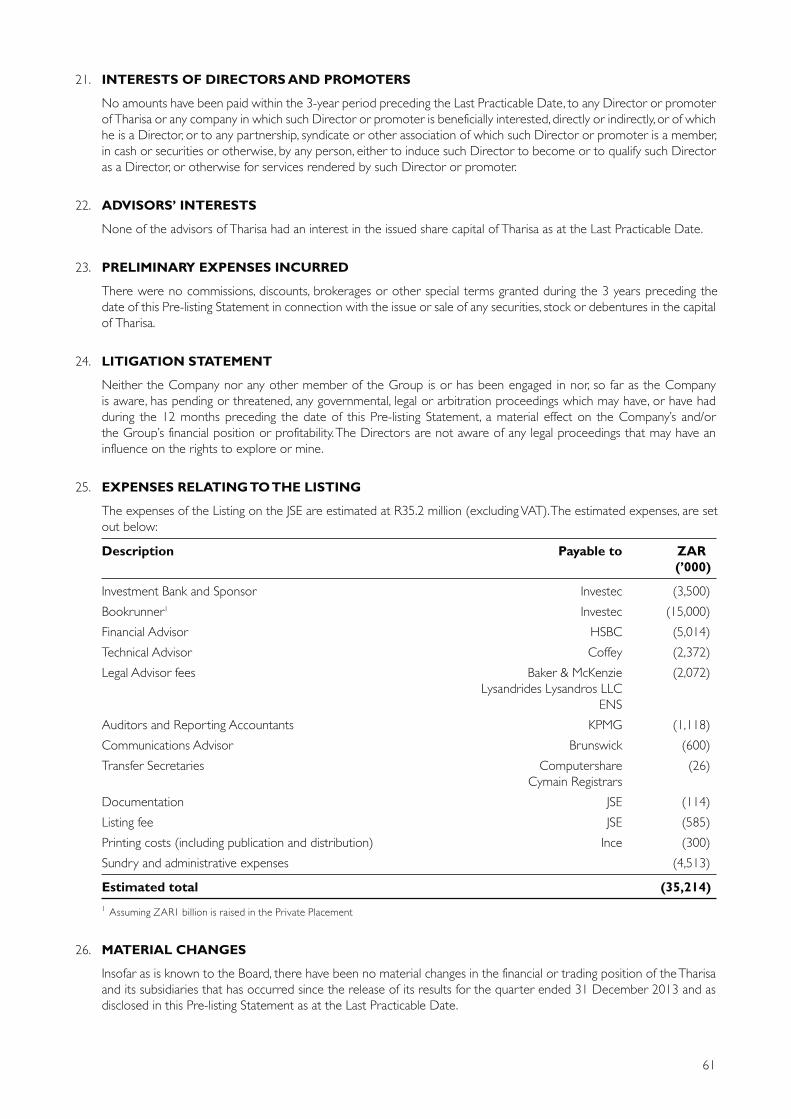
61
21. INTERESTS OF DIRECTORS AND PROMOTERS
No amounts have been paid within the 3-year period preceding the Last Practicable Date, to any Director or promoter
of Tharisa or any company in which such Director or promoter is beneficially interested, directly or indirectly, or of which
he is a Director, or to any partnership, syndicate or other association of which such Director or promoter is a member,
in cash or securities or otherwise, by any person, either to induce such Director to become or to qualify such Director
as a Director, or otherwise for services rendered by such Director or promoter.
22. ADVISORS’ INTERESTS
None of the advisors of Tharisa had an interest in the issued share capital of Tharisa as at the Last Practicable Date.
23. PRELIMINARY EXPENSES INCURRED
There were no commissions, discounts, brokerages or other special terms granted during the 3 years preceding the
date of this Pre-listing Statement in connection with the issue or sale of any securities, stock or debentures in the capital
of Tharisa.
24. LITIGATION STATEMENT
Neither the Company nor any other member of the Group is or has been engaged in nor, so far as the Company
is aware, has pending or threatened, any governmental, legal or arbitration proceedings which may have, or have had
during the 12 months preceding the date of this Pre-listing Statement, a material effect on the Company’s and/or
the Group’s financial position or profitability. The Directors are not aware of any legal proceedings that may have an
influence on the rights to explore or mine.
25. EXPENSES RELATING TO THE LISTING
The expenses of the Listing on the JSE are estimated at R35.2 million (excluding VAT). The estimated expenses, are set
out below:
Description Payable to ZAR
(’000)
Investment Bank and Sponsor Investec (3,500)
Bookrunner1 Investec (15,000)
Financial Advisor HSBC (5,014)
Technical Advisor Coffey (2,372)
Legal Advisor fees Baker & McKenzie
Lysandrides Lysandros LLC
ENS
(2,072)
Auditors and Reporting Accountants KPMG (1,118)
Communications Advisor Brunswick (600)
Transfer Secretaries Computershare
Cymain Registrars
(26)
Documentation JSE (114)
Listing fee JSE (585)
Printing costs (including publication and distribution) Ince (300)
Sundry and administrative expenses (4,513)
Estimated total (35,214)
1 Assuming ZAR1 billion is raised in the Private Placement
26. MATERIAL CHANGES
Insofar as is known to the Board, there have been no material changes in the financial or trading position of the Tharisa
and its subsidiaries that has occurred since the release of its results for the quarter ended 31 December 2013 and as
disclosed in this Pre-listing Statement as at the Last Practicable Date.

62
27. WORKING CAPITAL STATEMENT
The Board is of the opinion that on and with effect from the Listing Date:
• the Company will, in the ordinary course of business, be able to pay its debts for a period of 12 months;
• the assets of the Company, fairly valued, will be in excess of its liabilities for a period of 12 months. For this purpose
the assets and liabilities are recognised and measured in accordance with the accounting policies applied in the latest
audited financial results;
• the share capital and reserves of the Company will be adequate for business purposes for a period of 12 months;
and
• the working capital of the Company will be adequate for ordinary business purposes for a period of 12 months.
28. CONSENTS
Each of the Investment Bank, Bookrunner, Sponsor, Financial Advisor, Legal Advisors, Technical Advisor, Auditors, Reporting Accountants, Communication Advisor and Transfer Secretaries whose names are included in the “Corporate Information and Advisors” section of this Pre-listing Statement, have consented in writing to act in the capacities stated herein and to their names being included in this Pre-listing Statement and have not withdrawn their consents prior to
the publication of this Pre-listing Statement.
29. DOCUMENTS AVAILABLE FOR INSPECTION
The following documents, or copies thereof, will be available for inspection, during normal business hours at Eland
House, The Braes, 3 Eaton Avenue, Bryanston, Johannesburg, 2021, South Africa and Tharisa, Office 108 – 110,
S. Pittokopitis Business Centre, 17 Neophytou Nicolaides and Kilkis Streets, 8011 Paphos, Cyprus from the date of this
Pre-listing Statement until Tuesday, 8 April 2014:
• the Articles of Association of Tharisa and each of its subsidiaries;
• the pro forma statement of financial position and statement of financial performance of the Group and the signed
Reporting Accountants’ Report thereon;
• the consolidated annual financial statements of Tharisa for the 3 Financial Years ended 30 September 2011, 2012
and 2013;
• unaudited quarterly report for the 3 months ended 31 December 2013;
• the signed independent Reporting Accountants’ report on the historical financial information of Tharisa;
• the consent letters of the appointed professional advisors as set out in paragraph 28 of this Pre-listing Statement;
• the signed CPR prepared in accordance with the Listings Requirements which is set out in Annexure 15 of the
Pre-listing Statement and is also available on Tharisa’s website, www.Tharisa.com;
• the material contracts referred to in paragraph 18 of this Pre-listing Statement; and
• a signed copy of this Pre-listing Statement.
Signed in Johannesburg by Phoevos Pouroulis on his own behalf as a Director of Tharisa and on behalf of the Board, he being
duly authorised in terms of the powers of attorney granted to him by the Directors.
Phoevos Pouroulis
25 March 2014
Bryanston

63
ANNEXURE 1
HISTORICAL FINANCIAL INFORMATION
BASIS OF PREPARATION
The consolidated statements of financial position, comprehensive income, changes in equity and cash flows have been
extracted without adjustments from the audited financial statements. The audited financial statements were reported on by
KPMG (Cyprus) as Tharisa is incorporated and registered in Cyprus. The historical financial information has been derived
from the audited annual financial statements of Tharisa. These audited annual financial statements were prepared in accordance
with IFRS as adopted by the European Union. The historical financial information has been prepared in accordance with
International Financial Reporting Standards (“IFRS”). No changes to the consolidated statements of financial position,
comprehensive income, changes in equity and cash flows have been made as a result of the transition from IFRS as adopted
by the European Union to IFRS. KPMG Inc.’s Reporting Accountants’ Report on the historical financial information is contained
in Annexure 2
BUSINESS OVERVIEW AND OPERATIONS
Tharisa, domiciled, incorporated and registered in Cyprus as a public company limited by shares. Tharisa is an integrated
resources group incorporating mining, processing, beneficiation, marketing, sales and logistics of PGMs and Chrome
Concentrate through its 74% interest in Tharisa Minerals (mining and processing) and its wholly-owned subsidiaries including
Arxo Metals (processing and beneficiation), Arxo Logistics (logistics) and Arxo Resources and Dinami (collectively, marketing
and sales).
Tharisa’s objective is to become a leading natural resources company focused on originating, developing and operating mines
in the PGM, chrome and steel raw material sectors to service growing global demand through integrated mining, processing,
marketing, sales and logistics operations. The strategy is to focus on growth through the value accretive acquisition,
development and operation of large-scale and low cost projects that are in or close to production.
The Company is led by a strong management team with significant sector expertise and a track record in the origination,
development and operation of mining projects.
The Tharisa Mine commenced production in 2009 and, in the financial year ended 30 September 2013, produced over
57,400oz of contained PGMs in PGM Concentrate and over 1,192,000t of Chrome Concentrate. The Tharisa Mine is
currently at c.87% of steady state production of 4,800,000tpa RoM ore, with steady state production producing an average
of 144,000ozpa of contained PGMs in PGM Concentrate and 1,850,000tpa of Chrome Concentrate.
PGM Concentrate is sold to Impala Platinum in terms of a concentrate off take agreement with Tharisa Minerals.
Metallurgical and Chemical Grade Concentrate is marketed and sold, mainly to customers in China, by Arxo Resources and
Foundry and Chemical Grade Concentrate are sold by Arxo Metals to Rand York. The delivery of Chrome Concentrate to
customers is managed by Arxo Logistics.
FINANCIAL RESULTS AND POSITION
For the financial year ended 30 September 2013, there was a significant increase in revenue from US$53.9 million to
US$215.5 million following the commissioning of the Voyager Plant and the Arxo Metals foundry and chemical grade plant
and consequent increased production. The Chrome Concentrate sales are mainly on a CIF basis. If the insurance and freight
costs costs are excluded to enable a “like for like” comparision to be made, the contribution to revenue from Chrome
Concentrate sales amounted to US$140.8 million (2012: US$43.4 million) and PGM sales amounted to US$54.3 million
(2012: US$5.3 million). The respective contributions to gross profit/loss from Chrome Concentrate sales and PGM sales
amounted to US$22.1 million (2012: US$4.6 million) and US$3.8 million (2012: US$(12.8 million)). Gross profit/loss totalled
US$25.6 million (2012: US$(8.2 million)).
In terms of finance costs, the net charge to the income statement was US$62.3 million (2012: US$5.1 million) and relates
primarily to the fair value adjustments in respect of the internal rate of return calculation on the Convertible Preference
Shares of US$48.4 million (2012: US$5.7 million), with US$14.7 million (2012: US$1.6 million) relating primarily to the
interest on third party borrowings including (for the 2013 financial year) the B class preference dividend. The net loss
(after tax) after providing for the financing charges amounted to US$63.0 million (2012: US$38.7 million).

64
The Company has provided funding to Tharisa Minerals by way of preference shares. The preference shares are
US$ denominated while Tharisa Minerals reports in ZAR. The foreign currency translation differences relating primarily to
this inter group funding for the financial year amounted to US$38.8 million (2012: US$7.9 million) following the weaking of
the ZAR against the US$.
The basic and diluted earnings per share increased from a loss of US$3.40 per Share to a loss of US$6.31 per Share.
The diluted earnings per share is calculated based on the conversion of the Convertible Preference Shares assuming a
1:1 conversion ratio of the Convertible Preference Shares to Shares.
The Group has a negative total equity of US$53.6 million (2012: US$32.6 million positive) with the Convertible Preference
Shares being classified as a current liability.
Cash flows from operating activities before changes in working capital amounted to US$13.9 million (2012: US$(23.8 million))
and after taking into account working capital changes has reduced cash from used in operating activities of US$3.0 million
(2012: US$9.2 million).
DIVIDENDS
The Board of Directors does not recommend the payment of dividends.
SHARE CAPITAL
There have been no changes in the share capital of the Company during the year under review.
SUBSIDIARIES
The consolidated financial statements of the Group include the financial statements of the Company and its subsidiaries.
On 1 April 2013, Tharisa Administration Services Limited, a subsidiary of the Company, acquired Braeston Corporate
Consulting Services Proprietary Limited, a company incorporated in South Africa. The principal activity of Braeston Corporate
Consulting Services Proprietary Limited is the provision of management services to the Group.
On 30 May 2013, the Company incorporated Dinami Limited, a company established in Guernsey. The principal activity of
Dinami Limited is to provide consultancy services in relation to the Group’s foundry and chemical sales products.
Subsidiaries share of net profits/loss (after tax) was as follows:
Subsidiary
2013
(US$’000)
Tharisa Minerals (47,118)1
Arxo Logistics (410)
Arxo Metals (453)
Braeston Corporate Consulting Services (339)
Tharisa Administration Services 55
Tharisa Investments (4,467)
Arxo Resources 6,350
Tharisa Fujian Industrial (1,229)
Dinami 135
1The loss of US$47,118 reflects 100% of the loss of Tharisa Minerals and includes a foreign exchange loss of US$45,850 relating to inter-group funding.
MAIN RISKS
The main financial risks faced by the Group are disclosed in note 2(c) (going concern) and note 24 to the consolidated
financial statements.
FUTURE DEVELOPMENT
The Board of Directors does not anticipate significant changes in the operations of the Group in the foreseeable future.
BRANCHES
During the year the Group did not operate any branches.

65
BOARD OF DIRECTORS
The members of the Board of Directors as at the date of this report are disclosed on page 42. There were no significant
changes in the assignment of responsibilities of the Board of Directors.
EVENTS AFTER THE REPORTING PERIOD
Events after the reporting period are disclosed in note 29 of the consolidated financial statements. No material fact or
circumstance has occurred between the end of the latest financial year of the issuer and the date of the Pre-listing Statement.
INDEPENDENT AUDITORS
The independent auditors, KPMG Limited, have expressed their willingness to continue in office and a resolution fixing their
remuneration will be submitted at the Annual General Meeting.
On behalf of the Board of Directors
Michael Jones
Director
Paphos
13 February 2014

66
CONSOLIDATED STATEMENT OF COMPREHENSIVE INCOME
Notes
Years ended 30 September
2013
US$’000
2012
US$’000
2011
US$’000
Revenue 3 215,455 53,889 28,128
Cost of sales 3 (189,570) (62,114) (29,375)
Gross profit/(loss) 25,885 (8,225) (1,247)
Other income 4 48 667 435
Administrative expenses (26,596) (25,960) (36,059)
Results from operating activities (663) (33,518) (36,871)
Finance income 863 2,128 2,644
Finance costs (14,744) (1,597) (2,009)
Changes in fair value of financial liabilities at fair
value through profit or loss (48,424) (5,664) (61,031)
Net finance costs 5 (62,305) (5,133) (60,396)
Loss before taxation 6 (62,968) (38,651) (97,267)
Income tax 7 15,525 8,680 8,719
Loss for the year (47,443) (29,971) (88,548)
Other comprehensive income
Foreign currency translation differences for foreign
operations, net of nil tax (38,781) (7,858) (19,018)
Total comprehensive income for the year (86,224) (37,829) (107,566)
Loss for the year attributable to:
Owners of the Company (48,347) (26,018) (84,820)
Non-controlling interests 904 (3,953) (3,728)
Loss for the year (47,443) (29,971) (88,548)
Total comprehensive income for the year
attributable to:
Owners of the Company (75,989) (31,912) (98,806)
Non-controlling interests (10,235) (5,917) (8,760)
Total comprehensive income for the year (86,224) (37,829) (107,566)
Loss per share
Basic and diluted loss per share 8 (6.31) (3.40) (12.76)
Reconciliation of earnings to headline earnings
Loss for the year (48,347) (26,018) (84,820)
Adjustments
Impairment of goodwill 75 – –
Tax effect on goodwill impairment – – –
Impairment loss of PPE – Mining assets and
infrastructure 2,097 – –
Tax effect on impairment of PPE (587) – –
Headline earnings (46,762) (26,018) (84,820)
Headline loss per share (6.10) (3.40) (12.76)

67
CONSOLIDATED STATEMENT OF FINANCIAL POSITION
Notes
Years ended 30 September
2013
US$’000
2012
US$’000
2011
US$’000
Assets
Non-current assets
Property, plant and equipment 9 269,130 318,263 137,548
Goodwill 10 1,427 1,384 1,453
Deferred tax assets 19 20,623 6,403 –
Long-term deposits 11 7,708 – –
Other financial assets 12 3,774 3,837 3,128
Total non-current assets 302,662 329,887 142,129
Current assets
Inventories 13 24,043 28,297 22,418
Trade and other receivables 14 29,123 18,129 21,584
Other financial assets 12 311 – –
Current taxation 21 – 220 –
Cash and cash equivalents 15 28,017 52,805 134,783
Total current assets 81,494 99,451 178,785
Total assets 384,156 429,338 320,914
Equity
Ordinary share capital 16 6 6 6
Share premium 16 113,342 113,342 113,342
Other reserve 16 47,245 47,245 47,245
Foreign currency translation reserve 16 (30,170) (2,528) 3,367
Accumulated losses (167,859) (119,512) (92,184)
Equity attributable to owners of the Company (37,436) 38,553 71,776
Non-controlling interests (16,205) (5,970) (1,364)
Total equity (53,641) 32,583 70,412
Liabilities
Non-current liabilities
Convertible redeemable preference shares – – 207,184
Class B preference shares – – 13,130
Provisions 18 4,738 11,391 6,629
Deferred tax liabilities – – 2,578
Borrowings 20 84,855 121,424 3,070
Total non-current liabilities 89,593 132,815 232,591
Current liabilities
Convertible redeemable preference shares 17 260,291 212,791 –
Class B preference shares 17 12,171 12,548 –
Borrowings 20 44,645 3,297 –
Current taxation 21 294 117 83
Trade and other payables 22 30,803 35,187 17,828
Total current liabilities 348,204 263,940 17,911
Total liabilities 437,797 396,755 250,502
Total equity and liabilities 384,156 429,338 320,914
Net current liabilities (266,710) (164,489) 160,874
Total assets less current liabilities 35,952 165,398 303,003
Net asset value per share (8.69) 5.28 11.41
Net tangible asset value per share (8.93) 5.06 11.18

68
CO
NS
OL
IDA
TE
D S
TA
TE
ME
NT
OF
CH
AN
GE
S I
N E
QU
ITY
Att
rib
uta
ble
to
ow
ners
of
the C
om
pan
y
Ord
inary
share
cap
ital
US
$’0
00
Sh
are
pre
miu
m
US
$’0
00
Oth
er
rese
rves
US
$’0
00
Fo
reig
n
cu
rren
cy
tra
nsl
ati
on
rese
rve
US
$’0
00
Accu
mu
late
d
lo
sses
US
$’0
00
To
tal
US
$’0
00
No
n-
co
ntr
ollin
g
in
tere
st
US
$’0
00
To
tal
eq
uit
y
US
$’0
00
Bala
nce a
t 1 O
cto
ber
2012
6113,3
42
47,2
45
(2,5
28)
(119,5
12)
38,5
53
(5,9
70)
32,5
83
Tota
l com
pre
hen
sive
inco
me
for
the
year
Loss
for
the
year
––
––
(48,3
47)
(48,3
47)
904
(47,4
43)
Oth
er c
om
pre
hen
sive
inco
me
––
–(2
7,6
42)
–(2
7,6
42)
(11,1
39)
(38,7
81)
To
tal co
mp
reh
en
sive in
co
me f
or
the y
ear
––
–(2
7,6
42)
(48,3
47)
(75,9
89)
(10,2
35)
(86,2
24)
Tran
sact
ions
with o
wner
s of th
e
Com
pan
y re
cord
ed d
irec
tly
in e
quity
Contr
ibutions
by
ow
ner
s of th
e
Com
pan
y:–
––
––
––
–
Tota
l contr
ibutions
by
ow
ner
s of th
e
Com
pan
y–
––
––
––
–
Tota
l tra
nsa
ctio
ns
with o
wner
s of th
e
Com
pan
y–
––
––
––
Bala
nce a
t 30 S
ep
tem
ber
2013
6113,3
42
47,2
45
(30,1
70)
(167,8
59)
(37,4
36)
(16,2
05)
(53,6
41)
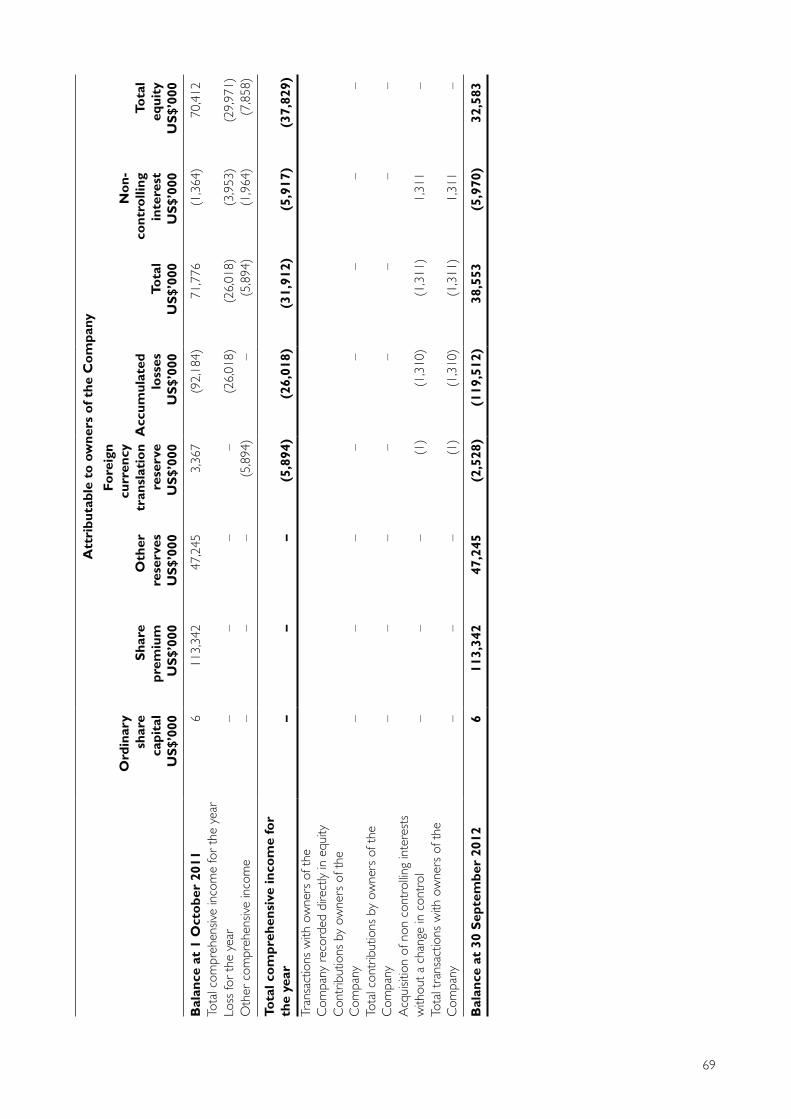
69
Att
rib
uta
ble
to
ow
ners
of
the C
om
pan
y
Ord
inary
share
cap
ital
US
$’0
00
Sh
are
pre
miu
m
US
$’0
00
Oth
er
rese
rves
US
$’0
00
Fo
reig
n
cu
rren
cy
tra
nsl
ati
on
rese
rve
US
$’0
00
Accu
mu
late
d
lo
sses
US
$’0
00
To
tal
US
$’0
00
No
n-
co
ntr
ollin
g
in
tere
st
US
$’0
00
To
tal
eq
uit
y
US
$’0
00
Bala
nce a
t 1 O
cto
ber
2011
6113,3
42
47,2
45
3,3
67
(92,1
84)
71,7
76
(1,3
64)
70,4
12
Tota
l com
pre
hen
sive
inco
me
for
the
year
Loss
for
the
year
––
––
(26,0
18)
(26,0
18)
(3,9
53)
(29,9
71)
Oth
er c
om
pre
hen
sive
inco
me
––
–(5
,894)
–(5
,894)
(1,9
64)
(7,8
58)
To
tal co
mp
reh
en
sive in
co
me f
or
the y
ear
––
–(5
,894)
(26,0
18)
(31,9
12)
(5,9
17)
(37,8
29)
Tran
sact
ions
with o
wner
s of th
e
Com
pan
y re
cord
ed d
irec
tly
in e
quity
Contr
ibutions
by
ow
ner
s of th
e
Com
pan
y–
––
––
––
–
Tota
l contr
ibutions
by
ow
ner
s of th
e
Com
pan
y–
––
––
––
–
Acq
uisitio
n o
f non c
ontr
olli
ng
inte
rest
s
without
a ch
ange
in c
ontr
ol
––
–(1
)(1
,310)
(1,3
11)
1,3
11
–
Tota
l tra
nsa
ctio
ns
with o
wner
s of th
e
Com
pan
y–
––
(1)
(1,3
10)
(1,3
11)
1,3
11
–
Bala
nce a
t 30 S
ep
tem
ber
2012
6113,3
42
47,2
45
(2,5
28)
(119,5
12)
38,5
53
(5,9
70)
32,5
83

70
CONSOLIDATED STATEMENT OF CASH FLOWS
Notes
Years ended 30 September
2013
US$’000
2012
US$’000
2011
US$’000
Cash flows from operating activities
Loss for the year (47,443) (29,971) (88,548)
Adjustments for :
Depreciation 6 12,438 5,160 1,360
Allowance for inventory obsolescence 6 – 4,492 –
Allowance for credit losses – – 896
Amounts written off directly in profit or loss 6 81 – –
Impairment of property plant and equipment 6 2,097 – –
Impairment of goodwill 6 75 – –
Through profit or loss 5 48,424 5,664 61,031
Changes in fair value of financial liabilities at fair value
Interest income 5 (607) (1,871) (616)
Changes in fair value of financial assets at fair value
through profit or loss 5, 6 54 470 –
Interest expense 5 14,336 972 1,442
Preference share dividend – – 402
Income tax 7 (15,525) (8,680) (8,719)
13,930 (23,764) (32,752)
Changes in:
– Inventories 4,254 (10,371) (7,752)
– Trade and other receivables (11,076) 3,455 (13,104)
– Trade and other payables (4,384) 17,359 (45)
– Provisions (5,000) 4,762 (4,435)
Cash used in operations (2,276) (8,559) (49,218)
Income tax paid (680) (636) (39)
Net cash used in operating activities (2,956) (9,195) (49,257)
Cash flows from investing activities
Interest received 399 1,643 616
Establishment of long-term deposits (7,708) – –
Acquisition of subsidiary net of cash acquired 23 154 – (588)
Additions to property, plant and equipment (24,316) (189,015) (40,698)
Additions of other financial assets (850) (1,127) (175)
Net cash used in investing activities (32,321) (188,499) (40,845)
Cash flows from financing activities
Proceeds from issue of ordinary share capital – – 61,603
Proceeds from issue of convertible redeemable
preference shares – – 150,144
Proceeds from borrowings, net of transaction costs 16,073 120,209 –
Repayment of borrowings (368) – (5,868)
Interest paid (248) (56) (489)
Net cash generated from financing activities 15,457 120,153 205,390
Net decrease in cash and cash equivalents (19,820) (77,541) 115,288
Cash and cash equivalents at the beginning of
the year 52,805 134,783 29,914
Effect of exchange rate fluctuations on cash held (4,968) (4,437) (10,419)
Cash and cash equivalents at the end of
the year 15 28,017 52,805 134,783

71
NOTES TO THE CONSOLIDATED FINANCIAL STATEMENTS FOR THE YEAR ENDED 30 SEPTEMBER 2013
1. BACKGROUND
Tharisa Plc (“the Company”) was incorporated in Cyprus on 20 February 2008 under registration number HE223412.
The name of the Company was changed from Tharisa Limited to Tharisa Plc on 19 January 2012. The principal activity
of the Company and its subsidiaries (together with the Company, “the Group”) is platinum group metals (“PGM”) and
chrome mining and processing. The Group holds the mining rights to 5,590 hectares of the Middle Group reef horizon
of the Bushveld Complex located on the farms Kafferskraal and Rooikoppies near Marikana in the North West Province
of South Africa.
The Company’s registered office is at Office 108 – 110, S. Pittokopitis Business Centre, 17 Neophytou Nicolaides and
Kilkis Streets, 8011 Paphos, Cyprus.
On 9 February 2009, the Company acquired 74% of the share capital of Tharisa Minerals Proprietary Limited, a company
established in South Africa. The principal activity of Tharisa Minerals Proprietary Limited is PGM and chrome mining and
processing.
On 2 November 2010, the Company incorporated Tharisa Investments Limited, a company established in Cyprus.
The principal activity of Tharisa Investments Limited is that of investment holding. On 15 February 2011, Tharisa
Investments Limited incorporated Tharisa Fujian Industrial Co., Limited, a company established in the People’s Republic
of China (“PRC”). The principal activity of Tharisa Fujian Industrial Co., Limited is that of ferrochrome smelting. Tharisa
Fujian Industrial Co., Limited has not commenced operations up to the date of this report. During April 2011, Tharisa
Investments Limited issued additional shares representing 15% of its expanded share capital to Fujian Wuhang Stainless
Steel Products Co., Limited (“Fujian”). On 22 November 2011, the Company and Fujian signed an agreement, according
to which Fujian transferred its 15% equity interests in Tharisa Investments Limited to the Company. The consideration
for this transfer was the par value of the shares transferred of US$22.5 and a call option written by the Company which
conferred to Fujian a right to purchase 15% of the equity capital of Tharisa Fujian Industrial Co., Limited at Chinese
Yuan Renminbi (“YUAN”) 100 any time after 31 December 2012. On 24 August 2011, Tharisa Investments Limited
incorporated Tharisa Investments (Hong Kong) Limited, a company established in Hong Kong. Tharisa Investments
(Hong Kong) Limited has not commenced operations up to the date of this report.
On 4 February 2011, the Company incorporated Arxo Resources Limited, a company established in Cyprus. The principal
activity of Arxo Resources Limited is the selling and distribution of chrome concentrate. On 7 December 2011, Arxo
Resources Limited, incorporated Arxo Metals Proprietary Limited, a company established in South Africa. The principal
activity of Arxo Metals Proprietary Limited is metal processing and currently produce foundry and chemical grade
products.
On 1 March 2011, the Company acquired 100% of the share capital of Arxo Logistics Proprietary Limited, a company
established in South Africa. The principal activity of Arxo Logistics Proprietary Limited is the provision of logistics
services.
On 31 May 2011, the Company incorporated Tharisa Administration Services Limited, a company established in Cyprus.
Tharisa Administration Services Limited provides management and administration services to the Group. On 1 April
2013, Tharisa Administration Services Limited, acquired Braeston Corporate Consulting Services Proprietary Limited,
a company established in South Africa. The principal activity of Braeston Corporate Consulting Services Proprietary
Limited is the provision of management services to the Group.
On 30 May 2013, the Company incorporated Dinami Limited, a company established in Guernsey. The principal activity
of Dinami Limited is the provision of consultancy services in relation to the sale of the Group’s foundry and chemical
chrome concentrate products.
2. SIGNIFICANT ACCOUNTING POLICIES
(a) Statement of compliance
The consolidated financial statements have been prepared in accordance with International Financial Reporting
Standards (“IFRS”) and the requirements of the Cyprus Companies Law, Cap. 113.
The accounting policies set out below have been applied consistently in the preparation of the consolidated
financial statements for all years presented.

72
(b) Basis of measurement
The consolidated financial statements are presented in US Dollars (US$) and are rounded to the nearest thousand. The consolidated financial statements are prepared on the historical cost basis except as otherwise stated in the accounting policies set out below.
(c) Going concern
At 30 September 2013, the Group’s current liabilities exceeded current assets by US$266,710 thousand and its total liabilities exceeded total assets by US$53,641 thousand. A significant portion of the Group’s current and total liabilities relates to convertible redeemable preference shares, Class B preference shares and loan from Langa Trust, the carrying amounts of which at 30 September 2013 amounted to US$260,291 thousand, US$12,171 thousand and US$2,870 thousand respectively. According to the terms of these instruments, which are set out in notes 17(a), 17(b) and 25 respectively, the convertible redeemable preference shares are, inter alia, convertible into ordinary shares upon listing of the Company’s ordinary shares on any stock exchange acceptable to the holders of the majority of the convertible redeemable preference shares, while Class B preference shares and loan from Langa Trust are expected to be repaid from the proceeds of such listing, on the assumption that the Company will raise adequate proceeds.
During the year, the Company prepared itself to undertake an Initial Public Offering (“IPO”) on the Alternative Investment Market of The London Stock Exchange Plc (“AIM”), and the process was expected to be completed in March 2013. However, the severe sovereign debt crisis experienced in Cyprus in March 2013, created an adverse impact on the Company’s IPO, as it significantly and adversely impacted investor confidence and sentiment, demand for the Company’s ordinary shares and ultimately the overall valuation of the Group. As a result of these conditions, the Board of Directors of the Company, in consultation with its Nominated Advisor to the IPO, invoked the material adverse change clause of the Articles of Association of the Company and deferred the IPO by a maximum of a year to 14 April 2014. This position of the Board of Director was also agreed by the holders of a majority of the Company’s convertible redeemable preference shares.
The Board of Directors of the Company, following the obtaining of South African Exchange Control approval, has initated the process for a primary inward listing on the Johannesburg Stock Exchange Limited (“JSE”). With a successful listing on the JSE, the Company’s convertible redeemable preference shares will be converted into fully paid ordinary shares and in addition the Group expects to raise adequate proceeds to repay its Class B preference shares and loan from Langa Trust.
In an event of a no listing scenario, according to the terms of the convertible redeemable preference shares, as set out in note 17(a), the Company within 10 business days from a redemption notice is required to redeem these shares for a consideration equal to the subscription price of each share with a return by applying an Internal Rate of Return (“IRR”) of 25%. However, the Board of Directors is of the opinion that, according to the Articles of Association of the Company and the terms governing the issuance of the convertible redeemable preference shares, the Company is required to redeem only those convertible redeemable preference shares for which it has received a redemption notice, and only to the extent that it has sufficient distributable reserves, with the remainder of the redemption amount to be paid upon the Company being able to pay the redemption amount.
Should the aforesaid listing not be achieved within the required time frame, and should the Company receives a redemption notice and there is a different interpretation of the legal obligation of the Company, then the Group may not have the necessary liquid funds required to redeem the convertible redeemable preference shares and also finance its working capital requirements. In such case the Group may not be able to continue as a going concern which is the basis of preparation of these consolidated financial statements and necessary adjustments will have to be made to bring the assets to their net realisable value and provide for any further liabilities which may arise. Furthermore, non-current assets will have to be reclassified as current assets and non-current liabilities as current liabilities accordingly. These consolidated financial statements do not include any adjustments that might be necessary should the Group not be able to continue as a going concern.
(d) Use of estimates and judgements
The preparation of the consolidated financial statements in conformity with IFRS requires management to make judgements, estimates and assumptions that affect the application of accounting policies and reported amounts of assets, liabilities, income and expenses. The estimates and associated assumptions are based on historical experience and various other factors that are believed to be reasonable under the circumstances, the results of which form the basis of making the judgements about carrying values of assets and liabilities that are not readily apparent from other sources. Actual results may differ from these estimates. The estimates and underlying assumptions are reviewed on an ongoing basis. Revisions to accounting estimates are recognised in the period in which the estimate is revised if the revision affects only that period, or in the period of the revision and future
periods if the revision affects both current and future periods.

73
Judgements made by management in the application of IFRS that have significant effect on the consolidated
financial statements and major sources of estimation uncertainty are as follows:
Impairment of assets:
The recoverable amount of each non-financial asset or cash-generating-unit (“CGU”) is determined as the higher
of the value-in-use and fair value less costs to sell, in accordance with the Group’s accounting policies (see note 2(s)).
Determination of the value-in-use of an asset or CGU based on a discounted cash flow model requires the use
of estimates and assumptions, including: the appropriate rate at which to discount the cash flows, the timing of
cash flows and expected life of the asset or CGU, exchange rates, commodity prices, ore reserves, future capital
requirements and future operating performance. Changes in these estimates and assumptions impact the
recoverable amount of the asset or the CGU and, accordingly, could result in an adjustment to the carrying
amount of that asset or CGU.
Mineral reserves:
Economically recoverable ore reserves represent the estimated quantity of product in an area of interest that can
be expected to be profitably extracted, processed and sold under current and foreseeable economic conditions.
The determination of ore reserves includes estimates and assumptions about a range of geological, technical and
economic factors, including: quantities, grades, production techniques, recovery rates, production costs, transport
costs, commodity demand, commodity prices and exchange rates. Changes in ore reserves impact the assessment
of recoverability of exploration and evaluation assets, property, plant and equipment, the carrying amount of
assets depreciated on a units-of-production basis, provision for site rehabilitation and the recognition of deferred
tax assets, including tax losses.
Rehabilitation provision:
The Group’s mining and exploration activities are subject to various laws and regulations governing the protection
of the environment. The Group recognises management’s best estimate for asset retirement obligations in the
period in which they are incurred. Actual costs incurred in future periods can differ materially from these estimates.
Additionally, future changes to environmental laws and regulations, life of mine estimates and discount rates can
affect the carrying amount of the provision. The estimated long-term environmental provision, comprising
rehabilitation and mine closure is based on the Group’s environmental policy taking into account the current
technological, environmental and regulatory requirements. The provision for future rehabilitation was determined
using calculations which required the use of estimates.
Inventories:
Net realisable value tests are performed at least annually based on the estimated future sales price of the
products based on prevailing metal prices, less estimated costs to complete production and bring the product to
sale. The nature of the net realisable value test inherently limits the ability to precisely monitor recoverability levels
and may result in additional write-downs of inventories in future periods.
(e) Adoption of new and revised IFRS and Interpretations
As from 1 October 2012, the Group adopted all of the IFRS and International Accounting Standards (IAS), which
are relevant to its operations. The adoption of these Standards did not have a significant effect on the consolidated
financial statements of the Group.
The following Standards, Amendments to Standards and Interpretations had been issued but are not yet effective
for the year ended 30 September 2013:
• IFRS 7 (Amendments) ‘’Financial Instruments’’ Disclosures – ’’Offsetting Financial Assets and Financial
Liabilities’’ (effective for annual periods beginning on or after 1 January 2013).
• IFRS 10 ‘’Consolidated Financial Statements’’ (effective for annual periods beginning on or after 1 January 2013).
• IFRS 11 ‘’Joint Arrangements’’ (effective for annual periods beginning on or after 1 January 2013).
• IFRS 12 ‘’Disclosure of Interests in Other Entities’’ (effective for annual periods beginning on or after
1 January 2013).
• IFRS 13 ‘’Fair Value Measurement’’ (effective for annual periods beginning on or after 1 January 2013).
• IAS 19 (Amendments) ‘’Employee Benefits’’ (effective for annual periods beginning on or after 1 January 2013).
• IAS 27 (Revised) ‘’Separate Financial Statements’’ (effective for annual periods beginning on or after
1 January 2013).
• IAS 28 (Revised) ‘’Investments in Associates and Joint ventures’’ (effective for annual periods beginning on or
after 1 January 2013).
74
• IAS 32 (Amendments) ‘’Offsetting Financial Assets and Financial Liabilities’’ (effective for annual periods
beginning on or after 1 January 2014).
• IFRIC 20 ‘’Stripping Costs in the Production Phase of a Surface Mine’’ (effective for annual periods beginning
on or after 1 January 2013).
• Improvement to IFRS’s 2009 – 2011 (effective for annual periods beginning on or after 1 January 2013).
• IFRS 1 (Amendments): “Government Loans” (effective for annual periods beginning on or after 1 January 2013).
• IFRS 10 ‘’Consolidated Financial Statements’’ Transition Guidance (effective for annual periods beginning on
or after 1 January 2013).
• IFRS 10 (Amendments) ‘’Consolidated Financial Statements’’ Investment Entities (effective for annual periods
beginning on or after 1 January 2013).
• IFRS 11 ‘’Joint Arrangements’’ Transition Guidance (effective for annual periods beginning on or after
1 January 2013).
• IFRS 11 (Amendments) ‘’Joint Arrangements’’ Investment Entities (effective for annual periods beginning on
or after 1 January 2013).
• IFRS 12 ‘’Disclosure of Interests in Other Entities’’ Transition Guidance (effective for annual periods beginning
on or after 1 January 2013).
• IFRS 12 (Amendments) ‘’Disclosure of Interests in Other Entities’’ Investment Entities (effective for annual
periods beginning on or after 1 January 2013).
• IFRS 7 (Amendments) ‘’Financial Instruments’’ Disclosures – ‘’Disclosures on transition to IFRS 9’’ (effective for
annual periods beginning on or after 1 January 2015).
• IFRS 9 ‘’Financial Instruments’’ (effective for annual periods beginning on or after 1 January 2015).
• IAS 19 (Amendments) “Defined Benefit Plans Employee Contributions” (effective for annual periods beginning
on or after 21 July 2014).
• Improvement to IFRS’s 2010 – 2012 (effective for annual periods beginning on or after 1 July 2014).
• Improvement to IFRS’s 2011 – 2013 (effective for annual periods beginning on or after 1 July 2014).
• IFRIC Interpretation 21 Levies (effective for annual periods beginning on or after 1 January 2014).
The Board of Directors expects that the adoption of the above financial reporting standards in future periods
will not have a significant effect on the consolidated financial statements of the Group except for the adoption
of IFRS 9 which could change the classification and measurement of financial assets. The Group does not plan to
early adopt this standard and the extent of the impact is in the process of being assessed by the Group.
(f) Basis of consolidation
The consolidated financial statements include, on a line-by-line basis, the financial statements of all subsidiaries.
The following policies have been applied during the consolidation process:
Business combinations:
The Group has applied the acquisition method for the business combinations disclosed in note 23.
Goodwill represents the excess of:
(i) the aggregate of the fair value of the consideration transferred, the amount of any non-controlling interest
in the acquiree and the fair value of the Group’s previously held equity interest in the acquiree; over
(ii) the net fair value of the acquiree’s identifiable assets and liabilities measured as at the acquisition date.
When (ii) is greater than (i), then this excess is recognised immediately in profit or loss as a gain on a bargain
purchase.
Goodwill is stated at cost less accumulated impairment losses. Goodwill arising on a business combination is
allocated to each CGU, or groups of CGUs, that is expected to benefit from the synergies of the combination
and is tested annually for impairment (see note 2(s)).
On disposal of a CGU during the year, any attributable amount of purchased goodwill is included in the calculation
of the profit or loss on disposal.
75
Subsidiaries and non-controlling interests:
Subsidiaries are entities controlled by the Group. Control exists when the Group has the power to govern the
financial and operating policies of an entity so as to obtain benefits from its activities. In assessing control, potential
voting rights that currently are exercisable are taken into account. The financial statements of subsidiaries are
included in the consolidated financial statements from the date that control commences until the date that
control ceases.
Non-controlling interests represent the equity in a subsidiary not attributable directly or indirectly to the
Company, and in respect of which the Group has not agreed any additional terms with the holders of those
interests which would result in the Group as a whole having a contractual obligation in respect of those interests
that meets the definition of a financial liability. For each business combination, the Group can elect to measure
any non-controlling interests either at fair value or at their proportionate share of the subsidiary’s net identifiable
assets.
Non-controlling interests are presented in the consolidated statement of financial position within equity, separately
from equity attributable to the owners of the Company. Non-controlling interests in the results of the Group are
presented on the face of the consolidated statements of comprehensive income as an allocation of the total
profit or loss and total comprehensive income for the year between non-controlling interests and the owners of
the Company.
Changes in the Group’s interests in a subsidiary that do not result in a loss of control are accounted for as equity
transactions, whereby adjustments are made to the amounts of controlling and non-controlling interests within
consolidated equity to reflect the change in relative interests, but no adjustments are made to goodwill and no
gain or loss is recognised.
When the Group loses control of a subsidiary, it is accounted for as a disposal of the entire interest in that
subsidiary, with a resulting gain or loss being recognised in profit or loss. Any interest retained in that former
subsidiary at the date when control is lost is recognised at fair value and this amount is regarded as the fair value
on initial recognition of a financial asset.
Transactions eliminated on consolidation:
Intra-group balances and transactions and any unrealised income and expenses arising from intra-group
transactions are eliminated in preparing the consolidated financial statements. Unrealised losses resulting from
intra group transactions are eliminated in the same way as unrealised gains, but only to the extent that there is
no evidence of impairment.
Foreign operations:
The assets and liabilities of foreign operations including goodwill and fair value adjustments arising on acquisition,
are translated to the presentation currency at exchange rates at the end of each reporting period. The income
and expenses of foreign operations are translated to the presentation currency using the average rate for the
year. Foreign currency differences are recognised in other comprehensive income and presented in the foreign
currency translation reserve in equity. When a foreign operation is disposed of, the cumulative amount of the
exchange differences relating to that foreign operation are transferred to profit or loss as part of the profit or
loss on disposal.
(g) Revenue
Revenue is measured at the fair value of the consideration received or receivable. Revenue is recognised to the
extent that it is probable that the economic benefits will flow to the Group and the revenue can be reliably
measured. The following specific recognition criteria must also be met before revenue is recognised:
Sale of chrome concentrate:
The Group enters into contracts for the sale of chrome concentrate. Revenue arising from chrome sales under
these contracts is recognised when the price is determinable, the product has been delivered in accordance with
the terms of the contract, the significant risks and rewards of ownership have been transferred to the customer,
collection of the sale price is probable and associated costs can be reliably estimated. These criteria may vary per
contract. As sales from chrome contracts are subject to a customer survey adjustment with regards to quality,
sales are initially recorded on a provisional basis using management’s best estimate of the chrome quality.
Subsequent adjustments are recorded in revenue to take into account final adjustments, if different from the
initial estimates.

76
Sale of PGM:
The Group enters into contracts for the sale of PGM. Revenue arising from PGM is initially recorded at the
estimated fair value of the consideration receivable at the date of delivery. Adjustments to the sale price occur
based on the movements in the metal market price up to the date of final pricing. The revenue adjustment
mechanism embedded within sale arrangements has the characteristic of a commodity derivative. Accordingly
the fair value of the final sale price adjustment is reestimated continuously and changes in fair value are recognsied
as an adjustment to revenue in profit or loss and trade receivables in the statement of financial position.
Rental income:
Rental income is recognised in profit or loss on a straight-line basis over the term of the lease. Lease incentives
granted are recognised as an integral part of the total rental income, over the term of the lease.
(h) Segment reporting
Operating segments, and the amounts of each segment item reported in the consolidated financial statements,
are identified from the financial information provided regularly to the Group’s most senior executive management
for the purposes of allocating resources to, and assessing the performance of, the Group’s various lines of
business and geographical locations. The Board of Directors is of the view that the Group had two operating
segments during the reporting period, the PGM segment and the chrome segment.
(i) Lease payments
Payments under leases which do not transfer substantially all the risks and rewards of ownership to the Group
are classified as operating leases. Operating lease payments are recognised in profit or loss on a straight-line basis
over the term of the lease. Lease incentives received are recognised as an integral part of the total lease expense,
over the term of the lease.
(j) Foreign currency transactions
Transactions in foreign currencies are translated to the respective functional currencies of Group entities at
exchange rates at the dates of the transactions. Monetary assets and liabilities denominated in foreign currencies
at the reporting date are retranslated to the functional currency at the foreign exchange rate at that date.
The foreign currency gain or loss on monetary items is the difference between amortised cost in the functional
currency at the beginning of the year, adjusted for effective interest and payments during the year, and the
amortised cost in foreign currency translated at the exchange rate at the end of the year.
Non-monetary assets and liabilities denominated in foreign currencies that are measured at fair value are
retranslated to the functional currency at the exchange rate at the date that the fair value was determined.
Non-monetary items in a foreign currency that are measured in terms of historical cost are translated using the
exchange rate at the date of the transaction. Foreign currency differences arising on retranslation are recognised
in profit or loss.
(k) Finance income and finance costs
Finance income comprises interest income on funds invested, gains on initial recognition and modification of
interest-free loans at fair value and net foreign currency gains. Interest income is recognised in profit or loss as it
accrues using the effective interest method.
Finance costs comprise interest expense on borrowings, dividends on preference shares classified as liabilities,
unwinding of the discount on provisions, impairment losses recognised on financial assets (other than trade
receivables) and net foreign currency losses. Borrowing costs that are not directly attributable to the acquisition,
construction or production of a qualifying asset (see note 2(o)) are recognised in profit or loss using the effective
interest method.
Foreign currency gains and losses are reported on a net basis.
(l) Employee benefits
Provident fund:
The Group’s salaried employees in South Africa are members of defined contribution retirement benefit plans.
The contributions to the plans range from a minimum of 3% to a maximum of 15% of staff ’s pensionable salary.
Contributions to the plans vest immediately. Contributions are accrued in the year in which the associated
services are rendered by employees.
The Group’s employees in Cyprus and the PRC do not participate in retirement benefit plans.

77
Short-term benefits:
Liabilities for employee benefits for wages, salaries, annual leave and sick leave that are expected to be settled within 12 months from the reporting date are calculated at undiscounted amounts based on remuneration wage and salary rates that the Group expects to pay as at the reporting date including related on-costs, such as workers compensation insurance and payroll tax. Non-accumulating monetary benefits such as medical care and motor vehicle expenses are expensed as the benefits are taken by the employees.
Termination benefits:
Termination benefits are recognised when, and only when, the Group demonstrably commits itself to terminate employment or to provide benefits as a result of voluntary redundancy by having a detailed formal plan which is without realistic possibility of withdrawal.
(m) Income tax
Income tax comprises current and deferred taxes. Income tax is recognised in profit or loss except to the extent that it relates to items recognised in other comprehensive income or directly in equity, in which case it is recognised in other comprehensive income or directly in equity, respectively.
Current tax is the expected tax payable on the taxable income for the year, using tax rates enacted or substantively enacted at the reporting date, and any adjustments to tax payable in respect of previous years.
Deferred tax is recognised in respect of temporary differences between the carrying amounts of assets and liabilities for financial reporting purposes and the amounts used for taxation purposes. Deferred tax is measured at the tax rates that are expected to be applied to temporary differences when they reverse, based on the laws that have been enacted or substantively enacted by the reporting date.
Apart from certain limited exceptions, all deferred tax liabilities and all deferred tax assets, to the extent that it is probable that future taxable profits will be available against which the asset can be utilised, are recognised. Future taxable profits that may support the recognition of deferred tax assets arising from deductible temporary differences include those that will arise from the reversal of existing taxable temporary differences, provided those differences relate to the same taxation authority and the same taxable entity, and are expected to reverse either in the same period as the expected reversal of the deductible temporary difference or in periods into which a tax loss arising from the deferred tax asset can be carried back or forward. The same criteria are adopted when determining whether existing taxable temporary differences support the recognition of deferred tax assets arising from unused tax losses and credits, that is, those differences are taken into account if they relate to the same taxation authority and the same taxable entity, and are expected to reverse in a period, or periods, in which the tax loss or credit can be utilised.
The limited exceptions to recognition of deferred tax assets and liabilities are those temporary differences arising from goodwill not deductible for tax purposes, the initial recognition of assets or liabilities that affect neither accounting nor taxable profit (provided they are not part of a business combination), and temporary differences relating to investments in subsidiaries to the extent that, in the case of taxable differences, the Group controls the timing of the reversal and it is probable that the differences will not reverse in the foreseeable future, or in the case of deductible differences, unless it is probable that they will reverse in the future.
Deferred tax assets and liabilities are offset if there is a legally enforceable right to offset current tax liabilities and assets, and they relate to income taxes levied by the same tax authority on the same taxable entity, or on different tax entities, but which they intend to settle current tax liabilities and assets on a net basis or their tax assets and liabilities will be realised simultaneously.
A deferred tax asset is recognised for unused tax losses, tax credits and deductible temporary differences, to the extent that it is probable that future taxable profits will be available against which they can be utilised. Deferred tax assets are reviewed at each reporting date and are reduced to the extent that it is no longer probable that the related tax benefit will be realised.
Additional income taxes that arise from the distribution of dividends are recognised at the same time as the liability to pay the related dividend is established.
In determining the amount of current and deferred tax, the Group takes into account the impact of uncertain tax positions and whether additional taxes and interest may be due. This assessment relies on estimates and assumptions and may involve a series of judgements about future events. New information may become available that causes the Group to change its judgement regarding the adequacy of existing tax liabilities; such changes to
tax liabilities will impact tax expense in the period that such a determination is made.
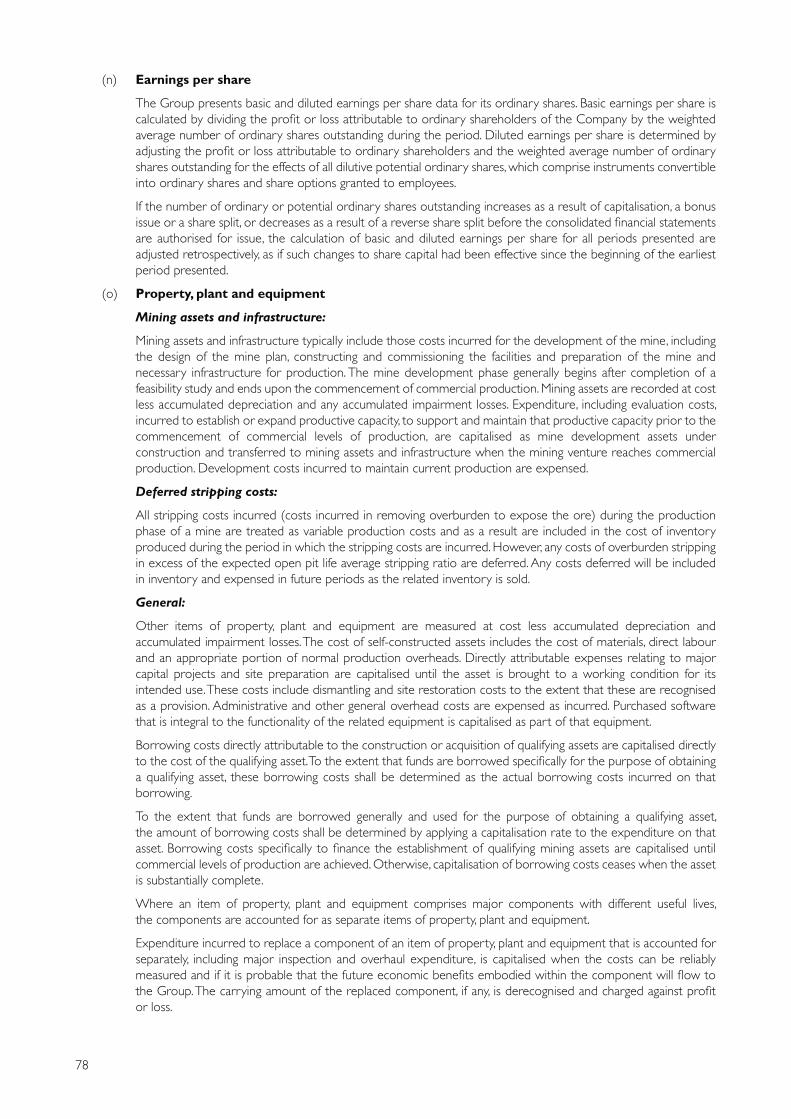
78
(n) Earnings per share
The Group presents basic and diluted earnings per share data for its ordinary shares. Basic earnings per share is
calculated by dividing the profit or loss attributable to ordinary shareholders of the Company by the weighted
average number of ordinary shares outstanding during the period. Diluted earnings per share is determined by
adjusting the profit or loss attributable to ordinary shareholders and the weighted average number of ordinary
shares outstanding for the effects of all dilutive potential ordinary shares, which comprise instruments convertible
into ordinary shares and share options granted to employees.
If the number of ordinary or potential ordinary shares outstanding increases as a result of capitalisation, a bonus
issue or a share split, or decreases as a result of a reverse share split before the consolidated financial statements
are authorised for issue, the calculation of basic and diluted earnings per share for all periods presented are
adjusted retrospectively, as if such changes to share capital had been effective since the beginning of the earliest
period presented.
(o) Property, plant and equipment
Mining assets and infrastructure:
Mining assets and infrastructure typically include those costs incurred for the development of the mine, including
the design of the mine plan, constructing and commissioning the facilities and preparation of the mine and
necessary infrastructure for production. The mine development phase generally begins after completion of a
feasibility study and ends upon the commencement of commercial production. Mining assets are recorded at cost
less accumulated depreciation and any accumulated impairment losses. Expenditure, including evaluation costs,
incurred to establish or expand productive capacity, to support and maintain that productive capacity prior to the
commencement of commercial levels of production, are capitalised as mine development assets under
construction and transferred to mining assets and infrastructure when the mining venture reaches commercial
production. Development costs incurred to maintain current production are expensed.
Deferred stripping costs:
All stripping costs incurred (costs incurred in removing overburden to expose the ore) during the production
phase of a mine are treated as variable production costs and as a result are included in the cost of inventory
produced during the period in which the stripping costs are incurred. However, any costs of overburden stripping
in excess of the expected open pit life average stripping ratio are deferred. Any costs deferred will be included
in inventory and expensed in future periods as the related inventory is sold.
General:
Other items of property, plant and equipment are measured at cost less accumulated depreciation and
accumulated impairment losses. The cost of self-constructed assets includes the cost of materials, direct labour
and an appropriate portion of normal production overheads. Directly attributable expenses relating to major
capital projects and site preparation are capitalised until the asset is brought to a working condition for its
intended use. These costs include dismantling and site restoration costs to the extent that these are recognised
as a provision. Administrative and other general overhead costs are expensed as incurred. Purchased software
that is integral to the functionality of the related equipment is capitalised as part of that equipment.
Borrowing costs directly attributable to the construction or acquisition of qualifying assets are capitalised directly
to the cost of the qualifying asset. To the extent that funds are borrowed specifically for the purpose of obtaining
a qualifying asset, these borrowing costs shall be determined as the actual borrowing costs incurred on that
borrowing.
To the extent that funds are borrowed generally and used for the purpose of obtaining a qualifying asset,
the amount of borrowing costs shall be determined by applying a capitalisation rate to the expenditure on that
asset. Borrowing costs specifically to finance the establishment of qualifying mining assets are capitalised until
commercial levels of production are achieved. Otherwise, capitalisation of borrowing costs ceases when the asset
is substantially complete.
Where an item of property, plant and equipment comprises major components with different useful lives,
the components are accounted for as separate items of property, plant and equipment.
Expenditure incurred to replace a component of an item of property, plant and equipment that is accounted for
separately, including major inspection and overhaul expenditure, is capitalised when the costs can be reliably
measured and if it is probable that the future economic benefits embodied within the component will flow to
the Group. The carrying amount of the replaced component, if any, is derecognised and charged against profit
or loss.

79
Maintenance and day to day servicing and repairs, which neither materially add to the value of assets nor
appreciably prolong their useful lives, are charged against profit or loss.
Gains and losses on disposal of an item of property, plant and equipment are determined by comparing the
proceeds from disposal with the carrying amount of the item and are recognised net within “other income” in
the statement of comprehensive income.
Government grants:
Government grants are recognised as a deduction in the carrying amount of the item of property, plant and
equipment they relate to, when there is reasonable assurance that they will be received, and the Group will
comply with the conditions associated with the grant.
Depreciation:
Depreciation of mining assets and infrastructure is capitalised against inventories using the units-of-production
method based on estimated economically recoverable proved and probable mineral reserves. Proved and
probable reserves reflect estimated quantities of economically recoverable resources which can be recovered in
the future from known mineral deposits. Depreciation is first charged on mining assets and infrastructure from
the date on which they are available for use.
For other property, plant and equipment, depreciation is recognised in profit or loss on a straight-line basis at
rates that will reduce the carrying amounts to estimated residual values over the estimated useful lives of the
assets as follows. Leasehold improvements on premises occupied under operating leases are written off over the
shorter of the lease term and the useful lives.
Depreciation, unless otherwise stated, is calculated as follows:
• buildings at 10% per annum;
• motor vehicles at 20% per annum;
• computer equipment and software at 33.3% per annum;
• office equipment at 33.3% per annum; and
• furniture at 20% per annum.
No depreciation is provided on freehold land and mine development assets under construction.
Depreciation methods, residual values and useful lives are reviewed at least annually, and adjusted if appropriate,
at each reporting date.
(p) Intangible exploration and evaluation assets
Exploration and evaluation costs, including the costs of acquiring prospecting rights and directly attributable
exploration expenditure, are capitalised as intangible exploration and evaluation assets on a project-by-project
basis, pending determination of the technical feasibility and commercial viability. Costs are recognised as
exploration and evaluation costs from the date of granting a prospecting right. The capitalised costs are presented
as intangible exploration and evaluation assets as a result of the nature of the assets acquired.
The technical feasibility and commercial viability of extracting a mineral resource is considered to be determinable
when proved reserves are determined to exist. Upon determination of proved reserves, intangible exploration
and evaluation assets attributable to those reserves are first tested for impairment and then reclassified from
intangible exploration and evaluation assets to other appropriate categories of non-current assets.
Depreciation or amortisation of these assets commences once these assets are appropriately reclassified and are
in commercial production.
Intangible exploration and evaluation assets are assessed for impairment in accordance with the Group’s
accounting policy (note 2(s)).
Also, additional guidance is provided by IFRS 6 “Exploration for and Evaluation of Mineral Resources” on indicators
of impairment, examples of which are as follows:
• The period to explore, as granted under the prospecting rights acquired, has expired during the period; or
will expire in the near future; or is not expected to be renewed;
• Further exploration on the project is neither budgeted nor planned for in the near future;
• A decision was made not to develop a project; and
• There is an indication that the carrying amount of the intangible exploration and evaluation asset is unlikely
to be recovered in full from a successful development or the sale of the project.

80
If a project is abandoned, the related costs are expensed in profit or loss immediately.
(q) Inventories
Inventories comprising PGM and chrome concentrate, ore stockpiled, in-process metal contained in ore and
consumable items are measured at the lower of cost and net realisable value. Cost is determined using the
weighted average method and includes direct mining expenditure and an appropriate portion of overhead
expenditure. Net realisable value is the estimated selling price in the ordinary course of business, less the
estimated costs of completion and costs to sell. Obsolete, redundant and slow moving inventories are identified
and written down to net realisable value.
(r) Financial instruments
Non-derivative financial assets:
The Group initially recognises loans and receivables and deposits on the date that they are originated. All other
financial assets (including assets designated at fair value through profit or loss) are recognised initially on the trade
date, which is the date that the Group becomes a party to the contractual provisions of the instrument.
The Group derecognises a financial asset when the contractual rights to the cash flows from the asset expire, or
it transfers the rights to receive the contractual cash flows on the financial asset in a transaction in which
substantially all the risks and rewards of ownership of the financial asset are transferred. Any interest in transferred
financial assets that is created or retained by the Group is recognised as a separate asset or liability.
On derecognition, the difference between the carrying amount of the financial asset and proceeds receivable and
any prior adjustment to reflect fair value that had been reported in other comprehensive income and accumulated
in equity are included in profit or loss for the period.
The Group’s non-derivative financial assets include the following:
• Financial assets at fair value through profit or loss:
A financial asset is classified at fair value through profit or loss if it is classified as held for trading or is
designated as such upon initial recognition. Financial assets are designated as at fair value through profit or
loss if the Group manages such investments and makes purchase and sale decisions based on their fair value
in accordance with the Group’s documented risk management or investment strategy. Attributable transaction
costs are recognised in profit or loss as incurred. Financial assets at fair value through profit or loss are
measured at fair value and changes therein are recognised in profit or loss.
• Held to maturity investments:
Held to maturity investments are non-derivative financial assets with fixed or determinable payments and
fixed maturities that the Group’s management has the positive intention and ability to hold to maturity and
are included in non-current assets, except for those with maturities within 12 months from the reporting date
which are classified as current assets. Held to maturity investments are stated at amortised cost less
impairment losses.
• Loans receivable:
Loans receivable are stated at amortised cost less impairment losses. Unless otherwise stated, these balances
have no fixed terms of repayment and are therefore deemed repayable on demand and deemed to have
carrying values equal to their fair values.
• Trade and other receivables:
Trade and other receivables originated by the Group are stated at their amortised cost less impairment
losses, except where the receivables are interest-free loans made to related parties without any fixed
repayment terms or the effect of discounting would be immaterial. Appropriate allowances for estimated
irrecoverable amounts are recognised in profit or loss when there is objective evidence that the asset is
impaired. The allowance recognised is measured as the difference between the asset’s carrying amount and
the present value of estimated future cash flows discounted at the effective interest rate computed at initial
recognition. Due to the short-term nature of the Group’s trade and other receivables, amortised cost
approximates fair value.
Non-derivative financial liabilities:
The Group initially recognises debt securities issued on the date that they are originated. All other financial
liabilities are recognised initially on the trade date, which is the date that the Group becomes a party to the
contractual provisions of the instrument.

81
The Group derecognises a financial liability when its contractual obligations are discharged, cancelled or expire.
On derecognition, the difference between the carrying amount of the financial liability, including related
unamortised costs, and the amount paid for it is included in profit or loss.
Non-derivative financial liabilities are recognised initially at fair value less any directly attributable transaction costs.
Subsequent to initial recognition, these financial liabilities are measured at amortised cost using the effective
interest method.
The Group’s non-derivative financial liabilities include the following:
• Trade and other payables:
Trade and other payables are stated at amortised cost. Due to the short-term nature of the Group’s trade
and other payables, amortised cost approximates fair value.
• Interest-bearing borrowings:
Interest-bearing borrowings are stated at amortised cost, using the effective interest rate method, with any
difference between cost and redemption value being recognised in profit or loss over the period of the
borrowings on an effective interest rate basis.
• Redeemable preference shares:
Redeemable preference shares are classified as a liability if they are redeemable on a specific date or at the
option of the preference shareholders, or if dividend payments are not discretionary. The liability is recognised
in accordance with the Group’s policy for interest-bearing borrowings. Dividends on redeemable preference
shares are recognised as a liability and recognised as an interest expense using the effective interest rate
method.
Financial liabilities at fair value through profit or loss:
The Group’s financial liabilities at fair value through profit or loss include the following:
• Hybrid financial liabilities:
A hybrid financial liability includes a non-derivative host contract and one or more embedded derivatives
with the effect that some of the cash flows of the instrument vary in a way similar to a stand-alone derivative.
The Group designates the entire hybrid liability as a financial liability at fair value through profit or loss unless:
(a) the embedded derivative(s) does not significantly modify the cash flows that otherwise would be
required by the contract; or
(b) it is clear with little or no analysis when a similar hybrid instrument is first considered that separation
of the embedded derivative(s) is prohibited, such as a prepayment option embedded in a loan that
permits the holder to prepay the loan for approximately its amortised cost.
Hybrid financial liabilities are recognised initially at fair value. Transaction costs that relate to the issue of the
liabilities are recognised immediately in profit or loss. At the end of each reporting period the fair value is
remeasured. The gain or loss on remeasurement to fair value is recognised immediately in profit or loss.
• Derivative financial instruments:
Derivative financial instruments are recognised initially at fair value. At the end of each reporting period the
fair value is remeasured. The gain or loss on remeasurement to fair value is recognised immediately in profit
or loss.
Financial assets and liabilities are offset and the net amount presented in the statement of financial position
when, and only when, the Group has a legal right to offset the amounts and intends either to settle on a net
basis or to realise the asset and settle the liability simultaneously.
The fair value of financial instruments traded in an organised financial market is measured at the applicable
quoted prices. The fair value of financial instruments not traded in an organised financial market is determined
using a variety of methods and assumptions that are based on market conditions and risks existing at the
reporting date, including independent appraisals and discounted cash flow methods.
Share capital:
Ordinary shares are classified as equity. Incremental costs directly attributable to the issue of ordinary shares are
recognised as a deduction from equity net of any tax effects. Holders of ordinary shares are entititled to dividends,
which are recognised as a liability in the period they are declared.

82
(s) Impairment
Financial assets:
Financial assets are assessed at each reporting date to determine whether there is any objective evidence that they are impaired. A financial asset is considered to be impaired if objective evidence indicates that a loss event has occurred after the initial recognition and the loss event had a negative effect on the estimated future cash flows of that asset, that can be estimated reliably.
Objective evidence of impairment includes observable data that comes to the attention of the Group about one or more of the following loss events:
• significant financial difficulty of the debtor;
• a breach of contract, such as a default or delinquency in interest or principal payments;
• its becoming probable that the debtor will enter bankruptcy or other financial reorganisation;
• significant changes in the technological, market, economic or legal environment that have an adverse effect on the debtor; and
• a significant or prolonged decline in the fair value of an investment in an equity instrument below its cost.
If any such evidence exists, any impairment loss is determined and recognised as follows:
An impairment loss in respect of a financial asset measured at amortised cost is calculated as the difference between its carrying amount and the present value of the estimated future cash flows discounted at the original effective interest rate. Individually significant financial assets are tested for impairment on an individual basis. The remaining financial assets are assessed collectively in groups that share similar credit risk characteristics.
All impairment losses are recognised in profit or loss and reflected in an allowance account against such financial assets. An impairment loss is reversed if the reversal can be related objectively to an event occurring after the impairment loss was recognised. The reversal is recognised in profit or loss.
Non-financial assets:
The carrying amounts of the Group’s non-financial assets, other than inventories and deferred tax assets, are reviewed at each reporting date to determine whether there is any indication of impairment. If any such indication exists, the asset’s recoverable amount is estimated. For goodwill and intangible assets that have indefinite lives or are not yet available for use, the recoverable amount is estimated annually whether or not there is any indication of impairment. An impairment loss is recognised whenever the carrying amount of an asset or its related CGU exceeds its recoverable amount. A CGU is the smallest identifiable asset group that generates cash flows that are largely independent from other assets and groups. Impairment losses are recognised in profit or loss. Impairment losses recognised in respect of CGUs are allocated first to reduce the carrying amount of any goodwill allocated to the CGUs (group of units) and then, to reduce the carrying amount of the other assets in the CGU (group of units) on a pro rata basis.
The recoverable amount of an asset or CGU is the greater of its value in use and its fair value less costs to sell. In assessing value in use, the estimated future cash flows are discounted to their present value using a pre-tax discount rate that reflects current market assessments of the time value of money and the risks specific to the assets. For the purpose of impairment testing, assets that cannot be tested individually are grouped together into the smallest group of assets that generates cash flows from continuing use that are largely independent of the cash inflows of the other assets of the CGU.
For the purposes of goodwill impairment testing, goodwill acquired in a business combination is allocated to groups of CGUs that are expected to benefit from the synergies of the combination.
An impairment loss in respect of goodwill is not reversed. In respect of other assets, impairment losses recognised in prior periods are assessed at each reporting date for any indication that the loss has decreased or no longer exists. An impairment loss is reversed through profit or loss if there has been a change in the estimates used to determine the recoverable amount. An impairment loss is reversed only to the extent that the asset’s carrying amount does not exceed the carrying amount that would have been determined, net of depreciation or amortisation, if no impairment loss had been recognised.
(t) Provisions
Provisions are recognised when the Group has a present legal or constructive obligation as a result of past events where it is probable that an outflow of resources embodying economic benefits will be required to settle the obligation, and a reliable estimate of the amount of the obligation can be made. Provisions are determined by discounting the expected future cash flows at a pre-tax rate that reflects current market assessments of the time
value of money and the risks specific to the liability.

83
Long-term environmental obligations are based on the Group’s environmental management plans, in compliance
with the current environmental and regulatory requirements.
Where it is not possible that an outflow of economic benefits will be required, or the amount cannot be
estimated reliably, the obligation is disclosed as a contingent liability, unless the probability of outflow of economic
benefits is remote. Possible obligations, whose existence will only be confirmed by the occurrence or
non-occurrence of one or more future events are disclosed as contingent liabilities unless the probability of
outflow of economic benefits is remote.
Rehabilitation costs:
The net present value of estimated future costs for mine closure and rehabilitation is recognised and provided
for in the consolidated financial statements and capitalised within mining assets on initial recognition. Rehabilitation
will generally occur on closure or after closure of a mine. Initial recognition of the provision is at the time that the
disturbance occurs and thereafter as and when additional disturbances take place.
The estimates are reviewed annually to take into account the effects of inflation and changes in estimates and are
discounted using rates that reflect the time value of money. Annual increases in the provision due to the passage
of time are recognised in profit or loss as an unwinding of the value of the provision expense. The present value
of additional disturbances and changes in the estimate of the rehabilitation liability is capitalised to mining assets
against an increase in the rehabilitation provision. The rehabilitation asset is depreciated as per the Group’s
accounting policy on depreciation (see note 2(o)). Cost of rehabilitation projects undertaken, included in the
estimates, are charged to the provision as incurred.
Costs for restoration and rehabilitation which are created on an ongoing basis during production of inventories
are provided for at their net present values and included as part of inventory costs. Environmental liabilities,
other than rehabilitation costs, which relate to liabilities arising from specific events, are recognised in profit or
loss when they are known, probable and may be reasonably estimated.
Gains or losses from the expected disposal of assets are not taken into account when determining the provision.
(u) Cash and cash equivalents
Cash and cash equivalents comprise cash at bank and on hand, demand deposits with banks and other financial
institutions, and short-term, highly liquid investments that are readily convertible into known amounts of cash and
which are subject to an insignificant risk of changes in value, having been within 3 months of maturity at acquisition.
(v) Related party transactions
For the purpose of these consolidated financial statements, a party is considered to be related to the Group if:
(i) The party has the ability, directly or indirectly through one or more intermediaries, to control the Group
or exercise significant influence over the Group in making financial and operating policy decisions, or has
joint control over the Group;
(ii) The Group and the party are subject to common control;
(iii) The party is an associate of the Group or a joint venture in which the Group is a venturer ;
(iv) The party is a member of key management personnel of the Group or the Group’s parent, or a close
family member of such individual, or is an entity under the control, joint control or significant influence of
such individuals;
(v) The party is a close family member of a party referred to in (i) or is an entity under the control, joint
control or significant influence of such individuals; or
(vi) The party is a post-employment benefit plan which is for the benefit of employees of the Group or of any
entity that is a related party of the Group.
Close family members of an individual are those family members who may be expected to influence, or be
influenced by, that individual in their dealings with the Group.
3. OPERATING SEGMENTS
The Group has 2 reportable segments, the chrome segment and the PGM segment. Information regarding the results
of each reportable segment is included below. Performance is measured based on segment revenue, cost of sales and
gross profit or loss, as included in the internal management reports that are reviewed by the Group’s most senior
executive management. Segment revenue, cost of sales and gross profit or loss are used to measure performance as
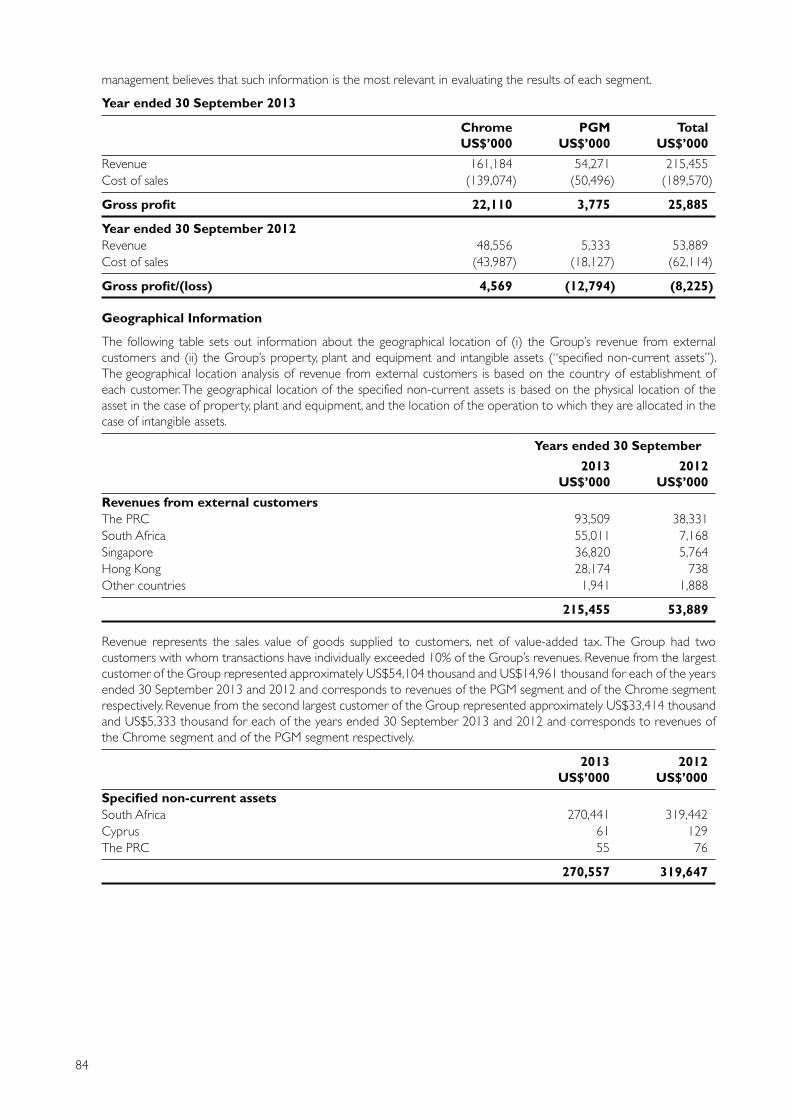
84
management believes that such information is the most relevant in evaluating the results of each segment.
Year ended 30 September 2013
Chrome
US$’000
PGM
US$’000
Total
US$’000
Revenue 161,184 54,271 215,455
Cost of sales (139,074) (50,496) (189,570)
Gross profit 22,110 3,775 25,885
Year ended 30 September 2012
Revenue 48,556 5,333 53,889
Cost of sales (43,987) (18,127) (62,114)
Gross profit/(loss) 4,569 (12,794) (8,225)
Geographical Information
The following table sets out information about the geographical location of (i) the Group’s revenue from external
customers and (ii) the Group’s property, plant and equipment and intangible assets (“specified non-current assets”).
The geographical location analysis of revenue from external customers is based on the country of establishment of
each customer. The geographical location of the specified non-current assets is based on the physical location of the
asset in the case of property, plant and equipment, and the location of the operation to which they are allocated in the
case of intangible assets.
Years ended 30 September
2013
US$’000
2012
US$’000
Revenues from external customers
The PRC 93,509 38,331
South Africa 55,011 7,168
Singapore 36,820 5,764
Hong Kong 28,174 738
Other countries 1,941 1,888
215,455 53,889
Revenue represents the sales value of goods supplied to customers, net of value-added tax. The Group had two
customers with whom transactions have individually exceeded 10% of the Group’s revenues. Revenue from the largest
customer of the Group represented approximately US$54,104 thousand and US$14,961 thousand for each of the years
ended 30 September 2013 and 2012 and corresponds to revenues of the PGM segment and of the Chrome segment
respectively. Revenue from the second largest customer of the Group represented approximately US$33,414 thousand
and US$5,333 thousand for each of the years ended 30 September 2013 and 2012 and corresponds to revenues of
the Chrome segment and of the PGM segment respectively.
2013
US$’000
2012
US$’000
Specified non-current assets
South Africa 270,441 319,442
Cyprus 61 129
The PRC 55 76
270,557 319,647
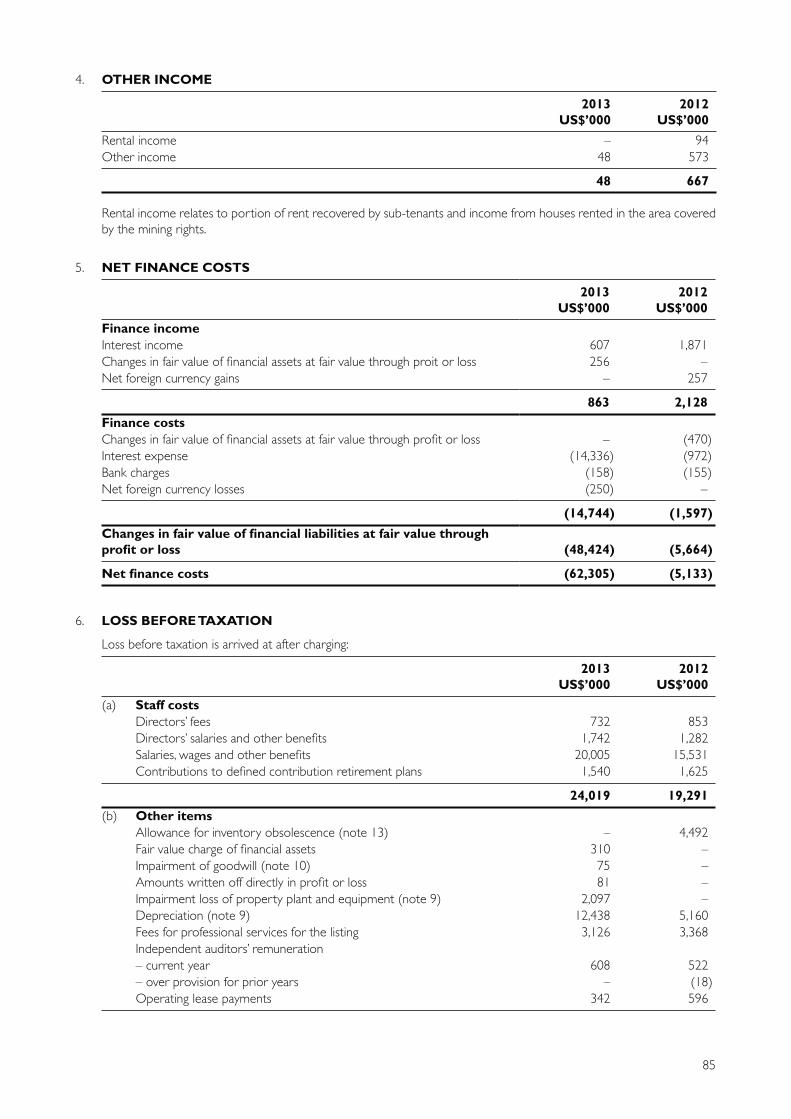
85
4. OTHER INCOME
2013
US$’000
2012
US$’000
Rental income – 94
Other income 48 573
48 667
Rental income relates to portion of rent recovered by sub-tenants and income from houses rented in the area covered
by the mining rights.
5. NET FINANCE COSTS
2013
US$’000
2012
US$’000
Finance income
Interest income 607 1,871
Changes in fair value of financial assets at fair value through proit or loss 256 –
Net foreign currency gains – 257
863 2,128
Finance costs
Changes in fair value of financial assets at fair value through profit or loss – (470)
Interest expense (14,336) (972)
Bank charges (158) (155)
Net foreign currency losses (250) –
(14,744) (1,597)
Changes in fair value of financial liabilities at fair value through
profit or loss (48,424) (5,664)
Net finance costs (62,305) (5,133)
6. LOSS BEFORE TAXATION
Loss before taxation is arrived at after charging:
2013
US$’000
2012
US$’000
(a) Staff costs
Directors’ fees 732 853
Directors’ salaries and other benefits 1,742 1,282
Salaries, wages and other benefits 20,005 15,531
Contributions to defined contribution retirement plans 1,540 1,625
24,019 19,291
(b) Other items
Allowance for inventory obsolescence (note 13) – 4,492
Fair value charge of financial assets 310 –
Impairment of goodwill (note 10) 75 –
Amounts written off directly in profit or loss 81 –
Impairment loss of property plant and equipment (note 9) 2,097 –
Depreciation (note 9) 12,438 5,160
Fees for professional services for the listing 3,126 3,368
Independent auditors’ remuneration
– current year 608 522
– over provision for prior years – (18)
Operating lease payments 342 596

86
2013 Directors’ remuneration
Director
Directors’
fees
(US$’000)
Salary
(US$’000)
Expense
allowance
(US$’000)
Other
material
benefits
received
(US$’000)
Pension
scheme
(US$’000)
Total
(US$’000)
L Pouroulis – 715 – – – 715
P Pouroulis – 538 13 17 16 584
M Jones – 439 – 21 66 526
J D Salter 252 – – – – 252
A Djakouris 235 – – – – 235
I Drapaniotis 155 – – – – 155
E Papacleovoulou 50 – – – – 50
C Chan 40 – – – – 40
Total 732 1,692 13 38 82 2,556
2012 Directors’ remuneration
L Pouroulis – 719 – – – 719
P Pouroulis – 547 – 15 31 594
J D Salter 205 – – – – 205
A Djakouris 227 – – – – 227
I Drapaniotis 154 – – – – 154
E Papacleovoulou 150 – – – – 150
C Chan 117 – – – – 117
Total 853 1,267 – 15 31 2,166
7. INCOME TAX
2013
US$’000
2012
US$’000
Corporate income tax for the year
– Cyprus 991 203
– South Africa 94 90
Special contribution for defence in Cyprus for the year 3 154
Deferred tax – origination and reversal of temporary differences (note 19) (16,613) (9,127)
Income tax credit (15,525) (8,680)
The entities within the Group are taxed in the countries in which they are incorporated and operate at the relevant
tax rates as follows:
Country 2013 2012
Tharisa Plc Cyprus 12.5% 10%
Tharisa Minerals Proprietary Limited South Africa 28% 28%
Tharisa Investments Limited Cyprus 12.5% 10%
Arxo Resources Limited Cyprus 12.5% 10%
Tharisa Fujian Industrial Co., Limited The PRC 25% 25%
Arxo Logistics Proprietary Limited South Africa 28% 28%
Tharisa Administration Services Limited Cyprus 12.5% 10%
Tharisa Investments (Hong Kong) Limited Hong Kong 16.5% 16.5%
Arxo Metals Proprietary Limited South Africa 28% 28%
Braeston Corporate Consulting Services Proprietary Limited South Africa 28% N/A
Dinami Limited Guernsey 0% N/A
Tax rates are not disclosed for the years when subsidiaries were not yet acquired or established by the Group.

87
Reconciliation between tax credit and accounting loss at applicable tax rates:
2013
US$’000
2012
US$’000
Loss before taxation (62,968) (38,651)
Notional tax on loss before taxation, calculated at the rates
applicable in the jurisdictions concerned (25,582) (10,854)
Non-taxable income (580) (667)
Non-deductible expenses 10,155 2,070
Recognition of deemed interest income for tax purposes 171 147
Tax losses not recognized for deferred tax purposes 308 470
Special contribution for defence (note (i)) 3 154
(15,525) (8,680)
Notes:
(i) Special contribution for defence is provided in Cyprus on certain interest income at the rate of 30% (15% until 29 April 2013). 100% of such
interest income is treated as non-taxable in the computation of chargeable income for corporation tax purposes.
(ii) No provision for PRC Income Tax was made as the PRC subsidiary has sustained losses for taxation purposes.
(iii) No provision for Hong Kong Profits Tax was made as the Hong Kong subsidiary did not earn any assessable profits.
8. LOSS PER SHARE
The calculation of basic loss per share was based on the loss attributable to the owners of the Company and the
weighted average number of ordinary shares outstanding during each year.
2013
US$’000
2012
US$’000
Loss for the year attributable to the owners of the Company (48,347) (26,018)
Weighted average number of ordinary shares outstanding during the year 7,662,320 7,662,320
Loss per share (US$) (6.31) (3.40)
The weighted average number of ordinary shares outstanding during the year is the number of ordinary shares
outstanding at the beginning of the year, adjusted by the number of ordinary shares issued during the year multiplied
by a time-weighting factor and increased by the weighted average number of shares attributable to the holders of the
Company’s convertible redeemable preference shares (note 17(a)), as detailed below:
2013
Number of
shares
2012
Number of
shares
Issued ordinary shares at beginning of year 6,169,900 4,345
Effect of share subdivision on 11 November 2011 (note 16(b)) – 6,165,555
Issued ordinary shares at end of year 6,169,900 6,169,900
Weighted number of convertible redeemable preference shares 1,492,420 1,492,420
Weighted average number of ordinary shares for determination of
loss per share 7,662,320 7,662,320
The Company’s convertible redeemable preference shares (see note 17(a)) are potential dilutive shares, but were
anti-dilutive during the reporting period. Accordingly, diluted loss per share is the same as basic loss per share for the
reporting period.
As further described in note 16 of these consolidated financial statements, each of the Company’s ordinary shares
was sub-divided into 1,420 ordinary shares on 11 November 2011. For the purpose of calculating basic and diluted
earnings per share, the weighted average number of ordinary shares used in the calculation reflects the effect of the
share subdivision as if it had occurred at the beginning of the earliest period presented.

88
9. PROPERTY, PLANT AND EQUIPMENT
Balance at1 October
2012US$’000
AdditionsUS$’000
TransfersUS$’000
ImpairmentsUS$’000
Exchangedifferences
US$’000
Balance at30 September
2013US$’000
Cost
Freehold land and buildings 16,251 1,363 – – (2,969) 14,645
Mine development assets under construction 136,718 – (126,450) – (10,268) –
Mining assets and infrastructure 169,606 21,874 124,681 (2,097) (45,220) 268,844
Leasehold improvements 77 2 56 – (24) 111
Computer equipment and software 1,341 932 – – (290) 1,983
Motor vehicles 254 60 – – (34) 280
Office equipment and furniture, social community and site office improvements 514 85 (56) – (78) 465
324,761 24,316 (1,769) (2,097) (58,883) 286,328
Balance at1 October
2012US$’000
Chargefor the
yearUS$’000
Writtenback on
disposalsUS$’000
Exchangedifferences
US$’000
Balance at30 September
2013US$’000
Accumulated depreciation
Freehold land and buildings – 12 – (1) 11
Mining assets and infrastructure 5,965 11,786 – (1,619) 16,132
Leasehold improvements 40 55 – (12) 83
Computer equipment and software 281 447 – (67) 661
Motor vehicles 64 43 – (9) 98
Office equipment and furniture, social community and site office improvements 148 95 – (30) 213
6,498 12,438 – (1,738) (17,198)
Balance at1 October
2011US$’000
AdditionsUS$’000
TransfersUS$’000
Exchangedifferences
US$’000
Balance at30 September
2012US$’000
Cost
Freehold land and buildings 23,101 3,250 (9,186) (914) 16,251
Mine development assets under construction 30,478 160,733 (47,566) (6,927) 136,718
Mining assets and infrastructure 84,289 33,421 56,734 (4,838) 169,606
Leasehold improvements 75 7 – (5) 77
Computer equipment and software 407 982 (5) (43) 1,341
Motor vehicles 227 38 (3) (8) 254
Office equipment and furniture, social community and site office improvements 484 60 (10) (20) 514
139,061 198,491 (36) (12,755) 324,761

89
Balance at1 October
2011US$’000
Chargefor the
yearUS$’000
Writtenback on
disposalsUS$’000
Exchangedifferences
US$’000
Balance at30 September
2012US$’000
Accumulated depreciation
Mining assets and infrastructure 1,334 4,780 – (149) 5,965
Leasehold improvements 14 28 – (2) 40
Computer equipment and software 80 208 – (7) 281
Motor vehicles 20 45 – (1) 64
Office equipment and furniture, social community and site office improvements 65 99 – (16) 148
1,513 5,160 – (175) 6,498
30 September2013
US$’000
30 September2012
US$’000
1 October2011
US$’000
Net book value
Freehold land and buildings 14,634 16,251 23,101
Mine development assets under construction – 136,718 30,478
Mining assets and infrastructure 252,712 163,641 82,955
Leasehold improvements 28 37 61
Computer equipment and software 1,322 1,060 327
Motor vehicles 182 190 207
Office equipment and furniture, social community and site office improvements 252 366 419
269,130 318,263 137,548
All of the Group’s land is freehold and located on the farms Kafferskraal 342 and Elandsdrift 467. All farms are situated
in the North West Province, Registration Division JQ, South Africa.
At 30 September 2013 and 2012, all of the property, plant and equipment of subsidiary company Tharisa Minerals
Proprietary Limited, the carrying amount of which amounted to US$264,357 thousand and US$317,066 thousand
respectively, is pledged as security against the secured bank borrowing (note 20(a)).
There have been no changes in the nature of Property, Plant and Equipment nor any change in the policy regarding the
use thereof.
10. GOODWILL
(a) Reconciliation of carrying amount
Cost
2013
US$’000
2012
US$’000
Balance at 1 October 1,384 1,453
Acquisition through business combination (note 23) 396 –
Effect of movements in exchange rate (278) (69)
Balance 30 September 1,502 1,384
Accumulated impairment losses
2013
US$’000
2012
US$’000
Balance at 1 October – –
Impairment of goodwill 75 –
Balance 30 September 75 –
Carrying amounts 30 September 1,427 1,384

90
Impairment test for goodwill
Impairment losses were recognised in relation to goodwill which arose from the acquisition of Arxo Logistics Proprietary
Limited and Braeston Corporate Consulting Services Proprietary Limited, as follows:
2013
US$’000
2012
US$’000
Arxo Logistics Proprietary Limited (note 10(b)(i)) 57 –
Braeston Corporate Consulting Services Proprietary Limited (note 10(b)(ii)) 18 –
Impairment loss 75 –
(i) Impairment loss on Arxo Logistics Proprietary Limited
At 30 September 2013, the carrying amount of Arxo Logistics Proprietary Limited CGU exceeded its recoverable
amount and thus impairment was recognised to reduce the carrying amount of goodwill. The recoverable
amount is determined based on value-in-use calculation. This calculation uses cash flow projections approved
by management covering a thirty one-year period. The growth rates used do not exceed the long-term average
growth rates for the business in which the CGU operates. The cash flows are discounted using a nominal discount
rate of 11.53%. The discount rate used is a pre-tax nominal rate and reflects specific risks relating to the relevant
segment.
(ii) Impairment loss on Braeston Corporate Consulting Services Proprietary Limited
At 30 September 2013, the carrying amount of Braeston Corporate Consulting Services Proprietary Limited
CGU exceeded its recoverable amount and thus impairment was recognised to reduce the carrying amount of
goodwill. The recoverable amount is determined based on value-in-use calculation. This calculation uses cash flow
projections approved by management covering a thirty one-year period. The growth rates used do not exceed
the long-term average growth rates for the business in which the CGU operates. The cash flows are discounted
using a nominal discount rate of 11.53%. The discount rate used is a pre-tax nominal rate and reflects specific
risks relating to the relevant segment.
11. LONG-TERM DEPOSITS
2013
US$’000
2012
US$’000
Long term deposits 7,708 –
The amount of US$7,708 thousand is restricted and designated as a “debt service reserve account” as required by
the terms of the senior debt facility of Tharisa Minerals Proprietary Limited. As at 30 September 2013, the long-term
deposits did not earn any interest and had no maturity date.
12. OTHER FINANCIAL ASSETS
2013
US$’000
2012
US$’000
Non-current:
Investments in cash funds and income funds (note 12(a)) 3,656 3,705
Interest rate caps (note 12(b)) 118 132
3,774 3,837
Current :
Investments at fair value through profit or loss 86 –
Discount facility (note 12(c)) 225 –
311 –
(a) The investment in cash funds and income funds is provided to Lombard Insurance Group as collateral against the
guarantee issued by Lombard Insurance Group to the Department of Minerals and Energy of South Africa in the
amount of South African Rand (“ZAR”) 78 million (see note 18). The balance is unsecured and is considered as
level 1 in the fair value hierarchy and held at fair value through profit or loss (designated), (note 24(d)).

91
(b) Interest rate caps were obtained from a consortium of financial institutions, against the floating 3-month
Johannesburg Interbank Agreed Rate (“JIBAR”) on 25% of the secured bank borrowing (note 20(a)). The interest
rate caps have a strike rate of 7.5% and terminate on 31 March 2017. The balance is held at fair value through profit
or loss (held for trading), (note 24(d)).
(c) Discount facility relates to fair value adjustments on the limited recourse disclosed receivables discounting facility
(“Discount facility”) with ABSA, Nedbank and HSBC in terms of which 98% of the sales of platinum, palladium and
gold (included in PGM) sold at an effective finance cost of JIBAR (3-month ) + 2%. The facility is for an amount of
ZAR300 million. The balance is held at fair value through profit or loss (designated), (note 24(d)).
13. INVENTORIES
2013
US$’000
2012
US$’000
Finished products 13,037 4,169
In progress metal 1,247 12,988
Ore stockpile 6,841 10,389
Consumables 2,918 751
24,043 28,297
Inventories are stated at the lower of cost and net realisable value.
The analysis of the amount of inventories recognised as an expense and included in profit or loss is as follows:
2013
US$’000
2012
US$’000
Carrying amount of inventories sold 119,627 39,323
Write-down of inventories – 4,492
119,627 43,815
All amounts of inventories are expected to be recovered within one year from each reporting date.
14. TRADE AND OTHER RECEIVABLES
2013
US$’000
2012
US$’000
Trade receivables
– Third parties 21,135 6,330
– Related parties (note 25) 60 65
Deposits, prepayments and other receivables 1,637 3,540
Value added tax recoverable 6,291 8,091
Foreign exchange forward contracts (note 24(d)) – 103
29,123 18,129
Trade and other receivables of the Group, are expected to be recoverable within one year from each reporting date.
The ageing of trade receivables after allowance for credit losses was as follows:
2013
US$’000
2012
US$’000
Current 21,108 6,395
Past due but not impaired 87 –
21,195 6,395

92
The movement in allowance for credit losses in respect of trade and other receivables of the Group during the year was as follows:
2013
US$’000
2012
US$’000
Balance at the beginning of the year 163 171
Amounts written off during the year directly against the financial asset (147) –
Exchange differences (16) (8)
Balance at the end of the year – 163
At 30 September 2013 and 2012 an amount of US$Nil thousand and US$163 thousand, respectively, of the Group’s trade receivables was determined to be impaired. The impaired trade receivables related to customers that were in financial difficulties and management assessed that the receivable balances are fully impaired. Consequently, specific allowance for credit losses was recognised against the respective balances. Based on past experience, management believes that no further impairment allowance is necessary in respect of the remaining trade and other receivables as there has not been a significant change in credit quality and the balances are still considered fully recoverable. The Group does not hold any collateral over these balances.
15. CASH AND CASH EQUIVALENTS
2013
US$’000
2012
US$’000
Bank balances 27,472 51,473
Call deposits 545 1,332
28,017 52,805
As at 30 September 2013, an amount of US$2,231 thousand was provided as security for a bank guarantee issued in favour of a trade creditor of the Group, an amount of US$2,500 thousand was placed as security against a credit facility of a subsidiary of the Company (note 20(c)) and US$327 thousand was provided as security against certain credit facilities of the Group.
16. SHARE CAPITAL AND RESERVES
(a) Movements in components of equity
The reconciliation between the opening and closing balances of each component of the Group’s consolidated equity is set out in the consolidated statement of changes in equity.
(b) Ordinary share capital
At 30 September 2013, the authorised ordinary share capital of the Company consisted of 10,000,000,000 ordinary shares of US$0.001 each (2012: 10,000,000,000 ordinary shares). The issued and fully paid share capital of the Company consisted of 6,169,900 ordinary shares of US$0.001 each (2012: 6,169,900 ordinary shares).
During the year ended 30 September 2012 each issued and unissued ordinary share of the Company of nominal value of US$1.42 was subdivided, into 1,420 ordinary shares, such that following the subdivision the authorised share capital of the Company is US$14,200 divided into 14,200,000 ordinary shares of US$0.001 and the issued and fully paid share capital of the Company is US$6,170 divided into 6,169,900 ordinary shares of US$0.001 each, effective on 11 November 2011. In addition, the authorised share capital of the Company was increased to US$10,000,000 divided into 10,000,000,000 ordinary shares of US$0.001 each also effective on 11 November 2011.
All shares rank equally with regard to the Company’s residual assets. The holders of ordinary shares are entitled
to receive dividends as declared from time to time and are entitled to one vote per share at meetings of the Company.
The Company did not issue any ordinary shares during the years ended 30 September 2013 and 30 September 2012.
(c) Nature and purpose of reserves
(i) Share premium:
The share premium reserve represents the excess of the issuance price of shares over their nominal value
to the extent that it is registered at the Company registrar in Cyprus.

93
(ii) Other reserve:
Other reserve represents the excess of the issuance price of the Company’s ordinary shares over the sum of their nominal value and share premium arising from such issuance as registered with the Registrar of Companies in Cyprus.
(iii) Foreign currency translation reserve:
The foreign currency translation reserve comprises all foreign currency differences arising from the translation of the financial statements of foreign operations.
(d) Capital management
The Company manages its capital to ensure that it will be able to continue as a going concern, while maximising the return to the owners through the optimisation of the debt and equity balance. The policy of the Board of Directors is to maintain a strong capital base to sustain future development of the business. The Company is not exposed to externally imposed capital requirements.
17. REDEEMABLE PREFERENCE SHARES
2013
US$’000
2012
US$’000
Convertible redeemable preference shares of the Company (note 17(a)) 260,291 212,791
Class B preference shares of a subsidiary (note 17(b)) 12,171 12,548
(a) Terms of convertible redeemable preference shares of the Company
Convertible redeemable preference shares relate to convertible redeemable preference shares of the Company. The authorised convertible redeemable preference share capital of the Company was US$1,156 at 30 September 2013 and 2012, divided into 1,156 shares of US$1.00 each. The issued convertible redeemable preference share capital of the Company consisted of 1,051 shares at 30 September 2013 and 2012. All shares were issued on 14 April 2011, at a price of US$142,857 each and are fully paid. Convertible redeemable preference shares rank before ordinary shares with respect to the return of the nominal value of capital but rank equally with ordinary shares with respect to the Company’s residual assets after return of the nominal amount of capital. The holders of convertible redeemable preference shares are entitled to receive dividends as declared from time to time and
are entitled to one vote per share at meetings of the Company.
The convertible redeemable preference shares shall be converted into ordinary shares upon:
(i) Listing of the Company’s ordinary shares on any stock exchange acceptable to the holders of the majority of the convertible redeemable preference shares;
(ii) The sale of any of the shares in the capital of the Company which will result in the purchaser of those shares acquiring control of the Company; or
(iii) The sale of all or substantially all of the assets of the Group.
Convertible redeemable preference shares shall be converted into the number of fully paid ordinary shares at the higher of the following:
(i) 1,420 ordinary shares for every one convertible redeemable preference share; or
(ii) The number of ordinary shares calculated by dividing the notional return amount by the offer price per ordinary share in an IPO, or on the sale of any of the shares in the capital of the Company which will result in the purchaser of those shares acquiring control of the Company that sale price per share, or in the sale of all or substantially all assets of the Group the imputed price per share.
The notional return amount is the amount calculated by applying to the subscription price for each convertible redeemable preference share an IRR of 25%, taking into account any cash dividends which have been paid by the Company to the holders of the convertible redeemable preference shares between the subscription date and the conversion date.
According to the original terms, if none of the above events occurs within 24 months from the date of issuance of the convertible redeemable preference shares, then within ten business days from the receipt of a redemption notice, the Company must redeem the shares for a consideration equal to the subscription price of each share with a return by applying an IRR of 25% taking into account any cash dividends which have been paid by the Company to the holders of the convertible redeemable preference shares between the subscription date and
the redemption date.
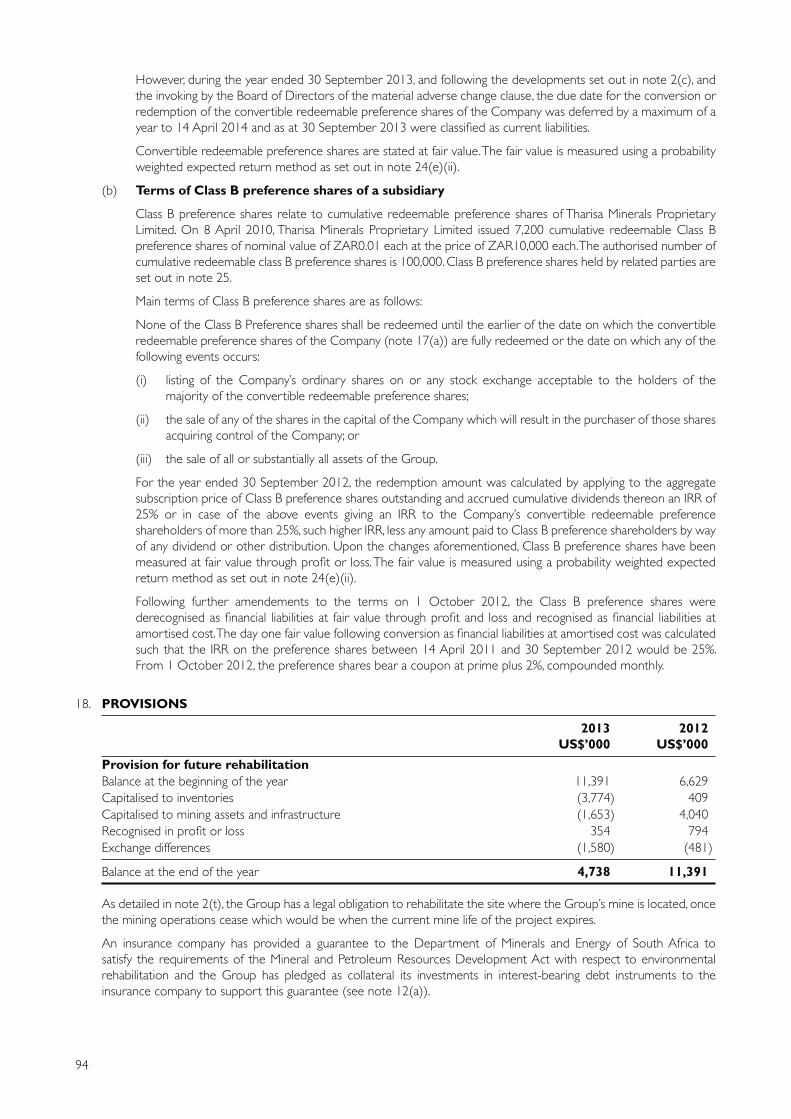
94
However, during the year ended 30 September 2013, and following the developments set out in note 2(c), and
the invoking by the Board of Directors of the material adverse change clause, the due date for the conversion or
redemption of the convertible redeemable preference shares of the Company was deferred by a maximum of a
year to 14 April 2014 and as at 30 September 2013 were classified as current liabilities.
Convertible redeemable preference shares are stated at fair value. The fair value is measured using a probability
weighted expected return method as set out in note 24(e)(ii).
(b) Terms of Class B preference shares of a subsidiary
Class B preference shares relate to cumulative redeemable preference shares of Tharisa Minerals Proprietary
Limited. On 8 April 2010, Tharisa Minerals Proprietary Limited issued 7,200 cumulative redeemable Class B
preference shares of nominal value of ZAR0.01 each at the price of ZAR10,000 each. The authorised number of
cumulative redeemable class B preference shares is 100,000. Class B preference shares held by related parties are
set out in note 25.
Main terms of Class B preference shares are as follows:
None of the Class B Preference shares shall be redeemed until the earlier of the date on which the convertible
redeemable preference shares of the Company (note 17(a)) are fully redeemed or the date on which any of the
following events occurs:
(i) listing of the Company’s ordinary shares on or any stock exchange acceptable to the holders of the
majority of the convertible redeemable preference shares;
(ii) the sale of any of the shares in the capital of the Company which will result in the purchaser of those shares
acquiring control of the Company; or
(iii) the sale of all or substantially all assets of the Group.
For the year ended 30 September 2012, the redemption amount was calculated by applying to the aggregate
subscription price of Class B preference shares outstanding and accrued cumulative dividends thereon an IRR of
25% or in case of the above events giving an IRR to the Company’s convertible redeemable preference
shareholders of more than 25%, such higher IRR, less any amount paid to Class B preference shareholders by way
of any dividend or other distribution. Upon the changes aforementioned, Class B preference shares have been
measured at fair value through profit or loss. The fair value is measured using a probability weighted expected
return method as set out in note 24(e)(ii).
Following further amendements to the terms on 1 October 2012, the Class B preference shares were
derecognised as financial liabilities at fair value through profit and loss and recognised as financial liabilities at
amortised cost. The day one fair value following conversion as financial liabilities at amortised cost was calculated
such that the IRR on the preference shares between 14 April 2011 and 30 September 2012 would be 25%.
From 1 October 2012, the preference shares bear a coupon at prime plus 2%, compounded monthly.
18. PROVISIONS
2013
US$’000
2012
US$’000
Provision for future rehabilitation
Balance at the beginning of the year 11,391 6,629
Capitalised to inventories (3,774) 409
Capitalised to mining assets and infrastructure (1,653) 4,040
Recognised in profit or loss 354 794
Exchange differences (1,580) (481)
Balance at the end of the year 4,738 11,391
As detailed in note 2(t), the Group has a legal obligation to rehabilitate the site where the Group’s mine is located, once
the mining operations cease which would be when the current mine life of the project expires.
An insurance company has provided a guarantee to the Department of Minerals and Energy of South Africa to
satisfy the requirements of the Mineral and Petroleum Resources Development Act with respect to environmental
rehabilitation and the Group has pledged as collateral its investments in interest-bearing debt instruments to the
insurance company to support this guarantee (see note 12(a)).

95
The interest rate used for estimating future costs is the long-term risk free rate as indicated by the R186 government
bond of South Africa, which was 7.92% and 7.45% as at 30 September 2013 and 2012, respectively. The net present
value of the current rehabilitation estimate is based on the average of the long-term inflation target range of the South
African Reserve Bank of between 3% and 6%.
19. DEFERRED TAX (LIABILITIES)/ASSETS
2013
US$’000
2012
US$’000
Recognised deferred tax assets/(liabilities)
At the beginning of the year 6,403 (2,578)
Temporary differences recognised in profit or loss in relation to:
– Capital allowances on property, plant and equipment (731) (52,521)
– Provisions (1,420) 1,468
– Tax losses 15,401 58,429
– Others 3,363 1,751
16,613 9,127
Exchange differences (2,393) (146)
At the end of the year 20,623 6,403
The Group did not have tax losses and temporary differences for which deferred tax was not recognised except
that the Group has not recognised deferred tax assets in respect of a subsidiary’s tax losses of US$980 thousand and
US$664 thousand as at 30 September 2013 and 2012, as it is not probable that future taxable profits against which the
losses can be utilised will be available in the relevant tax jurisdiction and entity. The tax losses at 30 September 2013
and 2012 expire in 2018 and 2017, respectively.
20. BORROWINGS
2013
US$’000
2012
US$’000
Non-current:
Secured bank borrowing (note 20(a)) 82,876 121,424
Other borrowings – loans payable to third parties (note 20(b)) 1,979 –
84,855 121,424
Current:
Secured bank borrowing (note 20(a)) 27,811 –
Other borrowings – loans payable to third parties (note 20(b)) 1,354 362
Other borrowings – bank credit and other facility (note 20(c)) 12,610 –
Other borrowings – loans payable to related parties (note 25) 2,870 2,935
44,645 3,297
(a) During the year ended 30 September 2012 the Group obtained financing of ZAR1 billion from a consortium
of banks in South Africa, to finance the expansion projects of its mining activities. The financing is for a period of
7 years and is repayable in 22 equal quarterly installments, with the first repayment date at 31 December 2013.
The financing bears interest at 3 month JIBAR plus 3.4% to 3.9% per annum. The financing was obtained by Tharisa
Minerals Proprietary Limited, a subsidiary of the Group, and is secured by the assets of the subsidiary and by the
shares of the Company in the subsidiary and is also guaranteed by the Company.
The loan contains financial covenants, which the borrower needs to maintain at levels in excess of:
• Debt service cover ratio at a level greater than 1.4 times.
• Loan life cover ratio at a level greater than 1.6 times.
• Reserve tail ratio at a level of 30% or greater.
(b) During the year ended 30 September 2012 the Group obtained a credit facility of ZAR35,000 thousand from a
third party. The facility is payable in 36 equal monthly instalments commencing 7 months after the first draw down.
Interest on the facility utilized as at the prevailing South African prime interest rate.

96
(c) During the year ended 30 September 2013 the Group obtained a US$12,500 thousand bank credit facility that
allows the Group to receive a percentage of trade receivables on receipt of an acceptable letter of credit which
results in significant shortening of the credit period. This facility has a tenor of 60 days and is secured by cash and
cash equivalents of the Group of US$2,500 thousand and is also guaranteed by the Company. The other facility
relates to the discounting with recourse of the letters of credits by the Group’s banks following performance of the
letter of credit conditions by the Group which results in funds being received in advance of the normal payment
date. Interest on these facilities ranges from US Libor plus 1.6% to 2.5%.
21. CURRENT TAXATION
Current taxation in the statements of financial position represents:
2013
US$’000
2012
US$’000
Corporate income tax recoverable (note 21(a)) – 220
Corporate income tax payable (note 21(a)) 294 110
Special contribution for defence (note 21(b)) – 7
294 117
(a) The above amounts are provided in Cyprus and South Africa.
(b) The above amounts are provided in Cyprus.
22. TRADE AND OTHER PAYABLES
2013
US$’000
2012
US$’000
Trade payables – third parties 14,339 10,006
Other payables 887 369
Accruals 13,722 23,407
Leave pay provision 1,631 1,308
Operating lease payable 74 –
Amount due to related parties (note 25) 150 97
30,803 35,187
All of the trade payables were current as at 30 September 2013 and 30 September 2012.
23. BUSINESS COMBINATIONS
(a) Acquisition of a subsidiary
Braeston Corporate Consulting Services Proprietary Limited:
On 1 April 2013, Tharisa Administration Services Limited acquired 100% of the ordinary share capital of Braeston
Corporate Consulting Services Proprietary Limited for US$108. Braeston Corporate Consulting Services
Proprietary Limited is a South African company that was acquired to provide and centralise management and
administration services primarily to other group companies. The subsidiary contributed revenue of US$4 thousand
to the Group during the period from 1 April 2013 to 30 September 2013. The subsidiary contributed a loss of
US$339 thousand during the period from 1 April 2013 to 30 September 2013. If the acquisition had occurred
on 1 October 2012, the subsidiary would have contributed revenue and loss of US$6 thousand and
US$384 thousand respectively for the year ended 30 September 2013.

97
Details of net assets acquired and goodwill are as follows:
Carrying amounts
and
fair values
US$’000
Trade and other receivables 17
Cash and cash equivalents 154
Trade and other payables (80)
Borrowings (487)
(396)
Goodwill arising from acquisition (note 10) 396
Consideration paid satisfied in cash –
Cash acquired (154)
Net cash inflow in respect of the acquisition of subsidiary (154)
Management has assessed that the fair values of the identifiable assets acquired and liabilities assumed were
approximately the same as the amounts presented in the books of the subsidiary on the acquisition date.
(b) Acquisition of non controlling interests
Tharisa Investments Limited:
On 22 November 2011, the Company and Fujian signed an agreement, according to which Fujian transferred its
15% equity interests in Tharisa Investments Limited to the Company. The consideration for this transfer was the
par value of the shares transferred of US$22.5 and a call option written by the Company which conferred to
Fujian a right to purchase 15% of the equity capital of Tharisa Fujian Industrial Co., Limited at YUAN 100 any time
after 31 December 2012.
The Group recognised an increase in non controlling interests of US$1,311 thousand, an increase in accumulated
losses of US$1,310 thousand and a decrease in foreign currency translation reserve of US$1 thousand.
The following summarises the effect of changes in the Company’s ownership interest in Tharisa Investments
Limited and its wholly-owned subsidiary Tharisa Fujian Industrial Co., Limited.
US$’000
Company’s ownership interest at 1 October 2011 4,365
Effect of increase in Company’s ownership interest 1,311
Share of comprehensive income 3,030
Company’s ownership interest at 30 September 2012 8,706
24. FINANCIAL RISK MANAGEMENT
In the ordinary course of business the Group is exposed to credit risk, liquidity risk, and market risk. This note presents
information about the Group’s exposure to each of the above risks and its objectives, policies and processes for
measuring and managing risks. Further quantitative disclosures are included throughout this note.
The Group’s risk management policies are established to identify and analyse the risks faced by the Group, to set
appropriate risk limits and controls and to monitor risks and adherence to limits. Risk management policies and systems
are reviewed regularly to reflect changes in market conditions and the Group’s activities. The Group, through its training
and management standards and procedures, aims to develop a disciplined and constructive control environment in
which all employees understand their roles and obligations.
The Board of Directors has overall responsibility for the establishment and oversight of the Group’s risk management
framework.
(a) Credit risk
Credit risk is the risk of financial loss to the Group if a customer or a counterparty to a financial instrument fails
to meet its contractual obligations and arises principally from the Group’s trade and other receivables and cash
and cash equivalents and deposits.

98
Trade and other receivables:
The Group’s exposure to credit risk is influenced mainly by the individual characteristics of each customer.
However, management also considers the demographics of the Group’s customer base, including the default risk
of the industry and country, in which customers operate, as these factors may have an influence on credit risk. In
monitoring customer credit risk, management reviews on a regular basis the ageing of trade and other receivables
to obtain comfort that there are no past due amounts.
The Group establishes an allowance for credit losses that represents its estimate of incurred losses in respect of
trade and other receivables. The main component of this allowance is a specific loss component that relates to
individually significant exposures. At the reporting date, none of the carrying amounts of trade and other
receivables is either past due or impaired, except for US$Nil thousand at 30 September 2013 and US$163 thousand
at 30 September 2012, for which a full allowance for credit losses has been recorded. Receivables that were
neither past due nor impaired relate to customers for whom there was no recent history of default and whom
have a good track record with the Group.
The allowance for credit losses in respect of trade and other receivables is used to record credit losses unless
management is satisfied that no recovery of the amount owing is possible and at that point the amount considered
irrecoverable is written off against the financial asset directly.
The most significant exposure of the Company to credit risk is represented by the carrying amount of trade
receivables. The Board of Directors performs regular ageing reviews of trade receivables to identify any doubtful
balances. Based on the review performed for the reporting period, the Board of Directors concluded that no
additional allowance for credit losses is necessary in respect of trade receivables. 37% and 46% of the total trade
receivables were due from the Group’s largest customer as at 30 September 2013 and 30 September 2012,
respectively.
Cash and cash equivalents and deposits:
The Group limits its exposures on cash and cash equivalents and deposits by dealing only with well-established
financial institutions of high quality credit standing. The majority of the Group’s cash resources were deposited
with The Hongkong and Shanghai Banking Corporation Limited based in Hong Kong and South Africa.
(b) Liquidity risk
Liquidity risk is the risk that the Group will encounter difficulties in meeting the obligations associated with its
financial liabilities that are settled by delivering cash or another financial asset. The Group’s approach to managing
liquidity is to ensure, as far as possible, that it will always have sufficient liquidity to meet its liabilities when due,
under both normal and stressed conditions, without incurring unacceptable losses or risking damage to the
Group’s reputation. Typically the Group ensures that it has sufficient cash on demand to meet expected
operational expenses, including the servicing of financial obligations. This excludes the potential impact of extreme
circumstances that cannot reasonably be predicted, such as natural disasters.
The following table shows the remaining contractual maturities of the Group’s financial liabilities at the end of the
reporting period, which are based on contractual undiscounted cash flows (including interest payments computed
using contractual rates or, if floating, based on rates current at the end of the reporting period) and the earliest
date the Group can be required to pay:
30 September 2013
Contractual undiscounted cash outflow
Within
1 year or
on demand
US$’000
More than
1 year but
less than
2 years
US$’000
More than
2 years but
less than
5 years
US$’000
More
than
5 years
US$’000
Total
US$’000
Carrying
amount
at
30 September
US$’000
Borrowings 46,866 29,531 74,048 10,612 161,057 129,500
Trade and other
payables 30,803 – – – 30,803 30,803
Class B preference
shares 12,171 – – – 12,171 12,171
Current taxation 294 – – – 294 294
90,134 29,531 74, 048 10,612 204,325 172,768

99
Contractual undiscounted cash outflow
Within
1 year or
on demand
US$’000
More than
1 year but
less than
2 years
US$’000
More than
2 years but
less than
5 years
US$’000
More
than
5 years
US$’000
Total
US$’000
Carrying
amount
at
30 September
US$’000
30 September 2012
Borrowings 3,596 55,314 66,412 – 125,322 124,721
Trade and other
payables 35,187 – – – 35,187 35,187
Class B preference
shares 14,983 – – – 14,983 12,548
Current taxation 117 – – – 117 117
53,883 55,314 66,412 – 175,609 172,573
The Board of Directors expects all of the convertible redeemable preference shares to be converted into the
Company’s ordinary shares upon listing of the Company’s ordinary shares (see note 2(c) and 17(a)) and that
there will be no cash redemption relating to the convertible redeemable preference shares. Should full redemption
of the convertible redeemable preference shares be required, the contractual undiscounted cash out flow
requirements of the Group with respect to these shares are estimated to amount to US$293,427 thousand and
US$234,213 thousand at 30 September 2013 and 2012, respectively.
(c) Market risk
Market risk is the risk that changes in market prices, such as foreign exchange rates and interest rates, will affect
the Group’s income and the values of its financial instruments. The objective of market risk management is to
manage and control market risk exposures within acceptable parameters, while optimising the return.
(i) Currency risk:
The Group is exposed to currency risk on transactions that are denominated in a currency other than the
respective functional currency of the Group entities. These currency risk exposures arise primarily from
exchange rate movements in ZAR, Euro (€), British Sterling (STG) and US$.
The following table details the Group’s exposure at the end of each reporting period to currency risk
arising from recognised assets and liabilities denominated in a currency other than the functional currency
of the entity to which they relate. Exposures in US$ relate to recognised assets and liabilities denominated
in US$ of entities of the Group that have a functional currency other than the US$. For presentation
purposes, the amounts of the exposure are shown in US$, translated using the spot rate at the reporting
date. Differences resulting from the translation of the financial statements of foreign operations into the
Group’s presentation currency are excluded.
At the reporting date the Group’s exposure to currency risk was as follows:
Amounts in US$’000
30 September 2013 30 September 2012
US$ ZAR € STG US$ ZAR € STG
Other financial assets – – – – 132 – – –
Trade and other receivables – 45 377 – 103 60 170 –
Cash and cash equivalents 6,227 123 85 1 4,601 440 76 –
Trade and other payables – (89) (565) (88) – (152) (278) –
Current taxation – – (274) – – – 190 –
6,227 79 (377) (87) 4,836 348 158 –
A 10% strengthening of the US$ against the above currencies at the reporting date would have changed
losses and equity by the amounts shown below. This analysis assumes that all other variables, and in particular
interest rates, remain constant. The analysis has been performed on the same basis for each reporting date.

100
30 September
2013
Decrease/
(increase)
in loss for
the year and
accumulated
losses
US$’000
30 September
2012
Decrease in loss
for the year and
accumulated
losses
US$’000
ZAR (7) (32)
€ 34 (14)
US$ (724) (562)
STG 8 –
A 10% weakening of the US$ against the above currencies at each reporting date would have had an equal
but opposite effect to the amounts shown above, on the basis that all other variables remain constant.
(ii) Interest rate risk:
Interest rate risk is the Group’s exposure to adverse movements in interest rates. It arises as a result of
timing differences on the repricing of assets and liabilities.
As at the reporting date, the interest rate profile of the Group was as follows:
30 September
2013
%
30 September
2012
%
30 September
2013
US$’000
30 September
2012
US$’000
Variable rate financial
assets
Investments in cash funds and
income funds 3.5% 6% 3,656 3,705
Cash and cash equivalents 4.6 5.5 – 7.5 8,677 20,536
12,333 24,241
Variable rate financial
liabilities
Secured bank borrowing JIBAR +3.4% JIBAR +3.4% 110,687 121,424
Other borrowings – Loan
from third party ZAR prime ZAR prime 3,333 362
Other borrowings – Bank
credit and other facility
US libor +1.6%
– 2.5% – 12,610 –
Other borrowings – Loan
payable to related party ZAR prime + 2% – 2.870 –
Class B preference shares ZAR prime+ 2% – 12,171 –
141,671 121,786
A change of 100 basis points in interest rates at each reporting date would have changed losses and equity
by the amounts shown below. This analysis assumes that all other variables, and in particular foreign currency
rates, remain constant. The analysis has been performed on the same basis for each reporting date.

101
30 September
2013
Decrease/
(increase)
in loss for the
year and
accumulated
losses
US$’000
30 September
2012
Decrease/
(increase)
in loss for the
year and
accumulated
losses
US$’000
Investments in cash funds and income funds 26 27
Cash and cash equivalents 62 148
Secured bank borrowing (797) (874)
Other borrowings – Loan from third party (24) (3)
Other borrowings – Bank credit and other facility (90) –
Other borrowings – Loan payable to related party (20) –
Class B preference shares (88) –
(931) (702)
A decrease of 100 basis points in interest rates at each reporting date would have had an equal but
opposite effect to the amounts shown above, on the basis that all other variables remain constant.
(d) Fair values
The Board of Directors considers that the fair values of significant financial assets and financial liabilities
approximate to their carrying values at each reporting date.
Financial instruments carried at fair value:
The following table presents the carrying values of financial instruments measured at fair value at the end of each
reporting period across the 3 levels of the fair value hierarchy defined in IFRS7, Financial Instruments: Disclosures,
with the fair value of each financial instrument categorised in its entirety based on the lowest level of input that
is significant to that fair value measurement.
The levels are defined as follows:
• Level 1 (highest level): fair values measured using quoted prices (unadjusted) in active markets for identical
financial instruments.
• Level 2: fair values measured using quoted prices in active markets for similar financial instruments, or
using valuation methodologies in which all significant inputs are directly or indirectly based on observable
market data.
• Level 3: fair values measured using valuation methodologies in which any significant inputs are not based on
observable market data.
Level 1
US$’000
Level 2
US$’000
Level 3
US$’000
30 September 2013
Financial assets
– Investments in cash funds and income funds 3,656 – –
– Interest rate caps 118 – –
– Discount facility – 225 –
– Investments at fair value through profit or loss 86 – –
3,860 225 –
Liabilities
– Convertible redeemable preference shares – – 260,291

102
Level 1
US$’000
Level 2
US$’000
Level 3
US$’000
30 September 2012
Assets
– Investments in cash funds and income funds 3,705 – –
– Interest rate caps 132 – –
– Foreign exchange forward contracts 103 – –
3,940 – –
Liabilities
– Convertible redeemable preference shares – – 212,791
– Class B preference shares – – 12,548
– Loan from Langa Trust – – 2,935
– – 228,274
The movement during the years ended 30 September 2013 and 2012 in the balance of Level 3 fair value measurements is as follows:
2013
US$’000
2012
US$’000
Convertible redeemable preference shares
At 1 October 212,791 207,184
Changes in fair value of financial liabilities at fair value through profit or loss 47,500 5,607
At 30 September 260,291 212,791
Total gains or losses for the year included in profit or loss 47,500 5,607
Class B preference shares
At 1 October 12,548 13,130
Derecognition from fair value basis to amortised cost upon term changes
(see note 17(b)) (13,289) –
Changes in fair value of financial liabilities at fair value through profit or loss 741 45
Exchange differences – (627)
At 30 September – 12,548
Total gains or losses for the year included in profit or loss 741 45
Other borrowings – loan payable to Langa Trust
At 1 October 2,935 3,070
Recognition at fair value through profit or loss upon term changes
(see note 25) (3,118) –
Changes in fair value of financial liabilities at fair value through profit or loss 183 12
Exchange differences – (147)
At 30 September – 2,935
Total gains or losses for the year included in profit or loss 183 12
(e) Estimation of fair values
The following summarises the major methods and assumptions used in estimating the fair values of financial instruments.
(i) Investments in cash funds and income funds, investments at fair value through profit or loss, forward exchange contracts and interest rate caps:
Fair values are based on quoted market prices at the end of the reporting period without any deduction for transaction costs.
(ii) Discount facility
The fair values are calculated by multiplying the actual metal quantities per discounted invoice with the difference between the hedged metal price per discounted invoice and the average spot metal price translated to ZAR using the average monthly rate.
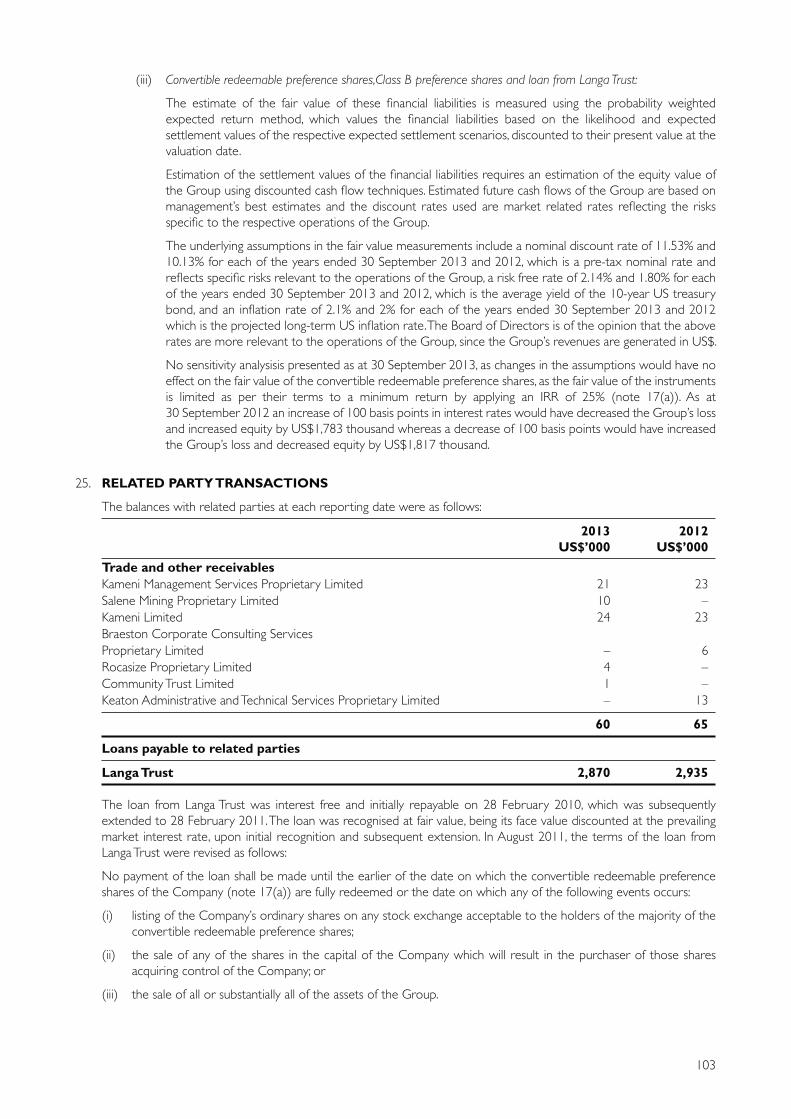
103
(iii) Convertible redeemable preference shares,Class B preference shares and loan from Langa Trust:
The estimate of the fair value of these financial liabilities is measured using the probability weighted
expected return method, which values the financial liabilities based on the likelihood and expected
settlement values of the respective expected settlement scenarios, discounted to their present value at the
valuation date.
Estimation of the settlement values of the financial liabilities requires an estimation of the equity value of
the Group using discounted cash flow techniques. Estimated future cash flows of the Group are based on
management’s best estimates and the discount rates used are market related rates reflecting the risks
specific to the respective operations of the Group.
The underlying assumptions in the fair value measurements include a nominal discount rate of 11.53% and
10.13% for each of the years ended 30 September 2013 and 2012, which is a pre-tax nominal rate and
reflects specific risks relevant to the operations of the Group, a risk free rate of 2.14% and 1.80% for each
of the years ended 30 September 2013 and 2012, which is the average yield of the 10-year US treasury
bond, and an inflation rate of 2.1% and 2% for each of the years ended 30 September 2013 and 2012
which is the projected long-term US inflation rate. The Board of Directors is of the opinion that the above
rates are more relevant to the operations of the Group, since the Group’s revenues are generated in US$.
No sensitivity analysisis presented as at 30 September 2013, as changes in the assumptions would have no
effect on the fair value of the convertible redeemable preference shares, as the fair value of the instruments
is limited as per their terms to a minimum return by applying an IRR of 25% (note 17(a)). As at
30 September 2012 an increase of 100 basis points in interest rates would have decreased the Group’s loss
and increased equity by US$1,783 thousand whereas a decrease of 100 basis points would have increased
the Group’s loss and decreased equity by US$1,817 thousand.
25. RELATED PARTY TRANSACTIONS
The balances with related parties at each reporting date were as follows:
2013
US$’000
2012
US$’000
Trade and other receivables
Kameni Management Services Proprietary Limited 21 23
Salene Mining Proprietary Limited 10 –
Kameni Limited 24 23
Braeston Corporate Consulting Services
Proprietary Limited – 6
Rocasize Proprietary Limited 4 –
Community Trust Limited 1 –
Keaton Administrative and Technical Services Proprietary Limited – 13
60 65
Loans payable to related parties
Langa Trust 2,870 2,935
The loan from Langa Trust was interest free and initially repayable on 28 February 2010, which was subsequently
extended to 28 February 2011. The loan was recognised at fair value, being its face value discounted at the prevailing
market interest rate, upon initial recognition and subsequent extension. In August 2011, the terms of the loan from
Langa Trust were revised as follows:
No payment of the loan shall be made until the earlier of the date on which the convertible redeemable preference
shares of the Company (note 17(a)) are fully redeemed or the date on which any of the following events occurs:
(i) listing of the Company’s ordinary shares on any stock exchange acceptable to the holders of the majority of the
convertible redeemable preference shares;
(ii) the sale of any of the shares in the capital of the Company which will result in the purchaser of those shares
acquiring control of the Company; or
(iii) the sale of all or substantially all of the assets of the Group.

104
Prior to 1 October 2012, the redemption amount was calculated by applying to the aggregate amount of the loan
outstanding as at the date of the issue of the Company’s convertible redeemable preference shares, an IRR of 25% or
in case of the above events giving an IRR to the convertible redeemable preference shareholders of more than 25%,
such higher IRR.
The loan has been subordinated in favour of the Group’s secured bank borrowings.
Upon the changes aforementioned, the loan has been measured at fair value through profit or loss for the year ended
30 September 2012. The fair value was measured using a probability weighted expected return method as set out in
note 24(e)(ii).
Following further amendements to the terms on 1 October 2012, the loan from Langa Trust was derecognised as a
financial liability at fair value through profit and loss and recognised as a financial liability at amortised cost. The day one
fair value following conversion as financial liabilities at amortised cost was calculated such that the IRR on the Langa
Trust loan between 14 April 2011 and 30 September 2012 would be 25%. From 1 October 2012, the Langa Trust loan
bears interest at prime plus 2%, compounded monthly.
2013
US$’000
2012
US$’000
Trade and other payables
Evi Papacleovoulou 34 96
Keaton Admininstrative and Technical Services Proprietary Limited 1 –
Kameni Management Services Proprietary Limited 11 –
Director – Antonios Djakouris 38 –
Director – John David Salter 28 –
Director – Ioannis Drapaniotis 38 –
Helen Pouroulis – 1
150 97
The above amounts are unsecured, interest free and with no fixed repayment dates.
Class B preference shares of a subsidiary held by related parties are as follows:
Number of
shares
2013
Carrying
amount
US$’000
2013
Number of
shares
2012
Carrying
amount
US$’000
2012
Arti Trust 4,000 6,998 4,000 7,258
Ditodi Trust 300 485 300 496
Makhaye Trust 300 485 300 496
The Phax Trust 600 970 600 992
The Rowad Trust 300 485 300 496
Jonathan Alan Clark – – 300 496
Moira June Jacquet-Briner 300 485 300 496
5,800 9,908 6,100 10,730
Convertible redeemable preference shares of the Company held by related parties.
Number of
shares
2013
US$’000
2013
Number of
shares
2012
US$’000
2012
Fujian Wuhang Stainless Steel Products Co. Limited 112 27,738 112 22,676

105
Significant transactions carried at arm’s length with related parties during the year were as follows:
2013
US$’000
2012
US$’000
Revenue
Hong Kong Heyi Mining Resource Co Limited 9,662 4
Rocasize Proprietary Limited 4 –
The Community Trust 1 –
9,667 4
Interest expense
Langa Trust 311 –
Arti Trust 661 –
Ditodi Trust 56 –
Makhaye Trust 56 –
The Phax Trust 112 –
The Rowad Trust 56 –
Jonathan Alan Clark 56 –
Moira June Jacquet-Briner 56 –
1,364 –
Rental expense
Helen Pouroulis – 25
Consulting and other management fees
Kameni Management Services Proprietary Limited – 145
Kameni Limited – 23
– 168
Travel expenses paid
Salene Mining Proprietary Limited 1 86
Relationships between parties:
Braeston Corporate Consulting Services Proprietary Limited:
One of the directors of the Company and one of the directors of Tharisa Minerals Proprietary Limited are shareholders
of Braeston Corporate Consulting Services Proprietary Limited. Braeston Corporate Consulting Services Proprietary
Limited ceased to be a related party on 1 April 2013 when it was 100% acquired by the Group.
Kameni Management Services Proprietary Limited (“Kameni”):
A director of the holding company of Kameni is also a director of Tharisa Minerals Proprietary Limited and of the
Company.
Kameni Limited:
A director of Kameni Limited is also a director of Tharisa Minerals Proprietary Limited.
Salene Mining Proprietary Limited:
A director of Salene Mining Proprietary Limited is also a director of Tharisa Minerals Proprietary Limited.
Keaton Administrative and Technical Services Proprietary Limited:
Two of the directors of the holding company of Keaton are also directors of the Company.
Medway Developments Limited:
Medway Developments Limited is the holding company of the Company.
Langa Trust:
One of the directors of the Company who is also a director of Tharisa Minerals Proprietary Limited is a beneficiary of
this trust.
Arti Trust:
One of the directors of Tharisa Minerals Proprietary Limited is a beneficiary of this trust.

106
Ditodi Trust:
The non-controlling interest of Tharisa Minerals Proprietary Limited is a beneficiary of this trust.
Makhaye Trust:
The non-controlling interest of Tharisa Minerals Proprietary Limited is a beneficiary of this trust.
The Phax Trust:
One of the Directors of the Company is a beneficiary of this trust.
The Rowad Trust:
One of the Directors of the Company is a beneficiary of this trust.
Jonathan Alan Clark:
Jonathan Alan Clark was a director of Tharisa Minerals Proprietary Limited until 25 September 2013. Jonathan Alan Clark ceased to be a related party on 25 September 2013 following his resignation as a director of Tharisa Minerals Proprietary Limited.
Moira June Jacquet-Briner:
Moira June Jacquet-Briner is a director Tharisa Minerals Proprietary Limited and in the non-controlling interest of Tharisa Minerals Proprietary Limited.
Fujian Wuhang Stainless Steel Products Co. Limited:
Fujian Wuhang Stainless Steel Products Co. Limited is a shareholder of the Company.
Evi Papacleovoulou:
Evi Papacleovoulou was a Director of the Company until 30 January 2013 and was the Company Secretary until 13 February 2014.
Helen Pouroulis:
Helen Pouroulis is a close family member of the chief executive officer of the Company.
Antonios Djakouris:
Antonios Djakouris is a director of the Company.
John David Salter:
John David Salter is a director of the Company.
Ioannis Drapaniotis:
Ioannis Drapaniotis is a director of the Company.
Hong Kong Heyi Mining Resource Co. Limited:
Hong Kong Heyi Mining Resource Co. Limited is a shareholder of the Company.
The Community Trust:
The Community Trust is a shareholder of Tharisa Minerals Proprietary Limited.
Rocasize Proprietary Limited:
Rocasize Proprietary Limited is a subsidiary of The Community Trust. .
26. CAPITAL COMMITMENTS
(a) Capital commitments of the Group in respect of property, plant and equipment outstanding at the reporting
period not provided for in the consolidated financial statements were as follows:
2013
US$’000
2012
US$’000
Contracted for 3,931 9,005
Authorised but not contracted for 6,808 24,340
10,739 33,345

107
(b) The Company holds an indirect 100% equity interest in Tharisa Fujian Industrial Co., Limited, the registered capital
of which is US$10,000 thousand. Up to 30 September 2013, US$4,200 thousand has been paid up. The remaining
US$5,800 thousand needs to be paid up by 14 February 2014.
(c) A Company guarantee was issued to ABSA Bank Limited which guarantees the payment of certain liabilities of
Arxo Logistics Proprietary Limited to ABSA Bank Limited totalling ZAR19,000 thousand.
27. OPERATING LEASES
Non-cancellable operating lease rentals are payable as follows:
2013
US$’000
2012
US$’000
Less than 1 year 292 287
Between 1 and 5 years 51 161
343 448
The Group leases a number of office facilities under operating leases. The leases typically run for a period of 2 to 3 years.
A portion of lease payments are increased every year to reflect market rentals. The amounts recognised as an expense
in profit or loss in respect of operating leases are disclosed in note 6. Certain leased office facilities are sublet by the
Group (see note 4).
Since the property titles did not pass to the Group, the Group determined that the leased office facilities are operating
leases. The rents paid to landlords are increased to market rents at regular intervals and the Group does not participate
in the residual value of the buildings, therefore, it was determined that substantially all the risks and rewards of the
buildings are with the landlords.
28. IMMEDIATE AND ULTIMATE CONTROLLING PARTY
At 30 September 2013, the Board of Directors considers the immediate parent and ultimate controlling party of the
Group to be Medway Developments Limited and Mr Adonis Pouroulis, respectively. Medway Developments Limited
is incorporated in Cyprus under the requirements of the Cyprus Companies Law, Cap. 113 and produces financial
statements available for public use in accordance with the requirements of the aforementioned law.
29. EVENTS AFTER THE REPORTING PERIOD
Following the year end, the Company provided a cash amount of US$8,476 thousand as security for a bank guarantee
for the debt service reserve account as required within the Common Terms Agreement for the project financing of
Tharisa Minerals Proprietary Limited as disclosed in note 20(a). This amount will be reduced by the additional amount,
if any, transferred by Tharisa Minerals Proprietary Limited to its debt service reserve account. The amount of security
includes a 10% margin for exchange rate fluctuations.
108
ANNEXURE 2
INDEPENDENT REPORTING ACCOUNTANTS’ REPORT ON THE HISTORICAL
FINANCIAL INFORMATION
The DirectorsTharisa plcOffice 108-110S. Pittokopitis Business Centre17 Neophytou Nicolaides and Kilkis Street8011 PaphosCyprus
20 March 2014
Dear Sirs
Independent Reporting Accountants’ Report on the Historical Financial Information of Tharisa plc
Introduction
At your request and for the purposes of the pre-listing statement to be dated on or about 25 March 2014, we have audited the historical financial information of Tharisa plc for the year ended 30 September 2013 and reviewed the historical financial information for the 3 months ended 31 December 2013 and for the years ended 30 September 2012 and 30 September 2011 presented in the Report of Historical Financial Information which comprises the consolidated statements of financial position, and the statements of comprehensive income, statements of changes in equity and cash flows for the 3 years then ended and a summary of significant accounting policies and other explanatory notes (“the Financial Information”), as presented in Annexure 1 and Annexure 5 to the pre-listing statement, in compliance with the JSE Listings Requirements.
KPMG Cyprus is the independent auditor to Tharisa plc. KPMG Inc. are the Independent Reporting Accountants to Tharisa plc.
Responsibility of the Directors
The directors of Tharisa plc are responsible for the compilation, contents and preparation of the pre-listing statement including the financial information in accordance with the JSE Listings Requirements. The directors are also responsible for the fair presentation of the Historical Financial Information in accordance with International Financial Reporting Standards and for such internal control as the directors determine is necessary to enable the preparation of the Historical Financial Information that is free from material misstatement, whether due to fraud or error.
Responsibility of the Independent Reporting Accountants
Our responsibility is to express an audit opinion on the Historical Financial Information based on our audit, for the year ended 30 September 2013 included in Annexure 1 to the pre-listing statement in accordance with International Standards on Auditing, and a review conclusion on the Historical Financial Information for the 3 month period ended 31 December 2013 and for each of the years ended 30 September 2012 and 30 September 2011 included in Annexure 2 and Annexure 5 to the pre-listing statement in accordance with International Standard on Review Engagements (ISRE) 2400 (Revised), Engagements to Review Historical Financial Statements. No adjustments have been made to the previously reported Historical Financial Information of Tharisa plc and its subsidiaries when compiling the consolidated Historical Information.
Consolidated Historical Financial Information for the year ended 30 September 2013
We have audited the Consolidated Historical Financial Information for the year ended 30 September 2013 attached as Annexure 1 to the pre-listing statement.
Responsibility of the independent reporting accountants on the Consolidated Historical Financial Information
Our responsibility is to express an opinion on the Consolidated Historical Financial Information for the year ended 30 September 2013. We conducted our audit in accordance with International Standards on Auditing. Those standards require that we comply with ethical requirements and plan and perform the audit to obtain reasonable assurance about whether the Historical Financial Information is free from material misstatement.

109
An audit involves performing procedures to obtain audit evidence about the amounts and disclosures in the Consolidated
Historical Financial Information. The procedures selected depend on the auditor’s judgement, including the assessment of
the risks of material misstatement of the Consolidated Historical Financial Information, whether due to fraud or error. In
making those risk assessments, the auditor considers internal control relevant to the entity’s preparation and fair
presentation of the Consolidated Historical Financial Information in order to design audit procedures that are appropriate
in the circumstances, but not for the purpose of expressing an opinion on the effectiveness of the entity’s internal control.
An audit also includes evaluating the appropriateness of accounting policies used and the reasonableness of accounting
estimates made by management, as well as evaluating the overall presentation of the Consolidated Historical Financial
Information.
We believe that the audit evidence we have obtained is sufficient and appropriate to provide a basis for our audit
opinion. The evidence included that previously obtained by KPMG Cyprus in the conduct of their audit of the annual
financial statements of Tharisa plc underlying the Consolidated Historical Financial Information for the year ended
30 September 2013.
Opinion
In our opinion, the Consolidated Historical Financial Information of Tharisa plc, as set out in Annexure 1 to the pre-listing
statement, presents fairly, in all material respects, for the purpose of the pre-listing statement the consolidated financial
position of Tharisa plc at 30 September 2013 and its financial performance and its cash flows for the year then ended in
accordance with International Financial Reporting Standards and in the manner required by the JSE Listings Requirements.
Emphasis of matter
We draw attention to note 2(c) to the Historical Financial Information which indicates that at 30 September 2013, the
Group’s current liabilities exceeded its current assets by US$266,710 thousand and its total liabilities exceeded total assets
by US$53,641 thousand. These conditions, along with the matters as set forth in note 2(c), indicate that in an event of a
no listing scenario and/or should there be a different interpretation to the Board of Directors’ opinion as to the legal
obligation of the Group to redeem the convertible redeemable preference shares, which will result in a full redemption
of the convertible redeemable preference shares, payable within 10 business days of a redemption notice, the Group may
not have the necessary liquid funds required to redeem its convertible redeemable preference shares and continue as a
going concern. Our opinion is not qualified in respect of this matter.
Consolidated Historical Financial Information for each of the 2 years ended 30 September 2012 and 30
September 2011
We have reviewed the Consolidated Historical Financial Information attached as Annexure 1 to the pre-listing statement
for each of the 2 years ended 30 September 2012 and 30 September 2011 prepared in accordance with International
Financial Reporting Standards.
Scope of our review
Our responsibility is to express a conclusion on the accompanying financial statements. We conducted our review in
accordance with International Standard on Review Engagements (ISRE) 2400 (Revised), Engagements to Review Historical
Financial Statements. ISRE 2400 (Revised) requires us to conclude whether anything has come to our attention that causes
us to believe that the financial statements, taken as a whole, are not prepared in all material respects in accordance with
the applicable financial reporting framework. This Standard also requires us to comply with relevant ethical requirements.
A review of financial statements in accordance with ISRE 2400 (Revised) is a limited assurance engagement. The
practitioner performs procedures, primarily consisting of making inquiries of management and others within the entity, as
appropriate, and applying analytical procedures, and evaluates the evidence obtained.
The procedures performed in a review are substantially less than those performed in an audit conducted in accordance
with International Standards on Auditing. Accordingly, we do not express an audit opinion on these financial statements.
Conclusion
Based on our reviews, nothing has come to our attention that causes us to believe that the Consolidated Historical
Financial Information as set out in Annexure 1 to the pre-listing statement for the 2 years ended 30 September 2012 and
30 September 2011 does not fairly present, in all material respects, the consolidated financial position of Tharisa plc as at
30 September 2012 and 30 September 2011, and of its consolidated financial performance and consolidated cash flows for
the years then ended in accordance with International Financial Reporting Standards and in the manner required by the
JSE Listings Requirements.

110
Consolidated Historical Financial Information for the 3 months ended 31 December 2013
We have reviewed the Consolidated Historical Financial Information attached as Annexure 5 to the pre-listing statement
for the 3 months ended 31 December 2013 prepared in accordance with International Accounting Standard 34 “Interim
Financial Reporting”.
Scope of our review
Our responsibility is to express a conclusion on the accompanying financial statements. We conducted our review in
accordance with International Standard on Review Engagements (ISRE) 2400 (Revised), Engagements to Review Historical
Financial Statements. ISRE 2400 (Revised) requires us to conclude whether anything has come to our attention that causes
us to believe that the financial statements, taken as a whole, are not prepared in all material respects in accordance with
the applicable financial reporting framework. This Standard also requires us to comply with relevant ethical requirements.
A review of financial statements in accordance with ISRE 2400 (Revised) is a limited assurance engagement. The
practitioner performs procedures, primarily consisting of making inquiries of management and others within the entity, as
appropriate, and applying analytical procedures, and evaluates the evidence obtained.
The procedures performed in a review are substantially less than those performed in an audit conducted in accordance
with International Standards on Auditing. Accordingly, we do not express an audit opinion on these financial statements.
Conclusion
Based on our review, nothing has come to our attention that causes us to believe that the Consolidated Historical Financial
Information as set out in Annexure 5 to the pre-listing statement for the 3 months ended 31 December 2013 does not
fairly present, in all material respects, the consolidated financial position of Tharisa plc as at 31 December 2013, and of its
consolidated financial performance and consolidated cash flows for the years then ended in accordance with International
Accounting Standard 34 “Interim Financial Reporting” and in the manner required by the JSE Listings Requirements.
Emphasis of matter
We draw attention to note 2(c) to the Historical Financial Information for the 3 months ended 31 December 2013, which
indicates that at 31 December 2013 the Group’s current liabilities exceeded current assets by US$293,155 thousand and
its total liabilities exceeded total assets by US$71,816 thousand. These conditions, along with the matters as set forth in
note 2(c), indicate that in an event of a no listing scenario, and/or should there be a different interpretation to the Board
of Directors’ opinion as to the legal obligation of the Group to redeem the convertible redeemable preference shares,
which will result in full redemption of the convertible redeemable preference shares, payable within 10 business days from
a redemption notice, the Group may not have the necessary liquid funds required to redeem its convertible redeemable
preference shares and continue as a going concern. Our conclusion is not qualified in respect of this matter.
Yours faithfully
KPMG Inc.
Registered Auditor
Per Shaun van den Boogaard KPMG Forum
Chartered Accountant (SA) 1226 Francis Baard Street
Registered Auditor Hatfield
Director 0083

111
ANNEXURE 3
PRO FORMA FINANCIAL INFORMATION
PRO FORMA STATEMENT OF FINANCIAL POSITION AND STATEMENT OF COMPREHENSIVE
INCOME
The pro forma consolidated statement of financial position and statement of comprehensive income of the Group prior to
and after the implementation of the Listing and Offer is set out below. The pro forma consolidated statement of financial
position and statement of comprehensive income of the Group have been presented for illustrative purposes only and may,
because of their nature, not give a fair reflection of the Company’s results, financial position and changes in equity following
the implementation of the Listing and Offer. It has been assumed for purposes of the pro forma financial effects that the Listing
and Offer was implemented with effect from 1 October 2012 and 30 September 2013 for the statement of comprehensive
income and statement of financial position purposes, respectively. The Directors are responsible for the preparation of the
pro forma consolidated statement of comprehensive income and statement of financial position. The pro forma financial
information has been presented in a manner consistent with both the format and accounting policies adopted by the issuer
in its report of historical financial information. The Reporting Accountants’ Report relating to the pro forma financial
information is set out in Annexure 1 to this Pre-listing Statement.
Years ended 30 September 2013
Before
Listing and
Offer
US$’000
Pro forma
adjustment
US$’000
After
Listing and
Offer
US$’000
Assets
Non-current assets
Property, plant and equipment 269,130 269,130
Goodwill 1,427 1,427
Deferred tax assets 20,623 20,623
Long-term deposits 7,708 7,708
Other financial assets 3,774 3,774
Total non-current assets 302,662 302,662
Current assets
Inventories 24,043 24,043
Trade and other receivables 29,123 29,123
Other financial assets 311 311
Current taxation – –
Cash and cash equivalents 28,017 81,170 109,187
Total current assets 81,494 162,664
Total assets 384,156 465,326
Equity
Ordinary share capital 6 229 235
Share premium 113,342 356,273 469,615
Other reserve 47,245 47,245
Foreign currency translation reserve (30,170) (30,170)
Accumulated losses (167,859) (167,859)
Equity attributable to owners of the Company (37,436) 319,066
Non-controlling interests (16,205) (16,205)
Total equity (53,641) 302,861

112
Years ended 30 September 2013
Before
Listing and
Offer
US$’000
Pro forma
adjustment
US$’000
After
Listing and
Offer
US$’000
Liabilities
Non-current liabilities
Provisions 4,738 4,738
Borrowings 84,855 84,855
Total non-current liabilities 89,593 89,593
Current liabilities
Convertible redeemable preference shares 260,291 (260,291) –
Class B preference shares 12,171 (12,171) –
Borrowings 44,645 (2,870) 41,775
Current taxation 294 294
Trade and other payables 30,803 30,803
Total current liabilities 348,204 72,872
Total liabilities 437,797 162,465
Total equity and liabilities 384,156 465,326
Net current liabilities (266,710) 89,792
Total assets less current liabilities 35,952 392,454
Shares in issue 6,169,900 235,449,533
Net asset value per share (US$) (8.69) 1.29
Tangible net asset value per share (US$) (8.93) 1.28
Notes to the pro forma statement of financial possition:
1. The figures in the “Before Listing and Offer” column have been extracted without adjustment from the audited financial statements of the Company
as at 30 September 2013.
2. Share capital and share premium have been adjusted to include the effects of:
• the issue of an additional 154,247,500 to existing Shareholders in terms of the Bonus Issue;
• the issue of 18,111,503 Shares in terms of the Offer (after the Bonus Issue), issued at a price of ZAR55.21 (converted at a US$/ZAR exchange rate
of 1:10.03) and a par value of US$0.001. This is based on the assumption that ZAR1 billion is raised in the Offer before expenses (approximately
US$99.7 million) based on an the spot exchange rate as at 30 September 2013 of US$1/ZAR of 1:10.03); and
• the issue of 56,290,630 Shares in terms of the conversion of the Convertible Preference Shares (after the Bonus Issue).
3. Transaction costs of approximately US$3.5 million as set out in paragraph 25 on page 61 of this Pre-listing Statement, have been taken into account
against share premium as costs directly attributable to the Listing and issue of shares.
4. Cash and cash equivalents have been adjusted for the proceeds received from the Offer, transaction costs and the repayment of the B Preference
Shares (US$12.2 million) and the Langa loan (US$2.9 million).
5. No interest benefit has been taken into account in regards to the cash received as the proceeds from the Offer will be applied to optimisation initiatives,
for working capital funding of the product pipeline, purchase of long-lead items, strategic spares, further de-risking of the operation by building a RoM
stockpile and to settle unsecured debt funders of Tharisa Minerals.
6. All adjustments are expected to have a continuing effect on the Company with the exception of the transaction costs
7. Shares in issue have been adjusted for the Offer, conversion of Convertible Preference Shares and Bonus Issue, such that there are 235,449,533 Shares
in issue post the Listing.
8. Excluding the effect of the Offer, the net asset value per Share and tangible net asset value per Share are US$1.39 and US$1.39, respectively.

113
Years ended 30 September 2013
Before
Listing and
Offer
US$’000
Pro-Form
adjustment
US$’000
After
Listing and
Offer
US$’000
Revenue 215,455 215,455
Cost of sales (189,570) (189,570)
Gross profit 25,885 25,885
Other income 48 48
Administrative expenses (26,596) (26,596)
Results from operating activities (663) (663)
Finance income 863 863
Finance costs (14,744) 1,572 (13,172)
Changes in fair value of financial liabilities at fair value through
profit or loss (48,424) 48,424 –
Net finance costs (62,305) (12,309)
Profit/(Loss) before taxation (62,968) (12,972)
Income tax 15,525 15,525
Loss for the year (47,443) 2,553
Other comprehensive income
Foreign currency translation differences for foreign operations,
net of nil tax (38,781) (38,781)
Total comprehensive loss for the year (86,224) (36,228)
Loss for the year attributable to:
Owners of the Company (48,347) 1,649
Non-controlling interests 904 904
Total comprehensive loss for the year
attributable to:
Owners of the Company (75,989) (25,993)
Non-controlling interests (10,235) (10,235)
Total comprehensive loss for the year (86,224) (36,228)
Reconciliation to headline earnings
Profit/(Loss) for the year (48,347) 1,649
Impairment of goodwill 75 75
Tax effect on goodwill impairment – –
Impairment loss of PPE – Mining assets and infrastructure 2,097 2,097
Tax effect on impairment of PPE (587) (587)
Headline earnings/(loss) (46,762) 3,234
Weighted average number of shares 7,662,320 235,449,533
Profit/(Loss) per share
Basic and diluted profit/(loss) per share to ordinary
shareholders (US$) (6.31) 0.01
Headline earnings/(loss) per share (US$) (6.10) 0.01
Notes to the pro forma statement of comprehensive income:
1. The figures in the “Before Listing and Offer” column have been extracted without adjustment from the audited financial statements of the Company
as at 30 September 2013.
2. The fair value adjustment on the Convertible Preference Shares, the B Preference Shares and the Langa loan have been reversed.
3. The finance costs on the B Preference Shares and the Langa loan have been reversed.
4. Shares in issue have been adjusted for the Offer, conversion of Convertible Preference Shares and Bonus Issue, such that there are 235,449,533 Shares
in issue post the Listing.
5. Excluding the effect of the Offer, the earnings per Share and headline earnings per Share are US$0.01 and US$0.01, respectively.

114
ANNEXURE 4
INDEPENDENT REPORTING ACCOUNTANTS’ REASONABLE ASSURANCE
REPORT ON THE PRO FORMA FINANCIAL INFORMATION
The Directors
Tharisa plc
Office 108 – 110
S. Pittokopitis Business Centre
17 Neophytou Nicolaides and Kilkis Street
8011
Paphos
Cyprus
20 March 2014
Report on the Compilation of Pro Forma Financial Information
We have completed our assurance engagement to report (“Report”) on the compilation of pro forma earnings and
diluted earnings, headline and diluted headline earnings, net asset value and net tangible asset value per share of Tharisa
plc (“Tharisa plc” or “the Company”), pro forma consolidated statement of financial position of Tharisa plc, the pro forma
consolidated statement of comprehensive income of Tharisa plc and the related notes, including a reconciliation showing
all of the pro forma adjustments to the share capital, reserves and other equity items relating to Tharisa plc (collectively,
“Pro forma Financial Information”). The Pro forma Financial Information is set out in Annexure 3 of the Pre-listing statement
to be issued by the Company on or about 25 March 2014 (“Pre-listing Statement”).
The Pro forma Financial Information has been compiled by the directors of Tharisa plc to illustrate the impact of the listing
and share issue (“Transaction”) as detailed in the Pre-listing Statement on the Company’s consolidated financial position
and changes in equity as at 30 September 2013 and the Company’s consolidated financial performance for the year ended
30 September 2013.
As part of this process, the Company’s consolidated statement of comprehensive income and consolidated statement of
financial position have been extracted by the directors from the Company’s published financial statements for the year
ended 30 September 2013 (“Published Financial Information”), on which an audit report has been published. In addition,
the directors have calculated the earnings, diluted earnings, headline earnings and diluted headline earnings per share for
the year ended 30 September 2013, and also the net asset value and net tangible asset value per share as at 30 September
2013 based on financial information extracted from the Published Financial Information.
Directors’ Responsibility for the Pro forma Financial Information
The directors of Tharisa plc are responsible for compiling the Pro forma Financial Information on the basis of the applicable
criteria as detailed in paragraphs 8.15 to 8.33 of the Listings Requirements of the JSE Limited and the SAICA Guide on
Pro forma Financial Information, revised and issued in September 2012 (“Applicable Criteria”).
Reporting Accountants’ responsibility
Our responsibility is to express an opinion about whether the Pro forma Financial Information has been compiled, in all
material respects, by the directors on the basis of the Applicable Criteria, based on our procedures performed.
We conducted our engagement in accordance with International Standard on Assurance Engagements (ISAE) 3420,
Assurance Engagements to Report on the Compilation of Pro Forma Financial Information Included in a Prospectus, issued by the
International Auditing and Assurance Standards Board. This standard requires that the reporting accountants’ comply with
ethical requirements and plan and perform procedures to obtain reasonable assurance about whether the directors have
compiled, in all material respects, the Pro forma Financial Information on the basis of the Applicable Criteria.
For purposes of this engagement, we are not responsible for updating or reissuing any reports or opinions on any Published
Financial Information used in compiling the Pro forma Financial Information, nor have we, in the course of this engagement,
performed an audit or review of the Published Financial Information used in compiling the Pro forma Financial Information.
The purpose of Pro forma Financial Information included in the Pre-listing Statement is solely to illustrate the impact of the
Transaction on the unadjusted Published Financial Information as if the Transaction had been undertaken on 1 October
2012 for purposes of the pro forma earnings, diluted earnings, headline and diluted headline earnings per share and the

115
pro forma consolidated statement of comprehensive income and on 30 September 2013 for purposes of the net asset
value and net tangible asset value per share and consolidated statement of financial position. Accordingly, we do not
provide any assurance that the actual outcome of the Transaction, subsequent to its implementation, will be as presented
in the Pro forma Financial Information.
A reasonable assurance engagement to report on whether the Pro forma Financial Information has been properly compiled,
in all material respects, on the basis of the Applicable Criteria involves performing procedures to assess whether the
Applicable Criteria used by the directors in the compilation of the Pro forma Financial Information provide a reasonable
basis for presenting the significant effects directly attributable to the Transaction and to obtain sufficient appropriate
evidence about whether:
• the related pro forma adjustments give appropriate effect to the Applicable Criteria; and
• the Pro forma Financial Information reflects the proper application of those pro forma adjustments to the unadjusted
Published Financial Information.
The procedures selected depend on the reporting accountants’ judgement, having regard to the reporting accountants’
understanding of the nature of the Company, the Transaction in respect of which the Pro forma Financial Information has
been compiled and other relevant engagement circumstances.
The engagement also involves evaluating the overall presentation of the Pro forma Financial Information.
We believe that the evidence we have obtained is sufficient and appropriate to provide a basis for our opinion.
Opinion
In our opinion, the Pro forma Financial Information has been compiled, in all material respects, on the basis of the Applicable
Criteria.
Yours faithfully
KPMG Inc.
Per Shaun van den Boogaard
Chartered Accountant (SA)
Director

116
ANNEXURE 5
QUARTERLY HISTORICAL FINANCIAL INFORMATION
CONDENSED CONSOLIDATED STATEMENT OF COMPREHENSIVE INCOME
Three months ended 31 December
2013 2012
Notes US$’000 US$’000
Revenue 4 65,674 31,771
Cost of sales 4 (54,567) (27,200)
Gross profit 11,107 4,571
Other income 14 15
Administrative expenses (5,589) (6,802)
Results from operating activities 5,532 (2,216)
Finance income 461 275
Finance costs (3,741) (3,963)
Changes in fair value of financial liabilities at fair
value through profit or loss (15,059) (8,473)
Net finance costs (18,339) (12,161)
Loss before taxation (12,807) (14,377)
Income tax credit 5 2,236 2,385
Loss for the period (10,571) (11,992)
Other comprehensive income
Foreign currency translation differences for foreign
operations, net of nil tax (7,604) (3,639
Total comprehensive income for the period (18,175) (15,631)
Loss for the period attributable to:
Owners of the Company (11,264) (11,236)
Non-controlling interests 693 (756
Loss for the period (10,571) (11,992)
Total comprehensive income for the period
attributable to:
Owners of the Company (17,112) (13,948)
Non-controlling interests (1,063) (1,683)
Total comprehensive income for the period (18,175) (15,631)
Loss per share
Basic and diluted loss per share (1.47) (1.47)
The notes on pages 120 to 128 form part of the condensed consolidated interim financial statements.

117
CONDENSED CONSOLIDATED STATEMENT OF FINANCIAL POSITION
31 December 30 September
2013 2013
Notes US$’000 US$’000
Assets
Non-current assets
Property, plant and equipment 6 257,462 269,130
Goodwill 7 1,354 1,427
Deferred tax assets 22,410 20,623
Long-term deposits 8 15,903 7,708
Other financial assets 9 3,759 3,774
Total non-current assets 300,888 302,662
Current assets
Inventories 10 22,162 24,043
Trade and other receivables 32,820 29,123
Other financial assets 9 86 311
Cash and cash equivalents 13,326 28,017
Total current assets 68,394 81,494
Total assets 369,282 384,156
Equity
Ordinary share capital 11 6 6
Share premium 113,342 113,342
Other reserve 47,245 47,245
Foreign currency translation reserve (36,018) (30,170)
Accumulated losses (179,123) (167,859)
Equity attributable to owners of the Company (54,548) (37,436)
Non-controlling interests (17,268) (16,205)
Total equity (71,816) (53,641)
Liabilities
Non-current liabilities
Provisions 13 4,647 4,738
Borrowings 14 74,902 84,855
Total non-current liabilities 79,549 89,593
Current liabilities
Convertible redeemable preference shares 12 275,350 260,291
Class B preference shares 12 12,001 12,171
Other financial liabilities 9 118 –
Borrowings 14 52,182 44,645
Current taxation 361 294
Trade and other payables 21,537 30,803
Total current liabilities 361,549 348,204
Total liabilities 441,098 437,797
Total equity and liabilities 369,282 384,156
Net current liabilities (293,155) (266,710)
Total assets less current liabilities 7,733 35,952
The condensed consolidated interim financial statements were approved by the Board of Directors on 13 March 2014.

118
CONDENSED CONSOLIDATED STATEMENT OF CHANGES IN EQUITY
Attributable to owners of the Company
Foreign
Ordinary currency Accumu- Non-
Share Share Other translation lated controlling Total
capital premium reserve reserve losses Total interests equity
US$’000 US$’000 US$’000 US$’000 US$’000 US$’000 US$’000 US$’000
Balance at 1 October 2013 6 113,342 47,245 (30,170) (167,859) (37,436) (16,205) (53,641)
Total comprehensive income for the
period:
Loss for the period – – – – (11,264) (11,264) 693 (10,571)
Other comprehensive income – – – (5,848) – (5,848) (1,756) (7,604)
Total comprehensive income
for the period – – – (5,848) (11,264) (17,112) (1,063) (18,175)
Transactions with owners of the
Company recorded directly in
equity
Contributions by owners of the
Company: – – – – – – – –
Total contributions by owners of the
Company – – – – – – – –
Total transactions with owners of
the Company – – – – – – – –
Balance at 31 December 2013 6 113,342 47,245 (36,018) (179,123) (54,548) (17,268) (71,816)
Balance at 1 October 2012 6 113,342 47,245 (2,528) (119,512) 38,553 (5,970) 32,583
Total comprehensive income for the
period:
Loss for the period – – – – (11,236) (11,236) (756) (11,992)
Other comprehensive income – – – (2,712) – (2,712) (927) (3,639)
Total comprehensive income
for the period – – – (2,712) (11,236) (13,948) (1,683) (15,631)
Transactions with owners of the
Company recorded directly in
equity
Contributions by owners of the
Company: – – – – – – – –
Total contributions by owners of the
Company – – – – – – – –
Total transactions with owners of
the Company – – – – – – – –
Balance at 31 December 2012 6 113,342 47,245 (5,240) (130,748) 24,605 (7,653) 16,952
The notes on pages 120 to 128 form part of the condensed consolidated interim financial statements.

119
CONDENSED CONSOLIDATED STATEMENT OF CASH FLOWS
Three months ended
31 December
2013 2012
Notes US$’000 US$’000
Cash flows from operating activities
Loss for the period (10,571) (11,992)
Adjustments for:
Depreciation 3,160 2,786
Changes in fair value of financial liabilities at fair value
through profit or loss 15(b) 15,059 8,473
Changes in fair value of financial assets at fair value
through profit or loss (9) 18
Impairment of goodwill 7 19 –
Interest income (102) (275)
Interest expense 3,710 3,364
Income tax (2,236) (2,385)
9,030 (11)
Changes in:
Inventories 1,881 (6,080)
Trade and other receivables (3,697) (9,568)
Trade and other payables (9,266) (2,068)
Provisions (91) 155
Cash used in operations (2,143) (17,572)
Income tax paid (316) (137)
Net cash used in operating activities (2,459) (17,709)
Cash flows from investing activities
Interest received 102 224
Additions to long-term deposits (8,195) –
Additions to property, plant and equipment 6 (1,911) (11,821)
Additions and disposals of investments (104) (181)
Net cash used in investing activities (10,108) (11,778)
Cash flows from financing activities
Proceeds and borrowings, net of transaction costs 7,007 14,376
Repayment of borrowings (7,862) –
Interest paid (101) (6)
Net cash (used in)/generated from financing activities (956) 14,370
Net decrease in cash and cash equivalents (13,523) (15,117)
Cash and cash equivalents at the beginning of the period 28,017 52,805
Effect of exchange rate fluctuations on cash held (1,168) 11
Cash and cash equivalents at the end of the period 13,326 37,699
The notes on pages 120 to 128 form part of the condensed consolidated interim financial statements.

120
NOTES TO THE CONDENSED CONSOLIDATED INTERIM FINANCIAL STATEMENTS
For the three months ended 31 December 2013
1. REPORTING ENTITY
Tharisa Plc (“the Company”) is a company domiciled in Cyprus. The condensed consolidated interim financial statements of the Company as at and for the three months ended 31 December 2013 comprise the Company and its subsidiaries (together referred to as the “Group”). The Group is primarily involved in platinum group metals (“PGM”) and chrome mining and processing. The Group holds the mining rights to 5,590 hectares of the Middle Group reef horizon of the Bushveld Complex located on the farms Kafferskraal and Rooikoppies near Marikana in the North West Province of South Africa.
2. BASIS OF PREPARATION
(a) Statement of compliance
These condensed consolidated interim financial statements have been prepared in accordance with IAS 34 Interim Financial Reporting. Selected explanatory notes are included to explain events and transactions that are significant to an understanding of the changes in financial position and performance of the Group since the last annual consolidated financial statements as at and for the year ended 30 September 2013. These condensed consolidated interim financial statements do not include all the information required for full annual financial statements, prepared in accordance with International Financial Reporting Standards.
These condensed consolidated interim financial statements were approved by the Board of Directors on 13 March 2014.
(b) Judgements and estimates
Preparing the condensed consolidated interim financial statements requires Management to make judgements, estimates and assumptions that affect the application of accounting policies and the reported amounts of assets and liabilities, income and expenses. Actual results may differ from these estimates.
In preparing these condensed consolidated interim financial statements, significant judgments made by Management in applying the Group’s accounting policies and the key sources of estimation uncertainty were the same as those applied to the consolidated financial statements as at and for the year ended 30 September 2013 except as stated in note 15(c)(iii).
(c) Going concern
At 31 December 2013, the Group’s current liabilities exceeded current assets by US$293,155 thousand and its total liabilities exceeded total assets by US$71,816 thousand. A significant portion of the Group’s current and total liabilities relates to convertible redeemable preference shares, Class B preference shares and loan from Langa Trust, the carrying amounts of which at 31 December 2013 amounted to US$275,350 thousand, US$12,001 thousand and US$2,833 thousand, respectively. According to the terms of these instruments, the convertible redeemable preference shares are, inter alia, convertible into ordinary shares upon listing of the Company’s ordinary shares on any stock exchange acceptable to the holders of the majority of the convertible redeemable preference shares, while Class B preference shares and loan from Langa Trust are expected to be repaid from the proceeds of such listing, on the assumption that the Company will raise adequate proceeds.
During the year ended 30 September 2013, the Company prepared itself to undertake an Initial Public Offering (“IPO”) on the Alternative Investment Market of The London Stock Exchange Plc (“AIM”), and the process was expected to be completed in March 2013. However, the severe sovereign debt crisis experienced in Cyprus in March 2013, created an adverse impact on the Company’s IPO, as it significantly and adversely impacted investor confidence and sentiment, demand for the Company’s ordinary shares and ultimately the overall valuation of the Group. As a result of these conditions, the Board of Directors of the Company, in consultation with its Nominated Advisor to the IPO, invoked the material adverse change clause of the Articles of Association of the Company and deferred the IPO by a maximum of a year to 14 April 2014. This position of the Board of Directors was also agreed by the holders of a majority of the Company’s convertible redeemable preference shares.
The Board of Directors of the Company, following the obtaining of South African exchange control approval, has initiated the process for a primary inward listing on the Johannesburg Stock Exchange (“JSE”). With a successful listing on the JSE, the Company’s convertible redeemable preference shares will be converted into fully paid ordinary shares and in addition the Group expects to raise adequate proceeds to repay its Class B preference shares and loan from Langa Trust.

121
In an event of a no listing scenario, according to the terms of the convertible redeemable preference shares, the Company within 10 business days from a redemption notice is required to redeem these shares for a consideration equal to the subscription price of each share with a return by applying an Internal Rate of Return of 25%. However, the Board of Directors is of the opinion that, according to the Articles of Association of the Company and the terms governing the issuance of the convertible redeemable preference shares, the Company is required to redeem only those convertible redeemable preference shares for which it has received a redemption notice, and only to the extent that it has sufficient distributable reserves, with the remainder of the redemption amount to be paid upon the Company being able to pay the redemption amount.
Should the aforesaid listing not be achieved within the required time frame, and should the Company receive a redemption notice and there is a different interpretation of the legal obligation of the Company, then the Group may not have the necessary liquid funds required to redeem the convertible redeemable preference shares and also finance its working capital requirements. In such case the Group may not be able to continue as a going concern which is the basis of preparation of these condensed consolidated interim financial statements and necessary adjustments will have to be made to bring the assets to their net realizable value and provide for any further liabilities which may arise. Furthermore, non-current assets will have to be reclassified as current assets and non-current liabilities as current liabilities accordingly. These condensed consolidated interim financial statements do not include any adjustments that might be necessary should the Group not be able to continue as a going concern.
3. SIGNIFICANT ACCOUNTING POLICIES
The accounting policies applied by the Group in these condensed consolidated interim financial statements are the same as those applied by the Group in the historical financial information as at and for the year ended 30 September 2013 except for the application of certain new and revised standards and interpretations which became effective for the first time for the year ending 30 September 2014. None of these standards and interpretations had a significant impact on the results for the three months ended 31 December 2013.
4. SEGMENT REPORTING
Throughout the period, the Group had two reportable segments, the chrome segment and the PGM segment. Information regarding the results of each reportable segment is included below. Performance is measured based on segment revenue, cost of sales and gross profit or loss, as included in the internal Management reports that are reviewed by the Group’s most senior executive management. Segment revenue, cost of sales and gross profit or loss are used to measure performance as Management believes that such information is the most relevant in evaluating the results of each segment.
Three months ended 31 December 2013
Chrome PGM Total
US$’000 US$’000 US$’000
Revenue 47,486 18,188 65,674
Cost of sales (42,332) (12,235) (54,567)
Gross profit 5,154 5,953 11,107
Three months ended 31 December 2012
Chrome PGM Total
US$’000 US$’000 US$’000
Revenue 23,835 7,936 31,771
Cost of sales (18,566) (8,634) (27,200)
Gross profit/(loss) 5,269 (698) 4,571
Geographical Information
The following tables set out information about the geographical location: (i) of the Group’s revenue from external
customers; and (ii) the Group’s property, plant and equipment and goodwill (“specified non-current assets”). The
geographical location analysis of revenue from external customers is based on the country of establishment of each
customer. The geographical location of the specified non-current assets is based on the physical location of the asset
in the case of property, plant and equipment and the location of the operation to which they are allocated in the case
of goodwill.

122
Three months ended
31 December
2013 2012
US$’000 US$’000
(i) Revenue from external customers
The People’s Republic of China (“PRC”) 20,856 12,198
South Africa 20,933 7,972
Hong Kong 12,440 6,652
Singapore 10,657 3,749
Other countries 788 1,200
65,674 31,771
31 December
2013
30 September
2013
US$’000 US$’000
(ii) Specified non-current assets
South Africa 258,723 270,441
Cyprus 43 61
The PRC 50 55
258,816 270,557
5. INCOME TAX CREDIT
Income tax credit is recognized based on Management’s best estimate of the weighted average annual income tax
rate expected for the full financial year applied to the pre-tax income of the interim period. The Group’s consolidated
effective tax rate for the three months ended 31 December 2013 and 2012 was 17.5% and 16.6%, respectively.
6. PROPERTY, PLANT AND EQUIPMENT
(a) Acquisitions and disposals
During the three months ended 31 December 2013 and 2012 the Group acquired assets with a cost, excluding
capitalized borrowing costs, of US$1,911 thousand and US$11,821 thousand, respectively.
There has been no disposal of assets during the three months ended 31 December 2013 and 2012, thus no gain
or loss on disposal has been recognized in profit or loss.
(b) Capital commitments
At 31 December 2013 and 30 September 2013, the Group’s capital commitments for contracts to purchase
property, plant and equipment amounted to US$1,285 thousand and US$10,739 thousand, respectively.
(c) Securities
At 31 December 2013 and 30 September 2013 an amount of US$252,696 thousand and US$264,357 thousand
of the carrying amount of the Group’s property, plant and equipment was pledged as security against secured
bank borrowing (see note 14).

123
7. GOODWILL
(a) Impairment test for goodwill
Impairment losses were recognised in relation to goodwill which arose from the acquisition of Arxo Logistics Proprietary Limited and Braeston Corporate Consulting Services Proprietary Limited, as follows:
Three months ended
31 December
2013 2012
US$’000 US$’000
Arxo Logistics Proprietary Limited (note 7(a)(i)) 14 –
Braeston Corporate Consulting Services Proprietary Limited
(note 7(a)(ii)) 5 –
Impairment loss 19 –
(b) Impairment assessment – Arxo Logistics Proprietary Limited
At 31 December 2013, the recoverable amount of goodwill that arose from the acquisition of Arxo Logistics Proprietary Limited Cash-Generating Unit (“CGU”) exceeded its carrying amount after impairment losses and thus no further impairment was recognised. The recoverable amount is determined based on value-in-use calculation. This calculation uses cash flow projections approved by Management covering a 54-year period. The growth rates used do not exceed the long-term average growth rates for the business in which the CGU operates. The cash flows are discounted using a nominal discount rate of 13.83%. The discount rate used is a pre-tax nominal rate and reflects specific risks relating to the relevant segment.
(c) Impairment assessment – Braeston Corporate Consulting Services Proprietary Limited
At 31 December 2013, the recoverable amount of goodwill that arose from the acquisition of Braeston Corporate Consulting Services Proprietary Limited Cash-Generating Unit (“CGU”) exceeded its carrying amount after impairment losses and thus no further impairment was recognised. The recoverable amount is determined based on value-in-use calculation. This calculation uses cash flow projections approved by Management covering a 54-year period. The growth rates used do not exceed the long-term average growth rates for the business in which the CGU operates. The cash flows are discounted using a nominal discount rate of 13.83%. The discount rate used is a pre-tax nominal rate and reflects specific risks relating to the relevant segment.
8. LONG-TERM DEPOSITS
As at 31 December 2013 and 30 September 2013, the amount of US$15,903 thousand and US$7,708 thousand respectively are restricted and designated as a “debt service reserve account” as required by the terms of the secured bank borrowings (note 14). As at 31 December 2013 and 30 September 2013, long-term deposits of US$8,477 thousand and US$Nil, respectively were deposited on one month notice account with interest of 0.1% p.a and US$7,426 thousand and US$7,708 thousand, respectively of deposits did not earn any interest and had no maturity date.
9. OTHER FINANCIAL ASSETS/(LIABILITIES)
31 December 30 September
2013 2013
US$’000 US$’000
Non-current :
Investments in cash funds and income funds (note 9(a)) 3,666 3,656
Interest rate caps (note 9(b)) 93 118
3,759 3,774
Current :
Investments at fair value through profit or loss 86 86
Discount facility (note 9(c)) (118) 225
(32) 311

124
(a) The investment in cash funds and income funds is provided to Lombard Insurance Group as collateral against
the guarantee issued by Lombard Insurance Group to the Department of Minerals and Energy of South Africa
in the amount of South African Rand (“ZAR”) 78 million. The balance is unsecured and is considered as level 1
in the fair value hierarchy and held at fair value through profit or loss (designated).
(b) Interest rate caps were obtained from a consortium of financial institutions, against the floating three-month
Johannesburg Interbank Agreed Rate (“JIBAR”) on 25% of the secured bank borrowing. The interest rate caps
have a strike rate of 7.5% and terminate on 31 March 2017. The balance is considered as level 1 in the fair value
hierarchy and held at fair value through profit or loss (held for trading).
(c) Discount facility relates to fair value adjustments on the limited recourse disclosed receivables discounting facility
(“Discount facility”) with certain banks in terms of which 98% of the receivables from the sale of platinum,
palladium and gold (included in PGM) is sold at an effective finance cost of JIBAR (3-month) + 2%. The facility
is for an amount of ZAR300 million. The balance is considered as level 2 in the fair value hierarchy and held at
fair value through profit or loss (designated). During the three months ended 31 December 2013, the negative
change in the fair value of US$346 thousand arose as a consequence of the embedded derivative and has been
included in “finance costs” in profit or loss.
10. INVENTORIES
31 December 30 September
2013 2013
US$’000 US$’000
Finished products 10,251 13,037
In progress metal 1,694 1,247
Ore stockpile 7,144 6,841
Consumables 3,073 2,918
22,162 24,043
The Group did not recognize any write-down of inventories during the three months ended 31 December 2013
and 2012.
11. ORDINARY SHARE CAPITAL
The Company did not issue any ordinary share capital and did not declare or pay any dividends during the three
months ended 31 December 2013 and 2012.
12. REDEEMABLE PREFERENCE SHARES
31 December 30 September
2013 2013
US$’000 US$’000
Convertible redeemable preference shares of the Company 275,350 260,291
Class B preference shares of a subsidiary 12,001 12,171
There have been no changes in the terms of convertible redeemable preference shares of the Company and class
B preference shares of a subsidiary during the period under review. The terms of the convertible redeemable
preference shares of the Company and class B preference shares of a subsidiary remain the same as those disclosed
in the Group’s consolidated financial statements as at and for the year ended 30 September 2013.
Convertible redeemable preference shares of the Company are stated at fair value. The fair value is measured using
a probability weighted expected return method as set out in note 15(c)(iii).
The Class B preference shares are stated at amortised cost at ZAR Prime rate plus 2%, compounded monthly.
13. PROVISIONS
The Group has a legal obligation to rehabilitate the site where the Group’s mine is located, once the mining operations
cease which would be when the current mine life of the project expires.

125
The provision for future rehabilitation at 31 December 2013 and 30 September 2013 amounted to US$4,647 thousand and US$4,738 thousand, respectively. During the three months ended 31 December 2013 and 31 December 2012, the provision for future rehabilitation capitalised to inventories was US$Nil and US$169 thousand respectively. The amounts recognised in profit or loss for the same periods amounted to US$93 thousand and US$203 thousand, respectively.
An insurance company provided a guarantee to the Department of Minerals and Energy of the Republic of South Africa to satisfy the requirements of the Mineral and Petroleum Resources Development Act with respect to environmental rehabilitation, and the Group ceded its investments in interest-bearing debt instruments of US$3,666 thousand and US$3,656 thousand as at 31 December 2013 and 30 September 2013, respectively, to the insurance company to support this guarantee.
The interest rate used for estimating future costs is the long-term risk free rate as indicated by the R186 government bond of South Africa, which was 7.92% as at 31 December 2013 and 30 September 2013. The net present value of the current rehabilitation estimate is based on the average of the long-term inflation target range of the South African Reserve Bank of between 3% and 6%, as at 31 December 2013 and 30 September 2013.
14. BORROWINGS
31 December 30 September
2013 2013
US$’000 US$’000
Non-current:
Secured bank borrowing 73,368 82,876
Other borrowings – loans payable to third parties 1,534 1,979
74,902 84,855
Current:
Secured bank borrowing 28,430 27,811
Other borrowings – loans payable to third parties 1,302 1,354
Other borrowings – bank and other credit facility 19,617 12,610
Other borrowings – loan payable to Langa Trust 2,833 2,870
52,182 44,645
There have been no changes in the terms, securities and financial covenants of the above borrowing facilities during the 3 months ended 31 December 2013, compared to those disclosed in the Group’s consolidated financial statements as at and for the year ended 30 September 2013.
15. FINANCIAL RISK MANAGEMENT
The aspects of the Group’s financial risk management objectives and policies are consistent with those disclosed in the Group’s consolidated financial statements as at and for the year ended 30 September 2013.
(a) Credit risk
The Group establishes an allowance for credit losses that represents its estimate of incurred losses in respect of trade and other receivables. The main component of this allowance is a specific loss component that relates to individually significant exposures. No allowance for credit losses was recorded by the Group during the three months ended 31 December 2013 and 2012. At the reporting date, none of the carrying amounts of trade and other receivables is either past due or impaired. Receivables that were neither past due nor impaired relate to customers for whom there was no recent history of default and who have a good track record with the Group.
(b) Fair values
The Board of Directors considers that the fair values of significant financial assets and financial liabilities approximate to their carrying values at each reporting date.
Financial instruments carried at fair value:
The following table presents the carrying values of financial instruments measured at fair value at the end of each reporting period across the three levels of the fair value hierarchy defined in IFRS 13, Fair Value Measurement, with the fair value of each financial instrument categorised in its entirety based on the lowest level of input that is significant to that fair value measurement.

126
Level 1 Level 2 Level 3
US$’000 US$’000 US$’000
31 December 2013
Assets
– Investments in cash funds and income funds 3,666 – –
– Interest rate caps 93 – –
– Investments at fair value through profit or loss 86 – –
3,845 – –
Liabilities
– Convertible redeemable preference shares – – 275,350
– Discount facility – 118 –
– 118 275,350
30 September 2013
Assets
– Investments in cash funds and income funds 3,656 – –
– Interest rate caps 118 – –
– Discount facility – 225 –
– Investments at fair value through profit or loss 86 – –
3,860 225 –
Liabilities
– Convertible redeemable preference shares – – 260,291
The movement of Level 3 fair value measurements is as follows:
Three months ended
31 December
2013 2012
US$’000 US$’0000
Convertible redeemable preference shares
At the beginning of the period 260,291 212,791
Changes in fair value of financial liabilities at fair value
through profit or loss 15,059 7,491
At the end of the period 275,350 220,282
Total gains or losses for the period included in profit or loss 15,059 7,491
Class B preference shares
At the beginning of the period – 12,548
Changes in fair value of financial liabilities at fair value through profit or loss – 788
Derecognition from fair value basis to amortised cost upon term changes – (13,336)
At the end of the period – –
Total gains or losses for the period included in profit or loss – 788
Borrowings – loan from Langa Trust
At the beginning of the period – 2,935
Changes in fair value of financial liabilities at fair value through profit or loss – 194
Derecognition from fair value basis to amortised cost upon term changes – (3,129)
At the end of the period – –
Total gains or losses for the period included in profit or loss – 194
127
(c) Estimation of fair values
The following summarises the major methods and assumptions used in estimating the fair values of financial
instruments.
(i) Investments in cash funds and income funds, investments at fair value through profit or
loss and interest rate caps
Fair values are based on quoted market prices at the end of the reporting period without any deduction
for transaction costs.
(ii) Discount facility
The fair values are calculated by multiplying the actual metal quantities per discounted invoice with the
difference between the hedged metal price per discounted invoice and the average spot metal price
translated to ZAR using the average monthly rate.
(iii) Convertible redeemable preference shares
The estimate of the fair value of the convertible redeemable preference shares as at 31 December 2013
and 30 September 2013 is measured using the probability weighted expected return method, which values
the financial liabilities based on the likelihood and expected settlement values of the respective expected
settlement scenarios, discounted to their present value at the valuation date. Estimation of the settlement
values of the financial liabilities requires an estimation of the equity value of the Group using discounted
cash flow techniques. Estimated future cash flows of the Group are based on Management’s best estimates
and the discount rates used are market-related rates reflecting the risks specific to the respective operations
of the Group.
The underlying assumptions in the fair value measurements include a nominal discount rate of 13.83% and
11.53% as at 31 December 2013 and 30 September 2013, respectively which is a pre-tax nominal rate and
reflects specific risks relevant to the operations of the Group, a risk free rate of 8.45% and 2.14% as at
31 December 2013 and 30 September 2013, respectively, which is the average yield of the 10-year South
African Government bond and 10-year US treasury bond, respectively, and an inflation rate of 5.4% and
2.1% as at 31 December 2013 and 30 September 2013, respectively, which is the South African inflation rate
and projected long-term US inflation treasury rate respectively. The Board of Directors is of the opinion
that the use of the equivalent South African rates as at 31 December 2013 is more relevant to the
operations of the Group, since the Group’s mining activities are concentrated in South Africa.
No sensitivity analysis is presented as at 31 December 2013 and 30 September 2013, as changes in the
assumptions would have no effect on the fair value of the convertible redeemable preference shares, as the
fair value of the instruments is limited as per their terms to a minimum return by applying an IRR of 25%.
16. RELATED PARTY TRANSACTIONS
(a) Parent and ultimate controlling party
At 31 December 2013, the Board of Directors considers the parent and ultimate controlling party of the Group
to be Medway Developments Limited and Mr. Adonis Pouroulis respectively. Medway Developments Limited is
incorporated in Cyprus under the requirements of the Cyprus Companies Law, Cap. 113 and produces financial
statements available for public use in accordance with the requirements of the abovementioned law.

128
(b) Transactions with related parties
Significant transactions carried at arm’s length with related parties during the three months ended 31 December
2013 and 2012 were as follows:
2013 2012
US$’000 US$’000
Revenue
Hong Kong Heyi Mining Resource Co Limited 5,385 –
Rocasize Proprietary Limited 4 –
Kameni Limited 2 –
5,391 –
Interest expense
Langa Trust 76 79
Arti Trust 161 169
Ditodi Trust 14 14
Makhaye Trust 14 14
The Phax Trust 27 29
The Rowad Trust 14 14
Jonathan Alan Clark 14 14
Moira June Jacquet-Briner 14 14
334 347
Donation expense
Rocasize Proprietary Limited 136 –
17. SUBSEQUENT EVENTS
There have been no material subsequent events between the reporting date and the date of approval of these
condensed consolidated interim financial statements.

129
ANNEXURE 6
SALIENT FEATURES OF THE ARTICLES OF ASSOCIATION
Set out below are extracts from the Articles of Association of Tharisa.
GLOSSARY OF TERMS
Articles means the Articles of Association of Tharisa, the salient details of which are set out in this Annexure.
Board means the Board of Directors from time to time of the Company or the Directors present at a meeting of the
Board of Directors at which a quorum is present.
CSD means a licensed South African Central Securities Depository.
A Director means any Executive or non-Executive Director or the Board of Directors of the Company.
JSE Listings Requirements means the Listings Requirements of the JSE, as amended from time to time.
The Law means the Cyprus Companies Law, Cap. 113 and any Regulations annexed thereto, as may be amended from
time to time.
Member(s) means the holder(s) of ordinary shares in the share capital of the company.
Ordinary Resolution means an ordinary resolution of the members in a General Meeting.
Register of Members and/or Securities Register means the principle register of members of the Company to be kept
accordance with the Law.
Seal means the common seal of the Company, the use of which is governed by the Law and the JSE Listings Requirements,
from time to time.
Securities means and includes, without limitation, shares in the capital of the Company or options, warrants, bonds, or
other rights to subscribe for or acquire or convertible into shares in the capital of the Company.
Shares mean ordinary shares with a par value of US$0.001 each in the issued share capital of the Company.
Stock Exchange means a regulated market for the buying and selling of public securities on which the securities of the
Company are listed from time to time.
Uncertificated Securities Register means the record of Uncertificated Securities administered and maintained by a
Participant or Central Securities Depositary, as determined in accordance with the rules of the CSD, and which forms part
of the Securities Register.
1. UNISSUED SHARES
4. Subject to the provisions of these Articles, the Law and any resolution of the Company at a General Meeting, the
Board may offer, allot (with or without conferring a right of renunciation), grant options over or otherwise deal with
or dispose of any unissued shares (whether forming part of the original or any increased capital) to such persons,
at such times and generally on such terms as the Board may decide but no share may be issued at a discount to the
consideration approved by the Board.
5. Subject to the Law and the JSE Listings Requirements, these Articles (including, but not limited to, Articles 6, 7
and 8 below) and the terms of any resolution of the Company at a General Meeting creating new shares: (a) the
unissued shares from time to time shall be under the control of the Board which may allot the same to such persons,
against cash or for such other consideration which is not cash, with such restrictions and conditions, in excess of their
nominal value, at their nominal value and/or with payment of commission and at such times as the Board shall deem
appropriate; and (b) the Board shall be authorised to grant any person the option to acquire from the Company
any authorised and unissued shares, including the right to subscribe for, or to convert or exercise any security into,
authorised and unissued shares, in each case on such terms as the Board shall deem appropriate.
6. Subject to the Law and the pre-emption rights contained in Article 7 below, the Company may at any time pass
a resolution of its members, referring to this Article 6, authorising the Directors to exercise all of the powers of the
Company to allot unissued securities and/or to grant options over unissued securities and the Directors shall, upon
the passing of such a resolution, be generally and unconditionally authorised to allot unissued securities and/or to
grant options over unissued securities as the Directors in their discretion deem fit, provided that:
130
(a) if and for so long as the shares of the Company are listed on the JSE and/or any freshly issued shares are to be made subject to a listing application, such allotment and/or grant shall be made subject to the JSE Listings Requirements;
(b) the nominal amount of such securities (where such securities are shares) or the nominal amount of the shares in respect of which such securities confer the right to subscribe for, or convert or exercise into (where such securities are not shares) shall not exceed, in aggregate, the sum specified in such resolution; and
(c) any such authority shall (unless otherwise specified in such resolution or subsequently varied or abrogated by a resolution passed by the members of the Company) expire on the date of the next annual General Meeting or 15 months after the date on which the authority was granted, whichever is the shorter, subject to the requirements of the JSE.
2. VARIATION OF RIGHTS ATTACHING TO SECURITIES
10. Subject to the Law and these Articles, and without prejudice to any special rights previously conferred on the holders of any existing shares or class of shares, any share in the company may be issued with such preferred, deferred or other special rights or such restrictions, whether in regard to dividend, voting, return of capital or otherwise as the Company may from time to time by Ordinary Resolution determine, provided that if and for so long as the shares of the Company are listed on the JSE, as the company may from time to time by Special Resolution determine.
12. If at any time the share capital is divided into different classes of shares, the rights attached to any class may, whether or not the Company is being wound up, be varied with the consent of the requisite number of votes of members passed at a separate General Meeting of the holders of the shares of the class, as per section 59A of the Law, or, if and for so long as the shares of the Company are listed on the JSE, by Special Resolution passed by the members at such General Meeting. To every such separate General Meeting the provisions of these Articles relating to General Meetings shall apply, but so that the necessary quorum shall be three members at least holding or representing by proxy one-third of the issued shares of the class and that any holder of shares of the class present in person or by proxy may demand a poll. The holders of shares of the class shall on a poll have one vote in respect of every share of the class held by them respectively.
62. Subject to section 59A of the Law, the Company may from time to time increase the share capital by such sum, to be divided into shares of such amount, as the resolution shall prescribe, provided that if and for so long as the shares of the Company are listed on the JSE, such increase in the share capital may only be effected by Special Resolution. Except to the extent otherwise provided in such applicable resolution, such new shares shall be subject to all the provisions applicable to the shares of the original share capital of the Company including, for the avoidance of doubt, the provisions of these Articles.63. The Company may by Ordinary Resolution (or, if and for so long as the shares of the Company are listed on the JSE, by Special Resolution):
(a) consolidate and divide all or any of its share capital into shares of larger amounts than its existing shares;
(b) subdivide its existing shares, or any of them, into shares of smaller amounts than is fixed by the Memorandum of Association subject, nevertheless, to the provisions of section 60(1)(d) of the Law;
(c) cancel any shares which, at the date of the passing of the Resolution, have not been taken or agreed to be taken by any person; and
(d) create any class of shares or convert shares of one class into shares of one or more other classes.
3. VOTES OF MEMBERS
91. Subject to any rights or restrictions for the time being attached to any class or classes of shares and subject also to any special provisions contained in these Articles, on a poll every member shall have one vote for each share of which he is the holder. If and for so long as the shares of the Company are listed on the JSE, the holders of securities of the Company other than ordinary shares shall not be entitled to vote on any resolution taken by the Company in General Meeting, unless so prescribed by the JSE Listings Requirements.
92. In the case of joint holders the vote of the senior who tenders a vote, whether in person or by proxy, shall be accepted to the exclusion of the votes of the other joint holders; and for this purpose seniority shall be determined by the order in which the names stand in the register of members.
93. A member of unsound mind, or in respect of whom an order has been made by a Court having jurisdiction in lunacy, may vote on a poll, by the administrator of his property, his committee, receiver, curator bonis, or other person in the nature of an administrator, committee, receiver or curator bonis appointed by that Court, and any such administrator, committee, receiver, curator bonis or other person may, on a poll, vote by proxy.

131
94. Unless the Directors determine otherwise, no member shall be entitled to vote at any General Meeting unless all
calls or other sums presently payable by him in respect of shares in the Company have been paid.
95. No objection shall be raised to the qualification of any voter except at the meeting or adjourned meeting at
which the vote objected to is given or tendered and every vote not disallowed at such meeting shall be valid for all
purposes. Any such objection made in due time shall be referred to the chairman of the meeting, whose decision
shall be final and conclusive.
96. On a poll, votes may be given either personally or by proxy.
97. Each member shall be entitled to appoint one or more proxies to attend on the same occasion, on condition
however that such appointment shall be made in one single instrument. Provided that the attendance on any occasion
of the person first mentioned in the instrument of proxy shall preclude any other person named therein from
attending and so on.
98. The instrument appointing a proxy shall be in writing signed by the appointer or of his attorney duly authorised
in writing, or, if the appointer is a corporation, either under Seal, or under the hand of an officer or attorney duly
authorised. A proxy need not be a member of the company.
99. The instrument appointing a proxy and the power of attorney or other authority, if any, under which it is signed
or a notarially certified copy of that power or authority shall be deposited at the registered office of the Company
not less than two working days before the time specified for holding the meeting or adjourned meeting at which
the person named in the instrument proposes to vote or be delivered at the place specified for that purpose in the
notice convening the meeting in such manner and at such time as may be specified in such notice. In case a poll is to
be taken at a time other than during the meeting at which such poll was demanded the instrument of proxy shall be
deposited at the place specified for taking the poll at least 15 minutes before the time appointed for taking the same.
Any instrument of proxy not deposited or delivered in the manner and at the time herein or in accordance with the
above provisions prescribed shall not be treated as valid.
100. An instrument appointing a proxy shall be in such form as may be prescribed by the Directors from time to time.
101. The instrument appointing a proxy shall be deemed to confer authority to demand or join in demanding a poll
or to agree to a meeting being called by shorter notice as provided in Article 77 above.
102. A vote given in accordance with the terms of an instrument of proxy shall be valid notwithstanding the previous
death or insanity of the principal or revocation of the proxy or of the authority under which the proxy was executed,
or the transfer of the share in respect of which the proxy is given, provided that no intimation in writing of such
death, insanity, revocation or transfer as aforesaid shall have been received by the Company at the office before the
commencement of the meeting or adjourned meeting at which the proxy is used.
103. The chairman of a General Meeting has no second or casting vote.
104. Any corporation which is a member of the Company may by resolution of its directors or other governing
body authorise such person as it thinks fit to act as its representative at any meeting of the company or of any class
of members of the company, and the person so authorised shall be entitled to exercise the same powers on behalf
of the corporation which he represents as that corporation could exercise if it were an individual member of the
company.
4. DIRECTORS
4.1 Qualification of Directors
108. If and for so long as the shares of the Company are listed on the JSE, the Board shall comprise at least
4 (four) directors, and there shall be no limitation as to the maximum number.
160. The quorum necessary for the transaction of the business of the Directors may be fixed by the Directors,
and unless so fixed shall be two. Where the quorum of Directors is two, the chairman shall not be permitted
to have a casting vote if only two Directors are present at a meeting of Directors. Provided however that so
long as the Company, pursuant to the provisions of these Articles, has only one Director a resolution in writing
signed by such Director in accordance with the provisions of Article 168 shall be deemed in all respects as a
resolution of the Directors passed at a meeting of the Directors at which a quorum was present.
153. The office of Director shall be vacated if the Director:
(a) becomes bankrupt or makes any arrangement or composition with his creditors generally; or
(b) becomes prohibited from being a Director by reason of any order made under section 180 of the Law or,

132
if and for so long as the shares of the Company are listed on the JSE, the JSE Listings Requirements; or
(c) becomes of unsound mind; or
(d) resigns his office by notice in writing to the Company:
(e) if his period of office has terminated in accordance with the provisions of these Articles; or
(f) shall for more than six months have been absent without permission of the Directors from at least three
consecutive meetings of the Directors duly convened and held during that period.
4.2 Remuneration of Directors
143. The remuneration of the executive Directors shall be determined by the Board from time to time and a
remuneration report may be presented to the members in General Meeting. The remuneration of executive
Directors shall be deemed to accrue from day to day.
144. The remuneration of Directors (other than any Director who for the time being holds an executive
office of employment with the Company or a subsidiary of the Company) shall be paid out of the funds of
the company by way of consideration for their services as Directors, and such fees shall be determined by the
Board from time to time. Any fee payable under this Article shall be distinct from any remuneration or other
amounts payable to a Director under other provisions of these Articles and shall accrue from day to day.
145. The Board may grant special remuneration to any Director who performs any special or extra services to
or at the request of the company, save where relating to a Director other than an executive Director, subject
to the limits prescribed by Article 147.
146. The appointment of any Director to perform such extra or special services, and the extra or special
remuneration to be paid to such Director by way of lump sum, salary, commission, participation in profits
or otherwise in addition to any remuneration provided for by or pursuant to any other Article, shall be
determined by a disinterested quorum of Directors.
147. A Director shall be paid out of the funds of the Company all travelling, hotel and other expenses properly
and necessarily incurred by him in and about the discharge of his duties and the business of the company,
including his expenses of travelling to and from meetings of the Board, committee meetings, General Meetings
and separate meetings of the holders of any class of securities of the Company.
148. Any Director who:
(a) serves on any executive or other committee; or
(b) devotes special attention to the business of the Company; or
(c) is required to reside abroad in a jurisdiction other than the Company’s principal place of business; or
(d) otherwise performs or binds himself to perform services which, in the opinion of the Directors, are
outside the scope of the ordinary duties of a Director, may be paid such extra remuneration or allowances
in addition to or in substitution of the remuneration to which he may be entitled as a Director, as a
disinterested quorum of the Directors may from time to time determine.
4.3 Borrowing Powers of Directors
128. The Directors may exercise all the powers of the Company to borrow or raise money, to guarantee,
to indemnify, to charge or mortgage its undertaking, property and uncalled capital, or any part thereof, and
to issue debentures, debenture stock, and other securities as security for any debt, loss or obligation of the
company or of any third party. If and for so long as the shares of the Company are listed on the JSE, no special
privileges relating to attending and voting at General Meetings and to the appointment of Directors shall be
granted to the holders of debt instruments issued by the Company.
4.4 Retirement or non-retirement of Directors
110. At each annual General Meeting 1/3 (one third) of the elected Directors for the time being, or if their
number is not 3 (three) or a multiple of 3 (three), the number nearest to 1/3 (one third), but not less than 1/3rd
1/3 (one third), shall retire from office, provided that if an elected Director is appointed as managing director
or as an employee of the Company in any other capacity, he or she shall not, while he or she continues to hold
that position or office, be subject to retirement by rotation and he or she shall not, in such case, be taken into
account in determining the rotation or retirement of Directors.

133
111. A retiring Director shall be eligible for re-election.
112. The Company at the General Meeting at which a Director retires in the manner aforesaid may fill the
vacated office by electing a person thereto, and in default the retiring Director, shall, if offering himself for re-
election, be re-elected by confirmation of the members present at such meeting, unless if at such meeting it is
expressly resolved not to fill such vacated office or unless an Ordinary Resolution for the re-election of such
Director shall have been put to the meeting and lost.
150. The Directors may grant retirement pensions or annuities or other gratuities or allowances, including
allowances on death, to any person or to the widow of or dependants of any person in respect of services
rendered by him to the Company whether as Director or Director in any executive office or in any other
office or employment under the Company or indirectly as an officer or employee of any subsidiary company of
the Company notwithstanding that he may be or may have been a Director of the Company and the Company
may make payments towards insurances or trusts for such purposes in respect of such persons and may include
rights in respect of such pensions, annuities and allowances in the terms or engagement of any such person,
without being precluded from granting such retirement pensions or annuities or other gratuities or allowances
including allowances of death not as a part and independently of the terms of any engagement but upon the
retirement, resignation or death of any such person as the Board may decide .
5. DIVIDENDS AND RESERVE
177. The Directors may from time to time pay to the members such interim dividends as appear to the Directors to
be justified by the profits of the Company. If at any time the share capital of the Company is divided into different
classes, the Board may pay such interim dividends on shares which rank after shares conferring preferential rights with
regard to dividend as well as on shares conferring preferential rights unless at the time of payment any preferential
dividend is in arrears. Provided that the Board acts in good faith it shall not incur any liability to the holders of shares
conferring preferential rights for any loss that they may suffer in consequence of the declaration or by the lawful
payment of any interim dividend on shares ranking after those with preferential rights.
178. No dividend shall be paid otherwise than out of profits and if and for so long as the shares of the Company
are listed on the JSE, dividends may only be declared and paid to members of the Company registered as such on
the Register of Members as at a date subsequent to the date of declaration or date of confirmation of the dividend,
whichever is the later.
179. The Directors may, before recommending any dividend, set aside out of the profits of the Company such sums
as they think proper as a reserve or reserves which shall, at the discretion of the Directors, be applicable for any
purpose to which the profits of the company may be properly applied, and pending such application may, at the like
discretion, either be employed in the business of the Company or be invested in such investments (other than shares
of the Company) as the Directors may from time to time think fit. The Directors may also without placing the same
to reserve carry forward any profits which they may think prudent not to divide.
180. Subject to the rights of persons, if any, entitled to shares with special rights as to dividend, all dividends shall be
declared and paid according to the amounts paid or credited as paid on the shares in respect whereof the dividend
is paid, but no amount paid or credited as paid on a share in advance of calls shall be treated for the purposes of this
regulation as paid on the share. All dividends shall be apportioned and paid proportionately to the amounts paid
or credited as paid on the shares during any portion or portions of the period in respect of which the dividend is
paid: but if any share is issued on terms providing that it shall rank for dividend as from a particular date, or in case
a unanimous decision of all the members of the company to that effect is passed, such share shall rank for dividend
accordingly.
181. The Directors may deduct from any dividend payable to any member all sums of money (if any) presently
payable by him to the company on account of calls or otherwise in relation to the shares of the company and they
may also deduct from any such dividends any other sums presently payable by him to the company for any reason.
182. Any General Meeting declaring a dividend or bonus may direct payment of such dividend or bonus wholly or
partly by the distribution of specific assets and in particular, but without prejudice to the generality of the foregoing,
of paid up shares, debentures or debenture stock of any other company or in any one or more of such ways, and
the Directors shall give effect to such resolution, and where any difficulty arises in regard to such distribution, the
Directors may settle the same as they think expedient.
183. Any dividend, interest or other monies payable in cash in respect of shares will be paid by electronic transfer
into the bank account of the Shareholder or bank account nominated by the holder whose name appears first on
the register, or if so requested by the member, may be paid by cheque or warrant sent through the post directed
to the registered address of the holder or, in the case of joint holders, to the registered address of that one of the

134
joint holders who is first named on the register of members or to such person and to such address as the holder or
joint holders may in writing direct. Every such cheque or warrant shall be made payable to the order of the person
to whom it is sent. Any one of two or more joint holders may give effectual receipts for any dividends, bonuses or
other monies payable in respect of the shares held by them as joint holders.
184. No dividend shall bear interest against the Company.
185. If cheques, warrants or orders for dividends or other sums payable in respect of a share sent by the Company to
the person entitled thereto by post are returned to the Company undelivered or left uncashed on two consecutive
occasions the Company shall not be obliged to send any further dividends or other moneys payable in respect of that
share due to that person until he notifies the Company of an address to be used for the purpose.
186. All dividends, interest or other sum payable and unclaimed for 12 months after having become payable may be
invested or otherwise made use of by the Board for the benefit of the Company until claimed and the Company shall
not be constituted a trustee in respect thereof. All dividends unclaimed for a period of 12 years after having become
due for payment shall (if the Board so resolves) be forfeited and shall revert to the Company.
187. The waiver in whole or in part of any dividend on any share by any document (whether or not under seal) shall
be effective only if such document is signed by the member (or the person entitled to the share in consequence of the
death, bankruptcy or mental disorder of the holder or otherwise by operation of law) and delivered by the Company
and only if or to the extent that the same is accepted as such or acted upon by the Company.
6. WINDING UP
203. If the Company is wound up, the surplus assets remaining after payment of all creditors are to be divided among
the members in proportion to the capital which at the commencement of the winding up is paid up on the shares
held by them, respectively and, if such surplus assets are insufficient to repay the whole of the paid up capital, they
are to be distributed so that as nearly as may be the losses are borne by the members in proportion to the capital
paid up at the commencement of the winding up on the shares held by them, respectively. This Article is subject to
the rights attached to any shares which may be issued on special terms or conditions.
204. If the Company shall be wound up the liquidator may, with the sanction of an extraordinary resolution of the
company and any other sanction required by the Law, divide amongst the members in specie or kind the whole or
any part of the assets of the Company (whether they shall consist of property of the same kind or not) and may,
for such purpose set such value as he deems fair upon any property to be divided as aforesaid and may determine
how such division shall be carried out as between the members or different classes of members. The liquidator may,
with the like sanction, vest the whole or any part of such assets in trustees upon such trusts for the benefit of the
contributories as the liquidator, with the like sanction, shall think fit, but so that no member shall be compelled to
accept any shares or other securities whereon there is any liability.

135
ANNEXURE 7
CORPORATE GOVERNANCE
Tharisa’s compliance with the King Code will be available on Tharisa’s website (www.tharisa.com)
1. APPLICATION AND APPROACH
The Directors endorse and accept full responsibility for the application of the principles necessary to ensure that
effective corporate governance is practiced consistently throughout the Company. In discharging this responsibility,
the intention is to comply with the requirements of the South African Code of Corporate Practices and Conduct as
set out in the King Code in both letter and spirit. The Company’s approach to corporate governance strives to be
stakeholder inclusive, based on good communication and integrated into every aspect of the Company’s business.
The Company has implemented policies evidencing a clear balance of power and authority at Board of Directors
level, to ensure no one Director has unfettered power of decision-making.
The Directors have pro-actively taken steps to ensure that all the elements required to make the Company fully
compliant with the recommendations incorporated in the King Code have been implemented other than not having
an independent internal audit function. The Company has adopted a Board Charter setting out roles, functions,
obligations, rights, responsibilities and powers of the Board and the policies and practices of the Board in respect of its
duties, functions and responsibilities. The Company has also adopted terms of reference for each of its committees.
The Board is of the opinion that the Company is compliant with the Listings Requirements and the King Code
in all material respects, other than having an Executive Chairman and not having an independent internal audit
function. In order to mitigate this non-compliance, David Salter has been appointed as Lead Independent Director
and PricewaterhouseCoopers has been appointed as the internal auditors of the Group.
2. BOARD OF DIRECTORS’ PRACTICES
The Board is ultimately responsible for the day-to-day management of the Company’s business, its strategy and key
policies. The Board is also responsible for approving the Company’s financial objectives and targets.
Members of the Board are appointed by the Company’s Shareholders. The Board also has the powers to appoint
additional Directors, subject to such appointment being approved by Shareholders. Pursuant to the terms of the
Board charter, appointments to the Board are made on the recommendation of the Nomination Committee.
A formal policy detailing the procedures for appointment to the Board has been adopted by the Company. A brief
curriculum vitae of each director standing for election or re-election will be provided in the notice of each general
meeting at which the appointment of such Director is considered.
The Directors who are also members of the executive committee of the Company are involved in the day-today
business activities of the Company and are responsible for ensuring that the decisions of the executive Committee
as approved by the Board are implemented in accordance with the mandate given by the Board and executive
committee. The Board is satisfied as to the appropriateness of the expertise of the Company Secretaries and will
consider, on an annual basis, and satisfy itself of the qualifications, experience and arms-length relationship of the
Company Secretaries with the Board. As noted above, a Board charter has been adopted where the terms of
reference of the Board are set out.
3. COMMITTEES
The deliberations of the various committees referred to below, do not reduce the individual and collective
responsibilities of Board members in regard to their fiduciary duties and responsibilities, and they must continue to
exercise due care and judgement in accordance with their statutory obligations.
These terms of reference are subject to the provisions of the Articles of Association and any other applicable law or
regulatory provision in force in Cyprus, and the Listings Requirements.

136
4. AUDIT COMMITTEE
The Audit Committee will provide the Board with additional assurance regarding the quality and reliability of financial
information used by the Board and the financial statements of the Company and its subsidiaries (collectively, the
Group). In addition, the Audit Committee will review the internal control systems, the financial control systems,
the accounting systems and reporting and the internal audit functions. It will also liaise with the Group’s external
auditors and monitor compliance with legal requirements, ensure management addresses any identified internal
control weakness, assess the performance of financial management, approve external audit fees, budgets, plans and
performance, and establish a policy regarding non-audit services provided by the external auditors.
The committee, which must comprise at least three independent non-Executive directors, is chaired by Antonios
Djakouris, an independent non-Executive Director. Other members of the Audit Committee are Ioannis Drapaniotis
and David Salter. The Group’s independent external auditors will attend committee meetings by invitation. It is
intended that the Audit Committee will meet at least twice per annum.
The committee is satisfied as to the appropriateness of the expertise of Michael Jones and will consider, on an annual
basis, and satisfy itself of the appropriateness of the expertise and experience of the Chief Finance Officer.
5. RISK COMMITTEE
The Risk Committee will review management reports on the adequacy and effectiveness of the Group’s risk
management functions, ensure compliance with the Group’s risk management policies and review the adequacy of
the Group’s insurance coverage.
The committee, which must comprise at least three members which includes Executive and non-Executive Directors,
comprises the entire board and is chaired by Antonios Djakouris, an independent non-Executive Director. Other
members of the Risk Committee are independent non-Executive Directors David Salter, Ioannis Drapaniotis, the
Executive Chairman Loucas Pouroulis, the Chief Executive Officer Phoevos Pouroulis and the Chief Finance Officer
Michael Jones. It is intended that the Risk Committee will meet at least twice per annum.
6. NOMINATION COMMITTEE
The Nomination Committee will ensure that the procedures for appointments to the Board are formal and
transparent by making recommendations to the Board on all new board appointments in accordance with the
Company’s policy for Board appointments. It will do so by regularly evaluating the Board performance, undertaking
performance appraisals of the Chairman and Directors, evaluating the effectiveness of Board committees and making
recommendations to the Board. The Nomination Committee will also determine the Board succession plans.
The Nomination Committee is chaired by David Salter, the Lead Independent Director. Other members of the
committee are Antonios Djakouris, an independent non-Executive Director, and Loucas Pouroulis, the Executive
Chairman. Loucas Pouroulis is entitled to participate and contribute to the Nomination Committee, but is not
entitled to vote on any matter before the Nomination Committee. In the event of a tied vote, David Salter shall have
a casting vote. It is intended that the Nomination Committee will meet at least twice per annum.
7. REMUNERATION COMMITTEE
The Remuneration Committee will consider the remuneration framework of the Chairman, Chief Executive Officer,
Chief Financial Officer, other executive directors of the Company, the Company Secretary and other members of
the executive management of the Company and its Subsidiaries, with the assistance and guidance of independent
experts. The committee will also consider bonuses, which are discretionary and based upon general economic
variables, the performance of the Company and each individual’s performance, share options and certain other
employee benefits and schemes. No remuneration of any nature shall be paid, increased or varied to any director
without the prior approval of the members of the Remuneration Committee. The committee will also produce an
annual remuneration report to be approved by Shareholders at the Company’s annual General Meeting.
The Remuneration Committee, which must only comprise of members of the Board the majority of which are non-
Executive Directors (of which the majority must be independent), is chaired by Antonios Djakouris, an independent
non-Executive Director. Other members of the committee are Ioannis Drapaniotis and David Salter, independent
non-Executive Directors. It is intended that the Remuneration Committee will meet at least twice per annum.

137
8. SAFETY, HEALTH AND ENVIRONMENT COMMITTEE
The Safety, Health and Environment Committee will develop and review the Group’s framework, policies and
guidelines on safety, health and environmental management, monitor key indicators on accidents and incidents
within the Group’s operations and consider developments in relevant safety, health and environmental practices
and regulations.
The Safety, Health and Environmental Committee is chaired by David Salter, an independent non-Executive Director.
The other members of the committee are Antonios Djakouris and Ioannis Drapaniotis, independent non-Executive
Directors. It is intended that the committee will meet at least twice per annum.
9. WHISTLEBLOWER POLICY
This policy has been established for the receipt, retention, and treatment of complaints received by the Company
regarding accounting, internal accounting controls, auditing matters or violations to the Company’s Code of Business
Conduct and Ethics and other corporate governance policies and the submission by employees of the Company, on a
confidential and anonymous basis, of concerns regarding questionable accounting, auditing matters or violations to the
Company’s code of business conduct and ethics. It is the duty of the Audit Committee to ensure that arrangements
are in place for the proportionate and independent investigation of such matters and appropriate follow-up action.
10. INTERNAL CONTROL SYSTEMS
To meet the Company’s responsibility to provide reliable financial information, the Company maintains financial and
operational systems of internal control. These controls are designed to provide reasonable assurance that transactions
are concluded in accordance with management’s authority, that the assets are adequately protected against material
losses, unauthorised acquisition, use or disposal, and that transactions are properly authorised and recorded.
The systems include a documented organisational structure and division of responsibility, established policies and
procedures which are communicated throughout the Group, and the careful selection, training and development
of people.
The Company monitors the operation of the internal control systems in order to determine if there are deficiencies.
Corrective actions are taken to address control deficiencies as they are identified. The Board, operating through the
Audit and Risk Committee, oversees the financial reporting process and internal control systems.
The Company does not have an independent internal audit function, the Directors do not believe that the Company
is sufficiently large to justify an internal audit function. The Audit Committee will consider annually whether there
is a need for an internal audit function and will make a recommendation to the Board. The reasons for the absence
of an internal audit function will be explained annually in the annual report of the Company. Notwithstanding this,
the Directors believe that the Company has appropriate internal control systems for a company of its size and that
the absence of an internal audit function is mitigated by the appointment of PricewaterhouseCoopers as the internal
auditors of the Group.
There are inherent limitations on the effectiveness of any system of internal control, including the possibility of human
error and the circumvention or overriding of controls. Accordingly, an effective internal control system can provide
only reasonable assurance with respect to financial statement preparation and the safeguarding of assets.
11. DEALINGS IN LINKED SHARES
On Listing, the Company will adopt a share dealing policy requiring all Directors and senior executives to obtain prior
written clearance from either the Chairman or the Chief Executive Officer to deal in linked shares. The Chairman
would require prior written clearance from the chairman of the Audit and Risk Committee. Closed periods (as defined
in the Listings Requirements) shall be observed as required by the Listings Requirements. During these periods, the
Company’s directors, executives and inside employees would not be permitted to deal in linked shares. Additional
closed periods would be enforced should the Company be subject to any corporate activity where a cautionary
announcement (as defined in the Listings Requirements) is published.

138
ANNEXURE 8
SHARE AWARD PLAN
Set out below are extracts from the Share Award Plan of Tharisa.
1. GLOSSARY OF TERMS
Adoption Date means the date on which the Plan is adopted by the Committee and approved by an ordinary
resolution (requiring a 75% majority vote by shareholders of the Company present or by proxy in a general meeting);
Appreciation Right means an Award which takes the form of a right to call for Shares of an aggregate Market Value
or receive a Cash Amount equal to the increase (if any) between the Date of Grant and the Exercise Date of the
Market Value of such number of Shares as is specified in the Notice of Award and has Vested;
Award means an award granted in the form of a Conditional Award or an Appreciation Right;
Capital Reorganisation means any variation in the share capital or reserves of the Company (including, without
limitation, by way of capitalisation issue, rights issue, sub-division, consolidation or reduction and specifically excluding
the issue of Shares as consideration for an acquisition, for cash or for a vendor consideration placing);
Cash Amount means, in relation to any cash payment in respect of any Shares that would otherwise be transferred
or issued (as applicable), the payment of an amount in cash equal to the Market Value of such Shares;
Committee means the Remuneration Committee of the Board of Directors of the Company or (where appropriate)
any other duly authorised sub-committee;
Conditional Award means an Award which takes the form of a contingent right to receive at no or nominal cost
such number of shares or receive a Cash Amount as is specified in the Notice of Award and has Vested;
Control means: (i) the control of the composition of the Board of Directors of the Company (as such control is
defined by Cyprus Companies Law); or (ii) the holding of the majority of the voting rights in the Company, in each
case whether through the ownership of shares or by virtue of an agreement or otherwise;
Consultant means any adviser, consultant, contractor, agent, business partner, service provider or other person who
is involved in the business of the Group;
Cyprus Companies Law means the Companies Law, Chapter 113 (CAP 113) of the laws of the Republic of Cyprus,
as amended from time to time;
Date of Grant means the date on which an Award is granted;
Dealing Day means any day on which the stock exchange on which the Shares are admitted to trading is open for
the transaction of business;
Employee means any employee (including an executive director) of any Group Company;
Exercise Date means, in relation to an Appreciation Right, the date on which the Company receives the notice of
exercise referred to in paragraph 3.2 below, provided that if Listing has occurred and such date is not a Dealing Day,
the Exercise Date shall be the following Dealing Day and if the Exercise Date would otherwise fall on a date when the
Company and/or the Participant would be subject to dealing restrictions, it shall be such later date as those dealing
restrictions lift;
Grant Period means the period of 60 days commencing on the date of the resolution of the Committee that
Awards be made;
Group means the Company and its Subsidiaries; Group Company means any one of them;
Listing means the admission of the shares on the JSE or other applicable stock exchange;
Market Value means, in relation to a share on any day, for so long as such shares are Listed, its volume weighted
average closing price as derived from the stock exchange on which the shares are listed during the immediately
preceding 30 Dealing Days or if the shares are not Listed otherwise as determined by the Committee;
Notice of Award means the notification to a Participant setting out the specific conditions of an Award in such form
as the Committee may determine from time to time;
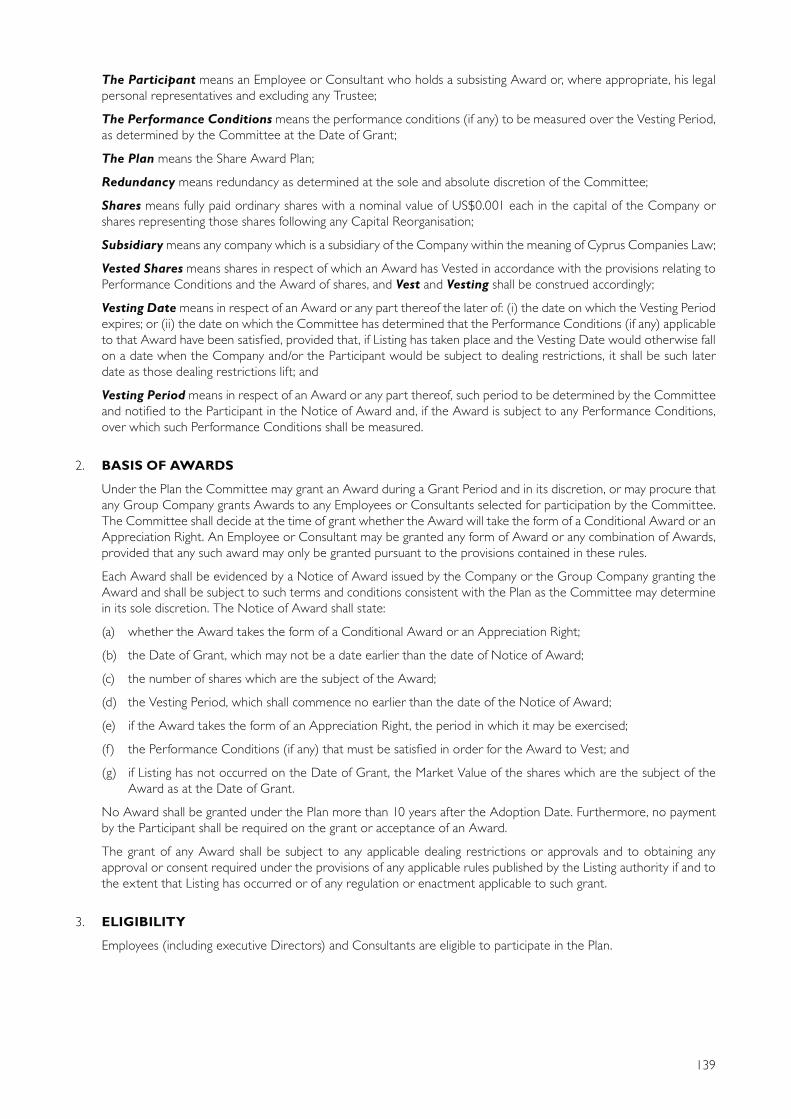
139
The Participant means an Employee or Consultant who holds a subsisting Award or, where appropriate, his legal
personal representatives and excluding any Trustee;
The Performance Conditions means the performance conditions (if any) to be measured over the Vesting Period,
as determined by the Committee at the Date of Grant;
The Plan means the Share Award Plan;
Redundancy means redundancy as determined at the sole and absolute discretion of the Committee;
Shares means fully paid ordinary shares with a nominal value of US$0.001 each in the capital of the Company or
shares representing those shares following any Capital Reorganisation;
Subsidiary means any company which is a subsidiary of the Company within the meaning of Cyprus Companies Law;
Vested Shares means shares in respect of which an Award has Vested in accordance with the provisions relating to
Performance Conditions and the Award of shares, and Vest and Vesting shall be construed accordingly;
Vesting Date means in respect of an Award or any part thereof the later of: (i) the date on which the Vesting Period
expires; or (ii) the date on which the Committee has determined that the Performance Conditions (if any) applicable
to that Award have been satisfied, provided that, if Listing has taken place and the Vesting Date would otherwise fall
on a date when the Company and/or the Participant would be subject to dealing restrictions, it shall be such later
date as those dealing restrictions lift; and
Vesting Period means in respect of an Award or any part thereof, such period to be determined by the Committee
and notified to the Participant in the Notice of Award and, if the Award is subject to any Performance Conditions,
over which such Performance Conditions shall be measured.
2. BASIS OF AWARDS
Under the Plan the Committee may grant an Award during a Grant Period and in its discretion, or may procure that
any Group Company grants Awards to any Employees or Consultants selected for participation by the Committee.
The Committee shall decide at the time of grant whether the Award will take the form of a Conditional Award or an
Appreciation Right. An Employee or Consultant may be granted any form of Award or any combination of Awards,
provided that any such award may only be granted pursuant to the provisions contained in these rules.
Each Award shall be evidenced by a Notice of Award issued by the Company or the Group Company granting the
Award and shall be subject to such terms and conditions consistent with the Plan as the Committee may determine
in its sole discretion. The Notice of Award shall state:
(a) whether the Award takes the form of a Conditional Award or an Appreciation Right;
(b) the Date of Grant, which may not be a date earlier than the date of Notice of Award;
(c) the number of shares which are the subject of the Award;
(d) the Vesting Period, which shall commence no earlier than the date of the Notice of Award;
(e) if the Award takes the form of an Appreciation Right, the period in which it may be exercised;
(f) the Performance Conditions (if any) that must be satisfied in order for the Award to Vest; and
(g) if Listing has not occurred on the Date of Grant, the Market Value of the shares which are the subject of the
Award as at the Date of Grant.
No Award shall be granted under the Plan more than 10 years after the Adoption Date. Furthermore, no payment
by the Participant shall be required on the grant or acceptance of an Award.
The grant of any Award shall be subject to any applicable dealing restrictions or approvals and to obtaining any
approval or consent required under the provisions of any applicable rules published by the Listing authority if and to
the extent that Listing has occurred or of any regulation or enactment applicable to such grant.
3. ELIGIBILITY
Employees (including executive Directors) and Consultants are eligible to participate in the Plan.

140
4. VESTING
4.1 Rights of Participants before Vesting:
Every Award granted under the Plan shall be personal to the Participant to whom it is granted and, except:
(a) to the extent necessary to enable a personal representative to realise the Award following the death of
a Participant; or
(b) with the prior written consent of the Committee to a family trust of which the beneficiaries are restricted
to the Participant and/or his or her spouse, widow, widower, children and step-children,
neither the Award nor the benefit thereof may be transferred, assigned, charged or otherwise alienated. Any
transfer or attempted transfer of an Award otherwise than as permitted by the Plan shall cause an Award to
lapse.
A Participant will have no rights in respect of any shares subject to an Award until the shares are issued or
transferred to him. Upon any such shares subject to an Award being issued or transferred to a Participant, the
Participant shall have such rights in respect of such shares as attach to those shares.
A Participant will have no rights to vote at any meeting of the Company or otherwise share in any distribution
of the Company by reason only of an Award being granted.
4.2 Vesting of Awards:
An Award may only be realised:
(a) if and to the extent that the Award has Vested; and
(b) (in the case of an Award granted to an Employee) by a Participant who has remained an Employee during
the Vesting Period.
Vested Shares under Conditional Awards will be released or the Cash Amount paid, as applicable, to
Participants automatically within 30 days of the Vesting Date. A Participant need take no action to realise a
Conditional Award.
To the extent that it is permitted under the Plan, Vested Appreciation Rights are exercisable up until the fifth
anniversary of the Date of Grant after which they will lapse. A Participant may exercise a Vested Appreciation
Right in whole or in part by written notice to the Company in such form as is required by the Company.
A Participant’s Award shall not Vest if and for so long as he has been suspended from his employment by
reason of suspected gross misconduct. Shares held in trust pursuant to an Award to any Participant may not
be sold on behalf of such Participant, prior to the Vesting Date in respect such Shares.
5. PERFORMANCE CONDITIONS
Performance Conditions shall be determined by the Committee at the Date of Grant. The Committee may determine
that an Award should be subject to multiple Performance Conditions or that an Award should be sub-divided and
that each part be subject to different Performance Conditions and/or that any part be free from Performance
Conditions.
If and to the extent that an Award is subject to Performance Conditions, the Award will Vest as to the percentage
of Shares determined in accordance with the Performance Conditions. An Award or any part thereof which is not
subject to Performance Conditions will, subject always to the rules of the Plan, Vest in full or in part, as applicable at
the end of the Vesting Period.
If an event or transaction occurs which causes the Committee to consider that any Performance Conditions, subject
to which a subsisting Award has been granted, are no longer appropriate, the Committee may substitute or vary the
Performance Conditions in such manner (and make such consequential amendments to the rules); as:
(a) is reasonable in the circumstances; and
(b) produces a fairer measure of performance and is neither materially more nor less difficult to satisfy.
The subsisting Award shall then take effect subject to the Performance Conditions as so substituted or varied.

141
6. LIMITS
6.1 Individual Limits
No Award may be granted under the Plan to the extent that the result of that grant would be that the
aggregate number of Shares realisable under that Award and of the Shares realisable under any other Awards
granted to him under the Plan would exceed 0.5 percent of the ordinary share capital of the Company for the
time being in issue. If the grant of any Award would have the result of breaching the individual limit, that Award
shall be treated as taking effect over the maximum number of Shares over which it could have been granted
without breaching such limit. Furthermore, approval is required by the passing of an ordinary resolution
(requiring a 75% majority vote by shareholders of the Company present or by proxy in a general meeting) in
order for an Award, which would result in a breach of the abovementioned limit, to Vest.
6.2 Plan Limits
No Award may be granted under the Plan to the extent that the result of that grant would be that the
aggregate number of Shares that could be issued on the realisation of that Award and any other Award
granted at the same time, when added to the number of Shares that could be or have been issued on the
realisation or exercise of any awards granted under any other share-based incentive plan established by the
Company or any other company under the Company’s Control would exceed 10 per cent of the ordinary
share capital of the Company for the time being in issue.
In determining the plan limit set out above, no account shall be taken of any Shares attributable to an Award
which has lapsed or otherwise become incapable of exercise. Furthermore, this limit may not be exceeded
except to the extent that approval has been granted by the passing of an ordinary resolution (requiring a 75%
majority vote by shareholders of the Company present or by proxy in a general meeting).
7. LEAVERS
At any time before the Vesting Date, an Award granted to an Employee shall lapse automatically on the Participant
ceasing to be an Employee (including as a result of resignation). Where a Participant was an Employee at the Date
of Grant and ceases to be an Employee at any time before the Vesting Date applicable to an Award by reason of:
(a) death;
(b) injury, disability or ill-health;
(c) redundancy;
(d) retirement; or
(e) any other reason where the Committee so determines in its absolute discretion,
his Award shall continue, and will Vest and be realisable at the end of the Vesting Period subject to the achievement
of the Performance Conditions (if any) at that time.
A female Participant shall not, to the extent required by applicable law, be treated as ceasing to be an Employee if
absent from work wholly or partly because of pregnancy or postnatal confinement, until she ceases to be entitled to
exercise any statutory or contractual entitlement to return to work.
If a Participant is relocated to work for the Group in another country and, as a result of such relocation, either:
(a) suffers a material tax disadvantage (this being shown to the satisfaction of the Committee) in relation to his
Award; or
(b) becomes subject to restrictions on his ability to realise his Award under the Plan,
or would suffer such disadvantage or become subject to such restrictions were it not for this provision, the Committee
may at its absolute discretion determine that the Award may be realised within the three months immediately before
or after the date of relocation provided that the number of Shares (or equivalent Cash Amount) in respect of which
the Award Vests shall be determined by the Committee by reference to the extent to which the Performance
Conditions (if any) are or will be met on the date of such relocation, subject to modification if the Committee
considers that any such Performance Conditions would be met to a greater or lesser extent at the end of the original
Vesting Period.

142
8. CORPORATE EVENTS FOR THE COMPANY
8.1 General offer
If any person (either alone or together with any person acting in concert with him) obtains Control of the
Company as a result of making a general offer to acquire the whole of the share capital of the Company
(other than those shares which are already owned by him and/or any person acting in concert with him), the
Company shall, as soon as reasonably practicable thereafter, give notice to each Participant of such general
or other offer. Each Participant may realise his Awards at such time before the date on which the acquirer
obtains Control as the Committee may determine and, if the Committee so requires, on terms such that the
realisation is conditional upon the acquirer obtaining Control. Failing any permitted realisation, the Awards
shall lapse automatically upon the date on which the acquirer obtains Control.
8.2 Scheme of arrangement
If a court shall direct that a meeting of the holders of Shares be convened pursuant to Cyprus Companies
Law for the purposes of considering a scheme of arrangement of the Company, each Participant may realise
his Awards conditionally in accordance with paragraph 7.7 below, on the scheme of arrangement being either
approved by the shareholders’ meeting or sanctioned by the court (as determined by the Committee in its
absolute discretion) (the Relevant Condition), between the date of the court’s direction and 12 noon on the
day immediately preceding the date for which the shareholders’ meeting is convened.
Failing any permitted realisation, the Awards (or such part thereof as the Committee may specify) shall be
incapable of realisation between the last time upon which permitted realisation may occur and the first date
on which it can be determined whether or not the Relevant Condition is satisfied. If the Relevant Condition is
not satisfied, the Awards shall continue. If the Relevant Condition is satisfied, the Awards (or such part thereof
as the Committee may specify) shall lapse automatically on the day immediately after the date on which the
scheme of arrangement is sanctioned by the court.
8.3 Adjustment of capital
In the event of a capitalisation issue, a special dividend, a rights issue or reduction of capital (Capital Adjustment),
the Company shall adjust the aggregate number of Shares that the Company is entitled to grant under any
Award to an Employee or Consultant subject to the provisions relating to individual limits under the Plan.
Any such adjustment by the Company shall be carried out in a manner so as to provide such Employee or
Consultant the same proportion of Shares as that to which he was previously entitled, prior to the Capital
Adjustment.
8.4 Internal reorganisation
Awards shall not be realisable if the purpose and effect of the scheme of arrangement is to create a new holding
company for the Company, such company having substantially the same shareholders and proportionate
shareholdings as those of the Company immediately prior to the scheme of arrangement. Awards will in such
circumstances not vest and will be replaced by equivalent share awards or options in the new holding company
in accordance with paragraph 8.
8.5 Restructuring
If the Committee becomes aware that the Company is or is expected to be affected by any dividend in specie,
super dividend, change of control or other corporate restructuring of the Company which, in the opinion
of the Committee, would affect the current or future value of any Awards, the Committee, acting fairly,
reasonably and objectively, may in its absolute discretion allow some or all Awards to be realised in accordance
with paragraph 8.7.
8.6 Voluntary winding-up
If notice is duly given of a resolution for a voluntary winding-up of the Company vested but unrealised Awards
will be released or become exercisable following such winding-up. Unvested Awards will vest at the time of
the winding-up and in accordance with paragraph 8.7.

143
8.7 Application of performance conditions and pro-rating
Where an Award becomes realisable before the expiry of the relevant Vesting Period under paragraph 7.1
to 7.6 above, the number of Shares in respect of which the Award shall Vest shall be determined by the
Committee by reference to the extent to which the Performance Conditions (if any) are met as at the date of
the relevant event, subject to modification if the Committee considers that any such Performance Conditions
would have been met to a greater or lesser extent at the end of the original Vesting Period.
9. EXCHANGE OF AWARDS
In the event of the occurrence of a change of Control referred to in paragraph 8.1, or a scheme of arrangement referred
to in paragraph 8.2 the Committee may, acting fairly and reasonably and having regard to all the circumstances of
the event, determine at any time before Awards Vest in accordance with these paragraphs (provided the acquiring
company so consents), that the Participant may agree to exchange his Award or that Awards will not Vest but shall
be automatically exchanged on such date as the Committee determines.
Where Awards are to be exchanged, any Award (the Old Right) will be surrendered in consideration of the grant
to the Participant of a new award (the New Right) which, in the opinion of the Committee, is equivalent to the
Old Right but relates to shares in a different company. The provisions of the Plan shall be construed in relation to
the New Right as if:
(a) the New Right were an Award granted under the Plan at the same time as the Old Right;
(b) references to any Performance Conditions were references to such new performance conditions relating to the
business or shares of the company whose shares are subject to the New Right (or any member of its group) as
the Committee may consider appropriate in the circumstances;
(c) references to the Company and the Group were references to the company whose shares are subject to the
New Right and its group; and
(d) references to Shares were references to shares in the company whose shares are subject to the New Right.
10. ADJUSTMENTS OF AWARDS
In the event of any Capital Reorganisation (or the implementation by the Company of a demerger or payment of
a super dividend which would otherwise materially affect the value of an Award) the Committee shall adjust the
number of Shares subject to Awards (including, for the avoidance of doubt, Vested Shares in respect of which any
Award has been realised but Shares have not yet been transferred to the Participant) and the Plan or individual
referred to in paragraphs 6.1 and 6.2 above, such that, following such adjustment, the number of Shares subject to
Awards provided to any Participant shall reflect the same proportion of Shares as that to which he would have been
entitled prior to such Capital Reorganisation.
11. AMENDMENT AND ADMINISTRATION
The decision of the Committee shall be final and binding in all matters relating to the Plan and it may at any time
discontinue the grant of further Awards.
Amendments by the Committee relating to:
(a) eligibility to participate in the Plan;
(b) the number of Shares which may be utilised for the purpose of the Plan;
(c) the basis for determining Awards;
(d) the amount payable on the grant or Vesting of an Award;
(e) the voting, dividend, transfer and other rights attached to the Awards;
(f) the adjustment of Awards in the event of the events listed in paragraph 7 above; and
(g) the procedure to be adopted in respect of the Vesting of Awards in the event of termination of employment,
must be approved by holders of Shares passing an ordinary resolution representing at least 75% of the votes cast in
favour of such resolution.

144
ANNEXURE 9
CURRICULUM VITAE OF THE DIRECTORS, SENIOR MANAGEMENT AND
COMPANY SECRETARIES
DIRECTORS
The following table lists the names, positions and ages of the Directors:
Name Position Age
Loucas Christos Pouroulis Executive Chairman 75
Phoevos Pouroulis Chief Executive Officer 39
Michael Gifford Jones Chief Finance Officer 51
John David Salter Lead Independent non-Executive Director 55
Ioannis Drapaniotis Independent non-Executive Director 74
Antonios Djakouris Independent non-Executive Director 66
Executive Directors
Loucas Pouroulis, aged 75
Executive Chairman
Mining and Metallurgical Engineering (Hons) (National Technical University of Athens, Greece)
Loucas has been an Executive Director of the Company since 27 October 2010 and is the Executive Chairman of the
Group, with responsibility for the development of strategy and identification of new opportunities for the Group. Loucas
joined the Group at its inception in 2008 and served in an advisory capacity prior to being appointed as a Director. Loucas
is the father of Phoevos Pouroulis, the Chief Executive Officer of the Company.
Loucas has a total of 50 years’ experience in mining exploration, project management, financing and the production of
open pit and underground mining operations including PGM and gold mines, having worked in various managerial and
operational positions in mining companies and ventures since 1964 and having acquired and sold interests in a number of
mining assets and operations. Loucas began his career in Cyprus in 1962, and his initial post-graduate training took place
in Germany, Sweden and Cyprus.
Loucas is trained as a mining metallurgical engineer.
He obtained an honours degree in mining and metallurgical engineering from the National Technical University of Athens
in 1962. From 1964 to 1971, Loucas was employed by Anglo American Corporation and worked as a manager at its East
Daggafontein mine and Western Deep Levels mine, at that time the world’s deepest gold mine.
In 1971, Loucas began acquiring his first mining rights in South Africa and in 1979 established Consolidated Modderfontein
to acquire, rehabilitate and operate disused gold mines considered uneconomical by other operators. During this time,
Loucas acquired the East Daggafontein mine from Anglo American Corporation and commercialised the carbon-in-pulp
process for gold recovery in South Africa. Loucas sold Consolidated Modderfontein in 1993.
Since 1985, Loucas has been a director of Salene Mining Proprietary Limited, which was the incubator company for the
Pouroulis family’s mining projects and investments. Salene does not currently have any investments in the mining sector
and is not engaged in any business that competes with the Group. He has also been a director of Salene Technologies
since June 2005. In 1987, Loucas established Lefkochrysos to mine PGMs in the Brits area. Lefkochrysos was floated on
the Johannesburg Stock Exchange in 1987 and subsequently sold to Rand Mines in 1988. In 1996 he co-founded Pacific
Platinum which became Aquarius Platinum, a PGM producer with operations in South Africa and Zimbabwe.
In 1997, he helped to establish Petra Diamonds, a diamond mining group and a supplier of rough diamonds to the
international market that is listed on the London Stock Exchange. In 2004, a consortium led by Loucas acquired 83.2% of
Barplats Investments Limited, the company then controlling the dormant PGM mining operation in the Brits area, from
Impala Platinum, which was merged and became known as Eastern Platinum Limited, a company listed on the Toronto
Stock Exchange, AIM and the Johannesburg Stock Exchange. In 2005 Loucas established Eland Platinum, a PGM exploration
and mining company that was listed on the Johannesburg Stock Exchange in 2006 with a value of approximately
US$90 million and was sold to Xstrata plc in 2007 for approximately US$1 billion. In 2007, Loucas established TransAfrika

145
Resources, a gold exploration and mining company at which he has been the non-Executive chairman since November
2007. In 2006, he helped establish Keaton Energy, a coal producing, exploration and development company, and Kameni,
a PGM exploration company at which he has been the non-Executive chairman since November 2008.
Phoevos Pouroulis, aged 39
Chief Executive Officer
Bachelor of Science and Business Administration (Boston University, USA)
Phoevos has been an Executive Director of the Company since 27 October 2010 and is the Chief Executive Officer of the
Group, with responsibility for the overall strategy and management of the Group. Mr Pouroulis joined the Group in 2009
and served in an advisory capacity prior to being appointed as a Director. Phoevos is the son of Loucas Pouroulis, the
Executive Chairman of the Company.
Phoevos has a total of 15 years’ experience in project management, mining design, commissioning and production of
mining operations including PGM and chrome mines, having worked in various managerial and operational positions in
mining companies since 1997. Phoevos obtained a Bachelor of Science and Business Administration Degree, majoring in
finance and organisational behavior, from Boston University in January 1997. From 1997 to 2003, Phoevos was a marketing
director for Medco South Africa Proprietary Limited a medical equipment supplies company that imported Chinese
medical equipment into South Africa. Phoevos has been a director of Salene Mining Proprietary Limited since June 1998.
Salene has been used as an incubator company for a number of the Pouroulis family’s projects and investments in the
mining and other sectors. Salene does not currently have any investments in the mining sector and is not engaged in any
business that competes with the Group. From 2003 to 2006 he was a commercial consultant and from 2007 to 2009 he
was the commercial director of Chromex Mining plc, a chrome mining company that was listed on AIM in September
2006 before subsequently being sold and delisted in December 2010.
Phoevos was involved in developing the Chromex Mining business from the acquisition of the mining exploration asset to
the raising of capital on AIM and the design, commissioning and production of chrome mining operations. From 2005 to
2006 Phoevos was a promoter and commercial advisor at Spruce Management, evaluating a copper exploration project
in Cuba, where he was involved in the commissioning of the bankable feasibility study and commercial negotiations
regarding the project. In 2006 Phoevos helped to establish Keaton Energy Holdings Limited and served as a founding
executive director prior to the listing of Keaton Energy on the Johannesburg Stock Exchange. He has been a non-executive
director of Keaton Energy since January 2008. He also founded Arxo Logistics, a mining logistics company which became
a subsidiary of the Group in March 2011. Phoevos was also a founding member of The Music for the Children Foundation,
a not-for-profit children’s fundraising charity, and served as its chairman from 2006 to 2010. Phoevos was appointed to
the Council of the International Chrome Development Association in 2013 and serves as a member on its management
committee. Phoevos is also a director of Tharisa Minerals.
Michael Jones, aged 51
Chief Finance Officer
Bachelor of Accounting (University of KwaZulu-Natal (Pietermaritzburg), South Africa), CA(SA), Member of the South
African Institute of Chartered Accountants
Michael was appointed as an Executive Director of the Company on 30 January 2013 and has been the Chief Finance
Officer of the Group since 1 May 2012. He is responsible for the overall finance operation and the financial reporting
management of the Group. Michael has 18 years of investment banking experience in corporate finance, including extensive
experience of equity and debt capital raisings, as well as five years of financial management experience of PGM and
chrome mining operations. From 1985 to 1988, Michael worked in the audit division of Arthur Andersen & Co., where he
completed his articles to qualify as a chartered accountant. From 1990 to 1995, Michael commenced his investment
banking career in the corporate finance division of UAL Merchant Bank Limited. From 1995 to 2000 Michael was Assistant
General Manager in the corporate finance department of The Board of Executors. From 2000 to 2008 Michael held the
position of Director Investment Banking with N M Rothschild & Sons (South Africa) Proprietary Limited. Michael was an
executive director and chief finance officer of Kameni from September 2008 to April 2012. Michael obtained a Bachelor
of Accountancy from University of Natal in December 1984. He is a chartered accountant and a member of the South
African Institute of Chartered Accountants. Michael is also a director of Tharisa Minerals.

146
Lead Independent non-Executive Director
David Salter, aged 55
Lead Independent non-Executive Director
Bachelor of Science (Hons), PhD in Mineral Technology (Imperial College, London, UK), FSAIMM
David has been a non-Executive Director of the Company since 27 October 2010 and was re-appointed as Lead
Independent non-Executive Director on 13 February 2014.
David has a total of 30 years of experience in the management and development of mining companies, including the
exploration, development and production of open pit and underground PGM mining operations, having worked in various
management positions in the mining industry since 1984. David obtained a bachelor of engineering degree in 1980 and a
doctorate in mineral technology for studies on base metal sulphides in 1984 from Imperial College, London. From 1984
to 1990, David worked for De Beers in Johannesburg, where he developed, patented and implemented new crushing and
sorting technologies for diamond recovery. In 1990, David established Matplant Process, a process design consultancy
company in the diamond industry which was acquired by De Beers in 1991 and renamed Debex Process. He continued
to work for Debex Process until 1994. From 1994 to 1998, David worked at Fluor Daniel, including working as the general
manager of Fluor’s sub-Saharan mining and metals operations from 1994 to 1997, where he was also project director on
Sasol Coal’s Twistdraai export coal project, due diligence manager for BHP-Billiton’s acquisition of Queensland Nickel and
pre-feasibility study manager for BHP-Billiton-Aneka Tambang’s Halmahera nickel project in Indonesia. He was seconded
to Fluor Chile in 1997 as project manager for an options study on a copper project in Peru and close out manager on the
Alumbrera copper project in Argentina.
From 1998 to 2005, David was group managing director of Salene Mining, a diverse group of mining companies representing
the Pouroulis family’s private holdings, and undertook various projects, including the bankable feasibility study on a
titanium project and the development of two PGM mines. From 2004 to 2005, David was managing director of Barplats
Investments Limited, and led the successful re-commissioning of the Crocodile River platinum mine. In 2006, David was
appointed as the founding managing director of Eland Platinum Limited, and held this position until Eland was acquired by
Xstrata plc in 2007. David has served as the non-executive chairman of Keaton Energy Holdings Limited since 2008 and
is a non-executive director of a number of unlisted resource companies. David has been a Fellow of the South African
Institute of Mining and Metallurgy since 1993. David is also a director of Tharisa Minerals.
Independent non-Executive Directors
Ioannis Drapaniotis, aged 74
Independent non-Executive Director
Bachelor of Engineering (Mining and Metallurgy) (National Technical University of Athens, Greece)
Ioannis has been an independent non-Executive Director of the Company since 3 May 2008. Ioannis has over 45 years of
experience in the mining and metallurgical sectors, having worked in various managerial and operational positions in
mining companies since 1964. Ioannis graduated from the National Technical University of Athens, Greece with a bachelor
of engineering degree in mining and metallurgy in June 1962. From 1964 to 1984, he worked in various positions at LARCO
S.A., a nickel manufacturing company and eventually assumed the position of director of mining. From 1984 to 1988, he
worked at Golden Dumps Proprietary Limited as group mining engineer and from 1988 to 1989 at Barplats Mines Limited
as operations and technical services manager of a PGM mine in South Africa. From 1990 to 1997, Ioannis worked for
Bauxite Parnasse Mining Co. in Greece and from 1992 as general manager was responsible for overall performance and
development of the company’s business. From 1998 to 2001, he worked for TVX Hellas S.A., a company established to
exploit a gold deposit in Greece, and was chairman and chief executive of the company, responsible for obtaining mining
permits, establishing the company and developing its mining operations. From 2001 to 2008, he joined the Federation of
Greek Industry as general manager and consultant to the chairman. Ioannis was also executive Chairman of the Hellenic
Institute for Occupational Health and Safety from July 2008 to September 2011.
Antonios Djakouris, aged 66
Independent non-Executive Director
Charted Accountant and Fellow of the Institute of Charted Accountants in England and Wales
Antonios has been an independent non-Executive Director of the Company since 11 October 2011. Antonios has
experience as a manager and director having served in a number of posts with Bank of Cyprus, and he also has audit
experience, having qualified and worked as a chartered accountant. Antonios qualified as a chartered accountant in the
UK in 1973, and became a fellow of the Institute of Chartered Accountants in England and Wales in 1979. From 1973 to

147
1980 he worked with the international audit firm Coopers and Lybrand (now part of PricewaterhouseCoopers). From
1980 to 2009, Antonios worked in a number of management roles at Bank of Cyprus. From 1980 to 1993 he served as a
manager in positions including internal audit, credit review and retail banking, and was involved in setting up the bank’s
Greek operations in 1990. From 1993 to 2009 Antonios served as group general manager in charge of operations, with
overall responsibility for human resources, information technology, organization and methods, properties and supplies.
From 2003 to 2009, he was given the additional responsibility of directing the Bank of Cyprus group’s overseas operations,
including banks in the UK, Australia, Russia, Romania and Ukraine. Antonios also served as the general manager of Bank
of Cyprus in Greece for 6 months from September 2007 to March 2008. Antonios currently serves in an honorary
capacity on the board and executive committee of the Cyprus Anti-Cancer Society, one of the largest charities in Cyprus.
GROUP MANAGEMENT
Senior management
The Company’s current senior management, in addition to the Executive Directors listed above, is as follows:
Name Position Age
Michelle Louise Taylor Executive – Corporate Affairs 47
Raymond Charles Lewis Kantor Executive – Legal Affairs 56
Gregory Paul Taurog Executive –Sales and Marketing 41
Michelle Taylor, aged 47
Executive – Corporate Affairs
ACIS Associate member of the Institute of Chartered Secretaries and Administrators
Michelle is the Executive – Corporate Affairs. She joined the Group in January 2008 and is responsible for oversight of the
day-to-day operations of the Group. Michelle has been involved with the Pouroulis family’s businesses for over 9 years and
is familiar with their operating and reporting procedures and management structure. Prior to working in the Company,
Michelle was a partner and head of corporate governance at Eversheds South Africa from 1999 to 2008, and advised a
number of listed companies including Eland Platinum Holdings, Barplats Investments Limited, Keaton Energy Holdings
Limited and Dimension Data Holdings Limited. From 2006 to 2008, she was the group company secretary of Dimension
Data Holdings plc, a company that was listed on the Johannesburg Stock Exchange and London Stock Exchange. Michelle
is an associate member of the Institute of Chartered Secretaries and Administrators.
Charles Kantor, aged 56
Executive – Legal Counsel
Bachelor of Commerce, Bachelor of Law (Rhodes University, South Africa): Notary Public, South Africa
Charles has been the Executive – Legal Affairs of the Group since November 2010 and is responsible for overseeing all
legal matters and all matters relating to transactions and risk management for the Group. Charles has a total of 10 years
of experience in the mining industry and has worked on various IPOs, mergers and acquisitions since 1999. From 1999 to
2009, he was a partner at Routledge Modise (later Eversheds South Africa), where he worked on various mining deals
including the listing and sale of Eland Platinum, and was appointed as head of Eversheds international mining law industry
sector in 2008. From 1992 to 1999, Charles was legal counsel at Datakor Holdings Limited, subsequently Dimension Data
Holdings plc. From 1986 to 1992, Charles was an associate and partner at Cliff Dekker and Todd in Johannesburg,
specialising in commercial and corporate law.
Charles received his bachelor of commerce and bachelor of laws degrees from Rhodes University in 1980 and 1982,
respectively, and was admitted as an attorney in 1986 in South Africa. He is also a notary public in South Africa.
Greg Taurog, aged 41
Executive – Sales and Marketing
Bachelor of Accounting Science (UNISA, South Africa)
Greg has been Executive Sales since 2014 and is responsible for all marketing activities of the Group. Greg has 20 years’
experience in international trade, cross-border relations and South African sales having held various managerial positions
and directorships with prominent companies in the industry since 1994. From 1994 to 1997 Greg worked at Macsteel
International where he was the Manager of the Raw Materials Department which he cofounded. Greg was also stationed
at Far East Commodities and Trading (FECAT), which is Macsteel’s affiliate company in Hong Kong. From 1997 to 2008
Greg joined Glencore and was responsible for their Metals and Minerals desk in Southern Africa. Prior to joining Tharisa,

148
Greg joined Metalmin, which is a boutique trading company active in chrome and other bulk ores.
Other management team members
Other members of the Group’s management team include:
Name Position Age
Leon Richardson Chief Executive Officer, Tharisa Minerals 52
Thabang Gabriel Maluke Executive Director – Human Capital and Transformation,Tharisa Minerals 47
Hans Jurie van Wyk Consulting Metallurgist, Tharisa Minerals 47
Christo Marias General Manager – Mining, Tharisa Minerals 46
Jan Johannes Hough General Manager – Process, Tharisa Minerals 41
Derek Baker Group SHE Manager Tharisa 54
Peter Chennells Head Smelting and Beneficiation, Tharisa Minerals 50
Tu Kun Managing Director China Operations 43
Elize Catharina Groesbeek Managing Director, Arxo Logistics 52
Marios Tavros Regional CFO Cyprus and Managing Director, Arxo Resources 43
Willem de Villiers Managing Director Arxo Metals 40
Leon Richardson, aged 52
Chief Executive Officer, Tharisa Minerals
National Higher Diploma in Extraction Metallurgy (Witwatersrand Technikon, South Africa)
Leon was appointed as General Manager Processing in June 2013 and in January 2014 was promoted to Chief Executive
Officer of Tharisa Minerals whereby he has overall responsibility for the mining and processing operations of the Tharisa
Mine. Leon started his career in 1982 with Johannesburg Consolidated Investments as a Learner Official Metallurgy and
held various positions in the technical field focusing on PGM production, smelting and conversion before accepting the
position as Plant Manager with Consolidated Metallurgical Industries in 1991, which was later incorporated into Xstrata
plc. He held various positions within the Xstrata group, which included ferrochrome production, logistical chain
management and operational management before accepting the post of group metallurgical manager for the Xstrata
Chrome Mining division.
Thabang Maluke, aged 47
Executive Director – Human Capital and Transformation, Tharisa Minerals
Diploma in Personnel Management (Institute of Personnel Management, South Africa), Masters Diploma in Human
Resources (Rand Afrikaans University, South Africa)
Thabang has been an Executive Director at Tharisa Minerals since April 2009 and is responsible for human resources and
stakeholders engagement in South Africa. He has over 24 years of experience in the mining industry. He previously
worked for Gold Fields Limited, DRD Gold Limited, and was head of human resources at Barplats Investments Limited.
Hans van Wyk, aged 47
Consulting Metallurgist, Tharisa Minerals
Bachelor of Engineering (University of Pretoria, South Africa)
Hans has been the Consulting Metallurgist of Tharisa Minerals since September 2011 and is responsible for overall
management of all processing, smelting and beneficiation operations at the Tharisa Mine. He has over 14 years’ experience
in the recovery of PGM and chrome, having worked on a number of PGM and chrome concentrator operations.
Christo Marais, aged 46
General Manager – Mining, Tharisa Minerals
National Higher Diploma (Wits, South Africa), Masters of Science in Engineering (Wits, South Africa), Graduate Diploma
in Engineering (Wits, South Africa)
Christo is responsible for the overall management of the mining discipline within the Tharisa Mine including the day to day
management of the mining contractors. Christo joined the Group in 2012. Christo has over 27 years of mining experience,
of which the majority was spent at senior management level. He was previously General Manager and Senior Mining
Engineer at a large multi-national mining company.

149
Jan Hough, aged 41
General Manager – Process, Tharisa Minerals
National Higher Diploma in Electrical Engineering (Vaal Triangle Technikon, South Africa)
Jan has been with Tharisa Minerals since March 2011 and is the General Manager, Process. Jan is responsible for production
at the Tharisa Mine concentrators. He has over 17 years’ experience of PGM mining operations, having worked in a
number of positions at Rustenburg Platinum Mines, part of the Anglo Platinum group. He also holds an Electrical Engineers
Certificate of Competency, issued by the Department of Minerals and Energy in 1998.
Derek Baker, aged 54
Group Safety Health and Environment Manager
National Higher Diploma in Rock Engineering and Mining Engineering (Technikon Witwatersrand, South Africa), Graduate
Diploma in Engineering in Mining Engineering (University of the Witwatersrand, South Africa)
Derek has been the Group Safety, Health and Environment Manager since 2011 and is responsible for the overall
management of the safety, health and environment portfolio for the Group. Derek is a qualified mining engineer with over
35 years of experience in the mining industry, including 15 years in the legislative environment of the Department of
Mineral Resources. Prior to joining Tharisa, he had 10 years of senior management safety, health and environmental
experience with Anglo Platinum including at Amandelbult, Anglo Platinum’s largest operation.
Peter Chennells, aged 50
Head of Smelting and Beneficiation, Tharisa Minerals
National Higher Diploma in Analytical Chemistry (Witswaterand Technikon, South Africa), Bachelor of Science (UNISA,
South Africa), Management Development Program (Wits Business School, South Africa)
Peter has been the head of smelting and beneficiation at the Group since June 2011 and is responsible for the development
and implementation of a PGM smelting and beneficiation process. Peter has 26 years of experience in the PGM industry
encompassing all aspects of PGM processing, process development and project management. Previously Peter was
business area manager for Anglo Platinum’s base metal refinery.
Tu Kun, aged 43
Director China
MA (Economics) (University of Foreign Economics and Trade)
Tu Kun has been with the Group since 2011 and is responsible for overall project development, public relations and
administration of the Group’s operations in China. He has 17 years’ experience in the field of ferro-alloys and was the
Managing Director of Mintal Group Co. Limited, a joint venture between China Minmetals Corporation and Goldman
Sachs. Tu Kun is the former vice Chairman of the China Ferro-Alloys Industry Association and has held a number of
positions for the People’s Republic of China Chamber of Commerce of Metals Minerals and Chemicals Importers and
Exporters (CCCMC), including managing director and board chairman.
Elize Groesbeek, aged 52
Managing Director, Arxo Logistics
Bachelor of Commerce in Logistics Management (UNISA, South Africa)
Elize has been the Managing Director of Arxo Logistics, a company that was established to develop the logistics for the
Tharisa Mine, since 2009. She is responsible for the overall management of the logistics and transport services provided
by Arxo Logistics to the Group’s operations. Elize has over 30 years’ experience in logistics. Prior to joining Arxo Logistics,
she worked for Columbus Stainless, holding various managerial positions, including sales and shipping supervisor, traffic
manager and logistics area manager.
Marios Tavros, aged 43
Regional CFO Cyprus and Managing Director, Arxo Resources
Bachelor of Arts Honours Degree and Associate of the Institute of Chartered Accountants in England and Wales
Marios has been with the Tharisa Group since 2011 and is the Regional CFO Cyprus of the Group’s Cypriot companies
and Managing Director of Arxo Resources. Marios is responsible for the day-to-day operations of the Cyprus office. This

150
includes the overall responsibility of the Group financial reporting process and also the trading function of Arxo Resources.
He has been a chartered accountant since 1995. Marios previously worked for 10 years in various senior financial positions
within a large property and tourism group in Cyprus.
Willem de Villiers, aged 40
Managing Director, Arxo Metals
Bachelor of Engineering in Metallurgical Engineering (University of Pretoria)
Willem is responsible for the overall management of beneficiation and value addition projects within the Group. Willem
has 14 years’ experience in the chrome and manganese industries. He has held positions in operations at BHP Billiton,
Samancor Chrome, Xstrata Alloys and was previously the Chief Operating Officer of Tata Steel KZN before joining
Tharisa.
COMPANY SECRETARIES
Lysandros Lysandrides
LLB (Hons), Queen Mary, University of London (2001)
Pg. Dip (Legal Practice)(Corporate Law), College of Law, London (2002)
Associate member of the Chartered Institute of UK Secretaries (ACIS)
Chartered Legal Executive Fellow (UK) (FILEX)
Cyprus Attorney-at-Law and member of the Cyprus Bar Association
Sanet de Witt
BSc (Natural Sciences) RAU (1987)
BProc UNISA (1993)
CIS UNISA (2003)
ACIS Associate member of the Institute of Chartered Secretaries and Administrators SA (ACIS)

151
ANNEXURE 10
OTHER DIRECTORSHIPS
The table below sets out the names of all the companies and partnerships and the nature of business of such companies
and partnerships of which the Directors of Tharisa and/or senior management of the Group are, or have been, either
directors or partners during the 5 years preceding the Last Practicable Date:
Loucas Christos Pouroulis
Current directorships
Name of company
Registration
number
Country of
incorporation
Registered
address
Date of
appointment
Friedshelf 1421 Proprietary
Limited
2013/005661/07 South Africa 1 Streatham Crescent, Bryanston, 2021
South Africa
16 January 2013
Goudini Platinum Proprietary
Limited
1989/002404/07 South Africa 1 Streatham Crescent, Bryanston, 2021
South Africa
1 January 2002
Kameni 2006/028498/06 South Africa Eland House, The Braes, 3 Eaton Avenue
Bryanston, 2021, South Africa
20 November 2008
Lanner Minerals Proprietary
Limited
2008/022726/07 South Africa Eland House, The Braes, 3 Eaton Avenue
Bryanston, 2021, South Africa
1 May 2009
Salene Management Services
Proprietary Limited
2001/012632/07 South Africa 1 Westminster Avenue, Bryanston, 2021
South Africa
1 October 2001
Salene Mining Proprietary
Limited
1984/011559/07 South Africa 1 Streatham Crescent, Bryanston, 2021
South Africa
23 January 1985
Salene Technologies Proprietary
Limited
2005/017949/07 South Africa 1 Streatham Crescent, Bryanston, 2021
South Africa
17 June 2005
Tharisa HE223412 Cyprus Office 108 – 110, S. Pittokopitis Business
Centre, 17 Neophytou Nicolaides and
Kilkis Street, 8011 Paphos, Cyprus
27 October 2010
TransAfrica Resources Limited 74241/C1/GBL Mauritius Suite 320 3rd floor Barkly Wharf,
Le Caudan Waterfront, Port Louis,
Mauritius
9 November 2007
John David Salter
Current directorships
Goudini Platinum Proprietary
Limited
1989/002404/07 South Africa 1 Streatham Crescent, Bryanston, 2021
South Africa
16 November 1999
Kameni 2006/028498/06 South Africa Eland House, The Braes, 3 Eaton Avenue
Bryanston, 2021, South Africa
20 November 2008
Keaton Energy Holdings Limited 2006/011090/06 South Africa Ground Floor, Block H, The Braes, 3 Eaton
Avenue, Bryanston, 2021, South Africa
16 January 2008
Nabera Mining Proprietary
Limited (Dormant)
1998/000137/07 South Africa Block 3, Silver Point Office Park, 22 Ealing
Crescent, Bryanston, 2052, South Africa
1 May 2003
Tamboti Platinum Proprietary
Limited
2007/035444/07 South Africa Eland House, The Braes, 3 Eaton Avenue
Bryanston, 2021, South Africa
1 May 2012
Tharisa (Fujian) Industrial 350000400003725 China 5th Floor Office Building No.2, Active
Area, Jingjang Industrial Zone, Luoyuan Bay
Development Zone, Luoyan County
Fuzhou City, China
12 May 2011
Tharisa Minerals 2006/009544/07 South Africa Eland House, The Braes, 3 Eaton Avenue
Bryanston, 2021, South Africa
9 December 2010
Tharisa HE223412 Cyprus Office 108 – 110, S. Pittokopitis Business
Centre, 17 Neophytou Nicolaides and
Kilkis Street, 8011 Paphos, Cyprus
27 October 2010
TransAfrica Resources Limited 74241/C1/GBL Mauritius Suite 320 3rd floor Barkly Wharf,
Le Caudan Waterfront, Port Louis,
Mauritius
9 November 2007
Past directorships Date of resignation
Streatham Management Services
Proprietary Limited
2007/011521/07 South Africa The Braes, 3 Eaton Avenue, Bryanston,
2021, South Africa
1 October 2009

152
Phoevos Pouroulis
Current directorships
Name of company
Registration
number
Country of
incorporation
Registered
address
Date of
appointment
Arxo Logistics 2009/006720/07 South Africa Eland House, The Braes, 3 Eaton Avenue
Bryanston, 2021, South Africa
2 April 2009
Arxo Metals 2011/143342/07 South Africa Eland House, The Braes, 3 Eaton Avenue
Bryanston, 2021, South Africa
7 December 2011
Arxo Resources HE221459 Cyprus Office 108 – 110, S. Pittokopitis Business
Centre, 17 Neophytou Nicolaides and
Kilkis Streets, 8011 Paphos, Cyprus
4 February 2011
Braeston Corporate Consulting
Services
2007/022755/07 South Africa Eland House, The Braes, 3 Eaton Avenue
Bryanston, 2021, South Africa
1 April 2013
Hazenov Investments
Proprietary Limited
1989/006383/07 South Africa KPMG Forum 1226 Schoeman Street
0083, South Africa
3 June 2008
Keaton Energy Holdings Limited 2006/011090/06 South Africa Ground Floor, Block H, The Braes, 3 Eaton
Avenue, Bryanston, 2021, South Africa
1 March 2007
Salene Mining Proprietary
Limited
1984/011559/07 South Africa 1 Streatham Crescent, Bryanston, 2021 26 June 1998
Spitfire Music SA Proprietary
Limited
1996/000582/07 South Africa 6 Streatham Crescent, Bryanston, 2021
South Africa
2 February 1996
Tharisa (Fujian) Industrial 350000400003725 China 5th Floor, Office Building No.2, Active
Area, Jingjang Industrial Zone, Luoyuan Bay
Development Zone, Luoyan County
Fuzhou City, China
9 December 2010
Tharisa Administration Services HE287964 Cyprus Office 108 – 110, S. Pittokopitis Business
Centre, 17 Neophytou Nicolaides and
Kilkis Streets, 8011 Paphos, Cyprus
31 May 2011
Tharisa Investments HE276151 Cyprus Office 108 – 110, S. Pittokopitis Business
Centre, 17 Neophytou Nicolaides and
Kilkis Streets, 8011 Paphos, Cyprus
30 January 2013
Tharisa Minerals 2006/009544/07 South Africa Eland House, The Braes, 3 Eaton Avenue
Bryanston, 2021, South Africa
9 December 2010
Tharisa HE223412 Cyprus Office 108 – 110, S. Pittokopitis Business
Centre, 17 Neophytou Nicolaides and
Kilkis Streets, 8011 Paphos, Cyprus
27 October 2010
Michael Gifford Jones
Current directorships
Arxo Logistics 2009/006720/07 South Africa Eland House, The Braes, 3 Eaton Avenue
Bryanston, 2021, South Africa
1 May 2012
Arxo Metals 2011/143342/07 South Africa Eland House, The Braes, 3 Eaton Avenue
Bryanston, 2021, South Africa
1 October 2012
Arxo Resources HE221459 Cyprus Office 108 – 110, S. Pittokopitis Business
Centre, 17 Neophytou Nicolaides and
Kilkis Streets, 8011 Paphos, Cyprus
30 January 2013
Braeston Corporate Consulting
Services
2007/022755/07 South Africa Eland House, The Braes, 3 Eaton Avenue
Bryanston, 2021, South Africa
1 April 2013
Tharisa Administration Services HE287964 Cyprus Office 108 – 110, S. Pittokopitis Business
Centre, 17 Neophytou Nicolaides and
Kilkis Streets, 8011 Paphos, Cyprus
23 May 2012
Tharisa Investments HE276151 Cyprus Office 108 – 110, S. Pittokopitis Business
Centre, 17 Neophytou Nicolaides and
Kilkis Streets, 8011 Paphos, Cyprus
30 January 2013
Tharisa Minerals 2006/009544/07 South Africa Eland House, The Braes, 3 Eaton Avenue
Bryanston, 2021, South Africa
1 May 2012
Tharisa HE223412 Cyprus Office 108 – 110, S. Pittokopitis Business
Centre, 17 Neophytou Nicolaides and
Kilkis Streets, 8011 Paphos, Cyprus
30 January 2013

153
Name of company
Registration
number
Country of
incorporation
Registered
address
Date of
appointment
Past directorships Date of resignation
Kameni 2006/028498/06 South Africa Eland House, The Braes, 3 Eaton Avenue
Bryanston, 2021, South Africa
1 May 2012
Kameni Management Services
Proprietary Limited
2008/016397/07 South Africa Eland House, The Braes, 3 Eaton Avenue
Bryanston, 2021, South Africa
1 May 2012
San Lameer Villa 3129
Proprietary Limited
2007/012081/07 South Africa 214 Windermere Road, Morningside
Durban, 4001, South Africa
19 August 2013
Sinvent Investments 155
Proprietary Limited
2008/007841/07 South Africa Eland House, The Braes, 3 Eaton Avenue
Bryanston, 2021, South Africa
1 May 2012
Tamboti Platinum Proprietary
Limited
2007/035444/07 South Africa Eland House, The Braes, 3 Eaton Avenue
Bryanston, 2021, South Africa
1 May 2012
Antonios Djakouris
Current directorships
Name of company
Registration
number
Country of
incorporation
Registered
address
Date of
appointment
Tharisa HE223412 Cyprus Office 108 – 110, S. Pittokopitis Business
Centre, 17 Neophytou Nicolaides and
Kilkis Streets, 8011 Paphos, Cyprus
11 October 2011
Past directorships Date of resignation
Bank of Cyprus Australia Limited Not available Australia Rialto Towers, 525 Collins Street
Melbourne, VIC 3000, Australia
September 2009
Bank of Cyprus Russia Not available Russian Federation 1 Suvorovskaya Sq. Moscow, 127473
Russian Federation
September 2009
CB Uniastrum Bank LLC Not available Russian Federation 1 Suvorovskaya Sq. Moscow, 127473
Russian Federation
September 2009
PJSB Bank of Cyprus Not available Ukraine 45 Urytskoho Street, Kiev, 03035, Ukraine September 2009
Cyprus Leasing Romania IFN SA Not available Romania Calea Dorobantilor, Nr 187, Bucharest
Sector 1, Romania
September 2009
BOC Ventures Limited Not available Cyprus Kyriakou Matsi 10, Agioi Omologites Liliana
Building, 2nd Floor, 1082, Egkomi, Cyprus
September 2009
Ioannis Drapaniotis
Current directorships
Name of Company
Registration
number
Country of
incorporation
Registered
address
Date of
appointment
Tharisa HE223412 Cyprus Office 108 – 110, S. Pittokopitis Business
Centre, 17 Neophytou Nicolaides and
Kilkis Streets, 8011 Paphos, Cyprus
27 October 2010
Past directorships Date of resignation
Hellenic Institute for
Occupational Health and Safety
Not applicable Greece Liosion 143 and Theirsiou 6, 10445, Attiki
Square, Athens, Greece
September 2011
Foundation of Economic and
Industrial Research (IOBE)
Not applicable Greece 11 Tsami Karatasou Street, 117 42 Athens
Greece
2012
Hellenic Developmental Co
(ELANET)
Not applicable Greece 4 Valaoritou Street, 10671, Athens, Greece 2012

154
ANNEXURE 11
ISSUES AND OFFERS OF SECURITIES
Issues and offers of securities of Tharisa and Tharisa’s material subsidiaries are as follows:
Tharisa
Ordinary shares
Please refer to paragraph 14 for all issues of shares. None of the shares have been repurchased.
Convertible preference shares
On 11 April 2011, the Company issued 1,051 Convertible Preference Shares as follows:
Date of
allotment Name of subscriber
Number
of shares
Subscription
price/US$
14-Apr-11 Artemis Nominees Limited 4 571,432
14-Apr-11 Danmark Investment Holdings Limited 4 571,432
14-Apr-11 Base Asia Pacific Limited 21 3,000,018
14-Apr-11 Elliott International, L.P. 35 5,000,030
14-Apr-11 Raiffeisen Investment Aktiengesellschaft 35 5,000,030
14-Apr-11 CITIC International Assets Management Limited 35 5,000,030
14-Apr-11 Swiss Asia Financial Services (HK) Limited 35 5,000,030
14-Apr-11 Fujian Wuhang Stainless Steel Products Co., Limited 112 16,000,096
14-Apr-11 Phillip Ventures Enterprise Fund 3 Limited 70 10,000,060
14-Apr-11 Phillip Ventures Enterprise Fund 2 Limited 70 10,000,060
14-Apr-11 Macquarie Capital (Hong Kong) Limited 105 15,000,090
14-Apr-11 Rance Holdings Limited 525 75,000,450
Issues of the Convertible Preference Shares were on identical terms and at the same price being US$142,857 per share
(being a premium of US$142,856 per share).
Save for the issue and offer of the Convertible Preference Shares to Fujian Wuhang Stainless Steel Products Co., Limited,
being an ordinary shareholder of the Company, none of the Convertible Preference Shares were issued to existing
Shareholders of Tharisa plc.
The reason for the premium as aforesaid, is that the consideration per share was agreed to be the same consideration per
share as was paid by the seed capital investors, being the agreed pre-money value of the Company at the time.
No asset was purchased as a result of the proceeds of the issue of the Convertible Preference Shares and none of the
Convertible Preference Shares have been redeemed or repurchased.
Conversion of share capital
On 4 April 2011, the authorised share capital of the Company was converted into US$ equivalent of €10,000, calculated
at the exchange rate of US$1.42 to €1.00, resulting in the share capital being divided into 10,000 ordinary shares of
US$1.42 each.
On 11 November 2011, the Company subdivided each ordinary share of US$1.42 in the capital of the Company into
1,420 shares and increased its authorised share capital to US$10,001,051 divided into 10,000,000,000 ordinary shares and
1,051 Convertible Preference Shares to the creation of 9,985,800,000 new shares.
Tharisa Minerals
In order to fund the capital requirements of Tharisa Minerals from time to time, Tharisa has subscribed for redeemable
cumulative preference shares (A Class Shares) in the capital of Tharisa Minerals. The issue price per share in each case was
US$102,857 per share for all subscriptions. None of these shares have been redeemed or repurchased by Tharisa Minerals.
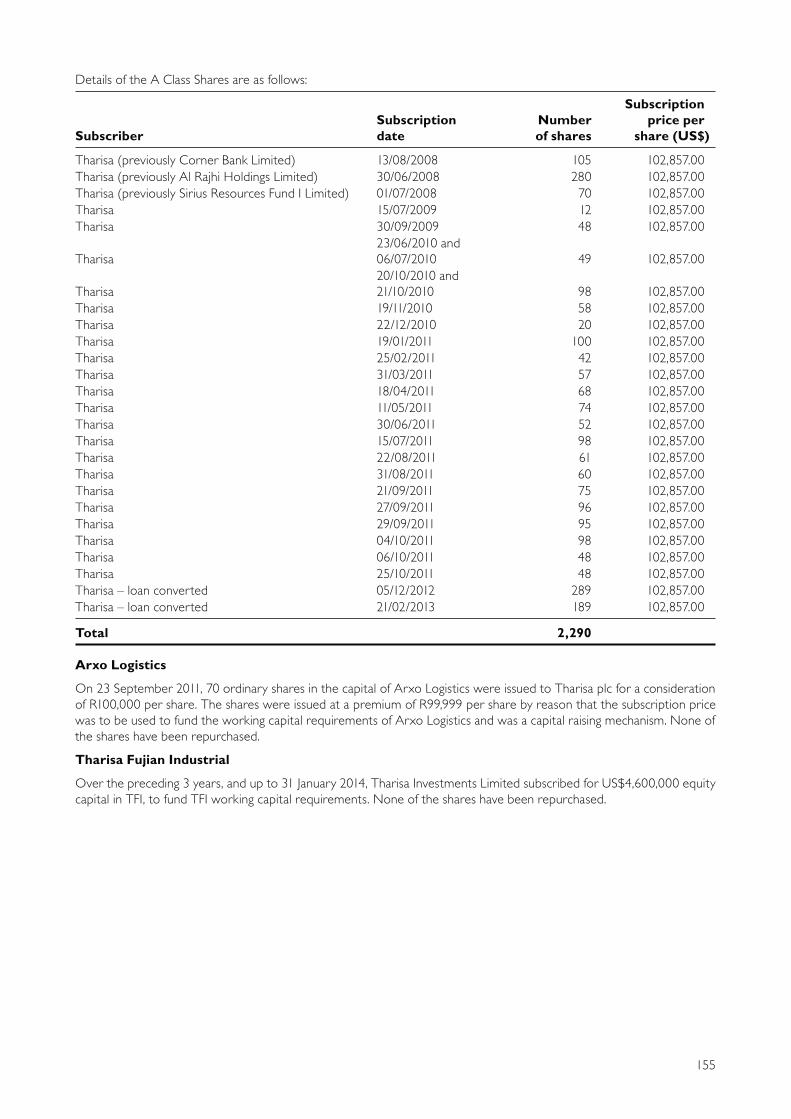
155
Details of the A Class Shares are as follows:
Subscriber
Subscription
date
Number
of shares
Subscription
price per
share (US$)
Tharisa (previously Corner Bank Limited) 13/08/2008 105 102,857.00
Tharisa (previously Al Rajhi Holdings Limited) 30/06/2008 280 102,857.00
Tharisa (previously Sirius Resources Fund I Limited) 01/07/2008 70 102,857.00
Tharisa 15/07/2009 12 102,857.00
Tharisa 30/09/2009 48 102,857.00
Tharisa
23/06/2010 and
06/07/2010 49 102,857.00
Tharisa
20/10/2010 and
21/10/2010 98 102,857.00
Tharisa 19/11/2010 58 102,857.00
Tharisa 22/12/2010 20 102,857.00
Tharisa 19/01/2011 100 102,857.00
Tharisa 25/02/2011 42 102,857.00
Tharisa 31/03/2011 57 102,857.00
Tharisa 18/04/2011 68 102,857.00
Tharisa 11/05/2011 74 102,857.00
Tharisa 30/06/2011 52 102,857.00
Tharisa 15/07/2011 98 102,857.00
Tharisa 22/08/2011 61 102,857.00
Tharisa 31/08/2011 60 102,857.00
Tharisa 21/09/2011 75 102,857.00
Tharisa 27/09/2011 96 102,857.00
Tharisa 29/09/2011 95 102,857.00
Tharisa 04/10/2011 98 102,857.00
Tharisa 06/10/2011 48 102,857.00
Tharisa 25/10/2011 48 102,857.00
Tharisa – loan converted 05/12/2012 289 102,857.00
Tharisa – loan converted 21/02/2013 189 102,857.00
Total 2,290
Arxo Logistics
On 23 September 2011, 70 ordinary shares in the capital of Arxo Logistics were issued to Tharisa plc for a consideration
of R100,000 per share. The shares were issued at a premium of R99,999 per share by reason that the subscription price
was to be used to fund the working capital requirements of Arxo Logistics and was a capital raising mechanism. None of
the shares have been repurchased.
Tharisa Fujian Industrial
Over the preceding 3 years, and up to 31 January 2014, Tharisa Investments Limited subscribed for US$4,600,000 equity
capital in TFI, to fund TFI working capital requirements. None of the shares have been repurchased.

156
ANNEXURE 12
DETAILS OF SUBSIDIARY COMPANIES
None of Tharisa’s subsidiaries are listed on the JSE. Details of Tharisa’s subsidiaries are as follows:
Name
Date of
incorporation
Registration
number
Country and
date of
incorporation
Issued share
capital
Effective
holding
(%)
Principal place
of business
Tharisa
Minerals 29 March 2006 2006/009544/07 South Africa
• 500 ordinary
shares of R1.00
each
• 7,200
redeemable
cumulative “B”
class preference
shares of
R0.01 each
• 2,290
redeemable
cumulative
preference
shares of
R0.01 each
74
Eland House
The Braes, 3 Eaton
Avenue, Bryanston
2021, South Africa
Arxo Resources 1 February 2008 HE221459 Cyprus
• 1 ordinary
share of
Euro (€) 1 each
100
Office 108 – 110
Sofoklis Pittokopitis
Business Centre
17 Neophytou
Nicolaides and
Kilkis Streets, 8011
Paphos, Cyprus
Arxo Logistics 2 April 2009 2009/006720/07 South Africa
• 170 ordinary
shares of
R1.00 each
100
Eland House
The Braes, 3 Eaton
Avenue, Bryanston
2021, South Africa
Arxo Metals 7 December 2011 2011/143342/07 South Africa
• 120 ordinary
shares of no
par value
100
Eland House
The Braes, 3 Eaton
Avenue, Bryanston
2021, South Africa
Tharisa
Adminstration
Services
31 May 2011 HE287964 Cyprus
• 1,000 ordinary
shares of
US$1.00 each
100
Office 108 – 110
Sofoklis Pittokopitis
Business Centre
17 Neophytou
Nicolaides and
Kilkis Streets, 8011
Paphos, Cyprus
Tharisa
Investments 2 November 2010 HE276151 Cyprus
• 15,025 A-class
shares of
US$0.01 each 100
Office 108 – 110
Sofoklis Pittokopitis
Business Centre
17 Neophytou
Nicolaides and
Kilkis Streets, 8011
Paphos, Cyprus

157
Name
Date of
incorporation
Registration
number
Country and
date of
incorporation
Issued share
capital
Effective
holding
(%)
Principal place
of business
Braeston
Corporate
Consulting
Services
15 August 2007 2007/022755/07 South Africa100 ordinary shares
of R1.00 each100
Eland House
The Braes, 3 Eaton
Avenue, Bryanston
2021, South Africa
Tharisa Fujian
Industrial 15 February 2011 350000400003725 PRC
Registered share
capital of
US$10.0 million
100
5th Floor, Office
Building of No. 2
Living District
Jingang Industrial
Area, Luoyuan Gulf
Development
Zone, Luoyuan
County, Fujian
Province, the PRC
Dinami 30 May 2013 56730 Guernsey1 ordinary share of
GBP1.00 each100
Trafalgar Court
2nd Floor
East Wing
Admiral Park
St Peter Port
Guernsey
GY1 3EL
Tharisa
Investments
(Hong Kong)
25 August 2010 1497193 Hong Kong1 ordinary share of
HK$1.00 each100 Dormant

158
ANNEXURE 13
OWNED AND LEASED PROPERTIES
Owned properties
All owned properties and properties that are leased are held in the name of Tharisa Minerals. As at the Last Practible
Date, the Group owned 114 portions of surface rights on Kafferskraal and 11 portions of surface rights on Elandsdrift. The
following table sets out details of the surface rights owned by the Group:
Title Deed
number Designation Province
Registration
division Farm/Portion
Land Plot
Area (Ha)
T098238/2008 Agricultural North West JQ Portion 29 Elandsdrift 28.1893
T062375/2011 Agricultural North West JQ Portion 64 Elandsdrift 21.4126
Registered Agricultural North West JQ Portion 89 Elandsdrift 29.7999
T42193/2013 Agricultural North West JQ Portion 90 Elandsdrift 32.5491
T070418/2008 Agricultural North West JQ Portion 91 Elandsdrift 15.2954
T076043/2008 Agricultural North West JQ Portion 92 Elandsdrift 15.2211
T020876/2009 Agricultural North West JQ Portion 94 Elandsdrift 24.5637
(Remaining Extent)
T064124/2011 Agricultural North West JQ Portion 111 Elandsdrift 21.4119
T091993/2012 Agricultural Limpopo JQ Portion 113 Elandsdrift 27.4090
T066004/2011 Agricultural North West JQ Portion 176 & 177 74.5439
Elandsdrift
T077397/2011 Mining North West JQ Portion 2 Kafferskraal 6.7776
T121204/2008 Mining North West JQ Portion 6 Kafferskraal 5.7288
(Half Share)
T120022/2008 Mining North West JQ Portion 6 Kafferskraal 5.7288
(Half Share)
T025675/2009 Mining North West JQ Portion 3 & 217 5.2642
Kafferskraal
T085400/2008 Mining Limpopo JQ Portion 9 Kafferskraal 5.1080
(Remaining Extent)
T066790/2008 Agricultural North West JQ Portion 15 & 206 10.4918
Kafferskraal
T120020/2008 Mining North West JQ Portion 20 Kafferskraal 0.4211
T118504/2008 Mining North West JQ Portion 22 Kafferskraal 4.2355
T110684/2008 Mining North West JQ Portion 23 Kafferskraal 8.2955
T101532/2008 Agricultural North West JQ Portion 25, 26, 27, 28, 207, 188, 205, 118 23.4828
& 105 Kafferskraal
T118592/2008 Agricultural North West JQ Portion 26 Kafferskraal 1.2640
(0.333 Undivided Share)
T118314/2008 Agricultural North West JQ Portion 26 Kafferskraal 1.2640
(0.333 Undivided Share)
T118312/2008 Agricultural North West JQ Portion 28 Kafferskraal 1.2640
(0.333 Undivided Share)
T034234/2009 Mining Limpopo JQ Portion 29 Kafferskraal 3.1164
Registered Agricultural Limpopo JQ Portion 38 & 147 Kafferskraal 21.782
T079401/2008 Mining North West JQ Portion 39 Kafferskraal 1.6202
T105486/2008 Mining North West JQ Portion 40 (Remaining 6.2442
Extent) & 116 Kafferskraal
T025674/2009 Mining North West JQ Portion 53 Kafferskraal 1.7816
T000791/2009 Mining Limpopo JQ Portion 76 Kafferskraal 0.4226
T048522/2012 Mining North West JQ Portion 83 Kafferskraal 0.8693
T099556/2008 Mining North West JQ Portion 84 Kafferskraal 3.3833
T084915/2008 . Mining North West JQ Portion 90 Kafferskraal 5.8173

159
Title Deed
number Designation Province
Registration
division Farm/Portion
Land Plot
Area (Ha)
T082771/2008 Mining Limpopo JQ Portion 91 Kafferskraal 5.8201
T120021/2008 Mining North West JQ Portion 96 Kafferskraal 46.6752
T083225/2008 Mining North West JQ Portion 114 Kafferskraal 7.0464
T065854/2008 Agricultural North West JQ Portion 120 Kafferskraal 4.6753
T073130/2008 Mining North West JQ Portion 122 Kafferskraal 6.1840
T068704/2008 Mining North West JQ Portion 123 Kafferskraal 8.5011
T073173/2008 Agricultural North West JQ Portion 133 Kafferskraal 1.8216
T071721/2012 Mining Limpopo JQ Portion 135 Kafferskraal 19.8972
T118525/2008 Mining North West JQ Portion 137 Kafferskraal 2.7395
T100467/2008 Mining North West JQ Portion 148 Kafferskraal 56.8411
Registered Agricultural North West JQ Portion 149 Kafferskraal 2.3084
T073806/2008 Mining North West JQ Portion 152 Kafferskraal 47.4762
T096270/2013 Agricultural North West JQ Portion 182 Kafferskraal 0.9200
T120019/2008 Mining North West JQ Portion 183 Kafferskraal 14.2118
T001829/2009 Mining North West JQ Portion 184 Kafferskraal 8.9428
T050806/2011 Mining North West JQ Portion 185 Kafferskraal 8.8959
T102908/2008 Mining North West JQ Portion 186 Kafferskraal 20.0862
T057904/2011 Mining North West JQ Portion 187 Kafferskraal 5.9013
T118591/2008 Agricultural Limpopo JQ Portion 188 Kafferskraal 0.2581
(0.14285 Undivided Share)
T118313/2008 Agricultural Limpopo JQ Portion 188 Kafferskraal 1.0323
(0.571428 Undivided Share)
T118590/2008 Agricultural Limpopo JQ Portion 189 Kafferskraal 4.5984
(0.42858 Undivided Share)
T118311/2008 Agricultural Limpopo JQ Portion 189 Kafferskraal 6.1311
(0.571428 Undivided Share)
T080336/2008 Mining Limpopo JQ Portion 190 Kafferskraal 1.6951
T071696/2009 Mining Limpopo JQ Portion 192 Kafferskraal 6.3575
T070210/2011 Mining Limpopo JQ Portion 193 Kafferskraal 7.9458
T121203/2008 Mining North West JQ Portion 218 Kafferskraal 20.6984
T100845/2008 Mining Limpopo JQ Portion 220 Kafferskraal 5.3523
(Remaining Extent)
T099555/2008 Mining North West JQ Portion 221 Kafferskraal 6.2279
T017297/2009 Mining North West JQ Portion 222 & 33 6.6920
Kafferskraal
T100545/2008 Mining Limpopo JQ Portion 224 Kafferskraal 7.4890
(Remaining Extent)
T100140/2008 Mining Limpopo JQ Portion 225 Kafferskraal 4.2153
T061351/2011 Mining Limpopo JQ Portion 226 Kafferskraal 6.7076
T107649/2008 Agricultural Limpopo JQ Portion 229 Kafferskraal 1.9713
T098463/2008 Agricultural North West JQ Portion 230 Kafferskraal 2.0519
T076858/2013 Agricultural North West JQ Portion 237 Kafferskraal 4.6677
T087239/2008 Mining Limpopo JQ Portion 240 Kafferskraal 5.3682
T011067/2009 Mining Limpopo JQ Portion 241 Kafferskraal 3.6184
T005977/2010 Mining North West JQ Portion 242 Kafferskraal 3.5596
T098550/2008 Mining Limpopo JQ Portion 243 Kafferskraal 1.9275
T105197/2008 Mining North West JQ Portion 250 Kafferskraal 2.6694
T006838/2009 Mining North West JQ Portion 251 Kafferskraal 5.8940
T080237/2011 Mining North West JQ Portion 256 Kafferskraal 29.1130
T080236/2011 Mining North West JQ Portion 257 Kafferskraal 27.9360
T084918/2012 Agricultural Limpopo JQ Portion 259 Kafferskraal 11.0629
T085030/2011 Agricultural North West JQ Portion 262 Kafferskraal 11.4825
T044101/2011 Mining North West JQ Portion 283 Kafferskraal 41.8432
T087558/2008 Mining North West JQ Portion 285 Kafferskraal 51.6692
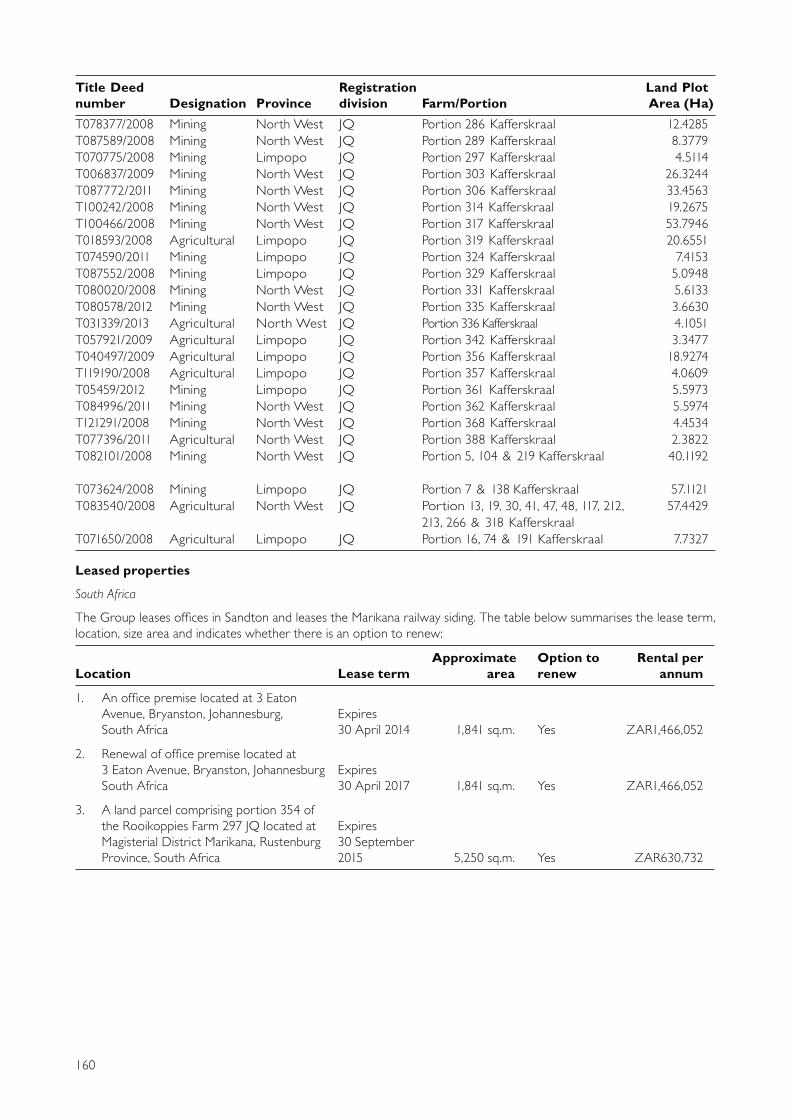
160
Title Deed
number Designation Province
Registration
division Farm/Portion
Land Plot
Area (Ha)
T078377/2008 Mining North West JQ Portion 286 Kafferskraal 12.4285
T087589/2008 Mining North West JQ Portion 289 Kafferskraal 8.3779
T070775/2008 Mining Limpopo JQ Portion 297 Kafferskraal 4.5114
T006837/2009 Mining North West JQ Portion 303 Kafferskraal 26.3244
T087772/2011 Mining North West JQ Portion 306 Kafferskraal 33.4563
T100242/2008 Mining North West JQ Portion 314 Kafferskraal 19.2675
T100466/2008 Mining North West JQ Portion 317 Kafferskraal 53.7946
T018593/2008 Agricultural Limpopo JQ Portion 319 Kafferskraal 20.6551
T074590/2011 Mining Limpopo JQ Portion 324 Kafferskraal 7.4153
T087552/2008 Mining Limpopo JQ Portion 329 Kafferskraal 5.0948
T080020/2008 Mining North West JQ Portion 331 Kafferskraal 5.6133
T080578/2012 Mining North West JQ Portion 335 Kafferskraal 3.6630
T031339/2013 Agricultural North West JQ Portion 336 Kafferskraal 4.1051
T057921/2009 Agricultural Limpopo JQ Portion 342 Kafferskraal 3.3477
T040497/2009 Agricultural Limpopo JQ Portion 356 Kafferskraal 18.9274
T119190/2008 Agricultural Limpopo JQ Portion 357 Kafferskraal 4.0609
T05459/2012 Mining Limpopo JQ Portion 361 Kafferskraal 5.5973
T084996/2011 Mining North West JQ Portion 362 Kafferskraal 5.5974
T121291/2008 Mining North West JQ Portion 368 Kafferskraal 4.4534
T077396/2011 Agricultural North West JQ Portion 388 Kafferskraal 2.3822
T082101/2008 Mining North West JQ Portion 5, 104 & 219 Kafferskraal 40.1192
T073624/2008 Mining Limpopo JQ Portion 7 & 138 Kafferskraal 57.1121
T083540/2008 Agricultural North West JQ Portion 13, 19, 30, 41, 47, 48, 117, 212, 57.4429
213, 266 & 318 Kafferskraal
T071650/2008 Agricultural Limpopo JQ Portion 16, 74 & 191 Kafferskraal 7.7327
Leased properties
South Africa
The Group leases offices in Sandton and leases the Marikana railway siding. The table below summarises the lease term,
location, size area and indicates whether there is an option to renew:
Location Lease term
Approximate
area
Option to
renew
Rental per
annum
1. An office premise located at 3 Eaton
Avenue, Bryanston, Johannesburg,
South Africa
Expires
30 April 2014 1,841 sq.m. Yes ZAR1,466,052
2. Renewal of office premise located at
3 Eaton Avenue, Bryanston, Johannesburg
South Africa
Expires
30 April 2017 1,841 sq.m. Yes ZAR1,466,052
3. A land parcel comprising portion 354 of
the Rooikoppies Farm 297 JQ located at
Magisterial District Marikana, Rustenburg
Province, South Africa
Expires
30 September
2015 5,250 sq.m. Yes ZAR630,732

161
Arxo Logistics will enter into an agreement on the same terms as Tharisa Minerals above for a portion of the ground floor
of 3 Eaton Avenue, save that the rental will be ZAR630,732 per annum.
Cyprus
The Group leases offices in Cyprus. The table below summarises the lease term, location, size area and indicates whether
there is an option to renew:
Location Lease term
Approximate
area
Option to
renew
Rental per
annum
1. Office Nos. 108, 109 & 110 and six
covered allocated parking spaces and
available guests parking spaces forming
part of the multi-store building known as
‘‘Sofoklis Pittokopitis Business Centre’’
situated at 17 Neophytou Nicolaides and
Kilkis Street, 8011, Paphos, Cyprus
Expires
20 April 2015 350 sq.m. No €40,800
PRC
The Group leases offices in China. The table below summarises the lease term, location, size area and indicates whether
there is an option to renew:
Location Lease term
Approximate
area
Option to
renew
Rental per
annum
1. A404 & 405, No. 1 Building, Huiyan Plaza,
No. 8, Beichen East Road, Chaoyang
District, Beijing, the PRC
Expires
4 April 2015
Gross floor area:
188.61 sq.m. No RMB475,020
2. 5th Floor, Office Building of No. 2 Living
District, Jingang Industrial Area, Luoyuan
Gulf Development Zone, Luoyuan County
Fujian Province, the PRC
Expires
14 December
2014 259 sq.m. Yes RMB38,304

162
ANNEXURE 14
MATERIAL CONTRACTS
The following contracts (not being contracts entered into in the ordinary course of business) have been entered into by
the Company or another member of the Group: (a) within the 2 years immediately preceding the Last Practicable Date
which are, or may be, material to the Company or any member of the Group, and (b) at any time and contain provisions
under which the Company or any member of the Group has an obligation or entitlement which is, or may be, material to
the Company or any member of the Group as at the date of this document:
1. INVESTMENT AGREEMENTS
Subscription agreements comprising:
1.1 a subscription agreement dated 22 March 2011 entered into between the Company as the issuer and Artemis
Nominees Limited as the subscriber in relation to the issue and subscription of 4 Convertible Preference Shares
in the share capital of the Company at a consideration of US$571,000;
1.2 a subscription agreement dated 22 March 2011 entered into between the Company as the issuer and Base Asia
Pacific Limited as the subscriber in relation to the issue and subscription of 21 Convertible Preference Shares in
the share capital of the Company at a consideration of US$3 million;
1.3 a subscription agreement dated 22 March 2011 entered into between the Company as the issuer and
CITIC International Assets Management Limited as the subscriber in relation to the issue and subscription of
35 Convertible Preference Shares in the share capital of the Company at a consideration of US$5 million;
1.4 a subscription agreement dated 22 March 2011 entered into between the Company as the issuer and Danmark
Investment Holdings Limited as the subscriber in relation to the issue and subscription of 4 Convertible Preference
Shares in the share capital of the Company at a consideration of US$571,000;
1.5 a subscription agreement dated 22 March 2011 entered into between the Company as the issuer and Elliott
International, L.P. as the subscriber in relation to the issue and subscription of 35 Convertible Preference Shares
in the share capital of the Company at a consideration of US$5 million;
1.6 a subscription agreement dated 22 March 2011 entered into between the Company as the issuer and Macquarie
Capital (Hong Kong) Limited as the subscriber in relation to the issue and subscription of 105 Convertible
Preference Shares in the share capital of the Company at a consideration of US$15 million;
1.7 a subscription agreement dated 22 March 2011 entered into between the Company as the issuer and Phillip
Ventures Enterprise Fund 2 Limited as the subscriber in relation to the issue and subscription of 70 Convertible
Preference Shares in the share capital of the Company at a consideration of US$10 million;
1.8 a subscription agreement dated 22 March 2011 entered into between the Company as the issuer and Phillip
Ventures Enterprise Fund 3 Limited as the subscriber in relation to the issue and subscription of 70 Convertible
Preference Shares in the share capital of the Company at a consideration of US$10 million;
1.9 a subscription agreement dated 22 March 2011 entered into between the Company as the issuer and Raiffeisen
Investment Aktiengesellschaft as the subscriber in relation to the issue and subscription of 35 Convertible
Preference Shares in the share capital of the Company at a consideration of US$5 million;
1.10 a subscription agreement dated 22 March 2011 entered into between the Company as the issuer and Rance
Limited the subscriber in relation to the issue and subscription of 525 Convertible Preference Shares in the share
capital of the Company at a consideration of US$75 million;
1.11 a subscription agreement dated 22 March 2011 entered into between the Company as the issuer and Swiss
Asia Financial Services (HK) Limited the subscriber in relation to the issue and subscription of 35 Convertible
Preference Shares in the share capital of the Company at a consideration of US$5 million;

163
1.12 a subscription agreement dated 22 March 2011 entered into between the Company as the issuer and Fujian
Wuhang as the subscriber in relation to the issue and subscription of 112 Convertible Preference Shares in the
share capital of the Company at a consideration of US$16 million;
1.13 a composite shareholders’ agreement dated 11 April 2011 entered into between: (1) the Company; and
(2) Medway, Al Salam, Corner Bank, Sirius Resources, Fujian Wuhang and HeYi Mining (together as shareholders),
governing the relationship between the shareholders regarding their shares in the Company together with the
following deeds of adherence by the Convertible Preference Shares binding them to the composite shareholder
agreement:
1.13.1 a deed of adherence dated 14 April 2011 made by Artemis Nominees Limited;
1.13.2 deed of adherence dated 14 April 2011 made by Base Asia Pacific Limited;
1.13.3 a deed of adherence dated 14 April 2011 made by CITIC International Assets Management Limited;
1.13.4 a deed of adherence dated 14 April 2011 made by Danmark Investment Holdings Limited;
1.13.5 a deed of adherence dated 14 April 2011 made by Elliott International, L.P.;
1.13.6 a deed of adherence dated 14 April 2011 made by Macquarie Capital (Hong Kong) Limited;
1.13.7 a deed of adherence dated 14 April 2011 made by Phillip Ventures Enterprise Fund 2 Limited;
1.13.8 a deed of adherence dated 14 April 2011 made by Phillip Ventures Enterprise Fund 3 Limited;
1.13.9 a deed of adherence dated 14 April 2011 made by Raiffeisen Investment Aktiengesellschaft;
1.13.10 a deed of adherence dated 14 April 2011 made by Rance Holdings Limited;
1.13.11 a deed of adherence dated 14 April 2011 made by Swiss Asia Financial Services (HK) Limited; and
1.13.12 a deed of adherence dated 14 April 2011 made by Fujian Wuhang.
2. THARISA MINERALS B CLASS PREFERENCE SHARE SUBSCRIPTION AGREEMENTS
2.1 A share subscription agreement between Tharisa Minerals and Jonathan Alan Clark whereby Jonathan Alan
Clark subscribed for 300 B class preference shares in the share capital of Tharisa Minerals at a consideration of
ZAR3,000,000 on 5 November 2009, as amended by addenda dated 26 August 2011 and 27 September 2013
respectively, between Tharisa Minerals and Jonathan Alan Clark.
2.2 A share subscription agreement between Tharisa Minerals and Ditodi Trust whereby Ditodi Trust subscribed
for 300 B class preference shares in the share capital of Tharisa Minerals at a consideration of ZAR3,000,000
on 6 November 2009, as amended by addenda dated 5 October 2011 and 30 September 2013 respectively,
between Tharisa Minerals and Ditodi Trust.
2.3 A share subscription agreement between Tharisa Minerals and Makhaye Trust whereby Makhaye Trust subscribed
for 300 B class preference shares in the share capital of Tharisa Minerals at a consideration of ZAR3,000,000
on 6 November 2009, as amended by addenda dated 5 October 2011 and 30 September 2013 respectively,
between Tharisa Minerals and Makhaye Trust.
2.4 A share subscription agreement between Tharisa Minerals and R O Trust whereby R O Trust subscribed for
100 B class preference shares in the share capital of Tharisa Minerals at a consideration of ZAR1,000,000 on
6 November 2009, as amended by addenda dated 5 October 2011 and 30 September 2013 respectively,
between Tharisa Minerals and R O Trust.
2.5 A share subscription agreement between Tharisa Minerals and Makarios Trust whereby Makarios Trust subscribed
for 300 B class preference shares in the share capital of Tharisa Minerals at a consideration of ZAR3,000,000
on 9 November 2009, as amended by addenda dated 5 October 2011 and 30 September 2013 respectively
between Tharisa Minerals and Makarios Trust.
2.6 A share subscription agreement between Tharisa Minerals and Moira June Jaquet-Briner whereby Moira June
Jaquet-Briner subscribed for 300 B class preference shares in the share capital of Tharisa Minerals at a consideration
of ZAR3,000,000 on 9 November 2009, as amended by addenda dated 5 October 2011 and 27 September
2013 respectively, between Tharisa Minerals and Moira June Jaquet-Briner.

164
2.7 A share subscription agreement between Tharisa Minerals and Clem Albert Foster Sweet whereby Clem
Albert Foster Sweet subscribed for 200 B class preference shares in the share capital of Tharisa Minerals at a
consideration of ZAR2,000,000 on 10 November 2009, as amended by addenda dated 5 October 2011 and
28 September 2013 respectively, between Tharisa Minerals and Clem Albert Foster Sweet.
2.8 A share subscription agreement between Tharisa Minerals and The Phax Trust whereby The Phax Trust subscribed
for 300 B class preference shares in the share capital of Tharisa Minerals at a consideration of ZAR3,000,000
on 10 November 2009, as amended by addend dated 5 October 2011 and 30 September 2013 respectively,
between Tharisa Minerals and The Phax Trust.
2.9 A share subscription agreement between Tharisa Minerals and R O Trust whereby R O Trust subscribed for
200 B class preference shares in the share capital of Tharisa Minerals at a consideration of ZAR2,000,000 on
10 November 2009, as amended by addenda dated 5 October 2011 and 30 September 2013 respsectively,
between Tharisa Minerals and R O Trust.
2.10 A share subscription agreement between Tharisa Minerals and The Phax Trust whereby The Phax Trust subscribed
for 300 B class preference shares in the share capital of Tharisa Minerals at a consideration of ZAR3,000,000
on 16 November 2009, as amended by addenda dated 5 October 2011 and 30 September 2013 respectively,
between Tharisa Minerals and The Phax Trust.
2.11 A share subscription agreement between Tharisa Minerals and The Rowad Trust whereby The Rowad Trust
subscribed for 300 B class preference shares in the share capital of Tharisa Minerals at a consideration of
ZAR3,000,000 on 16 November 2009, as amended by addenda dated 5 October 2011 and 27 September 2013
respectively, between Tharisa Minerals and The Rowad Trust.
2.12 A share subscription agreement between Tharisa Minerals and Arti Trust whereby Arti Trust subscribed for
4,000 B class preference shares in the share capital of Tharisa Minerals at a consideration of ZAR40,000,000
on 16 November 2009, as amended by addenda dated 5 October 2011 and 30 September 2013 respectively,
between Tharisa Minerals and Arti Trust.
2.13 A share subscription agreement between Tharisa Minerals and Barend Meulenbeld whereby Barend Meulenbeld
subscribed for 300 B class preference shares in the share capital of Tharisa Minerals at a consideration of
ZAR3,000,000 on 19 February 2010, as amended by addenda dated 5 October 2011 and 27 September 2013
respectively, between Tharisa Minerals and Barend Meulenbeld.
3. FUJIAN WUHANG SUBSCRIPTION AGREEMENT
On 20 May 2010, the Company, Medway and Fujian Wuhang entered into the Fujian Wuhang Subscription Agreement
for the purposes of Fujian Wuhang’s strategic investment in the Company and the potential development of a ferrochrome
smelter in the PRC. Pursuant to the terms of the Fujian Wuhang Subscription Agreement, on 27 November 2010, Fujian
Wuhang subscribed for 210 ordinary shares of €1.00 each in the capital of the Company. On 5 January 2011, both
Fujian Wuhang and HeYi Mining (which was nominated by Fujiang Wuhang to subscribe for shares for its own account)
subscribed for an aggregate of 456 shares of US$.00 each in the capital of the Company. The consideration paid by
Fujian Wuhang and HeYi Mining for each share was US$142,857.
4. SENIOR DEBT LOAN FACILITY AGREEMENT
Nature of agreement Senior Debt Loan Facility Agreement: financing an aggregate principal amount of
ZAR1 billion was provided to Tharisa Minerals. The primary purpose of the facility was to
fund the development and construction of the Voyager Plant at the Tharisa Mine. As at
30 September 2012 the facility was drawn down in full.
Parties involved HSBC Bank plc Johannesburg Branch, Nedbank Limited, ABSA Bank Limited, Tharisa
Minerals Proprietary Limited, Tharisa plc, Thari Resources and Business Venture
Investments No 1568 Proprietary Limited.
Date of agreement 21 February 2012
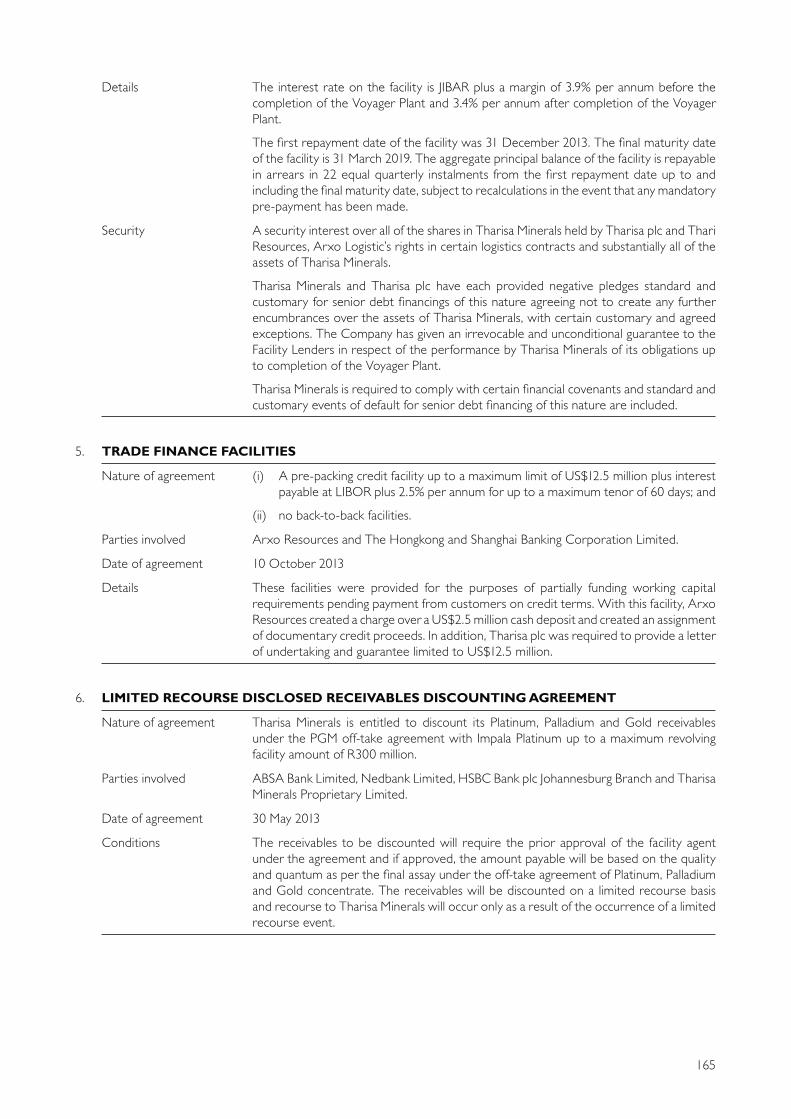
165
Details The interest rate on the facility is JIBAR plus a margin of 3.9% per annum before the
completion of the Voyager Plant and 3.4% per annum after completion of the Voyager
Plant.
The first repayment date of the facility was 31 December 2013. The final maturity date
of the facility is 31 March 2019. The aggregate principal balance of the facility is repayable
in arrears in 22 equal quarterly instalments from the first repayment date up to and
including the final maturity date, subject to recalculations in the event that any mandatory
pre-payment has been made.
Security A security interest over all of the shares in Tharisa Minerals held by Tharisa plc and Thari
Resources, Arxo Logistic’s rights in certain logistics contracts and substantially all of the
assets of Tharisa Minerals.
Tharisa Minerals and Tharisa plc have each provided negative pledges standard and
customary for senior debt financings of this nature agreeing not to create any further
encumbrances over the assets of Tharisa Minerals, with certain customary and agreed
exceptions. The Company has given an irrevocable and unconditional guarantee to the
Facility Lenders in respect of the performance by Tharisa Minerals of its obligations up
to completion of the Voyager Plant.
Tharisa Minerals is required to comply with certain financial covenants and standard and
customary events of default for senior debt financing of this nature are included.
5. TRADE FINANCE FACILITIES
Nature of agreement (i) A pre-packing credit facility up to a maximum limit of US$12.5 million plus interest
payable at LIBOR plus 2.5% per annum for up to a maximum tenor of 60 days; and
(ii) no back-to-back facilities.
Parties involved Arxo Resources and The Hongkong and Shanghai Banking Corporation Limited.
Date of agreement 10 October 2013
Details These facilities were provided for the purposes of partially funding working capital
requirements pending payment from customers on credit terms. With this facility, Arxo
Resources created a charge over a US$2.5 million cash deposit and created an assignment
of documentary credit proceeds. In addition, Tharisa plc was required to provide a letter
of undertaking and guarantee limited to US$12.5 million.
6. LIMITED RECOURSE DISCLOSED RECEIVABLES DISCOUNTING AGREEMENT
Nature of agreement Tharisa Minerals is entitled to discount its Platinum, Palladium and Gold receivables
under the PGM off-take agreement with Impala Platinum up to a maximum revolving
facility amount of R300 million.
Parties involved ABSA Bank Limited, Nedbank Limited, HSBC Bank plc Johannesburg Branch and Tharisa
Minerals Proprietary Limited.
Date of agreement 30 May 2013
Conditions The receivables to be discounted will require the prior approval of the facility agent
under the agreement and if approved, the amount payable will be based on the quality
and quantum as per the final assay under the off-take agreement of Platinum, Palladium
and Gold concentrate. The receivables will be discounted on a limited recourse basis
and recourse to Tharisa Minerals will occur only as a result of the occurrence of a limited
recourse event.

166
7. OPENCAST MINING WORKS AGREEMENT
Nature of agreement MCC was appointed as an independent contractor for the open pit mining operations
at the Tharisa Mine for an initial period of 6 years with effect from 21 May 2011 renewable
for successive 6-year periods unless terminated by either party giving 12 months’ notice
prior to the end of the applicable 6-year period.
Parties involved Tharisa Minerals Proprietary Limited and MCC Contracts Proprietary Limited.
Date of agreement 31 July 2011
Details MCC is required to provide all necessary plant, materials, labour, fuel, and transport that
are required for the mining operations and is paid on a monthly basis by reference to the
volume of material mined and transported from the open pit.
8. PGM CONCENTRATE OFF-TAKE AGREEMENT
Nature of agreement Tharisa Minerals and Impala Platinum entered into a long-term off-take agreement in
regard to Tharisa Minerals PGMs production at prevailing market prices.
Parties involved Tharisa Minerals and Impala Platinum.
Date of agreement July 2012
Details The contract will endure for an indefinite period terminable on 24 months’ notice,
provided that at least 66,000 oz of Platinum in concentrate shall have been delivered to
Impala Platinum.
9. CHROMITE ORE CONCENTRATE OFF-TAKE AGREEMENT
Nature of agreement Arxo Resources will supply 25,000t per month of 42% and/or 44% Chromite Ore
Concentrate from the Tharisa Mine.
Parties involved Noble, Arxo Resources and Tharisa.
Date of agreement 1 March 2013
Details The contract will endure for a finite period of 36 months. The price payable by Noble
for the concentrate is determined on a monthly basis by reference to the published CIF
Ferro Alloy net prices for SA 42% and 44% Chromite Ore, respectively.
10. ELECTRICITY SUPPLY AGREEMENT
Nature of agreement Eskom agreed to supply electricity to Tharisa Minerals and Tharisa Minerals agree to
take from Eskom all electricity required by Tharisa at the Tharisa Mine, subject to a
notified maximum demand of 40 MVA.
Parties involved Eskom Holdings SOC Limited and Tharisa Minerals Proprietary Limited.
Date of agreement 27 July 2012
Details The agreement commenced with effect from 30 June 2012 and will endure for an
indefinite period until terminated by either party on 6 months’ written notice of
termination.

167
11. MEMORANDUM OF AGREEMENT FOR THE SUPPLY OF WATER
Nature of agreement Samancor agreed to supply water via the Rand Water Board pipeline infrastructure to
Tharisa Minerals for the purposes of enabling Tharisa Minerals to maintain its emergency
dams located in its mining area.
Parties involved Samancor Chrome Limited and Tharisa Minerals Proprietary Limited.
Date of agreement 26 July 2013
Details Tharisa Minerals is entitled to draw from the Rand Water Board pipeline infrastructure
made available to Samancor a monthly quota of 38,000 kilolitres. Samancor is entitled
on 90 days prior written notice to Tharisa Minerals to reduce the quota of water
available for supply to Tharisa Minerals under the agreement. The agreement will
continue indefinitely until terminated by either party on 90 days prior written notice.
12. AGREEMENT FOR THE PROVISION OF RAIL TRANSPORT SERVICES DATED
Nature of agreement Transnet agreed to provide rail transportation services for the conveyance of freight by
Tharisa Minerals, subject to available capacity.
Parties involved Transnet SOC Limited and Arxo Logistics.
Date of agreement 18 December 2013
Details Tharisa Minerals is required to provide weekly rolling forecasts of its transportation
requirements by Transnet and Transnet agreed to incorporate same into its global train
plan for the following week, subject to available capacity. The term of the agreement is
set for a period of 12 months and subject to agreement of the parties is renewed
annually for successive 12-month periods.
13. AGREEMENT OF LEASE
Nature of agreement Transnet leased to Tharisa Minerals a certain portion of the farm Rooikoppies measuring
approximately 5,250 square metres of vacant land with rail infrastructure to be utilised
as a rail siding for the conveyance of Tharisa Minerals’ product.
Parties involved Transnet SOC Limited and Tharisa Minerals.
Date of agreement 31 October 2011
Details The agreement commenced on 1 November 2011 and will endure until 30 September
2015.
14. LOGISTICAL SERVICES AGREEMENT
Nature of agreement Tharisa Minerals appointed Arxo Logistics as its sole and exclusive provider and supplier
of logistical services to Tharisa Minerals.
Parties involved Arxo Logistics and Tharisa Minerals.
Date of agreement 5 November 2009
Details The agreement continues indefinitely until terminated by either party on 6 months’ prior
written notice.

168
15. AGENCY AND OFF-TAKE AGREEMENT
Nature of agreement Tharisa Minerals appointed Arxo Resources as Tharisa Minerals’ sole and exclusive agent
to sell and market its chrome products throughout the world.
Parties involved Arxo Resources and Tharisa Minerals Proprietary Limited.
Date of agreement 22 August 2011
Details The agreement continues indefinitely until terminated by either party on not less than
24 months’ notice of termination. In addition to providing the agency services, Arxo
Resources is entitled at any time and from time to time during the subsistence of the
agreement on written notice to Tharisa Minerals to be appointed as an off-taker of
chrome product. In this event the purchase price for the product would be the fair
market price thereof as agreed between the parties.

169
ANNEXURE 15
COMPETENT PERSON’S REPORT

Coffey Mining (SA) Pty Ltd (2006/030152/079) VAT Number (415 023 9327)
Block D, Somerset Office Estate, 604 Kudu Street, Allen’s Nek 1737Roodepoort, South Africa
Tharisa LimitedTharisa Chrome and PGM Mine, South Africa Competent Person’s Report (Effective Date 31 December 2013)Competent Person: Ken Lomberg (Pr.Sci.Nat.)
12.9(a)SRT1.1 A(ii) SVT2.9
Coffey Mining (SA) Pty Ltd
DOCUMENT INFORMATION
Tharisa MineCompetent Person’s Report - December 2013
Author(s):
Mr Jaco Lotheringen Associate Consultant - Ukwazi Mining Solutions Pr.Eng.
Mr Dave Dodd Associate Consultant – MDM Engineering FSAIMM
Mr Brandon Stobart Associate Consultant – SLR Consulting EAPSA, EAP
Mrs Alex Pheiffer Associate Consultant – SLR Consulting Pr.Sci.Nat.
Dr John James Associate Consultant - Celtis Geotechnical FSAIMM, FSANIR, MGSSA
Mr Hannes Bornman Manager Mining- Coffey Pr.Eng.
Mr Guy Wiid Associate Consultant – Epoch Resources Pr.Eng.
Mr Alan Goldschmidt Senior Consultant - Coffey Pr.Sci.Nat.
Mr Ken Lomberg Senior Principal Consultant – Coffey Pr.Sci.Nat.
Date: 31 December 2013
Project Number: JTHA06
Copies: Tharisa plc (2)
Coffey – Johannesburg (1)
Document Review and Sign Off
AuthorJaco Lotheringen
AuthorDavid Dodd
AuthorJohn James
AuthorBrandon Stobart
AuthorMrs Alex Pheiffer
AuthorHannes Bornman
AuthorGuy Wiid
AuthorAlan Goldschmidt
Supervising PrincipalKen Lomberg
The Reader is advised to read the Disclaimer (Section 2) of this document
SRT11A(i) SRT11A(iii) SVT2.14

Coffey Mining (SA) Pty Ltd
Tharisa MineCompetent Person’s Report - December 2013
Table of Contents
EXECUTIVE SUMMARY...........................................................................................................................iParticipants...................................................................................................................................... iIndependence................................................................................................................................. iiOwnership and Property Description .............................................................................................iiHistory of the Tharisa Mine Ownership ......................................................................................... iiiCurrent Mining Operations ............................................................................................................ iiiLegal Aspects and Legal Tenure .................................................................................................. ivGeology and Mineralisation............................................................................................................ vExploration and Geology.............................................................................................................. viiMineral Resource ........................................................................................................................ viiiMining Engineering...................................................................................................................... xiiiMineral Reserves ......................................................................................................................... xxGeotechnical Engineering ........................................................................................................... xxiMetallurgy and Processing ......................................................................................................... xxiiTailings Storage Facilities and Waste Rock Dumps ................................................................ xxviiInfrastructure ............................................................................................................................xxviiiEnvironmental Baseline............................................................................................................. xxixEnvironmental Approvals, Reporting and Management ............................................................ xxxEnvironmental Rehabilitation: Financial Closure Liability .......................................................... xxxValuation/Mine Economics........................................................................................................ xxxiRisk Summary ..........................................................................................................................xxxiii
1 Introduction and Terms of Reference ........................................................................................11.1 Scope of the Report...........................................................................................................11.2 Site Visits ...........................................................................................................................11.3 Competent Person’s Report ..............................................................................................11.4 Qualifications and Experience...........................................................................................11.5 Independence....................................................................................................................51.6 Legal Proceedings.............................................................................................................5
2 Disclaimer .....................................................................................................................................6
3 Property Description and Location ............................................................................................73.1 Mine Description and Location ..........................................................................................73.2 Mining Industry of South Africa .........................................................................................93.3 South African Taxes ....................................................................................................... 103.4 Mining Tenure................................................................................................................. 123.5 Company Structure......................................................................................................... 133.6 License Status ................................................................................................................ 13
3.6.1 Mining Right .......................................................................................................... 13
SRT1.1 A(i)

Coffey Mining (SA) Pty Ltd
Tharisa MineCompetent Person’s Report - December 2013
3.7 Surface Rights ................................................................................................................ 153.8 Agreements .................................................................................................................... 16
4 Accessibility, Climate, Local Resources, Infrastructure and Physiography ...................... 214.1 Mine Access ................................................................................................................... 214.2 Climate ........................................................................................................................... 214.3 Physiography.................................................................................................................. 214.4 Soils ................................................................................................................................ 224.5 Land Use ........................................................................................................................ 224.6 Flora and Fauna ............................................................................................................. 224.7 Groundwater................................................................................................................... 234.8 Surface Water................................................................................................................. 234.9 Local Resources and Infrastructure ............................................................................... 26
5 History ........................................................................................................................................ 275.1 Ownership History .......................................................................................................... 275.2 Work undertaken by the Previous License Holders ....................................................... 275.3 Historical Mineral Resources and Mineral Reserves ..................................................... 275.4 Occupational Health and Safety..................................................................................... 295.5 Production History .......................................................................................................... 29
5.5.1 Current Mining Operations .................................................................................... 295.5.2 Current Metallurgical Production ........................................................................... 315.5.3 Mine Personnel ..................................................................................................... 32
6 Geological Setting..................................................................................................................... 336.1 Regional Setting ............................................................................................................. 33
6.1.1 Bushveld Complex Stratigraphy ............................................................................ 336.1.2 Platinum Mineralisation ......................................................................................... 356.1.3 Chromite Mineralisation......................................................................................... 36
6.2 Local Geology................................................................................................................. 366.2.1 Tharisa Mine Area ................................................................................................. 366.2.2 Middle Group Chromitite Layers............................................................................ 39
6.3 Geology of the UG1 Chromitite Layer ............................................................................ 546.3.1 Full UG1 Chromitite Layer ..................................................................................... 566.3.2 Normal Reef .......................................................................................................... 566.3.3 Split Reef Facies ................................................................................................... 56
6.4 Structure ......................................................................................................................... 57
7 Exploration and Drilling............................................................................................................ 607.1 Previous Exploration....................................................................................................... 607.2 Exploration by Thari........................................................................................................ 607.3 Trenching and Pit Excavations....................................................................................... 607.4 Drilling............................................................................................................................. 627.5 Logging of Boreholes ..................................................................................................... 64
Coffey Mining (SA) Pty Ltd
Tharisa MineCompetent Person’s Report - December 2013
7.6 Sampling and Data Verification ...................................................................................... 647.6.1 Analytical Procedures............................................................................................ 667.6.2 Analytical Quality Control Data.............................................................................. 677.6.3 Assay Quality Control Data Assessment............................................................... 697.6.4 Chain of custody – Responsibility and accountability............................................ 707.6.5 Relative Density Determinations ........................................................................... 70
7.7 UG1 Chromitite Layer..................................................................................................... 707.7.1 Sampling Methodology.......................................................................................... 707.7.2 Analytical Procedures............................................................................................ 717.7.3 Chain of Custody – Responsibility and accountability........................................... 717.7.4 Bulk Density Measurements.................................................................................. 72
7.8 Summary ........................................................................................................................ 72
8 Mineral Resource Estimation................................................................................................... 738.1 Database ........................................................................................................................ 73
8.1.1 Borehole Database Development ......................................................................... 738.1.2 Borehole Database Validation............................................................................... 738.1.3 Assay Quality Control Data Assessment............................................................... 748.1.4 Conclusion............................................................................................................. 74
8.2 Bulk Density Database ................................................................................................... 748.3 Geological Modelling ...................................................................................................... 748.4 Statistics ......................................................................................................................... 768.5 Compositing.................................................................................................................... 768.6 Data Cutting.................................................................................................................... 778.7 Variography .................................................................................................................... 778.8 Block Model Development.............................................................................................. 798.9 Grade Estimation............................................................................................................ 79
8.9.1 Search Criteria ...................................................................................................... 808.9.2 Model Validation.................................................................................................... 80
8.10 Geological Loss .............................................................................................................. 818.11 MG Chromitite Layers Mineral Resource Reporting ...................................................... 82
8.11.1 Criteria for Mineral Resource Categorisation ........................................................ 838.11.2 Mineral Resource Classification ............................................................................ 848.11.3 Mineral Resource Statement ................................................................................. 84
8.12 UG1 Chromitite Layer..................................................................................................... 888.12.1 Methodology.......................................................................................................... 888.12.2 Compositing .......................................................................................................... 888.12.3 Statistical Analysis................................................................................................. 888.12.4 Geological Losses ................................................................................................. 88
8.13 UG1 Chromitite Layer Mineral Resource Reporting....................................................... 90
9 Mining Engineering ................................................................................................................... 919.1 Background .................................................................................................................... 91

Coffey Mining (SA) Pty Ltd
Tharisa MineCompetent Person’s Report - December 2013
9.2 Geotechnical Assessment.............................................................................................. 919.2.1 Geotechnical Environment .................................................................................... 919.2.2 Open Pit Slope Design .......................................................................................... 959.2.3 Underground Mining............................................................................................ 1039.2.4 Rock Engineering ................................................................................................ 1049.2.5 Conclusions......................................................................................................... 104
9.3 Open Pit Mine Design Study ........................................................................................ 1059.3.1 Design Criteria..................................................................................................... 1069.3.2 Box Cut Design Criteria and Mining Directions ................................................... 107
9.4 Equipment Selection..................................................................................................... 1089.4.1 Pit Optimisation ................................................................................................... 1089.4.2 Pit Optimisation Parameters................................................................................ 1099.4.3 Pit Optimisation Results ...................................................................................... 1099.4.4 Pit Design ............................................................................................................ 1129.4.5 Mining Methodology ............................................................................................ 1149.4.6 Destination Scheduling........................................................................................ 1149.4.7 Life of Mine Plan.................................................................................................. 114
9.5 Underground Mining ..................................................................................................... 1189.5.1 Introduction.......................................................................................................... 1189.5.2 Mining Method Selection ..................................................................................... 1189.5.3 Chromitite Layer Selection .................................................................................. 1199.5.4 Mining Cut ........................................................................................................... 1209.5.5 Underground Access Options ............................................................................. 1209.5.6 Geotechnical/ Hydrological Considerations......................................................... 1249.5.7 Equipment Selection ........................................................................................... 1249.5.8 Shift Cycle ........................................................................................................... 1249.5.9 Production Scheduling ........................................................................................ 1259.5.10 Infrastructure Requirements................................................................................ 1289.5.11 Labour ................................................................................................................. 1289.5.12 The Underground Cost Model ............................................................................. 128
10 Mineral Reserves..................................................................................................................... 12910.1 Open Pit Mineral Reserve Estimation .......................................................................... 129
10.1.1 Geological Losses ............................................................................................... 12910.1.2 Mining Recovery (Mining Loss) ........................................................................... 12910.1.3 Mining Dilution..................................................................................................... 12910.1.4 Metallurgical Recoveries ..................................................................................... 13010.1.5 Financial and Revenue Parameters .................................................................... 13010.1.6 Capital and Operating Costs ............................................................................... 13010.1.7 Mineral Reserve Tabulation ................................................................................ 131
10.2 Underground Mineral Reserve Estimation ................................................................... 13310.2.1 Geological Losses ............................................................................................... 13310.2.2 Mining External Dilution....................................................................................... 133

Coffey Mining (SA) Pty Ltd
Tharisa MineCompetent Person’s Report - December 2013
10.2.3 Mining Recovery.................................................................................................. 13310.2.4 Mining Extraction before Geological Losses ....................................................... 13310.2.5 Mineral Reserve Tabulation ................................................................................ 133
11 Mineral Processing and Metallurgical Testing..................................................................... 13511.1 Introduction................................................................................................................... 13511.2 Processing Facilities and Flow Sheets......................................................................... 13511.3 Genesis and Voyager Plant Metallurgical Performance............................................... 14111.4 Combined Genesis and Voyager Plant Operating Cost............................................... 14311.5 Tailings Storage Facilities and Waste Rock Dumps .................................................... 144
11.5.1 Design and Construction of the Tailings Storage Facilities ................................. 14511.5.2 Capital Costs for the TSFs .................................................................................. 14911.5.3 Environmental Protection Measures for the TSF ................................................ 15011.5.4 Design and Construction of the Waste Rock Dumps .......................................... 15211.5.5 Design Life of the Waste Rock Dumps................................................................ 15311.5.6 Capital costs for the construction of the Waste Rock Dumps ............................. 15511.5.7 Environmental Protection Measures of the Waste Rock Dumps......................... 155
11.6 Smelting and Beneficiation........................................................................................... 157
12 Infrastructure and Logistics................................................................................................... 15812.1 Roads ........................................................................................................................... 15812.2 Water Supply ................................................................................................................ 15812.3 Potable Water............................................................................................................... 15812.4 Process Water .............................................................................................................. 15812.5 Water Balance and Priority for Water Use ................................................................... 15812.6 Stormwater Management Plan..................................................................................... 15912.7 Containment Dams....................................................................................................... 16012.8 Power ........................................................................................................................... 16012.9 Communications........................................................................................................... 16012.10 Logistics of Chromite Concentrate Distribution ............................................................ 161
12.10.1 Current Logistics ................................................................................................. 16112.10.2 Planned Logistics ................................................................................................ 161
12.11 Occupational Health and Safety................................................................................... 16112.11.1 Key Areas of Legislation...................................................................................... 16112.11.2 Mine Health and Safety ....................................................................................... 16212.11.3 Processing Facilities Health and Safety. ............................................................. 16312.11.4 Work Camp Health and Safety............................................................................ 16312.11.5 Contractors Health and Safety ............................................................................ 16312.11.6 Legal Appointments............................................................................................. 164
13 Environmental and Social ...................................................................................................... 16513.1 Existing Environment.................................................................................................... 16513.2 Interested and Affected Parties (IAPs) Consultation Process...................................... 165
13.2.1 Authorities and interested and affected parties (IAPs) ........................................ 165

Coffey Mining (SA) Pty Ltd
Tharisa MineCompetent Person’s Report - December 2013
13.2.2 Summary of issues raised ................................................................................... 16613.3 Environmental Impact Assessment and Management................................................. 167
13.3.1 Specialist input .................................................................................................... 16713.3.2 Risk Analysis and Environmental Management .................................................. 16713.3.3 Summary of Potential Environmental Impacts .................................................... 171
13.4 Permitting ..................................................................................................................... 17213.5 Environmental Protection and Monitoring .................................................................... 173
13.5.1 Groundwater and Surface Water......................................................................... 17313.5.2 Air ........................................................................................................................ 17413.5.3 Blasting................................................................................................................ 17413.5.4 Noise ................................................................................................................... 17413.5.5 Bio monitoring ..................................................................................................... 17413.5.6 Tailings and Other Dams..................................................................................... 17413.5.7 Additional monitoring........................................................................................... 17413.5.8 General................................................................................................................ 17413.5.9 Reporting............................................................................................................. 175
13.6 Rehabilitation and Mine Closure .................................................................................. 17513.7 EMPR Performance Assessment (2013) ..................................................................... 17513.8 Social and Labour Plan ................................................................................................ 176
13.8.1 Objectives............................................................................................................ 17613.8.2 Employment Equity Plan ..................................................................................... 17713.8.3 Local Economic Development Programme ......................................................... 177
14 Technical-Economic Model .................................................................................................... 17914.1 Introduction................................................................................................................... 179
14.1.1 Competent Valuator and Effective Date .............................................................. 17914.1.2 Methodology........................................................................................................ 18014.1.3 Previous Valuations............................................................................................. 182
14.2 Sources of information ................................................................................................. 18214.3 Capital Budgets ............................................................................................................ 18314.4 Operating Costs............................................................................................................ 18414.5 Revenue Factors .......................................................................................................... 18414.6 Cost Factors ................................................................................................................. 18514.7 Steady State Production............................................................................................... 18514.8 Summary of the Technical Financial Model Inputs ...................................................... 18614.9 Cash Flow Approach – Excluding Inferred Resources................................................. 189
14.9.1 Opencast Mine .................................................................................................... 18914.9.2 Underground Mine............................................................................................... 18914.9.3 Modifying Factors ................................................................................................ 18914.9.4 Effect of Underground Production/Inferred Mineral Resources on DCF
Valuation ............................................................................................................. 18914.10 Market Approach .......................................................................................................... 19014.11 PGM Comparative Transactions .................................................................................. 190

Coffey Mining (SA) Pty Ltd
Tharisa MineCompetent Person’s Report - December 2013
14.12 Chrome Comparative Transactions.............................................................................. 19014.13 Value according to Market Approach ........................................................................... 19314.14 Summary ...................................................................................................................... 19314.15 Conclusion.................................................................................................................... 193
15 Risk Analysis ........................................................................................................................... 19515.1 Introduction................................................................................................................... 19515.2 Risk Summary .............................................................................................................. 19615.3 Geology and Mineral Resources .................................................................................. 19715.4 Mining ........................................................................................................................... 19715.5 Geotechnical Engineering ............................................................................................ 19815.6 Metallurgy and Processing ........................................................................................... 19815.7 Environmental............................................................................................................... 19815.8 Manpower and Management........................................................................................ 19915.9 Infrastructure ................................................................................................................ 19915.10 Risk Summary .............................................................................................................. 200
16 Glossary of Definitions and Technical Terms...................................................................... 201
17 References ............................................................................................................................... 206
18 Date and Signature Page........................................................................................................ 208

Coffey Mining (SA) Pty Ltd
Tharisa MineCompetent Person’s Report - December 2013
List of Tables
Table 1 – Mineral Resource Statement for the Tharisa Mine (31 December 2013) xi
Table 2 – Open Pit: Mineral Reserve Estimation Summary (31 December 2013) xvi
Table 3 – Underground Mine: Mineral Reserve Statement (31 December 2013) xix
Table 4 – Mineral Reserve (December 2013 xxi
Table 5 – Tailings Storage Facilities: Operational Life and Estimated Capital Costs xxvii
Table 6 – Waste Rock Dumps: Capacity, Operational Life and Estimated Capital Costs xxviii
Table 7 – Effect of Underground Production/Inferred Resources on DCF Valuation xxxi
Table 8 – Valuation at 31 December 2013 xxxii
Table 9 – Tharisa Minerals Technical Risk Summary xxxiii
Table 3.2_1 – A Summary of Mineral Exploration and Mining Rights (South Africa) 12
Table 4.8_1 – Calculated Peak Flow Rates and Flood Volumes 24
Table 5.3_1 – Mineral Resource Statement for the Tharisa Mine (30 September 2012) 28
Table 5.3_2 – Mineral Reserve Statement (30 September 2012) 29
Table 5.4_1 – Progressive Safety Statistics 29
Table 5.5.3_1 – Summary of Current Mine Staffing Levels (December 2013) 32
Table 6.2.2_1 - Average Intersection Thicknesses of the MG Chromitite Layers and Partings 41
Table 7.6.1_1 – Detection Limits Applicable to Tharisa Mine Data 67
Table 7.6.3 _1 – Summary of the Number of Control Samples 69
Table 8.3_1 - Summary of Stratigraphic Unit modeled 75
Table 8.4_1 - Coding for the various units of the MG Chromitite Layer Package 76
Table 8.7_1 – Summary of parameters for which variograms were developed 78
Table 8.9.1_1 – Sample Search Parameters 81
Table 8.11.1_1 – Confidence Levels of Key Criteria for Classification of MG Chromitite Layer 83
Table 8.11.3_1 – Mineral Resource Statement for the Tharisa Mine (31 December 2013) 86
Table 8.13_1 - UG1 Chromitite Mineral Resource Estimation (30 August 2012) 90
Table 9.2.1_1 - Summary of Joint Sets Identified in the Open Pit 93
Table 9.2.1_2 - Summary of Rock Mass Ratings 95
Table 9.2.1_3 - Summary of Rock Strengths 95
Table 9.2.2_1 - Summary of Rock Fall Hazard Analysis 100
Table 9.2.3_1 - Summary of the Relevant Geotechnical Data for Underground Mine Design 103
Table 9.5.5_1 – Decline System Design Capacities 121
SRT1.1 A(i)
Coffey Mining (SA) Pty Ltd
Tharisa MineCompetent Person’s Report - December 2013
Table 10.1.5_1 – Open Pit Feasibility: Financial and Revenue Parameters 130
Table 10.1.7_1 – Open Pit Mineral Reserve (December 2013) 132
Table 10.2.5_1 – Underground Mineral Reserve (December 2013) 134
Table 11.3_1 – Key Achieved and Planned Metallurgical Performance Statistics 142
Table 11.4_1 – Achieved and Planned Metallurgical Operating Cost 143
Table 11.5.1_1 – Waste Rock Capacity, Tailings Storage Capacity and Operational Life associated with the TSFs 149
Table 11.5.2_1 – Summary of Capital Costs for the TSFs 149
Table 11.5.3_1 – Tailings Complex Key Features and Environmental Protection Measures 150
Table 11.5.5_1 – Waste Rock Capacity and Operational Life associated with the WRDs 154
Table 11.5.6_1 – Summary of Capital Costs for the WRDs 155
Table 11.5.7_1 – Waste Rock Dumps Key Features and Environmental Protection Measures 155
Table 12.7_1 – Summary of Containment Dam Capacities 160
Table 13.3.3_1 – Summary of Potential Environmental Impacts 171
Table 13.5_1 – Environmental Monitoring Costs 173
Table 14.1.2_1 – Glossary of Valuation Terms (SAMVAL Code, 2008) 180
Table 14.1.2_2 – Relationship between Stages of Development and Valuation approaches for Mineral Properties 181
Table 14.3_1 – Total Capital Budget 183
Table 14.4_1 – Plant Recovery Parameters 184
Table 14.5_1 – Revenue Factors 184
Table 14.6_1 – Cost Factors 185
Table 14.7_1 – Steady State Production 185
Table 14.8_1 – Summary of the Technical Financial Model 187
Table 14.9.4_1 – Effect of Underground Production/Inferred Resources on DCF Valuation 189
Table 14.11_1 – PGM Valuation using Market Approach 191
Table 14.12_1 – Chromite Valuation using Market Approach 192
Table –Market Approach Valuation of 100% of Tharisa Mine 19314.13_1
Table 14.14_1 – Valuations of the Tharisa Mine on 31 December 2013 193
Table 14.15_1 – Preferred Valuation of the Tharisa Mine on 31 December 2013 194
Table 15.1_1 – Definitions of the Levels of Risk 195
Table 15.1_2 – Overall Risk Assessment Matrix 195
Table 15.2_1 – Overall Risk Assessment Analysis 196
Table 15.10_1 – Tharisa Minerals Technical Risk Summary 200

Coffey Mining (SA) Pty Ltd
Tharisa MineCompetent Person’s Report - December 2013
List of Figures
Figure 1 – Location of the Tharisa Mine ii
Figure 2 – Corporate Holdings Structure for the Tharisa Mine iv
Figure 3 – Summary of Stratigraphic Units modeled vi
Figure 4 – Google Image showing borehole locations and outcrop positions of UG1 and MG1 Chromitite Layers vi
Figure 5 – Map showing the Mining Layout xiv
Figure 6 – Integrated Mining Production Schedule xx
Figure 7 - Phase 1 Simplified Block Flow Diagram xxiii
Figure 8 – Genesis Plant (Phase 2): Simplified Block Flow Diagram xxiv
Figure 9 – Voyager Plant (Phase 3): Simplified Block Flow Diagram xxvi
Figure 3.1_1 – Map Showing the Geographic Location of the Tharisa Mine 8
Figure 3.1_2 – The Location of the Tharisa Mine on the Bushveld Complex 8
Figure 3.5_1 – Corporate Holdings Structure for Tharisa Mine 13
Figure 3.6.1_1 – Map showing the Mineral Right of the Tharisa Mine 14
Figure 3.7_1 – Map showing the Surface Right Holdings of Tharisa Mine 15
Figure 4.8_1 – River Systems and Catchment Boundaries in the Mine Area 25
Figure 5.5.1_1 – Historical Mining Production from the UG1 and MG Chromitite Layers 30
Figure 5.5.2_1 – Graph of the Historical Metallurgical Production 31
Figure 6.1.1_1 – Generalised Stratigraphic Column of Rustenburg Layered Suite, Bushveld Complex 34
Figure 6.2.1_1 – Summary of Stratigraphic Unit across Tharisa Mine 37
Figure 6.2.1_2 - Map of the Western Bushveld Complex showing the location of the Tharisa Mine 38
Figure 6.2.1_3 – Borehole locations and outcrop positions of UG1 and MG1 Chromitite Layers on a Google Image 39
Figure 6.2.2_1 - Generalised Stratigraphic Column of the MG Chromitite Layer at the Tharisa Mine 40
Figure 6.2.2_2 - Along strike section showing the variations in MG Chromitite Layer partings 42
Figure 6.2.2_3 - Downdip section showing the variations in MG Chromitite Layer partings 42
Figure 6.2.2_4 - MG1 Chromitite Layer and MG1 Shear facies outlines 44
Figure 6.2.2_5 - Typical MG1 Chromitite Layer Cr2O3 and 3PGE+Au geochemical signature 45
Figure 6.2.2_6 - Thickness isopachs for the parting between MG2A and MG1 Chromitite Layers 46
Figure 6.2.2_7- Thickness isopachs for the MG2B and MG2A Chromitite Layers parting 47
Figure 6.2.2_8 - Typical MG2 Chromitite Layer Cr2O3 and 3PGE+Au geochemical signature 48
Figure 6.2.2_9 - Typical MG3 Chromitite Layer Cr2O3 and 3PGE+Au geochemical signature 50
SRT1.1 A(i)
Coffey Mining (SA) Pty Ltd
Tharisa MineCompetent Person’s Report - December 2013
Figure 6.2.2_10 - Facies defined for the MG3 Chromitite Layer 51
Figure 6.2.2_11- Facies defined for the MG4(0) and MG4 Chromitite Layers 52
Figure 6.2.2_12 - Typical MG4(0) and MG4 Chromitite Layer Cr2O3 and 3PGE+Au geochemical signature 53
Figure 6.2.2_13 - Typical MG4A Chromitite Layer Cr2O3 and 3PGE+Au geochemical signature 54
Figure 6.3_1 – Outcrop positions of the Middle Group, UG1 and UG2 Chromitite Layers at the Tharisa Mine 55
Figure 6.3_2 – Schematic Diagram of the UG1 Chromitite Layer Model 56
Figure 6.3.3_1 – Structures in the UG1 Chromitite Layer 57
Figure 6.4_1 - Map Showing High Resolution Aeromagnetic Survey Interpretation 59
Figure 7.3_1 – Map Showing Distribution of the Historic Boreholes, Various Pits and the Stoped Out Area 61
Figure 7.3_2 – Photograph of Pit Sidewall showing the relationship of the various MG Chromitite Layers 62
Figure 7.4_1 – Location Plan for Drilling Programme on the Tharisa Mine 65
Figure 8.10_2 – Map showing the AppliedGeological Loss 82
Figure 8.11.2_1 – Plan of the classified mineral resources areas for the MG0 and MG1 Chromitite Layers 84
Figure 8.11.2_2 – Plan of the Classified Mineral Resources Areas for the MG2, MG3 and MG4 Chromitite Layers 85
Figure 8.12.1_1 – Plan view of the UG1 Chromitite Layers Mineral Resource 89
Figure 9.2.1_1 – Generalised Stratigraphy of the MG Chromitite Layers 92
Figure 9.2.1_2 – Stereonet of Joints Mapped from In Pit Observations 93
Figure 9.2.1_3 – Photograph Demonstrating the Method of Rock Mass Rating Determination 94
Figure 9.2.2_1 – Haines and Terbrugge Empirical Design Chart used to Assess Safe Pit Slope Angle 96
Figure 9.2.2_2 – Stereonet and Analysis of Planar sliding in the Northern Slope 97
Figure 9.2.2_3 – Stereonet and Analysis of Wedge Failure in the Northern Slope 97
Figure 9.2.2_4 – Stereonet and Analysis of Flexural Toppling Failure in the Northern Slope 98
Figure 9.2.2_5 – Schematic Plan of East Mine showing the positions of the Sections Modelled 99
Figure 9.2.2_6 – Diagram of the Proposed Highwall configuration showing Geology 99
Figure 9.2.2_7 – Graphic Example of the Hydrological Numerical Modelling Results 100
Figure 9.2.2_8 – The Proposed Final Pit Slope Design 101
Figure 9.2.2_9 – Illustration of the Types of Slope Failure Considered 102
Figure 9.3_1 – Open Pit Mining Engineering Process Flow 105
Figure 9.3.2_1 – Schematic Diagram showing Box Cut Positions and Steady State Mining Direction 108
Figure 9.4.3_1 – Incremental Open Pit Value Analysis 110
Figure 9.4.3_2 – Incremental Open Pit Value Analysis 111
Figure 9.4.3_3 – Schematic Diagram Showing Pit Configuration and Existing Infrastructure 112
Figure 9.4.4_1 – Open Pit Surface Layout 113
Coffey Mining (SA) Pty Ltd
Tharisa MineCompetent Person’s Report - December 2013
Figure 9.4.7_1 – Open Pit Mine Schedule with Mineral Reserve Classification 115
Figure 9.4.7_2 – Open Pit Mine Schedule with Mineral Reserve Classification 117
Figure 9.5.2_1 – Typical Bord and Pillar Layout 119
Figure 9.5.5_1 – Underground Layout for theMG2 Chromitite Layer 122
Figure 9.5.5_2 – Underground Layout for theMG4 Chromitite Layer 123
Figure 9.5.9_1 – Underground Mine Production Schedule 125
Figure9.5.6_2 – Underground Mine Schedule with Mineral Reserve Classification 126
Figure 11.2_1 - Phase 1 Simplified Block Flow Diagram 136
Figure 11.2_ Genesis Plant (Phase 2): Simplified Block Flow Diagram 1371 –
Figure 11.2_1 – Voyager Plant (Phase 3): Simplified Block Flow Diagram 139
Figure 11.2_2 – Foundry Project Simplified Flow Diagram 141
Figure 11.5.1_1 – Layout of Tharisa Mine's TSF 1 and TSF 2 (Combined Facility) 145
Figure 11.5.1_2 – Construction Phasing of TSF 1 146
Figure 11.5.1_3 – Construction Phasing of TSF 2 148
Figure 11.5.4_1 – Layout of Tharisa Mine's WRDs 153
List of Appendices
Appendix A – Checklist for JSE Listing Requirements, SAMREC and SAMVAL Codes
12.4(c)

Coffey Mining (SA) Pty Ltd
Tharisa Mine Page: iCompetent Person’s Report - December 2013
EXECUTIVE SUMMARY
Coffey Mining (South Africa) (Proprietary) Limited (Coffey) was requested by Tharisa plc, formerly Tharisa Limited (Tharisa or the Company), to complete a Competent Person’s Report (CPR) on the Tharisa Mine located in the North West Province of South Africa. This report complies with the Listing Requirements of the Johannesburg Stock Exchange (JSE); specifically the particular requirements applicable to Mineral Companies (Section 12) and is prepared in accordance with the guidelines of “The South African Code for Reporting of Exploration Results, Mineral Resources and Reserves (prepared by the South African Mineral Resource Committee (SAMREC) Working Group) (2007 and as amended in 2009)” (SAMREC Code) and “The South African Code for the Reporting of Mineral Asset Valuation (2008)(as amended in July 2009)” Prepared by The South African Mineral Asset Valuation Committee (SAMVAL) Working Group (SAMVAL Code).
This report is dated 31 December 2013 and Tharisa has advised Coffey that no material change has occurred to the Tharisa Mine since this date.
Participants
The participants consist of a number of technical experts brought together by Coffey to complete the CPR and are all Competent Person’s as defined in (SAMREC Code). The compilation of the CPR in accordance with the reporting requirements of the JSE was supervised by Mr Lomberg. The participants in the compilation of the CPR and their individual areas of responsibility are listed as follows:-
Ken Lomberg, Senior Principal Consultant, CoffeyProject management, mineral resources, geological interpretations, site visits, report preparation.
Alan Goldschmidt, Senior Consultant, CoffeyMineral resources, geological interpretations, report preparation.
Jaco Lotheringen, Associate Consultant – Ukwazi Mining SolutionsMining engineering, mineral reserve estimation, infrastructure, economic valuation, site visits, report preparation.
David Dodd, Associate Consultant – MDM EngineeringProcess engineering, infrastructure, site visits, report preparation.
Brandon Stobart, Associate Consultant – SLR Consulting (previously Metago) Environmental and Social, site visits, report preparation.
Alex Pheiffer, Associate Consultant – SLR Consulting (previously Metago)Environmental and Social, site visits, report preparation.
John James, Associate Consultant – Celtis GeotechnicalGeotechnical Engineering, site visits, report preparation.
Hannes Bornman, Manager Mining, CoffeyEconomic valuation, site visit, report preparation.
12.8(a)12.8(b)(i)12.912.9(h)(i)
12.912.9(c)

Coffey Mining (SA) Pty Ltd
Tharisa Mine Page: iiCompetent Person’s Report - December 2013
Independence
Coffey is an independent technical consulting group, with no direct or indirect interests in Tharisa.Neither Coffey, nor the key personnel responsible for the work, has any material interest in Tharisa, the companies associated with this project, their subsidiaries or their mineral properties. All work done by Coffey for Tharisa, is strictly in return for professional fees. Payment for the work is not in any way dependent on the outcome of the work or on the success or otherwise of Tharisa’s own business dealings. There is no conflict of interest in Coffey undertaking this work as contained in this document.
Ownership and Property Description
The Tharisa Mine a PGM and Chrome Mining Operation exploiting the Middle Group (MG) Chromitite Layers on two properties, being portions of the property Kafferskraal 342JQ and the whole of the property Rooikoppies 297JQ, located in the North West Province some 35km east of the city of Rustenburg and 95km from Johannesburg (Figure 1). The Tharisa Mine was developed by Tharisa Minerals (Pty) Ltd (Tharisa Minerals) which holds a mining right, granted by the Department of Mineral Resources (DMR) on 19 September 2008 and registered on 13 August 2009, to various portions of Kafferskraal 342JQ (in respect of PGMs (Platinum Group Metals), gold, silver, nickel, copper and chrome ore) and Rooikoppies 297JQ (PGMs, gold, silver, nickel, copper and chrome ore contained within the MG Chromitite Layers only).
Figure 1Location of the Tharisa Mine
Tharisa Mine
12.8(b)
12.9(h)(ii)12.9(h)(iii)SRT1.2A(i)

Coffey Mining (SA) Pty Ltd
Tharisa Mine Page: iiiCompetent Person’s Report - December 2013
A main road bisects the property in a north-south direction. The road provides access to the town of Marikana. The nearest major road, the N4 National Road links Pretoria with Rustenburg and crosses the south-eastern corner of the Kafferskraal property immediately south of the outcrop of the Middle Group (MG) Chromitite Layers. The east west Rustenburg-Brits railway line bisects the Rooikoppies property with a station located in the town of Marikana on the Rooikoppies property.
History of the Tharisa Mine Ownership
Thari Resources (Pty) Ltd (Thari) which was incorporated in January 2005, acquired prospecting rights for chrome and PGMs over various portions of the property Kafferskraal 342JQ and to the property Rooikoppies 297JQ in March 2006. Thari is a Historically Disadvantaged South African (HDSA) and woman controlled company focused on the minerals and energy sectors.
In March 2006 Thari established Tharisa Minerals as a wholly owned subsidiary. During September 2008, February 2009 and March 2009 the prospecting rights held by Thari were transferred to Tharisa Minerals after obtaining the necessary Ministerial approval in terms of Section 11 of the Mineral and Petroleum Resources Development Act, 2002 (MPRDA).
In March 2008, the mining rights for chrome ore, over portions 96 and 183 of Kafferskraal 342JQ were purchased from South African Producers and Beneficiators of Chrome Ore (Pty) Ltd. On 19 September 2008, the prospecting rights, including those for PGM and chrome ore, over various portions of Kafferskraal and the whole of Rooikoppies held by Tharisa Minerals, were converted into mining rights in terms of Section 16 of the MPRDA.
Tharisa plc was incorporated in February 2008 and after obtaining the necessary Ministerial approval acquired 74% of Tharisa Minerals on 9 February 2009. The remaining 26% is currently held by Thari (20%) and the Tharisa Community Trust (6%). In July 2011 the Tharisa Minerals mining right 49/2009 (MR) was amended in terms of Section 102 of the MPRDA to include portions 96 and 183 of Kafferskraal in respect of PGM, and to include PGM and chrome ore in respect of portion 286 of Kafferskraal.
The Tharisa Mine started trial mining in October 2008 and commenced production of ore on a small scale from March 2009, achieving an average throughput rate of 38,000tpm Run of Mine (RoM) with a small chrome concentrator. From 2010 to 2012 the mine undertook a number of process facility expansions (to increase processing capacity to 400,000tpm RoM).
Current Mining Operations
The mining operation is divided into the East and West Pits, located east and west of the Sterkstroom River - which runs north south through the Tharisa Mine property. The pits are designed to protect the water course and the local infrastructure running parallel to the river (Figure 5). Furthermore, the East Mine extends to the eastern boundary of the mining right while the West Mine extends to where the mineral resource is defined on the far western portion of the mine. As part of the ramp up to 400,000tpm of RoM ore, a central box cut was developed in the East Mine, from where the bulk of the tonnages will be delivered. Mining is being undertaken by Tharisa Mine’s appointed open pit mining
12.9(h)(ii)

Coffey Mining (SA) Pty Ltd
Tharisa Mine Page: ivCompetent Person’s Report - December 2013
contractor, MCC Contracts (Pty) Ltd (MCC). MCC has extensive open pit contract mining experience in Africa.
The average depth of mining is currently 29m and the mine is consequently producing largely freshmaterial from all of the five groups of the MG Chromitite Layers, namely the MG4 (MG4A and MG4),MG3, MG2, MG1 and MG0. Some mining has also taken place on the UG1 Chromitite Layer. The shallow MG1 Chromitite Layer was mined underground to a limited extent on the eastern boundary of the property by the previous mining right holder.
The mining schedule is co-ordinated to match the capacity of the processing facility. At steady state the Tharisa Mine will be mining and processing 4.8Mtpa of RoM ore.
The open pits will fulfil the production requirements until 2032, after which production will transition to underground bord and pillar mining. The last open pit tonnage will be mined in 2038.
The open pit design and schedule as well as the mine design and scheduling of the future underground operation, was undertaken by Ukwazi Mining Solutions (Pty) Ltd (Ukwazi). The two schedules have been combined into a combined production schedule.
Legal Aspects and Legal Tenure
The Tharisa Mine was developed by Tharisa Minerals which holds a mining right, granted by the DMRon 19 September 2008, to various portions of the property Kafferskraal 342JQ and to the property Rooikoppies 297JQ.
The corporate holding structure of the Tharisa Mine is represented in Figure 2.
Figure 2 Corporate Holdings Structure for the Tharisa Mine
Tharisa plc
Tharisa Minerals (Pty) Ltd
Tharisa Mine
Thari Resources (Pty) Ltd
Tharisa Community Trust
74%
20%
6%100%
12.9(h)(iv)
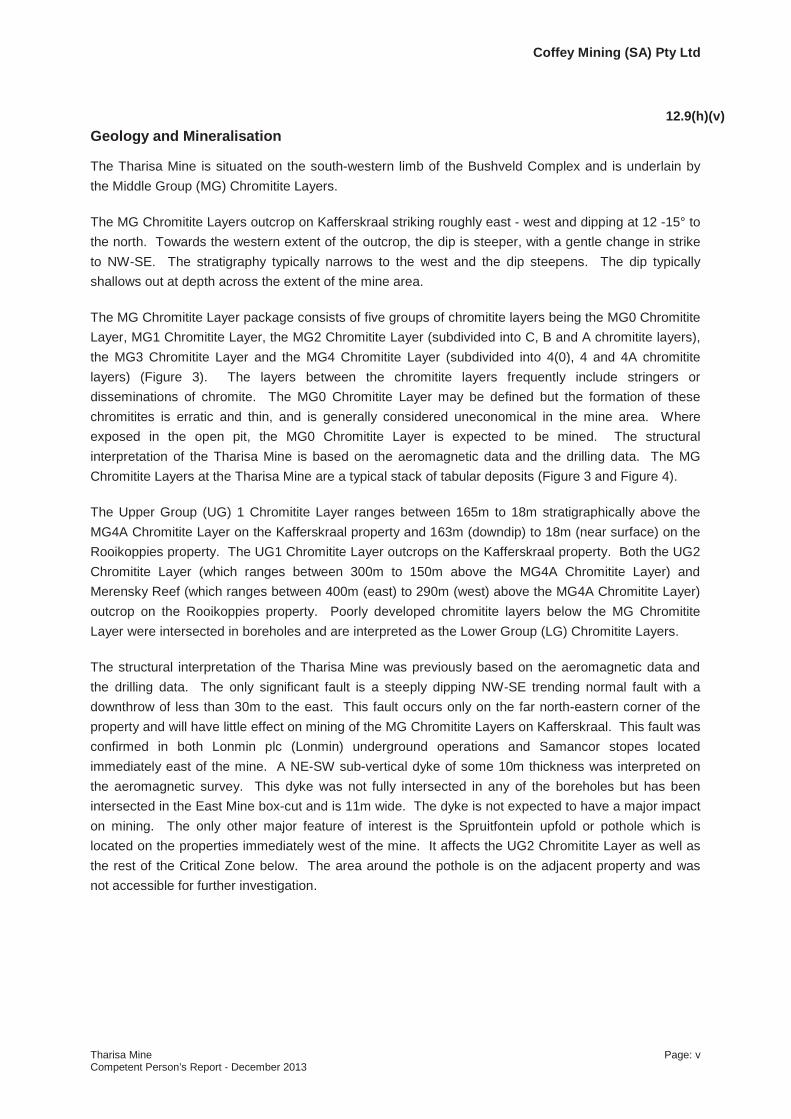
Coffey Mining (SA) Pty Ltd
Tharisa Mine Page: vCompetent Person’s Report - December 2013
Geology and Mineralisation
The Tharisa Mine is situated on the south-western limb of the Bushveld Complex and is underlain by the Middle Group (MG) Chromitite Layers.
The MG Chromitite Layers outcrop on Kafferskraal striking roughly east - west and dipping at 12 -15° to the north. Towards the western extent of the outcrop, the dip is steeper, with a gentle change in strike to NW-SE. The stratigraphy typically narrows to the west and the dip steepens. The dip typically shallows out at depth across the extent of the mine area.
The MG Chromitite Layer package consists of five groups of chromitite layers being the MG0 Chromitite Layer, MG1 Chromitite Layer, the MG2 Chromitite Layer (subdivided into C, B and A chromitite layers), the MG3 Chromitite Layer and the MG4 Chromitite Layer (subdivided into 4(0), 4 and 4A chromitite layers) (Figure 3). The layers between the chromitite layers frequently include stringers or disseminations of chromite. The MG0 Chromitite Layer may be defined but the formation of these chromitites is erratic and thin, and is generally considered uneconomical in the mine area. Where exposed in the open pit, the MG0 Chromitite Layer is expected to be mined. The structural interpretation of the Tharisa Mine is based on the aeromagnetic data and the drilling data. The MG Chromitite Layers at the Tharisa Mine are a typical stack of tabular deposits (Figure 3 and Figure 4).
The Upper Group (UG) 1 Chromitite Layer ranges between 165m to 18m stratigraphically above the MG4A Chromitite Layer on the Kafferskraal property and 163m (downdip) to 18m (near surface) on the Rooikoppies property. The UG1 Chromitite Layer outcrops on the Kafferskraal property. Both the UG2 Chromitite Layer (which ranges between 300m to 150m above the MG4A Chromitite Layer) and Merensky Reef (which ranges between 400m (east) to 290m (west) above the MG4A Chromitite Layer) outcrop on the Rooikoppies property. Poorly developed chromitite layers below the MG Chromitite Layer were intersected in boreholes and are interpreted as the Lower Group (LG) Chromitite Layers.
The structural interpretation of the Tharisa Mine was previously based on the aeromagnetic data and the drilling data. The only significant fault is a steeply dipping NW-SE trending normal fault with a downthrow of less than 30m to the east. This fault occurs only on the far north-eastern corner of the property and will have little effect on mining of the MG Chromitite Layers on Kafferskraal. This fault was confirmed in both Lonmin plc (Lonmin) underground operations and Samancor stopes located immediately east of the mine. A NE-SW sub-vertical dyke of some 10m thickness was interpreted on the aeromagnetic survey. This dyke was not fully intersected in any of the boreholes but has been intersected in the East Mine box-cut and is 11m wide. The dyke is not expected to have a major impact on mining. The only other major feature of interest is the Spruitfontein upfold or pothole which is located on the properties immediately west of the mine. It affects the UG2 Chromitite Layer as well as the rest of the Critical Zone below. The area around the pothole is on the adjacent property and was not accessible for further investigation.
12.9(h)(v)

Coffey Mining (SA) Pty Ltd
Tharisa Mine Page: viCompetent Person’s Report - December 2013
Figure 3
Summary of Stratigraphic Units modeled
Stratigraphic Column UnitMG4A Chromitite Layer
MG4 Chromitite LayerMG4 ChromititeMG4 – MG4 (0) PartingMG4(0) Chromitite
MG3 Chromitite Layer
MG3 Disseminated
MG3 Chromitite
MG3 Zebra
MG2 Chromitite Layer
MG2C ChromititePGEM+ PartingPEGMPEGM- PartingMG2B ChromititeMG2A – MG2B PartingMG2A Chromitite
MG1 Chromitite LayerMG0 Chromitite Layer
Figure 4 Google Image of the Tharisa Mine plan showing borehole locations and outcrop positions of UG1 and MG1
Chromitite Layers

Coffey Mining (SA) Pty Ltd
Tharisa Mine Page: viiCompetent Person’s Report - December 2013
The UG1 Chromitite Layer is stratigraphically situated in the Upper Critical Zone and is well developed in the Bushveld Complex. It comprises of massive chromitite, chromitiferous pyroxenite, bands of anorthosite, chromitite, norites and stringers of chromitites. The UG1 Chromitite Layer has an east-west strike and dips to the north. The dip angle varies from 10º in the east to 25º in the west. The thickness of the UG1 Chromitite Layer ranges from a few centimetres up to 3m in places. The lenses of anorthosite and pyroxenite are seen impregnated with numerous chromite grains in places. The hanging wall changes from pyroxenite to anorthositic norites. The footwall is formed by bifurcated bands of anorthosite and chromite lenses.
Exploration and Geology
The Tharisa Mine has been explored for its mineral potential since the early 1900s. Initially this was in the form of erratic exploration activities which included trenching and small open pits.
Various trenches were excavated on both the UG1 and the MG Chromitite Layers. The MG Chromitite Layers were previously exploited from three known pits, excavated by previous tenement holders and which remain unrehabilitated.
Six diamond boreholes were drilled during January 1997 by an entrepreneur, Mr Hennie Botha in the northwest part of Kafferskraal 342JQ property and on the adjacent property, Spruitfontein 341JQ. Five NQ size, vertical diamond boreholes were drilled along strike on Kafferskraal during 2006 by Thari Resources under the supervision of Coffey. A total of 121 vertical boreholes and 23 deflections, representing some 22,500m were drilled from March 2007 to October 2007. The drilling programme was designed so that boreholes would intersect the base of the MG1 Chromitite Layer at approximately 30m, 60m, 120m, 180m, 300m, 500m and 1000m below surface. A line of boreholes that intersected at 220m below surface was later added for greater coverage of the deposit. The drilling programme was designed to drill the deposit closest to the outcrop at higher density than further downdip so that the subsequent mineral resource estimate close to the outcrop could confidently be declared as an indicated and/or measured mineral resource in preparation for a feasibility study and the consideration of open pit mining. The programme for the deeper boreholes on the Rooikoppies property where Lonmin is mining the Merensky Reef and UG2 Chromitite Layer, was revised due to various difficulties relating to the siting of boreholes to prevent holing into existing underground infrastructure. Fewer, more widely spaced boreholes were therefore drilled.
Two fence lines (down dip) were drilled with TNW core size for metallurgical test purposes, intersecting the chromitite layers at 10m depth increments down to 60m below surface on the MG4 Chromitite Layer. Two NQ boreholes were drilled for geotechnical logging, sampling and to conduct rock strength tests. Six boreholes were drilled around the proposed civil engineering sites which coincide with the LG6 Chromitite Layer outcrop to ensure that a possible economical deposit was not being sterilised. Atotal of 10 boreholes were drilled on the Rooikoppies property to test the extension of the MG Chromitite Layer package down dip.
The collars of all the boreholes were surveyed. Downhole surveys were completed for all the boreholes drilled to a depth greater than 120m. All geological and sampling protocols used are to international standards. The precious metal analyses (Pt, Pd, Rh, Au, Ru, Ir, Os) were undertaken using NiS/MS

Coffey Mining (SA) Pty Ltd
Tharisa Mine Page: viiiCompetent Person’s Report - December 2013
analytical method and base metals analysis using the ICP Fusion D/OES analytical method, at Genalysis (Johannesburg).
A comprehensive quality assurance and quality control (QA/QC) programme was carried out concurrent with drilling. This included three certified reference standards, blanks and field duplicates. Each quality control aspect used was introduced in a ratio of 1:20. All assay issues were resolved and the assay data confirmed to be reliable and acceptable for a mineral resource estimate.
The geological modelling confirmed the tabular nature of the deposit and identified the major structural features (dykes and faults). The models were validated to ensure that the stratigraphic integrity was maintained. The result is five planar surfaces stacked on top of each other demonstrating the tabular nature of the deposit. The geological modelling utilised the other structural information gained from the aeromagnetic survey, trenching etc. It was noted that the dip flattens with depth.
Mineral Resource
The mineral resource estimate was completed over the mining right of Tharisa Minerals to a depth of 750m for the MG Chromitite Layers and UG1Chromitite Layer:-
MG4A Chromitite Layer
MG4 Chromitite Layer consisting of the MG4(0) and MG4 Chromitite Layer with the parting between them
MG3 Chromitite Layer with the disseminated material above and the disseminated chromitite below (“zebra”)
MG2 Chromitite Layer including the MG2A, MG2B, MG2C chromitite layers, the parting between the MG2A and MG2B Chromitite Layers as well as the PGM layer between the MG2B and MG2C Chromitite Layers and the associated partings
MG1 Chromitite Layer
MG0 Chromitite Layer
UG1 Chromitite Layer
MG Chromitite Layer
The data was coded for the different units within the MG and UG1 Chromitite Layer packages.Statistical analysis was then completed on both the raw and composite data grouped by unit type after examination of the data indicated that the units defined different geological populations and are statistically distinct.
Each intersection was composited after coding for all stratigraphic layers. The Pt, Pd, Rh, Au, Ru, Ir, Os, Cu, Ni, Al, Ca, Cr, Cr2O3, Fe, Mg and Si concentrations were composited utilising the weighting by density and thickness. This is considered necessary as the lithologies have significantly different densities. An analysis of the unit thickness showed that there is little correlation between the concentration and thickness confirming that the use of concentration was appropriate in the mineralresource estimate.
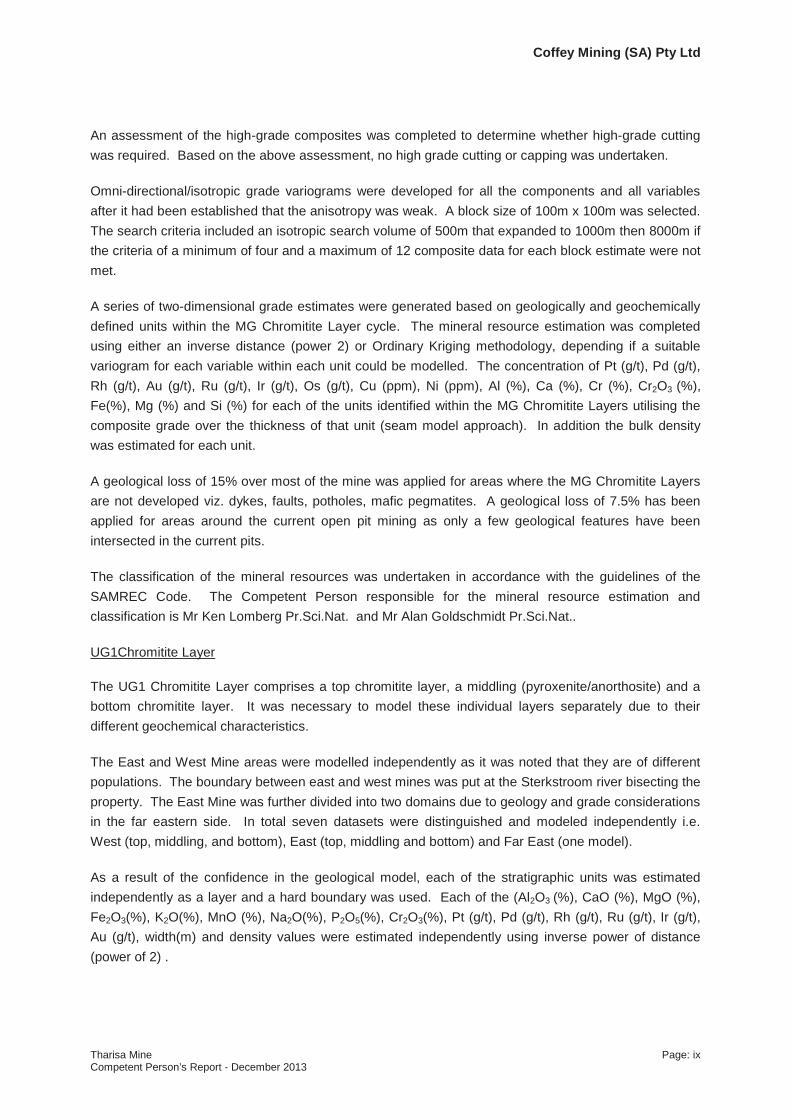
Coffey Mining (SA) Pty Ltd
Tharisa Mine Page: ixCompetent Person’s Report - December 2013
An assessment of the high-grade composites was completed to determine whether high-grade cutting was required. Based on the above assessment, no high grade cutting or capping was undertaken.
Omni-directional/isotropic grade variograms were developed for all the components and all variables after it had been established that the anisotropy was weak. A block size of 100m x 100m was selected.The search criteria included an isotropic search volume of 500m that expanded to 1000m then 8000m if the criteria of a minimum of four and a maximum of 12 composite data for each block estimate were not met.
A series of two-dimensional grade estimates were generated based on geologically and geochemically defined units within the MG Chromitite Layer cycle. The mineral resource estimation was completed using either an inverse distance (power 2) or Ordinary Kriging methodology, depending if a suitable variogram for each variable within each unit could be modelled. The concentration of Pt (g/t), Pd (g/t), Rh (g/t), Au (g/t), Ru (g/t), Ir (g/t), Os (g/t), Cu (ppm), Ni (ppm), Al (%), Ca (%), Cr (%), Cr2O3 (%), Fe(%), Mg (%) and Si (%) for each of the units identified within the MG Chromitite Layers utilising the composite grade over the thickness of that unit (seam model approach). In addition the bulk density was estimated for each unit.
A geological loss of 15% over most of the mine was applied for areas where the MG Chromitite Layers are not developed viz. dykes, faults, potholes, mafic pegmatites. A geological loss of 7.5% has been applied for areas around the current open pit mining as only a few geological features have been intersected in the current pits.
The classification of the mineral resources was undertaken in accordance with the guidelines of the SAMREC Code. The Competent Person responsible for the mineral resource estimation and classification is Mr Ken Lomberg Pr.Sci.Nat. and Mr Alan Goldschmidt Pr.Sci.Nat..
UG1Chromitite Layer
The UG1 Chromitite Layer comprises a top chromitite layer, a middling (pyroxenite/anorthosite) and a bottom chromitite layer. It was necessary to model these individual layers separately due to their different geochemical characteristics.
The East and West Mine areas were modelled independently as it was noted that they are of different populations. The boundary between east and west mines was put at the Sterkstroom river bisecting the property. The East Mine was further divided into two domains due to geology and grade considerations in the far eastern side. In total seven datasets were distinguished and modeled independently i.e.West (top, middling, and bottom), East (top, middling and bottom) and Far East (one model).
As a result of the confidence in the geological model, each of the stratigraphic units was estimated independently as a layer and a hard boundary was used. Each of the (Al2O3 (%), CaO (%), MgO (%), Fe2O3(%), K2O(%), MnO (%), Na2O(%), P2O5(%), Cr2O3(%), Pt (g/t), Pd (g/t), Rh (g/t), Ru (g/t), Ir (g/t), Au (g/t), width(m) and density values were estimated independently using inverse power of distance (power of 2) .

Coffey Mining (SA) Pty Ltd
Tharisa Mine Page: xCompetent Person’s Report - December 2013
The classification of the mineral resources was undertaken in accordance with the guidelines of theSAMREC Code. The Competent Person responsible for the mineral resource estimation and classification is Mr Ken Lomberg Pr.Sci.Nat.
The classification was based on the robustness of the various data sources available, confidence of the geological interpretation, variography and various estimation service variables (e.g. distance to data, number of data, maximum search radii etc).
In classification of the mineral resource estimate for the UG1 Chromitite Layer, consideration was given to the reasonable and realistic prospects for eventual economic extraction. As a result the declaration was made only for the areas where MG Chromitite Layer mining is anticipated to occur in open pit. The expansion of the declaration will require a financial assessment incorporating the potential movement of dumps and other surface infrastructure.
The mineral resource estimates for the MG and UG1 Chromitite Layers are presented in Table 1.

Cof
fey
Min
ing
(SA)
Pty
Ltd
Thar
isa
Min
eP
age:
xiC
ompe
tent
Per
son’
s R
epor
t - D
ecem
ber 2
013
Tabl
e 1
Min
eral
Res
ourc
e St
atem
ent f
or th
e Th
aris
a M
ine
(31
Dec
embe
r 201
3)
MG
4A C
HR
OM
ITIT
E LA
YER
Tonn
age
(Mt)
True
Th
ick
(m)
Bul
k D
ensi
ty
(t/m
3 )
Cr 2
O3
(%)
Pt
(g/t)
Pd
(g/t)
Rh
(g/t)
Au
(g/t)
Ru
(g/t)
Os
(g/t)
Ir (g/t)
3PG
E+
Au
(g/t)
Pt:P
d:R
h:A
u6P
GE
+Au
(g/t)
Pt:P
d:R
h:A
u:R
u:O
s:Ir
Cr:F
e6P
GE
+Au
(koz
)N
i (p
pm)
Mea
sure
d6.
709
1.43
3.69
24.8
90.
400.
150.
120.
000.
250.
040.
050.
6759
:22:
18:0
1.01
39:1
5:12
:0:2
5:4:
51.
1221
976
1
Indi
cate
d15
.927
1.59
3.70
24.2
90.
400.
150.
130.
000.
250.
040.
050.
6859
:23:
18:1
1.03
39:1
5:12
:0:2
5:4:
51.
1052
676
2
Infe
rred
68.5
161.
443.
7025
.18
0.39
0.14
0.13
0.00
0.26
0.05
0.05
0.67
59:2
1:19
:11.
0338
:14:
12:0
:26:
4:5
1.11
2,26
576
3
MG
4 an
d M
G4(
0) C
HR
OM
ITIT
E LA
YER
Pac
kage
Tonn
age
(Mt)
True
Th
ick
(m)
Bul
k D
ensi
ty
(t/m
3 )
Cr 2
O3
(%)
Pt
(g/t)
Pd
(g/t)
Rh
(g/t)
Au
(g/t)
Ru
(g/t)
Os
(g/t)
Ir (g/t)
3PG
E+
Au
(g/t)
Pt:P
d:R
h:A
u6P
GE
+Au
(g/t)
Pt:P
d:R
h:A
u:R
u:O
s:Ir
Cr:F
e6P
GE
+Au
(koz
)N
i (p
pm)
Mea
sure
d19
.645
4.14
3.75
26.5
20.
700.
190.
170.
003
0.33
0.06
0.08
1.07
66:1
8:16
:01.
5346
:13:
11:0
:21:
4:5
1.18
966
784
Indi
cate
d29
.785
3.00
3.65
24.7
61.
080.
220.
210.
003
0.36
0.08
0.11
1.51
71:1
5:14
:02.
0652
:11:
10:0
:18:
4:6
1.20
1,97
273
0
Infe
rred
170.
733
3.72
3.62
22.6
00.
990.
190.
190.
003
0.34
0.07
0.10
1.36
72:1
4:14
:01.
8853
:10:
10:0
:18:
4:6
1.15
10,3
1969
7
MG
3 C
HR
OM
ITIT
E LA
YER
Tonn
age
(Mt)
True
Th
ick
(m)
Bul
k D
ensi
ty
(t/m
3 )
Cr 2
O3
(%)
Pt
(g/t)
Pd
(g/t)
Rh
(g/t)
Au
(g/t)
Ru
(g/t)
Os
(g/t)
Ir (g/t)
3PG
E+
Au
(g/t)
Pt:P
d:R
h:A
u6P
GE
+Au
(g/t)
Pt:P
d:R
h:A
u:R
u:O
s:Ir
Cr:F
e6P
GE
+Au
(koz
)N
i (p
pm))
Mea
sure
d12
.369
3.74
3.25
13.0
70.
600.
350.
150.
006
0.22
0.04
0.06
1.10
54:3
2:14
:11.
4242
:25:
11:0
:15:
3:4
0.99
563
486
Indi
cate
d23
.451
4.13
3.22
18.0
10.
750.
440.
190.
005
0.27
0.05
0.08
1.39
54:3
2:14
:01.
8042
:25:
11:0
:15:
3:4
1.08
1,35
460
3
Infe
rred
67.3
763.
103.
2025
.65
1.01
0.58
0.26
0.00
50.
380.
080.
101.
8654
:31:
14:0
2.42
42:2
4:11
:0:1
6:3:
41.
135,
247
784
MG
2 C
HR
OM
ITIT
E LA
YER
Tonn
age
(Mt)
True
Th
ick
(m)
Bul
k D
ensi
ty
(t/m
3 )
Cr 2
O3
(%)
Pt
(g/t)
Pd
(g/t)
Rh
(g/t)
Au
(g/t)
Ru
(g/t)
Os
(g/t)
Ir (g/t)
3PG
E+
Au
(g/t)
Pt:P
d:R
h:A
u6P
GE
+Au
(g/t)
Pt:P
d:R
h:A
u:R
u:O
s:Ir
Cr:F
e6P
GE
+Au
(koz
)N
i (p
pm)
Mea
sure
d14
.555
3.30
3.62
19.3
31.
070.
280.
150.
004
0.27
0.05
0.08
1.51
71:1
8:10
:01.
9056
:15:
8:0:
14:3
:40.
9889
173
2
Indi
cate
d41
.692
3.59
3.67
17.7
90.
980.
280.
150.
004
0.24
0.05
0.07
1.42
69:2
0:10
:01.
7855
:16:
8:0:
14:3
:40.
922,
386
733
Infe
rred
286.
164
5.72
3.62
13.2
60.
700.
210.
110.
004
0.19
0.04
0.05
1.02
69:2
0:11
:01.
3054
:16:
8:0:
15:3
:40.
7511
,975
674
12.9
(h)(i
x)SR
T8B
(i)

Cof
fey
Min
ing
(SA)
Pty
Ltd
Thar
isa
Min
eP
age:
xii
Com
pete
nt P
erso
n’s
Rep
ort -
Dec
embe
r 201
3
MG
1 C
HR
OM
ITIT
E LA
YER
Tonn
age
(Mt)
True
Th
ick
(m)
Bul
k D
ensi
ty
(t/m
3 )
Cr 2
O3
(%)
Pt
(g/t)
Pd
(g/t)
Rh
(g/t)
Au
(g/t)
Ru
(g/t)
Os
(g/t)
Ir (g/t)
3PG
E+A
u(g
/t)P
t:Pd:
Rh:
Au
6PG
E+A
u (g
/t)P
t:Pd:
Rh:
Au:
Ru:
Os:
IrC
r:Fe
6PG
E+A
u (k
oz)
Ni
(ppm
)
Mea
sure
d-
Indi
cate
d14
.322
1.23
3.89
33.3
80.
340.
220.
110.
004
0.48
0.08
0.08
0.67
50:3
2:17
:11.
3026
:17:
9:0:
37:6
:61.
3459
981
0
Infe
rred
57.2
451.
233.
8932
.26
0.33
0.20
0.11
0.00
30.
450.
080.
070.
6451
:31:
17:1
1.24
26:1
6:9:
0:36
:6:6
1.29
2,27
780
3
MG
0 C
HR
OM
ITIT
E LA
YER
Tonn
age
(Mt)
True
Th
ick
(m)
Bul
k D
ensi
ty
(t/m
3 )
Cr 2
O3
(%)
Pt
(g/t)
Pd
(g/t)
Rh
(g/t)
Au
(g/t)
Ru
(g/t)
Os
(g/t)
Ir (g/t)
3PG
E+A
u (g
/t)P
t:Pd:
Rh:
Au
6PG
E+A
u (g
/t)P
t:Pd:
Rh:
Au:
Ru:
Os:
IrC
r:Fe
6PG
E+A
u (k
oz)
Ni
(ppm
)
Mea
sure
d1.
801
0.50
3.74
26.0
70.
570.
180.
160.
004
0.30
0.05
0.07
0.92
62:1
9:18
:01.
3343
:13:
12:0
:22:
4:5
1.09
7774
7
Indi
cate
d3.
188
0.72
3.75
27.0
80.
610.
190.
170.
004
0.32
0.06
0.07
0.98
62:2
0:17
:01.
4443
:14:
12:0
:22:
4:5
1.10
147
752
Infe
rred
0.01
10.
173.
7323
.76
0.45
0.17
0.15
0.00
60.
240.
040.
050.
7758
:22:
19:1
1.11
41:1
5:13
:1:2
2:4:
51.
000.
4071
1
UG
1 C
HR
OM
ITIT
E LA
YER
Tonn
age
(Mt)
True
Th
ick
(m)
Bul
k D
ensi
ty
(t/m
3 )
Cr 2
O3
(%)
Pt
(g/t)
Pd
(g/t)
Rh
(g/t)
Au
(g/t)
Ru
(g/t)
Os
(g/t)
Ir (g/t)
3PG
E+A
u (g
/t)P
t:Pd:
Rh:
Au
6PG
E+A
u (g
/t)P
t:Pd:
Rh:
Au:
Ru:
Os:
IrC
r:Fe
6PG
E+A
u (k
oz)
Ni
(ppm
)
Mea
sure
d
Indi
cate
d1,
500
2.17
3.75
23.6
80.
360.
280.
140.
030
0.21
0.82
44:3
5:17
:41.
1239
Infe
rred
TOTA
L M
INER
AL R
ESO
UR
CE
Tonn
age
(Mt)
True
Th
ick
(m)
Bul
k D
ensi
ty
(t/m
3 )
Cr 2
O3
(%)
Pt
(g/t)
Pd
(g/t)
Rh
(g/t)
Au
(g/t)
Ru
(g/t)
Os
(g/t)
Ir (g/t)
3PG
E+A
u (g
/t)P
t:Pd:
Rh:
Au
6PG
E+A
u (g
/t)P
t:Pd:
Rh:
Au:
Ru:
Os:
IrC
r:Fe
6PG
E+A
u (k
oz)
Ni
(ppm
)
Mea
sure
d55
.079
2.68
3.71
21.3
90.
730.
240.
160.
004
0.28
0.05
0.07
1.14
64:2
1:14
:01.
5348
:16:
10:0
:18:
3:5
1.07
2,71
769
9
Indi
cate
d12
9.86
42.
453.
7322
.24
0.80
0.27
0.16
0.00
40.
310.
060.
081.
2465
:22:
13:0
1.68
48:1
6:10
:0:1
8:3:
51.
097,
034
713
Infe
rred
650.
045
3.11
3.73
19.9
30.
740.
230.
150.
004
0.28
0.05
0.07
1.13
66:2
1:13
:01.
5449
:15:
10:0
:18:
4:5
0.98
32,0
8371
2
Tota
l83
4.98
92.
953.
7320
.38
0.75
0.24
0.15
0.00
40.
280.
050.
071.
1566
:21:
13:0
1.56
48:1
5:10
:0:1
8:4:
51.
0041
,834
712
Not
e: T
he m
iner
al re
sour
ce is
dec
lare
d to
a d
epth
of 7
50m
bel
ow s
urfa
ce.
The
cons
ider
atio
n of
real
istic
eve
ntua
l ext
ract
ion
nece
ssita
tes
that
the
min
eral
reso
urce
con
side
rs th
e M
G C
hrom
itite
Lay
er to
be
a ge
olog
ical
uni
t and
that
all
plat
inife
rous
and
chr
omife
rous
hor
izon
s w
ill be
min
ed
and
all P
GM
, Cu,
Ni a
nd C
r 2O
3re
cove
red.
The
UG
1 C
hrom
itite
Lay
er is
dec
lare
d fo
r the
par
t tha
t fal
ls w
ithin
the
curre
nt p
ropo
sed
open
pit
The
min
eral
reso
urce
is re
porte
d in
clus
ive
of th
e m
iner
al re
serv
e

Coffey Mining (SA) Pty Ltd
Tharisa Mine Page: xiiiCompetent Person’s Report - December 2013
Mining Engineering
Ukwazi initially undertook a Conceptual Study in 2007 and concluded a Feasibility Study in October 2008. Subsequently various revisions to the mine plan have been undertaken to match the requirements of the processing facilities, including both open pit and underground mine design and scheduling. The last revision was undertaken utilising the 2013 mineral resource update.
The open pit operation targets the MG0, MG1, MG2, MG3, MG4 and MG4A Chromitite Layers in an operation split into a West Mine and an East Mine. All Layers are targeted to be mined from the roof to the floor of the relevant chromitite layer, with the exception of the MG2 and MG3 Chromitite Layer.
The mining is planned to consist of two phases with an initial open pit phase followed by an underground phase. The open pit plan is based on fixed contract rates and volumes as determined through a detailed planning process. Based on a maximum of a 200m high wall, the life of pit and a 400,000tpm production profile, the open pit operation will continue until 2032 before underground mining becomes necessary. The last open pit tonnage will be mined in 2038. Underground mining of targeted layers would begin towards the end of the open pit operations.
Open Pit
Pit optimisation was undertaken using GEMCOM Whittle® pit optimisation software. The method is applied to a Selective Mining Unit (SMU) block model of the ore body, and progressively constructs lists of related blocks which should, or should not, be mined. The final lists define a pit outline that has the highest total relative value, subject to the required pit slopes. This outline includes every block which "adds value" when waste stripping is taken into account and excludes every block which "destroys value". It takes into account all revenues and costs as well as mining and processing parameters.
The optimisation process was undertaken utilising the two processes described below:
Creation of a range of nested pit shells of increasing sizes by varying the product price and generating a pit shell at each price point.
Selection of the optimal pit shell by generating various production schedules for each pit shell and calculating the net present value for each schedule. The output of this process is a series of “pit-versus-value” curves.
The pit selection strategy used considers the relative value of the selected case, but also maximises the life of the operation. Pit 24 was selected based on the selection criteria and contains a total of 107.2Mt of RoM ore. The selected pit perimeter shell is in line with the current infrastructure placement and previous optimisations conducted on the incremental pit analysis at a maximum high wall depth of 200m. The Open Pit layout is presented in Figure 5.
12.9(h)(vii)

Cof
fey
Min
ing
(SA)
Pty
Ltd
Thar
isa
Min
eP
age:
xiv
Com
pete
nt P
erso
n’s
Rep
ort -
Dec
embe
r 201
3
Figu
re 5
Map
sho
win
g th
e M
inin
g La
yout
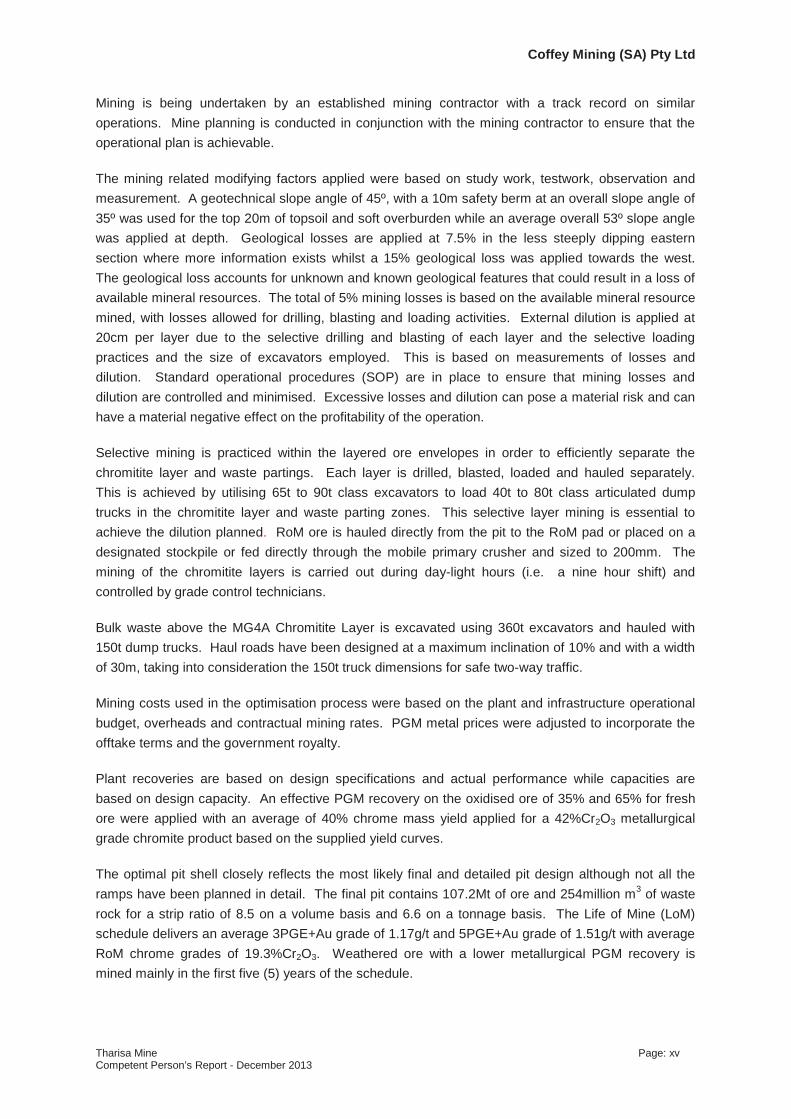
Coffey Mining (SA) Pty Ltd
Tharisa Mine Page: xvCompetent Person’s Report - December 2013
Mining is being undertaken by an established mining contractor with a track record on similar operations. Mine planning is conducted in conjunction with the mining contractor to ensure that the operational plan is achievable.
The mining related modifying factors applied were based on study work, testwork, observation andmeasurement. A geotechnical slope angle of 45º, with a 10m safety berm at an overall slope angle of 35º was used for the top 20m of topsoil and soft overburden while an average overall 53º slope angle was applied at depth. Geological losses are applied at 7.5% in the less steeply dipping eastern section where more information exists whilst a 15% geological loss was applied towards the west.The geological loss accounts for unknown and known geological features that could result in a loss of available mineral resources. The total of 5% mining losses is based on the available mineral resource mined, with losses allowed for drilling, blasting and loading activities. External dilution is applied at 20cm per layer due to the selective drilling and blasting of each layer and the selective loading practices and the size of excavators employed. This is based on measurements of losses and dilution. Standard operational procedures (SOP) are in place to ensure that mining losses and dilution are controlled and minimised. Excessive losses and dilution can pose a material risk and can have a material negative effect on the profitability of the operation.
Selective mining is practiced within the layered ore envelopes in order to efficiently separate the chromitite layer and waste partings. Each layer is drilled, blasted, loaded and hauled separately.This is achieved by utilising 65t to 90t class excavators to load 40t to 80t class articulated dump trucks in the chromitite layer and waste parting zones. This selective layer mining is essential to achieve the dilution planned. RoM ore is hauled directly from the pit to the RoM pad or placed on a designated stockpile or fed directly through the mobile primary crusher and sized to 200mm. The mining of the chromitite layers is carried out during day-light hours (i.e. a nine hour shift) and controlled by grade control technicians.
Bulk waste above the MG4A Chromitite Layer is excavated using 360t excavators and hauled with 150t dump trucks. Haul roads have been designed at a maximum inclination of 10% and with a width of 30m, taking into consideration the 150t truck dimensions for safe two-way traffic.
Mining costs used in the optimisation process were based on the plant and infrastructure operational budget, overheads and contractual mining rates. PGM metal prices were adjusted to incorporate the offtake terms and the government royalty.
Plant recoveries are based on design specifications and actual performance while capacities are based on design capacity. An effective PGM recovery on the oxidised ore of 35% and 65% for fresh ore were applied with an average of 40% chrome mass yield applied for a 42%Cr2O3 metallurgical grade chromite product based on the supplied yield curves.
The optimal pit shell closely reflects the most likely final and detailed pit design although not all the ramps have been planned in detail. The final pit contains 107.2Mt of ore and 254million m3 of waste rock for a strip ratio of 8.5 on a volume basis and 6.6 on a tonnage basis. The Life of Mine (LoM)schedule delivers an average 3PGE+Au grade of 1.17g/t and 5PGE+Au grade of 1.51g/t with averageRoM chrome grades of 19.3%Cr2O3. Weathered ore with a lower metallurgical PGM recovery is mined mainly in the first five (5) years of the schedule.
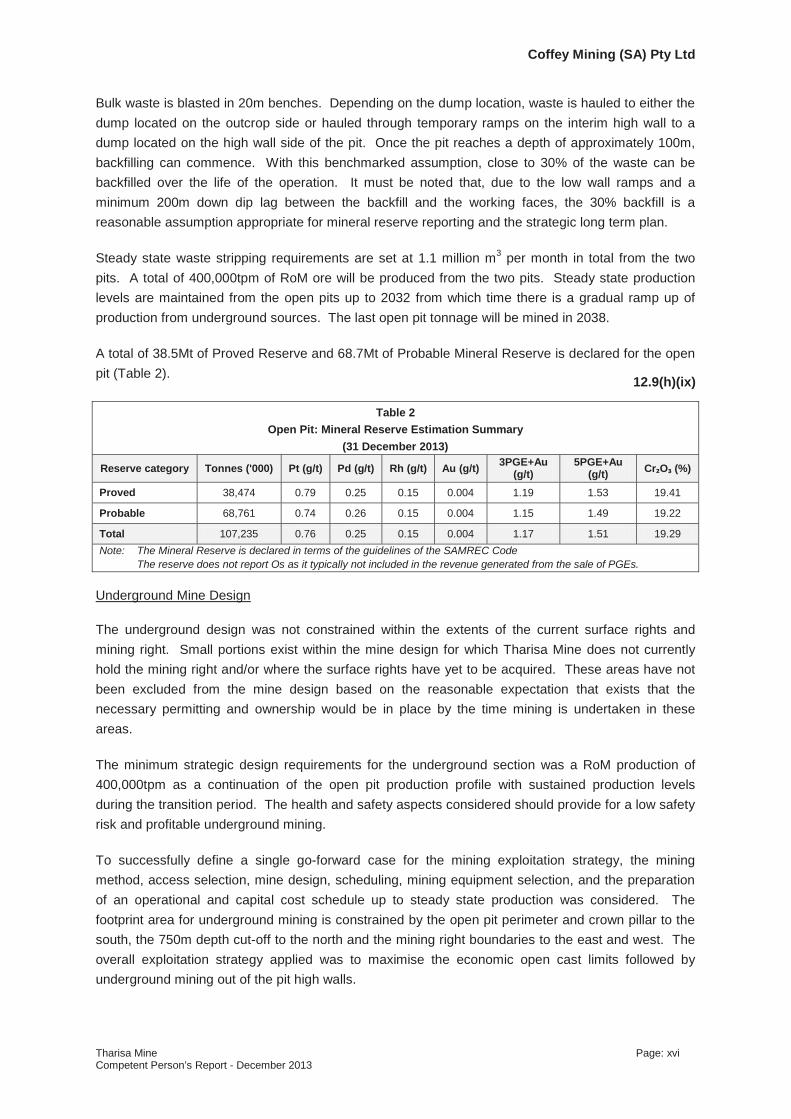
Coffey Mining (SA) Pty Ltd
Tharisa Mine Page: xviCompetent Person’s Report - December 2013
Bulk waste is blasted in 20m benches. Depending on the dump location, waste is hauled to either the dump located on the outcrop side or hauled through temporary ramps on the interim high wall to a dump located on the high wall side of the pit. Once the pit reaches a depth of approximately 100m, backfilling can commence. With this benchmarked assumption, close to 30% of the waste can be backfilled over the life of the operation. It must be noted that, due to the low wall ramps and a minimum 200m down dip lag between the backfill and the working faces, the 30% backfill is a reasonable assumption appropriate for mineral reserve reporting and the strategic long term plan.
Steady state waste stripping requirements are set at 1.1 million m3 per month in total from the two pits. A total of 400,000tpm of RoM ore will be produced from the two pits. Steady state production levels are maintained from the open pits up to 2032 from which time there is a gradual ramp up of production from underground sources. The last open pit tonnage will be mined in 2038.
A total of 38.5Mt of Proved Reserve and 68.7Mt of Probable Mineral Reserve is declared for the open pit (Table 2).
Table 2Open Pit: Mineral Reserve Estimation Summary
(31 December 2013)
Reserve category Tonnes ('000) Pt (g/t) Pd (g/t) Rh (g/t) Au (g/t) 3PGE+Au (g/t)
5PGE+Au (g/t) Cr O (%)
Proved 38,474 0.79 0.25 0.15 0.004 1.19 1.53 19.41
Probable 68,761 0.74 0.26 0.15 0.004 1.15 1.49 19.22
Total 107,235 0.76 0.25 0.15 0.004 1.17 1.51 19.29Note: The Mineral Reserve is declared in terms of the guidelines of the SAMREC Code
The reserve does not report Os as it typically not included in the revenue generated from the sale of PGEs.
Underground Mine Design
The underground design was not constrained within the extents of the current surface rights and mining right. Small portions exist within the mine design for which Tharisa Mine does not currently hold the mining right and/or where the surface rights have yet to be acquired. These areas have not been excluded from the mine design based on the reasonable expectation that exists that the necessary permitting and ownership would be in place by the time mining is undertaken in these areas.
The minimum strategic design requirements for the underground section was a RoM production of 400,000tpm as a continuation of the open pit production profile with sustained production levels during the transition period. The health and safety aspects considered should provide for a low safety risk and profitable underground mining.
To successfully define a single go-forward case for the mining exploitation strategy, the mining method, access selection, mine design, scheduling, mining equipment selection, and the preparation of an operational and capital cost schedule up to steady state production was considered. The footprint area for underground mining is constrained by the open pit perimeter and crown pillar to the south, the 750m depth cut-off to the north and the mining right boundaries to the east and west. The overall exploitation strategy applied was to maximise the economic open cast limits followed by underground mining out of the pit high walls.
12.9(h)(ix)

Coffey Mining (SA) Pty Ltd
Tharisa Mine Page: xviiCompetent Person’s Report - December 2013
A mining method selection study was undertaken to evaluate the productivity, equipment suitability, capital costs, operating costs, environmental aspects, and health and safety risks associated with various methods. A trackless Bord and Pillar was selected as the preferred mining method. Bord and Pillar mining is widely employed for the extraction of similar flat dipping deposits with the following advantages:
Development rates are faster compared to conventional systems.
The mining method offers greater flexibility in terms of dealing with geological and quality anomalies compared to other mining methods.
Safety is enhanced as fewer people are involved and most of the work is done from the protection of machinery.
Personnel, equipment and consumables can be moved efficiently and almost directly to the working faces.
Shift change-over times are reduced.
Supervision is improved as all working places can be visited with less effort compared to conventional methods.
An analysis was undertaken to select the appropriate mining horizons. From this analysis, the MG2 and MG4 Chromitite Layers were selected. After further scrutiny of the MG2 Chromitite Layer it was concluded that only the MG2A and MG2B Chromitite Layers including the waste parting, would be mined, while the MG2C Chromitite Layer would be excluded from the mining cut to reduce internal dilution. The combined thickness of the MG2A Chromitite Layer, parting and MG2B Chromitite Layer, in the greater part of the underground design area, is well over 1.8m and meets the minimum requirements of the equipment selected. A further constraint was applied that the maximum mining width should not exceed 4m. Where this was noted, the mining cut was re-stated for the MG2A Chromitite Layer only, taking the minimum width consideration into account.
The MG4 Chromitite Layer, at an average in situ thickness of 3.0m is wide enough for trackless Bord and Pillar mining and was selected as the second mining horizon. The parting between the MG2 and MG4 Chromitite Layers varies from 15m to 20m. The selected mining cut includes the MG4 Chromitite Layer, the pyroxenite parting below it and the MG4(0) Chromitite Layer below it. The same maximum and minimum criteria were used. However where the MG4 Chromite package thickness exceeded 4m, only MG4 Chromitite Layer was selected for the mining cut.
Mining extraction in the Bord and Pillar mining method is achieved by developing a series of roadways (rooms or bords) on the chromitite layer and connecting them by holings or cut-throughs to form pillars that provide support for the overlying strata. Mining extraction in this method is a function of the pillar sizes which in turn are a function of the depth below surface.
In order to accommodate the equipment sizes, production requirements and geotechnical considerations, minimum and maximum mining cuts were set at 1.8m and 4.5m respectively. Layers thinner than 1.8m were diluted up to a minimum height of 1.8m in the production sections and 4.5m in the declines.
Access to the underground mine will be gained through three sets of on reef declines. The advantages of this system are that all development is undertaken on the reef horizon, more information on the geology is obtained during development and no cross cut development in waste is
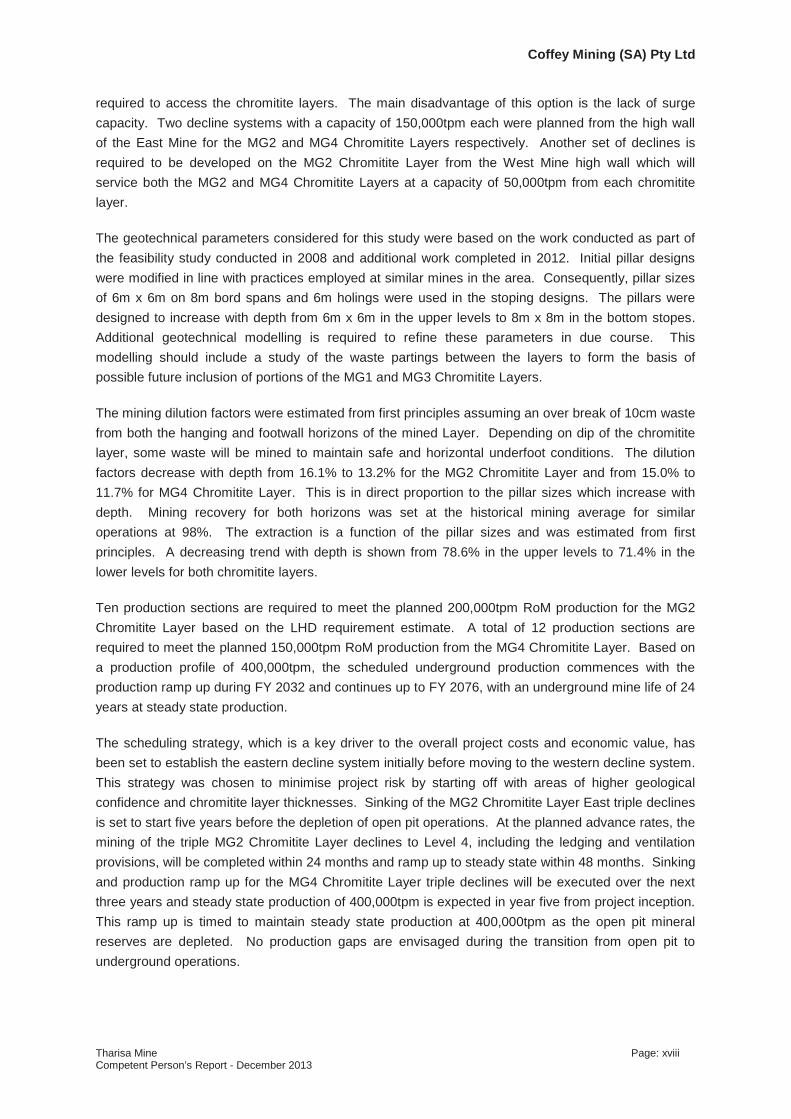
Coffey Mining (SA) Pty Ltd
Tharisa Mine Page: xviiiCompetent Person’s Report - December 2013
required to access the chromitite layers. The main disadvantage of this option is the lack of surge capacity. Two decline systems with a capacity of 150,000tpm each were planned from the high wall of the East Mine for the MG2 and MG4 Chromitite Layers respectively. Another set of declines is required to be developed on the MG2 Chromitite Layer from the West Mine high wall which will service both the MG2 and MG4 Chromitite Layers at a capacity of 50,000tpm from each chromitite layer.
The geotechnical parameters considered for this study were based on the work conducted as part of the feasibility study conducted in 2008 and additional work completed in 2012. Initial pillar designs were modified in line with practices employed at similar mines in the area. Consequently, pillar sizes of 6m x 6m on 8m bord spans and 6m holings were used in the stoping designs. The pillars were designed to increase with depth from 6m x 6m in the upper levels to 8m x 8m in the bottom stopes.Additional geotechnical modelling is required to refine these parameters in due course. This modelling should include a study of the waste partings between the layers to form the basis of possible future inclusion of portions of the MG1 and MG3 Chromitite Layers.
The mining dilution factors were estimated from first principles assuming an over break of 10cm waste from both the hanging and footwall horizons of the mined Layer. Depending on dip of the chromitite layer, some waste will be mined to maintain safe and horizontal underfoot conditions. The dilution factors decrease with depth from 16.1% to 13.2% for the MG2 Chromitite Layer and from 15.0% to 11.7% for MG4 Chromitite Layer. This is in direct proportion to the pillar sizes which increase with depth. Mining recovery for both horizons was set at the historical mining average for similar operations at 98%. The extraction is a function of the pillar sizes and was estimated from first principles. A decreasing trend with depth is shown from 78.6% in the upper levels to 71.4% in the lower levels for both chromitite layers.
Ten production sections are required to meet the planned 200,000tpm RoM production for the MG2 Chromitite Layer based on the LHD requirement estimate. A total of 12 production sections are required to meet the planned 150,000tpm RoM production from the MG4 Chromitite Layer. Based on a production profile of 400,000tpm, the scheduled underground production commences with the production ramp up during FY 2032 and continues up to FY 2076, with an underground mine life of 24 years at steady state production.
The scheduling strategy, which is a key driver to the overall project costs and economic value, has been set to establish the eastern decline system initially before moving to the western decline system.This strategy was chosen to minimise project risk by starting off with areas of higher geological confidence and chromitite layer thicknesses. Sinking of the MG2 Chromitite Layer East triple declines is set to start five years before the depletion of open pit operations. At the planned advance rates, the mining of the triple MG2 Chromitite Layer declines to Level 4, including the ledging and ventilation provisions, will be completed within 24 months and ramp up to steady state within 48 months. Sinking and production ramp up for the MG4 Chromitite Layer triple declines will be executed over the next three years and steady state production of 400,000tpm is expected in year five from project inception.This ramp up is timed to maintain steady state production at 400,000tpm as the open pit mineral reserves are depleted. No production gaps are envisaged during the transition from open pit to underground operations.

Coffey Mining (SA) Pty Ltd
Tharisa Mine Page: xixCompetent Person’s Report - December 2013
The underground operations are planned to make use of some of the existing infrastructure established for open pit operations and thus electricity, water, the plant, houses, offices and transport and communications networks are expected to be in place by the time the underground operations are conducted. Additional infrastructure provided in the capital cost estimate includes:
The ventilation network;
Underground workshops and fuelling facilities;
Pumping arrangements;
Washrooms and lamp room facilities; and
Emergency Facilities.
The mining operating costs were sourced mainly from an internal cost database and from relevant service providers. The operating expenditure estimate amounts to R445/t and is similar to other operations employing the same mining method.
A total of 18.7Mt of underground RoM can be declared as a Probable Mineral Reserve (Table 3).
Table 3Underground Mine: Mineral Reserve Statement
(31 December 2013)
Reserve category Tonnes ('000) Pt (g/t) Pd (g/t) Rh (g/t) Au (g/t) 3PGE+Au (g/t)
5PGE+Au (g/t) Cr O (%)
Proved - - - - - - - -
Probable 18,649 0.82 0.19 0.15 0.002 1.17 1.52 19.31
Total Reserve 18,649 0.82 0.19 0.15 0.002 1.17 1.52 19.31Note: The Mineral Reserve is declared in terms of the guidelines of the SAMREC Code.
The reserve does not report Os as it typically not included in the revenue generated from the sale of PGEs.
12.9(h)(ix)

Coffey Mining (SA) Pty Ltd
Tharisa Mine Page: xxCompetent Person’s Report - December 2013
Production Schedule
The combined LoM schedule for the current open pit and planned underground operations is presented in Figure 6.
Figure 6 Integrated Mining Production Schedule
Mineral Reserves
Modifying factors have been applied to the Mineral Resource to convert it to a Mineral Reserve. The modifying factors applied were geological losses (7.5% in the less steeply dipping eastern section and 15% in the steeper dipping western section of the West pit), mining recovery (mining loss of 5%) and mining dilution (7.1% on average). Metallurgical recoveries were applied at 50% and 70% for oxidised and fresh ore respectively and the 40% average Cr2O3 recovery was based on the process recovery curve. The discount rate applied in the DCF valuation was 9.24%..
12.9(h)(vii)
12.9(h)(ix)

Coffey Mining (SA) Pty Ltd
Tharisa Mine Page: xxiCompetent Person’s Report - December 2013
The Mineral Reserve estimate is presented in Table 4.
Table 4Tharisa Mine
Mineral Reserve (December 2013) (SAMREC Code)
Reserve Category Tonnes ('000) Pt (g/t)
Pd(g/t)
Rh (g/t)
Au (g/t)
3PGE+Au (g/t)
5PGE+Au (g/t)
Cr O(%)
Proved 38,474 0.79 0.25 0.15 0.004 1.19 1.53 19.41
Probable 87,410 0.76 0.24 0.15 0.004 1.16 1.50 19.24
Total Reserve 125,884 0.77 0.24 0.15 0.004 1.17 1.51 19.29
The reserve does not report Os as it typically not included in the revenue generated from the sale of PGMs.5PGE = Pt+Ir+Ru+Rh+Pd
Geotechnical Engineering
Data was collected from geotechnical logging in the current east and central pits of Tharisa Mine to determine stable slope angles. Acceptable design methodologies were used to quantify the appropriate slope angles that will allow for safe and effective extraction of the resource. Slope angles of 45° in saprolitic material and 53° overall slope angles in fresh rock up to an overall slope height of 210m were shown to be stable. Kinematic analysis suggests a possibility for toppling failure.Instability is expected to be on a bench scale and therefore catch berms must be maintained. Beside this potential minor mode of failure the safety factors are high.
An earlier geotechnical investigation was carried out by logging eight boreholes and sampling the lithological units prior to strength testing the samples. The pillar strengths and N’ values for underground mining were calculated and from this pillar sizes and stope spans designed. Mining aspects require that the bord spans be limited to 6m. The planned support for the stoping and development has also been designed incorporating these design parameters.
12.9(h)(vii)

Coffey Mining (SA) Pty Ltd
Tharisa Mine Page: xxiiCompetent Person’s Report - December 2013
Metallurgy and Processing
Introduction
The mineral processing facilities at the Tharisa Mine are designed to treat the MG Chromitite Layers of the Bushveld Complex. These layers vary in thickness, competence and chromite and PGM grades. Historically some of the MG Chromitite Layers have been mined for the recovery of chromite but not for PGMs. Tharisa Minerals has undertaken metallurgical tests on samples from these layers and confirmed the economic viability of mining and processing these ores for the recovery of chromite and PGM concentrates.
The Tharisa Mine has been developed in a phased manner as described below.
The first phase of the mine development involved the production of a chromite concentrate only from a pilot plant. Trial production commenced in March 2009. This pilot plant was later adapted to provide early revenue and from November 2009 the plant treated RoM ore at a throughput rate of 38,000tpm.
The second phase of the mine development involved the expansion of the mining operation and processing facility to mine and treat 100,000tpm of RoM ore. In addition the processing facility was expanded to incorporate both a 65,000tpm PGM recovery circuit and a secondary chromite recovery section. Commissioning of this phase commenced in August 2011 and was completed in February 2012. This plant is known as the “Genesis” plant.
The third phase of mine development increased the mining and processing rate by a further 300,000tpm. This was achieved through the construction of a new standalone concentrator that operates in parallel to the existing Genesis plant. The new 300,000tpm concentrator recovers a primary chromite concentrate, a PGM concentrate out of the primary chromite tailings and a secondary chromite concentrate out of the PGM tailings. At the conclusion of this third phase the total mining and processing throughput capacity of the Tharisa Mine is 400,000tpm (4.8Mtpa) of RoM ore. The 300,000tpm concentrator was commissioned between September and December 2012 and is known as the “Voyager” plant.
Processing Facilities and Flow sheets
The Tharisa Mine has been developed on a phased basis.
Phase 1 of the mine development involved the establishment of an open pit mining operation and chrome concentrator at a production rate of 38,000tpm. The chrome concentrator for Phase 1 was an adaptation of the original pilot plant. The plant (which was subsequently expanded to 100,000tpm in Phase 2) receives RoM ore from the open pit mining operation which is crushed to 12mm. The crushed ore is then milled in a single stage ball mill operating in closed circuit with a vibrating screen separating at 0.6mm. The milled ore passing through the screen is pumped to a spirals concentrator where the chromite is separated from the gangue minerals to produce a chromite concentrate typically grading at 42% Cr2O3. The chromite concentrate is dewatered by cyclones and stored on a drying pad from where it is despatched by truck. The water in the tailings from the spirals concentrator is recovered in a thickener and recirculated to the processing facility whilst the solid tailings stream is pumped from the thickener underflow to a tailings storage facility (TSF) which will be retreated in future to recover the contained PGMs. Additional water is recovered from the TSF and
12.9(h)(vii)

Coffey Mining (SA) Pty Ltd
Tharisa Mine Page: xxiiiCompetent Person’s Report - December 2013
returned to the processing facility. Phase 1 of the project has been in production since March 2009, prior to the expansion in Phase 2. A simplified block flow diagram for the Phase 1 processing facility is presented in Figure 7.
Figure 7 Phase 1 Simplified Block Flow Diagram
Phase 2 of the mine development, the Genesis plant, doubled the throughput of Phase 1 and additionally processes the tailings from the (enlarged) spirals concentrator to recover PGMs and to recover a secondary chromite concentrate from the PGM recovery section tailings. The Genesis spirals concentrator tailings stream is dewatered by a cluster of cyclones from where the coarse solids gravitate to three open circuit secondary ball mills operating in parallel. The fine solids feed a thickener from which the thickened fine solids are also pumped to the ball mills. The ground slurry discharging from the mills is collected in a common pump tank and pumped to a flotation plant for PGM recovery. The concentrate from the initial rougher flotation stage is subjected to three stages of cleaner flotation to produce the final PGM concentrate which is dewatered by a combination of a thickener and a filter before despatch by truck.
The PGM recovery section tailings stream is pumped to a secondary spirals concentrator section where the chromite liberated by the additional milling is separated from the gangue minerals to produce a second fine chromite concentrate. This fine chromite concentrate is dewatered by cyclone and stored on a dedicated drying pad from where it is despatched by truck. The water in the tailings from the secondary spirals section is recovered in a thickener and re-circulated whilst the solid tailings stream is pumped from the thickener underflow to a final TSF. A simplified block flow diagram for the Genesis plant is presented in Figure 8. Commissioning of the Genesis plant commenced in August 2011 and was completed in February 2012.
Primary Crushing
Sizing Screen
Stockpile
Primary Spirals
Mining
Primary Chromite Product
Tailings Thickener Water
WaterTemporary Storage Facility
Secondary Crushing
Mill Screen
Primary Milling

Coffey Mining (SA) Pty Ltd
Tharisa Mine Page: xxivCompetent Person’s Report - December 2013
Figure 8 Genesis Plant (Phase 2): Simplified Block Flow Diagram
Phase 3 of the project increased the throughput rate to a total of 400,000tpm by establishing the Voyager plant rated at 300,000tpm to operate in parallel with the 100,000tpm Genesis plant. The two processing facilities operate independently, apart from sharing of the TSF.
The Voyager plant receives RoM ore from the open pit mining operation which is then reduced to 80% passing 22mm in three stages of crushing. The crushed ore is stored on an open stockpile from where it is fed to two ball mills operating in parallel and in closed circuit with dedicated mill screens sizing at 0.6mm. Material coarser than 0.6mm is returned to the mills whilst the solids finer than 0.6mm pass through the screens and are pumped to the primary spirals concentrator for recovery of the coarse chromite. The chromite concentrate is dewatered by cyclone and stored on a drying pad from where it is despatched by truck. The tailings from the spirals concentrator is pumped to a classifying cyclone cluster where coarse solids discharge via the underflow to a single ball mill that operates in open circuit. The overflow from the primary cyclone cluster feeds a thickener where the contained water is recovered and returned to the process. The underflow from this thickener is then pumped to the PGM recovery section flotation plant where it is combined with the mill discharge for
Secondary Milling
PGM Rougher Flotation
Secondary Spirals
Secondary Chromite Product
Cleaner & Re-Cleaner
Flotation
ThickenerFilter PressPGM
Concentrate Product
WaterWater
Tailings Thickener
Water
Water
Tailings Storage Facility
Phase I Tailings
Rougher Concentrate Thickening
Rougher Concentrate
Regrind

Coffey Mining (SA) Pty Ltd
Tharisa Mine Page: xxvCompetent Person’s Report - December 2013
PGM recovery. The concentrate from the initial rougher flotation stage is then subjected to two stages of cleaner flotation to produce the final PGM concentrate that is dewatered by a combination of a thickener and a filter before despatch by truck.
The PGM recovery section tailings stream will be pumped to a secondary spirals concentrator section where the chromite liberated by the secondary milling will be separated from the gangue minerals to produce a second fine chromite concentrate. The fine chromite concentrate will then be dewatered by cyclone and stored on a dedicated drying pad from where it is despatched by truck. The water in the tailings from the secondary spirals concentrator will be recovered in a thickener and recirculated to the processing facility whilst the solid tailings will be pumped from the thickener underflow to a common TSF, which will be shared with the Genesis plant. A simplified block flow diagram for the Voyager plant is presented in Figure 9.
Construction of the Voyager plant commenced in July 2011 and was completed in September 2012.Commissioning of this plant commenced during August 2012 and first ore was introduced to the plant during September 2012. This plant has been in production since December 2013.
During the course of the project, it was considered that a potentially higher quality chromite product than metallurgical grade chrome could be achieved in the Genesis plant. This initiated a testwork programme, the results of which indicated that foundry grade, chemical grade and metallurgical grade products can be generated, albeit at a slightly lower combined yield than for a metallurgical grade product only.
The Tharisa Mine currently produces metallurgical, foundry and chemical grade chrome concentrates, and a PGM flotation concentrate, as its final products for sale to final customers. The chrome products are sold to a variety of international customers, primarily in China. The PGM concentrate is sold to IRS in terms of a long term offtake agreement.

Cof
fey
Min
ing
(SA)
Pty
Ltd
Thar
isa
Min
eP
age:
xxvi
Com
pete
nt P
erso
n’s
Rep
ort -
Dec
embe
r 201
3
Figu
re 9
Vo
yage
r Pla
nt (P
hase
3):S
impl
ified
Blo
ck F
low
Dia
gram
Cru
shin
g
Prim
ary
Mill
ing
(SA
G)
Stoc
kpile
Prim
ary
Spira
ls
Min
ing
Thic
kene
r &
Cyc
lone
Prim
ary
Chr
omite
Pr
oduc
t
Seco
ndar
y M
illin
gP
GM
Rou
gher
Fl
otat
ion
Seco
ndar
y Sp
irals
Seco
ndar
y C
hrom
ite
Prod
uct
Cle
aner
&
Re-
Cle
aner
Fl
otat
ion
Thic
kene
rFi
lter P
ress
PGM
C
once
ntra
te
Prod
uct
Wat
erW
ater
Taili
ngs
Thic
kene
rW
ater
Wat
er
Taili
ngs
Stor
age
Faci
lity

Coffey Mining (SA) Pty Ltd
Tharisa Mine Page: xxviiCompetent Person’s Report - December 2013
Tailings Storage Facilities and Waste Rock Dumps
The TSF design process was dominated by the need to create sufficient tailings storage capacity to serve the design life of the mine in the limited space available within the mining right area. The location of the orebody, and hence the open pit mining operations, within the mining right area necessitated that the TSF would be constructed in close proximity to the open pit.
The proximity of the TSF to the mining operations meant that one of the design priorities would be to minimise risks in terms of loss of life and future earnings and this in turn meant that the design of a robust impoundment would have to be adopted. A decision was thus made to use waste rock, from the open cast mining operations, to construct a tailings impoundment.
The first TSF (TSF 1) is currently being constructed while the design of the next TSF (TSF 2) is currently in progress. Table 5 summarises the operational life and capital costs associated with the construction of Tharisa Mine tailings storage facilities. These costs exclude rehabilitation and other life cycle costs.
Table 5
Tailings Storage Facilities: Operational Life and Estimated Capital Costs
Description Operational Life Cost
TSF 1 2011 – 2016 R57.9 mil
TSF 2 2016 – 2031 R105.0 mil
Future TSF 2031 – 2051 R185.0 mil
Total (excluding rehabilitation and closure costs) R347.9 mil
It is estimated that the tailings storage requirements for the 20 years following 2031, i.e. after TSF 2has reached full capacity, will have a capital cost implication of approximately R185 million. This estimate excludes rehabilitation and closure costs.
The Waste Rock Dumps (WRDs) will serve as storage facilities to accommodate all the excess waste rock generated by the open cast mining operations not being absorbed by the construction of the TSFs as well as other construction activities. It is the mine’s intention to partially backfill the open pits with the waste rock generated on an advancing basis once the pits have been sufficiently developed.
The WRDs were designed in such a manner to enable their on-going rehabilitation and the control of surface water runoff, as it is probable that they will become permanent features of the post mining landscape.
Tharisa Mine currently makes use of two operational WRD’s while two more WRDs will come online in 2015. The total waste rock capacity in the four WRDs is approximately 71.5Mm³. Table 6 summarises the capital costs, the waste rock capacity and operational life of all four WRDs.
12.9(h)(v)
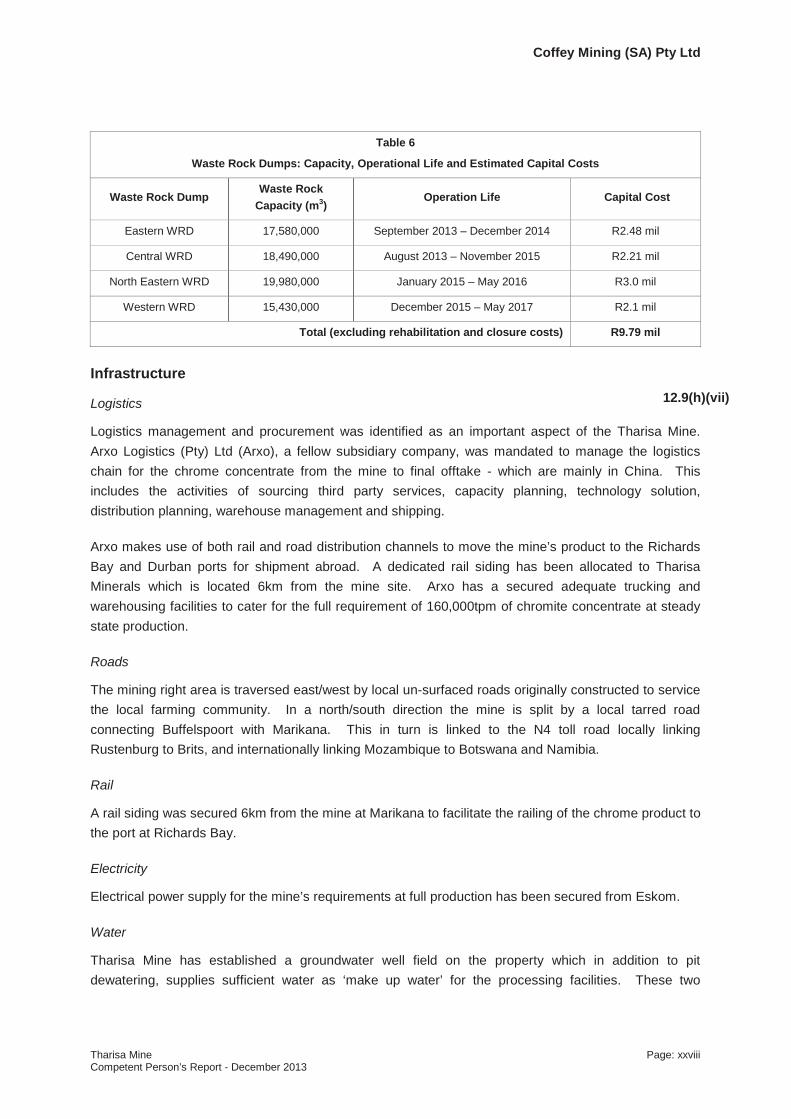
Coffey Mining (SA) Pty Ltd
Tharisa Mine Page: xxviiiCompetent Person’s Report - December 2013
Infrastructure
Logistics
Logistics management and procurement was identified as an important aspect of the Tharisa Mine.Arxo Logistics (Pty) Ltd (Arxo), a fellow subsidiary company, was mandated to manage the logistics chain for the chrome concentrate from the mine to final offtake - which are mainly in China. Thisincludes the activities of sourcing third party services, capacity planning, technology solution, distribution planning, warehouse management and shipping.
Arxo makes use of both rail and road distribution channels to move the mine’s product to the Richards Bay and Durban ports for shipment abroad. A dedicated rail siding has been allocated to Tharisa Minerals which is located 6km from the mine site. Arxo has a secured adequate trucking andwarehousing facilities to cater for the full requirement of 160,000tpm of chromite concentrate at steady state production.
Roads
The mining right area is traversed east/west by local un-surfaced roads originally constructed to service the local farming community. In a north/south direction the mine is split by a local tarred road connecting Buffelspoort with Marikana. This in turn is linked to the N4 toll road locally linking Rustenburg to Brits, and internationally linking Mozambique to Botswana and Namibia.
Rail
A rail siding was secured 6km from the mine at Marikana to facilitate the railing of the chrome product to the port at Richards Bay.
Electricity
Electrical power supply for the mine’s requirements at full production has been secured from Eskom.
Water
Tharisa Mine has established a groundwater well field on the property which in addition to pit dewatering, supplies sufficient water as ‘make up water’ for the processing facilities. These two
Table 6
Waste Rock Dumps: Capacity, Operational Life and Estimated Capital Costs
Waste Rock DumpWaste Rock
Capacity (m3)Operation Life Capital Cost
Eastern WRD 17,580,000 September 2013 – December 2014 R2.48 mil
Central WRD 18,490,000 August 2013 – November 2015 R2.21 mil
North Eastern WRD 19,980,000 January 2015 – May 2016 R3.0 mil
Western WRD 15,430,000 December 2015 – May 2017 R2.1 mil
Total (excluding rehabilitation and closure costs) R9.79 mil
12.9(h)(vii)

Coffey Mining (SA) Pty Ltd
Tharisa Mine Page: xxixCompetent Person’s Report - December 2013
sources will be sufficient to supply the mine’s water requirements at the planned steady state and for the anticipated LoM and are supplemented by Rand Water as well as excess water from nearby mining companies.
Environmental Baseline
Baseline environmental studies were undertaken to determine the state of the pre-mine environment and to assess potential environmental impacts relating to the mining activities at the mine.
Geology: Other than the potential for mineral sterilisation (which can be avoided) no impacts relating to the geology underlying the mine were identified.
Climate: No impacts relating to climate were identified, but climate data was used to assess air quality and surface water related impacts.
Topography: Potential impacts that were identified were safety issues relating to hazardous excavations and visual impacts
Soil and Land Capability: Potential impacts that were identified related to soil contamination, compaction and erosion.
Land Use: Potential Impacts on and around the mine such as impacts from blasting and traffic/public road disturbance were identified.
Biodiversity: Potential impacts relating to destruction of sensitive habitats, were identified.
Surface Water: Potential impacts relating to pollution of surface water and destruction of non-perennial water courses were identified.
Groundwater: Potential groundwater impacts relating to contamination and depletion of third parties groundwater were identified.
Air Quality: Potential air quality impacts relating to the generation of both small inhalable dust particulates and larger fallout dust were identified.
Noise: A potential impact relating to high noise levels to third parties was identified.
Sites of Archaeological and Cultural Interest: Potential impacts relating to the discovery of resources such as stone walled settlements, graveyards, a historical village and homestead, mining heritage remains, isolated and randomly scattered stone tools, historical houses and outdated and discarded agricultural implements, were identified.
Socio-economic: Potential impacts relating to positive economic benefits such as capital investment, employment, support services, and foreign exchange income were identified. In addition, a number of potential negative impacts were also identified. These included issues associated with involuntary relocation, informal settlements and associated problems of crime, disease and security concerns,
12.9(h)(viii)

Coffey Mining (SA) Pty Ltd
Tharisa Mine Page: xxxCompetent Person’s Report - December 2013
pressure on housing infrastructure and services, and issues around land sales and impacts on land values.
Environmental Approvals, Reporting and Management
Environmental Assessment Process
As the mine incorporates several listed environmental activities, the environmental assessment process was undertaken in terms of the National Environmental Management Act, 107 of 1998 (NEMA) and the regulations under Regulation 385 of 21/04/2006. In addition, the mine environmental assessment process was also undertaken in accordance with the requirements of the MPRDA and the regulations there under (Regulation 527 of 23/04/2004).
The Tharisa Mine has an approved Environmental Management Plan (EMP) by the DMR and the Provincial Department of Economic Development, Environment, Conservation and Tourism (DEDECT).The EMP makes provision for the rehabilitation of the mining footprint and associated infrastructure.
Water License
In order to conduct all water use and waste disposal activities lawfully an integrated license is required from the Department of Water Affairs (DWA) in terms of the National Water Act, 36 of 1998. The water use license was granted in July 2012.
Additional Licences and Authorisations required by the Tharisa Mine
Tharisa Minerals management is cognizant of the various permits and authorisations required as per the EIA/EMP report namely:
NEMA, MPRDA and NWA environmental authorisations for any proposed amendments;
In addition to the water licence that has been obtained, registration is required of both the sewage plant and the required personnel;
Permit for the removing or damaging of any protected plant species as needed;
Approval for the construction of new road intersections, diverting roads and closing roads; and
Permit for damaging or removing heritage resources such as graves.
Ongoing Environmental Management, Monitoring and Reporting
An assessment of compliance was carried out in July 2013 at which time some deviations from the EMP and water licence requirements were found. The required management interventions and/or authorisation processes are underway or imminent.
Environmental Rehabilitation: Financial Closure Liability
Current legislation requires that mining operations make financial provision for environmental rehabilitation and closure prior to commencement of any operations under the MPRDA. The calculations of the current financial closure liability associated with the Tharisa Mine were completed in
12.9(h)(viii)
12.9(h)(viii)

Coffey Mining (SA) Pty Ltd
Tharisa Mine Page: xxxiCompetent Person’s Report - December 2013
accordance with the Guideline Document for the Evaluation of the Quantum of Closure-Related Financial Provision Provided by a Mine as published by the DMR, previously the Department of Minerals and Energy (DME), dated January 2005. The EMP requirement is for the financial closure liability to be updated and submitted to the DMR annually. The most recent calculation values the closure liability at R100.5million (as at 30 September 2013). This calculation allows for making the open pits safe but excludes the cost of backfilling the open pits which was the original approved closure objective. Application is currently being made to amend this objective to partial backfill in accordance with the revised mine plan. Tharisa Minerals has provided for this amount through a Lombards policy to the value of R78million and a Stanlib investment account to the value of R37million. Feedback is pending from the DMR regarding the adequacy of the 2013 calculated value and the adequacy of the amounts provided.
Valuation/Mine Economics
A Technical Economic Model (TEM) for the Tharisa Mine has been constructed by Coffey in order to confirm the feasibility of the mine and to substantiate the declaration of mineral reserves. Most of the planned underground production would mine inferred mineral resources. The TEM was initiallyconstructed for mining opencast and then start moving underground in year 2032 for a 56 years LoM.Rather than to look at a TEM model that excludes the inferred mineral resources from the production profile, consideration was given to rather exclude the underground mining component. This assessmentconsiders that the ZAR2bn necessary to establish the underground mine will not be recouped by the 18,649Mt Probable Reserves available for underground mine production.
Table 7 presents aspects of the TEM in which the underground mine has been excluded as a close proxy for exclusion of the inferred mineral resources form the production profile.
Table 7
Tharisa Mine
Effect of Underground Production/Inferred Resources on DCF Valuation
Parameter UnitIncluding
Underground Production
Excluding Underground Production
Life of Mine Years 54 23
ROM over LOM Mt 246.27 106.09
LOM C2O3 Mt 95.72 40.65
LOM PGM's Moz 7.62 3.24
Capital ZAR Million 5,249 2,075
Discount Rate % 8 8
High NPV ZAR Million 23,173 20,331
Low NPV ZAR Million 14,567 13,996
Preferred NPV ZAR Million 19,957 18,162The underground mine has been excluded as a close proxy for exclusion of the inferred mineral resources form the production profile.
12.9(h)(xii)SVT2.1SVT2.10SVT2.15

Coffey Mining (SA) Pty Ltd
Tharisa Mine Page: xxxiiCompetent Person’s Report - December 2013
Coffey prefers the results of the Discounted Cash Flow (DCF) model that excludes the underground production as a close proxy for exclusion of inferred mineral resources.
The model confirmed that the mine is feasible with a positive Net Present Value (NPV). The model further confirmed that the mine is most sensitive to changes in revenue and least sensitive to changes in capital. This is because relatively little capital is spent on mining equipment as this is a contract open pit mining operation.
As a second valuation methodology, the Market Approach was applied. Recent transactions involving PGM producers as well as opencast chrome projects were used to attribute PGM and chrome market values to Tharisa mine.
Coffey prefers the Cash Flow Approach to valuating the Tharisa mine as it is a producing mine with known production and cost parameters.
The Market Approach valuation is based on a combination of transactions for properties that are somewhat dissimilar to the Tharisa Mine. Coffey considers it is not a true reflection of the market price of Tharisa Mine. Coffey thus values the Tharisa Mine on 31 December 2013 as shown in Table 8.
Table 8
Tharisa Mine
Valuation of the Tharisa Mine at 31 December 2013
Valuation Methodology Preferred Value(ZAR million)
High Value(ZAR million)
Low Value(ZAR million)
DCF incl. underground production 19,957 23,173 14,567
DCF excl. underground production 18,162 20,331 13,996
Comparative Transaction (ZAR million) 15,817 17,229 14,404
The value of the Tharisa Mine as at 31 December 2013 is considered to lie in the range of ZAR 13,996M to ZAR 20,331M with a preferred value of ZAR 18,162M.

Coffey Mining (SA) Pty Ltd
Tharisa Mine Page: xxxiiiCompetent Person’s Report - December 2013
Risk Summary
A summary of the perceived risks associated with the mine is presented in Table 9.
Table 9 Tharisa Minerals Technical Risk Summary
Item Relative RiskGeology and Mineral Resources LowMining Engineering and Mineral Reserves Low to MediumGeotechnical Engineering MediumMetallurgy and Processing MediumEnvironmental MediumManpower and Management MediumInfrastructure Medium
Based on the above risk summary, Coffey considers the Tharisa Mine to have an overall Low to Medium Risk.
12.9(h)(x)

Coffey Mining (SA) Pty Ltd
Tharisa Mine Page: 1Competent Person’s Report - December 2013
1 INTRODUCTION AND TERMS OF REFERENCE
1.1 Scope of the Report
Coffey Mining (South Africa) (Proprietary) Limited (Coffey) was requested by Tharisa plc, formerly Tharisa Limited (Tharisa or the Company), to complete a Competent Person’s Report (CPR) on the Tharisa Mine located in the North West Province, South Africa. The CPR is required to support a listing on the Johannesburg Stock Exchange (JSE) and has been compiled in accordance with the requirements of the JSE (Section 12).
1.2 Site Visits
Messrs Lomberg, Lotheringen, Dodd, Stobart, Bornman and Dr James have visited the property on a regular basis over a period of approximately seven years since 2007.
1.3 Competent Person’s Report
This report complies with the Listing Requirements of the JSE; specifically the particular requirements applicable to Mineral Companies (Section 12) and is prepared in accordance with the guidelines of “The South African Code for Reporting of Exploration Results, Mineral Resources and Reserves (prepared by the South African Mineral Resource Committee (SAMREC) Working Group) (2007 and as amended in 2009)” (SAMREC Code) and “The South African Code for the Reporting of Mineral Asset Valuation (2008)(as amended in July 2009)” Prepared by The South African Mineral Asset Valuation Committee (SAMVAL) Working Group (SAMVAL Code).
1.4 Qualifications and Experience
Coffey is part of Coffey International Limited, a specialist professional services consultancy with expertise in geosciences, international development (foreign aid programme assistance),and project management. Coffey is an integrated Australian-based consulting firm, which has been providing services and advice to the international mineral industry and financial institutions since 1987. Coffey, previously RSG Global, has maintained a fully operational office at Accra in Ghana since 1996, providing an operational base for consulting and contracting assignments throughout the West African region. An additional African office was established in Johannesburg, South Africa, in 1999 to support expanding activities within southern and eastern portions of the continent. In 2007 an additional office was established in Lusaka, Zambia to provide consulting services to the Zambian mineral industry.
Coffey has over 50 years of experience supplying specialist services to the mining industry and has completed projects in more than 70 countries, across most commodity types. Coffeyprovides ‘turn-key’ consulting, operational support and optimisation services, independent reports and a range of technical audits and studies. Coffey is professionally accredited in all mining jurisdictions globally and supported by a network of mining offices throughout the Americas, Africa and Australia.
12.8(a)12.9 12.9(e)SRT1.1A(ii)SVT2.2
SRT1.1A(iii)
12.8(b)12.9(c)SVT2.13
SVT2.14
Coffey Mining (SA) Pty Ltd
Tharisa Mine Page: 2Competent Person’s Report - December 2013
The participants consist of a number of technical experts brought together by Coffey to complete the CPR and are all “Competent Persons” as defined in the SAMREC code. Thecompilation of the CPR in accordance with the reporting requirements of the JSE was supervised by Mr Lomberg. The participants in the CPR and their individual areas of responsibility are listed as follows:-
Ken Lomberg, Senior Principal Consultant, Coffey B.Sc. (Hons) Geology, B.Com., M.Eng., FGSSA, Pr.Sci.Nat. Project management, mineral resources, geological interpretations, site visits, report preparation.
Mr Lomberg has some 25 years experience in the minerals industry (especially platinum and gold). He has been involved in exploration and mine geology and has had the privilege of assisting in bringing a mine to full production. His expertise is especially in project management, mineral reserve and resource estimation.
Mr Lomberg has undertaken mineral resource and reserve estimations and reviews for platinum, chromite, gold, copper, uranium and fluorite projects. He has assisted with the reviews or estimation of diamond and coal projects. He has assisted with or compiled Competent Person’s Reports/NI 43-101 for various companies that have been listed on the TSX, JSE and AIM.
Alan Goldschmidt, Senior Principal Consultant, CoffeyB.Sc. (Honours), GDE, Pr.Sci.Nat.Mineral resources, geological interpretations, report preparation.
Mr Goldschmidt has some 29 years’ experience in the minerals industry. He has been involved in exploration and mine geology. His expertise is project management, reserve, and resource estimation. Primarily he has been involved with geological block models and geostatistical resource estimation. He is registered with the South African Council for Natural Scientific Professions.
Jaco Lotheringen, Associate Consultant – Ukwazi Mining Solutions B.Eng., MSAIMM, Pr.Eng.Mining engineering, mineral reserve estimation, infrastructure, site visits, report preparation.
Mr. Lotheringen is a member in good standing of the Southern African Institute of Mining and Metallurgy (SAIMM) and is a registered Professional Mining Engineer with the Engineering Council of South Africa (ECSA). He has more than 14 years’ experience in the Mining and Minerals industries with the last nine years focussed primarily on the estimation and audit of mineral reserve estimates. Mr. Lotheringen has more than five years relevant experience in the planning and reserve estimation of similar platinum and chrome open cast operations.
SRT11A(i)

Coffey Mining (SA) Pty Ltd
Tharisa Mine Page: 3Competent Person’s Report - December 2013
Mr Lotheringen has undertaken mineral reserve estimations and reviews for platinum, gold, copper, chrome, manganese and iron ore projects. He has assisted on Competent Person’sReports/NI 43-101 for various projects that have been listed on the TSX, JSE and AIM.
David Dodd, Associate Consultant – MDM EngineeringB.Sc. (Hons) Chemical Engineering, FSAIMM Process engineering, infrastructure, site visits, report preparation.
Mr Dodd has over 35 years experience in the metallurgical industry of which the last 30 years have been specifically in the metallurgical project development field. He has been involved in the execution of numerous feasibility studies and implementation projects covering a wide range of minerals including platinum and chromite. These studies and projects have included establishment and management of metallurgical test campaigns, process development, detailed plant design, construction and commissioning of the constructed metallurgical plants.
Mr Dodd has undertaken studies and projects for the extraction of base metals, precious metals, energy minerals, industrial minerals and gemstones. He has managed, and signed off as competent person for, Feasibility Study/NI 43-101 reports for various projects that have been listed on the AIM, ASX, JSE and TSE.
Brandon Stobart, Associate Consultant – SLR Consulting (previously Metago)BA (Environmental Science). LLB, MBA, EAPSA, EAPEnvironmental and Social, site visits, report preparation.
Mr Stobart has some 15 years experience in the minerals industry in the field of mine permitting and environmental and social assessment. Mr Stobart has undertaken permitting, environmental and social reviews for platinum, chrome, copper, uranium, coal, manganese, diamond and gold projects. He has assisted or compiled Competent Person’s Reports/NI 43-101 for various listed companies.
Alex Pheiffer, Associate Consultant – SLR Consulting (previously Metago)B.Sc. (Honours), M.Sc., Pr.Sci.Nat.Environmental and social, report review.
Mrs Pheiffer has some 11 years experience in the minerals industry in the field of mine permitting and environmental and social assessment. Mrs Pheiffer has undertaken permitting, environmental and social reviews for platinum, chrome, uranium, coal, and gold projects. She has assisted with or compiled feasibility contributions for various listed projects. She is registered with the South African Council for Natural Scientific Professions.

Coffey Mining (SA) Pty Ltd
Tharisa Mine Page: 4Competent Person’s Report - December 2013
Guy Wiid, Associate Consultant – Epoch ResourcesB.Sc. (Eng) (Civil), M.Sc. (Eng) (Civil), Pr.Eng.Tailings facility design, site visits, report preparation.
Mr Wiid has been involved in the mining waste and environmental management field for 19 years during which time he has worked in the fields of power station and mining waste management, rehabilitation and closure design, implementation of environmental management systems, surface water management, due diligence investigations and project management of construction and rehabilitation contracts.
Dr John James, Associate Consultant – Celtis GeotechnicalB.Sc. (Hons) (Geology), PhD, FSAIMM, FSANIR, MGSSAGeotechnical Engineering, site visits, report preparation.
Dr James is the principal consultant for Celtis Geotechnical CC, consulting to various mining companies on projects in South Africa, Zambia, Botswana and Australia. While with Rodio SA, he managed exploration drilling, grouting, surface and underground geotechnical contracts in Turkey and South Africa.
He has experience in open pit mining, involved with supervising slope stability consultants at the then JCI's Platinum Mines and while with Rand Mines on outcrop mining. He has a total of 20 years experience in practical rock mechanics and design on gold mines, with Anglo-American, Rand Mines and JCI; this includes considerable experience in wide orebody mining, geology and all aspects of support design and backfill behaviour and placement; the Technology, Rock Mechanics and Design of hard rock, coal and base metal mines as well as tunnelling, and has also directed projects and research into mine design, technology transfer and auditing and assessment systems.
He was jointly awarded the M D G Salamon prize for the most important contribution to Rock Mechanics in 1997. He has published numerous publications on rock support and other relevant rock engineering topics.
Hannes Bornman, Manager Mining, CoffeyB.Eng. (Mining), MBA, Pr.Eng., FSAIMMEconomic valuation, site visit, report preparation.
Mr Bornman has 10 years production experience of hard rock mining in South African gold and platinum mines. He has broad experience in feasibility and due diligence studies both in South African and International contexts. He has travelled extensively within Central Asia and Russia. He has undertaken project risk assessment studies on mining projects in South Africa as well as in Mozambique and Mali.
SVT2.14
Coffey Mining (SA) Pty Ltd
Tharisa Mine Page: 5Competent Person’s Report - December 2013
1.5 Independence
Neither Coffey, nor the key personnel nominated for the completed and reviewed work, hasany interest (present or contingent) in Tharisa plc and it’s subsidiaries, its directors, senior management, advisers or the mineral properties reported on in this report. The proposed work, and any other work done by Coffey for Tharisa plc, is strictly in return for professional fees. Payment for the work is not in any way dependent on the outcome of the work, nor on the success or otherwise of Tharisa plc’s own business dealings. As such there is no conflict of interest in Coffey undertaking the CPR as contained in this document.
1.6 Legal Proceedings
Coffey is not aware of any legal proceedings against the Company that could adversely affect it’s ability or right to exploit the Tharisa Mine’s mineral resource and reserve.
12.8(b)12.9(c)SRT11A(ii)
12.8(d) SRT1.7ª(iv)

Coffey Mining (SA) Pty Ltd
Tharisa Mine Page: 6Competent Person’s Report - December 2013
2 DISCLAIMER
This report was prepared as a Competent Person’s Report, in accordance with both theSAMREC and SAMVAL Codes for Tharisa plc, by Coffey. The quality of information, conclusions and estimates contained herein is consistent with the level of effort involved in Coffey’s services and based on:
i) information available at the time of preparation by Tharisa plc and its subsidiaries,
ii) third party technical reports prepared by Government agencies and previous tenement holders, along with other relevant published and unpublished third party information, and
iii) the assumptions, conditions and qualifications set forth in this report.
This report is intended to be used by Tharisa plc, subject to the terms and conditions of its contract with Coffey.
The sole purpose of this report is for the use of the Directors of Tharisa plc and its Sponsorand advisors in connection with Tharisa plc’s listing prospectus and the report should not be used or relied upon for any other purpose.
Neither the whole nor any part of this report nor any reference thereto may be included in or with or attached to any document or used for any other purpose, without Coffey’s writtenconsent to the form and context in which it appears.
A final draft of this report was provided to Tharisa plc, along with a written request to identify any material errors or omissions, prior to lodgement.
Neither Coffey, nor the authors of this report, are qualified to provide extensive comment on legal facets associated with ownership and other rights pertaining to Tharisa Minerals’, mineral properties. Coffey did not see or carry out any legal due diligence confirming the legal title of Tharisa Minerals, to the mineral properties.
12.8(a)

Coffey Mining (SA) Pty Ltd
Tharisa Mine Page: 7Competent Person’s Report - December 2013
3 PROPERTY DESCRIPTION AND LOCATION
3.1 Mine Description and Location
Tharisa Minerals, a 74% held subsidiary of Tharisa plc, operates the Tharisa Mine. Tharisa Minerals holds a mining right, granted by the Department of Mineral Resources (DMR) on 19 September 2008 and registered on 13 August 2009, to various portions of the property of Kafferskraal 342JQ (in respect of PGMs (Platinum Group Metals), nickel, copper, silver and chrome) and to the whole property of Rooikoppies 297JQ (in respect of the PGMs, nickel, copper, silver and chrome contained within the MG Chromitite Layers only). The Tharisa Mine is located in the North West Province some 35km east of the city of Rustenburg (Figure 3.1_1) in the Marikana section of the south-western limb of the Bushveld Complex (Figure 3.1_2). The Marikana section is separated from the Brits section to the east by Wolhulterskop and from the Rustenburg section to the west by the Spruitfontein upfold.
The Tharisa Mine is located approximately 5km north of the Magaliesberg Mountains. These mountains are formed by quartzites (Transvaal Sequence), which are common as floor or basement rocks to the Bushveld Complex.
The nearest major road is the N4 National Road which links Pretoria with Rustenburg and crosses the south-eastern corner of the Kafferskraal property immediately south of the outcrop of the Middle Group (MG) Chromitite Layers. A secondary road bisects the property in a north-south direction providing access to the town of Marikana. The east west Rustenburg-Brits railway line bisects the Rooikoppies property with a station located in the town of Marikana on the Rooikoppies property.
SRT1.2A(i) SRT1.4A(i) SVT2.3

Coffey Mining (SA) Pty Ltd
Tharisa Mine Page: 8Competent Person’s Report - December 2013
Figure 3.1_1Map Showing the Geographic Location of the Tharisa Mine
Figure 3.1_2Generalised Geological Map of Bushveld Complex Showing the Location of the Tharisa Mine
Tharisa Mine

Coffey Mining (SA) Pty Ltd
Tharisa Mine Page: 9Competent Person’s Report - December 2013
3.2 Mining Industry of South Africa
Background
The mining industry in South Africa was traditionally controlled by six large mining conglomerates: Anglo American - De Beers, Gencor - Billiton, Gold Fields, JCI, Anglovaal and Rand Mines, which dominated gold, platinum, chrome, coal and base metal production.Sweeping changes in the industry have taken place as a result of a rising cost structure due to ageing mines and the impact of a new democratic constitution. This has led, in part, to the establishment of a growing mid-tier and junior developer and producer sector.
Historical Perspective - Legislative Development
Since about 1860, mining regulation in South Africa has evolved to keep pace with changing technological, economic, and socio-political needs to grow and sustain the country’s world-class mining industry.
Enactment of the Minerals Act, 50 of 1991 (Minerals Act) marked the consolidation of a substantial legislative modernisation that began in the 1960s. After the first democratic elections in 1994, all government policies and legislation were subject to fundamental review.A White Paper (government discussion document) on minerals and mining policy was published in October 1998. Mine health and safety was given first priority with the enactment of the Mine Health and Safety Act, (Act No 29 of 1996). The South African Parliament passed the Mineral and Petroleum Resources Development Act, Act 28 of 2002 (MPRDA) in August 2002, which was subsequently promulgated by the State President (Government Gazette, 1 May 2004).
Mineral and Petroleum Resources Development Act, 2002
The concept of state custodianship of mineral rights (now embodied in the MPRDA) has replaced the common law principles previously embodied in the Minerals Act. Enactment of the MPRDA places South Africa in line with global mineral ownership principles.
The mechanics for converting mineral rights previously held under the Minerals Act to mineral rights recognised under the MPRDA, were set out.
The Mineral and Petroleum Royalty Act, 2008
The Government has imposed the payment of royalties through the Mineral and Petroleum Royalty Act 28 of 2008 (Royalty Act) which gives effect to the MPRDA and which came into effect during the first half of 2010, but uncertainties surrounding it’s interpretation and implementation still exist. The Royalty Act requires that compensation be given to the State (as custodian) of the country’s Mineral and Petroleum Resources for the country’s “permanent loss of non-renewable resource”. The Royalty Act distinguishes between refined and unrefined mineral resources, where refined minerals have been refined beyond a condition specified by the Royalty Act, and unrefined minerals have undergone limited beneficiation as specified by the Royalty Act.

Coffey Mining (SA) Pty Ltd
Tharisa Mine Page: 10Competent Person’s Report - December 2013
The royalty rate structure is based on a formula that takes into account the profitability of Tharisa Minerals as follows:-
Unrefined:
Refined:
The maximum percentage royalty for refined mineral resources is 5%, whereas the maximum percentage royalty for unrefined mineral resources is 7%. The royalty is determined by multiplying the Gross sales value of the operation in respect of that mineral resource in a specified year by the percentage determined in accordance with the royalty formula. Both operating and capital expenditure incurred is deductable for the determination of earnings before interest and tax (EBIT).
In the case of the Tharisa Mine, the chromite concentrate and Platinum Group Metal (PGM) concentrate produced both classify as an ‘unrefined mineral resource’.
Electronic copies of the MPRDA and other regulations can be found on the DMR website: www.dmr.gov.za.
3.3 South African Taxes
Mining companies in South Africa are taxed at the standard corporate tax rate of 28%. In addition, a witholding tax on dividends is payable at the rate of 15% by the company. No other tax or withholding tax is payable in respect of dividends paid to shareholders.
Corporate tax is paid on all income, plus 50% of capital gains, less deductible operating expenditure and a capital expenditure allowance. Deductible expenditure includes rehabilitation expenditure actually incurred and annual contributions to an approved rehabilitation trust. Prospecting and capital development expenditure is treated as follows:
all prospecting and capital development expenditure is carried forward to the year of commencement of production;
thereafter the accumulated prospecting expenditure and all future prospecting expenditure is allowed as a deduction either in full or in annual instalments as determined by the South African Revenue Service;
in the year of commencement of production and thereafter the accumulated and future annual capital expenditure on shaft-sinking, mine equipment and mine development is deductible in full up to the amount of taxable income from mining before allowing for this capital expenditure allowance. Any excess of capital expenditure over such taxable income is carried forward for deduction from future taxable income from mining;
capital expenditure in respect of employees' housing, hospitals, schools, shops, recreational buildings and facilities and railway lines is deductible in 10 equal annual

Coffey Mining (SA) Pty Ltd
Tharisa Mine Page: 11Competent Person’s Report - December 2013
instalments. Capital expenditure in respect of motor vehicles intended for the private use of employees is deductible in five equal annual instalments. Each annual instalment is included in the above capital expenditure which is subject to the annual limit of taxable income from mining;
no deduction is allowed in respect of the cost of land and mineral rights; and
proceeds on the disposal of any asset previously included in the capital expenditure allowance are first deducted from any excess capital expenditure not already deducted and thereafter are included in full in taxable income. Such proceeds do not give rise to capital gains.
Value Added Tax (VAT) at 14% is payable on most goods and services in South Africa, however as it is claimable against any VAT charged on sales of product, it does not represent a cost to the Tharisa Mine.

Coffey Mining (SA) Pty Ltd
Tharisa Mine Page: 12Competent Person’s Report - December 2013
3.4 Mining Tenure
A summary of the pertinent aspects of the mineral exploration and mining rights for SouthAfrica are provided in Table 3.2_1.
Table 3.2_1Summary of Pertinent Aspects of the Mineral Exploration and Mining Rights
(South Africa)
Mining Act : Mineral and Petroleum Resources Development Act, No. 28 of 2002 (Implemented 1 May 2004)
State Ownership of Minerals : State custodianshipNegotiated Agreement : In part, related to work programmes and expenditure commitments.
Reconnaissance Permission : Yes Prospecting Right : Yes, Mining Right : YesRetention Permit : YesSpecial Purpose Permit/Right : YesSmall Scale Mining Rights : Yes.
Name : Prospecting RightPurpose : All exploration activities including bulk sampling.Maximum Area : No limit, Ministerial discretionDuration : Up to 5 years.Renewals : Once for 3 yearsArea Reduction : NoProcedure : Apply to Regional Department of Mineral Resources. Granted by : Minister
Name : Mining RightPurpose : Mining and processing of mineralsMaximum Area : No limit, Ministerial discretionDuration : Up to 30 years, Ministerial discretionRenewals : Yes, with justification, Ministerial discretionProcedure : Apply to Regional Department of Mineral ResourcesGranted by : Minister
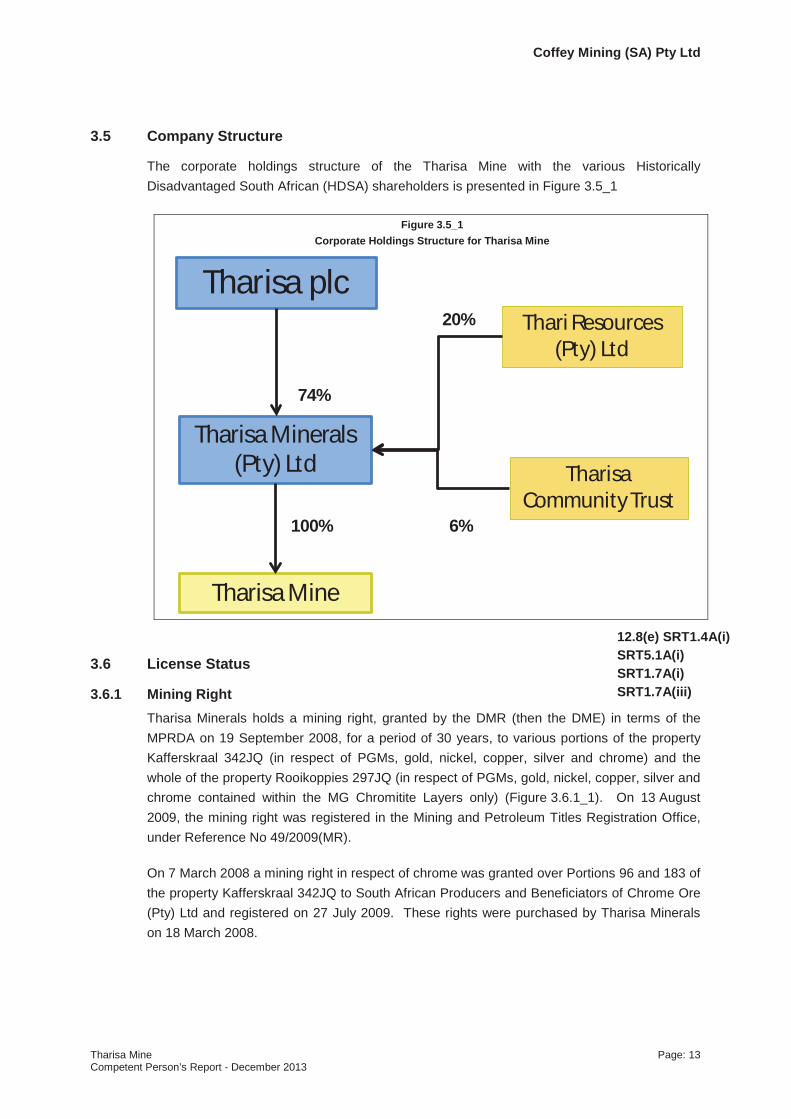
Coffey Mining (SA) Pty Ltd
Tharisa Mine Page: 13Competent Person’s Report - December 2013
3.5 Company Structure
The corporate holdings structure of the Tharisa Mine with the various Historically Disadvantaged South African (HDSA) shareholders is presented in Figure 3.5_1
Figure 3.5_1Corporate Holdings Structure for Tharisa Mine
3.6 License Status
3.6.1 Mining RightTharisa Minerals holds a mining right, granted by the DMR (then the DME) in terms of the MPRDA on 19 September 2008, for a period of 30 years, to various portions of the property Kafferskraal 342JQ (in respect of PGMs, gold, nickel, copper, silver and chrome) and the whole of the property Rooikoppies 297JQ (in respect of PGMs, gold, nickel, copper, silver and chrome contained within the MG Chromitite Layers only) (Figure 3.6.1_1). On 13 August2009, the mining right was registered in the Mining and Petroleum Titles Registration Office,under Reference No 49/2009(MR).
On 7 March 2008 a mining right in respect of chrome was granted over Portions 96 and 183 of the property Kafferskraal 342JQ to South African Producers and Beneficiators of Chrome Ore (Pty) Ltd and registered on 27 July 2009. These rights were purchased by Tharisa Mineralson 18 March 2008.
Tharisa plc
Tharisa Minerals (Pty) Ltd
Tharisa Mine
Thari Resources (Pty) Ltd
Tharisa Community Trust
74%
20%
6%100%
12.8(e) SRT1.4A(i) SRT5.1A(i) SRT1.7A(i) SRT1.7A(iii)

Coffey Mining (SA) Pty Ltd
Tharisa Mine Page: 14Competent Person’s Report - December 2013
In July 2011, an application was granted in terms of Section 102 of the MPRDA, to amend the existing mining right by the addition of Portions 96 (46.38ha), 183 (15.18ha) and 286 (13.29ha) of the property Kafferskraal 342JQ to the mining right 49/2009(MR).
Figure 3.6.1_1 Map showing the Mineral Rights of the Tharisa Mine
450
00 E
45000 E 5
0000
E
50000 E
-2850000 N -2850000 N
-2845000 N -2845000 N
-2840000 N -2840000 N
0 1000 2000 3000
Rooikoppies 297JQ
Kafferskraal 342JQ

Coffey Mining (SA) Pty Ltd
Tharisa Mine Page: 15Competent Person’s Report - December 2013
3.7 Surface Rights
The surface rights of several of the portions of Kafferskraal 342JQ have been purchased by Tharisa Minerals with the stated intent of obtaining other surface rights (Figure 3.7_1). It should be noted that should Tharisa Minerals not acquire all the surface rights of the area defined in the mining right, it will not be precluded from mining there.
Figure 3.7_1 Map showing the Surface Rights Holdings of Tharisa Mine
450
00 E
45000 E
500
00 E
50000 E
-2850000 N -2850000 N
-2845000 N -2845000 N
-2840000 N -2840000 N
0 1000 2000 3000
Mining Right
Rooikoppies 297JQ
Kafferskraal 342JQ
Surface Right

Coffey Mining (SA) Pty Ltd
Tharisa Mine Page: 16Competent Person’s Report - December 2013
3.8 Agreements
Senior Debt Loan Facility Agreement
Nature of Agreement Senior Debt Loan Facility Agreement: financing an aggregate principal amount of ZAR1 Billion was provided to Tharisa Minerals. The primary purpose of the facility was to fund the development and construction of the Voyager Plant at the Tharisa Mine. As at 30 September 2012 the facility was drawn down in full.
Parties involved HSBC Bank plc, Nedbank Limited, ABSA Bank Limited, Tharisa Minerals (Pty) Limited, Tharisa plc, Thari Resources (Pty) Limited and Business Venture Investments No 1568 (Pty) Limited
Date of Agreement 21 February 2012
Details The interest rate on the facility is JIBAR plus a margin of 3.9% per annum before the completion of the Voyager Plant and 3.4% per annum after completion of the Voyager Plant.
The first repayment date of the facility was 31 December 2013. The finalmaturity date of the facility is 31 March 2019. The aggregate principal balance of the facility is repayable in arrears in 22 equal quarterly instalments from the first repayment date up to and including the final maturity date, subject to recalculations in the event that any mandatory pre-payment has been made.
Security A security interest over all of the shares in Tharisa Minerals held by Tharisa plc and Thari Resources, Arxo Logistic’s rights in certain logistics contracts and substantially all of the assets of Tharisa Minerals.
Tharisa Minerals and Tharisa plc have each provided negative pledges standard and customary for senior debt financings of this nature agreeing not to create any further encumbrances over the assets of Tharisa Minerals, with certain customary and agreed exceptions. The company has given an irrevocable and unconditional guarantee to the facility lenders in respect of the performance by Tharisa Minerals of its obligations up to completion of the Voyager Plant.
Tharisa Minerals is required to comply with certain financial covenants and standard and customary events of default for senior debt financing of this nature are included.
Trade Finance Facilities
Nature of Agreement A pre-packing credit facility up to a maximum limit of US$20 Million plus interest payable at Libor plus 2.5% per annum for up to a maximum tenor of 60 days
combined back-to-back facilities up to an aggregate amount of US$10 Million plus interest payable at Libor plus 2.5% per annum..
Parties involved Arxo Resources Limited and Hong Kong and Shanghai Banking Corporation Limited (HSBC) and Tharisa plc
Date of Agreement 2 August 2012
Details These facilities were provided for the purposes of partially funding working
SRT1.7A(ii)

Coffey Mining (SA) Pty Ltd
Tharisa Mine Page: 17Competent Person’s Report - December 2013
capital requirements pending payment from customers on credit terms. With this facility and combined back-to-back facilities, Arxo Resources Limited created a charge over a US$1.5 Million cash deposit and created an assignment of documentary credit proceeds. In addition Tharisa plc was required to provide a letter of undertaking and guarantee limited to US$38 Million. Tharisa plc also provided an undertaking that the consolidated net tangible asset value of the group would be maintained at no less than US$30 Million
PGM Concentrate Off-take Agreement
Nature of Agreement Tharisa Minerals will supply PGM concentrate to IRS for use in its smelting and refining operations
Parties involved Tharisa Minerals (Pty) Limited and Impala Refining Services Limited
Date of Agreement 20 July 2012
Details The Agreement will endure for an indefinite period terminable by either party on 24 months notice provided that at least 660,000 ounces of platinum in concentrate shall have been delivered. The price payable by IRS for PGM concentrate is determined on a monthly basis by reference to the amount of PGM concentrate delivered, prevailing market prices for PGM’s and the quality of the PGM concentrate supplied by Tharisa Minerals
Limited Recourse Disclosed Receivables Discounting Agreement
Nature of Agreement Tharisa Minerals is entitled to discount its Platinum, Palladium and Gold receivables under the Off-take Agreement with Impala Refining Services Limited up to a maximum revolving facility amount of R300 Million.
Parties involved ABSA Bank Limited, Nedbank Limited, HSBC Bank plc and Tharisa Minerals (Pty) Limited
Date of Agreement 30 May 2013
Conditions The receivables to be discounted will require the prior approval of the facility agent under the agreement and if approved, the amount payable will be based on the quality and quantum as per the final assay under the off-take agreement of Platinum, Palladium and Gold concentrate. The receivables will be discounted on a limited recourse basis and recourse to Tharisa Minerals will occur only as a result of the occurrence of a limited recourse event

Coffey Mining (SA) Pty Ltd
Tharisa Mine Page: 18Competent Person’s Report - December 2013
Opencast Mining Works Agreement
Nature of Agreement MCC was appointed as an independent contractor for the open pit mining operations at the Tharisa Mine for an initial period of 6 years with effect from 21 May 2011 renewable for successive 6 year periods unless terminated by either party giving 12 months notice prior to the end of the applicable 6 year period.
Parties involved Tharisa Minerals (Pty) Limited and MCC Contracts (Pty) Limited
Date of Agreement 31 July 2011
Details MCC is required to provide all necessary plant, materials, labour, fuel, and transport that are required for the mining operations and is paid on a monthly basis by reference to the volume of material mined and transported from the open pit.
Chromite Ore Concentrate Off-Take Agreement
Nature of Agreement Arxo Resources will supply 25,000 tonnes per month of 42% and/or 44% Chromite Concentrate from the Tharisa Mine
Parties involved Noble Resources International PTE Limited, Arxo Resources Limited and Tharisa plc
Date of Agreement 1 March 2013
Details The contract will endure for a finite period of 36 months. The price payable by Noble for the concentrate is determined on a monthly basis by reference to the published CIF Ferro Alloy.net prices for SA 42% and 44% Chromite Concentrate, respectively.
Electricity Supply Agreement
Nature of Agreement Eskom agreed to supply electricity to Tharisa Minerals and Tharisa Minerals agree to take from Eskom all electricity required by Tharisa at the Tharisa Mine, subject to a notified maximum demand of 40 MVA
Parties involved Eskom Holdings SOC Limited and Tharisa Minerals (Pty) Limited
Date of Agreement 27 July 2012
Details The agreement commenced with effect from 30 June 2012 and will endure for an indefinite period until terminated by either party on 6 months written notice of termination.

Coffey Mining (SA) Pty Ltd
Tharisa Mine Page: 19Competent Person’s Report - December 2013
Memorandum of Agreement for the supply of Water
Nature of Agreement Samancor agreed to supply water via the Rand Water Board pipeline infrastructure to Tharisa Minerals for the purposes of enabling Tharisa Minerals to maintain its emergency dams located in its mining area.
Parties involved Samancor Chrome Limited and Tharisa Minerals (Pty) Limited
Date of Agreement 26 July 2013
Details Tharisa Minerals is entitled to draw from the Rand Water Board pipeline infrastructure made available to Samancor a monthly quota of 38,000 kilolitres. Samancor is entitled on 90 days prior written notice to Tharisa Minerals to reduce the quota of water available for supply to Tharisa Minerals under the agreement. The agreement will continue indefinitely until terminated by either party on 90 days prior written notice.
Agreement for the provision of Rail Transport Services
Nature of Agreement Transnet agreed to provide rail transportation services for the conveyance of freight by Tharisa Minerals, subject to available capacity.
Parties involved Transnet SOC Limited and Arxo Logistics (Pty) Limited
Date of Agreement 18 December 2013 [NOTE: Currently the agreement has not yet been signed by Transnet although it has been implemented and is fully operational]
Details Tharisa Minerals is required to provide weekly rolling forecasts of its transportation requirements by Transnet and Transnet agreed to incorporate same into its global train plan for the following week, subject to available capacity. The term of the agreement is set for a period of 12 months and subject to agreement of the parties is renewed annually for successive 12 month periods.
Agreement of Lease
Nature of Agreement Transnet leased to Tharisa Minerals a certain portion of the farm Rooikoppies measuring approximately 5250 square metres of vacant land with rail infrastructure to be utilised as a rail siding for the conveyance of Tharisa Minerals’ product
Parties involved Transnet SOC Limited and Tharisa Minerals (Pty) Limited
Date of Agreement 31 October 2011
Details The agreement commenced on 1 November 2011 and will endure until 30 September 2015.
Logistical Services Agreement
Nature of Agreement Tharisa Minerals appointed Arxo Logistics as its sole and exclusive provider and supplier of logistical services to Tharisa Minerals.
Parties involved Arxo Logistics (Pty) Limited and Tharisa Minerals (Pty) Limited
Date of Agreement 5 November 2009
Details The agreement continues indefinitely until terminated by either party on 6 months prior written notice.

Coffey Mining (SA) Pty Ltd
Tharisa Mine Page: 20Competent Person’s Report - December 2013
Agency and Off-Take Agreement
Nature of Agreement Tharisa Minerals appointed Arxo Resources as Tharisa Minerals’ sole and exclusive agent to sell and market its chrome products throughout the world
Parties involved Arxo Resources Limited and Tharisa Minerals (Pty) Limited
Date of Agreement 22 August 2011
Details The agreement continues indefinitely until terminated by either party on not less than 24 months notice of termination. In addition to providing the agency services, Arxo Resources is entitled at any time and from time to time during the subsistence of the agreement on written notice to Tharisa Minerals to be appointed as an off-taker of chrome product. In this event the purchase price for the product would be the fair market price thereof as agreed between the parties.

Coffey Mining (SA) Pty Ltd
Tharisa Mine Page: 21Competent Person’s Report - December 2013
4 ACCESSIBILITY, CLIMATE, LOCAL RESOURCES, INFRASTRUCTURE AND PHYSIOGRAPHY
4.1 Mine Access
The nearest major road is the N4 National Road which links Pretoria with Rustenburg and crosses the south-eastern corner of the Kafferskraal property immediately south of the outcrop of the MG Chromitite Layers. A secondary road bisects the property in a north-south direction providing access to the town of Marikana. The east west Rustenburg-Brits railway line bisects the Rooikoppies property with a station located in the town of Marikana on the Rooikoppies property.
The mine is located approximately 35km from the mining city of Rustenburg and 95km from Johannesburg.
4.2 Climate
A typical summer rainfall climate prevails in the area. Summer rain occurs mainly in the form of thunderstorms with a mean annual precipitation of approximately 680mm, and evaporation is about 1,800mm per year. Winds are generally light and blow predominantly from the north-west. Winters are cool and dry. Extreme weather conditions occur in the form of frost (2 to 20 occurrences per annum) and the occasional hail storm.
The average annual temperature for the year is approximately 19°C, with average maximum temperatures ranging between 22°C and 32°C and average minimum temperatures ranging between 2°C and 18°C. The hottest months are December to February. During April and May there is a noticeable drop in temperature, which signals the commencement of winter.The coldest months are June and July.
The area generally has a high S-Pan evaporation rate in the summer months from November to January. This gives rise to a high relative humidity. Evaporation is greater in summer than in winter, due to higher ambient temperatures.
4.3 Physiography
The topography on the Tharisa Mine property is gently undulating. The elevation ranges from 1,140m in the south-west to approximately 1,320m in the north. Immediately north of the project are a number of gabbro-norite hills. Approximately 5km to the south of the mine is the Magaliesberg Mountain range where the peaks rise to approximately 1400m above mean sea level (amsl). The perennial Sterkstroom and various non-perennial tributaries run through the mine area.
This area is located within the savannah biome, and consists typically of scattered trees and shrubs with continuous grass ground cover. Shrub and tree density increases along rivers and in the gabbro-norite hills. Land use is predominantly agricultural in the south with the Marikana operations of Lonmin plc (Lonmin) being situated on the northern part of the
SRT1.2A(i) SRT1.5A(i)SRT1.5A(ii)SRT1.6A(i)
SRT1.6B(i)
SRT1.6A(i) SRT1.6B(i) SRT1.6C(i)

Coffey Mining (SA) Pty Ltd
Tharisa Mine Page: 22Competent Person’s Report - December 2013
Rooikoppies property and the chrome operations of Samancor situated to the east of the mine.
4.4 Soils
Soils in and around the mine area include those of the orthic phase (Mispah, Glerosa and Hutton), structured forms (Milkwood, Mayo, Shortlands, Sterkspruit, Swartland and Valsrivier), and hydromorphic forms (Sepane, Rensburg and Bonheim). The heavy structured black and dark brown clay soils (Sterkspruit, Mayo and Swartland soil forms) are commonly referred to as “black-turf” or “Cotton Soils”.
4.5 Land Use
Land use around the Tharisa Mine consists of a mixture of farming, mining, residential, small business and general community activities. It is expected that agricultural production took place in the area for both subsistence farming by informal settlers and commercial farming, including crop production (maize, sunflowers, wheat, livestock feed) and livestock grazing.Due to overgrazing and subsistence farming practices by informal dwellers as well as the collection of vegetation mainly for firewood, parts of the general area were transformed. River systems within the area also show evidence of disturbance by agricultural activities.
A 275KV power line associated Eskom servitude, crosses through the eastern boundary of the mine area in a north-south direction. Smaller rural power lines and telephone lines currently service the residential areas within the western and eastern sections of the mine area. Infrastructure (pipes and canals) associated with the Buffelspoort Irrigation Board traverse various sections of the mine area in a south-north direction. There is also a network of tarred and gravel roads which exists in the area.
4.6 Flora and Fauna
The Tharisa Mine is located within the savannah biome, characterised by open Acacia karoo woodlands, which occur in valleys and slightly undulating plains, and some lowland hills. This vegetation unit is of significance because it is listed as endangered mainly due to severe impacts from transformation through cultivation and urbanisation. The following vegetation/habitat zones) exist within the Tharisa Mine area:
scattered open woodland (338 ha);
transformed cultivated land and built up areas (1276 ha);
rocky outcrops (23 ha);
wetland: river system and associated riparian vegetation (26 ha); and
azonal vegetation units.
Mammal species identified on site, through actual observation or capture, and through evidence of presence include Lepus saxatilis (scrub hare), Sylricapra grimmia (common duiker), Raphicerus campestris (steenbok), Helogale parvula (dwarf mongoose) and Hystrix

Coffey Mining (SA) Pty Ltd
Tharisa Mine Page: 23Competent Person’s Report - December 2013
africaeaustralis (porcupine). Bird species identified on site, through actual observation or capture, and through evidence of presence include Ardea melanocephala (Black - headed Heron), Plectropterus gambensis (Spur- winged Goose), Streptopelia senegalensis (Laughing Dove), Streptopelia capicola (Cape Turtle Dove) and Ploceus velatus (Southern Masked Weaver). Reptile and amphibian species identified on site, through actual observation or capture, and through evidence of presence include Kassina senegalensis (Bubbling Kassina), Phrynomantis bifasciatus (Banded Rubber Frog), Afrana angolensis (Common River Frog), Schismaderma carens (Red Toad), Bitis arietans (Puff Adder), Pachydactylis affinis (Transvaal Gecko) and Trachylepis striata (Eastern Striped Skink).
Invertebrate species that were identified on site, through actual observation or capture, and through evidence of presence include Astylus atromaculatus (Spotted Maise Beetle), Musca domestica (Robber Flies), Anoplolepis custodiens (Pugnacious Ant), Junonia hierta cebrene (Yellow Pansy), Gryllus bimaculatus (Common Garden Cricket) and Olorunia spp (Grass Funnel-web Spiders).
4.7 Groundwater
Ground water in and around the Tharisa Mine is typically between 10m and 30m below ground level. Ground water flow is generally influenced by the topography in the mine area.In general, the flow is from the higher ground in the south to lower lying areas in the north and towards water courses which occur in lower lying areas. The Tharisa Mine is underlain by a shallow upper weathered aquifer and a deeper fractured aquifer. The interface between these features is relatively impermeable. In the vicinity of the water courses, alluvium replaces the weathered overburden and the water courses do lose and gain water to the alluvium aquifer.Ground water is generally of good quality and can either be classified as ideal or good. Most of the boreholes in the vicinity of the mine are used for domestic and agricultural (livestock and irrigation) purposes.
4.8 Surface Water
The Tharisa Mine is located within the upper reaches of the A21K quaternary catchment, which falls within the Lower Crocodile Secondary catchment and the Crocodile West and Marico Water Management Area. The mine area is drained by the perennial Sterkstroom, which flows from the Buffelspoort Dam, south of the N4, in a northerly direction through the centre of the mine area and two unnamed non-perennial tributaries of the Brakspruit, an unnamed non-perennial tributary of the Maretlwane and an unnamed non-perennial tributary of the Elandsdriftspruit. Non-perennial tributaries of the Brakspruit traverse the western edge of the proposed mining area, the Maretlwane tributary originates in the eastern open pit, and the Elandsdriftspruit tributary traverses through the preferred tailings dam site and will need to be diverted for the project (Figure 4.8_1). Apart from the Sterkstroom, drainage lines within the mine area are not well defined and do not have distinct channels.
The run-off for the catchments associated with the mine area is not gauged. The mean annual runoff (MAR) was therefore simulated using rainfall-runoff response parameters from
SRT1.6A(i) SRT1.6B(i) SRT1.6C(i)

Coffey Mining (SA) Pty Ltd
Tharisa Mine Page: 24Competent Person’s Report - December 2013
WR90. The rainfall-runoff response of the catchment was assumed to be the same as the regional rainfall-runoff response as determined for quaternary catchment A21K and set out in WR90. According to Midgley et al (1994) the MAR for quaternary catchment A21K is 31.9Mm3/year. The normal dry weather flow for the non-perennial Elandsdriftspruit, Brakspruit and Maretlwane tributaries in the mine area is zero. The normal dry weather flow of the Sterkstroom is dependent on the rate of release from the Buffelspoort Dam situated about 3.25km upstream of the mine.
The regional maximum flood (RMF) peak flow rate was determined using Kovács method (1980). The peak flow rates and flood volumes calculated using the calculated flood peaks and the time of concentration for each catchment are also summarised in Table 4.8_1.
Table 4.8_1
Tharisa MineCalculated Peak Flow Rates and Flood Volumes
Catchment Area (km2)
Return period
1:20 1:50 1:100Regional Maximum Flood
RMF
Peak Flow Rate (m3/s)
Sterkstroom 140.3 314 444 544 1185
Elandsdriftspruit 3.3 25 35 43 181
Flood Volume (x106 m3)
Sterkstroom 140.3 7.36 10.39 12.73 -
Elandsdriftspruit 3.3 0.14 0.19 0.24 -
Flood lines for the Sterkstroom River were determined using the software package HEC-RAS River Analysis System version 3.1.3 (2005). Preliminary observations for the Sterkstroom indicate that the water quality is of a good quality. Water from the Sterkstroom is used for domestic purposes such as washing and bathing, livestock watering and for agricultural purposes. There are features that exhibit wetlands components within the mining area because of the associated biodiversity present. No pans or other wetlands occur in the mine area.

Coffey Mining (SA) Pty Ltd
Tharisa Mine Page: 25Competent Person’s Report - December 2013
Figure 4.8_1River Systems and Catchment Boundaries in the Mine Area
SRT1.6A(ii)
Coffey Mining (SA) Pty Ltd
Tharisa Mine Page: 26Competent Person’s Report - December 2013
4.9 Local Resources and Infrastructure
The Tharisa Mine is located 95km from Johannesburg and 35km east of the city of Rustenburg, which is a major centre for the platinum and chrome mining industries in the surrounding area. Rustenburg is located within the Rustenburg Local Municipality and Madibeng Local Municipalities and is part of the Bojanala Platinum District Municipality of the North West Province of South Africa. The city of Rustenburg serves as a base for providing a full range of urban amenities, including world class medical, educational, financial, retail and commercial services. Basic facilities and services are present within the immediate surrounding rural areas.

Coffey Mining (SA) Pty Ltd
Tharisa Mine Page: 27Competent Person’s Report - December 2013
5 HISTORY
5.1 Ownership History
Thari Resources (Pty) Ltd (Thari) which was incorporated in January 2005, acquired prospecting rights for chrome and PGMs over various portions of the property Kafferskraal 342JQ and to the property Rooikoppies 297JQ in March 2006. Thari is a HDSA and woman controlled company focused on the minerals and energy sectors.
In March 2006 Thari established Tharisa Minerals as a wholly owned subsidiary. In September 2008, the prospecting rights were transferred from Thari to Tharisa Minerals after obtaining the necessary Ministerial approval in terms of Section 11 of the MPRDA.
Tharisa plc was incorporated in February 2008 and after obtaining the necessary Ministerial approval acquired 74% of Tharisa Minerals on 9 February 2009. The remaining 26% is held by Thari (20%) and The Tharisa Community Trust (6%).
On 19 September 2008, the prospecting rights, for PGM and chrome, over various portions of Kafferskraal and the whole of Rooikoppies, held by Tharisa Minerals, were converted into amining right with the approval of the DMR. This mining right was registered to Tharisa Minerals on 13 August 2009. Subsequently, the mining right for chrome over portions 96 and 183 of the Kafferskraal 342 JQ was purchased from South African Producers and Beneficiators of Chrome Ore (Pty) Limited.
In July 2011, an application was granted in terms of Section 102 of the MPRDA, to amend the existing mining right by the addition of Portions 96, 183 and 286 of the property Kafferskraal 342JQ to the mining right 49/2009(MR).
5.2 Work undertaken by the Previous License Holders
Prior to Thari obtaining the prospecting rights, the only known exploration activities undertaken on the properties had been the regional mapping undertaken by the Geological Survey (now Council of Geoscience) and the drilling of six cored boreholes by an entrepreneur Mr Hennie Botha on Kafferskraal 342JQ and the adjacent property Spruitfontein 341JQ.
5.3 Historical Mineral Resources and Mineral Reserves
The mineral resource was initially estimated in 2008 and depleted based on the tonnage mined. The mineral resource reported as at September 2012 is presented in Table 5.3_1.The mineral reserve has been re-estimated a number of times utilising revised mining approaches and revised revenue and cost projections. The mineral reserve of September 2012 is reported in Table 5.3_2.
SRT1.3A(i) SVT2.4
SRT1.3B(i) SRT1.3C(i)

Coffey Mining (SA) Pty Ltd
Tharisa Mine Page: 28Competent Person’s Report - December 2013
Table 5.3_1
Mineral Resource Statement for the Tharisa Mine (30 September 2012)
MG4A CHROMITITE LAYER
Tonnage (Mt)
True Thick(m)
Bulk Density (t/m3)
Cr2O3(%)
6PGE+Au (g/t) Pt:Pd:Rh:Au:Ru:Os:Ir Cr:Fe 6PGE+Au
(koz) Ni
(ppm)
Measured 7,208 1.55 3.70 24.83 1.01 39:15:12:0:25:4:5 1.11 234 764
Indicated 15,753 1.59 3.70 24.51 1.04 39:15:12:0:25:4:5 1.10 525 766
Inferred 66,651 1.42 3.71 25.20 1.02 38:14:12:0:26:4:5 1.12 2,189 762
MG4 and MG4(0) CHROMITITE LAYER Package
Tonnage (Mt)
True Thick(m)
Bulk Density (t/m3)
Cr2O3(%)
6PGE+Au (g/t) Pt:Pd:Rh:Au:Ru:Os:Ir Cr:Fe 6PGE+Au
(koz) Ni
(ppm)
Measured 12,482 2.71 3.68 25.69 2.08 52:11:10:0:18:4:6 1.21 834 769
Indicated 31,618 3.25 3.63 24.24 2.02 52:11:10:0:18:4:6 1.20 2,054 719
Inferred 173,576 3.89 3.54 22.16 1.84 52:10:10:0:18:4:6 1.16 10,287 681
MG3 CHROMITITE LAYER
Tonnage (Mt)
True Thick(m)
Bulk Density (t/m3)
Cr2O3(%)
6PGE+Au (g/t) Pt:Pd:Rh:Au:Ru:Os:Ir Cr:Fe 6PGE+Au
(koz) Ni
(ppm))
Measured 4,721 1.22 3.73 26.75 2.26 46:11:17:0:17:3:5 1.20 343 818
Indicated 14,594 1.48 3.71 25.72 2.18 46:12:17:0:17:3:5 1.17 1,022 788
Inferred 66,214 1.48 3.71 25.43 2.24 45:12:17:0:17:3:5 1.13 4,761 788
MG2 CHROMITITE LAYER
Tonnage (Mt)
True Thick(m)
Bulk Density (t/m3)
Cr2O3(%)
6PGE+Au (g/t) Pt:Pd:Rh:Au:Ru:Os:Ir Cr:Fe 6PGE+Au
(koz) Ni
(ppm)
Measured 14,406 4.07 3.58 15.43 1.93 56:15:8:0:13:4:4 0.96 894 728
Indicated 45,586 4.90 3.53 13.23 1.67 55:16:8:0:13:4:4 0.87 2,447 711
Inferred 321,721 7.81 3.44 9.30 1.18 54:16:8:0:14:4:4 0.68 12,233 650
MG1 CHROMITITE LAYER
Tonnage (Mt)
True Thick(m)
Bulk Density (t/m3)
Cr2O3(%)
6PGE+Au (g/t) Pt:Pd:Rh:Au:Ru:Os:Ir Cr:Fe 6PGE+Au
(koz) Ni
(ppm)
Indicated 14,504 1.27 3.91 33.45 1.28 26:17:9:0:37:6:6 1.35 598 810
Inferred 56,008 1.23 3.91 32.74 1.24 26:16:9:0:37:6:6 1.31 2,238 801
UG1 CHROMITITE LAYER
Tonnage (Mt)
True Thick(m)
Bulk Density (t/m3)
Cr2O3(%)
6PGE+Au (g/t) Pt:Pd:Rh:Au:Ru:Os:Ir Cr:Fe 6PGE+Au
(koz) Ni
(ppm)
Indicated 1,500 2.17 3.75 23.68 1.12 39
TOTAL MINERAL RESOURCE
Tonnage (Mt)
True Thick(m)
Bulk Density (t/m3)
Cr2O3(%)
6PGE+Au (g/t) Pt:Pd:Rh:Au:Ru:Os:Ir Cr:Fe 6PGE+Au
(koz) Ni
(ppm)
Measured 38,817 2.35 3.65 21.85 1.85 51:13:10:0:17:4:5 1.09 2,305 759
Indicated 123,555 2.47 3.64 21.46 1.67 49:14:11:0:18:4:5 1.06 6,685 732
Inferred 684,170 3.16 3.55 17.59 1.44 49:13:10:0:18:4:5 0.94 31,708 694
Total 846,542 3.00 3.57 18.35 1.49 49:13:10:0:18:4:5 0.97 40,698 703Note: The mineral resource is declared to a depth of 750m below surface.
The consideration of realistic eventual extraction necessitates that the mineral resource considers the MG Chromitite Layer to be a geological unit and that all platiniferous and chromiferous horizons will be mined and all PGM, Cu, Ni and Cr2O3 recovered.The UG1 Chromitite Layer is declared for the part that falls within the current proposed open pitThe mineral resource is reported inclusive of the mineral reserve
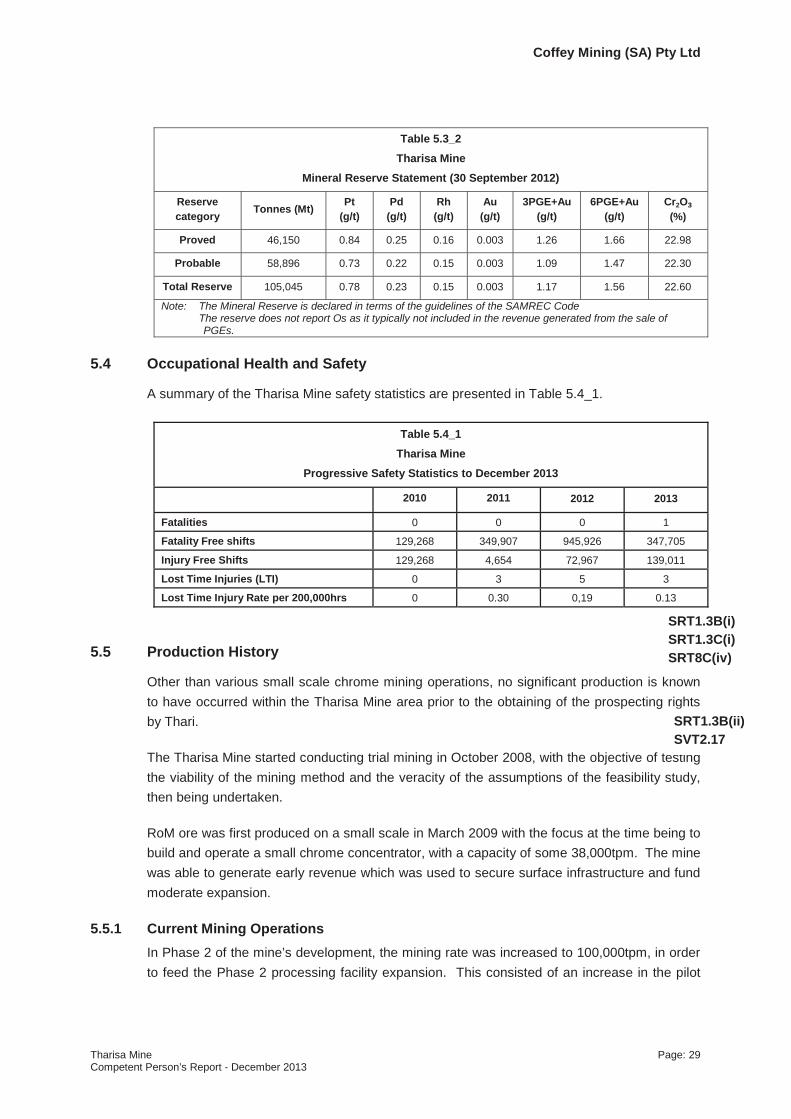
Coffey Mining (SA) Pty Ltd
Tharisa Mine Page: 29Competent Person’s Report - December 2013
Table 5.3_2 Tharisa Mine
Mineral Reserve Statement (30 September 2012)
Reservecategory Tonnes (Mt) Pt
(g/t)Pd
(g/t)Rh
(g/t)Au
(g/t)3PGE+Au
(g/t)6PGE+Au
(g/t)Cr2O(%)
Proved 46,150 0.84 0.25 0.16 0.003 1.26 1.66 22.98
Probable 58,896 0.73 0.22 0.15 0.003 1.09 1.47 22.30
Total Reserve 105,045 0.78 0.23 0.15 0.003 1.17 1.56 22.60
Note: The Mineral Reserve is declared in terms of the guidelines of the SAMREC CodeThe reserve does not report Os as it typically not included in the revenue generated from the sale of PGEs.
5.4 Occupational Health and Safety
A summary of the Tharisa Mine safety statistics are presented in Table 5.4_1.
Table 5.4_1Tharisa Mine
Progressive Safety Statistics to December 2013
2010 2011 2012 2013
Fatalities 0 0 0 1
Fatality Free shifts 129,268 349,907 945,926 347,705
Injury Free Shifts 129,268 4,654 72,967 139,011
Lost Time Injuries (LTI) 0 3 5 3
Lost Time Injury Rate per 200,000hrs 0 0.30 0,19 0.13
5.5 Production History
Other than various small scale chrome mining operations, no significant production is known to have occurred within the Tharisa Mine area prior to the obtaining of the prospecting rights by Thari.
The Tharisa Mine started conducting trial mining in October 2008, with the objective of testing the viability of the mining method and the veracity of the assumptions of the feasibility study,then being undertaken.
RoM ore was first produced on a small scale in March 2009 with the focus at the time being to build and operate a small chrome concentrator, with a capacity of some 38,000tpm. The mine was able to generate early revenue which was used to secure surface infrastructure and fund moderate expansion.
5.5.1 Current Mining OperationsIn Phase 2 of the mine’s development, the mining rate was increased to 100,000tpm, in order to feed the Phase 2 processing facility expansion. This consisted of an increase in the pilot
SRT1.3B(i) SRT1.3C(i) SRT8C(iv)
SRT1.3B(ii) SVT2.17

Coffey Mining (SA) Pty Ltd
Tharisa Mine Page: 30Competent Person’s Report - December 2013
plant throughput capacity to 100,000tpm as well as the incorporation of a PGM recovery circuit and additional chrome scavenging circuit. The Phase 2 processing facility was commissioned in February 2012. A 300,000tpm concentrator was commissioned to treat the increased RoM production in parallel to the existing 100,000tpm Phase 2 plant. The current mine capacity is 4.8Mtpa.
The historical mine production is presented in Figure 5.5.1_1:
As at 31 December 2013. the Tharisa Mine has produced 2,095,000t of 42% Cr2O3
chromite concentrate
The mining cost is currently R205 per Run of Mine (RoM) tonne
Tharisa Mine has secured sufficient supply of water and electricity to meet it’s requirementsfor steady state production for the LoM.
Figure 5.5.1_1Graph showing the Historical Mining Production from the UG1 and MG Chromitite Layers
Mining is being undertaken by the Tharisa Mine’s appointed mining contractor – MCC.
While the Phase 2 and 3 process facility expansions were underway, mine production waslimited to 38,000tpm of RoM ore throughput. With the commissioning of the 100,000t plant in February 2012, and the 300,000tpm plant in December 2012, RoM production has increased to 380,000tpm.
The depth of mining is currently up to 29m and the mine is producing fresh material from the six MG Chromitite Layers, namely the MG4A, MG4, MG3, MG2, MG1 and MG0. The shallow MG1 Chromitite Layer was mined underground to a limited extent on the eastern boundary of the property by the previous mining right holder.
0
50,000
100,000
150,000
200,000
250,000
300,000
350,000
400,000
450,000
Jun-
09
Oct
-09
Feb-
10
Jun-
10
Oct
-10
Feb-
11
Jun-
11
Oct
-11
Feb-
12
Jun-
12
Oct
-12
Feb-
13
Jun-
13
Oct
-13
ROM
Ton
nage
Pro
duct
ion
per m
onth
MG1 CL
MG2 CL
MG3 CL
MG4 CL
MG4A CL
UG1 CL

Coffey Mining (SA) Pty Ltd
Tharisa Mine Page: 31Competent Person’s Report - December 2013
The current mine plan is based on two open pit operations east and west of the Sterkstroom river which runs north south through the Tharisa Mine area. The pits are designed to protect the water course and the local infrastructure running parallel to the river. Currently RoMproduction is 380,000tpm.
The open pits will fulfil the production requirements until 2032, after which time production will transition to underground bord and pillar mining. The last open pit tonnage will be mined in 2038.
The mine design and schedule was completed by Ukwazi Mining Solutions (Proprietary) Limited (Ukwazi). The production profile has been designed to ensure steady ore to the processing facility.
5.5.2 Current Metallurgical ProductionThe historical production from the Tharisa processing facilities is presented in Figure 5.5.2_1.
Figure 5.5.2_1Graph of the Historical Metallurgical Production
As at 31 December 2013 a RoM stockpile of 56,500t existed with an additional stockpile of crushed material of 21,100t. The historical tailings from the chrome plant (arising prior to the commissioning of the Phase 2 plant, and therefore containing recoverable PGMs and chrome)
0%
5%
10%
15%
20%
25%
30%
35%
40%
45%
-
50,000
100,000
150,000
200,000
250,000
300,000
350,000
400,000
Oct
-09
Jan-
10
Apr-
10
Jul-1
0
Oct
-10
Jan-
11
Apr-
11
Jul-1
1
Oct
-11
Jan-
12
Apr-
12
Jul-1
2
Oct
-12
Jan-
13
Apr-
13
Jul-1
3
Oct
-13
Chro
miti
e Yi
eld
(%)
Prod
uctio
n To
nnag
e pe
r Mon
th
Metallurgical Production from the MG Chromitite Layers
Processed (t) Chrome produced (t) Chromite Yield (%)

Coffey Mining (SA) Pty Ltd
Tharisa Mine Page: 32Competent Person’s Report - December 2013
have been stockpiled separately for future treatment through the PGM recovery section. As at 31 December 2013 the PGM stockpile tonnage is estimated to be some 539,400t. This stockpile will eventaully be processed for chromite and PGM’s.
5.5.3 Mine PersonnelThe Tharisa Mine’s current staffing levels are summarised in Table 5.5.3_1.
Table 5.5.3_1Tharisa Mine
Summary of Current Mine Staffing Levels (December 2013)
Category In Service Planned Category In Service
Planned
General Management 9 11 Process 80 85
Technical Management 10 13 Operations 161 171
Safety 6 6 Engineering 81 91
Human Resources 32 40 IT 4 4
Finance 20 20 Security 2 2
Total Tharisa Minerals 402 444

Coffey Mining (SA) Pty Ltd
Tharisa Mine Page: 33Competent Person’s Report - December 2013
6 GEOLOGICAL SETTING
6.1 Regional Setting
The stable Kaapvaal and Zimbabwe Cratons in southern Africa are characterised by the presence of large mafic to ultramafic layered complexes, the best known of which are the Great Dyke in the Zimbabwe Craton and the Bushveld and Molopo Complexes in the Kaapvaal Craton. By far the largest, best-known and economically most important of these is the Bushveld Complex, which was intruded about 2,060 million years ago into rocks of the Transvaal Supergroup, largely along an unconformity between the Magaliesberg quartzite of the Pretoria Group and the overlying Rooiberg felsites. The total estimated extent of the Bushveld Complex is some 66,000 km2, of which about 55% is covered by younger formations. The mafic rocks of the Bushveld Complex host layers rich in PGM, chromium and vanadium, and constitute the world's largest known resource of these metals.
6.1.1 Bushveld Complex Stratigraphy The mafic rocks (collectively termed the Rustenburg Layered Suite) can be divided into five zones known as the Marginal, Lower, Critical, Main and Upper Zones from the base upwards (Figure 6.1.1_1).
The Marginal Zone is comprised of generally finer grained rocks than those of the interior of the Bushveld Complex and contains abundant xenoliths of country rock. It is highly variable in thickness and may be completely absent in some areas and contains no known economic mineralisation.
The Lower Zone is dominated by orthopyroxenite with associated olivine-rich cumulates in the form of harzburgites and dunites. The Lower Zone may be completely absent in some areas.
The Critical Zone is characterised by regular and often fine-scale rhythmic, or cyclic, layering of well-defined layers of cumulus chromite within pyroxenites, olivine-rich rocks and plagioclase-rich rocks (norites, anorthosites etc). The economically important PGM deposits are part of the Critical Zone.
The Critical Zone hosts all the chromitite layers of the Bushveld Complex, of which up to 14 have been identified. The first important cycle is the lower of the two Upper Group (UG) Chromitite Layers (the UG1 Chromitite Layer). This unit consists of a chromitite layer and underlying footwall chromitite layers that are interlayered with anorthosite. The most important of the chromite cycles for PGM mineralisation is the upper of the two UG Chromitite Layers (the UG2 Chromitite Layer) which averages some 1m in thickness and is mined throughout the Bushveld Complex.
Underlying the UG Chromitite Layers are the MG Chromitite Layers which consists of five groups of chromitite layers over an overall thickness of 50 – 80m. These chromitite layers are important as they contain significant concentrations of chromite and PGMs.
SRT1.2A(i) SRT1.2B(i) SRT1.4A(i) SRT1.4A(ii) SVT2.5
SRT4.1A(i)

Coffey Mining (SA) Pty Ltd
Tharisa Mine Page: 34Competent Person’s Report - December 2013
Figure 6.1.1_1Generalised Stratigraphic Column of Rustenburg Layered Suite, Bushveld Complex
(after Viljoen and Schürmann, 1998)
The two uppermost units of the Critical Zone are the Merensky and Bastard units. The former is also of great economic importance as it contains at its base the PGM-bearing Merensky Reef, a feldspathic pyroxenitic assemblage with associated thin chromitite layers that rarely exceeds 1m in thickness. The top of the Critical Zone is generally defined as the top of the robust anorthosite (the Giant Mottled Anorthosite) that forms the top of the Bastard cyclic unit.
UPPERZONE
MARGINALZONE
UPPER CRITICAL ZONE
MAIN ZONE
LOWER CRITICAL ZONE
LOWER ZONE
m
7 000 -
8 000 -
6 000 -
2 000 -
3 000 -
4 000 -
5 000 -
1 000 -
0 -
GabbroOlivine diorite Anorthosite
GabbroAnorthositeNoritePyroxenite
AnorthositeNoritePyroxenite
PyroxeniteHarzburgiteDunite
PyroxeniteHarzburgiteDunite
Norite
Pyroxenite Marker
Merensky Reef
Merensky Reef
UG2
UG1
MG4
MG3
MG2
MG1
LG7
LG6 & LG6A
LG5
Coffey Mining (SA) Pty Ltd
Tharisa Mine Page: 35Competent Person’s Report - December 2013
The Critical Zone may be subdivided into the Upper and Lower Critical Zones based on the last appearance of cumulus feldspar. This boundary is considered to be between the UG and MGChromitite Layers.
The economically viable chromite reserves of the Bushveld Complex, most of which are hosted in the Critical Zone, are estimated at 68% of the world's total, whilst the Bushveld Complex also contains 56% of all known platinum group metals. The Merensky Reef, which developed near the top of the Critical Zone, can be traced along strike for 280km and is estimated to contain 60,000t of PGM to a depth of 1 200m below surface. The pyroxenitic Platreef mineralisation, north of Mokopane (formerly Potgietersrus), contains a wide zone of more disseminated style platinum mineralisation, along with higher grades of nickel and copper than occur in the rest of the Bushveld Complex.
The well-developed Main Zone consists of norites grading upwards into gabbronorites. Itincludes several mottled anorthosite layers in its lower sector and a distinctive pyroxenite layer two thirds of the way up, termed the Pyroxenite Marker.
The base of the overlying Upper Zone is defined by the first appearance of cumulus magnetite above the Pyroxenite Marker. In all, 25 layers of cumulus magnetite punctuate the Upper Zone, the fourth (Main Magnetite layer) being the most prominent. This is a significant marker, some 2m thick, resting upon anorthosite, and is exploited for its vanadium content in the eastern and western limbs of the Bushveld Complex.
6.1.2 Platinum MineralisationThe Merensky Reef has traditionally been the most important platinum producing layer in the Bushveld Complex. Seismic surveys undertaken by the Council for Geoscience indicate that reflectors associated with the Merensky Reef can be traced as far as 50km down dip, to depths of 6,000m below surface. The Merensky Reef varies considerably in its nature, but can be broadly defined as a mineralised zone within, or closely associated with the ultramafic cumulate at the base of the Merensky cyclic unit.
In addition to the PGM mineralisation associated with the Merensky Reef, all chromitites in the Critical Zone at times contain elevated concentrations of PGMs. The UG2 Chromitite Layer is the only chromitite layer that is significantly exploited for PGMs at present.
The major geological features that affect the UG2 Chromitite Layer are faults, dykes, potholes and mafic/ultramafic pegmatites. Potholes are features of subsidence or erosion where the igneous layer is absent or occurs at a lower elevation in a modified form. Typically the PGMconcentration and the thickness of the layer are modified. Potholes typically approach a circular shape. Potholes occur within all stratigraphic units of the Bushveld Complex including the MGChromitite Layer. Poor ground conditions may be associated with potholes and pothole edges.On some mines, such as Bokoni (formerly known as Atok) and Northam, potholes may cause a geological loss of ground of up to 25%.
Another unique feature of the geology of the Bushveld Complex is the mafic/ultramafic pegmatites sometimes referred to as iron rich ultramafic pegmatites (IRUP’s) or replacement pegmatites. While these often destroy the structure of the chromitite layer, the PGMs may be

Coffey Mining (SA) Pty Ltd
Tharisa Mine Page: 36Competent Person’s Report - December 2013
unaffected. However, it can result in a mining problem, especially underground, as it becomes difficult to identify the mineralised horizons.
6.1.3 Chromite MineralisationThe first record of chrome in the Bushveld Complex is noted as an outcrop in the Hex River near Rustenburg in 1865. By the 1920s the various chromitite layers had been identified and traced over the known extent of the Bushveld Complex. Chromite mining started in earnest at about that time but it was not until the 1960s that South Africa became a major producer.
The Bushveld Complex hosts stratiform chromite deposits that are present as layers of massive chromitite. These layers are present in the Critical Zone and have been designated as the Lower Group (LG), MG and UG Chromitite Layers. The lower Critical Zone is host to the LG Chromitite Layers that consists of seven chromitite layers. The thickest and most significant being the LG6 Chromitite Layer. The MG Chromitite Layers consist of five individual chromite packages of which three are in the lower Critical Zone and two are in the upper Critical Zone.There are two UG Chromitite Layers with the UG2 Chromitite Layer being the most significant as a major source of PGM mineralisation.
Although remarkably consistent and continuous across the Bushveld Complex, the variations along strike have allowed the definition of 14 sections each with a unique character. The Tharisa Mine is located in the Marikana Section.
The LG6, MG1 and UG2 Chromitite Layers are the most exploited because of their mineralogical composition and because they can be mined by mechanised equipment both in open pit and underground. The LG6 Chromitite Layer is typically up to 1.05m thick and has a Cr2O3 grade of 46% to 48% and a Cr:Fe ratio of 1.56 – 1.60. Locally the LG Chromitite Layers may have much higher Cr:Fe ratios such as at Grasvaley (2.13 – 2.83) and Nietverdeind (1.88 – 2.06). The grade at Nietverdiend ranges from 48% to 51% Cr2O3.
The UG2 Chromitite Layer is typically up to 1m thick and has a Cr2O3 grade of 43.6% and a Cr:Fe ratio of 1.26 to 1.40. It has a significant PGM grade and so has been mined extensively to recover the PGMs.
The MG1 Chromitite Layer has been sporadically mined with the largest underground mining section being immediately east of the Tharisa Mine and mined by Samancor.
6.2 Local Geology
6.2.1 Tharisa Mine AreaThe Tharisa Mine is located on the south-western limb of the Bushveld Complex in the Marikana section, on the properties Kafferskraal 342JQ and Rooikoppies 297JQ. The Marikana section is separated from the Brits section to the east by Wolhulterskop and the Rustenburg section to the west by the Spruitfontein upfold (Figure 6.2.1_1).
The MG Chromitite Layers outcrop on Kafferskraal striking roughly east - west and dipping at 12-15° to the north to a depth estimated at over 1,000m. The total strike length is some 5,400m but only the first 3,900m has been declared in the mineral resource statement as the most westerly part is considered too narrow to be considered to have a “reasonable and realistic prospects for eventual economic extraction” (SAMREC, 2009). Towards the western extent of
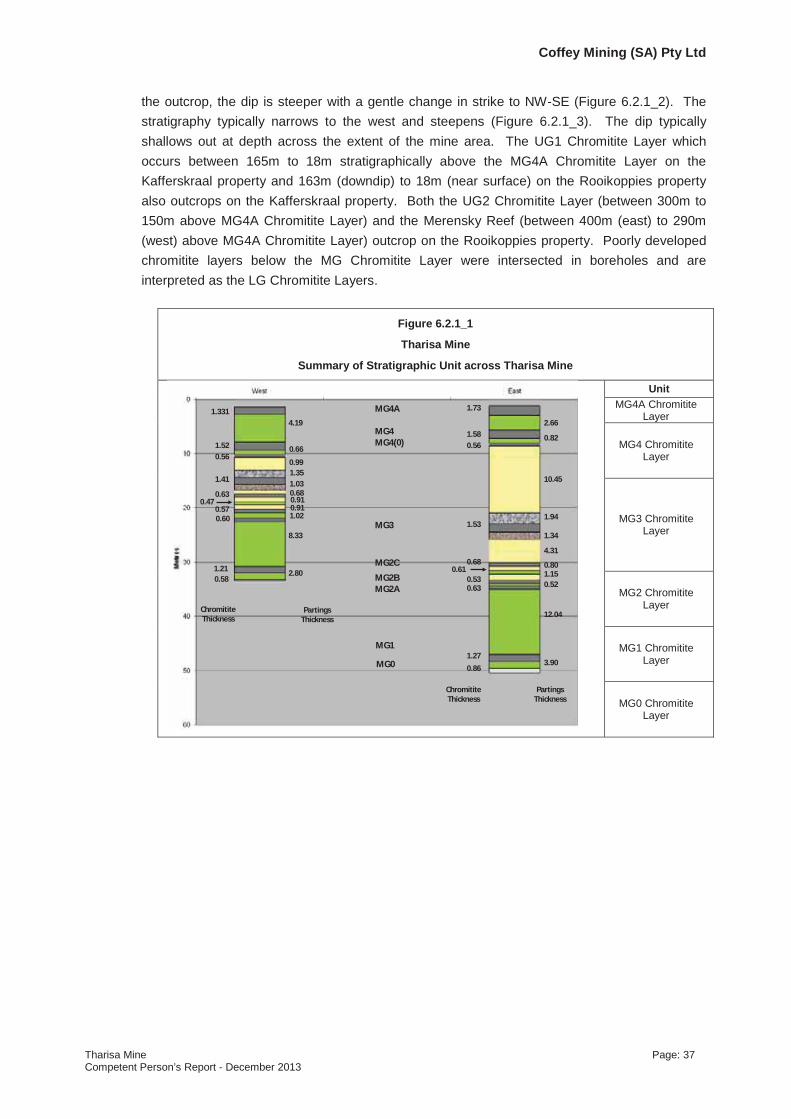
Coffey Mining (SA) Pty Ltd
Tharisa Mine Page: 37Competent Person’s Report - December 2013
the outcrop, the dip is steeper with a gentle change in strike to NW-SE (Figure 6.2.1_2). The stratigraphy typically narrows to the west and steepens (Figure 6.2.1_3). The dip typically shallows out at depth across the extent of the mine area. The UG1 Chromitite Layer which occurs between 165m to 18m stratigraphically above the MG4A Chromitite Layer on the Kafferskraal property and 163m (downdip) to 18m (near surface) on the Rooikoppies property also outcrops on the Kafferskraal property. Both the UG2 Chromitite Layer (between 300m to 150m above MG4A Chromitite Layer) and the Merensky Reef (between 400m (east) to 290m (west) above MG4A Chromitite Layer) outcrop on the Rooikoppies property. Poorly developed chromitite layers below the MG Chromitite Layer were intersected in boreholes and are interpreted as the LG Chromitite Layers.
Figure 6.2.1_1
Tharisa Mine
Summary of Stratigraphic Unit across Tharisa Mine
UnitMG4A Chromitite
Layer
MG4 Chromitite Layer
MG3 Chromitite Layer
MG2 Chromitite Layer
MG1 Chromitite Layer
MG0 Chromitite Layer
MG4A
MG4MG4(0)
MG3
MG2C
MG2BMG2A
MG1
1.73
1.580.56
1.53
0.68
0.530.63
1.27
Chromitite Thickness
Partings Thickness
2.66
0.82
1.94
4.31
0.80
12.04
1.15
Chromitite Thickness
Partings Thickness
1.331
1.520.56
0.63
1.41
0.600.57
1.21
10.45
4.19
0.66
0.68
0.99
0.91
8.33
MG0 0.86
1.34
0.52
0.61
3.90
1.351.03
0.911.02
2.800.58
0.47

Coffey Mining (SA) Pty Ltd
Tharisa Mine Page: 38Competent Person’s Report - December 2013
Figure 6.2.1_2
Map of the Western Bushveld Complex showing the location of the Tharisa Mine

Coffey Mining (SA) Pty Ltd
Tharisa Mine Page: 39Competent Person’s Report - December 2013
Figure 6.2.1_3
Borehole locations and outcrop positions of UG1 and MG1 Chromitite Layers represented on a Google Image of the Tharisa Mine
6.2.2 Middle Group Chromitite Layers The MG Chromitite Layer package consists of five groups of chromitite layers (the MG0 Chromitite Layer, MG1 Chromitite Layer, the MG2 Chromitite Layer (subdivided into C, B and Achromitite layers), the MG3 Chromitite Layer and the MG4 Chromitite Layer (subdivided into the 4(0), 4 and 4A chromitite layers) (Figure 6.2.2_1). The MG0 Chromitite Layer may be defined but formation of these chromitites is very erratic, thin and generally considered uneconomical in the mine area. However, where the MG1 Chromitite Layer immediately above is mined, there is merit in mining the MG0 Chromitite Layer as well. The MG0 Chromitite Layer Mineral Resource is declared for the area of the planned open pit.
The MG Chromitite Layer package (MG1 Chromitite Layer to MG4A Chromitite Layer) is developed over an average thickness of 74m in the East but thins to 50m in the West. The average thickness of the various units and subunits and a summary of the composite statistics are presented in Table 6.2.2_1. Down dip all partings thickness increase except for the MG4A – MG4 Chromitite Layer parting that decreases downdip. Figure 6.2.2_2 and Figure 6.2.2_3 are schematic representations of the variation within the MG Chromitite Layer packages and the parting thicknesses along strike and down dip respectively.
The entire MG and LG Chromitite Layers are truncated by the UG2 Chromitite Layer in the west at the neighbouring Spruitfontein upfold. The UG2 Chromitite Layer is reported to have a pothole morphology where it overlies the Transvaal Sequence rocks and truncates the MG and LG Chromitite Layers.

Coffey Mining (SA) Pty Ltd
Tharisa Mine Page: 40Competent Person’s Report - December 2013
Figure 6.2.2_1
Generalised Stratigraphic Column of the MG Chromitite Layer at the Tharisa Mine
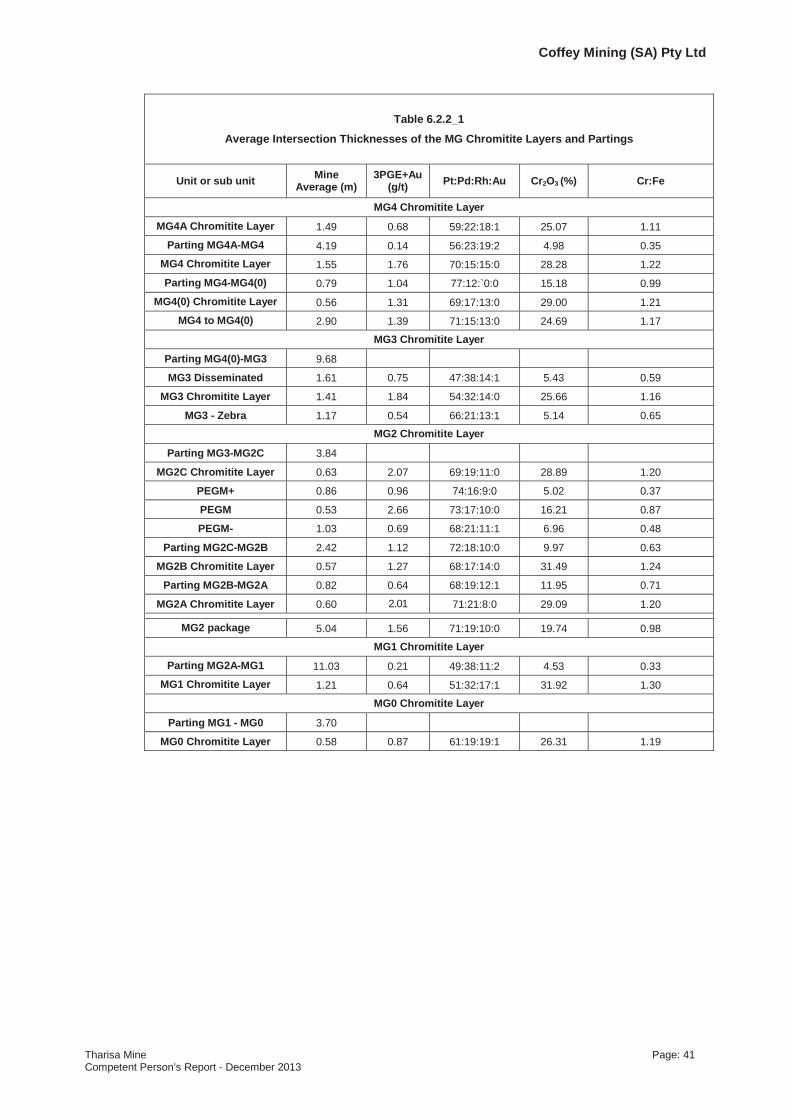
Coffey Mining (SA) Pty Ltd
Tharisa Mine Page: 41Competent Person’s Report - December 2013
Table 6.2.2_1
Average Intersection Thicknesses of the MG Chromitite Layers and Partings
Unit or sub unit MineAverage (m)
3PGE+Au(g/t) Pt:Pd:Rh:Au Cr2O3 (%) Cr:Fe
MG4 Chromitite Layer
MG4A Chromitite Layer 1.49 0.68 59:22:18:1 25.07 1.11
Parting MG4A-MG4 4.19 0.14 56:23:19:2 4.98 0.35
MG4 Chromitite Layer 1.55 1.76 70:15:15:0 28.28 1.22
Parting MG4-MG4(0) 0.79 1.04 77:12:`0:0 15.18 0.99
MG4(0) Chromitite Layer 0.56 1.31 69:17:13:0 29.00 1.21
MG4 to MG4(0) 2.90 1.39 71:15:13:0 24.69 1.17
MG3 Chromitite Layer
Parting MG4(0)-MG3 9.68
MG3 Disseminated 1.61 0.75 47:38:14:1 5.43 0.59
MG3 Chromitite Layer 1.41 1.84 54:32:14:0 25.66 1.16
MG3 - Zebra 1.17 0.54 66:21:13:1 5.14 0.65
MG2 Chromitite Layer
Parting MG3-MG2C 3.84
MG2C Chromitite Layer 0.63 2.07 69:19:11:0 28.89 1.20
PEGM+ 0.86 0.96 74:16:9:0 5.02 0.37
PEGM 0.53 2.66 73:17:10:0 16.21 0.87
PEGM- 1.03 0.69 68:21:11:1 6.96 0.48
Parting MG2C-MG2B 2.42 1.12 72:18:10:0 9.97 0.63
MG2B Chromitite Layer 0.57 1.27 68:17:14:0 31.49 1.24
Parting MG2B-MG2A 0.82 0.64 68:19:12:1 11.95 0.71
MG2A Chromitite Layer 0.60 2.01 71:21:8:0 29.09 1.20
MG2 package 5.04 1.56 71:19:10:0 19.74 0.98
MG1 Chromitite Layer
Parting MG2A-MG1 11.03 0.21 49:38:11:2 4.53 0.33
MG1 Chromitite Layer 1.21 0.64 51:32:17:1 31.92 1.30
MG0 Chromitite Layer
Parting MG1 - MG0 3.70
MG0 Chromitite Layer 0.58 0.87 61:19:19:1 26.31 1.19

Coffey Mining (SA) Pty Ltd
Tharisa Mine Page: 42Competent Person’s Report - December 2013
Figure 6.2.2_2
Along strike section showing the variations in MG Chromitite Layer partings
Figure 6.2.2_3
Downdip section showing the variations in MG Chromitite Layer partings

Coffey Mining (SA) Pty Ltd
Tharisa Mine Page: 43Competent Person’s Report - December 2013
Description of the MG0 Chromitite Layer
Some dissemination and more chromitite layers and stringers are developed in the footwall pyroxenite of the MG1 Chromitite Layer. These are termed the MG0 Chromitite Layer. The number of stringers and layers vary and little consistency was noticed within the MG0 Chromitite Layer.
Description of the MG1 Chromitite Layer
At the base of the MG Chromitite Layer Package is the MG1 Chromitite Layer (1.3m thick) with a feldspathic pyroxenite developed above for some 12m and which underlies the MG2 Chromitite Layer. The MG1 Chromitite Layer is typically a massive chromitite with minor feldspathic pyroxenite partings or layering. In some areas the MG1 Chromitite Layer has developed into two chromitite layers separated by a feldspathic pyroxenite. A textural feature called mottling is common in both the MG1 Chromitite Layer and MG2B Chromitite Layer. The mottles reflect large rounded individual silicate crystals (5mm in diameter), called oikocrysts (Schurmann, 1998). The MG1 Chromitite Layer becomes thinner to the west with a transition from 1.3m thick in the east to an average of 0.75m thick in the west. The MG1 Chromitite Layer has a relatively simple structure.
Borehole intersections and trench exposures clearly demonstrate that the MG1 Chromitite Layer thins towards the NW near surface and eventually disappears. Although outcrop of the MG1 Chromitite Layer disappears, it was intersected again downdip below 50m depth. It is not uncommon for the MG1 Chromitite Layer to split into more than one layer. The facies outlines defined are single, multiple (where the MG1 Chromitite Layer splits into various bands), thinning and missing (Figure 6.2.2_4). Shearing in and around the MG1 Chromitite Layer is common and can occasionally be present in the hanging wall but is more common within the MG1 Chromitite Layer or its immediate footwall.

Coffey Mining (SA) Pty Ltd
Tharisa Mine Page: 44Competent Person’s Report - December 2013
Figure 6.2.2_4
MG1 Chromitite Layer and MG1 Shear facies outlines
Mined out areas indicated with rehabilitated pits shown in blue
The MG1 Chromitite Layer carries the highest Cr content of all the MG Chromitite Layers with an average Cr2O3 grade of 33.9% and a Cr:Fe ratio of 1.34. The PGM concentration is low (0.6g/t 3PGM+Au). A definite geochemical signature is recognised where the top contact of the MG1 Chromitite Layer has the highest PGM concentrations grading down linearly to its bottom contact (Figure 6.2.2_5).
Midway between the MG1 Chromitite Layer and the overlaying MG2A Chromitite Layer, a thin chromitite stringer or some chromite dissemination is typically present within the felspathic pyroxenite. Figure 6.2.2_6 shows the parting/middling thickness between the MG1 and the MG2 Chromitite Layers.

Coffey Mining (SA) Pty Ltd
Tharisa Mine Page: 45Competent Person’s Report - December 2013
Figure6.2.2_5
Typical MG1 Chromitite Layer Cr2O3 and 3PGE+Au geochemical signature

Coffey Mining (SA) Pty Ltd
Tharisa Mine Page: 46Competent Person’s Report - December 2013
Figure 6.2.2_6
Thickness isopachs for the parting between MG2A and MG1 Chromitite Layers

Coffey Mining (SA) Pty Ltd
Tharisa Mine Page: 47Competent Person’s Report - December 2013
Description of the MG2 Chromitite Layer
The MG2 Chromitite Layer (some 4.6m thick) consists of three groupings of chromitite layers which from the base are the MG2A Chromitite Layer (0.6m thick), MG2B Chromitite Layer (0.6m thick) and the MG2C Chromitite Layer (0.6m thick). The partings are typically feldspathic pyroxenite with the parting between the MG2A Chromitite Layer and MG2B Chromitite Layer being on average 0.5m thick. The parting between the MG2B Chromitite Layer and MG2C Chromitite Layer is typically 2.4m thick and includes a platiniferous chromitite stringer (PGEM). Some 5.6m above the MG2C Chromitite Layer is the MG3 Chromitite Layer. The parting is generally an anorthosite or norite which forms the overlaying Anorthosite Marker.
The MG2A Chromitite Layer separates from the MG2B Chromitite Layer towards the NW along strike and downdip, with more than a metre separation closer to surface and up to 9m further downdip. Figure 6.2.2_7 presents the parting thickness between the MG2B and MG2A Chromitite Layers.
Figure 6.2.2_7
Thickness (Down Hole Intersection Length) isopachs for the parting between MG2B and MG2A Chromitite Layers
The MG2A and MG2B Chromitite Layers occasionally form a single chromitite layer but can be distinguished by a definite analytical signature. PGM concentrations are much higher in the MG2C and MG2A Chromitite Layers (±2g/t (3PGE+Au)) with a much lower concentration in the MG2B Chromitite Layer (±1g/t (3PGE+Au)). A few chromitite stringers, disseminated chromite within the middling pyroxenite and sometimes a chromitite layer at the base of these stringers, appear between the MG2C and MG2B Chromitite Layers. These have been coded PGEM and carry the highest concentration of PGMs within the MG2 Chromitite Layer at approximately 4g/t (3PGE+Au). A typical geochemical signature is presented in Figure 6.2.2_8. Typically an increase in PGM concentration from the MG2C Chromitite Layer top contact to the MG2C

Coffey Mining (SA) Pty Ltd
Tharisa Mine Page: 48Competent Person’s Report - December 2013
Chromitite Layer bottom contact can be noted. The MG2A Chromitite Layer displays the opposite signature.
Figure 6.2.2_8
Typical MG2 Chromitite Layer Cr2O3 and 3PGE+Au geochemical signature
The Anorthosite Marker (ANM), a prominent anorthosite, norite or a combination of the two, separates the MG2 Chromitite Layer from the overlying MG3 Chromitite Layer. Chromitite stringers are often present within the marker close to the top and bottom contacts and they may have high PGM concentration.

Coffey Mining (SA) Pty Ltd
Tharisa Mine Page: 49Competent Person’s Report - December 2013
Description of the MG3 Chromitite Layer
The MG3 Chromitite Layer is occasionally a massive chromitite layer but more often a very irregular, assemblage of chromitite layers and stringers within a norite and/or anorthosite, which is difficult to correlate. The top of the package typically consists of thin chromitite stringers and dissemination of chromite in norite which develops into a more massive layer at the base. Due to numerous chromitite layers and stringers comprising the MG3 Chromitite Layer, it is not easy to define the core of the MG3 Chromitite Layer package or the most appropriate mining unit.The mining unit is defined largely by the presence of massive chromitite. The upper or lower limits of the mining cut was defined where the immediate hanging or footwall becomes largely noritic or anorthositic with disseminations of chromite. This typically correlates with the reduction in PGM concentration. The chromitite is mineralised with PGM bearing minerals with the disseminated chromite bearing lithologies being much less mineralised or barren. The top contact of the MG3 Chromitite Layer is not always very clearly defined and hence the use of the bottom contact as the reference contact.
The mining cut of the MG3 Chromitite Layer (1.5m thick) consists of a chromitite with disseminated chromite in a norite or anorthosite immediately above and below the chromitite (Figure 6.2.2_9). The PGM concentrations are very erratic and no definite geochemical signature is defined (Figure 6.2.2_9).
Above the massive MG3 Chromitite Layer, a layer containing disseminated chromitite with an average thickness of 1.6m has been identified. This unit has sufficient lateral continuity that it has been possible to identify it in within the open pit and within exploration boreholes. The unit is referred to as the MG3 Disseminated or Hangingwall and coded as MG3D.
Immediately below the massive MG3 Chromitite Layer a zone in which chromitite layers are developed between layer of anorthosite and norite or disseminated within these lithologies, is developed. This zone is also of sufficient lateral continuity such that it has been possible to identify and was considered of economic significance. The zone is referred to as the MG3 Zebra because of the stripey appearance.
Based on geological and geochemical features, various facies of the MG3 Chromitite Layer can be defined (Figure 6.2.2_10). The MG4(0) Chromitite Layer is some 12m above the MG3 Chromitite Layer.

Coffey Mining (SA) Pty Ltd
Tharisa Mine Page: 50Competent Person’s Report - December 2013
Figure 6.2.2_9
Typical MG3 Chromitite Layer Cr2O3 and 3PGE+Au geochemical signature

Coffey Mining (SA) Pty Ltd
Tharisa Mine Page: 51Competent Person’s Report - December 2013
Figure 6.2.2_10
Facies defined for the MG3 Chromitite Layer
Description of the MG4 Chromitite Layer and MG4(0) Chromitite Layer
The MG4 Chromitite Layer consists of a lower chromitite (MG4(0) Chromitite Layer) (approximately 0.6m thick) immediately overlain by a norite (approximately 0.85m thick) followed by the chromitite layer of the MG4 Chromitite Layer (approximately 1.8m thick), overlain by another parting, of feldspathic pyroxenite composition, some 3.2m thick and finally overlain by the chromitite of the MG4A Chromitite Layer (approximately 1.5m thick).
The MG4 Chromitite Layer is consistent throughout the property in that it has a pyroxenite hangingwall and a norite footwall. At its base a chromitite layer (or layers) - the MG4(0) Chromitite Layer. This subdivision is based on a geochemical signature which does not necessarily correspond to an obvious parting above the last chromitite layer.
The MG4 Chromitite Layer has a relatively simple structure similar to the MG1, MG2 and MG3 Chromitite Layers.
Both the MG4 and MG4(0) Chromitite Layers may comprise more than one chromitite layer. The parting between MG4 and MG4(0) Chromitite Layers is mostly a norite with disseminated chromite or disseminated chromite in pyroxenite. The parting is up to 2m thick at its thickest but can also be entirely absent. Based on the geology of the MG4 and MG4(0) Chromitite Layers, various facies are defined (Figure 6.2.2_11).

Coffey Mining (SA) Pty Ltd
Tharisa Mine Page: 52Competent Person’s Report - December 2013
Figure 6.2.2_11
Facies defined for the MG4(0) and MG4 Chromitite Layers
The typical geochemical signatures of MG4 and MG4(0) Chromitite Layers are presented in Figure 6.2.2_12. The PGM concentration of the MG4(0) Chromitite Layer is approximately 1.3g/t (3PGE+Au) lower than the grade of the MG4 Chromitite Layer which has a PGMconcentration of approximately 1.7g/t (3PGE+Au).
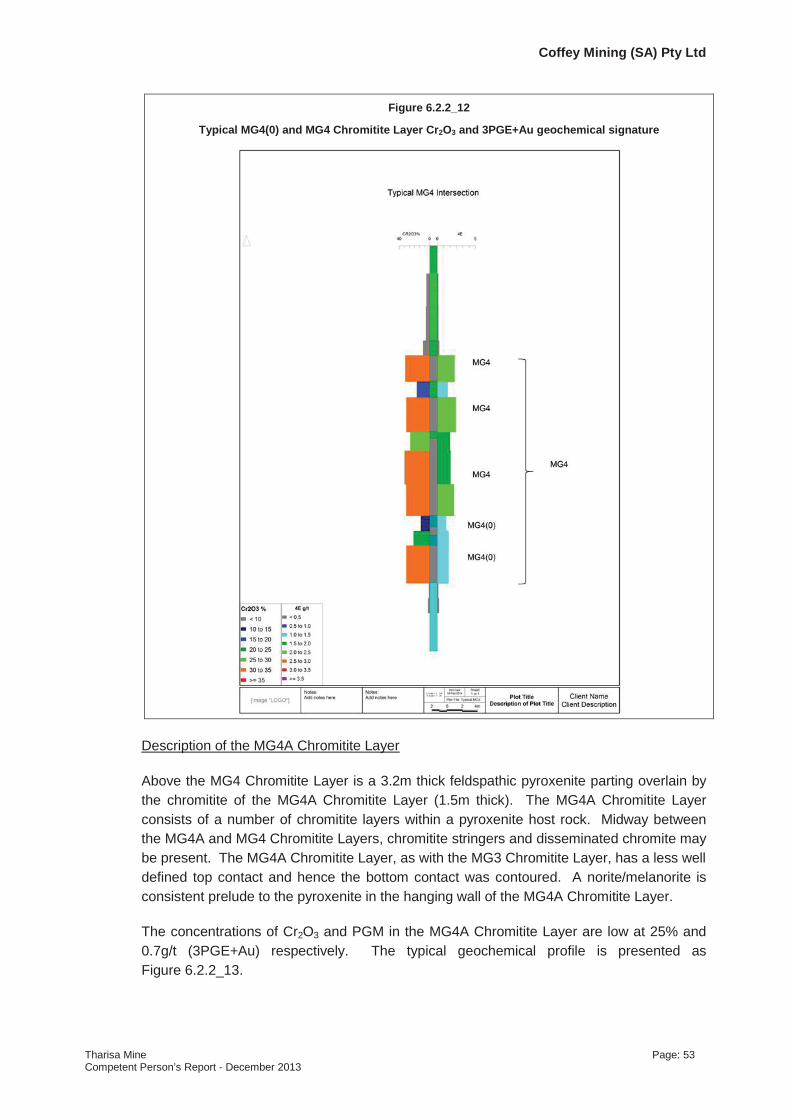
Coffey Mining (SA) Pty Ltd
Tharisa Mine Page: 53Competent Person’s Report - December 2013
Figure 6.2.2_12
Typical MG4(0) and MG4 Chromitite Layer Cr2O3 and 3PGE+Au geochemical signature
Description of the MG4A Chromitite Layer
Above the MG4 Chromitite Layer is a 3.2m thick feldspathic pyroxenite parting overlain by the chromitite of the MG4A Chromitite Layer (1.5m thick). The MG4A Chromitite Layer consists of a number of chromitite layers within a pyroxenite host rock. Midway between the MG4A and MG4 Chromitite Layers, chromitite stringers and disseminated chromite may be present. The MG4A Chromitite Layer, as with the MG3 Chromitite Layer, has a less well defined top contact and hence the bottom contact was contoured. A norite/melanorite is consistent prelude to the pyroxenite in the hanging wall of the MG4A Chromitite Layer.
The concentrations of Cr2O3 and PGM in the MG4A Chromitite Layer are low at 25% and 0.7g/t (3PGE+Au) respectively. The typical geochemical profile is presented as Figure 6.2.2_13.

Coffey Mining (SA) Pty Ltd
Tharisa Mine Page: 54Competent Person’s Report - December 2013
Figure 6.2.2_13
Typical MG4A Chromitite Layer Cr2O3 and 3PGE+Au geochemical signature
6.3 Geology of the UG1 Chromitite Layer
The UG1 Chromitite Layer is stratigraphically situated in the Upper Critical Zone and is well developed in the Bushveld Complex. It comprises the massive chromitite, chromitiferous pyroxenite, bands of anorthosite, chromitite and norites and stringers of chromitites. The UG1 Chromitite Layer has a strike direction of east-west and dips to the north with the dip varyingfrom 10º in the east to 25º in the west (Figure 4.1_1).

Coffey Mining (SA) Pty Ltd
Tharisa Mine Page: 55Competent Person’s Report - December 2013
Figure 6.3_1
Outcrop positions of the Middle Group, UG1 and UG2 Chromitite Layers at the Tharisa Mine
The thickness of the UG1 Chromitite Layer ranges from few centimetres up to 3m in places.The lenses of anorthosite and pyroxenite are seen impregnated with numerous chromite grains in places. The hanging wall changes from pyroxenite to anorthositic norites. The footwall is formed by bifurcated bands of anorthosite and chromite lenses.

Coffey Mining (SA) Pty Ltd
Tharisa Mine Page: 56Competent Person’s Report - December 2013
At Tharisa Mine, the UG1 Chromitite Layer has three distinguishable facies:
Full UG1 Chromitite Layer
Normal Reef
Split Reef Facies
Figure 6.3_2
Schematic Diagram of the UG1 Chromitite Layer Model
6.3.1 Full UG1 Chromitite LayerThis facies contributes 1% of the UG1 Chromitite Layer at Tharisa Mine. It is more prevalent to the west. It comprises a single massive chromitite layer with an average thickness of 2.5m.
6.3.2 Normal ReefThe Normal Reef facies of the UG1 Chromitite Layer comprises the massive chromitite with 10 to 100cm internal waste. The top and bottom chromitite layers have different geochemistry signatures suggesting that they were formed under different conditions and from different sources. The thicknesses of top and bottom layers differ considerably throughout the property.The thickness varies from 0.5m to 1.50m per layer.
This facies contribute 95% of the UG1 Chromitite Layer in the property.
6.3.3 Split Reef FaciesThe Split Reef facies contributes 4% of the UG1 Chromitite Layer at Tharisa. It comprises of numerous layers of chromitite, anorthosite and pyroxenite as shown in Figure 6.3.3_2.
The UG1 Chromitite Layer is affected by geological structures such as reef rolls, faults, potholing, intrusives such as iron-rich ultramafic pegmatites and dykes.

Coffey Mining (SA) Pty Ltd
Tharisa Mine Page: 57Competent Person’s Report - December 2013
Figure 6.3.3_1
Structures in the UG1 Chromitite Layer
6.4 Structure
The structural interpretation of the Tharisa Mine area is based on the aeromagnetic data and the drilling data. The MG Chromitite Layers at the Tharisa Mine are a stack of tabular deposits.
An Air Tractor 402A aircraft was used to conduct a high resolution aeromagnetic survey over the Tharisa Mine area during August 2007 (Figure 6.4_1). Total field magnetics were calculated with the use of 2 Cesium Vapour magnetometers. A DTM was constructed using real time differential GPS and a laser altimeter. A total of 900 line-km were covered. The survey lines were 0 degrees (true north) with 100m spacing. Tie lines perpendicular to the survey lines were spaced at 500m. Sample spacing was at 6.5m along the flight lines and ground clearance was 40m.
The only significant fault in the mine area is a steeply dipping NW-SE trending normal fault (Figure 6.4_1) with a downthrow of less than 30m to the east. This fault occurs only on the far north-eastern corner of the property and will have little effect on mining of the MG Chromitite Layers on Kafferskraal. This fault was confirmed in both Lonmin underground operations and Samancor stopes.
A low angled WNW-ESE trending thrust fault (Lonmin interpretation) is a prominent lineation on the aeromagnetic image. The fault is expected to have little impact on the mining of the MG Chromitite Layers.
A NE-SW striking sub-vertical dyke of approximately 10m thickness was interpreted from the aeromagnetic survey. This dyke was not fully intersected in any of the boreholes but was intersected in the East Mine box-cut and is 11m wide.
A NE-SW trending sub-vertical shear is exposed in the far eastern pit on Kafferskraal. Evidence of this shear was seen in boreholes K94, K6A and K20. It is evident as a lineation on the aeromagnetic survey. The MG1 Chromitite Layer thickness is reduced around the shear.Future open pit activities are not affected as the thinned MG1 Chromitite Layer has already been exploited in the area around the shear.

Coffey Mining (SA) Pty Ltd
Tharisa Mine Page: 58Competent Person’s Report - December 2013
An aeromagnetic anomaly north of the MG Chromitite outcrops, following the north-westerly curve along strike is interpreted as the anorthosite and norite in the UG1 Chromitite Layer footwall.
The only other major structural feature of interest is the Spruitfontein upfold or pothole to the west of the Tharisa Mine. It affects the UG2 Chromitite Layer as well as the rest of the Critical Zone below. The area around the pothole which is on the adjacent property was not accessible to further investigation.

Cof
fey
Min
ing
(SA)
Pty
Ltd
Thar
isa
Min
eP
age:
59C
ompe
tent
Per
son’
s R
epor
t - D
ecem
ber 2
013
Figu
re 6
.4_1
Map
Sho
win
g H
igh
Res
olut
ion
Aero
mag
netic
Sur
vey
Inte
rpre
tatio
n
N
-284
9000
-284
9000
-284
5000
-284
5000
44004400
5100 5100

Coffey Mining (SA) Pty Ltd
Tharisa Mine Page: 60Competent Person’s Report - December 2013
7 EXPLORATION AND DRILLING
7.1 Previous Exploration
The Tharisa Mine area has been explored for its mineral potential since the early 1900s.Initially this was in the form of erratic exploration activities which included trenching and small open pits.
7.2 Exploration by Thari
The mineral resource estimate is based predominately on a diamond drilling exploration programme managed by Coffey in 2007. Trenching was undertaken and utilised for geological understanding and geological modelling. Drilling for metallurgical sampling purposes was also undertaken but the associated assay data was not included in this modelling.
7.3 Trenching and Pit Excavations
Various trenches were historically excavated on both the UG1 and the MG Chromitite Layers.During the 2007 exploration programme additional trenching was undertaken on the MG Chromitite Layers. The MG Chromitite Layers were previously exploited from three known pits, excavated by previous tenement holders and which remain unrehabilitated. An additional two pits, one on portion 96 (Kafferskraal 342JQ) and another on portions 361/362(Kafferskraal 342JQ), were excavated and exposed the lower half of the MG Chromitite Layer package and were subsequently rehabilitated (backfilled). A sixth pit was opened and backfilled during 2007 on portion 286 of Kafferskraal 342JQ. The details of these excavations are presented in Figure 7.3_1. A photograph taken in 2006 of the pit on portion 286 (Kafferskraal 342JQ) is presented in Figure 7.3_2. The MG1 Chromitite Layer was mined out underground by Samancor on the eastern side of the Kafferskraal property.
SRT1.2B(i) SRT1.4A(i) SRT2.1A(i)
SRT2.2A(ii)

Coffey Mining (SA) Pty Ltd
Tharisa Mine Page: 61Competent Person’s Report - December 2013
Figure 7.3_1Map Showing Distribution of the Historic Boreholes, Various Pits and the Stoped Out MG1 Chromitite
Layer on the Eastern Side of Kafferskraal 342JQ.
Pits shown in blue have been rehabilitated

Coffey Mining (SA) Pty Ltd
Tharisa Mine Page: 62Competent Person’s Report - December 2013
Figure 7.3_2
Photograph of Pit Sidewall showing the relationship of the various MG Chromitite Layers(Pit on Portion 286)
7.4 Drilling
Six diamond boreholes were drilled during January 1997 by a local entrepreneur, Mr Hennie Botha, in the northwest part of Kafferskraal 342JQ property (K01, K02 and K03) and on the adjacent property, Spruitfontein 341JQ (BSB01, BSB02 and BSB03). A report was subsequently compiled by LW Schurmann. The only data available from this explorationprogramme are five of the logs included in the report. The core was not made available to Coffey. The original logs provide insufficient and inaccurate detail compared to geology of diamond boreholes drilled nearby during the 2007 Thari drilling programme. The collar positions could also not be verified. The data is therefore considered unreliable and was not included in the mineral resource estimate.
Five NQ diameter, vertical diamond boreholes totalling 654m were drilled along strike on Kafferskraal during 2006 by Thari under the supervision of Coffey. One TNW diameter diamond borehole (K4M1) was drilled 5m away from K4 for metallurgical testwork. The collar positions of these boreholes were surveyed by Clive Macintosh Surveys.
A total of 121 vertical boreholes and 23 deflections, representing 22,500m of drilling were completed in the period from March 2007 to October 2007 (Figure 7.4_1). Drilling was mainly of NQ (47.50mm) diameter except for 18 boreholes of TNW (60.4mm) diameter completed for metallurgical testwork. Four deep boreholes drilled on Rooikoppies were drilled BQ
SRT2.2A(i) SRT2.2A(ii) SRT3.2B(i)

Coffey Mining (SA) Pty Ltd
Tharisa Mine Page: 63Competent Person’s Report - December 2013
(36.27mm) diameter. A total of 13 NQ diameter deflections were drilled off some mother boreholes for lithological comparison. Ten TNW diameter deflections were drilled to contribute bulk material for the metallurgical testwork. Shallow percussion boreholes were drilled along the full strike extent on the MG1 Chromitite Layer, on the Kafferskraal property, to accurately demarcate it. A total of 31 boreholes were drilled (see orange coloured collars in Figure 7.4_1); the boreholes averaged 15m in depth. All borehole locations were clearly marked with cement beacons and a PVC rod. However, where the land has since been cultivated or illegally occupied, the beacons have been either displaced or destroyed.
The drilling programme was designed so that boreholes would intersect the base of the MG1 Chromitite Layer at approximately 30m, 60m, 120m, 180m, 300m, 500m and 1000m below surface. A line of boreholes that intersected at 220m below surface later added for greater coverage of the deposit. The drilling programme was designed to drill the deposit closest to the outcrop at higher density than further downdip so that the subsequent mineral resource estimate close to the outcrop could confidently be declared as an indicated and/or measured mineral resource in preparation for a feasibility study and the consideration of open pit mining.The programme for the deeper boreholes on the Rooikoppies property where Lonmin was then mining the Merensky Reef and UG2 Chromitite Layer, was revised due to various difficulties relating to siting the boreholes to avoid holing into existing underground infrastructure. Fewer, more widely spaced boreholes were therefore drilled.
Two fence lines (oriented in the down dip direction) were drilled with TNW diameter core for metallurgical test purposes, intersecting the chromitite layers at 10m depth increments down to 60m below surface on the MG4 Chromitite Layer. These boreholes are shown in red on Figure 7.4_1 as KM101 to KM120.
Two NQ boreholes, K96 and K24, were drilled at the request of Coffey for geotechnical logging, sampling and to conduct rock strength tests.
Six sterilisation boreholes (K100 and K124 to K128 indicated in cyan, Figure 7.4_1) were drilled around the proposed civil engineering sites which coincide with the LG6 Chromitite Layer outcrop. One borehole, K95, was drilled to intersect both the MG Chromitite Layer package and the LG Chromitite Layer package.
A total of 10 boreholes (in dark blue Figure 7.4_1) were drilled on the Rooikoppies property to test the extension of the MG Chromitite Layer package down dip.
The X, Y and Z coordinates of all drill collars have been accurately determined by a qualified surveyor of Trevor Cufflin Surveys cc. Downhole surveys were undertaken on all the boreholes drilled deeper than 120m by Reflex Africa.
The surface topography data was generated from an airborne survey.
All diamond drilling was undertaken by reputable drilling contractors to industry standard.Core recoveries were estimated to average >95%. Intersections of mineralisation with lower
Coffey Mining (SA) Pty Ltd
Tharisa Mine Page: 64Competent Person’s Report - December 2013
than 95% core recovery were redrilled. Core recovery over the MG1 Chromitite Layer averaged 80% due to the presence of a fault gouge commonly present or adjacent to the MG1 Chromitite Layer. The fault gouge within the more competent rock rendered core loss inevitable.
7.5 Logging of Boreholes
A detailed geological log of each borehole was undertaken. A geotechnician marked 1m intervals on the core with a black paint marker prior to logging by a geologist. Core was logged in detail, coding the various lithologies, dip angles, grain size, rock texture, alteration, weathering, mineralisation and structures. Chromitite layers were assigned friability (friable, semi-friable or hard) and were coded in a separate stratigraphic column on the logsheets.
Data from these hardcopy logsheets were captured into a SABLE database and validated.
For all chromitite layer intersections below 60m depth a rock quality designation (RQD) wascalculated starting 20m above the reef top contact. A RQD for each drill run length was calculated. Intersections within the run length with joints/fractures less than 10cm apart were measured with a clinorule and all these lengths were added together and the total then subtracted from the total drill run length. A percentage of intact core (>10cm pieces) was then recorded as the RQD for that run length.
7.6 Sampling and Data Verification
After logging, representative samples over various chromitite layer intersections were marked out on the core with a paint marker. Unique sample numbers were assigned and information for each sample recorded in a sample ticket book. Core with samples marked out was photographed with a digital camera both dry and wet. Subsequently the core was cut in half vertically along its length and across to obtain the marked out samples. Only half core was submitted for analyses. The other half was retained in the core tray for future reference.
The focus during sampling was to choose sample intervals according to lithologies in order to separate the chromitite from the host rock. Each designated unit (MG1, MG2, MG3, MG4(0) and MG4 Chromitite Layer) was sampled such that the geochemistry of the unit could be investigated.
SRT2.3A(i) SRT2.3B(i) SRT2.3C(i)
SRT2.3A(i) SRT2.3B(i) SRT2.3C(i) SRT3.1A(i) SRT3.1A(ii) SRT3.2A(i) SRT3.2A(ii) SRT3.2A(iii) SRT3.2A(iv) SRT3.2A(v) SRT3.2A(vi)

Cof
fey
Min
ing
(SA)
Pty
Ltd
Thar
isa
Min
eP
age:
65C
ompe
tent
Per
son’
s R
epor
t - D
ecem
ber 2
013
Figu
re 7
.4_1
Loca
tion
Plan
for D
rillin
g Pr
ogra
mm
e on
the
Thar
isa
Min
e
Coffey Mining (SA) Pty Ltd
Tharisa Mine Page: 66Competent Person’s Report - December 2013
The units were sampled as indicated below:
The MG4 Chromitite Layer was sampled continuously from the top of MG4A Chromitite Layer to the base of MG4(0) Chromitite Layer separating the chromitite within into different samples.
The MG3 Chromitite Layer was sampled continuously from the bottom to the top contact.
The MG2 Chromitite Layer was sampled continuously from the base of the MG2A Chromitite Layer to the top of the MG2C Chromitite Layer. The sampling was also undertaken so as to obtain the geochemical signatures of the chromitite layers separately from the partings.
The MG1 Chromitite Layer and MG0 Chromitite Layer were sampled continuously from the bottom contact to the top contact.
Two non-mineralised footwall and hangingwall samples were taken.
Sample intervals varied from an absolute minimum of 15cm for NQ core (20cm for BQ) to a maximum of 50cm. Chromitite samples included a 0.5 to 2cm host rock margin to avoid PGMand chrome loss during the core cutting process. This is the recognised standard for sampling of PGM deposits in the industry
Quality control monitoring protocols involved submission of sample blanks, duplicates and certified standards with the core sample batches. AMIS0010 and SARM8 were originally alternated as standards but AMIS0010 was later replaced with AMIS0006 due to lack of availability of AMIS0010.
Each sample was bagged separately with a numbered ticket inside the bag and the sample number also written on the outside of the sample bag. A dispatch form was submitted along with samples to ensure the total number of samples and correct sample numbers were recorded.
The sampling methodology is appropriate and supports the mineral resource estimate and classification made.
7.6.1 Analytical ProceduresAnalyses were undertaken by Genalysis, a certified laboratory. Genalysis is an accredited Laboratory with the South African National Analytical Standards (SANAS) with reference number T0464-11-2013.
Sample preparation was undertaken in the Genalysis facility in Johannesburg prior to a pulp being air freighted to Genalysis Perth for analysis. The sample preparation was undertaken using a jaw crusher to crush samples to minus 10mm in size. Pulverising of the samples wasundertaken to achieve 85% minus 75 m in size. All samples were assayed for PGM by 7E NiS/MS and for base metals by ICP Fusion D/OES.
SRT3.3A(i) –SRT3.3A(v) SRT3.4A(i) -SRT3.4A(iv)

Coffey Mining (SA) Pty Ltd
Tharisa Mine Page: 67Competent Person’s Report - December 2013
Detection limits are presented in Table 7.6.1_1.
Table 7.6.1_1
Detection Limits Applicable to Tharisa Mine Data
ElementDetection Limit
(ppb)Element
Detection Limit(ppm)
Pt 2 Cu 20Pd 2 Ni 20Rh 1 Cr 50Ru 2 Os 2 Ir 2
Au 5
The assay techniques used are considered appropriate for the PGM and base metal analyses and the mineral resource estimate.
7.6.2 Analytical Quality Control Data A comprehensive QA/QC programme was undertaken. The QA/QC programme identifies various aspects of the results that could have negatively influenced the subsequent resource estimate. It was possible to identify samples that had been swapped, missing samples, incorrect labelling amongst other aspects. Further, the QA/QC aims to confirm both the precision and accuracy of the laboratory and thereby confirm that the data used in the mineral resource estimate is of sufficient quality.
The control samples used comprised of two different certified standards, a blank and a duplicate for every 20 samples submitted. The intended aim was 5% coverage for each of the control sample types. Further control on data integrity was achieved through re-submittal of not less than 5% of the total samples to a referee laboratory (SGS Lakefield, Johannesburg).The quality control data was analysed on an on-going basis and generated numerous queries with the laboratory. All queries were satisfactorily resolved.
SGS Lakefield is an accredited Laboratory with the South African National Analytical Standards (SANAS) with reference number T0107-10-2013.
Definition of terms related to the QA/QC protocols applied and subsequent evaluations are provided below:
A standard is a reference sample with a known (statistically) element abundance and standard deviation. Reference standards are used to gauge the accuracy of analytical reporting by comparing the pre-determined values to those reported by the laboratory used during an exploration project.
SRT3.4A(ii) - SRT3.4A(iv)

Coffey Mining (SA) Pty Ltd
Tharisa Mine Page: 68Competent Person’s Report - December 2013
A blank is a standard with abundance of the element of interest below the level of detection of the analytical technique.
A duplicate is the split of a sample taken at a particular stage of the sampling process; e.g. Field Duplicate.
The precision and accuracy will be discussed in terms of the following statistical measures routinely applied by Coffey:-
Thompson and Howarth Plot showing the mean relative percentage error of grouped assay pairs across the entire grade range, used to visualise precision levels by comparing against given control lines.
Rank HARD Plot, which ranks all assay pairs in terms of precision levels measured as half of the absolute relative difference from the mean of the assay pairs (HARD), used to visualise relative precision levels and to determine the percentage of the assay pairs population occurring at a certain precision level.
Mean vs HARD Plot, used as another way of illustrating relative precision levels by showing the range of HARD over the grade range.
Mean vs HRD Plot is similar to the above, but the sign is retained, thus allowing negative or positive differences to be computed. This plot gives an overall impression of precision and also shows whether or not there is significant bias between the assay pairs by illustrating the mean percent half relative difference between the assay pairs (mean HRD).
Correlation Plot is a simple plot of the value of assay 1 against assay 2. This plot allows an overall visualisation of precision and bias over selected grade ranges. Correlation coefficients are also used.
Quantile-Quantile (Q-Q) Plot is a means where the marginal distributions of two datasets can be compared. Similar distributions should be noted if the data is unbiased.

Coffey Mining (SA) Pty Ltd
Tharisa Mine Page: 69Competent Person’s Report - December 2013
7.6.3 Assay Quality Control Data Assessment The quality control protocol required the use of two different certified standards, a blank and a coarse reject duplicate for every 20 samples. The intended aim was 5% coverage of each control. In addition some 5% of the samples were analysed by a referee laboratory (SGS Lakefield) (Table 7.6.3_1)
Table 7.6.3_1Summary of the Number of Control Samples
Submitted Samples ProportionStandard SARM8 567 11,344 4.9%Standard AMIS0006 240 11,344 2.1%Standard AMIS0010 324 11,344 2.9%Coarse Reject Duplicates 563 11,344 4.9%Blanks 571 11,344 5.0%Referee samples (pulps) 483 9,079 (actual samples) 5.3%Referee control samples (pulps) 119 2,265 (control samples) 5.3 %
Blanks
Blanks (washed silica sand) were introduced with each batch submitted to the laboratory to monitor contamination in the crushing process and pulverisation stages. Some 100g of blank material was supplied for each blank sample included in the sample batch.
The blanks were introduced at a frequency of 1 in 20 (5%).
Standards
The precision of laboratory results during the drilling/sampling programme were monitored with the use of two commercial standards supplied by Mintek in Johannesburg (SARM 8) and African Mineral Standards in Johannesburg (AMIS0006 and AMIS0010). Some 50g of standard material was supplied for each standard sample included in the sample batch. The standards were not crushed or milled as they were sufficiently fine grained (pulps). In addition the laboratory introduced their own standards for internal quality control purposes.
The standards were selected for the anticipated average PGM grade and a suitable matrix.Both selected standards are derived from UG2 Chromitite Layer in the Bushveld Complex.
Standards were introduced at a frequency of 1 in 20 (5%) or greater.
Duplicates
Duplicates were generated from the coarse rejects by the sample preparation laboratory. Adesignated sample was crushed and riffle split to provide a duplicate rather than resubmitting duplicates from previous sample batches. This was deemed to be the most practical method of providing duplicates due to the volume of samples being submitted and the remote location of the mine area.
Coffey Mining (SA) Pty Ltd
Tharisa Mine Page: 70Competent Person’s Report - December 2013
Duplicates were introduced at a frequency of 1 in 20 (5%) or greater.
Inter-Laboratory Analyses (Referee checks)
Pulps were submitted to an independent laboratory (SGS Lakefield) for comparative analysis.
7.6.4 Chain of custody – Responsibility and accountabilityThe full chain of custody was implemented for the sample submission by the geologists to the analytical laboratory.
The details of the samples to be submitted were recorded on standard documentation on site.The samples were checked by sampling personnel and the geologists prior to shipment. All details were provided on the despatch notes.
The assay certificates were e-mailed to the Project Geologist as csv files. Cross checking of the assay certificates with the results was possible as these included details of each batch including the shipment codes.
7.6.5 Relative Density Determinations Bulk density data determinations were derived via the Archimedean ‘weight in air/weight in water’ technique, using an appropriate procedure and an accurate balance. The core is essentially impermeable and contains no vugs or voids. These density determinations are therefore considered appropriate for bulk density. In total, 8,814 bulk density measurements were taken, representing samples submitted for chemical analysis and representing the various lithologies of the MG Chromitite Layers. The data was collected from all diamond drill boreholes in the latest drilling campaign.
7.7 UG1 Chromitite Layer
The UG1 Chromitite Layer was not logged in detail in the previous drilling campaigns as it was not deemed economic. In 2012, the core was relogged and sampled to determine the nature of the UG1 Chromitite Layer and allow the estimation of a mineral resource. An outcrop position of the UG1 Chromitite Layer was projected based on the present mining of the UG1 Chromitite Layer and the borehole intersections.
The layers have a north-south dip direction. All drilled boreholes on the northern side of the outcrop intersected the Layer at the anticipated depths; an indication of continuity of mineralization and consistency in dip angle. All boreholes that intersected the UG1 Chromitite Layer were logged and sampled. The logging was done 1m above and below the UG1 Chromitite Layer.
7.7.1 Sampling Methodology Representative samples over various UG1 Chromitite Layer intersections were marked out on the core with a paint marker. Unique sample numbers were assigned and information for each sample recorded in a sample ticket book. Core with samples marked out was
SRT2.4A(i) SRT2.4A(ii) SRT2.4B(i) SRT2.4B(ii) SRT2.4B(iii) SRT2.4C(i)
SRT2.3A(i) SRT2.3B(i) SRT2.3C(i)
SRT3.1A(i) -SRT3.1A(ii) SRT3.2A(i) –SRT3.2A(vi)

Coffey Mining (SA) Pty Ltd
Tharisa Mine Page: 71Competent Person’s Report - December 2013
photographed with a digital camera both dry and wet. Subsequently the core was cut in half vertically along its length and across to obtain the marked out samples. Only half core was submitted for analyses. The other half remained in the core tray for future reference.
The focus during sampling was to choose sample intervals according to lithologies in order to separate the mineralized layer from the host rock.
Sample intervals varied from an absolute minimum of 15cm for NQ core (20cm for BQ) to a maximum of 35cm. Chromitite samples included a 0.5 to 2cm host rock margin to avoid PGMand chrome loss during the core cutting process. This is the recognised standard for sampling of chromitite and PGM deposits in the industry
Quality control monitoring protocols involved submission of sample blanks, duplicates and certified standards with the core sample batches.
Each sample was bagged separately with the ticket number inside and the sample number also written on the outside of the sample bag. A dispatch form was submitted along with samples to ensure the total number of samples and correct sample numbers were recorded.
The sampling methodology is appropriate and supports the mineral resource estimate and classification made.
7.7.2 Analytical ProceduresSample preparation was undertaken in the SGS Lakefield laboratory in Johannesburg. The sample preparation was undertaken using a jaw crusher to crush samples to minus 10mm in size. Pulverising of the samples is undertaken to achieve 85% minus 75 m in size.
Analyses were undertaken by SGS Lakefield, a certified laboratory. All samples wereassayed for major oxides by XRF fusion and PGM by 6E NiS/MS. Selected samples were analysed for base metals by ICP Fusion D/OES.
The assay techniques used are considered appropriate for the major elements, PGM and base metal analyses and suitable for use in a mineral resource estimate.
7.7.3 Chain of Custody – Responsibility and accountabilityThe full chain of custody was implemented for the sample submission by the geologists to the analytical laboratory. The details of the samples to be submitted were recorded on standard documentation on site. The samples were checked by sampling personnel and the geologists prior to shipment. All details were provided on the despatch notes. The assay certificates were e-mailed to the Geologist as csv and pdf files. Cross checking of the assay certificates with the results was possible as these included details of each batch.
SRT3.3A(i) – SRT3.3A(v) SRT3.4A(i) - SRT3.4A(ii)

Coffey Mining (SA) Pty Ltd
Tharisa Mine Page: 72Competent Person’s Report - December 2013
7.7.4 Bulk Density Measurements Bulk density data determinations were derived via the Archimedean ‘weight in air/weight in water’ technique, using an appropriate procedure and an accurate balance. The core is essentially impermeable and contains no vugs or voids. These density determinations are therefore considered appropriate for bulk density. In total, 534 bulk density measurements were taken representing samples submitted for chemical analysis and representing the various lithologies of the UG1 Chromitite Layers. The density measurements were not taken from sheared and fractured cores as they are permeable.
7.8 Summary
The geological, collar and downhole survey data is considered to conform to international standards and to be suitable for use in a mineral resource estimation. The assay data are considered acceptable in terms of both assay precision and accuracy.
Coffey is not aware of any sample technique and data audits and reviews other than reported above.
SRT3.4A(iv)

Coffey Mining (SA) Pty Ltd
Tharisa Mine Page: 73Competent Person’s Report - December 2013
8 MINERAL RESOURCE ESTIMATION
8.1 Database
8.1.1 Borehole Database Development Coffey was commissioned to manage the drill programme in 2007. The following key digital data relevant to the resource estimation study was compiled by Coffey:-
A borehole database that included collar location, downhole survey, assay, and geology data was compiled.
Bulk density data and documentation.
Assay quality control data.
In November 2013, Coffey updated the borehole database utilising the knowledge gained during the exploration phase in 2008 and the subsequent knowledge gained during the open pit mining operation. The update consisted of the coding and re-coding of the various stratigraphic layers that constitute the MG Chromitite Layer packages and adding additional codes for units for which a better understanding had been gained. The following are new units that were not present in the initial database.
The MG4AD Layer which consists of disseminated mineralisation identified above the MG4A Chromitite Layer.
The MG3D Layer which consists of disseminated mineralisation has been defined. It is located directly above the primary MG3 Chromitite Layer.
The MG3 Zebra Layer has been defined. It consists of an accumulation of thinly laminated chromitite layers located directly below the MG3 Chromitite Layer.
Sub units within the parting between the MG2C and MG2B Chromitite Layers have been identified. These are as follows:
A layer named the PGEM Layer has been identified as within the parting.
Between this layer and the MG2C Chromitite Layer above is the PGEM+ Layer.
Between the PGEM Layer and the MG2B Chromitite Layer below is the PGEM- Layer.
8.1.2 Borehole Database ValidationThe drilling data was reviewed and validated prior to the resource evaluation studies.
The following general activities were undertaken during database validation:-
Ensuring compatibility of total borehole depth data in each of the collar, survey, assay and geology database files.
During the drilling programme the geological model was continuously updated and the boreholes validated on an individual basis.
Inspections of the borehole core and consideration of the assay data to ensure understanding of the mineralisation and eliminate problems with the correlation of assay results and geology.
Checking of borehole survey data for unusual or suspect downhole deviations.
SRT1.2B(i) SRT2.1A(i) SRT2.1B(i) SRT8B(ii) SRT8B(iii) SVT2.6

Coffey Mining (SA) Pty Ltd
Tharisa Mine Page: 74Competent Person’s Report - December 2013
Ensuring sequential downhole depth and interval data in the survey, assay and geology files.
Replacements of “less than detection limit” character entries with nominal low-grade values (half detection limit).
Coding and re-coding of the various stratigraphic layers of the borehole database utilising the knowledge gained during the exploration phase in 2008 and the subsequent knowledge gained during the open pit mining operation.
8.1.3 Assay Quality Control Data Assessment The quality control protocol implemented during the exploration drilling required the use of two different certified standards, a blank and a coarse reject duplicate for every 20 samples. The intended aim was 5% coverage of each control. In addition some 5% of the samples were analysed by a referee laboratory (SGS Lakefield) (Table 7.6.3_1)
8.1.4 ConclusionThe conclusion drawn is that the precision and accuracy of the assay data is acceptable for use in a mineral resource estimate.
8.2 Bulk Density Database
Bulk density data was collected routinely. In total, 8,814 bulk density measurements were taken, representing samples submitted for chemical analysis and representing the various lithologies of the MG Chromitite Layer. The data was collected from all diamond drill boreholes in the latest drilling campaign. Examination of the data confirmed internal constancy with the ranges and averages typical of the lithologies represented.
8.3 Geological Modelling
The Tharisa Mine deposit was modelled using the 3D software packages Datamine™Studio Version 3.21.6774.0 and Micromine™ Version 11. The geological modelling consisted of defining and then modelling the most appropriate contact in each Chromitite Layer across the property (Table 8.3_1).
SRT4.1A(ii) SRT4.1A(iii) SRT4.1B(i) -SRT4.1B(iii)SRT4.2B(iv)

Coffey Mining (SA) Pty Ltd
Tharisa Mine Page: 75Competent Person’s Report - December 2013
Table 8.3_1Summary of Stratigraphic Unit modeled
Unit Contact ModeledMG4A Chromitite Layer Base
MG4 Chromitite Layer Top
MG3 Chromitite Layer Base
MG2 Chromitite Layer Top MG2C Chromitite Layer
MG1 Chromitite Layer Top
MG0 Chromitite Layer Base
Wireframe surfaces for each of the five Chromitite Layer were modelled based on the borehole intersections. The models were validated to ensure that they did not cross and that the stratigraphic sequence was maintained. It was noted that the dip flattens with depth and the deepest borehole provided unusual data.
For the open pit area, more detail was required. Wireframe surfaces for each of the eighteen units were modelled based on the borehole intersections. The thickness of some of the units i.e. the vertical distance between some of the surfaces was small. The models were validated to ensure that they represented the geometry of the units and that the stratigraphic sequence was maintained. The resulting surfaces are stacked on top of each other demonstrating the tabular nature of the deposit. The modelling utilised the other structural information gained from the aeromagnetic survey, in pit observations, surface mapping, trenching etc.
An examination of the geology revealed that it changes from east to west. In the east the stratigraphy was typically well defined with all the layers being recognisable. Towards the west, the geology becomes more difficult. The identification and delineation of all stratigraphic units become more difficult as the separation of the units became narrower with some units overlying other units directly. Based on these observations a cut off was defined separating the eastern side of the property which is more constant geologically from the western part where the

Coffey Mining (SA) Pty Ltd
Tharisa Mine Page: 76Competent Person’s Report - December 2013
geology is significantly more complicated. This boundary also represents the extent where the mineral resource can be declared due to the uncertainties in the geology to the west.
8.4 Statistics
The data was coded for the different units within the MG Chromitite Layer package. Statistical analysis was then completed on both the raw and composite data grouped by unit type after examination of the data indicated that the units defined different geologically distinct populations and are well defined statistically (Table 8.4_1). Summary descriptive statistical analysis wascompleted based on the various geological units of the MG Chromitite Layer package
Table 8.4_1
Coding for the various units of the MG Chromitite Layer Package
DESCRIPTION LAYER STATIGRAPHY4A Disseminated Hangingwall 4AD
MG4
MG4A 4AParting MG4A-MG4 4A4MG4 4CRParting MG4-MG0 44ZMG4(0) 4ZParting MG4-MG3 4Z33CR Disseminated Hangingwall 3D
MG3MG3 3CRZebra 3CR Footwall 3ZEBParting MG3-MG2 2CHWMG2C 2C
MG2
PGEM Hangingwall PGEM+PGEM Layer PGEMPGEM Footwall PGEM- MG2B 2BParting MG2B-MG2A BAMG2A 2AParting MG2-MG1 2A1MG1 1CR MG1
MG0 MG0 MG0
8.5 Compositing
Each intersection was composited across the full thickness of each unit as defined in the coding in Table 8.4_1. The Pt, Pd, Rh, Au, Ru, Ir, Os, Cu, Ni, Al, Ca, Cr, Cr2O3, Fe, Mg and Si concentrations were composited utilising the weighting by density and thickness. This is considered necessary as the lithologies have significantly different densities. An analysis of the unit thickness showed that there is little correlation between the concentration and thickness confirming that the use of concentration was appropriate for use in grade estimation.

Coffey Mining (SA) Pty Ltd
Tharisa Mine Page: 77Competent Person’s Report - December 2013
8.6 Data Cutting
An assessment of the high-grade composites was completed to determine whether high-grade cutting was required. The approach taken to the assessment of the high-grade composites and outliers is summarised as:-
Detailed review of histograms and probability plots with significant breaks in populations interpreted as possible outliers.
Investigation of clustering of the higher grade data. High-grade data which clustered were considered to be real while high grade composites not clustered with other high grade data were considered to be a possible outlier and requiring further consideration either through cutting and/or search restriction.
The ranking of the composite data and the investigation of the influence of individual composites on the mean and standard deviation plots.
Where possible outliers were identified, an examination of the data was undertaken to confirm whether this was indeed an outlier. The potential influence on the mineral resource estimate was also considered. After this examination and assessment, no high grade cutting or capping was undertaken.
8.7 Variography
Variography is used to describe the spatial variability or correlation of an attribute (Pt, Pd, Rh, Au, Cu, Ni etc). The spatial variability is traditionally measured by means of a variogram, which is generated by determining the averaged squared difference of data points at a nominated distance (h), or lag (Srivastava and Isaacs, 1989). The averaged squared difference (variogram
-axis is the lag distance and the Y-distance.
The variography was calculated and modelled in the geostatistical software, Datamine. As only weak anisotropsy was determined, all experimental variograms were generated as an omnidirectional isotropic variogram. The nugget effects were considered after examination of the closely spaced boreholes and deflections as well as consideration for other chromitite layers in the Bushveld Complex. The nugget effects are generally moderate to high, typical of the platiniferous horizons of the Bushveld Complex. Where appropriate, variograms were developed for the estimations (Table 8.7_1).

Coffey Mining (SA) Pty Ltd
Tharisa Mine Page: 78Competent Person’s Report - December 2013
Table 8.7_1Summary of parameters for which variograms were modelled
MG
4AD
Chr
omiti
te L
ayer
MG
4A C
hrom
itite
Lay
er
PA
RTI
NG
MG
4 –
MG
4())
MG
3D C
hrom
itite
Lay
er
MG
3 C
hrom
itite
Lay
er
MG
4ZE
B C
hrom
itite
Lay
er
MG
2C C
hrom
itite
Lay
er
MG
2 P
GE
M+
MG
2 P
GE
M
MG
2 P
GE
M-
MG
2B C
hrom
itite
Lay
er
MG
2A C
hrom
itite
Lay
er
MG
1 C
hrom
itite
Lay
er
MG
1 C
hrom
itite
Lay
er
Thickness * m * m m * m m * m m m m m
3PGE+Au g/t g/t * g/t g/t * * g/t * g/t g/t g/t g/t g/t
Cr2O3 % % * % % * % % * % % % * %
Density * t/m3 * t/m3 t/m3 * t/m3 t/m3 t/m3 t/m3 t/m3 t/m3 * t/m3
Cu * ppm * * * ppm * ppm * * * ppm
Ni ppm ppm * ppm ppm * ppm Ppm ppm ppm ppm ppm ppm ppm
Cr % % * % % * * % * % % % * %
Pt * * * g/t g/t * * g/t g/t g/t g/t g/t g/t g/t
Pd g/t * * * * * * g/t g/t g/t g/t g/t g/t g/t
Au * g/t * g/t * * * * g/t * * * * g/t
Rh g/t * * g/t g/t * g/t g/t g/t g/t g/t g/t g/t
Ru g/t * * g/t g/t * g/t g/t g/t g/t g/t g/t g/t g/t
Os g/t * * g/t g/t * g/t g/t g/t g/t g/t g/t g/t g/t
Ir g/t g/t * g/t g/t g/t g/t g/t * g/t * g/t g/t g/t
Al * % % % * % % % % * * % %
Ca * * % % % % % % % % % % % %
Si % % * % % % % % % % % * %
Fe * % * % % % % % % % % * %
Mg * % * % % % % % % % % % * %
*- no variogram modeled and estimate undertaken using inverse distance squared

Coffey Mining (SA) Pty Ltd
Tharisa Mine Page: 79Competent Person’s Report - December 2013
8.8 Block Model Development
A series of two-dimensional seam model-type estimates based on geologically and geochemically defined units within the MG Chromitite Layer cycle, was undertaken (Table 8.4_1). Based on the average spacing of surface boreholes and the requirements of the mine design, a parent block size of 100m x 100 was used. No rotation of the model was undertaken.
In to this model, for each unit, grade variables and layer thicknesses were interpolated.
The MG0 Chromitite Layer was estimated as a single unit.
The MG1 Chromitite Layer was estimated as a single unit.
The MG2 Chromitite Layer was estimated as five units – three chromitite layers (MG2A Chromitite Layer, MG2B Chromitite Layer and MG2C Chromitite Layer) with the two partings being estimated independently due to the different geological and geochemical characteristics. The upper parting is further subdivided by a platiniferous layer (PEGM) into a lower parting (PEGM-) and an upper parting (PEGM+). Seven units – MG2C,PGEM+, PGEM, PGEM-, MG2B, MG2B-MG2A parting and MG2A Chromitite Layer.
The MG3 Chromitite Layer was estimated three separate units - MG3D, MG3 Chromitite Layer and MG3 Zebra.
The MG4 and MG4A Chromitite Layers were estimated as five units – three chromitite layers (MG4(0) Chromitite Layer, MG4 Chromitite Layer and MG4A Chromitite Layer) with the two partings being estimated independently due to the different geological and geochemical characteristics.
The data supplied included the ‘collar’ coordinates and survey data for both the mother holes and deflections. The data from the deflections thus formed part of the database as if it were an independent borehole. Each deflection within the borehole database was retained as separate data. These deflections have been offset from the surveyed chromitite layer intersection location of the mother hole by a nominal 1° at the top of wedge position. Where multiple deflections are developed, the deflections have been distributed around the borehole. The choice of displacement is arbitrary, given the scale of the borehole spacing. Maintaining the individual deflections as separate data rather than compositing the deflections to a single intersection composite is preferred.
In addition to the mineral resource estimate, the block model was utilised for subsequent mining studies. The precision of a block estimate is a function of the block size, related to the distribution of local data and the variogram structure. Although the MG Chromitite Layers have lateral variations, based on the distribution of data it is not considered possible to identify and hence it is considered impractical to selectively mine the higher grade blocks. Most of the selectivity is based on geological and geochemical characteristics of the different chromitite layers within the MG Chromitite Layer package i.e. selectivity dependent on the vertical stratigraphy.
8.9 Grade Estimation
The mineral resource estimation for the Tharisa Mine was completed using Ordinary Krigingand inverse distance weighting of borehole data. The intersected width, the density and the concentration of Pt (g/t), Pd (g/t), Rh (g/t), Au (g/t), Ru (g/t), Ir (g/t), Os (g/t), Cu (ppm), Ni (ppm),
SRT5.4B (iii) SRT4.2B(iii)
SRT4.2B(i) -SRT4.2B(vi)

Coffey Mining (SA) Pty Ltd
Tharisa Mine Page: 80Competent Person’s Report - December 2013
Al (%), Ca (%), Cr (%), Cr2O3 (%), Fe (%), Mg (%) and Si (%) of each of the units identified within the MG Chromitite Layers where the concentration or grade is for the composite over the thickness of that unit. The mineral resource estimate was completed for the area of the mining right of Tharisa Minerals.
The relationship between grade and thickness was examined for the most economically important elements namely 3PGE+Au (g/t) and Cr2O3 (%). Based on this analysis, the concentration of each element was estimated independently from the thickness (LENGTH) of the units. The grade estimation was carried out using the Datamine software.
8.9.1 Search CriteriaBased on the understanding of spatial variation of the data and of the geology, a spherical search was adopted. A number of search radii were tested for the different elements. The final selection of the search criteria was made after the various options were tested on the various units. The selection was based on an examination of the global grades as well as consideration for the geological variability and the observed east – west grade trends. The grade estimation utilised the search parameters presented in Table 8.9.1_1.
8.9.2 Model ValidationA visual and statistical review was completed on the estimates prior to accepting the model.Acceptable levels of mean reproduction are noted between the block model and input composite data.

Coffey Mining (SA) Pty Ltd
Tharisa Mine Page: 81Competent Person’s Report - December 2013
Table 8.9.1_1Sample Search Parameters
First Search Volume Second Search Volume Third Search Volume
Sea
rch
radi
us (m
)
Min
.N
o of
S
ampl
es
Max
.N
o of
S
ampl
es
Sea
rch
radi
us (m
)
Min
.N
o of
S
ampl
es
Max
.N
o of
S
ampl
es
Sea
rch
radi
us (m
)
Min
.N
o of
S
ampl
es
Max
.N
o of
S
ampl
es
MG4AD 500 3 20 1000 3 20 8000 3 20
MG4A 500 3 20 1000 3 20 8000 3 20
MG4A-MG4 Parting 500 3 20 1000 3 20 8000 3 20
MG4 500 3 20 1000 3 20 8000 3 20
Parting MG4 – MG4(0) 500 3 20 1000 3 20 8000 3 20
MG4(0) 500 3 20 1000 3 20 8000 3 20
MG3D 500 3 20 1000 3 20 8000 3 20
MG3CR 500 3 20 1000 3 20 8000 3 20
MG3-Zebra 500 3 20 1000 3 20 8000 3 20
MG2C 500 3 20 1000 3 20 8000 3 20
PGEM+ 500 3 20 1000 3 20 8000 3 20
PGEM 500 3 20 1000 3 20 8000 3 20
PGEM- 500 3 20 1000 4 20 8000 3 20
MG2B 500 3 20 1000 3 20 8000 3 20
Parting MG2B – MG2A 500 3 20 1000 3 20 8000 3 20
MG2A 500 3 20 1000 3 20 8000 3 20
MG1 500 3 20 1000 3 20 8000 3 20
MG0 500 3 20 1000 3 20 8000 3 20
8.10 Geological Loss
The major geological features that affect the Middle Group Chromitite Layer are faults, dykes, potholes and mafic/ultramafic pegmatites. The geological model developed presents a tabular deposit with some dykes and large displacement faults crossing the property. In addition larger potholes have been delineated. However the smaller scale faulting (<10m throw) and the presence of smaller potholes must be considered. The application of a geological loss is made based on a priori knowledge of the deposit and is intended to represent these areas where the Middle Group Chromitite Layer is replaced by mafic pegmatites, intersected by faults or dykes or disrupted by potholes.
The information gained from the current mining activities has served to inform the declaration of the geological loss in the areas that are anticipated to be mined by open pit. As a result the geological loss for the East Mine and the eastern side of the West Mine has been set at 7.5%.The geological loss for the remaining pit area has been set at 15% as has the area beyond the anticipated highwall where underground mining is planned to be undertaken. The details are depicted din Figure 8.10_1.
SRT4.1A(iv)

Coffey Mining (SA) Pty Ltd
Tharisa Mine Page: 82Competent Person’s Report - December 2013
Figure 8.10_1 Map showing the Applied Geological Loss
8.11 MG Chromitite Layers Mineral Resource Reporting
The classification of the mineral resources was undertaken in accordance with the guidelines of the SAMREC Code. The Competent Persons responsible for the mineral resource estimation and classification are Mr. Ken Lomberg Pr.Sci.Nat. and Mr Alan Goldschmidt Pr.Sci.Nat..
The classification of the mineral resource was based on the robustness of the various data sources available, confidence in the geological interpretation, variography and various estimation service variables (e.g.: distance to data, number of data, maximum search radii etc).
450
00 E
45000 E
500
00 E
50000 E
-2850000 N -2850000 N
-2845000 N -2845000 N
-2840000 N -2840000 N
0 1000 2000 3000
15%
7.5%

Coffey Mining (SA) Pty Ltd
Tharisa Mine Page: 83Competent Person’s Report - December 2013
8.11.1 Criteria for Mineral Resource CategorisationThe resource estimate was classified as a combination of Measured, Indicated and Inferred Resource based on the criteria set out in Table 8.11.1_1.
Table 8.11.1_1Confidence Levels of Key Criteria for Classification of MG Chromitite Layers of the Tharisa Mine
Items Discussion Confidence
MG0 MG1 MG2 MG3 MG4/MG4A
Drilling TechniquesDiamond drilling to International Standard. High High High High High
LoggingStandard nomenclature and procedures to international standards.
High High High High High
Drill Sample Recovery
The core recovery is estimated as >95% and is considered acceptable for mineral resource estimation.
High
High/Moderate
(Core very friable with generally
<90% recovery)
High High High
Sub-sampling Techniques and Sample Preparation
International standard for Diamond Drilling. High High High High High
Quality of Assay DataAvailable data is of international quality. High High High High High
Verification of Sampling and Assaying
Complete QA/QC programme employed. High High High High High
Location of Sampling Points
Survey of all collars with downhole survey. High High High High High
Data Density and Distribution
Drilled with a spacing of 250m to 2000m.
Classification based on borehole density and understanding of the underlying geology and geochemistry
Audits or Reviews None None None None None
Database IntegrityErrors identified and rectified. High High High High High
Geological Interpretation
Geological interpretation of each chromitite layer.Continuity of geology adequately demonstrated. Major structures identified.
High High High High High
Mineralisation TypeAble to correlate Chromitite Layers across the project.
High High High High High
Estimation and Modelling Techniques
Ordinary Kriging. High High High High High
Cut-off Grades
Geological interpretation of the mineralised horizon for grade composting
High High High High High
Mining Factors or Assumptions
None. High High High High High
It should be noted that the core recovery on the MG1 Chromitite Layer was considerably more difficult due to the very friable nature of the chromitite layer. This resulted in a lower confidence in the assays and hence the lower classification of the mineral resource.
SRT5.4B(iii) SRT5.5B(iii) SRT5.7B(i) – SRT5.7B(v) SRT7B(i) –SRT7B(iv) SRT8B(iv) SRT9A(i) SRT9B(i) SRT10B(i)

Coffey Mining (SA) Pty Ltd
Tharisa Mine Page: 84Competent Person’s Report - December 2013
8.11.2 Mineral Resource Classification The resource classification considers the above assessment and confidence in exploration data, geological understanding and grade estimation. The classification is presented in Figure 8.11.2_1 for MG1 Chromitite Layer and Figure 8.11.2_2 for the other Chromitite Layers.
Figure 8.11.2_1 Plan showing the location of the various classified mineral resources for the MG0 and MG1 Chromitite
Layers of the Tharisa Mine
8.11.3 Mineral Resource Statement The Mineral Resource Statement for the Tharisa Mine is presented in Table 8.11.3_1.
450
00 E
45000 E
500
00 E
50000 E
-2850000 N -2850000 N
-2845000 N -2845000 N
-2840000 N -2840000 N
Indicated
MG0 Chromitite Layer
2.50 5
kilometers
N
Measured
450
00 E
45000 E
500
00 E
50000 E
-2850000 N -2850000 N
-2845000 N -2845000 N
-2840000 N -2840000 N
MG1 Chromitite Layer
Inferred
Indicated
Mined Out
StopedOut
2.50 5
kilometers
N
SRT8B(i)

Cof
fey
Min
ing
(SA
) Pty
Ltd
Thar
isa
Min
e P
age:
85
Com
pete
nt P
erso
n’s
Rep
ort -
Dec
embe
r 201
3
Figu
re 8
.11.
2_2
Plan
sho
win
g th
e Lo
catio
n of
the
Vario
us C
lass
ified
Min
eral
Res
ourc
es fo
r the
MG
2, M
G3
and
MG
4 C
hrom
itite
Lay
ers
of th
e Th
aris
a M
ine
45000 E
45000 E
50000 E
50000 E
-285
0000
N
-285
0000
N
-284
5000
N
-284
5000
N
-284
0000
N
-284
0000
N
MG
2 C
hrom
itite
Lay
er
Infe
rred
Indi
cate
dM
easu
red
Min
edO
ut
2.5
05
kilo
met
ers
N
45000 E
45000 E 50000 E
50000 E -2
8500
00 N
-2
8500
00 N
-284
5000
N
-284
5000
N
-284
0000
N
-284
0000
N
MG
3 C
hrom
itite
Lay
er
Infe
rred
Indi
cate
d
Mea
sure
d
Min
edO
ut
2.5
05
kilo
met
ers
N
45000 E
45000 E
50000 E
50000 E
-285
0000
N
-285
0000
N
-284
5000
N
-284
5000
N
-284
0000
N
-284
0000
N
MG
4 C
hrom
itite
Lay
er
Infe
rred In
dica
ted
Mea
sure
dM
ined
Out
2.5
05
kilo
met
ers
N

Cof
fey
Min
ing
(SA)
Pty
Ltd
Thar
isa
Min
eP
age:
86C
ompe
tent
Per
son’
s R
epor
t - D
ecem
ber 2
013
Tabl
e8.
11.3
_1
Min
eral
Res
ourc
e St
atem
ent f
or th
e Th
aris
a M
ine
(31
Dec
embe
r 201
3)
MG
4A C
HR
OM
ITIT
E LA
YER
Tonn
age
(Mt)
True
Th
ick
(m)
Bul
k D
ensi
ty
(t/m
3 )
Cr 2
O3
(%)
Pt
(g/t)
Pd
(g/t)
Rh
(g/t)
Au
(g/t)
Ru
(g/t)
Os
(g/t)
Ir (g/t)
3PG
E+
Au
(g/t)
Pt:P
d:R
h:A
u6P
GE
+Au
(g/t)
Pt:P
d:R
h:A
u:R
u:O
s:Ir
Cr:F
e6P
GE
+Au
(koz
)N
i (p
pm)
Mea
sure
d6.
709
1.43
3.69
24.8
90.
400.
150.
120.
000.
250.
040.
050.
6759
:22:
18:0
1.01
39:1
5:12
:0:2
5:4:
51.
1221
976
1
Indi
cate
d15
.927
1.59
3.70
24.2
90.
400.
150.
130.
000.
250.
040.
050.
6859
:23:
18:1
1.03
39:1
5:12
:0:2
5:4:
51.
1052
676
2
Infe
rred
68.5
161.
443.
7025
.18
0.39
0.14
0.13
0.00
0.26
0.05
0.05
0.67
59:2
1:19
:11.
0338
:14:
12:0
:26:
4:5
1.11
2,26
576
3
MG
4 an
d M
G4(
0) C
HR
OM
ITIT
E LA
YER
Pac
kage
Tonn
age
(Mt)
True
Th
ick
(m)
Bul
k D
ensi
ty
(t/m
3 )
Cr 2
O3
(%)
Pt
(g/t)
Pd
(g/t)
Rh
(g/t)
Au
(g/t)
Ru
(g/t)
Os
(g/t)
Ir (g/t)
3PG
E+
Au
(g/t)
Pt:P
d:R
h:A
u6P
GE
+Au
(g/t)
Pt:P
d:R
h:A
u:R
u:O
s:Ir
Cr:F
e6P
GE
+Au
(koz
)N
i (p
pm)
Mea
sure
d19
.645
4.14
3.75
26.5
20.
700.
190.
170.
003
0.33
0.06
0.08
1.07
66:1
8:16
:01.
5346
:13:
11:0
:21:
4:5
1.18
966
784
Indi
cate
d29
.785
3.00
3.65
24.7
61.
080.
220.
210.
003
0.36
0.08
0.11
1.51
71:1
5:14
:02.
0652
:11:
10:0
:18:
4:6
1.20
1,97
273
0
Infe
rred
170.
733
3.72
3.62
22.6
00.
990.
190.
190.
003
0.34
0.07
0.10
1.36
72:1
4:14
:01.
8853
:10:
10:0
:18:
4:6
1.15
10,3
1969
7
MG
3 C
HR
OM
ITIT
E LA
YER
Tonn
age
(Mt)
True
Th
ick
(m)
Bul
k D
ensi
ty
(t/m
3 )
Cr 2
O3
(%)
Pt
(g/t)
Pd
(g/t)
Rh
(g/t)
Au
(g/t)
Ru
(g/t)
Os
(g/t)
Ir (g/t)
3PG
E+
Au
(g/t)
Pt:P
d:R
h:A
u6P
GE
+Au
(g/t)
Pt:P
d:R
h:A
u:R
u:O
s:Ir
Cr:F
e6P
GE
+Au
(koz
)N
i (p
pm))
Mea
sure
d12
.369
3.74
3.25
13.0
70.
600.
350.
150.
006
0.22
0.04
0.06
1.10
54:3
2:14
:11.
4242
:25:
11:0
:15:
3:4
0.99
563
486
Indi
cate
d23
.451
4.13
3.22
18.0
10.
750.
440.
190.
005
0.27
0.05
0.08
1.39
54:3
2:14
:01.
8042
:25:
11:0
:15:
3:4
1.08
1,35
460
3
Infe
rred
67.3
763.
103.
2025
.65
1.01
0.58
0.26
0.00
50.
380.
080.
101.
8654
:31:
14:0
2.42
42:2
4:11
:0:1
6:3:
41.
135,
247
784
MG
2 C
HR
OM
ITIT
E LA
YER
Tonn
age
(Mt)
True
Th
ick
(m)
Bul
k D
ensi
ty
(t/m
3 )
Cr 2
O3
(%)
Pt
(g/t)
Pd
(g/t)
Rh
(g/t)
Au
(g/t)
Ru
(g/t)
Os
(g/t)
Ir (g/t)
3PG
E+
Au
(g/t)
Pt:P
d:R
h:A
u6P
GE
+Au
(g/t)
Pt:P
d:R
h:A
u:R
u:O
s:Ir
Cr:F
e6P
GE
+Au
(koz
)N
i (p
pm)
Mea
sure
d14
.555
3.30
3.62
19.3
31.
070.
280.
150.
004
0.27
0.05
0.08
1.51
71:1
8:10
:01.
9056
:15:
8:0:
14:3
:40.
9889
173
2
Indi
cate
d41
.692
3.59
3.67
17.7
90.
980.
280.
150.
004
0.24
0.05
0.07
1.42
69:2
0:10
:01.
7855
:16:
8:0:
14:3
:40.
922,
386
733
Infe
rred
286.
164
5.72
3.62
13.2
60.
700.
210.
110.
004
0.19
0.04
0.05
1.02
69:2
0:11
:01.
3054
:16:
8:0:
15:3
:40.
7511
,975
674

Cof
fey
Min
ing
(SA)
Pty
Ltd
Thar
isa
Min
eP
age:
87C
ompe
tent
Per
son’
s R
epor
t - D
ecem
ber 2
013
MG
1 C
HR
OM
ITIT
E LA
YER
Tonn
age
(Mt)
True
Th
ick
(m)
Bul
k D
ensi
ty
(t/m
3 )
Cr 2
O3
(%)
Pt
(g/t)
Pd
(g/t)
Rh
(g/t)
Au
(g/t)
Ru
(g/t)
Os
(g/t)
Ir (g/t)
3PG
E+A
u (g
/t)P
t:Pd:
Rh:
Au
6PG
E+A
u (g
/t)P
t:Pd:
Rh:
Au:
Ru:
Os:
IrC
r:Fe
6PG
E+A
u (k
oz)
Ni
(ppm
)
Mea
sure
d0.
00#D
IV/0
!0.
00#D
IV/0
!-
Indi
cate
d14
.322
1.23
3.89
33.3
80.
340.
220.
110.
004
0.48
0.08
0.08
0.67
50:3
2:17
:11.
3026
:17:
9:0:
37:6
:61.
3459
981
0
Infe
rred
57.2
451.
233.
8932
.26
0.33
0.20
0.11
0.00
30.
450.
080.
070.
6451
:31:
17:1
1.24
26:1
6:9:
0:36
:6:6
1.29
2,27
780
3
MG
0 C
HR
OM
ITIT
E LA
YER
Tonn
age
(Mt)
True
Th
ick
(m)
Bul
k D
ensi
ty
(t/m
3 )
Cr 2
O3
(%)
Pt
(g/t)
Pd
(g/t)
Rh
(g/t)
Au
(g/t)
Ru
(g/t)
Os
(g/t)
Ir (g/t)
3PG
E+A
u (g
/t)P
t:Pd:
Rh:
Au
6PG
E+A
u (g
/t)P
t:Pd:
Rh:
Au:
Ru:
Os:
IrC
r:Fe
6PG
E+A
u (k
oz)
Ni
(ppm
)
Mea
sure
d1.
801
0.50
3.74
26.0
70.
570.
180.
160.
004
0.30
0.05
0.07
0.92
62:1
9:18
:01.
3343
:13:
12:0
:22:
4:5
1.09
7774
7
Indi
cate
d3.
188
0.72
3.75
27.0
80.
610.
190.
170.
004
0.32
0.06
0.07
0.98
62:2
0:17
:01.
4443
:14:
12:0
:22:
4:5
1.10
147
752
Infe
rred
0.01
10.
173.
7323
.76
0.45
0.17
0.15
0.00
60.
240.
040.
050.
7758
:22:
19:1
1.11
41:1
5:13
:1:2
2:4:
51.
000.
4071
1
UG
1 C
HR
OM
ITIT
E LA
YER
Tonn
age
(Mt)
True
Th
ick
(m)
Bul
k D
ensi
ty
(t/m
3 )
Cr 2
O3
(%)
Pt
(g/t)
Pd
(g/t)
Rh
(g/t)
Au
(g/t)
Ru
(g/t)
Os
(g/t)
Ir (g/t)
3PG
E+A
u (g
/t)P
t:Pd:
Rh:
Au
6PG
E+A
u (g
/t)P
t:Pd:
Rh:
Au:
Ru:
Os:
IrC
r:Fe
6PG
E+A
u (k
oz)
Ni
(ppm
)
Mea
sure
d
Indi
cate
d1.
500
2.17
3.75
23.6
80.
360.
280.
140.
030
0.21
0.82
44:3
5:17
:41.
1239
Infe
rred
TOTA
L M
INER
AL R
ESO
UR
CE
Tonn
age
(Mt)
True
Th
ick
(m)
Bul
k D
ensi
ty
(t/m
3 )
Cr 2
O3
(%)
Pt
(g/t)
Pd
(g/t)
Rh
(g/t)
Au
(g/t)
Ru
(g/t)
Os
(g/t)
Ir (g/t)
3PG
E+A
u (g
/t)P
t:Pd:
Rh:
Au
6PG
E+A
u (g
/t)P
t:Pd:
Rh:
Au:
Ru:
Os:
IrC
r:Fe
6PG
E+A
u (k
oz)
Ni
(ppm
)
Mea
sure
d55
.079
2.68
3.71
21.3
90.
730.
240.
160.
004
0.28
0.05
0.07
1.14
64:2
1:14
:01.
5348
:16:
10:0
:18:
3:5
1.07
2,71
769
9
Indi
cate
d12
9.86
42.
453.
7322
.24
0.80
0.27
0.16
0.00
40.
310.
060.
081.
2465
:22:
13:0
1.68
48:1
6:10
:0:1
8:3:
51.
097,
034
713
Infe
rred
650.
045
3.11
3.73
19.9
30.
740.
230.
150.
004
0.28
0.05
0.07
1.13
66:2
1:13
:01.
5449
:15:
10:0
:18:
4:5
0.98
32,0
8371
2
Tota
l83
4.98
92.
953.
7320
.38
0.75
0.24
0.15
0.00
40.
280.
050.
071.
1566
:21:
13:0
1.56
48:1
5:10
:0:1
8:4:
51.
0041
,834
712
Not
e: T
he m
iner
al re
sour
ce is
dec
lare
d to
a d
epth
of 7
50m
bel
ow s
urfa
ce.
The
cons
ider
atio
n of
real
istic
eve
ntua
l ext
ract
ion
nece
ssita
tes
that
the
min
eral
reso
urce
con
side
rs th
e M
G C
hrom
itite
Lay
er to
be
a ge
olog
ical
uni
t and
that
all
plat
inife
rous
and
chr
omife
rous
hor
izon
s w
ill be
min
ed
and
all P
GM
, Cu,
Ni a
nd C
r 2O
3re
cove
red.
The
UG
1 C
hrom
itite
Lay
er is
dec
lare
d fo
r the
par
t tha
t fal
ls w
ithin
the
curre
nt p
ropo
sed
open
pit
The
min
eral
reso
urce
is re
porte
d in
clus
ive
of th
e m
iner
al re
serv
e

Coffey Mining (SA) Pty Ltd
Tharisa Mine Page: 88Competent Person’s Report - December 2013
8.12 UG1 Chromitite Layer
8.12.1 MethodologyThe UG1 Chromitite Layer was modelled using the 3D software package Datamine™. The UG1 Chromitite Layer comprises the top chromitite layer, middling (pyroxenite/anorthosite) and bottom chromitite layers. It was necessary to further model individual layers because of the independent geochemical characteristics. Therefore three layers were modelled independently.
A plan showing the UG1 Chromitite Layer is presented in Figure 8.12.1_1. East and West Mines were modelled independently as it was noted that they are of different populations.The boundary between east and west mines was put at the river. East Mine was further divided into two domains due to geology and grade considerations in the far eastern side.
In total seven databases were distinguished and modeled independently i.e West (top, middling, and bottom), East (top, middling and bottom) and Far East (one model).
As a result of the confidence in the geological model, each of the stratigraphic units was estimated independently as a layer and hard boundary was used. Each of the (Al2O3(%),CaO(%), MgO(%), Fe2O3(%), K2O(%), MnO(%), Na2O(%), P2O5(%), Cr2O3(%), (Pt (g/t), Pd(g/t), Rh(g/t), Ru(g/t), Ir(g/t), Au(g/t), width(m) and density) values were estimated independently using inverse power of distance (power of 2).
Mean densities for each domain were used in tonnage calculations as the variability was low.
8.12.2 CompositingThe data was composited by stratigraphic unit (UG1 Chromitite Layer) to produce a “reef only” grade as well as composited to sub-stratigraphic zones (i.e Top, Middling and Bottom Chromitite Layers) and domains within UG1 chromitite layer (i.e West and East’s Top, Middling and Bottom Chromitite Layers and Far East).
8.12.3 Statistical AnalysisA detailed statistical analysis was undertaken according to the geological model developed for each mineralised domain and for each metal element per composite. The composited data shows more or less normal distributions.
8.12.4 Geological LossesThe deposit is known to be intersected by few faults, barren mafic and ultramafic dykes as well as potholes and replacement pegmatites which both have an effect on stratigraphic and grade continuity. A geological loss of 15% was applied.
SRT4.2B(i) -SRT4.2B(vi)
SRT4.1B(iv)

Cof
fey
Min
ing
(SA)
Pty
Ltd
Thar
isa
Min
eP
age:
89C
ompe
tent
Per
son’
s R
epor
t - D
ecem
ber 2
013
Figu
re 8
.12.
1_1
Plan
vie
w o
f the
UG
1 C
hrom
itite
Lay
er’s
Min
eral
Res
ourc
e.W
ith g
rey
colo
ur s
how
ing
the
posi
tion
of fi
nal p
it lim
its, g
reen
indi
cate
s pr
esen
t min
ing
stat
us o
n th
e M
iddl
e G
roup
in th
e ea
st a
nd to
the
wes
t bot
h M
iddl
e G
roup
(MG
) an
d U
pper
Gro
up (U
G1)
chr
omiti
tes
are
bein
g m
ined
.

Coffey Mining (SA) Pty Ltd
Tharisa Mine Page: 90Competent Person’s Report - December 2013
8.13 UG1 Chromitite Layer Mineral Resource Reporting
The mineral resource in respect of the UG1 Chromitite Layer is reported in Table 8.13_1. The classification of the mineral resources was undertaken in accordance with the guidelines of the SAMREC Code. The Competent Person responsible for the mineral resource estimation and classification is Mr. Ken Lomberg Pr.Sci.Nat.
The classification of the mineral resource was based on the robustness of the various data sources available, confidence in the geological interpretation, variography and various estimation service variables (e.g.: distance to data, number of data, maximum search radii etc).
Additional consideration has been given to the stand alone potential based on reasonable expectation of eventual economic extraction. It is therefore assumed that the UG1 Chromitite Layer is mined together with the Middle Group (MG) Chromitite Layers in the same open pit.
.
Table 8.13_1
Tharisa Minerals
UG1 Chromitite Mineral Resource Estimation
30 August 2012
LayerThickness
(m)Tonnage
(Mt)Cr2O3
(%)Pt
(g/t)Pd
(g/t)Rh (g/t)
Au (g/t)
3PGE+Au (g/t)
INDICATED MINERAL RESOURCE
West Mine
Top Layer 1.34 0.8 24.05 0.27 0.28 0.12 0.04 0.71Bottom Layer 0.92 0.6 23.13 0.48 0.29 0.17 0.03 0.97
TOTAL 2.26 1.4 23.70 0.36 0.29 0.14 0.03 0.82INFERRED MINERAL RESOURCE
East Mine
Top Layer 1.07 0.03 24.02 0.24 0.20 0.12 0.04 0.60Bottom Layer 1.00 0.02 19.10 0.28 0.10 0.12 0.04 0.55
TOTAL 2.07 0.05 23.01 0.26 0.17 0.13 0.04 0.60
TOTAL RESOURCE 2.17 1.50 23.68 0.36 0.28 0.14 0.03 0.82*Assuming UG1 Chromitite Layer is mined together with the Middle Group (MG) Chromitite Layers
.
SRT8B(i)

Coffey Mining (SA) Pty Ltd
Tharisa Mine Page: 91Competent Person’s Report - December 2013
9 MINING ENGINEERING
9.1 Background
Ukwazi initially undertook a conceptual mine design study in 2007 and a Feasibility Study was completed in October 2008. An an open pit and underground mine design and scheduling study was completed in 2013 to match the requirements of the processing facilities.
The selected exploitation strategy is the combined mining of the MG0, MG1, MG2, MG3, MG4, MG4(0) and MG4A Chromitite Layers which extend from surface to a depth of 750m below surface (mbs) at dips varying from 13° in the east to 16° in the west.
9.2 Geotechnical Assessment
This assessment is based on the on fracture logging and rockmass classification of 10 boreholes (eight geological boreholes and two additional boreholes to collect samples for rock strength testing) (James, 2008) and geotechnical data collected by Open House Management Solutions (Pty) Ltd (OHMS) n the current east and central pits of Tharisa Mine to determine stable slope angles (Cilliers and Bosman, 2013).
Further data collection and reassessment of the slope design will be undertaken as mining continues.
9.2.1 Geotechnical EnvironmentA detailed geotechnical study was undertaken by OHMS at the mine consisting of face mapping in the existing east and central pits. Samples were collected from existing exploration boreholes for rock strength testing. The major lithological units in the ore body were tested for Uniaxial Compressive Strength (UCS), Density, Elastic Modulus and Poisson’s Ratio.
These boreholes were selected to be at the location of the final pit walls.
There was also a previous geotechnical investigation in 2008 which included fracture logging and rock mass ratings of eight geological boreholes before splitting. The boreholes were selected to sample the area of the ore body and two additional geotechnical boreholes were drilled for sampling and strength testing.
It is planned to mine all the MG Chromitite Layers from the MG0 to the MG4A Chromitite Layers in the open pit (Figure 9.2.1_1). The MG Chromitite Layers sub outcrop beneath black turf soil and are separated by middlings of pyroxenite, anorthosite and norite. The footwall of the MG0 Chromitite Layer consists of pyroxenite.
SRT1.2C(i) SRT2.1C(i) SRT5.4B(i) SRT5.4B(ii) SRT10C(i)
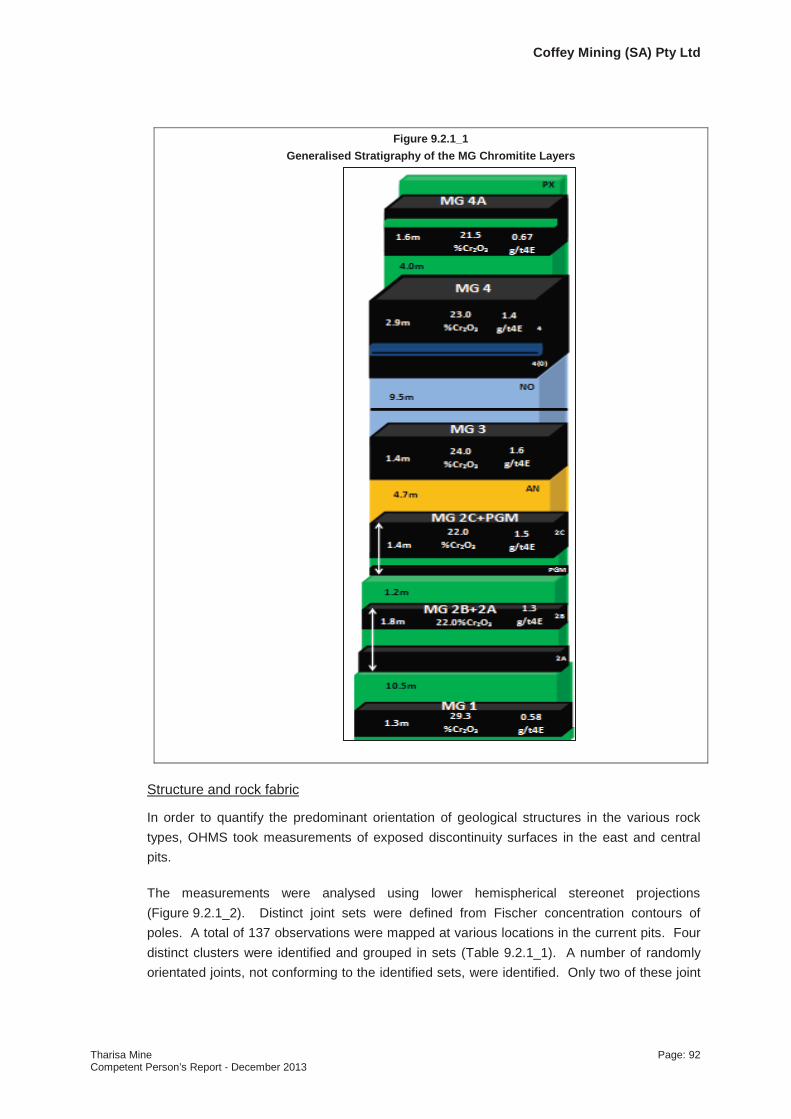
Coffey Mining (SA) Pty Ltd
Tharisa Mine Page: 92Competent Person’s Report - December 2013
Figure 9.2.1_1Generalised Stratigraphy of the MG Chromitite Layers
Structure and rock fabric
In order to quantify the predominant orientation of geological structures in the various rock types, OHMS took measurements of exposed discontinuity surfaces in the east and central pits.
The measurements were analysed using lower hemispherical stereonet projections(Figure 9.2.1_2). Distinct joint sets were defined from Fischer concentration contours of poles. A total of 137 observations were mapped at various locations in the current pits. Four distinct clusters were identified and grouped in sets (Table 9.2.1_1). A number of randomly orientated joints, not conforming to the identified sets, were identified. Only two of these joint
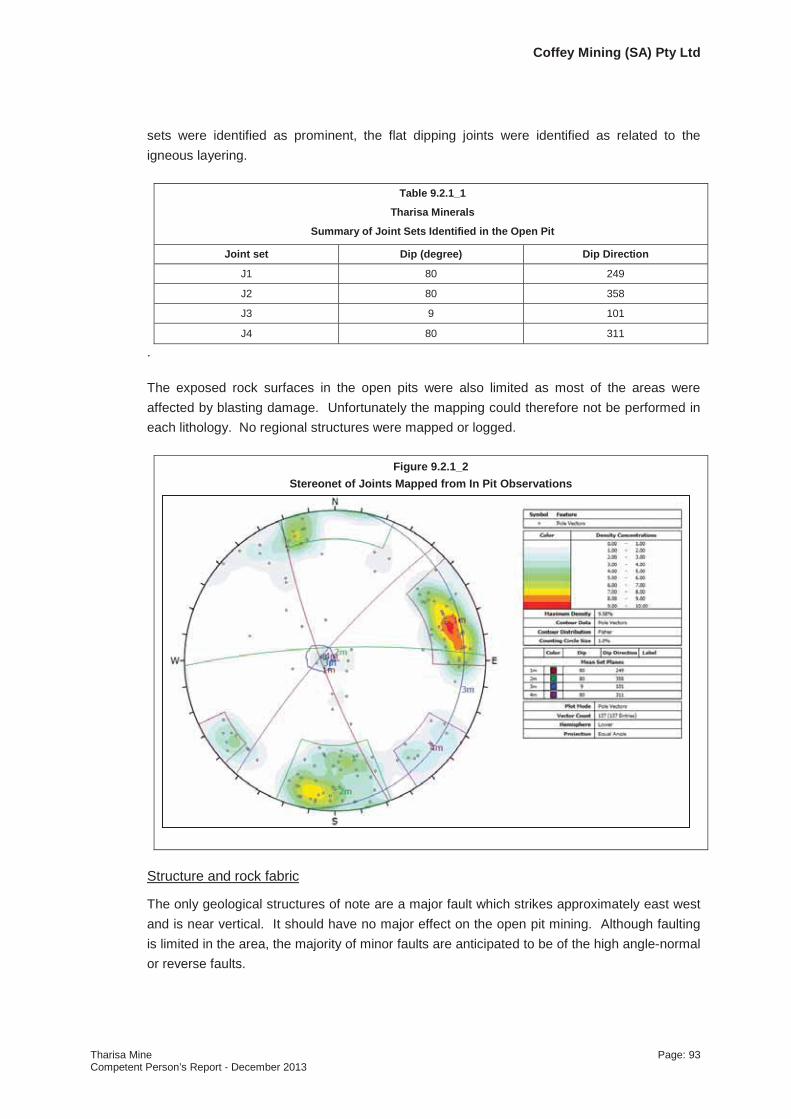
Coffey Mining (SA) Pty Ltd
Tharisa Mine Page: 93Competent Person’s Report - December 2013
sets were identified as prominent, the flat dipping joints were identified as related to the igneous layering.
Table 9.2.1_1
Tharisa Minerals
Summary of Joint Sets Identified in the Open Pit
Joint set Dip (degree) Dip Direction
J1 80 249
J2 80 358
J3 9 101
J4 80 311
.
The exposed rock surfaces in the open pits were also limited as most of the areas were affected by blasting damage. Unfortunately the mapping could therefore not be performed in each lithology. No regional structures were mapped or logged.
Figure 9.2.1_2Stereonet of Joints Mapped from In Pit Observations
Structure and rock fabric
The only geological structures of note are a major fault which strikes approximately east west and is near vertical. It should have no major effect on the open pit mining. Although faulting is limited in the area, the majority of minor faults are anticipated to be of the high angle-normal or reverse faults.

Coffey Mining (SA) Pty Ltd
Tharisa Mine Page: 94Competent Person’s Report - December 2013
A thin shear zone which is often altered is located below or in the MG1 Chromitite Layer. Due to its position it should have no effect on the design of the open pit. However in localised areas it may mean additional support or larger pillars needed in the underground mine.
From the site visits the following observations were made:
The drill core from the geological drilling campaign is in a good state and is stored in the core shed on the property.
Some of the RoM production has been affected by poor fragmentation. An accurate geotechnical model would provide information to optimise the blasting and reduce fragmentation issues.
Rock mass quality
The rock mass quality was quantified by OHMS using the RMR methodology proposed by Bieniawski and for the purpose of comparison the Bartons Q rating was also determined. The rock mass classification was done from exposures in the current east and central pit.Figure 9.2.1_3 illustrates the methodology for rating. The results are presented in Table 9.2.1_2.
Figure 9.2.1_3Photograph Demonstrating the Method of Rock Mass Rating Determination

Coffey Mining (SA) Pty Ltd
Tharisa Mine Page: 95Competent Person’s Report - December 2013
Table 9.2.1_2Tharisa Minerals
Summary of Rock Mass Ratings
AreaMG1
Chromitite Layer
MG2Chromitite
Layer
MG3Chromitite
Layer
MG4Chromitite
Layer
MG1- MG2 Chromitite
Layers Parting
MG2- MG3 Chromitite
Layers Parting
RMR 68 69 65 71 74 73
Q Rating 6.01 13.4 10.05 13.4 13.99 13.4
.
An adjusted MRMR value is used to take into account weathering. The rock mass ratings used for design purposes also allowed for existing blast damage. An MRMR average value of 53 was derived for the rock mass.
Rock strength testing
Samples were selected for a series of uniaxial and triaxial strength tests. All tests were conducted strictly according to the prescribed ISRM procedures.
The uniaxial compressive strength tests, of core samples collected from fresh rock, were performed to also quantify the Young’s modulus and Poisson’s ratio of the rocktypes. The UCS values obtained from the laboratory tests were evaluated using the Modulus ratio method: In addition Brazilian indirect tensile strength (UTB) testing was carried out which also confirmed the accuracy of the UCS values obtained as it is generally assumed that the UTB value approximates 10% of the UCS.
Table 9.2.1_3Tharisa Minerals
Summary of Rock StrengthsLithology UTB method Modulus Ratio method
Anorthosite 270.5MPa 229.08MPa
Pyroxenite 197.0MPa 186MPa
.
Hydrogeology
During the visits there was evidence of groundwater seepage from the exposed highwalls. Pit dewatering is conducted from toe drains at the advancing highwall. The hydrogeology is being monitored for environmental reasons as the mine deepens, this data should be incorporated in the geotechnical data base. The OHMS slope design is based on a dry slope as the pit will be dewatered.
9.2.2 Open Pit Slope DesignFor indicative purposes the Haines and Terbrugge empirical design chart was used to assess the probable safe slope angles (Figure 9.2.2_1). The adjusted MRMR value of 51 for fresh rock was used in the assessment.

Coffey Mining (SA) Pty Ltd
Tharisa Mine Page: 96Competent Person’s Report - December 2013
Figure9.2.2_1 Haines and Terbrugge Empirical Design Chart used to Assess Safe Pit Slope Angles
The Haines and Terbrugge design chart suggests that an overall slope angle of 52° in fresh rock will have a factor of safety of 1.2. This was taken as a guideline for further investigation using numerical modelling and kinematic analysis.
Kinematic analysis
The potential for structurally controlled failure modes of the northern highwall wasinvestigated. The discontinuities measured on the outcrops were used for a kinematic analysis. A slope angle of 52° was assessed. For planar sliding to occur, a discontinuity must daylight in the slope and the dip of the discontinuity must be lower than the friction angle. The analysis is presented in Figure 9.2.2__2.

Coffey Mining (SA) Pty Ltd
Tharisa Mine Page: 97Competent Person’s Report - December 2013
Figure 9.2.2_2 Stereonet and Analysis of Planar sliding in the Northern Slope
The wedge sliding kinematic analysis is based on the analysis of intersections of joint sets(Figure 9.2.2__3).
Figure 9.2.2_3 Stereonet and Analysis of Wedge Failure in the Northern Slope
The critical zone for flexural toppling is the highlighted region between the slip limit plane, stereonet perimeter and the 20° lateral limits. Any poles plotting in this region represent a potential risk of flexural toppling (Figure 9.2.2__4).

Coffey Mining (SA) Pty Ltd
Tharisa Mine Page: 98Competent Person’s Report - December 2013
Figure 9.2.2_4 Stereonet and Analysis of Flexural Toppling Failure in the Northern Slope
From the stereonets it was concluded that no planar or wedge type failures are anticipated in the final highwall slope. The orientation of Joint Set 2 indicates that toppling failure is possible. The scale of this was not assessed and the potential would depend on joint continuity and cohesion.
It was concluded that in the fresh rock, overall slope angles of 52° should be stable with catch berms of 9.4m wide.
Numerical Modelling
The slope stability was assessed using the Phase 2D, two dimensional, finite element software. The sections modelled for East Mine are shown in Figure 9.2.2_5. Models of 3 sections through the pit were constructed using the material properties as defined from laboratory tests and rock mass properties quantified using the RocData software program.

Coffey Mining (SA) Pty Ltd
Tharisa Mine Page: 99Competent Person’s Report - December 2013
Figure 9.2.2_5 Schematic Plan of East Mine showing the positions of the Sections Modelled
Only saprolitic and fresh rock material properties were used for the Highwall slope(Figure 9.2.2_6). An overall angle of 53° was used to investigate the stability of the slope.The angle modelled for saprolitic rock was 45°.
Figure 9.2.2_6 Diagram of the Proposed Highwall configuration showing Geology

Coffey Mining (SA) Pty Ltd
Tharisa Mine Page: 100Competent Person’s Report - December 2013
The models simulated completely dry slopes, as it was assumed that an effective dewatering program will be implemented. An example of the numerical modelling is presented in Figure 9.2.2_7.
Figure 9.2.2_7 Graphic Example of the Hydrological Numerical Modelling Results
The Finite Element models calculated contours of displacement for the highwall. The Factor of Safety (FoS) and the Probability of Failure (PoF) were determined from these models and presented in Table 9.2.2_1. The likelihood of failure occurring was shown to be remote given the high Factor of Safety and low Probability of Failure.
Table 9.2.2_1 Tharisa Minerals
Summary of Rock Fall Hazard AnalysisNorthern slope Slope angle (fresh rock) Slope angle (saprolitic rock) FoS PoF
Section 1 53° 45° 4.27 0
Section 2 53° 45° 4.25 0
Section 3 53° 45° 4.6 0
.
Rock fall hazard analysis
OHMS used The Trajec3D rigid body dynamics software to simulate the trajectory of probable fall bodies. This software simulated the fall paths for three dimensional bodies, over a three dimensional surface, representing a pit geometry. The aim is to determine fall body velocity and kinetic energy at impact with road ways or catch berms. Three fall body geometries wereselected for comparison, with two masses. The fall body geometries were selected to effectively simulate the most likely rock fall shape.

Coffey Mining (SA) Pty Ltd
Tharisa Mine Page: 101Competent Person’s Report - December 2013
None of the falling bodies roll down the pit slopes and therefore it was concluded that the width of the catch berms will be sufficient to catch possible falls.
Seismic Hazard
Using the seismic hazard map for South Africa produced by the South African Council for Geoscience it was concluded that Tharisa Mine does not fall within any of the zones of knownseismic activity, whether natural or mining induced. The historic peak ground acceleration values are of the lowest in the subcontinent and therefore it was concluded that the potential influence of seismic activity on the stability of the mine is negligible and was not aconsideration in the design of the slopes.
Conclusions
During the OHMS investigation, analyses and design, the following was carried out:
The geotechnical conditions have been comprehensively assessed and the results found to be similar those of the previous investigation.
Slope angles were determined from the Haines and Terbrugge design chart suggest overall slope angles of approximately 52° with a Factor of Safety of 1.2 in fresh rock.The proposed final design is presented in Figure 9.2.2_8.
Figure 9.2.2_8 The Proposed Final Pit Slope Design
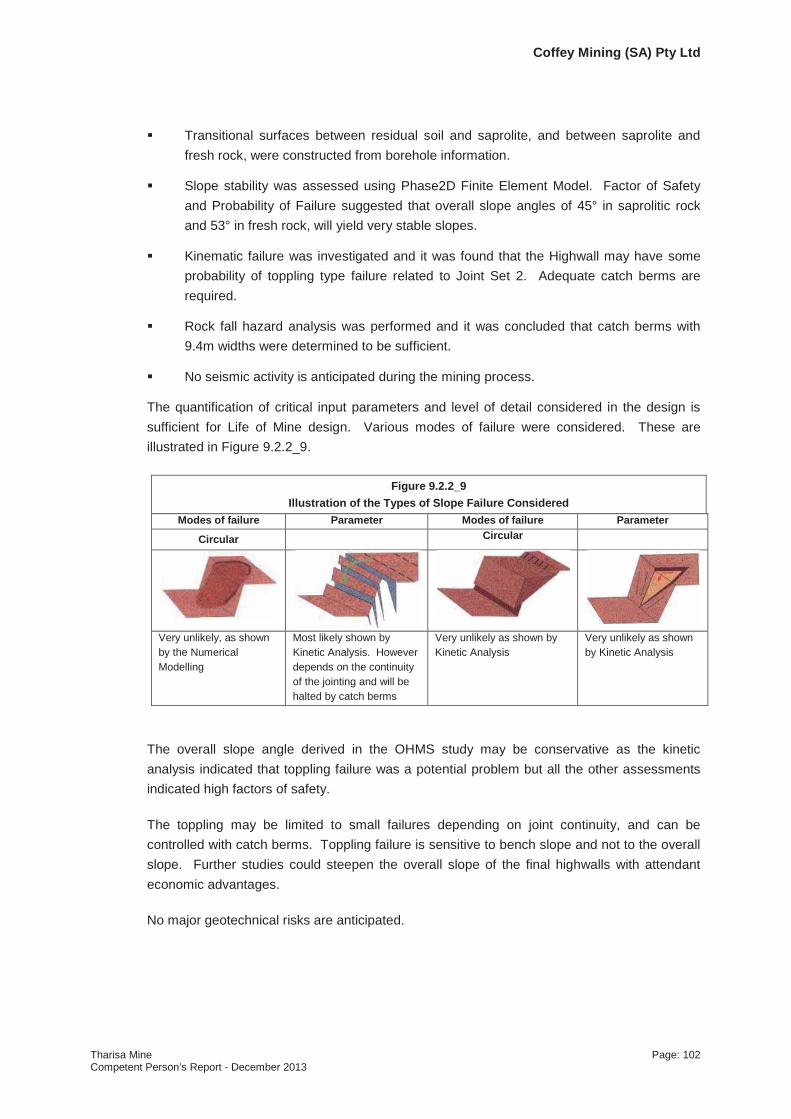
Coffey Mining (SA) Pty Ltd
Tharisa Mine Page: 102Competent Person’s Report - December 2013
Transitional surfaces between residual soil and saprolite, and between saprolite and fresh rock, were constructed from borehole information.
Slope stability was assessed using Phase2D Finite Element Model. Factor of Safety and Probability of Failure suggested that overall slope angles of 45° in saprolitic rock and 53° in fresh rock, will yield very stable slopes.
Kinematic failure was investigated and it was found that the Highwall may have some probability of toppling type failure related to Joint Set 2. Adequate catch berms are required.
Rock fall hazard analysis was performed and it was concluded that catch berms with 9.4m widths were determined to be sufficient.
No seismic activity is anticipated during the mining process.
The quantification of critical input parameters and level of detail considered in the design is sufficient for Life of Mine design. Various modes of failure were considered. These are illustrated in Figure 9.2.2_9.
Figure 9.2.2_9 Illustration of the Types of Slope Failure Considered
Modes of failure Parameter Modes of failure Parameter
Circular Circular
Very unlikely, as shown by the Numerical Modelling
Most likely shown by Kinetic Analysis. However depends on the continuity of the jointing and will be halted by catch berms
Very unlikely as shown by Kinetic Analysis
Very unlikely as shown by Kinetic Analysis
The overall slope angle derived in the OHMS study may be conservative as the kinetic analysis indicated that toppling failure was a potential problem but all the other assessments indicated high factors of safety.
The toppling may be limited to small failures depending on joint continuity, and can be controlled with catch berms. Toppling failure is sensitive to bench slope and not to the overall slope. Further studies could steepen the overall slope of the final highwalls with attendant economic advantages.
No major geotechnical risks are anticipated.

Coffey Mining (SA) Pty Ltd
Tharisa Mine Page: 103Competent Person’s Report - December 2013
9.2.3 Underground MiningWith regard to the future underground mining operation, the middlings between the various chromitite layers are a factor to consider in geotechnical design as with middlings of less than 12m it is usually necessary to superimpose the pillars. However the middlings between the MG1 and MG2A Chromitite Layers in most of the proposed underground mining areas are typically 12m to 15m or greater. The MG2C to MG4(0) Chromitite Layer middling is mainly 12m to 20m or greater. Thus interaction between the chromitite layers is not considered to be a concern. However this must be reassessed in localised areas once underground mining commences.
The mechanised trackless bord and pillar was deemed to be the best mining method for the mining resource under consideration.
The MG2 and MG4 Chromitite Layers were selected for underground mining. The combined thickness of the MG2A Chromitite Layer, parting and MG2B Chromitite Layer, in the greater part of the underground area, will be in excess of 1.8m. The MG4 Chromitite Layer is on average 3.0m thick and is wide enough for trackless Bord and Pillar mining and selected as the second mining horizon. Minimum and maximum mining cuts were set at 1.8m and 4.5m respectively.
The Potvin stability graph method was used to design stable panel spans for each chromitite layer. This method is widely used in South African platinum mines and incorporates the relevant geotechnical information based on a modification of Q, the Modified Stability Number N’. The maximum spans were calculated for used in a hybrid mining system. However recent findings indicate that in the MG1 Chromitite Layer, spans in conventional mining with mine poles and a middling to the MG2 Chromitite Layer of less than 15m, should be restricted to 15m.
Celtis Geotechnical investigated the maximum stable spans and pillar sizes for the underground mining as shown in Table 9.2.3_1.
Table 9.2.3_1
Tharisa Minerals
Summary of the Relevant Geotechnical Data for Underground Mine Design
Lithological Unit Average N' Average N" Minimum N' Minimum N"Hydraulic Radius
Minimum N' Unsupported
MG4 hangingwall 38.86 15.55 7.30 2.92 4.75
MG4A hangingwall 55.61 22.25 5.72 2.29 4.00
MG4- 4A middling 53.59 21.43 6.57 2.63 4.50
MG2 hangingwall 56.09 22.43 4.65 1.86 4.25MG2 footwall MG1 hangingwall 39.45 15.78 5.92 2.37 4.50
.

Coffey Mining (SA) Pty Ltd
Tharisa Mine Page: 104Competent Person’s Report - December 2013
However, for the planned trackless bord and pillar mining, a bord width of 6m will be used throughout.
The DRMS or rock mass strength for each chromitite layer to be mined was calculated taking into account the effects of weathering, joint orientation and method of excavation. This was used to calculate the size of the in-panel pillars. A range of pillar sizes for the various depths and mining widths were calculated. Rigid pillars will be left to prevent plug failure and back-break problems. Down to a depth of 600m, the pillars were designed as non-yielding pillars which can support the whole over burden load from surface. The stress was calculated using tributary areas theory, and the pillar strengths were calculated by the Hedley and Grant (H&G) formula. As the mining will all be below 200m below surface where tributary areas theory over-estimates the pillar loading, Factors of Safety in excess of 1.3 were considered stable.Below 350 m, crush pillars can be considered, sized to suit the mining width of each chromitite layer.
The primary support in Bord and Pillar mining is the in situ pillars. A pattern of 2.4m grouted roofbolts, or equivalent splitsets, spaced at 2m apart in the hanging wall should be sufficient under normal conditions. Long anchor tendon support will be installed if faulted areas are encountered.
Access to the underground workings will be through a triple decline shaft system on reef fromportals in the highwall of the opencast mining to the MG2 Chromitite Layer. This decline set will also be used as the main intake airways for the mine. Initial access will be on apparent dip. The decline support will depend on local geotechnical conditions and excavation dimensions. Below 350m it is anticipated that the geological losses in the area may providesufficient regional support. In some areas, specific regional pillars may need to be designed on the stoping horizon.
In order to proceed with the study for the future underground expansion of the mine, additional work will be required to verify the geotechnical conditions at the selected portal positions.
9.2.4 Rock EngineeringThe mine has appointed a competent rock engineering consultant to undertake regular visits and inspections to the mine including the collection of geotechnical data required to ratify the slope designs.
Mines in South Africa are required to have a Code of Practice (CoP) to combat rockfalls drawn up according to the guidelines of the Department of Mineral Resources. There is a CoP in place in the mine, which complies with the guidelines.
9.2.5 ConclusionsThe planned surface mining method has been devised with consideration of the geotechnical conditions anticipated in the ore body. The slope design is based on the study undertaken by

Coffey Mining (SA) Pty Ltd
Tharisa Mine Page: 105Competent Person’s Report - December 2013
OHMS. This is based on structural and geotechnical information obtained from in-pit joint mapping and the establishment of a geotechnical database.
The study ratifies the design of the highwalls by dynamic analysis and numerical modelling.
Regular monitoring of the pit wall conditions and rock conditions is being carried out and reports on conditions and stability are being produced.
Groundwater level measurement and monitoring is being conducted for environmental management purposes. This data should be included in the geotechnical database.
The underground mining design has been conducted using modified stability number studies for stope spans and the Hedley and Grant methodology to calculate stable pillar sizes.
No major geotechnical risks are anticipated.
9.3 Open Pit Mine Design Study
A Life of Mine (LoM) planning process was followed in order to declare a mineral reserve for the open pit as well as its transition into underground mining. Practical limitations were considered in order to balance pit life and economic value. The final pit dimensions were selected to maximise value, considering factors such as modifying factors, scheduling constraints, unit costs and potential revenue. Mining contractor costs, transport costs,overhead costs, product selling price, as well as infrastructure costs, were the major drivers in the cost model. The mining engineering process followed during the open pit mine design study is depicted in Figure 9.3_1.
Figure 9.3_1Open Pit Mining Engineering Process Flow

Coffey Mining (SA) Pty Ltd
Tharisa Mine Page: 106Competent Person’s Report - December 2013
9.3.1 Design CriteriaDesign criteria were applied throughout the planning process to ensure that the work was undertaken in accordance with the guidelines of the SAMREC Code and was a transparent reporting process as well as an executable plan.
Safety berm
The dimensions of the safety berm were calculated using global standards of good mining practice.
Berm height = 1.70m
Width of berm = 4.86m
Haul roads
All mining equipment operates within the mining industry standard gradient of 1:10 (10% or 6°). The width of the haul road was based on design criteria of a 3.5 multiple of the equipment width, plus the width of the safety berm with provision for a drainage channel which amounts to a minimum haul road width of 30m.
Haul road width: Two way traffic
Width of equipment = 7m
Width of haul road surface for two way traffic =23m
Safety berm = 5m
Drainage channel = 0.8m
Design width = 30m
Minimum operating width
The minimum operating width for the pit is limited by the equipment selection. For a 360t class hydraulic shovel, a minimum width of 40m is required for double sided loading. The 150t class haul trucks have a minimum turning diameter of 27.5m. For a double side loading configuration, a minimum mining operating width of 50m is sufficient for the bulk waste mining operations.
Bench height
A bench height of 20m for bulk waste was selected to accommodate the large sized equipment. The first bench in the weathered zone must be battered at an overall slope angle of 35°. The ore will be loaded in flitches depending on the MG Chromitite Layer thickness, using 65t excavators.

Coffey Mining (SA) Pty Ltd
Tharisa Mine Page: 107Competent Person’s Report - December 2013
Waste Backfill
The current Waste backfill is based on a reasonable estimate. Detailed design and scheduling of the backfill and final void rehabilitation will be conducted in the next planning cycle.
Waste backfill into the final void was considered during the haul road placement to optimise the available floor area available for dumping. Approximately 30% of all waste mined will be dumped in-pit on the exposed pit floor. This has a material cost advantage relative to dozing or loading and hauling of the waste material from out-of-pit WRDs during making safe process of the final void.
Initial waste material from the bulk waste above the MG4A Chromitite Layer as well as internal waste partings between the chromitite layers is being used for the construction of TSF walls.Further waste material is dumped on the permanent waste rock dumps (WRDs) that are constructed to a maximum height of 60m, in 15m lifts, with an overall slope angle of 16°. AWRD is constructed at a safe distance north of the East Mine high wall (WRD 1). Waste from the West Mine is hauled to the south of the outcrop (WRD 2). Existing dwellings to the south of the West Mine have been relocated to the north of the West Mine. An additional WRD is required for the East Mine to accommodate the balance of the waste material.
Other Considerations
Various infrastructure constraints were considered during the detailed and operational planning processes. The diversion of one road, an overhead power line and a water canal is required for pit development and infrastructure placement.
9.3.2 Box Cut Design Criteria and Mining DirectionsTwo boxcuts are established at the East Mine (East and Central pits) and a single boxcut at the West Mine. Each box cut has a 240m base width and will be benched back with a 75m working bench width and 20m high benches to enable the establishment of sufficient production faces to achieve the required tonnage (Figure 9.3.2_1).

Coffey Mining (SA) Pty Ltd
Tharisa Mine Page: 108Competent Person’s Report - December 2013
Figure 9.3.2_1
Schematic Diagram showing Box Cut Positions and Steady State Mining Direction
9.4 Equipment Selection
An open pit mining contractor is responsible for supplying all the required mining mobile equipment. MCC, the appointed mining contractor, operates on adjacent mines with similar equipment and has extensive experience in hard-rock open pit mining.
Selective drilling and blasting is practiced within the layered ore envelopes in order to efficiently separate the layers and waste partings. This is achieved by utilising 65t to 90t class excavators to load 40t to 80t class trucks in the layer and waste parting zones. Chromitite ore is hauled directly from the pit to the RoM stockpile and placed on a designated stockpile or feddirectly through the primary crusher and sized to 200mm. The mining of the layers is controlled by grade control technicians. Bulk waste above the MG4A Chromitite Layer is excavated using the 360t excavators and hauled with 150t dump trucks. Haul roads have been designed at a maximum inclination of 10% and with a minimum width of 30m, considering the 150t truck dimensions for safe two-way traffic.
9.4.1 Pit OptimisationPit optimisation was undertaken through GEMCOM Whittle® pit optimisation software. Themethod is applied to a Selective Mining Unit (SMU) block model of the ore body, and progressively constructs lists of related blocks that should, or should not, be mined. The final lists define a pit outline that has the highest total relative value, subject to the required pit slopes. This outline includes every block that "adds value" when waste stripping is taken into account and excludes every block that "destroys value". It takes into account all revenues and costs as well as mining and processing parameters.
Central Pit East Pit
Highwall
Rive
r exc
lusio
n
Mining Right Boundary
Highwall
East Mine
West Mine
Mined out Mined out

Coffey Mining (SA) Pty Ltd
Tharisa Mine Page: 109Competent Person’s Report - December 2013
The optimisation process was undertaken utilising the two processes described below:
Creation of a range of nested pit shells of increasing sizes by varying the product price and generating a pit shell at each price point.
Selection of the optimal pit shell by generating various production schedules for each pit shell and calculating the net present value for each schedule. The output of this process is a series of “pit-versus-value” curves.
Three pit-versus-value curves were generated:
Best case: corresponds to minimum stripping in which mining follows the sequence of nested pit shells. Although this method will give you the highest net present value, it is not practical. It serves to provide the upper limit with regards to pit size.
Worst case: waste material is removed level for level corresponding to the maximum stripping scenario and therefore lowest relative value. It serves to provide the lower limit with regards to pit size.
Specified case: a case between the best and worst cases and models the influence of pre-stripping on the value curve. Pit selection is based on the specified case value curve.
9.4.2 Pit Optimisation ParametersAn overall pit slope angles of 35° was assigned to the top 20m of overburden and 55° was assigned to the hard rock portion. This resulted in a total overall average slope angle of 53º.Mining costs were based on the agreed contractual MCC mining unit rates, plant estimated cost and existing bulk and local infrastructure costs. Long term forecast PGM prices were applied and converted to a Free on Mine (FOM) optimisation basis. A discount rate of 9.2% was applied.
(Note: the economic parameters used to optimise the open pit mining operation and determine the viability of the mining operation in order to declare a mineral reserve, may be different from those used in the valuations of the mine as a whole).
9.4.3 Pit Optimisation ResultsThe Whittle® optimisation process selects a combination of resource blocks that can be exposed to deliver the highest value in an open pit operation for a given set of design, operating and economic assumptions. It must be noted that the value stated in the optimisation process is a relative value based on the Whittle® schedule including fixed and variable operational cost. The resultant pit shell represents the optimum pit based on the criteria used. A selection process to select the ultimate pit included four pit selection strategies viz. optimum relative value, maximised relative value with extended life, revenue factors and incremental cut-off cost. A single case is selected as a basis for the preparation of the detailed mine plan.

Coffey Mining (SA) Pty Ltd
Tharisa Mine Page: 110Competent Person’s Report - December 2013
The application of the pit selection criteria are presented in Figure 9.4.3_1 for the various pit shells which are represented on the horizontal axis. In addition a marketability curve (Figure 9.4.3_2) which indicates the pit selection relative to the average and incremental cost per RoM tonne, was used.
Based on these criteria, Pit 24 was selected as it delivers a balance between maximised relative value and extended life. The RoM tonnes (purple bar) is maximised with the optimised waste stripping requirement shown in the blue bar. The pit selection strategy used considers the relative value of the selected case, but also maximises the life of the operation.The selection of Pit 24 is considered as the optimal pit, delivering maximized relative value with extended life, which is in line with the current infrastructure placement and previous optimisations conducted.
Figure 9.4.3_1
Incremental Open Pit Value Analysis

Coffey Mining (SA) Pty Ltd
Tharisa Mine Page: 111Competent Person’s Report - December 2013
Figure 9.4.3_2
Incremental Open Pit Value Analysis
The selected pit perimeter shell is in line with the current infrastructure placement and previous optimisations conducted on the incremental pit analysis at a maximum high wall depth of 200m as can been seen in Figure 9.4.3_3. Pit 24 contains an estimated 107.2MtRoM ore.
0.00
5.00
10.00
15.00
20.00
25.00
30.00
35.00
40.00
45.00
50.00
0
200
400
600
800
1,000
60 65 70 75 80 85 90 95 100
105
110
115
120
125
130
135
Millions Ave Cost per ROM t (FOM) Incr Cost per ROM t (FOM) Incr S/R S/R
ROM Tonnes [t]
Ave
Cost
& In
cr C
ost
- [R
/RO
M to
nne]
S/R & Incr S/R [t/t]

Coffey Mining (SA) Pty Ltd
Tharisa Mine Page: 112Competent Person’s Report - December 2013
Figure 9.4.3_3
Schematic Diagram Showing Pit Configuration and Existing Infrastructure
9.4.4 Pit DesignAs permanent ramps were not placed in the final high wall and access ramps were positioned on the footwall, the optimal pit shell closely reflects the most likely final and detailed pit design. For the purposes of the strategic plan and mineral reserve estimate, the pit shell was modified in areas along faults where impractical 'waste islands' were placed and in areas where slumps in the pit floor were planned. The position of low wall access ramps were considered and are critical to the sustainability of RoM production. The surface layout is presented in Figure 9.4.4_1.
Processing Facility
Highwall
Rive
r exc
lusio
nMining Right Boundary
Highwall
East MineWest Mine
Open Pit Offices
Mine Offices

Cof
fey
Min
ing
(SA)
Pty
Ltd
Thar
isa
Min
eP
age:
113
Com
pete
nt P
erso
n’s
Rep
ort -
Dec
embe
r 201
3
Figu
re 9
.4.4
_1
Ope
n Pi
t Sur
face
Lay
out

Coffey Mining (SA) Pty Ltd
Tharisa Mine Page: 114Competent Person’s Report - December 2013
9.4.5 Mining MethodologyWaste is blasted in 20m benches. Depending on the dump location, waste is hauled to the dump located on the outcrop side or hauled through temporary ramps on the interim high wall to a dump located on the high wall side of the pit. Once the pit reaches a depth of approximately 100m, backfill can commence. With this benchmarked assumption, close to 30% of the waste can be backfilled over the life of the operation. It must be noted that, due to the low wall ramps, envisaged potential underground infrastructure and a minimum 100m down dip lag between the backfill and the working faces, the 30% backfill percentage is a reasonable assumption. The Underground portals will be established from the highwall side of the pit.
The current reef mining methodology requires that production blocks which contain reef are blasted selectively, loaded in 5m flitches with 65t to 90t class hydraulic excavators. Grade control 'spotters' accompany the loading equipment to control losses and dilutions based on the selected mining cuts. The parting between the various economic chromitite layers are drilled and blasted as a single unit and are loaded selectively using smaller mining fleets.Reef and waste classification is conducted by a grade control 'spotter' who accompanies each excavator. Reef and waste haul destinations are determined by the mine.
Dilution is caused by overdrilling on the floor of the chromitite layers, whilst losses are mostly incurred due to overdrilling of the interburden waste above the Chromitite Layer. Appropriate measurements are in place to estimate and manage dilution and mining losses.
9.4.6 Destination SchedulingHauling distances per period are calculated from the schedule, based on the specific blast block mined, the dump destination and the haul route. Distances from the mined block to the closest ramp on each level are determined and added to the ramp and surface hauling distances. An appropriate cost model based on the contractual hauling rates and scheduled hauling distances has been compiled.
9.4.7 Life of Mine PlanMost of the material mined from the first 10 years of the schedule is from the Measured Mineral Resource category which has been converted into Proved Reserves (Figure 9.4.7_1).Indicated Mineral Resources were converted to Probable Reserves.

Coffey Mining (SA) Pty Ltd
Tharisa Mine Page: 115Competent Person’s Report - December 2013
Figure 9.4.7_1
Open Pit Mine Schedule with Mineral Reserve Classification
A depiction of the mining schedule is provided in Figure 9.4.7_2.
The schedule delivers an average 3PGE+Au grade of 1.2g/t over the life of the operation and 1.5g/t on a 5PGE+Au basis and RoM Chromite grades delivered at an average of 19% Cr2O3.Steady state waste stripping requirements are set at 1.1 million m3 per month in total from the two pits. Steady state production from the open pit is maintained up to 2032 when the underground production ramp up is planned.
Probable Mineral Reserve
Proved Mineral Reserve

Figure 9.4.7_2
Open Pit Mine Schedule with Mineral Reserve Classification
The figures below is a graphic representation of the mining sequence with the red indicated as the bulk waste and blue showing mining blocks that contain Chromitite Layers or selective waste.
January 2015 January 2017
January 2019 January 2021
January 2023 January 2025
Waste Waste
Waste
Waste Waste
Waste
Ore Ore
OreOre
Ore Ore
Tharisa Mine Page: 116Competent Person’s Report - December 2013
Coffey Mining (SA) Pty Ltd

January 2027 January 2029
January 2032 January 2033
Waste
Waste
Waste
Ore
OreOre
Tharisa Mine Page: 117Competent Person’s Report - December 2013
Coffey Mining (SA) Pty Ltd

Coffey Mining (SA) Pty Ltd
Tharisa Mine Page: 118Competent Person’s Report - December 2013
9.5 Underground Mining
9.5.1 IntroductionThe design requirements identified for the underground section included:
An underground RoM production of 400,000tpm as a continuation of the open pit production profile. Underground mining is expected to commence in 2032.
A transition period from surface to underground operations which will maintain constant plant feed rates at 400,000tpm.
Health and safety aspects were considered to deliver a relatively low risk operation.
Maintain profitability.
9.5.2 Mining Method Selection The critical aspects considered during the mining method selection included safety, the Chromitite Layer widths, dip, the required volume of RoM ore, minimised waste development and mining cost. Four mining methods were considered:
Conventional breast stoping;
Hybrid mining;
Mechanised dip mining;
Trackless Bord and Pillar.
Trackless Bord and Pillar mining was selected as the preferred mining method. Compared to the other systems, it offers the following advantages:
Development rates are faster.
Flexibility in dealing with geological structures.
Safety is enhanced as people are removed from high energy contact sources.Supervision is improved through mobile access to the workings.
Mining extraction is achieved by developing a series of bords on reef and connecting them via holings to form pillars that provide support for the overlying strata (Figure 9.5.2_1).
Three active faces are allowed for in each section for drilling, three for support, three for cleaning operations and a further three as production contingency.
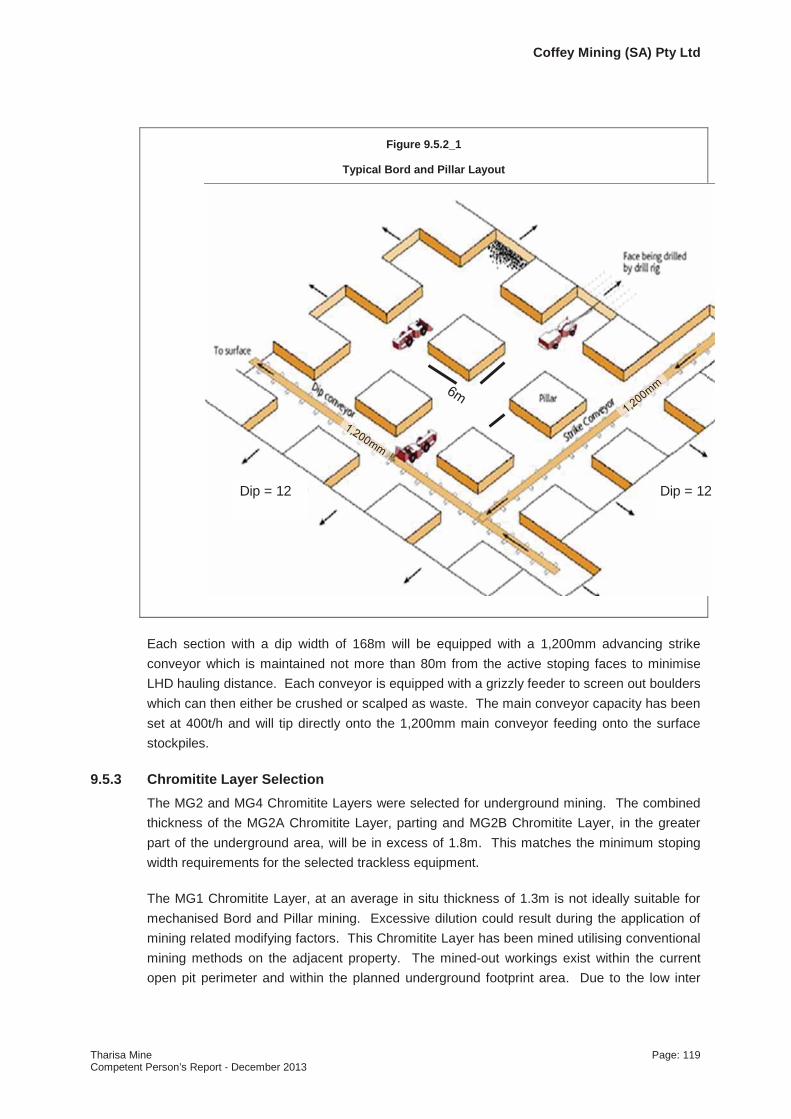
Coffey Mining (SA) Pty Ltd
Tharisa Mine Page: 119Competent Person’s Report - December 2013
Figure 9.5.2_1
Typical Bord and Pillar Layout
Each section with a dip width of 168m will be equipped with a 1,200mm advancing strike conveyor which is maintained not more than 80m from the active stoping faces to minimise LHD hauling distance. Each conveyor is equipped with a grizzly feeder to screen out boulders which can then either be crushed or scalped as waste. The main conveyor capacity has been set at 400t/h and will tip directly onto the 1,200mm main conveyor feeding onto the surface stockpiles.
9.5.3 Chromitite Layer SelectionThe MG2 and MG4 Chromitite Layers were selected for underground mining. The combined thickness of the MG2A Chromitite Layer, parting and MG2B Chromitite Layer, in the greater part of the underground area, will be in excess of 1.8m. This matches the minimum stoping width requirements for the selected trackless equipment.
The MG1 Chromitite Layer, at an average in situ thickness of 1.3m is not ideally suitable formechanised Bord and Pillar mining. Excessive dilution could result during the application of mining related modifying factors. This Chromitite Layer has been mined utilising conventional mining methods on the adjacent property. The mined-out workings exist within the current open pit perimeter and within the planned underground footprint area. Due to the low inter
Dip = 12Dip = 12

Coffey Mining (SA) Pty Ltd
Tharisa Mine Page: 120Competent Person’s Report - December 2013
burden parting between the MG1 and MG2 Chromitite Layers (10m average) only one of them has been selected. Detailed geotechnical work is required to characterise the parting and provide a solution to allow the mining of both the MG1 and MG2 Chromitite Layers.
The MG3 Chromitite Layer is relatively thin at an average in situ thickness of 1.4m and is midway between MG2 and MG4 horizons. This layer has been excluded from the underground investigation on the same grounds as the MG1 Chromitite Layer namely, the low in situ thickness.
The MG4 Chromitite Layer is on average 3.0m thick and is of sufficient thickness for trackless Bord and Pillar mining and therefore selected as the second mining horizon.
9.5.4 Mining CutMG4 Chromitite Layer
The MG4 Chromitite Layer, at an average in situ thickness of 3.0m is wide enough for trackless Bord and Pillar mining and was selected as the second mining horizon. The selected mining cut includes the MG4 Chromitite Layer, the pyroxenite parting below it and the MG4(0) Chromitite Layer below it. A maximum mining cut of 4m and a minimum of 1.8m were used as criteria for mining cut selection. However where the thickness exceeded 4m, only the MG4 Chromitite Layer was selected for the mining cut.
MG2 Chromitite Layer
The mining cut is taken as the MG2A-MG2B Chromitite Layer. The MG2C Chromitite Layer is not considered as part of the mining cut due to the width of the parting to the MG2C Chromitite Layer. The mining cut has been optimised to allow for a minimum 1.8m and a maximum 4.0m mining height. Where the Chromitite Layer exceeds 4.0m, the MG2A Chromitite Layer was targeted.
9.5.5 Underground Access OptionsA number of options to access the targeted reef horizons were considered and after a systematic analysis the top three options were:
Option I: A vertical shaft at the centre of gravity of the resource.
Option II: A footwall decline 20m below the targeted chromitite layers.
Option III: Declines on reef.
The on-reef declines, Option III, was considered to be the most suitable access system for the underground project. Plans showing the underground mining layout are presented in Figure 9.5.5_1 (MG2 Chromitite Layer) and Figure 9.5.5_2 (MG4 Chromitite Layer).

Coffey Mining (SA) Pty Ltd
Tharisa Mine Page: 121Competent Person’s Report - December 2013
The advantages of this system are:
All development is on reef.
More information on the geology is obtained during development.
No cross cut development in waste to reef horizons.
The main disadvantage of this option is the lack of surge capacity. A breakdown on the strike conveyor would have a direct impact on production because production can only commence once the ore handling system is operational.
The triple on-reef decline system will be used as the main ventilation intake airways for the mine and consists of:
Services Decline for access by trackless mobile equipment.
Main Conveyor Decline for ore handling. This decline accommodates other services such as pumping columns, potable water pipes, fuel lines, compressed air lines, power lines and a walkway. From investigations carried out, a 1 200mm size trough conveyor at a speed of 4m/s in this decline has the capacity to handle the planned tonnage including allowances for maintenance and unplanned disruptions.
Chairlift Decline primarily for the transportation of men to and from the working faces.
The dimensions of the three declines have been set at 6.0m wide by 4.5m high. All the declines will be developed at an apparent dip of 90 to facilitate access with mobile machinery.A crown pillar of 50m on dip separating the surface and underground operations was allowed for in the design. The RoM production capacity for each set of declines is presented inTable 9.5.5_1.
Table 9.5.5_1Decline System Design Capacities
Decline system Capacity per month [tonnes RoM per month]
MG2 East Decline 150,000
MG4 East Decline 150,000
MG2 West Decline 50,000
MG4 West Decline 50,000

Cof
fey
Min
ing
(SA)
Pty
Ltd
Thar
isa
Min
eP
age:
122
Com
pete
nt P
erso
n’s
Rep
ort -
Dec
embe
r 201
3
Figu
re 9
.5.5
_1
Und
ergr
ound
Lay
outf
or th
eMG
2 C
hrom
itite
Lay
er
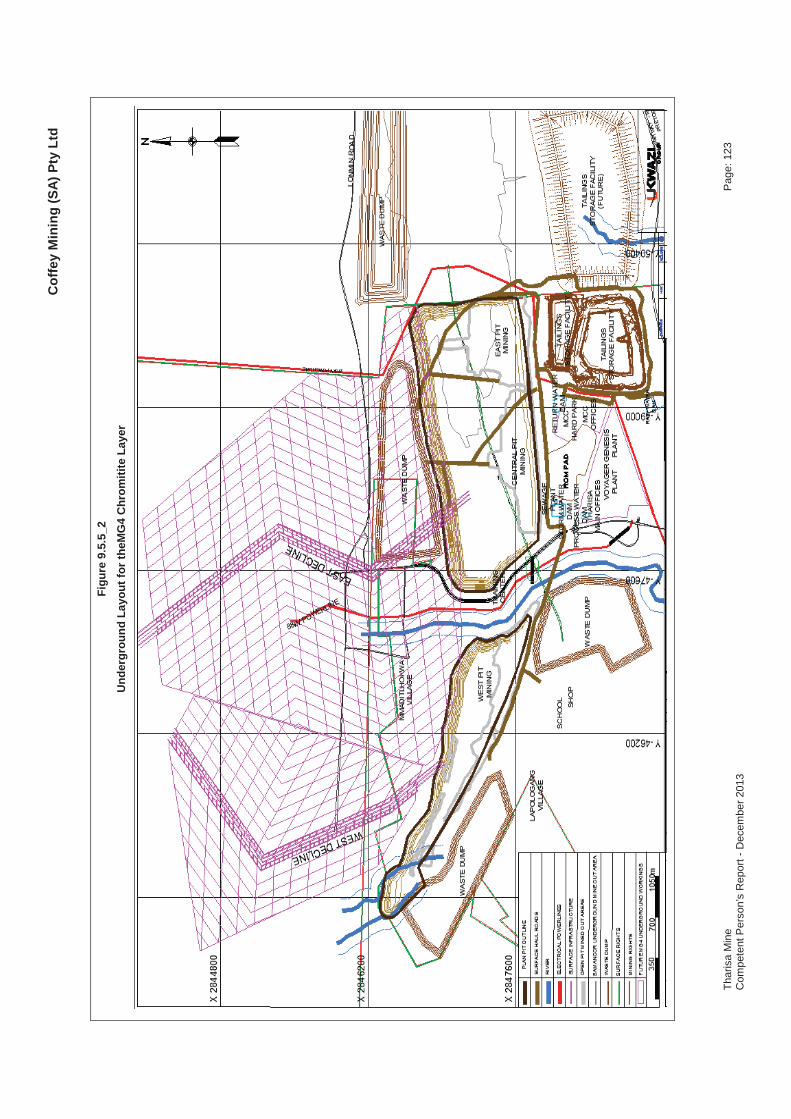
Cof
fey
Min
ing
(SA)
Pty
Ltd
Thar
isa
Min
eP
age:
123
Com
pete
nt P
erso
n’s
Rep
ort -
Dec
embe
r 201
3
Figu
re 9
.5.5
_2
Und
ergr
ound
Lay
out f
or th
eMG
4 C
hrom
itite
Lay
er

Coffey Mining (SA) Pty Ltd
Tharisa Mine Page: 124Competent Person’s Report - December 2013
9.5.6 Geotechnical/ Hydrological ConsiderationsThe geotechnical parameters and pillar designs were recommended by Dr J James, Geotechnical Engineer. The recommendation is for 6m x 6m pillars on 8m bord spans and 6m holings for the stoping designs. The pillars are designed to increase with depth from 6m x 6m in the upper levels to 8m x 8m in the lower areas.
The MG2A and MG2B Chromitite Layer and MG4 Chromitite Layer hanging walls are competent. A support pattern of 2.4m grouted roof bolts, or equivalent split sets, spaced on a 2m x 2m grid in the hanging wall was considered to be sufficient under normal conditions.Additional spot bolts would be required if faulted areas are encountered as mining progresses.
The general hydrological conditions for the area were described as wet and the shallow open pit being mined at the time of compiling this report is already being pumped almost continuously to maintain workable underfoot conditions.
Excessive water is not expected to cause any material risk to the planned underground operations. An appropriate water reticulation system has been provided for in the capital cost.To minimize the inflow of water into underground workings, diversion trenches or embankments will be installed around all the decline portals and all surface ventilation holings will be protected from surface run-off water.
9.5.7 Equipment Selection Equipment units were selected based on the planned production rates, Chromitite Layer geometry, excavation sizes and available technology. The minimum height that can be traversed safely and efficiently by low profile machines is currently 1.8m.
Based on the above criteria the most suitable Load Haul Dumper (LHD) was considered to be LH209L or equivalent. This LHD has a height of 1.69m and a bucket reach of almost 5m making it an appropriate match for the planned mining cuts.
In the drill rig category, the Sandvik DL230L (or equivalent), with a tramming height of 1.4m was considered to be the best fit.
9.5.8 Shift CycleMining production for the underground operations has been planned at two by 10 hour shifts, five days per week. Drilling, blasting, lashing and supporting will be the main activities on the morning shift while the back shift will mainly be for lashing. Blasting will be carried out once per day at the end of the morning shift while blasting during the sinking of the declines has been set at twice per day during the first 18 months. A period of at least three hours has been allowed for before re-entry.

Coffey Mining (SA) Pty Ltd
Tharisa Mine Page: 125Competent Person’s Report - December 2013
9.5.9 Production SchedulingBased on a production profile of 400,000tpm, the scheduled underground production commences during financial year (FY) 2027 and continues up to (FY) 2075 resulting in a mine life of 24 years at steady state production (Figure 9.5.9_1). The mine plans for the MG2 and MG4 Chromitite Layers underground mines are presented in Figure _2.
Figure 9.5.9_1
Underground Mine Production Schedule
The scheduling strategy, which is a key driver to the overall project costs and economic value, has been set to establish the Eastern decline system initially before moving to the Western decline system. This strategy was chosen to minimise project risk by starting off with areas of higher geological confidence and layer thicknesses. Sinking of the MG2 Chromitite Layer East triple declines system is set to start five years before the projected winding down of open pit operations. At the planned advance rate, the mining of the triple MG2 Chromitite Layer declines to the Level 3, including the ledging, will be completed within 24 months and ramp up to steady state within 48 months.

Figure 9.5.6_2Underground Mine Face Positions: MG2 Chromitite Layer
January 2028 January 2030
January 2040 January 2050
January 2060 January 2064
Tharisa Mine Page: 126Competent Person’s Report - December 2013
Coffey Mining (SA) Pty Ltd

Underground Mine Face Positions: MG4 Chromitite Layer
January 2028 January 2030
January 2040 January 2050
January 2060 January 2064
Tharisa Mine Page: 127Competent Person’s Report - December 2013
Coffey Mining (SA) Pty Ltd
Coffey Mining (SA) Pty Ltd
Tharisa Mine Page: 128Competent Person’s Report - December 2013
9.5.10 Infrastructure RequirementsThe underground operations are planned to leverage off existing infrastructure for open pit operations and thus electricity, water, the plant, houses, offices and transport and communications networks are expected to be in place when the underground operations commence. Additional infrastructure provided for in the capital cost estimate includes:
The ventilation network;
Underground workshops and fuelling facilities;
Pumping arrangements;
Washrooms and lamp room facilities; and
Emergency Facilities.
9.5.11 LabourExcept for a core owner’s team, the majority of the labour force will be contract labour. The Tharisa Mine is located in a prime mining area with an experienced pool of labour to choose from. The owner’s team, including the supervisory and management staff will be retained from the open pit operations. Appropriate induction and training is required to ensure a smooth transition to underground operations.
9.5.12 The Underground Cost ModelAn underground cost model was compiled from first principles. A contract mining site establishment fee of R20 million per decline were assumed.
Capital Costs
A capital cost outlay of R2.0 billion including a 10% contingency will be required to move the project to steady state production at a rate of 400,000tpm over a period of 5 years. Asummary of the initial major capital costs include:-
R1.3 billion for decline development, equipping and conveyor installations;
R120 million for site establishment, Preliminary and General and electricity costs;
R150 million for portal establishment and support; plus
a 10% contingency.
Mining Operating Costs
The mining operating costs were sourced from the Ukwazi database and from relevant service providers. The operating expenditure estimate of about R445/t (including a 10% contingency) compares favourably with other similar operations in the country employing the same mining method.

Coffey Mining (SA) Pty Ltd
Tharisa Mine Page: 129Competent Person’s Report - December 2013
10 MINERAL RESERVES
10.1 Open Pit Mineral Reserve Estimation
In order to declare mineral reserve it is necessary to plan a mine and confirm that the mine will be viable. Various technical aspects are considered in the mine design and costing.These aspects are known as modifying factors. These factors were applied to the mine design and schedule to convert the mineral resource to mineral reserve. The modifying factors applied were geological losses, mining recovery (mining loss) and mining dilution. The recoveries and cost assumptions are stated below the mining modifying factors.
10.1.1 Geological LossesGeological losses are applied at 7.5% for the East Mine and 15% for the West Mine in accordance with the recommendation of the Competent Person.
10.1.2 Mining Recovery (Mining Loss)Mining losses has been set at 5% and estimated based on previous performance and determined by observation and measurement in the existing operation. The sources of mining losses include mining activities close to geological features, misalignment of reef excavator bucket size with the chromitite layer thickness, incorrect loading on the roof and floor of the chromitite layers and losses due to blasting activities.
10.1.3 Mining DilutionA mining dilution of 7.1% was applied based on provisional on-site measurements. The dilution is low due to the fact that:
Selective drilling and blasting is undertaken;
Small class excavators are used to load the layers selectively in flitches;
Spotters are used to control the loading specifically on the Chromitite layer floor; and
Dilution is measured and managed on an on-going basis based on the current implemented SOP.
The selective drilling and blasting of the various layers was implemented in mid-2013. The applied dilution is measured on a continuous basis and is well controlled due to the potential material impact on the RoM grade.
SRT1.2C(i) SRT2.4C(i) SRT5.4C(i) – SRT5.4C(iii) SRT5.7C(i) – SRT5.7(vi) SRT7C(i) – SRT7C(v) SRT8C(i) - SRT8C(vi) SVT2.6 SVT2.7
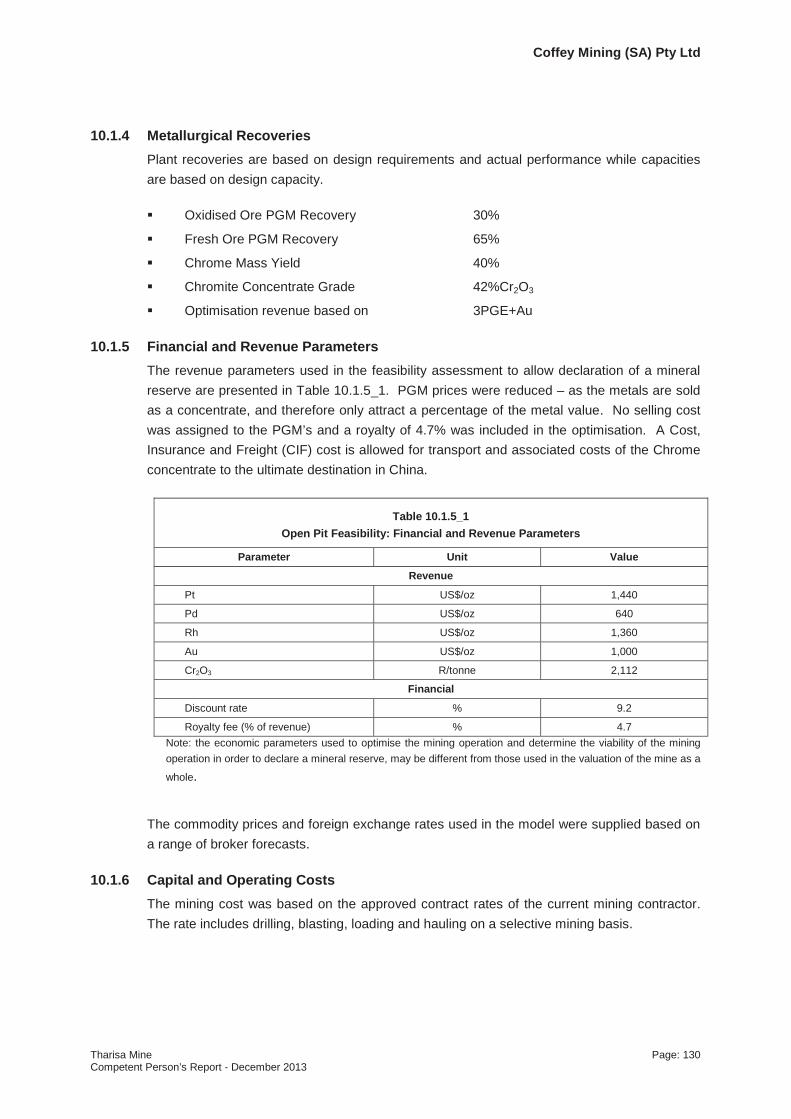
Coffey Mining (SA) Pty Ltd
Tharisa Mine Page: 130Competent Person’s Report - December 2013
10.1.4 Metallurgical RecoveriesPlant recoveries are based on design requirements and actual performance while capacities are based on design capacity.
Oxidised Ore PGM Recovery 30%
Fresh Ore PGM Recovery 65%
Chrome Mass Yield 40%
Chromite Concentrate Grade 42%Cr2O3
Optimisation revenue based on 3PGE+Au
10.1.5 Financial and Revenue ParametersThe revenue parameters used in the feasibility assessment to allow declaration of a mineral reserve are presented in Table 10.1.5_1. PGM prices were reduced – as the metals are sold as a concentrate, and therefore only attract a percentage of the metal value. No selling cost was assigned to the PGM’s and a royalty of 4.7% was included in the optimisation. A Cost, Insurance and Freight (CIF) cost is allowed for transport and associated costs of the Chrome concentrate to the ultimate destination in China.
Table 10.1.5_1Open Pit Feasibility: Financial and Revenue Parameters
Parameter Unit Value
Revenue
Pt US$/oz 1,440
Pd US$/oz 640
Rh US$/oz 1,360
Au US$/oz 1,000
Cr2O3 R/tonne 2,112
Financial
Discount rate % 9.2
Royalty fee (% of revenue) % 4.7Note: the economic parameters used to optimise the mining operation and determine the viability of the mining operation in order to declare a mineral reserve, may be different from those used in the valuation of the mine as a
whole.
The commodity prices and foreign exchange rates used in the model were supplied based on a range of broker forecasts.
10.1.6 Capital and Operating CostsThe mining cost was based on the approved contract rates of the current mining contractor.The rate includes drilling, blasting, loading and hauling on a selective mining basis.

Coffey Mining (SA) Pty Ltd
Tharisa Mine Page: 131Competent Person’s Report - December 2013
Minimal capital is required for the mining operation as the appointed mining contractor (MCC) supplies all the mining equipment. The capital is in effect incorporated into the mining rate which is captured in the mine operating cost estimate.
10.1.7 Mineral Reserve TabulationWith all the applicable modifying factors identified and evaluated as being reasonable, and the financial model yielding positive economic returns, the Mineral Resource within the mining footprint was converted to a mineral reserve. The mineral reserve is declared exclusive of the UG1 Chromitite Layer.
The Mineral Reserve Estimate for the open pit section for Tharisa Mine is presented in Table 10.1.7_1 in accordance with the SAMREC guidelines.

Cof
fey
Min
ing
(SA)
Pty
Ltd
Thar
isa
Min
eP
age:
132
Com
pete
nt P
erso
n’s
Rep
ort -
Dec
embe
r 201
3
Tabl
e 10
.1.7
_1
Thar
isa
Min
e: O
pen
Pit M
iner
alR
eser
ve (D
ecem
ber 2
013)
(SA
MR
EC C
ode)
Prov
ed M
iner
al R
eser
ve
Chr
omiti
te
Laye
rTo
nnes
(‘000
)Pt
(g/t)
Pd(g
/t)R
h(g/
t)Au
(g/t)
3PG
E+Au
(g
/t)R
u(g/
t)Ir(
g/t)
5PG
E+Au
(g
/t)C
r 2O
3(%
)C
u (%
)N
i (%
) C
r (%
)
MG
0
MG
1
MG
211
,817
1.03
0.26
0.15
0.00
41.
450.
250.
071.
7718
.31
0.00
20.
070
12.5
3
MG
310
,412
0.56
0.32
0.14
0.
005
1.03
0.20
0.
06
1.29
12
.23
0.00
30.
046
8.37
MG
411
,010
1.06
0.22
0.21
0.00
31.
490.
350.
111.
9525
.72
0.00
30.
075
17.6
0
MG
4A5,
234
0.34
0.13
0.11
0.00
30.
580.
220.
040.
8521
.44
0.00
20.
066
14.6
7
Tota
l38
,474
0.79
0.25
0.15
0.00
41.
190.
270.
081.
5319
.21
0.00
20.
064
13.1
4
Prob
able
Min
eral
Res
erve
Chr
omiti
te
Laye
rTo
nnes
(‘000
)Pt
(g/t)
Pd(g
/t)R
h(g/
t)Au
(g/t)
3PG
E+Au
(g
/t)R
u(g/
t)Ir(
g/t)
5PG
E+Au
(g
/t)C
r 2O
3(%
)C
u (%
)N
i (%
) C
r (%
)
MG
04,
473
0.40
0.13
0.12
0.00
30.
665
0.23
0.05
0.93
19.1
60.
002
0.06
013
.11
MG
18,
005
0.29
0.18
0.10
0.00
30.
570.
410.
071.
0528
.89
0.00
30.
069
19.7
7M
G2
21,4
541.
020.
280.
150.
004
1.45
0.25
0.07
1.77
18.1
10.
002
0.07
012
.39
MG
318
,825
0.59
0.34
0.
150.
005
1.06
0.21
0.06
1.33
12.8
10.
001
0.04
78.
76M
G4
9,96
01.
080.
240.
210.
003
1.52
0.36
0.11
1.99
25.3
00.
003
0.07
317
.31
MG
4A6,
043
0.35
0.14
0.11
0.00
40.
590.
220.
040.
8520
.83
0.00
20.
066
14.2
5
Tota
l68
,761
0.74
0.26
0.15
0.00
41.
150.
270.
071.
4919
.26
0.00
20.
064
13.1
8
Tota
l Min
eral
Res
erve
Chr
omiti
te
Laye
rTo
nnes
(‘000
)Pt
(g/t)
Pd(g
/t)R
h(g/
t)Au
(g/t)
3PG
E+Au
(g
/t)R
u(g/
t)Ir(
g/t)
5PG
E+Au
(g
/t)C
r 2O
3(%
)C
u (%
)N
i (%
) C
r (%
)
MG
04,
473
0.40
0.13
0.12
0.00
30.
660.
230.
050.
9319
.16
0.00
20.
060
13.1
1M
G1
8,00
50.
290.
180.
100.
003
0.57
0.41
0.07
1.05
28.8
90.
003
0.06
919
.77
MG
233
,272
1.03
0.27
0.15
0.00
41.
450.
250.
071.
7718
.18
0.00
20.
070
12.4
4M
G3
29,2
370.
580.
340.
150.
005
1.06
0.21
0.06
1.33
12.7
80.
001
0.04
813
.68
MG
420
,970
1.07
0.23
0.21
0.00
31.
500.
360.
111.
9725
.52
0.00
30.
074
17.4
6M
G4A
11,2
770.
340.
130.
110.
003
0.59
0.22
0.04
0.85
21.1
10.
002
0.06
614
.44
Tota
l10
7,23
50.
760.
250.
150.
004
1.17
0.27
0.07
1.51
19.2
90.
002
0.06
413
.20
SRT8
B(i)
Coffey Mining (SA) Pty Ltd
Tharisa Mine Page: 133Competent Person’s Report - December 2013
10.2 Underground Mineral Reserve Estimation
Mining related modifying factors applicable to the underground design are applied to convert the mineral resources to mineral reserves.
10.2.1 Geological LossesA geological loss of 15% has been applied based on the recommendations of the Competent Person.
10.2.2 Mining External DilutionThe mining dilution factors were calculated from first principles under the following assumptions:
A 10cm layer of waste from the hanging and footwall horizons of the mined chromitite layer will be mined and conveyed as RoM ore.
Depending on dip of the Chromitite Layer, some waste will also be mined to maintain safe and horizontal underfoot conditions as per design.
The dilution factors decrease with depth from 16.1% to 13.2% for MG2 Chromitite Layer and from 15.0% to 11.7% for MG4 Chromitite Layer. This is in direct proportion to the pillars sizes which increase with depth.
10.2.3 Mining RecoveryMining recovery for both chromitite layers was set at the historical mining average for similar operations at 98%.
10.2.4 Mining Extraction before Geological LossesThis is mainly a function of the pillar size and was estimated from first principles. Adecreasing trend with depth is shown from 78.6% in the upper levels to 71.4% in the lower levels for both Chromitite Layers.
10.2.5 Mineral Reserve TabulationIndicated Resources included in the mine plan were converted to Probable Mineral Reserves.
This project includes Probable Mineral Reserves and material from Inferred Resources. The Mineral Reserve Estimate for the Tharisa Mine is presented in Table 10.2.5_1 in accordance with the SAMREC guidelines.
The mineral reserve declaration is in respect of tonnage and grade delivered to the processing facility.
SRT5.4C(i)
SRT5.5C(iv) SRT8B(i)

Cof
fey
Min
ing
(SA)
Pty
Ltd
Thar
isa
Min
eP
age:
134
Com
pete
nt P
erso
n’s
Rep
ort -
Dec
embe
r 201
3
Tabl
e 10
.2.5
_1Th
aris
a M
ine:
Und
ergr
ound
Min
e M
iner
alR
eser
ve (D
ecem
ber 2
013)
Rep
orte
d in
term
s of
the
guid
elin
es o
f the
SAM
REC
Cod
e
Prov
edM
iner
alR
eser
ve
Chr
omiti
te
Laye
rTo
nnes
(‘000
)Pt
(g/t)
Pd(g
/t)R
h(g/
t)Au
(g/t)
3PG
E+Au
(g
/t)R
u(g/
t)Ir(
g/t)
5PG
E+Au
(g
/t)C
r 2O
3(%
)N
i (%
)C
u (%
)C
r (%
)
MG
2AB
- -
- -
- -
- -
- -
- -
-
MG
4-
- -
- -
- -
- -
- -
- -
Tota
l-
--
--
--
--
--
--
Prob
able
Min
eral
Res
erve
Chr
omiti
te
Laye
rTo
nnes
(‘000
)Pt
(g/t)
Pd(g
/t)R
h(g/
t)Au
(g/t)
3PG
E+Au
(g
/t)R
u(g/
t)Ir(
g/t)
5PG
E+Au
(g
/t)C
r 2O
3(%
)N
i (%
)C
u (%
)C
r (%
)
MG
2AB
6,64
60.
700.
210.
100.
002
1.02
0.20
0.05
1.27
17.3
70.
060
0.00
211
.88
MG
412
,002
0.89
0.18
0.17
0.00
21.
250.
310.
101.
6620
.39
0.06
10.
002
14.1
0
Tota
l18
,649
0.82
0.19
0.15
0.00
21.
170.
270.
081.
5219
.31
0.06
00.
002
13.3
1
Tota
l Min
eral
Res
erve
Chr
omiti
te
Laye
rTo
nnes
(‘000
)Pt
(g/t)
Pd(g
/t)R
h(g/
t)Au
(g/t)
3PG
E+Au
(g
/t)R
u(g/
t)Ir(
g/t)
5PG
E+Au
(g
/t)C
r 2O
3(%
)N
i (%
)C
u (%
)C
r (%
)
MG
2AB
6,64
60.
700.
210.
100.
002
1.02
0.20
0.05
1.27
17.3
70.
060
0.00
211
.88
MG
412
,002
0.89
0.18
0.17
0.00
21.
250.
310.
101.
6620
.39
0.06
10.
002
14.1
0
Tota
l18
,649
0.82
0.19
0.15
0.00
21.
170.
270.
081.
5219
.31
0.06
00.
002
13.3
1

Coffey Mining (SA) Pty Ltd
Tharisa Mine Page: 135Competent Person’s Report - December 2013
11 MINERAL PROCESSING AND METALLURGICAL TESTING
11.1 Introduction
The processing facilities at the Tharisa Mine are designed to treat the MG Chromitite Layers of the Bushveld Complex. These layers vary in thickness, competence and chromite and PGM grades. Historically some of the MG Chromitite Layers have been mined for the recovery of chrome but not for PGMs. Tharisa Minerals has undertaken metallurgical tests on samples from these layers and confirmed the economic viability of mining and processing these ores for the recovery of both the chromite and PGM concentrates and confirmed this with the subsequent operating results.
The Tharisa Mine has been developed in a phased manner as described below.
The first phase of the mine development involved the production of a chromite concentrate only from a pilot plant. Trial production commenced in March 2009. This pilot plant was later adapted to provide early revenue and from November 2009 the plant treated RoM ore at a throughput rate of 38,000tpm.
The second phase of the mine development involved the expansion of the mining operation and processing facility to mine and treat 100,000tpm of RoM ore. In addition the processing facility was expanded to incorporate both a 65,000tpm PGM recovery circuit and a secondary chromite recovery section. This is known as the Genesis plant. Commissioning of the Genesis plant commenced in August 2011 and was completed in February 2012.
The third phase of mine development increased the mining and processing rate by a further 300,000tpm. This was achieved through the construction of a new standalone concentrator which operates in parallel to the existing 100,000tpm processing facility.The new 300,000tpm concentrator, known as the Voyager plant, recovers a primary chromite concentrate, a PGM concentrate out of the primary chromite tailings and a secondary chromite concentrate out of the PGM tailings. At the conclusion of theVoyager plant the total mining and processing throughput capacity of the Tharisa Mine was 400,000tpm (4.8Mtpa) of RoM ore.
11.2 Processing Facilities and Flow Sheets
The processing facility design was based on testwork undertaken by Mintek. In addition trials were conducted on the Voyager and Genesis plants. This led to the removal of the rougher concentrate regrinding circuit, changes on the PGM flotation cleaner circuit and the addition of a crushing facility to the primary milling circuit to improve on the original design.
The Tharisa Mine has been developed on a phased basis.
Phase 1 of the mine development involved the establishment of an open pit mining operation and chrome concentrator at a production rate of 38,000tpm. The chrome concentrator for Phase 1 was adapted from the original pilot plant and includes receipt of RoM ore from the open pit mining operation and crushing of this ore to 12mm. The crushed ore is then milled in a single stage ball mill operating in closed circuit with a vibrating screen
SRT1.2C(i) SRT5.5A(i)SRT5.5B(i) – SRT5.5B(iii) SRT5.5C(i) – SRT5.5C(iii) SVT2.7
SRT3.2B(i) SRT5.8A(i) SRT5.8C(i)
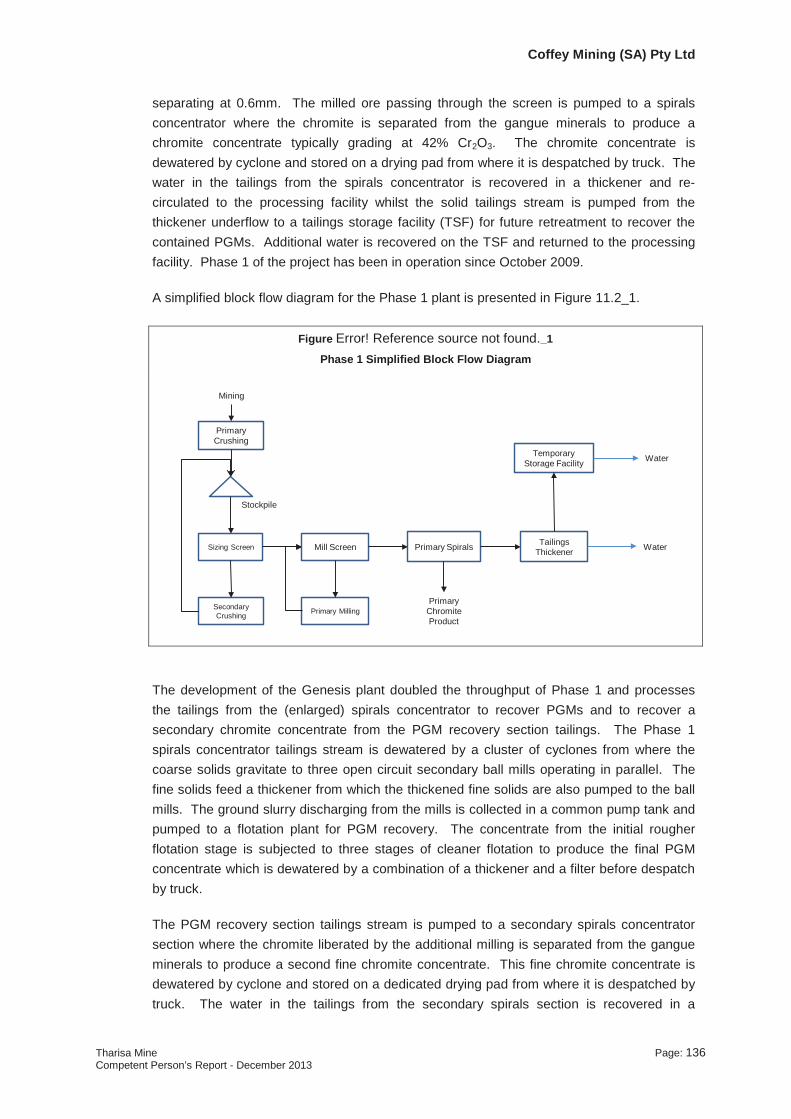
Coffey Mining (SA) Pty Ltd
Tharisa Mine Page: 136Competent Person’s Report - December 2013
separating at 0.6mm. The milled ore passing through the screen is pumped to a spirals concentrator where the chromite is separated from the gangue minerals to produce a chromite concentrate typically grading at 42% Cr2O3. The chromite concentrate is dewatered by cyclone and stored on a drying pad from where it is despatched by truck. The water in the tailings from the spirals concentrator is recovered in a thickener and re-circulated to the processing facility whilst the solid tailings stream is pumped from the thickener underflow to a tailings storage facility (TSF) for future retreatment to recover the contained PGMs. Additional water is recovered on the TSF and returned to the processing facility. Phase 1 of the project has been in operation since October 2009.
A simplified block flow diagram for the Phase 1 plant is presented in Figure 11.2_1.
Figure Error! Reference source not found._1
Phase 1 Simplified Block Flow Diagram
The development of the Genesis plant doubled the throughput of Phase 1 and processes the tailings from the (enlarged) spirals concentrator to recover PGMs and to recover a secondary chromite concentrate from the PGM recovery section tailings. The Phase 1 spirals concentrator tailings stream is dewatered by a cluster of cyclones from where the coarse solids gravitate to three open circuit secondary ball mills operating in parallel. The fine solids feed a thickener from which the thickened fine solids are also pumped to the ball mills. The ground slurry discharging from the mills is collected in a common pump tank and pumped to a flotation plant for PGM recovery. The concentrate from the initial rougher flotation stage is subjected to three stages of cleaner flotation to produce the final PGM concentrate which is dewatered by a combination of a thickener and a filter before despatch by truck.
The PGM recovery section tailings stream is pumped to a secondary spirals concentrator section where the chromite liberated by the additional milling is separated from the gangue minerals to produce a second fine chromite concentrate. This fine chromite concentrate is dewatered by cyclone and stored on a dedicated drying pad from where it is despatched by truck. The water in the tailings from the secondary spirals section is recovered in a
Primary Crushing
Sizing Screen
Stockpile
Primary Spirals
Mining
Primary Chromite Product
Tailings Thickener Water
WaterTemporary Storage Facility
Secondary Crushing
Mill Screen
Primary Milling

Coffey Mining (SA) Pty Ltd
Tharisa Mine Page: 137Competent Person’s Report - December 2013
thickener and re-circulated whilst the solid tailings stream is pumped from the thickener underflow to a final TSF. A simplified block flow diagram for the Genesis plant is presented in Figure 11.2_
Figure 11.2_2 Genesis Plant (Phase 2):Simplified Block Flow Diagram
The Genesis plant construction was completed and commissioning began during August 2011 with the commissioning completed in February 2012.
Phase 3 of the project increased the throughput rate to 400,000tpm by establishing a new processing facility rated at 300,000tpm, known as the Voyager plant, to operate in parallel with the 100,000tpm Phase 2 processing facility. The two processing facilities operate independently.
The Voyager plant receives RoM ore from the open pit mining operation which is then reduced to 80% passing 22mm in three stages of crushing. The crushed ore is stored on an open stockpile from where it is fed to two ball mills operating in parallel and in closed circuit with dedicated mill screens sizing at 0.6mm. Material coarser than 0.6mm is returned to the mills whilst the solids finer than 0.6mm pass through the screens and are pumped to the primary spirals concentrator for recovery of the coarse chromite. The chromite concentrate is dewatered by cyclone and stored on a drying pad from where it is despatched by truck.
Secondary Milling
PGM Rougher Flotation
Secondary Spirals
Secondary Chromite Product
Cleaner & Re-Cleaner
Flotation
ThickenerFilter PressPGM
Concentrate Product
WaterWater
Tailings Thickener
Water
Water
Tailings Storage Facility
Phase I Tailings
Rougher Concentrate Thickening
Rougher Concentrate
Regrind

Coffey Mining (SA) Pty Ltd
Tharisa Mine Page: 138Competent Person’s Report - December 2013
The tailings from the spirals concentrator is pumped to a classifying cyclone cluster where coarse solids discharge via the underflow to a single ball mill that operates in open circuit.The overflow from the primary cyclone cluster feeds a thickener where the contained water is recovered and returned to the process. The underflow from this thickener is then pumped to the PGM recovery section flotation plant where it is combined with the mill discharge for PGM recovery. The concentrate from the initial rougher flotation stage is then subjected to two stages of cleaner flotation to produce the final PGM concentrate that is dewatered by a combination of a thickener and a filter before despatch by truck.
The PGM recovery section tailings stream is pumped to a secondary spirals concentrator section where the chromite liberated by the secondary milling is separated from the gangue minerals to produce a second fine chromite concentrate. The fine chromite concentrate is then dewatered by cyclone and stored on a dedicated drying pad from where it is despatched by truck. The water in the tailings from the secondary spirals concentrator is recovered in a thickener and re-circulated to the processing facility whilst the solid tailings is pumped from the thickener underflow to a common TSF, which will be shared with the Phase 2 processing facility. A simplified block flow diagram for the Voyager plant is presented in Figure Figure 11.2_1.
Construction of the Voyager plant commenced in July 2011 and was completed in September 2012. Commissioning of this plant commenced during August 2012, first ore was introduced to the plant during September 2012 and commissioning was completed in December 2012.

Cof
fey
Min
ing
(SA)
Pty
Ltd
Thar
isa
Min
eP
age:
139
Com
pete
nt P
erso
n’s
Rep
ort -
Dec
embe
r 201
3
Figu
re 1
1.2_
1 Vo
yage
rPla
nt (P
hase
3):
Sim
plifi
ed B
lock
Flo
w D
iagr
am

Coffey Mining (SA) Pty Ltd
Tharisa Mine Page: 140Competent Person’s Report - December 2013
The Tharisa metallurgical and engineering team has undertaken a number of plant performance evaluation studies subsequent to the 400,000tpm processing facility being put into production. These studies have resulted in various plant upgrades that have improved the process plant performance in terms of both recovery and concentrate grade for both chromite and PGMs. In addition the primary spirals chromite concentrator for the Genesis plant has been modified to allow higher grade, higher value, foundry and chemical grade chromite concentrates (44% Cr2O3) to be scalped off as a separate concentrate in addition to the bulk metallurgical grade (42% Cr2O3) concentrate. The Genesis plant processes predominantly the MG1 and MG4A Chromitite Layers which contain the higher grade chromite. This modification (known as the Foundry Project) to the Genesis plant produces approximately 6,000tpm of foundry grade and 1,500tpm of chemical grade chromite in addition to the metallurgical grade chromite with a minor reduction in the total chromite production (but higher total value) from this plant. A simplified process flow diagram for the Foundry Project is presented in Figure 11.2_4.
Two further significant process plant upgrades are currently being evaluated, namely:
Wet High Intensity Magnetic Separation (WHIMS)
WHIMS tests on Tharisa material showed a potential of more than 10% increase in yield potential. During commissioning and operation of the plant it has been found that there is still recoverable chromite in the final tailings. These losses were found to be in the fines fraction where spiral efficiencies are low. By targeting a different property, namely the paramagnetic nature of chromite, it is possible to recover a large portion of the chromite lost by gravimetric methods. Tests results indicate a two stage WHIMS process will achieve an acceptable final concentrate.
High Energy Flotation
Due to the small grain size of the PGM minerals in the Tharisa ore, liberated fines are lost to tails in conventional flotation cells as they do not have enough energy to penetrate bubble surfaces. By combining high energy mechanisms with conventional mechanisms and dedicating the cleaner circuit to each of the fractions that is recovered from the two stages, the ultra-fine PGM minerals lost to tails can be recovered. Test work done on Tharisa material indicates that the implementation of high energy flotation has the potential to decrease the PGM tailings value by 30% or more.

Coffey Mining (SA) Pty Ltd
Tharisa Mine Page: 141Competent Person’s Report - December 2013
Figure 11.2_4Foundry Project Simplified Flow Diagram
11.3 Genesis and Voyager Plant Metallurgical Performance
The Tharisa combined Genesis and Voyager process plants have operated in production mode since December 2012. The ore that has been processed to date is from near surface and can be described as mixed rather than fresh ore. This means that the ore is partially oxidised which has a negative impact on the flotation recovery of the PGMs. As the mining pit deepens the RoM ore will increasingly become unoxidised with a resultant improvement in PGM recovery.

Coffey Mining (SA) Pty Ltd
Tharisa Mine Page: 142Competent Person’s Report - December 2013
The chemical and foundry grade chromite recovery circuits were commissioned in July 2013 and production of these higher grade concentrates has continued since then.
The key production data for 2013 together with the planned metallurgical performance is presented in Table 11.3_1.
Table 11.3_1Tharisa Mine
Key Achieved and Planned Metallurgical Performance StatisticsDescription Year 2013 2014 2015 2016 2017 2018Tonnes Milled (‘000t) 3,866 4,496 4,800 4,800 4,800 4,800RoM Chromite Grade (% Cr2O3) 20.7% 19.5% 19.8% 19.4% 19.7% 18.9%Foundry Chromite Concentrate (‘000t) 4 25 28 25 27 25Foundry Chromite Grade (% Cr2O3) 45.0% 45.0% 45.0% 45.0% 45.0% 45.0%Chemical Chromite Concentrate (‘000t)Genesis Plant 11 80 84 77 81 74
Chemical Chromite Grade (% Cr2O3)Genesis Plant 45.0% 45.0% 45.0% 45.0% 45.0% 45.0%
Chemical Chromite Concentrate (‘000t)Voyager Plant 47 100 114 128 128 125
Chemical Chromite Grade (% Cr2O3)Voyager Plant 44.0% 44.0% 44.0% 44.0% 44.0% 44.0%
Metallurgical Chromite Concentrate (‘000t) 1,130 1,342 1,532 1,635 1,656 1,598Metallurgical Chromite Grade (% Cr2O3) 42.0% 42.0% 42.0% 42.0% 42.0% 42.0%Total Chromite Concentrate (‘000t) 1,193 1,547 1,759 1,864 1,892 1,822Chromite Yield (%) 30.9% 34.4% 36.6% 38.8% 39.4% 38.0%PGM Concentrator Feed (‘000t) 2,894 3,295 3,456 3,168 3,168 3,168PGM Concentrator Feed Grade (g/t) 1.41 1.72 1.78 2.03 1.91 1.99PGMs Recovered (ounces) 57,421 111,167 131,338 139,455 144,693 146,668PGM Concentrate Grade (g/t) 60.00 120.81 120.00 120.00 120.00 120.00PGM Recovery (%) 43.7% 61.0% 66.3% 67.4% 74.5% 72.5%
The planned metallurgical production is based upon the following:
The tonnage and head grade from the mining schedule for this period
Foundry grade chromite concentrate production averaging 1.7% of total chromite concentrate
PGM recoveries are based upon the fresh ore and oxidised ore mix in the mining schedule for this period. Higher recoveries are achieved with fresh ore. High energy flotation has been tested on the plant and shown to achieve higher PGM recoveries
A programme of chromite spiral upgrading is currently under way to eliminate a beaching problem that has been encountered. Those spirals that have already been modified are achieving a 3% improvement in chromite recovery.
Pilot testing of WHIMS has shown a 2% increase in chromite recovery as fine chromite from tailings. Two WHIMS machines have been ordered and are schedule for commissioning in March 2014

Coffey Mining (SA) Pty Ltd
Tharisa Mine Page: 143Competent Person’s Report - December 2013
On-plant tests have shown that higher grade PGM concentrates can be readily produced without loss of PGM recovery and this is projected for 2014
Chemical grade chromite concentrate production averaging 11.4% of total chromite concentrate
Metallurgical grade chromite concentrate production averaging 86.9% of total chromite concentrate.
11.4 Combined Genesis and Voyager Plant Operating Cost
The operating costs for the combined Genesis and Voyager process facility are presented in the following categories for both the historical costs and the forecast costs:
Labour
The labour cost includes: salaries, employee benefits, training, travel, accommodation and expense claims.
Stores
The stores cost includes: mill steel, reagents, mill liners, mechanical spares, tools, laboratory consumables, lubricants, electrical spares, control and instrumentation spares, piping and valves, crane hire, engineering consumables, fuel, surveying and personnel protection equipment.
Sundries
The sundries cost includes: sampling and analysis, tailings management, consultants, IT, legal, office costs, security, outsourced services, insurances, medical and equipment hire.
Utilities
The utilities cost includes power and water supply.
The operating cost data for 2013 together with the planned operating cost is presented in Table 11.4_1.
Table 11.4_1Tharisa Mine
Achieved and Planned Metallurgical Operating Cost (ZAR/t)Operating Cost (ZAR/t) Year 2013 2014 2015 2016 2017 2018Labour 21.55 22.10 20.70 20.70 20.70 20.70Stores and Sundries 50.53 51.30 48.05 62.45 62.45 62.45Utilities 21.93 28.04 29.26 29.26 29.26 29.26TOTAL 94.01 101.44 98.01 112.41 112.41 112.41

Coffey Mining (SA) Pty Ltd
Tharisa Mine Page: 144Competent Person’s Report - December 2013
11.5 Tailings Storage Facilities and Waste Rock Dumps
The TSF design process was dominated by the need to create sufficient tailings storage capacity to serve the design life of the mine in the limited space available within the mining right area. The location of the orebody, and hence the open pit mining operations, within the mining right area necessitated that the TSF would be constructed in close proximity to the open pit.
The proximity of the tailings storage facility to the mining operations meant that one of the design priorities would be to minimise risks in terms of loss of life and future earnings and this in turn meant that the design of a robust impoundment would have to be adopted.
A decision was thus made to use waste rock, from the open cast mining operations, to construct a tailings impoundment. This would ultimately achieve the following:
The efficient use of the limited space available for mining infrastructure;
The construction of a robust structure with high factors of safety due its proximity to mining operations and the process plant;
Ease and ability to rehabilitate the side slopes of the TSF as soon as possible;
The reduction of the overall footprint of the waste storage areas (tailings and waste rock);
The reduction of closure costs.
The proximity of the TSFs to the open cast operations meant that the short waste rock haul distances lent themselves to constructing a stable rockfill wall without incurring exorbitant construction costs. This results in a solution that addresses the risks to the mine and at the same time disposes of the waste rock and tailings stream efficiently.
The Waste Rock Dumps (WRDs) will serve as storage facilities to accommodate all the excess waste rock generated by the open cast mining operations not being absorbed by the construction of the TSFs as well as other construction activities. It is the mine’s intention to backfill the open pits with the waste rock generated on an advancing basis once the pits have been sufficiently developed.
The design of the WRDs was governed by the following:
Maximise the storage capacity of the WRDs within the footprint designated for its development.
Ensure that its final geometry is such that it facilitates on-going rehabilitation and closure and also minimises the works required at the end of the life of mine to complete the closure process.
Ensure that surface water runoff and seepage emanating from the WRD is contained.

Coffey Mining (SA) Pty Ltd
Tharisa Mine Page: 145Competent Person’s Report - December 2013
11.5.1 Design and Construction of the Tailings Storage FacilitiesTSF 1 is currently being constructed with the design of the next TSF (TSF 2) in progress.Figure 11.5.1_1 shows the layout of TSF 1 and TSF 2. The construction of the rockfill walls will absorb approximately 22.2Mm3 of waste rock which would otherwise have been disposed of in dedicated WRDs, adding to the overall mine footprint and rehabilitation costs. The construction of TSF 1 and TSF 2 has been phased as shown in Figure 11.5.1_2 and Figure 11.5.1_3 respectively.
Figure 11.5.1_1Layout of Tharisa Mine's TSF 1 and TSF 2 (Combined Facility)

Coffey Mining (SA) Pty Ltd
Tharisa Mine Page: 146Competent Person’s Report - December 2013
Figure 11.5.1_2
Construction Phasing of TSF 1
TSF 1 Phase 1 TSF Expansion Phase A
TSF Expansion Phase B TSF Expansion Phase C
The phasing of the construction of TSF 1 was executed as follows:
TSF 1 Phase 1 is a small paddock whose construction was prioritised to provide a tailings storage facility for the early deployment of the 100,000tpm Genesis plant:
Construction completed and paddock commissioned in August 2011.
This phase provided 640,000m3 tailings storage capacity for a period of 20 months oftailings produced by the 100,000tpm Genesis plant.
Approximately 860,000m3 of waste rock was used for the construction of the impoundment walls.
TSF 1 Expansion Phases A, B and C will provide tailings storage capacity for tailings produced from both the 100,000tpm (Genesis plant) and the 300,000tpm (Voyager plant) for a total period of approximately four years. More specifically:

Coffey Mining (SA) Pty Ltd
Tharisa Mine Page: 147Competent Person’s Report - December 2013
TSF 1 Expansion Phase A:
Construction completed in July 2012 in time for the commissioning of the 300,000tpm Voyager plant.
Containment walls constructed to an elevation of 1,223mamsl which provided a storage capacity for about 17 months or 2.2Mm3 of tailings.
Approximately 3.3Mm3 of waste rock was used for the construction of the impoundment walls.
TSF 1 Expansion Phase B:
Completion of construction of Phase B in mid December 2013.
The containment walls were constructed to an elevation of 1,230mamsl which provides a storage capacity for about 10 months or 1.68Mm3 of tailings.
Approximately 1.4Mm3 of waste rock placed in the impoundment walls.
TSF 1 Expansion Phase C:
Completion of the containment wall to its final design elevation of 1,242mamsl is expected around April 2014.
Final wall provides tailings storage for a further 19 months or 3.23Mm3 of tailings.
A further 980,000m3 of waste rock will be used to construct the impoundment wall to its final height.

Coffey Mining (SA) Pty Ltd
Tharisa Mine Page: 148Competent Person’s Report - December 2013
Figure 11.5.1_3
Construction Phasing of TSF 2
The phasing of the construction of TSF 2 will be executed as follows:
TSF 2 Phase A:
Construction to commence in May 2014.
At an elevation of 1212mamsl this phase will provide 41 months of tailings storage capacity or 6.79Mm3 of tailings.
Approximately 7.05Mm3 of waste rock will be used for the construction of the impoundment walls.
TSF 2 Phase B:
Construction to commence after completion of Phase A.
At an elevation of 1,224mamsl this phase will provide 65 months of tailings storage capacity or 10.83Mm3 of tailings.
Approximately 5.17Mm3 of waste rock will be used for the construction of the impoundment walls.

Coffey Mining (SA) Pty Ltd
Tharisa Mine Page: 149Competent Person’s Report - December 2013
TSF 2 Phase C:
Construction to commence after completion of Phase B.
At a final design elevation of 1236mamsl this phase will provide 74 months of tailings storage capacity or 12.08Mm3 of tailings.
Approximately 2.35Mm3 of waste rock will be used for the construction of the impoundment walls.
Table 11.5.1_1 summarises the capacities and operation life of TSF 1 and TSF 2.
Table 11.5.1_1
Waste Rock Capacity, Tailings Storage Capacity and Operational Life associated with the TSFs
Tailings Storage
Facility
Waste Rock
Capacity (m3)
Tailings Storage
Capacity (m3)Operation Life
TSF 1 Phase 1 860,000640,000
(Genesis Plant)August 2011 – March 2013
TSF 1 Expansion 5,810,000
540,000
(Voyager Plant)October 2012 – March 2013
6,600,000
(Genesis and
Voyager)
April 2013 – July 2016
TSF 2 15,660,000 29,700,000 August 2016 – October 2031
11.5.2 Capital Costs for the TSFs
Table 11.5.2_1 summarises the capital expense costs associated with the construction TSF 1and TSF 2. These costs exclude rehabilitation and other life cycle costs.
Table 11.5.2._1
Summary of Capital Costs for the TSFs
Description Cost
TSF 1 Phase 1 (2011 - 2013) R12.2 mil
TSF 1 Expansion (2012 - 2016) R45.7 mil
TSF 2 (2016 - 2031) R105.0 mil
Future TSF (2031 -2051) R185.0 mil
Total (excluding rehabilitation and closure costs) R347.9 mil

Coffey Mining (SA) Pty Ltd
Tharisa Mine Page: 150Competent Person’s Report - December 2013
It is estimated that the tailings storage requirements for the 20 years following 2031, i.e. after TSF 2 has reached full capacity, will have a capital cost implication of approximately R160 million. This estimate excludes rehabilitation and closure costs.
11.5.3 Environmental Protection Measures for the TSF
The key design features and environmental protection measures for the TSFs are summarised in Table 11.5.3_1.
Table 11.5.3_1
Tailings Complex Key Features and Environmental Protection Measures
Feature Detail
Physical
DimensionsNo.1 – Footprint = 70ha; Max height = 40m; Tailings Capacity = 7.78Mm3;
Waste Rock Volume = 6.54Mm3
TSF No.2 – Footprint = 158 ha; Max height = 45m; Tailings Capacity = 29.7Mm3;Wall W
Tailings Delivery
and DepositionTwo slurry delivery pipelines per processing facility (i.e. Genesis and Voyager plants) for pumping tailings in slurry form to the TSFs. HDPE pipes are used for the delivery pipelines.
Each TSF will have delivery pipe uptakes situated on the side of the dam closest to the plants. These uptakes will be connected to a pipeline positioned around the inside crest of each TSF with flanged T pieces (allowing for open end deposition) positioned every 75m.Deposition will cycle around each TSF by continually opening and closing a number of the T Pieces.
Deposition in TSF 2 will only commence once TSF 1 has reached full capacity.
Diversion Storm water diversion trenches or swales around the upstream sides of both TSFs to direct clean surface water run-off around and away from the TSFs.
Topsoil Stripping Topsoil within the TSF footprint areas will be stripped and stockpiled in accordance with the topsoil conservation guide in close proximity to the final toe on the upstream side of each TSF. A stripping depth of 200mm was recommended by the soils study. Stripping and stockpiling of topsoil will be done as part of the initial TSF construction works.
Lining In-situ low permeability black clays or turf remaining after topsoil stripping will reduce infiltration of leachate from the TSFs to ground water. The black clays vary between 1.0m to 2.0m in the basin of TSF 1 and between 4.5m to 6m in the basin of TSF 2.
Seepage cut off trenches around the perimeter of the TSFs excavated into the insitu norites will assist to collect any water seeping through the basin of the TSFs. These trenches will be dewatered and the water pumped back for processing.
Embankments Compacted clay toe walls and elevated compacted clay platforms will be constructed along the inner toe of the TSFs to enable the construction and efficient operation of inner toe drains which will assist with the lowering of the elevation of the phreatic surface within the facilities as well as the consolidation of tailings.
Each TSF waste rock containment wall will be developed at an overall outside slope of 1V:3H. The waste rock will be spread in maximum 2m thick layers and compaction will be carried out by 20t vibratory rollers and as well as traffic compaction. The clay beneath the

Coffey Mining (SA) Pty Ltd
Tharisa Mine Page: 151Competent Person’s Report - December 2013
Table 11.5.3_1
Tailings Complex Key Features and Environmental Protection Measures
Feature Detail
waste rock walls will be removed allowing the walls to be founded on competent norite thus improving the overall stability of the TSF.
Various ramps at gradients of 1V:10H (6º) will be provided at various locations around each TSF to allow for access by both mine haul trucks and TSF operators onto the containment walls and into each TSF.
Under Drains &
Decanting systemA 750mm high by 6.5m wide wall toe drains constructed using filter sand and stone material will be installed along the upstream toe of the clay starter wall on a slightly elevated compacted clay platform. Water collected from the drain will be removed via a number of 160mm diameter HDPE pipes running beneath the rockfill wall.
Supernatant water will be decanted from each TSF via a central decant (penstock) and report to a concrete lined return water sump, from which water will be pumped back to the plant. The sumps will have a 1000m3 capacity.
Surface run-off from the TSF side slopes and ramps will be retained by a series of nominally compacted catchment paddocks (constructed using local clays) around the perimeter of each TSF. Water will then either evaporate or seep into the basin from these catchment paddocks.
Access and
Access ControlMining haul roads for construction of the TSF containment walls will have a minimum width of 25m and will be constructed using waste rock along the northern sides of the TSFs.
A 6m wide waste rock road will be constructed around the perimeter of each TSF for access during operations, routine inspections and maintenance.
A perimeter fence around each TSF is not planned. Rather a perimeter fence around the whole of the mine site will be installed.
Waste
MinimisationNo re-processing of the tailings is envisaged in future.
No opportunities for the reduction of the tailings production rate are envisaged.
Rehabilitation A 500mm topsoil cover to be applied over the outer slopes of the TSF. Topsoil rehabilitation and vegetation establishment to commence on completion of containment wall construction to final height.
Monitoring The monitoring of the TSFs will include:
Safety aspects e.g. monthly review of freeboard during operational phase, presence of seepage, functioning of blanket drains etc, quarterly inspections (operational phase) and annual audits.
Groundwater pollution aspects including monitoring of at least 3 boreholes located on the perimeter of each TSF to ascertain upstream and downstream groundwater levels and quality including pH, EC, TDS, NO3, Ca, Mg, Fe, Mn, Na, Cl, K, SO4, HCO3, PO4, Cr (VI) and piezometric level. Monitoring frequency of major cations and anions quarterly, minor constituents annually after 2 years of quarterly monitoring – quarterly report.
Vegetation cover and success rate. The rehabilitation and vegetation of the outer slope of each TSF will be done during the operational phase – quarterly report.
Erosion damage and general condition of catchment paddocks, drainage outlet pipes,

Coffey Mining (SA) Pty Ltd
Tharisa Mine Page: 152Competent Person’s Report - December 2013
Table 11.5.3_1
Tailings Complex Key Features and Environmental Protection Measures
Feature Detail
solution trench and sumps – quarterly report.
Dust generation – annual report.
Dust Control The height of the TSF waste rock containment walls being a minimum of 1m above the tailings beach gives both TSFs a low dust generation potential due to the coarse particle size of the waste rock. In addition, rehabilitation and vegetation of the TSF outside slopes further reduces the risk of dust generation.
During the construction of the TSF containment walls, dust suppression will be undertaken by wetting both the haul roads as well as the TSF walls.
Closure Ensure final level of tailings is at least 2m below the level of the waste rock containment wall crest to provide freeboard for storm water intercepted on the top surface. The top surface will serve as a store and evaporate facility for rainfall.
Adjust the topography of the top surface of the TSFs to create a low area near the centre of the facility. This will be developed as a wetland and will receive run-off from the entire top surface of the facility.
Remove all pipelines, pumps, barges, catwalks, electrical cables etc. from the TSF surfaces and surrounds.
Within a period of between 5 and 10 years after deposition ceases grout up the under drainage outlet pipes.
Construct the final cover to the top surface of the TSFs by importing topsoil from the topsoil stockpiles and covering the top surface with a minimum depth of topsoil of 0.3m.
Establish vegetation on the top surface of the TSFs using a selection of indigenous trees, shrubs, grasses, aloes etc.
The TSF catchment paddocks are rehabilitated in the same manner as for the waste rock dumps.
11.5.4 Design and Construction of the Waste Rock DumpsThe WRDs were designed in such a manner to enable their on-going rehabilitation and the control of surface water runoff, as it is probable that they will become permanent features of the post mining landscape.
The Eastern WRD is currently receiving waste rock produced from overburden removal from the Eastern as well as the Central Pits. The Central WRD is currently receiving waste rock produced by overburden removal in the Western Pit. The development of the proposed North Eastern WRD will commence once EIA approval is received. The Western WRD is still in the preliminary design phase and its development is expected to commence in the second half of 2015. Figure 11.5.4_1 shows the layout of all four WRDs as well as the pits from where the waste rock is sourced. The total approximate waste rock capacity in these four WRDs is 71.5Mm³.

Coffey Mining (SA) Pty Ltd
Tharisa Mine Page: 153Competent Person’s Report - December 2013
Figure 11.5.4_1
Layout of Tharisa Mine's WRDs
11.5.5 Design Life of the Waste Rock DumpsThe Eastern WRD will accommodate waste rock produced from the Eastern and Central Pits.
This facility provides storage capacity for a period of approximately 16 months of waste rock produced from both the Eastern and the Central Pits.
Full capacity is forecast to be reached in December 2014.
The Central WRD will accommodate waste rock produced from the Western Pit.
This facility provides storage capacity for a period of approximately 27 months of waste rock produced from the Western Pit.
Capacity is forecast to be reached in November 2015.
The North Eastern WRD will accommodate waste rock from the Eastern and the Central Pits as soon as the Eastern WRD has reached full capacity.
Start date for deposition of waste rock on this facility is forecast to be in January 2015.
This facility provides storage capacity for a period of approximately 15 months of waste rock produced from the Eastern and Central Pits.
Capacity is forecast to be reached in May 2016.

Coffey Mining (SA) Pty Ltd
Tharisa Mine Page: 154Competent Person’s Report - December 2013
The Western WRD will accommodate waste rock produced from the Western Pit.
Start date for deposition of waste rock on this facility is expected to be December 2015.
This facility provides storage capacity for a period of approximately 17 months of waste rock produced from the Western Pit.
Capacity is forecast to be reached in May 2017.
Table 11.5.5_1 summarises the waste rock capacity and operational life of all four WRDs.
Table 11.5.5_1
Waste Rock Capacity and Operational Life associated with the WRDs
Waste Rock Dump Waste Rock Capacity (m3) Operation Life
Eastern WRD 17,580,000 September 2013 – December 2014
Central WRD 18,490,000 August 2013 – November 2015
North Eastern WRD 19,980,000 January 2015 – May 2016
Western WRD 15,430,000 December 2015 – May 2017
Waste dump storage capacity additional to the Eastern, Western, Central, North Eastern dumps and backfill destinations for the East and West pits are required. A detailed design and destination schedule study is under way to confirm the operational waste dumping strategy and final placement of the additional dump to the east of the East pit over the life of the open pit. The destination schedule considers optimised haul routes, adherence to the regulatory requirements, rehabilitation, safe operation and the planned underground design. The additional waste dump would be the largest single destination of waste rock over the life of the operation.

Coffey Mining (SA) Pty Ltd
Tharisa Mine Page: 155Competent Person’s Report - December 2013
11.5.6 Capital costs for the construction of the Waste Rock DumpsTable 11.5.6_1 summarises the capital costs for Tharisa Mine’s Eastern, Central, North Eastern and Western WRDs. These costs exclude rehabilitation and other life cycle costs.
Table 11.5.6_1
Summary of Capital Costs for the WRDs
Description Cost
Eastern WRD R2.48 mil
Central WRD R2.21 mil
North Eastern Waste Rock Dump R3.00 mil
Western Waste Rock Dump R2.10 mil
Total (excluding rehabilitation and closure costs) R9.79 mil
11.5.7 Environmental Protection Measures of the Waste Rock DumpsThe key design features and environmental protection measures for the Tharisa Mine WRDs are summarised in Table 11.5.7_1.
Table 11.5.7_1
Waste Rock Dumps Key Features and Environmental Protection Measures
Feature Detail
Physical
Dimensions
Eastern WRD – Footprint = 77.84ha; Max height = 62m; Waste Rock Capacity = 17.6Mm3.
Central WRD – Footprint = 67.26 ha; Max height = 74m; Waste Rock Capacity = 18.49Mm3.
North Eastern WRD – Footprint = 94.47ha; Max height = 55m; Waste Rock Capacity = 19.98Mm3.
Western WRD – Footprint = 65.8ha; Max height = 60m; Waste Rock Capacity = 15.43Mm3.
Waste Rock
Transport and
Deposition
Open pit waste rock loaded onto mine dump trucks and transported to waste rock dumps.
Waste rock dump access ramps constructed with a maximum gradient of 1V:10H (6º) for mine dump trucks. Waste rock is dumped and spread/flattened with a bulldozer.
Diversion Storm water diversion trenches or swales around the upstream boundaries of the WRDs to direct clean surface water run-off around and away from the WRDs.
Topsoil Stripping Topsoil within the WRD footprint areas will be stripped and stockpiled in accordance with the topsoil conservation guide in close proximity to the final toe on the upstream side of each WRD. A stripping depth of 200mm was recommended by the soils study. Stripping and stockpiling of topsoil will be done immediately in advance of dumping.

Coffey Mining (SA) Pty Ltd
Tharisa Mine Page: 156Competent Person’s Report - December 2013
Table 11.5.7_1
Waste Rock Dumps Key Features and Environmental Protection Measures
Feature Detail
Lining No lining will be provided in addition to the in-situ black clays or turf found at surface. The low permeability clays will reduce infiltration of leachate from the waste rock to the ground water.
WRD Configuration
and Development
The WRDs are configured to enable their on-going rehabilitation and the control of surface water runoff. The configuration of the dumps may be summarised as follows:
The WRDs are expected to be constructed in 15m high lifts.
The side slopes of each lift of the dump will be constructed to slopes of 1V:3H.
At each lift the crest of the dump will be stepped in to allow for the creation of a 15m wide storm water control bench graded to drain towards the body of the WRD. This will also create an overall side slope geometry of 1V:4H for the dump.
A 1.5m high levelled wall will be constructed to the edge of the storm water control bench to collect surface water runoff from the slope above. The wall is expected to comprise a 1.5m high berm with an inside slope of 1V:1.5H placed, levelled and compacted during the placement of waste rock to also serve as a safety berm for traffic on the dump.
On commencement of the next lift of the dump the storm water control bench will be subdivided into paddocks by secondary storm water control berms to prevent the concentration of runoff at low points on the bench.
Benches will be top soiled and vegetated to enhance evapotranspiration. Infiltration of runoff into the dump will be encouraged by loosening the surface of the waste on thebench prior to the placement of soil.
Under Drains &
Surface Run-Off
Control
No under drains will be provided.
Surface run-off and toe seepage will be retained by a series of catchment paddocks (constructed using local clays) around the perimeter of each WRD and allowed to evaporate.
Access and Access
Controlul roads will have a minimum width of 25m and will be constructed using waste
rock.
A 6m wide waste rock road will be constructed around the perimeter of each WRD for access during operations, routine inspections and maintenance of the catchment paddocks.
A perimeter fence around each WRD is not planned. Rather a perimeter fence around the whole
Monitoring Monitoring of seepage water retained in the perimeter catchment paddocks and of boreholes around the perimeter of each WRD to determine pH, EC, TDS, NO3, Ca, Mg, Fe, Mn, Na, Cl, K, SO4, HCO3, PO4, Cr (VI).
Dust Control Operational Phase: Watering of haul roads for dust suppression.
Post Operational Phase: No measures necessary due to the coarse particle size distribution.
Rehabilitation and
Closure WRDs will be re-vegetated using a combination of indigenous trees, shrubs, and grasses etc. with the topsoil and clay removed from the footprint of each WRD serving as a growth medium. The vegetation will be irrigated initially until it is no longer dependant on
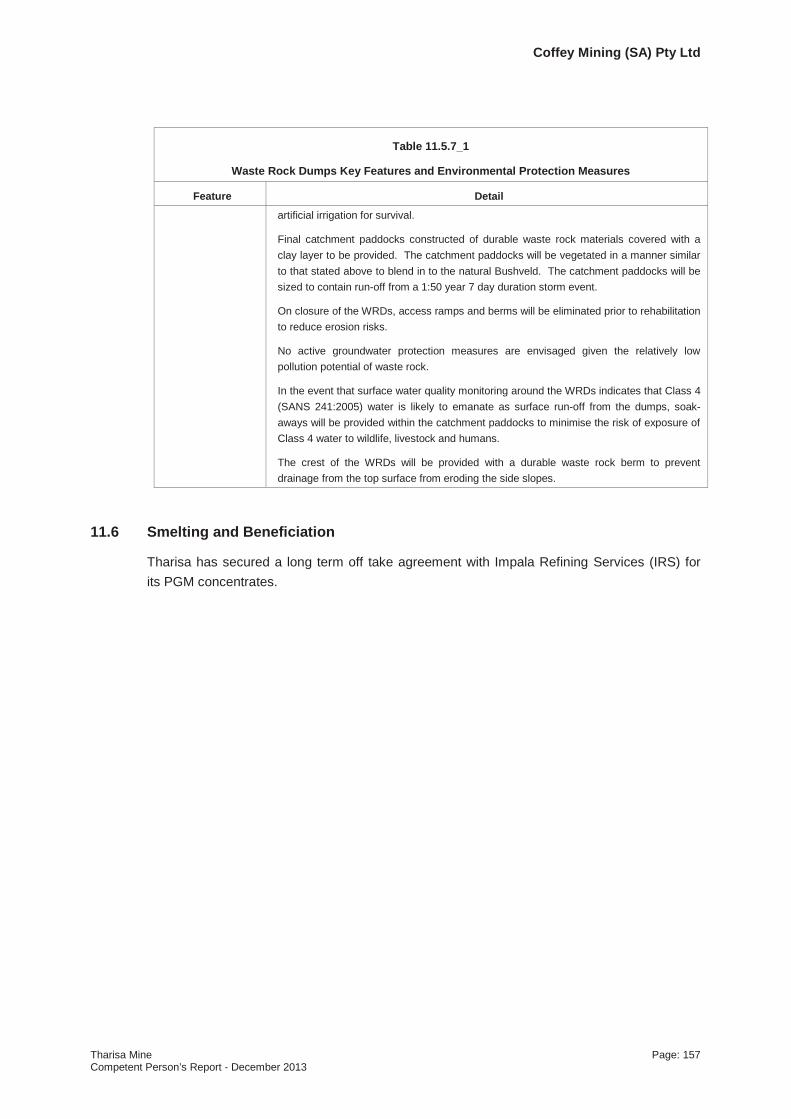
Coffey Mining (SA) Pty Ltd
Tharisa Mine Page: 157Competent Person’s Report - December 2013
Table 11.5.7_1
Waste Rock Dumps Key Features and Environmental Protection Measures
Feature Detail
artificial irrigation for survival.
Final catchment paddocks constructed of durable waste rock materials covered with a clay layer to be provided. The catchment paddocks will be vegetated in a manner similar to that stated above to blend in to the natural Bushveld. The catchment paddocks will be sized to contain run-off from a 1:50 year 7 day duration storm event.
On closure of the WRDs, access ramps and berms will be eliminated prior to rehabilitation to reduce erosion risks.
No active groundwater protection measures are envisaged given the relatively low pollution potential of waste rock.
In the event that surface water quality monitoring around the WRDs indicates that Class 4 (SANS 241:2005) water is likely to emanate as surface run-off from the dumps, soak-aways will be provided within the catchment paddocks to minimise the risk of exposure of Class 4 water to wildlife, livestock and humans.
The crest of the WRDs will be provided with a durable waste rock berm to prevent drainage from the top surface from eroding the side slopes.
11.6 Smelting and Beneficiation
Tharisa has secured a long term off take agreement with Impala Refining Services (IRS) for its PGM concentrates.

Coffey Mining (SA) Pty Ltd
Tharisa Mine Page: 158Competent Person’s Report - December 2013
12 INFRASTRUCTURE AND LOGISTICS
12.1 Roads
The Tharisa Mine is traversed east/west by local un-surfaced roads originally constructed to service the local farming community. In a north/south direction the mine is split by a local tarred road connecting Buffelspoort with Marikana. This in turn is linked to the N4 toll road locally linking Rustenburg to Brits, and internationally linking Mozambique to Botswana and Namibia.
12.2 Water Supply
The primary sources of water to the site are as follows:
Borehole water from an onsite wellfield;
Water from open pit dewatering;
Storm water;
Rand Water;
Excess water from nearby mining companies.
12.3 Potable Water
Potable water is obtained from either Rand Water or appropriate borehole water. The abstracted groundwater is treated in order to make it suitable for potable supply.
12.4 Process Water
The main water supply is obtained from dewatering of the open pits and borehole water from the onsite wellfield, supplemented by Rand Water as well as excess water from nearby mining companies. The monthly average make up water requirement is in the order of 195,000m3.This figure will vary between 125,000m3/month in average wet periods and 250,000m3/month in average dry periods.
12.5 Water Balance and Priority for Water Use
A site wide climatic water balance was modelled for the entire operation as part of the EIA/EMP report, which took cognisance of environmental conditions (such as seasonal changes, rainfall and evaporative loss). The water balance was modelled on monthly climatic data and predicted mine usage requirements.
A water use protocol has been adopted. The protocol ensures that dirty water is re-used as far as possible and that the water level in key storage dams is kept as low as possible to maximise storage capacity in the event of an extreme storm event (thus complying with the Regulation 704 requirement to not spill more than once in 50 years. The protocol for water use is as follows:
SRT5.6C(i) –SRT5.6C(iii)

Coffey Mining (SA) Pty Ltd
Tharisa Mine Page: 159Competent Person’s Report - December 2013
TSF/process water dam;
Storm water/pollution control dams;
Seepage/rainwater ingress to the open pits; and
Rand Water supply/groundwater abstraction boreholes/canal water.
The water use protocol is strictly applied in order to ensure compliance with Regulation 704 as well as to minimise water treatment and operating costs.
12.6 Stormwater Management Plan
A storm water management strategy for the mine was developed as part of the approved EIA/EMP and has been updated to cater for changes in mine infrastructure as presented in the attached SWMP figure; a summary of the key design features is presented below:
Clean storm water will be diverted around mine infrastructure and, where possible, routed towards existing watercourse(s) or conveyed into the veld;
Wherever possible, the footprint of dirty storm water catchment areas will be minimised by isolating these areas from clean water run off using bunds and/or channels;
Storm water from the surface of the TSF is pumped to the process water dam for re-use;
Storm water from the side slopes of TSF will drain towards the eastern pit;
Storm water from the plant area, will drain via channels to the plant storm water dam, any excess flow will be conveyed from the storm water dam to the Hernic Quarry;
Storm water from the East mining area will drain to the existing MCC dam; excess flow will be conveyed to the Storm water Dam;
Storm water from the plant storm water dam, MCC dam and Hernic quarry will be transferred to the process water dam for re-use in the plants;
Storm water and groundwater collected within the open pits will be pumped to the process water dam for re-use in the plants;
Storm water from the waste rock dumps will be collected by perimeter drainage ditches and passed through a settlement dam before it is used in the plants.

Coffey Mining (SA) Pty Ltd
Tharisa Mine Page: 160Competent Person’s Report - December 2013
12.7 Containment Dams
The operation features several containment and transfer dams which form part of the operational water management strategy for the mine; a summary of these dams is presented in the Table 12.7_1.
Table 12.7_1
Summary of Containment Dam CapacitiesDam Capacity (m3)
Raw Water Dam 44,000
Hernic Quarry 250,000
Plant Storm Water Dam 30,000
Process Water Dam 25,000
MCC Dam 40,000
The above mentioned dams as well as six (6) boreholes are authorised water uses as per Tharisa Minerals’ water use license which was issued in July 2012 by the Department of Water Affairs.
12.8 Power
During May 2010 Tharisa Minerals submitted an application to Eskom for a 40MVA premium power supply. Eskom submitted a budget quotation in October 2011 that was accepted by the mine. Detailed design commenced and construction started in December 2011. In order to meet the commissioning date of the concentrator, the project was split into three phases.Phase 1 was commissioned in June 2012 ahead of the scheduled concentrator commissioning date of July 2012. This phase secured a power supply of 30MVA which exceeded the mine’s current power requirement of 23MVA. Phase 2 which ensures a premium power supply has since been commissioned as well. Phase 3 which includes the construction of an overhead line between the Middlekraal substation and the Bighorn substation has commenced and is scheduled for completion in May 2014. This will increase the available power supply to the mine from the current 30MVA to 40MVA as per the original application to Eskom, leaving Tharisa Mine with a redundancy of 42.5% that will be able to accommodate all expansions planned for the short and medium term.
12.9 Communications
Tharisa Minerals recently completed an upgrade of its various information, communication and telecommunications systems, including the installation of a new enterprise resource planning (ERP) system, the virtualization of its servers and the installation of various high speed, point to point networks between its various sites. The networks that have been established allow for the use of virtual-private networks, the replication of servers, dedicated and high speed connections between the ERP system components, zero cost telephone calls between Tharisa’s various sites, as well as video conferencing facilities. Tharisa Minerals has

Coffey Mining (SA) Pty Ltd
Tharisa Mine Page: 161Competent Person’s Report - December 2013
also implemented a ‘unified e-mail management system’ which is hosted off-site, thereby providing continuity and back-up through the archiving of all inbound, outbound and internal e-mails.
12.10 Logistics of Chromite Concentrate Distribution
Chrome concentrate logistics management and procurement has been outsourced to aTharisa plc group company, Arxo Logistics (Pty) Ltd (Arxo), which is responsible for the cost-effective management of the entire logistics chain from the mine to Tharisa Minerals final customers, most of whom are in China. Arxo’s responsibilities include the activities of sourcing third party services, capacity planning, technology solutions, distribution planning, warehouse management and shipping.
12.10.1 Current Logistics Arxo makes use of various distribution channels to move the mine’s product to Richards Bay and Durban Ports for shipment abroad. A dedicated rail siding has been allocated to Tharisa and is located 6km from the mine site. Arxo has also secured adequate trucking andwarehousing facilities to cater for the full requirement of 160,000tpm of final chrome product.
12.10.2 Planned LogisticsRail transport – a long term maxirail contract has been entered into with Transnet.
Road transport:- Agreements have been entered into with a number of transporter contractors who have sufficient capacity to transport the balance of chromite concentrate not railed.
Storage Facilities Sufficient warehousing facilities have been secured and contracted to handle volumes in bulk or containers from the Tharisa Mine to FOB Durban. The following facilities have been secured at Richards Bay
45,000t at any given time through the dry bulk terminal. The dry bulk terminal is currently the most cost effective terminal to be used in conjunction with rail;
15,000t at any given time through the multipurpose terminal.
Shipping Facilities Shipping is not considered to be a risk due to the availability of bulk vessels and container shipping capacity.
12.11 Occupational Health and Safety
12.11.1 Key Areas of LegislationThe Mine Health and Safety Act No 29 of 1996 (MHSA) was developed under the auspices of a tripartite relationship between State, Employer and Employee organisations. The result is alarge emphasis on employee participation regarding the Health and Safety matters.

Coffey Mining (SA) Pty Ltd
Tharisa Mine Page: 162Competent Person’s Report - December 2013
Section 26 of the MHSA requires consultation between the employer (Tharisa Minerals) and employee representatives or organised labour in the form of Trade Unions. From this consultation a Health and Safety agreement must be concluded which spells out the management of the relationship between employer and employee regarding Health and Safety issues. As the Tharisa Mine employees are not unionised, this agreement is in the process of being finalised with the employee representatives. There after regular (monthly) interactions between management and employee representatives will take place.
Health and safety representatives have been appointed for the various designated working places as described in the Health and Safety Agreement, in compliance with the MHSA.
Other important sections of the MHSA deal with the Inspector of Mines’ powers when encountering unsafe or unhealthy occurrences, practices or conditions at a Mine, including the power to halt an operation should he consider the workplace to be unsafe or unhealthy(Section 50).
The inspector also has the option of imposing an administrative penalty in place of an instruction to halt operations at the mine (Section 54). To date no section 54 stoppages have been imposed on the mine.
Sections 60 and 65 of the MHSA deal with the requirement to conduct investigations or inquiries into any accident or occurrence at a mine. These sections are fairly wide ranging and allow for an inspector to have access to safety and health documentation kept by a mine
Other important sections of the MHSA deal with:-
Health and Safety Policy (Section 8)
Health and Safety Training (Section10)
Employer to access and respond to risk (Section 11)
Medical surveillance (Section 13)
Manufacturing and suppliers’ duty for the Health and Safety (Section 21)
From the above it can be seen that it is a fundamental requirement to have systems and resources in place to ensure compliance with the requirements of the MHSA and its associated regulations. Not meeting these obligations can result in severe penalties and consequences for the mine as well as its employers (including owners and managers) who failto comply with the MHSA.
12.11.2 Mine Health and Safety Tharisa Minerals is subject to the MHSA. The objectives of this Act are:
i) To protect the health and safety of the persons at the mine
ii) To require the employer and the employees to identify hazards and eliminate, control and minimise the risks relating to health and safety at the mine

Coffey Mining (SA) Pty Ltd
Tharisa Mine Page: 163Competent Person’s Report - December 2013
iii) To give effect to the public international law obligations of South Africa that concern health and safety at mines
iv) To provide for employees participation in matters of health and safety through health and safety representatives and the health and safety committees at mines
v) To provide for the effective monitoring of health and safety conditions
vi) To provide for the enforcement of health and safety measures
vii) To provide for the investigations and inquiries to improve health and safety at the mines
viii) To promote :
A culture of health and safety in the mining industry
Training in health and safety in the mining industry
Co-operation and consultation on health and safety between the State, employers, employees and their representatives.
The MHSA is administrated by the DMR and the Inspector of Mines conducts site inspections on a regular basis to ensure compliance with the requirements of the MHSA.
Wellness Programs which include policies dealing with HIV/AIDS and tuberculosis are being requested by the DMR to ensure that the mining industry caters not only for the occupational health of employees whilst at work, but also instil a program in which they promote awareness and provide treatment programmes for employees as well as surrounding communities regarding primary health issues such as HIV/AIDS, tuberculosis, cancer, hypertension etc.”
12.11.3 Processing Facilities Health and Safety.The processing facility is considered to be part of the Tharisa Mine and the same requirements in terms of the legislation are applicable.
12.11.4 Work Camp Health and SafetyTharisa Minerals does not make use of a work camp or single accommodation villages. All employees arrange their own housing in the local community or in a neighbouring town.Contractors have made similar arrangements for their employees.
12.11.5 Contractors Health and SafetyAll employees, including contractors, have to undergo a medical examination to ensure their fitness to work. This examination is conducted by a Tharisa Minerals appointed Occupational Health Practitioner. This examination is reviewed on an annual basis to ensure that persons are fit to perform their duties in a healthy and safe manner.
Tharisa Minerals makes use of a Contractors Compliance Pack (CCP) and all contractors are required to demonstrate their safety performance as well as compliance with the mine’s own Health and Safety requirements. This CCP is investigated on a regular basis for each contractor to encourage compliance with the mine’s system.

Coffey Mining (SA) Pty Ltd
Tharisa Mine Page: 164Competent Person’s Report - December 2013
12.11.6 Legal Appointments In terms of the requirements of the MHSA, all the legal appointments have been reviewed and suitable and experienced people have been appointed, and the DMR notified accordingly.These appointments have also been divided between the two appointed General Managers (Mining and Process) respectively.

Coffey Mining (SA) Pty Ltd
Tharisa Mine Page: 165Competent Person’s Report - December 2013
13 ENVIRONMENTAL AND SOCIAL
In 2008, an Environmental Impact Assessment and Environmental Management Programme (EIA/EMP) report was compiled for Tharisa Mine by Metago Environmental Engineers (Pty) Ltd (Metago), now SLR Consulting (Africa) (Pty) Ltd (SLR), an independent environmental consulting company. This EIA/EMP was submitted in support of the mining right application and the environmental authorisation applications in terms of the MPRDA and NEMA.Similarly, in 2012 Tharisa Mine received a water licence which sets out permitted water and waste activities and the required mitigation measures for managing potential water related impacts. This chapter identifies the related compliance issues and the potential environmental impacts (both biophysical and social) of the Tharisa Mine based on the outcomes of the EIA process. These impacts were assessed and management measures proposed with input from the various specialists. The outcome of the EIA/EMP process determined that all potential impacts of the mine can be managed to a satisfactory level, provided that the mitigation measures detailed in the EIA/EMP are adhered to.
13.1 Existing Environment
The details relating to the physiography, soils, land use, flora and fauna, groundwater, surface water and climate are presented in Section 4.
13.2 Interested and Affected Parties (IAPs) Consultation Process
The scope of environmental issues that were considered in the 2008 EIA were given specific context and focus through consultation with authorities and IAPs. Included below is a summary of the process that was followed, the people that were consulted and the issues that were identified. In addition, comment is also provide on the IAP consultation process that has commenced as part of the proposed EIA/EMP amendment.
13.2.1 Authorities and interested and affected parties (IAPs)The following authorities and IAPs were involved in the 2008 EIA/EMP process and are being involved once again in the current amendment process:
Regulatory authorities:
Department of Mineral Resources (DMR) (previously the DME)
Department of Economic Development Environment, Conservation and Tourism (DEDECT) (previously known as Department of Agriculture, Conservation and Environment (DACE))
Department of Water Affairs (DWA) (previously Department of Water Affairs and Forestry (DWAF))
Department of Environmental Affairs and Tourism: Air Pollution Management (DEAT:APM)
National Department of Agriculture (NDA)
SRT5.2A(i) - SRT5.2A(ii) SRT5.2B(i) - SRT5.2B(ii)SRT5.2C(iii) SRT5.2C(v)
Coffey Mining (SA) Pty Ltd
Tharisa Mine Page: 166Competent Person’s Report - December 2013
South African Heritage Resources Agency (SAHRA)
Department of Public Works and Roads
North West Parks and Tourism Board and
Department of Land Affairs (DLA)
Interested and Affected Parties (IAPs:)
landowners in and surrounding the mine area
land occupiers and communities in and surrounding the mine area (various villages, farm labourers, squatters and informal settlers)
surrounding mines and industries
non-government organisations
local authorities (Bojanala Platinum District Municipality, Rustenburg Local Municipality and Madibeng Local Municipality) and
any other people/entities that choose to register as IAPs
13.2.2 Summary of issues raisedA summary of issues raised by authorities and IAPs in 2008 is given below. Similar issues and concerns are being raised in the current amendment process. These include:
clarity on the environmental assessment process and procedural issues
understanding of the mine and alternatives
sterilisation of minerals
recognition of communities
topography
soils
land capability
blasting
land use – disruption to current activities
biodiversity
sensitive areas
air quality
noise
heritage resources
visual aspects
traffic/road use/transport
water supply
rehabilitation
disturbance of ground and surface water (quality and quantity) and

Coffey Mining (SA) Pty Ltd
Tharisa Mine Page: 167Competent Person’s Report - December 2013
socio-economic aspects (land values, relocation, crime, social investment, services/housing).
13.3 Environmental Impact Assessment and Management
The following section provides a summary of the findings of the 2008 EIA/EMP process and the associated environmental management measures.
13.3.1 Specialist inputSpecialist information was used both to determine the state of the pre-mine environment and to assess potential environmental impacts relating to the mining activities at the Tharisa Mine.This information was obtained from work done by the appointed specialists, Metago’s existing knowledge of both the region and the specific site and information provided by the technical project team. These specialist investigations are listed below and the findings have been incorporated in the impacts description to follow:
Design of waste facilities, floodlines, water balance, design of water management facilities and closure calculations
Land and aquatic biodiversity study
Groundwater study
Air quality study
Traffic study
Heritage study
Socio-economic impact assessment
Soils and land capability studies
Blast impact study and
Visual impact study.
13.3.2 Risk Analysis and Environmental Management Potential impacts were identified by Metago in consultation with IAPs and regulatory authorities specialist consultants and mine management. Where relevant, cumulative on and off-site impacts were considered. As indicated in the EIA/EMP report (2008), the discussion and impact assessment for each sub-section covered the construction, operational, decommissioning and closure phases where relevant.
The criteria used to assess the impacts and the method of determining the significance of the impacts was based on Metago’s method of determination of the significance of impacts. This method also complies with the method provided in the EIA guideline document.
Management measures to address the identified impacts were given in the corresponding section of Chapter 6 of the EIA/EMP report (2008). These management measures were taken into account in the assessment of the significance of the mitigated impacts.

Coffey Mining (SA) Pty Ltd
Tharisa Mine Page: 168Competent Person’s Report - December 2013
A discussion of the more significant project related issues is provided below:
Hazardous excavations: All excavations into which, or off which, people and animals couldfall, were considered hazardous. If unmanaged, these could result in high impacts because the excavations could cause injury or death to people and animals. With the security, fencing and warning measures, as included in the EIA/EMP report, this impact will be managed to an acceptable level.
Impact on soil resources and land capability: The majority of the pre-mining soils on site are considered to be of moderate agricultural potential. Approximately 750ha of land was expected to be disturbed by the mine. In the unmanaged scenario this impact could be of high significance, however the implementation of the topsoil management plan included in the EIA/EMP report mitigate this impact to an acceptable level and in the long term the majority of the disturbed land will be rehabilitated to a functional land use. The current EIA/EMP commitment is to restore the majority of the land back to agricultural potential but this commitment will change if the proposed amendment is approved. In the amended scenario, the land that hosts the open pits and waste rock dumps will not be restored to agricultural potential because the pits will be partially backfilled and all of the waste rock dumps will remain as permanent land forms.
Road disturbance and traffic safety: Changing the configuration of the road network, and increased traffic on existing public road networks could result in an inconvenience to current road users, greater accidents (to people and animals) and increased road damage. In the managed scenario, the largest component of mine related traffic (product carrying trucks) will be directed to the Marikana siding via a road diversion around Marikana or will use the N4.Relevant authorities will be consulted in this Marikana road diversion design and process, if required. This together with the other safety related measures included in the EIA/EMP report, mitigates related impacts to an acceptable level.
Infrastructure and blast related impacts: Damage (to people, animals and structures) from open pit blasting could potentially be caused by fly-rock, air blast and vibrations. In the unmanaged scenario this impact could be high, but with the appropriate infrastructure diversions/relocations, land acquisitions, blast designs, warning requirements and monitoring requirements (as included in the EIA/EMP report) these impacts will be reduced to acceptable levels.
Loss of biodiversity: Although large parts of the mine area were already disturbed by agricultural, community and mining related activities, the mine hosts some sensitive habitats with associated flora and fauna species. In the unmanaged scenario, the mine could damage this biodiversity and cause impacts of high significance. The infrastructure site selection process attempted to limit the disturbance of the more sensitive areas and the biodiversity action plan included in the EIA/EMP report was designed to further reduce the impacts to an acceptable level.

Coffey Mining (SA) Pty Ltd
Tharisa Mine Page: 169Competent Person’s Report - December 2013
Impact on surface water: The mine infrastructure will impact a number of non-perennial water courses. In the unmanaged scenario, the impact on water flows and surface hydrology will be high. With the implementation of the management measures, as included in the EIA/EMP report, this impact can be mitigated to an acceptable level. Notwithstanding the above, if the Tharisa Mine’s surface water systems are not managed, significant pollution could be released into the environment. The surface water management system design, as included in the EIA/EMP report, is therefore aimed at compliance with Regulation 704 of 4 June 1999 is sufficient to manage both clean and dirty surface water.
Impact on ground water: The specialist investigation conservatively predicted that the tailings dam complex could have a negative impact on water quality in surrounding ground and surface water resources. This includes some third party boreholes. Mine dewatering could also result in decreased yields at these boreholes. To cater for the event that these users experience negative impacts on their ground water supply, Tharisa Mine has committed to monitoring the boreholes of these landowners, implementing quality related remediation measures, and where required, compensating affected third parties with water of equivalent quality and quantity to what they enjoy at present. In the longer term there was the possibility that ground water contamination could reach surrounding water courses. Long term closure planning of the tailings dam is important in mitigating this potential impact.
Impact on air quality: In the unmanaged scenario, it was predicted that there could be unacceptable off-site impacts. To mitigate this, significant dust controls are required on the main emission sources, air quality will be monitored to check whether the controls are effective, and land has been purchased by Tharisa Minerals to keep unacceptable impacts within mine property as far as possible.
Visual impact: In the unmanaged scenario, it was predicted that there could be a high impact on sensitive views from the south of the mine, in particular. The measures included in the EIA/EMP report mitigate this impact to an acceptable level. Key management components include rehabilitation of the pre-built tailings dam walls from the outset, visual screening berms, and control of colours and lighting within the mine area.
Noise impact: In the unmanaged scenario, it was predicted that there would be a potential for high noise impacts on surrounding residents particularly at night. In the case of the President van Rensburg /Retief School there is the potential for high impacts during the day. The measures included in the EIA/EMP report mitigate this impact to an acceptable level. Key components include noise control berms and restrictions on operating times for certain noise generating activities.
Impact on heritage resources: The Tharisa Mine hosts a few significant heritage resources.Despite the avoidance of many of these through the site selection process, in the unmanaged scenario, the impact on some of these resources could be high. In the managed scenario, the necessary assessments and applications will be made for the grave sites that will be affected by the mine.
Coffey Mining (SA) Pty Ltd
Tharisa Mine Page: 170Competent Person’s Report - December 2013
Socio-economic impacts: The mine will have a number of positive economic benefits that will impact on the local area, the greater region and South Africa. These benefits will be in the form of capital investment, employment, support services, and foreign exchange income. In addition, a number of potential negative impacts were identified. These include: issues associated with involuntary relocation, informal settlements and associated problems of crime, disease and security concerns, pressure on housing infrastructure and services, and issues around land sales and impacts on land values. Clear policies and action plans to limit these potential negative impacts to an acceptable level are being developed and implemented by the mine.

Coffey Mining (SA) Pty Ltd
Tharisa Mine Page: 171Competent Person’s Report - December 2013
13.3.3 Summary of Potential Environmental ImpactsA summary of the significance of identified impacts in the 2008 EIA/EMP is provided in the Table 13.3.3_1.
Table 13.3.3_1 Summary of Potential Environmental Impacts
Section and subject Issue/Impact Significance of the impactUnmanaged Managed
5.1 Geology Sterilisation of mineral resources L L 5.2: Topography Hazardous excavations H M
Surface subsidence M L 5.3: Soils Loss of soil resources H M 5.4: Land capability Loss of land with agricultural potential H M 5.5: Surrounding land use
Roads and traffic impacts H M Mine infrastructure and blast related impacts H M
5.6: Biodiversity Impact on land related habitats and species H M Impact on aquatic related habitats and species H M
5.7: Surface water Alteration of surface drainage patterns H M Pollution of surface water H L
5.8: Groundwater Reduction in groundwater levels/availability – impact on groundwater users
H L
Reduction in groundwater levels/availability – impact on base flow
H M
Groundwater contamination H M 5.9: Air quality Dust generation H M 5.10: Noise Disturbing noise H M 5.11: Visual impacts Negative visual impacts H M 5.12: Heritage resources
Disturbance of archaeological, historical and cultural sites
H L
5.13: Socio-economic impacts
Positive socio-economic impacts M+ M+
Relocation H M Informal settlements and related safety, security, disease
H M-L
Pressure on housing and service M L Land sales and values M+ - M M+ - M-L
INTERPRETATION OF SIGNIFICANCE
Significance Decision guideline
High H It would influence the decision regardless of any possible mitigation.
Medium M It should have an influence on the decision unless it is mitigated.
Low L It will not have an influence on the decision.
+ denotes a positive impact.
The outcome of the EIA process determined that there was no environmental reason for the Tharisa Mine’s application not to be approved.
SRT5.2A(i) SRT5.2B(i)

Coffey Mining (SA) Pty Ltd
Tharisa Mine Page: 172Competent Person’s Report - December 2013
13.4 Permitting
The Tharisa Mine currently operates with the following environmental authorisations:
An environmental decision from the North West DMR in terms of the MPRDA for the mining operation; and
Environmental authorisation from the North West DEDECT in terms of the National Environmental Management Act, 107 of 1998 (NEMA) for the activities that were triggered by the mining operation as presented in the EIA/EMP report.
Waste and Water Management: Tharisa Minerals was granted an integrated water use license from the North West Province DWA in terms of the National Water Act, 36 of 1998 (NWA) in July 2012. Included in the license are relevant exemptions from Regulation 704 of 4 June 1999 as well as registration for all dams with a safety risk (i.e.with both a wall greater than 5m and a capacity of 50,000m3).
Approval for the construction of the road intersections, diverting roads and closing roads: Tharisa has confirmed that the D1325 road deviation approval has been obtained from the North West Department of Roads and Transport in terms of the relevant Provincial Road Ordinance.
Additional environmental authorisations/permits required are listed below:
Authorisation for existing and proposed changes to the mine infrastructure and operations: Tharisa Minerals has commissioned the amendment of the EIA/EMP to cater for the changes in terms of NEMA, MPRDA and other relevant legislation.
Registering the sewage plant in addition to the water licence that has been obtained: Tharisa Minerals has applied for the registration of both the sewage plant and the required personnel to the DWA in terms of Regulation 2834 of 27 December 1965.
Permit to removing or damaging any protected plant species: Tharisa Minerals will compile and submit the necessary documents when required. When needed the permits will be obtained from the Department of Agriculture, Fisheries and Forestry(DAFF) and DEDECT in terms of the National Forests Act, 84 of 1998 and the Nature Conservation ordinance of Transvaal (12 of 1983), respectively.
Permits for damaging or removing heritage resources such as graves: Tharisa Mineralshas applied for the necessary permits and is currently compiling the necessary documents that are needed for their approval. The permits required in terms of the National Heritage Act, 25 of 1999, the Ordinance on Exhumations, 12 of 1980, and the Human Tissues Act, 65 of 1983.
SRT5.1A(i) SRT5.2B(i)SRT5.2C(i)

Coffey Mining (SA) Pty Ltd
Tharisa Mine Page: 173Competent Person’s Report - December 2013
13.5 Environmental Protection and Monitoring
As indicated in the EIA/EMP report, Tharisa Minerals is committed to the monitoring programmes detailed below. Table 13.5_1 sets out the monitoring costs as per the EMP commitments.
Table 13.5_1Environmental Monitoring Costs
Item EMP Monitoring Commitment 2014 Budget Period
1 Water quality – monthly for surface d t l f d t
R 420,000 October 2013 to September 2014
2 Air quality – monthly R 375,000 October 2013 to September 2014
3 Noise monitoring – annually R 60,000 October 2013 to September 2014
4 Biomonitoring – biannually R80,000 October 2013 to September 2014
5EMP performance assessment –
every 2 years and WUL audit Annually
R 150,000 October 2013 to September 2014
6 Water quality – monthly for surface and quarterly for groundwater R90,000 (WULA assessment scheduled for 2014.
EMP assessment Scheduled for 2015)
TOTAL R 1,175,000Note: Expenditure has occurred as per budget
In general, the approach to each monitoring programme will include:
a formal procedure and appropriately calibrated equipment;
where samples require analysis they will be preserved according to laboratory
specifications;
an accredited, independent, commercial laboratory will undertake sample analyses;
parameters to be monitored will be identified in consultation with a specialist in the field
and/or the relevant authority;
if necessary, following the initial monitoring results, certain parameters may be removed
from the monitoring programme in consultation with a specialist and/or the relevant
authority;
monitoring data will be stored in a structured database;
data will be interpreted and reports on trends in the data will be compiled by an
appropriately qualified person on a quarterly basis; and
both the data and the reports will be kept on record for the life of mine.
13.5.1 Groundwater and Surface WaterA set of monitoring points (30 for ground water and eight for surface water), a programme and the parameters for both ground and surface water on and off the site have been set out.These parameters may be modified on the basis of input from an appropriate specialist and the DWA. It is also possible that the programme will be modified as part of the integrated water license process.
Coffey Mining (SA) Pty Ltd
Tharisa Mine Page: 174Competent Person’s Report - December 2013
13.5.2 AirDust monitoring comprising a network of 10 dust buckets (four directional and eight single) will be done. The dust buckets will be placed immediately downwind of potentially significant dust generating sources. The target off-site dust fallout reading is less than 500mg/m2/day. APM10 monitor for ambient concentrations has been set up in the middle of the mining right area adjacent to security control office. The buckets and PM10 monitor will be monitored on a monthly basis.
13.5.3 BlastingMonitoring is done for each blast to verify that fly rock is being contained within 500m from the blast, that the ground vibration is less than or equal to a peak particle velocity of 12mm/s at a distance of 500m from the blast, and that the airblast is less than or equal to 130dB. Specific locations of the monitoring seismographs have been identified by an appropriate specialist during the pre-blast survey. These points mayo move as the open pit mining progresses.
13.5.4 NoiseNoise monitoring will be done on an annual basis to confirm that implemented noise management measures are effective. Monitoring will be done by an appropriately qualified environmental noise specialist. The noise measurement points may be modified on the basis of input from an appropriate specialist.
13.5.5 Bio monitoringThe Tharisa Mine will monitor the aquatic ecology integrity of water courses in the vicinity of the mining operations as per the water license conditions. Monitoring points exist up and downstream in the Sterkstroom
13.5.6 Tailings and Other Dams In addition to the abovementioned environmental monitoring programmes, the following issues will, as a minimum and where applicable, be monitored by a professional engineer on a quarterly basis:
phreatic surface, slope stability, adequacy of freeboard, integrity of walls, the position of the pools, silt trap sediment, presence of seepage, and functioning of drains;
the success of vegetation establishment on the outer side walls; and
erosion damage.
13.5.7 Additional monitoringIn addition to the prescribed monitoring network as discussed above, the mine does ad hoc additional monitoring on request from neighbours to the south and west of the operations.
13.5.8 GeneralThe mine’s environmental manager will conduct internal management audits against the commitments in the EIA/EMP report. In the operational phase, these audits will be conducted
Coffey Mining (SA) Pty Ltd
Tharisa Mine Page: 175Competent Person’s Report - December 2013
on an annual basis. The audit findings will be documented for both record keeping purposes and for informing continual improvement.
In addition, and in accordance with the MPRDA and the NWA, an independent professional will conduct an EMP performance assessment every 2 years and a water licence assessment every year. The mine’s compliance with the provisions of the EMP and water licence will be assessed in the performance assessment.
13.5.9 ReportingAs a minimum, the following documents will be submitted to the relevant authorities on an ongoing basis:
EMP performance assessment, submitted every two years to DMR;
closure cost update, submitted annually to the DMR;
tailings, waste rock and DMS waste management and risk report, submitted annually to the DMR;
dust and noise monitoring reports, submitted annually to the DMR; and
water licence assessment and water monitoring reports, submitted annually to DWA.
13.6 Rehabilitation and Mine Closure
Tharisa’s philosophy towards rehabilitation is to do this concurrently with the operational phase, where possible, to limit the financial, environmental and social impact of the decommissioning and closure stages.
Tharisa does not have a detailed closure plan. Nonetheless, the calculations of the current financial closure liability associated with the mine were completed in accordance with the Guideline Document for the Evaluation of the Quantum of Closure-Related Financial Provision Provided by a Mine as published by the DMR, previously the Department of Minerals and Energy (DME), dated January 2005. The MPRDA requirement is for the financial closure liability to be updated and submitted to the DMR annually. The most recent calculation values the closure liability at R100,504,265 (as at 30 September 2013). This calculation allows for making the open pits safe (by sloping the pit walls and putting berms in place) but excludes the cost of backfilling the open pits with waste rock and restoring agricultural land potential which is the current approved closure objective. Application is currently being made to amend this objective to partial backfill in accordance with the revised mine plan. Tharisa has provided for this amount through a Lombards policy to the value of R78million and a Stanlib investment account to the value of R37million. Feedback is pending from the DMR regarding the adequacy of the 2013 calculated value and the adequacy of the amounts provided.
13.7 EMPR Performance Assessment (2013)
Based on the EMP and water licence performance assessments undertaken by the Ethical Exchange in July 2013 and a follow up site visit by SLR in November 2013, Tharisa Mine was

Coffey Mining (SA) Pty Ltd
Tharisa Mine Page: 176Competent Person’s Report - December 2013
found to be in compliance with the majority of its environmental and water management obligations. Of the observed non-compliances, some are listed below:
deviations from the approved infrastructure layout plan;
incorrect storage and handling of non-mineralised waste and hydrocarbons. It must be noted that most of these issues were addressed in 2013;
abstraction of water in excess of the authorised limits;
various surface water management aspects including the incomplete provision of clean and dirty water separation infrastructure around all stockpiles/dumps and the incorrect use of the unlined Hernic Quarry for dirty water storage;
unauthorised disposal of waste rock on a non-perennial watercourse;
temporary storage of tailings during the early development stage of the plant in an unauthorised facility; and
Incomplete implementation of the biodiversity and soil management plans.
Some of these issues are being addressed through management interventions but others require amendment to the existing authorisations. In this regard the following authorisation application processes are either in progress or imminent:
An EIA/EMP amendment that will address the infrastructure deviations. This amendment covers various new proposals including: additional infrastructure such as the chrome sand drying plant, additional processing facilities, the change from complete to partial pit backfill, the introduction of additional waste rock dumps, re-aligning and reshaping rock dump, and the increase of pit depth from 120m to an average depth of 180m.
A water licence amendment to address the various water and waste management issues.
A potential NEMA rectification application to address the unauthorised disposal of waste rock on a non-perennial watercourse. The relevance of this process is being investigated with the relevant authorities.
13.8 Social and Labour Plan
In compliance with its obligations under the MPRDA, whereby each mining company is required to adopt a new Social and Labour Plan each 5 years, in November 2013 Tharisa Minerals adopted a new Social and Labour Plan, the salient features of which are the following:
13.8.1 Objectives The objects of the Social and Labour Plan are to promote employment and advance social and economic welfare of the local communities contribute towards transformation in the mining sector and contribute towards socio economic development in the area in which the
SRT5.3C(i)

Coffey Mining (SA) Pty Ltd
Tharisa Mine Page: 177Competent Person’s Report - December 2013
Tharisa Mine is situated. In order to achieve the objectives, the following specific undertakings and commitments were given by Tharisa Minerals:
Local Recruitment
Tharisa Minerals agreed that all new novice and entry level appointments would be taken from the local community, unless such positions could not be filled from applicants within the local community.
Skills Development
Tharisa Minerals undertook and committed itself towards skills development of its workforce.This would be achieved through bursaries, internships, learnership and apprenticeship programmes, portable skills programmes, career progression programmes, mentorship programmes and community adult basic education, all of which are detailed on the Social and Labour Plant.
13.8.2 Employment Equity PlanTharisa Minerals bound itself to an employment equity plan whereby there would be focus on HDSA’s in management and participation of women in mining.
13.8.3 Local Economic Development ProgrammeThe aim of this programme is to eradicate poverty and create community upliftment. This is to be achieved via the following projects:
Housing Project
The provision of land, development of a formal township (in co-operation with the Rustenburg Local Municipality which would be required to provide bulk services) and construction of brick houses units for people who do not qualify for RDP houses.
Brickmaking Project
A brickmaking project, whereby bricks suitable for the housing project, RDP houses and paving would be manufactured from materials produced at the Tharisa Mine.
Sewing Project
A sewing project with particular focus on aspects of the PPE clothing to be used by the Tharisa Mine workforce.
Waste Management Project
A waste management project with focus initially of waste produced at the Tharisa Mine.
Cleaning Services Project
A cleaning services project with particular focus on the cleaning of the change-house at the Tharisa Mine.

Coffey Mining (SA) Pty Ltd
Tharisa Mine Page: 178Competent Person’s Report - December 2013
Paving Project
A brick-paving project with focus on the processing plan at the Tharisa Mine.

Coffey Mining (SA) Pty Ltd
Tharisa Mine Page: 179Competent Person’s Report - December 2013
14 TECHNICAL-ECONOMIC MODEL
14.1 Introduction
A Technical Economic Model (TEM) for the Tharisa Mine has been constructed by Coffey in order to confirm the feasibility of the mine and to substantiate the declaration of mineral reserves.
This valuation has been prepared in accordance with “The South African Code for the Reporting of Mineral Asset Valuation (The SAMVAL Code) 2008 Edition (as amended in July 2009)” prepared by The South African Mineral Asset Valuation Committee (SAMVAL) Working Group under the Joint Auspices of the Southern African Institute of Mining and Metallurgy and the Geological Society of South Africa (www.samcode.co.za).
14.1.1 Competent Valuator and Effective DateThe Competent Valuator for the purposes of this report is Hannes Bornman. He is a registered Professional Engineer (Pr.Eng.) in terms of the Engineering Profession Act, 46 of 2000 (:the EPA") and is a “Competent Person” as defined in the SAMREC Code. He has 30 years’ experience in hard and soft rock mining with more than 9 years experience in the valuation of platinum, chrome, gold, copper, coal, diamond, bauxite and uranium mines.
All the facts presented in this report are correct to the best knowledge of the Competent Valuator. This is a forward looking document and the analyses and conclusions are limited only by the reported forecasts and conditions. Neither Coffey, nor the Competent Valuator, has any material interest in Tharisa Mine, its Parent Companies, subsidiaries or projects. The work, and any other work done by Coffey for Tharisa, is strictly in return for professional fees. Payment for the work is not in any way dependent on the outcome of the work or on the success or otherwise of Tharisa’s own business dealings. There is no conflict of interest in Coffey undertaking the independent mine valuation as contained in this document.
Hannes Bornman is a full-time employee of Coffey and has sufficient experience which is relevant to the style of mineralization and type of mining under consideration and to the valuation which he is undertaking to qualify as a Competent Valuator as defined in “The South African Code for the Reporting of Mineral Asset Valuation (2008)(as amended in July 2009)” Prepared by The South African Mineral Asset Valuation Committee (SAMVAL) Working Group (SAMVAL Code). Hannes Bornman has visited the property under valuation and consents to the inclusion in the report of the matters based on his information in the form and context in which it appears.
The effective date of the valuation is 31 December 2013.
12.9(f) SRT5.7C(i) – SRT5.7C(vi)SRT10A(i) SVT2.8
SVT2.18
SVT2.14
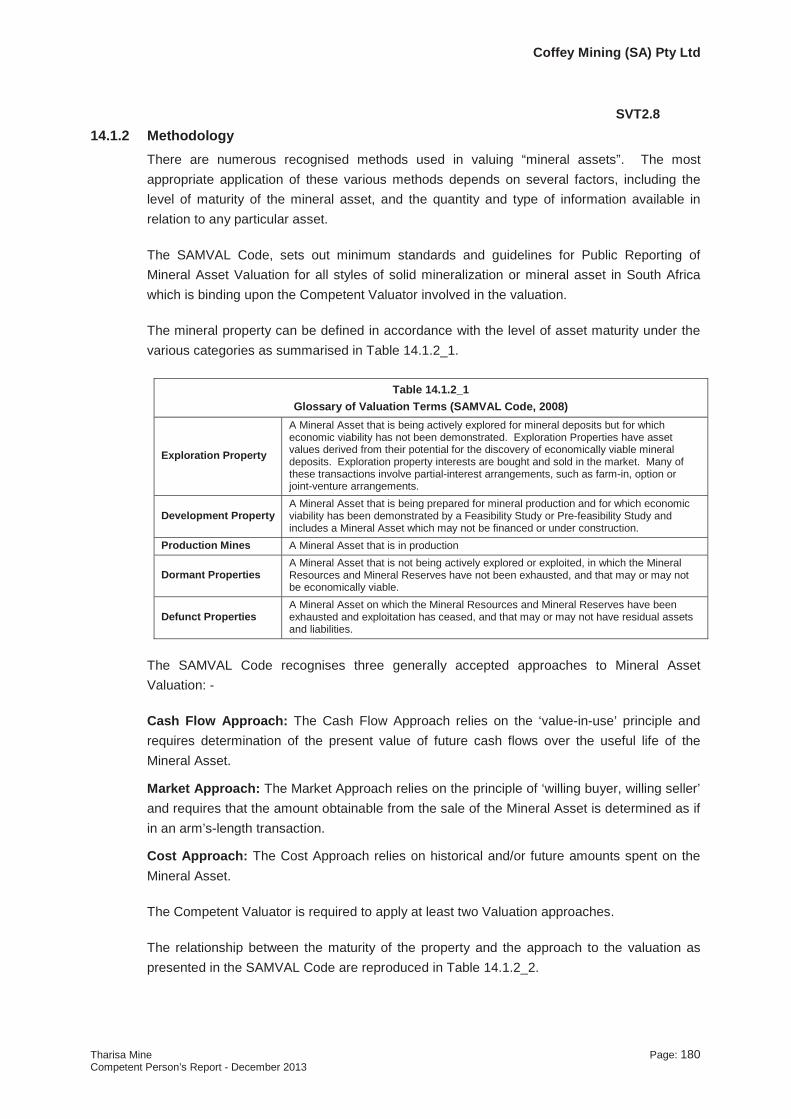
Coffey Mining (SA) Pty Ltd
Tharisa Mine Page: 180Competent Person’s Report - December 2013
14.1.2 MethodologyThere are numerous recognised methods used in valuing “mineral assets”. The most appropriate application of these various methods depends on several factors, including the level of maturity of the mineral asset, and the quantity and type of information available in relation to any particular asset.
The SAMVAL Code, sets out minimum standards and guidelines for Public Reporting of Mineral Asset Valuation for all styles of solid mineralization or mineral asset in South Africawhich is binding upon the Competent Valuator involved in the valuation.
The mineral property can be defined in accordance with the level of asset maturity under the various categories as summarised in Table 14.1.2_1.
Table 14.1.2_1Glossary of Valuation Terms (SAMVAL Code, 2008)
Exploration Property
A Mineral Asset that is being actively explored for mineral deposits but for which economic viability has not been demonstrated. Exploration Properties have asset values derived from their potential for the discovery of economically viable mineral deposits. Exploration property interests are bought and sold in the market. Many of these transactions involve partial-interest arrangements, such as farm-in, option or joint-venture arrangements.
Development PropertyA Mineral Asset that is being prepared for mineral production and for which economic viability has been demonstrated by a Feasibility Study or Pre-feasibility Study and includes a Mineral Asset which may not be financed or under construction.
Production Mines A Mineral Asset that is in production
Dormant PropertiesA Mineral Asset that is not being actively explored or exploited, in which the Mineral Resources and Mineral Reserves have not been exhausted, and that may or may not be economically viable.
Defunct Properties A Mineral Asset on which the Mineral Resources and Mineral Reserves have been exhausted and exploitation has ceased, and that may or may not have residual assets and liabilities.
The SAMVAL Code recognises three generally accepted approaches to Mineral Asset Valuation: -
Cash Flow Approach: The Cash Flow Approach relies on the ‘value-in-use’ principle and requires determination of the present value of future cash flows over the useful life of the Mineral Asset.
Market Approach: The Market Approach relies on the principle of ‘willing buyer, willing seller’ and requires that the amount obtainable from the sale of the Mineral Asset is determined as if in an arm’s-length transaction.
Cost Approach: The Cost Approach relies on historical and/or future amounts spent on the Mineral Asset.
The Competent Valuator is required to apply at least two Valuation approaches.
The relationship between the maturity of the property and the approach to the valuation as presented in the SAMVAL Code are reproduced in Table 14.1.2_2.
SVT2.8

Coffey Mining (SA) Pty Ltd
Tharisa Mine Page: 181Competent Person’s Report - December 2013
Table 14.1.2_2Relationship between Stages of Development and Valuation approaches for Mineral Properties
(SAMVAL Code)
Valuation Approach
Exploration Properties
Development Properties
Production Properties
Dormant PropertiesDefunct
PropertiesEconomically
ViableNot Viable
Cash Flow Not generally used Widely used Widely used Widely used
Not generally used
Not generally used
Market Widely used Less widely used
Quite widely used
Quite widely used Widely used Widely used
Cost Quite widely used
Not generally used
Not generally used
Not generally used
Less widely used
Quite widely used
In the case of Tharisa Mine, which is a producing mine, the primary valuation was undertaken using a discounted cashflow (DCF) approach utilising the planned production profile together with the costing relating to the LoM.
Discounted Cash Flow
In generating the financial model and deriving the valuations, the following approach was adopted:
The DCF valuation was set up in financial years ending September (the Company’s financial year end).
A discount rate of 8% per annum (in real terms) was assumed for the base case discount factor, but the NPV was also calculated for a range of discount rates.
The impact of the Mineral Royalties Act using the formula for unrefined metals was included.
Sensitivity analyses were performed to ascertain the impact of discount rates, commodity prices, exchange rates, total working costs and capital expenditures.
Valuation of the tax entity was performed on a stand-alone basis.
The full value of the operation was reported – no attributable value was calculated
The approach to the second valuation selected was that of looking at comparative transactions.
Comparative Transactions
Recent work was undertaken to determine market values for listed companies active in the Southern African region and these values were plotted against the respective stages of exploration (including resource definition) in order to create value benchmarks for comparison.
Analysis of the transaction data where transactions involved the acquisition of classified Mineral Resources can be used to investigate the value ascribed to contained metal in these resources. This is based on the reasonable assumption that effectively all the value was ascribed to those resources and their upside.
SVT2.12

Coffey Mining (SA) Pty Ltd
Tharisa Mine Page: 182Competent Person’s Report - December 2013
14.1.3 Previous ValuationsCoffey is unaware of any previous valuations that have been determined in accordance with the guidelines of the SAMVAL Code.
14.2 Sources of information
The information has been supplied by Tharisa and various independent technical advisors to Tharisa. It is based on this information that the cash flow model was constructed.
SVT2.18

Coffey Mining (SA) Pty Ltd
Tharisa Mine Page: 183Competent Person’s Report - December 2013
The following sources were used as inputs:
Commodity prices - Average of Macquarie, Investec, HSBC and ABSA - January 2014 real term view. (Published prices from Industrial Minerals for foundry sand and 45% chemical grade products); (For the purposes of the financial evaluation, foundry grade and 45% chemical grade chromite concentrate is sold to Arxo Metals at the price of 42% metallurgical grade chromite plus 10%).
Exchange rate forecasts - Average of Macquarie, Investec, HSBC and ABSA - January 2014 real term view.
Operating costs and capital expenditures – Tharisa Minerals.
RoM tonnage, chrome and PGM grade forecast – Ukwazi.
Grades, metal splits, recovery/yields and other process parameters – MDM Engineering and Tharisa Minerals actual plant performance data.
Royalties and taxes were calculated as per South African legislation.
No financing or other instruments were considered in the model and the NPV and IRR were calculated on the free cash flow of the project, both before and after tax and royalties. Depreciation and other non-cash items were ignored.
14.3 Capital Budgets
Table 14.3_1 is the summary of the capital budgets utilised in the TEM.
Table 14.3_1
Tharisa Mine
Total Capital Budget (ZAR millions)
Description 2014 2015 2016
Ongoing Capital 22.5 30.0 30.0
Strategic Spares 48.8 25.0 -
Tailings Storage Facility 46.0 20.0 15.0
Infrastructure 79.8 58.0 -
Magnetic Separation 46.6 170.0 -
High Energy Floatation 10.0 - -
Ultra-Fine Grind - 150.0 50.0
Rail Siding 5.0 150.0 50.0
Silos 10.0 30.0 -
TOTAL CAPITAL 268.7 633.0 145.0

Coffey Mining (SA) Pty Ltd
Tharisa Mine Page: 184Competent Person’s Report - December 2013
14.4 Operating Costs
Table 14.4_1 is the summary of the plant recovery parameters utilised in the technical-economic model.
Table 14.4_1
Tharisa Mine
Plant Recovery Parameters
Parameter 2014 2015 2016 2017Value (Long
Term avg)
Chrome Mass Yield 34% 37% 39% 39% 39%
PGM Concentrator recovery 61% 66% 67% 74% 73%
PGM Concentrate grade 121g/t 120g/t 120g/t 120g/t 120g/t
The following projects are planned to increase the chrome yield and PGM recoveries as indicated in Table 14.4_1:
Initial portion of magnetic separation in the Voyager (300ktpm) plant - May 2014
High energy floatation in the Voyager plant – May 2014
Full magnetic separation Voyager plant – FY2016
Ultra-fine-grind full benefit – FY2017
14.5 Revenue Factors
Table 14.5_1 is the summary of the revenue factors utilised in the technical-economic model.
Table 14.5_1 Tharisa Mine
Revenue Factors
Parameter Unit Value
Exchange rate long term (real) ZAR/US$ 10.61PGM Basket price (Real) long term US$/ troy oz (5PGE+Au) 1,429PGM Basket price (Real) long term ZAR/(5PGE+Au)kg 487,752Met Grade chrome concentrate CIF long term (42% Cr2O3) US$ / conc t 193Chemical-grade chromite 44% Cr2O3, wet bulk, CIF to China US$ / conc t 227Foundry-grade chromite 45% Cr2O3, wet bulk, (Arxo Metals) US$ / conc t 212Chemical-grade chromite 45% Cr2O3, wet bulk, (Arxo Metals) US$ / conc t 212Nickel Price US$/tonne 17,637Copper Price US$/tonne 6,614PGM payment factor (5PGE+Au) % 80%Nickel payment factor % 72.5%Copper payment factor % 67.5%
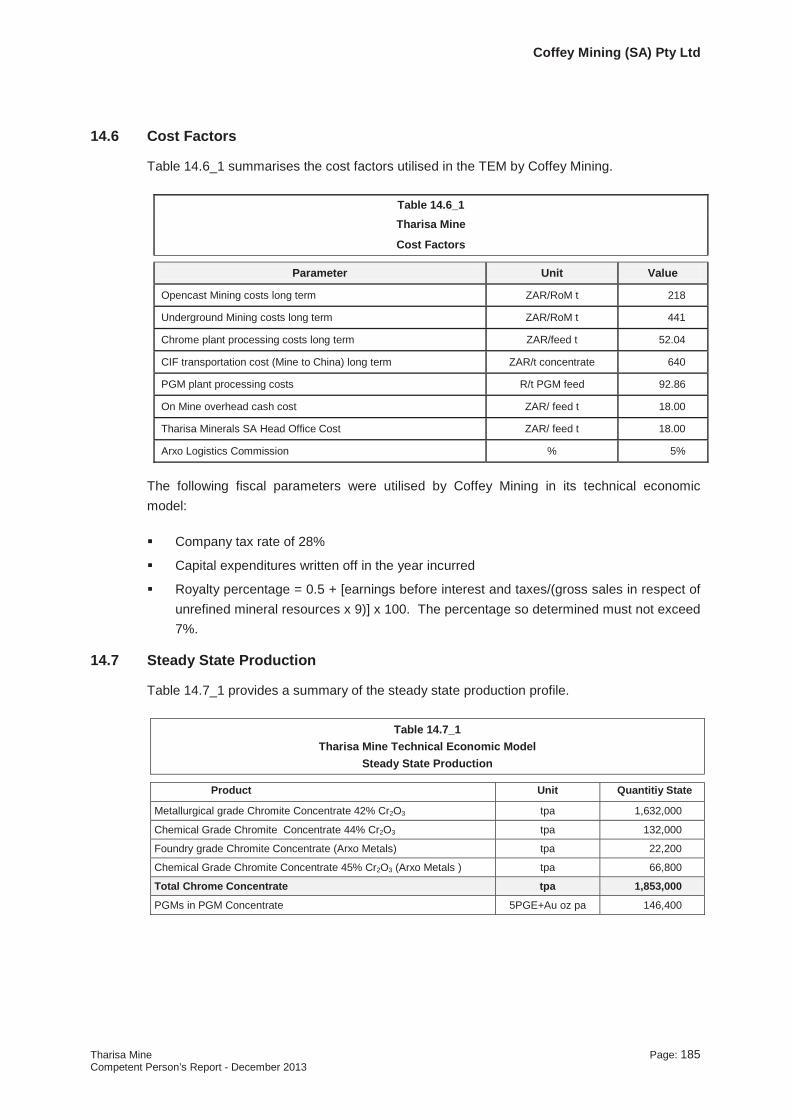
Coffey Mining (SA) Pty Ltd
Tharisa Mine Page: 185Competent Person’s Report - December 2013
14.6 Cost Factors
Table 14.6_1 summarises the cost factors utilised in the TEM by Coffey Mining.
Table 14.6_1 Tharisa Mine
Cost Factors
Parameter Unit Value
Opencast Mining costs long term ZAR/RoM t 218
Underground Mining costs long term ZAR/RoM t 441
Chrome plant processing costs long term ZAR/feed t 52.04
CIF transportation cost (Mine to China) long term ZAR/t concentrate 640
PGM plant processing costs R/t PGM feed 92.86
On Mine overhead cash cost ZAR/ feed t 18.00
Tharisa Minerals SA Head Office Cost ZAR/ feed t 18.00
Arxo Logistics Commission % 5%
The following fiscal parameters were utilised by Coffey Mining in its technical economic model:
Company tax rate of 28%
Capital expenditures written off in the year incurred
Royalty percentage = 0.5 + [earnings before interest and taxes/(gross sales in respect of unrefined mineral resources x 9)] x 100. The percentage so determined must not exceed 7%.
14.7 Steady State Production
Table 14.7_1 provides a summary of the steady state production profile.
Table 14.7_1Tharisa Mine Technical Economic Model
Steady State Production
Product Unit Quantitiy State
Metallurgical grade Chromite Concentrate 42% Cr2O3 tpa 1,632,000
Chemical Grade Chromite Concentrate 44% Cr2O3 tpa 132,000
Foundry grade Chromite Concentrate (Arxo Metals) tpa 22,200
Chemical Grade Chromite Concentrate 45% Cr2O3 (Arxo Metals ) tpa 66,800
Total Chrome Concentrate tpa 1,853,000
PGMs in PGM Concentrate 5PGE+Au oz pa 146,400
Coffey Mining (SA) Pty Ltd
Tharisa Mine Page: 186Competent Person’s Report - December 2013
14.8 Summary of the Technical Financial Model Inputs
Table 14.8_1 summaries the inputs and outputs of the TEM constructed by Coffey.
The TEM confirmed that the mine is viable with a positive Net Present Value (NPV). The TEM further confirmed that the mine is most sensitive to changes in revenue and least sensitive to changes in capital. This is because relatively little capital is spent on mining equipment as this is a contract mining operation.
SVT2.10

Cof
fey
Min
ing
(SA)
Pty
Ltd
Tabl
e 14
.8_1
Thar
isa
Min
e
Sum
mar
y of
the
Tech
nica
l Fin
anci
al M
odel
O
penc
ast M
inin
g O
penc
ast &
Und
ergr
ound
Min
ing
U/G
St
eady
St
ate
Dec
linin
g U
nder
grou
nd
U
nit
2014
20
15
2016
- 20
31
2032
20
33
2034
20
35
2036
20
37
2038
20
39 -
2059
20
60
2061
20
62
2063
20
64
2065
20
66
2067
RoM
tonn
age
Mtp
a 4.
557
4.80
0 4.
800
4.80
6 4.
800
4.81
6 4.
832
4.75
2 4.
767
4.79
0 4.
752
4.45
2 3.
996
3.47
1 3.
407
3.25
7 2.
949
2.75
8 2.
462
Gra
de to
PG
M c
ircui
t
5PG
E+A
u g/
t 1.
72
1.78
1.
97
2.01
2.
06
1.95
2.
03
1.98
1.
98
1.94
2.
00
2.06
2.
16
2.13
2.
10
2.14
2.
18
2.20
2.
22
Cr 2
O3
%
19.5
%
19.8
%
19.3
%
19.8
%
18.1
%
18.8
%
19.0
%
18.8
%
18.9
%
18.8
%
19.3
%
18.9
%
19.3
%
18.7
%
18.9
%
19.3
%
19.7
%
19.7
%
19.7
%
Met
al to
PG
M C
ircui
t
5PG
E+A
u K
g 5,
669
6,16
2 6,
228
6,36
5 6,
512
6,18
8 6,
424
6,26
5 6,
270
6,14
7 6,
279
6,02
3 5,
586
4,72
4 4,
584
4,45
9 4,
122
3,87
9 3,
499
Chr
ome
Plan
t
Chr
ome
plan
t fee
d M
tpa
4.49
6 4.
800
4.80
0 4.
800
4.80
0 4.
800
4.80
0 4.
800
4.80
0 4.
800
4.75
5 4.
452
3.99
6 3.
471
3.40
7 3.
257
2.94
9 2.
758
2.46
2
Yie
ld
%
34.4
%
36.6
%
38.7
%
39.7
%
36.6
%
37.9
%
38.1
%
37.8
%
38.1
%
37.9
%
39.0
%
38.7
%
40.5
%
40.6
%
40.8
%
41.6
%
42.4
%
42.4
%
42.4
%
Met
allu
rgic
al G
rade
(42%
) M
tpa
1.3
42
1.53
2
1.63
0
1.6
78
1.5
49
1.60
3
1.6
08
1.5
97
1.61
5
1.60
6
1.6
39
1.53
1
1.4
58
1.2
81
1.26
6
1.23
4
1.1
37
1.06
6
0.95
0
Che
mic
al G
rade
- (4
4%)
Mtp
a 0
.100
0
.114
0.
128
0
.135
0.
126
0.
130
0
.129
0.
128
0
.132
0
.131
0.
135
0
.132
0
.135
0
.127
0
.125
0.
122
0
.112
0
.105
0
.094
Foun
dry
grad
e - A
rxo
Met
als
Mtp
a 0
.025
0
.028
0.
025
0
.023
0
.020
0.
021
0.
023
0
.022
0
.021
0
.020
0.
020
0
.014
0.
007
-
-
-
- -
-
Che
mic
al G
rade
- (4
5%) A
rxo
Met
las
Mtp
a 0.
080
0
.084
0.
075
0
.069
0
.060
0
.063
0.
068
0.
067
0.
063
0
.062
0.
060
0.
043
0
.021
-
-
-
- -
-
Chr
ome
conc
entra
te p
rodu
ced
Mtp
a 1.
547
1.75
9 1.
858
1.90
6 1.
756
1.81
7 1.
827
1.81
4 1.
831
1.82
0 1.
855
1.72
1 1.
620
1.40
8 1.
391
1.35
6 1.
250
1.17
1 1.
044
PGM
Pla
nt
Flot
atio
n pl
ant f
eed
Mtp
a 3.
295
3.45
6 3.
168
3.16
8 3.
168
3.16
8 3.
168
3.16
8 3.
168
3.16
8 3.
136
2.91
7 2.
589
2.22
1 2.
180
2.08
5 1.
887
1.76
5 1.
575
PG
Es in
Pla
nt fe
ed
Kg
5,66
9
6,16
2
6,22
8
6,36
5
6,51
2
6,18
8
6,42
4
6,26
5
6,27
0
6,14
7
6,27
9
6,02
3
5,58
6
4,72
4
4,58
4
4,45
9
4,12
2
3,87
9
3,49
9
5PG
E+A
u ro
ughe
r fee
d gr
ade
g/t
1.72
1.
78
1.97
2.
01
2.06
1.
95
2.03
1.
98
1.98
1.
94
2.00
2.
06
2.16
2.
13
2.10
2.
14
2.18
2.
20
2.22
Con
cent
rato
r rec
over
y %
61
%
66%
72
%
75%
75
%
76%
74
%
74%
73
%
73%
73
%
74%
77
%
80%
80
%
80%
80
%
80%
80
%
PG
M's
in c
once
ntra
te
5PG
E+A
u K
g 3,
458
4,08
5 4,
480
4,78
4 4,
858
4,67
9 4,
784
4,62
3 4,
570
4,46
4 4,
565
4,47
3 4,
302
3,77
9 3,
667
3,56
8 3,
297
3,10
3 2,
800
PG
M's
in c
once
ntra
te
5PG
E+A
u oz
11
1,16
7 13
1,33
8 14
4,04
2 15
3,80
1 15
6,20
1 15
0,43
5 15
3,81
5 14
8,64
0 14
6,93
2 14
3,53
6 14
6,78
2 14
3,80
3 13
8,32
7 12
1,51
0 11
7,89
8 11
4,70
0 10
6,01
6 99
,775
90
,008
Con
cent
rate
gra
de
5PG
E+A
u g/
t 12
1 12
0 12
0 12
0 12
0 12
0 12
0 12
0 12
0 12
0 12
0 12
0 12
0 12
0 12
0 12
0 12
0 12
0 12
0
Tonn
es o
f con
cent
rate
to
nnes
28
,621
34
,042
37
,335
39
,865
40
,487
38
,992
39
,868
38
,527
38
,084
37
,204
38
,045
37
,273
35
,854
31
,495
30
,559
29
,730
27
,479
25
,861
23
,330
Exc
hang
e ra
te
ZAR
/US
D
10.5
9 10
.55
10.7
4 10
.61
10.6
1 10
.61
10.6
1 10
.61
10.6
1 10
.61
10.6
1 10
.61
10.6
1 10
.61
10.6
1 10
.61
10.6
1 10
.61
10.6
1
PG
M B
aske
t pric
e (R
eal)
US
D/o
z 1,
185.
18
1,36
2.78
1,
444.
73
1,42
9.42
1,
429.
42
1,42
9.42
1,
429.
42
1,42
9.42
1,
429.
42
1,42
9.42
1,
429.
42
1,42
9.42
1,
429.
42
1,42
9.42
1,
429.
42
1,42
9.42
1,
429.
42
1,42
9.42
1,
429.
42
PG
M B
aske
t pric
e (R
eal)
R/g
40
3.53
46
2.07
49
8.87
48
7.75
48
7.75
48
7.75
48
7.75
48
7.75
48
7.75
48
7.75
48
7.75
48
7.75
48
7.75
48
7.75
48
7.75
48
7.75
48
7.75
48
7.75
48
7.75
42%
met
gra
de c
hrom
e (C
IF to
Chi
na)
US
$/t c
onc
176.
50
185.
00
193.
78
192.
69
192.
69
192.
69
192.
69
192.
69
192.
69
192.
69
192.
69
192.
69
192.
69
192.
69
192.
69
192.
69
192.
69
192.
69
192.
69
SO
C A
gree
men
t IR
S P
aym
ent %
80
.0%
80
.0%
80
.0%
80
.0%
80
.0%
80
.0%
80
.0%
80
.0%
80
.0%
80
.0%
80
.0%
80
.0%
80
.0%
80
.0%
80
.0%
80
.0%
80
.0%
80
.0%
80
.0%
Arx
o Lo
gisr
tis C
omm
issi
on
%
5.0%
5.
0%
5.0%
5.
0%
5.0%
5.
0%
5.0%
5.
0%
5.0%
5.
0%
5.0%
5.
0%
5.0%
5.
0%
5.0%
5.
0%
5.0%
5.
0%
5.0%
Effe
ctiv
e 42
% M
et g
rade
pric
e (C
IF to
Chi
na)
ZAR
/tonn
e 1,
776
1,85
3 1,
977
1,94
3 1,
943
1,94
3 1,
943
1,94
3 1,
943
1,94
3 1,
943
1,94
3 1,
943
1,94
3 1,
943
1,94
3 1,
943
1,94
3 1,
943
Effe
ctiv
e 44
% C
hem
gra
de p
rice
(CIF
to
Chi
na)
ZAR
/tonn
e 2,
089
2,18
1 2,
326
2,28
6 2,
286
2,28
6 2,
286
2,28
6 2,
286
2,28
6 2,
286
2,28
6 2,
286
2,28
6 2,
286
2,28
6 2,
286
2,28
6 2,
286
Effe
ctiv
e 45
% C
hem
gra
de p
rice
(to A
rxo
met
als)
ZA
R/to
nne
1,95
3 2,
039
2,17
5 2,
137
2,13
7 2,
137
2,13
7 2,
137
2,13
7 2,
137
2,13
7 2,
137
2,13
7 2,
137
2,13
7 2,
137
2,13
7 2,
137
2,13
7
Effe
ctiv
e Fo
undr
y gr
ade
pric
e (to
Arx
o m
etal
s)
ZAR
/tonn
e 1,
953
2,03
9 2,
175
2,13
7 2,
137
2,13
7 2,
137
2,13
7 2,
137
2,13
7 2,
137
2,13
7 2,
137
2,13
7 2,
137
2,13
7 2,
137
2,13
7 2,
137
Effe
ctiv
e P
GM
Pric
e ZA
R/5
PG
E+A
u ou
nce
10,0
41
11,4
97
12,4
13
12,1
37
12,1
37
12,1
37
12,1
37
12,1
37
12,1
37
12,1
37
12,1
37
12,1
37
12,1
37
12,1
37
12,1
37
12,1
37
12,1
37
12,1
37
12,1
37
Chr
ome
Rev
enue
- E
xpor
t Chr
ome
conc
entra
te
ZAR
mil
2,59
2 3,
089
3,52
0 3,
570
3,29
8 3,
412
3,41
8 3,
395
3,43
8 3,
421
3,49
4 3,
277
3,14
1 2,
779
2,74
5 2,
675
2,46
6 2,
311
2,06
0
Chr
ome
Rev
enue
- S
ales
to A
rxo
Met
als
ZAR
mil
205
229
218
197
172
180
194
191
180
175
172
123
59
- -
- -
- -
PG
M R
even
ue (I
ncl B
ase
Met
als)
ZA
R m
il 1,
127
1,52
4 1,
805
1,88
3 1,
913
1,84
2 1,
883
1,82
0 1,
799
1,75
8 1,
797
1,76
1 1,
694
1,48
8 1,
444
1,40
5 1,
298
1,22
2 1,
102
TOTA
L R
EVEN
UE
ZAR
mil
3,92
4 4,
842
5,54
3 5,
650
5,38
3 5,
434
5,49
6 5,
405
5,41
7 5,
354
5,46
3 5,
161
4,89
3 4,
267
4,18
9 4,
080
3,76
5 3,
533
3,16
2
Ope
ratin
g C
ost
Min
ing
cost
s ZA
R m
il 96
1.1
1,02
6.3
1,04
4.3
916.
9 79
6.7
536.
9 78
0.9
1,02
7.3
1,62
5.4
1,96
5.2
2,12
2.9
1,92
9.0
1,72
9.4
1,49
9.3
1,46
9.7
1,40
5.5
1,26
9.4
1,18
8.3
1,06
0.3
Chr
ome
plan
t pro
cess
ing
cost
s ZA
R m
il 24
9.8
249.
8 24
9.8
249.
8 24
9.8
249.
8 24
9.8
249.
8 24
9.8
249.
8 24
9.6
237.
1 22
1.3
204.
3 18
8.6
180.
4 16
3.3
152.
7 13
6.3
Chr
ome
Tran
spor
t cos
t (C
IF to
Chi
na)
ZAR
mil
1,00
5.4
1,14
3.1
1,18
9.1
1,21
9.6
1,12
3.8
1,16
3.0
1,16
9.6
1,16
0.9
1,17
1.6
1,16
4.8
1,18
7.2
1,10
1.4
1,03
6.9
901.
2 89
0.1
867.
5 79
9.8
749.
4 66
8.1
PG
M p
lant
pro
cess
ing
cost
s ZA
R m
il 20
8.2
223.
0 29
2.3
292.
5 29
2.5
292.
4 29
2.5
292.
4 29
2.4
292.
3 29
2.3
287.
2 28
0.6
285.
0 22
0.9
211.
2 19
1.2
178.
8 15
9.6
Labo
rato
ry c
ost
ZAR
mil
14.8
14
.8
14.8
14
.8
14.8
14
.8
14.8
14
.8
14.8
14
.8
14.8
14
.8
14.8
14
.8
14.8
14
.8
14.8
14
.8
14.8
Thar
isa
Min
eP
age:
187
Com
pete
nt P
erso
n’s
Rep
ort -
Dec
embe
r 201
3
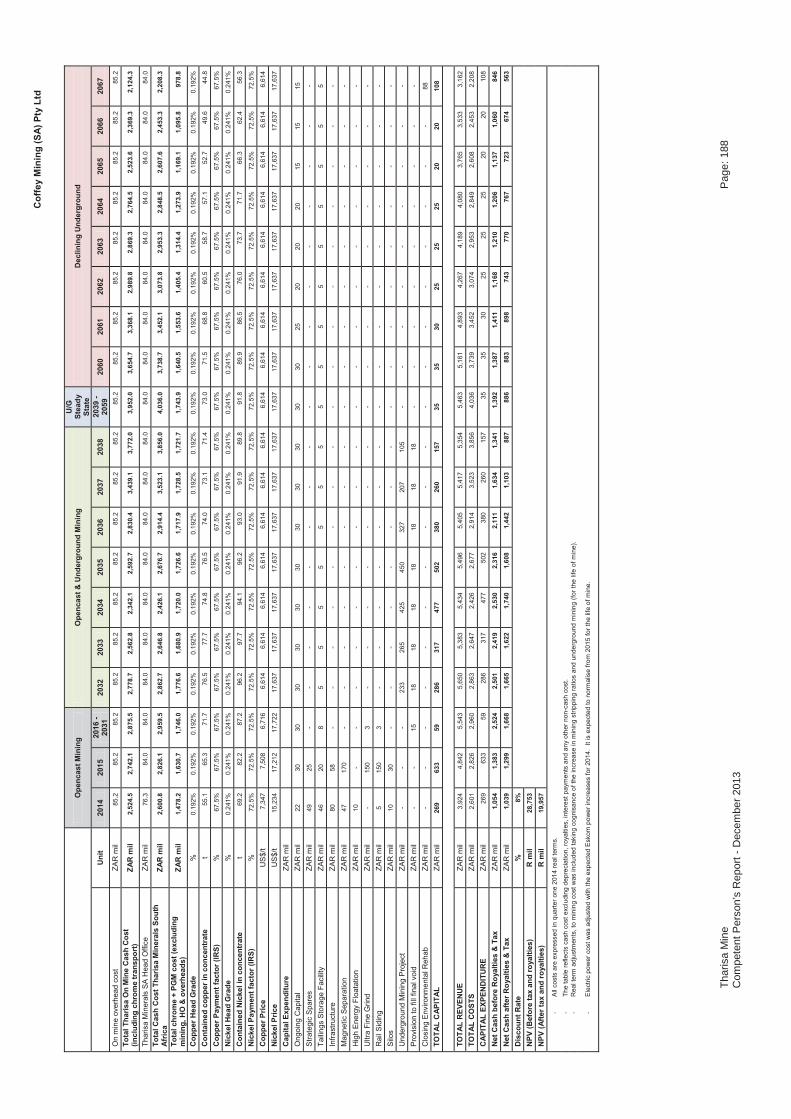
Cof
fey
Min
ing
(SA)
Pty
Ltd
O
penc
ast M
inin
g O
penc
ast &
Und
ergr
ound
Min
ing
U/G
St
eady
St
ate
Dec
linin
g U
nder
grou
nd
U
nit
2014
20
15
2016
- 20
31
2032
20
33
2034
20
35
2036
20
37
2038
20
39 -
2059
20
60
2061
20
62
2063
20
64
2065
20
66
2067
On
min
e ov
erhe
ad c
ost
ZAR
mil
85.2
85
.2
85.2
85
.2
85.2
85
.2
85.2
85
.2
85.2
85
.2
85.2
85
.2
85.2
85
.2
85.2
85
.2
85.2
85
.2
85.2
To
tal T
haris
a O
n M
ine
Cas
h C
ost
(incl
udin
g ch
rom
e tr
ansp
ort)
ZAR
mil
2,52
4.5
2,74
2.1
2,87
5.5
2,77
8.7
2,56
2.8
2,34
2.1
2,59
2.7
2,83
0.4
3,43
9.1
3,77
2.0
3,95
2.0
3,65
4.7
3,36
8.1
2,98
9.8
2,86
9.3
2,76
4.5
2,52
3.6
2,36
9.3
2,12
4.3
Thar
isa
Min
eral
s SA
Hea
d O
ffice
ZA
R m
il 76
.3
84.0
84
.0
84.0
84
.0
84.0
84
.0
84.0
84
.0
84.0
84
.0
84.0
84
.0
84.0
84
.0
84.0
84
.0
84.0
84
.0
Tota
l Cas
h C
ost T
haris
a M
iner
als
Sout
h Af
rica
ZAR
mil
2,60
0.8
2,82
6.1
2,95
9.5
2,86
2.7
2,64
6.8
2,42
6.1
2,67
6.7
2,91
4.4
3,52
3.1
3,85
6.0
4,03
6.0
3,73
8.7
3,45
2.1
3,07
3.8
2,95
3.3
2,84
8.5
2,60
7.6
2,45
3.3
2,20
8.3
Tota
l chr
ome
+ PG
M c
ost (
excl
udin
g m
inin
g, H
O &
ove
rhea
ds)
ZAR
mil
1,47
8.2
1,63
0.7
1,74
6.0
1,77
6.6
1,68
0.9
1,72
0.0
1,72
6.6
1,71
7.9
1,72
8.5
1,72
1.7
1,74
3.9
1,64
0.5
1,55
3.6
1,40
5.4
1,31
4.4
1,27
3.9
1,16
9.1
1,09
5.8
978.
8
Cop
per H
ead
Gra
de
%
0.19
2%
0.19
2%
0.19
2%
0.19
2%
0.19
2%
0.19
2%
0.19
2%
0.19
2%
0.19
2%
0.19
2%
0.19
2%
0.19
2%
0.19
2%
0.19
2%
0.19
2%
0.19
2%
0.19
2%
0.19
2%
0.19
2%
Con
tain
ed c
oppe
r in
conc
entr
ate
t 55
.1
65.3
71
.7
76.5
77
.7
74.8
76
.5
74.0
73
.1
71.4
73
.0
71.5
68
.8
60.5
58
.7
57.1
52
.7
49.6
44
.8
Cop
per P
aym
ent f
acto
r (IR
S)
%
67.5
%
67.5
%
67.5
%
67.5
%
67.5
%
67.5
%
67.5
%
67.5
%
67.5
%
67.5
%
67.5
%
67.5
%
67.5
%
67.5
%
67.5
%
67.5
%
67.5
%
67.5
%
67.5
%
Nic
kel H
ead
Gra
de
%
0.24
1%
0.24
1%
0.24
1%
0.24
1%
0.24
1%
0.24
1%
0.24
1%
0.24
1%
0.24
1%
0.24
1%
0.24
1%
0.24
1%
0.24
1%
0.24
1%
0.24
1%
0.24
1%
0.24
1%
0.24
1%
0.24
1%
Con
tain
ed N
icke
l in
conc
entr
ate
t 69
.2
82.2
87
.2
96.2
97
.7
94.1
96
.2
93.0
91
.9
89.8
91
.8
89.9
86
.5
76.0
73
.7
71.7
66
.3
62.4
56
.3
Nic
kel P
aym
ent f
acto
r (IR
S)
%
72.5
%
72.5
%
72.5
%
72.5
%
72.5
%
72.5
%
72.5
%
72.5
%
72.5
%
72.5
%
72.5
%
72.5
%
72.5
%
72.5
%
72.5
%
72.5
%
72.5
%
72.5
%
72.5
%
Cop
per P
rice
US
$/t
7,34
7 7,
508
6,71
6 6,
614
6,61
4 6,
614
6,61
4 6,
614
6,61
4 6,
614
6,61
4 6,
614
6,61
4 6,
614
6,61
4 6,
614
6,61
4 6,
614
6,61
4
Nic
kel P
rice
US
$/t
15,2
34
17,2
12
17,7
22
17,6
37
17,6
37
17,6
37
17,6
37
17,6
37
17,6
37
17,6
37
17,6
37
17,6
37
17,6
37
17,6
37
17,6
37
17,6
37
17,6
37
17,6
37
17,6
37
Cap
ital E
xpen
ditu
re
ZAR
mil
Ong
oing
Cap
ital
ZAR
mil
22
30
30
30
30
30
30
30
30
30
30
30
25
20
20
20
15
15
15
Stra
tegi
c S
pare
s ZA
R m
il 49
25
-
- -
- -
- -
- -
- -
- -
- -
- -
Tailin
gs S
tora
ge F
acilit
y ZA
R m
il 46
20
8
5 5
5 5
5 5
5 5
5 5
5 5
5 5
5 5
Infra
stru
ctur
e ZA
R m
il 80
58
-
- -
- -
- -
- -
- -
- -
- -
- -
Mag
netic
Sep
arat
ion
ZAR
mil
47
170
- -
- -
- -
- -
- -
- -
- -
- -
-
Hig
h E
nerg
y Fl
oata
tion
ZAR
mil
10
- -
- -
- -
- -
- -
- -
- -
- -
- -
Ultr
a Fi
ne G
rind
ZAR
mil
- 15
0 3
- -
- -
- -
- -
- -
- -
- -
- -
Rai
l Sid
ing
ZAR
mil
5 15
0 3
- -
- -
- -
- -
- -
- -
- -
- -
Silo
s ZA
R m
il 10
30
-
- -
- -
- -
- -
- -
- -
- -
- -
Und
ergr
ound
Min
ing
Pro
ject
ZA
R m
il -
- -
233
265
425
450
327
207
105
- -
- -
- -
- -
-
Pro
visi
on to
fill
final
voi
d ZA
R m
il -
- 15
18
18
18
18
18
18
18
-
- -
- -
- -
- -
Clo
sing
Env
ironm
enta
l Reh
ab
ZAR
mil
- -
- -
- -
- -
- -
- -
- -
- -
- -
88
TOTA
L C
APIT
AL
ZAR
mil
269
633
59
286
317
477
502
380
260
157
35
35
30
25
25
25
20
20
108
TO
TAL
REV
ENU
E ZA
R m
il 3,
924
4,84
2 5,
543
5,65
0 5,
383
5,43
4 5,
496
5,40
5 5,
417
5,35
4 5,
463
5,16
1 4,
893
4,26
7 4,
189
4,08
0 3,
765
3,53
3 3,
162
TOTA
L C
OST
S ZA
R m
il 2,
601
2,82
6 2,
960
2,86
3 2,
647
2,42
6 2,
677
2,91
4 3,
523
3,85
6 4,
036
3,73
9 3,
452
3,07
4 2,
953
2,84
9 2,
608
2,45
3 2,
208
CAP
ITAL
EXP
END
ITU
RE
ZAR
mil
269
633
59
286
317
477
502
380
260
157
35
35
30
25
25
25
20
20
108
Net
Cas
h be
fore
Roy
altie
s &
Tax
ZA
R m
il 1,
054
1,38
3 2,
524
2,50
1 2,
419
2,53
0 2,
316
2,11
1 1,
634
1,34
1 1,
392
1,38
7 1,
411
1,16
8 1,
210
1,20
6 1,
137
1,06
0 84
6
Net
Cas
h af
ter R
oyal
ties
& T
ax
ZAR
mil
1,03
9 1,
299
1,66
8 1,
665
1,62
2 1,
740
1,60
8 1,
442
1,10
3 88
7 88
6 88
3 89
8 74
3 77
0 76
7 72
3 67
4 56
3
Dis
coun
t Rat
e %
8%
N
PV (B
efor
e ta
x an
d ro
yalti
es)
R m
il 28
,753
NPV
(Afte
r tax
and
roya
lties
) R
mil
19,9
57
-
A
ll co
sts
are
expr
esse
d in
qua
rter o
ne 2
014
real
term
s.
-
T
he ta
ble
refle
cts
cash
cos
t exc
ludi
ng d
epre
ciat
ion,
roya
lties
, int
eres
t pay
men
ts a
nd a
ny o
ther
non
-cas
h co
st.
-
R
eal t
erm
adj
ustm
ents
, to
min
ing
cost
was
incl
uded
taki
ng c
ogni
sanc
e of
the
incr
ease
in m
inin
g st
rippi
ng ra
tios
and
unde
rgro
und
min
ing
(for t
he li
fe o
f min
e).
-
E
lect
ric p
ower
cos
t was
adj
uste
d w
ith th
e ex
pect
ed E
skom
pow
er in
crea
ses
for 2
014.
It i
s ex
pect
ed to
nor
mal
ise
from
201
5 fo
r the
life
of m
ine.
Thar
isa
Min
eP
age:
188
Com
pete
nt P
erso
n’s
Rep
ort -
Dec
embe
r 201
3

Coffey Mining (SA) Pty Ltd
Tharisa Mine Page: 189Competent Person’s Report - December 2013
14.9 Cash Flow Approach – Excluding Inferred Resources
14.9.1 Opencast MineThe tail of the opencast mine was shortened in this scenario due to the fixed costs on the mine that will have to be covered with diminished production in the last year or two.
14.9.2 Underground MineIn the valuation of the Tharisa Mine excluding the inferred mineral resources, it was decided to exclude the underground production profile as a close proxy for the exclusion of inferred mineral resources. This assessment considers that the ZAR2bn necessary to establish theunderground mine will not be recouped by the 18,649Mt Probable Reserves available for underground mine production. The bulk of the underground operations would obtain their production from areas declared as an inferred mineral resource.
14.9.3 Modifying FactorsAll modifying factors in this valuation are the same as in the valuation where the underground production, a proxy for the inferred mineral resources, were included.
14.9.4 Effect of Underground Production/Inferred Mineral Resources on DCF ValuationTable 14.9.4_1 presents aspects of the TEM in which the underground mine has been excluded as a close proxy for exclusion of the inferred mineral resources from the production profile.
Table14.9.4_1
Tharisa Mine Technical Economic ModelEffect of Underground Production/Inferred Resources on DCF Valuation
Parameter UnitIncluding
Underground Production
Excluding Underground Production
Life of Mine Years 54 23
ROM over LOM Mt 246.27 106.09
LOM C2O3 Mt 95.72 40.65
LOM PGM's Moz 7.62 3.24
Capital ZAR Million 5,249 2,075
Discount Rate % 8 8
High NPV ZAR Million 23,173 20,331
Low NPV ZAR Million 14,567 13,996
Preferred NPV ZAR Million 19,957 18,162
Coffey prefers the DCF valuation where the underground production has been excluded.

Coffey Mining (SA) Pty Ltd
Tharisa Mine Page: 190Competent Person’s Report - December 2013
14.10 Market Approach
Tharisa is unique in the sense that there are no other opencast chrome mines with PGM’s as co-products in South Africa. There are therefore no similar mine transactions that can be used to value Tharisa according to the Market Approach. Since it is an operating mine the Cost Approach is not generally used (Figure 1 in the SAMVAL Code).
Coffey approached the problem by first valuing the PGM content of Tharisa Mine, and then the chrome content, using publicly available transactions.
14.11 PGM Comparative Transactions
Table 14.11_1 shows the transactions relied upon as well as the resultant value attributable to Tharisa PGM’s, based on a Market Approach.
14.12 Chrome Comparative Transactions
Chromex sold its 74% interest in the Chromex mine to the Ruukki Group (Mogale Alloys) in 2010 for £37.0 million. The full consideration plus debt, less cash of this transaction was US$59.17 million as at the date of acquisition.
In 2009 AMCOL International Corporation bought Chrome Corporation’s 74% of the Ruighoek chromite mine for US$26.4 million. Using these two transactions, Coffey placed a value on the chromite content of Tharisa Mine, using the Market approach. Table 14.12_1 indicates the implied value of Tharisa Mine’s 835Mt chromitite resource based on the transactions described above.

Cof
fey
Min
ing
(SA)
Pty
Ltd
Tabl
e 14
.11_
1Th
aris
a M
ine
PGM
Val
uatio
n us
ing
Mar
ket A
ppro
ach
Targ
et*
Acqu
irer
Dat
e an
noun
ced
% o
f sha
res
acqu
ired
EV(U
S$m
)D
eal v
alue
(US$
m)
4PG
M R
esou
rces
pu
rcha
sed
(Moz
)D
eal V
alue
(U
S$/4
PGM
oz)
Nor
tham
E
NR
C
26-A
pr-1
012
.20%
2297
300
137.
117
.94
Ano
oraq
Res
ourc
es
Ang
lo P
latin
um
2-Fe
b-12
100.
00%
418
213
20.9
10.1
9
Zim
babw
e P
latin
um M
ines
Zi
mpl
ats
Mho
ndor
o –
Nge
xi, E
SO
T,
NIE
EF
11-J
an-1
351
.00%
1904
971
107.
417
.73
Mea
n of
all
15.2
8
Thar
isa
Impl
ied
Valu
atio
n
Tonn
es re
sour
ces
4PG
Mg/
tG
ram
s pe
r Oz
Oz
cont
aine
d 4P
GM
Mul
tiple
Tran
sact
ion
valu
e/re
sour
ces
valu
atio
n
US$
m
ZAR
m**
835,
000,
000
1.15
31.1
035
30,8
72,7
3115
.82
471.
89
5,21
9.07
Dis
coun
t fac
tor
100%
Ente
rpris
e va
lue
471.
895,
219.
07
*Ope
ratin
g PG
M m
ine
sale
s in
last
5 y
ears
**ZA
R:U
S$ a
t spo
t on
3/2/
2014
– 1
1.08
Thar
isa
Min
eP
age:
1C
ompe
tent
Per
son’
s R
epor
t - D
ecem
ber 2
013
91

Cof
fey
Min
ing
(SA)
Pty
Ltd
Tabl
e 14
.12_
1Th
aris
a M
ine
Chr
ome
Valu
atio
n us
ing
Mar
ket A
ppro
ach
Targ
et*
Acqu
irer
Dat
ean
noun
ced
% o
f sha
res
acqu
ired
Dea
l val
ue
(US$
m)
Chr
ome
reso
urce
Mt
Tran
sact
ion
US$
/tTa
rget
Cr 2
O3 %
Th
aris
a C
r 2O
3
%
Thar
isa
US$
/t ba
sed
on
grad
e
Thar
isa
impl
ied
valu
atio
n U
S$M
Chr
omex
Ruu
kki G
roup
30-S
ep-1
074
.00%
5931
.723
81.
8738
.22%
20.3
8%0.
9983
0.5
Rui
ghoe
k C
hrom
e P
roje
ct
AM
CO
L In
tern
atio
nal
Cor
pora
tion
23-F
eb-0
974
.00%
26.4
9.47
792
2.79
43.6
5%20
.38%
1.30
1085
.9
Mea
n va
lue
958.
2*C
hrom
e pr
ojec
t sal
es in
last
5 y
ears
Thar
isa
Min
eP
age:
192
Com
pete
nt P
erso
n’s
Rep
ort -
Dec
embe
r 201
3

Coffey Mining (SA) Pty Ltd
Tharisa Mine Page: 193Competent Person’s Report - December 2013
14.13 Value according to Market Approach
Based on the Market Approach the following value can thus be attributed to Tharisa as shown in Table 14.13_1.
Table 14.13_1Tharisa Mine
Market Approach Valuation of 100% of Tharisa Mine
Transaction type US$ ZARm
PGM comparable transaction valuation (Resources) 472 5,219
Chrome Corporation transaction valuation (Resources) 830 9,185Chromex transaction valuation (Resources) 1086 12,010Chrome comparable transaction valuation (Resources) 958 10,598
Low valuation 1,302 14,404
High valuation 1,558 17,229
Average 1,430 15,817
14.14 Summary
In the Valuation, a Comparative Transaction Valuation and a DCF Valuation were compared.Table 14.14_1 summarises the results of the valuations.
Table 14.14_1Tharisa Mine
Valuations of the Tharisa Mine on 31 December 2013
Valuation Methodology Preferred Value(ZAR million)
High Value(ZAR million)
Low Value(ZAR million)
DCF incl. underground production 19,957 23,173 14,567
DCF excl. underground production 18,162 20,331 13,996
Comparative Transaction (ZAR million) 15,817 17,229 14,404
14.15 Conclusion
Coffey prefers the Cash Flow Approach to valuating the Tharisa Mine as it is a producing mine with known production and cost parameters. Coffey prefers the DCF valuation excluding the underground production as a close proxy for exclusion of inferred mineral resources, as the inferred mineral resources have a lower level of confidence.
The Market Approach valuation is based on a combination of transactions for properties that is not very similar to the Tharisa Mine. Coffey considers that it is not a true reflection of the
SVT2.15

Coffey Mining (SA) Pty Ltd
Tharisa Mine Page: 194Competent Person’s Report - December 2013
market price of Tharisa Mine. Table 14.15_1 are thus the values Coffey attributes to Tharisa Mine.
Table 14.15_1Tharisa Mine
Preferred Valuation of the Tharisa Mine on 31 December 2013
Valuation Methodology Preferred ValueZAR million
High ValueZAR million
Low ValueZAR million
Discounted Cashflow excluding underground production 18,162 20,331 13,996

Coffey Mining (SA) Pty Ltd
Tharisa Mine Page: 195Competent Person’s Report - December 2013
15 RISK ANALYSIS
15.1 Introduction
The risk analysis presented here is not a formal risk assessment. Coffey prefers to highlight areas of risk and the potential impacts of that risk that would normally be expected in similar operations. The focus is on highlighting areas of risk that are of relevance to project financiers or to potential project purchasers or investors.
In this report the risk analysis determines the level of risk which is classified from minor to major, as presented in Table 15.1_1.
Table 15.1_1Definitions of the Levels of Risk
Level of Risk Explanation
Major RiskThe factor poses an immediate danger of a failure, which if uncorrected, will have a material effect (>15% to 20%) on the project cash flow and performance and could potentially lead to project failure.
Moderate RiskThe factor, if uncorrected, could have a significant effect (10% to 15% or 20%) on the project cash flow and performance unless mitigated by some corrective action.
Minor Riskthe factor, if uncorrected, will have little or no effect (<10%) on project cash flow and performance.
The likelihood of a risk must also be considered as is the likelihood that within a seven year period, the event may occur ans is classified as likely (will probably occur), possible (may occur) or unlikely (unlikely to occur).
The impact of a risk and its likelihood are combined into an overall risk assessment as presented in Table 15.1_2.
Table 15.1_2Overall Risk Assessment Matrix
Likelihood of Risk (within a 7 year
period)
Level of Risk
Minor Moderate Major
Likely Medium High High
Possible Low Medium High
Unlikely Low Low Medium
SRT6B(i) SRT6C(i)

Coffey Mining (SA) Pty Ltd
Tharisa Mine Page: 196Competent Person’s Report - December 2013
15.2 Risk Summary
Based on the sections above, a summary of the perceived risks to the Tharisa Mine are presented in Table 15.2_1.
Table 15.2_1Overall Risk Assessment Analysis
Hazard/Risk Issue Likelihood Consequence Rating
Overall Risk Assessment
Geology and Mineral ResourcesSignificant Variance in Resource Tonnage Unlikely Moderate LowResource Grade Variation Unlikely Moderate LowSignificant Variance in Geological losses Unlikely Minor LowWestern Extend of Mineral Resource Possible Minor Low
Mining EngineeringTonnage variation Possible Moderate MediumGrade Variation Possible Moderate MediumOpen Pit Mining Method Unlikely Minor LowProduction Schedule Unlikely Moderate LowHighwall Collapse Possible Moderate MediumUnderground Mining Method Unlikely Minor LowNegative change in Opex Possible Moderate MediumNegative change in Capex Possible Moderate Medium
Metallurgy and ProcessingProcess Technology Unlikely Minor LowRecoveries Unlikely Moderate MediumOre response to processing Unlikely Minor LowNegative change in Opex Possible Moderate MediumNegative change in Capex Possible Moderate Medium
Environmental*Potential for ground and surface water contamination Possible Moderate to Minor Medium to Low
Relocation of informal settlement and related social issues Unlikely Minor Low
Potential for air pollution Possible Minor LowBlasting and noise disturbance of surrounding land users Possible Minor Low
Soil and biodiversity management Possible Minor LowTraffic impacts Possible Minor LowDisturbance of archaeological resources Possible Minor LowRehabilitation and closure planning Possible Moderate to Minor Medium to LowOn going permitting Unlikely Minor LowTSF rehabilitation Unlikely Low Low
Manpower and ManagementLack of Skills availability Unlikely Moderate MediumInability to retain skills Unlikely Moderate MediumHIV Possible Minor LowLabour costs Unlikely Major MediumDisruptions to business Possible Moderate MediumIndustrial action Possible Moderate MediumSafety/DMR Possible Moderate Medium
InfrastructureWater Supply Unlikely Moderate MediumPower Supply Unlikely Moderate Medium* Environmental risks shown above reflects the managed scenario which assumes successful implementation of
the EMP commitments
Based on the above risk summary, Coffey considers the Tharisa Mine to have an overall.

Coffey Mining (SA) Pty Ltd
Tharisa Mine Page: 197Competent Person’s Report - December 2013
15.3 Geology and Mineral Resources
The level of technical risk is defined as the likelihood of variation of resource tonnage and/or grade from the stated values.
The geological model developed by Coffey and the application to the mineral resource estimate.
The geological model developed presents a tabular deposit with some dykes and faults crossing the property. However smaller scale faulting (<10m throw) must be considered. No potholes have been delineated although it is considered likely that some potholing of the MG Chromitite Layers has occurred. As these Chromitite Layers are not mined extensively elsewhere, it is difficult to assess the degree of potholing or the presence of small scale faulting. The application of a 7.5% - 15% geological loss is made based on knowledge of the Bushveld Complex and is intended to represent those areas where the MG Chromitite Layer is replaced by mafic pegmatites, intersected by faults or dykes, or disrupted by potholes.
The interpretation of the position of the most westerly point where a mineral resource can be declared is subjective.
The interpreted position is considered to represent the likely extent of the deposit that can realistically be exploited based on the current data available, the current understanding of the geology and the macro economic understanding. It is possible that this boundary could move. It is considered more likely to move westward, effectively increasing the mineral resource base.
The overall geological risk is therefore considered .
15.4 Mining
Coffey Mining associates a rating for the mining operation due to a concern relating to the amount of dilution which may report to the RoM ore and into the processing facility. Tharisa Minerals will need to place special emphasis on grade control and mining the width of the ore zone with limited dilution.
Any delay in the relocation of the roads, overhead power lines and water canals in the East Mine area could pose a scheduling risk. Reasonable time allocations have been made in the LoM schedule for these relocations. Sufficient flexibility exists in the mining plan to reschedule activities to maintain the planned build-up profile.
The planned construction of a dam from the pit void at the end of the economic life of the operation could pose a risk since the required regulatory approval still needs to be obtained.This application is in process and it is reasonable to assume that it will be approved. Detailed waste destination scheduling and design is currently under way.

Coffey Mining (SA) Pty Ltd
Tharisa Mine Page: 198Competent Person’s Report - December 2013
15.5 Geotechnical Engineering
Geotechnical open pit slope and underground bord and pillar designs have been carried out using a probability based design, numerical modelling and dynamic wedge analysis, developed from detailed rock mass and rock material data coupled with structural data collected, which provide for greater certainty in the geotechnical design that is at an acceptable level of confidence for a mine of this size.
Coffey associates a Low Risk with the geotechnical engineering.
15.6 Metallurgy and Processing
The existing spiral and PGM plant equipment is made up of conventional processing units (i.e.crushing, screening, milling, froth flotation and thickening) of mixed vintage and technically has little risk.
During the operation of the spiral plant some knowledge of the orebody was gained. It is important to understand any problem areas and address any weaknesses that may be present. Provided that the RoM head grade does not fall, and the mineralogy of the ore does not deteriorate from a flotation response aspect, then a reasonably efficient operation can be expected. Coffey cannot comment on maintenance aspects of the existing plant.
The risk associated with metallurgy and processing is deemed to be
15.7 Environmental
There are a number of environmental issues material to the future of the Tharisa Mine. Themore significant issues are:
• Potential for ground and surface water contamination and reduction of water resources available to surrounding users;
• Potential for air pollution;
• Blasting and noise disturbance of surrounding land users;
• Soil and biodiversity management;
• Traffic impacts;
• Disturbance of archaeological resources;
• Rehabilitation and closure planning; and
• On going permitting.
The outcome of the EIA/EMP process determined that all potential impacts of the mine can be managed to a satisfactory level, provided that the management measures detailed in the EIA/EMP report are adhered to.

Coffey Mining (SA) Pty Ltd
Tharisa Mine Page: 199Competent Person’s Report - December 2013
Coffey is of the opinion that a is associated with the environmental issuesbased on the managed scenario which assumes successful implementation of the EMP commitments.
15.8 Manpower and Management
The mining industry does not have a wealth of experienced workers immediately available.The suitable individuals will need to be identified and recruited and where there are skills or experience gaps, suitable training programmes implemented to provide the necessary skilling.
Coffey considers that there is in terms of the available skills and experience and of the projected productivity on the mine.
15.9 Infrastructure
Tharisa Minerals has obtained commitments to water and power that are suitable for the operation of the mine. According to their water consultant, there is enough water to take the mine up to 400,000tpm and maintain it at steady state production. Tharisa Minerals is finalising the arrangements with Eskom for provision of power to their final requirements but has the commitment from Eskom so that there is sufficient power for the steady production for the LoM.
Coffey associates a rating for the infrastructure aspects as there is a concern that there will be insufficient power on the national grid.

Coffey Mining (SA) Pty Ltd
Tharisa Mine Page: 200Competent Person’s Report - December 2013
15.10 Risk Summary
Based on the sections above, a summary of the perceived risks to the Tharisa Mine are presented in Table 15.10_1.
Table 15.10_1Tharisa Mine Technical Risk Summary
Item Relative RiskGeology and Mineral Resources LowMining Engineering and Mineral Reserves Low to MediumGeotechnical Engineering MediumMetallurgy and Processing MediumEnvironmental MediumManpower and Management MediumInfrastructure Medium
Based on the above risk summary, Coffey considers the Tharisa Mine to have an overall.

Coffey Mining (SA) Pty Ltd
Tharisa Mine Page: 201Competent Person’s Report - December 2013
16 GLOSSARY OF DEFINITIONS AND TECHNICAL TERMS
Term Description
Au Chemical symbol for Gold
Ir Chemical symbol for Iridium
Os Chemical symbol for Osmium
Pd Chemical symbol for Palladium
Pt Chemical symbol for Platinum
Rh Chemical symbol for Rhodium
Ru Chemical symbol for Ruthenium
3PGE+Au Pt, Pd, Rh and Au
4E Pt, Pd, Rh and Au
5PGE+Au Pt, Pd, Rh, Ru, Ir and Au
6PGE+Au Pt, Pd, Rh, Ru, Ir, Os and Au
7E Pt, Pd, Rh, Ru, Ir, Os and Au
aeromagnetic survey A geophysical survey method to measure the strength of the earth magnetic field using a magnetometer aboard or towed behind an aircraft.
AIDS Acquired immune deficiency syndrome or acquired immunodeficiency syndrome (AIDS) is a disease of the human immune system caused by the human immunodeficiency virus (HIV)
anorthosite A rock comprised of largely feldspar minerals and minor mafic iron-magnesium minerals
Arxo Arxo Logistics (Pty) Ltd, a company registered and incorporated in South Africa. Arxo is the appointed logistics contractor for the Tharisa Mine.
Bushveld ComplexA major intrusive igneous body in the northern part of South Africa, that has undergone remarkable magmatic differentiation. It is by far the largest layered intrusion known. The Bushveld Complex is a leading source of chromium and PGMs.
chromitite A rock composed essentially of chromite, that typically occurs as layers or irregular masses exclusively associated with magmatic complexes. The bulk of the world’s exploitable chromitite occurs almost exclusively in layered complexes.
chromitite layers Thick accumulations of chromite grains to form almost monomineralic bands or layers. Chromitite Layers are typically greater than 30cm thick..
chromium The element chromium (Cr) is classified as a metal and is situated between other metals such as vanadium (V), manganese (Mn) and molybdenum (Mo) in the Periodic Chart of Elements.
chromite a hard, black, refractory chromium-spinel mineral consisting of varying proportions of the oxides of iron chromium, aluminium and magnesium.
Chrome mass yield Chrome mass yield is calculated by dividing the chrome concentrate tonnes by the total feed tonnes and expressed as a percentage
Coffey Coffey Mining SA (Pty) Ltd, a company registered and incorporated in South Africa.
Competent Person’s Report
A Competent Person’s Report (CPR) is a Techno-Economic Report. It represents the opinions on a deposit of a registered professional, independent of the client and its subsidiaries. By reason of his/her education, professional associations and past relevant work experience, the person is deemed as qualified to form an opinion of the deposit.
composite A weighted accumulation of the intersection value to a specific length or over a specific stratigraphic unit
CPI Consumer Price Index
CPR Competent Person’s Report
Critical ZoneA stratigraphic zone within the Bushveld Complex where a wide variety of different igneous rock types occur which host the bulk of the significant PGM and chrome mineralization i.e.Merensky Reef and UG2 Chromitite Layer.
DME Department of Minerals and Energy – in 2009 the DME was split into the Department of Mineral Resources (DMR) and the Department of Energy (DoE)
DMR Department of Mineral Resources
SRT10A(ii)

Coffey Mining (SA) Pty Ltd
Tharisa Mine Page: 202Competent Person’s Report - December 2013
Term Description
DTM Digital Terrain Model
dyke A wall-like body of igneous rock that is intruded (usually vertically) into the surrounding rock in such a way that it cuts across the stratification (layering) of this rock.
DWA Department of Water Affairs
Eskom South African electrical utility company
fault A fractured surface in the earth’s crust along which rocks have moved relative to each other.
Feasibility StudyThe original feasibility study conducted by Coffey on the Tharisa Mine, which was concluded in October 2008
EIA Environmental Impact Assessment
EMP Environmental Management Programme
EPCM Engineering, Procurement and Construction Management
FOB Free on board
GATT General Agreement on Tariffs and Trade
GDP Gross Domestic Product
geostatistics A branch of statistics focusing on the understanding of spatial data
GPS Global Positioning system
HDSA Historically Disadvantaged South Africans
highwall The unexcavated face of exposed overburden of an opencast mine
HIV Human immunodeficiency virus
IAPs Interested and Affected Parties
ICP Fusion D/OES Analytical technique to measure the concentration of trace elements
Indicated Mineral Resource (SAMREC)
An ‘Indicated Mineral Resource’ is that part of a Mineral Resource for which tonnage, densities, shape, physical characteristics, grade and mineral content can be estimated with a reasonable level of confidence. It is based on information from exploration, sampling and testing of material gathered from locations such as outcrops, trenches, pits, workings and drill holes. The locations are too widely or inappropriately spaced to confirm geological or grade continuity but are spaced closely enough for continuity to be assumed.
Inferred Mineral Resource (SAMREC)
An ‘Inferred Mineral Resource’ is that part of a Mineral Resource for which volume or tonnage, grade and mineral content can be estimated with only a low level of confidence. It is inferredfrom geological evidence and sampling and assumed but not verified geologically or through analysis of grade continuity. It is based on information gathered through appropriate techniques from locations such as outcrops, trenches, pits, workings and drill holes that may be limited in scope or of uncertain quality and reliability.
IRUP
Iron-Rich Ultramafic Pegmatite – a type of rock which typically intruded into the Rustenburg Layered Suite of the Bushveld Complex, generally after the main mineralized layers were formed. IRUPs can replace the normal stratigraphic sequence over extensive areas, and can have a greater or lesser effect on the mineralized layers. They occur as pipes, dykes and sheets.
JSE JSE Stock Exchange South Africa. JSE Limited, a licensed exchange under the Securities Services Act, 2004
Kafferskraal 342JQ The farm Kafferskraal 342, registration division JQ, located in the Bojanala Municipal District in the North West Province, South Africa.
LG Chromitite Layer Lower Group Chromitite Layer
Lower Zone Stratigraphic unit of the Bushveld Complex
mafic pegmatites a suite of coarse-grained rocks that form discordant bodies within the layered sequence of the Bushveld Complex.
mamsl metres above mean sea level
MCC MCC Contracts (Pty) Ltd, a company registered and incorporated in South Africa. MCC is the appointed open pit mining contractor at the Tharisa Mine.
MDM Engineering MDM Engineering (Pty) Ltd, a company registered and incorporated in South Africa. MDM is the appointed engineering contractor responsible for the construction of the new 300,000 tonne

Coffey Mining (SA) Pty Ltd
Tharisa Mine Page: 203Competent Person’s Report - December 2013
Term Descriptionper month concentrator at the Tharisa Mine.
Measured Mineral Resource (SAMREC)
A ‘Measured Mineral Resource’ is that part of a Mineral Resource for which tonnage, densities, shape, physical characteristics, grade and mineral content can be estimated with a high level of confidence. It is based on detailed and reliable information from exploration, sampling and testing of material from locations such as outcrops, trenches, pits, workings and drill holes. Thelocations are spaced closely enough to confirm geological and grade continuity.
Metago Metago Environmental Engineers (Pty) Ltd (now trading as SLR Consulting (Africa) (Proprietary) Limited), a company registered and incorporated in South Africa.
Merensky ReefA pyroxenitic tabular layer or band within the Bushveld Complex containing economic concentrations of PGMs. The Merensky Reef is one of the principle PGM ore bodies within the Bushveld Complex and is mined extensively.
MG Middle Group with reference to MG Chromitite Layers
MG Chromitite Layers Group of five chromitite layers that are known in the lower and upper Critical Zone of the Bushveld Complex
MG0 Chromitite Layer Specific chromitite layer contained within the MG Chromitite Layer package
MG1 Chromitite Layer Specific chromitite layer contained within the MG Chromitite Layer package
MG2 Chromitite Layer Specific chromitite layer contained within the MG Chromitite Layer package
MG3 Chromitite Layer Specific chromitite layer contained within the MG Chromitite Layer package
MG4 Chromitite Layer Specific chromitite layer contained within the MG Chromitite Layer package
MG4A Chromitite Layer Specific chromitite layer contained within the MG Chromitite Layer package
MHSA Mine Health and Safety Act, Act 29 of 1996
Mineral Reserve (SAMREC)
A ‘Mineral Reserve’ is the economically mineable material derived from a Measured or Indicated Mineral Resource or both. It includes diluting and contaminating materials and allows for losses that are expected to occur when the material is mined. Appropriate assessments to a minimum of a Pre-Feasibility Study for a project and a Life of Mine Plan for an operation must have been completed, including consideration of, and modification by, realistically assumed mining, metallurgical, economic, marketing, legal, environmental, social and governmental factors (the modifying factors). Such modifying factors must be disclosed.
Mineral Resources (SAMREC)
A ‘Mineral Resource’ is a concentration or occurrence of material of economic interest in or on the earth’s crust in such form, quality and quantity that there are reasonable and realistic prospects for eventual economic extraction. The location, quantity, grade, continuity and other geological characteristics of a Mineral Resource are known, or estimated from specific geological evidence, sampling and knowledge interpreted from an appropriately constrained and portrayed geological model. Mineral Resources are subdivided, and must be so reported, in order of increasing confidence in respect of geoscientific evidence, into Inferred, Indicated or Measured categories
Mining RightA mining right is the permission granted by the State through the Department of Mineral Resources which gives you the authority to mine minerals within a certain area. A mining right may not exceed a period of 30 years.
MPRDA The Mineral and Petroleum Resources Development Act 28 of 2002 of South Africa
MRMR mining rock mass rating system
Mt million tonnes
MVA megavolt – ampere – a measure of required electrical power
NiS/MS Specialist analytical technique used to determine the concentration of PGMs
noriteA coarse-grained, basic igneous rock consisting of essential plagioclase feldspar, orthopyroxene (hypersthene or bronzite), and clinopyroxene (augite), often with accessory ilmenite.
oz fine ounce or troy ounce (31.1035g), used as a measure for the mass of precious metals
PGM Platinum Group Metals, being platinum, palladium, rhodium, ruthenium, iridium, osmium, and, for the purposes of this report and in accordance with industry practice, gold.
pillar Natural underground support system using unmined parts of the ore body
potholes A geological feature frequently occurring in the Bushveld Complex in which one layer of the Bushveld Complex transgresses its footwall and forms a basin-shaped depression.

Coffey Mining (SA) Pty Ltd
Tharisa Mine Page: 204Competent Person’s Report - December 2013
Term Description
Pr.Sci.Nat.Professional Natural Scientist in accordance with the rules of the South African Council for Natural Scientific Professionals which identifies him/her as a highly skilled professional with technical knowledge and competence.
Probable Mineral Reserve (SAMREC)
A ‘Probable Mineral Reserve’ is the economically mineable material derived from a Measured or Indicated Mineral Resource or both. It is estimated with a lower level of confidence than a Proved Mineral Reserve. It includes diluting and contaminating materials and allows for losses that are expected to occur when the material is mined. Appropriate assessments to a minimum of a Pre-Feasibility Study for a project or a Life of Mine Plan for an operation must have been carried out, including consideration of, and modification by, realistically assumed mining, metallurgical, economic, marketing, legal, environmental, social and governmental factors. Such modifying factors must be disclosed.
Prospecting Right A prospecting right is a permit which allows a company or an individual to survey or investigate an area of land for the purpose of identifying an actual or probable mineral deposit.
Proved Mineral Reserve (SAMREC)
A ‘Proved Mineral Reserve’ is the economically mineable material derived from a Measured Mineral Resource. It is estimated with a high level of confidence. It includes diluting and contaminating materials and allows for losses that are expected to occur when the material is mined. Appropriate assessments to a minimum of a Pre-Feasibility Study for a project or a Life of Mine Plan for an operation must have been carried out, including consideration of, and modification by, realistically assumed mining, metallurgical, economic, marketing, legal, environmental, social and governmental factors. Such modifying factors must be disclosed.
Pyroxeniterefers to a relatively uncommon dark-coloured rock consisting chiefly of pyroxene; pyroxene is
a type of rock containing sodium, calcium, magnesium, iron, titanium and 204luminium combined with oxygen.
QA/QC programme A programme of testing, used particularly for assays, to assist to confirm that the data used in a mineral resource estimation is reliable and comparable
RMR The rock mass rating (RMR) system is a geomechanical classification system for rocks, developed by Z. T. Bieniawski between 1972 and 1973.[1]
RoM Run of Mine
Rooikoppies 297JQ The farm Rooikoppies 297, registration division JQ, located in the Bojanala Municipal District in the North West Province, South Africa.
Royalty Act Mineral and Petroleum Resources Royalty Act, Act 28 of 2008.
RQD Rock quality designation which is a description using geotechnical engineering principles which that determines the quality of rock that was recovered when taking a core sample.
SAG mill Semi autogenous grinding mill
SAMRECThe South African Code for the Reporting of Exploration Results, Mineral Resources And Mineral Reserves (The SAMREC Code) (2007 Edition as amended July 2009) (prepared by The South African Mineral Resource Committee (SAMREC) Working Group)
Sponsor Macquarie Capital Securities Limited
tailings that portion of the ore from which most of the valuable material has been removed by concentration and which is therefore low in value and rejected.
Tharisa Tharisa plc formerly Tharisa Limited, a company registered and incorporated in the Republic of Cyprus.
Tharisa MineThe existing chrome and PGM mine and processing operations, owned by Tharisa Minerals, located in the Bushveld Complex, which is situated in the Magisterial District of Rustenburg, North West Province, South Africa
Tharisa Minerals Tharisa Minerals (Pty) Ltd, a company registered and incorporated in the Republic of South Africa, the developer and operator of the Tharisa Mine, held 74% by Tharisa.
The Company Tharisa plc, formerly Tharisa Limited, a company registered and incorporated in the Republic of Cyprus.
tpa tonnes per annum
tph tonnes per hour
tpm tonnes per month
TSF Tailings Storage Facility
UCS Uniaxial Compressive strength

Coffey Mining (SA) Pty Ltd
Tharisa Mine Page: 205Competent Person’s Report - December 2013
Term Description
UG2 Chromitite Layer Upper Group 2 Chromitite Layer of the Bushveld Complex that is well known and typically contains PGMs in a concentration that is sufficient for economic extraction
Uniaxial Compressive Strength Measure of the capacity of a material to withstand pushing forces
Ukwazi Ukwazi Mining Solutions (Pty) Ltd, a company registered and incorporated in South Africa.Ukwazi is the appointed mine design and scheduling contractor at the Tharisa Mine.
US$ United States Dollar (currency)
variogram The variogram is the key mathematical and graphical function in geostatistics as it is used to describe or fit a model of the spatial correlation of the observed phenomenon.
VAT Value added tax
WTO World Trade Organisation
ZAR South African Rand (currency)

Coffey Mining (SA) Pty Ltd
Tharisa Mine Page: 206Competent Person’s Report - December 2013
17 REFERENCES
Bieniawski Z. T. (1976). Rock mass classifications in rock engineering. Proc. Symp. on Exploration forRock Engineering. Johannesburg. ed. Bieniawski. publ. Balkema, Rotterdam. pp. 97 - 106.
Bolton R, Stobart B (October 2010).Environmental Management Programme Report Performance Assessment: Tharisa Mine. Metago Project Number: T014-16. Report No. 1Prepared For Tharisa Minerals (Pty) Ltd
Cilliers L and Bosman JD. (2013). Geotechnical Design For Tharisa Minerals (Pty) Ltd, Open House Management Solutions (Pty) Ltd (OHMS).
Haines A. and Terbrugge P.J. (1991). Preliminary estimation of rock slope stability using rock mass classification systems. Proc. 7th Cong. on Rock Mechanics. ISRM. Aachen, Germany. 2, ed. Wittke W. publ. Balkema, Rotterdam. pp. 887-892.
James JV. (2008). Tharisa minerals: - feasibility study, Geotechnical investigation and design, March 2008.
James JV. (2008 Geotechnical Report,Tharisa Open Cast Mine, Revised For A 200m Deep Open Cast Mine. August 2008
James JV and James KE.(2008). Tharisa Geotechnical Database spreadsheets
Kahn R (June 2008). Testwork on Shallow MG1 and MG4A reef intersections – Variability Study.
Kojovic T. (April 2011). Tharisa Design Review, Simulations for Tharisa Chrome Mill (SimSAGe).
Lameck NS (May 2011). Bench Scale Comminution Testwork Program to Generate Data for the Design of the Tharisa Chrome and Platinum Recovery Plant: Phase 1 (Mintek).
Lomberg K, Bornman H, Bainbridge F, Tukker H ( 17 September 2010). Tharisa Project, South Africa: Feasibility Study Update. Prepared by Coffey Mining (SA) (Pty) Ltd on behalf of Tharisa Minerals (Proprietary) Limited
Lomberg K, McKinney M, Malan I (31 August 2008). Tharisa Project. Exploration, Drilling, Database Development, Geological Modelling and Grade Estimation. Prepared by Coffey Mining on behalf of Tharisa Minerals (Pty) Ltd
Lotheringen JJ, Chitake A, Nyan J, Pretorious O (Sept 2012). Tharisa Chrome Mine.Technical support documentation on the Long Term Plan as basis of the December 2013Reserve estimate.
SRT1.3A(ii) SVT2.11

Coffey Mining (SA) Pty Ltd
Tharisa Mine Page: 207Competent Person’s Report - December 2013
Makhalemele N. (August 2008). Tharisa Minerals Bench Scale Comminution Testwork (Mintek).
MDM Design calculations
MDM Process Design Assumptions
Mudau M, Lomberg KG (August 2012). UG1 Chromitite Layer Mineral Resource Estimate.Prepared by Coffey Mining (SA) (Pty) Ltd on behalf of Tharisa Minerals (Proprietary) Limited
Sweet J. (April 2011). Memorandum presenting results of simulations conducted using JKSimMet to evaluate comminution circuit performance (MP Tech).
The South African Code for the Reporting of Exploration Results, Mineral Resources and Mineral Reserves (The SAMREC Code) (2007 Edition as Amended July 2009) (prepared by The South African Mineral Resource Committee (SAMREC) Working Group)
Site information and reports – existing operation
Stobart,B, Baloyi,N, Pheiffer A. (June 2008): Environmental Impact Assessment and Environmental Management Programme for the Proposed Platinum Group Metals Mine by Tharisa. Prepared by Metago Environmental Engineers (Pty) Ltd for Tharisa Minerals (Pty) Ltd.
Van Heerden F, James A, Van Niekerk S (June 2008): Waste, Surface Water and Closure Cost Report for the Proposed Platinum Group Metals Mine by Tharisa. Prepared by Metago Environmental Engineers (Pty) Ltd for Tharisa Minerals (Pty) Ltd.
Van Zyl S. (April 2010). PGM Scavenger Flotation Testwork on Tailings from Tharisa’s EarlyRevenue Chrome Plant (Mintek).
Vendor supplied information
Vorster F (January 2008). Variability Study on Chromite Bearing Middle Group Ore MG1 Phase 2 (Mintek).
Vorster F (January 2008). Variability Study on Chromite Bearing Middle Group Ore MG2-MG4 Phase 2 (Mintek).

Coffey Mining (SA) Pty Ltd
Tharisa Mine Page: 208Competent Person’s Report - December 2013
18 DATE AND SIGNATURE PAGE
This report titled Independent Competent Person’s Report entitled ”Tharisa Chrome and PGM Mine, South Africa Competent Person’s Report” with an effective date of 31 December 2013was prepared on behalf of Tharisa plc by Kenneth Lomberg, who takes overall responsibility for this report.
I have some 28 years experience in the minerals industry (especially platinum and gold). I havebeen involved in exploration and mine geology and have had the privilege of assisting in bringing a mine to full production. My expertise is especially in project management, mineral reserve and resource estimation.
I have undertaken mineral resource and reserve estimations and reviews for platinum, gold, copper, uranium and fluorite projects. I have assisted with the reviews or estimation of diamond and coal projects and assisted or compiled Competent Persons Reports/NI 43-101 for various projects that have been listed on the TSX, JSE and AIM stock exchanges
I am also Chairman of the SAMREC Working Group which is responsible for the SAMREC Code and I represent SAMREC on the CRIRSCO Executive.
I have practiced my profession continuously since 1985. I have over 5 years of relevant experience having completed mineral resource estimations on various properties located on the Bushveld Complex hosting Magmatic Layered Intrusive style mineralization.
I consider the Executive Summary to be a true reflection of this Competent Persons Report.
Dated at Johannesburg, this 31 December 2013
Mr Kenneth LombergSenior PrincipalB.Sc. (Hons) Geology, B.Com., M.Eng. (Pr.Sci.Nat. Membership No (400038/1)) 604 Kudu Avenue, Allens Nek,Roodepoort, Gauteng
12.9(a) 12.9(h)(xi) SRT1.1(ii) SRT11A(i) SVT2.9

Coffey Mining (SA) Pty Ltd
Tharisa Mine Page: 209Competent Person’s Report - December 2013
The Competent Valuator for the purposes of this report is Johannes Jurgens Bornman. He is a registered Professional Engineer (Pr.Eng.) in terms of the Engineering Profession Act, 46 of 2000 (:the EPA") and is a “Competent Valuator” as defined in the SAMVAL Code 2008 as amended July 2009. He is also a Fellow of the SAIMM. He has 30 years’ experience in hard and soft rock mining with more than 9 years experience in the valuation of platinum, chrome, gold, copper, coal, diamond, bauxite and uranium mines.
All the facts presented in this report are correct to the best knowledge of the Competent Valuator. This is a forward looking document and the analyses and conclusions are limited only by the reported forecasts and conditions. Neither Coffey, nor the Competent Valuator, has any material interest in Tharisa Mine, its Parent Companies, subsidiaries or projects. The work, and any other work done by the Competent Valuator for Tharisa, is strictly in return for professional fees. Payment for the work is not in any way dependent on the outcome of the work or on the success or otherwise of Tharisa’s own business dealings. As such there is no conflict of interest in the Competent Valuator undertaking the independent mine valuation as contained in this document.
Johannes Jurgens Bornman is a full-time employee of Coffey and has sufficient experience which is relevant to the style of mineralization and type of mining under consideration and to the valuation which he is undertaking to qualify as a Competent Valuator as defined in the South African Code for the Reporting of Mineral Asset Valuation (The SAMVAL Code) of 2008 as amended July 2009. Hannes Bornman has visited the property under valuation and consents to the inclusion in the report of the matters based on his information in the form and context in which it appears.
I consider the Executive Summary to be a true reflection of this Competent Valuator’s Report.
Dated at Johannesburg, this 31 December 2013.
________________________________________________________
Mr Johannes Jurgens Bornman
Principal Mining EngineerB.Eng., MBA(Pr.Eng. Membership No 20090201)604 Kudu Avenue, Allens Nek,Roodepoort, Gauteng
SVT2.14

Tharisa Mine Page: 210Competent Person’s Report - December 2013
Appendix AChecklist for JSE Listing Requirements, SAMREC and SAMVAL Codes
12.4(c)

Tharisa Mine Page: 211Competent Person’s Report - December 2013
TABLE REFERNCE ASSESSMENT CRITERIAREPORT SECTION
12.4 (c) This must be accompanied by a compliance checklist, cross referencing every paragraph in this section, together with the applicable sections in the SAMREC and SAMVAL codes to the relevant part of the Competent Person’s Report.
Appendix A
12.8 In addition to the relevant Listings Requirements applicable to pre-listing statements/listings particulars/prospectuses (as per Section 6) or Category 1 circulars (as per Section 9), the following information must be included in such documents where they are required to be prepared by Mineral Companies, and by non-Mineral Companies in respect of substantial mineral assets:
Noted
12.8 (a) a Competent Person’s Report, complying with:
(i) the SAMREC and SAMVAL Codes, (which, for purposes of this requirement, includes the guidelines in italics and Table 1 of the SAMREC and SAMVAL Codes); and
Summary, 1.1, 2
(ii) paragraph 12.9 of this section; Summary
12.8 (b) details of any direct or indirect beneficial interest, which each director (and his associates), Competent Person, Competent Valuator and, where applicable, related party (as defined in Section 10), has or, within two years of the date of the pre-listing statement, had:
Summary,1
(i) in any asset (including any right to explore for minerals): Summary,1.5,
(1) of the applicant issuer;
(2) which has been acquired or disposed of by, or leased to or by, the applicant issuer, including any interest in the consideration passing to or from the applicant issuer; and
(ii) in the share capital of the applicant issuer;
12.8 (c) financial information in terms of Section 8 of the Listing Requirements to the extent that theapplicant issuer has a financial history;
N/A
12.8 (d) a statement by the directors regarding any legal proceedings that may have an influence on the rights to explore or mine, or an appropriate negative statement; and
1.6
12.8 (e) confirmation that the applicant issuer, or its group (including companies in which it has investments), is in possession of the necessary legal title or ownership rights to explore, mine or explore and mine the relevant minerals.
3.6
Competent Person’s Report12.9 A Competent Person’s Report must comply with the SAMREC and SAMVAL Codes and
must:Title Page, Summary,1.1
12.9(a) have an effective date (being the date at which the contents of the Competent Person’s Report are valid) less than six months prior to the date of publication of the pre-listing statement, listing particulars, prospectus or Category 1 circular;
Title Page, 18
12.9(b) be updated prior to publication of the pre-listing statement, listing particulars, prospectus or Category 1 circular if further material data becomes available after the effective date;
Noted
12.9(c) if the Competent Person is not independent of the issuer, clearly disclose the nature of the relationship or interest;
Summary,1.3, 1.5
12.9(d) show the particular paragraph of this section, the SAMREC Code (including Table 1) and SAMVAL Code complied with in the margin of Competent Person’s Report;
Noted
12.9(e) contain a paragraph stating that all requirements of this section, the SAMREC Code (including Table 1) and SAMVAL Code have been complied with, or state that certain clauses were not applicable and provide a list of such clauses; and include a statement detailing:
Summary, 1
(i) exploration expenditure incurred to date by the applicant issuer and by other parties, where available;
N/A

Tharisa Mine Page: 212Competent Person’s Report - December 2013
(ii) planned exploration expenditure that has been committed, but not yet incurred, by the applicant issuer concerned; and
N/A
(iii) planned exploration expenditure that has not been committed to by the applicant issuer but which is expected to be incurred sometime in the future, in sufficient detail to fairly present future expectations;
N/A
12.9(f) contain a valuation section which must be completed and signed off by a Competent Valuator in terms of and in compliance with the SAMVAL Code;
14
12.9(g) be published in full on the applicant issuer’s website; Noted
12.9(h) be included in the relevant JSE document either in full or as an executive summary. The executive summary must be approved by the JSE (after approval by the Readers Panel) at the same time as the Competent Person’s Report is approved by the JSE and the Readers Panel. The executive summary should be a concise summary of the Competent Person’s Report and must cover, at a minimum, where applicable:
(i) purpose; Summary
(ii) project outline; Summary
(iii) location map indicating area of interest; Summary
(iv) legal aspects and tenure, including any disputes, risks or impediments; Summary
(v) geological setting description; Summary
(vi) exploration programme and budget; N/A
(vii) brief description of individual key modifying factors; Summary
(viii) brief description of key environmental issues; Summary
(ix) Mineral Resource and Mineral Reserve Statement; Summary
(x) reference to risk paragraph in the full Competent Person’s Report; Summary
(xi) statement by the Competent Person that the summary is a true reflection of the full Competent Person’s Report; and
18
(xii) summary valuation table. Where the cash flow approach has been employed, the valuation summary must include the discount rate(s) applied to calculate the NPV(s) (net present value(s)) per share with reference to the specific paragraph in the Competent Person’s Report. If inferred resources are used, show the summary valuation with and without inclusion of such inferred resources.
Summary

Tharisa Mine Page: 213Competent Person’s Report - December 2013
ASSESSMENT CRITERIA REPORT SECTION
:
(i) The report should have a title page and a table of contents that includes figures and tables.
Table of Contents, List of Tables, List of Figures
(ii) State for whom the report was prepared, whether it was intended as a full or partial evaluation or other purpose, what work was conducted, effective date of report, and what work remains to be done.
Title Page, 1.1
(iii) The Competent Person should state whether the document is SAMREC compliant. If a reporting code other than SAMREC has been used, the Competent Person should include an explanation of the differences.
1.3, 18
See 1.1 A (i) to (iii).
See 1.1 A (i) to (iii).
:
(i) Give a brief description of the scope of project (i.e. whether in preliminary sampling,advanced exploration, conceptual, pre-feasibility, or feasibility phase, Life of Mine plan for an ongoing mining operation or closure). This should include a description of the geological setting, deposit type, commodity, area of project, back-ground, andbusiness arrangement.
Summary, 3.1, 4, 6, 8
See 1.2 A.
6, 7(i) Brief description of mining, processing and other key technical factors.
See 1.2 A.
9, 10, 11(i) Brief description of mining, processing and other key technical factors.
:
(i) State historical background to the project and adjacent areas concerned, including known results of previous exploration and mining activities (type, amount, quantity and development work), previous ownership and changes thereto.
5
(ii) Reference all information used from other sources. 17
See 1.3 A (i) and (ii).
5.3, 5.5
(i) Discuss known or existing historical Mineral Resource estimates and performance statistics to actual production for past and current operations, including the reliability of these and how they relate to the SAMREC Code.
(ii) Previous successes or failures should be referred to transparently with reasons why the project should now be considered potentially economic. 5.5
See 1.3 B.
5.3, 5.5
(i) Discuss known or existing historical Mineral Reserve estimates and performance statistics to actual production for past and current operations, including the reliability of these and how they relate to the SAMREC Code.
:

Tharisa Mine Page: 214Competent Person’s Report - December 2013
ASSESSMENT CRITERIA REPORT SECTIONi) Include and reference a location or index map and more detailed maps showing all
important features described in the text, including all relevant cadastral and other infrastructure features. If adjacent or nearby properties have an important bearing on the report, then their location and common mineralized structures should be included on the maps. Reference all information used from other sources. All maps, plans and sections noted in this checklist should be legible and include a legend, coordinates, system of coordinates, scale bar and north arrow.
3.1, 3.6, 6, 7
(ii) Diagrams or illustrations should be legible, annotated and summarized. All Sections
See 1.4 (i) and (ii).
See 1.4 (i) and (ii).
(i) Description of location (country, province, and closest town/city, coordinate systems and ranges, etc.). Summary, 3.6 4
(ii) In respect of each property, diagrams, maps and plans should be supplied demonstrating the location of prospecting/mining rights, any historical and current workings, any exploration, and all principal geological features.
See 1.5 A (i) and (ii).
See 1.5 A (i) and (ii).
ASSESSMENT CRITERION: T 1.6 Topography and climate
(i) All relevant issues relating to the mineral project should be stated, such as the topography and climate, noting any conditions that may affect possible mining activities.
4, 4.3, 4.8
(ii) A general topo-cadastral map should be available to support the above statement. 4.2, 4.8
See 1.6 A (i) and (ii).
4.3, 4.8
(i) Topo-cadastral map in sufficient detail to support the assessment of eventual economics. Known associated climatic risks should be stated.
(i) Detailed topo-cadastral map. Where applicable aerial surveys should be checked with ground controls and surveys, particularly in areas of rugged terrain, dense vegetation or high altitude. 4.3, 4.8
:
The legal tenure should be verified to the satisfaction of the Competent Person, including a description of:(i) The nature of the issuer’s rights (e.g. prospecting and/or mining) and the right to use
the surface of the properties to which these rights relate; 3.6
(ii) The principal terms and conditions of all existing agreements, and details of those still to be obtained, (such as, but not limited to, concessions, partnerships, joint ventures, access rights, leases, historical and cultural sites, wilderness or national park and environmental settings, royalties, consents, permission, permits or authorizations)
3.8
(iii) The security of the tenure held at the time of reporting or that is reasonably expected to be granted in the future along with any known impediments to obtaining the right to operate in the area; and
3.6

Tharisa Mine Page: 215Competent Person’s Report - December 2013
ASSESSMENT CRITERIA REPORT SECTION(iv) A statement of any legal proceedings that may have an influence on the rights to
prospect or mine for minerals, or an appropriate negative statement. 1.6
See 1.7 A
See 1.7 A
:
(i) Identify and comment on the primary data elements (observation and measurements) used for the project and describe the management of these data or the database.This should describe the following relevant processes: acquisition (capture or transfer), validation, integration, control, storage, retrieval and backup processes.Final verification of data, including QA/ QC processes should also be part of the database. It is assumed that data are stored digitally but hand-printed tables with well organized data and information may also constitute a database.
7, 8
See 2.1 A (i).
8
(i) Identify and comment on interpreted data elements derived from primary data (modelled or analyzed) and used for the project, and describe the management of these data or the database.
See 2.1 B.
9
(i) Identify and comment on interpreted and planned data elements derived from modelled data and used for the project plans, and describe the management of these data or the database
:
(i) Describe the survey methods, techniques and expected accuracies of spatial data. 7 (ii) Representative models and/or maps and cross sections or other two or three
dimensional illustrations of results should exist, showing location of samples, accurate drill-hole collar positions, down-hole surveys, exploration pits, underground workings, relevant geological data, etc
7.3
See 2.2 A (i) and (ii).
See 2.2 A (i) and (ii).
:
(i) Describe the data acquisition or exploration techniques and the nature, level of detail, and confidence in the geological data used (i.e. stratigraphy, lithology, structure, alteration, mineralization, hydrology, geophysical, geochemical, petrography, mineralogy, geochronology, etc.).
7, 7.4, 7.5, 7.6, 7.7
(ii) Acknowledge and appraise data from other parties and reference all data and information used from other sources. 7.4
See 2.3 A (i) and (ii).
7, 7.5, 7.6, 7.7(i) Discuss geological data that could materially influence the estimated quantity and
quality of the Mineral Resource.

Tharisa Mine Page: 216Competent Person’s Report - December 2013
ASSESSMENT CRITERIA REPORT SECTIONSee 2.3 B
7, 7.5, 7.6, 7.7(i) Discuss geological data that could materially influence the estimated quantity and
quality of the Mineral Reserve.
:
(i) If target tonnage ranges are reported then the preliminary estimates or basis of assumptions made for bulk density or specific gravity(s) must be stated. 7.6.5
(ii) Specific gravity samples must be representative of the material for which a grade range is reported. 7.6.5
See 2.4 A (i) and (ii).
7.6.5
(i) Describe the method of bulk-density / specific-gravity determination with reference to the frequency of measurements, the size, nature and representativeness of the samples.
(ii) The bulk density for bulk material must have been measured by methods that adequately account for void spaces (vugs, porosity etc.), moisture and differences between rock and alteration zones within the deposit.
7.6.5
(iii) Discuss assumptions for bulk density estimates used in the evaluation process of the different materials 7.6.5
See 2.4 B (i) to (iii).
7.6.5, 10(i) Include bulk densities for materials mined additional to the Mineral Resource to the
same order of accuracy (such as waste, stripping and dilution material).
:
(i) All relevant general data should be discussed with reference to the nature, level of detail and confidence.
All Sections
:
(i) Discuss the governance of the sampling campaign and process, to ensure quality and representivity of samples and data, such as sample recovery, high grading, selective losses or contamination, core/hole diameter, internal and external QA/QC, and any other factors that may have resulted in or identified sample bias.
7.6, 7.7.1
(ii) State whether sample recoveries have been properly recorded and results assessed.In particular, state whether a relationship exists between sample recovery and grade, and sample bias (e.g. preferential loss/gain of fine/coarse material).
7.6, 7.7.1
:

Tharisa Mine Page: 217Competent Person’s Report - December 2013
ASSESSMENT CRITERIA REPORT SECTION(i) Appropriately describe each data set (e.g. geology, grade, density, quality, diamond
breakage, geo-metallurgical characteristics etc.), sample type, sample-size selection and collection methods. Data sets should include all relevant metadata, such as unique sample number, sample mass, collection date, spatial location etc.
7.6, 7.7.1
(ii) Demonstrate that adequate field sampling process verification tech-niques (QA/QC) have been applied, e.g. the level of duplicates, blanks, reference material standards, process audits, analysis, etc. If indirect methods of measurement were used (e.g. geophysical methods), these should be described, with attention given to the confidence of interpretation.
7.6, 7.7.1
(iii) If the geometry of the mineralization with respect to the drill-hole angle is known, its nature should be reported. If it is not known and only the downhole lengths are reported, there should be a clear
7.6, 7.7.1
(iv) Describe the validation procedures used to ensure the integrity of the data, e.g. transcription, input or other errors, between its initial collection and its future use for modelling (e.g. geology, grade, density, etc.)
7.6, 7.7.1
(v) Describe retention policy and storage of physical samples (e.g. core, sample reject, etc.) 7.6, 7.7.1
(vi) Describe the audit process and frequency (including dates of these audits) and disclose any material risks identified. relevant metadata, such as unique sample number, sample mass, collection date, spatial location etc.
7.6, 7.7.1
See 3.2 A (i) to (vI).
7.4, 11.2
(i) Where mineral processing or metallurgical testing analyses have been carried out (bulk-sampling / trial mining), include the results of the testing, details of the testing methods and procedures, and a discussion of whether the samples are representative.
See 3.2 B.
(i) Describe the location and accreditation of the laboratory or facility, summarizing the process and method used for sample preparation, sub-sampling and size reduction, and likelihood of inadequate or nonrepresentative samples (i.e. improper size reduction, contamination, screen sizes, granulometry, mass balance, etc.)
7.6.1, 7.7.2
(ii) For all sample types the nature, quality, verification and appropriateness of the sample-preparation technique should be discussed. 7.6.1, 7.7.2
(iii) If a drill-core sample is taken, state whether it was split or sawn and whether quarter, half or full core was submitted for analysis. If a non-core sample, state whether the sample was riffled, tube sampled, rotary split etc. and whether it was sampled wet or dry.
7.6.1, 7.7.2
(iv) Describe the quality control and quality assurance procedures adopted for all processes, including sub-sampling stages to maximize representivity of samples. This should include whether sample sizes are appropriate to the grain size of the material being sampled.
7.6.1, 7.7.2
(v) Describe the audit process and frequency (including dates of these audits) and disclose any material risks identified
See 3.3 A (i) to (v)
See 3.3 A (i) to (v)
(i) Identify the laboratory(s) and analytical method. Discuss the nature, quality and appropriateness of the assaying and laboratory processes and procedures used and whether the technique is considered partial or total.
7.6.1, 7.7.2

Tharisa Mine Page: 218Competent Person’s Report - December 2013
ASSESSMENT CRITERIA REPORT SECTION(ii) State the accreditation status and Registration Number of the laboratory. Laboratories
should be appropriately accredited. If not, this fact should be disclosed. 7.6.1, 7.6.2, 7.7.2
(iii) Discuss the nature of quality control procedures adopted and quality assurance thereof (e.g. reference material, standards, blanks, duplicates, external / referee laboratory checks) and state whether acceptable levels of accuracy (i.e. lack of bias) and precision have been established.
7.6.1, 7.6.2
(iv) Describe the audit process and frequency (including dates of these audits) and disclose any material risks identified. 7.6.1, 7.7.2, 7.8
See 3.4 A (i) to (iv).
See 3.4 B.
(i) Briefly describe the regional geology. 6 (ii) Describe the geological model, level of investigation (e.g. conceptual, prefeasibility
etc.) and inferences made from this model. 8.3
(iii) Discuss data density, distribution and reliability and whether the quality and quantity of information are sufficient to support statements, made or inferred, concerning the exploration target or deposit.
8.3
(iv) Reliable geological models and/or maps and cross sections that support interpretations should exist.
See 4.1 B (i) to (iv).
8.3
(i) Describe the geological model, construction technique and assumptions. Discuss the sufficiency of data density to assure continuity of mineralization and geology and provide an adequate basis for the estimation and classification procedures applied.
(ii) Describe the thoroughness (precision and accuracy) with which lithological, structural, mineralogical, alteration or other geological, geotechnical and geo-metallurgical characteristics were recorded.
8.3
(iii) Discuss whether consideration was given to alternative interpretations or models and their possible effect (or potential risk) if any, on the Mineral Resource estimate. 8.3
(iv) Discuss geological discounts (e.g. magnitude, per reef, domain, etc.), applied in the model, whether applied to mineralized and/or un-mineralized material (e.g. potholes, faults, dykes, etc).
8.10, 8.12.4
See 4.1 B (i) to (iv).
(i) If an exploration target or deposit is reported, then the estimation techniques used to determine the grade and tonnage ranges should be described in detail. NA
(i) Describe the determination of and estimation techniques applied to volume, density, grade, size distribution, value, geotechnical, geo-hydrological, geometallurgical or other appropriate models (e.g. section, polygon, inverse distance, geo-statistical or other method) should be stated and justified, together with key assumptions and implications thereof, including any adjustments made to data (i.e. compositing, grade cutting / capping), sample spacing, estimation unit size (block size), selective mining units, reconciliation, domaining and maximum distance of extrapolation from data points.
8.9, 8.12
(ii) Describe assumptions and justification of correlations made between variables. 8.9, 8.12

Tharisa Mine Page: 219Competent Person’s Report - December 2013
ASSESSMENT CRITERIA REPORT SECTION(iii) Discuss the block or grid cell size in relation to the average sample spacing and any
assumptions behind modelling of selective mining units (and nonlinear estimation techniques if used).
8.8, 8.9, 8.12
(iv) Any relevant specialized computer program (software) used should be named (with the version number) together with a reference to where all the original files are stored for this specific model.
8.3, 8.9, 8.12
(v) State the processes of checking and validation, the comparison of model information to sample data and use of reconciliation data, and whether the Mineral Resource estimate takes account of such information.
8.9, 8.12
(vi) Describe the assumptions made regarding the estimation of any by-products or deleterious elements. 8.9, 8.12
See 4.2 B (i) to (vi).
(i) A statement should be provided to the effect that such governmental requirements as may be required have been approved. 13.4
See 5.1 A (i).
See 5.1 A (i).
(i) Describe any obvious environmental factors that could have a significant effect on the prospects of any possible exploration target or deposit. 13, 13.3.3
13, 13.3.3(i) The necessary permits have been obtained, or there is reasonable basis to believe
that all permits required for the project can be obtained. 13, 13.3.3
(ii) Describe any environmental factors that could have a material effect on the likelihood of eventual economic extraction. Discuss possible means of mitigation. 13, 13.4
See 5.2 B (i) and (ii).
13, 13.4(iii) A statement should be provided to the effect that all necessary permits have been
approved(iv) Describe future yearly environmental liabilities / compliance methods and costs,
including reclamation and closure and their planned funding. 13
(v) Refer to Environmental Impact Study. 13
(i) A statement should be provided to the effect that mandatory social management programmes, if any, have been approved. 13.8

Tharisa Mine Page: 220Competent Person’s Report - December 2013
ASSESSMENT CRITERIA REPORT SECTION(i) Describe any obvious mining factors that could have a significant effect on the
prospects of any possible exploration target or deposit. NA
See 5.4 A (i). 9 (i) State the level of the techno / economic study – whether conceptual, prefeasibility,
feasibility or ongoing Life of Mine or strategic business plans.(ii) Disclose all assumptions made regarding possible mining methods, minimum mining
dimensions (or pit shell) and internal and, if applicable, external) mining dilution. (iii) It may not always
9
(iii) It may not always be possible to make assumptions regarding mining methods and parameters when estimating Mineral Resources. Where no mining assumptions have been made, this should be explained.
8.8, 8.11.1
See 5.4 B (i) to (iii).
10,10.2(i) State what resource models have been used in the study.
(ii) State and justify all modifying factors and assumptions made regarding mining methods, minimum mining dimensions (or pit shell) and internal and, if applicable, external) mining dilution used for the techno-economic study and signed-off, such as mining method, mine design criteria, infrastructure, capacities, production schedule, mining efficiencies, grade control, geotechnical and hydrological considerations, closure plans, and personnel requirements.
10
(iii) Optimization methods used in planning, list of constraints (practicality, plant, access,exposed reserves, stripped reserves, bottlenecks, draw control). 10
(i) Describe any obvious processing factors that could have a significant effect on the prospects of any possible exploration target or deposit. 11
(i) Discuss the level of study, possible processing methods and any processing factors that could have a material effect on the likelihood of eventual economic extraction. 11
(ii) The basis for assumptions or predictions regarding metallurgical amenability and any preliminary mineralogical test work should already be carried out. 11
(iii) It may not always be possible to make assumptions regarding metallurgical processes and parameters when reporting Mineral Resources. Where no assumptions have been made, this should be explained.
8.11.1, 11
(i) Describe and justify the processing method(s) to be used, equipment, plant capacity, efficiencies, and personnel requirements. 11
(ii) Discuss the nature, amount and representativeness of metallurgical test work undertaken and the recovery factors used. A detailed flow sheet / diagram and a mass balance should exist ,especially for multi-product operations from which the saleable materials are priced for different chemical and physical characteristics.
11
(iii) State what assumptions or allowances have been made for deleterious elements and the existence of any bulk-sample or pilot-scale test work and the degree to which such samples are representative of the ore body as a whole.
11
(iv) The tonnages and grades reported as Mineral Reserves must be in respect of material delivered to the processing facility. 10.2.5

Tharisa Mine Page: 221Competent Person’s Report - December 2013
ASSESSMENT CRITERIA REPORT SECTION
(i) Report in sufficient detail to demonstrate that the necessary facilities have been allowed for (which may include, but not be limited to, processing plant, tailings dam, leaching facilities, waste dumps, road, rail or port facilities, power supply, offices, housing, security, resource sterilization testing etc.). Detailed maps showing locations of facilities should exist. Project milestones and completion dates should be stated.
12
(ii) State assessment of value, ownership, type, extent and condition of plant and equipment that is significant to the existing operation(s). 12
(iii) Statement showing that all necessary logistics have been considered (electricity, reagents, fuels). 12
(i) Not usually reported. If mentioned, however, factors significant to project economics should be current and based on generally accepted industry practice and experience.Assumptions should be clearly defined.
NA
(i) In reporting, a Mineral Resource should meet the minimum requirement of ‘reasonable prospects for eventual economic extraction.’ 8.11.1
(ii) State and define the reasonable and realistic assumptions / parameters (albeit preliminary, e.g. cut-off grade, cut-off screen size, product price or other criteria) used to assess eventual likelihood of economic extraction.
8.11.1
(iii) These assumptions and factors should be reasonably developed and based on generally accepted industry practice and experience. If appropriate, state the level of study.
8.11.1
(iv) If applied, the basis of equivalent metal formulae should be reported. 8.11.1(v) Resource sensitivity – detailed description of method used and results obtained. 8.11.1
(i) For Mineral Reserves, parameters should be detailed with engineering completed to a pre-feasibility study level as defined in the SAMREC code. 10, 14
(ii) State, describe and justify all economic criteria that have been used for the study such as capital and operating costs, exchange rates, revenue / price curves, royalties, cut-off grades, reserve pay limits.
10, 14
(iii) Summary description of method used to estimate the commodity price profiles used for cut-off grade calculation, economic analysis and project valuation, including applicable taxes, inflation indices and exchange rates.
10, 14
(iv) The tonnages and grades reported as Mineral Reserves must be in respect of material delivered to the processing facility. 10, 14
(iv) Demonstrate that the product price assumptions are reasonable and supportable.Justify assumptions made concerning production cost and value of product. Consider transportation, treatment, penalties, exchange rates, marketing and other costs.
10, 14
(v) Allowances should be made for royalties payable, both to Government and private. 10, 14(vi) Resource / Reserve sensitivity – detailed description of method used and results
obtained. 10, 14
(i) Describe the valuable and potentially valuable product(s) including suitability of products to market. 11.2
See 5.8 A (i)
(i) Describe product to be sold. Discuss whether there exists a ready market for the product and whether contracts for the sale of the product are in place or expected to be readily obtained
11.2

Tharisa Mine Page: 222Competent Person’s Report - December 2013
ASSESSMENT CRITERIA REPORT SECTION
(i) Generally not applied NA
(i) Report any risk assessment completed to support the reasonable prospect of eventual economic extraction and disclose any material risks identified. 15
(i) Report a detailed assessment of technical, economic, political and other key risks to the project. Describe actions that will be taken to mitigate and/or manage the identified risks.
15
(i) For exploration targets and deposits, specific quantities and grades / qualities should be reported in ranges, the basis of which should be explained. NA
(i) Describe and justify criteria and methods used as the basis for the classification of the Mineral Resources into varying confidence categories. 8.11.1
(ii) Exceptions to the above should be discussed if they are material, and detailed reports thereof should exist. 8.11.1
(iii) Discuss whether account has been taken of all relevant factors, i.e. relative confidence in tonnage / grade computations, density, quality, value and distribution of primary data and information, confidence in continuity of the geological and mineralization models.
8.11.1
(iv) State whether the result appropriately reflects the Competent Person’s view of the deposit. 8.11.1
(i) Describe and justify criteria and methods used as the basis for the classification of the Mineral Reserves into varying confidence categories, which should be based on the Mineral Resource category, and include consideration of the confidence in all the modifying factors.
10
(ii) Discuss the proportion of Probable Mineral Reserves, which have been derived from Measured Mineral Resources (if any), including the reason(s) therefore. 10
(iii) Only Measured and Indicated Resources can be considered for inclusion in the Mineral Reserve. 10
(iv) Mineral Resources classified as Inferred Resources lack the requisite degree of confidence to be converted to a Reserve. 10
(v) State whether the result appropriately reflects the Competent Person’s view of the deposit. 10
(i) Where comprehensive reporting of all exploration results is not practicable, representative reporting of low and high-grades and widths should be practised together with their spatial location to avoid misleading the reporting of exploration results.
NA
(ii) Announcements by companies should comply with the SAMREC Code, where applicable, and insofar as they relate or refer to a Competent Person’s report they should:
Noted(a) Be approved in writing in advance of publication by the relevant Competent Person; and
(b) The Competent Person’s relationship to the issuer of the report, if any, should be clearly defined.
(iii) If grades are reported then it should be stated clearly whether these are regional averages or if they are selected individual samples taken from the property under discussion.
NA

Tharisa Mine Page: 223Competent Person’s Report - December 2013
ASSESSMENT CRITERIA REPORT SECTION
See 8.A (i) to (iii).
8.13, 10.25(i) Mineral Resources should be stated as inclusive or exclusive of Mineral Reserves.(ii) Report the Mineral Resource statements with sufficient detail indicating the source and
type of mineralization, such as open pit, underground, mineralization type, facies or ore body, surface dumps, stockpiles and all other sources
8
(iii) The Mineral Resource will include all remnants, stockpiles, tailings, and existing pillars where there may be reasonable and realistic prospects for eventual economic extraction. Inclusion or exclusion of existing pillars into the Mineral Resource will be determined site-by-site taking into consideration factors such as size, shape, grade, location and historical and geotechnical factors. A detailed listing of such exclusions and reasons therefore, signed by a relevant Competent Person, should exist.
8
(iv) Reconciliation – Report the reliability, of the current geological and resource models, and key assumptions, including the reliability of resource classifications. This should include a comparison with the previous Resource quantity and qualities, if available.Where appropriate, report and comment on any historic trends (e.g. global bias).
5.5
See 8 B (i) to (iv).
8.11.3, 10(i) Describe the Mineral Resource estimate used as a basis for the conversion to a
Mineral Reserve.(ii) Caution should be exercised if Inferred Resources are considered in economic
studies, and if included, full disclosure and the effect on the results of the economic studies should be stated.
10
(iii) A comparison between the two possibilities, the one with inclusion and the one without inclusion, should be fully explained in the Public Report in such a way so as not to mislead the investors. Inferred Mineral Resources may not be reported as Mineral Reserves.
10
(iv) The Mineral Reserve Statement should be reported with sufficient detail indicating the source and type of mineralization, such as open pit, underground, mineralization type, facies or ore body, surface dumps, stockpiles and all other sources.
10
(v) State the proportion of the total Reserves that is likely to be mined within the current assured tenure timeframe. 10
(vi) Reconciliation - Report historic reliability and reconciliation of the performance parameters, assumptions and modifying factors. This should include a comparison with the previous Reserve quantity and qualities, if available. Where appropriate, report and comment on any historic trends (e.g. global bias)
10
(i) The overall conclusions of relevant audits or reviews, with specific reference to compliance to relevant Codes, where significant deficiencies and remedial actions should be disclosed.
8.11.1
(ii) State type of review (e.g. independent, external) and name of the reviewer(s) together with their recognized professional qualifications. NA
See 9 A (i) and (ii).
8.11.1(i) The material results of any audits or reviews of Mineral Resource estimates. Specific
reference regarding all material deficiencies and remedial actions should be disclosed.
See 9 A (i) and (ii).
NA(i) The material results of any audits or reviews of Mineral Reserve estimates. Specific
reference regarding all material deficiencies and remedial actions should be disclosed.

Tharisa Mine Page: 224Competent Person’s Report - December 2013
ASSESSMENT CRITERIA REPORT SECTION(i) Description of any other material information that is likely to prevent or facilitate the
economic potential of the project. All Sections
(ii) A glossary of terms used in the report. 16
See 10 A (i) and (ii).
8.11.1(i) Discuss possible opportunities that may affect the Mineral Resource.
See 10 A (i) and (ii).
9
(i) While any other material information or opportunities affecting the project should be discussed, no material impediments to the profitable exploration of the property should remain.
(i) State the accountable Competent Person’s full name, address, registration number and name of the professional body or ROPO, on behalf of the JSE Limited, of which he or she is a member. State the relevant experience, of the Competent Person and other key technical staff who prepared and are responsible for the Public Report.
Document information, 14, 18
(ii) The Competent Person’s relationship to the issuer of the report, if any, should be clearly defined. 1.5
(iii) The Public Report should include a signature page for the Competent Person to attest to its release. Such page should include the date of sign-off and the effective date of the report.
Document information
See 11 A (i) to (iii).

Tharisa Mine Page: 225Competent Person’s Report - December 2013
THE SOUTH AFRICAN CODE FOR THE REPORTING OF MINERAL ASSET VALUATION (THE SAMVAL CODE) 2008 EDITION (as amended in July 2009)
TABLE 2: MINERAL ASSET VALUATION: REPORTING AND ASSESSMENT CRITERIA
TABLE REFERENCE ASSESSMENT CRITERIA REPORT SECTION
T2.1 Executive Summary An Executive Summary of the Mineral Asset Valuation (the Valuation) should be provided Summary
T2.2 Introduction and Scope
Introduction and scope, specifying commissioning instructions including reference to the Valuation, engagement letter, date, purpose and intended use of the Valuation. The Competent Valuator must fully disclose any interests in the Mineral Asset or commissioning entity.
Summary
Any restrictions on scope and special instructions followed by the Competent Valuator, and how these affect the reliability of the Valuation. Summary, 14, 1.1
T2.3 Identity and TenureThe identity, tenure and locations of the property interests, rights or securities to be valued (i.e. the physical, legal and economic characteristics of the property).
Summary, 3.1
T2.4 History History of activities, results and operations to date. Summary, 5
T2.5 Geological Setting Geological setting and mineralization should be described. 6
T2.6 Mineral Resources and Mineral Reserves
Mineral Resource and Mineral Reserve statements should be provided.They must be signed off by a Competent Person in compliance with the SAMREC Code.
8, 10
T2.7 Modifying Factors A statement of modifying factors should be included, separately summarizing material issues relating to each applicable modifying factor. 10
T2.8 Valuation Approaches and Methods
The valuation approaches and methods used in the Valuation should be described and justified in full. 14, 1.2
T2.9 Valuation DateA statement detailing the Report Date and the Valuation Date, as defined in this Code, and whether any material changes have occurred between the Valuation Date and the Report Date.
Title Page, 18
T2.10 Valuation Summary and Conclusions
A summary of the valuation details, consolidated into single material line items. The Valuation must specify the key risks and forecasts used in the Valuation. A cautionary statement concerning all forward-looking or forecast statements should be included.
Summary, 14.8
The valuation conclusions, illustrating a range of values, the best estimate value for each Valuation and whether the conclusions are qualified or subject to any restrictions imposed on the Competent Valuator.
14.8
T2.11 Sources of Information
The sources of all material information and data used in the report should be disclosed, as well as references to any published or unpublished technical papers used in the valuation, subject to confidentiality.
17
A reference should be made to any other report that has been compiled, for the purpose of providing information for the valuation including SAMREC compliant reports and any other contributions or reports from experts.
17
T2.12 Previous ValuationsThe Valuation should refer to all available previous valuations of the Mineral Asset that have been performed in the previous two years and explain any material differences between then and the present valuation.
14.13
T2.13 Competent Persons and Other Experts
Names and qualifications of Competent Persons or other experts who have provided the reports on which the Valuation has relied. Written consent to use and rely on such reports should be obtained. Significant contributions made by such experts should be highlighted individually.
Summary, 1.3
T2.14 Competent Valuator
The Valuation should contain: Document Information, 18
The signature of the Competent Valuator. Document Information,18
The Competent Valuator’s qualifications and experience in valuing mineral properties, or relevant valuation experience. 1.3, 14, 18
A statement that all facts presented in the report are correct to the best of the Competent Valuator’s knowledge; 14, 18
A statement that the analyses and conclusions are limited only by the reported forecasts and conditions; 14, 18

Tharisa Mine Page: 226Competent Person’s Report - December 2013
THE SOUTH AFRICAN CODE FOR THE REPORTING OF MINERAL ASSET VALUATION (THE SAMVAL CODE) 2008 EDITION (as amended in July 2009)
TABLE 2: MINERAL ASSET VALUATION: REPORTING AND ASSESSMENT CRITERIA
TABLE REFERENCE ASSESSMENT CRITERIA REPORT SECTION
A statement of the Competent Valuator’s present or prospective interest in the subject property or asset 1.1, 14.1.1, 18
A statement that the Competent Valuator’s compensation, employment or contractual relationship with the Commissioning Entity is not contingent on any aspect of the report;
14.1.1, 18
A statement that the Competent Valuator has no bias with respect to the assets that are the subject of the report, or to the parties involved with the assignment;
14.1.1, 18
A statement that the Competent Valuator has (or has not) made a personal inspection of the property; and 1.2,14.1.1, 18
A record of the Competent Persons and experts who have contributed to the Valuation. 14.1.1, 18
T2.15 Range of ValuesThe valuation of a Mineral Asset must report the Competent Valuator’s estimated value. A range of values must be provided, together with the estimated value.
Summary
T2.16 Identifiable Component Asset (ICA) Values
In some valuations, the Valuation should be broken down into Identifiable Component Asset Values (an ICA Valuation) equalling the Mineral Asset Value. This could be, for example, due to the requirements of other valuation rules and legislative practices including taxation (i.e. fixed property, plant and equipment relative to Mineral Asset Value allocations such as in recoupment or Capital Gains Tax calculations or where a commissioned Mineral Asset Valuation specifies a need for a breakdown of the Mineral Asset Valuation).In such cases, the separate allocations of value must be made by taking account of the value of every separately identifiable component asset.Allocation of value to only some and not all identifiable component assets is not allowed. This requires a specialist appraisal of each identifiable component asset of property, plant and equipment, with the ‘remaining’ value of the Mineral Asset being attributed to the Mineral Resources and Reserves. Such valuations must be performed by suitably qualified experts, among whom may be the Competent Valuator.If the Mineral Asset Valuation includes an ICA Valuation, the Competent Valuator must satisfy himself or herself that the ICA Valuation is reasonable before signing off the Mineral Asset Valuation.
NA
T2.17 Historic Verification A historic verification of the performance parameters on which the Mineral Asset Valuation is based should be presented. 5.5
T2.18 Market Assessment A comprehensive market assessment should be presented. 14.2
T2.19 Audits or Reviews The results of any audits or reviews of the Mineral Asset Valuation should be presented, together with a commentary on the findings. NA

443
ANNEXURE 16
OVERVIEW OF SOUTH AFRICAN LAWS AND REGULATIONS
The following is an overview of the South African laws and regulations which may be relevant to the Group and its
operations in South Africa. The following summary is not a comprehensive description of all relevant laws and regulations.
South African laws and regulations relating to exploration for and production of minerals
General
Mining in South Africa is primarily governed by the MPRDA. The MPRDA regulates the prospecting, mining, processing
and utilisation of minerals. It also provides for the rehabilitation of land disturbed by exploration and mining. The MPRDA
came into effect on 1 May 2004 and repealed the Minerals Act, 1991.
The objects of the MPRDA include:
(1) to substantially and meaningfully expand opportunities for historically disadvantaged persons to enter the mineral
and petroleum industries in order to benefit from the exploitation of the nation’s mineral and petroleum resources;
and
(2) to promote employment and advance the social and economic welfare of all South Africans.
The following relevant legislation is also applicable to the mining industry:
Mining Titles Registration Act, 1967 (‘‘MTRA’’)
The purpose of the MTRA is, essentially, to:
(1) regulate the registration of mineral and petroleum titles and other rights connected therewith;
(2) effect certain petroleum titles and other rights connected therewith;
(3) effect certain amendments as to where mining titles are registered (to ensure consistency with the MPRDA); and
(4) remove the functions relating to the registration of rights to minerals from the ambit of the Deeds Registries Act,
1937.
Registration of mineral and petroleum titles in terms of the MTRA creates a limited real right which is binding on third
parties.
Precious Metals Act, 2005 (‘‘PMA’’)
The PMA regulates the acquisition, possession, smelting, refining, beneficiation, use and disposal of precious metals
(i.e. gold, any PGM group metal and the ores of such metals and any other metals that the Minister of Mineral Resources
has declared by notice in the Government Gazette to be a precious metal for the purposes of the PMA).
Mineral and Petroleum Resources Royalty Act, 2008 (‘‘MPRRA’’)
Under the MPRRA, the holders of mineral rights are required to pay the State royalties for minerals removed and
disposed of during prospecting and for minerals mined. The method used to determine the royalty depends on whether
the mineral resource is refined or unrefined. The royalties incurred by the Group in respect of the 3 financial years ended
30 September 2010, 30 September 2011 and 30 September 2012 were ZAR312,000 (US$42,000), ZAR549,000
(US$79,000) and ZAR1,135,000 (US$141,000), respectively.
National regulatory authorities governing the mining industry
The DMR is the authority responsible for ensuring compliance with the MPRDA, the issuing of prospecting and mining
rights and ensuring compliance with those rights. Regional offices are located in each of the 9 provinces and applications
for a prospecting right or mining right must be lodged at the regional office where the land is situated. The Tharisa Mine
falls under the administrative jurisdiction of the North West Regional Office of the DMR.
Licensing
The Group is required to obtain various licences, authorisations and permits from relevant governmental authorities to
conduct its operations. In relation to the Tharisa Mine, licences, authorisations and permits would include: prospecting and
mining rights, water use licence and transportation and storage of hazardous substances permits.

444
Prospecting and mining rights
The DMR considers a wide range of factors and principles before approving any application for a prospecting or mining right. These factors include proposals relating to BEE and social responsibility and evidence of an applicant’s ability to conduct mining optimally. Section 11 of the MPRDA deals with the transferability of the rights and provides that prospecting or mining rights cannot be transferred, ceded, assigned, sublet etc without the consent of the Minister of Mineral Resources.
Prospecting right
In order to prospect for any mineral, a person must obtain a prospecting right from the DMR. No prospecting right will be granted if another person has a prospecting right or mining right for the same mineral and land. The holder of a prospecting right must commence prospecting operations within 120 days from the effective date of the prospecting right and in order to retain the prospecting right the holder must continuously and actively carry out prospecting operations in accordance with the prospecting work programme submitted with the prospecting right application and comply with the terms and conditions of the prospecting right and the requirements of the approved environmental management programme. A prospecting right is valid for the period stipulated in the prospecting right, which may not exceed 5 years, provided that it may be renewed for one additional period not exceeding 3 years.
Subject to compliance with the provisions of the MPRDA, the holder of a prospecting right has the exclusive right to apply for and be granted a mining right in respect of the minerals and area applicable to the prospecting right.
Mining right
In order to mine for any mineral or commence any work incidental thereto, a person must obtain a mining right from the DMR. The holder of a mining right must commence mining operations within one year from the effective date of the mining right and in order to retain the mining right, the holder of a mining right must actively and optimally conduct mining in accordance with the mining work programme.
A mining right is valid for the period stipulated in the mining right. The maximum period is 30 years, after which the holder of a mining right may apply to renew the mining right for further periods of up to 30 years for each renewal. A holder of a mining right has, subject to compliance with the requirements of the MPRDA, the exclusive right to apply for and be granted a renewal of the mining right in respect of the mineral and mining area to which the existing mining right relates. The holder of a mining right can carry out any other activity incidental to mining, provided the activity does not contravene the provisions of the MPRDA. The holder of a mining right may enter the land to which such right relates together with his or her employees, and may bring onto the land any plant, machinery or equipment and build, construct or lay down any surface, either aboveground or underground, which may be required for purposes of mining.
Export restrictions
The export of chrome is governed by the laws and regulations generally applicable to the export of goods. The export of precious metals is governed by the PMA. The PMA prohibits the export of any unwrought or semi-fabricated PGMs without the prior written approval of the Minister of Mineral Resources. In considering whether to grant the approval, the Minister of Mineral Resources will consider the promotion of equitable access to and the orderly local beneficiation of such metals.
The PMA also contains ongoing compliance obligations for any person who has been granted such an approval to export precious metals, in accordance with the terms and conditions of its licence and the provisions of the PMA. Once such approval is granted and subject to compliance with ongoing obligations, the holder of such an export licence need not seek further specific approval for the export of unwrought or semi-fabricated PGMs. Tharisa Minerals does not hold an export licence as it does not currently export PGMs.
Access to land
MPRDA
Under the MPRDA, any holder of a prospecting or mining right may enter the land to which such right relates. The holder of the mining right does not have to own the land in order to conduct mining or any other activity incidental to mining. Under the MPRDA, in situations where the landowner or lawful occupier of the land in question refuses access to the holder of the prospecting or mining right or places unreasonable demands in return for access to the land, the holder of a mining right must notify the relevant Regional Manager (in the Company’s case, the North West Regional Manager of the DMR).
The Regional Manager must, within 14 days from the date of being notified by the holder of the prospecting or mining right: (1) call upon the owner of the land to make representations regarding the issues raised by the holder of the prospecting or mining right; (2) inform that owner of the rights of the holder of the prospecting or mining right in terms of the MPRDA; (3) set out the provisions of the MPRDA which such owner is contravening; and (4) inform the owner of
the steps which may be taken against the owner, should he or she persist in contravening the provisions.

445
If the relevant Regional Manager concludes that the owner or lawful occupier of the land will suffer loss or damage as a
result of the mining operations, he or she may request the parties concerned to reach an agreement for the payment of
compensation for such loss or damage. If the parties are unable to reach agreement, the compensation must be determined
by arbitration or by a competent court. However, if the Regional Manager concludes that future negotiation between the
parties will detrimentally affect the objects of the MPRDA, the Regional Manager may recommend to the Minister of
Mineral Resources that the land in question be expropriated against fair value being paid to the owner or lawful occupier.
On the other hand, if the Regional Manager determines that the failure to reach agreement on the amount of compensation
is due to the fault of the holder of the mining right, the Regional Manager may prohibit the holder of the mining right from
commencing or continuing with mining operations until the dispute is settled by arbitration or by a competent court.
Land zoning
Where land that is the subject of a mining right under the MPRDA falls within a municipal area, the use of that land must
comply with the scheme regulations of the municipality, which determine the use to which the land may be put in
accordance with the applicable zoning. Land to be used for mining must be zoned as mining land or an application to
re-zone the land from another use type to mining land must be approved before mining operations commence. The
Company has successfully applied for the re-zoning of the land covering its open pit operations.
National heritage resources
The National Heritage Resources Act, 1999 (‘‘NHR Act’’) provides for the protection and management of heritage
resources, which include resources of archaeological, cultural or historical significance, collectively forming South Africa’s
national estate. Sites containing heritage resources must be investigated and, if necessary, protected for the nation. This
may include procedures relating to the relocation of graves. Heritage resources have been identified in the project area
in Tharisa Minerals’ environmental impact assessment reports (‘‘EIA’’) and their environmental management plans
(‘‘EMP’’). The EMP also sets out undertakings by and obligations on Tharisa Minerals relating to heritage resources.
South African laws and regulations relating to BEE
General
BEE is governed generally by the Broad-Based Black Economic Empowerment Act, 2003 (‘‘BEE Act’’) and the Codes of
Good practice promulgated under the BEE Act (‘‘Codes’’). BEE in the mining sector, however, is not governed by the BEE
Act or Codes but rather by the MPRDA and the Mining Charter promulgated under the MPRDA (‘‘Mining Charter’’),
a revised version of which came into effect on 20 September 2010.
Mining Charter
The Mining Charter came into force in 2004 and contains obligations on stakeholders (which includes holders of
prospecting rights and/or mining rights) to review the Mining Charter after 5 years to determine the progress made and
further steps required to achieve the objects of the Mining Charter. The revised Mining Charter sets targets from 2009
up to 2014. The objectives of the Mining Charter include the promotion of mining infrastructure in South Africa for
HDSAs and the promotion of economic opportunities for HDSAs in the mining sector. The term HDSA refers to any
South African citizen, category of persons or community, disadvantaged by unfair discrimination before the Interim
Constitution of the Republic of South Africa, 1993 came into operation.
The DMR will only issue a prospecting or mining right to an entity if that entity:
(1) reports its level of compliance with the Mining Charter each calendar year;
(2) has a minimum of 15% HDSA ownership as at March 2011 and has a plan to achieve at least 26% HDSA ownership
(which includes meaningful economic participation and full shareholder rights) by 2014; and
(3) has a plan to convert and upgrade all hostels in line with requirements of the Mining Charter (which ensures that
mine workers have a good living environment).
After fulfilling the 3 criteria above, an entity is measured on the BEE Scorecard contained in the Mining Charter and is
assigned a BEE score. An entity will be attributed a particular BEE compliance level as follows: 0% – 25% (gross non-
compliance), 25 – 50% (non-compliance), 50 – 75% (marginal to acceptable performance) and 75% – 100% (excellent
performance). Despite obtaining a specific score, the essential BEE requirement in the mining sector is whether the
measured entity fulfils the relevant conditions and obligations set out in its prospecting and/or mining right(s). Failure to
fulfil such conditions and obligations may result in the holder being sanctioned under the MPRDA including a monetary
fine, the prospecting right or mining right being cancelled/revoked or a refusal to renew the prospecting right or mining
right.

446
The elements of the Mining Charter BEE scorecard against which an entity is measured, are:
(1) ownership;
(2) procurement and enterprise development;
(3) beneficiation;
(4) employment equity;
(5) human resource development;
(6) mine community development;
(7) housing and living conditions;
(8) sustainable development and growth of the mining industry; and
(9) reporting (monitoring and evaluation).
The Mining Charter sets targets for the various elements. For example, the Mining Charter sets a target for the preferential
procurement element of procuring a minimum of 40% of capital goods from BEE entities by 2014 and the employment
equity element of 40% HDSA representation by 2014 at each of the levels of executive management (board), senior
management (EXCO), core and critical skills, middle management and junior management. In addition, mining companies
must identify and fast-track their existing talent pools through career path programmes to ensure high level operational
exposure. As at 31 December 2013, Tharisa Minerals has a BEE compliance score of 93.0% and therefore achieves an
excellent performance in terms of the Mining Charter.
South African laws and regulations relating to restrictions on foreign investments
General
South Africa has exchange control rules which restrict South African residents from expatriating funds from South Africa
and owning foreign funds or assets, without permission either from an Authorised Dealer (one of the major banks in
South Africa) or Exchange Control. The approvals required depend on the nature of the transaction and in certain
instances the amount of funds being transferred. In other words, there is no free movement of money out of South Africa
for residents. For exchange control purposes, natural persons will be resident in South Africa if they have taken up
permanent residence or are domiciled in South Africa. A legal entity will be regarded as being resident in South Africa if
it is registered in South Africa. Accordingly, Tharisa Minerals, Arxo Metals and Arxo Logistics will be considered resident
in South Africa for exchange control purposes.
Investments into South Africa
There is no restriction on the inflow of investments into South Africa by non-residents. Such transactions must be
concluded at arm’s length at fair market related prices and financed in an approved manner.
Where a non-resident intends to hold shares in a South African company, approval from an Authorised Dealer must be
obtained to hold the shares. The Authorised Dealer will endorse the share certificate in the name of the non-resident
with the words ‘‘non-resident’’. The endorsement ensures that any proceeds relating to a sale of the shares and any
income such as dividends and interest which are accruing to the non-resident may be transferred abroad.
South African laws relating to access to infrastructure
Water
The use of water in South Africa is governed by the NWA and the regulations promulgated under the NWA. A person
is only entitled to use water if it is permissible under the NWA. The environmental aspects of water use are discussed
under the environmental section below. Under the NWA, a person may:
(1) use water in or from a water resource on the land occupied by that person or from an area forming a boundary of
that land for reasonable domestic use, animal watering, fire fighting and recreational use;
(2) continue using water under an existing lawful water use licence issued in terms of the previous Water Act; and
(3) use water in terms of a general authorisation or specific licence. The nature and volume of the water use will
determine whether a general authorisation or specific licence is required.
447
Electricity
The supply (trading, generation, transmission or distribution) of electricity in South Africa is governed by the Electricity
Regulation Act, 2006 and regulations promulgated thereunder. There is currently a monopoly on the supply of electricity
in South Africa as only Eskom, an organ of state that was converted into a public company by the Eskom Conversion Act,
2001, has the licence to operate an electricity network and all electricity must be purchased from Eskom. In order to use
electricity, an entity may require Eskom to connect it to the electrical grid and Eskom may not refuse to make such a
connection.
Railway transportation
All transport by rail in South Africa is under the administration and control of Transnet Freight Rail (‘‘TFR’’), a division of
Transnet SOC Limited (‘‘Transnet’’). Transnet is wholly owned by the South African government. No independent
regulator (other than for safety purposes) has been appointed in order to regulate the business of TFR. The Deputy
Minister of Transport has, however, recently announced that such a regulator will be appointed in the near future. At
present, TFR do not publish any sort of tariff but quotes will be provided on request. TFR usually contracts on the basis
of its conditions of carriage which provide that TFR deals with all goods at the risk of the owner of the goods.
Road haulage
Roads are governed at a national level, in the main, by the South African National Roads Agency and National Roads Act,
1998. The agency has the power to reach agreement with any person who is authorised to operate a national road as a
toll road. Most routes to the relevant harbours will require road transport to proceed on various toll roads. Road use
(whether on toll roads or otherwise) by vehicles is governed by the National Road Traffic Act, 1996 (‘‘National Road
Traffic Act’’) and the many regulations passed in terms of that Act. The National Road Traffic Act and the regulations
passed in 2000, as amended, deal with the licensing of drivers and vehicles, the roadworthiness of vehicles, and the
conditions in terms of which certain goods, especially dangerous goods, must be carried, including the permissible
maximum and gross axle and axle unit mass load of a vehicle and the massload carrying capacity of roads and bridges.
Where indivisible loads exceed the maximum allowed load weights, then a request must be made for an exemption under
the National Road Traffic Act (the so-called abnormal load permit). Parties are free to contract with road hauliers on such
terms as may be negotiated. Many road hauliers operate in terms of standard trading terms that exclude or restrict liability.
Port access
There is both road and rail access to all ports. There are no specific regulations that determine port access and such access
is negotiated with the relevant Transnet division depending on the type of access required. Where access is to be by way
of a leasehold berth, then the access will be determined by negotiations (and the terms of any subsequent lease) with the
National Ports Authority. Use of any stockpile or dry bulk terminal will be determined by whatever terms are negotiated
with Transnet Port Terminals (‘‘TPT’’), a division of Transnet. The National Ports Authority tariffs are published each
April and are subject to regulation by the Ports Regulator. Generally, TPT operates in terms of standard trading terms that
are amended from time to time, with each type of terminal having its own dedicated set of terms. These terms contain
provisions that exclude or restrict Transnet’s liability. Transnet also attempts to regulate what goods are exported through
its ports through the operation of tariffs. The National Ports Authority tariffs are published each April and are subject to
regulation by the Ports Regulator. In the past, excessive tariff increases, either overall or on specific products, have been
effectively dealt with by the Ports Regulator.
South African laws and regulations relating to protection of the environment
Introduction
Environmental law in South Africa is becoming increasingly stringent and is based around the concept of integrated
environmental management. A justiciable environmental right is enshrined in the Bill of Rights under South Africa’s
Constitution. In essence, individuals are entitled to an environment that is not harmful to human health or well-being and
to have the environment protected for the benefit of present and future generations. This has created a new form of legal
standing for individuals and classes of individuals and has enabled the enforcement of environmental laws through, for
example, class actions.
Environmental management
Four major pieces of legislation presently account for the bulk of environmental management in South Africa. They are:
(1) the National Environmental Management Act, 1998 (‘‘NEMA’’);
(2) the National Water Act, 1998 (‘‘NWA’’);

448
(3) the National Environmental Management: Air Quality Act, 2004 (‘‘AQA’’); and
(4) the National Environmental Management: Waste Act, 2008 (‘‘Waste Act’’).
NEMA is the overarching legislation which provides an underlying framework and relates to all three fields of environmental
concern, namely resource conservation and exploitation, pollution control and waste management, and to a limited
degree, land use planning and development. NEMA is underpinned by the globally accepted concept of sustainable
development.
Two important principles are contained in NEMA:
(1) the ‘‘polluter pays’’ principle – which requires the person involved in any polluting activity to be responsible for the
costs of preventing or dealing with any pollution caused by that activity, instead of passing this responsibility on to
another. This principle is both proactive (preventative) and reactive (compensatory); and
(2) the precautionary principle – which requires the application of preventative measures in situations of scientific
uncertainty where a course of action may cause harm to the environment. This principle is applied in the provisions
relating to scoping and environmental impact assessment reports.
Environmental approval
The Environmental Impact Assessment Regulations 2010 (‘‘EIA Regulations 2010’’) issued under NEMA provides a list
of activities which require an environmental authorisation (‘‘EA’’) prior to commencement of the activity. Depending on
the anticipated severity of the impact, the application process will require either a basic assessment report (‘‘BAR’’) or a
scoping and environmental impact assessment report (‘‘S&EIR’’) to precede the granting of the EA. Three lists of
activities have been published under NEMA which are categorised on the basis of the severity of an activity’s environmental
impact or location in a geographically sensitive areas and therefore require either a BAR or an S&EIR. An activity requiring
a mining right as contemplated in the MPRDA, such as the Tharisa Mine, is considered to have a more severe environmental
impact and is listed as activity 19 (‘‘Activity 19’’) under the Environmental Impact Assessment Regulations Listing Notice
2, 2010 and requires an S&EIR prior to commencement. The commencement date for Activity 19 has not been published
and is currently not applicable. The Group’s application for an EA was submitted prior to 2010 in terms of the old EIA
regulations (i.e. the predecessor to the EIA Regulations 2010) and was granted in October 2009. The Group’s mining
activities triggered several listed activities, requiring both BARs and S&EIRs. All EAs granted prior to the commencement
of the EIA Regulations 2010 are deemed to be approved in terms of the EIA Regulations 2010. However, any expansion
of facilities will be regarded as a separate activity requiring the application for and obtaining of a further EA. It is also
common for EAs to be issued by provincial environmental authorities for certain activities that are carried out on mining
areas but are not directly related to mining operations, such as for road infrastructure. These authorisations are only
issued once an environmental impact assessment has been performed. Similarly, the Waste Act, AQA and NWA include
listed activities which may not commence until a licence or authorisation has been issued by the relevant authorities.
Compliance with the provisions of NEMA does not therefore absolve a person from complying with any other statutory
requirements to obtain authorisation from any organ of state allowing for the implementation of any activity in question.
Air pollution
Common law principles and case law applicable to the civil wrong of nuisance still play an important part in the control of
air pollution. Air pollution legislation falls within the ambit of the AQA, which repealed the Atmospheric Pollution
Prevention Act, 1965. On 31 March 2010, regulations were published under Government Notice 248 providing a list of
activities which result in atmospheric emissions which have or may have a significant detrimental effect on the environment,
including health, social conditions, economic conditions, ecological conditions or cultural heritage (‘‘AQA Regulations’’).
The activities listed in the AQA Regulations may not commence without either a provisional atmospheric emission licence
or an atmospheric emission licence. The AQA Regulations include activities relating to, amongst others, mineral processing,
blast furnace operations and the storage and handling of ore. South Africa has also acceded to the 1997 Kyoto Protocol
on measures to combat global warming.
Water pollution
South Africa’s water resources are regulated by the NWA. The NWA has provisions governing the prevention and
remediation of pollution, and provides for a liability regime similar to that of NEMA.
A water use licence or general authorisation, as the case may be, is required for the discharge of waste into a water
resource. The manner in which the waste water is treated must be done in accordance with the conditions prescribed in
the water use licence or general authorisation issued for the particular activity.

449
The infrastructure aspects of water use are discussed under the infrastructure section above. On 4 June 1999, regulations
were published under Government Gazette 704 relating to the use of water for mining and related activities aimed at the
protection of water resources (‘‘NWA Regulations’’). Under the NWA Regulations, any person intending to operate
a new mine or conduct a new mining related process must notify the DWA not less than 14 days before the start of such
activity. A mining related process includes the operation of washing processing facilities, mineral refineries, extraction
plants and mineral storage yards. Those in control of an existing mine or mining related process must submit a copy of its
environmental management programme (‘‘EMP’’) to DWA and also notify DWA in writing 14 days before the temporary
or permanent cessation of the operation of the mine or the conduct of the mining related process, or the resumption of
such operation or process. The NWA Regulations also prescribe, amongst others, restrictions on locality and use of
materials, capacity requirements of clean and dirty water systems, protection of water resources, security and additional
measures relating to pollution control.
Waste management
Although waste management is generally governed by the Waste Act, residue stockpiles and residue deposits at mines
are governed by the MPRDA. Residue deposits means any residue stockpiles remaining at the termination of mining, while
residue stockpiles means any product derived from a mining operation which is stockpiled or disposed. A mine is therefore
required to manage its residue stockpiles and residue deposits as prescribed in its approved EMP. Failure to comply with
the approved EMP is an offence.
Hazardous substances
Hazardous substances are regarded as dangerous goods and the storage of dangerous goods falls within the list of
activities published by NEMA. Depending on the quantity of dangerous goods being stored, a BAR or S&EIR must be
conducted and an authorisation obtained before the commencement of this activity.
Mines that make use of explosives will have conditions prescribed in its approved EMP and EA relating to the management
of the explosives, such as having the explosives stored safely in a demarcated area and the requirement of a permit to
transport the explosives to site. Regulations promulgated under the Occupational Health and Safety Act, 1993 are also
relevant as such Act also has an environmental aspect. The regulations deal with hazardous chemical substances, asbestos,
and general safety issues. They also incorporate various codes of practice which deal with, amongst others, the identification,
classification and transport of dangerous substances and goods which relates to any ‘‘existing contamination’’ on the site.
For example, if the mining site contains asbestos (as an existing contamination), Tharisa Minerals, as the employer, will
need to comply with the Asbestos Regulations under the Occupational Health and Safety Act, 1993.
Prospecting and mining
Under the MPRDA, an environmental impact assessment must be conducted for a mining right application and the
environmental impact assessment procedures are set out under the Mineral and Petroleum Resources Development
Regulations, 2004. These procedures are similar to the S&EIR process under NEMA. The applicant for a mining right will
make two applications: the first application to the DMR for approval of its EMP and the second application to the DEA,
for the granting of the EA (for all the listed activities under the NEMA regulations). EMPs are legislated for in the MPRDA.
The MPRDA requires that any prospecting or mining operations must be conducted in accordance with generally accepted
principles of sustainable development by integrating social, economic and environmental factors into the planning and
implementation of prospecting and mining projects. Although the EMP is approved by the DMR, this does not absolve the
holder from complying with the objectives under NEMA and applying for any other authorisation or licences required in
order to lawfully conduct all the activities of the mine.
A significant feature of the MPRDA is that the holder of a prospecting or mining right under the MPRDA is responsible for
any environmental damage, pollution or ecological degradation as a result of its prospecting or mining operations. The
directors of a company may be jointly and severally liable for any unacceptable negative impact on the environment. In
addition, the Minister of Mineral Resources will not approve an EMP and grant a mining right unless the prescribed financial
provisions for rehabilitation or management of the negative environmental impacts have been made. The environmental
liability of the mine must be re-assessed annually and, if applicable, the financial provisions must be increased to the
satisfaction of the Minister of Mineral Resources. Failure to comply with these provisions is an offence and may result in
sanctions, including the mining right being cancelled or revoked.
South African laws and regulations relating to health and safety
Health and safety in the mining sector is governed by the Mine Health and Safety Act, 1996 (‘‘MHS Act’’). The MHS Act
requires owners (which, in relation to mines, includes the holders of a prospecting permit or a mining authorisation issued
under the MRPD Act or the person for whom the mining activities are conducted) to:

450
(1) ensure responsibility for health and safety through the creation of codes of practice, training, identifying potential
hazardous factors and risks, investigating such risks, conducting occupational hygiene measures and establishing a
system of medical surveillance of employees exposed to health hazards; and
(2) safeguard the rights of employees to refuse to work in or move away from areas which are unsafe or potentially
unsafe.
The MHS Act provides for effective monitoring systems and involves inspections, investigations and enquiries to achieve
its aims. The legislation has created a system of employee, employer and State participation in health and safety matters.
The MHS Act provides for the establishment of the Mine Health and Safety inspectorate under the auspices of the DMR,
whose strategic objective is to improve occupational health and safety in mines through establishing systems for the
regulation, monitoring, auditing and inspection of mines. Inspectors are given wide powers to enter and inspect conditions
at a mine, to question people and to order the performance of certain acts in the interest of health and safety. Compliance
with the MHS Act and its regulations is mandatory and failure to comply is a criminal offence. The MHS Act provides
inspectors with wide powers, including but not limited to the right to issue contravention/prohibition notices and in so
doing, to suspend the non-compliant entity’s operations. These wide powers do not, however, include the power to
revoke or cancel a prospecting or mining right. In addition, the MHS Act provides for a monetary administrative fining
system which can be imposed on owners where there have been contraventions of the legislation.
There are two different statutes in South Africa that provide compensation for occupational diseases. These statutes are
the Compensation for Occupational Injuries and Diseases Act, 1993 (‘‘COIDA’’) and the Occupational Diseases in Mines
and Works Act, 1973 (‘‘ODMWA’’). ODMWA provides compensation for occupational lung diseases in miners and ex-
miners only. ODMWA pays lump sum benefits based on the level of impairment and does not make any further pension
provision. COIDA covers occupational injuries and diseases in all industries including those from the mining sector that are
not covered by ODMWA; for example noise-induced hearing loss. COIDA pays both lump sum and in certain circumstances
pensions for permanent disability. Compensation is made out of the fund established under the COIDA from employer
contributions and no common law action lies by an employee against the employer for an occupational injury or disease.
South African laws and regulations relating to employment and labour
General
Employment and labour matters in South Africa are primarily governed by the Labour Relations Act, 1995 (‘‘LRA’’). The
LRA provides a framework within which employees, trade unions, employers and employer organisations can bargain
collectively on wages, terms and conditions of employment and other matters of mutual interest and essentially gives
effect to and regulates an employee’s fundamental right to fair labour practices as conferred by the Constitution of the
Republic of South Africa, 1996. The Basic Conditions of Employment Act, 1997 (‘‘BCEA’’), prescribes minimum standards
of employment and regulates payment of remuneration, working hours, leave and termination of employment.
Trade unions
In South Africa, employees have the constitutional right to join, refuse to join or resign from a trade union. The primary
role of trade unions is to engage in collective bargaining with their members’ employers, and to represent their members
in grievance and disciplinary matters. Trade unions also appoint members or officials to bodies which monitor and
challenge employers’ compliance with their statutory obligations.
While trade unions may exist and function without registering with the Department of Labour, organisational rights
conferred by the LRA are restricted to registered unions. In relation to employees of the Group’s contractors, the
contractor and the Group are jointly and severally liable if the contractor, in respect of any of its employees, contravenes
a collective agreement concluded in a bargaining council that regulates terms and conditions of employment; a binding
arbitration award that regulates terms and conditions of employment; the BCEA; or a determination made in terms of the
Wage Act. There would also be joint and several liability where the contractor commits an act of unfair discrimination on
the employee, as a consequence of the express or implied instructions of the Group.

451 PRINTED BY INCE (PTY) LTD REF. W2CF17285

APPLICATION FORM
Tharisa plc(Incorporated in the Republic of Cyprus with limited liability)
(Registration number HE223412)
Share code: THA ISIN: CY0103562118
(“Tharisa” or “the Company” or together with its subsidiaries “the Group”)
APPLICATION FORM TO PARTICIPATE IN THE OFFER TO BE COMPLETED BY
QUALIFYING INVESTORS
The definitions commencing on page 16 of the Pre-listing Statement to which this Application Form is attached, apply mutatis mutandis throughout
this Application Form, unless the context clearly indicates otherwise.
The Offer comprises an offer for subscription of up to 23,393,971 shares at an issue price of between R42.75 and R55.21 per share. The price may
however be outside this range. The final price will be released on SENS on Friday, 4 April 2014. Successful Applicants will be advised of their allotment
of shares by not later than Thursday, 3 April 2014.
Dematerialised Shares
The allocated shares will be issued to successful Applicants in Dematerialised form only. Applicants, if they have not already done so, must appoint a
CSDP directly; or a broker, to receive and hold the Dematerialised Shares on their behalf. Applicants must contact their CSDP or broker and advise
that they have submitted an Application Form to participate in the Offer. Applicants must further make arrangements for payment of the aggregate
purchase price for such allocated shares to the designated account notified by Tharisa in writing. Payment must be received by 12:00 on Friday, 4 April
2014. Shares will be issued to successful Applicants and delivered to their CSDP or broker on the Listing Date. Details of the CSDP or broker must
be conveyed by successful Applicants to the Bookrunners before close of business on Friday, 4 April 2014.
Applicants will only be permitted to apply for Shares with a minimum total purchase price, per single addressee acting as
principal, of greater than or equal to R1,000,000 unless the Applicant is a person, acting as principal, whose ordinary business,
or part of whose ordinary business, is to deal in securities, whether as principal or agent (in reliance on sections 96(1)(a)(i) and
96(1)(b) of the Companies Act) or such Applicant falls within one of the other specified categories of persons listed in section
96(1) of the Companies Act.
Successful Applicants should note the provisions of section 122 of the Companies Act, which provides for a disclosure
requirement in circumstances where a multiple of 5% of the issued securities of a class are acquired in a regulated company,
as defined in the Companies Act.
Please refer to the instructions overleaf before completing this Application Form.
This Application Form, when completed, should be sent by email to George Nakos ([email protected]), Dean
McHendrie ([email protected]) and Ruan Nothnagel ([email protected]) or hand delivered to:
Investec Corporate Finance, a division of Investec Bank Limited
2nd Floor
100 Grayston Drive
Sandown
Sandton
2196
Attention: George Nakos, Dean McHendrie and Ruan Nothnagel
The Application Form must be received by no later than 12:00 on Wednesday, 2 April 2014.
NO LATE APPLICATIONS WILL BE ACCEPTED
Reservation of rights
The Directors of Tharisa reserve the right to accept or refuse any application(s), either in whole or in part, or to pro rate any or all application(s)
(whether or not received timeously) in such manner as they may determine.
The Directors of Tharisa reserve the right to accept or reject, either in whole or in part, any applications should the terms contained in this Pre-listing
Statement of which this Application Form forms part and the instructions herein are not properly complied with.

To the Directors:
Tharisa plc
1. I/We, the undersigned, confirm that I/we have full legal capacity to contract and, having read the Pre-listing Statement, hereby irrevocably apply
for and request you to accept my/our application for the undermentioned number of shares at the undermentioned price per share or any lesser
number that may in your absolute discretion be allotted to me/us.
2. I/We wish to receive my/our allocated shares in Dematerialised form and will email/hand this Application Form to George Nakos, Dean
McHendrie or Ruan Nothnagel, and will provide appropriate instructions to my/our CSDP or broker, as the case may be. I/We accept that
payment in respect of this application will be made by me/us and received into the designated account notified by Tharisa in writing by 12:00 on
Friday, 4 April 2014.
3. I/We understand that the Offer in terms of this Pre-listing Statement is subject to certain conditions.
Dated:
Signature:
Assisted by (where applicable):
Telephone number:
Cellphone number:
Email address:
Name of corporate body/Surname
First names in full (if individual)
Postal address (preferably PO Box address)
Postal code
Total number of shares applied for
(Enter figures only not words)
Price offered per share
(in cents)
Required information must be completed by CSDP or broker with their stamp and signature affixed thereto:
CSDP name
CSDP contact person
CSDP contact telephone number
CSA or bank CSD account number
Scrip account number
Settlement bank account number
Stamp and signature CSDP or broker
INSTRUCTIONS:
1. Copies or reproduction of the Application Form will be accepted at the discretion of the Directors of Tharisa.
2. Please refer to the terms and conditions of the Offer as set out in paragraph 2 on page 25 of the Pre-listing Statement. Applicants should consult
their CSDP or broker, banker or other professional advisor in case of doubt as to the correct completion of this Application Form.
3. Applicants must submit only one Application Form.
4. No receipts will be issued for Application Forms.
5. All alterations to this Application Form must be authenticated by a full signature.
6. In determining the basis of allocation, the date that people committed to applying for the placement of the shares in terms of the Offer will be
taken into account.
7. Applications are irrevocable and may not be withdrawn once submitted.
8. CSDPs and brokers will be required to retain this Application Form for presentation to the Directors, if required.

454

455

456

(Incorporated in the Republic of Cyprus with limited liability)(Registration number HE223412)Share code: THA ISIN: CY0103562118(“Tharisa” or “the Company” or together with its subsidiaries “the Group”)
PLC