01.ST.JOSEPH'S COLLEGE- CA- MARCH -2014.pdf - Primax ...
276
-
Upload
khangminh22 -
Category
Documents
-
view
1 -
download
0
Transcript of 01.ST.JOSEPH'S COLLEGE- CA- MARCH -2014.pdf - Primax ...


Page IMarch 2014Vol.2,Special Issue
Primax International Journal of Commerce and Management Research ISSN : 2321-3604
Primax International Journal ofCommerce and Management Research
(PIJCMR)
• Research Papers • Articles • Case studies
Primax Commerce and Management Research Academy# 1432, 11th Cross, Kengeri Satellite town,
Bangalore -60. Karnataka. Ph:09986530012Email: [email protected], [email protected]
www.primaxijcmr.com

Page II
ISSN : 2321-3604
March 2014Vol.2,Special Issue
Primax International Journal of Commerce and Management Research
Managing Editor:
Prof. T. Rajeswari., M.Sc.,M.A(Eng).,M.B.A.,M.A.(Soc).,
Coordinator:Dr.K.V.Ramanathan.,Professor –in –FinanceDayananda Sagar Business School,Bangalore -78
Dr.V.SelvarajHead & Associate Professor,Nehru Memorial College (Autonomous),Tiruchirappalli.
Dr M.Muthu GopalakrishnanAssociate Professor,Acharya Bangalore B School, Bangalore.
Publisher:
Primax Commerce and Management Research Academy, Bangalore-60
(Karnataka Reg.: 48/159/CE/0103/2013)
Issue:
Special Issue – Volume – II, March 2014
COPYRIGHT:
1. All rights reserved. And Copyright © 2013, Primax Commerce and Management ResearchAcademy.
2. Reproduction of any part of this Journal in the whole or in part without written permission from thepublisher is prohibited .
3. All rights reserved ISSN: 2321-3604
Contact:
Prof. T. Rajeswari., M.B.A.,M.A(Eng.) M.Sc.,M.A(Soc)
Founder and Managing Editor,Primax Commerce and Management Research Academy,#1432, 11th Cross, Kengeri Satellite town,Bangalore -60.Karnataka. Ph: +91 9986530012, +91 8971725451Email: [email protected], [email protected],

Page IIIMarch 2014Vol.2,Special Issue
Primax International Journal of Commerce and Management Research ISSN : 2321-3604
With Regards
Prof. T.Rajeswari., M.Sc.,M.A(Eng.).,M.B.A.,M.A (Soc)Managing Editor- PIJCMR.
“The secret of life is not enjoyment, but education through experience”. And Experience isthe only source of knowledge.
-Swami Vivekananda
Editor DeskDear All
Greetings to one and all…….
Since several years I was aspiring to reach all my colleagues of commerce and management fraternitythrough print and social media. This journal “Primax International journal of Commerce and ManagementResearch” is reflection of this yearning desire.
I am aware “Quality is never an accident; it is always the result of high intention, sincere effort, intelligentdirection and skilful execution”. My colleagues are with me as “pillars of strength” resonating the samevalues.
I seek your help in this pursuit of excellence by the contribution of excellence articles stimulating innovativeideas for dynamic market needs, which is powered by speed and quality concepts.
I reassure you, I keep in mind the great words of our former president of India A.P.J. Abdul Kalam “as acitizen of India, armed with knowledge, technical expertise, and above all a great sense of patriotism, wemust realize that small aim is a crime”.
Primax International journal of Commerce and Management Research not only aims to encourage thequalitative research work but also it is felt that the extent of contribution by the Management Academiciansand Institution is highly imperative at this juncture than any other discipline.
Authors have the liberty to extend valuable contributions in their specialized areas in a broader spectrum.The contribution shall be from transitions and challenges in areas such as marketing, finance, humanresource, logistics and supply chain, event management, product, production and operation management,consumer buying behavior, talent management, knowledge management, best practices of notablecorporate houses and businesses. We welcome reviews on books, blogs, case studies, research papers,working papers and so forth to express that you intend to communicate. Your suggestion will help forfurther enrichment of the journal to stand ahead of the rest. It is best assured it will maintain its quality andtimely presentation of the authors that shall be shared by all. “Please enrich me not to give a fish to eat butteach to catch a fish”, your stimulating contribution is the diet for this journal.
I once again thank all my colleagues, well-wishers, friends and above all God almighty who stood by mefrom concept to commissioning of this journal.
Wish you all a grand success!
Page IV
ISSN : 2321-3604
March 2014Vol.2,Special Issue
Primax International Journal of Commerce and Management Research
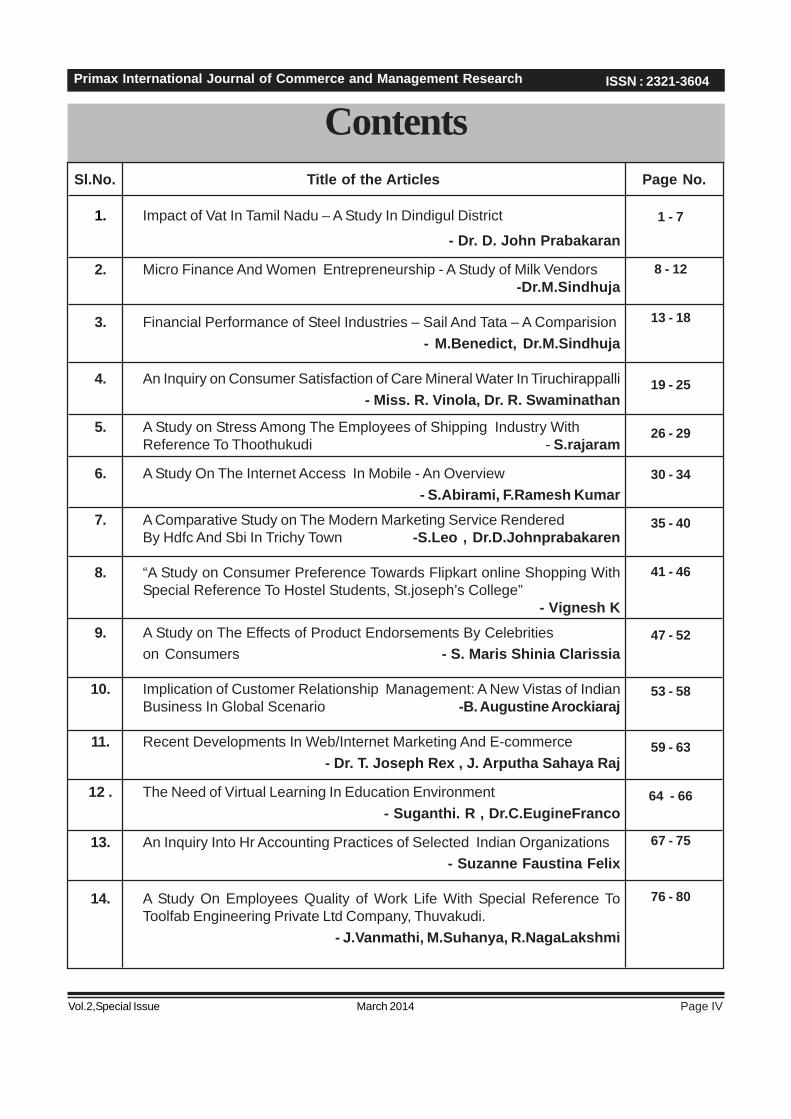
Contents
1 - 7
8 - 12
13 - 18
19 - 25
26 - 29
30 - 34
35 - 40
41 - 46
47 - 52
53 - 58
59 - 63
64 - 66
67 - 75
76 - 80
1. Impact of Vat In Tamil Nadu – A Study In Dindigul District
- Dr. D. John Prabakaran
2. Micro Finance And Women Entrepreneurship - A Study of Milk Vendors-Dr.M.Sindhuja
3. Financial Performance of Steel Industries – Sail And Tata – A Comparision- M.Benedict, Dr.M.Sindhuja
4. An Inquiry on Consumer Satisfaction of Care Mineral Water In Tiruchirappalli- Miss. R. Vinola, Dr. R. Swaminathan
5. A Study on Stress Among The Employees of Shipping Industry WithReference To Thoothukudi - S.rajaram
6. A Study On The Internet Access In Mobile - An Overview- S.Abirami, F.Ramesh Kumar
7. A Comparative Study on The Modern Marketing Service RenderedBy Hdfc And Sbi In Trichy Town -S.Leo , Dr.D.Johnprabakaren
8. “A Study on Consumer Preference Towards Flipkart online Shopping WithSpecial Reference To Hostel Students, St.joseph’s College”
- Vignesh K9. A Study on The Effects of Product Endorsements By Celebrities
on Consumers - S. Maris Shinia Clarissia
10. Implication of Customer Relationship Management: A New Vistas of IndianBusiness In Global Scenario -B. Augustine Arockiaraj
11. Recent Developments In Web/Internet Marketing And E-commerce- Dr. T. Joseph Rex , J. Arputha Sahaya Raj
12 . The Need of Virtual Learning In Education Environment- Suganthi. R , Dr.C.EugineFranco
13. An Inquiry Into Hr Accounting Practices of Selected Indian Organizations- Suzanne Faustina Felix
14. A Study On Employees Quality of Work Life With Special Reference ToToolfab Engineering Private Ltd Company, Thuvakudi.
- J.Vanmathi, M.Suhanya, R.NagaLakshmi
Sl.No. Title of the Articles Page No.

Page VMarch 2014Vol.2,Special Issue
Primax International Journal of Commerce and Management Research ISSN : 2321-3604
15. An Analytical Inquiry On Customer’s Attitude Towards Credit Cards WithSpecial Reference To State Bank of India In Trichy Town
- D. Selvalakshmi , Dr. K. Kumar16. An Analysis On Consumer Behaviour of Cosmetic Users In Trichy District
- R. Santhaseela , Dr. R. Saravanan17. Pros And Cons of Bancaassurance
-E. Miracle Muthu Mary, T. Shanmuga Priya
18. A Study On Customer Satisfaction & Awareness On E-bankingW Special Reference To Trichy Town
-R. Manikandan, Dr. S. Christuraja
19. A Study On Consumer Preferance Towards Laptops With SpecialReference To Tiruchirappalli Town - J. Arputha Sahaya Raj,
B.Adikkalamary , Y. Milton , B. Santhiya
20. The Journey of Ecommerce In India : A Road Map Showing The SurfacingProspects And Hurdles
- M. Antony Jesuraja , S. Domnic Xavier
21. A Study on Analysis of Employees Working Environment WithSpecial Reference To Srf Pvt Ltd.viralimali
- V.Vignesh, N. Gobinath , N.Guru, Dr. D. John Prakaran
22. Study On Quality Of Work Life In Baby Engineering Industries, Trichy- Prof. A. Hendry Ruban , B. Sudha , S. Kathiravan, A. Saranya
23. A Study on Customer Satisfaction In E-banking With SpecialReference To Iob, Icici Banks In Tiruchirappalli Town
-Y. Moydheen Sha
24. A Study On Customer Satisfaction Towards Professional CourierServices Response In Trichirappli- Rajees.J , Matharasi Vidhyabharathi.V, Aravinth.R, Kowsalya devi S
25. A Comparative Study On Modern Marketing Services RenderedBy Sbi And Icici In Trichy District- Dr.F.X.Virgin Fraga, M.Merin Fernando, D.Vedha Lakshmi, T.Ramya
26. A Study On Women Empowerment Through EntrepreneurshipWith Special Reference To Tiruchirappalli Town
- Pradeepa Sriniwasan
27. A Study On Depression And Stress Among College StudentsIn Tiruchirappalli Town
- Dr. N. Maheswari, B. Poornima
28. A Study On Consumer Behavior Towards Drinking Water In Trichy District- T. Priyanka, Dr. N. Mahewari
81 - 85
86 - 90
91 - 95
96 - 104
105 - 110
111 - 113
114 - 119
120 - 123
124 - 129
130 - 134
135 - 139
140 - 144
145 - 149
150 - 157

Page VI
ISSN : 2321-3604
March 2014Vol.2,Special Issue
Primax International Journal of Commerce and Management Research
29. A Study On Internet Marketing Research: Opportunities And Problems- M.G. Saranya, Prof. A. Hendry Ruban
30. A study on performance Appraisal and services of GovernmentHospital in Trichy
- Palanichamy.S, Dr A Francis Vijayakumar
31. The Study of Market Potential And Customer Preferences ofSpencer Retail Private Limited In Tiruchirappalli District
- Robert nelson.J, Dr. Francis Vijayakumar.A
32. Benefits Of Currency Hedging To Export Companies- Dr. R.Mayakkannan, S.Jayashree
33. A Study on Women Entrepreneurs In Tiruchirappalli District of Tamilnadu- Dr.P. Jayakumr, Dr. M. Vincentsahayaraj
34. Study on Select Bancassurance Companies In India - M.ESWARI
35. A Study On Customer Satisfaction Towardsairtel Mobile SimService In Trichirappalli District - Vaidheeswaran. G
36. A Study on Customer’s Satisfaction Towards Retail Services in Trichy.- Joe Johny Britto.J
37. Corporate Social Responsibility- G. Praveena, A.vellimalarRuby
38. “A Study On Satisfaction Level Of E-marketing User.”- B. Nalini, F.Ramesh Kumar
39. A Study on Implementation of 5‘S’in Hotel Ramyas Pvt Ltd. Tiruchirappalli- Venkatesan.S
40. The Study on Corporate Social Responsibility In EmergingMarkets-itc E-choupal - R.Ethelbert Preethi
41. A Study on The Reducing Stress In The Workplace of Select PrivateSector Sugar Mill In Tamilnadu - F. Ramesh kumar, B.Nalini
42. A Study on Problems Faced By Shgs In Lalgudi Taluk, Trichy- S. Anitha, M.Revathi , Dr. N. Maheshwari
43. A Study on Consumer Preference For Compact FluorescentLamp (Cfl) In Tiruchirappalli City
- M. Thiru Murugan, Dr. N. Maheshwari
44. Business Case For Corporate Social Responsibility- P. Reeta, P. Kalaivani
158 - 161
162 - 165
166 - 170
171 - 175
176 - 180
181 - 186
187 - 189
190 - 193
194 - 198
199 - 204
205 - 211
212 - 214
215 - 222
223 - 227
228 - 235
236 - 237

Page VIIMarch 2014Vol.2,Special Issue
Primax International Journal of Commerce and Management Research ISSN : 2321-3604
45. A Study on The organizational Climate In Ordnance Factory, Tiruchirappalli- Dr. F.X. Virgin Fraga
46. Stress Management Models And Techniques- A.Chinnakaruppan, Dr. L. Leo Franklin
47. A Study on Assessment of Employability Skills AmongFinal Year Arts And Science College Students In Tiruchirappalli Town.
- Dr. S. Joseph Xavier, J. Rajees
48. An Empirical Study on E-banking Practices And Customer Satisfaction- Dr. S.P. Dhandayuthapani
49. Marketing Mix Strategies of Private Label Brands (Plbs) In OrganizedRetail Outlets In Chennai, Tamilnadu - An Empirical Investigation
- K.R. Mahalaxmi1, Dr. A. Velanganni Joseph
238 - 241
242 - 245
246 - 250
251 - 257
258 - 264

Page 1March 2014Vol.2, Special Issue
Primax International Journal of Commerce and Management Research ISSN : 2321-3604
IMPACT OF VAT IN TAMIL NADU – A STUDY IN DINDIGUL
DISTRICT1 Dr. D. JOHN PRABAKARAN
ABSTRACTRationalization and harmonization of commodity taxation is a serious problem of the Indian tax system. The root ofthis problem lies in federal structure of the Indian constitution which makes intricate arrangements for the division oftaxation powers between the central and state government. Many trading communities, enterprises, dealers and thegeneral public are not aware of VAT in its fullest context. In the existing sales tax structure there are problems of doubletaxation on commodity and multiplicity of taxes, resulting in cascading tax burden. Today’s global economy, demandsa consistent, legal and regulatory tax framework to support electronic transactions across stage, national and internationalboundaries. This study makes an attempt to study the VAT and its implementation process.
1 Asst. Professor of Commerce and Head, Dept. of Commerce CA, St. Joseph’s College, Trichy.
INTRODUCTIONIn the Globalized economy, almost all the countries inthe world have come through many changes in the modeof their taxation and policy in order to accommodatenew economic order. India is not an exception to thisorder of the day.
As many countries predict, India is going to be the supereconomic power in the years to come and also verymuch ready and be accommodative always in acceptingthe new changes in the economic order, the governmentof India reaps fruits from the changes they haveundergone in the last ten years. Value Added Tax (VAT)is also an important and new dimension programme bywhich the Government of India is ready to venture in thetaxation policies and procedures. It was first initiatedin Brazil in 1960 and then in the European countries inthe early 1970’s. But in India it was implemented on the1st April 2005 and in Tamil Nadu it was introduced in2007.
VAT is aiming at the creation of the national commonmarket. It is also required under the General Agreementon Tariff and Trade (GATT) 1994, of World TradeOrganization. It means, any internal Indirect Tax imposedby a member state should be neutral for the smoothflow of world trade in goods and services. It is alsoagreed that in international trade, the principles of equaltreatment should be followed. Therefore VAT is seenas reflection of the successful way in which the tax canbe used in the growth of world trade, because of itsneutral aspect.
Value Added Tax or VAT is levied on top of the cost of aproduct or service and generates revenue for thegovernment. Value Added Tax, popularly known as ‘VAT’
is a special type of indirect tax in which a sum of moneyis levied at a particular stage in the sale of a product orservice.
STATEMENT OF THE PROBLEMRationalization and harmonization of commodity taxationis a serious problem of the Indian tax system. The rootof this problem lies in federal structure of the Indianconstitution which makes intricate arrangements for thedivision of taxation powers between the central and stategovernment. The problem has been further compoundedby the confrontation politics pursued by different politicalparties ruling at the centre and in the states.
Many trading communities, enterprises, dealers and thegeneral public are not aware of VAT in its fullest context.In the existing sales tax structure there are problems ofdouble taxation on commodity and multiplicity of taxes,resulting in cascading tax burden.
Initially, the public hue and cry against the introductionof Value Added Tax (VAT) had posed a great problem inits implementation. The traders and business men hadprojected VAT as the root cause of increase in price ofgoods. Business community exploited that VAT will leadto price rise and as such it is unconstitutional to replaceit with existing sales tax. However the real reason isdifferent. There is less scope of tax evasion under VATand there will be strict tax compliance. The tradingcommunity wants to retain the scope of tax evasion, asit existed under sales tax structure.
Today’s global economy, demands a consistent, legaland regulatory tax framework to support electronictransactions across stage, national and internationalboundaries. This study makes an attempt to study theVAT and its implementation process.

Page 2
ISSN : 2321-3604
March 2014Vol.2, Special Issue
Primax International Journal of Commerce and Management Research
OBJECTIVES1. To study the details about the VAT system.
2. To study the price and revenue trends in Dindigul District after implementation of VAT.
3. To give suggestions to implement VAT system in an effective manner.
METHODOLOGYThe secondary data were collected from journals, periodicals, books and reports, published articles, and alsothrough the data provided by the Commercial Tax Office, Dindigul to collect more information relevant to this research.
DINDIGUL DISTRICT COMMERCIAL TAX ASSESSMENT CIRCLES
REVENUE TRENDVAT is an efficient and tax payer-friendly system of taxation of goods and services in the country, in line withinternational best practices as well as the special characteristics of the Indian economy. The main objective of VATis improving tax compliance and also increases the revenue of the government. Keeping this objective in view, thisis an attempt has been made to analyze the revenue trend of Dindigul district commercial tax division.
4.4.1 Revenue Collection of Dindigul District AC- 1 Division
S.No Name of the C.T District
Name of the AssessmentCircles
1 Dindigul-I, Assessment Circle
2 Dindigul-II, Assessment Circle
3 Dindigul-III, Assessment Circle
4 Dindigul-IV, Assessment Circle
5 DINDIGUL Dindigul-V, Assessment Circle
6 Dindigul Rural Assessment Circle
7 Palani-I Assessment Circle
8 Palani-II Assessment Circle
9 Nilakottai Assessment Circle
10 Kodaikanal Assessment CircleSource : Office of Deputy Commissioner (CT)(FAC), Dindigul.
S.No Years Collection(Rs. in lakhs) Trend Value
1. 2002-03 147.79 169.29
2. 2003-04 168.71 165.94
3. 2004-05 167.73 162.59
4. 2005-06 187.27 159.24
5. 2006-07 180.62*** 155.89
6. 2007-08 114.50 152.54
7. 2008-09 148.48 149.19
***( 2006-2007 inclusive of three months VAT period 1.1.2007 on wards)

Page 3March 2014Vol.2, Special Issue
Primax International Journal of Commerce and Management Research ISSN : 2321-3604
The table 4.4.1 which shows the revenue collection of Dindigul District AC- 1 Division and its trend values. Duringthe periods 2002-03, 2003-04, 2004-05 and 2005-06 the revenue collection was Rs. 147.79 lakhs, Rs. 168.71lakhs, Rs. 167.73 lakhs, Rs. 187.27 lakhs respectively and their trend values were 169.29, 165.94, 162.59,159.24.During the periods 2007-08 and 2008-09 the revenue collection was Rs. 114.50 lakhs, Rs.148.48 lakhs respectively.Their trend values were 152.54 and 149.19. In the TNGST period there were uneven ups and downs in the collectionof the tax revenue whereas after implementing VAT system tax revenue was in an increased trend. Generallyrevenue collection has decreased during the VAT period comparing to TNGST period. In Dindigul District AC- 1Division within the VAT period the revenue has increased during 2008-09 comparing it to the previous year.
***( 2006-2007 inclusive of three months VAT period 1.1.2007 on wards)Source : Commercial Tax Office, Dindigul
The following details have been observed from the table 4.4.2 which shows the revenue collection of Dindigul DistrictCTO - 2 Division and its trend values. During the periods 2002-03, 2003-04, 2004-05 and 2005-06 the revenuecollection was Rs. 251.18 lakhs,Rs. 285.85 lakhs, Rs. 229.53 lakhs, Rs. 306.91 lakhs respectively and their trendvalues were 241.23, 262.82, 284.41, 306.00. During the periods 2007-08 and 2008-09 the revenue collection wasRs. 343.74 lakhs, Rs.373.56 lakhs respectively. Their trend values were 349.18 and 370.77. In the TNGST periodthere were uneven ups and downs in the collection of the tax revenue; whereas after implementing VAT system taxrevenue was in an increased trend. Generally revenue has increased after implementation of VAT in Dindigul IIassessment circle.
4.4.2 Revenue Collection of Dindigul District CTO - 2 Division
S.No Years Collection(Rs. in lakhs) Trend Value
1. 2002-03 251.18 241.23
2. 2003-04 285.85 262.82
3. 2004-05 229.53 284.41
4. 2005-06 306.91 306.00
5. 2006-07 351.23*** 327.59
6. 2007-08 343.74 349.18
7. 2008-09 373.56 370.77
4.4.3 Revenue Collection of Dindigul- III Assessment Circle
S.No Years Collection(Rs. in lakhs) Trend Value
1. 2002-03 253.88 197.91
2. 2003-04 235.28 218.66
3. 2004-05 188.41 239.41
4. 2005-06 222.88 260.16
5. 2006-07 212.80*** 280.91
6. 2007-08 334.86 301.66
7. 2008-09 373.02 322.41***( 2006-2007 inclusive of three months VAT period 1.1.2007 on wards)Source: Commercial Tax Office, Dindigul
Page 4
ISSN : 2321-3604
March 2014Vol.2, Special Issue
Primax International Journal of Commerce and Management Research
The following details have been observed from the table 4.4.3 which shows the revenue collection of Dindigul-IIIAssessment Circle and its trend values. During the periods 2002-03, 2003-04, 2004-05 and 2005-06 the revenuecollection was Rs. 253.88 lakhs, Rs. 235.28 lakhs, Rs. 188.41 lakhs, Rs. 222.88 lakhs respectively and their trendvalues were 197.91, 218.66, 239.41, 260.16. During the periods 2007-08 and 2008-09 the revenue collection wasRs. 334.86 lakhs, Rs.373.02 lakhs respectively. Their trend values were 301.66 and 322.41. In the TNGST periodthere were uneven ups and downs in the collection of the tax revenue whereas after implementing VAT system taxrevenue was in an increased trend. Generally revenue has increased after implementation of VAT in Dindigul IIIassessment circle.
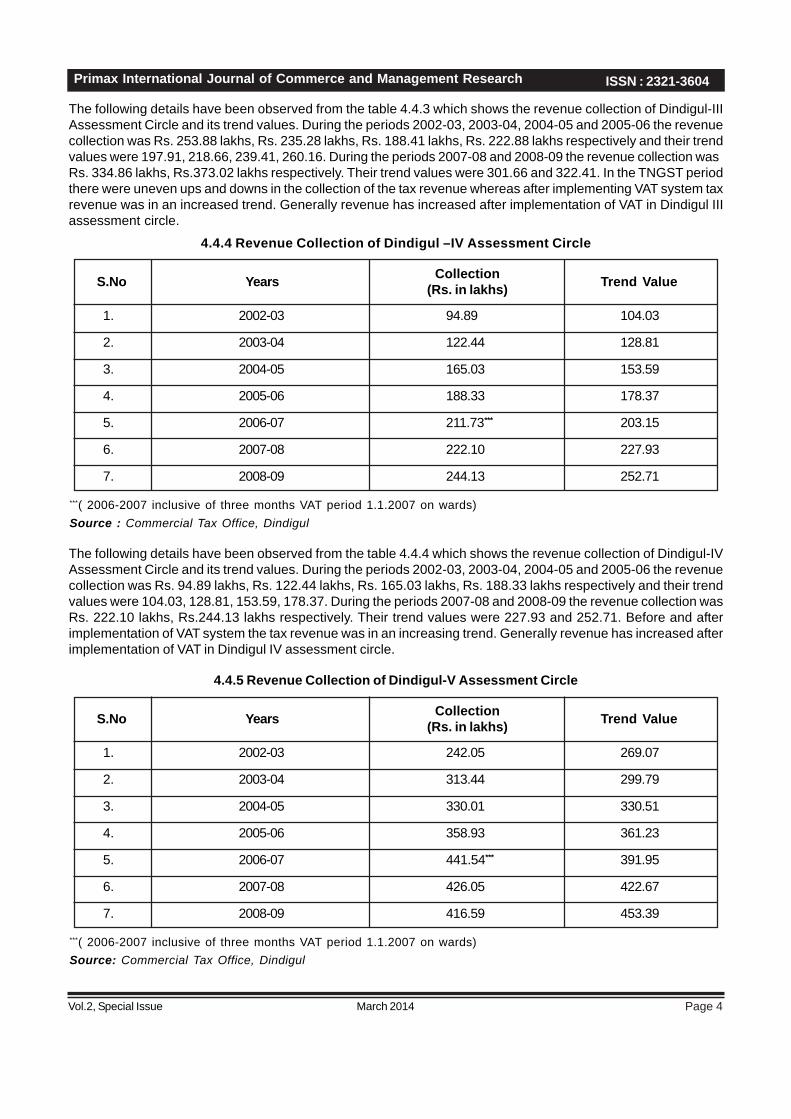
4.4.4 Revenue Collection of Dindigul –IV Assessment Circle
S.No Years Collection(Rs. in lakhs) Trend Value
1. 2002-03 94.89 104.03
2. 2003-04 122.44 128.81
3. 2004-05 165.03 153.59
4. 2005-06 188.33 178.37
5. 2006-07 211.73*** 203.15
6. 2007-08 222.10 227.93
7. 2008-09 244.13 252.71
***( 2006-2007 inclusive of three months VAT period 1.1.2007 on wards)Source : Commercial Tax Office, Dindigul
The following details have been observed from the table 4.4.4 which shows the revenue collection of Dindigul-IVAssessment Circle and its trend values. During the periods 2002-03, 2003-04, 2004-05 and 2005-06 the revenuecollection was Rs. 94.89 lakhs, Rs. 122.44 lakhs, Rs. 165.03 lakhs, Rs. 188.33 lakhs respectively and their trendvalues were 104.03, 128.81, 153.59, 178.37. During the periods 2007-08 and 2008-09 the revenue collection wasRs. 222.10 lakhs, Rs.244.13 lakhs respectively. Their trend values were 227.93 and 252.71. Before and afterimplementation of VAT system the tax revenue was in an increasing trend. Generally revenue has increased afterimplementation of VAT in Dindigul IV assessment circle.
4.4.5 Revenue Collection of Dindigul-V Assessment Circle
S.No Years Collection(Rs. in lakhs) Trend Value
1. 2002-03 242.05 269.07
2. 2003-04 313.44 299.79
3. 2004-05 330.01 330.51
4. 2005-06 358.93 361.23
5. 2006-07 441.54*** 391.95
6. 2007-08 426.05 422.67
7. 2008-09 416.59 453.39
***( 2006-2007 inclusive of three months VAT period 1.1.2007 on wards)Source: Commercial Tax Office, Dindigul

Page 5March 2014Vol.2, Special Issue
Primax International Journal of Commerce and Management Research ISSN : 2321-3604
The following details have been observed from the table 4.4.5 which shows the revenue collection of Dindigul-VAssessment Circle and its trend values. During the periods 2002-03, 2003-04, 2004-05 and 2005-06 the revenuecollection was Rs. 242.05 lakhs, Rs. 313.44 lakhs, Rs. 330.01 lakhs, Rs. 358.93 lakhs respectively and their trendvalues were 269.07, 299.79, 330.51, 361.23. During the periods 2007-08 and 2008-09 the revenue collection wasRs. 426.05 lakhs, Rs.416.59 lakhs respectively. Their trend values were 422.67 and 453.39. Under TNGST periodthe tax revenue was in an increasing trend, but after implementation of VAT the tax revenue was decreased.Generally revenue collection has increased during the VAT period comparing to TNGST period. In Dindugul VAssessment circle, within the VAT period the revenue has decreased during 2008-09 comparing to previous year.
4.4.6 Revenue Collection of Dindigul (Rural) Assessment Circle
S.No Years Collection(Rs. in lakhs) Trend Value
1. 2002-03 2334.97 2696.68
2. 2003-04 2860.37 2873.82
3. 2004-05 3204.34 3050.96
4. 2005-06 3311.46 3228.10
5. 2006-07 4344.84*** 3405.24
6. 2007-08 3076.39 3582.38
7. 2008-09 3464.09 3759.52
***( 2006-2007 inclusive of three months VAT period 1.1.2007 on wards)Source : Commercial Tax Office, Dindigul
The following details have been observed from the table4.4.6 which shows the revenue collection of Dindigul(Rural) Assessment Circle and its trend values. Duringthe periods 2002-03, 2003-04, 2004-05 and 2005-06 therevenue collection was Rs. 2334.97 lakhs, Rs. 2860.37lakhs, Rs. 3204.34 lakhs, Rs. 3311.46 lakhs respectivelyand their trend values were 2696.68, 2873.82, 3050.96,3228.10. During the periods 2007-08 and 2008-09 therevenue collection was Rs. 3076.39 lakhs, Rs.3464.09lakhs respectively. Their trend values were 3582.38 and3759.52. Before and after the implementation of VATsystem the tax revenue was in an increasing trend.Generally revenue collection has decreased during theVAT period comparing to TNGST period. In Dindugul(Rural) Assessment circle, within the VAT period theRevenue has increased during 2008-09 comparing it tothe previous year.
MAJOR FINDINGSDindigul district is divided into 10 assessment circle.The revenue impact of VAT in the above said 10 circleswere studied. The findings of that study weresummarized and given below:
The revenue trend of the Dindigul District AC – 1 Divisionwas decreased during the VAT period. The numbers of
VAT registered dealers in Dindigul District AC - 1 Divisionwere 350 as on 31.03.2009. In the TNGST period therewere uneven ups and downs in the collection of the taxrevenue whereas after implementing VAT system taxrevenue has come down. Generally revenue collectionhas decreased during the VAT period comparing to TNGSTperiod.
The revenue trend of the Dindigul District CTO – 2 Divisionwas increased during the VAT period. The number ofVAT registered dealers in Dindigul District CTO – 2Division were 414 as on 31.03.2009. In the TNGST periodthere were uneven ups and downs in the collection ofthe tax revenue; whereas after implementing VAT systemtax revenue was in an increased trend. Generally revenuehas increased after implementation of VAT in DindigulDistrict CTO – 2 Division.
The revenue trend of the Dindigul –III Assessment Circlewas increased during the VAT period. The numbers ofVAT registered dealers in Dindigul III Assessment Circlewere 426 as on 31.03.2009. In the TNGST period therewas uneven ups and downs in the collection of the taxrevenue whereas after implementing VAT system taxrevenue was in an increased trend. Generally revenuehas increased after implementation of VAT in Dindigul IIIassessment circle.

Page 6
ISSN : 2321-3604
March 2014Vol.2, Special Issue
Primax International Journal of Commerce and Management Research
The revenue trend of the Dindigul –IV Assessment Circlewas increased during the VAT period. The numbers ofVAT registered dealers in Dindigul-IV Assessment Circlewere 293 as on 31.03.2009. Before and afterimplementation of VAT system the tax revenue was inan increasing trend. Generally revenue has increasedafter implementation of VAT in Dindigul IV assessmentcircle.
The revenue trend of the Dindigul –V Assessment Circlewas increased during the VAT period. The numbers ofVAT registered dealers in Dindigul-V Assessment Circlewere 456 as on 31.03.2009.Under TNGST period thetax revenue was in an increasing trend, but afterimplementation of VAT the tax revenue was decreased.Generally revenue collection has increased during theVAT period comparing to TNGST period.
The revenue trend of the Dindigul (Rural) AssessmentCircle was decreased during the VAT period. Thenumbers of VAT registered dealers in Dindigul (Rural)Assessment Circle were 663 as on 31.03.2009. Beforeand after the implementation of VAT system the taxrevenue was in an increasing trend. Generally revenuecollection has decreased during the VAT periodcomparing to TNGST period.
The revenue trend of the Palani -I Assessment Circlewas decreased during the VAT period. The numbers ofVAT registered dealers in Palani-I Assessment Circlewere 350 as on 31.03.2009. Except the assessmentyear 2005-06 tax revenue was in an increasing trend inTNGST and VAT periods. Generally revenue has comedown after the implementation of VAT.
The revenue trend of the Palani -II Assessment Circlewas decreased during the VAT period. The numbers ofVAT registered dealers in Palani-II Assessment Circlewere 323 as on 31.03.2009. Under TNGST period thetax revenue was in an increasing trend, but afterimplementation of VAT the tax revenue was decreased.Generally revenue has come down after theimplementation of VAT.
The revenue trend of the Nilakottai Assessment Circlewas decreased during the VAT period. The numbers ofVAT registered dealers in Nilakottai Assessment Circlewere 352 as on 31.03.2009. Under TNGST period thetax revenue was in an increasing trend, but afterimplementation of VAT the tax revenue was decreased.Generally revenue has come down after theimplementation of VAT.
The revenue trend of the Kodaikanal Assessment Circlewas decreased during the VAT period. The numbers ofVAT registered dealers in Kodaikanal Assessment Circle
were 122 as on 31.03.2009. Before and afterimplementation of VAT system the tax revenue was inan increasing trend. Generally revenue has come downafter the implementation of VAT.
It is concluded that after implementation of VAT amongthe 10 circles in Dindigul revenue district five assessmentcircles tax revenue has been increased. (Dindigul DistrictCTO – 2 Division, Dindigul-III Assessment Circle,Dindigul-IV Assessment Circle, Dindigul-V AssessmentCircle and Dindigul (Rural) Assessment Circle. Theremaining five assessment (Dindigul District AC – 1Division, Palani –I Assessment Circle, Palani –IIAssessment Circle, Nilakottai Assessment Circle andKodaikanal Assessment Circle) circle tax revenue hasbeen decreased due to the following reasons;
After implementation of VAT due to the thresholdlimit of turnover numbers of tax payers are reduced.
After implementation of VAT in Dindigul districtdealers in Dindigul District AC – 1 Division, Palani–I Assessment Circle, Palani –II Assessment Circle,Nilakottai Assessment Circle and KodaikanalAssessment Circles have been traded maximumnumber of exempted goods.
SUGGESTIONSAt present Tamil Nadu Value Added Tax Act havefour slab rates of tax. Those are 0%, 4%, 12.5%and exempted. These multiple rates of tax have beencreating classifications and interpretational disputesand other complications for business man. It issuggested that the number of rates should be tworates among 1% - 4% for all goods that would becovered for VAT.
At present different rates of tax structure has beenfollowed under VAT system in different states of India.It has created the problem of in inter-state sales,relationship among states and in their administration.So, it is suggested uniform rates of tax should befollowed in all states of India. That would create goodrelationship among the states, encourage inter-statesales and create a common market.
VAT is believed to be a complicated tax system; taxpayers may have many doubts and fears about VATrequirements and VAT recording and accountingsystem. It is suggested that state government shouldcreate a VAT public unit to address the tax payer’squeries.
VAT requires more preparation than any other formof commodity tax and many difficulties inunderstanding VAT system for common people and

Page 7March 2014Vol.2, Special Issue
Primax International Journal of Commerce and Management Research ISSN : 2321-3604
there was a scope for negotiation, personalinterruption and corruption. It is suggested that avery simple, clear and adequate VAT law should beformulated. An extensive general informationcampaign to educate the public, businessmen andtraders on VAT should be launched. Information maybe disseminated through media such as radio,television, newspaper leaflets and should organizeseminars, workshops, training programmes, publictalk programmes, forums and meetings.
CONCLUSIONVAT was aiming at the creation of the national commonmarket. Any internal Indirect Tax imposed by a memberstate should be neutral for the smooth flow of world tradein goods and services. The value added tax systemwas designed to address various problems associatedwith the conventional sales tax system. In General salestax, there was no provision for input tax credit, whichmeant that the end consumer may pay tax on an inputthat had already been taxed previously. This was knownas cascading effect and which lead to increase inconsumer tax and price levels, which resulted increasingthe rate of evasion which is more detrimental to theeconomic growth. The main motive of implementing VATis to increase the revenue to the government bypreventing tax evasions and unfair trade practices,prevailing in the modern market.
REFERENCE:
Alan M. Cushnir, VAT and the Surrender of Leases,Journal of Property Finance, 1992, Vol:3, Issue:2,pp. 17-26.
Amaresh Bagchi, VAT and State Autonomy,Economic and Political Weekly, Vol XL No 18, April30-May 6, 2005.
Amit Suresh Tolani & Nandkishor Ramkrishna Udgiri,The Chartered Accountant Student, Vol. 10 ,No. 7,December 2006, pp. 9-13
Andrew D. Wells, VAT and property management:current details, Property Management, Vol:10,Issue:3,1992.
Adams, Charles 1998, Those Dirty Rotten Taxes,The Free Press, New York Ny.
Adams, Charles, 1993, For Good and Evil: TheImpact of Taxes on the Course of Civilization,Madison Books.
Astha Ahuja 2004, Value Added Tax Indian and GlobalExperiences, New Century Publications, New Delhi,India.
Chittora B.K 2005, Value Added Tax, MarkPublishers, Jaipur, India.

Page 8
ISSN : 2321-3604
March 2014Vol.2, Special Issue
Primax International Journal of Commerce and Management Research
MICRO FINANCE AND WOMENENTREPRENEURSHIP - A STUDY OF MILK VENDORS
1Dr.M.Sindhuja
ABSTRACTThis paper is an attempt to analyze the impact of micro finance on income and entrepreneurship of women in Milkvending. The study was conducted in Ottanchathiram and Battalagundu blocks of Dindigul District where NABARDand commercial banks and MahalirThittam extended micro finance to poorest among the poor women to take up Milkvending venture as Income Generating Activity (IGA). Data collected through pre–tested schedule by personalinterview method. The Kollapatty village of K.Pudur Panjayat in Ottanchathiram block and Lakshmipuram village ofMallarampatti Panchayat in Battalagundu block were selected. The total maintenance cost per annum per buffalowas found Rs. 15188.23 in Ottanchathiram block and in Battalagundu block it was Rs.12893.75. The net return wasfound to be Rs. 17599.31 in Ottanchathiram block and in Battalagundu block it was Rs.25655. In Dindigul district,18NGO’s have been approved by the Tamil Nadu Corporation for Women Development for the year 2012-13. As on date14609 SHGs groups have been formed under Mahalir Thittam with 2,21,562 women enrolled as members. Nearly 20per cent of the SHG members in this District are involved in milk vending activity.
1Assistant Professor of Commerce, Saraswathi Narayanan College, Madurai
Introduction:Women constitute half of the world’s population, performnearly two thirds of its work hours but receive only one-tenth of income and own one-hundredth of property. Theyare vital part of the Indian economy, constituting onethird of the national labour force and forming a majorcontributor to the survival of family. About 89 per cent oftotal female labour is involved in agriculture and alliedsectors. Women have extensive work load with dualresponsibility of farming in general and livestock andhousehold production in particular.
Micro finance is a broad term that includes deposits,loans, payment services and insurance to poor. Ingeneral this concept is understood as providing poorfamilies with small loans to help them to engage inproductive activities or expand their tiny businesses.Among various activities taken up by women, dairyenterprise has been considered as a potential means ofalleviating large scale employment, especially in ruralareas. Women play a key role in animal, farm and homemanagement. Successful dairy not only improves thesocio-economic status of rural women, but also assuresa sustained and assured means of income to supplementtheir income from the main enterprise.
To improve the socio-economic conditions of ruralwomen, the Mahalir Thittam has extended micro financeto poorest women entrepreneurs in the selected blocksof Dindigul district through SHGs during 2011-12 and2012-13. The main objective of this financial support forpoor women entrepreneur was to improve their socio-economic condition by engaging them in dairy enterprisefor generation of additional employment opportunity andenhancing their family income. An attempt is made in
the present paper to analyse the impact of thisprogramme on empowerment of rural poor women asdairy entrepreneurs after its 3 to 4 years operation inthe study area. The assessment of impact of microfinance on empowerment of rural women in terms ofincome and employment may help bankers, plannersand policy makers to extend similar financial assistancefor poor women entrepreneurs in other areas.
Objectives:
• To Study the Socio- economic status of rural womenbeneficiaries.
• To Assess the Impact of Micro finance on incomeand employment of rural women through dairyenterprise.
Methodology :To encourage the rural women, who are poorest amongthe poor in rural area and interested to take up dairyenterprise as an income generating activity were providedfinancial support for purchase of dairy animals particularlybuffaloes through Self Help Groups in two villages ofOttanchathiram and Battalagundu blocks in Dindiguldistrict, 10 women beneficiaries of Lakshmipuram villagein Battalagundu block and in Ottanchathiram block, 20women beneficiaries of Kollapatty village were selectedfor providing financial support. In all, 30 rural womenbeneficiaries who have availed financial support from theMahalir Thittam were selected for the present study.The data were collected from the respondents by personalinterview method using pre-tested schedule prepared forthe purpose. The secondary data relating to profile ofthe rural women beneficiaries prior to providing financialsupport was obtained from the reports maintained in the
Page 9March 2014Vol.2, Special Issue
Primax International Journal of Commerce and Management Research ISSN : 2321-3604
office of the Mahalir Thittam Dindigul district. The tabular analysis and percentages were used to analyze the data.
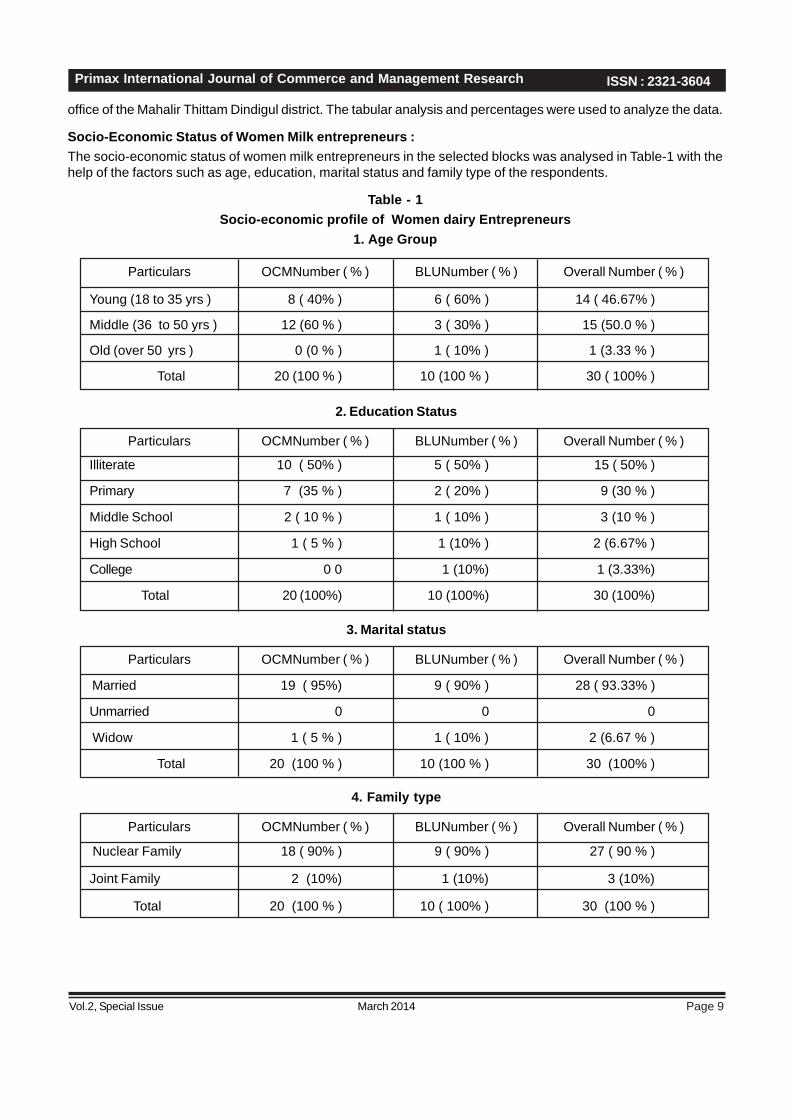
Socio-Economic Status of Women Milk entrepreneurs :The socio-economic status of women milk entrepreneurs in the selected blocks was analysed in Table-1 with thehelp of the factors such as age, education, marital status and family type of the respondents.
Table - 1Socio-economic profile of Women dairy Entrepreneurs
1. Age Group
Particulars
Young (18 to 35 yrs ) 8 ( 40% ) 6 ( 60% ) 14 ( 46.67% )
Middle (36 to 50 yrs ) 12 (60 % ) 3 ( 30% ) 15 (50.0 % )
Old (over 50 yrs ) 0 (0 % ) 1 ( 10% ) 1 (3.33 % )
Total 20 (100 % ) 10 (100 % ) 30 ( 100% )
OCMNumber ( % ) BLUNumber ( % ) Overall Number ( % )
Particulars
Illiterate 10 ( 50% ) 5 ( 50% ) 15 ( 50% )
Primary 7 (35 % ) 2 ( 20% ) 9 (30 % )
Middle School 2 ( 10 % ) 1 ( 10% ) 3 (10 % )
High School 1 ( 5 % ) 1 (10% ) 2 (6.67% )
College 0 0 1 (10%) 1 (3.33%)
Total 20 (100%) 10 (100%) 30 (100%)
OCMNumber ( % ) BLUNumber ( % ) Overall Number ( % )
2. Education Status
Particulars
Married 19 ( 95%) 9 ( 90% ) 28 ( 93.33% )
Unmarried 0 0 0
Widow 1 ( 5 % ) 1 ( 10% ) 2 (6.67 % )
Total 20 (100 % ) 10 (100 % ) 30 (100% )
OCMNumber ( % ) BLUNumber ( % ) Overall Number ( % )
3. Marital status
Particulars
Nuclear Family 18 ( 90% ) 9 ( 90% ) 27 ( 90 % )
Joint Family 2 (10%) 1 (10%) 3 (10%)
Total 20 (100 % ) 10 ( 100% ) 30 (100 % )
OCMNumber ( % ) BLUNumber ( % ) Overall Number ( % )
4. Family type

Page 10
ISSN : 2321-3604
March 2014Vol.2, Special Issue
Primax International Journal of Commerce and Management Research
The age distribution pattern of women beneficiaries indicated that half of the respondents (50.00%) were in middleaged group, nearly 47 per cent were in young age group and only 3.3 per cent were in old age group. The educationalstatus of beneficiaries indicated that 50 per cent of the beneficiaries were illiterates and nearly one third (30%) ofthem had primary education followed by 10 per cent had middle schooling, 6.67 per cent had secondary educationand only 3.33 per cent were educated up to college level in the study area. The analysis of marital status of thebeneficiaries revealed that about 93.33 per cent of the beneficiaries were married and the rest of them (6.67%) werewidows in the study area. The family profile of beneficiaries indicated that majority of the beneficiaries had nuclearfamily (90.00%) and 10 per cent of them had joint family in the study area.
Cost and Return of Women Milk Entrepreneurs:The maintenance cost of the buffalo and the return of income has been anaysed in Table-2 with the help of thevarious components of the costs and incomes
Table - 2 Costs and Returns of dairy Enterprise in Dindigul District
Rs. Per buffalo/annum
Particulars OCM Block (%) BTL Block (%)
A. Variable Cost (Rs.)
Dry Fodder 2339.75 (18.16%) 1400.33 (12.98%)
Green Fodder 425.63 (3.3%) 406.07 (3.76%)
Concentrates 054.30 (8.18%) 1004.7 (9.32%)
Labour 6900.50 (53.55%) 5920.50 (54.89%)
Miscellaneous 540.72 (4.19%) 417.38 (3.88%)
Interest on working capital 1625.86 (12.62%) 1635.81 (15.17%)
Total Variable Cost 12886.76 (100%) 10784.79 (100%)
B.Fixed Cost
Depreciation on Fixed Capital 1075.84 (46.74%) 1060.40 (50.28%)
Interest on Fixed Capital 1225.63 (53.26%) 1048.56 (49.72%)
Total Fixed Cost 2301.47 (100%) 2108.96 (100%)
C.Total Cost 15188.23 12893.75
D.Returns
Milk Production (Litres) 1208.06 ( 3.68%) 1336.93 (3.47%)
Value of Milk 28993.44 (88.43%) 32086.32 ( 83.24%)
Sale of FYM and Calf 2586.04 (7.89%) 5125.56 ( 3.29%)
Gross Return 32787.54 ( 100%) 38548.81 ( 100%)
E.Net Returns 17599.31 25655.06
Total cost incurred per annum for maintaining a dairy buffalo was found to be Rs. 15188.23 in Ottanchathiram blockand it was Rs. 12893.75 in Battalagundu block. Among the variable cost, labour cost constituted highest, it wasfound Rs. 12886.76 and Rs.10784.79 per annum in Ottanchathiram and Battalagundu blocks respectively. This is

Page 11March 2014Vol.2, Special Issue
Primax International Journal of Commerce and Management Research ISSN : 2321-3604
because of the dairying operations like, cleaning of animals, roughage collection and transportation, grazing ofanimals, cleaning of shed, milking and transportation of milk for marketing and the like. The per unit cost of labourwas high. In dairy enterprise, whether it is one animal or a unit of 4-5 animals labour required is more or less same.Thus the cost of labour could be reduced substantially by expanding the dairy unit. The other components ofmaintenance cost of dairy unit are cost of dry fodder, concentrates and interest on working capital. These all puttogether accounted for 46 per cent in the study area.
The milk production was found to be 1208.06 litres and 1336.93 litres in Ottanchathiram and Battalagundu blocksrespectively. Milk production is associated with feeding of green fodder, concentrates and technology adoption.The gross return and net return was found Rs. 32787.54 and Rs 17599.31 respectively in Ottanchathiram block,whereas in Battalagundu it was found to be Rs.38548.81 and Rs. 25655.06 respectively.
Impact of Micro Finance on Employment and Income Generation:The impact of Micro finance on the increase in the level of employment and increase in the income of the womenin the study area are analysed in Table-3 and Table-4
Table 3 Impact of Micro Finance on Employment and Income Generation in Ottanchathiram Block
N Categories Before Micro Finance After Micro Finance
EMPLOYMENT(Man days/Annum)
1. Low (Less than 107.93) 10 (50%) -
2. Medium (107.93-126.32) 4 (20%) -
3. High (More than 126.32) 6 (30%) 20 (100%)
Total 20 20
Mean 117.15 283.98
SD 21.58 39.86
INCOME (Rs./Annum)
1. Low (Less than Rs.7986.45) 4 (20%) 3 (15%)
2. Medium (7986.45 to 13713.15) 11 (55%) 8 (40%)
3. High (More than 13713.15) 5 (25%) 9 (45%)
Total 20 (100%) 20 (100%)
Mean 10850 15311.53
SD 6737.76 8059.42
Table 4 Impact of Micro Finance on Employment and Income Generation in Battalagundu Block
N Categories Before Micro Finance After Micro Finance
EMPLOYMENT(Man days/Annum)
1. Low (Less than 95.83) 2 (20%) -
2. Medium(95.83.-113.27) 6 (60%) -

Page 12
ISSN : 2321-3604
March 2014Vol.2, Special Issue
Primax International Journal of Commerce and Management Research
3. High (More than 113.27) 2 (20%) 10 (100%)
Total 10 10
Mean 104.40 264.58
SD 20.88 28.76
INCOME (Rs./Annum)
1. Low ( Less than Rs.4314.03) 4 (40%) 1 (10%)
2. Medium (4314.03- 6885.97) 3 (30%) -
3. High (More than 6885.97) 3 (30%) 9 (90%)
Total 10 (100%) 10 (100%)
Mean 5600 10914.41
SD 3025.81 3240.03
The changes in employment level of the beneficiaries inOttanchathiram block (Table 3) under high employmentcategory per annum had increased from 30 per centbefore availing microfinance to 100 per cent after providingmicrofinance. In case of Battalagundu block (Table 4)it is observed that the percentage of beneficiaries underhigh employment category increased from 20 per centbefore providing microfinance to 100 per cent afterproviding microfinance. It was observed that the numberof beneficiaries in Ottanchathiram block with highincome increased from 25 per cent before providingmicrofinance to 45 per cent after providing microfinance.In case of Battalagundu block (Table 4) it is observedthat the percentage of the beneficiaries with high incomeincreased from 30 per cent before providing microfinanceto 90 per cent after providing microfinance. Majority ofthe beneficiaries (90%) fell under high income categoryafter providing microfinance.
Conclusion:Empowering women is vital in developing countries likeIndia. Hence, conscious and continual effort isdemanded in this regard for the upliftment of society. InDindigul District, the income of the SHG womenentrepreneurs have been increased through theMicrofinance and if they are continuously motivated inthe right direction, they would develop the microentrepreneurship throughout the district soon.
References :Misra, J.P. and Pandey, B.K., 1986, An economicanalysis of banks dairy financing scheme for small andmarginal farmers and agricultural laborers under IRDPin Basti district of U.P. Indian Coop. Rev., 24 : 34-42.
Sarada, O., 2001, Empowerment of rural women in SelfHelp Groups in Prakasam district of Andhra Pradesh-An analysis. M.Sc. Thesis, Univ. Agric. Sci., Bangalore(India).
Savitha, S. Shetter, 2004, Role of rural women in AnimalHusbandry. M.H.Sc. Thesis, Univ. Agric. Sci., Dharwad(India).
Josily Samuel, 2006, Women empowerment throughmicro finance in Dindigul District of Tamil Nadu – Aneconomic analysis. M.Sc. (Agri.) Thesis, Univ. Agric.Sci., Dharwad (India).
Subodh Kumar, Hema Tripathi and Mandape, M. K.,2008, Income and employment status among SHGmembers in dairy husbandry. Indian Dairy Man., 60 :40-46.

Page 13March 2014Vol.2, Special Issue
Primax International Journal of Commerce and Management Research ISSN : 2321-3604
FINANCIAL PERFORMANCE OF STEEL INDUSTRIES – SAILAND TATA – A COMPARISION
1M.Benedict 2Dr.M.Sindhuja
ABSTRACTIndia is currently the fourth largest producer of crude steel in the world and is expected to become the second largestin the near future. The total market value of the Indian steel industry stood at $ 57.8 billion in 2011 and is predictedto touch $95.3 billion by 2016. The sector contributes to nearly 2 percent of the gross domestic product (GDP) andemploys over 5,00,000 people. In the present research paper an attempt has been made to study the financialperformance of two selected companies of public and private steel industry such as SAIL and TATA STEEL. Thepresent study covers the five year period for both companies. In the paper, it has been tried to compare and analyzethe Profitability, Liquidity and Management Efficiency of both the units with various financial tools and statisticaltechniques has been also derived some findings from the analysis. In the overall analysis, the performance of TATAis found to be better than SAIL during the study period. Due to the global economic slowdown, both SAIL and TATAperformance during the study period were not good.
1 Research Scholar, GTN Arts College, Dindigul, Tamilnadu, India.2 Assistant Professor Saraswathi Narayanan College, Madurai.
INTRODUCTION:Steel is inevitable to the development of global economyof modern life style. The degree of per capita consumptionof steel is treated as on important index of the level ofsocioeconomic development and living standard of thepeople in any nation. It is a product of large andtechnological complex industry having strong forward anddownward linkages in terms of turnover and incomegeneration. Steel industry was the vanguard in theliberalization of
industrial sector and has made rapid strides since then.Being a core sector, the steel industry reflects the overallgrowth of an economy in the long term. The demand forsteel is also derived from other sectors such asautomobiles, consumer durables and infrastructure. TheIndian steel sector enjoys advantages of domesticavailability of raw materials and inexpensive labour. Ironore is also available in abundant quantities, providing amajor cost advantage to the domestic steel industry.The liberalization of industrial policy and other initiativestaken by the Government of India have given a definiteimpetus for entry of private sectors in the steel industry.While the existing units are being modernized andexpanded, a large number of new steel plants have alsocome up in different part of the country based on modern,cost effective, state of the arty technologies.
REVIEW OF THE LITERATURE:Indian journal of applied research volume 3/issue 4/April2013"A comparative analysis of financial performanceof SAIL and JSW. The study covers the five year periodof both companies. It has been tried to analyze the
Profitability Liquidity and Management efficiency of bothunits with various financial tools and techniques.
Finance India, Vol xxvii No;2, June 2013 pages 547-554.“Financial performance of Iron and Steel industry in India;An analytical and comparative study of some selectedcompanies 1995-2005. To measure and assess financialperformance in terms of liquidity leverage, assetsmanagement and profitability of the selected public sectorand private sector companies.
Finance India,Vol XXVI No.3, Sep 2012, Page 961-970“A study on the investment Behavior of university andGovernment College Teachers in Tamilnadu”. The studyanalyses the financial profile by applying summarystatistical measure like profitability ratio and solvencyratio, compound Growth ratio, one way ANOVA; Trendanalysis; Factor analysis step wise multiple linearregression analysis have been used.
Indian journal of accounting volume XLII(1)Dec 201,“cash management performance evaluation bySudiptaGhosh. This study is comparison between TSLand SAIL. The empirical findings of the study reveal thatTSL on the average has utilized its cash more efficientlyin comparison to SAIL. TSL has better capacity toconvert its sales into cash than that of SAIL.
Mrs.Asha Sharma and R.B.Sharma, 2011. This studyis an attempt to identify and study the movement of keyfinancial performance and their relationship withprofitability of textile industry. In this study the keyidentified parameters move in a synchronous way goingup and coming down with basic profitability parameters.

Page 14
ISSN : 2321-3604
March 2014Vol.2, Special Issue
Primax International Journal of Commerce and Management Research
Objectives of the study:1. To evaluate the liquidity and profitability position of the steel industries.2. To ascertain the overall earning capacity of the selected units.
Hypothesis of the studyH1: There is significant difference in profitability, liquidity position, Management efficiency of both the selected units.
Research Design:1. Sample : The universe of the study consists of all the limited steel companies working in India and listed in
stock exchange in India. Here, researcher has selected two companies such as SAIL and TATA for this comparativestudy.
2. Tools and techniques: Ratio Analysis and other basic Statistical Techniques such as Mean, Standard Deviationand Correlation are used to analyse the secondary data Profitability ratio shows the financial soundness of thesteel units. The stake holders are interested to know its operational efficiency in terms of profitability. Theprofitability of SAIL and Tata is presented in Table-1
SAIL 13.40 15.73 11.04 7.44 4.76 10.47 4.43
TATA 21.09 19.96 22.94 19.23 12.94 19.23 3.79Net Profit Margin
(T-value: 3.36; Table value 2.84)
SAIL 27.61 20.46 12.88 10.91 6.67 15.71 8.32
TATA 15.01 13.06 14.86 14.77 12.80 14.10 1.08Return on Capital
Employed
(T-value: – 0.41; Table value 2.84)
SAIL 22.06 20.27 13.23 8.89 5.29 13.95 7.19
TATA 21.10 13.48 14.68 12.72 9.17 14.23 4.35Return on Net
Worth
(T-value: 0.08; Table value 2.84)
Table-1
Profitability of SAIL and TATA during 2009-2013
SAIL 20.41 22.69 16.37 13.15 10.34 16.59 5.07
TATA 37.68 35.70 39.06 33.99 29.12 35.11 3.86
YEARS
INDICATORS UNITS 2009 2010 2011 2012 2013 Mean S.D
OPERATINGPROFIT MARGIN
(T-value: 6.50; Table value 2.84)
SAIL 16.61 18.35 12.33 9.41 7.04 12.75 4.75
TATA 33.27 30.95 34.54 29.82 24.25 30.57 3.99
Profit BeforeInterest And Tax
Margin
(T-value: 6.42; Table value 2.84)
SAIL 17.48 19.40 12.88 9.74 7.20 13.34 5.12
TATA 33.69 31.36 35.16 30.60 24.83 31.13 3.96
Gross ProfitMargin
(T-value: 6.15; Table value 2.84)
Page 15March 2014Vol.2, Special Issue
Primax International Journal of Commerce and Management Research ISSN : 2321-3604
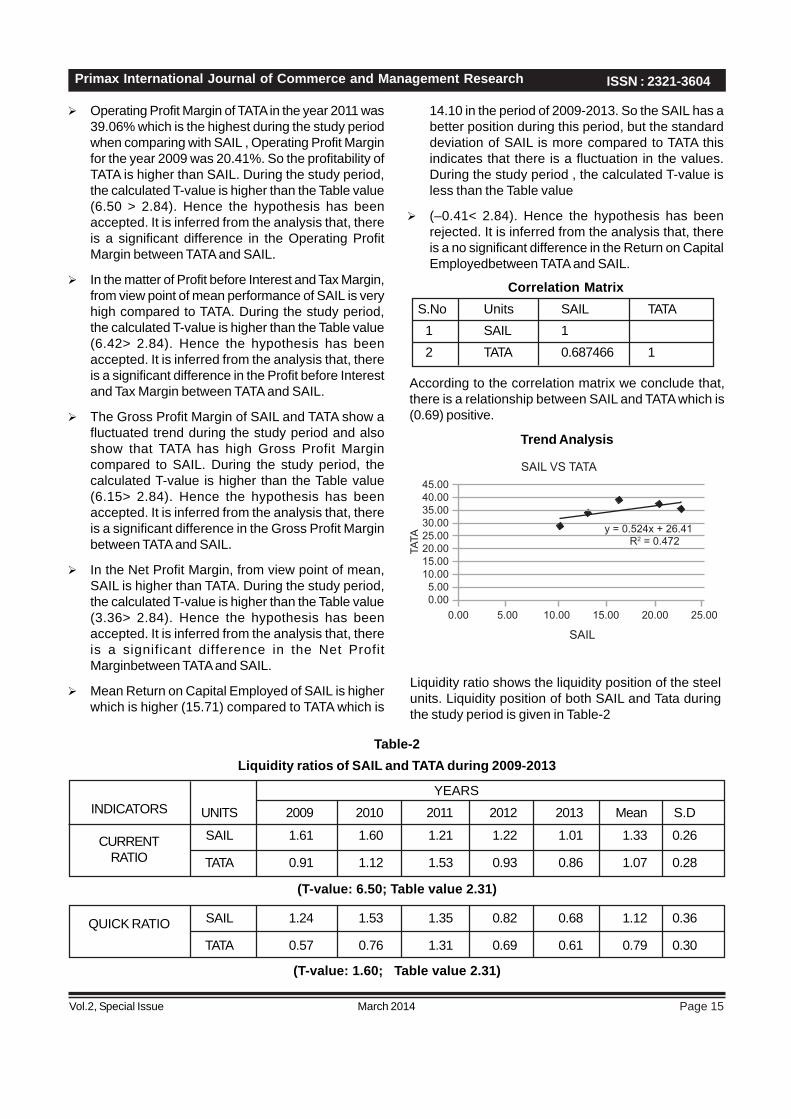
Operating Profit Margin of TATA in the year 2011 was39.06% which is the highest during the study periodwhen comparing with SAIL , Operating Profit Marginfor the year 2009 was 20.41%. So the profitability ofTATA is higher than SAIL. During the study period,the calculated T-value is higher than the Table value(6.50 > 2.84). Hence the hypothesis has beenaccepted. It is inferred from the analysis that, thereis a significant difference in the Operating ProfitMargin between TATA and SAIL.
In the matter of Profit before Interest and Tax Margin,from view point of mean performance of SAIL is veryhigh compared to TATA. During the study period,the calculated T-value is higher than the Table value(6.42> 2.84). Hence the hypothesis has beenaccepted. It is inferred from the analysis that, thereis a significant difference in the Profit before Interestand Tax Margin between TATA and SAIL.
The Gross Profit Margin of SAIL and TATA show afluctuated trend during the study period and alsoshow that TATA has high Gross Profit Margincompared to SAIL. During the study period, thecalculated T-value is higher than the Table value(6.15> 2.84). Hence the hypothesis has beenaccepted. It is inferred from the analysis that, thereis a significant difference in the Gross Profit Marginbetween TATA and SAIL.
In the Net Profit Margin, from view point of mean,SAIL is higher than TATA. During the study period,the calculated T-value is higher than the Table value(3.36> 2.84). Hence the hypothesis has beenaccepted. It is inferred from the analysis that, thereis a significant difference in the Net ProfitMarginbetween TATA and SAIL.
Mean Return on Capital Employed of SAIL is higherwhich is higher (15.71) compared to TATA which is
According to the correlation matrix we conclude that,there is a relationship between SAIL and TATA which is(0.69) positive.
Trend Analysis
Liquidity ratio shows the liquidity position of the steelunits. Liquidity position of both SAIL and Tata duringthe study period is given in Table-2
Correlation MatrixS.No Units SAIL TATA 1 SAIL 1 2 TATA 0.687466 1
14.10 in the period of 2009-2013. So the SAIL has abetter position during this period, but the standarddeviation of SAIL is more compared to TATA thisindicates that there is a fluctuation in the values.During the study period , the calculated T-value isless than the Table value
(–0.41< 2.84). Hence the hypothesis has beenrejected. It is inferred from the analysis that, thereis a no significant difference in the Return on CapitalEmployedbetween TATA and SAIL.
Table-2Liquidity ratios of SAIL and TATA during 2009-2013
YEARSUNITS 2009 2010 2011 2012 2013 Mean S.D
CURRENTRATIO
(T-value: 6.50; Table value 2.31)
INDICATORS
SAIL 1.61 1.60 1.21 1.22 1.01 1.33 0.26
TATA 0.91 1.12 1.53 0.93 0.86 1.07 0.28
SAIL 1.24 1.53 1.35 0.82 0.68 1.12 0.36
TATA 0.57 0.76 1.31 0.69 0.61 0.79 0.30QUICK RATIO
(T-value: 1.60; Table value 2.31)
SAIL VS TATA
SAIL
0.00 5.00 10.00
y = 0.524x + 26.41R2 = 0.472
15.00 20.00 25.00
45.0040.0035.0030.0025.0020.0015.0010.00
5.000.00
TATA

Page 16
ISSN : 2321-3604
March 2014Vol.2, Special Issue
Primax International Journal of Commerce and Management Research
SAIL 0.27 0.50 0.54 0.40 0.52 0.45 0.11
TATA 1.34 0.68 0.56 0.45 0.47 0.70 0.37DEBIT EQUITY
RATIO
(T-value: - 1.47; Table value 2.31)
SAIL 0.21 0.39 0.32 0.29 0.33 0.31 0.07
TATA 1.31 0.68 0.56 0.45 0.47 0.69 0.36
LONG TERMDEBIT EQUITY
RATIO
(T-value: - 2.38; Table value 2.31)
The current ratio of SAIL showed progressive andfluctuating trend during the study period. The currentratio of TATA also having fluctuating trend. It showsthat TATA has not maintained standard 2:1. Lookingto the result of ‘t’, it can be concluded that currentratio position of both the units are not same. Duringthe study period, the calculated T-value is higherthan the Table value (6.50 > 2.31). Hence thehypothesis is accepted. It is inferred from the analysisthat, there is significant difference in the CurrentRatio between TATA and SAIL.
A quick ratio of 1:1 is the standard norms forevaluating solvency position of business. The quickratio of SAIL is more than Standard norms and thequick ratio of TATA is not equal to standard norms. Itshows the better solvency position of SAIL. Boththe units are not significantly differing for this ratio.During the study period, the calculated T-value isless than the Table value (1.60< 2.31). Hence thehypothesis has been rejected. It is inferred from theanalysis that, there is a no significant difference inthe quick ratio between TATA and SAIL.
Debt equity ratio shows the relating contribution ofcreditor and owners. In general lower the debt equityratio, higher the degree of protection enjoyed bycreditors. From the view point of mean SAIL has agood position. During the study period , thecalculated T-value is less than the Table value (–1.47< 2.31). Hence the hypothesis has beenrejected. It is inferred from the analysis that, thereis a no significant difference in theDebit Equity ratiobetween TATA and SAIL.
In case of long term debt equity ratio, from view pointof mean TATA has a better position in long term debtequity ratio. During the study period , the calculatedT-value is less than the Table value (–2.38 < 2.31).Hence the hypothesis has been rejected. It is inferredfrom the analysis that, there is a no significantdifference in theLong TermDebit Equity ratio betweenTATA and SAIL
Analysis :-In second category of financial ratio is liquidity ratio.Various parties are interested in the liquidity position &long term soundness of the unit. The liquidity ratio showsthe liquidity position of the units.
Trend Analysis
SAIL VS TATA (Current Ratio)Li
quid
ity R
atio
ns
2009 2010 2011 2012 2013
SAILTATA
1.801.601.401.201.000.800.600.400.200.00
Correlation MatrixS.No Units SAIL TATA 1 SAIL 1 2 TATA 0.438653 1
2008 2009 2010 2011 2012 2013 2014
SAIL
TATA
2.00
1.50
1.00
0.50
0.00
y = -0.183x + 369.1R2 = 0.645
According to correlation matrix we conclude that, thereis a relationship between SAIL and TATA which is (0.44)positive.

Page 17March 2014Vol.2, Special Issue
Primax International Journal of Commerce and Management Research ISSN : 2321-3604
The management efficiency of SAIL and Tata with the help of various management efficiency indicators such asinvestment turnover ratio, debtors turnover ratio and assets turnover ratio are analysed during the study periodthrough Table-3
SAIL 1.42 0.95 0.79 0.81 0.75 0.94 0.28
TATA 0.48 0.42 0.43 0.45 0.49 0.45 0.03
ASSETS TURNOVER RATIO
(T-value: 3.94; Table value 2.31)
Table - 3Management Efficiencyof SAIL and TATA during 2009-2013
SAIL 5.86 6.02 5.13 3.71 2.79 4.70 1.41
TATA 9.36 10.30 7.44 6.98 7.27 8.27 1.47
YEARS
INDICATORS UNITS 2009 2010 2011 2012 2013 Mean S.D
IVESTMENTTURNOVER
RATIO
(T-value: - 3.92; Table value 2.31)
SAIL 9.71 10.30 11.11 12.46 14.43 11.60 1.89
TATA 41.29 46.58 68.46 51.10 44.91 50.47 10.66
DEBTORS TURNOVER RATIO
(T-value: - 8.03; Table value 2.31)
SAIL 1.35 1.20 1.16 1.15 1.09 1.19 0.10
TATA 1.22 1.12 1.32 1.48 1.01 1.23 0.18
FIXED ASSETSTURN OVER RATIO
(T-value: - 0.43; Table value 2.31)
Investment Turnover ratio both same. Both the ratiosof SAIL and TATA are highest in the year 2010 i.e.,6.02 and 10.30 respectively. From view point of meanTATA has a good position. During the study period,the calculated T-value is greater than the Table value(–3.92 > 2.31). Hence the hypothesis is accepted.It is inferred from the analysis that, there is asignificant difference in the Investment Turnover ratiobetween TATA and SAIL.
Debtor Turnover Ratio is in decreasing trend. ButSAIL has a better position as compared to TATAbecause in the 2013, DTR of SAIL is 14.43 daysand TATA has 44.91 days. From view point of meanSAIL has a good position. Moreover the co-efficientof variation of SAIL is less compared to TATA, SoSAIL is consistent. It is supported by t – value thatboth units are not same in debtor’s turnoverratio.During the study period, the calculated T-valueis greater than the Table value (–8.03 > 2.31). Hencethe hypothesis is accepted. It is inferred from the
analysis that, there is a significant difference in theDebtor Turnover Ratio between TATA and SAIL.
Fixed assets turnover ratio both are same. But theratios of SAIL was highest in the year 2009 i.e.,1.35 and FATR of TATA was highest in the year 2012i.e., 1.48. From the view point mean of FATR of bothare almost same. During the study period, thecalculated T-value is lesser than the Table value (–0.43 < 2.31). Hence the hypothesis is rejected It isinferred from the analysis that, there is a no significantdifference in theFixed assets turnover ratio betweenTATA and SAIL.
From view point of mean Assets Turn Ratio of SAILwas higher than the TATA. The value of ATR in SAILis good. During the study period, the calculated T-value is greater than the Table value (3.94 < 2.31).Hence the hypothesis is accepted. It is inferred fromthe analysis that, there is a significant difference intheassets turnover ratio between TATA and SAIL

Page 18
ISSN : 2321-3604
March 2014Vol.2, Special Issue
Primax International Journal of Commerce and Management Research
2009 2010 2011Year
2012 2013
SAILTATA
DTR
80.0070.0060.0050.0040.0030.0020.0010.00
0.00
SAIL Vs TATA (DTR)
Trend Analysis
Correlation MatrixS.No Units SAIL TATA 1 SAIL 1 2 TATA 0.093228 1
From the above correlation Table , the correlation valuefor SAIL & TATA is 0.093. This shows that there is veryless correlation between SAIL & TATA.
Findings of the study:1. The profitability position of TATA is better than SAIL.2. In the overall finding of efficiency of assets utilization
of TATA has a better position when compared withSAIL.
3. SAIL has better position in DTR, FATR and ATR whencompared with TATA
4. TATA has a better position in ITR compared withSAIL.
Conclusion:It is inferred from the analysis, that the profitability ofboth SAIL and TATA is more or less depending upon thebetter utilization of resources. TATA should have toconcentrate in improving the Debtors Turnover Ratio,Fixed Assets Ratio and Assets Turnover Ratio. SAIL
should give concentration to make optimum utilizationof available resources. Because during the study periodSAIL has failed to utilize the various assistance providedby the Government and it fails to make more earningscompared with TATA. But TATA has lowest financialposition compared with SAIL, however it can earn moreprofit or achieve high profit volume. Due to adversemovement in prices of imported coking coal and globalEconomic slowdown there is a decreasing trend of overallfinancial performance of both the units during the studyperiod.
REFERENCEInternational Journal of marketing, financial services andmanagement research Vol.1|Issue10|Oct 2012, Anempirical study of profitability analysis of selected steelcompanies in India
Ashasharma and R.B.Sharma “study on A comparisonfinancial performance in Textile industry”. InternationalJournal on Business Management Economics andInformation Technology|Vol-3, Jan 2011 PP 175-180.
Asian Journal of Management Research |2010|M.SRamaratnam, R.Jayaraman, “A study onmeasuring the financial soundness of select firms withspecial reference to Indian steel industry”.
Gupta L.C|1999|”Financial Ratios as forewarningIndicators of corporative sickness”, Feb 1999.
Beaver.W.H.,|1996|”Financial ratios and predictions offailure;Empirical research in according selectedstudies”, Journal of Accounting Research, 77-111.
Gupta.R.L and M.Radhasamy|1995|, “FinancialManagement Analysis”, 5th edition, Sultan Chand andsons, New Delhi-45.
Dr.S.K.KhartikTitto Varghese, Profitability AnalysisofPublic Sector Undertaking: A case Study of HindustanNewsprint Limited, The management accountant, Nov2011|Vol46|No 11|PP 1067-1073.
Indian Bureau of Mines |2011b|,Iron and steel-Vision 2020
Indicus Analytic|2009| “Indian Steel Industry| final reportprepared for the competition commission of India.
Websites:www.worldsteel.orgwww.sail.co.in|www.tatasteel.com|www.moneycontrol.com

Page 19March 2014Vol.2, Special Issue
Primax International Journal of Commerce and Management Research ISSN : 2321-3604
AN INQUIRY ON CONSUMER SATISFACTION OFCARE MINERAL WATER IN TIRUCHIRAPPALLI
1Miss. R. Vinola 2Dr. R. Swaminathan
1 Asst. Professor in Commerce and Management, Sri Saradha College for women, Perambalaur.2 Director, Commerce and Management studies, Thanthai Hans Rovers College, Perambalaur
INTRODUCTIONSatisfaction is the consumer’s fulfillment response. Itis a judgment that a product or service feature or theproduct or service itself provides a pleasurable level ofconsumption related fulfillment.
- Richard.L.Oliver
Production of goods and services, unless it is also satisfyhuman wants. Consumer satisfaction is an ambiguousand abstract concept and the actual manifestation tothe state of satisfaction will vary from person to person.The level of satisfaction can also vary depending on otheroptions; consumption is the role and end purpose of allproduction. There is an intimate connection amongproduct, service quality, customer’s satisfaction andcompany profitability. Consumers consider price, qualityavailability and convenient before purchasing anyproducts. If the consumer becomes habitual withconsumer products they stick on the same product formore time. Higher levels of quality result in higher levelsof consumer satisfaction.
Company’s first task is to create customers. But theconsumers fall a vast essay of product and rewardchoices, prices and suppliers. Customers are valuemaximizers, within the bounds of search costs andlimited knowledge mobility and income. To win today’smarket the companies must be consumer oriented.Consumer satisfaction is both a goal and a marketingtool. Companies need to the especially concerned todaywith their customer satisfaction level because the internetprovides a tool for consumers to spread bad word ofmouth as well as good word of mouth – to the rest of theworld. A customer centered organization makes it easyfor customer to register suggestions and complaints.
STATEMENT OF THE PROBLEMWater is a very vital source for the survival of life and theextent of their source such an important component ofthe earth system is being polluted. India has a very lowcapital availability of drinking water. Nearly 40000 ormore villages in the country may not be having drinkingwater. Water pollution occurs when chemicals, nutrientsor wastage enter water faster than they can be removed
by natural processes. The pollutants include sewage,industrial chemicals and effluents, slit, oil and otherwastes. Besides chemicals from air dissolved in rainwater and fertilizers, pesticides and herbicides soakedfrom the land and pollute water. The water may havebeen distilled for purity, it can leach out essential mineralsas it travels through the body. Many soft drinks aremade with purified water – a fact which disturbs manydieticians and health experts. The quantity of waste watercharged directly into the Cauvery is approximately 87,600cubic meters per day. The river has a total dissolvedsolid level of 1450 mg which is t times higher than theWHO’s permissible limit. WHO permissible limit is 500mg.
The economic importance of water is obvious and withgrowing needs all the water resources especially groundwater. There have also been reports of fraud in whichordinary tap water has been added to used mineral waterbottled and sold as a original article. So the study ismainly concentrate on product use and the consumersatisfaction of care mineral water. The study aims atanalyzing the consumer satisfaction of Care MineralWater of products, and also to obtain suggestion forimprovement of product and service and also helps forfinding out the satisfaction level of consumers. Thus theresearcher has carried out the study under the title “AStudy on Consumer Satisfaction of Care Mineral Waterin Tiruchirappalli”.
REVIEW OF LITERATUREAccording to Jagdeep Kapoor, Samsika marketingconsultants Ltd, “Good brands in general are those whichare built in the minds and hearts of consumers, not adagencies, good brands respond proactively toconsumers. Bad brands just react”.
According to Mustafa, “Power product is one occupiesthe relevant consumer appeal and price positions. Thesebrands are selected using criteria such as absolute size,brand strength, brand strength, brand relevancecompetitive advantage and potential for sustainedprofitable growth”.
Page 20
ISSN : 2321-3604
March 2014Vol.2, Special Issue
Primax International Journal of Commerce and Management Research
According to Philip Kotler, “Customer from serviceexpectations from many sources. Such as pastexperiences, word of mouth, and advertising. In generalcustomer compares the perceived service with theexpected service”.
According to Sanjeev Duggai, “Brand image is a set ofimages, symbol, ideas that a person has in mind whenhe thinks of a brand”.
In other words, brand image is the view (or) perceptionsthat a person has a brand.
According to John Deere, “Customer Loyalty – nearly98 per cent annual retention in some product areas –uses retired employees to interview defectors andcustomers”.
According to Sabrat Sabu and Bharat Dalal, “It’s not aneasy would for bands these days. The domesticslowdown is causing customers to down trade, puttingpressure on high value branded products”.
Care Mineral WaterCare Mineral water have succeeded in winning the heartsof Trichy people by their quality and services. Now theoccupy the No.1 position in the market. Ultra modernozonised method like UV treated water are treated byseven methods and it has been tested by experts ofquality control in lab then it has been sent as productsfor sale. Care Mineral Water contains some mineralswhich are less in their composition in order to completequality before sales. Manufacturers of Care Mineral Waterhave been following the rules of ISO standards and thequality is assured in Indian Standards. They are the IstCompany to receive ISO 9001-2000 which is aninternational quality award in Trichy.
SCOPE OF THE STUDYThe study is exclusively conducted among the consumerof Care Mineral Water of products which are dispersedin the area of Priyanga Nagar, Annamalai Nagar andThillai Nagar of Tiruchirappalli District. Therefore thisstudy proposes to survey the users of product with regardto their loyalty and awareness towards Care MineralWater of Products. This may be useful to the policymakers of brands to know the buyer behavior. It willalso helps to develop new features in the products. Dueto time factor the survey was restricted to small sampleof buyers in Priyanga Nagar, Annamalai Nagar and ThillaiNagar in Tiruchirappalli District.
OBJECTIVES OF THE STUDYThe objectives of the study are,1. To find out the factors that influences the consumer
to buy the Care Mineral Water.
2. To identify the typical use of Care Mineral Water.
3. To identify factors influencing purchase Care MineralWater.
4. To findout the level of satisfaction among variousconsumers.
5. To find out the consumer preferences among variousbrands.
6. To give suggestions for improvement of Care MineralWater.
HYPOTHESES1. There is no relationship between educational
qualification and factors creating brand awareness.
2. There is no relationship between age and brandpreferences.
3. There is no relationship between income and brandpreferences.
AREA OF THE STUDYTiruchirappalli, one of the major towns in Tamilnadu,which has been recently upgraded as corporation, issituated on the national highway connection Chennaiand Kanniyakumari. The town has rich and historicalassociation, which can be seen in the temples andfortress in the centre of the town.
SAMPLE DESIGNFor the purpose of the study 100 respondents wereselected by convenience Sampling Method.
METHODOLOGY AND TOOLS FOR THECOLLECTION OF DATAThis study on “Consumer Satisfaction of Care MineralWater in Tiruchirappalli” is based on survey method.Primary data is collected from 100 respondents usingInterview Schedule. In order to collect the primary data,interview schedule method was adopted. The primarydata was collected from 35 respondents in PriyangaNagar, 35 respondents in Annamalai Nagar, and 30respondents in Thillai Nagar in Tiruchirappalli District.The researcher used primary data and secondary werecollected from the magazines, books, newspaper andfrom various websites.
ANALYSIS AND INTERPRETATIONThe data collected has been analyzed by means ofpercentage analysis and researcher has used graph anddiagrams to represent the interpretation. Chi-square testis used to test the hypothesis.

Page 21March 2014Vol.2, Special Issue
Primax International Journal of Commerce and Management Research ISSN : 2321-3604
TESTING OF HYPOTHESESINTRODUCTIONThis chapter deals with the factors influencing Consumer Satisfaction among the respondents of Care MineralWater brand of products. Factors namely age and educational qualification and income have been identified to findout whether they influence brand awareness and preferences. In order to see whether there is any relationshipbetween these factors Chi-square test has been applied.
The above table shows that 60% of the respondents who have studied upto 10th and +@ std, 76% of graduation,84% of Post graduation and 64% of professionals qualified persons came to know about Care Mineral Waterthrough advertisements.
NULL HYPOTHESISThere is no relationship between educational qualification and brand awarenessIn order to see whether there is any relationship between educational qualification and brand awareness,
chi-square test has been applied.CHI-SQUARE TEST
Relationship between Educational Qualification and Brand Awareness
Item O E (O-E)2 (O-E)2/E
R1C1 0 0 0 0
R1C2 6 7.5 2.25 0.3
R1C3 38 37.5 0.25 0.006
R1C4 22 19.5 6.25 0.321
R1C5 9 10.5 2.25 0.214
R2C1 0 0 0 0
R2C2 0 1.1 1.21 1.1
R2C3 7 5.5 2.25 0.409
R2C4 2 2.86 0.739 0.259
R2C5 2 1.54 0.212 0.137
R3C1 0 0 0 0
R3C2 2 0.4 2.56 6.4
Source ofAwareness Illiterate Upto10th &
+2 Graduation PostGraduation Professional Total
Advertisement - — 6 60 38 76 22 84 9 64 75
Friends — — — — 7 14 2 8 2 14 11
Retailers — — 2 20 2 4 — — — — 4
Relations — — 1 10 1 2 2 8 2 16 6
Others — — 1 10 2 4 — — 1 8 4
Total — — 10 100 50 100 26 100 14 100 100

Page 22
ISSN : 2321-3604
March 2014Vol.2, Special Issue
Primax International Journal of Commerce and Management Research
R3C3 2 2 0 0
R3C4 0 1.04 1.082 1.04
R3C5 0 0.56 0.314 0.56
R4C1 0 0 0 0
R4C2 1 0.6 0.16 0.267
R4C3 1 3 4 1.333
R4C4 2 1.44 0.314 0.218
R4C5 2 0.84 1.345 1.602
R5C1 0 0 0 0
R5C2 1 0.4 0.36 0.9
R5C3 2 2 0 0
R5C4 0 1.04 1.082 1.04
R5C5 1 0.56 0.194 0.346
16.452
Degree of freedom = (R-1) (C - 1)= (5-1) (5 -1)= (4) (4) =16
Table value at 5% level = 26.296Calculate value = 16.452
Since, the calculate value is less than the table value, the hypothesis is accepted. So, there is no relationshipbetween Educational Qualification and factors creating Brand Awareness.
RELATIONSHIP BETWEEN AGE AND BRAND PREFERENCE
Care 14 70 29 85 19 90 10 67 8 80 80
Andavar 3 15 2 6 1 5 2 13 — — 8
Boor 2 10 1 3 1 5 — — — — 4
Nile — — 1 3 — — — — 1 10 2
VIP — — — — — — 1 7 — — 1
Sprinkle 1 5 1 3 — — — — 1 10 3
Spy — — — — — — 2 13 — — 2
Total 20 100 34 100 21 100 15 100 10 100 100
Brands Below 20 21 - 30 31 - 40 41 - 50 Above 50 Total
It is clear from the above table, that 70% of the respondents belong to the age group of below 20, 85% of therespondents belong to the age group of 21-30, 90% of the respondents belong to the age group of 31-40, 67% of therespondents belong to the age group of 41-50, and 80% of the respondents belong to the age group of above 50prefer the brand of care Mineral Water.

Page 23March 2014Vol.2, Special Issue
Primax International Journal of Commerce and Management Research ISSN : 2321-3604
NULL HYPOTHESISThere is no relationship between age and brand preferences.In order to see whether there is any relationship between age and preferences. Chi-Square test has been applied.
CHI-SQUARE TEST
Relationship between Age and Brand Preference
Item O E (O-E)2 (O-E)2/E
R1C1 14 16 4 0.25
R1C2 29 27.2 3.24 0.119
R1C3 19 16.8 4.84 0.288
R1C4 10 12 4 0.333
R1C5 8 8 0 0
R2C1 3 1.6 1.96 1.225
R2C2 2 2.72 0.518 0.191
R2C3 1 1.68 0.462 0.275
R2C4 2 1.2 0.64 0.533
R2C5 0 0.08 0.64 0.8
R3C1 2 0.8 1.44 1.8
R3C2 1 1.7 0.49 0.288
R3C3 1 1.05 0.0025 0.0002
R3C4 0 0.75 0.563 0.75
R3C5 0 0.5 0.25 0.5
R4C1 0 0.4 0.16 0.4
R4C2 1 0.68 0.102 0.150
R4C3 0 0.42 0.176 0.42
R4C4 0 0.03 0.09 0.3
R4C5 1 0.2 0.64 3.2
R5C1 0 0.2 0.04 0.2
R5C2 0 0.34 0.116 0.34
R5C3 0 0.21 0.044 0.21
R5C4 1 0.15 0.7225 4.81
R5C5 0 0.1 0.01 0.1
R6C1 1 0.6 0.16 0.27
R6C2 1 1.02 0.0004 0.0003

Page 24
ISSN : 2321-3604
March 2014Vol.2, Special Issue
Primax International Journal of Commerce and Management Research
R6C3 0 0.63 0.396 0.63
R6C4 0 0.45 0.203 0.45
R6C5 1 0.3 0.49 1.633
R7C1 0 0.4 0.16 0.4
R7C2 0 0.68 0.462 0.68
R7C3 0 0.42 0.176 0.42
R7C4 2 0.3 2.89 9.63
R7C5 0 0.2 0.04 0.2
31.797
Degree of freedom = (R-1) (C-1)= (7-1) (5-1)= (6) (4) =24
Table value at 5% level = 36.4Calculate value = 31.797
Since, the calculate value is less than the table value,the hypothesis is accepted. So, there is no relationshipbetween age and brand preferences.
SAMPLE FINDINGS1. 90% of the respondents are female.
2. 34% of the respondents belong to the age group21-30 years.
3. 50% of the respondents are Graduates.
4. 20% of the respondents are employees of variousconcerns.
5. Family size of the 44% of the respondents are 3-4.
6. 26% of the respondents are in the income group ofRs. above 20,00.
7. 100% of the respondents are buying the MineralWater for day to day life.
8. 80% of the respondents have stated that they preferCare Mineral Water for daily use.
9. 75% of the respondents have been influenced byadvertisement in purchase of mineral water.
10. 56% of the respondents prefer Care Mineral Waterbecause of its good quality.
11. More than 56% of the respondents are using CareMineral Water for more than 6 months.
12. 50% of the respondents purchase Care MineralWater Daily in day to day life.
SUGGESTIONS1. The manufacturer of Care Mineral Water should
concentrate on all parts of Tamil Nadu, for marketingtheir product.
2. The manufacturer must give wide publicity for theirproduct.
3. The company must take remedial measure to improvethe quality of the product in order to satisfy the peopleof all walking of life.
4. Mineral water is needed because of pollution on themain water source of Cauvery River. If the companyprovides good quality water with added minerals, itwill increase the sales volume.
5. The manufacturer or Care Mineral Water should tryto supply the water in different quantity waterpackets should be made available.
6. The price of the Care Mineral Water can be reducedto increase the consumers of Care Mineral Waterincreases the sales.
7. Continuous study indepth and Continuous study onattitudes taste and preference of consumer isessential in order to satisfy the needs of theconsumer.
CONCLUSIONThe ultimate aim of any organization is to satisfy theneeds and wants of consumers. Consumers considerprice, quality, durability and convenience beforepurchasing any products especially consumableproducts. Mostly if the consumer becomes habitual withconsumer products they stick on to the same productfor more time. Income, sex, profession and age playvery important role in determining the preference of anyproduct. Only if the consumers are understood fully, itwill be easy for any organization to take decisions on

Page 25March 2014Vol.2, Special Issue
Primax International Journal of Commerce and Management Research ISSN : 2321-3604
many variables. For consumers centered companies,customer satisfaction is both a goal and marketing tool.The link between consumer satisfaction and consumerloyalty is not proportional. Higher satisfaction createsan emotional bond with the brand loyalty. manycompany’s today are aiming for total consumersatisfaction. Some companies thick that they are gettinga sense of consumer satisfaction by tallying consumercomplaints. Suggestions forms and e-mail address servethis purpose. Many product improvement ideas comefrom listening consumer satisfaction.
References1. Domald Lehman and Russell Winer “Product
Management”, The third Edition.
2. Eric Arnould, Linda Price, George Zinkhan“Consumers”, The First Edition.
3. James M. Carman “Marketing Principles andMethods” University of California.
4. Kevin Lane Keller, Philip Kotler, “MarketingManagement” The 12th Edition.
JOURNALS1. Aditya Prakash Tripathi, “Trademark Law” The Indian
Journal of Marketing, Oct-2007.
2. Dr. K. Mallikarjana Reddy, “Consumer Behaviour,Indian Journal of Marketing, March/April-2002.
3. Jagadeep Kapoor, “Difference Perceived; Advertisingand Marketing”, Indian Journal of Marketing, Jan-2002.
4. Mustafa “Power Brands” Indian Management, Oct-2002.
5. “Marketing Mastermind”, The ICFAI University Press,April-2006.
6. Ranee Jhala, “Managing Brand Relationship forManagement Success” Indian Management, April-2003.

Page 26
ISSN : 2321-3604
March 2014Vol.2, Special Issue
Primax International Journal of Commerce and Management Research
A STUDY ON STRESS AMONG THE EMPLOYEES OF SHIPPINGINDUSTRY WITH REFERENCE TO THOOTHUKUDI
1 S.RAJARAM
ABSTRACTStress is a perceived dynamic state involving uncertainty about something important. The dynamic state can beassociated with opportunities, constrains, and demand. Stress is frequently a disabling human phenomenon. Stressat work has detrimental effect on the behavior of people, which results in personal and organizational inefficiency. Thepresent study highlights the stress among the employees working in shipping industry with reference to Thoothukudi.For the purpose of the study the primary data were collected from 120 sample respondents of various shippingcompanies and shipping agencies i.e., clearing and forwarding agencies in Thoothukudi.
Keywords: stress, shipping industry, job performance, job satisfaction
1 M.Phil Scholar, Department of Commerce, St.Xaviers college (Autonomous), Palayamkottai.
IntroductionStress is a perceived dynamic state involving uncertaintyabout something important. The dynamic state can beassociated with opportunities, constrains, and demand.Stress is frequently a disabling human phenomenon.Stress at work has detrimental effect on the behavior ofpeople, which results in personal and organizationalinefficiency. Job stress can be described as a conditionwhere job related factors interact with the worker tochange his or her psychological and physiologicalconditions, so that the person’s mind and/or body isforced to deviate from its normal way of functioning. Dueto the pervasiveness of stress in all aspects of work,the attainment of healthiest work environment is muchneeded. This requires an understanding of the types ofphysical and psychological stressors in workenvironment. The interaction of stressor with theindividual characteristics and their interventions may beformulated in the reduction of these stressors in the workplace and improved well – being of the employees. Inthis context, the present study highlights the stressamong the employees working in shipping industry withreference to Thoothukudi.
Statement of the ProblemThe Oxford dictionary gives the meaning of stress as“mental, emotional or physical strain or tension”. Stresscould be identified through pressures that can be goodonly when it can get us motivated to do something.Nevertheless, prolonged exposure to high levels ofpressure can lead to physical and mental problems. Theindividual health or happiness has been savaged by theeffects of stress and the organizations performance andwell – being are also not left untouched. A considerableburden is shared in the organization as well in the form
of absenteeism and turnover, job performance, healthcare cost, destructive and aggressive behaviour resultingin strikes and the sabotage. Hence, an attempt is madethrough this study, how to cope with stress effectively.
Scope of the StudyThe present study is devoted to study on stress amongthe employees working in shipping industry inThoothukudi. For the purpose of the study the primarydata were collected from 120 sample respondents ofvarious shipping companies and shipping agencies i.e.,clearing and forwarding agencies in Thoothukudi. Thestudy covers the time period of 6 months betweenDecember 2012 and May 2013.
Objectives of the StudyThe following are the prime objectives of the study;• To study the socio – economic status of the
employees.
• To examine the various factors of stress that affectsthe employees.
• To find the impact of stress among the employees.
• To provide valuable suggestions to cope with stresseffectively.
Hypotheses of the StudyIn tune with the objectives the following hypotheses wereframed. They are as follows;
• There is no significant association between thegender of the respondents and their level of stress.
• There is no significant association between the ageof the respondents and their level of stress.
• There is no significant association between the monthlyincome of the respondents and their level of stress.

Page 27March 2014Vol.2, Special Issue
Primax International Journal of Commerce and Management Research ISSN : 2321-3604
Collection of DataBoth primary and secondary data were used in this study. The primary data was collected through questionnairesdesigned exclusively for the study. The secondary data were collected from books, journals, magazines, newspapers,research papers and websites.
Sampling DesignThe sample size consists of 120 respondents from Thoothukudi, Tamilnadu. These one hundred and twentyrespondents were selected based on a simple random sampling method.
Tools of AnalysisThe data collected were processed employing the following statistical tools namely; descriptive (or) percentageanalysis, chi-square test and ranking analysis
Analysis and Interpretation of DataThe collected primary data were tabulated and interpreted by the researcher and presented in the form of bardiagrams, pie charts, etc., and the statistical tools such as chi-square test, and ranking method were also used.
Table 1: Socio-economic profile
Gender Frequency Percentage
Male 97 80.8
Female 23 19.2
Total 120 100
Age Frequency Percentage
20 – 30 51 42.5
31 – 40 33 27.5
41 – 50 17 14.1
Above 51 19 15.9
Total 120 100
Educational Qualification Frequency Percentage
School Level 16 13.3
UG 56 46.7
PG 26 21.6
Professional Studies 22 18.4
Total 120 100
Monthly Income Frequency Percentage
Below Rs. 5,000 22 18.3
Rs. 5,001 – 10,000 56 46.7
Rs. 10,001 – 15,000 22 18.3
Above Rs. 15001 20 16.7
Total 120 100

Page 28
ISSN : 2321-3604
March 2014Vol.2, Special Issue
Primax International Journal of Commerce and Management Research
Table 2: Rankings given by the respondents regarding the factors causing stress
S. Factors Strongly Agree Undecided Disagree Strongly Total % RankNo. Agree Disagree1. Job requirements 120 160 84 44 6 414 7.64 V
2. Job security 50 140 102 62 10 364 6.72 X
3. Pay/Salary 70 200 78 40 10 398 7.34 VII
4. Poor surroundings 40 72 108 98 9 327 6.03 XIII
5. Work overload 205 156 48 46 1 456 8.42 I
6. Work under load 45 112 126 64 9 356 6.57 XI
7. Health problems 45 68 99 98 12 322 5.94 XIV
8. Time pressure 75 236 60 42 5 418 7.71 IV
9. Same posture 40 180 108 44 9 381 7.03 IX
10. Routine job 130 180 54 52 5 421 7.77 III
11. Lack of opportunity 90 156 75 64 6 391 7.22 VIII
12. Updating knowledge 135 156 87 48 1 427 7.88 II
13. New technology 65 72 99 86 13 335 6.18 XII
14. Interpersonal relationship 175 84 72 68 6 405 7.47 VI
FindingsThe following findings of the study are given bellow;
• Majority (80.8%) of the respondents are male.
• It is found that gender of the respondents and theirlevel stress has no significant association betweenthem.
• Most (42.5%) of the respondents were in the agegroup between 20 and 30 and followed by that 27.5%of the respondents were in the age group between31 and 40.
• More than half (57.5%) of the respondents weremarried.
• Majority (46.7%) of the respondents wereundergraduates.
• The study reveals that most (46.7%) of therespondents were having monthly income betweenRs. 5,001 and Rs. 10,000.
Suggestions
• Counselors/social workers should be appointed inevery concern to deal with the psycho-social
problems faced by the employees so as to reducethe stress and strain of employees.
• Awareness programs on Stress Management, TimeManagement, Mental Health, PersonalityDevelopment, Physical fitness, etc, should beorganized for employees.
• The companies should conduct self periodical surveysamong their employees to measure the level ofstress or to find out any problems regardingemployees.
• Organize periodical classes for yoga and meditationfor acquiring stress – free life.
• Use positive affirmation at work place; and alwaystreat employees with respect and dignity.
• Clarify the tasks and ensure that authority equalsresponsibility.
• Technology plays an important role in taskmanagement, and effective use of technology mayreduce the stress level.

Page 29March 2014Vol.2, Special Issue
Primax International Journal of Commerce and Management Research ISSN : 2321-3604
ConclusionMany people spend half of their lives in work relatedactivities. No other single activity demands consistentlystress, as much physically, emotionally, and cognitivelyas work. Hence it is apparent that the health consequencesof stress can be numerous, when health is taken in itsbroader meaning as complete physical, mental, andsocial well being and not merely the absence of disease.Shipping and logistic industries are the mostemployment intensive sector. On the other side thisindustry fixed with pressure and deadlines to completethe given task. The study came out with certain findingsand few suggestions based on that. The research foundthat nearly half of the employees not affected by thehigh level of stress. This can be avoided throughcounseling, recreational activities, and relaxationtechniques.
References:
i. Brennfleck S. J. 2002. Stress-Related DisordersSourcebook. Detroit: Omnigraphics.
ii. Buzan, T. 2007. Age-Proof Your Brain. London:HarperThorsons.
iii. Cade, M.C., Coxhead, N. 1979. The Awakened Mind:Biofeedback and the Development of Higher Statesof Awareness. New York: Delacorte Press.
iv. Cotton, D. H. G. 1990. Stress Management: AnIntegrated Approach to Therapy. New York: Brunner/Mazel.
v. Danskin, D., Crow, M. 1981. Biofeedback: AnIntroduction and Guide. Palo Alto: Mayfield PublishingCompany
Web site:www.stress-relief-tools.comwww.stresscourse.tripod.comwww.stress.about.com

Page 30
ISSN : 2321-3604
March 2014Vol.2, Special Issue
Primax International Journal of Commerce and Management Research
A STUDY ON THE INTERNET ACCESSIN MOBILE –AN OVERVIEW
1S.Abirami 2F.Ramesh kumar
ABSTRACT
Accessing the Internet and speciûcally the World Wide Web from a mobile phone is common today. Especiallysince the usage fees for packet-data access dropped to a point where anybody who can afford a mobile phonecan afford mobile Internet access. Almost every mobile phone today comes with an integrated web browser thatcan display HTML web pages and execute JavaScript. Almost all major web sites such as news sites, socialnetworks, and shopping sites run websites that are optimized for small displays of mobile phones. Due to thebroad use of mobile web access we investigated possible privacy problems of mobile phone web access. Weconducted a study where we monitor all HTTP headers sent from mobile phones to our web server. We analyzedthe logged data for privacy problems. Through this study we determined that a worldwide privacy problem existswhen accessing the World Wide Web from a mobile phone.
1 PhD Research scholar, Department of Commerce, Government Arts College (Autonomous), Karur2 PhD Research scholar, Department of Commerce, Government Arts College (Autonomous), Karur
IntroductionAdvances in mobile technology have enabled a widerange of applications to be developed that can be usedby people on the move. Developers sometimes overlookthe fact that users will want to interact with such deviceswhile on the move. Small screen sizes, limitedconnectivity, high power consumption rates and limitedinput modalities are just some of the issues that arisewhen designing for small, portable devices. One of thebiggest issues is the context in which they are used.As these devices are designed to enable users to usethem while mobile, the impact that the use of thesedevices has on the mobility of the user is a critical factorto the success or failure of the application. The Internetbegan as a network funded by the US government tosupport projects within the government and atuniversities and research laboratories in the US – butgrew over time to include most of the world’s largeuniversities and the research arms of many technologycompanies. Use by a wider audience only came in 1995when restrictions on the use of the Internet to carrycommercial traffic were lifted.In the early to mid-1980s,most Internet access was from pesonal computer andworkstation directly connected to local area net work orfrom dial-up connection using modems and analogtelephone line. LANs typically operated at 10 Mbit/sand grew to support 100 and 1000 Mbit/s, while modemdata-rates grew from 1200 and 2400 bit/s in the 1980s,to 28 and 56 kbit/s by the mid to late 1990s. Initiallydial-up connections were made from terminal orcomputers running terminal elumation software toterminal service on LANs. These dial-up connections
did not support end-to-end use of the Internet protocolsand only provided terminal to host connections. Theintroduction of network access servers (NASs) supportingthe serial line internet protocol (SLIP) and later the point-to point protocol (PPP) extended the Internet protocolsand made the full range of Internet services available todial-up users, subject only to limitations imposed bythe lower data rates available using dial-up.
Provides improved access to Internet servicesBroadband provides improved access to Internet servicessuch as:
• Faster world wide web browsing
• Faster downloading of documents, photographs,videos, and other large files
• Telephony, radio, television, and videoconferencing
• Virtual private networks and remote systemadministration
• Online gaming, especially massively multiplayeronline role-playing games which are interaction-intensive
In the 1990s, the National Information Infrastructureinitiative in the U.S. made broadband Internet access apublic policy issue. In 2000, most Internet access tohomes was provided using dial-up, while manybusinesses and schools were using broadbandconnections. In 2000 there were just under 150 milliondial-up subscriptions in the 34 OECD countries and fewerthan 20 million broadband subscriptions. By 2004,

Page 31March 2014Vol.2, Special Issue
Primax International Journal of Commerce and Management Research ISSN : 2321-3604
broadband had grown and dial-up had declined so thatthe number of subscriptions was roughly equal at 130million each. In 2010, in the OECD countries, over 90%of the Internet access subscriptions used broadband,broadband had grown to more than 300 millionsubscriptions, and dial-up subscriptions had declinedto fewer than 30 million
The broadband technologies in widest use are ADSLand cable Internet access. Newer technologies includeVDSL and optical fibre extended closer to the subscriberin both telephone and cable plants. Fibre-opticcommunication, while only recently being used inpremises and to the curb schemes, has played a crucialrole in enabling broadband Internet access by makingtransmission of information at very high data rates overlonger distances much more cost-effective than copperwire technology.
In areas not served by ADSL or cable, some communityorganizations and local governments are installing Wi-Fi networks. Wireless and satellite Internet are often usedin rural, undeveloped, or other hard to serve areas wherewired Internet is not readily available.
Newer technologies being deployed for fixed (stationary)and mobile broadband access include WiMAX, LTE, andfixed wireless, e.g., Motorola Canopy.Starting in roughly2006, mobile broadband access is increasingly availableat the consumer level using “3G” and “4G” technologiessuch as HSPA, EV-DO, HSPA+, and LTE
Review of literatureHelft and vance,2010,in factmobile phones havebecome the most prevalent tool for media consumptionand personal computers in use,that number is staggeringhennig,2010.Eighty-three percent of american adults owna mobile,and this number is even higer for even higherfor american adults ages.Lenhart,2010.
The niesen company predicts thar more American willhave smartphones by the end of 2011 than feature phone“we are just at the beginning of new wireless era wheresmartphones will become the standard device consumerswill use to connect to friends, the internet and the worldat large”Entner, 2010
Morgan Stanley,2009,Smart phones and other mobiledevices wirh internet access allow people to access theweb on the go.Some estimate that more users willaccess the internet from mobile devices than desktopcomputers within a few years.
Horrigan, 2009, Pew research center’s internet andAmerican life project finds that almost a third of American
adults have used mobile devices to access the internet,and 19 percent of servey respondents had used asmartphone or other cell phone to access the internetthe day before the servey
Objectives of the study• To know the features people use the most on their
mobile phone
• To study the primary purpose for using internet onphone
• To study the benefits and limitation of using internet
Limitation of the study
• The data are collected within the Karur town, so itcannot be generalized.
• The collected data is limited only to the knowledgeof the Karur people.
• Vast analysis is not possible since time is a constaintand the sample size is fixed according to theresearcher convenience.
Research methodologyPrimary dataThey have been collected by there are how feel aboutand we are rearrange the questionnaire we can get theown opinion about internet access through mobile phone.
Secondary data They have been collected by some other person for theirpurpose and published. Secondary data is collectedfrom magazines, Internet , and research work,Newspapers etc.,
Data Analysis and interpretation Table-1
Gender wise classification of the respondents
S.No Gender No.of Percentagerespondents
1 Male 43 43
2 Female 57 57
Total 100 100
Source: Primary Data
The above table shows the gender wise classificationof the respondents. Out of 100 respondents 43% aremale and 57% are female. So majority of the respondentsare male.

Page 32
ISSN : 2321-3604
March 2014Vol.2, Special Issue
Primax International Journal of Commerce and Management Research
Table No: 2 AGE
The above tables shows that, 52 per cent of the respondents are belong to the age group of 18-28 years, 32 per centof the respondents are belong to the age group of 28-38 years, and 16 per cent of the respondents are age group isabove 38 years.Hence the majority of the respondents are 52 per cent of the respondents are belong to the agegroup of 18-28 years.
Table No: 3 Feature to be an important part of mobile phones
Source: Primary Data
Source: Primary Data
The above tables shows that, six per cent of the respondents are says that I wouldn’t buy it without this feature, 61per cent of the respondents are it is rather important, 18 per cent of the respondents are it is not really important,15 per cent of the respondents are it is not important at all. Hence, the majority are 61 per cent of the respondentsare it is rather important of mobile phone.
Table No: 4 Primary purpose for using internet on your mobile phone
Particular Respondents Percentage18-28 Years 52 5228-38 Years 32 32Above 38 Years 16 16Total 100 100
S.NO Statement No.of respondents Percentage
1 To browse WWW 65 65
2 To read news 4 4
3 To read/send e-mails 31 31
4 Total 100 100
Source: Primary Data
The above tables shows that, 65 per cent of the respondents are only to browse in using internet mobile phone, fourper cent of the respondents are read news in using internet mobile phone, 31 per cent of the respondents are reador sent e-mails through in using internet mobile phone. Hence the majority of 65 per cent of the respondents areonly to browse in using internet mobile phone.
S.NO Statement No.of respondents Percentage
1Yes I wouldn’t buy it without
this feature6 6
2Yes it is rather important
61 61
3 No it is not really important 18 18
4 No it is not important at all 15 15
5 Total 100 100

Page 33March 2014Vol.2, Special Issue
Primax International Journal of Commerce and Management Research ISSN : 2321-3604
Table No: 5 Benefits of using internet on your mobile phone
S.NO Statement No.of respondents Percentage1 Its accessible everywhere 57 57
2I can search for information
that I need urgently 32 32
3 It is a way to pass my time 6 6
4 It allow me to use online utilities when I am out 5 5
5 Total 100 100
Source: Primary Data
The above tables shows that, 57 per cent of the respondents are its accessible everywhere internet through mobilephone, 32 per cent of the respondents are i can search for information that I need urgently, six per cent of therespondents are it is a way to pass my time, five per cent of the respondents are it allow me to use online utilitieswhen i am out.Hence the majority of 57 per cent of the respondents are its accessible everywhere internet throughmobile phone.
Table No: 6 SMS
S.NO Statement No.of respondents Percentage
1 Very safe 57 57
2 Somewhat safe 19 19
3 Somewhat unsafe 15 15
4 Very unsafe 9 9
5 Total 100 100
Source: Primary Data
The above tables shows that, 57 per cent of the respondents are sending SMS through internet very safe, 19 percent of the respondents are sending SMS through internet somewhat safe, 15 per cent of the respondents aresending SMS through internet somewhat unsafe, nine per cent of the respondents are sending SMS throughinternet very unsafe.Hence the majority of 57 per cent of the respondents are sending SMS through internet verysafe.
Table No: 7 Mobile browser similar to the way you access the Internet on your PC
S.NO Statement No.of respondents Percentage1 Very safe 82 822 Somewhat safe 3 33 Somewhat unsafe 7 74 Very unsafe 8 8
5 Total 100 100
Source: Primary Data
The above tables shows that,82 per cent of the respondents are very safe mobile browser similar to the way youaccess the Internet on your PC,three per cent of the respondents are somewhat safe mobile browser similar to theway you access the Internet on your PC,seven per cent of the respondents are somewhat unsafe mobile browsersimilar to the way you access the Internet on your PC,eight per cent of the respondents are very unsafe mobilebrowser similar to the way you access the Internet on your PC.Hence majority of 82 per cent of the respondents arevery safe mobile browser similar to the way you access the Internet on your PC.
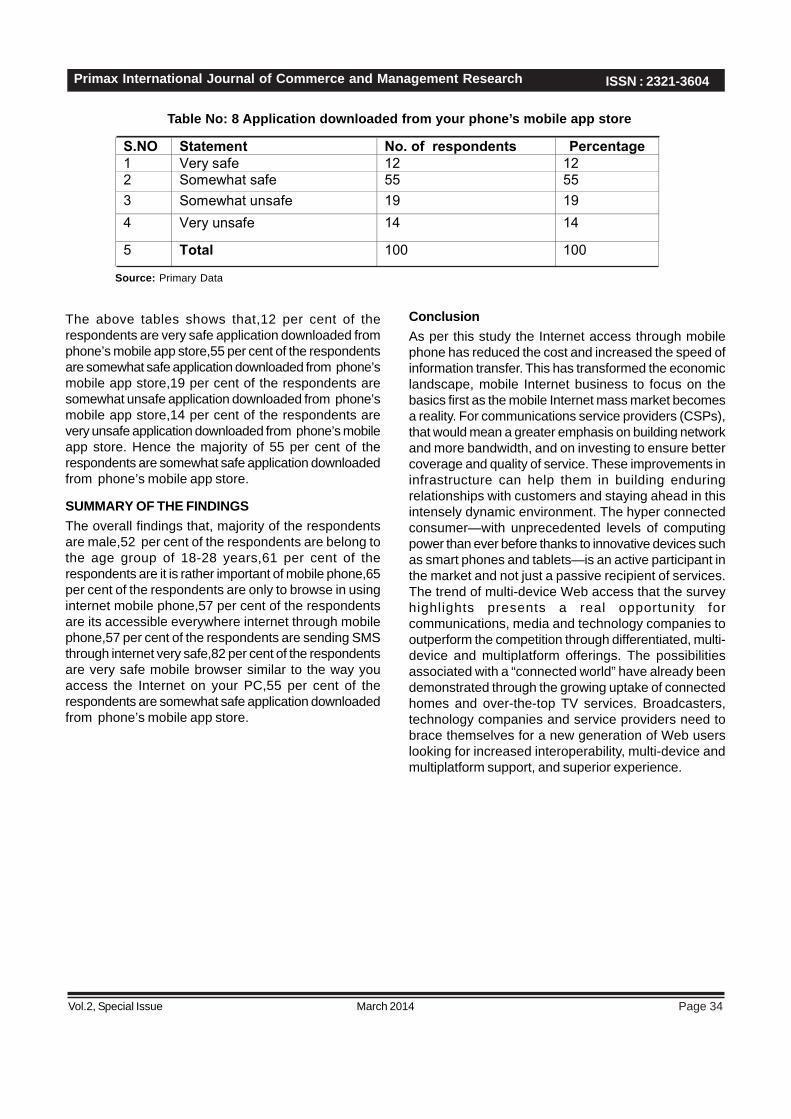
Page 34
ISSN : 2321-3604
March 2014Vol.2, Special Issue
Primax International Journal of Commerce and Management Research
Table No: 8 Application downloaded from your phone’s mobile app store
Source: Primary Data
The above tables shows that,12 per cent of therespondents are very safe application downloaded fromphone’s mobile app store,55 per cent of the respondentsare somewhat safe application downloaded from phone’smobile app store,19 per cent of the respondents aresomewhat unsafe application downloaded from phone’smobile app store,14 per cent of the respondents arevery unsafe application downloaded from phone’s mobileapp store. Hence the majority of 55 per cent of therespondents are somewhat safe application downloadedfrom phone’s mobile app store.
SUMMARY OF THE FINDINGSThe overall findings that, majority of the respondentsare male,52 per cent of the respondents are belong tothe age group of 18-28 years,61 per cent of therespondents are it is rather important of mobile phone,65per cent of the respondents are only to browse in usinginternet mobile phone,57 per cent of the respondentsare its accessible everywhere internet through mobilephone,57 per cent of the respondents are sending SMSthrough internet very safe,82 per cent of the respondentsare very safe mobile browser similar to the way youaccess the Internet on your PC,55 per cent of therespondents are somewhat safe application downloadedfrom phone’s mobile app store.
ConclusionAs per this study the Internet access through mobilephone has reduced the cost and increased the speed ofinformation transfer. This has transformed the economiclandscape, mobile Internet business to focus on thebasics first as the mobile Internet mass market becomesa reality. For communications service providers (CSPs),that would mean a greater emphasis on building networkand more bandwidth, and on investing to ensure bettercoverage and quality of service. These improvements ininfrastructure can help them in building enduringrelationships with customers and staying ahead in thisintensely dynamic environment. The hyper connectedconsumer—with unprecedented levels of computingpower than ever before thanks to innovative devices suchas smart phones and tablets—is an active participant inthe market and not just a passive recipient of services.The trend of multi-device Web access that the surveyhighlights presents a real opportunity forcommunications, media and technology companies tooutperform the competition through differentiated, multi-device and multiplatform offerings. The possibilitiesassociated with a “connected world” have already beendemonstrated through the growing uptake of connectedhomes and over-the-top TV services. Broadcasters,technology companies and service providers need tobrace themselves for a new generation of Web userslooking for increased interoperability, multi-device andmultiplatform support, and superior experience.
S.NO Statement No. of respondents Percentage
1 Very safe 12 12
2 Somewhat safe 55 55
3 Somewhat unsafe 19 19
4 Very unsafe 14 14
5 Total 100 100

Page 35March 2014Vol.2, Special Issue
Primax International Journal of Commerce and Management Research ISSN : 2321-3604
A COMPARATIVE STUDY ON THE MODERN MARKETINGSERVICE RENDERED BY HDFC AND SBI IN TRICHY TOWN
1S.Leo 2Dr.D.JohnPrabakaren
ABSTRACTToday banks have become a part of our life. There was a time when the dwellers of city alone could enjoy theirservices. Now banks offer access to even a common man and their activities extend to areas hither to untouched.Apart from their traditional business oriented functions, they have now come out to fulfill national responsibilities.Banks cater to the needs of agriculturists, industrialists, traders and to all the other sections of the society. The presentstudy under the title, “A comparative study on the Modern Marketing Service rendered by HDFC and SBI in TrichyTown”, is undertaken mainly to analyze the competition between the banks in rendering marketing services to thecustomers. The private banks are more consumers oriented than commercial banks because the technologicaladvancement used by the private banks are higher than the commercial banks. Businessmen need banking serviceto carry out their business transactions. The primary function of bank is to act as a channel for providing andtransferring finance to industry, individuals, society and the like. Therefore, it is important to study the modernmarketing services rendered by HDFC and SBI bank particularly at Triuchirappalli town in relation to the mode ofexchange of finance in the district as a whole.
1 PG research Scholar,Dept. of Commerce CA, St. Joseph’s College, Trichy2 Asst. Professor of Commerce and Head, Dept. of Commerce CA, St. Joseph’s College, Trichy
INTRODUCTIONToday banks have become a part of our life. There was atime when the dwellers of city alone could enjoy theirservices. Now banks offer access to even a commonman and their activities extend to areas hither tountouched. Apart from their traditional business orientedfunctions, they have now come out to fulfill nationalresponsibilit ies. Banks cater to the needs ofagriculturists, industrialists, traders and to all the othersections of the society. Thus they accelerate theeconomic growth of a country and steer the wheels ofthe economy towards its goal of “self-reliance in all fields”.It naturally arouses our interest in knowing about the‘bank’ and the various men and activities connected withit.
STATEMENT OF THE PROBLEMThe present study under the title, “A comparative studyon the Modern Marketing Service rendered by HDFCand SBI in Trichy Town”, is undertaken mainly to analyzethe competition between the banks in renderingmarketing services to the customers.
The private banks are more consumers oriented thancommercial banks because the technologicaladvancement used by the private banks are higher thanthe commercial banks.
IMPORTANCE OF THE STUDYNow-a-days money is very essential for all individualsas well as to industries, companies, etc. The mainsectors in Tiruchirappalli district are agriculture, smallbusiness, small scale industry and medium scaleindustry. They have also been slowly increasing everyyear. Individuals want to save money for their future, sothey need banking services.
Businessmen need banking service to carry out theirbusiness transactions. The primary function of bank isto act as a channel for providing and transferring financeto industry, individuals, society and the like. Therefore,it is important to study the modern marketing servicesrendered by HDFC and SBI bank particularly atTriuchirappalli town in relation to the mode of exchangeof finance in the district as a whole.
OBJECTIVES OF THE STUDYThe researcher has coined the following objectives forthis research.
To examine various service benefits rendered by‘State Bank of India’ and ‘HDFC’ to their customers.
To evaluate the major services schemes like ATM,credit card, Debit card, et al by HDFC and SBI.
To offer suggestions for improving modern servicesto be rendered by the banks.

Page 36
ISSN : 2321-3604
March 2014Vol.2, Special Issue
Primax International Journal of Commerce and Management Research
RESEARCH METHODOLOGYSource of DataThe sources of data are of two types, they arei) Primary source,ii) Secondary source
Primary data is obtained by collecting dates throughthe form of QUESTIONNAIRE method. The Questionnaireis given to the respondents who are availing the ModernMarketing Services from HDFC and SBI or both.
Secondary data is collected by having interaction withthe officials of HDFC and SBI and from the reports,journals, directives advertisement modes and the like.
Sample SizeHDFC and SBI banks are having many branches in TrichyTown. There are numerous numbers of customers tothese banks. But the sample was designed to 50respondents in total. Then it has been divided into two,which covers 25 respondents from ICICI customers andanother 25 respondents form SBI customers for thisresearch work.
Data Collection MethodConvenient sampling method was adopted for sampleselection and collection of information from them.
Analytical Tools UsedThe data has been interpreted with the help of variousdiagrams like bar diagrams, pie diagrams, etc. The datahas been further classified into percentages for easyunderstanding.
Area under StudyThe area covered under the study is Trichy town. Thestudy has been conducted in various areas ofTiruchirappalli l ike, Contonment, Thillainagar,Mainguardgate, Srirangam and Worraiyur.
LIMITATIONS OF THE STUDYThe study is restricted only to Trichirappalli towndue to lack of time.
Sample size is limited to 50 respondents of bothSBI and HDFC (1:1) because of cost constraint.
Comparison with other banks is not possible due totheir non-cooperation.
DATA ANALYSIS AND INTERPRETATION:Table 1 Particulars of the respondents on the basis of the nature of the accounts
Nature of the
Accounts
HDFC SBI
No. of respondents Percentage No. of respondents percentage
Savings a/c 24 96 22 88
Current a/c 1 4 1 4
Both - - 2 8
Total 25 100 25 100
Source: Primary Data
The above table depicts that, of the 25 respondents of HDFC, 24 respondents (96%) are having savings a/c and1 respondent (4%) is having current a/c. Of the 25 respondents of SBI, 22 respondents (88%) are having savingsbank a/c and only one respondent is having current a/c. and 2 respondents are having both types of a/c and onlyone respondent is having current a/c.
Table - 2 Particulars of the respondents on the basis of the media throughWhich they know about the bank
Media
HDFC SBI
No. of respondents Percentage No. of respondents Percentage
Through Agency 10 40 - -
Advertisement 9 36 5 20
Influenced by others 6 24 20 80
Total 25 100 25 100
Source: Primary Data

Page 37March 2014Vol.2, Special Issue
Primax International Journal of Commerce and Management Research ISSN : 2321-3604
The above table shows that 10 respondents (40%), 9 respondents (36%) and 6 respondents (24%) have come toknow about the bank through agency, advertisements and influenced by others in HDFC bank. For SBI bank, 5respondents (20%) and 20 respondents (80%) have come to know about the bank through advertisements andinfluenced by others respectively.
Table - 3 Particulars of the respondents on the basis of the Motivational factors
Factors
HDFC SBI
No. of respondents Percentage No. of respondents Percentage
Rate of return 5 20 6 24
Convenience 9 36 13 52
Need 11 44 6 24
Total 25 100 25 100
Source: Primary Data
The above table shows that, for HDFC bank there are 11 respondents (44%) who have been motivated for needfactor, 9 respondents (36%) have been motivated towards convenience and 5 respondents (20%) have been motivatedtowards the rate of return.
Whereas for SBI bank, there are 13 respondents (52%) motivated towards convenience, 6 respondents (24%) aremotivated towards the rate of return and the remaining 6 respondents (24%) are motivated towards the need factors.
Table - 4 Particulars of the respondents availing the modern services of HDFC bank
Services No. of respondents Percentage
ATM 25 100
Debit card 11 44
Credit card 9 36
Roaming current a/c 2 8
NRI services 1 4
Total 25 100
Source: Primary Data
Note: The total number of respondents of ICICI is 25. Therefore percentage is calculated for 25 respondents.
The respondents availing the modern services of HDFC bank of the 25 respondents, all the 25 respondents (100%)are availing ATM services, 11 respondents (44%) are availing the debit card services, 9 respondents (36%) arehaving credit card, 2 respondents (8%) and 1 respondent (4%) are availing the Roaming current account and NRIservices respectively.
It can be inferred that ATM is the top most modern service, which is availed by the respondents of HDFC bank.
Table - 5 Particulars of the respondents availing the modern services of SBI bank
Services No. of respondents Percenta ge
ATM 25 100
Debit card 25 100
Credit card 6 24
Total 25 100
Source: Primary Data

Page 38
ISSN : 2321-3604
March 2014Vol.2, Special Issue
Primax International Journal of Commerce and Management Research
Note: The total number of Respondents of SBI is 25. Therefore, percentage is calculated for 25 respondents.From the above table 100% of the customers of SBI is enjoying the modern service of both ATM and Debit card.There are yet another 6 respondents who are availing the credit card facility also.
Table -6 Particulars of the respondents on the basis of using ATM cards
Monthly usage
HDFC SBI
No. of respondents Perc entage No. of respondents percentage
Once 2 8 3 12
Twice 3 12 3 12
Thrice 5 20 8 32
More than 3 times 15 60 11 44
Total 25 100 25 100
Source: Primary Data
The above table shows that 60% of the respondents use their ATM cards more than three times in a month and 44%of SBI respondents use them more than three times in a month. There are 5(20%), 3(12%) and 2 (8%) respondentsof HDFC using the ATM cards thrice, twice and once respectively. In the same way, there are 8 (32%), 3(12%) and3(12%) of SBI respondents using their ATM cards thrice, twice and once respectively.
Table -7 Particulars of the respondents on the basis of using Debit cards
Monthly usage
HDFC SBI
No. of respondents Percentage No. of respondents percentage
Once 5 20 2 8
Twice 8 32 5 20
Thrice 2 8 1 4
More than 3
times
10 40 17 68
Total 25 100 25 100
Source: Primary Data
The above table shows that nearly 40% (10) and 68% (17) of both HDFC and SBI respondents use Debit cards formore than three times in a month. It is clearly found that the remaining 2(8%), 8(32%) and 5(20%) respondents ofHDFC and 1(4%), 5(20%) and 2(8%) of SBI respondents use their debit cards thrice, twice and once in each month.
Table - 8 Particulars of the respondents on the basis of using credit cards
Monthly usage
HDFC SBI
No. of respondents Percentage No. of respondents percentage
Once 7 28 5 20
Twice 2 8 8 32
Thrice 9 36 7 26
More than 3
times
7 28 5 28
Total 25 100 25 100
Source: Primary Data

Page 39March 2014Vol.2, Special Issue
Primax International Journal of Commerce and Management Research ISSN : 2321-3604
The above table stated that 7 respondents of HDFC and only 5 respondents of SBI are using credit cards more thanthree times in a month.
It is also tabulated that there are 9 (36%), 2 (8%) and 7(28%) of HDFC respondents and 7(28%), 8(32%) and 5(20%)of SBI respondents are using their credit cards for thrice, twice and once respectively in every months.
Table - 9 Particulars of the respondents on the basis of using ATM cards in other stations
Type
HDFC SBI
No. of respondents Percentage No. of respondents percentage
Using 15 60 13` 52
Not using 10 40 12 48
Total 25 100 25 100
Source: Primary Data
The above table states that only 60% (15) and 52% (13) of HDFC and SBI respondents use their cards in otherstations. The rest 40% (10) and 48%(12) of HDFC respondents and SBI respondents are not using such cards inout stations.
This table infers that most of the respondents are using ATM cards in other stations but meager respondents whoare not using ATM cards in other stations who are not using ATM cards in other stations is because of lessknowledge in using such cards.
Table - 10 Particulars of the respondents on the basis of their Deposits and withdrawals in HDFC bank
AmountDeposits With drawls
No. of respondents Percentage No. of respondents percentageUpto Rs.20,000 10 40 9 36Rs.20,000-Rs.50,000
8 32 7 28
Rs.50,000-Rs,1,00,000
4 16 1 4
Above 1,00,000 3 12 6 24None Nil Nil 2 8
Total 25 100 25 100Source: Primary Data
The above table shows that, There are 10(40%) respondents and 9 (36%) respondents who deposit and withdrawsupto Rs.20,000. Also there are 3(12%) respondents and 6(24%) respondents who deposits and withdraws amountabove RS.1,00,000.The meager amount of respondents does not withdraw any amount from their account because they want to saveamount for their future. Most of the persons who are withdrawing money many times in a year is because they wantto rotate it is their business. They are mostly business people.
Table -11 Particulars of the respondents on the basis of their deposits and withdrawals in SBI bank
AmountDeposits Wi th drawls
No. of respondents
Percentage No. of respondents
Percentage
Upto Rs.20,000 5 20 2 8Rs.20,000 -Rs.50,000 9 36 3 12Rs.50,000 -Rs,1,00,000 7 28 6 24Above 1,00,000 4 16 10 40None Nil Nil 4 16Total 25 100 25 100
Source: Primary Data

Page 40
ISSN : 2321-3604
March 2014Vol.2, Special Issue
Primax International Journal of Commerce and Management Research
The above table shows that,There are 5 (20%) and 2(8%)of respondents who deposit and withdraws uptoRs.20,000. 9(36%) and 3(12%) of respondents whodeposit and withdraw from Rs.20,000 to Rs.50,000.7(28%) and 6(24%) of respondents deposit and withdrawfrom Rs.50,000 to Rs.1,00,000. 4(16%) and 10(40%)respondents deposit and withdraws about Rs.1,00,000.
This implies that most of the respondents have depositsas well as withdrawals, because most of them arebusinessmen. Meager respondents are not withdrawingany amount, most of them are Government employeesand are saving their amounts for their future.
FINDINGS:Majority of the respondents switch their interest tohave savings account rather than current account;
HDFC bank reached the customers through agentsand advertisements, whereas SBI bank respondentsare influenced by other;
Convenience and needs made most of therespondents to become the customers of the bank;
100% of the respondents of HDFC bank avail theATM services;
100% of the respondents of SBI bank avail themodern service of ATM – cum - Debit cards;
½ of the respondents use ATM and debit cards morethan three times in a month;
Nearly 32% of respondents use their credit card forthree times in a month;
¾th of the respondents use their ATM cards inother stations like Chennai, Coimbatore, Bangaloreand also outside India;
Majority of the respondents of HDFC deposit andwithdraw a sum upto Rs.2000;
SUGGESTIONThe banks must reconstruct its present promotionalpolicies because most of the customers are notsatisfied with these programs of their banks;
No respondents of SBI knew about their bank throughagency. Therefore, agencies must be fixed to createawareness to the public about the benefits of thisbank;
Banks should take necessary steps for thecustomers who are very far away from the bank;
Roaming current account is a very good serviceprovided by HDFC bank. But there are very lessnumber of respondents availing this service. So,bank should concentrate on the above;
Some of the respondents feel the service chargesare high. Therefore, the respective bank should takeup effective steps to reduce the service charges;
HDFC bank should take necessary steps or try toreduce the interest rates for loans;
SBI bank must act quickly because manyrespondents feel that this bank consumers more timeto complete a transaction;
SBI bank must also take effective steps to processloans quickly;
Financial statements for the customer’s accountsmust be sent regularly to all the account holders ofthe respective bank;
CONCLUSIONThe researcher has taken at most steps to enlightenthe modern services rendered by HDFC and SBI banksat Trichirappalli town, with concrete objectives. Theresearcher finds that the services rendered are notreaching the poor and rural masses. The researcherhas also suggested certain suggestions to enlighten themodern services to the rural masses. There are manyways to develop this work in the country. Finally, theresearcher feels that the RBI should have more controlover the operations of both the banks.
REFERENCE:• Saxena K.K., Bank Marketing - concepts and
Applications, 1988, Skylark Publications.
• Jha.S.M, Services Marketing 2003, HimalayaPublishing House.
• Rajashekar. N. Banking in the New Millenium, 2003,ICFAI University.
• Dr.Nirmala Prasad.K. & Chandradass .J, Bankingand Financial Systems, 1994, Himalaya PublishingHouse.
• Gordan.E and Natarajan.K, Banking Theory, law &Practice, 2003, Himalaya Publication House.
• Madhukar R.K, Dynamics of Bank Marketing,1990,Sri Sudhindra Publishing House.
• Vasant Desai, Indian Banking – Nature & problems,1987, Himalaya publishing House.
• Vaish.M.C, Modern Baking, 1984, RBSA publishers.
• Sundharam P.M & Varshney P.N. Banking Theory,Law & Practice, 1992, Sultan Chand & sons.
• Balaji .B, Services Marketing and Management,2002,S.Chand & Co. Ltd.
WEB SITES:www.hdfc.com, www.sbi.co.in

Page 41March 2014Vol.2, Special Issue
Primax International Journal of Commerce and Management Research ISSN : 2321-3604
“A STUDY ON CONSUMER PREFERENCE TOWARDS FLIPKARTONLINE SHOPPING WITH SPECIAL REFERENCE TO HOSTEL
STUDENTS, ST.JOSEPH’S COLLEGE” 1Vignesh K
“REDISCOVER A GREAT SHOPPING TRADITION”-BRANDON GAILLE
ABSTRACTIn the recent past Internet has got a precious place in the economic activities. It makes the life of customers prosperand smooth. Now-a-days people show their interest on internet. They now feel satisfied by purchasing the productsonline.
The purpose of this study is to examine and analyze the consumer’s preferences towards online shopping (especiallyin case of flipkart.com users in hostel at St.Joseph’s college, trichy).
They want various services at their doorstep by saving their time and money. For this Flipkart e-market plays a veryimportant role as a new way of helping students and attracting them towards the market potentials. There are many e-commerce websites in the market website which deals with selling and purchasing of goods and services throughinternet and computer networks. Researcher aims to prove Flipkart.com as a successful e-commerce website bydifferent e-commerce websites available in the market. As a successful e-commerce website, flipcart.com increasesbusiness opportunities, competitiveness, better and profitable access to markets and saves users travel time andcost. This research paper also to analyze various aspects of flipkart.com on the basis of its security, quality of service,product availability, discounts payment mode and many more parameters. The success of Flipkart Company in Indiais depending upon its popularity, its branding image, its unique & fair policies, and its customer relations etc.
KEYWORDS: e-commerce, Internet, Network, Information Technology
1 PG Research Scholar, Department of Commerce CA, St.Joseph’s college, Tiruchirappalli
INTRODUCTIONElectronic commerce , commonly known as e-commerce or ecommerce, is a type of industry wherethe buying and selling of products or services isconducted over electronic systems such as the Internetand other computer networks. Electronic commercedraws on technologies such as mobilecommerce, electronic funds transfer, supply chainmanagement, Internet marketing, online transactionprocessing, electronic data interchange (EDI),inventorymanagement systems, and automated datacollection systems. Modern electronic commercetypically uses the World Wide Web at least at one pointin the transaction’s life-cycle, although it mayencompass a wider range of technologies such as e-mail, mobile devices, social media, and telephones aswell.
Online shopping or e-shopping is a form of electroniccommerce which allows consumers to directly buy goodsor services from a seller over the Internet using a webbrowser. Alternative names are: e-web-store, e-shop, e-store, Internet shop, web-shop, web-store, online store,online storefront and virtual store. An online shop evokesthe physical analogy of buying products or services ata bricks-and-mortar retailer or shopping center; theprocess is called business-to-consumer (B2C) online
shopping. In the case where a business buys fromanother business, the process is called business-to-business (B2B) online shopping. Retail success is nolonger all about physical stores. This is evident becauseof the increase in retailers
now offering online store interfaces for consumers. Withthe growth of online shopping, comes a wealth of newmarket footprint coverage opportunities for stores thatcan appropriately cater to offshore market demands andservice requirements.
DEFINITIONA type of business model, or segment of a larger businessmodel, that enables a firm or individual to conductbusiness over an electronic network, typically theinternet. Electronic commerce operates in all four of themajor market segments: business to business, businessto consumer, consumer to consumer and consumer tobusiness.
PROBLEMS OF THE STUDYThe most important problem and the primary reasonfor this research are to identify why the onlineshoppers do not prefer this site for making purchase.
The main problem is the purchasers are scared ofnot seeing the real product at the time of makingorder.

Page 42
ISSN : 2321-3604
March 2014Vol.2, Special Issue
Primax International Journal of Commerce and Management Research
The payment mode offered by the online market suitsthe customer at the time of making the payment.
OBJECTIVES
To study about the customer preference of onlineshopping in Flipkart.
To know the awareness of the consumers regardingthe price, brand and quality offered by the Flipkart.
To know the impact of the online advertisementprovided by Flipkart, on the consumer.
To study the customer satisfaction while makingonline shopping through Flipkart.
SCOPE OF THE STUDYThe scope of the study relates to the customerpreference of Flipkart.com in bellarmine hostel for onlinepurchasing of product. It deals with the reasons forpreference, cost aspects, level of satisfaction of theconsumers, identify the purchasing decision and learnthe impact of online advertisement which influences theconsumer to purchase the product in online market.
METHODOLOGYThe present study has been formed with primary andsecondary data. The primary data were collected throughdirect personal investigation. Some other information
related to consumer preferences is collected fromsecondary sources like journals, magazines,periodicals, books, newspapers, and internet.
The total numbers of samples selected were 50 (i.e.10% from the total universe) from the student friendsstayed in the hostel both post graduation first years andsecond years from the universe of 500. It is also adescriptive research paper based on secondary data.
Collection of dataTo fulfill the above objectives a structured form ofquestionnaire was distributed to 50 respondents inSt.Joseph’s college hostel during the period of February2014 and deliberate attempt was made to give a fairrepresentation to various attributes via age group, typeof product purchased and frequent visit of the website(Flipkart).
Analysis of dataThe data obtained as primary data were arranged andtabulated. The tabulated data are further analyzed andinterpreted. The statistical tools such as average andpercentage were widely used.
Use of statistical toolsThere are two statistical tools apply in this theses. It is,
1. Percentage.2. Chi – square test.
ANALYSIS AND INTERPRETATIONTABLE-1 Table showing Age wise classification of the respondents
Age No. of respondents PercentageBelow 20 29 58
21-30 17 3431-40 3 6
Above 40 1 2Total 50 100
Source: Primary Data
Interpretation:The above mentioned table shows that the majority of respondent i.e. 58% of them below the age group of 20; whereas 34% of they are between the age group of 21-30. The remaining very few respondents were in the age group of 31-40 and above 40. It is inferred that the use of Flipkart is a universal phenomenon and all the student respondentsusing Flipkart for online purchasing.
TABLE - 2 Table showing respondent classification according to the type of product purchasedProduct No of the respondent PercentageBooks 6 12
Foot wares 8 16Electronic goods 21 42
Merchandise 15 30Total 50 100
Source: Primary Data

Page 43March 2014Vol.2, Special Issue
Primax International Journal of Commerce and Management Research ISSN : 2321-3604
Interpretation:The above mention table shows that the majority of the respondent using Flipkart for the purpose of purchasingelectronic goods i.e. 42%. Whereas 30% of the respondent using the website for purchasing merchandise, a veryfew of the respondent were preferred to buy books and foot wares.
TABLE-3 Table showing respondent classification according to their satisfactionFrequency No of the respondent Percentage
Highly satisfied 13 26Satisfied 19 38
Good 14 28Bad 4 8
Total 50 100Source: Primary Data
Interpretation:The above mentioned table denotes, most of the Flipkart users are satisfied with the service provided by the onlinemarket at 38%. The next majorities of the respondent using online purchasing through Flipkart were 28% and ratedthe website as good. The lesser amount of respondent was showing their feedback in unfavoured manner.
TABLE- 4 Table showing respondent classification according to their frequent visit
Frequency No of the respondent PercentageVery often 4 8
Often 12 24Occasionally 23 46
Rarely 11 22Total 50 100
Source: Primary Data
Interpretation:The above mentioned table shows that most of the respondents are occasionally visit the website to see theproducts and offers provided by Flipkart. They respond at 46%. Similarly the respondents often visit the website by24% and 22% of the respondent rarely use the website.
Majority of the respondents belongs to occasionally visiting group because they are all interested to buy theproduct in online market as it is widely available to their expectations.
TABLE - 5 Table showing respondent classification according to the type of payment
Payment type No of the respondent PercentageCash on delivery 33 66
Card payment 8 16Online banking 9 18
Total 50 100Source: Primary Data
Interpretation:The above table shows the type of payment made by the respondent at the time of online shopping. As much as66% of the respondents use cash on delivery. Whereas 18% of the respondents uses internet banking for makingpayment, the lesser amount of respondents are using cards for their payment.
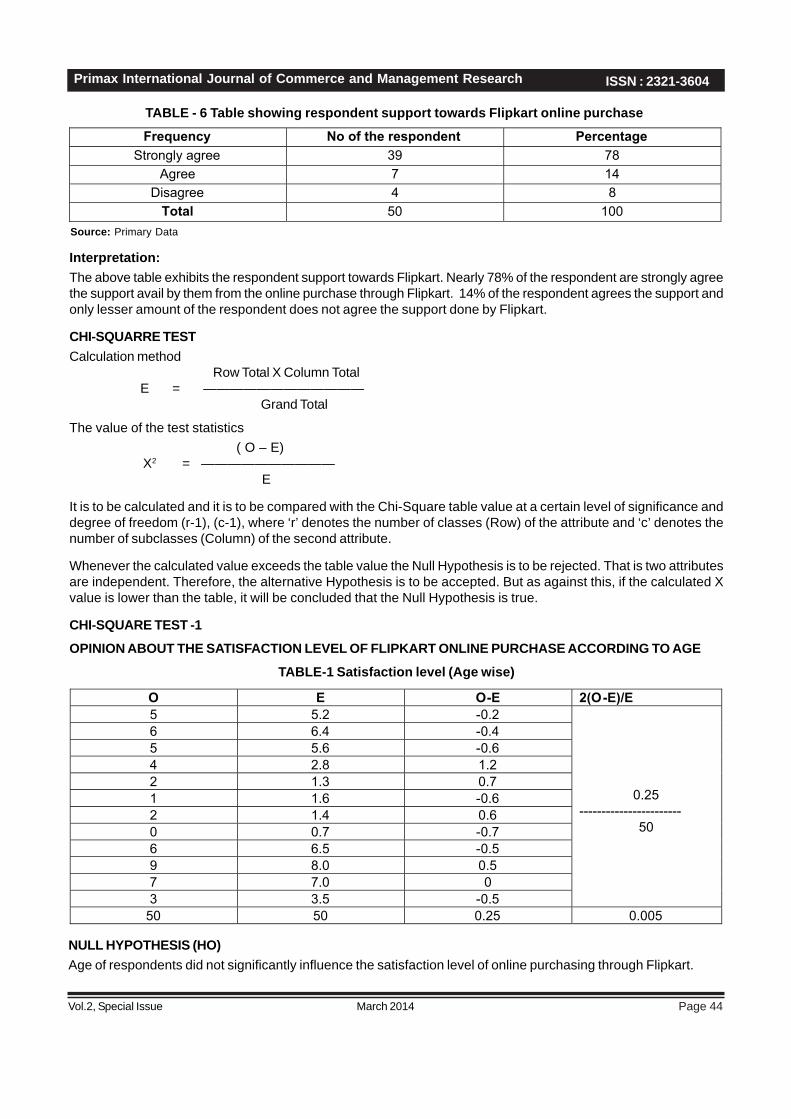
Page 44
ISSN : 2321-3604
March 2014Vol.2, Special Issue
Primax International Journal of Commerce and Management Research
TABLE - 6 Table showing respondent support towards Flipkart online purchase
Frequency No of the respondent PercentageStrongly agree 39 78
Agree 7 14Disagree 4 8
Total 50 100Source: Primary Data
Interpretation:The above table exhibits the respondent support towards Flipkart. Nearly 78% of the respondent are strongly agreethe support avail by them from the online purchase through Flipkart. 14% of the respondent agrees the support andonly lesser amount of the respondent does not agree the support done by Flipkart.
CHI-SQUARRE TESTCalculation method
Row Total X Column Total E = ————————————
Grand Total
The value of the test statistics ( O – E)
X2 = —————————— E
It is to be calculated and it is to be compared with the Chi-Square table value at a certain level of significance anddegree of freedom (r-1), (c-1), where ‘r’ denotes the number of classes (Row) of the attribute and ‘c’ denotes thenumber of subclasses (Column) of the second attribute.
Whenever the calculated value exceeds the table value the Null Hypothesis is to be rejected. That is two attributesare independent. Therefore, the alternative Hypothesis is to be accepted. But as against this, if the calculated Xvalue is lower than the table, it will be concluded that the Null Hypothesis is true.
CHI-SQUARE TEST -1
OPINION ABOUT THE SATISFACTION LEVEL OF FLIPKART ONLINE PURCHASE ACCORDING TO AGE
TABLE-1 Satisfaction level (Age wise)
O E O-E 2(O-E)/E5 5.2 -0.2
0.25-----------------------
50
6 6.4 -0.45 5.6 -0.64 2.8 1.22 1.3 0.71 1.6 -0.62 1.4 0.60 0.7 -0.76 6.5 -0.59 8.0 0.57 7.0 03 3.5 -0.5
50 50 0.25 0.005
NULL HYPOTHESIS (HO)Age of respondents did not significantly influence the satisfaction level of online purchasing through Flipkart.
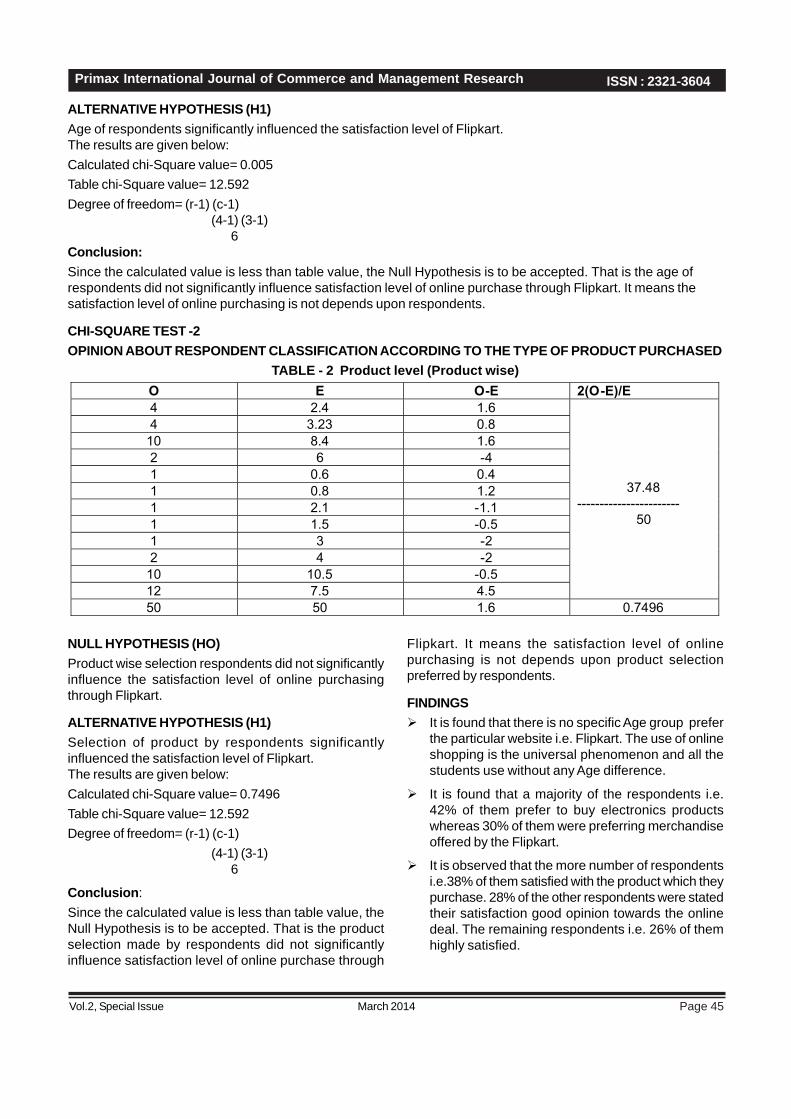
Page 45March 2014Vol.2, Special Issue
Primax International Journal of Commerce and Management Research ISSN : 2321-3604
ALTERNATIVE HYPOTHESIS (H1)Age of respondents significantly influenced the satisfaction level of Flipkart.The results are given below:Calculated chi-Square value= 0.005Table chi-Square value= 12.592Degree of freedom= (r-1) (c-1)
(4-1) (3-1) 6
Conclusion:Since the calculated value is less than table value, the Null Hypothesis is to be accepted. That is the age ofrespondents did not significantly influence satisfaction level of online purchase through Flipkart. It means thesatisfaction level of online purchasing is not depends upon respondents.
CHI-SQUARE TEST -2OPINION ABOUT RESPONDENT CLASSIFICATION ACCORDING TO THE TYPE OF PRODUCT PURCHASED
TABLE - 2 Product level (Product wise)O E O-E 2(O-E)/E4 2.4 1.6
37.48-----------------------
50
4 3.23 0.810 8.4 1.62 6 -41 0.6 0.41 0.8 1.21 2.1 -1.11 1.5 -0.51 3 -22 4 -2
10 10.5 -0.512 7.5 4.550 50 1.6 0.7496
NULL HYPOTHESIS (HO)Product wise selection respondents did not significantlyinfluence the satisfaction level of online purchasingthrough Flipkart.
ALTERNATIVE HYPOTHESIS (H1)Selection of product by respondents significantlyinfluenced the satisfaction level of Flipkart.The results are given below:Calculated chi-Square value= 0.7496Table chi-Square value= 12.592Degree of freedom= (r-1) (c-1)
(4-1) (3-1) 6
Conclusion:Since the calculated value is less than table value, theNull Hypothesis is to be accepted. That is the productselection made by respondents did not significantlyinfluence satisfaction level of online purchase through
Flipkart. It means the satisfaction level of onlinepurchasing is not depends upon product selectionpreferred by respondents.
FINDINGSIt is found that there is no specific Age group preferthe particular website i.e. Flipkart. The use of onlineshopping is the universal phenomenon and all thestudents use without any Age difference.
It is found that a majority of the respondents i.e.42% of them prefer to buy electronics productswhereas 30% of them were preferring merchandiseoffered by the Flipkart.
It is observed that the more number of respondentsi.e.38% of them satisfied with the product which theypurchase. 28% of the other respondents were statedtheir satisfaction good opinion towards the onlinedeal. The remaining respondents i.e. 26% of themhighly satisfied.

Page 46
ISSN : 2321-3604
March 2014Vol.2, Special Issue
Primax International Journal of Commerce and Management Research
It is found that the maximum of respondents i.e.46% of them visit the website occasionally, whereas24% from the remaining respondents using thewebsite often.
It is observed that the majority of the respondentsi.e. 66% of the regular user using cash on deliverypayment mode for their online shopping.
It is found that the overall support received by therespondents i.e. 78% of them strongly agree thatthey are using online shopping through Flipkart.
SUGGESITIONS
It is suggested that the mandatory delivery chargesfor below Rs.500, is to be reduced to Rs.300.
It is suggested that the discount must be providedto the bulk order purchase.
It is suggested that the shipping time should bereduced as much as possible.
Flipkart.com has introduced EMI but not advertisedproperly.
Schemes should be introduced for housewives andmiddle – class to motivate them to use thesefacilities.
LIMITATIONS
The data collected based on the questionnaire, sothe result would be varying according to the opinionof the individuals.
The sample size chosen for the study is confinedonly to the Hostel student’s of St.Joseph’s collegein trichy.
The statistical tools used to analyze the data havetheir own limitations.
Time and cost could be another limiting factor asthese have impact on any study.
CONCLUSIONAfter the introduction of online shopping there has beena tremendous changes occurred in normal shoppingstyle. From this research we conclude that the buyersare not willing does sweaty shopping with the directshops. Mostly youngsters and youth generation (20-25Age groups) are very much interested in online shoppingwith flipkart.com. Even though this study is brief theresearcher put up his effort in a nutshell.
REFERENCENargundkar, R., (2008), Market Research: Text andCases, 3rd Edition
Kotler, P. And Keller, K., (2009), Marketing Management,Pearson Education, 13thEdition.
www.google.comhttp://en.wikipedia.org/wiki/Flipkarthttp://www.businessworld.in/en/storypage/-/bw/e-tailers-set-to-ride-a-spending-spree/545535.37502/page/0www.slideshare.com www.flipkart.comwww.Yelp.comwww.kaboodle.comwww.zlio.com

Page 47March 2014Vol.2, Special Issue
Primax International Journal of Commerce and Management Research ISSN : 2321-3604
A STUDY ON THE EFFECTS OF PRODUCT ENDORSEMENTSBY CELEBRITIES ON CONSUMERS
1S. Maris Shinia Clarissia. ABSTRACT
The concept of celebrity endorsement has become a rage in India as well, with every company trying to rope ina brand ambassador of sorts for their brands. The increasing number of endorsements throws a valid questionto the consumers. Is there a science behind the choice of these endorsers or is it just by the popularitymeasurement? What are the reasons which lead to impact of celebrity endorsement on brands?
Celebrity endorsements pull in hundreds of norm every year, and are widely preferred by marketers to promotetheir products. Using celebrities for endorsing brands has become a trend for building the brands as well as thecompany’s image. Promotion of a company’s products through these celebrities is termed as celebrityendorsement. The company makes use of the celebrity’s characteristics and qualities to establish an analogywith the products specialties with an aim to position them in the minds of the target consumers. Celebrityendorsement, thus, is one of the powerful tools adopted by companies/marketers to consolidate their brand(s)in the crowded marketplace. This paper discussed the main and relevant concepts regarding celebrityendorsements.
1 HRD Co-Ordinator, Holy Cross College, Trichy
IntroductionMarketing is the process of performing marketingresearch, selling products or services to customers andpromoting them through advertising to further enhancesales. It generates the strategy that underlies salestechniques, business communication, and businessdevelopments. It is an integrated process through whichcompanies build strong customer relationships andcreate value for their customers and for themselves.Marketing is used to identify the customer, to satisfythe customer, and to keep the customer. With thecustomer as the focus of its activities, it can be concludedthat marketing management is one of the majorcomponents of business management.
Marketing practice was tended to be seen as a creativeindustry in the past, which included advertising,distribution and selling. Many people confuse marketingwith advertising or vice versa. While both componentsare important they are very different. Advertising is asingle component of the marketing process. It’s the partthat involves getting the word out concerning yourbusiness, product, or the services you are offering. Itinvolves the process of developing strategies such asad placement, frequency, etc.
Advertising includes the placement of an ad in suchmediums as newspapers, direct mail, billboards,television, radio, and of course the Internet. Advertisingis the largest expense of most marketing plans, withpublic relations following in a close second.
Commercial advertisers often seek to generate increasedconsumption of their products or services throughbranding, which involves the repetition of an image orproduct name in an effort to associate related qualitieswith the brand in the minds of consumers. Non-commercial advertisers who spend money to advertiseitems other than a consumer product or service includepolitical parties, interest groups, religious organizationsand governmental agencies. Modern advertisingdeveloped with the rise of mass production in the late19th and early 20th centuries. Mass media can be definedas any media meant to reach amass amount of people.Different types of media can be used to deliver thesemessages, including traditional media such asnewspapers, magazines, television, radio, outdoor ordirect mail; or new media such as websites and textmessages.
The TV commercial is generally considered the mosteffective mass-market advertising format; Virtualadvertisements may be inserted into regular televisionprogramming through computer graphics. This type ofadvertising focuses upon using celebrity power, fame,money, popularity to gain recognition for their productsand promote specific stores or products. Advertisersoften advertise their products, for example, whencelebrities share their favorite products or wear clothesby specific brands or designers. Celebrities are ofteninvolved in advertising campaigns such as television orprint adverts to advertise specific or general products.The use of celebrities to endorse a brand can have its

Page 48
ISSN : 2321-3604
March 2014Vol.2, Special Issue
Primax International Journal of Commerce and Management Research
downsides, however. One mistake by a celebrity can bedetrimental to the public relations of a brand.
Celebrity endorsements pull in hundreds of norm everyyear, and are widely preferred by marketers to promotetheir products. Using celebrities for endorsing brandshas become a trend for building the brands as well asthe company’s image. Promotion of a company’sproducts through these celebrities is termed as celebrityendorsement. The company makes use of the celebrity’scharacteristics and qualities to establish an analogy withthe products specialties with an aim to position them inthe minds of the target consumers. Celebrityendorsement, thus, is one of the powerful tools adoptedby companies/marketers to consolidate their brand(s)in the crowded marketplace.
Meaning and DefinitionCelebrity Endorsement: Celebrity branding is a typeof branding, or advertising, in which a celebrity uses hisor her status in society to promote a product, service orcharity Celebrity branding can take several differentforms, from a celebrity simply appearing inadvertisements for a product, service or charity, to acelebrity attending PR events, creating his or her ownline of products or services, and/or using his or her nameas a trend.
McCracken’s (1989) definition of a celebrity endorseris, “any individual who enjoys public recognition and whouses this recognition on behalf of a consumer good byappearing with it in an advertisement (marcoms), isuseful, because when celebrities are depicted inmarcoms, they bring their own culturally relatedmeanings, thereto, irrespective of the requiredpromotional role.”
Friedman and Friedman (1979) found empiricalevidence that, in the promotion of products high inpsychological and/or social risk, use of celebrity endorserwould lead to greater believability, a more favorableevaluation of the product and advertisement, and asignificantly more positive purchase intention.
Objective of the StudyThe main objective of my study is to find out theeffectiveness of celebrity endorsements in promoting aparticular brand to the target audience.
To study the impact of celebrity endorsements onbrands.
To analyze the reasons of how the increasing numberof endorsement alters the purchasing intention ofthe customer.
To find out how the endorsement of celebritiesinfluence an individual in adopting the attitudeadvocated by the communicator.
To analyze the reasons for the advertisement clutterbecause of multiple endorsements.
Methodology of the StudyThere are four main aspects involved researchmethodology: design, sampling, data collection anddata analysis. If inappropriate methodology is used, orif appropriate methodology is used poorly, the resultsof a study could be misleading. Hence, the researchershould be vigilant in selecting the appropriate methodof data collection; in order to attain the objective of thestudy secondary data collection methods will be mucheffective.
Secondary Sources at Data: in this method, datawill be collected front books, magazines, journals,internet sources and the collected data will be edited,analyzed and presented in a prescribed format.
Impact of Celebrity Endorsement on the Brand
Approval of a brand by a star fosters a sense ofMist for that brand among the target audience.
The celebrity endorser has a tremendous potentialto influence the profitability of endorsed products.
The endorsed brand will have more relativity andcredibility.
If the celebrity represents the values that conflictswith the brand values, the advertising would createconflict in the minds of the target audience.
Clutter in brand endorsements is very prominentthese days and such kind of over-exposure canbe bad for the brand as the recall value drops by ahuge margin.
Multiple product endorsement also has a negativeimpact on customers purchasing intentions.
Impact of Celebrity Endorsement:The concept of celebrity endorsement has become arage in India as well, with every company trying to ropein a brand ambassador of sorts for their brands.Theincreasing number of endorsements throws a validquestion to the consumers. Is there a science behindthe choice of these endorsers or is it just by thepopularity measurement? What are the reasons whichlead to impact of celebrity endorsement on brands?

Page 49March 2014Vol.2, Special Issue
Primax International Journal of Commerce and Management Research ISSN : 2321-3604
Businesses have long sought to distract and attract theattention of potential customers that live in a world ofever-increasing commercial bombardment. Everydayconsumers are exposed to thousands of voices andimages in magazines, newspapers, and on billboards,websites, radio and television. Every brand attempts tosteal at least a fraction of an unsuspecting person’s timeto inform him or her of the amazing and different attributesof the product at hand. Because of the constant mediasaturation that most people experience daily, theyeventually become numb to the standard marketingtechniques. The challenge of the marketer is to find ahook that will hold the subject’s attention.
Also from a marketing communications perspective, itis vital that firms design strategies that help to underpincompetitive differential advantage for the firm’s productor services. Accordingly, activities back-up otherelements in the marketing mix such as designing,branding, packaging, pricing, and place decisions in orderto attempt to create positive effects in the minds of theconsumers. In helping to achieve this, use of celebrityendorsers is a widely used strategy.
Memorable Ad Campaigns1. Amitabh BachchanBachchan has been for many years been a popularchoice for brands looking to establish a rapport withconsumers. He has also been linked with governmentand social welfare initiatives that help spread awareness.India’s largest biscuit maker Parle Products has ropedin superstar Amitabh Bachchan to endorse its new mid-premium cookie brand as it plans to take on one of rivalBritannia’s largest brands, Good Day, in a segment itdominates. Amitabh Bachchan is the goodwillambassador for Polio UNICEF campaign. He wasappointed as the ambassador in 2005 and has sincefronted their polio eradication programme successfully. In2012, the World Health Organisation (WHO) had takenIndia off the list of polio endemic countries. AmitabhBachchan was honoured for his contribution to thecause. Any recall of brand Cadbury would be incompletewithout him! Cadbury roped in Amitabh Bachchan in 2004to endorse its brand and regain consumer confidencefollowing a disastrous worm infestation controversy. Aseries of commercials form ‘Pappu Paas Ho Gaya’ to‘Kuch Meetha Ho Jaye’ saw the ads being liked by allage-groups. The character ‘Pappu’ was incidentally a

Page 50
ISSN : 2321-3604
March 2014Vol.2, Special Issue
Primax International Journal of Commerce and Management Research
big hit with many brands then using it to identify withthe under-dog, normal guy, like the one living next door.
Amitabh Bachchan- King of Endorsements hasendorsed various brands such as Banking- ICICI• SoftDrinks- Pepsi, Mirinda• Batteries- Eveready• Paints-Nerolac• Chocolates- Cadbury• Automobiles- MarutiSuzuki (Versa)• Writing Instruments- Parker Pens•Apparel- Reid & Tailor• Diet Supplements- Dabur•Personal Care- Emami• Real Estate- Sahara City Homes, Binani Cement, Navratna• Tanishq• Gujarat state•Maggi• ICICI• Luxor Nano Clean• Cadbury Dairy Milk•Zen Mobile• Emami Boroplus• Max New York LifeInsurance• Kalyan Jewellers etc. Now Big B is the seniorhorse of this endorsement race, and has one of the mostaccountable star appeal.
2. Shahrukh Khan:Shah Rukh Khan is top of the first ever Forbes IndiaCelebrity 100 list. The list, which ranks celebrities onthe basis of their income and popularity, will be releasedin a special edition of Forbes India magazine. SRK wasone of the first actors to endorse in consumer goodsand opened the doors for other stars. He is labelled as‘Brand SRK’ as he tops the list in endorsing nationaland international products. He has been the first choiceof many brands for promoting their products and ideas.According to a survey by TAM Media Research (2008),SRK had endorsed maximum brands on TV. He endorsesleading brands like Airtel, Videocon, Pepsodent, Emami,Hyundai Motors and Dish TV and international brandslike Nokia. Khan is often labelled by the Media as “BrandSRK” due to his various brand endorsement andentrepreneurship ventures. The Times of India noted“Khan has established himself as a brand on the map ofthe film industry. Hailing from a non-filmi backgroundwith no pedigree to boast of and no godfather to pullstrings, the St. Columba’s alumnus has become amuse.” In 2013,Forbes India named him ShahRukh.Inc and declared him India’s biggest Brand.
In August 2012, a promotional film starring Khan anddirected by filmmaker Aniruddha Roy Chowdhury wasreleased. The three minutes clip branded ‘Bengal Leads’which is the first-of-its-kind in West Bengal sinceIndependence showcased Bengal’s traditional touristspots, topographical and cultural diversity. It also featuredKhan speaking a few lines in Bengali, urging people tocome and visit what is called “Beautiful Bengal”. Thefilm, shot in both English and Bengali, was eventuallyawarded at the 2nd Asia TV and Film Festival on Journey,organized by the Japanese government.
3. Akshay Kumar:With his recent release Housefull 2, Akshay has set thebox office on fire. His name has been attached to a lotof brands like Thumbs Up, Bagpiper, Levis Jeans,Micromax, LG etc. He is officially announced as thebrand ambassador of Canada by the CanadaTourism Commission in Delhi. Akshay is thefirst Indian celebrity to be the brand ambassador ofCanada Tourism.
4. Ms Dhoni :Indian cricket captain Mahendra Singh Dhoni has toppedthe chart for celebrity endorsements on television duringthe first six months of 2013, leaving behind not only ShahRukh Khan and Sachin Tendulkar, but also the gorgeousladies of the silver screen. Interestingly, Dhoni also leftbehind many Bollywood actresses, who enjoyed acombined 45 per cent share of the total celebrityendorsements on TV between January and June. Duringthe period, Dhoni appeared for a host of brands,including Reebok, Aircel, Godrej and TVS.
5. Aishwarya Rai Bachchan:Rai made her first commercial for Camlin pencils whenshe was in the 9th grade. Rai became popular afterappearing in a Pepsi commercial with actor AamirKhan. She is the only female actor to have endorsedboth Pepsi and Coca-Cola. She is one of the top brandambassadors in the country and is one of the top paidBollywood actresses in this respect. She modelledfor Titan Watches, Longines watches, L’Oréal, Coca-Cola, Lakmé Cosmetics, Casio pager, Philips, Palmolive,Lux, Fuji films, Nakshatra Diamond Jewellery, and Kalyan Jewellers. She was named the official brandambassador for De Beers diamonds in India. Rai hasbeen ranked the 2nd most popular watch brandambassador worldwide in a survey, conducted by WorldWatch Report. In 2013 Rai and her husband AbhishekBachchan have been roped in as the brand ambassadorsby the TTK Prestige.
6. Sachin Tendulkar:While Sachin Tendulkar’s every move is being recorded,we take you through some of the brands he’s endorsed.Sachin Tendulkar has been sponsored by several brandsthroughout his career including Boost, Pepsi, ActionShoes, MRF, Adidas, Britannia, Fiat Palio , TVS,ESPN Star Sports , Sunfeast , Canon , Airtel ,Reynolds, G-Hanz, Sanyo BPL, Toshiba , Colgate-Palmolive, Philips, VISA, Castrol India , Ujala TechnoBright, Coca-Cola and Musafir.com.

Page 51March 2014Vol.2, Special Issue
Primax International Journal of Commerce and Management Research ISSN : 2321-3604
7. Katrina Kaif:Kaif is one of India’s highest paid celebrity endorsers,and is the ambassador of many prominent brandsincluding Slice, Nakshatra, Lux, Olay, Panasonic andPantene, among others. She is also the first Bollywoodactress to have a Barbie doll modelled after herself. In2012, International Advertising Associationnamed Kaif(along with Salman Khan) as the “Brand Endorser of theYear.
8. Deepika Padukone:Padukone is an active celebrity endorser for severalbrands and products, including Tissot, Sony Cybershot,Nescafe, Wrigley’s Orbit, Maybelline and Pepsi, amongothers. In 2012, it was reported that Padukone hadsigned on for an endorsement deal with Garnier worth 60million , a record breaking remuneration for an Indianactress.
9. Kareena Kapoor:As the diva of bollywood, Kareena kapoor has starred indifferent kinds of advertisisng. From age 20 to presenther face is still a puller for each product advertisisng.hereare some of the ads which she starred: Alpenlibbe, Airtel,Anne French, BMA Wealth Creators, Boro Plus, CitizenWatches, Gitanjali, Globus, Head and Shoulders, IBallPhone, Lakme, Lavie,Limca, Lux Beauty products,Mahindra Rodeo, Malabar Gold and Diamonds, MetroShoes,garnier, pepsi, Kurkure, Sony Products, Philipsand Vivel soaps
10. Anushka Sharma: Although the stars in the senior category have a greatersay, the younger generation actors are also coming upin huge numbers with demand different decreasinggradually. Affirming that Anushka Sharma is beingincluded in the popular category these days, she is alsogaining a lot in the race of the brands.While on one hand,Anushka is busy with the upcoming project of YashChopra, she is also seen to be busy doing ads. The girlfrom Rab Ne….has appeared as a face of manydeodorants and is also working in ads towards promotionof sleeveless in female dressing.
11. Virat Kohli:Kohli has endorsements with the following brands:PepsiCo, Nike, TVS Motors, Fastrack (from Titan), RoyalChallenge (from United Spirits), Sangam Suitings, Fairand Lovely, Herbalife, Flying Machine, 3C Company (areal estate player), Red Chief Shoes, Boost, ToyotaMotors, Celkon Mobiles, Cinthol (from Godrej), Munch(from Nestle).
12. Salman Khan:Salman Khan was associated as a brand when he haddone the advertisements for Hero Honda bikes andDouble Bull shirts, much before he entered film Industry.Even after he became a superstar, he never showedinterest in promoting himself as a brand, but he wassigned for Thums Up in 2002 and continued until itscontract was over. Later Akshay Kumar replaced Khan.Later he was the brand ambassador of softdrink Mountain Dew with whom he ended the contractin December 2010. And now he is once againpromoting Thums Up. He has also became the brandambassador for the travel website, Yatra.com, which alsomade him a shareholder. The actor has also done ajewellery brand, Sangini with Kareena Kapoor apart frominnerwear brand Dixcy Scott and tablet BlackBerryPlaybook .Britannia’ s Tiger biscuits is the latestendorsement of Salman. He is also the face of Ranbaxy’s Revital replacing Yuvraj Singh. Apart from thesebrands, he also has Rotomac Pen and SF SonicBatteries endorsements. Now Khan has been roped inas the brand ambassador of Dubai based fashionlabel Splash.
13. Joseph Vijay:In the year 2002, Vijay appeared as Coca Cola’s brandambassador in Tamil Nadu. He acted in a variety of SouthIndian Coca Cola advertisements, along with Katrina Kaif.In 2008, Vijay was signed up as the star ambassadorfor the Indian Premier League cricket team ChennaiSuper Kings, along with actress Nayanthara. In January2009, Vijay was approached as the brand ambassadorfor Coca Cola products. As of August 2010, Vijay wassigned by Jos Alukkas as their brand ambassador forTamil Nadu and Kerala. Vijay also signed for TataDocomo, who will be seen for the first time for an Adwith Tata Docomo.
14. Surya:Suriya has been the ambassador for TVS Motors,Aircel and Sunfeast since 2006. He has endorsedSaravana Stores, Bharathi Cements and EmamiNavaratna products since 2010. In 2011, he had signeda new deal with Nescafe, Close-Up (toothpaste) andmore recently with Zandu Balm brand as of May 2011,for which he appeared with actress Malaika Arora. As of2012, Suriya had endorsed the leading jewellery group,Malabar Gold. His wife Jyothika made a comebackthrough few among these commercials she did withhim. In 2013, he was awarded at the Edison Awards asthe Best Male Ambassador in South India.

Page 52
ISSN : 2321-3604
March 2014Vol.2, Special Issue
Primax International Journal of Commerce and Management Research
15. Asin Thottumkal:Asin has been the brand ambassador for severalcompanies and products, and has appeared incommercials for Amrutanjan, Big Bazaar, Clinic All Clear,Colgate, Fairever, Fair & Lovely, Lux,Mirinda, Parachute,Spinz talc, Sure anti-perspirant, Tanishq and Tata Sky.
16. Trisha Krishnan:Trisha replaced Rani Mukherjee as the brandambassador of Fanta India. She is the brand ambassadorof Scooty Pep+, for which she has replaced Preity Zinta.She is also the brand ambassador for Vivel Di Wills, aproduct by ITC Limited. In 2011, She replaced Asin inFairever fairness cream commercial.
17. Shweta TiwariShweta Tiwari has endorsed a number of popular brandslike Vardhman Knitting Yarn, Lijjat Papad, Johnson &Johnson, Surya Bulbs & Tubes, Dabur Amala and PPJewellers. Her endorsements lie in the range of Rs 2-10lakh. Shweta Tiwari Television Ads have endorsed otherbrands too like Pears, Amul Milk, Tanishq, Johnson’sBaby Milk Lotion, Reboonn Hair Shampoo Commercial,Dabur Hair Oil, Nirma Washing Powder, CellOne,Kalazone etc.
The Match-up Hypothesis:Several Research studies have examined the congruencybetween celebrity endorsers and brands to explain theeffectiveness of using famous persons to promote thebrands (Till and Buster, 1998), (Till and Shimp, 1998)Results show that a number of celebrity endorsementsproved very successful, whereas other completely failed.The match-up hypothesis specifically suggests that theeffectiveness depends on the existence of a “fit” betweenthe celebrity spokesperson and endorsed brand (Till andBuster, 1998). Though Oharian (1991)Indian MediaStudies Journal • Vol.1 • No.1. July-Dec. 2006 31
A Strategic Promotion Perspective acknowledges apopular person’s ability to create awareness and initialinterest for an advertisement. The researcher concludesthat this may not necessarily change consumer’sattitude towards the brands. The model emphasizes thatthe physical attractiveness of a celebrity endorser willenhance evaluations of the products characteristics onlyif the characteristics of the product “match-up” with theimage conveyed by the celebrity. Hence an extensionbeyond attractiveness and creditability towards aconsideration has to be done in terms of making theentire image of the celebrity with the endorsed brand.
Statement of the ProblemCelebrity endorsements have several benefits, likebuilding credibility and getting attention of the public,which can translate into higher sales. The most of thebig companies have developed a new strategy to enrollcelebrities and make than brand ambassadors of theirproducts to increase the product sale. Many risks havebeen associated with celebrity endorsements. The brandwill flop as quickly as it moved up in the market despitewell-known celebrities endorsing than. The benefitsaccrue over a period of time, with the celebrity campaignsand other factors contributing to the overall increase inthe brand value.
ConclusionThis paper discussed the main and relevant conceptsregarding celebrity endorsements. The concept wasmade clear by differentiating between Celebrity and Non-celebrity endorsements and how celebrities differ formaspirational reference groups. Further researcher haveshed some light on Pros and Cons of using celebritiesas endorsers and defined some other prevalent factorslike use of multiple celebrities and its effects etc. It wasnoteworthy to highlight various different types ofconsumer buying behaviours and narrowed thisadditionally by specially focusing on consumer buyingbehaviour in India.
An assessment of current market situation indicatedthat celebrity endorsement and advertising strategies ifcorrectly blended in terms of marrying the strengths ofthe brands with the celebrity’s quality indeed justify thehigh cost associated with this form of advertising.However, advertising needs to be aware of the complexprocessing underlying celebrity processing endorsementby gaining clarity on described concepts of celebrity.Marketer has to decide how far the benefits outweighthe risks associated. Advertisers agree that celebrityendorsement does not itself guarantee sales. It cancreate a buzz and make a consumer feel better aboutthe product, which in turn has to come to expectation ofcustomers as a real star by delivering the promise. Therehave been instances where the endorsement or realconsumers have started working better than celebrityendorsers.

Page 53March 2014Vol.2, Special Issue
Primax International Journal of Commerce and Management Research ISSN : 2321-3604
IMPLICATION OF CUSTOMER RELATIONSHIPMANAGEMENT: A NEW VISTAS OF INDIAN BUSINESS IN
GLOBAL SCENARIO1B. Augustine Arockiaraj
ABSTRACT
The new millennium is in the midst of explosive change witnessing rapidly changing market conditions, volatile equitymarkets, reconstructed value chains and new global competitors. Customer Relationship Management is to create acompetitive advantage by being the best at understanding, communicating, delivering and developing existingcustomer relationships in addition to creating and keeping new customers. It has emerged as one of the largestmanagement buzz word. Good customer relationships are the heart of business success. Customer RelationshipManagement is a strategy used to learn more about customers need and behaviors in order to develop strongerrelationships with them.
The changing business environment is characterized by economic liberalization, increasing competition, highconsumer choice, enlightened and demanding customer, more emphasis on quality and value of purchase. All thesechanges have made today’s producer shift from traditional marketing to modern marketing. Modern marketing callsfor more than developing a product, pricing it, promoting it and making it accessible to target customers. It demandsbuilding trust, a binding force and value added relationship with the customers to win their hearts. The new agemarketing aims at winning customer for ever, where companies greet the customers, create products to suit theirneeds, work hard to develop life time customers through the principles of customer delight, approval and enthusiasm.Customer Relationship Marketing that seeks to build, identify and maintain customer network through interactiveindividualized and value added contents over a long period has gained tremendous importance. This paper describesin a nutshell, how CRM –focused enterprises mobilize the entire company to better serve customers, locking in long-term relationships, CRM Business cycle, use of Technology in CRM and various aspect of marketing practices ofcustomer relationships that benefit both buyer and seller, in the context of Global organizational scenario.
Key words: Customer Relationship Management, Relationship Marketing, CRM Business Cycle and CRM -Implementation.
1 Asst. Professor, Dept. of BBA, St. Joseph’s College, Trichy
1. INTRODUCTION :In the early 90s smart marketers try to build up long-term trusting. “Win-Win” relationship with customers,distributors, dealers and suppliers. Customerrelationships are now at the fore front of business. Withthe recent Advent of the era of Liberalization, privatizationand Globalization (LPG) there has been totaltransformation from sellers market to buyers marketpaved the path for customer relationship marketing.Marketers realized, authentic marketing is not the artof selling what you make but knowing what to make.The present day Global business is to serve andmaintain good relations with the king-the customer. Inthe past, producers took their customers for grantedbecause at the time customers were not demanding orhard many alternative sources of supply or suppliers.But today there is a radical transformation. The changingbusiness environment is characterized by economicliberalization, increasing competition, high consumerchoice, enlightened and demanding customer, moreemphasis on quality, service and value of purchase.
Customer Relationship Management is a process ofdeveloping a co-operative and collaborative relationshipbetween the buyers and sellers is called customerrelationship management shortly called CRM. CRM aimsat focusing all the business or organizational activitiestowards creating and maintaining a customer. CRM isa new technique in marketing where the marketer triesto develop long term collaborative relationship withcustomers to develop them as life time customers. CRMaims to make the climb up the leader of loyalty.
2. WHAT IS CUSTOMER RELATIONSHIP MANAGEMENT?Customer Relationship Management (CRM) is a processby which a company maximizes customer informationin an effort to increase loyalty and retain customer’sbusiness over their lifetimes.The primary goals of CRM are to
* Build long term and profitable relationships withchosen customers
* Get closer to those customers at every point of contact* Maximize your company’s share of the customer’s
wallet

Page 54
ISSN : 2321-3604
March 2014Vol.2, Special Issue
Primax International Journal of Commerce and Management Research
* Referrals by satisfied customers that brought newcustomers.
2.1. CRM: In Marketing Literature ViewIn marketing literature the term’s customer relationshipmarketing and customer relationship management areused interchangeably. As Nevin (1990s) points out theseterms have been used to reflect a variety of themes andperspective that is broad and somewhat paradigmatic inapproach and orientation. A narrow perspective ofcustomer relationship management is databasemarketing emphasizing the promotional aspects ofmarketing linked to data-based efforts. Another narrow,yet relevant viewpoint is to consider CRM only ascustomer retention in which a variety of after marketingtactics is used for customer bonding or staying in touchafter the sale is made.
Berry (1995) in somewhat broader terms also has astrategic viewpoint about CRM. He stresses thatattracting new customers should be viewed only as anintermediate step in the marketing process. Developingcloser relationship with these customers and turningthem into loyal ones are equally important aspects ofmarketing. Thus he proposed relationship marketing as“attracting, maintaining, and in multi-serviceorganizations enhancing customer relationships”.
The core theme of all CRM and relationship marketingperspective is its focus on cooperative and collaborativerelationship between the firm and its customers and/orother marketing actors. Dwyer, Schurr and Oh (1987)have characterized such co-operative relationship asbeing interdependent and long-term oriented rather thanbeing concerned with short-term discrete transactions.The long-term orientation as often emphasized becauseit is believed that marketing actors will not engage inopportunistic behavior if they have a long-term orientationand that such relationship will be anchored on mutualgains cooperation (Ganesan 1994 Another importantfacet of CRM is “customer selectivity”. As severalresearch studies have shown not all customers areequally profitable for an individual company is not to reallyprune its customer base but to identify appropriateprograms and methods that would be profitable andcreate value for the firm and the customer.
The CRM may be defined as a comprehensive strategyand process of acquiring, retaining and partnering worthselective customers to create superior value for thecompany and the end customer. The purpose of CRMis to improve marketing productivity is achieved byincreasing marketing efficiency and by enhancing
marketing efficiency and by enhancing marketingeffectiveness (Sheth & Sisodia 1995). In CRM marketingefficiency is achieved because cooperative andcollaborative process help in reducing transaction costsand overall development costs for company.
3. CRM-PRACTICES: CUSTOMER RELATIONSHIP MARKETINGIn a new age Marketing aimed at winning customerforever, where companies greet the customers createproducts to suit their needs, work hard to develop life-time customer approval, customer enthusiasm, etc., ofways like sending thank-you cards, special discountcards, developed customer database : - a largestorehouse of customers personal profile, preferences,intentions, expected purchases, suggestions, etc.Customer education, customer invitation on specialoccasion in company and so on . Constant improvisation,customization, shift from marketing myopia to marketinghypermetropia. Provision of additional services and givingsomething special to customers beyond functional utilityinclusive of both the tangible and intangible attributebinds a consumer with the brand related brands andcompany itself.
In recent years, however, several factors have contributedto the rapid development and evolution of CRM. Theseinclude the following de-intermediation process in manyindustries due to the Advent of sophistication computerand telecommunication technologies that allowproducers to directly interact with end customers. Inmany industries such as airlines, banks, insurancecomputer program software, or household appliancesand even consumable, the de-intermediate process isfast changing the nature of marketing and consequentlymaking relationship marketing more popular. Databasesand direct marketing tools give them the means toindividualize their marketing efforts. As a result,producers do not need those functions formerlyperformed by the middlemen. Even consumers arewilling to undertake some of the responsibilities of directordering personal merchandising, and product use-related services with little help from the producers.
Thus relationship marketing is aimed to create strong,long lasting, fruitful relationships by developing long-termbonds through its various instruments of personalconnections as a result customer start identifying,associating themselves with the product, prefer andaccept company’s product and service over competitorsofferings, buys again, and recommend others to buy.

Page 55March 2014Vol.2, Special Issue
Primax International Journal of Commerce and Management Research ISSN : 2321-3604
3.1. A Model for Customer Relationship Marketing:
INPUT PROCESSING -UNIT OUTPUT
Customer need Customer Development Customer Retention
&Assessment & Acquisition through personalization & Referral New customers
I Customization
* Addition of value with * Relationship Marketing * High Customer
Product and service * Commitment satisfaction
* Contact & Involvement * Recognition * Increased market
* Intimacy & One to One * Reward share
Relationship * Reciprocation * High Customer loyalty
* Price offers * Transparency * High cu stomer
* Special facilities / Services * Share values retention index
* Information sharing * Life time customer
4. CRM BUSINESS CYCLEAs shown in the diagram below, any organization starts with the acquisition of customers.
1
Acquire & Retain
CRM
4
Interact & Deliver
2
Understand & Differentiate
3
Develop & Customize
4.1. Acquisition and RetainingAcquisition is a vital stage in building customerrelationship. For purpose of customer acquisition anorganization is likely to focus its attention the suspects,enquiries, lapsed customers, former customers,competitor’s customers referrals, and the existingbuyers. From these the organizations need to acquirecustomers and prospective customers and retain valuablecustomers.
4.2. Understand and DifferentiateOrganizations cannot have a relationship with customersunless they understand them… what they value, what
types of service are important to them, how and whenthey like to interact and what they want to buy. Trueunderstanding is based on a combination of detailedanalysis and interaction.
Several activities are important
Profiling to understand demographics, purchasepatterns and channel preference.
Segmentation to identify logical unique groups ofcustomers that tend to look alike and behave in asimilar fashion. While the promise of one-onemarketing sounds good, we have not seen many

Page 56
ISSN : 2321-3604
March 2014Vol.2, Special Issue
Primax International Journal of Commerce and Management Research
organizations that have mastered the art of treatingeach customer uniquely. Identification of actionablesegments is a practical place to start.
Primary research to capture needs and attitudes.
Customer valuation to understand profitability, as wellas lifetime value or long term potential. Value mayalso be based on the customer’s ability or inclinationto refer other profitable customers.
Customers need to see that the company is tailoringservice and communications based on what they havelearned independently and on what the customers havetold them.
4.3. Develop and CustomizeIn the product world of yesterday, companies developedproducts and services and expected customers to buythem. In a customer – focused world, product andchannel development has to follow the customer’s lead.Organizations are increasingly developing products andservices, and even new channels based on customerneeds and service expectations.
4.4. Interact and deliverInteraction is also a critical component of a successfulCRM initiative. It is important to remember thatinteraction doesn’t just occur through marketing andsales channels and media; customers interact in manydifferent ways with many different areas of theorganization, including distribution and shipping,customer service and online.
With access to information and appropriate training,organizations will be prepared to steadily increase thevalue they deliver to customers.
Quality is when your customers come back, not yourproducts- Mrs.Thatcher
5. SIX MARKETS FRAMEWORKThe broadened view of relationship marketing addressesa total of six key market domains, not just the traditionalcustomer market. The six markets are :
1. Customer Markets – Existing and prospectivecustomers as well as intermediaries.
2. Referral Markets – Existing Customers whorecommend to other prospects, and referral sourcesor multipliers such as doctors who refer patients toa hospital.
3. Influence Markets – Government, consumer groups,business press and financial analysts.
4. Recruitment Markets – For attracting the rightemployees to the organization.
5. Supplier Markets – Suppliers of raw materials,components, services etc.
6. Internal Markets – The organization including internaldepartments and staff.
“Think of the customer first, if you want the customerto think of you first”- Unknown
6. USE OF TECHNOLOGY IN CRMThe application of technology is the most exciting, fastestgrowing and changing the way customers get informationabout products and services. Technology includes allthe equipment, software, and communication links thatorganizations use to enable or improve their processes.They mostly used tools are explained below :
6.1.Sales force automation:These systems help in automating and optimizing salesprocesses to shorten the sales cycle and increasessales productivity. They enable the company to trackand manage all qualified leads, contacts andopportunities throughout the sales cycle includingcustomer support. They improve the effectiveness ofmarketing communications programmers for generatingquality leads as well as greater accuracy in salesforecasting. The Internet can be used by the companyin imparting proper training to its sales force. In depthproduct information, specialized databases of solutions,sales force support queries, and a set of internalinformation on the Internet can improve the productivityof the sales force.
6.2. Call centersCall Centre helps in automating the operations of inbound and outbound calls generated between companyand its customers. These solutions integrate the voiceswitch of automated telephone systems with agent hostsoftware allowing for automatic call routing to agents,auto display of relevant customer data, predictive dialing,self-service Interactive Voice Response systems, etc.These Systems are useful in high volume segments likebanking, telecom and hospitality. Today, more innovativechannels of interacting with customers are emerging asa result of new technology, such as global telephonebased call centers and the Internet. Companies arenow focusing to offer solutions that leverage the internetin building comprehensive CRM systems allowing themto handle customer interactions in all forms.
6.3 Data warehousingA data warehouse is an implementation of aninformational database used to store shareable datathat originates in an operational database-of-record andin external market data sources. It is typically a subjectdatabase that allows users to tap into a company’s vast

Page 57March 2014Vol.2, Special Issue
Primax International Journal of Commerce and Management Research ISSN : 2321-3604
store of operational data to track and respond to businesstrends and facilitates forecasting and planning efforts.
6.4. Data mining and OLAPData mining involves specialized software tools that allowusers to sift through large amounts of data to uncoverdata content relationships and build models to predictcustomer behavior. Data mining uses well-establishedstatistical and machine learning techniques to buildmodels that predict customer behavior.
OLAP (Online Analytical Processing) also known asmulti-dimensional data analysis, offers advancedcapabilities in querying and analyzing the information ina data warehouse. In some CRM initiatives, OLAP playsa major role in the secondary analysis that takes placeafter initial customer segmentation has occurred. Forexample, in CRM - based campaign managementsystems, OLAP is an excellent tool for analyzing thesuccess or failure of the promotional campaigns.
6.5. Decision support and Reporting toolsWeb enabled reporting tools and executive informationsystems are used to deploy the business informationthat has been discovered. This enhanced customerknowledge is distributed to executive decision-makersas well as to the operational customer contact points.Applications equipped with some of the samesophisticated modeling routines developed in the data-mining phase are applied to individual contacts in realtime.
6.6. Electronic point of sale (EPOS)The main benefit of EPOS and retail scanner systemsis the amount of timely and accurate information theydeliver. Advances in the technology have significantlyaided the scope for data analysis. In addition to theoriginal scanner-related data on sales rate, stock levels,stock turn, price and margin, retailers now haveinformation about the demographics, socio-economicand lifestyle characteristics of consumers.
7. IMPLEMENTATION:1. A separate relationship marketing cell is the need of
the hour. For proper monitoring of relationshipmarketing program the department should wellequipped with not only technical people but also wellequipped managers with interpersonal,communication and marketing tools as a whole.
2. Marketers are realizing that it cost less to retaincustomers than to complete for new customers. Onthe supply side, it really pays more to develop closerrelationship with customers through peopleequipment and procedure. It is high time to re-engineering the marketing department.
3. As customer expectations have rapidly changed overthe last two decades. Fueled by new technologyand growing availability of advanced product featuresand services customer’s expectations are changingalmost on a daily basis. Consumers are less willingto make compromises to trade-off in product andservice quality. So companies should continuouslysearch for value building approaches through asystem of Total Quality Management (TQM) reviewprocess, which will be, resulted in value-laden-relationship with customers.
4. In order to keep competitors away from customersight, cross selling and up selling can meet thecustomer requirement. How ever the idea seems topredominantly meet with the sellers need maximizehis revenues by exploiting relationship with customer.But CRM techniques should ensure mutualeconomic values to both customer and companies.
5. Companies need call centers to boost marketingeffort, as the Indian consumer starts becoming moreaware of the choice available worldwide, a numberof companies already use call centers as amarketing tool. It’s learning curve that a lot of Indiancompanies will go through.
6. If globalization proceeds as expected, it must surelyhave a major impact on how firms man age customerrelationships. A good training program forprogressing young dynamic international managersis the need of the hour global marketingcommunication. Global consumerism and business-process, re-engineering are three main factors forCRM in international market. A globalizecommunication strategy has to be integrated at thecorporate and strategic business unit level.
7. Managing Customer Relationship around the worldcalls for external & internal partnering across a firm’sworldwide organization.
8. CONCLUSIONCustomer Relationship Management is a potent tool,which helps to track down the changing customerprofiles, build on this information to get the necessaryproduct design and add value to the individual customer.Today’s customers are global and high degree of needfor cognition, recognition, approvals and respect. Theyprefer marketers who can give good product, deliver firstservice, repair, solve problems and improve products.Marketers are striving for a bond with customer, whichwill be strong and long lasting with the customer.
To implement CRM successfully will have to reorganizeour customers and change in the organizational mindset.When CRM works, it helps to solve this problem by

Page 58
ISSN : 2321-3604
March 2014Vol.2, Special Issue
Primax International Journal of Commerce and Management Research
meshing every one together and focusing the entireorganization on the customer. Like all strategic initiatives,CRM requires commitment and understanding thoughtthe Organization, not just in marketing. In all, it adds toa sense of expectation and loyalty being instilled withinthe consumer and development of a relational betweenorganization and customer that competitors find hard tobreak. Business decisions based on complete andreliable information about your customer. So CustomerRelationship Management is a New Vistas of IndianBusiness in Global Scenario
“ A customer is the most important visitoron our premises.
He is not an interruption on our work, he isthe purpose of it.
We are not doing him a favour by servinghim.
He is doing us a favour by giving us anopportunity to do so”
- Mahatma Gandhi
REFERENCES :
1. Govindarajan, M., 2009, “Marketing Management :Concepts, Cases, Challenges and Trends”, PHILearning Private Limited, New Delhi.
2. Natarajan, L., 2010, “Services Marketing” MarghamPublications, Chennai.
3. Kotler Philip, Millennium Edition, “MarketingManagement – Analysis, Planning, Implementation& Control”, PHI Learning Private Limited, New Delhi.
4. Jagdish N. Sheth, 2001, “Customer RelationshipManagement”, Tata McGraw – Hill PublishingCompany Limited, New Delhi.
5. Xavier, M.J., “Marketing in the new Millennium”,Vikash Publishing House Pvt. Ltd. New Delhi.
6. Drucker. P, Management Challenges for the 21st
Century, Harper Business, New York, 1999.

Page 59March 2014Vol.2, Special Issue
Primax International Journal of Commerce and Management Research ISSN : 2321-3604
RECENT DEVELOPMENTS IN WEB/INTERNET MARKETINGAND E-COMMERCE
1 Associate Professor, Department of Commerce, St. Joseph’s College (Autonomous), Tiruchirappalli.2 Assistant Professor, Department of Commerce CA, St. Joseph’s College (Autonomous), Tiruchirappalli.
1Dr. T. Joseph Rex 2J. Arputha Sahaya Raj
1. INTRODUCTIONThe growth of trade and commerce has increased thedemand for internet and electronic commerce. At presentgeographical coverage of market for products andservices is worldwide. It enforces the business to carryout its commercial activities like marketing, selling,delivering, servicing and paying for products and servicesthrough electronic commerce.
2. INTERNETThe internet is in an international network of computerscarrying unbelievable amount of information. It is a globalcollection of high-powered computers that are connectedto each other with network cables, telephone lines,microwave dishes, satellites etc.,The internet supports real time global communicationand collaboration among employees, customers,suppliers and other business partners. This enablesmembers of different organizations and people at differentlocations to work together to develop marketing andmaintain products and services.
3. E-COMMERCEIt refers to the paperless exchange of businessinformation using network-based technologies. In thepast, an information-using network based technologies.In the past, a consumer had ample time to go from storeto store locate a desired item, followed by bargaining,placing an order and finally getting the supply. This entireprocess could range from a few hours to weeksdepending on the product, quantity, quality and sourceof purchase. But the entire scenario has changed.
Everything in today’s world depends on electronicswhether it is:• E-DI (Electronic Data Interchange),• E-FT (Electronic Funds Transfer),• E-Cash (Electronic Cash),• E-Stamp (Electronic Stamp),• E-Mail (Electronic Business or Mail),
• E-Commerce (Electronic Commerce).
Electronic Document Interchange
Electronic
Fund Transfer
(EFT)
Electronic Data
Interchange
(EDI)Marketing,
Advertising
Electronic
Publishing
Sales, Customer
Support
Information
SharingCorporate
Digital Library
Collaborative
Work
Email Fax
Electronic Messaging
E-Commerce
BUSINESS APPLICATIONSIn this section, an attempt is made to give some of thebusiness applications of E-Commerce. The major areaof applications is business- to-consumer, business-to-business and internal business process.
a) Business-to-consumerE-Commerce, between business and consumers, isaccelerating the impact of information technology onconsumer behaviour and business processes andmarkets. It establishes the interrelationships amongE- Commerce, Consumer behaviour, and businessprocesses and competition. Retailing on the web isan example for the same.
b) Business-to-BusinessBusiness-to-Business electronic commerce is the
wholesale side of the commercial process. For example,suppose a business house wants to produce and sell aproduct to other business houses, it must purchase rawmaterials and variety of contract services from otherbusiness houses in order to produce and sell a product.It should also make up a network of businessrelationships.
c) Internal Business processThe purpose behind intra organisational E-commerceis to help a business maintain relationships, whichare critical in delivering superior customer service.Many Internet based enterprises are customer driven

Page 60
ISSN : 2321-3604
March 2014Vol.2, Special Issue
Primax International Journal of Commerce and Management Research
.
BUSINESS APPLICATIONSIn this section, an attempt is made to give some of thebusiness applications of E-Commerce. The major areaof applications is business- to-consumer, business-to-business and internal business process.
a) Business-to-consumerE-Commerce, between business and consumers, isaccelerating the impact of information technology onconsumer behaviour and business processes andmarkets. It establishes the interrelationships amongE- Commerce, Consumer behaviour, and businessprocesses and competition. Retailing on the web isan example for the same.
b) Business-to-BusinessBusiness-to-Business electronic commerce is thewholesale side of the commercial process. Forexample, suppose a business house wants to produceand sell a product to other business houses, it mustpurchase raw materials and variety of contractservices from other business houses in order toproduce and sell a product. It should also make up anetwork of business relationships.
c) Internal Business processThe purpose behind intra organisational E-commerceis to help a business maintain relationships, whichare critical in delivering superior customer service.Many Internet based enterprises are customer drivenand market driven. E-Commerce facilitates managersto communicate using Video conferencing, e-mail andbulletin boards so that information is betterdisseminated and right decisions can be made. Sinceinformation travels faster, there is a better co-ordinationbetween the various departments. In fact all effortsare being made to convert organisations into apaperless office.
d) Business value of E-commerceE-commerce helps a business house overcomegeographic, time, cost and structural barriers tobusiness success. These four capabilities emphasizehow several applications of E-commerce can help afirm to capture and provide information quickly to endusers at remote geographic location at reduced costsas well as supporting its strategic organizationalobjectives. These capabilities allow business housesto generate cost savings from using Internet, bettercustomer service and relationships through interactivemarketing.
FeaturesE-Commerce provides following features• Non-Cash Payment: E-Commerce enables use of
credit cards, debit cards, smart cards, electronic fundtransfer via bank’s website and other modes ofelectronics payment.
• 24x7 Service availability: E-commerce automatesbusiness of enterprises and services provided by themto customers are available anytime, anywhere. Here24x7 refers to 24 hours of each seven days of a week.
• Advertising / Marketing: E-commerce increases thereach of advertising of products and services ofbusinesses. It helps in better marketing managementof products / services.
• Improved Sales: Using E-Commerce, orders for theproducts can be generated anytime, anywhere withoutany human intervention. By this way, dependenciesto buy a product reduce at large and sales increases.
• Support: E-Commerce provides various ways toprovide pre sales and post sales assistance to providebetter services to customers.
• Inventory Management: Using E-Commerce,inventory management of products becomesautomated. Reports get generated instantly whenrequired. Product inventory management becomesvery efficient and easy to maintain.
• Communication improvement: E-Commerceprovides ways for faster, efficient, reliablecommunication with customers and partners.
E-Commerce advantages can be broadly classified inthree major categories:
• Advantages to Organizations• Advantages to Consumers
• Advantages to Society
Advantages to Organizations• Using E-Commerce, organization can expand their
market to national and international markets withminimum capital investment. An organization caneasily locate more customers, best suppliers andsuitable business partners across the globe.
• E-Commerce helps organization to reduce the costto create process, distribute, retrieve and manage thepaper based information by digitizing the information.
• E-commerce improves the brand image of thecompany.

Page 61March 2014Vol.2, Special Issue
Primax International Journal of Commerce and Management Research ISSN : 2321-3604
• E-commerce helps organization to provide bettercustomer services.
• E-Commerce helps to simplify the businessprocesses and make them faster and efficient.
• E-Commerce reduces paper work a lot.• E-Commerce increased the productivity of the
organization. It supports “pull” type supplymanagement. In “pull” type supply management, abusiness process starts when a request comes froma customer and it uses just-in-time manufacturingway.
Advantages to Customers• 24x7 support. Customer can do transactions for the
product or enquiry about any product/servicesprovided by a company any time, any where fromany location. Here 24x7 refers to 24 hours of eachseven days of a week.
• E-Commerce application provides user more optionsand quicker delivery of products.
• E-Commerce application provides user more optionsto compare and select the cheaper and better option.
• A customer can put review comments about a productand can see what others are buying or see the reviewcomments of other customers before making a finalbuy.
• E-Commerce provides option of virtual auctions.
• Readily available information. A customer can seethe relevant detailed information within seconds ratherthan waiting for days or weeks.
• E-Commerce increases competition among theorganizations and as result organizations providessubstantial discounts to customers.
Advantages to Society• Customers need not to travel to shop a product thus
less traffic on road and low air pollution.
• E-Commerce helps reducing cost of products so lessaffluent people can also afford the products.
• E-Commerce has enabled access to services andproducts to rural areas as well which are otherwisenot available to them.
• E-Commerce helps government to deliver publicservices like health care, education, social servicesat reduced cost and in improved way.
E-Commerce Trends for 20132013 is here and it’s slated to be the biggest e-commerceyear in history.
Consumers will demand more from the digital propertiesthey visit and businesses will race to not only provide astreamlined user experience, but also one that ispersonalized and intuitive. To ensure your enterprise getsits piece of the digital pie, prepare it for these 13 e-commerce trends for 2013.
Trend 1: Personalization for EveryonePersonalization is nothing new, but its widespreadpopularity is thanks to easily available complextechnology. Whether personalization is simple (basedon one or two collected insights) or complex (based onmultiple insights processed by detailed formulas andalgorithms), consumers are going to see sites thatincreasingly reflect their interests,wants and needs—and have little patience for sites that don’t.
Trend 2: Personalization Moves Beyond RetailMajor industries like finance, travel and media will leadthe charge, but also expect businesses in otherindustries, such as gaming and charity, to takeadvantage of personalization solutions to offer morecustom experiences.
Trend 3: Share More; Browse and Buy BetterConsumers will begin to see the data they share online—age, geography, life stage, social profile information (e.g.,married vs. single) put to use in offering them a morerelevant shopping experience. The result? No morewading through irrelevant offers or products to get to whatmatters to you.
Trend 4: Personalization in Real TimeSure, past site visits and stored information will alwaysbe important, but don’t you want to give customerscontent and offers that are relevant to their current visit?With real-time personalization, online retailers will ensurethey are creating an even more timely and customshopping experience.
Trend 5: Loyalty Will Be RewardedLoyalty programs aren’t just for frequent flyers anymore. They’ll become an important part of the ecommercelifecycle as businesses across industries (retail, finance,etc.) launch loyalty programs—and integrate data intocomprehensive customer profiles—to offer the next levelof personalization and service.
Trend 6: Mobile Grows UpIn 2013, an entirely different mobile game will emergeas mobile pulls up alongside—and even threatens topass—the traditional web experience. It’s no longerenough to just ensure that your site functions properlyon mobile devices, or that you have an app presence. As consumers adapt to living their lives from their mobile

Page 62
ISSN : 2321-3604
March 2014Vol.2, Special Issue
Primax International Journal of Commerce and Management Research
phones and tablets, they’ll expect platform-specificofferings that offer a better shopping experience, geo-specific content, special offers, and other elements thatcomplement and enhance life on the go.
Trend 7: Getting It Right on Every DeviceApple might still lead the smart phone charge, but theyaren’t the only player in town—and you shouldn’t assumethat your consumers are all on the same device.Responsive design will be a must have for mobile sites,ensuring your site is designed for optimal viewing nomatter what mobile or tablet device is being used. Goneare the days of resizing, scrolling, and otherwisestruggling to view a site depending on the size of yourcomputer or device screen.
Trend 8: The Same Consumer, Many ChannelsPCs rule the workday, tablets are used in the eveningand phones are always there. Whether its online or offline,on a mobile device or PC, marketing and offerings mustbe fully integrated with an on-the-go user in mind. Fromthe introduction of mobile devices and tablets in storeas a way for consumers to browse and engage to themapping of online and offline shopping profiles, the twoworlds are colliding—and overlapping.
Trend 9: Seamless Experiences Across All ChannelsConsumers will expect a completely seamless shoppingexperience no matter where they are—at their desktops,on their smart phones and tablets, or on social pagesand sites. Thankfully, with emerging tools andtechnologies, it’s now easier to integrate CRM andmultichannel data across all brand touch points.
Trend 10: Big Data Done BetterThe phenomenon of ‘Big Data’—while overhyped tosome—will actually be a very powerful trend if companiescan harness its power and use it wisely. Brands thatmeasure, analyze and directly translate this knowledgeinto improved decision-making and customer experienceswill improve business performance. In the coming year,expect to see more brands getting a handle on this tooffer customers more targeted offers across all channels,in real-time.
Trend 11: Big Data—A Consumer’s Best Friend2013 will see the end of big data as something to befeared. Instead, consumers will feel the benefits of amore personalized, customized online experience thatsaves them time, introduces them to new products, andhelps them shop better for themselves and their lovedones.
Trend 12: Social Media Comes in from the Cold
Probably one of the most important channels we’ll seecome of age is social media. For too long, marketershave treated social media as an island from the rest oftheir strategy—and failed to capitalize on its connectionto selling. Going forward, we’ll see more brands usingsocial data to personalize experiences on the website,as well as applying testing and personalization to theirown Facebook pages.
Trend 13: B2B As the New B2C When it comes to testing and personalization,consumer-facing businesses aren’t the only onescatching on. B2B companies—and their customers—are consumers that crave a great online experience to. More and more B2B sites will use testing andpersonalization to create well-optimized and targetedsites based on user behaviors.
5 E-Commerce Trends to Look for in 2014As new online sales platforms and Web design toolscontinue to emerge, becoming an e-commerceentrepreneur is an increasingly attainable dream formany aspiring business owners. While just aboutanyone can launch an online business, it takes adedicated salesperson to actually succeed, and thatmeans staying on top of current marketplace trends.If we are ready to take your e-commerce business tothe next level in 2014, Matt Winn, marketingcommunications manager for e-commerce platformprovider Volusion, advised watching these five currenttrends in online sales:
The importance of multichannel selling.As customer shopping behaviors become morefragmented, so must the presence of small onlinebusinesses owners. Simply having an e-commerce siteis no longer enough. Small and medium-size businesses(SMBs) should begin looking for efficient ways to expandtheir presence, including integrations with variousshopping feeds and other outlets that can reach moreconsumers.
Increased dependence on data.As smaller online businesses continue to expand theirpresence across channels, the need to turn toperformance data from both a channel-specific andholistic standpoint becomes even more important.Google Analytics is a good tool for this, becausebusiness owners can measure their site traffic frommultiple devices and referral sites.
Access through smart phones, tablets and othermobile devices.Volusion has seen major gains in e-commerce usage ofmobile devices such as smart phones and tablets,

Page 63March 2014Vol.2, Special Issue
Primax International Journal of Commerce and Management Research ISSN : 2321-3604
especially during the holiday season. The companyexpects this trend to accelerate as mobile adoptioncontinues to increase and more mobile technologiesbecome available. Small businesses should have amobile version of their website, with mobile-optimizedcheckout to help facilitate a better mobile experience.Small retailers should also look at their site acrossmultiple mobile devices and pay attention to newtechnologies, such as smartwatches.
Goodbye, traditional SEO.Google is constantly updating its algorithm in an effortto serve the best, most relevant content to its users.This means that traditional SEO tactics are falling bythe wayside, and an increased push toward quality,unique content — along with social media signals —will be of huge importance in 2014. To help stay aheadof the SEO curve, small retailers should focus less on“traditional” SEO tenets like keyword usage and density,and instead aim efforts toward creating content that istailored and useful for their target audience. For example,create more lifestyle-oriented content in the form of blogposts, videos and other types of media that encouragesharing by readers.
Small shops squeezed by larger merchants.As mega-retailers like Amazon continue to steal marketshare from other big-box retailers (both online and offline),smaller online businesses will need to become morenimble in how they compete, from a price, customer-service and marketing standpoint. This involvesidentifying true points of difference from larger merchants,showcasing these points in marketing and branding, anddelivering personalized experiences.
ConclusionElectronic commerce is generally considered to be thesales aspect of e-business. It also consists of theexchange of data to facilitate the financing and paymentaspects of business transactions. This is an effectiveand efficient way of communicating within an organizationand one of the most effective and useful ways ofconducting business. The concepts of e-commerce werehighly helped and useful process with all aspects. It canbe divided into E-tailing or “virtual storefronts” on websiteswith online catalogs, sometimes gathered into a “virtualmall”, Buying or selling on websites and/or onlinemarketplaces. The gathering and use of demographicdata through web contacts and social media, Electronicdata interchange, the business-to-business exchangeof data, E-mail and fax and their use as media forreaching prospective and established customers (forexample, with newsletters), Business-to-business buyingand selling the security of business transactions. E-Commerce advantages can be broadly classified in threemajor categories that are to be main advantages toOrganizations, Consumers and the Society.
References :1. http://smallbusiness.foxbusiness.com/marketing-
sales/2014/01/08/5-e-commerce-trends-to-look-for-in-2014/ By Nicole Fallon, Published January 08, 2014,BusinessNewsDaily
2. http://www.websitemagazine.com/content/blogs/posts/archive/2013/01/02/13-e-commerce-trends-for-2013.aspx
3. http://en.wikipedia.org/wiki/E-commerce
4. http://www.tutorialspoint.com/e_commerce/e_commerce_overview.htm

Page 64
ISSN : 2321-3604
March 2014Vol.2, Special Issue
Primax International Journal of Commerce and Management Research
THE NEED OF VIRTUAL LEARNING IN EDUCATIONENVIRONMENT
1Suganthi. R 2Dr.C.EugineFranco
Abstract
In the last decade Books and journals have found in the desktops of students and research scholars but nowthe trend is to be changed. Due to the invention of electronic resources, easy, quick and anytime access ofbooks and journals have made an effective learning. E-resources serve as a platform for random access tomultiple users at the same time and save plenty of time. In the e resources of virtual learning play a major roleis a system for delivering learning materials to students via the web. These systems include assessment,student tracking, and collaboration and communication tools. They can be accessed both on and off-campus,meaning that they can support students’ learning outside the lecture hall 24 hours a day, seven days a week.This enables institutions to teach not only traditional full-time students but also those who cannot regularly visitthe campus due to geographic or time restrictions, e.g. those on distance learning courses, doing eveningclasses, or workers studying part-time.
1 Research scholar, Commerce Department, St. Xavier’s college, Palayamkottai.2 Associate Professor and Head, Department of Commerce, St. Xavier’s college, Palayamkottai.
IntroductionIn the last decade Books and journals have found inthe desktops of students and research scholars but nowthe trend is to be changed. Due to the invention ofelectronic resources, easy, quick and anytime accessof books and journals have made an effective learning.E-resources serve as a platform for random access tomultiple users at the same time and save plenty of time.In the e resources of virtual learning play a major role isa system for delivering learning materials to studentsvia the web. These systems include assessment,student tracking, and collaboration and communicationtools. They can be accessed both on and off-campus,meaning that they can support students’ learning outsidethe lecture hall 24 hours a day, seven days a week.This enables institutions to teach not only traditionalfull-time students but also those who cannot regularlyvisit the campus due to geographic or time restrictions,e.g. those on distance learning courses, doing eveningclasses, or workers studying part-time.
Features of virtual learning• Virtual learning is the technology based thing which
is used to supports teaching and learning using acomputer web technology.
• The internet plays a major role provided virtual learningto deal with easy access information and knowledge
• Virtual learning fills the gap between a teacher and astudent in different ways.
• In synchronous systems of virtual learningparticipants meet in “real time”, and teachers conductlive classes in virtual classrooms.
• In virtual learning process teacher is able to presentlessons through video, PowerPoint, or chatting.
• The students are able to talk with other students andthe teacher, as well as collaborate with each other,answer questions, or pose questions.
BenefitsBenefits of a VLE content package file?• All the textbook-related resources are made available
in an institution’s own VLE
• Students don’t need to leave the institution’s network
• The single package makes it easy to import all thematerials at once, and therefore saves time
• Lecturers can integrate their chosen textbook’sresources with their own course materials so studentsonly need to go to one place to access all their coursecontent
• Virtual learning provides flexible to the user studentsand teachers uses it at anywhere and at any time.
• Class work can be scheduled around personal andprofessional work
• Reduces travel cost and time to and from school
• Learners may have the option to select learningmaterials that meets their level of knowledge andinterest
• Learners can study wherever they have access to acomputer and Internet
• Self-paced learning modules allow learners to workat their own pace

Page 65March 2014Vol.2, Special Issue
Primax International Journal of Commerce and Management Research ISSN : 2321-3604
• Flexibility to join discussions in the bulletin boardthreaded discussion areas at any hour, or visit withclassmates and instructors remotely in chat rooms
• Different learning styles are addressed and facilitationof learning occurs through varied activities
• Development of computer and Internet skills that aretransferable to other facets of learner’s lives
• Successfully completing online or computer-basedcourses builds self-knowledge and self-confidenceand encourages students to take responsibility fortheir learning
• The last and most important benefits is studentdownload the articles ,journals with full text withoutpaying any cost.
Disadvantages• Unmotivated learners or those with poor study habits
may fall behind.
• Lack of familiar structure and routine may take gettingused to.
• Students may feel isolated or miss social interaction.
• Instructor may not always be available on demand.
• Slow or unreliable Internet connections can befrustrating.
• Managing learning software can involve a learningcurve.
• Some courses such as traditional hands-on coursescan be difficult to simulate.
Methods of virtual learningSynchronous learningIn synchronous learning; learning and teaching takesplace in real time (same time) while the trainer andlearners are physically separated from each other (placeshift). Examples include• listening to a live radio broadcast• watching live a television broadcast• audio/video conferencing• Internet telephony• online lectures• two-way live satellite broadcast
Asynchronous learningCharacteristic for asynchronous learning is the fact thatthat the trainer prepares the courseware material before
the course takes place. The learner is free to decidewhen he wants to study the courseware
Examples include:• self paced courses taken via Internet or CD-Rom• videotaped classes• stored audio/video Web presentations or seminars• recorded audio tapes• Q & A mentoring• reading e-mail messages
Instructor led trainingIt refers to the traditional classroom training where ateacher teaches a classroom full of students.
The problems of this training are1. Distance: Bringing together the students under one
roof for requires time and money.
2. Audience size and response time: Same planningis required for smaller and larger group of studentsin planning, infrastructure and instructors.
3. Off the job time: working people face difficulty infinding a replacement for their jobs.
Impact of virtual learning on teaching learningprocess• Improves efficiency both in learning and teaching• Increases motivation• Deepens understanding• Promotes collaborate learning• Gives new approach to learning and working• Provides new ways interacting• Paves way for personality development• Increases social skills• Creates interest in learning• Helpful for self-evaluation• Wide reach and consistent• User convenient• Flexible and rich medium for students• Useful tool to address students with different learning
and cognitive styles• Self-pacing for slow and quick learners reduces
stress and increases satisfaction.
ConclusionVirtual learning environments provide versatileopportunities that can satisfy problems

Page 66
ISSN : 2321-3604
March 2014Vol.2, Special Issue
Primax International Journal of Commerce and Management Research
Associated with the application of soft skills online.However, establishing a truly successful learningenvironment must rely on methods different fromconventional approaches. These approaches mustsatisfy the demands of replicating aspects of humaninteraction that maintain learning resources that aredependent on soft skills.
Furthermore the adaptation of the environment canprovide access to resources maintained externally,reducing the maintenance of the environment andproviding the expansion of a community into both aneducational and social domain.
Bibliography www.virtuallrc.com/
• www.gavirtuallearning.org/ý
• www.qou.edu/arabic/.../distance Learning/virtualLearningEffectiveness
• www.tojned.net/pdf/v02i01/v2i1-01.

Page 67March 2014Vol.2, Special Issue
Primax International Journal of Commerce and Management Research ISSN : 2321-3604
AN INQUIRY INTO HR ACCOUNTING PRACTICES OF SELECTEDINDIAN ORGANIZATIONS
1Suzanne Faustina Felix
Abstract:
Human resource is the most valuable source of the any organization to value those resources on the monetary termshereby it is adopted the Present value of future earning model(Lev and Schwartz model)by the researcher,Employees ofthe companies in India are been valued and compared using this model.This research reveals an idea alone on the extentof valuing the HR.The figures so arrived are near and far to the actual one.The aggregate value of those figures might helpto identify the HR in the Indian organizations.
1 PhD research Scholar, Dept. of Commerce, St. Joseph’s College, Trichy.
INTRODUCTIONSince the days of industrial revolution, modernaccounting methods treat employees as expenses(wages & salaries) in their accounting reports. Financialaccount which shows as an asset on the balance sheetthose items as monetary value. As such there is noprovision of representing employees as an asset.
Human Resource Accounting restores the focus onpeople as the prime catalyst for business developmentand growth. Men, materials, machines, money andmethods are the resources required for an organization.These resources are broadly classified into twocategories, viz., animate and inanimate (human andphysical) resources. Men, otherwise known as the humanresources, are considered to be animate resources.Others, namely, materials, machines, money andmethods are considered to be inanimate or physicalresources.
Present value of future earning is availed with the help ofindividual annual earnings up to their retirement,Retirement age, the discount rate and the present ageof the individual. Most of public sector undertaking cannotdisregard their responsibility of HR valuation which isfruitful for an effective functioning of HR practices. Hencethe valuation would ensure the employee to understandtheir worth in the organization.
There are a few organizations, however, recognize thevalue of their human resources, and furnish the relatedinformation in their annual reports. In India, some of thesecompanies are: Infosys, Bharat Heavy Electricals Ltd(BHEL); the Steel Authority of India Ltd. (SAIL), theMinerals and Metals Trading Corporation of India Ltd.(MMTC), the Southern Petrochemicals IndustriesCorporation of India (SPIC), the Associated CementCompanies Ltd, Madras Refineries Ltd., the Hindustan
Zinc Ltd., Engineers India Ltd, the Oil and Natural GasCommission, Oil India Ltd., the Cement Corporation ofIndia Ltd. etc.
NEED OF THE STUDYHuman Asset is the most valuable asset for theorganization. An asset with the life in it gives life to theorganization. It cannot be merely measured as alongwith the other assets of the organization, it has to bemeasured more sensibly for which it needs to follow aseparate accounting practices called Human ResourceAccounting. There are several methods possessingdifferent valuation helps to ascertain the value of theemployees. Approaches to Human Resource Accountingare basically categorized as cost based and value basedapproach.
Cost based approach insists on amount spent onemployees where value based approach enables theemployees worth towards the organization. Conventionalaccounting standard follows the cost based approach.There were several models in the value based approachsuggested by different psychologist.
OJECTIVES OF THE STUDYThe objectives of the study are:• To study the value of Human Resources Accounting
of a few Indian Organization.
• To Identify the Factors affecting the Human ResourceValuation.
• To make the employees to be realized the worth oftheir own value.
• To value the Human Resource through Lev &Schwartz Model.
• To ensure that how far the employee data of Indianorganization suits for the Lev and Schwartz model.

Page 68
ISSN : 2321-3604
March 2014Vol.2, Special Issue
Primax International Journal of Commerce and Management Research
AREA COVEREDThe research covers eighty seven Indian Organizationwith respect to the Statement showing the particularsof employees who are in receipt of remuneration of notless than Rs. 24,00,000/- per annum during the financialyear 2009-10 or not less than Rs. 2,00,000/- per monthduring part of the financial year 2009-10
Types of Research
The analysis and interpretation of the data collectedregarding “Human Resource Accounting Practices inSelected Indian Organization”. In order to ascertainthe value of human resource, the researcher had usedLev and Schwartz Model (i.e. Present Value ofFuture Earning Model) for the Valuation.
Lev and Schwartz are of the opinion that thedetermination of the total value of a firm’s labour force is
a straightforward extension of the measurementprocedure of an individual value to the organization. Themodel identifies an individual’s expected economic valueto the organization to his future earnings for his remainingactive service life. His future expected income stream isdiscounted by an appropriate rate to arrive at the presentvalue of his service. The value of total human resourcesof an organization is found out by aggregating the presentvalue of all employees.
Human Capital is defined as the source of income overa period of time and its worth is the present value offuture incomes discounted by a certain rate.
According to Lev and Schwartz, the value of humancapital represented by a person of age r is the presentvalue of his remaining future earnings from hisemployment. The following formula is given by them forcalculating the value of an individual:
FORMULA:
Where Vr = the value of an individual who is r yearsold.
I (t) = the individual’s annual earnings up to hisretirementT = the retirement age
r = the discount rate specific to the person. t = active years of service R = the present age of the individual
Five - Dimensional
Model
Casual, Intervening
and End result model
Standard Cost
Approach
Opportunity Cost
Approach
Replacement Cost
Approach
Historical cost
Approach
Cost Based Approach Value Based Approach
Present Value of
future earnings
model
Human Asset
Multiplier Model
Aggregate Payment
Model
Stochastic Reward
Valuationmodel
Certaqinity
equivalent model
Approaches To HR
Accounting
Unpurchased
goodwill model

Page 69March 2014Vol.2, Special Issue
Primax International Journal of Commerce and Management Research ISSN : 2321-3604
INTERPRETATION AND ANALYSIS
TABLE SHOWING THE VALUE OF CHAIRMAN AND MANAGING DIRECTORS IN NATURE OFORGANIZATIONS
Discount rate
10%
9%
19%
NATURE
Chemicals &Fertilizers D/oFertilizer
Petroleum andNatural gas
Total
Value of chairman andManaging Director (Rs in
lacs)
53
278
331
Percentage ofchairman and
Managing director(in%)
16
84
100
Percentage ofdiscount rate(in
%)
53
47
100
Source: Secondary data
It is concluded that the value chairman and Managing Director is maximum of Rs. 278 lakhs in case of companygrouped under the head of petroleum and Natural gas, means that Chairman and Managing Director of this Companyhas more remaining years service that paves the way for gaining higher future income.
VALUE OF CHAIRMAN AND MANAGING DIRECTOR IN GROUPS
EXECUTIVE DIRECTOR:It is clear that the aggregate value of Executive Director is less of Rs 9,107,480 when compared to the Chairman andManaging Director of Rs 16, 555,728. The remuneration is a factor which has impact on increase in the value ofchairman & Managing Director despite of less remaining years of service.

Page 70
ISSN : 2321-3604
March 2014Vol.2, Special Issue
Primax International Journal of Commerce and Management Research
TABLE SHOWING THE VALUE OF EXECUTIVE DIRECTORS IN NATURE OF ORGANIZATION
Source: Secondary data
The result emerging out of the above table shows clearly that the Company grouped under environment and forestholds the maximum HR value of Rs.111.8 lakhs with the discount rate of 10 percent Hence it is concluded that theHR value of Executive Director is high of Rs. 111.8 lakhs in case of Companies under Environment and Forest whichmeans that the executive directors were given more importance for the companies in the field of environment andforest compared to the other nature of organization.
TABLE SHOWING VALUE OF THE MANAGING DIRECTOR IN NATURE OF ORGANIZATION
Discount rate
9.23
11.89
9.89
31.01
Source: Secondary data
TABLE SHOWING THE VALUE OF DIRECTORS IN NATURE OF ORGANIZATION
Name of the Ministry
Petroleum & Natural Gas
Heavy Industry & PublicEnterprise.
Environment And Forests
Finance D/o Economic Affairs
Agriculture Food And ConsumerAffairs
Total
HR Value(Rs in lacs)
97.0
107.0
111.8
25.7
60.4
402
Percentage ofthe value ofExecutiveDirector (in %)
24
27
28
6
15
100
Discount rate
0.09
0.10
0.11
0.10
0.10
0.50
Percentage ofDiscount rate(in%)
18
20
22
20
20
100
Ministry
Petroleum & Natural Gas
Steel
Agriculture Food &Consumer Affairs
TOTAL
Value of ManagingDirector
137.8
126.4
117.2
381.4
Percentage of theValue of MD
36
33
31
100
Percentage ofDiscount rate
30
38
32
100
GROUP
Textiles
Chemicals & FertilizersD/o Fertilizers
Petroleum & Natural Gas
Communication AndInformation Technology
TOTAL
HR value (Rsin lacs)
145
97
85
75
402
Percentage ofManaging Director
36%
24%
21%
19%
100%
disc rate%
12
9
10
11
42
Percentageof
29%
21%
24%
26%
100%
Source:Secondary data
The HR value of Managing Director is high of Rs. 137.8 laths in case of Companies under Petroleum and NaturalGas which means that the Managing directors were given more importance in the field of Petroleum and Natural Gascompared to the other nature of organization.

Page 71March 2014Vol.2, Special Issue
Primax International Journal of Commerce and Management Research ISSN : 2321-3604
The HR value of Director is high of Rs.145 lakhs in case of Companies under Textiles which means that the directorswere given more importance in the field of Textiles when compared to the other nature of organizations.
PERCENTAGE OF THE VALUE OF CHANNEL MANAGERS IN GROUPS
Group
Agriculture Food AndConsumer Affairs
Chemicals & Fertilizers D/oChemicals & Petrochemicals
Chemicals & Fertilizers D/oFertilizer
chemicals & Fertilizers D/oPharmaceuticals
Civil Aviation
Consumer Affairs And PublicDistribution
Finance
Heavy Industries & PublicEnterprises
Human ResourceDevelopment
Petroleum & Natural Gas
Power
Steel
Textiles
Total
Value of CH.MG (Rsin lacs)
163
144
191
168
106
110
145
209
188
184
156
152
157
2,073
Percentage ofCH&MG Value
8%
7%
9%
8%
5%
6%
7%
10%
9%
8%
8%
7%
8%
100%
Discount rate
9%
11%
11%
11%
19%
9%
16%
9%
11%
9%
12%
11%
10%
149%
Percentage ofDiscount rate
6%
7%
7%
7%
14%
6%
11%
6%
7%
6%
10%
7%
6%
100%
The results emerged out of the above table clearly shows that the Company grouped under Chemical and FertilizersD/o fertilizers holds the maximum HR value of Rs.191 lakhs with the discount rate of 11 percent whereas companiesgrouped under Civil Aviation holds the least value of HR of Rs 106 lakhs with the discount rate of 19 per cent.
Hence it is concluded that the HR value of Channel Manager is high of Rs 191 laths in case of Companies underChemical and Fertilizers D/o fertilizers which means that the Channel Manager had given more importance in thefield of Chemical and Fertilizers D/o fertilizers compared to the other nature of the organizations.
GENERAL MANAGERSThe aggregate value of General Manager are Rs14, 130,694, which is low when compared to the Senior Manager ofRs 15,212,428. Therefore the remuneration of Senior Managers are high when compared to General Managers.

Page 72
ISSN : 2321-3604
March 2014Vol.2, Special Issue
Primax International Journal of Commerce and Management Research
PERCENTAGE OF THE VALUE OF GENERAL MANAGERS IN GROUPS:
Percentage of theValue of Deputy
General Manager
9 %
8 %
11 %
7 %
5 %
9 %
10 %
10 %
10 %
8 %
6 %
7 %
100 %
Percentage ofDiscount rate
7 %
9 %
8 %
8 %
9 %
6 %
9 %
7 %
10 %
9 %
10 %
8 %
100 %Source: Secondary data
INTERPRETATION:It is concluded that the HR value of Deputy General Manager is high in case of Companies under Finance D/oEconomic Affairs (i.e. Rs.175 lakhs) which means that the executive directors were given more importance in thefield of Finance D/o Economic Affairs compared to the other nature of the organization.
TABLE SHOWING HR VALUE OF MANAGERIAL POSITIONS:
POSITION HR VALUE(Rs in
lakhs)
Percent Of Managerial
People
CHAIRMAN AND
MANAGING DIRECTOR 166 17%
EXECUTIVE DIRECTOR 91 8%
MANAGING DIRECTOR 131 11%
DIRECTOR 100 9%
CHANNEL MANAGER 159 16%
SENIOR MANAGER 152 14%
GENERAL MANAGER 141 13%
DEPUTY GENERAL
MANAGER 137 12%
TOTAL 1,078 100%
Ministry
Agriculture Food AndConsumer Affairs
Chemicals & FertilizersD/o Fertilizer
Finance D/o EconomicAffairs
Heavy Industries & PublicEnterprises
Human ResourceDevelopment
Petroleum & Natural Gas
Power
Science And Technology
Shipping
Steel
Textiles
Urban Development
Total
Value of DeputyGeneral Manager
(Rs. In lacs)
143
141
175
129
91
147
154
157
113
128
103
122
1,602
Discount rate
8%
11%
10%
10%
11%
9%
11%
8%
12%
11%
12%
10%
123%
Source: Secondary data

Page 73March 2014Vol.2, Special Issue
Primax International Journal of Commerce and Management Research ISSN : 2321-3604
INTERPRETATION:The results emerged out of the above table clearly showsthe Chairman and Managing Director has the highestaggregate value of Rs. 16,555,728 .In case of ExecutiveDirector which has the less HR value of Rs 9,107,480 ofall the other position. Value Managing director is Rs13,140,247,Value director stands at 10,049,687,whereasthe value of Channel Manager holds Rs. 15,933,145,thevalue of the position of senior manager holdsRs.15,212,428, value of general manager holdsRs.14,130,694 and value of Deputy General Managerholds 13,716,076.
FINDINGS• The analysis confirmed that HR value of the
managerial people are in confirmatory with thedesignation held by them .For instance, managershas the top most level like chairman and managingdirector have secured higher HR value than those atthe lower level.
• The discount rate played a pivotal role in determiningthe HR values of managers belonging to differentcategories. Such discount rate is decided by factorsuch as cost and value of equity and debt, corporatetax rate, correlation of the market value (beta) andrisk free rate.
• The study also found out that the organization largein size and high in value reported higher HR value fortheir managers than those which are smaller in sizeand lower in reputation.
• The majority of organizations covered in this studybelongs to Petroleum and Natural gas are 17 percent ,14 per cent of the organization belongs to HeavyIndustries And Public Enterprise,10 per cent belongsto Power and Communication, where as 8 per centbelongs to Steel and the others where 19 per cent.
• Among 195 employees, 73 per cent of them wereactive employees i.e. 144 employees, who are eligiblefor the valuation of human resources under Lev andSchwartz Model i.e. the present value of futureearning.
• The value chairman and Managing Director ismaximum of Rs. 278 lakhs in case of companygrouped under the head of petroleum and Natural gas.The aggregate value of both the Chairman & ManagingDirectors stands at 165, 55,728.
• The HR value of Executive Director is high of Rs.111.8 lakhs in case of Companies under Environmentand Forest which means that the executive directorswere given more importance in the field of environmentand forest compared to the other nature of theorganization.
· The aggregate value of Executive Director is less ofRs 9,107,480 when compared to the Chairman andManaging Director of Rs 16, 555,728. Theremuneration is a factor which has impact on increasein the value of chairman & Managing Director despiteof less remaining years of service.
• The HR value of Managing Director is high of Rs.137.8 lakhs in case of Companies under Petroleumand Natural Gas which means that the Managingdirectors were given better importance in the field ofPetroleum and Natural Gas compared to the othernature of the organization.
• The aggregate values of Managing Directors are Rs13,140,247 which are high when compared toExecutive Directors of Rs 9,107,480. Thus it specifiesthat there are more number of Executive Directorswas holding less remaining years of service.
• The HR value of Director is high of Rs.145 lakhs incase of Companies covered under the group ofTextiles which means that the directors were givenmore importance in the field of Textiles whencompared to the other nature of the organization.
• The aggregate values of Directors are Rs10,049,687.which is low when compared to ManagingDirectors of Rs 13,140,247. Thus it specifies thatthere are more number of directors holding lessremaining years of service.
• The HR value of Channel Manager is high of Rs 191lakhs in case of Companies under Chemical andFertilizers D/o fertilizers which means that theChannel Manager had given more importance in thefield of Chemical and Fertilizers D/o fertilizerscompared to the other nature of the organization.
• The aggregate values of Channel Managers are Rs15,933,145 which is high when compared to Directorsof Rs 10,049,687. Thus it specifies that the ChannelManagers holds on an aggregate of more remainingyears of service.
• The HR value of Senior Manager is high of Rs.211lakhs in case of Companies under the category Coalwhich means that the executive directors were givenmore importance in the field of Coal compared to theother nature of the organization.
• The aggregate values of Senior Managers are Rs15,212,428 which is low when compared to ChannelManagers of Rs 15,933,145. The result of thesechanges is in respect to the position they hold
• The HR value of General Manager is high of Rs 169lakhs in case Companies under Human ResourceDevelopment which means that the executive
•

Page 74
ISSN : 2321-3604
March 2014Vol.2, Special Issue
Primax International Journal of Commerce and Management Research
directors were given more importance in the field ofHuman Resource Development compared to the othernature of the organization.
• The aggregate values of General Manager are Rs14,130,694 which is low when compared to the SeniorManager of Rs 15,212,428. Therefore theremuneration of Senior Managers are high whencompared to General Managers.
• Hence it is concluded that the aggregate value ofDeputy General Manager are Rs 13,716,076 whichis low when compared to the General Managers ofRs 15,212,428. Therefore the remuneration of GeneralManagers are high when compared to GeneralManagers.
• The HR value of Deputy General Manager is high incase of Companies under Finance D/o EconomicAffairs (i.e. Rs.175 lakhs) which means that theexecutive directors were given more importance inthe field of Finance D/o Economic Affairs comparedto the other nature of the organization.
SUGGESTION:• It is essential for the company to revisit the salary
structure of the employee who would enjoy high HRvalue. This is because these managers areindispensable to the survival and the growth of theorganization.
• It is necessary for the companies to make sufficienteffort to retain those employees who have high HRvalue. In the options of that the rival organization maylure these prospective managers with more attractivebenefits and incentives. It is in the interest of thecompany to keep the attrition rate low for thesecategories of employees.
• Since HR values are determined by far and criticalvariable, the management must consider the HRvalues as indicators of the health of the organizationand accord the importance it disserves.
• The practice of valuing HR must be undertaken at alllevels of the organization and the record of the samemust be preserved religiously.
• Organizations of all dimensions must make it a habitand practice to conduct HR Valuation periodicallyand systematically.
• According to Lev and Schwartz Model the increaseor decrease in the value of human resource is affectedby factors such as present age of the employeesand the discount rate. The organization has to takeinto consideration of these both the factors.
• The investor can recognize the organization by meansof the value of human resource.
• The year to year difference in the discount rate hasto be ascertained clearly.
• Human Resource is the most valuable resource andit will more valuable when it is recognized by theorganization.
• If investors had better information available to them,they would be less quick to reward firms that engagein short-sighted (often excessive) cost cuttingstrategies that will have productivity consequencesin the out years
CONCLUSION:Human Resource Accounting is a recent phenomenonin India. Leading public sector units like OIL, BHEL,NTPC, MMTC, SAIL etc have started reporting “HumanResources” in their Annual Reports as additionalinformation from late seventies or early eighties .TheIndian Companies basically adopted the model of humanresource valuation advocated by Lev & Schwartz(1971).This is because the Indian Companies havefocused their attention on the present value of employeeearnings as a measure for their human capital.
However the application of Lev & Schwartz model by thepublic sector companies has in many cases led to overambitious and arbitrary value of the human assets withoutgiving any scope for interpreting along with the financialresults of the corporation. In the Indian context, moreparticularly in the public sector, the payments made tothe employees are not directly linked to productivity. Thefluctuations in value of employee’s contribution to theorganization are seldom proportional to the changes inpayment to employees
BIBLIOGRAPHY1. Eric G.Flamholtz (1999), Human Resource
Accounting: Advances in Concepts, methods andapplications 3rd edition, Kluwer Academic PublisherGroup, Netherlands Pg 25-100.
2. Pravin Durai (2010),Human Resource Management,Dorling Kindersley (India) pvt .ltd,
licensees of Pearsons education in south Asia, Pg602-614.
3. D.Prabhakar Rao (1993), Human Asset Accounting:An Evaluation of the Indian Practices, Pg 23-36.
4. John A.Brierley et al (2001), Human ResourceManagement: Issues in Accounting and Audit Firms,A Research Perspective, Gower Publishing ltd, Pg1-176.
5. R.K.Malik (1997), Human Resource Accounting andDecision Making, ANMOL Publications pvt.Ltd, NewDelhi, Pg 50-76.
Page 75March 2014Vol.2, Special Issue
Primax International Journal of Commerce and Management Research ISSN : 2321-3604
6. Ravindra Tiwari (1995),Human Resource Management 6th edition, Irwin Publication,Pg 1-15
7. Dr. M. K. Koley (1996), Human Resource Accounting, Institute of cost and works Accountants of India.
8. Hermanson, Roger H (1964); Accounting for Human Assets, Occasional Paper No. 14, Bureau of Business andEconomic Research, Michigan State University.
9. Likert Rensis (1967), The Human Organization, Its Management and Value, McGraw Hill Inc., New York, Pg137.
10.Carper W. Human Resource Accounting Revisited National Public Accountant 23
Page 76
ISSN : 2321-3604
March 2014Vol.2, Special Issue
Primax International Journal of Commerce and Management Research
A STUDY ON EMPLOYEES QUALITY OF WORK LIFE WITH SPECIALREFERENCE TO TOOLFAB ENGINEERING PRIVATE LTD COMPANY,
THUVAKUDI.11J.Vanmathi 3R.NagaLakshmi
2M.SuhanyaABSTRACT
A perfect Quality of Work Life would help the organization. Better quality of work life would lead to employee’swell-being thereby to the well-being of the whole organization. This is an attempt to capitalize the human assetsof the organization. Quality of Work Life improvements are defined as any activity which takes place at everylevel of an organization, which seeks greater organizational effectiveness through the enhancement of humandignity and growth. Since the employee is both a social and economic entity, possessing different characteristicsin various work situation. There can be perfect adjustments of the workers in his work unit if the workerpossesses the exact capacities required for the work. The work similarly affords the opportunity for exercisingthese capacities and the workers interests are generally satisfied in the performance of his job. However, ahappy combination of all the elements are seldom achieved in actual practice and a lack of balance form oneof the major causes of waste in production, dissatisfied employers and an unhappy employee.Hence the researcher decided to focus my research work on QUALITY OF WORK LIFE which is an essentialcriterion which caters to the well-being of the employee.
1 PG research Scholar, Dept. of Commerce CA, St. Joseph’s College, Trichy.2 PG research Scholar, Dept. of Commerce CA, St. Joseph’s College, Trichy.3 PG research Scholar, Dept. of Commerce CA, St. Joseph’s College, Trichy.
INTRODUCTION:Quality is no more a specialized word but has become anecessary and a must word for the best survival. In thisera, quality of human inputs is the greatest asset to anyorganization. Maintaining the quality of such humaninputs rises from maintaining the quality of work lifeperfectly.
A perfect Quality of Work Life would help the organization.Better quality of work life would lead to employee’s well-being thereby to the well-being of the whole organization.This is an attempt to capitalize the human assets of theorganization.
Quality of Work Life improvements are defined as anyactivity which takes place at every level of anorganization, which seeks greater organizationaleffectiveness through the enhancement of human dignityand growth.
NEED OF THE STUDY:Since the employee is both a social and economic entity,possessing different characteristics in various worksituation. There can be perfect adjustments of the workersin his work unit if the worker possesses the exactcapacities required for the work. The work similarlyaffords the opportunity for exercising these capacitiesand the workers interests are generally satisfied in theperformance of his job. However, a happy combinationof all the elements are seldom achieved in actual practice
and a lack of balance form one of the major causes ofwaste in production, dissatisfied employers and anunhappy employee.
Hence the researcher decided to focus my research workon QUALITY OF WORK LIFE which is an essentialcriterion which caters to the well-being of the employee.
OBJECTIVES OF THE STUDY:The objectives of the study are:• To know the existing work life of the employees.
• To study the level of workers satisfaction withreference to quality of work life.
• To understand the opinion of the workers regardingwork, work environment, relationship with superiors,safety and welfare measures and trainingprogrammes.
• To arrive at findings and suggestions to improve theliving standards of employees
METHODOLOGY:RESEARCH DESIGN:The type of research design used for the study isdescriptive and survey method.
SOURCES OF DATAFor smooth execution of research study theresearcher has gone for both primary and secondarydata.

Page 77March 2014Vol.2, Special Issue
Primax International Journal of Commerce and Management Research ISSN : 2321-3604
PRIMARY SOURCEThe information required for the study was directly collected from the respondents by using questionnaire methodas primary source to collect the data.
SECONDARY SOURCEThe records and documents pertaining to the details of the organization and the employees constitute the secondarysources.
SAMPLE SIZE:The sample size refers to the number of items to be selected from the universe to constitute sample, where ‘sample’is the respondents. The sample size for the study is 50 out of 206.
DATA ANALYSIS AND INTERPRETATION
Table: 1.1 : DISTRIBUTION OF THE RESPONDENTS IN PROVIDING SAFETY EQUIPMENTS
Source: Primary Data
Inference:It is inferred from the above table that majority of 30% of the respondents strongly agreed, 28% of the respondentsagreed, 16% of the respondents disagreed, 16% of the respondents neutral and 10% of the respondents stronglydisagreed that safety equipment’s are provided respectively.
Table: 1.2 : DISTRIBUTION OF THE RESPONDENTS IN PROVIDING LIGHTING AND AIRCIRCULATION AT WORK PLACE
S. No Response No. of Respondent (n:50) Percentage
1 Strongly agree 15 30
2 Agree 14 28
3 Neutral 8 16
4 Disagree 8 16
5 Strongly disagree 5 10
Source: Primary Data
Inference:It is inferred from the above table that majority of 30% of respondents agreed, 22% of the respondents stronglyagreed, 18% of the respondents neutral, 16% of the respondents disagreed and 14% of the respondents stronglydisagreed that lighting and air circulation is sufficiently provided at work place respectively.
S. No Response No. of Respondent (n:50) Percentage
1 Strongly agree 11 22
2 Agree 15 30
3 Neutral 9 18
4 Disagree 8 16
5 Strongly disagree 7 14

Page 78
ISSN : 2321-3604
March 2014Vol.2, Special Issue
Primax International Journal of Commerce and Management Research
Table: 1.3 - DISTRIBUTION OF THE RESPONDENTS IN GIVING ADEQUATE COMPENSATIONFOR THE WORK DONE
Source: Primary Data
Inference:It is inferred from the above table that majority of 38% of the respondents neutral, 32% of the respondentsagreed, 14% if the respondents disagreed, 12% of the respondents strongly agreed and 4% of the respondentsstrongly disagree that adequate compensation is given for the work done respectively.
Table: 1.4 - DISTRIBUTION OF THE RESPONDENTS TOWARD JOB SECURITY
S. No Response No. of Respondent (n:50) Percentage
1 Strongly agree 6 12
2 Agree 16 32
3 Neutral 19 38
4 Disagree 7 14
5 Strongly disagree 2 4
S. No Response No. of Respondent (n:50) Percentage
1 Strongly agree 10 20
2 Agree 21 42
3 Neutral 11 22
4 Disagree 6 12
5 Strongly disagree 2 4
Source: Primary Data
Inference:
It is inferred from the above table that majority of 42% of the respondents agreed, 22% of the respondents are
neutral, 20% of the respondents strongly agreed 12% of the respondents disagreed and 4% of the respondents
strongly disagreed that there is no threat towards job security respectively.
Table: 1.5 - DISTRIBUTION OF THE RESPONDENTS IN CONDUCTING STRESS RELIEVINGPROGRAMMES
S. No Response No. of Respondent (n:50) Percentage
1 Strongly agree 8 16
2 Agree 4 8
3 Neutral 3 6
4 Disagree 5 10
5 Strongly disagree 30 60
Source: Primary Data
Inference:
It is inferred from the above table that majority of 60% of the respondents strongly disagreed, 16% of the respondents
strongly agreed, 10% of the respondents disagreed, 8% of the respondents agreed and 6% of the respondents
neutral that stress relieving programmes tows arrangements are conducted respectively.

Page 79March 2014Vol.2, Special Issue
Primax International Journal of Commerce and Management Research ISSN : 2321-3604
Table: 1.6 - DISTRIBUTION OF THE RESPONDENTS ARE INTERESTED IN ATTENDING TRAINING PROGRAMMES
S. No Response No. of Respondent (n:50) Percentage
1 Strongly agree 10 20
2 Agree 22 44
3 Neutral 11 22
4 Disagree 4 8
5 Strongly disagree 3 6
Source: Primary Data
Inference:It is inferred from the above table that majority of 44% ofthe respondents agreed, 22% of the respondents neutral,20% of the respondents strongly agreed, 8% of therespondents disagreed and 6% of the respondentsstrongly disagreed that the respondents are interestedin attending treeing programmes respectively.
CHI-SQUARE TESTAIM:To find whether the employees level of exploiting theopportunities available to use and develop humancapacities varies with his age.
NULL HYPOTHESIS:There is no association between the age group withrespect of opportunities to use and develop humancapacities.
ALTERNATIVE HYPOTHESIS:There is a association between the age group withrespect of opportunities to use and develop humancapacities.
CALCULATED VALUE:The calculated value is 33.5714.
DEGREE OF FREEDOM: Degrees of freedom = (r-1) (c-1)
r = number of rowsc = number of columnsHerer = 5, c = 4= (5-1) (4-1)= 12
The table value of chi-square for 12 at 5% level ofsignificant is 21.026
Therefore calculated value > table value33.5714 > 21.026
Inference:Hence the calculated value of chi-square is greater thantable value, the alternative hypothesis is accepted. So,there is a association among the employees perception
towards the usage and development of human capacitiesin terms of age.
FINDINGS, SUGGESTIONS AND CONCLUSIONFINDINGS:
Nearly 50% of the respondents are satisfied with thesafety and healthy working conditions provided bythe organization, which includes working environment,first-aid facilities, infrastructural facilities, safetyequipment, lighting and ventilation facilities.
The respondents have agreed that they have the jobsecurity but they feel that the compensation providedby the organization is not adequate.
That stress relieving programmes and tourarrangement were not organized said 60% of therespondents.
Half of the respondents agreed that the trainingprogrammes helps to improve their skills, knowledgeand it was conducted by efficient faculty and there isenough sharing of information about the companyactivities.
SUGGESTIONS:WORK:
Productivity can be improved by motivation andtraining.
Division of work can also be implemented andsustained.
Work timings can be changed periodically accordingto shift basis.
WORK ENVIRONMENT:Sufficient tools can to be provided adequately.More spacious dining and restroom can be provided.
WORKER –SUPERIOR RELATIONSHIP:Arranging get-togethers for the workers will enhancegood relationship.

Page 80
ISSN : 2321-3604
March 2014Vol.2, Special Issue
Primax International Journal of Commerce and Management Research
SAFETY AND WELFARE MEASURES:Strictly adhering to use of safety equipment are givento each worker.
Preventive maintenance can be done in allmachineries and equipment to avoid accident andimprove safety of workers.
TRAINING:Required to upgrade their skills in other related areasalso.
Industrial training tour can be conducted for theemployees.
CONCLUSION:Quality of work life is mandatory in today’s organizationit is the watch word in today’s competitive businessenvironment which taps the worker’s high-order needsand thereby motivates them.
In this study it is found that majority of the respondentsare satisfied with their present work life. Attention issought in certain aspects of quality like stress relievingprogrammes, tour arrangement, canteen, restroomfacilities which need to be catered to build a more, safer,healthier and better organization/ work environment.
REFERENCES:1. Gupta,S.P., Gupta, M.P., Business statistics-Sultan
Chand & Sons, New Delhi.
2. Batra, G.S., Dangwal, R.C., Human ResourceManagement-New Delhi.
3. Kothari, C.R., Rsesarch Methodology Methods andTechniques-New Age international Publishers, NewDelhi.
4. SubbaRao, P., Personal and Human ResourceManagement, Himalaya Publications House, NewDelhi.
5. Aswathappa, K., Human Resource and PersonnelManagement, Tata McGraw-Hill Publishing CompanyLimited, New Delhi.

Page 81March 2014Vol.2, Special Issue
Primax International Journal of Commerce and Management Research ISSN : 2321-3604
AN ANALYTICAL INQUIRY ON CUSTOMER’S ATTITUDE TOWARDSCREDIT CARDS WITH SPECIAL REFERENCE TO STATE BANK OF
INDIA IN TRICHY TOWN1D. Selvalakshmi 2Dr. K. Kumar
Industrial Revolution in 1750, was the beginning of Machine age in Europe. This brought countriesand people together. The new system of the society that emerged during this period, calledcapitalism, mainly concentrated on expanding money. Commodities were the earliest kind of moneybut over time money evolved into paper currencies and checking accounts. The age of commoditymoney, gave way to the age of paper money.
1 Asst. Professor in Commerce, Sri Saradha College for women, Preambalur.2 Asst. Professor in Commerce, National College (Autonomous), Trichy.
Money is so much a part of our daily lives, that we pursueit recently yet seldom stop to consider its vital role asthe lubricant of economic activity. Last century the ageof bank money and our modern financial system withcurrency. Banks plays a vital role in the economic lifeof every modern state. They have control over aconsiderable part of the stock of money, in fact theirlending and investing activities cause changes in thequantity of money in circulation which in turn influencesthe nature and character of production in any country.
Banking is a service industry. It manages and providesfinance to every banker is not only to deal with hiscustomers but also prove a servant to the nation. Banksgenerally systematize processes as to providesatisfactory services to their customers. Service is theend product of a bank’s operations. Success and nameof any bank depend on the range and quality of theservices it can offer to its clientele, big or small. In realterms the utility of a bank is not limited to customers. Inthe wider perspective it works as a tool to achieveeconomic development. A bank, truly has to be a friend,philosopher and guide to his customers beside being aservant of the nation.
Industrial innovations and business expansion becomepossible through finance, provided by banks and otherfinancial institutions. Capital is the main factor formodern production and entrepreneurs and they arehelpless without adequate funds. Banks and other
financial institutions help them by providing necessaryfunds for their business.
Today there is extremely rapid innovation in differentforms of money and one of the important innovationsamong the different form is the credit cards and debitcards. The use of credit card substitutes and replacesthe use of cash. It enables the holder to pay for hispurchases of goods and services without involving cash.It increases the money in hand and acceleratesthevelocity of money to the extent that idle money of thecustomer is activated for purchase of goods and servicesfor credit card holders.
Many Indian and foreign banks have issued credit cardsto its customers. The issuing bank will have a tie upwith a number of establishments ranging from 5000 to18000 inclusive of hotels, hospitals, shops anddepartmental stores, which will honour the credit cardsand extend credit to individuals and households and theyshould by counted as part of the total bank credit andmoney supply in the economy.
STATEMENT OF THE PROBLEM
The present study under the title “A STUDY ONCUSTOMER’S PREFERENCE TOWARDS CREDITCARDS WITH SPECIAL REFERENCE TO STATE BANKOF INDIA CARDS IN TIRUCHIRAPALLI TOWN” will givea brief view about customer’s wants and needs towardsvariety of services provided by the State Bank of Indiacredit cards. It brings about need and importance ofcustomers preference to the banks.

Page 82
ISSN : 2321-3604
March 2014Vol.2, Special Issue
Primax International Journal of Commerce and Management Research
OBJECTIVES OF THE STUDY• To know the types of cards provided by State Bank
of India to its customers.
• To study the functions of State Bank of India creditcards.
• To understand the difference between credit cardsand debit cards.
• To analyse the purchasing behaviour of customers inrespect of credit card usage.
• To examine the customer satisfaction with referenceto the services offered by State Bank of India.
IMPORTANCE OF THE STUDYAny study on customer’s attitude becomes relevant onlyif the reason behind its existence is valid. The studymainly concentrates on the use of credit cards in ourdeveloping economy, its working and the growth rate ofcustomers. The number of members using it and thenumber of establishments honouring this credit card hasincreased fastly over the past twelve years. Some Indianbanks have joined with International Banks to providethis credit card facility on a worldwide basis, or atselected International centers. The study also coversthe satisfaction of customers regarding the servicesrendered by the State Bank of India.
AREA OF THE STUDYThe area of the study on customer’s attitude towardscredit cards is confined to people under variousoccupations residing in Trichy Town. This study hasbeen undertaken to know how the customers use theircredit cards in their day-to-day matters and to know theirsatisfaction towards the services rendered by the StateBank of India.
METHODOLOGYResearch involves more systematic structure ofinvestigation usually resulting in some sort of formalrecord of procedures and the report of the results orconclusions.
RESEARCH DESIGNThe study is mainly a descriptive research, designed todescribe the attitudes, opinions and behaviour ofcustomers on the usage of credit cards.
TOOLS FOR DATA COLLECTIONThere is a mixture of both primary and secondary datain this study. The primary data has been collected withthe help of structured Interview. The basic ideas andrelevant concepts of the study were collected from relatedbooks, magazines, journals and records, and theemployees of State Bank of India.
SAMPLINGSince the universe of the study is infinite, convenientsampling has been used. The sample covered differentclasses of customers in different occupations, 50cardholders were selected at random for the purpose ofcollection of data.
TOOLS USED FOR ANALYSIS AND INTERPRETATIONThe collected data has been represented in the form oftables, bar diagram, pie diagram etc.,. For understandingand interpretation the data are further simplified intopercentages. The statistical tools like correlation,regression and averages have been used to test the validityof hypothesis.
AGEWISE CLASSIFICATION OF RESPONDENTS
Age Group No. of Respondents percentage
Below 25 _ _
26 - 35 18 36
36 - 45 16 32
Above 45 16 32
T otal 50 100
Source: Primary Data
EDUCATIONAL WISE STATUS OF THE RESPONDENTSEducational qualification Numbers Percentage
Up to high school 5 10
Diploma degree 5 10
Graduate 18 36
Professional 22 44
Total 50 100
Source: Primary Data

Page 83March 2014Vol.2, Special Issue
Primax International Journal of Commerce and Management Research ISSN : 2321-3604
CLASSIFICATION OF RESPONDENTS ON THE BASIS OF THEIR EXPENDITURETHROUGH CREDIT CARDS
Expenditure Per
Month(In.Rs.)
No. of Respondents Percentage
Below - 1500 10 20
1501 - 3000 16 32
3001 - 4500 10 20
Above 4,500 14 28
Total 50 100
Source: Primary Data
TESTING OF HYPOTHESISThe hypothesis is “as the income of the customer increases, expenses by banking cards also increases”. And thisis proved with the help of Karl Pearson’s Coefficient of correlation.
RELATIONSHIP BETWEEN INCOME AND EXPENDITURE BY CARD
EXPENSES BY CARD
Income
Per month(Rs.)
1 - 1500 1501 - 3000 3001 - 4500
Above
4500
Total
Below 10,000 2 1 - - 3
10,001 - 20,000 3 8 2 - 13
20,001 - 30,000 4 4 5 8 21
Above 30,000 1 3 3 6 13
Total 10 16 10 14 50
Source: Primary Data
The cardholders earn more than Rs.20,000 per month and they spent nearly Rupees 4,500 per month through theircards that has been proved by the hypothesis.
nCorrelatio r=
N
fdyfdy
N
fdxfdx
N
fdyfdxdxdy
22
22 )()(
)(
∑−∑×
∑−∑
∑×∑−∑
Substituting the values
50
70
12
22
6
2
2
=
=∑
=∑
−=∑
−=∑
N
dy
fdx
fdy
fdx
25=∑ fdxdy

Page 84
ISSN : 2321-3604
March 2014Vol.2, Special Issue
Primax International Journal of Commerce and Management Research
As the value of ‘r’ is 0.857 it is concluded that there ishigh degree of positive correlation between the incomeof the cardholders and expenses met by the State Bankof India cards. Hence, the variables income andexpenses by card are positively correlated and are inclose relation to each other. To know the significanceof r, probable Error is calculated.
Probable error of the co-efficient of correlationThe probable error of the co-efficient of correlation helpsin interpreting its value with the help of probable error itis possible to determine the reliability of the value ofthe co-efficient. It is obtained as follows:-
P.E.r =0.6745N
r 21−
R=0.857 and N =50
P.E.r=0.674550
)857.0(1.
2−
=0711.7
2656.06745.0 ×
=0.0253
Units population correlation
=0.857± 0.0253=0.8317-0.8823
As the income of the people of the cardholder increasesthe expenditure by credit cards also increases.
Findings, Recommendations and conclusion• The respondents expressed mixed feeling about the
usefulness of credit cards in day-to-day consumption.• Recently, the expenditure through banking cards has
been increased.• The respondents engaged in business utilized their
cards to the full extent.• The services rendered by the State Bank of India were
found satisfactory but some of them are not satisfiedwith the Interest rate and service charge.
• Most of the customers were aware of different types ofcards and made maximum utilization of their cards.
• Most of the customers maintained separate accountsfor payments by their cards.
• Most of the cardholders were not benefited by therewards offered by the State Bank of India.
• As the income of the people or cardholders increasesthe expenditure by credit cards also increases.
RECOMMENDATIONSSome recommendations made on the basis of the findings.• The priority must be given to the middle class people
to accept the credit cards. For that the interest ratesshould be reduced.
• State Bank of India has to concentrate and encourageon Merchant Establishments for acceptance of bankingcards for the routine items.
• Bonus points should be given to the cardholders whosettle their bills promptly at time.
• The time for payment of bill should be increased, Sothat the cardholder purchasing power would increaseand make payment on the due date.
• The awareness of banking cards should be increasedmainly in rural and urban areas.
• The service centers must maintain good relationshipwith their customers and should solve their problemsand clarify doubts regarding settlements.
CONCLUSION
With the economic growth gradually out pacing populationgrowth and with a large number of affluent middle class,the potential market that India holds is immense. Creditcards are the key to the opening of bank accounts fordaily payments by the cardholders. Income tax difficultiesand high interest rates charged by banks and somerigorous terms as to the repayment of overdraft facilityhave led to less popularity of these credit cards in recent
857.0
7665.73585.3
36.22
32.6028.11
64.225
50
)22(70
50
)6(12
)50
226(25
22
=
×=
×
−=
−−×
−−
−×−−
=
P.E 0.6745 N
r 21−
[Note: If 0.6745 is omitted from the formula,
we get standard error of coefficient of correlation]

Page 85March 2014Vol.2, Special Issue
Primax International Journal of Commerce and Management Research ISSN : 2321-3604
years. The future will see through electronic money clearance of all receipts and payments on a daily basis,through satellite networking. But credit cards as a source of extending credit to individuals and households hascome to stay and credit cards should be counted as part of the total bank credit and money supply in the economy.Where only this plastic card will make all payments and receipts, as a result the flow of currencies will decreasetremendously. The banking cards business will grow by over 100 percent every year for next five years. Theinnovations in the banking sector are well accepted by the consumers to which is revealed by the study conducted.
BIBLIOGRAPHY
BOOK NAME AUTHOR NAME PUBLICATION
Banking theory an d practice Shekkar and Shekkar Vikas publishing
House Private Limited
Management of Banking
and Financial Institutions
Trilok Kumar Jain Kanishka Publishers
New Delhi
Fundamentals of marketing Stanton, William and Future
Charles
McGraw Bill Book Company
Indian Banking Vinayakan Kanishaka Publishers New Delhi
Business Statistics Gupta.S.P Chand&company , Delhi
Marketing of Financial
services and Markets
Avadhani.A Himalaya Publishing
House
JOURNALS AND PERIODICALS1. Brouchers of State Bank of India and its
subsidiaries from Marketing Limited.2. The Hindu……….15th March 20123. The Week……….19th December 2013
WEB SITES VISITED1. www.statebankofindia.com2. www.sbicard.com
Page 86
ISSN : 2321-3604
March 2014Vol.2, Special Issue
Primax International Journal of Commerce and Management Research
AN ANALYSIS ON CONSUMER BEHAVIOUR OFCOSMETIC USERS IN TRICHY DISTRICT
1 R. Santhaseela 2Dr. R. Saravanan
Abstract
Consumer is the king in modern marketing. The study of consumer behaviour becomes indispensable as the successor failure of a product depends upon the consumer. The present study attempts to know the buying behaviour ofcosmetic users. The investigation throws light on the different brands and references of the respondents belonging todifferent family income groups. The investigation has been undertaken to know and analyze the factors influencingthe consumers preference and to know the role of media in influencing them to prefer a particular brand. The findingsof the study would throw light on the brand that is mainly preferred and the reason behind the insistence of the brand.
The study is about the consumer preference towards cosmetic users in Tiruchirappalli town, consumer is a personrefers to the potential purchaser of product and services offered for sale. The aim of marketing is to meet and satisfy thetarget consumer’s needs and wants, perception, preferences, shopping and buying behaviour
IntroductionCosmetics are substances to enhance the beauty ofthe human body, cosmetics include all substances,preparations, devices and treatments used to clean, toalter the appearance or to alter the face and body. Theyare made for both men and women . Cosmetic includebeauty products for the hair, scalp, body face and hands.Consumer is the person who actually uses the product.The importance of consumption was recognized in earlyperiods, or at least two hundred years ago when Adamsmith stated ‘’consumption is the role and end purposeof all production.
The ultimate aim of the marketing is selling marketingis defined as managerial process through which productsare matched with markets. The success of businessfirms greatly depends upon how best they serve andsatisfy their customers. The business can proper onlyby satisfy the needs of customers. When a firm marketsproducts or services, it should aim to enjoy consumersatisfaction and profit maximization. Both these aimare attained through the product exchange. The goal ofeach country regardless of its economic system is toincrease productivity so as to fulfill all the wants andneeds of its citizen and this is to improve the standardof living of its people.
Consumer needs and desires are innumerable. A modernmarketer first fries to understand the consumer and theirresponse and then studies the basic characteristics oftheir behaviour. A producer or a manufacturer takes intoaccount many factors customer needs, desires,
prestige, income, education etc to make the productattractive and acceptable to its customers. Consumer’sdemand is an important factor in marketing the productsuccessfully. For Schiffman and Kamuck the termconsumer behaviour refers to ‘’the behaviour thatconsumer display in searching for, purchasing, usingevaluating and disposing of
products and services that they expect will satisfy theirneeds’’ and the study of consumer behaviour is the studyof how individuals make decisions to spend their availableresources like time, money, effort-on consumptionrelated items.
According to London and Della Bitta consumer behaviour‘’the decision process and physical activity individualsengage in when evaluating acquiring using or disposingof goods and services’’ Marketing consist of dealing withgoods and services. The goods produced or acquiredfor business purposes may be consumer goods like soap,shampoo, hair oils etc properly speaking the term thebusiness should be reserved for the exchange of goodsand services under taken continuously or at leastrecurrently.
American marketing Association defines that ‘’Marketingis performing business activities that direct flow of goodsand services from producer to consumer or user”.According to Pyle ‘’marketing comprises both buyingand selling activities’’ Therefore marketing managementis concerned with what buyers are really seeking in theirpurchase of goods and services. Since the ultimatemotive of all the marketing activities is consumer
1 Asst. Professor in Commerce, Sri Saradha College for Women, Perambalur.2 Asst. Professor in Commerce, Swam: Dhayanandha College of arts and Science, Manjakudi.

Page 87March 2014Vol.2, Special Issue
Primax International Journal of Commerce and Management Research ISSN : 2321-3604
satisfaction. The earlier times marketers could arrive ata fair understanding of consumers through the dailyexperience of selling products to consumers. But Growthin the size of films and markets has removed manymarketing decision makers from direct contact with theirconsumers. Increasingly marketing managers hare hadturn to consumers research, they are spending morethan ever before to study consumers and to understandwho buys? How they buy? When they buy? And whythey buy?.
The studies may help to know the reasons behindconsumer behaviour of cosmetic users and to find thevarious attributes that influence the people in purchaseof the cosmetic items.
Objectives of the study:1. To analyse the individual factors that influence the
consumers to purchase cosmetic items.
2. To find out the relationship between the family incomeand the expenses on cosmetic items.
3. To find out the satisfaction level of different brands.
4. To study the preferences pattern of consumer’sconsumption towards cosmetic items.
5. To examine the impact of Advertisement media overthe selection of the cosmetic items.
6. To consolidate findings and give suggestions.
Scope of the study:Consumer is the king in modern marketing. The studyof consumer behaviour becomes indispensable as thesuccess or failure of a product depends upon theconsumer. The present study attempts to know thebuying behaviour of cosmetic users. The investigationthrows light on the different brands and references ofthe respondents belonging to different family incomegroups. The investigation has been undertaken to knowand analyze the factors influencing the consumerspreference and to know the role of media in influencingthem to prefer a particular brand. The findings of thestudy would throw light on the brand that is mainlypreferred and the reason behind the insistence of thebrand.
Statement of the problem:The study is about the consumer preference towardscosmetic users in Tiruchirappalli town, consumer is aperson refers to the potential purchaser of product andservices offered for sale. The aim of marketing is to meetand satisfy the target consumer’s needs and wants,perception, preferences, shopping and buying behaviour.
But knowing consumer behaviour is never simple.Consumer may state their needs and wants but act otherwise. The may respond to influence that change theirmind at the taste minute. In the present competitivemarket, every marketer must know and locate theconsumer behaviour which is the outcome of consumerspreference and attitude towards a particular brand orproduct or service for his survival. The focus is on theconsumer and not on the marketers and this changehas led the researcher to take up this study.
Importance of the study:Cosmetic intends market today is very congested andso many companies are trying to capture the, marketwith our technologies, each product is different by smell,quality, price, size packaging etc Hence it becomesessential to know what factors affect the consumersmuch towards a particular brand so that the market couldbe assessed to know the reasons and situationsmotivating consumer for preferring a particular brand. Thisstudy has been undertaken with view to analyzeconsumer preference for cosmetic items and howconsumer selects cosmetic items so the researcher haredecided to conduct study in this Area.
Area of the study:Tiruchirappalli has been selected as the area of the study.It is situated on banks of river cauvery. Tiruchirappalli isthe fourth largest city in Tamilnadu. Tiruchirappalli is acentrally located district of Tamilnadu with an area of5.114 sq.km. It lies between 10o -11.30o northern latitudeand 77o to 45o of eastern longitude Tiruchirappalli isbounded by Salem and south Arcot District on North,Thanjavur districts on the east and erode district on thewest and pudukkottai on south, its population is nearly23,88,831. Trichirappalli is known for it Rock fort templewith a height of over 83 meters other renowned templesare the Srirangnathaswamy temple at Srirangam, theSiva temple at Thiruvanaikoil and Samyapuram Arul MiguMuthu Mariamman Temple.
Sampling technique:The researcher has used stratified random samplingmethod for selecting the respondents. From 49 Divisionsof Tiruchirappalli District, 5 divisions have been selectedat random namely Srirangam, Pettavaithalai, Lalgudi,Thillainagar, Palakarai etc, each division 30 respondentswere chosen using random sampling method. A pilotstudy was made among the shop owners to select thebands of fast moving cosmetic items profited by theconsumers, from the data colleted the first eight productsnamely tooth paste, Hair oil, shampoo, Face cream,Talcum powder, Toilet soap, Nail polish, kum-kum wereselected for the survey.

Page 88
ISSN : 2321-3604
March 2014Vol.2, Special Issue
Primax International Journal of Commerce and Management Research
Methodology:The study is concerned with consumer’s preference and their attitude to wards various cosmetic Hems. Hence themain source is the primary data. The questionnaire prepared by the investigator has been administered to consumerswho prefer different brands. To have an idea about cosmetic items, information has been collected from books,magazine and through internet.
Tools used for data collection:The data was collected through a structured questionnaire. The data collected from 150 respondents were presentedin the form of tables, bar diagram, histograms, pie diagram and percentages. The tools used for data collection arechi-square Test and rank correlation.
Hypothesis:There exist a direct relationship between the family income and the expenses on cosmetic items. Corre la t ionanalysis attempts to determine the degree of relationship between variables. Rank correlation is applicable only toindividuel observation. It is useful to measure the qualitative characteristics
Sex –Wise Rank of Reasons.
Reason Male
Preference Rank R1
Female
Preference Rank D=R1-R2 D
2
Fancy 16 2.5 12 2.5 0 0
Quality 35 1 43 1 0 0
Price 16 2.5 10 4 -1.5 2.25
Status 6 4 12 2.5 1.5 2.25
∑D2=4.50
R= I - 6∑ D2
n (n2-1)
Where
R= Rate Coefficient of correlation
D2 =sum of the square of the difference of 2 ranks
N= Number of observation
R= I - 6∑ D2
n (n2-1)
= 1 – 6x4.5 = 1 -27 =.55
4 (16-
Source: Primary Data
As the calculated value shows a moderate positive correlation It could be inferred that the preference of male andfemale for taking cosmetics is only upto 50percent.
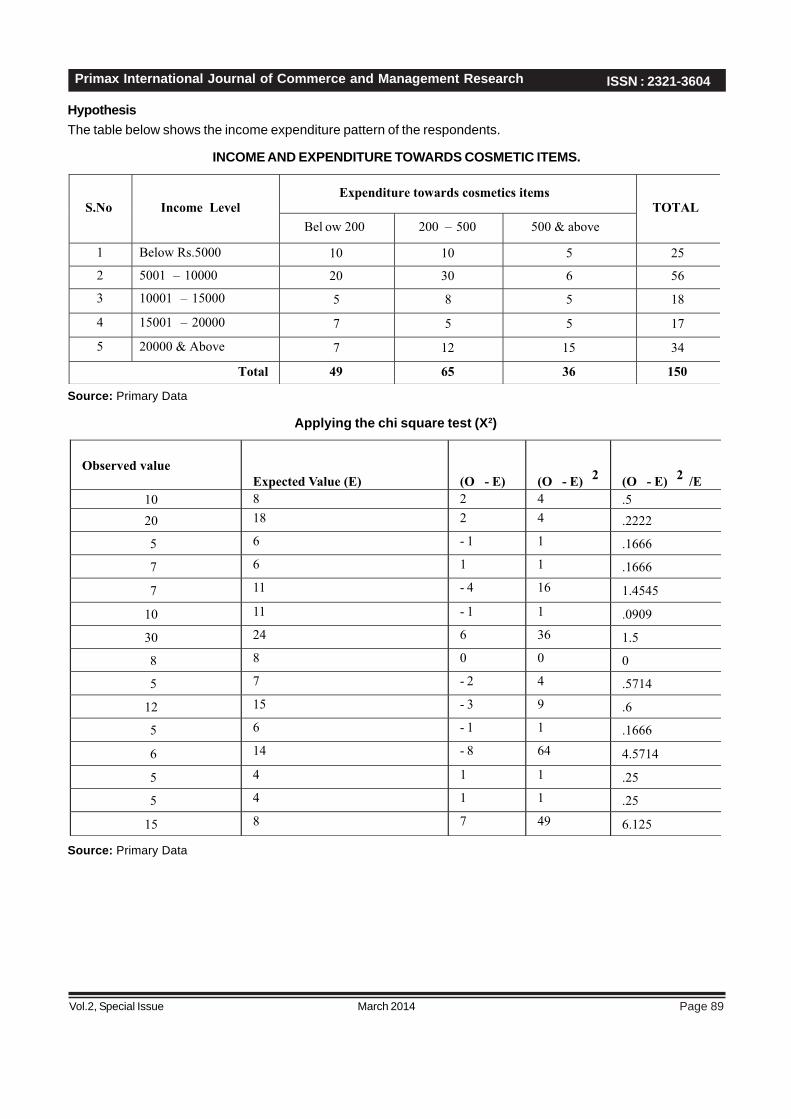
Page 89March 2014Vol.2, Special Issue
Primax International Journal of Commerce and Management Research ISSN : 2321-3604
HypothesisThe table below shows the income expenditure pattern of the respondents.
INCOME AND EXPENDITURE TOWARDS COSMETIC ITEMS.
S.No Income Level
Expenditure towards cosmetics items
TOTAL
Bel ow 200 200 – 500 500 & above
1 Below Rs.5000 10 10 5 25
2 5001 – 10000 20 30 6 56
3 10001 – 15000 5 8 5 18
4 15001 – 20000 7 5 5 17
5 20000 & Above 7 12 15 34
Total 49 65 36 150
Source: Primary Data
Applying the chi square test (X2)
Observed value
Expected Value (E) (O - E) (O - E)2
(O - E)2
/E
10 8 2 4 .5
20 18 2 4 .2222
5 6 - 1 1 .1666
7 6 1 1 .1666
7 11 - 4 16 1.4545
10 11 - 1 1 .0909
30 24 6 36 1.5
8 8 0 0 0
5 7 - 2 4 .5714
12 15 - 3 9 .6
5 6 - 1 1 .1666
6 14 - 8 64 4.5714
5 4 1 1 .25
5 4 1 1 .25
15 8 7 49 6.125
Source: Primary Data

Page 90
ISSN : 2321-3604
March 2014Vol.2, Special Issue
Primax International Journal of Commerce and Management Research
∑ (0-E)2/E = 16.6352
Degrees of freedom
( C-1) (r-1)
(3-1) (5-1) 8 degree for freedom. The tabulated value at 5% level of significance for 8 degree of
The calculated value ∑ (0-E)2 = 16.6352
E
Since the calculated value is more than table value, the null hypothesis is not accepted and so the expenditure oncosmetics influenced by their income.
REFERENCEAbdel Baset & I.M Hasounch : consumer behaviourC.L. Tyagi & Arunkumar : Consumer behaviourSheetal Kapoor : Understanding Buying behaviour of IndianfamiliesP.C. Jain Monika Bhatt : Consumer behaviour in Indian Context.Matin Khan : Consumer behaviour
WEBSITES:1. http://en.wikipedia.org/wiki/cosmetics2. http://en.wikipedia.org/wiki/beauty3. http://www.hyperdictionery.com/dictionary/soap4. http://www.anwsers.com/topic/cosmetic

Page 91March 2014Vol.2, Special Issue
Primax International Journal of Commerce and Management Research ISSN : 2321-3604
PROS AND CONS OF BANCAASSURANCE
1E. Miracle Muthu Mary 2T. Shanmuga Priya
AbstractBancassurance is a French term referring to the selling of insurance through a bank’s established distributionchannels.The bank insurance model (BIM), also sometimes known as bancassurance.Bancassurance is thepartnership or relationship between a bank and an insurance company. The insurance company uses the bank saleschannel in order to sell insurance products, an arrangement in which a bank and an insurance company form apartnership so that the insurance company can sell its products to the bank’s client base. Researches and present daystatistics speak about the need of a well equipped financial structure for a country that helps it to grow economically.The financial resources in the hands of people should be channelized in effective manner so as to increase thereturns from the basic financial structure of nation and also the quality of living of people. Insurance policies areinstruments/products that play major role in upholding the financial structure of developed countries.
Introduction
The banking sector has a wide network in the country.Nearly 65,700 branches of commercial banks are spreadover the country, serving 15,000 people per branch. Theaggregate amount of deposits was about Rs. 10 trillionthrough 406 million accounts. Further, nearly 60 percentof total accounts are from rural and semi-urban areas.
At this juncture, it is important to note that the privateand foreign insurance companies want to utilize themultiple channels with the commercial banks for theirbusiness. But the regulatory framework in the countryis conscious of customer’s benefit. All these factors havecreated a form of new business in the name of“Bancassurance”, i.e. insurance through bankingchannels.Bancassurance is a French term referring to the sellingof insurance through a bank’s established distributionchannels.The bank insurance model (BIM), alsosometimes known as bancassurance.Bancassuranceis the partnership or relationship between a bank andan insurance company. The insurance company usesthe bank sales channel in order to sell insuranceproducts, an arrangement in which a bank and aninsurance company form a partnership so that theinsurance company can sell its products to the bank’sclient base.BIM allows the insurance company to maintain smallerdirect sales teams as their products are sold throughthe bank to bank customers by bank staff and employeesas well.The bank and the insurance company share thecommission. Insurance policies are processed andadministered by the insurance company.
Bancassurance can be profitable for both companiesbanks and insurance in the view point Banks can earnadditional revenue by selling the insurance products,while insurance companies are able to expand theircustomer through banks without having to expand theirsales forces or pay commissions to insurance agentsor brokers.
Definition: Bancassurance means selling insuranceproduct through banks. Banks and insurancecompany come up in a partnership wherein the banksells the tied insurance company’s insuranceproducts to its clients
Description: Bancassurance arrangement benefitsboth the firms. On the one hand, the bank earns feeamount (non interest income) from the insurancecompany apart from the interest income whereas onthe other hand, the insurance firm increases itsmarket reach and customers. The bank acts as anintermediary, helping insurance firm reach its targetcustomer in order to increase its market share.
Various models are used by banks forbancassurance
(a)Strategic Alliance Model:
Strategic alliance model is a tie-up between a bank andan insurance company. The bank only markets theproducts of the insurance company. Except for marketingthe products, no other insurance functions are carriedout by the bank
(b) Full Integration Model:
Under this model entails a full integration of bankingand insurance services. The bank sells the insurance
1 Research Scholars, Department of Commerce, St. Xavier’s College, Palayamkottai.2 Research Scholars, Department of Commerce, St. Xavier’s College, Palayamkottai

Page 92
ISSN : 2321-3604
March 2014Vol.2, Special Issue
Primax International Journal of Commerce and Management Research
products under its brand acting as a provider of financialsolutions matching customer needs. Bank controls salesand insurer service levels including approach to claims.Under such an arrangement the Bank has an additionalcore activity almost similar to that of an insurancecompany.
(c) Mixed Models:Under this Model, the marketing is done by the insurer’sstaff and the bank is responsible for generating leadsonly. In other words, the database of the bank is sold tothe insurance company. The approach requires very littletechnical investment.
Need for bancassurance in IndiaResearches and present day statistics speak about theneed of a well equipped financial structure for a countrythat helps it to grow economically. The financialresources in the hands of people should be channelizedin effective manner so as to increase the returns fromthe basic financial structure of nation and also the qualityof living of people. Insurance policies are instruments/products that play major role in upholding the financialstructure of developed countries. Though the teethingphase of insurance, one may say is just past, a desirablefoothold is yet to be found. With growth in number ofmiddle class families in the country, RBI recognized theneed of an effective method to make insurance policiesreach people of all economic classes in every corner ofthe nation. Implementing bancassurance in India is onesuch development that took place towards the cause.The need and subsequent development of bancassurancein India began for the following reasons:
To improve the channels through which insurancepolicies are sold/marketed so as to make them reachthe hands of common man
To widen the area of working of banking sector havinga network that is spread widely in every part of thenation
To improve the services of insurance by creating acompetitive atmosphere among private insurancecompanies in the market .
Advantages of Bancassurance
Advantages to Customers:a) It encourages customers of banks to purchaseinsurance policies and further helps in building betterrelationship with the bank.
b) The people who are unaware of and/or are not in reachof insurance policies can be benefitted through widelydistributed banking networks and better marketingchannels of banks.
c) Increase in number of providers means increase incompetition and hence people can expect better premiumrates and better services from bancassurance ascompared to traditional insurance companies.
Other benefits• They can obtain a basket of products under one roof.• They get risk coverage at bank itself.• Availability of advices on financial planning.• Opportunity to make better informed choice in
financial matters like selection of insurance cover.• Ease of renewals through of executing standing
instructions
Advantages to Insurance Company
a) The insurance company hopes to attract furtherbusiness, from both existing and new policyholders,because of the fact that it can offer a wider range ofservices than before, i.e. it can give its customers accessto banking as well as to insurance services. It encouragescustomers of banks to purchase insurance policies andfurther helps in building better relationship with the bank.
b) The economics of the Bancassurance operation mayallow the insurer to offer products which are not feasiblethrough the insurer’s existing channels. For example,sales costs incurred under existing channels may forcepremium rates for a product to be uncompetitive, so theproduct is not sold. The costs via the Bancassurancechannel may be low enough to make it feasible.
c) The insurance company can offer to carry out theadministration activities of the bancassurer’s business,if for example the bancassurer is a separate company.Combining the bancassurer’s business with the otherbusiness of the insurer can produce economies of scalein administration costs (including capital expenditure).This in turn allows the insurer to improve profitabilityand to price future products with narrower margins, whichhelps to make the insurer’s products more competitive.
d) For both bank and insurer there is a great opportunityto learn and to make improvements in their ownoperation. Each gets exposure to the other’s distinctivemanagement styles, its objectives and measures andthe pressures which it can exert and which it feels. Thebenefit comes when either company can implementchanges as a result of the learning process.
Other benefits• Captures premium of bank financed assets• Greater geographical reach through banks’ network
at relatively lower cost• Access to banks customers
Page 93March 2014Vol.2, Special Issue
Primax International Journal of Commerce and Management Research ISSN : 2321-3604
• Gaining credibility in customer mindset byassociating with bank
• Ease of renewals and lower lapse incidence• Potential for cross selling• Potential for up-selling including depth and width• Selling personal lines of insurance products to banks,
depositors and other customers• Introducing co-branded products like Fire Policy for
Home Loans• Attracting walk-in customers in bank network
Advantages to Banks• Bank gets more non interest income• Bank gets new customers and better penetration in
existing customer base• Increased association with the bank• Branch achieves profitability target• It encourages customers of banks to purchase
insurance policies and further helps in building betterrelationship with the bank.
• The people who are unaware of and/or are not in reachof insurance policies can be benefitted through widelydistributed banking networks and better marketingchannels of banks.
• Increase in number of providers means increase incompetition and hence people can expect betterpremium rates and better services frombancassurance as compared to traditional insurancecompanies.
• There is no need of additional capital requirement forinsurance business by banks, as is required in thecase of lending activities by banks.
• Due to severe competition, banks are going in searchof customers for banking business; existingcustomers can be used for insurance too withoutadditional effort.
• Bancassurance business has a positive impact onthe financial statements of banks with enhanced ROAand ROE, because of increased income throughinsurance, but without an enhancement in Capital /Asset base.
• The surplus manpower in banks that has emergeddue to massive computerization could be redeployedtowards insurance business. So experienced humanresources could be utilized without any furtherinvestment in recruitment and training.
• At present, banks are insuring their own assets likebuildings, furniture, vehicles, computers, etc. withother insurance agencies. With bancassurance,banks will be able to insure their own assets.
• With the newly established business, banks couldtake up the insurance policies associated withinsurance-linked loans granted under their normalbanking practices like, crop loans, crop insurance,loans for animals, sheep rearing, poultry, vehicle andhousing loans, industrial loans against stock pledge,etc. which were hitherto issued by other insuranceagencies.
• Apart from all these, retention of existing customersis a great task in a service sector like banking, whichcould be made possible with the help ofbancassurance.
The following factors have mainly led to success ofbancassurance
(i) Pressure on banks’ profit margins. Bancassuranceoffers another area of profitability to banks with littleor no capital outlay. A small capital outlay in turnmeans a high return on equity.
(ii) A desire to provide one-stop customer service. Today,convenience is a major issue in managing a person’sday to day activities. A bank, which is able to marketinsurance products, has a competitive edge over itscompetitors. It can provide complete financialplanning services to its customers under one roof.
(iii) Opportunities for sophisticated product offerings.(iv) Opportunities for greater customer lifecycle
management.(v) Diversify and grow revenue base from existing
relationships.(vi) Diversifies risks by tapping another area of
profitability.(vii) The realization that insurance is a necessary
consumer need. Banks can use their large base ofexisting customers to sell insurance products.
(viii) Bank aims to increase percentage of non-interestfee income
(Ix) Cost effective use of premises
Demerits of bancassuranceBancassurance is a new system of insertinginsurance business into banking practices, which areby nature quite different. Thus differences may creepup among bank personnel. Bank executives may notconsider insurance as their core business andsimply leave it.
Since insurance and banking cultures differ, conflictsmay arise among the employees involved in bankingand those involved in insurance business. In casesuch culture differences are identified, specializedpersonnel must be employed exclusively forinsurance.
Page 94
ISSN : 2321-3604
March 2014Vol.2, Special Issue
Primax International Journal of Commerce and Management Research
In this business, employees will be dealing withcustomers with high net worth. So those employeeswho are assigned insurance business must be veryclear about service standards, policy issues, salesand marketing concepts.
Dissatisfaction in any one of the businesses may affectthe other as well. For instance, an individualdissatisfied with the insurance service offered by abank, will quit normal banking also. Likewise adissatisfied bank customer will not be interested inthe insurance service either.
Since the banking channel is utilized for insurancebusiness, the banker will be ultimately answerableto the insured persons.
There is likely to be another internal problem involvedin this practice. A bank employee who is assignedinsurance business may be reluctant to move outsidethe bank premises. Further, sometimes he would haveto work beyond the normal schedule hours of dutyalso. Likewise, a bank employee assigned theinsurance job may also be reluctant to receive leadsfor insurance business from his own colleagues.
Problems may also arise due to the transfer ofinsurance-trained personnel from one branch toanother. It is also possible that there may be amismatch of insurance-trained personnel in somebranches. Some branches may have excessivetrained personnel, while others may have a shortage.
Due to improved technology, policy expectations ofpolicyholders may not tally with the insurance serviceoffered by a bank, particularly in respect of disclosureof information to policyholders.
Expertise in fund management in bancassurance isalso a big challenge to the bankers. Unless there isproper Asset Liability Management (ALM), it will notsend out the correct signals to policyholders. Ininsurance, bonus or NAV is the key factor ofinvestment strategy, which requires a separateInvestment Research Cell. At the same time, dealingswith Assets Management Companies are alsonecessary.
Acquisition cost is also a challenge beforebancassurance. It includes cost of operation,distribution and technology. New insurancecompanies absorb all other costs in initial years, whilethe cost of technology for distribution is a criticalvariable.
Incentive is a stimulating factor to the sales force ininsurance business. So banks have to fix andimplement performance-linked incentives.
Data management of an individual customer’s identityand contact details may result in the insurancecompany utilizing the details to market their products,thus compromising on data security.
Better approach and services provided by banks tocustomer is a hope rather than a fact. This is becausemany banks in India are known for their bad customerservice and this fact turns worse when they areresponsible to sell insurance products. Work natureto market insurance products require submissiveattitude, which is a point that has to be worked on bymany banks in India.
There is a possibility of conflict of interest betweenthe other products of bank and insurance policies(like money back policy). This could confuse thecustomer regarding where he has to invest.
I.Meenakshi (2013), conducted a study onBancassurance:”Problems and Prospects inBancassurance”. In this study, it was found that therewere various problems in bancassurance.Uninterested and inefficient staff has been identifiedas the major problems , followed by ‘could not spendenough time on this’ and ‘no exclusive staff’ forbancassurance has been identified as the third majorproblem. The next problem is ‘not much rewardingand challenges’ ranked fourth. Next to this ‘inadequatepromotional efforts’ ranked fifth. ‘Difficult to convince’the potential consumer’s ranked sixth. After that‘pressing issues and challenging’ ranked seventh.Subsequently ranked eighth is stiff competition. Lackof infrastructure placed ninth, and at last consideredproblem is ‘low level of awareness among the public.
Conclusion
In India, for decades, customers were used to themonopolistic attitude of public sector insurancecompanies, despite there were many drawbacks in theirdealing, they enjoyed customer confidence, this trendcontinues even now mainly due to their governmentownership.
Under these circumstances, any new insurance productsrouted through the bancassurance channel would be wellreceived by the customers
Finally, insurance business will grow at a much fasterrate in the years to come. Bancassurance is substantialfor the present economy. Growth of insurance andbancassurance will be simultaneous, supporting eachother.

Page 95March 2014Vol.2, Special Issue
Primax International Journal of Commerce and Management Research ISSN : 2321-3604
Bibliography
• http://en.wikipedia.org/wiki/Bancassurance
• http://economictimes.indiatimes.com/definition/bancassurance
• http://tips.thinkrupee.com/articles/bancassurance-in-india.php
• Bodla B.S & M.C. Garg (2003): InsuranceFundamentals, Environment and Procedures, NewDelhi,
• Deep & Deep ICFAI (2003): Insurance Law &Regulations, Vol. I – III, Hyderabad ICFAI Press.
• Polande P.S. (2003): Insurance in India –Changing Policies & Emerging Opportunities,New Delhi.
• Usha Balasubramanyam (2004): InsuranceRegulatory Reforms, Journal of Insurance Law,ICFAI Press.
• I.Meenakshi (2013): Problems and prospects inbancassurance, Innovation in banking sector, Pg140-143.
Page 96
ISSN : 2321-3604
March 2014Vol.2, Special Issue
Primax International Journal of Commerce and Management Research
A STUDY ON CUSTOMER SATISFACTION & AWARENESS ONE-BANKING WITH SPECIAL REFERENCE TO TRICHY TOWN
1R. Manikandan, 2Dr. S. Christuraja
ABSTRACTElectronic banking or e-banking is automated delivery of new and traditional banking products and services directlyto the customer through electronic communication like computer, ATMs, and internet websites. The customersatisfaction level based on the analysis of data relating to 150 respondents indicates that there is significant correlationbetween age and occupation with other factors. In the analysis it was observed that particular age group has usedthese Services; the satisfaction of the customer majorly influenced the convenience, awareness, and responsiveness.In the present technology society, most of the banking customer prefer and switch to e-banking facilities. So thebanker may improve their services, loyalty to customers and their retention by increasing awareness of other agegroups and concentrating on the factors contributing customer satisfaction.
Key words – Customer satisfaction, Efficiency, Privacy of Information, Services
1 PG Research Scholar, Dept. of commerce CA, St. Joseph’s College, Trichy.2 Assistant Professor, Department of commerce, St. Joseph’s College, Trichy.
INTRODUCTION OF E-BANKINGThe world is changing at a staggering rate andtechnology is considered to be the key driver for thesechanges around us. An analysis of technology andits uses show that it has permeated in almost everyaspect of our life. Many activities are handledelectronically due to the acceptance of informationtechnology at home as well as at work place. Slowlybut steadily, the Indian customer is moving towards theinternet banking. The ATM and the Net transactions arebecoming popular. But the customer is clear on one thingthat he wants net-banking to be simple and the bankingsector is matching its steps to the march of technology.
E-banking or Online banking is a generic term for thedelivery of banking services and products through theelectronic channels such as the telephone, the internet,the cell phone etc. The concept and scope of e-bankingis still evolving. It facilitates an effective payment andaccounting system thereby enhancing the speedof delivery of banking services considerably. Severalinitiatives have been taken by the Government of Indiaas well as the RBI (Reserve Bank of India); havefacilitated the development of e-banking in India. Thegovernment of India enacted the IT Act, 2000, whichprovides legal recognition to electronic transactions andother means of electronic commerce. The RBI has beenpreparing to upgrade itself as regulator and supervisorof the technologically dominated financial system. Itissued guidelines on the risks and controls in computerand telecommunication systems to all banks, advisingthem to evaluate
the risks inherent in the systems and put in placeadequate control mechanisms to address these risks.
OBJECTIVES OF THE SUDY1 To analyze the reasons for opening bank account.2. To find out the reasons for preferring internet Banking
service.3. To understand the facilities mostly availed by the
respondents and the opinion about the service.4. To measure the Satisfaction level of the customer.5. To aware about E-banking services.
SCOPE OF THE STUDYNowadays the banking activities become fully automated.Through internet, customer can do their bankingactivities, from their home itself, giving better customersatisfaction. The project will analyze the customersatisfaction in the privacy of information, easiness touse, Efficiency, responsiveness, reliability, andconvenience. By this the banker can identify in whichdimension they lack and need to improve services totheir customer in order to improve satisfaction.
Features online or E-bankingThe common features fall broadly into severalcategoriesA bank customer can perform non-transactional tasksthrough online banking, including -
• Viewing account balances Viewing recenttransactions
• Downloading bank statements, for examplein PDF format
• Viewing images of paid cheques
• Ordering cheque books

Page 97March 2014Vol.2, Special Issue
Primax International Journal of Commerce and Management Research ISSN : 2321-3604
• download periodic account statements
• Downloading applications for M-banking, E-bankingetc.
Bank customers can transact banking tasks throughonline banking, including -
• Funds transfers between the customer’s linkedaccounts
• Paying third parties, including bill payments (see,e.g., BPAY) and telegraphic/wire transfers
• Investment purchase or sale
• Loan applications and transactions, such asrepayments of enrollments
• Register utility billers and make bill payments
• Financial institution administration
• Management of multiple users having varying levelsof authority
• Transaction approval process
• the process of banking has become much faster
Some financial institutions offer unique Internet bankingservices, for example
• Personal financial management support, such asimporting data into personal accounting software.Some online banking platforms support accountaggregation to allow the customers to monitor all oftheir accounts in one place whether they are withtheir main bank or with other institutions.
Customer SatisfactionCustomer satisfaction refers to the extent to whichcustomers are happy with the products and servicesprovided by a business. Customer satisfaction levels canbe measured using survey techniques and questionnaires.Gaining high levels of customer satisfaction is veryimportant to a business because satisfied customersare most likely to be loyal and to make repeat ordersand to use a wide range of services offered by a business.
The factors that affect customer satisfaction are:a) Courteous employeesb) Friendly employeesc) Billing timelinessd) Helpful employeese) Knowledgeable employeesf) Billing clarityg) Good valueh) Service quality
i) Accuracy in billingj) Competitive pricing
Customer LoyaltyLoyalty cannot be bought or forced on customersand a person does not automatically become loyalbecause he or she is satisfied with the servicesoffered by company. Becoming loyal is more like aprocess. A positive apprehension of service quality mightlead to satisfaction, but for a relation to develop,interaction between the customer and the bank,rather than just a feeling of satisfaction from thecustomer‘s side, will be required.
CONVENIENCE SERVICESOnline Banking Convenience: Online Banking allows youto access your accounts and manage your finances whenit’s convenient for you. View your accounts, transfermoney, pay bills, track spending, and earn cash backon your debit card purchases.
Different Types of E-Banking Services
1. Auto Bank Services.All people can have access to electronic bankingservices. In each town or city the different banks provideelectronic facilities for the benefit of their clients.Even the bigger garages offer automatic banking facilities,called auto banks, where people can do their bankingwithout queuing inside the bank.
Draw cash , deposit money or cheques get abalance enquiry, get mini-statements, makeinternal account transfers These are the transactionscan be done at an auto bank:
2. Online Banking ServicesThis service makes it possible to conduct your bankingfrom the comfort of your home or office. Onlinebanking (or Internet banking) allows customers ofa financial institution to conduct financial transactionson a secure website operated by the institution, whichcan be a retail or virtual bank, credit union or society. Itmay include of any transactions related to online usage
Cell phone Internet Services This system allows youto access the bank’s cell phone banking service via theInternet using your cell phone.
The following transactions can be conducted:*Get balance enquiries, *Make account payments,*Make inter-account transfers,
*Get mini-statements of the last five transactions*Recharge MTN and Vodacom prepaid airtime
*Increase or decrease your overdraft limit,

Page 98
ISSN : 2321-3604
March 2014Vol.2, Special Issue
Primax International Journal of Commerce and Management Research
3. Telephone Banking ServicesYour telephone gives you access to your bank accounts24 hours a day, seven days a week. You can do yourbanking from your home or office, from your car, andeven the beach.Once you have registered for telephonebanking services, you can:a. make paymentsb. transfer money between your linked accountsc. receive fax confirmation of transactions and copies
of your statementsd. get balance enquiries on all your linked accountse. increase or decrease overdraft limitf. recharge prepaid airtime on cell phonesg. confirm transactions per faxh. receive statements per fax
4. Internet BankingThis facility gives you access to you personal andbusiness accounts online, anytime, anywhere. Theservice is available seven days a week, 24 hours a day.The system gives you the freedom to choose your ownbanking hours, giving you greater control of your finances.It’s secure, fast and easy to use.
*get provisional statements*make account payments*make a once-off payment*set up future-dated payments*set up repeat payments*make inter-account transfers*stop debit orders and cheques*increase and decrease overdraft limits
Excellence, Reliability, commitment, professionalism &Service!!!! banking can simply be defined as the processof entering into transactions by a particular client andthe bank using modern technology, with the variouscapabilities of the computer and other technologicaldevelopments, online banking is one of the manybusiness that benefited from it. Since banking plays a
very important role in the economy of a nation, then thereis truly a need to maximize and improve its features tobe client friendly and easy to access.
There are of course the Advantages and disadvantagesof online banking.
Among the advantages of online banking in clued thefollowing1. Very convenient: Online banking is a totally easy
thing to do.2. Unlimited service day and night: The services and
various features of your bank are always availableseven days a week and 24 days and night.
3. No time constrain: Online banking is also stressfree because it never closes unlike the traditionalbanking that has cut-off time.
4. Easy to access via PC: Using your personalComputer, you can easily do various transactionswith your bank in view of your business or any otherpersonal or financial matters.
5. Easy way of payment: Bill payments can also behandled properly and smartly.
6. Smart. Online banking is also ubiquitous or simplyput smart.
7. Higher interest rate: Another great advantage of onlinebanking is the interest rates which basically rangebetween 5% to 3.49% annually. Unlike the traditionalbanking, online banking can earn you a better interestor return of investment both in your savings andchecking account.
8. Easy Transaction: Another advantage is the speedof every transaction. Online transactions, comparedto ATM or traditional banking, works faster. Thebusiness matters could benefit so much from thisspeed feature.
9. Banking online is both efficient and effective: Withjust one secure site, all your financial transactionscan be managed orderly
GENDER TOTAL PERCENTAGEMale 114 76%Female 36 24%Total 150 100%
On the other hand, the following are the disadvantagesof online banking:-1. First is the slow processing from the moment you
entered a financial transaction with your bank viathe computer. Usually the bank will require you to
submit certain documents like an identification car.Signature and like. Not only will the bank onlinerequire you to submit documents but also to providespecial power of attorney in cases where you wantto manage all your wealth and resources togetheras a couple and you wish to view it online. Certain

Page 99March 2014Vol.2, Special Issue
Primax International Journal of Commerce and Management Research ISSN : 2321-3604
technical procedures regarding online banking maybe taxing too and complicated.
2. Another disadvantage is the so-called learning curve.This means, banking online especially in locatingthe sites may be complicated and hard to find.
3. Another disadvantage is bank site changes. If thisoccurs, the bank will require you to re-enter all yourinformation again and other related data.
RESEARCH METHODOLOGYResearch is an intensive study conducted to arrive abetter conclusion of problems.
RESEARCH DESIGN : This study is of Descriptive natureand includes survey and fact finding enquiries. The major
purpose of descriptive research is description of the stateof affairs as it exists at present.
SAMPLING DESIGN : The sampling method used forthis study is Non Probability convenience sampling.SAMPLE SIZE: Sample size for the survey was 150.
DATA COLLECTION METHOD:The data were collectedthrough interview using schedule. The schedule wasframed with multiple choice questions and open endedquestions. The survey period was spread from 1 February,2014 to 10th February, 2014.
DATA COLLECTION SOURCES : Questionnaire wasprepared to collect primary data from the consumer. Thedata were collected from the company profile, magazinesand text books.
Age
AGE TOTAL NO. OF RESPONDENTS PERCENTAGE
Below 20 34 22.67%
21 - 30 40 26.67%
31 - 40 32 21.33%
41 - 50 27 18 %
Above 50 17 11.33%
Total 150 100%
Interpretation: the result shows that majority respondents i.e. 27% falls under the category of 21-30 years and23% falls under below 20 years it shows that E-banking is mainly famous among youngsters as they are majorusers of E-banking and Least comes under above 50 years.
Occupation:
INTERPRETATION & ANALYSISGENDERInterpretation: The result shows that majority of respondents i.e. 76% are using the E-banking services and 24%are the female who are using E-banking services. Female are not using this service because they have lessknowledge about the internet and they trust face to face interaction more. So it shows that E-Banking.
OCCUPATION TOTAL NO. OF RESPONDENTS PERCENTAGE
Government 37 24.65%
Private 40 26.67%
Business 48 32%
Others 25 16.67%
TOTAL 150 100%
Interpretation: interpretation: the result shows the majority of respondents that are using E-banking are Businessman. i.e. 32% they are using E-Banking services because it results in time saving. And 27% respondents are

Page 100
ISSN : 2321-3604
March 2014Vol.2, Special Issue
Primax International Journal of Commerce and Management Research
working in private sector and 24% respondents are working in govt. organizations and 17% are others whichincludes students and house wives they are using E-banking because it saves time and students they have completeknowledge of internet.
Income
INCOME TOTAL NO. OF RESPONDENTS PERCENTAGE
Below 10,000 23 15.33%
10,000 - 25,000 48 32%
25,000 - 50,000 45 30%
More than 50,000 34 22.67%
Total 150 100%
Interpretation: The result of this study shows that 32% of the respondents who are using E-banking fall under theincome category of 10,000-25,000 and 30% falls under the income category of 25,000 to 50,000 and 23% % fallsunder the income category of more than 50,000 and 15% % falls under the income category of below 10,000.
1. While opening up the Account, were you Aware of E-banking services provided by your bank?
Interpretation: According to this survey majority of respondents i.e.73% were aware about E-banking servicesprovided by their bank and 27% of respondents were not aware about the E-banking services provided by their bankat the time of opening up of their account because of lack of awareness and some are using banking services fromlast so many years at that time bank was not offering E-banking service so they were not aware at that time but nowthey are
2. Which of the following E-banking services is you Aware of?
Options No. of Respondents Percentage (100%)
Internet Banking 49 44.95%
Mobile Banking 97 88.99%
Phone Banking 67 61.47%
One Line Banking 12 11.01%
Debit Card 102 93.58%
21 19.27%Others
Options Total no of res pondents PERCENTAGE
Yes 109 72.67%
No 41 27.33%
Total 150 100%
Interpretation: According to this study almost every customer is using more one E-banking service and Debit Cardis used by almost 95% of respondents and mobile banking is used but 89% of respondents and 61% respondentsare using phone banking and only1 1% are using online banking this shows the trend that how customers are usingE-banking and among all the E-banking products debit cards are mostly used by respondents because they areeasy to use and do not require technical or computer knowledge.

Page 101March 2014Vol.2, Special Issue
Primax International Journal of Commerce and Management Research ISSN : 2321-3604
3. Are you availing E-Banking services?
Options No. of Respondents(109) Percentage
Yes 96 88%
No 13 12%
Total 109 100%
Interpretation: The results show that 88% respondents who are aware of E-bankingthey are availing E-bankingservices and 12% are not availing E-banking services yet they are aware of E-banking the reason is that they stillhave faith in traditional banking.
4. How convenient find Accessing your Bank online?
Options No. of Respondents Percentage
Easy 34 31%
Normal 53 49%
Difficult 22 20%
Interpretation:The results shows that 49% respondents found it normal when theyaccess their bank online and31% respondents found it easy in accessing their bank online and 20% respondents found it difficult to access theirbank online because of lack of internet knowledge and connectivity
5. how frequently do you use each of the following services?
Factors Once in a day
Once in a week
Once in a fortnight
Once in a monthly
Infrequently
Total
A Internet banking 55 50% 26 24% 11 10% 10 9% 7 6% 109B Mobile banking 45 41% 31 28% 15 14% 10 9% 8 7% 109C Phone banking 44 40% 31 28% 22 20% 9 8% 3 3% 109D Online banking 31 28% 23 21% 21 19% 16 15% 18 17% 109E Debit card 51 47% 42 39 9 8% 4 4% 3 3% 109
6. Which of the following factors influence you the most to use E-banking services?
Factors Strongly More than average
Average Less thanaverage
Not at all
Total
a. All time availability 55 50% 31 28% 13 12% 8 7% 2 2% 109b. Ease of use 49 45% 27 25% 17 16% 11 10% 5 5% 109c. Nearness 45 41% 33 30% 25 23% 4 4% 2 2% 109d. Security 43 39% 25 23% 19 17% 14 13% 8 7% 109e. Direct access 49 45% 31 28% 19 17% 8 7% 2 2% 109f. Friend\Relative 51 47% 27 25% 17 16% 10 9% 4 4% 109g. Status symbol 57 52% 31 28% 13 12% 6 6% 2 2% 109

Page 102
ISSN : 2321-3604
March 2014Vol.2, Special Issue
Primax International Journal of Commerce and Management Research
7. To what Extent is your Satisfied with your Banks’ E-Banking Services?
E-Banking services Total No. Respondents PercentageHighly satisfied 56 51%Satisfied 31 28%Neutral 4 4%Dissatisfied 15 14%Highly dissatisfied 3 3%TOTAL 109 100%
Interpretation: The most of the customers are really liked the facilities provided by banks as they strongly agree thatthe facilities are good for them so they like to avail the E-banking services provided by the different banks and theresult shows that 51%respondents are highly satisfied with the e-banking services provided by their bank and 28%respondents are satisfied with the e-banking services provided by their bank and 14% respondents are dissatisfiedwith the e-banking services provided by their bank.
8. Which of the following benefits accrue to you, while using E-banking services?
Benefits Total No. PercentageTime saving 56 51%Inexpensive 31 29%Easy processing 14 13%Easy Fund Transfer 8 7%Total 109 100%
9. Kindly rate the following reasons enlisted for not using the E-banking services?
Factors Highly important
More thanAverage
Average Less than Average
Less important
a. No need( Satisfied with traditional banking)
10 9% 4 4% 12 11% 3 3% 12 11%
b. It seems like a botheration 5 5% 0 0% 9 8% 16 15% 11 10%c. Insecurity 10 9% 7 6% 12 11% 4 4% 8 7%d. No access to
internet/mobile9 8% 3 3% 9 8% 8 7% 12 11%
e. Lack of operational knowledge
18 17% 3 3% 7 6% 7 6% 16 15%
f Hidden costs 12 11% 3 3% 9 8% 8 7% 9 8%
10. Rate the following statements with regards to potential problems identified in E-banking services?
Factors Highly considered Major Minor IgnorableTime consuming 18 17% 14 13% 9 8% 35 32% 33 30%Security Issue 8 7% 20 18% 29 27% 30 28% 22 20%ATM out of order 9 8% 18 17% 14 13% 33 30% 35 32%Internet Connectivity Issue 18 17% 25 23% 13 12% 29 27% 24 22%Password forgotten 22 20% 35 33% 9 8% 18 17% 25 23%Card misplaced/Misused 28 26% 16 15% 35 32% 21 19% 9 8%Difficulty in Claiming False transactions
35 32% 21 19% 29 27% 16 15% 8 7%

Page 103March 2014Vol.2, Special Issue
Primax International Journal of Commerce and Management Research ISSN : 2321-3604
11. If you use, rate your online banking facility on the following criteria using ascale of 1 to(where 1 is very dissatisfied and 5 is very satisfied)
Factors 1 2 3 4 5Quality of information 26 24% 36 33% 22 20% 17 16% 8 7%Quality and Quantity of content
14 13% 32 29% 46 42% 11 10% 6 6%
Security of personal information
35 32% 28 26% 18 17% 12 11% 16 15%
12. Would you like to use E Banking services after getting the required knowledgeabout the services offeredby the banks?
Get information about E -banking Total PercentageYes 89 59%NO 61 41%Total 150 100%
Interpretation: The result shows that 59% respondentswould like to use E Banking services after getting therequired knowledge about the services offered becausenowadays E-banking services considered very importantand everyone use these services daily to do work easilyand quickly but 41% respondents would not like to useE-Banking services after getting the required knowledgeabout the services offered by the banks.
Findings:1. From our study we find out that 114 male and 36
female are using E-banking services of both thebanks. So that’s why we considered only thosepersons who are having knowledge about all servicesof E-banking which is provided by the banks.
2. Most of the respondents who lies under the age of21-30 are using E-banking services as near about40 respondents are using these services becauseunder the age of these respondents they are havingmore knowledge about the services of e-banking.
3. Among those aware (which account for 150 innumber) about 109 persons use e-banking services,which is 73% of total population studied.
4. Amongst these Debit Card scores the largest usedservice status (68%) Close on the heels is MobileBanking (64.66%), Phone Banking (44.66%), whileOne Line banking lags behind by scoring the leastie.,0.08%.
5. Among the users, various problems that areencountered while using e-banking services.Firstlythey highly considered Difficulty in claiming falsetransactions are major reasons that create hurdlesin its usage, while card misplaced and misused,password forgetting, time consumption and internetconnectivity issue also considered seem to be theleast bothering problems.
Suggestions :1. Covering up the towns in rural areas with ATMs so
that the people in those area scan also avail betterservices.
2. Prompt dealing with permanent customers andspeedy transactions with out harassing thecustomers.
3. Fair dealing with the customers. More contributionsfrom the employees of . The staff should be co-operative, friendly and must be capableof understanding the problems of the customers.
4. Give proper training to customers for using E-banking
5. Create a trust in mind of customers towards securityof their accounts
6. Provide a platform from where the customers canaccess different accounts at single time without extracharge.
7. Make their sites more users friendly. Customersshould be motivated to use I-banking facilities more.
Conclusion The functions of online bank site in term of featuresand other service can help in creating online bankingadoption and create the customer loyalty level amongthe banks. Satisfaction customer online service qualityis one of the crucial determinants of the success ofonline banking Online banks must be alwaysadaptability of rapid changes in technology to presenta good service for customer in term of quality,availably, accessibility, interactivity and friendlinessto meet customer needs and focus always on increaselevel of customer satisfaction. Finally is the trustaspect. Online banking should be entered verycarefully if you wish to enjoy your financial life.

Page 104
ISSN : 2321-3604
March 2014Vol.2, Special Issue
Primax International Journal of Commerce and Management Research
References :
1. Averace Chrisanthi, Tony Carnford, DevelopingInformation Systems. Concepts, “Issues AndPractice”, Ed. Macmillan Press, 1993.
2. Oliver, R.L. (1997), Satisfaction: A Behaviouralperspective on the consumer, New York: TheMacGraw-Hill Companies, in Mägi,
3. Parasuraman, A., Ziethaml, V. A. and Berry, L. L.(1985) - A Conceptual Model of Service Quality andits Implications for Future Research¯, Journal ofMarketing, Vol. 49, (Fall), pp. 41-50.
4. Mattila, M., Karjaluoto, H., & Pento, T., (2003).Internet Banking adoption among maturecustomers: early majority or laggards?. Journal ofServices Marketing, 17, 514 – 528.
5. O’Hanlon J and Rocha, M., (1993), “ ElectronicBanking for Retail Customers”, Banking TechnologyLtd.
6. SCN Education B.V. (2001). Electronic Banking:The Ultimate Guide to Business and Technologyof Online Banking, (1st ed.). Germany: Vieweg.
7. Sohail, M.,and Shanmugham, B., (2003), “E-Banking and Customer Preferences in Malaysia:An Empirical Investigation,” Information Sciences,150(4), pp. 207-217.
8. AhamadKaleem,SaimaAhmed(2008),” Banker’sPerceptionof
Electronic Bankingin Pakistan “,Journal of InternetBanking and Commerce,Vol13,No1.

Page 105March 2014Vol.2, Special Issue
Primax International Journal of Commerce and Management Research ISSN : 2321-3604
A STUDY ON CONSUMER PREFERANCE TOWARDS LAPTOPS WITH SPECIAL REFERENCE TO TIRUCHIRAPPALLI TOWN
1J. Arputha Sahaya Raj 2B.Adikkalamary 3Y. Milton 4 B. Santhiya
ABSTRACTGood service and customer satisfaction are very important for companies for both small and big companies. Todaycompetition between companies is growing all the time is why good service is becoming more and more important.When a company manager serve its customer well enough and market them happy company can create long termcustomer relationship and possibly get Free marketing at the same time when satisfied. Customer tell about the goodservice they got satisfied customer have a positive impact on the company’s results and that is why it is important anand interesting to investigate this impact. When measuring customer satisfaction it’s possible to get useful informationof the company customer and the results can be used to improve the company and its service. Measuring customersatisfaction should be a continuous process that is carried out regularly, not just one if it is done regularly results will bemore beneficial. In this way we have to analysis and find out the study on consumer preference towards Laptops withSpecial Reference to Tiruchirappalli Town.
1 Assistant Professor, Department of commerce CA, St. Joseph’s College, Trichy.2 PG Research Scholar, Dept. of commerce CA, St. Joseph’s College, Trichy-2.3 P.G. Research Scholar, St.Joseph’s College, Trichy4 P.G. Research Scholar, St.Joseph’s College, Trichy
INTRODUCTION :A laptop computer, usually called a notebookcomputer by manufacturers, is a battery- or AC-poweredpersonal computer generally smaller than a briefcasethat can easily be transported and conveniently used intemporary spaces such as on airplanes, libraries,temporary offices, and at meetings. A laptop typicallyweighs less than 5 pounds and is 3 inches or less inthickness. Among the best-known makers of laptopcomputers are Dell Laptops, HP Laptops, LenovoLaptops, Toshiba Laptops, Samsung Laptops, AcerLaptops, Macbook Pro Price, Macbook Air Price, ASUSLaptops, Compaq and Apple Laptop computers generallycost more than desktop computers with the samecapabilities because they are more difficult to designand manufacture but work more effectively and efficiently.
STATEMENT OF THE PROBLEM:Difficulties in selecting a particular brand.
Problems faced by the consumers.
Changing – opinion on usage of a particular brand.
OBJECTIVES OF THE STUDY
To study Consumers Awareness towards Compaqlaptops.
To study Consumers preference towards Compaqlaptops.
To study the satisfaction level of consumers usingCompaq laptops.
To offer suggestion based on the views and opinionsexpressed by the consumers.
RESEARCH METHODOLOGYMarket research is the process of systematic gathering,recording and analyzing of data about customers,competitors and the market. Market research can helpcreate a business plan, launch a new product or service,fine tune existing products and services, expand intonew markets etc. It can be used to determine whichportion of the population will purchase the product/service,based on variables like age, gender, location and incomelevel. It can be found out what market characteristicsyour target market has. With market research companiescan learn more about current and potential customers.The purpose of market research is to help companiesmake better business decisions about the developmentand marketing of new products. Market researchrepresents the voice of the consumer in a company.
The methodology includes area of study, source of datasampling design, tools for analysis used and other relatedaspects.
AREA OF STUDYThe area covered under the study is Trichy town. Thestudy has been conducted in various areas ofTiruchirappalli l ike, Contonment, Thillainagar,Mainguardgate, Palakarai, Fort, Srirangam and Worraiyur.
SOURCE OF THE DATAPrimary data were used and questionnaires were framedfor data collection from 100 respondents.
SECONDARY DATAData’s were collected from various journals, magazinesand News Papers etc.,

Page 106
ISSN : 2321-3604
March 2014Vol.2, Special Issue
Primax International Journal of Commerce and Management Research
SAMPLING DESIGNConvenient sampling method is used for data collection.
TOOLS FOR ANALYSISSimple percentage analysis.
LIMITATIONS OF THE STUDY a) Confined only to Tiruchirappalli city. b) Only 100 respondents are taken into account.
DEFINITION OF CONSUMER :An individual who buys products or services for personaluse and not for manufacture or resale. A consumer issomeone who can make the decision whether or not topurchase an item at the store, and someone who canbe influenced by marketing and advertisements. Anytime someone goes to a store and purchases a toy,shirt, beverage, or anything else, they are making thatdecision as a consumer.
DEFINITION OF CONSUMER PREFERENCEThe study of demand in economics involves howconsumers select goods and services. According toJames C. Cox in The Economic Journal, consumereconomics traditionally operates on the hypothesis thatconsumers seek the most utility, or satisfaction, that
they can buy. Consumer preferences involve the rankingof goods and services according to how much benefitthey afford. The study of consumer preferences employsassumptions about consumers’ behavior and how theydecide preferences.
Elements of DefinitionA consumer preference explains how a consumer ranksa collection of goods or services or prefers one collectionover another. This definition assumes that consumersrank goods or services by the amount of satisfaction, orutility, afforded. Consumer preference theory does nottake the consumer’s income, good or service’s price, orthe consumer’s ability to purchase the product or service.
Consistent ChoicesA consumer preference assumes that the consumer canchoose consistently between or among goods andservices. The consumer must prefer one set of goods orservices over others or treat all as equally beneficial.Consistency is an issue when the consumer mustconsider more than two alternatives. If a consumer ranksdress shoes ahead of tennis shoes and tennis shoesahead of sandals, the consumer must prefer dress shoesto sandals.
ANALYSIS AND INTERPRETATION
Table -1 Showing the classification of the respondents according to theknowledge about computer skills
Source: Primary Data
INTERPRETATIONFrom the above table it can be observed that 25% of the respondents are just beginners, while 45% of the respondentsare intermediate, 30% of the respondents are expert.
Table - 2 Showing the classification of the respondents about their awareness of Compaq laptop
Knowledge about Computer Skills No.of.Respondents Percentage
Beginners 25 25%
Intermediate 45 45%
Expert 30 30%
TOTAL 100 100%
AWARENESS OF COMPAQ LAPTOP NO.OF.RESPONDENTS PERCENTAGE
YES 95 95%
NO 5 5%
TOTAL 100 100%
Source: Primary Data

Page 107March 2014Vol.2, Special Issue
Primax International Journal of Commerce and Management Research ISSN : 2321-3604
INTERPRETATIONFrom the above table it can be observed that 95% of the respondents are aware of Compaq laptop and 5% of therespondents are not.
Table-3 Showing the classification of the respondents through which source they are aware of thelaptop
SOURCE NO.OF.RESPONDENTS PERCENTAGE
Advertisements 4 4%
Friends and Relatives 27 27%
Self 53 53%
Others 16 16%
TOTAL 100 100%
INTERPRETATIONFrom the above table it can be observed that 4% of the respondents are aware through advertisement, 27% of therespondents are through friends and relatives, 53% know by themselves, 16% through others.
Table - 4 Showing the classification of the respondents through which media they are aware
Source: Primary Data
MEDIA NO.OF.RESPONDENTS PERCENTAGE
Newspaper and Magazines 23 23%Television and Radio 4 4%Posters and Banners 43 43%Internet Advertisements 20 20%Exhibitions 10 10%
TOTAL 100 100%Source: Primary Data
INTERPRETATIONFrom the above table it can be identified that 23% of the respondents through Newspaper and Magazines, while 4%through Television and Radio, 43% through Posters and Banners, 20% through Internet Advertisements, 10%through Exhibitions.
Table - 5 Showing the classification of the respondents which influence them to buy a Compaq laptop
INFLUENCE THEM TO BUY A COMPAQ LAPTOP
NO.OF.RESPONDENTS PERCENTAGE
Self 23 23%Family Members 47 47%Friends and Relatives 20 20%Children’s 2 2%Spouse 8 8%TOTAL 100 100%
Source: Primary Data

Page 108
ISSN : 2321-3604
March 2014Vol.2, Special Issue
Primax International Journal of Commerce and Management Research
INTERPRETATIONFrom the above table it can be observed that 23% of the respondents buy their laptops by themselves, 47% of therespondents are influenced by family members, 20% through friends and relatives, 2% through children, and 8%through their spouse.
Table - 6 Showing the classification of the respondent’s purpose for which they use laptop
PURPOSE FOR WHICH THEY USE LAPTOP
NO.OF.RESPONDENTS PERCENTAGE
Office use 27 27%
Educational use 49 49%Personal use 18 18%Web surfing 5 5%Others 1 1%TOTAL 100 100%
Source: Primary Data
INTERPRETATIONFrom the above table it can be observed that 27% of the respondents use their laptop for office use, while 49% ofthe respondents for educational use, 18% the respondents for personal use, 5% for web surfing, and 1% for others.
Table - 7 Showing the classification of the factors influenced to buy a Compaq laptop
FACTORS INFLUENCED NO.OF.RESPONDENTS PERCENTAGE
Connectivity and Mobility Features 22 22%
Value Added Features 3 3%
Post Purchase Services 10 10%
Peripheral Specifications 7 7%Core Technical Features 3 3%Physical Appearance 20 20%
Price and Payment Conditions 35 35%
TOTAL 100 100%
Source: Primary Data
INTERPRETATIONFrom the above table it can be observed that 22% of the respondents are influenced through connectivity andmobility features, while 3% of the respondents through value added features, 10% of the respondents through postpurchase services, 7% of the respondents through peripheral specifications, 3% through core technical features,20% through physical appearance, and 35% through price and payment conditions.
Table - 8 Showing the classification of how often they use laptop
HOW OFTEN THEY USE LAPTOP NO.OF.RESPONDENTS PERCENTAGE
Hourly 14 14%Daily 47 47%
Weekly 12 12%Fortnight 27 27%TOTAL 100 100%Source: Primary Data

Page 109March 2014Vol.2, Special Issue
Primax International Journal of Commerce and Management Research ISSN : 2321-3604
INTERPRETATIONFrom the above table it can be observed that 14% the respondents use hourly, while 47% of the respondents usedaily, 12% of the respondents use weekly, and 27% of the respondents use fortnight.
Table - 9 Showing the classification of how many years they are using laptop
YEARS NO.OF.RESPONDENTS PERCENTAGELess than 1 year 24 24%1-2 year 36 36%
2-3 year 20 20%More than 3 year 20 20%TOTAL 100 100%
INTERPRETATIONFrom the above table it can be observed that 24% the respondents are using less than one year, while 36% of therespondents are using 1-2 years, 20% of the respondents are using 2-3 years and 20% of the respondents areusing more than 3 years.
Table -10 Showing the satisfactory level of respondents with the features of Compaq laptop
Source: Primary Data
SATISFACTORY LEVEL OF RESPONDENTS WITH THEFEATURES OF COMPAQ LAPTOP NO.OF.RESPONDENTS PERCENTAGE
YES 62 62%
NO 38 38%
TOTAL 100 100%
Source: Primary Data
INTERPRETATIONFrom the above table it can be identified that 62% of the respondents are satisfied with the features of Compaqlaptop while, 38% of the respondents are not satisfied with that.
Table - 11 Showing the satisfactory level of respondents with the customer service of Compaq laptop
SATISFACTORY LEVEL OF RESPONDENTS WITH THE
CUSTOMER SERVICE OF COMPAQ LAPTOP
NO.OF.RESPONDENTS PERCENTAGE
YES 45 45%
NO 55 55%
TOTAL 100 100%
Source: Primary Data
INTERPRETATIONFrom the above table it can be identified that 45% of therespondents are satisfied with the after sales servicesof Compaq laptop while, 55% of the respondents arenot satisfied with that.
FINDINGSOut of the sample 57% belongs to male category,and only 43% belongs to the female category.
Majority of the respondents belongs to (45%) theage group of 20 to 40 years.

Page 110
ISSN : 2321-3604
March 2014Vol.2, Special Issue
Primax International Journal of Commerce and Management Research
Majority of the respondents are (57%) single.
Majority of the respondents are (54%) inpostgraduate level.
Greater part of the respondents is employed followedby business.
Majority of the respondents are (34%) belong to theincome group of 200000-300000 and 20% of therespondents belong to the income group of less than100000 and above 300000.
Most of the respondents are in the intermediatestage, followed by experts.
Most of the respondents are aware of Compaq laptop.
Most of the respondents are aware of the laptopthrough self followed by friends and relatives.
Most of the respondents are aware through postersand banners.
Most of the respondents are not influenced by familymembers.
Most of the respondents use their laptop foreducational use.
Most of the respondents are influenced by price andpayment condition.
Most of the respondents use their laptop daily.
Most of the respondents use laptop for 1-2 years.
Majority of the respondents are having complaintswith their laptop.
Most of the respondents are having complaint withthe low battery life.
Most of the respondents don’t have any idea ofchanging their laptop.
Most of the respondents preferred for dell laptop.
Most of the respondents recommend their brand forothers.
Most of the respondents saying the reason for notrecommending is not worthy and let others decide.
SUGGESTIONSAwareness:The consumers must be properly educated about thevarious purposes of using laptops other than educationand personal use. The consumers should be made awareof the add-on features and their purposes.
Advertisement:The laptops must be advertised even more frequentlythrough televisions to retain old consumers and to attractnew customers.
Competition:To overcome the competitive market and to attract theconsumers the company can adapt suitable salespromotion techniques.
Consumer satisfaction:The complaints filed by the consumers can be rectifiedas soon as possible to gain more consumer satisfactionlevel.
CONCLUSIONThe preferences never remain constant. So, efforts shouldbe taken by the manufacturer to make their productsattractive to retain their position in the market. For thispurpose, new models can be introduced at regularintervals and the prices must reduced so that peoplecan afford it. Concessions can be made for the studentsand some discounts can be allowed for others. Frequentadvertising can also be followed to retain the consumers.This is because the day by day the day the laptop isincreasing and the consumers always prefer the bestquality at affordable rate. The above study on consumerpreference towards Compaq laptop has been veryinformative and a source of exposure and knowledge.
References:
1. “Consumer”, wikipedia.com
2. “Marketing”, ROY KATZ, 10/01/2002, wikipedia.com
3. “Customer”, ROY KATZ, 10/10/2002, Wikipedia.com
4. “Customer”, Wikipedia.com
5. “Customer Satisfaction”, your dictionary
6. www.lenovo.com7. www.hp.com8. www.acer.com9. www.dell.com10. www.tricy.com11. ht tp : / /s3 .amazonaws.com/ppt -download/
shashankgprollno112-130507091013-phpapp01.p d f ? r e s p o n s e - c o n t e n t - d i s p o s i t i o n=attachment&Signature=zwJbRX6nrdAfMNg%2Fexds5t40vqM%3D&Expires=1393595325&AWSAccessKeyId=AKIAIW74DRRRQSO4NIKA
12. http://www.ehow.com/info_8698883_definition-consumer-preference.html#ixzz2ucsduOU2

Page 111March 2014Vol.2, Special Issue
Primax International Journal of Commerce and Management Research ISSN : 2321-3604
THE JOURNEY OF ECOMMERCE IN INDIA : A ROAD MAPSHOWING THE SURFACING PROSPECTS AND HURDLES
1M. Antony Jesuraja 2S. Domnic XavierABSTRACT
The ever-growing population of netizens across India gives an immense scope for ecommerce on par with its globalcounterpart. It is growing fast in this segment but not at the level playing field with the developed as well as emergingeconomies in the world. It has the potential to excel well by efficiently utilising the growing patronage among youth,middle class population and educated elders. It has high tech aspiring entrepreneurs who would like to adopt onlinebusiness as their model of success. Problems and Challenges are competing with opportunities and benefitsvigorously. In this scenario, it is highly imperative to look into the hurdles and bottlenecks of Ecommerce with a viewto facilitate its growth to its fullest potentiality through constructive collaborations among various players at differentlevels and maximise its contributions to its economy.
1 Professor, Department of Commerce, St. Joseph’s College, Trichy.2 Research scholar, Department of Commerce, St. Joseph’s College, Trichy
Introduction:As McKinsey & Co projects India would be havingbetween 330 million to 370 million internet users by 2015,11% of its population are active netizens as of now andbeing the third largest country in terms of number ofinternet users , India can exponentially lead itself to atremendous growth in online business and e-commerce.The consumer retail market segment in India which wasat $470 billion in 2011 and expected to grow at $675billion by 2016 and $850 billion by 2020, has the potentialto involve online trade significantly as the field is almostunder explored with $2.5 billion worth market in 2009and $6.3 billion in 2011 and $14 billion in 2012 at therate of 55% growth per year. So far The travel sectordominated by IRCTC with 40% of its booking throughonline) and Makemytrip.com, has been the largest playerof Ecommerce by absorbing the major junk of money tothe tune of 80% and leaving away the remaining to E-tailing consisting of online sale of durable goods, financialservices and digital downloads and also grows at 30.6%which is significantly higher compared to the growth ofother countries in this segment. It is way behind inexploding the capacity compared to their counterpartsUSA and China. With the mobile devices going smartand speed of internet expected to multiply with 3G onthe roll and 4G is expected to arrive, the middle classswelling rapidly in terms of size and income, thetraditional retailers aspiring to imprint their impressiononline and the global online players generously bettingtheir money on potential Indian internet users, onlinebusiness and ecommerce would occupy a significantplace in the coming years. Federation of Indian Exporters
organisation (FIEO) reported a mammoth 400% growthevery year in the online export sector with a size of $1.4bin 2012. As cost savy and value oriented exporters aregradually inching
towards online global market to find their buyers. In thisscenario, it is very much important to analyse theprospects and challenges, India would be facing in itsmarch on the cyber journey. It is also essential to identifythe key drivers that stimulate the development in thispart of the world.
Key drivers of Ecommerce and online business inIndia
• India as a consumption driven economy has theenormous potential to be fledging ecommerce marketas varieties of products and services are madeavailable with competitive prices and follow upservices.
• Broadband internet connections are growing at agalloping speed as network backbone readily adoptsitself to successive spectrums starting from 2G to3G and To 4G
• Manufacturers of communication devices see Indiaas a prospective market to develop their businessesby offering wide variant of conducive electronicdevices such as laptops, tablets, smart phones anddongles at different levels without compromising thecore features, thus they take the use of internet tothe individual and family level.
• As the youth of today are inherently associatethemselves with internet and view online shoppinglike any other shopping mode, it definitely has widescope for its growth and show ways to their eldercounterpart who are really catching up with theprevailing trends.
• Recent reports clearly highlight the fact that India israpidly moving towards urban centric population assignificant and consistent increase is visible in itspopulation and number of households. It has opened
Page 112
ISSN : 2321-3604
March 2014Vol.2, Special Issue
Primax International Journal of Commerce and Management Research
the gate for ecommerce as it can successfully selldifferent categories of products without anycumbersome bottle necks.
• Internet and mobile worlds are not in a mood to ignoresmaller towns and rural areas as sizeable populationwith high disposable income and aspiration to leada standard of living on par with their urban counterpartand they actively penetrate into this segment toenhance their income earning capacity (Onlineapparel retailer Myntra has 50% of its sales in smallcities and towns).
• The upward growth of middle class segment of thepopulation in terms of high disposable income andrising standard of living and the attitude to spendgenerously throws huge amount of opportunities tothe online business men especially etailers. Theiraggravating problems such as lengthy workinghours, increased travel times and lack of time forphysical shopping also pave way for onlineshopping(MyGrahak.com provides groceries onlineto 22000 consumers with a dream of capturing awhopping share in this segment).
• As budding and young entrepreneurs visualise theinternet and ecommerce as the thrust area for theirbusinesses and their desire to operate at the globallevel and almost everyone is aware and come withIT background the segment will live upto expectation.
• Application providers for Internet and ICT are workinground the clock by competing with one another toprovide applications conducive for e-tailing byenabling them to add varieties of products rangingfrom music to motor bikes in the virtual showroom.
• On par with traditional sellers (brick and mortar) theonline sellers as well as platform providers for salesintensively come out with innovative salespromotional methods such as ‘flash sales’, ‘ by inviteonly sales’ , ‘ cyber Monday’ , great online shoppingfestivals etc.
• Ecommerce operators are ready to patronage peoplewho are ready to provide products under innumerouscategories to offer theirs with attractive andcompetitive prices.
• Social networking sites such as face book, Tweeterand Orkut have billions of users under their umbrellato connect to and to communicate and share withone another which provides ample of opportunitiesto develop a platform for online businesses withoutmuch hurdles. The online business providers andtraders should sensitise themselves by closingmonitoring the needs and aspirations of netizens.
• Intrusion of global players into Indian ecommercesegment is on the card (Amazon by investing inJunglee and Ebay in Snapdeal $133million andMorgan Stanley investment management in Flipcartfor Rs. 2332 crores million). It can definitely upgradeand uplift technological ingrediants of Ecommerce.
• Cost involved in the traditional method of exportinggoods by way of labour, travel and international callsiin establishing contact with prospective importersor international buyers is high for exporters.
Benefits of Ecommerce
• Opening up the borders for export of commoditiesproduced by millions of SMEs and MSMEs withcross border trading websites such (30000 sellersof Ebay reach out 4 million consumers in and around3000 cities 15,000 sellers selling products to 120million people all over the world which is just smallcompared to millions of enterprises still not in thisprospective channel
• Empowerment of millions of small players to useEcommerce platform to get their supply chainshortened and tighten up the pilferage of money.
• Provides opportunities to build customer base fromtheir desktop by showcasing right type of productswith sincere and dedicated research. Devan Patodia, a Kolkotta based entrepreneur, who straight awayventured into online business, seized the opportunityto sell eco friendly cotton bags and packagingmaterials in the US market through online. He alsoexports silk based export and enjoys high returnwith minimum investment with an annual turnover ofRs. 4 crores. Sandeep Mehrotra of Uttar Pradeshand Naveen Pamnani of New Delhi who started astraditional traders were able to successfully intrudeinto the online segment by successfully surpassinginitial hurdles (Business Today June 2012).
• Share of Ecommerce in GDP to go at 4% by 2020and IT-BPO to pect at 10% and Tele communicationservices at 15% (NASSCOM report)
• Growth of ecommerce will have spillover effect inother forms of industries such as logistics and onlineadvertising media and IT/ ITES
• Online businesses have the capacity of providingquality jobs at different levels directly or indirectly.
Challenges of Ecommerce and online businesses:• Compared to the technological developments and
strengths, India is way behind in its infrastructuraldevelopments in comparison to other developed and

Page 113March 2014Vol.2, Special Issue
Primax International Journal of Commerce and Management Research ISSN : 2321-3604
emerging nations. It could not accelerate theinvestment in internet friendly infrastructures as it isvery slow and lethargic in attracting FDI from hi-techtransnational companies.
• Rigid governance and stringent laws make it worsefor the companies to actively engage and grow inthis segment
• Prevailing of low internet penetration (11%)far belowthe global average penetration of 34%
• Missing links in supply chains and lack in stretchingout to far flung areas
• Cash on delivery being predominant payment modeand meager presence and adoption of cheap onlinepayment modes. It is the costliest mode of paymentand erodes the returns of the companies involved inthe businesses.
• As the fraud and return of goods take place inbetween 5% to 25% in different categories, it is quitedifficult for the companies to survive and earn profit.Flipcart has restricted its shipment to Rs. 10,000 incertain areas of Uttarpradesh.
• Tax at multiple levels and at different rates. Eachstate has its own tax rates.
Solutions to the problems• Constructive co-operation among stakeholders and
players such as government, regulatory and industrybodies and other facilitators to smoothen the flow ofcapital in the right direction without much bottlenecks to invest in the technologies which are backbone to the industry.
• Implementation of Goods and service tax to maketax to look simple and uniform jurisdictional laws.National Council for Applied Economics Researchreports that GST can be an impetus to economicgrowth by .9% to 1.7 % which can magnitude theeffect (140 countries are adopting GST)
• Payment gateways to be established incollaboration with Banks, financial institutions andinternational providers of payment gateways suchas Paypal.com along with security providers to speedup the collection processes and provide securedpayments to customers and reduce costs .Increasing the confidence level of buyers and sellerswill multiply the quantum of businesses.
• Free or minimum cost delivery system should bebuilt up in collaboration with players in the distributionnetwork to increase the patronage for ecommerceoperations delivery or building own delivery systemwhich can be costly in terms of time, money andeffort. It should not make any compromise in makingtimely delivery in hours.
• Constructive collaboration is the need of the houramong logistics providers, warehouse operators,ecommerce platform providers, sellers and localgovernment bodies to smoothen the process ofdelivery by mutually benefitting each other.
Conclusion:Online businesses in India can be envisaged to have agreat future for the Ecommerce platform providers, sellersand buyers. They can create and maintain millions ofjobs and significantly contribute towards GDP of thenation. It also provides platform to venture into globalmarket with minimum investment and simple businessmodel. Though several key drivers stimulating theirprospects, a good number of challenges can come tothe surface to shape and induce them to achieve greaterglories in the coming years. They can be instrumentalin helping India to reach out the projections with ease.
References:
1) Ecommerce Rhetoric, reality and opportunity,Executive summary, https://www.kpmg.com/IN/en/IssuesAndInsights/.../KPMG-IAMAI-ES.pdf
2) FORRESTER, Trends in India’s E-commercemarket, www.assocham.org/arb/.../Forrester_Trends_In_Indias_eCommerc.pd August23, 2012.
3 )Pritam P Hans, Be a global Merchant, BusinessToday, June 2012, http://businesstoday.intoday.in/story/indian-exporters-take-benefits-of-online-shopping-business/1/184740.html
4) Arun Shroff, E-Commerce in India: Trends,Opportunities and Challenges, http://indiaadvisoryboard.com/e-commerce-in-india-trends-opportunities-and-challenges/ February 1, 2013,
5) India huge opportunity for eBay; lead $133 mnSnapdeal investment, Business Today, http://businesstoday.intoday.in/story/india-huge-opportunity-for-ebay/1/203789.html February 27,2014.
6) Jyoti Arora, Prospects of E-Retailing in India, IOSRJournal of Computer Engineering, Volume 10, Issue3(Mar-Apr.2013), PP 11-15, WWW. Iosrjournals. Org
7) Partha Sarathi, Anish Kumar Saha & Shahin AraBegum, The application of E-commerce in BusinessApplication : Their problems and prospects,International Journal of Computer Applications,Volume 49-No. 10, July 2012 PP36-40
8) Madan Lal, E-Commerce and M-CommerceRevolution: perspectives, problems and prospects,The Chartered Accountant, December 2005, 824-840.

Page 114
ISSN : 2321-3604
March 2014Vol.2, Special Issue
Primax International Journal of Commerce and Management Research
A STUDY ON ANALYSIS OF EMPLOYEES WORKINGENVIRONMENT WITH SPECIAL REFERENCE
TO SRF PVT LTD.VIRALIMALI
1V.Vignesh 2N. Gobinath 3N. Guru 4Dr. D. John Prakaran
ABSTRACT
The working environment provided by the management for its employees to perform better has been the majorobjective of the management from the old days to present organization management. The work place environmentin majority of industry is unsafe and unhealthy. People working in such environment are prone to occupationaldisease and it impacts on employee’s performance. Thus productivity is decreased due to the workplaceenvironment. The study was made to know, how the working environment influences the employees of SRF Pvt.Ltd. Viralimalai.
The study is based on bringing out the individual attitude in the organization. Attitudes are positive, negative orneutral views of persons, behavior and event. Attitude of an individual plays an important role in determining theorganization climate. Attitudes come from judgments. The study will provide the views and thoughts of theindividual. The inference drawn in the study will make the person in charge to take accurate steps in the areawhere there is a loop hole.
As the study will be of great help for the organization, thereby brings an excellence in their action.
1 PG research Scholar, Dept. of Commerce CA, St. Joseph’s College, Trichy.2 PG research Scholar, Dept. of Commerce CA, St. Joseph’s College, Trichy.3 PG research Scholar, Dept. of Commerce CA, St. Joseph’s College, Trichy4 Asst. Professor of Commerce and Head, Dept. of Commerce CA, St. Joseph’s College, Trichy
INTRODUCTIONWorking conditions refers to the working environmentand aspects of an employee’s terms and conditions ofemployment. This covers such matters as: theorganization of work and work activities; training, skillsand employability; health, safety and well-being; andworking time and work life balance.
Changes in working conditionsChanges in working conditions and others aspects ofthe employment relationship can generate seriousindustrial relations problems. One issue is that workersmay not have precise information about their workingconditions in the first place. This was addressed byCouncil Directive 91/533/EEC of 14 October 1991 on anemployer’s obligation to inform employees of theconditions applicable to the contract or employmentrelationship. The directive stipulates that the employermust provide information covering all essential aspectsof the employment relationship. The employer isobligated to prepare a document with the requiredinformation and give it to the employee not later thantwo months after the commencement of employment.Further, a new document that reflects any changes incore working conditions must be issued.
Working Environment MeasuresRequirements regarding systematic health, environmentand safety work in order to safeguard the employees’health, environment and safety, the employer shallensure that systematic health, environment and safetywork is performed at all levels of the undertaking. Thisshall be carried out in cooperation with the employeesand their elected representatives.
Special Safety PrecautionsIn order to maintain safety at the workplace, the employershall ensure that employees are informed of accidentrisks and that health hazards that may be connectedwith the work and that they receive the necessarytraining, practice and instruction, that employeescharged with directing or supervising other employeeshave the necessary competence to ensure that the workis performed in a proper manner with regard to healthsafety and expert assistance Act.
When satisfactory precautions to protect life and healthcannot be achieved by other means, the employer shallensure that satisfactory personal protective equipmentis made available to the employees, that the employeesare trained in the use of such equipment and that theequipment is used.

Page 115March 2014Vol.2, Special Issue
Primax International Journal of Commerce and Management Research ISSN : 2321-3604
Requirements Regarding the Psychosocial WorkingEnvironment
The work shall be arranged so as to preserve theemployees’ integrity and dignity.
Efforts shall be made to arrange the work so as toenable contact and communication with otheremployees of the undertaking.
Employees shall not be subjected to harassment orother improper conduct.
Employees shall, as far as possible, be protectedagainst violence, threats and undesirable strain asa result of conduct with other persons.
Physical working environment factors such as factorsrelating to building and equipment, indoor climate,lighting, noise, radiation and the like shall be fullysatisfactory with regard to the employees’ health,environment, safety and welfare.
NEED FOR THE STUDYThe following are the needs to do the research at SRFLIMITED, VIRALIMALAI.
The management was in the position to knowwhether the attitude of employee towards workingenvironment is conductive.
To measure the satisfaction level of the employees.
To get suggestions from the employees for furtherimprovement in existing human resource system.
To contribute to growth of the organization.
OBJECTIVE OF THE STUDY
PRIMARY OBJECTIVE
To study the attitude of employees towards theworking environment of SRF LIMITED VIRALIMALAI
SECONDARY OBJECTIVE
To study the effectiveness of the organization’sculture.
To identify the opinion on environment factors of thecompany.
To find the various factors which influence the jobsatisfaction of the employees.
STATEMENT OF THE PROBLEMThe working environment provided by the managementfor its employees to perform better has been the major
objective of the management from the old days to presentorganization management. The work place environmentin majority of industry is unsafe and unhealthy. Peopleworking in such environment are prone to occupationaldisease and it impacts on employee’s performance. Thusproductivity is decreased due to the workplaceenvironment. The study was made to know, how theworking environment influences the employees of SRFPvt. Ltd. Viralimalai.
SCOPE OF THE STUDYThe study is based on bringing out the individual attitudein the organization. Attitudes are positive, negative orneutral views of persons, behavior and event. Attitude ofan individual plays an important role in determining theorganization climate. Attitudes come from judgments.The study will provide the views and thoughts of theindividual. The inference drawn in the study will makethe person in charge to take accurate steps in the areawhere there is a loop hole. As the study will be of greathelp for the organization, thereby brings an excellencein their action.
RESEARCH METHOLOGY
RESEARCH DESIGN
Research design is a plan of action that guides the entireresearch. In this story Descriptive research design hasbeen adopted.
SAMPLING METHODSample design is a definite plan determined before anydata are actually collected for obtaining a sample froma given population. Simple random sampling techniquehas been used for the study. Samples have been drawnin such a way that every employee has an equal chanceof having included for investigation.
SAMPLE SIZEAmong 400 workers researcher has chosen 75respondents as sample size who are the employeesworking in SRF LIMITED, VIRALIMALAI.
METHOD OF DATA COLLECTIONThe primary data were collected from the respondentsthrough well designed questionnaire. The secondary datawere collected from the journal, periodicals, books,publication of reputed institutions.
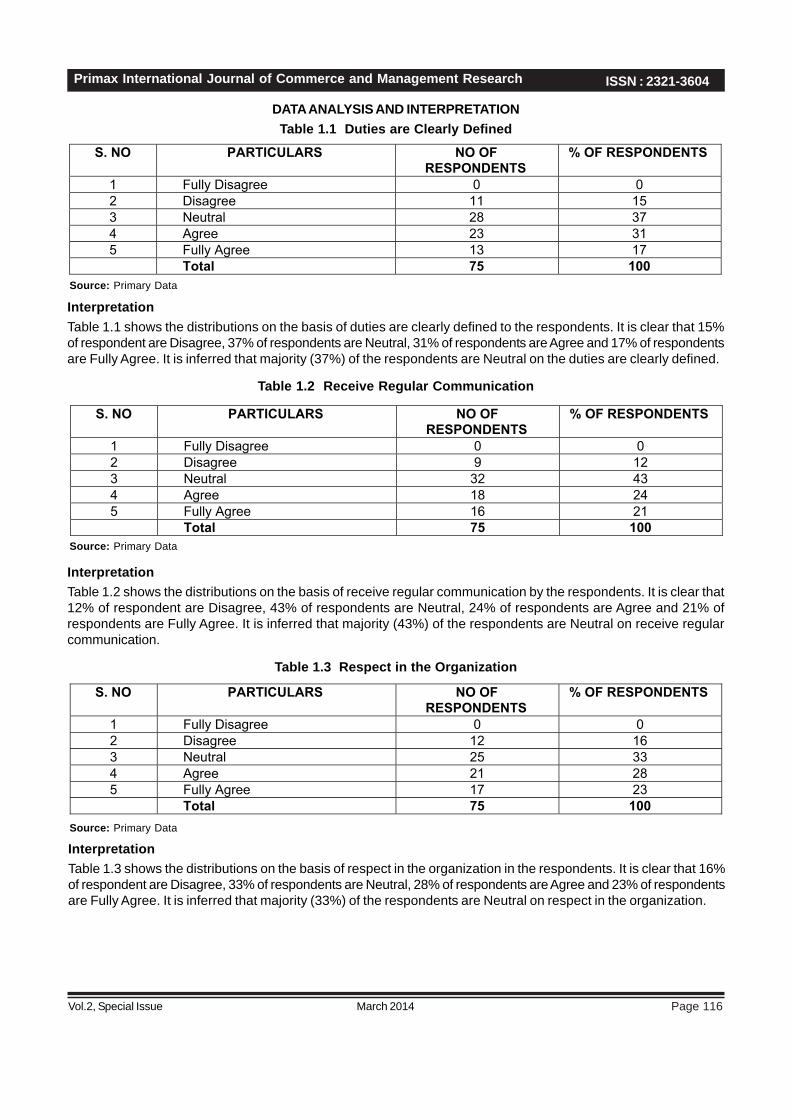
Page 116
ISSN : 2321-3604
March 2014Vol.2, Special Issue
Primax International Journal of Commerce and Management Research
DATA ANALYSIS AND INTERPRETATIONTable 1.1 Duties are Clearly Defined
S. NO PARTICULARS NO OF RESPONDENTS
% OF RESPONDENTS
1 Fully Disagree 0 02 Disagree 11 153 Neutral 28 374 Agree 23 315 Fully Agree 13 17
Total 75 100Source: Primary Data
InterpretationTable 1.1 shows the distributions on the basis of duties are clearly defined to the respondents. It is clear that 15%of respondent are Disagree, 37% of respondents are Neutral, 31% of respondents are Agree and 17% of respondentsare Fully Agree. It is inferred that majority (37%) of the respondents are Neutral on the duties are clearly defined.
Table 1.2 Receive Regular Communication
S. NO PARTICULARS NO OF RESPONDENTS
% OF RESPONDENTS
1 Fully Disagree 0 02 Disagree 9 123 Neutral 32 434 Agree 18 245 Fully Agree 16 21
Total 75 100Source: Primary Data
InterpretationTable 1.2 shows the distributions on the basis of receive regular communication by the respondents. It is clear that12% of respondent are Disagree, 43% of respondents are Neutral, 24% of respondents are Agree and 21% ofrespondents are Fully Agree. It is inferred that majority (43%) of the respondents are Neutral on receive regularcommunication.
Table 1.3 Respect in the Organization
S. NO PARTICULARS NO OF RESPONDENTS
% OF RESPONDENTS
1 Fully Disagree 0 02 Disagree 12 163 Neutral 25 334 Agree 21 285 Fully Agree 17 23
Total 75 100Source: Primary Data
InterpretationTable 1.3 shows the distributions on the basis of respect in the organization in the respondents. It is clear that 16%of respondent are Disagree, 33% of respondents are Neutral, 28% of respondents are Agree and 23% of respondentsare Fully Agree. It is inferred that majority (33%) of the respondents are Neutral on respect in the organization.

Page 117March 2014Vol.2, Special Issue
Primax International Journal of Commerce and Management Research ISSN : 2321-3604
Table 1.4 Sufficient Chance to Express his GrievancesS. NO PARTICULARS NO OF
RESPONDENTS% OF RESPONDENTS
1 Fully Disagree 4 52 Disagree 13 173 Neutral 21 284 Agree 20 275 Fully Agree 17 23
Total 75 100Source: Primary Data
InterpretationTable 1.4 shows the distributions on the basis of giving sufficient chance to the respondents to express theirgrievances. It is clear that 5% of respondent are Fully Disagree, 17% of respondent are Disagree, 28% of respondentsare Neutral, 27% of respondents are Agree and 23% of respondents are Fully Agree. It is inferred that majority (28%)of the respondents are Neutral on giving sufficient chance to the respondents to express their grievances.
Table 1.5 Take Care of his Health
S. NO PARTICULARS NO OF RESPONDENTS
% OF RESPONDENTS
1 Fully Disagree 3 42 Disagree 14 193 Neutral 26 344 Agree 20 275 Fully Agree 12 16
Total 75 100Source: Primary Data
InterpretationTable 1.5 shows the distributions on the basis of taking care of health of the respondents. It is clear that 4% ofrespondent are Fully Disagree, 19% of respondent are Disagree, 34% of respondents are Neutral, 27% of respondentsare Agree and 16% of respondents are Fully Agree. It is inferred that majority (34%) of the respondents are Neutralon Taking care of their health by the organization.
Table 1.6 Work Place is Neat and Maintained Well
S. NO PARTICULARS NO OF RESPONDENTS
% OF RESPONDENTS
1 Fully Disagree 0 02 Disagree 15 203 Neutral 28 374 Agree 23 315 Fully Agree 9 12
Total 75 100Source: Primary Data
InterpretationTable 1.6 shows the distributions on the basis of work place is neat and maintained well. It is clear that 20% ofrespondent are Disagree, 37% of respondents are Neutral, 31% of respondents are Agree and 12% of respondentsare Fully Agree. It is inferred that majority (37%) of the respondents are Neutral on work place is neat and maintainedwell.
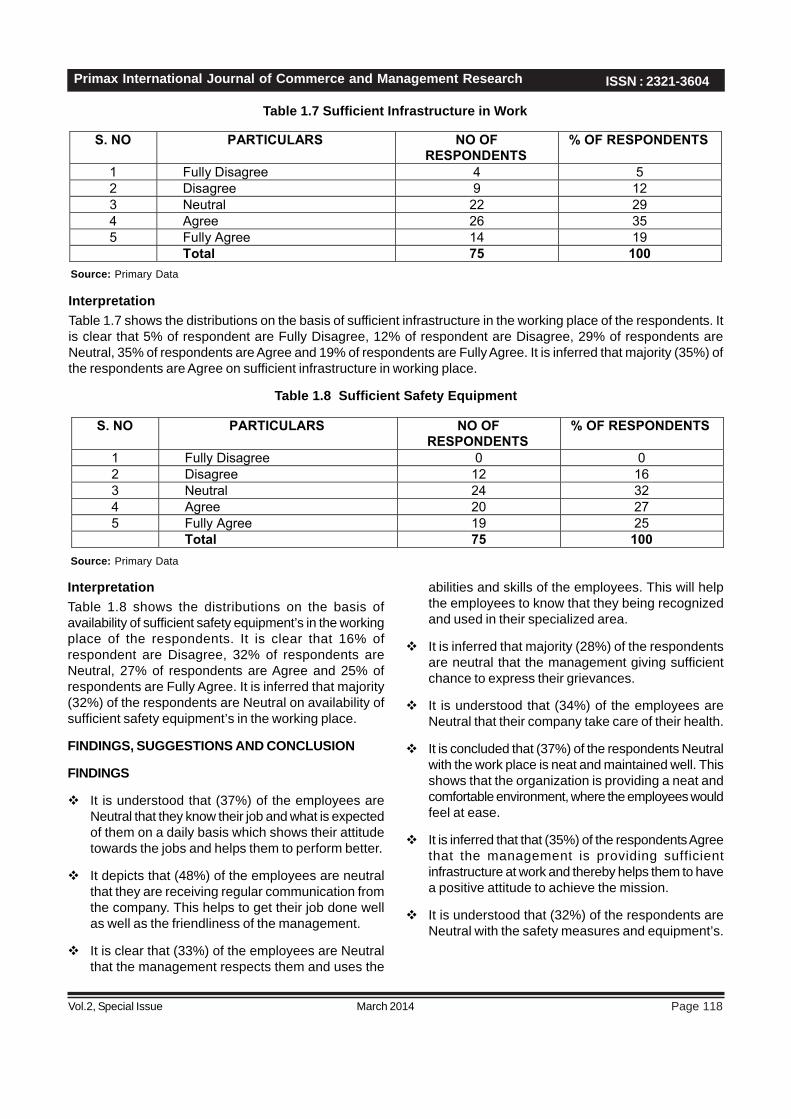
Page 118
ISSN : 2321-3604
March 2014Vol.2, Special Issue
Primax International Journal of Commerce and Management Research
Table 1.7 Sufficient Infrastructure in Work
S. NO PARTICULARS NO OF RESPONDENTS
% OF RESPONDENTS
1 Fully Disagree 4 52 Disagree 9 123 Neutral 22 294 Agree 26 355 Fully Agree 14 19
Total 75 100Source: Primary Data
InterpretationTable 1.7 shows the distributions on the basis of sufficient infrastructure in the working place of the respondents. Itis clear that 5% of respondent are Fully Disagree, 12% of respondent are Disagree, 29% of respondents areNeutral, 35% of respondents are Agree and 19% of respondents are Fully Agree. It is inferred that majority (35%) ofthe respondents are Agree on sufficient infrastructure in working place.
Table 1.8 Sufficient Safety Equipment
S. NO PARTICULARS NO OF RESPONDENTS
% OF RESPONDENTS
1 Fully Disagree 0 02 Disagree 12 163 Neutral 24 324 Agree 20 275 Fully Agree 19 25
Total 75 100Source: Primary Data
InterpretationTable 1.8 shows the distributions on the basis ofavailability of sufficient safety equipment’s in the workingplace of the respondents. It is clear that 16% ofrespondent are Disagree, 32% of respondents areNeutral, 27% of respondents are Agree and 25% ofrespondents are Fully Agree. It is inferred that majority(32%) of the respondents are Neutral on availability ofsufficient safety equipment’s in the working place.
FINDINGS, SUGGESTIONS AND CONCLUSION
FINDINGS
It is understood that (37%) of the employees areNeutral that they know their job and what is expectedof them on a daily basis which shows their attitudetowards the jobs and helps them to perform better.
It depicts that (48%) of the employees are neutralthat they are receiving regular communication fromthe company. This helps to get their job done wellas well as the friendliness of the management.
It is clear that (33%) of the employees are Neutralthat the management respects them and uses the
abilities and skills of the employees. This will helpthe employees to know that they being recognizedand used in their specialized area.
It is inferred that majority (28%) of the respondentsare neutral that the management giving sufficientchance to express their grievances.
It is understood that (34%) of the employees areNeutral that their company take care of their health.
It is concluded that (37%) of the respondents Neutralwith the work place is neat and maintained well. Thisshows that the organization is providing a neat andcomfortable environment, where the employees wouldfeel at ease.
It is inferred that that (35%) of the respondents Agreethat the management is providing sufficientinfrastructure at work and thereby helps them to havea positive attitude to achieve the mission.
It is understood that (32%) of the respondents areNeutral with the safety measures and equipment’s.

Page 119March 2014Vol.2, Special Issue
Primax International Journal of Commerce and Management Research ISSN : 2321-3604
SUGGESTIONS
Company should understand the profile of theemployees in allocation of workload, work timingsand also the external environment.
Company shall think of improving the share of femaleemployees substantially.
By providing additional benefits, moreencouragement can be given to the employees toachieve the mission.
Adequate training should be given in new technologyto build confidence in the employees and to build agood attitude among them.
Frequently the management can organize meetingwith the workers to develop the interrelationshipamong the superiors and workers.
Company should capitalize the positive contributingfactors like sufficient infrastructure, providing safetyequipment’s, adequate water facilities, promotionalsystem and providing regular refreshment.
Company should pay more attention towardstransportation facilities and should remove the scrapsimmediately from the working place.
CONCLUSION
The above findings and suggestions show that theattitude of employees is an important criterion forthe functioning of the organization.
Not only the material resources but also the humanresources are an important asset to the company.
Though the organization is performing well, there arecertain constraints which have to be overcome toreach greater heights.
There is good scope for improvement by way ofeffective planning and implementation.
REFERENCES
Beaker B and Gerhart B., “The impact of HumanResource Management on OrganizationalPerformance”. Bantom Books, 1996.
Belohlav A., “The Art of Displaying Your Employees”,Prentice Hall, 1955.
Bednar A and Levis W.H., “Attitude- ChangePrinciples”, Addison Wealey, 2001.
Hunsaker P.L., ‘Training in Interpersonal Skills”,Prentice Hall, 1996.
Sahl, Robert J., “Human Resources and LaborRelations”, 1990.
Kotter J.P and Schiesinger L.A., “Chossing Strtegiesfor Change”, Academic press, 2003.
York, David R., “Human Resources and LaborRelations”, 1985.
WEBSITESwww.citehr.comwww.srfindustries.comwww.hrmanagement.com
Page 120
ISSN : 2321-3604
March 2014Vol.2, Special Issue
Primax International Journal of Commerce and Management Research
STUDY ON QUALITY OF WORK LIFE IN BABYENGINEERING INDUSTRIES, TRICHY
1Prof. A. Hendry Ruban 2B. Sudha 3S. Kathiravan 4A. Saranya
ABSTRACTQuality of Work Life improvements are defined as any activity which takes place at every level of an organization,which seeks greater organizational effectiveness through the enhancement of human dignity and growth. A processthrough which the stockholders in the organization, management unions and employees – learn how to work togetherbetter to determine for themselves what actions, changes and improvements are desirables and workable in order toachieve the twin and simultaneous goals of an improved quality of life at work. Since the employee is both a socialand economic entity, possessing different characteristics in various work situation. There can be a perfect adjustmentsof the workers in his work unit if the worker possesses the exact capacities required for the work. The work similarlyaffords the opportunity for exercising these capacities and the workers interests are generally satisfied in theperformance of his job. However, a happy combination of all the elements are seldom achieved in actual practice anda lack of balance form one of the major causes of waste in production, dissatisfied employers and an unhappyemployee. Hence I decided to focus my research work on QUALITY OF WORK LIFE which is an essential criteriawhich caters to the well being of the employee.
1 Asst. Professor, Department of Commerce CA, St. Joseph’s College, Trichy.2 PG Research Scholar, Dept. of Commerce CA, St. Joseph’s College, Trichy.3 PG research Scholar, Dept. of Commerce CA, St. Joseph’s College, Trichy.4 PG research Scholar, Dept. of Commerce CA, St. Joseph’s College, Trichy
INTRODUCTIONQuality is no more a specialized word but has becomea necessary and a must word for the best survival. Inthis era, quality of human inputs is the greatest asset toany organization. Maintaining the quality of such humaninputs rises from maintaining the quality of work lifeperfectly.
A perfect Quality of Work Life would help theorganization. Better quality of work life would lead toemployees well being thereby to the well being of thewhole organization. This is an attempt to capitalize thehuman assets of the organization.
Quality of Work Life improvements are defined as anyactivity which takes place at every level of anorganization, which seeks greater organizationaleffectiveness through the enhancement of human dignityand growth.
A process through which the stockholders in theorganization, management unions and employees – learnhow to work together better to determine for themselveswhat actions, changes and improvements are desirablesand workable in order to achieve the twin andsimultaneous goals of an improved quality of life at work.
DEFINITIONSJ.RICHARD AND J. LOYDefines the Quality of Work Life as “the degree to whichmembers of work organization are able to satisfy
important personnel needs through their experience inthe organization”.
SANGEETHA JAIN “The whole parcel of the terms and notions all of whichreally belong under the Quality Work life umbrella. Theyinclude industrial effectiveness, human resourcedevelopment, organizational effectiveness, workrestructure, job enrichment, socio-technical systems,working humanization, work-group concepts, labormanagement, co-operation, working together, workersinvolvement, workers participation and co-operative workstructures”.
SHARMIR AND SALIMON (1985)Has defined quality of work life in the following way.“Quality of work life is comprehensive construct thataccess an individual’s job related well-being and theextent to which work experiences are rewarding fulfillingand devoid of stress and other negative personalconsequences”.
NADLER AND LAWLER“A way of thinking about people, work, and organization.Its distinctive elements are:1. A concern about the impact of work on people as
well as an organizational effectiveness
2. The idea of participation in organizational problemsolving and decision- making”.

Page 121March 2014Vol.2, Special Issue
Primax International Journal of Commerce and Management Research ISSN : 2321-3604
NEED OF THE STUDYSince the employee is both a social and economic entity,possessing different characteristics in various worksituation. There can be a perfect adjustments of theworkers in his work unit if the worker possesses theexact capacities required for the work. The work similarlyaffords the opportunity for exercising these capacitiesand the workers interests are generally satisfied in theperformance of his job. However, a happy combinationof all the elements are seldom achieved in actual practiceand a lack of balance form one of the major causes ofwaste in production, dissatisfied employers and anunhappy employee.
Hence I decided to focus my research work on QUALITYOF WORK LIFE which is an essential criteria whichcaters to the well being of the employee.
SCOPE OF THE STUDYThis study concerns the quality of work life provided atbaby engineering private ltd company. It highlights thearea of dissatisfaction as viewed by the employees andsuggests positive action to the taken by themanagement So as to ensure satisfaction and ease ofperformance.
OBJECTIVES OF THE STUDYThe objectives of the study are:
• To know the existing work life of the employees inBEPL.
• To study the level of workers satisfaction withreference to quality of work life at BEPL.
• To understand the opinion of the workers regardingwork, work environment, relationship with superiors,safety and welfare measures and trainingprogrammes.
• To arrive at findings and suggestions to improve theliving standards of employees
RESEARCH DESIGNThe type of research design used for the study isdescriptive and survey method.
METHODS OF DATA COLLECTIONThe researcher prepared the questionnaire thatcomprises of 58 questions in total. It is split into 3 parts.The first part consists of 10 questions explaining thepersonal details of the respondents.
The second parts comprises of 42 questions pertainingthe dimensions as QWL concept. The third partcomprises of 6 questions regarding suggestions. Thequestionnaire was framed in 5-point scale.
• Strongly agree• Agree• Nuetral• Disagree• Strongly disagree
SOURCES OF DATAFor smooth execution of research study the researcherhas gone for both primary and secondary data.
PRIMARY SOURCEThe information required for the study was directlycollected from the respondents by using questionnairemethod as primary source to collect the data.
SECONDARY SOURCEThe records and documents pertaining to the details ofthe organization and the employees constitute thesecondary sources.
SAMPLE SIZE:The sample size refers to the number of items to beselected from the universe to constitute sample, where‘sample’ is the respondents. The sample size for thestudy is 50 out of 206.
SAMPLE DESIGN:A sample design is a definite plan for obtaining a samplefrom a given population. It refers to the technique or theprocedure the researcher would adopt in selecting itemsfor the sample. While developing the sample design,the researcher has paid attention to the following point.
SAMPLING UNIT:A decision has to be taken concerning a sample unitbefore selecting sample the sampling units under studywas at BABY ENGINEERING PRIVATE LTD company,thuvakudi.
SAMPLING PROCEDURE:Simple random sampling method has been applied forthe selection of the sample from the universe 50 sampleswere selected constituting 24.27% of the universeaccordingly questionnaire were distributed to the samplerespondents to elicit their responses.
DATA ANALYSIS METHODThe collected data are converted into tables. To analyzethe data, the statistical tools namely Chi-square test.
Giving scores to each response as 1,2,3,4 &5 measuredthe perceptions of the workers. As instructed in thestandard scale, 5- Strongly agree, 4- Agree, 3-Undecided, 2- Disagree, 1- Strongly disagree.

Page 122
ISSN : 2321-3604
March 2014Vol.2, Special Issue
Primax International Journal of Commerce and Management Research
The Statistical tools used werePercentage AnalysisThis is the simplest form of analysis ie., the totalrespondents are together as per the similarity and thepercentage is taken from the whole number ofrespondents thereby giving us the percentage of eachgroup of the respondents.
Chi-square TestThe Chi-square test is one of the simplest and mostwidely used non-parametric tests in statistical work. Thequantity Chi-square describes the magnitude of the work.
CHI-SQUARE TESTAIM:To find whether the employees level of exploiting theopportunities available to use and develop humancapacities varies with his age
NULL HYPOTHESIS:There is no association between the age group withrespect of opportunities to use and develop humancapacities.
ALTERNATIVE HYPOTHESIS:There is a association between the age group withrespect of opportunities to use and develop humancapacities
CALCULATED VALUE:The calculated value is 33.5714.
DEGREE OF FREEDOM :
Degrees of freedom = (r-1) (c-1)r = number of rowsc = number of columns
here r = 5, c = 4= (5-1) (4-1)= 12
The table value of chi-square for 12 at 5% level ofsignificant is 21.026Therefore calculated value > table value 33.5714 > 21.026
Inference:Hence the calculated value of chi-square is greater thantable value, the alternative hypothesis is accepted. So,there is a association among the employees perceptiontowards the usage and development of human capacitiesin terms of age
FINDINGSIn this chapter the researcher gives findings as follows:
1. Findings based on Socio- demographiccharacteristics
2. Findings based on Dimensions of Quality of WorkLife
1. FINDINGS BASED ON SOCIO - DEMOGRAPHICCHARACTERISTICS
1. 60% of the respondents are of Age up to 35 years.
2. 70% of the respondents are in technical department.
3. 28% of the respondents are skilled workers.
4. 78% of the respondents are married.
5. 36% of the respondents have total years ofexperience between 6-10 years
6. 48% of the respondents have their Experience inthis organization between 6-10 years
7. 30% of the respondents educational qualification issslc.
8. 60% of the respondents are of nuclear type of Family.
9. 38% of the respondents income is above 4000.
2. FINDINGS BASED ON THE DIMENSIONS OFQUALITY OF WORK LIFE
Nearly 50% of the respondents are satisfied withthe safety and healthy working conditions providedby the organization, which includes workingenvironment, first-aid facilities, infrastructuralfacilities, safety equipment, lighting and ventilationfacilities.
The respondents have agreed that they have the jobsecurity but they feel that the compensation providedby the organization is not adequate.
Half of the respondents agreed that the trainingprogrammes helps to improve their skills, knowledgeand it was conducted by efficient faculty and thereis enough sharing of information about the companyactivities.
Most of the respondents have neutral response, thatthey have good relationship with superiors and thesuperiors invites their suggestion in all cases ofproblem and the organization facilitates selfimprovement for employees.
That stress relieving programmes and tourarrangement were not organized said 60% of therespondents.

Page 123March 2014Vol.2, Special Issue
Primax International Journal of Commerce and Management Research ISSN : 2321-3604
Nearly 50% of the respondents are satisfied withthe opportunity for career growth.
There was a neutral response towards extra-curricularactivities, quality of work life, community welfareprogrammes and interest in their work by therespondents.
60% of the respondents strongly agree on socialintegration in the work force.
Majority of the respondents are satisfied with workand quality of life.
Most of the respondents are not satisfied with thesupply of uniforms, shoes and restroom facilities.
There was a neutral response towards theinterpersonal relationship in the work organization.
SUGGESTIONSWORK
Productivity can be improved by motivation andtraining.
Division of work can also be implemented andsustained.
Work timings can be changed periodically accordingto shift basis.
WORK ENVIRONMENT
Sufficient tools can to be provided adequately.
More spacious dining and restroom can be provided.
WORKER –SUPERIOR RELATIONSHIP
Arranging get-togethers for the workers, will enhancegood relationship.
SAFETY AND WELFARE MEASURES
Strictly adhering to use of safety equipments givento each worker.
Preventive maintenance can be done in allmachineries and equipments to avoid accident andimprove safety of workers.
TRAINING
Required to upgrade their skills in other related areasalso.
Industrial training tour can be conducted for theemployees.
CONCLUSIONQuality of work life is mandatory in today’s organizationit is the watch word in today’s competitive businessenvironment which taps the worker’s high-order needsand thereby motivates them. In this study it is foundthat majority of the respondents are satisfied with theirpresent work life. Attention is sought in certain aspectsof quality like stress relieving programmes, tourarrangement, canteen, restroom facilities which needto be catered to build a more safer, healthier and betterorganization/ work environment.
REFERENCESBOOKS1. Gupta, S.P., Gupta, M.P., Business Statistics –
Sultan Chand & Sons, New Delhi.
2. Batra, G.S., Dangwal, R.C., Human ResourceManagement - New Strategies.
3. Kothari, C.R., Research Methodology Methods andTechniques – New Age International Publishers, NewDelhi..
4. Subba Rao, P., Personnel and Human ResourceManagerment, Himalaya Publication House, NewDelhi..
5. Aswathappa, K., Human Resources and PersonnelManagement, Tata McGraw-Hill Publishing CompanyLimited, New Delhi.

Page 124
ISSN : 2321-3604
March 2014Vol.2, Special Issue
Primax International Journal of Commerce and Management Research
A STUDY ON CUSTOMER SATISFACTION IN E-BANKING WITHSPECIAL REFERENCE TO IOB, ICICI BANKS IN
TIRUCHIRAPPALLI TOWN
1Y. Moydheen ShaAbstract
Nowadays, the electronic technology is playing a major role for the world of business especially in banking activities.Electronic banking (e-banking) is the newest delivery channel for banking services. E-banking provides enormousbenefits to consumers in terms of ease and cost of transactions, either through Internet, telephone or other electronicdelivery. Electronic finance (E-finance) has become one of the most essential technological changes in the financialindustry. E-finance as the provision of financial services and markets using electronic communication and computation.In practice, e-finance includes e-payment, e-trading, and e-banking.
Researches show that impact of internet banking on cost savings, revenue growth and increased customer satisfactionon Industry is tremendous and can be a potential tool for building a sound strategy. The paper fills significant gaps inknowledge about the consumer’s perspective of Internet banking, trace its present growth and project the likelyscenario. The paper presents the data, drawn from a survey of Internet banking consumers and the services providers(banks) that offer internet banking and develops a functional model for maximizing value to the consumers, which thebanks may choose to adopt Internet banking strategically.
Key words: ATM, e-Banking, e-payment, SWIFT.
1 Ph.D Research Scholar, PG Dept. of Commerce, Jamal Mohamed College(Autonomous), Trichy.
INRTODUCTIONNowadays, the electronic technology is playing a majorrole for the world of business especially in bankingactivities. Internet banking or e-banking is the newestdelivery channel for banking services. In fact, it haseffectively “opened” twenty-four hours a day, seven daysa week. Customers can do their daily banking activitieswithout having to wait in line or wait on hold for telephonebanking services.
E-Banking implies performing basic banking transactionby customers round the clock globally through electronicmedia. Alternatively electronic banking can be definedas “delivery of bank’s services to a customer at his officeor home by using electronic technology and this hasresulted in conceptualization of virtual banking”.
In traditional banking, the customer has to visit the branchof the bank in person to perform the basic bankingoperations viz., account enquiry, fund
transfer and cash withdrawal. The brick and mortarstructure of a bank is essential to perform the bankingfunctions.
On the other hand, E-Banking enables the customersto perform the basic banking transactions by sitting attheir office or at homes through PC or LAPTOP. Thecustomers can access the bank’s website for viewingtheir account details and perform the transactions on
account as per their requirements. Thus, today’s bankingis no longer confined to branches. Customers are beingprovided with additional delivery channels which are moreconvenient and are cost effective to the banks. This hasresulted in shrinking of geographical boundaries, easyreach to the clientele, reliable and secure services. TheE-Banking services include Automated Teller Machine,Plastic Card Currency, Internet Banking and ElectronicClearing Services.
E- BANKINGE- Banking can be defined as “delivery of bank’s servicesto a customer at his office or home using ElectronicTechnology.” The quality, range and price of theseelectronic services decide a bank’s competitive positionin the industry. Internet banking (or E-banking) meansany user with a personal computer and a browser canget connected to his bank’s website to perform any ofthe virtual banking functions. In internet banking systemthe bank has a centralized database that is web-enabled.All the services that the bank has
permitted on the internet are displayed in menu. Oncethe branch offices of bank are interconnected throughterrestrial or satellite links, there would be no physicalidentity for any branch. It would be a borderless entitypermitting anytime, anywhere and anyhow banking. Thenetwork which connects the various locations and givesconnectivity to the central office within the organization

Page 125March 2014Vol.2, Special Issue
Primax International Journal of Commerce and Management Research ISSN : 2321-3604
is called intranet. These networks are limited toorganizations for which they are set up. SWIFT is a liveexample of intranet application. Banks are using a varietyof names for online banking services, such as PCbanking, home banking, electronic banking or Internetbanking. Regardless of the given name, these systemscertainly offer specific advantages over the traditionalbanking methods.
STATEMENT OF PROBLEMThe study focus the customer satisfaction of e-bankingof Indian Overseas Bank(IOB) and ICICI Banks inTrichirappalli Town. All the Banks are introduce the e-banking facility since its inception and today is the bankhaving largest number of e-banking in the country. Asthe use of internet banking is increasing day-by-day, itis important to study the insight about the level ofcustomer satisfaction with respect to various aspectsof Bank and to identify the problem areas and proposedrecommendation leading to improvement. This study willalso help to gain knowledge about the e-banking to thecustomers.
OBJECTIVES OF THE STUDY• To examine the reach of internet banking
• To study the extent of awareness and the usage ofe-banking services in the study area
• To ascertain the customer’s satisfaction regardingvarious e-banking services provide by IOB and ICICIBanks
• To understand the different services& issues inInternet banking.
• To know about the customer satisfaction, its qualityand availability
• To recommend solutions based on the study
LIMITATIONS OF THE STUDYThe study has some limitations, these limitations thatneed to be acknowledged and addressed regarding thepresent study.
• The study is restricted to commercial banks locatedin Tiruchirappalli district only.
• The study is based on the opinion survey ofcustomers. But, the opinion expressed may differaccording to time and situation.
• The findings of the study can’t be generalized as thestudy is made covering a limited area namely,Tiruchirappalli district of Tamilnadu
REVIEW OF LITERATUREHsin-Ginn Hwang: The purpose of this study is todevelop a measurement instrument for customersatisfaction with internet banking (IBCS). A web surveywas used with the subjects being internet banking usersof Taiwanese banks. A total of 226 valid questionnaireswere obtained with an 85% response rate. The studydemonstrates that all the items in the Doll andTorkzadeh instrument for end-user computingsatisfaction measures are still valid in the context ofinternet banking.
Singhal,D and V.Padhmanabhan (2008) in their articleon “A Study on Customer Perception Towards internetbanking: Identifying major contributing factors” theybasically that, there are certain issues raised in currentliterature on e–banking that are considered as majorproblems of Internet banking amongst which include:the case of Internet criminals and fraudsters attempt tosteal customer information through various methodssuch as phishing and pharming.
Wan et al. (2005) study the customers’ adoption ofbanking channels in Hong Kong.They covered four major banking channels namely ATM,Branch Banking, Telephone Banking and InternetBanking. The study segmented the customers ondemographic variables and psychological beliefs aboutthe positive attributes processed by the channels. Thepsychological factors were ease of use, transactionsecurity, transaction accuracy, speediness,convenience, time utility, provision of different personalservices, social desirability, usefulness, economicbenefits, and user involvement
RESEARCH METHODOLOGYIn a view to precede the research in a systematic waythe following research methodology has been used.By means of obtaining detailed opinion of the customers,this research falls under the category of descriptiveresearch. Both primary and secondary data collectionwas made. As a source of primary data collection theinterview schedule was prepared in a view to obtaininformation from the respondents and apart from this togather some relevant secondary information thesecondary data were obtained from news papers,magazines, records, websites and books as a source.
The primary data was collected from about 150respondents. Based on the information obtained throughthe questionnaire cum interview schedule the data werecoded and some of the analytical tools like SimplePercentage and Chi-square methods were used toanalyze the data. The objectives are attained by

Page 126
ISSN : 2321-3604
March 2014Vol.2, Special Issue
Primax International Journal of Commerce and Management Research
collecting the secondary data from various journals, magazine and web sites. The study covered ICICI and IOBbank customers from different places in Tiruchirappalli city. The survey also focused on covering all the demographicfactors in the conveyance sample itself..
Analysis and Interpretation of the Primary data1. Demographic, socio and economic background of respondentsThe distributions of the Demographic, socio economic profile of the respondents are as follows:
Table No. 1 Distribution of Respondents on the basis of Demographic, Social and Economic background of 150customers
Sl.
No
Customer profile No. of
Frequency
% Sl.
No
Customer profile No. of
Frequency
%
1
Age
2
Sex
< 20 12 8 Male 123 82
20 -45 68 45 Female 27 18
45 -55 43 29
55 -65 22 15
> 65 5 3
3
Education
4
Occupation
HSC 18 12 Business men 23 15
Graduation 42 28 Employee 49 33
Post Graduation 53 35 Professional 60 40
Professional 37 25 Student 18 12
5
Type of A/c
6
Relationship with the Bank
SB a/c 102 68 >1 year 09 6
Current a/c 43 29 1 to 4 years 42 28
Other a/c 05 3 4 to 7 years 73 49
7 to 10 years 21 14
< 10 years 05 3
7
Deposit Amount
8
Monthly Income
Below Rs.10,000 89 59 Below Rs.20000 40 27
Rs.10,000 -50,000 30 20 Rs2 0000 -40000 63 42
Rs.50,000 -1,00,000 23 15 Rs 40000 -60000 24 16
Above Rs.1,00,000 08 06 Above Rs 60000 23 16
Source: Questionnaire Cum Interview Schedule

Page 127March 2014Vol.2, Special Issue
Primax International Journal of Commerce and Management Research ISSN : 2321-3604
Age:From the above table it is clear that 8% of therespondents belongs to the age group of<20, 45% ofthem are 20-45 years of age, 43% of them are between45-55 years, 15% of them are between 55-65 years and3% of them are above the age of 65 years.
Sex:From the above table shows 82% of respondents aremale and remaining 18% of respondents are female.
Education:The above table shows that 12% of the respondents haveHSC, 28% of the respondents have completedgraduation, 35% of them are post graduates, 25% ofthem are professionals.
Occupation:With regard to occupation, the above table shows that15% of the respondents are business men, 33% of therespondents are Employees, 40% of them areProfessionals and 12% are Students.
Type of account with the bank:The above table shows that 68% of the respondents arehaving saving account, 29% of them are having current
account and 3% of them are having other depositaccount.
Relationship with the bank:The above table shows that 6% of the respondents haveless than 1 year of relationship with the bank, 28% ofthem have 1 to 4 years, 49%of them having 4 to 7 years,14% of them are having 7 to 10 years of relationship,and 3% of them are having account with the bank formore than 10 years.
Amount of deposit with the bank:The table shows 59% of them are having belowRs10,000 as deposit in the bank, 20% of them are havingRs10,000 to Rs.50,000; 15% of them are havingRs.50,000 to Rs1,00,000;and 6% of them are havingabove Rs.1,00,000 as depositin the bank.
Monthly IncomeThe table shows 27% of them are having belowRs20,000 of income, 42% of them are having Rs20,000to Rs.40,000; 16% of them are having Rs.40,000 to Rs60,000; and 16 % of them are having above Rs. 60,000as a monthly income.
Table-2 showing the Customer’s opinion on e-banking
Sl Service provided by e -Banking HS S N D HD Tot al
1 Balance enquiry 45 62 31 8 4 150
2 Deposits using ATM 26 49 41 26 8 150
3 Withdrawals using ATM 90 35 17 8 0 150
4 e -Transfer of funds 33 53 26 21 17 150
5 Online Trading 40 65 26 9 10 150
6 Debit car d / Credit card 42 71 21 12 4 150
7 e -payments 35 61 32 19 3 150
8 e -Statement 46 73 24 7 0 150
9 Tele banking 26 38 42 29 15 150
10 ECS service 65 56 21 8 0 150
Source: Questionnaire cum Interview Schedule
From the above table shows the respondents opinionabout the internet banking. Here, ‘HS’ denotes HighlySatisfied, ‘S’ denotes Satisfied, ‘N’ stands Neutral, ‘D’stands Dissatisfied and ‘HD’ denotes Highly Dissatisfied.
Chi-Square AnalysisRelationship between demographic variables andrespondents satisfaction regarding e-banking.The opinion of respondents obtained in the followingfactors denoted as F1 – F10
F1. Balance Enquiry servicesF2. Deposits using ATMF3. Withdrawals using ATMF4. e-Transfer of fundsF5. Online TradingF6. Debit card / Credit cardF7. e-payments.F8. e-Statement

Page 128
ISSN : 2321-3604
March 2014Vol.2, Special Issue
Primax International Journal of Commerce and Management Research
F9. Tele bankingF10. ECS service
Table No-3 shows the Satisfaction of respondents on e-Banking
Satisfaction of respondents on e -bankin g in chi -square values
Demographic
Variables
Service Provided by Internet
Banking
Calculate
d Value
Chi -Square
value
Results
Age Balance Enquiry services F1 28.026 26.296 Rejected
Sex Deposits using ATM (F2) 19.069 9.488 Rejected
Education Withdrawals using ATM (F3) 14.782 21.026 Accepted
Occupation e-Transfer of funds (F4) 17.065 21.026 Accepted
Type of Account Online Trading (F5) 15.021 15.507 Accepted
Relationship with the
Bank
Debit card / Credit card (F6) 24.214 26.296 Accepted
Deposit Amount e-payments (F7) 19.265 21.026 Accepted
Monthly Income e-Statement (F8) 23.256 21.026 Rejected
The above table reveals that there is a relationshipbetween the respondent’s opinion on Service providedby Internet banking and the demographic variables likeAge, sex, Education, Occupation, type and amount,Years of relationship with the bank, amount depositedand monthly income of the customers.
H0: There is no relationship between demographicvariables and respondents satisfaction regarding internetbankingH1: There is a relationship between demographicvariables and respondents satisfaction regarding internetbanking.
FINDINGS:1. There is significance between the Age and Balance
Enquiry Service due to null hypothesis was rejected.
2. There is significance between the Sex and Depositusing ATM service due to null hypothesis wasRejected.
3. There is no significance between the Education andWithdrawals using ATM due to null hypothesis wasaccepted
4. There is no significance between the Occupation ande-transfer of funds due to null hypothesis wasaccepted
5. There is no significance between the Type of Accountand online trading Facility due to null hypothesiswas accepted.
6. There is no significance between the Relationshipand Debit card/Cerdit cardfacility due to nullhypothesis was accepted
7. There is no significance between the Amount ofDeposit and e-payments due to null hypothesis wasaccepted.
8. There is significance between the monthly incomeand e-statements service due to null hypothesis wasRejected.
SUGGESTIONSAbove analysis reveals that in general bank customersare happy about the various factors associated with e-Banking. But still customers have resistance to useinternet banking because of Safety issues.The customerfeels the absences of personnel touch in the onlineservice so the bankers should respondent to customersneed as soon as possible. The availability of informationshould be automatic to the customers periodically, beforethey make enquiry for account details. It is to besuggested to prevent online banking from remainingcustomers to prompt this service through advertising

Page 129March 2014Vol.2, Special Issue
Primax International Journal of Commerce and Management Research ISSN : 2321-3604
company and also Bank should provide the services indifferent languages. The bank should extend their tie-upcontracts with other various institutions whether financialor non-financial for convenience of its customers
The customers should be very careful while carrying outonline transactions that are transfer of account etc. Themost common fear in e-banking or net banking is that ofsecurity. Most people avoid Net banking because theyfear their account will be broken into by hackers.Customers should never share personal information likePIN numbers, passwords etc with anyone, includingemployees of the bank. PIN and/or passwords shouldbe changed immediately. Customers should properly signout their login after usage.
CONCLUSIONE-banking has become a necessary survival weapon andis fundamentally changing the banking industryworldwide. Today, the click of the mouse offerscustomers banking services at a much lower cost andalso empowers them with unprecedented freedom inchoosing vendors for their financial service needs. Therise of Internet banking is redefining business relationshipwith the customers. Thus internet Banking is becomingthe need of the hour and banks which omit to switchover to e-banking cannot survive in this competitive world.Though e-banking posses lot of threats and insecurityproblems these are like two sides of coins where wehave both advantages and disadvantages. The duty ofthe bankers is to concentrate on the latest securityaspects like fire walls and they should protect theprivacy of their customers.
REFERENCES:1. ICICI Bank Consumer Banking in India,
www.icicibank.com
2. Adoption of Internet Banking: An EmpiricalInvestigation of Indian Banking Sector By BalwinderSingh, Reader, Department of Commerce andBusiness Management, Guru Nanak Dev University,Amritsar, India.
3. Internet Banking Comptroller’s Handbook October1999.
4. Data Protection in Consumer E-banking Journal ofInternet Banking and Commerce, April 2006,vol.11,no.1 (http://www.arraydev.com/commerce/jibc/)
5. Basics of eCommerce – Legal & Security issues ISBN81-203-2432-3
6. “Customer satisfaction in the Indian banking sector –A Study”, IIMB Management review, Vol-20, No.1,March 2008.
7. eCommerce – Concepts, Models, Strategies, CSVMurthy, Himalaya Publishing House
8. eCommerce : An Indian Perspective , 2nd Ed. PTJoseph, SJ
9. Venkataramana.V, Somayajulu, “CRM – EmergingConcepts, Tools and Applications”,
Excel Books, New Delhi, 2005.
10. Measuring customer satisfaction with internetbanking: an exploratory study, International Journalof Electronic Finance, Volume 1, Number 3 / 2007,Volume 1, Number 3 / 2007

Page 130
ISSN : 2321-3604
March 2014Vol.2, Special Issue
Primax International Journal of Commerce and Management Research
A STUDY ON CUSTOMER SATISFACTION TOWARDS PROFESSIONALCOURIER SERVICES RESPONSE IN TRICHIRAPPLI
1Rajees.J 2Matharasi vidhyabharathi.V 3Aravinth.R 4Kowsalya devi S
Abstract
Communication is essential for mankind. From the era of conveying message through the messengers, we havecome to the age of interaction. Till the development of transportation services, we used animals and birds for sendingour views, messages, letters. Mail was carried by runners or couriers who journeyed on foot, on horse and camel andby bullock cards and horse carriage and country boats. There was no regular system of carrying parcels with theintroduction of railways it become possible to carry mails to distant places safety and at short regular intervals. Theprime focus is on the facts that development of transportation facilities fuelled the process of mail services and helpedthe department of posts in improving the quality of services. We cannot deny the fact the services in expensive innature served the socio economic sectors of the country substantially. Since 1907, when the railway mail service wasestablished till present, the department of posts has been found using the services of Indian railways both forquantitative and qualitative transformation in the postal system.With the increasing pressure of work and decreasing efficiency, the department of posts failed in managing themailing services which made it essential that an alternative system emerges to cater to the changing needs of tradeas well as the domestic sectors. The courier services thus came into existence. A number of organizations startedoffering the services are regional, national and international levels. Thus the courier services started to concentrate onthe development of quality marketing input get the quality marketing output.
As the name suggests, couriers belong to the services industry. They offer services to various segments, of which arediscussed in detail. Services can be defined as action services of organization services that maintain and improvesthe well being and functioning of people. As essential for any business customer satisfaction must be the outcome ofthe courier services business too.
1 Assistant professor of Commerce CA, St.Joseph’s College, Tiruchirapalli.2 PGResearch scholar, Department of commerce CA, St.Joseph’s College, Tiruchirapalli.3 PGResearch scholar, Department of commerce CA, St.Joseph’s College, Tiruchirapalli.4 PGResearch scholar, Department of commerce CA, St.Joseph’s College, Tiruchirapalli
PROFISSIONAL COURIER IN INDIAThe Professional Couriers has grown and placed itselfas an ultimate service provider in the Courier Industry inIndia with its assurance of 25 years expertise. We havealready registered our presence with our exclusive andlargest network in the courier and express industry inIndia. We have created bonds among all around us andwith the company by valuing the one-to-one relationship.We aim at doing things differently to create a revolutionin the customer service to keep all of us smiling withsatisfaction.
OBJECTIVES OF THE STUDY• To study the opinion about the professional courier
service
• To study the customer satisfactions recording deliveryof goods.
• To identify the reasons for preference of theprofessional courier service.
STATEMENT OF THE PROBLEMA study of courier service in Woraiyur, Trichy case studyof the professional courier service. It is meant foranalyzing whether the services rendered by theprofessional couriers are satisfactory to the inhabitantsof Trichy, what are the steps that should be taken tosolve the customer problem and suggest a few.
SCOPE OF THE STUDYThis study pertains to the overall functioning of theprofessional courier in Woriyur, Trichy city. The studyanalyses the general public’s degree of utilization of thecourier service in getting the delivery of goods a righttime in right place to a right person.
METHODOLOGYThe primary was collected from the respondents usinga well structured questionnaire to elicit the necessaryinformation which makes the possibility of getting therespondents opinion.

Page 131March 2014Vol.2, Special Issue
Primax International Journal of Commerce and Management Research ISSN : 2321-3604
The secondary data has been collected from the booksjournals and internet.l
SAMPLINGConvenient sampling has been used. The sample coversdifferent classes of customers. 100 samples wereselected for this purposes.
TOOLS AND DATA COLLECTIONFor the purposes of this study interview schedule wereused for the data collection. The study was made onextensive use of primary data to elicit the requiredinformation. Information was collected regarding thefactors that influence the attitude behaviour and opinionof the customers relating to the courier services.
HYPOTHESIS1. There is no relationship between postal services and
courier services.
2. There is no different between occupation and preferringthis courier services.
AREA OF THE STUDYTrichy town is taken as a whole for the purpose of thestudy. Tiruchirappalli is a centrally located district ofTamil Nadu. The specific area taken for the study isWoraiyur. It is an area where people belonging to theupper and middle strata of income, reside but a heavypressure of increase in population has led to increase indemand of increase in demand of this place given aportion for increasing income.
PROFILE OF THE PROFESSIONAL COURIERThe professional couriers are proud to introduce ourselvesas one of the leading courier companies which is capableof providing exemplary service through out the countryand abroad in any terrain and under any condition madepossible by the dedication of several hundredprofessionals who are trained to do the specified job inan outstanding fashion.
Data Analysis and InterpretationTable 1.1
Opinion about the courier serviceOpinion of Customer No. of. Respondent Percentage (%)
Fair 27 27
Better 48 48
Good 13 13
Best 12 12
Total 100 100
InferenceThe table shows that out of 100 customers the maximum of 48% of customers felt that the courier service is better.The table shows that out of 100 customers the maximum of 27% of customers felt that the courier service is fair.The table shows that out of 100 customers the maximum of 13% of customers felt that the courier service is good.The table shows that out of 100 customers the maximum of 12% of customers felt that the courier service is best.
Table 1.2Knowledge sources of professional courier ervice
Source No. of. Customers Percentage (%)
Friends 28 28
Neighbors 24 24
Advertisements 36 36
Others 12 12
Total 100 100
Inference

Page 132
ISSN : 2321-3604
March 2014Vol.2, Special Issue
Primax International Journal of Commerce and Management Research
The table shows that out of 100 customers the maximum of 36% of customers felt know about the courier servicethrough their advertisements.The table shows that out of 100 customers the maximum of 28% of customers felt know about the courier servicethrough their advertisements.The table shows that out of 100 customers the maximum of 24% of customers felt know about the courier servicethrough their advertisements.The table shows that out of 100 customers the maximum of 12% of customers felt know about the courier servicethrough their advertisements.
Table 1.3 Amount
Spend on Customer No. of. Respondent Percentage (%)
Minimum 31 31
Moderate 41 41
Maximum 28 28
Total 100 100
InferenceThe table shows that out of 100 customers the maximum of 41% of customers felt spend a moderate amount oncourier service.table shows that out of 100 customers the maximum of 31% of customers felt spend a moderate amount on courierservice.table shows that out of 100 customers the maximum of 28% of customers felt spend a moderate amount on courierservice.
TESTING OF HYPOTHESISChi-square test for independence of attributes1. H0: There is no relationship between courier service and postal service.H1: Courier service is better than postal services,
O E O -E (O -E)2 (O -E)
2 / E
20 12.6 7.4 54.76 4.34
8 14.7 -6.7 44.89 3.05
2 2.7 -0.7 0.49 0.18
7 8.4 -1.4 1.96 0.23
11 9.8 1.2 1.44 0.15
2 1.8 0.2 0.04 0.02
13 14.28 -1.28 1.64 0.11
21 16.66 4.34 18.83 1.13
- 3.06 -3.06 9.36 3.06
2 6.72 -4.72 22.28 3.32
9 7.84 1.16 1.34 0.17
5 1.44 3.56 12.67 8.8
X2 24.56

Page 133March 2014Vol.2, Special Issue
Primax International Journal of Commerce and Management Research ISSN : 2321-3604
Degree of Freedom = (r-1) (c-1)= (4-1) (3-1)= 3 x 2= 6%
X2 0.05 = 12.6Calculated value = 24.56
Inference:Since the calculated value is greater than table vale (24.56 > 12.6). Hence we reject H0. We concluded that courierservice is better than a postal service.
2. H0: There is no significant difference between the occupation and preferring this courier service.H1: There is no different between the occupation and preferring this courier service
O E O -E (O -E)2 (O -E)
2 / E
11 10.5 0.5 0.25 0.02
11 6.75 4.25 18.06 2.67
0 2.5 -2.5 6.25 2.50
0 2.5 -2.5 6.25 2.50
3 2.75 0.25 0.06 0.02
25 21.00 4 16 0.76
7 13.5 -6.5 42.25 3.12
7 5.0 2 4 0.80
4 5.0 -1 1 0.20
7 5.5 1.5 2.25 0.40
6 10.5 -4.5 20.25 1.92
9 6.75 2.25 5.06 0.74
3 2.5 0.5 0.25 0.10
6 2.5 3.5 12.25 5.00
3 2 .75 0.25 0.06 0.02
X2 20.79
Degree of Freedom = (r-1) (c-1)= (3-1) (5-1)= 2 x 4= 8%
X2 0.05 = 15.5Calculated value = 20.79
Inference:Since the calculated value is greater than table value(20.79 > 15.5). Hence we reject H0. We concluded thatthere is no different between occupation and preferringthis courier services.
FINDINGS• 53% of the respondence are male
• 40% of the people with in the age of group 20-30make use of courier service.
• 38% post graduates are used in courier servicesfrequently.
• 48% of the customers are of opinion that the courierservice is better.
• 36% of the people come to know about the courierservice through their advertisement.
• 41% of the customer spend a moderate amount oncourier service.

Page 134
ISSN : 2321-3604
March 2014Vol.2, Special Issue
Primax International Journal of Commerce and Management Research
• Most of the customer to amount spent for courierservices 41% are moderate.
• 77% of the customer directly approach theprofessional courier regarding any complaints.
• 50% of the customer prefers courier service becauseof it quick services.
• 34% of the customer are of opinion that the pricecharged by the courier service is better.
• 74% of the people recommended this courier for itsfast, quality and safety services.
• 39% of the customer to declare that serviceperformance of the courier is good.
• This satisfaction level of customers towardsprofessional courier are 88%.
SUGGESTIONS• Some of the customers feel that letters should be
dispatched on time. So proper methodology shouldbe adopted to carry out the process successfully.
• Avoid rough handling of non delivery documents.• Some customers feel that they should improve their
services in all interior places for easier access of thecustomers.
• In order to create more customer awareness aboutprofessional courier, it is necessary to advertise on
a large scale through all the fast selling news paperand magazines.
CONCLUSIONThe present research study was on earnest efforts takenby the researcher in order to study the customersatisfaction towards professional courier. Theprofessional courier is fast and efficient courier services.It benefits business people, government, employees,educational institution, students etc. Courier servicesshould be started in all areas in order to reach everynook and corner. Though the courier services was startedin 20th century, it is helpful for sending documents,parcels all over India abroad with cheaper cost and itwill reach the place very quickly.
REFERENCE1. S.M. JHA: Service Marketing2. M.M. VARAM and R.K. AGGARWAL: Marketing
Management
3. G.DAVID HUGHES: Marketing Management4. C.R. KOTHARI: Research Methodology
5. D.N. ELHANCE, VEENA ELHANCE, BMAGGARWAL: Fundamentals of Statistics
WEBSITEwww.tipcina.com

Page 135March 2014Vol.2, Special Issue
Primax International Journal of Commerce and Management Research ISSN : 2321-3604
A COMPARATIVE STUDY ON MODERN MARKETING SERVICESRENDERED BY SBI AND ICICI IN TRICHY DISTRICT
1DR.F.X.Virgin Fraga 2M.Merin Fernando 3D.Vedha Lakshmi & 4T.Ramya
Abstract
Now-a-days money is very essential for all individuals as well as to industries, companies, etc. The mainsectors in Tiruchirappalli district are agriculture, small business, small scale industry and medium scaleindustry. They have also been slowly increasing every year. Individuals want to save money for their future,so they need banking services. Businessmen need banking service to carryout their business transactions.The primary function of bank is to act as a channel for providing and transferring finance to industry, individuals,society. The present study under the title, “A study on the Modern Marketing Services rendered by ICICIand SBI in Trichy Town”, is undertaken mainly to analyse the competition between the banks in renderingmarketing services to the customers. The private banks are more consumer oriented than Public sectorbanks because the technological advancement used by the private banks are higher that that of publicsector banks.
INTRODUCTION
Today banks have become a part and parcel of our life.There was a time when the dwellers of city alone couldenjoy their services. Now banks offer access to even acommon man and their activities extend to areas hitherto untouched. Apart from their traditional businessoriented functions, they have now come out to fulfillnational responsibilities. Banks cater to the needs ofagriculturists, industrialists, traders and to all the othersections of the society. Thus they accelerate theeconomic growth of a country and steer the wheels ofthe economy towards its goal of “self reliance in all fields”.It naturally arouses our interest in knowing about the‘bank’ and the various men and activities connected withit.
ORIGIN OF BANKING:
Since the banking activities were started in differentperiods in different countries, there is no unanimous viewregarding the origin of the word ‘Bank’. The word ‘Bank’is said to have derived from the French word ‘Banco’, or‘Bancus’ or ‘Banc’ or ‘Banque’ which means, a ‘bench’.In fact the early Jews in Lombardly transacted theirbanking business by sitting on benches. When theirbusiness failed, the benches were broken and hence theword ‘bankrupt’ came into vogue. But Macleod hasexpressed a different view. According to him, the moneychangers were never called ‘Benchieri’ in the Middle Ages.So, this deviation may be a mere conjecture.
Another common held view is that the word ‘Bank’ mightbe originated from the German word ‘Back’ which meansa joint stock fund. Of course, a bank essentially dealswith funds. In due course, it was Italianised into ‘banco’,Frenchised into ‘bank’ and finally Anglicised in to ‘Bank’.This view is most prevalent even today.
EVOLUTION OF BANK MARKETING:Marketing as a concept evolved in banks in the postworld war II period. In the initial stages, marketing was,by and large, associated with advertising, publicrelations and the sales promotional aspects. Theoperative word in banks was ‘business development’and not selling or marketing of services. Bankers as abreed were known for their conservative approach.
It is true that, for long, banks got alone fine withoutmaking systematic marketing efforts. Banks did not feelthe need to go beyond emphasizing good public relationsand ‘business development’. But in the recent past,the markets have seen transformation. A reckoning ofthe realities of the market place cannot but beckon thebanks in India to be on the more in the marketing sense.Growing competition, emergence of a new range ofbanking services, need for innovative productdevelopment to keep pace with the level of economicdevelopment, compulsions in the area of profitability ofbanking business, coverage of new spatial areas,ensuring optimum use of the vast banking infrastructurealready built by the system, need for ensuring a better
1 Professor, Department of Commerce, St. Joseph’s College, Trichy.2 Research scholar, Department of Commerce, St. Joseph’s College, Trichy.3 Research scholar, Department of Commerce, St. Joseph’s College, Trichy.4Research scholar, Department of Commerce, St. Joseph’s College, Trichy.

Page 136
ISSN : 2321-3604
March 2014Vol.2, Special Issue
Primax International Journal of Commerce and Management Research
focus on customer satisfaction, improving the extentof professionalisation in banking and a betterappreciation of the long term perspectives are some ofthe valid reasons that can be cited to bring home theneed for a total marketing orientation in banks.
COMMERCIAL BANKS AND MARKETING:Commercial banks have played a vital role in giving adirection to economy’s development over time byfinancing the requirements of trade and industry thecountry. By encouraging thrift among people, bankshave fostered the process of capital formation thecountry. Commercial banks in advance the savers inthe community to hold their savings in the form ofsocially useful assets. After the nationalization of 14major commercial banks in 1969, banks woke up fromtheir splendid isolation and found themselves in a highlycompetitive and rapidly changing environment. As aresult, their approach to customers and marketunderwent a change and their focus was graduallyshifted to the marketing of products. The first majorstep in the direction of marketing was initiated by the‘State Bank of India’ when, in 1972, it reorganized itselfon the basis of major market segments, dividing thecustomers on the basis of their activities, and carvedout four major market segments, viz., the commercialand institutional segments, the small industries andsmall business segment, the agriculture segment andpersonal and services banking segment.The hallmark of the reorganized set-up was customerorientation. It aimed at:
a) A total view of customer’s needs;b) Meeting the identified needs in the best
possible manner by developing appropriate andsuitable services;
c) The identification of potential customers; andd) Conducting the activities at the branches on
the basis of carved out market segmentsinstead of job-wise.
PRIVATIZED BANKS: In the Privatized Banks, theIndustrial Credit and Investment Corporation of India(ICICI), plays a significant role in the development ofthe capital market. It has spread out its wings in thefield of marketing by rendering various services to thecustomers to avail a long term relationship with thebank. The services provided to the ICICI customers,are like ATMs, Debit Cards, Credit Cards, NRI services,Roaming current accounts, etc. Through these servicesthe customers of ICICI are motivated to avail the benefitsof all the products. Thus the banking culture spreadsits blessings far and wide in the economic systembenefiting the whole community.
STATEMENT OF THE PROBLEMThe present study under the title, “A study on theModern Marketing Services rendered by ICICI andSBI in Trichy Town”, is undertaken mainly to analysethe competition between the banks in renderingmarketing services to the customers. The private banksare more consumer oriented than Public sector banksbecause the technological advancement used by theprivate banks are higher that that of public sector banks.
IMPORTANCE OF THE STUDYNow-a-days money is very essential for all individualsas well as to industries, companies, etc. The mainsectors in Tiruchirappalli district are agriculture, smallbusiness, small scale industry and medium scaleindustry. They have also been slowly increasing everyyear. Individuals want to save money for their future, sothey need banking services. Businessmen need bankingservice to carryout their business transactions. Theprimary function of bank is to act as a channel forproviding and transferring finance to industry, individuals,society and the like. Therefore, it is important to studythe modern marketing services rendered by ICICI andSBI bank particularly at Triuchirappalli town in relationto the mode of exchange of finance in the district as awhole.
OBJECTIVES OF THE STUDYThe main objectives are:1) To identify the various marketing schemes rendered
by both the banks in Trichy Town.2) To examine various service benefits rendered by
‘State Bank of India’ and ‘Industrial Credit AndInvestment Corporation of India’ to their customers.
3) To analyze the service benefits from the view pointof the customers.
4) To evaluate the major services scheme like ATM,credit card, Debit card, et al by ICICI and SBI.
5) To offer suggestions for improving modern servicesto be rendered by the banks.
RESEARCH METHODOLOGYSOURCE OF DATAThe sources of data are of two types, they arei) Primary source, andii) Secondary sourcePrimary data is obtained by collecting data through theform of QUESTIONNAIRE method. The Questionnaireis given to the sample respondents who are availing theModern Marketing Services from ICICI and SBI.Secondary data is collected by having interaction withthe officials of ICICI and SBI and from the reports,journals, directives advertisement modes and the like.

Page 137March 2014Vol.2, Special Issue
Primax International Journal of Commerce and Management Research ISSN : 2321-3604
SAMPLE SIZEICICI and SBI banks are having many branches in TrichyTown. There are numerous numbers of customers tothese banks. But the sample was designed to 50respondents in total. Then it has been divided into two,which covers 25 respondents from ICICI customers andanother 25 respondents form SBI customers for thisresearch work.
DATA COLLECTION METHODConvenient sampling method was adopted for sampleselection and collection of information from them.
ANALYTICAL TOOLS USEDThe data has been interpreted with the help of variousdiagrams like bar diagrams, pie diagrams, etc. The datahas been further classified into percentages for easyunderstanding.
ABBREVIATIONS USED• ICICI Industrial Credit and Investment
Corporation of India• SBI State Bank of India• NRI Non-Residential Indian• ATM Automatic Teller Machine
AREA UNDER STUDYThe area covered under the study is Trichy town. Thestudy has been conducted in various areas ofTiruchirappalli like, Contonment, Thillainagar,Mainguardgate, Srirangam and Worraiyur.
Particulars of the respondents on the basis of the maintenance of the relationship with banks
Relationship ICICI
Continue 23 92 25 100
Discontinue 2 8 - -
Total 25 100 25 100
No. of re spondents Percentage
SBI
No. of re spondents Percentage
Source: Primary Data
Particulars of the respondents on the basis of the purpose for Opening an account
No. of re spondents Percentage
SBI
No. of re spondents Percentage
Source: Primary Data
ICICIPurpose
Savings 13 52 4 16
Security 9 36 20 80
Others 3 12 1 4
Total 25 100 25 100
Particulars of the respondents on the basis of satisfaction with the services
No. of re spondents Percentage
SBI
No. of re spondents
ICICIParticulars
Satisfied 15 60 17 68
Dissatisfied 10 40 8 32
Total 25 100 25 100
Source: Primary Data
Percentage

Page 138
ISSN : 2321-3604
March 2014Vol.2, Special Issue
Primax International Journal of Commerce and Management Research
No. of re spondents Percentage
SBI
No. of re spondents
ICICIProblems
Satisfied 15 60 17 68
Delay in completing the Transaction 9 36 5 20
Distance from your place 1 4 3 12
Delay in processing ofLoan operation 2 8 8 32
Fixed working hoursof the Bank 6 24 3 12
Technical problems - - 4 16
None 7 28 2 8
Total 25 100 25 100
Percentage
Particulars of the respondents on the basis of the problems faced by them
FINDINGS• 80% of respondents are male;• 44% of the respondents are graduates and it is clear
from the study that no illiterates are availing themodern services from the bank;
• 22% of the respondents are business people;• 7.2% of the respondents are married;• More number of respondents (i.e) 44% of the
respondents belong to the family size upto threemembers;
• The monthly income for 44% of the respondentsrange from Rs.5,000 to Rs.10,000;
• Nearly 6 respondents out of 50 have their accountsin both SBI and ICICI banks;
• Eventually 33 respondents in total have theiraccounts in other banks like nationalized bank,private and co-operative banks;
• In the above said respondents, some 7 respondentshave closed their accounts because of conveniencein other banks like easy approachability and closerto home;
• 88% of the respondents are interested to havesavings account rather than current account;
• 60% of the respondents in SBI and 36% of therespondents in ICICI have their accounts in a periodof more than 10 years.
• ICICI bank reached the customers through agentsand advertisements, whereas SBI bank respondentsare influenced by other;
• Convenience and needs made most of therespondents to become the customers of the bank;
• Most people opt the banks which are near to theirresidency;
• 100% of the respondents of ICICI bank avail theATM services;
• 100% of the respondents of SBI bank avail themodern service of ATM – cum - Debit cards;
• ½ of the respondents use ATM and debit cardsmore than three times in a month;
• Nearly 32% of respondents use their credit cardfor three times in a month;
• ¾th of the respondents use their ATM cards inother stations like Chennai, Coimbatore, Bangaloreand also outside India;
• Majority of the respondents of ICICI deposit andwithdraw a sum upto Rs.2000;
• Both the banks ICICI and SBI charge reasonableservice charges;
• Employees of the banks assist their customersduring transactions;
• The study reveals that 52% of the respondentsprefer ICICI for less time consuming;
• Also, 72% of the respondents prefer SBI bank forthe security;
• Majority of the respondents feel that transactionsare fast, accurate and are made easier in ICICI bank;
• ½ and 3/4th of the respondents of ICIC and SBIopen their accounts for the purposes of savingsand security;

Page 139March 2014Vol.2, Special Issue
Primax International Journal of Commerce and Management Research ISSN : 2321-3604
• Nearly every customers do wish to continue theirhealthy relationship with their respective banks;
• Probably ¾th of the customers have requested tosend their financial statement of their accountsregularly;
• Large number of respondents (i.e) ¾th of therespondents are satisfied with the services of theirbank.
SUGGESTION
• Females should be motivated to be a customerof the bank;
• Agriculturist should also be motivated;• Most of the customers are having accounts in
other banks, because of high interest for loans inICICI and less efficiently in transaction in SBIBank. So the respective banks must takenecessary steps to fulfill their needs properly;
• The banks must reconstruct its presentpromotional policies because most of thecustomers are not satisfied with these programsof their banks;
• No respondents of SBI knew about their bankthrough agency. Therefore, agencies must befixed to create awareness to the public about thebenefits of this bank;
• Banks should take necessary steps for thecustomers who are very far away from the bank;
• Roaming current account is a very good serviceprovided by ICICI bank. But there are very lessnumber of respondents availing this service. So,bank should concentrate on the above;
• Some of the respondents feel the service chargesare high. Therefore, the respective bank shouldtake up effective steps to reduce the servicecharges;
• ICICI bank should take necessary steps or try toreduce the interest rates for loans;
• SBI bank must act quickly because manyrespondents feel that this bank consumers moretime to complete a transaction;
• To avoid more time consumption the bank mayconcentrate on fixing up more counters;
• SBI bank must also take effective steps toprocess loans quickly;
• Dissatisfaction prevailing among the employeesregarding the services provided by the banksmust be taken care of;
• Financial statements for the customer’s accountsmust be sent regularly to all the account holdersof the respective bank;
CONCLUSIONThe researcher has taken atmost steps to enlight themodern services rendered by ICICI and SBI banks atTrichirappalli town, with concrete objectives. Theresearcher finds that the services rendered are notreaching the poor and rural masses. The researcherhas also suggested certain suggestions to enlight themodern services to the rural masses. There aremany ways to develop this work in the country.Finally, the researcher feels that the RBI should havemore control over the operations of both the banks.
REFERENCES
BOOKS:• Balaji .B, Services Marketing and Management,
2002, S.Chand & Co. Ltd.• Dr.Nirmala Prasad.K. & Chandradass .J, Banking
and Financial Systems, 1994, HimalayaPublishing House.
• Gordan.E and Natarajan.K, Banking Theory, law& Practice, 2003, Himalaya Publication House.
• Jha.S.M, Services Marketing 2003, HimalayaPublishing House.
• Madhukar R.K, Dynamics of Bank Marketing,1990, Sri Sudhindra Publishing House.
• Rajashekar. N. Banking in the New Millenium,2003, ICFAI University.
• Saxena K.K., Bank Marketing - concepts andApplications, 1988, Skylark Publications.
• Sundharam P.M & Varshney P.N. BankingTheory, Law & Practice, 1992, Sultan Chand &sons.
• Vaish.M.C, Modern Baking, 1984, RBSApublishers.
• Vasant Desai, Indian Banking – Nature &problems, 1987, Himalaya publishing House.

Page 140
ISSN : 2321-3604
March 2014Vol.2, Special Issue
Primax International Journal of Commerce and Management Research
A STUDY ON WOMEN EMPOWERMENT THROUGHENTREPRENEURSHIP WITH SPECIAL REFERENCE TO
TIRUCHIRAPPALLI TOWN1Pradeepa Sriniwasan
1 PG Research Scholar, Department of Commerce CA, St.Joseph’s College, Tiruchirapalli
ABSTRACT
Entrepreneurship is the need for the present society and for the future India. They are the driving forces behindIndian economy. Entrepreneurs are people who come out with a new ideas, innovations, do things, which are notgenerally done in the ordinary course of a business. Empowerment of women entrepreneur is a new mantra fordevelopment of economy. Women from the lower strata of the society though educated, are unable to find employmentin urban India. It is entrepreneurship that paves the path of these women in particular and society in general. Thestudy considers women from such lower strata of society turning into entrepreneurs in the city. It is observed thatwomen entrepreneur networks are major sources of knowledge about women’s entrepreneurship and they areincreasingly recognized as a valuable tool for its development and promotion. Of the 1.3 billion people who live inabsolute poverty around the globe, 70 percent are women work two-thirds of the world’s working hours; Womenearn only 10 percent of the world’s income. Women own less than 1 percent of the world’s property. Developingentrepreneurship among women will be right approach for Women Empowerment. This would enhance their socio-economic status. Once a woman feels that she is economically strong, she will feel equal to man in all respect. Forwhich an effort has been made in this paper is to identify empowerment of women’s through entrepreneurship.
INTRODUCTION“”Created for women by women…””
The term ‘women empowerment’ has come to occupyan important position globally over the years.Educational attainment and economic participation arethe key constituents in ensuring empowerment ofwomen. The economic empowerment of women is avital element of strong economic growth in any country.Entrepreneurship happens to be one of the best waytowards self sufficiency and poverty alleviation for womenin a country where employment is not guaranteed.Involvement of women in entrepreneurial activities wouldensure effective utilization of labour, generation of incomeand hence improvement in quality of life. Womenempowerment through entrepreneurship is a must for amodern developed economy. Generally, womenentrepreneurs in Trichy are engaged mainly in traditionalactivities like weaving, knitting, embroidery, running ofschools, crèches, doormat from banyan wastes, cushionmaking, jute bag training, craft works, readymadegarments, jam, jelly and pickle making etc. In recentyears it has been observed that women entrepreneursof Trichy are venturing into non-traditional traits also.The women have achieved immense development in theirstate of mind. With increase in dependency on servicesector, many entrepreneurial opportunities especially
for women have been created where they can excel theirskills with maintaining balance in their life. Accordingly,during the last two decades, increasing numbers ofIndian women have entered the field of entrepreneurshipand also they are gradually changing the face of businessof today, both literally and figuratively. But still they havenot capitalized their potential in India the way it shouldbe. The success of those women entrepreneurs willsignificantly speed up the progress of economicdevelopment and removal of poverty in the state. Asempowerment of women basically depends on gainingfinancial, social and cultural strength, their performanceas entrepreneurs in their business becomes crucial toreach this goal. In this context a measure of performanceof the women entrepreneurs over years would answerthe question if they have got empowered at all.
What is empowerment?Empowerment is the process of enhancing the capacityof individuals or groups to make choices and totransform those choices into desired actions andoutcomes. In management terms, empowerment couldalso mean the act of giving power and authority to aperson to perform his designated tasks.
However, there are many challenges involved insystematically documenting the empowering processand/or empowerment outcomes.
LOOK LIKE A GIRL, ACT LIKE A LADY, THINK LIKE A MAN, WORK LIKE A BOSS...!

Page 141March 2014Vol.2, Special Issue
Primax International Journal of Commerce and Management Research ISSN : 2321-3604
The concept of empowerment is difficult to defineand even more difficult to measure.
The impacts of empowerment are intangible,including such expressions as self-confidence, statusand decision-making. Attitudinal changes are alsodifficult to measure.
The process of empowerment is expressed and/orseen in a myriad of ways.
The manifestations of empowerment differ by socio-cultural setting, and even within the same socio-cultural setting, empowerment is experienced bydifferent groups in different ways.
What is Entrepreneurship? Entrepreneurship is the terminal stage of theentrepreneurial process wherein after setting up a ventureone looks for diversification and growth.
Who is an Entrepreneur?An entrepreneur is not a routine businessman he mightnot have resources but he will have ideas. He is innovativeand creative. He can convert a threat into an opportunity.Functionally all entrepreneurs are self-employed andincome generating persons but the reverse is not true-all self-employed and income generating persons arenot entrepreneurs.
What is Women Empowerment?Women’s empowerment refers to the ability of womento transform economic and social development whenempowered to fully participate in the decisions that affecttheir lives through leadership training, coaching,consulting, and the provision of enabling tools for womento lead within their communities, regions, and countries.
Need of women entrepreneurship:
The entrepreneurship plays a major role in theeconomic development of country.Entrepreneurship promotes increases in nationalproduction and productivity in the primary, secondaryand tertiary sector through technical and other formof innovation.
It promotes capital formation by mobilizing the idlesavings of the public.
It provides immediate large-scale employment. Thus,it helps to reduce the unemployment and under-employment problems in the country.
It facilitates the transfer of technology.
It helps in dispersal of economic power.
It stimulates the equitable redistribution of wealth,income and political power in the interests of thecountry.
It also reduces backward and forward linkage whichstimulates the process of economic development inthe country.
It also promotes country’s export trade.
DONT BE A WOMEN,THAT NEEDS A MAN...
BE A WOMEN,A MAN NEEDS...!
STATEMENT OF THE PROBLEMThe basic problem or difficulty of a women entrepreneuris that she is woman-this pertains to her responsibilitytowards facility, society and work. With joint familiesbreaking up, many women simply don’t have the supportof elders. Women have been confronted by suchdilemmas ever since they started leaving home for thework place. On the other hand, the attitude of the societytowards her and constraints in which she has to live andwork are not very conduce. The tradition, customs, sociocultural values, ethics, motherhood subordinates to linkhusband and men, physically weak, hard work areas,feeling of insecurity, cannot be tough etc are somepeculiar problems that the Indian women are comingacross while they jump into entrepreneurship.
OBJECTIVESTo identify the reasons for women for involvingthemselves in entrepreneurial activities.To recognise the success of women throughentrepreneurship.To identify the factors of hindrance for womenentrepreneurship.To determine the possible success factors forwomen in such entrepreneurial activities.To make an evaluation of people’s opinion aboutwomen entrepreneurship.
SCOPE OF THE STUDYThe study focuses on the women entrepreneurs inselected areas in Trichy town. The scope of the studyencompasses women entrepreneurs and the problemsfaced by women by them who are engaged in starting anew enterprise. It studies the reason which inducesthe women entrepreneurs to take up entrepreneurshipand the constraints of women entrepreneurship it create

Page 142
ISSN : 2321-3604
March 2014Vol.2, Special Issue
Primax International Journal of Commerce and Management Research
the confident among the women to meet their obstacles in the life and day-to-day operations in an effectivemanner. It creates the self empathy, self esteem, self-respect, courage to them.
HYPOTHESISEmpowerment through Entrepreneurship has an influence on the personal, economic and social status of women.
RESEARCH METHODOLOGY
Research design Survey method
Data collection Primary data collection: questionnaires and
interview method with women entrepreneurs.
Secondary data collection: data’s were
collected from websites, journals, books and
discussion with the public.
Sample area Tiruchirappalli town
Sample size 45(due to resource and time constraints a maximum of 400
samples has been identified as the universe. Among the
universe 11% i.e., 45 women entrepreneurs has selected by
the researcher for the study.)
FINDINGS OF STUDYThe data collected from the field are analyzed to assess the problems and prospect of Women Entrepreneurship.
TABLE-1 : Showing Age wise distribution of the Entrepreneurs
Frequency No. of Entrepreneurs Percentage
21 – 25 5 11%
25 – 35 19 42%
35 – 45 16 36%
45 and above 05 11%
Total 45 100% Source: Primary Data
Inference:In the above table it shows that the majority of women started their enterprise at the age of 25 – 45, whereas agefrom 21-25 are few to the field and 45 above are less in number.
TABLE- 2 : Showing qualification wise distribution of the Entrepreneurs
Frequency No. of Entrepreneurs Percentage
Below SSLC 9 20%
HSLC 15 33%
UG 16 36%
PG 5 11%
Total 45 100% Source: Primary Data
Inference:In the above the qualification of the women could get some other job. But they selected entrepreneurship
as career. This reflects the changing attitude of women entrepreneurship. As regards educational qualification tableshows that 9(20%) women entrepreneurs were below SSLC, 15(33%) were HSLC whereas 16(36%) were graduatesand 5(11%) of them were postgraduate.
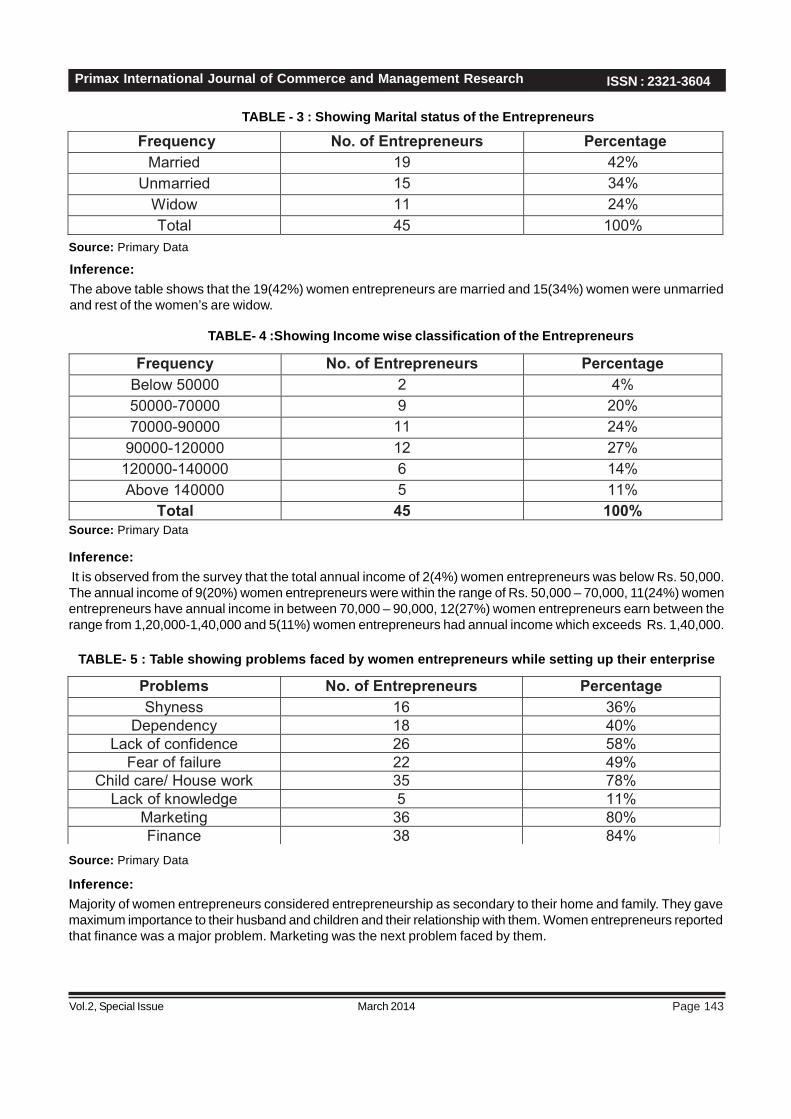
Page 143March 2014Vol.2, Special Issue
Primax International Journal of Commerce and Management Research ISSN : 2321-3604
TABLE - 3 : Showing Marital status of the Entrepreneurs
Frequency No. of Entrepreneurs Percentage
Married 19 42%
Unmarried 15 34%
Widow 11 24%
Total 45 100%
Source: Primary Data
Inference:The above table shows that the 19(42%) women entrepreneurs are married and 15(34%) women were unmarriedand rest of the women’s are widow.
TABLE- 4 :Showing Income wise classification of the Entrepreneurs
Frequency No. of Entrepreneurs Percentage
Below 50000 2 4%
50000-70000 9 20%
70000-90000 11 24%
90000-120000 12 27%
120000-140000 6 14%
Above 140000 5 11%
Total 45 100%
Source: Primary Data
Inference: It is observed from the survey that the total annual income of 2(4%) women entrepreneurs was below Rs. 50,000.The annual income of 9(20%) women entrepreneurs were within the range of Rs. 50,000 – 70,000, 11(24%) womenentrepreneurs have annual income in between 70,000 – 90,000, 12(27%) women entrepreneurs earn between therange from 1,20,000-1,40,000 and 5(11%) women entrepreneurs had annual income which exceeds Rs. 1,40,000.
TABLE- 5 : Table showing problems faced by women entrepreneurs while setting up their enterprise
Problems No. of Entrepreneurs Percentage
Shyness 16 36%
Dependency 18 40%
Lack of confidence 26 58%
Fear of failure 22 49%
Child care/ House work 35 78%
Lack of knowledge 5 11%
Marketing 36 80%
Finance 38 84%
Source: Primary Data
Inference:Majority of women entrepreneurs considered entrepreneurship as secondary to their home and family. They gavemaximum importance to their husband and children and their relationship with them. Women entrepreneurs reportedthat finance was a major problem. Marketing was the next problem faced by them.

Page 144
ISSN : 2321-3604
March 2014Vol.2, Special Issue
Primax International Journal of Commerce and Management Research
RECOMMENDATIONSIn view of the data’s cited above, it is necessary to adoptsome measures for development of entrepreneurshipamong women. Following recommendations have beenmade for the development of women entrepreneurship inTrichy:
The banks can play an important role by lendingmoney to women entrepreneurs.Banks, Government agencies etc. should launchawareness and publicity campaigns about schemesavailable for women.The Government can also help women in marketingtheir products through its outlets at various levels.The family members can also be involved in thebusiness with a view to sharing the burden ofentrepreneurial work.Training also plays a significant positive role inpromoting women entrepreneurs.Training organizations should provide them supportby constant monitoring and Follow -Up.
CONCLUSIONThe results show that profitability of the enterprise, loansavailed, confidence of women entrepreneurs to succeedare important determinants of the growth of net worth ofthe enterprises of women over the years of their existence,irrespective of the size of entrepreneurs at present.Entrepreneurship of women has enhanced their economicstatus and decision making power. Women entrepreneursare aware of opportunities available to them, but there isscope for improvement in it. Economic status, self worth,self confidence and social status of women entrepreneursare the variables that define empowerment of women.Women entrepreneurs in Self Help Group are moreempowered than other Non Self Help Groupsentrepreneurs. If women gain economic strength, theygain visibility and a voice at home, workplace andcommunity. This has an impact on their social status interms of increase in their literacy, education of theirchildren and family well being. Therefore, empowermentof women has a rich payoff in economic developmentand egalitarian goals of the society.
According to the study following conclusions are made:In the personality status, especially the selfconfidence and the psychological satisfaction gainedby entrepreneurs are very important; it enabled themto shoulder further entrepreneurial activity or face anyproblem in the family.However the entrepreneurs were of the opinion thatthe efficiency, skills, earnings, honour received andthe even elevated economic status of womenentrepreneurs cannot change the attitude of societytowards women in general. Male dominance insociety is reluctant to change their attitude towardswomen.The systematic and wholehearted role of the mentorNGO/s in the transformation of these women fromlower strata of the society.Backward and forward support from agencies to thesewomen entrepreneurs is the important factor tosustain them in their business ventures.Power over economic resources and participation indecision-making is making them more confident andthat is the women empowerment in true sense.
REFERENCESWomen Entrepreneurs - Rani(Lalitha. D)Empowerment of Women - Pandit(Vijayalakshmi.P)Women empowerment and globalization - Dr. MenuagrawalJournals
“Empowerment of Women through Self Help Groups”-Journal published by RVS College of Arts and Science
1. Empowering Women through Entrepreneurship: Astudy in Tamil Nadu, India
Geetha Sulur Nachimuthu and Barani Gunatharan;
International Journal of Trade, Economics andFinance, Vol. 3, No. 2, April 2012
2. Women Empowerment through Entrepreneurship:A Case Study of Guwahati Municipal Corporation,Marami Das] [ISSN: 2231-4946] Faculty Member,Swadeshi Academy Jr. College Research Scholar,CMJ University, Shillong, International Journal ofComputer Applications in Engineering Sciences

Page 145March 2014Vol.2, Special Issue
Primax International Journal of Commerce and Management Research ISSN : 2321-3604
A STUDY ON DEPRESSION AND STRESS AMONG COLLEGE STUDENTSIN TIRUCHIRAPPALLI TOWN
1Dr. N. Maheswari 2B. Poornima
ABSTRACTStress affects everyone differently and therefore, every one manages their stress differently. Many studies havebeen done on the importance of managing stress and methods of managing stress, based on different characteristicssuch as gender, culture, and ethnicity. However, there have not been many studies on how college students managestress. The Intend of this study is to analyise the stress level of college students.
INTRODUCTION Attending college can be a stressful experience for manynew and retaining students. Heavy academic workloadsand the feeling that you’re constantly racing to meetanother deadline can be daunting. And this is in additionto campus activities, new friendships, the pressure togo out multiple nights a week and variable sleepschedules that often come with the fast-paced collegelifestyle.
Stress is simply the body’s non-specific response to anydemand made on it. Stress is a nervous tension or anxiety.Stress been created by the means of expressing talentsand spending energies and pursuing happiness; It canalso cause exhaustion and illness, either physical orpsychological; heart attacks and accidents.
PROFILE OF THE CITYTiruchirappalli now called Trichy is situated on the banksof the Cauvery river. Trichy, the fourth largest city in thestate was a citadel of the early Cholas which later fell tothe Pallavas. Trichy’s most famous landmark is an 83mhigh rock which is the only outcrop in the otherwise flatland of the city. The most amazing fact about the rock isthat it is one of the oldest in the world-approximately3,800 years, which makes it as old as the rocks ofGreenland and older than the Himalayas.
SCOPE OF THE STUDYIt’s important to pay attention to stress because it canaffect the health. Research in learning about how stresscan affect the body, why sleep is so important and howto incorporate important stress-busting techniques,including useful time-management tips, has returned outto be important at the current scenario.
OBJECTIVIESTo identify the components of academic stressexperienced by students.
To identify the impact of academic stress amongthe students.
To examine the relationship between stress andacademic performance.
HYPOTHESISThere is a close relationship between sourcesof stress and impact of stress.There is a close relationship between sourcesof stress and potential personal consequences.
RESEARCH METHODOLOGY.The primary data was collected from the respondentsusing well structured questionnaire in order to elicitnecessary information which make the possibility ofgetting the respondents options. The secondary data hasbeen collected from the books, journals, internet.
SAMPLE SIZE: The research are collected information from 100respondents from various colleges in thiruchirapalli town.
SAMPLING TECHNIQUES:A non-probability sampling technique has been used.The tools used for this study are percentage analysisand chi-square.
REVIEW OF LITERATURE1. According to Lazarus & Folkman (1984), stress is a
mental or physical phenomenon formed through one’scognitive appraisal of the stimulation and is a resultof one’s interaction with the environment. Theexistence of stress depends on the existence of thestressor.
2. Feng (1992) and Volpe (2000) defined stressor asanything that challenges an individual’s adaptabilityor stimulates an individual’s body or mentality. Stresscan be caused by environmental factors, psychologicalfactors, biological factors, and social factors. It canbe negative or positive to an individual, depending onthe strength and persistence of the stress, theindividual’s personality, cognitive appraisal of thestress, and social support.
1 Asst. Professor, Department of Commerce CA, St.Joseph’s College, Tiruchirapalli.2 PG Research Scholar, Department of Commerce CA, St.Joseph’s College, Tiruchirapalli

Page 146
ISSN : 2321-3604
March 2014Vol.2, Special Issue
Primax International Journal of Commerce and Management Research
3. Stress from high expectations of teachers, parents, and self is usually an agony for students studying inschools (Cheng, 1999).
4. As observed by Lauren Bigham , Helen W. Bland , Bridget F. Melton (2012)[2], College years have been deemedas one of the most stressful periods of a person’s life. Coping mechanisms and lifestyle habits currently employedby the millennial college students are not only ineffective for alleviating stress, but also has the effect of puttingthese students at risk for low stress tolerance.
5. Research seems to show that stress is multifaceted and therefore the stress management techniques usedvaries from person to person. Among college women, one of the most effective ways to help them managestress is to provide support systems. (Johnson, et al. 2000)
6. The same was true for a study that focused on the interaction between role clarity, work overload, organizationalsupport among US army soldiers. While understanding their individual roles helped reduce stress no matter howgreat their workload was, having organizational support significantly reduced the amount of stress soldiers felt(Bliese & Castro, 2000)
7. Another study found that religiosity increased the positive outcomes towards stress and reduced the negativeoutcomes associated with stress among college students. According to Read & LeCheminant (2009), whenstudents were involved in their church and were more focused on their spirituality, the students seemed happierand were more well-adjusted to the stress they face.
8. Other studies that have shown that progressive muscle relaxation and/or relaxing music will reduce stressamong college studies (Kibler & Rider, 1983) and that biofeedback, when used consistently, also helps collegestudents learn to recognize and reduce stress. (Ratanasiripong, et al., 2010).
9. In an article about how administrators cope with stress, Swent (2001) states that school administrators andteachers tended to use more physiological activities to deal with stress than cognitive/psychological andinterpersonal activities. Therefore, stress management techniques vary greatly from person to person.
10.Wang and Ko (1999) pointed out that girls feel upset more easily than boys, mainly because of their concernsabout physical appearances. Girls may perceive themselves as”very ugly”, feel that they are too fat, too short,too high, or dislike their hair color or skin color
DATA ANALYSIS AND INTERPRETATIONTable No: 1 Academic demands causing stress
Particulars No of respondents Percentage
Maintaining time 25 25%
Duration of time 17 17%
Assignment 23 23%
Internal marks 20 20%
Exams 15 15%
Total 100 100
Interpretation:The above table denotes that 25% of the respondents felt that maintaining time causes stress, 17% of the respondentsfelt that duration of time causes stress, 23% of the respondents felt that assignment causes stress, 20% of therespondents felt that internal marks causes stress, 15% of the respondents felt that internal marks causes stress.
Table No: 2 personal consequences Particulars No of respondents Percentage
Inferiority complex 28 28%
Loneliness 23 23%
Avoided by society and friends 27 27%
Generally restlessness 22 22%
Total 100 100

Page 147March 2014Vol.2, Special Issue
Primax International Journal of Commerce and Management Research ISSN : 2321-3604
Interpretation:The above table denotes that 28% of the respondents had inferiority complex, 23% of the respondents felt loneliness,27% of the respondents tried to avoid by society and friends, and 22% of the respondents felt generally restlessness.
Table No: 3 - Impact of the stress on students Particulars No of respondents Percentage
Drop outs 19 19%
Drunkards 14 14%
Drug addiction 12 12%
Chain smokers 14 14%
Lose interest in education 19 11 %
Absenteeism 22 14%
Total
Interpretation:The above table denotes that 19% of the respondents became to drop outs, 14% of the respondents became todrunkards category, 12% of the respondents became drug addicted, 14% of the respondents became chain smokers,16% of the respondents belong to insanity category, 11% of the respondents had lost interest in education, 14% ofthe respondents maintained absenteeism.
Table No: 4 Relaxing Stress
Particulars No of respondents Percentage
Competition 28 28%
Cultural 26 26%
Yoga 22 22%
Meditation 24 24%
Total 100 100
Interpretation:The above table denotes that 28% of the respondents relaxed through to competitions conducted by college, 26%of the respondents relaxed through cultural, 22% of the respondents relaxed through yoga, 24% of the respondentsfollowed meditation activities.
HYPOTHESIS TESTING Table no:5 Relationship between Sources of stress and personal consequences
O E (o-e) (o-e)2 (o-e)2/e
6 7 -1 1 0.1428
7 5.75 1.25 1.5625 0.2717
6 6.75 0.75 0.5625 0.0 833
6 5.5 0.5 0.25 0.0454
6 4.76 1.24 1.5376 0.3230
4 3.31 0.69 0.4761 0.1438
3 4.59 -1.59 2.5281 0.5507
4 3.74 0.26 0.0676 0.0180
6 6.44 -0.44 0.1936 0.0300
5 5.29 -0.29 0.0841 0.0158
7 6.21 -0.79 0.6241 0.1004
5 5.06 -0.6 0.36 0.0711
5 5.6 -0.6 0.36 0.0642
4 4.6 -0.6 0.36 0.0782

Page 148
ISSN : 2321-3604
March 2014Vol.2, Special Issue
Primax International Journal of Commerce and Management Research
5 5.4 -0.4 0.16 0.0296
6 4.2 1.8 3.24 0.7714
5 4.2 0.8 0.64 0.1523
3 3.45 -0.45 0.20 0.058
6 4.05 1.95 3.80 0.9388
1 3.30 -2.30 5.29 1.6030
Total 5.4932
Calculated value is = 5.4932 Table value at 5% is 21.0
RESULTSince calculated value is lesser than the table value the Hypothesis is accepted.
Table No: 6 Relationship between sources of stress and impact of stressO E (o -e) (o -e)2 (o -e)2/e
3 4.75 -1.75 3.0625 0.644 7
4 3.5 0.5 0.25 0.0714
6 3 3 9 3
4 3.5 0.5 0.25 0.0714
4 4.75 -0.75 0.5625 0.1184
4 5.5 -1.5 -2.25 0.4090
3 3.23 -0.23 0.0529 0.0163
4 2.38 1.62 2.6244 1.102
1 2.09 -1.09 1.1881 0.5684
3 2.38 0.62 0.3844 0.1615
2 3.23 -1.23 1.5129 0.4683
4 3.74 0.26 0.0676 0.1785
4 4.37 -0.37 0.1369 0.0313
3 3.22 -0.22 0.0484 0.0150
2 2.76 -0.76 0.5776 0.2092
3 3.22 -0.22 0.0484 0.0150
5 4.37 -0.63 0.3969 0.0908
6 5.06 -0.94 0.8836 0.1746
5 3.80 1.20 1.44 0.3789
2 2.80 -0.80 0.64 0.2285
2 2.40 0.40 0.16 0.0666
3 2.80 0.20 0.04 0.0142
4 3.80 0.20 0.04 0.0105
4 4.40 0.40 0.16 0.0363
4 2.85 1.15 1.32 0.4640
1 2.10 1.10 1.21 0.5761
1 1.80 0.80 0.64 0.3555
1 2.10 1.10 1.21 0.5761
4 2.85 1.15 1.32 0.4640
4 3.30 0.70 0.49 0.1484
10.6669
Calculated value is =10.6669 Table value at 5% is 31.4
RESULTSince calculated value is lesser than the table value the Hypothesis is accepted.

Page 149March 2014Vol.2, Special Issue
Primax International Journal of Commerce and Management Research ISSN : 2321-3604
FINDINGSMost of the respondents(25%) expressed thatmaintaining time, assignment, internal marks arethe major stress on academic demands. But someof the respondents said that exams are the majorstress on academic demandsIt is found that most of the respondents (21%)belongto category that new environment, new responsibility,friends, financial security are the environmentaldemand causing stresses. The respondents also feltthat exposure to new people ideas , exposure tonew templates also causes stress.Most of the respondents(45%) responded that beingaway from home is causing stress but some of therespondents responded does not causes stress.Most of the respondents(40%) responded thatrelationship with friends relaxes does not causesstress. since some of the respondents respondedthat it does not.Most of the respondents (28%) express thatinferiority complex, loneliness, avoided by societyare the type of stress they experience.30% of the respondents stated that they go out withfriend on free time. 23% of the respondents statedthat listening to music, 22% of the respondents arewatching TV. 15% of the respondents are playingsports.Most of the respondents responded (34%) that whenfacing problems they talk with parents, talk withfriends, praying, but some of the respondentsresponded that smoking/drinking.Most of the respondents(28%)responded (that theirrelaxing stress is competition and but otherrespondents responded suggest yoga.
SUGGESTIONSThe college students should pay attention to theirphysical and mental health and examine theiremotions at all times to avoid onset of stress-induceddepression or physical disorders. Besides, theyshould learn to understand, accept and recognizetheir limits, take a positive attitude toward gettingalong with their friends, learn to express and managetheir emotions and effectively manage their emotionsso as to develop positive relations and an optimisticview of life.In their learning process, they should cultivate anundaunted spirit. Once any stress-induced emotionarises, they should relax through an appropriatechannel, examine their own problems, and seeksolutionsIn general , the students must build a positiveoutlook and a confident self image
CONCLUSIONCollege students feel relatively more stressors in thecareer aspect In addition, colleges should providecourses on life stress coping on a regular basis toconsolidate students’ psychology and teach them howto relax themselves along with stress managementskills. Through proper education, students are able toidentify stressors, manage them, and seek support.Teachers should also assist students with inferioracademic achievement to minimize their troubles withlearning.
REFERENCES Feng, G. F. (1992). Management of Stress andLoss.Taipei: Psychological Publishing Co.,Ltd.Lazarus, R. S., and Folkman, S. (1984). Stress,Appraisal, and Coping. New York: Springer.Wang, H. C. and Ko, H. W. (1999). AdolescentPsychology. Taipei: Psychological PublishingCo., Ltd.Cheng, C. S. (1999). Life Stress of and Guidance forAdolescents. Taipei: Psychological Publishing Co.,Ltd.Johnson, L.G., Schwartz, R.A., & Bower, B.L, (2000).Managing Stress among Adult Women Students nCommunity Colleges. Community College Journalof Research and Practice, 24, 289-300.Swent, B., (2001). How Administrators Cope withStress. Theory Into Practice, 22(1), 70-73.Kibler, V.E. & Rider, M.S., (Mar 1983). Effects ofProgressive Muscle Relaxation and Music on Stressas Measured by Finger Temperature Response.Journal of Clinical Psychology, 39(2), 213-215Merrill, R., Read, C., & LeCheminant, A., (Jul 2009).The influence of religiosity on positive and negativeoutcomes associated with stress among collegestudents.Mental Health, Religion & Culture, 12(5), 501-511.Bliese, P.D. & Castro, C.A., (2000) Role clarity, workoverload, and organizational support: multilevelevidence of the importance of support. Work &Stress, 14(1), 65-73.Ratanasiripong, P., Sverduk, K., Hayashino, D., &Prince, J., (Mar 2010). Setting Up theNext Generation Biofeedback Program for Stress andAnxiety Management for College Students: A Simpleand Cost-Effective Approach. College StudentJournal, 44(1), 97-100.Lauren Bigham , Helen W. Bland , Bridget F. MeltonStress Tolerance: New Challenges For MillennialCollege Students ,Jun2012, Vol. 46 Issue 2, P.362
www.psych.uncc.eduwww.rose-hulman.eduwww.uic.edu

Page 150
ISSN : 2321-3604
March 2014Vol.2, Special Issue
Primax International Journal of Commerce and Management Research
A STUDY ON CONSUMER BEHAVIOR TOWARDS DRINKINGWATER IN TRICHY DISTRICT
1T. Priyanka 2Dr. N. Mahewari
ABSTRACTThe study of consumers helps the firms and organizations to improve their marketing strategies by understandingissues such as how the consumers think, feel, and select between different alternatives, the psychology of how theconsumer is influenced by his or her environment (e.g., culture, family, signs, media), the behavior of consumerwhile shopping or making other marketing decisions. The study analyses the consumer motivation and decisionstrategies which differ between products according to their level of importance or interest. This helps marketers inadapting and improving their marketing campaigns and marketing strategies so that they can effectively reach theconsumer. Consumer behavior is the study of individuals, groups, or organizations and the processes they use toselect, secure, and dispose of products, services, experiences, or ideas to satisfy needs and the impact that theseprocesses have on the consumer and society. World Health Organization –General Dr. Margaret Chan deliveredtwo keynotes addresses, emphasizing how safe drinking water, sanitation, and hygiene are fundamental to health,well- being, and poverty eradication. So hygienic is very important to purified drinking water company to improvetheir standards.
1 PG Research Scholar, Department of Commerce CA, St.Joseph’s College, Tiruchirapalli.2 Assistant Professor, Department of Commerce CA, St.Joseph’s College, Tiruchirapalli.
INTRODUCTION
1. The study attempts to analyze the impact of advertisingon consumer buying behavior .Market provides a keyto gain actual success only to those brands whichmatch best to the current environment i.e." imperative"which can be delivered what are the people needsand they are ready to buy at the right time withoutany delay. The study, based on an analytical approachon a survey of 200 randomly selected consumers inAgra city, examined the role played by advertising ininfluencing consumers buying behavior for Nestle,which is one of the leading nutrition, health andwellness company. Results reveal that consumersare highly influenced by advertising in their preferencefor the brand. The mean value of the consumers’preference for Nestle is 4.36 which is the highest incomparison to the various brands. The major reasonsfor this preference are its attractive advertising policyand rich quality. In this reference, the survey revealsthat TV advertisements of Nestle influence the buyingof consumers the most. The creative presentation andlanguage of TV advertisements of Nestle aresuccessful to convey Message, Emotion, Valuesystem. regarding the product. The study clearlyreveals that the advertisement has its impact on buyingbehavior of consumers. Therefore, it is advisable tocompanies to emphasize their advertisementcampaign not only to retain their market but to heightit also. The consumption of organic food has increasedexponentially over the last decade, especially inWestern economies. China has an affluent urban
middle class population.
2. The consumption of organic food has increasedexponentially over the last decade, especially inWestern economies. China has an affluent urbanmiddle class population which is increasinglyattracted to the organic food market. This researchstudy involved a large sample size of respondents infour major cities of China. Data analysis wasperformed using structural equation modeling. Thefindings revealed that Chinese consumers' buyerbehavior of organic food is influenced by thedimensions of product, associated regulations andlifestyles. The unique model developed can be usedby academicians and practitioners globally toformulate effective marketing strategies in the future.
3. “Consumer behaviour refers to the actions and decisionprocesses of people who purchase goods andservices for personal consumption.”
4. Consumer behaviour refers to “the mental andemotional processes and the observable behaviour ofconsumers during searching for, purchasing and postconsumption of a product or service”.
How consumers make decisions to spend theiravailable resources such as money, time and efforton consumption and use-related items is the subjectof consumer behaviour study. Consumer behavior hastwo aspects: the final purchase activity which is visible

Page 151March 2014Vol.2, Special Issue
Primax International Journal of Commerce and Management Research ISSN : 2321-3604
to us and the decision process which may involvethe interplay of a number of complex variables notvisible to us. In fact, purchase behavior is the endresult of a long process of consumer decision-making.
5. Kotler and Keller state that the importance of studyingconsumer buying behavior as an area of marketing isincreasing due to several factors. In order to offer anyproduct or service to the customers businesses mustunderstand their customers’ culture, social group andmany other factors. Understanding these factors helpsbusinesses to draw an effective marketing plan in orderto satisfy the needs and wants of their customers inmore efficient way. According to Kotler and Keller(2012) the consumers usually pass through the fivestages which such as problem recognition, informationsearch, evaluation of alternatives, purchase decisionand post-purchase behavior. It is of great importancefor the marketers to identify and study all these stageswell in order to better find out about the buying behaviorof their consumers
6. According to Nargunkar (2008), globalization haschanged the way the businesses operate and targettheir customers. As more and more businesses areoperating in more than one country, they need tounderstand the different cultures and characteristicsof their customers. As businesses growgeographically, their customer bases change and theneeds of customers in one country varies from theneeds of the customers in another country. Therefore,the study of consumer buying behavior is essential inorder to target all the customers in all differentgeographical areas.
7. Another factor leading to the importance of learningcustomer buying behavior is rapid advancements inthe technology. Due to the development of informationtechnologies and IT systems, learning the customerbuying behavior has become more practical and easier.It is also stated that the large and multinational
businesses are investing significantly onimprovements of their IT systems in order to betterunderstand the needs and wants of their customers.This in turn enables them to identify what and howoften their customers are purchasing Brink and Berndt
OBJECTIVE OF THE STUDY• To study the consumer behavior while purchasing.• To analyze the factors influencing purchase of
packaged drinking water.• To analyze the level of awareness and satisfaction
regarding the usage of packaged drinking wateramong the customer.
SCOPE OF THE STUDY• The main purpose of the study is to identify the level
of awareness of the consumer about purified drinkingwater.
METHODOLOGY
The research design adopted for this study has beendescriptive in nature . the data is collect throughquestionnaire by direct survey method.• Primary data:
For the time constrains researcher collected only100 samples by issuing a well structuredquestionnaire in order to elicit necessary informationwhich makes the possibility of getting therespondents options.
• Secondary data:Datas were collected from websites, journals,articles, annual report of andavar packaged drinkingwater and discussion made with the publiccustomers.
SAMPLING TECHNIQUESampling techniques used in non probability conveniencesampling. The tools used for the study is percentageanalysis and chi- square.
DATA ANALYSIS AND INTERPRETATION
Table-1 : Table showing the brands of the customers normally prefer Serial number Brands No of customers Percentage
1 Andavar 30 30% 2 King 15 15% 3 Amma 40 40% 4 Tataplus 12 12% 5 Artic 3 3%
Total 100 100%Source: Primary Data
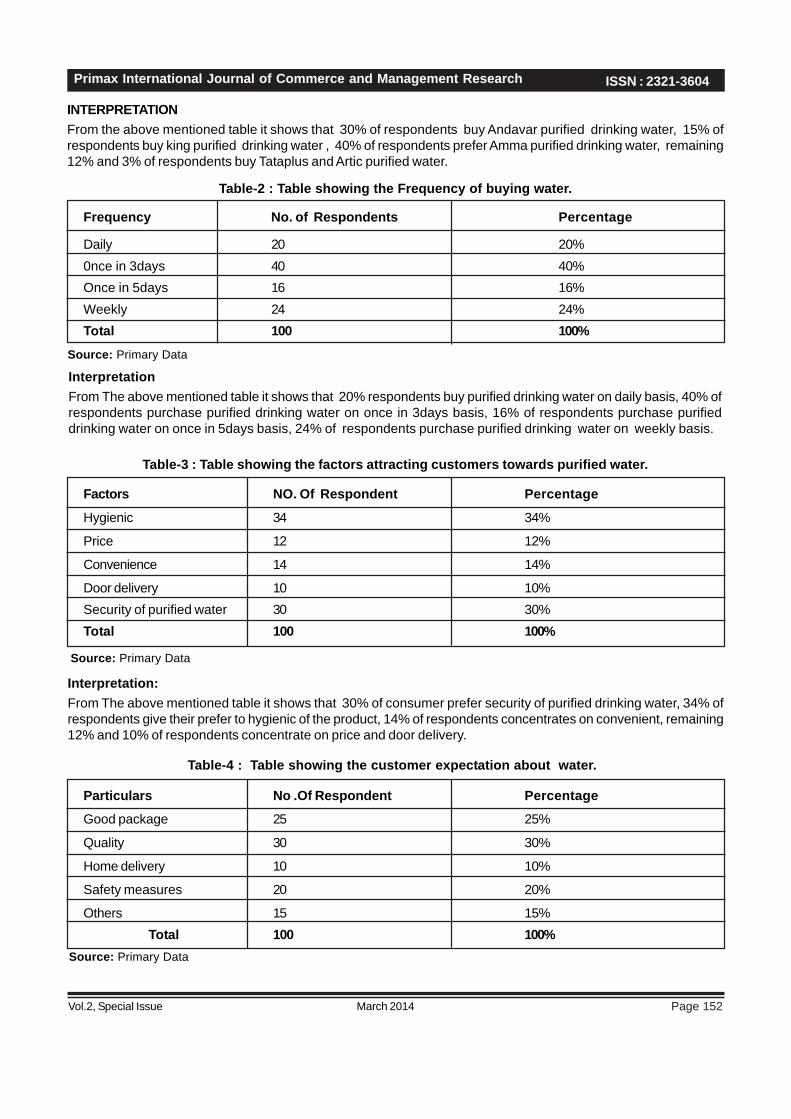
Page 152
ISSN : 2321-3604
March 2014Vol.2, Special Issue
Primax International Journal of Commerce and Management Research
INTERPRETATIONFrom the above mentioned table it shows that 30% of respondents buy Andavar purified drinking water, 15% ofrespondents buy king purified drinking water , 40% of respondents prefer Amma purified drinking water, remaining12% and 3% of respondents buy Tataplus and Artic purified water.
Table-2 : Table showing the Frequency of buying water.
Frequency No. of Respondents Percentage
Daily 20 20%0nce in 3days 40 40%Once in 5days 16 16%Weekly 24 24%Total 100 100%
Source: Primary Data
InterpretationFrom The above mentioned table it shows that 20% respondents buy purified drinking water on daily basis, 40% ofrespondents purchase purified drinking water on once in 3days basis, 16% of respondents purchase purifieddrinking water on once in 5days basis, 24% of respondents purchase purified drinking water on weekly basis.
Table-3 : Table showing the factors attracting customers towards purified water.
Factors NO. Of Respondent Percentage
Hygienic 34 34%
Price 12 12%
Convenience 14 14%
Door delivery 10 10%Security of purified water 30 30%Total 100 100%
Source: Primary Data
Interpretation:From The above mentioned table it shows that 30% of consumer prefer security of purified drinking water, 34% ofrespondents give their prefer to hygienic of the product, 14% of respondents concentrates on convenient, remaining12% and 10% of respondents concentrate on price and door delivery.
Table-4 : Table showing the customer expectation about water.
Particulars No .Of Respondent Percentage
Good package 25 25%
Quality 30 30%
Home delivery 10 10%
Safety measures 20 20%
Others 15 15% Total 100 100%
Source: Primary Data

Page 153March 2014Vol.2, Special Issue
Primax International Journal of Commerce and Management Research ISSN : 2321-3604
Table-5 : Table showing factors that the customer’s are satisfied.
Factors No Of Respondent Percentage
Price 15 15%
Quality & quantity 10 10%
Customers service 40 40%
Door delivery 15 15%
Package 20 20%
Total 100 100%Source: Primary Data
Interpretation:From the above mentioned table it shows that 15% of respondents satisfied on price, 10% of respondents aresatisfied with quality & quantity of water and 40% of respondents are satisfied on customer service, 15% ofrespondents satisfied on door delivery remaining 20% of respondents satisfied on water packaged system.
Table-6 : Table showing the annual income of customers
INCOME PER ANNAM No. of Respondent PercentageMore then 1,00,000 29 29%
1,00,000-1,50,000 35 35%
1,50,000-2,00,000 20 20%
Above 2,00,000 16 16%
Total 100 100%Source: Primary DataInterpretation:From the above mentioned table it shows that 29% of respondents get 1,00,000 as their income Per Annam , 35%of respondents get Rs.1,00,000 to 1,500,000 as their income Per Annam, 20% of respondents get Rs.1,50,000 to2,00,000 as their income Per Annam, 16% of respondents getRs.2,00,000 as their income Per Annam.
Table-7 : Table showing the amount spent on water:
Source: Primary Data
Amount No of respondent Percentage
Less than 500 35 35%
500-1000 54 54%Above 1000 11 11%
Total 100 100%
Interpretation:From the above mentioned table it shows that 35% of respondents spend Rs.500 on water, 54% of respondentsspend Rs.1000 on water, 11% of respondents spend Rs. above 1000 on water.

Page 154
ISSN : 2321-3604
March 2014Vol.2, Special Issue
Primax International Journal of Commerce and Management Research
Table - 8: The awareness of purified water:
Source: Primary Data
Particulars No of Respondent Percentage
Yes 90 90%
No 10 10%
Total 100 100%
Interpretation :From the above mentioned table it shows that 90% of respondents are aware about purified drinking water and 10%of respondents are not aware about purified drinking water.
Table-9: The way that customers came to know purified water
Particulars NO Of Respondents Percentage
Advertisement 69 69%
Magazines 6 6%
Friends 10 10%
Neighbors 15 15%
Total 100 100%
Source: Primary Data
Interpretation:From the above mentioned table it shows that 69% of respondents get awareness through advertisement, 6% ofrespondents get awareness through reading magazines, 10% of respondents get information from friends, 15% ofrespondents get awareness through neighbors.
Table-10: Table showing usual purchase place of the water:
Places No of Respondent PercentageBus stand 33 33%
Shopping malls 3 3%
Exhibition 24 24%
Hotels 25 25%
Theatres 15 15%Total 100 100%
Source: Primary Data
From the above mentioned table it shows that 33% of respondents purchase purified drinking water in bus standwhile travelling, 3% of respondents purchase purified drinking water in shopping malls, 24%of respondentspurchase purified drinking water inn exhibition, 25% of respondents purchase purified drinking water in hotels ,remaining 15%of respondents purchase purified drinking water in theatres.

Page 155March 2014Vol.2, Special Issue
Primax International Journal of Commerce and Management Research ISSN : 2321-3604
Table-11 : Table showing the reasons for purchasing purified water:
Reasons No of respondent PercentageHealth 22 22%
Hygienic 26 26%
Quality 10 10%
Price 30 30%
Convenience 12 12%
Total 100 100%Source: Primary Data
Interpretation:From the above mentioned table it shows that 22% of respondents consider health is reason for purchase purifieddrinking water, 26% of respondents consider hygienic reason for purchase purified drinking water, 10% of respondentsconsider quality is a reason for purchase purified drinking water, 30% of respondents consider price is a reason forpurchasing purified drinking water, 12% of respondents consider convenience is a reason for purchase purifieddrinking water.
Table-12 : Showing the factor to the verified awareness before using purified waterAwareness No. of respondents Percentage
Data manufacturingAnd expiry date 35 35%
Clean dispenser 15 15%
Seale pack 11 10%
Receipt of purchase water 30 30%
Crush the bottle after use 9 10%
Total 100 100%Source: Primary Data
Interpretation:From above mentioned table it shows that 35% of respondents having awareness about date manufacturing andexpiry date before using purified drinking water, 15% of respondents having awareness about clean dispenserbefore using purified drinking water, 11% of respondents verified the sealed pack before using purified drinkingwater, 30% of respondents verified Receipt of purchase water before using purified drinking water, 9% of respondentshave knowledge about crush the bottle after use.
HYPOTHESIS-1 : There is no relationship between income & average amount spent on water:Chi-square test
O E (O-E) (O-E)2 (O-E)2/E
8 6.09 1.91 3.6481 0.5990
18 15.66 2.34 5.4756 0.3496
3 7.25 -4.25 18.0625 2.4913
8 7.35 0.65 0.4225 0.05748
17 18.9 -1.9 3.61 0.01910
10 8.75 1.25 1.5625 0.1285m

Page 156
ISSN : 2321-3604
March 2014Vol.2, Special Issue
Primax International Journal of Commerce and Management Research
4 4.2 -0.2 0.04 9.5288
9 10.8 -1.8 3.24 6.3
7 5 2 4 0.8
1 3.36 -2.36 5.5696 1.6576
10 8.64 1.36 1.8496 0.2140
5 4 1 2 0.5
Total 16.8622
Degrees of freedom: = (c-1) (r-1) =(3-1) (4-1) =2.3=6Result:Table value 12.592 is less than the calculated value 16.8622 so the hypothesis.
HYPOTHESIS-2 : There is a close relationship between annual income and frequency of purchasing:Chi-square test
0 E O-E (O-E)2 (0-E)
2/E
7 5.8 1.2 1.44 0.2482
12 11.6 .4 .16 0.0138
4 4.64 -0.64 .4096 0.0883
6 6.96 -0.96 .9216 0.1324
9 7 2 4 0.5714
18 14 4 16 1.1429
3 5.6 -2.6 6.76 1.2071
5 8.4 -3.4 11.56 1.3761
2 0.4 1.6 2.56 6.4
6 8 -2 4 0.5
4 3.2 .8 0.64 0.2
8 4.8 3.2 10.24 2.1333
2 3.2 -2.1 1.44 0.45
4 6.4 -2.4 5.76 0.9
5 2.56 2.44 5.9536 2.3256
5 3.84 1.16 1.3456 0.3504
Total 18.0395
Degree of freedom: =(c-1) (r-1) =(4-1) (4-1) =3*3=9Result:Table value 16.9 is less than the calculated value is 18.0395, the research hypothesis is rejected and null hypothesisis accepted.
FINDINGS• 40% of respondents purchase packaged drinking water, 40% of respondents buy purified drinking water, 3%
of respondents purchase purified drinking water.• 40% of respondents purchase purified drinking water on once in 3days, 16% of respondents purchase
purified drinking water on once in 5 days.

Page 157March 2014Vol.2, Special Issue
Primax International Journal of Commerce and Management Research ISSN : 2321-3604
• 34% or respondents attracted by hygienic, 10% orrespondents attracted by door delivery
• 30% of respondents expect the quality from purifieddrinking water company, 10% of respondents expectthe home delivery for their convenience.
• 40% of respondents satisfied on customer serviceproduct, but only 10% of respondents satisfied onquality and quantity.
• 35% of respondents get Rs.1,00,000 to 1,50,000 astheir income per annam, 16% of respondents getRs. above 2,00,000 as their income per annam.
• 54% of respondents spend Rs.1000 on water, 11%ofrespondents spend Rs. Above 1000 on water.
• 90% of respondents aware about purified drinkingwater, 10% of respondents aware about purifieddrinking water.
• 69% of respondents get awareness throughadvertisement, 60% of respondents get awarenessthrough reading magazines.
• 33% of respondents purchase purified drinking waterin bus stand while travelling, 3% of respondentspurchase purified drinking water in shopping malls.
• 30% of respondents consider price is a reason forpurchase purified drinking water, only 10% ofrespondents consider quality is a reason for purchasepurified drinking water.
• 35% of respondents verified the date of manufacturingand date of expiry before using purified drinking water,only 10% of respondents verified crush the bottleafter use.
SUGGESTIONS• As the drinking water is very essential, the
manufacturing should concentrate on the factors ofquality, so that the proposition of buying packageddrinking water will get increase.
• The water is sourced by the manufactures by thenearby rivers and wells; hence proper water treatmenthas to be made.
• The aspect of quality has been always the influencingfactor on purchase. Consumer always prefer thequality of purified water for consumption, somanufactures should maintain quality to convert theconsumer into customer.
• The usage of packaged drinking water has madesignificant impact on the minds of normal man andbusiness class people; hence care should be takento ensure to preserve the color, taste and necessarynutrients in the packaged drinking water.
CONCLUSIONThe advent of packaged drinking water has gainedpopularity in many of the corporate, living rooms and inflats. Medical practitioners also suggest common publicto drinking purified waters to ensure good physical andmental health. If proper plans, strategies are made;there will be an absolute tapping of market can be madeenhancing a positive attitude on the minds of commonpublic.
REFERENCES1. Author, Dr. N. Naveen kumar, Dr. vijay kumar
Gangal, Kirti singh. International Journal of researchin commerce and management, ADVERTISINGAND CONSUMER BUYING BEHAVIOR.
2. Author(s), Chen, Yue. Article, publication year-2012.3. Author, Peter D. Bennett, ed.” Dictionary of
Marketing Terms” 2nd ed.1995.4. Author, James F. Engel, Roger D. Blackwell and
Paulw- Minjard. “CONSUMER BEHAVIOR”(1990).5. Author, Kotler p. and keller, k.(2011),” MARKETING
MANAGEMENT”, LONDON.6. Author, Nargundkar R.” MARKETING RESEARCH:
TEXT AND CASE”, Tata McGraw-Hill Education,publication year(2008).
7. Author, Brink, A. S.Berndt , A.” RELATIONSHIPMARKETING AND CUSTOMER RELATIONSHIPMANAGEMENT” , publication year-2009.

Page 158
ISSN : 2321-3604
March 2014Vol.2, Special Issue
Primax International Journal of Commerce and Management Research
A STUDY ON INTERNET MARKETING RESEARCH: OPPORTUNITIESAND PROBLEMS
1M.G. Saranya 2Prof. A. Hendry Ruban
ABSTRACTThe Internet is promised a brilliant future among the favourite tools of marketing researchers. Develops a typology ofInternet marketing surveys showing the existence of eight different designs that can be used by marketers. However,researchers who plan to develop research using the Internet need to be aware of several problems related to this newtool. In particular we show that the nature of the Internet creates different sampling problems. To identify these problems,a seven-step procedure following the steps of the sampling process is proposed.
IntroductionThe Internet as a marketing research tool is relativelynew and marketing researchers need to learn how touse it. In this paper we develop a framework to helpresearchers to identify potential opportunities andproblems related to the use of the Internet for theirmarketing research.
We organize our discussion around three importantthemes facing any researcher:(1) Survey design.
(2) Sampling; and(3) Field workWe first develop a typology of Internet marketing surveydesigns based on the different combinations of theobjectives of the survey, the selected sampling unit, andthe data collection method to be used. The result of thiscombination leads us to discuss eight different designs.We then develop a seven-step methodology to identifythe potential problems related to sampling and discussspecific problems with the fact the Internet is everchanging. Fieldwork problems are finally presented witha focus on the format of the questionnaire, the use ofsearch engines to obtain a frame and problems relatedto the sampling units.
ObjectivesTo know difficulties to do internet marketing research.
To develop a typology of Internet marketing surveydesigns that can be used my marketers.
To identify opportunities and problems.To know format of the questionnaire.
To identify the problems during survey.
A typology of Internet marketing survey designsThe first question to be asked by a marketer planning touse the Internet for its research is: what do I want to do?
What are the objectives of the research? Many differenttypes of research may be conducted through the Internetor with the help of the Internet. Atypology of Internet marketing research designs may beconstructed around three dimensions:(1) The objectives of the survey;
(2) The sampling units; and(3) The data collection method.The next paragraphs discuss these three dimensionsand their content. We then present eight differentresearch designs based on the combination of thesethree dimensions.
Objectives of the surveyMarketing researchers may use the Internet to meetthree different types of research objectives:(1) They can study how the Internet is used as a
marketing tool;
(2) They can use the Internet as an alternative mediumfor traditional questionnaire surveys; or
(3) They can use the Internet to study Internet consumerbehaviours.
The use of the Internet pertains to studies of the wayfirms use the Internet as a marketing tool. Pitts petal(1996) noticed that Web sites have been used to achievethe objectives of a number of marketing strategies, forexamples to:
Gain access to previously unknown or inaccessiblebuying influences;
Project a favourable corporate image;
Provide product information;Foster and encourage consumer involvement withthe product range;Generate qualified leads for sales people;
1 PG Research Scholar, Department of Commerce CA, St.Joseph’s College, Tiruchirapalli.2Assistant Professor, Department of Commerce CA, St.Joseph’s College, Tiruchirapalli

Page 159March 2014Vol.2, Special Issue
Primax International Journal of Commerce and Management Research ISSN : 2321-3604
Handle customer complaints, queries andsuggestions; and
Serve as an electronic couponing device.
Internet marketing research may be used to study theeffectiveness of these uses of the Internet.
The Internet could also be used to perform traditionalquestionnaire surveys. Except for technical particularities,there are no real differences between Internetquestionnaires and traditional mail or phonequestionnaires. The advantage of the Internet is that itcan offer a richer support for the questionnaire and italso allows data to be recorded automatically (which isa very important advantage). Internet questionnairesurveys could be used to investigate any traditionalmarketing research question ranging from firms’marketing strategies and policies to consumerbehaviours.
The third type of marketing objectives that could bereached by an Internet marketing survey is the study ofInternet marketing survey is the study of Internetconsumer behaviours, for example understanding howconsumers shop in cyberspace and why they do whatthey do. Internet consumption includes:• Gathering information passively via exposure to
advertising;• Shopping, which includes both browsing and
deliberate information search; and• The selection and buying of specific goods, services,
and information.These kinds of surveys are concerned about howconsumers use the Internet, how they navigate, how theybuy on the Internet, etc. Customer satisfaction relatedto Web sites could also be studied in the same way.
Sampling unitsThree different sampling units could be used in an internetmarketing survey:1) Web pages;2) Web sites; and
3) Internet users.A sample of web pages could be drawn to survey thedesign, the content, the advertising space on thesepages, or the time these pages remain unchanged, butalso the number of visitors that a page has or the timevisitors spend on a particular page. A sample of websites could be drawn to survey firms’ Internetcommunication and marketing strategies, the structureof a site, etc. Finally, a sample of Internet users couldbe drawn to study their general Internet behaviour, ortheir behaviour toward a particular web site or page. A
sample of Internet users could also be drawn to askthem to fill in an Internet questionnaire or to send then aquestionnaire by e-mail. These questionnaires may berelated to their Internet usage but not necessarily.
Data collection methodsThe third dimension of our typology of Internet marketingsurvey designs is related to the data collection methods.Three different methods may be used:I. Direct observation;
II. A questionnaire; or
III. An experiment.The direct observation of the content of a web site orpage could either be done by the researchers or asample of users. This method may be used to collectobjective data such as the number of advertisementson a page or the existence of frames or the number oflinks inside a particular page; or to collect subjectivedata such as the satisfaction of users or their reactionto the content or design of a web page.Four kinds of format could be used for Internetquestionnaire surveys:
Web sites questionnaires;
E-mail questionnaires;Text formatted forms sent by e-mail as an attachedfile; orDownloadable text formatted form posted at adesigned ftp which can be returned by mail or fax.
Except for technical issues, there are no real differencesbetween these forms of questionnaire and the traditionalquestionnaires by mail or by phone.An experiment can be conducted by the creation of anexperimental web site and by studying users’ behaviorstowards some manipulated changes in the site. Thecontent, the design, and/or the navigation flow may bemanipulated to identify their effect on consumerbehaviors.
Eight different designsEight different research designs may result from thecombination of these three dimensions.(1) The first and easiest design is to draw a sample of
web pages after the researchers have observed thecontent of the pages selected. This design may beused to study the use of the Internet as a marketingtool, especially the content of a page in terms ofimage or advertisement.
(2) A second design is to draw a sample of web pagesby a two-stage sampling procedure. The first stateconsists of drawing a sample of web sites and the

Page 160
ISSN : 2321-3604
March 2014Vol.2, Special Issue
Primax International Journal of Commerce and Management Research
second stage of drawing a sample of pages amongthe selected sites. This design allows theresearchers to control the representativity of thesample in terms of types of site. With this design,non-commercial sites could, for example, beeasily excluded from the sample. Observation mayalso be used to study the usage of the Internet as amarketing tool.
(3) A sample of web sites may also be drawn to studythe use of the Internet as a marketing tool byobservation but at a level higher than the web page.Compared with the previous design, this allows theresearcher to study the structure of a site. Use asimilar design to develop a typology of Internetretailers.
(4) In the previous two designs, the researchers werethe observers, but to study some subjectivecharacteristics of web site the observation couldbetter be done by a sample of customers. In thiscase two samples need to be drawn: first, a sampleof customers and then a second sample of web sitesor pages. This design may also be used to studythe use of the Internet as a marketing tool.
(5) A sample of web sites could also be drawn to obtainthe address of firms and/or the name of managers.Then a questionnaire could be sent to these firms ormanagers. This design is particularly interesting fortwo main reasons: first, before sending aquestionnaire, some characteristics of the firms tobe sampled could be checked to be sure that thesefirms belong effectively to the population to bestudied; second, web sites can offer to theresearchers information is not listed anywhere else,for example, an e-mail address.
(6) Instead of drawing a sample of sites, a sample ofInternet users could be drawn to send them aquestionnaire by e-mail or to send them to an Internetaddress where is located .A similar design couldalso be used by comely (1996) to investigate theuse of the internet as a data collection method. Butthis design could also be used in various differentquestionnaire surveys related or not to the internet.
(7) A sample of web sites and a sample of internet userscould also be drawn . the internet users are askedto visit selected web sites and to fill in a questionnaireconcerning their experience with the selected web
sites. Unlike the design where only the users aresampled, this design allows the researchers tocontrol which sites are visited by the internet users.
(8) An experimental design could also be used for aninternet marketing survey. An experimental designcould also be used for an internet marketing survey.An experimental web sites may be designed and asample of internet users could be drawn and askedto visit the site. Their behaviours could be studiedafter modifications of some characteristics of thesite, such as its content, visual design, or its navigational design.
Survey sampling problemsAfter having reviewed the different survey designspossible for an Internet marketing research survey andbefore presenting the practical problems of such surveys,we have to discuss the problems related to sampling.These problems are among the most difficult in the caseof Internet surveys and actually some of these are notyet completely resolved. The evolving nature of theInternet is the source of most of the problems related toselection of a probabilistic sample.
Moving universeAmong the more delicate sampling problems related withInternet survey is the fact that the Internet is a movinguniverse. The universe is the total group to be studied; itis the grand total of what is being measured. It must bedefined so clearly that one will have no difficulty indeciding which unit belongs to it. But the Internet ismoving, growing dramatically; many new sites are bornevery day and some others disappear. Consequently,the sampling universe changes every day and it isimpossible to know the probability of selection assignedto each possible sample. If at a point of time thisprobability could be known, it could not be for a periodof time. This leads to some problems of generalization.The results obtained from a survey at one point of timecould only be generalized for this point of time. Andproblems are equally important for surveys that last fora period of time. The only solution to these problems ofa moving universe is to substitute static indicators fordynamic ones and by surveying in several points of time.
Frame in a moving universe:A second important problem related with the internet isthe choice of a sampling frame. A sampling frame is thelist from which the sample will be the selected. Butresulting from the continuous births and death of websites, there is a difficulty in finding a sampling frame isrepresentation of the universe could be defined, that isnot the case for the frame. No frame is perfect but, with

Page 161March 2014Vol.2, Special Issue
Primax International Journal of Commerce and Management Research ISSN : 2321-3604
the Internet, the problem is particularly acute. Somesearch engines could be used to obtain lists of web sites,but the results of the survey could only be applied tothese lists. One solution to improve the validity of theresults is to evaluate the “representatively” of the frame.This can be done by the comparison of the sampledframe with other frames.
Field work problemsOnce the survey design has been defined, and once asample has been drawn, some practical problemssubsist. Among these problems, the most important are:1. The format of the questionnaire;2. The use of research engines to obtain a frame; and
3. Problems related to the sampling units.
Formats for the questionnaireThree kinds of formats could be used for thesequestionnaires:i) Web site questionnaires;ii) E-mail questionnaires; and
iii) Text form sent by e-mail as an attached file.Each one of these formats has some problems.
ConclusionThe Internet is a formidable tool for marketingresearchers, which offers many opportunities; howeverit also has several difficulties. In this paper, we attempted
to map the difficulties which lie on the road of the Internetmarketing researcher. We first developed a typology ofInternet marketing survey design, which proposes eightdifferent designs based on the objectives of theresearchers, the sampling unit, and the data collectionmethod. The second part of the paper identified, followingthe seven steps of the sampling process, the problemsrelated to sampling the Internet. Finally, we presentedsome practical problems in conducting research on theInternet.
ReferencesComley, P. (1996), The Use of the Internet as a DataCollection Method, SGA Market Research, http://sga.co.uk/esomar.htmlDeming, W.E. (1950), Some Theory of Sampling, Wiley,New York, NY.Fontenot, R.J. and Vlosky, R.P. (1998), “Exploratorystudy of Internet buyer-seller relationships”, paperpresented at the AMA Winter Educators’ Conference.Griffith, D.A. and Krampf, R.F. (1998), “An examinationof retail Web-sites: the impact of the retail marketingmix on consumer attitude”, paper presented at the AMAWinter Educators’ conference.

Page 162
ISSN : 2321-3604
March 2014Vol.2, Special Issue
Primax International Journal of Commerce and Management Research
A study on performance Appraisal and services of Government Hospital inTrichy
1Palanichamy.S 2Dr A Francis Vijayakumar
Abstract:Health care professional are becoming more involved in performance management as hospital restructure to increaseeffectiveness. Although they are hospital employees, they are subject to performance appraisals because the hospitalsare accountable to patients and the community for the quality of hospital services. The purpose of having a performanceappraisal program in hospital is to monitor employee’s performance, motivate staff and improve hospital moral. TheBritish association of medical man, agers has defined appraisal as “the process of periodically reviewing one’sperformance against the various elements of one’s job”. This paper will aim to describe the purpose & development ofan appraisal and service of government hospital in Trichy.
IntroductionServices marketing is a sub field of marketing whichcovers the marketing of both goods and services. Goodsmarketing include the marketing of fast moving consumergoods (FMCG) and durables. Services marketingtypically refer to the marketing of both business toconsumer (B2C) and business to business (B2B)services. Common examples of service marketing arefound in telecommunications, air travel, health care,financial services, all types of hospitality services, carrental services, and professional services.
A service, according to Vargo and Lusch (2004), is ‘theapplication of specialized competences (knowledge andskills) through deeds, processes, and performances forthe benefit of another entity or the entityitself. Services are economic activities, rather thantangible products, offered by one party to another.Rendering a service to recipients, objects, or otherassets depends on a time-sensitive performance to bringabout the desired result. In exchange for money, time,and effort, service customers expect value from accessto goods, labor, professional skills, facilities, networks,and systems; but they do not normally take ownershipof any of the physical elements involved.The promotion of economic activities offered bya business to its clients. Service marketing might includethe process of selling telecommunications, health treatment, financial, hospitality, car rental,air travel, and professional services. “Activities, benefits and satisfactions, which are offeredfor sale or are provided in connection with the sale ofgoods” (American Marketing Association, Committee ofDefinitions 1960)
Definitions “Services include all economic activities whose outputis not a physical product or construction, is generallyconsumed at the time it is produced, and provides addedvalue in forms (such as convenience, amusement,timeliness, comfort or health) that are essentiallyintangible concerns of its first purchaser” (Quinn, Baruchand Paquette, 1987)
Hospital Services There is a large network of public hospitals and nursingposts spread across the State to provide accessiblehealth care to all communities. There are also hospitalsupport services and palliative care facilities.
HospitalsHospitals provide a broad range of in-patient and out-patient health care services to match the needs of thecommunity.
In-Patient ServicesIn-patient services include medical, surgical, paediatric,obstetric and rehabilitation services. Many hospitals alsoprovide mental health services and services for olderpeople
Out-Patient ServicesMost hospitals provide out-patient services includingemergency services, day procedures, diagnostic andassessment services, and therapy services. Hospitalsalso support various community based programs toprevent or reduce the need for hospitalisation.
Public hospitalA public hospital or government hospital isa hospital which is owned by a government and receivesgovernment funding. This type of hospital provides
1 Research Scholar, Department of Commerce CA, St. Joseph’s college, Trichy.2 Assistant Professor, Department of Commerce, St. Joseph’s college, Trichy

Page 163March 2014Vol.2, Special Issue
Primax International Journal of Commerce and Management Research ISSN : 2321-3604
medical care free of charge, the cost of which is covered by the funding the hospital receives
Hospital services Definition Hospital services is a term that refers to medical and surgical services and the supporting laboratories, equipmentand personnel that make up the medical and surgical mission of a hospital or hospital system.
PurposeHospital services make up the core of a hospital’s offerings. They are often shaped by the needs or wishes of itsmajor users to make the hospital a one-stop or core institution of its local community or medical network. Hospitalsare institutions comprising basic services and personnel—usually departments of medicine and surgery—thatadminister clinical and other services for specific diseases and conditions, as well as emergency services. Hospitalservices cover a range of medical offerings from basic health care necessities or training and research for majormedical school centers to services designed by an industry-owned network of such institutions as health maintenanceorganizations (HMOs). The mix of services that a hospital may offer depends almost entirely upon its basic mission(s)or objective(s).
ObjectivesTo find out the awareness among the people those who need the specified treatment in the hospitalTo study the doctors specialty in Government hospitalTo analyze the level of service provided by government hospital and how far the patients assess the quality ofthe service. To analyze the facility involved in government hospitalTo study the public perception towards the performance of government hospital.
ScopeThis study is about to get the information why people choose the Government hospitalTo know the opinion of an individual patient about how doctors treatment in Government hospital.
LimitationShort period is limited 2 weeks
Research MethodologyThe sample size of user has been fixed arbitrarily as 100. By adopting convenience sample technique 100 Respondentswere contacted to identify their awareness. Reasonable care has been taken to include all type of visitors to thehospital.
Research InstrumentThe research tool used for collections data from the respondents is questionnaire. Questions were so drafted tocollect all required and relevant information for the study. The answer of the respondents were analyzed and usedin appropriate places in the report.
Data Analysis Analysis included data into simple ones regrouping rearranging the figure give in data and find out ratio andpercentage. It also consists in breaking down a complex set of facts or figure into simple element. It establishes arelationship between various amounts mentioned in data.
Data InterpretationIt consists in explaining the real significance of simplified analysis of data. The interpret means to put the meaningof data into simple terms of the benefit of a person. Interpretation is a mental process based on analysis andcriticism. Interpretation is not possible without analysis and without interpretation analysis has no value. Analysis and interpretation act as a bridge between arts of recording.
ToolsHere to calculate the performance appraisal and services of the government hospital the simple percentage methodis used.

Page 164
ISSN : 2321-3604
March 2014Vol.2, Special Issue
Primax International Journal of Commerce and Management Research
TABLEGeneral profile of the Respondent
FindingsThe field of study is undertaken with the prime object of knowing the awareness of the patients and the public, aboutthe facilities provided by the Government Hospital, Trichy. The following points were found after the study.
10% of the patients are aged below 20. 20% of the patients are aged between 20 to 30.30% patients are aged 30to 40.40% of the patients are aged above 40.So people are mostly going to hospital to take treatment that is 50%. To see ailing relation it accounts 30% and forother reason only 20%.In this 60 of staffs work during morning. 20% of staff work in the evening and only 20 of staffs work during the night.
Particular ClassificationNo.of
Respondent Percentage
Age Below 20 10 10
20 to 30 20 20
30 to 40 30 30
Above 40 40 40
Reason for coming hospital Take treatment 50 50
To see ailing relations 30 30
Others reason 20 20
Official working hours Morning 60 60
Evening 20 20
Night 20 20
Hospita l issuing ambulance for the place Needed at a correct time Yes 60 60
No 40 40
Facilities available in this hospital Bed facility 50 50
Modern equipment 10 10
Surgical facilities 20 20
Emergency treatment 20 20
Doctors are well trained in th eir field Yes 20 20
No 70 70
Sometimes 10 10
Medicines prescribed by the doctors areProvided in the hospital Yes 50 50
No 30 30
Sometimes 20 20
Insurance policy allowed by governmentHospital was very useful for public Yes 70 70
No 30 30
Satisfied with the facilities provided for the Inpatient in government hospital
Yes 50 50
No 30 30
Sometimes 20 20

Page 165March 2014Vol.2, Special Issue
Primax International Journal of Commerce and Management Research ISSN : 2321-3604
This table clearly explains that 60 of people said ambulances are available. 40% said no to this and 24% havereplied as sometimes.Here regarding facilities 50% had said bed facilities are available in GH, 10% had said modern facilities are availablein GH , 20% had said surgical facilities are available and finally 20% had said emergency treatment are availablein GH. 20% have said that doctors are really well trained in their field. 20% have said no for this and 10% have voted assometimes for this question.Regarding whether Medicines prescribed by Doctors are available in Market, 50% have replied yes, 30% havereplied No and 20% have replied sometimes.70% of the people had said yes for the availability of insurance policy in GH and 30% had said no for the availabilityof insurance policy in GH.50% of the people are satisfied with the facilities provided by the GH and 30% are not satisfied with the facilitiesprovided by the GH and finally 20% of the people are satisfied sometimes only.
ConclusionThe training period was very beneficial. It is a good golden opportunity for me. Adequate knowledge has beengained in various fields. The experience and knowledge gained during this period is very helpful. It gives the practicalexperience to the candidate. The co-operation of the respondents has enabled me to gain more knowledge and hasprovided experience in handling all the theoretical and practical aspects in day to day problems.The field study will be useful for in all my future careers.
Referencea. http://www.aueb.gr/users/esaopa/courses/part2.pdfb. http://en.wikipedia.org/wiki/Services_marketingc. http://www.businessdictionary.com/definition/service-marketing.htmld. http://www.health.wa.gov.au/services/category.cfm?Topic_ID=2e. http://en.wikipedia.org/wiki/Public_hospitalf. http://www.surgeryencyclopedia.com/Fi-La/Hospital-Services.htmlg. “Activities of Tamil Nadu Health System Project”h. “Tuber Clusis “-Tamil Nadu Governmenti. www.tngov.in

Page 166
ISSN : 2321-3604
March 2014Vol.2, Special Issue
Primax International Journal of Commerce and Management Research
THE STUDY OF MARKET POTENTIAL AND CUSTOMER PREFERENCESOF SPENCER RETAIL PRIVATE LIMITED IN TIRUCHIRAPPALLI
DISTRICT1Robert nelson.J 2 Dr. Francis Vijayakumar.A
ABSTRACTThe Indian retail industry is now beginning to evolve in the line with the transformation that has swept other largeeconomies. It witnesses tremendous growth with the changing demographics and an improvement in the quality of lifeof urban people. The growing affluence of India’s consuming class, the emergence of the new breed of entrepreneursand a flood of imported products in the food and grocery space, has driven the current retail boom in the domesticmarket.
The concept retail which includes the shopkeeper to customer interaction, has taken many forms and dimensions, fromthe traditional retail outlet and street local market shops to upscale multi brand outlets, especially stores or departmentalstores. Though at this moment, it is still premature to say that the Indian retail market will replicate the success storiesof names such as Wal-Mart stores, Sainsbury and Tesco but at least the winds are blowing in the direction of growth.
INTRODUCTION“Retailing is a distinct, diverse and dynamic sector”. “Itis an activity of enormous economic significance to mostdeveloped nations”. It generates revenue and wealth fornation, encourages investments and brings technologicaladvancements. Stated that “it bring the employment andcreates wealth of the economy”. “It is a vibrant part ofour changing society and a major source of employment”Retailing performs activities at larger level so it requiresmassive manpower to handle and manage its operations.Retailing also helps society in general by providing goodsand services in reasonable price and increasing theirstandards of living. “Retailing activity can be viewed asa significant contributor to the economy in general”.Retailing is the set of activities that markets products orservices to final consumers for their own personal orhousehold use. It does this by organizing their availabilityon a relatively large scale and supplying them toconsumers on a relatively small scale.” Retailing makesproducts and services available in large quantities.Retailers produce or order the products/services in bulkso they can take advantage of economy of scale andthus they can formulate competitive pricing strategies.Products and services are generally sold through thestore or on the internet.
Retailing- ‘Customer is king’“A customer is the most important visitor on ourpremises. He is not dependent on us. We aredependent on him. He is not an indirection on ourwork. He is the purpose of it. He is not an outside ofour business. He is the part of it and we are not
doing him a favour by servicing him. He is doing usa favour by giving as an opportunity to do so”.Source: Mahatma Gandhi.The word retail has its origin in French word retailer andmeans “to cut a piece off” or “to break bulk”. The termretailing defined as “all activities involved in selling goodand services directly to final consumer for their personaland non-business use”. In simple terms, it implies a first-hand transaction with customer.
DefinitionThe word retailing has its origins in the French verb „retailer, which means “to cut up”, and refers to one of thefundamental retailing activities which is to buy in largerquantities and sell in smaller quantities. For example, aconvenience store would buy tins of beans in units oftwo dozen boxes, but sell in single-tin units. However, aretailer is not the only type of business entity to ‘breakbulk’. Wholesalers also buy in larger quantities and sellto their customers in smaller quantities. It is the type ofcustomer, rather than the activity, that distinguishes aretailer from other distributive traders; the distinction beingthat a retailer sells to final consumers, unlike a wholesalerwho sells to a retailer or other business organizations.
A generally accepted definition of a retailer is ‘anyestablishment engaged in selling merchandise forpersonal or household consumption and renderingservices incidental to the sale of such goods’. There are,however, many businesses that carry out retailing activitythat are not in themselves classified as retailers. Forexample, a factory may engage in retailing activity byselling ‘seconds’ quality goods in the shop attached to
1Research Scholar, Department of Commerce CA, St. Joseph’s college, Trichy.2 Assistant Professor, Department of Commerce, St. Joseph’s college, Trichy

Page 167March 2014Vol.2, Special Issue
Primax International Journal of Commerce and Management Research ISSN : 2321-3604
its manufacturing premises. In the UK, a retailer is only classified as such for government reporting if the businessgains over half of its income from selling to the final consumer. The term retailing applies not only to the selling oftangibleProducts like loaves of bread or pairs of shoes, but also to the selling of service products. Companies who providemeals, haircuts and aromatherapy sessions are all essentially retailers, as they sell to the final consumer, and yetcustomers do not take goods away from these retailers in a carrier bag. The consumption of the service offeringcoincides with the retailing activity itself.
Objective of the studyØ To study about the perception of customers with reference to availability of product and service in supermarket’s/
Spencer’sØ To study about customer preferences and frequency of shoppingØ To understand the customer expectation form retail service provider.Ø To know the target customer’s of Spencer’s retail store.
Scope of the study:Ø Retail sector is divided in to 2 part- organized and unorganisedØ Over12 million outlets operate in the country and only 5% of them being larger than 500% sq ft (46m2) in size.
Organized retailing in India is projected to grow at the rate of 25-30% p.a., us estimated to grow from the US $330 billion in 2007 to US $ 427 billion by 2010 and US $ 637 billion by 2015.
Ø Retailing is emerging as a sunrise industry in India and is presently largest employer after agriculture. Someeconomists say that retailing is one of the pillars of the economy in India, and some say it is gold mine of Indianeconomy
Ø Organised retail formats prevalent globally: malls supermarkets, hypermarkets, discount stores, departmentstores, specialty stores, internet retailing convenience stores, MBO etc.
Ø The Indian retail market, which is the fifth largest retail destination globally, has been ranked the 2nd mostattractive emerging market for investment after Vietnam in the retail sector by AT Kearney’s seventh annualGlobal retail development index (GDRI), in 2008. The share of retail trade in the country’s gross domesticproduct (GDP) was between 8-10% in 2007. It is currently 12%, and is likely to research 22% by 2010.
Limitations of the study:Ø The sample size chosen is limited to 400 only because of time and financial constraint.Ø This study was based purely in Dr. A . S. Rao Nagar, Hyderabad.Ø Data collected may not be a representation of the entire population.Ø The time duration for this project was only for a period of 45 days.Ø I also took the view of respondents who don’t shop from supermarkets.Ø Information given by respondents may be correct and may not be correct.
Research methodology:Ø The study is relied on primary as well as secondary data.Ø The primary data is collected through personal interview using structured questionnaireØ The secondary is collected form management of the Spencer’s retail ltd, various books, journals and internet.
Data Analysis and interpretationTable 1
Age group No. of respondents % of respondents
18 -25 134 33.5
20 -25 152 38
36 -45 56 14
46 -55 27 6.75
55+ 31 7.75

Page 168
ISSN : 2321-3604
March 2014Vol.2, Special Issue
Primax International Journal of Commerce and Management Research
No of family and family member’s respondent
Member’s of family No. Of family % of family
1 2 0.5
2 20 5
3 42 10.5
4 123 30.75
5 138 34.5
6 54 13.5
7 15 3.75
8 4 1
9 1 0.25
10 1 0.25
Table 2
Education level of respondents
Education level No. Of respondents % of respondents
S.S.C 7 1.7 5
Inter 28 7
Graduate 215 53.75
Post graduate 138 34.5
Others 12 3
Table-4
Regular shopping of respondents
Shopping place No. Of respondents % of respondents
Supermarkets 284 71
Karan stores 45 11.25
Others 5 16.5
Supermarkets & Karan
stores 66 16.5
Table-3
Tables-5
No of respondents who Spencer’s for shopping
No. Of respondents Shop at Spencer’s % of respondents
203 Yes 50.75%
197 No 49.25%

Page 169March 2014Vol.2, Special Issue
Primax International Journal of Commerce and Management Research ISSN : 2321-3604
Finding of the study:Ø Consumer life style and spending pattern are
changing more and more customers are visitingsupermarket.
Ø Despite high footfalls, the conversion ratio has beennot good in the Spencer’s daily.
Ø More is creating intense competition beforeSpencer’s with the help of MORE @ YOUR DOOR.
Ø The other factors which attract the respondents tovarious super markets are variety of products offered,fresh products like fruits and vegetables, availabilityof dairy products, home delivery, parking facilities,accepting debit/ credit cards, fast billing, bookingcounters, customer service, courteous and friendlybehaviour and ambience.
Ø Store layout should be redesigned that a customercan have easy access to the product.
Ø People generally search for the product on offer sothe high margin product should be up fronted thatmean those item should be in the eye height so thatit easily catches the customers’ attention andgenerates impulse purchase.
Ø Spencer’s should provide better customer servicethan its competitors increase the variety ofmerchandise with deep assortment, arrangement ofproduct should be in proper way that creates goodstore image and it brings customers and works as aword of mouth marketing for attracting morecustomers. Spencer’s should also include apparelssegment in the store, should advertise throughpamphlets about various offers, provide parkingspace.
Suggestions and recommendation:Ø Customers are very eager to know about offers,
discount schemes provided by supermarket’s/Spencer’s then Spencer’s should do better promotionfor creating awareness about all offers with the helpof pamphlets, marketing gimmick using customerdatabase.
Ø Complained and feedback should be taken care inwell manner to create the loyalty and goodwill.
Ø Store layout should be redesigned that a customercan have easy access to the product.
Ø Spencer ’s should provide club Spencer ’smembership card (apart from HSBC Loyalty card),on that card one unique no. Should be there andoffer some point system on every purchase that willattract the customers, through that Spencer’s canincrease its sales.
Ø People generally search for the product on offer sothe high margin product should be up fronted thatmean those item should be in the eye height so thatit easily Catches the customer’s attention andgenerates impulse purchase.
Ø Spencer’s should provide better customer servicethan its competitor’s increase the variety ofmerchandise with deep assortment, arrangement ofproduct should be in proper way the created goodstore image and it brings customers and works as aword of mouth marketing for attracting morecustomers. Spencer’s should also include apparelssegment in the store, should advertise throughpamphlets about various offers, provide parkingspace.
Conclusion:In the organised retail market of Trichy, Spencer’s hascome up with hypermarket in the twin city, giving goodcompetition to its competitors like big bazaar and otherretail outlets. In the near future it plans to open manystores in Trichy and some stores in other part of ruralbased cities. Many more competitors has entered themarket and many are about to enter the market, makingSpencer’s journey even tougher. Hence, Spencer’s hasto take some important ste ps to overcome its problemareas and implement the suggestions before the existingand new retailers grab the opportunity making Spencer’sexistence.
Table-6
Shopping at Spencer’s in a week by respondents
No. Of times in a week No. Of respondents % of resp ondents
1 76 19
2 98 24.5
3 20 5
4 8 2
20 1 0.25
203 50.75

Page 170
ISSN : 2321-3604
March 2014Vol.2, Special Issue
Primax International Journal of Commerce and Management Research
Reference:
www.Spencerretail.comwww.Rpggroup.comwww.Scribt.com
Magazines:India todayBusiness IndiaHinduDeccan chronicles

Page 171March 2014Vol.2, Special Issue
Primax International Journal of Commerce and Management Research ISSN : 2321-3604
BENEFITS OF CURRENCY HEDGING TO EXPORT COMPANIES
1Dr. R.Mayakkannan 2S.Jayashree
AbstractOne of the biggest risk factors involved in operating an importing or exporting business is that while your sale is inprogress the value of a foreign currency may change relative to the value of the U.S. dollar. This means some of yourexport profits can get lost in translation. Overseas buyers typically pay in their own currency, which is then exchanged fordollars before it’s deposited in your bank. Here’s an example: You thought you were going to get $500,000 for thatshipment of wooden chairs your company exported to France. But by the time your goods make their way overseas ona barge and the buyer takes delivery, the dollar has weakened against the euro and you end up only getting $460,000.On the flip side: Instead of weakening, the dollar strengthens suddenly against the currency your buyer uses. By thetime your merchandise arrives, it costs the buyer more in the local currency to equal the dollar value you agreed upon,and now the buyer doesn’t want to take delivery and close the sale. As you can see, currency fluctuations can really takea bite out of your profits. That’s why savvy exporters and importers use currency hedging to protect their companies fromthe risk of changing currency values.
INTRODUCTIONIn 1971, the Bretton Woods system of administeringfixed foreign exchange rates was abolished in favor ofmarket-determination of foreign exchange rates; aregime of fluctuating exchange rates was introduced.Besides market-determined fluctuations, there was alot of volatility in other markets around the world owingto increased inflation and the oil shock. Corporatesstruggled to cope with the uncertainty in profits, cashflows and future costs. It was then that financialderivatives – foreign currency, interest rate, andcommodity derivatives emerged as means of managingrisks facing corporations. In India, exchange rates werederegulated and were allowed to be determined bymarkets in 1993. The economic liberalization of the earlynineties facilitated the introduction of derivatives basedon interest rates and foreign exchange. Howeverderivative use is still a highly regulated area due to thepartial convertibility of the rupee. Currently forwards,swaps and options are available in India and the use offoreign currency derivatives is permitted for hedgingpurposes only.
Meaning of Hedging:Hedging means taking a position in the future marketthat is opposite to position in the physical market witha view to reduce risk associated with unpredictable pricechange. A hedge is an investment that’s made, not somuch to take advantage of a situation, but to prevent oroffset another potentially risky or uncontrollablesituation. Making an investment to reduce the risk ofadverse price movements in an asset. Normally, a hedge
consists of taking an offsetting position in a relatedsecurity, such as a futures contract.
Meaning of currency HedgingCurrency hedging is the act of entering into a financialcontract in order to protect against unexpected, expectedor anticipated changes in currency exchange rates.Currency hedging is used by financial investors andbusinesses to eliminate risks they encounter whenconducting business internationally. Hedging can belikened to an insurance policy that limits the impact offoreign exchange risk
Types of currency Hedging:Spot Contracts:A foreign currency contract to buy or sell at the currentforeign currency rate, requiring settlement within twodays, As a foreign currency hedging due to the short-term settlement date, spot contracts are not appropriatefor many foreign currency hedging and trading strategies.Foreign currency spot contracts are more commonlyused in combination with other types of foreign currencyhedging vehicles when implementing a foreign currencyhedging strategy. For retail investors, in particular, thespot contract and its associated risk are often theunderlying reason that a foreign currency hedge mustbe placed. The spot contract is more often a part of thereason to hedge foreign currency risk exposure ratherthan the foreign currency hedging solution.
Forward Contracts:A foreign currency contract to buy or sell a foreigncurrency at a fixed rate for delivery on a specified future
1 Assistant Professor of Commerce, Sri Sankara Arts and Science College,Enathur, Kanchipuram.2 Research Scholar, Pondicherry University, Pondicherry.

Page 172
ISSN : 2321-3604
March 2014Vol.2, Special Issue
Primax International Journal of Commerce and Management Research
date or period, Foreign currency forward contracts areused as a foreign currency hedge when an investorhas an obligation to either make or take a foreigncurrency payment at some point in the future. If the dateof the foreign currency payment and the last trading dateof the foreign currency forwards contract are matchedup, the investor has in effect “locked in” the exchangerate payment amount
Foreign Currency Swaps:A financial foreign currency contract whereby the buyerand seller exchange equal initial principal amounts oftwo different currencies at the spot rate. The buyer andseller exchange fixed or floating rate interest paymentsin their respective swapped currencies over the term ofthe contract. At maturity, the principal amount iseffectively re-swapped at a predetermined exchange rateso that the parties end up with their original currencies.Foreign currency swaps are more often used bycommercials as a foreign currency hedging vehicle ratherthan by retail forex traders.
Data and Methodology1. Sources of data
The present study is based on secondary data ofCompanies currency hedging practices of RelianceIndustries Limited and Dr. Reddy LaboratoriesLimited Annual Report has been taken.
2. Period of dataReliance Industries Limited and Dr. ReddyLaboratories Limited are two export orientedcompanies. Therefore we have taken both companiesannual report of last 4 years for the year 2009 to2013.
Objective of the study1. To study the current currency hedging practices and
the use of currency hedging in export company2. To assess the effectiveness of currency hedging in
export oriented companies.
Limitations of the study1. This study is based on secondary data and hence
the suggestions derived may not be accurate.2. The period of study was very limited (4 years only).3. This study limits itself only in India.4. This study is based on only two companies.
Tools:These studies found result through statistical tools suchas Regression Analysis in Ms-Office excel Software.
PROFILE OF EXPORT COMPANIESThe Reliance Industries Limited and Dr. ReddyLaboratories Company has been taken to fulfill theobjectives of the study, since these companies involvein currency hedging activities.
Reliance industries limitedThe Reliance Company is India’s largest private sectorcompany on all major financial parameters. They arethe first private sector company from India to feature inthe Fortune Global 500 list of ‘World’s LargestCorporations’ and ranks 117th amongst the world’s Top200 companies in terms of profits. The company operatesworld-class manufacturing facilities across the countryat Allahabad, Barabanki, Dahej, Hazira, Hoshiarpur,Jamnagar, Nagothane, Nagpur, Naroda, Patalganga,Silvassa and Vadodara. The company operates in threebusiness segments: petrochemicals, refining, and oiland gas. The petrochemicals segment includesproduction and marketing operations of petrochemicalproducts. The refining segment includes production andmarketing operations of the petroleum products.The oil and gas segment includes exploration,development and production of crude oil and natural gas.The other segment of the company includes textile, retailbusiness and special economic zone (SEZ)development. In the year 1966 the RIL was founded byShri DhirubhaiH.Ambani, it was started as a small textilemanufacturer unit. In May 8, 1973 RIL was incorporatedand conformed their name as RIL in the year 1985. Overthe years, company has transformed their business frommanufacturing of textiles products into a petrochemicalmajor.
Major subsidiaries and associatesOn 31 March 2013, the company had 123 subsidiarycompanies and 10 associate companies.
Reliance Life Sciences works around medical, plantand industrial biotechnology opportunities. It specializesin manufacturing, branding, and marketing RelianceIndustries’ products in bio-pharmaceuticals,pharmaceuticals, clinical research services, regenerativemedicine, molecular medicine, novel therapeutics,befouls, plant biotechnology, and industrial biotechnologysectors of the medical business industry
Reliance Logistics is a single-window company sellingtransportation, distribution, warehousing, logistics, andsupply chain-related products, supported by in-housetelemetric and telemetry solutions. Reliance Logisticsis an asset based company with its own fleet andinfrastructure. It provides logistics services to Reliancegroup companies and outsiders.

Page 173March 2014Vol.2, Special Issue
Primax International Journal of Commerce and Management Research ISSN : 2321-3604
Reliance Clinical Research Services (RCRS), a contract research organization (CRO) and wholly owned subsidiaryof Reliance Life Sciences, specializes in the clinical research services industry. Its clients are primarily pharmaceutical,biotechnology and medical device companies.
Reliance Solar, the solar energy subsidiary of Reliance, was established to produce and retail solar energysystems primarily to remote and rural areas. It offers a range of products based on solar energy: solar lanterns,home lighting systems, street lighting systems, water purification systems, refrigeration systems and solar airconditioners.
DATA ANALYSIS AND INTERPRETAION: REGRESSION ANALYSISThe tool used in this study is regression. It is a statistical process for estimating the relationships among variables.It includes many techniques for modeling and analyzing several variables, when the focus is on the relationshipbetween a dependent variable and one or more independent variables. More specifically, regression analysis helpsone understand how the typical value of the dependent variable (or ‘Criterion Variable’) changes when any one of theindependent variables is varied, while the other independent variables are held fixed. We can test regression byusing the formula below.REGRESSION EQUATION:Y=a+BxY=DEPENDENT VARIABLE. A= ALPHABx=Regression coefficients for the independent variable.
Table no 1
Reliance industries limited
Model R R Square Adjusted R
Square
Std.Error Of The
Estimate
F
Value
Sig
1 0.654286591 0.428090943 0.142136414 28775.85514 1.4971 0.345713409
Percentage of forward contract on total sales
Year 2009 -2010 2010 -2011 2011 -2012 2012 -2013
% of sales 12. 62942 12.72676 7.587359 24.81619
The above Table no.2 reveals that F value is significant at 10% levels. This indicates that the variation caused byoption contract in sales is significant. The value of Correlation Coefficient (R) and Coefficient of Determination (Rsquare and Adjusted R square) of the model are shown in the Table. The value of correlation coefficient or R squareis 82%.These show that the independent variable option contract under reference has high degree of correlationwith sales. The regression results suggest that the model is a good fit as indicated by the values of R2 and Fstatistics. The coefficients of the independent variable suggest that option contract has positive and significant roleto accelerate sales. From the study it is known that 82% of the option contract is influenced by sales.
Percentage of forward contract on total sales
Year 2009 - 2010 2010 - 2011 2011 - 2012 2012 - 2013
% of sales 23.49841 11.3552 7.619792 0.640305
Total sales value of Reliance Industries Limited is Rs. 190881million for the financial year 2009-10 by hedging theirsales with option contract they minimize the risk of Rs. 44854 million which is almost 23% of total sales and 2010-11 the sales value is increased to 248170 million and their option contract value is 28181 million which is near to11% and lower than last year 2009-10.Total sales for 2011-12 was Rs 329904 million and hedging value was Rs.25138million which is 7.6% and lower than the last two years. In the year 2012 -13the sales value is Rs. 360297millionand hedging value is Rs. 2307 million this is the lowest value compare to last three years

Page 174
ISSN : 2321-3604
March 2014Vol.2, Special Issue
Primax International Journal of Commerce and Management Research
TABLE NO 3
Swap contract on total sales
Model R R Square Adjusted R
Square
Std.Error Of The
Estimate
F Value Sig
1 0.66160198 0.43771718 0.156575769 487.2745653 1.5569 0.33839802
Dr. Reddy laboratories limited: Forward contract on total sales
Model R R Square Adjusted R
Square
Std.Error Of The
Estimate
F Value Sig
1 0.223661777 0.050024591 -0.424963114 78.95766071 0.1053 0.776338223
Percentage of forward contract on total sales
Year 2009 -2010 2010 -2011 2011 -2012 2012 -2013
% of sales 0.242276 0.327493 0.08481 0.168892
Total sales value of Dr. Reddy’s Laboratories Limited isRs. 68517million for the financial year 2009-10 by hedgingtheir sales with forward contract they minimize the riskof Rs. 166 million which is almost .2% of total sales and2010-11 the sales value is increased to 72368 millionand their forward contract value is 237 million which isnear to .3% and higher than last year 2009-10.Totalsales for 2011-12 was Rs 94329million and hedging valuewas Rs. 80 million which is .08% and lower than thelast two years. In the year 2012 -13the sales value isRs.114215 and hedging value is Rs. 192.9million this isthe highest value compare to last two year.
SUMMARYOne of the biggest risk factors involved in operating animporting or exporting business is that while your saleis in progress the value of a foreign currency may changerelative to the value of the U.S. dollar. This means someof your export profits can get lost in translation. Overseasbuyers typically pay in their own currency, which is thenexchanged for dollars before it’s deposited in your bank.Here’s an example: You thought you were going to get$500,000 for that shipment of wooden chairs yourcompany exported to France. But by the time your goodsmake their way overseas on a barge and the buyer takesdelivery, the dollar has weakened against the euro andyou end up only getting $460,000. On the flip side: Insteadof weakening, the dollar strengthens suddenly againstthe currency your buyer uses. By the time yourmerchandise arrives, it costs the buyer more in the local
currency to equal the dollar value you agreed upon, andnow the buyer doesn’t want to take delivery and closethe sale. As you can see, currency fluctuations can reallytake a bite out of your profits. That’s why savvy exportersand importers use currency hedging to protect theircompanies from the risk of changing currency values.All the big retailers that operate internationally usecurrency hedging to make sure their profits aren’t erodedby currency changes, and small businesses can do it,too. Foreign exchange risk is difficult to control becauseunless you are a large import and export company, tohedge the currency risk would require paying spreadsand fees that would probably end up offsetting most ofthe potential benefits from hedging. However even largecompanies can get so focused on their regular businessactivity that they forget to hedge their currency exposure.Take BMW, one of the world’s largest car manufacturersfor example. In 2003, the Euro rallied 20 percent from alow of 1.04 to a high of 1.25 against the US dollar. Thecompany did very well and revenues increased 4.2percent.
Findings and suggestions:A forward contract booked by an exporter seeks to protecthis profitability from his business operations as long asthe forward contract is not cancelled and the contractedexport takes place as per the agreed timeline, the exportsdoes not make any gains/losses on account of thefluctuations in the foreign currency versus INR (if exportsinvoice in foreign currency If a forward contract (exports)

Page 175March 2014Vol.2, Special Issue
Primax International Journal of Commerce and Management Research ISSN : 2321-3604
is cancelled thus could be a gain for the exporter, if the foreign currency (VS INR) price depreciates as on date ofcancellation as compared to the spot rate on date of booking the contract. If a forward contract (exporter) iscancelled there could a loss to the exporter, if the foreign currency (VS INR) prices appreciate on date of cancellationas compared to the spot rate on date of booking the contract. Firms can make gains or losses from hedging. Thebasic purpose of hedging is to protect against excessive losses. Firms also tend to benefit from knowing exactlyhow much they will receive from the export deals and can avoid the uncertainty associated with future exchangerate movements. In DR. Reddy laboratories the option contract gives more gain to exporter that is the risk involvedhis minimize .when compared to forward contract and swap contract the options contract gives more gain in theyear 2012-13. In reliance industries limited the interest rate swap has increased by Rs. 238 in the year 2013. Thecurrency swaps has decreased by Rs. 880 in the year 2013. The options contract has decreased by Rs. 22831 inthe year 2013. The forward contract has increased by Rs. 64381 in the year 2013.
CONCLUSION:In the current scenario, hedging through derivative markets is a major challenge ever for the exporters. CurrencyDerivatives acts as a major tool for hedging the risk caused by exchange rate fluctuations. This study identifies thata perception with as per companies is that currency derivatives trading can be used for hedging, forex exposure.The nature of the derivatives instruments is to reduce the risk involved in foreign trade. So exporters are takingcurrency derivatives trading for reducing their risk involved in foreign trade and making profits and they consideredthese to be important factors for taking trade relate decisions. . They should be made aware of the various hedgingstrategies, which can be used for reducing their risk. Awareness about the various uses of currency derivatives canhelp traders to reduce risk and increase profits as the lack of knowledge appears to be the most significant barrierto exporters and importers as it prevents then form taking business decisions. Indian companies currently hedgetheir risk by entering into foreign currency forwards, swap and options agreements in over-the-counter market (OTC)market. An exchange traded platform for currency futures is considered to be more transparent, efficient andaccessible than the OTC market. A majority of the companies prefer the centralized approach to the decentralizedapproach as the companies seem to believe in controlling all their treasury activities from a single location in orderto hedge their risks. This would probably also help a MNC to focus on hedging the firm as a portfolio of currencypositions in order to take advantage of currency hedging.

Page 176
ISSN : 2321-3604
March 2014Vol.2, Special Issue
Primax International Journal of Commerce and Management Research
A STUDY ON WOMEN ENTREPRENEURS IN TIRUCHIRAPPALLIDISTRICT OF TAMILNADU
1Dr.P. Jayakumr 2Dr. M. Vincentsahayaraj
AbstractWomen entrepreneurs may be defined as, “women or group of women who initiate, organise and run businessenterprises”. The Government of India has defined women enterprises as, “An industrial unit where one or more womenentrepreneurs have not less than 51 per cent financial holding”. Women entrepreneurship needs tobestudied separatelyfor two mainreasons. Thefirst reasonsthat women’s entrepreneurship has been recognised during thelast decade asanimportant untapped source of economic growth.Women entrepreneurship has been emerging among women ofvarious classes. Research on entrepreneurships revealed that it has been the domain of men for a long. A researchconducted in Tiruchirappalli district on women entrepreneurs revealed that they are found in micro scale of operationin the trades of tailoring, beauty clinic, fancy stores petty shops, food based products readymade garments, etc. Theyfound themselves comfortable with the famine and service nature and micro scale of activates. It was underlined thatthe dual responsibility and associated lack of time to fully devote to business have made the women to confine to parttime and temporary nature of entrepreneurial activities. Also these women have lack of support from formal sector suchas banks, which made them increasingly, which made them increasingly, rely on moneylenders who charge reallyexorbitant rate of interest.Keywords: Entrepreneurs,Women Entrepreneurs,Employment,Timemanagement,break-even,Business problem.
Introduction“The Indian women has established equality with men inall walks of life and will never return to her former statusof a painted doll, child bearing Machine (or) a merehanger – on”-Mahatma Gandhi
“When women move forward, the family movesthe villagemoves” claimedJawaharlal Nehru. It is recognized theworld over that only when the women are in themainstream of progress can any economic and socialdevelopment be possible and meaningful.With the adventof mass media and so many awareness programmeswomen today are awaken to the new concepts of lifeand their changing roles in family and society. Womenhave started stepping out of the age-old conventions andnow they perform shoulder to shoulder with men in almostevery field.
They are growing more and more and more consciousof their role, status and rights in the society. Their hiddenentrepreneurial talents triggered by persistence andperseverance contribute to amazing results. Her needfor personal identity, craving for achievement, urge forindependence etc are responsible for womenentrepreneurs number around eight per cent of the totalentrepreneurs in India.
Women entrepreneurship is the thrust area at presentas the Government, banks and other agencies are outto serve this sector with the twin objectives of enhancingself employment opportunities in general andemployment of women in particular.
Womenentrepreneurs may be defined as, “women orgroup of women who initiate, organize and run businessenterprises”. The Government of India has defined womenenterprises as,”An industrial unit where one or morewomen entrepreneurs have not less than 51per centfinancial holding”.The present paper aims to study the socio-economicconditions of women entrepreneurs in the study area,motivational factors to become an entrepreneur and theproblems faced by them in course of their entrepreneurialpursuits. Because their role in the development of thefamily, society and in the nation is quite significant.
Objectives1. To analyse the socio-economic conditions of women
entrepreneurs in the study area.2. To highlight the obstacles and problems faced by
women entrepreneurs and3. To analyse the factors that help women to become
entrepreneurs.
Review of LiteratureDr. Manimekalai N. (1999) has examined the natureand the characteristics of rural and urban womenentrepreneurs and has pointed out strongly that there isa lot of potentiality among women and proper environmentshould be created to nurture entrepreneur, who belongmostly to the non-traditional group. While exploring theformal training and financial supports rendered byNational Institutions in India the investigator has pointed
1 Assistant Professor in Economics, Christhuraj College, Tiruchirappali.2 Assistant professor in Economics,SrinivasanDhanalakshmi College,Perambalur.

Page 177March 2014Vol.2, Special Issue
Primax International Journal of Commerce and Management Research ISSN : 2321-3604
out that these institutions offer much support to the urban women when compared to rural entrepreneurs.
Kamalakannan (2005) has identified the specific problems faced by women entrepreneurs in his analysis as stiffcompetition from men entrepreneurs, High prices of raw materials, financial, managerial and technical constraints,and poor co-operation from family members, attitude of the society towards women and problem of middlemen.
S. Muralikrishna (2006) in his study revealed that the higher number of entrepreneurs where in the age group of 25-30 years. This shows that majority of entrepreneurs at their early age.
Dr.Valasamma Antony(2007), in her article “Women entrepreneurs on the upbeat” pointed out that preference forself employment and the need for economic independence along with experience obtained from family businessconstituted the motivating elements for the women to enter into business.
MethodologyThis study is based on both primary and secondary data. Primary data will be collected from the 50 respondents inTiruchirappalli town through the interview schedule. Secondary data is collected from the books, journals and otherpublished materials. The collected data will be presented in the following tables.
India is a young nation in the literal sense of the term. The current proportion of the young in the population quiethigh.In the same way in the study area, the young women entrepreneur is higher than the other age group. Theabove table also shows that 78per cent of the respondents are found in the age group of 20-40 which is higher, andalso it is clear from the table that woman who are below the age of 20 and above 40were not interested inentrepreneurship.
Age No. of. respondents Percentage
Below 20 - -
20 - 30 20 40
30 - 40 19 38
40 - 50 11 22
Above 50 - -
Total 50 100
Table 1: Age distribution of women entrepreneurs
Source:Primary data
Table 2: Religion and Community wise classification of the respondents
CommunityReligion
Hindus Christians Muslims Total Percentage
BC 20 5 3 28 56
MBC 10 3 1 14 28
SC 5 2 1 8 16
Total 35 10 5 50
Percentage 70 20 10 100
Source:Primary data
The above table shows that 70per centof the respondents belong to Hindu religion and 56per cent of the respondentsbelong to backward Community and 16 per cent of the respondents belong to scheduled caste which is lowerbecause poverty is both a cause and consequences of low percentage in that community.

Page 178
ISSN : 2321-3604
March 2014Vol.2, Special Issue
Primax International Journal of Commerce and Management Research
Table 3: Marital status
Source:Primary data
Marriage is a universal phenomenon in India. The Indian women have married relatively early and only a very smallproportion have remained spinster. In the above table explains the 78 per cent of the respondentswere married and16per cent were Unmarried. The predominant reason for unmarried women not opting for entrepreneurship is theuncertainty of the place where they would be settling after the marriage.
Table 4:Educational Status of the Respondents
Source:Primary data
According to the census definition, a person is deemed as literate if he or she can read and write with understandingin any language. The above table shows that 46per cent of the respondents are graduates and 42per cent of therespondents are studied upto higher secondary level. This helps them to do the work better compared to poorlyqualified.
Table 5: Type of family
Source:Primary data
StatusNo. of.
respondentsPercentage
Married 39 78
Un Married 8 16
Widow 2 4
Divorce 1 2
Total 50 100
Educational
status
No. of.
respondentsPercentage
High school 2 4Higher secondary 21 42
Under graduate 23 46
Post Graduate 2 4Technical 2 4
Total 50 100
Type of familyNo. of.
respondentsPercentage
Nuclear family 40 80
Joint family 10 20
Total 50 100
The joint family system is prevalent in the large part of the country. In the above table of the 80 per cent respondentsbelonged to nuclear familiesare higher and 40per cent were in joint families. These respondents revealed that theirfamily elders were helping them by looking after their children when they were doing their businesses.

Page 179March 2014Vol.2, Special Issue
Primax International Journal of Commerce and Management Research ISSN : 2321-3604
Table 6: Distribution of the respondents by Motivational factors
Motivation No. of. respondents Percentage
Husband 14 28
Parents 6 12
Friends 11 22
Relatives 10 20
Society 5 10
Self 4 8
Total 50 100
Source:Primary data
The above table shows that majority of the respondents (28per cent) are motivated by their husband and 22per centare by their friends, this reveals that the male domination, attitude of the men towards females have changed.
Table 7: Nature of BusinessNature No.of. Respondents Percentage
Beauty Clinic 25 50
Fancy stores 10 20
Tailoring 5 10
Mess 2 4
Readymade garments 5 10
Vegetable shops 3 6
Total 50 100
Source:Primary data
The above table shows that the nature of business started by the respondents break popular assumption that thewomen are fit only for the ventures of tailoring pickle makingpapad, Agarpathi making 50per cent of the respondentsare engaged in beauty clinic due to less risk involved and more safety.
Table 8: Investment
Investment No.of. Respondents Percentage
Below 10,000 4 8
10,000 -25,000 2 4
25,000 -50,000 40 80
50,000 - 1,00,000 - -
Above 1,00,000 4 8
Total 50 100
Source:Primary data
The above table shows that only eight per cent of the respondents invested more than 1,00,000. It shows that thewomen did not want to take more risk by investing more.
Table 9: Business performance of the respondentsProfitability status No.of. Respondents Percentage
Profitable 20 40
break -even 16 32
Unprofitable 14 28
Total 50 100
Source:Primary data
It can be understood from the above table that the respondents are equally divided between three categories(profitable, break-even, and unprofitable) of business performance in terms of profitability. The third category saidthat they incurred losses in the first year of operation, but these women continued their business in spite of theinitial losses.

Page 180
ISSN : 2321-3604
March 2014Vol.2, Special Issue
Primax International Journal of Commerce and Management Research
Table 10: Problems faced by the respondents
Nature of Problem No.of. Respondents Percentage
Personal problem 20 40
Business problem 30 60
Total 50 100
Source:Primary data
The above table shows that 40per cent of therespondents are facing personal problems like,timemanagement, Life style changes, Stress in makingdecisions, Lack of free time, conflicting roles and 60percent are facing business problems like working capitalshortage, problems related to inputs, employees,market problems and harassment from officials. But itreveals that women entrepreneurs are mostly suffer bybusiness problems than personal problems.
Findings1) Nearly 78per cent of the respondents belong to age
group of 20-402) The study reveals that majority of the respondents
belong to Hindu Religion and backwardcommunity.
3) 46per cent of the respondents are graduates and42per cent of the respondents are studiedup to higher secondary level.
4) 78per cent of the respondents are married.5) 80per cent of the respondents live in nuclear family6) 28per cent of the respondents are motivated by their
husband and 22per cent aremotivated by their friends to undertake a business.
8) 50per cent of the respondents are engaged in beautyparlour because of less risk.
9) 80per cent of the respondents initial investment isbetween 25000 to 50,000.
10) 56per cent of the respondents revealed that theyare running a business at profit.
11) Majority of the women entrepreneurs (60per cent)are facing more business problemsthan personal problems.In short, the position of thewomen entrepreneurs in the studyarea is better afterthey became an entrepreneur.
SuggestionsThe DIC should identify skilled women who did not takeup any employment and motivate them to take up homebased entrepreneurial activities related to their skills.
The banks should provide credit at reasonable interestwithout insisting on collateral security in the form ofphysicalassets. The government should design a suitablescheme to attract women towards entrepreneurship andto keep their enterprises to survive.The success storiesof several women entrepreneurs should be discussedamong entrepreneurs to improve their business.
ConclusionTo conclude, women entrepreneurs play an emergingdiverse role in terms of enterprise creation in India. Ifthey are to continue to be a vibrant part of India’smovement toward market economies more support interms of infrastructure is needed. The government supportneeds to include more tax incentives, better creditconditions, advising and counsellingcentres and a strongbanking and Insurance system. With these supportsystem in place, women entrepreneurs will have an evengreater impact on the economic development of India.
Reference1. Dhameja. S.K., “Wopmen Entrepreneurs”, Deep &
Deep Publications Pvt Ltd., New Delhi, Pp114-118.2. Ganesan.S., Status of women Entrepreneurs in India”,
Kanishka Publishers, New Delhi Pp.97-100.3. Manimekalai. N., (1999), Nature and characteristics
of women entrepreneurs in India, Deep & DeepPublications Pvt Ltd., New Delhi,Pp 50-57.
4. NayanBarua&AparajectaBorkakoty, “Womenentrepreneurs” APH publishing co-operation, NewDelhi. Pp.44-48.
5. Soundarapandian, Women Entrepreneurship, Issuesand strategies, Kanishka Publishers, New Delhi,Pp.34-40.
6. Valasamma Antony, “Women Entrepreneurs on theupbeat – A study, Southern Economist Vol.25, No.21,March 2007, Pp.11-13.

Page 181March 2014Vol.2, Special Issue
Primax International Journal of Commerce and Management Research ISSN : 2321-3604
STUDY ON SELECT BANCASSURANCE COMPANIES IN INDIA
1M.ESWARI
1 Asst. Professor, Dept. of commerce with CA, NPR Arts and Science College, Natham.
AbstractBancassurance as a concept first began in India when the insurance industry opened up to private participation inDecember, 1999 Distribution of insurance products through bank branches, enlarged customers base, defensivepositioning, and size drive the insurers to embrace bancassurance. The focus that spur banks to seek distribution ofinsurance products through their branch network are asset accumulation, disinter mediation, lower risk and highermargin products (Unit-linked products), potential for cross-selling, scale, client solutions, risk diversification, cost benefitsand capturing increased profit.This study makes one to have an insight about the overview performance of the Bancassurance companies (ICICIPrudential Life Insurance Company, SBI Life insurance Company and HDFC Life insurance company). This study istotally to the present day’s problems pertaining to Bancassurance companies. An attempt has been made to use thevarious analysis and interpretation for the above problems.
1.1INTRODUCTION:Bancassurance is the distribution of insurance productsthrough a bank’s distribution channels. It is a servicethat can fulfill both banking and insurance needs at thesame time. Bancassurance as a concept first began inIndia when the insurance industry opened up to privateparticipation in December, 1999 Distribution of insuranceproducts through bank branches, enlarged customersbase, defensive positioning, and size drive the insurersto embrace bancassurance. The focus that spur banksto seek distribution of insurance products through theirbranch network are asset accumulation, disintermediation, lower risk and higher margin products (Unit-linked products), potential for cross-selling, scale, clientsolutions, risk diversification, cost benefits and capturingincreased profit.1.2 Review Of Literature:A brief discussion of the past studies relating to thebancassurance is presented here. The studies consistof materials from various agencies and academiccommunities.
The first article “ Bancassuracne: Driving factor” by GeoffMayne and Mathew Taylor1of Fitch insurance ratingsagency, speaks of bancassurance as an emergingconcept in the insurance industry seeking mew channelsof distribution in the global context. It analyses the prosand cons of the integration of insurance firms and banks.The article mentions that the concept of bancassurancehas gained popularity in recent years two differentmodels-the integrated organic approach (the Frenchmodel) and the merger approach (Netherlands-1991).The authors while giving the strategic rationale,enumerates the driving factor from the points of view ofboth insurers and bankers.
The second article “Convergence Strategies for Banking,Insurance and Investments” is sourced BankAdministration Institute2 and Boston consulting Groupon converging financial markets. The study identifies thefollowing key areas of opportunity for banks: increase inROI, customer retention and profitability, the lessons tobe learnt from European banks, leveraging branchnetwork and electronic distribution channels, focusingon underserved customer segments and growthopportunities. The article ends by spelling the way toexecute the winning strategy that requires carefulconsideration and co-ordination.
The third article “Bancassurance: Knowing and Growingwith your customer” by 3Angus His lop is a write-up.Which is a part of the joint study on creating Tomorrow’sleading Retail Bank by price Waterhouse coopers (PWC)and Economist Intelligence unit. It articulates thechallenge set for bancassurance to achieve realsynergistic competitive edge over specialist bank/insurance providers and new entrants. The authors focuson growing demand from customers for superior service,competitive prices and convenient access to a range ofdelivery channels. The emphasis is on making cross -selling an integral part of the corporate culture, and asintimacy develops, turn cross-selling intro cross - buyingby the customer.
The article Bancassurance: “Three Partnership Models”is written by 4Dorlisa K Flur, Darren Huston, and Lisa YLowie are the article suggests, based on research, thatthe sale of life insurance through banks will meetimportant set of consumer needs. The authors give thesteps to be followed by bancassurance startup:Develop the product → Build distribution→Generalsales lead → Sell the product → Process the policy

Page 182
ISSN : 2321-3604
March 2014Vol.2, Special Issue
Primax International Journal of Commerce and Management Research
1Geoff Mayne and Mathew Taylor © Fitch Insurance Ratings Agency, July 29, 2002.www.fitchratings.com originally published as “Bancassuramce overview”2 Bank Administration Institute. www.bai.org originally published as “Putting it Together: convergence strategies forBank, Insurance and Investments”.
Administer the policy. Three partnership models aresuggested, which are based on the nature and extendof association between the partners. The true value of
Bancssurance can be achieved by both the parties onlythrough concurrence of approaches, which is not amatter of choice but an imperative need.
The article “Bancassurance: Potential to Grow” is writtenby 5Y Chandra Sekhar and KBS Kumar. In this articletrace of as a matter of fact, only 25% of the globalinsurance population is insured and even among themmost are underinsured. Banks emerge as potentialwinners in this kind of scenario.6Graham Morris in his article “ Bancassurance in India– A beginning”, examines the question: whybancassurance in India? Augmenting of revenues seemsto be a major attraction for banks to sell insuranceproducts in view of the sharp decline in margins in theircore lending business. Some banks taking equity stakesin insurance companies in perhaps a precursor toassuming a bigger role by them in the future. Regulatoryissues, relevant business models, learning from theexperiences of other countries as a crucial factor forlong-term success are some of the important points dealtwith in the article. The author says that initial successesachieved augur well for bancassurance in India.
1.3 Scope Of The Study:This study makes one to have an insight about theoverview performance of the bancassurance companies(ICICI Prudential life insurance company, SBI Lifeinsurance Company and HDFC Life insurance company).This study is totally to the present day’s problemspertaining to bancassurance companies. An attempt hasbeen made to use the various analysis and interpretationfor the above problems.
1.4 Objectives Of The Study:The following are the objectives of the study:1. To trace the origin, growth and the development of
bancassurance.2. To analyze the performance of bancassurance.3. To offer the summary of findings and suggestions
based on the findings of the study.
1.5 Research Methodology:The present study is mainly based on secondary data.The required data were collected from books, journals,magazines, articles various websites and the like.
1.7 LIMITATIONS OF STUDY:The study has used secondary data for analyzing theperformance appraisal and operating efficiency, so it isnot cent percent accurate.
2. Bancassurance an overview2.1 IntroductionBancassurance commonly means selling insuranceproducts under the same roof of a bank. With the openingup of the insurance sector and with so many playersentering the Indian insurance industry, it is required bythe insurance companies to come up with innovativeproducts, create more customer awareness about theirproducts and offer them at a competitive price. Newentrants in the insurance sector had no difficulty inmatching their products with the customers needs andoffering them at a price acceptable to the customer.
2.2 Models of Bancassurance1) Distribution alliance between the insurance company
and the bank.2) Joint venture between the two companies.3) Merger between a bank and an insurer.4) Bank builds or buys own insurance productsMost of the bancassurance operations fall in the firstmodel.
2.3 Growth of Bancassurance:2.3.1 Banking + Insurance:Perhaps a decade ago, majority of the financialinstitutions would not have dreamt about integrating thetwo big forces to create bancassurance. Both theevolutions of new markets and marketing strategies haveprompted the big force to look at each other more closelyand come out with a strategy that would be beneficialfor both of them. It can be said as a package of financialservices, which offers both the banking and insurancesproducts under one roof. It is a combination, where boththe services co-exist and add value to institution.
2.4 The RBI Guidelines For Banks Entering IntoInsurance Sector.a) Joint ventures will be allowed for financially strong
banks wishing to undertake insurance business withrisk participation.
b) For banks, which are not eligible for this joint-ventureoption, an investment option of up to 10% of thenetwork of the bank or Rs.50crores whichever islower, is available.

Page 183March 2014Vol.2, Special Issue
Primax International Journal of Commerce and Management Research ISSN : 2321-3604
c) Finally, any commercial bank will be allowed toundertake insurance business as agent of insurancecompanies. This will be on a fee basis with no-riskparticipation.
2.5 IRDA Guidelines For The Bancassurancea) Each bank that sells insurance must have a chief
insurance executive to handle all the insuranceactivities.
b) All the people involved in selling should under-gomandatory training at an institute accredited by theIRDA and pass the examination conducted by theauthority.
c) Commercial banks, including co-operative banks andregional rural banks, may become corporate agentsfor one insurance company.
d) Banks cannot become insurance brokers.
2.7 Advantages Of Bancassurancea) Every insurance company wants to grow quickly to
reduce painful start–up expense overruns. Bankswith their huge networks and large customer basesgive insurers an opportunity to do this efficiently.
b) It gives the companies an opportunity to tap therural sectors. Selling insurance through traditionalmethods in these sectors is very expensive. A tie upwith an appropriate customer base can give aninsurer a cheap access to these areas.
c) Bancassurance enables one to have part of skilledprofessionals.
d) The margins of the banks in their core leadingbusiness are declining sharply. Opportunities likebancassurance augment their income
e) Bancassurance enables to develop a sales culturewithin the bank. It helps to change the traditionalmindset of banking companies.
The distribution of insurance products through banks hasbeen beneficial to both insurance and banking companiesas well as customers.
2.7.1 Advantages To Banksa) Production ability of the employees’ increases.b) By providing customers with both the services under
than one roof, they can improve overall customersatisfaction resulting in higher customer retentionlevels.
c) Increase in return on assets by building fee incomethrough the sales of insurance products.
d) Can have leverage on face-to-face contacts andawareness about the financial conditions ofcustomers to sell insurance products
e) Banks can cross sell insurance products E.g.: Term insurance products with loans
2.7.2 Advantages To Insurersa) Insurers can exploit the banks’ wide network of
branches for distribution of products. The penetrationof banks branches into the rural areas can be utilizedto sell products in those areas
b) Customer database like customers’ financialstanding, spending habits, investments and purchasecapability can be used to customize products andsell accordingly
c) Since banks have already established relationshipwith customers, conversion ratio of leads to sales islikely to be high. Further service aspect can also betackled easily.
2.7.3 ADVANTAGES TO CUSTOMERSa) Comprehensive Financial advisory services under
one roof. I.e., Insurance services along with otherfinancial services such as banking, mutual funds,personal loans and the like
b) Enhanced convenience on the part of the insuredc) Easy access for claims, as banks are a regular god) Innovative and better product ranges
3 Angus His Lop is leader of the Price Water House Coopers UK bamking practice © 2000 price water coopers. It refersto the network of member firms of price water house coopers international Limited.4 Dorlisa K Flur is a principal and Lisa Lowie is consultant in MC Kinsey’s Atlanta Office. Darren Huston is a consultant inthe pacific Northwest office.) The article was originally published in the Ackinsay quarterly 1997, as “Bancassurance”5 Y Chandra Sekhar and KBS Kumar Source: Charted Financial Analyst, Oct 2001. © ICFAI Press. Originally published as “Bancassurance: Big ForcesTogether”.6 Graham Morris Source: © Watson Wyatt. www.watsonwyatt.com originally published in Asia Pacific Insurance Review, March 2002 as“Bancassurance in India – The seeds area sown”.

Page 184
ISSN : 2321-3604
March 2014Vol.2, Special Issue
Primax International Journal of Commerce and Management Research
3.PERFORMANCE OF SELECTED BANCASSURANCE COMPANIESThe performance of the life insurance company mainly based on the total premium, schemes issued and businessforce of the company. The following table No. 3.1 shows the total premium, table no. 3.2 shows schemes, totalpremium and lives covered and table no. 3.3 shows the business force for three selected life insurance companiesfrom year of 2000 to 2013.
S.No Year ICICI Prudential life insurance company
HDFC Life insurance Company
SBI life insurance Company
1 2000 – 01 5.97 0.002 ---
2 2001 – 02 116.38 33.46 14.69
3 2002 – 03 417.62 148.83 72.39
4 2003 – 04 989.28 297.76 225.67
5 2004 – 05 2,36 3.82 686.63 601.18
6 2005 – 06 4,261.05 1569.91 1,075.32
7 2006 – 07 7,912.99 2855.57 2,928.49
8 2007 – 08 13,561.06 4858.56 5,622.14
9 2008 – 09 15,356.22 5564.69 7,212.10
10 2009 – 10 16.528.75 7005.10 10,104.03
11 2010 – 11 17.880.63 9,004.17 12,9 45.29
12 2011 – 12 14,021.58 10,202.40 13,133.74
13 2012 – 13 13,538.24 11,322.68 10,450.03
Table No.3.1: Total life insurance premium (Rs. Crore)
Source: compiled from irda annual report and (—) represents business not started
The above table no. 3.1 explains about the total life insurance premium of ICICI Prudential, HDFC Standard and SBIlife insurance companies from the year of 2000 to 2013. According to IRDA annual report all three companies gotimprovement from year to year. But ICICI prudential life insurance company got the first place compare to HDFC andSBI life insurance companies and HDFC Life insurance company got second position and SBI life insurancecompany got third position.
Table No.3. 2: Group new Business Performance on the basis of schemes, premium and lives covered(Premium in Rs. ‘000)(schemes and lives in nos.)
Life insurance
companiesSchemes Percentage Premium Percentage
Lives covered
Percentage
ICICI Prudential
220 100.00 1387 100.00 13,38,704 100.00
HDFC Standard
460 100.00 1141.81 100.00 18,72,088 100.00
SBI 217 100.00 2381.9 6 100.00 10,53,167 100.00
Source: compiled from IRDA Annual report
Note: new business premium includes first year premium and single premiumThe above table No.2 explains about the group new business performance on the basis of schemes, premium andlives covered. On the schemes point of view HDFC Standard life insurance company got first position and ICICI gotsecond position and SBI got third position and premium point of view SBI got first position, HDFC got Secondposition and ICICI got third position. Finally lives covered comparison point of view that HDFC got position and ICICIgot Second position and SBI Got third position

Page 185March 2014Vol.2, Special Issue
Primax International Journal of Commerce and Management Research ISSN : 2321-3604
Table No. 3.3:Individual business (with in India) – business in force (number of policies) (policies in ‘000)
Life insurance companies Total business in force as at 31-3-2013
ICICI Prudential 5577.18
HDFC Standard 4039.59
SBI 4605.54
The above table no. 3.3 explains the business force ofICICI Prudential, HDFC Standard, and SBI life insurancecompanies. Among that three companies comparisonICICI got first position, HDFC got second position andfinally SBI life insurance company.
SUMMARY OF FINDINGS• Bancassurance is the distribution of Insurance
products through a bank’s distribution channels.• Insurable population of over 1 billion spread all over
the country.• Bancassurance operation has four different Models.• Most of the bancassurance operations fall under
distribution alliance between the Insurance Companyand the bank model.
• There are several forms of partnership between banksand life insurers.
• Private Insurance companies are eager to board thebandwagon on of bancassurance.
• The global (developing counties) benchmark of 4.5per cent of GDP, India’s Life Insurance is only 2.9per cent of GDP.
• Bancassurance is a combination, where both theservices co-exist and add value to institution
• Bancassurance will be helpful to the insuranceseekers reducing time and expense of searching forgood quality insurance products at a fair price.
• Investor will be able to obtain high quality advicefrom trained financial consultants at one place andround the clock.
• Bancassurance is the most economical model forselling insurance products.
• Banking in India is being done in the ‘brick and click’model, which means that customers still walk intobank branches.
• Banks act as invest advisors to their customers,especially in villages, smaller towns and cities.
• Bancassurance offers a great opportunity to banksto improve their profitability by enhancing fee-basedincome.
• Bancassurance enables to develop a sales culturewith in the bank. It helps to change the traditional ofbanking companies.
• Productivity of the employees increases in banks.• Banks can cross sell insurance products• Insurers can exploit the bank’s wide network of
branches for distribution of products• Comprehensive Financial advisory services can be
had less than one roof.• Commissions paid to agents range between 5 to
10 percent of annual premium throughout the lengthof the underlying policy.
• Offering insurance products through a bank will costaround 20 per cent for one time.
• Bancassurance is an ideal launch pad for bothinsurance companies and banks to increase theirrevenues
• Bancassurance in India, the banking and Insurancesectors are regulated by two different entitles(banking by the RBI and Insurance by IRDA)
5.SUGGESTIONSAfter making a thorough analysis in the previouschapters, the following suggestions arerecommended to improve the performance of thecompany.
• More advertisements may be given to the conceptof Bancassurance with the help of customers.
• Personal services may be provided.• To instill confidence in the customers those
companies may introduce schemes in the contextof globalization.
• The HDFC standard & the SBI life insurance maytie up with the reputed commercial banks forenhancing its operations.
• Asset management group of those threecompanies may be so designed to improve thefinancial conditions.
• More suitable schemes may be introduced forvillage areas as well as urban areas.
• More incentive schemes may be introduced in duecourse to attract the prospective customers.
Page 186
ISSN : 2321-3604
March 2014Vol.2, Special Issue
Primax International Journal of Commerce and Management Research
CONCLUSIONThe selected Bancassurance companies [the ICICI prudential, the HDFC standard, the SBI life Insurance] have beenworking successfully. The overall financial position of these companies was increasing. These concerns have utilizedthe funds effectively.The ICICI prudential is No.1 Company and the other places are secured by the HDFC standardand the SBI life insurance. In this study, it has been identified certain areas where there is need of some minormodulation for the effective working of Bancassurance in the long run. This study helps to know the Bancassuraceactivities, models, and sound knowledge of financial position and performance appraisal of top 3 Life Insurancecompanies under Bancassurance.
BibliographyPillai R.S.N. & Bagavathi, Statistics Theory and Practice, S. Chand & Company Ltd. Ram Nagar, New Delhi, 2002Gupta .S.P and Gupta .M.P, Business Statistics, Sultan Chand & Sons Educational Publishers New Delhi 2003Maheswari .S.N, Management Accounting, Himalya Publishing House New Delhi 2003
Reports:Annual reports of the ICICI Prudential Life Insurance CompanyAnnual reports of the HDFC Standard Life Insurance CompanyAnnual reports of the SBI Life Insurance CompanyAnnual reports of the IRDA

Page 187March 2014Vol.2, Special Issue
Primax International Journal of Commerce and Management Research ISSN : 2321-3604
A STUDY ON CUSTOMER SATISFACTION TOWARDSAIRTEL MOBILESIM SERVICE IN TRICHIRAPPALLI DISTRICT
1Vaidheeswaran. G
Abstract:Customer satisfaction is widely recognized as a key pressure in the formation of consumers’ future purchase intentions.Satisfied customers are also likely to tell others of their favorable experiences and thus engage in positive word ofmouth advertising. The present study aims to investigate customer satisfaction in the organized retail outlets of airtel intrichirappalli district. The objectives are to identify the determinants of customer satisfaction in the airtel in trichirappalli,to identify the attitude and behavior of the customers those who are recharging, and to study about the future prospectsof airtel in the trichy city. Customer satisfaction is a significant subject for most marketers. A total of 50 questionnaireshave been randomly distributed to retail customers. Using simple percentage method and data collected is analyzed.The result of this analysis suggests the degree of customer satisfaction in terms of services provided by airtel intrichirappalli
1 PG Research Scholar, Department of Commerce CA, St. Joseph’s College, Tiruchirappalli
INTRODUCTIONDuring the past decade services have increasinglyassumed an important role in the Indian Economy. Thetrend was set and in the nineties services had gaineddominance. On the other hand, the competition inservice organizations is becoming intense and severe.As a result the service organizations to be successfulshould be more professional in their approach tomanage their business. Hence, it is in this context therole of marketing is gaining importance in serviceorganization.
DEFINITION:American Marketing Association, as early as 1960defined service as, “activities, benefits, or satisfactions,which are offered for sale, or provided in connection withthe sale of goods.” This definition took a very limitedview on services as it proposed that services are offeredonly in connection with the sale of goods.Robert Judd defined service as “a market transactionby an enterprise or entrepreneur where the object of themarket transaction is other than the transfer of ownershipof a tangible commodity.”
OBJECTIVESTo evaluate the performance of sales with regard toAIRTEL.To identify the effectiveness of advertisement in thepromotion of AIRTEL.To study the customer satisfaction in the serviceprovided by the AIRTEL.To study the preference of customers with regard toprepaid and postpaid cards issued by AIRTEL.
METHODOLOGYThe validity of only research work depends upon thereliability of the data. The data for this study werecollected with the help questionnaire. The primary datawere collected from the mobile users directly with thehelp of a well –structure questionnaire and a surveytechnique was employed from collecting data. Thesecondary data collected from internet and journals.Hence, it helps the researcher to do a good project reportin the study area.
SCOPE OF THE STUDYThis study is done in order to get to know thecustomers satisfaction on AIRTEL.It also gives detailed information about theconsumer’s opinion about the product.It studies the income of the consumer their behaviorfor the prepaid and postpaid to get to know the cardshas influenced the respondents.
PROBLEMS OF THE STUDY:To Know The Customers Awareness Level AboutThe Plans And Schemes Of The Airtel
LIMITATIONThe study is only suitable for the particular (Trichydistrict)The study details with consumer aspect only and itignores the seller’s aspect.The finding are drawn only on the basis of theinformation supplied by the respondents.The investigator has got limited time frame all therespondents.

Page 188
ISSN : 2321-3604
March 2014Vol.2, Special Issue
Primax International Journal of Commerce and Management Research
DATA ANALYSISThis chapter meant for analyzing the collected data by the investigatorWhich is used to ascertain the results for the defined problem in the study area.After analyzing the data, the investigator has tabulated all the informationCollected from the respondents and the growth rate could be found out through the tabulation, in accordance withthis investigator has used the simple percentage method (Bar diagram. Pie diagram, etc) wherever necessary.
TABLE: Satisfaction level towards service provided at airtel
PARTICULAR CLASSIFICATIONNO OF
RESPONDENT PERCENTAGE
AGE GROUP Below 20 25 50
20-25 10 20
25-30 3 6
Above 30 12 24
EDUCATIONAL LEVEL Higher Secondary 20 40
Academic Degree 10 20
Professional Degree 5 10
Diploma 5 10
Others 10 20
OCCUPATIONAL LEVEL Govt 15 30
Private 15 30
Students 10 20
Others 10 20
REASONS FOR SELECTING
AIRTELBrand Image 15 30Quick And Good Services 15 30
Widest Coverage 15 30
All Of The Above 5 10
SERVICES PROVIDE BY
OMPANY Excellent 25 50
Good 15 30
Poor 10 20
PERFORMANCE OF AIRTELExcellent 18 36
Good 22 44
Poor 10 20
WOULD U LIKE TO CHANGE
YOUR MOBILE CONNECTIONYes 15 30
No 35 70
THE REASONS FOR USING
MOBILE PHONEBusiness 17 34
Professional 13 26
Emergency 12 24
Fashion 8 16
AWARE OF SERVICE AND
OFFERED BY AIRTEL Yes 30 60
No 20 40
OPINION ON THE COST
STRUCTURE OF RECHARGE
CARD
Very High 8 16
High 12 24
Fair 10 20
Low 15 30
Neutral 5 10
CUSTOMER SERVICE YOU
PREFERManual 30 60
Computerized 20 40
SERVICES YOU PREFER ON
AIRTEL Prepaid 40 80
Postpaid 10 20

Page 189March 2014Vol.2, Special Issue
Primax International Journal of Commerce and Management Research ISSN : 2321-3604
FINDINGS & SUGGESTIONSFINDINGS:From a detailed study the investigator could arrive atfollowing1. From the study, consumer preference of a particular
age group use the AIRTEL MOBILE other age grouppeople are not aware of hills.
2. From the sex wise classification, more malerespondents use AIRTEL. But female respondentsare not shown their priority to this mobile.
3. Customers are habituated to use a particular mobiledue to coverage and so on.
4. More than half of the customers are using the AIRTELbecause of its Quick and Good services.
5. About ¾ of the consumers of AIRTEL are preferringthe prepaid card rather than the postpaid one.
6. By comparing other mobiles, the customers getawareness with regard to schemes, coverage, callcost and etc. it shows the competency of differentmobiles.
7. From the level of satisfaction, most of the customerswere satisfied of the using the AIRTEL.
8. The study shown that most of business peoplechoose this mobile.
9. Mobile phones are used in order to show the fashionand passion.
SUGGESTIONS:1. The incentive must be provided to sales executive in
order to enhance sales volume.2. The lucid pamphlets and browsers are to be given to
the customers with regard t new schemes. So thatthe rural people can also prefer the AIRTEL service.
3. The company should concentrate more on increasingthe towers in and around area for the purpose ofbetter coverage and services.
4. The company should have to reduce initial depositand call cost to encourage the customers to preferpost paid cards.
5. They should create more employment opportunitiesin the production unit and manufacture unit.
CONCLUSION:Nowadays it is very difficult to comprehend thepsychology of customers. It is very essential to conductMarketing research on customers, so that producerscan easily identify their likes and dislikes and toconcentrate o whims and fancy.In order to retain the consumer faith on the productentrepreneurs are to concentrate more on modernmethods of production there by they can not onlyenhancing the profit for the firm but also enhancing thesatisfaction among the customer.
BIBLIOGRAPHY:Websites:1. Jon R. Katzenbach and Jason A. Santamara,
wikipedia.com2. “ACCC”, wikipedia.com3. “Market”, wikipedia.com4. “Marketing”, wikipeida.com5. “Consumer”, wikipedia.com6. “Marketing”, ROY KATZ, 10/01/2002, wikipedia.com7. “Customer”, ROY KATZ, 10/10/2002, Wikipedia.com8. “Customer”, Wikipedia.com9. “Customer Satisfaction”, your dictionary10. www.airtel.com11. www.tricy.com

Page 190
ISSN : 2321-3604
March 2014Vol.2, Special Issue
Primax International Journal of Commerce and Management Research
A Study on Customer’s Satisfaction Towards Retail Services in Trichy.
1Joe Johny Britto.JAbstract:
Customer satisfaction and customer’s behavior is widely an important key pressure in the formation of consumers’future purchase intentions. This satisfaction level only able to customers to purchase more in the retail shop. Satisfiedcustomers are also likely to tell others of their favorable experiences and thus engage in positive word of mouthadvertising. The present study aims to investigate customer’s satisfaction and customer’s behavior in the organizedretail services in Trichy city of Tamil Nadu state in India. The objectives are to identify the determinants of customersatisfaction in the retail services in Trichy city, To identify the attitude and behavior of the customers those who arepurchasing in retail shop, and to study about the future prospects of organized retail services in the city. Customersatisfaction is a significant subject for most marketers. A total of 50 questionnaires have been randomly distributed toretail customers. Using simple percentage method and correlation method the data collected is analyzed. The resultof this analysis suggests the degree of customer satisfaction in terms of services provided by retail services in Trichy.
INTRODUCTION TO RETAIL MARKETINGRetailing is one of the oldest businesses that humancivilization has known. It acts as an interface betweenthe producer and consumer, improves the flow of goodsand services and raises the efficiency of distribution inan economy. For a strong, stable and consistentlygrowing economy, a well-organized and efficient retailsector is a must. Most of the developed and evenemerging economies had adopted the organized retaillong ago and percentage share of organized retail in totalretailing has increased over the years. However, India, aland of self-sufficient villages, has continued to relyprimarily on small, close to home shops.
Retail is the sale of goods and services from individualsor businesses to the end-user. Retailers are part of anintegrated system called the supply chain. A retailerpurchases goods or productsin large quantitiesfrom manufacturers directly or through a wholesale, andthen sells smaller quantities to the consumer for a profit.Retailing can be done in either fixed locations like storesor markets, door-to-door or by delivery. Retailingincludes subordinated services, such as delivery. Theterm “retailer” is also applied where a service providerservices the needs of a large number of individuals, suchas for the public. Shops may be on residential streets,streets with few or no houses or in a shopping mall.Shopping streets may be for pedestrians only.Sometimes a shopping street has a partial or full roof toprotect customers from precipitation. Online retailing, atype of electronic commerce used for business-to-consumer (B2C) transactions and mail order, are formsof non-shop retailing.
Shopping generally refers to the act of buying products.Sometimes this is done to obtain necessities such asfood and clothing; sometimes it is done asa recreational activity. Recreational shopping often
involves window shopping (just looking, not buying) andbrowsing and does not always result in a purchase.Definition of retail marketing:
Retail marketing is the range of activitiesundertaken by a retailer to promote awareness and salesof the company’s products. This is different from othertypes of marketing because of the components of theretail trade, such as selling finished goods in smallquantities to the consumer or end user, usually from afixed location. Retail marketing makes use of thecommon principles of the marketing mix, such asproduct, price, place and promotion. A study of retailmarketing at university level includes effectivemerchandising strategies, shopping and consumerbehavior, branding and advertising. Retail marketing isespecially important to small retailers trying to competeagainst large chain stores.
CHALLENGES:To achieve and maintain a foothold in an existing market,a prospective retail establishment must overcome thefollowing hurdles:
Regulatory barriers including• Restrictions on real estate purchases,especially as imposed by local governments andagainst “big-box” chain retailers;• Restrictions on foreign investment in retailers,in terms of both absolute amount of financingprovided and percentage share of voting stock(e.g., common stock) purchased;Unfavorable taxation structures, especially thosedesigned to penalize or keep out “big box”retailers (see “Regulatory” above);Absence of developed supply chain and integratedIT management;
1 PG Research scholar, Department of Commerce CA, St. Joseph’s College, Tiruchirappalli

Page 191March 2014Vol.2, Special Issue
Primax International Journal of Commerce and Management Research ISSN : 2321-3604
High competitiveness among existing market participants and resulting low profit margins, caused in partby Constant advances in product design resulting in constant threat of product obsolescence and price declinesfor existing inventory; and
OBJECTIVE:1. To study the consumer behavior towards retails shop in Trichy Chathram..2. To study the satisfaction level of consumer towards retails shop in Trichy Chathram.
SCOPE OF THE STUDY:The scope of the study is very short but valuable. The study deals with the customers satisfaction and customersbehavior towards retailers in Trichy.
Research MethodologyResearch designThe main aim of this survey is to know the customer satisfaction and customer behavior towards organized retailoutlets and find out the key factors for customer satisfaction. Therefore descriptive research is being adopted to findout the customer satisfaction and behavior of consumers.
Area of the studyThe survey is conducted among all class of customers who are the regular purchasers and occasional buyers in theorganized retail outlets in Chathram Bus stand Trichy.
Research approachSurvey method and questionnaires methodPrimary data is collected through survey method. All the respondents are asked to fill in the questionnaire bythemselves. The questionnaire contains open ended and closed ended questions and it is in a structured formatwhich is clear and simple to the respondents.
Sample SizeSample size taken in this study is 20.Period of StudyThe study was conducted during the period January 2014 to February 2014.Sampling TechniqueAs all the possible items are considered for research, the sampling method adopted is convenience sampling.
Data Usage:For analysis and interpretation, only primary data is used. However for conclusion and recommendations bothprimary and the secondary data along with the verbal knowledge and information although obtained from respondents,though they are outside the parameters of questionnaire were also included.The data collected from these sources were analyzed using various tools like simple percentage method.
Research Instrument:A standard questionnaire is prepared for the collection of data from various respondents. The questionnaire isdesigned in such a way that the aim of collecting essential information for the study would meet the set of objectives.
Tools:Microsoft Excel is used to tabulate and analyze the valid responses. Initially, a comprehensive data file was created.Then, variables and their Tabels were defined. Only statistical tools such as simple percentage method were usedfor the analysis.

Page 192
ISSN : 2321-3604
March 2014Vol.2, Special Issue
Primax International Journal of Commerce and Management Research
PARTICULAR CLASSIFICATIONNO OF RESPONDENT
TAGEPERCENTAGE
AGE Age below 25 20 40
Age from 26-30 15 30
Age from 31-35 5 10
Age above 36 10 20
Gender Male 30 60
Female 20 40
Educati onal Qulaification School Level 8 16
Graduate 12 24
ITI/ Diploma 20 40
Post Graduate 10 20
Monthly Income below 5000 5 10
Rs. 5001- Rs. 10000 15 30
Rs. 10001- Rs. 15000 5 10
Rs. 15001 - Rs. 20000 15 30
above 20001 20 40
total members in Family Two 15 30
Three 5 10
Four 25 50
above five 5 10
Interpretation:From the above table, it is clear that 60% of the respondents are male and 40% of the respondents are female. Afterdividing the respondents on the basis of gender, they are further divided according to their age. In this, it is found thatout of total respondents 40% are 25 years old and below, 30% age between 26-35, 10% belongs to the age groupof 36-45 and 20% are above 45 years. 24% and 20% of respondents are graduates and post graduates respectively.10% of respondents are in the income level of Rs 10,001-Rs 15, 000, 30% of respondents are in the income level ofRs 15,001-Rs20, 000 and 40% of respondents are above the income level of Rs 20,001.
PARAMETER HS S N DS HDS
Product Price Range 10 5 5 20 10
Self Service 18 5 12 7 8
Quality Of Service 20 10 5 5 10
Time saving 12 15 3 10 10
Home Delivery facilities 15 12 13 5 5
Store Entrance & walkways 8 2 10 20 10
Variety of Mode of Pa yment 10 5 15 10 10
Parking facilities 8 10 10 7 15
Fast Checkout 8 15 10 10 7
SATISFACTION LEVEL OF THE CUSTOMER:

Page 193March 2014Vol.2, Special Issue
Primax International Journal of Commerce and Management Research ISSN : 2321-3604
INTERPRETATION:It is very clear that Customers are very highly satisfiedwith the self service and Quality of service and Homedelivery. The customers are satisfied with the time savingand fast chek outs. The parking facilities remain a majorconcern as many are dissatisfied with this facility. Theretail price suffers from one shop to another. Thus it leadsto dissatisfaction. The another factors of dissatisfactionis the entrance & walkways. The mode of payment isthe factor of dissatisfaction is expressed by therespondents.
FINDING AND SUGGESTIONFINDINGS:1. It is clearly shows that customers are highly satisfied
in the Quality of Service and Home Delivery facilities.2. Most of the people are satisfied with the Time Saving
and Fast Checkout.3. Some of the people says no to the Variety of mode
of Payment.4. Most of the people are dissatisfied with the product
price range and store entrance & walkways.5. Only people highly dissatisfied with the parking
facilities.
SUGGESTIONS1. Most of the stores do not accept debit or credit card.
Since most of the customers are youngster andemployed, so they expected to make this facilityavailable to the customer.
2. Here nowadays coming in a car is a famous one socustomers are liking it a lot, so they all expectingfor a parking facilities if there is no parking facilitiesthen they dissatisfied a lot
Conclusion:Here the root of the study says that the customers arehighly satisfied in the retail shop rather than to purchasedirectly from the company. If they go to the companythey can only buy one certain product only but if they goto retail shop they can be able to purchase all type ofgoods within one roof. So that the customers says thatthey highly satisfied in the self service, quality of serviceand mainly in home deliveries also. So they also givesome tips to retail shop in a very effective manner whichwe have already seen in the finding and suggestion also.
References1. Harper, Douglas. ”retail”. Online Etymology
Dictionary. Retrieved 2008-03-16.2. ”2011 Top 250 Global Retailers”. Retrieved in January
2012.3. Steven Greenhouse (October 27, 2012). ”A Part-Time
Life, as Hours Shrink and Shift”. The New YorkTimes. Retrieved October 28, 2012.
4. Philip H. Mitchell 2008, Discovery-Based Retail,Bascom Hill Publishing Group ISBN 978-0-9798467-9-3
5. How to provide excellent customer service inretailCustomer Service: Facts, Quotes and Statistics
6. Deloitte, Switching Channels: Global Powers ofRetailing 2012, STORES, January 2012, G20.
7. US Census Bureau Retail sales Retail SalesRetailSales Definition
8. IOSR Journal of Business and Management(IOSRJBM) ISSN: 2278-487X Volume 3, Issue 4(Sep,-Oct. 2012), PP 34-40 www.iosrjournals.org
9. http://smallbusiness.chron.com/definition-retail-marketing-40196.html.

Page 194
ISSN : 2321-3604
March 2014Vol.2, Special Issue
Primax International Journal of Commerce and Management Research
CORPORATE SOCIAL RESPONSIBILITY
1G. Praveena 2A.vellimalarRuby
AbstractThe term “corporate social responsibility” became popular in the 1960s and has remained a term used indiscriminatelyby many to cover legal and moral responsibility more narrowly construed. CSR is titled to aid an organization’s missionas well as a guide to what the company stands for and will uphold to its consumers. Development business ethics is oneof the forms of applied ethics that examines ethical principles and moral or ethical problems that can arise in abusiness environment. ISO 26000 is the recognized international standard for CSR. Public sector organizations (theUnited Nations for example) adhere to the triple bottom line (TBL). It is widely accepted that CSR adheres to similarprinciples but with no formal act of legislation.
1Research Scholar, Dept. of Commerce, JJ College of Arts and Science, Pudukkottai2Research Scholar, Dept. of Commerce, JJ College of Arts and Science, Pudukkottai
IntroductionCorporate social responsibility is a form of corporateself-regulation integrated into a business model. CSRpolicy functions as a built-in, self-regulating mechanismwhereby a business monitors and ensures its activecompliance with the spirit of the law, ethical standards,and international norms. In some models, a firm’simplementation of CSR goes beyond compliance andengages in “actions that appear to further some socialgood, beyond the interests of the firm and that which isrequired by law.”CSR is a process with the aim toembrace responsibility for the company’s actions andencourage a positive impact through its activities on theenvironment, consumers, employees, communities,stakeholders and all other members of the public spherewho may also be considered as stakeholders.
CSR ApproachesSome commentators have identified a difference betweenthe Canadian (Montreal school of CSR), the ContinentalEuropean and the Anglo-Saxon approaches to CSR. Itis said that for Chinese consumers, a sociallyresponsible company makes safe, high-quality products;for Germans it provides secure employment; in SouthAfrica it makes a positive contribution to social needssuch as health care and education. And even withinEurope the discussion about CSR is very heterogeneous.A more common approach to CSR is corporatephilanthropy. This includes monetary donations and aidgiven to local and non-local nonprofit organizations andcommunities, including donations in areas such as thearts, education, housing, health, social welfare, and theenvironment, among others, but excluding politicalcontributions and commercial sponsorship of events.Some organizations do not like a philanthropy-basedapproach as it might not help build on the skills of localpopulations, whereas community-based developmentgenerally leads to more sustainable development.
Another approach to CSR is to incorporate the CSRstrategy directly into the business strategy of anorganization. For instance, procurement of Fair Tradetea and coffee has been adopted by various businessesincluding KPMG. Its CSR manager commented, “Fairtrade fits very strongly into our commitment to ourcommunities.”
Another approach is garnering increasing corporateresponsibility interest. This is called Creating SharedValue, or CSV. The shared value model is based on theidea that corporate success and social welfare areinterdependent. A business needs a healthy, educatedworkforce, sustainable resources and adept governmentto compete effectively. For society to thrive, profitableand competitive businesses must be developed andsupported to create income, wealth, tax revenues, andopportunities for philanthropy. Many companies use thestrategy of benchmarking to compete within theirrespective industries in CSR policy, implementation, andeffectiveness. Benchmarking involves reviewingcompetitor CSR initiatives, as well as measuring andevaluating the impact that those policies have on societyand the environment, and how customers perceivecompetitor CSR strategy. After a comprehensive studyof competitor strategy and an internal policy reviewperformed, a comparison can be drawn and a strategydeveloped for competition with CSR initiatives.
Social accounting, auditing, and reportingFor a business to take responsibility for its actions, thatbusiness must be fully accountable. Social accounting,a concept describing the communication of social andenvironmental effects of a company’s economic actionsto particular interest groups within society and to societyat large, is thus an important element of CSR.Social accounting emphasizes the notion of corporateaccountability. D. Crowther defines social accounting in

Page 195March 2014Vol.2, Special Issue
Primax International Journal of Commerce and Management Research ISSN : 2321-3604
this sense as “an approach to reporting a firm’s activitieswhich stresses the need for the identification of sociallyrelevant behavior, the determination of those to whomthe company is accountable for its social performanceand the development of appropriate measures andreporting techniques.”An example of social accounting,to a limited extent, is found in an annual Director’sReport, under the requirements of UK company lawA number of reporting guidelines or standards have beendeveloped to serve as frameworks for social accounting,auditing and reporting including:• AccountAbility’s AA1000 standard, based on John
Elkington’s triple bottom line (3BL) reporting• The Prince’s Accounting for Sustainability Project’s
Connected Reporting Framework• The Fair Labor Association conducts audits based
on its Workplace Code of Conduct and posts auditresults on the FLA website.
• The Fair Wear Foundation takes a unique approachto verifying labour conditions in companies’ supplychains, using interdisciplinary auditing teams.
• Global Reporting Initiative’s Sustainability ReportingGuidelines
• Economy for the Common Good’s Common GoodBalance Sheet
• GoodCorporation’s standard developed inassociation with the Institute of Business Ethics
• Synergy Codethic 26000 Social Responsibility andSustainability Commitment Management System(SRSCMS) Requirements — Ethical Business BestPractices of Organizations - the necessarymanagement system elements to obtain a certifiableethical commitment management system. Thestandard scheme has been build around ISO 26000and UNCTAD Guidance on Good Practices inCorporate Governance.The standard is applicableby any type of organization.;
• Earthcheck Certification / Standard• Social Accountability International’s SA8000
standard• Standard Ethics Aei guidelines• The ISO 14000 environmental management standard• The United Nations Global Compact requires
companies to communicate on their progress (or toproduce a Communication on Progress, COP), andto describe the company’s implementation of theCompact’s ten universal principles. This informationshould be fully integrated in the participant’s mainmedium of stakeholder communications, forexample a corporate responsibility or sustainabilityreport and/or an integrated financial and
sustainability report. If a company does not publishformal reports, a COP can be created as a stand-alone document.
• The United Nations Intergovernmental Working Groupof Experts on International Standards of Accountingand Reporting (ISAR) provides voluntary technicalguidance on eco-efficiency indicators, corporateresponsibility reporting, and corporate governancedisclosure.
The FTSE Group publishes the FTSE4Good Index, anevaluation of CSR performance of companies.In some nations, legal requirements for socialaccounting, auditing and reporting exist (e.g. in theFrench bilan social (fr)), though international or nationalagreement on meaningful measurements of social andenvironmental performance is difficult. Many companiesnow produce externally audited annual reports that coverSustainable Development and CSR issues (“TripleBottom Line Reports”), but the reports vary widely informat, style, and evaluation methodology (even withinthe same industry). Critics dismiss these reports as lipservice, citing examples such as Enron’s yearly“Corporate Responsibility Annual Report” and tobaccocorporations’ social reports.In South Africa, as of June 2010, all companies listedon the Johannesburg Stock Exchange (JSE) wererequired to produce an integrated report in place of anannual financial report and sustainability report. Anintegrated report includes environmental, social andeconomic performance alongside financial performanceinformation and is expected to provide users with a moreholistic overview of a company. However, this requirementwas implemented in the absence of any formal or legalstandards for an integrated report. An IntegratedReporting Committee (IRC) was established to issueguidelines for good practice in this field.
Social license“Social license” generally refers to a local community’sacceptance or approval of a company’s project orongoing presence in an area. It is increasinglyrecognized by various stakeholders and communitiesas a prerequisite to development. The development ofsocial license occurs outside of formal permitting orregulatory processes, and requires sustained investmentby proponents to acquire and maintain social capitalwithin the context of trust-based relationships. Oftenintangible and informal, social license can neverthelessbe realized through a robust suite of actions centeredon timely and effective communication, meaningfuldialogue, and ethical and responsible behavior.Local conditions, needs, and customs vary considerablyand are often opaque, but have a significant impact on

Page 196
ISSN : 2321-3604
March 2014Vol.2, Special Issue
Primax International Journal of Commerce and Management Research
the likely success of various approaches to buildingsocial capital and trust. These regional and culturaldifferences demand a flexible and responsive approachand must be understood early in order to enable thedevelopment and implementation of an effective strategyto earn and maintain social license. Governments couldfacilitate the necessary stakeholder mapping in regionsfor which they are responsible and provide a regulatoryframework that sets companies on the right path forengagement with communities and stakeholders.
Potential business benefitsThe scale and nature of the benefits of CSR for anorganization can vary depending on the nature of theenterprise, and are difficult to quantify, though there is alarge body of literature exhorting business to adoptmeasures beyond financial ones (e.g., Deming’sFourteen Points, balanced scorecards). Orlitzky,Schmidt, and Rynes found a correlation between social/environmental performance and financial performance.However, businesses may not be looking at short-runfinancial returns when developing their CSR strategy.Intel employs a 5-year CSR planning cycle
The definition of CSR used within an organization canvary from the strict “stakeholder impacts” definition usedby many CSR advocates and will often include charitableefforts and volunteering. CSR may be based within thehuman resources, business development or publicrelations departments of an organisation, or may be givena separate unit reporting to the CEO or in some casesdirectly to the board. Some companies may implementCSR-type values without a clearly defined team orprogramme.
Human resourcesA CSR program can be an aid to recruitment andretention particularly within the competitive graduatestudent market. Potential recruits often ask about afirm’s CSR policy during an interview, and having acomprehensive policy can give an advantage. CSR canalso help improve the perception of a company amongits staff, particularly when staff can become involvedthrough payroll giving, fundraising activities or communityvolunteering. CSR has been found to encouragecustomer orientation among frontline employees.
Risk managementManaging risk is a central part of many corporatestrategies. Reputations that take decades to build upcan be ruined in hours through incidents such ascorruption scandals or environmental accidents. Thesecan also draw unwanted attention from regulators, courts,governments and media. Building a genuine culture of‘doing the right thing’ within a corporation can offset theserisks.
Brand differentiationIn crowded marketplaces, companies strive for a uniqueselling proposition that can separate them from thecompetition in the minds of consumers. CSR can play arole in building customer loyalty based on distinctiveethical values. Several major brands, such as The Co-operative Group, The Body Shop and American Apparelare built on ethical values. Business serviceorganizations can benefit too from building a reputationfor integrity and best practice.
Engagement planAn engagement plan will assist in reaching a desiredaudience. A corporate social responsibility team, orindividual is needed to effectively plan the goals andobjectives of the organization. Determining a budgetshould be of high priority. The function of corporate socialresponsibility planning: 1. To add discussion andanalysis of a new set of risks into corporate decision-making. 2. To represent issues within the corporationthat watchdogs, NGOs and advocates represent withinsociety. 3. To assess the future. An organizations longterm and short term future needs to be thought of. 4. Tohelp prioritize consideration of socially andenvironmentally friendly projects that might otherwiselack a corporate advocate. 5. To keep corporations awareof potential major societal impacts even when a negativeimpact may not be immediate, and thus lessen liability.6. To positively influence decision making where societalimpacts are maximized, whilst ensuring efforts are withina given budget.
Developing an engagement planCommit to coming up with and improving on yourcompanies goals. CSR commitments communicate thenature and direction of the firm’s social and environmentalactivities and, will help others understand how theorganization is likely to behave in a particular situation1. Do a scan of CSR commitments2. Hold discussions with major stakeholders3. Create a working group to develop the commitments4. Prepare a preliminary draft5. Consult with affected stakeholders6. Revise and publish the commitments7. Consider what is feasible within the budget
Common Types of Corporate Social ResponsibilityActionsThere are many aspects of corporate socialresponsibility; whether a company decides to developone area of CSR, or multiple, the end result is a moreprofitable company experiencing a higher level ofemployee engagement. The following is a list of common

Page 197March 2014Vol.2, Special Issue
Primax International Journal of Commerce and Management Research ISSN : 2321-3604
ways corporate social responsibility is implemented byorganizations.1. Environmental Sustainability: Areas include
recycling, waste management, water management,using renewable energy sources, utilizing reusableresources, creating ‘greener’ supply chains, usingdigital technology instead of hard copies, developingbuildings according to Leadership in Energy andEnvironmental Design (LEED)® standards, etc. Thereis a business sector dedicated to specifically toenvironmental sustainability consulting forbusinesses of any size to utilize. The highest rankedsustainability consulting firm is Ernst & Young
2. Community Involvement: This can include raisingmoney for local charities, supporting communityvolunteerism, sponsoring local events, employingpeople from a community, supporting a community’seconomic growth, engaging in fair trade practices,etc. Starbucks is an example of a company thatfocuses on community involvement andengagement; since these programs began thecompany has seen higher profits and greateremployee engagement.
3. Ethical Marketing Practices: Companies thatethically market to consumers are placing a highervalue on their customers and respecting them aspeople who are ends in themselves. They do not tryto manipulate or falsely advertise to potentialconsumers. This is important for companies thatwant to be viewed as ethical.
PrinciplesThe main principles involving corporate socialresponsibility involve economic, legal, ethical anddiscretionary aspects. A corporation needs to generateprofits, while operating within the laws of the state. Thecorporation also needs to be ethical, but has the right tobe discretional about the decisions it makes. Levels ofcorporate social responsiveness to an issue includebeing reactive, defensive, responsive and interactive. Allterms are useful in issues management. Selecting whenand how to act can make a difference in the outcome ofthe action taken.
Ethical consumerismThe rise in popularity of ethical consumerism over thelast two decades can be linked to the rise of CSR. Asglobal population increases, so does the pressure onlimited natural resources required to meet risingconsumer demand (Grace and Cohen 2005, 147).Industrialization, in many developing countries, isbooming as a result of both technology andglobalization. Consumers are becoming more aware of
the environmental and social implications of their day-to-day consumer decisions and are therefore beginningto make purchasing decisions related to theirenvironmental and ethical concerns. However, thispractice is far from consistent or universal.
Globalization and market forcesAs corporations pursue growth through globalization,they have encountered new challenges that impose limitsto their growth and potential profits. Governmentregulations, tariffs, environmental restrictions and varyingstandards of what constitutes “labor exploitation” areproblems that can cost organizations millions of dollars.Some view ethical issues as simply a costly hindrance,while some companies use CSR methodologies as astrategic tactic to gain public support for their presencein global markets, helping them sustain a competitiveadvantage by using their social contributions to providea subconscious level of advertising. (Fry, Keim, Meiners1986, 105) Global competition places a particularpressure on multinational corporations to examine notonly their own labor practices, but those of their entiresupply chain, from a CSR perspective. that allgovernment is controlling.
Social awareness and educationThe role among corporate stakeholders is to workcollectively to pressure corporations that are changing.Shareholders and investors themselves, through sociallyresponsible investing are exerting pressure oncorporations to behave responsibly. The extension of SRIbodies driving corporations to include an element of‘ethical investment’ into their corporate agenda’sgenerates socially embedded issues. The main issuecorrelates to the development and overall idea of ‘ethicalinvesting’ or SRI, a concept that is constructed as ageneral social perspective. The problem becomesdefining what is classified as ‘ethical investing’. The ethicsor values of one SRI body will likely different from thenext since ethical opinions are inherently paradoxical.For example, some religious investors in the US havewithdrawn investment from companies that fail to fulfilltheir ethical expectations. The Non-governmentalorganizations are also taking an increasing role,leveraging the power of the media and the Internet toincrease their scrutiny and collective activism aroundcorporate behavior. Through education and dialogue, thedevelopment of community awareness in holdingbusinesses responsible for their actions is growing. Inrecent years, the traditional conception of CSR is beingchallenged by the more community-conscious CreatingShared Value concept (CSV), and several companiesare refining their collaboration with stakeholdersaccordingly.

Page 198
ISSN : 2321-3604
March 2014Vol.2, Special Issue
Primax International Journal of Commerce and Management Research
GeographyIn a geographical context, CSR is fundamentally anintangible populist idea without a conclusive definition.Corporations who employ CSR behaviors are empiricallydissimilar in various parts of the world. The issue of CSRdiversity is produced through the perpetual differencesembedded in the social, political, cultural, and economicstructures within individual countries. The immensegeographical separations feasibly contribute to theloosely defined concept of CSR and difficulty for corporateregulation.
Crises and their consequencesOften it takes a crisis to precipitate attention to CSR.One of the most active stands against environmentalmismanagement is the CERES Principles that resultedafter the Exxon Valdez incident in Alaska in 1989 (Graceand Cohen 2006). Other examples include the leadpoisoning paint used by toy giant Mattel, which requireda recall of millions of toys globally and caused thecompany to initiate new risk management and qualitycontrol processes. In another example, Magellan Metalsin the West Australian town of Esperance wasresponsible for lead contamination killing thousands ofbirds in the area. The company had to cease businessimmediately and work with independent regulatory bodiesto execute a cleanup. The company ordered a recall ofall apple or carrot juice products and introduced a newprocess called “flash pasteurization” as well asmaintaining lines of communication constantly open withcustomers.
ConclusionIncreasingly, corporations are motivated to become moresocially responsible because their most importantstakeholders expect them to understand and addressthe social and community issues that are relevant tothem. Understanding what causes are important toemployees is usually the first priority because of themany interrelated business benefits that can be derivedfrom increased employee engagement (i.e. more loyalty,improved recruitment, increased retention, higherproductivity, and so on). Key external stakeholdersinclude customers, consumers, investors (particularlyinstitutional investors), and communities in the areaswhere the corporation operates its facilities, regulators,academics, and the media.

Page 199March 2014Vol.2, Special Issue
Primax International Journal of Commerce and Management Research ISSN : 2321-3604
“A STUDY ON SATISFACTION LEVEL OF E-MARKETING USER.”
1B. Nalini 2F.Ramesh KumarAbstract
Consumer is a king of the market. Every human being is a consumer of different producers. If there is no consumer,there is no business. Without satisfaction of a product consumers can’t ready to purchase the product. Therefore,consumer satisfaction is very important to every business person. Consumer satisfaction refers to how satisfied customersare with the products or services they receive from a particular agency. The level of satisfaction is determined not onlyby the quality and type of consumer experience but also by the consumer’s expectations.
IntroductionToday world people are busy with their work .They can’tspend more time for shopping. E-marketing helps theirbusy people to purchase their product in easily mannerwith the finger trips of their people. It provides 24*7 hoursservice to the public with less cost and easilytransaction.
But some of the people are afraid to purchase the productthrough the online because it requires personalinformation for their money transaction. There are manyadvantage for it in the same manner we also face manyproblem regarding this. People are ready to purchasethrough the E-marketing when it gives more satisfactionto the consumer
Meaning and conceptsA consumer is an individual who purchase or has thecapacity to purchase goods and services offered for saleby marketing institutions in order to satisfy personal orhousehold needs, wants or desires.
According to a statement made by Mahatma Gandhi,‘consumer refers to the following, “A consumer is themost important visitor on our premises. He is notdependent on us. We are dependent on him. He is notan outsider to our business. He is part of it. We are notdoing him a favour by serving him. He is doing us afavour by giving us an opportunity to do so”.
Definition of Consumer SatisfactionAccording to Philip Kotler consumer satisfaction isdefined on, “personal feeling of pleasure resulting fromcomparing a product’s pursued performance in relationto his /her expectations”.Peter Drucker the renowned management Guru, has said“to satisfy the customers is the mission and purpose ofevery business”.
E-marketingE-Marketing includes all the impacts involved in theexchange process of transferring the possession and
ownership of goods or services from the producer to theultimate consumers through the electronic mode. Onlinemarketing refers to a set of powerful tools andmethodologies used for promoting products and servicesthrough the Internet.It includes a wider range of marketing elements thantraditional business marketing due to the extra channelsand marketing mechanisms available on the Internet.Online marketing is also known as Internet marketing,Web marketing, digital marketing and search enginemarketing (SEM). Online marketing connectsorganizations with qualified potential customers andtakes business development to a much higher level thantraditional marketing. online marketing has theadvantage of selling to customers 24 hours a day, 7days a week, and from all over the country.Online marketing can deliver several benefits suchas:• Growth in potential• Reduced expenses• Elegant communications• Better control• Improved customer service• Competitive advantage• Low costs• Flexibility and convenience• Multiple options• purchase at any time (24hour *7 days)
LimitationBuilding personnel relationship is impossibleUnable to try out the productIlliteracy people cannot purchase the goodConsumer may be rejected the product at any time
Scope of the studyThe satisfaction of consumers is different from one toanother. Each consumer has the different behavior in
1 Assistant Professor, Department of Commerce, St. Joseph’s College (Autonomous), Trichy

Page 200
ISSN : 2321-3604
March 2014Vol.2, Special Issue
Primax International Journal of Commerce and Management Research
their life. Consumer satisfaction is essential for every marketer to retention of consumer and for continuous sales ofthe product in the company. So, the marketer satisfies the consumer, when he must very well know the behaviorand expectations of consumer.
Objectives of the studyTo know the factor influence in the purchase of E-marketing.To study the satisfaction level of E-Marketing user.
METHODOLOGYPrimary Data:The researchers collect the primary data from the 35 respondents through the questionnaire method.Secondary Data:The researchers collect the secondary data from the websites for their reviews.
2 Ph.D., Research scholar, Department of Commerce, Government Arts College, Karur
DATA ANALYSIS AND INTERPRETATION Table: 4.1: Gender of the Respondent
S.no Particulars No of
Respondents
Percentage of
Respondents (%)
1. Male 21 60
2. Female 14 40
Total 35 100
Source: Primary data
It is inferred that 60 percentages of the respondents are male and 40 percentages of the respondents are femalecategory because when comparing to the female most of the male respondents are purchasing a product throughthe internet.
Table: 4.2: Age of the Respondent
S.noParticulars No of
Respondents
Percentage of
Respondents (%)
1. 17 - 20years 7 20
2. 20 - 23years 18 51
3. Above 23 years 10 29
Total 35 100
Source: Primary data
From the above table it shows that 20 percentage of the respondents are belong to the age of 17-20 years.51percentage of the respondents are belong to the age of 20-23 years because most of the respondents are belong tothis age is using more internet when compare to others.
Table: 4.3: Education qualification
S.no Education
Qualification
No of
Respondents
Percentage of
Respondents (%)
1. Under graduate 18 51
2. Post graduate 10 29
3. others 7 20
Total 35 100
Source: Primary data

Page 201March 2014Vol.2, Special Issue
Primax International Journal of Commerce and Management Research ISSN : 2321-3604
From the above table it reveals that 51 percentage of the respondents are belong to the under graduate and 20percentage respondents are other categories (i.e.) Diploma, IT I and so on.
Table: 4.4: Websites used as a place for E-marketing
S.no Particulars No of
Respondents
Percentage of
Respondents (%)
1. Snap deal 6 17
2. Flip kart 8 23
3. eBay 10 29
4. Amaz on 7 20
5. Naptol 4 11
Total 35 100
Source:Primary data
From the above table reveals 34 percentages of the respondents are strongly agreed that their go for the E-marketingbecause of more convenience and easy transaction.6 percentage of the respondents are strongly disagreed that itis not easy transaction for purchasing the product because it requires personal information for purchasing a product.
Table: 4.6: Product price is less
Particulars
No of
Respondents
Percentage of
Respondents (%)
1 Strongly agreed15 43
2 Agreed 6 17
3 Neutral9 26
4 Disagreed 4 11
5 Strongly Disagreed 1 3
Total 35 100
S.no
Source: Primary data
It is inferred that 43 percentages of the respondents are strongly agreed the price of the product is less whencompare to the direct marketing .3 percentage of the respondents are strongly disagreed that a price of the productis less.

Page 202
ISSN : 2321-3604
March 2014Vol.2, Special Issue
Primax International Journal of Commerce and Management Research
Table: 4.7: Product quality is good
Particulars
No of
Respondents
Percentage of
Respondents (%)
1 Strongly agreed 9 26
2 Agreed 14 40
3 Neutral 6 17
4 Disagreed 3 8.5
5 Strongly Disagreed 3 8.5
Total 35 100
S.no
Source:Primary data
Above table reveals that 40 percentage of the respondents are agreed the product quality is good and 8.5 percentagesof the respondents are disagreed and strongly disagreed. Because in sometime the product may received indamages and it is difficult to exchange the product.
Table: 4.8: Minimum time duration for purchasing
Particulars
No of
Respondents
Percentage of
Respondents (%)
1 Strongly agreed 1234
2 Agreed8 23
3 Neutral8 23
4 Disagreed3 9
5 Strongly Disagreed4 11
Total 35 100
S.no
Source:Primary data
It is inferred that 34 percentages of the respondents are strongly agreed .It consumes only less time for purchasingthe product. But 9 percentages of the respondents are disagreed because it takes more time to carefully fill up thenecessary detail.

Page 203March 2014Vol.2, Special Issue
Primax International Journal of Commerce and Management Research ISSN : 2321-3604
Table: 4.9: Types of the Product
S.no Particulars No of Respondents
Percentage of Respondents (%)
1. Books 8 23
2. Electronic Goods 9 26
3. Dress material 5 14
4. Cosmetic items 7 20
5. Other items 6 17
Total 35 100
Source:Primary data
From the above table shows that 26 percentages of the respondents are buying the electronic goods through E-marketing such as calculator, watch, mobiles and so on.14 percentage of the respondents are purchasing the dressmaterial.
Table: 4.10: Satisfaction level of E-Marketing
S.no Particulars No of Respondents
Percentage of Respondents (%)
1. Strongly agreed 6 17
2. Agreed 9 25.5
3. Neutral 15 43
4. Disagreed 3 8.5
5. Strongly Disagreed 2 6
Total 35 100
Source:Primary data
It is inferred that 43 percentages of the respondents areneutral in the satisfaction level of E-marketing and 6percentage of the respondents are not satisfied with theE-marketing.so the E-marketer try to improve thesatisfaction level of their consumer.
FINDING, SUGGESTION & CONCLUSIONFINDING:
60 % of the respondents are male respondentsbecause there are spend more time in internet.
51 % of the respondents are belonging to the age of20-23 years.
51% of the respondents are belong to the undergraduate who purchasing the product through E-marketing.
29 % of the respondents are choose e bay as theplace for the purchasing the product.34 % of the respondents are strongly agreed thattheir go for the E-marketing because of moreconvenience and easy transaction.
43 % of the respondents are strongly agreed theprice of the product is less when compare to thedirect marketing.
8.5 % of the respondents are disagreed and stronglydisagreed about the quality of the good. Becausein sometime the product may received in damagesand it is difficult to exchange the product.
34 % of the respondents are strongly agreed .Itconsumes only less time for purchasing the product.
26 % of the respondents are buying the electronicgoods through E-marketing such as calculator,watch, mobiles and so on.43 % of the respondents are neutral in thesatisfaction level of E-marketing.
Suggestion:• Provide the awareness about the E-marketing usage
to the illiteracy people. It will help to increase thesale volume of the marketer.
• E-marketer must maintain the secrecy of theconsumer account number.
• Most of the people are afraid the quality of theirproduct so the marketer must take care about theproduct how it distribute to the consumer.
Page 204
ISSN : 2321-3604
March 2014Vol.2, Special Issue
Primax International Journal of Commerce and Management Research
ConclusionConsumer is like the blood of our business and also asatisfying a consumer is also a difficult task. Creating anew consumer and retention an existing consumer isdifficult jobs in the world because more competitors areentering in the market daily. So, the consumersatisfaction is getting more importance in the E-marketingfunctions. The E-marketer tries to improve the satisfactionlevel of the consumer.
Reference:• http://www.techopedia.com/definition/26363/online-
marketing• http://smallbusiness.chron.com/six-benefits-
internet-marketing-31382.html• www.google.com / AdWords• http://www.agims.com/blog/2013/05/10-reasons-
internet-marketing-is-important-to-your-business-agi-marketing-solutions-el-paso-tx/
• ht tps: / /exploreb2b.com/ar t ic les/d i f ferent-components-of-internet-marketing

Page 205March 2014Vol.2, Special Issue
Primax International Journal of Commerce and Management Research ISSN : 2321-3604
A STUDY ON IMPLEMENTATION OF 5‘S’IN HOTEL RAMYASPVT LTD. TIRUCHIRAPPALLI
1Venkatesan.S
“A place for everything and everything in its place” is the mantra of the 5‘S’ method.- BENJAMIN FRANKLIN
ABSTRACT5‘S’ is a systematic technique used by organizations to improve quality environment, health, and safety at the workplace.The concept comes from five Japanese words; Seiri (sort), Seiton (set in order), Seiso (shine), Seiketsu (standardize),and Shitsuke (sustain). The main focus in 5‘S’ is to organize work places and spaces and also to standardize theworking methods to such an order, that they increase profitability. This system helps to organize a workplace forefficiency and decrease wasting and optimize quality and productivity via monitoring an organized environment. Italso provides useful visual evidences to obtain more firm results. The 5‘S’ Implementation are reduce inventory,efficient in work place usage, reduce time for searching spare parts, utensils, reduce work accident, increasediscipline, follow procedure and better relationship among employee. 5‘S’ plays an importance role of continuousimprovement in today’s organizations, and lack of sufficient evidence to show the positive impact of 5‘S’ on organizationalperformance, this paper aims to determine performance factors and characteristics in hotel’s and identifying theeffectiveness of 5‘S’ implementation on organizational performance as well. The targeted organization was chosenfrom hotel industry. The results of this research obtained from hotel organization performance after 5‘S’ implementation.The results show that 5‘S’ is an effective tool for improvement of organizational performance, regardless of organizationtype, size, its production or its service. Consequently, 5‘S’ techniques would strongly support the objectives oforganization to achieve continuous improvement and higher performance.
INTRODUCTIONIn recent years, the practice of 5‘S’ is commonly usedamong the Japanese firms in order to enhance humancapability and productivity. Since it was introduced byTakashi Osada in the early 1980s, it is believed thatapplying the 5‘S’ techniques could considerably raisethe environmental performance in production lineincluding housekeeping, health, safety and more. The5‘S’ is the acronym of five Japanese words which standsfor seiri (sort), seiton (Set in order), seiso (cleanliness),Seiketsu (standardization) and Shitsuke (discipline).
Nowadays in this dynamic and technological world, thesecret of surviving for any kind of organization is to becompetitive and pioneer in its products or services. Oneof the main parts of this way to succeed is continuousimprovement and increasing the quality of product orservice. Usually, this improvement has been achievedthrough implementation of best practices which arechosen to meet a particular objective. 5‘S’ is a way toimprove the performance and organize the whole systemwhich has been used first time by Japanese. It comesfrom five Japanese words start with S which is translatedinto English words to give the best explanation for them.As it will be discussed later, using 5‘S’ as a total qualitymanagement method is very effective and efficient forimprovement of whole organization. It has dramaticimplementation on safety and environmental issues,
1PG Research Scholar, Department of Commerce CA, St. Joseph’s College, Tiruchirapalli
rescue loss of resources and reduce cost effectivenessthat this study is going to investigate and prove.
5‘S’ - CONCEPT5‘S’ is the principles of work environment improvementderived from the Japanese words seiri, seiton, seiso,Seiketsu, and Shitsuke. In English the five Ss arerespectively described Sort, Set Shine, Standardize, andSustain. 5‘S’ is literally 5 abbreviations of Japanese wordswith 5 initials of S, these are:
1. Sort-- - Remove unused items from your venue ofwork. (Removal / organization)
2. Set in Order-Organize everything needed in properorder for easy operation. (Orderliness)
3. Shine - Maintain high standard of cleanness.(Cleanness)
4. Standardize - Set up the above three Ss as normsin every section of your place. (Standardize)
5. Sustain - Train and maintain discipline of thepersonnel engaged. (Self-Discipline)
A ‘5‘S’’ driven workplace enhances productivity andcompetitiveness and fosters a productivity culturethrough a continual process of identifying, reducing andeliminating MUDA (Japanese word for Waste). ‘5‘S’’ helpsto:(a) Identify, Reduce and Eliminate MUDA

Page 206
ISSN : 2321-3604
March 2014Vol.2, Special Issue
Primax International Journal of Commerce and Management Research
(b) Organized & World Class Gemba (Workplace)(c) Enhancement in Productivity & Competitiveness(d) Better Living and improved work life
Principle of 5‘S’The 5‘s’ are prerequisites for any improvement program.As waste is potential gain, so eliminating waste is again. 5‘s’ Philosophy focuses on effective work placeorganization, simplifies work environment, reduceswaste while improving quality and safety.
There is no hope for efficiency or quality improvementwith dirty work place, waste of time and scrap.
Advantages of 5‘S’1. Operations can be performed without error,
proceeding in a well-regulated fashion,resulting in fewer defective items thereby increasingthe overall quality of product.
2. Operations can be performed safely andcomfortably, reducing the chances of accidents.
3. Machinery and equipment can be carefullymaintained, reducing the number of breakdowns.
4. Operations can be performed efficiently, eliminatingwaste thereby increasing the efficiency andproductivity.
STATEMENT OF THE PROBLEMIn recent years, researchers and practitioners arepaying increasing attention to the phenomenon of newmanagement systems and their impact on company’sperformance.
The most important problem and the primary reasonfor this research are to study about the concept of 5‘S’and its implementation and impact on organizationalperformance. The main problem is many of theorganizations not aware of the technique of 5 S, eventhey know it, and they failed to implement this concept.In the industries like hotel there is in need of improvingtheir quality continuously to compete the competitoras well as to attract the customer and to increase theprofitability of the organization. Nowadays many of thehotels are not introducing the concepts available tomaintain the quality and to survive in the market. . Here,the concept of 5‘S’ is very much helpful to maintain thequality in services, HR, and overall organizationalefficiency, but still, there is a problem in implementation,training and understanding the concept. This papermainly focuses on explaining the concept to understandand help to realize the importance of implementationof 5‘S’ in the hotel industry especially in hotel Ramyas,Trichy.
OBJECTIVES OF THE STUDY There are many practices in the world to improve thequality of products/services and performance oforganizations, but generally companies looking for thebest practice to implement and utilize for achieving theirorganizational goals and objectives easier, sooner andwith less expenses. This study aims to investigate theimplementation of 5‘S’ practices on performance of hotelorganizations. Accordingly, the main objective of theresearch is to measure the organization’s performanceafter implementing 5‘S’ practice.
The following are the important objectives of the study:• To study the conceptual frame work of 5‘S’.• To identify the effective and efficient implementation
of 5‘S’ in the Hotel industry.• To study the implementation process of 5‘S’.• To identify the employee commitment towards the
organization after implementation of 5‘S’.• To study the waste elimination helps to reduce cost
effectiveness after implementation of 5‘S’.• To study overall support of the employee towards
the implementation of 5‘S’.
SCOPE OF THE STUDYThe scope of this work is limited to determineperformance factors and dimensions of hotelorganizations and also characteristics of thosedimensions, which will be proposed as questions, andfinally find out whether 5‘S’ is an effective method toimprove the whole performance of a hotel organization.It realized that the scope is ambitious in that, but itexamines a new outlook at organization and total qualityapproach, however it is limited enough to be a realisticbase for a research. The output of this research will helpus to locate 5‘S’ practices in the most suitableframework for total quality management and performanceimprovement in hotel organizations. This condition willcreate win-win situation between employer andemployees.
METHODOLOGYIn order to carry out the study, a methodological andstructured design has been used. Ramyas Hotel Pvt.Ltd, Tiruchirapalli has been purposely chosen for thestudy as it is one of the main Hotel in Tiruchirapalli.
Period of the studyThe study was conducted during the month of February2014. The total of 45 respondents were selected at arandom and questionnaire was obtained from thesecondary data has been used in designing thequestionnaire.

Page 207March 2014Vol.2, Special Issue
Primax International Journal of Commerce and Management Research ISSN : 2321-3604
Research design & Sample SizeThe researcher has chosen the descriptive design forresearch for conducting this research. Descriptiveresearch studies are concerned with describing thecharacteristics of particular individual or groups.
Sample SizeThe number of employees on the staff roll of the hotel is100 per shift i.e. (Total number of employees are 300)which constituted the universe of the present study. Fromthis universe, 45 selected employees are chosen asstudy respondent who constituted 15% of the population.These 45 selected employees are chose for the studyon a random sampling basis. Each department in thehotel is given adequate representation in the sample.
Data CollectionThe study is an exploratory study in nature and thereforethe researcher decided to use both primary andsecondary data for strengthening the objectives.
ANALYSIS AND INTERPRETATIONTABLE-1 : Showing age wise distribution of respondents
Pre-Test:Before going for any complete survey there is a need forthe Pre-Test. The researcher selected only 10respondents out of 45, for the Pre-Test. After getting thefeedback and suggestion from those employee’s theresearcher strengthened the questionnaire and obtainedthe relevant information from the respondents forimplementation of 5‘S’ technique.
Data Collection & Tools usedPrimary data:The primary data are collected with the help ofQuestionnaire.
Secondary data:The secondary data are taken from published recordsand information in E-libraries,
Documents, Books, Journals, Theses, Internetresources and related sources are used.
Frequency No. of respondent Percentage21-30 17 38 %31-50 22 49 %
Above 50 06 13%Total 45 100%
Interpretation:A glance at the above table reveals that the largest number of respondents (49%) belongs to the age group of 31-50,while 38% of them are in the category of 21-30. Only 13% of the respondents are at the level of above 50 agecategory. According to the ages of the respondents, experienced respondents are very high when compared to theyoung respondents ranging from 21-30.
TABLE-2 : Showing work experience under 5'S’ implementation
Source: Primary data
Frequency No. of respondent Percentage0-5 yrs 13 29 %
5-10 yrs 25 55 %10 above 07 16%
Total 45 100%Source: Primary data
Interpretation:From the above drawn table the majority of respondents are at 05-10 years (55%) whereas 0-5 years (29%). Just16% of the respondents are at above 10 years of experience in the hotel. According to the experience of respondents,the maximum experienced respondents i.e. 10 and above are very less namely 16 percent, whereas less experiencedrespondents are more i.e. 55 percent. Here less experienced respondents can be given additional care for them toconcentrate 5‘S’ Japanese Technique.

Page 208
ISSN : 2321-3604
March 2014Vol.2, Special Issue
Primax International Journal of Commerce and Management Research
TABLE-3 : Showing frequent practice of the seiri (sort) concept
Category Frequency PercentageVery often 30 67%
Often 15 33%Occasionally - -
Rarely - -Total 45 100%
Source: Primary data
Interpretation:The above mentioned table respondents are very often throw out the unnecessary waste form the hotel i.e. 67%whereas 37% of the respondents are say often the waste throws out form the hotel. None of them says the wastethrow out occasionally and rarely from the Hotel.
TABLE-4: Showing the way of following method in the seiton (set in order) concept
Category Frequency PercentageLabeling - -
Allotting rack - -Segregating the place - -
All the above 45 100%Total 45 100%
Interpretation:The above mentioned table shows that the entire respondents accepted all the process of set in order must beproperly followed by the organization.
TABLE-5 : Showing frequent process of seiso (clean) in the environment
Source: Primary data
Category Frequency PercentageStrongly agree 32 71%
Agree 05 11%Disagree 08 18%
Strongly disagree - -Total 45 100%
Source: Primary data
Interpretation:The data given above shows that 32 respondents were strongly agree about the cleanliness of their organization.Whereas 5 respondents were agree about the cleanliness the remaining 8 respondents were disagree about thefrequent cleanliness of the hotel.

Page 209March 2014Vol.2, Special Issue
Primax International Journal of Commerce and Management Research ISSN : 2321-3604
TABLE-6 : Showing the maintenance of seiketsu (standardize) in work place
Category Frequency PercentageStrongly agree 23 71%
Agree 08 18%Disagree 05 11%
Strongly disagree - -Total 45 100%
Source: Primary data
Interpretation:The above mentioned table shows that 71% of the respondents strongly agree that the standardization of workplace followed and maintained properly, whereas 18% of the respondents agree their opinion towards thestandardization. Remaining 11% of them disagrees the maintenance of standardization.
TABLE-7 : Showing maintenance of shitsuke (sustain – self discipline) in the organization
Category Frequency PercentageStrongly agree 17 38%
Agree 09 20%Disagree 09 20%
Strongly disagree 10 22%Total 45 100%
Source: Primary data
Interpretation:From the view of the above table it is clear that majority of the respondents i.e. 38% of them have strongly agreethat the employees maintain self-Discipline. Some respondents 20% agree that the self-Discipline. The remainingemployees disagree and strongly disagrees the self-Discipline among the employees.
TABLE-8 : Showing employees commitment towards after implementation of 5'S’
Category Frequency PercentageStrongly agree 32 71%
Agree 11 24%Disagree 02 5%
Strongly disagree - -Total 45 100%
Source: Primary data
Interpretation:From the above drawn table it is clear that majority of the respondents i.e. 71% of them strongly agree theircommitment towards the organization after implementation of 5‘S’, whereas 24% of them are also agree theircommitment towards the implementation process. Remaining 5% of the respondents not show their commitmentfor the implementation of 5‘S’.

Page 210
ISSN : 2321-3604
March 2014Vol.2, Special Issue
Primax International Journal of Commerce and Management Research
TABLE-9 : Showing waste elimination helps to reduce the cost effectiveness
Category Frequency PercentageStrongly agree 32 71%
Agree 11 24%Disagree 02 5%
Strongly disagree - -Total 45 100%
Interpretation:The above mentioned table shows that the majority of the respondents i.e. 71% of them strongly agree the wasteelimination helps to reduce the cost effectiveness. Some respondents i.e. 24% agree that the cost effectivenessuseful to the organization. A very few respondents says that elimination will not be a result of cost effectiveness.
TABLE-10 : Showing overall support of respondents towards the implementation of 5‘S’
Source: Primary data
Category Frequency PercentageStrongly agree 35 78%
Agree 08 18%Disagree 02 04%
Strongly disagree - -%Total 45 100%
Source: Primary data
Interpretation:The above mentioned table clearly shows that the majority of the respondents i.e. 78% of strongly agree implementationof 5‘S’ in hotel industry, whereas 18% of them agree about the implementation. Remaining 04% of them oppose theimplementation of 5‘S’.
TABLE-11 : Showing 5‘S’ implementation will be the reason for the business development
Category Frequency PercentageStrongly agree 20 45%
Agree 15 33%Disagree 10 22%
Strongly disagree - -%Total 45 100%
Source: Primary data
Interpretation:The above mentioned table shows that the maximum of 45% of the respondents accepted 5‘S’ implementation isthe reason for the business development, whereas 33% of them agree. The remaining respondents i.e. 22% disagreethe business development is only the reason for implementation of 5‘S’.

Page 211March 2014Vol.2, Special Issue
Primax International Journal of Commerce and Management Research ISSN : 2321-3604
FINDINGSIn the last section, after studying of 5‘S’ implementation,5‘S’ practice as one of the most appropriate practicesfor hotel organizations, with focus on total qualitymanagement approach was proposed.
• It is found that 5‘S’ is one of the important principleto maintain the quality in the Organization.
• It is found that majority of the respondents i.e. 78%of them support towards the implementation of 5‘S’.
• It is observed that 45% of the respondents says thatthe business development is occurred in theorganization for the implementation of 5‘S’.
• It is observed that using 5‘S’ principle managementshould reduce the cost effectiveness by way ofeliminating waste.
• It is observed that the 5‘S’ implementation helps toreduce the un-necessary searching in theOrganization.
• It is found that 5‘S’ implementation is the effectiveand efficient ways to achieve profitability.
RECOMMENDATIONS• According to the result the researcher recommended
that the future development of 5‘S’ practice will bethe key factor for the success of the organization.
• It is suggested that the 5‘S’ concept is not onlyapplied in hotel industry but also it is
applicable to any form of manufacturing and qualitymaintenance industries.
• It is advised that the employee need to maintainmore concentration and discipline towards the work.
CONCLUSIONA man who is performing well based on his/her abilities,knowledge, skills, and technicalities what he/she knowsthe organization which is performing well, that is based
on HR Management, Production Management,Marketing Management, and Financial Management andso on. These areas can be managed in the effective waythrough 5‘S’concept of Continuous Improvement. Herethis study makes us to understand the concept of 5‘S’,its implementation and the performance level of the HotelRamyas after implementation of 5‘S’.
REFERENCESModel projects:1. Introduction and implementation of the 5‘S’ operation
model for ST-Koneistus LTD. By veli-pekka pirtiijoki2. Quality improvement using 5‘S’ concept in
manufacturing industry- sarvin silvarao
3. 5‘S’ implementation and people involvementatmuehlbauer technologies sdn bhd.
4. Becker JE (2001). Implementing 5‘S’: To promotesafety and housekeeping. Professional Saf.46(8):29-31.
5. The impact of 5‘S’ implementation on industrialorganisation performance by arash ghodrati,norzimazulkifli.
6. A conceptual evaluation of 5‘S’ model in hotels DilekAcar Gürel.
7. The impact of 5‘S’ on the safety climate ofmanufacturing workers by siddarth sriniwasan
8. J.M. Juran and Frank M.Gryna- Quality planning andanalysis – TATA Mc Graw Hill, New Delhi.
Websites:1. www.google.com2. Www.yahoo.com3. www.studymode.com4. www.theseus.fi/bitstream/handle.../pirtijoki_veli-
pekka.pdf

Page 212
ISSN : 2321-3604
March 2014Vol.2, Special Issue
Primax International Journal of Commerce and Management Research
THE STUDY ON CORPORATE SOCIAL RESPONSIBILITY INEMERGING MARKETS-ITC e-CHOUPAL
1R.Ethelbert Preethi.
ABSTRACTCSR has become an integral part of corporate strategy. Companies have CSR teams that devise specific policies,strategies and goals for their CSR programs and set aside budgets to support them.
CSR has come a long way in India. From responsive activities to sustainable initiatives, corporate have clearlyexhibited their ability to make a significant difference in the society and improve the overall quality of life. Everyonesees CSR as part of a continuing process of building long-term value. Everything a company do, helps improve thereputation of company and encourage customers and other stakeholders to stay involved with it.
This paper tries to identify the after effects of e-Choupal in ITC and how this initiative has helped the company in itsprogress. CSR initiatives of some companies have also been discussed. There may be some scope for improvementbut serious efforts have been put into to get the best results.
1Asst. professor, Dept. of Business Administration, St. Joseph’s College, Trichy
INTRODUCTION:The 21st century is characterized by unprecedentedchallenges and opportunities, arising from globalization,the desire for inclusive development and the imperativesof climate change. It is recognized the world over thatintegrating social, environmental and ethicalresponsibilities into the governance of businessesensures their long term success, competitiveness andsustainability. The last thirty years have borne witnessto a radical change in the private sectors relationshipwith both the state and civil society. Firms have beenincreasingly called upon to adopt strategies beyond thefinancial aspects of their operations and consider thesocial and environmental impact of their businessactivities. In this context, many companies have modifiedtheir policies and activities and engaged into CorporateSocial Responsibility (CSR).
CSR has become an integral part of corporate strategy.Companies have CSR teams that devise specific policies,strategies and goals for their CSR programs and set asidebudgets to support them.
CSR has come a long way in India. From responsiveactivities to sustainable initiatives, corporate have clearlyexhibited their ability to make a significant difference inthe society and improve the overall quality of life. Everyonesees CSR as part of a continuing process of buildinglong-term value. Everything a company do, helps improvethe reputation of company and encourage customers andother stakeholders to stay involved with it.
This paper tries to identify the after effects of e-Choupalin ITC and how this initiative has helped the company inits progress. CSR initiatives of some companies havealso been discussed. There may be some scope for
improvement but serious efforts have been put into toget the best results.
OBJECTIVES:1) To study the efforts of Indian companies in this field
and their impacts on the company2) To find out how corporate social responsibility is
serving as a determinant of corporate success.3) To find the success of ITC after the implementation
of e-Choupal.
RESEARCH METHODOLOGY:RESEARCH DESIGN:The design used for this study is analytical in nature.This design is chosen to describe the success ofcompanies after the implementation of CSR. The viewsand opinions of companies about the CSR are highlightedthe facts to strengthen the success of CSR.
SOURCE OF DATA:Secondary data have been used for this study. It hasbeen obtained from the official websites as well fromjournals, newspapers and articles related to thecompanies, which are under the scope of this study.
SCOPE OF THE STUDYThis study will help the organization to implement andbetter development of CSR activities. The study explainshow CSR directly impacts in the profit and success ofthe organization.
LIMITATIONS:1. CSR initiatives practiced by companies were easily
available but the results of these initiatives are hardto find out.

Page 213March 2014Vol.2, Special Issue
Primax International Journal of Commerce and Management Research ISSN : 2321-3604
2. It was difficult to find out the contribution of the CSR practices to the profit of the company after they wereinitiated.
ITC s PERFORMANCE SINCE INCEPTION OF e-CHOUPAL:GROSS INCOME OF ITC : 2000-09 (Rs in crores)
Year gross
income
2000
8069.37
2001
8827.11
2002
9982.46
2003
11194.47
2004
12039.92
2005
13585.39
2006
16510.51
2007
19636.53
2008
21966.84
2009
23678.46
25000
20000
15000
10000
5000
02000 2001 2002 2003 2004 2005 2006 2007 2008 2009
gross income
Gross income
The above graph clearly depicts that the gross income has risen from 2000( e-CHOPAL). The grossincome has grown 193% from 2000. SALES OF ITC: 2000-09 (Rs in crores)
Year
Sales
2000
2475.45
2001
2516.44
2002
31.55.90
2003
3712.00
2004
4109.85
2005
4846.89
2006
6463.15
2007
8207.88
2008
9543.59
2009
10529.60
12000
10000
8000
4000
6000
2000
02000 2001 2002 2003 2004 2005 2006 2007 2008 2009
SALES
SALES
The above sales graph shows that there is huge growth in sales for ITC after theimplementation of e- CHOUPAL.

Page 214
ISSN : 2321-3604
March 2014Vol.2, Special Issue
Primax International Journal of Commerce and Management Research
LITERATURE REVIEW:Frederick, 2006: His research falls short of providingsatisfactory guidance to the practice of CSR.
King & Lenox, 2000; Muller & Kolk, 2010. This studyreveals that CSR practices are often evaluated in asimplified and superficial manner with actual CSRactivities.
Bondy 2008: His study results that our knowledge ofthe degree to which CSR practices have penetrated thefabric of business behavior is still embryonic. PaulHohnen in their paper on “CORPORATE SOCIALRESPONSIBILITY: An implementation guide for business”have said that there is no ̄ one –size-fits –all ̄ methodfor pursuing a corporate social responsibility (CSR)approach. Each firm has unique characteristics that willaffect how it views its operational context and its definingsocial responsibilities. Each will vary in its awarenessof CSR issues and how much it has already done towardsimplementing a CSR approach.
R. Edward Freeman, S. Ramakrishna Velamuri, BrianMoriarty in their study on “COMPANY STAKEHOLDERRESPONSIBILITY-A new approach to CSR” have pointedout the fact that if a company is enriching the lives of itsstakeholders. Pointed out the fact that if a company isenriching the lives of its stakeholders, then asking theadditional question of whether or not it is ¯sociallyresponsible simply makes no sense-it is meaninglessquestion. If the company is doing everything to keepstakeholders happy, then it deserves to be applaudedand offered as an example for other firms to emulate. Ifit is not doing it satisfactorily as particular stakeholdersthink it ought, the n these stakeholders could perhapsoffer to help it do them better, rather than appeal toactions and responsibilities that lie outside its day today activities.
CONCLUSION:As it was demonstrated at the beginning of the chapter,the importance of CSR has grown considerably over thelast twenty years or so. The expansion of global markets,the shrinking role of the state, the transformation of theworld in to a global village and the recent corporatescandals have greatly contributed to the prominence ofCSR and the characteristics it bears. After thecompletion of study named CORPORATE SOCIALRESPONSIBILITY IN EMERGING MARKETS‘I wouldlike to conclude that in today‘s competitive era CSRhas an important role to play. CSR initiatives practicedby the companies contribute to the profit and successof the company. As an example in the success of ITC,CSR initiative e- Choupal has an important role to playas it is one of the success factors of ITC. This has beenshowed with the help of graphs that depict the company‘sperformance since the e-Choupal has been initiated(2000). With time many other companies have startedtaking interest in this kind cause.
REFERENCE:1. India, Ministry of Corporate Affairs, Corporate Social
Responsibility Voluntary Guidelines 2009
2. The Challenges of Social Corporate SocialResponsibility: Facts for You, May 2013, pp. 38-39
3. Kuttayan Annamalai, Sachin Rao, what works ITC’se-Choupal and profitable rural Transformation
4. http://timesofindia.indiatimes.com/topic/Corporate-Social-Responsibility
5. http://en.wikipedia.org/wiki/Corporate_social_responsibility
6. www.e-choupal.com

Page 215March 2014Vol.2, Special Issue
Primax International Journal of Commerce and Management Research ISSN : 2321-3604
A STUDY ON THE REDUCING STRESS IN THE WORKPLACEOF SELECT PRIVATE SECTOR SUGAR MILL IN TAMILNADU
1F. Ramesh kumar 2B.Nalini
ABSTRACTMany employees agree one of the most common problems in the workplace today is stress. Stress causes loss ofproductivity, loss of efficiency, increased employee absenteeism, and many other problems. Stress comes fromseveral aspects of an employee’s life the workplace, social factors, and personal factors.Many aspects of the workplacecan lead to employee stress. One of the main causes of employee stress is change. Change can come in many formschanges in the industry, changes in the organizations strategies, organizational restructuring, policy changes, changesin responsibilities, and the addition of new equipment or technology. The work environment itself may also be a sourceof stress. Working conditions, lighting, inadequate equipment, an uncomfortable work station, physically demandingwork, and shiftwork are all sources of workplace stress. concepts and measures, an overview of the evidence linkingjob stress to ill health, estimates of the size of the problem, the benefits of reducing job stress, a summary of theintervention research on ways to prevent and control job stress, an outline of international best practice in job stressintervention and resources for workplace stakeholders to support efforts to implement best practice.
1 Ph.D, Research scholar, Department of Commerce, Government Arts College, Karur.2 AssistantProfessor, Department of Commerce, St. Joseph’s College, Trichy
IntroductionStress in the workplace
The term ‘job stress’ refers to distress resulting froma situation where the demands of a job are not matchedby the resources provided to get the job done. Either orboth sides of this equation can be modified to prevent orreduce job stress – modifying demands or stressors andimproving job resources. Resources might include aworker’s occupational skills, job experience or education,or organisational resources such as machinery, rawmaterials, or staffing levels available to produce goodsor provide services. Job stressors are working conditionsthat increase the risk of job stress and consequentimpacts on health.
There are numerous job stress terms, concepts, modelsand theories, all of which can be understood in thecontext of the job stress process. The process initiateswith exposure to stressors. Stressors arising from thework environment are classified as psychosocial orphysical. Psychosocial stressors, include job demands,job control, job insecurity, bullying, harassment and more.Physical stressors include noise and ergonomicexposures.
Exposure to stressors can lead to perceived distressstrictly speaking; job stress is short for job-relateddistress. Perceived distress can in turn lead to adverseshort-term responses, which can be physiological orbehavioural.Distress, as well as short-term responses,increase the risk of enduring health outcomes of aphysiological,or behavioural. Importantly, job stress canaffect health both directly – through neuroendocrine
mechanisms and indirectly – through health behaviouralpathways.
When job and workplace stress threatens to overwhelmyou, there are simple steps you can take to regain controlover yourself and the situation. Your newfound ability tomaintain a sense of self-control in stressful situationswill often be well-received by coworkers, managers, andsubordinates alike, which can lead to better relationshipsat work. Here are some suggestions for reducing jobstress by prioritizing and organizing your responsibilities.
Review of literatureBuddeberg-Fischer, in their book titled “Work stress andreduced health in young physicians: prospectiveevidence from Swiss residents” (2008) they investigatedthe perceived job stress, its association with the amountof working hours, and its impact on young physicians’self-reported health and their satisfaction with life duringresidency. Stress at work in young physicians, especiallywhen being experienced over a longer period inpostgraduate training, has to be a matter of concernbecause of its negative impact on health and lifesatisfaction and the risk of developing symptoms ofburnout in the long run.
Katherine Pollak. In their book titled “Stress managementin the workplace” (2009) it suggested that work stresssignificantly contribute to corporate health costs.Comparison through randomised controlled design ofstress management and intervention provided by aninstructor-led group and computer presented format, hasresulted in significantly higher attrition in computer basedpresentation format.

Page 216
ISSN : 2321-3604
March 2014Vol.2, Special Issue
Primax International Journal of Commerce and Management Research
Wated, research titled “The Role of Accent as a WorkStressor on Attitudinal and Health-Related WorkOutcomes”, (2006) has stated that, data collected fromthe employees who spoke English with a supportedaccent and prediction, by examining in their role in group,self-efficiency and perceived control in the process wherenone of the proposed coping mechanism had an impactof perceived discrimination on employees accent.
Yates, and Iva in their research work titled “ReducingOccupational Stress”, (2005) the survey explains in detailthat 40% of worker in a manufacturing company reportedthat their job was very stressful and another 25%expressed that this job was extremely increasing thestress towards their family life, this survey has identifiedvarious job conditions that can be adopted to maintain astress less work life which leads to a stress less familylife.
Ryan, P.In their book titled, “occupational stressreduction” (2005) they have attempted to address theissue of work-related stress through whole team trainingprogrammes, on a background of largely ineffectivestress reduction training programmes offered toindividuals within the workplace. The findings showsignificant implications to the conceptual, methodologicaland everyday organizational practice levels of tacklingthis central issue to the health of the workplace.
Time Management tips for reducing job stress• Create a balanced schedule. Analyze your
schedule, responsibilities, and daily tasks. All workand no play is a recipe for burnout. Try to find abalance between work and family life, socialactivities and solitary pursuits, daily responsibilitiesand downtime.
• Don t over-commits you. Avoid scheduling thingsback-to-back or trying to fit too much into one day.All too often, we underestimate how long things willtake. If you’ve got too much on your plate, distinguishbetween the “shoulds” and the “musts.” Drop tasksthat aren’t truly necessary to the bottom of the listor eliminate them entirely.
• Try to leave earlier in the morning. Even 10-15minutes can make the difference between franticallyrushing to your desk and having time to ease intoyour day. Don’t add to your stress levels by runninglate.
• Plan regular breaks. Make sure to take shortbreaks throughout the day to take a walk or sit backand clear your mind. Also try to get away from yourdesk or work station for lunch. Stepping away fromwork to briefly relax and recharge will help you bemore, not less, productive.
Task Management tips for reducing job stress• Prioritize tasks. Make a list of tasks you have to
do, and tackle them in order of importance. Do thehigh-priority items first. If you have somethingparticularly unpleasant to do, get it over with early.The rest of your day will be more pleasant as a result.
• Break projects into small steps. If a large projectseems overwhelming, make a step-by-step plan.Focus on one manageable step at a time, ratherthan taking on everything at once.
• Delegate responsibility. You don’t have to do it allyourself. If other people can take care of the task,why not let them? Let go of the desire to control oroversee every little step. You’ll be letting go ofunnecessary stress in the process.
• Be willing to compromise. When you asksomeone to contribute differently to a task, revise adeadline, or change their behavior at work, be willingto do the same. Sometimes, if you can both bend alittle, you’ll be able to find a happy middle groundthat reduces the stress levels for everyone.
Reduce job stress by improving emotionalintelligenceEven if you’re in a job where the environment has grownincreasingly stressful, you can retain a large measureof self-control and self-confidence by understanding andpracticing emotional intelligence.Emotional intelligenceis the ability to manage and use your emotions in positiveand constructive ways. When it comes to satisfactionand success at work, emotional intelligence matters justas much as intellectual ability. Emotional intelligence isabout communicating with others in ways that drawpeople to you, overcome differences, repair woundedfeelings, and defuse tension and stress.
Emotional intelligence in the workplace has fourmajor components• Self-awareness – The ability to recognize your
emotions and their impact while using gut feelingsto guide your decisions.
• Self-management – The ability to control youremotions and behavior and adapt to changingcircumstances.
• Social awareness – The ability to sense,understands, and reacts to other’s emotions andfeels comfortable socially.
• Relationship management – The ability to inspire,influences, and connects to others and managesconflict.

Page 217March 2014Vol.2, Special Issue
Primax International Journal of Commerce and Management Research ISSN : 2321-3604
Learn how managers or employers can reduce jobstressIt’s in a manager’s best interest to keep stress levels inthe workplace to a minimum. Managers can act aspositive role models, especially in times of high stress,by following the tips outlined in this article. If a respectedmanager can remain calm in stressful work situations,it is much easier for his or her employees to also remaincalm.
Additionally, there are a number of organizationalchanges that managers and employers can make toreduce workplace stress. These include:
Improve Communication• Share information with employees to reduce
uncertainty about their jobs and futures.• Clearly define employees roles and responsibilities.• Make communication friendly and efficient, not
mean-spirited or petty.
Consult your employees• Give workers opportunities to participate in decisions
that affect their jobs.• Consult employees about scheduling and work rules.• Be sure the workload is suitable to employees
abilities and resources; avoid unrealistic deadlines.• Show that individual workers are valued.• Offer rewards and incentives.• Praise good work performance, both verbally and
officially, through schemes such as Employee of theMonth.
• Provide opportunities for career development.• Promote an entrepreneurial work climate that gives
employees more control over their work.
Cultivate a friendly social climate• Provide opportunities for social interaction among
employees.
• Establish a zero-tolerance policy for harassment.• Make management actions consistent with
organizational values.
OBJECTIVE OF THE STUDY1. To study the factors of employee stress in private
sector sugar mill of Tamilnadu.
2. To know the handling mechanism of stress in mills.
3. To study the socio economic profile of the workersin the selected private sugar mills.
RESEARCH METHODOLOGYThere are 46 sugar mills in Tamil Nadu, of which 16 arein Cooperative sector and 27 are in Private Sector. Apartfrom these, the Tamil Nadu Sugar Corporation Limited,a Public Sector Company set up in 1974 under theCompanies Act is running three public sector sugar mills.Only private sector sugar mills in Tamil Nadu will beselected for this study. An interview schedule will beadministered to study the job stress of the selected mills.Data will be collected through interview scheduleconsigning wide work experience, pressure on the job,communication by the respondent mills.
Primary sources of data were derived from thequestionnaire and in-depth interview from employees ofselected sugar mills. The questionnaire was in twosections - the first contained questions on respondent’spersonal data, the second on the level work stress.Secondary source from company records, bulletins andother official documents also helped to conduct thepresent study. The adoption of these tools helped tocollect both quantitative and qualitative data.
A simple random sampling method is adopted for thisstudy. There are 200 employees out of 27 private sectorsugar a mill of Tamilnadu has been chosen for the study.
DATA ANALYSISTABLE NO: 1 GENDER
Particular Respondents PercentageMale 174 87
Female 26 13Total 200 100
Source: Primary data
Among the 200 respondents, 87 per cent respondents are male, and 13 percent are female. It is felt that majority ofthe respondents are male.

Page 218
ISSN : 2321-3604
March 2014Vol.2, Special Issue
Primax International Journal of Commerce and Management Research
TABLE NO: 2 WORK EXPERIENCE OF THE REPONDENTS
Experience Respondents Percentage
5 and below 12 6
6 to 10 Years 154 77Above 10Years 34 17
Total 200 100Source: Primary data
Among the 200 respondents, 6 per cent of the respondents belong to five years and below experience group, 77 percent of the respondents belong to six to 10 years experience group, 17per cent of the respondents belong to above10 years experience group. Hence the majority of 77percent of the respondents belong to six to 10 years in workexperience.
TABLE NO: 3 PRESSURE ON THE JOB
Statement Never Raerly Occasionally Usually Constantly Total
Overloaded at work, unable to complete tasks during an average
day
43(21.5%)
23(11.5%) 56
(28%)30
(15%)48
(24%)200
(100%)
Too much supervision 12(6%)
28(14%)
11(5.5%)
67(33.5%)
82(41%)
200(100%)
Job requirments are taking their toll on your
private life
45(22.5%)
92(46%)
32(16%)
12(6%)
19(9.5%)
200(100%)
Rushed to complete work or short on time
35(17.5%)
15(7.5%)
52(26%)
78(39%)
20(10%)
200(100%)
Among the 200 respondents, 24 per cent of the respondent opinions Overloaded at work,unable to complete tasksduring an average day to constantly,41 per cent of the respondent too much supervision to constantly,46 per cent ofthe respondent Job requirments are taking their toll on your private life to raerly,39 per cent of the respondent rushedto complete work or short on time to usually.
TABLE NO: 4 JOB DESCRIPTION CONFLICT
Source: Primary data
Statement Never Raerly Occasionally Usually Constantly Total
Uncertainty about yoour exact job responsibilities
34(17%)
50(25%)
64(32%)
19(9.5%)
33(16.5%)
200(100%)
Too much teamwork 76(38%)
11(5.5%)
32(16%)
10(5%)
71(35.5%)
200(100%)
Poor flow of information to you in order to carry out
your job
23(11.5%)
54(27%)
43(21.5%)
10(5%)
70(35%)
200(100%)
Discomfort in handling unethical assignments
54(27%)
20(10%)
93(46.5%)
11(5.5%)
22(11%)
200(100%)
Source: Primary data

Page 219March 2014Vol.2, Special Issue
Primax International Journal of Commerce and Management Research ISSN : 2321-3604
Among the 200 respondents, 32 per cent of the respondent Uncertainty about yoour exact job responsibilities tooccasionally, 38 per cent of the respondent too much teamwork to never, 35 per cent of the respondent poor flow ofinformation to you in order to carry out your job to constantly, 46.5 per cent of the respondent to discomfort inhandling unethical assignments to occasionally.
TABLE NO: 5 COMMUNICATION & COMFORT WITH SUPERVISOR
Statement Never Raerly Occasionally Usually Constantly Total
Ideas differ from those of your supervisor
54
(27%)
60
(30%)
23
(11.5)
12
(6)
51
(25.5)
200
(100)
Trouble talking to boss 20
(10%)16
(8%)35
(17.5%)76
(38%)53
(26.5%)200
(100%)
Unable to predict supervisor's
reactions34
(17%)
45
(22.5%)50
(25%)
22
(11%)
49
(24.5%)
200
(100%)
Boss gives little feedback about your work
69
(34.5%)
23
(11.5%)
57
(28.5%)
9
(4.5%)
42
(21%)
200
(100%)
Boss is overly critical of your work
33(16.5%)
45(22.5%)
88(44%)
25(12.5%)
9(4.5%)
200(100%)
Source: Primary data
Among the 200 respondents,30 per cent of the respondent Ideas differ from those of your supervisor to raerly,38 percent of the respondent Trouble talking to boss to usually, 25 per cent of the respondent Unable to predict supervisor’sreactions to Occasionally,34.5 per cent of the respondent boss gives little feedback about your work to never,44 percent of the respondent boss is overly critical of your work Occasionally.
TABLE NO: 6 JOB RELATED HEALTH CONCERNS
Statement Never Raerly Occasionally Usually Constantly Total
Work conditions
are unhealthy
34
(17%)
77
(38.5%)
19
(9.5%)
27
(13.5%)
43
(21.5%)
200
(100%)
Physical dangers
exist at work place
76
(38%)
34
(17%)
73
(36.5%)
7
(3.5% )
10
(5%)
200
(100%)
Heavy physical tasks to complete
55(27.5%)
20(10%)
67(33.5%)
12(6%)
46(23%)
200(100%)
Hostile threats from co -workers
22(11%)
15(7.5%)
45(22.5%)
44(22%)
74(37%)
200(100%)
Sick days are discouraged
12(6%)
56(28%)
78(39%)
31(15.5%)
23(11.5%)
200(100%)
Source: Primary data

Page 220
ISSN : 2321-3604
March 2014Vol.2, Special Issue
Primax International Journal of Commerce and Management Research
Among the 200 respondents, 21.5 per cent of the respondent Work conditions are unhealthy to Constantly, 38 percent of the respondent Physical dangers exist at work place to never, 27.5 per cent of the respondent to heavyphysical tasks to complete to never, 37 per cent of the respondent hostile threats from co-workers to Constantly, 39per cent of the respondent Sick days are discouraged to Occasionally.
TABLE NO: 7 WORK OVERLOAD STRESS
Statement Never Raerly Occasionally Usually Constantly Total
Can't consult with others on projects
11(5.5%)
68(34%)
65(32.5%)
33(16.5%)
23(11.5%)
200(100%)
Co-workers are inefficient
18(9%)
34(17%)
25(12.5%)
72(36%)
51(25.5%)
200(100%)
Often take work home to complete
20
(10%)
75
(37.5%)
32
(16%)
67
(33.5%)
6
(3%)200
(100%)
Responsibile for too many people/project
98
(49%)
33
(16.5%)
6
(3%)
45
(22.5%)
18
(9%)200
(100%)
Shortage of help at work
23(11.5%)
32(16%)
35(17.5%)
76(38%)
34(17%)
200(100%)
Source: Primary data
Among the 200 respondents, 34 per cent of the respondent Can’t consult with others on projects raerly, 36 per centof the respondent Co-workers are inefficient to usually,37.5 per cent of the respondent Often take work home tocomplete to raerly,49 per cent of the respondent responsibile for too many people/project to never,38 per cent of therespondent Shortage of help at work usually.
TABLE NO: 8 Nature of thte job
Statement True to almost no
extent
True to small extent
True to someextent
True to a greatextent
True to a very great
extent
Total
Poor working conditions 45(22.5%)
57(28.5%)
84(42%)
10(5%)
4(2%)
200(100%)
Work overload or underload
17(8.5%)
28(14% )
4(2%)
91(45.5%)
60(30%)
200(100%)
Inconvenient hours 89(44.5%)
20(10%)
67(33.5%)
14(7%)
10(5%)
200(100%)
excessive physical effort 60(30%)
77(38.5%)
13(6.5%)
45(22.5%)
5(2.5%)
200(100%)
Among the 200 respondents, 42per cent of the respondent Poor working conditions true to some extent,45.5 percent of the respondent work overload or underload to true to a great extent,44.5 per cent of the respondent inconvenienthours to true to almost no extent,38.5 per cent of the respondent excessive physical effort to true to small extent.
Source: Primary data

Page 221March 2014Vol.2, Special Issue
Primax International Journal of Commerce and Management Research ISSN : 2321-3604
TABLE NO: 9 Work Relationship
Statement True to almost no
extent
True to small extent
True to someextent
True to a greatextent
True to a very great
extent
Total
Poor relationship with co-workers, supervisor, or
staff
24(12%)
12(6%)
58(29%)
67(33.5%)
39(19.5%)
200(100%)
Problems in giving assignments to others
11(5.5%)
28(14%)
45(22.5%)
88(44%)
28(14%)
200(100%)
Competition among employees
47(23.5%)
50(25%)
67(33.5%)
6(3%)
30(15%)
200(100%)
Source: Primary data
Among the 200 respondents,33.5 per cent of the respondent Poor relationship with co-workers,supervisor,or staff totrue to a great extent,44 per cent of the respondent Problems in giving assignments to others to true to a greatextent,33.5 per cent of the respondent competition among employees to true to some extent.
TABLE NO: 10 Career Development
Statement True to almost no
extent
True to small extent
True to someextent
True to a greatextent
True to a very great
extent
Total
Lack of job security 45(22.5%)
58(29%)
15(7.5%)
47(23.5%)
35(17.5%)
200(100%)
Overqualified for job 24(12%)
38(19%)
42(21%)
70(35%)
26(13%)
200(100%)
Underqualified for job 16(8%)
24(12%)
57(28.5%)
41(20.5%)
62(31%)
200(100%)
Source: Primary data
Among the 200 respondents, 29 per cent of therespondent Lack of job security to true to small extent,35 per cent of the respondent overqualified for job to trueto a great extent, 31 per cent of the respondentunderqualified for job to true to a very great extent.
SUMMARY OF THE FINDINGSThe overall findings that,majority are the respondentsare male have been working in the mills,77 per cent ofthe respondents belong to six to 10 years experiencegroup, 46 per cent of the respondent Job requirmentsare taking their toll on your private life to raerly,46.5 percent of the respondent to discomfort in handlingunethical assignments to occasionally.44 per cent ofthe respondent boss is overly critical of your workOccasionally,39 per cent of the respondent Sick daysare discouraged to Occasionally,49 per cent of therespondent responsibile for too many people/project tonever,45.5 per cent of the respondent work overload orunderload to true to a great extent,44 per cent of therespondent Problems in giving assignments to others to
true to a great extent,35 per cent of the respondentoverqualified for job to true to a great extent.
ConclusionAs per this study which was under taken regarding thejob stress in private sector sugar mill of Tamil nadu.Workplace stress is costly and becoming more so,From theabove review it can be concluded that employee carrerdevelopment i.e.,salary and other benefit is very importantfor the sugar mills.The private sector sugar mills have toretify their overload,work relationship and understand theirfeeling and emotional,then only they are achievingincrease the productivity of the mills.It means theemployees are not satisfied with their salary and othermonetary benefits which are provided by the mills tothem.It is very important for mill to make an suggestthat policies benefits worker health also low rates ofillness,injury,and disability in its workforce and also themills have to take the counselling who are affect thestress in mill,then only they are achieving their goalsand activities.
Page 222
ISSN : 2321-3604
March 2014Vol.2, Special Issue
Primax International Journal of Commerce and Management Research
Reference1. Buddeberg-Fischer, (2008), “ Work stress and reduced health in young physicians: prospective evidence from
Swiss residents”. International Archives of Occupational and Environmental Health, Vol. 82 No.(1): pp.31-38
2. Katherine Pollak,”Stress management in the workplace: A comparison of a computer-based and an in-personstress- management intervention”, Vol.24, Issue 2, pp. 486-496, 2008.
3. Wated, “The Role of Accent as a Work Stressor on Attitudinal and Health-Related Work Outcomes”, InternationalJournal of Stress Management, Aug2006, Vol. 13 Issue 3, p329-350, 22p.

Page 223March 2014Vol.2, Special Issue
Primax International Journal of Commerce and Management Research ISSN : 2321-3604
A STUDY ON PROBLEMS FACED BY SHGs IN LALGUDI TALUK, TRICHY
1S. Anitha 2M.Revathi 3Dr. N. Maheshwari
ABSTRACT
Micro-finance provides credit to poor with no collateral obligations it encourages savings and promotes incomegenerating activities. Loans are provided at the market rate of interest and pressure is used in repayment. Microfinance is carried out through self help groups where pat the market rate of interest and pressure is used in repayment.Micro finance is carried out through seoor come together in the range of 10-20 by weekly and monthly meetingsthrough their interventions hither uncovered groups are covered with credit and in the process get empowered. Economicand social transformation is ultimately specific objectives of any third world country. Government policy, planning andits implementation are undoubtedly the instruments and the means for such social and economic transformation. InIndia right from independence apart from five year planning, now and then so many social economic developmentprogramme has been launched. During 20. programme, IRDP (Indian Rural Development Programme) some of theprogramme for economic and social development. In 1990’s Government launched a new programme called economicand social development through SHGs. In order to understand the feasibility of the programme. It is always good toevaluate application and functioning of any such programme, which will also help us to understand the progressivenessand productivity. Therefore an attend is made to more the operations of micro-credit programme through SHGsfunctioning in Lalgudi taluk in Trichy district.
1 PG Research Scholar, Dept. of Commerce CA, St. Joseph’s College, Trichy – 2.2 PG Research Scholar, Dept. of Commerce CA, St. Joseph’s College, Trichy – 2.3 Asst. Professor, Dept. of Commerce CA, St. Joseph’s College, Trichy – 2.
IntroductionThe award of the Nobel peace prize to Bangladesh’sMuhammad Yunus and the Grameen Bank set up byhim bring into focus the status of Micro-credit in India.The practice of “dispensing tiny” loans through acommercial bank is not alien to India and many othercountries. However, it was because of Prof. Yunus andthe Grameen Bank that micro finance, as an institutionalarrangement, came to be conceptualized andimplemented with a high degree of success andreplicated in many parts of the world including India.The difference then lies in the way the Grammen Bankpioneered the idea of lending to poor Bangladeshi womenon a sustainable basis. Until recently, in most developingcountries, lending to the weaker sections, if at allespecially to a target group of women, had been aperipheral activity for banks.
The Nobel citation says: “Lasting peace cannot beachieved unless large population groups find ways tobreak out of poverty. Micro credit is one such means”Indeed, the Grameen Bank’s success lies in itsbusiness model: the recovery rate is said to be over 96per cent, these short-period loans are dispersed withoutany king of collateral (but backed by group guarantee)and borrowers are required to serve some amounts.Hence over time may borrowers are able to escapepoverty. As many as 100 countries are reported to haveadopted the concept. Even advanced countries suchas the U.K. and the U.S. are turning to micro credit toaddress issues of poverty and deprivation.
The success of the Grameen Bank’s experiment is oftencited to support the currently fashionable but broadergoal of financial inclusion. There is, of course, muchmore to inclusion than micro credit but the success inBangladesh shows that even the more difficult inclusivepractices – such as viable lending to the poorer section– can be implemented with a high degree of success. Inany case, over the past few years at best the idea hascaught on many banks, including the bigger foreignbanks, are into micro credit in a big way. Quitesignificantly all these banks are viewing micro lendingas a commercial proposition, one in which they canearn money. There have been some very successfulattempts in different parts of the country to dispensesmall loans to groups of people including womenborrower. But impressive as these attempts were, theyhave not been translated into national level programmesworthy of emulation by other banks or, more importantly,adopted by policy makers.
IMPORTANCE OF THE STUDYMicro-finance provides credit to poor with no collateralobligations it encourages savings and promotes incomegenerating activities. Loans are provided at the marketrate of interest and pressure is used in repayment.Micro finance is carried out through self help groupswhere pat the market rate of interest and pressure isused in repayment. Micro finance is carried out throughseoor come together in the range of 10-20 by weeklyand monthly meetings through their interventions hither

Page 224
ISSN : 2321-3604
March 2014Vol.2, Special Issue
Primax International Journal of Commerce and Management Research
uncovered groups are covered with credit and in theprocess get empowered. A review of the genesis anddevelopment of SHGs in India reveals that the existingformal financial institutions have failed to provide financesto landless, marginalized and disadvantaged groups.This savings scheme acts as useful tool to help poor inaccessing financial resources and save them from theclutches of money lenders. The study helps to assessto what extent the effect of micro-credit programmethrough SHGs reckoned with. The study is focused onoperation of micro-credit programme in SHGs and howit is useful for the members of SHGs whether they areimproved of in all aspects of life namely economically,socially and politically or their level of status is remainingas it was and also study the various socio and economicproblems faced by the respondents. .
STATEMENT OF THE PROBLEM:Economic and social transformation is ultimately specificobjectives of any third world country. Government policy,planning and its implementation are undoubtedly theinstruments and the means for such social and economictransformation. In India right from independence apartfrom five year planning, now and then so many socialeconomic development programme has been launched.During 20. programme, IRDP (Indian Rural DevelopmentProgramme) some of the programme for economic andsocial development. In 1990’s Government launched anew programme called economic and social developmentthrough SHGs. In order to understand the feasibility ofthe programme. It is always good to evaluate applicationand functioning of any such programme, which will alsohelp us to understand the progressiveness andproductivity. Therefore an attend is made to more theoperations of micro-credit programme through SHGsfunctioning in Lalgudi taluk in Trichy district.
OBJECTIVES OF THE STUDY:The following are the objectives of the study:1. To understand operation of micro-credit programme
in SHGs of Lalgudi taluk.2. To evaluate the programme and performance of SHGs
in Lalgudi Taluk.
ANALYSISNature of the problem faced by the respondents
3. To understand the effect of micro-credit programmethrough SHGs developing rural women.
4. To study the socio, economical problems faced bythe SHGs in the study period.
METHODOLOGYThe study was taken up among SHG members in LalgudiTaluk. Lalgudi Taluk consists of two panchayat unionnamely Pullampadi and Lalgudi from both union 75members were selected. The total of 150 members wereselected as sample through random sample method. Theuniverse of the study consists of members of SHG inLalgudi Taluk. The researcher collected data from bothprimary and secondary sources. The primary data werecollected through questionnaire from the respondents.The secondary data were collected from the books,journals, magazines, NGOS and Governmentpublications. This study has been done in a systematicmanner to arrive at logical conclusion. The data werecollected through questionnaire and by personal interview.The respondents were identified and approached mostlyduring the evening time because the members go to thework in the morning and return in evening.
SCOPE OF THE STUDYThe study covers the member of SHGs unit operating inLalgudi Taluk. The main scope of the study is to explorethe problem faced by the SHGs. It is necessary to studythe activities of SHGs, because the emerging changesin the values and attitudes of the members of the SHGsare clear manifestation of socio-empowermentinterventions yielding relatively quicker results. The socio-economic programmes reinforce each other and promoteall round development of the children, the women, thehouseholds and the communities. It is a process whichultimately leads to self-fulfillment of each member of thesociety. It is in this direction that SHGs are movingtowards fulfilling their objectives with a meaningfulstrategic direction. The study deals with members howto mobilize and manage thrift activities, types of loansoffered by banks, how to utilize their amount which ishelpful in economic development of the members.
Source: Primary Data
Nature of problemNo. of Respondents
Yes % No % Total %Delay 7 5 80 53 87 58Lot of Enquires 15 10 30 20 45 30Red-tapism 8 5 10 7 18 12Total 30 20 120 80 150 100

Page 225March 2014Vol.2, Special Issue
Primax International Journal of Commerce and Management Research ISSN : 2321-3604
Relationship between the education of the respondents and the reason for joining in SHGs
Education
Reasons
Illiterate Upto Primary level
upto secondary level
College 4level
total percentage
Status 0 3 17 5 25 17
Suitability of organisation structure
3 12 10 0 25 17
Need for development
10 35 12 0 57 38
Inducement of the Neighbours
4 10 6 10 20 13
New area of learning
2 5 9 1 17 11
Source for General awareness
0 1 2 3 6 4
Total 19 66 56 9 150 100
Source: Primary Data
Relationship between range of Income earned by the respondents and contributions of SHGs
S.No Values Rank I Rank II
Rank III
Rank IV
Rank V
Rank VI
Total
1. Sense of harmony 10 0 20 80 21 19 150
2. Self confidence 30 93 0 10 10 7 150
3. Improvement in entrepreneurial skills
15 0 10 10 77 48 150
4. Knowledge about self 10 10 87 3 40 0 150
5. Knowledge about world
95 45 3 7 0 0 150
6. Social respect 0 2 30 40 2 76 150
Total 150 150 150 150 150 150
Source: Primary Data
Weighted average:1. Sense of harmony:
10x6+20x4+80x3+21x2+19x1/150=2.94
2. Self confidence:30x6+93x5+10x3+10x2+7x1/150 = 4.68
3. Improvement in entrepreneurial skill15x6+10x4+10x3++77x2+48x1/150 = 2.413
4. Knowledge about self10x6+10x5+87x4+3x3+40x2/150=3.646

Page 226
ISSN : 2321-3604
March 2014Vol.2, Special Issue
Primax International Journal of Commerce and Management Research
5. Knowledge about world95x6+45x5+3x4+7x3/150 = 5.52.
6. Social respect2x5+30x4+40x3+2x2+76x1/150=2.2
The main findings of the study:There are 41% of the respondents belong to the agegroup of between 35 and 45 which is the higher ofall.There are 94% of the respondents have not studiedbeyond school level. Definitely the SHG movement,which is an effective tools to empower in all aspectsof the life of the members.There are 43% of the respondents are daily wageearners or collie. 25% of the respondents engagedin agricultural activities and remaining respondentsengaged in other activities. It is observed that dailywage earners or coolie are very much interested injoining SHGs.There are 55% of the respondents are having thenumber of dependents of 1-3 members which ishighest of all.47% of the respondents earning below Rs. 1000.Only 3% of the respondents are earning above Rs.5000. It is analysed that the people who are lowincome are encouraged to join SHGs due to poverty.There are 55% of the respondents come under BCcommunity and 30% of the respondents come underSC community are most economically oppressedpeople. SHGs aim at improving their living status.39% of the SHG groups started in the year 2005.10% of the group commenced in the 2006. It isanalysed that the growth of SHG is increased yearby year. It is significant to note that surely SHGpromotes rural development.70% of the respondents reported that they have cometo know about SHGs through NGOs. It is analysedthat NGOs play an effective role to form and promoteSHGs programmeRegarding the total members in SHGs, 53% of therespondents expressed that there are 16 to 20members constitute their SHGs group.
SuggestionThe following are suggestions made, based on finding
and individuals interviews that the researchercontacted 150 samples in Lalgudi Taluk.
1. Group should utilize what is locally availableresources with the effective manner and should befocused in the group activities.
2. There should not be any discrimination among themembers. Everyone should co-operate and
participate actively in order to realize their groupgoals.
3. Non-governmental organization (NGOs) should playa significance role in empowering womenentrepreneur by providing base education to illiteratemember, motivation training and financial help etc.,
4. Frequent awareness campus can be organized byNGO to SHG members in order to familiarize themtowards government schemes availed by time to time.
5. Government should encourage successful groups andthey should be rewarded.
6. NGOs and bank should encourage and re-promotethe dissolution of groups.
7. Bank should arrange prompt delivery of loan to theSHGs members with minimum interest.
CONCLUSIONThe programme of micro financing through SHGs withthe intervention of NGOs and support from the governmenthas shown many positive impacts on rural poor women.It has become a powerful instrument in providing accessof banking services to poor and also in mobilizing theirsmall savings. This system not only provide credit, mostimportant input for development to the poorer sectionsof the society. SHG is a media for the development ofsavings habit among the women folk. It mobilizes alarge quantam of resources. It is window for bettertechnology and skill upgradation. It is helps to groupactivity and increase income level of the family which isstrengthen personal qualities and self confidence.
REFERENCES1. Thomas Fisher, Sriram M.S., beyond Micro-credit
(New Delhi: Vistaar Publications, 2002).2. Sharma B.B., Enclopaedic Dictionary of Sociology
(New Delhi: Anmol Publications, 1992).3. NABARD: Reports on SHGs – Bank linkage
programme cumulative progress (2002-03).4. Meenambigai. S, “Self Help Groups in Rural
Economy”, Kisan World, Vol. 31, April, 2004, pp.17-18.
5. Dr. Manimekalai. K, “Economic Empowerment ofWomen through Self – Help Groups”, Third Concept,Vol.17, February 2004, pp. 47-50.
6. Grumoorthy. T.K., “Self Help Groups Empower RuralWomen”, Vol.48, February 2000, pp. 36-39.
7. Kumaaran K.P., “Role of Self- Help Groups inpromoting micro enterprises”, Vol. 21, June 2002,pp. 232-250.
8. www.wikipedia.com/Grameen Bank/ html.9. “SHGs help remove property among rural women”,
The Hindu/India’s National News Paper, Friday, Mar07, 2003.
Page 227March 2014Vol.2, Special Issue
Primax International Journal of Commerce and Management Research ISSN : 2321-3604
10. Keya Sarkar, “India : A hotspot for Micro Finance”,April 28, 2006 (www. Index/Business/Column, 28,guest, html.
11. www.grameen.info.org/mcredit.html.12. www. t imeso f i nd ia . i nd ia t imes .com/ms id -
333350.prtpage-1.htm13. www.grameen.com/mcredit/unreport.html.

Page 228
ISSN : 2321-3604
March 2014Vol.2, Special Issue
Primax International Journal of Commerce and Management Research
A STUDY ON CONSUMER PREFERENCE FOR COMPACTFLUORESCENT LAMP (CFL) IN TIRUCHIRAPPALLI CITY
1M. Thiru Murugan 2Dr. N. Maheshwari
ABSTRACTA recent development in the house hold electrical products is Compact Fluorescent Lamps which reached each andevery house, in one way or other and knowingly or unknowingly we are using it, as it is a very good electricity powersaver. It is the most need of the hour along with the minimizing the use of petroleum related products. As per ourBureau of Energy Efficiency (BEE) (Ministry of Power, Government of India, “Energy conservation ranks top mostpriority in our country. Hence an attempt is made to study about the consumer preference, taste opinion about CFL inTiruchirappalli Town covering its history usage models, environmental concerns.This study relates to the consumer preference on Compact Fluorescent Lamp, their satisfaction, on the marketing pointof view in Tiruhirappalli city. The information required for the study has been collected from various books, articles andfrom web sites. This study is based on both primary and secondary data, primary data are collected from the samplerespondents by means of the questionnaire and the personal observation of the researcher and also personalinterview with the electrical dealers. Researcher collected data from 25 dealers and 100 respondents. The secondarydata source includes books, short notes, websites, manual and pamphlets. The study is based on simple randomsample method.
IntroductionIn olden days, goods were exchanged for goods.Production was restricted to domestic consumption. Ashuman wants are unlimited, mass production is carriedout. Due to the growth of civilization and standard ofliving of the people , business activities were developed.As a result of this, money as a medium of exchange. Ithas come into existence. All business related activitieshave shown tremendous growth. Business activitiesare classified into industry and commerce. Herecommerce includes trade and aids to trade such astransport, banking, insurance, warehousing, advertising,etc.,
PRODUCTSGood products are key to market success. The productrepresents a bundle of expectations of the consumers.The product satisfies the needs of society. A successfulproduct ensures its own promotion if satisfies the needsof consumers, that is the product is right to the market.A good product should be able to generate extra amountof enthusiasm which is important to marketorganizations. It gives the marketer independence indecision making. For the marketer, the meaning of theproduct is determined by the
needs and desires of the consumers. For instance, whenone buys toothpaste, he buys in the hope of gettingwhiter teeth, avoiding bad odour etc. That is, a consumerbuys the promise (product) of solving problems oravoiding one or enjoying one. For instance, one buys a
car expects trouble free journey, quick travel, comfortableseating etc.,
Anything that possesses utility is described as goods.A product is both what a seller has to sell and what abuyer has to buy. Thus, any enterprise that hassomething to sell, as tangible goods or not, is selling aproduct. People purchase products, because they arecapable of realizing some benefits to the purchase. Aproduct is one which satisfies the needs of consumers.“A product is anything that can be offered to a marketfor attention, acquisition, use or consumption that mightsatisfy a want or need. It includes physical objects,services, persons, place, organization and ideas”.
CONSUMER GOODSGoods are those tangible things which are describedhuman beings and for which they are willing to pay aprice. That is, goods may be defined as any commodity,product or services which are useful for people and havemonetary value. Again goods may be tangible orintangible. Tangible goods should have thecharacteristics of tangibility; i.e., the goods must betouched, seen, felt etc., for example, car scooter, soap,fan, cloth etc. Intangible goods may be in the form ofservices, such as repairing, services of banks andinsurances etc.“Goods are also known as commodities or products”They may mean any property or wares which aretransferable.
1 PG Research Scholar, Dept. of Commerce CA, St. Joseph’s College, Trichy2 Asst. Professor, Dept. of Commerce CA, St. Joseph’s College, Trichy.

Page 229March 2014Vol.2, Special Issue
Primax International Journal of Commerce and Management Research ISSN : 2321-3604
CLASSIFICATION OF CONSUMER GOODSConsumer goods are meant for final consumption. Onthe basis of buying habits, manufactured consumergoods are classified into three classes ie., Conveniencegoods, shopping goods and speciality goods.
CONVENIENCE GOODSGoods that the customer usually purchases frequently,immediately and with the minimum effort are known asconvenience goods. Low unit cost, available atconvenient places, at frequent intervals, with minimumeffort, etc., are important characteristics of conveniencegoods. Convenience goods are daily necessaries forhuman being; for instance, cigarettes, newspapers,soap, bread, sugar, coffee, tea, toothpaste etc.
SHOPPING GOODSShopping are consumers’ products. Consumers makecomparison in the selection of products as to quality,price, style, suitability, etc. in several stores. Examplesare cloth, furniture, television, radio, jewellery, washingmachines, fan etc. consumers compare the relativesuitability of alternative products before purchase.
SPECIALITY GOODSSpecialty goods are those ‘goods with uniquecharacteristics and or brand identification for which asignificant group of buyers are habitually willing to makea special purchasing effort.In the words of Copeland, specialty goods are “thosewhich have some particular attraction for the consumer,other than price, that induce him to put in special effortto visit the store in which they are sold and to make apurchase without shopping”; for example, watches,radios, etc. There are also known as luxurious goods.“Goods sold to consumers for direct consumption areconsumer goods”.
COMPACT FLUORESCENT LAMPA Compact Fluorescent Lamp (CFL) also known as aCompact Fluorescent Light Bulb or an energy savingslight bulb, is a type of Fluorescent lamp that fits into aregulars light bulb holder or plugs into a small lightsfixture. In comparison to incandescent light bulb,Compact Fluorescent Lamp have a larger rated life anduse less electricity. In fact, CFL save enough money inelectricity cost to make up for their higher initial pricewithin about 500 hours of use.
FEATURES• High luminous efficacy – saves upto 80% on
electricity cost compared to an ordinary bulb (GLS)• Plug in replacement to GLS• Less heat dissipation
• Longer average life upto 6000-8000 burning hourskeeps the maintenance cost low.
• Light weight• Flicker – free instant start• Very good colour rendition (Pure white)• Glows even at low voltage.• Very compact in size.
IMPORTANCE OF THE STUDYA recent development in the house hold electricalproducts is Compact Fluorescent Lamps which reachedeach and every house, in one way or other and knowinglyor unknowingly we are using it, as it is a very goodelectricity power saver. It is the most need of the houralong with the minimizing the use of petroleum relatedproducts. As per our Bureau of Energy Efficiency (BEE)(Ministry of Power, Government of India, “Energyconservation ranks top most priority in our country.Hence an attempt is made to study about the consumerpreference, taste opinion about CFL in TiruchirappalliTown covering its history usage models, environmentalconcerns.
OBJECTIVES OF THE STUDY1. To know factor influencing the consumer behaviour
of the consumers of compact florescent lamp inTiruchirappalli city.
2. To evaluate the satisfactory level of consumers ofCFL in Tiruchirappalli city.
3. To understand the most effective sources appealingthe consumer’s of CFL.
4. To study the gender profile of consumer of CFL, inTrichy City.
METHODOLOGYThis study relates to the consumer preference onCompact Fluorescent Lamp, their satisfaction, on themarketing point of view in Tiruhirappalli city. Theinformation required for the study has been collectedfrom various books, articles and from web sites. Thisstudy is based on both primary and secondary data,primary data are collected from the sample respondentsby means of the questionnaire and the personalobservation of the researcher and also personal interviewwith the electrical dealers. Researcher collected datafrom 25 dealers and 100 respondents. The secondarydata source includes books, short notes, websites,manual and pamphlets. The study is based on simplerandom sample method.
STATISTICAL TOOLSThe researcher has employed simple percentage methodas well as percentage tables and diagram for the purpose

Page 230
ISSN : 2321-3604
March 2014Vol.2, Special Issue
Primax International Journal of Commerce and Management Research
of easy understanding of the result of the research. Chi-square test and correlation analysis are used for analyzingthe relationship between the variables.
ANALYSISA comparison table gender group of respondents and selection of CFL BasisHypothesis:-Null hypothesis: There is no significant relationship between gender group and selection of CFLs.
G.group/Selection Male Female Total
Qualities 30 15 45
Price
Brand name
33 12 45
3 3 6
Others 2 2 4
Total 68 32 100
Contingency table 4 x 2 =8Calculation of expected frequency
G.group/Selection Male 1 Female 2 Total
Quality A 30.60 14.40 45
Price B 30.60 14.40 45
Brand name C 4.08 1.92 6
Others D 2.72 1.28 4
Total 68 32 100
2.72100
68x4D1
4.08100
68x6C1
30.60100
68x45B1
30.60100
68x45A1
==
==
==
==
1.28100
D2
1.92100
6x32
4x32
C2
14.40100
45x32B2
14.40100
45x32A2
==
==
==
==

Page 231March 2014Vol.2, Special Issue
Primax International Journal of Commerce and Management Research ISSN : 2321-3604
Degree of Freedom(R-1) x (C-1)(4-1) x (2-1)3 x 1 = 3At 3 degree of freedom 5% significance level, the table value is7.81 x2 = 3.82
Conclusion:The calculated value is much less than the table value, so the null hypothesis is accepted.A comparison table of income level of respondents and their awareness about CFL:Null hypothesis: there is no significant relationship between income level and awareness about CFl
Contingency table 4 x3 =12Calculation of expected frequency
Awareness\Income level Known fully Knows a little bit Does not know Total
Below 4000 2 2 2 6
4001-6000 5 16 2 23
6001-10000 40 20 2 62
Above 10000 7 2 0 9
Total 54 40 6 100
Combination O E (O-E) (O-E)E
(O-E)2
A1 30 30-60 -0.6 0.36 .01
B1 33 30.60 2.4 57.60 1.88
C1 3 4.08 -1.08 1.17 .29
D1 2 2.72 -.72 .52 .19
A2 15 14.40 .60 .36 .03
B2 12 14.40 -2.40 5.76 .40
C2 3 1.92 1.08 1.17 .61
D2 2 1.28 .72 .52 .41
Total 3.82
Known fully Total
Below 4000 3.24 2.4 .36 6
4001-6000 12.42 9.20 1.38 23
6001-10000 33.48 24.80 3.72 62
Above 10000 4.6 3.60 .54 9
Total 54 40 6 100
Does not knowKnows a little bitAwareness\Income level

Page 232
ISSN : 2321-3604
March 2014Vol.2, Special Issue
Primax International Journal of Commerce and Management Research
Degree of freedom(R-1) (C-1)(3-1) (4-1)2 x 3 = 6 degree freedom
36.100
6x6A
4.2100
40x6A
24.3100
6x54A
31
2
1
==
==
==
38.1100
6x23B
20.9100
40x23B
42.12100
54x23B
3
2
1
==
==
==
72.3100
6x62C
80.24100
40x62C
48.33100
54x62C
3
2
1
==
==
==
54.100
6x9D
60.3100
40x9D
86.4100
54x9D
3
2
1
==
==
==
Calculated value of x2 = 23.05The table value at 5% level of significance (at 6 degree = freedom) 12.59
Conclusion:The calculated value of x2 is greater than the table value (23.05 >12.59). Hence, it is significant that there isrelationship between income level and awareness about CFL and the null hypothesis is rejected.A comparison table of classification according brand and judging the quality of the CFLHypothesisThere is no significant relationship between brand preference and judging the quality of CFL.
Combination O E (O -E) (O -E)E
(O−E)2
= Σ(O−E)2
A1 2 3.24 -1.24 1.54 .47
B1 5 12.42 -7.42 55.06 4.44
C1 40 33.48 6.52 42.51 1.27
D1 7 4.86 2.14 4.58 .94
A2 2 2.4 -0.4 0.16 .07
B2 16 9.2 6.8 46.24 5.14
C2 20 24.80 -4.8 23.04 .93
D2 2 3.6 -1.6 2.56 .71
A3 2 .36 1.64 2.69 7.47
B3 2 1.38 .60 .38 .27
C3 2 3.72 1.72 2.96 .80
D3 0 .54 -.54 .29 .54
E23.05

Page 233March 2014Vol.2, Special Issue
Primax International Journal of Commerce and Management Research ISSN : 2321-3604
x = 28.147
100 = y = 254
100 =
Σxy = 646 57.1133646
887.43x1446646xy ===
Σx2xΣy2Σ
ConclusionThe result of the correlation is positive. Hence the hypothesis is accepted.A comparison table of realizing the effect of energy saving and place of purchase.HypothesisThere is no significant relationship between place of purchase and realizing effect of energy saving.
X x X2 Y y Y2 x y
27
28
10
3
26
3
3
12.72
13.72
-4.28
-11.28
11.72
-11.28
-11.28
161.80
188.23
18.32
127.27
137.36
127.24
127.24
56
25
11
8
31
0
-14
-17
961
0
196
289
394.32
0
59.92
191.76
100 887.43 100 1446 646
Bran d preference X Judging the quality of CFL Y
Philips 27 56 by using them
Orpat 28 25 from others experience
Havells 10 11 though advertisement
Standard 3
Un branded 26 8 some other reason
Crompton 3
Others 3
X Y
In a particular shop 35 Yes 55
Any convenient shop 45 Some extent 35
Credit facilities 5 No 6
Other reason 15 No idea 4
100 100

Page 234
ISSN : 2321-3604
March 2014Vol.2, Special Issue
Primax International Journal of Commerce and Management Research
X x X2 Y y Y2 Σ x y
35
45
5
15
10
20
-20
-10
100
400
400
100
55
35
6
4
30
10
-19
-21
900
100
361
441
300
200
380
210
100 1000 100 1802 1090
ConclusionThe result of the correlation is positive. Hence thehypothesis is accepted.
FINDINGS1. The majority of the respondents are in the age group
of 40 years and above.2. Among the whole respondents 90% are educated.3. The demand for CFL has been steadily increasing.
Since it is considered as an essential item.4. There are so many brands are available in the market.
We can divide them into two one is branded itemslike Philips, Orpat etc. other one being importedunbranded non-guaranteed items.
5. Both are selling equally in the market and the nonguaranteed item is selling fast because of its cheapprice.
6. As far as Trichy market is concerned stiff competitionis prevailing between Philips and Orpat. Orpat standsfirst getting 28% of respondents and Philips with 27%of respondents.
7. Many dealers are selling more than three brandsalong with non-guaranteed CFLs
8. Though GE and Oshram are internationally reputed,do not find major share because of its higher price,nil advertisement no proper distribution.
9. There is no quality complaint in all the leading CFLsand in particular there is nil complaint about OrpatCFLs.
10. Crompton which has a reputed name in Trichy marketfinds difficult to sell its CFLs where as Crompton isvery strong in other segments like Tube lights,chokes, bulbs etc.
x = 254
100 = y = 254
100 =
81.13421090
1802x10001090
y2xxy ===
ΣΣx2Σ
11. Most of the respondents appreciate the life of theCFLs of the leading companies.
12. In selection of a particular brand consumer are verywell aware and they also accepts dealerssuggestions.
13. Most of the consumers are selecting an electricalshop which is very near to them for the purchase ofCFLs.
14. It is accepted by almost all consumers that CFLsare really energy saving.
SUGGESTONSCFL market will be very bright in future and further ifthe price is reduced, the consumers will buy moreand more because of its advantages.Sales representatives are used widely in thiscompetitive world and also to survive. So they alsoplay a vital role in the marketing.Advertising in the local news papers is very essentialfor selling CFL products, but advertising are notutilized properly.Blackening at the initial part of the tube is seen inmany brands. This is the major complaint byconsumer about CFL. So manufacturers have torectify this complaint to improve quality.The government should give more advertisementregarding the energy saving concept. They have givenvery big advertisement on 15th August 2006 in allleading news papers to aware the general public tosave energy. Such kind of advertisement should begiven regularly to create awareness among the public.CFLs are essential and attractive products,Demonstration and window display should be usedproperly.The CFL such as suriya, bajaj, Osram, GE are notso popular among Trichy consumers. So themanufacturers , distributors have to take necessarysteps to make them popular among the consumers.Consumer buying a bulb will surely accept the CFL,if the shop keepers show a simple calculation of howCLFs are saving energy and money.

Page 235March 2014Vol.2, Special Issue
Primax International Journal of Commerce and Management Research ISSN : 2321-3604
CONCLUSIONThe Indian Electrical Market today has been heavilyloaded with many producers. Every second day thereis a new company by name of elite, bright etc. In sucha situation there is a caution to consumer, that theyshould be very careful in selecting their brand. Apartfrom leading lighting manufacturers there are manyelectrical goods manufacturers like Anchor, Lisha, Vinay,GM, Kundan, Cona, etc who do not show keen interest.When they also show interest along with finolex. Themarket will be very competitive, the price will be reduced,the quality will be improved and thereby the ultimatebeneficiary will be the consumers – the real kings.
REFERENCE1. Henry Assel, Consumer Behaviour Marketing Action
6th Edition Asian Books Private Limited, New Delhi.2. K.M. Matthew, Mamman Matthew – Malayala
Manorama Year book Manorama press, 2004.
3. Kathiresan & Radha –Marketing ManagementBhavani Publications, 1994
4. Michael R. Soloman Consumer Behaviour Buying,having being, 5th Edition Delhi, Prentice Hall of Indiapvt. Limited
5. N. Rajan Nair and Sanjith R.Nair – Marketing, NewDelhi, Sultan Chand & sons, 1993
6. Principles of marketing –Philip Kotler-Prentice Hallof India Private Limited, 1997
7. R.S.N Pillai & Bagavathi – Modern Marketing NewDelhi, S.Chand & Co, Limited.
8. SUJA R.Nair, Consuemr Behaviour in IndianPerspective, Himalaya Publishing House.
9. www.yahoosearch.com

Page 236
ISSN : 2321-3604
March 2014Vol.2, Special Issue
Primax International Journal of Commerce and Management Research
BUSINESS CASE FOR CORPORATE SOCIAL RESPONSIBILITY
1P. Reeta 2P. KalaivaniABSTRACT
Businesses can use CSR and corporate sustainability to produce direct benefits for the bottom line. For example,operational efficiencies can be achieved through reducing energy and materials as input factors for production. Wastescan also be reduced and materials can be recycled. These sorts of actions from eco-efficiency can produce concurrentenvironmental and economic benefits for the company and thereby contribute to stronger financial performance andmore positive profitability. Operational efficiencies can be achieved in other facets of CSR such as streamlining the waythat information is provided to the investment community as well as to other stakeholders that demand increasedtransparency. Managing potential risks and liabilities more effectively through CSR tools and perspectives can alsoreduce costs. Using corporate responsibility and sustainability approaches within business decision-making can resultnot only in reduced costs but can also lead to recognizing new market opportunities such as when new manufacturingprocesses are developed that can be expanded to other plants, regions or markets. There are various studies that haveexamined the relationship between CSR and corporate financial performance and most of the evidence suggests thatthe links are positive.sample method.
1 Research Scholar, Dept. of Commerce, JJ College of Arts and Science, Pudukkottai.2 Research Scholar, Dept. of Commerce, JJ College of Arts and Science, Pudukkottai
IntroductionCorporate social responsibility is about the integrationof social, environmental, and economic considerationsinto the decision-making structures and processes ofbusiness. It is about using innovation to find creativeand value-added solutions to societal and environmentalchallenges. It is about engaging shareholders and otherstakeholders and collaborating with them to moreeffectively manage potential risks and build credibilityand trust in society. It is about not only complying withthe law in a due diligent way but also about takingaccount of society’s needs and finding more effectiveways to satisfy existing and anticipated demands in orderto build more sustainable businesses. Ultimately, it isabout delivering improved shareholder and debt holdervalue, providing enhanced goods and services forcustomers, building trust and credibility in the societyin which the business operates, and becoming moresustainable over the longer term. Is there a businesscase for CSR, and if so, what is it? There are differentways to frame theWhile improved benefits because they are interrelated,they generally include the following: stronger financialperformance and profitability through operationalefficiency gains relations with the investment communityand better access to capital• enhanced employee relations that yield better results
respecting recruitment, motivation, retention, learningand innovation, and productivity
• stronger relationships with communities andenhanced licence to operate
• improved reputation and branding
Stronger Financial Performance and ProfitabilityBusinesses can use CSR and corporate sustainabilityto produce direct benefits for the bottom line. Forexample, operational efficiencies can be achievedthrough reducing energy and materials as input factorsfor production. Wastes can also be reduced andmaterials can be recycled. These sorts of actions fromeco-efficiency can produce concurrent environmental andeconomic benefits for the company and therebycontribute to stronger financial performance and morepositive profitability. Operational efficiencies can beachieved in other facets of CSR such as streamliningthe way that information is provided to the investmentcommunity as well as to other stakeholders that demandincreased transparency. Managing potential risks andliabilities more effectively through CSR tools andperspectives can also reduce costs. Using corporateresponsibility and sustainability approaches withinbusiness decision-making can result not only in reducedcosts but can also lead to recognizing new marketopportunities such as when new manufacturingprocesses are developed that can be expanded to otherplants, regions or markets. There are various studiesthat have examined the relationship between CSR andcorporate financial performance and most of the evidencesuggests that the links are positive.
Improved Relations With the Investment Communityand Better Access to CapitalThe investment community has been exploring the linksbetween corporate social responsibility and financialperformance of businesses. There is growing evidence

Page 237March 2014Vol.2, Special Issue
Primax International Journal of Commerce and Management Research ISSN : 2321-3604
(through indices such as the Dow Jones GroupSustainability Index (DJGSI), the FTSE4 Good indices,and the Jantzi Social Index) that companies that embracethe essential qualities of CSR generally outperform theircounterparts that do not use features of CSR . Thisinformation is being translated into action within theinvestment community (e.g. with creation of funds suchas Socially Responsible Investment, Domini SocialEquity Fund, EcoValue 21). An increasing number ofmutual funds are now integrating CSR criteria into theirselection processes to screen in sounder companiesand/or screen out businesses that do not meet certainenvironmental or social standards. Thus, a CSR approachby a company can improve the stature of the companyin the perspective of the investment community, acompany’s stock market valuation, and its capacity toaccess capital from that community.
Enhanced Employee Relations, Productivity andInnovationA key potential benefit from CSR initiatives involvesestablishing the conditions that can contribute toincreasing the commitment and motivation of employeesto become more innovative and productive. Companiesthat employ CSR related perspectives and tools tend tobe businesses that provide the pre-conditions forincreased loyalty and commitment from employees.These conditions can serve to help to recruit employees,retain employees, motivate employees to develop skills,and encourage employees to pursue learning to findinnovative ways to not only reduce costs but to alsospot and take advantage of new opportunities formaximizing benefits, reduce absenteeism, and may alsotranslate into marginally less demands for higher wages.
Stronger Relations With in Communities ThroughStakeholder EngagementA key feature of CSR involves the way that a companyengages, involves, and collaborates with its stakeholdersincluding shareholders, employees, debt holders,suppliers, customers, communities, non-governmentalorganizations, and governments. To the extent thatstakeholder engagement and collaboration involvemaintaining an open dialogue, being prepared to formeffective partnerships, and demonstrating transparency(through measuring, accounting, and reporting practices),the relationship between the business and thecommunity in which it operates is likely to be morecredible and trustworthy. This is a potentially important
benefit for companies because it increases their “licenceto operate”, enhances their prospects to be supportedover the longer term by the community, and improvestheir capacity to be more sustainable. Companies canuse stakeholder engagement to internalize society’sneeds, hopes, circumstances into their corporate viewsand decision-making. While there are many questionsabout how far a company’s responsibilities extend intocommunities relative to the roles of governments andindividual citizens, there is a strong argument that CSRcan effectively improve a company’s relations withcommunities and thereby produce some key featuresthat will improve business prospects for its future.
Improved Reputation and BrandingA potential benefit of CSR is that it can improve acompany’s reputation and branding and this in turnimproves the prospects for the company to be moreeffective in the way that it manages communicationsand marketing in efforts to attract new customers andincrease market share. CSR as a concept with varioustools can help a company to position itself in themarketplace as a company that is more responsibleand more sustainable than its competitors.
ConclusionCSR can be viewed by businesses as a form ofinvestment that helps to differentiate a company and itsgoods and services. What then is the right way to lookat CSR as an investment - particularly given that itfrequently involves intangible and less quantifiabledomains. The bottom line is that a prudent businessmay tend to regard CSR in the same way it treats mostinvestment decisions. It would be inclined to use thesame systematic approach to assess the anticipatedbenefits and related revenues relative to the costs thatit employs for investment proposals. A rigorous andsystematic approach to CSR investment is likely to yieldthe most positive results for both the business andsociety as it is likely to demonstrate the most efficientallocation of resources from the perspective of both thefirm and society.There are many different areas where a firm can investto develop CSR attributes (e.g. human resourcemanagement, environmental protection, health andsafety, community involvement, etc.). Investmentdecisions on CSR need to take account of variousfactors and parameters as well as the anticipated costand benefit stream to be produced by the investment.

Page 238
ISSN : 2321-3604
March 2014Vol.2, Special Issue
Primax International Journal of Commerce and Management Research
A STUDY ON THE ORGANIZATIONAL CLIMATE IN ORDNANCEFACTORY, TIRUCHIRAPPALLI
1Dr. F.X. VIRGIN FRAGAABSTRACT
Organizational climate is the manifestation of the attitudes of organizational members towards the organization itself.They may exist in different climates within different departments, in the organization and these sub-climates will beintegrated in the similar fashion of integrating attitudes of employees, so as to form the organizational climate.To measure organizational climate is an attempt to capture the essence, environment, order and pattern of an organizationor sub unitsThis study is analyzed undertaken to obtain the objectives, standard of recognition and appreciation, to analyze theperformance of the respondents, to rectify the grievance handling etc. Through this the organization level of functioning,satisfaction of the respondents can be known and proper formation can be done.
1 Assistant Professor, Department of Commerce CA, St. Joseph’s College, Trichy.
INTRODUCTIONOrganizational climate is a very important factor to beconsidered in studying and analyzing organizationsbecause it has a profound influence on the outlook,well-being and attributes of organizational members.It provides a useful platform for understanding suchcharacteristics of organization as stability, creativityand innovation, communication and effectiveness etc.Organizational climate is the manifestation of theattitudes of organizational members towards theorganization itself. They may exist in different climateswithin different departments, in the organization andthese sub-climates will be integrated in the similarfashion of integrating attitudes of employees, so asto form the organizational climate.To measure organizational climate is an attempt tocapture the essence, environment, order and patternof an organization or sub units.
NEED OF THE STUDYThis study is analyzed undertaken to obtain theobjectives, standard of recognition and appreciation,to analyze the performance of the respondents, torectify the grievance handling etc. Through this theorganization level of functioning, satisfaction of therespondents can be known and proper formation canbe done.
STATEMENT OF THE PROBLEMOrganizational climate is a perception that membershave about the structural characteristics of the firm.Understanding organizational climate, its nature andcomplexity is important, not only for enhancingorganizational performance, but also for enhancinghuman well being in organizations. The knowledge of
climate prevailing in an organization as a whole andin different parts thereof can help in better harnessingof human resources, enabling their effectivedevelopment and utilization.Organizational climate is created from the perceptionof organizational members about organizationaldimensions. Perception, being a cognitive process,is influenced by the personality, motivation, learningand experience of the individual. It is, thereof expectedthat organizational climate is influenced by the factorsthat influence perception.
OBJECTIVES OF THE STUDYThe objectives of the study have been divided intogeneral and specific objectives.
• General objectives• Specific objectives
General ObjectivesTo inquire into the factors constituting theorganizational climate of Ordnance factory,Tiruchirappalli with an accent on the identificationof the critical constituents of the organizationalclimate.
Specific Objectives1. To understand the employees’ perception of their
existing organizational climate.2. To identi fy the factors that const i tute the
organizational climate of the study unit.3. To study the relative importance of each one of
these factors in contributing to the climateformatting.
4. To rank these factors in the order of importance indetermining the existing organizational climate.

Page 239March 2014Vol.2, Special Issue
Primax International Journal of Commerce and Management Research ISSN : 2321-3604
5. To understand the extent of inf luence oforganizational climate in determining the employeejob satisfaction.
6. To make suggestions based on the findings toimprove the existing climate.
SCOPE OF THE STUDYThis study aims at providing an in-depth analysis ofthe factors constituting the organizational climate inOrdnance Factory, Tiruchirappalli.The present study aims at identifying the factors thatconstitute the organizational climate, how the factorscontribute to the formulation of climate, their existingposition, job satisfaction in the organizational climateand the ways of improving the climate with regard tothe findings and the suggestions.The study was also framed to know the pros and consof the respondents during their working hours. Thiswas mainly done to make their superiors know howfar their employees are able to co-operate andfunctional in this organization.
RESEARCH DESIGN & SAMPLE SIZEThe researcher has chosen the descriptive design for
research for conducting this research. Descriptiveresearch studies, are concerned with describing thecharacteristics of particular individual or groups.
Sample sizeThe number of employees on the staff roll of thecompany is 1800 which constituted the universe ofthe present study. From this universe, 281 employeesare chosen as study respondents who constituted 16per cent of the population. These 281 employees arechosen for the study on a stratified random samplingbasis. Each department in the company is givenadequate representation in the sample.
OBJECTIVITY & RATIONALITYIn this chapter, organizational climate is on the basis of
employer – employee relation. The date collected throughinterview-schedule, were analyzed with reference to theobjectives. The results are presented and discussed inrelation to objectivity and rationality is the frequencydistribution of tables in terms of their employer-employeerelations is shown from table 4.1 to 4.11.
The following table narrates the distribution of respondentsaccording to objectivity and rationality:- (Table-1)
Table-1 : OBJECTIVITY & RATIONALITYTable showing the recruitment policy of the organization based on merit
Source: Primary data
In the above mentioned table, 94 respondents agree that the recruitment policy has been based on merit, 90respondents broadly agree with the statement that recruitment is broad in merit. 47 respondents have not given anyopinion about this statement. 44 respondents disapproved of the statement, whereas 6 respondents have expressedno opinion about this statement.In the above mentioned table, majority of the respondents (i.e.94) are satisfied when the recruitment policy of the
organization is based on merit where the respondents can be properly trained for the development of the organization.
Category Frequency Percentage
Strongly agree
Agree
No opinion
Disagree
Strong Disagree
94
90
47
44
06
33.5
32
16.7
15.7
2.1
Total 281 100

Page 240
ISSN : 2321-3604
March 2014Vol.2, Special Issue
Primax International Journal of Commerce and Management Research
MONETARY BENEFITSTable showing that the organization gives reasonable incentives for outstanding performance:-
Source: Primary data
A close look at the above table will reveal that 19 respondents strongly agree that the organization is providingreasonable incentives for outstanding performance. To the maximum 127 of them, the organization is motivating andinspiriting them through respondents’ Incentives programmers. 68 of the respondents expressed no opinion. 32 ofthe respondents are against this incentive. 35 of respondents above the statement are insignificant & they agreewith the statement.In the organization, majority of the respondents had expressed that sufficient incentives are provided according to
the work load and their ability.
SAFETY & SECURITYTable showing that the employees’ health is given by the organization
Source: Primary data
The above table points out that 94 of the respondents feel happy and contented that the organization provideshousing eacilities.160 of the respondents are also grateful to the organization for their concern.5% of the respondentshave nothing to say.12 of them are not contented. Only one respondent disagreed which is insignificant.
RECOGNITION & APPRECIATIONTable showing that there is cordial relationship between the organization and employees.
Category Frequency Percentage
Strongly agreeAgree
No opinionDisagree
Strong Disagree
19127683235
6.845.224.211.412.5
Total 281 100
Category Frequency Percentage
Strongly agreeAgree
No opinionDisagree
Strong Disagree
671713274
23.8
11.42.51.4
Total 281 100
60.8
Source: Primary data
Category Frequency PercentageStrongly agree
AgreeNo opinionDisagree
Strong Disagree
531764831
18.962.617.11.10.4
Total 281 100

Page 241March 2014Vol.2, Special Issue
Primax International Journal of Commerce and Management Research ISSN : 2321-3604
From the above table, 53 of the respondents are havinggood understanding.62.6% of the respondents alsoconsider that there is flexible understanding.48 haveexpressed no opinion and one respondent not able toadjust which is insignificant.
Findings:1. In the organizational climate recruitment policy is
based on merit.94 of them had agreed that theorganization is favorable. And only 2.1% of them hadnot agreed with the statement.
2. In the recognition fair wages are given to therespondents.120 of the respondents had expressedthat their skill and efforts are recognized. On the otheronly 6 respondents had opposed the statement.
3. Even though the organization extracts work fromemployees their health is given preference. Among281 respondents 171 of the respondents accept thestatement and only 4 of the respondents felt that theorganization is having less concern about theemployees.
4. Apart from wages to employees organization provideshousing facilities. In the above 160 of the respondentsageed that the organization is more concerned aboutwelfare facility but only one respondent had notaccepted this statement.
5. With regard to relationship between organization andemployees 176 have cordial relationship and goodunderstanding with the rules and regulations but onerespondent does not accept this statement.
Suggestions:1. As there is no partiality the employees should feel
that they are made according to their skill and talentand to develop this proper training can be given.
2. The workers found that their works are more tediousand repetitive and so to avoid this work can be givenbased on their skill and ability.
3. The employees should be recognized and motivatedbased on their talent which creates maximumefficiency.
4. The respondents should always consider all are equaland no one should boss over others and in such acase there will not be lack of relationship in theorganization.
5. Very few respondents had agreed that there are freeand frank exchange of ideas and so the organizationshould take steps to get ideas from everyone
Conclusion:The overall conclusion from this study among the factorsis the inadequate monetary reward of an employee.Welfare facilities and grievance handling are importantissues. Therefore there is always a need for continuousresearch and full study to identify the factors responsiblefor the success or failure of organizational climate.
References:1. Anderson N.R.,and West M.A.,(1998) measuring
climate for group innovation :Development of the teamclimate inventory, Journal organizational behavior,19.
2. Brown S.P.and Williams,D.G.S.,(2000),Organizationalclimate and its relationship to job involvement,effortand performance,journal of applied psychology, 81(4)
3. Gray R., (2007) A climate of success, creating theright organizational climate for highperformance,journal of applied psychology, 81(4)
4. Asish Pandey, Rajan k. Gupta and A.P. Arora, journalof business ethics,vol88, no.2 (Aug 2009)
5. Mulki J.P. et.al.,J.F.Jeramillo and W.B.Locander,Critical role of leadership on ethical climate andsalesperson behaviours, journal oe business ethics8,(2009).

Page 242
ISSN : 2321-3604
March 2014Vol.2, Special Issue
Primax International Journal of Commerce and Management Research
STRESS MANAGEMENT MODELS AND TECHNIQUES
1A.Chinnakaruppan 2Dr. L. Leo Franklin
ABSTRACTStress produces numerous symptoms which vary according to persons, situations, and severity. These can includephysical health decline as well as depression. The process of stress management is named as one of the keys to ahappy and successful life in modern society. Although life provides numerous demands that can prove difficult tohandle, stress management provides a number of ways to manage anxiety and maintain overall well-being.Intervention is broken down into three steps: Primary, Secondary, and Tertiary. Primary deals with eliminating thestressors all together. Secondary deals with detecting stress and figuring out ways to cope with it and improving stressmanagement skills. Finally, tertiary deals with recovery and rehabbing the stress all together. These three steps areusually the most effective way to deal with stress not just in the workplace, but overall.
1Research Scholar, Dept. of Commerce, JJ College of Arts and Science Pudukkottai.2 Asst. Professor and, Dept. of Commerce, JJ College of Arts and Science Pudukkottai.S
IntroductionStress management refers to the wide spectrum oftechniques and psychotherapies aimed at controlling aperson’s levels of stress, especially chronic stress,usually for the purpose of improving everyday functioning.
In this context, the term ‘stress’ refers only to a stresswith significant negative consequences, or distress inthe terminology advocated by Hans Selye, rather thanwhat he calls eustress, a stress whose consequencesare helpful or otherwise positive.
Stress produces numerous symptoms which varyaccording to persons, situations, and severity. Thesecan include physical health decline as well asdepression. The process of stress management isnamed as one of the keys to a happy and successfullife in modern society. Although life provides numerousdemands that can prove difficult to handle, stressmanagement provides a number of ways to manageanxiety and maintain overall well-being. Despite stressoften being thought of as a subjective experience, levelsof stress are readily measureable using variousphysiological tests, similar to those used in polygraphs.
Many practical stress management techniques areavailable, some for use by health practitioners and othersfor self-help, which may help an individual to reducestress, provide positive feelings of being in control ofone’s life and promote general well-being.
The effectiveness of the different stress managementtechniques can be difficult to assess, as few of themhave received significant attention from researchers.Consequently, the amount and quality of evidence forthe various techniques varies widely. Some areaccepted as effective treatments for use inpsychotherapy, whilst others with less evidence favouring
them are considered alternative therapies. Manyprofessional organisations exist to promote and providetraining in conventional or alternative therapies.
There are several models of stress management, eachwith distinctive explanations of mechanisms forcontrolling stress. Much more research is necessary toprovide a better understanding of which mechanismsactually operate and are effective in practice.
Historical foundationsWalter Cannon and Hans Selye used animal studies toestablish the earliest scientific basis for the study ofstress. They measured the physiological responses ofanimals to external pressures, such as heat and cold,prolonged restraint, and surgical procedures, thenextrapolated from these studies to human beings.
Subsequent studies of stress in humans by Richard Raheand others established the view that stress is causedby distinct, measureable life stressors, and further, thatthese life stressors can be ranked by the median degreeof stress they produce (leading to the Holmes and RaheStress Scale). Thus, stress was traditionallyconceptualized to be a result of external insults beyondthe control of those experiencing the stress. Morerecently, however, it has been argued that externalcircumstances do not have any intrinsic capacity toproduce stress, but instead their effect is mediated bythe individual’s perceptions, capacities, andunderstanding.
ModelsTransactional modelRichard Lazarus and Susan Folkman suggested in 1984that stress can be thought of as resulting from an“imbalance between demands and resources” or as

Page 243March 2014Vol.2, Special Issue
Primax International Journal of Commerce and Management Research ISSN : 2321-3604
occurring when “pressure exceeds one’s perceived abilityto cope”. Stress management was developed andpremised on the idea that stress is not a direct responseto a stressor but rather one’s resources and ability tocope mediate the stress response and are amenable tochange, thus allowing stress to be controllable.Among the many stressors mentioned by employees,
these are the most common:• The way employees are treated by their bosses/
supervisors or company• Lack of job security• Company policies• Coworkers who don’t do their fair share• Unclear expectations• Poor communication• Not enough control over assignments• Inadequate pay or benefits• Urgent deadlines• Too much work• Long hours• Uncomfortable physical conditions• Relationship conflicts• Coworkers making careless mistakes• Dealing with rude customers• Lack of cooperation• How the company treats coworkersIn order to develop an effective stress managementprogramme it is first necessary to identify the factorsthat are central to a person controlling his/her stress,and to identify the intervention methods which effectivelytarget these factors. Lazarus and Folkman’sinterpretation of stress focuses on the transactionbetween people and their external environment (knownas the Transactional Model). The model contends thatstress may not be a stressor if the person does notperceive the stressor as a threat but rather as positiveor even challenging. Also, if the person possesses orcan use adequate coping skills, then stress may notactually be a result or develop because of the stressor.The model proposes that people can be taught to managetheir stress and cope with their stressors. They maylearn to change their perspective of the stressor andprovide them with the ability and confidence to improvetheir lives and handle all of types of stressors.
Health realization/innate health model]The health realization/innate health model of stress isalso founded on the idea that stress does notnecessarily follow the presence of a potential stressor.
Instead of focusing on the individual’s appraisal of so-called stressors in relation to his or her own coping skills(as the transactional model does), the health realizationmodel focuses on the nature of thought, stating that it isultimately a person’s thought processes that determinethe response to potentially stressful externalcircumstances. In this model, stress results fromappraising oneself and one’s circumstances through amental filter of insecurity and negativity, whereas a feelingof well-being results from approaching the world with a“quiet mind”.This model proposes that helping stressed individualsunderstand the nature of thought—especially providingthem with the ability to recognize when they are in thegrip of insecure thinking, disengage from it, and accessnatural positive feelings—will reduce their stress.
TechniquesHigh demand levels load the person with extra effort andwork. A new time schedule is worked up, and until theperiod of abnormally high, personal demand has passed,the normal frequency and duration of former schedulesis limited.Many techniques cope with the stresses life brings.Some of the following ways induce a lower than usualstress level, temporarily, to compensate the biologicaltissues involved; others face the stressor at a higherlevel of abstraction:• Autogenic training• Social activity• Cognitive therapy• Conflict resolution• Cranial release technique• Getting a hobby• Meditation• Mindfulness (psychology)• Deep breathing• Yoga Nidra• Nootropics• Reading novels• Prayer• Relaxation techniques• Artistic expression• Fractional relaxation• Physical exercise• Progressive relaxation• Spas• Somatics training

Page 244
ISSN : 2321-3604
March 2014Vol.2, Special Issue
Primax International Journal of Commerce and Management Research
• Spending time in nature• Stress balls• Natural medicine• Clinically validated alternative treatments• Time management• Planning and decision making• Listening to certain types of relaxing music• Spending quality time with petsTechniques of stress management will vary accordingto the philosophical paradigm.
Stress prevention & resilienceAlthough many techniques have traditionally beendeveloped to deal with the consequences of stressconsiderable research has also been conducted on theprevention of stress, a subject closely related topsychological resilience-building. A number of self-helpapproaches to stress-prevention and resilience-buildinghave been developed, drawing mainly on the theory andpractice of cognitive-behavioural therapy.
Measuring stressLevels of stress can be measured. One way is throughthe use of psychological testing: the Holmes and RaheStress Scale is used to rate stressful life events, whilethe DASS contains a scale for stress based on self-report items. Changes in blood pressure and galvanicskin response can also be measured to test stresslevels, and changes in stress levels. A digitalthermometer can be used to evaluate changes in skintemperature, which can indicate activation of the fight-or-flight response drawing blood away from theextremities. Cortisol is the main hormone released duringa stress response and measuring cortisol from hair willgive a 60-90 baseline stress level of an individual. Thismethod of measuring stress is currently the most popularmethod in the clinic.
EffectivenessStress management has physiological and immunebenefits.Positive outcomes are observed using a combination ofnon-drug interventions:• treatment of anger or hostility,• autogenic training• talking therapy (around relationship or existential
issues)• biofeedback• cognitive therapy for anxiety or clinical depression
Types of stressAcute stressAcute stress is the most common form of stress amonghumans worldwide. Acute stress deals with thepressures of the near future or dealing with the very recentpast. This type of stress is often misinterpreted for beinga negative connotation. While this is the case in somecircumstances, it is also a good thing to have someacute stress in life. Running or any other form ofexercise is considered an acute stressor. Some excitingor exhilarating experiences such as riding a rollercoaster is an acute stress but is usually very fun. Acutestress is a short term stress and in result, does nothave enough time to do the damage that long term stresscauses.
Chronic stressChronic stress is the exact opposite of acute stress. Ithas a wearing effect on people that can become a veryserious health risk if it continues over a long period oftime. Chronic stress can lead to memory loss, damagespacial recognition and produce a decreased drive ofeating. The severity varies from person to person andalso sex difference can be an underlying factor. Womenare able to take longer durations of stress than menwithout showing the same maladaptive changes. Mencan deal with shorter stress duration better than womencan but once males hit a certain threshold, the chancesof them developing mental issues increases drastically.
Stress in the workplaceStress in the workplace is a commonality throughoutthe world in every business. Managing that stressbecomes vital in order to keep up job performance aswell as relationship with co-workers and employers. Forsome workers, changing the work environment relieveswork stress. Making the environment less competitivebetween employees decreases some amounts ofstress. However, each person is different and somepeople like the pressure to perform better.
Salary can be an important concern of employees.Salary can affect the way people work because theycan aim for promotion and in result, a higher salary.This can lead to chronic stress.]
Cultural differences have also shown to have some majoreffects on stress coping problems. Eastern Asianemployees may deal with certain work situationsdifferently from how a Western North American employeewould. In order to manage stress in the workplace,employers can provide stress managing programs suchas therapy, communication programs, and a moreflexible work schedule.

Page 245March 2014Vol.2, Special Issue
Primax International Journal of Commerce and Management Research ISSN : 2321-3604
Medical Environment StressA study was done on the stress levels in generalpractitioners and hospital consultants in 1994. Over 500medical employees participated in this study done byDr. R.P Caplan. These results showed that 47% of theworkers scored high on their questionnaire for high levelsof stress. 27% of the general practitioners even scoredto be very depressed. These numbers came to a surpriseto Dr. Caplan and it showed how alarming the largenumber of medical workers become stressed outbecause of their jobs. Managers stress levels were notas high as the actual practitioners themselves. An eyeopening statistic showed that nearly 54% of workerssuffered from anxiety while being in the hospital. Althoughthis was a small sample size for hospitals around theworld, Caplan feels this trend is probably fairly accurateacross the majority of hospitals.
Stress Management Programs in WorkplaceMany businesses today have began to use StressManagement Programs for employees who are havingtrouble adapting to stress at the workplace or at home.Many people have spill over stress from home into theirworking environment. There are a couple of waysbusinesses today try to alleviate stress on theiremployees. One way is individual intervention. This startsoff by monitoring the stressors in the individual. Aftermonitoring what causes the stress, next is attacking thatstressor and trying to figure out ways to alleviate them inany way. Developing social support is vital in individualintervention, being with others to help you cope has provento be a very effective way to avoid stress. Avoiding thestressors all together is the best possible way to get ridof stress but that is very difficult to do in the workplace.Changing behavioral patterns, may in turn, help reducesome of the stress that is put on at work as well.
Employee Assistance Programs can include in-housecounseling programs on managing stress. Evaluativeresearch has been conducted on EAPs that teachindividual stress control and inoculation techniques suchas relaxation, biofeedback, and cognitive restructuring.Studies show that these programs can reduce the levelof physiological arousal associated with high stress.Participants who master behavioral and cognitive stress-relief techniques report less tension, fewer sleepdisturbances, and an improved ability to cope withworkplace stressors.
Another way of reducing stress at work is by simplychanging the workload for an employee. Some may betoo overwhelmed that they have so much work to getdone, or some also may have such little work that theyare not sure what to do with themselves at work.Improving communications between employees alsosounds like a simple approach, but it is very effective forhelping reduce stress. Sometimes making the employeefeel like they are a bigger part of the company, such asgiving them a voice in bigger situations shows that youtrust them and value their opinion. Having all theemployees mesh well together is a very underlying factorwhich can take away much of workplace stress. Ifemployees fit well together and feed off of each other,the chances of lots of stress is very minimal. Lastly,changing the physical qualities of the workplace mayreduce stress. Changing simple things such as thelighting, air temperature, odor, and up to date technology.
ConclusionIntervention is broken down into three steps: Primary,Secondary, Tertiary. Primary deals with eliminating thestressors all together. Secondary deals with detectingstress and figuring out ways to cope with it and improvingstress management skills. Finally, tertiary deals withrecovery and rehabbing the stress all together. Thesethree steps are usually the most effective way to dealwith stress not just in the workplace, but overall.
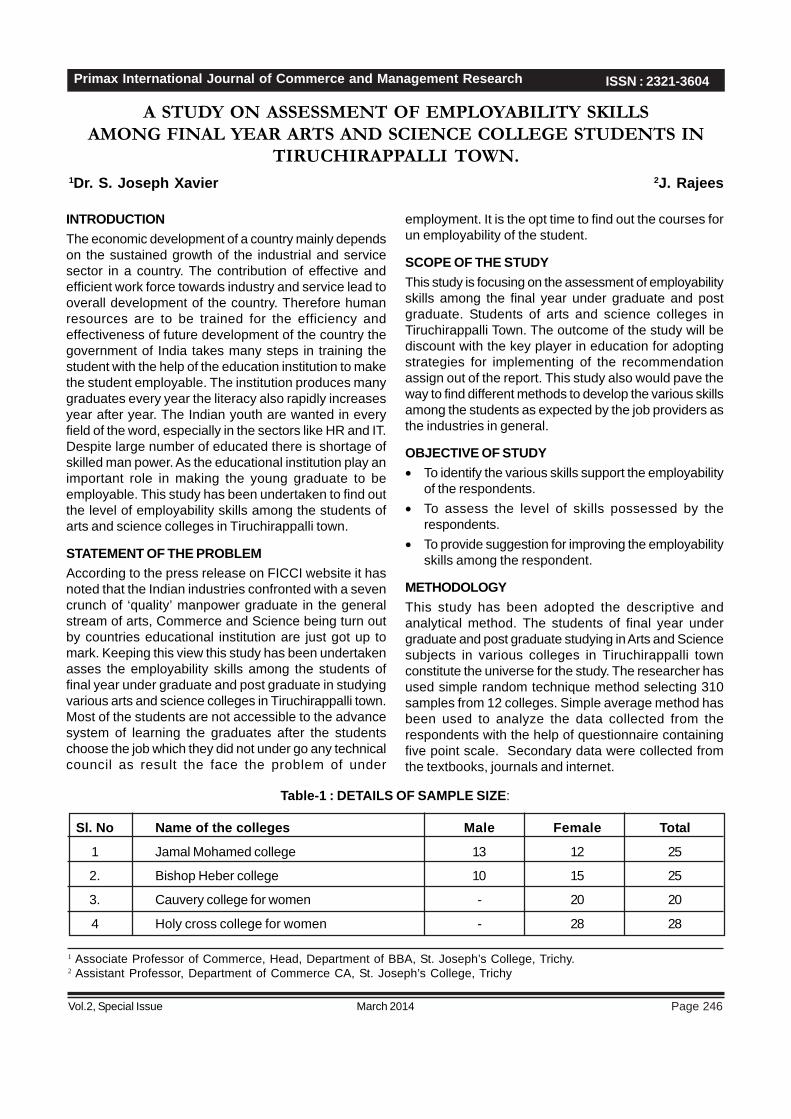
Page 246
ISSN : 2321-3604
March 2014Vol.2, Special Issue
Primax International Journal of Commerce and Management Research
A STUDY ON ASSESSMENT OF EMPLOYABILITY SKILLSAMONG FINAL YEAR ARTS AND SCIENCE COLLEGE STUDENTS IN
TIRUCHIRAPPALLI TOWN.1Dr. S. Joseph Xavier 2J. Rajees
1 Associate Professor of Commerce, Head, Department of BBA, St. Joseph’s College, Trichy.2 Assistant Professor, Department of Commerce CA, St. Joseph’s College, Trichy
INTRODUCTIONThe economic development of a country mainly dependson the sustained growth of the industrial and servicesector in a country. The contribution of effective andefficient work force towards industry and service lead tooverall development of the country. Therefore humanresources are to be trained for the efficiency andeffectiveness of future development of the country thegovernment of India takes many steps in training thestudent with the help of the education institution to makethe student employable. The institution produces manygraduates every year the literacy also rapidly increasesyear after year. The Indian youth are wanted in everyfield of the word, especially in the sectors like HR and IT.Despite large number of educated there is shortage ofskilled man power. As the educational institution play animportant role in making the young graduate to beemployable. This study has been undertaken to find outthe level of employability skills among the students ofarts and science colleges in Tiruchirappalli town.
STATEMENT OF THE PROBLEMAccording to the press release on FICCI website it hasnoted that the Indian industries confronted with a sevencrunch of ‘quality’ manpower graduate in the generalstream of arts, Commerce and Science being turn outby countries educational institution are just got up tomark. Keeping this view this study has been undertakenasses the employability skills among the students offinal year under graduate and post graduate in studyingvarious arts and science colleges in Tiruchirappalli town.Most of the students are not accessible to the advancesystem of learning the graduates after the studentschoose the job which they did not under go any technicalcouncil as result the face the problem of under
employment. It is the opt time to find out the courses forun employability of the student.
SCOPE OF THE STUDYThis study is focusing on the assessment of employabilityskills among the final year under graduate and postgraduate. Students of arts and science colleges inTiruchirappalli Town. The outcome of the study will bediscount with the key player in education for adoptingstrategies for implementing of the recommendationassign out of the report. This study also would pave theway to find different methods to develop the various skillsamong the students as expected by the job providers asthe industries in general.
OBJECTIVE OF STUDY• To identify the various skills support the employability
of the respondents.• To assess the level of skills possessed by the
respondents.• To provide suggestion for improving the employability
skills among the respondent.
METHODOLOGYThis study has been adopted the descriptive andanalytical method. The students of final year undergraduate and post graduate studying in Arts and Sciencesubjects in various colleges in Tiruchirappalli townconstitute the universe for the study. The researcher hasused simple random technique method selecting 310samples from 12 colleges. Simple average method hasbeen used to analyze the data collected from therespondents with the help of questionnaire containingfive point scale. Secondary data were collected fromthe textbooks, journals and internet.
Table-1 : DETAILS OF SAMPLE SIZE:
Sl. No Name of the colleges Male Female Total
1 Jamal Mohamed college 13 12 25
2. Bishop Heber college 10 15 25
3. Cauvery college for women - 20 20
4 Holy cross college for women - 28 28

Page 247March 2014Vol.2, Special Issue
Primax International Journal of Commerce and Management Research ISSN : 2321-3604
5 SRC college for women - 22 22
6 Shrimathi Indra college for women - 18 18
7 National college 22 10 32
8 EVR college 15 11 26
9 MIET college 10 12 22
10 Govt. Arts college 17 7 24
11 St. Joseph’s college 23 15 38
12 UD college 18 12 30
TOTAL 128 182 310
Assessment of employability skills:It refers to assess the skills possessed by the students of arts and science studying final year UG and PG.
Employability skills:Employability skills are those skills which are expected and required by the job provider for specific job. It is alsodefined as the skills that required not only to gain employment but also to progress with an enterprise so as toachieve one’s potential and contributes successfully to enterprise strategic direction”.
Skills adopted for this ResearchHere in this study the following are the skills taken for the study to assess the level of employability skills among therespondents.Communication skills- writing skills, speaking skills, computing skills, leadership skills and adoptability skills
Opinion of the respondents on writing skills:
The above table shows the opinion of the respondents regarding the writing skills possessed .it can be inferred that57.4% percentage of the students have got the skill of writing the leave letter on their own. 58% of the respondentshave not the skills of writing assignment on their own without grammar mistakes.48% of the respondents have notthe skills of writing the essays without grammar mistakes. Majority of the respondents that is 58% of the respondentshave not the writing skills.
Statements SDA % D % N % A % SA % Total
I can write leave letter on my own
- - - 10 3.2 122 39.3 178 57.4 310
I can write assignment in my own
180 58 80 25.8 20 6.5 17 5.5 13 4.2 310
No grammar mistakes
180 58 100 32.2 10 3.2 8 2.6 12 3.9 310
Writing essay without grammar mistakes
150 48 125 40 13 4.2 7 2.2 15 4.8 310
Can write business project report without mistakes
220 71 60 19 - - 20 6.5 15 4.8 310

Page 248
ISSN : 2321-3604
March 2014Vol.2, Special Issue
Primax International Journal of Commerce and Management Research
Opinion of the respondents regarding speaking skills
Statements SDA % D % N % A % SA % TotalCan speak any topic in the class
184 59 94 30 12 3.8 12 3.8 8 2.5 310
Speak without grammar mistakes
260 83.8 30 9.6 5 1.6 10 3.2 5 1.6 310
Successfully present the seminar
25 8 60 19 10 3.2 161 51.9 54 17.4 310
Speak without fear and grammar mistakes
182 58.7 72 23.2 10 3.2 35 11.3 11 3.5 310
Never hesitate to speak in front of the people
131 42.2 100 32.2 25 8 38 12.2 16 5.16 310
The above table shows the opinion of the respondents regarding the specking skills possessed. It can be inferredfrom the above table that only 2.5% of the respondents strongly agreed that they can speak on any topic in theclass and 59% of the respondents expressed that strongly that they cannot speak in any topic. 83.8% of therespondents strongly expressed that they cannot speak without grammar mistakes, 58.7% of the respondentsstrongly expressed that they have a fear while speaking and 42.2.of the respondents have expressed strongly thatthey hesitate to speak in front of the people. Only 1.6% of the respondents are able to speak without grammarmistakes.
Opinion of the respondents regarding leadership skills
Statements SDA % D % N % A % SA % TotalI Take initiatives in organize student programme
210 67.74 40 12.9 33 10.6 12 3.8 15 4.8 310
In my school / College I have been selected as leader
285 91.9 15 4.8 - - 8 2.5 2 0.6 310
I have capacity to take immediate and effective decisions .
12 3.8 10 3.2 13 4.2 202 65 73 23.5 310
I have good self esteem and mutual respect.
52 16.7 20 6.4 2 0.6 150 48 86 27.7 310
I Never worried about uncertainty or change behavior of others.
108 34.8 92 29.6 16 5.1 62 20 32 10.3 310
The above table showing the opinion regarding leadership skill possessed by the respondents.4.8%of the respondentsexpressed that they take initiative to organize the student programme and 67.74% of the respondents strongly saidthat they do not take any initiatives.0.6%of the respondents strongly agreed that they have been selected as theleader in the school and college level.91.9%of the respondents strongly expressed that they have not been selectedfor any leadership.48% of the respondents agreed that they have good self esteem and 16.7% of the respondentsstrongly said that they have no good self esteem.
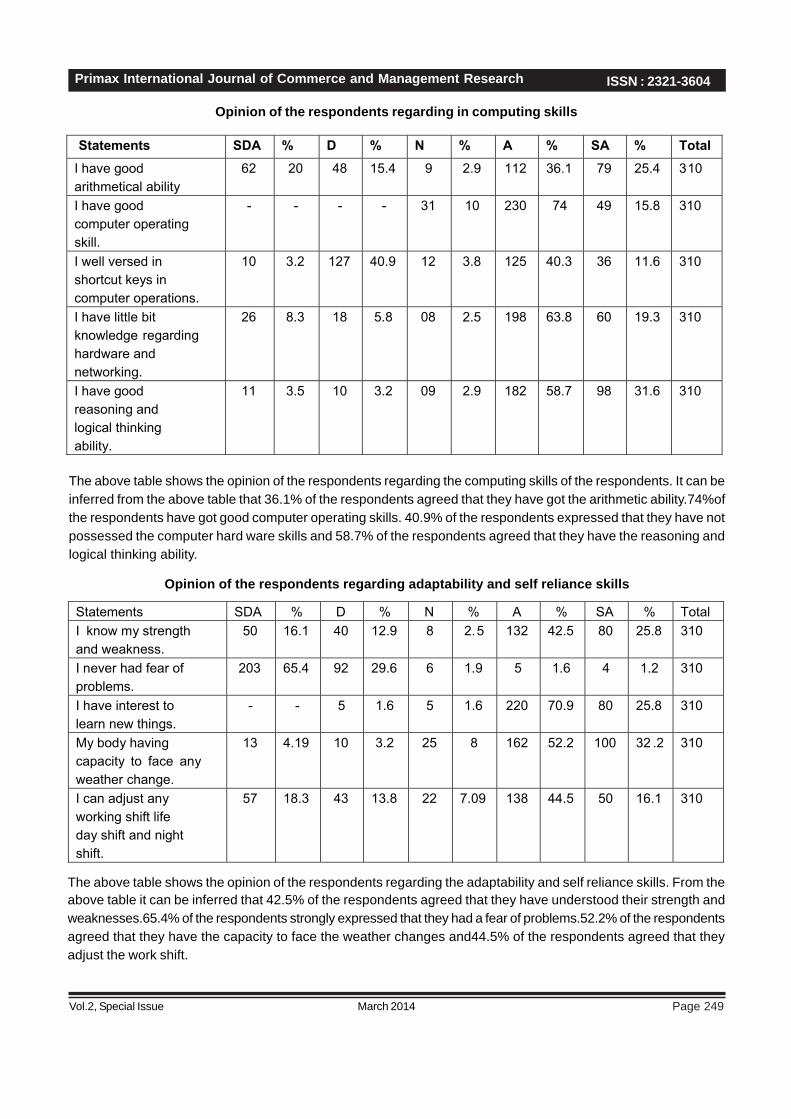
Page 249March 2014Vol.2, Special Issue
Primax International Journal of Commerce and Management Research ISSN : 2321-3604
Opinion of the respondents regarding in computing skills
Statements SDA % D % N % A % SA % TotalI have good arithmetical ability
62 20 48 15.4 9 2.9 112 36.1 79 25.4 310
I have good computer operating skill.
- - - - 31 10 230 74 49 15.8 310
I well versed in shortcut keys in computer operations.
10 3.2 127 40.9 12 3.8 125 40.3 36 11.6 310
I have little bit knowledge regarding hardware and networking.
26 8.3 18 5.8 08 2.5 198 63.8 60 19.3 310
I have good reasoning and logical thinking ability.
11 3.5 10 3.2 09 2.9 182 58.7 98 31.6 310
The above table shows the opinion of the respondents regarding the computing skills of the respondents. It can beinferred from the above table that 36.1% of the respondents agreed that they have got the arithmetic ability.74%ofthe respondents have got good computer operating skills. 40.9% of the respondents expressed that they have notpossessed the computer hard ware skills and 58.7% of the respondents agreed that they have the reasoning andlogical thinking ability.
Opinion of the respondents regarding adaptability and self reliance skills
Statements SDA % D % N % A % SA % TotalI know my strength and weakness.
50 16.1 40 12.9 8 2.5 132 42.5 80 25.8 310
I never had fear of problems.
203 65.4 92 29.6 6 1.9 5 1.6 4 1.2 310
I have interest to learn new things.
- - 5 1.6 5 1.6 220 70.9 80 25.8 310
My body having capacity to face any weather change.
13 4.19 10 3.2 25 8 162 52.2 100 32 .2 310
I can adjust any working shift life day shift and night shift.
57 18.3 43 13.8 22 7.09 138 44.5 50 16.1 310
The above table shows the opinion of the respondents regarding the adaptability and self reliance skills. From theabove table it can be inferred that 42.5% of the respondents agreed that they have understood their strength andweaknesses.65.4% of the respondents strongly expressed that they had a fear of problems.52.2% of the respondentsagreed that they have the capacity to face the weather changes and44.5% of the respondents agreed that theyadjust the work shift.

Page 250
ISSN : 2321-3604
March 2014Vol.2, Special Issue
Primax International Journal of Commerce and Management Research
Findings and suggestions• 57.4% percentage of the students have got the skill
of writing the leave letter on their own. 58% of therespondents have not the skills of writing assignmenton their own without grammar mistakes.48% of therespondents have not the skills of writing the essayswithout grammar mistakes. Majority of therespondents that is 58% of the respondents havenot the writing skills.
• 2.5% of the respondents strongly agreed that theycan speak on any topic in the class and 59% of therespondents expressed that strongly that they cannotspeak in any topic. 83.8% of the respondents stronglyexpressed that they cannot speak without grammarmistakes, 58.7% of the respondents stronglyexpressed that they have a fear while speaking and42.2.of the respondents have expressed strongly thatthey hesitate to speak in front of the people. Only1.6% of the respondents are able to speak withoutgrammar mistakes.
• 4.8%of the respondents expressed that they takeinitiative to organize the student programme and67.74% of the respondents strongly said that theydo not take any initiatives.0.6%of the respondentsstrongly agreed that they have been selected as theleader in the school and college level.91.9%of therespondents strongly expressed that they have notbeen selected for any leadership.48% of therespondents agreed that they have good self esteemand 16.7% of the respondents strongly said that theyhave no good self esteem.
• 36.1% of the respondents agreed that they have gotthe arithmetic ability.74%of the respondents have gotgood computer operating skills. 40.9% of therespondents expressed that they have not possessedthe computer hard ware skills and 58.7% of therespondents agreed that they have the reasoning andlogical thinking ability.
• 42.5% of the respondents agreed that they haveunderstood their strength and weaknesses.65.4% ofthe respondents strongly expressed that they had afear of problems.52.2% of the respondents agreedthat they have the capacity to face the weatherchanges and44.5% of the respondents agreed thatthey adjust the work shift.
Suggestions:• The students are to be motivated to improve the
writing skills by giving more exercises writing on theblack board, conducting dictations and conductingsmall tests.
• To improve the speaking skills the seminar conductedin the class rooms should effectively taken care ofand make the students to select the topic on theirown.
• To improve the leadership skills every student shouldbe given some assignment and that should beevaluated seriously.
• As the most of the students have the computing skillsthe students who are weak in such skills can betrained by the skilled students.
• To improve the adaptability skills the students are totrained in such a way that they should show morecare in taking care of their health.
Conclusion:Shifts in economies throughout the world, prompted byglobalization, technological change, increasedcompetition, and the growing sophistication of customersand clients mean that employers are increasingly lookingfor a set of generic skills to accompany technical skills.The outcome of the study will be discount with the keyplayer in education for adopting strategies forimplementing of the recommendation assign out of thereport. This study also would pave the way to find differentmethods to develop the various skills among thestudents as expected by the job providers as theindustries in general.
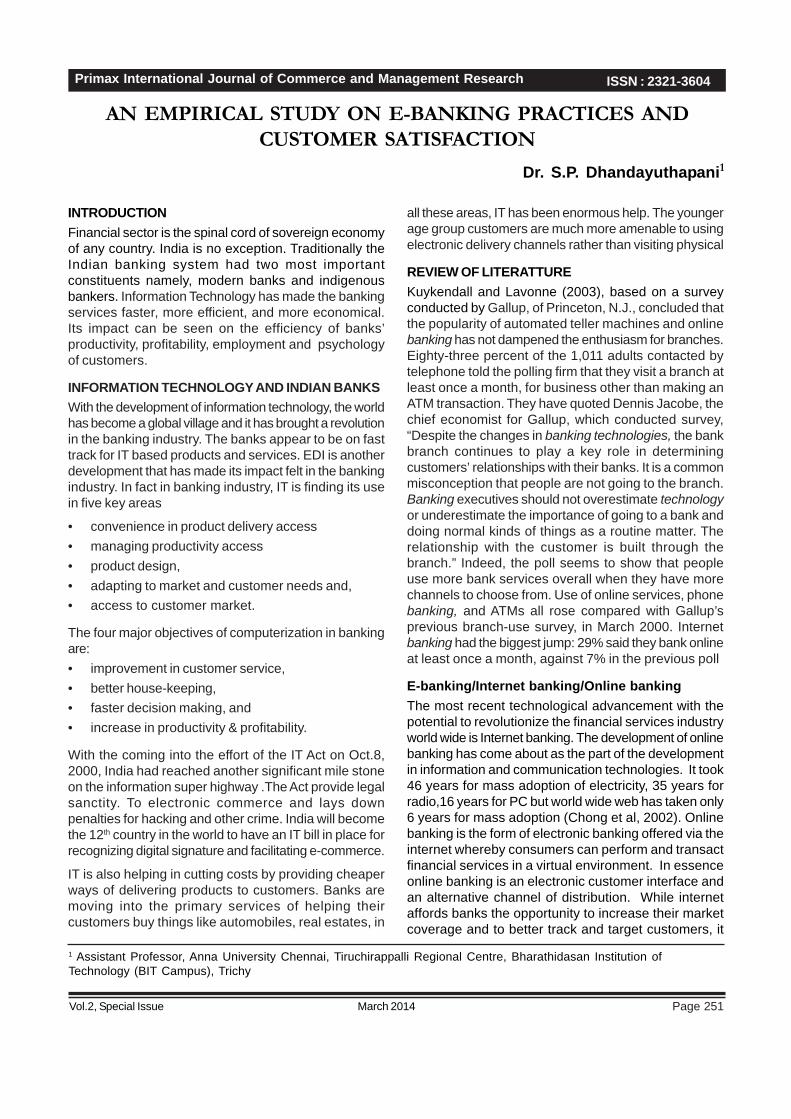
Page 251March 2014Vol.2, Special Issue
Primax International Journal of Commerce and Management Research ISSN : 2321-3604
AN EMPIRICAL STUDY ON E-BANKING PRACTICES ANDCUSTOMER SATISFACTION
Dr. S.P. Dhandayuthapani1
INTRODUCTIONFinancial sector is the spinal cord of sovereign economyof any country. India is no exception. Traditionally theIndian banking system had two most importantconstituents namely, modern banks and indigenousbankers. Information Technology has made the bankingservices faster, more efficient, and more economical.Its impact can be seen on the efficiency of banks’productivity, profitability, employment and psychologyof customers.
INFORMATION TECHNOLOGY AND INDIAN BANKSWith the development of information technology, the worldhas become a global village and it has brought a revolutionin the banking industry. The banks appear to be on fasttrack for IT based products and services. EDI is anotherdevelopment that has made its impact felt in the bankingindustry. In fact in banking industry, IT is finding its usein five key areas
• convenience in product delivery access• managing productivity access• product design,• adapting to market and customer needs and,• access to customer market.
The four major objectives of computerization in bankingare:• improvement in customer service,• better house-keeping,• faster decision making, and• increase in productivity & profitability.
With the coming into the effort of the IT Act on Oct.8,2000, India had reached another significant mile stoneon the information super highway .The Act provide legalsanctity. To electronic commerce and lays downpenalties for hacking and other crime. India will becomethe 12th country in the world to have an IT bill in place forrecognizing digital signature and facilitating e-commerce.
IT is also helping in cutting costs by providing cheaperways of delivering products to customers. Banks aremoving into the primary services of helping theircustomers buy things like automobiles, real estates, in
1 Assistant Professor, Anna University Chennai, Tiruchirappalli Regional Centre, Bharathidasan Institution ofTechnology (BIT Campus), Trichy
all these areas, IT has been enormous help. The youngerage group customers are much more amenable to usingelectronic delivery channels rather than visiting physical
REVIEW OF LITERATTUREKuykendall and Lavonne (2003), based on a surveyconducted by Gallup, of Princeton, N.J., concluded thatthe popularity of automated teller machines and onlinebanking has not dampened the enthusiasm for branches.Eighty-three percent of the 1,011 adults contacted bytelephone told the polling firm that they visit a branch atleast once a month, for business other than making anATM transaction. They have quoted Dennis Jacobe, thechief economist for Gallup, which conducted survey,“Despite the changes in banking technologies, the bankbranch continues to play a key role in determiningcustomers’ relationships with their banks. It is a commonmisconception that people are not going to the branch.Banking executives should not overestimate technologyor underestimate the importance of going to a bank anddoing normal kinds of things as a routine matter. Therelationship with the customer is built through thebranch.” Indeed, the poll seems to show that peopleuse more bank services overall when they have morechannels to choose from. Use of online services, phonebanking, and ATMs all rose compared with Gallup’sprevious branch-use survey, in March 2000. Internetbanking had the biggest jump: 29% said they bank onlineat least once a month, against 7% in the previous poll
E-banking/Internet banking/Online bankingThe most recent technological advancement with thepotential to revolutionize the financial services industryworld wide is Internet banking. The development of onlinebanking has come about as the part of the developmentin information and communication technologies. It took46 years for mass adoption of electricity, 35 years forradio,16 years for PC but world wide web has taken only6 years for mass adoption (Chong et al, 2002). Onlinebanking is the form of electronic banking offered via theinternet whereby consumers can perform and transactfinancial services in a virtual environment. In essenceonline banking is an electronic customer interface andan alternative channel of distribution. While internetaffords banks the opportunity to increase their marketcoverage and to better track and target customers, it

Page 252
ISSN : 2321-3604
March 2014Vol.2, Special Issue
Primax International Journal of Commerce and Management Research
gives customers the possibility of information and pricetransparency as well as ‘24/7’ accessibility. Onlinebanking is potentially the most radical innovation,especially in the context of bank dominated by the branchas the means to provide service to customers. (Bradleyand Stewart 2003).
STATEMENT OF THE PROBLEMInternet Banking is attractive because the consumer aremore satisfied with their banks, are less price sensitivehave the highest intention to repurchase, and providemore positive word of mouth information then other bankcustomers. In spite of these facilities, e-banking systemhas been subjected to the following criticism.* Lack of banking services through the web due to a
limited number of banks using the internet..* Data and Network security, in addition privacy
problems.* Lack and limitation of Govt. policies, regulations and
e-commerce laws as well as legislation to protectworkers and to make the Internet secure.
* Customers are fear to use of internet banking.* Non-cooperation among the old age staff in the
Banks.
METHODOLOGY:This study is based on both primary and secondary data.Primary data will be collected from the respondents bypreparing Questionnaire and interview schedule.Secondary data will be collected from published journalsand official website.
Statistical tools like percentage, Correlation,Regression, t-test, f-test and chi-square test will applyto know the level of satisfaction with e-banking.
LIMITATIONS OF THE STUDY;The following are the limitations of the present study.1. This study analyze the customers of Tanjore District
only.2. It doesn’t study about co-operative Land
development Banks’ customers.3. It concentrate only on private and commercial banks
who have core banking services and providing 3-banking facility.
Scope of the studyUndoubtedly e-banking is the technological wonders andis gaining popularity in banking transactions and it isimportant for banks to encourage customers to use e-banking. Banks-trusted business service providers, havethe opportunity to leverage their existing relationshipsto provide full range of high quality trusted internetbusiness services to their customers.
In India, there is less number of studies being conductedto identify how effectively the online channels are usedby banking industry to increase customer satisfaction.Hence, this study throws light on the e-banking servicesprovided by the banks in the study area and this researchstudy makes an attempt to analyze how banks areattracting the various customers and how the customersare satisfied with the e-banking services provided by thebanks. This study will be helpful to draw up further policyfor improving customer satisfaction with e-bankingpractices and act as a secondary data for furtherresearch.
RESEARCH MODELThe following research model is adopted for the study toanalyze customer satisfaction with e-banking practicesof the banks in the study area
Accessibility
Convenience
Privacy
Security
Design
Content
Speed
Fees andCharges
CustomerSatisfaction
The Research Framework
Hypotheses DevelopmentThe hypothesis designed for this study is based on thefollowing assumptions:H1: Accessibility, Convenience, Privacy, Security,
Design, Content, Speed and Fees and Chargeshave positive relationship with customer satisfaction.
H 2: The public and private sector banks customers havesimilar satisfaction with e-banking practices.
H3: The demographic variables (sex, age, occupation,income, educational qualifications and types ofaccount) have not influenced the customersatisfaction with e-banking practices in publicsector and private sector banks.
Population:The population defined for this study was limited tocustomer using e-banking services of public and privatesector banks in Thanjavur district of Tamilnadu. The

Page 253March 2014Vol.2, Special Issue
Primax International Journal of Commerce and Management Research ISSN : 2321-3604
present study covers bank branches for those bankgroups working in the Thanjavur district only.
Sample sizeIn Thanjavur district almost, all the major banks havebranches in this district. One public and one privatesector bank having the largest network of branches inthe district were identified. In the district, among thepublic sector banks State Bank of India (SBI) has largenumber branches (15 branches) as compared to otherbanks. Similarly, among private sector banks locatedin the district, ICICI bank has large number of Branches(5) as compared to other private sector banks. Twobranches from each bank viz., Kumbakonam andThanjavur selected as sample.
In Thanjavur and Kumbakonam branches of State Bankof India, there are 3943 and 2297 customers using e-banking services, particularly ATM. In the samebranches of ICICI bank there are 1628 and 1229customers. The sample size was calculated to guaranteea sufficient number of respondents in each bank branch.Thus, the following formula has been used to estimatethe population sample size (The Survey System, 2007):
t² * p * (1-p)Minimum Sample Size (n) =---------------------
m²Where:n = required sample size (minimum size)t = Confidence level at 95% (standard value of 1.96)p = Estimated fractional population of subgroupm = Margin of error at 5% (standard value of 0.05)As per the formula, the required sample size is 253customers from SBI and 116 customers from ICICI Bank.Therefore, sample size of 160 and 93 customers fromSBI and 66 and 50 customers from ICICI bank in therespective branch of Thanjavur & Kumbakonam aredetermined on the basis of proportionate to the totalcustomers. These samples are selected on the basisof Convenience sampling method. The reasons of usingthis sampling type are twofold. First, it offers an easyway to obtain the raw data for the further analysis.Second, it saves times and costs since the respondentscan be randomly selected.
DATA COLLECTIONThe primary data is collected with the help of pre-testedstructured questionnaires from a sample of 369respondents (253 and 116 respondents from one publicand one private sector bank) of selected branches ofSBI and ICICI Bank from Thanjavur district. The branchesand respondents are selected with the help ofconvenience sampling method.
The survey questionnaire measured eight dimensions ofe-banking service quality and its effect on customersatisfaction. A five point likert scale ranging from stronglyagree to strongly disagree was adopted as the scale forthe statements in the questionnaire and method of datacollection was through personal mode. The surveyquestionnaire has been designed using 29 statementsrelated to service quality dimensions i.e. Accessibility,Convenience, Privacy, Security, Design, Content, Speedand Fees and Charges. Each statement in thequestionnaire has positively worded. Reliability of thequestionnaire was tested using Cronbach’s alphareliability test.
Pilot Testing of InstrumentResearchers strongly recommend pilot testing of theinstrument. A sample of 50 customers was used, in thepilot testing, to validate the instrument. To validate theresults empirically, appropriate reliability and validitytests of the measurement were taken. Indeed, reliabilityrefers to the instrument’s ability to prove consistentresults in repeated uses, whereas validity refers to thedegree to which the instrument measures the conceptthe researcher wants to do. This provides confidencethat the empirical findings accurately reflect the proposedconstructs (Flynn et al., 1994). The reliability coefficient(Cronbach’s alpha) values for the eight areas Accessibility(0.840), Convenience (0.784), Privacy (0.913), Security(0.965), Design, (0.780); Content (0.701);, Speed (0.798);and Fees and Charges (0.791) were found to be withinlimits for further analysis. None of the reliability alphasis below the cutoff point of 0.60, which is generallyconsidered to be the criterion for demonstrating internalconsistency of new scales (Nunnally and Bernstein,1994).
PROBLEMS OF E-BANKING USERSGrowth of e-banking in India depends on many factors,such as computer knowledge, success of internetaccess, new online banking features, household growthof internet usage, legal and regulatory framework.E-banking can offer speedier, quicker and dependableservices to the customers for which they may be relativelysatisfied than that of manual system of banking.E-banking system not only generates latest viable return,it can get its better dealings with customers.
E-banking provides enormous benefits to consumers interms of the ease and cost of transactions. But it alsoposes new challenges for country authorities inregulating and supervising the financial system and indesigning and implementing macroeconomic policy.
This chapter highlights various issues and challengesrelated with e-banking and the problems of e-banking

Page 254
ISSN : 2321-3604
March 2014Vol.2, Special Issue
Primax International Journal of Commerce and Management Research
users in the study area, so that the future of e-banking can become good asset for overall growth in the globalizeworld.
ISSUES AND CHALLENGES OF E-BANKING SERVICESIn spite of the fact that electronic banking has lot of advantages, there are some hurdles of electronic banking. Themain hurdles are as follows:Customer skills, Security risks, Fraud in transactions, Fake bank websites/email, Use of trojan programs, Powerfailure, Atm theft, Risk management, Authentications and legal issues, Verifying and reputation risk
Problems in ATMsTo analyze the problems faced by the e-banking services user in the study area, all the possible problems weremade known to the respondents. They were asked to rank the reasons in the order of their importance. The ranksgiven by them were quantified by using the Garrett Ranking Technique (Garrett, 1969). The formula is given below: nPer cent position = Ó [ (Rij - 0.5) / Nj ] × 100 …(1) j=1
Where,Rij = Rank given for the ith item by the jth individual, andNj = Number of items ranked by the jth individual.
The problems faced by the ATMs users are discussed in the table I
TABLE 1 PROBLEMS OF ATMs USER (N = 382)
S.No Nature of problem Mean score Rank
01 Insufficient number of ATMs 132.34 I
02 Improper location of ATMs 114.58 III
03 Not maintaining adequate cash 106.57 V
04 Not maintaining denomination 88.39 IX
05 Security concern 104.82 VII
06 Poor connectivity 102.50 VIII
07 High fees and charges 84.66 X
08 Frequent out of order 121.28 II
09 Restriction for use other cards 105.08 VI
10 Long waiting time 107.97 IV
Source: Primary data
From table 1, it has been observed that the main problemfaced by the ATMs users in the study area is theinsufficient number of ATMs with a mean score of 132.34followed by frequent out of order with mean score of121.28. Improper location and long waiting time are thethird and fourth problems. Not maintaining adequate cashrestriction of using other bank cards are the fifth andsixth problem. The seventh, eighth, ninth and tenth
problems are the security concern, poor connectivity,not maintaining adequate denominations of cash andhigh fees and charges respectively. It can be inferredfrom the table that all the respondents are highlydissatisfied with the number of ATMs installed by thebanks. However it is noteworthy to mention that therespondents opined high fees and charges is the lastproblem of the ATMs users.
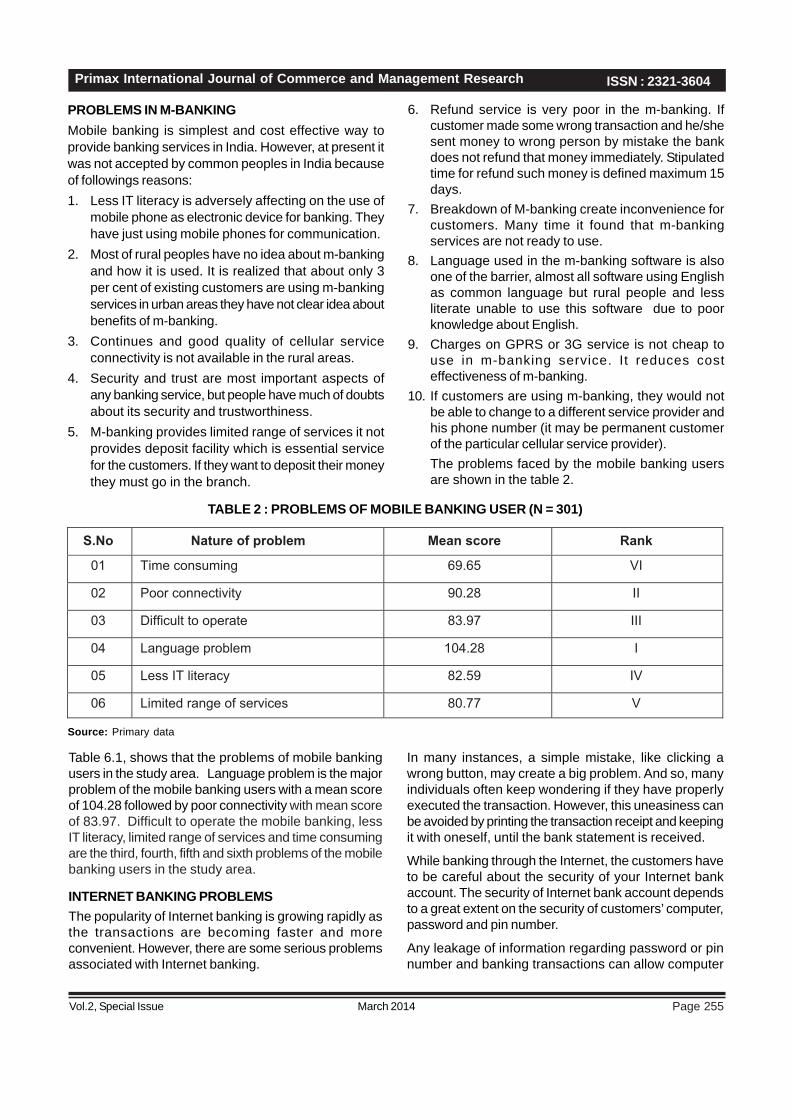
Page 255March 2014Vol.2, Special Issue
Primax International Journal of Commerce and Management Research ISSN : 2321-3604
PROBLEMS IN M-BANKINGMobile banking is simplest and cost effective way toprovide banking services in India. However, at present itwas not accepted by common peoples in India becauseof followings reasons:1. Less IT literacy is adversely affecting on the use of
mobile phone as electronic device for banking. Theyhave just using mobile phones for communication.
2. Most of rural peoples have no idea about m-bankingand how it is used. It is realized that about only 3per cent of existing customers are using m-bankingservices in urban areas they have not clear idea aboutbenefits of m-banking.
3. Continues and good quality of cellular serviceconnectivity is not available in the rural areas.
4. Security and trust are most important aspects ofany banking service, but people have much of doubtsabout its security and trustworthiness.
5. M-banking provides limited range of services it notprovides deposit facility which is essential servicefor the customers. If they want to deposit their moneythey must go in the branch.
6. Refund service is very poor in the m-banking. Ifcustomer made some wrong transaction and he/shesent money to wrong person by mistake the bankdoes not refund that money immediately. Stipulatedtime for refund such money is defined maximum 15days.
7. Breakdown of M-banking create inconvenience forcustomers. Many time it found that m-bankingservices are not ready to use.
8. Language used in the m-banking software is alsoone of the barrier, almost all software using Englishas common language but rural people and lessliterate unable to use this software due to poorknowledge about English.
9. Charges on GPRS or 3G service is not cheap touse in m-banking service. It reduces costeffectiveness of m-banking.
10. If customers are using m-banking, they would notbe able to change to a different service provider andhis phone number (it may be permanent customerof the particular cellular service provider).The problems faced by the mobile banking usersare shown in the table 2.
TABLE 2 : PROBLEMS OF MOBILE BANKING USER (N = 301)
S.No Nature of problem Mean score Rank
01 Time consuming 69.65 VI
02 Poor connectivity 90.28 II
03 Difficult to operate 83.97 III
04 Language problem 104.28 I
05 Less IT literacy 82.59 IV
06 Limited range of services 80.77 V
Source: Primary data
Table 6.1, shows that the problems of mobile bankingusers in the study area. Language problem is the majorproblem of the mobile banking users with a mean scoreof 104.28 followed by poor connectivity with mean scoreof 83.97. Difficult to operate the mobile banking, lessIT literacy, limited range of services and time consumingare the third, fourth, fifth and sixth problems of the mobilebanking users in the study area.
INTERNET BANKING PROBLEMSThe popularity of Internet banking is growing rapidly asthe transactions are becoming faster and moreconvenient. However, there are some serious problemsassociated with Internet banking.
In many instances, a simple mistake, like clicking awrong button, may create a big problem. And so, manyindividuals often keep wondering if they have properlyexecuted the transaction. However, this uneasiness canbe avoided by printing the transaction receipt and keepingit with oneself, until the bank statement is received.
While banking through the Internet, the customers haveto be careful about the security of your Internet bankaccount. The security of Internet bank account dependsto a great extent on the security of customers’ computer,password and pin number.
Any leakage of information regarding password or pinnumber and banking transactions can allow computer
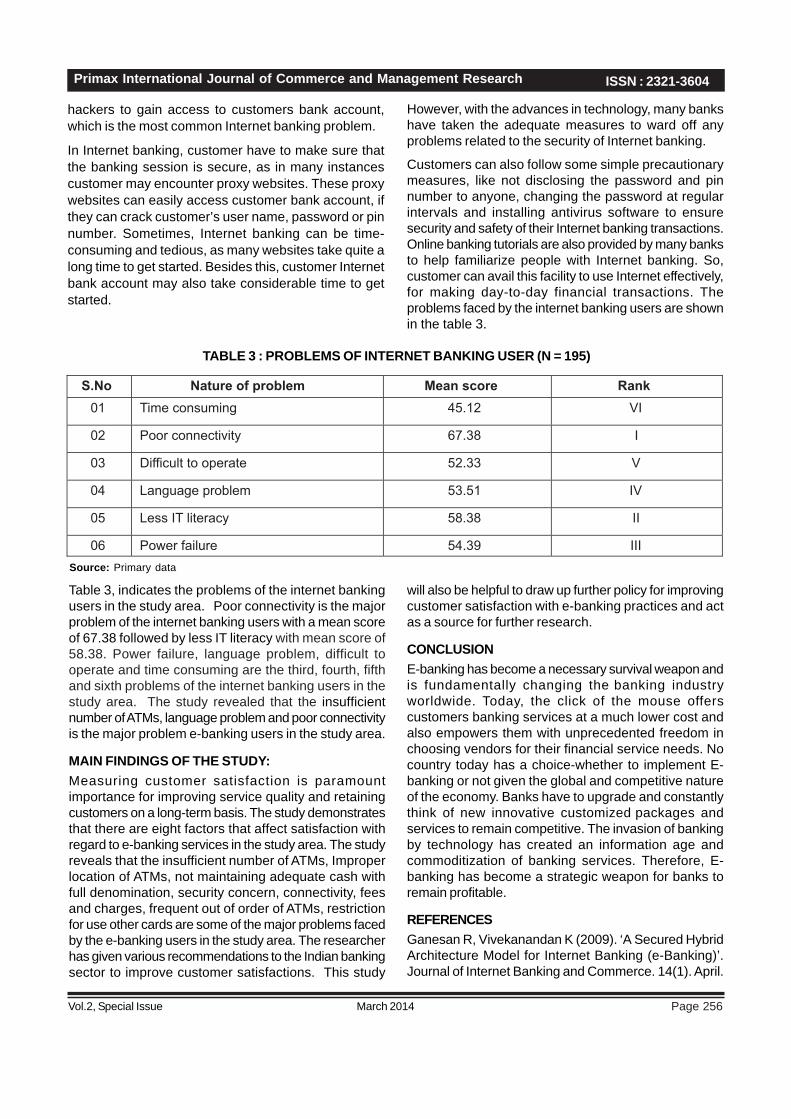
Page 256
ISSN : 2321-3604
March 2014Vol.2, Special Issue
Primax International Journal of Commerce and Management Research
hackers to gain access to customers bank account,which is the most common Internet banking problem.
In Internet banking, customer have to make sure thatthe banking session is secure, as in many instancescustomer may encounter proxy websites. These proxywebsites can easily access customer bank account, ifthey can crack customer’s user name, password or pinnumber. Sometimes, Internet banking can be time-consuming and tedious, as many websites take quite along time to get started. Besides this, customer Internetbank account may also take considerable time to getstarted.
However, with the advances in technology, many bankshave taken the adequate measures to ward off anyproblems related to the security of Internet banking.
Customers can also follow some simple precautionarymeasures, like not disclosing the password and pinnumber to anyone, changing the password at regularintervals and installing antivirus software to ensuresecurity and safety of their Internet banking transactions.Online banking tutorials are also provided by many banksto help familiarize people with Internet banking. So,customer can avail this facility to use Internet effectively,for making day-to-day financial transactions. Theproblems faced by the internet banking users are shownin the table 3.
TABLE 3 : PROBLEMS OF INTERNET BANKING USER (N = 195)
S.No Nature of problem Mean score Rank01 Time consuming 45.12 VI
02 Poor connectivity 67.38 I
03 Difficult to operate 52.33 V
04 Language problem 53.51 IV
05 Less IT literacy 58.38 II
06 Power failure 54.39 IIISource: Primary data
Table 3, indicates the problems of the internet bankingusers in the study area. Poor connectivity is the majorproblem of the internet banking users with a mean scoreof 67.38 followed by less IT literacy with mean score of58.38. Power failure, language problem, difficult tooperate and time consuming are the third, fourth, fifthand sixth problems of the internet banking users in thestudy area. The study revealed that the insufficientnumber of ATMs, language problem and poor connectivityis the major problem e-banking users in the study area.
MAIN FINDINGS OF THE STUDY:Measuring customer satisfaction is paramountimportance for improving service quality and retainingcustomers on a long-term basis. The study demonstratesthat there are eight factors that affect satisfaction withregard to e-banking services in the study area. The studyreveals that the insufficient number of ATMs, Improperlocation of ATMs, not maintaining adequate cash withfull denomination, security concern, connectivity, feesand charges, frequent out of order of ATMs, restrictionfor use other cards are some of the major problems facedby the e-banking users in the study area. The researcherhas given various recommendations to the Indian bankingsector to improve customer satisfactions. This study
will also be helpful to draw up further policy for improvingcustomer satisfaction with e-banking practices and actas a source for further research.
CONCLUSIONE-banking has become a necessary survival weapon andis fundamentally changing the banking industryworldwide. Today, the click of the mouse offerscustomers banking services at a much lower cost andalso empowers them with unprecedented freedom inchoosing vendors for their financial service needs. Nocountry today has a choice-whether to implement E-banking or not given the global and competitive natureof the economy. Banks have to upgrade and constantlythink of new innovative customized packages andservices to remain competitive. The invasion of bankingby technology has created an information age andcommoditization of banking services. Therefore, E-banking has become a strategic weapon for banks toremain profitable.
REFERENCESGanesan R, Vivekanandan K (2009). ‘A Secured HybridArchitecture Model for Internet Banking (e-Banking)’.Journal of Internet Banking and Commerce. 14(1). April.

Page 257March 2014Vol.2, Special Issue
Primax International Journal of Commerce and Management Research ISSN : 2321-3604
Accessed on 20th January, 2010 on http://www.arraydev.com/commerce/jibc/
Ganesh, C. & Varghese, M. E. (2003). Customer Servicein Banks: An Empirical Study. Vinimaya, 24(2): 14-26.
Garland, R. (2002). Estimating customer defection inpersonal retail banking. The International Journal of BankMarketing, 20 (7), 317-325.
Uppal R.K. (2008), “Customer Perception of E-BankingServices of Indian Banks: Some Survey Evidence”, ICFAIJournal of Bank Management Vol. VII, No. 1 (February),pp 63-78.
Uppal, R. K. and Kaur, R. (2007). Indian Banking Sector:Efficiency in the Post- Banking Sector Reforms Era NewChallenge and Future Opportunities. Prestige Journal ofBank Management and Research, 2(1): 42-55.
Vatanasombut, B., A.C. Stylianou, and M. Igbaria, “Howto Retain Online Customers,” Communications of theACM, Vol. 47, No. 6:65-69, 2004.
Zeithaml, V. A., Berry, L. L. & Parasuraman, A. (1996).“The behavioural consequences of service quality”.Journal of Marketing, 60 (1), 31-46.
Zeithaml, V.A., L.L. Berry, and A. Parasuraman, “TheBehavioral Consequences of Service Quality,” Journalof Marketing, Vol. 60, No. 2:31-46, 1996.
Zinkhan, G.M. and W.B. Locander, “ESSCA: A Multi-dimensional Analysis Tool for Marketing Research,”Journal of the Academy of Marketing Science, Vol. 16:36-46, 1988.

Page 258
ISSN : 2321-3604
March 2014Vol.2, Special Issue
Primax International Journal of Commerce and Management Research
MARKETING MIX STRATEGIES OF PRIVATE LABEL BRANDS(PLBs) IN ORGANIZED RETAIL OUTLETS IN CHENNAI,
TAMILNADU - AN EMPIRICAL INVESTIGATION
K.R. Mahalaxmi1 Dr. A. Velanganni Joseph2
1. Assistant Professor, Anna University Chennai, Tiruchirappalli Regional Centre, Bharathidasan Institution of Technology(BIT Campus), Trichy
2. Assistant professor , Anna University Chennai, Tiruchirappalli Regional Centre, Bharathidasan Institution of Technology(BIT Campus), Trichy
ABSTRACT The Indian retail industry is one of the fastest budding industries in India, especially over the last few years. Itcontributes 10 to 11 % of the GDP and 8 % of employment. Private label brands which were first introduced over 100years ago in few product categories, had seen an impressive growth in past few decades. The early growth of privatelabel brands in India has been limited to certain categories like grocery and apparel; it is gradually expanding intoother categories as well. Initially the private label brands being developed as a low-priced strategy to compete withnational brands. But the situation has been now been changed and now it is in a position to compete with nationalbrands. In this study it is examined the various factors influencing consumers perception towards Private LabelBrands in Organized retail outlets in Chennai, Tamilnadu.The research design chosen for the study is descriptive. A survey instrument was developed based on previousstudies done on consumer’s perception towards private label brands. Convenient sampling has been employed withthe questionnaires being collected from 352 respondents. The study was carried out in Chennai city, South India.Primary stage sampling units were the persons shopping in hypermarkets. Data was collected from consumersshopping in two leading hypermarkets in Chennai, Tamilnadu. Based on the test results some of the relevant findingswere derived that will be relevant to present Indian scenario.Key Words: Private Label Brands, Retail, Perception etc.
IntroductionStore brands or private label brands are brands owned,controlled, and sold exclusively by a retailer (Baltas,1997). Private label brands which were first introducedover 100 years ago in few product categories, had seenan impressive growth in past few decades (Tarzijan,2004). Private labels proliferated in a number of productcategories and garnered major market share as retailersperceived numerous benefits by their introduction. Apartfrom providing higher retail margins in comparison tonational brands (Ashley, 1998), private labels addeddiversity to the product line in a retail category (Raju etal. 1995). Added benefits accrued to the retailer in termsof differentiating its offerings from competing retailersas well as having greater leverage with manufacturers ofnational brands.
Private LabelA private label is characterized by being a productproduced, improved, processed, packed or distributedexclusively by the organization that has the brand control(AC Nielsen, 2002).It can carry the company’s name oruse other brands not associated to the company’s name.Still due to these characteristics and their appeals, the
market for private label has grown in the last few years.(AC Nielsen, 2004).
Reasons for the Growth Private Label around theworldAccording to Carmen Abril, professor of IE BusinessSchool, Spain the reasons driving the private label growtharea) An increased concentration among retailersb) An improved quality perception among consumersc) The rising social acceptance of private labels
consumptiond) The current economic downturn has further boosted
the appeal of private labels because of their priceutility and
e) The private label helps the retailer for convenientpricing for consumers.
Review of LiteratureMichael S. Pepe(2011), The purpose of this study is toinvestigate the influence of private label resourcespossessed by a supermarket retailer on the shoppingbehavior of loyal customers. The study examines whether

Page 259March 2014Vol.2, Special Issue
Primax International Journal of Commerce and Management Research ISSN : 2321-3604
or not private label products can help in the overallenhancement of product category performance. Thepaper examines the performance of a supermarketretailer in the Northeast United States that operates over100 stores and generates a total yearly sales volume inexcess of $3 bill ion. Data obtained from theSupermarket’s point of sale information were used. Thepaper then developed a research model from theliterature review and used structural equation modelingto analyze the data. The findings show that overall dollarsspent by loyal customers significantly impacted overallprofitability.
Philip M. Parker and Namwoon Kim(1995) This paperconsiders certain aspects of competition betweennational brands and quality equivalent private-label brands(a form of store, house or own-label branding). Weinvestigate the impact of advertising on the ability ofbrands to increase market power using a model ofCoumot competition. Supporting recent theoreticalarguments (though contradicting others), our industrystudy reveals that heavy advertising among nationalbrands can increase prices, revenues, and profits forboth national brands and private-label brands. Inparticular, we find that all players can peacefully co-exist: national brands collude amongst themselves,private-label brands collude amongst themselves, andnational brands collude with private-label brands. Thisholds despite price dispersion across brands, withprivate-label brands being sold at lower prices. Modeloutcomes are quantitatively validated by crosscompetitor correlations which reveal perfectlysynchronized pricing strategies, and qualitativelyvalidated by industry interviews.
Richard Volpe(2011) Over the past two decades, privatelabel food products have grown steadily in sales andoften directly compete for market share with nationalbrands. This competition lowers prices and increasesproduct choices for consumers. This report analyzesthe relationship between private label and national brandproduct prices and in-store promotions for two major U.S.grocery store chains during the 2007-2009 recessionand the year following the recession (2010). Retailerspromote private label products (offer price discounts)strategically in response to national brand pricingpromotions to protect private label market share duringnational brand promotions. However, the extent of theretailer response varies widely across supermarketdepartments and is also affected by both the density offood stores and the market share of supercenters withina market area. These findings hold true regardless ofthe state of the economy, although the magnitude of the
interaction between national brands and private labelsdiffers in times of recession and recovery.
Sarah Nyengerai et.al (2013)A survey was conductedin Harare, Bulawayo and Bindura to quantify the effectof selected variables on private label brand perception.The following variables were tested; familiarity, storeimage perception, selected demographic factors (ageand income) and consumer characteristics (intoleranceof ambiguity, price consciousness, the level at which anindividual believes brand names reflect product qualityand social status). Data was analysed using stepwisemultiple linear regression. The factors that were foundto have a significant and positive effect on private labelbrand perception were familiarity (p<0.01) and storeimage perception (p<0.05). The authors concluded thatthere is scope to increase growth of the private labelbrand market share in the grocery sector of Zimbabwe.The authors recommended that retailers should embarkon marketing strategies that focus on increasing thefamiliarity of private label brands such the use of in-storetastes. Recommendations were also made for retailersto focus on the improvement of store appearance andenvironment as this affects private label brand perception.
Prasanth MK et.al(2013) The time has come where storebrands are shaping the future of modern trade outlets inIndia. The private label brand was introduced as analternative to national brands. Initially it was positionedas low price and low quality, the own brands have moveda long way in establishing its identity. The store brandsare in par with the national brands at least in selectedchains and outlets in India in terms of quality and price.The private labels have established lion market share inmany parts of the developed world. The present researchcarried out at the selected retail a chain in Kerala suchas More, Spencer and Reliance Fresh analyses theconsumer perception and rating of the private labels.
Research Questions
1. To identify the product, price, place and promotionalfactors influencing consumers perception towardsPrivate Label Brands.
2. To examine variety and availability of private labelbrands will enhance the consumers perception
METHODOLOGYThe research design chosen for the study is descriptive.A survey instrument was developed based on previousstudies done on consumers’ perception towards privatelabel brands. Convenient sampling has been employedwith the questionnaires being collected from 352respondents. Primary stage sampling units were the

Page 260
ISSN : 2321-3604
March 2014Vol.2, Special Issue
Primax International Journal of Commerce and Management Research
persons shopping in hypermarkets. Data was collected from consumers shopping in two leading hypermarkets inChennai, Tamilnadu. Using Statistical Package for Social Sciences (SPSS) some of the relevant tools like a) Multipleregressionb) Factor Analysis andc) Reliability test were administered.
An examination had been made from the reliability of the data to check whether random error causing inconsistencyand in turn lower reliability is at a manageable level or not, by running reliability test. Amongst the reliability teststhat were run, the minimum value of coefficient alpha (Cronbach’s alpha) obtained was 0.783
Table 1 : Reliability Statistics
Cronbach’s Alpha
0.783
N of Items
37
An examination had been made from the reliability of the data to check whether random error causing inconsistencyand in turn lower reliability is at a manageable level or not by running reliability test. Based on the reliability test, theminimum value of co-efficient alpha (Cronbach’s Alpha) obtained was 0.783. This shows the data has satisfactoryinternal consistency reliability.
HYPOTHESISThere is a relationship among the factors that enhance the consumers perception towards PrivateLabel Brands
Table 2 : Model Summary
Model R R Square Adjusted R Square Std. Error of the Estimate
1 0.785 0.616 0.574 0.327
Predictors:(Constant),The above model summary table shows R-Square for this model is 0.616. This means that 61.6 percent of thevariation in overall consumer’s perception can be explained from the 12 independent variables. This table alsoshows the adjusted R-Square for the model as 0.574.Any time another independent variable is added to a multipleregression model, the R-Square will increase (even if only slightly). Consequently, it becomes difficult to determinewhich models do the best job of explaining variation in the same dependent variable. The adjusted R-Square justwhat its name implies. It adjusts the R-Square by the number of predictor variables in the model. This adjustmentallows the easy comparison of the explanatory power of models with different numbers of predictor’s variable. It alsohelps as to decide how many variables to include in our regression model.
Table 3 : Regression Anova
Model Sum of Squares Df Mean Square F Sig.1 Regression 19.175 12 1.598 14.942 0.000
Residual 11.977 112 0.107Total 31.152 124
Predictors:(Constant), Dependent Variable:The ANOVA table, as displayed in the above table 2 shows the F ratio for the regression model that indicates thestatistical significance of the overall regression model. The larger the F ratio there will be more variance in thedependent variable that is associated with the independent variable. The F ratio = 14.942. The statistical significanceis 0.000 – the “Sig”. So reject the null hypothesis. There is relationship between independent and dependentvariables.

Page 261March 2014Vol.2, Special Issue
Primax International Journal of Commerce and Management Research ISSN : 2321-3604
Table 4 : Coefficients
ModelUnstandardised coefficient
Standardized Coefficients T Sig.
B Std. Error Beta
(Constant) -2.171 0.651 -3.331 0.001
Variety 0.414 0.105 0.476 3.955 0.000
Brand Image / Brand Name -0.117 0.102 -0.128 -1.150 0.253
Price charged 0.279 0.067 0.270 4.143 0.000
Perceived quality 0.028 0.062 0.035 0.454 0.651
Trust in brand 0.044 0.069 0.046 0.634 0.527
Availability 0.359 0.075 0.393 4.792 0.000
Accessibility 0.067 0.062 0.067 1.085 0.280
Attractive packaging 0.095 0.075 0.095 1.257 0.211
Intrinsic clues 0.182 0.062 0.183 2.934 0.004
Extrinsic clues -0.05 0.048 -0.077 -1.042 0.300
Store image/ store name -0.024 0.056 -0.027 -0.420 0.675
store promotion 0.364 0.064 0.377 5.714 0.000
To determine if one or more of the independent variables are significant predictors of overall perception of consumerstowards private label brands, we examine the information provided in the coefficient table. From the above 12independent statements only 4 independent statements are statistically significant the standardized coefficientbeta column reveals that Variety has a beta coefficient 0.476, which is significant (0.000). Brand Image / BrandName have a beta coefficient -0.128, which is not significant (0.253). Price charged has a beta coefficient 0.270,which is significant (0.000). Perceived quality has a beta coefficient 0.035, which is not significant (0.651). Trust inbrand has a beta coefficient 0.046, which is not significant (0.527). Availability has a beta coefficient 0.393, which issignificant (0.000). Accessibility has a beta coefficient 0.067, which is not significant (0.280). Attractive packaginghas a beta coefficient 0.095, which is not significant (0.211). Intrinsic clues have a beta coefficient 0.183, which isnot significant (0.004). Extrinsic clues have a beta coefficient -0.077, which is not significant (0.300). Store image/store name has a beta coefficient -0.027, which is not significant (0.675). Store promotion has a beta coefficient0.377, which is significant (0.000).
FACTOR ANALYSISKMO and Barlett’s TestThe individual statements on the factors influencing consumers towards private label brands was examined usingfactor analysis based on 25 individual statements and the reliability of the samples collected was tested for internalconsistency of the grouping of the items.
Table 5 : KMO and Bartlett’s Test
0.501
Bartlett's Test of Sphericity 1418.026
Df
Approx. Chi-Square
300.000Sig. 0.000
Kaiser-Meyer-Olkin Measure ofSampling Adequacy.

Page 262
ISSN : 2321-3604
March 2014Vol.2, Special Issue
Primax International Journal of Commerce and Management Research
KMO measure of sampling adequacy is an index to examine the appropriateness of factor analysis. High valuesbetween 0.5 and 1.0 indicate factor analysis is appropriate. Values below 0.5 imply that factor analysis may not beappropriate. From the above table it is seen that Kaiser-Meyer-Olkin measure of sampling adequacy index is .501and hence the factor analyses is appropriate for the given data set. Barlett’s Test of Sphericity is used to examinethe hypothesis that the variables are uncorrelated. It is based on Chi-Square transformation of the determinant ofcorrelation matrix. A large value of the test statistic will favor the rejection of the null hypothesis. In turn this wouldindicate that factor analysis is appropriate. Bartlett’s test of Sphericity Chi-square statistics is 1418.026, thatshows the 25 statements are correlated and hence as inferred in KMO, factor analysis is appropriate for the givendata set.
Table 6 : Total Variance Explained
Extraction Method: Principal Component Analysis.Eigen value represents the total variance explained by each factor. Percentage of the total variance attributed toeach factor. One of the popular methods used in Exploratory Factor Analysis is Principal Component Analysis,where the total variance in the data is considered to determine the minimum number of factors that will account formaximum variance of data.
Component
Initial Eigen values Extraction Sums ofSquared Loadings
Rotation Sums ofSquared Loadings
TotalVariance
% of Cumulative % Total % of Variance
Cumulative % Total % of Variance Cumulative %
1 4.549 18.197 18.197 4.549 18.197 18.197 2.925 11.700 11.7002 2.442 9.769 27.966 2.442 9.769 27.966 2.654 10.615 22.3163 2.393 9.573 37.539 2.393 9.573 37.539 2.093 8.372 30.6884 1.836 7.344 44.883 1.836 7.344 44.883 2.012 8.049 38.7375 1.803 7.212 52.095 1.803 7.212 52.095 1.958 7.830 46.5676 1.560 6.240 58.335 1.560 6.240 58.335 1.667 6.670 53.2377 1.422 5.687 64.022 1.422 5.687 64.022 1.651 6.603 59.8408 1.258 5.031 69.052 1.258 5.031 69.052 1.602 6.407 66.2479 1.113 4.452 73.504 1.113 4.452 73.504 1.584 6.334 72.581
10 1.027 4.109 77.613 1.027 4.109 77.613 1.258 5.032 77.61311 0.882 3.528 81.14212 0.780
0.5813.120 84.262
13 2.323 86.58414 0.490 1.959 88.54315 0.472 1.887 90.43016 0.428 1.713 92.14417 0.385 1.541 93.68518 0.335 1.340 95.02519 0.283 1.133 96.15820 0.251
0.1871.004 97.162
21 0.746 97.90822 0.174 0.695 98.60423 0.171 0.683 99.28724 0.105 0.422 99.70825 0.073 0.292 100.000

Page 263March 2014Vol.2, Special Issue
Primax International Journal of Commerce and Management Research ISSN : 2321-3604
Table 7 : Rotated Component Matrix
Component
1 2 3 4 5 6 7 8 9 10PLB provides variety of assortment
-0.005
-0.068 0.045
-0.018
-0.113 0.003
-0.032 0.853
-0.100
-0.013
PLB are well known and ease to make purchase decision
-0.189 0.329
-0.226
-0.276 0.172 0.471
-0.202 0.421
-0.117
-0.168
PLB Product is unique and specific in nature
-0.086 0.009
-0.153 0.079
-0.220 0.124
-0.519 0.161 0.438
-0.046
PLB is easy to differentiate from the National brand
-0.068 0.218
-0.133 0.750
-0.034 0.103
-0.339
-0.188
-0.225 0.217
PLB provide value for money
-0.001 0.367 0.146 0.028 0.151
-0.141 0.106
-0.080 0.027 0.740
PLB are innovative 0.187 0.254-
0.053 0.708 0.073 0.013 0.245 0.021 0.049-
0.112
PLB is convenient to purchase 0.587 0.380 0.027 0.032
-0.054
-0.513
-0.069 0.149 0.207
-0.029
PLB needs to create more awareness to the consumer 0.315 0.452 0.196
-0.189 0.177
-0.201
-0.045
-0.306 0.121
-0.487
PLB has better promotional strategies 0.269 0.392 0.271 0.195 0.188 0.063 0.254 0.061
-0.451
-0.395
PLB are popular among the brands available in the stores
-0.144 0.312 0.715 0.180 0.165
-0.259 0.090 0.070 0.148
-0.137
PLB are simple to read and understand
-0.034
-0.227 0.133 0.579 0.202 0.068
-0.012 0.497 0.053 0.024
PLB often comes with discount and offer 0.161 0.100 0.834
-0.055 0.003 0.103 0.047
-0.025
-0.058 0.043
PLB product purchase improves the Retailers image 0.231 0.229 0.136 0.328 0.491 0.247
-0.266 0.148
-0.303 0.175
PLB are available only in specific category merchandise 0.328 0.232 0.634
-0.295
-0.047 0.152
-0.192 0.134
-0.009 0.275
PLB purchase saves money and provides good value 0.009
-0.259 0.067 0.220 0.835 0.085
-0.035 0.041 0.093
-0.003
PLB draws more no of customers to the stores
-0.045 0.775 0.205 0.162
-0.043 0.164
-0.054 0.012 0.045 0.098
Quality of PLB is superior 0.134 0.227-
0.021-
0.135 0.815-
0.139 0.143-
0.154 0.007 0.031
PLB are easily available in preferred shopping destination 0.062 0.826 0.163 0.096 0.014
-0.097 0.133
-0.149 0.070 0.136
PLB are attractive to make purchase of the product 0.235 0.084
-0.033 0.039
-0.045 0.081 0.841
-0.002 0.019 0.058

Page 264
ISSN : 2321-3604
March 2014Vol.2, Special Issue
Primax International Journal of Commerce and Management Research
Extraction Method: Principal Component Analysis.Rotation Method: Varimax with Kaiser Normalization.Rotation converged in 18 iterations.
The factors that influence the consumers towards privatelabel brands comprised of 25 individual statements. Outof 25 factors, 10 individual factors influence more, thefactors are:1. PLB provides variety of assortment2. Easy to differentiate from the National brand3. Value for money4. Often comes with discount and offer5. Saves money and provides good value6. Easily available in preferred shopping destination7. Attractive to make purchase of the product8. Exhibits current trends in their product category9. Feel confident when I buy PLB10. Improves the Brand image of the product
CONCLUSIONOver the past two decades, private label food productshave grown steadily in sales and often directly competefor market share with national brands. This competitionlowers prices and increases product choices forconsumers. Initially it was positioned as low price andlow quality, the own brands have moved a long way inestablishing its identity. In this study it is found out thatconsumers feel confident, Value for their money, Variety,Availability about the private label brands. Consumersare having a favorable image about private label brands.Retailers to focus on the improvement of storeappearance and environment as this affects private labelbrand perception.
ReferencesAshley, S., (1998), “How to Effectively Compete AgainstPrivate-Label Brands”, Journal Of Advertising Research,Vol.38, No.1, pp. 75-82.
Baltas, G., (1997), “Determinants of Store Brand Choice:A Behavioral Analysis, Journal of Product and BrandManagement”, Vol. 6, No.5, pp.315-324.
Michael S. Pepe, Russell Abratt, Paul Dion, Theimpact of private label brands on customer loyalty and
product category profitability, Journal of Product & BrandManagement, Vol. 20 Iss: 1, pp.27 – 36
P.M. Parker & N.Kim, National Brands versus Private-Labels: An empirical study of competition, advertisingand collusion, A working paper in the INSEAD WorkingPaper Series is intended as a means whereby a facultyresearcher’s thoughts and findings may becommunicated to interested readers
Raju, J., Sethuraman, R., and Dhar, S., (1995), “TheIntroduction and Performance of Store Brands”,Management Science, Vol. 41, No.6, pp.957-978.
Richard Volpe, The Relationship Between NationalBrand and Private Label Food Products: Prices,Promotions, Recessions, and Recoveries, EconomicResearch Report No. (ERR-129) 31 pp, December 2011
Richardson P.S., Jain A.K. and Dick A., (1996).Household store brand proneness: a framework. Journalof Retailing,72 (2): 159-185
Rzem H. and Debabi M., (2012). Store Image as amoderator of store brand attitude. Journal of BusinessStudies,Quarterly 4(1): 130-148
Sarah Nyengerai, Divaries Jaravaza, PaulMukucha,Ranganai Chirimubwe and EvansManjoro, Determinants of Perception towards PrivateLabel Brands in Zimbabwe: The Role of Familiarity, StoreImage, Demographic Factors and ConsumerCharacteristics, Greener Journal of Business andManagement Studies, Vol. 3 (5) pp. 224-230, July 2013
Semeijn J, van Riel A.C.R and Ambrosini A.B.,(2004). Consumer evaluations of store brands: effectsof store image and product attributes. Journal of Retailingand Consumer Services 11:247-258
Vahie A. and Paswan A., (2006). Private label brandimage: its relationship with store image and nationalbrand. International Journal of Retail and DistributionManagement 34 (1):67-84
Van Riel, A.C.R., Lemmink J. and Ouwersloot, H.,(2001). Consumer‘ evaluations of brand extensions:differencesbetween goods and services. Journal ofService Research 3 (3): 220–231.

Page 265March 2014Vol.2, Special Issue
Primax International Journal of Commerce and Management Research ISSN : 2321-3604
Dear Professors / Researchers…
Spare a moment of your time to assess the standards of research papers/articles/case studiesand other information published in current “Primax International Journal of Marketing”. Give your candidcomments constructive criticism and valuable suggestions to scale-up our future vertex.
Primax International Journal of Commerce and Management Research
Frank opinion about the Journal
___________________________________________________________________________________
___________________________________________________________________________________
_________________________________________________________
Name & Occupation :
Phone :
Email-ID :
Contents of the Journal
Relevance of the Abstracts
Standard of articles
Pertinence of the review of literature
Writing methodology
Research Methodology format
Level of data analysis and interpretation
Standard of Conclusion
Pertinence of Bibliographic
Overall rating/ standard
Aspects Excellent Good Average Poor Couldn’tread
Observation