Mapping the mab 383C epitope to α2(187–199) of the Torpedo acetylcholine receptor on the...
15
Mapping the mAb 383C Epitope to a 2 (187–199) of the Torpedo Acetylcholine Receptor on the Three-dimensional Model Robert H. Fairclough 1 *, George M. Twaddle 1 , Eswari Gudipati 1 Remington J. S. Stone 1 , David P. Richman 1 , David A. Burkwall 2 and Robert Josephs 2 1 University of California Davis, Department of Neurology, Davis CA 95616, USA 2 University of Chicago Department of Molecular Genetics & Cell Biology 920 E. 58th Street, Chicago IL 60637, USA Monoclonal antibody 383C is an anti-acetylcholine receptor antibody whose binding to the receptor is blocked by a-bungarotoxin and by car- bamylcholine. Monoclonal antibody 383C binds to the a subunit of the Torpedo acetylcholine (ACh) receptor as well as to its V8-protease 20 kDa fragment that possesses the affinity alkylatable Cys192/193. In an epitope scanning experiment spanning the N-terminal 211 amino acid residues of the a subunit, 383C binds uniquely to three overlapping peptides; a(184 – 196), a(187 – 199) and a(190–202). These peptides span a cluster of amino acid residues implicated in the binding of acetylcholine, including Cys192/193. To map the location of these residues on the three-dimensional model of the ACh receptor, we have employed a combination of X-ray diffrac- tion from oriented complexes of 383C with ACh receptor-enriched mem- brane vesicles and electron microscopy of negatively stained tubular arrays of 383C/receptor complexes. The X-ray diffraction study finds extra electron density in the presence of 383C centered 35 A ˚ above the synaptic side phosphate head groups. The electron micrographic images display extra stain exclusion from the antibody at a site adjacent to the a 2 subunit on the periphery of the rosette clockwise to the a 2 vertex. This mapping localizes several residues of the ACh receptor a subunit involved in the binding of acetylcholine. Despite these residues being present in both a subunits, only the a 2 subunit is decorated with this monoclonal antibody. # 1998 Academic Press Keywords: acetylcholine receptor; anti-acetylcholine receptor monoclonal antibody; mAb epitope mapping; 3-D epitope mapping; acetylcholine binding residues *Corresponding author Introduction The acetylcholine (ACh) binding sites of the Tor- pedo ACh receptor are crafted from several amino acid side-chains of the a subunits: the affinity alkylatable cystine (Kao et al., 1984; Kao & Karlin, 1986) at a(192–193), tyrosine at a-190 (Dennis et al., 1988; Abramson et al., 1989), tyrosine at a-198 E-mail address of the corresponding author: [email protected] Abbreviations used: ACh, acetylcholine; a-Btx, a-bungarotoxin; BSA, bovine serum albumin; DAB, diaminobenzidine; DMF, dimethylformamide; ECL, enhanced chemiluminescence; ELISA, enzyme-linked immunosorbant assay; EM, electron microscopy; Fab, antigen binding fragment of an immunoglobulin; Fc, the crystallizing fragment (constant region) of an immunoglobulin; Fmoc, N-fluorenylmethyloxycarbonyl; Fv, the variable region of an Fab fragment of an immunoglobulin; GARP, goat anti-rat peroxidase conjugate; IgG1, rat immunoglobulin with a g 1 heavy chain subclass; mAb, monoclonal antibody; MeOH, methanol; MIR, main immunogenic region; OPD, orthophenylenediamine; PBS, phosphate-buffered saline; Pipes, 1,4- piperazinediethanesulfonic acid; PMSF, phenylmethylsulfonylfluoride; psi, 1 psi 6.9 kPa; PVDF, polyvinylidene difluoride; R m , relative mobility; scFv, genetically engineered single chain Fv fragment of an mAb; SSRL, Stanford Synchrotron Radiation Laboratory; TEA, triethanolamine. Article No. mb982000 J. Mol. Biol. (1998) 282, 301–315 0022 – 2836/98/370301–15 $30.00/0 # 1998 Academic Press
Transcript of Mapping the mab 383C epitope to α2(187–199) of the Torpedo acetylcholine receptor on the...
Article No. mb982000 J. Mol. Biol. (1998) 282, 301±315
Mapping the mAb 383C Epitope to aaa2(187±199)of the Torpedo Acetylcholine Receptor on theThree-dimensional Model
Robert H. Fairclough1*, George M. Twaddle1, Eswari Gudipati1
Remington J. S. Stone1, David P. Richman1, David A. Burkwall2
and Robert Josephs2
1University of CaliforniaDavis, Department ofNeurology, DavisCA 95616, USA2University of ChicagoDepartment of MolecularGenetics & Cell Biology920 E. 58th Street, ChicagoIL 60637, USA
E-mail address of the correspon
Abbreviations used: ACh, acetydiaminobenzidine; DMF, dimethyimmunosorbant assay; EM, electrcrystallizing fragment (constant reregion of an Fab fragment of an iimmunoglobulin with a g1 heavyimmunogenic region; OPD, orthopiperazinediethanesulfonic acid; Pdi¯uoride; Rm, relative mobility; sSynchrotron Radiation Laboratory
0022±2836/98/370301±15 $30.00/0
Monoclonal antibody 383C is an anti-acetylcholine receptor antibodywhose binding to the receptor is blocked by a-bungarotoxin and by car-bamylcholine. Monoclonal antibody 383C binds to the a subunit of theTorpedo acetylcholine (ACh) receptor as well as to its V8-protease 20 kDafragment that possesses the af®nity alkylatable Cys192/193. In an epitopescanning experiment spanning the N-terminal 211 amino acid residues ofthe a subunit, 383C binds uniquely to three overlapping peptides;a(184±196), a(187±199) and a(190±202). These peptides span a cluster ofamino acid residues implicated in the binding of acetylcholine, includingCys192/193.
To map the location of these residues on the three-dimensional modelof the ACh receptor, we have employed a combination of X-ray diffrac-tion from oriented complexes of 383C with ACh receptor-enriched mem-brane vesicles and electron microscopy of negatively stained tubulararrays of 383C/receptor complexes. The X-ray diffraction study ®ndsextra electron density in the presence of 383C centered 35 AÊ above thesynaptic side phosphate head groups. The electron micrographic imagesdisplay extra stain exclusion from the antibody at a site adjacent to thea2 subunit on the periphery of the rosette clockwise to the a2 vertex. Thismapping localizes several residues of the ACh receptor a subunitinvolved in the binding of acetylcholine. Despite these residues beingpresent in both a subunits, only the a2 subunit is decorated with thismonoclonal antibody.
# 1998 Academic Press
Keywords: acetylcholine receptor; anti-acetylcholine receptor monoclonalantibody; mAb epitope mapping; 3-D epitope mapping; acetylcholinebinding residues
*Corresponding authorIntroduction
The acetylcholine (ACh) binding sites of the Tor-pedo ACh receptor are crafted from several amino
ding author: rhfairclough@
lcholine; a-Btx, a-bungarotlformamide; ECL, enhanceon microscopy; Fab, antigegion) of an immunoglobu
mmunoglobulin; GARP, gochain subclass; mAb, monphenylenediamine; PBS, phMSF, phenylmethylsulfonycFv, genetically engineered; TEA, triethanolamine.
acid side-chains of the a subunits: the af®nityalkylatable cystine (Kao et al., 1984; Kao & Karlin,1986) at a(192±193), tyrosine at a-190 (Dennis et al.,1988; Abramson et al., 1989), tyrosine at a-198
ucdavis.edu
oxin; BSA, bovine serum albumin; DAB,d chemiluminescence; ELISA, enzyme-linkedn binding fragment of an immunoglobulin; Fc, thelin; Fmoc, N-¯uorenylmethyloxycarbonyl; Fv, the variableat anti-rat peroxidase conjugate; IgG1, rat
oclonal antibody; MeOH, methanol; MIR, mainosphate-buffered saline; Pipes, 1,4-l¯uoride; psi, 1 psi � 6.9 kPa; PVDF, polyvinylidenesingle chain Fv fragment of an mAb; SSRL, Stanford
# 1998 Academic Press

302 Mapping �(187±199) of the ACh Receptor
(Middleton & Cohen, 1991), tyrosine at a-93 (Galziet al., 1990; Cohen et al., 1991), and tryptophan ata-149 (Dennis et al., 1988). In addition to these af®-nity-labeled residues, Karlin has presented evi-dence for aspartate and glutamate carboxylategroups of the g and d subunits within 0.9 nm ofa-C192/193 (Czajkowski & Karlin, 1991). The dsubunit carboxylates map to residues d D165, dD180 and d E182 (Czajkowski & Karlin, 1995), andmutation d D180N results in a 100-fold decrease inthe af®nity of the ACh receptor for ACh(Czajkowski et al., 1993). Dennis et al. (1988) andCzajkowski et al. (1993) have presented schematicrepresentations of ACh binding sites lined withsome or all of these residues.
The distance of the agonist binding site on theACh receptor above the synaptic head groups ofthe lipid bilayer has been measured via resonanceenergy transfer as 35 AÊ (Valenzuela et al., 1994).From the 9 AÊ resolution density map of the AChreceptor, Unwin (1993) has proposed that the AChbinding sites lie in two pockets, each formed at thetop of three a-helices in the synaptic protrusion ofthe two a subunits. These pockets lie at the sameradius from the central axis of the receptor as thea-bungarotoxin (a-Btx) binding sites mapped onthe projection structure of a-Btx/ACh receptorcomplexes from negatively stained preparations of¯attened tubes (Kubalek et al., 1987). The photo-af®nity labeling studies by Pedersen & Cohen(1990) and Chiara & Cohen (1997), and the cross-linking studies by Czajkowski & Karlin (1991)suggest that the agonist/antagonist binding sitesreside near or at the interfaces between the a and gsubunit and between the other a and d subunitrather than interior to the a subunits alone.
To begin to study the localization of the acetyl-choline binding regions on the ACh receptor, wehave employed monoclonal antibody (mAb) 383C,a rat IgG1, from the library produced by Gomez &Richman (1983). This antibody was initially tar-geted for detailed study because of the ability ofa-Btx to block the binding of the antibody to theACh receptor (Gomez & Richman, 1983). Sub-sequent studies revealed that carbamylcholine wasable to completely block the titration of the AChreceptor with 383C (Mihovilovic & Richman, 1987;Fairclough et al., 1998). However, complexes of383C with the membrane-bound ACh receptorwere still able to bind half as much carbamylcho-line as untreated ACh receptor (Mihovilovic &Richman, 1987).
Here, we map the mAb 383C epitope to the line-ar sequence residues 187 to 199 of the a subunit.We then map the position of the mAb epitope rela-tive to the phosphate head groups of the lipidbilayer using small-angle X-ray diffraction from383C/ACh receptor complexes oriented in a cen-trifugal ®eld. And ®nally, we map the 383C epi-tope around the ACh receptor rosette usingFourier image processing of negatively stained ¯at-tened tubes with a helical arrangement of 383C/ACh receptor complexes in the native membrane.
What emerges from this study is a localization onthe ACh receptor three-dimensional density mapof an a-subunit segment including residues Y190,C192, C193, and Y198 from one of the two a sub-units of the ACh receptor in the closed restingstate. A preliminary report of this work has beenpresented elsewhere (Fairclough et al., 1993).
Results
Peptide mapping the 383C epitope
To identify which subunit of the ACh receptor isrecognized by mAb 383C, we separated the sub-units on an SDS/10% polyacrylamide gel, trans-ferred the protein to nitrocellulose membranes,probed with 383C, and developed with goat anti-rat peroxidase conjugate followed by DAB/H2O2
substrate with the result displayed in the right-hand lane of Figure 1. The left lane is a Coomassiebrilliant blue R-250 stained blot of the ACh recep-tor subunits labeled at the left as a, b, g, d and d±d.The markers on the right indicate the positions ofCoomassie-stained low molecular mass standardsof 66, 45 and 31 kDa. The Western blot indicatesthat 383C recognizes the a subunit following SDSdenaturation and subunit separation (Blair et al.,1987).
To narrow the location of the 383C epitopewithin the a subunit, we cleaved the ACh receptorwith V8 protease, ran the digest on an SDS/15%polyacrylamide gel, and transferred the separatedpeptides to a PVDF membrane. Figure 2(a) pre-sents the Coomassie-stained peptides generated bythis procedure, and Figure 2(b) is a plot of the rela-tive mobility Rm, versus log M (molecular mass) ofthe standards. Table 1 presents the Rm and calcu-lated molecular mass of the V8-generated peptidesin the range of 13 to 35 kDa. The replica PVDFmembrane with separated V8 peptides stainedwith 383C is presented in Figure 2(c). The darkband lowest in lanes 5 to 8 has an Rm value of0.494, which corresponds to the Coomassie-stainedband marked by the arrow in lane 3 of Figure 2(a).The apparent molecular mass of this band is20 kDa, as judged by its Rm value and the proteinstandard curve presented in Figure 2(b). The20 kDa peptide begins with aS-173 or aS-162 andcontains amino acid residues from the a subunitthat have been implicated in binding acetylcholine,including the af®nity alkylatable C(192±193): seePedersen et al. (1986).
To further narrow the site recognized by mAb383C, we synthesized 67 overlapping 13 residuepeptides on a matrix of plastic pins. The sequencesof the peptides correspond to the N-terminal 211amino acid residues of the a subunit. The tenN-terminal residues of each peptide overlap theC-terminal ten residues of the preceding peptide,as illustrated at the top of Figure 3. The peptidematrix is probed with mAb 383C and then devel-oped with goat anti-rat peroxidase conjugated anti-serum followed by H2O2/orthophenylenediamine

Figure 1. Western blot of the ACh receptor subunitsseparated on an SDS/10% polyacrylamide gel, trans-ferred to nitrocellulose, and probed with anti-AChreceptor mAb 383C. The left lane contains the separatedACh receptor subunits stained with Coomassie brilliantblue R-250 and the right lane contains the ACh receptorsubunits probed with mAb 383C and detected with goatanti-rat peroxidase conjugate with H2O2/diaminobenzi-dine substrate. Molecular mass standards were run onthe same gel, transferred to nitrocellulose and stainedwith Coomassie; the positions of selected standards(kDa) are indicated at the right.
Figure 2. V8 protease-generated peptide fragmentsof ACh receptor subunits run on an SDS/15% poly-acrylamide gel and transferred to two replicate PVDFmembranes: the ®rst for (a) Coomassie brilliant blueprotein staining and (b) molecular mass analysis, andthe second for (c) mAb 383C staining in a Westernblot experiment. Lane 1 is the Bio-Rad prestainedlow molecular mass standards, lane 10 is the Phar-macia horse myoglobin peptides, lane 2 is undigestedACh receptor subunits, lane 3 is empty, lanes 4 to 8are 10 mg of SDS/heat-denatured ACh receptor sub-units treated with 0.13, 0.50, 0.75, 1.00 and 1.25 mg ofV8 protease, respectively, and lane 9 is 1.0 mg of V8protease alone. (b) A least-squares analysis of therelative mobility of the peptide standards versus logmolecular mass of the standards. The lowest molecu-lar mass V8 peptide stained with 383C is 20 kDa asevaluated from the standard curve and with a rela-tive mobility of 0.494.
Mapping �(187±199) of the ACh Receptor 303
substrates. The pins are removed from the wells,and the absorbance of each well at 450 nm is readon a 96-well micro-titer plate reader. The results ofthis peptide scan with 383C are presented at thebottom of Figure 3. mAb 383C binds to the pep-tides spanning the a subunit sequence from resi-dues 184 to 202 with the most reactive peptidebeing that corresponding to a(187±199).
Localization of 383C epitope relative to thelipid bilayer
To determine the position of the 383C epitopealong the axis of the ACh receptor, we employedsmall-angle X-ray diffraction from centrifugallyoriented, receptor-enriched membrane vesiclesdecorated with mAb 383C. The diffracted X-rayamplitudes along the meridian (Figure 4(a)) weresubjected to 40 cycles of constrained iterativere®nement (Stroud & Agard, 1979) starting withthe ACh receptor membrane electron density pro-

Table 1. Properties of V8 protease bands
Rm of protein bandsMolecular mass
(kDa) 383C binding
0.300 34.7 �0.359 29.3 �0.429 24.0 ÿ0.494 20.0 �0.524 18.4 ÿ0.588 15.3 ÿ0.629 13.6 ÿ
Figure 3. Peptide scan of overlapping 13 residue pep-tides corresponding to the N-terminal 211 amino acidresidues of the a-subunit probed for binding of mAb383C. Top: The overlapping scheme for the 13 residuepeptides with a ten residue overlap with the previouspeptide. Bottom: The A450 � 1000 of the plates in whichpeptide pins were developed with 383C cell culturesupernatant followed by goat anti-rat peroxidase conju-gate and a substrate of H2O2/orthophenylenediamine asdescribed in Methods. Peak A450 occurred in the wellcorresponding to the pin with peptide 187±199attached.
304 Mapping �(187±199) of the ACh Receptor
®le reported by Klymkowsky & Stroud (1979).The re®ned electron density pro®le obtained fromthe 383C-decorated membrane vesicles was com-pared to that obtained from ACh receptor mem-brane vesicles treated with mAb 85E, a negativecontrol anti-ACh receptor mAb directed to anepitope on the d subunit, which is occluded in
Figure 4. (a) Meridional small-angle X-ray diffractionamplitudes from complexes of 383C with ACh receptormembrane vesicles oriented by ultracentrifugation. Thesmooth curve is the real part of the calculated structurefactors following 40 cycles of constrained interativere®nement as described in Methods. (b) The electrondensity pro®les for ACh receptor complexes with mAb383C (continuous line) and 85E (dotted line). The brokencurve is the difference between the 383C-treated and85E-treated samples. The extra electron density centeredat 95 AÊ in the sample with 383C best represents thelocation of the 383C Fv portion of the antibody alongthe ACh receptor axis.

Figure 5. Electron micrographs of undecorated (top)and 383C decorated (bottom) tubular arrays of AChreceptor applied to glow-discharged thin carbon ®lmsand stained with phosphotungstic acid.
Mapping �(187±199) of the ACh Receptor 305
membrane vesicles (data not shown). InFigure 4(b) the electron density distributions fromthe two samples are presented along with adifference pro®le. The difference pro®le has onemajor broad peak with a band-width of 25 AÊ
centered 35 AÊ above the synaptic side phosphategroups, which are located at the Z coordinatewith the greatest electron density in the anti-body/ACh receptor pro®les. The difference pro-®le also displays several narrower bands ofwidth 6 to 13 AÊ in the transmembrane region ofthe lipid bilayer and in the cytoplasmic domain.The X-ray experiments were conducted in thepresence of Tb(III) for anomalous scattering stu-dies of the distribution of bound Tb(III) in thepresence of various antibodies. The narrow bandsin the difference pro®le from 0 to 65 AÊ in Zlikely represent different amounts of Tb(III)bound and trapped in the transmembrane ionchannel, where several distinct ion-bindingregions have been characterized (Fairclough et al.,1986). The 25 AÊ broad band in the difference pro-®le peaks is in a region where no Tb(III) is seenin ACh receptor-enriched membranes (Faircloughet al., 1986). We interpret this band in the differ-ence pro®le as deriving from the increased elec-tron density contributed by the immobilized Fvportion of mAb 383C bound to the ACh receptorhead region.
Localization of 383C epitope around the AChreceptor rosette
To determine the position of the 383C epitopeon the ACh receptor rosette, we have employedelectron microscopy of the tubular helical arraysformed by ACh receptor dimers in the nativepostsynaptic membrane fragments isolated fromTorpedo marmorata electroplax and studied exten-sively by electron crystallography by Unwin(1993). We have analyzed micrographs of unde-corated (Figure 5, top) and of mAb 383C-deco-rated (Figure 5, bottom) ACh receptor tubularhelical arrays adsorbed to thin carbon ®lms andnegatively stained with 2% (w/v) phospho-tungstic acid at pH 7.0. Figure 6(a) is the Four-ier transform of an undecorated tube, andFigure 6(b) derives from a 383C-decorated tube.The lattice corresponding to the side being ana-lyzed is indexed in Figure 6(c). For each image,this lattice is masked and Fourier ®ltered.A small reference image is cut from the ®lteredimage to cross-correlate with the un®lteredimage in order to determine the distortions tothe side of the tube being analyzed. The cross-correlation map along with the reciprocal latticecoordinates from the Fourier transform are usedto calculate local displacements from an ideallattice. These are used to straighten the warpedlattice, and the effect of straightening is assessedby the Fourier transform of the straightenedimage (Figure 7). The optimally straightenedtube is used to determine structure factors:
jFhkjexp(ifhk). These are averaged with thoseobtained from the other side of the ¯attenedtube as well as with those from other micro-graphs. A summary of these structure factorsfor the native undecorated and 383C-decoratedACh receptor are presented in Tables 2 and 3,respectively. The averaged decorated and unde-corated images derive from at least 2500 recep-tors. By back-transforming the structure factorsderived from the images of the undecoratedtubes, one obtains an averaged image of thestain-excluding mass of the ACh receptor, whichis presented in Figure 8(a) for three unit cellsin the a unit cell coordinate and two unit cellsin the b unit cell coordinate (see Figure 9(a) forthe unit cell diagram). A Fourier difference mapis produced by subtracting the average structurefactors for the undecorated arrays from those ofthe 383C-decorated arrays and back-transform-ing. This difference map is presented inFigure 8(b) for three unit cells in the a directionand two unit cells in the b direction. The great-est differences in this map, the red ovals withthe white dots, fall in pairs along the latitudesone-quarter and three-quarters of the distancefrom the top to the bottom of the map. Thenext greatest differences fall directly below theleft-most white dot and above the right-mostwhite dot of the middle pair. Along with thisregion, three additional smaller differencesappear at the other corners of a rectangle belowand to the left of the middle pair. To seewhere the regions of extra stain exclusion lineup on the receptor array, the red differencemap is overlaid on the green ACh receptor

306 Mapping �(187±199) of the ACh Receptor
array in Figure 8(c). The greatest increase instain exclusion in the 383C-decorated array (redregion with white dots in Figure 8(c)) occurs onthe periphery of the green rosettes close to thepentagonal vertex associated with the a2 subunitin the subunit organizational scheme mappedby Kubalek et al. (1987). To assess the mostprobable site of the 383C-increased stain exclu-sion, we calculated a statistical difference map(Kubalek et al., 1987), which is presented inFigure 8(d). The blue and red regions corre-spond to the 95% and 99% con®dence levels,respectively, for added stain exclusion in thepresence of 383C. The position of this increasefalls 6� clockwise to the a2 vertex as illustratedin Figure 9(a).
Discussion
Sequence localization of the 383Cbinding region
The mAb 383C epitope is centered on a subunitresidues 187 to 199. The a subunit peptide scan of383C binding suggests that residues to the N-term-inal half of this peptide are more crucial for bind-ing 383C than those of the C-terminal half, since383C binds to a(184±196) better than to a(190±202): see Figure 3(b). In the 383C binding sequence,a(187±199), residues Y190, C192, C193, and Y198have been modi®ed by agonist/antagonist af®nityagents (see Introduction). The portion of the total383C epitope represented by a(187±199) is dis-cussed in more detail in the accompanying paper(Fairclough et al., 1998). The blocking effects of car-bamylcholine and a-Btx on the binding of 383C tothe ACh receptor are consistent with this peptidebeing ``obscured'' in the presence of these AChreceptor ligands, so that mAb 383C does not bindto the ACh receptor in their presence.
Critique of X-ray technique and results
Small-angle X-ray diffraction experiments areparticularly well suited to study electron densitydistributions of proteins in membranes perpen-dicular to the plane of the bilayer (Levine &Wilkins, 1971; Wilkins et al., 1971; Ross et al., 1977;Fairclough et al., 1986; Asturias et al., 1994; Milleret al., 1996). Our studies here and those reported
Figure 6. Fourier transform of the (a) top and (b) bot-tom images of Figure 5. The re¯ections from one side ofthe ¯attened tubes are indexed in (c). In the transformpresented in (a) several re¯ections from the side beingprocessed are identi®ed by arrows. The re¯ections aresomewhat diffuse and spread over three or more pixels.This is caused by a slight curve in the tubular crystalresulting in long-range misalignment of the rosettes.

Figure 7. Fourier transform of the undecoratedstraightened tube. Nearly every re¯ection from thestraightened side has a width of one pixel. The group ofsuperlattice re¯ections, one of which is labelled s, isresponsible for the 2-fold symmetry seen in the sub-sequent ®ltrations.
Mapping �(187±199) of the ACh Receptor 307
by Fairclough et al. (1986) show the ACh receptorto be 120 to 125 AÊ tall, and it extends asymmetri-cally across the membrane to a level �60 AÊ above(to the left of) the synaptic side phosphate headgroups, which in Figure 4(b) correspond to the lar-gest electron density, and are located at 60 AÊ onthe Z coordinate. Although our electron densitydistribution differs in magnitude from that calcu-lated from the electron micrographic studyreported by Beroukhim & Unwin (1995), the distri-bution from our X-ray study is consistent with theoverall size and position in the membrane of theACh receptor determined by electron microscopyof the frozen hydrated crystalline preparations.Both studies have the receptor being 120 to 125 AÊ
Table 2. Structure factors for undecorated tubes
hk jFj f jFj f jFj f jFj f
0 ÿ5 11 193 9 178 8 139 4 2070 ÿ4 69 172 57 180 88 184 57 1800 ÿ3 7 ÿ65 22 7 13 ÿ41 12 440 ÿ2 148 176 176 177 125 184 123 1720 ÿ1 12 205 24 149 21 157 7 1291 ÿ4 108 183 88 182 139 179 98 1791 ÿ2 100 184 131 178 81 191 97 1751 ÿ1 27 ÿ16 42 ÿ12 23 ÿ11 25 71 0 166 ÿ3 172 0 129 4 143 21 2 98 ÿ1 111 ÿ1 109 3 136 ÿ51 3 21 190 22 193 17 169 21 1832 ÿ4 46 182 32 189 75 177 61 1862 ÿ3 26 26 18 ÿ14 44 0 45 62 ÿ2 97 2 75 12 100 ÿ2 111 12 ÿ1 24 159 22 147 31 169 21 1542 0 83 180 52 164 78 178 110 1793 ÿ2 7 ÿ9 4 25 7 9 14 2
tall and extending �60 AÊ above the synaptic sidephosphate head groups (Unwin,1993; Beroukhim& Unwin, 1995). The differences in relative electrondensity in the two pro®les are likely the result ofthe greater density of protein per phosphate groupin the crystalline arrays studied by electronmicroscopy (EM). The membrane vesicles orientedin our X-ray study have regions of closely packedACh receptor, regions of loosely packed AChreceptor, as well as regions apparently devoid ofACh receptor. The electron density pro®le obtainedin our X-ray studies is an average of these variousregions, whereas the pro®le from the EM study isonly from the crystalline packed ACh receptorregions. In the non-crystalline ACh receptor mem-brane preparations used for the X-ray work, thegreatest electron density occurs at the level of thesynaptic side phosphate head groups.
Vertical localization of the 383C binding region
The electron density pro®les presented inFigure 4(b) serve as the basis for mapping the pos-ition of the 383C epitope along the central axis ofthe receptor. The pro®le in the presence of 383Ccompared to that in the presence of 85E has extraelectron density in the region of Z � 95 AÊ and inthe lipid bilayer region at Z � 50 AÊ . The extra elec-tron density in this second region is likely theresult of more Tb(III) in the channel region in thepresence of 383C compared to 85E. This secondregion overlaps with several of the Tb(III) bindingsites reported by Fairclough et al. (1986), whereasthe ®rst region shows an absence of any Tb(III)binding domain. That leaves the mAb combiningsite as the source of extra density at Z � 95 AÊ inthe presence of 383C. The half-width of this extradensity is 25 AÊ . Thus the 383C epitope mappedrelative to the synaptic side phosphate headgroups of the lipid bilayer is centered 35 AÊ abovethese head groups, and 30 AÊ down from the top ofthe synaptic head. This location is consistent withthe ¯uorescence energy transfer data reported byValenzuela et al. (1994), who found dansyl-C6-
jFj f jFj f hFi sF hfi sf
5 147 3 143 6.1 3.2 170.7 29.083 173 57 176 68.3 14.1 177.6 4.619 1 9 50 11.4 6.3 2.8 45.7
111 184 119 175 133.3 24.2 177.8 4.911 231 14 203 12.6 6.9 174.7 39.9
155 180 97 185 114.1 26.7 178.9 3.678 181 75 173 93.2 21.0 179.8 6.626 ÿ11 22 23 26.8 7.4 ÿ4.9 15.3
149 ÿ5 134 1 148.6 17.2 ÿ0.3 3.3109 3 138 ÿ1 116.7 16.3 ÿ0.5 3.021 186 23 173 20.6 2.1 177.3 11.074 182 65 181 58.9 16.8 182.1 4.236 ÿ1 38 2 34.0 10.6 3.5 13.197 5 116 0 99.1 14.3 2.5 5.025 165 26 161 24.6 3.6 160.0 7.983 179 117 180 86.9 23.5 177.8 6.37 ÿ35 12 ÿ6 8.2 3.7 ÿ3.6 20.1
Table 3. Structure factors for 383C decorated tubes
hk j Fj f jFj f jFj f jFj f jFj f hFi sF hfi sf
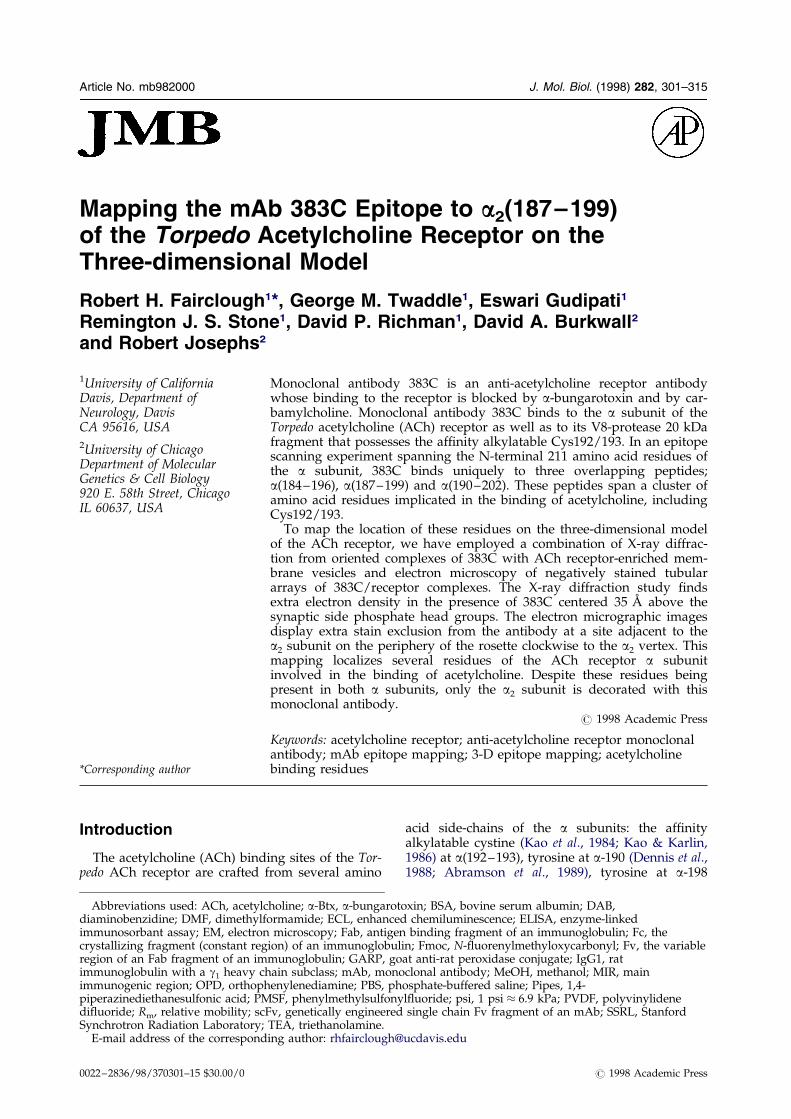
0 ÿ5 7 171 9 203 8 203 10 210 9 196 8.4 1.2 198.1 15.20 ÿ4 59 185 67 179 78 181 75 179 72 182 70.2 7.5 181.1 2.50 ÿ3 8 ÿ51 10 56 8 118 7 ÿ33 10 146 2.4 7.1 67.8 75.60 ÿ2 126 181 130 180 127 182 134 186 131 178 129.5 3.2 181.4 3.00 ÿ1 32 192 32 197 26 164 14 145 17 179 23.1 8.5 180.2 21.91 ÿ4 112 183 126 180 143 176 118 177 127 179 125.1 11.7 178.9 2.71 ÿ2 99 178 144 184 100 185 115 180 121 118 115.7 18.4 181.7 2.91 ÿ1 40 ÿ20 38 ÿ8 41 8 31 ÿ14 20 29 32.8 8.9 ÿ3.9 20.01 0 181 4 157 ÿ1 154 ÿ3 159 2 166 1 163.3 10.8 0.7 2.71 2 106 ÿ1 86 4 125 ÿ1 98 3 108 ÿ4 104.5 14.3 ÿ0.2 3.31 3 16 165 23 192 25 182 23 177 17 194 20.5 4.0 182.5 11.82 ÿ4 80 179 89 178 73 189 83 180 89 182 82.6 6.7 181.4 4.42 ÿ3 35 ÿ19 32 ÿ13 27 15 38 6 33 ÿ2 32.3 4.1 ÿ3.1 13.82 ÿ2 131 ÿ1 96 ÿ4 112 ÿ3 118 ÿ2 114 ÿ2 114.2 12.7 ÿ2.3 1.12 ÿ1 242 173 29 157 29 160 28 179 28 201 26.5 2.4 173.7 15.52 0 101 181 87 183 86 183 101 180 98 180 94.6 7.5 181.3 1.53 ÿ2 17 ÿ1 15 ÿ2 9 ÿ3 18 ÿ9 14 ÿ6 14.6 3.5 ÿ4.4 3.3
308 Mapping �(187±199) of the ACh Receptor
choline bound to the acetylcholine binding sites35 AÊ above the lipid bilayer head groups labeledwith rhodamine and eosin. This location is alsoclose to the level of the cavities mapped by Unwin(1993) in the a subunits near the top of threea-helices (see Figure 9(b)). He has proposed thatthese cavities are potential ACh binding sites.
Figure 8. Stain-exclusion maps calculated from structureson to the subunit arrangement described by Kubalek et adesignations are the two joined by a d±d disul®de bond.even though the magni®cation of the individual micro(b) Difference map between native receptor and 383C labereceptor array (green). Note that the major difference in(d) Statistical difference map with the 99% and 95% con®d
The location of the 383C epitope 30 AÊ downfrom the top of the ACh receptor differs from thatof mAb 35, the only other mAb epitope to be loca-lized on the three-dimensional structure of thereceptor. The mAb 35 epitope was localized nearthe top of the receptor by cryo-EM on helical AChreceptor arrays decorated with scFv and Fab frag-
factors obtained from the Fourier transforms. For compari-l. (1987), the two rosettes in the center labeled with subunit
The use of structure factors allows averaging of particlesgraphs may be different. (a) Undecorated ACh receptor.led receptor. (c) Difference map (red) overlaid on the native
density resides next to the a2 subunit of the receptors.ence levels shown in red and blue, respectively.

Figure 9. (a) A schematic of the unit cell outlined onthe ACh receptor dimer as in the scheme described byKubalek et al. (1987) for purposes of correlating ourmAb location (black circle) with their subunit assign-ments. The short side of the unit cell is the a unit cellcoordinate and the long side is the b unit cell coordi-nate. (b) ACh receptor cross-section from Unwin (1993)embellished with the position of the immobilized regionof mAb 383C (shaded region) centered 30 AÊ below thetop of the ACh receptor and 35 AÊ up from the level ofthe synaptic side phosphate head groups. This localiz-ation is just above the cavity (star) mapped by Unwin(1993) as a prospective agonist binding pocket.
Mapping �(187±199) of the ACh Receptor 309
ments of mAb 35 (Beroukhim & Unwin, 1995). Theepitope of mAb 35, which is directed againstthe main immunogenic region, appears to be on aloop of the a subunit that extends to a level >60 AÊ
above the lipid bilayer. Furthermore, both a sub-units are recognized by these Fabs, whereas onlyone a subunit of the membrane-embedded AChreceptor is recognized by 383C (Fairclough et al.,1998).
The ability of 383C to bind to the ACh receptorat this level is rather remarkable. How does anantibody gain access to an epitope 25 to 30 AÊ
down from the top of the protein when the proteinis tightly packed and, in some instances, exists in acrystalline array? One possibility is that the epitopeis in a broad valley that is ®lled with the sugarmoieties of the O and N-linked oligosaccharide. Inorder to bind, the antibody gently moves the oligo-saccharide aside to gain access to the epitope.A second possibility is that the epitope is on theperimeter of the ACh receptor or on the lip of thewell leading to the ion channel, where suf®cientroom exists to enable the antibody to nestle intothe well or between the rosettes. The electronmicroscopic study helps to distinguish amongthese possibilities.
Critique of EM technique and results
The unprocessed images from the electronmicrographs of 383C decorated and undecoratedreceptors (Figure 5) are indistinguishable. Eventhe averaged maps of the decorated and undeco-rated receptors look similar, indicating that theportion of the antibody immobilized and stain-excluding is relatively small. The phases arebarely affected by antibody binding. Because theunit cell has 2-fold symmetry, maps were re®nedto the best 2-fold phase origin before averagingthe data. The phases and amplitudes of individ-ual sets of data representing labeled andunlabeled tubes generally lie within one standarddeviation of the average value and always arewithin two standard deviations. For the deco-rated and undecorated arrays, the phase of onlyone structure factor deviates more than 20� fromperfect 2-fold symmetry, and 14 structure factorsdeviate from perfect 2-fold symmetry by lessthan 6�. In the native set of data, the (0, ÿ1), the(0, ÿ3), and the (0, ÿ5) structure factors havestandard deviations of 40�, 46�, and 29�, respect-ively. These re¯ections are weak, having ampli-tudes near 10 as compared to amplitudes of 140for the ®rst-order re¯ections. In addition the(0, ÿ1) re¯ection lies near the origin of the trans-form in a relatively noisy region, and the (0, ÿ5)re¯ection is the weakest re¯ection in the trans-form. For the labeled receptors, the least reliablere¯ection is the (0, ÿ3), which has an averagephase value of 68� and a standard deviation of76�. Structure factors that deviate signi®cantlyfrom centrosymmetric symmetry are always weakre¯ections, representing less than 2% of the totalpower and less than 4% of the power in thesecond and higher-order re¯ections. To examinetheir contribution to the location of the antibodylabel, we synthesized maps with and withoutthese re¯ections. Their exclusion had no discern-ible effect on the difference map locating the anti-body.

310 Mapping �(187±199) of the ACh Receptor
In-plane projection localization of the383C epitope
The electron micrographic localization of the383C epitope on ¯attened, negatively stained tubesof ACh receptor arrays results in a projection ofthe three-dimensional structure of the ACh recep-tor/383C complex onto a plane with the view ofthe ACh receptor from above the synaptic sidedown and parallel with the central axis of thereceptor (Figure 8(a)). The position of the extrastain-exclusion provided by the antibody is visual-ized in the difference map between the decoratedand undecorated arrays (Figure 8(b)). In thisFigure, the underlying ACh receptor array of (a) isnot visible. The greatest differences are localizedon the six bilobed red/white regions along twolatitudes: one located one-quarter of the distancefrom the top to the bottom, and the other three-quarters of this distance. Smaller differences areobserved as single-lobed regions lying in the top,central and bottom portions of Figure 8(b). Thebilobed differences in Figure 8(b) are also the lar-gest relative to the standard deviations of the den-sities at each pixel in the averaged images used tocalculate the difference map. This information ispresented in the statistical difference map inFigure 8(d) following the method of Kubalek et al.(1987).
To observe where the differences map relative tothe ACh receptor array, we overlaid the differencemap (red) onto the array of the ACh receptors(green) in Figure 8(c). The electron micrographiclocalization places the 383C combining site on theouter rim of the ACh receptor rosette, where thereappears to be suf®cient room for a Fab arm of themAb to nestle between the rosettes in the array,and possibly enough room to accommodate bothFab arms of a single mAb to crosslink pairs ofrosettes (Figure 8(c)). This position maps to aregion closest to a-helix I in ag of Unwin's 9 AÊ
three-dimensional map (see Unwin (1996),Figure 4). Difference maps for other Fab fragmentsor protein ligands (Kubalek et al., 1987) haveresulted in additional stain-excluding material ontop of the glycoprotein wall of the rosette. The383C difference map is the ®rst to exhibit substan-tial stain-excluding material on the periphery ofthe rosette. The stain excluded in this part of themap (red) is greater than that over the glycoproteinwall (yellow in Figure 8(c)) or adjacent to a1. How-ever, the most stain-excluding material over theglycoprotein wall is concentrated over the d sub-unit, which was occasionally weakly stained inWestern blots with 383C cell culture supernatants.Our reading of the difference map in light of thestatistical difference map places the 383C site onthe ACh receptor periphery adjacent to a2, and weattribute the other stain-excluding material toeither Fc fragments or a small contamination of dsubunit directed material.
With the Fourier methods used in the analysis ofthe micrographs, most of the mass of 383C is not
observed, because ¯exibility of the a(187±199) seg-ment combined with the ¯exibility between thevariable and constant domains of the Fab arms aswell as in the mAb hinge region provides multiplenon-periodic dispositions of much of the mAbmass. Fourier methods do not amplify non-peri-odic structural features, and hence most of themAb mass is not observed in the ®ltered images.What is observed on the perimeter of the rosette isan additional area of stain exclusion that corre-sponds to 8000 AÊ 2. The extension of this extramass in the Z direction is 25 AÊ as seen in the X-raydifference map. Employing these estimates for thevolume imaged by the combination of the twotechniques and converting to molecular mass usingthe mass of the synaptic head of the ACh receptorand its imaged volume, we estimate the molecularmass of the imaged portion of the mAb to be18 kDa. This corresponds to about 70% of the massof the Fv portion of the antibody.
The added mass is attached to residues a187 toa199 of a2 subunit on the periphery of the rosette.This represents the ®rst three-dimensional localiz-ation on the ACh receptor model of residues impli-cated in the binding of acetylcholine. This mapsuggests to us that these residues in the absence ofagonist are on the ACh receptor surface or pro-trude from the surface near a-helix I that de®nesthe vertex of a2. The physical location of the 383Cepitope on the periphery of the receptor does notpreclude binding of 383C or its Fab fragments tothe other a subunit. However, mAb 383C has apreference for binding to residues 187 to 199 on a2
rather than to that on a1 or a statistical mix of thetwo. It is not clear why a1 is not labeled, althoughUnwin's (1996) ®nding that the two a subunitshave different conformations may provide ananswer. A second possibility may be that stericconstraints prevent antibody binding to a1.
The ®nding of the agonist binding residues onthe perimeter of the ACh receptor of one of the asubunits is somewhat surprising, since it is dif®cultto imagine how these residues, disposed awayfrom the body of the receptor facing upwards, canbind acetylcholine and translate the binding eventinto an opening of the ion channel. Since the equiv-alent set of residues on a1 do not bind 383C, onepossible reason 383C binds a2 is that segment 187±199 in this subunit is more weakly secured to thebody of the receptor compared to that in a1. Theseresidues in a2 may comprise a ¯exible loop inwhich they spend some time facing upwardstoward the antibody combining site. If in the pre-sence of carbamylcholine, the a2 (187±199) residuesmore closely resemble those in a1, immobilizedand facing inward toward the binding cavities asproposed by Unwin (1993), they will not be avail-able to bind 383C. There are certainly other ratio-nales for the lack of binding 383C in the presenceof the agonist, but none so simple.

Mapping �(187±199) of the ACh Receptor 311
Methods
Preparation of ACh receptor enriched membranes
Alkali-stripped receptor-enriched membrane vesicles(Neubig et al., 1979) were prepared from frozen T. cali-fornica electric organ by a modi®cation of the methodof Klymkowsky et al. (1980). Frozen tissue (100 g of 1to 2 cm3 chunks) was suspended in 200 ml of degassedhomogenization buffer (50 mM Tris (pH 7.4), 1 MNaCl, 10 mM EGTA, 10 mM EDTA, 10 mM iodoaceta-mide, 0.6 mM PMSF) supplemented with proteaseinhibitors leupeptin, pepstatin and aprotinin, each at1 mg/100 ml. The mixture was purged with argon andhomogenized on ice at full speed in a Virtis 23 blenderfor ®ve to seven minutes. The homogenate was spunat 6500 rpm in a Sorvall SS34 rotor for 15 minutes toremove cell debris, and the supernatant pouredthrough eight layers of cheesecloth and spun at18,000 rpm in an SS34 rotor for one hour. The high-speed pellets were each resuspended in 6 to 8 ml ofbuffer A (10 mM phosphate, 1 mM EDTA, 1 mMEGTA, 0.025% NaN3, pH 7.8) and Dounce homogen-ized. The homogenate was spun at 6500 rpm in anSS34 rotor for 15 minutes, and the supernatant care-fully removed with a 25 ml pipette and spun at18,000 rpm in the SS34 rotor. The pellets of this highspeed centrifugation were resuspended in 20 ml dis-tilled water and the pH raised to 11 with 0.5% NaOHand the mixture allowed to incubate at 23�C for onehour. These alkali-stripped membranes were collectedby centrifugation at 23,000 rpm for 45 minutes in aBeckman SW 28 rotor and resuspended in 2 ml of 24%(w/v) sucrose in buffer A and the material layeredonto a discontinuous sucrose gradient in buffer Aformed by layering 5.4 ml of each of 36, 34, 32, 30, 28and 26% sucrose successively in an SW 28 ultracleartube. The gradients were spun overnight at 23,000 rpmat 4�C. The gradients were dripped into 1.5 ml frac-tions, for which the sucrose concentration was readand the protein concentration determined by a Lowryassay with BSA as a standard. The peak protein frac-tions were collected and diluted in buffer A and pel-leted in an SW 28 rotor and resuspended in buffer Anominally at 3.0 mg/ml. Following resuspension of thevesicles, the protein concentration was determined viaa modi®ed Lowry/Folin assay (Markwell et al., 1978),the protein composition was assessed by SDS/poly-acrylamide gel electrophoresis (Laemmli, 1970), andtoxin binding was quanti®ed using an [125I]aBtx bind-ing assay (Schmidt & Raftery, 1973). Membrane prep-arations routinely were found to bind between 2 and6 pmol of toxin per microgram of protein. The mem-branes were also assayed via ELISA for the ability ofselected members of the Gomez/Richman anti-AChreceptor mAb library to titrate the ACh receptor.
Preparation of ACh receptor helical tubes for EM
Tissue (100 g) from Torpedo marmorata was homogen-ized in 200 ml of degassed buffer B (20 mM phospatebuffer (pH 7.4), 400 mM NaCl, 10 mM NEM, 5 mMPMSF) using a Virtis 23 blender at top speed for three tofour minutes. The homogenate was spun at 6500 rpm for20 minutes in an SS34 Sorvall rotor. The supernatantwas poured through two layers of cheesecloth and spunat 18,000 rpm in an SS34 rotor. The pellet was resus-pended in buffer B and a second differential centrifu-gation performed. The high-speed pellet was
resuspended in water at a nominal concentration of 10 to15 mg/ml and a Lowry protein assay performed todetermine the protein concentration. The membraneswere then diluted to 1 and 2 mg/ml in 100 mM sodiumcacodylate buffer (pH 6.8) with 0.3 mg/ml leupeptin and1 mg/ml pepstatin (crystallizing buffer) as described byKubalek et al. (1987) and set at 4�C to anneal.
Western blots of mAbs to ACh receptor subunits
Alkali-stripped ACh receptor-enriched membranes(10 mg/lane) were boiled in Laemmli sample bufferand electrophoresed at 150 V on an SDS/10% polyacryl-amide Laemmli (1970) gel. The ACh receptor subunitswere electroblotted onto nitrocellulose membranes forone hour at 4�C using a Tris/glycine transfer system(Bio-Rad). Electroblotted membranes were immersed in5% (w/v) BSA, PBS, 0.05% (v/v) Tween-20 for one hourto block non-speci®c binding sites. The lanes were cutinto strips and probed with anti-ACh receptor or controlmAb hybridoma cell culture supernatants in 0.05%Tween-20 for one to two hours at 4�C. The nitrocellulosestrips were then washed three times in PBS andimmersed in 1%BSA, PBS, 0.05% Tween-20 with a 1:1000dilution of peroxidase-conjugated goat anti-rat IgG,heavy and light chain speci®c antiserum (Organon Tech-nika) for one hour at 4�C. The strips were washed againin PBS and placed in 10 mM Tris-HCl (pH 7.4) with per-oxidase substrates 1 mg/ml diaminobenzidine (DAB)and 0.1% (v/v) H2O2. Electroblotted low molecular massprotein standards on unblocked nitrocellulose weredetected with 0.2% (w/v) Coomassie brilliant blue R-250in 10% (v/v) acetic acid, 50% (v/v) MeOH in water anddestained in 10% acetic acid, 20% MeOH in water. Theresults of the staining procedures are presented inFigure 1.
Western blots of V8 protease-treated ACh receptor
Alkali-stripped ACh receptor-enriched membranesamples (12.7 mg each) in buffer A (10 ml) were diluted inLaemmli sample buffer (10 ml) containing 0.125 M Tris-HCl (pH 6.8), 0.5% SDS, 10% glycerol and 0.0001%bromphenol blue and heated for two minutes by immer-sion in boiling water. These samples were subjected tolimited proteolysis (0.5 hour at 23�C) with increasingamounts (0, 0.125, 0.5, 0.75, 1.0 and 1.25 mg) of Staphylo-coccus aureus V8 protease (Boehringer Mannheim, India-napolis, IN., 0.5 unit/mg with casein as substrate) andelectrophoresed (SDS-PAGE, 15% resolving, 6% stackinggel) at 150 V along with standards. Proteins/peptidesseparated in the gel were electrophoretically transferredonto PVDF membrane (Bio-Rad, 0.2 mm), and stainedwith 0.2% Coomassie brilliant blue R-250 in 10% aceticacid, 50% MeOH in water and destained in 10% aceticacid, 20% MeOH in water. The protein bands are shownin Figure 2(a). The relative mobility, Rm, is de®ned as theratio of the distance traveled by the protein in the separ-ating gel to the distance traveled by the tracking dye.For the standard proteins, Rm is plotted versus the logar-ithm of the molecular mass in Figure 2(b). In a parallelexperiment, a set of identical peptides/protein wastransferred to a PVDF membrane that was then blockedfor one hour at 23�C with 4% (w/v) dry milk in PBS.This membrane was probed for one hour at 23�C withmAb 383C cell culture supernatant diluted 1/10 with 4%dry milk in PBS followed by four washes with PBS. Therat mAb 383C was detected by a one hour incubation

312 Mapping �(187±199) of the ACh Receptor
with a 1/2000 dilution of peroxidase conjugated goatanti-rat IgG (GARP) in 4% dry milk in PBS. This was fol-lowed by four washes (ten minutes each) with PBS toremove excess conjugate. The peroxidase was thendetected with ECL chemiluminescent substrate system(Amersham) and exposure of the PVDF membrane andsubstrate to ®lm. The ®lm was developed and the resultsare shown in Figure 2(c).
Synthesis of peptides spanning the N-terminal 211amino acid residues of the aaa-subunit
In all 67 sequential overlappping tridecapeptides (tenresidue overlap, i.e. pep1, residues 1 to 13; pep2, 4 to 16,etc.) corresponding to the N-terminal half of the a sub-unit (residues 1 to 211) were synthesized on derivatizedpolyethylene pins (epitope scanning kit, CambridgeResearch Biochemicals) according to Geysen et al. (1984).The synthetic procedures were based on the principles ofMerri®eld's solid phase peptide synthesis (Erickson &Merri®eld, 1976), but using N-¯uorenylmethyloxycarbo-nyl (Fmoc) protecting group strategy. Synthesis of pep-tides was accomplished by repetitive cycling of Fmoc-deprotection (20% piperidine in DMF, 30 minutes at23�C), washing (DMF, MeOH), and coupling of Fmoc-amino acid penta¯uorophenyl ester (CambridgeResearch Biochemicals) dissolved in HOBt-DMF at therate of one amino acid residue per day. After removingthe terminal Fmoc-protecting group, the N-terminalamino group was capped by acetylation (acetic anhy-dride/TEA/DMF, 5:1:50, by vol.). Side-chain protectinggroups were then deprotected using tri¯uoroacetic acidcontaining 2.5% ethanedithiol and 2.5% anisole, washedand stored at 4�C.
Probing the pins with 383C
A peptide pin-based ELISA was started by incubatingthe peptide pins for one hour at room temperature inprecoat buffer (2% BSA, 0.1% Tween-20 in PBS, pH 7.4)to reduce non-speci®c binding of antibody. Overnightincubation at 4�C with mAb 383C cell culture supernant(diluted 1/10 with precoat buffer) was followed by fourwashes in PBS. Reaction for one hour at 23�C with goatanti-rat IgG conjugated to horseradish peroxidasediluted (1/1000) in precoat buffer was followed by fourwashes of ten minutes each in PBS to remove excess con-jugate. The presence of antibody bound to the pins wasdetected by reaction for 45 minutes with a freshly pre-pared enzyme substrate solution (1 mg/ml OPD and1 ml/ml of 3% H2O2 in 0.1 M sodium citrate buffer,pH 4.5). The enzyme reaction was stopped by removingthe peptide pins from the substrate solution. The absor-bance of the converted substrate in each well wasmeasured with an ELISA plate reader (MolecularDevices) at 450 nm and the data plotted as shown inFigure 3.
SAXD of mAb/ACh receptor complexes
For each complex studied, 0.5 mg of membrane-bound protein was removed from buffer A by dilution,sedimentation, and resuspension in 10 mM Pipes(pH 7.0) at a concentration of 5.0 mg/ml: 100 ml of thispreparation represented 1.2 nmol of toxin sites, to whichwas added 3.7 nmol of mAb in an additional 100 to200 ml of buffer, depending on the antibody. The AChreceptor (�4 mM toxin sites) and mAb (�12 mM) were
allowed to incubate for two hours at room temperaturethen brought up to 3.6 ml with Pipes buffer containing100 mM NaCl and 50 mM Tb(III), and the membranespelleted for 27 hours at 45,000 rpm in a BeckmanSW50.1 rotor equiped with plastic funnels modeled afterthose designed by Ross et al. (1977) to direct membranesinto X-ray sample cells with Mylar windows. Followingcentrifugation, the supernatant was removed by pipette,excess buffer was removed from the top of the orientedmembrane pellets with absorbent paper, and the cell wassealed with silicone high-vacuum grease (Dow Corning).X-ray diffraction experiments were conducted at theStanford Synchrotron Radiation Laboratory (SSRL) beamline II-2 while the synchrotron was operating at an elec-tron energy of 3.0 GeV and 30 to 60 mA of ring current.A small-angle scattering camera employing a Gabriel(1977) linear position-sensitive proportional counter withdelay line encoding (Miake-Lye, 1983; Miake-Lye et al.,1983; Hubbard, 1987) was installed on beam line II-2, afocussed, bending magnet end station equipped with aSi 111 two-crystal monochromator just upstream fromthe camera. The energy selected was 7495 eV, just belowthe Tb(III) L3 absorption edge at 7515 eV. The sampleholder allows for the positioning of the oriented sampleso the intensities recorded on the detector lie along eitherthe meridian or subsequently along the equator of theX-ray scattering pattern of the centrifugally orientedmembrane sample.
Scattering pro®les from the meridian and equatorwere reduced as described (Fairclough et al., 1986) toobtain the observed meridional amplitudes, jF(S)j, pre-sented in Figure 4(a). A starting electron density pro®ler(z) from Klymkowsky & Stroud (1979) was then sub-jected to 40 cycles of constrained iterative re®nement(Stroud & Agard, 1979) using the jF(S)j data as described(Fairclough et al., 1986).
EM of mAb/ACh receptor complexes
A portion (30 ml) of ACh receptor annealed tubes wasincubated at room temperature with 200 ml cell culturesupernatant containing mAb 383C for one hour. Thetube/mAb complexes were separated from excess mAbby airfuge centrifugation for ten minutes at 20 psi in a30� A-100 rotor, and the pellets were resuspended in200 ml of cell culture supernatant, incubated for an hour,airfuge pelleted, and resuspended in crystallizing buffer:5 ml of this complex was applied to a glow-dischargedthin carbon ®lm over a holey grid. After 15 seconds, 2%(w/v) phosphotungstic acid was used to stain the gridand the excess was blotted with Whatman 3MM ®lterpaper. Grids were scanned at low magni®cation (3000�)on a Philips CM 10 electron microscope for elongatedstructures, which were then micrographed at 100 keVusing the Philips low-dose kit at a magni®cation of39,000� or in some cases 35,000� using Kodak S0163®lm. Micrographs of tubular structures were initiallyscreened by optical diffraction. Strongly diffracting struc-tures with well-preserved crystalline lattices were digi-tized on an Optronics P-1000 rotating drum scanner at araster step size of 25 mm, yielding a pixel size of 6.4 AÊ
for micrographs taken at a magni®cation of 39,000�.
Image processing of digitized micrographs
Antibody-decorated receptor tubes look much likeundecorated tubes (Figure 5). In order to see the locationof the antibody, it is necessary to average the images

Mapping �(187±199) of the ACh Receptor 313
from several tubes and to correct for small local distor-tions in the tube lattice. We have used the methoddescribed by Kubalek et al. (1987) following that ofHenderson et al. (1986), which involves a cross-corre-lation procedure to determine the amount of lattice dis-tortion and then correcting for the distortion. A smallreference image, required by the procedure, is obtainedby lattice pass ®ltering the tube and selecting an undis-torted region of the ®ltered tube as the reference. In prac-tice, several different regions are tested as references,because the initial choice is not always the best. Typi-cally, three areas are selected from the ®ltered image ofthe tube and reference images are cut from each of them.Each reference is used to create a straightened imageand the transforms of the straightened images are com-pared to determine the best choice using the followingtwo criteria. (1) Peaks in straightened tubes should beone pixel wide (images are 128 � 512, padded to512 � 512, and are oriented so that the width of the peakcorresponds to the long dimension of the tube), whereasin the unstraightened tubes they are three to ®ve pixelswide. (2) The maximum peak intensity at several ®rstand second-order spots as well as three super-latticespots is used to determine the best straightened image.
The size of the reference area must be chosen withcare. A larger than optimal reference area produces acleaner cross-correlation map and produces straightenedimages that have fewer areas of distortion. On the otherhand, it causes excessive averaging to take place and theimage might not be optimally straightened. Using asmall reference area is a more aggressive approach thatcan produce better straightened images but, if the chosenreference area is too small, distortions are evident in thestraightened images. The best size for each referenceimage can be discovered only by experiment. For ourwork, we have found the best size to be around 30 pixelssquare, which is about 1/100 of the original image size.
A cross-correlation map is made for the best referenceimage and the image of the tube. The reciprocal latticevectors are carefully measured to 0.1 pixel by a least-squares procedure using all of the principal re¯ections inorder to obtain the best estimate of the (0,1) and (1,0) lat-tice vectors. These are used along with the cross corre-lation map to generate a straightened image using theprocedure described by Henderson et al. (1986).
Structure factors are then generated from the Fouriertransform of the straightened image. The use of structurefactors allows us to average in reciprocal space all thereceptors, not just in one tube, but in several tubes. Thisis particularly convenient, because adding the structurefactor ®les is independent of the image magni®cation.This averaging allows us to eliminate some of the vari-ation between individual subunits caused by such thingsas staining differences, beam damage, or contamination.In generating the structure factors, we average a regionin the vicinity of the reciprocal lattice peaks. We com-monly use a radius of 1.4 pixels. The phase origin is thenre®ned to 2-fold symmetry using the procedure outlinedby DeRosier & Moore (1970). Generally, residuals of onlya few percent are observed after re®nement. The 2-foldsymmetry can then be ``forced'' by setting the phases to0� or 180�.
In compiling the averaged set of structure factors, thetotal intensity of each tube was scaled to a commonvalue before averaging the data. The data from the aver-aged structure factor ®le were then used to generate amap of the unit cell containing two receptors. A differ-ence map is generated from the averaged data of the
383C labeled receptors minus the averaged data fromthe native receptors. In practice, difference maps syn-thesized from ``forced'' or ``unforced'' structure factorswere very similar and in either case the antibodylocation was the same.
In order to evaluate which region of the differencemap most likely represents the location of the antibodyFv region, we calculated a statistical difference mapusing the difference of absorbance between the averageddecorated and undecorated maps at each pixel, anddivided it by the standard error of the difference of theimages at each pixel to give us Student's t. The result ofthis calculation demonstrated that the most probablelocation for the 383C Fv region is the red/white bilobedregions along the latitudes at one-quarter and three-quarters between the top and bottom of the differencemap, and that there is 99% con®dence of a differencebetween the two sets of maps in the red region ofFigure 8(d).
The software used in these calculations was the VMSversion of the MRC package written at the MRC Labora-tory of Molecular Biology, Cambridge and later modi®edby Dr Timothy Baker at Purdue. The least-squaresextraction of the lattice vectors, the real space straighten-ing procedure, and calculation of the statistical differencemap were written in our laboratory.
Acknowledgements
We thank Michele Mandala, Joanne Baker, DavidSanden and Jenny Holly for excellent technical assist-ance; Leon Gross and Suzanne Black for early forays indeveloping the image analysis protocols; Jing Shang forexcellent assistance in the peptide pin synthesis; andShao Huang for implementing the chemiluminescentdetection system for the Western blots. The T. marmoratafor this work was kindly supplied by the Marine Station,Arcachon, France , and the T. californica was supplied byPaci®c Biomarine Labs, Venice, CA. This work was sup-ported by grants from the National Institutes of Health:NS 15462 to D.P.R.; NS 24304 to D.P.R., R.H.F. and R.J.;HL 22654 to R.J.; RR01209 to SSRL. G.M.T. was sup-ported, in part, by the neuroimmunology training grantto the University of Chicago (T32NS 07113). E.G. wassupported, in part, by an Osserman fellowship from theMyasthenia Gravis Foundation, and a grant from theChicago chapter of the Myasthenia Foundation. TheX-ray work was performed at the DOE-supportedStanford Synchrotron Radiation Lab with the small-anglescattering camera facility funded by the NIH biotechnol-ogy resource program.
References
Abramson, S. N., Li, Y., Culver, P. & Taylor, P. (1989).An analogue of lophotoxin reacts covalently withtyr190 in the a-subunit of the nicotinic acetylcholinereceptor. J. Biol. Chem. 264, 12666±12672.
Asturias, F. J., Fischetti, R. F. & Blasie, J. K. (1994).Changes in the pro®le structure of the sarcoplasmicreticulum membrane induced by phosphorylationof the Ca2� ATPase enzyme in the presence ofterbium: a time resolved X-ray diffraction study.Biophys. J. 66, 1653±1664.

314 Mapping �(187±199) of the ACh Receptor
Beroukhim, R. & Unwin, N. (1995). Three-dimensionallocation of the main immunogenic region of theacetylcholine receptor. Neuron, 15, 323±331.
Blair, D. A., Mihovilovic, M., Agius, M. A., Fairclough,R. H. & Richman, D. P. (1987). Human � humanhybridomas from patients with myasthenia gravis:possible tools for idiotypic therapy for myasthenia.In Myasthenia Gravis: Biology and Treatment. Ann.N.Y. Acad. Sci., vol. 505, pp. 155±167, N.Y. Acad.Sci., New York.
Chiara, D. C. & Cohen, J. B. (1997). Identi®ciation ofamino acids contributing to high and low af®nityd-tubocurarine sites in the Torpedo nicotinic acetyl-choline receptor. J. Biol. Chem. 272, 32940±32950.
Cohen, J. B., Sharp, S. D. & Liu, W. S. (1991). Structureof the agonist-binding site of the nicotinic acetyl-choline receptor. J. Biol. Chem. 266, 23354±23364.
Czajkowski, C. & Karlin, A. (1991). Agonist binding siteof Torpedo electric tissue nicotinic acetylcholinereceptor. A negatively charged region of the d sub-unit within 0.9 nm of the a subunit binding site dis-ul®de. J. Biol. Chem. 266, 22603±22612.
Czajkowski, C. & Karlin, A. (1995). Structure of the nic-otinic receptor acetylcholine-binding site. Identi®-cation of acidic residues in the d subunit within0.9 nm of the a subunit binding site disul®de. J. Biol.Chem. 270, 3160±3164.
Czajkowski, C., Kaufman, C. & Karlin, A. (1993). Nega-tively charged amino acid residues in the nicotinic dsubunit that contribute to the binding of acetyl-choline. Proc. Natl Acad. Sci. USA, 90, 6285±6289.
Dennis, M., Giradat, J., Kotzyba-Hibert, F., Goeldner,M., Hirth, C., Chang, J.-Y., Lazure, C., ChreÂtien, M.& Changeux, J.-P. (1988). Amino acids of the Tor-pedo marmorata acetylcholine receptor a subunitlabeled by a photoaf®nity ligand for the acetyl-choline binding site. Biochemistry, 27, 2346±2357.
DeRosier, D. & Moore, P. B. (1970). Reconstruction ofthree-dimensional images from electron micro-graphs of structures with helical symmetry. J. Mol.Biol. 52, 355±369.
Erickson, B. W. & Merri®eld, R. B. (1976). Solid-phasepeptide synthesis. In The Proteins (Neurath, H. &Hill, R. L., eds), 3rd edit., vol. 2, pp. 255±527,Academic Press, New York.
Fairclough, R. H., Miake-Lye, R. C., Stroud, R. M.,Hodgson, K. O. & Doniach, S. (1986). Location ofterbium binding sites on acetylcholine receptor-enriched membranes. J. Mol. Biol. 189, 673±680.
Fairclough, R. H., Josephs, R. & Richman, D. P. (1993).Imaging ligand binding sites on the Torpedo acetyl-choline receptor. In Myasthenia Gravis and RelatedDisorders: Experimental and Clinical Aspects. Ann.N.Y. Acad. Sci., vol. 681, pp. 113±125, N.Y. Acad.Sci., New York.
Fairclough, R. H., Twaddle, G. M., Gudipati, E., Lin,M. Y. & Richman, D. P. (1998). Differential surfaceaccessibility of a(187±199) in the Torpedo acetyl-choline receptor a subunits. J. Mol. Biol. 282, 317±330.
Gabriel, A. (1977). Position sensitive X-ray detector. Rev.Sci. Instrum. 48, 1303±1305.
Galzi, J.-L., Revah, F., Black, D., Goeldner, M., Hirth, C.& Changeux, J.-P. (1990). Identi®cation of a novelamino acid a-tyrosine 93 within the cholinergicligand-binding sites of the acetylcholine receptor byphotoaf®nity labeling. J. Biol. Chem. 265, 10430±10437.
Geysen, H. M., Meloen, R. H. & Barteling, S. J. (1984).Use of peptide synthesis to probe viral antigens forepitopes to a resolution of a single amino acid. Proc.Natl Acad. Sci. USA, 81, 3998±4002.
Gomez, C. M. & Richman, D. P. (1983). Anti-acetyl-choline receptor antibodies directed against thea-bungarotoxin binding site induce a unique formof experimental myasthenia. Proc. Natl Acad. Sci.USA, 80, 4089±4093.
Henderson, R., Baldwin, J. M., Downing, K. H., Lepault,J. & Zemlin, E. (1986). Structure of purple mem-brane from Halobacterium halobium: recording,measurement and evaluation of electron micro-graphs at 3.5 AÊ resolution. Ultramicroscopy, 19, 147±178.
Hubbard, S. R. (1987). Small-angle X-ray scatteringstudies of calcium binding proteins in solution. PhDthesis, Stanford University.
Kao, P. N. & Karlin, A. (1986). Acetylcholine receptorbinding site contains a disul®de cross-link betweenadjacent half-cystinyl residues. J. Biol. Chem. 264,8085±8088.
Kao, P. N., Dwork, A. J., Kaldany, R.-R. J., Silver, M. L.,Wideman, J., Stein, S. & Karlin, A. (1984). Identi®-cation of the a subunit half-cystine spec®callylabeled by an af®nity reagent for the acetylcholinereceptor binding site. J. Biol. Chem. 259, 11662±11665.
Klymkowsky, M. W. & Stroud, R. M. (1979). Immunos-peci®c identi®cation and three-dimensional struc-ture of a membrane-bound acetylcholine receptorfrom Torpedo californica. J. Mol. Biol. 128, 319±334.
Klymkowsky, M. W., Heuser, J. E. & Stroud, R. M.(1980). Protease effects on the structure of acetyl-choline receptor membranes from Torpedo californica.J. Cell Biol. 85, 823±838.
Kubalek, E., Ralston, S., Lindstrom, J. & Unwin, N.(1987). Location of subunits within the acetylcholinereceptor by electron image analysis of tubular crys-tals from Torpedo marmorata. J. Cell Biol. 105, 9±18.
Laemmli, U. K. (1970). Cleavage of structure proteinsduring the assembly of the head of bacteriophageT4. Nature, 227, 680±685.
Levine, Y. K. & Wilkins, M. H. F. (1971). Structure oforiented lipid bilayers. Nature New Biol. 230, 69±72.
Markwell, M. A. K., Hass, S. M., Bieber, L. L. & Tolburt,N. E. (1978). A modi®cation of the Lowry pro-cedure to simplify protein determination in mem-brane and lipo-protein samples. Anal. Biochem. 87,206±210.
Miake-Lye, R. C. (1983). Anomalous X-ray scattering asa probe of biological structure. PhD thesis, StanfordUniversity.
Miake-Lye, R. C., Doniach, S. & Hodgson, K. O. (1983).Anomalous X-ray scattering from terbium-labeledparvalbumin in solution. Biophys. J. 41, 287±292.
Middleton, R. E. & Cohen, J. B. (1991). Mapping of theacetylcholine binding site of the nicotinic acetyl-choline receptor: [3H]nicotine as an agonist photo-af®nity label. Biochemistry, 30, 6987±6997.
Mihovilovic, M. & Richman, D. P. (1987). Monoclonalantibodies as probes of the a-bungarotoxin andcholinergic binding regions of the acetylcholinereceptor. J. Biol. Chem. 262, 4978±4986.
Miller, J. P., Herbette, L. G. & White, R. E. (1996). X-raydiffraction analysis of cytochrome P450 2B4 reconsi-tituted into liposomes. Biochemistry, 35, 1466±1474.
Neubig, R. R., Krodel, E. K., Boyd, N. D. & Cohen, J. B.(1979). Acetylcholine and local anesthetic binding to

Mapping �(187±199) of the ACh Receptor 315
Torpedo nicotinic postsynaptic membranes afterremoval of nonreceptor peptides. Proc. Natl Acad.Sci. USA, 76, 690±694.
Pedersen, S. E. & Cohen, J. B. (1990). d-Tubocurarinebinding sites are located at a-g and a-d subunitinterfaces of the nicotinic acetylcholine receptor.Proc. Natl Acad. Sci. USA, 87, 2785±2789.
Pedersen, S. E., Dreyer, E. B. & Cohen, J. B. (1986).Location of ligand-binding sites on the nicotinicacetylcholine receptor a-subunit. J. Biol. Chem. 261,13735±13743.
Ross, M. J., Klymkowsky, M. W., Agard, D. A. &Stroud, R. M. (1977). Structural studies of a mem-brane-bound acetylcholine receptor from Torpedocalifornica. J. Mol. Biol. 116, 635±659.
Schmidt, J. & Raftery, M. A. (1973). A simple assay forthe study of solubilized acetylcholine receptors.Anal. Biochem. 52, 349±354.
Stroud, R. M. & Agard, D. A. (1979). Structure determi-nation of asymetric membrane pro®les using aniterative Fourier method. Biophys J. 25, 495±512.
Unwin, N. (1993). Nicotinic acetylcholine receptor at 9 AÊ
resolution. J. Mol. Biol. 229, 1101±1124.Unwin, N. (1996). Projection structure of the nicotinic
acetylcholine receptor: distinctconformations of thea subunits. J. Mol. Biol. 257, 586±596.
Valenzuela, C. F., Weign, P., Yguerabide, J. & Johnson,D. A. (1994). Transverse distance between the mem-brane and the agonist binding sites on the Torpedoacetylcholine receptor: a ¯uorescence study. Biophys.J. 66, 674±682.
Wilkins, M. H. F., Blaurock, A. E. & Engelman, D. M.(1971). Bilayer structure in membranes. Nature NewBiol. 230, 72±76.
Edited by B. Holland
(Received 2 December 1997; received in revised form 4 June 1998; accepted 11 June 1998)


![Quantification of [11C]yohimbine binding to α2 adrenoceptors in rat brain in vivo](https://static.fdokumen.com/doc/165x107/633453e376a7ca221d08a4ae/quantification-of-11cyohimbine-binding-to-2-adrenoceptors-in-rat-brain-in-vivo.jpg)