Mapping of Genomic Regions Associated With Net Form of Netblotch Resistance In Barley
9
© CSIRO 2003 10.1071/AR03026 0004-9409/03/111359 www.publish.csiro.au/journals/ajar Australian Journal of Agricultural Research, 2003, 54, 1359–1367 CSIRO PUBLISHING Mapping of genomic regions associated with net form of net blotch resistance in barley H. Raman A,F , G. J. Platz B , K. J. Chalmers C , R. Raman A , B. J. Read A , A. R. Barr D , and D. B. Moody E A NSW Agriculture, Wagga Wagga Agricultural Institute, Wagga Wagga, NSW 2650, Australia. B Agency for Food and Fibre Sciences, Department of Primary Industries, Hermitage Research Station, Warwick, Qld 4370, Australia. C CRC for Molecular Plant Breeding, Department of Plant Science, University of Adelaide, Glen Osmond, SA 5064, Australia. D Department of Plant Science, University of Adelaide, Glen Osmond, SA 5064, Australia. E Department of Primary Industries, Victorian Institute for Dryland Agriculture, Private Bag 260, Horsham, Vic. 3401, Australia. F Corresponding author; email: [email protected] Abstract. Quantitative trait loci (QTLs) associated with resistance to net blotch and their chromosomal locations were determined from analyses of doubled haploid progeny of Alexis/Sloop, Arapiles/Franklin, Sloop/Halcyon, and recombinant inbred lines of Sloop-sib/Alexis. Five QTLs on chromosomes 2H, 3H, and 4H were found to be associated with seedling resistance to the net form of net blotch. In Arapiles/Franklin and Alexis/Sloop populations, 4 significant QTLs explaining 9–17% of the variation in net blotch resistance were detected on 2H and 3H. A major locus, QRpts4L accounting for 64% of the variation in infection type, was detected on 4H in the Sloop/Halcyon population. In Sloop/Halcyon, 2 microsatellite markers, EBmac0906 and GMS089, and AFLP marker P13/M50- 108, co-segregated and detected maximum variability for net blotch resistance as revealed by bootstrap analysis. EBmac0906 and Bmac0181 were validated in F 2 progeny of an Ant29/Halcyon population and reliably predicted phenotypes of 93% of lines resistant and susceptible to net blotch. These markers may be used within breeding programs to select alleles favourable for net blotch resistance derived from Halcyon. AR03026 Mappingnetbl otchresistance H.Raman etal . Additional keywords: seedling resistance, Pyrenophora teres f. teres, QTL, validation. Introduction Net blotch, caused by the fungus Drechslera teres (Sacc.) Shoem. f. teres Smedeg. (Teleomorph: Pyrenophora teres Drechs. f. teres Smedeg), is one of the most significant foliar diseases of barley throughout the world (Shipton et al. 1973). The disease exists as two forms, the spot form caused by P. teres f. maculata and the net form caused by P. teres f. teres, and these can be differentiated on the basis of leaf symptoms (Smedegaard-Petersen 1971). Although the common name often embraces both forms of the disease, in this paper it refers exclusively to the net form and is abbreviated as NFNB. This disease causes a net type lesion, which is characterised by elongate, dark brown blotches often with a net-like pattern. In susceptible seedlings, production of toxins by the pathogen leads to rapid and extensive leaf death. The disease can cause yield losses in excess of 50% and also considerably reduce grain quality (Tekauz 1990; Steffenson et al. 1996; Poulsen et al. 1999). Identification of sources of resistance to NFNB and an understanding of their genetics are very important in developing resistant varieties (Jalli and Robinson 2000). NFNB resistance is due to either one or several genes and is dependent upon the source of resistance, plant development stage (seedling or adult), and the pathotype used for testing (Mode and Schaller 1958; Wilcoxson et al. 1992; Graner et al. 1996; Steffenson et al. 1996). At adult plant stages, 7– 12 quantitative trait loci (QTLs) associated with net blotch resistance have been identified, located on all barley chromosomes except 5H (Steffenson et al. 1996; Richter et al. 1998). Most Australian barley cultivars are susceptible or moderately susceptible to one or more pathotypes of the disease (G. J. Platz, unpublished data). However, useful variability for resistance is present in world barley
Transcript of Mapping of Genomic Regions Associated With Net Form of Netblotch Resistance In Barley

© CSIRO 2003 10.1071/AR03026 0004-9409/03/111359
www.publish.csiro.au/journals/ajar Australian Journal of Agricultural Research, 2003, 54, 1359–1367
CSIRO PUBLISHING
Mapping of genomic regions associated with net form of netblotch resistance in barley
H. RamanA,F, G. J. PlatzB, K. J. ChalmersC, R. RamanA, B. J. ReadA, A. R. BarrD, andD. B. MoodyE
ANSW Agriculture, Wagga Wagga Agricultural Institute, Wagga Wagga, NSW 2650, Australia.BAgency for Food and Fibre Sciences, Department of Primary Industries, Hermitage Research Station,
Warwick, Qld 4370, Australia.CCRC for Molecular Plant Breeding, Department of Plant Science, University of Adelaide,
Glen Osmond, SA 5064, Australia.DDepartment of Plant Science, University of Adelaide, Glen Osmond, SA 5064, Australia.
EDepartment of Primary Industries, Victorian Institute for Dryland Agriculture, Private Bag 260, Horsham, Vic. 3401, Australia.
FCorresponding author; email: [email protected]
Abstract. Quantitative trait loci (QTLs) associated with resistance to net blotch and their chromosomal locationswere determined from analyses of doubled haploid progeny of Alexis/Sloop, Arapiles/Franklin, Sloop/Halcyon, andrecombinant inbred lines of Sloop-sib/Alexis. Five QTLs on chromosomes 2H, 3H, and 4H were found to beassociated with seedling resistance to the net form of net blotch. In Arapiles/Franklin and Alexis/Sloop populations,4 significant QTLs explaining 9–17% of the variation in net blotch resistance were detected on 2H and 3H. A majorlocus, QRpts4L accounting for 64% of the variation in infection type, was detected on 4H in the Sloop/Halcyonpopulation. In Sloop/Halcyon, 2 microsatellite markers, EBmac0906 and GMS089, and AFLP marker P13/M50-108, co-segregated and detected maximum variability for net blotch resistance as revealed by bootstrap analysis.EBmac0906 and Bmac0181 were validated in F2 progeny of an Ant29/Halcyon population and reliably predictedphenotypes of 93% of lines resistant and susceptible to net blotch. These markers may be used within breedingprograms to select alleles favourable for net blotch resistance derived from Halcyon.AR03026Mapping net bl otch r es i st anceH. Ramanet al .
Additional keywords: seedling resistance, Pyrenophora teres f. teres, QTL, validation.
IntroductionNet blotch, caused by the fungus Drechslera teres (Sacc.)Shoem. f. teres Smedeg. (Teleomorph: Pyrenophora teresDrechs. f. teres Smedeg), is one of the most significant foliardiseases of barley throughout the world (Shipton et al. 1973).The disease exists as two forms, the spot form caused byP. teres f. maculata and the net form caused by P. teres f.teres, and these can be differentiated on the basis of leafsymptoms (Smedegaard-Petersen 1971). Although thecommon name often embraces both forms of the disease, inthis paper it refers exclusively to the net form and isabbreviated as NFNB. This disease causes a net type lesion,which is characterised by elongate, dark brown blotchesoften with a net-like pattern. In susceptible seedlings,production of toxins by the pathogen leads to rapid andextensive leaf death. The disease can cause yield losses inexcess of 50% and also considerably reduce grain quality
(Tekauz 1990; Steffenson et al. 1996; Poulsen et al. 1999).Identification of sources of resistance to NFNB and anunderstanding of their genetics are very important indeveloping resistant varieties (Jalli and Robinson 2000).NFNB resistance is due to either one or several genes and isdependent upon the source of resistance, plant developmentstage (seedling or adult), and the pathotype used for testing(Mode and Schaller 1958; Wilcoxson et al. 1992; Graneret al. 1996; Steffenson et al. 1996). At adult plant stages, 7–12 quantitative trait loci (QTLs) associated with net blotchresistance have been identified, located on all barleychromosomes except 5H (Steffenson et al. 1996; Richteret al. 1998).
Most Australian barley cultivars are susceptible ormoderately susceptible to one or more pathotypes of thedisease (G. J. Platz, unpublished data). However, usefulvariability for resistance is present in world barley

1360 Australian Journal of Agricultural Research H. Raman et al.
germplasm (Tekauz and Buchannon 1977) and has beenexploited to introduce useful genes from different resistantsources into barley breeding programs. The cultivars Alexis,Franklin, and Halcyon are being used to introgress desirablegenes for disease resistance, malting quality, and growthhabit into adapted Australian barley cultivars. Screening ofparental lines of populations within the Australian NationalBarley Molecular Marker Program (NBMMP) with a rangeof Australian pathotypes of NFNB identified differences insusceptibilities at the seedling stage between Alexis andSloop, Arapiles and Franklin, and Sloop and Halcyon.
Selection for net blotch resistance in breeding programshas been based on host reaction at the seedling and/or adultplant stage. Molecular markers are recognised as powerfultools for indirect selection and would enhance the efficiencyand accuracy of screening for NFNB resistance.Furthermore, quantitative analysis has proven useful forlocating genes controlling complex traits and provides amore accurate estimation of gene location than qualitativeanalysis because of its lower sensitivity to even modestnumbers of phenotypic mis-scores (Wright et al. 1998). Therole and location of QTLs controlling resistance to NFNB inSloop, Arapiles, Alexis, Franklin, and Halcyon wereunknown. Identification of molecular markers associatedwith major gene loci and QTLs conferring NFNB resistanceis imperative for marker assisted selection (MAS) and tofacilitate combination of various QTLs to develop higherlevels of net blotch resistance. This paper reports themapping of QTLs for net blotch resistance in 4 populationsderived from Alexis/Sloop, Sloop-sib/Alexis, Arapiles/Franklin, and Sloop/Halcyon as part of the NBMMP.
Materials and methods
Mapping populations and genetic maps
Three doubled haploid (DH) mapping populations derived from Alexis/Sloop, Arapiles/Franklin, and Sloop/Halcyon and one population of F4-derived recombinant inbred lines (RILs) from Sloop-sib/Alexis weregenerated by the NBMMP. Full linkage maps based upon amplifiedfragment length polymorphism (AFLP), restriction fragment lengthpolymorphism (RFLP), microsatellite, and single nucleotide poly-morphism (SNP) markers were constructed (Barr et al. 2003, this issue;Read et al. 2003, this issue; D. B. Moody et al. unpublished data). Thesemolecular maps were utilised to define the location of QTLs and thelinked markers associated with NFNB resistance at the seedling stage.
Pathogen isolates
Screening of parental lines in the NBMMP with a selection of net blotchisolates (Gupta et al. 2003, this issue) indicated that isolate NB34differentiated between Arapiles and Franklin and Alexis and Sloop,whereas NB50 gave superior separation between Halcyon and Sloop.Cultures of NB34 and NB50, preserved in the form of infected dry leafat –70°C, were retrieved from storage and heat-shocked at 45°C for3 min. Infected leaf pieces were maintained in a moist dish for 2–3 daysat 19°C with 12 h of light (12 L) supplied by 2 blue-black and one coolwhite fluorescent tube from a distance of 20 cm. Conidia were thenpicked from the leaf with a sterile needle, cultured on V8 agar, andincubated in the dark at 25°C for 5 days. Plugs were cut from the edges
of colonies, placed on peanut oatmeal agar medium (Speakman andPommer 1986), and incubated for 9 days at 19°C and 12 L as above.
Screening for net blotch resistance
Two replications of 5–7 seeds of each line were sown at 3 sites aroundthe circumference of a 10-cm maxi pot (Garden City Plastics)containing a peat/loam/vermiculite medium (1 : 2 : 1 by vol.) and raisedin a glasshouse at 15/25°C and 10–12 h photoperiod. Plants werefertilised weekly after emergence, with single strength Aquasol(Hortico Australia) to avoid any nutrient deficiency. After about 14days, when seedlings were at the 2-leaf stage, they were inoculated withan aqueous suspension containing 15 000 conidia of the target isolate/mL. Pots were arranged shoulder to shoulder and 200 mL of suspensionwas applied per m2 of occupied bench space using an airless spray gun(Krebs Inc.). Inoculated seedlings were incubated in a fogging chamberat 19°C under 14-h dark followed by 10-h light. Seedlings were thenreturned to the glasshouse and infection response (IR) on the secondleaf recorded 8 days later using the scale of Tekauz (1985). IRs used foranalysis were means of the 2 replicates.
Statistical analyses
Chi-square analyses were performed to test the goodness-of-fit of theobserved over the expected genetic ratios for net blotch infectionresponse.
QTL analysis
The 4 fully constructed linkage maps of the above populations wereutilised for QTL analyses. Marker and quantitative phenotypic datafrom infection response (1–10) were evaluated using MapManagerQTX (MMQTX) version 17b (Manly et al. 2001). Initially, a single-point regression analysis was performed using the ‘QTL MarkerRegression’ with a threshold of P = 0.001. The significant associationsbetween markers and infection response data were tested usinglikelihood ratio statistics (LRS, Haley and Knott 1992). As a secondstep, simple interval mapping (SIM) analysis was performed to findevidence of QTLs by MapManager and/or QTL Cartographer (Wang etal. 2003) and QGENE (Nelson 1997). Significance thresholds for thetest statistics were estimated by 1000 permutations at a significancelevel of P = 0.001 (Doerge and Churchill 1996) by following thealgorithm implemented in MMQTX. QTL effects were consideredsignificant either when they exceeded a log10 of the odds ratio (LOD)score of 3.0 or the calculated statistic value by permutation tests(significant at P = 0.05, highly significant at P = 0.001). Theconventional base LOD score was converted to LRS by multiplying itby 4.60 for comparisons as described by Manly et al. (2001). QTLswere declared at the genomic position of the test statistic’s peak for themain effect and/or their interaction with environment. Bootstrapanalysis was performed to estimate a confidence interval and to recordthe position of the maximum LRS (Visscher et al. 1996). In a thirdapproach, composite interval mapping (CIM) was performed to explorethe effect of QTL combinations and to separate additionalenvironmental effects that may have reduced the significance ofestimated marker trait association (Zeng 1994). To reveal interactionsor epistatic effects, 2-locus analysis was performed using P = 10e–6 andinteractions were tested for significance with an additive model usingpermutation tests in MMQTX.
Nomenclature of QTLs
A ‘QRpt’ indicates a QTL/genomic region for resistance to P. teres f.teres. This is followed by ‘s’ to indicate a seedling and followed by thebarley chromosome arm onto which the QTL/genomic region wasmapped.

Mapping net blotch resistance Australian Journal of Agricultural Research 1361
Validation of microsatellite markers linked with NFNB resistance in Halcyon
An F2 population comprising 81 plants derived from Ant29/Halcyonwas screened for resistance to NFNB as described above. Healthy leafsamples from these were used for validation of 4 microsatellite markers(EBmac0906, Bmac0310, Bmag0353, Bmac0181), which mappedwithin 10 cM of the locus conferring NFNB resistance in Sloop/Halcyon. These markers have been reported to map closely in barleypopulations derived from Lina/Canada Park, WB229/Yambla, andDayton/Harlan Hybrid (Ramsay et al. 2000; Raman et al. 2002, 2003,this issue). Deoxyribonucleic acid was extracted in 2 mL Eppendorftubes as described previously (Raman and Read 2000). Microsatelliteanalyses were performed following PCR conditions as described byRamsay et al. (2000).
Results
Seedling resistance to net form of net blotch
The IRs of all parents were consistent across replicates,although Arapiles showed a 2-unit difference (Table 1).Although most lines gave IRs similar to those reported byGupta et al. (2003), Alexis was higher (6.5 v. 4.5) andArapiles lower (8 v. 10) than in the initial parent screening.
After inoculation with the appropriate isolate, all plantsdeveloped classical symptoms of NFNB, which alloweddiscrimination of resistant and susceptible genotypes. Thedistribution of IRs varied among populations (Fig. 1).
Transgressive segregation for disease response wasobserved especially in the Alexis/Sloop and Sloop-sib/Alexis populations (Fig. 1). This indicated that the parentscarried different resistance genes.
QTL analyses
QTL analysis by SIM detected 5 QTLs/genomic regions on2H, 3H, and 4H, contributing 7–64% phenotypic variancefor net blotch resistance (Table 2).
Alexis/Sloop
In the DH population of Alexis/Sloop, one significant QTL,QRpts3L from Alexis flanked with P14/M61-154 and P13/
0
5
10
15
20
25
1 2 3 4 5 6 7 8 9 10
0
5
10
15
20
25
30
35
0
5
10
15
20
25
30
35
40
0
2
4
6
8
10
12
14
16
(a)
(b) (d)
S
F
S
H
S
A
A
AR
➾
(c)
Num
ber
of li
nes
Infection response (1−10)
➾
➾➾
1 2 3 4 5 6 7 8 9 10 1 2 3 4 5 6 7 8 9 10
1 2 3 4 5 6 7 8 9 10
➾
➾
➾
➾
Fig. 1. Frequency distribution of phenotypes for net form of net blotch resistance in 4 segregating barley populations: (a) Alexis × Sloop DHpopulation; (b) Sloop-sib × Alexis RI lines; (c) Arapiles × Franklin DH population; and (d) Sloop × Halcyon DH population. Parental meansindicated for Alexis (A), Sloop (S), Arapiles (AR), Franklin (F), and Halcyon (H).
Table 1. Seedling infection response of mapping parents to 2 pathotypes of net blotch (scale 1–10 where 1
is resistant and 10 is susceptible)
Parent Isolate Reaction to P. teres f. teresReplicate 1 Replicate 2
Alexis NB34 6 7Sloop NB34 9 9Franklin NB34 3 3Arapiles NB34 7 9Halcyon NB50 3 3Sloop NB50 9 9
1362 Australian Journal of Agricultural Research H. Raman et al.
M50-331 (LRS = 18.5, r2 = 17%), was detected on 3HL(Table 2, Fig. 2b). However, another non-significant ‘weak’QTL from Sloop, reaching close to the level of significance(LRS = 11.7/LOD > 2.5, r2 = 11%), was identified on 2HS(Table 2, Fig. 2a).
In the RILs of Sloop-sib/Alexis, a similar QTL, QRpts3Lflanked with P14/M61-154 and ABG4, was detected on 3HL(Fig. 2d). The AFLP locus XP14/M61-154 detectedmaximum variability (LRS = 17.4, r2 = 13%) as revealed bybootstrap analysis (Table 2). SIM indicated that QRpts3Lfrom Alexis increased the phenotypic variation for resistanceto NFNB. Another non-significant weak QTL approachingthe level of significance (LRS = 12.4, r2 = 9%) was alsodetected with MMQTX on 2HS in RILs of Sloop-sib/Alexis(Table 2). This weak QTL—QRpts2Sa in Fig. 2c—wassignificant, attaining an LOD score of >3.0, when intervalmapping was carried out with QGene. This software alsodetected a genomic region, designated as QRpt2sb, whichhad an LOD score of 3.0 (Fig. 2c).
Arapiles/Franklin
SIM and CIM showed evidence for a total of 4 QTLsaffecting NFNB resistance in the DH population of Arapiles/
Franklin. One highly significant QTL, designated asQRpts2S, from Franklin, was flanked with P13/M47-399 andco-segregating markers P14/M47-299 and P14/M48-332(LRS = 22.9, r2 = 13%) on 2HS. A second QTL, QRpts2L,nearing the level of significance (LRS = 12.5/LOD = 2.7)and explaining 7% of the phenotypic variance, was detectedat XP11/M62-160 on 2HL (Table 2). A third highlysignificant QTL, QRpts3La, flanked with P11/M62-261 andBmag0225 markers (LRS = 28.7, r2 = 16%), from Arapiles,and a fourth significant QTL (QRpts3Lb) with markerintervals of P11/M62-212 and P13/M48-312 detecting 9% ofphenotypic variance, were identified on 3HL (Table 2). At 3of the 4 QTLs linked with NFNB resistance, alleles fromFranklin were in the direction of increasing resistance, andan allele from Arapiles at the QRpts3La locus increasedresistance to isolate NB34. Similar QTLs were detectedusing the QTL Cartographer program.
Sloop/Halcyon
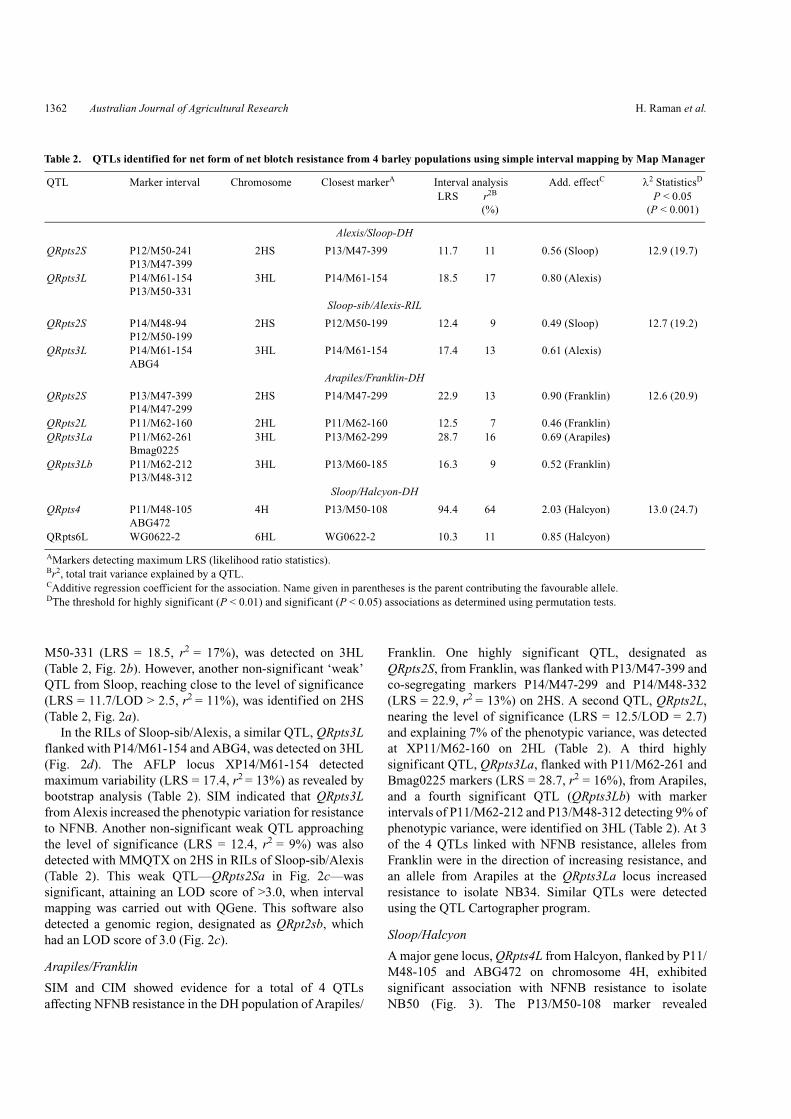
A major gene locus, QRpts4L from Halcyon, flanked by P11/M48-105 and ABG472 on chromosome 4H, exhibitedsignificant association with NFNB resistance to isolateNB50 (Fig. 3). The P13/M50-108 marker revealed
Table 2. QTLs identified for net form of net blotch resistance from 4 barley populations using simple interval mapping by Map Manager
QTL Marker interval Chromosome Closest markerA Interval analysis Add. effectC λ2 StatisticsD
LRS r2B
(%)P < 0.05
(P < 0.001)
Alexis/Sloop-DH
QRpts2S P12/M50-241 P13/M47-399
2HS P13/M47-399 11.7 11 0.56 (Sloop) 12.9 (19.7)
QRpts3L P14/M61-154 P13/M50-331
3HL P14/M61-154 18.5 17 0.80 (Alexis)
Sloop-sib/Alexis-RIL
QRpts2S P14/M48-94P12/M50-199
2HS P12/M50-199 12.4 9 0.49 (Sloop) 12.7 (19.2)
QRpts3L P14/M61-154 ABG4
3HL P14/M61-154 17.4 13 0.61 (Alexis)
Arapiles/Franklin-DH
QRpts2S P13/M47-399P14/M47-299
2HS P14/M47-299 22.9 13 0.90 (Franklin) 12.6 (20.9)
QRpts2L P11/M62-160 2HL P11/M62-160 12.5 7 0.46 (Franklin)QRpts3La P11/M62-261
Bmag02253HL P13/M62-299 28.7 16 0.69 (Arapiles)
QRpts3Lb P11/M62-212P13/M48-312
3HL P13/M60-185 16.3 9 0.52 (Franklin)
Sloop/Halcyon-DH
QRpts4 P11/M48-105ABG472
4H P13/M50-108 94.4 64 2.03 (Halcyon) 13.0 (24.7)
QRpts6L WG0622-2 6HL WG0622-2 10.3 11 0.85 (Halcyon)
AMarkers detecting maximum LRS (likelihood ratio statistics).Br2, total trait variance explained by a QTL.CAdditive regression coefficient for the association. Name given in parentheses is the parent contributing the favourable allele.DThe threshold for highly significant (P < 0.01) and significant (P < 0.05) associations as determined using permutation tests.

Mapping net blotch resistance Australian Journal of Agricultural Research 1363
maximum LRS (94.4) as detected by bootstrap analyses andaccounted for 64% of the total variation of net blotchresistance (Table 2).
Similar results were found with simple regressionanalysis using QTL Cartographer. The AFLP marker P13/
M50-108 co-segregated with P14/M16-154, P13/M51-4,and microsatellite markers EBmac0906 and GMS089. Thesemapped in a cluster in the Sloop/Halcyon DH population(Read et al. 2003). A weak QTL peak on locus Xwg0622b,syn. ‘Xwg0622-2’, on 6HL approached close to the level ofsignificance (LRS = 10.3) and explained 11% of thephenotypic variation, but was not statistically significant(Table 2). The Halcyon allele at this locus conferred NFNBresistance. Two-locus analysis showed non-significantinteractions.
Validation of ‘QRpts4’
Results of the validation experiment comprising 81 plants ofan F2 population derived from Ant29/Halcyon showed thatmicrosatellite markers EBmac0906 and Bmac0181 may beused for marker assisted selection. The primer sequences ofthese microsatellite markers were:
XP
12/M51-259
XP
11/M62-224
XP
14/M61-242
XP
11/M48-241
XE
Bm
ac708X
bcd131b
Xabg705b
Xbcd131a
XB
mag13
Xab
g4
XP
13/M50-331
XP
14/M61-154
XB
mag225
Xgm
s116
XP
14/M48-216
XB
mac67
XP
32/M50-328
XB
mag131
XP
11/M62-261
XP
14/M55-265
Xabg471
XP
13/M59-132
Xabc171a
XP
14/M47-64
Xbg123
Xw
g645X
cdo36
Xbcd292
Xabc171b
X43T
H1d7
ksuF41X
XH
VM
54
XE
Bm
ac415X
cdo665a
Xaw
bma21
XB
mag125
Xcdo474
Xabg14
XB
mag378
XB
mag114
XE
Bm
ac684X
Bm
ac93
XB
mag518
XE
Bm
ac623
XE
Bm
ac607
XE
Bm
ac640
Xpsr131
Xabg2
XH
VM
36X
P13/M
47-399
XP
12/M50-241
Xw
g516
LOD
Xbg123
Xw
g645
Xcdo36
Xbcd292
Xabc171b
X43T
H1d7
XksuF
41
XH
VM
54
XE
Bm
ac415
Xcdo665a
Xaw
bma21
XB
mag125
Xcdo474
Xabg14
XB
mag378
XB
mag
114X
EB
mac684
XB
mac93
XB
mag518
XE
Bm
ac623
XE
Bm
ac607
XE
Bm
ac640X
psr131
Xab
g2
XP
12/M50-199
XH
VM
36X
P14/M
48-94
Xw
g516
XE
Bm
ac708
Xbcd131b
Xabg705b
Xbcd131a
XB
mag13
Xab
g4
XP
14/M61-154
Xgm
s116
Xw
g178
XB
mac67
XB
mag131
Xabg471
Xabc171a
(a)
(b)
(c)
(d )
XB
mag225
QRpts3L
QRpts2Sa
QRpts3L
QRpts2S
QRpts2Sb
0
0
3.0
5.18
3.0 3.06
0
3.0
4.03
0
3.0
2.70
Fig. 2. Map location of QTL associated with net form of net blotchresistance identified using QGENE. Region at or above the thresholdLOD score (3.0) shows significant association. (a) QRpts2S onchromosome 2H in Alexis × Sloop DH population; (b) QRpts3L onchromosome 3H in Alexis × Sloop DH population; (c) QRpts2Sa andQRpts2Sb on 2HS in RILs of Sloop-sib × Alexis; (d) QRpts3L onchromosome 3H in RILs of Sloop-sib × Alexis. Note that for clarity,marker density has been reduced. The actual LOD score of QRpts2Sawas 5.19.
Fig. 3. A major gene associated with net form of net blotchresistance in Sloop × Halcyon DH population on chromosome 4H,detected with SIM using MMQTX. The thresholds for highlysignificant (P < 0.001 = LRS > 24.7), significant (P < 0.05 = LRS >13.0), and suggestive (P = 0.63) as determined using permutation testsare indicated. The histogram indicates the output from bootstrapanalysis showing maximum LRS within an identified genomic region,QRpts4L.

1364 Australian Journal of Agricultural Research H. Raman et al.
Bmac0181F: 5′-ATAGATCACCAAGTGAACCAC-3′Bmac0181R: 5′-GGTTATCACTGAGGCAAATAC-3′
EBmac0906F: 5′-CAAATCAATCAAGAGGCC-3′EBmac0906R: 5′-TTTGAAGTGAGACATTTCCA-3′
Both the markers EBmac0906 and Bmac0181 co-segregated co-dominantly in F2 progeny of the Ant29/Halcyon population. Chi-square analysis indicated that thesesegregation ratios (20 : 43 : 18) fit a single gene model.Resistant and susceptible phenotypes could be correlatedwith 93% reliability with the respective marker alleleassociated with resistance/susceptibility to NFNB. In somecases, resistant and intermediate resistant phenotypes toNFNB could not be correlated with the expected markeralleles. F3 progeny testing is being performed to confirm thegenotypes of F2 families. Other markers, such as Bmac0310and Bmag0353 that mapped within 5–10 cM of EBmac0906in a DH population of Canada Park/Lina (Ramsay et al.2000; Raman et al. 2003), were also polymorphic in the F2population of Ant29/Halcyon.
Discussion
QTL mapping, utilising molecular linkage maps, has provento be a useful tool for locating major and minor genes, andinvestigating the parental origins of the favourable QTLalleles controlling genetic variation for NFNB resistance atthe seedling stage. In this study, significant putative QTLsfor NFNB resistance were detected on chromosomes 2H,3H, and 4H in 4 barley populations derived from Alexis/Sloop, Sloop-sib/Alexis, Arapiles/Franklin, and Sloop/Halcyon. Several qualitative and quantitative genesconferring net blotch resistance at the seedling stage havebeen previously reported on 1H, 2H, 3H, 4H, 6H, and 7H.Major genes for net blotch resistance in barley, Pt.d/Rpt3.don chromosome 2H (Bockelman et al. 1977; A. Graner andA. Tekauz, unpublished data) and Pt1 syn. Pt.a/ Rpt1 andRpt2c on chromosome 3H, have been reported (Schaller1955; Mode and Schaller 1958; Khan and Boyd 1969a;Bockelman et al. 1977; Wilcoxson et al. 1992; Graner et al.1996). On chromosome 2HS, a QTL for resistance to netblotch of adult plants has been described (Pecchioni et al.1996; Steffenson et al. 1996). Other qualitative genes fordisease resistance including Ryd2 for resistance to barleyyellow dwarf virus (Collins et al. 1996), Rhy, Rh, and Rrs forscald resistance (Graner and Tekauz 1996; Graner et al.2000; Genger et al. 2003, this issue), and rym 4, rym5, andrym11 for virus resistance to strains of BaMMV and BaYMV(Graner and Bauer 1993; Bauer et al. 1997; Graner et al.1999), also mapped close to Pt.a/Pt.1 gene for net blotchresistance on the proximal region of 3HL. On chromosome4H, a large region of the genetic map of Sloop/Halcyoncovering ~50 cM exhibited significant association withNFNB resistance (Fig. 4). In this region, several genes such
as Ml-g and ml-o for resistance to Blumeria graminis f. sp.hordei (Görg et al. 1993), QTLs for quantitative resistance toPuccinia striiformis f. sp. hordei and net blotch in bothseedling and adult plant stages, were identified (Hinze et al.1991; Chen et al. 1994; Steffenson et al. 1996; Manninen etal. 2000). Interestingly, in both the populations derived fromAlexis and Sloop (DH/RILs) and Arapiles/Franklin, thesame genomic regions of linkage map/QTLs were detectedon 2H and 3H (Table 2, Fig. 4). Alexis and Franklin are bothderivatives of Triumph; Sloop and Arapiles both haveProctor and CI3576 in their pedigree and Franklin also hasProctor in its ancestry. Identification of the same genomicregions/loci suggests that there is a possibility of the samegenes or gene clusters associated with NFNB resistance.Hence our results corroborated with previous findings thatdisease resistance regions are conserved on the genome(Graner et al. 2000). Furthermore, investigations usinggenetic and molecular analyses have shown that resistancegenes and their analogues/homologues are also clustered ingenomes of different species (Parniske et al. 1997; Meyerset al. 1998).
All of the QTLs identified in Alexis/Sloop, Sloop-sib/Alexis, Arapiles/Franklin, and Sloop/Halcyon, occurred at 5genomic regions that correlated with previously identifiedmajor genes/QTLs conferring net blotch resistance. In Fig. 4,the estimated locations of the ‘putative’ QTLs identified forNFNB resistance in this experiment are compared with thosepreviously reported.
Mean IRs for Alexis and Arapiles differed between theseexperiments and the initial parent screening (Alexis 6.5 and4.5, Arapiles 8 and 10, respectively). In the parentscreening, inoculum was applied with an airbrush, but as thechanges in IRs of the parents were in opposite directions, itis unlikely that this was the reason for disagreement.Inoculum was applied evenly and at the same rate in allexperiments so the variation between experiments was mostlikely a factor of environment. Khan and Boyd (1969b)documented that the resistances of some genotypes wereparticularly sensitive to environmental influences and it isour experience that this occurs more often with genotypesthat are moderately resistant to moderately susceptible, e.g.Alexis.
Isolate NB34 is virulent on the parents Sloop andArapiles, moderately virulent on Alexis, and avirulent onFranklin. In this study, both Sloop and Arapiles appeared tohave a significant QTL on chromosome 2H and 3H,respectively. The alleles at these loci are obviouslyinadequate to impart resistance to these varieties in theseedling stage. The QTL on 3H in Alexis appears to explainthe moderate level of resistance in that variety; however,some 25% of the progeny derived from Alexis and Sloopparents were more resistant than the Alexis parent. It appearsthat recombination of the allele(s) on 2H from Sloop with theallele(s) on 3H from Alexis may have given these lines

Mapping net blotch resistance Australian Journal of Agricultural Research 1365
resistance superior to Alexis. Cherif and Harrabi (1993)showed transgressive segregation of progeny of 2 susceptibleparents, so it is reasonable to expect that a high proportion ofresistant segregants could result from a cross between amoderately susceptible and a susceptible line, each carryingdifferent but complementary genes for resistance.
The resistance in Franklin appears to be conditioned byalleles on chromosomes 2H and 3H. Franklin is stronglyresistant to NB34 isolate of net blotch (IR = 3) and compareswith the most resistant progeny of the Alexis/Slooppopulation. It is suggested that the alleles at these loci have acomplementary gene action and can be further enhancedwhen combined with the relatively ineffective allele on 3Hfrom Arapiles.
In this study, individual QTLs explained 7–64% of thephenotypic variation. Some of the QTL regions with an LODscore of ≥2.5 in DH populations from Alexis/Sloop andSloop/Halcyon were very close to reaching levels ofsignificance (Table 2). Therefore it is possible that thepresence of other ‘potential QTLs’ that may have had asignificant association with the trait, could not be detected
due to the specific environments encountered, pathotypeused, inoculum density/unit area, relatively small populationsizes, and high threshold levels (Beavis 1994). In the presentinvestigation, trait–marker associations were made only atthe seedling stage and this may not translate to resistance inthe adult plant stages. However, for some resistances,seedling resistance to net blotch is closely correlated withadult plant resistance (Tekauz 1986). Steffenson et al. (1996)found that the QTL on chromosome 4H, presumably the oneidentified in the Sloop/Halcyon population, functioned inboth seedling and adult plants.
Besides determining chromosomal locations, QTLanalysis has enabled us to determine genetic control ofNFNB by identifying linked genomic regions, therebyeliminating the need to make arbitrary infection classes fromfrequency distributions. QTL mapping using linkage mapsalso provided markers that can be used directly for markerassisted selection, as most of the maps used in this studywere constructed using both RFLP and microsatellitemarkers. For example, in the Sloop/Halcyon population, amajor QTL explaining 64% of NFNB resistance is
Fig. 4. Barley chromosomes showing mapped chromosome regions associated with net blotch resistance (distances are not marked).

1366 Australian Journal of Agricultural Research H. Raman et al.
associated with microsatellite markers EBmac0906 andGMS089, providing markers suitable for MAS without theneed for further manipulation such as conversion intopolymerase chain reaction format. RFLP and AFLP markersare costly to implement for routine MAS in breedingprograms. On the other hand, microsatellite markers arehighly polymorphic, co-dominant, less costly to assay, andare better suited to automation, therefore providing asuperior alternative.
Our preliminary results on the validation of molecularmarkers associated with NFNB have indicated that the linkedmarkers may be used to select loci for NFNB resistance fromHalcyon. Furthermore, the microsatellite markers mapped inthe QTL region exhibited high polymorphic informationcontent values in Australian and European barley germplasm(Raman et al. 2003), indicating that these markers can beused in different genetic backgrounds. Recently, consensusmaps of barley have been developed (Karakousis et al. 2003,this issue) and this will allow further selection of markersmapped closer to the QTLs identified.
From these studies, the information generated onchromosomal location and identification of markers linkedto genes conferring resistance to NFNB will allow theAustralian barley breeding programs to introgress thesegenes into adapted germplasm and select lines carrying thefavourable alleles using marker assisted selection. Since P.teres is a highly variable pathogen (Steffenson and Webster1992), it is important to combine different QTLs and majorgenes to develop broad spectrum and high levels ofresistance. Genomic regions identified in this study willfacilitate in (1) monitoring introgression of pathotype-specific major genes/QTLs and epistatic gene interactions,(2) pyramiding of different genes conferring resistance to P.teres, (3) establishing pleiotrophy with other traits, and (4)pedigree-based association mapping.
Acknowledgments
The authors thank the Grains Research and DevelopmentCorporation, Australia, for their financial support, andrecognise the valuable technical assistance that made thiswork possible.
ReferencesBarr AR, Jefferies SP, Broughton S, Chalmers KJ, Kretschmer JM,
Boyd WJR, Collins HM, Roumeliotis S, Logue SJ, Coventry SJ,Moody DB, Read BJ, Poulsen D, Lance RCM, Platz GJ, Park RF,Panozzo JF, Karakousis A, Lim P, Verbyla AP, Eckermann PJ (2003)Mapping and QTL analysis of the barley population Alexis × Sloop.Australian Journal of Agricultural Research 54, 1117–1123.
Bauer E, Weyen J, Schiemann A, Graner A, Ordon F (1997) Molecularmapping of novel resistance resistance genes against Barley MildMosaic Virus (BaMMV). Theoretical and Applied Genetics 95,1263–1269. doi:10.1007/S001220050691.
Beavis WD (1994) The power and deceit of QTL experiment lessons fromcomparative QTL studies. In ‘49th Annual Corn and Sorghum IndustryResearch Conference’. pp. 250–266. (ASTA: Washington, DC)
Bockelman HE, Sharp EL, Eslick RF (1977) Trisomic analysis of genesfor resistance to scald and net blotch in several barley cultivars.Canadian Journal of Botany 55, 2142–2148.
Chen FQ, Prehn D, Hayes PM, Mulrooney D, Corey A, Vivar H (1994)Mapping genes for resistance to barley stripe rust (Pucciniastriiformis f.sp. hordei). Theoretical and Applied Genetics 88, 215–219.
Cherif M, Harrabi M (1993) Transgressive segregation for resistance toPyrenophora teres in barley. Plant Pathology 42, 617–621.
Collins NC, Paltridge NG, Ford CM, Symons RH (1996) The Yd2 genefor barley yellow dwarf virus resistance maps close to thecentromere on the long arm of barley chromosome 3. Theoreticaland Applied Genetics 92, 858–864. doi:10.1007/S001220050203.
Doerge RW, Churchill GA (1996) Permutation tests for multiple lociaffecting a quantitative character. Genetics 142, 285–294.
Genger RK, Williams KJ, Raman H, Read BJ, Wallwork H, Burdon JJ,Brown AHD (2003) Leaf scald resistance genes in Hordeumvulgare and Hordeum vulgare ssp. spontaneum: parallels betweencultivated and wild barley. Australian Journal of AgriculturalResearch 54, 1335–1342.
Görg R, Hollricher K, Schulze-Lefert P (1993) Functional analysis andRFLP mediated mapping of the Mlg resistance locus in barley. ThePlant Journal 3, 857–866. doi:10.1046/J.1365-313X.1993.03060857.X.
Graner A, Bauer E (1993) RFLP mapping of the ym4 virus resistancegene in barley. Theoretical and Applied Genetics 86, 689–693.
Graner A, Foroughi-Wehr B, Tekauz A (1996) RFLP mapping of a genein barley conferring resistance to net blotch (Pyrenophora teres).Euphytica 91, 229–234.
Graner A, Michalek W, Streng S (2000) Molecular mapping of genesconferring resistance to viral and fungal pathogens. Barley GeneticsVIII, 45–52.
Graner A, Streng S, Kellermann A, Schiemann A, Bauer E, Waugh R,Pellio B, Ordon F (1999) Molecular mapping and genetic fine-structure of the rym5 locus encoding resistance to different strainsof the Barley Yellow Mosaic Virus Complex. Theoretical andApplied Genetics 98, 285–290. doi:10.1007/S001220051070.
Graner A, Tekauz A (1996) RFLP mapping in barley of a dominantgene conferring resistance to scald (Rhynchosporium secalis).Theoretical and Applied Genetics 93, 421–425. doi:10.1007/S001220050297.
Gupta S, Loughman R, Platz GJ, Lance RCM (2003) Resistance incultivated barleys to Pyrenophora teres f. teres and prospects of itsutilisation in marker identification and breeding. Australian Journalof Agricultural Research 54, 1379–1386.
Haley SD, Knott SA (1992) A simple regression method for mappingquantitative trait loci in line crosses using flanking markers.Heredity 69, 315–324.
Hinze K, Thompson RD, Ritter E, Salamini F, Schulze-Lefert P (1991)Restriction fragment length polymorphism-mediated targeting ofthe ml-o resistance locus in barley (Hordeum vulgare L.).Proceedings of the National Academy of Sciences of the UnitedStates of America 88, 3691–3695.
Jalli M, Robinson J (2000) Stable resistance in barley to Pyrenophorateres f. teres isolates from the Nordic–Baltic region after increase onstandard host genotypes. Euphytica 113, 71–77 doi:10.1023/A:1003912825455.
Karakousis A, Gustafson JP, Chalmers KJ, Barr AR, Langridge P(2003) A consensus map of barley integrating SSR, RFLP, andAFLP markers. Australian Journal of Agricultural Research 54,1173–1185.
Khan TN, Boyd WJR (1969a) Inheritance of resistance to net blotch inbarley. II. Genes conditioning resistance against race W.A.-2.Canadian Journal of Genetics and Cytology 11, 592–597.

Mapping net blotch resistance Australian Journal of Agricultural Research 1367
http://www.publish.csiro.au/journals/ajar
Khan TN, Boyd WJR (1969b) Environmentally induced variability inthe host reaction of barley to net blotch. Australian Journal ofBiological Sciences 22, 1237–1244.
Manly KF, Cudmore RH Jr, Meer JM (2001) Map Manager QTX, cross-platform software for genetic mapping. Mammalian Genome 12,930–932. doi:10.1007/S00335-001-1016-3.
Manninen O, Kalender R, Robinson J, Schulman AH (2000)Application of BARE-1 retrotransposon markers to the mapping ofa major resistance gene for net blotch in barley. Molecular andGeneral Genetics 264, 325–334. doi:10.1007/S004380000326.
Meyers BC, Chin DB, Shen KA, Sivaramakrishnan S, Lavelle DO,Zhang Z, Michelmore RW (1998) The major resistance gene clusterin lettuce is highly duplicated and spans several megabases. ThePlant Cell 10, 1817–1832. doi:10.1105/TPC.10.11.1817.
Mode CJ, Schaller CW (1958) Two additional factors for host resistanceto net blotch in barley. Agronomy Journal 50, 15–18.
Nelson JC (1997) QGENE: software for marker based genomic analysisand breeding. Molecular Breeding 3, 239–245. doi:10.1023/A:1009604312050.
Parniske M, Hammond-Kosack KE, Golstein C, Thomas CM, JonesDA, Harrison K, Wulff BBH, Jones JDG (1997) Novel resistancespecificities results from sequence exchange between tandemlyrepeated genes at the Cf-4/9 locus of tomato. Cell 91, 821–832.
Pecchioni N, Faccioli P, Toubia-Rahme H, Vale G, Terzi V (1996)Quantitative resistance to barley leaf stripe (Pyrenophora graminea)is dominated by one major locus. Theoretical and Applied Genetics93, 97–101. doi:10.1007/S001220050253.
Poulsen DME, Johnston RP, Platz GJ, Fox G, Kelly A, Sturgess JM,Fromm RL, Laufer MJ Inkerman PA Butler D (1999) Effects offoliar diseases on Northern Region grain production in the 1998winter cropping season. In ‘Proceedings of the 9th AustralianBarley Technical Symposium’. Melbourne, Australia. pp. 2.20.01–2.20.05. http://www.regional.org.au/au/abts/1999/poulsen.htm?PHPSESSID=3bfd038b2176fe3721f835f6cfe64379#TopOfPage.
Raman H, Karakousis A, Moroni JS, Raman R, Read BJ, Garvin DF,Kochian LV, Sorrells ME (2003) Development and allele diversityof microsatellite markers linked to the aluminium tolerance geneAlp in barley. Australian Journal of Agricultural Research 54,1315–1321.
Raman H, Moroni JS, Sato K, Read BJ, Scott BJ (2002) Identificationof AFLP and microsatellite markers linked with an aluminiumtolerance gene in barley (Hordeum vulgare L.). Theoretical andApplied Genetics 105, 458–464. doi:10.1007/S00122-002-0934-0.
Raman H, Read BJ (2000) Molecular breeding for resistance to RussianWheat Aphid in barley. Journal of Agricultural Genomics 5, 1–5.(http://www.cabi-publishing.org/gateways/jag/papers00/paper100/indexploo.html)
Ramsay L, Macaulay M, degli Ivanissevich S, MacLean K, Cardle L,Fuller J, Edwards KJ, Tuvesson S, Morgante M, Massari A, MaestriE, Marmiroli N, Sjakste T, Ganal M, Powell W, Waugh R (2000) Asimple sequence repeat based linkage map of barley. Genetics 156,1997–2005.
Read BJ, Raman H, McMichael G, Chalmers KJ, Ablett GA, Platz GJ,Raman R, Genger RK, Boyd WJR, Li CD, Grime CR, Park RF,Wallwork H, Prangnell R, Lance RCM (2003) Mapping and QTLanalysis of the barley population Sloop × Halcyon. AustralianJournal of Agricultural Research 54, 1145–1153.
Richter K, Schondelmaier J, Jung C (1998) Mapping of quantitativetrait loci affecting Drechslera teres resistance in barley withmolecular markers. Theoretical and Applied Genetics 97, 1225–1234. doi:10.1007/S001220051014.
Schaller CW (1955) Inheritance of resistance to net blotch of barley.Phytopathology 45, 174–176.
Shipton WA, Khan TN, Boyd WJR (1973) Net blotch of barley. Reviewof Plant Pathology 52, 269–290.
Smedegaard-Petersen V (1971) Pyrenophora teres f. maculata f. nov.and Pyrenophora teres f. teres on barley in Denmark. Aarsskr K Vet-Landbohojsk, 124–144.
Speakman JB, Pommer EH (1986) A simple method for producinglarge volumes of Pyrenophora teres spore suspension. Bulletin ofthe British Mycological Society 20, 129.
Steffenson BJ, Hayes PM, Kleinhofs A (1996) Genetics of seedling andadult plant resistance to net botch (Pyrenophora teres f. teres) andspot blotch (Cochliobolus sativus) in barley. Theoretical andApplied Genetics 92, 552–558. doi:10.1007/S001220050162.
Steffenson BJ, Webster RK (1992) Quantitative resistance toPyrenophora teres f. teres in barley. Phytopathology 82, 407–411.
Tekauz A (1985) A numerical scale to classify reactions of barley toPyrenophora teres. Canadian Journal of Plant Pathology 7, 181–183.
Tekauz A (1986) Effect of plant stage and leaf position on the reactionof barley to Pyrenophora teres. Canadian Journal of PlantPathology 8, 380–386.
Tekauz A (1990) Characterisation and distribution of pathogenicvariation in Pyrenophora teres f. sp teres and P. teres f. sp. maculatafrom western Canada. Canadian Journal of Plant Pathology 12,141–148.
Tekauz A, Buchannon KW (1977) Distribution and sources ofresistance to biotypes of Pyrenophora teres in Western Canada.Canadian Journal of Plant Pathology 57, 389–395.
Visscher PM, Thompson R, Haley CS (1996) Confidence intervals inQTL mapping by bootstrapping. Genetics 143, 1013–1020.
Wang S, Basten CJ Zeng Zhao-Bang (2003) Windows QTLcartographer program. http://statgen.ncsu.edu/qtlcart/WQTLCart.htm.
Wilcoxson RD, Rasmusson DC, Treeful LM, Suganda T (1992)Inheritance of resistance to Pyrenophora teres in Minnesota barley.Plant Disease 76, 367–369.
Wright RJ, Thaxton PM, EI-Zik KM, Paterson AH (1998) D-subgenome bias of Xcm resistance genes in tetraploid Gossypium(cotton) suggests that polyploid formation has created novelavenues for evolution. Genetics 149, 1987–1996.
Zeng ZB (1994) Precision mapping of quantitative trait loci. Genetics136, 1457–1468.
Manuscript received 31 January 2003, accepted 1 August 2003