Science Education – An Event Staged on Two Stages Simultaneously
Upload
independentCategory
view
0download
0
C
Mr
AGa
b
h
••••
a
ARRAA
KEMSBVf
fha
M
h0
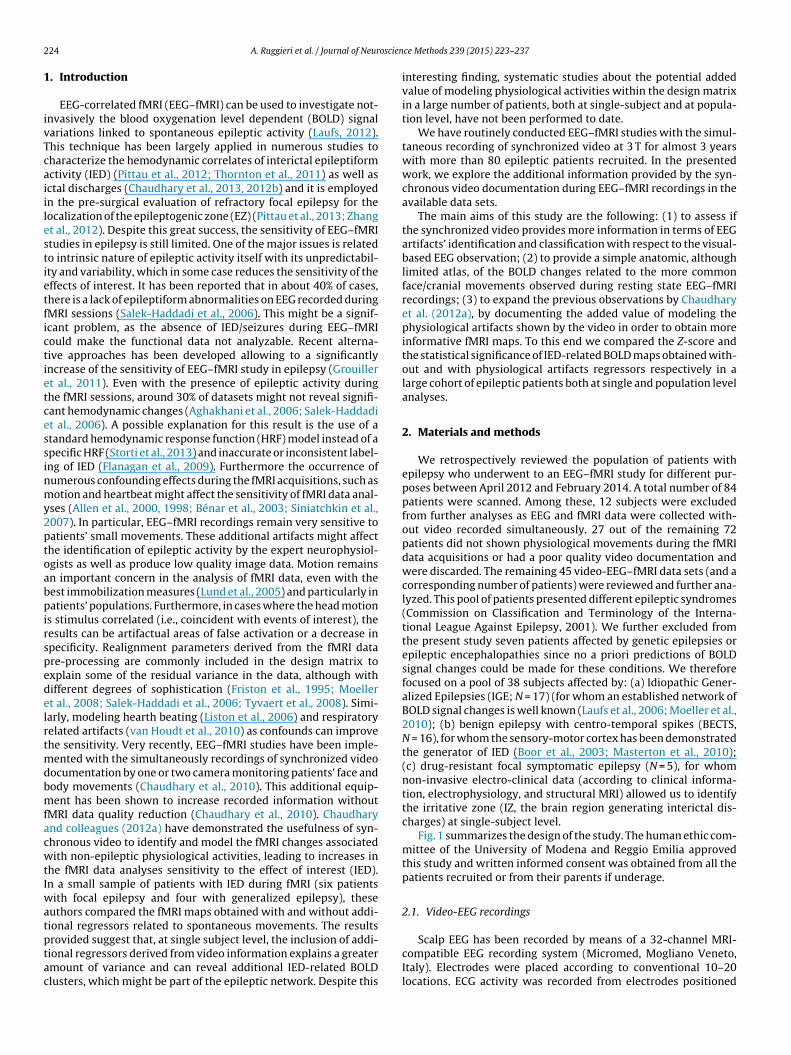
Journal of Neuroscience Methods 239 (2015) 223–237
Contents lists available at ScienceDirect
Journal of Neuroscience Methods
jo ur nal ho me p age: www.elsev ier .com/ locate / jneumeth
linical Neuroscience
apping (and modeling) physiological movements during EEG–fMRIecordings: The added value of the video acquired simultaneously
ndrea Ruggieri a, Anna Elisabetta Vaudanoa, Francesca Benuzzia, Marco Serafinib,iuliana Gessaroli a, Valentina Farinelli a, Paolo Frigio Nichelli a, Stefano Meletti a,∗
Department of Biomedical, Metabolic, and Neural Science, University of Modena and Reggio Emilia, NOCSAE Hospital, ASL Modena, ItalyUnit of Health Physics, ASL, I-41100 Modena, Italy
i g h l i g h t s
Video acquisition during fMRI allows a reliable way to detect facial movements.Modeling facial movements lead to more informative fMRI maps.Inclusion of facial movements in the SPM is particularly important in surgical candidates.We provided a reliable method for brain mapping spontaneous swallowing and blinking.
r t i c l e i n f o
rticle history:eceived 3 June 2014eceived in revised form 6 October 2014ccepted 9 October 2014vailable online 22 October 2014
eywords:EG–fMRIovements
wallowinglinkingideo
MRI data quality
a b s t r a c t
Background: During resting-state EEG–fMRI studies in epilepsy, patients’ spontaneous head–face move-ments occur frequently. We tested the usefulness of synchronous video recording to identify and modelthe fMRI changes associated with non-epileptic movements to improve sensitivity and specificity of fMRImaps related to interictal epileptiform discharges (IED).New methods: Categorization of different facial/cranial movements during EEG–fMRI was obtained for 38patients [with benign epilepsy with centro-temporal spikes (BECTS, n = 16); with idiopathic generalizedepilepsy (IGE, n = 17); focal symptomatic/cryptogenic epilepsy (n = 5)]. We compared at single subject-and at group-level the IED-related fMRI maps obtained with and without additional regressors related tospontaneous movements. As secondary aim, we considered facial movements as events of interest to testthe usefulness of video information to obtain fMRI maps of the following face movements: swallowing,mouth–tongue movements, and blinking.Results: Video information substantially improved the identification and classification of the artifactswith respect to the EEG observation alone (mean gain of 28 events per exam).Comparison with existing method: Inclusion of physiological activities as additional regressors in the GLMmodel demonstrated an increased Z-score and number of voxels of the global maxima and/or new BOLD
clusters in around three quarters of the patients. Video-related fMRI maps for swallowing, mouth–tonguemovements, and blinking were comparable to the ones obtained in previous task-based fMRI studies.Conclusions: Video acquisition during EEG–fMRI is a useful source of information. Modeling physiologicalmovements in EEG–fMRI studies for epilepsy will lead to more informative IED-related fMRI maps indifferent epileptic conditions.© 2014 Elsevier B.V. All rights reserved.
Abbreviations: BECTS, benign epilepsy with centro-temporal spikes; BOLD, blood oxunctional magnetic resonance imaging; FWE, family wise error; GLM, general linear memodynamic response function; ICA, independent component analysis; IED, interictal epgainst epilepsy; IZ, irritative zone; SPM, statistical parametric mapping.∗ Corresponding author at: Department of Biomedical, Metabolic, and Neural Science, Uodena, Italy. Tel.: +39 0593961676; fax: +39 0593961336.
E-mail address: [email protected] (S. Meletti).
ttp://dx.doi.org/10.1016/j.jneumeth.2014.10.005165-0270/© 2014 Elsevier B.V. All rights reserved.
ygen level dependent; DMN, default mode network; EZ, epileptogenic zone; fMRI,odel; GM, global maxima; GSWD, generalized spike and wave discharges; HRF,
ileptic discharges; IGE, idiopathic generalized epilepsies; ILAE, international league
niversity of Modena and Reggio Emilia, NOCSAE Hospital, via Giardini 1355, 41126
2 oscien
1
ivTcaiilestietfictietcessinmy2ptoabpirspedelrtmdbmfacwtIwatptac
24 A. Ruggieri et al. / Journal of Neur
. Introduction
EEG-correlated fMRI (EEG–fMRI) can be used to investigate not-nvasively the blood oxygenation level dependent (BOLD) signalariations linked to spontaneous epileptic activity (Laufs, 2012).his technique has been largely applied in numerous studies toharacterize the hemodynamic correlates of interictal epileptiformctivity (IED) (Pittau et al., 2012; Thornton et al., 2011) as well asctal discharges (Chaudhary et al., 2013, 2012b) and it is employedn the pre-surgical evaluation of refractory focal epilepsy for theocalization of the epileptogenic zone (EZ) (Pittau et al., 2013; Zhangt al., 2012). Despite this great success, the sensitivity of EEG–fMRItudies in epilepsy is still limited. One of the major issues is relatedo intrinsic nature of epileptic activity itself with its unpredictabil-ty and variability, which in some case reduces the sensitivity of theffects of interest. It has been reported that in about 40% of cases,here is a lack of epileptiform abnormalities on EEG recorded duringMRI sessions (Salek-Haddadi et al., 2006). This might be a signif-cant problem, as the absence of IED/seizures during EEG–fMRIould make the functional data not analyzable. Recent alterna-ive approaches has been developed allowing to a significantlyncrease of the sensitivity of EEG–fMRI study in epilepsy (Grouillert al., 2011). Even with the presence of epileptic activity duringhe fMRI sessions, around 30% of datasets might not reveal signifi-ant hemodynamic changes (Aghakhani et al., 2006; Salek-Haddadit al., 2006). A possible explanation for this result is the use of atandard hemodynamic response function (HRF) model instead of apecific HRF (Storti et al., 2013) and inaccurate or inconsistent label-ng of IED (Flanagan et al., 2009). Furthermore the occurrence ofumerous confounding effects during the fMRI acquisitions, such asotion and heartbeat might affect the sensitivity of fMRI data anal-
ses (Allen et al., 2000, 1998; Bénar et al., 2003; Siniatchkin et al.,007). In particular, EEG–fMRI recordings remain very sensitive toatients’ small movements. These additional artifacts might affecthe identification of epileptic activity by the expert neurophysiol-gists as well as produce low quality image data. Motion remainsn important concern in the analysis of fMRI data, even with theest immobilization measures (Lund et al., 2005) and particularly inatients’ populations. Furthermore, in cases where the head motion
s stimulus correlated (i.e., coincident with events of interest), theesults can be artifactual areas of false activation or a decrease inpecificity. Realignment parameters derived from the fMRI datare-processing are commonly included in the design matrix toxplain some of the residual variance in the data, although withifferent degrees of sophistication (Friston et al., 1995; Moellert al., 2008; Salek-Haddadi et al., 2006; Tyvaert et al., 2008). Simi-arly, modeling hearth beating (Liston et al., 2006) and respiratoryelated artifacts (van Houdt et al., 2010) as confounds can improvehe sensitivity. Very recently, EEG–fMRI studies have been imple-
ented with the simultaneously recordings of synchronized videoocumentation by one or two camera monitoring patients’ face andody movements (Chaudhary et al., 2010). This additional equip-ent has been shown to increase recorded information without
MRI data quality reduction (Chaudhary et al., 2010). Chaudharynd colleagues (2012a) have demonstrated the usefulness of syn-hronous video to identify and model the fMRI changes associatedith non-epileptic physiological activities, leading to increases in
he fMRI data analyses sensitivity to the effect of interest (IED).n a small sample of patients with IED during fMRI (six patients
ith focal epilepsy and four with generalized epilepsy), theseuthors compared the fMRI maps obtained with and without addi-ional regressors related to spontaneous movements. The results
rovided suggest that, at single subject level, the inclusion of addi-ional regressors derived from video information explains a greatermount of variance and can reveal additional IED-related BOLDlusters, which might be part of the epileptic network. Despite thisce Methods 239 (2015) 223–237
interesting finding, systematic studies about the potential addedvalue of modeling physiological activities within the design matrixin a large number of patients, both at single-subject and at popula-tion level, have not been performed to date.
We have routinely conducted EEG–fMRI studies with the simul-taneous recording of synchronized video at 3 T for almost 3 yearswith more than 80 epileptic patients recruited. In the presentedwork, we explore the additional information provided by the syn-chronous video documentation during EEG–fMRI recordings in theavailable data sets.
The main aims of this study are the following: (1) to assess ifthe synchronized video provides more information in terms of EEGartifacts’ identification and classification with respect to the visual-based EEG observation; (2) to provide a simple anatomic, althoughlimited atlas, of the BOLD changes related to the more commonface/cranial movements observed during resting state EEG–fMRIrecordings; (3) to expand the previous observations by Chaudharyet al. (2012a), by documenting the added value of modeling thephysiological artifacts shown by the video in order to obtain moreinformative fMRI maps. To this end we compared the Z-score andthe statistical significance of IED-related BOLD maps obtained with-out and with physiological artifacts regressors respectively in alarge cohort of epileptic patients both at single and population levelanalyses.
2. Materials and methods
We retrospectively reviewed the population of patients withepilepsy who underwent to an EEG–fMRI study for different pur-poses between April 2012 and February 2014. A total number of 84patients were scanned. Among these, 12 subjects were excludedfrom further analyses as EEG and fMRI data were collected with-out video recorded simultaneously. 27 out of the remaining 72patients did not shown physiological movements during the fMRIdata acquisitions or had a poor quality video documentation andwere discarded. The remaining 45 video-EEG–fMRI data sets (and acorresponding number of patients) were reviewed and further ana-lyzed. This pool of patients presented different epileptic syndromes(Commission on Classification and Terminology of the Interna-tional League Against Epilepsy, 2001). We further excluded fromthe present study seven patients affected by genetic epilepsies orepileptic encephalopathies since no a priori predictions of BOLDsignal changes could be made for these conditions. We thereforefocused on a pool of 38 subjects affected by: (a) Idiopathic Gener-alized Epilepsies (IGE; N = 17) (for whom an established network ofBOLD signal changes is well known (Laufs et al., 2006; Moeller et al.,2010); (b) benign epilepsy with centro-temporal spikes (BECTS,N = 16), for whom the sensory-motor cortex has been demonstratedthe generator of IED (Boor et al., 2003; Masterton et al., 2010);(c) drug-resistant focal symptomatic epilepsy (N = 5), for whomnon-invasive electro-clinical data (according to clinical informa-tion, electrophysiology, and structural MRI) allowed us to identifythe irritative zone (IZ, the brain region generating interictal dis-charges) at single-subject level.
Fig. 1 summarizes the design of the study. The human ethic com-mittee of the University of Modena and Reggio Emilia approvedthis study and written informed consent was obtained from all thepatients recruited or from their parents if underage.
2.1. Video-EEG recordings
Scalp EEG has been recorded by means of a 32-channel MRI-compatible EEG recording system (Micromed, Mogliano Veneto,Italy). Electrodes were placed according to conventional 10–20locations. ECG activity was recorded from electrodes positioned

A. Ruggieri et al. / Journal of Neuroscience Methods 239 (2015) 223–237 225
F tive p2 ed baa
ompifipE
apustotlpTtMtId
2
atvu
ig. 1. Flowchart of the present study. We retrospectively reviewed all the consecu012 until the 28th of February 2014. The selected cohort of patients was then dividcquisitions. See main text for detailed description of the study design.
ver the chest. Prior to in-magnet EEG recording, 10 min out-ofagnet EEG was collected in a room adjacent to the scanner. Foam
ads were used to help secure the EEG leads, minimize motion andmprove the patient’s comfort. Data were transmitted via an opticber cable from the amplifier (1024 Hz sampling rate) to a com-uter located outside the scanner room. To avoid saturation, theEG amplifiers have a resolution of 22 bits with a range of ±25.6 mV.
The patient was constantly observed and recorded by means of small camcorder positioned on the head coil inside the scannerointing to the patient’s face to obtain a split-screen video-EEG doc-mentation during the fMRI recording. The system is formed by amall video-camera (2 cm3) shielded using copper tape and fixed onhe coil by means of a flexible arm which allows to orient the pointf greatest clinical interest. The camera has been installed on a sys-em of infrared illumination that allows making recordings even inow light conditions. The camera is equipped with a cable, appro-riately shielded, used both for power and for signal transmission.he video signal, still in analog format, once crossed the penetra-ion panel of the scanner room, is sent to a control monitor in the
RI console and to a PC for recording synchronized video-EEG datahrough a commercial digital system (Micromed, Mogliano Veneto,taly). The patient was asked to rest with eyes closed and keep stilluring fMRI acquisitions.
.2. fMRI acquisition
Functional data have been acquired using Philips Intera system
t 3 T and a gradient-echo echo-planar sequence from 30 axial con-iguous slices (TR = 3.000 ms; TE = 50 ms; in-plane matrix = 64 × 64;oxel size: 4 × 4 × 4) over two 10-min sessions (200 vol-mes/session) with continuous simultaneous EEG recording. Aatients with epilepsy that underwent an EEG–fMRI recording from the 1st of Aprilsed on the presence of good quality video recorded simultaneously during the fMRI
high-resolution T1-weighted anatomic image has been acquired toallow accurate anatomic localization of BOLD increases/decreases.The volume consisted of 170 sagittal slices (TR = 9.9 ms; TE = 4.6 ms;in plane matrix = 256 × 256; voxel size = 1 mm × 1 mm × 1 mm).
2.3. Data processing
2.3.1. Video-EEG data analysisOff-line analysis of the EEG was performed by means of the
BrainQuick System Plus software (Micromed, Mogliano Veneto,Italy), including the correction of the gradient artifacts (Allen et al.,2000) and filtering of the EEG signal. In addition, the EEG data wereexported in the .edf format and reviewed and analyzed by meansof the BrainVision Analyzer 2.0 software (Brain Products, Munich,Germany). A bandpass filter between 1 and 70 Hz was applied tothe continuous recording and channels showing high impedance orelectrode displacement artifacts were interpolated through a cubicspline. EEG Independent Component Analysis (ICA) (Avanzini et al.,2014; Bell and Sejnowski, 1995; Makeig et al., 2004; Vaudano et al.,2014) was applied in order to separate the generators of EEG activ-ities by maximizing the statistical independence among them. Tooptimize artifactual activities detection, blinks and saccades weremarked on channel Fp1; R-peaks due to cardiac artifact were alsomarked for subsequent artifact removal when present.
Two experienced epileptologist (AR, AEV) reviewed the videorecordings independently in order to identify movements. Thefollowing physiological activities of not epileptic origin were con-
sidered: (1) swallowing, (2) lower face movements (this includeslip smacking, lip twitches and chewing), (3) blinking and eyesmovements, (4) head jerks, (5) voluntary speech, and finally(6) yawning. After identification, the physiological artifacts were
2 oscience Methods 239 (2015) 223–237
mlrbm
(esoe
2
Nfrsf
ows
f2ie
(
r
v(
smid
ow(Btstwmwe
(Gtvdwrq
p
iw
Table 1Details of physiological movements classification.
Movementtype
Total no.of events
No. ofpatients
No. of movementsper patient
Blinking and eyes movements 594 15 39.6Head jerks 410 27 15.2Lower face movements 263 30 8.8Swallowing 152 23 6.6Voluntary speech 3 2 –
26 A. Ruggieri et al. / Journal of Neur
anually marked on EEG and exported as single event or variable-ength blocks depending on their duration observed by video. Theesulted export files were included within the fMRI models (seeelow) and treated as regressor together with the IEDs and realign-ent parameters.In a subsequent analysis, two expert electroencephalographers
SM, GG) reviewed all the pre-processed EEG data sets (after gradi-nt and cardiac artifact removal) blindly from the video (and ILAEyndrome classification of patients) and marked the visually rec-gnized artifacts and IEDs on the EEG trace. These events werexported and included in the fMRI model as event of interest.
.3.2. fMRI data analysisThe Matlab 7.1 and SPM8 (Welcome Department of Imaging
euroscience, London, United Kingdom) software was used forMRI data analysis. All functional volumes were slice time cor-ected, realigned to the first volume acquired, normalized to atandard EPI template and smoothed with 8 mm × 8 mm × 8 mmull-width half maximum (FWHM) Gaussian Kernel.
First level analysis. In order to provide the hemodynamic mapsf the recorded IED and movements, the fMRI data were analyzedithin the General Liner Model (GLM) framework. For each EPI
ession and each patient, three GLMs were constructed as follows:GLM1 includes (i) the effect of interest (IED) represented as stick
unctions or blocks (for runs or series of events) as appropriated; (ii)4 realignment parameters [six scan realignments parameters from
mage pre-processing and a Volterra expansion of these (Fristont al., 1996)] as confounds.
GLM2 includes (i) IED; (ii) visually recognized artifacts on EEGblindly from the video); (iii) 24 realignment parameters.
GLM3 includes (i) IED; (ii) video-based movements; (iii) 24ealignment parameters.
For each GLM, IEDs and physiological movements were con-olved with HRF plus temporal (TD) and dispersion (DD) derivativesLemieux et al., 2008).
For those patients who did not show IED during fMRI acqui-itions, the GLM was constructed by including the physiologicalovements and 24 realignment parameters only. This was done
n order to obtain an atlas of the head–facial movements indepen-ently on the presence of IED.
The fMRI [F]-maps for each GLM were generated for each effectf interest: IED and physiological movements. The resulted mapsere thresholded at p < 0.05, corrected for multiple comparisons
FWE). An uncorrected threshold (p < 0.001) was considered if theOLD maps did not revealed any changes at the more conserva-ive approach. This was motivated by the following reasons: (a) thetatistical significance of fMRI maps has been used as criteria forhe GLMs comparisons both at single and group-level analyses; (b)e aim to extract as much information as possible from the fMRIaps and any hemodynamic cluster coming out from the GLMsas evaluated in term of its clinical meaning by comparison with
lectro-clinical information.The cluster containing the statistically most significant change
global maxima: GM) and other clusters resulting from the threeLMs were compared for their statistical significance and spa-
ial extent (number of voxels and Z-score). BOLD clusters in theentricular system, vascular tree and the edges of the brain wereiscarded. The number of scans affected by head motion >0.2 mmas calculated using a specific script, analogously to previous
eports (Chaudhary et al., 2012a; Salek-Haddadi et al., 2006) foruality control of the acquired data.
Group-level analysis. Two fMRI data second-level analyses were
erformed to satisfy the main aims of the work.In order to provide a brain atlas of the physiological artifactsn term of BOLD changes, a second-level random effect analyses
as performed by grouping the parameter estimates obtained by
Yawning 2 1 –
single-subject analyses relative of each type of physiological effectas classified previously. Group-level analysis results were consid-ered significant at the p < 0.05 corrected for FWE. The fMRI t-mapswere superimposed on the canonical T1-weighted images as imple-mented in SPM8.
In order to compare at the group level the IED-related BOLDmaps obtained without and with additional regressors for phys-iological movements, patients belonging to two homogeneousepileptic conditions (IGE and BECTS) were selected. For both pop-ulation, the single-subject derived contrast images related to thethree GLMs, separately, were collected and a random effect wasperformed within each group. The resulted fMRI maps were thresh-olded at the p < 0.05 corrected for FWE. The group-level analyseswere compared in term of Z-score and the statistical significance ofIED-related BOLD clusters.
3. Results
The different types and numbers of detected movements aresummarized in Table 1. Regarding the prevalence of physiologicalmovements in the population, a high proportion of patients dis-played lower face movements (30/38, 78%) and head jerks (27/38,71%), followed by swallowing (23/38, 60%), blinking and other eyesmovements (15/38, 39%), and only a few spoke (2/38, 5%) or yawned(1/38, 2%). The different types of physiological movements wereequally distributed among patients’ groups belonging to differentILAE syndromes (Chi-square test).
As expected, the video-based analysis allowed the recognitionof a greater number of events related to physiological movementswith respect to the EEG-based analysis (Supplementary Table 1).Indeed, the total number of physiological movements identified byvideo was 1424 versus 632 detected by EEG observation. Similarly,among the different physiological events, the expert, by looking theEEG without video, was able to classify only blinking events whilethe other artifacts were generally described as “general move-ments” without any further classification. In particular the expertidentified 557 general movements and 75 blinking. Notably, in 31out of 38 patients (82%) the video analysis was superior to EEG inthe identification of physiological movements with a mean gainof 28.3 events per exam. Interestingly, in seven patients (18%) theexpert marked more artifacts by the EEG-based analysis than wereobserved on the video inspection. These were false positive resultsdue to the attribution of movement to artifacts with a differentorigin (e.g. electrode contact or gradient artifacts).
Supplementary Table 1 related to this article can be found, inthe online version, at http://dx.doi.org/10.1016/j.jneumeth.2014.10.005.
3.1. BOLD changes related to physiological movements
A random effect group analysis was performed for the followingphysiological movements (Fig. 2 and Table 2): (1) swallowing; (2)lower face movements; (3) head jerks; (4) blinking. Given the smallnumber of patients, we performed only a single-subject analysis for

A. Ruggieri et al. / Journal of Neuroscience Methods 239 (2015) 223–237 227
Fig. 2. BOLD maps of the recorded facial movements. Swallowing (23 patients), lower face movements (30 patients), blinking (14 patients) and head jerks (27 patients) weremodeled at the group level by using a random-effect analysis. Saccades, speech and yawning were displayed as resulted from a single subject-level analysis. All the displayedB emenS h phy
taBaLabt(B
OLD changes (all BOLD increases) are overlaid into the canonical T1 image as implee the main text for a detailed description of the BOLD modification related to eac
he voluntary speech, “other eye movements” events (saccades),nd the yawning. At the group level, swallowing corresponds toOLD signal increases over the bilateral sensory-motor cortex (GMt the left precentral gyrus), right precuneus and bilateral thalamus.ower face movements were correlated to positive BOLD changest the sensory-motor cortex (GM at the left precentral gyrus) while
linking demonstrated an hemodynamic increase covering a pos-erior network which includes the left posterior cingulate cortexGM) and the bilateral calcarine cortex. Head jerks correspond toOLD signal increases at the bilateral sensory-motor cortex andted in SPM8. For all the maps the statistical threshold is p < 0.05 corrected for FWE.siological event.
supplementary motor area (SMA). Notably, no decreases in BOLDsignal were observed related to any type of physiological activity.
3.2. IED-related BOLD changes
Among the 38 patients, 28 (73%) presented IED during the fMRI
recordings. These patients were affected by IGE (13 cases), BECTS(11 cases), focal epilepsies (4 cases). The electro-clinical infor-mation are summarized in the Supplementary Table 2. The IEDrecorded were represented by focal single spikes or sharp-waves
228 A. Ruggieri et al. / Journal of Neuroscien
Table 2BOLD changes related to physiological movements at group-level analysis.
Movement’s type BOLD change* No. of voxel Z-score
Swallowing Bilateral sensory-motorcortex
81 5.51
Right precuneus 110 5.50Left thalamus 12 5.15
Lower face movements Bilateral sensory-motorcortex
385 4.89
Blinking Left posterior cingulate 15 4.06Calcarine cortex 1563 4.03
Headjerks
Bilateral sensory-motorcortex
1038 4.41
Bilateral supplementary 7689 4.80
wrdm
t1
3
(st#B2aor
BmdWup“
targs
coseBctt(ctsoi
motor area
* Threshold P < 0.05 corrected for FWE.
ith different localization in patients with BECTS and drug-esistant focal epilepsies, run of generalized spike-and-waveischarges (GSWD) in IGE. The number of scans affected by headotion (≥0.2 mm) ranged from 0 to 78 (Table 3).Supplementary Table 2 related to this article can be found, in
he online version, at http://dx.doi.org/10.1016/j.jneumeth.2014.0.005.
.2.1. IGE subgroupThe number of GSWD per session ranged between 0 and 28
median: 4, medium length: 1.33 s) (Table 3). For each GLM and IGEubject, fMRI data analyses revealed BOLD changes at a statisticalhreshold of p < 0.05 corrected for FWE. 11 out of 13 patients (#1, #3,5, #7, #10, #12, #13, #14, #15, #16, #17) shown GSWD-relatedOLD maps concordant with the available literature (Benuzzi et al.,012; Gotman, 2008; Moeller et al., 2008; Vaudano et al., 2009)cross all the three GLMs. In one case (#11), such map was revealednly by the GLM in which physiological activities were included asegressor (GLM2 and GLM3).
The location, number of voxels and statistical significance ofOLD clusters for each GLM are shown in Table 4. Given theain purpose of the present work, we will describe the results
erived from the comparison of the GLM3 versus GLM1 and GLM2.hen comparing the Z-scores and number of voxels, these val-
es increased for the global maxima or other blobs in 6 out of 13atients (#5, #7, #10, #11, #14, #15) (highlighted by the symbols�” “©” in Table 4).
GLM3 related BOLD maps revealed additional IED-related clus-ers in 4/13 patients (#7, #9, #11, #15) with respect to the GLM1nd only in one case (#7) with respect to the GLM2 (highlighted ined in Table 4), while no cluster was lost. In one patient (#13), thelobal maxima Z-score was increased for the GLM3, but the clusterize decreased.
At the group level (Fig. 3), GLM1 showed no GSWD-related BOLDhanges at the threshold of 0.05 FWE. At a less conservative thresh-ld (p < 0.001, uncorrected for FWE) the GLM1-based fMRI maphown hemodynamic increases at the bilateral thalami, while bilat-ral DMN, bilateral basal ganglia and superior frontal gyrus shown aOLD decrease. GLM2 demonstrated GSWD-related negative BOLDhanges at the left precuneus when applying a conservative sta-istical approach (p < 0.05 FWE corrected), while no increase inhe thalamic structure were detected even at a lower thresholdsee Table 5). Finally, GLM3 displayed GSWD-related hemodynamichanges over the posterior part of the DMN by using a statistical
hreshold of p < 0.05 corrected for FWE. When applying a less con-ervative approach, the revealed BOLD pattern was similar to thene shown by the GLM1 and GLM2, but the Z-score of all the clustersncreased (see Table 5).ce Methods 239 (2015) 223–237
3.2.2. BECTS subgroupThe number of IED per session ranged between 0 and 640
(median: 250) (see Table 3). GLM3 revealed IED-related BOLDchanges at a statistical threshold of p < 0.05 corrected for FWE inall the subjects, while GLM1 in 10/11 and GLM2 in 7/11. The loca-tion, number of voxels and statistical significance of BOLD clustersfor the three GLMs are shown in Table 4. In all the BECTS patients,the results of all GLMs were concordant in term of the global max-ima: in 7 out 11 cases (#25, #26, #29, #30, #33, #34, #36) the globalmaxima was located over the sensory-motor cortex. Two patientsdemonstrated a main hemodynamic increases at the inferior pari-etal lobuli (#27, #37) while one case had the global maxima at theoccipital cortex (#31) and one at the temporal lobe (#23). In sevenpatients (#23, #26, #30, #31, #34, #36, #37), the number of vox-els and the Z-score of the IED-related global maxima increased forGLM3 compared to GLM1 and GLM2 (highlighted by the symbols“�” “©” in Table 4).
Additional IED-related BOLD clusters were revealed by GLM3 for2 out of 11 patients (#30, #34) (highlighted in red in Table 4).
The second-level analyses (Fig. 4) were performed for right-sided centro-temporal spikes across the 11 patients. At the grouplevel, the three GLMs revealed an isolated blob of BOLD signalincrease at the right post-central gyrus by applying a conservativestatistical approach (p < 0.05 FWE corrected). The cluster size andthe Z-score of this cluster were higher for GLM3 compared to theGLM1 and GLM2 (Table 5).
3.2.3. Drug-resistant focal epilepsy subgroupFour patients (three females) affected by focal epilepsy had
IED during the EEG–fMRI recordings (Supplementary Table 2 andTable 3). The number of IED per session ranged between 0 (session1,Pt#19) and 179 (session1, Pt#18) (median: 120). The results of thethree GLMs for each patient are displayed into Fig. 5 and Table 6.
Patient #18, affected by right posterior focal epilepsy, showedright occipital spikes during the fMRI recordings. The GLM1 demon-strated a small blob as BOLD decrease at the right pre-central gyruswhen using an uncorrected threshold (p < 0.001). On the contrary,GLM2 and GLM3 showed highly significant (p < 0.05 corrected forFWE) main cluster of positive BOLD change at the right temporo-occipital cortex. The cluster size and the Z-score were higher forGLM3 compared to the GLM2 (highlighted by the symbol “©” inTable 6). The location of this cluster is congruent with the presumedirritative zone as determined by non-invasive pre-surgery workup.
Patient #19 showed bilateral temporo-parietal spike-wave withright-side predominance. All the three GLMs revealed a similarBOLD pattern concordant with the presumed IZ. However, theGLM1 and GLM2 results showed additional small blobs distant fromthe presumed IZ (the left middle temporal gyrus and left middlefrontal gyrus) that disappeared with the GLM3 analysis.
Patient #20 was affected by a posterior cryptogenic focalepilepsy. The scalp EEG revealed spikes mapping over the right andleft parieto-occipital leads independently. The three GLMs showeda similar fMRI map with positive BOLD change at the bilateralfusiform cortex. However, cluster size and Z-score were higherfor GLM3 respect with both GLM1 and GLM2 (highlighted by thesymbols “�” and “©” in Table 6).
Patient #22 is affected by symptomatic focal epilepsy of rightparietal polymicrogyria. Right temporal spike-wave were recordedduring the fMRI sessions. GLM1 and GLM3 demonstrated a globalmaxima located at the peripheral edge of the dysplasia, while for
the GLM2 it was located at the bilateral, more left, superior frontalgyrus. The results of GLM3 were of greater Z-score and number ofvoxels with respect to GLM1 and GLM2 (highlighted by the symbols“�” and “©” in Table 6).
A. Ruggieri et al. / Journal of Neuroscience Methods 239 (2015) 223–237 229
Table 3Interictal epileptic discharges (IED) and head motion during video-EEG–fMRI.
Pt ID ILAE syndrome EPI session IED type No. of IED Mean length (s) (Inter scan > 0.2 mm)
1 IGE 1 GSWD 5 1.33 222 GSWD 4 1.44 23
3 IGE 1 GSWD 12 3.43 512 GSWD 21 3.15 24
5 IGE 1 GSWD 6 3.17 72 GSWD 6 5.31 11
7 IGE 1 GSWD 2 5.45 192 GSWD 2 3.51 74
9 IGE 1 GSWD 3 2.03 452 GSWD 3 3.95 38
10 IGE 1 GSWD 5 5.19 02 GSWD 27 1.78 0
11 IGE 1 GSWD 4 3.52 152 GSWD 19 2.83 0
12 IGE 1 GSWD 9 5.18 72 GSWD 28 1.60 48
13 IGE 1 GSWD 2 2.22 02 GSWD 4 1.20 17
14 IGE 1 0 0 0 22 GSWD 6 4.11 10
15 IGE 1 GSWD 4 2.23 02 GSWD 2 2.77 0
16 IGE 1 GSWD 3 1.46 102 GSWD 14 1.60 31
17 IGE 1 GSWD 4 1.66 52 GSWD 1 1.12 3
18 FE 1 R O S 179 <1 72 R O S 58 <1 21
19 FE 1 0 0 0 322 B P SW(>R) 7 3.87 17
20 FE 1 R PO S; L PO S 178; 120 <1 432 R PO S; L PO S 143; 178 <1 21
22 FE 1 R TP SW 23 <1 02 R TP SW 25 <1 3
23 BECTS 1 R T SW 260 <1 152 R T SW 135 <1 42
25 BECTS 1 B TO S 360 <1 492 B TO S 302 <1 24
26 BECTS 1 L CT S 53 <1 422 B CT S 90 <1 24
27 BECTS 1 R CT S 150; 97 <1 732 R CT S 138 <1 57
29 BECTS 1 L CT S 53 <1 432 B CT S 90 <1 78
30 BECTS 1 R CT S 150 <1 522 R CT S 138 <1 70
31 BECTS 1 L FCT SW 261 <1 672 B FCT SW 288 <1 49
33 BECTS 1 B T Sh W 240 <1 72 B T Sh W 279 <1 5
34 BECTS 1 B CT SW 541 <1 02 B CT SW 640 <1 7
36 BECTS 1 B FC S 47 <1 502 0 0 0 32
37 BECTS 1 B CTP SW 506 <1 382 B CTP SW 524 <1 24
IGE: idiopathic generalized epilepsy; BECTS: benign epilepsy with centro temporal spikes; FE: focal epilepsy; GSWD: generalized spike-wave discharges; B: bilateral; L: left; R:right; S: spike; ShW: sharp wave; SW: spike-wave; P: parietal; O: occipital; TP: temporo-parietal; PO: parieto-occipital; T: temporal; CT: centro-temporal; FC: fronto-central;TO: temporo-occipital; FCT: fronto-centro-temporal; CTP: centro-parieto-temporal.

230 A. Ruggieri et al. / Journal of Neuroscience Methods 239 (2015) 223–237
Table 4IED-related BOLD changes in IGE and BECTS patients.
Pt ID ILAE syndrome Location (sign of BOLD changes)/no. of voxels/Z-score
GLM1 GLM2 GLM3
1 IGE 1.B MOG(i)/173/7.18 1.B MOG(i)/165/7.02 1.B MOG(i)/126/6.782.B MFG(i)/290/6.20 2.B MFG(i)/261/6.23 2.B MFG(i)/125/5.313.B MeFG(i)/338/6.14 3.B P(d)/217/5.33 3.B MeFG(i)/172/5.824.B P(d)/240/5.01 4.B MeFG(i)/534/5.01 4.B P(d)/78/5.78
3 IGE 1.DMN(d)/74660/ > 7.71 1.DMN(d)/80391/ > 7.24 1.DMN(d)/22238/ > 7.012.B Th(i)/1603/ > 7.71 2.B Th(i)/80391/ > 7.24 2.B Th(i)/1093/ > 7.013.B BG(d)/809/ > 7.71 3.B BG(d)/992/ > 7.24
5 IGE 1.DMN(d)/18920/ > 7.34 1.DMN(d)/18620/ > 7.51 1.DMN(d)/18950/ > 7.9 �©2.B Th(i)/605/6.89 2.B Th(i)/524/7.33 2.B Th(i)/485/6.573.B Ce(d)/306/6.83 3.B Ce(d)/296/6.53 3.B Ce(d)/355/6.91 �©4.B Insula(i)/120/6.04 4.B Insula(i)/138/6.12 4.B Insula(i)/98/5.745.R BG(d)/21/5.27 5.R BG(d)/11/5.05 5.R BG(d)/14/5.18
7 IGE 1.DMN(d)/1311/ > 7.78 1.DMN(d)/1311/ > 7.78 1.B MFG(i)/974/7.502.B BG(d)/272/6.77 2. B BG(d)/272/6.77 2.DMN(d)/1054/6.783.B Th(i)/55/5.55 3. B Th(i)/55/5.55 3.B BG(d)/234/6.55
4.B Th(i)/121/5.69�©9 IGE 1.B PCG(i)/2913/ > 7.61 1.B PCG(i)/3349/ > 7.70 1.B PCG(i)/1567/ > 7.12
2.B IPL(i)/609/7.61 2.B IPL(i)/658/7.70 2.B IPL(i)/475/6.913. B SMA(i)/640/5.38 3.B SPL(i)/744/6.50 3.B SPL(i)/522/6.12
4.B SMA(i)/601/6.36 4.B SMA(i)/312/5.84
10 IGE 1.DMN(d)/2939/ > 7.75 1.DMN(d)/5417/ > 7.82 1.B Th(i)/1770/ > 7.57�©2.B Th(i)/1394/ > 7.05 2.B Th(i)/1294/ > 7.40 2.DMN(d)/1628/6.903.B BG(d)/248/5.85 3.B Ce(d)/482/6.47 3.B BG(d)/24/5.274.B Ce(d)/84/5.60 4.B BG(d)/417/5.74 4.B Ce(d)/49/5.18
11 IGE 1.L Ce(i)/45/5.69 1.DMN(d)/19712/ > 7.57 1.DMN(d)/26127/ > 7.78 ©2.B Ce(i)/1018/6.91 2.B Ce(i)/2445/7.46 �©3.B BG(d)/25/5.01 3.B BG(d)/292/6.46 ©
12 IGE 1.DMN(d)/82852/ > 5.67 1.DMN(d)/63813/ > 5.71 1.DMN(d)/80886/ > 5.502.B BG(d)/3271/ > 5.67 2.B BG(d)/2279/ > 5.71 2.B BG(d)/3365/ > 5.503.B Th(i)/2381/ > 5.67 3.B Th(i)/1938/ > 5.71 3.B Th(i)/2378/ > 5.50
13 IGE 1.B STG(d)/278/6.11 1.L STG(i)/308/6.22 1.L STG(d)/230/6.302.B MFG(d)/108/5.84 2.R IFG(d)/161/6.283.R IFG(d)/243/5.70 3.L P(d)/101/5.71 �4.L P(d)/140/5.23 4. B MFG(d)/65/5.66
14 IGE 1.DMN(d)/3746/ > 7.84 1.DMN(d)/3905/ > 7.14 1.DMN(d)/4125/ > 7.90 �©2.B BG(d)/681/7.05 2.B BG(d)/682/7.14 2.B BG(d)/707/7.08 �©
15 IGE 1.L SPL(d)/56/5.07 1.L SPL(d)/167/5.41 1.L SPL(d)/627/5.51�©2.R P(d)/31/4.96 2.R P(d)/190/5.33 ©
16 IGE 1.L IPL(d)/725/6.28 1.L IPL(d)/307/5.89 1.L IPL(d)/315/5.712.L SFG(d)/111/5.65 2.L SFG(d)/21/5.18 2.L SFG(d)/48/5.38
17 IGE 1.R SFG(d)/175/7.20 1.R SFG(d)/30/5.39 1.R IFG(d)/731/6.972.B P(d)/3292/6.43 2.L PCG(i)/11/4.99 2.R SFG(d)/537/6.063.R IFG(d)/1228/6.28 3.R MFG(d)/17/4.97 3.B IPL(d)/1038/5.954.B IPL(d)/3292/5.57 4.B P(d)/38/4.96 4.B P(d)/1038/5.72
23 BECTS 1.R STG(i)/11/5.13 1.R STG(d)/2/4.90 1.R STG(i)/15/5.24 �©25 BECTS 1.R PCG(i)/141/6.98 1.R PCG(i)/126/6.80 1.R PCG (i)/139/6.80
26 BECTS 1.R PCG(i)/46/5.19 1.R PCG(i)/56/5.22 1.R PoCG(i)/70/5.27�©2.R PoCG(i)/46/5.19 2.R PoCG(i)/56/5.18 2.R PCG (i)/70/5.25�©
27 BECTS 1.R IPL(i)/23/4.98 1.R IPL(i)/3/4.72 1.R IPL(i)/9/4.90 ©29 BECTS 1.R PoCG(i)/3/4.67 *1.R PoCG(i)/80/4.48 1.R PoCG(i)/5/4.72�©
*2.R FG(i)/126/3.96
30 BECTS SR: 1.R PCG(i)/1/4.44 SR:*1.R PCG(i)/314/4.36 SR: 1. R PCG(i)/3/4.70 �©SL:*1.LPoCG(i)/46/3.78
31 BECTS 1.L Calcarine Cortex(i)/1/4.43 *1.L Calcarine Cortex(i)/207/4.34 1.L Calcarine Cortex(i)/1/4.23
33 BECTS 1.R PoCG(i)/322/6.52 1.R PoCG(i)/331/6.51 1.R PoCG(i)/305/6.422.R PCG(i)/322/6.46 2.R PCG(i)/331/5.36 2.R PCG(i)/305/6.17
34 BECTS 1.B PCG(i)/3479/7.34 1.B PCG(i)/3451/7.42 1.B PCG(i)/4240/7.56 �©2.B Insula(i)/3451/6.96 2.B Insula(i)/2181/7.50 ©
36 BECTS *1.B PoCG(i)/669/4.65 *1.B PoCG(i)/669/4.65 1.R PoCG(i)/18/4.92 �©

A. Ruggieri et al. / Journal of Neuroscience Methods 239 (2015) 223–237 231
Table 4 (Continued)
Pt ID ILAE syndrome Location (sign of BOLD changes)/no. of voxels/Z-score
GLM1 GLM2 GLM3
37 BECTS 1.B IPL(i)/47565/ > 7.73 1.B IPL(i)/45168/ > 7.09 1.B IPL(i)/42874/ > 7.362.B SMA(i)/434/ > 7.73 2.B Insula(i)/45168/ > 7.09 2.B SMA(i)/380/ > 7.36 ©3. B Th(i)/81/ > 7.73 3.B SMA(i)/81/ > 7.09 3.B Insula(i)/81/ > 7.364.B Insula(i)/81/ > 7.73 4.R Calcarine Cortex (i)/81/ > 7.09 4.B Th(i)/195/6.55 ©5.R Calcarine Cortex(i)/174/7.73 5.B Th(i)/78/ > 6.73 5.R Calcarine Cortex(i)/22/5.11
For each subject, the areas showing BOLD signal changes are listed by number of voxels and Z-score. IGE: idiopathic generalized epilepsy; BECTS: benign epilepsy with centrotemporal spikes; the symbol “�” highlighted BOLD clusters for which the cluster size, Z-score and statistical significance increased from GLM3 respect to GLM1; the symbol“©” highlighted BOLD clusters for which the cluster size, Z-score and statistical significance increased from GLM3 respect to GLM2. Additional BOLD clusters are shown inred color. B: bilateral; L: left; P: precuneus; R: right; AC: anterior cingulate; BG: basal ganglia; Ce: cerebellum; Cu: cuneus; LG: lingual gyrus; Po: pons; Pu: putamen; SL: leftside centro-temporal spikes; SR: right side centro-temporal spikes; Th: thalamus; DMN: default mode network; IFG: inferior frontal gyrus; IOG: inferior occipital gyrus; IPL:inferior parietal lobule; ITG: inferior temporal gyrus; MFG: middle frontal gyrus; MOG: middle occipital gyrus; MTG: middle temporal gyrus; PCG: precentral gyrus; SFG:superior frontal gyrus; SMA: supplementary motor area; SOG: superior occipital gyrus; SPL: superior parietal lobule; STG: superior temporal gyrus; TO: temporo-occipitaljunction; MeFG: medial frontal gyrus; PoCG: postcentral gyrus; *p = 0.001 uncorrected.
Fig. 3. Group analyses results related to the IED in IGE population. Panel A demonstrated the BOLD maps ({F} SPM map) related to each GLM. While the DMN involvementwas documented by all the GLMs (even with different thresholds), the thalamic hemodynamic change was observed only by the GLM1 and GLM3. The crosshair indicates theglobal maxima. The hemodynamic changes are overlaid on the T1 canonical image. See the text for detailed description of the BOLD signal increases/decreases. R = right; n.c.:not corrected. Panel B: Canonical T1 axial and sagittal slices displaying the overlapping clusters from the three GLMs (all the maps refer to a p < 0.001 uncorrected threshold).Green color results from GLM1, cyan form the GLM2 and red from the GLM3.

232 A. Ruggieri et al. / Journal of Neuroscience Methods 239 (2015) 223–237
Table 5Second-level IED-related BOLD changes.
ILAE syndrome Location (sign of BOLD signal)/no. of voxels/Z-score
GLM1 GLM2 GLM3
IGE 1.L inferior frontal gyrus(d)/1101/4.76*
1.L precuneus (d)/75/5.45 1.B inferior parietal lobule(d)/12/4.81
2.B middle frontal gyrus(d)/1101/4.58*
2.B inferior parietal lobuli(d)/259/3.93*
2.R precuneus(d)/51/4.75
3.B superior frontal gyrus(d)/713/4.19*
3.B superior frontal gyrus(d)/2/3.60*
3.B basal ganglia (d)/181/4.59*
4.B thalamus(i)/524/4.03*
4.B middle frontal gyrus(d)/54/3.54*
4.R inferior frontal gyrus(d)/569/4.80*
5.B basal ganglia(d)/207/4.03*
5.B thalamus(i)/138/3.98*
6.B inferior parietal lobule(d)/165/3.94*
6.B middle frontal gyrus(d)/569/3.74*
7.B precuneus(d)/1232/3.83*
7.B superior frontal gyrus(d)/104/3.29*
BECTS 1.R Post-Central gyrus(i)/331/3.85
1.R Post-Central gyrus(i)/350/3.58
1.R Post-Central gyrus(i)/522/3.9
F els ant (i): in
4
wgpde
TI
FZsu
or each subject, the areas showing BOLD signal changes are listed by number of voxemporal spikes; *p = 0.001, uncorrected; L: left; B: bilateral; R: right; (d): decrease;
. Discussion
Despite the wide application of EEG–fMRI for studying patientsith epilepsy, the sensitivity of this method is still limited and a
reat effort has been done recently to maximize the amplitude ofotentially clinically relevant information from every EEG–fMRIataset (Grouiller et al., 2011; Lemieux et al., 2007; Salek-Haddadit al., 2006; Storti et al., 2013). In this work we investigated the
able 6ED-related BOLD changes in drug-resistant focal epilepsy patients.
Pt ID Location (sign of BOLD changes)/no. of voxels/Z-score
GLM1 GLM2
18 1.R pre-central gyrus(d)/3/3.32*
1.R m(i)/3/
19 1.R inferior parietal lobule(i)/2313/7.46
1.R su(i)/15
2.R superior occipital gyrus(i)/2313/6.80
2.R p(i)/15
3.R inferior temporal gyrus(i)/145/6.59
3.R Inlobul
4.R precuneus(i)/2313/6.54
4.L m(d)/5
5.R pre-central gyrus(i)/97/6.03
5.R in(i)/12
6.L middle temporal gyrus(i)/11/5.31
6.R p(i)/40
20 1.L fusiform gyrus(i)/4384/7.75
1.L fu(i)/43
2.R fusiform gyrus(i)/4994/7.18
2.R fu(i)/49
22 1.R Insula(i)/11/4.35*
1.B su(i)/17
2.B precuneus(d)/60/4.32*
2.B ci(i)/64
3.R lingual gyrus(i)/9/3.60*
3.B p(d)/6
4.R cingulate gyrus(i)/16/3.45*
4.R p(i)/21
5.R pre-central gyrus(i)/11/3.23*
5.R li(i)/28
6. B superior frontal gyrus(i)/18/3.12*
6. Ins(i)/28
or each subject, the areas showing BOLD signal changes are listed by number of voxels-score and statistical significance increased from GLM3 respect to GLM1; the symbolignificance increased from GLM3 respect to GLM2. Additional BOLD clusters are showncorrected.
d Z-score. IGE: idiopathic generalized epilepsy; BECTS: benign epilepsy with centrocrease.
clinical usefulness of the video recorded simultaneously withEEG and fMRI signals in a large number of patients with epilepsyrecorded in our center for different purposes. The main findings ofour work are the following:
(1) Video information substantially improved the identificationand classification of the movements’ artifacts with respect tothe EEG observation made by expert electro-physiologists.
GLM3
iddle temporal gyrus4.89
1.R middle temporal gyrus(i)/11/5.29 ©
perior occipital gyrus69/6.21
1.R inferior temporal gyrus(i)/97/6.35
recuneus69/6.06
2.R inferior parietal lobule(i)/176/5.71
ferior parietale(i)/10/5.83
3.R precuneus(i)/109/5.35
iddle frontal gyrus/5.66
4.R superior occipital gyrus(i)/109/5.14
ferior temporal gyrus1/5.40
5.R pre-central gyrus(i)/18/5.09
re-central gyrus/4.25
siform gyrus88/7.79
1.L fusiform gyrus(i)/4417/7.84 �©
siform gyrus52/7.16
2.R fusiform gyrus(i)/5003/7.24 �©
perior frontal gyrus/4.46*
1.R Insula(i)/21/4.47* �©
ngulate gyrus/4.38*
2.B precuneus(d)/63/4.42 *�©
recuneus4/4.17*
3.R cingulate gyrus(i)/24/4.05*�
re-central gyrus/4.00*
4.R lingual gyrus(i)/47/3.96* �©
ngual gyrus/3.92*
5.B superior frontal gyrus(i)/18/3.67*�
ula/3.92*
6.R pre-central gyrus(i)/21/3.52* �
and Z-score. The symbol “�” highlighted BOLD clusters for which the cluster size, “©” highlighted BOLD clusters for which the cluster size, Z-score and statisticaln in red color. B: bilateral; L: left; R: right; (d): decrease; (i): increase; *p = 0.001

A. Ruggieri et al. / Journal of Neuroscience Methods 239 (2015) 223–237 233
Fig. 4. Group analyses results related to the IED in BECTS population. Panel A: GLMs results: IED-related BOLD map derived from each GLM analysis ({F} SPM map). BOLDs 0.05 cc oronac
(
(
ignal increase is detected at the right post-central gyrus for all GLMs’ analyses (p <
anonical image, coronal slice. The crosshair indicates the global maxima. Panel B: color results from GLM1, cyan form the GLM2 and red from the GLM3. R = right.
2) We provided a simple anatomic atlas of the BOLD changesrelated to the more common face/cranial movements observedduring resting state EEG–fMRI recordings.
3) The inclusion of physiological activities as additional regressorin the GLM model, demonstrated an increased Z-score and clus-ter size of the global maxima (GM) and/or new BOLD clustersin about three quarters of the patients studied. Specifically, 7out of 28 patients showed new blobs with GLM3 analysis (thatincluded regressors derived by video-identified movements)and 17 out of 28 subjects showed an increase on cluster sizeand Z-score of the GM or other blobs. Overall 85% of the sampleshowed more clinically informative fMRI maps by the appli-
cation of GLM3. Overall considered, the findings of our studyconfirm and extend previous observation obtained on a limitedgroup of epileptic patients (Chaudhary et al., 2012a) and under-score that the synchronized video-EEG–fMRI is worthwhile,orrected). The hemodynamic changes are displayed onto the glass-brain and the T1l T1 image displaying the overlapping clusters from GLM1, GLM2 and GLM3. Green
especially in studies of individual subjects with focal epilepsy,where the correct localization of the brain region that generatesIED is particularly important.
4.1. Video-based versus EEG-based artifacts’ recognition
We demonstrated the usefulness of the synchronized videoboth in quantitative and qualitative terms compared to visual EEGinspection. Indeed, the total number of movements identified byvideo was 1424 versus 632 detected by EEG observation only.In addition, among the different physiological events, the expertwas able to classify only blinking while the other artifacts were
generally described as “general movements” without further clas-sification.At single subject level, in 31 out of 38 patients (82%) the videoanalysis was superior with respect to the EEG in the identification of

234 A. Ruggieri et al. / Journal of Neuroscience Methods 239 (2015) 223–237
Fig. 5. Single subject IED-related fMRI maps in focal epileptic patients. Panel A: {F} fMRI maps derived from all the GLMs analyses for each case. BOLD signal increases ared rlaid oB overlaG
pTmc(
avsvitcapc
4
T
isplayed in red; BOLD signal decreases in blue. The hemodynamic changes are oveOLD signal changes. Panel B: patient’s individual T1 structural slice displaying the
LM2 and red from the GLM3. R = right.
hysiological movements with a mean gain of 28.3 events per exam.his represents an important issue since mistakes in EEG–fMRIarkup will result in modifications to the resulting SPMs that may
ompromise the scientific and clinical interpretations of the resultsFlanagan et al., 2009; Pedreira et al., 2014).
Intriguingly, in seven patients (18%) the expert marked morertifacts by EEG inspection than the ones really present on theideo. In the EEG–fMRI studies, the electrodes represent very sen-itive motion sensors. These electrodes are capable of picking upery small patient’s movements that may be undetected on visualnspection of the video record. However, they may also some-imes pick up small non-patient movements (such as electrode’somponent movement, and air conditioner turbulence). Thereforertifacts in the EEG will represent both very subtle subject basedhysiological movements as well as some movement artifacts notaused by the subject.
.2. BOLD changes related to physiological movements
We observed multiple cranial/facial spontaneous movements.he most frequent was blinking, followed by head jerks, lower
n the subject’s T1 scan on axial slices. See the text for a detailed description of thepping clusters from the three GLMs. Green color results from GLM1, cyan form the
face movements (mouth–tongue) and swallowing, while a very fewpatients presented artifacts related to voluntary speech and yawn-ing. The high number of such events per subject allowed us to usethem not only as a confounds, but also as events of interest to obtainfMRI maps of facial movements at single-subject and group level.
Several studies have attempted to identify the neural correlatesof swallowing using fMRI in healthy subjects, both in adults andin children (Hamdy et al., 1999; Hartnick et al., 2001; Malandrakiet al., 2009; Mosier et al., 1999). Despite differences in method-ology, these studies reported highly similar results. A consistentinvolvement of the primary sensory-motor cortex, the supplemen-tary motor area (SMA), the cingulate gyrus, and the inner faceof the frontal operculum were identified across different works(Malandraki et al., 2009; Martin et al., 1999; Mihai et al., 2013).In our study, consistently with previous observations, swallowingcorresponds to a network of BOLD signal increases over the bilateralsensory-motor cortex, the frontal operculum and bilateral thala-
mus (Fig. 2 and Table 2) (Malandraki et al., 2009; Martin et al., 2004).Concerning lower face movements, we observed BOLD signalpositive changes in a cortical network substantially overlappingwith the regions involved in swallowing.

oscien
sccs(tbe
b22eaktceH
apci
4
i(mwGBk(Aotidac
BtHwcGsomray
fiictBts
A. Ruggieri et al. / Journal of Neur
Behind the epilepsy field, the video-recognition of spontaneouswallowing during resting-state fMRI recordings could have severallinical applications for patients who are neurologically/cognitivelyompromised and for whom a task-based fMRI paradigm is not fea-ible. Swallowing can be affected in various neurological disordersstroke, Parkinson disease, tumors, etc.) and the identification ofhe networks involved in this complex physiological process mighte helpful in the management of patients affected by dysphagia (Lit al., 2009; Suntrup et al., 2013).
As concern blinking, there is a very wide literature regardingoth humans and animal models (Chung et al., 2006; Guipponi et al.,014; Hupé et al., 2012; van Koningsbruggen et al., 2012; Yoon et al.,005). Eye-blinks are defined as a rapid closing and opening of theyelid and three types of blinks are known: spontaneous, reflexive,nd voluntary. In our study we considered the spontaneous blin-ing only. We found positive BOLD changes in a posterior networkhat included the left posterior cingulate cortex and the bilateralalcarine cortex. These findings are totally concordant with thexisting evidence in previous fMRI studies (Chaudhary et al., 2012a;upé et al., 2012).
Finally, regarding head jerks, we found BOLD signal increasest the bilateral sensory-motor cortex and SMA. This is in line withrevious evidences (Jansen et al., 2012, Chaudhary et al., 2010),onfirming that almost always, physiological head motion resultsn a BOLD increase in relevant brain areas.
.3. Comparison between GLMs analyses in epileptic patients
Within the IGE group in 8/13 patients (61%), the resultsmproved from GLM1 to GLM3. This percentage decreases to 46%6/13) when comparing the GLM2 and GLM3 (Table 4). The fMRI
aps demonstrated the involvement of a thalamic-cortical net-ork in agreement with previous studies (Benuzzi et al., 2012;otman, 2008; Moeller et al., 2008; Vaudano et al., 2009). The newlyOLD changes revealed by GLM3 were all located within areasnown to be involved for the generation and maintenance of GSWDHamandi et al., 2008; Moeller et al., 2008; Vaudano et al., 2009).n intriguing aspect is that almost all these BOLD clusters werebserved also by the GLM2 but neglected by the GLM1. It meanshat the quality of the final results would be improved if artifactsdentified on review of the EEG alone were incorporated into theesign matrix. Nevertheless, the findings derived from the GLM3re of better quality as demonstrated by the increased Z-score andluster’s size.
At the random effect level, the hemodynamic networks showedOLD signal increases at the bilateral thalami, and decreases athe bilateral DMN and basal ganglia for both GLM1 and GLM3.owever, GLM3 demonstrated a higher statistical significanceith respect to the GLM1, as the fMRI map survived at a more
onservative threshold (p < 0.05 FWE corrected). Regarding theLM2, it displayed a DMN deactivation but it missed to reveal aubcortical involvement, even by applying an uncorrected thresh-ld (Fig. 3, Table 5). The reason for this finding is unclear. Weight speculate that the visual-based physiological activities’
ecognition could have considered brief EEG abnormalities asrtifact, erroneously hence impacting the subsequent fMRI anal-sis.
In the BECTS population 72% of fMRI maps presented improvedndings when modeling physiological activities by video. Specif-
cally, in 6 out of 11 patients quality of results improved whenomparing GLM3 versus GLM1; this ratio increased to 8/11, in
he comparisons between GLM2 and GLM3. Newly GLM3-basedOLD cluster was observed only in one patient (#30); this addi-ional blob was missed by both the GLM1 and GLM2. Clinicallypeaking, although detected with an uncorrected threshold, thece Methods 239 (2015) 223–237 235
GLM3-revealed an fMRI map that substantially contributed toa better knowledge of epilepsy in this child, by showing theprobable origin of left-side centro-temporal spikes recorded onEEG.
At the group level analysis, we did not detect any change of thehemodynamic pattern among the three GLMs. Notably, however,the Z-score and cluster size increased in the GLM3 compared toGLM1 and GLM2. These findings are in agreement with previousevidences in this type of epileptic syndrome (Archer et al., 2003;Boor et al., 2003; Lengler et al., 2007; Moeller et al., 2013).
Overall considered, our results in IGE and BECTS shown anobjective (increase Z-score, cluster size) improvement of the IED-related fMRI maps in more than half of the patients. This findingfits well with the results of the previous study of Chaudhary andcolleagues (2012) where this ratio is around 60% of the patientsinvestigated.
In patients with drug-resistant focal epilepsy, 3/4 patientsdemonstrated improved results of the GLM3 versus the GLM1 andGLM2. In details, in patient #18, GLM3 and GLM2 demonstratedBOLD signal changes well compatible with the electro-clinicalhypothesis while GLM1 shown a small blob of BOLD decrease farfrom the presumed IZ (Fig. 5). Notably, the Z-score and cluster sizeof the GLM3 map was increased with respect to the GLM2 (Table 6).Patients #20 and #22 showed similar fMRI patterns across all theGLMs, while the Z-score and cluster-size increased in the GLM3.Although based on a small sample of patients, our findings sup-port the inclusion of physiological activities within the GLM asit improves the proper localization of epileptic abnormalitiesnot-invasively.
4.4. Methodological considerations
The EEG–fMRI studies in epileptic patients usually take moretime than the functional studies for cognitive purposes for the needto collect as many epileptic events as possible. Furthermore, in ourcenter, we record both adults and children and in the latter group,the compliance to such long lasting fMRI sessions might be difficultand extra-care should be taken to limit their movements inside thescanner. While several publications have dealt with the problem ofmotion during fMRI acquisitions (Chaudhary et al., 2010; Fristonet al., 1996; Jansen et al., 2012; Tong and Frederick, 2014), therecording of physiological movements and their impact on the sub-sequent fMRI data analysis has been considered only recently. Theimplementation of video recordings during fMRI acquisition allowsthe researcher to monitor the behavior of the patient inside thescanner with implication on his safety and, as demonstrated by ourand others works, on the quality of the resulted EEG–fMRI maps. Inour EEG–fMRI setting, the number of EEG channels recorded insidethe scanner was limited to 32, with one additional channel for ECGand one for EMG. Given the low number of available electrodes,we were not able to record the electro-oculography activity for theeyes movements and blinking and electromyography for the lowerface movements. In future, it would be advantageous to monitorthe physiological activities by additional channels that could alsoled to automate the process of identification of physiological eventsduring the fMRI recordings.
Finally, the fMRI data analyses performed in our work were con-ducted using an approach validated in previous publications fromour group (Vaudano et al., 2013, 2014) and others (Chaudhary et al.,2012a; Jansen et al., 2012). In particular, we took care to reducemotion related fMRI variance by using the six realignment param-
eters with the Volterra expansion of these (Friston et al., 1996).The number of scans affected by head motion (>0.2 mm) was inline with previous findings in different subjects (Chaudhary et al.,2012a; Salek-Haddadi et al., 2006; Thornton et al., 2010).
2 oscien
4
eficfiscmmur
C
cit
A
RAf
R
A
A
A
A
A
B
B
B
B
C
C
C
C
C
F
F
F
36 A. Ruggieri et al. / Journal of Neur
.5. Conclusions
Physiological activities during fMRI recordings are a commonvent. Their recognition without synchronized video might be dif-cult and we showed that both false positive and negative errorsan be performed by the expert electrophysiologist. We have con-rmed, on a large sample of epileptic patients, the usefulness of theimultaneous acquisition of the video during fMRI. To conclude, weould assess that modeling spontaneous/automatic cranial/facialovements in EEG–fMRI study for epilepsy will lead to more infor-ative IED-related fMRI maps. The best finding derived by the
se of simultaneous video recording and in patients with surgical-emediable focal epilepsies.
onflicts of interest
None of the authors has any conflict of interest to disclose. Weonfirm that we have read the Journal’s position on issues involvedn ethical publication and affirm that this report is consistent withhose guidelines.
cknowledgments
This work was supported by a grant of “Fondazione Cassa diisparmio di Modena”, Modena, Italy: Ricerca Internazionale 2010.EV has a post-doc bursary from this grant. AR has a Ph.D. bursary
rom the University of Modena and Reggio Emilia.
eferences
ghakhani Y, Kobayashi E, Bagshaw AP, Hawco C, Bénar CG, Dubeau F, et al. Cor-tical and thalamic fMRI responses in partial epilepsy with focal and bilateralsynchronous spikes. Clin Neurophysiol 2006;117:177–91.
llen PJ, Josephs O, Turner R. A method for removing imaging artifact from contin-uous EEG recorded during functional MRI. NeuroImage 2000;12:230–9.
llen PJ, Polizzi G, Krakow K, Fish DR, Lemieux L. Identification of EEG events inthe MR scanner: the problem of pulse artifact and a method for its subtraction.NeuroImage 1998;8:229–39.
rcher JS, Briellman RS, Abbott DF, Syngeniotis A, Wellard RM, Jackson GD. Benignepilepsy with centro-temporal spikes: spike triggered fMRI shows somato-sensory cortex activity. Epilepsia 2003;44:200–4.
vanzini P, Vaudano AE, Vignoli A, Ruggieri A, Benuzzi F, Darra F, et al. Low fre-quency mu-like activity characterizes cortical rhythms in epilepsy due to ringchromosome 20. Clin Neurophysiol 2014;125:239–49.
ell AJ, Sejnowski TJ. An information–maximization approach to blind separationand blind deconvolution. Neural Comput 1995;7:1129–59.
énar C, Aghakhani Y, Wang Y, Izenberg A, Al-Asmi A, Dubeau F, et al. Quality of EEGin simultaneous EEG–fMRI for epilepsy. Clin Neurophysiol 2003;114:569–80.
enuzzi F, Mirandola L, Pugnaghi M, Farinelli V, Tassinari CA, Capovilla G, et al.Increased cortical BOLD signal anticipates generalized spike and wave dis-charges in adolescents and adults with idiopathic generalized epilepsies.Epilepsia 2012;53:622–30.
oor S, Vucurevic G, Pfleiderer C, Stoeter P, Kutschke G, Boor R. EEG-related func-tional MRI in benign childhood epilepsy with centrotemporal spikes. Epilepsia2003;44:688–92.
haudhary UJ, Duncan JS, Lemieux L. Mapping hemodynamic correlates of seizuresusing fMRI: a review. Hum Brain Mapp 2013;34:447–66.
haudhary UJ, Rodionov R, Carmichael DW, Thornton RC, Duncan JS, Lemieux L.Improving the sensitivity of EEG–fMRI studies of epileptic activity by modellingeye blinks, swallowing and other video-EEG detected physiological confounds.NeuroImage 2012a;61:1383–93.
haudhary UJ, Carmichael DW, Rodionov R, Thornton RC, Bartlett P, VulliemozS, et al. Mapping preictal and ictal haemodynamic networks using video-electroencephalography and functional imaging. Brain 2012b;135:3645–63.
haudhary UJ, Kokkinos V, Carmichael DW, Rodionov R, Gasston D, Dun-can JS, et al. Implementation and evaluation of simultaneous video-electroencephalography and functional magnetic resonance imaging. MagnReson Imaging 2010;28:1192–9.
hung JY, Yoon HW, Song MS, Park H. Event related fMRI studies of volun-tary and inhibited eye blinking using a time marker of EOG. Neurosci Lett2006;395:196–200.
lanagan D, Abbott DF, Jackson GD. How wrong can we be? The effect of inaccurate
mark-up of EEG/fMRI studies in epilepsy. Clin Neurophysiol 2009;120:1637–47.riston KJ, Williams S, Howard R, Frackowiak RS, Turner R. Movement-related effectsin fMRI time-series. Magn Reson Med 1996;35:346–55.
riston KJ, Frith CD, Frackowiak RS, Turner R. Characterizing dynamic brainresponses with fMRI: a multivariate approach. NeuroImage 1995;2:166–72.
ce Methods 239 (2015) 223–237
Gotman J. Epileptic networks studied with EEG–fMRI. Epilepsia 2008;49:42–51.Grouiller F, Thornton RC, Groening K, Spinelli L, Duncan JS, Schaller K, et al.
With or without spikes: localization of focal epileptic activity by simulta-neous electroencephalography and functional magnetic resonance imaging.Brain 2011;134:2867–86.
Guipponi O, Odouard S, Pinède S, Wardak C, Ben Hamed S. fMRI cortical correlatesof spontaneous eye blinks in the nonhuman primate. Cereb Cortex 2014 [Epubahead of print].
Hamandi K, Laufs H, Nöth U, Carmichael DW, Duncan JS, Lemieux L. BOLD and per-fusion changes during epileptic generalised spike wave activity. NeuroImage2008;39:608–18.
Hamdy S, Mikulis DJ, Crawley A, Xue S, Lau H, Henry S, et al. Cortical activationduring human volitional swallowing: an event-related fMRI study. Am J Physiol1999;277:G219–25.
Hartnick CJ, Rudolph C, Willging JP, Holland SK. Functional magnetic resonanceimaging of the pediatric swallow: imaging the cortex and the brainstem. Laryn-goscope 2001;111:1183–91.
Hupé JM, Bordier C, Dojat M. A BOLD signature of eyeblinks in the visual cortex.NeuroImage 2012;15(61):149–61.
Jansen M, White TP, Mullinger KJ, Liddle EB, Gowland PA, Francis ST, et al. Motion-related artefacts in EEG predict neuronally plausible patterns of activation infMRI data. NeuroImage 2012;59:261–70.
Laufs H. Functional imaging of seizures and epilepsy: evolution from zones tonetworks. Curr Opin Neurol 2012;25:194–200.
Laufs H, Lengler U, Hamandi K, Kleinschmidt A, Krakow K. Linking generalized spike-and-wave discharges and resting state brain activity by using EEG/fMRI in apatient with absence seizures. Epilepsia 2006;47:444–8.
Lemieux L, Laufs H, Carmichael D, Paul JS, Walker MC, Duncan JS. Non-canonical spike-related BOLD responses in focal epilepsy. Hum Brain Mapp2008;29:329–45.
Lemieux L, Salek-Haddadi A, Lund TE, Laufs H, Carmichael D. Modelling largemotion events in fMRI studies of patients with epilepsy. Magn Reson Imaging2007;25:894–901.
Lengler U, Kafadar I, Neubauer BA. Krakow K. fMRI correlates of interictal epilep-tic activity in patients with idiopathic benign focal epilepsy of childhood. asimultaneous EEG-functional MRI study. Epilepsy Res 2007;75:29–38.
Li S, Luo C, Yu B, Yan B, Gong Q, He C, et al. Functional magnetic resonance imagingstudy on dysphagia after unilateral hemispheric stroke: a preliminary study. JNeurol Neurosurg Psychiatry 2009;80:1320–9.
Liston AD, Lund TE, Salek-Haddadi A, Hamandi K, Friston KJ, Lemieux L. Modellingcardiac signal as a confound in EEG–fMRI and its application in focal epilepsystudies. NeuroImage 2006;30:827–34.
Lund TE, Norgaard MD, Rostrup E, Rowe JB, Paulson OB. Motion or activity: their rolein intra- and inter-subject variation in fMRI. NeuroImage 2005;26:960–4.
Makeig S, Debener S, Onton J, Delorme A. Mining event-related brain dynamics.Trends Cogn Sci 2004;8:204–10.
Malandraki GA, Sutton BP, Perlman AL, Karampinos DC, Conway C. Neural activationof swallowing and swallowing-related tasks in healthy young adults: an attemptto separate the components of deglutition. Hum Brain Mapp 2009;30:3209–26.
Martin RE, MacIntosh BJ, Smith RC, Barr AM, Stevens TK, Gati JS, et al. Cere-bral areas processing swallowing and tongue movement are overlappingbut distinct: a functional magnetic resonance imaging study. J Neurophysiol2004;92:2428–43.
Martin RE, Kemppainen P, Masuda Y, Yao D, Murray GM, Sessle BJ. Features ofcortically evoked swallowing in the awake primate (Macaca fascicularis). J Neu-rophysiol 1999;82:1529–41.
Masterton RA, Harvey AS, Archer JS, Lillywhite LM, Abbott DF, Scheffer IE, et al. Focalepileptiform spikes do not show a canonical BOLD response in patients withbenign rolandic epilepsy (BECTS). NeuroImage 2010;51:252–60.
Mihai PG, von Bohlen Und Halbach O, Lotze M. Differentiation of cerebral represen-tation of occlusion and swallowing with fMRI. Am J Physiol Gastrointest LiverPhysiol 2013;15(304):G847–54.
Moeller F, Stephani U, Siniatchkin M. Simultaneous EEG and fMRI recordings(EEG–fMRI) in children with epilepsy. Epilepsia 2013;54:971–82.
Moeller F, LeVan P, Muhle H, Stephani U, Dubeau F, Siniatchkin M, et al.Absence seizures: individual patterns revealed by EEG–fMRI. Epilepsia2010;51:2000–10.
Moeller F, Siebner HR, Wolff S, Muhle H, Granert O, Jansen O, et al. Simulta-neous EEG–fMRI in drug-naive children with newly diagnosed absence epilepsy.Epilepsia 2008;49:1510–9.
Mosier KM, Liu WC, Maldjian JA, Shah R, Modi B. Lateralization of cortical func-tion in swallowing: a functional MR imaging study. Am J Neuroradiol 1999;20:1520–6.
Pedreira C, Vaudano AE, Thornton RC, Chaudhary UJ, Vulliemoz S, Laufs H, et al. Clas-sification of EEG abnormalities in partial epilepsy with simultaneous EEG–fMRIrecordings. NeuroImage 2014, pii:S1053-8119(14)00374-7.
Pittau F, Fahoum F, Zelmann R, Dubeau F, Gotman J. Negative BOLD response tointerictal epileptic discharges in focal epilepsy. Brain Topogr 2013;26:627–40.
Pittau F, Dubeau F, Gotman J. Contribution of EEG/fMRI to the definition of theepileptic focus. Neurology 2012;78:1479–87.
Salek-Haddadi A, Diehl B, Hamandi K, Merschhemke M, Liston A, Friston K, et al.
Hemodynamic correlates of epileptiform discharges: an EEG–fMRI study of 63patients with focal epilepsy. Brain Res 2006;1088:148–66.Siniatchkin M, Moeller F, Jacobs J, Stephani U, Boor R, Wolff S, et al. Spatial filters andautomated spike detection based on brain topographies improve sensitivity ofEEG–fMRI studies in focal epilepsy. NeuroImage 2007;37:834–43.

oscien
S
S
T
T
T
T
A. Ruggieri et al. / Journal of Neur
torti SF, Formaggio E, Bertoldo A, Manganotti P, Fiaschi A, Toffolo GM.Modelling hemodynamic response function in epilepsy. Clin Neurophysiol2013;124:2108–18.
untrup S, Teismann I, Bejer J, Suttrup I, Winkels M, Mehler D, et al. Evidencefor adaptive cortical changes in swallowing in Parkinson’s disease. Brain2013;136:726–38.
hornton R, Vulliemoz S, Rodionov R, Carmichael DW, Chaudhary UJ, DiehlB, et al. Epileptic networks in focal cortical dysplasia revealed usingelectroencephalography–functional magnetic resonance imaging. Ann Neurol2011;70:822–37.
hornton RC, Rodionov R, Laufs H, Vulliemoz S, Vaudano A, Carmichael D, et al.Imaging haemodynamic changes related to seizures: comparison of EEG-basedgeneral linear model, independent component analysis of fMRI and intracranialEEG. NeuroImage 2010;53:196–205.
ong Y, Frederick BD. Studying the spatial distribution of physiological effects onBOLD signals using ultrafast fMRI. Front Hum Neurosci 2014;8:196.
yvaert L, Hawco C, Kobayashi E, LeVan P, Dubeau F, Gotman J. Different structuresinvolved during ictal and interictal epileptic activity in malformations of corticaldevelopment: an EEG–fMRI study. Brain 2008;131:2042–60.
ce Methods 239 (2015) 223–237 237
van Houdt PJ, Ossenblok PP, Boon PA, Leijten FS, Velis DN, Stam CJ, et al. Correctionfor pulse height variability reduces physiological noise in functional MRI whenstudying spontaneous brain activity. Hum Brain Mapp 2010;31:311–25.
van Koningsbruggen MG, Peelen MV, Davies E, Rafal RD. Neural control of voluntaryeye closure: a case study and an fMRI investigation of blinking and winking.Behav Neurol 2012;25:103–9.
Vaudano AE, Ruggieri A, Vignoli A, Avanzini P, Benuzzi F, Gessaroli G, et al. Epilepsy-related brain networks in ring chromosome 20 syndrome: an EEG–fMRI study.Epilepsia 2014;55:403–13.
Vaudano AE, Avanzini P, Tassi L, Ruggieri A, Cantalupo G, Benuzzi F, et al. Causalitywithin the epileptic network: an EEG–fMRI study validated by intracranial EEG.Front Neurol 2013;4:185.
Vaudano AE, Laufs H, Kiebel SJ, Carmichael DW, Hamandi K, Guye M, et al. Causalhierarchy within the thalamo-cortical network in spike and wave discharges.
PLoS ONE 2009;4:e6475.Yoon HW, Chung JY, Song MS, Park H. Neural correlates of eye blinking; improvedby simultaneous fMRI and EOG measurement. Neurosci Lett 2005;38:26–30.
Zhang J, Liu W, Chen H, Xia H, Zhou Z, Wang L, et al. EEG–fMRI validation studies incomparison with icEEG: a review. Int J Psychophysiol 2012;84:233–9.
Copyright © 2022 FDOKUMEN