MAP D-PHASE: Real-Time Demonstration of Weather Forecast Quality in the Alpine Region
16
A six-month project successfully tested real-time, end-to-end mul- timodel hydrometeorological forecasts for heavy precipitation and related flooding events in many different catchments in the Alps. A s the first research and development project (RDP) of the World Weather Research Programme (WWRP), the Mesoscale Alpine Programme (MAP) made important contributions to our knowledge on atmospheric processes de- termined by and influencing weather in mountainous terrain between 1994 and 2005 (Bougeault et al. 2001). A wealth of sci- entific results (Volkert and Gutermann 2007) was produced in research areas ranging from atmospheric dynamics to mountain hydrology. On the basis of these very positive results, the WWRP Scientific Steering Committee asked the MAP community to consider a forecast demonstration project (FDP). Generally, a FDP aims at demonstrating the advances a research and develop- ment activity (or any other trigger) has brought to operational atmospheric forecasting. Thus, a FDP MAP D-PHASE Real-Time Demonstration of Weather Forecast Quality in the Alpine Region BY MATHIAS W. ROTACH, PAOLO AMBROSETTI, FELIX AMENT, CHRISTOF APPENZELLER, MARCO ARPAGAUS, HANS-STEFAN BAUER, ANDREAS BEHRENDT, FRANÇOIS BOUTTIER, ANDREA BUZZI , MATTEO CORAZZA, SILVIO DAVOLIO, MICHAEL DENHARD, MANFRED DORNINGER, LIONEL FONTANNAZ, JACQUELINE FRICK, FELIX FUNDEL, URS GERMANN, T HERESA GORGAS, CHRISTOPH HEGG, ALESSANDRO HERING, CHRISTIAN KEIL, MARK A. LINIGER, CHIARA MARSIGLI, RON MC T AGGART-COWAN, ANDREA MONTAINI, KEN MYLNE, ROBERTO RANZI, EVELYNE RICHARD, ANDREA ROSSA, DANIEL SANTOS-MUÑOZ, CHRISTOPH SCHÄR, Y ANN SEITY , MICHAEL STAUDINGER, MARCO STOLL, HANS V OLKERT , ANDRE WALSER, Y ONG WANG, JOHANNES WERHAHN, VOLKER WULFMEYER, AND MASSIMILIANO ZAPPA Flooding in the small town of Laufen, Switzerland on 23 August 2007. Photograph courtesy of the State Police corps.
-
Upload
independent -
Category
Documents
-
view
1 -
download
0
Transcript of MAP D-PHASE: Real-Time Demonstration of Weather Forecast Quality in the Alpine Region

A six-month project successfully tested real-time, end-to-end mul-timodel hydrometeorological forecasts for heavy precipitation and related f looding events in many dif ferent catchments in the Alps.
A s the first research and development project (RDP) of the World Weather Research Programme (WWRP), the Mesoscale Alpine Programme (MAP) made important
contributions to our knowledge on atmospheric processes de-termined by and influencing weather in mountainous terrain between 1994 and 2005 (Bougeault et al. 2001). A wealth of sci-entific results (Volkert and Gutermann 2007) was produced in research areas ranging from atmospheric dynamics to mountain hydrology. On the basis of these very positive results, the WWRP Scientific Steering Committee asked the MAP community to consider a forecast demonstration project (FDP). Generally, a FDP aims at demonstrating the advances a research and develop-ment activity (or any other trigger) has brought to operational atmospheric forecasting. Thus, a FDP
MAP D-PHASEReal-Time Demonstration of Weather Forecast Quality in the Alpine Region
bY MaTHiaS W. ROTaCH, PaOlO aMbROSeTTi, FeliX aMeNT, CHRiSTOF aPPeNZelleR, MaRCO aRPagaUS, HaNS-STeFaN baUeR, aNDReaS beHReNDT, FRaNÇOiS bOUTTieR, aNDRea bUZZi, MaTTeO CORaZZa, SilViO DaVOliO, MiCHael DeNHaRD, MaNFReD DORNiNgeR, liONel FONTaNNaZ, JaCQUeliNe FRiCK, FeliX FUNDel, URS geRMaNN, THeReSa gORgaS, CHRiSTOPH Hegg, aleSSaNDRO HeRiNg, CHRiSTiaN Keil, MaRK a. liNigeR, CHiaRa MaRSigli, RON MCTaggaRT-COWaN, aNDRea MONTaiNi, KeN MYlNe, RObeRTO RaNZi, eVelYNe RiCHaRD, aNDRea ROSSa, DaNiel SaNTOS-MUÑOZ, CHRiSTOPH SCHÄR, YaNN SeiTY, MiCHael STaUDiNgeR, MaRCO STOll, HaNS VOlKeRT, aNDRe WalSeR, YONg WaNg, JOHaNNeS WeRHaHN, VOlKeR WUlFMeYeR, aND MaSSiMiliaNO ZaPPa
Flooding in the small town of Laufen, Switzerland on 23 August 2007. Photograph courtesy of the State Police corps.
• dealswiththeforecastofweatherwithinterna-tionalrelevance(high-impactweather);
• demonstrates a clear advance in forecastingcapability;
• providesclearevaluationprotocols;and• ischaracterizedbyanexpectationofsuccess.
ThefirstFDPwasrealizedontheoccasionoftheSydneyOlympicGamesin2000(Keenanetal.2003).TheMAPSteeringCommitteemandatedaworkinggrouptoinvestigatetheprospectsforaMAPFDPandsupportedthegroup’sproposaltofocusontheprecipitation-relatedaspects(so-calledwetMAP).TheprojectacronymD-PHASEcarriesthedoublemeaningofDemonstrationofProbabilisticHydro-logicalandAtmosphericSimulationofFloodEventsinthealpineregionaswellasthefourthphaseofMAP.TheScientificSteeringCommitteeofWWRPendorsedD-PHASEasanFDPin itsmeeting inOctober2005.
ThepresentpapergivesanoverviewofthegoalsofD-PHASEandpresentstheproject’scentralfacility,the“visualizationplatform.”Examplesofapplicationsaregivenaswellasasummaryofuserfeedbackandanoverallsummaryandoutlook.
OVERVIEW ON MAP D-PHASE. Improve-mentofhigh-resolutionnumericalmodelingwasoneofMAP’smostsuccessfulachievements.Forthefirsttimeinaprojectofcomparablesize,ahigh-resolution(3-kmgridsize)mesoscalemodelwasusedinthemissionplanningprocessduringtheintensiveobservationperiod(IOP;Benoitetal.2002,2003),andhigh-resolutionnumericalmodelingwassuc-cessfullyusedfordifferentcasestudiesinrelationtoorographicprecipitation(Richardetal.2007)
orotherprocesses(e.g.,Weigeletal.2006;RotachandZardi2007).MAP’shydrologicalcommunitypioneeredtheoperationalcouplingofdeterministicatmosphericandhydrologicalmodels(Ranzietal.2003)andinvestigatedtheperformanceofcoupledsystems(BacchiandRanzi2003).
Radarobservationofprecipitationincomplexter-rainisextremelychallenging(requiringcorrectionofclutterandshadingduetotopography).MAPhastriggeredasubstantialimprovementintheperfor-manceofoperationalradarproducts(Germannetal.2006).Finally,MAPhasalsosubstantiallyadvancedourunderstandingoftheprocessesrelatedtooro-graphicprecipitation(RotunnoandHouze2007).
AttheoutsetofMAP(BinderandSchär1996),probabilisticmodelingofatmosphericprocesseshadneitherexplicitlybeenidentifiedasaresearchtopic,norhadfollow-onhydrologicalensemblemodeling.Still,MAPhastriggeredanumberofstudiesinves-tigatingthepredictabilityoforographicallyinflu-encedprecipitation(WalserandSchär2004;Walseretal.2004a;Hoheneggeretal.2006;HoheneggerandSchär2007).Also, intheaftermathofMAP,ahigh-resolutionensemblepredictionsystem[theLimitedAreaEnsemblePredictionSystem,basedontheConsortiumforSmallScaleModeling(COSMO)model]hasbeendeveloped(Moltenietal.2001;Marsiglietal.2001;Walseretal.2004b)andusedforfirststepsintohydrologicalensembleprediction(Siccardietal.2005;Verbuntetal.2007).
Onthebasisofthesefindings,andbearinginmindthatorographicprecipitationhasoften ledtodisastrousf loodingeventswidespreadovertheAlps,itwasdecidedtodevotetheMAPFDPtothedemonstrationofforecastcapabilitywithrespecttoheavyprecipitationeventsintheAlps.Theemphasis
AFFILIATIONS: Rotach, ambRosetti, appenzelleR, aRpagaus, Fontannaz, Fundel, geRmann, heRing, linigeR, stoll, and WalseR—Federal Office for Meteorology and Climatology (MeteoSwiss), Zurich, Switzerland; ament—University of Hamburg, Hamburg, Germany; baueR, behRendt, and WulFmeyeR—University of Hohenheim, Stuttgart, Germany; bouttieR and seity—Météo-France, Toulouse, France; buzzi and davolio—ISAC-CNR, Bologna, Italy; coRazza—ARPAL CRMI-PC, Genova, Italy; denhaRd—German Weather Service (DWD), Offenbach, Germany; doRningeR and goRgas—University of Vienna, Vienna, Austria; FRick, hegg, and zappa—Swiss Federal Institute WSL, Birmensdorf, Switzerland; keil and volkeRt—DLR, Oberpfaffenhofen, Germany; maRsigli and montaini—ARPA-SIM, Bologna, Italy; mctaggaRt-coWan—Canadian Meteorological Centre, Environment Canada, Dorval, Quebec, Canada; mylne—Met Office, Exeter, United Kingdom; Ranzi—University of Brescia, Italy; RichaRd—University Paul Sabatier, Toulouse, France; Rossa—ARPAV, Centro Meteorologico
Teolo, Italy; santos-muñoz—AEMet, Madrid, Spain; schäR—ETHZ, Zurich, Switzerland; staudingeR and Wang—Central Institute for Meteorology and Geodynamics, Vienna, Austria; WeRhahn—Institute for Meteorology and Climate Research–Atmospheric Environmental Research (IMK-IFU), Garmisch-Partenkirchen, GermanyA supplement to this article is available online (10.1175/2009BAMS2776.2)
CORRESPONDING AUTHOR: Dr. Mathias W. Rotach, Federal Office of Meteorology and Climatology, Kraehbuehlstrasse 58, Zurich CH-8044, Switzerland.E-mail: [email protected]
The abstract for this article can be found in this issue, following the table of contents.DOI:10.1175/2009BAMS2776.1
In final form 5 March 2009©2009 American Meteorological Society
1322 september 2009|

wasputonhigh-resolutionoperationalmodeling,beitprobabilisticordeter-ministic.
D-PHASEwas setupas an end-to-end f loodwarning system as it issketchedinFig.1.“Endtoend”inthiscontextmeansthattheentirechainfromtheatmospheric forecastmodels to the decisionmakeras theenduser ispartof thesystem.Some5daysbefore apossibleevent,atmosphericensem-blepredictionsystemsmayissuea“prealert”—thatis,indicatingthatathresholdmight be exceeded in acertainregionintheAlps.At this stage, thresholdsareprimarily applied toprecipitation,althoughthefirsthydrologicalmodelsstart todetermine fore-castsforrunoffatvariousstations.As timecomesclosertothepossibleevent,high-resolutiondeterministicatmosphericmodelswithaleadtimeof18–36hstart,andsodothecor-respondinghydrologicalmodels.Atalllevelsofthevisualization platform(VP;seethenextsection)col-oredwarningsaredisplayed,fromwhichusersmayseeimmediatelywhethertheirregionisindanger.Atthetimeoftheforecastedevent,usersalsohaveaccesstonowcastingfacilitiestojudgethe“present”situa-tionandtocometothemostbeneficialdecision.
Participatingatmosphericmodels(Table1)includemanyofthehigh-resolution(i.e.,afewkilometersgridsize)deterministicoperationalmodelsthatarepresentlybeingdevelopedinEuropeaswellastheirlower-resolutiondrivingmodels.Inaddition,acollec-tionofensemblepredictionsystemsatintermediateresolutionisonthelist;forexample,apoorman’sensemblepredictionsystem(EPS;Micro-PEPS),likethatoftheshort-rangenumericalweatherpredictionproject(SRNWP;DenhardandTrepte2006)thathasbeenconstructedfromtheparticipatinghigh-resolutionmodelsespeciallyforD-PHASE(refertohttp://dx.doi.org/10.1175/2009BAMS2776.2).
Thecollectionofhydrologicalmodels(Table2)includesbothdeterministicandensembleprediction
systems(Zappaetal.2008).Thelattersystemscon-stituteadvancementintheconceptual treatment ofhydrologicalforecasts,andtheD-PHASEoperationsperiodwasanexcellentopportunitytodemonstratewhethertheyalsoconstituteadvancement inthequality ofhydrologicalforecasts.
AllnowcastingproductsontheVParesumma-rizedinTable3.Someoftheproductsareofferedontheentire“D-PHASEdomain”(Fig.2).Additionally,someoperationalinstitutionsintheAlpineregion(MeteoSwiss,Météo-France,andtheregionalmeteo-rologicalserviceofEmilia-Romagna,Italy)offeredtheirradarandnowcastingtoolsspecificallydesignedforcertainregionsandapplications.
Animportantgroupofprojectparticipantsaretheendusers;thatis,thosepeoplewhouseinformationontheVPfortheirdecisionsorforfurtherelabora-tionofdata.DifferentfromMAPwhen“targetareas”hadbeenspecifiedbeforehandaccordingtoscientificcriteria(Bougeaultetal.2001),thepresenceofaninterestedenduserandhis/herliaisonwithahydro-logicalmodelerdefineda“participatingcatchment”forD-PHASE.Inthisspirithydrologicalforecastswereproducedforatotalof43catchments.Endusers
Fig. 1. Schematic representation of the various components of the D-PHASE end-to-end flood forecasting system. (top)–(bottom) Note the time running. The green, blue, purple, and white boxes denote tools that are employed within the indicated periods of time. The open diamond at the end of each period symbolizes the question that can be answered (such as “is there a possible event ahead?”). If no, then the alert cycle comes to an end; if yes, then the information is passed to the forecasters (green boxes) and/or the end users (black rectangle).
1323september 2009AmerICAN meteOrOLOGICAL sOCIetY |

asthe“customers”oftheD-PHASEinformationweregrantedfreeaccesstoallproductsontheVPforthe“priceoffeedback.”Oneofthegoalsoftheprojectwastosystematicallyevaluatetheuserfeedbackasasub-jectivemeasureofperformance,contrastthistotheobjectivemeasures(modelskillscores,amongothers),andmaketheresultsavailabletothecommunity.Preliminaryresultsarepresentedlater.
D-PHASEprofitedfromasuccessfulcollaborationwiththeWWRPRDPConvectiveandOrographically-inducedPrecipitationStudy(COPS;Wulfmeyeretal.2008,unpublishedmanuscript).Havingsimilarobjec-tives,itwasdecidedtopoolresourcesandcoordinateeffortsformutualbenefit.Therefore,theD-PHASEoperationsperiod(DOP)wasdefinedtolastfromJunetoNovember2007,includingtheCOPSfield
Table 1. Atmospheric models participating in D-PHASE (real time only; limited-area ensemble prediction systems, and high-resolution deterministic models) with model specifications (computational domain).
Model name on data archive Model*
Ensemble size (1 = deterministic)
Mesh size [km (degrees)]
Forecast range (h)
Institution and contact person(s)
CLEPS COSMO-LEPS 16 10 (0.09) 132ARPA Emilia-Romagna, Andrea Montani
MOGREPS MOGREPS 24 25 (0.22) 54Met Office, Kelvyn Robertson
INMSREPS SREPS 20 (0.25) 72 AEMET, Daniel Santos
CSREPS COSMO-SREPS 16 10 (0.09) 72ARPA Emilia-Romagna, Chiara Marsigli
LAMEPSAT ALADIN-LAEF 17 (0.15) 60 ZAMG, Sabine Leroch
PEPS PEPS variable (0.0625) 42EUMETNET SRNWP, Michael Denhard
MPEPS Micro-PEPS variable (0.02) 18 DWD, Michael Denhard
COSMOCH7 COSMO-7 1 7 (0.0625) 72 MeteoSwiss, Felix AmentCOSMOCH2 COSMO-2 1 2.2 (0.02) 24
LMEURO COSMO-ME 1 7 (0.0625) 72 CNMCA, Lucio TorrisiLMITA COSMO-IT 1 2.8 (0.025) 30
LAM17 COSMO-I7 1 7 (0.0625) 72 ARPA Emilia-Romagna, Davide CesariLAMI28 COSMO-I2 1 2.8 (0.025) 48
LME COSMO-EU 1 7 (0.0625) 78 DWD, Michael DenhardLMK COSMO-DE 1 2.8 (0.025) 21
ISACMOL MOLOCH 1 (BC from GFS) 2.2 (0.02) 39 ISAC-CNR, Silvio Davolio
ISACMOL2 MOLOCH 1 (BC from IFS) 2.2 (0.02) 48 ISAC-CNR, Silvio Davolio
ARPALMOL MOLOCH 1 2.2 (0.02) 36ARPA Liguria, Matteo Corazza
QBOLAM33 QBOLAM 1 33 (0.3) 60 APAT, Stefano MarianiQBOLAM11 QBOLAM 1 11 (0.1) 48
ALADFR ALADIN 1 (0.1) 30 Météo-France, Eric Bazile (ALADFR), Yann Seity (AROME)AROME AROME 1 (0.04) 30
MM5_2_CT MM5 1 (0.02) 24 University of Hohenheim, Hans-Stefan Bauer, Matthias GrzeschikMM5_2_4D MM5 1 (0.02) 24
MM5_60 MM5 1 (0.56) 72 FZK IMK-IFU, Johannes Werhahn, Andreas Marx
MM5_15 MM5 1 (0.14) 72
MM5_375 MM5 1 (0.04) 60
ALADAT ALADIN 1 9.6 (0.07 × 0.11) 48 ZAMG, Yong Wang
CMCGEML GEM-LAM 1 15 (0.135, 0.188) 24 Environment Canada, Ron McTaggart-Cowan CMCGEMH GEM-LAM 1 2.5 (0.0225, 0.0327) 18
*For the high-resolution deterministic models, the coarser-resolution driving model(s) are also listed (if their output is provided).
1324 september 2009|

phase[June–August(JJA)]aswellastheMAPspecialobservingperiod[September–November(SON)].Anessentialaccomplishmentwastheprovisionofalargesetofmodelvariablesinaharmonizedformat[griddedbinaryedition1(GRIB1)]usingtheso-calledTIGGE+table(formoreinformationonTIGGEandtheWWRPTHORPEXprogramthatdefinedthistable,seewww.wmo.int/pages/prog/arep/wwrp/new/thorpex_new.html).Thisenabledtheproduc-tionofplotsofalargesetofforecastswithexactlythesamedomainsandcolorsforthesameatmosphericvariables.TheD-PHASEdomainentirelyincludestheCOPSdomain(Fig.2).TheCOPSmissionplan-ningteamsuccessfullyusedtheD-PHASEinformationontheVP(mainlyatmo-sphericforecasts)fortheiroperationsbetweenJuneandAugust2007.Allofthedata,theobservationsduetoCOPS,andnumeri-calmodelresultsproducedbyD-PHASEare storedata jointdataarchiveattheWorldDataCenterforClimate(WDCC),runbytheMaxPlanckInstituteforMeteorologyHamburg(Wunram2006).
THE VISUALIZATION PLATFORM. Forthedu- rationoftheDOP,allgraph-icalD-PHASEinformation(forecasts,warnings,now-castingproducts)wasdis-
playedontheWeb-basedVP.Onthreelevels[Alpinewide,region(country),catchment]userscouldchoosebetweenthefollowingdifferentoptions:
• eye catching warning maps in“traffic-lightcolors”:asanexampleascreenshotoflevel1isgiveninFig.3fortheextraordinaryeventon8/9August2007;
• more detailed information onduration,peakamounts,andmore,featuringacomparisonofallmodels;
• harmonized model productssuchasplots,crosssec-tionsormeteogramsbasedontheTIGGE+dataset;
Table 2. Hydrological models participating in D-PHASE (real-time only). A hydrological model running in ensemble mode is denoted as e-hm; a hydrological model running deterministically is denoted as d-hm.
Model name on data archive
Applications (No. of catchments) Driving model
Institution and contact person(s)
PREVAH (e-hm, d-hm) 6 in Switzerland 2 in Italy
CLEPS, COSMOCH2, COSMOCH7, MM5_15
ETHZ/WSL, Simon Jaun, Massimiliano Zappa
HBV (e-hm, d-hm) 12 in Switzerland CLEPS, PEPS, COSMOCH2, COSMOCH7, (IFS)
BAFU, Stephan Vogt
LAMBRO (e-hm, d-hm) 2 in Italy CLEPS, LAMI28, ISACMOL ARPA Lombardia, Matteo Cislaghi
DIMOSOP (e-hm, d-hm) 10 in Italy CLEPS, ISACMOL, ISACMOL2 University of Brescia, Roberto Ranzi
FEST (e-hm) 2 in Switzerland 1 in Italy
CLEPS POLIMI, Giovanni Ravazzani
LARSIMBY (d-hm) 10 in Germany LME, GFS, GME WWA Kempten, Uwe Ehret
LARSIMBW (d-hm) 2 in Germany LMK, LME LUBW, Werner Schulz
Fig. 2. Map of the Alps (color shading) with the outlines of the model domains of some of the high-resolution atmospheric D-PHASE models of Table 1. The red rhombus depicts the D-PHASE domain, while the blue square shows the COPS domain.
1325september 2009AmerICAN meteOrOLOGICAL sOCIetY |

• nowcasting products suchasradarloops,extrapo-latedtrajectories,andcomposites;and
• validation products [ViennaEnhancedResolutionAnalysis(VERA)analysesinparticular,discussedlater]anddifferenceplotsbetweenaspecificmodelandtheseanalyses.
TheprobablymostattractivesingleaspectoftheVPwasthatallofthewarningswerebasedonthesamethresholdsandprocedures.Allofthemodelsagreedonajointoutputformatandusedthesameprogramtodeterminethresholdexceedance(theroutinewasdifferentforeachcategoryofmodels—deterministicorensemble,atmosphericorhydrologicalforecasts).Thus,ifaparticularregionorcatchmentwasred(severestthreshold)asforecastedbyoneparticularmodelandonlyorange(secondhighestthreshold)byanothermodel,therewasadifferenceinthemodelresultsandnotintheanalysis(howtodefinetheareabordersandthethreshold,howtosumup,andsoon).ThephilosophyofD-PHASEwithrespecttowarningswasdirectedtowardthehighestprobabilityofdetec-tion(POD):ifonlyonemodelexceededathresholdforaparticularcatchment,thiscatchmentassumedthecorrespondingcoloronthesummaryplot.
BearinginmindthatD-PHASEwasanexperi-mentalsystem(experimentaltodemonstrateopera-tionalfitness),thewarninglevels(thresholds;WLs)weresetratherlow:
• WL3(red):returnperiodof10yr,• WL2(orange):returnperiodof180days,and• WL1(yellow):returnperiodof60days.
Noalert (green)wasgivenwhennoneof themodels(neitherprecipitationnorrunoff)exceededanyoftheWLs.WarningsfrombothatmosphericandhydrologicalEPSswere issued if33%of theensemblemembersexceeded thecorrespondingWL.ReturnlevelsweredeterminedforeachregionandcatchmentseparatelyonthebasisofstatisticsofannualmaximaofdailyprecipitationderivedfromtheFreiandSchär(1998)precipitationclimatologyandscalingassumptionswithrespecttodurationandarea.
Theseratherlowwarninglevelswereemployedtogetat leastsome“events”duringthe6-monthDOP.Anotherboundarycondition fordefiningwarning levelswas thatD-PHASEcatchmentsbelong todifferent countrieswith theirdiffer-entoperationalalert levelsandsystems.A joint(comparable)definitionforD-PHASEwouldhaverequiredchoosingoneof thealertdefinitions,leavingoneprivilegedcountryversusalltheothercountries.Definitionusingreturnperiodsallowedtheuseofa jointapproachwithconsiderationofregionalvariability.Note that thisdefinitionofwarning levels is linkedwithdifferentabsolutenumbersindifferentcatchments,whichisatoddswiththecurrentpracticeinmanyoperationalser-vices.Infact,thedefinitionofwarningthresholdsbasedonreturnlevelswasanissueofmajorcon-cernamongtheatmosphericforecastersandalsothe“endusers.”Thisprobablybestillustratestheinherentdifficultyofan(international)FDP:ontheonehanditmustnecessarilybeexperimental(ifthedemonstrationispositive,thentheresultsmay
becomeoperational),butitdealswithaveryseriousissue(severeweather), inwhich the stakeholdersneedclearproceduresandboundary conditions tofindoptimalsolutions incaseofanemergency.
Beyond the coloredwarningmaps, theplat-form a lso featured thecorresponding detai ledinformation.Foreachtar-getregionandcatchment,thedurationand levelofwarningweregraphicallydisplayedforeachmodelinparallel (atmosphericforecastsfortargetregionsand catchments, hydro-
Fig. 3. Screenshot of the D-PHASE VP for 8 Aug 2007, level 1 (alpine-wide view). Blue areas denote the Ligurian (west) and Adriatic (east) Seas, respec-tively. Green, yellow, orange, and red areas correspond to the defined warning levels (refer to text). Adopted from Zappa et al. (2008).
1326 september 2009|

logicalforecastsforrunoffstations).Evenmoredetailwasavailablebyclickingonthedesiredproperty.Again, theD-PHASEphilosophywithrespect tographicaldisplaywastouseidentical graphics forallthedifferentmodels,producedbythesamescriptsappliedtoallthemodels.Figure4highlightsthisasanexampleforthe28/29August2007event.Thesamescalesandcolorsand same spatial representationallowforconcentratingontheessen-tialdifferencesintheprecipitationfields.Apartfrom2Dplots,variouscrosssectionsormeteogramscanbeselected.EPSscandisplayprob-abilityofexceedance foragiven(selectable)thresholdorensembleaverages.
FromtheVP,userscandirectlyreachthevariousnowcastingap-plicationsthroughanInternetlink.Table3listsalloftheavailableinformation.
EXAMPLES OF APPLICATIONS. In thissectionaselectionofapplicationsandproducts,whichweredesignedortestedduringtheDOP,ispresented.Fourselectedexamplesarediscussedhereinsomedetail. Intheonlinesupplement(http://dx.doi.org/10.1175/2009BAMS2776.2), threead-ditionalapplications (studies)of theD-PHASEdatasetsandconceptsarepresented.Thefirststudyshowsthat theCOSMO-LEPS24-hprecipitationforecastcanbesubstantiallyimprovedbycalibrationbasedonreforecasts(Fundeletal.2009).Thesec-ondstudyaddressestheoperationalassimilationofGPSdatawithinthefifth-generationPennsylvaniaStateUniversity–NationalCenterforAtmosphericResearchMesoscaleModel(MM5)four-dimensionalvariationaldataassimilation(4DVAR)system(Zusetal.2008).Thethirdstudyexploresthepotentialofahigh-resolutionpoorman’sensemble(Micro-PEPS).Additionalapplicationscanbe found inArpagausetal.(2009)andZappaetal.(2008)forapplicationsfromD-PHASEofamorehydrologi-calnature.
Verif ication of precipitation alerts using operational data. TheD-PHASEdatasetoffersamplepossibili-tiestoobjectivelyverifymodeldataagainstobser-vations.Oneofthefirstsucheffortswasperformedusing theSwissradarcomposite for JJA(Ament
Fig. 4. Screenshot of the graphical display facility on the D-PHASE VP. Example of 12-h accumulated precipitation, valid 0000 UTC 29 Aug 2007, from (top left) COSMO-2, (top right) Application de la Rechereche à l’Operationnel pour la Méso-Echelle (Arome), (bottom left) MOLOCH, and (bottom right) COSMO-7. See Table 1 for model names.
andArpagaus2008).Resultshavealreadybeenvaluableinassessingmodeldeficienciesandhaveevenledtothedetectionofamajorbuginoneoftheparticipatingmodels.Here,weconcentrateonwarnings—thecoreproductofD-PHASE—issuedbyallmodelsinthesameformatduringtheDOP.Thepresentevaluationisbasedonsome18targetregionsinSwitzerlandbecauseofhigh-qualitydata,butitwillbeperformedforvariousmodelparametersandtheentireD-PHASEdomainoncetheobservationaldataarereadyandavailable.Referencealerts fortheevaluationarebasedonacombinationofradar(Germannetal.2006)andraingaugeobservationsofdailyprecipitationsumsinterpolatedontoa1-kmgridaccordingtoFreietal. (2006)andFreiandSchär(1998).Radardataarespatiallyandtemporallyaveragedtoobtainhourlytimeseriesforeachtargetregion.Then,systematicerrorsinradarobservationsarecorrectedbyadaily,multiplicativecalibrationtoenforceanexactmatchwithcorrespondingdailysumsofthegaugeanalysis.
Here,wefocusontheshort-rangetimescale,whichiswellcoveredbytheconvection-permittingmodels.Consequently,shortaccumulationperiods(3,6,and12h)andthemostrecentforecastsareconsidered(thefirstthreeforecasthoursaredis-cardedtoaccountforproductiontime).Toavoiddoublepenaltyeffects,bothmodelandobserva-tionsareaggregatedon6-hintervalsbyanalyzingwhethertherewasanyalertwithineachinterval.
1327september 2009AmerICAN meteOrOLOGICAL sOCIetY |

Thistemporallycoarsenedinformationstillsatisfiestheneedsofmostusers.
Modelperformanceisquantifiedbythe“relativevalue”(Richardson2000),whichvariesbetween0(noskill)and1(perfectmodel)andindicateswhatfractionofeconomicsavingscanbeachievedrela-tivetothemaximumpossible(costsfor“noforecast”minuscostsfor“perfectforecast”).TherelativevaluestronglydependsontheratioofcostsCforprotectiveactionstolossesLincaseofnoprotection.Thecost–lossratioC/Lreflectstheuser’ssensitivityagainstthetwotypesoferroneousforecasts:missedeventsarecriticalforlowC/L(e.g.,alertinglocalrescueorgani-zation)andfalsealarmsforhighC/L(e.g.,evacuatinganentiretown).
Thevalidationofalldeterministicmodels(Fig.5a)withhourlyresolutionandcoveringSwitzerlandindicatesthattoday’smodelshaveapositiveeco-nomicvalueoverawiderangeofC/Lratios.Thenewhigh-resolution,convection-permittingmodelsare
beneficialinthisrespect.Furtheranalysiswillrevealwhetherthisadvantagecanmainlybeattributedtobetterrepresentationofconvection,improvedoro-graphicforcing,orfasterreinitialization.
Allmodelalertscanbecombinedtoyieldamul-timodelalertsystem(MMAS)byassumingthattheforecastedprobabilityofaneventequalsthefractionofmodelsissuinganalert.Thedecisionalert“yes”or“no”canbeoptimizedtotheuser’sC/Lbydefininganappropriatenumberofmodelsthatarerequired“yes”toissueanalert(Fig.5b).Becauseofthisoptimiza-tion,aMMAScancoverawiderrangeofC/Lratiosthanadeterministicforecast;forthepresentcaseitreacheshigherrelativevalues,especiallyforlowC/L. Similarimprovementcanbeachievedbyvaryingthealertthresholdusedbyasingledeterministicforecast(i.e.,thebestmodelinthepresentanalysis);forthis,predictedprecipitationamountsaremultipliedbyaconstant“factor,”whichisequivalenttovaryingthewarninglevel.Notethatthefactorusedtoobtain
Table 3. Nowcasting and online monitoring tools participating in D-PHASE. Coverage refers to the main region. Because of the extension of the underlying observing systems (e.g., radar), some neighboring re-gions are also covered but possibly with a reduced data quality.
Name Purpose CoverageInstitution and
contact person(s)
MeteoSwiss NASSQuantitative precipitation estimate based on radar
Switzerland plus boarder areaMeteoSwiss, Urs Germann
Piemonte-MeteoSwiss com-posite
Quantitative precipitation estimate based on radar
Piemonte and SwitzerlandARPA Piemonte/MeteoSwiss, Roberto Cremonini/ Urs Germann
MeteoSwiss ENASSEnsemble quantitative precipitation estimate based on radar
Switzerland plus boarder areaMeteoSwiss, Urs Germann
MeteoSwiss TRTThunderstorms Radar Tracking
Switzerland plus boarder areaMeteoSwiss, Alessandro Hering
DLR Cb-TRAM
Tracking and monitoring severe convection using multichannel Meteosat-8 SEVIRI data
D-PHASE and COPS domainDLR, Arnold Tafferner
ARPA-SIM radar products (northern) ItalyARPA-Emilia Romagna, Andrea Montani
Météo-France radar products FranceMétéo-France, Philippe Frayssinet
VERAAnalysis of surface fields for online monitoring
D-PHASE and COPS domainUniversity of Vienna, Manfred Dorninger
NWP minus VERAOnline monitoring for some of the NWP models; surface fields
D-PHASE and COPS domainUniversity of Vienna, Theresa Gorgas
CLEPS versus satelliteOnline monitoring of CLEPS versus satellite observations
D-PHASE and COPS domainDLR, Christian Keil
1328 september 2009|
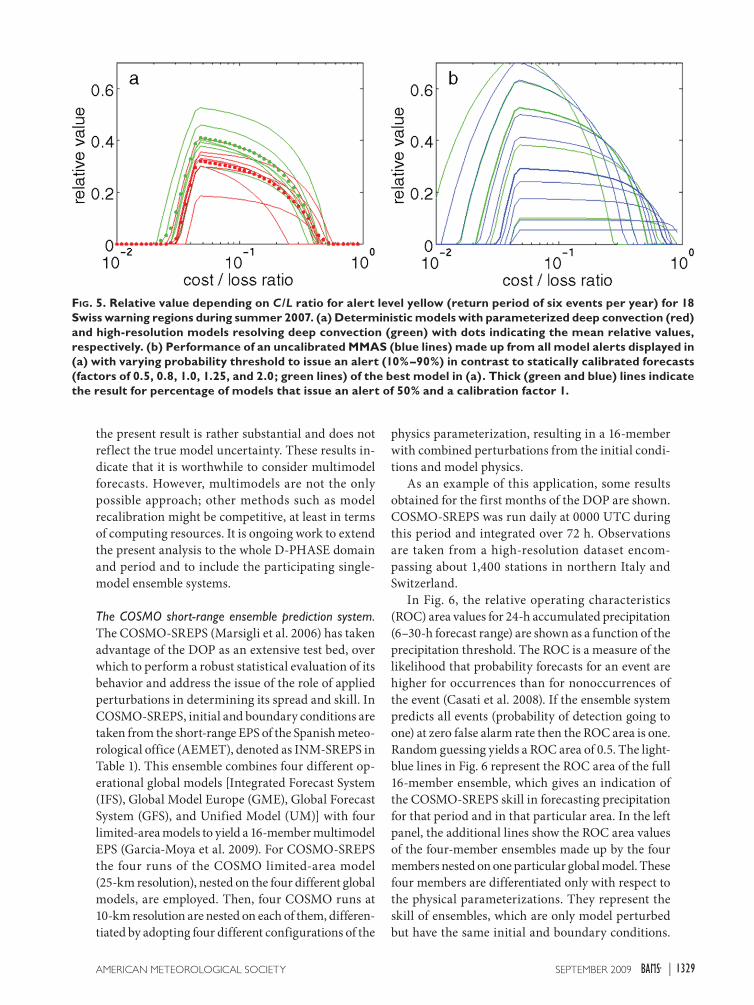
thepresentresultisrathersubstantialanddoesnotreflectthetruemodeluncertainty.Theseresultsin-dicatethatitisworthwhiletoconsidermultimodelforecasts.However,multimodelsarenottheonlypossibleapproach;othermethodssuchasmodelrecalibrationmightbecompetitive,atleastintermsofcomputingresources.ItisongoingworktoextendthepresentanalysistothewholeD-PHASEdomainandperiodandtoincludetheparticipatingsingle-modelensemblesystems.
The COSMO short-range ensemble prediction system. TheCOSMO-SREPS(Marsiglietal.2006)hastakenadvantageoftheDOPasanextensivetestbed,overwhichtoperformarobuststatisticalevaluationofitsbehaviorandaddresstheissueoftheroleofappliedperturbationsindeterminingitsspreadandskill.InCOSMO-SREPS,initialandboundaryconditionsaretakenfromtheshort-rangeEPSoftheSpanishmeteo-rologicaloffice(AEMET),denotedasINM-SREPSinTable1).Thisensemblecombinesfourdifferentop-erationalglobalmodels[IntegratedForecastSystem(IFS),GlobalModelEurope(GME),GlobalForecastSystem(GFS),andUnifiedModel(UM)]withfourlimited-areamodelstoyielda16-membermultimodelEPS(Garcia-Moyaetal.2009).ForCOSMO-SREPSthefourrunsof theCOSMOlimited-areamodel(25-kmresolution),nestedonthefourdifferentglobalmodels,areemployed.Then,fourCOSMOrunsat10-kmresolutionarenestedoneachofthem,differen-tiatedbyadoptingfourdifferentconfigurationsofthe
physicsparameterization,resultingina16-memberwithcombinedperturbationsfromtheinitialcondi-tionsandmodelphysics.
Asanexampleofthisapplication,someresultsobtainedforthefirstmonthsoftheDOPareshown.COSMO-SREPSwasrundailyat0000UTCduringthisperiodandintegratedover72h.Observationsaretakenfromahigh-resolutiondatasetencom-passingabout1,400stationsinnorthernItalyandSwitzerland.
InFig.6, therelativeoperatingcharacteristics(ROC)areavaluesfor24-haccumulatedprecipitation(6–30-hforecastrange)areshownasafunctionoftheprecipitationthreshold.TheROCisameasureofthelikelihoodthatprobabilityforecastsforaneventarehigherforoccurrencesthanfornonoccurrencesoftheevent(Casatietal.2008).Iftheensemblesystempredictsallevents(probabilityofdetectiongoingtoone)atzerofalsealarmratethentheROCareaisone.RandomguessingyieldsaROCareaof0.5.Thelight-bluelinesinFig.6representtheROCareaofthefull16-memberensemble,whichgivesanindicationoftheCOSMO-SREPSskillinforecastingprecipitationforthatperiodandinthatparticulararea.Intheleftpanel,theadditionallinesshowtheROCareavaluesofthefour-memberensemblesmadeupbythefourmembersnestedononeparticularglobalmodel.Thesefourmembersaredifferentiatedonlywithrespecttothephysicalparameterizations.Theyrepresenttheskillofensembles,whichareonlymodelperturbedbuthavethesameinitialandboundaryconditions.
Fig. 5. Relative value depending on C/L ratio for alert level yellow (return period of six events per year) for 18 Swiss warning regions during summer 2007. (a) Deterministic models with parameterized deep convection (red) and high-resolution models resolving deep convection (green) with dots indicating the mean relative values, respectively. (b) Performance of an uncalibrated MMAS (blue lines) made up from all model alerts displayed in (a) with varying probability threshold to issue an alert (10%–90%) in contrast to statically calibrated forecasts (factors of 0.5, 0.8, 1.0, 1.25, and 2.0; green lines) of the best model in (a). Thick (green and blue) lines indicate the result for percentage of models that issue an alert of 50% and a calibration factor 1.
1329september 2009AmerICAN meteOrOLOGICAL sOCIetY |

Apartfromthedecreaseinskillevidentwhenpassingfroma16-membertoafour-memberensemble,whichisexpected,theinterestingpointisthatthedifferent4-memberensembleshavedifferentskill,thatdrivenbyUMshowinghigherROCareavalues,whereasthatdrivenbyGFSbeingleastskillful.
IntherightpanelofFig.6, the4-memberen-semblesmadeupfromidenticalphysicsperturbationsareshown.Theserepresenttheskillofensemblesthatareperturbedintheinitialandboundaryconditionsonlybuthavethesamemodelsetup.ComparingthetwopanelsofFig.6indicatesthatperturbationofinitialconditionsgenerallyyieldssomewhatmoreskillfulperformancethanphysicalperturbation.This indicatesthatthehigherdegreeofdiversityamongmemberswithdifferentinitialandbound-aryconditionsyieldsbetterskillascomparedtothesmaller-scalevariabilityintroducedbythephysicsperturbations.
Asfortheroleofthedifferentparameterizations,thefour-memberensembleinwhichmodelperturba-tion“p2”isappliedtoeachmember(redlineintherightpanelofFig.6)turnsouttobemoreskillfulthanotherfour-memberensembles.Forthepresentpurposeofdemonstration,itdoesnotmattertowhichparameterp2refers,althoughtheperformanceofdifferentparameterswillbeanalyzedinmoredetailinthefuture.Asageneralconclusion,thisresultin-dicatesthatoptimaltuningofamultimodelensemblebearssomepotentialforimprovingtheskill.
Operational nowcasting of thunderstorms in the Alps using TRT. Localflashfloodscancauseseveredam-ageincomplexterrainandrequirethetrackingofindividual,evenrelativelysmall thunderstorms.
Orographymayalso lead to theorganizationofconvectivecellsatthemeso-betascale(20–200km)in thepre-Alpineandplateauregion.A typicalproblemofnowcasting is thus the identificationandtrackingofstormcellsasintheThunderstormIdentification,Tracking,andNowcasting(TITAN;DixonandWiener1993)ortheStormClassificationIdentificationandTracking(SCIT;Johnsonetal.1998)algorithms.
TheDOPwasanexcellentopportunitytodem-onstratetheperformanceoftheoperational,object-orientednowcastingsystemThunderstormsRadarTracking(TRT).TRTisamultiple-radar,multiple-sensorsystemthatusesheuristic-andcentroid-basedmethodsfortheautomaticdetection,tracking,char-acterization,andextrapolationofintenseconvectivecells.Itfullyexploitsvolumetricreflectivitydataofmultiple-radarcompositestodescribethe3Dstormstructureandproperties(Heringetal.2006)andistunedtoidentifyindividualcellsratherthanstormsystems.Hence,theevolutionofcell-basedattributes,likeverticallyintegratedliquid(VIL)15/45-dBZechotops,thealtitudeofmaximumstormref lectivity,andcloud-to-groundlightningflashes,areavailabletoforecastersinrealtimeaswellastherespectivegriddedfields.
TRTisbasedonadynamicthresholdschemeap-pliedtothereflectivitydataofmultiple-radarcom-positeswithatimeresolutionof5minandaspatialresolutionof2km(Heringetal.2004).Itisabletoidentifyeachstormobjectatindividualthresholds,dependingonthestageofthestorm’slifecycle.Withthecurrentthresholds,thunderstormcellsassmallas16km2(fourpixels)canbeidentified.Adetectedstormcellistrackedinsuccessiveimagesusingthe
Fig. 6. ROC area as a function of threshold for 24-h accumulated precipitation in the Alpine region (high-resolution precipitation dataset in northern Italy and Switzerland as a reference). (left) Full 16-member COSMO-SREPS (light-blue) vs 4-member ensembles with identical “mother run” (blue: ECMWF, red: GME, green: GFS, black: UM). (right) Same as (left) but for identical physical perturbation (blue: p1, red: p2, green: p3, black: p4).
1330 september 2009|

methodof thegeographicaloverlappingofcells.Complexcaseswithseveralcells,splits,andmergersarealsotakenintoaccount.
ThelatestimprovementinTRTisthecellseverityranking(CSR),developedforD-PHASEandtestedduringtheDOP.Itsgoalistofindandhighlightthemostdangerousandstrongestcellsbycombiningthemostsignificantcellseverityattributesintoonesingleparameter.Forthispurposecellsareclassifiedintofourdistinctcategoriesofseverityandrepresentedbyacolor-codedellipse(Fig.7).Theseveritycategoriesarecomputedbyintegratingthethreecell-basedattributesVIL,themeanof45-dBZecho-topaltitude,andthemaximumcellreflectivity,withadifferentweighting(Heringetal.2008).
TRTalsoincludesa1-hpositionforecast.Thethunderstorm’sestimatedfuturepositioniscomputedusingtheindividualcell’sweighteddisplacementvelocity.Theexpectedpositionisdisplayedwithanellipsefilledwithparallellines(Fig.7),andittakesintoaccountthespread(standarddeviation)ofthevelocityvectorsfromthelastthree5-mintimesteps.Thesizeoftheellipseisproportionaltotheuncer-taintyofthepositionforecast(i.e., the largertheellipse,thegreatertheuncertainty).
CSRwassuccessfullyusedbyforecastersduringtheDOP,anditallowedforecasterstofocusonthemostseverecellsmaintainingsituationalawarenessandtospeedupthedecisionprocessofthunderstormwarnings.Likewise,CSRhasbeenaverypopularandeasy-to-usenowcastingproductfortheendusers.AsystematicevaluationoftheextrapolationroutinewillbeperformedusingtheD-PHASEdata.
VERA. VERAisahigh-resolution,real-timeanalysistoolforapplicationsovercomplextopography.Itspurposeistoprovidethebestpossibleautomatedatmosphericanalysistoassessthemodelforecastsfortheongoingsituationandthustodecidethemosttrustworthymodel.VERAusesphysicalaprioriknowledge(so-calledfingerprints)oftypicalmeteo-rologicalpatternsoccurringovercomplexterrain.Forexample,thepatternsofmesoscalecoldhighsorheatlowsovercomplexterraininundisturbedweathersituationsarestronglyconnectedtotopography.Thefingerprintapproachusesthisinformationtorefinetheanalysis.DetailsofthetechnicalimplementationforVERAcanbefoundinSteinackeretal.(2000,2006)orBicaetal.(2007).
Acomprehensivedataqualitycontrol(QC)schemeisusedupstreamoftheanalysistoexcludeerrone-ousdata.Thismoduledetectsandfiltersunrealisticsinglemeasurements,grosserrors,andsystematic
errors,thuseliminatinginthespinupoftheanalysiserroneouspatternsduetodataerrors(Häberlietal.2004).Ifthedomainunderconsiderationis largeenough,thenVERAestimationofmeanareapre-cipitationyieldssatisfyingresults(Dorningeretal.2008).
VERAwas setup for theD-PHASEdomain(Fig. 2) and for theparametersmean sea levelpressure,(equivalent)potentialtemperature,10-mwind,precipitation,andmoisturef luxdivergence.DatafromtheWorldMeteorologicalOrganization’s(WMO’s)GlobalTelecommunicationsSystems(GTS)wereusedtoproducemodel-independentanalysesonanhourlybasisinrealtimeduringtheDOP.Twenty-twominutesafterobservations,thegraphicswereavailableontheVP.Thelocationandstrengthofthemeteorologicalphenomenonunderconsiderationwerecomparedtomodel forecastsontheVERAgridinrealtimeforselectedmodels.VERA-to-modeldifferencesguidedtheforecasterconcerningoptimalmodelchoice(differentmodelsorinitializationtimes).
Figure8showsanexampleofafrontalmovementfrom18-and6-hforecasts,respectively,issuedbyCOSMO-2.BotharecomparedtothesameVERAanalysis.Theforecastedfrontalsystem(intermsof
Fig. 7. Operational visualization of the TRT cell ranking product over the Alpine region (0650 UTC 21 Jun 2007). The solid-shaded ellipses indicate the current position and size of the thunderstorm cells. Hatched ellipses show a 60-min forecast of each cell’s position, and the size is proportional to the uncertainty of the forecast. The cell objects are classified into the four categories: very weak (not visualized), weak (green), moderate (yellow), and severe (red). Elliptical arcs show the cell’s expected position in 15-min steps.
1331september 2009AmerICAN meteOrOLOGICAL sOCIetY |

thelocationofthegradientoftheequivalentpotentialtemperature)lacksbehindtheanalysisfortheolderforecast.Inthemorerecentforecast,thepositionsofforecastedandanalyzedfrontlocationsfitquitewell.Therefore,theforecasterwouldrelyonthenewerforecastinthiscase.
OnlineVERAwas intendedasadditional in-formation to theusers.Still, a reanalysisof theDOPisplannedusingadditionaldatafromvarioussourcesintheD-PHASEdomainandhigh-densitydatasetsintheCOPSdomain,notavailableinrealtime.Thisreanalysiswillagainbecomparedtoallthemodelrunsandwillresultinacomprehensivemodelintercomparisonwithanindependentrefer-ence.Clearly,theseanalyseswillalsobevaluableforprocessstudies.
USER FEEDBACK. Social scientif ic approach. AcentralpartofevaluationactivitiesforD-PHASEwasasocialscientificevaluationfocusingontheusersoftheVP.BecauseoneofthegoalsofD-PHASEwastoinvestigateandimprovesituationanalysisanddecision-makingprocessesbyusers,itwasnecessarytosurveyusersinadditiontoobjectivelyevaluatingmodelquality.Theapproachwas tomeasuringchangesinsteadofsimplyassessingposthocjudg-mentsabouttheusefulnessorsuccess,asisusuallydone.AnotheraimoftheDOPwastocreateimprovedunderstandingamongusersofprognosticinforma-tionandnewapproachessuchasensemblemodeling.Thus,thegoalsofthesocialscientificevaluationweretoestablishwhethertheapproacheswereunderstood
byusers,howthequalityofthesituationanalysisimproved,andhowthemutualperceptionoftwousergroups—endusers(civilprotection,amongothers)andatmosphericforecasters—hadchangedduringtheDOP.
Acombinationofmethodswaschosen:
• aquantitativequasi-experimentalapproachtoassesschangesduringtheDOP.[Forthis,26userscompletedtwoquestionnaires,oneinthebegin-ningandoneaftertheDOP.],
• a1-dayworkshopwith16userstodiscusstheoutcomesof theDOPandpossiblemeasuresforimprovingtheVP[InformationonthemainproblemsencounteredandonusageofD-PHASEinformationwascollected.],and
• interviewswithselecteduserstoinvestigatehowD-PHASEtoolswere incorporated intodailypractice.
Themaininstrumentoftheevaluation,thesemi-standardizedquestionnaire,containedquestionsabout
• theVPperse;thatis,itsperformance,accessibility,andgeneralvaluefortheusers;
• contentontheVP;thatis,clarityofinformation,comprehensibility,complexity,andadequacyofinformationandperceivedqualityofmodelfore-casts;
• effectoftheplatformontheusers;thatis,riseincomprehensionofmodels,duties,andproblems
Fig. 8. Real-time COSMO-2-minus-VERA comparison of equivalent potential temperature; valid at 0600 UTC 18 Sep 2007. Shown is the northern part of Switzerland and surrounding countries. (left) 18-h forecast with COSMO-2; (right) 6-h forecast with COSMO-2. The color code depicts the difference (COSMO-2 forecast mi-nus VERA analysis). Red means predicted values higher than analyzed and blue means predicted values lower than analyzed. Solid lines mean VERA analysis and dashed lines mean COSMO-2 predictions. Bold solid lines depict country borders. GTS data are the data source for analyzed fields.
1332 september 2009|

ofotherusergroups;riseinself-perceivedcompe-tence(certaintywithowndecisions);andgeneraljudgmentsontheusefulnessofinformationwithregardtosituationanalysisanddecisionsupport.
PreliminaryresultsindicatethatD-PHASEwasreg-ularlyusedandthattheinformationwasincorporatedintodecisionprocedures.D-PHASEwasmainlyusedbeforeevents,forexample,incasesoffirstevidenceforpossibleevents.Itwasusedlessoftenduringeventsforestimatingtheseverityortheevent’sevolution.EndusersratedtheD-PHASEplatformasvaluable,trust-worthy,andeasytonavigate.Roomforimprovementwasnotedconcerningthetechnicalperformanceoftheplatform(speedandavailabilityofservices).
Amongtheelementsontheplatform,regionalandlocalmapsweremostoftenused.NoparticularinformationwasmissedontheVP.Onthecontrary,theamountofinformationwasconsidered“rathertoolarge.”Mostusersindicatedthattheyhadbeenabletointerprettheinformationbutnotallmodelswere(sub-jectively)ratedequallytrustworthy.Usersfoundtheinformationbeneficialtosupportsituationanalysisanddecisionmakingbutcouldnotdecideifdecisionshadactuallyimprovedinspecificcases.Theavailabil-ityofensemblemodelsandprobabilisticinformation,whichwaslargelyunknowntomostofenduserspriortotheDOP,wasperceivedasaddedvalue.
Feedback from atmospheric forecasters. AsubjectiveverificationwasperformeddailyduringtheDOPbytheon-dutyforecastersofMeteoSwiss.Thisevalu-ationwastargetedtoassessthetruebenefitsofthewarningprocessfortheforecasterandthusdirectlyrespondstotherequirementsofaFDP.
Severalquestionswereaddressedwithanonlinemultiplechoicequestionnaire.Questionsrangedfrom“countablefacts”(concerningmodelsemployed,f lowsituation,andsoon)tosubjectivejudgments(e.g.,determiningwhichVPcomponenthelpedthemostinthesituationanalysis?).Somepreliminaryresultsthatcanbededucedfromaquicksurveyofthereturnedforms,areexpressedinthefollowingforecasterstatements:
• Limited-areaensemblepredictionsystemshaveasignificantpositiveeffect(ascomparedtohavingonlydeterministicmodels available) for theestimationoftheprecipitationamountandforbuildingconfidenceintotheforecast.
• For precipitation events in theAlps, high-resolutionmodelsprovideaddedvalueinabouthalfofthecases.(Inmostothercasestheyhave
noaddedvalue,andsometimes thesemodelsevenprovideapoorerguidancethanthecoarsermodels.)Thebenefitofthehigherresolutionismorepronouncedforensemblesystemsthanfordeterministicmodels.Convection-resolvingde-terministicmodelssometimesfailedtoproduceanyprecipitationatall,particularlyinconvectivesituations.[Notethatthisstatementtosomeextentcontraststotheobjectiveverificationresults(e.g.,Fig.5).Clearly,thereasonsforthedifferencesinsubjectiveandobjectivejudgmentfromdifferentusergroupswillbethesubjectofdeeperanalysisoftheresultsfromthisproject.]
• ConcerningalertsandtheirpresentationontheVP,thelargevarietyofmodelswasappreciatedbymanyforecasters.Asfor traditionalmodelproducts(plots,meteograms,amongothers),how-ever,thereislittleadvantageinhaving(too)manymodelsofthesametypeatdispositiontoincreaseforecastconfidence.ThenumberofavailablemodelsduringD-PHASEwastoolargetocopewithandforecastershadtorestricttheirattentiontowell-knownmodels.Thisholdstruefornormalaswellasforhigh-impactweathersituations.
• Asuitablevisualizationsystemisessential fortheforecasterstoeffectivelyusethevastamountofdataandtoextracttheessentialfactswithoutlosingrelevantinformation.TheVP,designedwiththecontributionoftheforecasters,wasasuccessfortheduty.Theautomaticalertsallowedforarapidoverviewoftherelevantinformationandeasyaccesstothedatarequiredinthewarningprocess.However,theaddedvalueoftheVPde-pendsonthespread(bothtemporalandspatial)amongthevisualizedmodels.
• Therewasnospecialpreferenceamongthenewlyavailablesystems(i.e.,modelsortoolsintroducedattheoccasionofD-PHASE)inbestsupportingtheforecastersintheirdecision-makingprocess.
• Atmosphericforecastersappreciatedtheavail-abilityofhydrological information tobetteraddressenduserneedsandimprovetheirownunderstandingofthehydrologicalprocesses.
• Last,butnot least: theacceptanceof thenewgenerationofNWPmodelsystemsaswellasthewholeD-PHASEforecastingsystemandVPdif-feredstronglyamongtheindividualforecasters.
SUMMARY AND CONCLUSIONS. TheWWRPForecastDemonstrationProjectD-PHASEsuccessfullydemonstrated recent advances inforecastingheavyprecipitationeventsandrelatedfloodsintheAlpineregion.Manyoftheseadvances
1333september 2009AmerICAN meteOrOLOGICAL sOCIetY |

havebeeninitiatedduringtheMesoscaleAlpineProgramme(MAP).Inthiscontributionwehavepresentedtheoverallbackgroundoftheproject,itselements,andanumberofapplicationsthatweretriggeredbyD-PHASE.
Atabareminimum,D-PHASEhasproducedanunprecedenteddatasetthatbringstogetherresultsfrommorethan30atmosphericmodelingsystemswithacommondomain,acommonoutputformat,jointwarningprocedures,andplotsusingthesamecoding(thatcanbecomparedwithoutadaptation).Atthesametime,hydrologicalrunoffsimulationswereperformedinmorethan40catchmentsallovertheAlps,andnowcastinginformationwasprovidedtothenumerousendusers.ThecollaborationwiththeWWRPRDPCOPSfurthermorebroughtauniqueopportunitytohavehigh-qualityobservationaldatainasubdomainandsubperiodoftheDOP.
Theavailabledatasetwillallowfor
• systematicallydemonstrating theadditionalvalueofconvection-permittinghigh-resolutionatmosphericmodeling(encouragingpreliminaryresults,suchasinFig.5);
• investigatingthepropertiesandperformanceofEPSs,bothforatmosphericandhydrologicalmodels.Examplescanbefoundinthe“Examplesofapplications”sectionandintheonlinesupplement[http://dx.doi.org/10.1175/2009BAMS2776.2;hydrologicalexamplesarereportedinZappaetal.(2008)andGermannetal.(2009)];
• studyingpredictabilityofconvectionprocessesandconvectiveinitiationusingthepresentmodelresultsinconnectionwiththeobservationalre-sultsofCOPS;
• identify benchmarkmodels of a l l types bycomparingthemwitharangeofothermodelsofthesamecategory,orevenothermodeltypes;
• systematicallyevaluatingnowcastingtoolssuchasthepositionforecastofconvectivesystemsintheTRT(see“Operationalnowcastingofthun-derstormsintheAlpsusingTRT”section)usingtheavailabledataandpossiblyextendingtheirfunctionalityby introducingmodelproducts;and
• judgingtheenduserfeedbackonitsowngrounds(andaccepttheconsequences)andcomparingittothe“objective”verificationresults,thuslearningevenmoreconcerningtheimprovementoftheoverallforecasting/warningsystem.
JustasMAPprovedthefeasibilityofatmospheric/hydrological coupling (e.g.,Ranzi et al. 2007),
D-PHASEsuccessfullydemonstrateditsoperationaluseandextensiontoensembletechniques.Judgingfromtheforecaster’spreliminaryconclusion(seethe“Userfeedback”section),thisisnotonlyanadvanceintechnicaltermsbutitalsohelpstherespectivecommunitiestotakeintoaccounttheother’ssphere(hydrosphereversusatmosphere) to improvethedecisionsandforecastsinone’sownmodels.When“expanding”intootherareassuchasairqualityorhealthfactorforecasting,theatmosphericcommunityshouldkeepsuchanexperiencewellinmind.
ThesinglemostimportantfactorofsuccessforD-PHASEwasprobablytheinteroperabilityofallofthemodels.Commonformats,commonwarninglevels,andcommonroutinestoactuallydeterminethewarningsfromthemodeloutputsrenderedtheresultscomparableandthereforehighlyvaluable.
ThepresentFDPhasprovidedapreciousdatasetthathastobefurtherexploited.InconjunctionwiththereferenceobservationaldatasetduetoCOPSinpartsofthedomainandduringpartsoftheDOP,thesedataarenowavailableasatestbedforatmo-sphericconvection,incombinationwithorographicprecipitationandcoupledtohydrologicalmodeling.Atthetimeofwriting,suchplansarebeingconsideredwithinworkinggroupsofWWRPandtheHydrologicEnsemblePredictionExperiment(HEPEX).
ACKNOWLEDGMENTS. MostauthorshavebeenfundedbytheirhomeinstitutionswhomadeD-PHASEhappen:MeteoSwiss,UniversityofVienna,SwissFederalInstituteforForestSnowandLandscapeResearch,ARPA-SIM,UniversityofBrescia,Météo-France,ISAC-CNR,USAM,MetOffice,UniversityPaulSabatier,ARPAV,ETHZ,ZAMG,DLR,DeutscherWetterdienst(DWD),andUniversityofHohenheim.D-PHASEprofitedfromresearchcontractsintheframeworkofCOST731,fromtheSwissNationalCentreforCompetenceinResearchClimate(NCCRClimate)aswellasfromSBFC05.0105.COPS,bythecollaborationwithwhichD-PHASElargelyprofited,wasfundedbytheGermanResearchFounda-tion(DFG)withinthePriorityProgram1167.SomeoftheverificationexercisesandmodelingstudiesprofitedfromdataexchangethroughCOSMO,inparticularthehigh-resolutionprecipitationnetworkfedbytheItalianregionalmeteorologicalservicesofBolzano,Emilia-Romagna,Friuli-Venezia-Giulia,Liguria,Marche,Piemonte,Trento,andARPAVeneto.TheSpanishMeteorologicalserviceINM[recentlychangedtoAgenciaEstataldeMeteorologia(AEMET)]kindlyprovidedtheboundaryfieldsfortheCOSMO-SREPSproject,andARPAPiemontecontrib-utedtotheSwiss–Italianradarcomposit.TheefficientandflexibleprogrammingoftheD-PHASEVPthrough
1334 september 2009|

next-generationsoftwareanditsowner,G.Kittel,isverymuchacknowledged.
REFERENCESAment,F.,andM.Arpagaus,cited2008:Precipitation
forecastsinSwitzerland—Anassessmentbythefore-castdemonstrationprojectMAPD-PHASE.[Avail-ableonlineatwww.smr.arpa.emr.it/dphase-cost/presentazioni/21-May/Morning/Session_3_am/3.04-amt/200805_ament_dphase_bologna.pdf.]
Arpagaus,M.,andCoauthors,2009:MAPD-PHASE:DemonstratingforecastcapabilitiesforfloodeventsintheAlpineregion.MeteoSwissPublicationSeries78,75pp.[Availableonlineatwww.meteoschweiz.admin.ch/web/de/forschung/publikationen/meteo-schweiz_publikationen/veroeffentlichungen.html.]
Bacchi,B.,andR.Ranzi,2003:Hydrologicalandmeteo-rologicalaspectsoffloodsintheAlps:Anoverview.Hydrol. Earth Syst. Sci., 7, 784–798.
Benoit,R.,andCoauthors,2002:Thereal-timeultrafin-escaleforecastsupportduringthespecialobservingperiodoftheMAP.Bull. Amer. Meteor. Soc., 83, 85–109.
—,N.Kouwen,W.Yu,S.Chamberland, andP.Pellerin,2003:HydrometeorologicalaspectsoftheReal-TimeUltrafinescaleForecastSupportduringtheSpecialObservingPeriodoftheMAP.Hydrol. Earth Syst. Sci., 7, 877–889.
Bica,B.,andCoauthors,2007:Thermallyanddynami-callyinducedpressurefeaturesovercomplexterrainfromhigh-resolutionanalyses. J. Appl. Meteor. Climatol., 46, 50–65.
Binder,P.,andC.Schär,1996:MAPdesignproposal.MesoscaleAlpineProgrammeRep.,79pp.[Avail-ableonlineatwww.map.meteoswiss.ch/map-doc/proposal.htm.]
Bougeault,P.,andCoauthors,2001:TheMAPspecialobservingperiod.Bull. Amer. Meteor. Soc., 82, 433–462.
Casati,B.,andCoauthors,2008:Forecastverification:Currentstatusandfuturedirections.Meteor. Appl., 15, 3–18,doi:10.1002/met.52.
Denhard,M.,andS.Trepte,2006:CalibrationoftheEuropeanmulti-modelensembleSRNWP-PEPS.Proc. Second THORPEX Int. Science Symp., WMOTech.Document 1355,WWRP/THORPEX 7,Landshut,Germany,THORPEX,56–57.
Dixon,M.,andG.Wiener,1993:TITAN:Thunderstormidentification,tracking,analysis,andnowcasting—Aradar-basedmethodology. J. Atmos. Oceanic Technol., 10, 785–797.
Dorninger,M.,S.Schneider,R.Steinacker,2008:On
theinterpolationofprecipitationdataovercomplexterrain.Meteor. Atmos. Phys., 175–189,doi:10.1007/s00703-008-0287-6.
Frei,C.,andC.Schär,1998:AprecipitationclimatologyoftheAlpsfromhigh-resolutionrain-gaugeobserva-tions.Int. J. Climatol., 18, 873–900.
—,R.Schöll,S.Fukutome,J.Schmidli,andP.L.Vidale,2006:Futurechangeofprecipitationex-tremes inEurope:Intercomparisonofscenariosfromregionalclimatemodels.J. Geophys. Res., 111, D06105,doi:10.1029/2005JD005965.
Fundel,F.,M.A.Liniger,A.Walser,C.Frei,andC.Appenzeller,2009:Calibratedprecipitationforecastsforalimitedareaensembleforecastsystemusingreforecasts.Mon. Wea. Rev., inpress.
Garcia-Moya,J.A.,A.Callado,C.Santos,D.Santos-Munoz,andJ.Simarro,2009:Predictabilityforshort-rangeforecast:Amulti-modelapproach.AEMETTech.Rep.,inpress.
Germann,U.,G.Galli,M.Boscacci,andM.Bolliger,2006:Radarprecipitationmeasurementinamoun-tainousregion.Quart. J. Roy. Meteor. Soc., 132, 1669–1692.
—,M.Berenguer,D.Sempere-Torres,andM.Zappa,2009:Ensembleradarprecipitationestimationforhydrologyinamountainousregion.Quart. J. Roy. Meteor. Soc., 135, 445–456,doi:10.1002/qj.375.
Häberli,C.,I.Groehn,R.Steinacker,W.Pöttschacher,andM.Dorninger,2004:PerformanceofthesurfaceobservationnetworkduringMAP.Meteor. Z., 13, 109–122.
Hering,A.M.,C.Morel,G.Galli,S.Sénési,P.Ambrosetti,andM.Boscacci,2004:Nowcastingthunderstormsinthealpineregionusingaradarbasedadaptivethresholdingscheme.Proc. Third European Conf. on Radar in Meteorology and Hydrology (ERAD), Visby,Sweden,ERAD,206–211.
—,U.Germann,M.Boscacci,andS.Sénési,2006:OperationalthunderstormnowcastingintheAlpineregionusing3D-radarsevereweatherparametersandlightningdata.Proc. Fourth European Conf. on Radar in Meteorology and Hydrology (ERAD), Barcelona,Spain,ERAD,453–456.[Availableon-lineatwww.grahi.upc.es/ERAD2006/proceedings-Mask/00122.pdf.]
—,—,—,and—,2008:Operationalnow-castingofthunderstormsintheAlpsduringMAPD-PHASE.Proc. Fifth European Conf. on Radar in Meteorology and Hydrology (ERAD), Helsinki,Finland,ERAD,5pp.
Hohenegger,C.,andC.Schär,2007:Atmosphericpre-dictabilityatsynopticversuscloud-resolvingscales.Bull. Amer. Meteor. Soc., 88, 1783–1793.
1335september 2009AmerICAN meteOrOLOGICAL sOCIetY |

—,D.Lüthi,andC.Schär,2006:Predictabilitymys-teriesincloud-resolvingmodels.Mon. Wea. Rev., 134, 2095–2107.
Johnson,J.T.,P.L.MacKeen,A.Witt,E.D.Mitchell,G.J.Stumpf,M.D.Eilts,andK.W.Thomas,1998:TheStormCellIdentificationandTrackingalgo-rithm:AnenhancedWSR-88Dalgorithm.Wea. Forecasting, 13, 263–276.
Keenan,T.,andCoauthors,2003:TheSydney2000WorldWeatherResearchProgrammeForecastDem-onstrationProject:Overviewandcurrentstatus.Bull. Amer. Meteor. Soc., 84, 1041–1054.
Marsigli,C.,A.Montani,F.Nerozzi,T.Paccagnella, S.Tibaldi,F.Molteni,andR.Buizza,2001:Astrat-egyforhigh-resolutionensembleprediction.PartII:Limited-areaexperimentsinfourAlpinef loodevents.Quart. J. Roy. Meteor. Soc., 127, 2095–2115.
—,—,andT.Paccagnella,cited2006:TheCOSMO-SREPSproject.[Availableonlineathttp://SRNWP.met/hu/annual_meetings/2006/programme2006/html.]
Molteni,F.,R.Buizza,C.Marsigli,A.Montani,F.Nerozzi,andT.Paccagnella,2001:Astrategyforhigh-resolutionensembleprediction.PartI:Definitionofrepresenta-tivemembersandglobal-modelexperiments.Quart. J. Roy. Meteor. Soc., 127, 2069–2094.
Ranzi,R.,B.Bacchi, andG.Grossi,2003:RunoffmeasurementsandhydrologicalmodellingfortheestimationofrainfallvolumesinanAlpinebasin.Quart. J. Roy. Meteor. Soc., 129, 653–672.
—,M.Zappa,andB.Bacchi,2007:HydrologicalaspectsoftheMesoscaleAlpineProgramme:Find-ingsfromfieldexperimentsandsimulations.Quart. J. Roy. Meteor. Soc., 133, 867–880.
Richard,E.,A.Buzzi,andG.Zängel,2007:Quantita-tiveprecipitationforecastintheAlps:Theadvancesachievedby theMesoscaleAlpineProgramme.Quart. J. Roy. Meteor. Soc., 133, 831–846.
Richardson,D.S.,2000:SkillandrelativeeconomicvalueoftheECMWFensemblepredictionsystem.Quart. J. Roy. Meteor. Soc., 126, 649–667.
Rotach,M.W.,andD.Zardi,2007:Ontheboundary-layerstructureoverhighlycomplexterrain:KeyfindingsfromMAP.Quart. J. Roy. Meteor. Soc., 133, 937–948,doi:10.1002/qj.71.
Rotunno,R.,andR.A.Houze,2007:Lessonsonoro-graphicprecipitationfromtheMesoscaleAlpinePro-gramme.Quart. J. Roy. Meteor. Soc., 133, 811–830.
Siccardi,F.,G.Boni,L.Ferraris,andR.Rudari,2005:Ahydrometeorologicalapproachforprobabilis-
tic f loodforecast.J. Geophys. Res., 110,D05101,doi:10.1029/2004JD005314.
Steinacker,R.,C.Häberli,andW.Pöttschacher,2000:Atransparentmethodfortheanalysisandqualityevoluationofirregularlydistributedandnoisyobser-vationaldata.Mon. Wea. Rev., 128, 2303–2316.
—,andCoauthors,2006:Amesoscaledataanalysisanddownscalingmethodovercomplexterrain.Mon. Wea. Rev., 134, 2758–2771.
Verbunt,M.,A.Walser, J.Gurtz,A.Montani,and C.Schär,2007:Probabilisticfloodforecastingwithalimited-areaensemblepredictionsystem:Selectedcasestudies.J. Hydrometeor., 8, 897–909.
Volkert,H.,andT.Gutermann,2007:Inter-domaincooperationformesoscaleatmosphericlaboratories:TheMesoscaleAlpineProgrammeasarichstudycase.Quart. J. Roy. Meteor. Soc., 133, 949–968.
Walser,A.,andC.Schär,2004:Convection-resolvingprecipitationforecastinganditspredictabilityinAlpinerivercatchments.J. Hydrol., 288, 57–73.
—,D.Lüthi,andC.Schär,2004a:Predictabilityofprecipitationinacloud-resolvingmodel.Mon. Wea. Rev., 132, 560–577.
—,M.W.Rotach,M.Arpagaus,C.Appenzeller, C.Marsigli,andA.Montani,2004b:ALimited-AreaEnsemblePredictionSystem.Preprints,Int. Workshop on Timely Warnings of Heavy Precipita-tion Episodes and Flash Floods, Ljubljana,Solvenia,SloveniaMeteorologicalSociety,45–50.
Weigel,A.P.,F.K.Chow,M.W.Rotach,R.L.Street,andM.Xue,2006:High-resolutionlarge-eddysimula-tionsofflowinasteepAlpinevalley.PartII:Flowstructureandheatbudgets.J. Appl. Meteor. Climatol., 45, 87–107.
Wulfmeyer,V.,andCoauthors,2008:Researchcam-paign:TheConvectiveandOrographicallyInducedPrecipitationStudy.Bull. Amer. Meteor. Soc., 89, 1477–1486.
Wunram,C.,2006:ConceptofCOPSlongtermdataarchive.Proc. First MAP D-PHASE Scientif ic Meeting, Vienna,Austria,WorldWeatherResearchProgramme,33.
Zappa,M.,andCoauthors,2008:MAPD-PHASE:Real-timedemonstrationofhydrologicalensemblepredictionsystems.Atmos. Sci. Lett., 9, 80–87,doi:10.1002/asl.183.
Zus,F.,M.Grzeschik,H.S.Bauer,V.Wulfmeyer, G.Dick,andM.Bender,2008:Developmentandop-timizationoftheIPMMM5GPSslantpath4DVARSystem.Meteor. Z., 17, 867–885.
1336 september 2009|