
Manual for statistics on energy consumption in households
170
Manual for statistics on energy consumption in households Manuals and guidelines ISSN 2315-0815
-
Upload
khangminh22 -
Category
Documents
-
view
1 -
download
0
Transcript of Manual for statistics on energy consumption in households
Manual for statistics on energy consumption in households
Man
ual fo
r statistics on
energ
y con
sum
ptio
n in
ho
useh
old
s
Manuals and guidelines
ISSN 2315-0815
KS-GQ
-13-003-EN-N
doi:10.2785/45686

HOW TO OBTAIN EU PUBLICATIONS
Free publications:• one copy:
via EU Bookshop (http://bookshop.europa.eu);
• more than one copy or posters/maps: from the European Union’s representations (http://ec.europa.eu/represent_en.htm); from the delegations in non-EU countries (http://eeas.europa.eu/delegations/index_en.htm); by contacting the Europe Direct service (http://europa.eu/europedirect/index_en.htm) or calling 00 800 6 7 8 9 10 11 (freephone number from anywhere in the EU) (*).
(*) The information given is free, as are most calls (though some operators, phone boxes or hotels may charge you).
Priced publications:• via EU Bookshop (http://bookshop.europa.eu).
Priced subscriptions:• viaoneofthesalesagentsofthePublicationsOfficeoftheEuropeanUnion
(http://publications.europa.eu/others/agents/index_en.htm).
Manuals and guidelines
Manual for statistics on energy consumption in households

More information on the European Union is available on the Internet (http://europa.eu).
Cataloguing data can be found at the end of this publication.
Luxembourg: Publications Office of the European Union, 2013
ISBN 978-92-79-33007-0 ISSN 2315-0815 doi:10.2785/45686 Cat. No: KS-GQ-13-003-EN-N
Theme: Environment and energy Collection: Manuals and guidelines
© European Union, 2013 Reproduction is authorised provided the source is acknowledged.
Photo credits: © iStockphoto, except for: ‘Photograph 1.1: Eurostat’s offices in Luxembourg’: © European Union; ‘Photograph 3.3: Incorrect monitor placement near direct sunlight’ and ‘Photograph 3.4: Correct placement hidden on a bookshelf’: © DECC – Julian Prime.
Europe Direct is a service to help you find answers to your questions about the European Union.
Freephone number (*):00 800 6 7 8 9 10 11
(*) The information given is free, as are most calls (though some operators, phone boxes or hotels may charge you).
Manual for Statistics on Energy Consumption in Households 3
IntroductionThe statistical domain of energy is a good example of how our changing world impacts on the requirements of public data.
Until the early 1970s, there was little concern about energy scarcity. High energy consumption levels were taken as a positive sign of public welfare and public attention concentrated on the supply of cheap energy. Some echoes of the mind-set of those days can still be found in the level of statistical detail available for the supply side of energy statistics, compared to the consumption side for which data availability is no match at all.
The energy world has changed. Today in the EU the main political issues regarding energy are our import dependency, the environmental impact and the competitivity of our energy markets. Energy efficiency improvements in the EU will become one of the most prominent contributions to address these major concerns.
It is in this modern context that policymakers need statisticians to concentrate on generating more detailed data on energy consumption. This need was laid down in Regulation (EC) No 1099/2008 of the European Parliament and of the Council of 22 October 2008 on energy statistics: article 9 explicitly gave the Commission and the EU Member States a mandate to develop this.
Therefore, I welcome the progress made on statistics on energy consumption in households in the EU. This constitutes a first significant step in the right direction. Furthermore, given that statistical development needs to address both quality and methodology, this manual is a contribution to both. We therefore hope that this practical book becomes an essential tool for all statisticians and statistical institutes wanting to advance in the domain of statistics on energy consumption in households.
This book would not have been possible without the hard work, the competence and the initiative of a team comprising some of our most knowledgeable institutions in the EU: the Institute for the Diversification and Saving of Energy of Spain (IDAE), Statistics Austria, Statistics Netherlands (CBS), the Statistical Office of the Republic of Slovenia (SORS) and the Department of Energy and Climate Change (DECC) of the UK. I wish to thank Wolfgang Bittermann, Jens Nielsen, Mojca Suvorov, Duncan Millard, Julian Prime and Pilar de Arriba Segurado for this splendid achievement, without forgetting the valuable contributions of Ryzard Gilecki, the Rheinisch-Westfälisches Institut für Wirtschaftsforschung e.V. and Matthias Büsch. My very special thanks go to Jesús Pedro García Montes for his contribution and his successful coordination of the team of this ESSNet project, which also included a training session for statisticians on this topic.
Pedro Díaz MuñozDirector
Eurostat – Directorate of Sectoral and Regional Statistics
4 Manual for Statistics on Energy Consumption in Households
AcknowledgementsThe Manual for Energy Statistics in Households (MESH) was a Eurostat supported project delivered by the following people and organisations:
Coordination for Eurostat:
Roeland Mertens, Principal Energy StatisticianEurostat
Project management:
Jesús Pedro García Montes, Energy Statistics Coordinator.Planning and Studies Department IDAE – Spain
Contributing partners:
Wolfgang Bittermann, Head of Energy Statistics Statistics AustriaJens Buurgaard Nielsen, Statistical Researcher Statistics NetherlandJesús Pedro García Montes, Energy Statistics Coordinator.Pilar de Arriba Segurado,Project Manager.Planning and Studies DepartmentIDAE – SpainMojca Suvorov,Director of Environmental StatisticsStatistical Office of the Republic of SloveniaDuncan Millard, Chief Statistician.Julian Prime, Statistician – Renewables, energy efficiency and heat.Department of Energy & Climate Change.United Kingdom
In addition the MESH team would like to thank to Rheinisch-Westfälisches Institut für Wirtschaftsforschung e.V. (RWI) on behalf of Federal Ministry of Economics and Technology of Germany and Ryszard Gilecki of Agencja Rynku Energii S.A. of Poland for their contribution to the project.
Manual for Statistics on Energy Consumption in Households 5
Contents
Introduction . . . . . . . . . . . . . . . . . . . . . . . . . . . . . . . . . . . . . . . . . . . . . . . . . . . . . . . . . . . . . . . . . . . . . . . . . . . . . . . . . . . . . . . . 3
Background . . . . . . . . . . . . . . . . . . . . . . . . . . . . . . . . . . . . . . . . . . . . . . . . . . . . . . . . . . . . . . . . . . . . . . . . . . . . . . . . . 9Why do we need a manual for energy statistics in the household sector? . . . . . . . . . . . . . . . . . . . . . . . . . . . . . . . 11
Initial developments . . . . . . . . . . . . . . . . . . . . . . . . . . . . . . . . . . . . . . . . . . . . . . . . . . . . . . . . . . . . . . . . . . . . . . . . . . . . . . . . . 12
Contents of the manual . . . . . . . . . . . . . . . . . . . . . . . . . . . . . . . . . . . . . . . . . . . . . . . . . . . . . . . . . . . . . . . . . . . . . . . . . . . . . . 12
Chapter 1: Situation of energy statistics in the household sector in the EU . . . . . . . . . . . . . . . . . . . . . . 15Introduction . . . . . . . . . . . . . . . . . . . . . . . . . . . . . . . . . . . . . . . . . . . . . . . . . . . . . . . . . . . . . . . . . . . . . . . . . . . . . . . . . . . . . . . . . 17
1 .1 . Main actors in EU statistics . . . . . . . . . . . . . . . . . . . . . . . . . . . . . . . . . . . . . . . . . . . . . . . . . . . . . . . . . . . . . . . . . . . . . . . 17
1 .2 . The Eurostat 2008 Task Force . . . . . . . . . . . . . . . . . . . . . . . . . . . . . . . . . . . . . . . . . . . . . . . . . . . . . . . . . . . . . . . . . . . . . 18
1 .3 . Methods of data collection commonly used . . . . . . . . . . . . . . . . . . . . . . . . . . . . . . . . . . . . . . . . . . . . . . . . . . . . . . 19
1 .4 . Coverage of variables . . . . . . . . . . . . . . . . . . . . . . . . . . . . . . . . . . . . . . . . . . . . . . . . . . . . . . . . . . . . . . . . . . . . . . . . . . . . 20
1 .5 . Degree of coverage in EU . . . . . . . . . . . . . . . . . . . . . . . . . . . . . . . . . . . . . . . . . . . . . . . . . . . . . . . . . . . . . . . . . . . . . . . . 25
1 .6 . Summary and conclusions . . . . . . . . . . . . . . . . . . . . . . . . . . . . . . . . . . . . . . . . . . . . . . . . . . . . . . . . . . . . . . . . . . . . . . . 25
Chapter 2: Definitions . . . . . . . . . . . . . . . . . . . . . . . . . . . . . . . . . . . . . . . . . . . . . . . . . . . . . . . . . . . . . . . . . . . . . . . . 27Introduction . . . . . . . . . . . . . . . . . . . . . . . . . . . . . . . . . . . . . . . . . . . . . . . . . . . . . . . . . . . . . . . . . . . . . . . . . . . . . . . . . . . . . . . . . 29
2 .1 . The household sector boundaries . . . . . . . . . . . . . . . . . . . . . . . . . . . . . . . . . . . . . . . . . . . . . . . . . . . . . . . . . . . . . . . . 29
2 .2 . List of definitions . . . . . . . . . . . . . . . . . . . . . . . . . . . . . . . . . . . . . . . . . . . . . . . . . . . . . . . . . . . . . . . . . . . . . . . . . . . . . . . . 31 2 .2 .1 . Housing stock characteristics . . . . . . . . . . . . . . . . . . . . . . . . . . . . . . . . . . . . . . . . . . . . . . . . . . . . . . . . . . . . . . . . . . . . . . . 31 2 .2 .2 . Household characteristics . . . . . . . . . . . . . . . . . . . . . . . . . . . . . . . . . . . . . . . . . . . . . . . . . . . . . . . . . . . . . . . . . . . . . . . . . . 32 2 .2 .3 . Consumption / expenditure of energy commodities . . . . . . . . . . . . . . . . . . . . . . . . . . . . . . . . . . . . . . . . . . . . . . . . . 32 2 .2 .4 . Household energy end-uses . . . . . . . . . . . . . . . . . . . . . . . . . . . . . . . . . . . . . . . . . . . . . . . . . . . . . . . . . . . . . . . . . . . . . . . . 32 2 .2 .5 . Penetration of energy efficiency technologies . . . . . . . . . . . . . . . . . . . . . . . . . . . . . . . . . . . . . . . . . . . . . . . . . . . . . . . 38 2 .2 .6 . Energy controls . . . . . . . . . . . . . . . . . . . . . . . . . . . . . . . . . . . . . . . . . . . . . . . . . . . . . . . . . . . . . . . . . . . . . . . . . . . . . . . . . . . . . 39
Chapter 3: Description of methods . . . . . . . . . . . . . . . . . . . . . . . . . . . . . . . . . . . . . . . . . . . . . . . . . . . . . . . . . . . 41Introduction . . . . . . . . . . . . . . . . . . . . . . . . . . . . . . . . . . . . . . . . . . . . . . . . . . . . . . . . . . . . . . . . . . . . . . . . . . . . . . . . . . . . . . . . . 43
3 .1 . Business surveys . . . . . . . . . . . . . . . . . . . . . . . . . . . . . . . . . . . . . . . . . . . . . . . . . . . . . . . . . . . . . . . . . . . . . . . . . . . . . . . . . 44 Introduction . . . . . . . . . . . . . . . . . . . . . . . . . . . . . . . . . . . . . . . . . . . . . . . . . . . . . . . . . . . . . . . . . . . . . . . . . . . . . . . . . . . . . . . . . . . . . . 44 3 .1 .1 . Strengths and weaknesses of business surveys . . . . . . . . . . . . . . . . . . . . . . . . . . . . . . . . . . . . . . . . . . . . . . . . . . . . . . 44 3 .1 .2 . Issues to consider . . . . . . . . . . . . . . . . . . . . . . . . . . . . . . . . . . . . . . . . . . . . . . . . . . . . . . . . . . . . . . . . . . . . . . . . . . . . . . . . . . . 45 3 .1 .3 . The Questionnaire Design Process . . . . . . . . . . . . . . . . . . . . . . . . . . . . . . . . . . . . . . . . . . . . . . . . . . . . . . . . . . . . . . . . . . 47 3 .1 .4 . More information . . . . . . . . . . . . . . . . . . . . . . . . . . . . . . . . . . . . . . . . . . . . . . . . . . . . . . . . . . . . . . . . . . . . . . . . . . . . . . . . . . . 473 .2 . Households surveys . . . . . . . . . . . . . . . . . . . . . . . . . . . . . . . . . . . . . . . . . . . . . . . . . . . . . . . . . . . . . . . . . . . . . . . . . . . . . . 47 3 .2 .1 . Strength and weaknesses . . . . . . . . . . . . . . . . . . . . . . . . . . . . . . . . . . . . . . . . . . . . . . . . . . . . . . . . . . . . . . . . . . . . . . . . . . . 47 3 .2 .2 . Survey design . . . . . . . . . . . . . . . . . . . . . . . . . . . . . . . . . . . . . . . . . . . . . . . . . . . . . . . . . . . . . . . . . . . . . . . . . . . . . . . . . . . . . . 47
6 Manual for Statistics on Energy Consumption in Households
3 .2 .3 . Survey methods . . . . . . . . . . . . . . . . . . . . . . . . . . . . . . . . . . . . . . . . . . . . . . . . . . . . . . . . . . . . . . . . . . . . . . . . . . . . . . . . . . . . 49 3 .2 .4 . Questionnaire design . . . . . . . . . . . . . . . . . . . . . . . . . . . . . . . . . . . . . . . . . . . . . . . . . . . . . . . . . . . . . . . . . . . . . . . . . . . . . . . 50 3 .2 .5 . Guidelines for wording survey questions . . . . . . . . . . . . . . . . . . . . . . . . . . . . . . . . . . . . . . . . . . . . . . . . . . . . . . . . . . . . 51 3 .2 .6 . Interviewer training . . . . . . . . . . . . . . . . . . . . . . . . . . . . . . . . . . . . . . . . . . . . . . . . . . . . . . . . . . . . . . . . . . . . . . . . . . . . . . . . 52 3 .2 .7 . Data validation . . . . . . . . . . . . . . . . . . . . . . . . . . . . . . . . . . . . . . . . . . . . . . . . . . . . . . . . . . . . . . . . . . . . . . . . . . . . . . . . . . . . . 52 3 .2 .8 . Survey frequency . . . . . . . . . . . . . . . . . . . . . . . . . . . . . . . . . . . . . . . . . . . . . . . . . . . . . . . . . . . . . . . . . . . . . . . . . . . . . . . . . . . 52 3 .2 .9 . Summary and conclusions . . . . . . . . . . . . . . . . . . . . . . . . . . . . . . . . . . . . . . . . . . . . . . . . . . . . . . . . . . . . . . . . . . . . . . . . . . 523 .3 . Use of administrative data . . . . . . . . . . . . . . . . . . . . . . . . . . . . . . . . . . . . . . . . . . . . . . . . . . . . . . . . . . . . . . . . . . . . . . . . 52 Introduction . . . . . . . . . . . . . . . . . . . . . . . . . . . . . . . . . . . . . . . . . . . . . . . . . . . . . . . . . . . . . . . . . . . . . . . . . . . . . . . . . . . . . . . . . . . . . . 52 3 .3 .1 . Strengths and weaknesses of using administrative data . . . . . . . . . . . . . . . . . . . . . . . . . . . . . . . . . . . . . . . . . . . . . . 53 3 .3 .2 . Examples of energy-relevant administrative data . . . . . . . . . . . . . . . . . . . . . . . . . . . . . . . . . . . . . . . . . . . . . . . . . . . . 54 3 .3 .3 . Producing statistics from an administrative data source . . . . . . . . . . . . . . . . . . . . . . . . . . . . . . . . . . . . . . . . . . . . . . 55 3 .3 .4 . Quality and accuracy issues . . . . . . . . . . . . . . . . . . . . . . . . . . . . . . . . . . . . . . . . . . . . . . . . . . . . . . . . . . . . . . . . . . . . . . . . . 57 3 .3 .5 . Adding information from other registers: Data matching . . . . . . . . . . . . . . . . . . . . . . . . . . . . . . . . . . . . . . . . . . . . 57 3 .3 .6 . Summary and conclusions . . . . . . . . . . . . . . . . . . . . . . . . . . . . . . . . . . . . . . . . . . . . . . . . . . . . . . . . . . . . . . . . . . . . . . . . . . 583 .4 . Modelling . . . . . . . . . . . . . . . . . . . . . . . . . . . . . . . . . . . . . . . . . . . . . . . . . . . . . . . . . . . . . . . . . . . . . . . . . . . . . . . . . . . . . . . 58 Introduction . . . . . . . . . . . . . . . . . . . . . . . . . . . . . . . . . . . . . . . . . . . . . . . . . . . . . . . . . . . . . . . . . . . . . . . . . . . . . . . . . . . . . . . . . . . . . . 58 3 .4 .1 . Strength and weaknesses . . . . . . . . . . . . . . . . . . . . . . . . . . . . . . . . . . . . . . . . . . . . . . . . . . . . . . . . . . . . . . . . . . . . . . . . . . . 58 3 .4 .2 . Types of and typical cases for modelling . . . . . . . . . . . . . . . . . . . . . . . . . . . . . . . . . . . . . . . . . . . . . . . . . . . . . . . . . . . . 58 3 .4 .3 . Typical model assumptions . . . . . . . . . . . . . . . . . . . . . . . . . . . . . . . . . . . . . . . . . . . . . . . . . . . . . . . . . . . . . . . . . . . . . . . . . 59 3 .4 .4 . Risks . . . . . . . . . . . . . . . . . . . . . . . . . . . . . . . . . . . . . . . . . . . . . . . . . . . . . . . . . . . . . . . . . . . . . . . . . . . . . . . . . . . . . . . . . . . . . . . 59 3 .4 .5 . Summary and conclusions . . . . . . . . . . . . . . . . . . . . . . . . . . . . . . . . . . . . . . . . . . . . . . . . . . . . . . . . . . . . . . . . . . . . . . . . . . 603 .5 . In situ measurements . . . . . . . . . . . . . . . . . . . . . . . . . . . . . . . . . . . . . . . . . . . . . . . . . . . . . . . . . . . . . . . . . . . . . . . . . . . . 60 Introduction . . . . . . . . . . . . . . . . . . . . . . . . . . . . . . . . . . . . . . . . . . . . . . . . . . . . . . . . . . . . . . . . . . . . . . . . . . . . . . . . . . . . . . . . . . . . . . 60 3 .5 .1 . Strength and weakness . . . . . . . . . . . . . . . . . . . . . . . . . . . . . . . . . . . . . . . . . . . . . . . . . . . . . . . . . . . . . . . . . . . . . . . . . . . . . 61 3 .5 .2 . Previous experiences with in situ measurements . . . . . . . . . . . . . . . . . . . . . . . . . . . . . . . . . . . . . . . . . . . . . . . . . . . . . 61 3 .5 .3 . Methodological issues for in situ measurement of electricity use in the household sector . . . . . . . . . . . . . 62 3 .5 .4 . Methodological issues for in situ measurement of household temperatures and thermal properties of
buildings . . . . . . . . . . . . . . . . . . . . . . . . . . . . . . . . . . . . . . . . . . . . . . . . . . . . . . . . . . . . . . . . . . . . . . . . . . . . . . . . . . . . . . . . . . 66 3 .5 .5 . Summary and conclusions . . . . . . . . . . . . . . . . . . . . . . . . . . . . . . . . . . . . . . . . . . . . . . . . . . . . . . . . . . . . . . . . . . . . . . . . . . 68
Chapter 4: Practical examples of methods . . . . . . . . . . . . . . . . . . . . . . . . . . . . . . . . . . . . . . . . . . . . . . . . . . . . . 69Introduction . . . . . . . . . . . . . . . . . . . . . . . . . . . . . . . . . . . . . . . . . . . . . . . . . . . . . . . . . . . . . . . . . . . . . . . . . . . . . . . . . . . . . . . . . 71
4 .1 . Business surveys . . . . . . . . . . . . . . . . . . . . . . . . . . . . . . . . . . . . . . . . . . . . . . . . . . . . . . . . . . . . . . . . . . . . . . . . . . . . . . . . . 71 4 .1 .1 . United Kingdom good practice examples . . . . . . . . . . . . . . . . . . . . . . . . . . . . . . . . . . . . . . . . . . . . . . . . . . . . . . . . . . . 714 .2 . Households suveys . . . . . . . . . . . . . . . . . . . . . . . . . . . . . . . . . . . . . . . . . . . . . . . . . . . . . . . . . . . . . . . . . . . . . . . . . . . . . . 72 4 .2 .1 . Face to face Survey in the frame of the SECH-SPAHOUSECH project (Spain) . . . . . . . . . . . . . . . . . . . . . . . . . . . 72 4 .2 .2 . Mail survey: Electricity and natural gas consumption of households by purpose (Austria) . . . . . . . . . . . . . 72 4 .2 .3 . CATI/CAPI survey: Energy consumption of households (Slovenia) . . . . . . . . . . . . . . . . . . . . . . . . . . . . . . . . . . . . . 76 4 .2 .4 . Panel survey: Energy consumption of private households (Germany) . . . . . . . . . . . . . . . . . . . . . . . . . . . . . . . . . 77 4 .2 .5 . Interviewer training (United Kingdom) . . . . . . . . . . . . . . . . . . . . . . . . . . . . . . . . . . . . . . . . . . . . . . . . . . . . . . . . . . . . . . 784 .3 . Administrative data . . . . . . . . . . . . . . . . . . . . . . . . . . . . . . . . . . . . . . . . . . . . . . . . . . . . . . . . . . . . . . . . . . . . . . . . . . . . . . 79 4 .3 .1 . Client registers of energy companies in the Netherlands . . . . . . . . . . . . . . . . . . . . . . . . . . . . . . . . . . . . . . . . . . . . . 79 4 .3 .2 . Administrative data from energy companies: experience from other countries . . . . . . . . . . . . . . . . . . . . . . . 84
Manual for Statistics on Energy Consumption in Households 7
4 .4 . Modelling . . . . . . . . . . . . . . . . . . . . . . . . . . . . . . . . . . . . . . . . . . . . . . . . . . . . . . . . . . . . . . . . . . . . . . . . . . . . . . . . . . . . . . . 90 4 .4 .1 . The Cambridge Housing Model (United Kingdom) . . . . . . . . . . . . . . . . . . . . . . . . . . . . . . . . . . . . . . . . . . . . . . . . . . . 90 4 .4 .2 . Model based data validation procedure (Austria) . . . . . . . . . . . . . . . . . . . . . . . . . . . . . . . . . . . . . . . . . . . . . . . . . . . . 91 4 .4 .3 . Model based Estimation of Energy Consumption in Second Residences (Austria) . . . . . . . . . . . . . . . . . . . . . 934 .5 . In situ measurements . . . . . . . . . . . . . . . . . . . . . . . . . . . . . . . . . . . . . . . . . . . . . . . . . . . . . . . . . . . . . . . . . . . . . . . . . . . . 94 4 .5 .1 . Good Practices on in situ electricity measurements . . . . . . . . . . . . . . . . . . . . . . . . . . . . . . . . . . . . . . . . . . . . . . . . . . 94 4 .5 .2 . Best Practices’ on in situ thermal measurements . . . . . . . . . . . . . . . . . . . . . . . . . . . . . . . . . . . . . . . . . . . . . . . . . . . . . 100
Chapter 5: Country case studies . . . . . . . . . . . . . . . . . . . . . . . . . . . . . . . . . . . . . . . . . . . . . . . . . . . . . . . . . . . . . . 103Introduction . . . . . . . . . . . . . . . . . . . . . . . . . . . . . . . . . . . . . . . . . . . . . . . . . . . . . . . . . . . . . . . . . . . . . . . . . . . . . . . . . . . . . . . . . 105
5 .1 . Country case study: Austria . . . . . . . . . . . . . . . . . . . . . . . . . . . . . . . . . . . . . . . . . . . . . . . . . . . . . . . . . . . . . . . . . . . . . . 105
5 .2 . Country case study: Germany . . . . . . . . . . . . . . . . . . . . . . . . . . . . . . . . . . . . . . . . . . . . . . . . . . . . . . . . . . . . . . . . . . . . 108
5 .3 . Country case study: The Netherlands . . . . . . . . . . . . . . . . . . . . . . . . . . . . . . . . . . . . . . . . . . . . . . . . . . . . . . . . . . . . . 112
5 .4 . Country case study: Poland . . . . . . . . . . . . . . . . . . . . . . . . . . . . . . . . . . . . . . . . . . . . . . . . . . . . . . . . . . . . . . . . . . . . . . 114
5 .5 . Country case study: Slovenia . . . . . . . . . . . . . . . . . . . . . . . . . . . . . . . . . . . . . . . . . . . . . . . . . . . . . . . . . . . . . . . . . . . . . 118
5 .6 . Country case study: Spain . . . . . . . . . . . . . . . . . . . . . . . . . . . . . . . . . . . . . . . . . . . . . . . . . . . . . . . . . . . . . . . . . . . . . . . . 122
5 .7 . Country case study: United Kingdom . . . . . . . . . . . . . . . . . . . . . . . . . . . . . . . . . . . . . . . . . . . . . . . . . . . . . . . . . . . . . 124
Chapter 6: Going beyond the regulation . . . . . . . . . . . . . . . . . . . . . . . . . . . . . . . . . . . . . . . . . . . . . . . . . . . . . . 127Introduction . . . . . . . . . . . . . . . . . . . . . . . . . . . . . . . . . . . . . . . . . . . . . . . . . . . . . . . . . . . . . . . . . . . . . . . . . . . . . . . . . . . . . . . . . 129
6 .1 . Definition of levels of coverage . . . . . . . . . . . . . . . . . . . . . . . . . . . . . . . . . . . . . . . . . . . . . . . . . . . . . . . . . . . . . . . . . . . 129 6 .1 .1 . Demographic and social variables . . . . . . . . . . . . . . . . . . . . . . . . . . . . . . . . . . . . . . . . . . . . . . . . . . . . . . . . . . . . . . . . . . . 129 6 .1 .2 . Dwelling variables . . . . . . . . . . . . . . . . . . . . . . . . . . . . . . . . . . . . . . . . . . . . . . . . . . . . . . . . . . . . . . . . . . . . . . . . . . . . . . . . . . 130 6 .1 .3 . Energy uses . . . . . . . . . . . . . . . . . . . . . . . . . . . . . . . . . . . . . . . . . . . . . . . . . . . . . . . . . . . . . . . . . . . . . . . . . . . . . . . . . . . . . . . . 132 6 .1 .4 . Energy technologies . . . . . . . . . . . . . . . . . . . . . . . . . . . . . . . . . . . . . . . . . . . . . . . . . . . . . . . . . . . . . . . . . . . . . . . . . . . . . . . . 132 6 .1 .5 . Penetration of new energy efficiency technologies . . . . . . . . . . . . . . . . . . . . . . . . . . . . . . . . . . . . . . . . . . . . . . . . . . 136
Chapter 7: Other issues . . . . . . . . . . . . . . . . . . . . . . . . . . . . . . . . . . . . . . . . . . . . . . . . . . . . . . . . . . . . . . . . . . . . . . . 139Introduction . . . . . . . . . . . . . . . . . . . . . . . . . . . . . . . . . . . . . . . . . . . . . . . . . . . . . . . . . . . . . . . . . . . . . . . . . . . . . . . . . . . . . . . . . 141
7 .1 . Renewable energy statistics . . . . . . . . . . . . . . . . . . . . . . . . . . . . . . . . . . . . . . . . . . . . . . . . . . . . . . . . . . . . . . . . . . . . . . 141 Introduction . . . . . . . . . . . . . . . . . . . . . . . . . . . . . . . . . . . . . . . . . . . . . . . . . . . . . . . . . . . . . . . . . . . . . . . . . . . . . . . . . . . . . . . . . . . . . . 141 7 .1 .1 . Definitions . . . . . . . . . . . . . . . . . . . . . . . . . . . . . . . . . . . . . . . . . . . . . . . . . . . . . . . . . . . . . . . . . . . . . . . . . . . . . . . . . . . . . . . . . 141 7 .1 .2 . PV, wind, small hydro . . . . . . . . . . . . . . . . . . . . . . . . . . . . . . . . . . . . . . . . . . . . . . . . . . . . . . . . . . . . . . . . . . . . . . . . . . . . . . . 142 7 .1 .3 . Solar heat . . . . . . . . . . . . . . . . . . . . . . . . . . . . . . . . . . . . . . . . . . . . . . . . . . . . . . . . . . . . . . . . . . . . . . . . . . . . . . . . . . . . . . . . . . 142 7 .1 .4 . Renewable heat from heat pumps . . . . . . . . . . . . . . . . . . . . . . . . . . . . . . . . . . . . . . . . . . . . . . . . . . . . . . . . . . . . . . . . . . 144 7 .1 .5 . Solid biofuels . . . . . . . . . . . . . . . . . . . . . . . . . . . . . . . . . . . . . . . . . . . . . . . . . . . . . . . . . . . . . . . . . . . . . . . . . . . . . . . . . . . . . . . 144 7 .1 .6 . Data validation . . . . . . . . . . . . . . . . . . . . . . . . . . . . . . . . . . . . . . . . . . . . . . . . . . . . . . . . . . . . . . . . . . . . . . . . . . . . . . . . . . . . . 146 7 .1 .7 . Summary and conclusions . . . . . . . . . . . . . . . . . . . . . . . . . . . . . . . . . . . . . . . . . . . . . . . . . . . . . . . . . . . . . . . . . . . . . . . . . . 1467 .2 . Fuel poverty . . . . . . . . . . . . . . . . . . . . . . . . . . . . . . . . . . . . . . . . . . . . . . . . . . . . . . . . . . . . . . . . . . . . . . . . . . . . . . . . . . . . . 147 Introduction . . . . . . . . . . . . . . . . . . . . . . . . . . . . . . . . . . . . . . . . . . . . . . . . . . . . . . . . . . . . . . . . . . . . . . . . . . . . . . . . . . . . . . . . . . . . . . 147 7 .2 .1 . Ways to measure fuel poverty . . . . . . . . . . . . . . . . . . . . . . . . . . . . . . . . . . . . . . . . . . . . . . . . . . . . . . . . . . . . . . . . . . . . . . . 152 7 .2 .2 . Next steps . . . . . . . . . . . . . . . . . . . . . . . . . . . . . . . . . . . . . . . . . . . . . . . . . . . . . . . . . . . . . . . . . . . . . . . . . . . . . . . . . . . . . . . . . . 153
8 Manual for Statistics on Energy Consumption in Households
7 .2 .3 . Comparisons across Europe . . . . . . . . . . . . . . . . . . . . . . . . . . . . . . . . . . . . . . . . . . . . . . . . . . . . . . . . . . . . . . . . . . . . . . . . . 154 7 .2 .4 . Summary and conclusions . . . . . . . . . . . . . . . . . . . . . . . . . . . . . . . . . . . . . . . . . . . . . . . . . . . . . . . . . . . . . . . . . . . . . . . . . . 154 7 .2 .5 . Selected other references for information . . . . . . . . . . . . . . . . . . . . . . . . . . . . . . . . . . . . . . . . . . . . . . . . . . . . . . . . . . . 1547 .3 . Data matching . . . . . . . . . . . . . . . . . . . . . . . . . . . . . . . . . . . . . . . . . . . . . . . . . . . . . . . . . . . . . . . . . . . . . . . . . . . . . . . . . . . 155 Introduction . . . . . . . . . . . . . . . . . . . . . . . . . . . . . . . . . . . . . . . . . . . . . . . . . . . . . . . . . . . . . . . . . . . . . . . . . . . . . . . . . . . . . . . . . . . . . . 155 7 .3 .1 . Definitions of data matching . . . . . . . . . . . . . . . . . . . . . . . . . . . . . . . . . . . . . . . . . . . . . . . . . . . . . . . . . . . . . . . . . . . . . . . . 155 7 .3 .2 . Uses of matched data . . . . . . . . . . . . . . . . . . . . . . . . . . . . . . . . . . . . . . . . . . . . . . . . . . . . . . . . . . . . . . . . . . . . . . . . . . . . . . . 156 7 .3 .3 . Benefits and challenges of data matching . . . . . . . . . . . . . . . . . . . . . . . . . . . . . . . . . . . . . . . . . . . . . . . . . . . . . . . . . . . 156 7 .3 .4 . Considerations when planning to undertake data matching . . . . . . . . . . . . . . . . . . . . . . . . . . . . . . . . . . . . . . . . . 157 7 .3 .5 . Examples of data matching in other countries . . . . . . . . . . . . . . . . . . . . . . . . . . . . . . . . . . . . . . . . . . . . . . . . . . . . . . . 158 7 .3 .6 . Case study: The United Kingdom’s National Energy Efficiency Data-Framework . . . . . . . . . . . . . . . . . . . . . . . 159 7 .3 .7 . Data matching references . . . . . . . . . . . . . . . . . . . . . . . . . . . . . . . . . . . . . . . . . . . . . . . . . . . . . . . . . . . . . . . . . . . . . . . . . . 161
Acronyms . . . . . . . . . . . . . . . . . . . . . . . . . . . . . . . . . . . . . . . . . . . . . . . . . . . . . . . . . . . . . . . . . . . . . . . . . . . . . . . . . . . 163

Background

Background
Manual for Statistics on Energy Consumption in Households 11
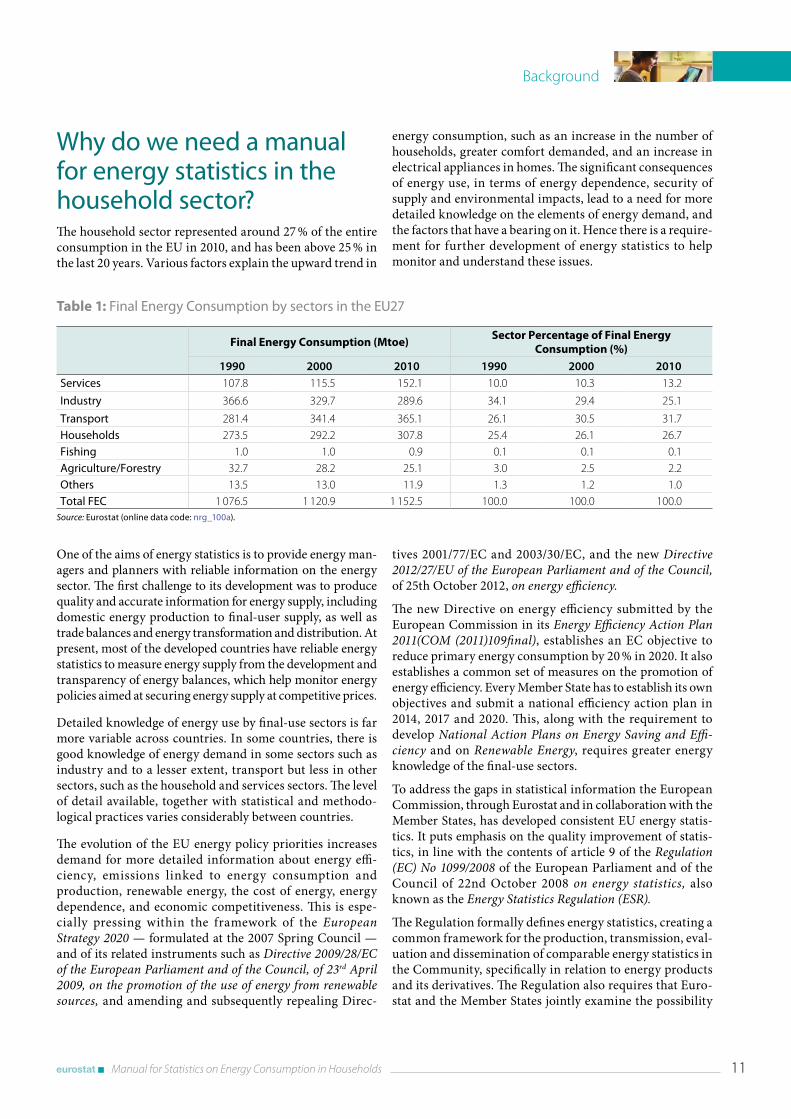
Why do we need a manual for energy statistics in the household sector?The household sector represented around 27 % of the entire consumption in the EU in 2010, and has been above 25 % in the last 20 years. Various factors explain the upward trend in
energy consumption, such as an increase in the number of households, greater comfort demanded, and an increase in electrical appliances in homes. The significant consequences of energy use, in terms of energy dependence, security of supply and environmental impacts, lead to a need for more detailed knowledge on the elements of energy demand, and the factors that have a bearing on it. Hence there is a require-ment for further development of energy statistics to help monitor and understand these issues.
Table 1: Final Energy Consumption by sectors in the EU27
Final Energy Consumption (Mtoe)Sector Percentage of Final Energy
Consumption (%)
1990 2000 2010 1990 2000 2010Services 107.8 115.5 152.1 10.0 10.3 13.2
Industry 366.6 329.7 289.6 34.1 29.4 25.1
Transport 281.4 341.4 365.1 26.1 30.5 31.7 Households 273.5 292.2 307.8 25.4 26.1 26.7 Fishing 1.0 1.0 0.9 0.1 0.1 0.1 Agriculture/Forestry 32.7 28.2 25.1 3.0 2.5 2.2 Others 13.5 13.0 11.9 1.3 1.2 1.0 Total FEC 1 076.5 1 120.9 1 152.5 100.0 100.0 100.0
Source: Eurostat (online data code: nrg_100a) .
One of the aims of energy statistics is to provide energy man-agers and planners with reliable information on the energy sector. The first challenge to its development was to produce quality and accurate information for energy supply, including domestic energy production to final-user supply, as well as trade balances and energy transformation and distribution. At present, most of the developed countries have reliable energy statistics to measure energy supply from the development and transparency of energy balances, which help monitor energy policies aimed at securing energy supply at competitive prices.
Detailed knowledge of energy use by final-use sectors is far more variable across countries. In some countries, there is good knowledge of energy demand in some sectors such as industry and to a lesser extent, transport but less in other sectors, such as the household and services sectors. The level of detail available, together with statistical and methodo-logical practices varies considerably between countries.
The evolution of the EU energy policy priorities increases demand for more detailed information about energy effi-ciency, emissions linked to energy consumption and produc tion, renewable energy, the cost of energy, energy dependence, and economic competitiveness. This is espe-cially pressing within the framework of the European Strategy 2020 — formulated at the 2007 Spring Council — and of its related instruments such as Directive 2009/28/EC of the European Parliament and of the Council, of 23rd April 2009, on the promotion of the use of energy from renewable sources, and amending and subsequently repealing Direc-
tives 2001/77/EC and 2003/30/EC, and the new Directive 2012/27/EU of the European Parliament and of the Council, of 25th October 2012, on energy efficiency.
The new Directive on energy efficiency submitted by the European Commission in its Energy Efficiency Action Plan 2011(COM (2011)109final), establishes an EC objective to reduce primary energy consumption by 20 % in 2020. It also establishes a common set of measures on the promotion of energy efficiency. Every Member State has to establish its own objectives and submit a national efficiency action plan in 2014, 2017 and 2020. This, along with the requirement to develop National Action Plans on Energy Saving and Effi-ciency and on Renewable Energy, requires greater energy knowledge of the final-use sectors.
To address the gaps in statistical information the European Commission, through Eurostat and in collaboration with the Member States, has developed consistent EU energy statis-tics. It puts emphasis on the quality improvement of statis-tics, in line with the contents of article 9 of the Regulation (EC) No 1099/2008 of the European Parliament and of the Council of 22nd October 2008 on energy statistics, also known as the Energy Statistics Regulation (ESR).
The Regulation formally defines energy statistics, creating a common framework for the production, transmission, eval-uation and dissemination of comparable energy statistics in the Community, specifically in relation to energy products and its derivatives. The Regulation also requires that Euro-stat and the Member States jointly examine the possibility
Background
12 Manual for Statistics on Energy Consumption in Households
of improving the existing knowledge on final energy con-sumption. This should be done by analyzing the current situation on the methodologies used at national and EC level to provide the relevant statistics, taking into account the existing studies and other pilot studies and their results, as well as the cost/benefit analyses. This work will lead to improve the knowledge and the available information on energy consumption in each sector covering sources and main uses, and gradually integrate the resulting elements from statistics from year 2012 onwards, with an initial focus on the Household sector.
Through the joint work of Eurostat and Member States and financial support from Eurostat to support studies in coun-tries (see section below) a proposal was agreed by Member States in early 2013 that additional data would be provided on the following areas: space heating, space cooling, water heating, cooking, electrical appliances and other uses.
Initial developmentsAfter discussions between Eurostat and the Member States on the existing statistics at sectoral level, it was decided to start with the household sector rather than transport or ser-vices, given its complexity and relevance in overall energy consumption and its energy saving potential.
The work began when a Task Force was created in 2008 to set out recommendations on the basic information required by users of statistics to understand energy consumption in the household sector. During this work the variability between Member States in terms of the availability of statistics and the extent of knowledge relating to the household sector also became clearer.
All these issues were presented to the Eurostat Energy Statis-tics Working Group meeting, which was held on 29th June 2009. It became clear that there were a number of methods for producing statistics in this sector, such as carrying out surveys, taking actual measurements in homes, using ad-ministrative data and developing models.
Recognizing the resource constraint that many countries faced Eurostat allocated a budget of €1.5million to facilitate and co-fund statistical studies in the household sector which could support these methods. This resulted in the SECH Pilot Projects (Development of Detailed Statistics on Energy Con-sumption in Households), promoted by Eurostat in the Mem-ber States. Seventeen countries in the EU joined this initiative to implement specific projects aimed at improving the energy consumption knowledge of the household sector in year 2009 and 2010.
This work provided data to individual member states and also provided valuable insight in the different techniques that could be used to gather household data. At the same time it
raised some key questions of the need for common defini-tions, wider guidance on how various approaches could be used and the need to consider household energy use data alongside other key developments such as renewables and energy poverty.
Contents of the manualThe large variation in the availability of household energy statistics and the knowledge associated with the household sector at EU level, leads to the need of promoting and imple-menting additional actions enabling the comparability of results. To take this forward Eurostat decided to develop a statistics manual for the household sector alongside an associ-ated training course within the framework of the ESSNet Programme (1). The aim is to help all Member States improve their data on the household sector generally, learn alternative techniques and specifically to meet the new requirements of the Energy Statistics Regulation. This project was led by Spain (Institute for the Diversification and Energy Saving IDAE) with other partners being Austria (Statistics Austria ST AT), the Netherlands (Statistics Netherlands CBS), Slovenia (Sta-tistical Office of the Republic of Slovenia SORS) and the UK (Department of Energy and Climate Change DECC).
This manual aims to be a reference document, a guidebook, and hopefully a source of inspiration for new ideas that can help statisticians provide comprehensive and comparable data on household energy use. Through this it is hoped that it will support the development of policies and monitoring of them at individual member state and EU level.
The manual is set out in 7 key chapters plus this Background. After this background, Chapter 1 gives an overview of en-ergy statistics in the European Union, the current approach-es used, as well as the recommendations established by the 2008 Task Force and the systems and methods of gathering information. The degree of coverage of the requirements established in the 2008 Task Force and the need to develop an energy statistics Manual addressed at the households sector complete this chapter.
Chapter 2 sets out the boundaries of the household sector and definitions of the key elements that need to be measured. The aim of this chapter is to establish definitions valid throughout the European Union that will enable comparison of energy statistics for the households sector among the countries of the European Union.
The theory of the different systems of acquisition and pro-duction of data such as surveys, administrative data, meas-urements in situ, modelling, etc., is presented in Chapter 3.
(1) A tool designed to provide an answer to the needs for greater synergy and harmonisation in the European Statistical Systems (ESS) as stated in 2002 by the DGINS Conference, and made up by the directors of the National Statistics Institutes (NSIs).

Background
Manual for Statistics on Energy Consumption in Households 13
This theoretical information is complemented in Chapter 4 with the presentation of good practices of different member states for the acquisition and production of information.
Chapter 5 presents the integrated approaches used in several Member States which show how the various methods are combined to produce statistical information in particular countries.
Chapter 6 looks beyond the present and future reporting requirements to show different possibilities to disaggregate
the information that go beyond the minimum levels set out in the regulation.
The manual concludes with Chapter 7 which shows methods on the production of renewable energy statistics in house-holds, how household energy statistics can help to improve the knowledge of fuel poverty, and the benefits of data matching techniques to produce energy statistics.

Situation of energy statistics in the household sector in the EU

Situation of energy statistics in the household sector in the EU 1
Manual for Statistics on Energy Consumption in Households 17
IntroductionReliable and detailed data are critical for informed policy decision making, a well-functioning market and effective regulation. This implies a high level of expertise in the col-lection, analysis and dissemination of energy statistics on both supply and demand.
Statistics are essential for the development, implementation, monitoring and evaluation of policies at European and na-tional level. In the European context, the statistics are devel-oped, produced, and disseminated on the basis of uniform standards and harmonised methods, where the National Sta-tistical Institutes (NSIs) and other national authorities of the EU Member States collect and produce harmonised data that are compiled by Eurostat to construct statistics at EU level.
Energy statistics inform major political issues in the Euro-pean Union such as the liberalisation of the energy market, its sustainability (including the environmental concerns) and energy security (e.g. the energy dependency on imports). This has required extensive data needs, initially focused on pro-duction and aggregate demand, but new priorities focusing on more detailed understanding of energy consumption and efficiency has increased the need for far more detailed data on energy use.
The actions promoted by Eurostat to develop statistics on energy consumption in the household (also referred to as residential) sector are set in this context and the development of this manual is part of this effort.
1 .1 . Main actors in EU statisticsEurostat is the Statistical Office of the European Communi-ties. Its mission is to provide the European Union with high-quality statistical information. For that purpose, it gathers and analyses figures from the national statistical offices across Europe and provides comparable and harmonised data for the European Union to use in the definition, imple-mentation and analysis of Community policies. Its statistical products and services are also of great value to Europe’s business community, professional organisations, academics, librarians, NGOs, the media and citizens.
Eurostat was established in 1953 to meet the requirements of the Coal and Steel Community. Over the years its task has broadened and when the European Community was founded in 1958 it became a Directorate-General of the European Commission. Eurostat’s key role is to supply statistics to other DGs and supply the Commission and other European Institutions with data so they can define, implement and analyse Community policies.
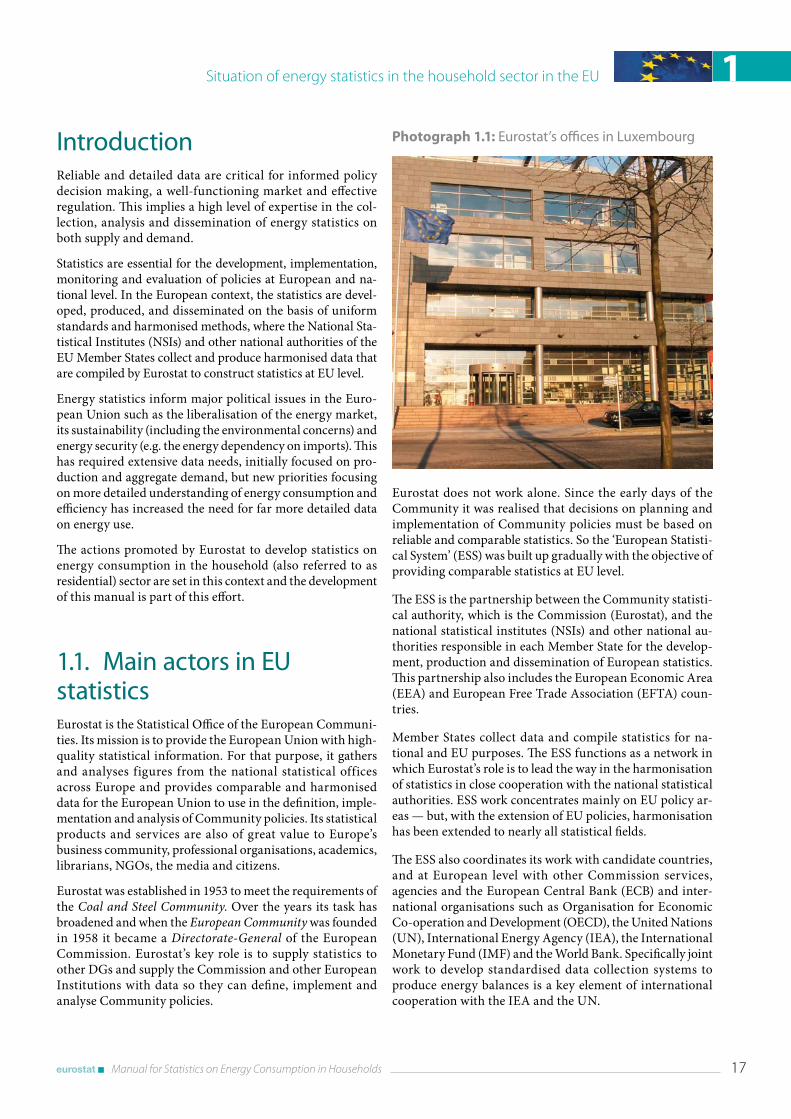
Photograph 1.1: Eurostat’s offices in Luxembourg
Eurostat does not work alone. Since the early days of the Community it was realised that decisions on planning and implementation of Community policies must be based on reliable and comparable statistics. So the ‘European Statisti-cal System’ (ESS) was built up gradually with the objective of providing comparable statistics at EU level.
The ESS is the partnership between the Community statisti-cal authority, which is the Commission (Eurostat), and the national statistical institutes (NSIs) and other national au-thorities responsible in each Member State for the develop-ment, production and dissemination of European statistics. This partnership also includes the European Economic Area (EEA) and European Free Trade Association (EFTA) coun-tries.
Member States collect data and compile statistics for na-tional and EU purposes. The ESS functions as a network in which Eurostat’s role is to lead the way in the harmonisation of statistics in close cooperation with the national statistical authorities. ESS work concentrates mainly on EU policy ar-eas — but, with the extension of EU policies, harmonisation has been extended to nearly all statistical fields.
The ESS also coordinates its work with candidate countries, and at European level with other Commission services, agencies and the European Central Bank (ECB) and inter-national organisations such as Organisation for Economic Co-operation and Development (OECD), the United Nations (UN), International Energy Agency (IEA), the International Monetary Fund (IMF) and the World Bank. Specifically joint work to develop standardised data collection systems to produce energy balances is a key element of international cooperation with the IEA and the UN.
Situation of energy statistics in the household sector in the EU1
18 Manual for Statistics on Energy Consumption in Households
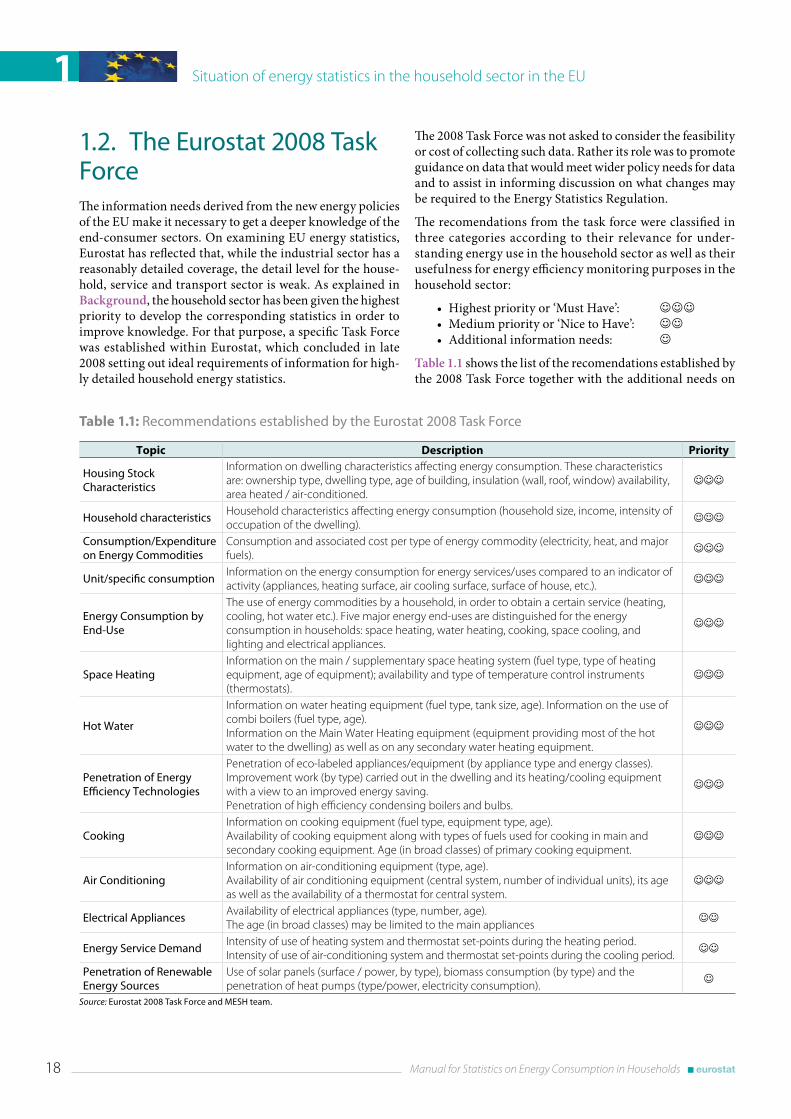
1 .2 . The Eurostat 2008 Task ForceThe information needs derived from the new energy policies of the EU make it necessary to get a deeper knowledge of the end-consumer sectors. On examining EU energy statistics, Eurostat has reflected that, while the industrial sector has a reasonably detailed coverage, the detail level for the house-hold, service and transport sector is weak. As explained in Background, the household sector has been given the highest priority to develop the corresponding statistics in order to improve knowledge. For that purpose, a specific Task Force was established within Eurostat, which concluded in late 2008 setting out ideal requirements of information for high-ly detailed household energy statistics.
The 2008 Task Force was not asked to consider the feasibility or cost of collecting such data. Rather its role was to promote guidance on data that would meet wider policy needs for data and to assist in informing discussion on what changes may be required to the Energy Statistics Regulation.
The recomendations from the task force were classified in three categories according to their relevance for under-standing energy use in the household sector as well as their usefulness for energy efficiency monitoring purposes in the household sector:
• Highest priority or ‘Must Have’: JJJ• Medium priority or ‘Nice to Have’: JJ• Additional information needs: J
Table 1.1 shows the list of the recomendations established by the 2008 Task Force together with the additional needs on
Table 1.1: Recommendations established by the Eurostat 2008 Task Force
Topic Description Priority
Housing Stock Characteristics
Information on dwelling characteristics affecting energy consumption. These characteristics are: ownership type, dwelling type, age of building, insulation (wall, roof, window) availability, area heated / air-conditioned.
JJJ
Household characteristicsHousehold characteristics affecting energy consumption (household size, income, intensity of occupation of the dwelling).
JJJ
Consumption/Expenditure on Energy Commodities
Consumption and associated cost per type of energy commodity (electricity, heat, and major fuels).
JJJ
Unit/specific consumptionInformation on the energy consumption for energy services/uses compared to an indicator of activity (appliances, heating surface, air cooling surface, surface of house, etc.).
JJJ
Energy Consumption by End-Use
The use of energy commodities by a household, in order to obtain a certain service (heating, cooling, hot water etc.). Five major energy end-uses are distinguished for the energy consumption in households: space heating, water heating, cooking, space cooling, and lighting and electrical appliances.
JJJ
Space HeatingInformation on the main / supplementary space heating system (fuel type, type of heating equipment, age of equipment); availability and type of temperature control instruments (thermostats).
JJJ
Hot Water
Information on water heating equipment (fuel type, tank size, age). Information on the use of combi boilers (fuel type, age).Information on the Main Water Heating equipment (equipment providing most of the hot water to the dwelling) as well as on any secondary water heating equipment.
JJJ
Penetration of Energy Efficiency Technologies
Penetration of eco-labeled appliances/equipment (by appliance type and energy classes).Improvement work (by type) carried out in the dwelling and its heating/cooling equipment with a view to an improved energy saving.Penetration of high efficiency condensing boilers and bulbs.
JJJ
CookingInformation on cooking equipment (fuel type, equipment type, age).Availability of cooking equipment along with types of fuels used for cooking in main and secondary cooking equipment. Age (in broad classes) of primary cooking equipment.
JJJ
Air ConditioningInformation on air-conditioning equipment (type, age).Availability of air conditioning equipment (central system, number of individual units), its age as well as the availability of a thermostat for central system.
JJJ
Electrical AppliancesAvailability of electrical appliances (type, number, age).The age (in broad classes) may be limited to the main appliances
JJ
Energy Service DemandIntensity of use of heating system and thermostat set-points during the heating period.Intensity of use of air-conditioning system and thermostat set-points during the cooling period.
JJ
Penetration of Renewable Energy Sources
Use of solar panels (surface / power, by type), biomass consumption (by type) and the penetration of heat pumps (type/power, electricity consumption).
J
Source: Eurostat 2008 Task Force and MESH team .
Situation of energy statistics in the household sector in the EU 1
Manual for Statistics on Energy Consumption in Households 19
information, classified according to the aforementioned cat-egories.
In addition to the information set out by the 2008 Task Force, this manual also covers energy poverty, with the aim of help-ing to develop data in the area linked to the European energy policy develop as specified in the Communication of the Commission to the European Council and to the European Parliament, dated 10th January 2007, ‘An energy policy for Europe’ (COM (2007) 1 final).
The requirements of the 2008 Task Force was taken as the start-ing point for the analyses the current level of coverage of energy statistics in the household sector, as described in section 1.5.
1 .3 . Methods of data collection commonly usedTo evaluate the availability of statistics on energy consumption in households a questionnaire was designed and distributed by Eurostat to the Member States in 2008 and updated in preparation for this manual in 2012. In addition other sources of information have been used, including methodological re-ports related to energy statistics in the household sector pro-vided by several countries, or identified from other sources.
EU’s Member States collect data on energy consumption in the household sector, utilising four different methods:
• Surveys: designed to collect households energy con-sumption, as well as often other more general surveys
that serve to complete and check the information col-lected by the ad-hoc surveys. These general surveys are, mainly, surveys to energy suppliers, surveys on households’ budgets and surveys on housing stock characteristics and would include ad-hoc surveys.
• Administrative sources: the collection of data through systems (private or in government) set up for pur-poses such as billing or the operation of government policy, through which data can be extracted for the production of statistics.
• In situ measurements: detailed studies often of elec-tricity, but also temperature and thermal efficiencies where information is collected through meters or other monitoring points placed in different pieces of equipment or rooms from a selected number of dwell-ings in order to collect very detailed information.
• Modelling: estimation process of residential energy consumption data through a specific methodology designed for this purpose.
In addition to the use of the individual methods described above, a number of countries use an integrated approach, which combines the use of some or all of these methods. This can have significant benefit as it helps to overcome the weaknesses of each individual method (as described in Chapter 3). The coun-try case studies presented in Chapter 5 provides examples of the integrated approach in countries such as Spain, United Kingdom, Austria, the Netherlands, and Slovenia.
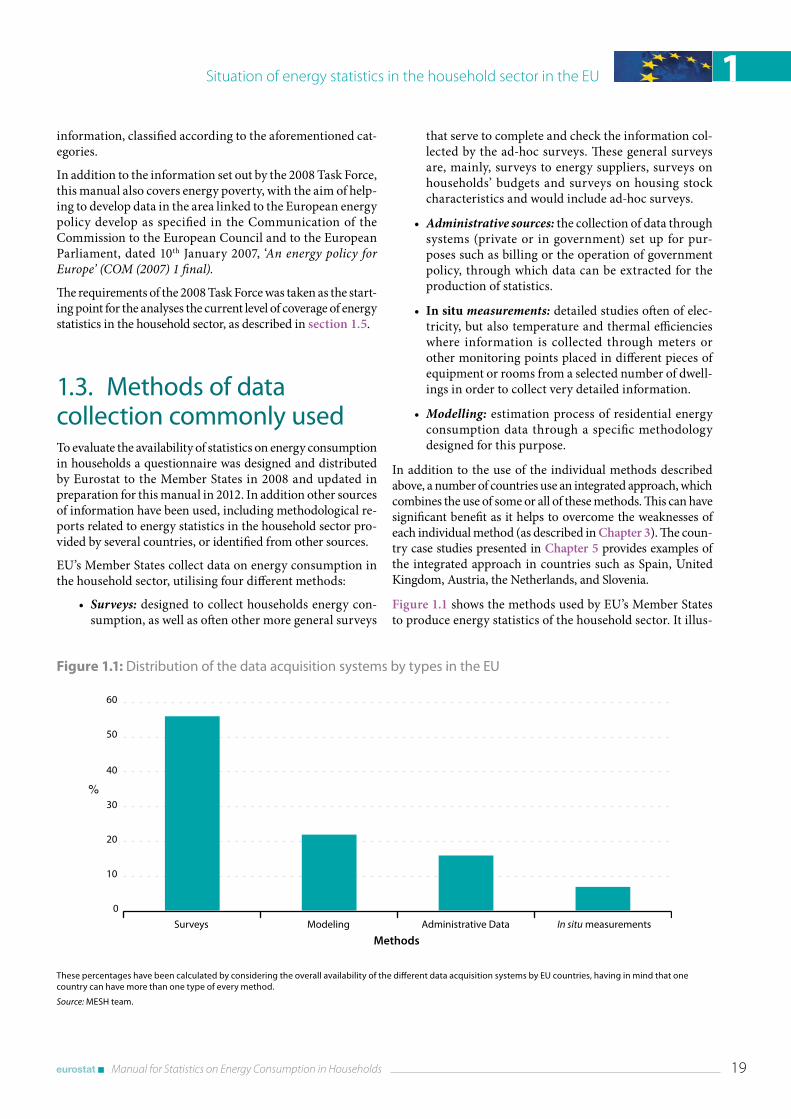
Figure 1.1 shows the methods used by EU’s Member States to produce energy statistics of the household sector. It illus-
Surveys Modeling Administrative Data In situ measurements
0
10
30
20
40
50
60
Methods
%
Figure 1.1: Distribution of the data acquisition systems by types in the EU
These percentages have been calculated by considering the overall availability of the different data acquisition systems by EU countries, having in mind that one country can have more than one type of every method .
Source: MESH team .
Situation of energy statistics in the household sector in the EU1
20 Manual for Statistics on Energy Consumption in Households
trates that surveys are the most widespread system through-out the EU followed by methods based on models and use of administrative data. In situ measurements are less used.
All Member States carry out surveys to determine energy consumption in the household sector. In total, 67 surveys are conducted by the Member States, with an average of 2.6 sur-veys per country and a maximum of 9 surveys in any one country.
Both administrative sources and modelling are widely used: 15 out of the 27 EU countries use some administrative sourc-es, with modelling, used in 12 countries but covering 26 models. Only 8 EU Member States carry out some in situ measurement, whether as a source of primary data collection or as an additional measurement method included in their ad-hoc surveys.
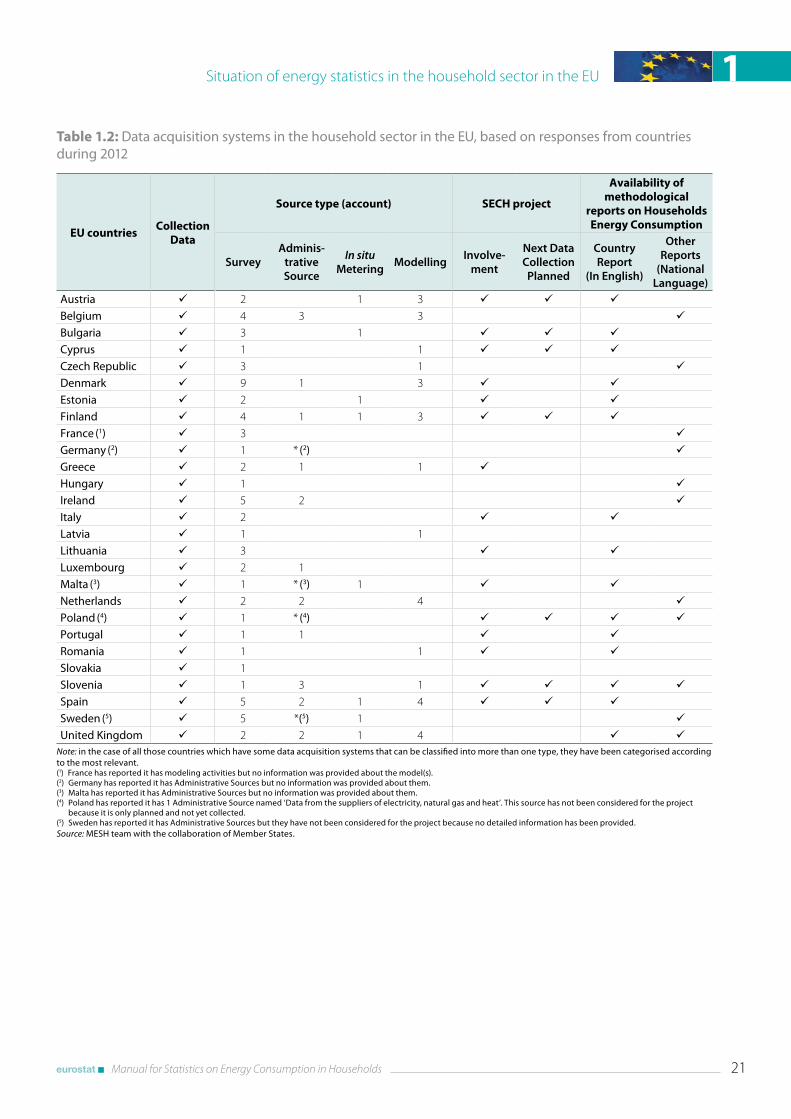
Table 1.2 shows a high level summary of the collection of the energy statistics in the household sector in the EU countries.
As outlined in Background, Eurostat provided funding assistance to member states to improve data on household energy consumption via the SECH project. Over the 2 years of funding, 17 countries took part and have made available methodological reports on the energy consumption in the household sector. The participating countries in the SECH project are mainly located in three geographical areas: Eastern; Mediterranean; and Central-Northern. The SECH projects contributed significantly to a better knowledge of the consumption of the household sector in the above geographic areas and also in the whole of the European Union.
1 .4 . Coverage of variablesAs well as investigating the methods used to collect data, analysis has also been undertaken on the variables collected, including:
• Construction characteristics of the household build-ings.
• Socioeconomic characteristics of the households.• Energy consumption by end uses.• Energy consumption and expenditure by commodities.
• Types of fuel used for space heating, water heating and cooking.
• Penetration of renewable energy.• Energy consumption by type of electrical appliances.
Overall categories like space heating, water heating, housing stock characteristics, household characteristics, electrical appliances and the penetration of renewable energy sources are collected in almost all countries. However, the level of detail does vary:
• Most countries collect data regarding energy con-sumption by end-use.
• All countries collect data concerning consumption/expenditure of energy commodities.
• All countries compile some space heating statistics.• More than half of EU’s countries collect some data
about water heating.• A quarter of the countries compile relevant data on
cooking.• Air conditioning is not widely collected, but the major-
ity of the countries of southern Europe compile data for this type of equipment.
• More than half of the Member States collect some in-formation on the penetration of energy efficient tech-nologies, but only a few countries record a large numbers of variables.
• Housing stock characteristics are covered by the whole EU.
• Half of the countries record data concerning unit‑spe-cific consumption data. Nevertheless, only six coun-tries cover all the variables.
• All countries compile information about household characteristics.
• Most countries collect data related to electrical appli-ances. In total countries have provided information on energy consumption for around 80 different appli-ances.
• One third of countries analyse energy service demand.• All the countries cover some of the variables of the
penetration of renewable energy sources.• Data on energy poverty are only compiled in a very
small number of countries.
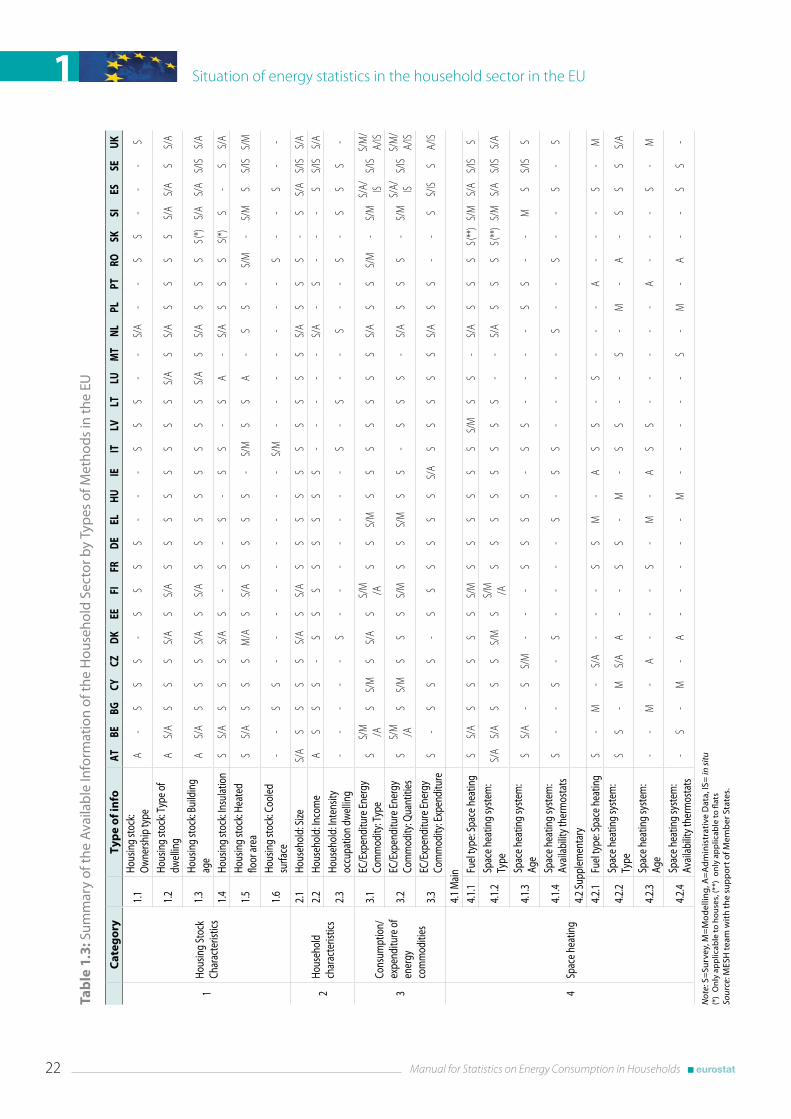
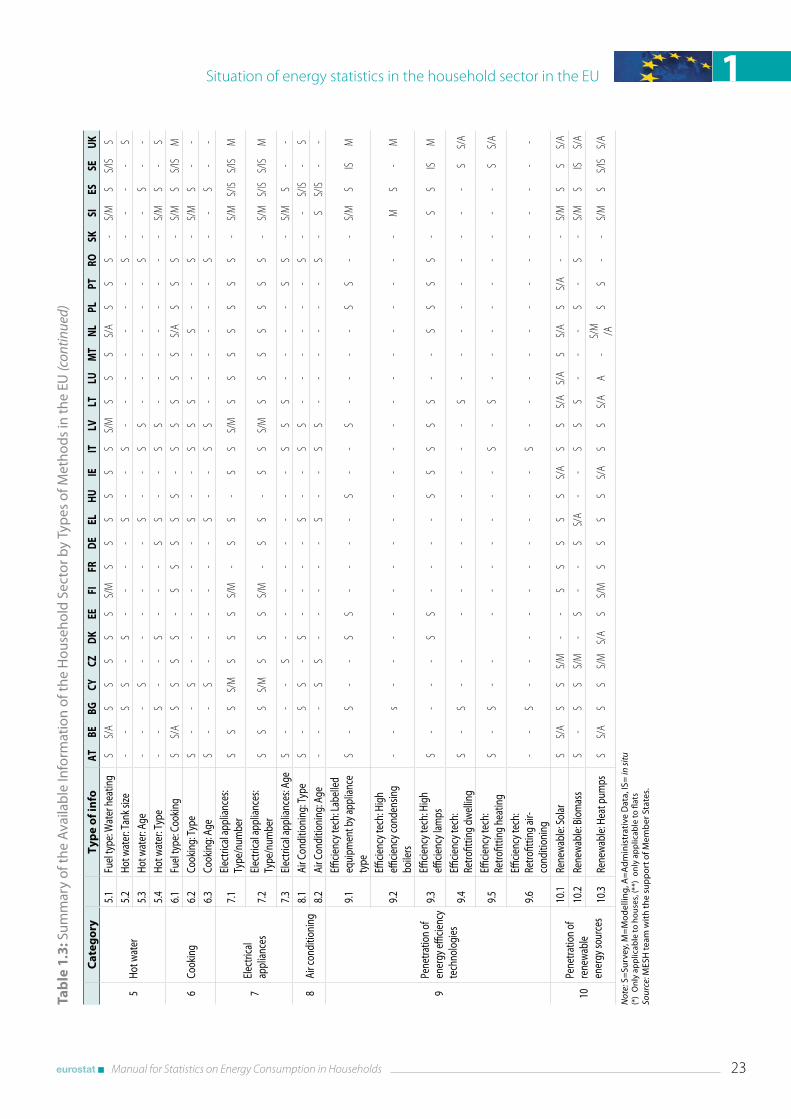
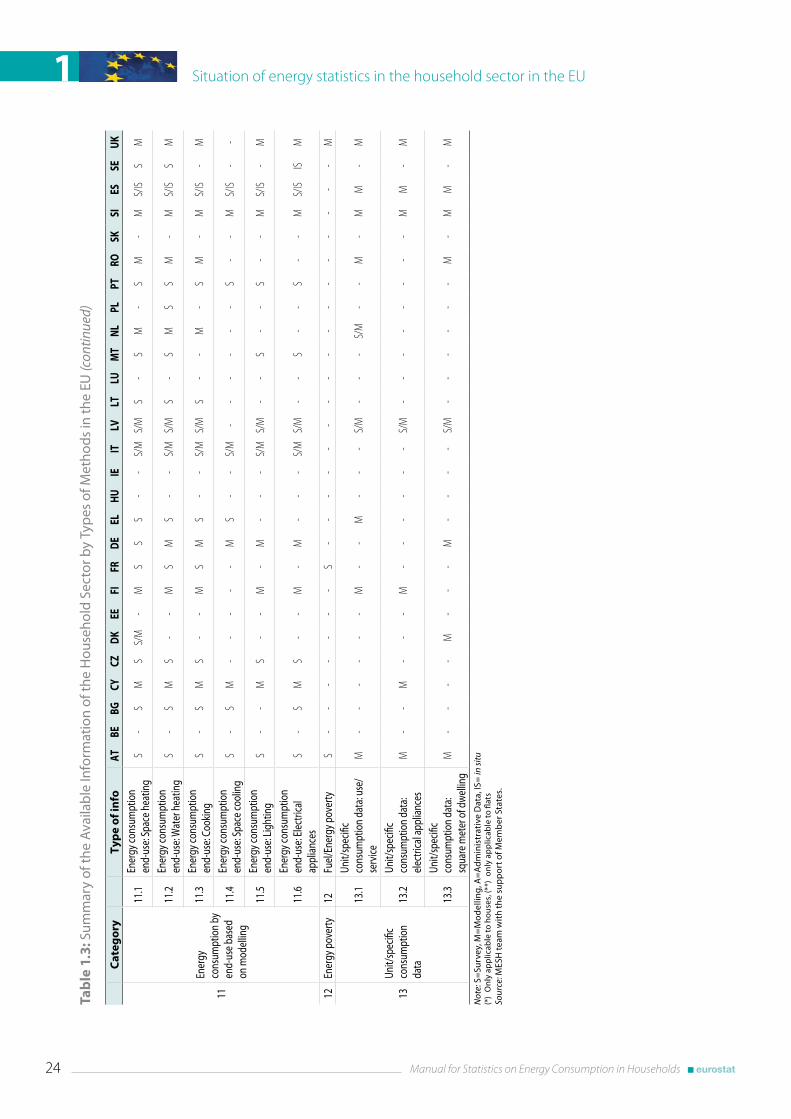
A summary of the methods used for data collection by key variable in the household sector is shown in the Table 1.3.
Situation of energy statistics in the household sector in the EU 1
Manual for Statistics on Energy Consumption in Households 21
Table 1.2: Data acquisition systems in the household sector in the EU, based on responses from countries during 2012
EU countriesCollection
Data
Source type (account) SECH project
Availability of methodological
reports on Households Energy Consumption
SurveyAdminis-
trative Source
In situ Metering
ModellingInvolve-
ment
Next Data Collection Planned
Country Report
(In English)
Other Reports
(National Language)
Austria ü 2 1 3 ü ü üBelgium ü 4 3 3 üBulgaria ü 3 1 ü ü üCyprus ü 1 1 ü ü üCzech Republic ü 3 1 üDenmark ü 9 1 3 ü üEstonia ü 2 1 ü üFinland ü 4 1 1 3 ü ü üFrance (1) ü 3 üGermany (2) ü 1 * (2) üGreece ü 2 1 1 üHungary ü 1 üIreland ü 5 2 üItaly ü 2 ü üLatvia ü 1 1Lithuania ü 3 ü üLuxembourg ü 2 1 Malta (3) ü 1 * (3) 1 ü üNetherlands ü 2 2 4 üPoland (4) ü 1 * (4) ü ü ü üPortugal ü 1 1 ü üRomania ü 1 1 ü üSlovakia ü 1 Slovenia ü 1 3 1 ü ü ü üSpain ü 5 2 1 4 ü ü üSweden (5) ü 5 *(5) 1 üUnited Kingdom ü 2 2 1 4 ü ü
Note: in the case of all those countries which have some data acquisition systems that can be classified into more than one type, they have been categorised according to the most relevant .(1) France has reported it has modeling activities but no information was provided about the model(s) .(2) Germany has reported it has Administrative Sources but no information was provided about them .(3) Malta has reported it has Administrative Sources but no information was provided about them .(4) Poland has reported it has 1 Administrative Source named ‘Data from the suppliers of electricity, natural gas and heat’ . This source has not been considered for the project
because it is only planned and not yet collected .(5) Sweden has reported it has Administrative Sources but they have not been considered for the project because no detailed information has been provided .Source: MESH team with the collaboration of Member States .
Situation of energy statistics in the household sector in the EU1
22 Manual for Statistics on Energy Consumption in Households
Tab
le 1
.3: S
umm
ary
of th
e A
vaila
ble
Info
rmat
ion
of th
e H
ouse
hold
Sec
tor b
y Ty
pes
of M
etho
ds in
the
EU
Cat
ego
ryTy
pe
of i
nfo
ATBE
BGCY
CZDK
EEFI
FRDE
ELHU
IEIT
LVLT
LUM
TNL
PLPT
ROSK
SIES
SEUK
1Ho
usin
g St
ock
Char
acte
ristic
s
1 .1
Hous
ing
stoc
k: Ow
ners
hip
type
A-
SS
S-
SS
SS
--
-S
SS
--
S/A
--
SS
--
-S
1 .2
Hous
ing
stoc
k: Ty
pe o
f dw
ellin
gA
S/A
SS
SS/
AS
S/A
SS
SS
SS
SS
S/A
SS/
AS
SS
SS/
AS/
AS
S/A
1 .3
Hous
ing
stoc
k: Bu
ildin
g ag
eA
S/A
SS
SS/
AS
S/A
SS
SS
SS
SS
S/A
SS/
AS
SS
S (*)
S/A
S/A
S/IS
S/A
1 .4
Hous
ing
stoc
k: In
sula
tion
SS/
AS
SS
S/A
S-
S-
S-
SS
-S
A-
S/A
SS
SS(
*)S
-S
S/A
1 .5
Hous
ing
stoc
k: He
ated
flo
or ar
eaS
S/A
SS
SM
/AS
S/A
SS
SS
-S/
MS
SA
-S
S-
S/M
-S/
MS
S/IS
S/M
1 .6
Hous
ing
stoc
k: Co
oled
su
rface
--
SS
--
--
--
--
-S/
M-
--
--
--
S-
-S
--
2Ho
useh
old
char
acte
ristic
s
2 .1
Hous
ehol
d: Si
zeS/
AS
SS
SS/
AS
S/A
SS
SS
SS
SS
SS
S/A
SS
S-
SS/
AS/
ISS/
A2 .
2Ho
useh
old:
Inco
me
AS
SS
-S
SS
SS
SS
S-
--
--
S/A
-S
--
-S
S/IS
S/A
2 .3
Hous
ehol
d: In
tens
ity
occu
patio
n dw
ellin
g-
--
--
S-
--
--
--
S-
S-
-S
--
S-
SS
S-
3
Cons
umpt
ion/
expe
nditu
re o
f en
ergy
co
mm
oditi
es
3 .1
EC/E
xpen
ditu
re En
ergy
Co
mm
odity
: Typ
eS
S/M
/A
SS/
MS
S/A
SS/
M
/AS
SS/
MS
SS
SS
SS
S/A
SS
S/M
-S/
MS/
A/ ISS/
ISS/
M/
A/IS
3 .2
EC/E
xpen
ditu
re En
ergy
Co
mm
odity
: Qua
ntiti
esS
S/M
/A
SS/
MS
SS
S/M
SS
S/M
SS
-S
SS
-S/
AS
SS
-S/
MS/
A/ ISS/
ISS/
M/
A/IS
3 .3
EC/E
xpen
ditu
re En
ergy
Co
mm
odity
: Exp
endi
ture
S-
SS
S-
SS
SS
SS
S/A
SS
SS
SS/
AS
S-
-S
S/IS
SA/
IS
4Sp
ace
heat
ing
4 .1
Mai
n4 .
1 .1
Fuel
type
: Spa
ce h
eatin
gS
S/A
SS
SS
SS/
MS
SS
SS
SS/
MS
S-
S/A
SS
SS (
**)
S/M
S/A
S/IS
S
4 .1 .
2Sp
ace
heat
ing
syst
em:
Type
S/A
S/A
SS
SS/
MS
S/M
/A
SS
SS
SS
SS
--
S/A
SS
SS (
**)
S/M
S/A
S/IS
S/A
4 .1 .
3Sp
ace
heat
ing
syst
em:
Age
SS/
A-
SS/
M-
--
SS
SS
-S
S-
--
-S
S-
-M
SS/
ISS
4 .1 .
4Sp
ace
heat
ing
syst
em:
Avai
labi
lity t
herm
osta
tsS
--
S-
S-
--
-S
-S
S-
--
-S
--
S-
-S
-S
4 .2
Supp
lem
enta
ry
4 .2 .
1Fu
el ty
pe: S
pace
hea
ting
S-
M-
S/A
--
-S
SM
-A
SS
-S
--
-A
--
-S
-M
4 .2 .
2Sp
ace
heat
ing
syst
em:
Type
SS
-M
S/A
A-
-S
S-
M-
SS
--
S-
M-
A-
SS
SS/
A
4 .2 .
3Sp
ace
heat
ing
syst
em:
Age
--
M-
A-
--
S-
M-
AS
S-
--
--
A-
--
S-
M
4 .2 .
4Sp
ace
heat
ing
syst
em:
Avai
labi
lity t
herm
osta
ts-
S-
M-
A-
--
--
M-
--
--
S-
M-
A-
-S
S-
Not
e: S
=Su
rvey
, M=
Mo
del
ling
, A=
Ad
min
istr
ativ
e D
ata,
IS=
in si
tu(*
) O
nly
ap
plic
able
to h
ous
es, (
**)
on
ly a
pp
licab
le to
flat
sSo
urce
: MES
H te
am w
ith
the
sup
por
t of M
emb
er S
tate
s .
Situation of energy statistics in the household sector in the EU 1
Manual for Statistics on Energy Consumption in Households 23
Cat
ego
ryTy
pe
of i
nfo
ATBE
BGCY
CZDK
EEFI
FRDE
ELHU
IEIT
LVLT
LUM
TNL
PLPT
ROSK
SIES
SEUK
5Ho
t wat
er
5 .1
Fuel
type
: Wat
er h
eatin
gS
S/A
SS
SS
SS/
MS
SS
SS
SS/
MS
SS
S/A
SS
S-
S/M
SS/
ISS
5 .2
Hot w
ater
: Tan
k size
--
SS
-S
--
--
S-
-S
--
--
--
-S
--
--
S5 .
3Ho
t wat
er: A
ge-
--
S-
--
--
-S
--
SS
--
--
--
S-
-S
--
5 .4
Hot w
ater
: Typ
e-
-S
--
S-
--
SS
--
SS
--
--
--
--
S/M
S-
S
6Co
okin
g6 .
1Fu
el ty
pe: C
ookin
gS
S/A
SS
SS
-S
SS
SS
-S
SS
SS
S/A
SS
S-
S/M
SS/
ISM
6 .2
Cook
ing:
Typ
eS
--
S-
--
--
-S
--
SS
S-
-S
--
S-
S/M
S-
-6 .
3Co
okin
g: A
geS
--
S-
--
--
-S
--
SS
--
--
--
S-
-S
--
7El
ectri
cal
appl
ianc
es
7 .1
Elec
trica
l app
lianc
es:
Type
/num
ber
SS
SS/
MS
SS
S/M
-S
S-
SS
S/M
SS
SS
SS
S-
S/M
S/IS
S/IS
M
7 .2
Elec
trica
l app
lianc
es:
Type
/num
ber
SS
SS/
MS
SS
S/M
-S
S-
SS
S/M
SS
SS
SS
S-
S/M
S/IS
S/IS
M
7 .3
Elec
trica
l app
lianc
es: A
geS
--
-S
--
--
--
--
SS
S-
--
-S
S-
S/M
S-
-
8Ai
r con
ditio
ning
8 .1
Air C
ondi
tioni
ng: T
ype
S-
SS
-S
--
--
S-
-S
S-
--
--
-S
--
S/IS
-S
8 .2
Air C
ondi
tioni
ng: A
ge-
--
SS
--
--
-S
--
SS
--
--
--
S-
SS/
IS-
-
9Pe
netra
tion
of
ener
gy effi
cienc
y te
chno
logi
es
9 .1
Efficie
ncy t
ech:
Labe
lled
equi
pmen
t by a
pplia
nce
type
S-
S-
-S
S-
--
-S
--
S-
--
-S
S-
-S/
MS
ISM
9 .2
Efficie
ncy t
ech:
Hig
h effi
cienc
y con
dens
ing
boile
rs-
-s
--
--
--
--
--
--
--
--
--
--
MS
-M
9 .3
Efficie
ncy t
ech:
Hig
h effi
cienc
y lam
psS
--
--
SS
--
--
SS
SS
S-
-S
SS
S-
SS
ISM
9 .4
Efficie
ncy t
ech:
Re
trofit
ting
dwel
ling
S-
S-
-
--
--
--
--
-S
--
--
--
--
-S
S/A
9 .5
Efficie
ncy t
ech:
Re
trofit
ting
heat
ing
S-
S-
-
--
--
--
-S
-S
--
--
--
--
-S
S/A
9 .6
Efficie
ncy t
ech:
Re
trofit
ting
air-
cond
ition
ing
--
S-
--
--
--
--
-S
--
--
--
--
--
--
-
10Pe
netra
tion
of
rene
wab
le
ener
gy so
urce
s
10 .1
Rene
wab
le: S
olar
SS/
AS
SS/
M-
-S
SS
SS
S/A
SS
S/A
S/A
SS/
AS
S/A
--
S/M
SS
S/A
10 .2
Rene
wab
le: B
iom
ass
S-
SS
S/M
-S
--
SS/
A-
-S
SS
--
-S
-S
-S/
MS
ISS/
A
10 .3
Rene
wab
le: H
eat p
umps
SS/
AS
SS/
MS/
AS
S/M
SS
SS
S/A
SS
S/A
A-
S/M
/A
SS
--
S/M
SS/
ISS/
A
Tab
le 1
.3: S
umm
ary
of th
e A
vaila
ble
Info
rmat
ion
of th
e H
ouse
hold
Sec
tor b
y Ty
pes
of M
etho
ds in
the
EU (c
ontin
ued)
Not
e: S
=Su
rvey
, M=
Mo
del
ling
, A=
Ad
min
istr
ativ
e D
ata,
IS=
in si
tu(*
) O
nly
ap
plic
able
to h
ous
es, (
**)
on
ly a
pp
licab
le to
flat
sSo
urce
: MES
H te
am w
ith
the
sup
por
t of M
emb
er S
tate
s .
Situation of energy statistics in the household sector in the EU1
24 Manual for Statistics on Energy Consumption in Households
Cat
ego
ryTy
pe
of i
nfo
ATBE
BGCY
CZDK
EEFI
FRDE
ELHU
IEIT
LVLT
LUM
TNL
PLPT
ROSK
SIES
SEUK
11
Ener
gy
cons
umpt
ion
by
end-
use
base
d on
mod
ellin
g
11 .1
Ener
gy co
nsum
ptio
n en
d-us
e: Sp
ace
heat
ing
S-
SM
SS/
M-
MS
SS
--
S/M
S/M
S-
SM
-S
M-
MS/
ISS
M
11 .2
Ener
gy co
nsum
ptio
n en
d-us
e: W
ater
hea
ting
S-
SM
S-
-M
SM
S-
-S/
MS/
MS
-S
MS
SM
-M
S/IS
SM
11 .3
Ener
gy co
nsum
ptio
n en
d-us
e: C
ookin
gS
-S
MS
--
MS
MS
--
S/M
S/M
S-
-M
-S
M-
MS/
IS-
M
11 .4
Ener
gy co
nsum
ptio
n en
d-us
e: Sp
ace
cool
ing
S-
SM
--
--
-M
S-
-S/
M-
--
--
-S
--
MS/
IS-
-
11 .5
Ener
gy co
nsum
ptio
n en
d-us
e: Li
ghtin
gS
--
MS
--
M-
M-
--
S/M
S/M
--
S-
-S
--
MS/
IS-
M
11 .6
Ener
gy co
nsum
ptio
n en
d-us
e: El
ectri
cal
appl
ianc
esS
-S
MS
--
M-
M-
--
S/M
S/M
--
S-
-S
--
MS/
ISIS
M
12En
ergy
pov
erty
12Fu
el/E
nerg
y pov
erty
S-
--
--
--
S-
--
--
--
--
--
--
--
--
M
13Un
it/sp
ecifi
c co
nsum
ptio
n da
ta
13 .1
Unit/
spec
ific
cons
umpt
ion
data
: use
/se
rvice
M-
--
--
-M
--
M-
--
S/M
--
-S/
M-
-M
-M
M-
M
13 .2
Unit/
spec
ific
cons
umpt
ion
data
: el
ectri
cal a
pplia
nces
M-
-M
--
-M
--
--
--
S/M
--
--
--
--
MM
-M
13 .3
Unit/
spec
ific
cons
umpt
ion
data
: sq
uare
met
er o
f dw
ellin
gM
--
--
M-
--
M-
--
-S/
M-
--
--
-M
-M
M-
M
Not
e: S
=Su
rvey
, M=
Mo
del
ling
, A=
Ad
min
istr
ativ
e D
ata,
IS=
in si
tu(*
) O
nly
ap
plic
able
to h
ous
es, (
**)
on
ly a
pp
licab
le to
flat
sSo
urce
: MES
H te
am w
ith
the
sup
por
t of M
emb
er S
tate
s .
Tab
le 1
.3: S
umm
ary
of th
e A
vaila
ble
Info
rmat
ion
of th
e H
ouse
hold
Sec
tor b
y Ty
pes
of M
etho
ds in
the
EU (c
ontin
ued)
Situation of energy statistics in the household sector in the EU 1
Manual for Statistics on Energy Consumption in Households 25
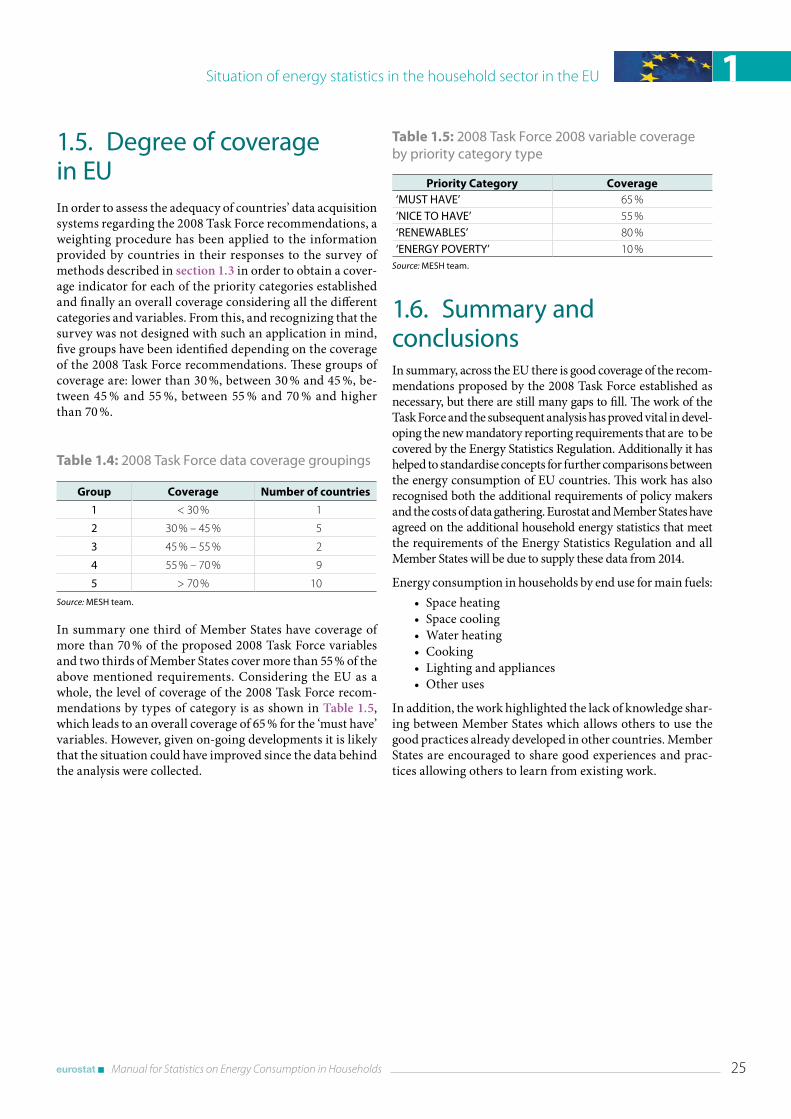
1 .5 . Degree of coverage in EUIn order to assess the adequacy of countries’ data acquisition systems regarding the 2008 Task Force recommendations, a weighting procedure has been applied to the information provided by countries in their responses to the survey of methods described in section 1.3 in order to obtain a cover-age indicator for each of the priority categories established and finally an overall coverage considering all the different categories and variables. From this, and recognizing that the survey was not designed with such an application in mind, five groups have been identified depending on the coverage of the 2008 Task Force recommendations. These groups of coverage are: lower than 30 %, between 30 % and 45 %, be-tween 45 % and 55 %, between 55 % and 70 % and higher than 70 %.
Table 1.4: 2008 Task Force data coverage groupings
Group Coverage Number of countries
1 < 30 % 1
2 30 % – 45 % 5
3 45 % – 55 % 2
4 55 % – 70 % 9
5 > 70 % 10
Source: MESH team .
In summary one third of Member States have coverage of more than 70 % of the proposed 2008 Task Force variables and two thirds of Member States cover more than 55 % of the above mentioned requirements. Considering the EU as a whole, the level of coverage of the 2008 Task Force recom-mendations by types of category is as shown in Table 1.5, which leads to an overall coverage of 65 % for the ‘must have’ variables. However, given on-going developments it is likely that the situation could have improved since the data behind the analysis were collected.
Table 1.5: 2008 Task Force 2008 variable coverage by priority category type
Priority Category Coverage‘MUST HAVE’ 65 %‘NICE TO HAVE’ 55 %‘RENEWABLES’ 80 %‘ENERGY POVERTY’ 10 %
Source: MESH team .
1 .6 . Summary and conclusionsIn summary, across the EU there is good coverage of the recom-mendations proposed by the 2008 Task Force established as necessary, but there are still many gaps to fill. The work of the Task Force and the subsequent analysis has proved vital in devel-oping the new mandatory reporting requirements that are to be covered by the Energy Statistics Regulation. Additionally it has helped to standardise concepts for further comparisons between the energy consumption of EU countries. This work has also recognised both the additional requirements of policy makers and the costs of data gathering. Eurostat and Member States have agreed on the additional household energy statistics that meet the requirements of the Energy Statistics Regulation and all Member States will be due to supply these data from 2014.
Energy consumption in households by end use for main fuels:• Space heating• Space cooling• Water heating• Cooking• Lighting and appliances• Other uses
In addition, the work highlighted the lack of knowledge shar-ing between Member States which allows others to use the good practices already developed in other countries. Member States are encouraged to share good experiences and prac-tices allowing others to learn from existing work.

Definitions

Definitions 2
Manual for Statistics on Energy Consumption in Households 29
IntroductionAs stated in the opening chapter, this manual is designed to help develop comparable statistics on energy consumption in the household sector. It also aims to be concrete and prac-tical tool, to be used for developing the relevant statistics in the household sector while guaranteeing the homogeneity and comparability of results.
The purpose of this chapter is to establish common bounda-ries for the household sector and to define major energy end-uses in households and other relevant energy variables in order to get a comparable statistics of energy consumption in households. One of the key elements of data quality is coherence. The use of common concepts, definitions and classifications promotes coherence. That is why the defini-tions are listed in this early chapter.
Some of the defined variables may not be considered as directly energy relevant at a first glance (e.g. number of occupants in the dwelling, ownership type of the dwelling, etc.). Those var-iables are essential in understanding differences in energy use and through that can be used for the estimations and modeling to derive also the data that could not be surveyed directly; use of hot water in the dwelling highly correlates with number of occupants; lower degree of energy efficiency may be observed in rented homes compared to owned ones, etc.
Comparability between countries can be achieved only when these statistics are based on the same definitions. In this re-spect the common use of a core set of definitions is essential for the purpose. This chapter presents EU definitions drawn from available knowledge and experience across EU and internationally.
Some of the definitions which are presented here have been used in the Regulation (EC) No 1099/2008 of the European Parliament and of the Council of 22 October 2008 on energy statistics (ESR). Member States of the EU are expected to use these definitions in meeting requirements of regulation in order to ensure the proper comparability of all results. To provide a manual with a lasting legacy, the definitions pre-sented go beyond the needs of current and planned reporting requirements, but to promote consistency of any additional work undertaken by MS compilers of the household energy statistics are strongly encouraged to these definitions.
2 .1 . The household sector boundariesIn this section the boundaries of the household sector are established in order to delimit the uses and activities of it.
Household means a person living alone or a group of peo-ple who live together in the same private dwelling and
sharing expenditures including the joint provision of the essentials of living. (Regulation 1177/2003 concerning Community statistics on income and living conditions EU‑SILC).
Household members who are away from home on extended periods (as college students, members of the armed forces, etc.) do not count.
The household sector, also known as the residential (or domestic) sector is therefore, a collective pool of all house-holds in a country.
First of all, it is necessary to define what type of residences, activities, and services should be included in the household sector. In terms of energy consumption, the household sector includes all energy-using activities related to private dwellings. Collective residences which can be permanent (e.g. prisons) or temporary (e.g. hospitals, hotels, pensions) should be excluded (as these are covered in consumption in the service sector).
According to ESR energy used in all transport activities should be reported in the transport sector and not in the household sector. Also the consumption for charging electric cars, bicycles at home should ideally be included in the trans-port sector.
Households may have more than one residence. Primary residence is a dwelling which is the usual place of residence of the householder; it is occupied for at least half of the year by the householder. Secondary residences are therefore occupied for less than six months of the year by the house-holder.
The methodology developed is valid for application both in primary and secondary residences, since the energy services and end uses are the same. When calculating the energy consumption in households the distinction between primary and secondary residences should be taken into account regarding parameters of the duration of occupation and the level of use of the equipment. Therefore the energy consump-tion for the secondary residences should be calculated sepa-rately having in mind those differences. See also Chapter 3 Description of Methods.
Energy consumption associated with economic activities of households should ideally be excluded from the total household energy consumption. These activities include agricultural economic activities on small farms and other economic activities carried out in a household’s residence, such as teleworking. However in reality it is difficult to distinguish consumption from small home offices and similar uses from pure household use without separate metering or specific data sources. For this purpose specific questions (e.g. time dedication to home economic activity) may be asked in the surveys in order to estimate economic energy use and allow it to be moved to the industrial or most likely services sector.
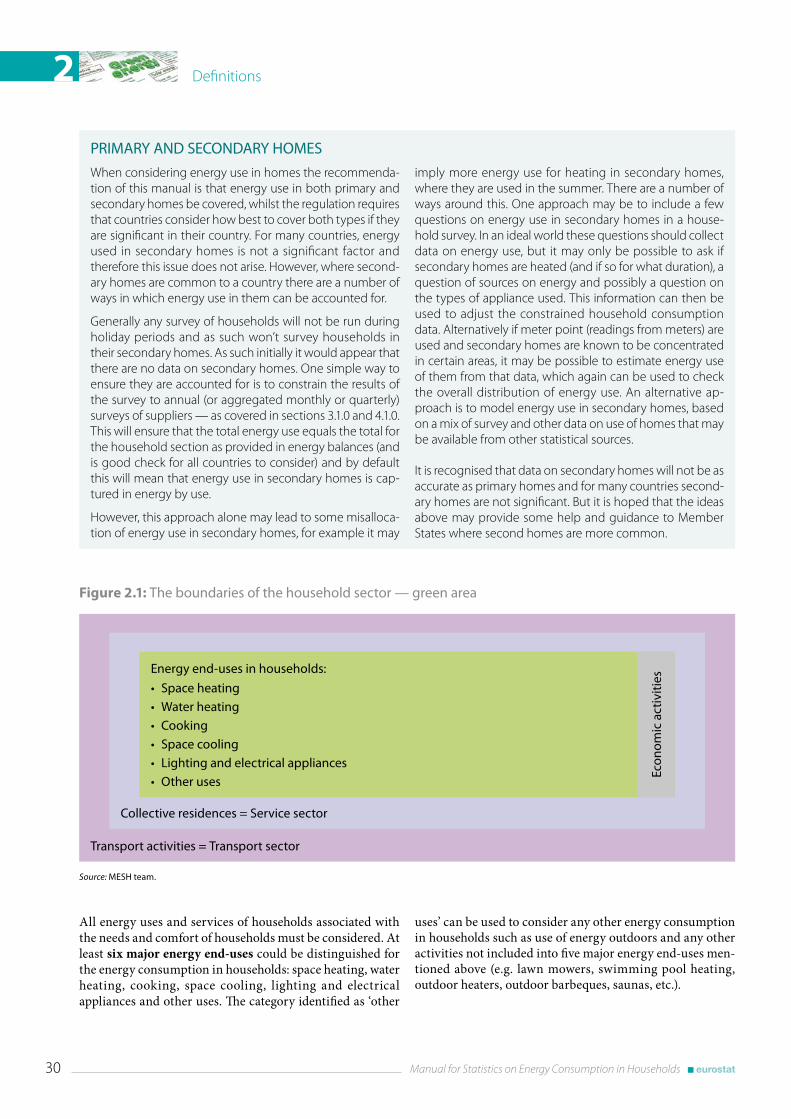
Definitions2
30 Manual for Statistics on Energy Consumption in Households
All energy uses and services of households associated with the needs and comfort of households must be considered. At least six major energy end-uses could be distinguished for the energy consumption in households: space heating, water heating, cooking, space cooling, lighting and electrical appliances and other uses. The category identified as ‘other
PRIMARY AND SECONDARY HOMES
When considering energy use in homes the recommenda-tion of this manual is that energy use in both primary and secondary homes be covered, whilst the regulation requires that countries consider how best to cover both types if they are significant in their country. For many countries, energy used in secondary homes is not a significant factor and therefore this issue does not arise. However, where second-ary homes are common to a country there are a number of ways in which energy use in them can be accounted for.
Generally any survey of households will not be run during holiday periods and as such won’t survey households in their secondary homes. As such initially it would appear that there are no data on secondary homes. One simple way to ensure they are accounted for is to constrain the results of the survey to annual (or aggregated monthly or quarterly) surveys of suppliers — as covered in sections 3.1.0 and 4.1.0. This will ensure that the total energy use equals the total for the household section as provided in energy balances (and is good check for all countries to consider) and by default this will mean that energy use in secondary homes is cap-tured in energy by use.
However, this approach alone may lead to some misalloca-tion of energy use in secondary homes, for example it may
imply more energy use for heating in secondary homes, where they are used in the summer. There are a number of ways around this. One approach may be to include a few questions on energy use in secondary homes in a house-hold survey. In an ideal world these questions should collect data on energy use, but it may only be possible to ask if secondary homes are heated (and if so for what duration), a question of sources on energy and possibly a question on the types of appliance used. This information can then be used to adjust the constrained household consumption data. Alternatively if meter point (readings from meters) are used and secondary homes are known to be concentrated in certain areas, it may be possible to estimate energy use of them from that data, which again can be used to check the overall distribution of energy use. An alternative ap-proach is to model energy use in secondary homes, based on a mix of survey and other data on use of homes that may be available from other statistical sources.
It is recognised that data on secondary homes will not be as accurate as primary homes and for many countries second-ary homes are not significant. But it is hoped that the ideas above may provide some help and guidance to Member States where second homes are more common.
Figure 2.1: The boundaries of the household sector — green area
Source: MESH team .
Transport activities = Transport sector
Collective residences = Service sector
Energy end-uses in households:
• Space heating• Water heating• Cooking• Space cooling• Lighting and electrical appliances• Other uses
Econ
omic
act
iviti
es
uses’ can be used to consider any other energy consumption in households such as use of energy outdoors and any other activities not included into five major energy end-uses men-tioned above (e.g. lawn mowers, swimming pool heating, outdoor heaters, outdoor barbeques, saunas, etc.).
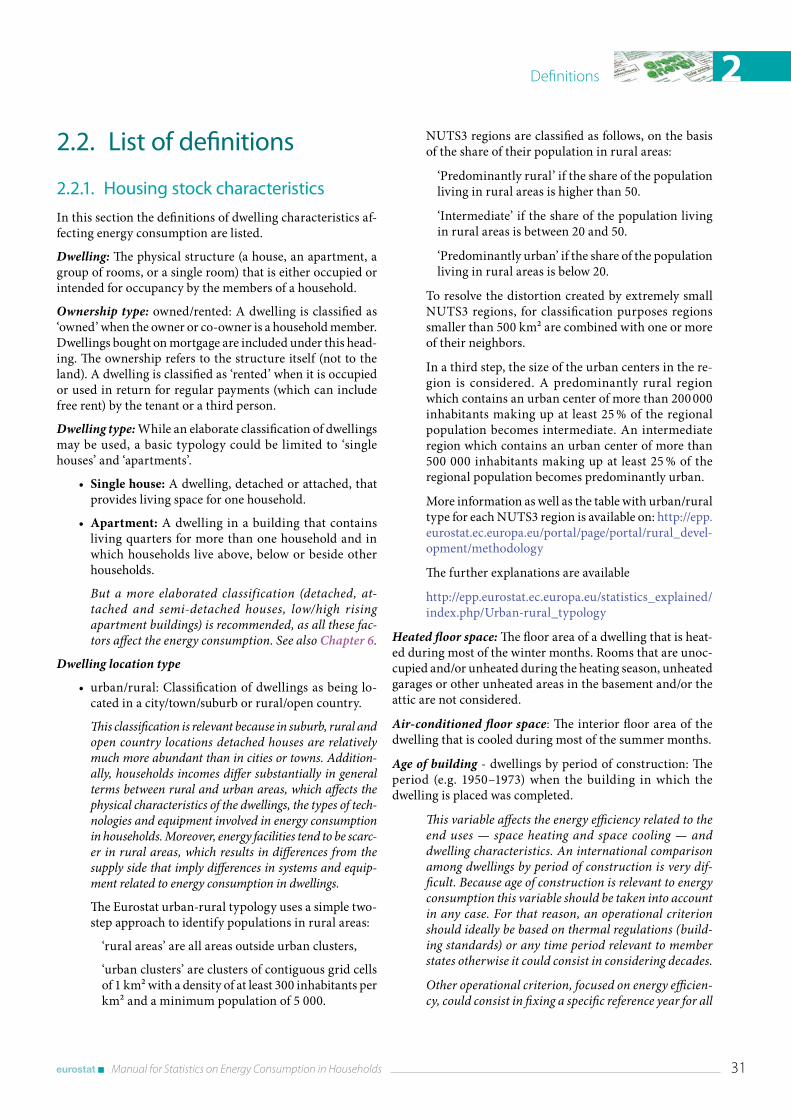
Definitions 2
Manual for Statistics on Energy Consumption in Households 31
2 .2 . List of definitions
2 .2 .1 . Housing stock characteristics
In this section the definitions of dwelling characteristics af-fecting energy consumption are listed.
Dwelling: The physical structure (a house, an apartment, a group of rooms, or a single room) that is either occupied or intended for occupancy by the members of a household.
Ownership type: owned/rented: A dwelling is classified as ‘owned’ when the owner or co-owner is a household member. Dwellings bought on mortgage are included under this head-ing. The ownership refers to the structure itself (not to the land). A dwelling is classified as ‘rented’ when it is occupied or used in return for regular payments (which can include free rent) by the tenant or a third person.
Dwelling type: While an elaborate classification of dwellings may be used, a basic typology could be limited to ‘single houses’ and ‘apartments’.
• Single house: A dwelling, detached or attached, that provides living space for one household.
• Apartment: A dwelling in a building that contains living quarters for more than one household and in which households live above, below or beside other households.
But a more elaborated classification (detached, at-tached and semi-detached houses, low/high rising apartment buildings) is recommended, as all these fac-tors affect the energy consumption. See also Chapter 6.
Dwelling location type
• urban/rural: Classification of dwellings as being lo-cated in a city/town/suburb or rural/open country.
This classification is relevant because in suburb, rural and open country locations detached houses are relatively much more abundant than in cities or towns. Addition-ally, households incomes differ substantially in general terms between rural and urban areas, which affects the physical characteristics of the dwellings, the types of tech-nologies and equipment involved in energy consumption in households. Moreover, energy facilities tend to be scarc-er in rural areas, which results in differences from the supply side that imply differences in systems and equip-ment related to energy consumption in dwellings.
The Eurostat urban-rural typology uses a simple two-step approach to identify populations in rural areas:
‘rural areas’ are all areas outside urban clusters,
‘urban clusters’ are clusters of contiguous grid cells of 1 km² with a density of at least 300 inhabitants per km² and a minimum population of 5 000.
NUTS3 regions are classified as follows, on the basis of the share of their population in rural areas:
‘Predominantly rural’ if the share of the population living in rural areas is higher than 50.
‘Intermediate’ if the share of the population living in rural areas is between 20 and 50.
‘Predominantly urban’ if the share of the population living in rural areas is below 20.
To resolve the distortion created by extremely small NUTS3 regions, for classification purposes regions smaller than 500 km² are combined with one or more of their neighbors.
In a third step, the size of the urban centers in the re-gion is considered. A predominantly rural region which contains an urban center of more than 200 000 inhabitants making up at least 25 % of the regional population becomes intermediate. An intermediate region which contains an urban center of more than 500 000 inhabitants making up at least 25 % of the regional population becomes predominantly urban.
More information as well as the table with urban/rural type for each NUTS3 region is available on: http://epp.eurostat.ec.europa.eu/portal/page/portal/rural_devel-opment/methodology
The further explanations are available
http://epp.eurostat.ec.europa.eu/statistics_explained/index.php/Urban-rural_typology
Heated floor space: The floor area of a dwelling that is heat-ed during most of the winter months. Rooms that are unoc-cupied and/or unheated during the heating season, unheated garages or other unheated areas in the basement and/or the attic are not considered.
Air-conditioned floor space: The interior floor area of the dwelling that is cooled during most of the summer months.
Age of building - dwellings by period of construction: The period (e.g. 1950–1973) when the building in which the dwelling is placed was completed.
This variable affects the energy efficiency related to the end uses — space heating and space cooling — and dwelling characteristics. An international comparison among dwellings by period of construction is very dif-ficult. Because age of construction is relevant to energy consumption this variable should be taken into account in any case. For that reason, an operational criterion should ideally be based on thermal regulations (build-ing standards) or any time period relevant to member states otherwise it could consist in considering decades.
Other operational criterion, focused on energy efficien-cy, could consist in fixing a specific reference year for all
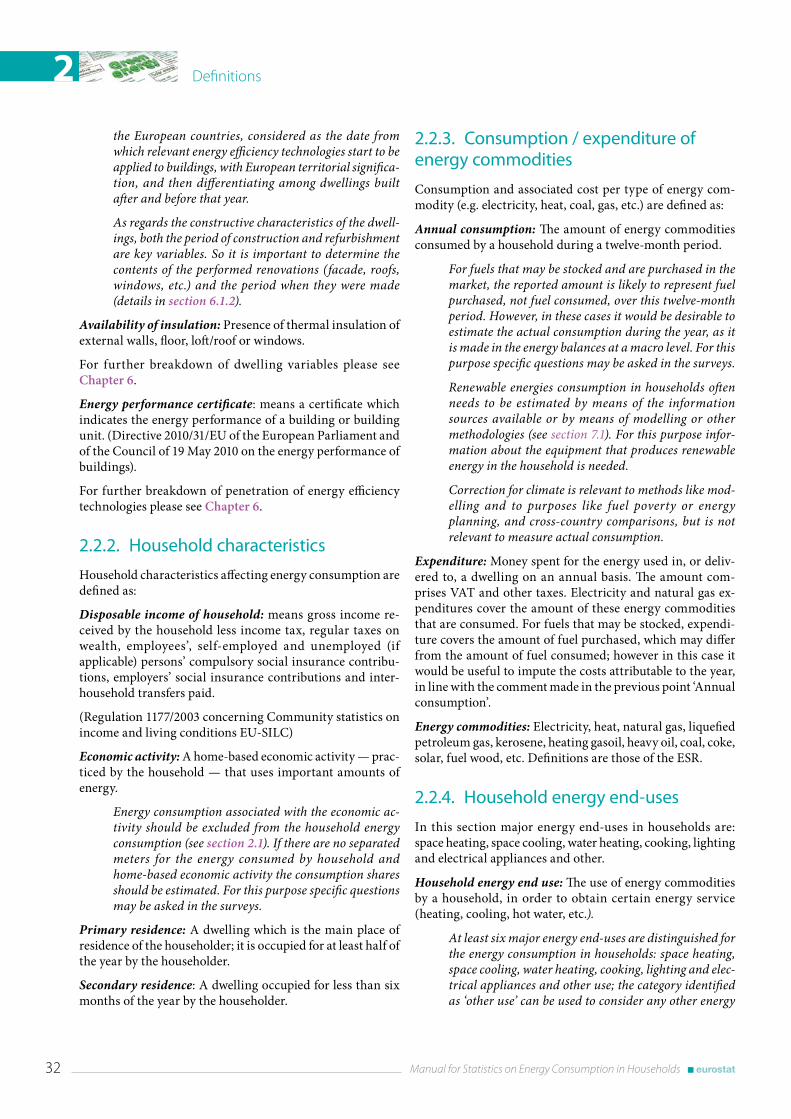
Definitions2
32 Manual for Statistics on Energy Consumption in Households
the European countries, considered as the date from which relevant energy efficiency technologies start to be applied to buildings, with European territorial significa-tion, and then differentiating among dwellings built after and before that year.
As regards the constructive characteristics of the dwell-ings, both the period of construction and refurbishment are key variables. So it is important to determine the contents of the performed renovations (facade, roofs, windows, etc.) and the period when they were made (details in section 6.1.2).
Availability of insulation: Presence of thermal insulation of external walls, floor, loft/roof or windows.
For further breakdown of dwelling variables please see Chapter 6.
Energy performance certificate: means a certificate which indicates the energy performance of a building or building unit. (Directive 2010/31/EU of the European Parliament and of the Council of 19 May 2010 on the energy performance of buildings).
For further breakdown of penetration of energy efficiency technologies please see Chapter 6.
2 .2 .2 . Household characteristics
Household characteristics affecting energy consumption are defined as:
Disposable income of household: means gross income re-ceived by the household less income tax, regular taxes on wealth, employees’, self-employed and unemployed (if applicable) persons’ compulsory social insurance contribu-tions, employers’ social insurance contributions and inter-household transfers paid.
(Regulation 1177/2003 concerning Community statistics on income and living conditions EU‑SILC)
Economic activity: A home-based economic activity — prac-ticed by the household — that uses important amounts of energy.
Energy consumption associated with the economic ac-tivity should be excluded from the household energy consumption (see section 2.1). If there are no separated meters for the energy consumed by household and home-based economic activity the consumption shares should be estimated. For this purpose specific questions may be asked in the surveys.
Primary residence: A dwelling which is the main place of residence of the householder; it is occupied for at least half of the year by the householder.
Secondary residence: A dwelling occupied for less than six months of the year by the householder.
2 .2 .3 . Consumption / expenditure of energy commodities
Consumption and associated cost per type of energy com-modity (e.g. electricity, heat, coal, gas, etc.) are defined as:
Annual consumption: The amount of energy commodities consumed by a household during a twelve-month period.
For fuels that may be stocked and are purchased in the market, the reported amount is likely to represent fuel purchased, not fuel consumed, over this twelve-month period. However, in these cases it would be desirable to estimate the actual consumption during the year, as it is made in the energy balances at a macro level. For this purpose specific questions may be asked in the surveys.
Renewable energies consumption in households often needs to be estimated by means of the information sources available or by means of modelling or other methodologies (see section 7.1). For this purpose infor-mation about the equipment that produces renewable energy in the household is needed.
Correction for climate is relevant to methods like mod-elling and to purposes like fuel poverty or energy planning, and cross-country comparisons, but is not relevant to measure actual consumption.
Expenditure: Money spent for the energy used in, or deliv-ered to, a dwelling on an annual basis. The amount com-prises VAT and other taxes. Electricity and natural gas ex-penditures cover the amount of these energy commodities that are consumed. For fuels that may be stocked, expendi-ture covers the amount of fuel purchased, which may differ from the amount of fuel consumed; however in this case it would be useful to impute the costs attributable to the year, in line with the comment made in the previous point ‘Annual consumption’.
Energy commodities: Electricity, heat, natural gas, liquefied petroleum gas, kerosene, heating gasoil, heavy oil, coal, coke, solar, fuel wood, etc. Definitions are those of the ESR.
2 .2 .4 . Household energy end-uses
In this section major energy end-uses in households are: space heating, space cooling, water heating, cooking, lighting and electrical appliances and other.
Household energy end use: The use of energy commodities by a household, in order to obtain certain energy service (heating, cooling, hot water, etc.).
At least six major energy end-uses are distinguished for the energy consumption in households: space heating, space cooling, water heating, cooking, lighting and elec-trical appliances and other use; the category identified as ‘other use’ can be used to consider any other energy

Definitions 2
Manual for Statistics on Energy Consumption in Households 33
consumption in households such as use of energy for the outdoor and any other activities not included into five major energy end-uses mentioned above (e.g. lawn mowers, swimming pool heating, outdoor heaters, out-door barbeques, saunas, etc.).
2.2.4.1. Space heating
Space heating: refers to the use of energy to provide heat (i.e. thermal energy) in an interior area of a dwelling.
Space heating can be achieved by means of many heating systems and fuels.
Main and supplementary space heating systems
According to the amount of heat provided to the dwell-ing and the frequency of use, the space heating systems can be separated into main and supplementary space heating systems
The main space-heating system provides most of the heat to the dwelling. The supplementary space-heating equipment is used less often than the main space-heating system.
Collective and individual space heating systems
According to the number of dwellings served by heating systems they can be further divided to the collective and individual space heating systems.
The collective space heating system is serving more than one dwelling: multiple dwellings in one building (boiler room for the whole building), several buildings, community, district (local, community or district heating plants).
An individual space heating system provides heat to a single dwelling.
Central and local space heating
In case the dwelling is served by collective heating system it is heated by central space heating. If the dwelling is served by the individual space heating system it can be further divided to central heating for entire dwelling and local heat-ing for dedicated area or room within the dwelling.
Central space heating provides heat for the entire dwelling: generally hot water and steam systems with floor radiators or wall furnaces providing central heating for one dwelling, gas, heat pumps, etc.
Local space heating provides heat for a dedicated area or room within a dwelling: standalone stoves using oil products or other fuels, such as coal or wood, fireplaces, standalone electric heaters, gas convector heaters electric radiators, etc.
Figure 2.2: Types of space heating
Collective system(more than one dwelling in one building or several buildings or district)
Individual system(single dwelling)
Central space heating(entire dwelling)
Local space heating (dedicated area within the dwelling)
Central space heating(entire dwelling)
Space heating systems
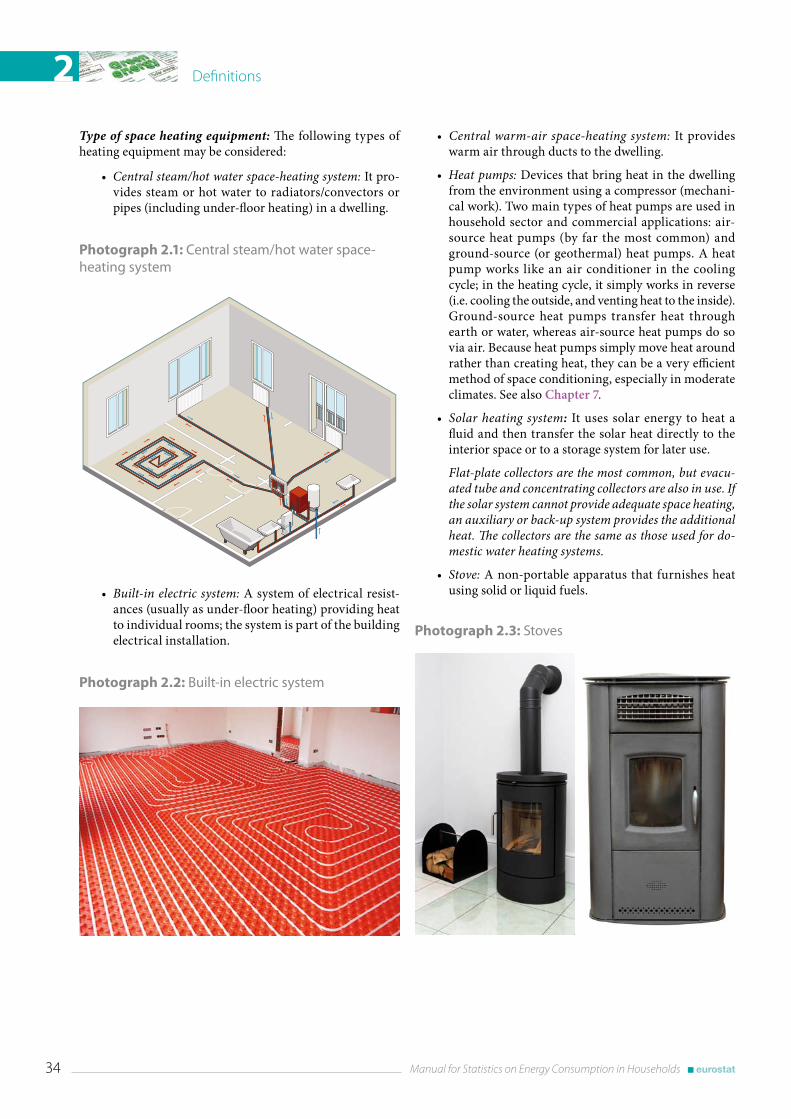
Definitions2
34 Manual for Statistics on Energy Consumption in Households
Type of space heating equipment: The following types of heating equipment may be considered:
• Central steam/hot water space-heating system: It pro-vides steam or hot water to radiators/convectors or pipes (including under-floor heating) in a dwelling.
Photograph 2.1: Central steam/hot water space-heating system
• Built-in electric system: A system of electrical resist-ances (usually as under-floor heating) providing heat to individual rooms; the system is part of the building electrical installation.
Photograph 2.2: Built-in electric system
• Central warm-air space-heating system: It provides warm air through ducts to the dwelling.
• Heat pumps: Devices that bring heat in the dwelling from the environment using a compressor (mechani-cal work). Two main types of heat pumps are used in household sector and commercial applications: air-source heat pumps (by far the most common) and ground-source (or geothermal) heat pumps. A heat pump works like an air conditioner in the cooling cycle; in the heating cycle, it simply works in reverse (i.e. cooling the outside, and venting heat to the inside). Ground-source heat pumps transfer heat through earth or water, whereas air-source heat pumps do so via air. Because heat pumps simply move heat around rather than creating heat, they can be a very efficient method of space conditioning, especially in moderate climates. See also Chapter 7.
• Solar heating system: It uses solar energy to heat a fluid and then transfer the solar heat directly to the interior space or to a storage system for later use.
Flat-plate collectors are the most common, but evacu-ated tube and concentrating collectors are also in use. If the solar system cannot provide adequate space heating, an auxiliary or back-up system provides the additional heat. The collectors are the same as those used for do-mestic water heating systems.
• Stove: A non-portable apparatus that furnishes heat using solid or liquid fuels.
Photograph 2.3: Stoves
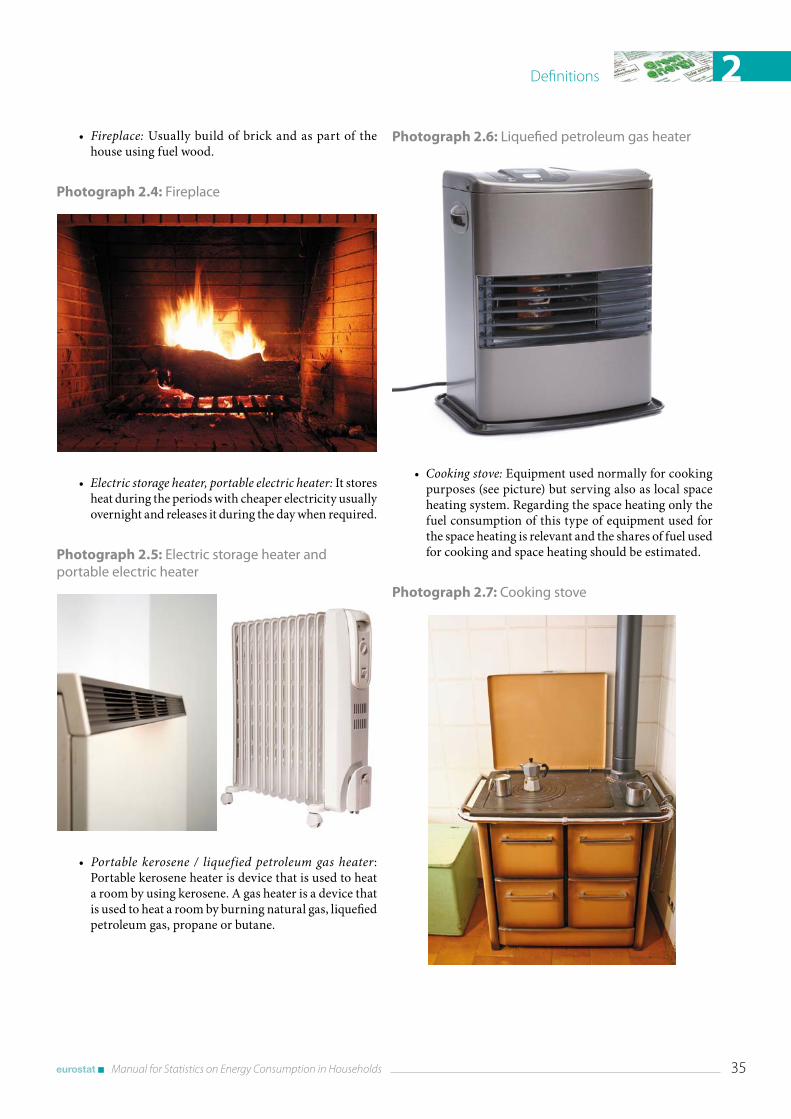
Definitions 2
Manual for Statistics on Energy Consumption in Households 35
• Fireplace: Usually build of brick and as part of the house using fuel wood.
Photograph 2.4: Fireplace
• Electric storage heater, portable electric heater: It stores heat during the periods with cheaper electricity usually overnight and releases it during the day when required.
Photograph 2.5: Electric storage heater and portable electric heater
• Portable kerosene / liquefied petroleum gas heater: Portable kerosene heater is device that is used to heat a room by using kerosene. A gas heater is a device that is used to heat a room by burning natural gas, liquefied petroleum gas, propane or butane.
Photograph 2.6: Liquefied petroleum gas heater
• Cooking stove: Equipment used normally for cooking purposes (see picture) but serving also as local space heating system. Regarding the space heating only the fuel consumption of this type of equipment used for the space heating is relevant and the shares of fuel used for cooking and space heating should be estimated.
Photograph 2.7: Cooking stove

Definitions2
36 Manual for Statistics on Energy Consumption in Households
• Reversible heat pumps; see Chapter 7.
Age of the space heating equipment: Age of the main heating system of the household.
Energy sources for heat generation: Heating systems can generate heat using a different number of energy sources such as electricity, natural gas, coal, fuel oil, liquefied petroleum gas, kerosene, biomass and solar thermal energy. Definitions are those of the ESR.
2.2.4.2. Space cooling
Space cooling: refers to the use of energy for cooling in a dwelling by a refrigeration system and/or unit. Fans, blowers and other appliances not connected to a refrigeration unit are excluded from this section, and should be covered in the lighting and electrical appliances section.
Central and local air conditioning systems
Equipment used for a space cooling can be divided into two broad categories: central cooling systems or local (room-dedicated) cooling systems.
Central air conditioning systems have ducts to bring cooled air in the individual rooms of the dwelling.
Local air conditioning system: electrically driven individual units that provide cooling to single room of a dwelling (wall air conditioners, split systems).
Reversible heat pumps are heat pumps that can be used in reverse mode to cool the air. See Chapter 7.
There are also other possible cooling systems such as swamp coolers (or evaporative coolers) which cool air through evap-oration of water, district cooling, etc.
Age of the cooling system: The age, in broad classes, of the cooling system or the oldest individual unit.
2.2.4.3. Water heating
Water heating: This energy service is referred to the use of energy to heat water for hot running water, bathing, cleaning and other non-cooking applications. Swimming pool heating is excluded and should be included in other uses.
A number of tank-based or tank-less systems can be used to heat the water. Domestic hot water can be produced alone or in combination with space heating systems.
Water Heater/Boiler: A thermally insulated vessel designed for heating and storing hot water.
Tank size, age: The volume (litres) and age of the water heat-er. Broad classes may be used for reporting tank size and age.
Combi boiler: A combi boiler is a high-efficiency water heat-er and a central space heating boiler, combined within one compact unit. It provides heat for radiators and domestic hot water. No separate hot water vessel is required.
Energy sources for water heating: The main energy sources used for water heating include electricity, natural gas, coal, fuel oil, liquefied petroleum gas, kerosene, biomass and solar thermal energy. Definitions are those of the ESR.
2.2.4.4. Cooking
Cooking: This energy service is the use of energy to prepare meals (excluding appliances for auxiliary cooking — micro-wave ovens, kettles, coffee makers, etc.).
Preparing meals can be achieved using a wide range of stoves, ovens, cookers which are considered to be cooking equipment. Appliances like microwave ovens, kettles, coffee makers, toasters are, due to the difficulty in sepa-rating their respective consumption, classified as electri-cal appliances where possible.
Cooking Equipment: The following equipment types may be considered:
• Kitchen stove or cooker.
Photograph 2.8: Kitchen stove or cooker (see also photograph 2 .7)

Definitions 2
Manual for Statistics on Energy Consumption in Households 37
• Oven: standalone or build in the cooker.
Photograph 2.9: Ovens
• Hob or stovetop or cooktop.
Photograph 2.10: Hob, stovetop and cooktop
Use of various fuels for outdoor barbeques should be included within ‘other use’ category and not cooking.
Energy sources for cooking: The main energy sources used for cooking are natural gas, electricity, biomass, liquefied petroleum gas, kerosene and coal. Definitions are those of the ESR.
2.2.4.5. Lighting and electrical appliances
Lighting and electrical appliances: This category includes the use of electricity for lighting and any other electrical ap-pliances in a dwelling not considered within other end uses.
Interior or exterior lighting of dwellings is mainly powered by electricity. Incandescent lamps are slowly being replaced by more efficient fixtures, e.g. fluorescent tube lamps, compact fluorescent lamps (CFLs), halogen lamps, and LED (light emit-ting diodes). Households that do not have access to electricity still rely on traditional forms of lighting such as kerosene and liquefied petroleum gas lamps, and sometimes even candles and flash lights. Only electricity consumption for lighting is considered.
Availability and number by types of light bulbs in the dwelling: The following light bulbs may be considered: incan-descent bulbs (1), compact fluorescent lamps (2), fluorescent tube lamps (3), halogen, lamps (4) and LED (5).

Definitions2
38 Manual for Statistics on Energy Consumption in Households
Photograph 2.11: Types of bulbs
1 2 3
4 5
From the number and type of the light bulbs and the average time of usage the consumption of electricity for lighting could be estimated.
Availability and number of electrical appliances: Which should include: refrigerators; freezers; washing machines; dryers; dishwashers; televisions; and personal computers.
Appliances encompass two main categories: large (or major) appliances (sometimes also called white appliances or white goods) and other (usually much smaller) appliances, also called brown appliances. Large appliances mainly include refrigera-tors, freezers, washing machines, dryers and dish washers. Other appliances include a wide range of appliances from electronic equipment such as TV, computers, audio and video equipment to vacuum cleaners, microwave ovens, and irons, fans and blow-ers. Almost all appliances are powered by electricity.
Cookers, stoves, ovens and hobs should be included in ‘Cook-ing’ but other cooking appliances such as microwave ovens, kettles, coffee makers should be included here.
Air conditioning units should be included in ‘Space cooling’ and appliances for space or water heating in their respective services. See Chapter 6 for additional detail.
Energy sources for lighting and electrical appliances: Only electricity consumption for lighting and electrical appli-ances is considered.
2.2.4.6. Other end uses
Other end uses: All other end uses not included previously.
This category covers any other energy consumption in house-holds such as use of energy for the outdoor and any other activities not included into five major energy end-uses men-tioned above (e.g. lawn mowers, swimming pool heating, outdoor heaters, outdoor barbeques, saunas, etc.).
2 .2 .5 . Penetration of energy efficiency technologies
Penetration of labeled appliance/equipment: Energy effi-ciency (classes according to Directive 2010/30/EU on the indication by labeling and standard product information of the consumption of energy) for the following electrical ap-pliances: refrigerators, freezers and combined appliances, washing machines, tumble dryers and combined appliances,
Definitions 2
Manual for Statistics on Energy Consumption in Households 39
dishwashers, ovens, air conditioners, televisions, light bulbs and tubes.
Improvement work: carried out in the dwelling or to heating/air-conditioning equipment with a view to improve energy saving; the following work may be concerned: the roof/loft insulation, exterior wall insulation, windows, heating system and air-conditioning equipment.
Penetration of high-efficiency condensing boilers: The avail-ability of high efficiency condensing boiler.
High–efficiency condensing boiler: is designed to recover energy normally discharged to the atmosphere through the flue. This extra energy is recovered cooling the exhaust gases so that steam condenses to liquid water, recovering the latent heat of vaporization.
Diffusion of high efficiency bulbs: see section Lighting and electrical appliances.
2 .2 .6 . Energy controls
Energy service demand: Intensity of use of heating and/or cooling system and thermostat set points during the heating and/or cooling period.
Thermostat: A device that turns on or off the heating and/or cooling system so that a desired temperature is reached in a space.
Availability of thermostat: Number of thermostats control-ling the main heating and/or cooling system.
Thermostat types: Manual on-off thermostat, allowing the manual control of the heating and/or cooling period during the day. Programmable thermostat, designed to adjust auto-matically the temperature at different times of the day or night and days of the week.
Availability and type of thermostats
As regards thermostats, it has proven very difficult to achieve realistic information about their precise management in households (i.e. the set point fixed during the heating season). In any case, collecting information about its availability, type, and frequency of use may be enough, providing that the average room temperature in dwelling during the heating/cooling season can be estimated by means of any of the sta-tistical sources available (for instance, simply asking the household about it). See in situ measurement section 3.5 for information on measuring temperatures.


Description of methods

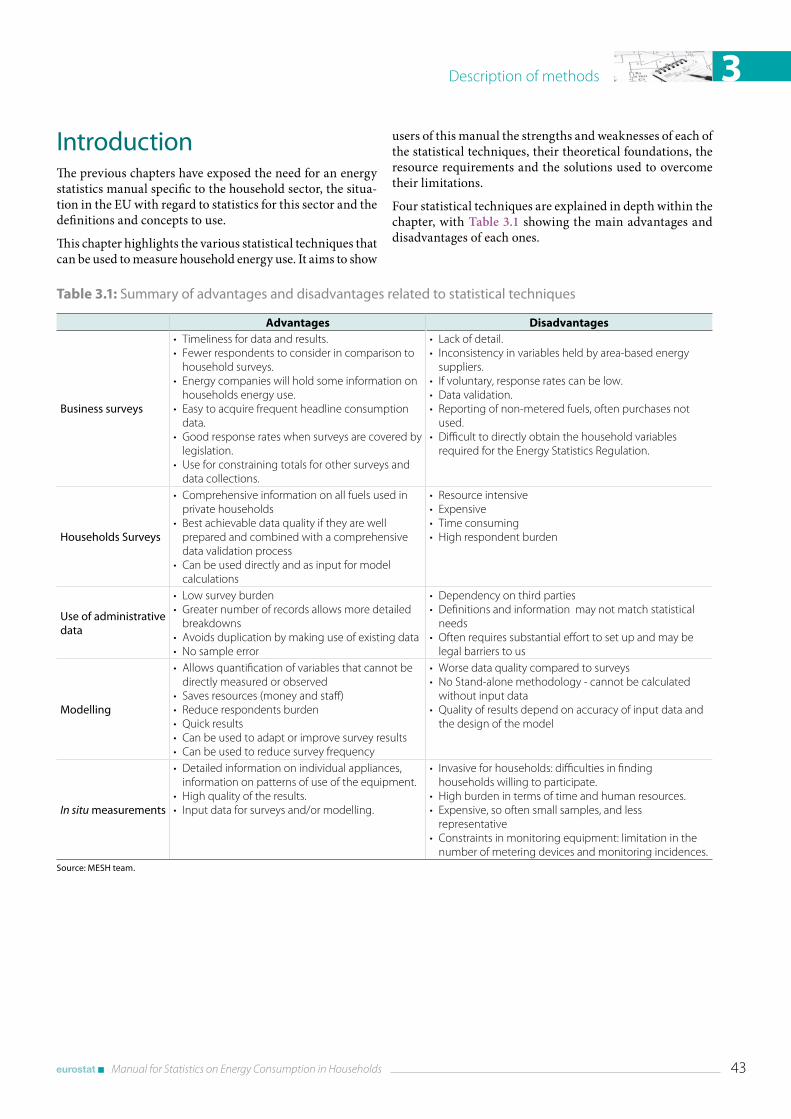
Description of methods 3
Manual for Statistics on Energy Consumption in Households 43
IntroductionThe previous chapters have exposed the need for an energy statistics manual specific to the household sector, the situa-tion in the EU with regard to statistics for this sector and the definitions and concepts to use.
This chapter highlights the various statistical techniques that can be used to measure household energy use. It aims to show
Table 3.1: Summary of advantages and disadvantages related to statistical techniques
Advantages Disadvantages
Business surveys
• Timeliness for data and results.• Fewer respondents to consider in comparison to
household surveys.• Energy companies will hold some information on
households energy use.• Easy to acquire frequent headline consumption
data.• Good response rates when surveys are covered by
legislation.• Use for constraining totals for other surveys and
data collections.
• Lack of detail.• Inconsistency in variables held by area-based energy
suppliers.• If voluntary, response rates can be low.• Data validation.• Reporting of non-metered fuels, often purchases not
used.• Difficult to directly obtain the household variables required for the Energy Statistics Regulation.
Households Surveys
• Comprehensive information on all fuels used in private households
• Best achievable data quality if they are well prepared and combined with a comprehensive data validation process
• Can be used directly and as input for model calculations
• Resource intensive• Expensive• Time consuming• High respondent burden
Use of administrative data
• Low survey burden• Greater number of records allows more detailed
breakdowns • Avoids duplication by making use of existing data• No sample error
• Dependency on third parties• Definitions and information may not match statistical
needs• Often requires substantial effort to set up and may be
legal barriers to us
Modelling
• Allows quantification of variables that cannot be directly measured or observed
• Saves resources (money and staff)• Reduce respondents burden• Quick results• Can be used to adapt or improve survey results• Can be used to reduce survey frequency
• Worse data quality compared to surveys• No Stand-alone methodology - cannot be calculated
without input data • Quality of results depend on accuracy of input data and
the design of the model
In situ measurements
• Detailed information on individual appliances, information on patterns of use of the equipment.
• High quality of the results.• Input data for surveys and/or modelling.
• Invasive for households: difficulties in finding households willing to participate.
• High burden in terms of time and human resources.• Expensive, so often small samples, and less
representative• Constraints in monitoring equipment: limitation in the
number of metering devices and monitoring incidences.Source: MESH team .
users of this manual the strengths and weaknesses of each of the statistical techniques, their theoretical foundations, the resource requirements and the solutions used to overcome their limitations.
Four statistical techniques are explained in depth within the chapter, with Table 3.1 showing the main advantages and disadvantages of each ones.
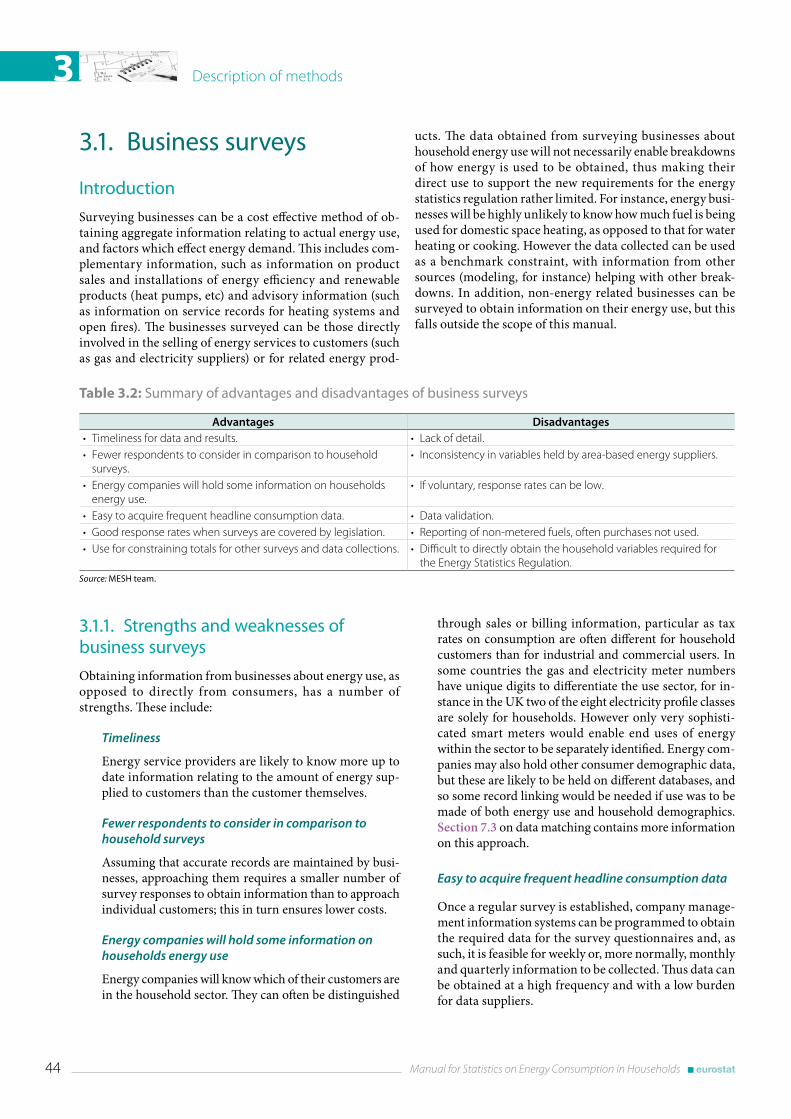
Description of methods3
44 Manual for Statistics on Energy Consumption in Households
3 .1 . Business surveys
Introduction
Surveying businesses can be a cost effective method of ob-taining aggregate information relating to actual energy use, and factors which effect energy demand. This includes com-plementary information, such as information on product sales and installations of energy efficiency and renewable products (heat pumps, etc) and advisory information (such as information on service records for heating systems and open fires). The businesses surveyed can be those directly involved in the selling of energy services to customers (such as gas and electricity suppliers) or for related energy prod-
ucts. The data obtained from surveying businesses about household energy use will not necessarily enable breakdowns of how energy is used to be obtained, thus making their direct use to support the new requirements for the energy statistics regulation rather limited. For instance, energy busi-nesses will be highly unlikely to know how much fuel is being used for domestic space heating, as opposed to that for water heating or cooking. However the data collected can be used as a benchmark constraint, with information from other sources (modeling, for instance) helping with other break-downs. In addition, non-energy related businesses can be surveyed to obtain information on their energy use, but this falls outside the scope of this manual.
Table 3.2: Summary of advantages and disadvantages of business surveys
Advantages Disadvantages• Timeliness for data and results. • Lack of detail.• Fewer respondents to consider in comparison to household
surveys.• Inconsistency in variables held by area-based energy suppliers.
• Energy companies will hold some information on households energy use.
• If voluntary, response rates can be low.
• Easy to acquire frequent headline consumption data. • Data validation.• Good response rates when surveys are covered by legislation. • Reporting of non-metered fuels, often purchases not used.• Use for constraining totals for other surveys and data collections. • Difficult to directly obtain the household variables required for
the Energy Statistics Regulation.Source: MESH team .
3 .1 .1 . Strengths and weaknesses of business surveys
Obtaining information from businesses about energy use, as opposed to directly from consumers, has a number of strengths. These include:
Timeliness
Energy service providers are likely to know more up to date information relating to the amount of energy sup-plied to customers than the customer themselves.
Fewer respondents to consider in comparison to household surveys
Assuming that accurate records are maintained by busi-nesses, approaching them requires a smaller number of survey responses to obtain information than to approach individual customers; this in turn ensures lower costs.
Energy companies will hold some information on households energy use
Energy companies will know which of their customers are in the household sector. They can often be distinguished
through sales or billing information, particular as tax rates on consumption are often different for household customers than for industrial and commercial users. In some countries the gas and electricity meter numbers have unique digits to differentiate the use sector, for in-stance in the UK two of the eight electricity profile classes are solely for households. However only very sophisti-cated smart meters would enable end uses of energy within the sector to be separately identified. Energy com-panies may also hold other consumer demographic data, but these are likely to be held on different databases, and so some record linking would be needed if use was to be made of both energy use and household demographics. Section 7.3 on data matching contains more information on this approach.
Easy to acquire frequent headline consumption data
Once a regular survey is established, company manage-ment information systems can be programmed to obtain the required data for the survey questionnaires and, as such, it is feasible for weekly or, more normally, monthly and quarterly information to be collected. Thus data can be obtained at a high frequency and with a low burden for data suppliers.
Description of methods 3
Manual for Statistics on Energy Consumption in Households 45
Good response rates
Many countries will have legislation which requires en-ergy companies to report specific data to Ministry’s. This ensures very high compliance with surveys. However, where the legislation is not in place, good working rela-tionships between Government and the energy industry usually results in a high response rate.
Use for constraining totals for other surveys and data collections
Data from businesses can be used as control totals for data coming from household surveys and other informa-tion, so that proportions derived from sample surveys can be grossed to the whole population, and associated sampling errors produced. For instance in the UK the data provided by energy companies on total consump-tion of particular fuels in the household sector is used as a constraining total for the modeling of end use data derived Housing Surveys.
However there are a number of limitations when relying on business surveys for obtaining information relating to house-hold energy use. These include:
Lack of detail
It is not feasible for businesses to provide survey responses in great depth; survey responses are often provided in one or two dimensions (such as ‘total con-sumption’ or ‘total consumption in household during month X’). As electricity and gas markets have become more liberalised, the amount of additional (non-busi-ness essential) data held by energy companies has re-duced. Multi-dimension information can be obtained from access to detailed administrative records (see section 3.3), through data matching (see section 3.1.2) or from consumer surveys.
Inconsistency in variables held by area-based energy suppliers
Many energy businesses can be responsible for providing energy for a specific geographic area, such as covering a distribution area. Unless there is a country wide agree-ment for standard data provision, it is likely that the data providers for different geographic areas would not all have the same level of data, or would have data for dif-ferent variables or time periods. So there can be limita-tions to inter-area comparisons.
If voluntary, response rates can be low
Respondents need to be made aware of any legal require-ments for the provision of data. If data are only collected on a voluntary basis, response rates, and response qual-ity can suffer. Despite this, voluntary agreements with businesses to provide data can work well, particularly if
the legislation process is complex. Data protection legis-lation can help reassure respondents that commercial information provided in responses will not provide any competitive advantage to other companies. Surveys originating from Ministries are often considered more trustworthy than those coming from external contrac-tors, so this can help improve response rates for volun-tary surveys.
Data validation
Plausibility and consistency checks on data are usual practice. However it can be difficult to validate individ-ual survey responses against other sources, particularly if there are no other comprehensive data sources. Com-parisons of raw data from companies over time is a sen-sible way to look at quality. If data cannot be validated against other sources, poor data quality could be an issue if companies wished to give a wrong message in their response. However if they were users of the aggregate statistical output then there is less incentive to do this.
Non-metered fuels
A lack of specific contracts between householders and suppliers of non-metered fuels (such as coal, oil, and wood) makes the collection of usable data more difficult. A householder can choose one of many different fuel suppliers, and thus grossing for both the individual household and supplier level can be problematic.
3 .1 .2 . Issues to consider
Good preparation is required before carrying out a business survey for the first time. A number of key areas need to be considered before a pilot questionnaire is designed. These are briefly covered below.
What data are required and to what frequency
This may seem obvious, but a clear understanding of the purpose of the data collection is required before consid-ering how they should be collected. This phase may de-cide that an alternate good practice method may be more appropriate.
Who to survey
Depending on the data, the businesses chosen for the survey need to be carefully selected. For some areas, e.g. electricity and gas, there can be a number of participants in the market who could provide similar data. For in-stance electricity suppliers and electricity distributors may hold similar information, but who is best placed to respond to the survey? In other areas things may not be so clear cut — for instance a business survey to collect information on wood use could go to a number of or-ganizations who either would not have complete market
Description of methods3
46 Manual for Statistics on Energy Consumption in Households
coverage (for instance because of the ‘gray’ market in wood supply), or could provide some duplication with other surveys (for instance a survey of forest owners and wood mills). Some information can also be collected from manufacturers (e.g. boiler makers, heat pump man-ufacturers, etc.) in order to provide some headline infor-mation on demand for / sales of these products.
Complexity of the data to be collected
Particularly detailed data requests can benefit from technical business surveys. However other approaches, including bespoke research studies, may be of more use if it is felt that particular market participants cannot provide the information required.
Costs of running and responding to surveys
Running surveys can be expensive. Consideration needs to be given to both costs for the organization running the survey, and also the costs to the respondents. Key costs for assessing respondent burden include:
• The number of questions and length of the question-naire;
• Complexity of the data to be collected and reported;• Timeliness of reporting data.
Statutory requirement or voluntary participation
Different approaches may be required if the survey (or its results) is mandated in legislation, or if the results are being obtained under a form of a ‘gentleman’s agreement’. If response is statutory, consideration need to be given to ensure that all respondents can and do respond, and what action will be taken to ensure compliance. For voluntary participation, it is still important to get a good response rate, so following up non-respondents should still be car-ried out. Ensuring that the respondents know why the data are being collected, how they are to be used, and how they can use aggregated published data, can help ensure that response rates are high.
Census or survey and sampling method
If there are a small number of similar-sized market par-ticipants, it often makes sense to carry out a census of all participants, rather than a sample survey. A fully com-pleted census will reduce the level of inaccuracy in re-sults, as there will be no sampling errors. However with a larger number of potential participants, a sampling approach may be more appropriate. There are a variety of options, including a mixed approach where all large market participants form a census, with a sample of smaller participants. The boundary of when to choose to carry out a census and when to do a survey is not fixed, but cost and accuracy play an important part in making this choice.
Frequency
As previously mentioned, data collection is expensive, so they need to be carried out at a suitable frequency. If timely data are required, it is sensible to ask fewer ques-tions; more in-depth data requests should be asked less frequently. For instance, in surveys of electricity suppli-ers, it may make sense to ask for key data every month, but detailed breakdowns every year.
Data quality
The quality of survey results is affected by a number of factors of the survey design and approach. Response rates (and associated treatment of non-response), response bias rates and incorrect classification of responses (for instance, tariff data), can all have detrimental effects on the quality of the resulting data and subsequent analysis. Knowledge of the market and coverage can also be points to consider for non-metered fuels.
Validation
Robust validating procedures need to be used. Basic checks include comparing with previous responses from the same company (for instance looking at the previous month, or the same month in the previous year) and checking that differences seem plausible. Also checking trends for one data supplier with trends for other suppli-ers; so for instance if company X has shown a 5 % in-crease in reported household energy use, how plausible is it that company Y has shown a 10 % increase? There could be valid reasons (such as the market share of com-pany Y has also increased), so results should be validated by considering any other related information.
Data protection and restricted access
All statistical agencies should be aware of local legisla-tion relating to the protection of information. Whilst it is unlikely that questionnaire responses provided by businesses will contain personal level data, the aggregate responses are still likely to be commercially sensitive. As such, all questionnaire responses should be considered as restricted, with limited access within the statistical agency, and not passed in an unprocessed format to others. Once aggregated, data can still be statistical dis-closive if, for instance, cells in a table are populated by just one or two respondents, or if the reply from one respondent dominates the totals; this could potentially identify the market share for a particular company. The greater the level of disaggregation, the more likely the data would be confidential and therefore disclosive.
Dissemination and re-use of data
A publication and data release strategy should be devised early in the survey design phase. Respondents to question-
Description of methods 3
Manual for Statistics on Energy Consumption in Households 47
naires should be advised before participating where and when their data will be published and how they will be used.
User needs
Obtaining information from the users of the published analysis (for instance, examining what they are using the data for) can help shape the future data collection. Ad-ditionally if survey respondents know that the data are going to be used they may make additional effort to en-sure timely and accurate responses are submitted.
3 .1 .3 . The Questionnaire Design Process
Details of issues to be considered when designing business questionnaires are covered in the consumer surveys section of this manual.
3 .1 .4 . More information
Eurostat’s ‘Handbook on design and implementation of busi-ness surveys’ provides the principles and methods that should be considered in setting up new surveys as well as for the redesign of existing ones.
http://epp.eurostat.ec.europa.eu/portal/page/portal/prod-uct_details/publication?p_product_code=CA-09-97-818
At the time of writing, an ESS-NET project (‘MEMOBUST’) is ongoing to update this handbook. Further information can be found here: http://www.cros-portal.eu/content/memobust
3 .2 . Households surveys
Introduction
Consumer surveys are the traditional instrument of statisti-cians to collect data on household energy consumption. Their main advantage is that they can be designed for each data need like a general overview about all fuels used or special information like electricity use types of household appli-ances. However, it can be difficult for households to answer all questions on their energy consumption. Therefore it’s necessary to have in mind that the reported data should be checked and validated comprehensively.
Although alternative methodologies to obtain such informa-tion in a cheaper and/or quicker manner exist (and are de-scribed below), consumer surveys conducted as face to face or telephone interview are currently still the most common survey approach for official statistics on household energy consumption.
In comparison to supplier surveys — mostly a census — con-sumer surveys are normally conducted as sample surveys.
3 .2 .1 . Strength and weaknesses
The following table gives an overview about the main advan-tages and disadvantages of consumer surveys.
Table 3.3: Summary of advantages and disadvantages of business surveys
Advantages Disadvantages• Comprehensive information
on all fuels used in private households.
• Best achievable data quality if they are well prepared and combined with a comprehensive data validation process.
• Can be used directly and as input for model calculations.
• Resource intensive.• Expensive.• Time consuming.• High respondent burden.
Source: MESH team .
3 .2 .2 . Survey design
This part focuses on planning aspects before establishing a new survey. On the outset, to be able to design and implement a good survey, its purpose has to be clear. The first step is to define the objectives of the survey and the questions that the survey will answer, for example what the survey is to cover, how the information will improve policy-making, what are the targets to assess, geographical coverage, level of precision required from the results, legal requirements and so on.
To survey every single dwelling with the aim to gather data on domestic consumption is impractical, costly and lengthy. One method of approach, in this case, is to survey suffi-ciently large and representative samples and the results weighted to infer on the whole population. Therefore house-hold energy consumption surveys are mostly conducted as sample surveys.
The selection of the households for the sample must follow a structured procedure that ensures the factors used to design the sample will provide a sample that is representative of households in the country. Factors to consider in the selec-tion of the sample include the type of dwelling (apartment vs. single family house), the climate zones, the location (rural vs. urban) or other factors that explain differences in the energy consumption of the households at national level. So, for instance, for a country which covers several climatic re-gions a regional breakdown is more important than for a more uniform country. The proportions of the selected households within the sample should be compared with the information provided by the national statistical body.
Depending on quality aspects, like the acceptable statistical error and specific user needs as described in the paragraph above, the range of the sample size normally starts with a
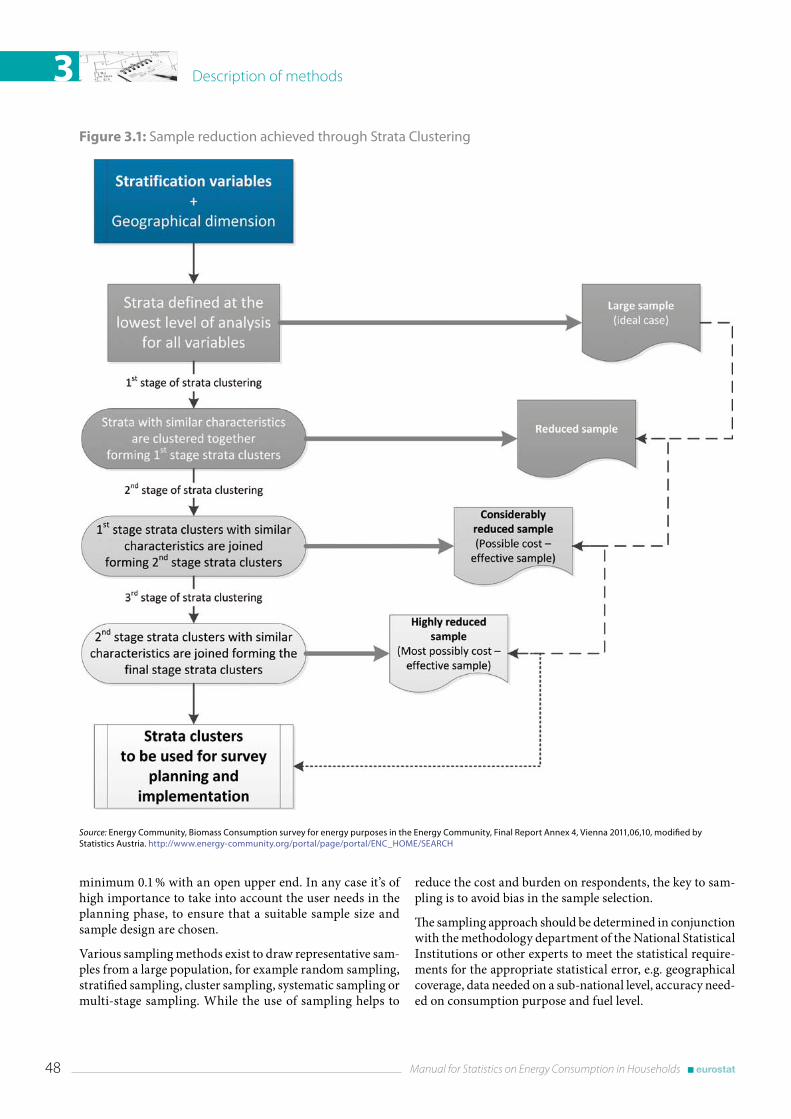
Description of methods3
48 Manual for Statistics on Energy Consumption in Households
Figure 3.1: Sample reduction achieved through Strata Clustering
Source: Energy Community, Biomass Consumption survey for energy purposes in the Energy Community, Final Report Annex 4, Vienna 2011,06,10, modified by Statistics Austria . http://www .energy-community .org/portal/page/portal/ENC_HOME/SEARCH
minimum 0.1 % with an open upper end. In any case it’s of high importance to take into account the user needs in the planning phase, to ensure that a suitable sample size and sample design are chosen.
Various sampling methods exist to draw representative sam-ples from a large population, for example random sampling, stratified sampling, cluster sampling, systematic sampling or multi-stage sampling. While the use of sampling helps to
reduce the cost and burden on respondents, the key to sam-pling is to avoid bias in the sample selection.
The sampling approach should be determined in conjunction with the methodology department of the National Statistical Institutions or other experts to meet the statistical require-ments for the appropriate statistical error, e.g. geographical coverage, data needed on a sub-national level, accuracy need-ed on consumption purpose and fuel level.
Description of methods 3
Manual for Statistics on Energy Consumption in Households 49
Strata clustering or establishing a panel (if multiyear funding is available) can help to reduce sample size and save resources (see section 4.2.4 Germany). The advantage of clustering is smaller samples, the disadvantage is the higher statistical error caused by the reduced sample.
Stratification can be done ex ante or ex post. Ex ante stratifica-tion is used to reduce the costs of achieving a given accuracy or to ensure enough data for comparison between predefined gro ups. Ex post stratification can be used to correct non respon-ses or other bias in results. In any case clustering is a complex and non-trivial methodology and therefore the methodologi cal division has to be integrated into planning and analysis.
Panel surveys (see section 4.2.4 Germany) are a very good instrument to observe developments continuously and with relatively low costs if enough volunteers join the action, but they have to be designed carefully to minimize distorted results. Further potential problems are drop outs (house-holds no longer wishing or able to participate), and influences of the survey itself on the behaviour of the respondents.
As advised in this manual the observation units are house-holds but additional national data needs mean that different units like dwellings may be chosen e.g. in Greece. The respondents in any case are members of the respective household or inhabitants of the dwelling.
In general, household energy consumption surveys should include as a minimum the frequently used energy carriers in households broken down by the main consumption pur-poses: space heating and cooling, water heating, cooking and electricity use for other purposes to meet the data needs for the reporting obligations according to the ESR.
Detailed consumption pattern of electricity for lightning and electric appliances are difficult to obtain from such a survey. If this information is needed it makes more sense to conduct a separated electricity consumption survey or an in situ elec-tricity measures programme. Such additional methods are extremely complex and rather expensive. Therefore it makes sense to keep their frequency low and to use them as input into modeling exercises (see sections 3.4 and 3.5).
Although fuel consumption of privately owned cars is not attributed to households but to road transport, additional questions on fuel type, average consumption, annually mile-age driven and age of the cars can make sense. Normally households know this much better than dwelling bound en-ergy consumption and this information is very useful for compiling energy accounts and energy efficiency indicators for transport.
Due to the time requirements of surveys, some countries con-tract a company to run the survey, although this may increase in costs compared to running the survey with an in-house team. Whenever it is possible, the use of a specialized company, which incorporates its own panel of households, is very advan-tageous for the execution of the survey because a high response rate is guaranteed.
3 .2 .3 . Survey methods
There are various methods as to how a questionnaire based survey can be administered, for example face-to-face, by post, web-based, by telephone interview, with each method having its own advantages and disadvantages. It is also pos-sible to use a combination of those methods, e.g. sending out a questionnaire by post in advance of a telephone interview to invite participation or improve response. This is espe-cially useful when long or complex questionnaires are used.
E-mail or postal method: the use of mail questionnaires is fairly cheap, quick and interviewer bias is eliminated. The major weakness of this method is the high non-response rates associated with it. The answers to the questions are taken at their face value as there is no opportunity to probe; it is dif-ficult to ascertain whether the respondent answered the ques-tions truthfully. Usually this approach is useful only when the questionnaire is fairly simple, and therefore, not suitable for complex surveys. An exception is shown in section 4.2.2 for Austria, were a complex survey was conducted via mail and email, but in this case, the respondents explained their willingness to join the exercise before. A potential bias caused by using emails only, is that possibly fewer elderly people are familiar with the internet compared to younger households.
Web-based method: the rapid expansion of the internet has resulted in one of the most dramatic changes in survey research in recent years. Web-based surveys provide the abil-ity to collect data quickly and at low cost. With Web-based surveys, the invitation reaches the subject almost instantane-ously and responses are received in electronic format which facilitates data analysis. Web-based surveys can be tailored to provide ease of use by including pop-up instructions, drop-down boxes, and check boxes. Skip patterns can be built in to allow easy navigation. Some of the disadvantages of web-based surveys are the possible sources of error, ethical issues, expertise required and an increased likelihood of non-response which arises when individuals in a sample are unwilling or unable to complete a survey or have no access to the web. Also with web-based surveys, protecting partici-pant privacy and confidentiality could be a challenge. A po-tential bias is that possibly fewer elderly people have email accounts compared to younger households.
Telephone interview method: this method allows rapid inter-action with respondents enabling instant clarification and elaboration on ambiguous issues. Telephone surveys, how-ever, can be expensive; the sampling frame (list from which the sample is drawn) can be unreliable and calls to respond-ents need to be at convenient times. Lack of respondents’ availability and lack of co-operation are the main barriers to response when dealing with telephone (and face-to-face) survey interviews. An increasing problem could be the decreasing share of landline phones, especially in younger households. This may introduce bias against younger home owners. For example see section 4.2.3 Slovenia.

Description of methods3
50 Manual for Statistics on Energy Consumption in Households
Face-to-face interview method: this method is most common in collecting data through large-scale sample surveys and usually result in high response rates. This method entails interviewers going to selected respondents to collect infor-mation by asking questions. The main advantage of this method is that the interviewers can persuade respondents (through motivation) to answer questions and can better explain the objectives of the survey. Further, this method provides greater potential for collecting statistical informa-tion on conceptually difficult topics. However the main lim-itations in using the face-to-face interview method are that different interviewers may give different interpretations to the questions; interviewers may introduce bias in the results by suggesting answers to respondents; personal characteristics of interviewers for example, age, sex and at times even race, may influence attitudes of respondents. For an example see section 4.2.1 Spain.
For any interview method computer assistance improves data quality. Therefore it should be applied in all cases if possible. With a portable computer, CAPI (Computer Assisted Per-sonal Interview) allows interviewers to conduct face-to-face interview using the computer. After the interviews, the inter-viewers send the data to a central computer, either by data communication or by sending a data disk using regular mail. CAPI can also include a CASI (Computer Assisted Self-Inter-view) session where the interviewer hands over the computer to the respondent for a short period, remaining at the same time available for instructions and assistance. Some of the most advantages of this method are:
• routing errors will not happen;
• automatic validation checks because the program per-forms some internal validity checks;
• automatic data cleaning which allows results to be available after the data collection phase;
• automatic interviewer control;
• more privacy for the respondents because the answers are directly typed into the computer and cannot be read by anyone else, which help the respondents feel more confident, increasing the willingness to answer the questionnaires;
• new possibilities to formulate the questions, such as randomizing the order and possible response catego-ries of the questions which reduces both systematic question sequence and question format effects.
However, limitations exist such as the time required in the questionnaire design and programming and the potential refusal of responds not familiar with computers to partici-pate in the survey.
Where the survey is conducted as an interview on a voluntary basis it can help to do it together with an obligatory interview
survey (e.g. the labour force survey). This increases the re-sponse rate significantly.
If the results of the survey are planned to be used for reporting obligations of the RES-directive, a special focus has to be giv-en to renewables. Detailed information on how reliable data in this difficult field can be achieved is given in section 7.1.
The best period to run such a survey is shortly after heating season e.g. May or June, depending on the geographical position and climate conditions. The survey should not be conducted during the heating season, because this most like-ly leads to underestimation of fuel use for space heating.
It is recommended to send a letter to the chosen households before the survey starts. This letter informs the respondents about the purpose and the content of the survey, as well as the data they will be asked for. The respondents can also be asked to prepare the data on energy consumption (quantities and expenses), electrical appliances (energy classes), light bulbs and cars (fuel consumption, distance travelled). The notification letter could be accompanied by examples of en-ergy bills, to assist the households in providing the requested data. Finally, the confidentiality aspect should be stressed, to avoid reservations in this respect.
3 .2 .4 . Questionnaire design
A questionnaire consists of a sequence of questions designed to obtain information from a respondent. Questionnaires play a central role in the data collection process since they have a major impact on data quality and data accuracy.
The design of questionnaires should take into account the statistical requirements of data users, administrative require-ments of the survey organisation, the requirements for data processing, as well as the nature and characteristics of the re-spondent population. Good questionnaires should impose low response burden on respondents and they should be able to capture data efficiently and with a minimum number of errors.
Problems faced during questionnaire design include: deciding what questions to ask, how to best word them and how to organise the questions to achieve the objectives of the survey. The goal is to obtain information in such a way that survey respondents understand the questions and can provide the answers easily in a form that is suitable for subsequent pro-cessing and analysis.
The questionnaire should be clear and as simple and as short as possible, but it has to include all necessary questions. For complex areas it makes sense to favour a more comprehensive but clear questionnaire rather than a short and potentially misleading one. An appropriate questionnaire design influ-ences the response rate positively. If using a questionnaire for the first time, or important changes are introduced to the existing questionnaire, it is useful to conduct a test survey on a small sample (100–200 households), a few months before
Description of methods 3
Manual for Statistics on Energy Consumption in Households 51
the main survey. The test survey points out the questions which cause major problems to the respondents, allowing adjustments to be made to these questions, thus improving the questionnaire for the main action.
If it is manageable, quantities and expenditures should be asked to calculate prices. These prices provide valuable infor-mation for data validation by comparing them with average prices. If not known from other sources, the floor area of the dwelling and the number and age of inhabitants or household members should be asked (see Chapter 2 for definitions and Chapter 6 for options for demographic variables).
Additional information like insulation measures, type of heating system, number and type of electrical appliances or the use of thermostats/heating controls can better improve the understanding of consumption patterns. Therefore it is highly recommended to include such questions in the survey. (see Chapter 2 for definitions and Chapter 6 for options for these variables).
The key to questionnaire design is clarity. The general presentation of the form must be easy to follow and the questions themselves should be clear, simple and easy to understand. Key to the survey requirements are to
Explain to the respondents why the information is needed.
Make sure all questions relate to the survey’s objectives.
Avoid leading questions (e.g. ’Do you agree that....’).
Keep open-ended questions to a minimum — multi-ple choice answers are more likely to invite participa-tion.
Avoid ambiguity.
Use language that the target audience can under-stand to boost interest.
3 .2 .5 . Guidelines for wording survey questions
Questions should be clear and meaningful to all survey re-spondents. The survey data will be of higher quality, if the respondents can easily understand the meaning of the words used. Respondents will also be more willing to participate and able to provide information if they clearly understand what is being asked of them. Inappropriately worded ques-tions can distort the survey results as respondents will be more likely to misinterpret the words.
To avoid these problems, the following should be borne in mind:
(a) Keep it simple
The best way to communicate clearly with respondents is to use simple, everyday words and ensure that all terms are appropriate for the population being surveyed. Always con-sider the language skills of respondents when developing questions. Try to choose words that are easy for everybody to understand. In general, avoid using technical words or spe-cialised jargon with which respondents are unfamiliar. However, if such terms are needed, respondents should be given additional clarification or definitions. New or complex concepts must be clearly defined so that all respondents have the same understanding of the question.
(b) Acronyms and abbreviations
Acronyms and abbreviations are often found in technical, scientific and business writings. However, in surveys of the household population, they should be avoided if possible as it is likely that some respondents might not be familiar with their meanings.
(c) Ensure that questions are applicable
Surveys should impose minimum burden on respondents. One important way to implement this is to ensure that respondents are only asked the relevant questions. This helps to reduce the length of interviews, cut down on the time respondents are required to participate, and lower the cost of the survey. Questionnaire designers should also ensure that relevant questions are being asked otherwise respondents may choose not to respond or may provide false information.
(d) Be specific
The wording of survey questions must be as specific as pos-sible to ensure that respondents understand exactly what is required of them. For each question, it should be clearly specified:
• What the information will be used for (e.g. to assist with government policies, to improve the service, etc.);
• What information should be included in or excluded from the response;
• What units the answer should be provided in (e.g. KWh, KW, tonnes, kg, £ etc.);
• What time period the question refers to (e.g. weekly, monthly, quarterly etc.) and so on.
(e) Avoid double-barrelled questions
A question that actually asks two questions in one is called a double-barreled question. These questions generally deal with more than one concept. For example:
Do you plan to leave your current energy provider for a new one during the year and which one are you contemplating?
Description of methods3
52 Manual for Statistics on Energy Consumption in Households
This question may be very difficult for some respondents to answer since their personal situation may not fit into a simple yes or no. Questionnaire designers should ensure that:
• questions are as simple as possible;
• key words in the question are highlighted;
• examples are included where necessary to assist clari-fication;
• only questions relevant to the survey’s objectives are asked.
(f) Avoid leading questions
A leading question is one that suggests (or leads) the respond-ent to a certain answer. In other words, the way the question is phrased has an influence on the response. Leading ques-tions can easily distort survey responses and affect survey results. There is not much to gain from a leading question as there is no way of understanding the truthful opinion of a respondent. Example of a leading question:
Do you agree that energy from renewable source is better for the environment?
Survey questions should ensure that all possible alternatives are clear to the respondent.
In theory, providing possible alternative responses in the question makes it more likely that people will reflect on the answer before responding and thus provide a more reliable answer.
3 .2 .6 . Interviewer training
In case of interviews the interviewers should have a good knowledge on the different fuels. Furthermore, the inter-viewers should be well trained on consumption patterns of different types of fuel burning appliances and household purposes (e.g. space heating, water heating and cooking). Practical leaf lets with region-specific examples about electricity, natural gas and district heat bills for private households, and training in reading the bills could enable the interviewers to assist the respondents (see section 4.2.5, United Kigndom).
3 .2 .7 . Data validation
Because of the complexity of energy consumption surveys, the data collected cannot normally be used directly, but has to be checked and validated very carefully. Generally this can be done with any information available from a wide variety of different sources, but official sources should be preferred. One very important aspect is the fact, that in the case of stor-able fuels like fuel oil, gasoil, coal or fuel wood normally the purchased and not the consumed quantities are known and reported. Data validation procedures can be model based
crosschecks and comparisons to grossed aggregate energy consumption from the survey can be compared with sup-plier surveys (see business survey section).
Another aspect that can be improved with additional infor-mation is the grossing up procedure. Here the number of gas and electricity meters attributed to households — informa-tion that should be available from the suppliers — can be used to achieve more realistic figures.
In case an over- or under-coverage of a certain population group is detected a correction of this bias should be done by reweight-ing the sample by making use of demographic variables.
3 .2 .8 . Survey frequency
The survey frequency should not exceed 5 years to provide information on developments in time. The extrapolation of the results until the next survey and the follow up revision of the period between the last two survey cycles can be done with heating and cooling degree days and trend analyses, as well as representative household variables such as the annual sales of household appliances or the penetration of energy efficient appliances by energy classes. Some details how doing this will be given in section 3.5.
3 .2 .9 . Summary and conclusions
• The 5 main elements to achieve good results are a careful preparation, a clear understanding of the needs for the survey, a clear and simple questionnaire, well trained interviewers and comprehensive data validation.
• Grossing up procedures can be improved by using supplier information, e.g. gas meters attributed to households.
• Model based extrapolation e.g. heating degree days help to decrease survey frequency.
3 .3 . Use of administrative data
Introduction
This chapter covers the use of administrative data and secon da ry sources for the purpose of household energy statistics.
Administrative data, often abbreviated as ‘admin data’, is according to Eurostat ‘the data derived from an administra-tive source, before any processing or validation by the NSIs’ (2). An administrative source is ‘a data holding contain-
(2) As defined by the Eurostat ESSNET admin data Glossary: http://essnet.admindata.eu/Glossary/List
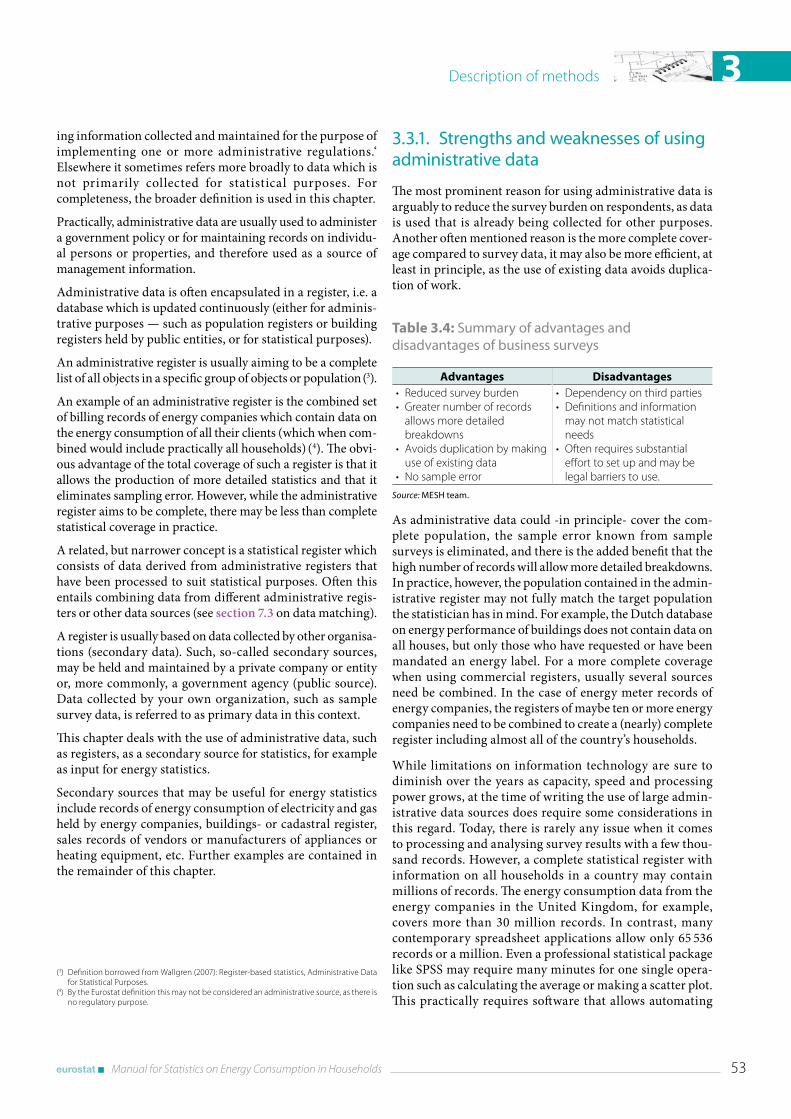
Description of methods 3
Manual for Statistics on Energy Consumption in Households 53
ing information collected and maintained for the purpose of implementing one or more administrative regulations.‘ Elsewhere it sometimes refers more broadly to data which is not primarily collected for statistical purposes. For completeness, the broader definition is used in this chapter.
Practically, administrative data are usually used to administer a government policy or for maintaining records on individu-al persons or properties, and therefore used as a source of management information.
Administrative data is often encapsulated in a register, i.e. a database which is updated continuously (either for adminis-trative purposes — such as population registers or building registers held by public entities, or for statistical purposes).
An administrative register is usually aiming to be a complete list of all objects in a specific group of objects or population (3).
An example of an administrative register is the combined set of billing records of energy companies which contain data on the energy consumption of all their clients (which when com-bined would include practically all households) (4). The obvi-ous advantage of the total coverage of such a register is that it allows the production of more detailed statistics and that it eliminates sampling error. However, while the administrative register aims to be complete, there may be less than complete statistical coverage in practice.
A related, but narrower concept is a statistical register which consists of data derived from administrative registers that have been processed to suit statistical purposes. Often this entails combining data from different administrative regis-ters or other data sources (see section 7.3 on data matching).
A register is usually based on data collected by other organisa-tions (secondary data). Such, so-called secondary sources, may be held and maintained by a private company or entity or, more commonly, a government agency (public source). Data collected by your own organization, such as sample survey data, is referred to as primary data in this context.
This chapter deals with the use of administrative data, such as registers, as a secondary source for statistics, for example as input for energy statistics.
Secondary sources that may be useful for energy statistics include records of energy consumption of electricity and gas held by energy companies, buildings- or cadastral register, sales records of vendors or manufacturers of appliances or heating equipment, etc. Further examples are contained in the remainder of this chapter.
(3) Definition borrowed from Wallgren (2007): Register-based statistics, Administrative Data for Statistical Purposes.
(4) By the Eurostat definition this may not be considered an administrative source, as there is no regulatory purpose.
3 .3 .1 . Strengths and weaknesses of using administrative data
The most prominent reason for using administrative data is arguably to reduce the survey burden on respondents, as data is used that is already being collected for other purposes. Another often mentioned reason is the more complete cover-age compared to survey data, it may also be more efficient, at least in principle, as the use of existing data avoids duplica-tion of work.
Table 3.4: Summary of advantages and disadvantages of business surveys
Advantages Disadvantages• Reduced survey burden• Greater number of records
allows more detailed breakdowns
• Avoids duplication by making use of existing data
• No sample error
• Dependency on third parties• Definitions and information
may not match statistical needs
• Often requires substantial effort to set up and may be legal barriers to use.
Source: MESH team .
As administrative data could -in principle- cover the com-plete population, the sample error known from sample surveys is eliminated, and there is the added benefit that the high number of records will allow more detailed breakdowns. In practice, however, the population contained in the admin-istrative register may not fully match the target population the statistician has in mind. For example, the Dutch database on energy performance of buildings does not contain data on all houses, but only those who have requested or have been mandated an energy label. For a more complete coverage when using commercial registers, usually several sources need be combined. In the case of energy meter records of energy companies, the registers of maybe ten or more energy companies need to be combined to create a (nearly) complete register including almost all of the country’s households.
While limitations on information technology are sure to diminish over the years as capacity, speed and processing power grows, at the time of writing the use of large admin-istrative data sources does require some considerations in this regard. Today, there is rarely any issue when it comes to processing and analysing survey results with a few thou-sand records. However, a complete statistical register with information on all households in a country may contain millions of records. The energy consumption data from the energy companies in the United Kingdom, for example, covers more than 30 million records. In contrast, many contemporary spreadsheet applications allow only 65 536 records or a million. Even a professional statistical package like SPSS may require many minutes for one single opera-tion such as calculating the average or making a scatter plot. This practically requires software that allows automating
Description of methods3
54 Manual for Statistics on Energy Consumption in Households
several steps without requiring the user to start the next one after waiting for the first results. Packages like SPSS, SAS and R allow this if correctly set up. Still, more complex operations may easily require the need to process the data overnight, which greatly slows down the process. A great way to proceed quickly is to start working with a small sample of the database and when everything works as in-tended, repeat all the steps on the full dataset. The increas-ing attention to ‘Big Data’ as a source for statistics greatly stimulates the need for and development of statistical meth-ods specific for very large datasets.
In conclusion, make sure to consult your IT department or data scientists to ascertain that your software, hardware, and network are up to the task.
Quality and accuracy issues(below), and statistics based on these sources may or may not be more accurate than sample surveys. This requires careful examination of the data for all classes of error discerned (see later). Unfortunately, when working with secondary sources it is often limited how much information can be obtained about quality and Administra-tive sources also contain errors that could arise from a num-ber of sources. The reason for this is that documentation may be inadequate or may not include the perspective of the statistician. In such cases one must rely on the goodwill of an external entity (the owner of the administrative register) to explain the finer details of the data source.
In many countries there are few, if any, administrative sourc-es available or the statistical agency’s access to these is legally or otherwise restricted.
Also, the statistician does not have control over the defini-tions used or the data collected. With a survey, extra questions can easily be added to check the accuracy of responses. Be-cause administrative data is collected by another organiza-tion, the statistician usually has little, if any, influence on the data collection process, definitions of variables and units used, time period covered, etc. The definition of the variables included may not be identical to the standard definition used for official statistics. The units in secondary sources may, for household energy statistics, include households and busi-nesses alike, with no distinction.
Even if the administrative sources are already in place, this does not necessarily mean that it can be used immediately. In fact, in many cases, it may take years of work to transform the data in an administrative source into data that is useful for statistical purposes. This is especially true for commer-cially held sources or when a legal framework has to be developed first in order to obtain access to the source.
Finally, reduced cost is often assumed as an advantage, but this is certainly not automatically so. The time and resources it may take to set up a useful statistical register in the first place and to produce valuable results may, at least in the first years, be very considerable.
3 .3 .2 . Examples of energy-relevant administrative data
At the time of writing, not many EU countries collect house-hold energy data from administrative sources. This section gives an overview of the range of uses, while Chapter 4, prac-tical examples of methods, goes into more depth with a few examples.
A few countries, particularly the Scandinavian countries, the Netherlands, Slovenia and the United Kingdom, make exten-sive use of administrative data and registers in general, but statistical institutes in most other countries do not, either because the data is not collected in the first place, or because the law does not permit the statistical institute to use this data.
The energy-related variables that at the time of writing are collected from administrative sources in EU countries include:
• Annualised consumption of gas and electricity at household level.
• Various aspects of energy performance of buildings (insulation, heating equipment, etc.).
• Housing stock characteristics (number of households, composition, dwelling types, etc.).
Amongst the most useful data collected is the data held by the network operators or energy suppliers, as is currently practised in the United Kingdom and the Netherlands. Here, the annualised consumption of natural gas and electricity from at least ten operators with combined client records to-talling millions of consumers is assembled into statistical registers. These allow breakdowns of energy consumption at a detailed geographical level and, if data is matched to data from other sources, consumption can also be broken down by dwelling type, household size, income, and more. For more details, see section 4.3. Practical examples of methods. In the coming years, as smart meters become standard (5), instead of annualised consumption it should be possible to break down consumption by hour or less, and with even greater quality. However, there are many potential sources of data that can be used, if not for producing statistics then at least for providing error-checking information, or for match-ing with other variables in order to make certain break-downs. This could include administrative sources such as:
• Buildings register or cadastral register (may contain information on location, age, type of dwelling, and heating system).
• Renewable energy subsidy/grant register (often has information on the installed capacity and number of renewable energy installations in a given year.
(5) In the case of the United Kingdom, there are plans for replacing all meters by smart meters by 2020.
Description of methods 3
Manual for Statistics on Energy Consumption in Households 55
• Energy Performance of Buildings database set up for EU Directive 2002/91/EC (may contain detailed infor-mation on heating equipment, insulation, and other energy efficiency characteristics) of buildings.
• Sales records of vendors or manufacturers of appli-ances or heating equipment.
• Records from insulation fitters of homes that they have put insulation in.
• Records of chimney sweeps of the properties that they have swept.
• Sales records of central heating and heat pump ven-dors or manufacturers.
• Registry of premiums paid for scrapping/recycling of appliances.
• Address register.
• Population register.
• Business register.
• Taxation register (includes information on income).
3 .3 .3 . Producing statistics from an administrative data source
3.3.3.1. General considerations
It may be easy or hard to finding a register to use; this depends on circumstances that are hard to generalise. However, it is important to be prepared for a lot of work.
It is important to consider the number of sources needed. In the case of assembling a statistical register from energy companies data; this may have to include ten or more different operators, each having a different system and using different definitions. This can result in more work than originally was anticipated.
The first step would often be to obtain a sample of the admin-istrative source of interest, to assess how useful it is for sta-tistical purposes, and to get an idea of how much work is required. It also pays to understand the purpose of the administrative source as good as possible, a step that will often highlight potential quality issues. As the intended use of the source usually differs, one should also be prepared for unforeseen actions.
Do not be deterred by initial reluctance on the part of the data owner. Take the time to build up working relationships, and mobilise support from interested parties that may carry weight with the owner of the administrative data. Take care to highlight benefits to data suppliers, including their own needs as users of data, and (repeatedly) explain in detail how confidentiality is ensured.
3.3.3.2. Energy consumption data from energy companies
The best example of the use of administrative data for house-hold energy statistics is probably the use of the energy con-sumption data provided by energy companies. This is described in greater detail in section 4.3. Energy consump-tion data can be obtained in principle from energy suppliers, metering companies, and network operators. These institu-tions should exist in all EU-countries. The 3rd internal en-ergy market directive package requires that electricity trans-mission network operators shall unbundle ownership from production and supply activities (with an exception of small utilities serving less than 100.000 customers), meaning that from a practical point of view there are more players from which the statistician could obtain data. In practice, at the time of writing, the energy markets are often structured dif-ferently, so statisticians need to be familiar with their par-ticular national circumstances. While the energy market package has resulted in more competition in the energy mar-kets, to obtain a complete list of all units of interest (clients) will require combining data from several if not numerous sources. Still, this approach can be a cost effective way of obtaining data on household energy consumption, and, com-bined with other registers, can allow very detailed break-downs of household energy consumption, even down to neighbourhood level.
In the Netherlands and the United Kingdom, there are roughly ten network operators, while there are dozens of suppliers. Statistics Netherlands has built a register based on the data from network operators, while in the United King-dom the data came from separate metering companies.
3.3.3.3. Developing new legal frameworks
In some countries, it may be necessary to develop a legal frame-work to use data from an externally owned administrative source. Often, the holder may not be legally allowed to share data that contains personal identifiers. In many countries, a legal framework may even be infeasible due to privacy issues. One way around this limitation could be to ask the source own-er holder to provide data at an aggregated level (see section 4.3 Practical examples of methods, example from Spain).
In the Netherlands there is already a relatively well developed framework allowing Statistics Netherlands to use adminis-trative data (registers) from others. However, obtaining the administrative registers of the energy network operators (private entities) took 5+ years of legal negotiation. In the end, an amendment to the statistics law was prepared, with the reduction of the respondent burden as the main argu-ment, which forced/enabled energy network operators to provide their client records to Statistics Netherlands. The records had to be delivered according to a specific template.
The first step for the statistician is to seek advice from their NSI-lawyers on these issues.
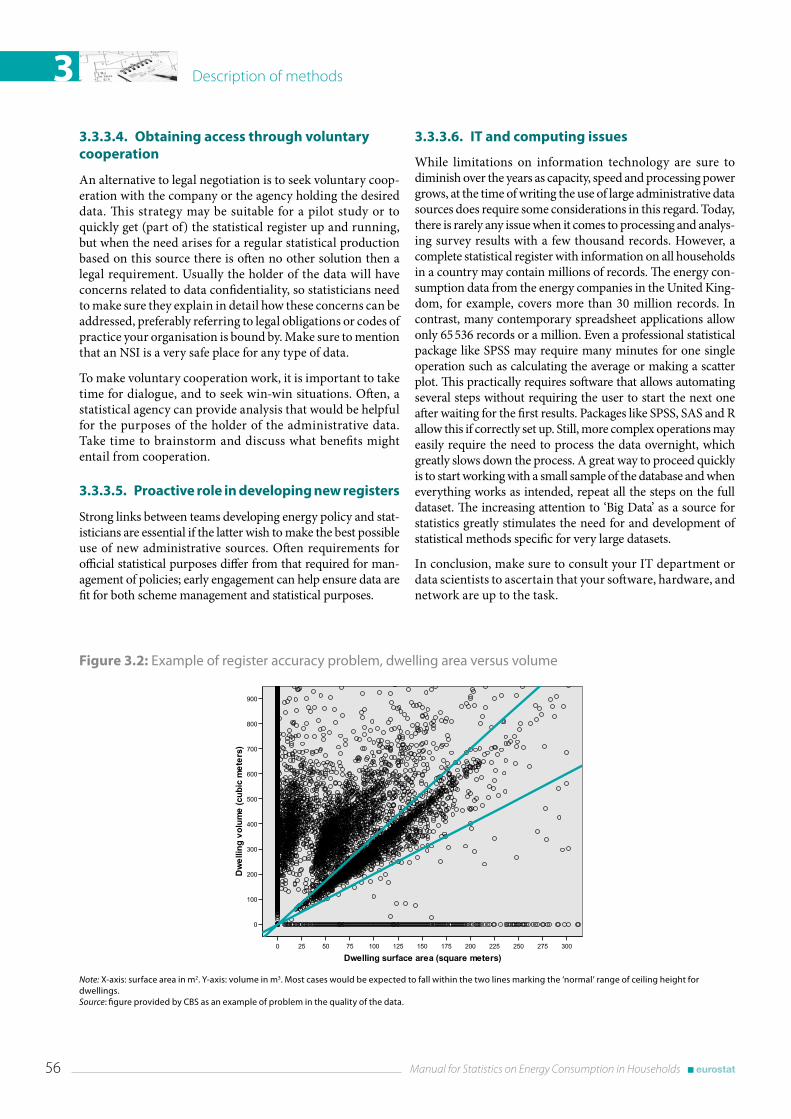
Description of methods3
56 Manual for Statistics on Energy Consumption in Households
3.3.3.4. Obtaining access through voluntary cooperation
An alternative to legal negotiation is to seek voluntary coop-eration with the company or the agency holding the desired data. This strategy may be suitable for a pilot study or to quickly get (part of) the statistical register up and running, but when the need arises for a regular statistical production based on this source there is often no other solution then a legal requirement. Usually the holder of the data will have concerns related to data confidentiality, so statisticians need to make sure they explain in detail how these concerns can be addressed, preferably referring to legal obligations or codes of practice your organisation is bound by. Make sure to mention that an NSI is a very safe place for any type of data.
To make voluntary cooperation work, it is important to take time for dialogue, and to seek win-win situations. Often, a statistical agency can provide analysis that would be helpful for the purposes of the holder of the administrative data. Take time to brainstorm and discuss what benefits might entail from cooperation.
3.3.3.5. Proactive role in developing new registers
Strong links between teams developing energy policy and stat-isticians are essential if the latter wish to make the best possible use of new administrative sources. Often requirements for official statistical purposes differ from that required for man-agement of policies; early engagement can help ensure data are fit for both scheme management and statistical purposes.
3.3.3.6. IT and computing issues
While limitations on information technology are sure to diminish over the years as capacity, speed and processing power grows, at the time of writing the use of large administrative data sources does require some considerations in this regard. Today, there is rarely any issue when it comes to processing and analys-ing survey results with a few thousand records. However, a complete statistical register with information on all households in a country may contain millions of records. The energy con-sumption data from the energy companies in the United King-dom, for example, covers more than 30 million records. In contrast, many contemporary spreadsheet applications allow only 65 536 records or a million. Even a professional statistical package like SPSS may require many minutes for one single operation such as calculating the average or making a scatter plot. This practically requires software that allows automating several steps without requiring the user to start the next one after waiting for the first results. Packages like SPSS, SAS and R allow this if correctly set up. Still, more complex operations may easily require the need to process the data overnight, which greatly slows down the process. A great way to proceed quickly is to start working with a small sample of the database and when everything works as intended, repeat all the steps on the full dataset. The increasing attention to ‘Big Data’ as a source for statistics greatly stimulates the need for and development of statistical methods specific for very large datasets.
In conclusion, make sure to consult your IT department or data scientists to ascertain that your software, hardware, and network are up to the task.
Figure 3.2: Example of register accuracy problem, dwelling area versus volume
Note: X-axis: surface area in m2 . Y-axis: volume in m3 . Most cases would be expected to fall within the two lines marking the ‘normal’ range of ceiling height for dwellings . Source: figure provided by CBS as an example of problem in the quality of the data .
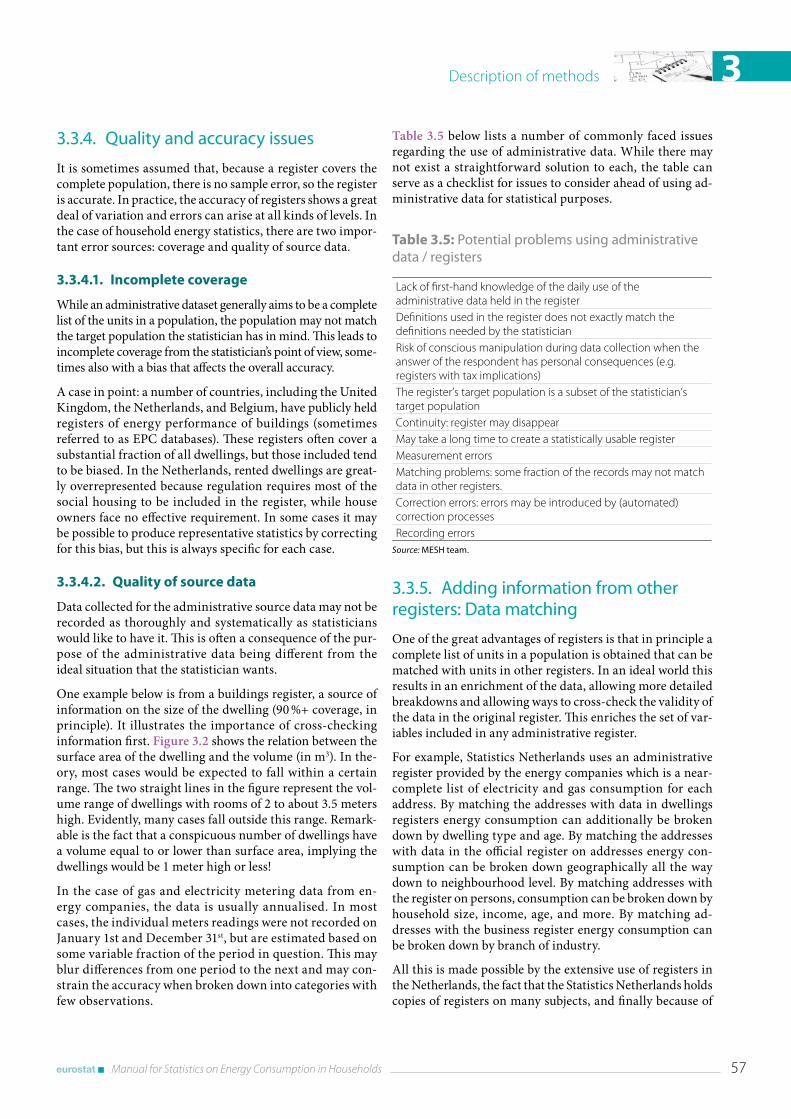
Description of methods 3
Manual for Statistics on Energy Consumption in Households 57
3 .3 .4 . Quality and accuracy issues
It is sometimes assumed that, because a register covers the complete population, there is no sample error, so the register is accurate. In practice, the accuracy of registers shows a great deal of variation and errors can arise at all kinds of levels. In the case of household energy statistics, there are two impor-tant error sources: coverage and quality of source data.
3.3.4.1. Incomplete coverage
While an administrative dataset generally aims to be a complete list of the units in a population, the population may not match the target population the statistician has in mind. This leads to incomplete coverage from the statistician’s point of view, some-times also with a bias that affects the overall accuracy.
A case in point: a number of countries, including the United Kingdom, the Netherlands, and Belgium, have publicly held registers of energy performance of buildings (sometimes referred to as EPC databases). These registers often cover a substantial fraction of all dwellings, but those included tend to be biased. In the Netherlands, rented dwellings are great-ly overrepresented because regulation requires most of the social housing to be included in the register, while house owners face no effective requirement. In some cases it may be possible to produce representative statistics by correcting for this bias, but this is always specific for each case.
3.3.4.2. Quality of source data
Data collected for the administrative source data may not be recorded as thoroughly and systematically as statisticians would like to have it. This is often a consequence of the pur-pose of the administrative data being different from the ideal situation that the statistician wants.
One example below is from a buildings register, a source of information on the size of the dwelling (90 %+ coverage, in principle). It illustrates the importance of cross-checking information first. Figure 3.2 shows the relation between the surface area of the dwelling and the volume (in m3). In the-ory, most cases would be expected to fall within a certain range. The two straight lines in the figure represent the vol-ume range of dwellings with rooms of 2 to about 3.5 meters high. Evidently, many cases fall outside this range. Remark-able is the fact that a conspicuous number of dwellings have a volume equal to or lower than surface area, implying the dwellings would be 1 meter high or less!
In the case of gas and electricity metering data from en-ergy companies, the data is usually annualised. In most cases, the individual meters readings were not recorded on January 1st and December 31st, but are estimated based on some variable fraction of the period in question. This may blur differences from one period to the next and may con-strain the accuracy when broken down into categories with few observations.
Table 3.5 below lists a number of commonly faced issues regarding the use of administrative data. While there may not exist a straightforward solution to each, the table can serve as a checklist for issues to consider ahead of using ad-ministrative data for statistical purposes.
Table 3.5: Potential problems using administrative data / registers
Lack of first-hand knowledge of the daily use of the administrative data held in the registerDefinitions used in the register does not exactly match the definitions needed by the statisticianRisk of conscious manipulation during data collection when the answer of the respondent has personal consequences (e.g. registers with tax implications)The register’s target population is a subset of the statistician’s target population Continuity: register may disappearMay take a long time to create a statistically usable registerMeasurement errorsMatching problems: some fraction of the records may not match data in other registers. Correction errors: errors may be introduced by (automated) correction processes Recording errors
Source: MESH team .
3 .3 .5 . Adding information from other registers: Data matching
One of the great advantages of registers is that in principle a complete list of units in a population is obtained that can be matched with units in other registers. In an ideal world this results in an enrichment of the data, allowing more detailed breakdowns and allowing ways to cross-check the validity of the data in the original register. This enriches the set of var-iables included in any administrative register.
For example, Statistics Netherlands uses an administrative register provided by the energy companies which is a near-complete list of electricity and gas consumption for each address. By matching the addresses with data in dwellings registers energy consumption can additionally be broken down by dwelling type and age. By matching the addresses with data in the official register on addresses energy con-sumption can be broken down geographically all the way down to neighbourhood level. By matching addresses with the register on persons, consumption can be broken down by household size, income, age, and more. By matching ad-dresses with the business register energy consumption can be broken down by branch of industry.
All this is made possible by the extensive use of registers in the Netherlands, the fact that the Statistics Netherlands holds copies of registers on many subjects, and finally because of
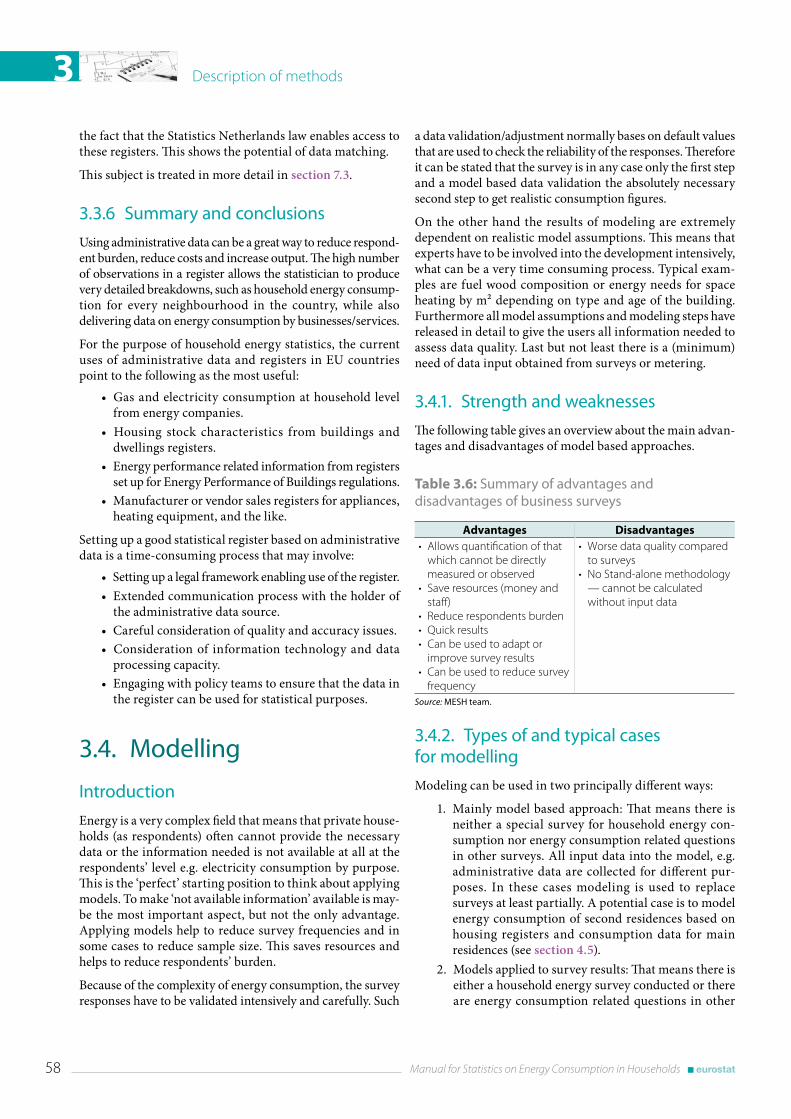
Description of methods3
58 Manual for Statistics on Energy Consumption in Households
the fact that the Statistics Netherlands law enables access to these registers. This shows the potential of data matching.
This subject is treated in more detail in section 7.3.
3 .3 .6 Summary and conclusions
Using administrative data can be a great way to reduce respond-ent burden, reduce costs and increase output. The high number of observations in a register allows the statistician to produce very detailed breakdowns, such as household energy consump-tion for every neighbourhood in the country, while also delivering data on energy consumption by businesses/services.
For the purpose of household energy statistics, the current uses of administrative data and registers in EU countries point to the following as the most useful:
• Gas and electricity consumption at household level from energy companies.
• Housing stock characteristics from buildings and dwellings registers.
• Energy performance related information from registers set up for Energy Performance of Buildings regulations.
• Manufacturer or vendor sales registers for appliances, heating equipment, and the like.
Setting up a good statistical register based on administrative data is a time-consuming process that may involve:
• Setting up a legal framework enabling use of the register.• Extended communication process with the holder of
the administrative data source.• Careful consideration of quality and accuracy issues.• Consideration of information technology and data
processing capacity.• Engaging with policy teams to ensure that the data in
the register can be used for statistical purposes.
3 .4 . Modelling
Introduction
Energy is a very complex field that means that private house-holds (as respondents) often cannot provide the necessary data or the information needed is not available at all at the respondents’ level e.g. electricity consumption by purpose. This is the ‘perfect’ starting position to think about applying models. To make ‘not available information’ available is may-be the most important aspect, but not the only advantage. Applying models help to reduce survey frequencies and in some cases to reduce sample size. This saves resources and helps to reduce respondents’ burden.
Because of the complexity of energy consumption, the survey responses have to be validated intensively and carefully. Such
a data validation/adjustment normally bases on default values that are used to check the reliability of the responses. Therefore it can be stated that the survey is in any case only the first step and a model based data validation the absolutely necessary second step to get realistic consumption figures.
On the other hand the results of modeling are extremely dependent on realistic model assumptions. This means that experts have to be involved into the development intensively, what can be a very time consuming process. Typical exam-ples are fuel wood composition or energy needs for space heating by m² depending on type and age of the building. Furthermore all model assumptions and modeling steps have released in detail to give the users all information needed to assess data quality. Last but not least there is a (minimum) need of data input obtained from surveys or metering.
3 .4 .1 . Strength and weaknesses
The following table gives an overview about the main advan-tages and disadvantages of model based approaches.
Table 3.6: Summary of advantages and disadvantages of business surveys
Advantages Disadvantages• Allows quantification of that
which cannot be directly measured or observed
• Save resources (money and staff)
• Reduce respondents burden• Quick results• Can be used to adapt or
improve survey results• Can be used to reduce survey
frequency
• Worse data quality compared to surveys
• No Stand-alone methodology — cannot be calculated without input data
Source: MESH team .
3 .4 .2 . Types of and typical cases for modelling
Modeling can be used in two principally different ways:
1. Mainly model based approach: That means there is neither a special survey for household energy con-sumption nor energy consumption related questions in other surveys. All input data into the model, e.g. administrative data are collected for different pur-poses. In these cases modeling is used to replace surveys at least partially. A potential case is to model energy consumption of second residences based on housing registers and consumption data for main residences (see section 4.5).
2. Models applied to survey results: That means there is either a household energy survey conducted or there are energy consumption related questions in other

Description of methods 3
Manual for Statistics on Energy Consumption in Households 59
surveys e.g. in the household budget survey. Model assumptions are applied to obtain information which cannot be asked directly. Typical cases are:• consumption breakdown by purpose if a fuel is used
for more than one purpose (e.g. electricity).• fuel shares if more than one fuel are used for one
purpose (e.g. for space heating).
Other (frequent) necessities for applying models include:
• Conversion of the surveyed period to calendar years.• Estimate not metered consumption of not purchased
fuels like solar and ambient heat.• Estimate the consumption of not standardized bio-
fuels, mainly fuel wood.• Useful heat calculation.• Model based data validation.
3 .4 .3 . Typical model assumptions
Depending on the purpose different modeling parameters can be applied. Typical model assumptions used by a large number of countries are:
Heating degree days normally are used for climate correction and extrapolation of heating shares of overall energy con-sumption. For the time being, at least 2 different approaches are used in this Europe. While Eurostat promotes the 15°/18° approach but other models like the 12°/20° approach are still in use in some countries. The first one focuses more on the climatic situation of southern countries while the second one was originally developed for Central and North Europe. For countries that have not already established a certain model, it is recommended to invent the 15°/18° approach (see box of following page) for reasons of comparability.
Heating degree day (HDD) = Sum of differences be-tween a given indoor temperature (BT = 18° C) and the daily average outdoor temperature, if latter is lower than an assumed limit for heating of 15° C (Model 15/18).
Heating degree total = Sum of HDD of a given period.
This model 15/18 means that days with an average tem-perature (in a 24 hours period) over 15.0° C are not taken into account, but days with an average up to and includ-ing 15.0° C are included with their difference to 18.0° C.
In the following examples for four days are displayed:
1st day: Ø temperature of – 6.0° C: 24.0 points
2nd day: Ø temperature of + 1.5° C: 16.5 points
3rd day: Ø temperature of +15.0° C: 3.0 points
4th day: Ø temperature of +15.1° C: 0 points
Due to the technical development and the increasing penetra-tion of air condition also in the private households cooling
degree days are of growing importance, especially but not only in the southern member states. For the time being, no gener-ally agreed methodology for cooling degree days is available.
Default consumption quantities for space heating (by m² and depending on insulation measures as well as building age), for water heating (by person) and cooking (depending on family size) can be used to break down energy consumption by purposes.
Assumptions on the typical (regional/national) fuel wood mixture or on its water content can be used for modeling consumption quantities and energy content of fuel wood.
Penetration of energy saving appliances, the composition of heating systems, and typical consumption behaviour (depending on socioeconomic parameters) can be used for modeling energy efficiency indicators.
All these model assumptions can be applied by their own, combined with each other or with additional national or regional presumptions. This opens a broad field for modeling and can help the energy statistic compilers to obtain realistic estimations where surveys run into their limits.
Section 4.4 provides some examples of model used in United Kingdom and Austria.
3 .4 .4 . Risks
There are a lot of advantages but also some serious risks by applying model calculations. The main advantages are the saving of resources, the reduction of respondents’ burden, and quick results. On the other hand it has to be pointed out clearly that modeling produces second best results. Addition-ally everybody thinking about modeling has to be aware that modeling includes specific problems that should be avoided as far as possible.
The most important risks are:
• to use unrealistic or outdated default values and/or assumptions e.g. in case of electricity average con-sumption of appliances;
• to use default values from another country with dif-ferent regional/national circumstances in case of unavailability of own data;
• to calculate ‘desirable’ results by incorrect application of additional information.
For these reasons the applied parameters has to be chosen very carefully and in close collaboration with local experts. Especially parameters and/or default values taken over from other countries has to be checked extensively if they meet the own circumstances. Assumptions and default values that are applied e.g. for a more detailed data breakdown or analysis has to be checked continuously concerning their actuality. Assumptions that appear quite reasonable but have not been tested may easily lead to an accumulation of errors.
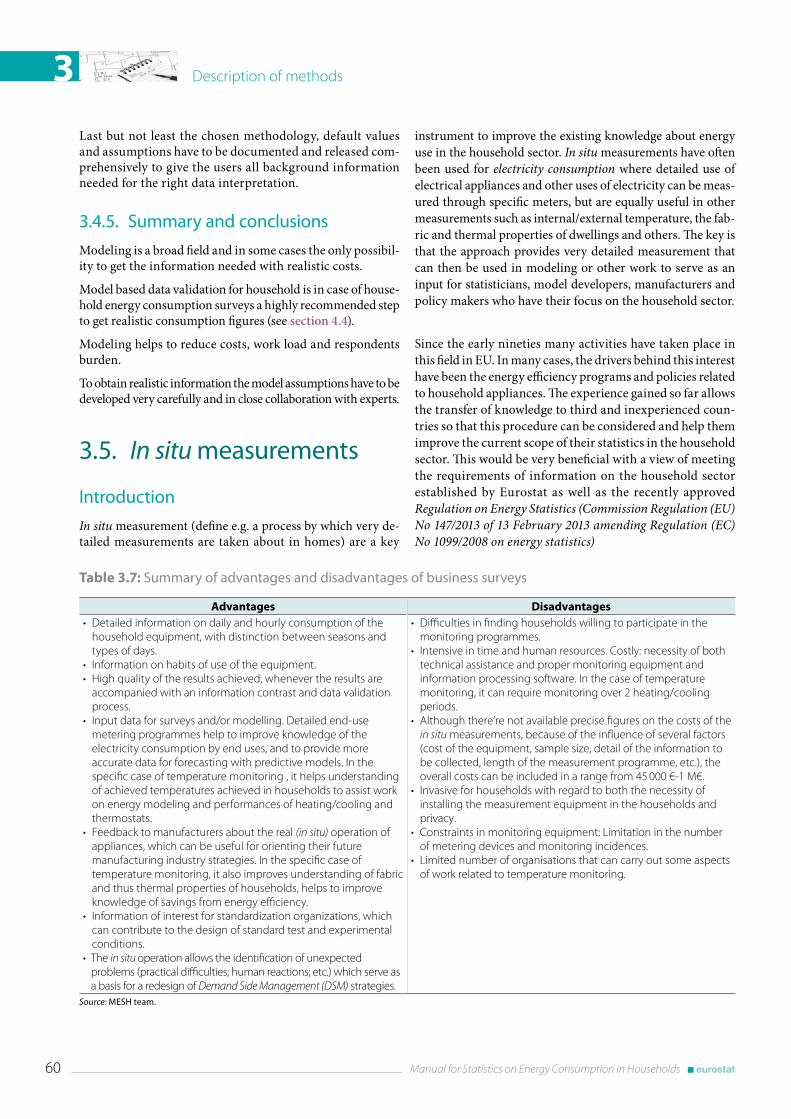
Description of methods3
60 Manual for Statistics on Energy Consumption in Households
Last but not least the chosen methodology, default values and assumptions have to be documented and released com-prehensively to give the users all background information needed for the right data interpretation.
3 .4 .5 . Summary and conclusions
Modeling is a broad field and in some cases the only possibil-ity to get the information needed with realistic costs.
Model based data validation for household is in case of house-hold energy consumption surveys a highly recommended step to get realistic consumption figures (see section 4.4).
Modeling helps to reduce costs, work load and respondents burden.
To obtain realistic information the model assumptions have to be developed very carefully and in close collaboration with experts.
3 .5 . In situ measurements
Introduction
In situ measurement (define e.g. a process by which very de-tailed measurements are taken about in homes) are a key
instrument to improve the existing knowledge about energy use in the household sector. In situ measurements have often been used for electricity consumption where detailed use of electrical appliances and other uses of electricity can be meas-ured through specific meters, but are equally useful in other measurements such as internal/external temperature, the fab-ric and thermal properties of dwellings and others. The key is that the approach provides very detailed measurement that can then be used in modeling or other work to serve as an input for statisticians, model developers, manufacturers and policy makers who have their focus on the household sector.
Since the early nineties many activities have taken place in this field in EU. In many cases, the drivers behind this interest have been the energy efficiency programs and policies related to household appliances. The experience gained so far allows the transfer of knowledge to third and inexperienced coun-tries so that this procedure can be considered and help them improve the current scope of their statistics in the household sector. This would be very beneficial with a view of meeting the requirements of information on the household sector established by Eurostat as well as the recently approved Regulation on Energy Statistics (Commission Regulation (EU) No 147/2013 of 13 February 2013 amending Regulation (EC) No 1099/2008 on energy statistics)
Table 3.7: Summary of advantages and disadvantages of business surveys
Advantages Disadvantages• Detailed information on daily and hourly consumption of the
household equipment, with distinction between seasons and types of days.
• Information on habits of use of the equipment.• High quality of the results achieved, whenever the results are
accompanied with an information contrast and data validation process.
• Input data for surveys and/or modelling. Detailed end-use metering programmes help to improve knowledge of the electricity consumption by end uses, and to provide more accurate data for forecasting with predictive models. In the specific case of temperature monitoring , it helps understanding of achieved temperatures achieved in households to assist work on energy modeling and performances of heating/cooling and thermostats.
• Feedback to manufacturers about the real (in situ) operation of appliances, which can be useful for orienting their future manufacturing industry strategies. In the specific case of temperature monitoring, it also improves understanding of fabric and thus thermal properties of households, helps to improve knowledge of savings from energy efficiency.
• Information of interest for standardization organizations, which can contribute to the design of standard test and experimental conditions.
• The in situ operation allows the identification of unexpected problems (practical difficulties; human reactions; etc.) which serve as a basis for a redesign of Demand Side Management (DSM) strategies.
• Difficulties in finding households willing to participate in the monitoring programmes.
• Intensive in time and human resources. Costly: necessity of both technical assistance and proper monitoring equipment and information processing software. In the case of temperature monitoring, it can require monitoring over 2 heating/cooling periods.
• Although there’re not available precise figures on the costs of the in situ measurements, because of the influence of several factors (cost of the equipment, sample size, detail of the information to be collected, length of the measurement programme, etc.), the overall costs can be included in a range from 45 000 €-1 M€.
• Invasive for households with regard to both the necessity of installing the measurement equipment in the households and privacy.
• Constraints in monitoring equipment: Limitation in the number of metering devices and monitoring incidences.
• Limited number of organisations that can carry out some aspects of work related to temperature monitoring.
Source: MESH team .
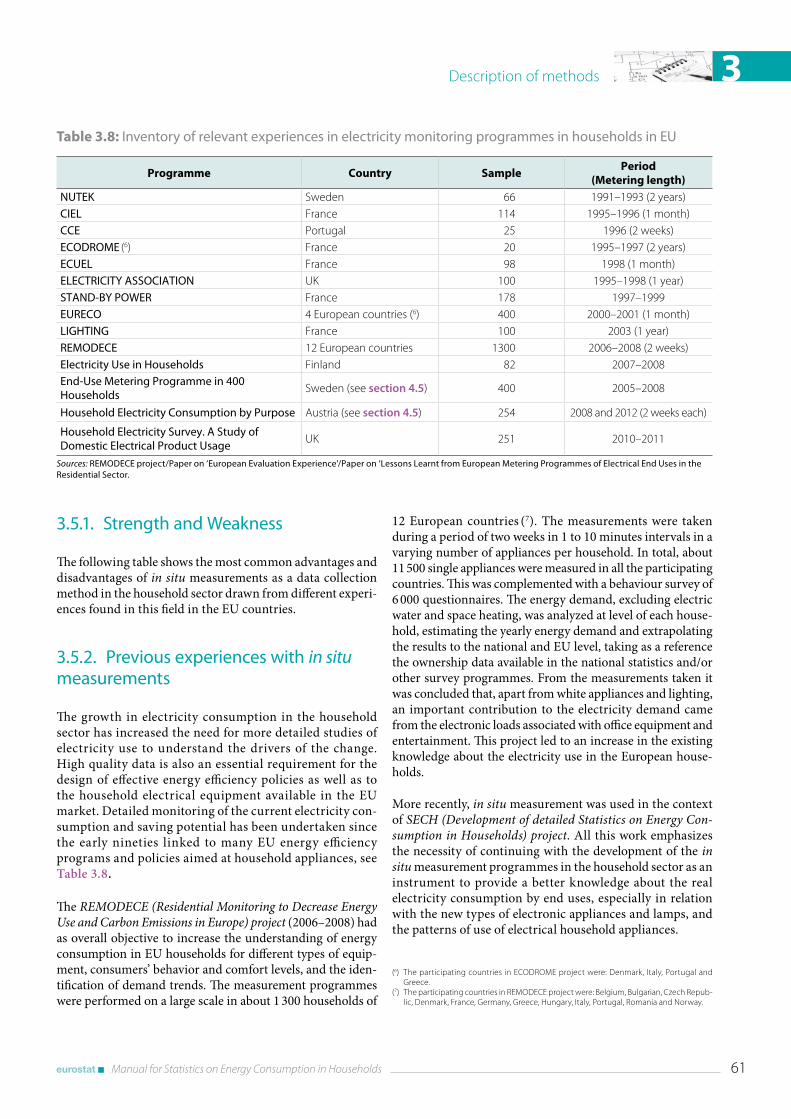
Description of methods 3
Manual for Statistics on Energy Consumption in Households 61
3 .5 .1 . Strength and Weakness
The following table shows the most common advantages and disadvantages of in situ measurements as a data collection method in the household sector drawn from different experi-ences found in this field in the EU countries.
3 .5 .2 . Previous experiences with in situ measurements
The growth in electricity consumption in the household sector has increased the need for more detailed studies of electricity use to understand the drivers of the change. High quality data is also an essential requirement for the design of effective energy efficiency policies as well as to the household electrical equipment available in the EU market. Detailed monitoring of the current electricity con-sumption and saving potential has been undertaken since the early nineties linked to many EU energy efficiency programs and policies aimed at household appliances, see Table 3.8.
The REMODECE (Residential Monitoring to Decrease Energy Use and Carbon Emissions in Europe) project (2006–2008) had as overall objective to increase the understanding of energy consumption in EU households for different types of equip-ment, consumers’ behavior and comfort levels, and the iden-tification of demand trends. The measurement programmes were performed on a large scale in about 1 300 households of
Table 3.8: Inventory of relevant experiences in electricity monitoring programmes in households in EU
Programme Country SamplePeriod
(Metering length)NUTEK Sweden 66 1991–1993 (2 years)CIEL France 114 1995–1996 (1 month)CCE Portugal 25 1996 (2 weeks)ECODROME (6) France 20 1995–1997 (2 years)ECUEL France 98 1998 (1 month)ELECTRICITY ASSOCIATION UK 100 1995–1998 (1 year)STAND-BY POWER France 178 1997–1999EURECO 4 European countries (6) 400 2000–2001 (1 month)LIGHTING France 100 2003 (1 year)REMODECE 12 European countries 1300 2006–2008 (2 weeks)Electricity Use in Households Finland 82 2007–2008End-Use Metering Programme in 400 Households
Sweden (see section 4.5) 400 2005–2008
Household Electricity Consumption by Purpose Austria (see section 4.5) 254 2008 and 2012 (2 weeks each)
Household Electricity Survey . A Study of Domestic Electrical Product Usage
UK 251 2010–2011
Sources: REMODECE project/Paper on ‘European Evaluation Experience’/Paper on ‘Lessons Learnt from European Metering Programmes of Electrical End Uses in the Residential Sector .
12 European countries (7). The measurements were taken during a period of two weeks in 1 to 10 minutes intervals in a varying number of appliances per household. In total, about 11 500 single appliances were measured in all the participating countries. This was complemented with a behaviour survey of 6 000 questionnaires. The energy demand, excluding electric water and space heating, was analyzed at level of each house-hold, estimating the yearly energy demand and extrapolating the results to the national and EU level, taking as a reference the ownership data available in the national statistics and/or other survey programmes. From the measurements taken it was concluded that, apart from white appliances and lighting, an important contribution to the electricity demand came from the electronic loads associated with office equipment and entertainment. This project led to an increase in the existing knowledge about the electricity use in the European house-holds.
More recently, in situ measurement was used in the context of SECH (Development of detailed Statistics on Energy Con-sumption in Households) project. All this work emphasizes the necessity of continuing with the development of the in situ measurement programmes in the household sector as an instrument to provide a better knowledge about the real electricity consumption by end uses, especially in relation with the new types of electronic appliances and lamps, and the patterns of use of electrical household appliances.
(6) The participating countries in ECODROME project were: Denmark, Italy, Portugal and Greece.
(7) The participating countries in REMODECE project were: Belgium, Bulgarian, Czech Repub-lic, Denmark, France, Germany, Greece, Hungary, Italy, Portugal, Romania and Norway.
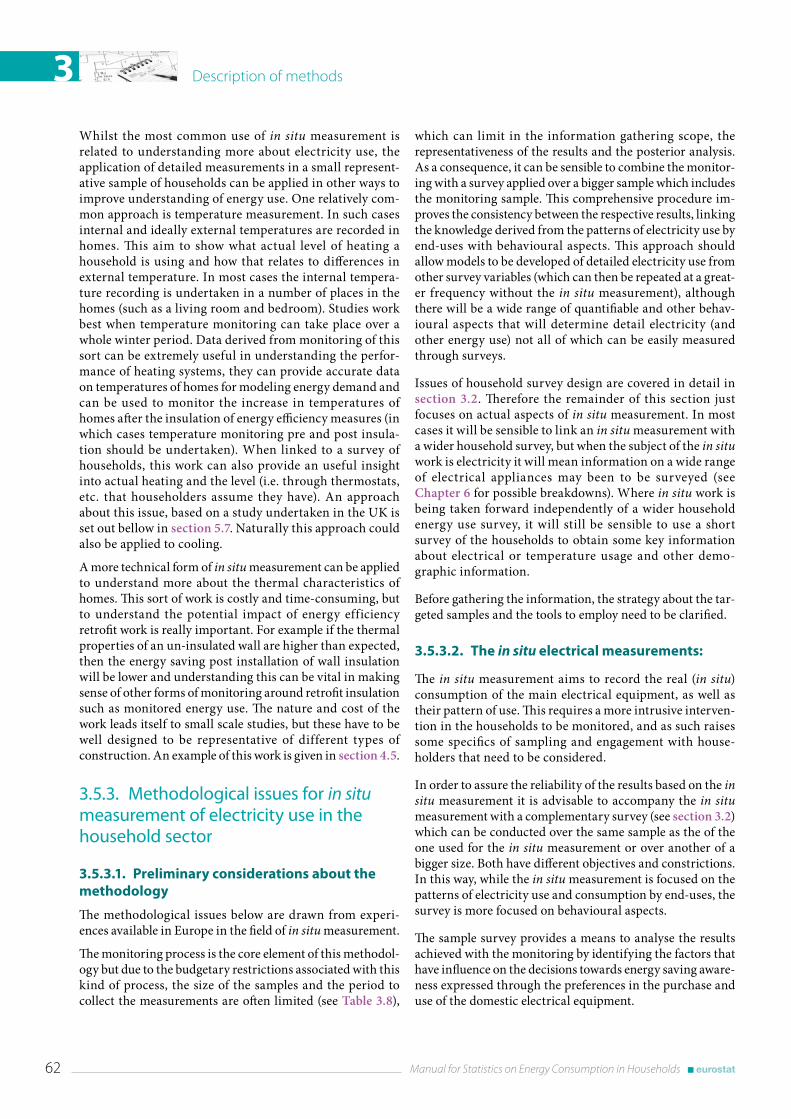
Description of methods3
62 Manual for Statistics on Energy Consumption in Households
Whilst the most common use of in situ measurement is related to understanding more about electricity use, the application of detailed measurements in a small represent-ative sample of households can be applied in other ways to improve understanding of energy use. One relatively com-mon approach is temperature measurement. In such cases internal and ideally external temperatures are recorded in homes. This aim to show what actual level of heating a household is using and how that relates to differences in external temperature. In most cases the internal tempera-ture recording is undertaken in a number of places in the homes (such as a living room and bedroom). Studies work best when temperature monitoring can take place over a whole winter period. Data derived from monitoring of this sort can be extremely useful in understanding the perfor-mance of heating systems, they can provide accurate data on temperatures of homes for modeling energy demand and can be used to monitor the increase in temperatures of homes after the insulation of energy efficiency measures (in which cases temperature monitoring pre and post insula-tion should be undertaken). When linked to a survey of households, this work can also provide an useful insight into actual heating and the level (i.e. through thermostats, etc. that householders assume they have). An approach about this issue, based on a study undertaken in the UK is set out bellow in section 5.7. Naturally this approach could also be applied to cooling.
A more technical form of in situ measurement can be applied to understand more about the thermal characteristics of homes. This sort of work is costly and time-consuming, but to understand the potential impact of energy efficiency retrofit work is really important. For example if the thermal properties of an un-insulated wall are higher than expected, then the energy saving post installation of wall insulation will be lower and understanding this can be vital in making sense of other forms of monitoring around retrofit insulation such as monitored energy use. The nature and cost of the work leads itself to small scale studies, but these have to be well designed to be representative of different types of construction. An example of this work is given in section 4.5.
3 .5 .3 . Methodological issues for in situ measurement of electricity use in the household sector
3.5.3.1. Preliminary considerations about the methodology
The methodological issues below are drawn from experi-ences available in Europe in the field of in situ measurement.
The monitoring process is the core element of this methodol-ogy but due to the budgetary restrictions associated with this kind of process, the size of the samples and the period to collect the measurements are often limited (see Table 3.8),
which can limit in the information gathering scope, the representativeness of the results and the posterior analysis. As a consequence, it can be sensible to combine the monitor-ing with a survey applied over a bigger sample which includes the monitoring sample. This comprehensive procedure im-proves the consistency between the respective results, linking the knowledge derived from the patterns of electricity use by end-uses with behavioural aspects. This approach should allow models to be developed of detailed electricity use from other survey variables (which can then be repeated at a great-er frequency without the in situ measurement), although there will be a wide range of quantifiable and other behav-ioural aspects that will determine detail electricity (and other energy use) not all of which can be easily measured through surveys.
Issues of household survey design are covered in detail in section 3.2. Therefore the remainder of this section just focuses on actual aspects of in situ measurement. In most cases it will be sensible to link an in situ measurement with a wider household survey, but when the subject of the in situ work is electricity it will mean information on a wide range of electrical appliances may been to be surveyed (see Chapter 6 for possible breakdowns). Where in situ work is being taken forward independently of a wider household energy use survey, it will still be sensible to use a short survey of the households to obtain some key information about electrical or temperature usage and other demo-graphic information.
Before gathering the information, the strategy about the tar-geted samples and the tools to employ need to be clarified.
3.5.3.2. The in situ electrical measurements:
The in situ measurement aims to record the real (in situ) consumption of the main electrical equipment, as well as their pattern of use. This requires a more intrusive interven-tion in the households to be monitored, and as such raises some specifics of sampling and engagement with house-holders that need to be considered.
In order to assure the reliability of the results based on the in situ measurement it is advisable to accompany the in situ measurement with a complementary survey (see section 3.2) which can be conducted over the same sample as the of the one used for the in situ measurement or over another of a bigger size. Both have different objectives and constrictions. In this way, while the in situ measurement is focused on the patterns of electricity use and consumption by end-uses, the survey is more focused on behavioural aspects.
The sample survey provides a means to analyse the results achieved with the monitoring by identifying the factors that have influence on the decisions towards energy saving aware-ness expressed through the preferences in the purchase and use of the domestic electrical equipment.
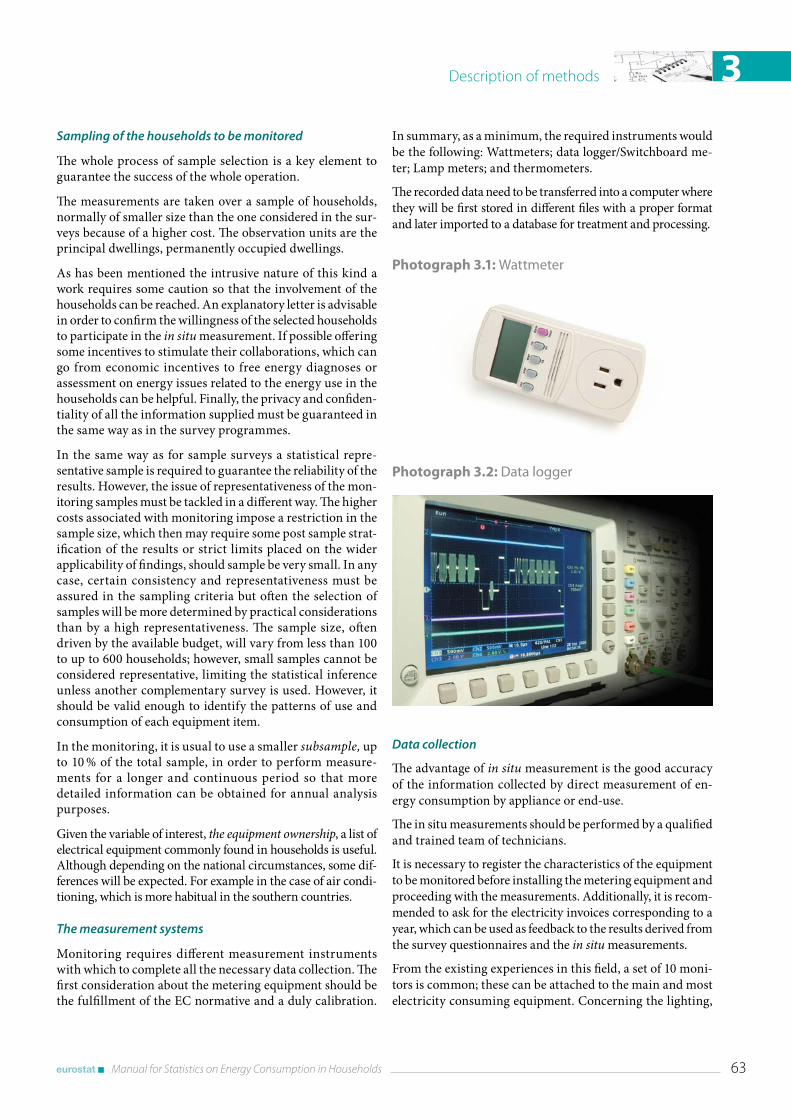
Description of methods 3
Manual for Statistics on Energy Consumption in Households 63
Sampling of the households to be monitored
The whole process of sample selection is a key element to guarantee the success of the whole operation.
The measurements are taken over a sample of households, normally of smaller size than the one considered in the sur-veys because of a higher cost. The observation units are the principal dwellings, permanently occupied dwellings.
As has been mentioned the intrusive nature of this kind a work requires some caution so that the involvement of the households can be reached. An explanatory letter is advisable in order to confirm the willingness of the selected households to participate in the in situ measurement. If possible offering some incentives to stimulate their collaborations, which can go from economic incentives to free energy diagnoses or assessment on energy issues related to the energy use in the households can be helpful. Finally, the privacy and confiden-tiality of all the information supplied must be guaranteed in the same way as in the survey programmes.
In the same way as for sample surveys a statistical repre-sentative sample is required to guarantee the reliability of the results. However, the issue of representativeness of the mon-itoring samples must be tackled in a different way. The higher costs associated with monitoring impose a restriction in the sample size, which then may require some post sample strat-ification of the results or strict limits placed on the wider applicability of findings, should sample be very small. In any case, certain consistency and representativeness must be assured in the sampling criteria but often the selection of samples will be more determined by practical considerations than by a high representativeness. The sample size, often driven by the available budget, will vary from less than 100 to up to 600 households; however, small samples cannot be considered representative, limiting the statistical inference unless another complementary survey is used. However, it should be valid enough to identify the patterns of use and consumption of each equipment item.
In the monitoring, it is usual to use a smaller subsample, up to 10 % of the total sample, in order to perform measure-ments for a longer and continuous period so that more detailed information can be obtained for annual analysis purposes.
Given the variable of interest, the equipment ownership, a list of electrical equipment commonly found in households is useful. Although depending on the national circumstances, some dif-ferences will be expected. For example in the case of air condi-tioning, which is more habitual in the southern countries.
The measurement systems
Monitoring requires different measurement instruments with which to complete all the necessary data collection. The first consideration about the metering equipment should be the fulfillment of the EC normative and a duly calibration.
In summary, as a minimum, the required instruments would be the following: Wattmeters; data logger/Switchboard me-ter; Lamp meters; and thermometers.
The recorded data need to be transferred into a computer where they will be first stored in different files with a proper format and later imported to a database for treatment and processing.
Photograph 3.1: Wattmeter
Photograph 3.2: Data logger
Data collection
The advantage of in situ measurement is the good accuracy of the information collected by direct measurement of en-ergy consumption by appliance or end-use.
The in situ measurements should be performed by a qualified and trained team of technicians.
It is necessary to register the characteristics of the equipment to be monitored before installing the metering equipment and proceeding with the measurements. Additionally, it is recom-mended to ask for the electricity invoices corresponding to a year, which can be used as feedback to the results derived from the survey questionnaires and the in situ measurements.
From the existing experiences in this field, a set of 10 moni-tors is common; these can be attached to the main and most electricity consuming equipment. Concerning the lighting,
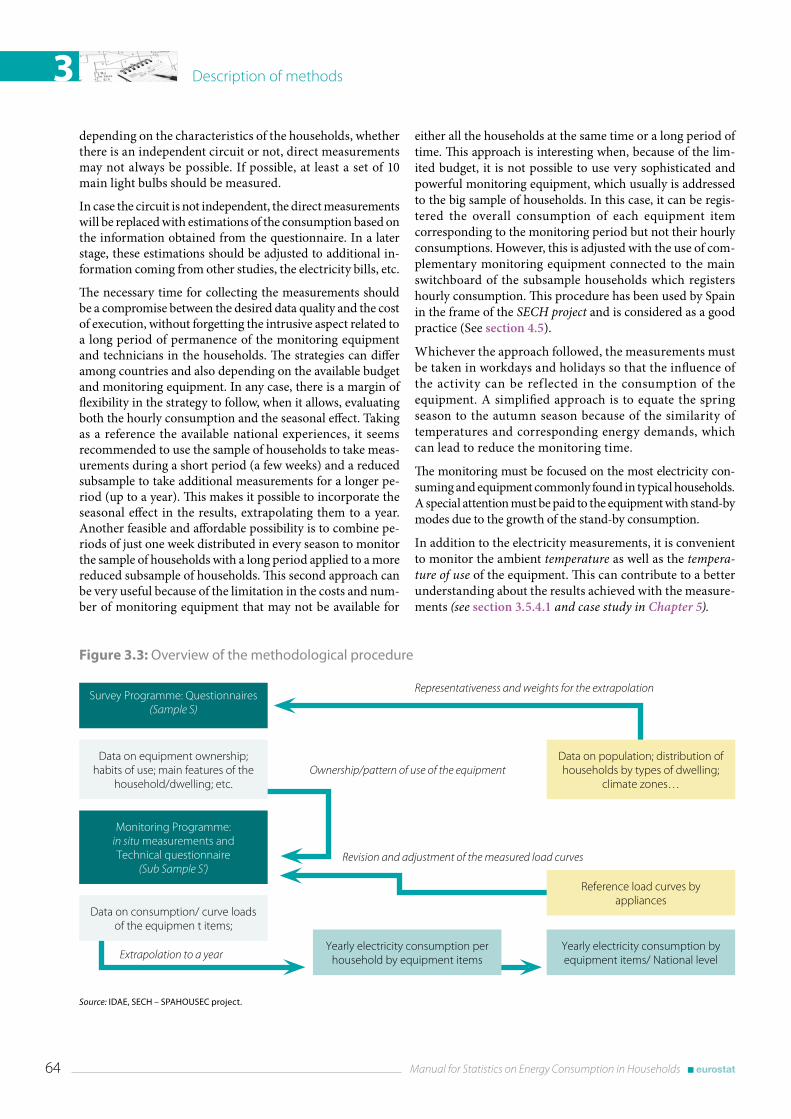
Description of methods3
64 Manual for Statistics on Energy Consumption in Households
depending on the characteristics of the households, whether there is an independent circuit or not, direct measurements may not always be possible. If possible, at least a set of 10 main light bulbs should be measured.
In case the circuit is not independent, the direct measurements will be replaced with estimations of the consumption based on the information obtained from the questionnaire. In a later stage, these estimations should be adjusted to additional in-formation coming from other studies, the electricity bills, etc.
The necessary time for collecting the measurements should be a compromise between the desired data quality and the cost of execution, without forgetting the intrusive aspect related to a long period of permanence of the monitoring equipment and technicians in the households. The strategies can differ among countries and also depending on the available budget and monitoring equipment. In any case, there is a margin of flexibility in the strategy to follow, when it allows, evaluating both the hourly consumption and the seasonal effect. Taking as a reference the available national experiences, it seems recommended to use the sample of households to take meas-urements during a short period (a few weeks) and a reduced subsample to take additional measurements for a longer pe-riod (up to a year). This makes it possible to incorporate the seasonal effect in the results, extrapolating them to a year. Another feasible and affordable possibility is to combine pe-riods of just one week distributed in every season to monitor the sample of households with a long period applied to a more reduced subsample of households. This second approach can be very useful because of the limitation in the costs and num-ber of monitoring equipment that may not be available for
either all the households at the same time or a long period of time. This approach is interesting when, because of the lim-ited budget, it is not possible to use very sophisticated and powerful monitoring equipment, which usually is addressed to the big sample of households. In this case, it can be regis-tered the overall consumption of each equipment item corresponding to the monitoring period but not their hourly consumptions. However, this is adjusted with the use of com-plementary monitoring equipment connected to the main switchboard of the subsample households which registers hourly consumption. This procedure has been used by Spain in the frame of the SECH project and is considered as a good practice (See section 4.5).
Whichever the approach followed, the measurements must be taken in workdays and holidays so that the influence of the activity can be ref lected in the consumption of the equipment. A simplified approach is to equate the spring season to the autumn season because of the similarity of temperatures and corresponding energy demands, which can lead to reduce the monitoring time.
The monitoring must be focused on the most electricity con-suming and equipment commonly found in typical households. A special attention must be paid to the equipment with stand-by modes due to the growth of the stand-by consumption.
In addition to the electricity measurements, it is convenient to monitor the ambient temperature as well as the tempera-ture of use of the equipment. This can contribute to a better understanding about the results achieved with the measure-ments (see section 3.5.4.1 and case study in Chapter 5).
Figure 3.3: Overview of the methodological procedure
Source: IDAE, SECH – SPAHOUSEC project .
Survey Programme: Questionnaires (Sample S)
Monitoring Programme:in situ measurements and Technical questionnaire
(Sub Sample S’)
Extrapolation to a year
Representativeness and weights for the extrapolation
Ownership/pattern of use of the equipment
Revision and adjustment of the measured load curves
Yearly electricity consumption by equipment items/ National level
Data on population; distribution of households by types of dwelling;
climate zones…
Data on equipment ownership; habits of use; main features of the
household/dwelling; etc.
Reference load curves by appliances
Data on consumption/ curve loads of the equipmen t items;
Yearly electricity consumption per household by equipment items
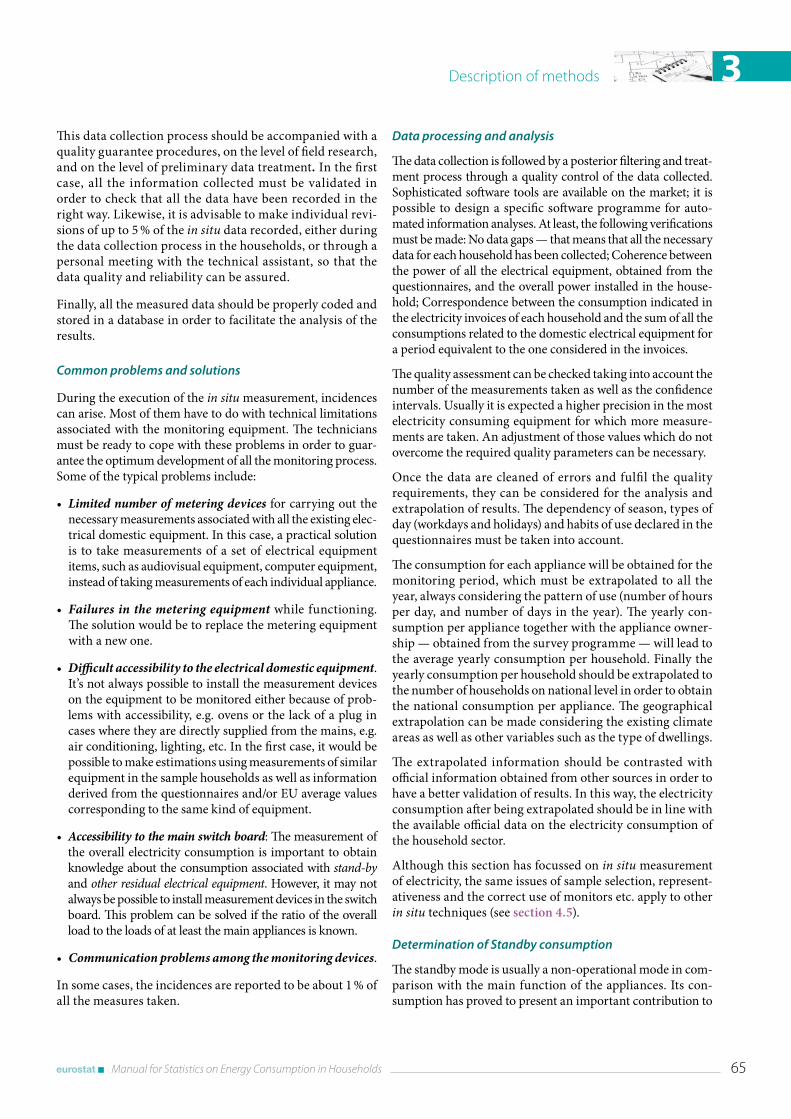
Description of methods 3
Manual for Statistics on Energy Consumption in Households 65
This data collection process should be accompanied with a quality guarantee procedures, on the level of field research, and on the level of preliminary data treatment. In the first case, all the information collected must be validated in order to check that all the data have been recorded in the right way. Likewise, it is advisable to make individual revi-sions of up to 5 % of the in situ data recorded, either during the data collection process in the households, or through a personal meeting with the technical assistant, so that the data quality and reliability can be assured.
Finally, all the measured data should be properly coded and stored in a database in order to facilitate the analysis of the results.
Common problems and solutions
During the execution of the in situ measurement, incidences can arise. Most of them have to do with technical limitations associated with the monitoring equipment. The technicians must be ready to cope with these problems in order to guar-antee the optimum development of all the monitoring process. Some of the typical problems include:
• Limited number of metering devices for carrying out the necessary measurements associated with all the existing elec-trical domestic equipment. In this case, a practical solution is to take measurements of a set of electrical equipment items, such as audiovisual equipment, computer equipment, instead of taking measurements of each individual appliance.
• Failures in the metering equipment while functioning. The solution would be to replace the metering equipment with a new one.
• Difficult accessibility to the electrical domestic equipment. It’s not always possible to install the measurement devices on the equipment to be monitored either because of prob-lems with accessibility, e.g. ovens or the lack of a plug in cases where they are directly supplied from the mains, e.g. air conditioning, lighting, etc. In the first case, it would be possible to make estimations using measurements of similar equipment in the sample households as well as information derived from the questionnaires and/or EU average values corresponding to the same kind of equipment.
• Accessibility to the main switch board: The measurement of the overall electricity consumption is important to obtain knowledge about the consumption associated with stand-by and other residual electrical equipment. However, it may not always be possible to install measurement devices in the switch board. This problem can be solved if the ratio of the overall load to the loads of at least the main appliances is known.
• Communication problems among the monitoring devices.
In some cases, the incidences are reported to be about 1 % of all the measures taken.
Data processing and analysis
The data collection is followed by a posterior filtering and treat-ment process through a quality control of the data collected. Sophisticated software tools are available on the market; it is possible to design a specific software programme for auto-mated information analyses. At least, the following verifications must be made: No data gaps — that means that all the necessary data for each household has been collected; Coherence between the power of all the electrical equipment, obtained from the questionnaires, and the overall power installed in the house-hold; Correspondence between the consumption indicated in the electricity invoices of each household and the sum of all the consumptions related to the domestic electrical equipment for a period equivalent to the one considered in the invoices.
The quality assessment can be checked taking into account the number of the measurements taken as well as the confidence intervals. Usually it is expected a higher precision in the most electricity consuming equipment for which more measure-ments are taken. An adjustment of those values which do not overcome the required quality parameters can be necessary.
Once the data are cleaned of errors and fulfil the quality requirements, they can be considered for the analysis and extrapolation of results. The dependency of season, types of day (workdays and holidays) and habits of use declared in the questionnaires must be taken into account.
The consumption for each appliance will be obtained for the monitoring period, which must be extrapolated to all the year, always considering the pattern of use (number of hours per day, and number of days in the year). The yearly con-sumption per appliance together with the appliance owner-ship — obtained from the survey programme — will lead to the average yearly consumption per household. Finally the yearly consumption per household should be extrapolated to the number of households on national level in order to obtain the national consumption per appliance. The geographical extrapolation can be made considering the existing climate areas as well as other variables such as the type of dwellings.
The extrapolated information should be contrasted with official information obtained from other sources in order to have a better validation of results. In this way, the electricity consumption after being extrapolated should be in line with the available official data on the electricity consumption of the household sector.
Although this section has focussed on in situ measurement of electricity, the same issues of sample selection, represent-ativeness and the correct use of monitors etc. apply to other in situ techniques (see section 4.5).
Determination of Standby consumption
The standby mode is usually a non-operational mode in com-parison with the main function of the appliances. Its con-sumption has proved to present an important contribution to
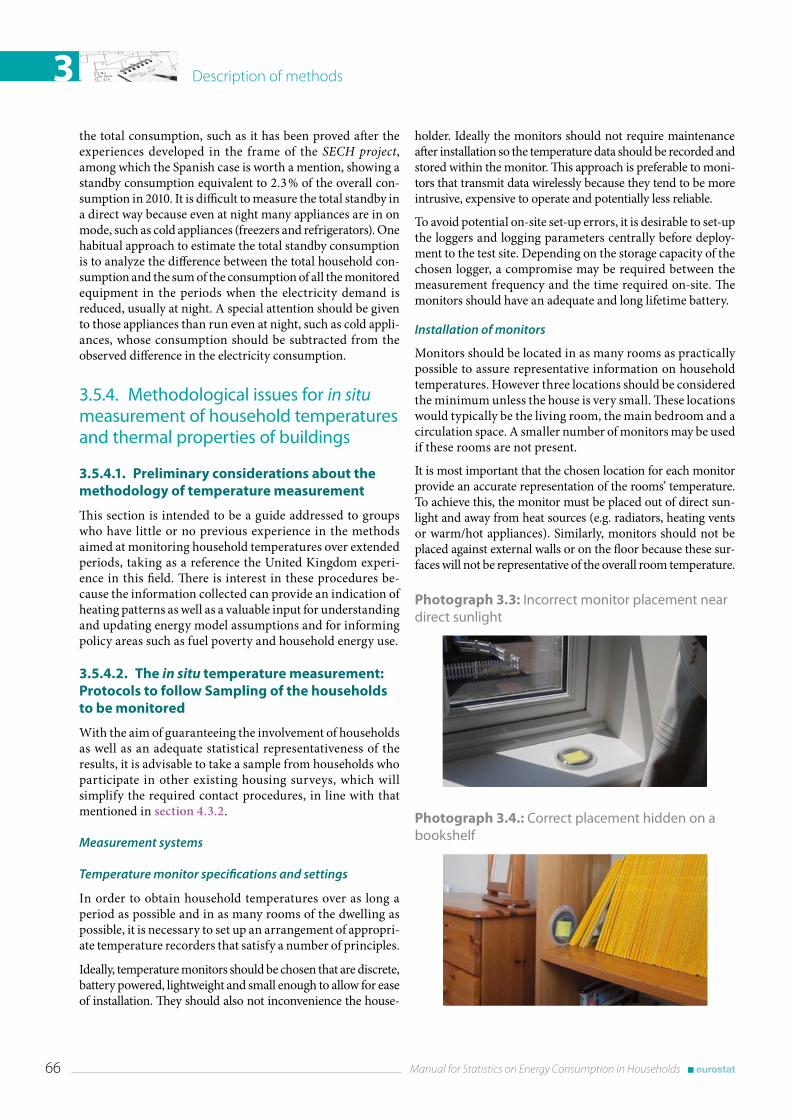
Description of methods3
66 Manual for Statistics on Energy Consumption in Households
the total consumption, such as it has been proved after the experiences developed in the frame of the SECH project, among which the Spanish case is worth a mention, showing a standby consumption equivalent to 2.3 % of the overall con-sumption in 2010. It is difficult to measure the total standby in a direct way because even at night many appliances are in on mode, such as cold appliances (freezers and refrigerators). One habitual approach to estimate the total standby consumption is to analyze the difference between the total household con-sumption and the sum of the consumption of all the monitored equipment in the periods when the electricity demand is reduced, usually at night. A special attention should be given to those appliances than run even at night, such as cold appli-ances, whose consumption should be subtracted from the observed difference in the electricity consumption.
3 .5 .4 . Methodological issues for in situ measurement of household temperatures and thermal properties of buildings
3.5.4.1. Preliminary considerations about the methodology of temperature measurement
This section is intended to be a guide addressed to groups who have little or no previous experience in the methods aimed at monitoring household temperatures over extended periods, taking as a reference the United Kingdom experi-ence in this field. There is interest in these procedures be-cause the information collected can provide an indication of heating patterns as well as a valuable input for understanding and updating energy model assumptions and for informing policy areas such as fuel poverty and household energy use.
3.5.4.2. The in situ temperature measurement: Protocols to follow Sampling of the households to be monitored
With the aim of guaranteeing the involvement of households as well as an adequate statistical representativeness of the results, it is advisable to take a sample from households who participate in other existing housing surveys, which will simplify the required contact procedures, in line with that mentioned in section 4.3.2.
Measurement systems
Temperature monitor specifications and settings
In order to obtain household temperatures over as long a period as possible and in as many rooms of the dwelling as possible, it is necessary to set up an arrangement of appropri-ate temperature recorders that satisfy a number of principles.
Ideally, temperature monitors should be chosen that are discrete, battery powered, lightweight and small enough to allow for ease of installation. They should also not inconvenience the house-
holder. Ideally the monitors should not require maintenance after installation so the temperature data should be recorded and stored within the monitor. This approach is preferable to moni-tors that transmit data wirelessly because they tend to be more intrusive, expensive to operate and potentially less reliable.
To avoid potential on-site set-up errors, it is desirable to set-up the loggers and logging parameters centrally before deploy-ment to the test site. Depending on the storage capacity of the chosen logger, a compromise may be required between the measurement frequency and the time required on-site. The monitors should have an adequate and long lifetime battery.
Installation of monitors
Monitors should be located in as many rooms as practically possible to assure representative information on household temperatures. However three locations should be considered the minimum unless the house is very small. These locations would typically be the living room, the main bedroom and a circulation space. A smaller number of monitors may be used if these rooms are not present.
It is most important that the chosen location for each monitor provide an accurate representation of the rooms’ temperature. To achieve this, the monitor must be placed out of direct sun-light and away from heat sources (e.g. radiators, heating vents or warm/hot appliances). Similarly, monitors should not be placed against external walls or on the floor because these sur-faces will not be representative of the overall room temperature.
Photograph 3.3: Incorrect monitor placement near direct sunlight
Photograph 3.4.: Correct placement hidden on a bookshelf
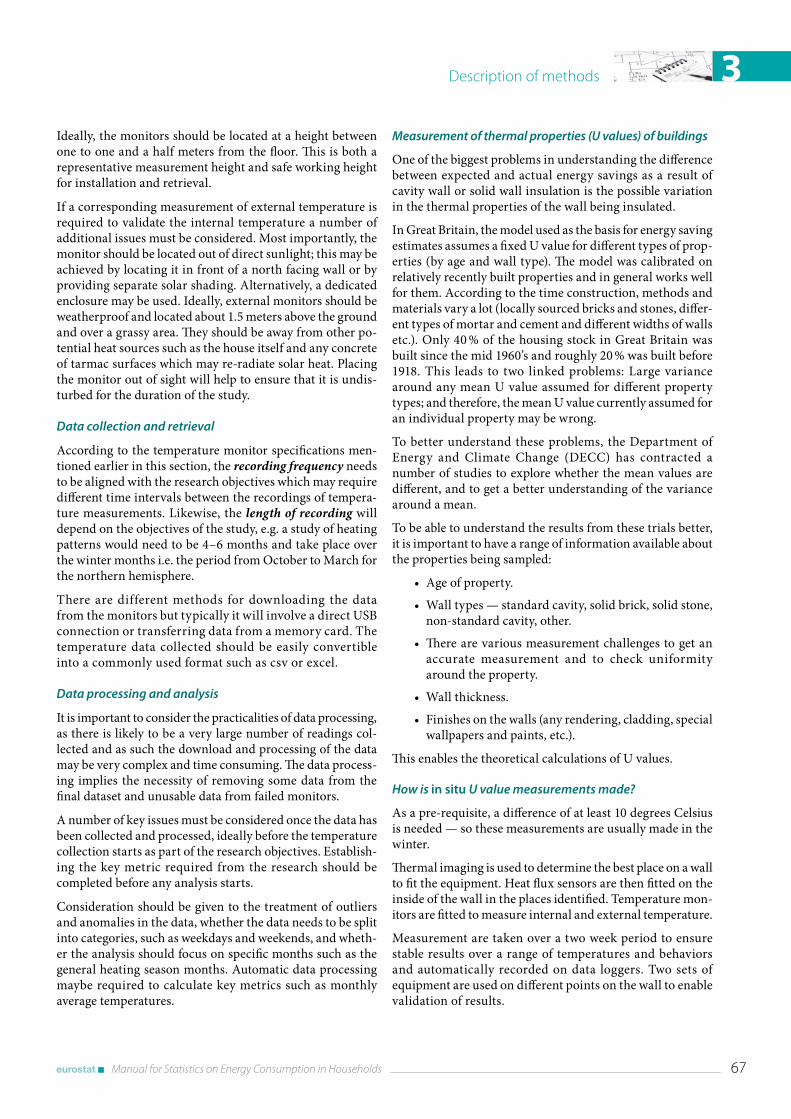
Description of methods 3
Manual for Statistics on Energy Consumption in Households 67
Ideally, the monitors should be located at a height between one to one and a half meters from the floor. This is both a representative measurement height and safe working height for installation and retrieval.
If a corresponding measurement of external temperature is required to validate the internal temperature a number of additional issues must be considered. Most importantly, the monitor should be located out of direct sunlight; this may be achieved by locating it in front of a north facing wall or by providing separate solar shading. Alternatively, a dedicated enclosure may be used. Ideally, external monitors should be weatherproof and located about 1.5 meters above the ground and over a grassy area. They should be away from other po-tential heat sources such as the house itself and any concrete of tarmac surfaces which may re-radiate solar heat. Placing the monitor out of sight will help to ensure that it is undis-turbed for the duration of the study.
Data collection and retrieval
According to the temperature monitor specifications men-tioned earlier in this section, the recording frequency needs to be aligned with the research objectives which may require different time intervals between the recordings of tempera-ture measurements. Likewise, the length of recording will depend on the objectives of the study, e.g. a study of heating patterns would need to be 4–6 months and take place over the winter months i.e. the period from October to March for the northern hemisphere.
There are different methods for downloading the data from the monitors but typically it will involve a direct USB connection or transferring data from a memory card. The temperature data collected should be easily convertible into a commonly used format such as csv or excel.
Data processing and analysis
It is important to consider the practicalities of data processing, as there is likely to be a very large number of readings col-lected and as such the download and processing of the data may be very complex and time consuming. The data process-ing implies the necessity of removing some data from the final dataset and unusable data from failed monitors.
A number of key issues must be considered once the data has been collected and processed, ideally before the temperature collection starts as part of the research objectives. Establish-ing the key metric required from the research should be completed before any analysis starts.
Consideration should be given to the treatment of outliers and anomalies in the data, whether the data needs to be split into categories, such as weekdays and weekends, and wheth-er the analysis should focus on specific months such as the general heating season months. Automatic data processing maybe required to calculate key metrics such as monthly average temperatures.
Measurement of thermal properties (U values) of buildings
One of the biggest problems in understanding the difference between expected and actual energy savings as a result of cavity wall or solid wall insulation is the possible variation in the thermal properties of the wall being insulated.
In Great Britain, the model used as the basis for energy saving estimates assumes a fixed U value for different types of prop-erties (by age and wall type). The model was calibrated on relatively recently built properties and in general works well for them. According to the time construction, methods and materials vary a lot (locally sourced bricks and stones, differ-ent types of mortar and cement and different widths of walls etc.). Only 40 % of the housing stock in Great Britain was built since the mid 1960’s and roughly 20 % was built before 1918. This leads to two linked problems: Large variance around any mean U value assumed for different property types; and therefore, the mean U value currently assumed for an individual property may be wrong.
To better understand these problems, the Department of Energy and Climate Change (DECC) has contracted a number of studies to explore whether the mean values are different, and to get a better understanding of the variance around a mean.
To be able to understand the results from these trials better, it is important to have a range of information available about the properties being sampled:
• Age of property.
• Wall types — standard cavity, solid brick, solid stone, non-standard cavity, other.
• There are various measurement challenges to get an accurate measurement and to check uniformity around the property.
• Wall thickness.
• Finishes on the walls (any rendering, cladding, special wallpapers and paints, etc.).
This enables the theoretical calculations of U values.
How is in situ U value measurements made?
As a pre-requisite, a difference of at least 10 degrees Celsius is needed — so these measurements are usually made in the winter.
Thermal imaging is used to determine the best place on a wall to fit the equipment. Heat flux sensors are then fitted on the inside of the wall in the places identified. Temperature mon-itors are fitted to measure internal and external temperature.
Measurement are taken over a two week period to ensure stable results over a range of temperatures and behaviors and automatically recorded on data loggers. Two sets of equipment are used on different points on the wall to enable validation of results.
Description of methods3
68 Manual for Statistics on Energy Consumption in Households
WHAT IS A U VALUE?
A measure of heat loss in a building element such as a wall, floor or roof. It measures how well parts of a building transfer heat. The higher the U value the worse the ther-mal performance of the element being assessed.
Analysis of the results
The theoretical U values acts both as a form of quality assur-ance for the overall study, but also a means of identifying unusual properties where the monitored results are signifi-cantly different to the theoretical results (potentially evi-dence of misclassification of wall type/insulation/air gaps/unusual moisture content, etc.).
By comparing the U value assumed by the model, with the calculated U value and the in situ monitored U value, it is obtained a better estimate of the mean U value for different property types, some indication of the likely range and variance around this mean, and some guidance to property assessors/surveyors on factors to look for when making savings estimates from energy efficiency measures.
Validation of the results
For some properties, there can be large differences between the monitored and calculated U values which are not readily explained.
By conducting further tests, such as drilling into the walls in order to check whether the wall has been classified correctly as cavity or solid, or whether for cavities there is already in-sulation present, and if so what condition it is in and moisture tests on the bricks, it is possible to resolve some of these stranger readings.
In a recent study of 300 properties (mixture of solid walls, filled and unfilled cavity walls), of the 10 unfilled cavity wall properties where the U values were much lower than the cal-culated values, drilling showed that 9 of these were actually filled cavities. They had been classified as unfilled as there were no visible signs of cavity wall insulation and no record of it from the current householder. This validation work has helped to show that there was no fundamental problem with the in situ measurement method, rather the prior understand-ing of the state of insulation in the property.
3 .5 .5 . Summary and conclusions
The main objective of the in situ measurement programmes is to determine a detailed understanding of a component of energy use, be it temperature, thermal efficiency or electricity. For electricity it works to determine the breakdown of the electricity consumption by end uses with accuracy. An addi-tional objective is a better knowledge of the standby consump-tion by end uses. These results serve as a basis for a better design of effective policies intended to improve the energy efficiency in the household sector.
The keys of success of the in situ measurement programmes are: the selection of the sample of households; to guarantee the col-laboration of the selected households; the design of a comple-mentary questionnaire; the election of the metering equipment; the training of the technicians in charge of the monitoring operations; and the quality control procedures during the data collection process and the posterior data treatment.
The frequency of the monitoring should be 4–5 years in a way that the changes associated with technological advances, the human behaviour, and policies can be incorporated so that the electricity consumption by end uses can be estimated in a reliable way.

Practical examples of methods

Practical examples of methods 4
Manual for Statistics on Energy Consumption in Households 71
IntroductionThis chapter intends to advance the practical understanding of the methodologies covered in Chapter 3 by providing a selection of good and varied practices for each of the different methods described previously.
The chapter is structured in four sections which describe some of the experiences of selected countries of the most common data collection methods applied in the household sector. The selection of the countries for each of the methods has been based on both the experience of the chosen coun-
tries on a given method and the availability of documenta-tion providing detailed and quality information on such practices. Therefore, the experiences described aim to be representatives of the methods considered in Chapter 3 of the Manual. The examples offered aim to bring the theory to life and show how practical issues can be resolved and aim to give users of the manual a guide to applying methods.
Table 4.1 shows a set of practices selected from six European countries. The prevalence of surveys supports the analysis done in Chapter 1 about the current situation of the energy statistics in the household sector.
Table 4.1: Summary of good practices by type
Data Collection Method Good PracticeBusiness surveys • Compilation of electricity data though use of surveys of suppliers (UK)
Households surveys
• Face to face Survey in the frame of the SECH-SPAHOUSECH project (Spain)• Mail survey: Electricity and natural gas consumption of households by purpose (Austria)• CATI/CAPI survey: Energy consumption of households (Slovenia)• Panel survey: Energy consumption of private households (Germany)
Use of administrative data
• Client registers of energy companies in the Netherlands• Administrative data of energy companies data: experience from other countries (United
Kingdom, Spain)• Use of management information data from policies (United Kingdom)
Modelling• The Cambridge Housing Model (UK)• Model based data validation procedure (Austria)• Model based estimation of energy consumption in second residences (Austria)
In situ measurements
• End Use Metering in 400 Households (Sweden)• Measurements of Electricity Consumption in the Household Sector (Spain)• Household Electricity Consumption by Purposes (Austria)• Best Practices’ on in situ Thermal Measurements (UK)• Experiences with the collection of household temperatures• Experiences with in situ U-value measurements
4 .1 . Business surveys
4 .1 .1 . United Kingdom good practice examples
4.1.1.1. Compilation of electricity data though use of surveys of suppliers
In the United Kingdom the Department of Energy and Cli-mate Change (DECC) carries out monthly and annual sur-veys of around 30 electricity suppliers, 15 of which supply to the domestic/household sector (with some supplying under several different brand names). Survey questionnaires are completed each month showing electricity sales, split by four consuming sectors: domestic, commercial, industrial and other. On an annual basis more detailed data are collected with additional breakdowns of electricity sales by tariff type (standard, prepayment, economy 7, and prepayment econo-my 7). The disadvantage of using this data set is that no com-
prehensive information on how the electricity is used is collected, however most customers on the economy 7 tariffs use electricity for heating purposes.
On a monthly basis, individual data series (by company and sector) are checked for unexpected trends, including large changes in sales relative to previous months or the corre-sponding month a year earlier, with any anomalies investigated with the reporting company. The data are then aggregated to show monthly electricity sales by sector. A similar process is carried out to the annual data.
In the domestic sector, movements in sales are generally driven by temperatures (especially in the winter, where more electricity may be used for heating and lighting), so tem-perature comparisons with previous years are often made (comparison against gas sales is also made, as this should show similar movements). Other factors considered when analysing sales (in all sectors) will include: the number of working days in a period (generally consumption is higher on working days) — which will be influenced by the presence
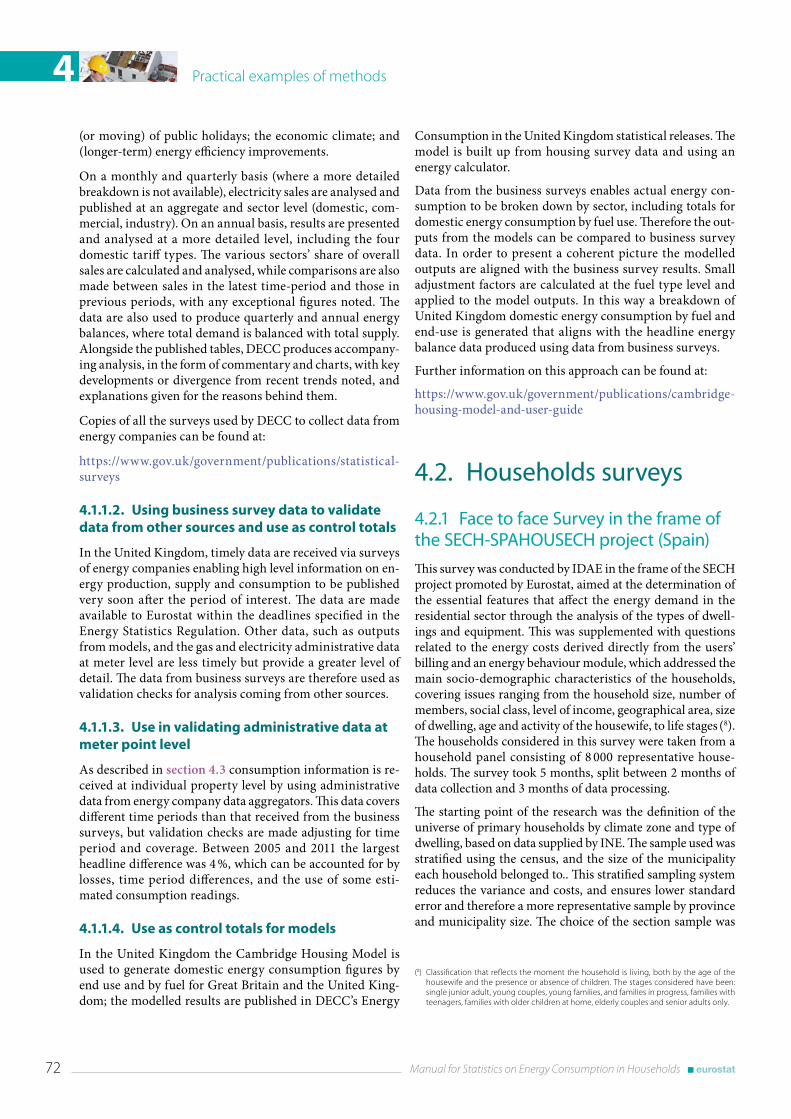
Practical examples of methods4
72 Manual for Statistics on Energy Consumption in Households
(or moving) of public holidays; the economic climate; and (longer-term) energy efficiency improvements.
On a monthly and quarterly basis (where a more detailed breakdown is not available), electricity sales are analysed and published at an aggregate and sector level (domestic, com-mercial, industry). On an annual basis, results are presented and analysed at a more detailed level, including the four domestic tariff types. The various sectors’ share of overall sales are calculated and analysed, while comparisons are also made between sales in the latest time-period and those in previous periods, with any exceptional figures noted. The data are also used to produce quarterly and annual energy balances, where total demand is balanced with total supply. Alongside the published tables, DECC produces accompany-ing analysis, in the form of commentary and charts, with key developments or divergence from recent trends noted, and explanations given for the reasons behind them.
Copies of all the surveys used by DECC to collect data from energy companies can be found at:
https://www.gov.uk/government/publications/statistical-surveys
4.1.1.2. Using business survey data to validate data from other sources and use as control totals
In the United Kingdom, timely data are received via surveys of energy companies enabling high level information on en-ergy production, supply and consumption to be published very soon after the period of interest. The data are made available to Eurostat within the deadlines specified in the Energy Statistics Regulation. Other data, such as outputs from models, and the gas and electricity administrative data at meter level are less timely but provide a greater level of detail. The data from business surveys are therefore used as validation checks for analysis coming from other sources.
4.1.1.3. Use in validating administrative data at meter point level
As described in section 4.3 consumption information is re-ceived at individual property level by using administrative data from energy company data aggregators. This data covers different time periods than that received from the business surveys, but validation checks are made adjusting for time period and coverage. Between 2005 and 2011 the largest headline difference was 4 %, which can be accounted for by losses, time period differences, and the use of some esti-mated consumption readings.
4.1.1.4. Use as control totals for models
In the United Kingdom the Cambridge Housing Model is used to generate domestic energy consumption figures by end use and by fuel for Great Britain and the United King-dom; the modelled results are published in DECC’s Energy
Consumption in the United Kingdom statistical releases. The model is built up from housing survey data and using an energy calculator.
Data from the business surveys enables actual energy con-sumption to be broken down by sector, including totals for domestic energy consumption by fuel use. Therefore the out-puts from the models can be compared to business survey data. In order to present a coherent picture the modelled outputs are aligned with the business survey results. Small adjustment factors are calculated at the fuel type level and applied to the model outputs. In this way a breakdown of United Kingdom domestic energy consumption by fuel and end-use is generated that aligns with the headline energy balance data produced using data from business surveys.
Further information on this approach can be found at:
https://www.gov.uk/government/publications/cambridge-housing-model-and-user-guide
4 .2 . Households surveys
4 .2 .1 Face to face Survey in the frame of the SECH-SPAHOUSECH project (Spain)
This survey was conducted by IDAE in the frame of the SECH project promoted by Eurostat, aimed at the determination of the essential features that affect the energy demand in the residential sector through the analysis of the types of dwell-ings and equipment. This was supplemented with questions related to the energy costs derived directly from the users’ billing and an energy behaviour module, which addressed the main socio-demographic characteristics of the households, covering issues ranging from the household size, number of members, social class, level of income, geographical area, size of dwelling, age and activity of the housewife, to life stages (8). The households considered in this survey were taken from a household panel consisting of 8 000 representative house-holds. The survey took 5 months, split between 2 months of data collection and 3 months of data processing.
The starting point of the research was the definition of the universe of primary households by climate zone and type of dwelling, based on data supplied by INE. The sample used was stratified using the census, and the size of the municipality each household belonged to.. This stratified sampling system reduces the variance and costs, and ensures lower standard error and therefore a more representative sample by province and municipality size. The choice of the section sample was
(8) Classification that reflects the moment the household is living, both by the age of the housewife and the presence or absence of children. The stages considered have been: single junior adult, young couples, young families, and families in progress, families with teenagers, families with older children at home, elderly couples and senior adults only.
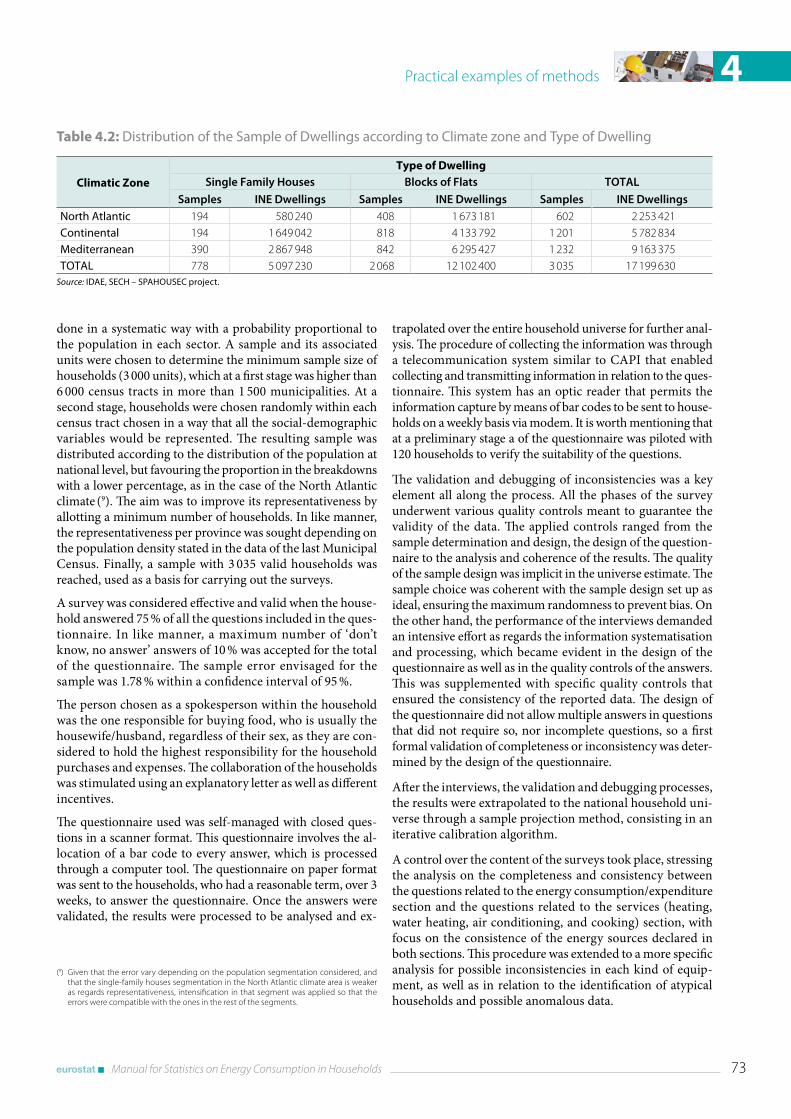
Practical examples of methods 4
Manual for Statistics on Energy Consumption in Households 73
Table 4.2: Distribution of the Sample of Dwellings according to Climate zone and Type of Dwelling
Climatic Zone
Type of DwellingSingle Family Houses Blocks of Flats TOTAL
Samples INE Dwellings Samples INE Dwellings Samples INE DwellingsNorth Atlantic 194 580 240 408 1 673 181 602 2 253 421Continental 194 1 649 042 818 4 133 792 1 201 5 782 834Mediterranean 390 2 867 948 842 6 295 427 1 232 9 163 375TOTAL 778 5 097 230 2 068 12 102 400 3 035 17 199 630
Source: IDAE, SECH – SPAHOUSEC project .
done in a systematic way with a probability proportional to the population in each sector. A sample and its associated units were chosen to determine the minimum sample size of households (3 000 units), which at a first stage was higher than 6 000 census tracts in more than 1 500 municipalities. At a second stage, households were chosen randomly within each census tract chosen in a way that all the social-demographic variables would be represented. The resulting sample was distributed according to the distribution of the population at national level, but favouring the proportion in the breakdowns with a lower percentage, as in the case of the North Atlantic climate (9). The aim was to improve its representativeness by allotting a minimum number of households. In like manner, the representativeness per province was sought depending on the population density stated in the data of the last Municipal Census. Finally, a sample with 3 035 valid households was reached, used as a basis for carrying out the surveys.
A survey was considered effective and valid when the house-hold answered 75 % of all the questions included in the ques-tionnaire. In like manner, a maximum number of ‘don’t know, no answer’ answers of 10 % was accepted for the total of the questionnaire. The sample error envisaged for the sample was 1.78 % within a confidence interval of 95 %.
The person chosen as a spokesperson within the household was the one responsible for buying food, who is usually the housewife/husband, regardless of their sex, as they are con-sidered to hold the highest responsibility for the household purchases and expenses. The collaboration of the households was stimulated using an explanatory letter as well as different incentives.
The questionnaire used was self-managed with closed ques-tions in a scanner format. This questionnaire involves the al-location of a bar code to every answer, which is processed through a computer tool. The questionnaire on paper format was sent to the households, who had a reasonable term, over 3 weeks, to answer the questionnaire. Once the answers were validated, the results were processed to be analysed and ex-
(9) Given that the error vary depending on the population segmentation considered, and that the single-family houses segmentation in the North Atlantic climate area is weaker as regards representativeness, intensification in that segment was applied so that the errors were compatible with the ones in the rest of the segments.
trapolated over the entire household universe for further anal-ysis. The procedure of collecting the information was through a telecommunication system similar to CAPI that enabled collecting and transmitting information in relation to the ques-tionnaire. This system has an optic reader that permits the information capture by means of bar codes to be sent to house-holds on a weekly basis via modem. It is worth mentioning that at a preliminary stage a of the questionnaire was piloted with 120 households to verify the suitability of the questions.
The validation and debugging of inconsistencies was a key element all along the process. All the phases of the survey underwent various quality controls meant to guarantee the validity of the data. The applied controls ranged from the sample determination and design, the design of the question-naire to the analysis and coherence of the results. The quality of the sample design was implicit in the universe estimate. The sample choice was coherent with the sample design set up as ideal, ensuring the maximum randomness to prevent bias. On the other hand, the performance of the interviews demanded an intensive effort as regards the information systematisation and processing, which became evident in the design of the questionnaire as well as in the quality controls of the answers. This was supplemented with specific quality controls that ensured the consistency of the reported data. The design of the questionnaire did not allow multiple answers in questions that did not require so, nor incomplete questions, so a first formal validation of completeness or inconsistency was deter-mined by the design of the questionnaire.
After the interviews, the validation and debugging processes, the results were extrapolated to the national household uni-verse through a sample projection method, consisting in an iterative calibration algorithm.
A control over the content of the surveys took place, stressing the analysis on the completeness and consistency between the questions related to the energy consumption/expenditure section and the questions related to the services (heating, water heating, air conditioning, and cooking) section, with focus on the consistence of the energy sources declared in both sections. This procedure was extended to a more specific analysis for possible inconsistencies in each kind of equip-ment, as well as in relation to the identification of atypical households and possible anomalous data.
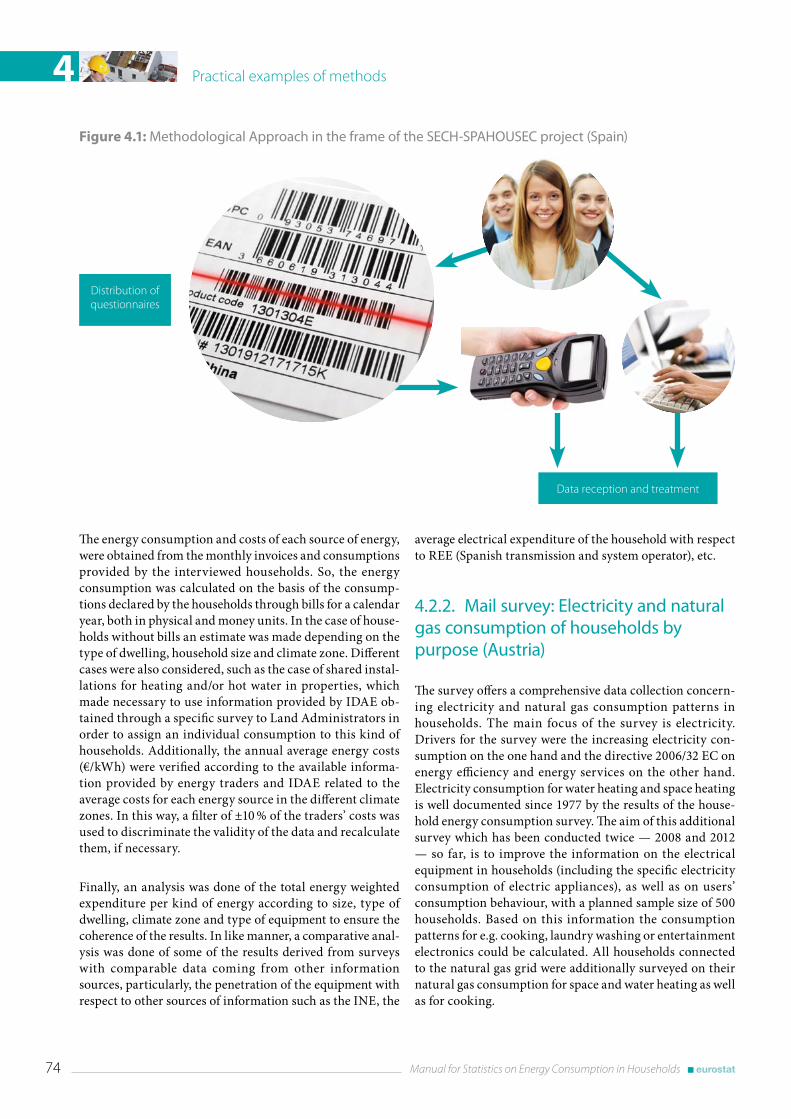
Practical examples of methods4
74 Manual for Statistics on Energy Consumption in Households
The energy consumption and costs of each source of energy, were obtained from the monthly invoices and consumptions provided by the interviewed households. So, the energy consumption was calculated on the basis of the consump-tions declared by the households through bills for a calendar year, both in physical and money units. In the case of house-holds without bills an estimate was made depending on the type of dwelling, household size and climate zone. Different cases were also considered, such as the case of shared instal-lations for heating and/or hot water in properties, which made necessary to use information provided by IDAE ob-tained through a specific survey to Land Administrators in order to assign an individual consumption to this kind of households. Additionally, the annual average energy costs (€/kWh) were verified according to the available informa-tion provided by energy traders and IDAE related to the average costs for each energy source in the different climate zones. In this way, a filter of ±10 % of the traders’ costs was used to discriminate the validity of the data and recalculate them, if necessary.
Finally, an analysis was done of the total energy weighted expenditure per kind of energy according to size, type of dwelling, climate zone and type of equipment to ensure the coherence of the results. In like manner, a comparative anal-ysis was done of some of the results derived from surveys with comparable data coming from other information sources, particularly, the penetration of the equipment with respect to other sources of information such as the INE, the
average electrical expenditure of the household with respect to REE (Spanish transmission and system operator), etc.
4 .2 .2 . Mail survey: Electricity and natural gas consumption of households by purpose (Austria)
The survey offers a comprehensive data collection concern-ing electricity and natural gas consumption patterns in households. The main focus of the survey is electricity. Drivers for the survey were the increasing electricity con-sumption on the one hand and the directive 2006/32 EC on energy efficiency and energy services on the other hand. Electricity consumption for water heating and space heating is well documented since 1977 by the results of the house-hold energy consumption survey. The aim of this additional survey which has been conducted twice — 2008 and 2012 — so far, is to improve the information on the electrical equipment in households (including the specific electricity consumption of electric appliances), as well as on users’ consumption behaviour, with a planned sample size of 500 households. Based on this information the consumption patterns for e.g. cooking, laundry washing or entertainment electronics could be calculated. All households connected to the natural gas grid were additionally surveyed on their natural gas consumption for space and water heating as well as for cooking.
Figure 4.1: Methodological Approach in the frame of the SECH-SPAHOUSEC project (Spain)
Distribution of questionnaires
Data reception and treatment
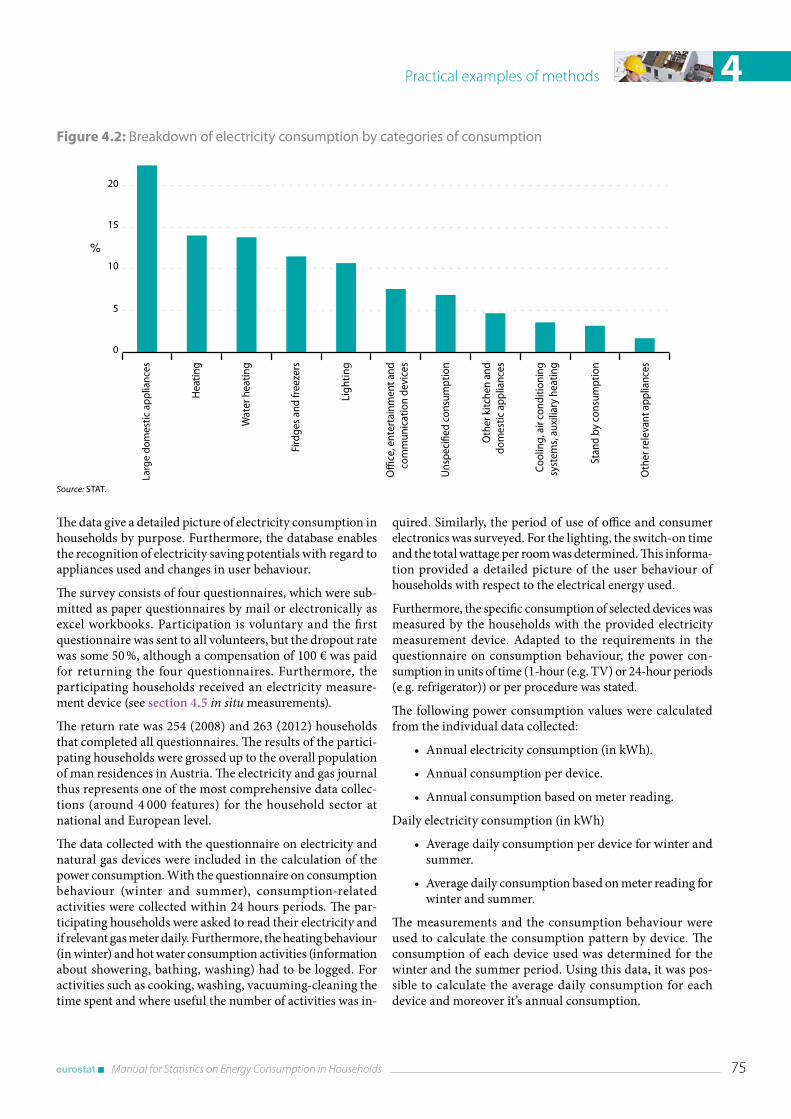
Practical examples of methods 4
Manual for Statistics on Energy Consumption in Households 75
Figure 4.2: Breakdown of electricity consumption by categories of consumption
Source: STAT .
Hea
ting
Wat
er h
eatin
g
Ligh
ting
Uns
peci
fied
cons
umpt
ion
Stan
d by
con
sum
ptio
n
Oth
er re
leva
nt a
pplia
nces
0
5
10
15
20
25
%
Offi
ce, e
nter
tain
men
t and
co
mm
unic
atio
n de
vice
s
Oth
er k
itche
n an
d do
mes
tic a
pplia
nces
Cool
ing,
air
cond
ition
ing
syst
ems,
aux
iliar
y he
atin
g
Fird
ges
and
free
zers
Larg
e do
mes
ticap
plia
nces
The data give a detailed picture of electricity consumption in households by purpose. Furthermore, the database enables the recognition of electricity saving potentials with regard to appliances used and changes in user behaviour.
The survey consists of four questionnaires, which were sub-mitted as paper questionnaires by mail or electronically as excel workbooks. Participation is voluntary and the first questionnaire was sent to all volunteers, but the dropout rate was some 50 %, although a compensation of 100 € was paid for returning the four questionnaires. Furthermore, the participating households received an electricity measure-ment device (see section 4.5 in situ measurements).
The return rate was 254 (2008) and 263 (2012) households that completed all questionnaires. The results of the partici-pating households were grossed up to the overall population of man residences in Austria. The electricity and gas journal thus represents one of the most comprehensive data collec-tions (around 4 000 features) for the household sector at national and European level.
The data collected with the questionnaire on electricity and natural gas devices were included in the calculation of the power consumption. With the questionnaire on consumption behaviour (winter and summer), consumption-related activities were collected within 24 hours periods. The par-ticipating households were asked to read their electricity and if relevant gas meter daily. Furthermore, the heating behaviour (in winter) and hot water consumption activities (information about showering, bathing, washing) had to be logged. For activities such as cooking, washing, vacuuming-cleaning the time spent and where useful the number of activities was in-
quired. Similarly, the period of use of office and consumer electronics was surveyed. For the lighting, the switch-on time and the total wattage per room was determined. This informa-tion provided a detailed picture of the user behaviour of households with respect to the electrical energy used.
Furthermore, the specific consumption of selected devices was measured by the households with the provided electricity measurement device. Adapted to the requirements in the questionnaire on consumption behaviour, the power con-sumption in units of time (1-hour (e.g. TV) or 24-hour periods (e.g. refrigerator)) or per procedure was stated.
The following power consumption values were calculated from the individual data collected:
• Annual electricity consumption (in kWh).
• Annual consumption per device.
• Annual consumption based on meter reading.
Daily electricity consumption (in kWh)
• Average daily consumption per device for winter and summer.
• Average daily consumption based on meter reading for winter and summer.
The measurements and the consumption behaviour were used to calculate the consumption pattern by device. The consumption of each device used was determined for the winter and the summer period. Using this data, it was pos-sible to calculate the average daily consumption for each device and moreover it’s annual consumption.
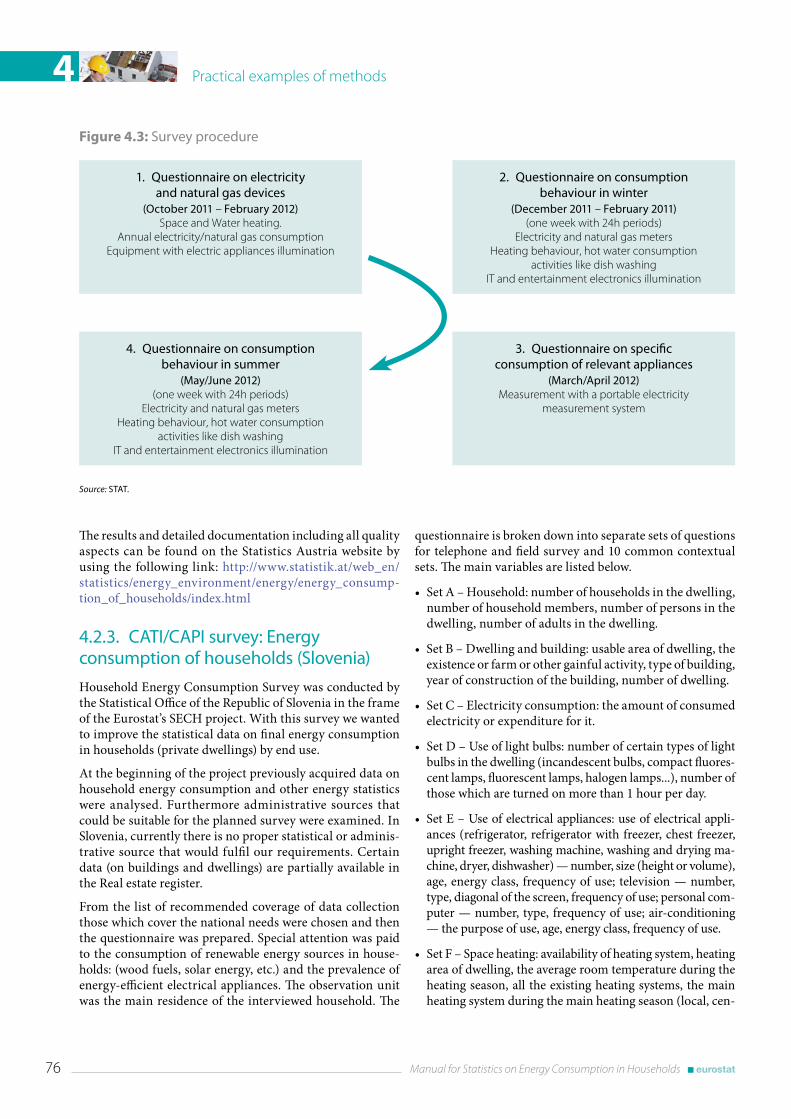
Practical examples of methods4
76 Manual for Statistics on Energy Consumption in Households
The results and detailed documentation including all quality aspects can be found on the Statistics Austria website by using the following link: http://www.statistik.at/web_en/statistics/energy_environment/energy/energy_consump-tion_of_households/index.html
4 .2 .3 . CATI/CAPI survey: Energy consumption of households (Slovenia)
Household Energy Consumption Survey was conducted by the Statistical Office of the Republic of Slovenia in the frame of the Eurostat’s SECH project. With this survey we wanted to improve the statistical data on final energy consumption in households (private dwellings) by end use.
At the beginning of the project previously acquired data on household energy consumption and other energy statistics were analysed. Furthermore administrative sources that could be suitable for the planned survey were examined. In Slovenia, currently there is no proper statistical or adminis-trative source that would fulfil our requirements. Certain data (on buildings and dwellings) are partially available in the Real estate register.
From the list of recommended coverage of data collection those which cover the national needs were chosen and then the questionnaire was prepared. Special attention was paid to the consumption of renewable energy sources in house-holds: (wood fuels, solar energy, etc.) and the prevalence of energy-efficient electrical appliances. The observation unit was the main residence of the interviewed household. The
questionnaire is broken down into separate sets of questions for telephone and field survey and 10 common contextual sets. The main variables are listed below.
• Set A – Household: number of households in the dwelling, number of household members, number of persons in the dwelling, number of adults in the dwelling.
• Set B – Dwelling and building: usable area of dwelling, the existence or farm or other gainful activity, type of building, year of construction of the building, number of dwelling.
• Set C – Electricity consumption: the amount of consumed electricity or expenditure for it.
• Set D – Use of light bulbs: number of certain types of light bulbs in the dwelling (incandescent bulbs, compact fluores-cent lamps, fluorescent lamps, halogen lamps...), number of those which are turned on more than 1 hour per day.
• Set E – Use of electrical appliances: use of electrical appli-ances (refrigerator, refrigerator with freezer, chest freezer, upright freezer, washing machine, washing and drying ma-chine, dryer, dishwasher) — number, size (height or volume), age, energy class, frequency of use; television — number, type, diagonal of the screen, frequency of use; personal com-puter — number, type, frequency of use; air-conditioning — the purpose of use, age, energy class, frequency of use.
• Set F – Space heating: availability of heating system, heating area of dwelling, the average room temperature during the heating season, all the existing heating systems, the main heating system during the main heating season (local, cen-
Figure 4.3: Survey procedure
Source: STAT .
1 . Questionnaire on electricity and natural gas devices
(October 2011 – February 2012)Space and Water heating.
Annual electricity/natural gas consumption Equipment with electric appliances illumination
2 . Questionnaire on consumption behaviour in winter
(December 2011 – February 2011)(one week with 24h periods)
Electricity and natural gas metersHeating behaviour, hot water consumption
activities like dish washingIT and entertainment electronics illumination
4 . Questionnaire on consumption behaviour in summer
(May/June 2012)(one week with 24h periods)
Electricity and natural gas metersHeating behaviour, hot water consumption
activities like dish washingIT and entertainment electronics illumination
3 . Questionnaire on specific consumption of relevant appliances
(March/April 2012)Measurement with a portable electricity
measurement system
Practical examples of methods 4
Manual for Statistics on Energy Consumption in Households 77
tral, district), type of heating fuel/energy source, amount of fuel/energy consumed or expense for it, availability and type of heat pump.
• Set G – Use of wood fuels: use of wood fuels — type, quan-tity, expenditure.
• Set H – Hot sanitary water: availability of hot sanitary water, availability of a solar heating system — size, type, age; fuel/energy for water heating (during and outside the heating season).
• Set I – Cooking: number of cooked meals per week, the main source of energy for cooking, type of cooking plate, use of gas bottles, use of electric ovens, use of microwave ovens.
• Set J – Cars: availability of a car, number of cars, engine capacity, age of the car, fuel type, distance travelled, aver-age fuel consumption.
All questions in the questionnaire referred to the period of last 12 months. The person interviewed for the chosen dwelling was a member of the household living in the dwell-ing and with the best knowledge of energy consumption in the dwelling. Only households which occupied the chosen dwelling at least for 12 months were actually interviewed. Business offices, weekend or holiday apartments and institu-tional households were also not taken into account; only dwellings with private households were surveyed.
The survey focused on quantities of consumed energy and fuels and the related expenses. If the respondent could not provide accurate data, he/she was asked to give an estimate. In the cases of multi-dwelling houses, the respondents were asked to estimate data only to their dwelling; even they shared common connections (e.g. electricity meter, heating appliance) in the house. If such estimations were done they were particularly highlighted in the questionnaire.
To test the questionnaire as well as the average interview duration (16 minutes) and the response rate a pilot survey with a sample of 156 units was conducted by 3 experienced interviewers. The sample for the pilot survey was simple ran-dom sample. It was stratified by the statistical region, type of settlement and linkage to a farm. The sample frame for the main survey was the Central register of the population, from which persons older than 18 were chosen. These persons determined the households. Target population was private households in Slovenia.
The sample size was 6 000 (out of an overall population of 813 thousand households). The sampling plan was stratified in two stages. It was explicitly stratified by type of the settlement (by number of population and share of agricultural house-holds) and statistical regions and implicitly stratified by whether there was a farm at the address or not, by the main heating system in the building, age of the building and the number of dwellings in the building. In the initial sample size there were 5 818 eligible units, and 3 945 units took part in the
survey. That means that the eligibility rate was 97.0 % and the response rate was 67.8 %.
Before the interview all chosen units received notification letter that informed them about the implementation and purpose of the survey, as well as about the content of the survey and the data surveyed. Additionally they were asked to prepare the data on energy consumption (quantities and expenses), electrical appliances (energy classes), light bulbs and cars (fuel consumption, distance travelled). The notifica-tion letter was accompanied by examples of actual electricity and gas bills on which the requested data e.g. consumed quantities and costs were highlighted.
The survey was conducted as combined CATI/CAPI approach; first wave was telephone interviewing from the studio (CATI). Those respondents without a landline telephone connection or those that weren’t reachable by phone were interviewed per-sonally (CAPI). To conduct the survey took 7 weeks.
In advance of the survey, training for interviewers took place and an interviewer manual with instructions and explanations on each question was prepared. The CATI/CAPI software had integrated many checks to assist and warn interviewer already during the interview.
For imputation we used data from auxiliary questions which were easier to respond. For example, missing consumption quantities have been imputed based on the related expendi-tures. If the expenditures were not known, hot-deck method, which involves replacing missing values with values from a ‘similar’ responding unit, was used for the imputation. For data gaps of questions that didn’t have auxiliary questions we also used hot-deck method for imputation.
Edited and imputed data were then weighed to improve the representativeness of the sample so that the sample repre-sented the surveyed population as closely as possible. Data were weighted because of different probability of selection, non-response and adaptation to the known population composition. For the adaptation we used statistical regions, settlement types and data from the Real estate register: number of inhabited dwellings, age and type of buildings and main type of heating in dwellings.
Calculated data was analysed and compared to data from previous surveys and other energy statistics. The results of the survey served as input to a model which was developed by our subcontractor (see section 5.5 Slovenia)
4 .2 .4 . Panel survey: Energy consumption of private households (Germany)
In an on-going effort to establish an energy panel in Germany, the most recent documented survey covers the energy con-sumption of approximately 7 000 households nationwide for the years 2009 and 2010, with earlier survey waves covering the years since 2003. Data for the years 2011 and 2012 will be
Practical examples of methods4
78 Manual for Statistics on Energy Consumption in Households
gathered at the outset of 2014, with additional improvements on the questionnaire and survey design currently in progress.
The samples of participating households are drawn from the population of German-speaking residents aged 14 to 69, with the aim of assembling a representative panel.
Each participating household is equipped with an interface that projects the questions on the respondent’s television screen and allows an easy implementation of complex ques-tionnaires by filter techniques and visual assistance. Respondents may answer the questions at any time of their choosing; they are not under time pressure and are not obli-gated to complete the questionnaire in a single session. The forsa tool, which immediately saves the collected information on a server, further allows for automatic consistency and validity checks during the data input by the participant. This ensures that the collected data is of high quality.
The survey gathers information about the energy consump-tion of various fuels of private households as well as the corresponding expenditures. In addition, households also disclose the use of renewable energies, socio-economic char-acteristics, and their ownership of electrical appliances.
With a participation rate of approximately 70 %, the often encountered problem of a low participation rate poses no issue. However, there exist two groups of survey participants for which we seek to improve the number of observations: low income households and households that predominantly employ district heating. More detail is given in section 5.2 Country case study: Germany.
4 .2 .5 . Interviewer training (United Kingdom)
The English Housing Survey (EHS), formerly the English House Condition Survey (EHCS), comprises the IHS ‘core module’ of questions, key descriptive and demographic de-tails on all members of the household (these questions are common to many surveys), housing specific topics such as rent and mortgage payments and attitudes to the home. The EHS module is asked of the Household Reference Person or partner only. The survey also contains a physical survey.
The interviews are conducted using computer-assisted per-sonal interviewing (CAPI) which provides automatic route-ing and range checks.
Interviewers working on the EHS are drawn from the ONS pool of interviewers. All interviewers pass a six-week training period as part of their induction to the ONS and before being allocated ‘live’ work. Before starting work on the EHS all interviewers are required to attend a one-day briefing on the survey. New briefings are held periodically to maintain a sufficient number of interviewers trained on the EHS. Over 400 interviewers are trained to work on the survey.
All sampled addresses receive an advance letter to help en-courage participation which informs the householder that an interviewer will be calling, and provides information and what to expect when the interviewer arrives. Interviewers are provided with a specific EHS ‘purpose leaflet’ which they distribute to (potential) respondents at their discretion. This leaflet describes the survey, what information is collected and how the data will be used. Finally a further leaflet is left with householders whose property had been selected for a physical survey describing the purpose of the surveyors visit. These leaflets are reviewed annually and latest versions are available on the EHS website.
https://www.gov.uk/english-housing-survey-guidance-for-survey-users-and-participating-households
Prior to seeking an interview with a respondent at a sampled address there are a series of contact procedures undertaken using the EHS ‘doorstep form’. These include:
• collecting ‘first impression’ data from the sampled ad-dress to be used in non-response analysis;
• dwelling identification and, where necessary, random-ly selecting a dwelling;
• identifying households and, where necessary, ran-domly selecting a household for interview;
• collecting information from neighbours about non‑contacts and vacant addresses.
One of the interviewer’s tasks is to gain consent from those households eligible for the physical survey for the surveyor to call.
As part of their training, interviewers are briefed on how to explain the physical survey to respondents and collect information about their preferred times for a visit. An Interviewer-Surveyor Protocol has been developed to fa-cilitate this process.
As part of the interview, private sector tenants are asked for permission to contact their landlord and to provide their landlord contact details. This survey with landlords and agents collects information on the size and composition of different groups of landlords, their property portfolio, why they are involved in renting, how they approach the mainte-nance and management of their properties, their future plans and their views on a range of issues within the private sector market.
The Private Landlord Survey (PLS) was conducted in spring 2010 based on landlord contact details collected in 2007/08 (in the EHCS) and in 2008/09 (in the EHS) and results will be available in 2011.
Physical survey fieldwork
The physical survey component of the EHS built upon the EHCS and much of the methodology was carried forward,
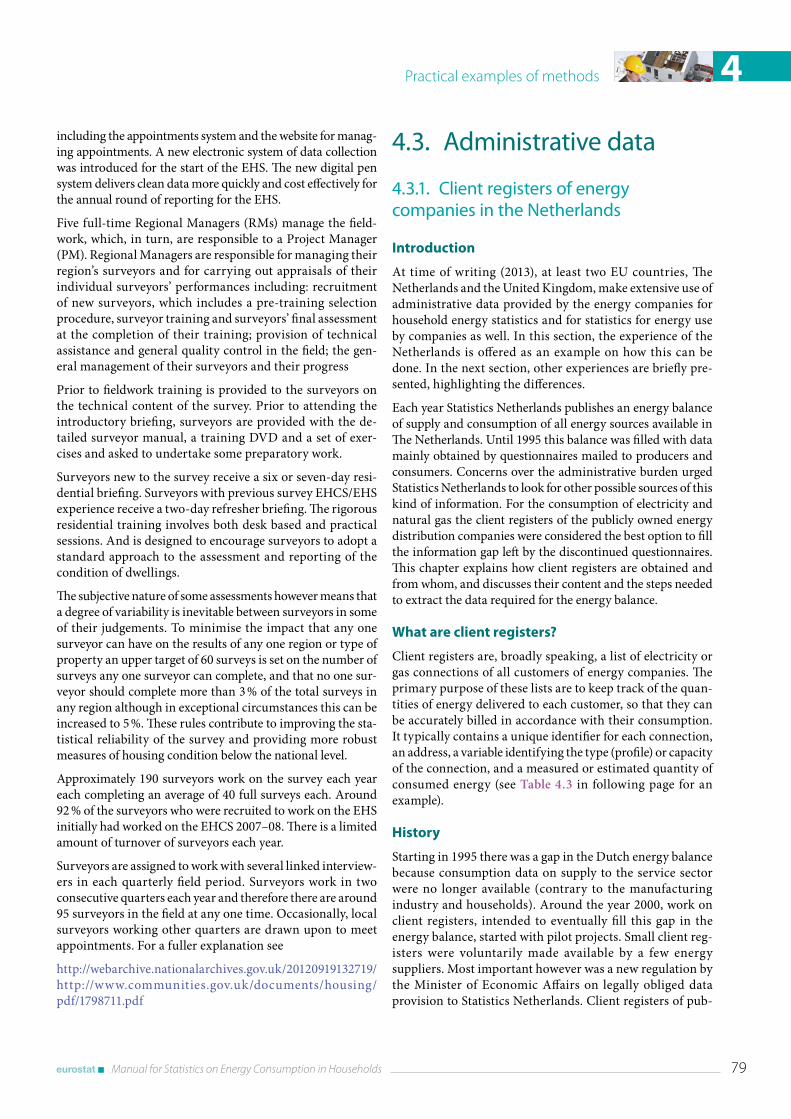
Practical examples of methods 4
Manual for Statistics on Energy Consumption in Households 79
including the appointments system and the website for manag-ing appointments. A new electronic system of data collection was introduced for the start of the EHS. The new digital pen system delivers clean data more quickly and cost effectively for the annual round of reporting for the EHS.
Five full-time Regional Managers (RMs) manage the field-work, which, in turn, are responsible to a Project Manager (PM). Regional Managers are responsible for managing their region’s surveyors and for carrying out appraisals of their individual surveyors’ performances including: recruitment of new surveyors, which includes a pre-training selection procedure, surveyor training and surveyors’ final assessment at the completion of their training; provision of technical assistance and general quality control in the field; the gen-eral management of their surveyors and their progress
Prior to fieldwork training is provided to the surveyors on the technical content of the survey. Prior to attending the introductory briefing, surveyors are provided with the de-tailed surveyor manual, a training DVD and a set of exer-cises and asked to undertake some preparatory work.
Surveyors new to the survey receive a six or seven-day resi-dential briefing. Surveyors with previous survey EHCS/EHS experience receive a two-day refresher briefing. The rigorous residential training involves both desk based and practical sessions. And is designed to encourage surveyors to adopt a standard approach to the assessment and reporting of the condition of dwellings.
The subjective nature of some assessments however means that a degree of variability is inevitable between surveyors in some of their judgements. To minimise the impact that any one surveyor can have on the results of any one region or type of property an upper target of 60 surveys is set on the number of surveys any one surveyor can complete, and that no one sur-veyor should complete more than 3 % of the total surveys in any region although in exceptional circumstances this can be increased to 5 %. These rules contribute to improving the sta-tistical reliability of the survey and providing more robust measures of housing condition below the national level.
Approximately 190 surveyors work on the survey each year each completing an average of 40 full surveys each. Around 92 % of the surveyors who were recruited to work on the EHS initially had worked on the EHCS 2007–08. There is a limited amount of turnover of surveyors each year.
Surveyors are assigned to work with several linked interview-ers in each quarterly field period. Surveyors work in two consecutive quarters each year and therefore there are around 95 surveyors in the field at any one time. Occasionally, local surveyors working other quarters are drawn upon to meet appointments. For a fuller explanation see
http://webarchive.nationalarchives.gov.uk/20120919132719/http://www.communities.gov.uk/documents/housing/pdf/1798711.pdf
4 .3 . Administrative data
4 .3 .1 . Client registers of energy companies in the Netherlands
Introduction
At time of writing (2013), at least two EU countries, The Netherlands and the United Kingdom, make extensive use of administrative data provided by the energy companies for household energy statistics and for statistics for energy use by companies as well. In this section, the experience of the Netherlands is offered as an example on how this can be done. In the next section, other experiences are briefly pre-sented, highlighting the differences.
Each year Statistics Netherlands publishes an energy balance of supply and consumption of all energy sources available in The Netherlands. Until 1995 this balance was filled with data mainly obtained by questionnaires mailed to producers and consumers. Concerns over the administrative burden urged Statistics Netherlands to look for other possible sources of this kind of information. For the consumption of electricity and natural gas the client registers of the publicly owned energy distribution companies were considered the best option to fill the information gap left by the discontinued questionnaires. This chapter explains how client registers are obtained and from whom, and discusses their content and the steps needed to extract the data required for the energy balance.
What are client registers?
Client registers are, broadly speaking, a list of electricity or gas connections of all customers of energy companies. The primary purpose of these lists are to keep track of the quan-tities of energy delivered to each customer, so that they can be accurately billed in accordance with their consumption. It typically contains a unique identifier for each connection, an address, a variable identifying the type (profile) or capacity of the connection, and a measured or estimated quantity of consumed energy (see Table 4.3 in following page for an example).
History
Starting in 1995 there was a gap in the Dutch energy balance because consumption data on supply to the service sector were no longer available (contrary to the manufacturing industry and households). Around the year 2000, work on client registers, intended to eventually fill this gap in the energy balance, started with pilot projects. Small client reg-isters were voluntarily made available by a few energy suppliers. Most important however was a new regulation by the Minister of Economic Affairs on legally obliged data provision to Statistics Netherlands. Client registers of pub-
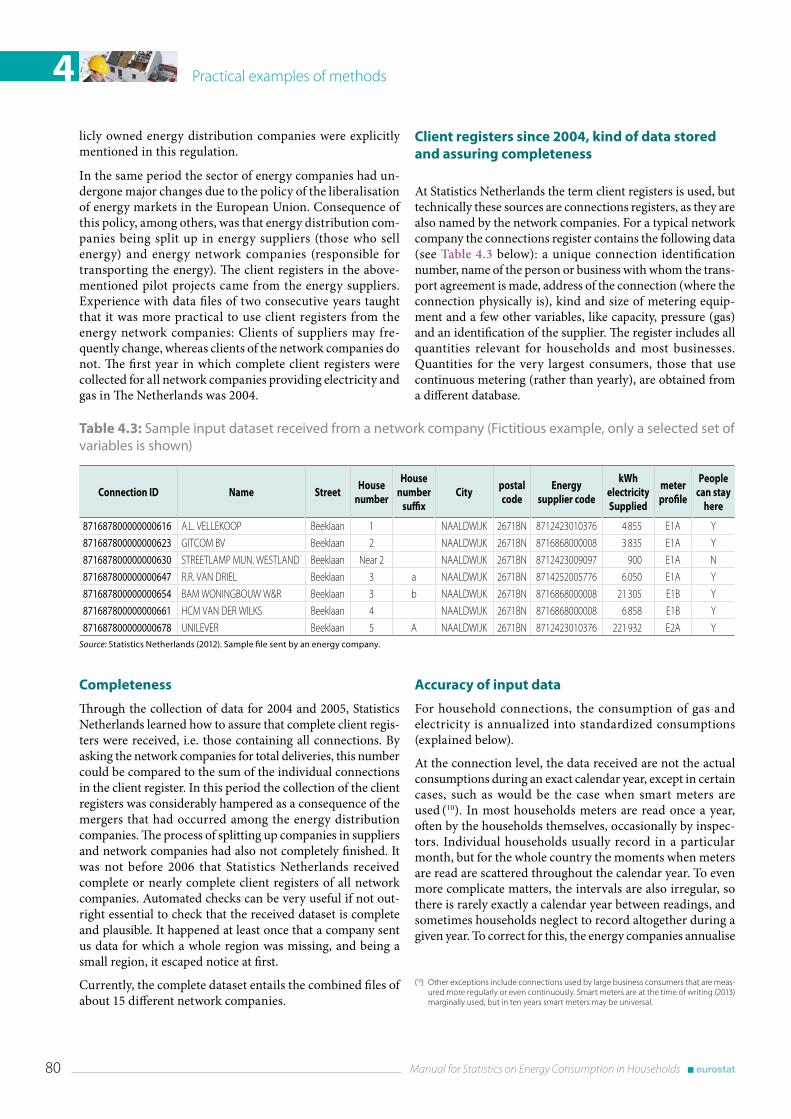
Practical examples of methods4
80 Manual for Statistics on Energy Consumption in Households
licly owned energy distribution companies were explicitly mentioned in this regulation.
In the same period the sector of energy companies had un-dergone major changes due to the policy of the liberalisation of energy markets in the European Union. Consequence of this policy, among others, was that energy distribution com-panies being split up in energy suppliers (those who sell energy) and energy network companies (responsible for transporting the energy). The client registers in the above-mentioned pilot projects came from the energy suppliers. Experience with data files of two consecutive years taught that it was more practical to use client registers from the energy network companies: Clients of suppliers may fre-quently change, whereas clients of the network companies do not. The first year in which complete client registers were collected for all network companies providing electricity and gas in The Netherlands was 2004.
Client registers since 2004, kind of data stored and assuring completeness
At Statistics Netherlands the term client registers is used, but technically these sources are connections registers, as they are also named by the network companies. For a typical network company the connections register contains the following data (see Table 4.3 below): a unique connection identification number, name of the person or business with whom the trans-port agreement is made, address of the connection (where the connection physically is), kind and size of metering equip-ment and a few other variables, like capacity, pressure (gas) and an identification of the supplier. The register includes all quantities relevant for households and most businesses. Quantities for the very largest consumers, those that use continuous metering (rather than yearly), are obtained from a different database.
Table 4.3: Sample input dataset received from a network company (Fictitious example, only a selected set of variables is shown)
Connection ID Name StreetHouse
number
House number
suffixCity
postal code
Energy supplier code
kWh electricity Supplied
meter profile
People can stay
here
871687800000000616 A.L. VELLEKOOP Beeklaan 1 NAALDWIJK 2671BN 8712423010376 4 855 E1A Y
871687800000000623 GITCOM BV Beeklaan 2 NAALDWIJK 2671BN 8716868000008 3 835 E1A Y
871687800000000630 STREETLAMP MUN. WESTLAND Beeklaan Near 2 NAALDWIJK 2671BN 8712423009097 900 E1A N
871687800000000647 R.R. VAN DRIEL Beeklaan 3 a NAALDWIJK 2671BN 8714252005776 6 050 E1A Y
871687800000000654 BAM WONINGBOUW W&R Beeklaan 3 b NAALDWIJK 2671BN 8716868000008 21 305 E1B Y
871687800000000661 HCM VAN DER WILKS Beeklaan 4 NAALDWIJK 2671BN 8716868000008 6 858 E1B Y
871687800000000678 UNILEVER Beeklaan 5 A NAALDWIJK 2671BN 8712423010376 221 932 E2A YSource: Statistics Netherlands (2012) . Sample file sent by an energy company .
Completeness
Through the collection of data for 2004 and 2005, Statistics Netherlands learned how to assure that complete client regis-ters were received, i.e. those containing all connections. By asking the network companies for total deliveries, this number could be compared to the sum of the individual connections in the client register. In this period the collection of the client registers was considerably hampered as a consequence of the mergers that had occurred among the energy distribution companies. The process of splitting up companies in suppliers and network companies had also not completely finished. It was not before 2006 that Statistics Netherlands received complete or nearly complete client registers of all network companies. Automated checks can be very useful if not out-right essential to check that the received dataset is complete and plausible. It happened at least once that a company sent us data for which a whole region was missing, and being a small region, it escaped notice at first.
Currently, the complete dataset entails the combined files of about 15 different network companies.
Accuracy of input data
For household connections, the consumption of gas and electricity is annualized into standardized consumptions (explained below).
At the connection level, the data received are not the actual consumptions during an exact calendar year, except in certain cases, such as would be the case when smart meters are used (10). In most households meters are read once a year, often by the households themselves, occasionally by inspec-tors. Individual households usually record in a particular month, but for the whole country the moments when meters are read are scattered throughout the calendar year. To even more complicate matters, the intervals are also irregular, so there is rarely exactly a calendar year between readings, and sometimes households neglect to record altogether during a given year. To correct for this, the energy companies annualise
(10) Other exceptions include connections used by large business consumers that are meas-ured more regularly or even continuously. Smart meters are at the time of writing (2013) marginally used, but in ten years smart meters may be universal.
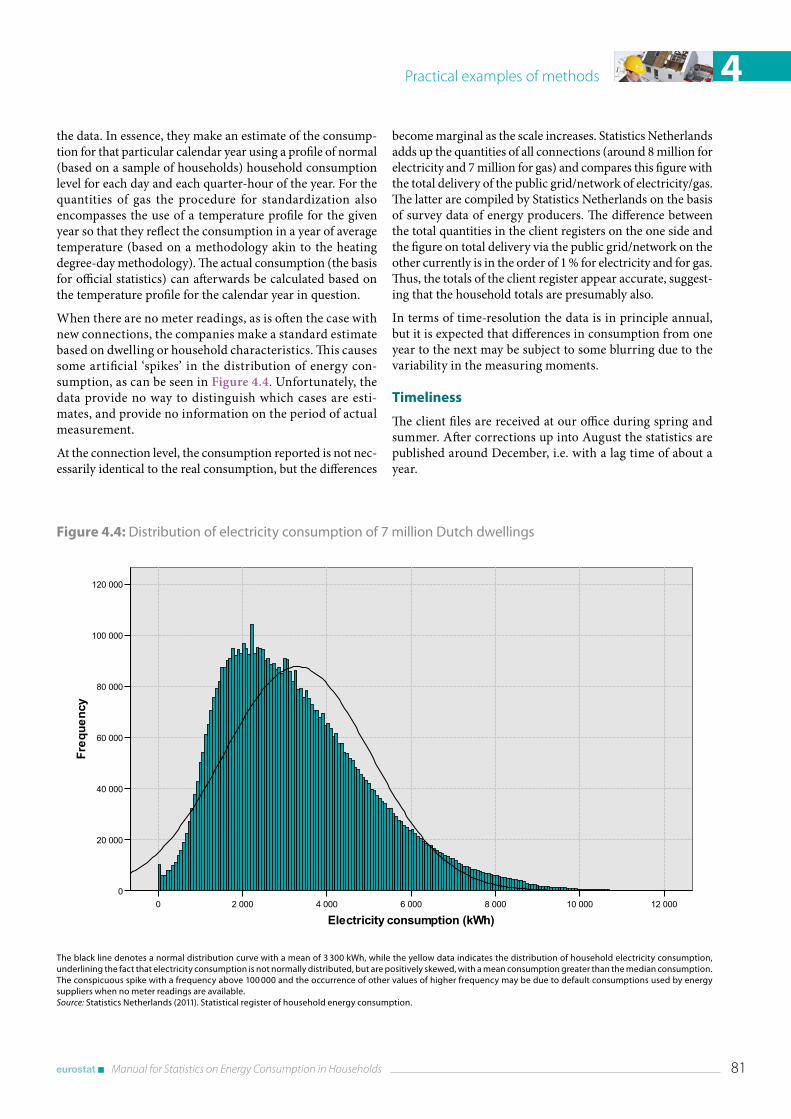
Practical examples of methods 4
Manual for Statistics on Energy Consumption in Households 81
Figure 4.4: Distribution of electricity consumption of 7 million Dutch dwellings
The black line denotes a normal distribution curve with a mean of 3 300 kWh, while the yellow data indicates the distribution of household electricity consumption, underlining the fact that electricity consumption is not normally distributed, but are positively skewed, with a mean consumption greater than the median consumption . The conspicuous spike with a frequency above 100 000 and the occurrence of other values of higher frequency may be due to default consumptions used by energy suppliers when no meter readings are available . Source: Statistics Netherlands (2011) . Statistical register of household energy consumption .
the data. In essence, they make an estimate of the consump-tion for that particular calendar year using a profile of normal (based on a sample of households) household consumption level for each day and each quarter-hour of the year. For the quantities of gas the procedure for standardization also encompasses the use of a temperature profile for the given year so that they reflect the consumption in a year of average temperature (based on a methodology akin to the heating degree-day methodology). The actual consumption (the basis for official statistics) can afterwards be calculated based on the temperature profile for the calendar year in question.
When there are no meter readings, as is often the case with new connections, the companies make a standard estimate based on dwelling or household characteristics. This causes some artificial ‘spikes’ in the distribution of energy con-sumption, as can be seen in Figure 4.4. Unfortunately, the data provide no way to distinguish which cases are esti-mates, and provide no information on the period of actual measurement.
At the connection level, the consumption reported is not nec-essarily identical to the real consumption, but the differences
become marginal as the scale increases. Statistics Netherlands adds up the quantities of all connections (around 8 million for electricity and 7 million for gas) and compares this figure with the total delivery of the public grid/network of electricity/gas. The latter are compiled by Statistics Netherlands on the basis of survey data of energy producers. The difference between the total quantities in the client registers on the one side and the figure on total delivery via the public grid/network on the other currently is in the order of 1 % for electricity and for gas. Thus, the totals of the client register appear accurate, suggest-ing that the household totals are presumably also.
In terms of time-resolution the data is in principle annual, but it is expected that differences in consumption from one year to the next may be subject to some blurring due to the variability in the measuring moments.
Timeliness
The client files are received at our office during spring and summer. After corrections up into August the statistics are published around December, i.e. with a lag time of about a year.
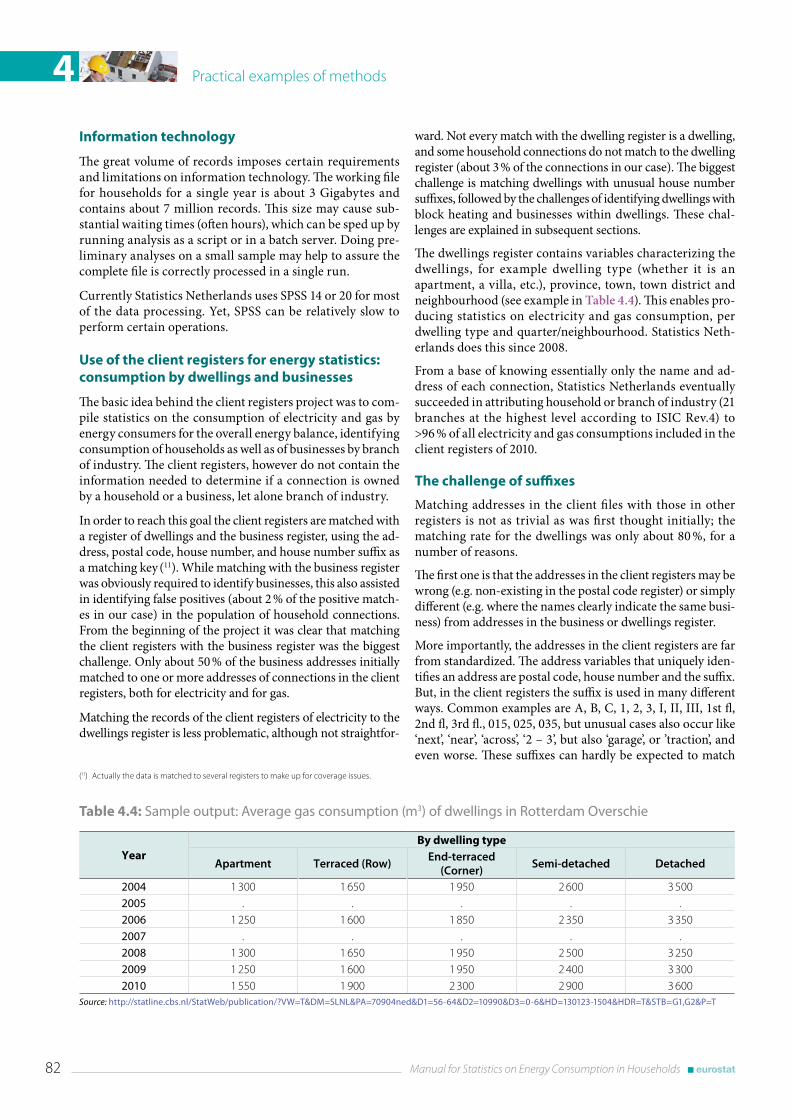
Practical examples of methods4
82 Manual for Statistics on Energy Consumption in Households
Information technology
The great volume of records imposes certain requirements and limitations on information technology. The working file for households for a single year is about 3 Gigabytes and contains about 7 million records. This size may cause sub-stantial waiting times (often hours), which can be sped up by running analysis as a script or in a batch server. Doing pre-liminary analyses on a small sample may help to assure the complete file is correctly processed in a single run.
Currently Statistics Netherlands uses SPSS 14 or 20 for most of the data processing. Yet, SPSS can be relatively slow to perform certain operations.
Use of the client registers for energy statistics: consumption by dwellings and businesses
The basic idea behind the client registers project was to com-pile statistics on the consumption of electricity and gas by energy consumers for the overall energy balance, identifying consumption of households as well as of businesses by branch of industry. The client registers, however do not contain the information needed to determine if a connection is owned by a household or a business, let alone branch of industry.
In order to reach this goal the client registers are matched with a register of dwellings and the business register, using the ad-dress, postal code, house number, and house number suffix as a matching key (11). While matching with the business register was obviously required to identify businesses, this also assisted in identifying false positives (about 2 % of the positive match-es in our case) in the population of household connections. From the beginning of the project it was clear that matching the client registers with the business register was the biggest challenge. Only about 50 % of the business addresses initially matched to one or more addresses of connections in the client registers, both for electricity and for gas.
Matching the records of the client registers of electricity to the dwellings register is less problematic, although not straightfor-
(11) Actually the data is matched to several registers to make up for coverage issues.
ward. Not every match with the dwelling register is a dwelling, and some household connections do not match to the dwelling register (about 3 % of the connections in our case). The biggest challenge is matching dwellings with unusual house number suffixes, followed by the challenges of identifying dwellings with block heating and businesses within dwellings. These chal-lenges are explained in subsequent sections.
The dwellings register contains variables characterizing the dwellings, for example dwelling type (whether it is an apartment, a villa, etc.), province, town, town district and neighbourhood (see example in Table 4.4). This enables pro-ducing statistics on electricity and gas consumption, per dwelling type and quarter/neighbourhood. Statistics Neth-erlands does this since 2008.
From a base of knowing essentially only the name and ad-dress of each connection, Statistics Netherlands eventually succeeded in attributing household or branch of industry (21 branches at the highest level according to ISIC Rev.4) to >96 % of all electricity and gas consumptions included in the client registers of 2010.
The challenge of suffixes
Matching addresses in the client files with those in other registers is not as trivial as was first thought initially; the matching rate for the dwellings was only about 80 %, for a number of reasons.
The first one is that the addresses in the client registers may be wrong (e.g. non-existing in the postal code register) or simply different (e.g. where the names clearly indicate the same busi-ness) from addresses in the business or dwellings register.
More importantly, the addresses in the client registers are far from standardized. The address variables that uniquely iden-tifies an address are postal code, house number and the suffix. But, in the client registers the suffix is used in many different ways. Common examples are A, B, C, 1, 2, 3, I, II, III, 1st fl, 2nd fl, 3rd fl., 015, 025, 035, but unusual cases also occur like ‘next’, ‘near’, ‘across’, ‘2 – 3’, but also ‘garage’, or ’traction’, and even worse. These suffixes can hardly be expected to match
Table 4.4: Sample output: Average gas consumption (m3) of dwellings in Rotterdam Overschie
YearBy dwelling type
Apartment Terraced (Row)End-terraced
(Corner)Semi-detached Detached
2004 1 300 1 650 1 950 2 600 3 5002005 . . . . .2006 1 250 1 600 1 850 2 350 3 3502007 . . . . .2008 1 300 1 650 1 950 2 500 3 2502009 1 250 1 600 1 950 2 400 3 3002010 1 550 1 900 2 300 2 900 3 600
Source: http://statline .cbs .nl/StatWeb/publication/?VW=T&DM=SLNL&PA=70904ned&D1=56-64&D2=10990&D3=0-6&HD=130123-1504&HDR=T&STB=G1,G2&P=T
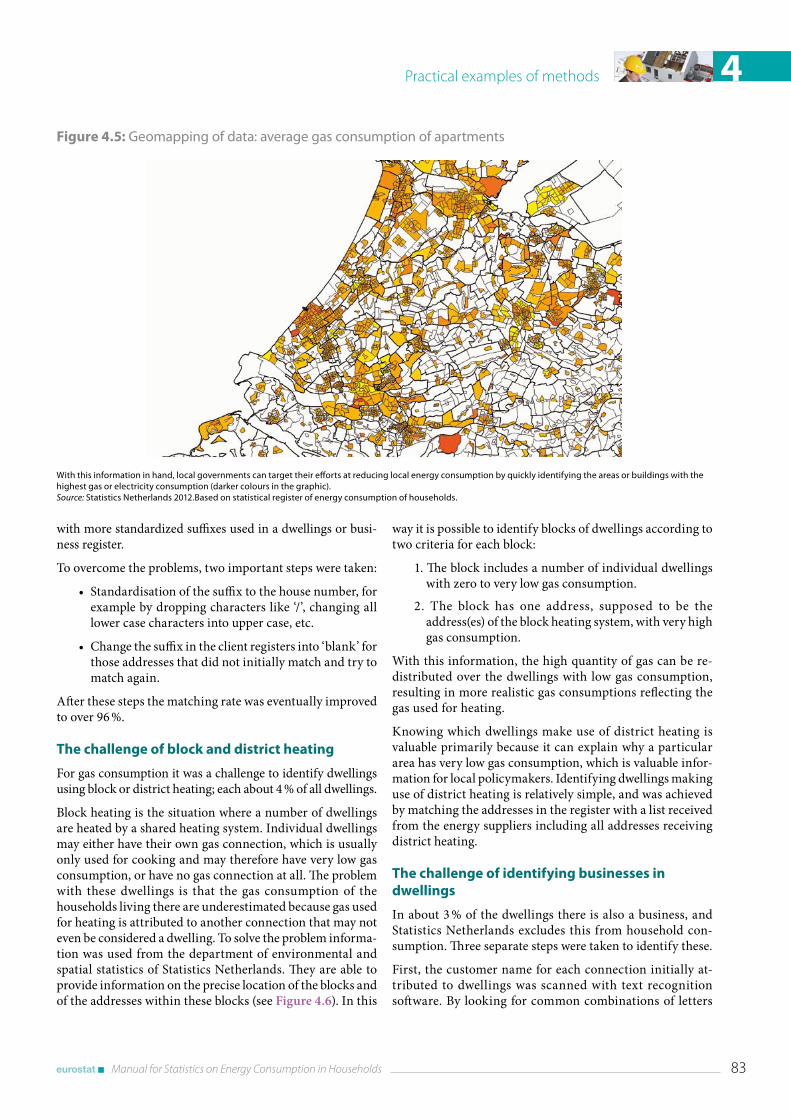
Practical examples of methods 4
Manual for Statistics on Energy Consumption in Households 83
Figure 4.5: Geomapping of data: average gas consumption of apartments
With this information in hand, local governments can target their efforts at reducing local energy consumption by quickly identifying the areas or buildings with the highest gas or electricity consumption (darker colours in the graphic) . Source: Statistics Netherlands 2012 .Based on statistical register of energy consumption of households .
with more standardized suffixes used in a dwellings or busi-ness register.
To overcome the problems, two important steps were taken:
• Standardisation of the suffix to the house number, for example by dropping characters like ‘/’, changing all lower case characters into upper case, etc.
• Change the suffix in the client registers into ‘blank’ for those addresses that did not initially match and try to match again.
After these steps the matching rate was eventually improved to over 96 %.
The challenge of block and district heating
For gas consumption it was a challenge to identify dwellings using block or district heating; each about 4 % of all dwellings.
Block heating is the situation where a number of dwellings are heated by a shared heating system. Individual dwellings may either have their own gas connection, which is usually only used for cooking and may therefore have very low gas consumption, or have no gas connection at all. The problem with these dwellings is that the gas consumption of the households living there are underestimated because gas used for heating is attributed to another connection that may not even be considered a dwelling. To solve the problem informa-tion was used from the department of environmental and spatial statistics of Statistics Netherlands. They are able to provide information on the precise location of the blocks and of the addresses within these blocks (see Figure 4.6). In this
way it is possible to identify blocks of dwellings according to two criteria for each block:
1. The block includes a number of individual dwellings with zero to very low gas consumption.
2. The block has one address, supposed to be the address(es) of the block heating system, with very high gas consumption.
With this information, the high quantity of gas can be re-distributed over the dwellings with low gas consumption, resulting in more realistic gas consumptions reflecting the gas used for heating.
Knowing which dwellings make use of district heating is valuable primarily because it can explain why a particular area has very low gas consumption, which is valuable infor-mation for local policymakers. Identifying dwellings making use of district heating is relatively simple, and was achieved by matching the addresses in the register with a list received from the energy suppliers including all addresses receiving district heating.
The challenge of identifying businesses in dwellings
In about 3 % of the dwellings there is also a business, and Statistics Netherlands excludes this from household con-sumption. Three separate steps were taken to identify these.
First, the customer name for each connection initially at-tributed to dwellings was scanned with text recognition software. By looking for common combinations of letters
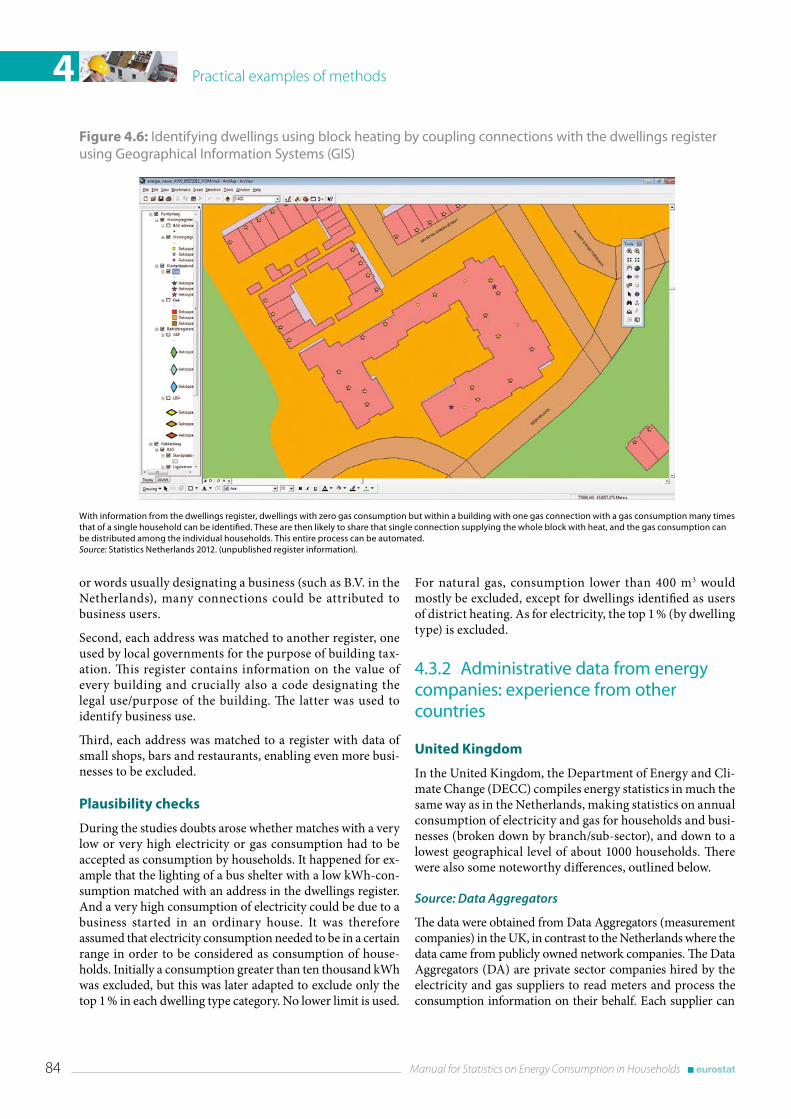
Practical examples of methods4
84 Manual for Statistics on Energy Consumption in Households
or words usually designating a business (such as B.V. in the Netherlands), many connections could be attributed to business users.
Second, each address was matched to another register, one used by local governments for the purpose of building tax-ation. This register contains information on the value of every building and crucially also a code designating the legal use/purpose of the building. The latter was used to identify business use.
Third, each address was matched to a register with data of small shops, bars and restaurants, enabling even more busi-nesses to be excluded.
Plausibility checks
During the studies doubts arose whether matches with a very low or very high electricity or gas consumption had to be accepted as consumption by households. It happened for ex-ample that the lighting of a bus shelter with a low kWh-con-sumption matched with an address in the dwellings register. And a very high consumption of electricity could be due to a business started in an ordinary house. It was therefore assumed that electricity consumption needed to be in a certain range in order to be considered as consumption of house-holds. Initially a consumption greater than ten thousand kWh was excluded, but this was later adapted to exclude only the top 1 % in each dwelling type category. No lower limit is used.
For natural gas, consumption lower than 400 m3 would mostly be excluded, except for dwellings identified as users of district heating. As for electricity, the top 1 % (by dwelling type) is excluded.
4 .3 .2 Administrative data from energy companies: experience from other countries
United Kingdom
In the United Kingdom, the Department of Energy and Cli-mate Change (DECC) compiles energy statistics in much the same way as in the Netherlands, making statistics on annual consumption of electricity and gas for households and busi-nesses (broken down by branch/sub-sector), and down to a lowest geographical level of about 1000 households. There were also some noteworthy differences, outlined below.
Source: Data Aggregators
The data were obtained from Data Aggregators (measurement companies) in the UK, in contrast to the Netherlands where the data came from publicly owned network companies. The Data Aggregators (DA) are private sector companies hired by the electricity and gas suppliers to read meters and process the consumption information on their behalf. Each supplier can
Figure 4.6: Identifying dwellings using block heating by coupling connections with the dwellings register using Geographical Information Systems (GIS)
With information from the dwellings register, dwellings with zero gas consumption but within a building with one gas connection with a gas consumption many times that of a single household can be identified . These are then likely to share that single connection supplying the whole block with heat, and the gas consumption can be distributed among the individual households . This entire process can be automated . Source: Statistics Netherlands 2012 . (unpublished register information) .
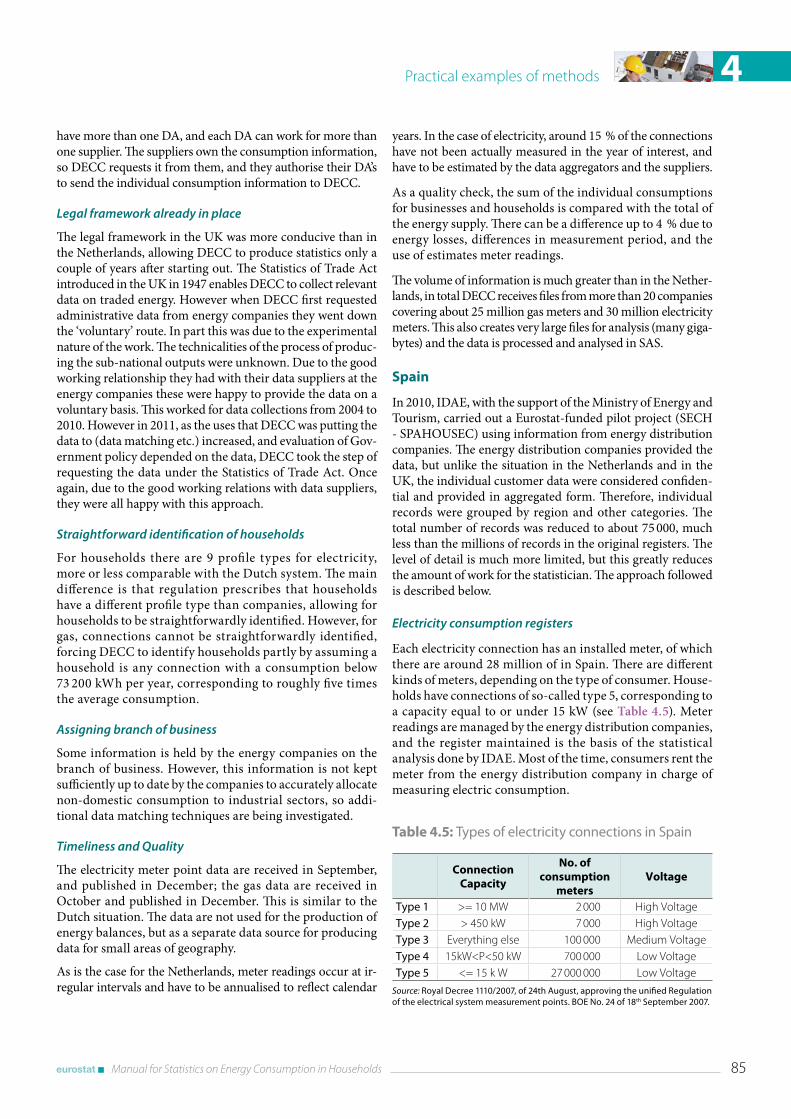
Practical examples of methods 4
Manual for Statistics on Energy Consumption in Households 85
have more than one DA, and each DA can work for more than one supplier. The suppliers own the consumption information, so DECC requests it from them, and they authorise their DA’s to send the individual consumption information to DECC.
Legal framework already in place
The legal framework in the UK was more conducive than in the Netherlands, allowing DECC to produce statistics only a couple of years after starting out. The Statistics of Trade Act introduced in the UK in 1947 enables DECC to collect relevant data on traded energy. However when DECC first requested administrative data from energy companies they went down the ‘voluntary’ route. In part this was due to the experimental nature of the work. The technicalities of the process of produc-ing the sub-national outputs were unknown. Due to the good working relationship they had with their data suppliers at the energy companies these were happy to provide the data on a voluntary basis. This worked for data collections from 2004 to 2010. However in 2011, as the uses that DECC was putting the data to (data matching etc.) increased, and evaluation of Gov-ernment policy depended on the data, DECC took the step of requesting the data under the Statistics of Trade Act. Once again, due to the good working relations with data suppliers, they were all happy with this approach.
Straightforward identification of households
For households there are 9 profile types for electricity, more or less comparable with the Dutch system. The main difference is that regulation prescribes that households have a different profile type than companies, allowing for households to be straightforwardly identified. However, for gas, connections cannot be straightforwardly identified, forcing DECC to identify households partly by assuming a household is any connection with a consumption below 73 200 kWh per year, corresponding to roughly five times the average consumption.
Assigning branch of business
Some information is held by the energy companies on the branch of business. However, this information is not kept sufficiently up to date by the companies to accurately allocate non-domestic consumption to industrial sectors, so addi-tional data matching techniques are being investigated.
Timeliness and Quality
The electricity meter point data are received in September, and published in December; the gas data are received in October and published in December. This is similar to the Dutch situation. The data are not used for the production of energy balances, but as a separate data source for producing data for small areas of geography.
As is the case for the Netherlands, meter readings occur at ir-regular intervals and have to be annualised to reflect calendar
years. In the case of electricity, around 15 % of the connections have not been actually measured in the year of interest, and have to be estimated by the data aggregators and the suppliers.
As a quality check, the sum of the individual consumptions for businesses and households is compared with the total of the energy supply. There can be a difference up to 4 % due to energy losses, differences in measurement period, and the use of estimates meter readings.
The volume of information is much greater than in the Nether-lands, in total DECC receives files from more than 20 companies covering about 25 million gas meters and 30 million electricity meters. This also creates very large files for analysis (many giga-bytes) and the data is processed and analysed in SAS.
Spain
In 2010, IDAE, with the support of the Ministry of Energy and Tourism, carried out a Eurostat-funded pilot project (SECH - SPAHOUSEC) using information from energy distribution companies. The energy distribution companies provided the data, but unlike the situation in the Netherlands and in the UK, the individual customer data were considered confiden-tial and provided in aggregated form. Therefore, individual records were grouped by region and other categories. The total number of records was reduced to about 75 000, much less than the millions of records in the original registers. The level of detail is much more limited, but this greatly reduces the amount of work for the statistician. The approach followed is described below.
Electricity consumption registers
Each electricity connection has an installed meter, of which there are around 28 million of in Spain. There are different kinds of meters, depending on the type of consumer. House-holds have connections of so-called type 5, corresponding to a capacity equal to or under 15 kW (see Table 4.5). Meter readings are managed by the energy distribution companies, and the register maintained is the basis of the statistical analysis done by IDAE. Most of the time, consumers rent the meter from the energy distribution company in charge of measuring electric consumption.
Table 4.5: Types of electricity connections in Spain
Connection
Capacity
No. of consumption
meters Voltage
Type 1 >= 10 MW 2 000 High VoltageType 2 > 450 kW 7 000 High VoltageType 3 Everything else 100 000 Medium Voltage Type 4 15kW<P<50 kW 700 000 Low VoltageType 5 <= 15 k W 27 000 000 Low Voltage
Source: Royal Decree 1110/2007, of 24th August, approving the unified Regulation of the electrical system measurement points . BOE No . 24 of 18th September 2007 .
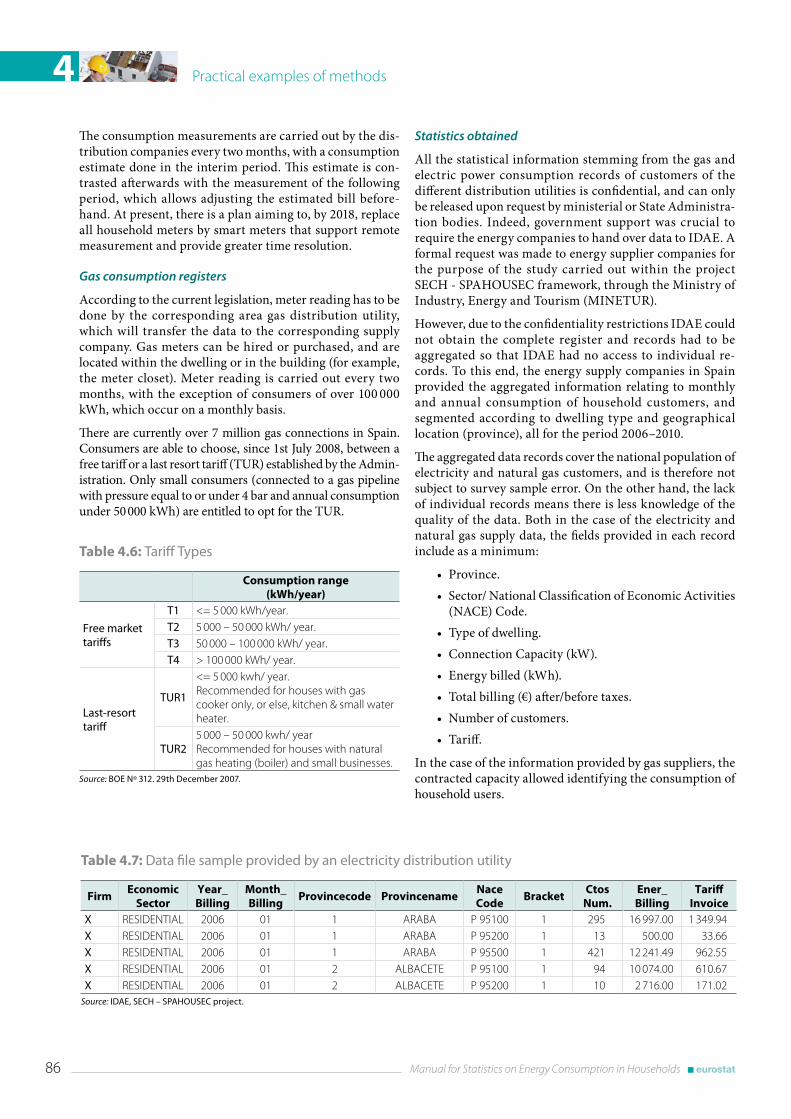
Practical examples of methods4
86 Manual for Statistics on Energy Consumption in Households
The consumption measurements are carried out by the dis-tribution companies every two months, with a consumption estimate done in the interim period. This estimate is con-trasted afterwards with the measurement of the following period, which allows adjusting the estimated bill before-hand. At present, there is a plan aiming to, by 2018, replace all household meters by smart meters that support remote measurement and provide greater time resolution.
Gas consumption registers
According to the current legislation, meter reading has to be done by the corresponding area gas distribution utility, which will transfer the data to the corresponding supply company. Gas meters can be hired or purchased, and are located within the dwelling or in the building (for example, the meter closet). Meter reading is carried out every two months, with the exception of consumers of over 100 000 kWh, which occur on a monthly basis.
There are currently over 7 million gas connections in Spain. Consumers are able to choose, since 1st July 2008, between a free tariff or a last resort tariff (TUR) established by the Admin-istration. Only small consumers (connected to a gas pipeline with pressure equal to or under 4 bar and annual consumption under 50 000 kWh) are entitled to opt for the TUR.
Table 4.6: Tariff Types
Consumption range (kWh/year)
Free market tariffs
T1 <= 5 000 kWh/year.T2 5 000 – 50 000 kWh/ year.T3 50 000 – 100 000 kWh/ year.T4 > 100 000 kWh/ year.
Last-resort tariff
TUR1
<= 5 000 kwh/ year. Recommended for houses with gas cooker only, or else, kitchen & small water heater.
TUR25 000 – 50 000 kwh/ year Recommended for houses with natural gas heating (boiler) and small businesses.
Source: BOE Nº 312 . 29th December 2007 .
Table 4.7: Data file sample provided by an electricity distribution utility
FirmEconomic
SectorYear_Billing
Month_Billing
Provincecode ProvincenameNace Code
BracketCtos
Num.Ener_Billing
Tariff Invoice
X RESIDENTIAL 2006 01 1 ARABA P 95100 1 295 16 997.00 1 349.94X RESIDENTIAL 2006 01 1 ARABA P 95200 1 13 500.00 33.66X RESIDENTIAL 2006 01 1 ARABA P 95500 1 421 12 241.49 962.55X RESIDENTIAL 2006 01 2 ALBACETE P 95100 1 94 10 074.00 610.67X RESIDENTIAL 2006 01 2 ALBACETE P 95200 1 10 2 716.00 171.02
Source: IDAE, SECH – SPAHOUSEC project .
Statistics obtained
All the statistical information stemming from the gas and electric power consumption records of customers of the different distribution utilities is confidential, and can only be released upon request by ministerial or State Administra-tion bodies. Indeed, government support was crucial to require the energy companies to hand over data to IDAE. A formal request was made to energy supplier companies for the purpose of the study carried out within the project SECH - SPAHOUSEC framework, through the Ministry of Industry, Energy and Tourism (MINETUR).
However, due to the confidentiality restrictions IDAE could not obtain the complete register and records had to be aggregated so that IDAE had no access to individual re-cords. To this end, the energy supply companies in Spain provided the aggregated information relating to monthly and annual consumption of household customers, and segmented according to dwelling type and geographical location (province), all for the period 2006–2010.
The aggregated data records cover the national population of electricity and natural gas customers, and is therefore not subject to survey sample error. On the other hand, the lack of individual records means there is less knowledge of the quality of the data. Both in the case of the electricity and natural gas supply data, the fields provided in each record include as a minimum:
• Province.
• Sector/ National Classification of Economic Activities (NACE) Code.
• Type of dwelling.
• Connection Capacity (kW).
• Energy billed (kWh).
• Total billing (€) after/before taxes.
• Number of customers.
• Tariff.
In the case of the information provided by gas suppliers, the contracted capacity allowed identifying the consumption of household users.
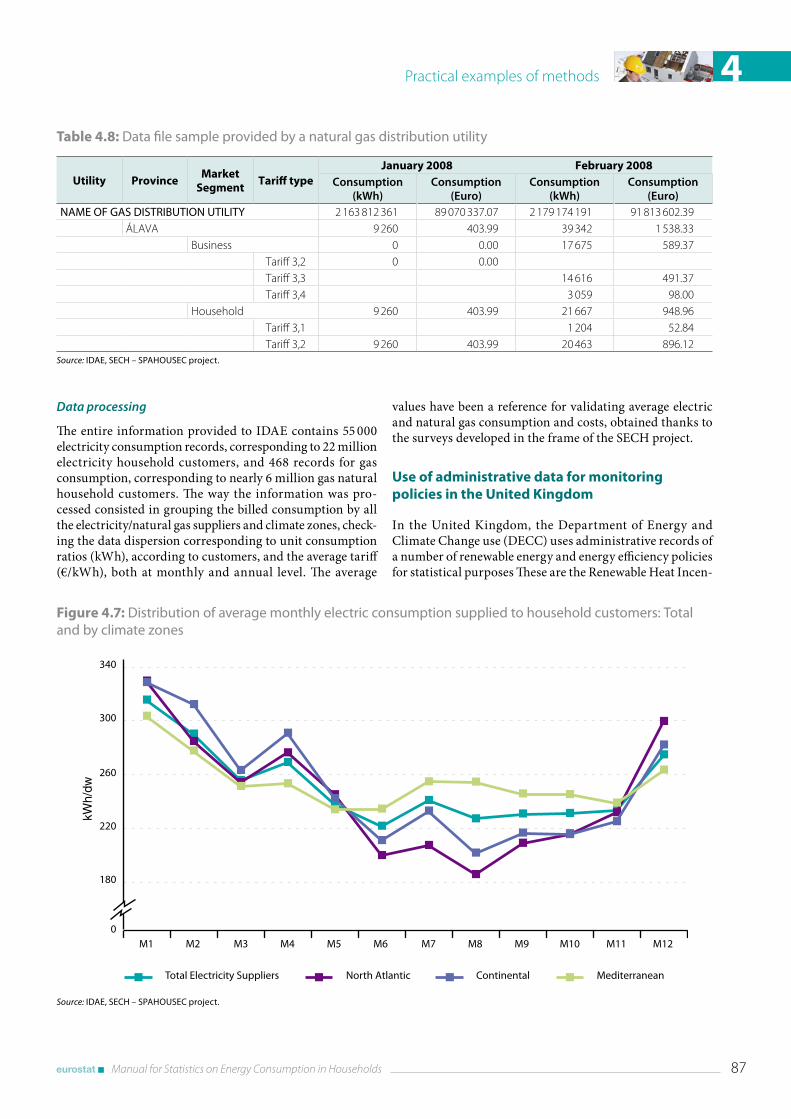
Practical examples of methods 4
Manual for Statistics on Energy Consumption in Households 87
Table 4.8: Data file sample provided by a natural gas distribution utility
Utility Province Market
SegmentTariff type
January 2008 February 2008Consumption
(kWh)Consumption
(Euro)Consumption
(kWh)Consumption
(Euro)NAME OF GAS DISTRIBUTION UTILITY 2 163 812 361 89 070 337.07 2 179 174 191 91 813 602.39
ÁLAVA 9 260 403.99 39 342 1 538.33Business 0 0.00 17 675 589.37
Tariff 3,2 0 0.00Tariff 3,3 14 616 491.37Tariff 3,4 3 059 98.00
Household 9 260 403.99 21 667 948.96Tariff 3,1 1 204 52.84Tariff 3,2 9 260 403.99 20 463 896.12
Source: IDAE, SECH – SPAHOUSEC project .
Figure 4.7: Distribution of average monthly electric consumption supplied to household customers: Total and by climate zones
Source: IDAE, SECH – SPAHOUSEC project .
M1 M2 M3 M4 M5 M6 M7 M8 M9 M10 M11 M12
180
0
220
260
300
340
kWh/
dw
Total Electricity Suppliers North Atlantic Continental Mediterranean
Data processing
The entire information provided to IDAE contains 55 000 electricity consumption records, corresponding to 22 million electricity household customers, and 468 records for gas consumption, corresponding to nearly 6 million gas natural household customers. The way the information was pro-cessed consisted in grouping the billed consumption by all the electricity/natural gas suppliers and climate zones, check-ing the data dispersion corresponding to unit consumption ratios (kWh), according to customers, and the average tariff (€/kWh), both at monthly and annual level. The average
values have been a reference for validating average electric and natural gas consumption and costs, obtained thanks to the surveys developed in the frame of the SECH project.
Use of administrative data for monitoring policies in the United Kingdom
In the United Kingdom, the Department of Energy and Climate Change use (DECC) uses administrative records of a number of renewable energy and energy efficiency policies for statistical purposes These are the Renewable Heat Incen-
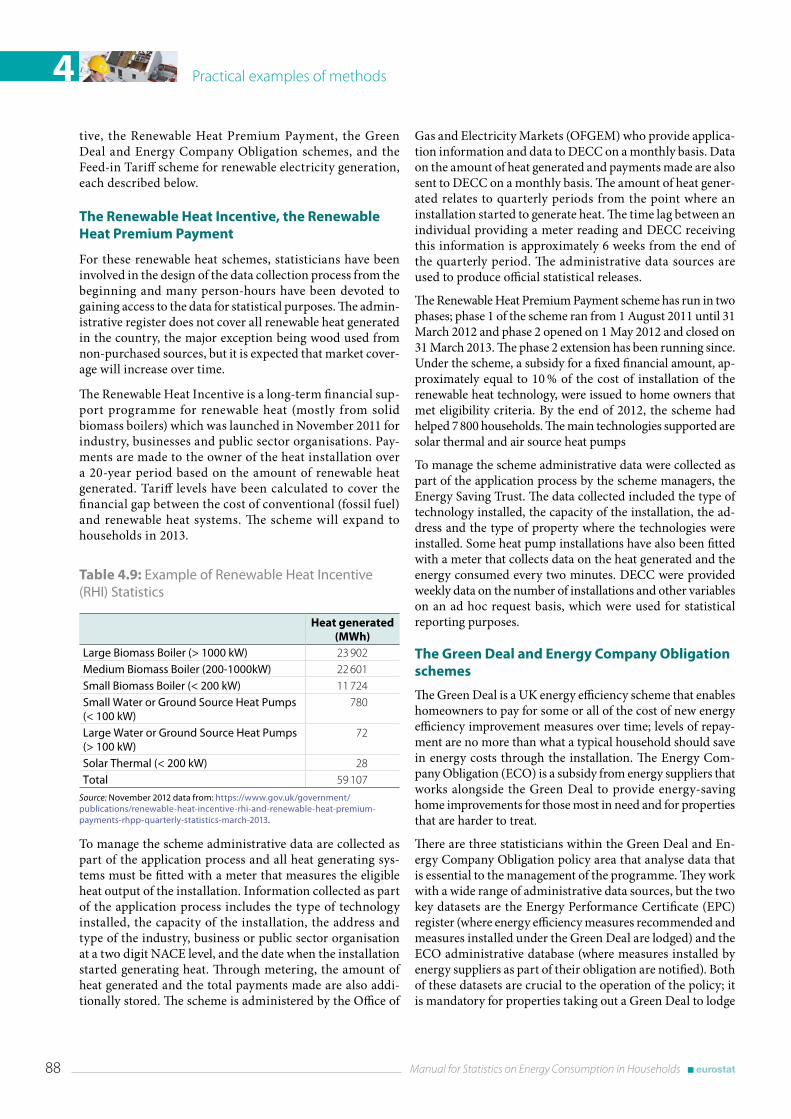
Practical examples of methods4
88 Manual for Statistics on Energy Consumption in Households
tive, the Renewable Heat Premium Payment, the Green Deal and Energy Company Obligation schemes, and the Feed-in Tariff scheme for renewable electricity generation, each described below.
The Renewable Heat Incentive, the Renewable Heat Premium Payment
For these renewable heat schemes, statisticians have been involved in the design of the data collection process from the beginning and many person-hours have been devoted to gaining access to the data for statistical purposes. The admin-istrative register does not cover all renewable heat generated in the country, the major exception being wood used from non-purchased sources, but it is expected that market cover-age will increase over time.
The Renewable Heat Incentive is a long-term financial sup-port programme for renewable heat (mostly from solid biomass boilers) which was launched in November 2011 for industry, businesses and public sector organisations. Pay-ments are made to the owner of the heat installation over a 20-year period based on the amount of renewable heat generated. Tariff levels have been calculated to cover the financial gap between the cost of conventional (fossil fuel) and renewable heat systems. The scheme will expand to households in 2013.
Table 4.9: Example of Renewable Heat Incentive (RHI) Statistics
Heat generated (MWh)
Large Biomass Boiler (> 1000 kW) 23 902Medium Biomass Boiler (200-1000kW) 22 601Small Biomass Boiler (< 200 kW) 11 724Small Water or Ground Source Heat Pumps (< 100 kW)
780
Large Water or Ground Source Heat Pumps (> 100 kW)
72
Solar Thermal (< 200 kW) 28Total 59 107
Source: November 2012 data from: https://www .gov .uk/government/publications/renewable-heat-incentive-rhi-and-renewable-heat-premium-payments-rhpp-quarterly-statistics-march-2013 .
To manage the scheme administrative data are collected as part of the application process and all heat generating sys-tems must be fitted with a meter that measures the eligible heat output of the installation. Information collected as part of the application process includes the type of technology installed, the capacity of the installation, the address and type of the industry, business or public sector organisation at a two digit NACE level, and the date when the installation started generating heat. Through metering, the amount of heat generated and the total payments made are also addi-tionally stored. The scheme is administered by the Office of
Gas and Electricity Markets (OFGEM) who provide applica-tion information and data to DECC on a monthly basis. Data on the amount of heat generated and payments made are also sent to DECC on a monthly basis. The amount of heat gener-ated relates to quarterly periods from the point where an installation started to generate heat. The time lag between an individual providing a meter reading and DECC receiving this information is approximately 6 weeks from the end of the quarterly period. The administrative data sources are used to produce official statistical releases.
The Renewable Heat Premium Payment scheme has run in two phases; phase 1 of the scheme ran from 1 August 2011 until 31 March 2012 and phase 2 opened on 1 May 2012 and closed on 31 March 2013. The phase 2 extension has been running since. Under the scheme, a subsidy for a fixed financial amount, ap-proximately equal to 10 % of the cost of installation of the renewable heat technology, were issued to home owners that met eligibility criteria. By the end of 2012, the scheme had helped 7 800 households. The main technologies supported are solar thermal and air source heat pumps
To manage the scheme administrative data were collected as part of the application process by the scheme managers, the Energy Saving Trust. The data collected included the type of technology installed, the capacity of the installation, the ad-dress and the type of property where the technologies were installed. Some heat pump installations have also been fitted with a meter that collects data on the heat generated and the energy consumed every two minutes. DECC were provided weekly data on the number of installations and other variables on an ad hoc request basis, which were used for statistical reporting purposes.
The Green Deal and Energy Company Obligation schemes
The Green Deal is a UK energy efficiency scheme that enables homeowners to pay for some or all of the cost of new energy efficiency improvement measures over time; levels of repay-ment are no more than what a typical household should save in energy costs through the installation. The Energy Com-pany Obligation (ECO) is a subsidy from energy suppliers that works alongside the Green Deal to provide energy-saving home improvements for those most in need and for properties that are harder to treat.
There are three statisticians within the Green Deal and En-ergy Company Obligation policy area that analyse data that is essential to the management of the programme. They work with a wide range of administrative data sources, but the two key datasets are the Energy Performance Certificate (EPC) register (where energy efficiency measures recommended and measures installed under the Green Deal are lodged) and the ECO administrative database (where measures installed by energy suppliers as part of their obligation are notified). Both of these datasets are crucial to the operation of the policy; it is mandatory for properties taking out a Green Deal to lodge
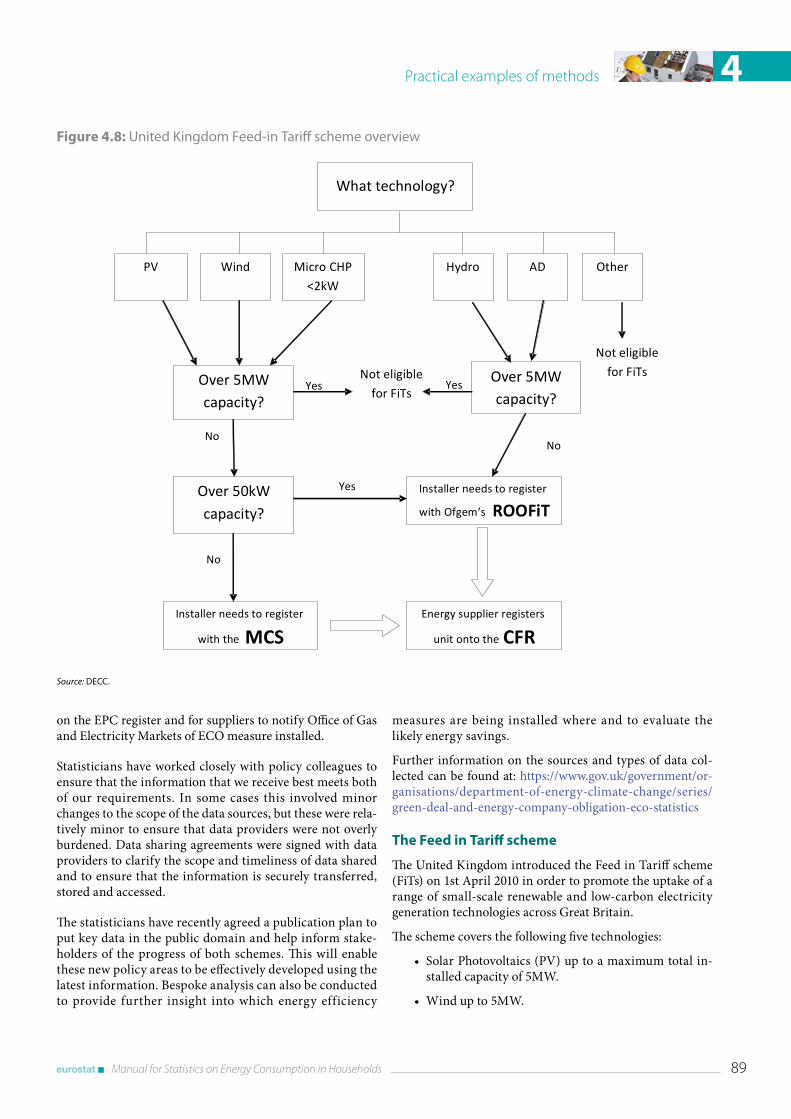
Practical examples of methods 4
Manual for Statistics on Energy Consumption in Households 89
on the EPC register and for suppliers to notify Office of Gas and Electricity Markets of ECO measure installed.
Statisticians have worked closely with policy colleagues to ensure that the information that we receive best meets both of our requirements. In some cases this involved minor changes to the scope of the data sources, but these were rela-tively minor to ensure that data providers were not overly burdened. Data sharing agreements were signed with data providers to clarify the scope and timeliness of data shared and to ensure that the information is securely transferred, stored and accessed.
The statisticians have recently agreed a publication plan to put key data in the public domain and help inform stake-holders of the progress of both schemes. This will enable these new policy areas to be effectively developed using the latest information. Bespoke analysis can also be conducted to provide further insight into which energy efficiency
measures are being installed where and to evaluate the likely energy savings.
Further information on the sources and types of data col-lected can be found at: https://www.gov.uk/government/or-ganisations/department-of-energy-climate-change/series/green-deal-and-energy-company-obligation-eco-statistics
The Feed in Tariff scheme
The United Kingdom introduced the Feed in Tariff scheme (FiTs) on 1st April 2010 in order to promote the uptake of a range of small-scale renewable and low-carbon electricity generation technologies across Great Britain.
The scheme covers the following five technologies:
• Solar Photovoltaics (PV) up to a maximum total in-stalled capacity of 5MW.
• Wind up to 5MW.
Figure 4.8: United Kingdom Feed-in Tariff scheme overview
Source: DECC .
What technology?
Over 5MW capacity?
Energy supplier registers
unit onto the CFR
Installer needs to register
with the MCS
Installer needs to register
with Ofgem’s ROOFiT
Over 5MW capacity?
Over 50kW capacity?
PV AD Hydro Micro CHP
<2kW Wind Other
Not eligible
for FiTs Not eligible
for FiTs Yes Yes
Yes
No
No
No
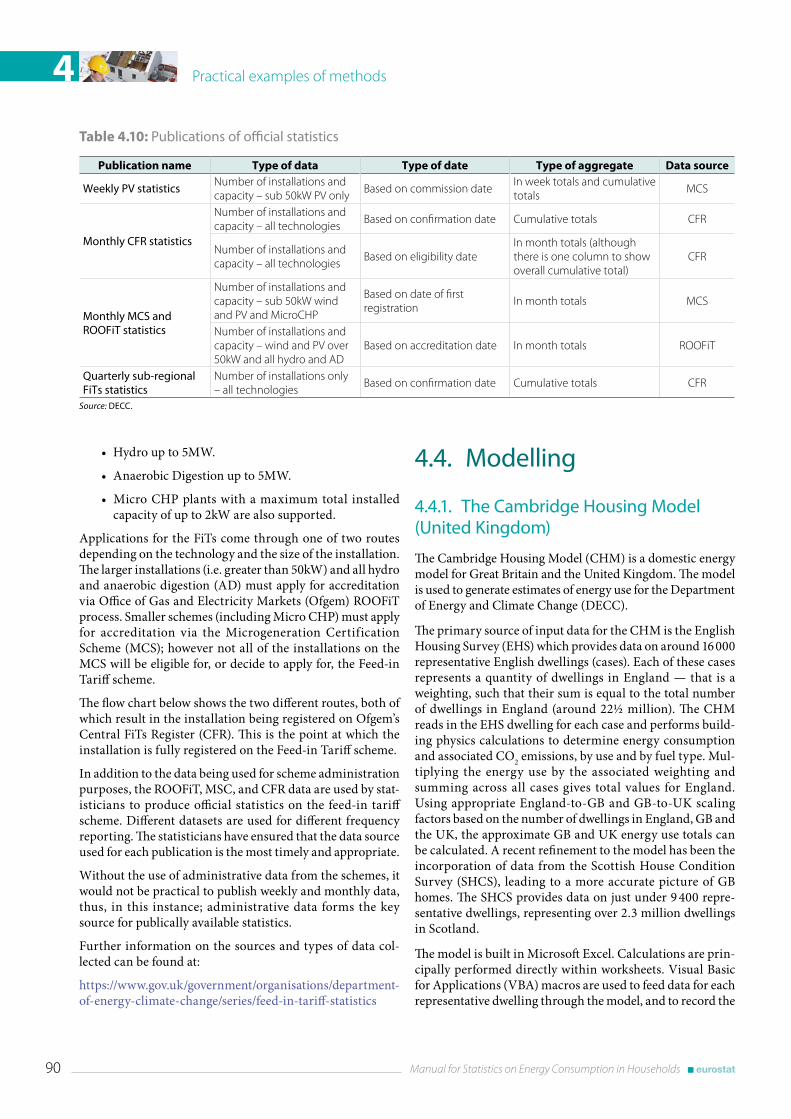
Practical examples of methods4
90 Manual for Statistics on Energy Consumption in Households
• Hydro up to 5MW.
• Anaerobic Digestion up to 5MW.
• Micro CHP plants with a maximum total installed capacity of up to 2kW are also supported.
Applications for the FiTs come through one of two routes depending on the technology and the size of the installation. The larger installations (i.e. greater than 50kW) and all hydro and anaerobic digestion (AD) must apply for accreditation via Office of Gas and Electricity Markets (Ofgem) ROOFiT process. Smaller schemes (including Micro CHP) must apply for accreditation via the Microgeneration Certification Scheme (MCS); however not all of the installations on the MCS will be eligible for, or decide to apply for, the Feed-in Tariff scheme.
The flow chart below shows the two different routes, both of which result in the installation being registered on Ofgem’s Central FiTs Register (CFR). This is the point at which the installation is fully registered on the Feed-in Tariff scheme.
In addition to the data being used for scheme administration purposes, the ROOFiT, MSC, and CFR data are used by stat-isticians to produce official statistics on the feed-in tariff scheme. Different datasets are used for different frequency reporting. The statisticians have ensured that the data source used for each publication is the most timely and appropriate.
Without the use of administrative data from the schemes, it would not be practical to publish weekly and monthly data, thus, in this instance; administrative data forms the key source for publically available statistics.
Further information on the sources and types of data col-lected can be found at:
https://www.gov.uk/government/organisations/department-of-energy-climate-change/series/feed-in-tariff-statistics
4 .4 . Modelling
4 .4 .1 . The Cambridge Housing Model (United Kingdom)
The Cambridge Housing Model (CHM) is a domestic energy model for Great Britain and the United Kingdom. The model is used to generate estimates of energy use for the Department of Energy and Climate Change (DECC).
The primary source of input data for the CHM is the English Housing Survey (EHS) which provides data on around 16 000 representative English dwellings (cases). Each of these cases represents a quantity of dwellings in England — that is a weighting, such that their sum is equal to the total number of dwellings in England (around 22½ million). The CHM reads in the EHS dwelling for each case and performs build-ing physics calculations to determine energy consumption and associated CO2 emissions, by use and by fuel type. Mul-tiplying the energy use by the associated weighting and summing across all cases gives total values for England. Using appropriate England-to-GB and GB-to-UK scaling factors based on the number of dwellings in England, GB and the UK, the approximate GB and UK energy use totals can be calculated. A recent refinement to the model has been the incorporation of data from the Scottish House Condition Survey (SHCS), leading to a more accurate picture of GB homes. The SHCS provides data on just under 9 400 repre-sentative dwellings, representing over 2.3 million dwellings in Scotland.
The model is built in Microsoft Excel. Calculations are prin-cipally performed directly within worksheets. Visual Basic for Applications (VBA) macros are used to feed data for each representative dwelling through the model, and to record the
Table 4.10: Publications of official statistics
Publication name Type of data Type of date Type of aggregate Data source
Weekly PV statisticsNumber of installations and capacity – sub 50kW PV only
Based on commission dateIn week totals and cumulative totals
MCS
Monthly CFR statistics
Number of installations and capacity – all technologies
Based on confirmation date Cumulative totals CFR
Number of installations and capacity – all technologies
Based on eligibility dateIn month totals (although there is one column to show overall cumulative total)
CFR
Monthly MCS and ROOFiT statistics
Number of installations and capacity – sub 50kW wind and PV and MicroCHP
Based on date of first registration
In month totals MCS
Number of installations and capacity – wind and PV over 50kW and all hydro and AD
Based on accreditation date In month totals ROOFiT
Quarterly sub-regional FiTs statistics
Number of installations only – all technologies
Based on confirmation date Cumulative totals CFR
Source: DECC .
Practical examples of methods 4
Manual for Statistics on Energy Consumption in Households 91
results. The calculations used in the CHM are based on the UK Standard Assessment Procedure for Energy Rating of Dwellings (‘SAP’) methodology, with a modification to in-clude appliances and cooking energy use.
Further details, and the model itself, can be found from a link at:
https://www.gov.uk/government/publications/cambridge-housing-model-and-user-guide
Information on English Housing Survey can be found here:
https://www.gov.uk/government/organisations/department-for-communities-and-local-government/series/english-housing-survey
4 .4 .2 . Model based data validation procedure (Austria)
The new approach for model based data validation was imple-mented the first time in 2004. Up to and including the 2000 survey, only the individual energy sources themselves were checked for plausibility, any missing data were calculated (quantity-value pairs) and substitutions were made if neces-sary. Such routines continue to be used, but with the addi-tional step that the total of the reported energy consumption is then checked against a calculated (modelled) overall consumption. This modelled consumption for each individu-al household is calculated from basic data for that household, on the one hand (floor space, number of people in household) and pre-set parameters for the individual types of use (space heating, water heating and cooking), on the other hand. To identify the right ‘reported’ energy consumption per house-hold in this way involves some quite complicated plausibility routines, because one or more alternative quantities have to be calculated if the quantity-value pairs do not match and these alternative quantities then, when variably applied, lead to a number of different calculated overall energy consump-tion figures. The modelled standard value is then used to select the quantity-value pairs that appear most probable.
This procedure described in detail below was implemented, because the survey results showed unreliable consumption pattern for several fuels and they were in contradiction to other information available. The results were analysed and discussed together with external experts mainly from Univer-sities and the data validation methodology was developed together with these experts. Of course this model is continu-ously developing further and the default values used have to be adapted permanently to changing circumstances. The default values are derived from households using a single fuel for the respective purpose (water heating, cooking) and from internet research, for space heating they are based on research of the technical university of Vienna. The results now are in a reliable range for all fuels and can be used — together with other surveys’ results — to compile annual energy balances for Austria and its Laender (regions).
The data validation procedure is conducted in ACCESS-VBA. The processing is based on the original, untreated data-set.
For checking the plausibility of single data sets the following set of tables with factors as follows are used:
• Fuel specific conversion factors with corresponding calorific values.
• Fixed upper limits of fuel amounts and corresponding expenses.
• Laender specific prices for natural gas, non‑ inter-ruptible and interruptible electricity.
• Average prices for the other fuels.
• Average annual energy consumption for water heating and cooking and
• Average annual energy consumption for space heating per m² depending on the dwelling’s age and size.
Single Data Level
At first, common plausibility checks and data validation in accordance with data correction are conducted on single data level — that means that all data reported on household level is used:
a) Using upper thresholds concerning the annual energy consumption of every fuel; unrealistic amounts res-pectively costs are reduced.
b) Checks on impossible fuel — purpose combinations and correction if necessary (e.g. district heat, solar energy and heat pumps cannot be used for cooking).
c) Item non response in case of missing amount OR price: completion of pairs of varieties by use of average consumption amounts / prices. Item non response in case of missing amount AND price: calculation of pairs of varieties by use of average consumption de-pending on the purpose, the fuel and the number of persons in the household.
The plausibility checks are separated into two parts: Com-puter aided checks are run during the interview (software: BLAISE) on single plausibility items (e.g. fuel amounts above average, deviations beyond 50 % of the market price). As the data validation can be suppressed during the inter-view to ensure finishing the survey, these checks have to be implemented in the second plausibility part again and checks or data-validation and — correction are conducted on the overall dataset by use of VBA-routines.
Completion and Creation of Pair of Variables
Completion of Pair of Variables in Case of Missing Amounts OR Costs
Incomplete pair of variables are completed by using average market prices as follows:

Practical examples of methods4
92 Manual for Statistics on Energy Consumption in Households
• Laender‑specific prices for non‑interruptible / inter-ruptible electricity and natural gas are based on infor-mation given by the energy suppliers (local players) and information derived from annual bills or further sources (e.g. internet publications).
• Concerning other fuels such as coals or LPG, the aver-age prices are calculated by using the extreme value-adjusted median derived from completely reported pair of varieties of the survey itself.
Creation of Pair of Varieties in Case of Missing Amounts AND Costs
In case of unknown amount and costs for a fuel used in the household, the fuel amount is calculated by summing up assumed default amounts for the announced end-use catego-ries as follows:
Calculation of the Share for Water Heating
If a fuel is used for water heating and both the amounts and costs are unknown, the households need for water heating is calculated as a proportion of the average annual consump-tion based on the number of persons living in the household. In case of using more than one fuel for water heating, the calculated overall amount for water heating is divided by the number of all fuels reported for this end-use category.
Calculation of the Share for Cooking
In case of missing amounts and costs concerning the end-use category cooking, the amount and corresponding costs are computed as the proportion of average annual consumption based on the number of persons living in the household. In case of using more than one fuel for cooking, the calculated overall amount for cooking is divided by the number of all fuels reported for this end-use category.
Calculation of the Share for Space Heating
In contrast to the energy needs for water heating and cooking the energy consumption for space heating does not depend on the number of persons but is highly related to the dwell-ing’s size and age and the living space. Figures used are split into three construction periods and into three classes of dwelling size.
As the number of flats per dwelling as well as the size and the age of the building are provided for every household by means of the Labour Force Survey, the figures for space heat-ing needs are directly applicable to each single data record. Compared with the former method of using Laender‑specific averages of fuel-specific energy needs for space heating, the new approach provides much more precise results.
Calculation of the Share for Space Heating in Case of more than one Fuel used for Space Heating
In case of 2 or more fuels used for space heating, the calcula-tion of the overall share for space heating in the household is much more complex and therefore expanded by the following factors:
• The 50 % lower threshold of the assumed final energy consumption (FEC),
• The total of the reported FEC at this point of calcula-tion,
• The heating system in forms of a single heater or central heating system and
• The predefinition of the share for space heating con-cerning the fuel predominantly used for space heating to 70 % of all fuels used for space heating (the percentage of 30 % is split in equal shares to the remaining fuels).
These factors are combined to calculate the share for space heating of one household as follows:
• If the sum of the calculated energy needs for water heating and cooking, all other reported amounts and 70 % of the calculated share for space heating concern-ing the fuel predominantly used for space heating is less than 50 % of the lower threshold of the assumed FEC, the calculated share for the fuel used predominantly for heating amounts to 70 % whereas 30 % account for the additional heating fuels with unknown amounts.
• If the sum (see above) is equal or above the 50 % lower threshold, the share for space heating concerning the predominantly used heating fuel is not assumed to account for 70 % but to 100 %. Further shares for space heating of additional heating fuels are not calculated with the exception of natural gas, wood pellets, wood chips, solar heat and heat pumps.
• Shares for space heating of fuels that are NOT the predominantly heating fuel represent the remaining 30 % and are split in equal parts.
After computing the single shares the overall fuel consump-tion and corresponding costs are calculated in the following order: water heating; cooking; space heating. If a particular fuel is allocated to more than one end-use category, the single shares are summed up and for this total the costs are calcu-lated by use of the average market prices.
Calculation of the annual Final Energy Consumption (FEC)
The consumed amounts that are reported in various physical units are converted (standardized) to kWh by means of calo-rific values. Default values of the average annual consump-tion per end-use category (space heating, water heating, cooking) enable the allocation of consumption shares for
Practical examples of methods 4
Manual for Statistics on Energy Consumption in Households 93
fuels where the amount as well as the costs have not been reported. Furthermore, default values are used to calculate the assumed FEC (= average energy need for space heating + average energy need for water heating + average energy need for cooking) of one household.
Data is checked by summing up the reported FEC on house-hold’s level and compared with a target figure, the assumed FEC. The assumed FEC is calculated by using default values for average FEC for space heating, average FEC for water heat-ing and average FEC for cooking depending on the number of persons living in one household respectively the dwelling’s age and size.
A ±50 % range of tolerance of the calculated assumed FEC is used and the overall fuel consumption per household is cor-rected in case of a divergence of the reported FEC of more or less than 50 % compared to the assumed FEC.
Household level
Calculation of the Reported FEC and the Assumed FEC
The single data correction and completion / creation of pairs of varieties is followed by the calculation of the recorded FEC on household’s level as sum of all fuels used; The reported FEC is compared to the assumed FEC — calculated by means of the end-use categories’ specific average annual amounts —, plausibility checked and possibly corrected. The tolerance interval is ±-50 % of the assumed FEC. Whether the annual energy consumption of a household can be classified as real-istic or not, the following procedures are conducted:
1. At first the reported FEC is calculated as sum of all recorded, corrected and complemented energy con-sumptions (all converted to kWh) in the household. Exceptions on this are made for non-interruptible electricity consumption that is added by summing up the default values for space heating, water heating and cooking as well as for solar heat and heat pumps that are always calculated as sums of the average annual energy shares for space and / or water heating. Elec-tricity consumption concerning the category ‘other purposes’ such as lighting, refrigerator or consumer electronics is not taken into account at this level due to its large range of variation. This share is considered for the final energy consumption at first within the frame of the fuels’ aggregation on National- and Laender‑scale.
2. As a comparable measure, the assumed FEC is used. This figure is calculated as the sum (kWh) of the aver-age annual shares for space heating, water heating and cooking as those apply to the reported predomi-nantly used heating fuel. In case of the main heating system is a single heater, the share for space heating has to be reduced by means of reducing the reported
flat’s size (m²) to 60 %. This applies to all fuel possibly used in single heaters.
3. If the reported FEC differs from the assumed FEC by more than 50 %, it is to be assumed as unrealistic and the reported FEC stepwise corrected by use of the ±50 %-tolerance range of the assumed FEC.
Correcting the FEC on Household’s Level in three Steps
All reported FEC within the thresholds are classified as real-istic and therefore are not edited any further, all reported FEC outside the target are corrected as follows:
In a first step, all pairs of varieties are proofed on plausible ratios of amount and costs. In case of unrealistic prices (the ratio of amount and costs is not in the ±25 % tolerance interval), the amounts are corrected by means of the reported costs and the reported FEC is calculated anew. If the tolerance interval of the assumed FEC is already met at this point, the data record is accepted as plausible and no further corrections are conducted.
If all prices are within tolerance but the reported FEC is too high, the consumed amount of all fuels used is reduced step-wise till the +50 % threshold of the assumed FEC is reached.
If all prices are within tolerance but the reported FEC is too low, the consumed amount of the predominantly fuel used for space heating is raised stepwise till the – 50 % threshold is reached whilst all other fuels’ amounts stay untouched.
Grossing up
In a finishing step, the reported energy amounts and costs that were corrected on household’s level as well as the calculated consumptions concerning solar heat and heat pumps are grossed up on Laender level by using following additional data (from other sources):
• Age of the dwelling.
• Size of the dwelling.
• Gas meters attributed to households.
• number of installed pellets boilers (<=100 kW).
• number of wood chips boilers (<=100 kW).
In contrast to earlier plausibility programs concerning the energy consumption of households, Laender‑specific param-eters have been implemented, providing substantially im-proved results of regional energy use.
4 .4 .3 . Model based Estimation of Energy Consumption in Second Residences (Austria)
The voluntary survey ‘Energy Consumption in Households’, conducted every two years within the frame of the obliga-tory Labour Force Survey is based on a sample of Austrian
Practical examples of methods4
94 Manual for Statistics on Energy Consumption in Households
households with main residence. For the overall final energy consumption in the household sector, secondary residences have to be considered, too. The estimation of the final energy consumption in secondary residences is done by a model based calculation.
This model uses information from the building register (dwellings registered as second homes) and socioeconomic data derived from the Labour Force Survey and Household Energy Consumption survey.
The first step is an extrapolation, i.e. the number of secondary residences is updated separately for all Laender. This ex-trapolation is based on information on the number of main and secondary residences derived from the dwelling census of 2001. It also differentiates between two dwelling categories taking into account the building’s size: detached / semi-de-tached houses and apartment buildings.
By means of the updated number of secondary residences, the final energy consumptions’ share on the total final energy consumptions of detached / semi-detached houses and apart-ment buildings is estimated for all Laender. This step not only distinguishes between the two dwelling types but also between uses of the dwelling (five for main residences and six for sec-ondary residences), primarily considering the percentage of times a flat or house is heated (secondary heating systems included):
• Unoccupied, never heated (only relevant for secondary residences).
• Without electronic frost protection, seldom heated.
• With electronic frost protection, seldom but never fully heated.
• With electronic frost protection, seldom fully heated.
• With electronic frost protection, temporarily fully heated.
• Fully heated, partially occupied.
These shares of secondary residences per type of use and the intensity of the final energy consumption are estimated in comparison to main residences. Based on the calculated six types of use, three characteristic types of heat supply are con-sidered for secondary residences in both dwelling categories:
• With electronic frost protection.
• Seldom / temporarily fully heated.
• Fully heated.
In order to estimate the effects of the final energy consump-tion per fuel on both dwelling types, the share of secondary residences on the overall number of households is corrected by means of the average living area in m² per fuel mainly used for space heating. The distribution of the average useful area is also derived from the building register, taking into account the differentiation between main and secondary residences,
the type of the dwelling (detached / semi-detached houses or apartment buildings) and the type of main fuel used for space heating. Based on the previous steps with the resulting cor-rected shares of secondary residences and by means of the results from the latest survey on Energy Consumption in Households, the output is modelled.
4 .5 . In situ measurements
Introduction
This section shows a selection of good practices employed by some European countries in the field of in situ measure-ments. Although there can be differences with regard to the practical implementation of the in situ measurement pro-grammes among the selected cases, all of the them are main-ly focused on the determination of the electricity consump-tion by end-uses and follow a similar structure, which is basically coherent with the points highlighted in section 3.5.
This section is divided in two areas focused on in situ electric-ity and in situ thermal measurement, where some interesting country experiences have been selected to serve as a practical orientation of the theoretical principles recommended in-cluded in section 3.5.
4 .5 .1 . Good Practices on in situ electricity measurements
4.5.1.1. Sweden: End Use Metering Programme in 400 Households
The monitoring programme was developed in the frame of a project ‘End-use metering programme in 400 households in Sweden, assessment of the potential electricity savings’, fi-nanced by the Swedish Energy Agency. This project was a part of the agencies program ‘Improved energy statistics in buildings and industry’. Its main goal was to monitor all main electric appliances for 400 households and 20 common areas in residential blocks. The project was carried out from August 2005 to December 2008.
General characteristics of the measurement programmes
A Multi-stage process took place over a period of 3 years. 3 000 questionnaires were sent to households, during this period. Of those who returned the questionnaire, and volunteered to participate in physical metering of the households electricity use, a sample of 400 households was drawn. In these house-holds, the electricity use at apparatus level was metered.
The selection of the households was done by the Swedish Energy Agency, leading to a good picture of the types of

Practical examples of methods 4
Manual for Statistics on Energy Consumption in Households 95
households present in Sweden. The distribution of the house-holds between apartments and houses was well balanced.
40 households were measured for one year. All the main electrical appliances were monitored at a time interval of 10 minutes; a direct measure was done for the rest. Most of the households were located in the Mälardalen region with one of these households located in the far north of Sweden, one other in the south of Sweden. Due to the number of metering devices, it was possible to monitor 20 households at the same time. Therefore this part was achieved in two years: first year: 20 households; second year: 20 households.
360 households were monitored for one month. All the main electrical appliances were monitored at a time interval of 10 minutes; a direct measure was done for the rest. 9 of these households were located in the far north of Sweden, 9 in the south (Skåne region) and the rest in the Mälardalen region. 26 metering equipment sets were used for that part: the pro-gramme was a succession of ‘installation of the monitoring equipment’/‘recording the data for one month’/‘dismantling the equipment’.
During the monitoring phase, all the appliances were regis-tered. A questionnaire ensured identification of all the appli-ances and types of lighting (model types, wattage, etc.).
With regard to the metering devices, some considerations are necessary about the following appliances:
• Audiovisual Site: In order to limit the number of me-ters used, parts of the appliances were monitored to-gether with TV’s always monitored apart. This site usu-ally groups all the equipment around television sets: TV; Hi-fi; DVD player; VCR; Satellite; Home cinema; Xbox; PS2; Projector; etc.
• Computer Sites: Computer equipment, as most of the electronic appliances, might draw much Standby pow-er. It looked therefore interesting and justified, to me-ter the computer sites. This category includes all the appliances that make up a working place (e.g. CPU, a monitor and a printer, modem/ADSL box). The total consumption of this set was analyzed, rather than the consumption of each appliance.
It is probably the first time in Europe that direct meter-ing on computers was carried out, as 451 computer sites and 139 laptops were studied and metered.
• Heating/Water Heater: In this programme, all the con-sumption involved in the heating production was mon-itored, generally directly from the switchboard. According to the questionnaire that each household owner had to fill in, the households were split in two categories: the ones ‘with direct electric heating’ (ra-diators or electric furnace) and the ones ‘without direct electric heating’ (district heating, heat pump or other types of energy). This concerned only the houses, the apartments were not split in two categories. The water
heater was monitored directly from the switchboard in the case of a three phased appliance or with a wattmeter in the case of a mono-phased device with standard electric plug.
Several types of metering devices were used to develop the monitoring programme.
• Lampmeters were used to measure the consumption of the light sources that draw a constant electrical power. All the light points with constant power were metered. The lampmeter measured the time during which the light source was switched on and the power was measured separately during the meter installation. From these two measurements, it was possible to de-termine the consumptions of each light point in the households.
• Wattmeters were connected in series with the other types of appliances to measure their consumptions. Additionally, Wattmeters connected in series with the lamp were used to determine the consumptions of the halogen lights, for which the power drawn was not constant.
• Main switchboard: Some appliances were monitored directly from the main switchboard of the household, by using a specific measuring system installed inside the fuse box.
• Thermometers to monitor the internal and external temperatures.
Once the data collection was concluded, the coherence of the records was checked through a control process based on a software tool. The data were subsequently assembled in a database. The filtering and preparation work was very long and meticulous. It was necessary to be sure that the data used was robust. It was decided to remove from the database any record that was doubtful or not reliable. The data were stored in 4 different databases: appliances monitored one month (54 million records), lighting monitored one month (53 million records), appliances monitored one year (55 million records) and lighting monitored one year (54 million records).
The sums per families of appliances and per type of room for lighting were also calculated and introduced into new databases. This allowed an easier approach to the appliance analysis. The annual consumption of the different appli-ances was calculated on a ‘per type of household’ basis. The total electricity consumption was monitored for the house-hold from the main electric switchboard. On the other hand, according to the questionnaire that each household owner had to fill in, the households were split in two catego-ries: the ones ‘with direct electric heating’ and the ones ‘without direct electric heating’.
Some appliances showed seasonality effects but most of the households were only monitored for one month, so it was necessary to apply a seasonality correction. This correction
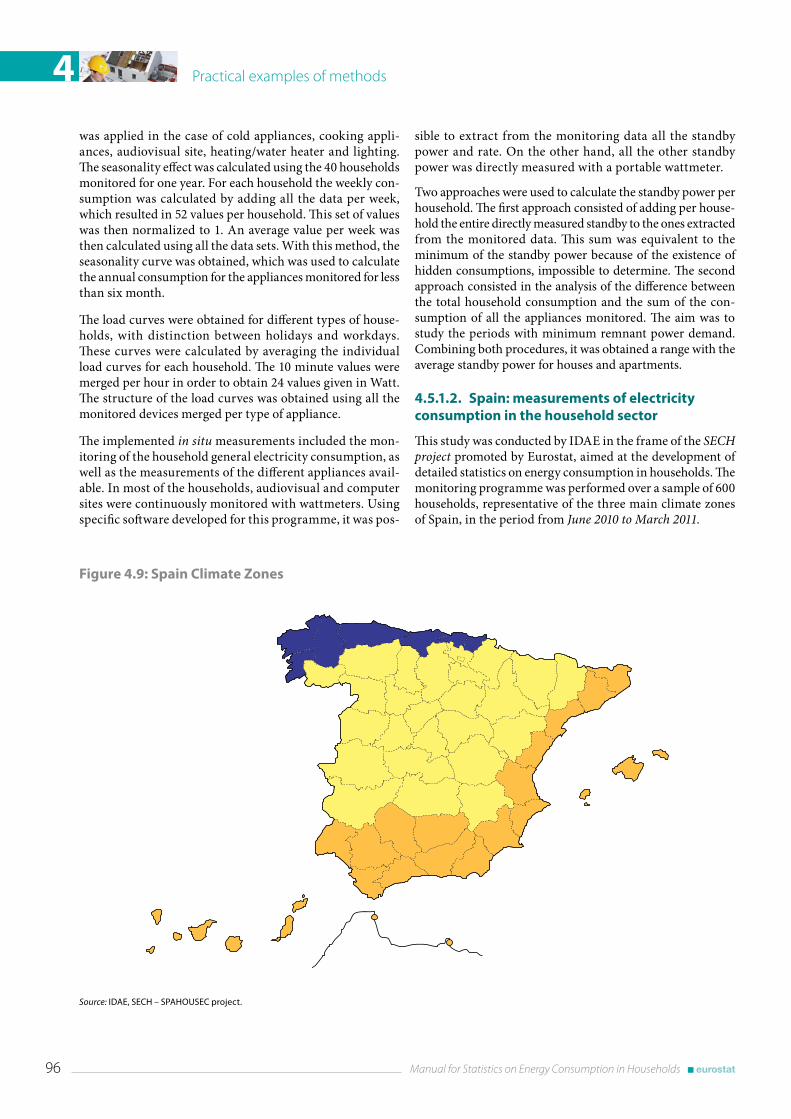
Practical examples of methods4
96 Manual for Statistics on Energy Consumption in Households
was applied in the case of cold appliances, cooking appli-ances, audiovisual site, heating/water heater and lighting. The seasonality effect was calculated using the 40 households monitored for one year. For each household the weekly con-sumption was calculated by adding all the data per week, which resulted in 52 values per household. This set of values was then normalized to 1. An average value per week was then calculated using all the data sets. With this method, the seasonality curve was obtained, which was used to calculate the annual consumption for the appliances monitored for less than six month.
The load curves were obtained for different types of house-holds, with distinction between holidays and workdays. These curves were calculated by averaging the individual load curves for each household. The 10 minute values were merged per hour in order to obtain 24 values given in Watt. The structure of the load curves was obtained using all the monitored devices merged per type of appliance.
The implemented in situ measurements included the mon-itoring of the household general electricity consumption, as well as the measurements of the different appliances avail-able. In most of the households, audiovisual and computer sites were continuously monitored with wattmeters. Using specific software developed for this programme, it was pos-
sible to extract from the monitoring data all the standby power and rate. On the other hand, all the other standby power was directly measured with a portable wattmeter.
Two approaches were used to calculate the standby power per household. The first approach consisted of adding per house-hold the entire directly measured standby to the ones extracted from the monitored data. This sum was equivalent to the minimum of the standby power because of the existence of hidden consumptions, impossible to determine. The second approach consisted in the analysis of the difference between the total household consumption and the sum of the con-sumption of all the appliances monitored. The aim was to study the periods with minimum remnant power demand. Combining both procedures, it was obtained a range with the average standby power for houses and apartments.
4.5.1.2. Spain: measurements of electricity consumption in the household sector
This study was conducted by IDAE in the frame of the SECH project promoted by Eurostat, aimed at the development of detailed statistics on energy consumption in households. The monitoring programme was performed over a sample of 600 households, representative of the three main climate zones of Spain, in the period from June 2010 to March 2011.
Figure 4.9: Spain Climate Zones
Source: IDAE, SECH – SPAHOUSEC project .
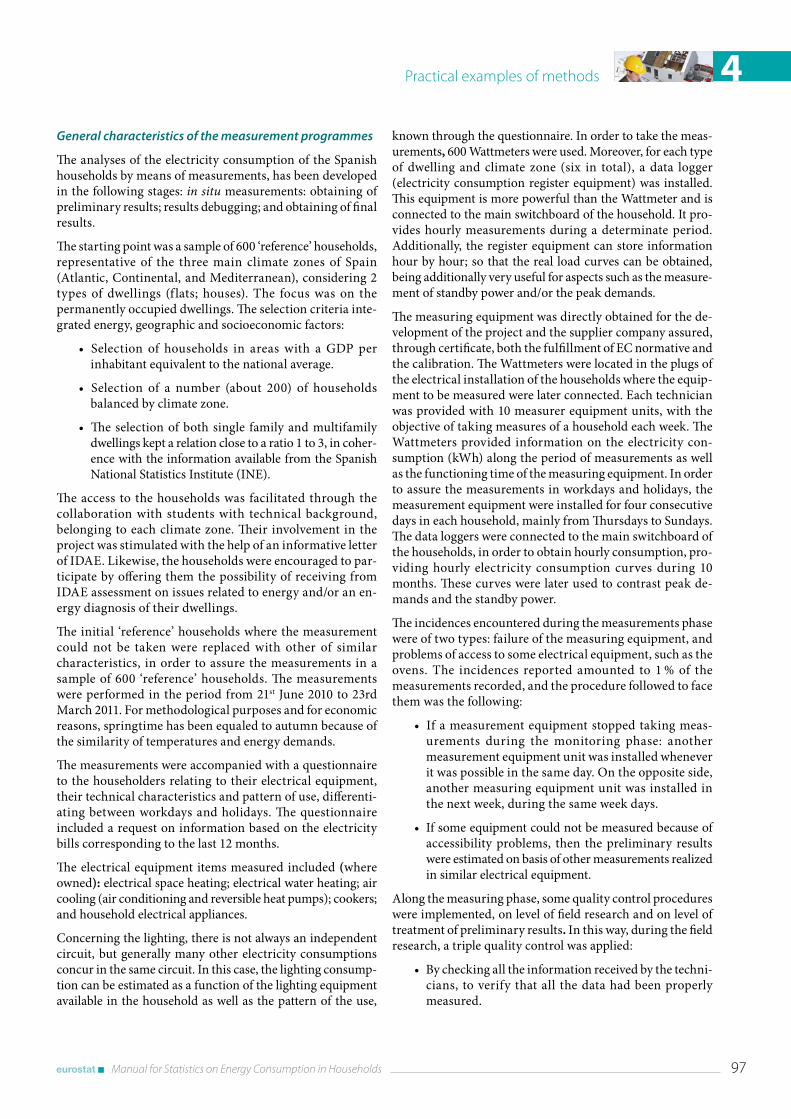
Practical examples of methods 4
Manual for Statistics on Energy Consumption in Households 97
General characteristics of the measurement programmes
The analyses of the electricity consumption of the Spanish households by means of measurements, has been developed in the following stages: in situ measurements: obtaining of preliminary results; results debugging; and obtaining of final results.
The starting point was a sample of 600 ‘reference’ households, representative of the three main climate zones of Spain (Atlantic, Continental, and Mediterranean), considering 2 types of dwellings (f lats; houses). The focus was on the permanently occupied dwellings. The selection criteria inte-grated energy, geographic and socioeconomic factors:
• Selection of households in areas with a GDP per inhabitant equivalent to the national average.
• Selection of a number (about 200) of households balanced by climate zone.
• The selection of both single family and multifamily dwellings kept a relation close to a ratio 1 to 3, in coher-ence with the information available from the Spanish National Statistics Institute (INE).
The access to the households was facilitated through the collaboration with students with technical background, belonging to each climate zone. Their involvement in the project was stimulated with the help of an informative letter of IDAE. Likewise, the households were encouraged to par-ticipate by offering them the possibility of receiving from IDAE assessment on issues related to energy and/or an en-ergy diagnosis of their dwellings.
The initial ‘reference’ households where the measurement could not be taken were replaced with other of similar characteristics, in order to assure the measurements in a sample of 600 ‘reference’ households. The measurements were performed in the period from 21st June 2010 to 23rd March 2011. For methodological purposes and for economic reasons, springtime has been equaled to autumn because of the similarity of temperatures and energy demands.
The measurements were accompanied with a questionnaire to the householders relating to their electrical equipment, their technical characteristics and pattern of use, differenti-ating between workdays and holidays. The questionnaire included a request on information based on the electricity bills corresponding to the last 12 months.
The electrical equipment items measured included (where owned): electrical space heating; electrical water heating; air cooling (air conditioning and reversible heat pumps); cookers; and household electrical appliances.
Concerning the lighting, there is not always an independent circuit, but generally many other electricity consumptions concur in the same circuit. In this case, the lighting consump-tion can be estimated as a function of the lighting equipment available in the household as well as the pattern of the use,
known through the questionnaire. In order to take the meas-urements, 600 Wattmeters were used. Moreover, for each type of dwelling and climate zone (six in total), a data logger (electricity consumption register equipment) was installed. This equipment is more powerful than the Wattmeter and is connected to the main switchboard of the household. It pro-vides hourly measurements during a determinate period. Additionally, the register equipment can store information hour by hour; so that the real load curves can be obtained, being additionally very useful for aspects such as the measure-ment of standby power and/or the peak demands.
The measuring equipment was directly obtained for the de-velopment of the project and the supplier company assured, through certificate, both the fulfillment of EC normative and the calibration. The Wattmeters were located in the plugs of the electrical installation of the households where the equip-ment to be measured were later connected. Each technician was provided with 10 measurer equipment units, with the objective of taking measures of a household each week. The Wattmeters provided information on the electricity con-sumption (kWh) along the period of measurements as well as the functioning time of the measuring equipment. In order to assure the measurements in workdays and holidays, the measurement equipment were installed for four consecutive days in each household, mainly from Thursdays to Sundays. The data loggers were connected to the main switchboard of the households, in order to obtain hourly consumption, pro-viding hourly electricity consumption curves during 10 months. These curves were later used to contrast peak de-mands and the standby power.
The incidences encountered during the measurements phase were of two types: failure of the measuring equipment, and problems of access to some electrical equipment, such as the ovens. The incidences reported amounted to 1 % of the measurements recorded, and the procedure followed to face them was the following:
• If a measurement equipment stopped taking meas-urements during the monitoring phase: another measurement equipment unit was installed whenever it was possible in the same day. On the opposite side, another measuring equipment unit was installed in the next week, during the same week days.
• If some equipment could not be measured because of accessibility problems, then the preliminary results were estimated on basis of other measurements realized in similar electrical equipment.
Along the measuring phase, some quality control procedures were implemented, on level of field research and on level of treatment of preliminary results. In this way, during the field research, a triple quality control was applied:
• By checking all the information received by the techni-cians, to verify that all the data had been properly measured.
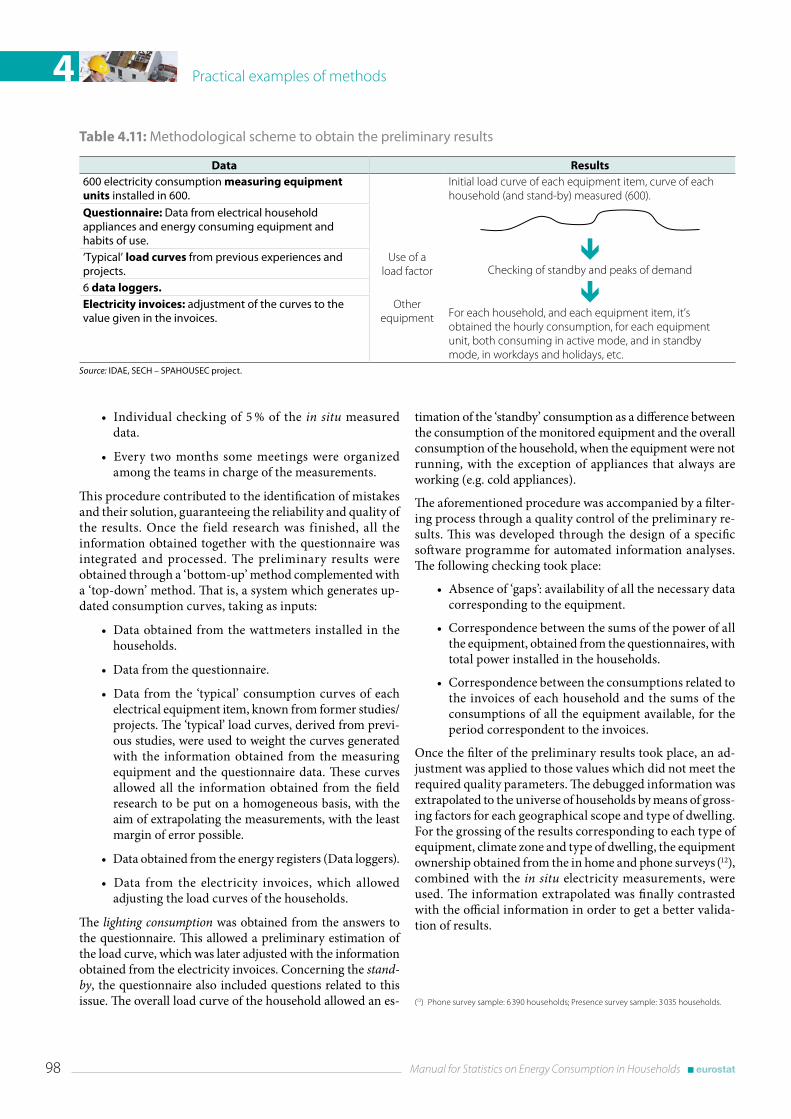
Practical examples of methods4
98 Manual for Statistics on Energy Consumption in Households
• Individual checking of 5 % of the in situ measured data.
• Every two months some meetings were organized among the teams in charge of the measurements.
This procedure contributed to the identification of mistakes and their solution, guaranteeing the reliability and quality of the results. Once the field research was finished, all the information obtained together with the questionnaire was integrated and processed. The preliminary results were obtained through a ‘bottom-up’ method complemented with a ‘top-down’ method. That is, a system which generates up-dated consumption curves, taking as inputs:
• Data obtained from the wattmeters installed in the households.
• Data from the questionnaire.
• Data from the ‘typical’ consumption curves of each electrical equipment item, known from former studies/projects. The ‘typical’ load curves, derived from previ-ous studies, were used to weight the curves generated with the information obtained from the measuring equipment and the questionnaire data. These curves allowed all the information obtained from the field research to be put on a homogeneous basis, with the aim of extrapolating the measurements, with the least margin of error possible.
• Data obtained from the energy registers (Data loggers).
• Data from the electricity invoices, which allowed adjusting the load curves of the households.
The lighting consumption was obtained from the answers to the questionnaire. This allowed a preliminary estimation of the load curve, which was later adjusted with the information obtained from the electricity invoices. Concerning the stand-by, the questionnaire also included questions related to this issue. The overall load curve of the household allowed an es-
timation of the ‘standby’ consumption as a difference between the consumption of the monitored equipment and the overall consumption of the household, when the equipment were not running, with the exception of appliances that always are working (e.g. cold appliances).
The aforementioned procedure was accompanied by a filter-ing process through a quality control of the preliminary re-sults. This was developed through the design of a specific software programme for automated information analyses. The following checking took place:
• Absence of ‘gaps’: availability of all the necessary data corresponding to the equipment.
• Correspondence between the sums of the power of all the equipment, obtained from the questionnaires, with total power installed in the households.
• Correspondence between the consumptions related to the invoices of each household and the sums of the consumptions of all the equipment available, for the period correspondent to the invoices.
Once the filter of the preliminary results took place, an ad-justment was applied to those values which did not meet the required quality parameters. The debugged information was extrapolated to the universe of households by means of gross-ing factors for each geographical scope and type of dwelling. For the grossing of the results corresponding to each type of equipment, climate zone and type of dwelling, the equipment ownership obtained from the in home and phone surveys (12), combined with the in situ electricity measurements, were used. The information extrapolated was finally contrasted with the official information in order to get a better valida-tion of results.
(12) Phone survey sample: 6 390 households; Presence survey sample: 3 035 households.
Table 4.11: Methodological scheme to obtain the preliminary results
Data Results600 electricity consumption measuring equipment units installed in 600 .
Initial load curve of each equipment item, curve of each household (and stand-by) measured (600).
Checking of standby and peaks of demand
For each household, and each equipment item, it’s obtained the hourly consumption, for each equipment unit, both consuming in active mode, and in standby mode, in workdays and holidays, etc.
Questionnaire: Data from electrical household appliances and energy consuming equipment and habits of use .‘Typical’ load curves from previous experiences and projects .
Use of a load factor
6 data loggers.Electricity invoices: adjustment of the curves to the value given in the invoices .
Other equipment
Source: IDAE, SECH – SPAHOUSEC project .
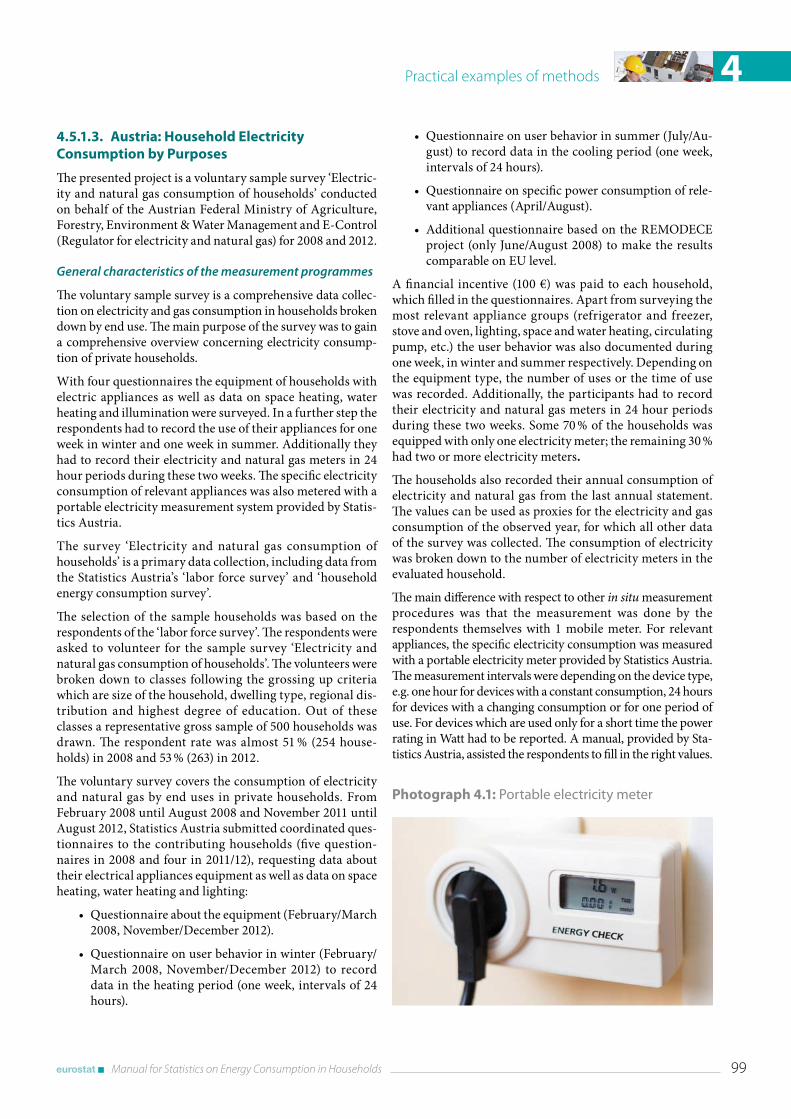
Practical examples of methods 4
Manual for Statistics on Energy Consumption in Households 99
4.5.1.3. Austria: Household Electricity Consumption by Purposes
The presented project is a voluntary sample survey ‘Electric-ity and natural gas consumption of households’ conducted on behalf of the Austrian Federal Ministry of Agriculture, Forestry, Environment & Water Management and E-Control (Regulator for electricity and natural gas) for 2008 and 2012.
General characteristics of the measurement programmes
The voluntary sample survey is a comprehensive data collec-tion on electricity and gas consumption in households broken down by end use. The main purpose of the survey was to gain a comprehensive overview concerning electricity consump-tion of private households.
With four questionnaires the equipment of households with electric appliances as well as data on space heating, water heating and illumination were surveyed. In a further step the respondents had to record the use of their appliances for one week in winter and one week in summer. Additionally they had to record their electricity and natural gas meters in 24 hour periods during these two weeks. The specific electricity consumption of relevant appliances was also metered with a portable electricity measurement system provided by Statis-tics Austria.
The survey ‘Electricity and natural gas consumption of households’ is a primary data collection, including data from the Statistics Austria’s ‘labor force survey’ and ‘household energy consumption survey’.
The selection of the sample households was based on the respondents of the ‘labor force survey’. The respondents were asked to volunteer for the sample survey ‘Electricity and natural gas consumption of households’. The volunteers were broken down to classes following the grossing up criteria which are size of the household, dwelling type, regional dis-tribution and highest degree of education. Out of these classes a representative gross sample of 500 households was drawn. The respondent rate was almost 51 % (254 house-holds) in 2008 and 53 % (263) in 2012.
The voluntary survey covers the consumption of electricity and natural gas by end uses in private households. From February 2008 until August 2008 and November 2011 until August 2012, Statistics Austria submitted coordinated ques-tionnaires to the contributing households (five question-naires in 2008 and four in 2011/12), requesting data about their electrical appliances equipment as well as data on space heating, water heating and lighting:
• Questionnaire about the equipment (February/March 2008, November/December 2012).
• Questionnaire on user behavior in winter (February/March 2008, November/December 2012) to record data in the heating period (one week, intervals of 24 hours).
• Questionnaire on user behavior in summer (July/Au-gust) to record data in the cooling period (one week, intervals of 24 hours).
• Questionnaire on specific power consumption of rele-vant appliances (April/August).
• Additional questionnaire based on the REMODECE project (only June/August 2008) to make the results comparable on EU level.
A financial incentive (100 €) was paid to each household, which filled in the questionnaires. Apart from surveying the most relevant appliance groups (refrigerator and freezer, stove and oven, lighting, space and water heating, circulating pump, etc.) the user behavior was also documented during one week, in winter and summer respectively. Depending on the equipment type, the number of uses or the time of use was recorded. Additionally, the participants had to record their electricity and natural gas meters in 24 hour periods during these two weeks. Some 70 % of the households was equipped with only one electricity meter; the remaining 30 % had two or more electricity meters.
The households also recorded their annual consumption of electricity and natural gas from the last annual statement. The values can be used as proxies for the electricity and gas consumption of the observed year, for which all other data of the survey was collected. The consumption of electricity was broken down to the number of electricity meters in the evaluated household.
The main difference with respect to other in situ measurement procedures was that the measurement was done by the respondents themselves with 1 mobile meter. For relevant appliances, the specific electricity consumption was measured with a portable electricity meter provided by Statistics Austria. The measurement intervals were depending on the device type, e.g. one hour for devices with a constant consumption, 24 hours for devices with a changing consumption or for one period of use. For devices which are used only for a short time the power rating in Watt had to be reported. A manual, provided by Sta-tistics Austria, assisted the respondents to fill in the right values.
Photograph 4.1: Portable electricity meter
Practical examples of methods4
100 Manual for Statistics on Energy Consumption in Households
When metering was impossible (e.g. built-in appliances) or in case of problems in dealing with the instrument, the me-dian of the existing values was used. The median was also used for plausibility checks. All values which were greater than 75 % from the median were replaced by the median. For all devices without measured values, default values provided by experts were used.
All households connected to the natural gas grid had to report their natural gas consumption for space and water heating as well as for cooking.
In a first step the questionnaires were checked concerning typing errors and implausible entries. These errors could be mostly avoided with internal checks. Afterwards plausibility checks were operated. Although the number of surveyed features was about 4 000, each of them was checked and the internal consistency of each questionnaire was verified. In contrast the consistency between the questionnaires was verified only partially because changes between the surveyed periods are possible e.g. in case of equipment with electric devices.
By combining user behavior with metered device-specific consumption, or in case non- metered devices with default values, the average consumptions for all surveyed appliances were calculated. The quantities for space and water heating were estimated based on daily meter readings corrected by the daily appliance consumptions. By multiplying the daily usage with its specific consumption, a characteristic con-sumption for each device and household was calculated for every day. These consumption patterns were calculated for summer and winter season separately. Given that the average holiday period in Austria is about two weeks, 350 days of use were chosen for device use. The electricity consumption, recorded in the winter and summer questionnaire, was used to calculate the average daily electricity consumption for winter and for summer, as well as for the observed calendar year. The results were extrapolated to the overall household population, considering the principal residences and the representativeness criteria.
4 .5 .2 . Best Practices’ on in situ thermal measurements
4.5.2.1. United Kingdom
Unlike the previous section focused on the electricity in situ measurement, the present section is addressed to the in situ thermal measurement, for which two interesting case studies, both developed in United Kingdom, have been selected.
Experiences in United Kingdom with the collection of household temperatures
The most recent use of temperature monitoring in the United Kingdom occurred in 2011. Every year a survey is run on
housing in England which collects a lot of data on insulation and energy use, although the latter is not required at a detailed level.
With the aim of validating models every 5 years or even longer, a more detailed Energy Follow Up Survey is run. This survey takes a sample from households who have been in the Housing Survey, hence why it is called a follow up. In the 2011 survey around 2 000 households were surveyed and provided detailed information on energy consumption, heating sys-tem, thermostats, hours of heating and temperature amongst many variables. But in order to validate and understand more about temperature, physical temperature loggers were fitted into around 900 households. The loggers were put in the main bedroom, lounge and hallway of each property, except in very small properties where only 2 were installed. The loggers recorded temperatures every 20 minutes for a course of a year. External temperatures were collected from local Met Office data.
The complete procedure followed to collect and process household temperatures is described in section 4.5, in section 5.7, which, in turn, is based on the experience reached in United Kingdom in this field. Work is ongoing on analyz-ing these data but it will make a considerable impact into understand energy use, efficiency of heating systems, heating duration, comfort and fuel poverty.
Experiences in United Kingdom with in situ U-value measurements
As it has been mentioned in section 3.5, one of the biggest problems in understanding the difference between expected and actual energy savings as a result of cavity wall or solid wall insulation is the possible variation in the thermal properties of the wall being insulated. In Great Britain, the model used as the basis for energy saving estimates assumes a fixed U value for different types of properties (by age and wall type). The model was calibrated on relatively recently built properties and in general works well for them. How-ever, when going back further in time; construction methods and materials varied a lot.
Different studies have been conducted in United Kingdom to explore whether the mean values are different, and to get a better understanding of the variance around a mean. Minimum information about the properties needs to be sampled to enable the theoretical calculation of U values: Age of property; Wall types; Wall thickness; Finishes on the walls.
Lessons from in situ monitoring experiences in the United Kingdom
In situ monitoring of U values has been crucial in building understanding in the United Kingdom of why expected en-ergy savings from different types of wall insulation are not observed in statistical data on energy consumption per

Practical examples of methods 4
Manual for Statistics on Energy Consumption in Households 101
household using meter point data. The studies conducted have shown that the assumed U values (pre-insulation) used in the main building energy model (SAP) are on average too high — which means that savings from insulation are over-estimated. This combined with other evidence (on assump-tions about heating patterns and internal temperatures) has allowed the United Kingdom to develop in-use factors which are applied to expected savings from wall insulation (which reduce the expected savings in line with the findings from real world evidence).
These in-use factors have been incorporated in the Green Deal policy and Energy Company Obligations.
Some detailed examples can be found in the following govern-ment and third sector funded studies:
• ‘Thermal transmittance of walls of dwellings before and after application of cavity wall insulation’. (March 2008). https://www.gov.uk/government/publi-cations/thermal-transmittance-of-walls-of-dwellings-before-and-after-application-of-cavity-wall-insulation
• ‘U-values and traditional buildings in situ measure-ments and their comparisons to calculated values’. (January 2011). http://www.historic-scotland.gov.uk/technicalpapers.


Country case studies

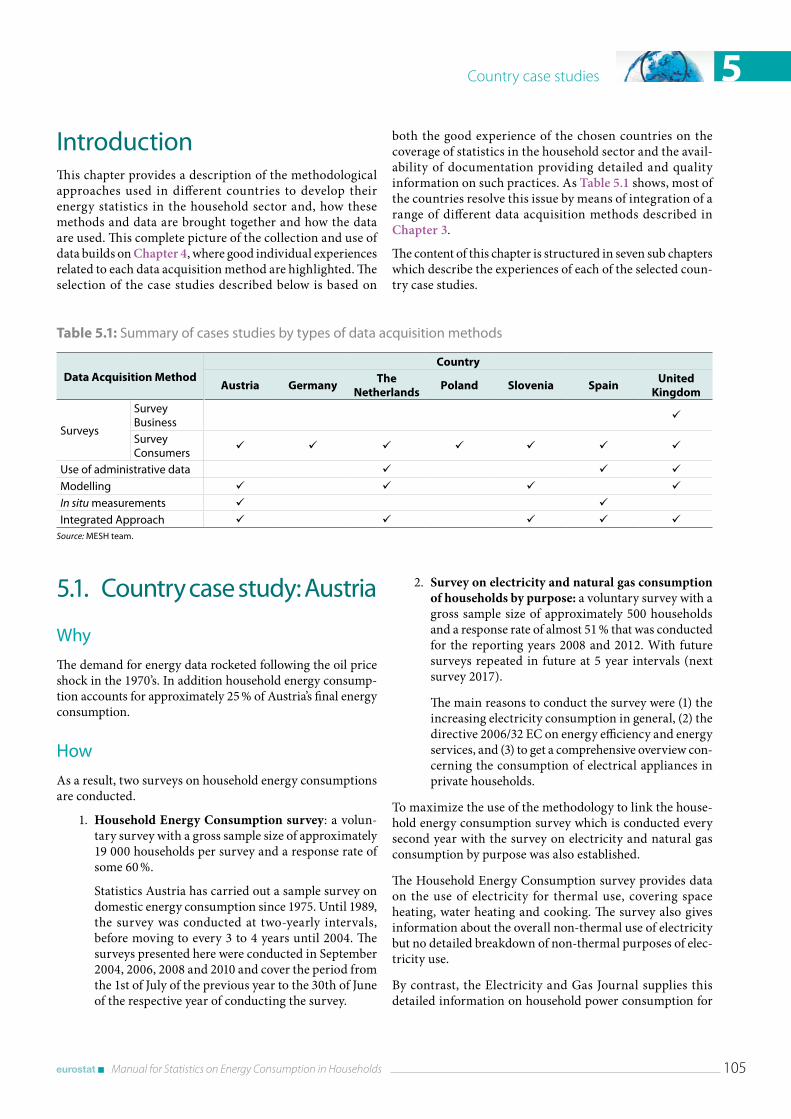
Country case studies 5
Manual for Statistics on Energy Consumption in Households 105
Table 5.1: Summary of cases studies by types of data acquisition methods
Data Acquisition MethodCountry
Austria GermanyThe
NetherlandsPoland Slovenia Spain
United Kingdom
Surveys
Survey Business
ü
Survey Consumers
ü ü ü ü ü ü ü
Use of administrative data ü ü üModelling ü ü ü üIn situ measurements ü üIntegrated Approach ü ü ü ü ü
Source: MESH team .
IntroductionThis chapter provides a description of the methodological approaches used in different countries to develop their energy statistics in the household sector and, how these methods and data are brought together and how the data are used. This complete picture of the collection and use of data builds on Chapter 4, where good individual experiences related to each data acquisition method are highlighted. The selection of the case studies described below is based on
5 .1 . Country case study: Austria
Why
The demand for energy data rocketed following the oil price shock in the 1970’s. In addition household energy consump-tion accounts for approximately 25 % of Austria’s final energy consumption.
How
As a result, two surveys on household energy consumptions are conducted.
1. Household Energy Consumption survey: a volun-tary survey with a gross sample size of approximately 19 000 households per survey and a response rate of some 60 %.
Statistics Austria has carried out a sample survey on domestic energy consumption since 1975. Until 1989, the survey was conducted at two-yearly intervals, before moving to every 3 to 4 years until 2004. The surveys presented here were conducted in September 2004, 2006, 2008 and 2010 and cover the period from the 1st of July of the previous year to the 30th of June of the respective year of conducting the survey.
both the good experience of the chosen countries on the coverage of statistics in the household sector and the avail-ability of documentation providing detailed and quality information on such practices. As Table 5.1 shows, most of the countries resolve this issue by means of integration of a range of different data acquisition methods described in Chapter 3.
The content of this chapter is structured in seven sub chapters which describe the experiences of each of the selected coun-try case studies.
2. Survey on electricity and natural gas consumption of households by purpose: a voluntary survey with a gross sample size of approximately 500 households and a response rate of almost 51 % that was conducted for the reporting years 2008 and 2012. With future surveys repeated in future at 5 year intervals (next survey 2017).
The main reasons to conduct the survey were (1) the increasing electricity consumption in general, (2) the directive 2006/32 EC on energy efficiency and energy services, and (3) to get a comprehensive overview con-cerning the consumption of electrical appliances in private households.
To maximize the use of the methodology to link the house-hold energy consumption survey which is conducted every second year with the survey on electricity and natural gas consumption by purpose was also established.
The Household Energy Consumption survey provides data on the use of electricity for thermal use, covering space heating, water heating and cooking. The survey also gives information about the overall non-thermal use of electricity but no detailed breakdown of non-thermal purposes of elec-tricity use.
By contrast, the Electricity and Gas Journal supplies this detailed information on household power consumption for
Country case studies5
106 Manual for Statistics on Energy Consumption in Households
non-thermal uses. With a suitable model the detailed infor-mation from the Electricity and Gas Journal should be able to be transferred to the results of the Household Energy Use survey.
The aims of these activities are manifold. The original aim, as required by law, is to record domestic energy consumption with the objective of making relevant information available for National Accounts. The second aim was to improve the sectoral structure of energy consumption patterns and expen-ditures on energy in the context of Energy Balances and Energy Accounts. Thirdly, the data on fuel wood consumption is an important input for reporting obligations concerning the RES Directive. Last but not least the detailed breakdown of electricity consumption by purpose related to the socioeco-nomic background provides necessary information for the Energy Efficiency Directive (2006/32/EC) and is a solid basis for forecasts on electricity demand.
What
The Household Energy Consumption Survey is an independ-ent voluntary module appended to the mandatory Labor Force Survey. Since 2006 the energy consumption survey is conducted by Computer assisted telephone interview (CATI), whilst a proportion of the Labor Force Survey also uses CATI. The energy data, along with basic data from the Labor force survey such as size of dwelling and building, construction period of the building, heating system and number of persons living in the household are transmitted in electronic form upon completion of the survey.
The grossing up is done using the criteria of labor force survey, only in case of cars and additionally with data on number of dwellings by building size and construction period, number of households connected to the natural gas grid and heating systems available for wood chips and pellets (2008 only) in case of dwelling bound fuel con-sumption.
The core of the survey program has essentially remained the same over the years. Adaptations had to be made from time to time, however, to take account of changing conditions or new situations. In September 2004, for example, following the complete restructuring of the entire survey (switch from face-to-face interviews to CATI), a totally new program was introduced for data control.
A new approach to data control was implemented the first time in 2004. Up to and including the 2000 survey, only the individual energy sources themselves were checked for plau-sibility, any missing data were calculated (using quantity-value pairs) and substitutions made if necessary. Such routines continue to be used, with the additional step that the total of the reported energy consumption is then checked against a calculated (modeled) overall consumption. This modeled consumption for each household is calculated from
basic data for that household, (floor space, and number of people in household) and pre-set parameters for the indi-vidual types of use (space heating, water heating and cooking). To identify the right ‘reported’ energy consump-tion per household in this way involves some quite compli-cated plausibility routines, because one or more alternative quantities have to be calculated if the quantity-value pairs do not match and these alternative quantities then, when vari-ably applied, lead to a number of different calculated overall energy consumption figures. The fictitious standard value is then used to select the quantity-value pairs that appear most probable. For further details see section 4.4.2. Model based data validation procedure (Austria)
The Household Energy Consumption Survey focuses on household energy consumption in main residences only. The consumption in second homes is modelled from the results of the survey and additional information from the building register and the results of the Labour Force Survey, to get the overall energy consumption of households that is needed for compiling the energy balances. For further details see section 4.4.3. Model based estimation of energy consump-tion in second residences (Austria).
The first section of the survey comprises all dwelling-bound consumption on the main residence and the associated ex-penditure, broken down by the following fuels:
• Hard coal
• Lignite
• Brown coal briquettes
• Coke
• Fuel wood
• Pellets
• Wood briquettes
• Wood chips
• Fuel oil
• LPG
• Electricity (broken down into non‑interruptible and interruptible)
• Natural gas
• Solar
• Heat pumps
• District heat
• Central heating, fuel unknown
Differentiated according to types of use as follows:
• Space heating
• Water heating

Country case studies 5
Manual for Statistics on Energy Consumption in Households 107
• Cooking
• Other uses (only with concern to electricity: light, con-sumer electronics etc.).
The second part focus on the age of the primary heating system, the type of additional heating systems used, if any, air conditioning and insulation measures.
The third, completely independent, section relates to energy consumption of vehicles — age of car — air conditioning — fuel used — annual mileage — average fuel consumption per 100 km, in each case with a separate set of questions for the household’s first and second car.
The survey ‘Electricity and natural gas consumption of households by purpose’ is a primary data collection. The voluntary survey covers the consumption of electricity and natural gas in private households, broken down by consump-tion purpose.
The statistics cover the consumption of electricity and natu-ral gas in private households. With five questionnaires the equipment of households with electric appliances as well as data on space heating, water heating and illumination were surveyed. In a further step, the respondents had to record the use of their appliances for one week in winter and for one week in summer. Additionally, they had to read out their electricity and natural gas meters in 24 hour periods during these two weeks. Last but not least, the specific electricity consumption of relevant appliances had to be metered with a portable electricity measurement system provided by Sta-tistics Austria.
One third of the data was sent by email and two thirds were transferred by regular mail.
The linkage between the two surveys was done by statistical data matching and by using the following variables (V1 to V11), which were present in all data records, whereby the data records from the survey ‘Electricity and natural gas con-sumption of households by purpose’ served as the ‘donor data records’ for the ‘recipient data records’ of the Household Energy Consumption Survey because of the detailed infor-mation they contained regarding power consumption for non-thermal uses:
• V1: Number of persons in the household (5 categories)
• V2: Number of dwellings in the property (5 categories)
• V3: Federal province (9 categories)
• V4: Age of property (8 categories)
• V5: Legal relationship to the dwelling (6 categories)
• V6: Use of solar heating (2 categories)
• V7: Primary heating system (5 categories)
• V8: Space heating with electricity (2 categories)
• V9: Water heating with electricity (2 categories)
• V10: Living area (m²)
• V11: Overall power consumption (kWh/a).
Issues
Whilst the approach provides a comprehensive set of house-hold energy consumption data, there are a number of issues with detailed data. These include:
• The results are produced at sub‑national level and at this level the statistical error for not frequently used fuels is high.
• Because the surveys focus is on households in their main residence the consumption in second homes has to be estimated.
• The breakdown of consumption by thermal purposes is based on default values on fuel consumption by m² (space heating) and number of household members (water heating and cooking).
• The reporting period is not the calendar year and has therefore to be converted to calendar years with heat-ing degree days.
• The survey frequency is bi‑annual and therefore the year after the most recent survey has to be extrapolated with heating degree days. After the follow up survey these data have to be revised to take into account the structural changes.
Use
• Energy balances and joint questionnaires
• Energy accounts
• Reporting obligations along RES Directive
• Reporting obligations along Energy Efficiency and Building Directive
• Calculation of Energy saving potentials.
Coverage
The surveys provide a good picture for quantities of all fre-quently used fuels and the related expenditures, both by consumption purposes on national and sub national (Laender of Austria) level and the fuel consumption of private cars as well as related costs and annually driven km.
Future plans
Since all current needs can be fulfilled with the already existing data collection and analyses activities no concrete actions are planned for the time being, besides the continuous check and adaptation of the default values and model assumptions used.
Country case studies5
108 Manual for Statistics on Energy Consumption in Households
5 .2 . Country case study: Germany
Why
On behalf of the German Ministry of Economics and Technol-ogy, RWI and Forsa conduct an efficient survey with respect to the energy consumption of private households to gather full information on all energy sources employed by households including energy consumption of private vehicles.
The data collected are used to inform the public and policy makers in detail about household energy consumption, such as the individual households’ consumption of fossil fuels. In addition these surveys provide information on housing con-ditions, the characteristics of the household dwelling, and the endowment with electric appliances.
The data also serve scientific purposes as a foundation to determine the consumption of various fuels for residential purposes including private car use. The data enables analysis of the determinants of household energy consumption, the change in household energy consumption with respect to energy prices, or energy poverty. Insights gathered from the scientific analysis of the survey data ultimately facilitate policy advice.
In an on-going effort to establish an energy panel in Germany, the most recent documented survey covers the energy con-sumption of approximately 7 000 households nationwide for the years 2009 and 2010, with earlier survey waves covering the years since 2003. Data for the years 2011 and 2012 will be gathered at the outset of 2014, with additional improvements on the questionnaire and survey design currently in progress.
How
Sampling
The samples of participating households are drawn from the population of German-speaking residents aged 14 to 69, with the aim of assembling a representative panel, the only panel of its kind that covers energy consumption of households over multiple years in Europe . Recruitment is via a multistage, random-sampling procedure based on computer-supported telephone interviews.
Survey instrument
Each participating household is equipped with an interface that projects the questions on the respondent’s television screen and allows an easy implementation of complex ques-tionnaires by filter techniques and visual assistance. Respond-ents may answer the questions at any time of their choosing; they are not under time pressure and are not obligated to
complete the questionnaire in a single session. The forsa tool, which immediately saves the collected information on a server, allows for automatic consistency and validity checks during the data input by the participant. This ensures that the collected data is of high quality.
Notoriously critical points for surveys on energy consumption are the complex heating bills for dwelling in multi-family homes with central heating. To address this challenge, an interview tool was developed that draws extensively on the visualizing and filter abilities of the forsa tool. After a house-hold has indicated its respective billing company, the survey procedure subsequently presents an exemplary bill issued by the company. The tool goes step by step through the details of the exemplary bill, while highlighting the parameters of interest (see Table 5.1). By this means, both the error rate and drop-out quota of households living in multi-family houses with central heating were reduced substantially.
To glean an impression regarding the validity of the data obtained from this approach, billing information for a sub-sample of house-holds from the year 2005 was requested from the firm that issued the bill. A comparison of the original bill with the exemplary bill used in the survey re-vealed a high degree of validity, providing some assurance of the reliability of the information.
Measuring consumption is particularly challenging for stock-able fuels, such as fuel oil. Typically, households are able to provide information about the purchased quantity, but the delivered amount is likely to deviate from the quantity that is actually consumed. To mitigate such problems, for the target years 2006 to 2008, for instance, the households’ deliveries were surveyed for the period from 2005 to 2009, and the household’s fuel consumption was calculated using informa-tion of heating-degree days (HDD) of the corresponding years. The household-specific climate conditions were ob-tained by a grid of climate stations operated by Deutscher Wetterdienst, and geographically interpolated to the house-holds’ places of residence.
By summing the quantity of fuel delivered while simultane-ously taking into account the HDD, it is possible to estimate the yearly consumption for a household according to the following formula for the year 2006:
=2006,i 2006,i * =∑
2009
2005t,i
t
Quantity Delivered
Consumption HDD
=∑
2009
2005t,i
t
HDD
Where is the household-specific heating degree days in year t at the location of household i, which is in turn calculated as the sum of household-specific degree days within the year t:
∈= ∑, ,t i d i
d t
HDD G
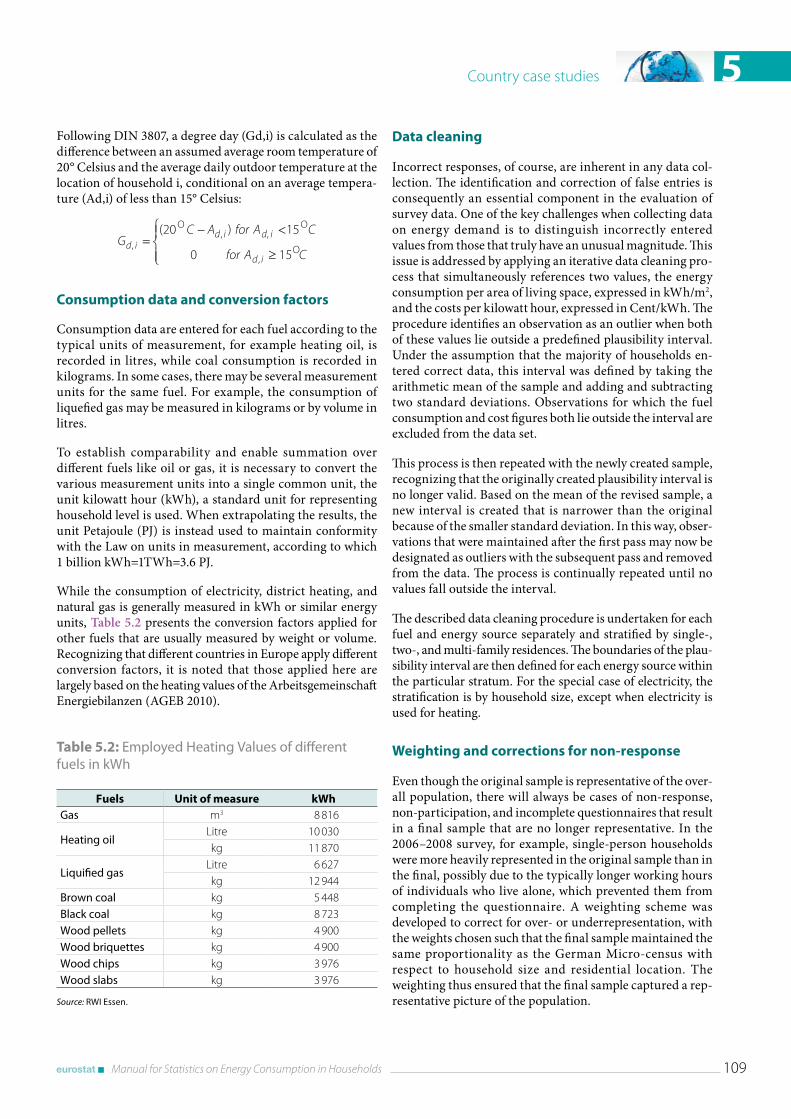
Country case studies 5
Manual for Statistics on Energy Consumption in Households 109
Following DIN 3807, a degree day (Gd,i) is calculated as the difference between an assumed average room temperature of 20° Celsius and the average daily outdoor temperature at the location of household i, conditional on an average tempera-ture (Ad,i) of less than 15° Celsius:
Ο Ο
Ο
− <= ≥
, ,,
,
(20 ) 15
0 15
d i d id i
d i
C A for A CG
for A C
Consumption data and conversion factors
Consumption data are entered for each fuel according to the typical units of measurement, for example heating oil, is recorded in litres, while coal consumption is recorded in kilograms. In some cases, there may be several measurement units for the same fuel. For example, the consumption of liquefied gas may be measured in kilograms or by volume in litres.
To establish comparability and enable summation over different fuels like oil or gas, it is necessary to convert the various measurement units into a single common unit, the unit kilowatt hour (kWh), a standard unit for representing household level is used. When extrapolating the results, the unit Petajoule (PJ) is instead used to maintain conformity with the Law on units in measurement, according to which 1 billion kWh=1TWh=3.6 PJ.
While the consumption of electricity, district heating, and natural gas is generally measured in kWh or similar energy units, Table 5.2 presents the conversion factors applied for other fuels that are usually measured by weight or volume. Recognizing that different countries in Europe apply different conversion factors, it is noted that those applied here are largely based on the heating values of the Arbeitsgemeinschaft Energiebilanzen (AGEB 2010).
Table 5.2: Employed Heating Values of different fuels in kWh
Fuels Unit of measure kWhGas m3 8 816
Heating oilLitre 10 030kg 11 870
Liquified gasLitre 6 627kg 12 944
Brown coal kg 5 448Black coal kg 8 723Wood pellets kg 4 900Wood briquettes kg 4 900Wood chips kg 3 976Wood slabs kg 3 976
Source: RWI Essen .
Data cleaning
Incorrect responses, of course, are inherent in any data col-lection. The identification and correction of false entries is consequently an essential component in the evaluation of survey data. One of the key challenges when collecting data on energy demand is to distinguish incorrectly entered values from those that truly have an unusual magnitude. This issue is addressed by applying an iterative data cleaning pro-cess that simultaneously references two values, the energy consumption per area of living space, expressed in kWh/m2, and the costs per kilowatt hour, expressed in Cent/kWh. The procedure identifies an observation as an outlier when both of these values lie outside a predefined plausibility interval. Under the assumption that the majority of households en-tered correct data, this interval was defined by taking the arithmetic mean of the sample and adding and subtracting two standard deviations. Observations for which the fuel consumption and cost figures both lie outside the interval are excluded from the data set.
This process is then repeated with the newly created sample, recognizing that the originally created plausibility interval is no longer valid. Based on the mean of the revised sample, a new interval is created that is narrower than the original because of the smaller standard deviation. In this way, obser-vations that were maintained after the first pass may now be designated as outliers with the subsequent pass and removed from the data. The process is continually repeated until no values fall outside the interval.
The described data cleaning procedure is undertaken for each fuel and energy source separately and stratified by single-, two-, and multi-family residences. The boundaries of the plau-sibility interval are then defined for each energy source within the particular stratum. For the special case of electricity, the stratification is by household size, except when electricity is used for heating.
Weighting and corrections for non-response
Even though the original sample is representative of the over-all population, there will always be cases of non-response, non-participation, and incomplete questionnaires that result in a final sample that are no longer representative. In the 2006–2008 survey, for example, single-person households were more heavily represented in the original sample than in the final, possibly due to the typically longer working hours of individuals who live alone, which prevented them from completing the questionnaire. A weighting scheme was developed to correct for over- or underrepresentation, with the weights chosen such that the final sample maintained the same proportionality as the German Micro-census with respect to household size and residential location. The weighting thus ensured that the final sample captured a rep-resentative picture of the population.
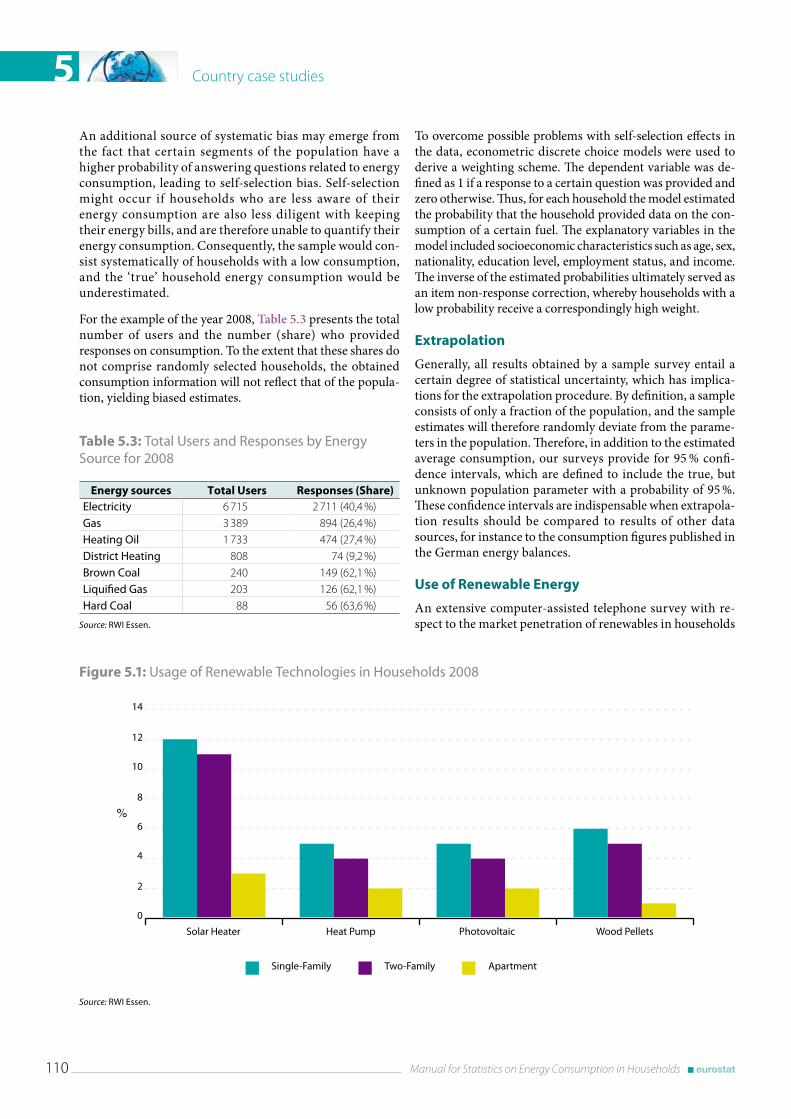
Country case studies5
110 Manual for Statistics on Energy Consumption in Households
An additional source of systematic bias may emerge from the fact that certain segments of the population have a higher probability of answering questions related to energy consumption, leading to self-selection bias. Self-selection might occur if households who are less aware of their energy consumption are also less diligent with keeping their energy bills, and are therefore unable to quantify their energy consumption. Consequently, the sample would con-sist systematically of households with a low consumption, and the ‘true’ household energy consumption would be underestimated.
For the example of the year 2008, Table 5.3 presents the total number of users and the number (share) who provided responses on consumption. To the extent that these shares do not comprise randomly selected households, the obtained consumption information will not reflect that of the popula-tion, yielding biased estimates.
Table 5.3: Total Users and Responses by Energy Source for 2008
Energy sources Total Users Responses (Share)Electricity 6 715 2 711 (40,4 %)Gas 3 389 894 (26,4 %)Heating Oil 1 733 474 (27,4 %)District Heating 808 74 (9,2 %)Brown Coal 240 149 (62,1 %)Liquified Gas 203 126 (62,1 %)Hard Coal 88 56 (63,6 %)
Source: RWI Essen .
To overcome possible problems with self-selection effects in the data, econometric discrete choice models were used to derive a weighting scheme. The dependent variable was de-fined as 1 if a response to a certain question was provided and zero otherwise. Thus, for each household the model estimated the probability that the household provided data on the con-sumption of a certain fuel. The explanatory variables in the model included socioeconomic characteristics such as age, sex, nationality, education level, employment status, and income. The inverse of the estimated probabilities ultimately served as an item non-response correction, whereby households with a low probability receive a correspondingly high weight.
Extrapolation
Generally, all results obtained by a sample survey entail a certain degree of statistical uncertainty, which has implica-tions for the extrapolation procedure. By definition, a sample consists of only a fraction of the population, and the sample estimates will therefore randomly deviate from the parame-ters in the population. Therefore, in addition to the estimated average consumption, our surveys provide for 95 % confi-dence intervals, which are defined to include the true, but unknown population parameter with a probability of 95 %. These confidence intervals are indispensable when extrapola-tion results should be compared to results of other data sources, for instance to the consumption figures published in the German energy balances.
Use of Renewable Energy
An extensive computer-assisted telephone survey with re-spect to the market penetration of renewables in households
Figure 5.1: Usage of Renewable Technologies in Households 2008
Source: RWI Essen .
Solar Heater Heat Pump Photovoltaic Wood Pellets
0
2
4
6
8
10
12
14
%
Single-Family Two-Family Apartment
Country case studies 5
Manual for Statistics on Energy Consumption in Households 111
was conducted in the fall of 2006. In total, more than 80 000 households were interviewed about whether they use a heat pump, solar heating, wood pellets, or a photovoltaic device. Based on these results for 2006, the market penetration of renewables in 2007 and 2008 was updated using the 6 700 participating households of the forsa panel. For instance, if the number of solar heating systems rose by 2 % between 2006 and 2007 in the forsa household panel, the telephone survey results were updated in a similar manner.
According to Figure 5.2, about 12 % of all single-family homes and 11 % of all two-family homes had solar heating at the end of 2006. Heat pumps and wood pellets were used in less than 6 % of all single- and two-family homes. Basically, no difference between single- and two-family homes existed for the usage of photovoltaic: about 4.5 % of these houses are equipped with such a facility. Renewable technologies are generally much less present in apartment houses, since the building owner typi-cally does not benefit from the installed systems.
Decomposition of Electricity Consumption: the Energy Diary
Electricity is probably the most versatile fuel in the household sector. Electricity can be used for various purposes, for instance lighting, cooking, hot water preparation, and the usage of electric appliances. Typically, only the total electricity consumption of a household is known, if at all. In order to differentiate electricity consumption into single usage pur-poses, an additional survey called ‘Energy Diary’ was designed to collect information about the equipment and usage of elec-tric appliances for a sample of almost 900 households. The ‘Energy Diary’ is conducted on a more or less regular basis, with the same set of households providing reliable insights into the electricity consumption behavior of the household sector. So far data from four waves exist originating from surveys performed in August and November 2010, as well as in March and August 2011.
What
The survey gathers information about the energy consump-tion of various fuels of private households as well as the corresponding expenditures. In addition, households also disclose the use of renewable energies, socio-economic characteristics, and the ownership of electrical appliances. Presently, the data collected across the surveys conducted since 2003 are cleaned and labeled into a single dataset which will be made available to re-searchers at no cost for further scientific analysis.
Issues
With a participation rate of approximately 70 %, the often encountered problem of a low participation rate is not an issue. However, there are two groups of survey participants
for which improvements to the number of observations are sought: low income households and households that pre-dominantly employ district heating.
In the future the overall sample size will significantly increase so that the number of observations for both groups will natu-rally increase. Moreover, the possibility of oversampling low income households to arrive at a higher number of observa-tions is being investigated. Both measures will increase the precision and reliability of the findings.
The low number of observations for households relying on district heating occurs because only 10 % of those households disclose suitable information, possibly reflecting that the data requirements imposed on households with district heating are too high. Work is underway to try to cut the data require-ments without losing precision.
The survey data has already yielded several scientific publica-tions and project reports that address various dimensions of energy consumption. Grösche and Schröder (2011), for ex-ample, explore the willingness-to-pay for alternative fuel mixes, with an eye towards understanding the level of public support for renewable energies. Grösche and Vance (2009) address the issue of home retrofits, specifically quantifying the extent to which public policies to support energy-saving retrofitting suffer from free-ridership. Also addressing the topic of retrofitting, a related paper by Frondel, Grösche, and Schmidt (2008) explores the effectiveness of home audits. Other publications from the project document the survey instrument and data collect in both English (RWI and forsa, 2011a) and German (RWI and forsa, 2011b). These can be downloaded from the project web site, http://www.rwi-essen.de/forschung-und-beratung/umwelt-und-ressourcen/pro-jekte/39/.
Coverage
For the 2006–2008 survey, for instance, an initial sample of 9 575 households was selected, of which 6 715 ultimately par-ticipated in the survey, yielding a participation rate of roughly 70 %. The spatial distribution of households, presented in Figure 5.1 by way of zip codes, spans representatively across Germany and is particularly concentrated in regions of high population density, such as the capital Berlin.
The information disclosed by the participating households is supplemented by temperature readings form weather stations to account for local weather phenomena. The temperature data is spatially interpolated using a Geographic Information System (GIS) so that every household can be assigned a num-ber of heating degree days that prevailed at the level of the zip-code.
For the years 2003 through 2008, approximately 50 weather stations were used for the spatial interpolation of the tempera-ture data, extended to about 500 weather stations for the sur-veys from 2009 onwards, providing a significant improvement.
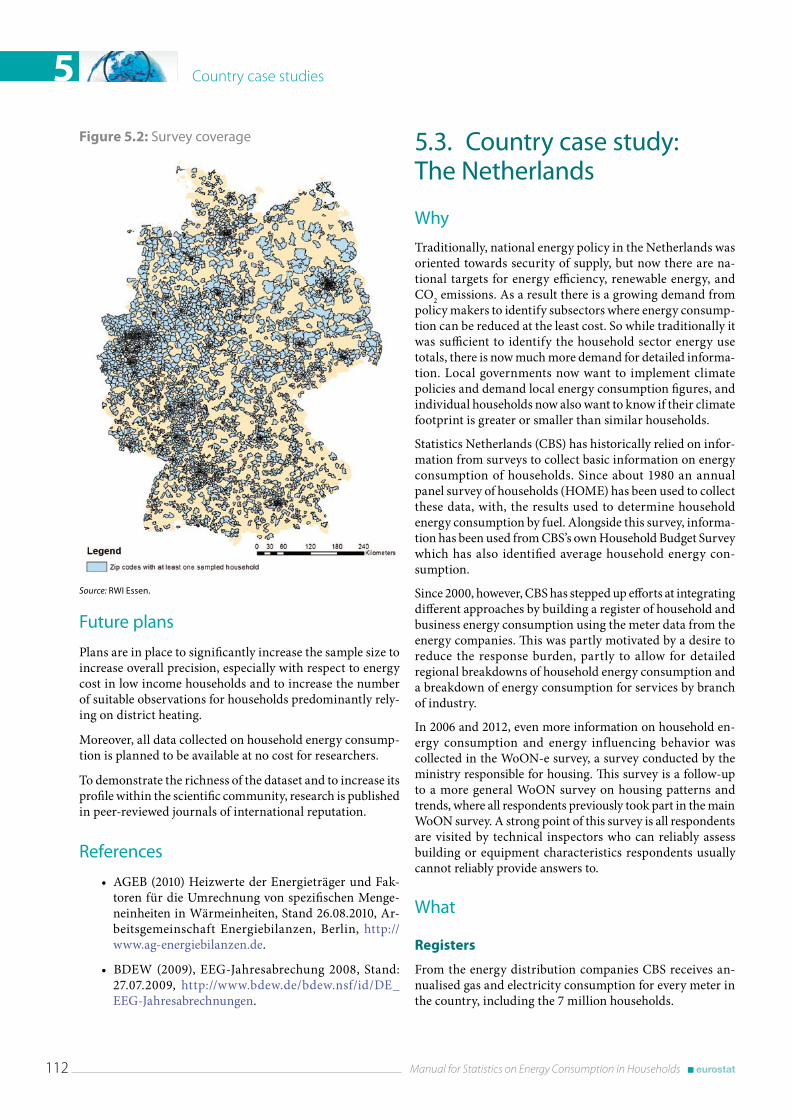
Country case studies5
112 Manual for Statistics on Energy Consumption in Households
Figure 5.2: Survey coverage
Source: RWI Essen .
Future plans
Plans are in place to significantly increase the sample size to increase overall precision, especially with respect to energy cost in low income households and to increase the number of suitable observations for households predominantly rely-ing on district heating.
Moreover, all data collected on household energy consump-tion is planned to be available at no cost for researchers.
To demonstrate the richness of the dataset and to increase its profile within the scientific community, research is published in peer-reviewed journals of international reputation.
References
• AGEB (2010) Heizwerte der Energieträger und Fak-toren für die Umrechnung von spezifischen Menge-neinheiten in Wärmeinheiten, Stand 26.08.2010, Ar-beitsgemeinschaft Energiebilanzen, Berlin, http://www.ag-energiebilanzen.de.
• BDEW (2009), EEG‑Jahresabrechung 2008, Stand: 27.07.2009, http://www.bdew.de/bdew.nsf/id/DE_EEG-Jahresabrechnungen.
5 .3 . Country case study: The Netherlands
Why
Traditionally, national energy policy in the Netherlands was oriented towards security of supply, but now there are na-tional targets for energy efficiency, renewable energy, and CO2 emissions. As a result there is a growing demand from policy makers to identify subsectors where energy consump-tion can be reduced at the least cost. So while traditionally it was sufficient to identify the household sector energy use totals, there is now much more demand for detailed informa-tion. Local governments now want to implement climate policies and demand local energy consumption figures, and individual households now also want to know if their climate footprint is greater or smaller than similar households.
Statistics Netherlands (CBS) has historically relied on infor-mation from surveys to collect basic information on energy consumption of households. Since about 1980 an annual panel survey of households (HOME) has been used to collect these data, with, the results used to determine household energy consumption by fuel. Alongside this survey, informa-tion has been used from CBS’s own Household Budget Survey which has also identified average household energy con-sumption.
Since 2000, however, CBS has stepped up efforts at integrating different approaches by building a register of household and business energy consumption using the meter data from the energy companies. This was partly motivated by a desire to reduce the response burden, partly to allow for detailed regional breakdowns of household energy consumption and a breakdown of energy consumption for services by branch of industry.
In 2006 and 2012, even more information on household en-ergy consumption and energy influencing behavior was collected in the WoON-e survey, a survey conducted by the ministry responsible for housing. This survey is a follow-up to a more general WoON survey on housing patterns and trends, where all respondents previously took part in the main WoON survey. A strong point of this survey is all respondents are visited by technical inspectors who can reliably assess building or equipment characteristics respondents usually cannot reliably provide answers to.
What
Registers
From the energy distribution companies CBS receives an-nualised gas and electricity consumption for every meter in the country, including the 7 million households.
Country case studies 5
Manual for Statistics on Energy Consumption in Households 113
HOME panel survey
The HOME survey (~1500 respondents) collects a lot of information on energy end-uses in households. This ranges from meter readings, to type of heating, cooking, and hot-water equipment, to energy saving measures, number and type of electrical appliances, and frequency of use of energy-consuming equipment.
WoON-e housing survey
The WoON-e survey (~4800 respondents) is a follow-up sur-vey focusing on energy use in the context of a larger housing survey. Numerous technical energy-relevant building aspects (characteristics of insulation, heating equipment, etc.) are recorded by trained inspectors and survey questions capture much information related to energy use and behavior. This survey also has a module for reliably quantifying wood use for heating purposes. However, there is little information collected on energy use of appliances.
Household Budget Survey
The Household budget survey (~1500 respondents) collects information on expenditure including, expenditure on natu-ral gas and electricity. Previously, there was a breakdown of less frequently used fuel types (fuel oil, wood pellets, etc.), but the results for these variables are now unfit for energy statistical purposes.
How
While CBS has access to various energy consumption sur-veys, its work is focused on building the energy consumption register based on billing data from the energy distribution companies. This information is matched with information from other registers, mainly the business register, and the address and dwellings register in order to obtain a very com-prehensive picture of who consumes how much gas and elec-tricity. The process is described in detail in section 4.3.
From these registers, statistics are published on average household gas and electricity consumption by:
• Dwelling type (apartment, detached, etc.)• Household size• Neighbourhood
In principle, other breakdowns are possible, as energy con-sumption can be matched with other registers to break down by income, dwelling size, and many other variables.
Soon, CBS will also use this information for calculating the total amounts of electricity and gas consumed by households and businesses for the purpose of the energy balance.
Breakdown by end-use
In the Netherlands a breakdown of energy consumption by end-use (heating, hot water, appliances, etcetera) can be done
relatively accurately thanks to rather consistent fuel choices. With few exceptions, households use natural gas for heating and hot water and electricity for other uses. Cooking uses both, but energy used for cooking is a small fraction of the energy used for heating and hot water, cooling is rarely used, and renewable energy use is still marginal. The one tricky issue is separating the gas used for heating from that used for hot water, as this consumption is rarely metered separately. To do this, a relatively complicated model is used that takes into account patters of use as well as technical characteristics. One alternative to such a model could be using seasonal information. Assuming hot-water and cooking gas use is relatively season-independent (or of known variability) and knowing that almost no one heats the house in summer, in-formation on gas use in the summer could be used to esti-mate annual use for non-heating purposes.
If properly integrated, existing sources would in principle form a sufficient basis for estimating energy consumption by end-use. From the registers of the energy companies a total is obtained, to which a breakdown can be applied. The break-down itself will have to be determined from the surveys in combination with models.
A breakdown of natural gas for heating, hot water, and cook-ing, is already available in the HOME survey, thanks to a model and the extensive information collected on technical characteristics and patterns of use. This survey may unfor-tunately be terminated, and if so CBS may be able to rely on the WoON-e survey. This does not come with a full model directly suitable for making a breakdown of gas use, but it does record most if not all important technological aspects that can be used in an adapted model or for development of a new model. The WoON-e is only implemented every six years due to the great cost of having trained inspectors on site in addition to the survey. However, the breakdown as known to CBS has changed only very slowly over the past decades, and even if the frequency turns out to be too low, it is expected it will be possible, perhaps through other surveys to monitor a few key variables at smaller intervals.
Issues
Developing the client registers took much more time than ex-pected. Getting a legal requirement in place for the energy companies to deliver the data took several years, but also the development work took more time than expected. The informa-tion received contains no information on the user, it only has information on consumption, measurement profile (connection type), and address. Households could be relatively straightfor-wardly identified by matching the addresses with the dwelling register, though the issue of sorting out consumption for users of district or block heating required elaborate steps.
An issue at meter level is that the billed consumption is nearly always an estimate of the real consumption in a given calen-dar year. The meters are in reality read at irregular intervals,
Country case studies5
114 Manual for Statistics on Energy Consumption in Households
in many cases not even every year. However, at national level this error is minimal.
At the moment the client registers provides the most stable source of information. In the past CBS has used results from the household budget survey, the HOME survey, and the national housing survey for more detailed information on energy use in households, but downscaling or even the con-tinuity of these surveys have become a concern recently, as CBS may have to create new sources of information.
One last issue illustrates the usefulness of integrating different methods. CBS has two surveys plus the client files which for a number of years have overlapping coverage. However, espe-cially for gas consumption, there are substantial discrepancies in measured average household gas consumption, with differ-ences for some years exceeding 10 %. It has proven challenging to identify the reasons for this discrepancy, but it could shed light on new factors that need to be taken in to account for determining average household energy consumption correctly.
UseThe register data is currently used to support local energy and climate policies by providing detailed local energy con-sumption data. In the near future, CBS will use the results for the energy balance (total consumption of gas and electric-ity by households and businesses). Recently, the register data has been used to providing energy consumption data for the national housing survey so as to reduce survey burden and improve accuracy. Finally, the data is also used in carbon footprint calculators used by households.
The results of the HOME survey is not used anymore for official statistics, but still serves as important inputs in offi-cial energy models used by the government, and to inform energy and climate policy. The WoON-e survey is used to inform energy saving policy for the household sector.
CoverageCBS currently publishes statistics on average and total con-sumption of gas and electricity of households. However, CBS has access to surveys (e.g. HOME, WoON-e) owned by other institutions which have much more detailed information on energy consumption, including end-uses.
5 .4 . Country case study: Poland
WhyThe interest in the detailed household energy information in Poland dates back to the early 1990s when the market driven
transformation of the national economy was initiated. The Government was worried at that time with sharply rising energy prices and the implications of this for households in which energy wastage was common, the energy consuming equipment usually old and the knowledge of how to save energy very small. In order to prepare the policy guidelines in this area, to make recommendations for households and to acquire the expertise what energy efficiency measures would be appropriate, the Government had to collect the deeper and wider data on household energy consumption than were available at that time. Therefore, the first question-naire-based survey of household energy consumption was carried out in 1994.
After Poland’s accession to the European Union (and during the pre-accession period), the energy policy of the Poland evolved to the point at which it is mostly driven by the EU requirements and policies, such that there are few autono-mous Government initiatives in the field of energy efficiency which are not the direct transpositions or implications of the EU policy. Nevertheless, during the last 10 or more years, the Government of Poland has put much effort in the preparation and implementation of various initiatives and policies aimed at improving the energy efficiency of the household sector as well as of the other economic sectors. Market forces have also had an impact as energy prices became very high, compared to the previous 20 years ago, meaning fewer people can now afford to waste energy or not care about the efficiency or energy saving.
The present policy of the Government (Ministry of Economy) related to the energy in households concentrates firstly on the issues arising from the implementation of the Energy Effi-ciency Directive (2006/32/EC, to be in short time replaced by 2012/27/EU). The second important point of this policy is the equipment labelling, according to the Energy Labelling Di-rective (2010/30/EU and the associated delegated acts), and the third is a promotion of the renewable sources, in line with the Energy Renewable Directive (2009/28/EC). In order to pursue effectively the objectives implied by these directives, the Government must have access to the detailed information on the energy consumption quantities, costs, equipment characteristics, equipment penetration, etc. Therefore, pres-ently the system of the regular household energy surveys has been introduced, with the subsequent and comparable sur-veys being performed each 3 years.
As mentioned above, before, the first questionnaire-based survey of household energy consumption was carried out in Poland in 1994. This survey was generally a success, tak-ing into account a lack of experience and little application of the knowledge already existing in the EU. The authors of the survey were however cautious of some methodo-logical and procedural weaknesses which slightly decreased the value of the results. Nevertheless, an estimated true picture of household energy consumption was achieved for the first time.
Country case studies 5
Manual for Statistics on Energy Consumption in Households 115
A few years later Poland made a giant step forward with the expertise in the field of the household energy surveys. This happened thanks to the participation in the widely designed project, Harmonisation of Energy Statistics’, implemented in the framework of the PHARE pre-accession programme fund-ed by the European Union. The project was coordinated by Eurostat and implemented in 3 phases, during 1997–1999, in 10 countries of the Central and Eastern Europe which later became the EU Member States. The project comprised all important issues of the energy statistics, not just the house-holds, though the household energy was one of central points of the work. The other central points were critical reviews of the energy statistics arrangements in 10 participating coun-tries, identification of the main areas where the arrangements or results were weak, and consequently creating the founda-tions for the improvement in these areas. All participating countries have acquired a large quantity of expertise from the transfer of knowledge from within the EU, and also from comparing their own achievements and troubles between them and with the EU counterparts.
Within the ‘Harmonization of Energy Statistics’ project a coordinated household energy consumption survey was per-formed in all 10 participating countries. The survey was based on an unified methodological approach and an unified questionnaire (unification of the questionnaire included gen-eral contents and ideas, not the details and not the graphical design). The participants of the project had the opportunity to meet several times, to discuss the issues and to read the results and reports of all participating countries. This had created the large value added of the project. After its imple-mentation, the participating countries have achieved the improved capability to satisfy the information requirements of EU and IEA.
The next household energy survey, financed only from the national sources, was conducted in Poland just before the EU accession, in 2003. It was based on the already mature meth-odology, applying the expertise which was transferred from Eurostat and the EU countries during the harmonization project and at the other occasions.
After that survey quite a long time break occurred in Poland before the next household survey. This break was certainly connected with the fact that there was no EU-coordinated or EU-sponsored household energy survey until 2010. In 2010 Poland participated in the framework of the SECH project. At the same time the data requirements arising from the Energy Efficiency Directive (2006/32/EC) and the Energy Renewable Directive (2009/28/EC) became more important and more urgent, so the Ministry of Economy and the Cen-tral Statistical Office have fortunately made a joint decision to perform the household energy surveys in the regular cycles of 3 years, and to finance them even if EU would not provide any sponsoring for this objective. Two consecutive surveys have now been performed: in 2010 with 2009 data, and in 2013 with 2012 data.
How
Poland has a long tradition of the household energy surveys. The procedures and details of such surveys are quite mature though they are certainly being improved with each indi-vidual survey. The summary of main features is given below, with some associated comments and a critical discussion.
a) Respondents answers are written on the paper copies of the questionnaire. Data are entered into computers in the regional statistical offices, after being fully filled in on the paper and sent to the office. The con-tents of the questionnaires, explanations of them and all other associated material have evolved to be more user friendly, although no conclusion has been reached on the possibility of using some form of the Computer Assisted Interview. A paper questionnaire has one large strength: it is more easily readable for the wide audience than any form of electronic ques-tionnaire, but has also one equally large weakness: nobody is able to verify data online during the inter-view when there are several pages of the question-naire and quite complicated relations between some questions or their answers and between some items of the questionnaire.
b) Interviewers visit the respondents in person. This mode of contact has also one tremendous advantage and one equally tremendous disadvantage. A per-sonal visit is very practical, especially in the contacts with the older persons. It permits good answers to be given in the situations when a respondent needs some additional help in order to respond. With this mode of contact, an interviewer may also look around and appropriately identify the pieces of existing equip-ment when a respondent is not capable of so doing. On the other hand, a personal visit is an extremely expensive mode of contact, particularly in the rural areas when in many cases a travel to / from respondent may take much more time than the interview itself. In the conditions of Polish statistics there is however one point which substantially reduces the cost of the personal interview. The energy survey is closely linked organizationally or just attached to the survey of household budgets which means that the inter-viewer performs two surveys at one visit. In this con-text it may be said that the incremental cost of energy survey is relatively low with such arrangements. Also, the respondents answering the energy survey have already some experience with the budget survey and therefore with the statistical procedures, and last but not least, the workload which the energy survey puts on a respondent is small in comparison with the budget survey so it might conclude that having the budget survey behind them, the respondents recog-nise the energy survey to be surprisingly small, and are therefore more cooperative.
Country case studies5
116 Manual for Statistics on Energy Consumption in Households
c) Respondents are randomly selected from the existing register of households. The mode of selection has a scientific base and takes into account at least the variables of family size, municipality size and geo-graphical location within the country. There is no division by climate zones because the climate differ-ences are too small in Poland to be important. Each selected household has an associated weight which is an integer number representing the size of the sub-population which this household is representing in the sample. A simplification is that one, two or more households are selected from each administrative unit of the country, depending on the size of the unit, and providing also that the appropriate representative structure of family types is guaranteed at the level of the whole country.
d) Interviewers training is performed in two stages. In the first stage the regional leaders (coordinators of the survey in the areas of activity of the regional statisti-cal offices) are trained in the capital city of Warsaw. In the second stage the regional leaders teach the interviewers who survey the respondents in each of the regions. Such two-level training arrangement has proved to be effective and low cost solution.
e) Two institutions perform the survey, having the clear division of responsibilities. All household energy sur-veys have been conducted in Poland by two collaborat-ing institutions. One of them is the Central Statistical Office (CSO) which does the respondents selection, the interviewing (and employs the interviewers) and data entry to the computers. The electronic file of the questionnaires is an intermediate product which ends the engagement of CSO and starts the activity of the second institution, the Energy Market Agency (EMA) which is a specialized technical agency involved in many issues of energy statistics and many other forms of energy research. The primary job of EMA within the household surveys consists of data verification, results calculation and writing the technical reports. Of course in practice two institutions coordinate in some way all tasks and exchange the views on all de-tails, though the main clear division between the phases of data collection and data processing remains valid. Such two-institutions arrangement has proved to be effective and there is no plan to change it.
f) Response rates are good though some questions remain unanswered more frequently than others. The 2010 sur-vey (the last one finished, as the 2013 survey is still in the phase of data processing) had the sample size of 4 698 respondents. The survey interviewers had col-lected 4 565 filled questionnaires which, though not free from the omissions and mistakes, constituted the very rich factual material for the further processing and analyses. The response rate, higher than 97 %,
should be assessed as very good. This is mainly the achievement of good interviewers who visit the re-spondents personally, create good relations with them and know well their “local markets” like good trade representatives. It should be added that the response rate of 97 % is calculated as the share of questionnaires in which at least the most important questions were answered in a useful way. Within these questionnaires there are omissions for more difficult questions, like the volumes of electricity or gas consumption, or the properties thermal insulation. Algorithms and com-puter programs are used for processing and in the situation of selected items non-availability and are effective in the task of extracting the maximum pos-sible knowledge even for these questions for which the numbers of answers were relatively low.
g) Methods other than surveys were not seriously tried and are not planned. The reason for that is most probably some mix of good results of the performed surveys, some dose of conservatism and of course the limita-tions of budgets. While the implemented surveys gave the Government institutions the results which they consider satisfactory for their needs, they present no special will to try the other ways of household energy data collection, improvement or enlargement. Meth-ods like the electricity sub-metering would be very useful in order to enlarge the files of existing data and to fill up the other dimension of detail but the public institutions are cautious to spend money on the ac-tivities which undoubtedly bear some risk of being non-successful. At present, the next questionnaire-based survey is already planned in 3-year cycle, to be performed in 2016 with 2015 data, and no other ways of household energy data collection are seriously planned by the public institutions.
What
The questionnaire used in the 2010 and 2013 surveys is ma-ture and produces sufficient data for both national and inter-national requirements and is a trade-off between and the practical and possible. There are many data items which are not being collected through this questionnaire which might be very useful for some researchers or institutions. At the same time the questionnaire must be kept manageable for the survey personnel and understandable for the respondents. The present Polish questionnaire is a good point of compro-mise, but perhaps on the large side. Therefore, any further enlargement of this questionnaire is not foreseen. If much more data on household energy would be necessary, the other ways of collecting it must be considered. Some very technical information, concerning for example the charac-teristics and effects of thermal insulation goes beyond the possibilities of a large-sample questionnaire-based survey. This may require the professional assessment of building
Country case studies 5
Manual for Statistics on Energy Consumption in Households 117
designs or energy audits of buildings, which are beyond the competence of both respondent and interviewer.
The present questionnaire is composed of the following parts:
Part 1. Identification of household.
Part 2. Structural characteristics of dwelling.
Part 3. Fuels and energy commodities used for space heating, water heating and food cooking.
Part 4.1. Equipment used for space heating and water heating.
Part 4.2. Equipment used for air conditioning.
Part 4.3. Equipment used for food cooking.
Part 5.1. Lighting equipment.
Part 5.2. Electrical appliances and electronic devices.
Part 6. Presence of measurement and regulation equipment.
Part 7. Quantities and values of consumed fuels and energy commodities.
Part 8. Additional information on biomass fuels.
Part 9. Additional information on solar collectors.
Part 10. Additional information on heat pumps.
Part 11. Passenger cars.
The structure of the questionnaire is reflected in a set of computer programs which constitute a tool for data valida-tion as well as calculation and presentation of the results. The main program prints 35 standard tables of the results. There are also optional modules which may be used to calculate additional tables or the same main tables but for the sub-files of the full questionnaires file, for example for urban or rural households, for single-family or multi-family buildings, for country regions (however, the results for the small regions may not be representative). These optional modules create a base for preparation of the additional results which may be highly useful for the energy efficiency analyses and for the other topics of research. The set of computer programs is also easily extendable so the new modules can be programmed in a consistent way when a need arises. Questionnaire files are stored in spreadsheets which are commonly known and easy for the eventual additional ad hoc searches and calculations.
Issues
The questionnaire and procedures are quite mature and well tested, however some outstanding difficulties exist, including:
a) Some questions seem to be too difficult for the partici-pants. Some questions, for example those concerning thermal insulation of buildings, types of windows or power ratings of lamps, are constantly too difficult for
both the respondents and interviewers. They should be probably removed from the questionnaire but a decision to do this is being postponed.
b) Attachment of the energy survey to the budget survey improves response rate and reduces cost, but has also disadvantages. This relates to some methodology pro-cesses of the budget survey that are not practical for the energy survey, for example: (1) a tendency to treat only the money actually spent as the cost of service; the energy data must include the total annual pay-ments even when the arrears take place, (2) a ten-dency to treat the multi-generation families leaving together at one home as the separate families; the budget survey people assume that such families usually have the separate means of living and thus classify them as the separate families; from the energy point of view such approach is not appropriate be-cause all installations, invoices etc. are normally at the level of a home or an apartment and not at the level of its parts. The interviewers are of course trained and have the written explanations how to treat such cases but they have usually a long experience with the budget methodology so the misunderstandings do occur. Nevertheless, the attachment of energy survey to the budget survey has more advantages than disad-vantages. Ultimately, it is highly probable that the en-ergy survey would not be conducted at all if it were not attached to the budget survey.
c) Existence of the economic activities at home makes it difficult to report the appropriate data. Economic activ-ity undertaken at home are quite common and range from the small professional or office-type activities which occupy one room or only a part of it to agricul-tural holdings in which the buildings for plant or animal production may be 10 or more times bigger than a residential building. There is a clear recom-mendation that in such cases all data should relate only to the household part of an apartment, building or holding. However, in many cases a division or separa-tion between the household part and the economic activity may be only roughly estimated, and estimation error of can be very large especially for big scale agri-cultural activity. Currently there is not a good solution to this problem, but separate local supply and meter-ing of electricity may help in the future.
d) Solid fuel consumption results are always too high. In every household energy survey conducted by now in Poland the solid fuel, i.e. coal and wood, consump-tion data acquired were higher or even much higher than expected. There is no good explanation of this fact. It is easier for understanding in case of wood where one can argue that there is no credible data on the total national supply or annual availability of fuel wood, and also that many respondents (at least those
Country case studies5
118 Manual for Statistics on Energy Consumption in Households
who obtain wood in non-commercial way) are not able to report the real quantity of consumed wood in cubic meters or in any other unit of measure. The situation is more surprising for coal where the na-tional balances are a reliable source of information but the total quantity of coal used from the survey is higher than is allocated to the households in the existing balance, even taking into account some pos-sible shifts or re-allocations within the balance. Dis-cussions and the additional research did not lead to the problem’s solution. The most possible reasons may be a bias in the sample selection (there are not however any symptoms of bias in the other parts of the results), non-ability of many respondents to report the true data, or the persistent underestima-tion of coal imports to Poland and this will be looked at again on the 2013 survey.
e) Institutional and legal barriers limit a participation of the energy distributors and traders. In order to make the household energy data more precise and more reliable it would be very useful to assure the participation of the energy distributors and/or traders to supplement the individual respondent data with more precise de-tails of their electricity/gas consumption. In the past surveys the consumption quantities data calculated from the survey responses are less accurate than data from the regular statistics supplied by the energy com-panies. A linkage of both data sets at the level of a single respondent and the following joint data processing would certainly create a good quantity of value added. However, currently laws on both the personal data protection and the company data confidentiality are reducing the will of companies to engage.
Use
The primary institution that uses the results of the household energy surveys is the Ministry of Economy. This Ministry has a leading role in the implementation of the Energy Efficiency Directive (2006/32/EC), Energy Labelling Directive (2010/30/EU) and the Energy Renewable Directive (2009/28/EC). The Ministry has a special interest in: (1) the energy characteris-tics of insulated vs. not insulated buildings, (2) energy effi-ciency classes of the devices, (3) penetration of new types of lighting equipment (quite good now though the Edison bulbs still prevail), (4) penetration of solar collectors and heat pumps (still very low).
Apart from the Ministry of Economy, some other institu-tions, like research institutes and the offices of regional administration, have been using some data from the surveys. Summary results were published, also the additional tables or partial results based on some subsets of the full question-naires for those who asked for them.
Coverage
Concerning the ‘Recommended scope of a data collection exercise in the households sector’, presented by Eurostat at the meeting of the Working Group on 8 December 2008, the results for most items were obtained in Poland. Few items for which data are not available are as follows:
a) Household incomes as a factor affecting energy con-sumption. Income data are very sensitive, respondents have a tendency to underestimate the incomes. Though the income data are collected within the household budget survey, no calculations vis-a-vis the energy consumption details were made but may be possible in the future.
b) Energy consumption by end use. These data cannot be calculated directly from the survey responses because the respondents are not able to provide consumption quantities of multi-purpose energy commodities, like electricity or gas by end use. Cooperation of the en-ergy distributors which have some technical knowl-edge would be highly useful but as it was mentioned above legal barriers currently prevent this, whilst modeling y would be highly desirable here but its implementation is still a matter of future.
5 .5 . Country case study: Slovenia
Why
Energy statistics in Slovenia have traditionally been focused on energy supply and energy dependency. The majority of energy statistics surveys in Slovenia are focused on energy producers and energy suppliers. From which the aggregated data about the production, import, export and supply of various energy products and the consumption of main con-sumers groups are obtained, namely the manufacturing and construction, transport, households and other consumption.
More detailed data for energy consumption in the manufac-turing and construction section are obtained by an annual survey of end users in manufacturing and construction which enables the disaggregation of consumption data to the divisions within the sections C and F.
In the last few years the focus of energy policy has moved to-wards understanding better and monitoring energy end-use, energy efficiency and renewable energy. The first step towards collecting more detailed information about final energy con-sumption in households in Slovenia was taken in 1997. After the first attempt some adjustments of the methodology were
Country case studies 5
Manual for Statistics on Energy Consumption in Households 119
done and the second survey was carried out in 2003. The re-sults of both surveys were not considered satisfactory.
Taking into account the past experience and new findings Slovenia established new methodology for measuring en-ergy consumption in households in 2010, using a combined approach: direct survey followed by modeling work. The work was done in the frame of the Eurostat’s SECH pro-grame.
How
The sample
For the 2010 survey of household energy consumption data the target population was private households in Slovenia. Since the energy consumption is closely linked to the dwelling than to the household, the survey was focused on the dwellings of the selected households. As such the sample frame was the Central register of the population aged 18 and more, from which we chose persons and thus the ad-dresses of the chosen persons we determined the house-holds
The size of the sample was 6 000 (the population in Slovenia 2 million; with 813 000 households). The sampling plan was stratified in two stages. It was explicitly stratified by type of the settlement (by number of population and share of agri-cultural households) and statistical regions and implicitly stratified by whether there was a farm at the address or not, by the main heating system in the building, age of the build-ing and the number of dwellings in the building.
The survey
The main survey was carried out by a combined method of interviewing; initially using telephone interviewing (CATI), with a follow up of personally (CAPI) for reporting units without a telephone number or weren’t reachable by phone). The duration of the main survey was 7 weeks.
The person interviewed for the chosen dwelling was a mem-ber of the household living in the dwelling and with the best knowledge of energy consumption in the dwelling. Only households which had occupied the chosen dwelling for at least for 12 months were interviewed, business offices, week-end or holiday apartments and institutional households were also not taken into account; only dwellings with private households were surveyed.
In the survey (which covered the last 12 months) questions were asked about the quantities of consumed energy and fuels and their expenses. If the household didn’t have accurate data, estimates were accepted. For cases of multi-dwelling houses, householders estimated data related only to the selected dwell-ing although they shared some common connections (e.g. electricity meter, heating appliance) in the house, f such esti-mations were marked in the questionnaire.
In the initial sample size there were 5 818 eligible units, and 3 945 units took part in the survey. That means that the eli-gibility rate was 97.0 % and the response rate was 67.8 %.
Data processing
The programme for data input used integrated logical con-trols that prevented mistakes during the interviewing. Imputation was used with data from auxiliary questions which were easier to respond, for example, data gaps on the consumption of energy sources were imputed based on the known amount paid for this source. If the amount paid was not known, the hot-decking method was used for the impu-tation as it was for data gaps for questions that didn’t have auxiliary questions.
Edited and imputed data were weighed to improve the rep-resentativeness of the sample so that the sample represented the surveyed population as closely as possible. Data were weighted because of the different probability of selection, non-response and post-stratification to the known popula-tion composition, using statistical regions, settlement types and data from the Real estate register: number of inhabited dwellings, age and type of buildings and main type of heating in dwellings.
The modeling
The results of the survey served as an input to the model which was developed by Energy Efficiency Centre at the Jožef Stefan Institute.
The model of energy consumption in households is part of a model ‘Reference eco-energy system of Slovenia (REES-SLO2)’, which was developed in environment MESAP as a linear network model of processes and connections (the ref-erence energy system). The model is calibrated on the basis of statistical data and is connected to the indicator system of statistical indicators and indicators for monitoring EU and Slovenian policies. The model is implemented, used and pe-riodically updated by Energy Efficiency Centre at the Jožef Stefan Institute.
Energy consumption was modeled using the following sets:
• space heating;
• water heating;
• household appliances and other electricity use.
Within the set of space heating firstly the energy required for heating (heat according to standard) was estimated, which depending on the housing stock — with areas of single and multi-family buildings divided into classes of energy effi-ciency. Total area of dwellings is consistent with the statisti-cal data (Housing stock based on the methodology of Census of population, households and housing 2002). The division of dwelling areas into the classes is based on analysis of data on renovations and year of construction from the Real Estate
Country case studies5
120 Manual for Statistics on Energy Consumption in Households
Register. The required energy is then, based on the propor-tions of central and local heating divided to the required energy in the local or central heating systems in single and multi-family buildings. This step also includes assessment of residents’ behavior in relation to energy efficiency (distribu-tion of areas to the standard and conscious behavior). Next is a further division of the required energy to sparsely and densely populated areas, because the structure of heating sources in these areas varies a lot. When dividing, the re-quired energy is multiplied by a factor of climate variability, which is calculated based on the temperature deficit in the analysed year in relation to the long-term average. This gives us the ‘actual’ required energy, which must be produced by boiler or heat pumps or obtained through solar panels, elec-tric heaters or district heating. The model includes many technologies for producing the required energy: standard and improved gas (LPG or natural gas), oil, wood and coal boilers, heat pumps, solar panels, district heating, electric heaters and combined heat and power units.
Next is the set of water heating. Heat demand for water heat-ing is estimated from the average hot water consumption per person (45 l), the temperature difference between cold and heated water (50°C) and the population of Slovenia. Required energy is then divided according to the method of water heating — central in the winter, central in the summer and local. Required heat prepared in central systems in the winter is divided to sparsely and densely populated areas and is then added to the required heat in the central heating system for space heating. Required heat in the central systems in the summer is estimated based on responses from the survey; the same applies to local systems. The last set is the most com-prehensive as it covers the electricity consumption by various household appliances (cooling and freezing appliances, dish-washers, washing machines, dryers, ovens and microwave ovens, stoves), personal computers, televisions, air condition-ers and lighting. In this model, each appliance is represented by a sub-model. Estimates of energy consumption of appli-ances is based on the number of appliances in households, their distribution by age and energy efficiency class and household behavior of appliance use (this does not apply to cooling and freezing appliances).
Model assumptions are firstly based on analysis of responses from the Household energy consumption survey 2010, and then adjusted (calibrated) so that the total energy consump-tion on the national level is equal to the statistical data col-lected from the supply side.
What
There were ten sets of variables in the Household energy consumption survey in 2010. The main variables are listed below.
Set A Household: number of households in the dwelling, number of household members, number of persons in the dwelling, number of adults in the dwelling.
Set B Dwelling and building: usable area of dwelling, the existence or farm or other gainful activity, type of building, year of construction of the building, number of dwelling.
Set C Electricity consumption: the amount of consumed electricity or expenditure.
Set D Use of light bulbs: the number of certain types of light bulbs in the dwelling (incandescent bulbs, compact fluores-cent lamps, fluorescent lamps, halogen lamps...), the number of those which are turned on more than 1 hour per day.
Set E Use of electrical appliances: the use of electrical appli-ances (refrigerator, refrigerator with freezer, chest freezer, upright freezer, washing machine, washing and drying ma-chine, dryer, dishwasher): number, size (height or volume), age, energy class, frequency of use, television: number, type, diagonal of the screen, frequency of use, personal computer: number, type, frequency of use, air-conditioning: the pur-pose of use, age, energy class, frequency of use,
Set F Space heating: the availability of heating system, heat-ing area of dwelling, the average room temperature during the heating season, all the existing heating systems, the main heating system during the main heating season (local, cen-tral, district), type of heating fuel/energy source, the amount of fuel/energy consumed or expense for it, the availability and type of heat pump.
Set G Use of wood fuels: use of wood fuels: type, quantity, expenditure.
Set H Hot water: the availability of hot water, the availability of a solar heating system: size, type, age, fuel/energy for wa-ter heating (during and outside the heating season).
Set I Cooking: number of cooked meals per week, the main source of energy for cooking, type of cooking plate, the use of gas bottles, use of electric ovens, use of microwave ovens.
Set J Cars: availability of a car, number of cars, engine capac-ity, age of the car, fuel type, distance travelled, average fuel consumption.
From the results of the survey/modeling work the following data were compiled.
Final energy consumption in households in natural and energy units by energy sources: extra light fuel oil, natural gas, firewood, wood chips, wood pellets, wood briquettes, wood waste, liquefied petroleum gas, electricity, coal, pe-troleum.
Final energy consumption by end use: space heating, water heating, cooking, other use by energy source: extra light fuel oil, natural gas, wood fuels, liquefied petroleum gas, electric-ity, coal, district heat, solar energy, geothermal energy.

Country case studies 5
Manual for Statistics on Energy Consumption in Households 121
Electricity consumption by end use for: space heating, water heating, cooking, lighting, refrigerators and refrigerators with freezer, upright and chest freezers, washing and wash-ing and drying machines (for washing), dryers and washing and drying machines (for drying, dishwashers, ovens and microwave ovens, personal computers and monitors, televi-sions, air conditioners, other.
Shares of space and water heating systems by types ( %): local heating, central heating, district heating.
Energy use for space and water heating split by local and central heating by energy sources: extra light fuel oil, natural gas, wood fuels, liquefied petroleum gas, electricity, coal, district heat, solar energy, geothermal energy.
Equipment of dwellings with light bulbs by type of bulb ( %): incandescent light bulb, compact fluorescent lamps, fluores-cent lamps, halogen lamps.
Share of electrical appliances and appliances with energy label ( %): washing machine, dryer, washing and drying ma-chine, refrigerator or refrigerator with freezer, upright or chest freezer, dishwasher, oven, microwave oven, television, personal computer.
Average distance travelled and fuel consumption of passen-ger cars.
The detailed results of the survey are available on the web site of the Statistical Office of the Republic of Slovenia as First release and also as detailed tables in SI-STAT data portal.
http://www.stat.si/eng/novica_prikazi.aspx?id=5027
http://pxweb.stat.si/pxweb/Database/Environment/18_en-ergy/07_18154_housh_consumption/07_18154_housh_con-sumption.asp
The methodological explanations, the questionnaire and the quality report all in English are also available on the web site of the Statistical Office of the Republic of Slovenia.
http://www.stat.si/doc/metod_pojasnila/18-154-ME.htm
http://www.stat.si/doc/pub/Household%20energy%20con-sumption%20survey.pdf
http://www.stat.si/doc/metodologija/kakovost/LPK_APEGG_2010_en.pdf
Issues
Costs
The costs of customer surveys are always an issue. They main-ly depend on the sample size, the length of the questionnaire, the duration of the interview and the number of interviewers needed. Therefore it is important to assure that the interview-ers are skilled and trained, that the questions are clear and in a logical order and that the households are informed prior to
the survey. Below are some examples used for the Household energy consumption survey.
Pilot survey
Before the main survey a pilot survey done by 3 experienced interviewers and around 150 households from the selected sample. This tested the course of the interview and possible misunderstandings in the questionnaire which were later adjusted and corrected. The pilot survey we also measured the average duration of the interview (16 minutes) and the response rate.
The notification letter
Before the survey started notification letters were sent to all households in the sample. In the letter they were informed them about the implementation and the purpose of the survey, about the content of the survey, the data we are inter-ested in, and asked them to prepare the data on energy consumption (quantities and expenses), electrical appliances (energy classes), light bulbs (types and numbers) and cars (fuel consumption, distance travelled). The notification letter was accompanied by examples of actual electricity, gas and heat bills on which the numbers important for the survey e.g. consumed quantities and costs were highlighted.
Training and control of interviewers
Before the beginning of the survey interviewers were trained including providing instructions and explanations of indi-vidual questions. When the survey started the statistician –methodologist was present in the telephone studio and controlled the interviewers and assisted them through the whole questionnaire. This kind of control is very important at the beginning of the survey in order to find and replace the interviewers with poor work performance.
Use
With the new combined approach the detailed energy con-sumption in households data are available on annual basis. They are used in the various policy documents covering energy efficiency and renewable energy, for the greenhouse gas emissions calculations and also for the preparation of national energy programme.
Data are connected to the indicator system of statistical in-dicators and indicators for monitoring EU and Slovenian policies.
Coverage
The data cover most of the aspects of the 2008 Task-Force. Some data, for instance about thermostat set-points for heating and cooling were not surveyed via statistical survey because they are already part of the database used by the
Country case studies5
122 Manual for Statistics on Energy Consumption in Households
model. The same is true also for some parts dealing with the penetration of energy efficiency technologies and renewable energy sources. In general the combined approach proved to be successful in providing comprehensive and reliable data on energy consumption in households.
Future Plans
The approach for the Household energy consumption survey in 2010 proved to be successful and it laid down the bases for the integration of the survey into regular work. But the costs of the survey are too high to allow us the annual periodicity of the survey/modeling approach. Therefore the survey will be conducted every three years (next in 2014). In the inter-mediate years the model will be used with aggregated input data from the supply side. The model will be reviewed with full data set from the new consumer’s survey.
5 .6 . Country case study: Spain
Why
In Spain the Ministry of Industry, Energy and Tourism (MI-NETUR) is the body in charge of the energy policy. The In-stitute for Diversification and Saving of Energy (IDAE), a body linked to MINETUR, through the Secretariat of State for Energy, carries out the energy policies of the Government aimed at reducing energy dependence, promoting saving and energy efficiency, and boosting local renewable energies.
The need to have information to study of the policies cur-rently in force led IDAE to undertake work to achieve a deeper knowledge of the energy final consumptions. IDAE has carried out the Sectorial Energy Studies project since 2007 with a view to –improving knowledge on energy con-sumption in the various final-use sectors in more detail than presented in energy-balances. The study of the Residential Consumption Analysis (SPAHOUSEC) was developed as a part of this strategy, partially funded by Eurostat’s SECH program and was created with the intention of providing a basis for further investigations on the household sector con-sumption.
The first studies aimed at explaining energy consumption in the household sector in Spain date back to the 1990’s. A study carried out by the Red Eléctrica de España in year 1998 pro-vided data on electricity consumed by type of electric appli-ance. Nevertheless, this study did not cover other energy and services and thus provided a partial approach to the sector’s consumption.
The SECH-SPAHOUSEC study carried out in Spain in 2010, with partial funding by Eurostat, was the first one to tackle the household sector’s consumption as a whole, with itemised
information at service and energy-use level. This kind of study is planned to be improved and repeated periodically, within a period no longer than five years, with a method developed to extrapolate and adjust the data for the years intervening between studies.
How
For the SECH-SPAHOUSEC study, a methodology integrat-ing several statistic techniques was developed including: data matching, surveys, measures ‘on location’ and use of admin-istrative data. However, it was not deemed appropriate to out a modelling exercise given the lack of the necessary data to feed a model and budgetary limitations.
The key factors for the design of the survey were the climate areas chosen: Atlantic-North, Continental and Mediterra-nean and types of houses: flats and one-family dwellings, enlarging the scope of the latter to both detached and ter-raced houses.
The study used two kinds of surveys, a telephone one and a ‘panel’ based on the. This approach reflected that one of the objectives was to determine the costs/benefit ratio of each kind of survey as well as their reliability. The objectives of both surveys were to determine the features of the houses and the families; establish the existing equipment its energy la-belling; and use and to know the energy sources used for energy consumption.
Central heating and hot water systems were also examined through a survey conducted with to the land agents that provided information on the energy consumption of resi-dents’ associations, and the economic cost linked to them.
In parallel to surveys, in situ measurements ‘of electric con-sumption were done — in detail for each kind of equipment — in 600 houses during summer, autumn and winter time. Autumn was paired with spring time because of the simi-larities in temperatures and the energy demand of these sea-sons. Measurements were made in every house for four subsequent days, including two working days and two non-working days. Surveys on equipment were also carried out in these houses as well as on the electric power billing with a view to estimating non-measurable energy consumption such as standby mode in specific equipment and with lighting.
The information received from the surveys went through several validation and cleansing processes. The first one en-sured a minimum number of effective interviews for each survey operation. Thus, for the phone survey, achieved 6 390 interviews taking an effective interview as one with at least 75 % of the questions answered. Whilst the panel survey achieved 3 035 responses. The information gathered from land managers covered 3 337 dwellings, located in the Atlan-tic-North and Continental area, and no relevant information was obtained for the Mediterranean area, where installations of the kind are not usual.
Country case studies 5
Manual for Statistics on Energy Consumption in Households 123
Apart from the validations of information carried out in the interview, or done afterwards, which led to interview revisions. For example, cross checks were done between energy consumptions and the related expenditure, and where the deviations in unit costs was over ± 5 % the data were revised or discarded. The average unit costs were established thanks to information from energy traders and a computer tool existing in IDAE, which determined the average cost of an energy unit for natural gas, electricity, diesel oil and LPG ones.
The consumption of renewable energies in households was treated differently given the low penetration that the tele-phone and panel surveys could not account for properly and that a large part of the renewable energy consumption in Spanish households relies on the non-commercial bio-mass consumption. Thus, the ad-hoc statistics IDAE for each kind of renewable energy were used in order to establish the renewable energy consumption rate. In this sense, the IDAE uses three clear-cut statistical operations: thermal biomass, solar thermal and geothermal energy. The results of these statistics for the residential household sector were included in the study through data-matching techniques.
The trading companies were also requested the aggregated data on economic and energy consumption at the level of each climate zone. Information was provided about both electric power and natural gas for consumption and billing by tariff brackets and climate zone. Information was also provided for other fuels such as fuel oil and PLG on supply by climate zone.
Finally, all the information compiled was included by climate zone and kind of dwelling using data matching techniques. The final aggregation of the kinds of dwelling and climate zones was used to determine consumption in the household sector at national level, split by heating, SHW, kitchen, air conditioning, lighting and 9 kinds of electric appliances (fridges, freezers, washing machines, dryers, dishwashers, ovens, TV sets, computers and other electric equipment), apart from standby consumption.
What
One of the main objectives was to cover most of the require-ments of Eurostat’s 2008 Task-Force. As stated below in the coverage section, the coverage rates achieved were above stated recommendations.
The main compiled data have provided more knowledge of energy use in households and the use of existing equipment, as well as of the energy consumption per service (heating, cooling, hot water, lighting and electric appliances) and the economic costs associated with it. Information about instant and daily costs has also been compiled for each of the electric appliances considered.
Issues
Traditionally, the response rate to the survey operations is usually one of their critical features. For this reason, IDAE established that an interview can be considered as effective when the interviewee answers at least 75 % of the questions in the survey. This solution maximised the cost/benefit rate in surveys.
To deal with contradictory data, two approaches were used. For contradictory data within a same survey operation be-tween 7 % and 10 %, and were solved with new specific ques-tions to the relevant interviewees. Where this didn’t work adjustments were made with information coming from other survey responses with the same, homogeneous features.
The second typology of contradictory data was detected on comparing the results of the phone, ‘panel’, and on-location measurements. Most of the contradictions concentrated on dwelling equipment, and lesser discrepancies were found in panel and on-location measurements, with the main ones between measurement and phone surveys. Discrepancies were solved mostly with weighted averages of the various data, except when two surveys offered similar data and the relevant third survey differed from the formers, in such case the data used were the weighted average of consistent surveys.
Validation procedures were established for the energy cost and consumption, comparing the unit energy costs with the information provided by traders and that held by IDAE itself. This process did not admit divergences in the unit energy costs over ± 5 %. If any of these costs exceeded this threshold, the interviewee was contacted again to solve the discrepancy, and whenever a solution was not possible, the interview for the consumption and energy cost sections was discarded, resulting in a loss of 10 % approximately.
The process showed that the phone surveys achieved a good cost/benefit to compile information about the features of dwellings and households, and about the equipment rates, but not for information on consumption and energy costs.
In the section on use of the equipment by the user, all of the surveys provide quite similar results. Nonetheless, it seems more logical to include this information request in the survey requesting information on energy consumption and associ-ated costs to support further research.
Use
Given that this was the first time such a survey had been car-ried out in Spain the results were encouraging but could not be included in the Action Plans in 2011, but will be in the future.
The results of the study will soon be included in the detailed energy actions in Spain and results submitted to interna-tional organisations and institutions, such as the IEA and
Country case studies5
124 Manual for Statistics on Energy Consumption in Households
Eurostat. The replication and extrapolation of these results in a near future will lead the way to future planning actions.
Finally, it is envisaged to include the results of the study in further phases of the European Commission’s ODYSSEE-MURE project on sectorial energy indicators and energy efficiency.
Coverage
The coverage of the recommendations of 2008 Task-Force has been assessed at 84 %. With the areas accounting for greater difficulty have been very definite and specific. For example, in terms of the dwelling and equipment features, Spanish households are unaware of their house insulation and they do not usually know how much their hot water storage tank holds, regardless of their tenancy or ownership status. There-fore, this information was not included in the research.
A serious lack of knowledge in everything related to mod-ernisation and rehabilitation, not only in housing but also in the main heating and air-conditioning equipment units was noticed. Equally little knowledge was detected in house-holds in terms of the efficiency (Energy Labelling) of electric appliances. It was detected that users have not been capable of determining how they use thermostats in heating and air-conditioning therefore, no valid conclusions have been obtained from this issue.
5 .7 . Country case study: United Kingdom
Why
Energy policy in the United Kingdom is the responsibility of the Department of Energy and Climate Change (DECC). DECC exists to head off two risks — a shortfall in secure, affordable energy supplies and catastrophic climate change. To ensure that DECC’s mission — to ‘Power the country and protect the planet’ — is achieved, a high level of policy fo-cussed analysis is required. To underpin this, detailed data are collected. Examples of DECC’s policies and work areas that the statistics help to monitor are:
Security of supply
Energy Security matters: consumers, businesses, everyone expects there to be light, warmth and fuel when they need it. Having detailed data on production and consumption helps to minimise risks of any unplanned disruptions caused by accidents or extreme weather and in the long term analysis helps to ensure we have policies that will deliver stable and reliable supplies.
Decarbonisation of the heat supply
Heat is the single biggest reason we use energy in the United Kingdom. Without changing the way we produce and con-sume heat, the United Kingdom will not meet its carbon reduction targets or it renewable energy directive obligations. To do this we need to have a good understanding of how we generate, distribute and use heat in buildings.
Renewable Energy Directive
Like all member states, the United Kingdom has a challeng-ing target to increase the amount of energy coming from renewable sources. The Directive focuses on final energy consumption, and so policies being delivered to help meet our target require detailed information on how energy is used
Increased focus on the performance of, and energy savings from, energy efficiency policies
Tackling energy inefficiency is a vital tool in increasing en-ergy security and supporting the fight against climate change. A detailed understanding of the amount of energy that will be saved when retrofitting a building with new energy efficiency measures is a key use of the energy and related buildings data that DECC collects. DECC’s National Energy Efficiency Da-taframework helps to measure real (not theoretical) energy savings when insulation improvements are made to homes.
Increasing prices
As wholesale and consumer energy prices rise, an increased focus on energy expenditure necessitates more detailed in-formation and explanation for consumers on where and how they use energy.
Introduction and evaluation of policies
Before any energy policy is introduced, an impact assessment includes information relating to financial costs and savings, and changes in energy use as a result of the policy are also included. DECC’s energy statistics feed into this and are also even more central to the monitoring and evaluation of the policies.
Background
The United Kingdom has been producing aggregate energy data for over 60 years. However, this has tended to be domi-nated by production and aggregate use of headline fuels. More recently and, linked to the reasons discussed above increased focus has been placed on why people are using energy (for instance, the purpose or service they gain from the energy e.g. heat), understanding and addressing fuel poverty and what options exist to reduce energy consump-tion, whilst maintaining the same service. Linked to this has been an increased appetite for monitoring and evaluating
Country case studies 5
Manual for Statistics on Energy Consumption in Households 125
policies, thinking about smarter ways to capture and re-use data and a desire to produce more data at local levels. All this has resulted in a significant increase in household energy use data available for the United Kingdom.
How
The United Kingdom has historically used a top-down approach for the collection of energy data, sending question-naires to the energy producers and obtaining information relating to production and sales from them. There are no regular surveys of end users, and the data required for the reporting requirements in energy statistics regulation 1099/2008 are obtained from surveys of around 100 energy producers in the coal, oil, gas and electricity sectors.
There is a composite approach to producing information on how energy is used in households. There are regular housing surveys, carried out by statistics teams in other parts of Government for each of the United Kingdom countries, and — whilst no information is collected on energy consumption — a variety of data relating to drivers in energy use (includ-ing dwelling and household information, building geometry, ventilation and other items causing heat loss, space heating systems, hot water systems, and lighting) are collected from the participants. These metrics then from key inputs into energy models, which, when combined with information on external temperature, and estimated internal temperatures, enable property level estimate of energy use to be obtained. These property-level estimates are then grossed up to repre-sent the United Kingdom housing stock. The aggregate level consumption figures are then compared to the information obtained from the energy suppliers; the difference is usually small, and these can be adjusted by using different assump-tion on the internal temperature.
Information on the processes including the conversion of housing survey data for use in the energy model, and the energy models themselves, can be found on the following website: https://www.gov.uk/government/organisations/de-partment-of-energy-climate-change/series/domestic-energy-fact-file-and-housing-surveys
In 2003 there was a shift in the focus of energy policy in the United Kingdom to encourage local and regional decision making to help deliver national energy policy objectives. To enable effective monitoring of this approach the energy statistics team consulted key stakeholders to agree a process of receiving data from the gas and electricity companies administrative records to enable sub-national energy sta-tistics to be collated. This had the added benefit of obtaining gas and electricity consumption for each electricity and gas meter point in the country, with the understanding that these would be used for statistical purposes only. However this data does not contain any information on how the energy is used.
What and When
The outputs from the energy models enable fuel-specific en-ergy use information to be calculated.
Fuel type: Solid fuel; gas; electricity; oil; heat sold; bioenergy & waste.
End uses: Space heating; water; cooking; lighting & appli-ances.
Provisional estimates are produced around 7 months after the end of the calendar year which the data relate to; this ties in with the United Kingdom’s first release of a complete energy balance. However a more robust estimate will be released 12 months later, once the model has been fully recalibrated and new data from the housing surveys incorporated.
The data are published in DECC’s ‘Energy Consumption in the United Kingdom’ National Statistics publication, but as yet are not fully integrated into the energy balance releases, however the data are constrained to the fuel totals in the energy balances.
Issues
The non-energy inputs to the model are based on outputs from housing surveys.
These are subject to a number of uncertainties, with uncer-tainties around a number of parameters in the modelling including: the housing data; sampling error in the outputs of the housing surveys; and uncertainties in estimates of internal temperatures. Sampling errors from the housing surveys are relatively small, because the sample size is over 16 000 homes. However there is a chance of inaccuracy from characteristics of dwellings that are hard to record. For example, where difficulties accessing a loft or the inside of a cavity wall mean it is hard to assess insulation thickness, or when it is not obvi-ous whether an installed boiler is an efficiency condensing boiler or a less efficient non-condensing boiler. Monte Carlo simulation is used to assess uncertainty.
Use
As referred to above, the data on the end uses of energy has helped to inform the development and evaluation of a num-ber of key United Kingdom heat and energy efficiency related policies. Further information on the heat policies which made extensive use of the end use data can be found here:
https://www.gov.uk/government/publications/the-future-of-heating-meeting-the-challenge
More information on how detailed administrative data relating to insulation and individual consumers energy use, through the National Energy Efficiency Data Framework project is covered in section 7.3 of this manual.

Country case studies5
126 Manual for Statistics on Energy Consumption in Households
Coverage
Through the variety of data collection surveys, use of admin-istrative sources and models, the United Kingdom are able to meet the new data supply requirements of Energy Statistics Regulation. However, for one particular end use, space cool-ing, the amount of energy used for this purpose in the Unit-ed Kingdom is small. Few homes in the United Kingdom have air conditioning (around 2 % of homes have some form of portable air conditioning unit and less than 1 % have a fixed air conditioning unit); coverage of electricity used for these sources is included in appliance use.
Through use of administrative data sources and modelling, the United Kingdom can able to produce energy consump-tion data for small geographic breakdowns — gas and elec-tricity covering around 100 customers, and other fuels for the 400+ local ‘NUTS based’ areas. However these are on a total fuel use basis, and our modelling for end use is not cur-rently applied at this level. We are also considering if the use of weather corrected data — particularly for heating demand — is of more use to data users than non-weather corrected (i.e. actual) data.
Future plans
The requirements of policy makers and other users of data means that work in this area will continue and need to
expand. To meet the growing needs, the United Kingdom will be looking to maximise the data that can be obtained through the administrative process linked to the implemen-tation of policies. Examples relating to small scale renewa-bles, energy efficiency retrofit, and renewable heat can be found at:
https://www.gov.uk/government/organisations/department-of-energy-climate-change/series/feed-in-tariff-statistics;
https://www.gov.uk/government/organisations/department-of-energy-climate-change/series/estimates-of-home-insula-tion-levels-in-great-britain and
https://www.gov.uk/government/organisations/department-of-energy-climate-change/series/renewable-heat-incentive-renewable-heat-premium-payment-statistics respectively.
The United Kingdom also seeks to further explore data matching and data linking to ensure that all the possible value can be extracted from each dataset (such as matching individual responses in the English Housing Survey to the energy and property information in the National Energy Efficiency Data Framework) and related modelling work. All of this will be supplemented by headline surveys of producers and households, all-be-it with possible reduced coverage than in earlier work.

Going beyond the regulation

Going beyond the regulation 6
Manual for Statistics on Energy Consumption in Households 129
IntroductionThe initial chapters of this manual have explained the work, supported by Eurostat that has been undertaken to better understand the needs for improved household energy con-sumption data and the current approach taken by Member States. Following this work additional information on house-hold energy use is planned to become integrated into the scope of the Energy Statistics Regulation 1099/2008 by 2014. To help support Member States produce this information, Chapter 2 in this manual provided definitions and bounda-ries, whilst Chapters 3 and 4 set out the range of applicable methods and examples of their use across Member States, with a wider analysis of individual countries approaches set out in Chapter 5 which should provide guidance on how these new requirements can be met.
This chapter takes the preceding work on and looks to the future in terms of how countries may choose to expand data collection on the household sector for their needs and the needs of their users.
6 .1 . Definition of levels of coverageThe inclusion of data under discussion regards information on energy consumption in households by end use for main fuels (see Chapter 2):
• Space heating
• Space cooling
• Water heating
• Cooking
• Lighting and appliances
• Other uses
Individual Member States may wish to use the approaches set out in this manual to go beyond the required data. Addi-tional data could help better understand household energy use in their countries, and provide data that can help inform and monitor policies. Whilst individual Member States can choose what, if any, additional information they wish to collect, there are some benefits in comparability of data across countries if common definitions (as covered in Chapter 2) and breakdowns of variables can be used.
As such the remainder of this chapter explores ways in which variables can be broken down to allow a more detailed un-derstanding of household energy use to be provided above that required by the Regulation. The tables included in this chapter aim to set out the key definitions to measure the use of household energy. It does this by setting out definitions in 2 to 4 levels, where level 1 is the broadest and should be the
level that all countries can aim for whilst levels 2, 3 and 4 provide further detail that may be beneficial and useful to measure, and can be seen as a desired next step.
Household energy demand is influenced by a wide range of factors, including the type of dwelling, number of people living there, the types of energy used, climatic variations, the level of insulation, and other factors. So to understand more about energy use it may be beneficial to consider how these and other variables can be broken down. The first section describes some of the breakdown of socio demographic variables that may be useful in understanding energy use, whilst the second looks more at energy and energy efficiency variables.
6 .1 .1 . Demographic and social variables
One of the determinants of household energy consumption is the number of occupants. Often a household with more occupants will use more energy. But it is also important to understand the type of people in the home, for example the number of adults (and additionally the number of those who are pensioners — so may stay at home for longer periods) and children (possibly by broad age categories — teenage children may use more IT equipment than younger ones).
Analysis according to the household life cycles can be inter-esting in order to study in detail the energy consumption of households. The stages of the life cycle are a classification that reflects the moment of life of a household, both by the age of the female occupant (where applicable) and the presence or not of children.
The lifestyle of a home is influenced by the cultural character-istics of each society, for example, the following stages of life for households have been considered in the studies in Spain:
• Adult Junior Single: households with one unmarried adult of age between 18 and 44 years old.
• Young couples: households of couples without chil-dren, female occupants age 18 to 44 years.
• Young families: homes with 1 or more adults and with 1 or more children, the age of the youngest of the chil-dren will be between 0 and 5 years.
• Families in progress: homes with 1 or more adults and with 1 or more children, the age of the youngest of the children will be between 6–12 years.
• Families with adolescents: homes with 1 or more adults and with 1 or more children, the age of the youngest of the children will be between 13 to 17 years.
• Families with older children: households with 3 or more adults.
• Mature couples: households of couples without chil-dren, female occupants age 45 or greater.
• Adult Senior Single: households with one unmarried adult of age 45 or greater.

Going beyond the regulation6
130 Manual for Statistics on Energy Consumption in Households
The level of household income also has a very important role in the energy consumption of families. High income levels are typically associated with larger dwellings and more equipment ownership which leads to a greater energy consumption; low income levels often mean the opposite. Income can also be a factor in the levels of insulation or use of heating/cooling systems. Income levels do vary across Member States, so whilst the inclusion of income as a socio demographic vari-able can be useful, the approach to income questions should be aligned to approaches used elsewhere in individual Mem-ber States. Given the reluctance of some households to declare their income level in some cases this information can be re-placed by social class, which can be inferred through of the type of work of the head of household and the associated education level.
It may also be important to understand the economic circum-stances of people in the household, for example people work-ing full or part time, or non-economically active and thus at home for more time. Likewise, and understanding of whether people work from home can help understand differences in energy use (for example much high use of electricity).
6 .1 .2 . Dwelling variables
This section is dedicated to gathering information on dwelling characteristics affecting energy consumption. Theoretically, the energy consumption varies with the size and level of energy efficiency of the building. Size is important because more energy is needed to heat/cool a greater volume of air, and more appliances are typically used in larger houses. En-ergy efficiency is a major factor and while some countries can obtain energy efficiency ratings from Energy Performance of Buildings databases, most will have to look to simpler char-acteristics that can nevertheless be very useful for breaking down energy consumption.
The main characteristics are: ownership type, property size, dwelling type, age of building, insulation (wall, roof, and window) availability and heated and cooled areas. Different levels of coverage for each subtype of requirement can be seen in the Table 6.1.
The type (or tenure) of ownership of a dwelling can provide significant information. Different studies in Member States have established that the degree of energy efficiency is lower in private rented dwellings than in social rented or privately owned dwellings. This is due to a ‘split incentive’ whereby the tenant benefits, but requires the landlord to invest, so unless the landlord can see a return on the investment through higher rents they do not benefit. Socially rented properties tend to have higher levels of efficiency as the owner in most cases has a wider social obligation to provide good quality and efficient homes for tenants. For private homes the owner is also the ‘tenant’ so in general privately owned homes are more efficient, but the level of income can also impact here.
There are a lot of varieties in the type and size of homes in different countries of the European Union. Despite this, from an energy point of view, the biggest differences in consump-tion and behavior occurs between singles houses (detached or semi-detached) and apartments; in Spain for example the consumption of a single house is twice the consumption of an apartment. The difference is due to a combination of dif-ferences in size, heat loss, and number of occupants. Linked to the type and tenure of dwellings it can also be useful to understand how big the property is, either as a direct floor area measure or indirectly through the number of rooms. Research undertaken in the United Kingdom has shown that each additional bedroom after 3 add a fairly constant increase in energy use.
The age of the dwelling has a vital importance in energy consumption, especially energy intended for heating and
Figure 6.1: Median gas and electricity consumption in 2011, by number of bedrooms, England and Wales
Source: DECC .
Number of bedrooms
5 or more
4
3
All dwellings
2
1
00 5 0002 5005 0007 500 10 000 15 000 20 000 25 000
Electricity consumption, kWh Gas consumption, kWh
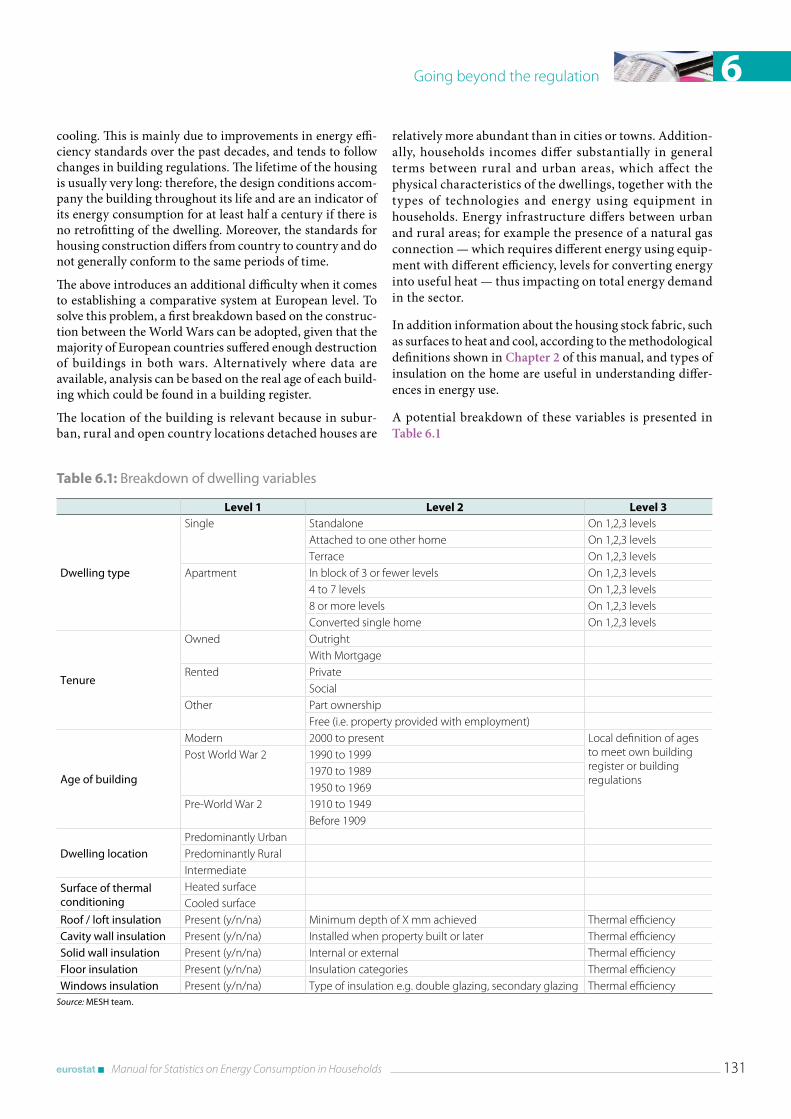
Going beyond the regulation 6
Manual for Statistics on Energy Consumption in Households 131
cooling. This is mainly due to improvements in energy effi-ciency standards over the past decades, and tends to follow changes in building regulations. The lifetime of the housing is usually very long: therefore, the design conditions accom-pany the building throughout its life and are an indicator of its energy consumption for at least half a century if there is no retrofitting of the dwelling. Moreover, the standards for housing construction differs from country to country and do not generally conform to the same periods of time.
The above introduces an additional difficulty when it comes to establishing a comparative system at European level. To solve this problem, a first breakdown based on the construc-tion between the World Wars can be adopted, given that the majority of European countries suffered enough destruction of buildings in both wars. Alternatively where data are available, analysis can be based on the real age of each build-ing which could be found in a building register.
The location of the building is relevant because in subur-ban, rural and open country locations detached houses are
relatively more abundant than in cities or towns. Addition-ally, households incomes differ substantially in general terms between rural and urban areas, which affect the physical characteristics of the dwellings, together with the types of technologies and energy using equipment in households. Energy infrastructure differs between urban and rural areas; for example the presence of a natural gas connection — which requires different energy using equip-ment with different efficiency, levels for converting energy into useful heat — thus impacting on total energy demand in the sector.
In addition information about the housing stock fabric, such as surfaces to heat and cool, according to the methodological definitions shown in Chapter 2 of this manual, and types of insulation on the home are useful in understanding differ-ences in energy use.
A potential breakdown of these variables is presented in Table 6.1
Table 6.1: Breakdown of dwelling variables
Level 1 Level 2 Level 3
Dwelling type
Single Standalone On 1,2,3 levelsAttached to one other home On 1,2,3 levelsTerrace On 1,2,3 levels
Apartment In block of 3 or fewer levels On 1,2,3 levels4 to 7 levels On 1,2,3 levels8 or more levels On 1,2,3 levelsConverted single home On 1,2,3 levels
Tenure
Owned OutrightWith Mortgage
Rented PrivateSocial
Other Part ownership Free (i.e. property provided with employment)
Age of building
Modern 2000 to present Local definition of ages to meet own building register or building regulations
Post World War 2 1990 to 19991970 to 19891950 to 1969
Pre-World War 2 1910 to 1949Before 1909
Dwelling locationPredominantly UrbanPredominantly RuralIntermediate
Surface of thermal conditioning
Heated surfaceCooled surface
Roof / loft insulation Present (y/n/na) Minimum depth of X mm achieved Thermal efficiencyCavity wall insulation Present (y/n/na) Installed when property built or later Thermal efficiencySolid wall insulation Present (y/n/na) Internal or external Thermal efficiencyFloor insulation Present (y/n/na) Insulation categories Thermal efficiencyWindows insulation Present (y/n/na) Type of insulation e.g. double glazing, secondary glazing Thermal efficiency
Source: MESH team .
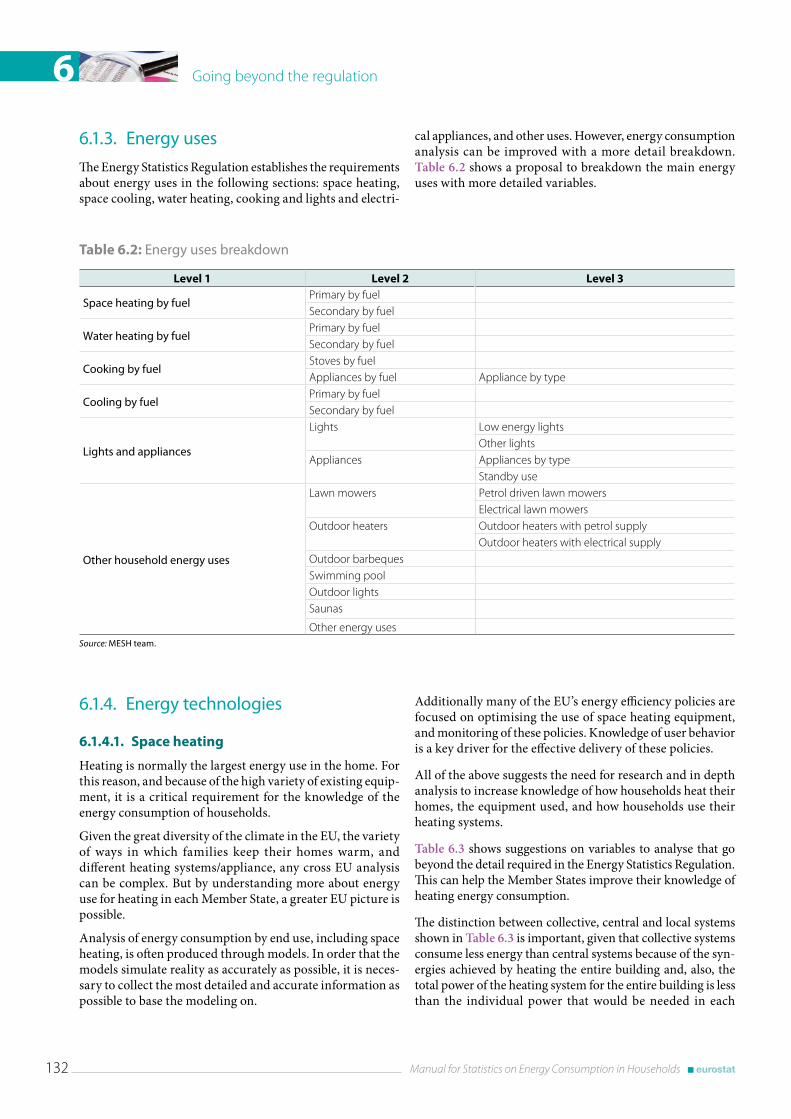
Going beyond the regulation6
132 Manual for Statistics on Energy Consumption in Households
6 .1 .3 . Energy uses
The Energy Statistics Regulation establishes the requirements about energy uses in the following sections: space heating, space cooling, water heating, cooking and lights and electri-
cal appliances, and other uses. However, energy consumption analysis can be improved with a more detail breakdown. Table 6.2 shows a proposal to breakdown the main energy uses with more detailed variables.
6 .1 .4 . Energy technologies
6.1.4.1. Space heating
Heating is normally the largest energy use in the home. For this reason, and because of the high variety of existing equip-ment, it is a critical requirement for the knowledge of the energy consumption of households.
Given the great diversity of the climate in the EU, the variety of ways in which families keep their homes warm, and different heating systems/appliance, any cross EU analysis can be complex. But by understanding more about energy use for heating in each Member State, a greater EU picture is possible.
Analysis of energy consumption by end use, including space heating, is often produced through models. In order that the models simulate reality as accurately as possible, it is neces-sary to collect the most detailed and accurate information as possible to base the modeling on.
Table 6.2: Energy uses breakdown
Level 1 Level 2 Level 3
Space heating by fuelPrimary by fuelSecondary by fuel
Water heating by fuelPrimary by fuelSecondary by fuel
Cooking by fuelStoves by fuelAppliances by fuel Appliance by type
Cooling by fuelPrimary by fuelSecondary by fuel
Lights and appliances
Lights Low energy lightsOther lights
Appliances Appliances by typeStandby use
Other household energy uses
Lawn mowers Petrol driven lawn mowersElectrical lawn mowers
Outdoor heaters Outdoor heaters with petrol supplyOutdoor heaters with electrical supply
Outdoor barbequesSwimming poolOutdoor lightsSaunas
Other energy usesSource: MESH team .
Additionally many of the EU’s energy efficiency policies are focused on optimising the use of space heating equipment, and monitoring of these policies. Knowledge of user behavior is a key driver for the effective delivery of these policies.
All of the above suggests the need for research and in depth analysis to increase knowledge of how households heat their homes, the equipment used, and how households use their heating systems.
Table 6.3 shows suggestions on variables to analyse that go beyond the detail required in the Energy Statistics Regulation. This can help the Member States improve their knowledge of heating energy consumption.
The distinction between collective, central and local systems shown in Table 6.3 is important, given that collective systems consume less energy than central systems because of the syn-ergies achieved by heating the entire building and, also, the total power of the heating system for the entire building is less than the individual power that would be needed in each
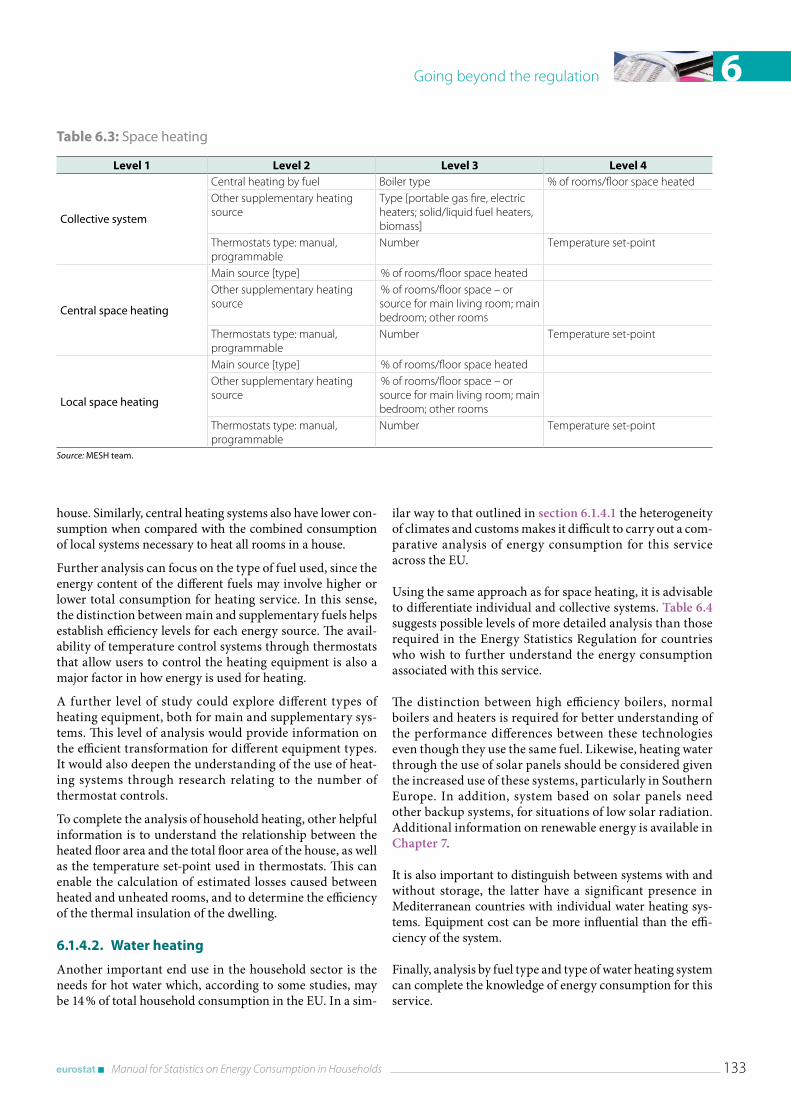
Going beyond the regulation 6
Manual for Statistics on Energy Consumption in Households 133
house. Similarly, central heating systems also have lower con-sumption when compared with the combined consumption of local systems necessary to heat all rooms in a house.
Further analysis can focus on the type of fuel used, since the energy content of the different fuels may involve higher or lower total consumption for heating service. In this sense, the distinction between main and supplementary fuels helps establish efficiency levels for each energy source. The avail-ability of temperature control systems through thermostats that allow users to control the heating equipment is also a major factor in how energy is used for heating.
A further level of study could explore different types of heating equipment, both for main and supplementary sys-tems. This level of analysis would provide information on the efficient transformation for different equipment types. It would also deepen the understanding of the use of heat-ing systems through research relating to the number of thermostat controls.
To complete the analysis of household heating, other helpful information is to understand the relationship between the heated floor area and the total floor area of the house, as well as the temperature set-point used in thermostats. This can enable the calculation of estimated losses caused between heated and unheated rooms, and to determine the efficiency of the thermal insulation of the dwelling.
6.1.4.2. Water heating
Another important end use in the household sector is the needs for hot water which, according to some studies, may be 14 % of total household consumption in the EU. In a sim-
ilar way to that outlined in section 6.1.4.1 the heterogeneity of climates and customs makes it difficult to carry out a com-parative analysis of energy consumption for this service across the EU.
Using the same approach as for space heating, it is advisable to differentiate individual and collective systems. Table 6.4 suggests possible levels of more detailed analysis than those required in the Energy Statistics Regulation for countries who wish to further understand the energy consumption associated with this service.
The distinction between high efficiency boilers, normal boilers and heaters is required for better understanding of the performance differences between these technologies even though they use the same fuel. Likewise, heating water through the use of solar panels should be considered given the increased use of these systems, particularly in Southern Europe. In addition, system based on solar panels need other backup systems, for situations of low solar radiation. Additional information on renewable energy is available in Chapter 7.
It is also important to distinguish between systems with and without storage, the latter have a significant presence in Mediterranean countries with individual water heating sys-tems. Equipment cost can be more influential than the effi-ciency of the system.
Finally, analysis by fuel type and type of water heating system can complete the knowledge of energy consumption for this service.
Table 6.3: Space heating
Level 1 Level 2 Level 3 Level 4
Collective system
Central heating by fuel Boiler type % of rooms/floor space heatedOther supplementary heating source
Type [portable gas fire, electric heaters; solid/liquid fuel heaters, biomass]
Thermostats type: manual, programmable
Number Temperature set-point
Central space heating
Main source [type] % of rooms/floor space heatedOther supplementary heating source
% of rooms/floor space – or source for main living room; main bedroom; other rooms
Thermostats type: manual, programmable
Number Temperature set-point
Local space heating
Main source [type] % of rooms/floor space heatedOther supplementary heating source
% of rooms/floor space – or source for main living room; main bedroom; other rooms
Thermostats type: manual, programmable
Number Temperature set-point
Source: MESH team .
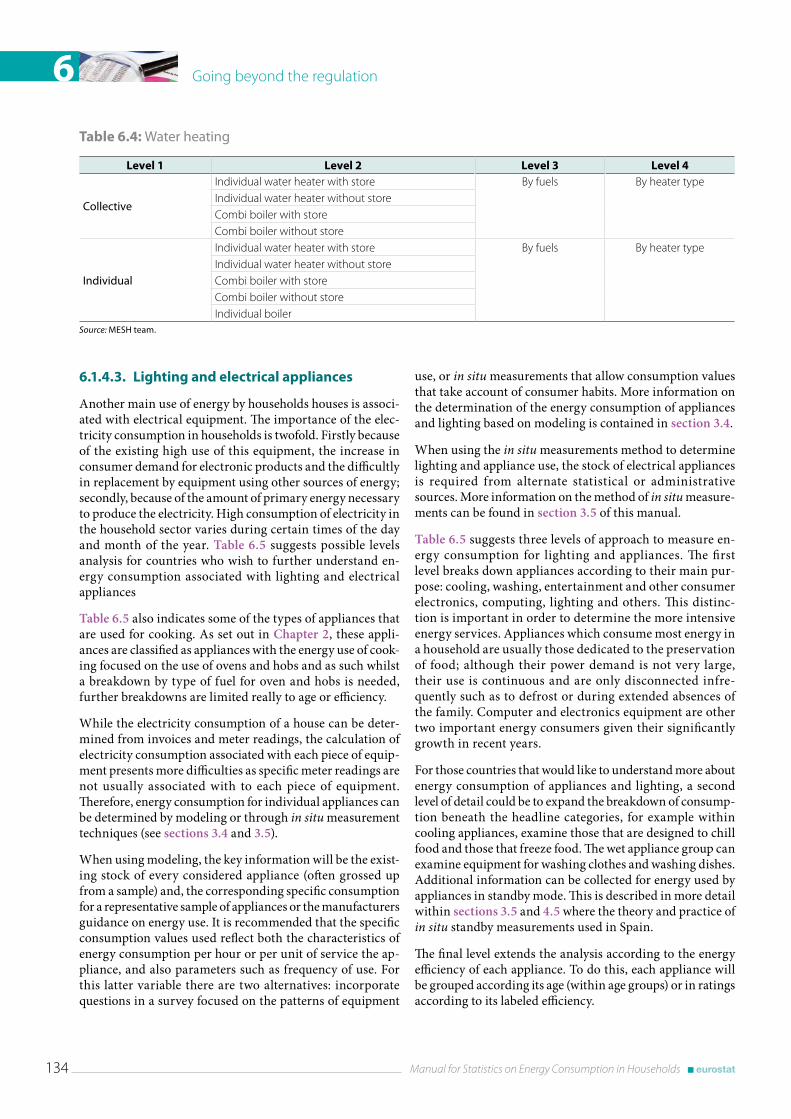
Going beyond the regulation6
134 Manual for Statistics on Energy Consumption in Households
6.1.4.3. Lighting and electrical appliances
Another main use of energy by households houses is associ-ated with electrical equipment. The importance of the elec-tricity consumption in households is twofold. Firstly because of the existing high use of this equipment, the increase in consumer demand for electronic products and the difficultly in replacement by equipment using other sources of energy; secondly, because of the amount of primary energy necessary to produce the electricity. High consumption of electricity in the household sector varies during certain times of the day and month of the year. Table 6.5 suggests possible levels analysis for countries who wish to further understand en-ergy consumption associated with lighting and electrical appliances
Table 6.5 also indicates some of the types of appliances that are used for cooking. As set out in Chapter 2, these appli-ances are classified as appliances with the energy use of cook-ing focused on the use of ovens and hobs and as such whilst a breakdown by type of fuel for oven and hobs is needed, further breakdowns are limited really to age or efficiency.
While the electricity consumption of a house can be deter-mined from invoices and meter readings, the calculation of electricity consumption associated with each piece of equip-ment presents more difficulties as specific meter readings are not usually associated with to each piece of equipment. Therefore, energy consumption for individual appliances can be determined by modeling or through in situ measurement techniques (see sections 3.4 and 3.5).
When using modeling, the key information will be the exist-ing stock of every considered appliance (often grossed up from a sample) and, the corresponding specific consumption for a representative sample of appliances or the manufacturers guidance on energy use. It is recommended that the specific consumption values used reflect both the characteristics of energy consumption per hour or per unit of service the ap-pliance, and also parameters such as frequency of use. For this latter variable there are two alternatives: incorporate questions in a survey focused on the patterns of equipment
use, or in situ measurements that allow consumption values that take account of consumer habits. More information on the determination of the energy consumption of appliances and lighting based on modeling is contained in section 3.4.
When using the in situ measurements method to determine lighting and appliance use, the stock of electrical appliances is required from alternate statistical or administrative sources. More information on the method of in situ measure-ments can be found in section 3.5 of this manual.
Table 6.5 suggests three levels of approach to measure en-ergy consumption for lighting and appliances. The first level breaks down appliances according to their main pur-pose: cooling, washing, entertainment and other consumer electronics, computing, lighting and others. This distinc-tion is important in order to determine the more intensive energy services. Appliances which consume most energy in a household are usually those dedicated to the preservation of food; although their power demand is not very large, their use is continuous and are only disconnected infre-quently such as to defrost or during extended absences of the family. Computer and electronics equipment are other two important energy consumers given their significantly growth in recent years.
For those countries that would like to understand more about energy consumption of appliances and lighting, a second level of detail could be to expand the breakdown of consump-tion beneath the headline categories, for example within cooling appliances, examine those that are designed to chill food and those that freeze food. The wet appliance group can examine equipment for washing clothes and washing dishes. Additional information can be collected for energy used by appliances in standby mode. This is described in more detail within sections 3.5 and 4.5 where the theory and practice of in situ standby measurements used in Spain.
The final level extends the analysis according to the energy efficiency of each appliance. To do this, each appliance will be grouped according its age (within age groups) or in ratings according to its labeled efficiency.
Table 6.4: Water heating
Level 1 Level 2 Level 3 Level 4
Collective
Individual water heater with store By fuels By heater typeIndividual water heater without storeCombi boiler with storeCombi boiler without store
Individual
Individual water heater with store By fuels By heater typeIndividual water heater without storeCombi boiler with storeCombi boiler without storeIndividual boiler
Source: MESH team .
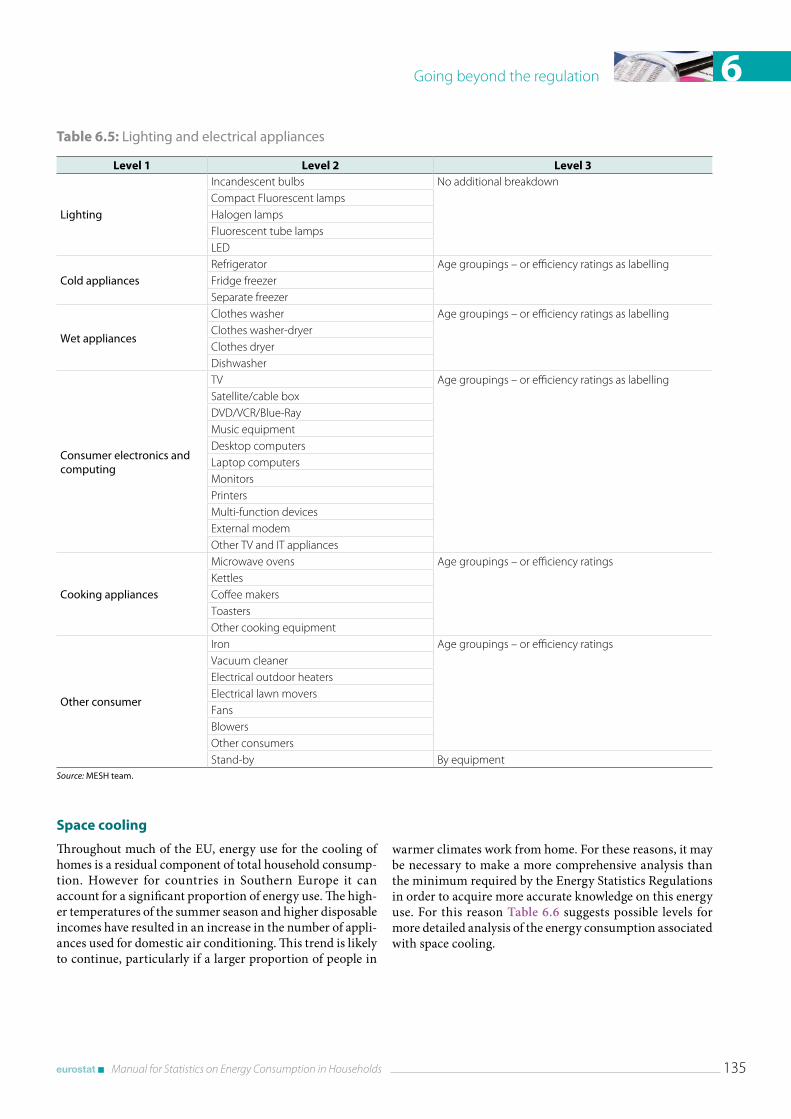
Going beyond the regulation 6
Manual for Statistics on Energy Consumption in Households 135
Space cooling
Throughout much of the EU, energy use for the cooling of homes is a residual component of total household consump-tion. However for countries in Southern Europe it can account for a significant proportion of energy use. The high-er temperatures of the summer season and higher disposable incomes have resulted in an increase in the number of appli-ances used for domestic air conditioning. This trend is likely to continue, particularly if a larger proportion of people in
warmer climates work from home. For these reasons, it may be necessary to make a more comprehensive analysis than the minimum required by the Energy Statistics Regulations in order to acquire more accurate knowledge on this energy use. For this reason Table 6.6 suggests possible levels for more detailed analysis of the energy consumption associated with space cooling.
Table 6.5: Lighting and electrical appliances
Level 1 Level 2 Level 3
Lighting
Incandescent bulbs No additional breakdownCompact Fluorescent lampsHalogen lampsFluorescent tube lampsLED
Cold appliancesRefrigerator Age groupings – or efficiency ratings as labellingFridge freezerSeparate freezer
Wet appliances
Clothes washer Age groupings – or efficiency ratings as labellingClothes washer-dryerClothes dryerDishwasher
Consumer electronics and computing
TV Age groupings – or efficiency ratings as labellingSatellite/cable boxDVD/VCR/Blue-RayMusic equipmentDesktop computersLaptop computersMonitorsPrintersMulti-function devicesExternal modemOther TV and IT appliances
Cooking appliances
Microwave ovens Age groupings – or efficiency ratingsKettlesCoffee makersToastersOther cooking equipment
Other consumer
Iron Age groupings – or efficiency ratingsVacuum cleanerElectrical outdoor heatersElectrical lawn moversFansBlowersOther consumersStand-by By equipment
Source: MESH team .
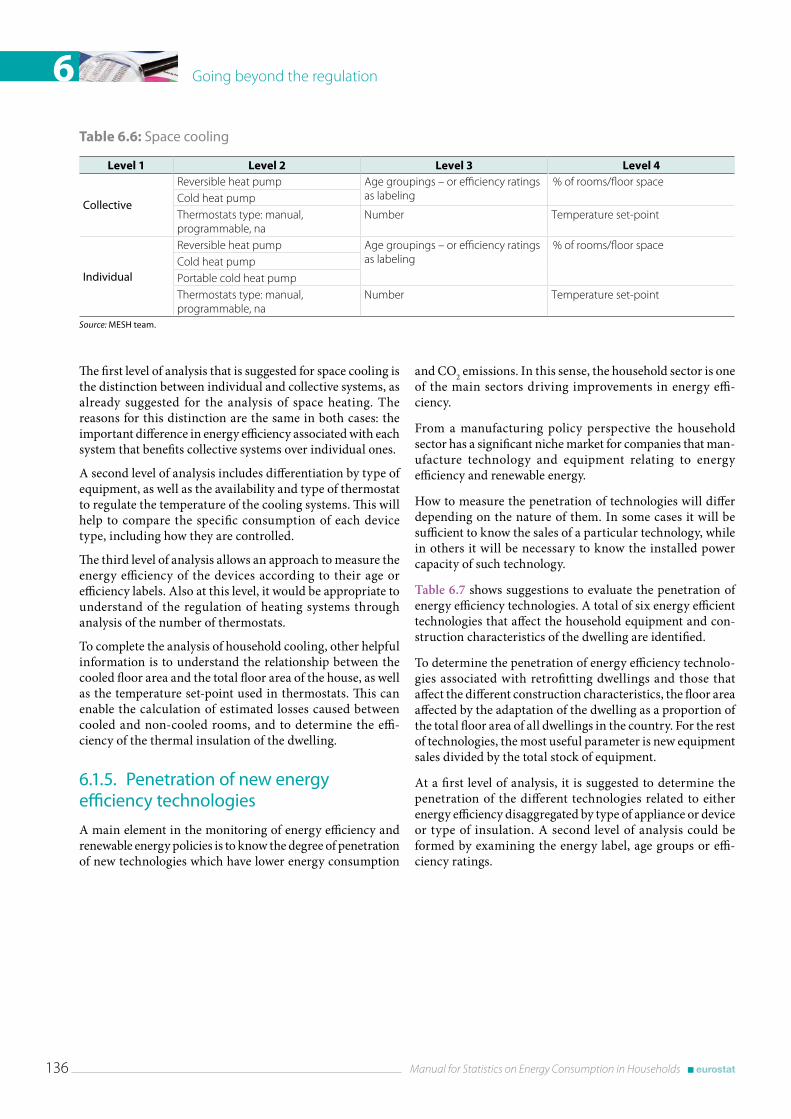
Going beyond the regulation6
136 Manual for Statistics on Energy Consumption in Households
The first level of analysis that is suggested for space cooling is the distinction between individual and collective systems, as already suggested for the analysis of space heating. The reasons for this distinction are the same in both cases: the important difference in energy efficiency associated with each system that benefits collective systems over individual ones.
A second level of analysis includes differentiation by type of equipment, as well as the availability and type of thermostat to regulate the temperature of the cooling systems. This will help to compare the specific consumption of each device type, including how they are controlled.
The third level of analysis allows an approach to measure the energy efficiency of the devices according to their age or efficiency labels. Also at this level, it would be appropriate to understand of the regulation of heating systems through analysis of the number of thermostats.
To complete the analysis of household cooling, other helpful information is to understand the relationship between the cooled floor area and the total floor area of the house, as well as the temperature set-point used in thermostats. This can enable the calculation of estimated losses caused between cooled and non-cooled rooms, and to determine the effi-ciency of the thermal insulation of the dwelling.
6 .1 .5 . Penetration of new energy efficiency technologies
A main element in the monitoring of energy efficiency and renewable energy policies is to know the degree of penetration of new technologies which have lower energy consumption
and CO2 emissions. In this sense, the household sector is one of the main sectors driving improvements in energy effi-ciency.
From a manufacturing policy perspective the household sector has a significant niche market for companies that man-ufacture technology and equipment relating to energy efficiency and renewable energy.
How to measure the penetration of technologies will differ depending on the nature of them. In some cases it will be sufficient to know the sales of a particular technology, while in others it will be necessary to know the installed power capacity of such technology.
Table 6.7 shows suggestions to evaluate the penetration of energy efficiency technologies. A total of six energy efficient technologies that affect the household equipment and con-struction characteristics of the dwelling are identified.
To determine the penetration of energy efficiency technolo-gies associated with retrofitting dwellings and those that affect the different construction characteristics, the floor area affected by the adaptation of the dwelling as a proportion of the total floor area of all dwellings in the country. For the rest of technologies, the most useful parameter is new equipment sales divided by the total stock of equipment.
At a first level of analysis, it is suggested to determine the penetration of the different technologies related to either energy efficiency disaggregated by type of appliance or device or type of insulation. A second level of analysis could be formed by examining the energy label, age groups or effi-ciency ratings.
Table 6.6: Space cooling
Level 1 Level 2 Level 3 Level 4
Collective
Reversible heat pump Age groupings – or efficiency ratings as labeling
% of rooms/floor spaceCold heat pumpThermostats type: manual, programmable, na
Number Temperature set-point
Individual
Reversible heat pump Age groupings – or efficiency ratings as labeling
% of rooms/floor spaceCold heat pumpPortable cold heat pumpThermostats type: manual, programmable, na
Number Temperature set-point
Source: MESH team .
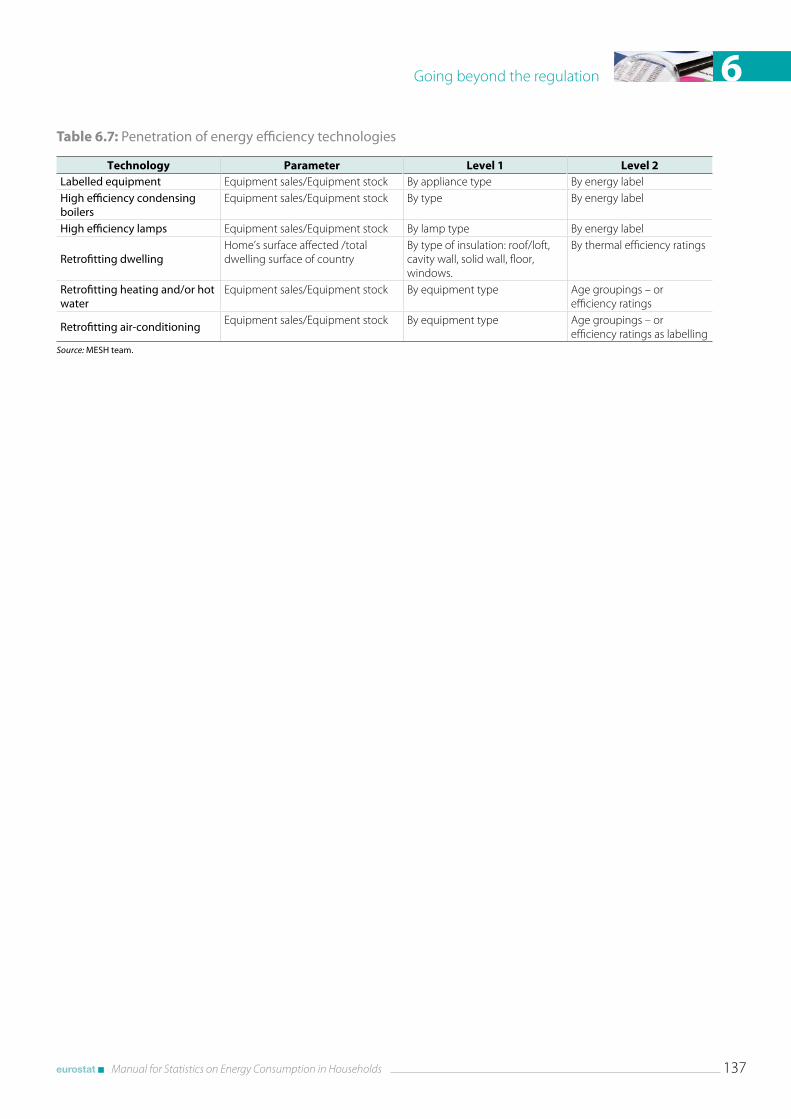
Going beyond the regulation 6
Manual for Statistics on Energy Consumption in Households 137
Table 6.7: Penetration of energy efficiency technologies
Technology Parameter Level 1 Level 2Labelled equipment Equipment sales/Equipment stock By appliance type By energy labelHigh efficiency condensing boilers
Equipment sales/Equipment stock By type By energy label
High efficiency lamps Equipment sales/Equipment stock By lamp type By energy label
Retrofitting dwellingHome’s surface affected /total dwelling surface of country
By type of insulation: roof/loft, cavity wall, solid wall, floor, windows.
By thermal efficiency ratings
Retrofitting heating and/or hot water
Equipment sales/Equipment stock By equipment type Age groupings – or efficiency ratings
Retrofitting air-conditioningEquipment sales/Equipment stock By equipment type Age groupings – or
efficiency ratings as labellingSource: MESH team .


Other issues

Other issues 7
Manual for Statistics on Energy Consumption in Households 141
IntroductionThis chapter takes a wider look at the household sector by showing how energy use by householders is linked to wider developments in energy. Like Chapter 6, elements covered here are not part of the new requirements to provide data on households, as set out in the changes to the Energy Statistics Regulation, but are aimed at providing wider context for both measurement and understanding of household energy use.
The chapter starts by exploring renewables use in households, and thus proving a link between this work on households and the Energy Renewable Directive (2009/28/EC) . It explores how renewables use can be measured in households, explores some of the technical issues around heat pumps and wood use and reinforces that households are increasing likely to be greater consumers of renewables and thus its measurement is key in understanding household energy use.
The second section explores the issue of energy (or fuel) pov-erty. Again this is beyond the remit of agreed changes in the Energy Statistics Regulation, but is becoming a growing area of importance as consumers face increases in the cost of energy. The section does not explore energy poverty in the absolute sense (that is the absence of energy), rather it looks at different ways in which the concept of expenditure on energy and the required spending on energy for health reasons can be meas-ured and how it may impact on different types of households.
The final section is more methodological, but with a forward look. Data matching, whereby different datasets can be linked together, offers a new means of exploiting the maximum poten-tial of data and at the same time provides a route to understand-ing wider issues around energy use in households, for example the energy savings from retrofitting energy efficiency features. The section covers the issues to be addressed in undertaking this work and provides examples of work undertaken. Increas-ingly looking to maximise the use of data, rather than collecting new data, is a major opportunity for all statisticians and thus this section aims to provide some initial thoughts on the topic.
7 .1 . Renewable energy statistics
Introduction
This chapter focuses on renewable energy sources which can be used directly by households.
Any energy purchased by households as heat (13) or electric-ity (14) is excluded. Bio-methane, which is injected into natu-
(13) e.g. solar heat, geothermal heat, heat from biofuels which is fed into a district heating network and sold as heat.
(14) Electricity produced from photovoltaic, micro hydro and micro wind that is fed into any electricity network and sold as electricity. That means only that part of electricity that is produced and consumed directly by the household should be taken into account.
ral gas grids, and renewable cooling with ice (e.g. use of per-mafrost soils or natural ice in ice cellars) are also excluded. Solar cooling is a special use of solar heat and therefore is included in solar heat.
It is difficult to produce reliable statistics on consumption of renewable energy, as they are not normally metered (e.g. solar or ambient heat) or are very heterogeneous (e.g. non-standardised biofuels). However, renewable energy sources are now widely used in private households and becoming increasingly important.
Aspects of quality covered in this chapter are valid for all fuels but are of particular importance for renewable energy and for this reason the manual has devoted a section spe-cifically to the measurement of renewable energy consump-tion.
7 .1 .1 . Definitions
The definition of Renewables focused on in this chapter fol-lows Article 2 of the directive 2009/28/EC of the European Parliament and of the Council on the promotion of the use of energy from renewable sources and Annex B 5.1. of regu-lation (EC) No 1099/2008 of the European Parliament and of the Council on energy statistics and includes the following for the household sector:
Solar Energy: Solar radiation exploited for hot water produc-tion and electricity generation. The energy production is the heat available to the heat transfer medium, i.e. the incident solar energy less the optical and collectors losses. Passive solar energy for the direct heating, cooling and lightning of dwellings or other buildings is not included.
• Of which solar Photovoltaic (PV): Sunlight converted into electricity by the use of solar cells usually made of semi-conducting material which exposed to light will generate electricity.
• Of which solar thermal: equipment for production of domestic hot water or for seasonal heating of swim-ming pools (e.g. flat plate collectors, mainly of the thermo syphon type).
Renewable energy from heat from heat-pumps: the amount of aerothermal, geothermal or hydrothermal energy cap-tured by heat-pumps.
Geothermal heat: Energy available as heat emitted from within the earth’s crust, usually in the form of hot water or steam. It is exploited at suitable sites directly as heat for dis-trict heating, agriculture etc. It is not normally used as heat source for a single household, but in rare cases it can be. If it is used as district heat it cannot be assigned for the household sector, but as transformation input for district heat produc-tion. Heat produced by using geothermal heat pumps should not be included here but as ambient heat.
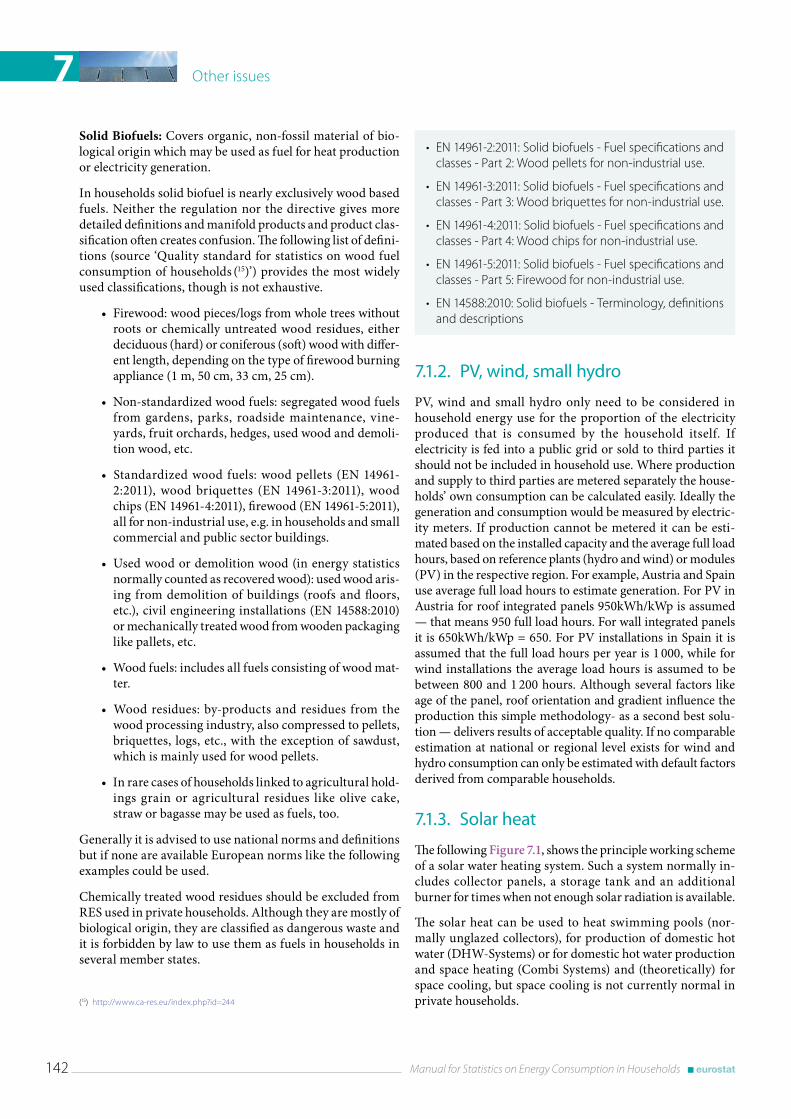
Other issues7
142 Manual for Statistics on Energy Consumption in Households
Solid Biofuels: Covers organic, non-fossil material of bio-logical origin which may be used as fuel for heat production or electricity generation.
In households solid biofuel is nearly exclusively wood based fuels. Neither the regulation nor the directive gives more detailed definitions and manifold products and product clas-sification often creates confusion. The following list of defini-tions (source ‘Quality standard for statistics on wood fuel consumption of households (15)’) provides the most widely used classifications, though is not exhaustive.
• Firewood: wood pieces/logs from whole trees without roots or chemically untreated wood residues, either deciduous (hard) or coniferous (soft) wood with differ-ent length, depending on the type of firewood burning appliance (1 m, 50 cm, 33 cm, 25 cm).
• Non‑standardized wood fuels: segregated wood fuels from gardens, parks, roadside maintenance, vine-yards, fruit orchards, hedges, used wood and demoli-tion wood, etc.
• Standardized wood fuels: wood pellets (EN 14961‑2:2011), wood briquettes (EN 14961-3:2011), wood chips (EN 14961-4:2011), firewood (EN 14961-5:2011), all for non-industrial use, e.g. in households and small commercial and public sector buildings.
• Used wood or demolition wood (in energy statistics normally counted as recovered wood): used wood aris-ing from demolition of buildings (roofs and floors, etc.), civil engineering installations (EN 14588:2010) or mechanically treated wood from wooden packaging like pallets, etc.
• Wood fuels: includes all fuels consisting of wood mat-ter.
• Wood residues: by‑products and residues from the wood processing industry, also compressed to pellets, briquettes, logs, etc., with the exception of sawdust, which is mainly used for wood pellets.
• In rare cases of households linked to agricultural hold-ings grain or agricultural residues like olive cake, straw or bagasse may be used as fuels, too.
Generally it is advised to use national norms and definitions but if none are available European norms like the following examples could be used.
Chemically treated wood residues should be excluded from RES used in private households. Although they are mostly of biological origin, they are classified as dangerous waste and it is forbidden by law to use them as fuels in households in several member states.
(15) http://www.ca-res.eu/index.php?id=244
• EN 14961-2:2011: Solid biofuels - Fuel specifications and classes - Part 2: Wood pellets for non-industrial use.
• EN 14961-3:2011: Solid biofuels - Fuel specifications and classes - Part 3: Wood briquettes for non-industrial use.
• EN 14961-4:2011: Solid biofuels - Fuel specifications and classes - Part 4: Wood chips for non-industrial use.
• EN 14961-5:2011: Solid biofuels - Fuel specifications and classes - Part 5: Firewood for non-industrial use.
• EN 14588:2010: Solid biofuels - Terminology, definitions and descriptions
7 .1 .2 . PV, wind, small hydro
PV, wind and small hydro only need to be considered in household energy use for the proportion of the electricity produced that is consumed by the household itself. If electricity is fed into a public grid or sold to third parties it should not be included in household use. Where production and supply to third parties are metered separately the house-holds’ own consumption can be calculated easily. Ideally the generation and consumption would be measured by electric-ity meters. If production cannot be metered it can be esti-mated based on the installed capacity and the average full load hours, based on reference plants (hydro and wind) or modules (PV) in the respective region. For example, Austria and Spain use average full load hours to estimate generation. For PV in Austria for roof integrated panels 950kWh/kWp is assumed — that means 950 full load hours. For wall integrated panels it is 650kWh/kWp = 650. For PV installations in Spain it is assumed that the full load hours per year is 1 000, while for wind installations the average load hours is assumed to be between 800 and 1 200 hours. Although several factors like age of the panel, roof orientation and gradient influence the production this simple methodology- as a second best solu-tion — delivers results of acceptable quality. If no comparable estimation at national or regional level exists for wind and hydro consumption can only be estimated with default factors derived from comparable households.
7 .1 .3 . Solar heat
The following Figure 7.1, shows the principle working scheme of a solar water heating system. Such a system normally in-cludes collector panels, a storage tank and an additional burner for times when not enough solar radiation is available.
The solar heat can be used to heat swimming pools (nor-mally unglazed collectors), for production of domestic hot water (DHW-Systems) or for domestic hot water production and space heating (Combi Systems) and (theoretically) for space cooling, but space cooling is not currently normal in private households.
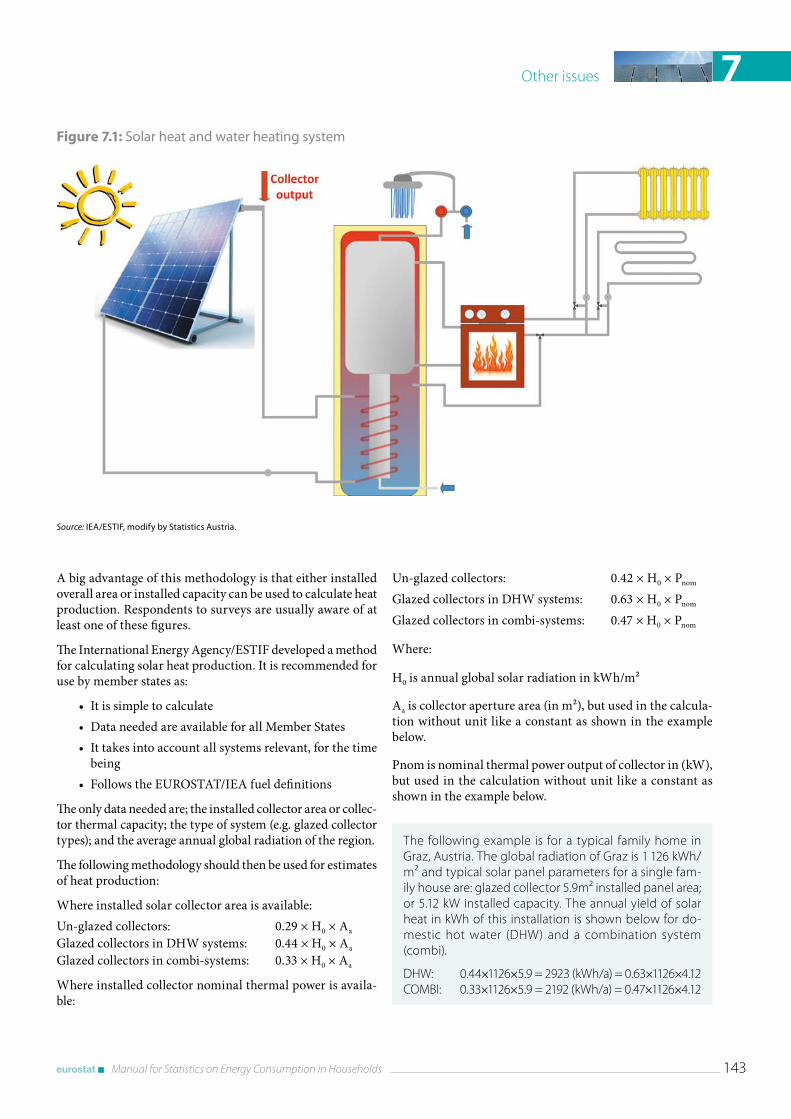
Other issues 7
Manual for Statistics on Energy Consumption in Households 143
A big advantage of this methodology is that either installed overall area or installed capacity can be used to calculate heat production. Respondents to surveys are usually aware of at least one of these figures.
The International Energy Agency/ESTIF developed a method for calculating solar heat production. It is recommended for use by member states as:
• It is simple to calculate• Data needed are available for all Member States• It takes into account all systems relevant, for the time
being• Follows the EUROSTAT/IEA fuel definitions
The only data needed are; the installed collector area or collec-tor thermal capacity; the type of system (e.g. glazed collector types); and the average annual global radiation of the region.
The following methodology should then be used for estimates of heat production:
Where installed solar collector area is available:Un-glazed collectors: 0.29 × H0 × Aa
Glazed collectors in DHW systems: 0.44 × H0 × Aa
Glazed collectors in combi-systems: 0.33 × H0 × Aa
Where installed collector nominal thermal power is availa-ble:
Un-glazed collectors: 0.42 × H0 × Pnom
Glazed collectors in DHW systems: 0.63 × H0 × Pnom
Glazed collectors in combi-systems: 0.47 × H0 × Pnom
Where:
H0 is annual global solar radiation in kWh/m²
Aa is collector aperture area (in m²), but used in the calcula-tion without unit like a constant as shown in the example below.
Pnom is nominal thermal power output of collector in (kW), but used in the calculation without unit like a constant as shown in the example below.
The following example is for a typical family home in Graz, Austria. The global radiation of Graz is 1 126 kWh/m² and typical solar panel parameters for a single fam-ily house are: glazed collector 5.9m² installed panel area; or 5.12 kW installed capacity. The annual yield of solar heat in kWh of this installation is shown below for do-mestic hot water (DHW) and a combination system (combi).
DHW: 0.44×1126×5.9 = 2923 (kWh/a) = 0.63×1126×4.12COMBI: 0.33×1126×5.9 = 2192 (kWh/a) = 0.47×1126×4.12
Figure 7.1: Solar heat and water heating system
Source: IEA/ESTIF, modify by Statistics Austria .

Other issues7
144 Manual for Statistics on Energy Consumption in Households
7 .1 .4 . Renewable heat from heat pumps
In March 2013 the Commission released the guidelines for Member States on calculating renewable energy from heat pumps from different heat pump technologies pursuant to Article 5 of Directive 2009/28/EC of the European Parlia-ment and of the Council. These guidelines provide the infor-mation needed to calculate renewable heat produced from heat pumps properly.
7 .1 .5 . Solid biofuels
Wood based biofuels
This section focuses on wood based biofuels as these domi-nate biofuel consumption in households. More detail on this area is provided due to the greater complexity of estimating non-standardized wood fuel consumption. There are three main issues:
1. Non-standardized wood fuels are very heterogeneous, because of:
• the different types of wood which have different volume to mass conversion factors,
• widely different energy contents, due to
• widely different water contents.
2. Non-standardized wood fuels have an unusual market place, because of:
• a high share of wood not being purchased,
• different sources of wood,
• informal markets,
• varying consumption behaviour, compared to fossil fuels and electricity (e.g. sporadic users, who may be unable to give reliable data on quantity of wood fuel used and frequency of use; careless use of wood fuels if they are free of charge; etc.).
3. Wood fuels are difficult to survey because:
• respondents are often cannot quantify use,
• no standards available,
• often no existing bills,
• many different units used,
• no possibility for validation of results with other infor-mation on amounts and values.
Below are nine steps to help ensure reliable information:
1. Consumption surveys with representative samples and adequate frequencies (ideally the survey should be part of an existing general energy survey to enrich the data available for analysis and to minimise costs).
2. Well trained and experienced interviewers and an appropriate questionnaire design.
3. Well defined common wood fuel mix at regional or national level (depending on the regional spread of the most frequent tree or wood species).
4. Defined regional or national average water content of wood fuel (depending on storage period).
5. Average mass by volume unit(s) based on wood fuel mix and water content.
6. Average calorific value(s) based on the defined wood fuel mix and water content.
7. Default values for consumption by purpose (space heating, water heating, cooking) based on experts experience as basis for data validation.
8. Well documented data validation procedure.
9. Availability of time series (at least 3 survey cycles are necessary to get an impression on data reliability).
Default values
The gross calorific value (GCV) of bone dry wood matter is similar for all wood species. There is a small difference be-tween coniferous wood (19 MJ/kg) and deciduous wood (18 MJ/kg), due to the higher resin and lignin content of coniferous wood, but the variation in the energy content of wood is more dependent on the water content.
Furthermore, there is a difference between water content (based on wood wet weight) and moisture (based on wood dry weight). In the wood trade, the water content is used and is expressed as the percentage of water on the total wood weight. For example, 1 ton of wood chips with a water content of 40 % consist of 400 kg water and 600 kg wood dry matter.
Firewood and wood chips are normally stored for at least two years before use. During the first year, the water content from fresh cut wood decreases from about 55 %, with a net calo-rific value (NCV) of about 7.0 MJ/kg for a firewood mixture of 50 % deciduous and coniferous wood, to about 30 %, and after the second year to about 20 % with a corresponding NCV of about 12.2 MJ/kg and 14.3 MJ/kg, respectively.
Table 7.1 and 7.2 provide standard values for wood fuels; these could be used where no national standards are available.
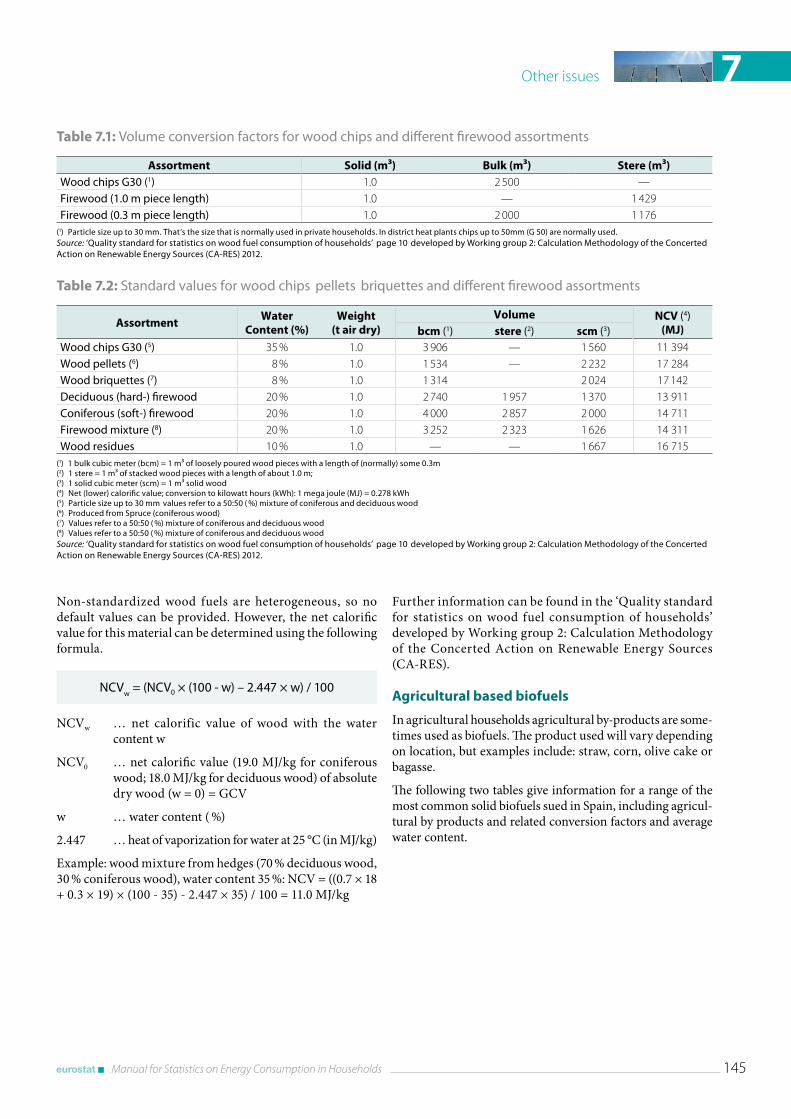
Other issues 7
Manual for Statistics on Energy Consumption in Households 145
Non-standardized wood fuels are heterogeneous, so no default values can be provided. However, the net calorific value for this material can be determined using the following formula.
NCVw
= (NCV0 × (100 - w) – 2 .447 × w) / 100
NCVw … net calorific value of wood with the water content w
NCV0 … net calorific value (19.0 MJ/kg for coniferous wood; 18.0 MJ/kg for deciduous wood) of absolute dry wood (w = 0) = GCV
w … water content ( %)
2.447 … heat of vaporization for water at 25 °C (in MJ/kg)
Example: wood mixture from hedges (70 % deciduous wood, 30 % coniferous wood), water content 35 %: NCV = ((0.7 × 18 + 0.3 × 19) × (100 - 35) - 2.447 × 35) / 100 = 11.0 MJ/kg
Further information can be found in the ‘Quality standard for statistics on wood fuel consumption of households’ developed by Working group 2: Calculation Methodology of the Concerted Action on Renewable Energy Sources (CA-RES).
Agricultural based biofuels
In agricultural households agricultural by-products are some-times used as biofuels. The product used will vary depending on location, but examples include: straw, corn, olive cake or bagasse.
The following two tables give information for a range of the most common solid biofuels sued in Spain, including agricul-tural by products and related conversion factors and average water content.
Table 7.1: Volume conversion factors for wood chips and different firewood assortments
Assortment Solid (m³) Bulk (m³) Stere (m³)Wood chips G30 (1) 1.0 2 500 —Firewood (1 .0 m piece length) 1.0 — 1 429Firewood (0 .3 m piece length) 1.0 2 000 1 176
(1) Particle size up to 30 mm . That’s the size that is normally used in private households . In district heat plants chips up to 50mm (G 50) are normally used .Source: ‘Quality standard for statistics on wood fuel consumption of households’ page 10 developed by Working group 2: Calculation Methodology of the Concerted Action on Renewable Energy Sources (CA-RES) 2012 .
Table 7.2: Standard values for wood chips pellets briquettes and different firewood assortments
AssortmentWater
Content (%) Weight
(t air dry) Volume NCV (4)
(MJ) bcm (1) stere (2) scm (3)Wood chips G30 (5) 35 % 1.0 3 906 — 1 560 11 394Wood pellets (6) 8 % 1.0 1 534 — 2 232 17 284Wood briquettes (7) 8 % 1.0 1 314 2 024 17 142Deciduous (hard-) firewood 20 % 1.0 2 740 1 957 1 370 13 911Coniferous (soft-) firewood 20 % 1.0 4 000 2 857 2 000 14 711Firewood mixture (8) 20 % 1.0 3 252 2 323 1 626 14 311Wood residues 10 % 1.0 — — 1 667 16 715
(1) 1 bulk cubic meter (bcm) = 1 m³ of loosely poured wood pieces with a length of (normally) some 0 .3m(2) 1 stere = 1 m³ of stacked wood pieces with a length of about 1 .0 m;(3) 1 solid cubic meter (scm) = 1 m³ solid wood(4) Net (lower) calorific value; conversion to kilowatt hours (kWh): 1 mega joule (MJ) = 0 .278 kWh(5) Particle size up to 30 mm values refer to a 50:50 ( %) mixture of coniferous and deciduous wood(6) Produced from Spruce (coniferous wood)(7) Values refer to a 50:50 ( %) mixture of coniferous and deciduous wood(8) Values refer to a 50:50 ( %) mixture of coniferous and deciduous woodSource: ‘Quality standard for statistics on wood fuel consumption of households’ page 10 developed by Working group 2: Calculation Methodology of the Concerted Action on Renewable Energy Sources (CA-RES) 2012 .
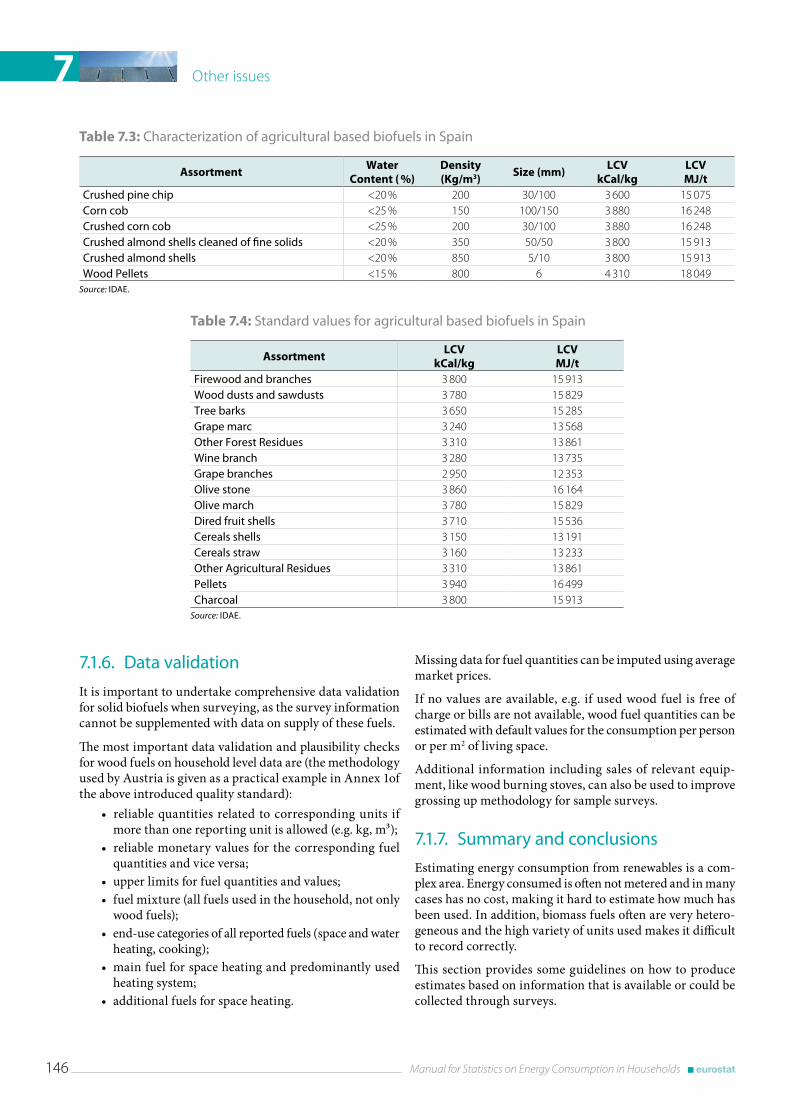
Other issues7
146 Manual for Statistics on Energy Consumption in Households
7 .1 .6 . Data validation
It is important to undertake comprehensive data validation for solid biofuels when surveying, as the survey information cannot be supplemented with data on supply of these fuels.
The most important data validation and plausibility checks for wood fuels on household level data are (the methodology used by Austria is given as a practical example in Annex 1of the above introduced quality standard):
• reliable quantities related to corresponding units if more than one reporting unit is allowed (e.g. kg, m³);
• reliable monetary values for the corresponding fuel quantities and vice versa;
• upper limits for fuel quantities and values;• fuel mixture (all fuels used in the household, not only
wood fuels);• end‑use categories of all reported fuels (space and water
heating, cooking);• main fuel for space heating and predominantly used
heating system;• additional fuels for space heating.
Missing data for fuel quantities can be imputed using average market prices.
If no values are available, e.g. if used wood fuel is free of charge or bills are not available, wood fuel quantities can be estimated with default values for the consumption per person or per m2 of living space.
Additional information including sales of relevant equip-ment, like wood burning stoves, can also be used to improve grossing up methodology for sample surveys.
7 .1 .7 . Summary and conclusions
Estimating energy consumption from renewables is a com-plex area. Energy consumed is often not metered and in many cases has no cost, making it hard to estimate how much has been used. In addition, biomass fuels often are very hetero-geneous and the high variety of units used makes it difficult to record correctly.
This section provides some guidelines on how to produce estimates based on information that is available or could be collected through surveys.
Table 7.3: Characterization of agricultural based biofuels in Spain
AssortmentWater
Content ( %)Density (Kg/m3)
Size (mm)LCV
kCal/kgLCV MJ/t
Crushed pine chip <20 % 200 30/100 3 600 15 075Corn cob <25 % 150 100/150 3 880 16 248Crushed corn cob <25 % 200 30/100 3 880 16 248Crushed almond shells cleaned of fine solids <20 % 350 50/50 3 800 15 913Crushed almond shells <20 % 850 5/10 3 800 15 913Wood Pellets <15 % 800 6 4 310 18 049
Source: IDAE .
Table 7.4: Standard values for agricultural based biofuels in Spain
AssortmentLCV
kCal/kgLCV MJ/t
Firewood and branches 3 800 15 913Wood dusts and sawdusts 3 780 15 829Tree barks 3 650 15 285Grape marc 3 240 13 568Other Forest Residues 3 310 13 861Wine branch 3 280 13 735Grape branches 2 950 12 353Olive stone 3 860 16 164Olive march 3 780 15 829Dired fruit shells 3 710 15 536Cereals shells 3 150 13 191Cereals straw 3 160 13 233Other Agricultural Residues 3 310 13 861Pellets 3 940 16 499Charcoal 3 800 15 913
Source: IDAE .
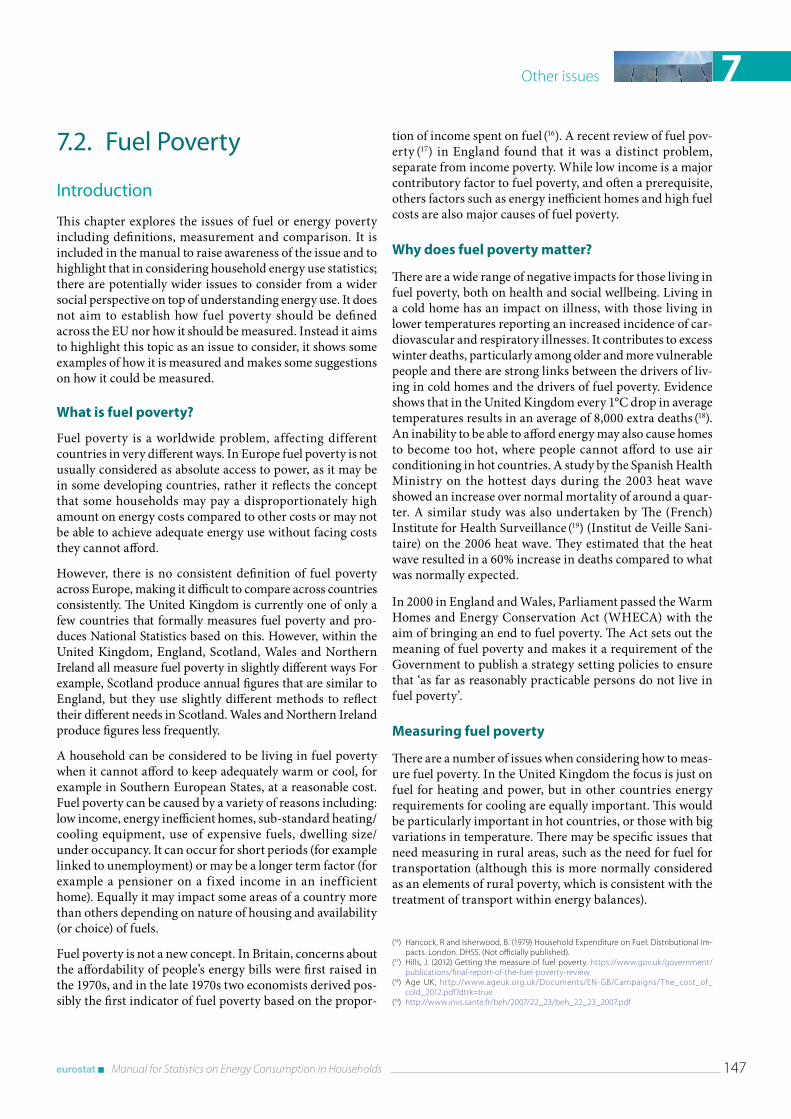
Other issues 7
Manual for Statistics on Energy Consumption in Households 147
7 .2 . Fuel Poverty
Introduction
This chapter explores the issues of fuel or energy poverty including definitions, measurement and comparison. It is included in the manual to raise awareness of the issue and to highlight that in considering household energy use statistics; there are potentially wider issues to consider from a wider social perspective on top of understanding energy use. It does not aim to establish how fuel poverty should be defined across the EU nor how it should be measured. Instead it aims to highlight this topic as an issue to consider, it shows some examples of how it is measured and makes some suggestions on how it could be measured.
What is fuel poverty?
Fuel poverty is a worldwide problem, affecting different countries in very different ways. In Europe fuel poverty is not usually considered as absolute access to power, as it may be in some developing countries, rather it reflects the concept that some households may pay a disproportionately high amount on energy costs compared to other costs or may not be able to achieve adequate energy use without facing costs they cannot afford.
However, there is no consistent definition of fuel poverty across Europe, making it difficult to compare across countries consistently. The United Kingdom is currently one of only a few countries that formally measures fuel poverty and pro-duces National Statistics based on this. However, within the United Kingdom, England, Scotland, Wales and Northern Ireland all measure fuel poverty in slightly different ways For example, Scotland produce annual figures that are similar to England, but they use slightly different methods to reflect their different needs in Scotland. Wales and Northern Ireland produce figures less frequently.
A household can be considered to be living in fuel poverty when it cannot afford to keep adequately warm or cool, for example in Southern European States, at a reasonable cost. Fuel poverty can be caused by a variety of reasons including: low income, energy inefficient homes, sub-standard heating/cooling equipment, use of expensive fuels, dwelling size/under occupancy. It can occur for short periods (for example linked to unemployment) or may be a longer term factor (for example a pensioner on a fixed income in an inefficient home). Equally it may impact some areas of a country more than others depending on nature of housing and availability (or choice) of fuels.
Fuel poverty is not a new concept. In Britain, concerns about the affordability of people’s energy bills were first raised in the 1970s, and in the late 1970s two economists derived pos-sibly the first indicator of fuel poverty based on the propor-
tion of income spent on fuel (16). A recent review of fuel pov-erty (17) in England found that it was a distinct problem, separate from income poverty. While low income is a major contributory factor to fuel poverty, and often a prerequisite, others factors such as energy inefficient homes and high fuel costs are also major causes of fuel poverty.
Why does fuel poverty matter?
There are a wide range of negative impacts for those living in fuel poverty, both on health and social wellbeing. Living in a cold home has an impact on illness, with those living in lower temperatures reporting an increased incidence of car-diovascular and respiratory illnesses. It contributes to excess winter deaths, particularly among older and more vulnerable people and there are strong links between the drivers of liv-ing in cold homes and the drivers of fuel poverty. Evidence shows that in the United Kingdom every 1°C drop in average temperatures results in an average of 8,000 extra deaths (18). An inability to be able to afford energy may also cause homes to become too hot, where people cannot afford to use air conditioning in hot countries. A study by the Spanish Health Ministry on the hottest days during the 2003 heat wave showed an increase over normal mortality of around a quar-ter. A similar study was also undertaken by The (French) Institute for Health Surveillance (19) (Institut de Veille Sani-taire) on the 2006 heat wave. They estimated that the heat wave resulted in a 60% increase in deaths compared to what was normally expected.
In 2000 in England and Wales, Parliament passed the Warm Homes and Energy Conservation Act (WHECA) with the aim of bringing an end to fuel poverty. The Act sets out the meaning of fuel poverty and makes it a requirement of the Government to publish a strategy setting policies to ensure that ‘as far as reasonably practicable persons do not live in fuel poverty’.
Measuring fuel poverty
There are a number of issues when considering how to meas-ure fuel poverty. In the United Kingdom the focus is just on fuel for heating and power, but in other countries energy requirements for cooling are equally important. This would be particularly important in hot countries, or those with big variations in temperature. There may be specific issues that need measuring in rural areas, such as the need for fuel for transportation (although this is more normally considered as an elements of rural poverty, which is consistent with the treatment of transport within energy balances).
(16) Hancock, R and Isherwood, B. (1979) Household Expenditure on Fuel: Distributional Im-pacts. London. DHSS. (Not officially published).
(17) Hills, J. (2012) Getting the measure of fuel poverty. https://www.gov.uk/government/publications/final-report-of-the-fuel-poverty-review
(18) Age UK, http://www.ageuk.org.uk/Documents/EN-GB/Campaigns/The_cost_of_cold_2012.pdf?dtrk=true
(19) http://www.invs.sante.fr/beh/2007/22_23/beh_22_23_2007.pdf
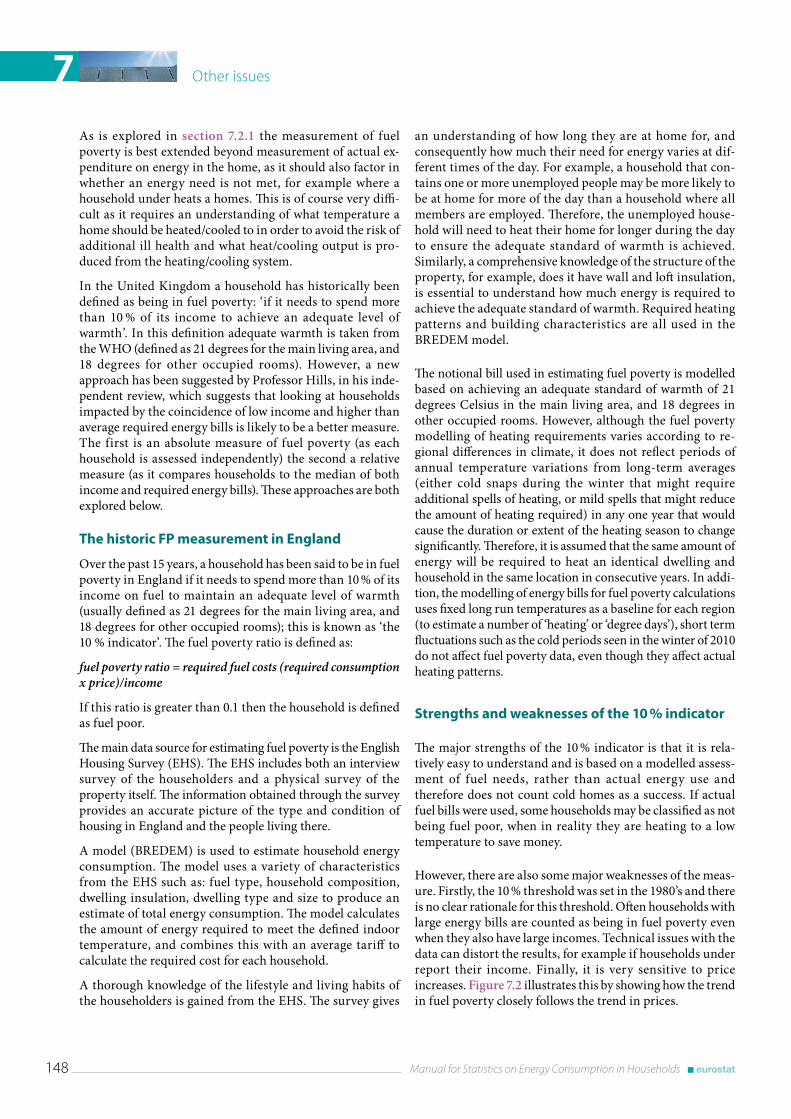
Other issues7
148 Manual for Statistics on Energy Consumption in Households
As is explored in section 7.2.1 the measurement of fuel poverty is best extended beyond measurement of actual ex-penditure on energy in the home, as it should also factor in whether an energy need is not met, for example where a household under heats a homes. This is of course very diffi-cult as it requires an understanding of what temperature a home should be heated/cooled to in order to avoid the risk of additional ill health and what heat/cooling output is pro-duced from the heating/cooling system.
In the United Kingdom a household has historically been defined as being in fuel poverty: ‘if it needs to spend more than 10 % of its income to achieve an adequate level of warmth’. In this definition adequate warmth is taken from the WHO (defined as 21 degrees for the main living area, and 18 degrees for other occupied rooms). However, a new approach has been suggested by Professor Hills, in his inde-pendent review, which suggests that looking at households impacted by the coincidence of low income and higher than average required energy bills is likely to be a better measure. The first is an absolute measure of fuel poverty (as each household is assessed independently) the second a relative measure (as it compares households to the median of both income and required energy bills). These approaches are both explored below.
The historic FP measurement in England
Over the past 15 years, a household has been said to be in fuel poverty in England if it needs to spend more than 10 % of its income on fuel to maintain an adequate level of warmth (usually defined as 21 degrees for the main living area, and 18 degrees for other occupied rooms); this is known as ‘the 10 % indicator’. The fuel poverty ratio is defined as:
fuel poverty ratio = required fuel costs (required consumption x price)/income
If this ratio is greater than 0.1 then the household is defined as fuel poor.
The main data source for estimating fuel poverty is the English Housing Survey (EHS). The EHS includes both an interview survey of the householders and a physical survey of the property itself. The information obtained through the survey provides an accurate picture of the type and condition of housing in England and the people living there.
A model (BREDEM) is used to estimate household energy consumption. The model uses a variety of characteristics from the EHS such as: fuel type, household composition, dwelling insulation, dwelling type and size to produce an estimate of total energy consumption. The model calculates the amount of energy required to meet the defined indoor temperature, and combines this with an average tariff to calculate the required cost for each household.
A thorough knowledge of the lifestyle and living habits of the householders is gained from the EHS. The survey gives
an understanding of how long they are at home for, and consequently how much their need for energy varies at dif-ferent times of the day. For example, a household that con-tains one or more unemployed people may be more likely to be at home for more of the day than a household where all members are employed. Therefore, the unemployed house-hold will need to heat their home for longer during the day to ensure the adequate standard of warmth is achieved. Similarly, a comprehensive knowledge of the structure of the property, for example, does it have wall and loft insulation, is essential to understand how much energy is required to achieve the adequate standard of warmth. Required heating patterns and building characteristics are all used in the BREDEM model.
The notional bill used in estimating fuel poverty is modelled based on achieving an adequate standard of warmth of 21 degrees Celsius in the main living area, and 18 degrees in other occupied rooms. However, although the fuel poverty modelling of heating requirements varies according to re-gional differences in climate, it does not reflect periods of annual temperature variations from long-term averages (either cold snaps during the winter that might require additional spells of heating, or mild spells that might reduce the amount of heating required) in any one year that would cause the duration or extent of the heating season to change significantly. Therefore, it is assumed that the same amount of energy will be required to heat an identical dwelling and household in the same location in consecutive years. In addi-tion, the modelling of energy bills for fuel poverty calculations uses fixed long run temperatures as a baseline for each region (to estimate a number of ‘heating’ or ‘degree days’), short term fluctuations such as the cold periods seen in the winter of 2010 do not affect fuel poverty data, even though they affect actual heating patterns.
Strengths and weaknesses of the 10 % indicator
The major strengths of the 10 % indicator is that it is rela-tively easy to understand and is based on a modelled assess-ment of fuel needs, rather than actual energy use and therefore does not count cold homes as a success. If actual fuel bills were used, some households may be classified as not being fuel poor, when in reality they are heating to a low temperature to save money.
However, there are also some major weaknesses of the meas-ure. Firstly, the 10 % threshold was set in the 1980’s and there is no clear rationale for this threshold. Often households with large energy bills are counted as being in fuel poverty even when they also have large incomes. Technical issues with the data can distort the results, for example if households under report their income. Finally, it is very sensitive to price increases. Figure 7.2 illustrates this by showing how the trend in fuel poverty closely follows the trend in prices.
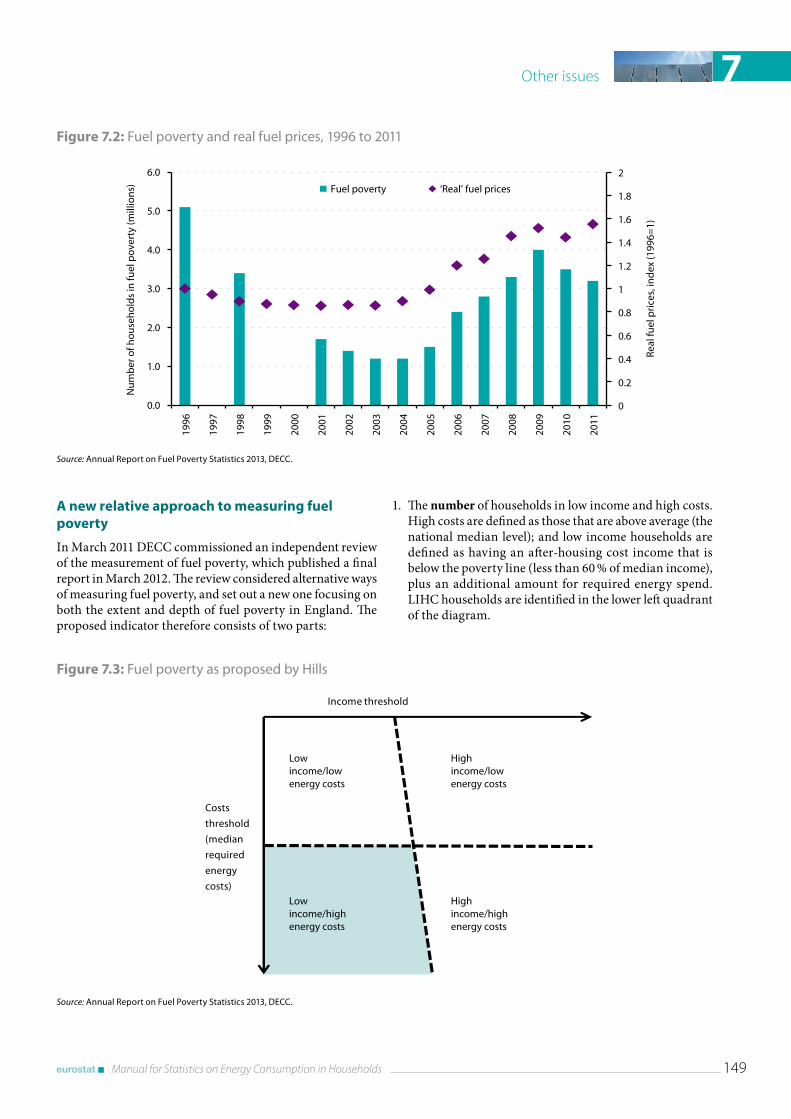
Other issues 7
Manual for Statistics on Energy Consumption in Households 149
A new relative approach to measuring fuel poverty
In March 2011 DECC commissioned an independent review of the measurement of fuel poverty, which published a final report in March 2012. The review considered alternative ways of measuring fuel poverty, and set out a new one focusing on both the extent and depth of fuel poverty in England. The proposed indicator therefore consists of two parts:
1. The number of households in low income and high costs. High costs are defined as those that are above average (the national median level); and low income households are defined as having an after-housing cost income that is below the poverty line (less than 60 % of median income), plus an additional amount for required energy spend. LIHC households are identified in the lower left quadrant of the diagram.
Figure 7.2: Fuel poverty and real fuel prices, 1996 to 2011
Source: Annual Report on Fuel Poverty Statistics 2013, DECC .
0
0.2
0.4
0.6
0.8
1
1.2
1.4
1.6
1.8
2
0.0
1.0
2.0
3.0
4.0
5.0
6.019
96
1997
1998
1999
2000
2001
2002
2003
2004
2005
2006
2007
2008
2009
2010
2011
Real
fuel
pric
es, i
ndex
(199
6=1)
Num
ber
of h
ouse
hold
s in
fuel
pov
erty
(mill
ions
) Fuel poverty ‘Real’ fuel prices
Figure 7.3: Fuel poverty as proposed by Hills
Source: Annual Report on Fuel Poverty Statistics 2013, DECC .
Income threshold
Costs
threshold
(median
required
energy
costs)
Lowincome/lowenergy costs
Highincome/lowenergy costs
Lowincome/highenergy costs
Highincome/highenergy costs
Other issues7
150 Manual for Statistics on Energy Consumption in Households
Figure 7.4: The fuel poverty gap
Source: Annual Report on Fuel Poverty Statistics 2013, DECC .
Fuel poverty gaps
Fuel poverty
Income threshold
Costs
threshold
(median
required
energy
costs)
2. The depth of ‘fuel poverty’ amongst these households, measured in terms of a fuel poverty gap (marked as A and B on Figure 7.4). The gap is defined as the amount by which the assessed energy needs of fuel poor households exceed the threshold for reasonable costs (median re-quired energy costs). This is summed for all households that have both low income and high costs to give an ag-gregate fuel poverty gap.
Under this indicator, a fuel poor household is one that fac-es higher than typical costs; and were it to spend that amount, would fall below the poverty line. The income threshold means that no wealthy households with high energy bills will be classified as fuel poor, as happens in the current measure.
As this indicator is relative, it provides a much steadier trend in the number of fuel poor households over time than the 10 % indicator (see Figure 7.5). This is because changes in incomes, prices or energy efficiency will only affect the num-ber of households in fuel poverty if they change differently for those in or near the low income high costs group than for other households.
As a result of this, the LIHC indicator is not as responsive as the 10 % measure to changes in fuel prices. Households are measured by the proportion by which their bills are greater or less than average. When prices rise equally across all households, these proportions do not change. For example, if prices were to rise by 10 % for all households, then a house-hold that previously had costs that were five per cent higher than the median costs will still have costs that are five per cent higher, assuming all other factors stay the same. As a
result, the fuel poverty status of the household is unlikely to change, unless the extra costs of fuel bring their income be-low the threshold.
The fuel poverty gap, on the other hand, is measured in pounds rather than proportions. Therefore under the exam-ple above, a 10 % rise in prices for all households will mean a greater increase, in pounds, of the bill of households above the median bill than for those at the median level. This means the gap is closely linked to fuel prices.
Figure 7.5 also shows that the aggregate fuel poverty gap is much more responsive to price changes, with a substantial increase between 2004 and 2009. This was followed by a slight decrease due to falling prices in 2010, before rising again in 2011. This trend is fairly similar to the trend in the number of fuel poor households under the 10 % measure.
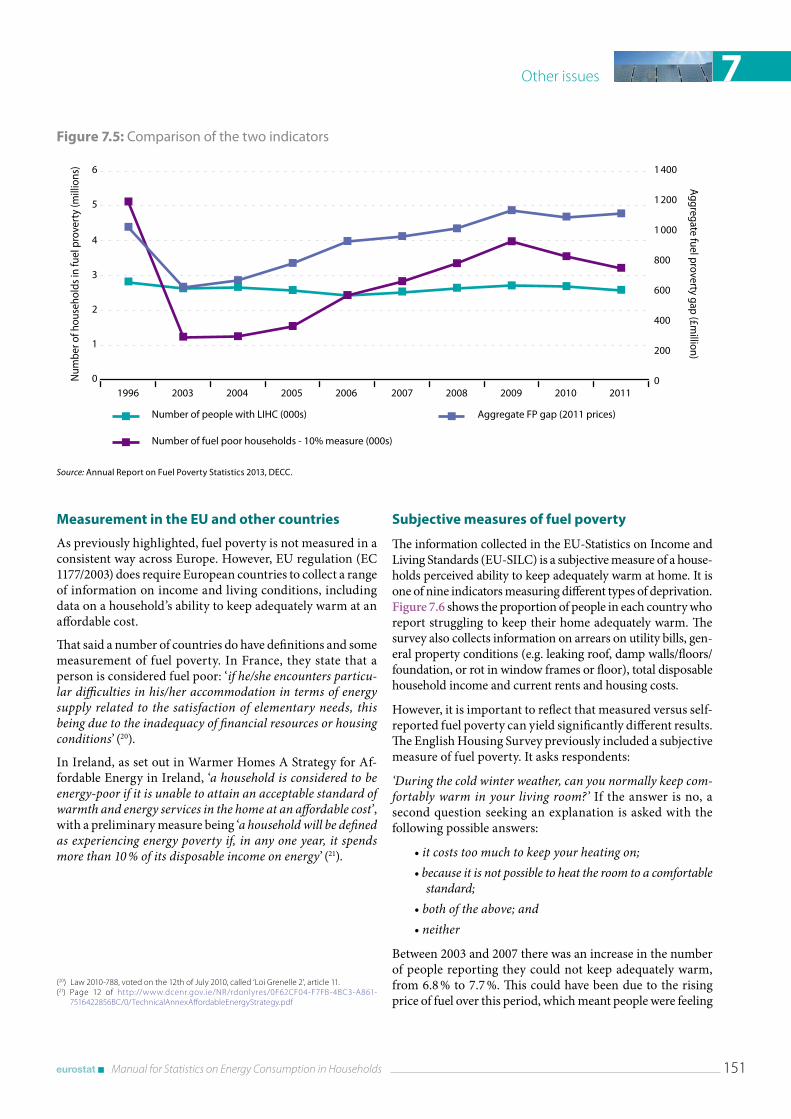
Other issues 7
Manual for Statistics on Energy Consumption in Households 151
Measurement in the EU and other countries
As previously highlighted, fuel poverty is not measured in a consistent way across Europe. However, EU regulation (EC 1177/2003) does require European countries to collect a range of information on income and living conditions, including data on a household’s ability to keep adequately warm at an affordable cost.
That said a number of countries do have definitions and some measurement of fuel poverty. In France, they state that a person is considered fuel poor: ‘if he/she encounters particu-lar difficulties in his/her accommodation in terms of energy supply related to the satisfaction of elementary needs, this being due to the inadequacy of financial resources or housing conditions’ (20).
In Ireland, as set out in Warmer Homes A Strategy for Af-fordable Energy in Ireland, ‘a household is considered to be energy-poor if it is unable to attain an acceptable standard of warmth and energy services in the home at an affordable cost’, with a preliminary measure being ‘a household will be defined as experiencing energy poverty if, in any one year, it spends more than 10 % of its disposable income on energy’ (21).
(20) Law 2010-788, voted on the 12th of July 2010, called ‘Loi Grenelle 2’, article 11.(21) Page 12 of http://www.dcenr.gov.ie/NR/rdonlyres/0F62CF04-F7FB-4BC3-A861-
7516422856BC/0/TechnicalAnnexAffordableEnergyStrategy.pdf
Subjective measures of fuel poverty
The information collected in the EU-Statistics on Income and Living Standards (EU‑SILC) is a subjective measure of a house-holds perceived ability to keep adequately warm at home. It is one of nine indicators measuring different types of deprivation. Figure 7.6 shows the proportion of people in each country who report struggling to keep their home adequately warm. The survey also collects information on arrears on utility bills, gen-eral property conditions (e.g. leaking roof, damp walls/floors/foundation, or rot in window frames or floor), total disposable household income and current rents and housing costs.
However, it is important to reflect that measured versus self-reported fuel poverty can yield significantly different results. The English Housing Survey previously included a subjective measure of fuel poverty. It asks respondents:
‘During the cold winter weather, can you normally keep com-fortably warm in your living room?’ If the answer is no, a second question seeking an explanation is asked with the following possible answers:
• it costs too much to keep your heating on;• because it is not possible to heat the room to a comfortable
standard;• both of the above; and• neither
Between 2003 and 2007 there was an increase in the number of people reporting they could not keep adequately warm, from 6.8 % to 7.7 %. This could have been due to the rising price of fuel over this period, which meant people were feeling
Figure 7.5: Comparison of the two indicators
Source: Annual Report on Fuel Poverty Statistics 2013, DECC .
BB B B B B B B B B
B
B BB
B
B
B
B
BB
1996 2003 2004 2005 2006 2007 2008 2009 2010 20110
1
2
3
4
5
6 1 400
1 000
1 200
800
600
400
200
0Num
ber o
f hou
seho
lds
in fu
el p
rove
rty
(mill
ions
)
Aggregate fuel proverty gap (£m
illion)
B Number of people with LIHC (000s)
B Number of fuel poor households - 10% measure (000s)
B Aggregate FP gap (2011 prices)
B
BB
B
B BB
BB B
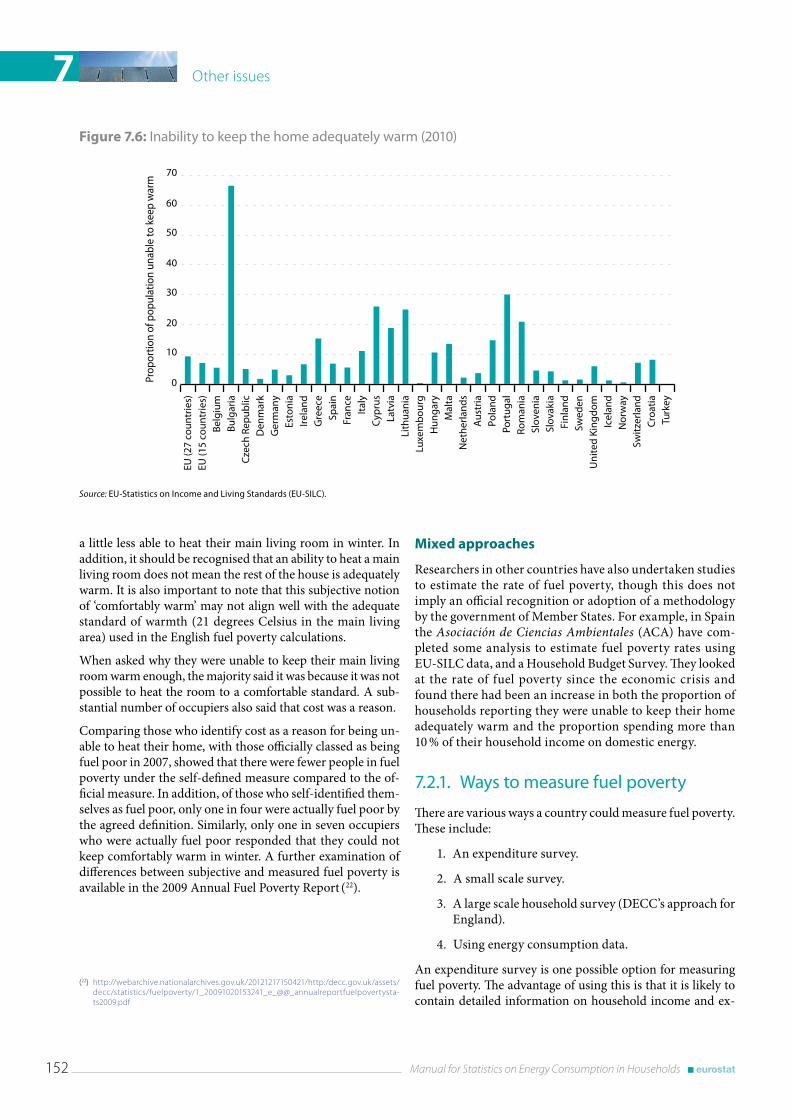
Other issues7
152 Manual for Statistics on Energy Consumption in Households
a little less able to heat their main living room in winter. In addition, it should be recognised that an ability to heat a main living room does not mean the rest of the house is adequately warm. It is also important to note that this subjective notion of ‘comfortably warm’ may not align well with the adequate standard of warmth (21 degrees Celsius in the main living area) used in the English fuel poverty calculations.
When asked why they were unable to keep their main living room warm enough, the majority said it was because it was not possible to heat the room to a comfortable standard. A sub-stantial number of occupiers also said that cost was a reason.
Comparing those who identify cost as a reason for being un-able to heat their home, with those officially classed as being fuel poor in 2007, showed that there were fewer people in fuel poverty under the self-defined measure compared to the of-ficial measure. In addition, of those who self-identified them-selves as fuel poor, only one in four were actually fuel poor by the agreed definition. Similarly, only one in seven occupiers who were actually fuel poor responded that they could not keep comfortably warm in winter. A further examination of differences between subjective and measured fuel poverty is available in the 2009 Annual Fuel Poverty Report (22).
(22) http://webarchive.nationalarchives.gov.uk/20121217150421/http:/decc.gov.uk/assets/decc/statistics/fuelpoverty/1_20091020153241_e_@@_annualreportfuelpovertysta-ts2009.pdf
Mixed approaches
Researchers in other countries have also undertaken studies to estimate the rate of fuel poverty, though this does not imply an official recognition or adoption of a methodology by the government of Member States. For example, in Spain the Asociación de Ciencias Ambientales (ACA) have com-pleted some analysis to estimate fuel poverty rates using EU‑SILC data, and a Household Budget Survey. They looked at the rate of fuel poverty since the economic crisis and found there had been an increase in both the proportion of households reporting they were unable to keep their home adequately warm and the proportion spending more than 10 % of their household income on domestic energy.
7 .2 .1 . Ways to measure fuel poverty
There are various ways a country could measure fuel poverty. These include:
1. An expenditure survey.
2. A small scale survey.
3. A large scale household survey (DECC’s approach for England).
4. Using energy consumption data.
An expenditure survey is one possible option for measuring fuel poverty. The advantage of using this is that it is likely to contain detailed information on household income and ex-
Figure 7.6: Inability to keep the home adequately warm (2010)
Source: EU-Statistics on Income and Living Standards (EU-SILC) .
0
10
20
30
40
50
60
70EU
(27
coun
trie
s)EU
(15
coun
trie
s)Be
lgiu
mBu
lgar
iaC
zech
Rep
ublic
Den
mar
kG
erm
any
Esto
nia
Irel
and
Gre
ece
Spai
nFr
ance
Ital
yC
ypru
sLa
tvia
Lith
uani
aLu
xem
bou
rgH
unga
ryM
alta
Net
herla
nds
Aus
tria
Pola
ndPo
rtug
alRo
man
iaSl
oven
iaSl
ovak
iaFi
nlan
dSw
eden
Uni
ted
King
dom
Icel
and
Nor
way
Switz
erla
ndC
roat
iaTu
rkey
Prop
ortio
n of
pop
ulat
ion
unab
le to
kee
p w
arm
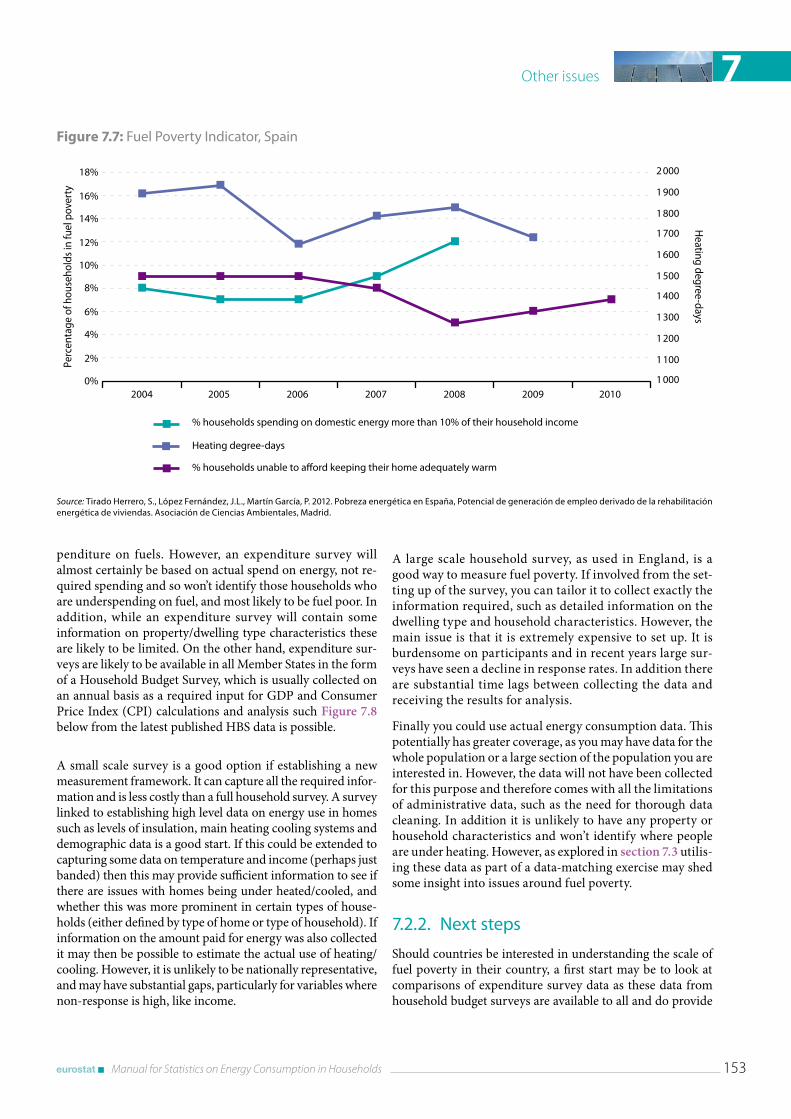
Other issues 7
Manual for Statistics on Energy Consumption in Households 153
penditure on fuels. However, an expenditure survey will almost certainly be based on actual spend on energy, not re-quired spending and so won’t identify those households who are underspending on fuel, and most likely to be fuel poor. In addition, while an expenditure survey will contain some information on property/dwelling type characteristics these are likely to be limited. On the other hand, expenditure sur-veys are likely to be available in all Member States in the form of a Household Budget Survey, which is usually collected on an annual basis as a required input for GDP and Consumer Price Index (CPI) calculations and anal ysis such Figure 7.8 below from the latest published HBS data is possible.
A small scale survey is a good option if establishing a new measurement framework. It can capture all the required infor-mation and is less costly than a full household survey. A survey linked to establishing high level data on energy use in homes such as levels of insulation, main heating cooling systems and demographic data is a good start. If this could be extended to capturing some data on temperature and income (perhaps just banded) then this may provide sufficient information to see if there are issues with homes being under heated/cooled, and whether this was more prominent in certain types of house-holds (either defined by type of home or type of household). If information on the amount paid for energy was also collected it may then be possible to estimate the actual use of heating/cooling. However, it is unlikely to be nationally representative, and may have substantial gaps, particularly for variables where non-response is high, like income.
A large scale household survey, as used in England, is a good way to measure fuel poverty. If involved from the set-ting up of the survey, you can tailor it to collect exactly the information required, such as detailed information on the dwelling type and household characteristics. However, the main issue is that it is extremely expensive to set up. It is burdensome on participants and in recent years large sur-veys have seen a decline in response rates. In addition there are substantial time lags between collecting the data and receiving the results for analysis.
Finally you could use actual energy consumption data. This potentially has greater coverage, as you may have data for the whole population or a large section of the population you are interested in. However, the data will not have been collected for this purpose and therefore comes with all the limitations of administrative data, such as the need for thorough data cleaning. In addition it is unlikely to have any property or household characteristics and won’t identify where people are under heating. However, as explored in section 7.3 utilis-ing these data as part of a data-matching exercise may shed some insight into issues around fuel poverty.
7 .2 .2 . Next steps
Should countries be interested in understanding the scale of fuel poverty in their country, a first start may be to look at comparisons of expenditure survey data as these data from household budget surveys are available to all and do provide
Figure 7.7: Fuel Poverty Indicator, Spain
Source: Tirado Herrero, S ., López Fernández, J .L ., Martín García, P . 2012 . Pobreza energética en España, Potencial de generación de empleo derivado de la rehabilitación energética de viviendas . Asociación de Ciencias Ambientales, Madrid .
BB B
B
B
B B BB
BB
B
2004 2005 2006 2007 2008 2009 20100%
2%
4%
6%
8%
10%
12%
14%
16%
18%
1 000
1 100
1 200
1 300
1 400
1 500
1 600
1 700
1 800
1 900
2 000
Perc
enta
ge o
f hou
seho
lds
in fu
el p
over
ty
B % households spending on domestic energy more than 10% of their household income
B % households unable to afford keeping their home adequately warm
BB
B
BB
B
Heating degree-days
B Heating degree-days
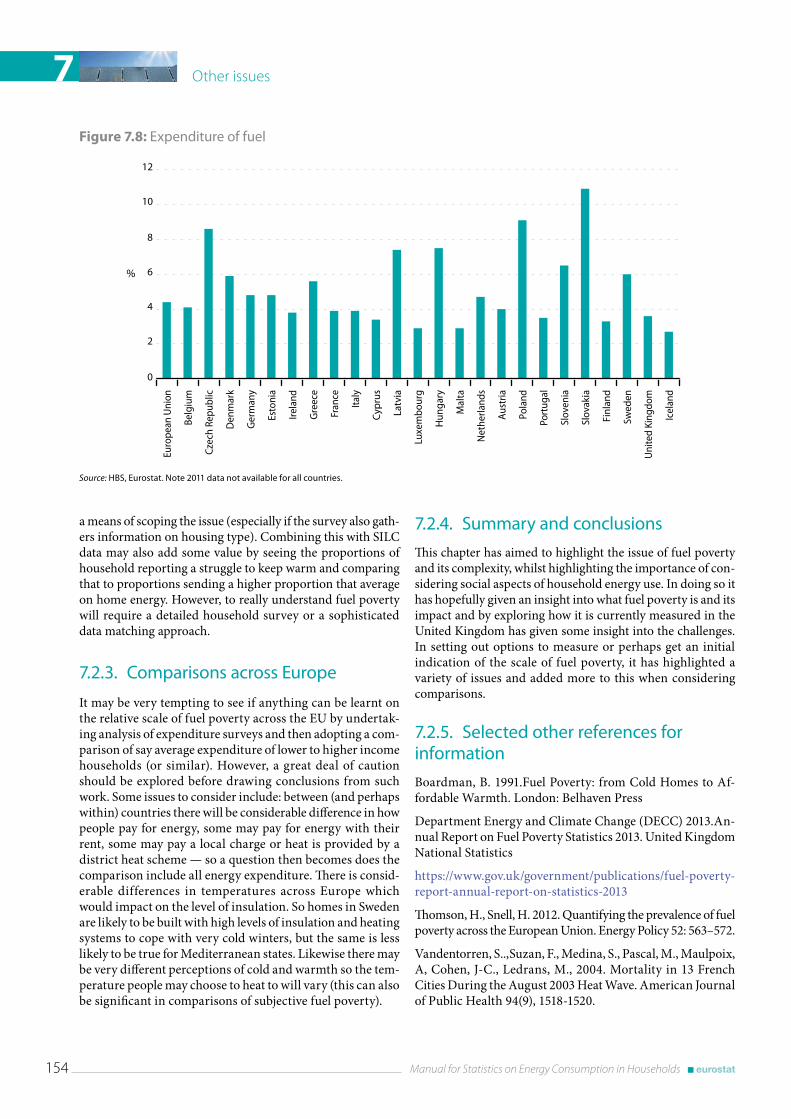
Other issues7
154 Manual for Statistics on Energy Consumption in Households
a means of scoping the issue (especially if the survey also gath-ers information on housing type). Combining this with SILC data may also add some value by seeing the proportions of household reporting a struggle to keep warm and comparing that to proportions sending a higher proportion that average on home energy. However, to really understand fuel poverty will require a detailed household survey or a sophisticated data matching approach.
7 .2 .3 . Comparisons across Europe
It may be very tempting to see if anything can be learnt on the relative scale of fuel poverty across the EU by undertak-ing analysis of expenditure surveys and then adopting a com-parison of say average expenditure of lower to higher income households (or similar). However, a great deal of caution should be explored before drawing conclusions from such work. Some issues to consider include: between (and perhaps within) countries there will be considerable difference in how people pay for energy, some may pay for energy with their rent, some may pay a local charge or heat is provided by a district heat scheme — so a question then becomes does the comparison include all energy expenditure. There is consid-erable differences in temperatures across Europe which would impact on the level of insulation. So homes in Sweden are likely to be built with high levels of insulation and heating systems to cope with very cold winters, but the same is less likely to be true for Mediterranean states. Likewise there may be very different perceptions of cold and warmth so the tem-perature people may choose to heat to will vary (this can also be significant in comparisons of subjective fuel poverty).
7 .2 .4 . Summary and conclusions
This chapter has aimed to highlight the issue of fuel poverty and its complexity, whilst highlighting the importance of con-sidering social aspects of household energy use. In doing so it has hopefully given an insight into what fuel poverty is and its impact and by exploring how it is currently measured in the United Kingdom has given some insight into the challenges. In setting out options to measure or perhaps get an initial indication of the scale of fuel poverty, it has highlighted a variety of issues and added more to this when considering comparisons.
7 .2 .5 . Selected other references for information
Boardman, B. 1991.Fuel Poverty: from Cold Homes to Af-fordable Warmth. London: Belhaven Press
Department Energy and Climate Change (DECC) 2013.An-nual Report on Fuel Poverty Statistics 2013. United Kingdom National Statistics
https://www.gov.uk/government/publications/fuel-poverty-report-annual-report-on-statistics-2013
Thomson, H., Snell, H. 2012. Quantifying the prevalence of fuel poverty across the European Union. Energy Policy 52: 563–572.
Vandentorren, S..,Suzan, F., Medina, S., Pascal, M., Maulpoix, A, Cohen, J‑C., Ledrans, M., 2004. Mortality in 13 French Cities During the August 2003 Heat Wave. American Journal of Public Health 94(9), 1518-1520.
Figure 7.8: Expenditure of fuel
Source: HBS, Eurostat . Note 2011 data not available for all countries .
0
2
4
6
8
10
12
%
Euro
pean
Uni
on
Belg
ium
Czec
h Re
publ
ic
Den
mar
k
Ger
man
y
Esto
nia
Irela
nd
Gre
ece
Fran
ce
Italy
Cyp
rus
Latv
ia
Luxe
mbo
urg
Hun
gary
Mal
ta
Net
herla
nds
Aus
tria
Pola
nd
Port
ugal
Slov
enia
Slov
akia
Finl
and
Swed
en
Uni
ted
King
dom
Icel
and
Other issues 7
Manual for Statistics on Energy Consumption in Households 155
7 .3 . Data matching
Introduction
Data matching is the combining of two or more datasets on the basis of information available on both datasets. For ex-ample, two datasets containing address information can be joined together based on the address information on each dataset. It allows data obtained from separate sources to be used more effectively, thereby enhancing the value of the original sources. Data matching can also reduce the potential burden on data Should be providers by reducing the need for further data collection. However, where data matching in-volves the integration of records for the same units (e.g. households) it also raises important issues of privacy and subject consent. The holding of identifying information also raises issues about confidentiality and security.
This section outlines what data matching is and how it can benefit data providers and policy developers. It also addresses some of the issues associated with data matching and provides a case study of data matching in the United Kingdom’s Depart-ment of Energy and Climate Change. This section compliments section 3.3 on administrative data, data matching is often used to enable more use to be made of administrative data.
7 .3 .1 . Definitions of data matching
Data matching involves combining one or more datasets together based on information available on these datasets. The data used in matching can be from administrative sources, commercially available data, survey data or any combination of these.
There are a number of different methods which may be used for data matching. These are summarised below and are often used in combination.
Exact matching or merging
Exact matching or merging occurs when there is a unique identifier associated with each record available on all the datasets being matched, such as an individual’s identity num-ber or a unique property reference number. Linking the data-sets via this unique identifier is then a relatively trivial task.
Probability matching
Probability matching allows matching to take place where there are small differences in the data on the two datasets, as a result of, say, an address with a miss spelt street name. During probability matching both statistical sources are grouped using one or more non unique identifying variables such as the postcode. This allows the datasets to be grouped into subsets of households that should be in the same area. Specific key variables from each record in the statistical
sources are then compared (such as house name or number and street), weights are allocated depending on the level of agreement and these are totaled to produce a score indicat-ing the overall level of confidence in the match. For example, if a record exists in each dataset with the same house num-ber, street and postcode then it will get a high score say, 100. However if there is a record on each dataset that has the same street name and post code but a different but similar house name (e.g. Random House and Randmo House) then it will also get a high score, but not as high as the previous example, say 90. Matches are then made by comparing the highest total weight to a specified threshold. All properties with a match score above the specified threshold (e.g. 80) are assumed to match.
This method of matching is most commonly used where two datasets should both hold the same information, such as ad-dresses, but due to administrative or data input errors there are some differences in the way the information is recorded on the two datasets.
Statistical matching
Statistical matching is frequently used where the base statis-tical sources have few or no common records, making the matching of identical records impossible for the majority of the data. Matches are made on the basis of similarity of char-acteristics rather than uniquely identifying information as is the case with exact and probability matching.
This method of matching is usually used to match data from different surveys. This is the most appropriate method in these circumstances because it is unlikely that the same individuals will have been covered in each of the surveys to be matched. However, each property or individual can be matched with individuals with similar characteristics. Where one of the datasets to be matched has information for the full population of properties or people to be considered this approach should not be required.
For example, it would be used to match two surveys with a number of similar variables, to enable analysis of the other, different, variables. Individual properties from one survey can be paired with similar properties on the other survey based on the variables which are common between the two surveys. The more variables which appear on both datasets the better the pairing is likely to be. In order to match infor-mation related to households energy consumption variables such as region, floor area, property type, property age and number of occupants could be used.
Data linking
Data linking is not the same as data matching. It involves creating a relationship between data held in two or more dif-ferent sources without having to actually physically hold a matched version of the datasets. For example, a unique ID which is held on records relating to the same property or

Other issues7
156 Manual for Statistics on Energy Consumption in Households
person on each of the data sources. This association may be used for updating sources at the same time, or in order to allow access to another (separate) statistical source. The link should be removed once the statistical reason for the link ceases to exist. Data linking does not result in a matched dataset. It is not considered further in this section of the guidance.
7 .3 .2 . Uses of matched data
Data matching is used for statistical and research purposes. Matching is carried out regularly by commercial organiza-tions and Governments throughout the world. It enables analysis that would not be possible from individual sources of data independently. Matching is also used in some other specific circumstances, for example, it is often used in fraud or other crime prevention. In these circumstances it can be useful to compare similar information from different sources to ensure that individuals are reporting correct information.
While there is a lot that can be learnt from all uses of data matching, it is data matching for statistical and research purposes, and specifically in relation to energy consumption, which is the focus of this section.
Within Europe, matched datasets have been used to start building a model of energy consumption (United Kingdom and Netherlands). Energy consumption data has been matched with information about properties and occupants in order to inform the models.
Matched data has also been used to help with fuel poverty policy, including matching modeled consumption require-ments to observed consumption, and to estimate the impacts of energy efficiency measures (United Kingdom).
7 .3 .3 . Benefits and challenges of data matching
This section outlines some of the benefits and weaknesses of data matching as well as challenges associated with using data matching. Data matching can be a cost effective and efficient alternative to large scale data collections. However, data matching has its own challenges, most importantly data protection, data sharing legislation and data quality, and can only be adopted as a preferred approach once these have been considered.
Benefits
The biggest benefit and driver for data matching is the ability to make further use of existing datasets. This reduces re-spondent burden and the cost of data collection. In this respect, it has many of the same benefits (and weaknesses) as using administrative data (see section 3.3).
In addition, it increases the potential of data beyond what could be collected in surveys or solely from a single admin-istrative source. For example, it is possible to collect more detailed and accurate data on households energy consump-tion from energy suppliers’ administrative data than it would be through survey questions. It also allows more complex questions to be answered, such as estimating the impact of energy efficiency measures. This could not be determined through a straight forward survey question, but can be done making use of data available through admin-istrative sources. This allows better analysis to inform policy development.
Alternatively, if administrative data on energy consump-tion is available but there is no other relevant administra-tive data available, then it might be possible to match the consumption data with relevant survey data. This reduces the burden of asking additional question in the survey and is likely to be more accurate than asking each household to provide an estimate of its own consumption as part of the survey.
Where administrative sources are matched there are also advantages to be gained from the size of the datasets available for analysis. Having coverage of the majority of the relevant population in a country effectively provides census data rather than a sample. This means more detailed analysis can be undertaken and makes it more likely to be possible to determine whether observed changes in consumption are significant, and therefore whether a given policy is having an impact. It would be extremely costly to get equivalent data through a survey.
There is now a greater emphasis, including from Eurostat and national statistical institutes, on making the best possible use of administrative data and this in turn increases the impor-tance of data matching due to the additional flexibility of analysis it allows.
Weaknesses
Legal restrictions
The most significant challenge with data matching is legisla-tion around data sharing, particularly where the data concerned is considered personal data — as most data at household level are. It is essential to consult with a legal expert in the relevant country before sharing any data be-tween parties or matching data from different sources even within the same organization. The legal expert will be able to advise on whether data sharing is possible and if not, what steps it may be possible to take to enable data sharing, for example, including an additional question in a survey asking for permission to match the respondents answers with another source of data for specified purposes. Many countries also have codes of practice and guidance which should be followed.
Other issues 7
Manual for Statistics on Energy Consumption in Households 157
Discussions within each country are important to reassure individuals and organizations about how the data will be used and demonstrate that confidentiality of these data and data protection are a high priority. Time should be allowed for negotiating legal hurdles as this is often a significant cause of delay. It is also important to include time and resource for liaising with energy suppliers and other data providers to gain their buy in for use of the data.
In addition to legal issues around data protection, there are a number of other weaknesses to consider, these are not like-ly to stop the analysis being possible but may reduce the value of any outputs.
Flexibility
As with administrative data, there is little flexibility in the data used in data matching. The analysis must make use of the data available and cannot ask specific questions in the way a survey would be able to. Data matching does have more flexibility than solely using administrative data, as it may be possible to match other sources in order to answer the key analysis questions. However, this will not always be possible and sometimes the analysis undertaken will be determined by the data available.
Timeliness
Similarly, the timeliness of the data used in data matching can be an issue. The matching is reliant on other data sources, therefore it will never provide the most timely analysis on a subject. There may be a delay of months or years compared with analysis of survey data which can be produced quickly following field work.
Unmatched records
When data are matched, there will be a proportion of records on each source which cannot be matched to the other source(s). The quality of the matching will depend on the quality of the information being matched. The match rate can be improved by formatting data before matching, so the relevant variable (e.g. address) is in the same format on both sources and using a combination of probability matching and exact matching. It is often difficult to differentiate with absolute certainty which properties are commercial or industrial and which are residen-tial. In a number of cases residential properties may be used for small businesses, and there is no reliable identifier of use available. It is also worth being aware that it is usually much easier to accurately match address information for households than for commercial or industrial addresses.
Where the match rate remains low it is important to under-stand any bias in the data. This will include bias as a result of any probability matching undertaken and bias as a result of unmatched records this could be done by comparing the distribution of the matched data to the distribution of the data in the original data source or by comparing it to a dif-ferent source which provides similar information.
7 .3 .4 . Considerations when planning to undertake data matching
Having made a decision to undertake data matching there are a number of considerations which need to be thought about before proceeding. The most important consideration is data sharing and data protection, and users should be aware of the European Data Protection Directive and relevant national laws. In addition, there are a number of other areas which it is useful to consider. These are summarized below.
Data transfer
Data should be transferred securely, ideally via a secure FTP (a protocol that allows users to copy files between two net-works securely). If it must be transferred physically, then data should be encrypted and the medium used should be password protected.
Choosing the matching variables
It is most likely that the datasets would be matched at prop-erty level based on the address of each property. If there is already a unique property identifier then this could be used for a more straight forward matching process. Likewise, if a meter number (electricity or gas) exists in the datasets to be matched then this may provide a good unique identifier.
Address matching
In order to match address information it is important to get the format of addresses on the different sources consistent. One option is to use a unique property identifier (or unique property reference number, UPRN). For example in the United Kingdom, there is a national address gazetteer (NAG) with a unique number for each property. Once each source has been assigned a unique property reference number it can then be used as a spine to match all sources to each other.
The alternative, which is likely to be the preferred method if only two datasets are included in the matching, is to match on the address information in the two datasets. However, even in these circumstances it can be useful to use a na-tional address register to validate the address information on data sources.
When matching the address information — whether between data sources or a data source and the national address gazet-teer — there are likely to be a number of challenges. Differ-ences in address information on the two sources will occur for a number of reasons, for example, misspelling of property names, or address information being included in different lines (e.g. the city might be written in address line 2 on one source and address line 3/city on another source). Flats are often more problematic to match than other properties, as they often have different formats in different datasets, for example the first line of the address might be, 9a Fictional Road, Flat 9a Fictional Road or Flat A 9 Fictional Road. These
Other issues7
158 Manual for Statistics on Energy Consumption in Households
would not immediately match, but represent the same property. Finally, postcode information is often saved in dif-ferent formats on different sources of data.
In order to address some of these issues described above data cleansing and validation should be undertaken. For example, postcode information can be formatted so all postcodes are stored as the same length and/or with all spaces removed.
Programmes can also be set up to implement probability or fuzzy matching. This is used where an exact match is not pos-sible. For example it might match on words that are similar phonetically, or on words which have two letters transposed. Another option is to allow matches for words which are ab-breviations, such as road/rd or street/st. The match would be assigned a score based on a pre-agreed priority of matches, matches can then be included or rejected based on the score assigned to each record match.
Where changes to address formatting are required, the orig-inal format address data should always be retained so that there is a record of the original address for each dataset.
Any unmatched records should be reviewed before being dismissed. It is often possible to match further records by considering the address formats of those records which have not originally matched. It is also important to review the unmatched records to ensure there is no systematic bias in the unmatched records. For example to confirm they are not all from the same geographic area, or don’t all have the same length unique identifier. More information on quality assur-ing the match rates is included in comparison with other sources.
Deciding who will undertake the matching
With the appropriate expertise, address matching can be undertaken in statistical offices. This can be done in standard statistical software or using specific commercial products. Where there is insufficient expertise or resource in house, individuals or organizations can be contracted to undertake matching work. If external experts are commissioned, then it is important to agree in advance exactly what the scope of the matching is, including specifying what quality of match will be acceptable (such as inclusion of matches with mis-spellings or street names which are phonetically similar) and what proportion of records must be matched in order to sign off the work.
Whether the matching is undertaken internally or exter-nally it is sensible to have a control group of accurately matched records to test that the algorithm developed for the matching is working properly and to quality assure the matching.
Comparison with other sources
Comparison of the output matched data with data from other sources can help validate the matching process. This com-parison can take two forms. Firstly the matched data should be compared to the full dataset including unmatched records, in order to confirm there is no bias in those records which have been successfully matched. For example, a comparison of any year’s consumption (ideally by region) for the matched dataset and the dataset used as an input in the matching.
In addition, it is worthwhile comparing the data in the matched dataset with data from other sources, such as survey or other admin data. This can be done by any aggregate level categories available from both sources, such as checking the dataset has the correct distribution of records by NUTS (or region). This will ensure the user has an understanding of any weaknesses in the data and any systematic errors in the matching.
Imputing missing data
Organisations carrying out matching may find that some records do not have all the required information in them, either because a survey question has no response, or some administrative data has not been fully completed. If all records are required to have values for all variables then consideration may be given to imputation of the missing information. One approach which could be used is hot deck-ing. This method makes use of data already in the dataset to fill the gaps. A record which has the same characteristics for all available variables can be used to replace the missing data. This record can be chosen at random from the set of relevant records using a computer programme.
7 .3 .5 . Examples of data matching in other countries
To date, there have been a relatively small number of exam-ples of data matching in order to inform energy policy in countries across Europe. These provide useful learning for the potential for other countries.
United Kingdom — admin and survey data: In the United Kingdom, the Department of Energy and Climate (DECC) collects gas and electricity consumption from energy suppli-ers administrative systems, this provides gas and electricity consumption data for nearly every property in the country. This has been matched with other sources to help understand how energy is consumed. The matched dataset has been used to build models of energy consumption as well as to provide more straight forward outputs on consumption by single variables. These same data sources have also been matched with information about energy efficiency measures installed in households to provide estimates of the impact of core energy efficiency measures and to explore the possibility of developing a model of energy demand. More information on this is provided in the case study (7.3.6).
Other issues 7
Manual for Statistics on Energy Consumption in Households 159
The United Kingdom has also undertaken a pilot exercise, matching energy consumption data with housing survey data (from the English Housing Survey). Consent for the matching was requested in the survey, with data from the survey, including modelled consumption, then being matched with gas and electricity consumption data from suppliers admin-istrative data. This has been undertaken in order to inform fuel poverty policy and compares modelled energy require-ments with households’ observed consumption.
Netherlands — admin data: The Netherlands use energy consumption data from client records of the energy com-panies, which provides gas and electricity consumption data for all connections in the country. This information has been linked with information on the population and buildings registers for the Netherlands. While there is not full coverage of all variables, this does provide information on social variables, such as household income, occupation etc and building information, including surface area build-ing type etc. This linked data has been used to undertake some preliminary regression analysis to try and identify the variables which have the most influence on energy con-sumption, and which variables have strong covariation but little independent impact.
In the case of the United Kingdom and Netherlands, the models of consumption produced have only explained around one third of the variation in household energy con-sumption, suggesting that variables like individual behaviour explain most of the variation in energy consumption.
Austria — survey data: Austria matched data from two sur-veys, the Electricity and Natural Gas Consumption by Purposes Survey and the Energy Consumption in House-holds Survey, using statistical matching. Eleven variables present in all the data records were used to match data from the two datasets. These included; number of people in house-hold; federal province; and water heating with electricity (yes/no). Where there was more than one record on the first survey which matched the second survey equally well (i.e. the same match score or distance), one of the records would be selected at random. The project was carried out in order to understand more about the non-thermal uses of electricity and gas. The analysis is updated every two years, with the most recent results published here:
http://www.statistik.at/web_en/statistics/energy_environ-ment/energy/energy_consumption_of_households/index.html
7 .3 .6 . Case study: The United Kingdom’s National Energy Efficiency Data-Framework
What is NEED?
The United Kingdom’s National Energy Efficiency Data-Framework (NEED) is a framework for combining data from existing sources (administrative and commercial) to provide insights into how energy is used and what the impact of energy efficiency measures is, for different types of property and household (23).
In 2004 DECC first started to collect individual meter point data for gas and electricity. By working closely with the en-ergy industry and other key energy efficiency stakeholders, plans were established to match the consumption data with additional data sources, creating NEED. Gas and electricity consumption data are matched, at an individual property level, with information about energy efficiency measures installed in households (held by a private organization on behalf of Government), property attributes (held by another Government department) and household characteristics (purchased from the private sector). Over the coming years more of the consumption data will come from Smart Meters improving this aspect of data in NEED. NEED supports DECC to:
• develop, monitor and evaluate key policies (including the Green Deal);
• identify energy efficiency potential which sits outside the current policy framework;
• develop a greater understanding of the drivers of en-ergy consumption; and
• gain a deeper understanding of the impacts of energy efficiency measures for households and businesses.
Datasets are combined within the framework using the National Land and Property Gazetteer (NLPG) Unique Property Reference Number (UPRN) as a spine. Address data from each of the datasets included in NEED is matched with the address information from the NLPG to assign the UPRN to each record within that dataset, exact and probability matching are used in this matching. The UPRN is then used to link records from one dataset to the corresponding record in each of the other datasets, via an exact match, or merge. The diagram above shows how this works for the core data used for analysis of household data.
(23) https://www.gov.uk/government/organisations/department-of-energy-climate-change/series/national-energy-efficiency-data-need-framework

Other issues7
160 Manual for Statistics on Energy Consumption in Households
Challenges with setting up NEED
The most significant challenge to overcome when setting up the framework was ensuring agreement to use the data and adherence to data protection legislation. Initially, consump-tion data were provided by energy suppliers under a voluntary agreement. Since 2010, these data are now supplied to DECC under the United Kingdom’s Statistics of Trade Act. This provides more protection for the energy suppliers in terms of how the department must ensure security of data and more certainty in the supply of data for DECC.
The data matched with consumption come from a variety of sources, each with different agreements in place, with differing conditions of use. For example, data about people living in households is modelled data from a commercial organisation and is leased through a commercial license. Once leased these can be used by DECC in any way is wishes. On the other ex-treme, information about the physical attributes of properties are based on another Government agency which is not allowed to share individual household data with any other organisa-tion. To be able to make use of these data in the analysis, all analysis using this information must be undertaken by staff of that agency, for the NEED analysis two staff from DECC are
seconded to VOA to carry out the relevant work and can re-turn with aggregate results.
In addition to the challenges described above, there were some more logistical challenges, such as having adequate IT infrastructure to hold and examine such a large dataset and challenges with ensuring key stakeholders were aware of and supported the work.
Benefits of NEED
NEED has reduced the United Kingdom’s reliance on survey data and technical monitoring trials. It has provided evi-dence for the department which may not have been possible via any other approach due to the time and costs involved. It has filled a number of evidence gaps, such as improving the department’s understanding of the impact of energy effi-ciency measures and continues to have a huge potential for further analysis.
In addition, it has helped to direct priorities for further re-search by identifying gaps in understanding, such as why only approximately one third of energy consumption in households can be explained by the variables available in NEED.
Figure 7.9: How NEED works
Source: NEED Report (DECC 2012) .
HEED
Energyefficiencymeasures
Propertyatributes
VOA
Consumption(Elec. and gas)
NLPGUnique property
referencenumber
Householdcharacteristics
Experian
EnergySuppliers

Other issues 7
Manual for Statistics on Energy Consumption in Households 161
The analysis from NEED has been used to inform policy development, such as the United Kingdom’s Green Deal policy, and is a core element of a number of planned evalua-tions. Data from NEED have been published at NUTS3 which has provided local communities with more detailed data about consumption in their area. It is planned that in future an anonymised dataset will be produced which will be avail-able to approved researchers, further increasing the potential of analysis with these data.
Future plans for NEED
Work to develop NEED further is ongoing. The value of the data matching approach used to create NEED has been clear from the analysis it has made possible. However, there are still a number of areas for further development and there is a lot of additional work that can be done to make full use of the potential of these data.
Improvements to the quality and range of data in NEED will continue over the next 12 months. In addition, DECC is working towards producing an anonymised dataset using a sample of data from NEED. This dataset would allow ap-proved researchers to use the data in NEED to carry out
additional analysis, further building the evidence base avail-able to inform policy.
In the longer term DECC will also look to expand the analysis to cover additional energy efficiency and heating measures as they become more popular. It will also continue to develop a model of energy consumption carrying out further work to understand the key drivers of consumption.
7 .3 .7 . Data matching references
United Kingdom National Statistics Data matching protocolhttp://www.ons.gov.uk/ons/guide-method/the-national-sta-tistics-standard/code-of-practice/protocols/data-matching.pdf
Statistical Matching: a tool for integrating data in National Statistical Instituteshttp://epp.eurostat.ec.europa.eu/cache/ITY_OFFPUB/KS-RA-13-020/EN/KS-RA-13-020-EN.PDF
NEED Report (DECC 2012)https://www.gov.uk/government/publications/national-en-ergy-efficiency-data-need-report-summary-of-analysis

Manual for Statistics on Energy Consumption in Households 163
Acronyms
AD: Anaerobic Digestion.
CAPI: Computer Assisted Personal Interview.
CATI: Computer Assisted Telephone Interview.
CBS: Statistics Netherlands / Centraal Bureau voor de Statistiek
CFL: compact fluorescent lamps.
CFR: Central FiT Register (United Kingdom).
CHM: Cambridge Housing Model (United Kingdom).
CHP: Combined Heat and Power generation.
DECC: Department of Energy and Climate Change.
DHW: Domestic Hot Water.
EHS: English Housing Survey (United Kingdom).
EN: European Norm.
EPC: Energy Performance Certificate for buildings.
ESR: Regulation (EC) No 1099/2008 of the European Parliament and of the Council of 22 October 2008 on energy statistics
ESTIF: European Solar Thermal Industry Federation.
FEC: Final Energy Consumption.
FiTs: feed in tariff scheme is a policy mechanism de-signed to accelerate investment in renewable energy technologies.
FP: Fuel Poverty.
GCV: Gross Calorific Value.
GDP: Gross Domestic Product.
HBS: Household budget Survey.
IDAE: Institute for the Diversification and Saving of En-ergy.
IEA: International Energy Agency.
INE: National Statistics Institute from Spain.
ISIC: International Standard Industrial Classification.
kW: thousands of Watts. Watt is the unit of power in the International System of Units (SI).
kWh: kilowatt hour, a unit of energy equal to 1 000 Watts hours or 3.6 megajoules
LCV: Lower Calorific Value (NCV).
LED: light emit ting diodes.
LIHC: Low Income High Cost (Fuel Poverty, United King-dom).
MCS: Microgeneration Certificate Scheme (United King-dom).
MESH: manual for statistics on energy consumption in households.
MS: Member State.
MW: Mega Watt.
NACE: statistical classification of economic activities in the European Community.
NCV: Net Calorific Value (LCV).
NEED: national Energy efficiency data framework from United Kingdom.
NSI: National Statistical Institutes.
NUTS: Nomenclature of Territorial Units for Statistics.
Ofgem: Office of Gas and Electricity Markets from United Kingdom.
PV: photovoltaic, referring to solar panels producing electricity.
SECH: SECH Pilot Projects was a programme promoted by Eurostat in the Member States for development of detailed statistics on energy consumption in house-holds.
SORS: Statistical Office of the Republic of Slovenia.
SPSS: SPSS is a statistical software package.
ST AT: Statistics Austria.
TUR: last resort tariff (Spain).
U-value: a measure of thermal efficiency of walls.
VOA: Valuation Office Agency from United Kingdom.


European Commission
Manual for statistics on energy consumption in households
Luxembourg: Publications Office of the European Union
2013 — 166 pp. — 21 x 29.7 cm
Theme: Environment and energy Collection: Manuals and guidelines
ISBN 978-92-79-33007-0ISSN 2315-0815doi:10.2785/45686Cat. No: KS-GQ-13-003-EN-N


HOW TO OBTAIN EU PUBLICATIONS
Free publications:• one copy:
via EU Bookshop (http://bookshop.europa.eu);
• more than one copy or posters/maps: from the European Union’s representations (http://ec.europa.eu/represent_en.htm); from the delegations in non-EU countries (http://eeas.europa.eu/delegations/index_en.htm); by contacting the Europe Direct service (http://europa.eu/europedirect/index_en.htm) or calling 00 800 6 7 8 9 10 11 (freephone number from anywhere in the EU) (*).
(*) The information given is free, as are most calls (though some operators, phone boxes or hotels may charge you).
Priced publications:• via EU Bookshop (http://bookshop.europa.eu).
Priced subscriptions:• viaoneofthesalesagentsofthePublicationsOfficeoftheEuropeanUnion
(http://publications.europa.eu/others/agents/index_en.htm).

2013 edition
Manual for statistics on energy consumption in households
Man
ual fo
r statistics on
energ
y con
sum
ptio
n in
ho
useh
old
s
Manuals and guidelines
ISSN 2315-0815
201
3 e
ditio
n
KS-GQ
-13-003-EN-N
doi:10.2785/45686