
Manoj Kumar Valluru.pdf - White Rose eTheses Online
256
i ARGONAUTE10 inhibits INDEHISCENT to regulate shoot apical meristem and replum development in Arabidopsis thaliana A thesis submitted for the degree of Doctor of Philosophy Manoj Kumar Valluru December 2017 Department of Molecular Biology and Biotechnology University of Sheffield
-
Upload
khangminh22 -
Category
Documents
-
view
1 -
download
0
Transcript of Manoj Kumar Valluru.pdf - White Rose eTheses Online

i
ARGONAUTE10 inhibits INDEHISCENT to
regulate shoot apical meristem and replum
development in Arabidopsis thaliana
A thesis submitted for the degree of Doctor of Philosophy
Manoj Kumar Valluru
December 2017
Department of Molecular Biology and Biotechnology
University of Sheffield

ii
Acknowledgments
गुरु ब्रम्हा गुरु विष्णू Guru Brahmaa Guru Vishnu
गुरुुः देिो महेश्िरा Gurur Devo Maheshwarah
गुरु शाक्षात परब्रम्हा Guru Saakshaata Parabrahma
तस्मै श्री गुरुिे नमुः Tasmai Shri Guruve Namah
This verse from Skanda Purana translates as: The true teacher is Brahma (God as
Creator), The true teacher is Vishnu (God as Sustenance), The true teacher is Shiva (God
as the destroyer of the ego or ignorance), My Salutation to such a teacher, who is verily
united with God.
I would like to thank my supervisor Dr Karim Sorefan for all of his help, advice and
understanding throughout my PhD. A great deal of help has also come from lab
members both past and present, for which I am deeply grateful. This includes Peter
Venn, Matthew Parker, James Thackery, Giulia Arsuffi, Colette L Baxter, Dr Nicholas
Zoulias and colleagues from Dr Stuart Casson’s lab. I am grateful to the researchers who
have contributed seeds and transgenic material to this study. The pIND::IND-YFP was
kindly provided by Professor Lars Østergaard at John Innes Centre, United Kingdom. The
35S:LhGR>>PHB was kindly provided by Professor Miltos Tsiantis at Max Planck Institute
for Plant Breeding Research, Germany. The pMDC32-GR plasmid was kindly provided by
Dr Stuart Casson at Department of Molecular Biology and Biotechnology, The University
of Sheffield, United Kingdom. Many thanks to Marion Bauch for advice on histological
work, Dr Svetlana Sedelnikova for protein work, Dr Paul Heath for microarray work and
Dr Chris Hill for Electron Microscopy work. I gratefully acknowledge the funding
provided by the University of Sheffield studentship. I would also like to thank my parents
and my family. Finally, I would like to dedicate this thesis to my loving wife, Judith
Valluru.

iii
Abstract
ARGONAUTE10 (AGO10) regulates shoot apical meristem (SAM) and gynoecium
development by controlling Class III HOMEODOMAIN-LEUCINE ZIPPER (HD-ZIP III)
transcription factor expression. The ago10zwl-3 mutant failed to establish SAM, leaf
adaxial identity, and carpel margin meristems (CMMs). However, the factors that act
downstream of AGO10 and HD-ZIP III genes to regulate development are not known.
This work has identified that the INDEHISCENT (IND) bHLH transcription factor functions
downstream of AGO10 and HD-ZIP III genes to ensure proper SAM and replum
development. IND overexpression causes SAM defects similar to ago10zwl-3 mutants, and
the ind mutation partially rescues ago10 mutant phenotypes. IND overexpression
negatively regulates tissue bilateral symmetry by repressing polar auxin transport (PAT),
AGO10 and probably CUC1 expression. However, HD-ZIP III transcription factors PHB and
REV indirectly repress IND and promote CUC1 expression. AGO10 and IND regulate each
other antagonistically. AGO10 repression of IND is essential for SAM and replum
development because overexpression of IND impairs tissue bilateral symmetry. This is
the first study to demonstrate a role for IND in SAM development and that the main
function of AGO10 is to maintain proper IND expression.

iv
Table of Contents
Acknowledgments--------------------------------------------------------------------------------------- ii
Abstract ---------------------------------------------------------------------------------------------------- iii
List of tables and figures ------------------------------------------------------------------------------ xii
List of abbreviations --------------------------------------------------------------------------------- xvii
CHAPTER 1. General Introduction ------------------------------------------------------------------- 2
1.1 Shoot apical meristem and leaf primordia ------------------------------------------------- 2
1.1.1 Hormonal regulation ----------------------------------------------------------------------- 3
1.1.1.1 Auxins regulate SAM and leaf development ------------------------------------ 5
1.1.1.2 Cytokinins regulate SAM and leaf development ------------------------------- 8
1.1.2 CLAVATA/WUSCHEL loop ---------------------------------------------------------------- 10
1.1.3 Adaxial, abaxial and boundary genes ------------------------------------------------- 13
1.2 ARGONAUTE proteins -------------------------------------------------------------------------- 15
1.2.1 ARGONAUTE proteins control SAM and leaf development ---------------------- 16
1.3 Similar genes regulate SAM and floral to fruit transition ------------------------------ 19
1.4 Hypothesis and Objectives -------------------------------------------------------------------- 24
CHAPTER 2. Materials and Methods --------------------------------------------------------------- 27
2.1 Materials ------------------------------------------------------------------------------------------ 27
2.1.1 General laboratory materials ----------------------------------------------------------- 27
2.1.2 Plant materials ----------------------------------------------------------------------------- 27

v
2.2 Plant methods ----------------------------------------------------------------------------------- 28
2.2.1 Plant growth conditions ------------------------------------------------------------------ 28
2.2.2 Hormone and chemical treatments --------------------------------------------------- 29
2.2.3 Shoot apical meristem phenotype analysis ------------------------------------------ 29
2.3 Nucleic acid techniques ----------------------------------------------------------------------- 30
2.3.1 Plant genomic DNA extraction --------------------------------------------------------- 30
2.3.2 Plant total RNA extraction --------------------------------------------------------------- 30
2.3.3 cDNA synthesis ----------------------------------------------------------------------------- 31
2.3.4 Primer design ------------------------------------------------------------------------------- 32
2.3.5 Polymerase chain reaction (PCR) ------------------------------------------------------ 33
2.3.6 Quantitative reverse transcriptase PCR (qRT-PCR) -------------------------------- 34
2.3.7 Agarose gel electrophoresis ------------------------------------------------------------- 35
2.3.8 DNA gel extraction ------------------------------------------------------------------------ 35
2.4 Chromatin immunoprecipitation (ChIP) methods --------------------------------------- 36
2.4.1 Chromatin immunoprecipitation ------------------------------------------------------ 36
2.4.2 ChIP qPCR and ChIP-Seq analysis ------------------------------------------------------ 37
2.5 Microarray methods --------------------------------------------------------------------------- 38
2.5.1 Microarray ---------------------------------------------------------------------------------- 38
2.5.2 Microarray analysis ----------------------------------------------------------------------- 38
2.6 Bioinformatics ----------------------------------------------------------------------------------- 39
2.6.1 Sequence alignments --------------------------------------------------------------------- 39

vi
2.6.2 GSEA analysis ------------------------------------------------------------------------------- 39
2.6.3 Library files for GSEA ---------------------------------------------------------------------- 40
2.6.4 MOTIF and DAP-Seq analysis ------------------------------------------------------------ 40
2.6.5 Protein structure modelling ------------------------------------------------------------- 41
2.7 Imaging techniques ----------------------------------------------------------------------------- 42
2.7.1 β-Glucuronidase (GUS) assay ----------------------------------------------------------- 42
2.7.2 Sample fixation, clearing, and preparation ------------------------------------------ 42
2.7.3 Embryo dissection and light microscopy --------------------------------------------- 43
2.7.4 Confocal Microscopy ---------------------------------------------------------------------- 44
2.7.5 Scanning Electron Microscopy (SEM) ------------------------------------------------- 45
2.8 Statistical analysis ------------------------------------------------------------------------------- 45
CHAPTER 3. AGO10 and HD-ZIP III transcription factors regulate IND -------------------- 47
3.1 Introduction -------------------------------------------------------------------------------------- 47
3.2 Results --------------------------------------------------------------------------------------------- 49
3.2.1 Characterisation of AGO family gene expression in SAM and other tissues - 50
3.2.2 Characterisation of AGO10 -------------------------------------------------------------- 53
3.2.2.1 AGO10 expression -------------------------------------------------------------------- 53
3.2.2.2 Genotyping ago10 mutant zwl-3 ------------------------------------------------- 53
3.2.2.3 zwl-3 developmental phenotypes ------------------------------------------------ 54
3.2.2.4 Summary ------------------------------------------------------------------------------- 55
3.2.3 Characterisation of IND ------------------------------------------------------------------- 59

vii
3.2.3.1 IND expression ------------------------------------------------------------------------ 59
3.2.3.2 Loss of ind developmental phenotypes ----------------------------------------- 59
3.2.3.3 Overexpression of IND developmental phenotypes ------------------------- 60
3.2.3.4 IND regulates leaf polarity genes ------------------------------------------------- 61
3.2.3.5 Summary ------------------------------------------------------------------------------- 62
3.2.4 IND and AGO10 pathway ---------------------------------------------------------------- 68
3.2.4.1 IND and AGO10 negatively regulate each other ------------------------------ 68
3.2.4.2 IND and AGO10 double mutant ind-6 zwl-3 developmental phenotypes
----------------------------------------------------------------------------------------------------- 69
3.2.4.3 Summary ------------------------------------------------------------------------------- 70
3.2.5 PHB and REV regulate IND, SPT and HEC1 gene expression --------------------- 72
3.3 Discussion ----------------------------------------------------------------------------------------- 78
3.3.1 IND may regulate SAM size and promote leaf abaxial fate ---------------------- 78
3.3.2 AGO10-IND regulate SAM development --------------------------------------------- 78
3.3.3 AGO10-IND regulate gynoecium development ------------------------------------- 79
3.3.4 Conclusion ----------------------------------------------------------------------------------- 80
CHAPTER 4. IND and HD-ZIP III transcription factors regulate CUC1 ---------------------- 82
4.1 Introduction -------------------------------------------------------------------------------------- 82
4.2 Results --------------------------------------------------------------------------------------------- 86
4.2.1 PIN1, PID, CUC and SAM-associated gene expression in mutants -------------- 86
4.2.2 miRNA164, miRNA165 and miRNA166 expression in mutants------------------ 92

viii
4.2.3 PHB and REV upregulate CUC1 gene expression ----------------------------------- 93
4.2.4 IND downregulates CUC1 gene expression ------------------------------------------ 95
4.2.5 SPT and HEC1 do not directly regulate CUC1 gene expression ------------------ 97
4.2.5.1 35S:SPT-VP16-GR and spt-12 microarray data analysis ---------------------- 97
4.2.5.2 pAlcA:HEC1 and hec1,2,3 microarray data analysis ------------------------ 102
4.2.5.3 Summary ----------------------------------------------------------------------------- 103
4.2.6 35S:CUC1 and cuc1 microarray data analysis ------------------------------------- 103
4.3 Discussion --------------------------------------------------------------------------------------- 108
4.3.1 AGO10 regulates auxin responses --------------------------------------------------- 108
4.3.2 AGO10 regulates cytokinin responses ---------------------------------------------- 108
4.3.3 Understanding the role of miR164a-c in ago10 mutants ----------------------- 109
4.3.4 Understanding the role of IND-CUC1 in ago10 mutants ------------------------ 110
4.3.5 Understanding the role of IND-CUC1 in gynoecium development ----------- 110
4.3.6 Conclusion --------------------------------------------------------------------------------- 111
CHAPTER 5. Auxin and cytokinin control IND regulated gene expression ------------- 114
5.1 Introduction ------------------------------------------------------------------------------------ 114
5.2 Results ------------------------------------------------------------------------------------------- 116
5.2.1 Microarray analysis of IND-regulated genes --------------------------------------- 116
5.2.1.1 Differential gene expression analysis ------------------------------------------ 116
5.2.1.2 Gene-set enrichment analysis (GSEA) ----------------------------------------- 122
5.2.1.3 Induction of IND for 24 hours can affect meristem gene expression --- 122

ix
5.2.1.5 Motif and TF enrichment analysis ---------------------------------------------- 130
5.2.1.6 Summary ----------------------------------------------------------------------------- 132
5.2.2 Microarray analysis of IND plus auxin regulated genes ------------------------- 135
5.2.2.1 Differential gene expression analysis ------------------------------------------ 135
5.2.2.2 Gene-set enrichment analysis (GSEA) ----------------------------------------- 135
5.2.2.3 IND plus auxin negatively regulate meristem associated gene sets ---- 137
5.2.2.4 Motif and TF enrichment analysis ---------------------------------------------- 139
5.2.2.5 Summary ----------------------------------------------------------------------------- 141
5.2.3 Microarray analysis of IND plus cytokinin regulated genes -------------------- 143
5.2.3.1 Differential gene expression analysis ------------------------------------------ 143
5.2.3.2 Gene-set enrichment analysis (GSEA) ----------------------------------------- 143
5.2.3.3 IND plus cytokinin negatively regulate meristem associated gene sets 144
5.2.3.4 Motif and TF enrichment analysis ---------------------------------------------- 146
5.2.3.5 Summary ----------------------------------------------------------------------------- 147
5.2.4 IND overexpression inhibits auxin transport in leaf primordia ---------------- 151
5.2.5 IND signalling network analysis ------------------------------------------------------ 152
5.2.6 Methylation and hormones regulate IND ------------------------------------------ 155
5.2.6.1 Cistrome and epicistrome data analysis to study IND gene binding TFs
--------------------------------------------------------------------------------------------------- 155
5.2.6.2 Hormone treatment regulates GUS activity in pIND::GUS seedlings --- 160
5.2.6.3 Summary ----------------------------------------------------------------------------- 160

x
5.3 Discussion --------------------------------------------------------------------------------------- 164
5.3.1 Overexpression of IND impairs bilateral symmetry ------------------------------ 164
5.3.2 IND redundantly regulates floral development ----------------------------------- 166
5.3.3 IND redundantly regulate leaf development -------------------------------------- 167
5.3.4 Hormones and IND can regulate each other -------------------------------------- 169
5.3.5 Conclusion --------------------------------------------------------------------------------- 170
CHAPTER 6. General Discussion ------------------------------------------------------------------- 173
6.1 Understanding the role of IND in gynoecium and SAM development --------- 173
6.2 Understanding the role of AGO10-IND in SAM development -------------------- 175
6.3 Understanding the role of AGO10-IND in replum development ---------------- 177
6.4 Summary of findings ----------------------------------------------------------------------- 178
CHAPTER 7. References ----------------------------------------------------------------------------- 180
CHAPTER 8. Appendix ------------------------------------------------------------------------------- 214

xi
List of tables and figures
Chapter 1
Figure 1.1 Key elements of auxin and cytokinin signal perception. ................................. 4
Figure 1.2 The shoot apical meristem of Arabidopsis thaliana and the integrated
network of SAM regulation. ............................................................................................ 12
Figure 1.3 Biogenesis of Plant miRNAs and Structure of the Argonaute protein,
modified image from (Voinnet, 2009). ........................................................................... 18
Figure 1.4 Key elements of Arabidopsis floral to gynoecium development pathway
(1.4B modified image from (Schuster et al., 2015)). ....................................................... 22
Figure 1.5 Similar genes regulate SAM (left) and fruit (right) development. ................. 25
Chapter 2
Table 2.1 Plant lines relating to multiple chapters. ........................................................ 27
Table 2.2 Hormones and chemicals. ............................................................................... 29
Figure 2.1 Light microscope image of the 3-day-old shoot apical meristem. ................ 30
Table 2.3 List of primers used for qRT-PCR, genotyping, sequencing and ChIP qPCR. .. 32
Table 2.4 Data sets used for analysis. ............................................................................. 39
Figure 2.2 Profile of the running ES score and positions of geneset members on the
rank ordered list. Blue-Pink O' Gram in the space of the analysed geneset. ................. 40
Figure 2.3 Tools and pathway for protein structure modelling...................................... 42
Figure 2.4 Single image (Left) and combined multiple images (right). ........................... 44
Table 2.5 Excitation Lasers. ............................................................................................. 45
xii
Chapter 3
Figure 3.1 Argonaute protein family and their gene expression in A. thaliana. ............ 49
Figure 3.2 AGO10-YFP and IND-YFP expression in Arabidopsis. ..................................... 52
Figure 3.3 Mutations in zwl‐3 change the amino acid sequence in Piwi functional
domain of AGO10. ........................................................................................................... 56
Figure 3.4 SAM phenotypes of zwl-3 seedlings. ............................................................. 57
Figure 3.5 ind loss-of-function mutation rescues fruit and seedling phenotypes of
ago10zwl-3. ........................................................................................................................ 58
Figure 3.6 Phenotypic and molecular characterisation of an inducible IND line. .......... 64
Figure 3.7 IND regulate leaf polarity genes. ................................................................... 66
Figure 3.8 SAM phenotype of Ler and mutants (ind-6, zwl-3, and ind-6 zwl-3). ............ 67
Figure 3.9 AGO10 regulates IND and HEC1 gene expression. ........................................ 71
Figure 3.10 PHB and REV transcription factors regulate IND, SPT, and HEC1. ............... 75
Figure 3.11 PHV and REV directly bind to SPT and HEC1 genes. .................................... 76
Figure 3.12 PHB and IND miRNA target sites.................................................................. 77
Figure 3.13 Schematic representation of the AGO10-PHB-REV-IND signalling cascade 80
Chapter 4
Figure 4.1 Illustration depicting mutants defective in certain patterning steps in
embryogenesis. Image modified from (Prigge et al., 2005). .......................................... 85
Figure 4.2 Gene expression in Ler and mutant phenotypes (ind-6, zwl-3, and ind-6 zwl-
3). .................................................................................................................................... 89
Figure 4.3 PIN1, PID and CUC family gene expression in Ler and mutant phenotypes
(ind-6, zwl-3, and ind-6 zwl-3). ........................................................................................ 90

xiii
Figure 4.4 miRNA164, miRNA165 and miRNA166 expression in Ler and mutants (ind-6,
zwl-3, and ind-6 zwl-3). ................................................................................................... 91
Figure 4.5 REV ChIP-Seq and CUC1 gene expression. ..................................................... 94
Figure 4.6 IND ChIP-qRT-PCR and CUC gene expression. ............................................... 96
Figure 4.7 The spt cuc1, ind spt and hec1,2,3 spt fruit phenotype images from (Girin et
al., 2011; Kamiuchi et al., 2014; Nahar et al., 2012; Schuster et al., 2015). ................... 99
Figure 4.8 35S::SPT-VP16-GR and spt-12 microarray. .................................................. 100
Figure 4.9 pAlcA::HEC1 and hec1,2,3 microarray. ........................................................ 101
Figure 4.10 35S::CUC1 and cuc1 microarray. ................................................................ 106
Figure 4.11 The cuc1 cuc2, ago10 (zwl-3) and rpl-1 fruit phenotype images from this
study and (Ishida et al., 2000; Roeder et al., 2003). ..................................................... 107
Figure 4.12 Schematic representation of the AGO10-PHB-REV-IND-CUC1 signalling
cascade. ......................................................................................................................... 112
Chapter 5
Figure 5.1 35S::IND:GR (DEX vs. DMSO) differential gene expression. ........................ 119
Figure 5.2 Comparative analysis of 35S::IND:GR microarray data (induced for 6 hours
and 24 hours). ............................................................................................................... 120
Figure 5.3 35S::IND:GR (DEX vs. DMSO) Arabidopsis biological process gene-set
enrichment analysis (GSEA). ......................................................................................... 121
Figure 5.4 IND regulates hormone biosynthesis genes. ............................................... 126
Figure 5.5 Arabidopsis thaliana transcription factor (TF) family and DNA motif GSEA.
....................................................................................................................................... 129
Table 5.1 Summary of GSEA analysis: Biological process in Arabidopsis ..................... 133
Figure 5.6 35S::IND:GR (DEX+AUX vs. AUX) differential gene expression. ................... 134

xiv
Figure 5.7 35S::IND:GR (DEX+AUX vs. AUX) Arabidopsis biological process GSEA. ...... 136
Figure 5.8 IND plus IAA and IND plus BAP downregulate meristem gene expression. 138
Figure 5.9 35S::IND:GR (DEX+CYT vs. CYT) differential gene expression. .................... 142
Figure 5.10 35S::IND:GR (DEX+CYT vs. CYT) Arabidopsis biological process GSEA. ..... 145
Figure 5.11 IND differentially regulates meristem specific genes; gene list from (Yadav
et al., 2009). .................................................................................................................. 149
Figure 5.12 IND inhibits auxin transport in leaf primordia. .......................................... 150
Figure 5.13 IND signalling cascade analysis using STRING. .......................................... 154
Figure 5.14 Different family TFs bind to the IND gene, and IND gene methylation can
affect IND-TF interactions. ............................................................................................ 158
Table 5.2 IND gene binding transcription factors from DAP-Seq data (GEO:
GSM1925338) analysis. ................................................................................................. 159
Table 5.3 GO Term Enrichment analysis of IND gene-binding transcription factors
p<0.05. .......................................................................................................................... 159
Figure 5.15 Hormonal treatments regulate IND-GUS activity in pIND::GUS seedlings.
....................................................................................................................................... 161
Figure 5.16 Schematic representation of IND regulated gene networks and associated
leaf and fruit phenotypes. ............................................................................................. 163
Chapter 6
Figure 6.1 Schematic representation of the AGO10-PHB-REV-IND-CUC1 signalling
cascade and associated mutant or overexpression phenotypes. ................................. 172
Chapter 8
Figure 8.1 Structural mapping of mutations in ZLLzll‐3. ................................................. 214

xv
Figure 8.2 Mutations in zwl‐3 change the amino acid sequence in N-terminal, partial N-
domain and Piwi-domain of ZLL/AGO10. ...................................................................... 215
Figure 8.3 PHB and IND gene expression in dcl and other mutants impaired in small
RNA biogenesis (Laubinger et al., 2010). ...................................................................... 216
Table 8.1 Gene expression values (2-ΔCT) used for the heat map in Chapter 4 (Fig 4.2).
....................................................................................................................................... 216
Table 8.2 ........................................................................................................................ 217
Table 8.3 ........................................................................................................................ 217
Table 8.4 ........................................................................................................................ 217
Table 8.5 ........................................................................................................................ 219
Table 8.6 ........................................................................................................................ 220
Table 8.7 ........................................................................................................................ 220
Table 8.8 ........................................................................................................................ 222
Table 8.9 ........................................................................................................................ 223
Table 8.10 ...................................................................................................................... 223
Table 8.11 ...................................................................................................................... 225
Table 8.12 ...................................................................................................................... 232
Figure 8.4 Arabidopsis TF families image adapted from (Hong, 2016; Riechmann et al.,
2000). ............................................................................................................................ 237
Figure 8.5 DR5rev::GFP in SAM and leaf primordia. ..................................................... 238
Figure 8.6 Stress responses regulate IND gene expression (Zeller et al., 2009). ......... 238

xvi
List of abbreviations
AGO ARGONAUTE
ARF AUXIN RESPONSE FACTOR
AS ASYMMETRIC LEAVES
AUX Auxin
BAP 6-Benzylaminopurine
ChIP Chromatin immunoprecipitation
CHY Cycloheximide
CMM Carpel margin meristem
CUC CUP-SHAPED COTYLEDON
CUP Cup-shaped or single leaf
CYT Cytokinin
CZ Central zone
DEX Dexamethasone
DMSO Dimethyl sulfoxide
EMS Ethyl methanesulfonate
EtH Ethanol
ETT ETTIN
FC Fold change
GEO Gene Expression Omnibus
GR Glucocorticoid receptor
GSEA Gene Set Enrichment Analysis
GUS β-Glucuronidase
HD-ZIP III Class III HOMEODOMAIN-LEUCINE ZIPPER
HEC HECATE
IAA Indole-3-acetic acid
IND INDEHISCENT
LM Large meristem
NES Normalized Enrichment Score
NM No-meristem or flat apex
NPA N-1-naphthylphthalamic acid

xvii
OC Organizing centre
PAT Polar auxin transport
PHB PHABULOSA
PHV PHAVOLUTA
PID PINOID
PIN Pin-shaped or filamentous-like
PIN1 PIN-FORMED 1
PL Pointed leaves
PZ Peripheral zone
REV REVOLUTA
RPL REPLUMLESS
RZ Rib zone
SAM Shoot apical meristem
SPT SPATULA
TF Transcription factor
VM Valve margin
WT Wild type


1
Chapter 1 General Introduction

2
CHAPTER 1. General Introduction Aristotle considered the parts of plants as ‘organs,’ which can move upwards qua ‘fiery’
or downwards qua ‘earthy,’ depending on the organ’s function (Johansen, 1997).
Embryologist Caspar Friedrich Wolff studied the development of these organs and
concluded that all the above-ground plant organs are shoot apex derivatives (Aulie,
1961). The shoot apex consists of an apical meristem and subjacent leaf primordia. The
shoot apical meristem (SAM) maintains its basic structure from germination throughout
the life of the plant, which in some tree species can be hundreds of years. The
intermediate juvenile meristems undergo a transition from a vegetative phase to the
formation of the inflorescence and to flowering. The gynoecium is derived from carpels
that arise from the terminating floral meristem and fruit is formed from the gynoecium
after flowering.
Wolff observed the commonality of development between foliage leaves and floral
petals, and wrote: “All parts of the plant – except the shoot and the root –can be
attributed to the structure of the leaf; they are nothing but modifications of leaves”
(From the Doctoral Thesis 'Theoria generationis' of Caspar Friedrich Wolff, submitted in
1759 to the University of Halle, Germany) (Aulie, 1961). Interestingly, carpels are also
considered to be evolved from leaves (Scutt et al., 2006). Girin et al. stated that “Carpels
are modified leaves, the gynoecium can thus be seen as two modified leaves (the
presumptive valves) fused to two modified meristems (the presumptive repla).” Many of
the genes involved in fruit development also have a role in SAM and leaf development
(Girin et al., 2009). Understanding how these genes function in the SAM and leaf
primordia can provide insight into their function in fruit development. This introduction
will provide an overview of the similar elements of postembryonic-SAM and fruit
development and generate an integrated view of the topic.
1.1 Shoot apical meristem and leaf primordia
Arabidopsis thaliana is a good model system for understanding the mechanisms of the
complex processes of SAM and leaf development. In Arabidopsis, the SAM develops
during embryogenesis between the two embryonic leaves or cotyledons. The SAM is a
domed triangle consisting of approximately 500 cells, and is divided into three distinct

3
cell layers (L1, L2, and L3) (Barton, 2010; Dodsworth, 2009) (Fig 1.2). The L1 and L2
(tunica layers) grow as two-dimensional sheets of cells by anticlinal cell divisions: L1
(protoderm) gives rise to epidermal cells and L2 gives rise to mesophyll cells. L3 (Corpus)
cells can divide into all planes to form the central tissues of the leaf and stem. Cells from
all three meristem layers participate in leaf primordium formation. The SAM can be
divided into three functional zones: central zone (CZ), peripheral zone (PZ) and rib zone
(RZ) (Fig 1.2). Approximately 35 stem cells reside in the CZ, which is maintained by a low
cell division rate (Dodsworth, 2009). The CZ generates cells for both PZ and RZ. The PZ is
responsible for the formation of lateral organ primordia (e.g., leaves), whereas the RZ
maintains the majority of shoot (stem) growth. This process pushes the SAM upward
and sustains the continuous acropetal growth of the shoot, and produces intermittently
lateral appendages at precise phyllotactic locations. Maintenance of SAM and the
initiation of new leaves are regulated by streams of signals such as phytohormones and
transcription factors from different directions.
1.1.1 Hormonal regulation
Plant hormones or phytohormones are also termed plant growth regulators. Plant
hormones are produced in multiple tissues and flow between organs via the vasculature.
They also use special transporters and are involved in different developmental
processes, as well as in responses to external signals (Santner et al., 2009; Wolters and
Jurgens, 2009). There are seven classical plant hormones namely auxin, cytokinin,
gibberellins, abscisic acid, ethylene, salicylic acid and jasmonic acid. Particularly auxin,
cytokinin, and gibberellins are involved in lateral organ initiation and patterning of the
SAM. Auxin, cytokinin and gibberellin signals can crosstalk and regulate different
transcription factors that can be either synergistic or antagonistic. These transcription
factors can regulate tissue polarity (e.g., leaf adaxial and abaxial polarity), stem cell
maintenance in the SAM, and proper organ separation (e.g., boundary formation by
separation of leaf primordia from SAM). Changes in auxin, cytokinin and gibberellin
biosynthesis or distribution can affect development and tissue patterning. In the next
subsections, the major plant hormones auxin and cytokinin are briefly described, and
their roles in regulating SAM and leaf development are discussed.

4
Figure 1.1 Key elements of auxin and cytokinin signal perception. Elements of the (A) auxin and
(B) cytokinin signalling are outlined above as discussed in the text. (C) Auxin and cytokinin
activity at the vegetative SAM showing auxin maxima at locations of primordia formation
(purple) and cytokinin maximum at the OC (blue).

5
1.1.1.1 Auxins regulate SAM and leaf development
Auxin is a well-studied phytohormone. Indole-3-acetic acid (IAA) is the predominant
auxin in plants. IAA biosynthesis occurs mostly through one tryptophan (Trp)-
independent and four Trp-dependent pathways named after the main intermediates:
the indole-3-acetamide (IAM), indole-3-acetaldoxime (IAOx), tryptamine (TAM), and
indole-3-pyruvic acid (IPA) pathways. The TAM and IPA pathways are well studied in
planta. The TAA gene family encode Tryptophan Aminotransferase of Arabidopsis 1
(TAA1), a long-predicted key enzyme in the IPA pathway, and its paralogue TRYPTOPHAN
AMINOTRANSFERASE RELATED (TAR) catalyzes the transamination of tryptophan to
form IPA. The IAA levels are reduced in taa mutants, and this shows that the TAA
dependent IPA pathway contributes to IAA production (Sparks et al., 2013; Stepanova
et al., 2008; Teale et al., 2006; Vanneste and Friml, 2009). However, TAA1 and YUCCA
(YUC) proteins function in the same pathway for auxin biosynthesis (Stepanova et al.,
2011). The flavin monooxygenase-like enzymes of the YUC family catalyze the
conversion of the tryptophan to N-hydroxyl-tryptamine, a precursor of indole-3-
acetaldoxime that can be subsequently used in the biosynthesis of IAA. In Arabidopsis,
the YUC family has 11 members. Mutations in multiple YUC genes impair local auxin
biosynthesis and accumulation, which results in severe developmental defects such as
production of curled leaves and infertile radialised fruits (pin shaped) (Cheng et al.,
2006). The auxin synthesized by YUC proteins is necessary for floral, leaf, root apex and
shoot apex development (Cheng et al., 2006; Sparks et al., 2013; Teale et al., 2006;
Vanneste and Friml, 2009).
In plants, high auxin concentrations are required for the initiation of a new organ (Fig
1.1C, 1.2). Auxin has two distinct major modes of transport: one is for rapid, long-
distance source-to-sink transport through the vascular cambium and vascular
parenchyma. The other, short-range transport occurs in a cell-to-cell manner by means
of the polar distribution of particular influx and efflux carrier proteins. The AUXIN1/LIKE-
AUX1 (AUX/LAX) family influx carrier proteins work to pump auxin into the cell, and the
PIN-FORMED (PIN), ABC TRANSPORTER B (ABCB) and PIN-LIKES (PILS) efflux carrier
proteins transport auxin from cells into the apoplast. The PINOID (PID) serine-threonine
protein kinase facilitates trafficking of the PIN to the plasma membrane and directly
controls PIN polarity via direct phosphorylation of the transporter (Friml et al., 2004;

6
Sparks et al., 2013; Teale et al., 2006; Vanneste and Friml, 2009). Auxin distribution is
the key for auxin-mediated developmental processes (Larsson et al., 2014; Qi et al.,
2014). Auxin accumulates locally within a single cell or a small group of cells generating
auxin maxima, and as a result auxin gradients form within tissues. AUX1 and PIN1 are
expressed in the SAM, and PIN transporters are required for the creation of auxin
maxima (Fig 1.2) (Caggiano et al., 2017; Heisler et al., 2005). AUX1 is also required for
the restriction of organ boundaries and aux1 mutation results in the formation of fused
organs and interferes with auxin uptake (Lincoln et al., 1990; Reinhardt et al., 2003).
There are eight PIN proteins in Arabidopsis, and loss of PIN1 function leads to a
characteristic pin or cup shaped leaf that is one of the hallmarks of defective auxin efflux
(Aida et al., 2002; Friml et al., 2003; Furutani et al., 2004; Liu et al., 1993). Multiple pin
mutants show defects in embryo development, organogenesis, and meristem
patterning (Friml et al., 2003; Liu et al., 1993; Vieten et al., 2005). PIN1 regulates
patterning at the meristem through the control of CUP-SHAPED COTYLEDON (CUC) gene
expression (Aida et al., 2002; Furutani et al., 2004; Sparks et al., 2013; Teale et al., 2006;
Vanneste and Friml, 2009; Vernoux et al., 2010). PID control organ separation and pid
mutants also have pin-like inflorescences (Fig 1.2) (Christensen et al., 2000; Furutani et
al., 2004; Vernoux et al., 2010).
Although much less is known about the ways the IAA is catabolized, different studies
indicate that the oxidation of IAA into 2-oxindole-3-acetic acid (oxIAA) is most common
mechanism to inactivate auxin (Stepanova and Alonso, 2016). In Arabidopsis thaliana,
DIOXYGENASE OF AUXIN OXIDATION (DAO) enzymes catalyse the oxidative reaction
(Zhang and Peer, 2017). Oxidation of IAA regulate several developmental processes,
including root hair elongation, lateral root formation, rosette size, and fertility
(Stepanova and Alonso, 2016; Zhang and Peer, 2017).
The complex auxin responses are perceived by two groups of genes and a four-protein
receptor complex: Aux/IAA genes, AUXIN RESPONSE FACTOR (ARF) genes and the SCFTIR1
complex (Sparks et al., 2013; Teale et al., 2006; Vanneste and Friml, 2009). The Aux/IAA
gene family consists of 29 members in Arabidopsis (Rouse et al., 1998). Aux/IAA genes
negatively regulate auxin signalling. Typically, Aux/IAA genes encode proteins with four
highly conserved domains and have indeed been found in the nucleus. Domain I is

7
required for transcriptional repression, and Domain II (degron) is essential for auxin-
stimulated Aux/IAA proteolysis. The other domains form homo- and heterodimers with
ARFs. The ARFs (23 members in Arabidopsis) are a class of plant-specific transcription
factors, which are grouped into three subsets and vary between 57 and 129 kDa in size.
The amino acid sequence in a non-conserved central domain region determines whether
a particular ARF can either activate or repress transcription (Ulmasov et al., 1999). The
amino-terminal B3-like DNA-binding domain of ARFs bind to the auxin-responsive
element (ARE; TGTCTC), a consensus sequence found in promoters of auxin-inducible
genes, in an auxin-independent manner (Boer et al., 2014; Ulmasov et al., 1999; Ulmasov
et al., 1995). The carboxy-terminal region of the Aux/IAA proteins interact with ARFs,
and this interaction blocks ARE-mediated transcription (Sparks et al., 2013; Teale et al.,
2006; Vanneste and Friml, 2009). The SCFTIR1 complex consists of the E3 ubiquitin-
protein ligase RINGBOX PROTEIN 1 (RBX1), S PHASE KINASE ASSOCIATED PROTEIN 1
(SKP1), CULLIN 1 (CUL1) and F-box protein TIR1 (700 predicted F-box genes in
Arabidopsis) (Dharmasiri et al., 2005; Gray et al., 2001; Kepinski and Leyser, 2005). The
domain II (degron) of Aux/IAA interacts with TIR1, and auxin enhances interaction
between Aux/IAA and TIR1. An increase in auxin levels recruits Aux/IAA-ARF inhibitors
to the SCFTIR1 complex and directs Aux/IAA proteins for degradation by the 26S
proteasome, releasing the ARFs so that they can act as transcription factors (Fig 1.1A)
(Boer et al., 2014; Gray et al., 2001; Rouse et al., 1998). ARFs are highly involved in
regulating organogenesis during plant development. Transcription factors ARF3 and
ARF4 mediate the KANADI (KAN) pathway and establish leaf abaxial polarity, ARF7 and
ARF19 regulate leaf expansion and lateral root development (Fahlgren et al., 2006;
Hunter et al., 2006; Kelley et al., 2012; Nemhauser et al., 2000; Sessions et al., 1997;
Sessions and Zambryski, 1995; Tsukaya, 2013; Vanneste and Friml, 2009). MONOPTEROS
(MP) induces expression of LEAFY (LFY) and AINTEGUMENTA (ANT) to regulate
organogenesis. MP is only expressed at the meristem periphery (Fig 1.2), and mutation
in MP induces a pin-like phenotype (Aida et al., 2002; Bhatia et al., 2016; Vernoux et al.,
2010). Auxin has emerged as a crucial hormone in the shoot meristem, and it is also
associated with another essential hormone “cytokinin” in SAM development (Fig 1.1C)
(Su et al., 2011).

8
1.1.1.2 Cytokinins regulate SAM and leaf development
The cytokinins are N6-substituted adenine-based molecules that affect many aspects of
plant growth and development, including germination, root and shoot meristem
function and leaf senescence (Kieber and Schaller, 2014; Santner et al., 2009; Wolters
and Jurgens, 2009). The most abundant cytokinin in Arabidopsis is trans-zeatin (tZ). The
enzyme ADENOSINE PHOSPHATE-ISOPENTENYLTRANSFERASE (IPT) converts AMP and
dimethylallyl pyrophosphate (DMAPP) to the active cytokinin N6-(∆2-
isopentenyl)adenine (iP) riboside 5′-tri-, 5′-di- or 5′-monophosphate. The Arabidopsis
genome encodes nine IPT enzymes, designated as AtIPT1 to 9. The cytokinins have
isoprenoid side chains, and initial products are converted to tZ by hydroxylation of the
isoprenoid side chain by a cytochrome P450 enzyme. Cytokinin ribotides are converted
into active free-base cytokinins by the LONELY GUY (LOG) family of enzymes (LOG1-8 in
Arabidopsis). LOG7 and LOG4 play a significant role in SAM growth, and disruption of
LOG genes leads to severe retardation of shoot growth and defects in the maintenance
of the apical meristem (Fig 1.2). The Arabidopsis genome encodes seven CYTOKININ
OXIDASE GENES (CKX), and these enzymes break-down the N6-side chains from a subset
of cytokinins (tZ and iP). CKX genes are induced rapidly upon cytokinin treatment, and
overexpression of these genes leads to a reduced level of endogenous cytokinin. Long
distance transport of cytokinins occurs in the xylem and phloem (Kieber and Schaller,
2014; Santner et al., 2009).
Cytokinins such as tZ and iP, as well as dihydrozeatin, benzyladenine and kinetin, directly
bind to membrane-associated ARABIDOPSIS HISTIDINE KINASE RECEPTORS (AHK2,
AHK3, and AHK4), and that binding occurs through the CHASE domain. AHK2 and AHK3
receptors are involved in the control of leaf cell formation and root branching (Hutchison
et al., 2006; Riefler et al., 2006). AHKs transfer a phosphate to ARABIDOPSIS HISTIDINE-
CONTAINING PHOSPHOTRANSFER (AHP) proteins (AHP1-5 in Arabidopsis) and these
proteins are translocated into the nucleus where they phosphorylate ARABIDOPSIS
RESPONSE REGULATOR (ARR) proteins (Hwang and Sheen, 2001; Kieber and Schaller,
2014; Santner et al., 2009; Sheen, 2002). The ARRs are transcription factors classified
into two groups: negative (type-A ARRs) or positive (type-B ARRs) effectors of cytokinin
signalling. There are ten type-A ARRs and eleven type-B ARRs in the Arabidopsis genome.
The type-B ARRs (ARR14, ARR18, ARR19, ARR20, and ARR21) can alter or activate

9
cytokinin signalling. The type-B arr mutants exhibit reduced shoot development,
aborted primary root growth, enlarged seed size and repression of cytokinin-regulated
genes (Argyros et al., 2008; Mason et al., 2005). The type-A ARRs are transcriptionally
induced in response to cytokinin, and these type-A ARRs (ARR3, ARR4, ARR5, ARR6,
ARR7, ARR8, ARR9, and ARR15) function as negative regulators of cytokinin signalling
(Fig 1.1B). Type-A arr mutants exhibited an increased sensitivity for the induction of
cytokinin-regulated gene expression (Buechel et al., 2010; Jennifer et al., 2004; Kieber
and Schaller, 2014).
The class I KNOTTED-LIKE (KNOX) homeobox transcription factors (SHOOT
MERISTEMLESS (STM), BREVIPEDICELLUS (BP), KNOTTED-LIKE FROM ARABIDOPSIS
THALIANA 2 (KNAT2), and KNOTTED1-LIKE HOMEOBOX GENE 6 (KNAT6) are required to
establish and maintain the SAM (Fig 1.2). The KNOX transcription factors increase
cytokinin levels in the SAM by inducing the expression of IPT7, and KNOX genes are up-
regulated in response to induced elevation of cytokinin levels (Yanai et al., 2005). These
studies show that there may be a positive feedback loop between cytokinin and KNOX
signalling in the SAM. The low GA/high cytokinin environment in the SAM favours
formation and maintenance of the SAM identity (Kieber and Schaller, 2014; Tsukaya,
2013; Vernoux et al., 2010). In the SAM, GA biosynthesis occurs in leaf primordia (Hu et
al., 2008). GA 20-oxidase (GA20ox) and GA 3β-hydroxylase (GA3ox) genes regulate GA
biosynthesis (Sun, 2008). In order to maintain SAM, STM and BP promotes cytokinin
biosynthesis by inducing IPT7 and suppress gibberellin biosynthesis in the SAM by
downregulating GA-biosynthesis gene GA20ox1 (Fig 1.2) (Hay et al., 2002; Jasinski et al.,
2005). However, STM and BP do not regulate GA3ox1 gene expression (Hay et al., 2002).
Increased GA3ox1-GUS expression in the SAM and stem were previously reported and
loss of ga3ox1 affects both stem and leaf development, which suggests that GA3ox1
function in SAM may be promoted by different pathway (Mitchum et al., 2006; Talon et
al., 1990).
The transcription factor WUSCHEL (WUS) positively regulates cell proliferation in the
SAM. In the SAM, cytokinin up-regulates WUS expression by CVL1/CLV3 and WUS
represses type-A ARR gene expression to promote cell proliferation. WUS and the bHLH
transcription factor HECATE 1 (HEC1) competitively regulate ARR7, and ARR7 is

10
repressed by WUS and activated by HEC1 (Fig 1.2) (Schuster et al., 2014). MP-mediated
auxin signalling negatively regulates type-A ARRs (ARR7 and ARR15), which are negative
regulators of cytokinin signalling (Fig 1.1, 1.2) (Schuster et al., 2014; Zhao et al., 2010).
Auxin and cytokinin signalling maintain appropriate auxin and cytokinin concentrations
during plant development. Auxin and cytokinin interactions are essential for organ
formation and meristem function (Muller and Sheen, 2008; Su et al., 2011).
1.1.2 CLAVATA/WUSCHEL loop
The CZ harbours a small group of cells in the L3 layer underneath the stem cell region
known as the organizing centre (OC) (Fig 1.2). Cells in the OC express the homeodomain
protein WUS, and it is essential for the maintenance of the stem cell reservoir (Perales
and Reddy, 2012; van der Graaff et al., 2009). In wus mutants, stem cells are not
maintained and are consumed by developing organ primordia, resulting in premature
termination of the SAM (Barton, 2010; Dodsworth, 2009; Miwa et al., 2009; Williams
and Fletcher, 2005). The stem cells communicate with the OC via the CLAVATA (CLV)
signalling pathway. The CLV3 gene encodes a small secreted polypeptide that is
produced by the stem cells in the CZ (L1 and L2). clv3 mutants show enlarged SAMs
accompanied by over-proliferation of cells in the CZ, and conversely, overexpression of
CLV3 results in reduced WUS expression and premature termination of the SAM. The
CLV1 gene encodes a leucine-rich repeat (LRR) receptor-like kinase, and the CLV2 gene
encodes an LRR receptor-like protein without a kinase domain; both are expressed in
the L3 layer (OC) of the SAM. CLV3 interacts with the CLV1–CLV2 receptor complex in
the L3 and overlaps with WUS expression in the L3 layer (Dodsworth, 2009; Miwa et al.,
2009; Perales and Reddy, 2012). CLV signalling limits the size of the WUS expression
domain by decreasing the number of WUS-expressing cells and inhibits cell division
within the CZ, leading to a decrease in the number of CLV3-expressing cells. Decreased
CLV3 production leads to an increase in the number of WUS-expressing cells, and this
elegant negative feedback loop between CLV3 and WUS stabilizes the number of stem
cells in the SAM (Fig 1.2) (Dodsworth, 2009).

11
12
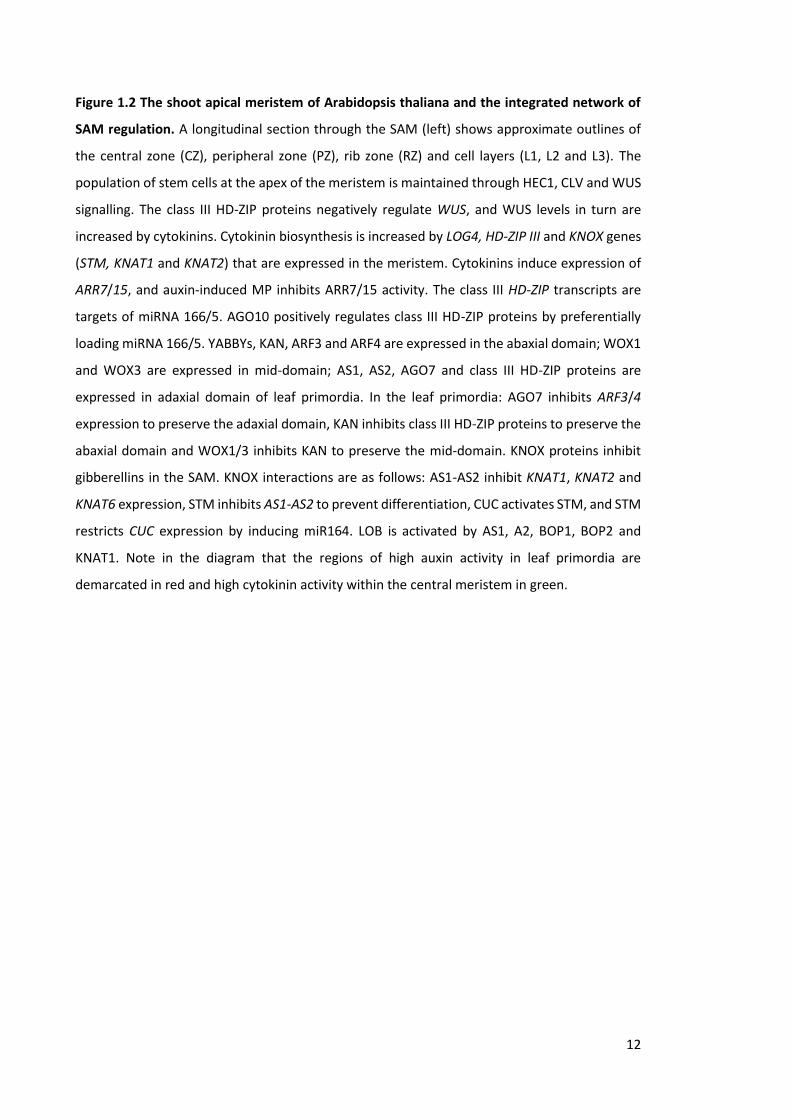
Figure 1.2 The shoot apical meristem of Arabidopsis thaliana and the integrated network of
SAM regulation. A longitudinal section through the SAM (left) shows approximate outlines of
the central zone (CZ), peripheral zone (PZ), rib zone (RZ) and cell layers (L1, L2 and L3). The
population of stem cells at the apex of the meristem is maintained through HEC1, CLV and WUS
signalling. The class III HD-ZIP proteins negatively regulate WUS, and WUS levels in turn are
increased by cytokinins. Cytokinin biosynthesis is increased by LOG4, HD-ZIP III and KNOX genes
(STM, KNAT1 and KNAT2) that are expressed in the meristem. Cytokinins induce expression of
ARR7/15, and auxin-induced MP inhibits ARR7/15 activity. The class III HD-ZIP transcripts are
targets of miRNA 166/5. AGO10 positively regulates class III HD-ZIP proteins by preferentially
loading miRNA 166/5. YABBYs, KAN, ARF3 and ARF4 are expressed in the abaxial domain; WOX1
and WOX3 are expressed in mid-domain; AS1, AS2, AGO7 and class III HD-ZIP proteins are
expressed in adaxial domain of leaf primordia. In the leaf primordia: AGO7 inhibits ARF3/4
expression to preserve the adaxial domain, KAN inhibits class III HD-ZIP proteins to preserve the
abaxial domain and WOX1/3 inhibits KAN to preserve the mid-domain. KNOX proteins inhibit
gibberellins in the SAM. KNOX interactions are as follows: AS1-AS2 inhibit KNAT1, KNAT2 and
KNAT6 expression, STM inhibits AS1-AS2 to prevent differentiation, CUC activates STM, and STM
restricts CUC expression by inducing miR164. LOB is activated by AS1, A2, BOP1, BOP2 and
KNAT1. Note in the diagram that the regions of high auxin activity in leaf primordia are
demarcated in red and high cytokinin activity within the central meristem in green.

13
1.1.3 Adaxial, abaxial and boundary genes
During germination, the SAM becomes active and stem cells in the CZ divide into founder
cells, and these are pushed outward into the peripheral zone to form leaf primordium
(Barton, 2010; Tsukaya, 2013). At this stage, the leaf primordium establishes polarity
along the adaxial (upper side) and abaxial (lower side) axis. The adaxial side of leaf
primordium is closest to the SAM, and abaxial is away from the centre of the SAM (Fig
1.2). Class III HOMEO DOMAIN LEUCINE ZIPPER (HD-ZIP) transcription factors
PHABULOSA (PHB), PHAVOLUTA (PHV), REVOLUTA (REV), CORONA (CNA) and
INCURVATA promote adaxial leaf fate (upper side of the leaf) (Elhiti and Stasolla, 2009;
Liu et al., 2009; Mallory et al., 2004; McConnell et al., 2001; Zhou et al., 2007). HD-ZIP
III transcription factors also downregulate WUS transcription in wild-type plants, and
this shows that HD-ZIP III repress stem cell fate in the SAM. Loss of HD-ZIP III results in
embryo defects with an enlarged SAM and formation of radial and abaxialised leaves
(Barkoulas et al., 2007; Fambrini and Pugliesi, 2013; Szakonyi et al., 2010; Tsukaya,
2013). HD-ZIP III genes positively regulate the transcription of LITTLE ZIPPER (ZPR) genes
and ZPR proteins negatively regulate HD-ZIP III activity by forming heterodimers with
HD-ZIP III proteins (Kim et al., 2008; Wenkel et al., 2007). In addition to ZPRs, HD-ZIP III
transcripts are degraded by microRNAs (miRNAs) miR165/166 in Arabidopsis (Fig 1.2)
(Zhu et al., 2011b).
Transcription factors YABBY (YAB), KANADI (KAN), ETTIN (ETT)/AUXIN RESPONSE
TRANSCRIPTION FACTOR 3 (ARF3) and ARF4 promote abaxial leaf fate (lower side of the
leaf) (Fig 1.2) (Tsukaya, 2013). FILAMENTOUS FLOWER (YAB1/FIL), YAB2, YAB3, and YAB5
are members of the YAB gene family. YAB family genes encode HIGH-MOBILITY GROUP
(HMG)-like proteins and interact in a complex with LEUNIG and LEUNIG-LIKE co-
repressors as well as the co-regulator SUESS. Loss of YAB1 and YAB3 leads to partial loss
of abaxial fate (Eshed et al., 2004; Kumaran et al., 2002; Sarojam et al., 2010; Siegfried
et al., 1999). The combined loss of ARF3 and ARF4 genes results in adaxialised leaves.
ARF3 and ARF4, are negatively regulated by trans-acting small interfering RNA (TAS3) via
miR390 (Fahlgren et al., 2006; Garcia et al., 2006; Hunter et al., 2006).
KAN (KAN1, KAN2, and KAN3) genes are GARP-domain transcription factors and loss of
KAN gene function results in adaxialisation of leaves. KAN promotes abaxial fate through

14
suppression of the adaxial HD-ZIP III transcription factors and LOB-domain transcription
factor ASYMMETRIC LEAVES2 (AS2). AS2 also suppresses KAN genes, class I KNOX genes,
and ARF3 (Emery et al., 2003; Kelley et al., 2012; Tsukaya, 2013). KAN and HD-ZIP III
transcription factors suppress each other to promote abaxial and adaxial leaf fate
(Emery et al., 2003). In addition to the two-domain theory (adaxial and abaxial), Nakata
et al. (2012) reported a three-domain theory (adaxial, middle and abaxial). Nakata et al.
(2012) found that PRESSED FLOWER (PRS)/WUSCHEL-RELATED HOMEOBOX 3 (WOX3)
and WOX1 genes promote middle domain leaf fate. In prs wox1 double mutants, adaxial
and abaxial-like cell types coexist in the region neighbouring the margin and this suggest
PRS and WOX1 are required for normal patterning of adaxial and abaxial side–specific
tissues in the lateral region (Nakata et al., 2012; Nakata and Okada, 2012). A recent study
reported that YAB1 is also expressed in the middle domain, and this suggests that the
middle domain is a part of the abaxial domain. KAN family genes suppress the expression
of both middle domain genes WOX1 and WOX3 (Fig 1.2) (Nakata et al., 2012; Nakata and
Okada, 2012; Tsukaya, 2013).
As the leaf primordium grows away from the SAM, a clear physical boundary is formed
between the developing leaf and the SAM. The LATERAL ORGAN BOUNDARY (LOB), CUC
and BLADE ON PETIOLE (BOP) gene families express at the boundary and regulate leaf
development (Fig 1.2). JAGGED LATERAL ORGANS (JLO) and LOB are the members of the
LOB family. Loss of JLO leads to inactivation of SAM and causes leaf lobing (Fambrini and
Pugliesi, 2013; Szakonyi et al., 2010; Tsukaya, 2013). JLO upregulates KNOX expression,
and LOB is activated by BP/KNAT1 (KNOX gene), AS1, AS2, BOP1 and BOP2. BOP 1 and 2
activate AS1-AS2 on the adaxial side of leaf primordium and suppress the expression of
class I KNOX genes in leaf primordia (Ikezaki et al., 2010; Tsukaya, 2013). In the bop
mutant, the adaxial and abaxial polarity is disturbed, and ectopic lamina is formed in the
place of the petiole (Tsukaya, 2013). CUC genes (CUC1-3) encode NAC domain
transcription factors, and they promote expression of class I KNOX genes (STM and
KNAT6). Conversely STM represses CUC1 and CUC2 transcripts by activating miR164 (Fig
1.2). CUC transcription factors regulate development of leaf marginal structures, and cuc
mutants lack SAM and form goblet-shaped cotyledons (Hasson et al., 2011; Laufs et al.,
2004; Sieber et al., 2007; Spinelli et al., 2011; Taoka et al., 2004). Different miRNAs
maintain the level of abaxial/ adaxial identity and boundary genes by cleaving the target

15
mRNA. These miRNAs are transcribed by RNA-dependent RNA polymerases and
processed by DICER like, and ARGONAUTE (AGO) proteins, which are central to plant
small-RNA biogenesis and function (Fig 1.3).
1.2 ARGONAUTE proteins
In plants, transcriptional gene silencing (TGS) maintains genome integrity and post-
transcriptional gene silencing (PTGS) control the expression of mRNA transcripts to
regulate defence against invading pathogens, developmental transition and responses
to environmental stresses. RNA silencing pathways are directed by a specific class of
small RNA (sRNA) such as short interfering RNAs (siRNAs) and microRNAs (miRNAs) or
hairpin RNAs (hpRNAs) (Axtell, 2013; Voinnet, 2009). Small RNAs derived from single-
stranded precursors with a hairpin structure are called hpRNAs or miRNAs and those
derived from double-stranded precursors referred to as siRNAs. Regulatory small RNAs
in plants are predominantly 18 to 21 nucleotides in length. Biochemical steps involved
in the plant RNA silencing pathways are (1) double-stranded RNA (dsRNA) synthesis, (2)
dsRNA processing into 18–21 nucleotide long sRNAs, (3) methylation of sRNA, and (4)
sRNA incorporation into effector RNA-induced silencing complex (Fig 1.3) (Axtell, 2013;
Brodersen and Voinnet, 2006; Rubio-Somoza and Weigel, 2011; Voinnet, 2009).
Generally, dsRNA is synthesized by one of six RNA-DEPENDENT RNA POLYMERASES
(RDR1–6) using an RNA template. DAWDLE (DDL) stabilizes pri-miRNAs or dsRNA for
their conversion in nuclear processing centre called D-body. The physical interaction of
the C2H2-zinc finger protein SERRATE (SE) with the double-stranded RNA-binding
protein HYPONASTIC LEAVES1 (HYL1), one of the DICER RNase III-like endonuclease
family (DCL1-4) proteins and nuclear cap-binding complex (CBC) occurs in the D-body.
These proteins interact in order to process dsRNA and result in the release of short
double-stranded duplexes 18–21 nucleotides long. Upon dicing by DCL, sRNA duplexes
are either retained in the nucleus for TGS or exported to the cytoplasm for PTGS. Mature
miRNAs are exported to the cytoplasm through the action of the exportin 5 orthologue
HASTY. Exported mature miRNAs are methylated by HUA ENHANCER 1 (HEN1), and this
reaction protects miRNAs from being degraded by the SMALL RNA DEGRADING
NUCLEASE (SDN) class of exonucleases (Axtell, 2013; Brodersen and Voinnet, 2006;

16
Rubio-Somoza and Weigel, 2011; Voinnet, 2009). The miRNA is loaded into a RNaseH-
like ARGONAUTE (AGO) protein to form the catalytic core of an RNA-induced silencing
complex (RISC) that scans the cell for complementary nucleic acids to execute their
function. AGO proteins carry out the RNA silencing reaction by endonucleolytic cleavage
or ‘’slicing’’ at the centre of sRNA-target hybrids (Fig 1.3). This depends on the class of
sRNA loaded by AGO and AGO protein family member loaded with the sRNA (Hock and
Meister, 2008; Kim, 2011; Meister, 2013). AGOs are large proteins that typically have a
molecular weight of 90-100 kDa and are composed of a single variable N-terminal
domain and a conserved C-terminal domain, including the PAZ, MID and PIWI domains.
The N-terminal domain regulates the separation of the sRNA-target hybrid duplex post
cleavage. The PAZ and MID domains anchor the 3' and 5' ends of the bound sRNA to the
target mRNA, and PIWI domain specifies the endonuclease or slicer activity (Fig 1.3).
PIWI domains show extensive homology to RNase H and carry an Asp-Asp-His (DDH)
motif in its active site. Mutation in the DDH motif abolishes the endonuclease activity of
AGOs (Hock and Meister, 2008; Kim, 2011; Meister, 2013).
1.2.1 ARGONAUTE proteins control SAM and leaf development
AGO proteins are encoded by different species, and many organisms encode multiple
members of the family. The Arabidopsis genome encodes ten AGO family members.
Loss-of-function ago mutants display different plant developmental defects such as the
establishment of leaf adaxial-abaxial polarity, shoot apical meristem and root
development (Kim, 2011; Zhang and Zhang, 2012; Zhu et al., 2011b). AGO1 is the
prominent member of the Arabidopsis AGO protein family because it is required for the
function of most miRNAs including miR165/166. AGO1 represses the HD-ZIP III
transcripts in the abaxial domain via miR165/166 (Fig 1.2). The closest homologue of the
AGO1 gene is AGO10 and has 78% identity with AGO1 in their PAZ/PIWI domains but
less than 20% similarity in their N-terminal regions. Some of the ago1 mutant
phenotypes resemble those of ago10 mutants, and double mutants result in embryonic
lethality (Kim, 2011; Zhang and Zhang, 2012; Zhu et al., 2011b).
AGO1 and 10 compete for miR165/166, although AGO10 has a stronger binding affinity
for miR166 than AGO1 (Lynn et al., 1999; Mallory et al., 2009). Zhu et al. (2011) found
that in the ago10 mutant miR166 has increased binding affinity to AGO1, which resulted

17
in the down-regulation of HD-ZIP III transcripts. AGO10 possesses the DDH motif and
plants expressing AGO10, or AGO10 DDH mutants showed normal HD-ZIP III family gene
expression. Zhu and colleagues also showed that AGO10 positively regulates HD-ZIP III
family genes by acting as a specific decoy for miR166/165, and that AGO10 is not
involved in the translational repression of HD-ZIP III genes (Fig 1.2) (Zhang and Zhang,
2012; Zhu et al., 2011b). This shows that AGO10 preserves adaxial identity by regulating
HD-ZIP III, and it also behaves very differently from other AGOs.
Transacting short interfering RNA (siRNA) are derived from non-coding, single-stranded
transcripts, the pri-tasiRNAs, are converted into dsRNA by DCL4, RDR6, DRB4, and SGS3.
Similar to miRNAs, mature tasiRNAs guide cleavage and degrade cellular transcripts. In
Arabidopsis, there are three ta-siRNA gene families (TAS1, TAS2, and TAS3) that are
transcribed to produce tasiRNAs (Axtell, 2013; Fahlgren et al., 2006; Kim, 2011; Rubio-
Somoza and Weigel, 2011; Voinnet, 2009). In TAS3 tasiRNA biogenesis, miR390 is
explicitly loaded to AGO7 and triggers production of a TAS3 family of secondary siRNA.
ARF3 (ETTIN) and ARF4 transcription factors specify leaf abaxial identity, and their
transcripts are cleaved by AGO1 loaded with TAS3-derived trans-acting siRNA (Garcia et
al., 2006; Iwasaki et al., 2013; Takahashi et al., 2013). TAS3 and AGO7 are expressed in
the adaxial leaf domain, and their product tasiR-ARF regulates ARF3/4 in this region. This
shows that AGO7 preserves adaxial identity by suppressing abaxial domain genes
ARF3/4 (Fig 1.2) (Endo et al., 2013; Fahlgren et al., 2006; Hunter et al., 2006;
Montgomery et al., 2008). The interplay between AGO10-loaded miR165/166 and
AGO7- loaded miR390 sets the precise gradient boundaries between the abaxial and
adaxial domains. These studies show that AGO1, AGO7 and AGO10 play an important
role in SAM and leaf development (Fig 1.2).

18
Figure 1.3 Biogenesis of Plant miRNAs and Structure of the Argonaute protein, modified image
from (Voinnet, 2009). Plant pri-miRNAs are transcribed by RNA-dependent RNA polymerases
(RNA Pol II), and protein DAWDLE (DDL) stabilises pri-miRNAs for their conversion in D-bodies
(SE, HYL1, DCL1, and CBC) to stem-loop pre-miRNAs. The mature miRNAs produced by DCL1 are
methylated by HEN1 and exported to the cytoplasm through HASTY. The non-methylated
miRNA* is degraded by the SDN class of exonucleases. The miRNA strand is then incorporated
into AGO proteins to carry out the RNA silencing reaction by slicing. Argonaute proteins consist
of a variable N-terminal domain and three conserved C-terminal domains, the PAZ, MID and
PIWI domains. PAZ and MID domain are required for small RNA binding, and the PIWI domain
specifies the endonuclease activity.

19
1.3 Similar genes regulate SAM and floral to fruit transition
The juvenile SAM undergoes a complex transition to form a mature fruit. The juvenile
SAM generates leaves and shoots during the vegetative phase, and in the reproductive
phase, it becomes an inflorescence meristem and flowers are produced. After
fertilisation, the female parts of the flower develop into a fruit. The transition from
juvenile shoots to more mature vegetative shoots and the subsequent transition from
the vegetative phase to the formation of inflorescence varies considerably among
angiosperms. In recent years, studies on the mechanisms of differentiation of the floral
meristem and their lateral outgrowths focused on Arabidopsis and tomato. In
Arabidopsis, LEAFY (LFY) and APETALA1 (AP1) genes promote initial floral meristem
identity (Fletcher, 2002; Vijayraghavan et al., 2005). AGAMOUS (AG) is necessary for
stem cell termination because the termination of stem cell activities in the floral
meristem is required for normal flower development (Fletcher, 2002). Similar to the
SAM, WUS also regulates stem cells in the floral meristem. AG terminates stem cells in
the floral meristem by repressing the expression of the stem cell regulator WUS (Fig 1.4)
(Fletcher, 2002). In the SAM, AGO1, AGO10 and HD-ZIP III transcription factors regulate
stem cells and leaf development (Fig 1.2). Indeterminate flower, AGO10 is expressed in
the floral meristem and the adaxial side of carpels. AGO1, AGO10, miR172-mediated
regulation of AP2 gene and miR165/166-mediated regulation of HD-ZIP III genes are
necessary for floral stem cell termination. AGO10 regulates floral stem cell termination
by repressing the expression of the WUS (Fig 1.4) (Ji et al., 2011; Landau et al., 2015).
Loss of AGO10 and reduced expression of the HD-ZIP III genes result in opposite effects
on stem cell regulation between the SAM and the floral meristems (Ji et al., 2011;
Landau et al., 2015; Tucker et al., 2013; Zhou et al., 2015; Zhu et al., 2011b). The reason
for opposite effects in the two types of meristems is currently unknown, and this missing
link should be investigated.
SAMs form leaves and associated meristems, whereas the floral meristem generates
sepals, petals, stamens, and carpels (Fig 1.4). The Arabidopsis gynoecium is derived from
the fusion of two carpels. It is a highly complex assembly comprised of different
tissues that work together to support fertilisation and fruit development. These
processes are regulated by different proteins and particularly the basic helix-loop-helix

20
(bHLH) transcription factors. In Arabidopsis, bHLH proteins are also involved in SAM
developmental signalling, stomatal patterning, trichome, and root hair differentiation
and axillary meristem formation (Li et al., 2006; Toledo-Ortiz et al., 2003; Zhao et al.,
2012). The bHLH transcription factor superfamily is one of the largest transcription
factor families in Arabidopsis. There are 147 bHLH genes in Arabidopsis, and based on
structural analysis they are divided into 12 subfamilies (Li et al., 2006; Toledo-Ortiz et
al., 2003). The bHLH is defined by the signature domain, which consists of 60 amino acids
with two functionally distinct regions (N-terminal end and C-terminal end). The N-
terminal end of the domain comprises 15 amino acids, this domain is involved in DNA
binding (E-box binding (5’-CANNTG-3’) and non-E-box binding) and the C-terminal end
is essential for dimerization.
The patterning of gynoecia occurs along three axes: apical-basal, mediolateral, and
abaxial-adaxial (Fig 1.4). The bHLH transcription factors SPATULA (SPT), HECATE1
(HEC1), HEC2 and HEC3 are involved in apical-basal patterning of the gynoecium by
carpel fusion as well as transmitting tract formation (Fig 1.4) (Gremski et al., 2007;
Ostergaard, 2009). Mutations in the SPT gene lead to defects in the development of the
stigma, style, septum and transmitting tract. Similar defects were observed in hec
double and triple mutants. The HEC proteins physically interact with SPT in yeast two-
hybrid assays, which suggests that these factors may jointly activate or repress
downstream target genes (Gremski et al., 2007; Ostergaard, 2009; Seymour et al., 2013).
However, HEC1 is also involved in SAM stem cell maintenance by balancing proliferation
versus differentiation (Fig 1.2) (Schuster et al., 2014). HEC1 function is critically
dependent on SPT for stem cell proliferation (Schuster et al., 2014). In the SAM, HEC1
regulates cytokinin signalling by activating ARR7 (Fig 1.2).
HEC1 and SPT buffer auxin and cytokinin signals during gynoecium development (Fig
1.4). SPATULA enables cytokinin signalling by activating ARR1 expression in gynoecia,
and SPT is necessary for positive cytokinin signalling output in the young gynoecium
(Reyes-Olalde et al., 2017). HEC1 and SPT stimulate auxin biosynthesis and activate the
expression of PIN3 and regulate auxin distribution during early stages of gynoecium
development. Auxin also activates ETT and restricts apical tissue proliferation by
negatively regulating HEC1 and SPT (Nemhauser et al., 2000; Schuster et al., 2015).

21
INDEHISCENT (IND) belongs to the same clade of the Arabidopsis bHLH family as the
HEC1/2/3 and IND is a paralogue of HEC3 that is only present in the Brassicaceae (Kay
et al., 2013b). Interestingly, hec spt phenocopies ind spt unfused carpel phenotype and
35S::HEC1 inflorescence also looks similar to 35S::IND inflorescence (Girin et al., 2011;
Schuster et al., 2015; Sorefan et al., 2009a). However, IND do not interact with HEC1/2/3
or regulate their gene expression, which suggest they may function independently
(Gremski, 2006). Similar to HEC1/2/3, IND also interact with SPT and regulates a
common set of target genes (Girin et al., 2011; Gremski et al., 2007). Interestingly, IND
directly regulates SPT gene expression (Girin et al., 2011; Groszmann et al., 2010;
Ichihashi et al., 2010b). SPT and IND control radiality at the gynoecium apex by
controlling polar auxin transport (PAT) (Moubayidin and Ostergaard, 2014), which is
essential for medial versus lateral tissue specification in gynoecia (Larsson et al., 2014).
SPT and IND control PAT by repressing PINOID (PID) expression, and this promotes
apolar PIN localisation and subsequent formation of the radial auxin ring at the
gynoecium apex (Moubayidin and Ostergaard, 2014). These studies show the close
relationship between HECs, SPT and IND in fruit development signalling (Fig 1.4) (Girin
et al., 2011; Liljegren et al., 2004a; Ostergaard, 2009; Seymour et al., 2013).
CUC genes regulate SAM formation and separation of organs from the meristem. They
are expressed in the boundaries between organs (Wang et al., 2016). Overexpression of
CUC1 and CUC2 prevents carpel fusion in the apical region. Interestingly CUC1 and CUC2
expression is negatively regulated in the apical region of the gynoecial primordium by
SPT, and this repression is essential for carpel fusion (Nahar et al., 2012). These studies
show that SPT, HEC1 and CUC1 play key roles in SAM development as well as carpel
fusion (Fig 1.2, 1.4). Similar to SPT-HEC1 in SAM, we do not know if SPT-IND has a role in
SAM development and this should be investigated.
22
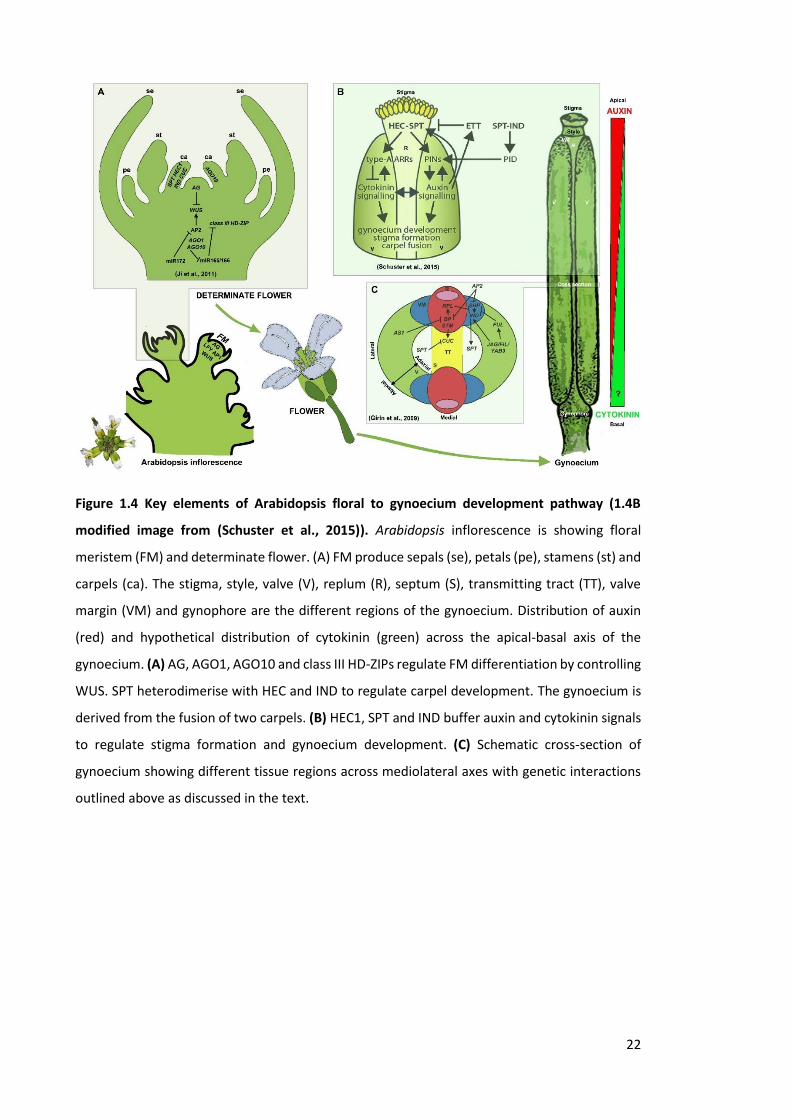
Figure 1.4 Key elements of Arabidopsis floral to gynoecium development pathway (1.4B
modified image from (Schuster et al., 2015)). Arabidopsis inflorescence is showing floral
meristem (FM) and determinate flower. (A) FM produce sepals (se), petals (pe), stamens (st) and
carpels (ca). The stigma, style, valve (V), replum (R), septum (S), transmitting tract (TT), valve
margin (VM) and gynophore are the different regions of the gynoecium. Distribution of auxin
(red) and hypothetical distribution of cytokinin (green) across the apical-basal axis of the
gynoecium. (A) AG, AGO1, AGO10 and class III HD-ZIPs regulate FM differentiation by controlling
WUS. SPT heterodimerise with HEC and IND to regulate carpel development. The gynoecium is
derived from the fusion of two carpels. (B) HEC1, SPT and IND buffer auxin and cytokinin signals
to regulate stigma formation and gynoecium development. (C) Schematic cross-section of
gynoecium showing different tissue regions across mediolateral axes with genetic interactions
outlined above as discussed in the text.

23
The fruit develops from the gynoecium after fertilisation. The stigma, style, ovary, and
gynophore are the four different regions of the gynoecium and the fruit. The ovary
houses the developing seeds and comprises several distinct tissues: two valves (seedpod
walls), replum (middle ridge), septum, and valve margins. The replum has meristematic
properties because early repla are essential for the development of all the marginal
tissues of the fruit (septum, repla, style, and stigma) (Girin et al., 2009; Roeder and
Yanofsky, 2006). Replum development is promoted by the BEL1-like homeodomain
transcription factor REPLUMLESS (RPL). RPL also regulates stem cell fate in the SAM by
interacting with KNOX I meristem gene BP/KNAT1 (Bhatt et al., 2004; Cole et al., 2006).
Interestingly, KNOX I meristem genes BP and STM is also expressed in the replum and
are involved in replum development (Ragni et al., 2008). ASYMMETRIC LEAVES (AS1)
and AS2 are involved in leaf primordia formation by silencing class I KNOX meristem
identity genes (Iwasaki et al., 2013; Xu et al., 2003). Similar to leaf primordia, AS1 is
involved in medio-lateral patterning of the fruit, particularly regulating valve and replum
development (Alonso-Cantabrana et al., 2007). AS1 possibly does this by negatively
regulating class I KNOX meristem identity genes. CUC transcription factors activate
KNOX I meristem gene STM expression in the SAM and STM restricts CUC expression by
inducing miR164 (Laufs et al., 2004; Spinelli et al., 2011). In gynoecia, CUC1 and CUC2
are expressed in the inner edge and the middle of the septum (Kamiuchi et al., 2014;
Nahar et al., 2012). CUC1 and CUC2 are required for septum and replum formation.
These studies demonstrate that RPL, AS1, KNOX I and CUC genes regulate both SAM
development and formation of medial tissues in gynoecium (Fig 1.2, 1.4).
The valve margins are the zones where the fruit opens. Each valve margin consists of
two layers: a separation layer and a lignified layer. These layers allow the valve to
separate from the replum. The SHATTERPROOF 1 (SHP1) and SHP2 MADS-box genes
specify valve margin identity (Fig 1.4) (Liljegren et al., 2000). SHP positively regulates
bHLH transcription factors IND and ALCATRAZ (ALC) (Liljegren et al., 2004a). IND and ALC
heterodimerize to specify the separation layer, and IND is primarily responsible for the
development of the lignified layer of the valve margin. A local auxin minimum is
necessary for specification of the valve margin (Sorefan et al., 2009a). IND creates auxin
minima in the valve margin cells by inhibiting PID and related kinases to direct the
localisation of PIN auxin efflux carriers (Sorefan et al., 2009a). RPL negatively regulates

24
SHP, restricting its expression to the valve margin (Roeder et al., 2003). The MADS-box
gene FRUITFULL (FUL) indirectly regulates valve cell development. In the ful mutant,
SHP, IND, and ALC are all ectopically expressed throughout the valves, indicating that
FUL negatively regulates SHP, IND, and ALC to prevent valve cell lignification (Fig 1.4)
(Roeder et al., 2003). In the fruit, JAGGED (JAG)/ FILAMENTOUS FLOWER (FIL) activity
promotes valve and valve margin formation. JAG/FIL positively regulates the valve-
promoting gene FUL and the valve margin identity genes SHP1, SHP2, IND and ALC (Fig
1.4) (Gonzalez-Reig et al., 2012). In the SAM, JAG/FIL activity promotes leaf formation
and abaxial leaf specification (Fig 1.2) (Kumaran et al., 2002; Siegfried et al., 1999).
Interestingly, induced overexpression of IND produces several phenotypes, such as pin
and cup shaped leaves (Fig 1.5) (Moubayidin and Ostergaard, 2014). IND overexpression
phenocopies ago10, hd-zip iii, cuc mutants and 35S::miR166a transgenic seedlings (Fig
1.5). IND-SPT regulates PAT in gynoecia. PAT also regulates leaf patterning in SAM
(Reinhardt et al., 2003). This suggests that IND could regulate PAT and meristem genes
to control SAM or leaf development, but this should be investigated further.
1.4 Hypothesis and Objectives
The studies discussed in section 1.3 demonstrate that genes involved in SAM
development also regulate gynoecium and fruit development (Fig 1.5). IND regulates
PAT and patterning in gynoecium and fruit. An important question to address is what
roles does IND play to regulate SAM. We hypothesised that IND is associated with PAT
and the AGO10-HD-ZIP III pathway to control SAM and leaf development in Arabidopsis.
The first results section of my thesis will examine the link between IND and AGO10-HD-
ZIP III pathway. The second results chapter will detail how other SAM-associated
proteins are involved in the IND-AGO10-HD-ZIP III pathway. The third results chapter will
detail how auxin and cytokinin regulate the IND gene-regulatory network. My three
result chapters integrate experimental data and pathway construction and develop
novel insights into how AGO10-IND function in SAM and gynoecium.

25
Figure 1.5 Similar genes regulate SAM (left) and fruit (right) development. Induced
overexpression of IND produces several phenotypes (35S::IND:GR+DEX: pin and cup shaped)
similar to ago10 mutant and 35S::miR166a transgenic seedlings (ago10 E-G: no-meristem, pin
and cup shaped). Phenotypes suggest that IND may have a regulatory role in the SAM, but the
elements of this regulatory pathway are unknown.

26
Chapter 2 Materials and Methods

27
CHAPTER 2. Materials and Methods
2.1 Materials
2.1.1 General laboratory materials
General laboratory consumables such as Eppendorf tubes, polymerase chain reaction
(PCR) plates and tissue culture plates were purchased from Star Labs. Levington®
Advance Seed and Modular F2+S compost plus horticultural grade sand mixture (pH 5.3-
6.0) was purchased from ICL, Ipswich, UK. General laboratory chemicals of analytical
grade were purchased from Sigma-Aldrich, Fisher, Duchefa Biochemie, Alfa Aesar, and
TAAB. Enzymes and reagents were ordered from Abcam, GE, BIO-RAD, Invitrogen, Gen
script, and Roche, and gel extraction and miniprep kits were from Qiagen or Sigma.
Water used for preparing growth media, buffers and solutions were either reverse
osmosis filtered or deionised ultra-high-purity water; nuclease-free water for molecular
works involving DNA and RNA was purchased from Fisher. Custom oligonucleotides and
probes were synthesised by Sigma and Genscript.
2.1.2 Plant materials
All plant lines were of the Columbia (Col) and Landsberg erecta (Ler) ecotypes. Details
of the mutant and transgenic lines used in this study are presented in Table 2.1. Plant
lines were originally bought from NASC seed stock centre (Nottingham, UK). See
Acknowledgements for stock donors.
Table 2.1 Plant lines relating to multiple chapters.
Line Allele Gene name Gene ID Mutation Reference
ind (Col) ind-2
INDEHISCENT AT4G00120
EMS (Liljegren et al.,
2004b)
ind (Ler) ind-6 Ds gene trap insertion
(Wu et al., 2006)
35S::IND-GR (Col)
35S::IND:GR Transgene
(Sorefan et al., 2009b)
pIND:: GUS (Col)
IND::GUS L0266
Transgene (Sorefan et al.,
2009b)
ago10 (Col) ago10-4 SALK_138011 ARGONAUTE10 AT5G43810
T-DNA insertion
(Zhu et al., 2011a)
ago10 (Ler) zwl-3 EMS (Endrizzi et al., 1996)
phb er (Col) phb-12 er-2 SALK_023802
PHABULOSA AT2G34710
T-DNA insertion
(Prigge et al., 2005)
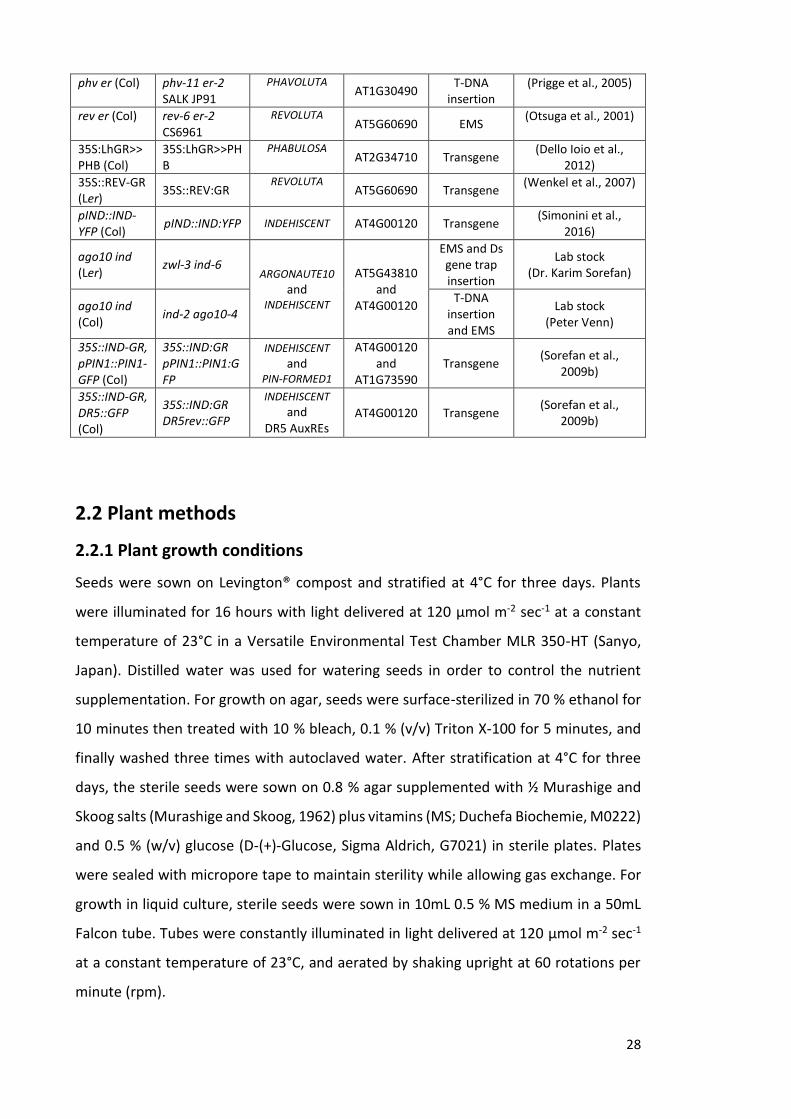
28
phv er (Col) phv-11 er-2 SALK JP91
PHAVOLUTA AT1G30490
T-DNA insertion
(Prigge et al., 2005)
rev er (Col) rev-6 er-2 CS6961
REVOLUTA AT5G60690 EMS
(Otsuga et al., 2001)
35S:LhGR>>PHB (Col)
35S:LhGR>>PHB
PHABULOSA AT2G34710 Transgene
(Dello Ioio et al., 2012)
35S::REV-GR (Ler)
35S::REV:GR REVOLUTA
AT5G60690 Transgene (Wenkel et al., 2007)
pIND::IND-YFP (Col)
pIND::IND:YFP INDEHISCENT AT4G00120 Transgene (Simonini et al.,
2016)
ago10 ind (Ler)
zwl-3 ind-6 ARGONAUTE10
and INDEHISCENT
AT5G43810 and
AT4G00120
EMS and Ds gene trap insertion
Lab stock (Dr. Karim Sorefan)
ago10 ind (Col)
ind-2 ago10-4 T-DNA
insertion and EMS
Lab stock (Peter Venn)
35S::IND-GR, pPIN1::PIN1-GFP (Col)
35S::IND:GR pPIN1::PIN1:GFP
INDEHISCENT
and PIN-FORMED1
AT4G00120 and
AT1G73590 Transgene
(Sorefan et al., 2009b)
35S::IND-GR, DR5::GFP (Col)
35S::IND:GR DR5rev::GFP
INDEHISCENT
and DR5 AuxREs
AT4G00120 Transgene (Sorefan et al.,
2009b)
2.2 Plant methods
2.2.1 Plant growth conditions
Seeds were sown on Levington® compost and stratified at 4°C for three days. Plants
were illuminated for 16 hours with light delivered at 120 µmol m-2 sec-1 at a constant
temperature of 23°C in a Versatile Environmental Test Chamber MLR 350-HT (Sanyo,
Japan). Distilled water was used for watering seeds in order to control the nutrient
supplementation. For growth on agar, seeds were surface-sterilized in 70 % ethanol for
10 minutes then treated with 10 % bleach, 0.1 % (v/v) Triton X-100 for 5 minutes, and
finally washed three times with autoclaved water. After stratification at 4°C for three
days, the sterile seeds were sown on 0.8 % agar supplemented with ½ Murashige and
Skoog salts (Murashige and Skoog, 1962) plus vitamins (MS; Duchefa Biochemie, M0222)
and 0.5 % (w/v) glucose (D-(+)-Glucose, Sigma Aldrich, G7021) in sterile plates. Plates
were sealed with micropore tape to maintain sterility while allowing gas exchange. For
growth in liquid culture, sterile seeds were sown in 10mL 0.5 % MS medium in a 50mL
Falcon tube. Tubes were constantly illuminated in light delivered at 120 µmol m-2 sec-1
at a constant temperature of 23°C, and aerated by shaking upright at 60 rotations per
minute (rpm).

29
2.2.2 Hormone and chemical treatments
Hormones and chemicals were ordered and stored according to Table 2.2. Seedlings
were grown in plant agar medium or liquid culture medium containing hormones and
chemicals: 6-Benzylaminopurine (BAP), Indole-3-acetic acid (IAA), N-1-
naphthylphthalamic acid (NPA), Abscisic acid (ABA), 1-Aminocyclopropane carboxylic
acid (ACC), Jasmonic acid (JA), Cycloheximide (CHY), Dexamethasone (DEX) and mock
solutions (Table 2.2). Final concentrations of 100 nM BAP, 10 μM IAA, 10 μM NPA, 10
μM ABA, 10 μM ACC, 10 μM JA, 10 µM DEX and 10 µM CHY were used for treatment.
The mock solution contained DMSO (Fisher, BP231), dH2O (Fisher, W/0100/21) and
EtOH (Fisher, E/0650DF/17). All treated plants with their respective controls were grown
simultaneously under the same conditions.
Table 2.2 Hormones and chemicals.
Name Company name and product code
Solvent Stock concentration
Storage temperature (°C)
ABA SLS #A1049 EtOH 70 % (v/v) 10 mM -20
ACC Sigma Aldrich #A3903 dH2O 10 mM -20
BAP Duchefa #B0904 DMSO 100 mM -20
IAA Duchefa #I0901 DMSO 100 mM -20
JA Sigma Aldrich #J2500 EtOH 1.6 % (v/v) 10 mM 4
NPA Duchefa #N0926 DMSO 100 mM -20
CHY Acros Organics #357420010 DMSO 10 mM -20
DEX Alfa Aesar #A17590 DMSO 10 mM -20
2.2.3 Shoot apical meristem phenotype analysis
Analysis of SAM phenotypes was done on 3 and 7 day old seedlings. Seedlings were
transferred to a Petri dish filled with sterile water. Forceps were used to hold one
cotyledon while pulling the second cotyledon downwards to peel the seedling into two.
This peeled cotyledon was transferred to a microscope slide and aligned on top of 1 %
agarose gel. Two cotyledons of a seedling were observed under a light microscope to
analyse the phenotype of shoot apical meristem (Fig 2.1).

30
Figure 2.1 Light microscope image of the 3-day-old shoot apical meristem.
2.3 Nucleic acid techniques
2.3.1 Plant genomic DNA extraction
Genomic DNA was extracted using Edward’s extraction buffer (200 mM Tris (pH 7.5),
250 mM NaCl, 25 mM EDTA, 0.5% SDS). Individual Arabidopsis leaves, or seedlings were
placed in 1.5 mL microcentrifuge tubes, flash frozen with liquid nitrogen and then
ground with plastic pestles. 400 µL of Edward’s extraction buffer was added and mixed
by inversion. After centrifugation at 16000 rpm for 5 minutes, 300 µL of DNA-containing
supernatant was transferred to fresh tubes containing 300 µL isopropanol and 1 µl
GlycoBlueTM (Ambion®, Thermo Fisher Scientific, U.S.), mixed by inversion and further
centrifuged for 10 minutes. The supernatants were discarded, and the pellets were
washed with 70 % EtOH before being air dried for 15 minutes at room temperature, and
finally resuspended in 100 µL of Tris-EDTA (TE) buffer (10 mM Tris-HCl (pH 7.5), 1 mM
EDTA) or 100 µL of dH2O.
2.3.2 Plant total RNA extraction
Plant tissue was collected into 2 mL tubes containing a 4 mm steel ball bearing. Seedlings
with metal balls are snap-frozen in liquid nitrogen and vortexed until they form a pale
green powder. Once all samples are prepared, total nucleic acid (TNA) was extracted
using a phenol-chloroform extraction procedure adapted from (White and Kaper, 1989).
Tubes were transferred to ice, and 600 µL of freshly made extraction buffer (100 mM
Glycine, 10 mM EDTA, 100 mM NaCl, 2 % SDS, pH9.5) was added to each sample. The
homogenized material was transferred to a chilled microcentrifuge tube containing 600

31
µL phenol (pH4) and mixed immediately by vortexing for 10 seconds. Tubes were then
centrifuged for 10 minutes at 16,000 × g at 4°C to separate plant debris from the
supernatant. The upper phase was transferred to a fresh tube on ice, containing 600 µL
of 25:24:1 phenol:chloroform:isoamyl alcohol and centrifuged for 10 minutes at 16,000
× g at 4°C. The upper phase containing RNA was transferred to a fresh tube containing
500µL chloroform:isoamyl alcohol, on ice. Tubes were vortexed for 10 seconds and
centrifuged for 5 min 16,000 × g at 4°C. The upper phase was transferred to a sterile
tube, and the TNA fraction was precipitated by the addition of 40 µL 4 M sodium acetate
pH5.2, 800 µL absolute ethanol, and 1 µL GlycoBlueTM. This was mixed by inversion and
incubated for 15 minutes on ice or stored overnight at -20°C. The TNA was recovered
from solution by centrifugation for 15 minutes at 16,000 × g at 4°C. The supernatant was
removed by aspiration. To remove residual salts, the pellet was rinsed with 80 % ethanol
and immediately centrifuged for 5 minutes at 16,000 × g at 4°C. The ethanol was
removed by aspiration, and the pellet was allowed to dry at room temperature for 10
minutes. The TNA pellet was resuspended in the 30-50 µL RNase-free water on ice. The
TNA extract was stored at -80°C.
Total RNA yield was quantified using NanoDrop (Thermofisher). A 260/280 ratio of 2.0
is generally accepted as ‘pure’ for RNA. RNA quality was checked on a 1% TBE agarose
gel. The gel was loaded with approximately 1 µg TNA extract denatured for 5 minutes at
65°C with an equal volume of 2× gel-loading solution containing 10 ml deionized
formamide, 200 μl 0.5 M EDTA, pH 8.0, 1mg xylene cyanol FF and 1 mg bromophenol
blue. To remove contaminating genomic DNA, TNA was treated with DNase using the
Ambion DNA-free™ kit or SIGMA Dnase I Kit (AMPD1). 1-2 µg TNA was incubated at 37°C
for 30 minutes with 2U rDNaseI in DNase I Buffer. The DNase was inactivated using a 1:5
volume of DNase Inactivation Reagent and incubated for 2 minutes at room
temperature, mixing 2-3 times. To remove the DNase enzyme, the tubes were
centrifuged at 10,000 × g for 90 seconds. The supernatant containing the RNA was
transferred to a fresh tube and stored at -80°C.
2.3.3 cDNA synthesis
Complementary DNA (cDNA) from 1–2 µg of DNase I treated TNA was synthesised using
a High Capacity cDNA Reverse Transcription Kit (Invitrogen, #4374966). A 2X RT master

32
mix was prepared on ice containing 10X RT buffer, 10X RT random primers, 25X dNTP
mix, reverse transcriptase, RNase inhibitor and nuclease-free dH2O. 10 μL of 2X RT
master mix and 10 μL of RNA were mixed in a fresh PCR tube. Tubes were centrifuged
to eliminate any air bubbles. Thermal cycler conditions listed below were used for the
run. After the run, diluted (1:4) cDNA was stored at –20°C until use.
Step 1 Step 2 Step 3 Step 4
Temperature (oC) 25 37 85 4
Time 10 minutes 120 minutes 5 minutes ∞
2.3.4 Primer design
Arabidopsis genomic DNA or mRNA sequences were acquired using Ensembl-Plant
(http://plants.ensembl.org/) and TAIR (https://www.arabidopsis.org/). For qRT-PCR, to
avoid amplification of contaminated genomic DNA, primers were designed to hybridize
to the 3′ end of one exon and an exon-exon junction, or the other half to the 5′ end of
the adjacent exon. Chromatin immunoprecipitation (ChIP) qRT-PCR primers were
designed either side of the previously characterised or predicted transcription factor
binding sites. Genotyping primers were designed either side of the predicted mutation
site or reporter sequence. Primers for qRT-PCR assays and sequencing were designed
using NCBI Primer-BLAST. A list of the primers used is provided in Table 2.3.
Table 2.3 List of primers used for qRT-PCR, genotyping, sequencing and ChIP qPCR.
qRT-PCR
Name Forward primer (5'-3') Reverse primer (5'-3')
ACTIN2 TCAGATGCCCAGAAGTGTGTT CCGTACAGATCCTTCCTGATA
AGO10 CCTTTGTAGCCATGCGGGTATTCA TGCACCGCGCATAGGTATAACAG
AGO7 GGCCGGTCAAGTTTAAGCTTTGGTG CGTGTCTGCAAATCAGTAGGGCAAG
ARF3 CCATATCGACCCATAGCGTTTTCAG CCCAATGCAAAAGGGATAGTCAACA
ARF4 GCCATGGGCAGGTTTACTGGATAC TAACATCAAACCCCTGTGAGGGTGA
ARR7 CTCAATGCCAGGACTTTCAGG TCCTCTGCTCCTTCTTTGAGAC
AS1 TGAAGAAGGATGGTGAGATGGG TCTCTCGGACCGAACTGTCT
AS2 CCAACTACACGCTTTTTGTATGC TCCCTCTCCCTGCGAGTAAAT
CLV3 AAGGACTTTCCAACCGCAAG AGTTGTTGAACTGGACCGGA
CUC1 GAGCCTTGGGAGCTTCCTGA TGTTCGTTCTCAGTCCCGTT
CUC2 CAAGTGTGAGCCTTGGCAACT TAGTTCTCAGTCCCGTCGGAT
CUC3 CTACAAAGGTAGGGCTCCACG TGCAAATCACCCATTCCTCCTT
HEC1 GATCTTCCGTATCGCCGTGA CTTCTATGCCTAGCCGCCAC
IND GAACCGCCGTAACGTAAGGA AAGCTGTGTCCATCTTCGCA
KAN GCGGCCATGAAAGAGCAACT CAGCAGGCTTGTTAGTGGTC
KNAT1 GGAGCTCCACCTGATGTGGTT CAACATGTCACAGTATGCTTCCA

33
MP AGGACTCAAACGTCAGCTCC CGCGGAATCAGGAACACGTA
PHB CATGCTGGAAACGACTCTTGTAGCC CGTTGCCTGCTCGTAAGATACCATC
PHV GGCTCCCAATACGGTAGCTCATTTC CATCGACACCATAGTCTGCCCATTC
PID TCCCTCTCTTCCGCCAGATT AGCATAATGTGACCGTCGGA
PIN1 CAGGGGAATAGTAACGACAACC ACCTTAGCCTGCGTCGTTTT
REV GCTTCGACCCCTTTATGAGTCATCC CAGGCTGCCTTCCTAATCCATACAC
RPL CGACGAGGTTTACAAGAGGT TAAGTTAGCGTACGGAGCAG
SPT GGGAAGGTGGGTTAACTCATCCAAG ACATAGAGATCCCGAAGTTGGGACA
STM TTGTCAGAAGGTTGGAGCAC TCAAGCCCTGGATCTTCACC
WOX1 CGACACGCAACCAGAGAAAC CAACTGCATCATCTGCCACG
WUS TCCCAGCTTCAATAACGGGA CCTCCACCTACGTTGTTGTAAT
YAB1 CGTAACTGTCCGATGTGGTTG AAGTAAGAGTGAGGACCGAGC
YAB2 TTGTGACGGTGAGATGTGGC CCAGAGAGGTTGTGTGCTGT
YAB3 GGAGGAAATGCGAAGCGGAG CCACTGATCTTCCGTTGCGA
YUC1 CCGGAACACCGTTCATGTGT CGGTCGGTATTTCCAAACGA
ZPR1 TCAGACACACCCACGAGATTAG CATCTTTTTCTCTTCCCGCCAC
Genotyping and Sequencing
Name Forward primer (5'-3') Reverse primer (5'-3')
AGO10-1 TCTCTAGCGTCACTCTTCTTCT TTAGCTCTCTTGTTGGTTGAGT
AGO10-2 AGCTGCATTCATCGAGCCT CATACCGCCACTAACAGTACC
AGO10-3 AGAGAATCTGTGAAACCGAGC AGCTTGAGGAACCGACGTAA
AGO10-1 (2) CGCTGATTTGCCTACCAAGGA
AGO10-2 (2) AGTATCACGAGAACGGGAAAG
AGO10-3 (2) GCTTGTGCATCGCTTGAACC
CYP79B2 1 CCATGCAGAGACAACAGAAACC TCGGCTAAGAAGGACTTGACT
CYP79B2 2 AGAACACTGCACCTGACGG GGCGTCGTCTCATCTCACTT
EGFP/YFP CTACGGCAAGCTGACCCTGA CCTTGAAGAAGATGGTGCGCT
GR AGCATTACCACAGCTCACCC GATCTCCAACCCAGGGCAAA
ChIP qPCR
Name Forward primer (5'-3') Reverse primer (5'-3')
CUC1 CTGTCAAATATCACATCAGTTGCT AACCCTAGAGTTCCCAAATGTT
AGO10 CCTCTTTACACGTGATTTTTAAAAGAGA CACTCACCGACCAATGAAGAA
PID TTCGTTTATTCTAGCCATTTCACA CCTCTCGCTAATTTTTGTTTTGTT
2.3.5 Polymerase chain reaction (PCR)
PCR reactions were performed with 1X Q5 Reaction Buffer, 200 µM dNTPs, 0.5 µM of
each primer, 0.02U/µl Q5® Hot Start High-Fidelity DNA Polymerase (NEB, M0493), 1X Q5
High GC Enhancer and 1-2 µg template in a total volume of 25 or 50 µL on T100™
Thermal Cycler (Bio-Rad). PCR conditions were one cycle at 98oC for 30 seconds and 35
cycles of 98oC for 10 seconds, 56 oC for 30 seconds followed by 72oC for 1 minute and
one cycle at 72oC for 2 minutes. PCR products were checked by agarose gel
electrophoresis. Samples were subsequently submitted for sequencing at the Core

34
Genomics Facility, University of Sheffield. Samples were sequenced using the Applied
Biosystems' 3730 DNA Analyser, and sequencing results were analysed using SnapGene
and BioEditor software.
2.3.6 Quantitative reverse transcriptase PCR (qRT-PCR)
qRT-PCR is a quick and dependable technique for monitoring the gene expression
profile. The qRT-PCR has become the gold standard method of choice for the
quantification of specific mRNAs and miRNAs. This method is fast, extremely sensitive,
and accurate. It requires only very small amounts of input total RNA and is relatively
simple to perform. Three biological and three technical repeats were performed for all
the experiments. qRT-PCR was performed with SYBR Green Jump-start Taq Ready-mix
(Sigma, S4438) on the Mx3005P qPCR System (Agilent Technologies Genomics). The
SYBR Green I dye chemistry uses the SYBR Green I dye to detect PCR products by binding
to double-stranded DNA formed during PCR. Because the SYBR Green I dye binds to all
double-stranded DNA, the result is an increase in fluorescence intensity proportional to
the amount of double-stranded PCR product produced. Reactions were prepared using
2X JumpStart Taq Ready Mix, 1X ROX Reference Dye, 300 nM forward primer, 300 nM
reverse primer, 500 ng template DNA and nuclease-free water and 15 μl of each reaction
was transferred to an optical 96 well plate (Star Labs). The plate was covered with an
optical adhesive film (Bio-Rad, #MSB-1001), and the plate was centrifuged briefly to
eliminate air bubbles from the solutions. PCR conditions listed below were used for the
run. After the run, PCR products were checked by agarose gel electrophoresis and the
melting curve analysis. The threshold cycle (CT) was automatically determined by the
Mx3005P qPCR System, and comparative CT method (also known as the 2 –ΔΔCT
method) was used to analyse the qRT-PCR data (Schmittgen and Livak, 2008).
Housekeeping genes such as UBIQUITIN C, BETA-ACTIN, GAPDH, 18S RIBOSOMAL RNA
(18S rRNA), 5S RIBOSOMAL RNA (5S rRNA) were used as these are common endogenous
references in qRT-PCR. ACTIN2 was used as a normalisation control.
Step
PCR
Initial denaturation
CYCLE (40 Cycles) Dissociation/melt
Denature Anneal/ Extend
Time 2 minutes 15 seconds 1 minute 2 minute 1 minute 2 minutes
Temp 94 °C 94 °C 60 °C 94 °C 60 °C 94 °C

35
The below equation was used to compare the gene expression in two different samples
(e.g. sample 1 and sample 2); each sample was related to an internal control gene.
Sample 1 may be the treated sample and sample 2, the untreated control or Calibrator.
ΔCT = (CT gene of interest - CT normalisation control)
–ΔΔCT = - [(ΔCT) sample 1 - (ΔCT) sample 2)]
Fold change = 2 –ΔΔCT
2.3.7 Agarose gel electrophoresis
PCR products were mixed with 6x loading buffer (0.2 % w/v bromophenol blue, 50 % v/v
glycerol) before routinely electrophoresed together with 5 μL of 100 bp or 1 kb DNA
ladder (NEB) on 1 % w/v 10-well 100 mL agarose gels prepared using TAE
(Tris/Acetate/EDTA) buffer containing ethidium bromide (3 µl of 10 mg/ml ethidium
bromide). Gels were run at 150 V for 1 hour and then imaged using a gel imaging system
(UVP gel doc).
2.3.8 DNA gel extraction
DNA was recovered from agarose gel using the QIAquick Gel Extraction Kit (Qiagen,
#28704). Each DNA fragment of interest was excised from the agarose gel using a clean
scalpel blade over a UVP gel doc UV-transilluminator and transferred to a pre-weighed
2 ml microcentrifuge tube. Buffer QG was added in a 3:1 ratio to the gel (v/w) and
incubated at 50oC for 10 minutes with regular vortexing until all the material was
dissolved. Isopropanol was added at a 1:1 ratio to the dissolved solution. The dissolved
solution was then transferred to the QIAquick spin column, centrifuged at 14000 rpm
for 1 minute at room temperature. The flow-through was discarded, the filter was
washed with 500 μL Buffer GC and the tube centrifuged for 1 minute. Again the flow-
through was discarded, the filter was washed with 750 μL Buffer PE and the tube was
centrifuged for 1 minute at room temperature. Centrifugation was repeated after
discarding the flowthrough in order to remove any remnant drops of wash buffer and
dry the DNA-containing filter. The column was then transferred to a fresh
microcentrifuge tube, 30 μL of Buffer EB was added to elute the DNA, left to stand for 5

36
minutes, and then the eluate collected after centrifugation at top speed for 1 minute at
room temperature.
2.4 Chromatin immunoprecipitation (ChIP) methods
2.4.1 Chromatin immunoprecipitation
ChIP is a powerful method for studying transcription factor (TF)–DNA interactions in
vivo. The immunoprecipitation (IP) of cross-linked chromatin with antibodies specific for
TFs was followed by PCR, to detect a potential enrichment or depletion of a DNA
sequence of interest within IP fractions, and is already routinely used in many labs. In
contrast to animal cells, however, plant cells have a rigid cell wall which poses limitations
to the simple utilization of protocols established for animals. The laboratory protocol
has been optimised successfully in order to identify direct target genes of the IND TF in
Arabidopsis (Girin et al., 2011). 35S::IND:GR seeds were grown for 7 days in 50 ml of
liquid culture medium with constant shaking. After 7 days of growth under constant
light, seedlings were treated with a final concentration of 10 µM DEX (treatment) and
DMSO (control) for 6 hours. DMSO is a vehicle control.
Seedlings were washed in distilled water and immersed in cross-link buffer consisting of
0.4 M sucrose, 10 mM Tris–HCl (pH 8.0), 1 mM EDTA, 1 mM PMSF and 1 %
Formaldehyde. Glycine was added to 0.1 M and incubated for a further 10 minutes. The
seedlings were washed in distilled water and frozen in liquid nitrogen. The tissue was
resuspended in chromatin extraction buffer 1 (0.4 M sucrose, 10 mM Tris–HCl (pH 8.0),
5 mM β-mercaptoethanol, 1 mM phenylmethylsulfonyl fluoride (PMSF) and Protease
Inhibitor Cocktail) and filtered through two layers of miracloth into a new ice-cold 50 ml
tube. The solution was centrifuged for 10 minutes at 10,000 rpm at 4oC. The supernatant
was discarded and the pellet resuspended in 1.5 ml of EB2 buffer (0.25 M sucrose, 10
mM Tris–HCl (pH 8.0), 5 mM b-mercaptoethanol, 10 mM MgCl2, 1% Triton X-100, 1 mM
PMSF, and Protease Inhibitor cocktail), before transferring the solution to a 1.5 ml
microcentrifuge tube. The tube was centrifuged at 14,000 rpm for 10 minutes at 4oC,
and the supernatant was discarded. The pellet was resuspended in 500 µl of EB3 buffer
(1.7 M sucrose, 10 mM Tris–HCl (pH 8.0), 5 mM β-mercaptoethanol, 2 mM MgCl2, 0.15
% Triton X-100, 1 mM PMSF, and Protease Inhibitor Cocktail). The solution was layered

37
onto another 500 µl of EB3 in a new 1.5 ml microcentrifuge tube and centrifuged at
14,000 rpm for 1 hour at 4°C. The supernatant was discarded, and nuclear lysis buffer
(50 mM Tris-HCl (pH 8.0), 10 mM EDTA, 1 % SDS, 2 mM PMSF, and Protease inhibitor
cocktail) was added to the final pellet. Sonication was performed on ice for 10 minutes
at 13 microns for 20 seconds “ON cycle”, 40 seconds “OFF cycle”.
Sonication sheared the DNA to approximately 300- to 1,000-bp fragments with the main
peak of 500 bp. After pre-clearing with 30 µl of Dynabeads-protein A (Invitrogen Ltd,
100-02D), immunoprecipitations were performed overnight at 4oC anti-GR antibody
(Abcam, AB3580). No antibody control was included during immunoprecipitation step.
After incubation, beads were washed once with 1 ml of high-salt wash buffer, once with
1 ml of low-salt wash buffer, once with 1 ml of LiCl buffer (one wash), and 1 ml of TE
buffer. The washed beads and input fraction were resuspended in elution buffer (1 %
SDS and 0.1 M NaHCO3) and incubated overnight at 65oC. After cross-link reversal of the
immunoprecipitated and Input DNA, the DNA was purified using the phenol-chloroform
extraction. Each pellet was resuspended in 15 µl of TE buffer. The DNA concentration
was determined using NanoDrop and was stored at -20°C until use.
2.4.2 ChIP qPCR and ChIP-Seq analysis
Before moving on to microarray hybridization or sequencing, the ChIP DNA was analysed
by qPCR to confirm enrichment of known target genes relative to non-target control
genes. Alternatively, if no known target was available as a positive control, the amounts
of immunoprecipitated DNA were compared to that of the negative control, which was
an immunoprecipitation that uses no antibody, or a sample without antigen. qPCR was
performed using 35S::IND:GR samples (DEX treated, DMSO treated and no antibody
control). The values correspond to the fold enrichment between DEX treated input with
the GR antibody and DMSO treated input with the GR antibody. Primers used for ChIP
qPCR are listed in Table 2.3. Processed ChIP-Seq files were visualised using Integrative
Genomics Viewer (IGV, Broad Institute, USA). Public datasets used for ChIP-Seq analysis
are listed in Table 2.4.

38
2.5 Microarray methods
2.5.1 Microarray
The microarray is used to measure the expression levels of large numbers of genes
simultaneously. For microarray, 35S::IND:GR seeds were germinated in 10 ml of liquid
culture medium with constant shaking. After 7 days growth under constant light,
seedlings were treated with a final concentration of 10 µM DEX, 1 μM BAP and 10 μM
IAA diluted in DMSO for 6 hours. The no-treatment controls were treated with the
equivalent volume of DMSO (Fisher, #BP231). Treatments were done in biological
triplicates. Tissue was collected before and after treatment and snap frozen in liquid
nitrogen for TNA extraction. Dr Paul Heath performed the microarray (Arabidopsis Gene
1.0 ST Array, Thermofisher, #901915) at the University of Sheffield core facility for
microarray and next generation sequencing. An Agilent 2100 bioanalyser was used to
examine RNA integrity and concentration. Hybridization and scanning procedures were
conducted according to the manufacturer (Affymetrix) using Affymetrix Gene Chip
hybridisation system.
2.5.2 Microarray analysis
Arabidopsis Gene 1.0 ST Array CEL files were processed and normalised (RMA algorithm)
using Affymetrix® Expression Console™ software. CHP files were generated after
normalisation. Arabidopsis Gene 1.0 ST Array CHP files were analysed using Affymetrix®
Transcriptome Analysis Console (TAC) software. Arabidopsis Gene 1.0 ST library files are
modified to add TAIR ID and protein family details. These files are transferred to
Affymetrix® TAC software. Statistical analysis was performed using Affymetrix® TAC
software to obtain a list of differentially expressed genes following treatment. Fold
change (FC) was calculated for Condition1 vs. Condition2 using 2^[Condition1 Bi-weight
Avg Signal (log2) - Condition2 Bi-weight Avg Signal (log2)]. Condition Bi-weight Avg Signal
(log2) is the Tukey's Bi-weight average of exon intensity of all the samples in a condition.
Genes above 1.5 FC and below -1.5 FC were filtered based on significance (p-value ≤
0.05) One-Way Between-Subject ANOVA p-value (Condition1 vs. Condition2). Filtered
data were transferred to Excel for further analysis (Avg: Average).

39
Hierarchical clustering and data visualisation were done using EXPANDER (EXpression
Analyzer and DisplayER) (http://acgt.cs.tau.ac.il/expander/) (Shamir et al., 2005).
Similarity matrix analysis and heat maps were generated using Morpheus
(https://software.broadinstitute.org/morpheus/). Pearson and Spearman rank
correlations were selected for similarity matrix analysis. Pathway analysis was
performed using MapMan (http://mapman.gabipd.org/) and STRING (https://string-
db.org/) software. VENNY 2.0 was used for creating Venn diagrams. Gene ontology (GO)
analysis was performed using Gene Set Enrichment Analysis (GSEA) software
(http://software.broadinstitute.org/gsea/) (Subramanian et al., 2007) and PANTHER
(http://pantherdb.org/). Public data sets used for the analysis are listed in Table 2.4.
Table 2.4 Data sets used for analysis.
Description Method ArrayExpress/GEO ID
Reference
AtGenExpress: Hormone treatment Microarray GSE39384 (Goda et al., 2008)
PlantCistromeDB DAP-Seq GSM1925338 (O'Malley et al., 2016)
REVOLUTA ChIP ChIP-seq GSE26722 (Brandt et al., 2012)
AGO1 and AGO10 CLIP CLIP-Seq GSE39885 (Zhu et al., 2011b)
SPATULA inducible expression Microarray GSE12913 (Reymond et al., 2012)
spatula mutant Microarray NASCARRAYS-505 (Josse et al., 2011)
HECATE inducible expression & hec mutant
Microarray E-MTAB-2193 (Schuster et al., 2014)
CUC1 over expression Microarray GSE27482 (Takeda et al., 2011)
cuc1 mutant Microarray GSE20705 (Koyama et al., 2010)
Shoot meristem stem cell niche Microarray GSE28109 (Yadav et al., 2014)
IND inducible expression for 24 hours Microarray E-GEOD-28898 (Voinnet et al., 2011)
IND inducible expression with IAA and BAP
Microarray E-MTAB-3812 This work
Ler and mutants ago10, ind, ago10 ind mRNA-Seq - Dr Karim Sorefan
Ler and mutants ago10, ind, ago10 ind sRNA-Seq - Dr Karim Sorefan
2.6 Bioinformatics
2.6.1 Sequence alignments
CLC Sequence Viewer (Qiagen) was used for sequence alignment (DNA, RNA, or protein),
construction and visualisation of phylogenetic trees. NCBI basic local alignment search
tool (BLAST) was also used for alignment. Multiple sequence alignments were done
using multiple sequence comparison by log-expectation tool (MUSCLE)
(http://www.ebi.ac.uk/Tools/msa/muscle/).
2.6.2 GSEA analysis

40
GSEA is a software developed by the Broad Institute. It was used to perform GO and
MOTIF. Microarray dataset (*.gct format), GSEA library (*.gmt format), and phenotype
label (*.cls format) files were used for GSEA analysis. One thousand sample
permutations were selected for any analysis. GSEA computes four key statistics for the
report: Enrichment Score (ES), Normalized Enrichment Score (NES), False Discovery Rate
(FDR), and Nominal P-Value. ES reflects the degree to which a gene set is
overrepresented at the top or bottom of a ranked list of genes (Fig 2.2). NES (actual ES/
mean (ESs against all permutations of the dataset)) can be used to compare analysis
results across gene sets. After analysis, GSEA report was viewed in a web browser (HTML
Report) and transferred to Excel. An enrichment map was created and visualised using
Cytoscape (http://apps.cytoscape.org/apps/enrichmentmap). The parameters used for
enrichment map generation were a p-value of 0.05 or below, a Q-value cut-off of 0.05
and an overlap coefficient cut-off of 0.5.
Figure 2.2 Profile of the running ES score and positions of geneset members on the rank
ordered list. Blue-Pink O' Gram in the space of the analysed geneset.
2.6.3 Library files for GSEA
Gene set files for gene function, and protein families (Group of genes) were created
using previously published A. thaliana TAIR GO (http://www.geneontology.org) and
Arabidopsis Gene 1.0 ST Array library files (Thermofisher, 901915).
2.6.4 MOTIF and DAP-Seq analysis

41
PlantCistromeDB (http://neomorph.salk.edu/dap_web/pages/index.php) was created
by O’Malley et al., using DNA affinity purification sequencing (DAP-seq) (O'Malley et al.,
2016). PlantCistromeDB is the collection of motifs and peaks of 529 Arabidopsis
transcription factors. Motif logos, peaks (FRiP ≥5%) and Target genes (FRiP ≥5%) were
downloaded from PlantCistromeDB. The fraction of reads in peaks (FRiP) is the fraction
of all mapped reads that fall into the called peak regions, calculated by dividing the
usable reads in significantly enriched peaks by the total number of all usable reads.
Downloaded Target genes (FRiP ≥5%) were analysed in Microsoft Excel 2013.
Arabidopsis Motif Scanner (AMS) and TAIR Patmatch were used to identify the positions
of cis-regulatory elements in the 2000bp upstream promoter region in Arabidopsis
genome. Motifs collected from PlantCistromeDB and Arabidopsis protein-binding
microarray database were used to search in AMS and TAIR Patmatch. A GSEA Motif
library file was created using the AMS output (Motifs and associated gene groups). This
file was used for Motif GSEA analysis. Motif enrichment analysis using the GSEA tool is
better when compared to the MEME Motif enrichment tool (http://meme-
suite.org/tools/centrimo) because better statistics are generated using GSEA, such as a
higher permutation.
2.6.5 Protein structure modelling
Available protein structures were downloaded from Protein Data Bank (PDB).
Unavailable structures were created using protein structure prediction tools. One
method is ab initio modelling, which involves predicting protein 3D structures from the
amino acid sequence, but the prediction accuracy is low. Tools used for studying in silico
protein interactions and pathways were outlined in Figure 2.3. Phyre2 (Kelley et al.,
2015) was used to predict and analyse protein structure. Phyre2 uses advanced remote
homology detection methods to build 3D models. Arabidopsis protein sequences were
extracted from UniProt and submitted to Phyre2 for modelling. Predicted structures
were downloaded in pdb format and used for further analysis. Self-assembly of identical
protein subunits was predicted using Rosetta Symmetric Docking
(http://rosie.rosettacommons.org/).

42
Figure 2.3 Tools and pathway for protein structure modelling.
2.7 Imaging techniques
2.7.1 β-Glucuronidase (GUS) assay
The promoter-driven GUS assay is the most commonly used technique for tissue-specific
expression patterns in Arabidopsis. In this procedure, the GUS enzyme converts 5-
bromo-4-chloro-3-indolyl glucuronide (X-Gluc) to a blue product. The staining is very
sensitive. Processed samples were examined under a dissecting microscope for bright
blue colour over a transparent background. GUS assay was performed on pIND::GUS
seedlings and leaves at different developmental stages. Samples were vacuum
infiltrated and incubated in the GUS assay buffer (0.1 M phosphate buffer [pH 7], 10 mM
EDTA, 0.1 % Triton X-100, 1 mg/mL X-Glue A, 2 mM potassium ferricyanide) overnight at
37oC, and cleared in 50 % ethanol. GUS staining was observed under a light microscope
and photographs were taken with a CCD camera.
2.7.2 Sample fixation, clearing, and preparation

43
Plastic embedding gives better cellular definition compared to paraffin embedding.
Histology samples were embedded using 1 % Technovit 7100 resin solution (TAAB,
#T218). Technovit 7100 penetrates and polymerizes all tissue specimens evenly for light-
microscope examination. For this reason, this method is an ideal tool for visualizing plant
cellular morphology and phenotype. Samples were fixed in fixing buffer consisting of a
7:1 ratio of 100 % Ethanol and acetic acid by vacuum infiltration for 20 minutes.
Decolourised samples were incubated with 2x 100 % ethanol for 30 minutes. After
incubation, samples were infiltrated in a sufficient amount of TECHNOVIT 1 solution for
1-48 hours, depending on specimen thickness and type of tissue. After incubation, 1 ml
of the solution was poured into a Histoform S mould (TAAB, #T393), followed by the
infiltrated specimens, which were positioned as required. At room temperature (23℃)
the specimens set within approximately 2-4 hours. Histobloc (TAAB, #T395) was then
placed in the recess of the embedding mould Histoform S. Technovit 3040 (TAAB, #T224)
was poured into the recess at the back of the Histobloc to a level of about 2 mm above
the base of the Histobloc. After about 10 minutes the Histobloc together with the fixed
specimen was removed from the Histoform S mould. The samples were sectioned at 8-
10 µm thick with a Histoknife (TAAB, #T553) on a microtome (Leica RM2145) and dried
on glass slides. Staining or enzymatic reactions were carried out without removing the
resin.
2.7.3 Embryo dissection and light microscopy
For late-stage embryo imaging, seeds were dissected using a light stereo microscope. A
few seeds were transferred onto the slide with wet Whatman paper, and the embryos
were dissected out of the seed coat under a light stereomicroscope using fine forceps
and needles. The seed was held with fine forceps by the micropylar end, and an incision
was made on the other end of the seed coat with a needle or another pair of fine forceps.
Gentle pressure was applied on the micropylar side of the seed using the forceps slanted
to one side, causing the embryos to pop out of the seed coat. These were immediately
transferred into a vial containing a few millilitres of cold water. Isolated embryos were
used for staining and imaging. Seedlings were also dissected using a light stereo
microscope. Peeled cotyledons with SAM were imaged at different focus distances using
a Leica light microscope. Photographs were taken with a CCD camera. Captured images
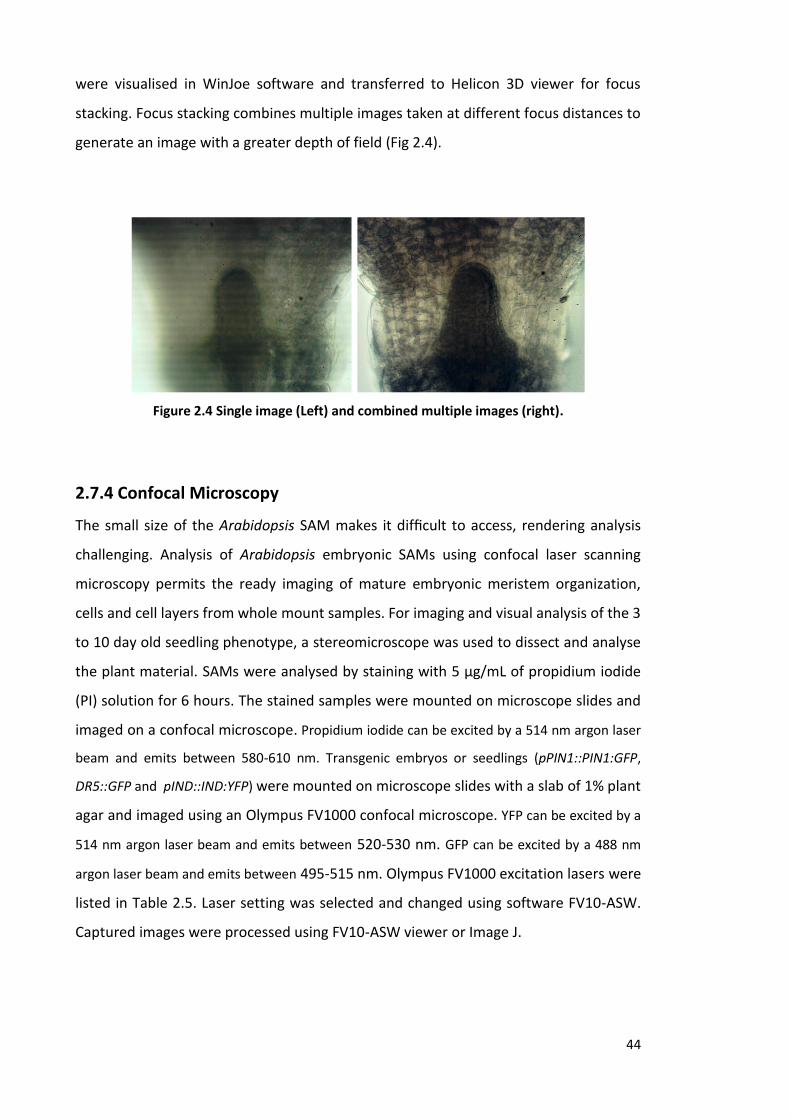
44
were visualised in WinJoe software and transferred to Helicon 3D viewer for focus
stacking. Focus stacking combines multiple images taken at different focus distances to
generate an image with a greater depth of field (Fig 2.4).
Figure 2.4 Single image (Left) and combined multiple images (right).
2.7.4 Confocal Microscopy
The small size of the Arabidopsis SAM makes it difficult to access, rendering analysis
challenging. Analysis of Arabidopsis embryonic SAMs using confocal laser scanning
microscopy permits the ready imaging of mature embryonic meristem organization,
cells and cell layers from whole mount samples. For imaging and visual analysis of the 3
to 10 day old seedling phenotype, a stereomicroscope was used to dissect and analyse
the plant material. SAMs were analysed by staining with 5 µg/mL of propidium iodide
(PI) solution for 6 hours. The stained samples were mounted on microscope slides and
imaged on a confocal microscope. Propidium iodide can be excited by a 514 nm argon laser
beam and emits between 580-610 nm. Transgenic embryos or seedlings (pPIN1::PIN1:GFP,
DR5::GFP and pIND::IND:YFP) were mounted on microscope slides with a slab of 1% plant
agar and imaged using an Olympus FV1000 confocal microscope. YFP can be excited by a
514 nm argon laser beam and emits between 520-530 nm. GFP can be excited by a 488 nm
argon laser beam and emits between 495-515 nm. Olympus FV1000 excitation lasers were
listed in Table 2.5. Laser setting was selected and changed using software FV10-ASW.
Captured images were processed using FV10-ASW viewer or Image J.

45
Table 2.5 Excitation Lasers.
Laser source Excitation wavelength
Dyes & Fluorophores Emission colour
405 Diode 405 nm DAPI, Hoechst Violet
Multi-line Argon
457 nm CFP Cyan
488 nm Alexa 488, Oregon Green, FITC, GFP, EGFP, DiO, Cy2 Green
514 nm YFP, EYFP Yellow
Green HeNe 543 nm Cy3, TRITC, mCherry, Alexa 543, Alexa 594 Orange-red
Red HeNe 633 nm Alexa 633, Alexa 647, Cy5, TO-PRO3, Far red
2.7.5 Scanning Electron Microscopy (SEM)
Samples were fixed in 3 % Glutaraldehyde/0.1 M sodium cacodylate buffer, washed in
0.1 M sodium cacodylate buffer to remove unbound fixative and secondarily fixed in 2
% aqueous osmium tetroxide for 1 hour. Specimens were dehydrated through a
sequentially graded series of ethanol, 50 %-100 %, for 30 minutes per step, finally into
100 % ethanol before being dried over anhydrous copper sulphate. Specimens were
critically point dried using CO2 as the transitional fluid. After drying, the specimens were
mounted on 12.5 mm diameter stubs, attached with sticky tabs and coated in an
Edwards S150B sputter coater with approximately 25 - 30 nm of gold. Dr Chris Hill
(Electron Microscopy Officer) processed samples before imaging. Specimens were
viewed using a Philips SEM XL-20 Scanning Electron Microscope at an accelerating
voltage of 20 kV in Biomedical Science Electron Microscopy Unit, University of Sheffield.
2.8 Statistical analysis
Phenotype and qRT-PCR data were analysed using tools within the GraphPad Prism 7
software. Student’s t-test was performed using Microsoft Excel 2013, and one-way
analysis of variance (ANOVA) with Tukey's multiple comparisons test was performed in
GraphPad Prism 7. Unless otherwise stated, data are presented as mean +/- standard
error of the mean (SEM). Significance was determined at a p-value at or below 0.05.
False Discovery Rate (FDR) q-values were also generated from bioinformatics analysis
(Microarray and GSEA). Q-values are the name given to the adjusted p-values.

46
Chapter 3 AGO10 and HD-ZIP III
transcription factors
regulate IND

47
CHAPTER 3. AGO10 and HD-ZIP III transcription factors regulate IND
3.1 Introduction
In Arabidopsis, leaf primordium development is dependent on establishing polarity
along the adaxial (upper side) and abaxial (lower side) axes. The adaxial leaf face is
promoted by the HD-ZIP III transcription factors PHABULOSA (PHB), PHAVOLUTA (PHV)
and REVOLUTA (REV) (Elhiti and Stasolla, 2009; Liu et al., 2009; Mallory et al., 2004;
McConnell et al., 2001; Zhou et al., 2007). Consequently, loss-of-function mutations in
HD-ZIP III genes result in the formation of abaxialised and radialised leaves or terminated
meristem with no leaves. Conversely, gain-of-function mutations in HD ZIP III genes
cause adaxialised and radialised leaves (Barkoulas et al., 2007; Fambrini and Pugliesi,
2013; Prigge et al., 2005; Szakonyi et al., 2010; Tsukaya, 2013). Therefore, HD-ZIP III
expression must be tightly controlled and this involves an elegant mechanism requiring
miRNAs 165/166, AGO1 and AGO10.
HD-ZIP III expression is targeted and subsequently downregulated by the AGO1-
miR165/166 in the shoot apical meristem (SAM) and leaf primordia (Liu et al., 2009;
Miyashima et al., 2013; Tucker et al., 2013; Zhou et al., 2007; Zhou et al., 2015; Zhu et
al., 2011b). However, AGO1 and AGO10 compete for miR165/166 binding. Although
AGO10 has a stronger binding affinity for miR166 than AGO1, and AGO10 positively
regulates HD-ZIP III family genes by acting as a specific decoy for miR166/165 (Lynn et
al., 1999; Mallory et al., 2009), AGO10 is not involved in the post-translational repression
of HD-ZIP III genes (Zhang and Zhang, 2012; Zhu et al., 2011b). Also, loss of function
ago10 mutants and 35S::miR166a transgenic lines appear similar to hd-zip iii mutant
seedlings (Endrizzi et al., 1996; Moussian et al., 2003; Moussian et al., 1998; Prigge et
al., 2005; Zhu et al., 2011b). Together these studies suggest AGO10 promotes the adaxial
leaf fate by positively regulating HD-ZIP III transcription factors.
In the reproductive phase, termination of stem cell activities in the floral meristem is
essential for normal flower development. AGO10 and HD-ZIP III genes regulate floral
stem cell termination and promote normal flower development (Ji et al., 2011; Landau
et al., 2015). Loss of AGO10 results in prolonged stem cell activity in floral meristem and

48
ago10 mutants produce abnormal, bulged gynoecia (Ji et al., 2011). This shows that
AGO10 and HD-ZIP III genes play an important role in leaf development and floral
differentiation. It is not known how AGO10 and HD-ZIP III transcription factors regulate
other factors that control gynoecium patterning and this should be investigated.
The bHLH transcription factors IND and SPT regulate gynoecium patterning and their
interaction is crucial for the fusion of carpels (Girin et al., 2011; Groszmann et al., 2010;
Groszmann et al., 2008). The unfused apical carpel phenotype in the spt mutant were
strongly enhanced in the ind spt double mutant (Girin et al., 2011). This shows that IND
may regulate gynoecium development through the formation of a heterodimer with
SPT. Moubayidin showed that overexpression of IND using 35S::IND:GR seedlings
produced radialised leaves (rod or pin-like and cup-like structures) and this leaf
radialisation is lost in the spt mutant background (Moubayidin and Ostergaard, 2014).
Therefore, both IND and SPT are necessary for mediating organ radialisation, similar to
gynoecium development.
Since IND overexpression, ago10 and hd-zip iii caused similar phenotypes, we
hypothesised that IND is associated with the AGO10-HD-ZIP III pathway to control SAM
or leaf development in Arabidopsis. In this chapter, we show that SAM development is
regulated AGO10 by regulating IND expression. This chapter aims to study the
connection between IND and AGO10-HD-ZIP III.

49
3.2 Results
Figure 3.1 Argonaute protein family and their gene expression in A. thaliana. (A) Circular
phylogram showing Arabidopsis AGO family amino acid sequence alignment classified into three
different clades, namely the AGO1/AGO5/AGO10, AGO2/AGO3/AGO7, and
AGO4/AGO6/AGO8/AGO9 clades. (B) Heat map with hierarchical clustering of samples and
genes (one minus Pearson correlation): At-TAX developmental gene expression analysis of AGO
family members (Z-score), (C) AGO family gene expression in Arabidopsis SAM protoplast cells
(Z-score) (GEO:GSE28109). (Blue: low gene expression, Red: high gene expression).

50
3.2.1 Characterisation of AGO family gene expression in SAM and other
tissues
The Arabidopsis genome encodes ten AGO family members. AGO amino acid sequences
were aligned using CLC bio software. Based on their amino acid sequence homology
AGO proteins were classified into three different clades: AGO1/AGO5/AGO10,
AGO2/AGO3/AGO7 and AGO4/AGO6/AGO8/AGO9 clades (Fig 3.1A). The Arabidopsis
AGO protein family can be divided into three functional groups: RNA slicers
(AGO1/5/10), RNA binders (AGO2/3/7 (AGO7 also cuts)) and chromatin modifiers
(AGO4/6/8/9) (Kim, 2011). AGO1 and AGO10 are expressed in SAM and leaf primordia,
but their gene expression in other tissues is not known (Liu et al., 2009; Tucker et al.,
2008). Also, gene expression of other AGOs has not been well characterised in SAM and
other tissues. We investigated whether other AGOs may be important for SAM
development. To characterise AGO1 to 10 gene expression during Arabidopsis
development, gene expression data from the Arabidopsis thaliana Tiling Array Express
(At-TAX) database (Laubinger et al., 2008) was analysed using cluster analysis (Fig 3.1B).
Hierarchical clustering (one minus Pearson correlation) was performed using Morpheus
(Broad Institute, USA). Compared to other AGOs, higher AGO2, AGO3, and AGO7
expression was observed in senescing leaves (Fig 3.1B). Higher AGO4 and AGO6
expression was observed in the vegetative shoot meristem and inflorescence shoot
meristem (Fig 3.1B). Higher AGO3, AGO4, AGO5 and AGO9 expression was observed in
stage 15 flowers and fruits (Fig 3.1B). AGO10 was highly expressed in seedlings, the
vegetative shoot meristem, inflorescence shoot meristem and stage 15 fruit (Fig 3.1B).
AGO1 was highly expressed in roots, seedlings, stem and the inflorescence shoot
meristem (Fig 3.1B).
To investigate AGO expression in the different tissues of the SAM, we mined the SAM
stem cell niche transcriptomic data sets (Yadav et al., 2009; Yadav et al., 2014). Yadav et
al. (2009; 2014) used different promoters with fluorescent reporters to mark cells of
SAM and protoplasted cells were FACS sorted (L1 epidermal cell type- HIGH MOBILITY
GROUP (HMG), L1 differentiating cells- MERISTEM LAYER 1 (AtML1), L2 subepidermal
cell type- HOMEODOMAIN GLABROUS 4 (PHDG4), OC WUS-expressing cells, CZ CLV3-
expressing cells, PZ organ circumference-KAN1, Organ primordia-FIL, LATERAL

51
SUPPRESSOR (LAS)-expressing cells, Phloem- S17 and Xylem-AtHB8). FACS sorted cells
were processed for Affymetrix GeneChip ATH1 microarray (Yadav et al., 2014). To
characterise AGO1 to 10 gene expression in the SAM, gene expression data from
processed microarray files (GEO: GSE28109) was analysed and hierarchical clustering
was performed (one minus Pearson correlation) (Fig 3.1C). Higher AGO2 and AGO4-7
expression was observed in adaxial cells-LAS (Fig 3.1C). Higher AGO9 expression was
observed in organ primordia-FIL (Fig 3.1C). Higher AGO3 expression was observed in
Phloem-S17 and Xylem-AtHB8 (Fig 3.1C). AGO4 to AGO7 was highly expressed in
epidermal (HMG, AtML1, and HDG4), CLV3 and WUS cells (Fig 3.1C). AGO1 was highly
expressed in organ circumference-KAN1, epidermal (HMG, AtML1, and HDG4) and
WUSCHEL cells (Fig 3.1C). AGO10 was highly expressed in Phloem-S17, Xylem-AtHB8,
CLV3 and WUS cells (Fig 3.1C).
In summary, AGO4 and AGO6 expression in shoot meristem, CLV3 cells, and WUS cells
suggest they may have a role in the function of the SAM. AGO1 and AGO10 expression
in the SAM match with previously published work (Liu et al., 2009; Tucker et al., 2008).
AGO10 expression in fruit, phloem cells, and xylem cells suggest a possible role of AGO10
in fruit and vascular development.

52
Figure 3.2 AGO10-YFP and IND-YFP expression in Arabidopsis. No YFP expression observed in
Col-0 controls: 3 days old SAM (A) and stage 8 gynoecium (G). AGO10-YFP expression observed
in the SAM and adaxial side of leaf primordia (3DAG) (B). AGO10-YFP expression observed in the
floral meristem (H), style and non-distinct valves of stage 9 gynoecium (J), valves of stage 12
gynoecium and petal vasculature (K). No AGO10-YFP expression observed in stage 17 fruit (L).
Very weak (*) IND-YFP expression observed in primordia and SAM (3DAG and 7DAG) (C and D).
Image show GUS expression in primordia and the SAM of pIND::GUS (7DAG) (E). The histological
section shows GUS expression in the SAM of pIND::GUS (7DAG) (F). No IND-YFP expression
observed in floral meristem (I). IND-YFP expression observed in stigma, style and valve margins
of stage 14 fruit (M).

53
3.2.2 Characterisation of AGO10
3.2.2.1 AGO10 expression
To test whether AGO10 gene expression pattern from the previous section matches with
AGO10 protein expression, we used a pZLL::ZLL-YFP (AGO10/ZLL/ZWILLE/PINHEAD)
transgenic line to characterise AGO10-YFP expression in seedlings, gynoecium, and fruit
using confocal microscopy. Col-0 was used as a negative control. Confocal imaging was
done to detect YFP expression using an argon laser at an excitation wavelength of 514
nm (Chapter 2, Section 2.7.4). Fluorescence corresponding to YFP expression was not
observed in the Col-0 SAM with primordia (3DAG, Fig 3.2A) and stage 8 gynoecia (Fig
3.2G). AGO10-YFP expression was observed on the adaxial side of primordia and SAM
(Fig 3.2B) of pZLL::ZLL-YFP (3DAG). Flower and fruit development is divided into 20
stages (Smyth et al., 1990). YFP expression was observed in floral meristem (Fig 3.2H),
style and presumptive valves of stage 9 gynoecia (Fig 3.2J), valves of stage 12 gynoecia
and petal vasculature (Fig 3.2K) of pZLL::ZLL-YFP. AGO10-YFP expression was not
observed in stage 17 fruit of pZLL::ZLL-YFP (Fig 3.2L). The AGO10-YFP expression in leaf
primordia and floral meristem is consistent with previously published work (Ji et al.,
2011; Tucker et al., 2008). AGO10-YFP expression in SAM, leaf and reproductive tissues
matched with AGO10 gene expression. The AGO10-YFP expression in gynoecia suggests
a novel role in early gynoecium development.
3.2.2.2 Genotyping ago10 mutant zwl-3
Identification of the mutation in different ago10 alleles can help determine the function
of different domains and is also important for genotyping. The ago10 alleles zll (1 to 16)
and pinhead (pnh 1 to 11) have been commonly used in various studies (Poulsen et al.,
2013). zll-3 is the most commonly used ago10 allele (Endrizzi et al., 1996; Mcconnell and
Barton, 1995; Moussian et al., 1998), however, the mutation has not been characterised
(Poulsen et al., 2013). Therefore, the ago10 locus in zll-3 plants was sequenced. The
terms zwillie-3 (zwl-3) or ago10zwl-3 were used in this thesis instead of zll-3, although zwl-
3/ago10zwl-3 and zll-3 are one of the same. To study the mutation, AGO10 cDNA was PCR
amplified using zwl-3 and Ler (wild-type) cDNA samples, and PCR products were Sanger
sequenced at the University of Sheffield (UOS) sequencing facility (Chapter 2, Section
2.3). Sequences were aligned using Bioedit software (Ibis Therapeutics, Canada) and
analysed using NCBI tools (NCBI, USA). Unusually for an EMS mutant, we found that the

54
zwl-3 mutation was complex and had mutations that disrupted two domains of AGO10.
Sequence analysis showed that zwl-3 possess a missense mutation (G to A) at position
2399 bp downstream of the ATG. This mutation was predicted to cause an amino acid
substitution (G to D) at position 707 aa of the AGO10 Piwi domain (Fig 3.3B, Fig 8.1 and
8.2), which can change the amino acid sequence and its functional activity (Endrizzi et
al., 1996). The zwl-3 missense mutation is identical to zll-2 (Moussian et al., 1998;
Poulsen et al., 2013). zwl-3 also harbours a partial CYP79B2 gene insertion in the AGO10
exon2 region (Fig 3.3B, Fig 8.1 and 8.2). There is a possibility of duplication or deletion
of CYP79B2 gene in zwl-3. To examine mutations and changes in CYP79B2, sequencing
was done on PCR amplified zwl-3 and Ler CYP79B2 cDNA. Sequence analysis showed no
mutation or deletion in zwl-3 CYP79B2 in comparison to Ler CYP79B2 (Fig 3.3B). This
suggests possibly part of CYP79B2 (Chr4) gene was copied to the AGO10 exon2 region
(Chr5). The AGO10 exon2 region codes for the N-terminal domain, this domain is
variable across different AGOs. Gregory et al. showed mutation within the N-terminus
of AGO1 results in weak developmental defects in ago1-38 (Gregory et al., 2008). Similar
to ago1-38, the partial CYP79B2 insertion in the AGO10 exon2 region may enhance the
loss of ago10 activity in zwl-3.
3.2.2.3 zwl-3 developmental phenotypes
To analyse SAM phenotypes, zwl-3 and Ler were grown on 0.5 % MS plant agar plates.
3-day old seedlings were dissected to image the SAM, and 14-day old seedlings were
imaged without dissection. Imaging was performed using a light microscope. After
imaging and analysis, zwl-3 seedlings were classified into wild-type looking (WT), cup-
shaped or single leaf (CUP), pin-shaped or filamentous-like (PIN) and no-meristem or flat
apex (NM) phenotypes (Fig 3.4). The 3DAG zwl-3 WT image shows two primordia, small
emerging primordia and SAM (Fig 3.4) and 14DAG zwl-3 WT image shows cotyledons
and normal leaves similar to Ler (Fig 3.4). The 3DAG zwl-3 CUP image shows a bulged
SAM with no primordia (Fig 3.4) and the 14DAG zwl-3 CUP image shows cotyledons and
cup-shaped single leaf (Fig 3.4). The 3DAG zwl-3 PIN image shows pointed SAM with no
primordia (Fig 3.4) and 14DAG zwl-3 PIN image show cotyledons and pin-shaped SAM
(Fig 3.4). The 3DAG zwl-3 NM image shows dissected cotyledon with no SAM (Fig 3.4)
and 14DAG zwl-3 NM image show only cotyledons (Fig 3.4). All zwl-3 seedlings produced

55
two cotyledons, which suggests that CUP, PIN, and NM were late stage embryo or post-
embryonic meristem termination phenotypes.
The 14-day old zwl-3 seedlings were quantified to examine the frequency of different
phenotypes. The bar chart shows 29% WT, 11% CUP, 49% PIN and 11% NM zwl-3
seedlings (3 biological replicates, n=50, Fig 3.5D). The WT zwl-3 seedlings continued
development and produced flowers and fruits allowing investigation into the role of
AGO10 in fruit development. The Ler and zwl-3 stage 17 fruits were imaged for
phenotype analysis (Fig 3.5A). The image shows wild-type Ler stage 17 fruit and small
bulged stage 17 zwl-3 fruit (Fig 3.5A). When compared to stage 17 Ler fruit, a smaller
replum was observed in stage 17 zwl-3 fruit (Fig 3.5C). From phenotype analysis, we can
draw that many of the zwl-3 seedlings undergo meristem termination and few of the
zwl-3 seedlings undergo development and produce small bulged fruits with smaller
repla.
3.2.2.4 Summary
In summary, the zwl-3 AGO10 gene possesses two mutations, a missense mutation
causing an amino acid substitution (G707D) in the Piwi domain, and insertion of a partial
CYP79B2 gene in the exon2 region. The meristem termination by the loss of AGO10 in
ago10zwl-3, and expression of AGO10pZLL::ZLL-YFP in SAM and leaf primordia demonstrates
that AGO10 is required for proper SAM development, in agreement with previously
published work (Moussian et al., 1998; Tucker et al., 2008; Tucker et al., 2013). The
bulged small fruit phenotype of ago10zwl-3 and expression of AGO10pZLL::ZLL-YFP in gynoecia
suggests that AGO10 may also regulate fruit development.

56
Figure 3.3 Mutations in zwl‐3 change the amino acid sequence in Piwi functional domain of
AGO10. AGOs consist of a single variable N-terminal domain and three conserved C-terminal
domains (PAZ, MID, and Piwi). The PAZ domain recognises, and anchors sRNA to its target mRNA,
and the Piwi domain regulates catalytic activity (slice, bind or lock). When compared to wild-
type AGO10 (A), zwl-3 possesses a missense mutation (GGC to GAC) in the Piwi domain and also
harbours an insertion (cytochrome P450: CYP79B2) in the exon2 region (B). A missense mutation
(GGC to GAC) at AGO10 Piwi domain can change the amino acid sequence (G to D).
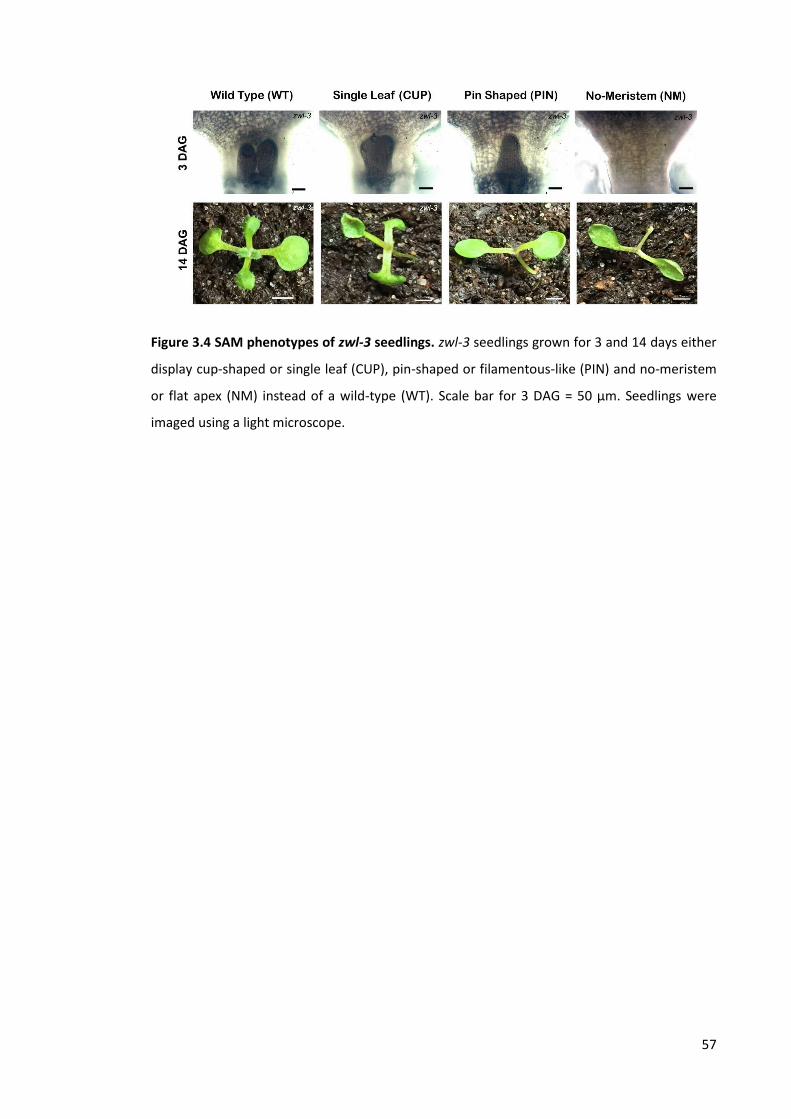
57
Figure 3.4 SAM phenotypes of zwl-3 seedlings. zwl-3 seedlings grown for 3 and 14 days either
display cup-shaped or single leaf (CUP), pin-shaped or filamentous-like (PIN) and no-meristem
or flat apex (NM) instead of a wild-type (WT). Scale bar for 3 DAG = 50 µm. Seedlings were
imaged using a light microscope.

58
Figure 3.5 ind loss-of-function mutation rescues fruit and seedling phenotypes of ago10zwl-3.
(A) Stage 17 fruit phenotypes of Ler, ind-6, zwl-3 and ind-6 zwl-3 plants. (B) GUS staining in stage
17 fruit shows high expression in valve margins and repla of ind-6 zwl-3 when compared to ind-
6. (C) AGO10 and IND regulate replum width. White line with double arrows indicates repla of
Ler, ind-6, zwl-3 and ind-6 zwl-3 stage 17 fruits. (D) Seedlings (14 DAG) shows a higher
percentage of PIN and NM phenotypes in zwl-3 and the WT phenotype in ind-6 zwl-3 (n=3
biological replicates). Values are means ± SE. Tukey's multiple comparisons test (ind-6 zwl-3 vs.
zwl-3), *p<0.001.

59
3.2.3 Characterisation of IND
3.2.3.1 IND expression
Arabidopsis thaliana - Tiling Array Express data analysis showed IND gene expression in
seedlings and the vegetative meristem (Laubinger et al., 2008). Therefore, the
localisation of IND expression in the SAM and leaf primordia was investigated. In this
study pIND::GUS and pIND::IND-YFP transgenic lines were used to characterise IND
expression in SAM, leaf primordia and reproductive tissues. These transgenic lines were
also previously used in different studies (Liljegren et al., 2004a; Simonini et al., 2016).
Interestingly, IND-YFP expression was not observed in floral meristems of pIND::IND-YFP
(Fig 3.2I). However, IND-YFP expression was observed in stigma, style and valve margins
of stage 14 fruit (Fig 3.2M) of pIND::IND-YFP lines. The IND-YFP expression in fruit was
consistent with previously published work (Simonini et al., 2016). Very weak IND-YFP
expression was observed in primordia and SAM (Fig 3.2C and D) of pIND::IND-YFP (3DAG
and 7DAG). In pIND::GUS (7DAG) lines, GUS activity was observed in SAM and leaf
primordia and (Fig 3.2E). The histological resin sections of pIND::GUS seedlings (7DAG)
showed GUS accumulation in the SAM (Fig 3.2F). The IND promoter-driven GUS and IND-
YFP expression in the SAM and leaf primordia suggest that IND may have a role in SAM
development.
3.2.3.2 Loss of ind developmental phenotypes
IND is required for valve margin development, but we do not know if the loss of IND can
affect SAM development. Therefore, ind SAM and fruit developmental phenotypes were
analysed using the ind allele ind-6. ind-6 is an enhancer trap line that carries a Ds
insertion after 183 nucleotides of IND, carrying a GUS reporter gene (Wu et al., 2006).
To analyse the SAM phenotypes, ind-6 and Ler were grown on 0.5 % MS plant agar
plates. The 3-day old seedlings were stained using propidium iodide (PI) and dissected
to image the SAM. Imaging was done using confocal microscopy (Fig 3.8A). After
imaging, the width of the SAM was measured for quantification (n=10 seedlings). The
mean width of the ind-6 SAM was 45 µm whereas the Ler SAM was significantly larger
or wider at 50 µm (p<0.05) (Fig 3.8B). Regardless of the small SAM, ind-6 seedlings
continued development and produced flowers and fruits. The Ler and ind-6 stage 17
fruits were imaged for phenotype analysis (Fig 3.5A). The image shows wild type Ler
stage 17 fruit and ind-6 stage 17 fruit (Fig 3.5A). When compared to stage 17 Ler fruit,

60
large repla (indicated by the white line with double arrows) and no valve margins were
observed in stage 17 ind-6 fruit (Fig 3.5C). The ind-6 fruit phenotype data match with
previously published work (Liljegren et al., 2004a; Wu et al., 2006). The ind-6 small SAM
phenotype suggests that IND regulate SAM size.
3.2.3.3 Overexpression of IND developmental phenotypes
The balance of abaxial and adaxial polarity is vital for normal leaf development (Szakonyi
et al., 2010). Loss of abaxial polarity produces adaxialised leaves, and loss of adaxial
polarity produces abaxialised leaves (Emery et al., 2003; Iwasaki et al., 2013; Kumaran
et al., 2002; McConnell et al., 2001; Xu et al., 2003). Moubayidin and Ostergaard
reported that overexpression of IND could produce radialised leaves, such as rod or pin-
like and cup-like structures, but the polarity of these structures was not examined in
detail (Moubayidin and Ostergaard, 2014).
To examine these phenotypes in detail, 35S::IND:GR transgenic seeds were grown on
half MS plant agar plates supplemented with 10 µM dexamethasone (DEX) or DMSO.
DEX was used to induce IND activity. After 21 days, samples were imaged using light
microscopy and processed for SEM imaging. Processed samples were imaged at the
University of Sheffield Biomedical Science electron microscopy facility. The 21 DAG
35S::IND:GR+DMSO images show normal leaves and a floral meristem (Fig 3.6K and L).
After imaging and analysis, 21 DAG 35S::IND:GR+DEX were classified into different
phenotypes: pointed leaves (PL), cup-shaped or single leaf (CUP), pin-shaped or
filamentous-like (PIN) and large meristem (LM) phenotypes (Fig 3.6A-J). The PL images
(Fig 3.6E and F) show two leaves with trichomes on the adaxial surface and two pointed
leaves with elongated epidermal cells. The CUP images (Fig 3.6A and B) show cotyledons,
and a single CUP shaped leaf with trichomes on the inner epidermis, and the outer
epidermis without trichomes. The PIN images (Fig 3.6C and D) show cotyledons and pin-
shaped SAM with elongated epidermal cells. The LM images (Fig 3.6G-J) show a large
SAM with pin-shaped primordia.
In Arabidopsis, leaves produced at an early stage of development lack trichomes on their
abaxial surface (Telfer et al., 1997). Therefore, abaxialised and adaxialised leaves can be
defined based on the distribution of trichomes on the leaf surface. The trichome

61
distribution in 35S::IND:GR+DEX CUP, PIN and LM suggest that overexpression of IND
promotes abaxialised leaves (Fig 3.6).
3.2.3.4 IND regulates leaf polarity genes
We hypothesised that overexpression of IND can regulate leaf polarity gene expression.
Using qRT-PCR, leaf polarity gene expression was examined in 10 µM DEX, 10 µM
cycloheximide (CHY) and DMSO-treated 35S::IND:GR seedlings treated for 6 hours in
liquid media. CHY is an effective protein synthesis inhibitor which was used in
combination with DEX to examine IND-only regulated gene expression. A heat map of
gene expression fold change (DEX vs. DMSO and DEX+CHY vs. CHY) in 35S::IND:GR
seedlings was generated using Morpheus. Gene expression fold change (DEX vs. DMSO
and DEX+CHY vs. CHY) was also presented as a bar chart. Previous studies reported IND
downregulates PINOID (PID) expression, so PID was used as a control to validate the
35S::IND:GR qRT-PCR experiment. In this experiment, PID expression was decreased in
the presence of DEX and significantly decreased in the presence of DEX+CHY (p<0.05, Fig
3.7B). The PID expression pattern is consistent with other published studies (Moubayidin
and Ostergaard, 2014; Sorefan et al., 2009a).
The abaxial and adaxial leaf polarity is regulated by different genes (Garcia et al., 2006;
Szakonyi et al., 2010). In Arabidopsis, AGO10, PHB, PHV, REV, ZPR1, AGO7 and AS1
regulate adaxial leaf polarity. These adaxial genes were screened in this experiment.
AGO10 expression was decreased in the presence of DEX with a twelve-fold decrease in
expression in the presence of DEX+CHY (p<0.05, Fig 3.7B). PHB expression was increased
two-fold in the presence of DEX (p<0.05) and DEX+CHY (Fig 3.7A). PHV expression was
significantly decreased in the presence of DEX+CHY (p<0.05) whereas no change was
observed in the presence of DEX (Fig 3.7A). No significant change of REV expression was
observed in the presence of DEX and DEX+CHY (Fig 3.7A). ZPR1 expression was
significantly increased in the presence of DEX (p<0.05) and increased four-fold in the
presence of DEX+CHY (p<0.05, Fig 3.7A). AGO7 expression was increased three-fold in
the presence of DEX (p<0.05) and increased in the presence of DEX+CHY (p<0.05, Fig
3.7A). AS1 expression was increased in the presence of DEX (p<0.05) whereas no change
was observed in the presence of DEX+CHY (Fig 3.7A). This data suggests of IND may
inhibit adaxial leaf polarity by downregulating AGO10 and upregulating ZPR1. AGO10

62
positively regulates PHB, PHV, and REV, and ZPR1 negatively regulates PHB, PHV, and
REV by forming non-functional heterodimers (Kim et al., 2008; Wenkel et al., 2007; Zhu
et al., 2011b). Loss of PHB, PHV and REV function promotes abaxialised leaf growth
(Emery et al., 2003; McConnell et al., 2001; Otsuga et al., 2001).
In Arabidopsis, KAN, YAB1, ARF4, and WOX1 regulate abaxial leaf polarity. These abaxial
genes were screened in this experiment. There was a five-fold increase in WOX1
expression in the presence of DEX (p<0.05) but no change in expression was observed
in the presence of DEX+CHY (Fig 3.7A). KAN and YAB1 expression were increased in the
presence of both DEX (p<0.05) and DEX+CHY (Fig 3.7A). ARF4 expression was increased
in the presence of DEX and DEX+CHY (p<0.05, Fig 3.7A). AGO7 negatively regulates ARF4
expression (Garcia et al., 2006; Hunter et al., 2006; Montgomery et al., 2008),
interestingly AGO7 was increased (p<0.05) compared to ARF4 in the presence of DEX
(Fig 3.7A). This suggests that IND may not regulate abaxial leaf polarity via ARF4.
However, overexpression of IND may promote abaxial leaf polarity by upregulating KAN,
YAB1, and WOX1. In Arabidopsis, KNAT1, WUS, and CLV3 regulate SAM development.
KNAT1, WUS and CLV3 genes were also screened in this experiment. WUS expression
was variable (data not shown) and CLV3 expression was not significantly regulated in the
presence of DEX and DEX+CHY (Fig 3.7B). However KNAT1 expression was increased in
the presence of DEX (p<0.05) and also DEX+CHY (Fig 3.7A), suggesting IND upregulates
KNAT1 expression. Overexpression of KNAT1 negatively regulates leaf development by
producing lobed leaves with ectopic meristems (Chuck et al., 1996). However, these
phenotypes were not observed in 35S::IND:GR+DEX seedlings and this suggests the
phenotypes observed in IND:GR lines may not be caused by KNAT1 overexpression.
3.2.3.5 Summary
In summary, IND-YFP expression and loss of ind phenotype studies demonstrate that
IND may regulate SAM size. Phenotype analysis following IND overexpression and
induction, and qRT-PCR suggests that IND may promote leaf abaxialisation and meristem
termination.

63

64
Figure 3.6 Phenotypic and molecular characterisation of an inducible IND line. 35S::IND:GR
seedlings treated with 10 µM dexamethasone and DMSO (21 DAG) either produce (A and B)
cup-shaped or single leaf, (C and D) pin-shaped or filamentous-like, (G-J) large meristem and (E
and F) pointed leaves instead of a (K and L) normal meristem. (M) Heat map of the meristem
and leaf polarity identity genes that were differently expressed in 35S::IND:GR seedlings treated
for 6 hours with 10 µM dexamethasone (DEX vs. DMSO) and 10 µM dexamethasone plus 10 µM
cycloheximide (DEX+CHY vs. CHY) (Fold change from qRT–PCR data, n=3 biological replicates).
(Blue: low gene expression, Red: high gene expression).

65

66
Figure 3.7 IND regulate leaf polarity genes. (A) The bar chart version of heat map from Fig 2.6M
show differentially expressed meristem and leaf polarity identity genes in 35S::IND:GR (Fold
change from qRT-PCR data, DEX vs. DMSO and DEX+CHY vs. CHY, n=3). The bar chart shows PHV
expression was decreased in the presence of DEX+CHY. ARF4 expression was significantly
increased in the presence of DEX+CHY. AS1 and WOX1 expression were significantly increased
in the presence of DEX. ZPR1 and AGO7 expression were significantly increased in the presence
of DEX and DEX+CHY. KAN, YAB1, KNAT1 and PHB expression was significantly increased in the
presence of DEX and also increased in the presence of DEX+CHY. No significant change of REV
and CLV3 expression was observed in the presence of DEX and DEX+CHY. (B) The bar chart shows
PID and AGO10 expression was decreased in the presence of DEX and decreased in the presence
of DEX+CHY. (C) IND-AGO10 promoter interaction was tested by ChIP-qRT-PCR using
35S::IND:GR line, the bar chart shows four-fold enrichment for AGO10 (upstream 926-1175 bp)
in the presence of DEX (n=3). Values are means ± SE. Unpaired t-test (DEX vs. DMSO and
DEX+CHY vs. CHY), *p<0.05.

67
Figure 3.8 SAM phenotype of Ler and mutants (ind-6, zwl-3, and ind-6 zwl-3). (A) Three-day-
old seedlings stained with propidium iodide showing SAM with leaf primordia (LP) and abnormal
phenotypes zwl-3 CUP, zwl-3 PIN and zwl-3 NM (Scale bar = 50 µm). SAM size (width) was
measured. (B) Ler SAM was large compared to ind-6, zwl-3 and ind-6 zwl-3 (n=10). Values are
means ± SE. Tukey's multiple comparisons test, *p<0.05 (Ler vs. mutants).
68
3.2.4 IND and AGO10 pathway
3.2.4.1 IND and AGO10 negatively regulate each other
The data from section 3.2.3 shows that overexpression and DEX-induction of IND:GR can
downregulate AGO10. We tested whether IND can possibly downregulate AGO10 by
binding to the AGO10 promoter by ChIP. 35S::IND:GR seeds were grown in liquid media
and on day seven seedlings were treated with 10 µM DEX and DMSO for 6 hours. Treated
samples were processed for ChIP (Chapter 2, Section 2.4). From previous yeast one-
hybrid interaction study we know that IND can bind to G-box element CACGTG (Girin et
al., 2011). A G-box element CACGTG was located 1162-1167 upstream of AGO10.
pAGO10 (primers designed to amplify upstream 926-1175 bp) was tested by qRT-PCR
(Chapter 2, Section 2.3) and fold enrichment (DEX vs. DMSO) was determined. There
was a four-fold enrichment for pAGO10 (upstream 926-1175 bp) in the presence of DEX
(Fig 3.7C). This data suggests IND binds to the AGO10 promoter and downregulates
AGO10.
AGO10 possibly downregulates IND to control the antagonistic function of IND in SAM
development. To examine this, cDNA was prepared from 14 day old Ler, and zwl-3 (WT,
CUP, PIN, and NM) seedlings and gene expression were quantified using qRT-PCR. Gene
expression fold change (zwl-3 vs. Ler) shows that IND was upregulated in all zwl-3
seedlings regardless of phenotype, and there was an eight-fold increase of IND
expression in zwl-3 PIN when compared to wild-type Ler (p<0.05) (Fig 3.9). Upregulation
of IND in zwl-3 suggests that AGO10 negatively regulates IND.
IND interacts with SPT to regulate organ patterning, and SPT also interacts with HEC1 to
regulate SAM development (Girin et al., 2011; Schuster et al., 2015; Schuster et al., 2014;
Sparks and Benfey, 2014). SPT and HEC1 gene expression was also screened in this
experiment. HEC1 expression was decreased in all zwl-3 phenotypes, and there was a
nine-fold decrease of HEC1 expression in zwl-3 NM compared to wild-type Ler (p<0.05)
(Fig 3.9). SPT expression was weakly decreased in all zwl-3 phenotypes (Fig 3.9). This
data suggests AGO10 positively regulates HEC1 and may not regulate SPT expression.
This shows that loss of AGO10 in ago10zwl-3 possibly promotes IND and SPT interaction.

69
3.2.4.2 IND and AGO10 double mutant ind-6 zwl-3 developmental phenotypes
The data from sections 3.2.2 and 3.2.3 suggests that overexpression of IND phenocopies
ago10zwl-3. If IND overexpression is associated with zwl-3 phenotypes, then the loss of
ind in zwl-3 should rescue the wild-type phenotype. Ler, zwl-3, and ind-6 zwl-3 were
grown on half MS plant agar plates, and the SAM phenotype was analysed. The 3-day
old seedlings were stained using propidium iodide (PI) and dissected to image the SAM,
and 14-day old seedlings were imaged without dissection using light microscopy. PI-
stained seedlings were imaged using confocal microscopy (Fig 3.8A). After imaging, the
width of the SAM (Ler, zwl-3 WT, and ind-6 zwl-3 WT) was measured for quantification
(n=10 seedlings). After imaging and analysis, 3 and 14 day old ind-6 zwl-3 seedlings were
classified into WT, CUP, PIN and NM phenotypes and these phenotypes are similar to
zwl-3 (3.2.3, Fig 3.8A). The 3 day old zwl-3 CUP tissue appeared as a packed cluster of
small cells when compared to elongated cells in zwl-3 PIN (Fig 3.8A). The PI stained zwl-
3 WT SAM and ind-6 zwl-3 WT SAM appeared small when compared to Ler SAM (Fig
3.8A). The bar chart show 43.5 µm zwl-3 WT SAM, 46 µm ind-6 zwl-3 WT SAM and
significantly large 50 µm Ler SAM (Ler vs. mutants, p<0.05) (Fig 3.8B). No significant
difference was observed between zwl-3 WT SAMs and ind-6 zwl-3 WT SAMs. The 14 day
old zwl-3 and ind-6 zwl-3 seedlings were quantified to examine the frequency of
different phenotypes. The ind-6 zwl-3 WT phenotype was present in 75% of samples
when compared to zwl-3 WT (p<0.05) (Fig 3.5D). No significant difference was observed
between ind-6 zwl-3 CUP and zwl-3 CUP (Fig 3.5D). The ind-6 zwl-3 PIN phenotypes were
significantly decreased (p<0.05) when compared to zwl-3 PIN (Fig 3.5D). The proportion
of ind-6 zwl-3 NM seedlings was significantly decreased when compared to zwl-3 NM
(p<0.05) (Fig 3.5D). These data suggest that loss of IND in the ind-6 zwl-3 double mutant
rescues the WT phenotype.
The ind-6 zwl-3 WT seedlings undergo development and produce flowers and fruits. The
Ler, zwl-3 and ind-6 zwl-3 stage 17 fruits were imaged for phenotype analysis (Fig 3.5A).
The image shows small bulged stage 17 zwl-3 fruit and big bulged stage 17 ind-6 zwl-3
fruit (Fig 3.5A). The stage 17 ind-6 zwl-3 fruit was small when compared to stage 17 Ler
fruit (Fig 3.5A). The stage 17 zwl-3 fruit was very small (Fig 3.5A). When compared to
stage 17 ind-6 zwl-3 fruit, small repla were observed in stage 17 zwl-3 fruit (Fig 3.5C).
The stage 17 ind-6 zwl-3 fruit replum looks similar to stage 17 Ler fruit replum (Fig 3.5C).

70
Fruit phenotype analysis suggests that loss of IND in the ind-6 zwl-3 double mutant also
rescues fruit size and size of replum.
The ind-6 mutant is an enhancer trap line that carries a Ds insertion and a GUS reporter
gene (Wu et al., 2006). Wu et al. reported that the expression pattern of the GUS gene
in an ind-6 silique likely represents that of IND in WT (Wu et al., 2006). They also stated
that the GUS signal was absent in other parts of the plants. This shows ind-6 zwl-3 can
be used to test if the loss of AGO10 in ago10zwl-3 can upregulate ind-GUS expression in
ind-6 zwl-3. To study this further, the GUS assay was used to examine stage 17 ind-6 and
ind-6 zwl-3 fruits, and the resulting fruits were imaged using light microscopy. The image
shows GUS activity accumulation in valve margins of stage 17 ind-6 and ind-6 zwl-3 fruits
(Fig 3.5B). When compared to stage 17 ind-6 fruit, high GUS activity accumulation was
observed in valve margins and the replum of stage 17 ind-6 zwl-3 fruit (Fig 3.5B). This
data shows that loss of AGO10 upregulates ind-GUS expression in the valve margins and
replum. This suggests that AGO10 may negatively regulate IND expression in valve
margins and replum.
3.2.4.3 Summary
In summary, IND binds to the AGO10 promoter and downregulates AGO10. The
phenotype analysis and qRT-PCR studies suggest that AGO10 may negatively regulate
IND in seedlings to prevent meristem termination and in fruit to preserve the replum.
This demonstrates that IND and AGO10 negatively regulate each other.

71
Figure 3.9 AGO10 regulates IND and HEC1 gene expression. IND, HEC1 and SPT gene expression
was quantified in zwl-3 and Ler seedlings using qRT-PCR (n=3 biological replicates). The bar chart
shows that IND gene expression was upregulated in zwl-3 relative to Ler and significantly
upregulated in zwl-3 PIN and NM. HEC1 gene expression was downregulated in zwl-3 relative to
Ler and significantly downregulated in zwl-3 WT, CUP and NM. Values are means ± SE. Tukey's
multiple comparisons test (Ler vs. zwl-3), *p<0.05.

72
3.2.5 PHB and REV regulate IND, SPT and HEC1 gene expression
The data from section 3.2.4 shows AGO10 negatively regulates IND, yet the regulatory
mechanism is unknown. We do not know if AGO10 can downregulate IND via miRNA.
The Arabidopsis small RNA project data was used to examine if IND is targeted by small
RNAs (http://asrp.danforthcenter.org/). Arabidopsis thaliana small RNA project data is
a collection of different studies from the Carrington laboratory. The data include
identified Arabidopsis small RNAs sequences (GSE6682) and ARGONAUTE-small RNA
interactions (GSE12037). These data tracks were loaded in a genome browser (JBrowse)
and analysed for PHB (Control) and IND miRNA target sites. The miRNA166 and 165
target sites were observed in PHB (Fig 3.12A). No miRNA target sites were observed in
IND (Fig 3.12B), but a transposable element (AT4TE00200) was located at the end of 3'-
untranslated region (3'-UTR) region of IND. Small RNAs can prevent the expression of
transposable elements (Dr Karim Sorefan also identified a possible miRNA target site in
the transposable element region of IND and observed none in the coding region)
(Hollister et al., 2011; Sorefan et al., 2012). The 5'-UTR and 3'-UTR do not code for
protein, so this suggests that small RNAs do not inhibit IND expression. In addition,
Arabidopsis thaliana - Tiling Array Express small RNA data also suggest that small RNAs
do not inhibit IND expression (Fig 8.3). This shows that AGO10 inhibits IND via other
proteins. Since AGO10 positively regulates HD-ZIP III transcription factors (PHB, PHV,
and REV), they may regulate IND gene expression. To test this hypothesis, cDNA was
prepared from 14 day old Col-0, ago10-4, phb-12 er-2, phv-11 er-2 and rev-6 er-2
seedlings and gene expression was quantified using qRT-PCR. Gene expression fold
change (mutants vs. Col-0) was determined. There was a three-fold increase in IND
expression in ago10-4 (Fig 3.10A). There was a three-fold increase in IND expression in
phb-12 er-2, phv-11 er-2 and six-fold increase in rev-6 er-2 (Fig 3.10A). Upregulation of
IND in hd-zip III mutants (phb-12 er-2, phv-11 er-2, and rev-6 er-2) suggests that PHB,
PHV, and REV negatively regulate IND.
PHB, PHV and REV transcription factors may directly regulate IND, HEC1, and SPT. We
failed to construct a 35S::PHV:GR plasmid. Therefore only 35S:LhGR>>PHB and
35S::REV:GR transgenic lines were used in this study to examine whether inducible
activity of overexpressed HD-ZIP III transcription factors can regulate IND, SPT, and HEC1
gene expression. Gene expression was examined following treatment with 10 µM DEX,

73
10 µM cycloheximide (CHY) and DMSO-treated seedlings (35S:LhGR>>PHB and
35S::REV:GR) using qRT-PCR (treated for 6 hours in liquid media). Gene expression fold
change (DEX vs. DMSO and DEX+CHY vs. CHY) was determined. IND expression was
decreased two-fold in the presence of DEX (35S:LhGR>>PHB and 35S::REV:GR) (p<0.05),
but no significant difference was observed in the presence of DEX+CHY (35S:LhGR>>PHB
and 35S::REV:GR) (Fig 3.10B). This suggests that PHB and REV downregulate IND. HEC1
expression was decreased 1.5 fold in the presence of DEX (35S:LhGR>>PHB) (p<0.05) and
no significant difference was observed in the presence of DEX+CHY (35S:LhGR>>PHB)
(Fig 3.10B). HEC1 expression was increased two-fold in the presence of DEX+CHY
(35S::REV:GR) (p<0.05) and no significant difference was observed in the presence of
DEX (35S::REV:GR) (Fig 3.10B). This suggests that REV upregulates HEC1 and this result
was consistent with previously published work (Reinhart et al., 2013). SPT expression
was significantly increased two-fold in the presence of DEX (35S:LhGR>>PHB) (p<0.05)
and also increased in the presence of DEX+CHY (35S:LhGR>>PHB) (p<0.05) (Fig 3.10B).
SPT expression was increased three-fold in the presence of DEX+CHY (35S::REV:GR)
(p<0.05) but no significant difference observed in the presence of DEX (35S::REV:GR) (Fig
3.10B). This suggests that PHB and REV directly upregulate SPT.
PHB, PHV and REV transcription factors may bind to the promoter region of IND, SPT,
and HEC1. PHV DAP-seq (GEO:GSM1925338) (O'Malley et al., 2016) and REV ChIP-seq
(GEO:GSE26722) (Brandt et al., 2012) datasets were analysed to study whether PHV and
REV transcription factors bind to the promoter region of IND, SPT, and HEC1 (no PHB
datasets were found in GEO or ArrayExpress). DNA affinity purification sequencing (DAP-
seq) is a high-throughput transcription factor binding site discovery method. O'Malley
et al. used DAP-seq to examine Arabidopsis genomic DNA interaction with in-vitro-
expressed transcription factors. PHV DAP-seq (GEO:GSM1925338) data were compared
with a list of bHLH genes curated from the TAIR database, and a Venn diagram was
generated using VENNY 2.1. The Venn diagram shows 7310 PHV target genes labelled in
the blue intersecting circle, 96 bHLH genes labelled in the yellow intersecting circle and
the overlapping region shows that PHV binds to 65 bHLHs (Fig 3.11A). SPT and HEC1
were on the list of 65 bHLHs, but not IND. This suggests PHV binds to SPT and HEC1. REV
ChIP-seq (GEO:GSE26722) data were compared with a list of bHLH genes, and a Venn
diagram was generated using VENNY 2.1. Venn diagram shows 10744 REV target genes

74
labelled in the blue intersecting circle, 57 bHLH genes labelled in the yellow intersecting
circle and the overlapping region shows that REV binds to 104 bHLHs (Fig 3.11A). SPT
and HEC1 were on the list of 104 bHLHs, but not IND. This suggests REV binds to SPT and
HEC1.
In summary, these studies demonstrate that PHB and REV may negatively regulate IND
by indirectly downregulating IND gene expression. The ChIP-seq and qRT-PCR
experiments suggest that REV binds to SPT and HEC1 and upregulates SPT and HEC1
gene expression. The DAP-seq and qRT-PCR experiments suggest that PHV binds to SPT
and HEC1, and PHB directly upregulates SPT gene expression. This shows that PHB and
REV may promote SPT and HEC1 and inhibit IND.

75
Figure 3.10 PHB and REV transcription factors regulate IND, SPT, and HEC1. (A) The bar chart
shows IND was upregulated in 7-day-old ago10-4, phb-12 er-2, phv-11 er-2 and rev-6 er-2
seedlings (fold change of wild-type Col-0 vs. mutants) (n=3 biological replicates). (B) qRT-PCR
was performed on DMSO, 10µM dexamethasone and 10µM cycloheximide-treated
35S:LhGR>>PHB and 35S::REV:GR seedlings (6 hours). The bar chart shows PHB and REV
downregulate IND (DEX vs. DMSO), PHB directly upregulates SPT, and REV directly upregulates
SPT and HEC1 expression (DEX+CHY vs. CHY). Values are means ± SE. Unpaired t-test (Col-0 vs.
mutants, DEX vs. DMSO and DEX+CHY vs. CHY), *p<0.05

76
Figure 3.11 PHV and REV directly bind to SPT and HEC1 genes. (A) PHV DAP-seq (blue,
GEO:GSM1925338) and (B) REV ChIP-seq (blue, GEO:GSE26722) data were analysed to identify
PHV and REV binding bHLH transcription factor family genes (yellow). (A) Venn diagram was
showing that PHV can directly bind to SPT and HEC1 but not to IND. (B) Venn diagram was
showing that REV can directly bind to SPT and HEC1 but not to IND.

77
Figure 3.12 PHB and IND miRNA target sites. Image of small RNA project JBrowse-Arabidopsis
shows the PHB and IND genes and miRNA target site tracks. (A) PHB is targeted by miRNA165
and miRNA166. (B) No miRNA target sites found for IND.

78
3.3 Discussion
3.3.1 IND may regulate SAM size and promote leaf abaxial fate
Wu et al. reported that IND could regulate cytokinesis (by unequal cell division) in the
seven-layer zone of fruit at stage 17 (Wu et al., 2006). Cell size and cell proliferation in
plants are organ-specific. In the meristem, cell divisions are often unequal, and cells
actively control their size (Serrano-Mislata et al., 2015). This chapter show that IND is
weakly expressed in the SAM and primordia, and that ind seedlings produced a small
SAM but did not affect leaf polarity (Fig 3.2 and 3.8). If IND is regulating cytokinesis in
the SAM, cell division orientation alone is not sufficient to regulate morphogenesis in
the meristem. An altered cell division pattern in the meristem can lead to an altered
pattern of expression of genes implicated in leaf development (Wyrzykowska and
Fleming, 2003). Interestingly, overexpression of IND produced a large meristem (failed
to produce leaves), with pin and cup shaped abaxialised leaves (Fig 3.6). In addition,
induction of IND also upregulated leaf abaxial polarity genes KAN, YAB1, and WOX1 (Fig
3.7). It has been demonstrated that YAB1 (FIL) acts redundantly to promote the
expression of SHP/IND in valve margins (Dinneny et al., 2005). This indicates that IND
and YAB1 may regulate each other in fruit as well as in leaves. Interestingly, induction of
IND directly downregulated leaf adaxial polarity gene AGO10. Although, overexpression
of IND seedling phenotypes were also similar to ago10zwl-3 phenotypes. These data, in
agreement with our results, suggest that IND may regulate SAM size by regulating
cytokinesis and promote leaf abaxial polarity by inhibiting AGO10. However, the pattern
of cytokinesis in ind should be investigated.
3.3.2 AGO10-IND regulate SAM development
Argonaute proteins play a significant role in all sRNA guided gene-silencing processes
(Kim, 2011; Meister, 2013). In Arabidopsis, AGO10 is involved in maintaining SAM and
leaf polarity by preserving HD-ZIP III gene expression. AGO10 is expressed in seedlings,
and particularly in the SAM and adaxial domain of the leaf (Liu et al., 2009; Tucker et al.,
2008; Zhang and Zhang, 2012; Zhu et al., 2011b). Loss of AGO10 in ago10zwl-3 inhibits
SAM and leaf development. This chapter shows that IND is upregulated in ago10zwl-3 and
loss of IND partially rescues ago10zwl-3 phenotypes (Fig 3.5 and 3.9). This demonstrates
that AGO10 negatively regulate IND and thus promotes SAM development.

79
AGO10 does not splice IND via the miRNA pathway (Fig 4.12B). However, AGO10 may
regulate IND via HD-ZIP III TFs. Interestingly, the PIN phenotype produced by
overexpression of IND and ago10zwl-3 resembles the phb rev mutant (Prigge et al., 2005).
This chapter shows that PHB and REV indirectly downregulate IND gene expression (Fig
3.10). This suggests that AGO10 indirectly inhibits IND via HD-ZIP III transcription factors.
IND belongs to the same clade of bHLH transcription factors as HEC proteins; IND
regulates SPT gene expression and also directly interacts with SPT (Girin et al., 2011).
Moubayidin demonstrated that IND and SPT are necessary for mediating leaf
radialization (PIN and CUP) because the radialisation was lost in the spt mutant
background (Moubayidin and Ostergaard, 2014). Interestingly this study has found that
PHB and REV can upregulate SPT, and REV can also upregulate HEC1 (Fig 3.11). In
addition, HEC1 expression was downregulated in ago10zwl-3 (Fig 3.9). Interestingly, SPT
and HEC1 interaction can regulate the SAM development (Schuster et al., 2014; Sparks
and Benfey, 2014). Together these studies suggest that AGO10-PHB-REV may promote
SAM development by repressing IND and promoting SPT and HEC1 expression and
possibly SPT-HEC1 dimer signalling (Fig 3.13).
3.3.3 AGO10-IND regulate gynoecium development
As well as in the vegetative SAM, AGO10 is also expressed in the floral meristem and
regulates floral meristem differentiation (Ji et al., 2011). Since AGO10 is also expressed
in the adaxial domain of carpels (Ji et al., 2011), AGO10 may possibly have a role in
regulating adaxial polarity of fruit valves. AGO10 possibly regulates adaxial polarity of
fruit valves via HD-ZIP III (Nole-Wilson et al., 2010). This chapter shows AGO10
expression in the floral meristem, gynoecium and up to stage 15 fruit, and that loss of
AGO10 in ago10zwl-3 impairs replum and fruit growth (Fig 3.2 and 3.5). The
homeodomain protein RPL regulates the development of fruit repla (Roeder et al.,
2003). rpl-1 and zwl-3 stage 17 fruits produce small repla, and these fruits look alike
(Roeder et al., 2003). Similar to RPL, AGO10 may regulate replum development.
In Arabidopsis fruit, SHP positively regulates IND to promote valve margin development
(Liljegren et al., 2000; Liljegren et al., 2004a). Loss of SHP or IND produces indehiscent
fruits without valve margins (Liljegren et al., 2000; Liljegren et al., 2004a). It has been

80
demonstrated that SHP and IND expression are inhibited in the replum by RPL (Roeder
et al., 2003). Roeder et al. reported the ectopic expression of SHP and IND (GT140) in
the replum of rpl-1 stage 17 fruit and replum development is restored in rpl-1 shp1 shp2.
This shows that SHP and IND inhibit replum development. Similar to rpl-1 stage 17 fruits,
ectopic ind-GUS expression was observed in the replum of ind-6 zwl-3 fruit at stage 17,
and replum development was restored in ind-6 zwl-3 (Fig 3.5). Similar to RPL, AGO10
also inhibits IND to promote replum development. During fruit development, AGO10
expression was observed from stage 1 to stage 15 and IND/SHP expression was observed
from stage 8 to stage 17 (Fig 3.2) (Ji et al., 2011; Liljegren et al., 2000; Liljegren et al.,
2004a; Savidge et al., 1995). This suggests that AGO10 may inhibit IND at an early stage
of fruit development and that IND may inhibit AGO10 at a late stage of fruit
development. From this, we can draw that AGO10 and IND may inhibit each other (Fig
3.13).
3.3.4 Conclusion
This chapter demonstrates that IND regulates the size of the SAM and may promote leaf
abaxial polarity by inhibiting AGO10. We found that AGO10 inhibits IND via PHB and REV
in SAM to promote SPT and HEC1 (Fig 3.13). Similar to the SAM, AGO10 may represses
IND to promote replum development.
Figure 3.13 Schematic representation of the AGO10-PHB-REV-IND signalling cascade

81
Chapter 4 IND and HD-ZIP III
transcription factors
regulate CUC1

82
CHAPTER 4. IND and HD-ZIP III transcription factors regulate CUC1
4.1 Introduction
Leaf polarity in Arabidopsis is regulated by various signalling elements such as
hormones, transcription factors and miRNAs. Importantly, gradients of these elements
are crucial for establishing leaf adaxial and abaxial fate. In tomato, Kim et al. showed
that movement of mRNA across cells could cause changes in leaf morphology (Kim et
al., 2001).
The cell-to-cell movement of proteins and nucleic acids is regulated by plasmodesmata
(Wu et al., 2002), and the auxin hormone gradient is regulated by PIN proteins (Friml et
al., 2003). Change in gradients of these elements can affect leaf adaxial or abaxial fate
and produce cup and pin-shaped leaves. These leaf phenotypes are also observed in as1,
ago10, hd-zip iii, and pin1 cuc1 cuc2 mutant lines as well as seedlings treated with polar
auxin transport inhibitors (Aida et al., 2002; Moussian et al., 1998; Prigge et al., 2005;
Xu et al., 2003; Zhao et al., 2010). AS1 is one of the key regulators of leaf adaxial fate. In
tomato and Arabidopsis, loss of as1 results in cup and needle or pin-shaped abaxialised
leaves (Kim et al., 2003b; Xu et al., 2003; Zoulias et al., 2012).
In Arabidopsis, AGO10 inhibits miRNA165/166 and positively regulates HD-Zip III to
establish the leaf adaxial domain (Liu et al., 2009). In a recent study, histological analysis
revealed that ago10zll-1 mutants were able to initiate the cotyledons (Leaf 1 and 2) and
embryonic meristem but failed to maintain the leaf polarity and the meristem in a
proportion of seedlings after late stages of embryogenesis (Lee and Clark, 2015; Tucker
et al., 2008; Tucker et al., 2013). This suggests ago10zwl-3 cup and pin phenotypes are
embryonic or post-embryonic. The hd-zip iii mutant seedlings produce cup- and pin-
shaped structures. In contrast, the hd-zip iii mutants produced cup and pin-shaped
cotyledons Leaf 1 and 2), which suggests HD-Zip III genes are involved in patterning at
an early stage of embryogenesis (Lee and Clark, 2015; Prigge et al., 2005).
During the early stage of embryogenesis, the apical cell differentiates and establishes
peripheral and central domains, and at this stage each domain consists of four cells (Fig

83
4.1 B and C). These cells further divide to establish medial (SAM) and lateral (cotyledon-
forming) domains at a late stage of embryogenesis (Fig 4.1 D). PIN proteins maintain
high auxin levels in the apical cell; loss of pin1 leads to frequent failure to form an
embryo proper (Friml et al., 2003) (Fig 4.1 A and B). Prigge et al. discussed that HD-Zip
III genes may be involved in differentiating between central and peripheral cells during
wild-type embryogenesis (Fig 4.1 B and C). Loss of hd-zip iii promotes peripheral identity
and generates single, radially symmetric cotyledons (Prigge et al., 2005). PIN1 and PID
regulate the formation of auxin gradient maxima at the tips of the lateral domains and
promote cotyledon outgrowth by preventing CUC gene expression from expanding to
the lateral domain (Furutani et al., 2004). A single cup-shaped cotyledon is formed when
the medial domain is not distinguished from the lateral (cotyledon-forming) domains
(Fig 4.1 C and D). Aida et al. demonstrated that cuc1 cuc2 double mutant seedlings
completely lack an embryonic SAM, and two cotyledons are fused along both edges to
form one cup-shaped structure (Aida et al., 1997). CUC1 and CUC2 genes are required
for preventing cotyledons and floral organs from fusing with each other (Aida et al.,
1997; Takada et al., 2001). This shows that PIN1, PID and CUC genes are crucial for
establishing the boundary between the SAM and primordia, and for cotyledon
outgrowth.
The pin and cup-shaped leaves in ago10 mutants may have formed because of changes
in PIN1, PID and CUC gene expression triggered during embryogenesis (e.g. modified
cotyledons) and post embryogenesis (e.g. modified leaves). In Chapter 3, phenotype
analysis showed that ago10zll-3 seedlings produced pin shaped meristems and the indind-
6 mutation partially rescued the ago10zll-3 pin phenotype (Chapter 3, Fig 4.1E). We
hypothesised that indind-6 may rescue the ago10zll-3 phenotype by regulating PIN1, PID or
CUC gene expression (Fig 4.1E). A few of the pin phenotypes may have switched to cup
phenotypes by rescuing PIN1 and PID but not CUC in indind-6 ago10zll-3 (Fig 4.1E). Loss of
ago10-hd-zip iii and overexpression of IND may promote cup and pin phenotypes by
regulating PIN1, PID and CUC. We hypothesised that IND may promote pin and cup by
negatively regulating PIN1, PID and CUC in ago10zll-3. In this chapter, the link between
the AGO10-PHB-REV-IND pathway (Chapter 3) and PIN1-PID-CUC is examined.

84

85
Figure 4.1 Illustration depicting mutants defective in certain patterning steps in
embryogenesis. Image modified from (Prigge et al., 2005). The first zygotic (A) division is
asymmetric and produces an apical and basal cell (B). Apical-basal polarity is established after
the first zygotic division. Apical-basal polarity is lost in multiple pin and hd-zip iii mutants and
these mutants produce a defective embryo. Apical cells differentiate to establish central and
peripheral domains (C). Medial and lateral (cotyledon-forming) domains are established at a late
stage of embryogenesis (D). Cotyledons are fused in pin cuc mutants because the medial domain
is not distinguished from the lateral domains (red dashed arrow indicate the phenotypic
change). (E) Schematic diagram describing a hypothesis to explain the various phenotypes of
ago10 mutants. Image shows a high frequency of WT phenotype in ind-6 zwl-3 (top green) and
high frequency of PIN phenotype in zwl-3 (top red). Severe ago10 pin phenotypes are caused by
high IND gene expression (lower red) and possibly low expression of PIN1, PID and CUC (lower
green) or polar auxin transport defective. The indind-6 mutation reduces the severity of ago10zwl-
3 phenotypes by reducing IND expression and restoring PIN1, PID and CUC expression and auxin
transport.

86
4.2 Results
4.2.1 PIN1, PID, CUC and SAM-associated gene expression in mutants
We hypothesised that the indind-6 mutation rescues the ago10zwl-3 phenotype by rescuing
PIN1, PID, CUC, and perhaps the expression of other genes associated with SAM
development (these genes were discussed in Chapter 1). We tested this hypothesis by
measuring gene expression using qRT-PCR. PIN1, PID and CUC gene expression was
examined along with other genes involved in SAM and leaf polarity in 7-day old Ler, ind-
6, zwl-3 (WT, CUP, PIN and NM) and ind-6 zwl-3 double mutant (WT, CUP and PIN)
seedlings. A heat map depicting levels of gene expression in mutant seedlings was
generated using Morpheus (Fig 4.2). The gene expression values (2-ΔCT) used for heat
map is provided in the Table 8.1. We also measured the expression of genes that
regulate leaf polarity such as AS1, AS2, AGO10, PHB, PHV and REV that regulate adaxial
fate (Emery et al., 2003; Iwasaki et al., 2013; Zhu et al., 2011b), and YABBYs, KAN, ARF3
and ARF4 that regulate abaxial leaf fate (Eshed et al., 2004; Fahlgren et al., 2006; Garcia
et al., 2006; Kelley et al., 2012; Siegfried et al., 1999).
When compared to Ler, gene expression of AS2, PHB, PHV and REV was decreased in all
mutant phenotypes of zwl-3 and ind-6 zwl-3 double mutant but not as strongly in zwl-3
WT phenotypes (Fig 4.2). In addition, the severity of ago10zwl-3 phenotypes positively
correlated with PHB, PHV and REV. Interestingly, AS1 gene expression was increased in
zwl-3 (WT, CUP and PIN) and decreased in ind-6 zwl-3 double mutant (CUP and PIN) (Fig
4.2). Increase in AS1 expression alone may not be sufficient to rescue adaxial fate in zwl-
3.
Consistent with the abaxialisation of ago10zwl-3 mutant meristem phenotypes, KAN,
ARF3 and ARF4 expression was increased in zwl-3 (PIN and CUP) (Fig 4.2). ARF4
expression was also increased in zwl-3 WT seedlings (Fig 4.2). When compared to Ler,
gene expression of KAN, ARF3 and ARF4 was decreased in ind-6, zwl-3 (NM) and ind-6
zwl-3 double mutant seedlings (CUP and PIN) (Fig 4.2). YAB3 gene expression was
decreased in zwl-3 (CUP, PIN and NM) and ind-6 zwl-3 (WT, CUP and PIN) (Fig 4.2). This
shows that abaxial fate-determining genes were promoted in zwl-3 compared to the ind-
6 zwl-3 double mutant. This suggests that IND may regulate leaf abaxial fate by

87
upregulating KAN, ARF3 and ARF4 gene expression in zwl-3. However, several lines of
evidence suggest that overexpression of ARF3 and ARF4 in ago10zwl-3 mutants is not
sufficient to cause the meristem phenotypes (Fahlgren et al., 2006; Hunter et al., 2006).
The class I KNOX transcription factors (STM and BP) positively regulate cytokinin
biosynthesis (Yanai et al., 2005). BP and STM gene expression was examined in mutants.
BP gene expression was increased in zwl-3 (WT, CUP and PIN) and ind-6 zwl-3 double
mutant (WT and CUP) (Fig 4.2). STM gene expression was decreased in ind-6, zwl-3 (WT,
CUP, PIN and NM) and ind-6 zwl-3 double mutant (CUP and PIN) (Fig 4.2). This shows
that BP may be positively regulating cytokinin biosynthesis in zwl-3 and ind-6 zwl-3.
Cytokinins induce the expression of ARR7 and ARR7 negatively regulates cytokinin
signalling in the SAM. Interestingly, ARR7 gene expression was increased in zwl-3 (CUP,
PIN and NM) and ind-6 zwl-3 (CUP and PIN) (Fig 4.2). Auxin signalling inhibits ARR7
expression in the SAM. YUC1 regulates auxin biosynthesis, while PIN1 and PID regulate
auxin transport. YUC1 gene expression was decreased in zwl-3 (CUP, PIN and NM) and
ind-6 zwl-3 (CUP and PIN) (Fig 4.2). Gene expression fold change of PIN1 and PID (Ler Vs.
mutants) is presented in Figure 4.3B. PIN1 gene expression was decreased in zwl-3 (PIN)
and ind-6 zwl-3 (CUP and PIN) (p<0.05) (Fig 4.2 and Fig 4.3B). PID gene expression was
decreased in ind-6, zwl-3 (NM) and ind-6 zwl-3 (CUP and PIN) (p<0.05) (Fig 4.2 and Fig
4.3B). This shows that zwl-3 (CUP and PIN) and ind-6 zwl-3 (CUP and PIN) are defective
in auxin signalling. Loss of auxin signalling may have promoted ARR7 expression in CUP
and PIN because auxin signalling inhibits ARR7 in normal SAMs via MP (ARF5) (Zhao et
al., 2010).
However, PIN1 is also necessary for the proper spatial expression of CUC1 (Aida et al.,
2002). Loss of cuc mutants generates cup-shaped or fused cotyledon phenotypes which
are similar to cup-shaped leaf in zwl-3 and ind-6 zwl-3 mutants. CUC1, CUC2 and CUC3
gene expression were examined in mutants. Gene expression fold change of CUC1, CUC2
and CUC3 (Ler Vs. mutants) was presented in Figure 4.3A. CUC1 gene expression was
decreased in zwl-3 (WT, CUP, PIN and NM) (p<0.05) (Fig 4.2 and Fig 4.3A). Interestingly,
CUC1 gene expression in ind-6 zwl-3 was similar to Ler (Fig 4.2). CUC2 and CUC3 gene
expression was decreased in zwl-3 (CUP, PIN and NM) and ind-6 zwl-3 (CUP and PIN) (Fig
4.2 and Fig 4.3B). CUC1 and CUC2 are required for STM expression, and STM can directly

88
activate CUC1 gene expression. Interestingly, CUC1 and CUC2 gene expression was
similar to Ler (Fig 4.2). This shows that loss of indind-6 in ago10zll-3 rescues CUC1 gene
expression, suggesting that IND may negatively regulate CUC1 in zwl-3.
In summary, these results demonstrate that IND may downregulate the boundary
specification gene CUC1 and upregulate abaxial fate genes (KAN, ARF3 and ARF4) in
ago10zll-3. zwl-3 (CUP and PIN) and ind-6 zwl-3 (CUP and PIN) phenotypes may be
defective in auxin signalling. The increase in ARR7 expression suggests that cytokinin
signalling was negatively regulated in zwl-3 (CUP and PIN) and ind-6 zwl-3 (CUP and PIN)
phenotypes.

89
Figure 4.2 Gene expression in Ler and mutant phenotypes (ind-6, zwl-3, and ind-6 zwl-3). The
heat map shows hierarchical clustering of samples and genes (one minus Pearson correlation):
PIN1, PID, CUC and other SAM and leaf polarity gene expression in 7 day old Ler, ind-6, zwl-3
(WT, CUP, PIN and NM) and ind-6 zwl-3 (WT, CUP and PIN) seedlings (Z-score of 2-ΔCT values from
qRT-PCR). Top, sample tree; left, gene tree. (Blue: decreased gene expression, Red: increased
gene expression)
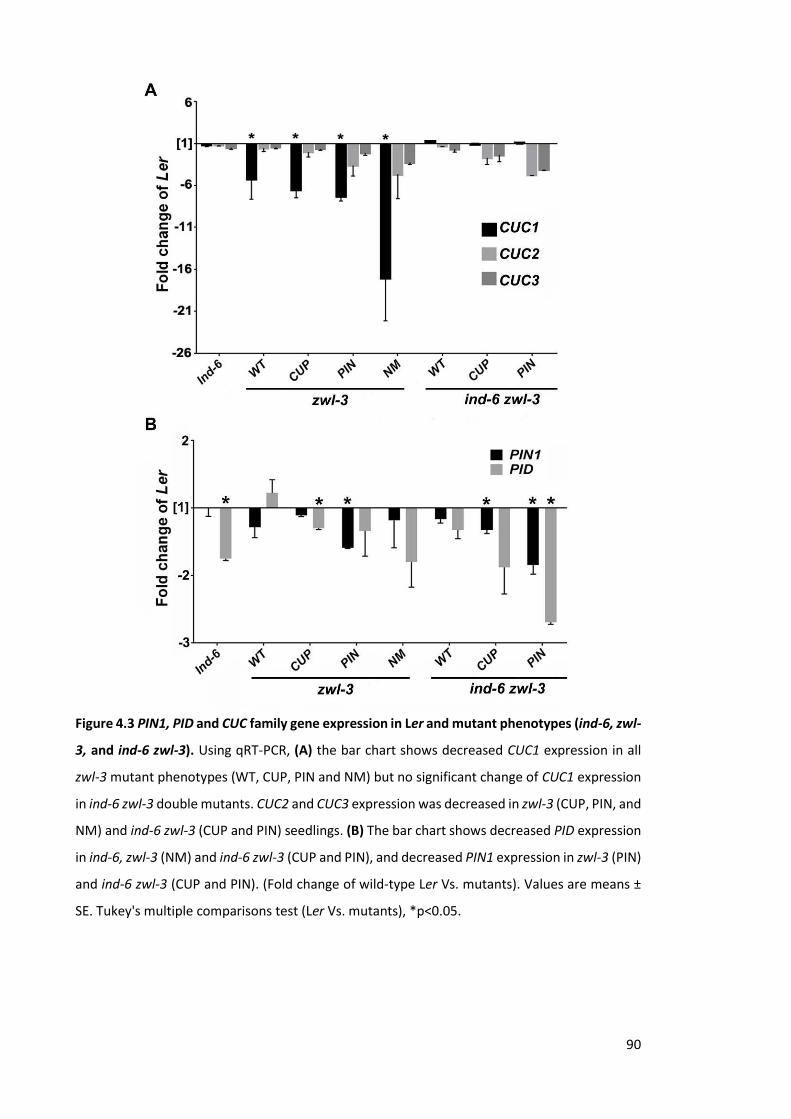
90
Figure 4.3 PIN1, PID and CUC family gene expression in Ler and mutant phenotypes (ind-6, zwl-
3, and ind-6 zwl-3). Using qRT-PCR, (A) the bar chart shows decreased CUC1 expression in all
zwl-3 mutant phenotypes (WT, CUP, PIN and NM) but no significant change of CUC1 expression
in ind-6 zwl-3 double mutants. CUC2 and CUC3 expression was decreased in zwl-3 (CUP, PIN, and
NM) and ind-6 zwl-3 (CUP and PIN) seedlings. (B) The bar chart shows decreased PID expression
in ind-6, zwl-3 (NM) and ind-6 zwl-3 (CUP and PIN), and decreased PIN1 expression in zwl-3 (PIN)
and ind-6 zwl-3 (CUP and PIN). (Fold change of wild-type Ler Vs. mutants). Values are means ±
SE. Tukey's multiple comparisons test (Ler Vs. mutants), *p<0.05.

91
Figure 4.4 miRNA164, miRNA165 and miRNA166 expression in Ler and mutants (ind-6, zwl-3,
and ind-6 zwl-3). (A) Heat map with hierarchical clustering of samples and miRNA (one minus
Pearson correlation): miR166A-G expression was increased in zwl-3 and ind-6 zwl-3, and
miR164A-C expression was decreased in ind-6 zwl-3 (Z-score of sRNA-seq data, n=2 biological
replicates). (B) The northern blot image show increased miR166a expression in zwl-3 and ind-6
zwl-3, and decreased miR164 expression in ind-6 zwl-3 (n=2 biological replicates). (C) AGO1 and
AGO10 associated CLIP-Seq (RNA isolated by crosslinking immunoprecipitation) data
(GEO:GSE39885) was analysed and fold enrichment of miRNA164a-c, miRNA165ab, and
miRNA166a-g in the total recovered miRNA pool was determined. When compared to AGO1,
miRNA165ab, and miRNA166a-g was highly enriched in AGO10. When compared to AGO10,
miRNA164a-c was slightly more enriched in AGO1. Tukey's multiple comparisons test (Ler Vs.
mutants), *p<0.05 (Blue: decreased expression, Red: increased expression).

92
4.2.2 miRNA164, miRNA165 and miRNA166 expression in mutants
Previous studies show that miR164 can degrade CUC1 and CUC2 transcripts in
Arabidopsis (Laufs et al., 2004; Sieber et al., 2007). The decrease of CUC1 in ago10zll-3
suggests that AGO1 or AGO10 can possibly regulate CUC1 via miR164. CUC1 expression
was rescued in indind-6 ago10zll-3, which suggests IND could regulate CUC1 via miR164.
Small RNA-Seq was performed on Ler, ind-6, zwl-3 and ind-6 zwl-3 seedlings (performed
by Dr Karim Sorefan). In addition, AGO1 and AGO10 CLIP-Seq (RNA isolated by
crosslinking immunoprecipitation) data (GEO: GSE39885) (Zhu et al., 2011b) was
analysed to examine the link between AGO1-AGO10-IND and miR164. Northern blots
were performed to examine miR166a, miR164 and U6 (control) expression in Ler, ind-6,
zwl-3 and ind-6 zwl-3 seedlings (Fig 4.4B) (experiment performed by Dr Karim Sorefan).
MiR165ab and miR166a-g were used as positive controls because they target HD-ZIP III
transcripts and it is known that AGO10 preferentially loads miR165ab and miR166a-g. A
heat map of miRNA expression in Ler, ind-6, zwl-3 and ind-6 zwl-3 seedlings was
generated using Morpheus (Fig 4.4A). In zwl-3 and ind-6 zwl-3 seedlings, the levels of
miR166a-g are significantly increased when compared to wild-type Ler (p<0.05, Fig
4.4A). This was previously observed in multiple ago10 loss-of-function mutants (Yu et
al., 2017; Zhou et al., 2015). Data from northern blotting also shows an increase of
miR166a expression in zwl-3 and ind-6 zwl-3, which is consistent with RNA-Seq data (Fig
4.4B). It is not known how AGO10 can upregulate the levels of miR165ab and miR166a-
g. MiR164a-c expression was decreased in ind-6, zwl-3 and ind-6 zwl-3 seedlings when
compared to Ler (Fig 4.4A). Data from northern blotting also shows a decrease of miR164
expression in ind-6 zwl-3 and this matches with RNA-Seq data (Fig 4.4B). It is not known
how the loss of ind can significantly downregulate the levels of miR164a-g in ind-6 zwl-
3 seedlings. AGO1 and AGO10 CLIP-Seq data was presented in Figure 4.4C. miR165ab
and miR166a-g are highly enriched in AGO10 when compared to AGO1 (Fig 4.4C).
MiR164a-c are slightly more enriched in AGO1 when compared to AGO10 (Fig 4.4C). This
suggests miR164a-c are preferentially loaded into AGO1 to target CUC1 and CUC2
transcripts. If AGO1-miR164a-c is degrading CUC1, loss of CUC1 expression should be
observed in zwl-3 and ind-6 zwl-3 seedlings. If AGO10-miR164a-c is degrading CUC1, an
increase in CUC1 expression should be observed in zwl-3 and ind-6 zwl-3 seedlings.
Interestingly, CUC1 expression was decreased in zwl-3 and restored in ind-6 zwl-3. These

93
results suggest a decrease in expression of CUC1 in zwl-3 seedlings is not associated with
AGO10-miR164a-c or AGO1-miR164a-c.
4.2.3 PHB and REV upregulate CUC1 gene expression
Prigge et al. demonstrated phb rev mutants could produce two cotyledons without a
meristem, a fused single cotyledon and pin-shaped radially symmetric organ (Prigge et
al., 2005). The cuc mutants also produce fused cotyledons. This suggests that there is a
possible link between PHB-REV and CUC1. PHB and REV transcription factors may
regulate CUC1 gene expression. Therefore, 35S:LhGR>>PHB and 35S::REV:GR transgenic
lines were used in this study to examine whether induction of PHB and REV can regulate
CUC1 gene expression. Gene expression was examined following treatment with 10 µM
DEX and DMSO-treated seedlings (35S:LhGR>>PHB and 35S::REV:GR) using qRT-PCR
(treated 7-day old seedling for 6 hours in liquid media and also grown for 7 days on 10
µM DEX and DMSO treated half MS plant agar plates). Gene expression fold change (DEX
vs. DMSO) was determined. No significant change of CUC1 expression was observed in
seedlings (35S:LhGR>>PHB and 35S::REV:GR) treated with DEX for 6 hours (Fig 4.5D).
CUC1 expression was increased in seedlings (35S:LhGR>>PHB and 35S::REV:GR) grown
on DEX for 7 days (Fig 4.5D). This shows that PHB and REV transcription factors
upregulate CUC1 gene expression. Since this is not a rapid response, PHB and REV may
be forming a complex with other transcription factors or regulating other proteins to
upregulate CUC1 gene expression. Therefore, we tested whether REV regulates CUC1
directly.
If REV is directly upregulating CUC1, it may bind to the promoter region of CUC1. REV
(35S::FLAG-GR-REVd) ChIP-seq dataset from the study published by Brandt et al.
(GEO:GSE26722) (Brandt et al., 2012) was analysed to examine if the REV transcription
factor can bind to the promoter region of CUC1. DEX-induced REV and control tracks
were loaded into genome browser and aligned with the Arabidopsis TAIR 10 genome.
The total read counts (CUC1 promoter) from both DEX-induced REV and control samples
were logged and analysed for statistical significance.

94
Figure 4.5 REV ChIP-Seq and CUC1 gene expression. (A) Image exported from the IGV genome
browser showing CUC1 gene, REV (35S::FLAG-GR-REVd induced using DEX, ChIP-seq from
GEO:GSE26722) and control peaks. (B) Image shows REV binding sites (514bp, 657bp, 1221bp,
1704bp and 1910bp) located in the upstream region of CUC1 gene and REV binding sequence
AT[G/C]AT. (C) The bar chart shows high CUC1 sequence read counts in REV and low CUC1
sequence read counts in control. (D) CUC1 gene expression in 35S:LhGR>>PHB and 35S::REV:GR
(fold change from qRT-PCR data, 6 hours DEX versus 6 hours DMSO and 7DAG DEX vs. 7DAG
DMSO, n=3). The bar chart shows increased CUC1 expression in 35S:LhGR>>PHB and
35S::REV:GR seedlings were grown in the presence of DEX for 7 days. Values are means ± SE.
Unpaired t-test (6 hours DEX vs. 6 hours DMSO and 7DAG DEX vs. 7DAG DMSO), *p<0.05.

95
When compared to control, CUC1 sequence read counts were significantly high in REV
(p<0.05, Fig 4.5C). A previous study identified AT[G/C]AT as the in vitro binding sequence
for HD-ZIP III proteins and this sequence was identified in the top 50 putative REV-target
genes (Brandt et al., 2012; Sessa et al., 1998). Sequence motif AT[G/C]AT was found in
the promoter region (514bp, 657bp, 1221bp, 1704bp and 1910bp) of the CUC1 gene (Fig
4.5B). When compared to control, several REV peaks were observed in the upstream
promoter region of the CUC1 gene (Fig 4.5A). This shows that REV can bind to the
promoter region of CUC1 gene.
In summary, these results demonstrate that PHB upregulates CUC1 gene expression and
REV may directly bind to the CUC1 promoter and upregulate CUC1 gene expression.
4.2.4 IND downregulates CUC1 gene expression
The data from Chapter 3 shows increased expression of IND in ago10zll-3, and data in
Section 4.2.1 shows decreased expression of CUC1 in ago10zll-3. Compared to ago10zll-3
mutants, CUC1 gene expression was rescued in indind-6 ago10zll-3. We hypothesised that
IND overexpression in ago10zll-3 mutants may cause downregulation of CUC1 expression.
This was studied using qRT-PCR. The expression of CUC1, CUC2 and CUC3 transcripts was
examined in 10 µM DEX, 10 µM cycloheximide (CHY) and DMSO-treated 35S::IND:GR
seedlings treated for 6 hours in liquid media. CHY is an effective protein synthesis
inhibitor which was used in combination with DEX to examine whether IND induction
immediately regulated gene expression. Gene expression fold change (DEX vs. DMSO
and DEX+CHY vs. CHY) is presented in Figure 4.6A. CUC1 gene expression was decreased
in the presence of DEX (p<0.05) and DEX+CHY (p<0.05, Fig 4.6A). CUC2 gene expression
was increased in the presence of DEX+CHY (Fig 4.6A). CUC3 gene expression was
increased in the presence of DEX and decreased in the presence of DEX+CHY (Fig 4.6A).
This shows that translation is not required for ectopic induction of IND to regulate CUC1
expression. Therefore IND immediately downregulates CUC1 gene expression.

96
Figure 4.6 IND ChIP-qRT-PCR and CUC gene expression. (A) CUC1, CUC2 and CUC3 gene
expression in 35S::IND:GR (Fold change from qRT-PCR data, DEX vs. DMSO and DEX+CHY vs. CHY,
n=3). The bar chart show decreased CUC1 expression in the presence of DEX and DEX+CHY,
increased CUC2 expression in the presence of DEX+CHY and increased CUC3 expression in the
presence of DEX and decreased in the presence of DEX+CHY. (B) IND-CUC1 promoter interaction
was tested by ChIP-qRT-PCR using the 35S::IND:GR line, the bar chart shows three-fold
enrichment for CUC1 (upstream 29 bp-34 bp 5’-UTR) in the presence of DEX (n=3). (C) Illustration
of the CUC1 gene showing E-box element CANNTG, E-box variant CACGCG, and ChIP-qRT-PCR
forward and reverse primer sites. Values are means ± SE. Unpaired t-test (DEX vs. DMSO and
DEX+CHY vs. CHY), *p<0.05.

97
IND can possibly downregulate CUC1 by directly binding to the CUC1 promoter. IND-
CUC1 promoter interaction was tested by ChIP. 35S::IND:GR seeds were grown in liquid
media and on day seven, seedlings were treated with 10 µM DEX and DMSO for 6 hours.
Treated samples were processed for ChIP (Chapter 2, Section 2.4). From a previous yeast
one-hybrid interaction study we know that IND can bind to the G-box element CACGTG
and E-box variant CACGCG (Girin et al., 2011). An E-box element CANNTG was located
49 bp of 5’-UTR CUC1 (Fig 4.6C). CUC1 expression was tested by qRT-PCR using primers
designed to amplify upstream 29bp-34bp 5’-UTR (Chapter 2, Section 2.3) and fold
enrichment (DEX Vs. DMSO) was determined. There was a three-fold enrichment for
CUC1 (upstream 29bp-34bp 5’-UTR) in the presence of DEX (Fig 4.6B). This data
demonstrates that IND binds to the CUC1 promoter.
In summary, these results demonstrated that IND may directly bound to the CUC1
promoter and downregulated CUC1 gene expression.
4.2.5 SPT and HEC1 do not directly regulate CUC1 gene expression
4.2.5.1 35S:SPT-VP16-GR and spt-12 microarray data analysis
In Arabidopsis, SPT promotes the growth of carpel marginal tissues, including the
septum and transmitting tract. Girin et al. demonstrated that spt single mutants are
defective in the development of septum, transmitting tract, stigma, and style (unfused
style) (Fig 4.7D) (Girin et al., 2011). Stigma and style defects in the spt mutant gynoecium
were strongly enhanced in the ind spt double mutant (Fig 4.7B and D) (Girin et al., 2011).
A study by Girin et al. showed that IND and SPT interaction is crucial for the fusion of
carpels (Girin et al., 2011). Interestingly, Nahar et al. reported that CUC1 was
accumulated ectopically in spt unfused carpels, and the split phenotype of carpels was
suppressed in the spt cuc1 double mutant (Fig 4.7D and E) (Nahar et al., 2012). This
shows that SPT can positively regulate carpel fusion in the apical gynoecium through the
negative regulation of CUC1 expression. Results from section 4.2.4 suggest that IND can
directly downregulate CUC1 expression. It is not known if SPT downregulation of CUC1
is IND-dependent or if SPT alone can directly downregulate CUC1 gene expression. To
test this, gene expression was analysed in the spt mutant (spt-12, ATH1 Genome Array,
n=2, NASCARRAYS-505) and DEX+CHY-mediated induction of SPT (35S::SPT-VP16-GR,
URGV Arabidopsis thaliana 25K CATMA_v2.2, n=3, GSE12913) microarray datasets

98
(Josse et al., 2011; Reymond et al., 2012). PHB, PHV and REV were also included in the
analysis because Chapter 3 shows that they regulate SPT.
A list of differentially expressed genes was summarised in a table (Table 8.2). A total of
114 genes were differentially expressed in 35S::SPT-VP16-GR seedlings (DEX+CHY vs.
CHY) (FC >1 or <-1, p<0.05): 94 genes were upregulated and 20 genes were
downregulated. A total of 1524 genes were differentially expressed in spt-12 seedlings
(spt-12 vs. Col-0); 734 genes were upregulated, and 789 genes were downregulated (FC
>1 or <-1, p<0.05). 35S::SPT-VP16-GR (GSE12913) data were compared with spt-12
(NASCARRAYS-505), and a Venn diagram was generated using VENNY 2.1. The Venn
diagram shows 107 differentially expressed genes in 35S::SPT-VP16-GR seedlings
(DEX+CHY vs. CHY) labelled in the blue intersecting circle, 1517 differentially expressed
genes in spt-12 seedlings (spt-12 vs. Col-0) labelled in the yellow intersecting circle, and
the overlapping region shows 7 genes differentially regulated in both datasets (Fig 4.8A).
The PHB, PHV, REV, CUC1 and HEC1 genes were not on that list. However, genes
AT1G19310, TZF5 and PYL4 were downregulated in spt-12 seedlings (spt-12 vs. Col-0)
and uprregulated in 35S::SPT-VP16-GR seedlings (DEX+CHY vs. CHY). This suggests SPT
may directly regulate AT1G19310, TANDEM CCCH ZINC FINGER PROTEIN 5 (TZF5) and
PYRABACTIN RESISTANCE 1-LIKE 4 (PYL4) gene expression. PYL4 is an ABA receptor,
which is known to regulate ABA signalling (Gonzalez-Guzman et al., 2012). SPT promotes
seed dormancy by regulating ABA signalling (Vaistij et al., 2013), SPT many regulate this
process possibly by directly regulating PYL4.
The PHB, PHV, REV, CUC1 and HEC1 gene expression fold change (spt-12 vs. Col-0 and
35S::SPT-VP16-GR DEX+CHY vs. CHY) is presented Figures 4.8B and C. The expression of
PHB, PHV and REV was significantly decreased in spt-12 seedlings (spt-12 vs. Col-0,
p<0.05, Fig 4.8B). No change in CUC1 and HEC1 gene expression was observed in spt-12
seedlings (spt-12 vs. Col-0, Fig 4.8B). No change in PHB, PHV, REV, CUC1 and HEC1 gene
expression was observed in 35S::SPT-VP16-GR seedlings (DEX+CHY vs. CHY, Fig 4.8C).

99
Figure 4.7 The spt cuc1, ind spt and hec1,2,3 spt fruit phenotype images from (Girin et al., 2011;
Kamiuchi et al., 2014; Nahar et al., 2012; Schuster et al., 2015). (A) Col-0 fruit image shows
stigma (top arrow) and style (bottom arrow). (B-D) spt, ind spt and hec1,2,3 spt fruit image show
stigma and style defective unfused carpels (arrow). (E) spt cuc1 fruit image shows style and
stigma (arrow) without split phenotype. (F) cuc1 cuc2 spt fruit image shows normal style and
stigma (arrow) without replum. It is not known if SPT and HEC1 can directly downregulate CUC1
gene expression.

100
Figure 4.8 35S::SPT-VP16-GR and spt-12 microarray. (A) The overlapping region of the Venn
diagram shows 7 genes differentially expressed in both 35S::SPT-VP16-GR seedlings (p<0.05,
DEX+CHY vs. CHY) and spt-12 seedlings (p<0.05, spt-12 vs. Col-0). (B) The bar chart shows PHB,
PHV, REV, CUC1 and HEC1 gene expression in spt-12 seedlings (spt-12 vs. Col-0). (C) The bar chart
shows PHB, PHV, REV, HEC1, CUC1 and IND gene expression in 35S::SPT-VP16-GR seedlings
(DEX+CHY vs. CHY). One-Way ANOVA *p<0.05, Gene Fold Change (linear) >1 or <-1, Blue:
decreased gene expression, Red: increased gene expression.

101
Figure 4.9 pAlcA::HEC1 and hec1,2,3 microarray. (A) The overlapping region of the Venn
diagram shows 19 genes differentially expressed in both hec1,2,3 Inflorescence apices (p<0.05,
hec1,2,3 vs. Col-0) and pAlcA::HEC1 Inflorescence apices (p<0.05, pAlcA::HEC1+EtH vs.
pAlcA::GUS+EtH). (B) The bar chart shows PHB, PHV, REV, CUC1 and SPT gene expression in
pAlcA::HEC1 inflorescence apices (pAlcA::HEC1+EtH vs. pAlcA::GUS+EtH). (C) The bar chart
shows PHB, PHV, REV, HEC1, CUC1 and SPT gene expression hec1,2,3 Inflorescence apices
(hec1,2,3 vs. Col-0). One-Way ANOVA *p<0.05, Gene Fold Change (linear) >1 or <-1, Blue:
decreased gene expression, Red: increased gene expression.

102
4.2.5.2 pAlcA:HEC1 and hec1,2,3 microarray data analysis
In Arabidopsis, HEC1, HEC2 and HEC3 are essential for transmitting tract formation.
Schuster et al. demonstrated that HEC1 interacts with SPT to control carpel fusion, and
stigma-style defects in the spt mutant gynoecium were strongly enhanced in the
hec1,2,3 spt quadruple mutant (Fig 4.7C and D) (Gremski et al., 2007; Schuster et al.,
2015). SPT promotes carpel fusion in the apical gynoecium by inhibiting CUC1 expression
(Nahar et al., 2012), but the results from section 4.2.5.1 suggest SPT does not directly
regulate CUC1 gene expression. It is not known if SPT downregulation of CUC1 is HEC1-
dependent or if HEC1 alone can downregulate CUC1 gene expression. To test this, gene
expression was analysed in microarray datasets that characterise the hec1,2,3 triple
mutant (hec1,2,3, ATH1 Genome Array, n=2, E-MTAB-2193) and ethanol (EtH)-mediated
overexpression of HEC1 (pAlcA::HEC1, ATH1 Genome Array, n=2, E-MTAB-2193)
(Schuster et al., 2014). The PHB, PHV and REV were also included in the analysis because
Chapter 3 shows that they regulate HEC1.
A list of differentially expressed genes was generated from these analyses and these are
presented in a table (Table 8.3). A total of 193 genes were differentially expressed in
hec1,2,3 Inflorescence apices (hec1,2,3 vs. Col-0) (FC >1.5 or <-1.5, p<0.05): 106 genes
were upregulated and 87 genes were downregulated. Similarly, a total of 144 genes
were differentially expressed in pAlcA::HEC1 Inflorescence apices (pAlcA::HEC1+EtH vs.
pAlcA::GUS+EtH): 43 genes were upregulated, and 101 genes were downregulated. The
hec1,2,3 data was compared with pAlcA::HEC1 and a Venn diagram was generated using
VENNY 2.1. The Venn diagram shows 174 differentially expressed genes in hec1,2,3
Inflorescence apices (hec1,2,3 vs. Col-0) labelled in the blue intersecting circle, 124
differentially expressed genes in pAlcA::HEC1 Inflorescence apices (pAlcA::HEC1+EtH vs.
pAlcA::GUS+EtH) labelled in the yellow intersecting circle, and the overlapping region
shows 19 genes differentially regulated in both datasets (Fig 4.9A). The PHB, PHV, REV,
CUC1 and SPT genes were not on that list. However, genes AT5G23820, AT3G21950 and
AT1G53885 were upregulated in pAlcA::HEC1 Inflorescence apices (pAlcA::HEC1+EtH vs.
pAlcA::GUS+EtH) and downregulated in hec1,2,3 Inflorescence apices (hec1,2,3 vs. Col-
0). This suggests HEC1 may positively regulate AT5G23820, AT3G21950 and AT1G53885
gene expression. Alternatively, genes NUCLEAR FACTOR Y, SUBUNIT A10 (NF-YA10),
NUCLEAR FACTOR Y, SUBUNIT A3 (NF-YA3), NUCLEAR FACTOR Y, SUBUNIT A2 (NF-YA2),

103
NUCLEAR FACTOR Y, SUBUNIT A5 (NF-YA5), SUBTILISIN-LIKE PROTEASE SBT1.1 (SBTI1),
AQUAPORIN PIP1-2 (PIP1B), PURPLE ACID PHOSPHATASE 17 (PAP17), MITOCHONDRIAL
UNCOUPLING PROTEIN 6 (DIC3), GLUCOSE-6-PHOSPHATE/PHOSPHATE TRANSLOCATOR
2 (GPT2), JASMONATE O-METHYLTRANSFERASE (JMT), AT2G37770, AT1G32900 and
AT2G29670 were downregulated in pAlcA::HEC1 Inflorescence apices (pAlcA::HEC1+EtH
vs. pAlcA::GUS+EtH) and upregulated in hec1,2,3 Inflorescence apices (hec1,2,3 vs. Col-
0). This suggests HEC1 may negatively regulate NF-YA10, NF-YA3, NF-YA2, NF-YA5, SBTI1,
PIP1B, PAP17, DIC3, GPT2, JMT, AT2G37770, AT1G32900 and AT2G29670 gene
expression. NF-YA Proteins positively regulate flowering via FLOWERING LOCUS T
(Siriwardana et al., 2016), this suggests HEC1 may control flowering by regulating NF-
YA10, NF-YA3, NF-YA2 and NF-YA5 gene expression.
The PHB, PHV, REV, CUC1 and SPT gene expression fold change (hec1,2,3 vs. Col-0 and
pAlcA::HEC1+EtH vs. pAlcA::GUS+EtH) is presented in Figures 4.9B and C. No change in
PHB, PHV, REV, CUC1 and SPT gene expression was observed in hec1,2,3 Inflorescence
apices and pAlcA::HEC1 seedlings (hec1,2,3 vs. Col-0 and pAlcA::HEC1+EtH vs.
pAlcA::GUS+EtH, Fig 4.9B and C).
4.2.5.3 Summary
In summary, these results demonstrate that HEC1 does not regulate SPT gene expression
and SPT does not regulate IND and HEC1 gene expression. SPT and HEC1 do not regulate
CUC1 gene expression. This suggests that SPT and HEC1 were not required for IND
downregulation of CUC1 gene expression. Downregulation of PHB, PHV and REV in spt-
12 suggests that SPT may positively regulate PHB, PHV and REV.
4.2.6 35S:CUC1 and cuc1 microarray data analysis
In Arabidopsis, CUC genes prevent the fusion of cotyledons and are essential for the
formation of carpel margin meristems (CMMs) during fruit development (Kamiuchi et
al., 2014). cuc1 cuc2 double mutant fruits also often lack the repla in their upper parts
(Fig 4.7F) (Ishida et al., 2000; Kamiuchi et al., 2014). During embryogenesis, the KNOX I
protein STM positively regulates CUC gene expression and CUC1 also activates STM gene
expression (Aida et al., 1999; Spinelli et al., 2011). The STM expression in CMMs was
strictly dependent on CUC1 and CUC2 activity. This regulatory activity increases the

104
amount of the STM-RPL complex in CMMs and antagonises the valve/valve margin
factors (Kamiuchi et al., 2014). The results from section 4.2.4 show that the valve margin
factor IND downregulates CUC1 gene expression. It is not known if CUC1 can
downregulate IND gene expression. To test this, gene expression was analysed from
microarray datasets characterising cuc1 mutant (cuc1, Agilent Arabidopsis V3 (4x44k)
Microarray, n=3, GSE20705) and overexpression of CUC1 (35S::CUC1, Agilent
Arabidopsis 1 Microarray, n=2, GSE27482) (Koyama et al., 2010; Takeda et al., 2011).
The PHB, PHV and REV were also included in the analysis because section 4.2.3 shows
that PHB and REV upregulate CUC1. A list of differentially expressed genes is presented
in a table (Table 8.4). A total of 4648 genes were differentially expressed in cuc1
seedlings (cuc1 vs. Col-0) (FC >1.5 or <-1.5, p<0.05): 2319 genes were upregulated and
2329 genes were downregulated. A total of 326 genes were differentially expressed in
35S::CUC1 seedlings (35S::CUC1 vs. Ler) (FC >1 or <-1, p<0.05): 245 genes were
upregulated, and 81 genes were downregulated. cuc1 (GSE20705) data were compared
with 35S::CUC1 (GSE27482), and a Venn diagram was generated using VENNY 2.1. The
Venn diagram shows 4574 differentially expressed genes in cuc1 seedlings (cuc1 vs. Col-
0) labelled in the blue intersecting circle, 252 differentially expressed genes in 35S::CUC1
seedlings (35S::CUC1 vs. Ler) labelled in the yellow intersecting circle, and the
overlapping region shows 74 genes differentially regulated in both datasets (Fig 4.10A).
The PHB, PHV, REV, SPT, IND and HEC1 genes were not on that list.
However, STM expression was increased in 35S::CUC1 seedlings (35S::CUC1 vs. Ler,
p<0.05, Fig 4.10A) and this is consistent with previously published work (Kamiuchi et al.,
2014). Interestingly, RPL expression was also increased in 35S::CUC1 seedlings
(35S::CUC1 vs. Ler). This suggests that CUC1 upregulates RPL gene expression (p<0.05,
Fig 4.10A). GA3ox1 expression was increased in cuc1 seedlings (cuc1 vs. Col-0) and
decreased in 35S::CUC1 seedlings (35S::CUC1 vs. Ler). This suggests that CUC1
downregulates GA3ox1 gene expression (p<0.05, Fig 4.10A). In addition, genes BETA-
GLUCOSIDASE 1 (BGLU18), PROBABLE CARBOXYLESTERASE 13 (CXE13),
FERREDOXIN/THIOREDOXIN REDUCTASE SUBUNIT A2 (FTRA2), LOB DOMAIN-
CONTAINING PROTEIN 40 (LBD40), 26S PROTEASOME NON-ATPASE REGULATORY
SUBUNIT 4 HOMOLOG (MBP1), PROBABLE INACTIVE PURPLE ACID PHOSPHATASE 1
(PAP1), PROBABLE PEROXYGENASE 3 (RD20), and RAN-BINDING PROTEIN 1 HOMOLOG

105
A (SIRANBP) were upregulated in cuc1 seedlings (cuc1 vs. Col-0) and downregulated in
35S::CUC1 seedlings (35S::CUC1 vs. Ler). This suggests CUC1 may negatively regulate
BGLU18, CXE13, FTRA2, LBD40, MBP1, PAP1, RD20, and SIRANBP gene expression.
Alternatively, genes PROBABLE ACYL-ACTIVATING ENZYME 17 (AAE17), CASEIN KINASE
II SUBUNIT ALPHA-3 (CKA3), CYSTEINE-RICH RECEPTOR-LIKE PROTEIN KINASE 10
(CRK10), CDPK-RELATED KINASE 3 (CRK3), PROTEIN EARLY RESPONSIVE TO
DEHYDRATION 15 (ERD15), ENT-KAURENOIC ACID OXIDASE 2 (KAO2), INOSITOL
TRANSPORTER 1 (INT1), TRANSCRIPTION FACTOR PIF3 (PIF3) and SMALL AUXIN
UPREGULATED RNA 1 (SAUR1) were downregulated in cuc1 seedlings (cuc1 vs. Col-0)
and upregulated in 35S::CUC1 seedlings (35S::CUC1 vs. Ler). This suggests CUC1 may
positively regulate AAE17, CKA3, CRK10, CRK3, ERD15, KAO2, INT1, PIF3 and SAUR1 gene
expression. PIF3 controls hypocotyl and cotyledon development by regulating
photoinduced signal transduction (Kim et al., 2003a; Ni et al., 1998), this suggests CUC1
may possibly regulate cotyledon development via controlling PIF3 gene expression.
SAUR1 an auxin responsive gene which is induced with auxin treatment (Goda et al.,
2008; Goda et al., 2004), this suggests CUC1 may possibly regulate auxin responses. The
PHB, PHV, REV, SPT, IND and HEC1 gene expression fold change (cuc1 vs. Col-0 and
35S::CUC1 vs. Ler) is presented in Figures 4.10B and C. The PHB and PHV expression was
significantly decreased in cuc-1 seedlings (cuc1 vs. Col-0, p<0.05, Fig 4.10B). No change
in REV, SPT, IND and HEC1 gene expression was observed in cuc-1 seedlings (cuc1 vs.
Col-0, Fig 4.10B). REV expression was two-fold increased but this was not significant, and
no change in PHB or PHV gene expression was observed in 35S::CUC1 seedlings
(35S::CUC1 vs. Ler, Fig 4.10C).
In summary, these results demonstrate that CUC1 does not directly regulate IND gene
expression. Downregulation of PHB and PHV in cuc1 suggests that CUC1 may positively
regulate PHB and PHV in seedlings. STM and RPL expression was increased in 35S::CUC1
seedlings, which suggests that CUC1 may positively regulate replum by directly
promoting STM-RPL in CMMs. GA3ox1 positively regulates gibberellin biosynthesis
(Arnaud et al., 2010; Talon et al., 1990). GA3ox1 gene expression was increased in cuc1
seedlings and decreased in 35S::CUC1 seedlings. This demonstrates CUC1 may inhibit
gibberellin biosynthesis by downregulating GA3ox1.

106
Figure 4.10 35S::CUC1 and cuc1 microarray. (A) The overlapping region of Venn diagram shows
74 genes differentially expressed in both cuc1 seedlings (p<0.05, cuc1 vs. Col-0) and 35S:CUC1
seedlings (p<0.05, 35S::CUC1 vs. Ler). (B) The bar chart shows PHB, PHV, REV, SPT, HEC1 and IND
gene expression in cuc1 seedlings (cuc1 vs. Col-0), * denotes significance. (C) The bar chart shows
PHB, PHV and REV gene expression in 35S::CUC1 seedlings (35S::CUC1 vs. Ler). Unpaired t-test
*p<0.05, Gene Fold Change (linear) >1 or <-1, Blue: decreased gene expression, Red: increased
gene expression.

107
Figure 4.11 The cuc1 cuc2, ago10 (zwl-3) and rpl-1 fruit phenotype images from this study and
(Ishida et al., 2000; Roeder et al., 2003). (A) cuc1 cuc2 fruit image show small replum (sp). (B)
ago10zwl-3 fruit image show small replum. (C) rpl-1 fruit image show small replum (Black arrow).
(D) Cross-section of the wild type replum region showing replum (R), lignified layer (LL) at the
valve margins (VM). AGO10, RPL, CUC1 and CUC2 inhibit valve margin factors and promote
replum development. V= valves

108
4.3 Discussion
4.3.1 AGO10 regulates auxin responses
In Arabidopsis, PIN1 and PID proteins regulate auxin transport and they are important
for proper meristem and leaf development (Heisler et al., 2005; Huang et al., 2010;
Larsson et al., 2014). Auxin transport rapidly and dynamically relocalises auxin in plant
tissues to form auxin maxima (Larsson et al., 2014; Sorefan et al., 2009a). Auxin maxima
in the SAM promote the formation of leaf primordia and auxin minima establish the
boundary between the SAM and leaf primordia, which is also known as organ separation
(Aida et al., 2002; Christensen et al., 2000; Furutani et al., 2004; Heisler et al., 2005).
Multiple studies have demonstrated that pin1, pid and cuc mutants produce cup and pin
shaped phenotypes (Aida et al., 1997; Aida et al., 1999; Aida et al., 2002; Furutani et al.,
2004; Hibara et al., 2006). The CUP and PIN phenotypes were also observed in phb rev
and ago10zwl-3 mutants, suggesting that the AGO10-HD-ZIPIII pathway regulates auxin
responses (Moussian et al., 2003; Moussian et al., 1998; Prigge et al., 2005). Several lines
of evidence support this hypothesis. A study by Heisler et al. showed that the expression
pattern of the REV gene (pREV::REV-VENUS) coincides with the pattern of auxin
distribution and auxin transport (DR5::GFP, pPIN1::PIN1-GFP) (Heisler et al., 2005).
Interestingly, a study by Reinhart et al. reported that REV (GR-REV) overexpression
upregulated the auxin biosynthesis genes YUC5 and TAA1, suggesting that REV promotes
auxin biosynthesis (Reinhart et al., 2013). Therefore, loss of rev function may cause CUP
and PIN shaped phenotypes by disrupting auxin biosynthesis and auxin distribution. The
data presented in this chapter show that YUC1, PIN, and PID expression are reduced in
zwl-3 (CUP and PIN) and ind-6 zwl-3 (CUP and PIN) mutants (Fig 4.2 and 4.3B). Since REV
expression is reduced in ago10 and ind6 zwl-3 (CUP and PIN) mutants it is plausible that
the CUP and PIN phenotypes are the results of a loss in rev dependent auxin responses.
4.3.2 AGO10 regulates cytokinin responses
Cytokinin is an important regulator of meristem development. ARR7 is the main
response gene of cytokinin signalling and is often used as a marker of cytokinin
responses. For example, overexpression of ARR7 suppresses shoot regeneration
(Buechel et al., 2010) and constitutive expression of ARR7 (35S::ARR7) also results in the
PIN phenotype, which is reminiscent of the zwl-3 PIN and ind-6 zwl-3 PIN (Leibfried et

109
al., 2005; Zhao et al., 2010). Cytokinin and auxin signalling are also integrated via ARR7.
Auxin downregulates expression of ARR7. Zhao et al. also observed an increase in ARR7
expression in the SAM of the yuc, pin1, pid mutants as well as plants treated with auxin
transport inhibitor N-1-naphthylphthalamic acid (NPA) (Zhao et al., 2010). This
demonstrates that ARR7 activation can be directly induced by the loss of local auxin
accumulation. Results from this chapter also report an increase in ARR7 gene expression
in zwl-3 (CUP and PIN) and ind-6 zwl-3 (CUP and PIN) phenotypes (Fig 4.2). Since ARR7
is thought to be a negative regulator of cytokinin signalling, the cup and pin phenotypes
of ago10zwl-3 mutants may be caused by reduced cytokinin signalling.
4.3.3 Understanding the role of miR164a-c in ago10 mutants
In Arabidopsis, CUC1, CUC2, and CUC3 genes regulate organ separation and SAM
development. The loss of CUC promotes organ fusion and produces fused CUP shaped
cotyledons (Aida et al., 1997; Aida et al., 1999; Aida et al., 2002; Furutani et al., 2004;
Hibara et al., 2006; Takada et al., 2001). The fused CUP shaped leaves of zwl-3 and ind-
6 zwl-3 mutants look similar to cuc mutant CUP shaped cotyledons. The analysis in this
chapter also found decreased expression of CUC1, CUC2, and CUC3 in zwl-3 and
decreased expression of CUC2 and CUC3 in ind-6 zwl-3 (Fig 4.3A). The fused CUP shaped
leaf of zwl-3 may be a result of the decreased CUC1/2/3 expression. Multiple studies
have shown that miR164 targets CUC1 and CUC2 transcripts (Hasson et al., 2011; Laufs
et al., 2004; Sieber et al., 2007; Spinelli et al., 2011), and overexpression of miR164 in
the tomato and Arabidopsis plants affects leaf and floral organ development by
promoting organ fusion (Rosas Cárdenas et al., 2017). However, results from this
chapter suggest that a decrease in CUC expression in zwl-3 and ind-6 zwl-3 seedlings is
probably not caused through misregulation of miR164a-c. We found miR164a-c
expression was significantly decreased in ind-6 zwl-3 seedlings, which would be
expected to cause an increase in CUC expression (Fig 4.4A and B). It is not known how
the loss of IND in ind-6 zwl-3 seedlings can result in significant reduction of miR164a-c,
but this is probably not due to changes in AGO10 levels because miR164 does not bind
AGO10. Possibly, the decrease in miR164a-c levels in ind-6 zwl-3 mutants represents a
negative feedback response to maintain CUC expression.

110
4.3.4 Understanding the role of IND-CUC1 in ago10 mutants
Similar to cuc pin1 mutants (Furutani et al., 2004), overexpression of IND produces PIN
and CUP shaped leaves (Chapter 3). To this effect, results from ChIP experiments
presented in Section 4.2.4 show that IND can bind to the CUC1 promoter and
downregulate CUC1 gene expression (Fig 4.6). In addition, a study by Sorefan et al.
demonstrated that IND promotes auxin minima by downregulation of PIN1 and PID
(Sorefan et al., 2009a). This suggests that IND repress CUC1 and PIN1 expression and
may impair SAM and leaf development. The analysis in this chapter and Chapter 3 also
found increased expression of IND and decreased expression of CUC1 in zwl-3. The
increased IND expression and decreased CUC1 gene expression pattern coincides with
an increase in the zwl-3 PIN phenotype (Fig 4.1E and 4.3A). The loss of IND and normal
CUC1 gene expression patterns coincide with decreased ind-6 zwl-3 PIN phenotype (Fig
4.1E and 4.3A). From this, we can draw that IND may negatively regulate PIN1, PID, and
CUC1 in zwl-3 and may promote CUP and PIN phenotypes. However, IND does not
regulate CUC2 and CUC3 gene expression. The decreased expression of CUC2 and CUC3
in zwl-3 and ind-6 zwl-3 may be the result of a loss in rev dependent auxin responses.
Results from Section 4.2.3 show that AGO10 may positively regulate CUC1 via PHB and
REV (Fig 4.5). AGO10 may also regulate STM via CUC1 because CUC1 promotes STM
expression (Aida et al., 1999; Spinelli et al., 2011). However, STM also promotes AGO10
to maintain central meristem cells (Endrizzi et al., 1996). These data, in agreement with
our results, suggest that AGO10 represses IND gene expression via HD-ZIP III to regulate
CUC1 expression and to promote SAM development (Fig 4.12).
4.3.5 Understanding the role of IND-CUC1 in gynoecium development
During fruit development, CUC1 and CUC2 are expressed in the septum of gynoecium
(expressed from stage 7) (Ishida et al., 2000). CUC1 and CUC2 are required for the
septum and replum formation and overexpression of CUC prevents apical carpel fusion
(Ishida et al., 2000; Kamiuchi et al., 2014; Nahar et al., 2012) (Fig 4.7D and E, 4.11A). A
different study showed that SPT could negatively regulate CUC1 and CUC2 expression to
promote carpel fusion in the apical gynoecium (Nahar et al., 2012). The results from this
chapter suggest that SPT does not directly regulate CUC1 gene expression (Fig 4.8).

111
However, SPT and IND interaction is crucial for carpel fusion in the apical gynoecium
(Girin et al., 2011). Therefore, IND may be repressing CUC1 expression.
However in the medial tissue, CUC1 promotes STM expression and acts upstream of STM
in replum formation (Kamiuchi et al., 2014). Interestingly, STM also physically interacts
with the replum factor RPL (Byrne et al., 2003). The results from this chapter
demonstrate that CUC1 significantly upregulates STM and RPL gene expression (Fig
4.10A). From this, we can draw that CUC1 may promote replum formation by
upregulating STM and RPL and possibly by promoting their interaction in carpel margin
meristems. RPL promotes replum development by inhibiting valve margin factors
(Roeder et al., 2003). Since CUC1 does not regulate IND and SPT gene expression (Fig
4.10), CUC1 may inhibit the valve margin factors SPT and IND via STM and RPL. In
Arabidopsis, gibberellins promote differentiation of fruit valve margins (Arnaud et al.,
2010). The results from this chapter demonstrate that CUC1 may negatively regulate
gibberellin biosynthesis by downregulating GA3ox1 gene expression (Fig 4.10A).
Interestingly, GA3ox1 is a direct target of IND because IND directly upregulates GA3ox1
gene expression (Arnaud et al., 2010). Taken together, these studies indicate that CUC1
may inhibit valve margin development (Fig 4.11D), SPT and IND may inhibit CUC1 to
promote valve margin development. Similar to CUC1, CUC2 and RPL, AGO10 is also
essential for replum and septum development (Fig 4.11) (Lynn et al., 1999). In addition,
results from Chapter 3 and other published work demonstrate that AGO10 and RPL
inhibit the valve margin factor IND (Roeder et al., 2003). These studies suggest that
AGO10 may inhibit IND and promote replum development by upregulating CUC1
expression (Fig 4.12).
4.3.6 Conclusion
This chapter demonstrates that zwl-3 (CUP and PIN) and ind-6 zwl-3 (CUP and PIN)
phenotypes are defective in auxin and cytokinin signalling. In particular, a decrease in
PIN1, PID, and CUC1/2/3 gene expression may promote CUP and PIN phenotypes.
Similar to PIN1 and PID, we found that IND can directly downregulate CUC1 gene
expression and may promote CUP and PIN phenotypes in zwl-3. Since AGO10
upregulates CUC1 and downregulates IND via PHB and REV, AGO10 may inhibit IND to
promote CUC1 gene expression and thus coordinate SAM and leaf development (Fig

112
4.12). In addition, CUC1 may promote replum development by upregulating RPL-STM
and may negatively regulate valve margin genes via RPL-STM. Together these studies
suggest that AGO10-IND-CUC1 may regulate both SAM and replum development.
Figure 4.12 Schematic representation of the AGO10-PHB-REV-IND-CUC1 signalling cascade.

113
Chapter 5 Auxin and cytokinin control
IND regulated gene
expression

114
CHAPTER 5. Auxin and cytokinin control IND regulated gene expression
5.1 Introduction
The yin and yang of auxin and cytokinin hormones can control gynoecium and SAM
patterning. Polar auxin transport is essential for the radialisation process and medial
versus lateral tissue specification in Arabidopsis gynoecia (Larsson et al., 2014;
Moubayidin and Ostergaard, 2014; Nole-Wilson et al., 2010). Cytokinin signalling is
essential for carpel margin meristem (CMM) growth and carpel fusion in Arabidopsis
gynoecia (Reyes-Olalde et al., 2017; Schuster et al., 2015). Interestingly, a recent study
showed that SPT can regulate cytokinin signalling as well as auxin biosynthesis in
Arabidopsis gynoecia. SPT enables cytokinin signalling by regulating ARR1, and both
activate auxin biosynthesis via TAA1 and auxin transport via PIN3 at the medial domain
of the gynoecium (Reyes-Olalde et al., 2017). PIN1 proteins regulate auxin flux from the
base to the top of the developing gynoecium. Apical PIN localisation at the plasma
membrane is regulated by PID, and lateral PIN localisation at the plasma membrane is
regulated by SERINE/THREONINE-PROTEIN KINASE 2 (WAG2) (Moubayidin and
Ostergaard, 2014; Sorefan et al., 2009a). SPT also interacts with IND and HEC1 to control
polar auxin transport (Girin et al., 2011; Schuster et al., 2015). SPT-HEC1 promotes auxin
transport by directly inducing PIN1 expression in the lateral part of gynoecia (Schuster
et al., 2015) and SPT-IND regulates auxin transport by repressing PID expression and
inducing WAG2 expression in the valve margins as well as in the gynoecium apex (Girin
et al., 2011; Sorefan et al., 2009a).
Interestingly, auxin also limits HEC and SPT activity through ETT function (Gremski et al.,
2007; Heisler et al., 2001; Nemhauser et al., 2000; Schuster et al., 2015). ETT expression
is specific to the adaxial domain at an early stage of gynoecium development. Loss of
ETT results is abnormal patterning of gynoecium (Sessions et al., 1997; Sessions and
Zambryski, 1995). Similar to SPT-IND, ETT and IND also regulate carpel development by
repressing PID expression (Girin et al., 2011; Simonini et al., 2016). Interestingly, ETT and
IND most likely heterodimerise to repress PID expression. Simonini et al. demonstrated
that ETT and IND proteins interact in an IAA-sensitive manner. This suggests that auxin
can influence IND targeted gene expression. A recent study also showed that cytokinin

115
can rescue valve margin formation in an ind mutant (Marsch-Martinez et al., 2012).
These studies demonstrate that auxin-cytokinin and IND-SPT-HEC1 activities are coupled
together in controlling gynoecium development.
As in gynoecium development, cytokinin and SPT-HEC1 functions are coupled together
in controlling SAM development. Cytokinin regulates the size of the SAM by controlling
stem cell proliferation, and cytokinin signalling can also control phyllotaxis via AHP6
(Besnard et al., 2014). HEC1 and SPT are also expressed in the centre of the SAM.
Schuster et al. demonstrated that HEC1-SPT can regulate the size of SAM (Schuster et
al., 2014). HEC1 also promotes stem cell proliferation in the SAM by regulating cytokinin
signalling (Schuster et al., 2014). Cytokinin promotes valve margin formation, but we do
not know if cytokinin can regulate IND in the SAM.
Polar auxin transport between leaf primordia and the SAM contributes to establishing
leaf polarity. Loss of auxin transport can lead to leaf polarity defects (Qi et al., 2014). A
recent study demonstrated that PIN1-dependent auxin efflux can play a role in the
formation of the auxin minimum at the leaf axil. This is important for axillary meristem
initiation (Wang et al., 2014). Interestingly, IND also regulates auxin minimum formation
in the fruit valve margin via PID and WAG2 expression (Sorefan et al., 2009a). Since
AGO10 negatively regulates IND in the SAM (Chapter 3 and 4), IND may possibly interact
with ETT to regulate auxin minima in the leaf (abaxial). Similar to gynoecia, auxin may
influence IND-ETT activity in the leaf (abaxial). Since HEC1 is not expressed in leaf
primordia, this suggests that ETT may be repressing HEC1 expression in leaf primordia.
Since auxin and cytokinin are key regulators of SAM and leaf development, it is
important to understand the bigger role of IND in SAM and leaf development. This can
be investigated by studying IND-regulated gene regulatory networks on their own as
well as in the presence of auxin and cytokinin. In this chapter, how auxin and cytokinin
can influence IND in regulating target gene networks will be examined.

116
5.2 Results
Descriptors used for microarray sample comparison: DMSO was used as a vehicle
control, DEX was used to induce IND (IND), IAA is an auxin (AUX), and BAP is a cytokinin
(CYT). DEX was compared with DMSO (DEX vs. DMSO), DEX plus IAA was compared with
IAA (DEX+AUX vs. AUX), and DEX plus BAP was compared with BAP (DEX+BAP vs. BAP).
5.2.1 Microarray analysis of IND-regulated genes
5.2.1.1 Differential gene expression analysis
We have shown that IND regulates several genes associated with SAM development,
however it is not known whether IND can affect other gene networks (Arnaud et al.,
2010; Girin et al., 2011; Liljegren et al., 2004a; Moubayidin and Ostergaard, 2014;
Simonini et al., 2016; Sorefan et al., 2009a). Therefore we investigated the effect of
upregulating IND on global gene expression changes using microarray analysis. For the
microarray, total RNA was isolated from 35S::IND:GR seedlings (7DAG), which were
treated with either 10 µM DEX or DMSO for 6 hours in liquid media (n=3). Quality control
and microarray hybridisation (Arabidopsis Gene 1.0 ST Array, Thermofisher, 901915;
previously known as an Affymetrix array) was performed at the University of Sheffield
core facility for microarray and next-generation sequencing. Arabidopsis Gene 1.0 ST
Array CEL files were processed and normalised using Affymetrix® Expression Console™
software. Affymetrix® Transcriptome Analysis Console (TAC) software was used to
perform differential gene expression analysis.
Genes were considered to be differentially expressed if the per-gene variance with p-
value was below 0.05 and the linear fold change was greater than 1.5 or below -1.5
compared to control seedlings. A total of 921 genes were significantly differentially
expressed in 35S::IND:GR seedlings (DEX vs. DMSO, FC >1.5 or <-1.5, p<0.05): 339 genes
were upregulated, and 582 genes were downregulated (Fig 5.1). The heat map shows
the top 30 differentially expressed genes (Fig 5.1). For example the SENESCENCE-
ASSOCIATED GENE 29 (SAG29, AT5G13170) was thirteen fold highly upregulated in
35S::IND:GR seedlings (Fig 5.1). IND Arabidopsis Gene 1.0 ST microarray data was also
validated using qRT-PCR, and a list of differentially expressed genes was summarised in

117
a table (Table 8.5 and 8.6). Out of 36, 24 genes broadly showed similar expression in
microarray analysis and qRT-PCR experiments (Table 8.5, Pearson correlation coefficient
(r): 0.85).
We compared our microarray results with a published IND overexpression and induction
dataset to validate our analysis and identify genes that are regulated over time (Table
8.7). The Voinnet et al. (2011) microarray used 35S::IND:GR seedlings but induced IND
for 24 hours. This study was published in array express (10 µM DEX-induced vs. non-
induced, Arabidopsis thaliana 34.6K CATMA_v5 microarray, E-GEOD-28898). To identify
co-regulated genes, 35S::IND:GR (induced for 6 hours) data were compared with
35S::IND:GR (induced for 24 hours). A Venn diagram of genes from the two datasets was
generated using VENNY 2.1 (Fig 5.2A). The Venn diagram shows 2869 (50%) differentially
expressed genes in 35S::IND:GR seedlings (induced for 6 hours, DEX vs. DMSO, FC >1 or
<-1, p<0.05) labelled in the blue intersecting circle, 2121 (37%) differentially expressed
genes in 35S::IND:GR seedlings (induced for 24 hours, DEX vs. DMSO, FC >1 or <-1,
p<0.05) labelled in the yellow intersecting circle, and the overlapping region shows 746
(13%) genes co-regulated or differentially regulated in both datasets (Fig 5.2A). In the
overlapping gene list, 671 genes were co-regulated (Pearson correlation coefficient (r):
0.9) and 75 genes were differentially regulated (Pearson correlation coefficient (r): -0.9).
This shows that around 13% of genes were regulated by IND overexpression at 6hrs and
24hrs.
We selected several genes that were shown to be regulated by IND (induced for 6 and
24 hours). An expression profile of these genes were presented in a heat map (Fig 5.2B).
At 6 hours and 24 hours the expression of SAG29, GIBBERELLIN 3-BETA-DIOXYGENASE 1
(GA3ox1) and SPT were similar, and this suggests that IND targets SAG29, GA3ox1 and
SPT (Fig 5.2B). The GA3ox1 and SPT expression patterns were consistent with previously
published work (Arnaud et al., 2010; Girin et al., 2011; Groszmann et al., 2010). The HD-
ZIP I gene HOMEOBOX 12 (HB-12) regulates leaf growth by promoting cell expansion and
endoreduplication (Hur et al., 2015). When compared to 6 hours, HB-12 was 2-fold
downregulated in 24 hours (Fig 5.2B). When compared to 6 hours, leaf polarity genes
PHB, KAN2, ARF4, and AS1 were more upregulated. In particular, WUS related homeobox
1 (WOX1) was 6.2 fold highly upregulated at 24 hours (Fig 5.2B). WOX1 promotes margin

118
formation at the adaxial-abaxial boundary and overexpression of WOX1 negatively
regulate SAM development possibly by polyamine homeostasis or regulating CLV3
expression (Nakata et al., 2012; Nakata and Okada, 2012; Zhang et al., 2011b). This
suggests that IND may negatively regulate leaf growth and SAM development by
downregulating HB-12 and upregulating WOX1.
When compared to 6 hours, TCP5 (TEOSINTE BRANCHED 1, cycloidea and PCF
transcription factor 5) was 2-fold upregulated in 24 hours (Fig 5.2B). A study by Koyama
et al. showed that TCP3 transcription factors negatively regulate CUC by directly
activating expression of AS1 and miR164 (Koyama et al., 2010). TCP3, TCP8, TCP11 and
TCP14 were also upregulated in 35S::IND:GR seedlings in both datasets (DEX vs. DMSO,
p<0.05, Fig 5.2C). Data from Chapter 4 suggests that IND directly downregulates CUC1
gene expression and IND may also downregulate CUC1 via the TCP pathway (Fig 5.2D).
CUC1/2/3 genes were not differentially expressed in 35S::IND:GR seedlings at 6 and 24
hours in the microarray datasets (Table 8.5), therefore IND downregulation of CUC1 may
not be an immediate response.

119
Figure 5.1 35S::IND:GR (DEX vs. DMSO) differential gene expression. Scatter plot showing
Tukey's bi-weight average signal (log2) of 10µM Dexamethasone (DEX) and DMSO treated
35S::IND:GR samples: 339 genes were upregulated (Red), and 582 genes were downregulated
(Green) in DEX vs. DMSO (the smaller p-value, the bigger the X). Heat map of top 30 differentially
regulated genes in DEX vs. DMSO (One-Way ANOVA p<0.05, Gene Fold Change (linear) >1.5 or
<-1.5). (Blue: low gene expression, Red: high gene expression).

120
Figure 5.2 Comparative analysis of 35S::IND:GR microarray data (induced for 6 hours and 24
hours). (A) The overlapping region of the Venn diagram shows 746 genes were expressed in
35S::IND:GR seedlings (induced for 6 hours, DEX vs. DMSO, FC >1 or <-1, p<0.05) and 35S::IND:GR
seedlings (induced for 24 hours, DEX vs. DMSO, FC >1 or <-1, p<0.05). (B) The heatmap shows
selected genes from the overlapping gene list, which were differentially expressed following 6
hours of IND induction (DEX vs. DMSO) and 24 hours (DEX vs. DMSO). (C) The bar chart shows
TCP3, TCP5, TCP8, TCP11 and TCP14 gene expression in 35S::IND:GR seedlings (6 hours
induction, DEX vs. DMSO). (D) Pathway showing that IND may downregulate CUC by
upregulating TCP-AS1. (Blue: low gene expression, Red: high gene expression)

121
Figure 5.3 35S::IND:GR (DEX vs. DMSO) Arabidopsis biological process gene-set enrichment
analysis (GSEA). Cytoscape generated GSEA data of 35S::IND:GR treated with DEX and DMSO
showing significantly (p<0.05) enriched gene-sets (Blue - negatively enriched; Red - positively
enriched). Closely related gene-sets are connected by a green line. Gene sets for gibberellin
biosynthetic process, pollen tube, cell wall modification and asymmetric cell division sets were
positively enriched in DEX treated 35S::IND:GR seedlings. Gene sets for defence response,
ethylene, salicylic acid, jasmonic acid, abscisic acid and ion transport signalling sets were
negatively enriched in DEX treated 35S::IND:GR seedlings.

122
5.2.1.2 Gene-set enrichment analysis (GSEA)
We use GSEA to understand which pathways are regulated by IND overexpression. GSEA
is a powerful analytical tool used to study groups of genes or proteins that share
common biological function, protein domain, chromosomal location, or regulation in
large datasets (Subramanian et al., 2007; Subramanian et al., 2005). For analysis, specific
data is required, namely expression datasets, phenotype labels (e.g., control vs.
treated), gene sets, and annotations. There are only a few pre-made gene sets in GSEA
database, and Arabidopsis gene sets are not available in the GSEA database. Yi et al.
created an Arabidopsis GSEA gene set database in 2013, however it is outdated (Yi et al.,
2013). We took the initiative to create an Arabidopsis gene set GSEA library file based
on biological function and protein family in collaboration with Matthew Parker, (UoS,
data not shown). We analysed Arabidopsis GO annotation files from the Gene Ontology
Consortium to create an Arabidopsis gene set GSEA library file. Arabidopsis Gene 1.0 ST
microarray expression data sets (6 hours, DEX vs. DMSO), Arabidopsis biological function
gene, set GSEA library file, and phenotype label (DEX vs. DMSO) were used for GSEA
analysis. Analysed data was exported to Cytoscape for analysis and visualisation (Fig
5.3). When compared to DMSO, 35 gene sets were positively enriched and 147 gene sets
were negatively enriched in DEX (p<0.05, Fig 5.3, Table 5.1). Significantly enriched gene
sets were summarised in a table (Table 8.10). When compared to DMSO, gene sets for
the gibberellin biosynthetic process, pollen tubes, cell wall modification and asymmetric
cell division were positively enriched in DEX (p<0.05, Fig 5.3). Consistently, these
positively enriched IND biological functions are also reported in different studies
(Arnaud et al., 2010; Kay et al., 2013a; Mitsuda and Ohme-Takagi, 2008; Ogawa et al.,
2009; Wu et al., 2006). When compared to DMSO, signalling gene sets for defence
response, ethylene, salicylic acid, jasmonic acid, abscisic acid and ion transport were
negatively enriched in DEX (p<0.05, Fig 5.3). GSEA results suggest that IND may possibly
regulate hormone signalling (gibberellin, ethylene, salicylic acid, jasmonic acid and
abscisic acid).
5.2.1.3 Induction of IND for 24 hours can affect meristem gene expression
Since overexpression of IND promotes leaf polarity defects (Chapter 3), it is important
to understand whether IND regulates any meristem gene sets. GSEA analysis showed
that meristem maintenance and meristem initiation gene sets were not significantly
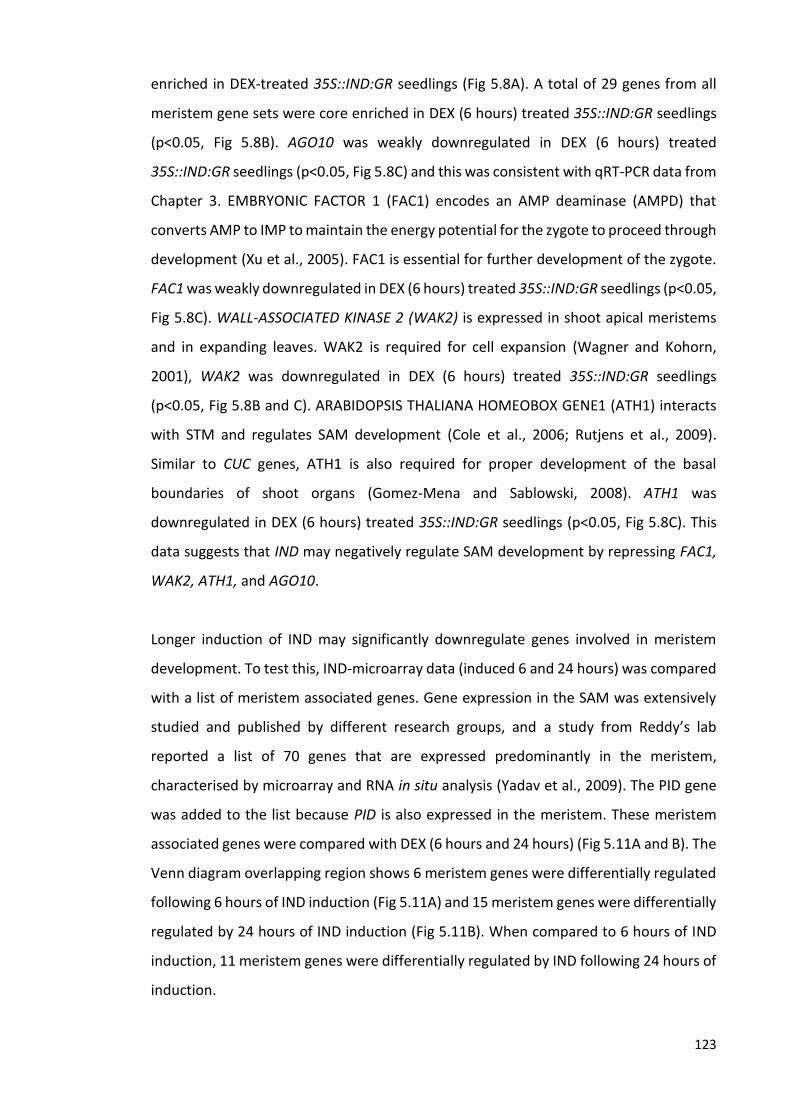
123
enriched in DEX-treated 35S::IND:GR seedlings (Fig 5.8A). A total of 29 genes from all
meristem gene sets were core enriched in DEX (6 hours) treated 35S::IND:GR seedlings
(p<0.05, Fig 5.8B). AGO10 was weakly downregulated in DEX (6 hours) treated
35S::IND:GR seedlings (p<0.05, Fig 5.8C) and this was consistent with qRT-PCR data from
Chapter 3. EMBRYONIC FACTOR 1 (FAC1) encodes an AMP deaminase (AMPD) that
converts AMP to IMP to maintain the energy potential for the zygote to proceed through
development (Xu et al., 2005). FAC1 is essential for further development of the zygote.
FAC1 was weakly downregulated in DEX (6 hours) treated 35S::IND:GR seedlings (p<0.05,
Fig 5.8C). WALL-ASSOCIATED KINASE 2 (WAK2) is expressed in shoot apical meristems
and in expanding leaves. WAK2 is required for cell expansion (Wagner and Kohorn,
2001), WAK2 was downregulated in DEX (6 hours) treated 35S::IND:GR seedlings
(p<0.05, Fig 5.8B and C). ARABIDOPSIS THALIANA HOMEOBOX GENE1 (ATH1) interacts
with STM and regulates SAM development (Cole et al., 2006; Rutjens et al., 2009).
Similar to CUC genes, ATH1 is also required for proper development of the basal
boundaries of shoot organs (Gomez-Mena and Sablowski, 2008). ATH1 was
downregulated in DEX (6 hours) treated 35S::IND:GR seedlings (p<0.05, Fig 5.8C). This
data suggests that IND may negatively regulate SAM development by repressing FAC1,
WAK2, ATH1, and AGO10.
Longer induction of IND may significantly downregulate genes involved in meristem
development. To test this, IND-microarray data (induced 6 and 24 hours) was compared
with a list of meristem associated genes. Gene expression in the SAM was extensively
studied and published by different research groups, and a study from Reddy’s lab
reported a list of 70 genes that are expressed predominantly in the meristem,
characterised by microarray and RNA in situ analysis (Yadav et al., 2009). The PID gene
was added to the list because PID is also expressed in the meristem. These meristem
associated genes were compared with DEX (6 hours and 24 hours) (Fig 5.11A and B). The
Venn diagram overlapping region shows 6 meristem genes were differentially regulated
following 6 hours of IND induction (Fig 5.11A) and 15 meristem genes were differentially
regulated by 24 hours of IND induction (Fig 5.11B). When compared to 6 hours of IND
induction, 11 meristem genes were differentially regulated by IND following 24 hours of
induction.

124
Here we summarise the expression changes of the 15 genes that were differentially
regulated at either 6hrs and/or 24hrs. ULTRAPETALA1 (ULT1) gene controls shoot size
and also regulates floral meristem by promoting AGAMOUS (AG) (Engelhorn et al., 2014;
Fletcher, 2001). ULT1 also promotes apical polarity by negatively regulating SPT in
gynoecium (Pires et al., 2014). ULT1 and SPT were upregulated by IND following both 6
and 24 hours of induction (Fig 5.14E). LATE MERISTEM IDENTITY1/ HOMEOBOX 51
(HB51) is a meristem identity regulator (Saddic et al., 2006), which was upregulated by
IND following both 6 and 24 hours of induction (Fig 5.11E). HOMEODOMAIN GLABROUS2
(HDG2) is one of the key regulators of stomatal differentiation (Peterson et al., 2013).
HDG2 was upregulated by IND following 6 hours of induction (Fig 5.11E). PHB and AS1
were both upregulated by IND following 24 hours of induction (Fig 5.2B, Fig 5.11E) (these
genes were also discussed in the previous section). CHOLINE KINASES (CK) regulate
phospholipid biosynthesis in Arabidopsis (Lin et al., 2015; Tasseva et al., 2004): CK3 was
downregulated by IND following both 6 and 24 hours of induction (Fig 5.11E). Lipid
transport gene AT3G53980 was downregulated by IND following 24 hours of induction
(Fig 5.11E). Sucrose transporter gene SWEET10 was also downregulated by IND
following 24 hours of induction (Fig 5.11E). TERMINAL FLOWER1 (TFL1) is a key regulator
of the development of the inflorescence meristem (Liljegren et al., 1999), TFL1 was
downregulated by IND following 24 hours of induction (Fig 5.11E). GIBBERELLIN 3-
OXIDASE 3 (GA3ox3) is one of the key oxidase enzymes in the biosynthesis of gibberellin
(Hu et al., 2008). GA3ox3 was downregulated by IND following 24 hours of induction (Fig
5.11E). PID kinase regulates proper auxin distribution via PIN proteins (Friml et al., 2004).
PID was downregulated by IND following both 6 and 24 hours (Fig 5.11E) and this result
is consistent with previously published work (Sorefan et al., 2009a). AINTEGUMENTA-
like 5 (AIL5) and (AIL7) proteins control phyllotaxis, and they are required to maintain
PIN1 expression at the periphery of the meristem (Pinon et al., 2013; Prasad et al., 2011),
AIL5 and AIL7 were downregulated by IND following 24 hours of induction (Fig 5.11E).
G-BOX BINDING FACTOR 6 (GBF6) transcription factor recruits the histone acetylation
machinery to activate auxin-induced transcription (Weiste and Droge-Laser, 2014), GBF6
was downregulated by IND following 24 hours of induction (Fig 5.11E). DWARF IN LIGHT
1 (DFL1) belongs to the auxin-inducible gene family. DFL1 regulates hypocotyl elongation
(Nakazawa et al., 2001), DFL1 was downregulated by IND following 24 hours of induction
(Fig 5.11E). These results suggest that longer induction of IND may inhibit PAT and auxin

125
signalling by repressing PID, AIL5, AIL7, and GBF6. These represent genes that are either
regulated by IND over a long time period or are genes that function indirectly after IND
induction and have functions later in meristem development.
5.2.1.4 IND regulates genes involved in hormone biosynthesis
Results from GSEA analysis show that IND may regulate hormone signalling (gibberellin,
ethylene, salicylic acid, jasmonic acid and abscisic acid). Since IND regulates gibberellin
biosynthesis via GA3ox1, IND may also regulate other genes involved in hormone
biosynthesis. To test this, gene expression of genes involved in hormone biosynthesis
were examined in 35S::IND:GR seedlings following 6 hours of induction, DEX vs. DMSO,
p<0.05, Fig 5.4).
Gibberellin biosynthesis: GA3ox1 is involved in the production of bioactive gibberellin
(GA) (Talon et al., 1990). GA3ox1 was upregulated in 35S::IND:GR seedlings (DEX vs.
DMSO, p<0.05, Fig 5.4).
Auxin biosynthesis: L-TRYPTOPHAN-PYRUVATE AMINOTRANSFERASE 1 (TAA1) is
involved in auxin (IAA) biosynthesis. TAA1 can convert L-tryptophan and pyruvate to
indole-3-pyruvic acid (IPA) and alanine (Stepanova et al., 2008; Tao et al., 2008). Indole-
3-pyruvate monooxygenase YUCCA2 (YUC2) converts the IPA produced by the TAA1 to
indole-3-acetic acid (IAA) (Zhao et al., 2001). TAA1, YUC2, YUC3, and YUC5 were
upregulated in 35S::IND:GR seedlings (DEX vs. DMSO, p<0.05, Fig 5.4).
Cytokinin biosynthesis: Adenosine phosphate-isopentenyl transferase (IPT) proteins
regulate cytokinin biosynthesis. Loss of IPT3 abolishes cytokinin production (Galichet et
al., 2008). IPT3 was downregulated in 35S::IND:GR seedlings (DEX vs. DMSO, p<0.05, Fig
5.4).

126
Figure 5.4 IND regulates hormone biosynthesis genes. (A) Table showing a list of differentially
expressed genes for hormone biosynthesis in 10 µM Dexamethasone (DEX) and DMSO treated
35S::IND:GR seedlings. Pathway showing IND may positively regulate gibberellin (GA3OX1) and
auxin (TAA1, YUC2, YUC3 and YUC5) biosynthesis and may negatively regulate cytokinin (IPT3
and CKX5), ethylene (ACS6 and ACS7), jasmonic acid (ACX1, JAZ6, OPCL1, MFP2 and OPR1) and
abscisic acid (AAO2 and AAO3) biosynthesis.

127
Ethylene biosynthesis: 1-aminocyclopropane-1-carboxylate synthase (ACS) enzymes
play a major role in ethylene biosynthesis. ACS catalyse the conversion of S-adenosyl-L-
methionine into 1-AMINOCYCLOPROPANE-1-CARBOXYLATE (ACC), a direct precursor of
ethylene (Adams and Yang, 1979; Peng et al., 2005; Yang and Hoffman, 1984). ACS6 and
ACS7 were downregulated in 35S::IND:GR seedlings (DEX vs. DMSO, p<0.05, Fig 5.4).
Jasmonic acid biosynthesis: PEROXISOMAL ACYL-COENZYME AN OXIDASE 1 (ACX1) is
involved in the biosynthesis of jasmonic acid (JA) (Cruz Castillo et al., 2004). 12-
OXOPHYTODIENOATE REDUCTASE 1 (OPR1) reduces 12-oxophyodienoic acid (OPDA) to
3-oxo-2-(2'-pentenyl)-cyclopentane-1-octanoic acid (OPC-8:0), the natural precursor of
jasmonic acid. OPC-8:0 CoA LIGASE1 (OPCL1) converts OPC-8:0 into OPC-8:0-CoA,
respectively (Kienow et al., 2008). OPC-8:0-CoA undergoes three rounds of oxidation to
form (+)-7-iso-JA, jasmonic acid (Schaller and Stintzi, 2009). ACX1, OPCL1, and OPR1
were downregulated in 35S::IND:GR seedlings (DEX vs. DMSO, p<0.05, Fig 5.4).
Abscisic acid biosynthesis: ABSCISIC-ALDEHYDE OXIDASE (AAO) is involved in the last
step of the abscisic acid (ABA) biosynthesis. ABA precursor abscisic aldehyde is oxidised
to ABA, via AAO (Seo et al., 2000). AAO2 and AAO3 were downregulated in 35S::IND:GR
seedlings (DEX vs. DMSO, p<0.05, Fig 5.4).
These results demonstrate that IND may promote auxin and gibberellin biosynthesis and
may inhibit cytokinin, ethylene, jasmonic acid and abscisic acid biosynthesis (Fig 5.4).

128

129
Figure 5.5 Arabidopsis thaliana transcription factor (TF) family and DNA motif GSEA. (A) Many
of the bHLH family proteins bind to G-box (CACGTG). AT4G00120 (IND) binds to E-box variant
(CACGCG). Heat map of GSEA data showing significantly (p<0.05) enriched (B) Motif and (C) TF
gene sets that were regulated by IND (DEX vs. DMSO), IND plus IAA (DEX+AUX vs. AUX) and IND
plus BAP (DEX+CYT vs. CYT). (B) STY, ARR-B, MYB, PBE-BOX and ARF motif gene sets were
positively enriched in all conditions (p<0.05). AHL Motif gene set was positively enriched in IND
(DEX vs. DMSO) and IND plus IAA (DEX+AUX vs. AUX). HD-WUS, DOF, HD-ZIP and AP2 motif gene
sets were positively enriched, and the TCP motif gene set was negatively enriched in IND plus
IAA (DEX+AUX vs. AUX) (p<0.05). NAC and WRKY motif gene sets were negatively enriched in
IND (DEX vs. DMSO) and IND plus BAP (DEX+CYT vs. CYT) (p<0.05). MYB-R2R3 and GARP-G2 motif
gene sets were positively enriched in IND plus IAA (DEX+AUX vs. AUX) and IND plus BAP
(DEX+CYT vs. CYT) (p<0.05). HSF motif gene set was positively enriched in IND plus BAP (DEX+CYT
vs. CYT) (p<0.05). (C) B3, MYB, and M-TYPE TF gene sets were positively enriched in all conditions
(p<0.05). HD-ZIP gene set was positively enriched in IND (DEX vs. DMSO) (p<0.05). MYB-related
TF gene set was positively enriched, and WRKY was negatively enriched in IND (DEX vs. DMSO)
and IND plus IAA (DEX+AUX vs. AUX) (p<0.05). C2H2 and NFX1 TF gene sets were positively
enriched, and CPP and HSF were negatively enriched in IND plus IAA (DEX+AUX vs. AUX) (p<0.05).
ERF gene set was positively enriched in IND plus IAA (DEX+AUX vs. AUX) and IND plus BAP
(DEX+CYT vs. CYT) (p<0.05). WOX gene set was positively enriched, and bHLH gene set was
negatively enriched in IND plus BAP (DEX+CYT vs. CYT) (p<0.05). (Size: Number of genes in each
gene set, Blue: negatively enriched, Red: positively enriched and Brown: p<0.05).

130
5.2.1.5 Motif and TF enrichment analysis
It is important to understand if IND regulated genes are enriched in known TF binding
motifs and whether IND regulates the corresponding TFs. This was tested using GSEA.
Often motifs indicate sequence-specific binding sites for transcription factors. The
motifs represent known or likely cis-regulatory elements in the 2000bp upstream
promoter region (Yu et al., 2016). Cis-acting enhancers have key roles in controlling gene
transcription (Arnone and Davidson, 1997). Motif enrichment analysis was used to study
which DNA-binding transcription factors control the transcription of a set of genes by
detecting enrichment of known binding motifs in the gene promoter regions. Motif
enrichment analysis was performed using the GSEA tool (Subramanian et al., 2005;
Weidner, 2017; Yi et al., 2013). For enrichment analysis, Arabidopsis transcriptional
regulatory motifs were extracted from a plant cistrome and protein-binding microarray
database (Franco-Zorrilla et al., 2014; O'Malley et al., 2016). Arabidopsis Motif Scanner
and TAIR Patmatch were used to identify the positions of cis-regulatory elements in the
Arabidopsis genome (Mele, 2016; Yan et al., 2005). Gene sets were created using data
curated from Arabidopsis Motif Scanner and TAIR Patmatch. Motif gene sets consist of
genes grouped by cis-regulatory motifs that they share in their promoter regions.
Arabidopsis transcription factor family gene sets were created using a plant transcription
factor database (Fig 8.4) (Hong, 2016; Jin et al., 2017; Riechmann et al., 2000). Using this
we can link changes in putative gene expression to putative cis-regulatory elements and
transcription factors (Birnbaum et al., 2001). Different data files were used for motif and
transcription factor enrichment analysis: Arabidopsis Gene 1.0 ST microarray expression
data set (DEX vs. DMSO), Arabidopsis motif gene set or transcription factor family gene
set GSEA library file and phenotype label (DEX vs. DMSO). After analysis, data were
presented in a heat map (Fig 5.5B and C).
IND is a bHLH transcription factor so we investigated whether the bHLH cis-element was
enriched in DEX vs. DMSO. The bHLH family proteins preferably bind to E-box DNA motif
CANNTG (N = any nucleotide) and CACGTG (E-box type) G-box motif (Toledo-Ortiz et al.,
2003). Toledo et al. identified 147 bHLH protein-encoding genes. Several studies have
characterised the binding elements for a few of the bHLH family proteins (Franco-Zorrilla
et al., 2014; Girin et al., 2011; Heim et al., 2003; Jin et al., 2017; O'Malley et al., 2016).
These elements were aligned and presented in Fig 5.5A. Arabidopsis bHLH family protein

131
binding element alignment shows that CACGTG (G-box motif) was a consensus sequence
(Fig 5.5A). The E-box variant PBE-BOX (CACATG) motif gene set was positively enriched
in DEX vs. DMSO (p<0.05, Fig 5.5B). This suggests that IND may target genes encoding
the PBE-BOX. However, only a small enrichment of the PBE element was observed, but
this may be because the element was very common (12,078 genes).
Several TF elements were positively enriched in the DEX vs. DMSO. The ARFs are B3
superfamily transcription factors. Auxin-responsive elements (AuxREs) (TGTCNN) and
ARF (TGTCTC) motifs are associated with auxin response and mediate auxin responsive
upregulation (Boer et al., 2014; Ulmasov et al., 1999; Ulmasov et al., 1995). The ARF
(TGTCTC) motif gene set was positively enriched in DEX vs. DMSO (p<0.05, Fig 5.5B). The
STYLISH (STY, CCTAGG) motif is associated with IAA biosynthesis rates and IAA levels
(Eklund et al., 2010). The STY (CCTAGG) motif gene set was positively enriched in DEX
vs. DMSO (p<0.05, Fig 5.5B). AT-hook Motif Nuclear Localized (AHL) proteins recognise
A/T-rich motifs (AATATATT) and contribute to downregulation of target genes (Fujimoto
et al., 2004). The AHL (AATATATT) motif gene set was positively enriched in DEX vs.
DMSO (p<0.05, Fig 5.5B). MYB is one of the largest transcription factor superfamilies in
Arabidopsis. MYB-related transcription factors bind to the motif sequence AGATATT
(Franco-Zorrilla et al., 2014). The MYB (AGATATT) motif gene set was positively enriched
in DEX vs. DMSO (p<0.05, Fig 5.5B). MYB GARP type-B ARRs are primary transcription
factors involved in cytokinin signalling. Type-B ARRs recognise the motif containing the
sequence core element AGAT (Argyros et al., 2008; Hosoda et al., 2002; Sheen, 2002).
The ARR-B (AAGATTTT) motif gene set was positively enriched in DEX vs. DMSO (p<0.05,
Fig 5.5B).
Several TF elements were negatively enriched in the DEX vs. DMSO. NAC (NAM (no apical
meristem), ATAF and CUC (cup-shaped cotyledon)) family transcription factors are
involved in regulating several developmental or stress-related responses. NAC
transcription factors recognise a motif containing the sequence core element CGT[G/A]
(Olsen et al., 2005; Puranik et al., 2012; Tran et al., 2004). The NAC (TTACGTGT) motif
gene set was negatively enriched in DEX vs. DMSO (p<0.05, Fig 5.5B). WRKY family
transcription factors regulate developmental processes and plant responses to abiotic
and biotic stresses. WRKY transcription factors recognise the W-box (TTGAC[C/T])

132
(Ciolkowski et al., 2008; Eulgem et al., 2000). The WRKY motif gene set was negatively
enriched in DEX vs. DMSO (p<0.05, Fig 5.5B).
Since we found several TF elements were enriched in DEX vs. DMSO, we analysed
whether the expression of TF gene families were also enriched. M-TYPE (MADS-box) and
Homeodomain-leucine zipper (HD-ZIP) transcription factors are the key regulators of
developmental processes, such as meristem identity (Alvarez-Buylla et al., 2000; Ariel et
al., 2007; Parenicova et al., 2003). R1R2R3-MYB are collectively referred to as MYB-
related proteins (Chen et al., 2006). B3, MYB, MYB-related, HD-ZIP and M-TYPE
transcription factor family gene sets were positively enriched in DEX vs. DMSO (p<0.05,
Fig 5.5C). The WKRY transcription factor family gene set was negatively enriched in DEX
vs. DMSO (p<0.05, Fig 5.5C).
Since B3, MYB, and WKRY transcription factor family gene sets and their motif gene sets
were enriched in DEX-treated 35S::IND:GR seedlings, IND may regulate B3, MYB and
WKRY transcription factor family genes and their targeted gene expression.
5.2.1.6 Summary
In summary, these results suggest that IND may promote leaf mid and abaxial fate by
upregulating WOX1. Since CUC genes were not differentially regulated after 6 or 24
hours of IND induction, IND may gradually downregulate CUC by upregulating TCP-AS1.
GSEA analysis suggests IND may promote gibberellin and auxin biosynthesis and may
inhibit ethylene, jasmonic acid and abscisic acid biosynthesis and signalling. Longer IND
expression may negatively regulate SAM development and PAT by repressing FAC1,
WAK2, ATH1, AGO10, PID, AIL5, AIL7 and GBF6. IND may regulate these functions by
upregulating B3, MYB, HD-ZIP, M-TYPE and downregulating WKRY transcription factor
family genes.

133
Table 5.1 Summary of GSEA analysis: Biological process in Arabidopsis
DEX and DMSO treated 35S::IND:GR seedlings (DEX vs. DMSO)
326 / 835 gene sets were upregulated in
phenotype DEX, 18 gene sets were
significant at FDR < 25%, 18 gene sets were
significantly enriched at nominal p-value <
1% and 35 gene sets were significantly
enriched at nominal p-value < 5%
509 / 835 gene sets were downregulated in
phenotype DEX, 154 gene sets were
significantly enriched at FDR < 25%, 109 gene
sets were significantly enriched at nominal p-
value < 1% and 147 gene sets were significantly
enriched at nominal p-value < 5%
DEX plus IAA and IAA treated 35S::IND:GR seedlings (DEX+AUX vs. AUX)
245 / 835 gene sets were upregulated in
phenotype DEX+AUX, 103 gene sets were
significant at FDR < 25%, 54 gene sets were
significantly enriched at nominal p-value <
1% and 83 gene sets were significantly
enriched at nominal p-value < 5%
590 / 835 gene sets were downregulated in
phenotype DEX+AUX, 408 gene sets were
significantly enriched at FDR < 25%, 225 gene
sets were significantly enriched at nominal p-
value < 1% and 309 gene sets were significantly
enriched at nominal p-value < 5%
DEX plus BAP and BAP treated 35S::IND:GR seedlings (DEX+CYT vs. CYT)
239 / 835 gene sets were upregulated in
phenotype DEX+CYT, 78 gene sets were
significant at FDR < 25%, 49 gene sets were
significantly enriched at nominal p-value <
1% and 72 gene sets were significantly
enriched at nominal p-value < 5%
596 / 835 gene sets were downregulated in
phenotype DEX+CYT, 270 gene sets were
significantly enriched at FDR < 25%, 161 gene
sets were significantly enriched at nominal p-
value < 1% and 227 gene sets were significantly
enriched at nominal p-value < 5%

134
Figure 5.6 35S::IND:GR (DEX+AUX vs. AUX) differential gene expression. Scatter plot showing
Tukey's Bi-weight average signal (log2) of 10 µM DEX plus 10 µM IAA (DEX+AUX) and 10 µM IAA
(AUX) treated 35S::IND:GR samples: 588 genes were upregulated (Red), and 541 genes were
downregulated (Green) in DEX+AUX vs. AUX (the smaller p-value, the bigger the X). Heat map of
top 30 differentially regulated genes in DEX+AUX vs. AUX (One-Way ANOVA p<0.05, Gene Fold
Change (linear) >1.5 and <-1.5). (Blue: low gene expression, Red: high gene expression).

135
5.2.2 Microarray analysis of IND plus auxin regulated genes
5.2.2.1 Differential gene expression analysis
Since auxin regulates IND and ETT protein interaction (Simonini et al., 2016), it is
important to understand whether auxin can influence IND-regulated gene expression.
Therefore we investigated the effect of IND plus auxin on global gene expression
changes using microarray analysis. For the microarray, total RNA was isolated from
35S::IND:GR seedlings (7DAG), which were treated with either 10 µM DEX plus 10 µM
IAA or 10 µM IAA for 6 hours in liquid media (n=3). The microarray was performed and
analysed as described in section 5.2.1.1. A total of 1129 genes were differentially
expressed in 35S::IND:GR seedlings (DEX+AUX vs. AUX, FC >1.5 or <-1.5, p<0.05): 588
genes were upregulated, and 541 genes were downregulated (Fig 5.6). The heat map
shows top 30 differentially expressed genes in 35S::IND:GR seedlings (DEX+AUX vs. AUX)
(Fig 5.6). SAG29 and GA3ox1 were also upregulated in 35S::IND:GR seedlings (DEX+AUX
vs. AUX, p<0.05, Fig 5.6). When compared to IND (921 genes, Fig 5.1), a large number of
genes were upregulated by IND plus IAA alone (1129 genes, Fig 5.6). This shows that IAA
treatment enhanced IND-associated gene expression. A list of differentially expressed
genes was summarised in a table (Table 8.8).
5.2.2.2 Gene-set enrichment analysis (GSEA)
It is important to understand the biological function of IND + IAA regulated genes, and
this was studied using GSEA. Arabidopsis Gene 1.0 ST microarray expression datasets
(DEX+AUX vs. AUX), Arabidopsis biological function gene, set GSEA library file and
phenotype label (DEX+AUX vs. AUX) were used for GSEA analysis. Analysed data was
exported to Cytoscape for analysis and visualisation (Fig 5.7). When compared to IAA,
83 gene sets were positively enriched (p<0.05) and 309 gene sets were negatively
enriched in DEX plus IAA (p<0.05; Fig 5.7, Table 5.1). When compared to IND (Section
5.2.1.2), a large number of gene sets were enriched in IND plus IAA (Table 5.1).
Significantly enriched gene sets were summarised in a table (Table 8.11).

136
Figure 5.7 35S::IND:GR (DEX+AUX vs. AUX) Arabidopsis biological process GSEA. Cytoscape
generated image of GSEA data from 35S::IND:GR seedlings treated with both 10 µM DEX + 10
µM IAA (DEX+AUX) and 10 µM IAA (AUX) alone, showing significantly (p<0.05) enriched gene-
sets (Blue: low, Red: high). Closely related gene-sets were connected by a green line.
Photosynthetic, rRNA processing, and starch biosynthetic process sets were positively enriched
in DEX+AUX treated 35S::IND:GR seedlings. Meristem, bilateral symmetry, organ
morphogenesis, telomere maintenance and cell division sets were negatively enriched in
DEX+AUX treated 35S::IND:GR seedlings.

137
Several gene sets were positively or negatively enriched in the IND plus IAA (DEX+AUX
vs. AUX). Photosynthetic, rRNA processing, and starch biosynthetic process gene sets
were positively enriched in DEX plus IAA (p<0.05, Fig 5.7). Meristem, bilateral symmetry,
organ morphogenesis, telomere maintenance and cell division gene sets were
negatively enriched in DEX plus IAA (p<0.05, Fig 5.7). GSEA results suggest that IND plus
auxin may negatively regulate meristem and organ development processes.
5.2.2.3 IND plus auxin negatively regulate meristem associated gene sets
GSEA analysis from section 5.2.2.2 suggests that IND plus auxin negatively regulate
meristem gene sets. In particular, meristem maintenance and meristem initiation gene
sets were negatively enriched in DEX plus IAA treated 35S::IND:GR seedlings (p<0.05; Fig
5.8A). A total of 66 genes from all meristem gene sets were core enriched in DEX plus
IAA treated 35S::IND:GR seedlings (p<0.05; Fig 5.8B). APETALA2 (AP2) regulates the stem
cell niche in the SAM and is also essential for flower development (Kunst et al., 1989;
Wurschum et al., 2006). Interestingly, AP2 prevents replum and valve margin
overgrowth by negatively regulating SHP, IND, BP and RPL (Ripoll et al., 2011). AP2 was
downregulated in DEX plus IAA treated 35S::IND:GR seedlings (p<0.05; Fig 5.8C).
MONOPTEROS (MP) is an auxin response factor that orientates PIN1 localisation and
also regulates apical patterning partially through the control of CUC gene expression
(Aida et al., 2002; Bhatia et al., 2016). MP was downregulated in DEX plus IAA treated
35S::IND:GR seedlings (p<0.05; Fig 5.8C). TORNADO2 (TRN2) regulate cell proliferation
in SAM, control leaf patterning and promote megasporogenesis (Chiu et al., 2007; Cnops
et al., 2006; Lieber et al., 2011). TRN2 was downregulated in DEX plus IAA treated
35S::IND:GR seedlings (p<0.05; Fig 5.8C). Similar to DEX treated 35S::IND:GR seedlings,
FAC1 and ATH1 were also downregulated in DEX plus IAA treated 35S::IND:GR seedlings
(p<0.05; Fig 5.8B and C). When compared to DEX treated 35S::IND:GR seedlings, a higher
number of meristem genes and gene sets were downregulated in DEX plus IAA treated
35S::IND:GR seedlings (Fig 5.8). These data suggest that IAA may regulate IND activity to
control meristem associated gene expression.

138
Figure 5.8 IND plus IAA and IND plus BAP downregulate meristem gene expression. (A) The
GSEA analysis shows meristem maintenance and meristem initiation gene sets were significantly
negatively enriched in 10 µM DEX + 10 µM IAA (DEX+AUX) and 10 µM DEX + 1 µM BAP (DEX+CYT)
treated 35S::IND:GR seedlings. (B) Venn diagram showing core enriched genes from all meristem
gene sets, which were downregulated in 10 µM DEX, 10 µM DEX + 10 µM IAA (DEX+AUX) and 10
µM DEX + 1 µM BAP (DEX+CYT) treated 35S::IND:GR seedlings (FC <-1, One-Way ANOVA p<0.05).
When compared to DEX (14), more genes were downregulated in DEX+AUX (46) and DEX+CYT
(33). (C) Heat map showing selected meristem genes were downregulated in DEX (ATH1, WAK2,
FAC1 and AGO10), DEX+AUX (ATH1, FAC1, MP, AP2 and TRN2) and DEX+CYT (JAG, AGO10 and
TRN2) (*p<0.05).

139
Similar to section 5.2.1.3, meristem genes were identified within the DEX plus IAA
treated 35S::IND:GR microarray dataset (Fig 5.11C). The Venn diagram overlapping
region shows 7 meristem genes that were regulated by IND plus auxin following 6 hours
induction (Fig 5.11C). Similar to IND, ULT1 and HB51 were also upregulated by IND plus
auxin following 6 hours induction (Fig 5.11E). ABNORMAL FLORAL ORGANS (YAB1, AFO)
is the member of the YABBY family and regulates abaxial fate specification in leaves
(Siegfried et al., 1999), YAB1 was upregulated by IND plus auxin (Induced for 6 hours, Fig
5.11E). Sucrose transporter gene SWEET1 was downregulated by 6 hours of IND plus
auxin treatment (Fig 5.11E). MP was downregulated by 6 hours of IND plus auxin (Fig
5.11E). Similar to DEX-treated, GBF6 and PID were also downregulated by 6 hours of DEX
plus IAA treatment (Fig 5.11E). These results suggest that IND plus auxin affect meristem
gene expression and also negatively regulate auxin transport and auxin signalling in the
meristem.
5.2.2.4 Motif and TF enrichment analysis
It is important to understand if IND plus auxin regulated genes are enriched in known TF
binding motifs and whether IND plus auxin regulates the corresponding TF. This was
tested using GSEA. Different data files were used for motif and transcription factor
enrichment analysis: Arabidopsis Gene 1.0 ST microarray expression data set (DEX +AUX
vs. AUX), Arabidopsis motif gene set or transcription factor family gene set GSEA library
file and phenotype label (DEX+AUX vs. AUX). GSEA data was presented in a heat map
(Fig 5.5B and C).
Several TF elements were positively or negatively enriched in the IND plus IAA (DEX+AUX
vs. AUX). Similar to DEX-treated, STY, ARR-B, MYB, PBE-BOX, ARF and AHL motif gene
sets were also positively enriched in DEX plus IAA (p<0.05, Fig 5.5B). WUS homeobox-
containing (WOX) proteins may negatively regulate gene expression by recognizing the
element TCAATCA (Franco-Zorrilla et al., 2014). The HD-WUS (TCAATCA) motif gene set
was positively enriched in IND plus IAA (p<0.05, Fig 5.5B). DOF (DNA-binding with one
finger) domain proteins recognise a DNA element AAAG (Franco-Zorrilla et al., 2014).
The DOF (AAAAAGTG) motif gene set was positively enriched in IND plus IAA (p<0.05,
Fig 5.5B). HD-ZIP binds as dimers to a DNA motif AATNATT (Sessa et al., 1998). The HD-
ZIP (AATCATT) motif gene set was positively enriched in IND plus IAA (p<0.05, Fig 5.5B).

140
AP2 proteins bind to DNA motif CCTCGTAC, and they are involved in repression of
flowering (Franco-Zorrilla et al., 2014; Yant et al., 2010). The AP2 (CCTCGTA) motif gene
set was positively enriched in IND plus IAA (p<0.05; Fig 5.5B). R2R3 proteins can bind to
a different DNA target motif GTTAGNTA and participate in a large variety of biological
processes (Prouse and Campbell, 2012). The MYB-R2R3 (GTTAGGT) motif gene set was
positively enriched in IND plus IAA (p<0.05; Fig 5.5B). MYB-GARP-G2 transcription
factors are required for leaf development, chlorophyll biosynthesis, and light-harvesting
functions. MYB-GARP-G2 transcription factors recognise core sequence AGATTCT
(Franco-Zorrilla et al., 2014; Waters et al., 2009). The GARP-G2 (AGATTCT) motif gene
set was positively enriched in IND plus IAA (p<0.05, Fig 5.5B). TCP transcription factors
regulate plant development and defence responses. TCPs bind to GGNCCCAC and
G(T/C)GGNCCC sequences (Kosugi and Ohashi, 2002). The TCP (GGGCCCA) motif gene
set was negatively enriched in IND plus IAA (p<0.05, Fig 5.5B).
Since we found several TF elements that were enriched in IND plus IAA, we analysed
whether the expression of TF gene families was also enriched in IND plus IAA. Similar to
DEX-treatment, B3, MYB, MYB-related and M-TYPE TF family gene sets were also
positively enriched, and the WRKY TF family gene set was negatively enriched in DEX
plus IAA (p<0.05; Fig 5.5C). The ETHYLENE RESPONSE FACTOR (ERF) TFs belong to
AP2/ERF family, a large group of plant-specific TFs which are involved in DNA binding.
ERF members are involved in responses to biotic stresses and ethylene-responsive gene
transcription (Ohmetakagi and Shinshi, 1995). The ERF TF family gene set was positively
enriched in IND plus IAA (p<0.05; Fig 5.5C). The C2H2 zinc finger TFs are involved in a
wide range of functions such as transcriptional regulation, RNA metabolism and
chromatin-remodelling (Englbrecht et al., 2004). The C2H2 TF family gene set was
positively enriched in IND plus IAA (p<0.05, Fig 5.5C). The nuclear factor (NF-X1, NF-YA,
NF-YB, and NF-YC) TFs are also involved in a wide range of functions such as plant
growth, development, and stress responses (Jin et al., 2017). The NF TF family gene set
was positively enriched in IND plus IAA (p<0.05; Fig 5.5C). CPP-like (cysteine-rich
polycomb-like protein) TFs are involved in the development of reproductive tissue and
control of cell division in plants (Yang et al., 2008). The CPP TF family gene set was
negatively enriched in IND plus IAA (p<0.05; Fig 5.5C). Heat stress TFs (HSF) are the key

141
regulators of the plant heat stress response (Kotak et al., 2004). The HSF TF family gene
set was negatively enriched in IND plus IAA (p<0.05; Fig 5.5C).
Since B3, MYB, and ERF transcription factor family gene sets and their motif gene sets
were enriched in DEX plus IAA, IND plus auxin may regulate B3, MYB, and ERF
transcription factor family genes and their targeted gene expression.
5.2.2.5 Summary
In summary, these results suggest that auxin enhances IND-regulated gene expression.
GSEA analysis suggests that IND plus auxin may promote starch biosynthesis and may
inhibit meristem development and leaf bilateral symmetry. IND plus auxin may regulate
these functions by upregulating B3, MYB, C2H2, NF, CPP, HSF, ERF, M-TYPE and
downregulating WKRY transcription factor family genes. IND plus auxin may negatively
regulate meristem development and leaf bilateral symmetry by repressing FAC1, MP,
PID, GBF6, ATH1 and TRN2 gene expression. IND plus auxin may also promote style
formation by repressing AP2 gene expression.

142
Figure 5.9 35S::IND:GR (DEX+CYT vs. CYT) differential gene expression. Scatter plot showing
Tukey's Bi-weight average signal (log2) of 10µM DEX plus 1 µM BAP (CYT) and 1 µM BAP treated
35S::IND:GR samples: 415 genes were upregulated (Red), and 491 genes were downregulated
(Green) in DEX+CYT vs. CYT (smaller p-value, the bigger the X). Heat map of the top 30
differentially regulated genes in DEX+CYT vs. CYT (One-Way ANOVA p<0.05, Gene Fold Change
(linear) >1.5 and <-1.5). (Blue: low gene expression, Red: high gene expression).

143
5.2.3 Microarray analysis of IND plus cytokinin regulated genes
5.2.3.1 Differential gene expression analysis
Cytokinin positively regulates valve margin development (Marsch-Martinez et al., 2012).
Since IND is a key regulator of fruit valve margins and cytokinin also promote valve
margins, it is important to understand if cytokinin can influence IND regulated gene
expression. Therefore the effect of IND plus cytokinin on global gene expression changes
was investigated using microarray analysis. For the microarray, total RNA was isolated
from 35S::IND:GR seedlings (7DAG), which were treated with either 10 µM DEX plus 1
µM BAP or 1 µM BAP for 6 hours in liquid media (n=3). The microarray was performed
and analysed as described in section 5.2.1.1. A total of 906 genes were differentially
expressed in 35S::IND:GR seedlings (DEX+CYT vs. CYT, FC >1.5 or <-1.5, p<0.05): 415
genes were upregulated and 491 genes were downregulated (Fig 5.9). The heat map
shows the top 30 differentially expressed genes in 35S::IND:GR seedlings (DEX+CYT vs.
CYT, p<0.05, Fig 5.7). SAG29 was also upregulated in 35S::IND:GR seedlings (DEX+CYT vs.
CYT, p<0.05, Fig 5.9). A list of differentially expressed genes was summarised in a table
(Table 8.9).
5.2.3.2 Gene-set enrichment analysis (GSEA)
We use GSEA to understand which pathways are regulated by IND plus cytokinin.
Arabidopsis Gene 1.0 ST microarray expression datasets (DEX+CYT vs. CYT), Arabidopsis
biological function gene, set GSEA library file, and phenotype label (DEX+CYT vs. CYT)
were used for GSEA analysis. Analysed data was exported to Cytoscape for analysis and
visualisation (Fig 5.10). When compared to BAP-treated, 72 gene sets were positively
enriched and 227 gene sets were negatively enriched in DEX + BAP treated 35S::IND:GR
seedlings (p<0.05; Fig 5.10, Table 5.1). When compared to IND (Section 5.2.1.2), a large
number of gene sets were enriched in IND plus CYT. Significantly enriched gene sets
were summarised in a table (Table 8.12).
Several gene sets were positively or negatively enriched in the IND plus cytokinin
(DEX+AUX vs. AUX). Photosynthetic, rRNA processing, pollen tube, cell wall modification
and defence response gene sets were positively enriched in DEX plus BAP (p<0.05; Fig
5.10). Meristem, pattern specification, organ morphogenesis and cell size gene sets

144
were negatively enriched in DEX plus BAP (p<0.05; Fig 5.10). GSEA results suggest that
IND plus cytokinin may negatively regulate meristem and organ development processes.
5.2.3.3 IND plus cytokinin negatively regulate meristem associated gene sets
GSEA analysis from section 5.2.3.2 suggests that IND plus cytokinin negatively regulate
meristem gene sets. In particular, meristem maintenance and meristem initiation gene
sets were negatively enriched in DEX plus BAP (p<0.05; Fig 5.8A). A total of 54 genes
from all meristem gene sets were core enriched in DEX plus BAP (p<0.05, Fig 5.8B).
JAGGED (JAG) promote leaf growth, fruit valve and valve margin development (Dinneny
et al., 2005; Gonzalez-Reig et al., 2012; Ohno et al., 2004). JAG was downregulated in
DEX + BAP treated 35S::IND:GR seedlings (p<0.05, Fig 5.8C). Similar to DEX plus IAA
treated 35S::IND:GR seedlings, TRN2 was also downregulated in DEX plus BAP treated
35S::IND:GR seedlings (p<0.05, Fig 5.8C). Similar to DEX treated 35S::IND:GR seedlings,
AGO10 was also downregulated in DEX plus BAP treated 35S::IND:GR seedlings (p<0.05,
Fig 5.8C). When compared to DEX treated 35S::IND:GR seedlings, a higher number of
meristem genes and gene sets were downregulated in DEX plus BAP treated 35S::IND:GR
seedlings (Fig 5.8). These data suggest that BAP may regulate IND activity to control
meristem associated gene expression.
Similar to section 5.2.1.3, meristem genes were identified within the DEX + BAP treated
35S::IND:GR microarray dataset (Fig 5.11D). The Venn diagram overlapping region
shows 3 meristem genes regulated by IND plus cytokinin following 6 hours of induction,
Fig 5.11D). Similar to DEX-treatment, HDG2 and HB51 were upregulated and PID was
downregulated by DEX plus BAP following 6 hours of induction (Fig 5.14E).

145
Figure 5.10 35S::IND:GR (DEX+CYT vs. CYT) Arabidopsis biological process GSEA. Cytoscape
generated image of the GSEA data output from microarray analysis following 10 µM DEX + 1 µM
BAP (DEX+CYT), and 1 µM BAP (CYT) treated 35S::IND:GR seedlings showing significantly
(p<0.05) enriched gene-sets (Blue: negatively enriched, Red: positively enriched). Closely related
gene sets were connected by a green line. Photosynthetic, rRNA processing, pollen tube, cell
wall modification and defence response sets were positively enriched. Meristem, pattern
specification, organ morphogenesis and cell size sets were negatively enriched.

146
5.2.3.4 Motif and TF enrichment analysis
It is important to understand if IND plus cytokinin regulated genes are enriched in known
TF binding motifs and whether IND plus cytokinin regulates the corresponding TF. This
was tested using GSEA. Different data files were used for motif and transcription factor
enrichment analysis: Arabidopsis Gene 1.0 ST microarray expression data set (DEX+CYT
vs. CYT), Arabidopsis motif gene set or transcription factor family gene set GSEA library
file and phenotype label (DEX+CYT vs. CYT). After analysis, data was presented in a heat
map (Fig 5.5B and C).
Several TF elements were positively or negatively enriched by IND in the presence of
cytokinin (DEX+CYT vs. CYT). Similar to the DEX-treatment, STY, ARR-B, MYB, PBE-BOX
and ARF motif gene sets were positively enriched, and NAC and WRKY motif gene sets
were negatively enriched in in DEX plus BAP (p<0.05, Fig 5.5B). Similar to DEX plus IAA,
MYB-R2R3 and GARP-G2 Motif gene sets were positively enriched in DEX plus BAP
treated 35S::IND:GR seedlings (p<0.05, Fig 5.5B). Heat shock transcription factors (HSFs)
are a group of proteins highly induced under stress conditions. HSFs can bind to both
primary and secondary motifs (GAAGCTTC and TTCTAGAA, respectively). HSF
(TTCTAGAA) motif gene set was positively enriched in DEX plus BAP (p<0.05, Fig 5.5B).
Since we found several TF elements were enriched we analysed whether the expression
of TF gene families were also enriched. Similar to DEX-treatment, B3, MYB and M-TYPE
TF family gene sets were also positively enriched in DEX plus BAP (p<0.05, Fig 5.5C).
Similar to DEX plus IAA, the ERF TF family gene set was positively enriched in DEX plus
BAP (p<0.05, Fig 5.5C). The WOX TFs are a subclade of the homeobox transcription factor
superfamily, they regulate multiple developmental processes in plants by the promotion
of cell division activity and also by prevention of premature cell differentiation (van der
Graaff et al., 2009). The WOX TF family gene set was positively enriched in DEX plus BAP
(p<0.05, Fig 5.5C). The bHLH TF family gene set was negatively enriched in DEX plus BAP
(p<0.05, Fig 5.5C).
Since B3 and MYB family gene sets and their motif gene sets were enriched in DEX plus
BAP, IND plus cytokinin may regulate B3 and MYB transcription factor family genes and
their targeted gene expression.

147
5.2.3.5 Summary
In summary, these results suggest that cytokinin enhances IND regulated gene
expression. GSEA analysis suggests that IND plus cytokinin may promote pollen tube
development and may inhibit meristem and organ development processes. IND plus
cytokinin may regulate these functions by upregulating B3, MYB, WOX, ERF, M-TYPE and
downregulating bHLH transcription factor family genes. IND plus cytokinin may
negatively regulate meristem and organ development process by repressing PID, GBF6,
AGO10 and TRN2 gene expression. IND plus cytokinin may negatively regulate fruit valve
formation by repressing JAG gene expression.

148

149
Figure 5.11 IND differentially regulates meristem specific genes; gene list from (Yadav et al.,
2009). (A-D) Venn diagrams showing a comparative analysis of DEX (6 and 24 hours induction),
DEX+AUX (6 hours induction) and DEX+CYT (6 hours induction) data compared with 71
differentially expressed genes (DEG) in SAM (Yadav et al., 2009). (A) The overlapping region
shows 6 meristem genes were regulated by DEX (6 hours induction). (B) The overlapping region
shows 15 meristem genes were regulated by DEX (24 hours induction). (C) The overlapping
region shows 7 meristem genes were regulated by DEX+AUX (6 hours induction). (D) The
overlapping region shows 3 meristem genes were regulated by DEX+CYT (6 hours induction).
When compared to other conditions, many meristem genes were regulated by DEX (24 hours
induction). (E) All differentially regulated meristem genes were presented in a Heatmap. (Blue:
low gene expression, Red: high gene expression and Brown denoting p<0.05).

150
Figure 5.12 IND inhibits auxin transport in leaf primordia. Confocal images of DR5rev::GFP in
(A) 35S::IND:GR+DMSO and (B) 35S::IND:GR+DEX (24 hours induction) at 4DAG SAM (S) and leaf
primordia (P). (A) GFP expression was observed in the SAM at the tip of leaf primordia and in
mid domain of leaf primordia. (B) GFP expression was increased at the tip of leaf primordia, and
no GFP expression was observed in mid domain of leaf primordia. Confocal images of
pPIN1::PIN1:GFP in (C) 35S::IND:GR+DMSO, (D) 35S::IND:GR+DEX, (E) 35S::IND:GR+DEX+IAA and
(E) 35S::IND:GR+NPA at leaf primordia (24 hours induction). The PIN1:GFP signal in 35S::IND:GR
leaf primordia (C) was decreased with 10µM DEX (D), 10µM DEX+AUX (E) and 10µM NPA (F)
treatment (indicated with an arrowhead). (Scale bar = 50 µm).

151
5.2.4 IND overexpression inhibits auxin transport in leaf primordia
Results from the IND microarray study suggest that induction of IND (including IND plus
IAA and IND plus BAP) can downregulate PID expression in seedlings (Section 5.2).
Sorefan et al. demonstrated that IND regulates auxin transport in the separation layer
by repressing PID and inducing WAG2 expression at the valve margins, which leads to
PIN relocation from apico-basal to apolar-lateral (Sorefan et al., 2009a). It is not known
if IND can regulate auxin transport in the SAM and leaf primordia by altering PIN1
expression. This hypothesis was tested using pPIN1::PIN1:GFP 35S::IND:GR and
DR5rev::GFP 35S::IND:GR double-transgenic lines. The DR5rev::GFP reporter was used
to visualise auxin responses in the SAM and leaf primordia. The pPIN1::PIN1:GFP
reporter was used to visualise PIN1 expression in leaf primordia. These double
transgenic lines were grown on plant agar plates for 3 days, and seedlings were
transferred to plant liquid media supplemented with DMSO, 10 µM DEX, 10 µM DEX plus
IAA and 10 µM NPA. DMSO was a vehicle control, DEX was used to induce IND and NPA
was a polar auxin transport inhibitor. After 24 hours of treatment, seedlings were
dissected and imaged for GFP expression in the SAM and leaf primordia using confocal
microscopy.
In the vehicle control, the pPIN1::PIN1-GFP signal was detected in the leaf primordia,
and PIN1 appears to be polarly localised in cells of leaf primordia (Fig 5.12C). This
expression pattern was consistent with another published study (Chen et al., 2013). The
pPIN1::PIN1-GFP signal was decreased in the leaf primordia of DEX (Fig 5.12D), and DEX
plus IAA (Fig 5.12E) treated 35S::IND:GR seedling. Interestingly, Sorefan et al. also
reported similar pPIN1::PIN1-GFP expression pattern in valve cells of a stage-10 induced
35S::IND:GR gynoecium (Sorefan et al., 2009a). In the NPA treatment, the pPIN1::PIN1-
GFP signal was decreased in the leaf primordia, and this expression pattern was
consistent with published studies (Heisler et al., 2005; Qi et al., 2014; Wenzel et al.,
2007). NPA inhibits PIN1 expression and loss of PIN1 results in inhibition of auxin
transport between leaf primordia and the SAM (Guenot et al., 2012; Qi et al., 2014). The
PIN1 pattern of expression in response to NPA treatment was similar to that observed
with the DEX or DEX plus IAA treatment (Fig 5.12D-F). These data suggest that IND may
inhibit auxin transport in leaf primordia by downregulating PIN1 protein levels.

152
We predicted that IND downregulation of PIN1 in leaf primordia would cause a change
in auxin responses in DEX treated 35S::IND:GR seedlings. In the vehicle control, the
DR5rev::GFP signal was detected in the SAM at the tip and mid domain of leaf primordia
as well as in the areas of presumptive leaf primordia initiation (Fig 5.12A) and this
expression pattern was consistent with another published study (Chen et al., 2013;
Guenot et al., 2012) (Fig 8.5). After IND induction, increased DR5rev::GFP signal was
detected in areas of presumptive leaf primordia initiation as well as in the tips of leaf
primordia, and no signal was detected in the mid domain of leaf primordia (Fig 5.12B).
In the DEX treated 35S::IND:GR seedlings, auxin may be accumulating at the tip of leaf
primordia because the PIN1 expression was decreased in the mid domain of leaf
primordia (Fig 8.5). pPIN1::PIN1-GFP expression correlates with DR5rev::GFP suggesting
that IND may inhibit auxin transport between leaf primordia and the SAM (Fig 5.12B, D,
and F).
5.2.5 IND signalling network analysis
A network representation of pathway models involving many functional partnerships,
and interactions that occur between genes, proteins or metabolites was carefully
assembled into a graph. However, since this information was sourced from multiple
resources it was important to understand which elements were associated with IND
from these multiple resources. Therefore, STRING (Search Tool for the Retrieval of
Interacting Genes/Proteins) was used to study known and predicted IND-protein
interactions and IND signalling cascades. The network showed that IND was associated
with 12 genes/proteins (Fig 5.13A). They were SPT, PAR1, STY1, STY2, ETT, MYB26, JAG,
AGL8, RPL, SHP1, SHP2 and AT4G32272 (Fig 5.13A). Other studies also reported that IND
interacts with At2g18970, At2g39000, At3g51730, At5g06290, PIF3, PIF4, PIL6 and ALC
(Gremski, 2006; Liljegren et al., 2004a). These additional data exhibit notable differences
in terms of quality and completeness. Many of these proteins are involved in patterning
of the gynoecium. SPT, ETT, HEC, PIF3, PIF4 and PIL6 proteins regulate Style formation
(Gremski, 2006; Gremski et al., 2007; Heisler et al., 2001; Schuster et al., 2015). SHP1,
SHP2, ALC and SPT proteins regulate valve margin formation (Girin et al., 2011; Liljegren
et al., 2000; Liljegren et al., 2004a). Additionally, HEC proteins regulate valve margin

153
formation (Schuster et al., 2015). JAG promotes valve and valve margin formation
(Dinneny et al., 2005). RPL and FUL inhibit valve margin formation (Roeder et al., 2003).
The gene expression analysis shows that IND overexpression can also regulate some of
the genes identified in the network in seedlings (Fig 5.13B). An expression profile of
these genes was presented in a heatmap (Fig 5.13B). SPT was upregulated in both DEX
(DEX vs. DMSO) as well as DEX plus IAA (DEX+AUX vs. AUX) (p<0.05, Fig 5.13B). MYB
DOMAIN PROTEIN 26 (MYB26) regulates endothecium lignification as well as anther
dehiscence (Steiner-Lange et al., 2003; Yang et al., 2007). MYB26 was upregulated in
DEX (DEX vs. DMSO) (p<0.05, Fig 5.13B). PHYTOCHROME INTERACTING FACTOR 3-LIKE 6
(PIL6) induces leaf senescence and also regulates carpel development via SPT (Reymond
et al., 2012). PIL6 was downregulated in DEX (DEX vs. DMSO) (p<0.05, Fig 5.13B). SHP1
positively regulates IND and ALC to promote valve margin formation (Liljegren et al.,
2000). SHP1 was weakly upregulated in DEX plus IAA (DEX+AUX vs. AUX) (p<0.05, Fig
5.13B). AT4G32272 is a nucleotide/sugar transporter family protein, AT4G32272 was
weakly downregulated in DEX plus IAA (DEX+AUX vs. AUX) (p<0.05, Fig 5.13B). JAG
protein promotes valve and valve margin formation (Dinneny et al., 2005), JAG was
downregulated in DEX plus BAP (DEX+BAP vs. BAP) (p<0.05, Fig 5.13B). These data
suggest that IND may also regulate anther dehiscence in addition to valve margin
development.

154
Figure 5.13 IND signalling cascade analysis using STRING. (A) STRING signalling cascade showing
known and predicted IND interactions. (B) Heat map of the IND pathway associated genes that
were differentially expressed following 10 µM DEX, 10 µM DEX plus 10 µM IAA (DEX+AUX) and
10 µM DEX plus 1 µM BAP (DEX+CYT) treated 35S::IND:GR seedlings. SPT and MYB26 were
upregulated, and PIL6 was downregulated by IND (DEX). SPT and SHP1 were upregulated, and
AT4G32272 was downregulated by IND plus IAA (DEX+AUX). JAG was downregulated by IND plus
BAP (DEX+CYT). *One-Way ANOVA p<0.05. (Blue: low gene expression, Red: high gene
expression).

155
5.2.6 Methylation and hormones regulate IND
5.2.6.1 Cistrome and epicistrome data analysis to study IND gene binding TFs
We do not know if any TFs can bind to the IND gene. This was studied by analysing
Arabidopsis cistrome and epicistrome data (O'Malley et al., 2016). The cistrome is the
comprehensive set of transcription factor binding cis-elements in an organism, and an
epicistrome incorporates tissue-specific DNA methylation changes and TF-specific
methylation sensitivities to these binding profiles (O'Malley et al., 2016). Using DNA
affinity purification sequencing, O’Malley et al. defined the Arabidopsis cistrome and
epicistrome by resolving motifs and peaks for 529 transcription factors (DNA used in
DAP-seq retains 5-methylcytosines and methylcytosines were removed by PCR for
ampDAP-seq) (O'Malley et al., 2016). The DAP-seq and ampDAP-seq datasets were
analysed to examine if any of the 529 transcription factors can bind to the cis-elements
of the IND gene. Analysed DAP-seq and ampDAP-seq data was presented in figure 5.14A
and B. DAP-seq data analysis shows 59 TFs that bind to the IND gene (Table 5.2) and
ampDAP-seq data analysis shows that 59 TFs bind to the IND gene (methylcytosines
were removed) and 29 TFs were common to both data sets (Fig 5.14B). Since this DNA
is from young leaf tissue, this data suggests that methylation in the IND gene can affect
IND-TF interactions in a young leaf. DNA methylation acts to repress gene transcription
and this can be tissue specific (Saze et al., 2012; Widman et al., 2014). H3 lysine 27
trimethylation (H3K27me3) is one of the major determinants of tissue-specific
expression patterns in plants (Zhang et al., 2007). In Arabidopsis, Polycomb-group (Pc-
G) proteins can repress target genes by catalysing H3K27me3 (Lafos et al., 2011). The
H3K27me3-ChIP (GEO:GSE24474) data suggest that H3K27me3 can target IND in a young
leaf (Fig 5.14C). H3K27me3-ChIP data in conjugation with ampDAP-seq data suggest that
IND gene transcription may be controlled by methylation in leaf tissue.
Gene Ontology (GO) biological process analysis was performed to determine the
function of the IND gene-binding transcription factors (59 TFs from DAP-seq). Gene
Ontology (GO) biological process analysis was done using PANTHER
(http://pantherdb.org/). Gene Ontology (GO) biological process terms that were
enriched by more than 10 fold were listed in Table 5.3. The data suggest that many of
the IND gene-binding TFs are involved in a hormone-mediated signalling pathway,

156
particularly ethylene signalling (Table 5.3). A large number of IND-TFs belongs to
APETALA2-ETHYLENE-RESPONSIVE ELEMENT BINDING PROTEIN (AP2-EREBP) family (23
and 20) (Fig 5.14A). AP2-EREBP family TFs are mediators of stress responses and
developmental programs (Licausi et al., 2013).
The gene expression analysis shows that IND can regulate few of the IND-TFs (Fig 5.14C).
Gene expression profiling of these TFs was presented in a heatmap (Fig 5.14C). HB51
was upregulated by IND (DEX vs. DMSO), IND plus IAA (DEX+AUX vs. AUX) and IND plus
BAP (DEX+CYT vs. CYT) (p<0.05, Fig 5.14C). SQUAMOSA PROMOTER BINDING PROTEIN-
LIKE 5 (SPL5) is involved in regulation of flowering and vegetative phase change (Jung et
al., 2016), SPL5 was upregulated by IND, IND plus IAA and IND plus BAP (p<0.05, Fig
5.14C). DREB and EAR motif protein 2 (DEAR2) is an AP2-EREBP family protein, DEAR2
was upregulated by IND and IND plus IAA (p<0.05, Fig 5.14C). HOMEOBOX-LEUCINE
ZIPPER 4 (HAT2) regulates auxin-mediated morphogenesis (Bou-Torrent et al., 2012;
Sawa et al., 2002; Sorin et al., 2009), HAT2 was upregulated by IND and IND plus BAP
(p<0.05, Fig 5.14C). KUODA1 (KUA1) specifically controls cell expansion during leaf
development (Lu et al., 2014), KUA1 was upregulated by IND plus IAA (p<0.05, Fig 5.14C).
Ethylene and salt inducible 3 (ESE3) is upregulated in response to ethylene and high salt
(Zhang et al., 2011a), ESE3 was upregulated by IND and IND plus BAP (p<0.05, Fig 5.14C).
HB51, SPL5, DEAR2, HAT2, KUA1, and ESE3 may promote or repress IND gene
expression, and this should be investigated.

157

158
Figure 5.14 Different family TFs bind to the IND gene, and IND gene methylation can affect
IND-TF interactions. (A) DAP-Seq and ampDAP-Seq (methylation-free) data (GEO:GSM1925338)
analysis presented in the heat map shows different family TFs bind to the IND gene and
particularly large number of AP2-EREBP TFs bind to the IND gene (both methylation and
methylation-free). (B) The Venn diagram shows that removing methylcytosines from the IND
gene (ampDAP-seq) can alter the TF binding pattern, in particular 30 TFs prefer to bind
methylation-free IND gene alone (ampDAP-seq in yellow circle). (C) The heat map shows a few
of these TF family genes were also regulated by IND (DEX vs. DMSO), IND plus IAA (DEX+AUX vs.
AUX) and IND plus BAP (DEX+CYT vs. CYT) (p<0.05). (D) In a young leaf, Polycomb-group (Pc-G)
proteins can repress IND gene expression by catalysing histone H3 lysine 27 trimethylation
(H3K27me3) (GEO:GSE24474).

159
Table 5.2 IND gene binding transcription factors from DAP-Seq data (GEO: GSM1925338)
analysis.
TF Family Transcription factors bind to cis-elements of IND gene
AP2-EREBP RAP2.10, RAP2.6, AT2G33710, ESE3, AT1G71450, AT5G65130, CEJ1, CBF1, ERF7, AT1G19210, ERF38, ERF8, DEAR3, ERF11, AT4G16750, ERF10, ERF4, RRTF1, ERF15, AT1G22810, AT1G12630, CBF4 and CRF10
C2C2-DOF AT2G28810, AT5G62940, AT3G45610, OBP3, AT5G02460, AT5G66940 and DOF45
MYB-related KUA1, AT1G49010, LHY1, RVE1, and AT3G09600
HB ATHB21, ATHB53, ATHB5 and ATHB40
MYB MYB119, MYB98 and MYB67
Homeobox HAT2 and HDG1
Trihelix GT2 and GTL1
C2H2 AT5G22990 and AT2G15740
CPP AT2G20110
G2-like AT2G01060
HSF HSFA6B
LOB-AS2 LBD2
MADS SVP
mTERF AT5G23930
NAC SND3
Orphan BBX31
REM REM19
SBP SPL9
ZF-HD ATHB23
Table 5.3 GO Term Enrichment analysis of IND gene-binding transcription factors p<0.05.
GO biological process GO ID Fold Enrichment
Ethylene-activated signaling pathway GO:0009873 34.2
Cellular response to ethylene stimulus GO:0071369 30.23
Phosphorelay signal transduction system GO:0000160 27.09
Response to ethylene GO:0009723 23.5
Negative regulation of transcription, DNA-templated GO:0045892 16.1
Negative regulation of RNA biosynthetic process GO:1902679 14.76
Negative regulation of nucleic acid-templated transcription
GO:1903507 14.76
Hormone-mediated signaling pathway GO:0009755 10.67
Cellular response to hormone stimulus GO:0032870 10.06

160
5.2.6.2 Hormone treatment regulates GUS activity in pIND::GUS seedlings
Results from the previous section suggest that ethylene can possibly regulate IND.
Similar to ethylene, other hormones may also regulate IND gene expression. This was
examined using pIND::GUS seedlings. pIND::GUS seedlings were germinated on plant
agar media supplemented with 10 µM jasmonic acid (JA), 10 µM abscisic acid (ABA), 10
µM indole-3-acetic acid (IAA, auxin), 10 µM 6-benzylaminopurine (BAP, cytokinin) and
10 µM 1-aminocyclopropane carboxylic acid (ACC, an ethylene precursor). After two
weeks, GUS staining was performed in untreated and hormone-treated pIND::GUS
seedlings. When compared to untreated seedlings, no GUS staining was observed in
seedlings grown on abscisic acid (Fig 5.15A and C). However, ABA treatment for 12 hours
did not affect IND expression in seedlings (Fig 8.6). Loss of GUS expression may be the
result of impaired seed germination. When compared to untreated seedlings, reduced
GUS staining was observed in seedlings grown on ACC and jasmonic acid (Fig 5.15A, B,
and F). Higher GUS staining was observed in seedlings grown on cytokinin (BAP) (Fig
5.15E). No difference in GUS staining was observed in untreated seedlings and seedlings
grown on auxin (IAA) (Fig 5.15A and D). These data suggest that ethylene (ACC) and
jasmonic acid inhibit IND expression whereas cytokinin (BAP) induces IND expression.
5.2.6.3 Summary
In summary, these results suggest that IND gene transcription may be controlled by
methylation (DNA/Histone) in leaf tissue. Different families of TFs can bind to the IND
gene, and GO analysis suggests that most of them are ethylene responsive. GUS activity
in pIND::GUS seedlings suggest that ethylene and jasmonic acid may negatively regulate
IND and cytokinin may positively regulate IND.

161
Figure 5.15 Hormonal treatments regulate IND-GUS activity in pIND::GUS seedlings. (A-F) GUS
activity accumulation driven by the IND promoter in pIND::GUS seedlings (16 DAG): images show
high expression in cytokinin (E) and reduced expression in jasmonic acid (B), abscisic acid (C),
and ACC (F) treated seedlings. When compared to untreated control (A), no change in expression
was observed in auxin (D). (Scale bar for A, B, D and F = 1.5 mm, E = 1 mm and C = 0.5 mm).
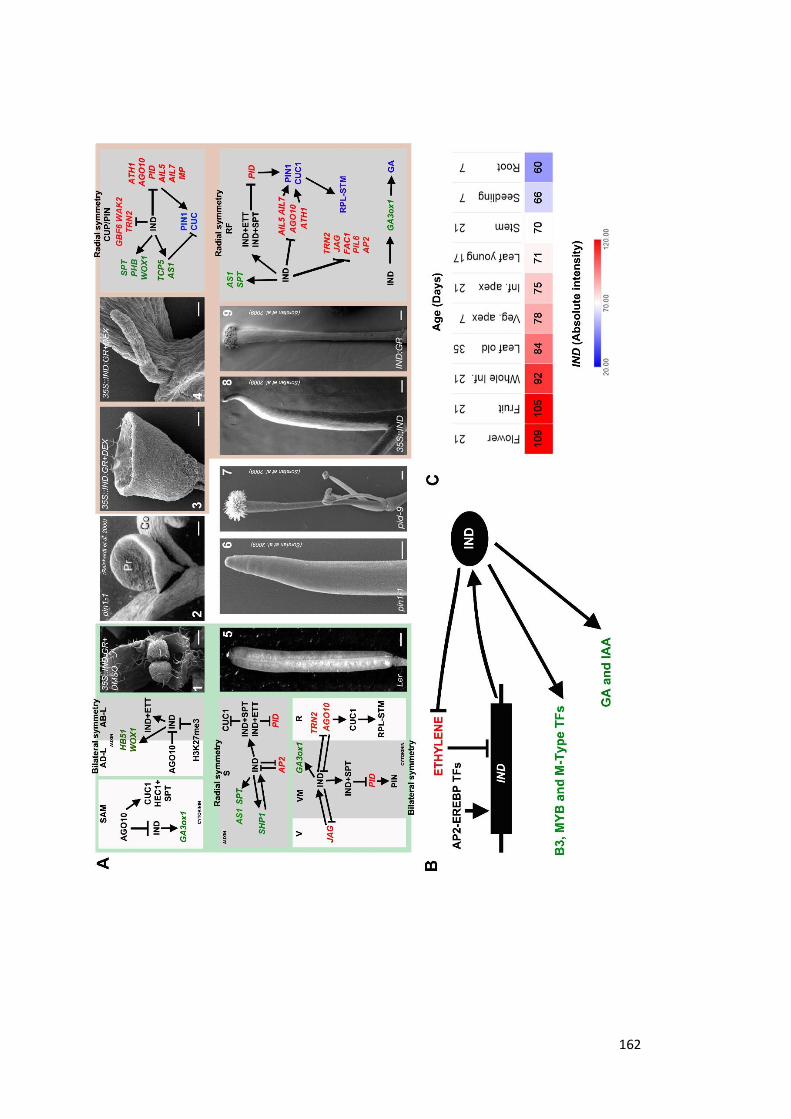
162

163
Figure 5.16 Schematic representation of IND regulated gene networks and associated leaf and
fruit phenotypes. Overexpression of IND plants produce (A3 and A4) cup or pin shaped leaves,
(A8) pin shaped inflorescence and (A9) radially symmetric fruit (similar to monocarpous). These
phenotypes look similar to (A2 and A6) pin1-1 and (A7) pid-9 mutants. Schematic IND gene
regulatory network involved in (A1, A3, and A4) seedling and (A5, A8, and A9) fruit development
are outlined above as discussed in the text. (B) AP2-EREBP TFs and ethylene may regulate IND,
and in response, IND may inhibit ethylene signalling and promote GA as well as IAA biosynthesis
by upregulating B3, MYB and M-Type TFs. (C) The heat map shows absolute intensity values of
IND (Gene expression data from At-TAX) in different tissues of Arabidopsis and high IND
expression is observed in reproductive tissues and low expression in root and seedlings.

164
5.3 Discussion
5.3.1 Overexpression of IND impairs bilateral symmetry
Auxin and cytokinin hormones play a key role in development and patterning of SAM
and gynoecium tissues (Besnard et al., 2014; Larsson et al., 2014; Moubayidin and
Ostergaard, 2014; Qi et al., 2014; Reyes-Olalde et al., 2017). Auxin and cytokinin can
regulate IND and orchestrate patterning in gynoecium. Auxin regulates polarity at the
gynoecium apex by modulating IND and ETT interaction, and cytokinin promotes valve
margin formation by regulating IND and SHP (Marsch-Martinez et al., 2012; Simonini et
al., 2016). In addition, the data from this chapter also suggest auxin and cytokinin can
modulate IND-regulated gene expression. In particular, functional gene expression
analysis suggests that IND significantly downregulates meristem identity and bilateral
symmetry genes in the presence of auxin and cytokinin. Bilateral symmetry is a
symmetrical arrangement of an organism or part of an organism (e.g. leaf adaxial-
abaxial) along a central axis divided into two identically reflected halves (Moubayidin
and Ostergaard, 2015). Auxin transport is crucial for tuning bilateral symmetry in leaf
(adaxial-abaxial) and gynoecium (medial-lateral) (Larsson et al., 2014; Qi et al., 2014).
PID kinase regulates polar auxin transport via PIN proteins (Christensen et al., 2000;
Friml et al., 2004). Results from this chapter show that IND can significantly
downregulate PID expression in the presence of auxin and cytokinin. In addition to PID,
IND may also repress PIN1 by downregulating AGO10, AIL5, AIL7 and MP gene
expression (Aida et al., 2002; Bhatia et al., 2016; Nole-Wilson et al., 2010; Pinon et al.,
2013; Prasad et al., 2011; Roodbarkelari et al., 2015; Wenzel et al., 2007) (Fig 5.16). IND
minimises auxin flow in the style (gynoecium apex) and valve margins by downregulating
PIN1 (Moubayidin and Ostergaard, 2014). Similar to the gynoecium, overexpression of
IND may minimise auxin flow between leaf and the SAM by downregulating PIN1 (Fig
5.12). Inhibition of auxin transport between leaf primordia and the SAM enhances leaf
polarity defects and promotes abaxialised radially symmetric leaves (Qi et al., 2014).
Overexpression of IND also produces radially symmetric leaves (PIN and CUP shaped),
inflorescence (PIN shaped) and fruits (apical-basal monocarpous looking), and these
phenotypes resemble pin1, pid and cuc mutants (Aida et al., 1997; Aida et al., 1999; Aida
et al., 2002; Furutani et al., 2004; Moubayidin and Ostergaard, 2014; Reinhardt et al.,
2000; Sorefan et al., 2009a) (Fig 5.16 A). Similar to the gynoecium apex, overexpression

165
of IND may be mimicking bilateral-to-radial transition in the leaf primordia (Moubayidin
and Ostergaard, 2014). These studies suggest that overexpression of IND minimises
auxin flow and impairs bilateral symmetry.
CUC genes also regulate bilateral symmetry (Furutani et al., 2004). PIN1, MP, ATH1, and
AGO10-REV promote CUC function (Aida et al., 2002; Furutani et al., 2004; Gomez-Mena
and Sablowski, 2008). PIN1 and MP regulate apical patterning (shift from radial to
bilateral symmetry) in the embryo, partially by controlling CUC expression (Aida et al.,
2002; Furutani et al., 2004). ATH1 also regulates the boundary between the stem and
both vegetative and reproductive organs by partially controlling CUC genes (Gomez-
Mena and Sablowski, 2008). The data in Chapter 3 and 4 suggest that AGO10-REV
regulates bilateral symmetry of the leaf by promoting CUC1 expression. IND, AS1, and
TCPs negatively regulate CUC1 (Koyama et al., 2010). Chapter 4 data suggest that IND
negatively regulates CUC1 and can directly repress CUC1 expression. In addition to IND,
CIN-like TCPs also negatively regulate CUC1 via AS1, and overexpression of TCPs also
suppresses the formation of shoot meristems by promoting fusion of cotyledons
(Koyama et al., 2010). This suggests that overexpression of TCPs may impair the bilateral
symmetry of the leaf (Koyama et al., 2010). Results from this chapter demonstrate that
overexpression of IND may also negatively regulate CUC1 expression by downregulating
PIN1, MP, and ATH1, and upregulating TCP5 and AS1. Loss of cuc can also affect RPL-
STM and disrupt the replum-septum formation (Kamiuchi et al., 2014). These studies
suggest that overexpression of IND gradually downregulates CUC1 and impairs bilateral
symmetry.
Overexpression of IND with auxin and cytokinin downregulates TRN2 and WAK2
expression. TRN2 and WAK2 proteins regulate leaf and SAM development (Chiu et al.,
2007; Cnops et al., 2006; Wagner and Kohorn, 2001). TRN2 is a transmembrane
tetraspanin protein, loss of trn2 leads to asymmetric leaf growth and can affect leaf and
SAM development (Chiu et al., 2007; Cnops et al., 2006). WAK2 regulates pectin
activation and leaf cell expansion (Wagner and Kohorn, 2001). In addition to auxin
minima and CUC1, IND may also impair the bilateral symmetry of the leaf by repressing
TRN2 and WAK2.
166
5.3.2 IND redundantly regulates floral development
The Arabidopsis gynoecium is a complex structure, which exhibits radial symmetry at
the apex (similar to monocarpous) and bilateral symmetry at the medial-lateral domain
(similar to syncarpous) (Smyth et al., 1990). Valve, valve margin and replum factors
regulate gynoecium (medial-lateral) bilateral symmetry by competitively regulating each
other. IND is one of the key factors for valve margin development (Liljegren et al.,
2004a). IND regulates valve margin development by minimising auxin flow and also by
promoting SPT and GA3ox1 (Arnaud et al., 2010; Girin et al., 2011; Sorefan et al., 2009a).
IND-GUS, SPT-GUS and GA3ox1-GUS expression in valve margins were previously
reported in different studies and Ind or spt or ga3ox1 mutants also failed to establish
valve margin (Arnaud et al., 2010; Girin et al., 2011; Liljegren et al., 2004a). Which
suggests IND and its downstream targets SPT and GA3ox1 are required for valve margin
development.
The valve factor JAG regulates valve margin development by promoting SHP and IND
(Dinneny et al., 2005; Gonzalez-Reig et al., 2012). Data from this chapter suggests that
overexpression of IND with cytokinin downregulates JAG expression. Alternatively, JAG
may also negatively regulate SHP and IND by promoting FUL (Alonso-Cantabrana et al.,
2007; Dinneny et al., 2005; Liljegren et al., 2004a). This suggests that IND may repress
JAG/FUL to preserve the valve margin domain. Data from Chapters 3 and 4 suggest that
AGO10-HD-ZIP III negatively regulates IND to promote replum development. In addition
to AGO10, TRN2 also regulates carpel and replum development (Chiu et al., 2007). Data
from this chapter suggests that overexpression of IND with cytokinin downregulates
AGO10 and TRN2 expression. Together these studies demonstrate that IND may
promote valve margin development by repressing valve and replum factors.
At stage 8/9, the apical style becomes radially symmetric. Different studies demonstrate
that SHP1, SHP2, IND, SPT, ETT and HEC proteins promote style development (Colombo
et al., 2010; Girin et al., 2011; Moubayidin and Ostergaard, 2014; Schuster et al., 2015;
Sessions et al., 1997; Sessions and Zambryski, 1995; Simonini et al., 2016). In particular,
IND-SPT proteins orchestrate the switch from bilateral to radial symmetry by controlling
PIN protein localisation and thus generating the auxin ring at the apex (Girin et al., 2011;
Moubayidin and Ostergaard, 2014). In addition, IND-ETT also contributes to the

167
formation of an auxin ring (auxin maxima) at the apex by repressing PID (Simonini et al.,
2016). However, Chapter 4 results suggest that IND and SPT may repress CUC1 and
promote carpel fusion at the gynoecium apex (Nahar et al., 2012). Interestingly, AS1 and
AS2 negatively regulate CUCs to promote the development of perianth organs (Xu et al.,
2008). In addition, IND may also repress CUC1 by promoting AS1 in gynoecium apex. But
we do not know if ETT represses AS1 in the gynoecium apex because ETT and ARF4
promote leaf abaxial domain by epigenetically repressing AS1-AS2 (Machida et al.,
2015). SHP1 and SHP2 promote IND and regulate valve margin development (Dinneny
et al., 2005; Liljegren et al., 2000). AP2 negatively regulates SHP and IND to control the
overgrowth of valve margin (Ripoll et al., 2011). In addition to valve margins, SHPs also
regulate style development (Colombo et al., 2010). Interestingly, overexpression of IND
with auxin downregulates AP2 expression and upregulates SHP1 expression. Therefore
this suggests that IND may promote SHP1 in the gynoecium apex by repressing AP2.
However, the loss of ind mutant fruits do not show any defects in style development,
although ind spt double mutant fruits do show defects in style development (unfused
carpels) (Girin et al., 2011). Together, these studies suggest that IND redundantly
regulates symmetry transition and thus style development.
Interestingly, IND expression is also observed around stage 8 in anther and pollen of a
wild-type Arabidopsis (Kay et al., 2013b). IND regulates anther and pollen development
by promoting GA biosynthesis via GA3ox1 (Kay et al., 2013a). Similar to IND in the
gynoecium, the MYB26 protein regulates anther indehiscence in Arabidopsis (Steiner-
Lange et al., 2003; Yang et al., 2007). Data from this chapter suggest that overexpression
of IND upregulates MYB26 and GA3ox1 expression. Together these studies demonstrate
that IND may contribute to anther indehiscence by promoting MYB26 and GA3ox1.
5.3.3 IND redundantly regulate leaf development
The Arabidopsis leaf is a complex structure that exhibits bilateral symmetry at the
medial-lateral domain. Several proteins regulate leaf polarity (adaxial-abaxial) and
bilateral symmetry. Loss or overexpression of polarity proteins can impair the leaf
bilateral symmetry (Dello Ioio et al., 2012; Eshed et al., 2004; Ikezaki et al., 2010; Iwasaki
et al., 2013; Kim et al., 2008; Koyama et al., 2010; Kumaran et al., 2002; Machida et al.,
2015; McConnell et al., 2001; Nakata et al., 2012; Siegfried et al., 1999; Xu et al., 2003).

168
IND is also expressed in wild-type leaves, and overexpression of IND disrupts leaf
bilateral symmetry and promotes radial symmetry. However, leaf bilateral symmetry is
still intact in ind mutant plants, therefore IND may regulate leaf development by
promoting SPT as well as interacting with SPT and ETT. However, overexpression of SPT
decreases the cell size in fully expanded leaves (Ichihashi et al., 2010a). Alternatively,
similar to the gynoecium, IND-SPT and IND-ETT may repress PID to control auxin
transport in the leaf. Auxin transport from leaves to the shoot apex creates a lower auxin
zone on the adaxial side of the leaf, and this auxin depletion is essential for leaf adaxial
development (Qi et al., 2014). IND-SPT and IND-ETT may control PID-PIN1 and thus limit
auxin in the adaxial side of the leaf. However, overexpression of IND may totally repress
PID-PIN1 and promote auxin accumulation in leaf primordia (Caggiano et al., 2017;
Guenot et al., 2012; Sorefan et al., 2009a) (Fig 5.12).
Auxin accumulation in leaf primordia significantly upregulates WOX1 expression
(Caggiano et al., 2017). Interestingly, overexpression of IND also significantly
upregulates WOX1 expression. Similar to pWOX1::GUS, IND promoter-driven GUS
expression is also observed in leaf margin serrated regions (Nakata et al., 2012). WOX1
regulates blade outgrowth, and leaf adaxial-abaxial patterning and overexpression of
WOX1 leads to defects in meristem development (Nakata et al., 2012; Zhang et al.,
2011b). These studies suggest that IND-SPT and IND-ETT may promote WOX1 in leaf
primordia by modulating auxin transport. HB51 also regulates leaf margin development
and serration (Saddic et al., 2006). In addition to WOX1 and IND, HB51 promoter-driven
GUS expression is also observed in the leaf margin and serrated regions (Saddic et al.,
2006). This suggests that IND may regulate leaf serration by promoting HB51 and WOX1
expression. The leaf serration phenotype should be analysed in ind mutant plants.
Together these studies demonstrate that IND redundantly regulates leaf development.
The results from Chapters 3 and 4 demonstrate that AGO10 can repress IND expression
and suggests that minimising IND expression is essential for establishing leaf bilateral
symmetry as well as for normal SAM development. Interestingly Pc-G proteins can also
repress IND in leaf tissue by catalysing H3K27me3 methylation (Lafos et al., 2011). In
addition to H3K27me, ampDAP-seq data analysis suggests that DNA methylation can
also regulate TF and IND gene interactions (O'Malley et al., 2016). Together, these

169
studies suggest that histone and DNA methylation may also repress IND expression in
the leaf tissue.
5.3.4 Hormones and IND can regulate each other
Auxin and cytokinin responses during gynoecium development are well studied using
reporter lines TCS::GUS or TCS::GFP (Cytokinin) and DR5::GUS or DR5::GFP (Auxin)
(Sabatini et al., 1999; Zurcher et al., 2013). At stage 8/9, cytokinin responses are
previously observed in valve margin and medial tissues (CMMs) and auxin responses are
previously observed in style as well as in medial-lateral tissues (replum and valves)
(Larsson et al., 2014; Marsch-Martinez et al., 2012; Moubayidin and Ostergaard, 2014).
However, cytokinin treatment can also rescue the valve margin in shp and ind mutants
(Marsch-Martinez et al., 2012). Furthermore, results from this chapter show that
cytokinin (BAP) can also promote IND promoter-driven GUS expression. Exogenous BAP
application can also affect apical-basal patterning in gynoecium (Zuniga-Mayo et al.,
2014). BAP-induced gynoecium apical-basal phenotypes also look similar to ett, pin1 and
overexpression of IND gynoecium phenotypes (Sessions et al., 1997; Sessions and
Zambryski, 1995; Sorefan et al., 2009a; Zuniga-Mayo et al., 2014). These studies suggest
that cytokinin may promote IND and redundantly regulate valve margin development.
IND may also regulate cytokinin signalling via SPT because SPT promotes ARR1 and
activates auxin biosynthesis via TAA1 (Reyes-Olalde et al., 2017). Alternatively, IND may
also control cytokinin biosynthesis because results from this data suggest that
overexpression of IND can repress IPT3 expression. IPT3 is one of the key regulators of
cytokinin biosynthesis, and loss of IPT3 can affect cytokinin production (Galichet et al.,
2008). These studies suggest that IND may control cytokinin levels to promote apical
tissue development because auxin maxima are essential for apical tissue patterning in
gynoecia. Similar to SPT, IND may promote auxin biosynthesis because results from this
chapter suggest that overexpression of IND can upregulate TAA1 expression. We do not
know if IND is regulating TAA1 via SPT. Together these studies suggest that IND-SPT and
auxin-cytokinin work together to establish patterning during gynoecium development.
Ethylene, JA and ABA are stress response hormones (Nguyen et al., 2016) and the results
from this chapter show that ethylene and JA can repress IND promoter-driven GUS
expression. In addition, Arabidopsis thaliana Tiling Array Express (At-TAX) abiotic stress

170
data also suggests that 12 hours of salt, osmotic and cold stress can repress IND
expression (Fig 8.6) (Zeller et al., 2009). This suggests that stress responses can
negatively regulate IND gene expression. However, overexpression of IND may also
inhibit ethylene, JA and ABA biosynthesis and signalling. Therefore, IND may negatively
regulate stress response signalling by repressing ethylene, JA and ABA. Ethylene, JA and
ABA hormones crosstalk through ERFs under abiotic stress (Muller and Munne-Bosch,
2015). In addition, DAP-seq data analysis suggests that ERFs (AP2-EREBP TFs) can bind
to cis-elements of the IND gene (O'Malley et al., 2016). We do not know if these ERFs
can repress or induce IND expression. Together, these studies suggest that IND and
stress response hormones may negatively regulate each other.
5.3.5 Conclusion
Even though gene expression study conducted in seedlings, still similar genes can
regulate both seedling and floral development. So, results were discussed from the point
of seedling as well as gynoecium development. This chapter demonstrates that auxin
and cytokinin can enhance IND regulated gene expression. In particular, IND with auxin
and cytokinin may promote radial symmetry by inhibiting bilateral symmetry. IND may
regulate radial symmetry by indirectly repressing PIN1 and CUC1 by downregulating PID
and also by regulating other elements as shown in figure 5.16A. IND also regulates genes
involved in floral and leaf development. Gene expression data suggest that IND may
redundantly regulate style development and apical carpel fusion by upregulating AS1,
SPT, and SHP1 and also by downregulating AP2, PID and CUC1 (Fig 5.16 A5). Gene
expression data suggest that IND may redundantly regulate leaf development by
upregulating WOX1 and HB51 (Fig 5.16 A1). The functional relationship of these genes
should be investigated by classical genetic studies. In addition to AGO10, H3K27me may
promote bilateral symmetry of the leaf by repressing IND (Fig 5.16 A1). A large number
of AP2-EREBP family TFs bind to the IND gene. AP2-EREBP TFs and cytokinins may
promote IND gene expression (Fig 5.16 B). Interestingly, many of the IND binding TFs are
involved in ethylene signalling. However, IND and ethylene responses may negatively
regulate each other (Fig 5.16 B).

171
Chapter 6 General Discussion

172
Figure 6.1 Schematic representation of the AGO10-PHB-REV-IND-CUC1 signalling cascade and
associated mutant or overexpression phenotypes. The ago10, phb rev, and cuc1 pin1 mutants
produce identical leaf (CUP and PIN) and gynoecium (small bulged) phenotypes. Overexpression
of IND also produces similar phenotypes possibly by repressing PAT, CUC1, and AGO10.
However, AGO10 promotes CUC1, SPT-HEC1 and represses IND via PHB and REV. This suggests
that AGO10 and IND repress each other’s expression.

173
CHAPTER 6. General Discussion We found that AGO10 and IND antagonise each other’s expression as a mechanism to
maintain repression of IND in AGO10 expressing tissues. Morphological analysis from
Chapter 3 suggests that repression of IND by AGO10 is essential for SAM and replum
tissue polarity because overexpression of IND impairs bilateral tissue symmetry.
Molecular and cell biology analysis from Chapters 4 and 5 demonstrate that IND
overexpression may negatively regulate bilateral tissue symmetry by repressing polar
auxin transport (PAT), CUC1 and AGO10. I suggest that the ability of AGO10 to switch off
IND activity in SAM and replum tissue may be essential for establishing tissue bilateral
symmetry.
6.1 Understanding the role of IND in gynoecium and SAM development
The Arabidopsis gynoecium is the most complex structure in plants, and its patterning
occurs along three axes: apical-basal, medial-lateral, and abaxial-adaxial. TFs, hormones
and transport proteins orchestrate gynoecium patterning. We show that IND dependent
gene regulatory networks may be conserved in the seedlings and gynoecium (Chapter
5). Therefore, the genetic networks we identify in our microarray analysis may have
important implications for understanding gynoecium development. In particular SHP1,
SHP2, IND, SPT, ETT and HEC proteins as well as auxin maxima are important for apical
gynoecium patterning (Colombo et al., 2010; Girin et al., 2011; Moubayidin and
Ostergaard, 2014; Schuster et al., 2015; Sessions et al., 1997; Sessions and Zambryski,
1995; Simonini et al., 2016).
Interactions between SHP1, SHP2, IND, SPT, ETT and HEC proteins are essential for
proper gynoecium development. SHP1 and SHP2 proteins promote IND expression in
the gynoecium (Liljegren et al., 2004a). AP2 acts upstream of SHP1, SHP2 and IND by
repressing their expression in the gynoecium (Ripoll et al., 2011). I show that inducing
IND in the presence of auxin (Chapter 5) downregulates AP2 and upregulate SPT and
SHP1 expression. This suggests that in the absence of auxin, AP2 represses SPT and SHP1,
however IND integrates auxin signals to promote expression of SHP1 and SPT, thereby
promoting apical gynoecium development through a positive feedback mechanism.
174
IND-SPT, IND-ETT, and SPT-HEC proteins interact to orchestrate the switch from bilateral
(medial-lateral) to radial (apical) symmetry (Girin et al., 2011; Gremski et al., 2007;
Moubayidin and Ostergaard, 2014; Schuster et al., 2015; Simonini et al., 2016).
Functional loss of these proteins can impair apical tissue growth (e.g., unfused carpels)
(Girin et al., 2011; Schuster et al., 2015). In particular, CUC1 and CUC2 genes inhibit the
radiality of apical gynoecia (Nahar et al., 2012), and SPT and AS1 act upstream of CUC1/2
by repressing their expression. (Gonzalez-Reig et al., 2012; Nahar et al., 2012). Inducible
SPT gene-expression data from Chapter 4 suggests that SPT does not directly regulate
CUC1 and CUC2 expression. However, IND can directly repress CUC1 and PID expression
and upregulate AS1 expression (Chapter 4 and 5). PID promotes CUC expression in the
Arabidopsis embryo, and we do not know whether PID can regulate CUC1 and CUC2
expression in gynoecium (Furutani et al., 2004). This suggests that IND may directly or
indirectly repress CUC1 expression and may promote apical gynoecium patterning.
However, this should be investigated by conducting classical genetic studies.
Valve, valve margin, and replum factors regulate medial-lateral gynoecium patterning
by competitively regulating each other. IND is an essential factor for valve margin
development (Liljegren et al., 2004a). IND and SPT regulate valve margin development
by minimising auxin flow and by promoting cytokinin responses in the valve margin
(Arnaud et al., 2010; Girin et al., 2011; Sorefan et al., 2009a). JAG positively regulates
the valve margin identity gene IND and the valve-promoting gene FUL (Dinneny et al.,
2005; Gonzalez-Reig et al., 2012). However, FUL negatively regulates IND and restricts
IND expression to the valve margin (Liljegren et al., 2004a). We show that inducing IND
in the presence of cytokinin (Chapter 5) downregulates JAG expression, and this
demonstrates that IND may restrict JAG-FUL expression to the valve by a negative
feedback mechanism. However, this phenomenon should be investigated further.
IND is weakly expressed in seedlings and the vegetative meristem (Laubinger et al.,
2008). However, there are no research studies to support a functional role for IND in
SAM development. Morphological studies from Chapter 3 demonstrate that IND is
required to promote meristem size. However, the reduced indind-6 SAM size did not
affect SAM and leaf development. Interestingly, overexpression of IND resulted in a
large meristem, and leaf development was arrested (Chapter 3). Both the published

175
literature and indind-6 SAM size data from Chapter 3 suggest that IND may regulate SAM
size by controlling polar nuclei fusion during female gametogenesis (Pagnussat et al.,
2005) or by controlling cytokinesis (by unequal cell division) (Wu et al., 2006). However,
the pattern of cytokinesis in the indind-6 SAM should be investigated further. Similar to
their role in the gynoecium, IND-SPT and IND-ETT may repress PID and control auxin
transport in the leaf (Girin et al., 2011; Simonini et al., 2016). However, loss of indind-6
did not affect leaf bilateral symmetry (Chapter 3). The Arabidopsis leaf exhibits bilateral
symmetry at the medial-lateral domain. Interestingly, overexpression of IND disrupted
bilateral leaf symmetry and promoted abaxialised radial symmetry (PIN and CUP
shaped) (Chapter 3) (Moubayidin and Ostergaard, 2014). Auxin transport from leaves to
the shoot apex creates a lower auxin zone on the adaxial side of the leaf, and this auxin
depletion is essential for leaf adaxial development (Qi et al., 2014). Overexpression of
IND downregulates PID-PIN1 and thus impairs the bilateral leaf symmetry (Chapter 3
and 5) (Caggiano et al., 2017; Guenot et al., 2012; Sorefan et al., 2009a). This suggests
that IND may establish leaf polarity by regulating PAT. However, the role of IND-SPT and
IND-ETT in leaf tissue should be investigated by conducting classical genetic studies.
Different proteins regulate leaf polarity (adaxial-abaxial) and loss or overexpression of
polarity proteins can impair leaf bilateral symmetry (Dello Ioio et al., 2012; Eshed et al.,
2004; Ikezaki et al., 2010; Iwasaki et al., 2013; Kim et al., 2008; Koyama et al., 2010;
Kumaran et al., 2002; Machida et al., 2015; McConnell et al., 2001; Nakata et al., 2012;
Siegfried et al., 1999; Xu et al., 2003). Overexpression of IND can also upregulate or
downregulate leaf polarity genes. WOX1 regulates leaf adaxial-abaxial patterning
(Nakata et al., 2012; Zhang et al., 2011b) and we have found in Chapter 3 and 5 that
overexpression of IND significantly upregulates WOX1 expression. However, auxin
accumulation in leaf primordia also significantly upregulates WOX1 expression
(Caggiano et al., 2017). This suggests that IND may indirectly promote WOX1 by
controlling PAT in leaf primordia. AGO10 regulates leaf adaxial fate (Liu et al., 2009) and
induction of IND can directly downregulate AGO10 expression (Chapter 3). Taken
together, these studies support the findings in this thesis that overexpression of IND
may impair bilateral leaf symmetry by altering leaf polarity gene expression.
6.2 Understanding the role of AGO10-IND in SAM development

176
In Arabidopsis, AGO10 is expressed in seedlings, particularly in the SAM and adaxial
domain of the leaf. AGO10 regulates SAM development and leaf polarity by preserving
HD-ZIP III gene expression (Liu et al., 2009; Tucker et al., 2008; Zhang and Zhang, 2012;
Zhu et al., 2011b). Loss of AGO10 impairs SAM and leaf development (Endrizzi et al.,
1996; Moussian et al., 1998). In particular, the ago10zwl-3 seedlings produced CUP and
PIN phenotypes (Chapter 3). However, several studies have demonstrated that pin1, pid,
and cuc mutants can produce CUP- and PIN-shaped phenotypes (Aida et al., 1997; Aida
et al., 1999; Aida et al., 2002; Furutani et al., 2004; Hibara et al., 2006) (Fig 6.1). PIN1,
PID and CUC genes are important for proper meristem and leaf development because
these proteins regulate auxin responses (Aida et al., 2002; Furutani et al., 2004; Heisler
et al., 2005; Huang et al., 2010; Larsson et al., 2014). Interestingly, PIN1, PID, and
CUC1/2/3 expression are decreased in ago10zwl-3 (CUP and PIN) seedlings, and this data
suggests that ago10zwl-3 (CUP and PIN) phenotypes are defective in auxin signalling
(Chapter 4). However, several studies suggest that auxin responses and HD-ZIP III (PHB
and REV) genes can regulate each other (Bou-Torrent et al., 2012; Muller et al., 2016;
Nole-Wilson et al., 2010; Reinhart et al., 2013). In addition, PHB and REV can upregulate
CUC1 expression (Chapter 4). Taken together, these studies support the findings of this
thesis that the AGO10-HD-ZIP III pathway can control auxin responses as well as CUC1
expression and thus regulate SAM development.
Overexpression of IND can impair bilateral leaf symmetry by inhibiting PAT as well as by
directly downregulating CUC1 (Chapter 3, 4 and 5). Interestingly, IND expression was
increased whereas PIN1 and CUC1 were decreased in ago10zwl-3 seedlings (Chapter 3
and 4). We found that loss of IND partially rescues CUC1 expression as well as ago10
phenotypes, and this suggests that increased IND expression may have promoted CUP
and PIN phenotypes in ago10zwl-3. IND may also modulate PAT and CUC1 expression by
regulating AS1, TCP, AIL5, AIL7 and MP expression (Chapter 5) (Aida et al., 2002; Bhatia
et al., 2016; Koyama et al., 2010; Pinon et al., 2013; Prasad et al., 2011; Wenzel et al.,
2007). However, PHB and REV can indirectly downregulate IND gene expression
(Chapter 3), and this suggests that AGO10 indirectly inhibits IND via HD-ZIP III
transcription factors in wild-type seedlings. Together these studies suggest that AGO10-
PHB-REV may promote SAM development and leaf bilateral symmetry by repressing IND
(Fig 6.1).
177
6.3 Understanding the role of AGO10-IND in replum development
AGO10-REV regulate floral meristem differentiation and gynoecium development (Ji et
al., 2011; Nole-Wilson et al., 2010). In particular, REV promotes CMM development
(Nole-Wilson et al., 2010). In addition, CUC1 and CUC2 genes promote CMM
development (Ishida et al., 2000; Kamiuchi et al., 2014; Nahar et al., 2012). Interestingly,
REV can directly upregulate CUC1 expression (Chapter 4). However, the ago10 and cuc1
cuc2 mutants produce small fruits with reduced replum (width), and these fruits are
identical to rpl mutants (Chapter 3 and 4) (Ishida et al., 2000; Roeder et al., 2003) (Fig
6.1). STM and RPL proteins regulate replum development (Bhatt et al., 2004; Ragni et
al., 2008; Roeder et al., 2003). Overexpression of CUC1 upregulates STM and RPL, which
suggests that CUC1 may regulate replum development by promoting STM-RPL (Chapter
4). Together these studies suggest that AGO10-REV may regulate replum development
by promoting CUC1, STM, and RPL. However, the role of AGO10-CUC1 and AGO10-RPL
in gynoecium tissue should be investigated by conducting classical genetic studies.
Replum factors and valve margin factors regulate each other in an antagonistic fashion.
IND promotes valve margin development, and it has been demonstrated that IND
expression is inhibited in the replum by RPL (Liljegren et al., 2000; Liljegren et al., 2004a;
Roeder et al., 2003). In addition, AGO10 may promote replum development by
repressing IND expression because the loss of IND rescues ago10 replum phenotype in
ind ago10 double mutants (Chapter 3). IND may promote valve margin development by
repressing AGO10 and CUC1 expression. IND represses CUC1, both directly but also
possibly indirectly by inhibiting PAT and upregulating AS1 (Chapter 4 and 5). AS1
negatively regulates replum development by repressing medial factors BP, RPL, CUC1
and CUC2 (Gonzalez-Reig et al., 2012; Xu et al., 2008). These studies suggest that AGO10
and IND may antagonistically regulate each other along the mediolateral axis of the
Arabidopsis fruit (Fig 6.1). However, the role of AGO10-IND-CUC1 in the gynoecium
tissue should be investigated further.

178
6.4 Summary of findings
To summarise, this thesis has found:
Overexpression of IND inhibits SAM development and tissue bilateral symmetry.
Overexpression of IND impairs leaf bilateral symmetry by repressing PAT, AGO10
and CUC1 expression.
AGO10-PHB-REV promote SAM and replum development by repressing IND.
Further research should focus on:
Investigating the role of IND-ETT and IND-SPT in leaf development.
Investigating the role of AGO10 and IND in CMM development.

179
Chapter 7 References

180
CHAPTER 7. References
Adams, D.O., and Yang, S.F. (1979). Ethylene Biosynthesis - Identification of 1-
Aminocyclopropane-1-Carboxylic Acid as an Intermediate in the Conversion of
Methionine to Ethylene. Proceedings of the National Academy of Sciences of the
United States of America 76, 170-174.
Aida, M., Ishida, T., Fukaki, H., Fujisawa, H., and Tasaka, M. (1997). Genes
involved in organ separation in Arabidopsis: an analysis of the cup-shaped
cotyledon mutant. The Plant cell 9, 841-857.
Aida, M., Ishida, T., and Tasaka, M. (1999). Shoot apical meristem and cotyledon
formation during Arabidopsis embryogenesis: interaction among the CUP-
SHAPED COTYLEDON and SHOOT MERISTEMLESS genes. Development 126,
1563-1570.
Aida, M., Vernoux, T., Furutani, M., Traas, J., and Tasaka, M. (2002). Roles of PIN-
FORMED1 and MONOPTEROS in pattern formation of the apical region of the
Arabidopsis embryo. Development 129, 3965-3974.
Alonso-Cantabrana, H., Ripoll, J.J., Ochando, I., Vera, A., Ferrandiz, C., and
Martinez-Laborda, A. (2007). Common regulatory networks in leaf and fruit
patterning revealed by mutations in the Arabidopsis ASYMMETRIC LEAVES1
gene. Development 134, 2663-2671.
Alvarez-Buylla, E.R., Liljegren, S.J., Pelaz, S., Gold, S.E., Burgeff, C., Ditta, G.S.,
Vergara-Silva, F., and Yanofsky, M.F. (2000). MADS-box gene evolution beyond
flowers: expression in pollen, endosperm, guard cells, roots and trichomes. The
Plant journal : for cell and molecular biology 24, 457-466.
Argyros, R.D., Mathews, D.E., Chiang, Y.H., Palmer, C.M., Thibault, D.M.,
Etheridge, N., Argyros, D.A., Mason, M.G., Kieber, J.J., and Schaller, G.E. (2008).
Type B response regulators of Arabidopsis play key roles in cytokinin signaling
and plant development. Plant Cell 20, 2102-2116.
Ariel, F.D., Manavella, P.A., Dezar, C.A., and Chan, R.L. (2007). The true story of
the HD-Zip family. Trends in plant science 12, 419-426.
Arnaud, N., Girin, T., Sorefan, K., Fuentes, S., Wood, T.A., Lawrenson, T.,
Sablowski, R., and Ostergaard, L. (2010). Gibberellins control fruit patterning in
Arabidopsis thaliana. Genes & development 24, 2127-2132.

181
Arnone, M.I., and Davidson, E.H. (1997). The hardwiring of development:
organization and function of genomic regulatory systems. Development 124,
1851-1864.
Aulie, R.P. (1961). Caspar Friedrich Wolff and his 'Theoria generationis', 1759. J
Hist Med Allied Sci 16, 124-144.
Axtell, M.J. (2013). Classification and comparison of small RNAs from plants.
Annu Rev Plant Biol 64, 137-159.
Barkoulas, M., Galinha, C., Grigg, S.P., and Tsiantis, M. (2007). From genes to
shape: regulatory interactions in leaf development. Current opinion in plant
biology 10, 660-666.
Barton, M.K. (2010). Twenty years on: the inner workings of the shoot apical
meristem, a developmental dynamo. Developmental biology 341, 95-113.
Besnard, F., Refahi, Y., Morin, V., Marteaux, B., Brunoud, G., Chambrier, P.,
Rozier, F., Mirabet, V., Legrand, J., Laine, S., et al. (2014). Cytokinin signalling
inhibitory fields provide robustness to phyllotaxis. Nature 505, 417-421.
Bhatia, N., Bozorg, B., Larsson, A., Ohno, C., Jonsson, H., and Heisler, M.G. (2016).
Auxin Acts through MONOPTEROS to Regulate Plant Cell Polarity and Pattern
Phyllotaxis. Current Biology 26, 3202-3208.
Bhatt, A.A., Etchells, J.P., Canales, C., Lagodienko, A., and Dickinson, H. (2004).
VAAMANA - a BEL1-like homeodomain protein, interacts with KNOX proteins BP
and STM and regulates inflorescence stem growth in Arabidopsis. Gene 328, 103-
111.
Birnbaum, K., Benfey, P.N., and Shasha, D.E. (2001). cis element/transcription
factor analysis (cis/TF): a method for discovering transcription factor/cis element
relationships. Genome Res 11, 1567-1573.
Boer, D.R., Freire-Rios, A., van den Berg, W.A., Saaki, T., Manfield, I.W., Kepinski,
S., Lopez-Vidrieo, I., Franco-Zorrilla, J.M., de Vries, S.C., Solano, R., et al. (2014).
Structural basis for DNA binding specificity by the auxin-dependent ARF
transcription factors. Cell 156, 577-589.
Bou-Torrent, J., Salla-Martret, M., Brandt, R., Musielak, T., Palauqui, J.C.,
Martinez-Garcia, J.F., and Wenkel, S. (2012). ATHB4 and HAT3, two class II HD-

182
ZIP transcription factors, control leaf development in Arabidopsis. Plant signaling
& behavior 7, 1382-1387.
Brandt, R., Salla-Martret, M., Bou-Torrent, J., Musielak, T., Stahl, M., Lanz, C., Ott,
F., Schmid, M., Greb, T., Schwarz, M., et al. (2012). Genome-wide binding-site
analysis of REVOLUTA reveals a link between leaf patterning and light-mediated
growth responses. The Plant journal : for cell and molecular biology 72, 31-42.
Brodersen, P., and Voinnet, O. (2006). The diversity of RNA silencing pathways in
plants. Trends in genetics : TIG 22, 268-280.
Buechel, S., Leibfried, A., To, J.P., Zhao, Z., Andersen, S.U., Kieber, J.J., and
Lohmann, J.U. (2010). Role of A-type ARABIDOPSIS RESPONSE REGULATORS in
meristem maintenance and regeneration. European journal of cell biology 89,
279-284.
Byrne, M.E., Groover, A.T., Fontana, J.R., and Martienssen, R.A. (2003).
Phyllotactic pattern and stem cell fate are determined by the Arabidopsis
homeobox gene BELLRINGER. Development 130, 3941-3950.
Caggiano, M.P., Yu, X.L., Bhatia, N., Larsson, A., Ram, H., Ohno, C., Sappl, P.,
Meyerowitz, E.M., Jonsson, H., and Heisler, M.G. (2017). Cell type boundaries
organize plant development. Elife 6.
Chen, M.K., Wilson, R.L., Palme, K., Ditengou, F.A., and Shpak, E.D. (2013).
ERECTA Family Genes Regulate Auxin Transport in the Shoot Apical Meristem
and Forming Leaf Primordia. Plant physiology 162, 1978-1991.
Chen, Y.H., Yang, X.Y., He, K., Liu, M.H., Li, J.G., Gao, Z.F., Lin, Z.Q., Zhang, Y.F.,
Wang, X.X., Qiu, X.M., et al. (2006). The MYB transcription factor superfamily of
arabidopsis: Expression analysis and phylogenetic comparison with the rice MYB
family. Plant Mol Biol 60, 107-124.
Cheng, Y., Dai, X., and Zhao, Y. (2006). Auxin biosynthesis by the YUCCA flavin
monooxygenases controls the formation of floral organs and vascular tissues in
Arabidopsis. Genes & development 20, 1790-1799.
Chiu, W.H., Chandler, J., Cnops, G., Van Lijsebettens, M., and Werr, W. (2007).
Mutations in the TORNADO2 gene affect cellular decisions in the peripheral zone
of the shoot apical meristem of Arabidopsis thaliana. Plant Mol Biol 63, 731-744.

183
Christensen, S.K., Dagenais, N., Chory, J., and Weigel, D. (2000). Regulation of
auxin response by the protein kinase PINOID. Cell 100, 469-478.
Chuck, G., Lincoln, C., and Hake, S. (1996). KNAT1 induces lobed leaves with
ectopic meristems when overexpressed in Arabidopsis. Plant Cell 8, 1277-1289.
Ciolkowski, I., Wanke, D., Birkenbihl, R.P., and Somssich, I.E. (2008). Studies on
DNA-binding selectivity of WRKY transcription factors lend structural clues into
WRKY-domain function. Plant Mol Biol 68, 81-92.
Cnops, G., Neyt, P., Raes, J., Petrarulo, M., Nelissen, H., Malenica, N., Luschnig,
C., Tietz, O., Ditengou, F., Palme, K., et al. (2006). The TORNADO1 and
TORNADO2 genes function in several patterning processes during early leaf
development in Arabidopsis thaliana. Plant Cell 18, 852-866.
Cole, M., Nolte, C., and Werr, W. (2006). Nuclear import of the transcription
factor SHOOT MERISTEMLESS depends on heterodimerization with BLH proteins
expressed in discrete sub-domains of the shoot apical meristem of Arabidopsis
thaliana. Nucleic Acids Res 34, 1281-1292.
Colombo, M., Brambilla, V., Marcheselli, R., Caporali, E., Kater, M.M., and
Colombo, L. (2010). A new role for the SHATTERPROOF genes during Arabidopsis
gynoecium development. Developmental biology 337, 294-302.
Cruz Castillo, M., Martinez, C., Buchala, A., Metraux, J.P., and Leon, J. (2004).
Gene-specific involvement of beta-oxidation in wound-activated responses in
Arabidopsis. Plant physiology 135, 85-94.
Dello Ioio, R., Galinha, C., Fletcher, A.G., Grigg, S.P., Molnar, A., Willemsen, V.,
Scheres, B., Sabatini, S., Baulcombe, D., Maini, P.K., et al. (2012). A
PHABULOSA/cytokinin feedback loop controls root growth in Arabidopsis.
Current biology : CB 22, 1699-1704.
Dharmasiri, N., Dharmasiri, S., and Estelle, M. (2005). The F-box protein TIR1 is
an auxin receptor. Nature 435, 441.
Dinneny, J.R., Weigel, D., and Yanofsky, M.F. (2005). A genetic framework for
fruit patterning in Arabidopsis thaliana. Development 132, 4687-4696.
Dodsworth, S. (2009). A diverse and intricate signalling network regulates stem
cell fate in the shoot apical meristem. Developmental biology 336, 1-9.

184
Eklund, D.M., Staldal, V., Valsecchi, I., Cierlik, I., Eriksson, C., Hiratsu, K., Ohme-
Takagi, M., Sundstrom, J.F., Thelander, M., Ezcurra, I., et al. (2010). The
Arabidopsis thaliana STYLISH1 Protein Acts as a Transcriptional Activator
Regulating Auxin Biosynthesis. Plant Cell 22, 349-363.
Elhiti, M., and Stasolla, C. (2009). Structure and function of homodomain-leucine
zipper (HD-Zip) proteins. Plant signaling & behavior 4, 86-88.
Emery, J.F., Floyd, S.K., Alvarez, J., Eshed, Y., Hawker, N.P., Izhaki, A., Baum, S.F.,
and Bowman, J.L. (2003). Radial patterning of Arabidopsis shoots by class III HD-
ZIP and KANADI genes. Current biology : CB 13, 1768-1774.
Endo, Y., Iwakawa, H.O., and Tomari, Y. (2013). Arabidopsis ARGONAUTE7 selects
miR390 through multiple checkpoints during RISC assembly. EMBO reports 14,
652-658.
Endrizzi, K., Moussian, B., Haecker, A., Levin, J.Z., and Laux, T. (1996). The SHOOT
MERISTEMLESS gene is required for maintenance of undifferentiated cells in
Arabidopsis shoot and floral meristems and acts at a different regulatory level
than the meristem genes WUSCHEL and ZWILLE. Plant Journal 10, 967-979.
Engelhorn, J., Moreau, F., Fletcher, J.C., and Carles, C.C. (2014). ULTRAPETALA1
and LEAFY pathways function independently in specifying identity and
determinacy at the Arabidopsis floral meristem. Ann Bot-London 114, 1497-
1505.
Englbrecht, C.C., Schoof, H., and Bohm, S. (2004). Conservation, diversification
and expansion of C2H2 zinc finger proteins in the Arabidopsis thaliana genome.
Bmc Genomics 5.
Eshed, Y., Izhaki, A., Baum, S.F., Floyd, S.K., and Bowman, J.L. (2004). Asymmetric
leaf development and blade expansion in Arabidopsis are mediated by KANADI
and YABBY activities. Development 131, 2997-3006.
Eulgem, T., Rushton, P.J., Robatzek, S., and Somssich, I.E. (2000). The WRKY
superfamily of plant transcription factors. Trends in plant science 5, 199-206.
Fahlgren, N., Montgomery, T.A., Howell, M.D., Allen, E., Dvorak, S.K., Alexander,
A.L., and Carrington, J.C. (2006). Regulation of AUXIN RESPONSE FACTOR3 by
TAS3 ta-siRNA affects developmental timing and patterning in Arabidopsis.
Current biology : CB 16, 939-944.
185
Fambrini, M., and Pugliesi, C. (2013). Usual and unusual development of the dicot
leaf: involvement of transcription factors and hormones. Plant cell reports 32,
899-922.
Fletcher, J.C. (2001). The ULTRAPETALA gene controls shoot and floral meristem
size in Arabidopsis. Development 128, 1323-1333.
Fletcher, J.C. (2002). Shoot and floral meristem maintenance in arabidopsis.
Annu Rev Plant Biol 53, 45-66.
Franco-Zorrilla, J.M., Lopez-Vidriero, I., Carrasco, J.L., Godoy, M., Vera, P., and
Solano, R. (2014). DNA-binding specificities of plant transcription factors and
their potential to define target genes. Proceedings of the National Academy of
Sciences of the United States of America 111, 2367-2372.
Friml, J., Vieten, A., Sauer, M., Weijers, D., Schwarz, H., Hamann, T., Offringa, R.,
and Jurgens, G. (2003). Efflux-dependent auxin gradients establish the apical-
basal axis of Arabidopsis. Nature 426, 147-153.
Friml, J., Yang, X., Michniewicz, M., Weijers, D., Quint, A., Tietz, O., Benjamins,
R., Ouwerkerk, P.B.F., Ljung, K., Sandberg, G., et al. (2004). A PINOID-dependent
binary switch in apical-basal PIN polar targeting directs auxin efflux. Science 306,
862-865.
Fujimoto, S., Matsunaga, S., Yonemura, M., Uchiyama, S., Azuma, T., and Fukui,
K. (2004). Identification of a novel plant MAR DNA binding protein localized on
chromosomal surfaces. Plant Mol Biol 56, 225-239.
Furutani, M., Vernoux, T., Traas, J., Kato, T., Tasaka, M., and Aida, M. (2004). PIN-
FORMED1 and PINOID regulate boundary formation and cotyledon development
in Arabidopsis embryogenesis. Development 131, 5021-5030.
Galichet, A., Hoyerova, K., Kaminek, M., and Gruissem, W. (2008). Farnesylation
directs AtIPT3 subcellular localization and modulates cytokinin biosynthesis in
Arabidopsis. Plant physiology 146, 1155-1164.
Garcia, D., Collier, S.A., Byrne, M.E., and Martienssen, R.A. (2006). Specification
of leaf polarity in Arabidopsis via the trans-acting siRNA pathway. Current biology
: CB 16, 933-938.
Girin, T., Paicu, T., Stephenson, P., Fuentes, S., Korner, E., O'Brien, M., Sorefan,
K., Wood, T.A., Balanza, V., Ferrandiz, C., et al. (2011). INDEHISCENT and

186
SPATULA interact to specify carpel and valve margin tissue and thus promote
seed dispersal in Arabidopsis. Plant Cell 23, 3641-3653.
Girin, T., Sorefan, K., and Ostergaard, L. (2009). Meristematic sculpting in fruit
development. Journal of experimental botany 60, 1493-1502.
Goda, H., Sasaki, E., Akiyama, K., Maruyama-Nakashita, A., Nakabayashi, K., Li,
W., Ogawa, M., Yamauchi, Y., Preston, J., Aoki, K., et al. (2008). The AtGenExpress
hormone and chemical treatment data set: experimental design, data
evaluation, model data analysis and data access. The Plant journal : for cell and
molecular biology 55, 526-542.
Goda, H., Sawa, S., Asami, T., Fujioka, S., Shimada, Y., and Yoshida, S. (2004).
Comprehensive comparison of auxin-regulated and brassinosteroid-regulated
genes in Arabidopsis. Plant physiology 134, 1555-1573.
Gomez-Mena, C., and Sablowski, R. (2008). ARABIDOPSIS THALIANA HOMEOBOX
GENE1 establishes the basal boundaries of shoot organs and controls stem
growth. Plant Cell 20, 2059-2072.
Gonzalez-Guzman, M., Pizzio, G.A., Antoni, R., Vera-Sirera, F., Merilo, E., Bassel,
G.W., Fernandez, M.A., Holdsworth, M.J., Perez-Amador, M.A., Kollist, H., et al.
(2012). Arabidopsis PYR/PYL/RCAR receptors play a major role in quantitative
regulation of stomatal aperture and transcriptional response to abscisic acid.
Plant Cell 24, 2483-2496.
Gonzalez-Reig, S., Ripoll, J.J., Vera, A., Yanofsky, M.F., and Martinez-Laborda, A.
(2012). Antagonistic gene activities determine the formation of pattern elements
along the mediolateral axis of the Arabidopsis fruit. PLoS genetics 8, e1003020.
Gray, W.M., Kepinski, S., Rouse, D., Leyser, O., and Estelle, M. (2001). Auxin
regulates SCFTIR1-dependent degradation of AUX/IAA proteins. Nature 414,
271.
Gregory, B.D., O'Malley, R.C., Lister, R., Urich, M.A., Tonti-Filippini, J., Chen, H.,
Millar, A.H., and Ecker, J.R. (2008). A link between RNA metabolism and silencing
affecting Arabidopsis development. Developmental cell 14, 854-866.
Gremski, K. (2006). Gynoecium patterning in Arabidopsis thaliana : control of
transmitting tract development by the HECATE genes (UC San Diego Electronic
Theses and Dissertations: University of California, San Diego).

187
Gremski, K., Ditta, G., and Yanofsky, M.F. (2007). The HECATE genes regulate
female reproductive tract development in Arabidopsis thaliana. Development
134, 3593-3601.
Groszmann, M., Bylstra, Y., Lampugnani, E.R., and Smyth, D.R. (2010). Regulation
of tissue-specific expression of SPATULA, a bHLH gene involved in carpel
development, seedling germination, and lateral organ growth in Arabidopsis.
Journal of experimental botany 61, 1495-1508.
Groszmann, M., Paicu, T., and Smyth, D.R. (2008). Functional domains of
SPATULA, a bHLH transcription factor involved in carpel and fruit development
in Arabidopsis. The Plant journal : for cell and molecular biology 55, 40-52.
Guenot, B., Bayer, E., Kierzkowski, D., Smith, R.S., Mandel, T., Zadnikova, P.,
Benkova, E., and Kuhlemeier, C. (2012). PIN1-Independent Leaf Initiation in
Arabidopsis. Plant physiology 159, 1501-1510.
Hasson, A., Plessis, A., Blein, T., Adroher, B., Grigg, S., Tsiantis, M., Boudaoud, A.,
Damerval, C., and Laufs, P. (2011). Evolution and diverse roles of the CUP-
SHAPED COTYLEDON genes in Arabidopsis leaf development. Plant Cell 23, 54-
68.
Hay, A., Kaur, H., Phillips, A., Hedden, P., Hake, S., and Tsiantis, M. (2002). The
gibberellin pathway mediates KNOTTED1-type homeobox function in plants with
different body plans. Current biology : CB 12, 1557-1565.
Heim, M.A., Jakoby, M., Werber, M., Martin, C., Weisshaar, B., and Bailey, P.C.
(2003). The basic helix-loop-helix transcription factor family in plants: a genome-
wide study of protein structure and functional diversity. Molecular biology and
evolution 20, 735-747.
Heisler, M.G., Atkinson, A., Bylstra, Y.H., Walsh, R., and Smyth, D.R. (2001).
SPATULA, a gene that controls development of carpel margin tissues in
Arabidopsis, encodes a bHLH protein. Development 128, 1089-1098.
Heisler, M.G., Ohno, C., Das, P., Sieber, P., Reddy, G.V., Long, J.A., and
Meyerowitz, E.M. (2005). Patterns of auxin transport and gene expression during
primordium development revealed by live imaging of the Arabidopsis
inflorescence meristem. Current biology : CB 15, 1899-1911.

188
Hibara, K., Karim, M.R., Takada, S., Taoka, K.I., Furutani, M., Aida, M., and Tasaka,
M. (2006). Arabidopsis CUP-SHAPED COTYLEDON3 regulates postembryonic
shoot meristem and organ boundary formation. Plant Cell 18, 2946-2957.
Hock, J., and Meister, G. (2008). The Argonaute protein family. Genome biology
9, 210.
Hollister, J.D., Smith, L.M., Guo, Y.L., Ott, F., Weigel, D., and Gaut, B.S. (2011).
Transposable elements and small RNAs contribute to gene expression
divergence between Arabidopsis thaliana and Arabidopsis lyrata. Proceedings of
the National Academy of Sciences of the United States of America 108, 2322-
2327.
Hong, J.C. (2016). Chapter 3 - General Aspects of Plant Transcription Factor
Families A2 - Gonzalez, Daniel H. In Plant Transcription Factors (Boston:
Academic Press), pp. 35-56.
Hosoda, K., Imamura, A., Katoh, E., Hatta, T., Tachiki, M., Yamada, H., Mizuno, T.,
and Yamazaki, T. (2002). Molecular structure of the GARP family of plant Myb-
related DNA binding motifs of the Arabidopsis response regulators. Plant Cell 14,
2015-2029.
Hu, J.H., Mitchum, M.G., Barnaby, N., Ayele, B.T., Ogawa, M., Nam, E., Lai, W.C.,
Hanada, A., Alonso, J.M., Ecker, J.R., et al. (2008). Potential sites of bioactive
gibberellin production during reproductive growth in Arabidopsis. Plant Cell 20,
320-336.
Huang, F., Zago, M.K., Abas, L., van Marion, A., Galvan-Ampudia, C.S., and
Offringa, R. (2010). Phosphorylation of conserved PIN motifs directs Arabidopsis
PIN1 polarity and auxin transport. Plant Cell 22, 1129-1142.
Hunter, C., Willmann, M.R., Wu, G., Yoshikawa, M., de la Luz Gutierrez-Nava, M.,
and Poethig, S.R. (2006). Trans-acting siRNA-mediated repression of ETTIN and
ARF4 regulates heteroblasty in Arabidopsis. Development 133, 2973-2981.
Hur, Y.S., Um, J.H., Kim, S., Kim, K., Park, H.J., Lim, J.S., Kim, W.Y., Jun, S.E., Yoon,
E.K., Lim, J., et al. (2015). Arabidopsis thaliana homeobox 12 (ATHB12), a
homeodomain-leucine zipper protein, regulates leaf growth by promoting cell
expansion and endoreduplication. New Phytol 205, 316-328.

189
Hutchison, C.E., Li, J., Argueso, C., Gonzalez, M., Lee, E., Lewis, M.W., Maxwell,
B.B., Perdue, T.D., Schaller, G.E., Alonso, J.M., et al. (2006). The Arabidopsis
Histidine Phosphotransfer Proteins Are Redundant Positive Regulators of
Cytokinin Signaling. The Plant cell 18, 3073-3087.
Hwang, I., and Sheen, J. (2001). Two-component circuitry in Arabidopsis
cytokinin signal transduction. Nature 413, 383.
Ichihashi, Y., Horiguchi, G., Gleissberg, S., and Tsukaya, H. (2010a). The bHLH
Transcription Factor SPATULA Controls Final Leaf Size in Arabidopsis thaliana.
Plant and Cell Physiology 51, 252-261.
Ichihashi, Y., Horiguchi, G., Gleissberg, S., and Tsukaya, H. (2010b). The bHLH
transcription factor SPATULA controls final leaf size in Arabidopsis thaliana. Plant
& cell physiology 51, 252-261.
Ikezaki, M., Kojima, M., Sakakibara, H., Kojima, S., Ueno, Y., Machida, C., and
Machida, Y. (2010). Genetic networks regulated by ASYMMETRIC LEAVES1 (AS1)
and AS2 in leaf development in Arabidopsis thaliana: KNOX genes control five
morphological events. The Plant journal : for cell and molecular biology 61, 70-
82.
Ishida, T., Aida, M., Takada, S., and Tasaka, M. (2000). Involvement of CUP-
SHAPED COTYLEDON genes in gynoecium and ovule development in Arabidopsis
thaliana. Plant & cell physiology 41, 60-67.
Iwasaki, M., Takahashi, H., Iwakawa, H., Nakagawa, A., Ishikawa, T., Tanaka, H.,
Matsumura, Y., Pekker, I., Eshed, Y., Vial-Pradel, S., et al. (2013). Dual regulation
of ETTIN (ARF3) gene expression by AS1-AS2, which maintains the DNA
methylation level, is involved in stabilization of leaf adaxial-abaxial partitioning
in Arabidopsis. Development 140, 1958-1969.
Jasinski, S., Piazza, P., Craft, J., Hay, A., Woolley, L., Rieu, I., Phillips, A., Hedden,
P., and Tsiantis, M. (2005). KNOX action in Arabidopsis is mediated by coordinate
regulation of cytokinin and gibberellin activities. Current biology : CB 15, 1560-
1565.
Jennifer, P., Haberer, G., Ferreira, F.J., Deruère, J., Mason, M.G., Schaller, G.E.,
Alonso, J.M., Ecker, J.R., and Kieber, J.J. (2004). Type-A Arabidopsis Response

190
Regulators Are Partially Redundant Negative Regulators of Cytokinin Signaling.
The Plant cell 16, 658-671.
Ji, L., Liu, X., Yan, J., Wang, W., Yumul, R.E., Kim, Y.J., Dinh, T.T., Liu, J., Cui, X.,
Zheng, B., et al. (2011). ARGONAUTE10 and ARGONAUTE1 regulate the
termination of floral stem cells through two microRNAs in Arabidopsis. PLoS
genetics 7, e1001358.
Jin, J., Tian, F., Yang, D.C., Meng, Y.Q., Kong, L., Luo, J., and Gao, G. (2017).
PlantTFDB 4.0: toward a central hub for transcription factors and regulatory
interactions in plants. Nucleic Acids Res 45, D1040-D1045.
Johansen, T.K. (1997). Sight. In Aristotle on the Sense-Organs, T.K. Johansen, ed.
(Cambridge: Cambridge University Press), pp. 23-115.
Josse, E.M., Gan, Y., Bou-Torrent, J., Stewart, K.L., Gilday, A.D., Jeffree, C.E.,
Vaistij, F.E., Martinez-Garcia, J.F., Nagy, F., Graham, I.A., et al. (2011). A DELLA in
disguise: SPATULA restrains the growth of the developing Arabidopsis seedling.
Plant Cell 23, 1337-1351.
Jung, J.H., Lee, H.J., Ryu, J.Y., and Park, C.M. (2016). SPL3/4/5 Integrate
Developmental Aging and Photoperiodic Signals into the FT-FD Module in
Arabidopsis Flowering. Molecular plant 9, 1647-1659.
Kamiuchi, Y., Yamamoto, K., Furutani, M., Tasaka, M., and Aida, M. (2014). The
CUC1 and CUC2 genes promote carpel margin meristem formation during
Arabidopsis gynoecium development. Front Plant Sci 5, 165.
Kay, P., Groszmann, M., Ross, J.J., Parish, R.W., and Swain, S.M. (2013a).
Modifications of a conserved regulatory network involving INDEHISCENT
controls multiple aspects of reproductive tissue development in Arabidopsis.
New Phytol 197, 73-87.
Kay, P., Groszmann, M., Ross, J.J., Parish, R.W., and Swain, S.M. (2013b).
Modifications of a conserved regulatory network involving INDEHISCENT
controls multiple aspects of reproductive tissue development in Arabidopsis.
New Phytol 197, 73-87.
Kelley, D.R., Arreola, A., Gallagher, T.L., and Gasser, C.S. (2012). ETTIN (ARF3)
physically interacts with KANADI proteins to form a functional complex essential

191
for integument development and polarity determination in Arabidopsis.
Development 139, 1105-1109.
Kelley, L.A., Mezulis, S., Yates, C.M., Wass, M.N., and Sternberg, M.J. (2015). The
Phyre2 web portal for protein modeling, prediction and analysis. Nature
protocols 10, 845-858.
Kepinski, S., and Leyser, O. (2005). The Arabidopsis F-box protein TIR1 is an auxin
receptor. Nature 435, 446.
Kieber, J.J., and Schaller, G.E. (2014). Cytokinins. The Arabidopsis book /
American Society of Plant Biologists 12, e0168.
Kienow, L., Schneider, K., Bartsch, M., Stuible, H.P., Weng, H., Miersch, O.,
Wasternack, C., and Kombrink, E. (2008). Jasmonates meet fatty acids: functional
analysis of a new acyl-coenzyme A synthetase family from Arabidopsis thaliana.
Journal of experimental botany 59, 403-419.
Kim, J., Yi, H., Choi, G., Shin, B., Song, P.S., and Choi, G. (2003a). Functional
characterization of phytochrome interacting factor 3 in phytochrome-mediated
light signal transduction. Plant Cell 15, 2399-2407.
Kim, K.W., Eames, Andrew L., & Waterhouse, Peter M (2011). RNA Processing
Activities of the Arabidopsis Argonaute Protein Family. In RNA Processing, P.
Grabowski, ed. (University of Pittsburgh, USA: INTECH Open Access Publisher),
pp. 136-156.
Kim, M., Canio, W., Kessler, S., and Sinha, N. (2001). Developmental changes due
to long-distance movement of a homeobox fusion transcript in tomato. Science
293, 287-289.
Kim, M., McCormick, S., Timmermans, M., and Sinha, N. (2003b). The expression
domain of PHANTASTICA determines leaflet placement in compound leaves.
Nature 424, 438-443.
Kim, Y.S., Kim, S.G., Lee, M., Lee, I., Park, H.Y., Seo, P.J., Jung, J.H., Kwon, E.J., Suh,
S.W., Paek, K.H., et al. (2008). HD-ZIP III activity is modulated by competitive
inhibitors via a feedback loop in Arabidopsis shoot apical meristem
development. Plant Cell 20, 920-933.

192
Kosugi, S., and Ohashi, Y. (2002). DNA binding and dimerization specificity and
potential targets for the TCP protein family. The Plant journal : for cell and
molecular biology 30, 337-348.
Kotak, S., Port, M., Ganguli, A., Bicker, F., and von Koskull-Doring, P. (2004).
Characterization of C-terminal domains of Arabidopsis heat stress transcription
factors (Hsfs) and identification of a new signature combination of plant class A
Hsfs with AHA and NES motifs essential for activator function and intracellular
localization. Plant Journal 39, 98-112.
Koyama, T., Mitsuda, N., Seki, M., Shinozaki, K., and Ohme-Takagi, M. (2010). TCP
transcription factors regulate the activities of ASYMMETRIC LEAVES1 and
miR164, as well as the auxin response, during differentiation of leaves in
Arabidopsis. Plant Cell 22, 3574-3588.
Kumaran, M.K., Bowman, J.L., and Sundaresan, V. (2002). YABBY polarity genes
mediate the repression of KNOX homeobox genes in Arabidopsis. Plant Cell 14,
2761-2770.
Kunst, L., Klenz, J.E., Martinez-Zapater, J., and Haughn, G.W. (1989). AP2 Gene
Determines the Identity of Perianth Organs in Flowers of Arabidopsis thaliana.
The Plant cell 1, 1195-1208.
Lafos, M., Kroll, P., Hohenstatt, M.L., Thorpe, F.L., Clarenz, O., and Schubert, D.
(2011). Dynamic Regulation of H3K27 Trimethylation during Arabidopsis
Differentiation. PLoS genetics 7.
Landau, U., Asis, L., and Eshed Williams, L. (2015). The ERECTA, CLAVATA and
class III HD-ZIP Pathways Display Synergistic Interactions in Regulating Floral
Meristem Activities. Plos One 10, e0125408.
Larsson, E., Roberts, C.J., Claes, A.R., Franks, R.G., and Sundberg, E. (2014). Polar
Auxin Transport Is Essential for Medial versus Lateral Tissue Specification and
Vascular-Mediated Valve Outgrowth in Arabidopsis Gynoecia[W]. Plant
physiology 166, 1998-U1237.
Laubinger, S., Zeller, G., Henz, S.R., Sachsenberg, T., Widmer, C.K., Naouar, N.,
Vuylsteke, M., Scholkopf, B., Ratsch, G., and Weigel, D. (2008). At-TAX: a whole
genome tiling array resource for developmental expression analysis and
transcript identification in Arabidopsis thaliana. Genome biology 9, R112.

193
Laufs, P., Peaucelle, A., Morin, H., and Traas, J. (2004). MicroRNA regulation of
the CUC genes is required for boundary size control in Arabidopsis meristems.
Development 131, 4311-4322.
Lee, C., and Clark, S.E. (2015). A WUSCHEL-Independent Stem Cell Specification
Pathway Is Repressed by PHB, PHV and CNA in Arabidopsis. Plos One 10.
Leibfried, A., To, J.P., Busch, W., Stehling, S., Kehle, A., Demar, M., Kieber, J.J.,
and Lohmann, J.U. (2005). WUSCHEL controls meristem function by direct
regulation of cytokinin-inducible response regulators. Nature 438, 1172-1175.
Li, X., Duan, X., Jiang, H., Sun, Y., Tang, Y., Yuan, Z., Guo, J., Liang, W., Chen, L.,
Yin, J., et al. (2006). Genome-wide analysis of basic/helix-loop-helix transcription
factor family in rice and Arabidopsis. Plant physiology 141, 1167-1184.
Licausi, F., Ohme-Takagi, M., and Perata, P. (2013). APETALA2/Ethylene
Responsive Factor (AP2/ERF) transcription factors: mediators of stress responses
and developmental programs. New Phytol 199, 639-649.
Lieber, D., Lora, J., Schrempp, S., Lenhard, M., and Laux, T. (2011). Arabidopsis
WIH1 and WIH2 Genes Act in the Transition from Somatic to Reproductive Cell
Fate. Current Biology 21, 1009-1017.
Liljegren, S.J., Ditta, G.S., Eshed, Y., Savidge, B., Bowman, J.L., and Yanofsky, M.F.
(2000). SHATTERPROOF MADS-box genes control seed dispersal in Arabidopsis.
Nature 404, 766-770.
Liljegren, S.J., Gustafson-Brown, C., Pinyopich, A., Ditta, G.S., and Yanofsky, M.F.
(1999). Interactions among APETALA1, LEAFY, and TERMINAL FLOWER1 specify
meristem fate. Plant Cell 11, 1007-1018.
Liljegren, S.J., Roeder, A.H., Kempin, S.A., Gremski, K., Ostergaard, L., Guimil, S.,
Reyes, D.K., and Yanofsky, M.F. (2004a). Control of fruit patterning in Arabidopsis
by INDEHISCENT. Cell 116, 843-853.
Liljegren, S.J., Roeder, A.H.K., Kempin, S.A., Gremski, K., Ostergaard, L., Guimil,
S., Reyes, D.K., and Yanofsky, M.F. (2004b). Control of fruit patterning in
Arabidopsis by INDEHISCENT. Cell 116, 843-853.
Lin, Y.C., Liu, Y.C., and Nakamura, Y. (2015). The Choline/Ethanolamine Kinase
Family in Arabidopsis: Essential Role of CEK4 in Phospholipid Biosynthesis and
Embryo Development. Plant Cell 27, 1497-1511.

194
Lincoln, C., Britton, J.H., and Estelle, M. (1990). Growth and development of the
axr1 mutants of Arabidopsis. Plant Cell 2, 1071-1080.
Liu, C., Xu, Z., and Chua, N.H. (1993). Auxin Polar Transport Is Essential for the
Establishment of Bilateral Symmetry during Early Plant Embryogenesis. The Plant
cell 5, 621-630.
Liu, Q., Yao, X., Pi, L., Wang, H., Cui, X., and Huang, H. (2009). The ARGONAUTE10
gene modulates shoot apical meristem maintenance and establishment of leaf
polarity by repressing miR165/166 in Arabidopsis. The Plant journal : for cell and
molecular biology 58, 27-40.
Lu, D., Wang, T., Persson, S., Mueller-Roeber, B., and Schippers, J.H.M. (2014).
Transcriptional control of ROS homeostasis by KUODA1 regulates cell expansion
during leaf development. Nat Commun 5.
Lynn, K., Fernandez, A., Aida, M., Sedbrook, J., Tasaka, M., Masson, P., and
Barton, M.K. (1999). The PINHEAD/ZWILLE gene acts pleiotropically in
Arabidopsis development and has overlapping functions with the ARGONAUTE1
gene. Development 126, 469-481.
Machida, C., Nakagawa, A., Kojima, S., Takahashi, H., and Machida, Y. (2015). The
complex of ASYMMETRIC LEAVES (AS) proteins plays a central role in antagonistic
interactions of genes for leaf polarity specification in Arabidopsis. Wires Dev Biol
4, 655-671.
Mallory, A.C., Hinze, A., Tucker, M.R., Bouche, N., Gasciolli, V., Elmayan, T.,
Lauressergues, D., Jauvion, V., Vaucheret, H., and Laux, T. (2009). Redundant and
specific roles of the ARGONAUTE proteins AGO1 and ZLL in development and
small RNA-directed gene silencing. PLoS genetics 5, e1000646.
Mallory, A.C., Reinhart, B.J., Jones-Rhoades, M.W., Tang, G., Zamore, P.D.,
Barton, M.K., and Bartel, D.P. (2004). MicroRNA control of PHABULOSA in leaf
development: importance of pairing to the microRNA 5' region. The EMBO
journal 23, 3356-3364.
Marsch-Martinez, N., Ramos-Cruz, D., Reyes-Olalde, J.I., Lozano-Sotomayor, P.,
Zuniga-Mayo, V.M., and de Folter, S. (2012). The role of cytokinin during
Arabidopsis gynoecia and fruit morphogenesis and patterning. Plant Journal 72,
222-234.

195
Mason, M.G., Mathews, D.E., Argyros, D.A., Maxwell, B.B., Kieber, J.J., Alonso,
J.M., Ecker, J.R., and Schaller, G.E. (2005). Multiple Type-B Response Regulators
Mediate Cytokinin Signal Transduction in Arabidopsis. The Plant cell 17, 3007-
3018.
Mcconnell, J.R., and Barton, M.K. (1995). Effect of Mutations in the Pinhead Gene
of Arabidopsis on the Formation of Shoot Apical Meristems. Dev Genet 16, 358-
366.
McConnell, J.R., Emery, J., Eshed, Y., Bao, N., Bowman, J., and Barton, M.K.
(2001). Role of PHABULOSA and PHAVOLUTA in determining radial patterning in
shoots. Nature 411, 709-713.
Meister, G. (2013). Argonaute proteins: functional insights and emerging roles.
Nature reviews Genetics 14, 447-459.
Mele, G. (2016). Arabidopsis Motif Scanner. BMC Bioinformatics 17, 50.
Mitchum, M.G., Yamaguchi, S., Hanada, A., Kuwahara, A., Yoshioka, Y., Kato, T.,
Tabata, S., Kamiya, Y., and Sun, T.P. (2006). Distinct and overlapping roles of two
gibberellin 3-oxidases in Arabidopsis development. The Plant journal : for cell
and molecular biology 45, 804-818.
Mitsuda, N., and Ohme-Takagi, M. (2008). NAC transcription factors NST1 and
NST3 regulate pod shattering in a partially redundant manner by promoting
secondary wall formation after the establishment of tissue identity. The Plant
journal : for cell and molecular biology 56, 768-778.
Miwa, H., Kinoshita, A., Fukuda, H., and Sawa, S. (2009). Plant meristems:
CLAVATA3/ESR-related signaling in the shoot apical meristem and the root apical
meristem. Journal of plant research 122, 31-39.
Miyashima, S., Honda, M., Hashimoto, K., Tatematsu, K., Hashimoto, T., Sato-
Nara, K., Okada, K., and Nakajima, K. (2013). A comprehensive expression
analysis of the Arabidopsis MICRORNA165/6 gene family during embryogenesis
reveals a conserved role in meristem specification and a non-cell-autonomous
function. Plant & cell physiology 54, 375-384.
Montgomery, T.A., Howell, M.D., Cuperus, J.T., Li, D., Hansen, J.E., Alexander,
A.L., Chapman, E.J., Fahlgren, N., Allen, E., and Carrington, J.C. (2008). Specificity

196
of ARGONAUTE7-miR390 interaction and dual functionality in TAS3 trans-acting
siRNA formation. Cell 133, 128-141.
Moubayidin, L., and Ostergaard, L. (2014). Dynamic control of auxin distribution
imposes a bilateral-to-radial symmetry switch during gynoecium development.
Current biology : CB 24, 2743-2748.
Moubayidin, L., and Ostergaard, L. (2015). Symmetry matters. New Phytol 207,
985-990.
Moussian, B., Haecker, A., and Laux, T. (2003). ZWILLE buffers meristem stability
in Arabidopsis thaliana. Development genes and evolution 213, 534-540.
Moussian, B., Schoof, H., Haecker, A., Jurgens, G., and Laux, T. (1998). Role of the
ZWILLE gene in the regulation of central shoot meristem cell fate during
Arabidopsis embryogenesis. The EMBO journal 17, 1799-1809.
Muller, B., and Sheen, J. (2008). Cytokinin and auxin interaction in root stem-cell
specification during early embryogenesis. Nature 453, 1094-1097.
Muller, C.J., Valdes, A.E., Wang, G.D., Ramachandran, P., Beste, L., Uddenberg,
D., and Carlsbecker, A. (2016). PHABULOSA Mediates an Auxin Signaling Loop to
Regulate Vascular Patterning in Arabidopsis. Plant physiology 170, 956-970.
Muller, M., and Munne-Bosch, S. (2015). Ethylene Response Factors: A Key
Regulatory Hub in Hormone and Stress Signaling. Plant physiology 169, 32-41.
Murashige, T., and Skoog, F. (1962). A Revised Medium for Rapid Growth and Bio
Assays with Tobacco Tissue Cultures. Physiol Plantarum 15, 473-497.
Nahar, M.A., Ishida, T., Smyth, D.R., Tasaka, M., and Aida, M. (2012). Interactions
of CUP-SHAPED COTYLEDON and SPATULA genes control carpel margin
development in Arabidopsis thaliana. Plant & cell physiology 53, 1134-1143.
Nakata, M., Matsumoto, N., Tsugeki, R., Rikirsch, E., Laux, T., and Okada, K.
(2012). Roles of the middle domain-specific WUSCHEL-RELATED HOMEOBOX
genes in early development of leaves in Arabidopsis. Plant Cell 24, 519-535.
Nakata, M., and Okada, K. (2012). The three-domain model: a new model for the
early development of leaves in Arabidopsis thaliana. Plant signaling & behavior
7, 1423-1427.
Nakazawa, M., Yabe, N., Ichikawa, T., Yamamoto, Y.Y., Yoshizumi, T., Hasunuma,
K., and Matsui, M. (2001). DFL1, an auxin-responsive GH3 gene homologue,
197
negatively regulates shoot cell elongation and lateral root formation, and
positively regulates the light response of hypocotyl length. Plant Journal 25, 213-
221.
Nemhauser, J.L., Feldman, L.J., and Zambryski, P.C. (2000). Auxin and ETTIN in
Arabidopsis gynoecium morphogenesis. Development 127, 3877-3888.
Nguyen, D., Rieu, I., Mariani, C., and van Dam, N.M. (2016). How plants handle
multiple stresses: hormonal interactions underlying responses to abiotic stress
and insect herbivory. Plant Mol Biol 91, 727-740.
Ni, M., Tepperman, J.M., and Quail, P.H. (1998). PIF3, a phytochrome-interacting
factor necessary for normal photoinduced signal transduction, is a novel basic
helix-loop-helix protein. Cell 95, 657-667.
Nole-Wilson, S., Azhakanandam, S., and Franks, R.G. (2010). Polar auxin
transport together with aintegumenta and revoluta coordinate early Arabidopsis
gynoecium development. Developmental biology 346, 181-195.
O'Malley, R.C., Huang, S.S., Song, L., Lewsey, M.G., Bartlett, A., Nery, J.R., Galli,
M., Gallavotti, A., and Ecker, J.R. (2016). Cistrome and Epicistrome Features
Shape the Regulatory DNA Landscape. Cell 165, 1280-1292.
Ogawa, M., Kay, P., Wilson, S., and Swain, S.M. (2009). ARABIDOPSIS
DEHISCENCE ZONE POLYGALACTURONASE1 (ADPG1), ADPG2, and QUARTET2
are Polygalacturonases required for cell separation during reproductive
development in Arabidopsis. Plant Cell 21, 216-233.
Ohmetakagi, M., and Shinshi, H. (1995). Ethylene-Inducible DNA-Binding
Proteins That Interact with an Ethylene-Responsive Element. Plant Cell 7, 173-
182.
Ohno, C.K., Reddy, G.V., Heisler, M.G.B., and Meyerowitz, E.M. (2004). The
Arabidopsis JAGGED gene encodes a zinc finger protein that promotes leaf tissue
development. Development 131, 1111-1122.
Olsen, A.N., Ernst, H.A., Leggio, L.L., and Skriver, K. (2005). NAC transcription
factors: structurally distinct, functionally diverse. Trends in plant science 10, 79-
87.
Ostergaard, L. (2009). Don't 'leaf' now. The making of a fruit. Current opinion in
plant biology 12, 36-41.

198
Otsuga, D., DeGuzman, B., Prigge, M.J., Drews, G.N., and Clark, S.E. (2001).
REVOLUTA regulates meristem initiation at lateral positions. Plant Journal 25,
223-236.
Pagnussat, G.C., Yu, H.J., Ngo, Q.A., Rajani, S., Mayalagu, S., Johnson, C.S.,
Capron, A., Xie, L.F., Ye, D., and Sundaresan, V. (2005). Genetic and molecular
identification of genes required for female gametophyte development and
function in Arabidopsis. Development 132, 603-614.
Parenicova, L., de Folter, S., Kieffer, M., Horner, D.S., Favalli, C., Busscher, J.,
Cook, H.E., Ingram, R.M., Kater, M.M., Davies, B., et al. (2003). Molecular and
phylogenetic analyses of the complete MADS-box transcription factor family in
Arabidopsis: new openings to the MADS world. Plant Cell 15, 1538-1551.
Peng, H.P., Lin, T.Y., Wang, N.N., and Shih, M.C. (2005). Differential expression of
genes encoding 1-aminocyclopropane-1-carboxylate synthase in Arabidopsis
during hypoxia. Plant Mol Biol 58, 15-25.
Perales, M., and Reddy, G.V. (2012). Stem cell maintenance in shoot apical
meristems. Current opinion in plant biology 15, 10-16.
Peterson, K.M., Shyu, C., Burr, C.A., Horst, R.J., Kanaoka, M.M., Omae, M., Sato,
Y., and Torii, K.U. (2013). Arabidopsis homeodomain-leucine zipper IV proteins
promote stomatal development and ectopically induce stomata beyond the
epidermis. Development 140, 1924-1935.
Pinon, V., Prasad, K., Grigg, S.P., Sanchez-Perez, G.F., and Scheres, B. (2013).
Local auxin biosynthesis regulation by PLETHORA transcription factors controls
phyllotaxis in Arabidopsis. Proceedings of the National Academy of Sciences of
the United States of America 110, 1107-1112.
Pires, H.R., Monfared, M.M., Shemyakina, E.A., and Fletcher, J.C. (2014).
ULTRAPETALA trxG Genes Interact with KANADI Transcription Factor Genes to
Regulate Arabidopsis Gynoecium Patterning. Plant Cell 26, 4345-4361.
Poulsen, C., Vaucheret, H., and Brodersen, P. (2013). Lessons on RNA silencing
mechanisms in plants from eukaryotic argonaute structures. Plant Cell 25, 22-37.
Prasad, K., Grigg, S.P., Barkoulas, M., Yadav, R.K., Sanchez-Perez, G.F., Pinon, V.,
Blilou, I., Hofhuis, H., Dhonukshe, P., Galinha, C., et al. (2011). Arabidopsis

199
PLETHORA transcription factors control phyllotaxis. Current biology : CB 21,
1123-1128.
Prigge, M.J., Otsuga, D., Alonso, J.M., Ecker, J.R., Drews, G.N., and Clark, S.E.
(2005). Class III homeodomain-leucine zipper gene family members have
overlapping, antagonistic, and distinct roles in Arabidopsis development. Plant
Cell 17, 61-76.
Prouse, M.B., and Campbell, M.M. (2012). The interaction between MYB proteins
and their target DNA binding sites. Bba-Gene Regul Mech 1819, 67-77.
Puranik, S., Sahu, P.P., Srivastava, P.S., and Prasad, M. (2012). NAC proteins:
regulation and role in stress tolerance. Trends in plant science 17, 369-381.
Qi, J., Wang, Y., Yu, T., Cunha, A., Wu, B., Vernoux, T., Meyerowitz, E., and Jiao,
Y. (2014). Auxin depletion from leaf primordia contributes to organ patterning.
Proceedings of the National Academy of Sciences of the United States of America
111, 18769-18774.
Ragni, L., Belles-Boix, E., Gunl, M., and Pautot, V. (2008). Interaction of KNAT6
and KNAT2 with BREVIPEDICELLUS and PENNYWISE in Arabidopsis
inflorescences. Plant Cell 20, 888-900.
Reinhardt, D., Mandel, T., and Kuhlemeier, C. (2000). Auxin regulates the
initiation and radial position of plant lateral organs. Plant Cell 12, 507-518.
Reinhardt, D., Pesce, E.R., Stieger, P., Mandel, T., Baltensperger, K., Bennett, M.,
Traas, J., Friml, J., and Kuhlemeier, C. (2003). Regulation of phyllotaxis by polar
auxin transport. Nature 426, 255-260.
Reinhart, B.J., Liu, T., Newell, N.R., Magnani, E., Huang, T., Kerstetter, R.,
Michaels, S., and Barton, M.K. (2013). Establishing a framework for the
Ad/abaxial regulatory network of Arabidopsis: ascertaining targets of class III
homeodomain leucine zipper and KANADI regulation. Plant Cell 25, 3228-3249.
Reyes-Olalde, J.I., Zuniga-Mayo, V.M., Serwatowska, J., Chavez Montes, R.A.,
Lozano-Sotomayor, P., Herrera-Ubaldo, H., Gonzalez-Aguilera, K.L., Ballester, P.,
Ripoll, J.J., Ezquer, I., et al. (2017). The bHLH transcription factor SPATULA
enables cytokinin signaling, and both activate auxin biosynthesis and transport
genes at the medial domain of the gynoecium. PLoS genetics 13, e1006726.
200
Reymond, M.C., Brunoud, G., Chauvet, A., Martinez-Garcia, J.F., Martin-
Magniette, M.L., Moneger, F., and Scutt, C.P. (2012). A Light-Regulated Genetic
Module Was Recruited to Carpel Development in Arabidopsis following a
Structural Change to SPATULA. Plant Cell 24, 2812-2825.
Riechmann, J.L., Heard, J., Martin, G., Reuber, L., Jiang, C.Z., Keddie, J., Adam, L.,
Pineda, O., Ratcliffe, O.J., Samaha, R.R., et al. (2000). Arabidopsis transcription
factors: Genome-wide comparative analysis among eukaryotes. Science 290,
2105-2110.
Riefler, M., Novak, O., Strnad, M., and Schmülling, T. (2006). Cytokinin Receptor
Mutants Reveal Functions in Shoot Growth, Leaf Senescence, Seed Size,
Germination, Root Development, and Cytokinin Metabolism. The Plant cell 18,
40-54.
Ripoll, J.J., Roeder, A.H.K., Ditta, G.S., and Yanofsky, M.F. (2011). A novel role for
the floral homeotic gene APETALA2 during Arabidopsis fruit development.
Development 138, 5167-5176.
Roeder, A.H., Ferrandiz, C., and Yanofsky, M.F. (2003). The role of the
REPLUMLESS homeodomain protein in patterning the Arabidopsis fruit. Current
biology : CB 13, 1630-1635.
Roeder, A.H., and Yanofsky, M.F. (2006). Fruit development in Arabidopsis. The
Arabidopsis book / American Society of Plant Biologists 4, e0075.
Roodbarkelari, F., Du, F., Truernit, E., and Laux, T. (2015). ZLL/AGO10 maintains
shoot meristem stem cells during Arabidopsis embryogenesis by down-
regulating ARF2-mediated auxin response. BMC Biol 13, 74.
Rosas Cárdenas, F., Ruiz Suárez, Y., Cano Rangel, R., Luna Garcia, V., González
Aguilera, K., Marsch Martínez, N., and de Folter, S. (2017). Effect of Constitutive
miR164 Expression on Plant Morphology and Fruit Development in Arabidopsis
and Tomato. Agronomy 7, 48.
Rouse, D., Mackay, P., Stirnberg, P., Estelle, M., and Leyser, O. (1998). Changes
in auxin response from mutations in an AUX/IAA gene. Science 279, 1371-1373.
Rubio-Somoza, I., and Weigel, D. (2011). MicroRNA networks and developmental
plasticity in plants. Trends in plant science 16, 258-264.

201
Rutjens, B., Bao, D.P., van Eck-Stouten, E., Brand, M., Smeekens, S., and
Proveniers, M. (2009). Shoot apical meristem function in Arabidopsis requires
the combined activities of three BEL1-like homeodomain proteins. Plant Journal
58, 641-654.
Sabatini, S., Beis, D., Wolkenfelt, H., Murfett, J., Guilfoyle, T., Malamy, J., Benfey,
P., Leyser, O., Bechtold, N., Weisbeek, P., et al. (1999). An auxin-dependent distal
organizer of pattern and polarity in the Arabidopsis root. Cell 99, 463-472.
Saddic, L.A., Huvermann, B.R., Bezhani, S., Su, Y.H., Winter, C.M., Kwon, C.S.,
Collum, R.P., and Wagner, D. (2006). The LEAFY target LMI1 is a meristem identity
regulator and acts together with LEAFY to regulate expression of CAULIFLOWER.
Development 133, 1673-1682.
Santner, A., Calderon-Villalobos, L.I., and Estelle, M. (2009). Plant hormones are
versatile chemical regulators of plant growth. Nature chemical biology 5, 301-
307.
Sarojam, R., Sappl, P.G., Goldshmidt, A., Efroni, I., Floyd, S.K., Eshed, Y., and
Bowman, J.L. (2010). Differentiating Arabidopsis shoots from leaves by combined
YABBY activities. Plant Cell 22, 2113-2130.
Savidge, B., Rounsley, S.D., and Yanofsky, M.F. (1995). Temporal relationship
between the transcription of two Arabidopsis MADS box genes and the floral
organ identity genes. The Plant cell 7, 721-733.
Sawa, S., Ohgishi, M., Goda, H., Higuchi, K., Shimada, Y., Yoshida, S., and Koshiba,
T. (2002). The HAT2 gene, a member of the HD-Zip gene family, isolated as an
auxin inducible gene by DNA microarray screening, affects auxin response in
Arabidopsis. Plant Journal 32, 1011-1022.
Saze, H., Tsugane, K., Kanno, T., and Nishimura, T. (2012). DNA Methylation in
Plants: Relationship to Small RNAs and Histone Modifications, and Functions in
Transposon Inactivation. Plant and Cell Physiology 53, 766-784.
Schaller, A., and Stintzi, A. (2009). Enzymes in jasmonate biosynthesis - structure,
function, regulation. Phytochemistry 70, 1532-1538.
Schmittgen, T.D., and Livak, K.J. (2008). Analyzing real-time PCR data by the
comparative C(T) method. Nature protocols 3, 1101-1108.

202
Schuster, C., Gaillochet, C., and Lohmann, J.U. (2015). Arabidopsis HECATE genes
function in phytohormone control during gynoecium development.
Development 142, 3343-3350.
Schuster, C., Gaillochet, C., Medzihradszky, A., Busch, W., Daum, G., Krebs, M.,
Kehle, A., and Lohmann, J.U. (2014). A regulatory framework for shoot stem cell
control integrating metabolic, transcriptional, and phytohormone signals.
Developmental cell 28, 438-449.
Scutt, C.P., Vinauger-Douard, M., Fourquin, C., Finet, C., and Dumas, C. (2006).
An evolutionary perspective on the regulation of carpel development. Journal of
experimental botany 57, 2143-2152.
Seo, M., Peeters, A.J., Koiwai, H., Oritani, T., Marion-Poll, A., Zeevaart, J.A.,
Koornneef, M., Kamiya, Y., and Koshiba, T. (2000). The Arabidopsis aldehyde
oxidase 3 (AAO3) gene product catalyzes the final step in abscisic acid
biosynthesis in leaves. Proceedings of the National Academy of Sciences of the
United States of America 97, 12908-12913.
Serrano-Mislata, A., Schiess, K., and Sablowski, R. (2015). Active Control of Cell
Size Generates Spatial Detail during Plant Organogenesis. Current Biology 25,
2991-2996.
Sessa, G., Steindler, C., Morelli, G., and Ruberti, I. (1998). The Arabidopsis Athb-
8, -9 and -14 genes are members of a small gene family coding for highly related
HD-ZIP proteins. Plant Mol Biol 38, 609-622.
Sessions, A., Nemhauser, J.L., McColl, A., Roe, J.L., Feldmann, K.A., and
Zambryski, P.C. (1997). ETTIN patterns the Arabidopsis floral meristem and
reproductive organs. Development 124, 4481-4491.
Sessions, R.A., and Zambryski, P.C. (1995). Arabidopsis gynoecium structure in
the wild and in ettin mutants. Development 121, 1519-1532.
Seymour, G.B., Ostergaard, L., Chapman, N.H., Knapp, S., and Martin, C. (2013).
Fruit development and ripening. Annu Rev Plant Biol 64, 219-241.
Shamir, R., Maron-Katz, A., Tanay, A., Linhart, C., Steinfeld, I., Sharan, R., Shiloh,
Y., and Elkon, R. (2005). EXPANDER--an integrative program suite for microarray
data analysis. BMC Bioinformatics 6, 232.

203
Sheen, J. (2002). Phosphorelay and transcription control in cytokinin signal
transduction. Science 296, 1650-1652.
Sieber, P., Wellmer, F., Gheyselinck, J., Riechmann, J.L., and Meyerowitz, E.M.
(2007). Redundancy and specialization among plant microRNAs: role of the
MIR164 family in developmental robustness. Development 134, 1051-1060.
Siegfried, K.R., Eshed, Y., Baum, S.F., Otsuga, D., Drews, G.N., and Bowman, J.L.
(1999). Members of the YABBY gene family specify abaxial cell fate in
Arabidopsis. Development 126, 4117-4128.
Simonini, S., Deb, J., Moubayidin, L., Stephenson, P., Valluru, M., Freire-Rios, A.,
Sorefan, K., Weijers, D., Friml, J., and Østergaard, L. (2016). A noncanonical auxin-
sensing mechanism is required for organ morphogenesis in Arabidopsis. Genes
& development 30, 2286-2296.
Siriwardana, C.L., Gnesutta, N., Kumimoto, R.W., Jones, D.S., Myers, Z.A.,
Mantovani, R., and Holt, B.F., 3rd (2016). NUCLEAR FACTOR Y, Subunit A (NF-YA)
Proteins Positively Regulate Flowering and Act Through FLOWERING LOCUS T.
PLoS genetics 12, e1006496.
Smyth, D.R., Bowman, J.L., and Meyerowitz, E.M. (1990). Early flower
development in Arabidopsis. Plant Cell 2, 755-767.
Sorefan, K., Girin, T., Liljegren, S.J., Ljung, K., Robles, P., Galvan-Ampudia, C.S.,
Offringa, R., Friml, J., Yanofsky, M.F., and Ostergaard, L. (2009a). A regulated
auxin minimum is required for seed dispersal in Arabidopsis. Nature 459, 583-
U114.
Sorefan, K., Girin, T., Liljegren, S.J., Ljung, K., Robles, P., Galvan-Ampudia, C.S.,
Offringa, R., Friml, J., Yanofsky, M.F., and Ostergaard, L. (2009b). A regulated
auxin minimum is required for seed dispersal in Arabidopsis. Nature 459, 583-
586.
Sorefan, K., Pais, H., Hall, A.E., Kozomara, A., Griffiths-Jones, S., Moulton, V., and
Dalmay, T. (2012). Reducing ligation bias of small RNAs in libraries for next
generation sequencing. Silence 3, 4.
Sorin, C., Salla-Martret, M., Bou-Torrent, J., Roig-Villanova, I., and Martinez-
Garcia, J.F. (2009). ATHB4, a regulator of shade avoidance, modulates hormone
response in Arabidopsis seedlings. Plant Journal 59, 266-277.

204
Sparks, E., Wachsman, G., and Benfey, P.N. (2013). Spatiotemporal signalling in
plant development. Nature reviews Genetics 14, 631-644.
Sparks, E.E., and Benfey, P.N. (2014). HEC of a job regulating stem cells.
Developmental cell 28, 349-350.
Spinelli, S.V., Martin, A.P., Viola, I.L., Gonzalez, D.H., and Palatnik, J.F. (2011). A
mechanistic link between STM and CUC1 during Arabidopsis development. Plant
physiology 156, 1894-1904.
Steiner-Lange, S., Unte, U.S., Eckstein, L., Yang, C.Y., Wilson, Z.A., Schmelzer, E.,
Dekker, K., and Saedler, H. (2003). Disruption of Arabidopsis thaliana MYB26
results in male sterility due to non-dehiscent anthers. Plant Journal 34, 519-528.
Stepanova, A.N., and Alonso, J.M. (2016). Auxin catabolism unplugged: Role of
IAA oxidation in auxin homeostasis. Proceedings of the National Academy of
Sciences of the United States of America 113, 10742-10744.
Stepanova, A.N., Robertson-Hoyt, J., Yun, J., Benavente, L.M., Xie, D.Y., DoleZal,
K., Schlereth, A., Jurgens, G., and Alonso, J.M. (2008). TAA1-mediated auxin
biosynthesis is essential for hormone crosstalk and plant development. Cell 133,
177-191.
Stepanova, A.N., Yun, J., Robles, L.M., Novak, O., He, W., Guo, H., Ljung, K., and
Alonso, J.M. (2011). The Arabidopsis YUCCA1 flavin monooxygenase functions in
the indole-3-pyruvic acid branch of auxin biosynthesis. Plant Cell 23, 3961-3973.
Su, Y.H., Liu, Y.B., and Zhang, X.S. (2011). Auxin-cytokinin interaction regulates
meristem development. Molecular plant 4, 616-625.
Subramanian, A., Kuehn, H., Gould, J., Tamayo, P., and Mesirov, J.P. (2007).
GSEA-P: a desktop application for Gene Set Enrichment Analysis. Bioinformatics
23, 3251-3253.
Subramanian, A., Tamayo, P., Mootha, V.K., Mukherjee, S., Ebert, B.L., Gillette,
M.A., Paulovich, A., Pomeroy, S.L., Golub, T.R., Lander, E.S., et al. (2005). Gene
set enrichment analysis: a knowledge-based approach for interpreting genome-
wide expression profiles. Proceedings of the National Academy of Sciences of the
United States of America 102, 15545-15550.

205
Sun, T.-p. (2008). Gibberellin Metabolism, Perception and Signaling Pathways in
Arabidopsis. The Arabidopsis book / American Society of Plant Biologists 6,
e0103.
Szakonyi, D., Moschopoulos, A., and Byrne, M.E. (2010). Perspectives on leaf
dorsoventral polarity. Journal of plant research 123, 281-290.
Takada, S., Hibara, K., Ishida, T., and Tasaka, M. (2001). The CUP-SHAPED
COTYLEDON1 gene of Arabidopsis regulates shoot apical meristem formation.
Development 128, 1127-1135.
Takahashi, H., Iwakawa, H., Ishibashi, N., Kojima, S., Matsumura, Y.,
Prananingrum, P., Iwasaki, M., Takahashi, A., Ikezaki, M., Luo, L., et al. (2013).
Meta-analyses of microarrays of Arabidopsis asymmetric leaves1 (as1), as2 and
their modifying mutants reveal a critical role for the ETT pathway in stabilization
of adaxial-abaxial patterning and cell division during leaf development. Plant &
cell physiology 54, 418-431.
Takeda, S., Hanano, K., Kariya, A., Shimizu, S., Zhao, L., Matsui, M., Tasaka, M.,
and Aida, M. (2011). CUP-SHAPED COTYLEDON1 transcription factor activates
the expression of LSH4 and LSH3, two members of the ALOG gene family, in
shoot organ boundary cells. The Plant journal : for cell and molecular biology 66,
1066-1077.
Talon, M., Koornneef, M., and Zeevaart, J.A. (1990). Endogenous gibberellins in
Arabidopsis thaliana and possible steps blocked in the biosynthetic pathways of
the semidwarf ga4 and ga5 mutants. Proceedings of the National Academy of
Sciences of the United States of America 87, 7983-7987.
Tao, Y., Ferrer, J.L., Ljung, K., Pojer, F., Hong, F.X., Long, J.A., Li, L., Moreno, J.E.,
Bowman, M.E., Ivans, L.J., et al. (2008). Rapid synthesis of auxin via a new
tryptophan-dependent pathway is required for shade avoidance in plants. Cell
133, 164-176.
Taoka, K., Yanagimoto, Y., Daimon, Y., Hibara, K., Aida, M., and Tasaka, M. (2004).
The NAC domain mediates functional specificity of CUP-SHAPED COTYLEDON
proteins. The Plant journal : for cell and molecular biology 40, 462-473.

206
Tasseva, G., Richard, L., and Zachowski, A. (2004). Regulation of
phosphatidylcholine biosynthesis under salt stress involves choline kinases in
Arabidopsis thaliana. FEBS Lett 566, 115-120.
Teale, W.D., Paponov, I.A., and Palme, K. (2006). Auxin in action: signalling,
transport and the control of plant growth and development. Nature reviews
Molecular cell biology 7, 847-859.
Telfer, A., Bollman, K.M., and Poethig, R.S. (1997). Phase change and the
regulation of trichome distribution in Arabidopsis thaliana. Development 124,
645-654.
Toledo-Ortiz, G., Huq, E., and Quail, P.H. (2003). The Arabidopsis basic/helix-
loop-helix transcription factor family. Plant Cell 15, 1749-1770.
Tran, L.S.P., Nakashima, K., Sakuma, Y., Simpson, S.D., Fujita, Y., Maruyama, K.,
Fujita, M., Seki, M., Shinozaki, K., and Yamaguchi-Shinozaki, K. (2004). Isolation
and functional analysis of Arabidopsis stress-inducible NAC transcription factors
that bind to a drought-responsive cis-element in the early responsive to
dehydration stress 1 promoter. Plant Cell 16, 2481-2498.
Tsukaya, H. (2013). Leaf development. The Arabidopsis book / American Society
of Plant Biologists 11, e0163.
Tucker, M.R., Hinze, A., Tucker, E.J., Takada, S., Jurgens, G., and Laux, T. (2008).
Vascular signalling mediated by ZWILLE potentiates WUSCHEL function during
shoot meristem stem cell development in the Arabidopsis embryo. Development
135, 2839-2843.
Tucker, M.R., Roodbarkelari, F., Truernit, E., Adamski, N.M., Hinze, A., Lohmuller,
B., Wurschum, T., and Laux, T. (2013). Accession-specific modifiers act with
ZWILLE/ARGONAUTE10 to maintain shoot meristem stem cells during
embryogenesis in Arabidopsis. BMC Genomics 14, 809.
Ulmasov, T., Hagen, G., and Guilfoyle, T.J. (1999). Activation and repression of
transcription by auxin-response factors. Proceedings of the National Academy of
Sciences of the United States of America 96, 5844-5849.
Ulmasov, T., Liu, Z.B., Hagen, G., and Guilfoyle, T.J. (1995). Composite structure
of auxin response elements. Plant Cell 7, 1611-1623.
207
Vaistij, F.E., Gan, Y., Penfield, S., Gilday, A.D., Dave, A., He, Z., Josse, E.M., Choi,
G., Halliday, K.J., and Graham, I.A. (2013). Differential control of seed primary
dormancy in Arabidopsis ecotypes by the transcription factor SPATULA.
Proceedings of the National Academy of Sciences of the United States of America
110, 10866-10871.
van der Graaff, E., Laux, T., and Rensing, S.A. (2009). The WUS homeobox-
containing (WOX) protein family. Genome biology 10, 248.
Vanneste, S., and Friml, J. (2009). Auxin: a trigger for change in plant
development. Cell 136, 1005-1016.
Vernoux, T., Besnard, F., and Traas, J. (2010). Auxin at the Shoot Apical Meristem.
Csh Perspect Biol 2.
Vieten, A., Vanneste, S., Wiśniewska, J., Benková, E., Benjamins, R., Beeckman,
T., Luschnig, C., and Friml, J. (2005). Functional redundancy of PIN proteins is
accompanied by auxin-dependent cross-regulation of PIN expression.
Development 132, 4521-4531.
Vijayraghavan, U., Prasad, K., and Meyerowitz, E. (2005). Specification and
maintenance of the floral meristem: interactions between positively-acting
promoters of flowering and negative regulators. Curr Sci India 89, 1835-1843.
Voinnet, O. (2009). Origin, biogenesis, and activity of plant microRNAs. Cell 136,
669-687.
Wagner, T.A., and Kohorn, B.D. (2001). Wall-associated kinases are expressed
throughout plant development and are required for cell expansion. Plant Cell 13,
303-318.
Wang, Q., Hasson, A., Rossmann, S., and Theres, K. (2016). Divide et impera:
boundaries shape the plant body and initiate new meristems. New Phytol 209,
485-498.
Wang, Y., Wang, J., Shi, B.H., Yu, T., Qi, J.Y., Meyerowitz, E.M., and Jiao, Y.L.
(2014). The Stem Cell Niche in Leaf Axils Is Established by Auxin and Cytokinin in
Arabidopsis. Plant Cell 26, 2055-2067.
Waters, M.T., Wang, P., Korkaric, M., Capper, R.G., Saunders, N.J., and Langdale,
J.A. (2009). GLK Transcription Factors Coordinate Expression of the
Photosynthetic Apparatus in Arabidopsis. Plant Cell 21, 1109-1128.

208
Weidner, C., Steinfath, M., Wistorf, E., Oelgeschläger, M., Schneider, M. R.,
Schönfelder, G. (2017). A Protocol for Using Gene Set Enrichment Analysis to
Identify the Appropriate Animal Model for Translational Research. J Vis Exp 126.
Weiste, C., and Droge-Laser, W. (2014). The Arabidopsis transcription factor
bZIP11 activates auxin-mediated transcription by recruiting the histone
acetylation machinery. Nat Commun 5.
Wenkel, S., Emery, J., Hou, B.H., Evans, M.M., and Barton, M.K. (2007). A
feedback regulatory module formed by LITTLE ZIPPER and HD-ZIPIII genes. Plant
Cell 19, 3379-3390.
Wenzel, C.L., Schuetz, M., Yu, Q., and Mattsson, J. (2007). Dynamics of
MONOPTEROS and PIN-FORMED1 expression during leaf vein pattern formation
in Arabidopsis thaliana. Plant Journal 49, 387-398.
White, J.L., and Kaper, J.M. (1989). A Simple Method for Detection of Viral
Satellite Rnas in Small Plant-Tissue Samples. Journal of virological methods 23,
83-93.
Widman, N., Feng, S., Jacobsen, S.E., and Pellegrini, M. (2014). Epigenetic
differences between shoots and roots in Arabidopsis reveals tissue-specific
regulation. Epigenetics-Us 9, 236-242.
Williams, L., and Fletcher, J.C. (2005). Stem cell regulation in the Arabidopsis
shoot apical meristem. Current opinion in plant biology 8, 582-586.
Wolters, H., and Jurgens, G. (2009). Survival of the flexible: hormonal growth
control and adaptation in plant development. Nature reviews Genetics 10, 305-
317.
Wu, H., Mori, A., Jiang, X., Wang, Y., and Yang, M. (2006). The INDEHISCENT
protein regulates unequal cell divisions in Arabidopsis fruit. Planta 224, 971-979.
Wu, X., Weigel, D., and Wigge, P.A. (2002). Signaling in plants by intercellular RNA
and protein movement. Genes & development 16, 151-158.
Wurschum, T., Gross-Hardt, R., and Laux, T. (2006). APETALA2 regulates the stem
cell niche in the Arabidopsis shoot meristem. Plant Cell 18, 295-307.
Wyrzykowska, J., and Fleming, A. (2003). Cell division pattern influences gene
expression in the shoot apical meristem. Proceedings of the National Academy
of Sciences of the United States of America 100, 5561-5566.

209
Xu, B., Li, Z., Zhu, Y., Wang, H., Ma, H., Dong, A., and Huang, H. (2008).
Arabidopsis genes AS1, AS2, and JAG negatively regulate boundary-specifying
genes to promote sepal and petal development. Plant physiology 146, 566-575.
Xu, J., Zhang, H.Y., Xie, C.H., Xue, H.W., Dijkhuis, P., and Liu, C.M. (2005).
EMBRYONIC FACTOR 1 encodes an AMP deaminase and is essential for the
zygote to embryo transition in Arabidopsis. Plant Journal 42, 743-756.
Xu, L., Xu, Y., Dong, A., Sun, Y., Pi, L., Xu, Y., and Huang, H. (2003). Novel as1 and
as2 defects in leaf adaxial-abaxial polarity reveal the requirement for
ASYMMETRIC LEAVES1 and 2 and ERECTA functions in specifying leaf adaxial
identity. Development 130, 4097-4107.
Yadav, R.K., Girke, T., Pasala, S., Xie, M., and Reddy, G.V. (2009). Gene expression
map of the Arabidopsis shoot apical meristem stem cell niche. Proceedings of
the National Academy of Sciences of the United States of America 106, 4941-
4946.
Yadav, R.K., Tavakkoli, M., Xie, M., Girke, T., and Reddy, G.V. (2014). A high-
resolution gene expression map of the Arabidopsis shoot meristem stem cell
niche. Development 141, 2735-2744.
Yan, T., Yoo, D., Berardini, T.Z., Mueller, L.A., Weems, D.C., Weng, S., Cherry, J.M.,
and Rhee, S.Y. (2005). PatMatch: a program for finding patterns in peptide and
nucleotide sequences. Nucleic Acids Res 33, W262-266.
Yanai, O., Shani, E., Dolezal, K., Tarkowski, P., Sablowski, R., Sandberg, G.,
Samach, A., and Ori, N. (2005). Arabidopsis KNOXI proteins activate cytokinin
biosynthesis. Current biology : CB 15, 1566-1571.
Yang, C.Y., Xu, Z.Y., Song, J., Conner, K., Barrena, G.V., and Wilson, Z.A. (2007).
Arabidopsis MYB26/MALE STERILE35 regulates secondary thickening in the
endothecium and is essential for anther dehiscence. Plant Cell 19, 534-548.
Yang, S.F., and Hoffman, N.E. (1984). Ethylene Biosynthesis and Its Regulation in
Higher-Plants. Annu Rev Plant Phys 35, 155-189.
Yang, Z.F., Gu, S.L., Wang, X.F., Li, W.J., Tang, Z.X., and Xu, C.W. (2008). Molecular
evolution of the CPP-like gene family in plants: Insights from comparative
genomics of Arabidopsis and rice. J Mol Evol 67, 266-277.

210
Yant, L., Mathieu, J., Dinh, T.T., Ott, F., Lanz, C., Wollmann, H., Chen, X.M., and
Schmid, M. (2010). Orchestration of the Floral Transition and Floral Development
in Arabidopsis by the Bifunctional Transcription Factor APETALA2. Plant Cell 22,
2156-2170.
Yi, X., Du, Z., and Su, Z. (2013). PlantGSEA: a gene set enrichment analysis toolkit
for plant community. Nucleic Acids Res 41, W98-103.
Yu, C.P., Lin, J.J., and Li, W.H. (2016). Positional distribution of transcription
factor binding sites in Arabidopsis thaliana. Sci Rep 6, 25164.
Yu, Y., Ji, L.J., Le, B.H., Zhai, J.X., Chen, J.Y., Luscher, E., Gao, L., Liu, C.Y., Cao, X.F.,
Mo, B.X., et al. (2017). ARGONAUTE10 promotes the degradation of miR165/6
through the SDN1 and SDN2 exonucleases in Arabidopsis. Plos Biol 15.
Zeller, G., Henz, S.R., Widmer, C.K., Sachsenberg, T., Ratsch, G., Weigel, D., and
Laubinger, S. (2009). Stress-induced changes in the Arabidopsis thaliana
transcriptome analyzed using whole-genome tiling arrays. Plant Journal 58,
1068-1082.
Zhang, J., and Peer, W.A. (2017). Auxin homeostasis: the DAO of catabolism.
Journal of experimental botany 68, 3145-3154.
Zhang, L.X., Li, Z.F., Quan, R.D., Li, G.J., Wang, R.G., and Huang, R.F. (2011a). An
AP2 Domain-Containing Gene, ESE1, Targeted by the Ethylene Signaling
Component EIN3 Is Important for the Salt Response in Arabidopsis. Plant
physiology 157, 854-865.
Zhang, X.Y., Clarenz, O., Cokus, S., Bernatavichute, Y.V., Pellegrini, M., Goodrich,
J., and Jacobsen, S.E. (2007). Whole-genome analysis of histone H3 lysine 27
trimethylation in Arabidopsis. Plos Biol 5, 1026-1035.
Zhang, Y., Wu, R., Qin, G., Chen, Z., Gu, H., and Qu, L.J. (2011b). Over-expression
of WOX1 leads to defects in meristem development and polyamine homeostasis
in Arabidopsis. Journal of integrative plant biology 53, 493-506.
Zhang, Z., and Zhang, X. (2012). Argonautes compete for miR165/166 to regulate
shoot apical meristem development. Current opinion in plant biology 15, 652-
658.

211
Zhao, H., Li, X., and Ma, L. (2012). Basic helix-loop-helix transcription factors and
epidermal cell fate determination in Arabidopsis. Plant signaling & behavior 7,
1556-1560.
Zhao, Y., Christensen, S.K., Fankhauser, C., Cashman, J.R., Cohen, J.D., Weigel, D.,
and Chory, J. (2001). A role for flavin monooxygenase-like enzymes in auxin
biosynthesis. Science 291, 306-309.
Zhao, Z., Andersen, S.U., Ljung, K., Dolezal, K., Miotk, A., Schultheiss, S.J., and
Lohmann, J.U. (2010). Hormonal control of the shoot stem-cell niche. Nature
465, 1089-1092.
Zhou, G.K., Kubo, M., Zhong, R., Demura, T., and Ye, Z.H. (2007). Overexpression
of miR165 affects apical meristem formation, organ polarity establishment and
vascular development in Arabidopsis. Plant & cell physiology 48, 391-404.
Zhou, Y., Honda, M., Zhu, H., Zhang, Z., Guo, X., Li, T., Li, Z., Peng, X., Nakajima,
K., Duan, L., et al. (2015). Spatiotemporal sequestration of miR165/166 by
Arabidopsis Argonaute10 promotes shoot apical meristem maintenance. Cell
Rep 10, 1819-1827.
Zhu, H., Hu, F., Wang, R., Zhou, X., Sze, S.-H., Liou, L.W., Barefoot, A., Dickman,
M., and Zhang, X. (2011a). Arabidopsis ARGONAUTE10 specifically sequesters
miR166/165 to regulate ahoot apical meristem development. Cell 145, 242-256.
Zhu, H., Hu, F., Wang, R., Zhou, X., Sze, S.H., Liou, L.W., Barefoot, A., Dickman,
M., and Zhang, X. (2011b). Arabidopsis Argonaute10 specifically sequesters
miR166/165 to regulate shoot apical meristem development. Cell 145, 242-256.
Zoulias, N., Koenig, D., Hamidi, A., McCormick, S., and Kim, M. (2012). A role for
PHANTASTICA in medio-lateral regulation of adaxial domain development in
tomato and tobacco leaves. Ann Bot 109, 407-418.
Zuniga-Mayo, V.M., Reyes-Olalde, J.I., Marsch-Martinez, N., and de Folter, S.
(2014). Cytokinin treatments affect the apical-basal patterning of the
Arabidopsis gynoecium and resemble the effects of polar auxin transport
inhibition. Frontiers in Plant Science 5.
Zurcher, E., Tavor-Deslex, D., Lituiev, D., Enkerli, K., Tarr, P.T., and Muller, B.
(2013). A Robust and Sensitive Synthetic Sensor to Monitor the Transcriptional

212
Output of the Cytokinin Signaling Network in Planta. Plant physiology 161, 1066-
1075.

213
Chapter 8 Appendix

214
CHAPTER 8. Appendix
Figure 8.1 Structural mapping of mutations in ZLLzll‐3. (A) Topology diagram of the human Ago2
structure adapted from (Poulsen et al., 2013). (B) Human AGO1 and Arabidopsis ZLL structure
comparison using TM-align. (C and D) N-terminal and partial N-domain of ZLL Ler are not aligned
with ZLLzll‐3. (E) Close-up view of the Piwi domain containing the modelled G707D ZLLzll‐3
mutation. (F) Close-up view of the modelled ZLL Ler and ZLLzll‐3 N-terminal and partial N-domain.

215
Figure 8.2 Mutations in zwl‐3 change the amino acid sequence in N-terminal, partial N-domain
and Piwi-domain of ZLL/AGO10. When compared to wild-type AGO10 (A), zwl-3 possesses a
missense mutation (G to D) in the Piwi-domain and also harbours an insertion (cytochrome
P450: CYP79B2) in the N-terminal and N-domain.

216
Figure 8.3 PHB and IND gene expression in dcl and other mutants impaired in small RNA
biogenesis (Laubinger et al., 2010). On the left line graph display Intensity values of PHB or IND
vs. tissue samples and on the right heat map display mean-normalised values of PHB or IND vs.
tissue samples. When compared to WT, PHB expression increased in se mutants. Stable IND
expression observed in the inflorescence or seedling samples.
Table 8.1 Gene expression values (2-ΔCT) used for the heat map in Chapter 4 (Fig 4.2).
Sample Ler Ind-6zwl-3
WT
zwl-3
CUP
zwl-3
PIN
zwl-3
NM
ind-6
zwl-3
WT
ind-6
zwl-3
CUP
ind-6
zwl-3
PIN
CUC1 0.002 0.002 0.001 0.000 0.000 0.000 0.003 0.002 0.002
YUC1 0.003 0.003 0.003 0.001 0.001 0.001 0.003 0.001 0.002
STM 0.008 0.007 0.006 0.007 0.005 0.005 0.009 0.006 0.006
CUC3 0.009 0.006 0.006 0.005 0.004 0.003 0.005 0.004 0.002
CUC2 0.009 0.008 0.006 0.005 0.003 0.003 0.007 0.004 0.002
PHV 0.015 0.012 0.009 0.008 0.006 0.006 0.011 0.007 0.006
ARF4 0.019 0.016 0.023 0.022 0.023 0.016 0.019 0.017 0.015
REV 0.029 0.020 0.017 0.015 0.009 0.011 0.018 0.016 0.014
PHB 0.035 0.033 0.015 0.018 0.013 0.010 0.029 0.018 0.012
AS2 0.049 0.050 0.040 0.019 0.030 0.016 0.033 0.031 0.019
BP 0.071 0.070 0.084 0.080 0.090 0.050 0.099 0.094 0.065
KAN 0.076 0.051 0.063 0.057 0.066 0.035 0.063 0.039 0.041
ARF3 0.095 0.045 0.072 0.082 0.068 0.045 0.052 0.049 0.036
PID 0.101 0.057 0.123 0.077 0.082 0.058 0.077 0.056 0.037
ARR7 0.169 0.102 0.266 0.355 0.462 0.299 0.191 0.381 0.294
PIN1 0.227 0.230 0.179 0.205 0.143 0.210 0.195 0.171 0.124
RPL 0.428 0.354 0.294 0.346 0.332 0.325 0.230 0.227 0.153
YAB3 0.608 0.670 0.505 0.303 0.310 0.149 0.384 0.291 0.168
AS1 1.173 1.334 1.619 1.481 1.561 1.126 1.243 0.986 0.834

217
Table 8.2 Differentially regulated genes in both 35S::SPT-VP16-GR seedlings (p<0.05, DEX+CHY
vs. CHY) and spt-12 seedlings (p<0.05, spt-12 vs. Col-0).
GS 35S::SPT-VP16-GR
spt-12
AT1G19310 1.356579 -1.4625
TZF5 1.203 -1.36616
PYL4 1.158247 -1.79431
NAC014 1.132099 1.31552
AT5G22580 1.06268 2.196684
AT1G68360 -1.08489 -1.61543
AT1G08350 -1.17451 -1.4226
Table 8.3 Differentially regulated genes in both hec1,2,3 Inflorescence apices (p<0.05, hec1,2,3
vs. Col-0) and pAlcA::HEC1 Inflorescence apices (p<0.05, pAlcA::HEC1+EtH vs.
pAlcA::GUS+EtH).
GS hec1,2,3 pAlcA::HEC1
GPT2 9.09 -5.35
NF-YA10 3.2 -1.51
NF-YA3 2.82 -1.87
JMT 2.58 -1.74
NF-YA2 2.2 -2.22
NF-YA5 2.03 -1.68
PAP17 2.01 -3.85
AT2G29670 1.91 -1.66
AT1G32900 1.89 -1.53
AT2G37770 1.86 -2.29
DIC3 1.86 -1.79
BGLU11 1.61 -1.78
PIP1B 1.52 -1.52
SBTI1.1 1.51 -2.11
AT5G23820 -1.68 1.78
AT3G21950 -1.75 1.6
AT1G53885 -2.05 2.66
AT1G16850 -2.23 -1.63
ATGSTF3 -2.8 -1.56
Table 8.4 Differentially regulated genes in both cuc1 seedlings (p<0.05, cuc1 vs. Col-0) and
35S::CUC1 seedlings (p<0.05, 35S::CUC1 vs. Ler).
GS cuc1 35S::CUC1
AT5G58980 -6.42531 1.200286
AT2G17975 -3.42775 1.25874
AT4G34770 -3.28304 5.004542
UBC17 -2.871 -1.95598
AT5G02610 -2.61046 -1.08348
CAT3 -2.28821 -1.24534
AT3G27200 -2.26497 1.535055
AT4G28240 -2.05639 1.615215
IAA6 -2.00651 -1.81687
AT2G04570 -1.89925 -1.30852
AT1G01770 -1.83727 -1.2631
AT3G60510 -1.80683 1.363822
PIF3 -1.75915 1.702813
AT1G67300 -1.75844 1.190356
AAE17 -1.72599 1.609895
AT1G73980 -1.71718 1.317883
ERD15 -1.71345 1.68441
AT1G76630 -1.70675 1.961813
CER26-LIKE -1.70511 -1.88722
KAO2 -1.69564 5.046723
AT5G40540 -1.68935 1.318511
CRK3 -1.64251 2.080767
MSRB1 -1.63843 -1.11209
AT2G47250 -1.63491 1.378063
AT1G18270 -1.62829 1.81654
CRK10 -1.58383 1.354056
CKA3 -1.5786 2.352427
ATCTH -1.54279 1.385844
INT1 -1.53668 1.242063

218
AT1G32580 1.521208 1.54025
AT4G37250 1.523126 2.416576
AT1G06010 1.541731 1.215343
RPL 1.555367 11.30851
AT5G07820 1.571736 1.495227
TOPII 1.572114 1.537849
PMEPCRF 1.583181 3.640814
IPMI2 1.596806 2.655957
ENODL13 1.597188 2.662754
CYCA3;4 1.650558 1.045567
AT3G07270 1.651075 1.681018
TINY2 1.68977 1.249884
AT3G17940 1.723295 2.078132
UGT71B1 1.736684 1.585383
SIRANBP 1.768175 -1.20958
GTR1 1.81729 1.301557
BAG4 1.828396 1.328216
CXE13 1.867473 -1.49537
RLK902 1.869506 2.007074
MYB29 1.891197 11.58867
GA3OX1 1.898537 -2.04158
AT3G53190 1.909437 3.386096
SCPL45 1.910643 1.755524
FTRA2 1.919676 -1.20814
KNATM 1.934229 1.161482
AT1G62190 1.937868 1.181389
AT5G67150 1.953362 1.949194
STM 1.958376 4.307137
IAR3 2.006088 -1.39985
RD20 2.015566 -1.80066
AT1G12960 2.023285 1.130521
SRG1 2.149221 3.331493
JAL22 2.263742 3.475705
AT2G34810 2.273639 -1.98812
AT3G15720 2.368176 2.529814
CUC2 2.380805 1.698123
AT5G17160 2.707963 2.520414
AT3G60270 2.83153 1.812063
AT3G51930 3.325268 1.573045
LBD40 3.523152 -1.9024
BGLU18 3.528023 -4.67844
PAP1 4.0895 -2.58709
AT4G17920 4.263427 2.729153
AT2G38390 4.853381 -1.35231
MBP1 5.540413 -1.58017

219
Table 8.5 24 genes broadly showed similar expression in microarray analysis and qRT-PCR
experiments (35S::IND:GR seedlings, DEX vs. DMSO, 6 hours). CUC1/2/3 genes were not
differentially regulated in 35S::IND:GR seedlings at 6 and 12 hours in the microarray datasets
(DEX vs. DMSO).
GS qRT-PCR Microarray
IPT3 -2.4 -1.9
ARR7 -3.2 -1.6
CKX4 -8.4 -1.1
PID -4.8 -1.1
AGO10 -1.6 -1.1
IPT7 -3.2 -1.1
IPT8 -1.2 -1.0
HEC1 3.2 1.0
YAB2 1.4 1.1
PHV 1.1 1.1
PID2 1.5 1.1
YAB1 2.5 1.1
ARF3 1.3 1.2
CLV3 1.8 1.2
STM 1.5 1.3
ZPR1 2.5 1.3
PHB 1.7 1.3
KNAT1 2.2 1.4
ARF4 1.4 1.4
AS1 1.8 1.5
CKX5 2.2 1.5
WOX1 4.9 1.6
AGO7 3.6 1.7
SPT 1.3 1.8
GS qRT-PCRMicroarray
6hrs
Microarray
12hrs
CUC1 -1.6 1.3 1.1
CUC2 1.3 -1.1 1.1
CUC3 -1.1 1.0 -1.3

220
Table 8.6 Differentially regulated genes in 35S::IND:GR seedlings (DEX vs. DMSO 6 hours, One-
Way ANOVA p<0.05, Gene Fold Change (linear) >3 or <-3)
GS
Fold Change (linear)
(DEX vs.
DMSO) 6 hrs
SAG29 13.58
AT2G28570 4.92
AT2G35640 4.85
LOL1 4.82
GA3OX1 4.71
SRG3 4.67
AT5G53048 4.51
XTH15 4.29
MYB111 4.03
AT2G28510 3.7
AT5G47550 3.67
AT5G61610 3.26
SPX1 3.17
CP1 3.13
XTH32 3.06
HB51 3.05
TI1 -3.02
AT2G41230 -3.02
OPT1 -3.02
AT5G43450 -3.03
AT1G51890 -3.05
UMAMIT29 -3.05
AT1G65845 -3.07
AT1G52200 -3.08
AT1G51790 -3.09
AT4G16260 -3.11
PER4 -3.12
PDF1.4 -3.18
AT3G19850 -3.19
PTR3 -3.19
NRT1.7 -3.21
UGT74F2 -3.21
HLECRK -3.23
AT2G43620 -3.28
AT5G44585 -3.28
RLP21 -3.29
PR4 -3.31
cPT4 -3.4
AT2G17740 -3.47
IOS1 -3.54
HSP90.1 -3.59
CYP72A8 -3.62
AT3G28270 -3.66
NAC6 -3.67
AT2G36690 -3.7
AT1G51820 -3.74
CORI3 -3.74
AT4G12490 -3.76
AT3G16530 -3.77
GSTF7 -3.81
KCS12 -3.99
AT4G01870 -4.01
AT4G15700 -4.06
SQE6 -4.11
FRK1 -4.23
AT5G42830 -4.36
Rap2.6L -4.41
AT3G46280 -4.96
MLO12 -5.17
AT5G39580 -5.17
CYP71B23 -5.25
PRX71 -5.46
AT1G36622 -5.56
AT4G12500 -5.68
AT1G36640 -5.69
AT4G12290 -6.73
AT4G22470 -6.93
AT5G44575 -8.01
MT1B -11.07
Table 8.7 Differentially regulated genes in 35S::IND:GR seedlings (DEX vs. DMSO 12 hours,
One-Way ANOVA p<0.05, Gene Fold Change (linear) >3 or <-3)
GS
Fold Change (linear)
(DEX vs.
DMSO) 12hrs
DFR 14.2
SAG29 11.8
AT5G61610 11.3
LDOX 8.5
TOM20-2 8.2
GSTF12 7.3
AT2G34020 7.3
UF3GT 6.9
AT2G28510 6.7
ETC1 6.5
AT5G45650 6.4
AT2G11880 6.2
WOX1 6.2
MYB111 6.1
AT1G74010 6.0
PMEPCRF 5.4
SLAH2 5.2
FLS1 4.9
GA3OX1 4.8
PAP1 4.8
AT1G08590 4.7
PUB22 4.6
BOR1 4.6
AT5G45276 4.5
CIPK18 4.4
PAP14 4.4
AT5G66500 4.3
SCPL13 4.3
AT3G14820 4.2

221
CER1 4.2
AT5G50060 4.2
TBL34 4.2
TIL1 4.2
LRX2 4.1
SPL5 4.1
AT1G13750 4.0
DCF 4.0
AT1G33440 4.0
XTH32 3.9
SWEET8 3.8
AT3G61490 3.8
AT5G34880 3.8
HB51 3.8
AT4G05220 3.8
CM1 3.7
AT2G40250 3.7
AT3G21660 3.7
PAP15 3.7
TT4 3.7
AT5G50620 3.7
AT1G31510 3.7
OFP5 3.6
SULTR1;1 3.6
AT1G54120 3.6
VDD 3.6
AT5G13200 3.5
F3H 3.5
AT1G42980 3.4
CHIL 3.4
AT1G21320 3.4
MLO2 3.4
AT1G72140 3.4
AT4G33170 3.4
AT4G10500 3.3
AT2G40460 3.3
AT4G19720 3.3
BGLU47 3.3
AT5G22540 3.3
GDPD6 3.2
TAT3 3.2
AT5G19100 3.2
MAP65-9 3.2
AT1G56710 3.2
AT5G44950 3.2
AT3G56620 3.2
GDU2 3.2
PME3 3.2
AT1G43770 3.2
AT1G52470 3.2
AT5G56400 3.1
AT3G14560 3.1
AT3G51660 3.1
AT4G37530 3.1
AT5G38900 3.1
ZFP8 3.1
AT5G19110 3.1
AT3G44970 3.1
AT3G62270 3.1
AT1G06000 3.1
PAL1 3.0
SIP2 3.0
UGT78D1 3.0
AT3G16330 3.0
AT4G15590 3.0
AT3G45400 -3.0
CIPK16 -3.0
AT5G49170 -3.0
HAT1 -3.0
EXPA17 -3.0
AT1G19100 -3.0
AT4G22470 -3.0
AT1G69526 -3.0
CYP710A2 -3.0
AT5G01015 -3.0
APG8A -3.0
AT3G62550 -3.0
AT2G44380 -3.0
AT3G04250 -3.1
AT4G12410 -3.1
PPDK -3.1
ERF9 -3.1
AT1G52200 -3.1
CYP81H1 -3.1
AT1G67390 -3.1
4CL3 -3.1
AT3G22060 -3.1
E12A11 -3.1
AT1G12845 -3.1
AT5G48900 -3.1
AT3G26960 -3.1
AT4G36660 -3.2
CASP2 -3.2
AT4G00870 -3.2
AT2G06980 -3.2
WOX5 -3.2
AT4G00780 -3.2
UGT85A3 -3.2
AT3G12260 -3.2
AT3G48640 -3.2
AT1G29140 -3.2
AT4G16000 -3.2
AT1G35380 -3.2
AGP4 -3.2
FDH -3.2
GAMMA-TIP -3.2
MYBL2 -3.2
AT5G64090 -3.2
UBC17 -3.2
AT1G27670 -3.3
AT4G16670 -3.3
AT1G51720 -3.3
SWEET10 -3.3
AT2G21680 -3.3
RECQSIM -3.3
AT5G65120 -3.3
AT1G09460 -3.3
AIF1 -3.3
AT4G27300 -3.3
AIL7 -3.3
PIP2A -3.4
ABCG5 -3.4
PIN5 -3.4
AT5G27220 -3.4
At5g57880 -3.4
AT4G01410 -3.4
GSTF2 -3.4
AT3G25190 -3.4
AT5G62730 -3.4
PDF1.4 -3.4
AT2G19970 -3.4
AT2G11640 -3.5
AT3G12710 -3.5
HB2 -3.5
AT2G41570 -3.5
AT1G27100 -3.6
AT5G12940 -3.6
DIT2.1 -3.6
AT5G62280 -3.6
NAC3 -3.6
PR-1-LIKE -3.6
AT1G65280 -3.7
AT1G09320 -3.7

222
CYP71B24 -3.7
AT1G09390 -3.7
MEE3 -3.7
GA3OX3 -3.7
AT1G11070 -3.7
AT3G02670 -3.7
AT2G17740 -3.8
NAC010 -3.8
EXPA11 -3.9
HSP17.4 -3.9
IAA32 -4.0
SQE6 -4.1
PLA2-ALPHA -4.1
ABCI7 -4.1
AT4G26485 -4.1
SECA2 -4.2
AT2G29500 -4.3
RCI3 -4.3
BG1 -4.4
AT4G34419 -4.4
AT5G66420 -4.6
UMAMIT14 -4.6
AT4G08300 -4.6
AT4G35720 -4.6
GLYI4 -4.6
UMAMIT29 -4.6
RALFL18 -4.6
DIR1 -4.7
BEE1 -4.7
GLYI7 -4.8
AT4G30450 -5.0
THA1 -5.1
AT3G12910 -5.1
AT3G62930 -5.2
AT2G10260 -5.3
CYP71B23 -5.6
AT3G14210 -5.8
AT5G44585 -6.4
AT5G19890 -6.6
ARCK1 -6.8
AT1G16950 -6.9
CHAT -7.1
AT5G01740 -7.8
AT5G39520 -8.2
OPT1 -8.4
AT1G26761 -8.6
Table 8.8 Differentially regulated genes in 35S::IND:GR seedlings (DEX+AUX vs. AUX 6 hours,
One-Way ANOVA p<0.05, Gene Fold Change (linear) >3 or <-3)
M Symbol
Fold Change (linear) (DEX+AUX vs. AUX)
SAG29 17
AT1G78860 8.92
MYB111 4.77
ICL 4.62
AT5G61610 4.52
FLS1 4.3
AT5G59680 3.97
AT2G28510 3.94
CP1 3.9
AT2G28570 3.79
AT1G55380 3.76
TRM13 3.63
GA3OX1 3.61
LOL1 3.44
RHS19 3.43
AT3G13310 3.35
GPAT1 3.3
PMEPCRF 3.28
CEL5 3.24
AT5G55970 3.23
AT5G47050 3.09
KMD1 3.06
TT4 3.06
GolS1 -3.02
SAUR19 -3.08
CRK14 -3.12
AT2G29500 -3.16
NRT1.7 -3.18
GSTU24 -3.22
KCS12 -3.27
CORI3 -3.36
PRX71 -3.37
ABCB15 -3.4
ROF2 -3.41
AT2G18193 -3.49
SQE6 -3.55
AtCDC48B -3.61
UGT76B1 -3.67
HSP70 -3.85
DOX1 -3.91
AT5G44910 -4.04
AT4G12290 -4.16
AT1G52200 -4.29
AT2G36690 -4.38
AT1G51830 -4.41
AT5G51440 -4.43
WRKY49 -4.86
MT1B -5.03
CYP71B23 -5.34
AT1G51840 -5.49
OPT1 -5.54
HSP90.1 -7.23

223
Table 8.9 Differentially regulated genes in 35S::IND:GR seedlings (DEX+CYT vs. CYT 6 hours,
One-Way ANOVA p<0.05, Gene Fold Change (linear) >3 or <-3)
M Symbol
Fold Change (linear) (DEX+CYT vs. CYT)
SAG29 6.34
AT2G28570 6.1
XTH15 5.04
ABCG43 4.98
AT5G61610 4.83
LOL1 3.97
AT3G13310 3.95
LDOX 3.77
PCME 3.48
DFR 3.37
FAR1 3.33
AT3G56620 3.2
ELIP1 3.14
AT1G53870 3.11
PUB22 3.11
AT5G44570 3.11
AT4G03140 3.1
AT5G66650 3.1
HB51 3.03
AT4G15390 -3.08
AT5G62360 -3.08
AT5G44680 -3.14
MYB74 -3.15
AIR1 -3.54
AT1G63600 -3.7
CORI3 -3.78
AT4G12545 -3.84
ABCG4 -3.9
AT2G18980 -4.7
AT3G19850 -4.77
MRN1 -4.83
AT5G18030 -6.17
Table 8.10 35S::IND:GR (DEX vs. DMSO 6hours) significantly enriched gene-sets (FDR q-val <0.05).
NAME SIZE NES
Cellular process involved in reproduction 35 1.96
Galactolipid biosynthetic process 51 1.88
Plant-type cell wall modification 167 1.81
Pollen tube development 59 1.8
Defense response 359 -1.64
Response to symbiotic fungus 36 -1.64
Karyogamy 32 -1.65
Oxygen binding 231 -1.65
Response to jasmonic acid stimulus 262 -1.65
Defense response by callose deposition in cell wall 16 -1.65
S-adenosylmethionine-dependent methyltransferase activity 26 -1.67
Regulation of cell proliferation 41 -1.67
Positive regulation of flavonoid biosynthetic process 103 -1.69
Peroxidase activity 80 -1.69
Metal ion transport 29 -1.69
UDP-glycosyltransferase activity 99 -1.7
Response to absence of light 32 -1.7
Regulation of gene expression 26 -1.71
Protein import into nucleus 95 -1.72

224
Regulation of ion transport 26 -1.73
Ammonium transport 28 -1.74
Response to mechanical stimulus 54 -1.75
Cellular response to hypoxia 23 -1.76
ER to Golgi vesicle-mediated transport 89 -1.77
Nucleotide transport 25 -1.78
Salicylic acid mediated signaling pathway 156 -1.79
Response to ethylene stimulus 253 -1.79
Electron carrier activity 53 -1.79
Cell death 58 -1.8
Anion transport 37 -1.81
Response to fungus 103 -1.81
Glutathione transferase activity 46 -1.82
Pyrimidine ribonucleotide biosynthetic process 130 -1.84
Protein folding 285 -1.86
Embryo sac egg cell differentiation 137 -1.86
Basic amino acid transport 26 -1.86
Tryptophan biosynthetic process 19 -1.87
Response to virus 30 -1.87
Cellular amino acid metabolic process 24 -1.88
Heat acclimation 79 -1.9
Cellular response to heat 15 -1.9
Cellular response to nitric oxide 20 -1.91
Hyperosmotic salinity response 159 -1.91
Detection of bacterium 15 -1.92
Response to zinc ion 58 -1.94
Endoplasmic reticulum unfolded protein response 183 -1.95
Response to oxidative stress 181 -1.98
Protein targeting to mitochondrion 102 -1.98
Response to insect 43 -1.99
Innate immune response 89 -2
Defense response, incompatible interaction 85 -2
Leaf senescence 66 -2.01
Response to other organism 81 -2.03
Response to wounding 321 -2.04
Nucleotide biosynthetic process 84 -2.06
Jasmonic acid mediated signaling pathway 274 -2.07
Defense response to fungus, incompatible interaction 41 -2.07
Plant-type hypersensitive response 37 -2.07
Response to bacterium 167 -2.09
Response to salicylic acid stimulus 140 -2.1
Response to heat 228 -2.13
Transition metal ion transport 112 -2.13
Detection of external stimulus 17 -2.13
Response to high light intensity 205 -2.14

225
Amino acid import 72 -2.15
Nitrate transport 204 -2.19
Regulation of hydrogen peroxide metabolic process 181 -2.2
RNA methylation 168 -2.21
Defense response to bacterium, incompatible interaction 35 -2.23
Regulation of multi-organism process 89 -2.25
Defense response to bacterium 327 -2.25
Organ senescence 28 -2.26
Response to nitrate 193 -2.29
Protein targeting to membrane 362 -2.3
Regulation of plant-type hypersensitive response 365 -2.31
Systemic acquired resistance, salicylic acid mediated signaling pathway
249 -2.32
Response to hydrogen peroxide 186 -2.33
Response to molecule of bacterial origin 94 -2.34
Oligopeptide transport 104 -2.34
Negative regulation of defense response 263 -2.39
Regulation of defense response 102 -2.4
Para-aminobenzoic acid metabolic process 36 -2.41
Response to cyclopentenone 146 -2.41
Response to chitin 415 -2.45
Detection of biotic stimulus 100 -2.46
Negative regulation of programmed cell death 164 -2.47
Toxin catabolic process 208 -2.47
Proline transport 73 -2.47
MAPK cascade 203 -2.48
Defense response to fungus 309 -2.54
Salicylic acid biosynthetic process 205 -2.56
Respiratory burst involved in defense response 120 -2.63
Response to endoplasmic reticulum stress 175 -2.69
Systemic acquired resistance 239 -2.73
Amino acid transport 143 -2.75
Table 8.11 35S::IND:GR (DEX+AUX vs. AUX 6 hours) significantly enriched gene-sets (FDR q-val <0.05).
NAME SIZE NES
Triplet codon-amino acid adaptor activity 109 2.84
Photosystem ii assembly 172 2.79
Photosynthetic electron transport in photosystem i 48 2.69
Pentose-phosphate shunt 173 2.68
Translational elongation 141 2.61
Carotenoid biosynthetic process 95 2.57
Plastid organization 81 2.54

226
Positive regulation of catalytic activity 103 2.54
Chloroplast thylakoid membrane 270 2.5
mRNA modification 97 2.47
Maltose metabolic process 148 2.47
Starch biosynthetic process 183 2.44
Anthocyanin biosynthetic process 48 2.4
Photosynthesis 183 2.3
Photosynthesis, light reaction 144 2.3
Isopentenyl diphosphate biosynthetic process 224 2.28
ncRNA metabolic process 77 2.28
Thylakoid membrane organization 198 2.26
Chloroplast relocation 96 2.26
Chloroplast thylakoid lumen 68 2.23
Chlorophyll biosynthetic process 108 2.2
Response to far red light 94 2.2
Phosphatidylglycerol biosynthetic process 63 2.19
Response to red light 95 2.18
rRNA processing 219 2.17
Chloroplast photosystem ii 18 2.16
Response to UV-B 96 2.16
Flavonoid biosynthetic process 60 2.14
Chlorophyll binding 31 2.13
PSII associated light-harvesting complex ii catabolic process 28 2.04
Myo-inositol hexakisphosphate biosynthetic process 63 2.03
Trichoblast differentiation 45 2.01
Response to UV 34 2.01
Thylakoid 19 1.98
Regulation of protein dephosphorylation 135 1.87
Response to gibberellin stimulus 94 1.86
Plant-type cell wall modification 167 1.83
Transcription from plastid promoter 72 1.83
Hydrolase activity, acting on glycosyl bonds 40 1.82
Serine-type carboxypeptidase activity 55 1.82
Response to sucrose stimulus 201 1.79
Pectate lyase activity 25 1.78
Stomatal complex morphogenesis 135 1.76
Poly(u) RNA binding 17 1.76
Response to hypoxia 77 1.74
Integral to plasma membrane 39 1.73
Response to karrikin 126 1.7
Peptidyl-cysteine s-nitrosylation 16 1.7
Pollen sperm cell differentiation 27 1.68
Light-harvesting complex 19 1.68
Pectinesterase inhibitor activity 63 1.67
Chloroplast thylakoid 19 1.66

227
Actin cytoskeleton 15 1.65
Extracellular region 60 1.62
Starch catabolic process 17 1.61
Lateral root development 76 -1.52
Response to iron ion 26 -1.52
Pollen tube guidance 19 -1.53
Defense response 359 -1.53
Cell wall modification involved in abscission 15 -1.53
Brassinosteroid mediated signaling pathway 37 -1.54
Cytokinesis 37 -1.54
Cobalt ion binding 44 -1.54
Signal transduction 337 -1.54
Regulation of organelle organization 15 -1.54
Vegetative phase change 64 -1.54
Lignin biosynthetic process 49 -1.54
Protein auto phosphorylation 145 -1.54
Cell plate 26 -1.55
Cytosolic large ribosomal subunit 120 -1.55
Megagametogenesis 23 -1.55
Seed maturation 42 -1.55
Regulation of chromosome organization 98 -1.55
Cellulose biosynthetic process 76 -1.55
Calcium ion transport 117 -1.56
Transition metal ion transport 112 -1.56
Sister chromatid cohesion 137 -1.56
Nucleolus organization 23 -1.56
Motor activity 17 -1.56
Protein phosphorylation 267 -1.56
Metal ion transport 29 -1.56
Cytoskeleton organization 110 -1.56
Embryonic pattern specification 37 -1.57
Mitochondrial inner membrane 81 -1.57
Ribonuclease activity 20 -1.58
Microtubule binding 37 -1.58
Cellular response to nitrogen starvation 23 -1.58
Nucleoplasm 20 -1.58
Determination of bilateral symmetry 116 -1.59
Positive regulation of abscisic acid mediated signaling pathway 18 -1.59
Protein import into peroxisome matrix 92 -1.59
Iron ion transport 114 -1.6
Long-chain fatty acid metabolic process 25 -1.6
Response to arsenic-containing substance 36 -1.6
Hyperosmotic response 95 -1.6
Cellular amino acid metabolic process 24 -1.61
Regulation of stomatal movement 38 -1.61

228
Pollen germination 48 -1.62
Defense response to fungus, incompatible interaction 41 -1.62
Brassinosteroid biosynthetic process 115 -1.63
Cell growth 111 -1.63
Clathrin binding 16 -1.63
Response to oxidative stress 181 -1.63
Defense response to virus 56 -1.63
Phosphorylation 20 -1.64
Reproduction 17 -1.64
ATP binding 391 -1.65
Actin nucleation 98 -1.66
Acropetal auxin transport 15 -1.66
Copper ion binding 164 -1.66
Gene silencing 57 -1.66
Cell proliferation 160 -1.66
Protein homodimerization activity 81 -1.66
D-xylose metabolic process 34 -1.67
Regulation of dna replication 110 -1.67
Methyltransferase activity 26 -1.67
Response to wounding 321 -1.67
Response to cadmium ion 290 -1.68
Response to gamma radiation 74 -1.68
Response to ozone 32 -1.68
Response to ethylene stimulus 253 -1.69
Cellular modified amino acid biosynthetic process 34 -1.69
Ubiquitin-dependent protein catabolic process 268 -1.69
Response to cytokinin stimulus 61 -1.69
Cell wall modification 57 -1.69
Golgi organization 177 -1.7
Regulation of telomere maintenance 52 -1.7
Covalent chromatin modification 19 -1.71
Response to superoxide 31 -1.71
Response to other organism 81 -1.71
Vacuole 63 -1.71
Peroxisome organization 28 -1.71
Proteasomal protein catabolic process 93 -1.71
Regulation of multi-organism process 89 -1.72
Nuclear pore 17 -1.72
Telomere maintenance in response to dna damage 52 -1.72
Protein deubiquitination 52 -1.72
Polyamine catabolic process 36 -1.72
Response to chitin 415 -1.73
GTPase activity 42 -1.73
Response to zinc ion 58 -1.73
Response to water deprivation 332 -1.73

229
Defense response by callose deposition 46 -1.73
Tricarboxylic acid cycle 15 -1.73
Abscisic acid mediated signaling pathway 212 -1.73
Systemic acquired resistance, salicylic acid mediated signaling pathway
249 -1.74
Photomorphogenesis 206 -1.75
Response to glucose stimulus 77 -1.75
Positive regulation of organelle organization 48 -1.75
Glucosinolate biosynthetic process 162 -1.76
Golgi apparatus 295 -1.76
Mitochondrial outer membrane 15 -1.76
Chromatin modification 28 -1.77
Primary shoot apical meristem specification 43 -1.77
Regulation of mitotic cell cycle 28 -1.78
Leaf vascular tissue pattern formation 24 -1.79
Response to abscisic acid stimulus 443 -1.79
Jasmonic acid mediated signaling pathway 274 -1.79
MAPK cascade 203 -1.81
Negative regulation of flower development 43 -1.81
Cell division 76 -1.81
Intracellular membrane-bounded organelle 28 -1.81
ATP-dependent helicase activity 74 -1.82
Nucleotide binding 166 -1.82
Protein serine threonine kinase activity 248 -1.82
Dna methylation 167 -1.82
Endoplasmic reticulum membrane 45 -1.83
Cellular membrane fusion 270 -1.83
Male meiosis 17 -1.83
Somatic cell dna recombination 31 -1.83
Production of ta-siRNAs involved in RNA interference 111 -1.85
Purine nucleotide biosynthetic process 31 -1.85
Nucleolus 85 -1.85
Basipetal auxin transport 20 -1.86
Calcium-mediated signaling 53 -1.86
Negative regulation of biological process 42 -1.86
Protein transporter activity 59 -1.87
Heat acclimation 79 -1.87
RNA splicing 46 -1.88
Leaf development 125 -1.88
Response to bacterium 167 -1.89
Golgi vesicle transport 158 -1.89
Detection of biotic stimulus 100 -1.89
Histone h3-k9 methylation 178 -1.89
Response to insect 43 -1.9
Oligopeptide transporter activity 17 -1.9

230
Gene silencing by RNA 96 -1.91
Peptidase activity 55 -1.91
Calcium-transporting ATPase activity 16 -1.91
Nitrogen compound metabolic process 15 -1.91
Organ morphogenesis 99 -1.92
Endosome 229 -1.93
Cellular response to iron ion 30 -1.94
Tissue development 46 -1.94
Virus induced gene silencing 99 -1.94
Developmental growth 46 -1.94
Dna recombination 51 -1.95
Protein desumoylation 79 -1.95
Glycolysis 195 -1.95
ATPase activity, coupled to transmembrane movement of substances
100 -1.95
Nuclear-transcribed mRNA catabolic process 96 -1.95
Nuclear envelope 48 -1.95
Detection of bacterium 15 -1.96
Microtubule motor activity 66 -1.96
Response to auxin stimulus 364 -1.96
Cell death 58 -1.96
Root development 127 -1.96
Respiratory burst involved in defense response 120 -1.96
Hydrogen peroxide biosynthetic process 76 -1.96
Detection of external stimulus 17 -1.97
Salicylic acid mediated signaling pathway 156 -1.97
Regulation of cell proliferation 41 -1.98
Leaf senescence 66 -1.98
Regulation of cell differentiation 38 -1.98
Proteasome assembly 84 -1.98
Histone lysine methylation 94 -1.99
Positive regulation of flavonoid biosynthetic process 103 -2
Histone modification 60 -2
Xylem and phloem pattern formation 63 -2.01
Methylation-dependent chromatin silencing 115 -2.02
Endoplasmic reticulum 495 -2.02
Chromatin silencing by small RNA 114 -2.03
Hyperosmotic salinity response 159 -2.03
Proteasome core complex assembly 125 -2.04
RNA interference 72 -2.04
Fatty acid beta-oxidation 168 -2.05
Floral organ formation 73 -2.06
Response to virus 30 -2.06
Pyrimidine ribonucleotide biosynthetic process 130 -2.07
Trans-Golgi network 218 -2.07

231
Calmodulin binding 183 -2.07
Response to symbiotic fungus 36 -2.08
Negative regulation of defense response 263 -2.08
Ammonium transport 28 -2.08
Cytokinesis by cell plate formation 181 -2.09
Response to misfolded protein 181 -2.09
Meristem maintenance 67 -2.09
Production of siRNA involved in RNA interference 40 -2.09
Cell communication 53 -2.1
Gluconeogenesis 163 -2.1
mRNA export from nucleus 56 -2.11
Regulation of ion transport 26 -2.13
Anion transport 37 -2.13
Glutathione transferase activity 46 -2.13
Histone phosphorylation 61 -2.14
Protein targeting to mitochondrion 102 -2.14
Post-translational protein modification 94 -2.15
Response to carbohydrate stimulus 22 -2.16
RNA processing 135 -2.18
Defense response to bacterium 327 -2.18
Production of miRNAs involved in gene silencing by miRNA 128 -2.18
Proteasome core complex 23 -2.18
Response to molecule of bacterial origin 94 -2.18
Nucleotide transport 25 -2.19
Protein targeting to membrane 362 -2.21
Regulation of plant-type hypersensitive response 365 -2.22
Helicase activity 41 -2.23
Defense response to bacterium, incompatible interaction 35 -2.23
Salicylic acid biosynthetic process 205 -2.23
Defense response by callose deposition in cell wall 16 -2.24
Proteasomal ubiquitin-dependent protein catabolic process 112 -2.26
Cullin deneddylation 101 -2.27
Basic amino acid transport 26 -2.27
Protein maturation 53 -2.3
Defense response to fungus 309 -2.3
Tryptophan biosynthetic process 19 -2.31
Karyogamy 32 -2.32
Mitotic cell cycle 160 -2.32
Indole acetic acid biosynthetic process 108 -2.33
Embryo sac egg cell differentiation 137 -2.33
Oligopeptide transport 104 -2.34
Plant-type hypersensitive response 37 -2.35
Proline transport 73 -2.36
Gravitropism 122 -2.36
Microtubule cytoskeleton organization 139 -2.36

232
Nitrate transport 204 -2.37
N-terminal protein myristoylation 149 -2.37
Tryptophan catabolic process 79 -2.38
Organ senescence 28 -2.38
Innate immune response 89 -2.4
Endoplasmic reticulum unfolded protein response 183 -2.4
Response to nitrate 193 -2.4
Chromatin silencing 121 -2.4
Protein glycosylation 104 -2.42
RNA methylation 168 -2.44
Proteasome complex 52 -2.44
Regulation of defense response 102 -2.45
Coumarin biosynthetic process 53 -2.45
Protein n-linked glycosylation 93 -2.47
Negative regulation of programmed cell death 164 -2.49
Toxin catabolic process 208 -2.5
Protein folding 285 -2.51
Response to cyclopentenone 146 -2.51
Protein import into nucleus 95 -2.52
Response to high light intensity 205 -2.56
Amino acid import 72 -2.56
Para-aminobenzoic acid metabolic process 36 -2.59
Nucleotide biosynthetic process 84 -2.61
ER to Golgi vesicle-mediated transport 89 -2.64
Response to heat 228 -2.69
Systemic acquired resistance 239 -2.82
Amino acid transport 143 -2.86
Response to hydrogen peroxide 186 -2.96
Response to endoplasmic reticulum stress 175 -3.18
Table 8.12 35S::IND:GR (DEX+CYT vs. CYT 6 hours) significantly enriched gene-sets (FDR q-val <0.05).
NAME SIZE NES
Response to absence of light 32 2.78
Response to UV-B 96 2.46
Chlorophyll binding 31 2.34
Anthocyanin biosynthetic process 48 2.33
Response to mechanical stimulus 54 2.27
Photosynthetic electron transport in photosystem I 48 2.25
Intracellular signal transduction 136 2.15
ncRNA metabolic process 77 2.13
Pentose-phosphate shunt 173 2.12
Chloroplast thylakoid membrane 270 2.06

233
PSII associated light-harvesting complex II catabolic process 28 2.05
Photosynthesis 183 2.04
Plant-type cell wall modification 167 2.03
Photosystem ii assembly 172 1.99
Generation of precursor metabolites and energy 62 1.95
Cellular process involved in reproduction 35 1.95
rRNA modification 20 1.95
Flavonoid biosynthetic process 60 1.93
Carotenoid biosynthetic process 95 1.91
Hydrolase activity, acting on glycosyl bonds 40 1.89
Ethylene mediated signaling pathway 106 1.87
Myo-inositol hexakisphosphate biosynthetic process 63 1.87
Response to red light 95 1.85
Chloroplast relocation 96 1.84
Response to sucrose stimulus 201 1.81
Isopentenyl diphosphate biosynthetic process 224 1.81
Light-harvesting complex 19 1.81
Mitochondrial respiratory chain complex i 66 1.79
Triplet codon-amino acid adaptor activity 109 1.78
Purine base transport 119 1.76
Thylakoid 19 1.75
Anther dehiscence 16 1.74
Cellular response to hypoxia 23 1.72
Purine base transmembrane transporter activity 22 1.7
Response to chitin 415 1.69
Regulation of pollen tube growth 17 1.68
Pollen tube growth 247 1.66
Photosynthesis, light reaction 144 1.65
Fatty acid catabolic process 61 1.65
Chloroplast thylakoid lumen 68 1.65
Translational elongation 141 1.65
Petal morphogenesis 15 1.65
Thylakoid membrane organization 198 1.64
Defense response by callose deposition 46 1.64
Pollen exine formation 59 1.64
Nucleobase-containing compound transport 28 1.63
Toxin catabolic process 208 -1.58
Cell growth 111 -1.58
Positive regulation of cell proliferation 70 -1.58
Positive regulation of organelle organization 48 -1.58
Helicase activity 41 -1.58
Anion transport 37 -1.59
Response to molecule of bacterial origin 94 -1.6
Organ morphogenesis 99 -1.6
ER to Golgi vesicle-mediated transport 89 -1.6

234
Metal ion transmembrane transporter activity 27 -1.6
ATPase activity, coupled to transmembrane movement of substances 100 -1.61
Tissue development 46 -1.61
Flower morphogenesis 64 -1.62
Plant-type cell wall organization 102 -1.63
Trehalose biosynthetic process 22 -1.63
Heat acclimation 79 -1.63
Nuclear pore 17 -1.63
Ammonium transport 28 -1.63
Lignan biosynthetic process 15 -1.63
RNA interference 72 -1.63
Cellulose metabolic process 31 -1.64
Anchored to membrane 228 -1.64
Response to cyclopentenone 146 -1.64
Translation initiation factor activity 77 -1.64
Gravitropism 122 -1.64
mRNA processing 26 -1.64
Polar nucleus fusion 21 -1.65
Response to heat 228 -1.65
Endoplasmic reticulum 495 -1.65
Plant-type cell wall biogenesis 103 -1.66
Mediator complex 27 -1.66
Protein phosphorylation 267 -1.66
Cell differentiation 136 -1.66
Regulation of plant-type hypersensitive response 365 -1.67
Polysaccharide catabolic process 27 -1.67
Protein targeting to membrane 362 -1.67
Glucuronoxylan metabolic process 173 -1.67
Photomorphogenesis 206 -1.67
Response to desiccation 38 -1.67
Protein homodimerization activity 81 -1.68
Anthocyanin accumulation in tissues in response to uv light 110 -1.68
Response to bacterium 167 -1.68
Xylan biosynthetic process 174 -1.68
Metal ion transport 29 -1.68
Oxidoreductase activity 47 -1.68
Calmodulin binding 183 -1.68
Root development 127 -1.69
Response to zinc ion 58 -1.69
Methyltransferase activity 26 -1.69
Protein glycosylation 104 -1.69
Basic amino acid transport 26 -1.69
ATP binding 391 -1.71
Maintenance of meristem identity 26 -1.73
Nuclear-transcribed mRNA catabolic process 96 -1.74

235
Developmental growth 46 -1.74
Histone modification 60 -1.75
Nuclear mRNA splicing, via spliceosome 95 -1.75
Pseudouridine synthase activity 17 -1.75
Meristem maintenance 67 -1.75
Tryptophan biosynthetic process 19 -1.75
Cell death 58 -1.75
Regulation of ion transport 26 -1.75
Protein n-linked glycosylation 93 -1.76
Response to xenobiotic stimulus 77 -1.76
Auxin homeostasis 21 -1.76
Positive regulation of cellular process 30 -1.76
Coumarin biosynthetic process 53 -1.77
Nucleotide transport 25 -1.77
Positive regulation of flavonoid biosynthetic process 103 -1.77
Hydrogen peroxide biosynthetic process 76 -1.77
Protein desumoylation 79 -1.77
Protein folding 285 -1.78
Xylem and phloem pattern formation 63 -1.78
Nucleoplasm 20 -1.78
ATP-dependent helicase activity 74 -1.78
Leaf senescence 66 -1.78
Histone methylation 66 -1.78
Regulation of meristem growth 147 -1.79
Cellular amino acid metabolic process 24 -1.79
Tryptophan catabolic process 79 -1.79
Positive gravitropism 25 -1.8
Response to cytokinin stimulus 61 -1.8
Cytokinin metabolic process 18 -1.8
Cell tip growth 75 -1.81
Growth 56 -1.81
Megagametogenesis 23 -1.81
Protein deubiquitination 52 -1.82
Protein serine threonine kinase activity 248 -1.83
Floral organ formation 73 -1.83
Leaf development 125 -1.83
Post-translational protein modification 94 -1.84
Protein maturation 53 -1.85
Sterol biosynthetic process 160 -1.86
Amino acid import 72 -1.87
Polysaccharide biosynthetic process 89 -1.87
Para-aminobenzoic acid metabolic process 36 -1.88
Leaf vascular tissue pattern formation 24 -1.89
Nuclear envelope 48 -1.89
Regulation of anion channel activity 30 -1.89

236
Indole acetic acid biosynthetic process 108 -1.9
Cullin deneddylation 101 -1.9
RNA processing 135 -1.9
Proline transport 73 -1.91
Glucosinolate biosynthetic process 162 -1.91
Regulation of hormone levels 64 -1.92
Auxin polar transport 73 -1.93
Response to hydrogen peroxide 186 -1.93
Regulation of cell size 49 -1.93
Lateral root formation 33 -1.93
Cell wall organization 130 -1.94
Transcription factor import into nucleus 45 -1.94
Systemic acquired resistance 239 -1.95
Purine nucleotide biosynthetic process 31 -1.95
Multidimensional cell growth 80 -1.97
Response to virus 30 -1.97
Transmembrane receptor protein tyrosine kinase signaling pathway 129 -1.97
Root hair elongation 173 -2
Organ senescence 28 -2.02
Root hair cell differentiation 140 -2.03
Peroxidase activity 80 -2.06
Cell wall pectin metabolic process 27 -2.06
Plant-type cell wall cellulose metabolic process 24 -2.09
Root morphogenesis 43 -2.1
Protein targeting to mitochondrion 102 -2.16
RNA methylation 168 -2.16
Pattern specification process 55 -2.2
Karyogamy 32 -2.22
Brassinosteroid biosynthetic process 115 -2.24
Response to endoplasmic reticulum stress 175 -2.27
Nucleotide biosynthetic process 84 -2.3
Oligopeptide transport 104 -2.34
Embryo sac egg cell differentiation 137 -2.37
Amino acid transport 143 -2.37
mRNA export from nucleus 56 -2.42
Pyrimidine ribonucleotide biosynthetic process 130 -2.47
Protein import into nucleus 95 -2.65
Cellular response to iron ion starvation 115 -2.67
Iron ion transport 114 -2.77
Transition metal ion transport 112 -2.82
Nitrate transport 204 -2.96
Response to nitrate 193 -3.05

237
Figure 8.4 Arabidopsis TF families image adapted from (Hong, 2016; Riechmann et al., 2000).

238
Figure 8.5 DR5rev::GFP in SAM and leaf primordia. DR5rev::GFP in (A) 35S::IND:GR+DMSO is
similar to (A) WT (Guenot et al., 2012). DR5rev::GFP in (B) 35S::IND:GR+DEX (24 hours induction)
is similar to (A) pin1 (Guenot et al., 2012).
Figure 8.6 Stress responses regulate IND gene expression (Zeller et al., 2009). Heatmap display
intensity values of IND vs. treatments. When compared to mock treatment, IND expression
decreased in 12 hours of salt, osmotic and cold stress conditions.