Copyright by Sai Sriharsha Manoj Varma Konda 2014
133
Copyright by Sai Sriharsha Manoj Varma Konda 2014
-
Upload
khangminh22 -
Category
Documents
-
view
0 -
download
0
Transcript of Copyright by Sai Sriharsha Manoj Varma Konda 2014

Copyright
by
Sai Sriharsha Manoj Varma Konda
2014

The Dissertation Committee for Sai Sriharsha Manoj Varma Konda certifies that this is the approved version of the following dissertation:
Theory and Computational Studies of Mechanochemical Phenomena
Committee:
Dmitrii E. Makarov, Supervisor
Christopher W. Bielawski
Peter J. Rossky
Issac C. Sanchez
Graeme Henkelman

Theory and Computational Studies of Mechanochemical Phenomena
by
Sai Sriharsha Manoj Varma Konda, B.S.; M.S.; M.S.
Dissertation
Presented to the Faculty of the Graduate School of
The University of Texas at Austin
in Partial Fulfillment
of the Requirements
for the Degree of
Doctor of Philosophy
The University of Texas at Austin May 2014

To my grandfather

v
Acknowledgements
First and foremost, I would like to thank my supervisor, Dr. Dmitrii Makarov for
his support, patience, enthusiasm and remarkable scientific intuition. It has been a great
learning experience and I could not have asked for a better mentor when it came to
developing as a scientific professional. I am also grateful to Dr. Christopher Bielawski
for his collaboration and support, without whom, this work would have not been possible.
I would like to thank Dr. Peter Rossky, Dr. Isaac Sanchez and Dr. Graeme Henkelman
for agreeing to be on the thesis committee. I also would like to specially thank my former
supervisor, Dr. Scott Kirkby, for his guidance, advice and help in the initial stages of my
graduate studies at ETSU.
I have been really fortunate to work and share the graduate school experience
with many close friends. I would like to thank Penny Kile, Brooke Graham, Betsy
Hamblen and Rachel Walker at the Graduate Office for their continuous support and for
putting up with my endless queries and questions. My sincere thanks to John Brantley,
for having introduced me to the topic of mechanochemistry and without whose
collaboration this work would not be complete. I have been very lucky to have
officemates in Dr. Alex Hawk and Dr. Ryan Cheng for the majority of my stay at UT-
Austin. I will always cherish the wonderful memories, whether it was discussing science
or playing numerous tennis and “office ping-pong” matches. Similarly, thanks to Dr. Stas
Avdoshenko, Dr. Atanu Das and Rachel Craigmile, current Makarov group members, for

vi
being such great friends and keeping the workplace ever lively. Finally, to all the
wonderful friends (too numerous to name everyone) at Austin, Johnson City, India and
elsewhere, thank you for the hikes, bike rides, great parties, smiles and support at all
times.
Last but not the least, to my wonderful family: Thanks to mom, dad, sister, aunt
and my grandparents for making me what I am today. Even though I have been away for
a long time, you have always provided me the strength, support and encouragement for
accomplishing my dreams in life. The final word of thanks to my wife, for being my best
friend and companion for life.

vii
Theory and Computational Studies of Mechanochemical Phenomena
Sai Sriharsha Manoj Varma Konda, Ph.D.
The University of Texas at Austin, 2014
Supervisor: Dmitrii E. Makarov
Mechanochemistry, or the modulation of chemical reactivity through the
application of mechanical forces, has shown to facilitate a number of otherwise
prohibitive chemical transformations. Computational approaches employing electronic
structure calculations have explained a number of mechanochemically activated
processes such as thermally inaccessible isomerizations and cycloreversions, symmetry-
forbidden electrocyclic ring openings or activation of latent catalysts and, more recently,
have been successfully used to design novel mechanosensitive systems. A significant
limitation of such approaches, however, is their high computational cost, as finding force-
dependent transition states requires multiple saddle searches and consequently, multiple
energy evaluations. To circumvent this problem, an approximation has been proposed,
extending the well know “Bell formula”, which estimates the force-dependent reaction
barrier based on zero-force transition state properties. We demonstrate the numerical
efficiency of this approximation termed as extended Bell theory (EBT) by comparing to
existing theories and experiments. We also apply this method to suggest the unexplored,

viii
yet potentially useful possibility of suppressing chemical reactions through mechanical
perturbation. Furthermore, in sharp contrast to simple, one-dimensional theories, our
analysis reveals that the anti-Hammond effect is dominant in the mechanical activation of
polyatomic molecules. Finally, we propose a numerical scheme to address the drawback
of the EBT approximation, which is the failure to account for force-induced instabilities.
Our approach provides a computationally efficient recipe to track the instabilities and
follow the evolution of the reactant or transition states at any explicit force. We provide a
classification of the different instability scenarios, and provide an illustrative example for
each case.

ix
Table of Contents
List of Figures ........................................................................................................ xi
Chapter 1: Introduction ...........................................................................................1 Mechanochemistry ..........................................................................................1 Advances in force manipulation techniques ...................................................4
Atomic force microscopy (AFM) ..........................................................5 Optical tweezers (OT) ............................................................................6 Sonication ..............................................................................................7
Objective and overview of thesis ....................................................................9
Chapter 2: Chemical Reactions Modulated by Mechanical Stress: Extended Bell Theory ...........................................................................................................12 Abstract .........................................................................................................12 Introduction ...................................................................................................13 Theory ...........................................................................................................17 Numerical tests of EBT .................................................................................24 Mechanical compliance of a molecule within EBT ......................................30 Concluding remarks ......................................................................................37
Chapter 3: Regiochemical Effects on Molecular Stability: A Mechanochemical Evaluation of 1,4- and 1,5-Disubstituted Triazoles ......................................40 Abstract .........................................................................................................40 Introduction ...................................................................................................40 Model ............................................................................................................41 Results ...........................................................................................................43 Conclusions ...................................................................................................49
Chapter 4: Molecular Catch Bonds and the Anti-Hammond Effect in Polymer Mechanochemistry ........................................................................................51 Abstract .........................................................................................................51 Introduction ...................................................................................................51 Theoretical discussion ...................................................................................52

x
Computational results and discussion ...........................................................56 Conclusions ...................................................................................................67 Appendix .......................................................................................................67
Computational details: Benchmark studies ..........................................67 Prevalence of the anti-Hammond effect on multidimensional energy
landscapes: Probability considerations .......................................70 Illustrative Examples of Catch Bond Behavior ...................................72
Chapter 5: Exploring the topography of the stress-modified energy landscapes of mechanosensitive molecules .........................................................................77 Abstract .........................................................................................................77 Introduction ...................................................................................................77 Evolution of PES saddles and minima in response to an external force .......81 Computational details and systems of interest ..............................................85 Results: Analysis of reactant- and transition-state instabilities occurring in well
studied mechanophores ........................................................................86 Case 1: A TS saddle coalesces with a RS minimum. The barrier between
the two vanishes. .........................................................................88 Case 2: A TS saddle coalesces with a rank 2 saddle. ...........................91 Case 3: A RS minimum is destabilized by the force. ..........................94 Case 4: Cusp catastrophe .....................................................................96
Concluding remarks ......................................................................................98 Appendix .....................................................................................................102
Fold catastrophe on a 2D PES ...........................................................102 Comparison to previous work: An illustrative example ....................105
References ............................................................................................................108

xi
List of Figures
Figure 1.1: Cartoon representation of a one-dimensional model of a force-modified
PES. .....................................................................................................2
Figure 1.2: “Unclicking the click”. The application of ultrasound to a triazole
embedded within a polymer chain (PMA) yields a cycloreversion
process (red). The resulting azide and alkyne substrates undergo a click
reaction to generate the triazole (black)8. ...........................................3
Figure 1.3: A simplified AFM set-up consisting of the biopolymer that is held in
between the cantilever tip and the substrate surface. The displacement of
the cantilever is measured by the reflection of the laser beam on the
detector. ...............................................................................................6
Figure 1.4: A general representation of an OT setup that utilizes radiation pressure
to exert mechanical forces. .................................................................7
Figure 1.5: Different stages in the process of solvent cavitation that generates shear
forces responsible for the elongation of the polymer chain resulting in a
chemical reaction17. .............................................................................9
Figure 2.1: Conrotatory pathway for electrocyclic ring-opening of (a) cis and (b)
trans 1,2-dimethylbenzocyclobutene. The force applied to two carbons
lowers the reaction barrier if the distance Rij between these atoms is
longer in the transition state than it is in the reactant state. ..............15
Figure 2.2: Simple one-dimensional model of a chemical reaction modulated by a
mechanical force. The force lowers the reaction barrier and shifts the
reactant and transition-state conformations toward one another. .....18

xii
Figure 2.3: The conrotatory electrocyclic ring-opening of (a) cis 1,2-
dimethylbenzocyclobutene leads to the cis, trans diene A and (b) trans
1,2-dimethylbenzocyclobutene leads to the trans, trans diene B. The
curved arrows indicate the direction in which the orbitals associated with
the C1-C2 σ-bond open. Hydrogen atoms are implicit in the structure,
including at the atoms C1 and C1. ......................................................26
Figure 2.4: Comparison of the force dependence of the reaction barrier obtained by
different methods for (a) cis and (b) trans 1,2-
dimethylbenzocyclobutene. Solid line: EBT. Dotted line: Bell’s formula.
Dashed line: “exact” result obtained from constrained structure
optimization. .....................................................................................29
Figure 2.5: The reactant (a) and transition-state (b) energies of cis-1,2-
dimehtylbenzocyclobutene as a function of the extension Rij. The energy
in each case is measured relative to its respective minimum value. Solid
lines show the harmonic approximation (Eqs. 2.16, 2.18) while the solid
symbols represent results of constrained optimization. ....................34
Figure 2.6: The reactant (a) and transition-state (b) energies of trans-1,2-
dimehtylbenzocyclobutene as a function of the extension Rij. The energy
in each case is measured relative to its respective minimum value. Solid
lines show the harmonic approximation (Eqs. 2.16, 2.18) while the solid
symbols represent results of constrained optimization. ....................36
Figure 3.1: Structures of 1,5-disubstituted (left) and 1,4-disubstituted (right)
triazoles contained within a poly(methyl acrylate) (PMA). ..............41
Figure 3.2: Reactant state geometries of TA1-TA7. Legend: C, black; H, white; F,
green; N, blue. ...................................................................................46

xiii
Figure 3.3: Force curves for TA1 (black), TA2 (blue), TA4 (red), TA5 (green),
TA6 (orange), and TA7 (violet). Energy barrier refers to the predicted
activation energy for the cycloreversion of the triazole analogue. ...48
Figure 4.1: Force induced changes on a reaction pathway. (A) The Hammond effect,
where the “true” reaction coordinate (RC, red line) is aligned with the
mechanical coordinate (R). Mechanical equilibrium necessitates that a
pulling force (F) shifts the TS toward the reactant state minimum
(because the TS energy exhibits a maximum along R). The shifted RC
and the new TS are shown as a dashed red line and a blue “X”,
respectively. (B) The anti-Hammond effect, where there is misalignment
between RC and R (so that the TS exhibits a minimum as a function of
R) and the TS is more compliant than the reactant. (C) Catch bond
behavior, where molecular distortion along R initially decreases but later
increases along the RC. .....................................................................54
Figure 4.2: Mechanophore models. .....................................................................57
Figure 4.3: Computed values of !R and !! for all possible combinations of pulling
points for the indicated mechanophores. Nearly all combinations result
in a positive value of !! ; however, both signs of !R are present with
almost equal frequency. ....................................................................60

xiv
Figure 4.4: Examples of mechanically accelerated and mechanically suppressed
reactivity. (A) Computed changes in the activation energy (equal to UTS !UR ! F"R , where Ur(TS ) is the reactant (or TS) energy on the
force-modified potential energy surface) for the cycloreversion of a
Diels-Alder adduct using pulling points for reaction acceleration (blue)
and pulling points for reaction suppression (red). Note the rollover
behavior: a catch bond at low forces is superseded by a slip bond at a
higher force. (B) Computed changes in the activation energy for the
cycloreversion of a Diels-Alder adduct using the pulling points for
reaction acceleration (blue) and the pulling points for reaction
suppression (red). ..............................................................................62
Figure 4.5: Computed values of !R and !TS calculated at the B3LYP/6-31G* level
of theory for all possible pulling points in the indicated mechanophores.
65
Figure 4.6: Comparison plots of !R and !" calculated using B3LYP/6-31G*
(black) and M05-2X/6-31++G**/6-31G* (red) functionals. ............69
Figure 4.7: Computed values of !R at the B3LYP/6-31G* level of theory for the
formal cycloreversion of a furan/maleimide Diels-Alder adduct.
According to our theoretical predictions, pulling on the bridgehead C7
and the imide N17 facilitates the reaction. In contrast, pulling on the
methine C3 and N17 suppresses the same transformation. Internuclear
distances are indicated in Angstroms. Atom code: C (Black), H (White),
N (Blue), O (Red). ............................................................................74

xv
Figure 4.8: Computed values of !R at the B3LYP/6-31G* level of theory for the
formal cycloreversion of a maleimide/anthracene Diels-Alder adduct.
According to our theoretical predictions, pulling on the imide N31 and
the anthracene C5 facilitates the reaction. In contrast, pulling on the
imide N31 and the anthracene C8 suppresses the cycloreversion reaction.
Internuclear distances are indicated in Angstroms. Atom code: C
(Black), H (White), N (Blue), O (Red). ............................................75
Figure 4.9: Computed changes in the activation energy (B3LYP/6-31G* level of
theory) for the cycloreversion of a maleimide/anthracene Diels-Alder
adduct using the hydrogen atom substituents on the N/C centers (as
opposed to the ring N/C atoms; cf Fig. 4.4B) as pulling points for
reaction acceleration (blue) and suppression (red). ..........................76
Figure 5.1: Cartoon representation of various instabilities occurring when the
molecular PES is deformed by the application of a force. The red line
shows the change in potential energy as the system evolves along its
(local) reaction coordinate while the dashed line shows the energy
variation along a transverse degree of freedom. Black arrows show
relative movement of the PES critical points as the force approaches a
critical value corresponding to the instability. ..................................87
Figure 5.2: Reaction pathway for ring-opening of DBC. The pulling points are
shown in red. .....................................................................................89

xvi
Figure 5.3: Fold catastrophe on the DBC potential energy surface (Case 1): (a) The
activation barrier for ring-opening reaction of DBC as a function of the
pulling force applied between the C1 and C2 atoms, as shown in Fig. 2.
The EBT estimate is shown as a dashed line. (b) Force dependence of
the lowest three non-zero eigenvalues of the TS and RS Hessians. Red:
TS modes. Blue: RS modes. Horizontal black line denotes a zero-
frequency baseline. Inset shows a magnified image of the low
eigenvalue range where the negative TS mode and the positive RS mode
simultaneously approach the zero-baseline at a critical force. .........90
Figure 5.4: Possible reactant and transition-state structures of CHD encountered in
the conrotatory ring-opening (RS1! TS1! P1) and ring-flip (RS1!
RF-TS! RS2) reactions. Red arrows schematically show the force
vectors orientation with respect to mirror-plane of RF-TS structure. The
symmetry-related structures shown in light gray are not explicitly
considered in our calculations. ..........................................................92
Figure 5.5: Fold catastrophe on the CHD potential energy surface (Case 2): (a)
Ring-opening activation barrier for CHD plotted as a function of an
external force applied between the H1 and H2 atoms, as shown in Fig.
5.4. The EBT estimate is shown as a dashed line. (b) Force dependence
of the lowest three non-zero eigenvalues for TS1 and RS1. Red: TS1
modes. Blue: RS1 modes. Horizontal black line denotes a zero-
frequency baseline. Inset shows a magnified image of the low
eigenvalue range where one of the positive TS1 modes is approaching
the zero-baseline at a critical force. ..................................................93

xvii
Figure 5.6: Fold catastrophe on the CHD potential energy surface (Case 3): (a) The
activation barrier for the ring-flip reaction (i.e. the one from RS1 to RS2
in Fig. 5.4) plotted as a function of a force applied between the H1 and
H3, as shown in Fig. 4. The EBT estimate is shown as a dashed line. (b)
Force dependence of the lowest three non-zero eigenvalues for the RF-
TS and RS1 Hessians. Red: RF-TS modes. Blue: RS1 modes. ........95
Figure 5.7: Cusp catastrophe on the CHD potential energy surface (Case 4): (a) The
activation barrier for the ring-flip reaction (i.e. the one from RS1 to RS2
in Fig. 5.4) as a function of a force applied between the C1 and C2
atoms. The EBT estimate is shown as a dashed line. (b) Force
dependence of the lowest three non-zero eigenvalues of the RF-TS and
RS1 (or, equivalently, RS2) Hessians. Red: RF-TS modes. Blue: RS1
(RS2) modes. Horizontal black line denotes a zero- frequency baseline.
97
Figure 5.8: Any configuration (x, y) can be made a critical point on a force-
modified PES by applying an appropriate force, but its properties (i.e.
whether the critical point is a minimum, saddle, or a maximum) are
entirely determined by the zero-force PES U(x, y) , whose contour plot
is shown here. In 2D, the (x, y) plane is then divided into the regions of
elliptic points (red, blue) corresponding, respectively, to the minima and
the maxima of the force-modified PES, and hyperbolic points (green),
which are saddles. The parabolic points belonging to the lines that
separate these regions are where the force-induced instabilities take
place. The specific PES used to make this plot is given by U(x, y) = x2 / 2 ! x3 / 3+ (1 / 2) y4 / 4 + y2 (0.75 ! x) / 2"# $% + 0.2xy
3 / 3 .100

xviii
Figure 5.9: Ring-opening of CHD through the conrotatory (C-TS) and disrotatory
(D-TS) transition states. The pulling points used in the calculation are
shown in color. ................................................................................106
Figure 5.10: Activation energy for ring-opening of CHD plotted as a function of a
pulling force applied between (a) H4-H5 and (b) H6-H7 atom pairs for
conrotatory (red) and disrotatory (blue) reaction pathways. Solid line:
Numerical results using Eqs. 5.8 and 5.9. Dashed line: EBT. ........107

1
Chapter 1: Introduction
MECHANOCHEMISTRY
A simple view of a chemical reaction A! B, consists of a transformation of
molecules labeled as reactants ( A ) to products ( B ). Typically the reactants and products
are stable molecules, which means that an activation energy barrier must be overcome for
the progress of a reaction. Given a sufficient time span, the familiar Maxwell-Boltzmann
distribution1, 2 predicts the statistical probability for conversion of reactants into products
as ! exp[!"V# kBT ] . However, this phenomenon is a rare event with the probability
decreasing exponentially with increasing barrier height !V " . Experimentalists often
resort to thermal or photochemical activation to accelerate desired chemical reactions.
Unfortunately, thermal activation often leads to undesirable side reactions such as
decomposition. As such, an external perturbation through which a reaction is not only
accelerated but also directed in a selective manner holds significant importance. While
commonly used thermodynamic parameters such as temperature or pressure are scalar
quantities, mechanical force is a vector that enables it’s use to direct chemical
transformations along selected pathways. Such a methodology wherein mechanical forces
are harnessed to control chemical reactivity is termed as mechanochemistry3-17. The first
known theoretical model to understand mechanochemistry was proposed by Eyring, who
predicted that a mechanical force could alter the potential energy surface (PES) along the
mechanical coordinate (x) by lowering the activation energy barrier (Fig. 1.1)18, 19.

2
Consequently, increased reaction rate accompanied by selective bond scission could
potentially minimize unwanted reactivity and lead to the development of novel materials.
Figure 1.1: Cartoon representation of a one-dimensional model of a force-modified PES.
Recent advances in the nascent field of mechanochemistry involve experimental
techniques exploiting mechanical forces from high molecular weight polymers that are
covalently attached to chemical entities termed as mechanophores3-17. A specific example
is the “unclicking of the click” reaction (Figure 1.2), wherein the unfavorable
cycloreversion of the highly inert triazole to the constituent azide and alkyne was readily
achieved through the application of mechanical forces8. The coupling between chemical
V(x) – f.x
Reaction coordinate (x)
!V ‡( f )
Ene
rgy
V(x)

3
and mechanical processes has long been recognized as an important component of
biological activity. This includes phenomena such as mechanical unfolding of proteins,
which is believed to account for viscoelasticity of muscle fiber20 and for high toughness
and strength of natural materials21-23. Moreover, processes such as protein degradation24-29
and control of enzymatic activity30 are known to proceed through mechanically induced
conformational changes. In a broader context, mechanical forces are involved in studies
such as single-molecule pulling of biomolecules20, 30-64, molecular motors65-67, molecular
force-probes68-70, DNA and protein translocation through biological and solid-state
pores25, 71-79 and materials chemistry3, 5-8, 11, 13-15, 80-89.
Figure 1.2: “Unclicking the click”. The application of ultrasound to a triazole embedded within a polymer chain (PMA) yields a cycloreversion process (red). The resulting azide and alkyne substrates undergo a click reaction to generate the triazole (black)8.
NN
NOO
OO
PMAPMA
FORCE FORCE
ULTRASOUND CLICK REACTION
O
O
PMA
N3O
O
PMA

4
ADVANCES IN FORCE MANIPULATION TECHNIQUES
Experimental work employing mechanical forces can be broadly classified under
two categories: (a) Solution-based studies of mechanoresponsive polymers (b) Single-
molecule studies. Mechanical activation by ultrasound is the most popular solution-based
method as it offers great selectivity3, 15, 16, 90-92. The forces and the strain rates generated by
sonication are often higher as compared to flow fields that enables its use to mechanically
facilitate a number of novel reactions. The observed signal in these bulk experiments is
the ensemble average over Avogadro number of molecules. Consequently, the signal is
dominated by major contributors and the fluctuations arising from transient process is
often averaged out. While these techniques are often robust, they cannot track individual
trajectories in real time, an advantage offered by single-molecule techniques.
Single-molecule manipulation methods such as atomic force microscopy (AFM)
and optical tweezers offer high spatio-temporal resolution and have become the popular
choice for investigating the dynamics of biopolymers such as DNA and proteins20, 30-64.
While bulk methods provide a mean value of a given ensemble measurement, single-
molecule experiments report the distribution of these values. This approach is useful in
identifying transient processes; for example, monitoring molecular fluctuations, alternate
reaction mechanisms and even the detection of non-equilibrium states of the molecule
found far from the average of the population93-97. In what follows, a brief overview of the
popular force manipulation techniques is provided.

5
Atomic force microscopy (AFM)
In an AFM experiment, a single biopolymer such as a polyprotein or DNA is
attached between a cantilever with a sharp tip and a substrate surface mounted on a
piezoelectric positioner (Fig. 1.3). The tip and the surface are functionalized to hold the
molecule of interest. As the distance between the cantilever and the piezoelectric actuator
is increased, the molecule is stretched resulting in a signal as a function of the tip
position. Any resistance in the conformational change of the biomolecule is provided by
the deflection of the laser beam from the cantilever to a sensitive photodetector. This
allows one to measure the force exerted by the molecule attached to the tip. Depending
on the shape and the material properties of the cantilever, the range of force offered by
AFM are typically in the 101 - 103 pN range98.

6
Figure 1.3: A simplified AFM set-up consisting of the biopolymer that is held in between the cantilever tip and the substrate surface. The displacement of the cantilever is measured by the reflection of the laser beam on the detector.
Optical tweezers (OT)
Optical trapping offers another effective way to study biopolymers. Experiments
involving OT utilize micrometer-sized beads that are attached to the molecule of interest.
The other end is either attached to a surface or a second bead, hence forming a single-
molecule tether (Fig. 1.4). A highly focused laser beam from a microscope objective is
then used to optically trap the beads. The equilibrium position of the bead is near the
middle of the laser beam. As a result, any shift in the position of the bead from the center
of the optical trap generates a restoring force that is linearly proportional to the
magnitude of the displacement. OT setups offer a sub-nanometer resolution for the

7
measurement of the position of the trapped beads and the forces are in the order of 0.1 –
100 pN99.
Figure 1.4: A general representation of an OT setup that utilizes radiation pressure to exert mechanical forces.
While the use of AFM and OT allows a precise control of mechanical force, they
are however not suitable for practical synthetic efforts. Recent advances in sonication and
the development of molecular force probes has led to the application of mechanical
forces to a large number of molecules in solution.
Sonication
Sonochemistry, or the study of chemical effects using ultrasound has seen a rapid
growth in its application to synthesis and design of novel organic materials in recent
years90-92. As shown in Figure 1.5, acoustic fields created by ultrasound pull the ends of
the polymer chain in opposing directions, generating a mechanical force on the molecular

8
entity (termed as mechanophore) embedded within these chains17. The velocity gradients
are not created by the direct interaction with the acoustic field, rather, from the solvent
cavitation process. This involves the formation, growth and subsequent collapse of
solvent bubbles. The polymer chains in the vicinity of the collapsing bubble are pulled
towards them at higher velocities than the chains that are farther away from the cavitation
process. Consequently, a mechanical force is transmitted to the mechanophore near the
midpoint of the polymer chain. The magnitude of these forces, which is of the order of 10
– 103 pN, is dependent on the molecular weight of the polymer, as mechanical activation
is not seen beneath a certain threshold.

9
Figure 1.5: Different stages in the process of solvent cavitation that generates shear forces responsible for the elongation of the polymer chain resulting in a chemical reaction17.
OBJECTIVE AND OVERVIEW OF THESIS
The concept central to the above mentioned experimental procedures is the
determination of the force dependence of the reaction rate. Electronic structure
calculations have been employed to great effect to investigate the force effects on the
reaction rate3-7, 13, 14, 69, 81-89. The main goal of the thesis is to formulate a theoretical view
and develop predictive computational models of the diverse mechanochemical
phenomena. The motivation for the work comes from advances in experiments that

10
demand a better understanding of these phenomena. Existing one-dimensional models are
often inaccurate to explain mechanical activation processes46, 100, 101. The approach
presented in this work establishes a direct connection between intrinsic chemical
reactivity and mechanical behavior, by proposing higher-dimensional theories. We
further show that the differences between low- and high-dimensional views are not
merely a quantitative one, but new emergent behaviors are expected instead7, 83, 84, 102. Each
of the following chapters are self-contained stories and a brief overview is as follows:
In Chapter 2, we propose a computationally cheap and efficient model termed as
extended Bell theory (EBT) to understand and predict the force dependence of the
reaction barrier83. We show that EBT is quantified by two parameters !R and !" that
determine the mechanical susceptibility of any reaction pathway. Electronic structure
calculations were performed on well-studied mechanophores to demonstrate the
numerical efficiency of this model. As an extension, Chapter 3 discusses a case study
where results from EBT compliment and provide a mechanistic understanding of the
experimental work performed in Prof. Christopher Bielawski’s lab at UT-Austin7.
Chapter 4 describes a survey of mechanophoricity, which is the identification and
characterization of novel mechanochemical systems. We show that EBT based theoretical
analysis can guide rational design of new mechanophores. We present an argument that
the novel trends predicted in this work are a direct consequence of the multidimensional
nature of the mechanochemical processes; a fact that is not accounted by commonly used
one-dimensional models46, 100, 101. Our computational results also demonstrate the first
instance of reaction suppression arising from the application of mechanical forces84.

11
While EBT approximation is shown to work remarkably well for a variety of
cases, it is not without limitations. The most obvious of them is that it is an
approximation. Most notably, EBT fails to account for force-induced instabilities in the
reaction mechanisms at high forces. For example, there may be a switch in reaction
mechanism at high forces that is triggered by the disappearance of the transition state.
Chapter 5 introduces an exact approach that follows the evolution of critical points
(reactant or transition states) on the molecule’s PES as a function of an external force. By
drawing parallels from catastrophe theory, we provide a robust framework supported by
electronic structure calculations to classify these instabilities as the PES topology varies
with force102.

12
Chapter 2: Chemical Reactions Modulated by Mechanical Stress: Extended Bell Theory
ABSTRACT
A number of recent studies have shown that mechanical stress can significantly
lower or raise the activation barrier of a chemical reaction. Within a common
approximation due to Bell [Science, 1978. 200, 618-627], this barrier is linearly
dependent on the applied force. A simple extension of Bell’s theory that includes higher
order corrections in the force predicts that the force-induced change in the activation
energy will be given by –FΔR –ΔχF2/2. Here ΔR is the change of the distance between
the atoms, at which the force F is applied, from the reactant to the transition state, and
Δχ is the corresponding change in the mechanical compliance of the molecule.
Application of this formula to the electrocyclic ring-opening of cis and trans 1,2-
dimethylbenzocyclobutene shows that this extension of Bell’s theory essentially recovers
the force dependence of the barrier, while the original Bell formula exhibits significant
errors. Because the extended Bell theory avoids explicit inclusion of the mechanical
stress or strain in electronic structure calculations, it allows a computationally efficient
characterization of the effect of mechanical forces on chemical processes. That is, the
mechanical susceptibility of any reaction pathway is described in terms of two
parameters, ΔR and Δχ, both readily computable at zero force.

13
INTRODUCTION
Mechanochemistry, an emerging field that deals with the coupling between
mechanical and chemical phenomena, holds great promise for precise control of chemical
reactivity. Unlike scalar quantities such as pressure or temperature, the vectorial character
of an applied mechanical force allows one to precisely guide molecular systems along
desired reaction pathways, which may be unique from common thermal or
photochemically driven processes3, 6. Recent developments in mechanochemistry include
experimental techniques allowing application of mechanical forces to molecular entities
covalently attached to high molecular weight polymers3, 5 and single-molecule methods
(AFM and optical tweezers) to stretch individual proteins and RNA45. In addition, it is
possible to design molecular machines that utilize energy of chemical reactions to exert
mechanical forces and perform work63, 64.
Rational control of chemical reactivity through application of mechanical stress
requires an understanding of the effect of the force on the rate of a chemical reaction as
well as on the stability of the respective reactants and/or reactive intermediates. Consider,
for example, the reaction shown in Fig. 2.1: If a stretching force is applied to an
arbitrarily selected pair of atoms, will that force speed up or suppress the reaction? What
is the magnitude of this effect? Which pair of atoms should be selected in order to
achieve the maximum rate enhancement? As electronic structure or molecular dynamics
calculations are arguably less expensive than the design of an appropriate experimental
system, computational predictions are of obvious value for answering these questions.

14
Mechanical pulling processes can be incorporated in electronic structure
calculations in a number of ways. Suppose, for example, that one pulls on a pair of atoms,
i and j, as illustrated in Fig. 2.1. This can be achieved, computationally, by imposing
strain via a constraint on the distance Rij between the two atoms 4, 6, 86, 87. Alternatively,
one can impose a stress via an additional energy term of the form -FRij (where F is the
pulling force) added to the molecule’s potential energy86. By computing how stress or
strain affects the energies of the stable-state and transition-state structures of the
molecule(s) in the reaction of interest, it is then possible to estimate the force dependence
of the reaction rate. This procedure is costly, however, as it requires multiple transition-
state searches (and, consequently, multiple energy evaluations) that must be performed
for each value of the force or constraint. If one desires to know how the pulling depends
on the positions i and j at which the forces are applied, this further increases the
computational cost by a factor of N(N-1)/2, where N is the total number of atoms in the
system.

15
Figure 2.1: Conrotatory pathway for electrocyclic ring-opening of (a) cis and (b) trans 1,2-dimethylbenzocyclobutene. The force applied to two carbons lowers the reaction barrier if the distance Rij between these atoms is longer in the transition state than it is in the reactant state.
F F
i j
Reactant
Transition state
ProductR(TS)ij
Transition state
Product
R(TS)ij
Reactant
ji
F
F
Reactant

16
To avoid high computational cost, simple, approximate theories have been widely
used. Perhaps the most widespread approximation is the one introduced by Bell100, 101,
which states that upon the application of a force F, the barrier of chemical reaction is
changed by an amount equal to !F"Rij , where !Rij is the change in the distance
between the atoms (to which the force is applied) from the stable (reactant) state to the
transition state. Bell’s theory thus predicts a linear relationship between the logarithm of
the rate and the force. As !Rij can be estimated from the stable- and transition-state
geometries at zero force, Bell’s formula offers tremendous computational savings,
providing the force dependence of the reaction rate, at any force, without having to
actually impose such a force (or a constraint) in the electronic structure calculations.
Unfortunately, in practice this linear relationship is commonly violated because the
distance change !Rij is itself force-dependent6, 48, 51, 53, 56, 71, 86. Other approaches, which
approximately account for the force-induced changes in the molecular geometry, have
also been proposed86. Somewhat surprisingly, however, one straightforward refinement of
Bell’s formula, although pointed out in the literature13, 14, has not been commonly used to
improve the accuracy of the calculations. Specifically, Bell’s formula, predicting the
linear force dependence of the reaction barrier, is nothing but a Taylor series truncated to
first order in the force. The second order term is, however, also readily obtained.
Moreover, evaluation of this second-order term does not require any additional
information other than the Hessian matrices of the molecule in the reactant and the
transition states. The latter comes at no additional cost as they are readily evaluated by

17
most electronic structure codes. The purpose of this chapter is to derive such an improved
approximation in terms of electronic structure data and to evaluate its performance. We
call this approximation extended Bell theory (EBT). In what follows, we show that EBT
accounts, rather accurately, for the nonlinearity of the force dependence of the reaction
barrier observed in the more expensive calculations that explicitly include mechanical
forces. We further expose certain mathematical peculiarities of EBT arising from the
multidimensional character of the underlying potential energy surface and make
connection to other approaches used in the literature.
EBT is related to the harmonic transition theory103 in that both approximations
assume quadratic potential energy surfaces in the vicinity of the reactant and transition
states. We further show that the same approximation readily yields other useful
mechanical properties of the molecule, such as its effective compliance in response to the
mechanical stress.
The remainder of this chapter is organized as follows: In Section 2 we derive the
EBT approximation. In Section 3 we examine the accuracy of the method by studying
numerical examples. Section 4 derives and tests relationships describing the mechanical
compliance of a molecule in the harmonic approximation. Section 5 concludes with a
discussion of extensions and limitations of the method.
THEORY
We start with illustrating EBT in a simple one-dimensional model of a reaction
governed by a potential V(s), which is a function of a single reaction coordinate s (Fig.

18
2.2). The minimum of the potential is located at s = s(0) and the maximum is at s(TS ) ,
where the superscripts (0) and (TS) refer, respectively, to the stable, reactant
conformation and to the transition state.
Figure 2.2: Simple one-dimensional model of a chemical reaction modulated by a mechanical force. The force lowers the reaction barrier and shifts the reactant and transition-state conformations toward one another.
When a force f is exerted along the reaction coordinate, the system feels the
potential V (s)! fs , with a modified activation energy barrier46, 47:
V ! ( f ) =V (TS ) "V (0) =V[s(TS )( f )]"V[s(0)( f )]" f [s(TS )( f )" s(0)( f )] .
(2.1)
The force-dependent rate is estimated using transition-state theory as
k( f ) = !( f )exp "V# ( f )kBT
$
%&
'
() , (2.2)
V(s)
V(s)-fs
s(0)(f ) s(TS)(f )
ener
gy
reaction coordinate s

19
where the prefactor ν depends on the vibrational frequency in the stable state. For
condensed-phase reactions, the prefactor also contains an appropriate transmission factor
that accounts for the recrossings of the transition state103. Because k(f) is exponentially
dependent on the force, it is reasonable to neglect the much weaker force dependence of
the prefactor itself, i.e., !( f ) "!(0) .
The locations s(0),(TS )( f ) of the potential minimum and maximum satisfy the
equation
!V (s)" f = 0 (2.3)
Expanding Eq. 2.3 in a Taylor series, we get, to first order in f:
s(TS ),(0)( f ) ! s(TS ),(0)(0)+ f""V [s(TS ),(0)(0)]
. (2.4)
That is, the potential minimum shifts to the right (since !!V > 0 ) and the transition state is
shifted to the left. Substituting this into Eq. 2.1, we find, to second order in the force13, 14:
V ! ( f ) =V ! (0)" f s(TS )(0)" s(0)(0)#$ %& "f 2
21
''V s(TS )(0)#$ %&" 1
''V s(0)(0)#$ %&
()*
+*
,-*
.* (2.5)
The first term in Eq. 2.5 corresponds to Bell’s theory101, in which the activation barrier is
linearly dependent on the force. The second term describes the “Hammond” effect48, 53, 56,
71, i.e. the force-induced shift of the positions of the transition and reactant states. Notice
that the second term is always positive since !!V [s(0)(0)]> 0 and !!V [s(TS )(0)]< 0 .
Eq. 2.5 is obviously an approximation that is valid only for a sufficiently low
force. As f is increased, there is a critical value f = fc , after which the barrier disappears

20
altogether and Eq. 2.5 becomes meaningless. At f < fc , Eq. 2.5 is exact for a cusp-shaped
parabolic potential56, 104, provided that one sets !!V s(TS )(0)"# $% = & . For more realistic
potentials, Eq. 2.5 often still remains a reasonable approximation as long as the applied
force is considerably smaller than fc. For example, if V(s) is a cubic parabola56, the
relative error in the barrier introduced by this approximation is less than 3% for f < 0.5 fc
. The quadratic approximation of Eq. 2.5, however, breaks down in the vicinity of fc,
where the activation barrier vanishes with a power law dependence on (f-fc) (see, e.g.,
refs.105-107).
To conclude our discussion of the 1D case, we point out a useful relationship
derived by Suzuki and Dudko 108, which is true for any force (as long as a barrier is still
present):
dV ! / df = s(0)( f )" s(TS )( f ) (2.6)
This follows immediately from Eqs. 2.1 and 2.3.
We now turn to the general case and describe the configuration of a molecule
consisting of N atoms by a 3N-dimensional vector: r = (x1, y1, z1,..., xN , yN , zN ) . Conjugate
to it is a 3N-dimensional force vector f = ( fx1, fy1, fz1,..., fxN , fyN , fzN ) , where Fi=
( fxi , fyi , fzi ) is a three-dimensional force vector acting on the i-th atom. The energetics of
the system is described by the Born-Oppenheimer potential energy surface V=V(r). The
generalization of the above equations to many dimensions is straightforward. In
particular, to first order in the force we find that the stable and the transition state

21
configurations undergo force-induced shifts according to an equation analogous to Eq.
2.4:
r(0),(TS )(f ) = r(0),(TS )(0)+ h(0),(TS )( )!1 f , (2.7)
where
h(0),(TS ) = !2V!r" !r# r=r(0 ),(TS ) (0)
(2.8)
is the Hessian matrix computed for the reactant/transition state at zero force. For the
reaction barrier, we obtain an equivalent of Eq. 2.5:
V ! (f ) =V ! (0)" f r(TS )(0)" r(0)(0)#$ %& "12f T h(TS )( )"1 " h(0)( )"1#
$%& f
'V ! (0)+ (V1! (f )+ (V2
! (f ), (2.9)
where f T denotes the transposed force vector.
If the molecule is free to rotate and translate in space, its Hessian matrix h is
generally singular (with six zero eigenvalues corresponding to rigid-body motion) and
therefore not invertible. Eqs. (2.7) and (2.9), then, appear to be ill-defined. This
predicament is easily surmounted, however, by noting that the only physically
meaningful force vectors f are those orthogonal to the null space of the Hessian matrix.
Indeed, only such vectors can ensure that the system is in mechanical equilibrium such
that the total force and the torque acting on the molecule are both zero. As a consequence,
all the inverses in Eqs. 2.7 and 2.9 should be understood as generalized inverses
(pseudoinverses), with the 6 zero eigenmodes suppressed in their spectral expansion.

22
An important difference between the multidimensional case and the 1D example
described above is that, unlike the 1D case, !V2" can be either positive or negative.
Indeed, while the compliance matrix in the stable state, h(0)( )!1 , is non-negative definite
and so f T h(0)( )!1"#
$% f is nonnegative, nothing can be said in advance about the sign of
f T h(TS )( )!1"#
$% f . Indeed, the transition-state Hessian has one negative and several non-
negative eigenvalues, except in one dimension, where it is negative-definite. Therefore,
the second-order term can make the force dependence either stronger or weaker.
Our theory so far is general in that it allows forces to be simultaneously applied to
several atoms. Most experimental scenarios are limited to pulling on one pair of atoms, i
and j (Fig. 2.1). Let F be the three-dimensional vector representing such a force. From
here on, we will use upper-case bold symbols for three-dimensional vectors representing
positions of and forces on individual atoms. We will continue to use lower-case boldface
symbols to represent 3N-dimensional vectors and (3N) × (3N) matrices corresponding to
the configuration of the entire molecule. The mechanical equilibrium of the system
requires that F always act along the line connecting the atoms. Let E=F/|F| be the unit
vector along the force direction. Therefore, the following condition must hold at any
point of the pulling process:
R j !Ri
R j !Ri
= E , (2.10)

23
where Ri is the three-dimensional vector describing the position of atom i. To evaluate
Eq. 2.9, we note that the 3N-dimensional force vector has the following components:
fxi = !FEx , fyi = !FEy , fzi = !FEz ,fxj = FEx , fyj = FEy , fzj = FEz ,fxk = fyk = fzk = 0, for k " i, j
(2.11)
In particular, the expression for the first order correction to the barrier height can be
simplified to give:
!V1" (F) = #f r(TS )(0)# r(0)(0)$% &' = #F E R j
(TS )(0)#R j(0)(0)$% &' #E Ri
(TS )(0)#Ri(0)(0)$% &'{ }
= #F R j(TS )(0)#Ri
(TS )(0) # R j(0)(0)#Ri
(0)(0)$% &' ( #F Rij(TS ) # Rij
(0)( ) (2.12)
This shows that (weakly) pulling on a pair of atoms, i and j, will lower the
reaction barrier by an amount that is proportional to the difference between the (zero-
force) inter-atomic distances Rij in the transition and the reactant states. If the distance
Rij between the two atoms is longer in the transition state than it is in the stable
configuration then application of a force between these two atoms will accelerate the
reaction. In the opposite case, application of the force will slow the reaction down.
The quadratic correction to the barrier, !V2" , is, likewise, easily evaluated using
Eqs. 2.9 and 2.11, given the Hessian matrices corresponding to the stable and the
transition-state configurations.
Finally, an analog of the Suzuki-Dudko formula 108 can be derived for an arbitrary
force (for which the barrier still exists):
dV ! / dF = " Rij(TS ) " Rij
(0)( ) (2.13)

24
In accord with other predictions108, pulling on a pair of atoms that are further apart
in the transition state than in the stable conformation will speed up the reaction. In
contrast, pulling on the atoms that approach one another when going from the stable state
to the transition state will slow the reaction down. In the biophysics literature, the latter
case is known as the catch-bond behavior55, 61. As previously pointed out58, 109,
multidimensionality of the energy landscape is essential for the catch-bond behavior.
More generally, a one-dimensional picture is often insufficient to describe the effect of a
mechanical force on many processes involving biomolecules 39, 110, 111, and obviously the
dependence of the mechanical response on the choice of the atoms at which the force is
applied 112, 113.
The first-order term (Eq. 2.12) corresponds to the standard approximation due to
Bell101. When supplemented with the second-order term as in Eq. 2.9, we call the result
extended Bell theory (EBT).
NUMERICAL TESTS OF EBT
The electrocyclic ring-openings of the cis and trans substituted
benzocyclobutenes are pericyclic transformations that are governed by orbital symmetry,
as predicted by the Woodward-Hoffman rules11, 114. For example, as shown in Figure 2.3,
the C1-C2 σ-bond orbitals open in a conrotatory manner (rotation in the same direction) in
order to constructively overlap with the LUMO of the π-system associated with the fused
arene. Depending on the stereochemistry of the benzocyclobutene starting material, this
process affords either a cis, trans diene (A) or a trans, trans diene (B) as the product11. It

25
should be noted that these are the expected products of thermal activation; photochemical
excitation induces disrotatory ring opening (orbital rotation in the opposite direction) and
affords the opposite outcomes (i.e., cis 1,2-dimethylbenzocyclobutene is converted to B
and trans 1,2-dimethylbenzocyclobutene is converted to A)11. The mechanically
facilitated ring opening is unique, however, in that, regardless of the stereochemistry of
the benzocyclobutene starting material, application of vectorially opposed forces across
the methyl substituents generates only the trans, trans diene product11. Such reactivity
necessitates that both formally allowed and disallowed electrocyclic processes can be
promoted under stress. As such, the coupling of mechanical forces to chemical systems
creates opportunities for accessing otherwise prohibitive transformations. EBT offers a
simple, fast, and effective computational method that can aid in the understanding of
mechanically induced chemical processes as well as the development of reactions that are
altogether new.

26
Figure 2.3: The conrotatory electrocyclic ring-opening of (a) cis 1,2-dimethylbenzocyclobutene leads to the cis, trans diene A and (b) trans 1,2-dimethylbenzocyclobutene leads to the trans, trans diene B. The curved arrows indicate the direction in which the orbitals associated with the C1-C2 σ-bond open. Hydrogen atoms are implicit in the structure, including at the atoms C1 and C1.
To test EBT, we have used it to estimate the force effect on the barrier for the
conrotatory electrocyclic ring-opening of cis and trans 1,2-dimethylbenzocyclobutene86.
As in an earlier study by Ribas-Arino et al86, the pulling force was assumed to act
between the substituent carbon atoms, as shown in Fig. 2.1 (atoms i and j). In our study,
calculations were performed with the NWChem package115 using density functional
theory116, employing the 6-31G* basis set117 and the B3LYP exchange-correlation energy
functional118. EBT calculation involves computing the reactant and transition state
structures in the absence of the force, which are shown in Figure 2.1 (MacMolPlt
C1 C2
C1 C2
Conrotatory
Conrotatory
(a)
(b)
A
B

27
software119 was used to generate the plots). The EBT force dependence of the reaction
barrier was then computed using Eqs. 9 and 11.
To compare EBT with the “exact” (inasmuch as the underlying potential energy
surface is deemed exact) result, we have computed the activation barriers for a series of
constraints imposed on the distance between the two atoms. It is important, however, to
realize that such a “constant extension” calculation does not directly correspond to a
constant force scenario assumed above. Indeed, when a constant force is imposed on a
pair of atoms, the extension (i.e., the distance between those atoms) is different in the
reactant and the transition state. As a result, the barrier encountered by the system is
different from that measured under the conditions where the extension is fixed. The
observation that controlling stress or strain leads to different mechanical responses
underscores the importance of knowing exactly how the pulling process is executed46, 47.
Assuming one pulls on the atoms i and j, the correspondence between the constant
force and the constant extension scenarios is established by the formula:
V ! (F) =U (TS )[Rij(TS )(F)]"U (0)[Rij
(0)(F)]" F Rij(TS )(F)" Rij
(0)(F)#$ %& (2.14)
Here U (0,TS )(Rij ) is the energy of the molecule in the reactant or transition state computed
with the distance between the atoms fixed at Rij, and Rij(0,TS )(F) is the distance between
the atoms (in the reactant or transition state) as a function of the applied force. That is, to
simulate the force through a constraint, one should apply different constraints in the
transition and stable states, so as to impose the same stretching force in each case. The
dependence Rij(0,TS )(F) can be computed by inverting the obvious relationship:

28
F = dU (0,TS )(Rij ) / dRij (2.15)
A comparison between Bell’s theory, EBT, and “exact” force dependence obtained
through Eqs. 2.14 and 2.15, is shown in Figure 2.4. Consistent with earlier observations6,
86, Bell’s formula performs rather poorly for the cis-isomer except at very low forces
while EBT remains practically exact throughout the entire range of forces of ~1 nN and
lower, where the specific reaction channel considered here exists (Fig. 2.4a). Moreover,
the force dependence of the barrier found here is nearly identical to that estimated in
ref.86. Also note that the second-order correction to the activation barrier is negative in
this case, making the force dependence stronger. As discussed in Section 2, this behavior
cannot be predicted by one-dimensional models, for which the second-order correction is
always positive.

29
Figure 2.4: Comparison of the force dependence of the reaction barrier obtained by different methods for (a) cis and (b) trans 1,2-dimethylbenzocyclobutene. Solid line: EBT. Dotted line: Bell’s formula. Dashed line: “exact” result obtained from constrained structure optimization.
0 200 400 600 800 1000 1200 140025
30
35
40
force, pN
Energy�kcal�
mol�
0 200 400 600 800 1000
26
28
30
32
34
36
38
force, pN
Energy�kcal�
mol�

30
In the trans-case (Fig. 2.4b) Bell’s formula is already nearly exact and the second-
order correction provided by EBT is relatively small. The origins of this difference
between the mechanical responses of the cis- and trans-isomers are further discussed in
the next Section.
MECHANICAL COMPLIANCE OF A MOLECULE WITHIN EBT
The harmonic approximation employed in EBT also allows one to readily obtain
another important parameter, the effective mechanical compliance of the molecule, in its
reactant configuration, with respect to pulling on any pair of atoms. That is, it allows one
to estimate the energy U (0)(Rij ) as a function of the distance Rij between the atoms one
pulls on. Because the underlying potential assumed by EBT is harmonic, one expects
that, when stretched between a pair of atoms, the molecule will effectively behave as a
Hookean spring with a potential of the form
U (0)(Rij ) =U(0)[R
ij
(0)(0)]+ kij(0)[Rij ! Rij
(0)(0)]2 / 2 , (2.16)
where Rij(0)(0) is the equilibrium distance between the atoms. When the distance between
a pair of atoms is increased, other atoms, of course, also become displaced. Since no
external forces act on those atoms, their positions are determined from the condition that
they are in mechanical equilibrium. One can view the finding of U (0)(Rij ) as a coarse-
graining procedure in which all of the atomic coordinates, except for the coordinates of
the atoms i and j, are eliminated based on the above mechanical equilibrium condition.
As the atoms of the molecule can be arbitrarily relabeled, it is convenient to assume that

31
one always pulls on the first two atoms. We then write the molecule’s Hessian matrix in
the block-diagonal form:
h(0) =h11(0) h12
(0)
h21(0) h22
(0)
!
"##
$
%&&
(2.17)
Here h11(0) , h12
(0) ,h21(0) , and h22
(0) are, respectively, 6×6, 6×(3N-6), (3N-6)×6, and (3N-
6)×(3N-6) matrices. The (3N-6) degrees of freedom of the unconstrained atoms are
eliminated through the standard coarse graining procedure120-122, to obtain an effective
6×6 Hessian matrix that describes the mechanical response of the pair of atoms one is
pulling on. This matrix is given by the Schur complement:
h11(0) = h11
(0) - h12(0) h22
(0)( )-1 h21(0) (2.18)
This matrix should, of course, coincide with the Hessian matrix computed from Eq. 2.16.
This, in particular, means that is has five zero eigenvalues and one nonzero eigenvalue
equal to 2kij(0) . Thus, starting with the full hessian matrix h(0) , performing coarse-
graining via Eq. 2.18 and, finally, diagonalizing the resulting 6×6 Hessian matrix, one
can find the effective spring constant kij(0)with respect to pulling on any pair of atoms.
One can also formally define the effective stiffness kij(TS ) of the molecule
corresponding to the transition state (as well as to any critical point of the molecule’s
potential energy surface), although, stretching the molecule while maintaining its
transition-state configuration does not correspond to any experimental scenario. This
stiffness can be estimated again from Eq. 2.18 by using the Hessian matrix corresponding

32
to the transition state. Note that, while kij(0) is always positive, kij
(TS )may be either positive
or negative.
The stiffness kij (and its inverse, the compliance χij) of the molecule in its reactant
and the transition state configurations determines how the reactant or transition-state
conformation is deformed by the force. Indeed, using Eqs. 2.15 and 2.16, we find:
Rij(0,TS ) = Rij
(0,TS )(0)+ F / kij(0,TS ) = Rij
(0,TS )(0)+ ! ij(0,TS )F , (2.19)
an equivalent of Eqs. 2.4 and 2.7. Furthermore, the difference between the compliances in
the transition and reactant state configurations determines the second-order response of
the reaction barrier to the force. Indeed, the EBT formula for the force-dependent rate
(Eq. 2.9) can be conveniently rewritten in a one-dimensional form similar to Eq. 2.513, 14:
V ! (F) =V ! (0)" F Rij(TS ) " Rij
(0)( )" (# ij(TS ) " # ij
(0) )F2 / 2 , (2.20)
which can be derived by substituting Eqs. 2.16 and 2.19 into Eq. 2.14. This result shows
that, while the extension or contraction of the distance Rij determines the first-order
effect of the force on the barrier, the curvature of the dependenceV ! (F) is controlled by
the difference in the compliances of the transition and reactant states. The latter effect
accounts for the change in the elastic energy stored by the molecule when going from the
reactant state to the transition state.
The relative importance of the second-order correction thus depends on the
compliance of the molecule in the reactant and the transitions state. More precisely, the
second-order term in Eq. 2.20 is negligible when F ! Rij
(TS ) ! Rij(0) / " ij
(TS ) ! " ij(0) . In the

33
same range of forces, therefore, stiffer molecules will be better described by Bell’s
formula than more compliant ones. For example, the trans-isomer of 1,2-
dimethylbenzocyclobutene is fairly stiff in both the reactant and transition states (
k (0) ! 48.5 N/m, k (TS ) ! 67.8N/m) as compared to the cis-isomer ( k (0) ! 34.0 N/m,
k (TS ) !11.6N/m), which exhibits a much softer transition state. This explains the relative
success of Bell’s theory in the former case given comparable values of the stretching
force. Indeed, a stiffer molecule stretched by a force undergoes a smaller deformation,
resulting in a smaller overall elastic energy; this elastic energy can be altogether
neglected for sufficiently stiff molecules.

34
Figure 2.5: The reactant (a) and transition-state (b) energies of cis-1,2-dimehtylbenzocyclobutene as a function of the extension Rij. The energy in each case is measured relative to its respective minimum value. Solid lines show the harmonic approximation (Eqs. 2.16, 2.18) while the solid symbols represent results of constrained optimization.
�
�
�� �
�
�
�
�
�
2.5 3.0 3.5 4.00
5
10
15
20
constraint �Angstrom�
Energy�kcal�
mol�
�
�
�� �
�
�
�
�
�
3.0 3.2 3.4 3.6 3.8 4.0 4.2 4.40
2
4
6
constraint �Angstrom�
Energy�kcal�
mol�

35
The quality of the harmonic approximation (Eq. 2.18), when applied to the same
model systems as in Section 3, is examined in Figures 2.5 and 2.6. Using Eq. 2.16 and
2.18, we calculate a harmonic estimate of U (0,TS )(Rij ) and compare it with the “exact”
result obtained via constrained optimization of the reactant and transition states, as
described in Section 3. While the harmonic approximation is exact for small extensions,
nonlinear effects become significant for larger extensions. In the case of the cis isomer,
the harmonic approximation is seen to work better for the transition state than for the
reactant. For the trans-isomer, we see an opposite trend: Significant deviations from the
harmonic approximation are observed in the transition state for rather small deformations
(~0.1Å). Nevertheless, because the stiffness of the molecule (i.e., the curvature of the
dependence seen in Fig. 2.6b) is much higher in this case than for the cis-isomer, the
resulting elastic energy is very small, only fractions of kcal/mol (given the same value of
the force), and so the elastic energy term is essentially negligible in the force dependence
of the activation barrier observed in Fig. 2.4b.

36
Figure 2.6: The reactant (a) and transition-state (b) energies of trans-1,2-dimehtylbenzocyclobutene as a function of the extension Rij. The energy in each case is measured relative to its respective minimum value. Solid lines show the harmonic approximation (Eqs. 2.16, 2.18) while the solid symbols represent results of constrained optimization.
�
��
�
�
�
�
�
3.4 3.6 3.8 4.0 4.2 4.40
5
10
15
constraint �Angstrom�
Energy�kcal�
mol�
�
��
�
�
�
�
�
�
4.70 4.75 4.80 4.85 4.900.0
0.2
0.4
0.6
0.8
constraint �Angstrom�
Energy�kcal�
mol�

37
Finally, it is instructive to compare EBT to the phenomenological cusp-shaped
potential model (CSPM)56, 104, which is perhaps the simplest model that can account for
experimentally observed deviations from Bell’s theory 71. Similarly to EBT, CSPM
assumes the effective potential along the pulling coordinate Rij to be a harmonic reactant
well. In contrast, the cusp-shaped barrier implies that the location of the CSPM transition
state does not depend on the force. Formally, this corresponds to setting ! ij(TS ) = 0 in
EBT, or, equivalently, to dropping the term containing the transition-state Hessian in Eq.
2.9. Both CSPM and EBT predict that the reaction barrier V ! (F) is a second-degree
polynomial of F. However, in the multidimensional case, there is qualitative difference
between the CSPM and EBT predictions regarding the curvature of the V ! (F)
dependence. Specifically, CSPM always predicts the last term in Eq. 2.20 to be positive
so that the overall force dependence of the reaction barrier V ! (F) is weaker than in
Bell’s theory. As discussed in Section 2, this is not necessarily the case for EBT: While
! ij(0) is always positive, the sign of ! ij
(TS ) can be variable, and the resulting force
dependence of the reaction barrier can be either stronger (cf. Fig. 2.4a) or weaker than
that predicted by Bell’s formula.
CONCLUDING REMARKS
In this chapter, we have examined an extension of Bell’s theory that includes
second-order corrections in the dependence of the reaction barrier on the mechanical
force. Our approach is exact (inasmuch as the energies predicted by electronic structure

38
calculations are viewed as exact) in the limit of sufficiently weak force. Like the original
formulation developed by Bell, the extended Bell theory requires only zero-force
information about the structures and the energies of the molecule in the transition and the
reactant state. Therefore, this approach allows one to predict the effect of a mechanical
force, applied to any atoms of the molecule, without explicitly incorporating stress or
strain into electronic structure calculations. Our numerical example shows that EBT is
considerably more accurate than the standard formula due to Bell. Moreover, EBT
provides a convenient way of characterizing the sensitivity of any reaction pathway to a
mechanical force using two parameters, namely the change in distance, !R , and the
change in the compliance, !" , between the initial and transition states. The sign and
magnitude of these two quantities allow one to quickly predict the force dependence of
the reaction rate.
This substantial computational gain offered by EBT over explicit calculations
involving force comes at a cost: First, while the second-order correction is sufficient in
the examples considered in Section 3, there is no guarantee that this is always the case for
any value of the force that is relevant in practice. Second, our theory assumes that the
force continuously transforms the transition state without changing its underlying
properties. At sufficiently high forces, however, the topography of the underlying
potential surface may change and the saddle point – and the corresponding reaction
channel – may, for example, disappear altogether. When this happens, then one has no
other choice but to explicitly include the force in the calculations86. An example of this
behavior is readily seen in the example studied in Section 3, where EBT provides no

39
warning signs that the conrotatory reaction channel would disappear86 for forces higher
than ~1nN.
While the above caveats certainly cannot be disregarded, we note that the validity
of our approach for any given reaction is straightforward to verify by comparing the EBT
prediction with a calculation that explicitly includes a force that corresponds to the
maximum relevant force. Such a test is relatively inexpensive because it involves a single
transition state search. Moreover, even in the regime where the accuracy of EBT is not
satisfactory, using the EBT estimate for the force-induced transition-state distortion (Eq.
2.7) as the initial guess may help speed up the search for the correct transition state.

40
Chapter 3: Regiochemical Effects on Molecular Stability: A Mechanochemical Evaluation of 1,4- and 1,5-Disubstituted Triazoles
ABSTRACT
Mechanochemistry or the modulation of chemical reactivity using mechanical
forces has shown great promise in directing chemical transformations in otherwise
prohibitive pathways. A recent study has shown that the highly inert 1,2,3-triazole
molecule is susceptible to cycloreversion in the presence of ultrasound8. This work is
extended to the case where polymer chains of varying molecular weight were grown from
1,4- and 1,5-disubstituted triazoles. Experimental evidence suggests that the rate constant
for the cycloreversion of the 1,5-disubstituted triazoles was 1.2 times larger than that of
the 1,4-disubstituted congener7. The difference was attributed to the increase mechanical
deformability of the 1,5-regioisomer as compared to the 1,4-isomer. This interpretation
was supported by computational studies, which employed the extended Bell theory to
predict the force dependence of the activation barriers for the cycloreversions of both
isomers.
INTRODUCTION
The burgeoning field of polymer mechanochemistry, wherein exogenous forces
are directed to chemical functionalities in a locally anisotropic manner through polymer
actuators, presents the opportunity to precisely direct chemical reactivity down specific
pathways3, 15. As a result, mechanical forces have been shown to facilitate a number of
intriguing, and often novel, transformations6, 8, 11, 123-125. For example, a recent study has
shown that mechanochemical approaches could effect the formal [3+2] cycloreversion of

41
1,4-disubstituted 1,2,3-triazoles, a process that currently cannot be accessed through any
other stimuli (thermal, photochemical, etc.)8. We hypothesized that the 1,5-disubstitued
isomers126 of 1,2,3-triazoles, might also be susceptible to cycloreversion under
mechanical activation (Figure. 3.1). Furthermore, we reasoned that 1,4- and 1,5-
disubstituted triazole mechanophores presented a unique opportunity to explore
regiochemical effects on molecular stability using polymer mechanochemistry. Although
stereochemistry has been shown to influence mechanochemical transformations11, 89, 127,
there have been no reports demonstrating how mechanical processes are influenced by
the regiochemistry of the polymer attachments on the mechanophore. Beyond enriching
the field of mechanochemistry13, 128, such an endeavor was envisioned to provide insight
that would be beneficial for the rational design of new mechanophores as well as force-
responsive materials.
Figure 3.1: Structures of 1,5-disubstituted (left) and 1,4-disubstituted (right) triazoles contained within a poly(methyl acrylate) (PMA).
MODEL
Following ref.83, the reaction barrier, as a function of force F, was computed
according to the formula:

42
V ! (F) =V ! (0)" f r(TS )(0)" r(0)(0)#$ %& "12f T h(TS )( )"1 " h(0)( )"1#
$%& f
'V ! (0)+ (V1! (F)+ (V2
! (F) (3.1)
Here f = ( fx1, fy1, fz1,..., fxN , fyN , fzN ) is a 3N-dimensional force vector, whose components
are given by the equations
fxi = !FEx , fyi = !FEy , fzi = !FEz ,fxj = FEx , fyj = FEy , fzj = FEz ,fxk = fyk = fzk = 0, for k " i, j
, (3.2)
assuming that the pulling force is applied to atoms i and j such that it is aligned along the
vector
(Ex ,Ey ,Ez ) ! E =R j "Ri
R j "Ri (3.3)
connecting those atoms. The matrices h(0) and h(TS ) in Eq. 3.1 are the Hessian matrices
corresponding to the zero-force reactant and transition states and h(0,TS )( )!1 is regarded as
a generalized inverse that suppresses the terms corresponding to rigid body motion in the
spectral expansion of the matrix.
The first- and second-order contributions can also be written, respectively, as
V1! (F) = "F Rij
(TS ) " Rij(0)( ) (3.4)
and
V2! (F) = "(# ij
(TS ) " # ij(0) )F2 / 2 (3.5)

43
Here Rij(0,TS ) is the distance between the atoms in the reactant or transition state and ! ij
(0,TS )
is the corresponding molecular compliance (which is positive for the reactant state but
can be either positive or negative for the transition state). The explicit expression for the
compliances in terms of the Hessian matrices is given in ref. 83.
According to Eqs. 3.4 and 3.5, the first-order effect of the force on the reaction
barrier is determined by the change in the distance Rij , while the curvature of the
dependenceV ! (F) is controlled by the difference in the compliances of the transition and
reactant states.
RESULTS
Experimental evidence suggests that the rate constant for the cycloreversion of
1,5-triazole ( k1,5 = 3.22 !10"5 min"1 ) to be 1.2 times larger than that of the 1,4-isomer (
k1,4 = 2.76 !10"5 min"1 )7. In an effort to explain the aforementioned rate differences, we
first reasoned that the 1,5-triazole was more responsive to mechanical activation in part
because the vicinal polymer attachments were localizing the mechanical forces generated
under ultrasound to a smaller region of the triazole (i.e. the N1-C5 bond). In contrast, the
polymers attached to the 1,4-regioisomer would translate mechanical energy across the
heterocyclic scaffold, effectively requiring additional force to facilitate the cycloreversion
process. We also reasoned that (1) the N1-C5 bond should be more susceptible to
mechanical deformation than the N3-C4 bond (due to the rigidity imposed by the π-

44
character in the N2-N3 bond) and (2) the N1-C5 bond of the 1,5-regioisomer should be
slightly weakened as a consequence of steric congestion.
To explore these viewpoints more quantitatively, we employed electronic
structure calculations to probe the mechanically induced cycloreversion processes.
Specifically, we used the recently described extended Bell theory (EBT)83, which offers a
computationally inexpensive alternative to methods that explicitly include the effect of
mechanical stress6, 86, 87 or strain4 on molecular potential energy surfaces. Regardless, EBT
accurately predicts mechanochemical reactivity using standard geometry optimizations
and saddle point searches performed for mechanically unperturbed molecules83. The
method also determines the force dependence of the activation barrier for a given
transformation using only two parameters. The first parameter is the change in distance
between the two atoms to which the force is applied in going from the reactant state to
the transition state (TS). If this distance increases, then applying an elongational force
across those two atoms should lower the overall reaction barrier.24 Conversely, if the
distance between these atoms decreases at the TS, then applying an elongational force
should retard activation. The second parameter is the difference in the molecular
compliance between the TS and the reactant state, which determines the curvature of the
force dependence of the activation barrier. Thus, EBT generalizes the classic Bell
model101, which assumes that the barrier is linearly dependent on the force. While this
method requires that the applied force not be too large, the amount of information that
can be extracted from such a relatively simple set of calculations makes EBT attractive
for the evaluation of mechanochemical phenomena.

45
EBT calculations for the triazole cycloreversions were performed with the
NWChem package115 using density functional theory116, employing the 6-31G* basis
set117 and the B3LYP exchange-correlation energy functional118. Triazoles featuring 1,4-
and 1,5-dimethyl substituents (TA1 and TA2, respectively; Figure 3.2) were initially
chosen for the in silico evaluation of the cycloreversion process. In the case of TA1, the
N1 and C4 atoms were considered to be the points to which the pulling forces were
applied, as we reasoned that these nuclei would simulate the translation of mechanical
force to the triazole moeity. Similarly, the N1 and C5 atoms were treated as the pulling
points for EBT analysis of TA2. To determine which set of pulling points would more
readily facilitate the triazole cycloreversion, the internuclear distances between the
aforementioned atoms in TA1 and TA2 were calculated in the reactant and transition
state geometries. As expected, the change in distance between the pulling points in TA2
was larger than the corresponding change between the pulling points in TA1 (0.93 Å for
TA2 vs 0.62 Å for TA1). As such, TA2 was predicted to be more susceptible to
mechanical activation than TA1 (vide infra; Figure 3.2). By extension, 1,5-disubstituted
triazoles should respond to mechanical forces (i.e. undergo mechanical cycloreversion)
more readily than their 1,4-disubstituted congeners, which was consistent with the
experimental observations previously discussed.

46
Figure 3.2: Reactant state geometries of TA1-TA7. Legend: C, black; H, white; F, green; N, blue.
The intrinsic reactivity of the 1,2,3-triazole was explored through evaluation of an
analogue bearing only hydrogen substituents, and therefore devoid of steric bulk or
highly perturbing electronic effects (TA3; Figure 3.2). As in the aforementioned
calculations, the change in the N1-C5 internuclear distance from the reactant state to the
transition state was larger than the corresponding change in the N1-C4 distance (0.85 Å vs
0.60 Å), consistent with the hypothesis that direct bond activation in the 1,5-regioisomer
(in contrast to force translation across the 1,4-regioisomer) facilitates the cycloreversion

47
process by pulling the triazole into a TS geometry for the retro-[3+2] reaction. Since
stereoelectronic effects were negligible in TA3, this result also suggested that the N1-C5
bond is inherently more susceptible to mechanical deformation than the N3-C4 bond,
which could result from the rigidity imposed by the N2-N3 bond (vide supra).
Collectively, these results further supported the conclusion that 1,5-disubstituted triazoles
were intrinsically more susceptible to mechanical activation than the corresponding 1,4-
regioisomers.
Having explored the intrinsic susceptibility of 1,4- and 1,5-disbustituted triazoles
to mechanical activation, the response of the cycloreversion energy barrier to exogenous
forces was probed using EBT. Figure 3.3 shows the predicted changes in the reaction
barriers for the cycloreversions of TA1 (black) and TA2 (blue) as a function of force,
hereafter referred to as force curves (FCs). A series of functionalized triazole analogues
(TA4-TA7, Figure 3.2) were also evaluated computationally in the manner previously
discussed (vide supra) to elucidate electronic or steric effects on the cycloreversion
process. Importantly, the zero force barriers corresponding to cycloreversions of the 1,5-
regioisomers were lower than those of the analogous 1,4-regioisomers in all cases.
Building on this result, we sought to draw a comparison between predicted trends in
cycloreversion and known triazole reactivity. We reasoned that electron deficient
triazoles should be predicted to undergo cycloreversion more readily than electron rich
analogues, as electron deficient triazoles are known to participate in the Dimroth
rearrangement129. Toward this end, the zero force barriers to cycloreversion for
bis(trifluoromethyl) substituted triazoles (TA4 and TA5) and dimethyl substituted

48
triazoles (TA1 and TA2) were compared. As expected, the activation energies for the
cycloreversions involving the dimethylated isomers (Ea = 90.7 kcal/mol for TA1; Ea =
88.9 kcal/mol for TA2) were found to be larger than those for the analogous
trifluoromethyl congeners (Ea = 85.0 kcal/mol for TA4; Ea = 68.7 kcal/mol for TA5).
Since this result conformed to our prediction, we turned our attention to an evaluation of
steric effects on the cycloreversion processes.
Figure 3.3: Force curves for TA1 (black), TA2 (blue), TA4 (red), TA5 (green), TA6 (orange), and TA7 (violet). Energy barrier refers to the predicted activation energy for the cycloreversion of the triazole analogue.
To explore the role of sterics, the cycloreversions of dimethyl substituted triazoles
were compared to bis(t-butyl) analogues (TA6 and TA7). We reasoned that the relative
0 500 1000 1500 2000 2500 3000
20
40
60
80
force, pN
Energy�kcal�
mol�

49
differences between the zero force energy barriers for each set of analogues would reveal
the extent to which steric congestion influenced the cycloreversion processes. In accord
with this assessment, the difference between the aforementioned barriers for the
cycloreversions of TA1 and TA2 (ΔEa= 1.87 kcal/mol) was calculated to be smaller than
that of TA6 and TA7 (ΔEa= 11.37 kcal/mol). This result also demonstrated that steric
interactions present in 1,5-disubstituted triazoles were increasing the overall molecular
compliances, as evidenced by the appreciable curvature of the FC for TA7. Indeed, the
FCs for all of the 1,5-analogues exhibited greater curvature than those of the
corresponding 1,4-isomers. It should also be noted that TA7 exhibited the largest force
dependence of all the small molecule analogues that were analyzed using EBT, as
evidenced by the precipitous decrease in activation energy for the cycloreversion of this
analogue under increasing force (Figure 3.3). Collectively, these results indicated that, in
combination with the intrinsic deformability of the N1-C5 bond, steric congestion
rendered the 1,5-regioisomer more susceptible to mechanical activation than the 1,4-
regioisomer.
CONCLUSIONS
In summary, we provide computational evidence for the mechanically facilitated
cycloreversion of 1,5-disubstituted triazoles to afford azide and terminal alkyne moieties.
In agreement with experimental data, the difference in the rate of cycloreversion between
the 1,5- and 1,4-isomer was explained computationally by a combination of increased
molecular compliance and direct bond activation in the case of the former. In a broader

50
context, these results indicate that the relative regiochemistry of the polymer attachments
on a mechanophore must be considered when evaluating or designing mechanochemical
systems.

51
Chapter 4: Molecular Catch Bonds and the Anti-Hammond Effect in Polymer Mechanochemistry
ABSTRACT
While the field of polymer mechanochemistry has traditionally focused on the use
of mechanical forces to accelerate chemical processes, theoretical considerations predict
an underexplored alternative: the suppression of reactivity through mechanical
perturbation. Here, we use electronic structure calculations to analyze the mechanical
reactivity of six mechanophores, or chemical functionalities that respond to mechanical
stress in a controlled manner. Our computational results indicate that appropriately
directed tensile forces could attenuate (as opposed to facilitate) mechanochemical
phenomena. Accompanying experimental studies supported the theoretical predictions
and suggested that relatively simple computational models may be used to design new
classes of mechanically responsive materials. In addition, our computational studies and
theoretical considerations implicated the prevalence of the anti-Hammond (as opposed to
Hammond) effect (i.e., the increased structural dissimilarity between the reactant and
transition state upon lowering of the reaction barrier) in the mechanical activation of
polyatomic molecules.
INTRODUCTION
The use of mechanical forces to bias chemical reactions, commonly referred to as
mechanochemistry3, 15, 16, has increasingly found applications in the synthetic and
materials science communities. Within this field, polymer mechanochemistry, or the
mechanical manipulation of reactive functional groups (termed mechanophores)

52
embedded within polymeric matrices, has attracted considerable attention due to its
ability to facilitate a number of otherwise kinetically inaccessible processes7-12, 127. While
theoretical models have been shown to successfully account for these experimental
observations13, 69, 81-83, 85, 86, 89, 130, such models are typically used as post-experimental
rationalizations. Here, we show that theoretical analysis may be used to guide the rational
design of mechanophores that exhibit novel, force induced reactivity. Moreover, our
results uncovered general trends in the mechanical response of polyatomic molecules that
have significant implications for the design of new mechanophores and force responsive
materials. These trends stem from the inherent multidimensionality of mechanochemical
processes and, therefore, cannot be accounted for by one-dimensional models commonly
used to explain mechanical activation100, 101. Indeed, while the one-dimensional
approximation necessitates that force acts in the direction of the reaction coordinate (RC),
thereby lowering the transition state (TS) barrier and accelerating the associated
transformation, we will show that such an alignment between the force and a typical RC
is extremely improbable in the high-dimensional configuration space of a typical
mechanophore.
THEORETICAL DISCUSSION
Misalignment between mechanical stress and the targeted reaction pathway can
result in a number of distinct scenarios. Figure 4.1 illustrates some of these activation
motifs using a model two-dimensional potential energy surface (PES) that exhibits a
single minimum (which corresponds to the reactant) and a saddle-point (which

53
corresponds to the TS). Of the two coordinates that specify the molecular configuration,
R quantifies the mechanical strain (which, in most experimental studies, corresponds to
the distance between a pair of atoms on which the applied force is exerted), and X
represents the remaining molecular degrees of freedom. While similar scenarios to those
depicted in Figure 4.1 have been explored108, 109, 131, we emphasize that the reduction to
two degrees of freedom is an oversimplification in the present context and is only used
for illustrative purposes.
A force F acting along the mechanical coordinate R performs mechanical work (
W = F!R ) as the molecule evolves toward the TS, where !R is the change in the
mechanical pulling coordinate. The activation energy is effectively lowered by W and the
transition rate k(F) is enhanced by a factor of eWkBT = e
F!RkBT . This result, commonly
referred to in the literature as the “Bell formula” 10, 11, however, does not account for the
force induced displacement of the reactant and transition states. If the true RC (i.e., the
steepest descent path connecting the TS saddle point to the reactant state minimum on the
PES) coincides with the mechanical coordinate (Fig. 4.1A) then a stretching force pushes
the TS toward the reactant. This phenomenon is usually referred to as the Hammond
effect, which posits that the reactant and TS structures are driven toward each other as the
barrier separating them is lowered13, 48. As the Hammond effect reduces the molecular
distortion (i.e., !R ), it weakens the force dependence of the reaction rate.

54
Figure 4.1: Force induced changes on a reaction pathway. (A) The Hammond effect, where the “true” reaction coordinate (RC, red line) is aligned with the mechanical coordinate (R). Mechanical equilibrium necessitates that a pulling force (F) shifts the TS toward the reactant state minimum (because the TS energy exhibits a maximum along R). The shifted RC and the new TS are shown as a dashed red line and a blue “X”, respectively. (B) The anti-Hammond effect, where there is misalignment between RC and R (so that the TS exhibits a minimum as a function of R) and the TS is more compliant than the reactant. (C) Catch bond behavior, where molecular distortion along R initially decreases but later increases along the RC.
F
R
X TS
R
TS energy
RC
F
R
XTS
R
TS energy
RC
R
X
TS
R<0
RC
F
A (Hammond) B (anti-Hammond)
C (Catch bond)

55
A very different scenario is shown in Fig. 4.1B, where the mechanical coordinate
is misaligned with the RC in the vicinity of the TS saddle such that the TS energy
exhibits a minimum (rather than a maximum) when R is varied. Consequently, a pulling
force F may increase the separation between the TS and the reactant, thus resulting in
“anti-Hammond” behavior. In this case, the structural separation between the reactant and
the TS increases, but the energy barrier between these two states decreases. As the anti-
Hammond effect increases the work done by the force, it provides an additional
acceleration of the reaction rate.
These considerations are quantified in the recently reported Extended Bell Theory
(EBT)69, 83, 85, which accounts for the force induced shifts of the TS and reactant states
along a given reaction pathway in the 3N-dimensional (where N is the number of atoms)
configuration space of the molecular system of interest. To second order in the applied
force, the reaction rate k(F) is given by56:
ln k(F) k(0) = kBT( )!1 F"R + F2"# 2( )
(4.1)
The F!R term in Eq. 4.1 is identical to Bell’s formula. The quadratic term results from
the interplay of two effects: (1) the elastic energy stored in the molecule as a result of
mechanical deformation and (2) the additional work done by the applied force as a result
of the Hammond or anti-Hammond shift in !R . This shift is described by the formula:
!!R = !RTS " !Rr = #TSF " # rF = !#F (4.2)
where ! r and !TS are, respectively, the compliances of the reactant state and TS in
response to pulling along R. These compliances can be computed from the molecule’s (

56
3N ! 3N ) Hessians in the reactant and TS configurations56 as described below. A key
departure from one-dimensional theories10, 11 is that the TS compliance ( !TS ) can be either
positive or negative56. As a result, both anti-Hammond (!R > 0;!" > 0 ) and Hammond (
!R > 0;!" < 0 ) behavior is possible. We emphasize that the Hammond or anti-Hammond
behavior is controlled by!!R , which is the shift in the reactant-to-TS distortion in
response to force.
COMPUTATIONAL RESULTS AND DISCUSSION
To explore the correlation between mechanical activation and the direction along
which the pulling force is exerted, we have performed a comprehensive survey of all
possible pulling scenarios in the context of six previously reported mechanically induced
transformations: the conrotatory electrocyclic ring opening of cis and trans-disubstituted
benzocyclobutene11, the formal [3+2] cycloreversion of 1,2,3-triazoles7, 8, the formal
[4+2] cycloreversions of a furan/maleimide Diels-Alder adduct and a
maleimide/anthracene Diels-Alder adduct10, and the isomerization of a spiropyran
derivative12 (Figure 4.2).

57
Figure 4.2: Mechanophore models.
In order to probe the intrinsic reactivity of each mechanophore in the absence of
strongly perturbing steric or electronic environments, we employed truncated analogues
bearing only hydrogen substituents (although methyl substituents were used to account
for stereochemistry when necessary). For the same reason, polymeric handles, while
important70, 82, were not included in the calculations. In other words, the force in Eq. 4.1 is
assumed to be exerted directly on a pair of atoms belonging to the mechanophore. The
mechanism through which the force is transmitted to the mechanophore and its
dependence on, e.g., experimental design or the structure of the polymer backbone, is not
considered here. Instead, we sought to demonstrate that the qualitative trends one obtains
from our simplified model can aid in the experimental design of new systems (even
though some pulling scenarios are strictly “thought” experiments).
EBT calculations were performed with the NWChem package115 using density
functional theory116, employing the 6-31G* basis set117 and the B3LYP exchange-
correlation energy functional118. To verify the insensitivity of our results to the choice of
NHN
NHN3+
O NH
O
O
O+
HNO
O
O
OHN
+HNO
O
NHO
NH
O

58
the density functional and the basis set, we also repeated calculations using the M05-2X
hybrid meta exchange-correlation functional132 and the 6-31++G**/6-31G* basis sets (see
the Appendix for details). The nature of the stationary points was confirmed by a
vibrational frequency analysis. In addition, each TS was confirmed by following the
reaction coordinate from the TS to the reactant and the product using the intrinsic
reaction coordinate (IRC) method133, 134. The force dependence of the reaction rate was
estimated using Eq. 1, where !R = RTS " Rr was computed from optimized reactant and
TS geometries. To compute !" = "TS # " r we used the identity83 ! r ,TS = 2 " , where ! is
the nonzero eigenvalue of the 6x6 matrix
h11 = h11 - h12 h22( )-1
h21 (4.3)
computed, respectively, from the reactant or TS Hessian matrix
h =h11 h12
h21 h22
!
"##
$
%&&
(4.4)
In Eq. 4.4, this matrix is written in block-form in terms of, respectively, 6×6, 6×(3N-6),
(3N-6)×6 and (3N-6)×(3N-6) matrices h11 , h12 , h21 , and h2283. Eq. 4.4 further assumes
that the atoms are renumbered such that one always pulls on atoms 1 and 2. In contrast to
the experimental and earlier computational studies, we evaluated allN(N !1) 2 possible
pulling points for each mechanophore scaffold of N atoms, thus resulting in a total of
1456 simulated pulling experiments. The use of the EBT approximation allows one to
accomplish this seemingly formidable task at modest computational expense.

59
We systematically determined!" (i.e., !TS " ! r ) and !R (i.e., RTS ! Rr ) for each
atom pair, and the corresponding results are summarized in Fig 4.3. Surprisingly, a
comparable number of instances of reaction suppression (!R < 0 ) and enhancement (
!R > 0 ) were observed. This finding is counterintuitive, as is apparent from the thought
experiment involving the application of forces to the two atoms belonging to a diatomic
molecule. Suppressing bond scission would require that the forces push the atoms toward
each other, but such an arrangement of atoms leads to mechanical instability akin to that
experienced by a pencil balanced on its tip. Direct bond compression, therefore, cannot
account for reaction suppression, which, instead, must require an indirect mechanism
involving coupled distortions of multiple bonds. A cartoon depiction of this suppression
mechanism is given in Fig. 4.1C, where a RC in the multidimensional configuration
space diverges from the mechanical coordinate such that the stretching force pushes the
molecule away from its energetically favorable pathway.

60
Figure 4.3: Computed values of !R and !! for all possible combinations of pulling points for the indicated mechanophores. Nearly all combinations result in a positive value of !! ; however, both signs of !R are present with almost equal frequency.

61
A similar phenomenon has been observed for the forced dissociation of
biomolecular adhesion complexes135, where mechanical suppression of dissociation is
known as the “catch bond” or “molecular jamming” effect55, 61. While theoretically
predicted81, 85, 108, 109, 131, catch bonds are fairly atypical; conversely, “slip bonds”, whose
dissociation is promoted by force, are more common136. Only recently have catch bond
effects (i.e., the apparent strengthening of a covalent bond under mechanical stress) been
implicated in mechanochemical transformations involving non-biological chemical
systems. In particular, Boulatov and colleagues reported the kinetic stabilization of esters
toward hydrolysis under tension137, and Marx et al. showed that disulfide bonds are less
susceptible to nucleophilic attack under the action of mechanical force138. Our results,
however, suggest that catch bonds may be common in a variety of chemical
transformations. A few salient examples are presented in Fig. 4.4, which show that even a
subtle change in mechanophore design may result in a switch from slip bond to catch
bond behavior. Moreover, a “rollover” phenomenon similar to that predicted for
biomolecular catch bonds81, 108, 109, 131 is observed (i.e., a catch bond at low forces that
becomes superseded by a slip bond at higher forces; for further details, see Figs. 4.7 -
4.9). The ability to selectively suppress a chemical transformation through the application
of mechanical stress could have important design implications, particularly in the context
of molecular machines or force responsive materials139. For example, mechanical
degradation of such systems could be attenuated by directing external loads to
mechanically labile bonds in a manner that would suppress bond scission. Furthermore,

62
Figure 4.4: Examples of mechanically accelerated and mechanically suppressed reactivity. (A) Computed changes in the activation energy (equal to UTS !UR ! F"R , where Ur(TS ) is the reactant (or TS) energy on the force-modified potential energy surface) for the cycloreversion of a Diels-Alder adduct using pulling points for reaction acceleration (blue) and pulling points for reaction suppression (red). Note the rollover behavior: a catch bond at low forces is superseded by a slip bond at a higher force. (B) Computed changes in the activation energy for the cycloreversion of a Diels-Alder adduct using the pulling points for reaction acceleration (blue) and the pulling points for reaction suppression (red).

63
catch bond effects could potentially be harnessed to access materials that become more
mechanically robust under stress.
A separate but equally intriguing trend observed in Fig. 4.3 is the predominantly
positive sign of !" , which underscores the prevalence of the anti-Hammond effect in
this study. While puzzling at first glance, this result stems from the multidimensional
character of the underlying PES. A negative sign for the TS compliance ( !TS ), which
would lead to a negative !" , becomes statistically unlikely for systems of high
dimensionality. Indeed, as shown in Fig. 4.1A, !TS is negative only when the RC is
sufficiently aligned with the mechanical coordinate R such that strain causes the TS
energy to decrease. Since the TS configuration corresponds to a first-order saddle, there
is only one normal mode along which the energy decreases, while there are 3N-1 modes
along which the energy increases (or remains constant). Thus, the probability of favorable
alignment between R and the RC becomes vanishingly small with increasing number of
atoms, N. If, for example, the pulling direction is a random vector in the 3N-dimensional
space, then this probability is shown (Appendix) to decrease exponentially with N,
thereby rendering a negative value of !TS highly improbable even for systems of modest
size. Indeed, for all cases displayed in Fig. 4.3, !TS was found to have a positive value
(Fig. 4.5). Note, however, that symmetry requirements may lead to perfect alignment
between R and RC in certain pulling arrangements. Such cases would be exceptions to
the trend observed here.

64
Of course, a positive sign for !TS does not guarantee anti-Hammond behavior,
since !" could still be negative if !TS < ! r . This scenario, while explaining the few
instances of negative !" observed in Fig. 4.3, should be rare, considering that the TS of
a reaction involving bond scission is expected to be more mechanically labile than the
relatively stable reactant state.

65
Figure 4.5: Computed values of !R and !TS calculated at the B3LYP/6-31G* level of theory for all possible pulling points in the indicated mechanophores.

66
Although our findings are based on calculations that employ the EBT
approximation (whose limitations have been discussed in the literature83, 85, 140), the above
general considerations indicate that our conclusions are, in fact, not critically dependent
on the underlying EBT assumptions. For example, recent studies70, 140 highlight the effect
of the statistical-mechanical properties of the polymer backbone attached to the
mechanophore on the overall mechanochemical reactivity. It would appear that multiple
polymer conformations would invalidate the EBT assumption of a single TS. This
situation is, however, common in condensed phase rate theory, where the assumption of a
single PES saddle is inevitably incorrect. Coarse graining is the standard way of treating
this problem, where nonreactive degrees of freedom (such as those of the polymer
backbone or a solvent) are removed; as a result, the PES becomes replaced by a (typically
smoother) effective free energy surface (FES)141. Within this framework, the EBT
formula (4.1) can be derived from Kramers’ type theory or its multidimensional
generalization due to Langer (see, e.g., Hanggi et al.103), provided that the extension !R
is replaced by the statistically averaged extension and the susceptibilities ! r and !TS are
computed from the Hessian matrices of the FES108, 142. While the computation of a FES is
a nontrivial task, the above arguments show that the anti-Hammond effect is caused not
by some specific properties of the underlying PES but simply by its inherent multi-
dimensionality. As such, this argument equally applies to any multidimensional FES. In
support of this coarse-grained view of mechanochemical phenomena, studies of a two-
dimensional FES led to the prediction of anti-Hammond behavior in force-induced
protein unfolding131, a finding supported by kinetic studies143.

67
CONCLUSIONS
In sum, theoretical analysis revealed that anti-Hammond (rather than Hammond)
behavior should be prevalent in the mechanically induced changes of molecular energy
landscapes. In addition, our computational model predicted that mechanical forces may
facilitate or suppress a given chemical transformation, depending on how they are
applied. Experimental results supported the theoretically predicted reactivity trends and
demonstrated that subtle changes in mechanophore design can lead to dramatic (and even
counterintuitive) changes in mechanically induced reactivity84. Moreover, the work
reported here constitutes the first example of utilizing a theoretical model in the a priori
design and development of a novel mechanophore. Beyond its fundamental importance,
the ability to mechanically suppress chemical reactivity is expected to find applications in
materials science (e.g., materials that resist mechanical degradation under stress) and
facilitate future studies of force-induced biochemical phenomena 79.
APPENDIX
Computational details: Benchmark studies
DFT with the B3LYP functional was previously used for several
mechanochemical studies involving the COGEF and EFEI methods for simulating
mechanical stress11, 86, 89. B3LYP with the 6-31G* basis set was proven to provide
excellent geometries for reactants and transition states involving pericyclic reactions144.
To verify that our results were insensitive to the choice of the functional, we have also
repeated calculations using the M05-2X functional, which was shown to compare well

68
with the more expensive and accurate electronic structure methods145, 146. Specifically, we
compared the results from B3LYP/6-31G* with M05-2X/6-31++G**/6-31G* for 5
distinct mechanochemical processes: the conrotatory electrocyclic ring opening of a cis-
and trans-disubstituted benzocyclobutene, the formal [3+2] cycloreversion of a 1,2,3-
triazole, and the formal [4+2] cycloreversions of a furan/maleimide Diels-Alder adduct
and a maleimide/anthracene Diels-Alder adduct. Results from B3LYP/6-31G* were
compared with M05-2X/6-31G* for the maleimide/anthracene Diels-Alder adduct owing
to the size of the mechanophore. We determined !" (i.e., !TS " ! r ) and !R (i.e.,
RTS ! Rr ) for each atom pair using EBT (Eq. 4.1 from main text), and plotted the results
from M05-2X/6-31++G**/6-31G* in comparison to B3LYP/6-31G* in Fig. 4.6.

69
Figure 4.6: Comparison plots of !R and !" calculated using B3LYP/6-31G* (black) and M05-2X/6-31++G**/6-31G* (red) functionals.

70
Prevalence of the anti-Hammond effect on multidimensional energy landscapes: Probability considerations
Here we estimate the probability that “random” strain will decrease the energy of
the molecule at the TS saddle resulting in . In the vicinity of a TS saddle-point, the
energy of the molecule (relative to that of the saddle) can be written in terms of
appropriately chosen normal coordinates as
U = ! k1u12 2 + kiui
2 2i=2
n
" ,
where n = 3N-6 is the total number of degrees of freedom, excluding the translations and
rotations. The first term accounts for the displacement along the unstable barrier mode.
For simplicity, we will further assume that all ki’s are the same. Whenever the molecule’s
atoms are subjected to a small displacement, this sets a directional unit vector
u = (u1,....,un ) in the n-dimensional space of the molecule’s internal degrees of freedom.
The ends of all such vectors lie on an n-dimensional sphere of unit radius. The
susceptibility !TS is negative if !u12 2 + ui
2 2i=2
n
" < 0 . Assuming random direction of the
vector, the probability of this is given by
Pn = Sn!1!1 dsn!1"(u1
2 ! ui2
i=2
n
# )$ dsn!1$ = Sn!1!1 dsn!1"(2u1
2 !1)$ , (4.5)
where !(x) is the Heaviside step function, Sn!1 " dsn!1 = 2#n/2 $(n / 2)% is the surface
area of the sphere, and dsn!1 indicates integration over the (n-1)-dimensional surface of
the sphere. Using the spherical coordinates
!TS < 0

71
u1 = cos!1u2 = sin!1 cos!2
u3 = sin!1 sin!2 cos!3
...un"1 = sin!1 sin!2...sin!n"2 cos!n"1
un = sin!1 sin!2...sin!n"2 sin!n"1
and
dsn!1 = sinn!2"1 sin
n!3"2...sin"n!2d"1d"2...d"n!1 ,
we observe that integration over !1 decouples from that over the rest of the variables;
therefore, the ratio of the two surface integrals in Eq. 4.5 can be written in terms of one-
dimensional integrals:
Pn =d!1 sin
n"2!1#(2cos2!1 "1)
0
$
%
d!1 sinn"2!1
0
$
%= 1"
d!1 sinn"2!1
$ /4
3$ /4
%
d!1 sinn"2!1
0
$
%= 1"
dx(1" x2 )(n"3)/2"1/ 2
1/ 2
%
dx(1" x2 )(n"3)/2"1
1
%
where x = cos!1 . For large n values, both integrals are dominated by the values of x that
are close to 0; thus, their ratio is close to 1 and Pn becomes vanishingly small. In fact, Pn
decreases exponentially with increasing n. Since the number of possible pulling
directions (3N)(3N-1)/2 increases quadratically with the number of atoms, the probability
that one of them will align with the unstable direction to result in a negative !TS becomes
vanishingly small as N increases.

72
Illustrative Examples of Catch Bond Behavior
The formal [4+2] cycloreversions of a furan/maleimide and a maleimide/
anthracene Diels-Alder adduct were investigated for possible catch-bond scenarios using
EBT. As shown in Figs. 4.4A and 4.7, the application of a mechanical force leads to
initial reaction suppression at low forces and a rollover at high forces. The experimental
pulling points correspond to atoms (bridgehead C7 and the imide N17; Fig. 4.7) that are
further apart in the transition state than in the reactant configuration, which leads to an
acceleration of the reaction. However, EBT calculations suggest that pulling on atoms C3
and N17 (which move closer together in the transition state; Fig. 4.7) leads to a “jamming
effect”. This scenario is depicted in Fig. 4.1C where the mechanical pulling coordinate,
R, first decreases but eventually increases at higher forces. An alternative explanation for
the “jamming effect” is that the application of a stretching force at atoms C3 and N17
prevents the necessary motion/mode to access the transition state. Specifically, a
stretching force exerted on these atoms could promote a “slipping” motion, as opposed to
the necessary pseudo-butterfly motion, that prevents cycloreversion. This effect can be
overcome at sufficiently high forces, which results in the dissociation of the
furan/maleimide fragments. A similar scenario can be seen in Figs. 4.4B and 4.8, where
pulling on the mechanical coordinate leads to reaction suppression with no rollover at
high forces. The experimental pulling points correspond to the atom pair (anthracene C5
and imide N31) that facilitates the reaction, whereas pulling on atoms C8 and N31 leads to
suppression of chemical reactivity. The absence of rollover at high forces results from a
greater contribution of the first order term (F!R ) as compared to the second order term (

73
F2!" 2 ) and from the overall convexity of the energy barrier plotted as a function of the
force (Fig. 4.4B), which, in turn, is a consequence of the negative sign of !" .
Previous theoretical accounts have explored mechanochemical reactivity using
hydrogen atoms as the pulling points85, 147. Consequently, we have investigated the
mechanical suppression of reactivity in the maleimide/anthracene Diels-Alder adduct
using the hydrogen atom substituents on C5, C8 and imide N31 as the pulling points (Fig.
4.9). Consistent with the trends shown in Fig. 4.4B, employing the hydrogen atoms as
pulling points results in suppression of reactivity when pulling on the C8 and N31 hydrogen
atom substituents; conversely, the selection of the hydrogen atom substituents on C5 and
N31 as the pulling points results in an acceleration of mechanochemical reactivity.

74
Figure 4.7: Computed values of !R at the B3LYP/6-31G* level of theory for the formal cycloreversion of a furan/maleimide Diels-Alder adduct. According to our theoretical predictions, pulling on the bridgehead C7 and the imide N17 facilitates the reaction. In contrast, pulling on the methine C3 and N17 suppresses the same transformation. Internuclear distances are indicated in Angstroms. Atom code: C (Black), H (White), N (Blue), O (Red).

75
Figure 4.8: Computed values of !R at the B3LYP/6-31G* level of theory for the formal cycloreversion of a maleimide/anthracene Diels-Alder adduct. According to our theoretical predictions, pulling on the imide N31 and the anthracene C5 facilitates the reaction. In contrast, pulling on the imide N31 and the anthracene C8 suppresses the cycloreversion reaction. Internuclear distances are indicated in Angstroms. Atom code: C (Black), H (White), N (Blue), O (Red).

76
Figure 4.9: Computed changes in the activation energy (B3LYP/6-31G* level of theory) for the cycloreversion of a maleimide/anthracene Diels-Alder adduct using the hydrogen atom substituents on the N/C centers (as opposed to the ring N/C atoms; cf Fig. 4.4B) as pulling points for reaction acceleration (blue) and suppression (red).

77
Chapter 5: Exploring the topography of the stress-modified energy landscapes of mechanosensitive molecules
ABSTRACT
We propose a method for computing the activation barrier for chemical reactions
involving molecules subjected to mechanical stress. The method avoids reactant and
transition-state saddle optimizations at every force by, instead, solving the differential
equations governing the force dependence of the critical points (i.e. minima and saddles)
on the system’s potential energy surface (PES). As a result, only zero-force geometry
optimization (or, more generally, optimization performed at a single force value) is
required by the method. In many cases, minima and transition-state saddles only exist
within a range of forces and disappear beyond a certain critical point. Our method
identifies such force-induced instabilities as points at which one of the Hessian
eigenvalues vanishes. We elucidate the nature of those instabilities as fold and cusp
catastrophes, where two or three critical points on the force-modified PES coalesce, and
provide a classification of various physically distinct instability scenarios, each illustrated
with a concrete chemical example.
INTRODUCTION
Control of chemical reactivity by mechanical forces has been the subject of many
theoretical and experimental activities over the last several years. The coupling between
chemical and mechanical processes has been explored, for example, in the context of
single-molecule pulling studies of biomolecules20, 30-64, DNA and protein transport across
pores25, 71-77, molecular motors65-67, and materials chemistry3, 5-8, 11, 13-15, 80-89. Unlike

78
thermodynamic variables such as temperature or pressure, a mechanical force is a vector,
a property that enables its use to drive chemical reactions along specific, desirable
pathways. Rate calculations employing ab initio potential energy surfaces offer insights
into the force effect on the reaction rates3-7, 13, 14, 69, 81-89, 148 and, recently84, have been
employed for first principles design of mechanophores (i.e., mechanoresponsive
molecules). The starting point of most such studies is the expression for the force-
dependent reaction rate,
k(f ) = vexp ! "E(f )kBT
#$%
&'(
, (5.1)
where !E(f ) is the force-dependent activation barrier. Here, the force f is viewed as a
vector in the 3N-dimensional space of the N-atomic molecular system. In other words,
any combination of forces applied to each individual atom is, in principle, allowed, as
long as the total force and the total torque on then molecule are zero, ensuring its
mechanical stability. The most common pulling scenario involving a pair of opposing
forces applied to two atoms then corresponds to a more restrictive choice of the force f.
The activation barrier is computed as the energy difference between the
transition-state (TS) saddle and the reactant-state (RS) minimum on the force-deformed
potential energy surface (PES):
Vf (r) =V (r)! fr . (5.2)
Here V (r) is the zero-force potential energy viewed as a function of the 3N-dimensional
configuration vector r, whose components are the x, y, and z coordinates of each atom. If

79
rRS (f ) and rTS (f ) are the force-dependent positions of the RS minimum and the saddle,
then we have
!E(f ) "V rTS (f )[ ]#V rRS (f )[ ]# f rTS (f )# rRS (f )[ ] (5.3)
Two types of approaches have been proposed to estimate the activation barrier of
Eq. 5.3. The first one is “exact”82, 86 (inasmuch as the computed underlying potential
energy and transition-state theory expression of Eq. 5.1 are deemed exact). For any value
of the applied force, it seeks, numerically, the minimum and the saddle configurations
rRS (f ) and rTS (f ) corresponding to the force-modified potentialVf (r) . Equivalently, the
same result can be obtained from minimum and saddle-searches on a strain-modified
PES, where appropriate distance constraints are applied to the pulling points3, 4, 89. These
brute-force approaches are costly because a saddle-point search, for any force, requires
evaluation of the electronic energies for multiple molecular structures. In response to this
challenge, approximate methods were sought that estimate the force dependence of the
activation barrier using electronic energies and molecular configurations at zero-force.
The simplest one neglects the force dependence of the configurations rRS (f ) and rTS (f )
thus resulting in a linear force dependence of the barrier in Eq.3. This result is commonly
referred as the “Bell formula”101 although it was proposed earlier in different contexts19,
100.
A simple extension of the Bell formula69, 83, 85, 88 accounts for the displacements in
rRS (f ) and rTS (f ) to first order, and for the change in the reaction barrier to second order
in the force f. Perhaps somewhat inaccurately, we termed this approach the extended Bell

80
theory (EBT)83. Like Bell’s formula, EBT does not require any information other than the
TS and RS configurations, energies, and Hessians evaluated at zero force, thus providing
considerable computational savings as compared to the brute-force approaches. EBT can
also be extended to include quantum mechanical effects149. The disadvantage of the EBT
approximation is that it is just that: an approximation. Its most glaring deficiency is that it
fails to account for the changes in the reaction mechanism that may occur at high forces.
That is, the particular TS may disappear at a certain value of the force, resulting in a
switch to an alternative reaction mechanism150 or even to a barrierless, downhill process.
EBT, in contrast, assumes that the TS configuration evolves continuously with the force
and, therefore, exists regardless of the value of the force83, 85. Although chemical insight
combined with calculations may allow one to discover such reaction mechanism switches
even within the EBT framework85, a more automated way of detecting those phenomena
is desirable.
A switch in a reaction mechanism presents a difficulty even for brute-force
calculations. In practice, disappearance of a particular TS at a certain force is manifested
by the failure of the optimization routine to find a saddle point85. But such a failure could
also be blamed on an inadequate saddle search routine or impatience of the researcher.
Moreover, finding the exact force at which the TS disappears by analyzing the code’s
failures is both problematic and inefficient.
The purpose of this chapter is to describe and validate an exact method that tracks
the evolution of any given PES critical point (RS or TS) as a function of the applied
force. Depending on both the pulling geometry and the energetics of the reaction, the

81
force-induced evolution of a critical point may come to an end at a certain force, above
which this critical point no longer exists. Our method automatically detects such force-
induced instabilities. We further classify possible types of instabilities encountered as the
PES topology evolves with the force. By adapting results from differential geometry and
catastrophe theory to the specific case of force-modified PES, we thus provide a
systematic mathematical framework for describing mechanochemical phenomena.
EVOLUTION OF PES SADDLES AND MINIMA IN RESPONSE TO AN EXTERNAL FORCE
Consider a one-dimensional particle subjected to a potential V (x) and an external
force f. The critical points of the force-modified potential, Vf (x) =V (x)! fx , are given by
(d dx) V (x)! fx[ ] = 0 or
!V (x) = f . (5.4)
If the force is increased by df then the change in the critical point position can be found
from the equation
!V (x + dx) = !V (x)+ !!V (x)dx = f + df ,
or
dx = df !!V [x( f )] , (5.5)
where x( f ) describes the “trajectory” spanned by the critical point when the force is
varied. Eqs. 5.4 - 5.5 are easily generalized to the multidimensional potential of Eq. 5.2.
The molecular configurations corresponding to its critical points (i.e., minima, saddles
and maxima) satisfy the equation

82
!V = f , (5.6)
where !V is the PES gradient. The multidimensional equivalent of Eq. 5.5 is then
dr = h!1[r(f )]df , (5.7)
where h(r) is the Hessian matrix corresponding to the PES V (r) . In most of the pulling
studies, the direction of the force vector is constant, so we can write f = Fl , where F is
the absolute value of the force and l is a vector that specifies its direction. Integrating Eq.
5.7, we now obtain
r(F) = r(0)+ h!1[r( "F )]0
F
# ld "F (5.8)
The approach presented here is based on Eq. 5.8. Starting with a zero-force TS
saddle or RS minimum, we propagate Eq. 5.8 numerically using a finite difference
method. Thus, the method requires only a single saddle search performed at zero force,
just like in EBT. At the same time, uncontrolled approximations inherent to EBT are no
longer made.
The reaction barrier is now computed using Eq. 5.3, or, equivalently
!E(F) "V rTS (F)[ ]#V rRS (F)[ ]# Fl rTS (F)# rRS (F)[ ] (5.9)
It is also possible to write an equation analogous to Eq. 5.8 for the barrier itself (see
refs.83, 108, 109):
!E(F) = !E(0)" d #F [rTS ( #F )" rRS ( #F )]l0
F
$ (5.10)

83
In practice, we do not need to integrate Eq. 5.10 since we can estimate the barrier directly
from Eq. 5.9.
Eqs. 5.5 and 5.7 assume that the PES is locally quadratic. This assumption breaks
down if the Hessian matrix becomes singular and thus non-invertible. In 1D, this happens
at the inflection points of V (x) , where !!V (x) = 0 . In an M-dimensional molecular
space, such offending points occupy (M-1)-dimensional surfaces and so instances where a
curve r(F) hits such a surface are common. Such events are not merely numerical
nuisance: they signify qualitative changes in the reaction mechanism, where, for example,
a particular TS saddle ceases to exist. The calculation, therefore, must be terminated and
alternative reaction mechanisms have to be considered. The points where Hessian
singularities are encountered, or the “catastrophes” in the language of catastrophe
theory151, 152, are the force-induced instabilities previously discussed in the context of
mechanochemistry85 Similar phenomena are well known in the theory of phase
transitions. In the next Section we will provide both a classification of possible
catastrophes relevant for the calculation of force-dependent reaction rates and illustrate
them with chemical examples. Before doing so, we close this Section with two
comments. First, unless internal coordinates are used to specify the molecular
configuration r, h(r) is already singular, with at least 3 eigenvalues corresponding to
rigid-body translations (see Section 5 for further discussion of the precise number of zero
modes and its dependence on the pulling setup). This complication can be avoided by
replacing the inverses appearing in Eqs. 5.7 – 5.8 with the generalized inverse83, where
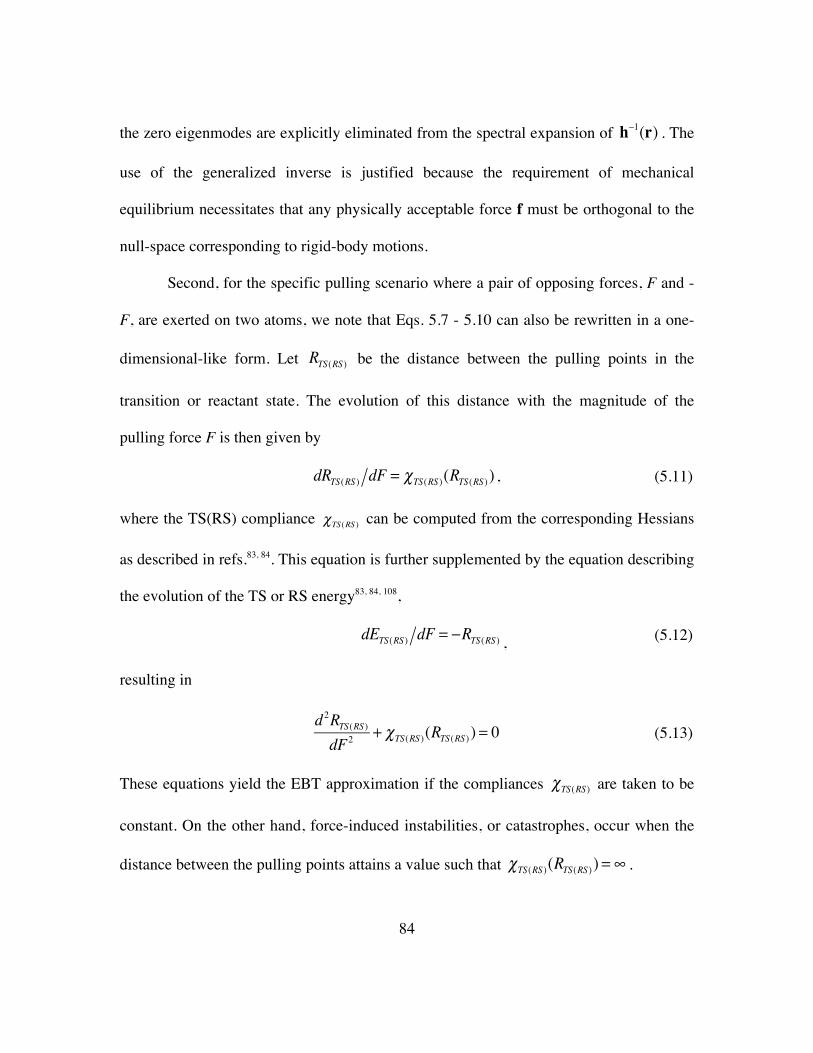
84
the zero eigenmodes are explicitly eliminated from the spectral expansion of h!1(r) . The
use of the generalized inverse is justified because the requirement of mechanical
equilibrium necessitates that any physically acceptable force f must be orthogonal to the
null-space corresponding to rigid-body motions.
Second, for the specific pulling scenario where a pair of opposing forces, F and -
F, are exerted on two atoms, we note that Eqs. 5.7 - 5.10 can also be rewritten in a one-
dimensional-like form. Let RTS(RS ) be the distance between the pulling points in the
transition or reactant state. The evolution of this distance with the magnitude of the
pulling force F is then given by
dRTS(RS ) dF = !TS(RS )(RTS(RS ) ) , (5.11)
where the TS(RS) compliance !TS(RS ) can be computed from the corresponding Hessians
as described in refs.83, 84. This equation is further supplemented by the equation describing
the evolution of the TS or RS energy83, 84, 108,
dETS(RS ) dF = !RTS(RS ) , (5.12)
resulting in
d 2RTS(RS )dF2 + !TS(RS )(RTS(RS ) ) = 0
(5.13)
These equations yield the EBT approximation if the compliances !TS(RS ) are taken to be
constant. On the other hand, force-induced instabilities, or catastrophes, occur when the
distance between the pulling points attains a value such that !TS(RS )(RTS(RS ) ) = " .

85
COMPUTATIONAL DETAILS AND SYSTEMS OF INTEREST
To test the approach of the previous Section, we have applied it to the ring-
opening reactions of trans 1,2-dimethylbenzocyclobutene (DBC) and 1,3-cyclohexadiene
(CHD)83, 85, 86. This choice was largely guided by the availability of an earlier study by
Bailey and Mosey85, to which our results can be compared.
All calculations were performed with an in-house python script embedded in the
NWCHEM package115. The calculations reported in the main text employ density
functional theory with the B3LYP exchange-correlation functional118. The analytical
hessian implementation available for the B3LYP exchange-correlation functional was
found to significantly reduce numerical errors and computational expense required for the
eigenvalue analysis, which is reported in the Results section in order to elucidate the
precise nature of force-induced instabilities. However in order to compare our results to
those of Bailey and Mosey85, we have also performed calculations using
CASSCF(6,6)/6-31G** (same level of theory as in ref. 85) and found that our predictions
for the force dependence of activation barriers are virtually indistinguishable from those
of ref.85. See Appendix for further details.
Electronic structure calculations were performed at the B3LYP/6-31G* and
B3LYP/6-31G** level of theory for DBC and CHD, respectively. Eq. 5.8 was integrated
with Heun’s predictor-corrector algorithm153 using, respectively, a force step of 4.1 pN
and 0.8 pN for DBC and CHD. The activation barrier was then computed, as a function
of the force, using Eq. 5.9.

86
RESULTS: ANALYSIS OF REACTANT- AND TRANSITION-STATE INSTABILITIES OCCURRING IN WELL STUDIED MECHANOPHORES
When applied to the evolution of a molecular PES, catastrophe theory makes a
general prediction151. If only a single parameter is varied (force) and in the absence of any
special symmetries of the underlying PES, the only possible force-induced instability is
of the fold-catastrophe type, where two critical points disappear via coalescence with one
another. This prediction is explicitly proven, for a two-dimensional PES, in Appendix A.
This type of instability has been studied quite extensively for one-dimensional
potentials40, 105-107, 154, where the RS minimum and the TS maximum merge with one
another resulting is the disappearance of the activation barrier.
When, however, the force-modified PES has certain symmetry, another type of
instability is possible, where two equivalent critical points merge with a third one,
resulting in a single critical point. Known as the cusp catastrophe, this type of instability
is also well known in the context of second-order phase transitions.
Because the minima and rank 1 saddles have special physical significance as
reactant and transition states, the above two mathematical possibilities result in several
physically distinct scenarios shown in Figure 5.1. In what follows, these scenarios are
described and illustrated with specific chemical examples.

87
Figure 5.1: Cartoon representation of various instabilities occurring when the molecular PES is deformed by the application of a force. The red line shows the change in potential energy as the system evolves along its (local) reaction coordinate while the dashed line shows the energy variation along a transverse degree of freedom. Black arrows show relative movement of the PES critical points as the force approaches a critical value corresponding to the instability.
(a) (b)
(c) (d)

88
Case 1: A TS saddle coalesces with a RS minimum. The barrier between the two vanishes.
The scenario where the barrier separating the RS and the TS disappears when the
RS minimum and the TS saddle merge (Fig. 5.1a) is illustrated by the conrotatory ring-
opening of DBC (Fig. 5.2), with a pair of opposing forces applied to the substituent
carbon atoms (C1 and C2) as in earlier studies83, 86. As the magnitude of the pulling force
is increased, the barrier between the RS and the TS disappears (Fig. 5.3a), and, at the
same time, the negative eigenvalue of the TS Hessian matrix approaches zero from below
while one of the positive eigenvalues of the RS Hessian approaches zero from above
(Fig. 5.3b). Use of EBT in this case does not lead to qualitative errors because the EBT
calculation should, of course, be stopped whenever the barrier it predicts vanishes.
Nevertheless, EBT significantly underestimates the precise value of the force at which
this happens (see the dashed line in Fig. 5.3a).

89
Figure 5.2: Reaction pathway for ring-opening of DBC. The pulling points are shown in red.

90
Figure 5.3: Fold catastrophe on the DBC potential energy surface (Case 1): (a) The activation barrier for ring-opening reaction of DBC as a function of the pulling force applied between the C1 and C2 atoms, as shown in Fig. 2. The EBT estimate is shown as a dashed line. (b) Force dependence of the lowest three non-zero eigenvalues of the TS and RS Hessians. Red: TS modes. Blue: RS modes. Horizontal black line denotes a zero- frequency baseline. Inset shows a magnified image of the low eigenvalue range where the negative TS mode and the positive RS mode simultaneously approach the zero-baseline at a critical force.

91
Case 2: A TS saddle coalesces with a rank 2 saddle.
The case where the TS saddle coalesces with a rank 2 saddle (Fig. 5.1b) is
exemplified by the conrotatory ring-opening of CHD (RS1 ! TS1 ! P1 in Fig. 5.4)
while a pair of opposing forces are applied to the H1 and H2 atoms, as shown in Fig. 5.4.
Note that the same pulling points are labeled differently (H5-H6) in ref.85. The pulling
force lowers the reaction barrier until a critical force of ~ 1585 pN is reached, beyond
which the conrotatory transition state (labeled TS1 in Fig. 5.4) disappears. In contrast to
Case 1, however, the reactant state RS1 undergoes no instability and so the energy
difference between TS1 and RS1 does not vanish (Fig. 5.5a). Consequently, EBT
calculations provide no immediate means for detecting this type of instability and
erroneously predict the existence of the conrotatory pathway beyond the critical force.
The coalescence of TS1 with a rank 2 saddle is evident from the analysis of the transition
state Hessian spectrum (Figs. 5.5b), with its positive eigenvalue approaching zero from
above. At the same time, the nature of the minimum, RS1, does not change and the
corresponding eigenvalues remain finite (except for those that are always identically
equal to zero due to the translational and rotational invariance). We note that this scenario
was previously found in ref.85, where the disappearance of the conrotatory transition state
TS1 was deduced from the failure of the optimization routine to converge to a saddle
beyond a critical force. Our method both allows one to precisely locate this instability
and clarifies the changes in the PES topology that lead to this type of scenario.

92
Figure 5.4: Possible reactant and transition-state structures of CHD encountered in the conrotatory ring-opening (RS1! TS1! P1) and ring-flip (RS1! RF-TS! RS2) reactions. Red arrows schematically show the force vectors orientation with respect to mirror-plane of RF-TS structure. The symmetry-related structures shown in light gray are not explicitly considered in our calculations.

93
Figure 5.5: Fold catastrophe on the CHD potential energy surface (Case 2): (a) Ring-opening activation barrier for CHD plotted as a function of an external force applied between the H1 and H2 atoms, as shown in Fig. 5.4. The EBT estimate is shown as a dashed line. (b) Force dependence of the lowest three non-zero eigenvalues for TS1 and RS1. Red: TS1 modes. Blue: RS1 modes. Horizontal black line denotes a zero- frequency baseline. Inset shows a magnified image of the low eigenvalue range where one of the positive TS1 modes is approaching the zero-baseline at a critical force.

94
Case 3: A RS minimum is destabilized by the force.
A RS can be destabilized by a force when it coalesces with a rank 1 saddle.
Although, fundamentally, this mechanism is identical to that of Case 1, its practical
implications are different in that the saddle involved in the RS destabilization is different
from the TS of the reaction under study. The same reaction as in Case 2, the conrotatory
ring-opening of CHD, provides an example of this scenario when a pair of opposing
forces are applied to H1 and H3 (Fig. 5.4). At zero force, the reactant RS1 is separated
from the (symmetrically equivalent) RS2 and interconversion between RS1 and RS2
involves a ring-flip reaction through a saddle that we denote RF-TS.
At nonzero force, this symmetry is broken and, as the force is increased, RS1
merges with RF-TS at a force of about ~ 675 pN (Fig. 5.6a). At forces above this critical
value, only RS2 exists. As in Case 1, one positive eigenvalue of the RS1 Hessian matrix
and the negative eigenvalue of the RF-TS Hessian matrix approach zero, respectively,
from above and below (Fig. 5.6b). An upshot of this instability is that the reaction
pathway RS1 ! TS1 ! P1 ceases to exist above 675 pN, in agreement with the
findings of ref.85.

95
Figure 5.6: Fold catastrophe on the CHD potential energy surface (Case 3): (a) The activation barrier for the ring-flip reaction (i.e. the one from RS1 to RS2 in Fig. 5.4) plotted as a function of a force applied between the H1 and H3, as shown in Fig. 4. The EBT estimate is shown as a dashed line. (b) Force dependence of the lowest three non-zero eigenvalues for the RF-TS and RS1 Hessians. Red: RF-TS modes. Blue: RS1 modes.

96
Case 4: Cusp catastrophe
In Case 3, application of a force between the H1 and H3 atoms breaks the
symmetry of the two states, RS1 and RS2, which are symmetrically equivalent at zero
force. As a result, when the force is increased RS1 merges with RF-TS, while RS2
survives. If, in contrast, the C1 and C2 atoms in CHD are used as the pulling points (Fig.
5.4) the symmetry between RS1 and its mirror image RS2 is preserved even at a finite
force. When the force is increased, the barrier to the ring-flip reaction disappears through
a cusp catastrophe, where the three critical points, RS1, RS2, and RF-TS merge
simultaneously into a single minimum (Figs. 5.7a,b). Since RS1 and RS2 are the mirror
images of one another, the eigenvalue spectra of the RS1 and RS2 hessians are identical,
with one positive eigenvalue approaching zero from above at the instability point (Fig.
5.7b), while the negative eigenvalue of the RF-TS hessian approaches zero from below.
Of course, such a choice of pulling points is unreasonable if acceleration of the
ring-opening of CHD is desired, as the force is not aligned with the desired reaction
pathway. Moreover, the instability we observe here occurs at a force so high that other
mechanically induced bond rupture processes will likely take place. Nevertheless, the
point of the exercise reported here is to point the possibility of a cusp-catastrophe
instabilities in systems of high symmetry, regardless of their relevance for the particular
reaction studied here. Figures 5.1c,d further elaborates on various scenarios where cusp
catastrophes may be encountered. Specifically, the spatial location of the cusp
catastrophe corresponds to a point where the reaction pathway bifurcates via the splitting
of either a saddle or a reactant minimum into two.

97
Figure 5.7: Cusp catastrophe on the CHD potential energy surface (Case 4): (a) The activation barrier for the ring-flip reaction (i.e. the one from RS1 to RS2 in Fig. 5.4) as a function of a force applied between the C1 and C2 atoms. The EBT estimate is shown as a dashed line. (b) Force dependence of the lowest three non-zero eigenvalues of the RF-TS and RS1 (or, equivalently, RS2) Hessians. Red: RF-TS modes. Blue: RS1 (RS2) modes. Horizontal black line denotes a zero- frequency baseline.

98
CONCLUDING REMARKS
Mechanochemistry holds promise to guide chemical transformation along
otherwise inaccessible pathways and/or to mechanically stabilize transient molecular
structures. There are, however, fundamental limitations on the type of PES
transformations that can be achieved by subjecting molecules to constant forces. In
particular, since the force-modified potential of Eq. 5.2 is linear in the force f, the
molecule’s Hessian, which determines the stability of any molecular configuration r in
the presence of a force, depends on the configuration only and not (explicitly) on the
force.
To illustrate this point, consider a two-dimensional PES U(x, y) (Fig. 5.8) and its
force-modified counterpart Uf (x, y) =U(x, y)! fxx ! fyy . Application of an appropriate
force ( fx , fy ) = !U(x0, y0 ) ensures that the configuration (x0, y0 ) is a critical point of
Uf (x, y) , but the type of this critical point is entirely determined by the properties of the
zero-force PES, since both U(x, y) and Uf (x, y) have identical Hessians. As a result, the
configurational space (x,y) is divided into three distinct regions (Fig. 5.8): Elliptic points
(colored red in Fig. 5.8), where both eigenvalues of the Hessian h(x, y) are positive,
become stable minima when an appropriate force is applied. Hyperbolic points, where
h(x, y) has a positive and a negative eigenvalue (green), become rank-1 saddles when an
appropriate force is applied. A hyperbolic point cannot correspond to a stable molecular
structure under any constant force. Finally, configurations corresponding to the elliptic
points (blue) where both eigenvalues of h(x, y) are negative can only be maxima on the

99
force-modified PES. The mechanical instabilities studied in this paper occur at the
parabolic points belonging to the lines that separate the regions of elliptic and hyperbolic
points. Therefore, the configurations corresponding to these instabilities are implicitly
determined by the equation
deth(x, y) = 0
This argument, when extended to spaces of higher dimensionality, leads to the conclusion
that molecular configurations r corresponding to mechanical instabilities must lie on the
hypersurfaces (lines in 2D) that satisfy the equation
de !t h(r) = 0 , (5.14)
where the prime indicates that the zero eigenvalues corresponding to the translations and,
where appropriate, rotations (see below) are omitted from the determinant.

100
Figure 5.8: Any configuration (x, y) can be made a critical point on a force-modified PES by applying an appropriate force, but its properties (i.e. whether the critical point is a minimum, saddle, or a maximum) are entirely determined by the zero-force PES U(x, y) , whose contour plot is shown here. In 2D, the (x, y) plane is then divided into the regions of elliptic points (red, blue) corresponding, respectively, to the minima and the maxima of the force-modified PES, and hyperbolic points (green), which are saddles. The parabolic points belonging to the lines that separate these regions are where the force-induced instabilities take place. The specific PES used to make this plot is given by U(x, y) = x2 / 2 ! x3 / 3+ (1 / 2) y4 / 4 + y2 (0.75 ! x) / 2"# $% + 0.2xy
3 / 3 .
Determination of the number of zero modes that are to be omitted from Eq. (5.14)
is subtle. Recall that the 3N components of the force vector f are the x, y, and z
components of the forces acting on each atom. If f is subject to the physically sensible
requirement that the sum of all the forces acting on the molecule’s atoms is zero, then the
resulting force-modified PES is invariant with respect to arbitrary translations but –

101
generally – not rotations. Thus, in contrast to the equilibrium zero-force RS or TS
configuration, whose Hessian has 6 zero eigenvalues (5 for linear molecules), for “most”
configurations h(r) has only three zero eigenvalues corresponding to translations.
However, in the more specific case where opposing forces act on a pair of atoms, the
force-modified PES retains a symmetry with respect to rotations around the axis
connecting the two atoms and so the Hessian has 4 zero eigenvalues. Note that the
condition f=0 may itself be viewed as an instability point, since the rotational symmetry
of the zero-force PES is (fully or partially) destroyed by application of an arbitrarily
small force and, as a result, one or more Hessian eigenvalues vanish when the force
approaches zero. This behavior is, indeed, observed in Figs. 5.3, 5.5 - 5.7.
Since, in addition to offering a general framework for understanding mechanical
instabilities, this paper purports to provide a numerical approach to computing force-
dependent activation barriers, comments concerning the numerical efficiency of the
method are in order. The anecdotal experience provided by the calculations we have
performed so far is that, away from the instabilities, the force dependence of the
activation barrier, !E(F) , converges quickly to the exact curve as the finite-difference
force step is decreased. This is not surprising since the EBT result may be viewed as a
single-step finite-difference approximation to Eqs. 5.8 - 5.9, where the RS and TS
hessians are taken to be constant matrices evaluated at zero force. Since in most cases
EBT is already a good approximation, further reduction of the force step is likely to lead
to quick improvement. However, if the precise identification of the instability points
and/or hessian eigenvalue analysis in the vicinity of those points is desired, the numerical

102
demands are found to increase rapidly. The reason is, again, not surprising since the
inverse h!1 needed in Eqs. 5.7 – 5.8 diverges as F ! Fc!1/2 in the vicinity of the force
F ! Fc where the instability takes place (see Appendix). Adaptive finite-difference
schemes with a force step that decreases in the vicinity of the instability point may be
useful in this case. In addition, accurate solution of Eqs. 5.7 – 5.8 in the vicinity of Fc
places an increased demand on the accuracy of the hessian matrix h itself. This should be
kept in mind in situations where the matrix h cannot be evaluated analytically and finite-
difference approximations are used instead.
APPENDIX
Fold catastrophe on a 2D PES
To examine the behavior of a PES in the vicinity of a catastrophe, consider the
force-modified PES of the form
VF (x, y) =V (x, y)! F(lxx + lyy) ,
where the vector l = (lx ,ly ) specifies the direction of the force, whose magnitude is given
by F. Suppose the Hessian,
h =Vxx VxyVyx Vyy
!
"##
$
%&&
becomes singular at some critical value of the force, F = Fc . We then consider the
variation of the PES in vicinity F = Fc , viewing
! = F " Fc

103
as a small parameter. Let us further assume that, at ! = 0 , the critical point (minimum,
saddle, or a maximum) of the potential VFc (x, y) is located at x = y = 0 . Since one of the
Hessian eigenvalues must vanish at this point, the Taylor expansion of the PES near this
point, to third order, can be written in the form
VFc (x, y) = ky2 2 + Cn,3!nx
ny3!nn=0
3
" (A5.1)
Here the coordinate y is chosen to coincide with the eigenvector of h that has a
nonzero eigenvalue k. Since the other eigenvalue must be zero, the term quadratic in x is
absent in this expansion. At F ! Fc , we can write
VF (x, y) = ky2 2 + Cn,3!nx
ny3!n ! (F ! Fc )(lxx + lyy) =n=0
3
" ky2 2 + Cn,3!nxny3!n !#(x + y)
n=0
3
" , (A5.2)
where we can always chose lx = ly = 1 by rescaling the coordinates. Our goal is to find
the fate of the critical point when the force is changed from Fc to F = Fc +! , where ! is
small. By setting the first derivatives of the potential to zero, we obtain the equations
satisfied by the critical point:
!" + Cn,3!nnxn!1y3!n = 0
n=1
3
# (A5.3)
ky !" + C3!n,nnyn!1x3!n = 0
n=1
3
# (A5.4)
We will allow ! to be of either sign and look for the solution in the form of a power law:
x =! " a , y = # " b (A5.5)

104
It can be shown that, if a>b, equations A5.3 – 5.4 cannot be satisfied. Assuming then
a<b, we write Eq. A5.3, to lowest order in ! :
!" + 3C3,0x2 = !" + 3C3,0#
2 " 2# = 0 (A5.6),
which gives a = 1/ 2 and
! 2 = sign(" )3C3,0
(A5.7)
Importantly, a pair of real-valued solutions to Eq. A5.7, ± ! , exists only for a
negative ! if C3,0 < 0 and vice versa. Therefore, the corresponding pair of critical points
of the force-modified PES disappears as the force approaches Fc from below or above,
depending on the sign of the anharmonic coefficient C3,0 .
Substituting Eq. A5.7 into A5.4 one obtains, to lowest order in ! ,
k! " b #" +C2,1$2 " 2a = 0 ,
resulting in b=1.
Do the nontrivial critical points obtained at nonzero ! correspond to minima,
saddles, or maxima? To answer this question, we need to examine the sign of the
determinant of the hessian calculated at this point. Evaluating the second derivatives of
the potential to lowest order in ! , we obtain
h !±6C3,0 " # 1 2 ±2C2,1 " # 1 2
±2C2,1 " # 1 2 k
$
%
&&&
'
(
)))
and

105
deth = ±6kC3,0 ! " 1 2
(A5.8)
Since, according to Eq. A5.8, det h has opposite signs for the two critical points, one of
them must be a saddle and the other a minimum or a maximum.
Two important observations that are used in the main body of this article are as
follows:
1. A pair of critical points that differ in their saddle rank by 1, e.g. a maximum and a
saddle or a minimum or a saddle, coalesce and vanish when the force approaches
a critical value from above or from below (depending on the local PES details
near the critical point).
2. This is accompanied by the vanishing of one of the eigenvalues of the Hessian h.
From Eq. A5.8 we also see that the vanishing eigenvalue approaches zero as
! 1 2 = F " Fc1 2 .
Comparison to previous work: An illustrative example
To provide a comparison with previously published data, here we focus on the
example of the previously studied ring-opening of CHD85 using the H4 - H5 and H6 - H7
atom pairs as the pulling points (Fig. 5.9). Note that the same pulling points were referred
to as H2-H3 and H1-H4 in ref. 85. In contrast to the processes discussed in the main text,
regardless of its magnitude, a force applied between these pulling points does not
destabilize the reactant minimum. As discussed in ref. 85, the ring-opening reaction may
proceed through the conrotatory and disrotatory transition states (RS ! C-TS ! P and
RS ! D-TS ! P, respectively, in Fig. 5.9). The electronic structure calculations were

106
performed at the same level of theory (CASSCF(6,6)/6-31G** ) as in ref. 85 and a force
increment of ~ 4.1 pN was used to integrate Eq. 5.8. The force dependences of the
reaction barrier obtained for each pathway are visually indistinguishable from the barrier
vs. force plots reported by Bailey and Mosey85 (Fig. 5.10). Consistent with their
observations, a pulling force applied between the H4 - H5 atoms suppresses the reaction
along the disrotatory pathway (blue line in Fig. 5.10a) and promotes the reaction along
the conrotatory pathway (red line in Fig. 5.10a). The case of the H6-H7 pulling points
(Fig. 5.10b) is an example, where EBT predictions significantly diverge from the exact
result at high forces. Again, our approach in this case yields results that are virtually
indistinguishable from the calculations reported in ref.85.
Figure 5.9: Ring-opening of CHD through the conrotatory (C-TS) and disrotatory (D-TS) transition states. The pulling points used in the calculation are shown in color.

107
Figure 5.10: Activation energy for ring-opening of CHD plotted as a function of a pulling force applied between (a) H4-H5 and (b) H6-H7 atom pairs for conrotatory (red) and disrotatory (blue) reaction pathways. Solid line: Numerical results using Eqs. 5.8 and 5.9. Dashed line: EBT.

108
References
1. D. Chandler, Introduction to Modern Statistical Mechanics. (Oxford University Press, Oxford, 1987).
2. M. E. Tuckerman, Statistical Mechanics: Theory and Molecular Simulation. (Oxford University Press, Oxford, 2010).
3. M. M. Caruso, D. A. Davis, Q. Shen, S. A. Odom, N. R. Sottos, S. R. White and J. S. Moore, Chemical Reviews 109 (11), 5755-5798 (2009).
4. M. K. Beyer, Journal of Chemical Physics 112 (17), 7307-7312 (2000). 5. M. K. Beyer and H. Clausen-Schaumann, Chemical Reviews 105 (8), 2921-2948
(2005). 6. J. M. Lenhardt, M. T. Ong, R. Choe, C. R. Evenhuis, T. J. Martinez and S. L.
Craig, Science 329 (5995), 1057-1060 (2010). 7. J. N. Brantley, S. S. M. Konda, D. E. Makarov and C. W. Bielawski, J Am Chem
Soc 134 (24), 9882-9885 (2012). 8. J. N. Brantley, K. M. Wiggins and C. W. Bielawski, Science 333, 1606 (2011). 9. K. M. Wiggins and C. W. Bielawski, Angew. Chem., Int. Ed. 51, 1640-1643,
S1640/1641-S1640/1611 (2012). 10. K. M. Wiggins, J. A. Syrett, D. M. Haddleton and C. W. Bielawski, J Am Chem
Soc 133 (18), 7180-7189 (2011). 11. C. R. Hickenboth, J. S. Moore, S. R. White, N. R. Sottos, J. Baudry and S. R.
Wilson, Nature 446 (7134), 423-427 (2007). 12. D. A. Davis, A. Hamilton, J. Yang, L. D. Cremar, G. D. Van, S. L. Potisek, M. T.
Ong, P. V. Braun, T. J. Martinez, S. R. White, J. S. Moore and N. R. Sottos, Nature 459, 68-72 (2009).
13. R. Boulatov and T. J. Kucharski, Journal of Materials Chemistry 21 (23), 8237-8255 (2011).
14. Z. Huang and R. Boulatov, Chemical Society reviews 40 (5), 2359-2384 (2011). 15. A. L. Black, J. M. Lenhardt and S. L. Craig, J. Mater. Chem. 21, 1655-1663
(2011). 16. J. N. Brantley, K. M. Wiggins and C. W. Bielawski, Polym. Int. (2012). 17. K. M. Wiggins, J. N. Brantley and C. W. Bielawski, Chemical Society Reviews
42 (17), 7130-7147 (2013). 18. H. Eyring, J Chem Phys 3, 107 (1935).

109
19. H. Eyring, J. Chem. Phys. 4, 283 (1936). 20. A. Minajeva, M. Kulke, J. M. Fernandez and W. A. Linke, Biophysical Journal
80, 1442 (2001). 21. N. Becker, E. Oroudjev, S. Mutz, J. P. Cleveland, P. K. Hansma, C. Y. Hayashi,
D. E. Makarov and H. G. Hansma, Nature Materials 2, 278 (2003). 22. G. E. Fantner, E. Oroudjev, G. Schitter, l. S. Golde, P. Thumer, M. M. Finch, P.
Turner, T. Gutsmann, D. E. Morse, H. Hansma and P. K. Hansma, Biophysical Journal 90, 1411-1418 (2006).
23. B. L. Smith, T. E. Schaffer, M. Viani, J. B. Thompson, N. A. Frederick, J. Kindt, A. Belcher, G. D. Stucky, D. E. Morse and P. K. Hansma, Nature 399, 761 (1999).
24. C. Lee, M. P. Schwartz, S. Prakash, M. Iwakura and A. Matouschek, Mol. Cell 7, 627-637 (2001).
25. D. E. Makarov, Acc Chem Res 42 (2), 281-289 (2009). 26. A. Matouschek, Current Opinion in Structural Biology 13, 98-109 (2003). 27. A. Matouschek and C. Bustamante, Nat Struct Biol 10 (9), 674-676 (2003). 28. S. Prakash and A. Matouschek, Trends in Biochemical Sciences 29 (11), 593-600
(2004). 29. K. Shariff, S. Ghosal and A. Matouschek, Biophysical Journal 86, 3647-3652
(2004). 30. J. Alegre-Cebollada, R. Perez-Jimenez, P. Kosuri and J. M. Fernandez, Journal of
Biological Chemistry 285, 18961-18966 (2010). 31. P. E. Marsalek, H. Lu, H. Li, M. Carrion-Vazquez, A. F. Oberhauser, K. Schulten
and J. Fernandez, Nature 402, 100 (1999). 32. E. Paci and M. Karplus, J. Mol. Biol. 288, 441-459 (1999). 33. D. K. Klimov and D. Thirumalai, Proc. Natl. Acad. Sci. USA 97 (13), 7254
(2000). 34. D. E. Makarov, P. K. Hansma and H. Metiu, J. Chem. Physics 114, 9663 (2001). 35. A. F. Oberhauser, P. K. Hansma, M. Carrion-Vazquez and J. M. Fernandez, Proc.
Natl. Acad. Sci USA 98 (2), 468-472 (2001). 36. M. Rief, J. M. Fernandez and H. E. Gaub, Phys. Rev. Lett. 81, 4764 (1998). 37. M. Rief, M. Gautel, F. Oesterhelt, J. M. Fernandez and H. E. Gaub, Science 276,
1109-1112 (1997). 38. M. Schlierf, H. Li and J. M. Fernandez, Proc. Natl. Acad. Sci USA 101, 7299
(2004).

110
39. S. Kirmizialtin, L. Huang and D. E. Makarov, J. Chem. Phys. 122, 234915 (2005). 40. D. J. Lacks, Biophysical Journal 88, 3493-3501 (2005). 41. B. Isralewitz, M. Gao and K. Schulten, Current Opinion in Structural Biology 11,
224-230 (2001). 42. S. Izrailev, S. Stepaniants, M. Balsera, Y. Oono and K. Schulten, Biophysical
Journal 72 (4), 1568-1581 (1997). 43. H. Lu, B. Isralewitz, A. Krammer, V. Vogel and K. Schulten, Biophysical Journal
75, 662 (1998). 44. H. Lu and K. Schulten, Chemical Physics 247, 141 (1999). 45. C. Bustamante, Y. R. Chemla, N. R. Forde and D. Izhaky, Ann. Rev. Biochem 73,
705-748 (2004). 46. E. Evans and K. Ritchie, Biophysical Journal 72, 1541-1555 (1997). 47. E. Evans and K. Ritchie, Biophysical Journal 76, 2439 (1999). 48. C. Hyeon and D. Thirumalai, Biophysical journal 90 (10), 3410-3427 (2006). 49. C. Hyeon, G. Morrison and D. Thirumalai, Proc. Natl. Acad. Sci. U. S. A. 105
(28), 9604-9609 (2008). 50. C. Hyeon and D. Thirumalai, Proc. Natl. Acad. Sci. U. S. A. 102 (19), 6789-6794
(2005). 51. D. E. Makarov, Biophys J 92 (12), 4135-4136 (2007). 52. D. J. Brockwell, E. Paci, R. C. Zinober, G. S. Beddard, P. D. Olmsted, D. A.
Smith, R. N. Perham and S. E. Radford, Nature structural biology 10 (9), 731-737 (2003).
53. P.-C. Li and D. E. Makarov, J. Chem. Phys. 119, 9260 (2003). 54. V. Barsegov, G. Morrison and D. Thirumalai, Phys Rev Lett 100 (24), 248102
(2008). 55. V. Barsegov and D. Thirumalai, Proc. Natl. Acad. Sci. U. S. A. 102 (6), 1835-
1839 (2005). 56. O. K. Dudko, G. Hummer and A. Szabo, Phys Rev Lett 96 (10), 108101 (2006). 57. M. Sotomayor and K. Schulten, Science 316 (5828), 1144-1148 (2007). 58. O. K. Dudko, G. Hummer and A. Szabo, Proc. Natl. Acad. Sci. U. S. A. 105 (41),
15755-15760 (2008). 59. D. J. Brockwell, G. S. Beddard, E. Paci, D. K. West, P. D. Olmsted, D. A. Smith
and S. E. Radford, Biophysical Journal 89 (1), 506-519 (2005).

111
60. R. B. Best, E. Paci, G. Hummer and O. K. Dudko, J. Phys. Chem. B 112, 5968-5976 (2008).
61. O. V. Prezhdo and Y. V. Pereverzev, Acc Chem Res 42 (6), 693-703 (2009). 62. D. E. Makarov, in Single-molecule studies of protein structure and function,
edited by A. Oberhauser (Springer, New York, 2012), pp. 235. 63. I. Franco, C. B. George, G. C. Solomon, G. C. Schatz and M. A. Ratner, J Am
Chem Soc 133 (7), 2242-2249 (2011). 64. M. McCullagh, I. Franco, M. A. Ratner and G. C. Schatz, J Am Chem Soc 133
(10), 3452-3459 (2011). 65. M. E. Fisher and A. B. Kolomeisky, Proc. Natl. Acad. Sci. U. S. A. 96 (12), 6597-
6602 (1999). 66. M. E. Fisher and A. B. Kolomeisky, Proc. Natl. Acad. Sci. U. S. A. 98 (14), 7748-
7753 (2001). 67. A. B. Kolomeisky, J Phys Condens Matter 25 (37), 370301 (2013). 68. Q.-Z. Yang, Z. Huang, T. J. Kucharski, D. Khvostichenko, J. Chen and R.
Boulatov, Nature Nano 4 (5), 302-306 (2009). 69. Z. Huang and R. Boulatov, Pure App. Chem. 82 (4), 931-951 (2010). 70. Y. Tian and R. Boulatov, Chemphyschem 13 (9), 2277-2281 (2012). 71. O. K. Dudko, J. Mathe, A. Szabo, A. Meller and G. Hummer, Biophys J 92 (12),
4188-4195 (2007). 72. S. Matysiak, A. Montesi, M. Pasquali, A. B. Kolomeisky and C. Clementi, Phys
Rev Lett 96 (11), 118103 (2006). 73. L. Huang, S. Kirmizialtin and D. E. Makarov, J. Chem. Phys. 123, 124903 (2005). 74. D. K. West, D. J. Brockwell and E. Paci, Biophysical Journal 91, L51-L53 (2006). 75. L. Huang and D. E. Makarov, J Chem Phys 129 (12), 121107 (2008). 76. D. Panja, G. T. Barkema and A. B. Kolomeisky, J Phys Condens Matter 25 (41),
413101 (2013). 77. P. Tian and I. Andricioaei, J Mol Biol 350 (5), 1017-1034 (2005). 78. D. E. Makarov, Protein and Peptide Letters 21 (3), 217-226 (2014). 79. A. T. Hawk, S. S. M. Konda and D. E. Makarov, J. Chem. Phys. 139 (6), 064101
(2012). 80. J. N. Brantley, K. M. Wiggins and C. W. Bielawski, Polym Int 62, 2 (2013). 81. P. Dopieralski, P. Anjukandi, M. Ruckert, M. Shiga, J. Ribas-Arino and D. Marx,
J. Mater. Chem. 21 (23), 8309-8316 (2011).

112
82. J. Ribas-Arino and D. Marx, Chem. Rev. 112 (10), 5412-5487 (2012). 83. S. S. M. Konda, J. N. Brantley, C. W. Bielawski and D. E. Makarov, J. Chem.
Phys. 135, 164103 (2011). 84. S. S. M. Konda, J. N. Brantley, B. T. Varghese, K. M. Wiggins, C. W. Bielawski
and D. E. Makarov, J Am Chem Soc 135 (34), 12722-12729 (2013). 85. A. Bailey and N. J. Mosey, J Chem Phys 136, 044102 (2012). 86. J. Ribas-Arino, M. Shiga and D. Marx, Angewandte Chemie-International Edition
48 (23), 4190-4193 (2009). 87. G. S. Kochhar, A. Bailey and N. J. Mosey, Angewandte Chemie-International
Edition 49 (41), 7452-7455 (2010). 88. R. Boulatov, Pure and Applied Chemistry 83 (1), 25-41 (2011). 89. M. J. Kryger, A. M. Munaretto and J. S. Moore, J. Am. Chem. Soc. 133, 18992-
18998 (2011). 90. K. S. Suslick and G. J. Price, Annual Review of Materials Science 29 (1), 295-
326 (1999). 91. K. S. Suslick, Science 247 (4949), 1439-1445 (1990). 92. K. S. Suslick and D. J. Flannigan, Annual Review of Physical Chemistry 59 (1),
659-683 (2008). 93. B. Schuler, Chemphyschem 6 (7), 1206-1220 (2005). 94. B. Schuler, E. A. Lipman and W. A. Eaton, Nature 419 (6908), 743-747 (2002). 95. O. Bilsel and C. R. Matthews, Current Opinion in Structural Biology 16 (1), 86-
93 (2006). 96. A. A. Deniz, T. A. Laurence, G. S. Beligere, M. Dahan, A. B. Martin, D. S.
Chemla, P. E. Dawson, P. G. Schultz and S. Weiss, Proceedings of the National Academy of Sciences 97 (10), 5179-5184 (2000).
97. X. Michalet, S. Weiss and M. Jäger, Chemical Reviews 106 (5), 1785-1813 (2006).
98. M. Grandbois, M. Beyer, M. Rief, H. Clausen-Schaumann and H. E. Gaub, Science 283 (5408), 1727-1730 (1999).
99. A. Borgia, P. M. Williams and J. Clarke, Annual Review of Biochemistry 77 (1), 101-125 (2008).
100. S. N. Zhurkov, International Journal of Fracture Mechanics 1 (4), 311-322 (1965). 101. G. I. Bell, Science 200, 618-627 (1978).

113
102. S. S. M. Konda, S. M. Avdoshenko and D. E. Makarov, J. Chem. Phys. 140 (10), 104114 (2014).
103. P. Hanggi, P. Talkner and M. Borkovec, Rev. Mod. Phys. 62, 251 (1990). 104. G. Hummer and A. Szabo, Biophysical Journal 85 (1), 5 (2003). 105. O. K. Dudko, A. E. Filippov, J. Klafter and M. Urbakh, Proc Natl Acad Sci U S A
100 (20), 11378-11381 (2003). 106. C. E. Maloney and D. J. Lacks, Phys Rev E Stat Nonlin Soft Matter Phys 73 (6 Pt
1), 061106 (2006). 107. D. J. Lacks, J. Willis and M.-P. Robinson, The Journal of Physical Chemistry B
114 (33), 10821-10825 (2010). 108. Y. Suzuki and O. K. Dudko, Phys Rev Lett 104 (4), 048101 (2010). 109. Y. Suzuki and O. K. Dudko, Journal of Chemical Physics 134 (6), 065102 (2011). 110. D. K. West, E. Paci and P. D. Olmsted, Phys Rev E Stat Nonlin Soft Matter Phys
74 (6 Pt 1), 061912 (2006). 111. Z. T. Yew, M. Schlierf, M. Rief and E. Paci, Phys Rev E Stat Nonlin Soft Matter
Phys 81 (3 Pt 1), 031923 (2010). 112. D. J. Brockwell, E. Paci, R. C. Zinober, G. S. Beddard, P. D. Olmsted, D. A.
Smith, R. N. Perham and S. E. Radford, Nature Structural Biology 10 (9), 731 (2003).
113. P.-C. Li and D. E. Makarov, J. Chem. Phys. 121, 4826 (2004). 114. R. B. Woodward and R. Hoffmann, Angew. Chem. Int. Ed. Engl. 8, 781-853
(1969). 115. M. Valiev, E. J. Bylaska, N. Govind, K. Kowalski, T. P. Straatsma, H. J. J. Van
Dam, D. Wang, J. Nieplocha, E. Apra, T. L. Windus and W. A. de Jong, Comp. Phys. Comm. 181 (9), 1477-1489 (2010).
116. R. G. Parr and W. Yang, Density-functional theory of atoms and molecules. (Oxford University Press, New York 1989).
117. M. S. Gordon, J. S. Binkley, J. A. Pople, W. J. Pietro and W. J. Hehre, J Am Chem Soc 104 (10), 2797-2803 (1982).
118. A. D. Becke, Journal of Chemical Physics 98 (2), 1372 (1993). 119. B. M. Bode and M. S. Gordon, Journal of Molecular Graphics and Modelling 16
(3), 133-138 (1998). 120. K. Eom, S. C. Baek, J. H. Ahn and S. Na, Journal of computational chemistry 28
(8), 1400-1410 (2007). 121. R. J. Guyan, AIAA Journal 3 (2), 380 (1965).

114
122. R. Soheilifard, D. E. Makarov and G. J. Rodin, J. Chem. Phys. 135 (5), 054107 (2011).
123. A. G. Tennyson, K. M. Wiggins and C. W. Bielawski, J. Am. Chem. Soc. 132 (Copyright (C) 2012 American Chemical Society (ACS). All Rights Reserved.), 16631-16636 (2010).
124. K. M. Wiggins, T. W. Hudnall, A. G. Tennyson and C. W. Bielawski, J. Mater. Chem. 21 (Copyright (C) 2012 American Chemical Society (ACS). All Rights Reserved.), 8355-8359 (2011).
125. K. M. Wiggins, J. A. Syrett, D. M. Haddleton and C. W. Bielawski, J. Am. Chem. Soc. 133, 7180-7189 (2011).
126. B. C. Boren, S. Narayan, L. K. Rasmussen, L. Zhang, H. Zhao, Z. Lin, G. Jia and V. V. Fokin, J Am Chem Soc 130 (28), 8923-8930 (2008).
127. J. M. Lenhardt, A. L. Black and S. L. Craig, J. Am. Chem. Soc. 131 (Copyright (C) 2012 American Chemical Society (ACS). All Rights Reserved.), 10818-10819 (2009).
128. C. R. Hickenboth, J. D. Rule and J. S. Moore, Tetrahedron 64 (36), 8435-8448 (2008).
129. T. Horneff, S. Chuprakov, N. Chernyak, V. Gevorgyan and V. V. Fokin, J Am Chem Soc 130 (45), 14972-14974 (2008).
130. I. Franco, G. C. Schatz and M. A. Ratner, J Chem Phys 131 (12), 124902 (2009). 131. O. K. Dudko, T. G. Graham and R. B. Best, Phys Rev Lett 107 (20), 208301
(2011). 132. Y. Zhao, N. E. Schultz and D. G. Truhlar, Journal of Chemical Theory and
Computation 2 (2), 364-382 (2006). 133. C. Gonzalez and H. B. Schlegel, J Chem Phys 90 (4), 2154-2161 (1989). 134. C. Gonzalez and H. B. Schlegel, The Journal of Physical Chemistry 94 (14),
5523-5527 (1990). 135. B. T. Marshall, M. Long, J. W. Piper, T. Yago, R. P. McEver and C. Zhu, Nature
423 (6936), 190-193 (2003). 136. H. Li and Y. Cao, Acc. Chem. Rev. 43 (10), 1331-1341 (2010). 137. S. Akbulatov, Y. Tian, E. Kapustin and R. Boulatov, Angewandte Chemie
International Edition 52 (27), 6992-6995 (2013). 138. P. Dopieralski, J. Ribas-Arino, P. Anjukandi, M. Krupicka, J. Kiss and D. Marx,
Nat Chem 5 (8), 685-691 (2013). 139. W. R. Browne and B. L. Feringa, Nat. Nano. 1 (1), 1748-3387 (2006).

115
140. Y. Tian and R. Boulatov, Chemical Communications 49 (39), 4187-4189 (2013). 141. G. A. Voth and R. M. Hochstrasser, The Journal of Physical Chemistry 100 (31),
13034-13049 (1996). 142. D. E. Makarov, in Single-molecule studies of proteins, edited by A. F. Oberhauser
(Springer, New York, 2013). 143. B. Jagannathan, P. J. Elms, C. Bustamante and S. Marqusee, Proceedings of the
National Academy of Sciences (2012). 144. V. Guner, K. S. Khuong, A. G. Leach, P. S. Lee, M. D. Bartberger and K. N.
Houk, The Journal of Physical Chemistry A 107 (51), 11445-11459 (2003). 145. E. R. Johnson, P. Mori-Sanchez, A. J. Cohen and W. Yang, J Chem Phys 129
(20), - (2008). 146. Y. Zhao and D. G. Truhlar, Journal of Chemical Theory and Computation 7 (3),
669-676 (2011). 147. M. T. Ong, J. Leiding, H. Tao, A. M. Virshup and T. J. MartiÃÅnez, J Am Chem
Soc 131 (18), 6377-6379 (2009). 148. C. R. Hickenboth, J. S. Moore, S. R. White, N. R. Sottos, J. Baudry and S. R.
Wilson, Nature 446, 423-427 (2007). 149. D. E. Makarov, J Chem Phys 135 (19), 194112 (2011). 150. T. G. Graham and R. B. Best, J Phys Chem B 115 (6), 1546-1561 (2011). 151. R. Gilmore, Catastrophe Theory for Scientists and Engineers (John Wiley and
Sons, New Yourk, Chichester, Brisbane, Toronto, 1981). 152. D. J. Wales, Science 293 (5537), 2067-2070 (2001). 153. S. Chapra and R. Canale, Numerical Methods for Engineers. (McGraw-Hill,
2009). 154. C. L. Dias, M. Dube, F. A. Oliveira and M. Grant, Phys Rev E Stat Nonlin Soft
Matter Phys 72 (1 Pt 1), 011918 (2005).