
Managing IT Performance to Create Business Value - Ganino
389
-
Upload
khangminh22 -
Category
Documents
-
view
4 -
download
0
Transcript of Managing IT Performance to Create Business Value - Ganino


Managing ITPerformance
to CreateBusiness Value

Managing ITPerformance
to CreateBusiness Value
Jessica Keyes

CRC PressTaylor & Francis Group6000 Broken Sound Parkway NW, Suite 300Boca Raton, FL 33487-2742
© 2016 by Taylor & Francis Group, LLCCRC Press is an imprint of Taylor & Francis Group, an Informa business
No claim to original U.S. Government works
Printed on acid-free paperVersion Date: 20160504
International Standard Book Number-13: 978-1-4987-5285-5 (Hardback)
This book contains information obtained from authentic and highly regarded sources. Reasonable efforts have been made to publish reliable data and information, but the author and publisher cannot assume responsibility for the valid-ity of all materials or the consequences of their use. The authors and publishers have attempted to trace the copyright holders of all material reproduced in this publication and apologize to copyright holders if permission to publish in this form has not been obtained. If any copyright material has not been acknowledged please write and let us know so we may rectify in any future reprint.
Except as permitted under U.S. Copyright Law, no part of this book may be reprinted, reproduced, transmitted, or uti-lized in any form by any electronic, mechanical, or other means, now known or hereafter invented, including photocopy-ing, microfilming, and recording, or in any information storage or retrieval system, without written permission from the publishers.
For permission to photocopy or use material electronically from this work, please access www.copyright.com (http://www.copyright.com/) or contact the Copyright Clearance Center, Inc. (CCC), 222 Rosewood Drive, Danvers, MA 01923, 978-750-8400. CCC is a not-for-profit organization that provides licenses and registration for a variety of users. For organizations that have been granted a photocopy license by the CCC, a separate system of payment has been arranged.
Trademark Notice: Product or corporate names may be trademarks or registered trademarks, and are used only for identification and explanation without intent to infringe.
Visit the Taylor & Francis Web site athttp://www.taylorandfrancis.com
and the CRC Press Web site athttp://www.crcpress.com

v
Contents
Preface ixacknowledgments xiauthor xiii
chaPter 1 designing Performance-Based strategic Planning systems 1IT Roadmap 2Strategic Planning 2Strategy Implementation 5
Implementation Problems 8In Conclusion 11References 12
chaPter 2 designing Performance management and measurement systems 13Developing the QI Plan 15Balanced Scorecard 18Establishing a Performance Management Framework 20Developing Benchmarks 22Looking Outside the Organization 26Process Mapping 27In Conclusion 29Reference 29
chaPter 3 designing metrics 31What Constitutes a Good Metric? 32IT-Specific Measures 36System-Specific Metrics 41Financial Metrics 45
Initial Benefits Worksheet 49Continuing Benefits Worksheet 49Quality Benefits Worksheet 51Other Benefits Worksheet 51

vi Contents
ROI Spreadsheet Calculation 51Examples of Performance Measures 52In Conclusion 55
Project/Process Measurement Questions 55Organizational Measurement Questions 55
References 55
chaPter 4 estaBlishing a software measurement Program 57Resources, Products, Processes 59Direct and Indirect Software Measurement 59Views of Core Measures 60
Strategic View 60Tactical View 60Application View 60
Use a Software Process Improvement Model 61Organization Software Measurement 61Project Software Measurement 62
Software Engineering Institute Capability Maturity Model 62Identify a Goal-Question-Metric (GQM) Structure 63Develop a Software Measurement Plan 64Example Measurement Plan Standard 66In Conclusion 70
chaPter 5 designing PeoPle imProvement systems 71Impact of Positive Leadership 73Motivation 75Recruitment 76Employee Appraisal 78Automated Appraisal Tools 82Dealing with Burnout 83In Conclusion 86References 87
chaPter 6 knowledge and social enterPrising Performance measurement and management 89Using Balanced Scorecards to Manage Knowledge-Based Social Enterprising 90Adopting the Balanced Scorecard 91Attributes of Successful Project Management Measurement Systems 93Measuring Project Portfolio Management 95Project Management Process Maturity Model (PM)2 and Collaboration 99In Conclusion 102References 102
chaPter 7 designing Performance-Based risk management systems 103Risk Strategy 103Risk Analysis 104Risk Identification 105Sample Risk Plan 108RMMM Strategy 111Risk Avoidance 113Quantitative Risk Analysis 116Risk Checklists 119IT Risk Assessment Frameworks 120

viiContents
Risk Process Measurement 123In Conclusion 126Reference 126
chaPter 8 designing Process control and imProvement systems 127IT Utility 127Getting to Process Improvements 131Enhancing IT Processes 132New Methods 132Process Quality 134Process Performance Metrics 137Shared First 140
Step 1: Inventory, Assess, and Benchmark Internal Functions and Services 141Tasks 141
Step 2: Identify Potential Shared Services Providers 143Tasks 143
Step 3: Compare Internal Services versus Shared Services Providers 143Step 4: Make the Investment Decision 144Step 5: Determine Funding Approach 144Step 6: Establish Service-Level Agreements 144Step 7: Postdeployment Operations and Management 145
Configuration Management 145CM and Process Improvement 145Implementing CM in the Organization 146
In Conclusion 147References 147
chaPter 9 designing and measuring the it Product strategy 149Product Life Cycle 149Product Life-Cycle Management 152Product Development Process 153Continuous Innovation 155Measuring Product Development 159In Conclusion 160References 160
chaPter 10 designing customer value systems 161Customer Intimacy and Operational Excellence 161Customer Satisfaction Survey 162Using Force Field Analysis to Listen to Customers 164Customer Economy 166Innovation for Enhanced Customer Support 167Managing for Innovation 170In Conclusion 173References 173
aPPendix i 175aPPendix ii 213aPPendix iii 217aPPendix iv 223aPPendix v 255aPPendix vi 273

viii Contents
aPPendix vii 279aPPendix viii 285aPPendix ix 309aPPendix x 317aPPendix xi 333aPPendix xii 339aPPendix xiii 351aPPendix xiv 357aPPendix xv 361index 369
ix
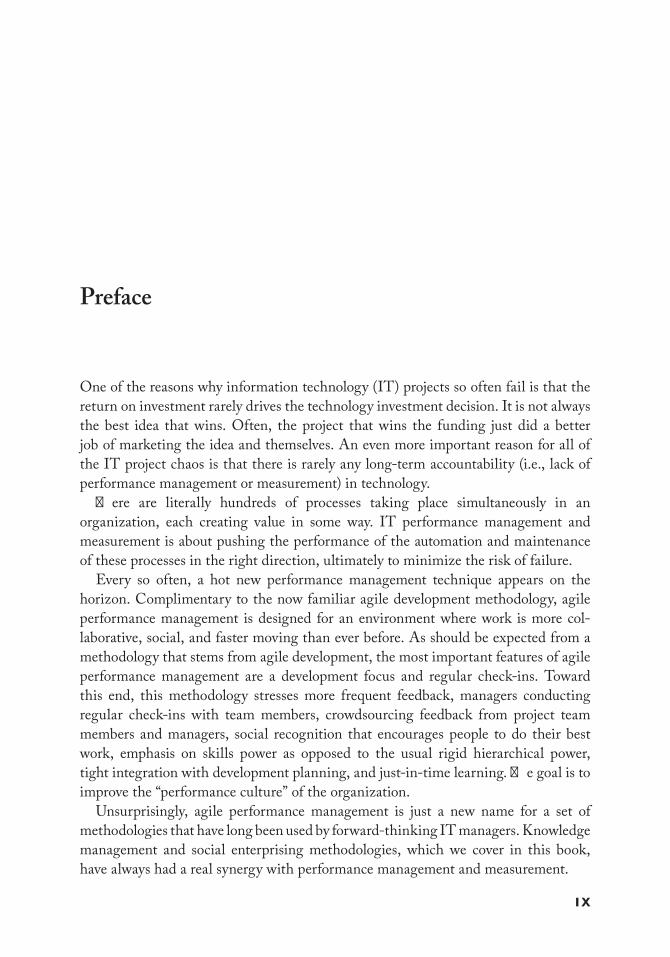
Preface
One of the reasons why information technology (IT) projects so often fail is that the return on investment rarely drives the technology investment decision. It is not always the best idea that wins. Often, the project that wins the funding just did a better job of marketing the idea and themselves. An even more important reason for all of the IT project chaos is that there is rarely any long-term accountability (i.e., lack of performance management or measurement) in technology.
There are literally hundreds of processes taking place simultaneously in an organization, each creating value in some way. IT performance management and measurement is about pushing the performance of the automation and maintenance of these processes in the right direction, ultimately to minimize the risk of failure.
Every so often, a hot new performance management technique appears on the horizon. Complimentary to the now familiar agile development methodology, agile performance management is designed for an environment where work is more col-laborative, social, and faster moving than ever before. As should be expected from a methodology that stems from agile development, the most important features of agile performance management are a development focus and regular check-ins. Toward this end, this methodology stresses more frequent feedback, managers conducting regular check-ins with team members, crowdsourcing feedback from project team members and managers, social recognition that encourages people to do their best work, emphasis on skills power as opposed to the usual rigid hierarchical power, tight integration with development planning, and just-in-time learning. The goal is to improve the “performance culture” of the organization.
Unsurprisingly, agile performance management is just a new name for a set of methodologies that have long been used by forward-thinking IT managers. Knowledge management and social enterprising methodologies, which we cover in this book, have always had a real synergy with performance management and measurement.

x PrefaCe
This volume thoroughly explains the concepts behind performance management and measurement from an IT “performance culture” perspective. It provides examples, case histories, and current research on critical issues such as performance measure-ment and management, continuous process improvement, knowledge management, risk management, benchmarking, metrics selection, and people management.

xi
Acknowledgments
I would especially like to thank those who assisted me in putting this book together. As always, my editor, John Wyzalek, was instrumental in getting my project approved and providing great encouragement.

xiii
Author
Jessica Keyes is president of New Art Technologies, Inc., a high-technology and management consultancy and development firm started in New York in 1989.
Keyes has given seminars for such prestigious universities as Carnegie Mellon, Boston University, University of Illinois, James Madison University, and San Francisco State University. She is a frequent keynote speaker on the topics of competitive strat-egy and productivity and quality. She is former advisor for DataPro, McGraw-Hill’s computer research arm, as well as a member of the Sprint Business Council. Keyes is also a founding board of director member of the New York Software Industry Association. She completed a two-year term on the Mayor of New York City’s Small Business Advisory Council. She currently facilitates doctoral and other courses for the University of Phoenix and the University of Liverpool. She has been the editor for WGL’s Handbook of eBusiness and CRC Press’ Systems Development Management and Information Management.
Prior to founding New Art Technologies, Keyes was managing director of R&D for the New York Stock Exchange and has been an officer with Swiss Bank Co. and Banker’s Trust, both in New York City. She holds a masters of business administra-tion from New York University, and a doctorate in management.
A noted columnist and correspondent with over 200 articles published, Keyes is the author of the following books:
Balanced Scorecard, CRC Press, 2005Bring Your Own Devices (BYOD) Survival Guide, CRC Press, 2013Datacasting, McGraw-Hill, 1997Enterprise 2.0: Social Networking Tools to Transform Your Organization, CRC
Press, 2012How to Be a Successful Internet Consultant, 2nd Ed, Amacom, 2002

xiv author
How to Be a Successful Internet Consultant, McGraw-Hill, 1997Implementing the Project Management Balanced Scorecard, CRC Press, 2010Infotrends: The Competitive Use of Information, McGraw-Hill, 1992Knowledge Management, Business Intelligence, and Content Management: The IT
Practitioner’s Guide, CRC Press, 2006Leading IT Projects: The IT Manager’s Guide, CRC Press, 2008Marketing IT Products and Services, CRC Press, 2009Real World Configuration Management, CRC Press, 2003Social Software Engineering: Development and Collaboration with Social Networking,
CRC Press, 2011Software Engineering Handbook, CRC Press, 2002Technology Trendlines, Van Nostrand Reinhold, 1995The CIO’s Guide to Oracle Products and Solutions, CRC Press, 2014The Handbook of eBusiness, Warren, Gorham & Lamont, 2000The Handbook of Expert Systems in Manufacturing, McGraw-Hill, 1991The Handbook of Internet Management, CRC Press, 1999The Handbook of Multimedia, McGraw-Hill, 1994The Handbook of Technology in Financial Services, CRC Press, 1998The New Intelligence: AI in Financial Services, HarperBusiness, 1990The Productivity Paradox, McGraw-Hill, 1994The Software Engineering Productivity Handbook, McGraw-Hill, 1993The Ultimate Internet Sourcebook, Amacom, 2001Webcasting, McGraw-Hill, 1997X Internet: The Executable and Extendable Internet, CRC Press, 2007

1
1Designing Performance-BaseD
strategic Planning systems
A company’s technology strategy is often subordinate to its business strategy. Here, a management committee, or some other planning body meticulously plans the company’s long-range plan. The technology chiefs are called from their basement perches only to plan for one or another automated system as it meets a comparatively short-term goal from one or more of the business units. In some companies, this planning process is akin to weaving cloth. In weaving, thread after thread is woven so tightly that, when complete, the cloth’s individual threads are nearly impossible to distinguish from one another. The strength and resiliency of the completed cloth are the result of this careful weaving.
A company, too, is made up of many threads, each with its own strategy. Only when all of these unmatched threads, or strategies, are woven evenly together can a success-ful general business strategy be formulated. But first, those crafting the corporate (and information technology [IT]) strategy have to understand exactly what strategy is.
McKinsey research (Desmet et al. 2015) indicates that some organizations are rec-ognizing that rigid, slow-moving strategic models are no longer sufficient. The goal is to adapt to a structure that is agile, flexible, and increasingly collaborative while keeping the rest of the business running smoothly.
One way to become agile is by simplifying. The focus should be to allow structure to follow strategy and align the organization around its customer objectives with a focus on fast, project-based structures owned by working groups comprising different sets of expertise, from research to IT.
The important thing is to focus on processes and capabilities. Having a clear view of what McKinsey calls a company’s Digital Quotient™ (DQ ) is a critical first step to pinpoint digital strengths and weaknesses. A proprietary model, DQ is a compre-hensive measurement of a company’s digital maturity. The assessment allows organi-zations to identify their digital strengths and weaknesses across different parts of the organization and compare them against hundreds of organizations around the world. It also helps companies realize their digital aspirations by providing a clear view of what actions to take to deliver rapid results and sustain long-term performance.
DQ assesses four major outcomes that have been proved to drive digital performance:
1. Strategy: The vision, goals, and strategic tenets that are in place to meet short-term, mid-term, and long-term digital–business aspirations
2. Culture: The mind-sets and behaviors critical to capture digital opportunities

2 Managing it PerforManCe to Create Business Value
3. Organization: The structure, processes, and talent supporting the execution of the digital strategy
4. Capabilities: The systems, tools, digital skills, and technology in place to achieve strategic digital goals
Some companies have set up incubators or centers of excellence, each integrated into the main business, during the early stages of a digital transformation to culti-vate capabilities. AT&T opened three AT&T Foundry innovation centers to serve as mobile app and software incubators. Today, projects at these centers are com-pleted three times faster than elsewhere within the company. After testing the innovation model externally through its incubator, AT&T established a technology innovation council and a crowdsourcing engine to infuse best practices and inno-vation across the rest of the organization. Of course, everything done is carefully measured.
IT Roadmap
A technology roadmap assists the chief information officer (CIO) to act more in line with the strategy of the organization as a whole, for example, it is a plan that matches the short-term and long-term goals with specific technology solutions to meet those goals. A roadmap is the governing document that dictates specifically how IT will support the business strategy over a window of time, usually 3–5 years. Most road-maps contain a strategy statement, with a list of strategic priorities for the business; a prioritized list of improvement opportunities; high-level justifications for each project; costs and schedule for each project; and a list of owners and stakeholders for each project.
A technology roadmap has several major uses. It helps reach a consensus about a set of needs and the technologies required to satisfy those needs; it provides a process to help forecast technology developments; and it provides a framework to help plan and coordinate technology developments. The technology roadmapping process usually consists of three phases, as shown in Table 1.1.
Strategic Planning
It is said that, “failing to plan is planning to fail.” Strategic management can be defined as the art and science of formulating, implementing, and evaluating cross-functional decisions that enable an organization to achieve its objectives. Put simply, strategic management is planning for an organization’s future. The plan becomes a roadmap to achieve the goals of the organization, with IT as a centerpiece of this plan. Much like the map a person uses when taking a trip to another city, the roadmap serves as a guide for management to reach the desired destination. Without such a map, an organization can easily flounder.

3Designing PerforManCe-BaseD strategiC Planning systeMs
The value of strategic planning for any business is to be proactive in taking advan-tage of opportunities while minimizing threats posed in the external environment. The planning process itself can be useful to “rally the troops” toward common goals and create “buy in” to the final action plan. The important thing to consider in think-ing about planning is that it is a process, not a one-shot deal. The strategy formulation process, which is shown in Figure 1.1, includes the following steps:
1. Strategic planning to plan (assigning tasks, time, etc.) 2. Environmental scanning (identifying strengths and weaknesses in the inter-
nal environment and opportunities and threats in the external environment) 3. Strategy formulation (identifying alternatives and selecting appropriate
alternatives) 4. Strategy implementation (determining roles, responsibilities, and a time frame) 5. Strategy evaluation (establishing specific benchmarks and control procedures,
revisiting the strategy at regular intervals to update plans, etc.)
Table 1.1 Steps for Creating a Technology Roadmap
SATISFY ESSENTIAL CONDITIONSIDENTIFY AND CLARIFY CONDITIONS AND TAKE STEPS TO
MEET UNMET CONDITIONS
Phase 1: Preliminary
Provide leadership/sponsorship Committed leadership is needed. Leadership must come from one of the participants—that is, the line organization must drive the process and use the roadmap to make resource allocation decisions.
Define scope and boundaries The roadmap must support the company’s vision. The planning horizon and level of details should be set during this step.
Phase 2: Development
Identify the focus Common product needs are identified and accepted by the participants of the planning process.
Identify the critical system requirements and targets
Examples of targets are reliability and costs.
Specify major technology areas Example technology areas are market assessment, system development, and component development.
Specify technology drivers and their targets
The critical system requirements are transformed into technology drivers with targets. These drivers will determine which technology alternatives are selected.
Identify technology alternatives and their time lines
Time durations or scale and intervals can be used for time line.
Recommend the technology alternatives that should be pursued
Keep in mind that alternatives will differ in costs, time line, and so on. Thus, a lot of trade-off has to be made between different alternatives for different targets, performance over costs, and even target over target.
Create technology roadmap report The roadmap report consists of five parts: identification and description of each technology area; critical factors in the roadmap; unaddressed areas; implementation recommendations; and technical recommendations.
Phase 3: Follow-up
Roadmap is critiqued, validated, edited, and then accepted by the group. A plan needs to be developed using the technology roadmap. Periodical reviews must be planned for.

4 Managing it PerforManCe to Create Business Value
Business tactics must be consistent with a company’s competitive strategy. A com-pany’s ability to successfully pursue a competitive strategy depends on its capabilities (internal analysis) and how these capabilities are translated into sources of competitive advantage (matched with external environment analysis). The basic generic strategies that a company can pursue are shown in Figure 1.2.
In all strategy formulation, it is vital for the company to align the strategy tactics with its overall source of competitive advantage. For example, many small companies make the mistake of thinking that product giveaways are the best way to promote their business or add sales. In fact, the opposite effect may happen if there is a mis-alignment between price (lowest cost) and value (focus).
Strategic planningto plan
Strategyevaluation
Strategyimplementation
Strategyformulation
Strategyformulation
Environmentalscanning
Figure 1.1 Strategy formulation.
Costleadership
Focus
DifferentiationSpeed
Figure 1.2 Basic competitive strategies.

5Designing PerforManCe-BaseD strategiC Planning systeMs
Michael Porter’s (1980) Five Forces model gives another perspective on an indus-try’s profitability. This model helps strategists develop an understanding of the exter-nal market opportunities and threats facing an industry generally, which gives context to specific strategy options.
Specific strategies that a company can pursue should align with the overall generic strategy selected. Alternative strategies include forward integration, backward inte-gration, horizontal integration, market penetration, market development, product development, concentric diversification, conglomerate diversification, horizontal diversification, joint venture, retrenchment, divestiture, liquidation, and a combined strategy. Each alternative strategy has many variations. For example, product devel-opment could include research and development pursuits, product improvement, and so on. Strategy selection will depend on management’s assessment of the company’s strengths, weaknesses, opportunities, and threats (SWOT) with consideration of strategic “fit.” This refers to how well the selected strategy helps the company achieve its vision and mission.
Strategy Implementation
According to several surveys of top executives, only 19% of strategic plans actually meet their objectives. Strategies frequently fail because the market conditions they were intended to exploit change before the strategy takes effect. An example of this is the failure of many telecom companies that were born based on projected pent-up demand for fiber-optic capacity fueled by the growth of the Internet. Before much of the fiber-optic cable could even be laid, new technologies were introduced that permitted a dramatic increase of capacity on the existing infrastructure. Virtually overnight, the market for fiber-optic collapsed.
Strategic execution obstacles are of two varieties: problems generated by forces external to the company, as our telecom example demonstrates, and problems internal to the company. Internal issues test the flexibility of companies to launch initiatives that represent significant departures from long-standing assumptions about who they are and what they do. Can they integrate new software into their infrastructure? Can they align their human resources?
What could these companies have done to ensure that their programs and initia-tives were implemented successfully? Did they follow best practices? Were they aware of the initiative’s critical success factors? Was there sufficient senior-level involvement? Was planning thorough and all-encompassing? Were their strategic goals aligned throughout the organization? And most importantly, were their implementation plans able to react to continual change?
Although planning is an essential ingredient for success, implementing a strategy requires more than just careful initiative planning. Allocating resources, scheduling, and monitoring are indeed important, but it is often the intangible or unknown that gets in the way of ultimate success. The ability of the organization to adapt to the

6 Managing it PerforManCe to Create Business Value
dynamics of fast-paced change as well as the desire of executive management to sup-port this challenge is what really separates the successes from the failures.
TiVo was presented with a challenge when it opted to, as its CEO puts it, “forever change the way the world watches TV.” The company pioneered the digital video recorder (DVR), which enables viewers to pause live TV and watch it on their own schedules. There are millions of self-described “rabid” users of the TiVo service. In a company survey, over 40% said they would sooner disconnect their cell service than unplug their TiVo.
TiVo is considered disruptive technology because it forever changes the way the public does something. According to Forbes.com’s Sam Whitmore (2004), no other $141 million company has come even close to transforming government policy, audi-ence measurement, direct response and TV advertising, content distribution, and society itself.
But TiVo started off on shaky footing and continues to face challenges that it must address to survive. Therefore, TiVo is an excellent example of continual adaptive stra-tegic implementation, and is worth studying.
Back in the late 1990s, Michael Ramsey and James Barton, two forward thinkers, came up with the idea that would ultimately turn into TiVo. They quickly assembled a team of marketers and engineers to bring their product to market and unveiled their product at the National Consumer Electronics show in 1999. TiVo hit the shelves a short 4 months later. Ramsey and Barton, founders and C-level executives, were actively involved every step of the way—a key for successful strategic implementations.
Hailed as the “latest, greatest, must-have product,” TiVo was still facing consider-able problems. The first was consumer adoption rates. It takes years before any new technology is widely adopted by the public-at-large. To stay in business, TiVo needed a way to jump-start its customer base. On top of that, the firm was bleeding money, so it had to find a way to staunch the flow of funds out of the company.
Their original implementation plan did not include solutions to these problems. But the firm reacted quickly to their situation by jumping into a series of joint ventures and partnerships that would help them penetrate the market and increase their profit-ability. An early partnership with Philips Electronics provided them with funding to complete their product development. Deals with DirectTV, Comcast Interactive, and other satellite and cable companies gave TiVo the market penetration it needed to be successful. The force behind this adaptive implementation strategy was Ramsey and Barton, TiVo’s executive management team. Since implementations often engender a high degree of risk, the executive team must be at the ready should there be a need to go to “Plan B.” Ramsey and Barton’s willingness to jump into the fray to find suitable partnerships enabled TiVo to stay the course—and stay in business.
But success is often fleeting, which is why performance monitoring and a continual modification of both the strategic plan and resulting implementation plan is so very important. Here again, the presence of executive oversight must loom large. Executive management must review progress on an almost daily basis for important strategic

7Designing PerforManCe-BaseD strategiC Planning systeMs
implementations. While many executives might be content just to speak to his or her direct reports, an actively engaged leader will always involve others lower down the chain of command. This approach has many benefits including reinforcing the impor-tance of the initiative throughout the ranks and making subordinate staff feel like they are an important part of the process. The importance of employee buy-in to strategic initiatives cannot be underestimated in terms of ramifications for the success of the ultimate implementation. Involved, excited, and engaged employees lead to success. Unhappy, fearful, disengaged employees do not.
TiVo competes in the immense and highly competitive consumer electronics indus-try where being a first mover is not always a competitive advantage. Competition comes in fast and hard. Cable and satellite providers are direct competitors. It is the indirect competitors, however, that TiVo needs to watch out for. Although Microsoft phased out its UltimateTV product, the company still looms large by integrating some extensions into its Windows operating system that provide similar DVR function-ality. TiVo’s main indirect competitor, however, is digital cable’s pay-per-view and video-on-demand services, as well as services such as Hulu and Netflix. The question becomes—will DVRs be relegated to the technological trash heap of history where it can keep company with the likes of Betamax and eight-track tapes? Again, this is where executive leadership is a must if implementation is to be successful. Leaders must continually assess the environment and make adjustments to the organization’s strategic plan and resulting implementation plans, particularly where technology is concerned. They must provide their staff with the flexibility and resources to quickly adapt to changes that might result from this reassessment.
TiVo continues to seek partnerships with content providers, consumer electronics manufacturers, and technology providers to focus on the development of interactive video services. One of its more controversial ideas was the promotion of “advertain-ment.” These are special-format commercials that TiVo downloads onto its customers’ devices to help advertisers establish what TiVo calls “far deeper communications” with consumers. TiVo continues to try to dominate the technology side of the DVR market by constant research and development. They have numerous patents and patents pend-ing. Even if TiVo—the product—goes under, TiVo’s intellectual property will provide a continuing strategic asset.
Heraclitus, a Greek philosopher living in the sixth century BC said, “Nothing endures but change.” That TiVo has survived up to this point is a testament to their willingness to adapt to continual change. That they managed to do this when so many others have failed demonstrates a wide variety of strategic planning and implemen-tation skill-sets. They have an organizational structure that is able to quickly adapt to whatever change is necessary. Although a small company, their goals are care-fully aligned throughout the organization, at the organizational, divisional, as well as employee level. Everyone at TiVo has bought into the plan and is willing to do what it takes to be successful. They have active support from the management team, a critical success factor for all strategic initiatives. Most importantly, they are skillful at

8 Managing it PerforManCe to Create Business Value
performance management. They are acutely aware of all environmental variables (i.e., competition, global economies, consumer trends, employee desires, industry trends, etc.) that might affect their outcomes and show incredible resourcefulness and resil-iency in their ability to reinvent themselves.
It is a truism that the strategy and the firm must become one. In doing so, the firm’s managers must direct and control actions and outcomes and, most critically, adjust to change. Executive leadership can do this not only by being actively engaged themselves but also by making sure all employees involved in the implementation are on the same page. How is this done? There are several techniques, including the ones already mentioned. Executive leadership should frequently review the progress of the implementation and jump into the fray when required. This might translate to finding partnerships, as was the case with TiVo, or simply quickly signing off on additional resources or funding. More importantly, executive leadership must be an advocate—cheerleader—for the implementation with an eye toward rallying the troops behind the program. Savvy leaders can accomplish this through frequent communications with subordinate employees. Inviting lower-level managers to meetings, such that they become advocates within their own departments, is a wonderful method for cascading strategic goals throughout the organization. E-mail communications, speeches, news-letters, webinars, and social media also provide a pulpit for getting the message across.
Executive leadership should also be mindful that the structure of the organization can have a dramatic impact on the success of the implementation. The twenty-first-century organizational structure includes the following characteristics: bottom-up, inspirational, employees and free agents, flexible, change, and “no compromise” to name a few. Merge all of this with a fair rewards system and compensation plan and you have all the ingredients for a successful implementation. As you can see, organi-zational structure, leadership, and culture are the key drivers for success.
Implementation Problems
Microsoft was successful at gaining control of people’s living rooms through the Trojan horse strategy of deploying the now ubiquitous Xbox. Hewlett-Packard (HP) was not so successful in raising its profile and cash flow by acquiring rival computer maker Compaq—to the detriment of its CEO, who was ultimately ousted. Segway, the gyroscope-powered human transport brainchild of the brilliant Dean Kamen, received a lukewarm reception from the public. Touted as “the next great thing” by the technology press, the company had to reengineer its implementation plan to reorient its target customer base from the general consumer to specific categories of consum-ers, such as golfers, cross-country bikers, as well as businesses.
Successful implementation is essentially a framework that relies on the relationship between the following variables: strategy development, environmental uncertainty, organizational structure, organizational culture, leadership, operational planning, resource allocation, communication, people, control, and outcome. One major reason

9Designing PerforManCe-BaseD strategiC Planning systeMs
why so many implementations fail is that there are no practical, yet theoretically sound, models to guide the implementation process. Without an adequate model, organizations try to implement strategies without a good understanding of the mul-tiple variables that must be simultaneously addressed to make implementation work.
In HP’s case, one could say that the company failed in its efforts at integrating Compaq because it did not clearly identify the various problems that surfaced as a result of the merger, and then use a rigorous problem-solving methodology to find solutions to the problems. Segway, on the other hand, framed the right problem (i.e., “the general consumer is disinterested in our novel transport system”) and ultimately identified alternatives such that they could realize their goals.
The key is to first recognize that there is a problem. This is not always easy as there will be differences of opinions among the various managerial groups as to whether a problem exists and as to what it actually is. In HP’s case, the problems started early on when the strategy to acquire Compaq was first announced. According to one fund manager who did not like the company before the merger, the acquisition just doubled the size of its worst business (De Aenlle 2005). We should also ask about the role of executive leadership in either assisting in the problem determination pro-cess or verifying that the right problem has indeed been selected. While HP’s then CEO Carly Fiorina did a magnificent job of implementing her strategy using three key levers (i.e., organizational structure, leadership, and culture), she most certainly dropped the ball by disengaging from the process and either not recognizing that there was a problem within HP or just ignoring the problem for other priorities. The management team needs to pull together to solve problems. The goal is to help posi-tion the company for the future. You are not just dealing with the issues of the day; you are always looking for the set of issues that are over the next hill. A management team that is working well sees the next hill, and the next hill. This is problem-solving at its highest degree.
There are many questions that should be asked when an implementation plan appears to go off track. Is it a people problem? Was the strategy flawed in the first place? Is it an infrastructural problem? An environmental problem? Is it a combina-tion of problems? Asking these questions will enable you to gather data that will assist in defining the right problem to be solved. Of course, responding “yes” to any one or more of these questions is only the start of the problem definition phase of problem-solving. You must also drill down into each of these areas to find root causes of the problem. For example, if you determined that there is a people problem, you then have to identify the specifics of this particular problem. For example, in a company that has just initiated an off-shoring program, employees may feel many emotions: betrayed, bereft, angry, scared, and overwhelmed. Unless management deals with these emo-tions at the outset of the off-shoring program, employee productivity and efficiency will undoubtedly be negatively impacted.
Radical change to the work environment may also provoke more negatively aggres-sive behavior. When the U.S. Post Office first automated its postal clerk functions,

10 Managing it PerforManCe to Create Business Value
management shared little about what was being automated. The rumor mill took over and somehow employees got the idea that massive layoffs were in the works. Feeling that they needed to fight back, some postal employees actually sabotaged the new automated equipment. Had management just taken a proactive approach by provid-ing adequate and continuing communications to the employees prior to the automa-tion effort, none of this would have happened. Sussman (Lynch 2003) neatly sums up management’s role in avoiding people problems through the use of what he calls “the new metrics”—return on intellect (ROI), return on attitude (ROA), and return on excitement (ROE). As the title of the Lynch article suggests, it is important that leaders challenge the process, inspire a shared vision, enable others to act, model the way, and encourage the heart.
It is also quite possible to confuse symptoms of a problem with the problem itself. For example, when working with overseas vendors, it is sometimes hard to reach these people due to the difference in time zones. This is particularly true when working with Asian firms, as they are halfway across the globe. Employees working with these external companies might complain about lack of responsiveness when the real prob-lem is that “real time” communications with these companies are difficult due to time zone problems. The problem, then, is not “lack of responsiveness” by these foreign vendors, but lack of an adequate set of technologies that enable employees and vendors to more easily communicate across different time zones, vast distances, and in differ-ent languages (i.e., video conferencing tools, instant messaging tools are all being used for these purposes).
Once the problem has been clearly framed, the desired end state and goals need to be identified and some measures created so that it can be determined whether the end state has actually been achieved. Throughout the problem-solving process, relevant data must be collected and the right people involved. Nowhere are these two seem-ingly simple caveats more important than in identifying the end state and the metrics that will be used to determine whether your goals have been achieved.
Strategy implementation usually involves a wide variety of people in many depart-ments. Therefore, there will be many stakeholders that will have an interest in seeing the implementation succeed (or fail). To ensure success, the implementation manager needs to make sure that these stakeholders are aligned, have bought into the strategy, and will do whatever it takes to identify problems and fix them. The definition of the end state and associated metrics are best determined in cooperation with these stakeholders, but must be overseen and approved by management. Once drafted, these must become part of the operational control system.
A scorecard technique aims to provide managers with the key success factors of a business and to facilitate the alignment of business operations with the overall strat-egy. If the implementation was properly planned, and performance planning and measurement well integrated into the implementation plan, a variety of metrics and triggers will already be visually available for review and possible adaptation to the cur-rent problem-solving task.

11Designing PerforManCe-BaseD strategiC Planning systeMs
A variety of alternatives will probably be identified by the manager. Again, the qual-ity and quantity of these alternatives will be dependent on the stakeholders involved in the process. Each alternative will need to be assessed to determine: (a) viability; (b) completeness of the solution (i.e., does it solve 100% of the problem, 90%, 50%, etc.); (c) costs of the solution; (d) resources required by the solution; and (e) any risk factors involved in implementing the alternative. In a failed implementation situation that resulted from a variety of problems, there might be an overwhelming number of possible alternatives. None of these might be a perfect fit. For example, replacing an overseas vendor gone out of business only solves a piece of the problem and, by itself, is not a complete solution. In certain situations, it is quite possible that a complete solu-tion might not be available. It might also be possible that no solution is workable. In this case, a host of negative alternatives such a shutting down the effort or selling the product/service/division might need to be evaluated.
Once a decision is made on the appropriate direction to take, based on the alter-native or a combination of alternatives selected, a plan must be developed to imple-ment the solution. We can either develop an entirely new implementation plan or fix the one we already have. There are risks and rewards for either approach, and the choice you make will depend on the extent of the problems you identified in the original plan.
In Conclusion
Strategic planning is not a one-time event. It is rather a process involving a contin-uum of ideas, assessment, planning, implementation, evaluation, readjustment, revi-sion and, most of all, good management. IT managers need to make sure that their strategies are carefully aligned with corporate and departmental strategic plans—and consistent with the organizational business plan, as shown in Figure 1.3.
IT plan
Strategic plan
Business plan
Figure 1.3 The relationship between the business plan, strategic plan, and IT plans.

12 Managing it PerforManCe to Create Business Value
ReferencesDe Aenlle, C. (2005). See you, Carly. Goodbye, Harry. Hello investors. The New York Times.
March 13.Desmet, D., Duncan, E., Scanlan, J., and Singer, M. (2015). Six building blocks for creat-
ing a high-performing digital enterprise. McKinsey & Company Insights & Publications. September. Retrieved from http://www.mckinsey.com/insights/organization/six_build-ing_blocks_for_creating_a_high_performing_digital_enterprise?cid=other-eml-nsl-mip-mck-oth-1509.
Lynch, K. (2003). Leaders challenge the process, inspire a shared vision, enable others to act, model the way, encourage the heart. The Kansas Banker, 93(4) 15–17.
Porter, M. E. (1980). Competitive Strategy. New York: Free Press.Whitmore, S. (2004). What TiVo teaches us. Forbes. July 7.

13
2Designing Performance
management anD measurement systems
Performance management is a structured process for setting goals and regularly check-ing progress toward achieving those goals. It includes activities that ensure organi-zational goals are consistently met in an effective and efficient manner. The overall goal of performance management is to ensure that an organization and its subsystems (processes, departments, teams, etc.), are optimally working together to achieve the results desired by the organization.
An organization can achieve the overall goal of effective performance management by continuously engaging in the activities shown in Table 2.1.
Performance management encompasses a series of steps with some embedded deci-sion points. The first step ensures that the resources dedicated to manage and mea-sure performance are directed to the organizational strategic goals and mission. The primary reason to measure and manage performance is to drive quality improvement (QI). The dialogue about an organization’s priorities should include the organization’s strategic plan, quality management plan, and similar strategic documents. Often, an organization reflects on what is not working well to determine its focus. In some cases, improvement priorities are determined by external expectations.
The time that an organization’s leaders spend discussing priorities is time well spent. These strategic discussions improve buy-in from key leaders within the organization and encourage reflection from multiple perspectives.
After an organization discusses what is important to measure, the next step is to choose specific performance measures. Performance measures serve as indicators for the effectiveness of systems and processes. Measure what is important based on the evaluation of an organization’s internal priorities as well as what is required to meet external expectations.
It is important to include staff in the measure selection process since staff will be involved in the actual implementation of measurement and improvement activities. Buy-in from staff significantly facilitates these steps. It is also a good idea to use exist-ing measures, if possible. Criteria for measures include
1. Relevance: Does the performance measure relate to a frequently occurring condition or does it have a great impact on stakeholders at an organization’s facility?

14 Managing it PerforManCe to Create Business Value
2. Measurability: Can the performance measure realistically and efficiently be quantified given the facility’s finite resources?
3. Accuracy: Is the performance measure based on accepted guidelines or devel-oped through formal group decision-making methods?
4. Feasibility: Can the performance rate associated with the performance mea-sure realistically be improved given the limitations of the organization?
Once performance measures are chosen, an organization collects the baseline data for each measure. Baseline data are a snapshot of the performance of a process or out-come that is considered normal, average, or typical over a period of time and reflects existing care systems. Determining the baseline involves calculating the measure. As an organization assesses where it is before embarking on a QI program, it often finds that its data reflect a lower-than-desired performance. This should not cause alarm but rather provide the opportunity to focus QI efforts to improve performance.
Established performance measures include details about the numerator and denom-inator to calculate the measure. Specifically, it is important to record the following for each measure:
1. Data source 2. Collection method 3. Frequency of data collection 4. Standardized time to collect data as applicable 5. Staff responsible for measurement and other aspects of the measurement pro-
cess to create a detailed record
The baseline reflects the current status quo. The larger the desired change, the more the underlying systems have to change. Some organizations choose to set aims that indicate a percentage of improvement expected over their baseline, while oth-ers choose aims that reflect their desired performance, regardless of their baseline performance.
Once the baseline calculation is complete, an organization decides if performance is satisfactory or improvements are needed. To provide context for evaluating baseline data, an organization may choose to compare and benchmark its data against other organizations. Benchmarking is a process that compares organizational performance
Table 2.1 Performance Management Activities
IDENTIFYING AND PRIORITIZING DESIRED RESULTS
Establishing means to measure progress toward those resultsSetting standards for assessing how well results are achievedTracking and measuring progress toward resultsExchanging ongoing feedback among those individuals working to achieve resultsPeriodically reviewing progressReinforcing activities that achieve resultsIntervening to improve progress where needed

15DESIGNING PERFORMANCE MANAGEMENT SYSTEMS
with industry best practices, which may include data from local, regional, or national sources. Benchmarking brings objectivity to the analysis of performance and identifies the strengths and weaknesses of an organization.
If an organization is satisfied with its current level of performance, then it should put a system in place to monitor performance periodically. If an organization’s perfor-mance is less than desired, then it may establish an aim for improvement. Sometimes, the barriers to QI exist in the structure or system. It may be beneficial to examine the system as it supports or inhibits QI. While much of the structure/system cannot be changed, it is likely that there are some areas where change is possible. Some actions include
1. Construct flowcharts depicting inputs, outputs, customers, and interfaces with other organizations. These can be constructed for various levels of the organization. Attempt to identify likely QI areas.
2. Implement quality teams. 3. Ask the people involved for ideas about changing the structure/system. 4. Track improvement progress after a change has been made. 5. Staff members need to be aware of the importance of a quality and/or produc-
tivity improvement process. 6. Write down the organization’s quality and/or productivity improvement pol-
icy and then make sure everyone sees it.
A critical part of QI is to measure when changes occur. In the same way that data for the baseline measurement are calculated, periodic calculations of performance measures should be accomplished. For an organization actively engaged in improve-ment work, this is often monthly. As performance is measured over time, a trend develops. It is important to use the same methodology to collect and calculate the data each time.
Changes that improve the underlying critical pathway often reflect improved per-formance on the measure. An organization may choose to continue its improvement efforts as it moves toward its target or goal for the performance measure. An organiza-tion that is not experiencing improvement may reflect on the trend data and use the opportunity to reevaluate its approach. All changes do not result in improvement and reflection on other change opportunities may be required to get improvement back on track. Most organizations continue to test changes and make improvements until their aims have been achieved.
Developing the QI Plan
QI refers to activities aimed at improving performance and is an approach to the continuous study and improvement of the processes of providing services to meet the needs of the individual and others. Continuous quality improvement (CQI) refers to an ongoing effort to increase an organization’s approach to manage performance,

16 Managing it PerforManCe to Create Business Value
motivate improvement, and capture lessons learned in areas that may or may not be measured. It is an ongoing effort to improve the efficiency, effectiveness, quality, or performance of services, processes, capacities, and outcomes.
The key elements of a QI plan include a description of the purpose, priorities, pol-icies, and goals of the QI program, as well as a description of the organizational systems needed to implement the program, including QI committee structure and functions; descriptions of accountability, roles, and responsibilities; the process for gaining consumer input; core measures and measurement processes; and a description of the communication and evaluation plan.
Describe the purpose of the QI plan, including the organization’s mission and vision, policy statement, the types of services provided, and so on. Also, define the key concepts and quality terms used in the QI program/project so that there is a consistent language throughout the organization regarding quality terms.
Organizational structure is a formal, guided process for integrating the people, information, and technology of an organization, and serves as a key structural ele-ment that allows organizations to maximize value by matching their mission and vision to their overall strategy in QI. Implementing a QI plan requires a clear delin-eation of oversight roles and responsibilities, and accountability. The QI plan should clearly identify who is accountable for QI processes, such as evaluation, data col-lection, analysis education, and improvement planning. The specific organizational structure for implementing a QI plan can vary greatly from one organization to another. In all cases, it is recommended that a quality coordinator is assigned to sup-port the process.
Depending on the size of the organization, who participates in QI activities may vary. For example, in small organizations, most of the staff members are involved in all aspects of QI work. In larger organizations, a quality committee is often estab-lished that includes senior management, designated QI staff if there are any, and other key players in the organization with the expertise and authority to determine program priorities, support change, and if possible, allocate resources. The main role of this group is to develop an organizational QI plan, charter a team, establish QI priorities and activities, monitor progress toward goal attainment, assess quality programs, and conduct annual program evaluation.
Areas for improvement can be identified by routinely and systematically assessing performance. QI projects may be identified from self-assessment, customer satisfac-tion surveys, or formal organizational review that identifies gaps in services. Staff from all levels should be included to brainstorm and develop a list of changes that they think will improve the process. The QI projects that are selected and prioritized should show alignment with the organization’s mission.
Key program goals and objectives should be defined for the current year. This list should be tailored to the program and include specific objective(s) that need to be accomplished to successfully achieve the goal. The objective(s) for each of the selected goals need to be specific, measurable, achievable, relevant, and time-framed (SMART)

17DESIGNING PERFORMANCE MANAGEMENT SYSTEMS
objectives so that you will be able to clearly determine whether the objectives have been met at the end of the year by using a specified set of QI tools.
For example,
By December 29, 2018 (timebound), increase the number of training sessions given for QI staff on “QI concepts and tools” (specific and relevant) from 6 to 10 (measurable and achievable).
Generally, the QI committee identifies and defines goals and specific objectives to be accomplished each year. These goals may include training of staff regarding both CQI principles and specific QI initiative(s). Progress in meeting these goals and objectives is an important part of the annual evaluation of QI activities.
Performance measurement, discussed in more depth in the next chapter, describes how performance is measured and data are collected, monitored, and analyzed. It is used to monitor important aspects of an organization’s programs, systems, and pro-cesses; compare its current performance with the previous year’s performance, as well as benchmarks and theoretical test performance measures; and identify opportunities for improvement in management, development, and support services. The basic steps are to determine performance measures and develop indicators to measure perfor-mance. To do this will require the measurement population to be defined, the data collection plan and method to be described (e.g., survey, data analysis, interviews), and an analysis plan to be determined.
The QI methodology and quality tools/techniques to be utilized throughout the organization must be clearly identified. Strategies for improvement in the existing process can be identified by using QI tools such as benchmarking, fishbone diagram, root-cause analysis, and so on.
The plan-do-study-act cycle is one of the more widely used QI methodologies for testing a change on a small scale—by planning change and collecting baseline data, testing the change and collecting data, observing the results and analyzing the data, and acting on what is learned. If the change did not result in improvement in the pro-cess, try another strategy. If the change resulted in improvement, adopt the change, monitor the process periodically, and implement the change on a larger scale.
A number of other QI approaches have also been used. Based on your organiza-tional priorities, the QI committee can choose a preferred approach such as Six Sigma (define, measure, analyze, improve, and control) and FADE (focus, analyze, develop, execute, and evaluate).
Once a QI initiative is launched, it is important to have regular communication on QI with all staff including the board and stakeholders. Regular updates on how the QI plan is being implemented, how training activities are being conducted, and improvement charting are important parts of any communication plan. The prog-ress in QI projects can be documented using activity logs, issue identification logs, meeting minutes, and so on. Improvement efforts can be communicated through

18 Managing it PerforManCe to Create Business Value
various methods, such as kick-off meetings or all-employee meetings; storyboards and/or posters displayed in common areas; sharing organization’s annual QI plan evaluation; e-mails, memos, newsletters, and/or handouts; and informal verbal communication.
Hewlett-Packard (HP) has adopted a similar methodology that they refer to as total quality control (TQC). A fundamental principle of TQC is that all company activities can be scrutinized in terms of the processes involved; metrics can be assigned to each process to evaluate effectiveness. HP has developed numerous measurements, as shown in Table 2.2.
The TQC approach places quality/productivity assessment high on the list of soft-ware-development tasks. When projects are first defined, along with understanding and evaluating the process to be automated, the team defines the metrics that are to be used to measure the process.
HP has also established a systems software certification program to ensure measur-able, consistent, high-quality software through defining metrics, setting goals, col-lecting and analyzing data, and certifying products for release.
HP’s results are impressive. Defects are caught and corrected early, when costs to find and fix are lower. Less time is spent in the costly system test and integration phases, and on maintenance. This results in lower overall support costs and higher productivity. It has also increased quality for HP’s customers. HP’s success demon-strates what a corporate-wide commitment to productivity and quality measures can achieve.
Balanced Scorecard
We addressed the concept of the IT roadmap in Chapter 1. One of the popular tech-niques that many companies have selected is the balanced scorecard, as shown in Figure 2.1. Heralded as one of the most significant management ideas of the past 75 years, the balanced scorecard has been implemented in companies to measure as well as manage the IT effort.
Robert S. Kaplan and David P. Norton developed the balanced scorecard approach in the early 1990s to compensate for their perceived shortcomings of using only
Table 2.2 HP TQC Program
METRIC GOAL
Break-even time Measures return on investment. Time until development costs are offset by profits.Time to market Measures responsiveness and competitiveness. Time from project go-ahead until
release to market.Progress rate Measures accuracy of schedule. Ratio of planned to actual development time.Post-release defect density Measures effectiveness of test processes. Total number of defects reported during the
first 12 months after product release.Turnover rate Measures morale. Percentage of staff leaving.Training Measures investment in career development. Number of hours per year.

19DESIGNING PERFORMANCE MANAGEMENT SYSTEMS
financial metrics to judge corporate performance. They recognized that in this “New Economy” it was also necessary to value intangible assets. Because of this, they urged companies to measure such esoteric factors as quality and customer satisfaction. By the mid-1990s, the balanced scorecard became the hallmark of a well-run company. Kaplan and Norton (2001) often compare their approach for managing a company with that of pilots viewing assorted instrument panels in an airplane cockpit—both have a need to monitor multiple aspects of their working environment.
In the scorecard scenario, a company organizes its business goals into discrete, all-encompassing perspectives: financial, customer, internal process, and learning/growth. The company then determines cause–effect relationships—for example, sat-isfied customers buy more goods, which increases revenue. Next, the company lists measures for each goal, pinpoints targets, and identifies projects and other initiatives to help reach those targets.
Departments create scorecards tied to the company’s targets, and employees and projects have scorecards tied to their department’s targets. This cascading nature pro-vides a line of sight between each individual, what he or she is working on, the unit that he or she supports, and how that impacts the strategy of the whole enterprise.
The balanced scorecard approach is more than just a way to identify and monitor metrics. It is also a way to manage, change, and increase a company’s effectiveness, productivity, and competitive advantage. Essentially, a company that uses the score-card to identify and then realize strategic goals can be referred to as a strategy-focused
Objectives Measures
FinancialHow do we look to shareholders?
Targets Initiatives
Objectives Measures
CustomerHow do customers see us?
Targets Initiatives Objectives Measures
Internal business processesWhat must we excel at?
Targets Initiatives
Objectives Measures
Learning and growth
Vision and strategy
How can we sustain our ability to change and improve
Targets Initiatives
Figure 2.1 The balanced scorecard and its four perspectives.
20 Managing it PerforManCe to Create Business Value
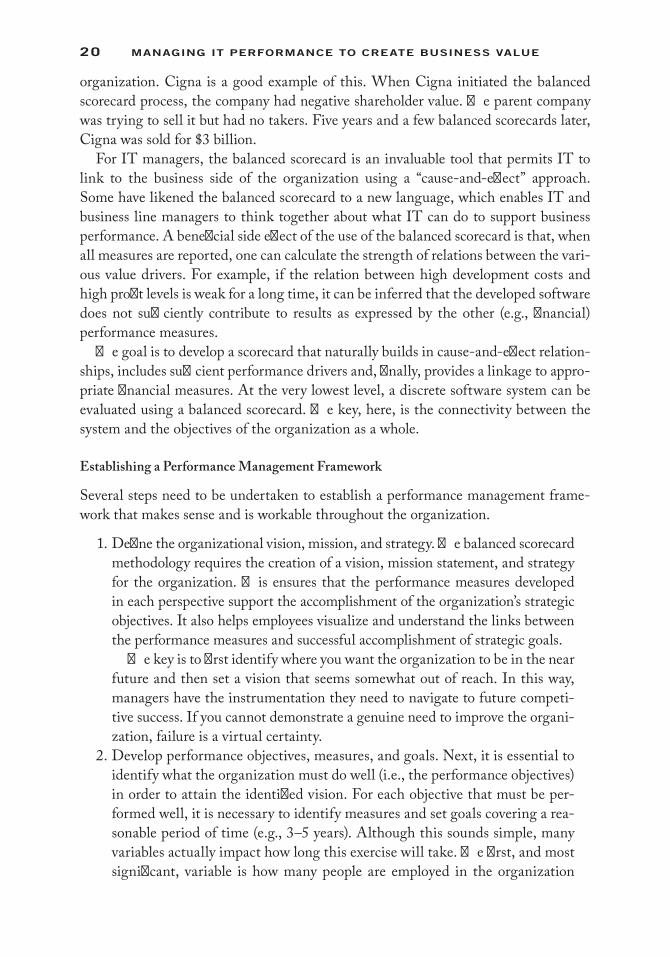
organization. Cigna is a good example of this. When Cigna initiated the balanced scorecard process, the company had negative shareholder value. The parent company was trying to sell it but had no takers. Five years and a few balanced scorecards later, Cigna was sold for $3 billion.
For IT managers, the balanced scorecard is an invaluable tool that permits IT to link to the business side of the organization using a “cause-and-effect” approach. Some have likened the balanced scorecard to a new language, which enables IT and business line managers to think together about what IT can do to support business performance. A beneficial side effect of the use of the balanced scorecard is that, when all measures are reported, one can calculate the strength of relations between the vari-ous value drivers. For example, if the relation between high development costs and high profit levels is weak for a long time, it can be inferred that the developed software does not sufficiently contribute to results as expressed by the other (e.g., financial) performance measures.
The goal is to develop a scorecard that naturally builds in cause-and-effect relation-ships, includes sufficient performance drivers and, finally, provides a linkage to appro-priate financial measures. At the very lowest level, a discrete software system can be evaluated using a balanced scorecard. The key, here, is the connectivity between the system and the objectives of the organization as a whole.
Establishing a Performance Management Framework
Several steps need to be undertaken to establish a performance management frame-work that makes sense and is workable throughout the organization.
1. Define the organizational vision, mission, and strategy. The balanced scorecard methodology requires the creation of a vision, mission statement, and strategy for the organization. This ensures that the performance measures developed in each perspective support the accomplishment of the organization’s strategic objectives. It also helps employees visualize and understand the links between the performance measures and successful accomplishment of strategic goals.
The key is to first identify where you want the organization to be in the near future and then set a vision that seems somewhat out of reach. In this way, managers have the instrumentation they need to navigate to future competi-tive success. If you cannot demonstrate a genuine need to improve the organi-zation, failure is a virtual certainty.
2. Develop performance objectives, measures, and goals. Next, it is essential to identify what the organization must do well (i.e., the performance objectives) in order to attain the identified vision. For each objective that must be per-formed well, it is necessary to identify measures and set goals covering a rea-sonable period of time (e.g., 3–5 years). Although this sounds simple, many variables actually impact how long this exercise will take. The first, and most significant, variable is how many people are employed in the organization

21DESIGNING PERFORMANCE MANAGEMENT SYSTEMS
and the extent to which they will be involved in setting the vision, mission, measures, and goals.
The balanced scorecard translates an organization’s vision into a set of performance objectives distributed among four perspectives: financial, cus-tomer, internal business processes, and learning and growth. Some objec-tives are maintained to measure an organization’s progress toward achieving its vision. Other objectives are maintained to measure the long-term driv-ers of success. Through the use of the balanced scorecard, an organization monitors both its current performance (financial, customer satisfaction, and business process results) and its efforts to improve processes, motivate and educate employees, and enhance information systems—its ability to learn and improve.
When creating performance measures, it is important to ensure that they link directly to the strategic vision of the organization. The measures must focus on the outcomes necessary to achieve the organizational vision and the objectives of the strategic plan. When drafting measures and setting goals, ask whether or not achievement of the identified goals will help realize the organizational vision.
Each objective within a perspective should be supported by at least one mea-sure that will indicate an organization’s performance against that objective. Define measures precisely, including the population to be measured, the method of measurement, the data source, and the time period for the measurement. If a quantitative measure is feasible and realistic, then its use should be encouraged.
When developing measures, it is important to include a mix of quantita-tive and qualitative measures. Quantitative measures provide more objectivity than qualitative measures. They may help to justify critical management deci-sions on resource allocation (e.g., budget and staffing) or systems improve-ment. The company should first identify any available quantitative data and consider how it can support the objectives and measures incorporated in the balanced scorecard. Qualitative measures involve matters of perception, and therefore of subjectivity. Nevertheless, they are an integral part of the busi-ness scorecard methodology. Judgments based on the experience of customers, employees, managers, and contractors offer important insights into acquisi-tion performance and results.
3. Finally, it takes time to establish measures, but it is also important to recog-nize that they might not be perfect the first time. Performance management is an evolutionary process that requires adjustments as experience is gained in the use of performance measures.
If your initial attempts at implementation are too aggressive, the resulting lack of organizational “buy-in” will limit your chance of success. Likewise, if implementation is too slow, you may not achieve the necessary organiza-tional momentum to bring the balanced scorecard to fruition. Incorporating

22 Managing it PerforManCe to Create Business Value
performance measurement and improvement into your existing management structure, rather than treating it as a separate program, will greatly increase the balanced scorecard’s long-term viability.
To achieve long-term success, it is imperative that the organizational culture evolves to the point where it cultivates performance improvement as a continuous effort. Viewing performance improvement as a one-time event is a recipe for failure.
Creating, leveraging, sharing, enhancing, managing, and documenting balanced scorecard knowledge will provide critical “corporate continuity” in this area. A knowl-edge repository will help to minimize the loss of institutional performance manage-ment knowledge that may result from retirements, transfers, promotions, and so on.
Developing Benchmarks
The central component of any performance management and measurement system is benchmarking. A benchmark is a point of reference from which measurements may be made. It is something that serves as a standard by which others may be measured.
The purpose of benchmarking is to assist in the performance improvement process. Specifically, benchmarking can
1. Identify opportunities 2. Set realistic but aggressive goals 3. Challenge internal paradigms on what is possible 4. Understand methods for improved processes 5. Uncover strengths within your organization 6. Learn from the leaders’ experiences 7. Better prioritize and allocate resources
Table 2.3 describes the ramifications of not using benchmarking.
Table 2.3 Benchmarking versus Not Benchmarking
WITHOUT BENCHMARKING WITH BENCHMARKING
Defining customer requirements
Based on history/gut feeling Based on market realityActing on perception Acting on objective evaluation
Establishing effective goals Lack external focus Credible, customer focusedReactive ProactiveLagging industry Industry leadership
Developing true measures of productivity
Pursuing pet projects Solving real problemsStrengths and weaknesses not
understoodPerformance outputs known, based
on best in classBecoming competitive Internally focused Understand the competition
Evolutionary change Proven performanceLow commitment High commitment
Industry practices Not invented here Proactive search for changeFew solutions Many options
Breakthroughs

23DESIGNING PERFORMANCE MANAGEMENT SYSTEMS
Obviously, benchmarking is critical to your organization. However, benchmark-ing needs to be done with great care. There are actually times when you should not benchmark:
1. You are targeting a process that is not critical to the organization. 2. You do not know what your customers require from your process. 3. Key stakeholders are not involved in the benchmarking process. 4. Inadequate resources, including budgetary, have been committed. 5. There is strong resistance to change. 6. You are expecting results instantaneously.
Most organizations use a four-phase model to implement benchmarking:
1. Plan 2. Collect 3. Analyze 4. Adapt
When planning a benchmarking effort, considerable thought should be given to who is on the benchmarking team. In some cases, team members will need to be trained in the different tools and techniques of the benchmarking process.
The creation of a benchmarking plan is similar to the creation of a project plan for a traditional systems development effort, with a few twists:
1. The scope of the benchmarking study needs to be established. All projects must have boundaries. In this case, you will need to determine which depart-mental units and/or processes will be studied.
2. A purpose statement should be developed. This should state the mission and goals of the plan.
3. If benchmarking partners (i.e., other companies in your peer grouping who agree to be part of your effort) are to be used, specific criteria for their involve-ment should be noted. In addition, a list of any benchmarking partners should be provided. The characteristics of benchmarking partners that are impor-tant to note include: policies and procedures, organizational structure, finan-cials, locations, quality, productivity, competitive environment, and products/services.
4. Define a data collection plan and determine how the data will be used, man-aged, and ultimately distributed.
5. Finally, your plan should discuss how implementation of any improvements resulting from the benchmarking effort will be accomplished.
The collection phase of a benchmarking effort is very similar to the requirements elicitation phase of software engineering. The goal is to collect data and turn them into knowledge.
24 Managing it PerforManCe to Create Business Value
During the collection phase, the focus is on developing data collection instruments. The most widely used is the questionnaire with follow-up telephone interviews and site visits. Other methods include interviewing, observation, participation, documen-tation, and research.
Once the data have been collected, they should be analyzed. Hopefully, you will have managed to secure the cooperation of one or more benchmarking partners so that your analysis will be comparative rather than introspective.
The goal of data analysis is to identify any gaps in performance. Once you find these, you will need to
1. Identify the operational best practices and enables. In other words, what are your partners doing right that you are not? Then you need to find out exactly “how” they are doing it.
2. Formulate a strategy to close these gaps by identifying opportunities for improvement.
3. Develop an implementation plan for these improvements.
The analysis phase uses the outputs of the data collection phase—that is, the ques-tionnaires, interviews, observations, and so on. It is during this phase that process mapping and the development of requisite process performance measurements are performed.
Process performance measurements should be
1. Tied to customer expectations 2. Aligned with strategic objectives 3. Clearly reflective of the process and not influenced by other factors 4. Monitored over time
Once the plan has been formulated and receives approval from management, it will be implemented in this phase. Traditional project management techniques should be used to control, monitor, and report on the project. It is also during this phase that the continuous improvement plan is developed. In this plan, new benchmarking opportu-nities should be identified and pursued.
The benchmarking maturity matrix can be used for a periodic review of the bench-marking initiative. They stress that to understand an initiative’s current state and find opportunities for improvement, the organization must examine its approach, focus, culture, and results. The benchmarking maturity matrix demonstrates the maturity of 11 key elements derived from 5 core focus areas: management culture (e.g., expects long-term improvement), benchmarking focal point (e.g., team), processes (e.g., coach-ing), tools (e.g., intranet), and results.
The 11 key elements within the matrix are
1. Knowledge management/sharing 2. Benchmarking

25DESIGNING PERFORMANCE MANAGEMENT SYSTEMS
3. Focal point 4. Benchmarking process 5. Improvement enablers 6. Capture storage 7. Sharing dissemination 8. Incentives 9. Analysis 10. Documentation 11. Financial impact
The five maturity levels are, from lowest to highest:
1. Internal financial focus, with short-term focus that reacts to problems 2. Sees need for external focus to learn 3. Sets goals for knowledge sharing 4. Learning is a corporate value 5. Knowledge sharing is a corporate value
Based on these two grids, a series of questions are asked and a score is calculated:
Key 1: Which of the following descriptions best defines your organization’s ori-entation toward learning?
Key 2: Which of the following descriptions best defines your organization’s ori-entation toward improving?
Key 3: How are benchmarking activities and/or inquiries handled within your organization?
Key 4: Which of the following best describes the benchmarking process in your organization?
Key 5: Which of the following best describes the improvement enablers in place in your organization?
Key 6: Which of the following best describes your organization’s approach for capturing and storing best practices information?
Key 7: Which of the following best describes your organization’s approach for sharing and disseminating best practices information?
Key 8: Which of the following best describes your organization’s approach for encouraging the sharing of best practices information?
Key 9: Which of the following best describes the level of analysis done by your organization to identify actionable best practices?
Key 10: How are business impacts that result from benchmarking projects docu-mented within your organization?
Key 11: How would you describe the financial impact resulting from bench-marking projects?
The maturity matrix is a good tool for internal assessment as well as for compari-sons to other companies.

26 Managing it PerforManCe to Create Business Value
Looking Outside the Organization
Competitive analysis serves a useful purpose. It helps organizations devise their stra-tegic plans and gives them insight into how to craft their performance indicators. It is quite possible that information coupled with the experience of a seasoned industry manager is more than adequate to take the place of expensive experts in the field of competitive analysis.
The goal of this technique is to analyze one competitor at a time to identify strate-gies and predict future moves. The key difference between this technique and others is the level of involvement of senior managers of the firm. In most companies, research is delegated to staff who prepare a report on all competitors at once. An alternative is to gather the information on just one competitor, and then use senior managers to logically deduce the strategy of the competitor in question.
Once the competitor is chosen, a preliminary meeting is scheduled. It should be attended by all senior managers who might have information or insight to contribute concerning this competitor. This includes the chief executive officer as well as the general manager and managers from sales, marketing, finance, and manufacturing. A broader array of staff attending is important to this technique since it serves to provide access to many diverse sources of information. This permits the merger of external information sources—as well as internal sources—collected by the organization, such as documents, observations, and personal experiences.
At this meeting, it is agreed that all attendees spend a specified amount of time collecting more recent information about a competitor. At this time, a second meeting is scheduled in which to review this more recent information.
At an information meeting, each attendee will receive an allotment of time to present his or her intimation to the group. The group will then perform a relative strengths/weaknesses analysis. This will be done for all areas of interest uncovered by the information obtained by the group. The analysis will seek to draw conclu-sions about two criteria. First, is a competitor stronger or weaker than your company? Second, does the area have the potential to affect customer behavior?
Unless the area meets both of these criteria, it should not be pursued further either in analysis or discussion. Since managers do not always agree on what areas to include or exclude, it is frequently necessary to appoint a moderator who is not part of the group.
At this point, with areas of concern isolated, it is necessary to do a comparative cost analysis. The first step here is to prepare a breakdown of costs for your product. This includes labor, manufacturing, cost of goods, distribution, sales, administrative as well as other relevant items of interest as necessary.
At this point, compare the competitor’s cost for each of these factors according to the following scale:
Significantly higherSlightly higher
27DESIGNING PERFORMANCE MANAGEMENT SYSTEMS
Slightly lowerSignificantly lower
Now, translate these subjective ratings to something a bit more tangible, such as slightly higher is equivalent to 15%. By weighting each of these factors by its relative contribution to the total product cost, it is now possible to calculate the competitor’s total costs.
Analysis of competitor motivation is perhaps the most intangible of the steps. The group must now attempt to analyze their competitor’s motivation by determining how the competitor measures success as well as what its objectives and strategies are.
During the research phase, the senior manager and his or her staff gather consid-erable information on this topic. By using online databases and websites, it is possible to collect information about self-promotions, annual reports, press releases, and the like. In addition, information from former employees, the sales force, investment analysts, suppliers, and mutual clients is extremely useful and serves to broaden the picture.
Based on the senior managers’ understanding of the business, it is feasible to be able to deduce the competitor’s motivation. Motivation can often be deduced by observ-ing the way the competitor measures itself. Annual reports are good sources for this information. For example, a competitor that wants to reap the benefits of invest-ment in a particular industry will most likely measure success in terms of return on investment.
By reviewing information on the competitor’s strengths and weaknesses, relative cost structure, goals, and strategies, the total picture of the firm can be created.
Using this information, the group should be able to use individual insights into the process of running a business in a similar industry to determine the competitor’s next likely moves.
For example, analysis shows that a competitor is stronger in direct sales, has a cost advantage in labor, and is focused on growing from a regional to a national firm. The group would draw the conclusion that the competitor will attempt to assemble a direct sales effort nationwide, while positioning itself on the basis of low price.
Process Mapping
Process mapping is an approach to systematically analyzing a particular process. It provides a focal point for the performance improvement and measurement processes.
Process mapping involves mapping each individual step, or unit operation, under-taken in that process in chronological sequence. Once individual steps are identified, they can be analyzed in more detail.
Because it is best done in small teams, process mapping is an important focal point for employee involvement. The act of defining each unit operation of a given pro-cess gives a much deeper understanding of the process to team members—sometimes leading to ideas for immediate operational improvements.

28 Managing it PerforManCe to Create Business Value
The following six steps will help you apply process mapping to your company’s operational processes:
Step 1: Understanding the basic process mapping toolStep 2: Creating a flowchart of your product’s life cycleStep 3: Using the flowchart to define boundariesStep 4: Identifying the processes within the boundaries you have setStep 5: Applying the basic process mapping tool to each processStep 6: Compiling your results
The first basic step in process mapping is to break down a process into its compo-nent steps, or unit operations. The process map depicts these steps and the relationship between them.
The second basic step in process mapping is to analyze each unit operation in the form of a diagram that answers the following questions:
1. What is the product input to each unit operation? (The product input to a given unit operation is generally the product output of the preceding unit operation. For the first unit operation of a process, there may not be any “product input.”)
2. What are the nonproduct inputs to the unit operation? (These include raw materials and components as well as energy, water, and other resource inputs.)
3. What is the product output of the unit operation? 4. What are the nonproduct outputs of the unit operation? (These include solid
waste, water discharge, air emissions, noise, etc.) 5. What are the environmental aspects of the unit operation? (These may have
been designated as inputs or outputs.)
The first application of the basic process mapping approach is to create a simple flowchart or process map showing the main stages of the life cycle of your product, from raw material extraction to end-of-life disposal (or reuse or recycling).
On the simple process map, draw a dotted line around the processes that you want to include in your analysis, as shown in Figure 2.2.
Your next step is to identify the processes included in the scope you selected. As you look at your life-cycle process map, most of your basic processes will be obvious. However, there may be some processes or operations that are not central to making your product but have an impact nonetheless.
Now you need to apply the process mapping tool to each of these processes to gen-erate a process map showing the unit operations for each process. You can then use a unit operation diagram to identify the relevant aspects of each unit operation. Be sure to include employees familiar with the operation in question on the team that identi-fies the aspects.
If you have completed the previous steps, you have identified unit operations for all of your organization’s processes and identified the relevant aspects for each unit

29DESIGNING PERFORMANCE MANAGEMENT SYSTEMS
operation. You will then use these data to evaluate which of the aspects that you have selected for analysis are significant.
In Conclusion
Organizations seek to create an efficient and effective performance management sys-tem to translate vision into clear measurable outcomes that define success, and that are shared throughout the organization and with customers and stakeholders. Doing this provides a tool for assessing, managing, and improving the overall health and success of business systems.
ReferenceKaplan, R. S. and Norton, D. P. (2001). On balance (interview). CFO, Magazine for Senior
Financial Executives. February.
Screenreclamation
Shipproduct
Use/disposeof product
Extract rawmaterial
Design andprepare art
Preparescreen
Transportraw material
Transportprocessinputs
Store processinputs
Make processinputs
= Aspects identification boundary
Figure 2.2 Life-cycle process map for a screen-printing operation with boundaries defined.

31
3Designing metrics
We measure productivity and quality to quantify the project’s progress as well as to quantify the attributes of the product. A metric enables us to understand and manage the process as well as to measure the impact of change to the process—that is, new methods, training, and so on. The use of metrics also enables us to know when we have met our goals—that is, usability, performance, and test coverage.
In measuring software systems, we can create metrics based on the different parts of a system—that is, requirements, specifications, code, documentation, tests, and training. For each of these components, we can measure its attributes, which include usability, maintainability, extendibility, size, defect level, performance, and complete-ness. While the majority of organizations will use metrics found in books such as this one, it is possible to generate metrics specific to a particular task. The characteristics of metrics dictate that they should be collectable, reproducible, pertinent, and system independent.
The nuts and bolts of actually creating these sorts of metrics often run into some obstacles. Many employees complain that it is just not possible to measure—that is, develop metrics for what they do. That is simply not true. Areas previously thought to be “unmeasurable” have been shown to be measurable if someone is motivated and creative enough to pursue an innovative approach.
Many employees stress the unfairness of being measured because they feel that they do not have any control over the outcome or the impact. Although it is rare that any one specific person has total control over the outcome, the impact on the results should be clearly demonstrable. These same employees also suggest that measurement will invite unfair comparisons. However, comparison is going to happen whether they like it or not. By taking the initiative, the employee can help the team or organization by proactively comparing performance, determining how well they are doing, and seeking ways to improve their performance.
Employees also fear that the results will be used against them. They need to be convinced that demonstrating openness and accountability, even when the news is not so good, inspires trust. If they are open about where they need to improve, most people will give them the benefit of the doubt as long as they demonstrate that they are sincerely seeking to improve.
Two of the biggest complaints are that data to be used for measurement are not available and/or the team simply does not have the resources to collect the data. In this age of information technology, it is hard to believe that performance data are not

32 Managing it PerforManCe to Create Business Value
available. If a project is important enough to fund, staff should be able to find some way to collect data on its effectiveness. It can be as simple as a desktop spreadsheet using information collected from a hard-copy log or it can be trained observer ratings, with numerous variations in between. What is important is that critical indicators of success are identified and measured consistently and conscientiously. Dedicating a small percentage of staff time to come up with thoughtful measures, collecting the data on those measures, and then using the data to manage for results, will generally save a larger portion of their time that they would have spent correcting problems down the road.
What Constitutes a Good Metric?
Now that the team is on board with the measurement process, they need to spend some time preparing meaningful performance measures. Table 3.1 provides 10 criteria for effective measures.
A wide variety of metrics are available. You will have to determine which metrics are right for your organization. However, before you even select the metrics you will be using, you will need to gear your company up for the process of creating and/or selecting from those available metrics. A typical method for a benchmarking initiative consists of
1. Selecting the process and building support. It is more than likely that there will be many processes to benchmark. Break down a large project into dis-crete, manageable subprojects. These subprojects should be prioritized, with those critical to the goals of the organization taking priority.
2. Determining current performance. Quite a few companies decide to bench-mark because they have heard the wonderful success stories of Motorola, General Electric, or more modern companies such as Facebook and Google. During my days with the New York Stock Exchange, the chairman was for-ever touting the latest current management fad and insisting that we all fol-low suit. The problem is that all organizations are different and, in the case
Table 3.1 Criteria of Effective Measures
RESULTS ORIENTED FOCUSED PRIMARILY ON DESIRED OUTCOMES, LESS EMPHASIS ON OUTPUTS
Important Concentrate on significant mattersReliable Accurate, consistent information over timeUseful Information is valuable to both policy and program decision-makers and can be used to
provide continuous feedback on performance to agency staff and managersQuantitative Expressed in terms of numbers or percentagesRealistic Measures are set that can be calculatedCost-effective The measures themselves are sufficiently valuable to justify the cost of collecting the dataEasy to interpret Do not require an advanced degree in statistics to use and understandComparable Can be used for benchmarking against other organizations, internally and externallyCredible Users have confidence in the validity of the data
33Designing MetriCs
of benchmarking, extremely issue-specific. Before embarking on a bench-marking effort, the planners need to really investigate and understand the business environment and the impact of specific business processes on overall performance.
3. Determining where performance should be. Perhaps just as importantly, the organization should benchmark itself against one of its successful competi-tors. This is how you can determine where “you should be” in terms of your own organization’s performance.
4. Determining the performance gap. You now know where you are (No. 2 on this list) as well as where you would like to be (No. 3 on this list). The dif-ference between the two is referred to as the performance gap. The gap must be identified, organized, and categorized. In other words, the causal factor should be attributed to people, process, technology, or cultural influences, and then prioritized.
5. Designing an action plan. Technologists are most comfortable with this step as an action plan is really the same thing as a project plan. It should list the chronological steps for solving a particular problem as identified in num-ber 4. Information in this plan should also include problem-solving tasks, who is assigned to each task, and the time frame.
6. Striving for continuous improvement. In the process-improvement business, there are two catchphrases: “process improvement” and “continuous improve-ment.” The former is reactive to a current set of problems and the latter is proactive, meaning that the organization should continuously be searching for ways to improve.
One of the reasons why there are more than a handful of performance measure-ment implementation failures is that the metrics were poorly defined. Therefore, one of the most critical of tasks confronting the team is the selection of metrics. However, you cannot just select some from column A and some from column B. Different met-rics work differently for different companies, and even within different divisions of the same company.
One method that can be used to select among the plethora of metrics is the ana-lytic hierarchy process (AHP). AHP is a framework of logic and problem-solving that organizes data into a hierarchy of forces that influence decision results. It is a simple, adaptable methodology used by government as well as many commercial organizations. One of the chief selling points of this methodology is that it is participative, promotes consensus, and does not require any specialized skillsets to utilize.
AHP is based on a series of paired comparisons in which users provide judgments about the relative dominance of the two items. Dominance can be expressed in terms of preference, quality, importance, or any other criterion. Metric selection usually begins by gathering participants together for a brainstorming session. The number

34 Managing it PerforManCe to Create Business Value
of participants selected should be large enough to ensure that a sufficient number of metrics are initially identified.
Participants, moderated by a facilitator, brainstorm a set of possible metrics and the most important metrics are selected. Using a written survey, each participant is asked to compare all possible pairs of metrics in each of the four errors as to their relative importance using a scale as shown in Table 3.2.
From the survey responses, the facilitator computes the decision model for each participant that reflects the relative importance of each metric. Each participant is then supplied with the decision models of all other participants and is asked to rethink their original metric choices. The group meets again to determine the final set of metrics for the scorecard. The beauty of this process is that it makes readily apparent any inconsistencies in making paired comparisons and prevents metrics from being discarded prematurely.
Clinton et al. (2002) provide an example of using AHP to determine how to weight the relative importance of the categories and metrics used in a balanced scorecard framework. A group of participants meet to compare the relative importance of the four balanced scorecard categories in the first level of the AHP hierarchy. They may want to consider the current product life-cycle stage when doing their comparisons. For example, while in the product-introduction stage, formalizing business processes may be of considerable relative importance. When dealing with a mature or declining product, on the other hand, the desire to minimize variable cost per unit may dictate that the financial category be of greater importance than the other three scorecard categories. They provide the following illustrative sample survey question that might deal with this issue:
Survey question: In measuring success in pursuing a differentiation strategy for each pair, indicate which of the two balanced scorecard categories is more important. If you believe
Table 3.2 AHP Pairwise Comparisons
COMPARATIVE IMPORTANCE DEFINITION EXPLANATION
1 Equally important Two decision elements (e.g., indicators) equally influence the parent decision element.
3 Moderately more important One decision element is moderately more influential than the other.
5 Strongly more important One decision element has stronger influence than the other.7 Very strongly more important One decision element has significantly more influence over the
other.9 Extremely more important The difference between influences of the two decision elements is
extremely significant.2, 4, 6, 8 Intermediate judgment values Judgment values between equally, moderately, strongly, very
strongly, and extremely.Reciprocals If v is the judgment value when i is compared with j, then 1/v is
the judgment value when j is compared with i.

35Designing MetriCs
that the categories being compared are equally important in the scorecard process, you should mark a “1.” Otherwise, mark the box with the number that corresponds to the intensity on the side that you consider more important described in the aforementioned scale.
Consider the following examples:
Customer 9 8 7 6 5x
4 3 2 1 2 3 4 5 6 7 8 9 Financial
In this example, the customer category is judged to be strongly more important than the financial category.
Customer 9 8 7 6 5 4 3 2 1x
2 3 4 5 6 7 8 9 Internal Business Processes
In this example, the customer category is judged to be equally important to the internal business processes category.
The values can then be entered into AHP software, such as Expert Choice (http://www.expertchoice.com/software/), which will compute local and global weights with each set of weights always equal to “1.” Local weights are the relative importance of each metric within a category and global weights are the relative importance of each metric to the overall goal. The software will show the relative importance of all met-rics and scorecard categories. For example, in our prior example the results might have been
CATEGORY RELATIVE WEIGHT
Innovation and learning .32Internal business processes .25Customer .21Financial .22Total 1.00
The results show that the participants believe that the most important category is innovation and learning. If, within the innovation and learning category, it is deter-mined that the market share metric is the most important, with a local weight of .40, then we can calculate the global outcome by multiplying the local decision weights from Level 1 (categories) by the local decision weight for level 2 (metrics).
Using determined metrics for each of the four perspectives of the balanced score-card, an example of the final calculation is shown in Table 3.3.
The results indicate that the least important metric is revenue from the customer category and the most important metric is market share from the innovation and learning category.

36 Managing it PerforManCe to Create Business Value
IT-Specific Measures
The four balanced scorecard perspectives might require some modification to be effec-tive as an information technology (IT) scorecard. The reason for this is that the IT department is typically an internal rather than external service supplier and projects are commonly carried out for the benefit of both the end users and the organization as a whole—rather than individual customers within a large market.
Four alternative perspectives might include
1. User orientation (end-user view) a. Mission: Deliver value-adding products and services to end users b. Objectives: Establish and maintain a good image and reputation with end
users, exploit IT opportunities, establish good relationships with the end-user community, satisfy end-user requirements, and be perceived as the preferred supplier of IT products and services
2. Business value (management’s view) a. Mission: Contribute to the value of the business
Table 3.3 AHP Global Outcome Worksheet
BALANCED SCORECARD
STRATEGIC OBJECTIVE: SUCCESS IN PURSUING A DIFFERENTIATION STRATEGY
CATEGORIES AND METRICS LEVEL ONE × LEVEL TWOGLOBAL
OUTCOME
INNOVATION AND LEARNINGMarket share (.40 × .32) .128No. of new products (.35 × .32) .112Revenue from new products (.25 × .32) .080Total: Innovation and learning .320INTERNAL BUSINESS PROCESSESNo. of product units produced (.33 × .25) .08333Minimizing variable cost per unit (.33 × .25) .08333No. on-time deliveries (.33 × .25) .08333Total internal business processes .250CUSTOMERRevenue (.20 × .21) .042Market share (.38 × .21) .080QFD (quality function deployment) score (.42 × .21) .088Total customer .210FINANCIALCash value-added (.28 × .22) .062Residual income (.32 × .22) .070Cash flow ROI (.40 × .22) .088Total financial .220Sum of the global weights 1.00

37Designing MetriCs
b. Objectives: Establish and maintain a good image and reputation with management, ensure that IT projects provide business value, control IT costs, and sell appropriate IT products and services to third parties
3. Internal processes (operations-based view) a. Mission: Deliver IT products and services in an efficient and effective
manner b. Objectives: Anticipate and influence requests from end users and manage-
ment, be efficient in planning and developing IT applications, be efficient in operating and maintaining IT applications, be efficient in acquiring and testing new hardware and software, and provide cost-effective training that satisfies end users
4. Future readiness (innovation and learning view) a. Mission: Deliver continuous improvement and prepare for future
challenges b. Objectives: Anticipate and prepare for IT problems that could arise, con-
tinuously upgrade IT skills through training and development, regularly upgrade IT applications portfolio, regularly upgrade hardware and soft-ware, and conduct cost-effective research into emerging technologies and their suitability for the business
It is then possible to drill down to provide IT-specific measures for each of these four perspectives. Most of the metrics that appear in Table 3.4 have been derived from mainstream literature.
It is important to note that the three key balanced scorecard principles of cause-and-effect relationships, sufficient performance drivers, and linkage to financial mea-sures are built into this IT scorecard. Cause-and-effect relationships can involve one or more of the four perspectives. For example, better staff skills (future readiness perspective) will reduce the frequency of bugs in an application (internal operations perspective).
In a typical company, senior management might question the benefits of large investments in IT and want IT to be better aligned with corporate strategy. Some of the concerns of the different stakeholder groups might be
1. Senior management a. Does IT support the achievement of business objectives? b. What value does the expenditure on IT deliver? c. Are IT costs being managed effectively? d. Are IT risks being identified and managed? e. Are targeted intercompany IT synergies being achieved? 2. Business unit executives a. Are IT services delivered at a competitive cost? b. Does IT deliver on its service-level commitments?

38 Managing it PerforManCe to Create Business Value
Table 3.4 IT Scorecard Metrics
PERSPECTIVE METRIC
User orientation Customer satisfaction
BUSINESS VALUECost control Percentage over/under IT budget
Allocation to different budget itemsIT budget as a percentage of revenueIT expenses per employee
Sales to third parties Revenue from IT-related products/servicesBusiness value of an IT project Traditional measures (e.g., ROI, payback)
Business evaluation based on information economics: value linking, value acceleration, value restructuring, technological innovation
Strategic match with business contribution to: product/service quality, customer responsiveness, management information, process flexibility
Risks Unsuccessful strategy risk, IT strategy risk, definitional uncertainty (e.g., low degree of project specification), technological risk (e.g., bleeding edge hardware or software), development risk (e.g., inability to put things together), operational risk (e.g., resistance to change), IT service delivery risk (e.g., human/computer interface difficulties)
Business value of the IT department/functional area
Percentage of resources devoted to strategic projects
Percentage of time spent by IT manager in meetings with corporate executives
Perceived relationship between IT management and top management
INTERNAL PROCESSESPlanning Percentage of resources devoted to planning and review of IT activitiesDevelopment Percentage of resources devoted to applications development
Time required to develop a standard-sized new applicationPercentage of applications programming with reused codeTime spent to repair bugs and fine-tune new applications
Operations Number of end-user queries handledAverage time required to address an end-user problem
FUTURE READINESSIT specialist capabilities IT training and development budget as a percentage of overall IT budget
Expertise with specific technologiesExpertise with emerging technologiesAge distribution of IT staff
Satisfaction of IT staff Turnover/retention of IT employeesProductivity of IT employees
Applications portfolio Age distributionPlatform distributionTechnical performance of applications portfolioUser satisfaction with applications portfolio
Research into emerging technologies IT research budget as percentage of IT budgetPerceived satisfaction of top management with the reporting on how
specific emerging technologies may or may not be applicable to the company

39Designing MetriCs
c. Do IT investments positively affect business productivity or the customer experience?
d. Does IT contribute to the achievement of our business strategies? 3. Corporate compliance internal audit a. Are the organization’s assets and operations protected? b. Are the key business and technology risks being managed? c. Are proper processes, practices, and controls in place? 4. IT organization a. Are we developing the professional competencies needed for successful
service delivery? b. Are we creating a positive workplace environment? c. Do we effectively measure and reward individual and team performance? d. Do we capture organizational knowledge to continuously improve
performance? e. Can we attract/retain the talent we need to support the business?
One of the most important things a chief information officer (CIO) can do is con-vince senior management that IT is not a service provider, but a strategic partner. As shown in Table 3.5, there are some important differences.
Being a strategic partner enables us to develop an IT scorecard that will encompass the following four quadrants:
1. Customer orientation: To be the supplier of choice for all information services, either directly or indirectly through supplier relationships
2. Corporate contribution: To enable and contribute to the achievement of busi-ness objectives through effective delivery of value-added information services
3. Operational excellence: To deliver timely and effective services at targeted service levels and costs
4. Future orientation: To develop the internal capabilities to continuously improve performance through innovation, learning, and personal organiza-tion growth
The relationship between IT and business can be more explicitly expressed through a cascade of balanced scorecards, as shown in Figure 3.1.
Cascading scorecards can be used within IT as well. Each set of scorecards is actually composed of one or more unit scorecards. For example, the IT operations
Table 3.5 Service Provider to Strategic Partner
SERVICE PROVIDER STRATEGIC PARTNER
IT is for efficiency IT for business growthBudgets are driven by external benchmarks Budgets are driven by business strategyIT is separable from the business IT is inseparable from the businessIT is seen as an expense to control IT is seen as an investment to manageIT managers are technical experts IT managers are business problem solvers

40 Managing it PerforManCe to Create Business Value
scorecard might also include a scorecard for the IT service desk. The resulting IT scorecard consists of objectives, measures, and benchmarks, as shown in Tables 3.6 through 3.9.
The measure of each of these unit scorecards is aggregated in the IT scorecard. This, in turn, is fed into and evaluated against the business scorecard.
There are a wide variety of other IT-oriented metrics that an organization can utilize, as shown in Table 3.10. Others can be found in various appendices of this book.
Hopefully by now you understand the importance of developing cascading sets of interlinked scorecards. From a departmental perspective, you will need to review, understand, and adhere to the organizational scorecard from a macro perspective.
Business balancedscorecard
IT balancedscorecard
IT developmentbalanced
scorecards
IT operationsbalanced
scorecards
Figure 3.1 Cascade of balanced scorecards.
Table 3.6 Corporate Contribution Scorecard Evaluates IT from the Perspective of Senior Management
OBJECTIVE MEASURES BENCHMARKS
Business/IT alignment Operational plan/budget approval Not applicableValue delivery Measured in business unit performance Not applicableCost management Attainment of expense and recovery targets Industry expenditure comparisons
Attainment of unit cost targets Compass operational ‘top performance’ levelsRisk management Results of internal audits Defined sound business practices
Execution of security initiative Not applicableDelivery of disaster recovery assessment Not applicable
Intercompany synergy achievement
Single system solutions Merger and acquisition guidelinesTarget state architecture approval Not applicableAttainment of targeted integrated cost
reductionsNot applicable
IT organization integration Not applicable

41Designing MetriCs
However, you will need to review the departmental- and system-level scorecards from a micro level.
System-Specific Metrics
Systems are what compose the micro level. For example, enterprise resource plan-ning (ERP) is one of the most sophisticated and complex of all software systems. It is a customizable software package that includes integrated business solutions
Table 3.7 Customer Orientation Scorecard Evaluated the Performance of IT from the Perspective of Internal Business Users
OBJECTIVE MEASURES BENCHMARKS
Customer satisfaction Business unit survey ratings• Cost transparency and levels• Service quality and responsiveness• Value of IT advice and support• Contribution to business objectives
Not applicable
Competitive costs • Attainment of unit cost targets• Blended labor rates
Compass operational ‘top level performing’ levelsMarket comparisons
Development services performance
Major project success scores• Recorded goal attainment• Sponsor satisfaction ratings• Project governance rating
Not applicable
Operational services performance
Attainment of targeted service levels Competitor comparisons
Table 3.8 Operational Excellence Scorecard Views IT from the Perspective of IT Managers and Audit and Regulatory Bodies
OBJECTIVE MEASURES BENCHMARKS
Development process performance
Function point measures of:• Productivity• Quality• Delivery rate
To be determined
Operational process performance
Benchmark based measures of:• Productivity• Responsiveness• Change management effectiveness• Incident occurrence levels
Selected compass benchmark studies
Process maturity Assessed level of maturity and compliance in priority processes within:• Planning and organization• Acquisition and implementation• Delivery and support• Monitoring
To be defined
Enterprise architecture management
• Major project architecture approval• Product acquisition compliance to
technology standards• “State of the infrastructure”
assessment
Sound business practices

42 Managing it PerforManCe to Create Business Value
Table 3.9 Future Orientation Perspective Shows IT Performance from the Perspective of the IT Department Itself: Process Owners, Practitioners, and Support Professionals
OBJECTIVE MEASURES BENCHMARKS
Human resource management
Results against targets:• Staff complement by skill type• Staff turnover• Staff “billable” ratio• Professional development days per
staff member
Market comparisonIndustry standard
Employee satisfaction
Employee satisfaction survey scores in:• Compensation• Work climate• Feedback• Personal growth• Vision and purpose
North American technology-dependent companies
Knowledge management
• Delivery of internal process improvements to library
• Implementation of “lessons-learned” sharing process
Not applicable
Table 3.10 Frequently Used Metrics
SYSTEM/SERVICE/FUNCTION POSSIBLE METRIC(S)
R&D Innovation captureNo. of quality improvementsCustomer satisfaction
Process improvement Cycle time, activity costsNo. supplier relationshipsTotal cost of ownership
Resource planning, account management Decision speedLowering level of decision authority
Groupware Cycle time reductionPaperwork reduction
Decision support Decision reliabilityTimelinessStrategic awarenessLowering level of decision authority
Management information systems Accuracy of dataTimeliness
e-Commerce Market sharePrice premium for products/services
Information-based products and services Operating marginsNew business revenuesCash flowKnowledge retention

43Designing MetriCs
for core business processes such as production planning and control and ware-house management. Rosemann and Wiese (1999) use a modified balanced score-card approach to
1. Evaluate the implementation of ERP software 2. Evaluate the continuous operation of the ERP installation
Along with the four balanced scorecard perspectives of financial, customer, internal processes, and innovation and learning, they have added a fifth for the purposes of ERP installation—the project perspective. The individual project requirements, such as identification of critical path, milestones, and so on, are covered by this fifth per-spective that represents all the project-management tasks. Figure 3.2 represents the Rosemann–Wiese approach.
Most ERP implementers concentrate on the financial and business process aspects of ERP implementation. Using the ERP balanced scorecard would enable them to also focus on customer, innovation, and learning perspectives. The latter is particularly important as it enables the development of alternative values for the many conceivable development paths that support a flexible system implementation.
Implementation measures might include
1. Financial: Total cost of ownership, which would enable identification of mod-ules where overcustomization took place
2. Project: Processing time along the critical path, remaining time to the next milestone, and time delays that would affect financial perspective
Financial perspective:What are the detailed
costs of the ERPimplementation?
Customer perspective:Dose the ERP softwareefficiently support user
needs
Internal processes: DoseERP improve internal
business processesProject
perspective
Innovation and learning:Is ERP flexible enough tointegrate future changes?
Figure 3.2 The ERP balanced scorecard.
44 Managing it PerforManCe to Create Business Value
3. Internal processes: Processing time before and after ERP implementation, and coverage of individual requirements for a process
4. Customer: Linkage of customers to particular business processes automated, and resource allocation per customer
5. Innovation and learning: Number of alternative process paths to support a flexible system implementation, number of parameters representing unused customizing potential, and number of documents describing customizing decisions
As in all well-designed balanced scorecards, this one demonstrates a very high degree of linkage in terms of cause-and-effect relationships. For example, “customer satisfaction” within the customer perspective might affect “total cost of ownership” in the financial perspective, “total project time” in the project perspective, “fit with ERP solution” in the internal process perspective, and “user suggestions” in the innovation and learning perspective.
Rosemann and Weise do not require the project perspective in the balanced score-card for evaluating the continuous operation of the ERP installation. Here, the imple-mentation follows a straightforward balanced scorecard approach. Measures include
1. Financial: Compliance with budget for hardware, software, and consulting 2. Customer: a. Coverage of business processes: Percentage of covered process types, per-
centage of covered business transactions, and percentage of covered trans-actions valued good or fair
b. Reduction of bottlenecks: Percentage of transactions not finished on schedule, and percentage of canceled telephone order processes due to noncompetitive system response time
3. Internal process: a. Reduction of operational problems: number of problems with customer
order processing system, percentage of problems with customer order pro-cessing system, number of problems with warehouse processes, number problems with standard reports, and number of problems with reports on demand
b. Availability of the ERP system: average system availability, average down-time, and maximum downtime
c. Avoidance of operational bottlenecks: average response time in order pro-cessing, average response time in order processing at peak time, average number of online transaction processing (OLTP) transactions, and maxi-mum number of OLTP transactions
d. Actuality of the system: average time to upgrade the system, release levels behind the actual level
e. Improvement in system development: punctuality index of system deliv-ery, and quality index

45Designing MetriCs
f. Avoidance of developer bottlenecks: average workload per developer, rate of sick leave per developer, and percentage of modules covered by more than two developers
4. Innovation and learning: a. Qualification: Number of training hours per user, number of training
hours per developer, qualification index of developer (i.e., how qualified is this developer to do what he or she is doing)
b. Independency of consultants: Number of consultant days per module in use >2 years, number of consultant days per module in use <2 years
c. Reliability of software vendor: number of releases per year, number of functional additions, number of new customers
It should be noted that these metrics can be used outside of the balanced scorecard approach as well.
Financial Metrics
Cost–benefit analysis and return on investment (ROI) are typically utilized during the project proposal stage to win management approval. However, these and other financial metrics provide a wonderful gauge for performance.
Cost–benefit analysis is quite easy to understand. The process compares the costs of the system with the benefits of having that system. We all do this on a daily basis. For example, if we go out to buy a new $1000 personal computer, we weigh the cost of expending that $1000 against the benefits of owning the personal computer. For example, these benefits might be
1. No longer have to rent a computer. Cost savings $75 per month. 2. Possible to earn extra money by typing term papers for students. Potential
earnings $300 per month.
We can summarize this as shown in Table 3.11.One-time capital costs such as computers are usually amortized over a certain period
of time. For example, a computer costing $1000 can be amortized over 5 years, which means that instead of comparing a one-time cost of $1000 with the benefits of pur-chasing the PC, we can compare a monthly cost instead. Not all cost–benefit analyses are so clear-cut, however. In our previous example, the benefits were both financially
Table 3.11 Cost–Benefit Analysis
COSTS/ONE TIME BENEFITS/YEAR
$1000 1. Rental computer savings: $75 × 12 = $9002. Typing income: $300 × 12 = $3600
$1000/one time $4500/yearPotential savings/earnings $3500/first year; $4500 subsequent years

46 Managing it PerforManCe to Create Business Value
based. Not all benefits are so easily quantifiable. We call benefits that cannot be quan-tified “intangible benefits.” Examples are
1. Reduced turnaround time. 2. Improved customer satisfaction. 3. Compliance with mandates. 4. Enhanced interagency communication.
Aside from having to deal with both tangible and intangible benefits, most cost–benefit analyses also need to deal with several alternatives. For example, let’s say that a bank uses a loan processing system that is old and often has problems. There might be several alternative solutions:
1. Rewrite the system from scratch 2. Modify the existing system 3. Outsource the system
In each case, a spreadsheet should be created that details one-time as well as con-tinuing costs. These should then be compared with the benefits of each alternative, both tangible as well as intangible.
An associated formula is the benefit–cost ratio (BCR). The computation of the financial BCR is done within the construct of the following formula: benefits/cost. All projects have associated costs. All projects will also have associated benefits. At the outset of a project, costs will far exceed benefits. However, at some point the benefits will start outweighing the costs. This is called the break-even point. The analysis that is done to figure out when this break-even point will occur is called break-even analy-sis. In Table 3.12, we see that the break-even point comes during the first year.
Calculating the break-even point in a project with multiple alternatives enables the project manager to select the optimum solution. The project manager will generally select the alternative with the shortest break-even point.
Most organizations want to select projects that have a positive ROI. The ROI is the additional amount earned after costs are earned back. In our aforementioned “buy versus not buy” PC decision, we can see that the ROI is quite positive during the first, and especially during subsequent years of ownership.
ROI is probably the most favored and critical of all finance metrics from a manage-ment stand-point. Table 3.13 provides a list of questions that ROI can help answer.
Table 3.12 Break-Even Analysis
COSTS/ONE TIME BENEFITS/YEAR
$1000 1. Rental computer savings: $75 × 12 = $9002. Typing income: $300 × 12 = $3600
$1000/one time $4500/yearPotential savings/earnings $3500/first year; $4500 subsequent years

47Designing MetriCs
The IT department and the finance department need to be joint owners of the ROI process.
The basic formula for ROI is
ROIBenefit Cost
Cost=
−( ) .
The results of this calculation can be used to either measure costs or mea-sure benefits, each having its own advantages and disadvantages, as shown in Table 3.14.
ROI calculations require the availability of large amounts of accurate data, which is sometimes unavailable to the IT manager. Many variables need to be considered and decisions made regarding which factors to calculate and which to ignore. Before starting an ROI calculation, identify the following factors:
1. Know what you are measuring: Successful ROI calculators isolate their true data from other factors, including the work environment and the level of man-agement support.
2. Do not saturate: Instead of analyzing every factor involved, pick a few. Start with the most obvious factors that can be identified immediately.
3. Convert to money: Converting data into hard monetary values is essential in any successful ROI study. Translating intangible benefits into dollars is chal-lenging and might require some assistance from the accounting or finance departments. The goal is to demonstrate the impact on the bottom line.
4. Compare apples with apples: Measure the same factors before and after the project.
Table 3.13 Questions ROI Can Answer
REQUIRED INVESTMENT IT OPERATING EFFICIENCY
How much investment–including capital expense, planning and deployment, application development, and ongoing management and support–will the project require?
How will the project improve IT, such as simplifying management, reducing support costs, boosting security, or increasing IT productivity?
FINANCIAL BENEFITS RISKWhat are the expected financial benefits of the project,
measured according to established financial metrics, including ROI, … savings, and payback period?
What are the potential risks associated with the project? How likely will risks impact the implementation schedule, proposed spending, or derived target benefits?
STRATEGIC ADVANTAGE COMPETITIVE IMPACTWhat are the project’s specific business benefits, such as
operational savings, increased availability, increased revenue, or achievement of specific goals?
How does the proposed project compare with competitor’s spending plans?
ACCOUNTABILITYHow will we know when the project is a success? How will
the success be measured (metrics and time frames)?
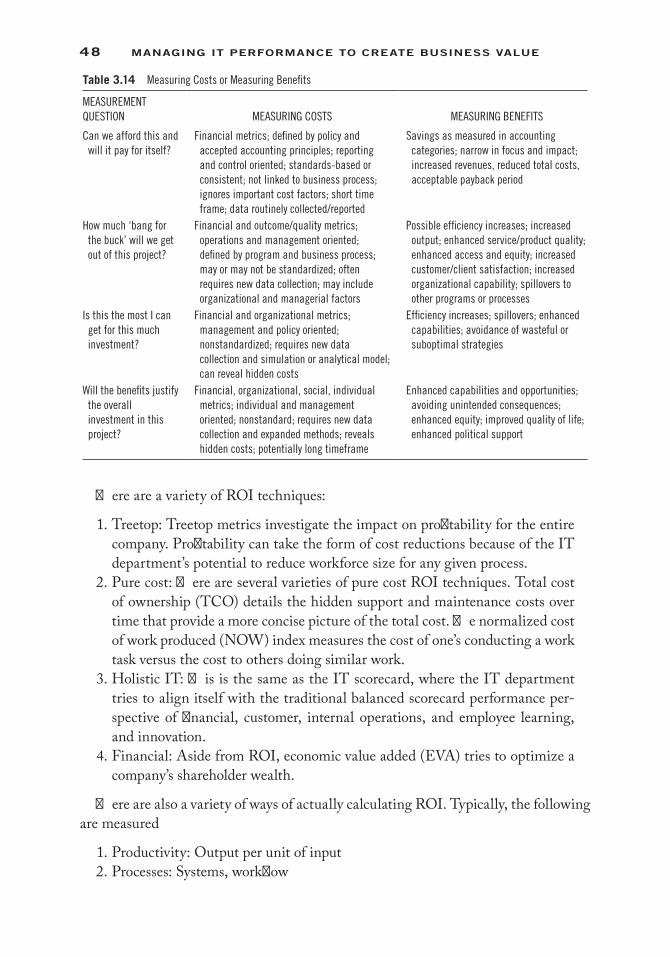
48 Managing it PerforManCe to Create Business Value
There are a variety of ROI techniques:
1. Treetop: Treetop metrics investigate the impact on profitability for the entire company. Profitability can take the form of cost reductions because of the IT department’s potential to reduce workforce size for any given process.
2. Pure cost: There are several varieties of pure cost ROI techniques. Total cost of ownership (TCO) details the hidden support and maintenance costs over time that provide a more concise picture of the total cost. The normalized cost of work produced (NOW) index measures the cost of one’s conducting a work task versus the cost to others doing similar work.
3. Holistic IT: This is the same as the IT scorecard, where the IT department tries to align itself with the traditional balanced scorecard performance per-spective of financial, customer, internal operations, and employee learning, and innovation.
4. Financial: Aside from ROI, economic value added (EVA) tries to optimize a company’s shareholder wealth.
There are also a variety of ways of actually calculating ROI. Typically, the following are measured
1. Productivity: Output per unit of input 2. Processes: Systems, workflow
Table 3.14 Measuring Costs or Measuring Benefits
MEASUREMENT QUESTION MEASURING COSTS MEASURING BENEFITS
Can we afford this and will it pay for itself?
Financial metrics; defined by policy and accepted accounting principles; reporting and control oriented; standards-based or consistent; not linked to business process; ignores important cost factors; short time frame; data routinely collected/reported
Savings as measured in accounting categories; narrow in focus and impact; increased revenues, reduced total costs, acceptable payback period
How much ‘bang for the buck’ will we get out of this project?
Financial and outcome/quality metrics; operations and management oriented; defined by program and business process; may or may not be standardized; often requires new data collection; may include organizational and managerial factors
Possible efficiency increases; increased output; enhanced service/product quality; enhanced access and equity; increased customer/client satisfaction; increased organizational capability; spillovers to other programs or processes
Is this the most I can get for this much investment?
Financial and organizational metrics; management and policy oriented; nonstandardized; requires new data collection and simulation or analytical model; can reveal hidden costs
Efficiency increases; spillovers; enhanced capabilities; avoidance of wasteful or suboptimal strategies
Will the benefits justify the overall investment in this project?
Financial, organizational, social, individual metrics; individual and management oriented; nonstandard; requires new data collection and expanded methods; reveals hidden costs; potentially long timeframe
Enhanced capabilities and opportunities; avoiding unintended consequences; enhanced equity; improved quality of life; enhanced political support

49Designing MetriCs
3. Human resources: Costs and benefits for a specific initiative 4. Employee factors: Retention, morale, commitment, and skills
The ROI calculation is not complete until the results are converted to dollars. This includes looking at combinations of hard and soft data. Hard data include such tra-ditional measures as output, time, quality, and costs. In general, hard data are readily available and relatively easy to calculate. Soft data are hard to calculate and include morale, turnover rate, absenteeism, loyalty, conflicts avoided, new skills learned, new ideas, successful completion of projects, and so on, as shown in Table 3.15.
After the hard and/or soft data have been determined, they need to be converted to monetary values
Step 1: Focus on a single unit.Step 2: Determine a value for each unit.Step 3: Calculate the change in performance. Determine the performance change
after factoring out other potential influences on the training results.Step 4: Obtain an annual amount. The industry standard for an annual perfor-
mance change is equal to the total change in performance data during 1 year.Step 5: Determine the annual value. The annual value of improvement equals
the annual performance change, multiplied by the unit value. Compare the product of this equation with the cost of the program using this formula: ROI = net annual value of improvement − program
What follows is an example of an ROI analysis for a system implementation. Spreadsheets were used to calculate ROI at various stages of the project: planning, development, and implementation.
Initial Benefits Worksheet
Calculation: hours/person average × cost/hour × no. of people = total $ saved
1. Reduced time to learn system/job (worker hours) 2. Reduced supervision (supervision hours) 3. Reduced help from coworkers (worker hours) 4. Reduced calls to help line 5. Reduced down time (waiting for help, consulting manuals, etc.) 6. Fewer or no calls from help line to supervisor about overuse of help service
Continuing Benefits Worksheet
Calculation: hours/person average × cost/hour × no. of people = total $ saved
1. Reduced time to perform operation (worker time) 2. Reduced overtime 3. Reduced supervision (supervisor hours)
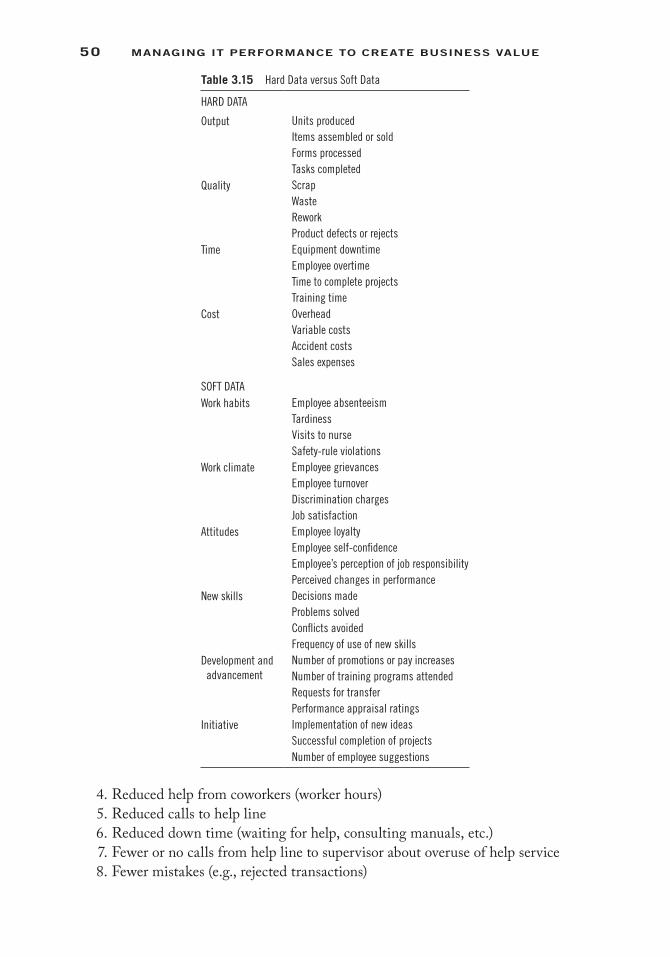
50 Managing it PerforManCe to Create Business Value
4. Reduced help from coworkers (worker hours) 5. Reduced calls to help line 6. Reduced down time (waiting for help, consulting manuals, etc.) 7. Fewer or no calls from help line to supervisor about overuse of help service 8. Fewer mistakes (e.g., rejected transactions)
Table 3.15 Hard Data versus Soft Data
HARD DATA
Output Units producedItems assembled or soldForms processedTasks completed
Quality ScrapWasteReworkProduct defects or rejects
Time Equipment downtimeEmployee overtimeTime to complete projectsTraining time
Cost OverheadVariable costsAccident costsSales expenses
SOFT DATAWork habits Employee absenteeism
TardinessVisits to nurseSafety-rule violations
Work climate Employee grievancesEmployee turnoverDiscrimination chargesJob satisfaction
Attitudes Employee loyaltyEmployee self-confidenceEmployee’s perception of job responsibilityPerceived changes in performance
New skills Decisions madeProblems solvedConflicts avoidedFrequency of use of new skills
Development and advancement
Number of promotions or pay increasesNumber of training programs attendedRequests for transferPerformance appraisal ratings
Initiative Implementation of new ideasSuccessful completion of projectsNumber of employee suggestions

51Designing MetriCs
9. Fewer employees needed 10. Total savings in 1 year 11. Expected life of system in years
Quality Benefits Worksheet
Calculation: unit cost × no. of units = total $ saved
1. Fewer mistakes (e.g., rejected transactions) 2. Fewer rejects-ancillary costs 3. Total savings in 1 year 4. Expected life of system in years
Other Benefits Worksheet
Calculation: = $ saved per year
1. Reduced employee turnover 2. Reduced grievances 3. Reduced absenteeism/tardiness (morale improvements)
ROI Spreadsheet Calculation
Calculation: ROI = (Benefits − Costs/Costs)
1. Initial time saved total over life of system 2. Continuing worker hours saved total over life of system 3. Quality improvements with fixed costs total over life of system 4. Other possible benefits total over life of system 5. Total benefits 6. Total system costs (development, maintenance, and operation)
These ROI calculations are based on valuations of improved work product, what is referred to as a cost-effectiveness strategy.
ROI evaluates an investment’s potential by comparing the magnitude and timing of expected gains to the investment costs. For example, a new initia-tive costs $500,000 and will deliver an additional $700,000 in increased prof-its. Simple ROI = gains − investment costs. ($700,000 − $500,000 = $200,000. $200,000/$500,000 = 40%.) This calculation works well in situations where benefits and costs are easily known, and is usually expressed as an annual percentage return.
However, technology investments frequently involve financial consequences that extend over several years. In this case, the metric has meaning only when the time period is clearly stated. Net present value (NPV) recognizes the time value of money by discounting costs and benefits over a period of time, and focuses either on the impact on cash flow rather than net profit, or savings.

52 Managing it PerforManCe to Create Business Value
A meaningful NPV requires sound estimates of the costs and benefits and use of the appropriate discount rate. An investment is acceptable if the NPV is positive. For example, an investment costing $1 million has an NPV of savings of $1.5 million. Therefore, ROI = the NPV of savings − initial investment cost/initial investment cost. ($1,500,000 − $1,000,000 = $500,000. $500,000/$1,000,000 = 50%.) This may also be expressed as ROI = $1.5M (NPV of savings)/$1M (initial investment) × 100 = 150%.
The internal rate of return (IRR) is the discount rate that sets the net present value of the program or project to zero. While the internal rate of return does not gener-ally provide an acceptable decision criterion, it does provide useful information, par-ticularly when budgets are constrained or there is uncertainty about the appropriate discount rate.
The U.S. CIO Council developed (see Appendix VIII) the value measuring meth-odology (VMM) to define, capture, and measure value associated with electronic ser-vices unaccounted for in traditional ROI calculations, to fully account for costs, and to identify and consider risk.
Most companies track the cost of a project using only two dimensions: planned costs versus actual costs. Using this particular metric, if managers spend all of the money that has been allocated to a particular project, they are right on target. If they spend less money, they have a cost underrun—a greater expenditure results in a cost overrun. However, this method ignores a key third dimension—the value of work performed.
Earned-value management—or EVM—enables you to measure the true cost of performance of long-term capital projects. Even though EVM has been in use for years, government contractors are the major practitioners of this method.
The key tracking EVM metric is the cost performance index or CPI, which has proved remarkably stable over the course of most projects. The CPI shows the rela-tionship between the value of work accomplished (“earned value”) and the actual costs, as shown in the following example.
If the project is budgeted to have a final value of $1 billion, but the CPI is running at 0.8 when the project is, say, one-fifth complete, the actual cost at completion can be expected to be around $1.25 billion ($1 billion/0.8). You are earning only 80 cents of value for every dollar you are spending. Management can take advantage of this early warning by reduc-ing costs while there is still time.
Several software tools, including Microsoft Project, have the capability of working with EVM.
Examples of Performance Measures
Table 3.16 provides examples of performance measures that are typical for many IT projects. While the category and metrics columns are fairly representative of those used in IT projects in general, the measure of success will vary greatly and should be established for each individual project, as appropriate.

53Designing MetriCs
Table 3.16 IT Performance Measures
CATEGORY FOCUS PURPOSE MEASURE OF SUCCESS
Schedule performance
Tasks completed vs. tasks planned at a point in time.
Assess project progress. Apply project resources.
100% completion of tasks on critical path; 90% all others
Major milestones met vs. planned.
Measure time efficiency. 90% of major milestones met.
Revisions to approved plan. Understand and control project “churn.”
All revisions reviewed and approved.
Changes to customer requirements.
Understand and manage scope and schedule.
All changes managed through approved change process.
Project completion date. Award/penalize (depending on contract type).
Project completed on schedule (per approved plan).
Budget performance
Revisions to cost estimates. Assess and manage project cost.
100% of revisions are reviewed and approved.
Dollars spent vs. dollars budgeted.
Measure cost-efficiency. Project completed within approved cost parameters.
Return on investment (ROI). Track and assess performance of project investment portfolio.
ROI (positive cash flow) begins according to plan.
Acquisition cost control. Assess and manage acquisition dollars.
All applicable acquisition guidelines followed.
Product quality
Defects identified through quality activities.
Track progress in, and effectiveness of, defect removal.
90% of expected defects identified (e.g., via peer reviews, inspections).
Test case failures vs. number of cases planned.
Assess product functionality and absence of defects.
100% of planned test cases execute successfully.
Number of service calls. Track customer problems. 75% reduction after 3 months of operation.
Customer satisfaction index. Identify trends. 95% positive rating.Customer satisfaction trend. Improve customer
satisfaction.5% improvement each quarter.
Number of repeat customers. Determine if customers are using the product multiple times (could indicate satisfaction with the product).
“X” percentage of customers use the product “X” times during a specified time period.
Number of problems reported by customers.
Assess quality of project deliverables.
100% of reported problems addressed within 72 h.
Compliance Compliance with Enterprise Architecture model requirements.
Track progress toward department-wide architecture model.
Zero deviations without proper approvals.
Compliance with interoperability requirements.
Track progress toward system interoperability.
Product works effectively within system portfolio.
Compliance with standards. Alignment, interoperability, consistency.
No significant negative findings during architect assessments.
For website projects, compliance with style guide.
To ensure standardization of website.
All websites have the same “look and feel.”
Compliance with Section 508. To meet regulatory requirements.
Persons with disabilities may access and utilize the functionality of the system.
(Continued)

54 Managing it PerforManCe to Create Business Value
Table 3.16 (Continued) IT Performance Measures
CATEGORY FOCUS PURPOSE MEASURE OF SUCCESS
Redundancy Elimination of duplicate or overlapping systems.
Ensure return on investment. Retirement of 100% of identified systems.
Decreased number of duplicate data elements.
Reduce input redundancy and increase data integrity.
Data elements are entered once and stored in one database.
Consolidate help desk functions.
Reduce dollars spent on help desk support.
Approved consolidation plan by June 30, 2002.
Cost avoidance
System is easily upgraded. Take advantage of, for example, COTS upgrades.
Subsequent releases do not require major “glue code” project to upgrade.
Avoid costs of maintaining duplicate systems.
Reduce IT costs. 100% of duplicate systems have been identified and eliminated.
System is maintainable. Reduce maintenance costs. New version (of COTS) does not require “glue code.”
Customer satisfaction
System availability (up time).
Measure system availability. 100% of requirement is met. (e.g., 99% M–F, 8 a.m. to 6 p.m., and 90% S & S, 8 a.m. to 5 p.m.).
System functionality (meets customer’s/user’s needs).
Measure how well customer needs are being met.
Positive trend in customer satisfaction survey(s).
Absence of defects (that impact customer).
Number of defects removed during project life cycle.
90% of defects expected were removed.
Ease of learning and use. Measure time to becoming productive.
Positive trend in training survey(s).
Time it takes to answer calls for help.
Manage/reduce response times.
95% of severity one calls answered within 3 h.
Rating of training course. Assess effectiveness and quality of training.
90% of responses of “good” or better.
Business goals/mission
Functionality tracks reportable inventory.
Validate system supports program mission
All reportable inventory is tracked in system.
Turnaround time in responding to congressional queries.
Improve customer satisfaction and national interests.
Improve turnaround time from 2 days to 4 h.
Maintenance costs. Track reduction of costs to maintain system.
Reduce maintenance costs by two-thirds over a 3-year period.
Standard desktop platform. Reduce costs associated with upgrading user’s systems.
Reduce upgrade costs by 40%.
Time taken to complete tasks.
To evaluate estimates. Completions are within 90% of estimates.
Number of deliverables produced.
Assess capability to deliver products.
Improve product delivery 10% in each of the next 3 years.

55Designing MetriCs
In Conclusion
The following set of questions is intended to assist in stimulating the thought process to determine performance measures that are appropriate for a given project or organization.
Project/Process Measurement Questions
• What options are available if the schedule is accelerated by 4 months to meet a tight market window?
• How many people must be added to get 2 months of schedule compression and how much will it cost?
• How many defects are still in the product and when will it be good enough so that I can ship a reliable product and have satisfied customers?
• How much impact does requirements growth have on schedule, cost, and reliability?
• Is the current forecast consistent with our company’s historical performance?
Organizational Measurement Questions
• What is the current typical time cycle and cost of our organization’s develop-ment process?
• What is the quality of the products our organization produces?• Is our organization’s development process getting more or less effective and
efficient?• How does our organization stack up against the competition?• How does our organization’s investment in process improvement compare
with the benefits we have achieved?• What impact are environmental factors such as requirements volatility and
staff turnover having on our process productivity?• What level of process productivity should we assume for our next develop-
ment project?
ReferencesClinton, B., Webber, S. A., and Hassell, J. M. (2002). Implementing the balanced scorecard using
the analytic hierarchy process. Management Accounting Quarterly, 3(3), 1–11.Rosemann, M. and Weise, J. (1999). Measuring the performance of ERP software—A balanced
scorecard approach. Proceedings of the 10th Australasian Conference on Information Systems, Wellington: Victoria University of Wellington.

57
4estaBlishing a software measurement Program*
This chapter provides an overview of software measurement and an infrastructure for establishing a software measurement program. It is recommended to start small and build on success. It is also recommended to combine a software measurement program with a software process improvement initiative so that the measurement program is sustainable. As far as possible, establish automated mechanisms for measurement data collection and analysis. Automated methods should be a support resource of the mea-surement process rather than a definition of the process. Regularly collect the core measurements and additional measurements specific to the local goals in the organi-zation. Plan and schedule the resources that will be required to collect and analyze the measurement data within the organization’s overall software process improve-ment efforts and the specific organization’s projects. Evolve the measurement program according to the organization’s goals and objectives. Provide a mechanism for projects and the organization’s software process improvement group to consolidate software project measurements.
The following four steps illustrate a comprehensive process for establishing a software measurement program.
Step 1: Adopt a software measurement program model
1. Identify resources, processes, and products 2. Derive core measurement views
Step 2: Use a software process improvement model
1. Establish a baseline assessment of the project/organization 2. Set and prioritize measurable goals for improvement 3. Establish an action plan with measures 4. Accomplish actions and analyze results 5. Leverage improvements through measurement
* This chapter has been adapted from the book Leading IT Projects: The IT Manager’s Guide by Jessica Keyes. Auerbach, 2008.

58 Managing it PerforManCe to Create Business Value
Step 3: Identify a goal-question-metric (GQM) structure
1. Link software goals with corporate goals 2. Derive measures from attribute questions 3. Establish success criteria for measurement
Step 4: Develop a software measurement plan and case
1. Plan: what, why, who, how, when 2. Case: measurement evidence and analysis results
An organization may decide to implement a subset of these activities. Organizations should tailor their use of the activities as necessary to meet the organization and proj-ect goals and objectives. Each of these four major activities is described in the follow-ing subsections.
An organization or a project must understand what to measure, who is interested in the results, and why. To assist this understanding, it is recommended that a software measurement program model be adopted such as illustrated in Figure 4.1.
The measurement program model provides a simple framework for specifically identifying what software attributes are of potential interest to measure, who the various customers of measurement results might be, and why such measurement results are of interest to those customers. The measurement program model includes the general software objects of measurement interest such as resources, processes, and products. The measurement customers include the end-use customer, software organization and project management, and software application personnel. These customers need software measures for different reasons. Their viewpoints drive the eventual measurement selection priorities and must be integrated and consistent to be most effective.
To establish a successful measurement program (e.g., one that is used for organiza-tion and/or project decision-making and lasts more than 2 years), it is necessary to have a basic understanding of measurement.
Resource
ProcessSoftwarequality
Strategictacticalapplication
Customer-basedproject management
engineering
View 1
View 2
View 3Product
Figure 4.1 Software measurement program model.
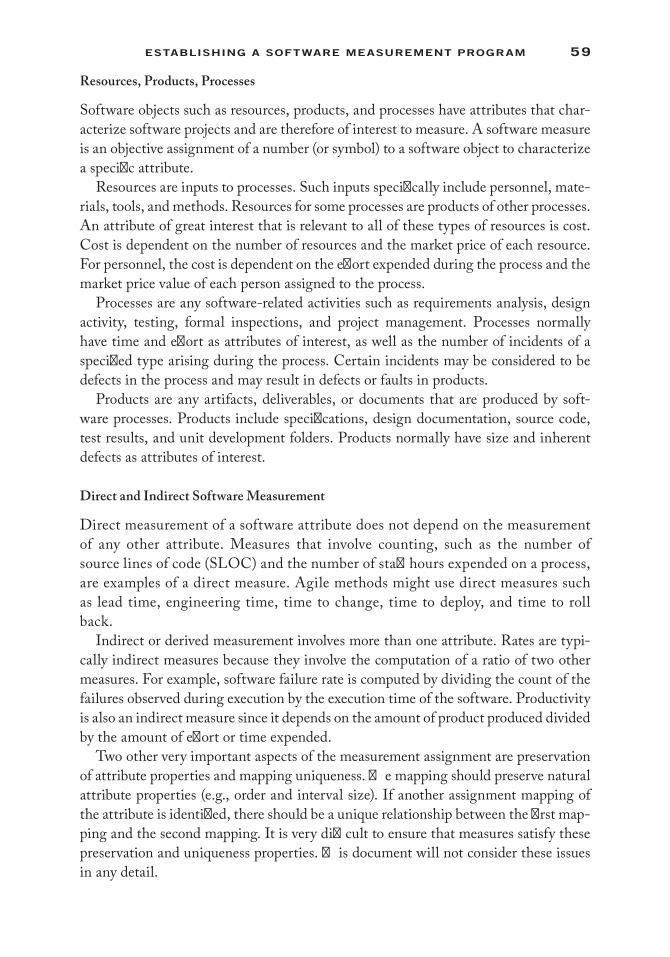
59estaBlishing a software MeasureMent PrograM
Resources, Products, Processes
Software objects such as resources, products, and processes have attributes that char-acterize software projects and are therefore of interest to measure. A software measure is an objective assignment of a number (or symbol) to a software object to characterize a specific attribute.
Resources are inputs to processes. Such inputs specifically include personnel, mate-rials, tools, and methods. Resources for some processes are products of other processes. An attribute of great interest that is relevant to all of these types of resources is cost. Cost is dependent on the number of resources and the market price of each resource. For personnel, the cost is dependent on the effort expended during the process and the market price value of each person assigned to the process.
Processes are any software-related activities such as requirements analysis, design activity, testing, formal inspections, and project management. Processes normally have time and effort as attributes of interest, as well as the number of incidents of a specified type arising during the process. Certain incidents may be considered to be defects in the process and may result in defects or faults in products.
Products are any artifacts, deliverables, or documents that are produced by soft-ware processes. Products include specifications, design documentation, source code, test results, and unit development folders. Products normally have size and inherent defects as attributes of interest.
Direct and Indirect Software Measurement
Direct measurement of a software attribute does not depend on the measurement of any other attribute. Measures that involve counting, such as the number of source lines of code (SLOC) and the number of staff hours expended on a process, are examples of a direct measure. Agile methods might use direct measures such as lead time, engineering time, time to change, time to deploy, and time to roll back.
Indirect or derived measurement involves more than one attribute. Rates are typi-cally indirect measures because they involve the computation of a ratio of two other measures. For example, software failure rate is computed by dividing the count of the failures observed during execution by the execution time of the software. Productivity is also an indirect measure since it depends on the amount of product produced divided by the amount of effort or time expended.
Two other very important aspects of the measurement assignment are preservation of attribute properties and mapping uniqueness. The mapping should preserve natural attribute properties (e.g., order and interval size). If another assignment mapping of the attribute is identified, there should be a unique relationship between the first map-ping and the second mapping. It is very difficult to ensure that measures satisfy these preservation and uniqueness properties. This document will not consider these issues in any detail.
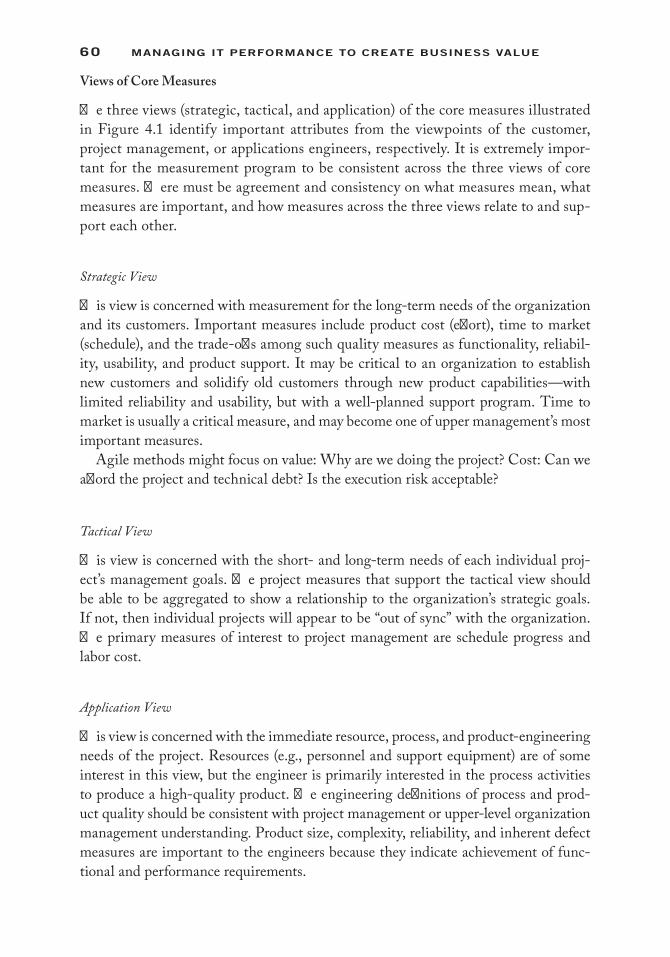
60 Managing it PerforManCe to Create Business Value
Views of Core Measures
The three views (strategic, tactical, and application) of the core measures illustrated in Figure 4.1 identify important attributes from the viewpoints of the customer, project management, or applications engineers, respectively. It is extremely impor-tant for the measurement program to be consistent across the three views of core measures. There must be agreement and consistency on what measures mean, what measures are important, and how measures across the three views relate to and sup-port each other.
Strategic View
This view is concerned with measurement for the long-term needs of the organization and its customers. Important measures include product cost (effort), time to market (schedule), and the trade-offs among such quality measures as functionality, reliabil-ity, usability, and product support. It may be critical to an organization to establish new customers and solidify old customers through new product capabilities—with limited reliability and usability, but with a well-planned support program. Time to market is usually a critical measure, and may become one of upper management’s most important measures.
Agile methods might focus on value: Why are we doing the project? Cost: Can we afford the project and technical debt? Is the execution risk acceptable?
Tactical View
This view is concerned with the short- and long-term needs of each individual proj-ect’s management goals. The project measures that support the tactical view should be able to be aggregated to show a relationship to the organization’s strategic goals. If not, then individual projects will appear to be “out of sync” with the organization. The primary measures of interest to project management are schedule progress and labor cost.
Application View
This view is concerned with the immediate resource, process, and product-engineering needs of the project. Resources (e.g., personnel and support equipment) are of some interest in this view, but the engineer is primarily interested in the process activities to produce a high-quality product. The engineering definitions of process and prod-uct quality should be consistent with project management or upper-level organization management understanding. Product size, complexity, reliability, and inherent defect measures are important to the engineers because they indicate achievement of func-tional and performance requirements.

61estaBlishing a software MeasureMent PrograM
Use a Software Process Improvement Model
In order for a software measurement program to be successful, the measurement activities should be conducted within the environment of continuous software process improvement. Without such an environment, measures will not be seen as value-added and the measurement program will not be sustainable. Two models are important to a software process improvement initiative and the integration of software measure-ment, as illustrated in Figure 4.2. The initiate, diagnose, establish, act, and leverage (IDEAL) model provides an organization with an approach to continuous improve-ment. The capability maturity model (CMM) can be used to establish a measurement baseline.
The IDEAL model provides a framework for conducting process improvement activities at the organization level and the project level. The IDEAL model is similar to the plan/do/check/act model.
Organization Software Measurement
During the initiate stage, the organization goals and measures for the improve-ment are defined along with success criteria. The diagnose stage includes baselining the organization’s current process capability (e.g., using the Software Engineering Institute [SEI] CMM during a software process assessment) in accordance with the measures inherent in the assessment process. The establish stage provides focus for identifying specific improvements that will be accomplished by action teams and the measures for those improvements. Prioritized improvement actions are determined
Leveraging
Acting
EstablishingDiagnosing
InitiatingSoftware process
improvement model1. Establish baseline assessment of project/organization2. Set and prioritize measurable goal for improvement3. Establish action plan with measures4. Accomplish actions and analyze results5. Leverage improvements through measurement
InitialRepeatable
DefinedManaged
Optimized
Dynamic
Process controlCross-project
ProjectNone
IDEALModel
CMMModel
Figure 4.2 Software process improvement models.

62 Managing it PerforManCe to Create Business Value
and action teams are formed to develop specific plans that address the high-priority improvements. The act stage includes implementation of the action team plan, including the collection of measurements to determine if the improvement has been (or can be) accomplished. The leverage stage includes documenting the results of the improvement effort and leveraging the improvement across all applicable organiza-tion projects.
Project Software Measurement
During the initiate stage, the project goals and measures for success are defined along with success criteria. A project software measurement plan should be developed or included as part of the software project management information (e.g., referenced as an appendix to a software development plan). The diagnose stage includes document-ing and analyzing the project’s measures as a measurement case during the project life cycle in accordance with the measures in the measurement plan. The establish stage provides focus on identifying specific project or organization improvements that might be accomplished. Prioritized improvement actions are determined and assigned to project or organization level, as appropriate. For more mature organizations, project teams can accomplish the improvements during the project. For less mature organi-zations, the identified improvements will serve as lessons learned for future projects. Action teams are formed (by the project or organization) and a plan is developed to address the high-priority improvements. The act and leverage stages of the project are limited to making midcourse project corrections based on the measurement informa-tion. Such measurement data and the actions taken are recorded in the measurement case. The project’s measurement case then becomes the complete documentation of the project management and engineering measures, any changes to the project direc-tion based on measurement analysis, and lessons learned for future projects.
Software Engineering Institute Capability Maturity Model
The SEI CMM serves as a guide for determining what to measure first and how to plan an increasingly comprehensive improvement program. The measures suggested for different levels of the CMM are illustrated in Table 4.1. The set of core measures described in this document primarily address Level 1, 2, and 3 issues.
Level 1 measures provide baselines for comparison as an organization seeks to start improving. Measurement occurs at a project level without good organization control, or perhaps on a pilot project with better controls.
Level 2 measures focus on project planning and tracking. Applicable core measures are the staff effort and schedule progress. Size and defect data are necessary to under-stand measurement needs for Level 3 and Level 4 and to provide a database for future evaluations. Individual projects can use the measurement data to set process entry and exit criteria.

63estaBlishing a software MeasureMent PrograM
Level 3 measures become increasingly directed toward measuring and comparing the intermediate and final products produced across multiple projects. The measure-ment data for all core measures are collected for each project and compared with organization project standards.
Level 4 measures capture characteristics of the development process to allow con-trol of the individual activities of the process. This is usually done through techniques such as statistical process control where upper and lower bounds are set for all core measures (and any useful derived measures). Actual measure deviation from the esti-mated values is tracked to determine whether the attributes being measured are within the statistically allowed control bounds. A decision process is put into place to react to projects that do not meet the statistical control boundaries. Process improvements can be identified based on the decision process.
Level 5 processes are mature enough and managed carefully enough that the sta-tistical control process measurements from Level 4 provide immediate feedback to individual projects based on integrated decisions across multiple projects. Decisions concerning dynamically changing processes across multiple projects can then be opti-mized while the projects are being conducted.
Identify a Goal-Question-Metric (GQM) Structure
One of the organization’s or project’s most difficult tasks is to decide what to mea-sure. The key is to relate any measurement to organization and project goals. One method for doing this is to use the goal-question-metric (GQM) paradigm, illustrated in Figure 4.3 with a partial example related to software reliability.
This method links software goals to corporate goals and derives the specific soft-ware measures that provide evidence of whether the goals are met. Since such mea-sures are linked directly to organization goals, it is much easier to show the value of the measurement activity and establish success criteria for measurement.
Table 4.1 Relationship of Software Measures to Process Maturity
MATURITY LEVEL MEASUREMENT FOCUS APPLICABLE CORE MEASURES
1 Establish baselines for planning and estimating project resources and tasks
Effort, schedule progress (pilot or selected projects)
2 Track and control project resources and tasks
Effort, schedule progress (project by project basis)
3 Define and quantify products and processes within and across projects
Products: Size, defectsProcesses: Effort, schedule(compare above across projects)
4 Define, quantify, and control subprocesses and elements
Set upper and lower statistical control boundaries for core measures. Use estimated vs. actual comparisons for projects and compare across projects.
5 Dynamically optimize at the project level and improve across projects
Use statistical control results dynamically within the project to adjust processes and products for improved success.

64 Managing it PerforManCe to Create Business Value
The GQM method to software measurement uses a top-down approach with the following steps:
1. Determine the goals of the organization and/or project in terms of what is wanted, who wants it, why it is wanted, and when it is wanted.
2. Refine the goals into a set of questions that require quantifiable answers. 3. Refine the questions into a set of measurable attributes (measures for data col-
lection) that attempt to answer the question. 4. Develop models relating each goal to its associated set of measurable attributes.
Some attributes of software development, such as productivity, are dependent on many factors that are specific to a particular environment. The GQM method does not rely on any standard measures and the method can cope with any environment.
This activity may be conducted concurrently with any other software measurement activities and may be used to iteratively refine the software measurement program model, core measurement views, and process improvement efforts.
Develop a Software Measurement Plan
The software measurement program activities provide organization and project-specific planning information and a variety of measurement data and analysis results. These
What is existingnumber ofoperational
faults?
Number andtype of fault
reports
Goal Question Metric
Number ofdefects found,
number ofsystem failures
Number of userrejections
A ten timesimprovement
in post-defects innext fivemonths
Number oferrors not
caught
Number ofreliability errors
How effectiveare inspection
techniquesduring
development?
How effective isthe test
strategy?
What factorsaffect
reliability?
How effectiveare acceptance
tests?
Figure 4.3 Goal-question-metric (GQM) paradigm.
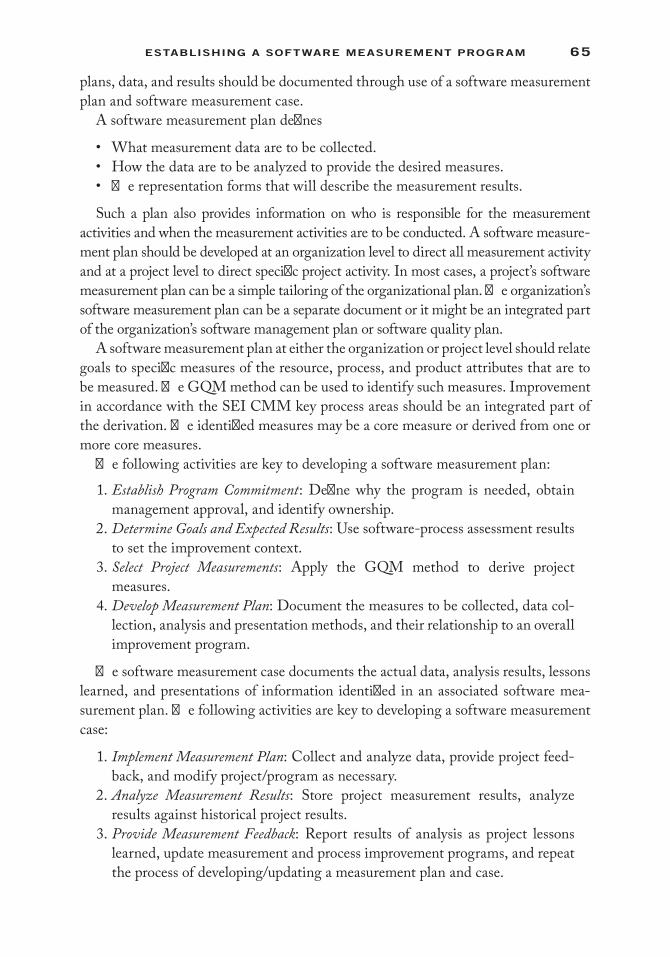
65estaBlishing a software MeasureMent PrograM
plans, data, and results should be documented through use of a software measurement plan and software measurement case.
A software measurement plan defines
• What measurement data are to be collected.• How the data are to be analyzed to provide the desired measures.• The representation forms that will describe the measurement results.
Such a plan also provides information on who is responsible for the measurement activities and when the measurement activities are to be conducted. A software measure-ment plan should be developed at an organization level to direct all measurement activity and at a project level to direct specific project activity. In most cases, a project’s software measurement plan can be a simple tailoring of the organizational plan. The organization’s software measurement plan can be a separate document or it might be an integrated part of the organization’s software management plan or software quality plan.
A software measurement plan at either the organization or project level should relate goals to specific measures of the resource, process, and product attributes that are to be measured. The GQM method can be used to identify such measures. Improvement in accordance with the SEI CMM key process areas should be an integrated part of the derivation. The identified measures may be a core measure or derived from one or more core measures.
The following activities are key to developing a software measurement plan:
1. Establish Program Commitment: Define why the program is needed, obtain management approval, and identify ownership.
2. Determine Goals and Expected Results: Use software-process assessment results to set the improvement context.
3. Select Project Measurements: Apply the GQM method to derive project measures.
4. Develop Measurement Plan: Document the measures to be collected, data col-lection, analysis and presentation methods, and their relationship to an overall improvement program.
The software measurement case documents the actual data, analysis results, lessons learned, and presentations of information identified in an associated software mea-surement plan. The following activities are key to developing a software measurement case:
1. Implement Measurement Plan: Collect and analyze data, provide project feed-back, and modify project/program as necessary.
2. Analyze Measurement Results: Store project measurement results, analyze results against historical project results.
3. Provide Measurement Feedback: Report results of analysis as project lessons learned, update measurement and process improvement programs, and repeat the process of developing/updating a measurement plan and case.

66 Managing it PerforManCe to Create Business Value
Example Measurement Plan Standard
This document contains an example of a standard defining the contents and structure of a software measurement plan for each project of an organization. The term measure-ment plan will be used throughout.
1 Introduction
This standard provides guidance on the production of a measurement plan for indi-vidual software projects.
1.1 Scope This standard is mandatory for all projects. Assistance in applying it to existing projects will be given by the organization measures coordinator.
2 Policy
It is policy to collect measures to assist in the improvement of
• The accuracy of cost estimates• Project productivity• Product quality• Project monitoring and control
In particular, each project will be responsible for identifying and planning all activ-ities associated with the collection of these measures. The project is responsible for the definition of the project’s objectives for collecting measures, analyzing the measures to provide the required presentation results, and documenting the approach in an internally approved measurement plan. The project is also responsible for capturing the actual measurement information and analysis results. The form of this actual mea-surement information could be appended to the measurement plan or put in a separate document called a measurement case.
3 Responsibility and Authorities
The project leader/manager shall be responsible for the production of the project mea-surement plan at the start of the project. Advice and assistance from the organization measures coordinator shall be sought when needed. The measurement plan shall be approved by the project leader/manager (if not the author), product manager, organi-zation measures coordinator, and project quality manager.
4 General Information
4.1 Overview of Project Measures Activities The collection and use of measures must be defined and planned into a project during the start-up phase. The haphazard collection of measures is more likely to result in the collection of a large amount of inconsistent

67estaBlishing a software MeasureMent PrograM
data that will provide little useful information to the project management team, or for future projects. The following activities shall be carried out at the start of the project:
• Define the project’s objectives for collecting measures.• Identify the users of the measures-derived information, as well as any particu-
lar requirements they may have.• Identify the measures to meet these objectives or provide the information.
Most, if not all, of these should be defined at the organization level.• Define the project task structure, for example, work breakdown structure
(WBS).• Define when each measure is to be collected, in terms of the project task
structure.• Define how each measure is to be collected, in terms of preprinted forms/
tools, who will collect it, and where/how it will be stored.• Define how the data will be analyzed to provide the required information,
including the specification of any necessary algorithms, and the frequency with which this will be done.
• Define the organization, including the information flow, within the project required to support the measures collection and analyses activities.
• Identify the standards and procedures to be used.• Define which measures will be supplied to the organization.
4.2 Purpose of the Measurement Plan The project’s measurement plan is produced as one of the start-up documents to record the project’s objectives for measures collection and how it intends to carry out the program. The plan also
• Ensures that activities pertinent to the collection of project measures are con-sidered early in the project and are resolved in a clear and consistent manner.
• Ensures that project staff are aware of the measures activities and provides an easy reference to them.
The measurement plan complements the project’s quality and project plans, high-lighting matters specifically relating to measures. The measurement plan information can be incorporated into the quality and/or project plans. Information and instruc-tions shall not be duplicated in these plans.
4.3 Format Section 5 defines a format for the measurement plan in terms of a set of headings that are to be used, and the information required to be given under each heading. The front pages shall be the minimum requirements for a standard configu-rable document.
4.4 Document Control The measurement plan shall be controlled as a configurable document.

68 Managing it PerforManCe to Create Business Value
4.5 Filing The measurement plan shall be held in the project filing system.
4.6 Updating The measurement plan may require updating during the course of the project. Updates shall follow any changes in requirements for collecting measures or any change to the project that results in change to the project WBS. The project leader/manager shall be responsible for such updates or revisions.
5 Contents of Measurement Plan
This section details what is to be included in the project’s measurement plan. Wherever possible, the measurement plan should point to existing organization standards, and so on, rather than duplicating the information. The information required in the plan is detailed under appropriate headings in the following section.
For small projects, the amount of information supplied under each topic may amount to only a paragraph or so and may not justify the production of the mea-surement plan as a separate document. Instead, the information may form a separate chapter in the quality plan, with the topic headings forming the sections/paragraphs in that chapter. On larger projects, a separate document will be produced, with each topic heading becoming a section in its own right.
THEMATIC OUTLINE FOR A MEASUREMENT PLAN
Section 1 Objectives for Collecting MeasuresThe project’s objectives for collecting measures shall be described here. These will also include the relevant organization objectives. Where the author of the measurement plan is not the project leader/manager, project management agree-ment to these objectives will be demonstrated by the fact that the project man-ager is a signatory to the plan.
Section 2 Use and Users of InformationProvide information that includes
• Who will be the users of the information to be derived from the measures• Why the information is needed• Required frequency of the information
Section 3 Measures to Be CollectedThis section describes the measures to be collected by the project. As far as pos-sible, the measures to be collected should be a derivative of the core measures. If organizational standards are not followed, justification for the deviation should be provided. Project-specific measures shall be defined in full here in terms of the project tasks.

69estaBlishing a software MeasureMent PrograM
A GQM approach should be used to identify the measures from the stated project objectives. The results of the GQM approach should also be documented.
Section 4 Collection of MeasuresProvide information that includes
• Who will collect each measure• The level within the project task against which each measure is to be
collected• When each measure is to be collected in terms of initial estimate, reesti-
mates, and actual measurement• How the measures are to be collected, with reference to proformas, tools,
and procedures as appropriate• Validation to be carried out, including details of the project-specific
techniques if necessary, and by whom• How and where the measures are to be stored—including details of elec-
tronic database/spreadsheet/filing cabinet as appropriate; how the data is amalgamated and when it is archived; who is responsible for setting up the storage process; and who is responsible for inserting the data into the database
• When, how, and which data are provided to the organization measures database
Section 5 Analysis of MeasuresProvide information that includes
• How the data are to be analyzed, giving details of project-specific tech-niques if necessary, any tools required, and how frequently it is to be carried out
• The information to be provided by the analysis• Who will carry out the analysis• Details of project-specific reports, frequency of generation, how they are
generated, and by whom
Section 6 Project OrganizationDescribe the organization within the project that is required to support the mea-surement activities. Identify roles and the associated tasks and responsibilities. These roles may be combined with other roles within the project to form com-plete jobs for individual people.
The information flow between these roles and the rest of the project should also be described.

70 Managing it PerforManCe to Create Business Value
In Conclusion
This final section provides examples, summarized in Table 4.2, that illustrate the use of the recommended core measures (with some minor variations) for a variety of software projects.
Section 7 Project Task StructureDescribe or reference the project’s task structure. It should be noted that the project’s measurement activities should be included in the project task structure.
Section 8 StandardsThe measurement standards and procedures to be used by the project must be given, indicating which are organization standards and which are project spe-cific. These standards will have been referenced throughout the plan, as neces-sary. If it is intended not to follow any of the organization standards in full, this must be clearly indicated in the relevant section of the measurement plan, and a note made in this section.
Table 4.2 Core Measures for Example Projects
CORE MEASURES
PROJECT A: LARGE
EMBEDDED DEVELOPMENT
PROJECT B: COMMERCIAL
PURCHASE
PROJECT C: INFORMATION
SYSTEM DEVELOPMENT
PROJECT D: SIMULATION ANALYSIS CODE
SUPPORT
PROJECT E: GRAPHICAL USER INTERFACE SMALL
DEVELOPMENT
Size SLOC (reused and new)
Disk space (utilized)
Function points (reused and new)
SLOC (total, new and modified for each release)
Function points (reused and new)
Effort Staff hours (development)
Staff hours (installation and updates)
Staff hours (development)
Staff hours (total, change request for each release)
Staff hours (development)
Progress to schedule
Total months (estimated and actual)
Installation time (estimated and actual for initial release and updates)
Total months (estimated and actual)
Total months (estimated and actual for each release)
Total months (estimated and actual)
Task months (estimated and actual)
Task months (estimated and actual)
Task months (estimated and actual for each release)
Task months (estimated and actual)
Task completion ratio per reporting period
Task completion ratio per reporting period
Task completion ratio per reporting period
Task completion ratio per reporting period
Defects Inspection defects (major and minor)
Operational failures (all)
Inspection defects (major and minor)
Inspection defects (major and minor)
Test failures (major and minor)
Test failures (major and minor)
Operational problem reports (all)
Test failures (major and minor)
Test failures (major and minor total and in modified code)
Operational problem reports (all)
Operational problem reports (all)
Operational problem reports (all)
Operational problem reports (all and for modified code)

71
5Designing PeoPle
imProvement systems
One of the newer management ideas currently trending is something called holacracy. Supporters insist that it is a new way of running an organization that removes power from a hierarchy and distributes it across clear roles. These roles can be executed anonymously, without the micromanagement of a boss. A holacratic organization (or information technology [IT] department or team) comes with a clear set of rules and processes for how a team breaks up its work, and defines its roles and expectations, as shown in Table 5.1, which compares a holacratic team with a traditional one.
Shared leadership models have been around for quite some time. Joe Raelin (2008) was very specific in his definition of the shared model of leadership, which he refers to as “leaderful” practice. In his treatise on using action learning to, as he puts it, “unlock the capacity of everyone in the organization,” he implies that collaborative leadership is a form of just-in-time leadership where any employee who has the capacity and willingness to lead, will.
According to Raelin, collaborative leadership is based on a simple humanistic precept—that people who have a stake in a venture, and participate in that venture, will be fully committed to that venture. Collaborative leadership requires just this sort of full commitment, which extends itself to leadership and decision-making across all levels and processes.
For the most part, and despite the popularity of the “flat” organizational structure, leadership remains hierarchical. Raelin poetically describes this as, “a coterie of sub-ordinates” who “await their marching orders from detached bosses.” In an organiza-tion made rich by leaderfulness, the subordinates may be leaders, and the bosses are no longer detached. Instead, boss and subordinates collaborate toward a specific end.
Raelin’s shared model of leaderful practice is based on four operational perspec-tives: concurrent, collective, collaborative (which he also refers to as mutual), and compassionate—that is, the four c’s. Concurrent leadership is perhaps the “c” that would cause the most trouble in a typical organization. Concurrent leadership means that several people can be leaders at the same time. Traditionally, this is not the case, so an organizational bent on employing the action learning paradigm would have to retrench and relearn. Collective leadership means that anyone and everyone on a team can be a leader while collaborative leadership means that everyone is in control and can speak for the team. The last two perspectives are not all that uncommon in practice, as leaderless teams are seen widely and discussed in the literature. The

72 Managing it PerforManCe to Create Business Value
last perspective is perhaps the most important. In compassionate leadership, team members strive to maintain the dignity of all team members by carefully considering each individual whenever any decision is made. Raelin’s belief is that action learning in this way creates an organization where everyone participates in leadership. It they choose to become leaders, employees need not stand by and be dependent. Raelin further asserts that the link between work-based, or action learning, and leaderful practice creates a “spirit of free inquiry” so that employees go beyond the problem itself in divergent, but creative and often profitable ways.
Action learning has great potential. It can produce more frequent “aha” moments than traditional methods. However, to engage in such methods would probably entail a major paradigm shift among current organizational leaders and staff. These sorts of “culture shock” issues are far more pronounced when dealing with the global culture issue. Raelin describes many cultural challenges. For example, in many cul-tures, employees are viewed as passive and dependent, while managers are active and authoritarian. Cross-cultural studies also point out the problems with originating, distributing, and sharing feedback. My own studies on ethnicity’s effect on knowledge sharing run parallel to the various studies cited by Raelin. The ability to understand what was being communicated, cultural mores in terms of the way different groups communicated, and work ethic were cited as barriers to knowledge sharing by the participants in my studies. Trust, comfort, and respect figure prominently in all stud-ies on this issue.
There would seem to be some solutions to culture clash problems inherent in global teams. Yiu and Saner, as cited in Raelin, found that they had to make cultural modi-fications to a training program to adapt it to Chinese culture. Modifications included personal coaching, identifying just the right individuals to work on these teams, mod-ifying reflective activities to focus on more tasks and methodologies than individual challenges and relationships, and training senior managers so that they support these action learning projects. It is evident that a careful examination needs to be done of each “host” culture so that the seeds of action learning and collaborative leadership may germinate.
Table 5.1 Holacracy vs. Traditional Organizational Structure
TRADITIONAL TEAM STRUCTURE HOLACRATIC
Job descriptions: Job descriptions are imprecise, rarely updated, and often irrelevant. Each person has just one job.
Roles: Roles are defined around the work, not people, and are updated regularly. People fill several roles.
Delegated authority: Managers delegate authority. Their decisions always rule.
Distributed authority: Authority is truly distributed to teams and roles. Decisions are made locally.
Big re-orgs: The organizational structure is mandated from the top.
Rapid iterations: The organizational structure is regularly updated via small iterations. Every team self-organizes.
Office politics: Implicit rules slow down change and favor people “in the know.”
Transparent rules: Everyone is bound by the same rules, CEO included. Rules are visible to all.
Source: http://www.holacracy.org.
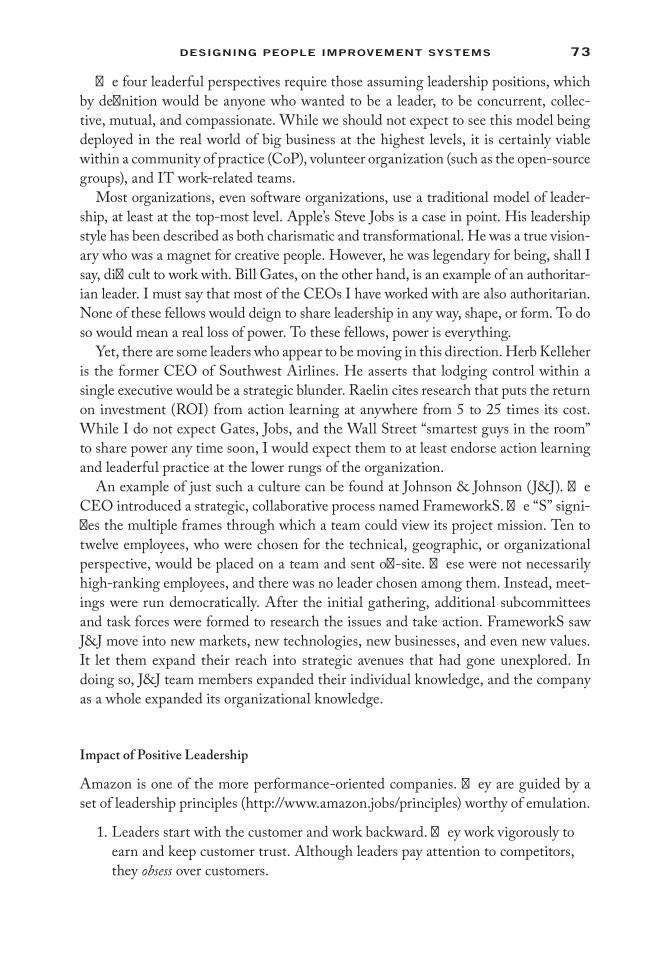
73Designing PeoPle iMProVeMent systeMs
The four leaderful perspectives require those assuming leadership positions, which by definition would be anyone who wanted to be a leader, to be concurrent, collec-tive, mutual, and compassionate. While we should not expect to see this model being deployed in the real world of big business at the highest levels, it is certainly viable within a community of practice (CoP), volunteer organization (such as the open-source groups), and IT work-related teams.
Most organizations, even software organizations, use a traditional model of leader-ship, at least at the top-most level. Apple’s Steve Jobs is a case in point. His leadership style has been described as both charismatic and transformational. He was a true vision-ary who was a magnet for creative people. However, he was legendary for being, shall I say, difficult to work with. Bill Gates, on the other hand, is an example of an authoritar-ian leader. I must say that most of the CEOs I have worked with are also authoritarian. None of these fellows would deign to share leadership in any way, shape, or form. To do so would mean a real loss of power. To these fellows, power is everything.
Yet, there are some leaders who appear to be moving in this direction. Herb Kelleher is the former CEO of Southwest Airlines. He asserts that lodging control within a single executive would be a strategic blunder. Raelin cites research that puts the return on investment (ROI) from action learning at anywhere from 5 to 25 times its cost. While I do not expect Gates, Jobs, and the Wall Street “smartest guys in the room” to share power any time soon, I would expect them to at least endorse action learning and leaderful practice at the lower rungs of the organization.
An example of just such a culture can be found at Johnson & Johnson (J&J). The CEO introduced a strategic, collaborative process named FrameworkS. The “S” signi-fies the multiple frames through which a team could view its project mission. Ten to twelve employees, who were chosen for the technical, geographic, or organizational perspective, would be placed on a team and sent off-site. These were not necessarily high-ranking employees, and there was no leader chosen among them. Instead, meet-ings were run democratically. After the initial gathering, additional subcommittees and task forces were formed to research the issues and take action. FrameworkS saw J&J move into new markets, new technologies, new businesses, and even new values. It let them expand their reach into strategic avenues that had gone unexplored. In doing so, J&J team members expanded their individual knowledge, and the company as a whole expanded its organizational knowledge.
Impact of Positive Leadership
Amazon is one of the more performance-oriented companies. They are guided by a set of leadership principles (http://www.amazon.jobs/principles) worthy of emulation.
1. Leaders start with the customer and work backward. They work vigorously to earn and keep customer trust. Although leaders pay attention to competitors, they obsess over customers.

74 Managing it PerforManCe to Create Business Value
2. Leaders are owners. They think long term and do not sacrifice long-term value for short-term results. They act on behalf of the entire company, beyond just their own team. They never say “that’s not my job.”
3. Leaders expect and require innovation and invention from their teams and always find ways to simplify. They are externally aware, look for new ideas from everywhere, and are not limited by “not invented here.”
4. Leaders are right a lot of the time. They have strong business judgment and good instincts. They seek diverse perspectives and work to disconfirm their beliefs.
5. Leaders raise the performance bar with every hire and promotion. They recognize exceptional talent, and willingly move them throughout the orga-nization. Leaders develop leaders and take seriously their role in coaching others.
6. Leaders have relentlessly high standards—many people may think these standards are unreasonably high. Leaders are continually raising the bar and driving their teams to deliver high-quality products, services and processes. Leaders ensure that defects do not get sent down the line and that problems are fixed so they stay fixed.
7. Thinking small is a self-fulfilling prophecy. Leaders create and communicate a bold direction that inspires results. They think differently and look around corners for ways to serve customers.
8. Speed matters in business. Many decisions and actions are reversible and do not need extensive study. Calculated risk taking is valued.
9. Accomplish more with less. Constraints breed resourcefulness, self-sufficiency, and invention. There are no extra points for growing headcount, budget size, or fixed expense.
10. Leaders are never done learning and always seek to improve themselves. They are curious about new possibilities and act to explore them.
11. Leaders listen attentively, speak candidly, and treat others respectfully. They are vocally self-critical, even when doing so is awkward or embarrassing. Leaders do not believe their or their team’s body odor smells of perfume. They benchmark themselves and their teams against the best.
12. Leaders operate at all levels, stay connected to the details, audit frequently, and are skeptical when metrics and anecdote differ. No task is beneath them.
13. Leaders are obligated to respectfully challenge decisions when they disagree, even when doing so is uncomfortable or exhausting. Leaders have conviction and are tenacious. They do not compromise for the sake of social cohesion. Once a decision is determined, they commit wholly.
14. Leaders focus on the key inputs for their business and deliver them with the right quality and in a timely fashion. Despite setbacks, they rise to the occa-sion and never settle.

75Designing PeoPle iMProVeMent systeMs
Leadership such as this is a prerequisite for quality and productivity improvement. Unless a leader’s commitment is visible and real, those involved in the performance improvement efforts do not see the quality process as important. A leader’s day-to-day behavior is an important clue to others as to what value performance improvement has to that person. Some possible actions include
1. Practice what is preached. Set examples of quality and productivity improve-ment at top levels.
2. Regularly review the organization’s progress toward meeting its goals and objectives.
3. Find out why goals have not been reached. 4. Pick a few important areas and demonstrate your commitment through visible
personal involvement (e.g., personal phone calls to customers).
People need to know that their managers have the capability, desire, and resources to help them solve problems and to provide advice on quality and productivity improvement. Toward this end, make sure middle-managers and managers follow up on problems brought to their attention; learn about quality and productivity tools and techniques; and serve as coaches for quality improvement projects.
The managers (at all levels) in an organization, by their words, actions, support, and choices, make it clear to organizational members what is important. For everyone in the organization to become committed to quality and/or productivity improvement, it must be clear that the managers are so committed. Some ways to send this message include
1. Listen to organizational members. 2. Emphasize quality and productivity improvement at all levels of the
organization. 3. Hold regular meetings attended by representatives from all levels of the orga-
nization to discuss progress and barriers to improvement. 4. Recognize and publicize success stories.
Motivation
People are the most basic quality and productivity factor in any organization. The attitudes and morale of the workforce are important determinants of quality and pro-ductivity improvement. Motivation underlies every person’s performance. Motivation is affected by the quality of leadership, job fulfillment, personal recognition, and the overall support present in the working environment. Here are some things to consider to improve morale.
• Resolve complaints.• Assign jobs in an equitable manner.• Recognize top performance.• Make sure appropriate training is available for advancement.

76 Managing it PerforManCe to Create Business Value
It is important that a spirit of cooperation and teamwork exists in all areas of the organization. When individuals are rewarded only for their own accomplishments, team efforts can suffer. Some actions include
• Reward team accomplishments—utilize recognition, increased responsibili-ties, and some time off.
• Set aside a few hours every few months for team members to sit down together to discuss how they are working together or any problems they may be having.
• Encourage teams to develop group identities (a logo, team name). Locate members in the same area if possible.
• Establish cross-functional quality teams.
People want to have their ideas and opinions given careful consideration. When initi-ating a quality improvement process, everyone should be involved since people’s support and commitment are necessary for success. Some ideas to get people involved follow.
• Use a team approach to clarify mission, define performance measures, set goals, and so on.
• If a total-team approach is not appropriate, allow work group members to “vote” and to suggest alternative performance measures, goals, and so on.
People must perceive that there are enough of the appropriate personnel to get the job done and that their work goals or standards are fair. Some actions include
• Reexamine workloads and reassign people if necessary.• Allow organizational members to participate in setting work goals/standards.
If participation is not possible, perhaps voting among a set of alternatives could be utilized.
Social interactions may not appear to be related to quality improvement at first glance. However, in most organizations people need to work together for a common goal to accomplish their work successfully. It is certainly easier and more enjoyable to work together in a friendly atmosphere and, most likely, more productive as well. In order to promote a friendly work environment, you may wish to
• Encourage after-work recreational activities.• Encourage fair treatment of all organizational members.• Make sure work is assigned equitably.• Ensure that work goals/standards are reasonable.• Discourage favoritism.
Recruitment
A survey from global services provider Appirio (appirio.com/category/resource/it-tal-ent-wars-gig-economy-report) found that 90% of C-level executives agree that recruit-ing and retaining technology talent is a top business challenge. The study also found

77Designing PeoPle iMProVeMent systeMs
that organizations now devote about one-third of their human resources budgets to hiring IT talent.
Perhaps the most productivity-enhancing thing an organization can do is hire the right people in the first place. Back in 1912, the intelligence quotient (IQ ) was intro-duced. Popular for decades and still used at times today, the IQ test has fallen some-what out of favor. In the 1990s, emotional intelligence became the desired metric. Emotional intelligence is a set of skills that contribute to a person’s ability to judge and regulate emotion in oneself and others. EQ , as emotional intelligence has come to be called, has really taken off as a measure of personality traits that will lead to success in a particular role.
Of course, the field of personality and skills measurement never stays stagnant for long. TIME magazine (Gray, 2015) talks about something they refer to as the X quotient—or XQ. It is a set of qualities that are so murky that they are hard to describe. What they do know is that an algorithm has discovered a correlation between a candi-date’s answers (such as a preference for art or music) and responses given by their most successful current employees.
That this can be done at all is due to the availability of big data, where any and all data are collected to be mined for predictions and lessons through the use of power-ful software called data analytics. Data analytics looks for patterns to help optimize performance, of both the organization and its employees.
Infor, a New York–based software company (www.infor.com), asserts that they assess the “Behavioral DNA” of a million candidates a month. This is a measure of 39 behavioral, cognitive, and cultural traits, and compares them with the personality traits of the company’s top performers. The claim here is that assessment in this way lowers turnover and provides a better job fit for the employee. As can be expected, these tests are stressful, often requiring the prospective employee to answer hundreds of questions, some quite similar to one another. Employee assessment has become the next big thing. Romantic matchmaker e-Harmony is entering the fray in 2016 with Elevated Careers. Their claim is that no existing jobs website (e.g., Monster) has really matched personalities in terms of the applicant and the manager.
Testing is no panacea, however. Often, the company can get caught up in the claims of the test designers and their interpretation of the answers. For example, a question about the number of books read in a year tells the test designers that the test taker wants to come across as intellectual. The test takers make the grand leap that read-ers of 10 books a year (what 10 books are we talking about, by the way?) also can be presumed to take courses, go to museums, and probably keep up to date in their jobs. These correlations are not necessarily true.
Quite some time ago, Google wanted to develop a better way to promote engineers. The analytics folks discovered an algorithm that could predict, for some employees, who would get promoted with 90% accuracy. When the engineers heard about this, they protested. They did not want to be involved with any part of the algorithm. They insisted that these decisions were too important to be left to a “black box” and wanted

78 Managing it PerforManCe to Create Business Value
people to make them. Google has not abandoned analytics, however. It does use these in combination with other techniques. One of these techniques is the fabled live inter-view wonderfully portrayed in the hilarious Owen Wilson and Vince Vaughn movie, The Intern. Two of the questions that are rumored to have been asked at one of these interviews are
1. Why are manhole covers round? 2. You need to check that your friend, Bob, has your correct phone number, but
you cannot ask him directly. You must write the question on a card and give it to Eve who will take the card to Bob and return the answer to you. What must you write on the card, besides the question, to ensure that Bob can encode the message so that Eve cannot read your phone number?
More Google and other IT-field-oriented interview questions can be found in Appendix I.
Fernández-Aráoz (2014), a senior advisor at a global search firm, insists that there is really a scarcity of talent to be hired. He suggests stressing potential over experi-ence. Indicators of potential include motivation, curiosity, insight, engagement, and determination. While Fernández-Aráoz’s take is that potential should be the defining measure, he also suggests evaluating other traits including intelligence, values, and leadership abilities. The best leaders should be able to demonstrate strategic orienta-tion, market insight, results orientation, customer impact, collaboration and influence, a drive toward organizational development, success in building and leading effective teams, and change leadership.
Employee Appraisal
There is no hard and fast rule on how to conduct a traditional performance appraisal interview. Fairly typical is the methodology used by Jacksonville University (2010), with common pitfalls to be avoided found in Table 5.2.
An appraisal interview should help improve an employee’s job performance by
1. Using this opportunity to communicate your appreciation for the employee’s contribution.
2. Informing the employee of his or her overall performance appraisal and the criteria used for determining the rating.
3. Having an open proactive dialogue with the employee about how he or she can correct any performance weaknesses and build on strengths.
4. Clarifying any misunderstanding about the performance expectations of the employee.
5. Building and cultivating a stronger working relationship between the man-ager and employee.
6. Establishing goals and objectives for the coming year.

79Designing PeoPle iMProVeMent systeMs
More harm than good can result if the appraisal interview is improperly conducted. Therefore, careful planning is necessary prior to conducting the interview. The man-ager should select a minimum of five factors applicable to the employee’s position requirements. If there is more than one incumbent in the same position, all should be evaluated with the same chosen criteria. Additionally, the manager should:
1. Schedule an appointment time convenient for both the manager and employee. 2. Provide a private environment to keep interruptions to a minimum. 3. Review pertinent employee information, including personnel records, perfor-
mance and project status reports, and position descriptions. 4. Decide what is to be accomplished in the interview. Avoid ambiguity to (a)
clarify the chosen performance criteria, (b) carefully measure the reasons for giving specific ratings, and (c) determine which areas of improvement are needed.
Table 5.2 Pitfalls of Performance Appraisals
PITFALLS SUGGESTIONS
1. THE ISOLATED INCIDENT A rating should not be based on a few isolated
incidents. When this is done, the rating is unfairly influenced by nontypical instances of favorable or unfavorable performances.
1. Consider the entire appraisal period. Enumerate high points and low points in performance, and then assign a rating that typifies the individual’s normal performance.
Do not attempt to assign a rating to an element of performance and then create justification to support it.
Be able to explain the reason for each rating. 2. THE “HALO” EFFECT Examples: An employee’s work is of good quality;
therefore other ratings (such as those on promptness or quantity) are higher than normal. Another employee is frequently absent, with the result that the ratings on other factors are unusually low.
2. Rate each factor independently. When rating more than one person simultaneously, it
may be helpful to rate all employees’ performance on one factor rather than one employee’s performance on all factors.
Use the overall rating to give weight to individual factors.
3. THE “CLUSTER” TENDENCY The tendency to consider everyone in the work group
is above average, average, or below average. Some raters are considered “tough” because they normally “cluster” their people at a low level. Others are too lenient. “Clustering” overall ratings usually indicates that the rater has not sufficiently discriminated between high and low levels of performance.
3. In a group of people in similar jobs, performance is likely to be spread over most performance categories.
Review your own record as a rater. Check the tendency to be either “too tough” or “too lenient” in your appraisals.
4. RATING THE JOB AND NOT THE INDIVIDUAL Individuals in higher-rated jobs are often considered
superior performers to those in lower-rated jobs. This normally means that confusion exists between the performance appraisal and how the job is evaluated.
4. Consider how an individual is performing in relation to what is expected.
Rate the person’s performance, not the job.
5. LENGTH OF SERVICE BIAS There is a tendency to allow the period of an
individual’s employment to influence the rating. Normally, performance levels should be higher as an individual gains training and experience, but this is not always the case.
5. Recognize the some people may never achieve top ratings, regardless of length of service.
Watch closely the progress of newcomers and be ready to recognize superior performance if it is achieved.

80 Managing it PerforManCe to Create Business Value
5. Consider the employee’s point of view. Anticipate what his or her reaction to the discussion might be, remembering that each employee is different and each may react differently in an interview.
6. To begin the discussion satisfactorily, have an opening statement carefully prepared (e.g., We are here to discuss your performance for the 2015 rating period.)
7. Maintain a positive attitude. At the time of the interview, if the manager is upset or angry, the interview should be delayed to a more appropriate time.
8. Have the necessary forms or information ready to present at the proper time; searching for such information during an interview is distracting. Have informa-tion ready to present to avoid distractions (i.e., searching for information, etc.)
The manager’s introductory remarks often set the tone of the entire interview. For that reason, it would be advantageous for the manager to create a friendly, constructive atmosphere at the outset. The manager should
1. Be natural. The approach should be friendly, courteous, and professional. 2. Put the employee at ease and establish a rapport. This can be done with a
pleasant greeting and a friendly statement that is of interest to the employee that would prompt a reply.
3. Explain to the employee the purpose of the interview and how he or she will be appraised. The employee should have a clear understanding of the criteria used in determining the rating.
The employee–manager discussion is the crux of the process—the manager should be prepared to face various reactions from the employee. Most employees are doing a satisfactory job and are happy to know where they stand and how they can improve job performance. However, dealing with employees who are poorly performing or who are skeptical of the ratings is more difficult. The following guidelines may be useful in dealing with either situation. The manager should
1. Compliment the employee without going to extremes. Failure to recognize good performance may cause a “what’s the use?” attitude. However, overdo-ing the compliments will raise questions about the manager’s sincerity and abilities.
2. Constructive criticism. If pointing out a weakness, offer the employee a con-structive means to correct it.
3. Clarify the reasons why the rating was given. Cite specific examples of performance—deal with facts and avoid generalities.
4. Be sure that the employee understands what is expected of him or her. 5. Ask questions and listen. Allow the employee to express reactions to the eval-
uation; this can result in discovering the underlying causes for marginal per-formance. This process should not be a one-way dialogue, but a meaningful conversation.

81Designing PeoPle iMProVeMent systeMs
6. Do not interrupt—but make sure the discussion is not sidetracked by irrel-evant topics.
7. Ask the employee for suggestions on how job performance can be improved. Use this opportunity to guide employees toward improvement.
8. Keep the appraisal job-centered. Avoid discussion regarding personality shortcomings, unless they adversely affect departmental operations or the employee’s performance.
9. Maintain objectivity. Do not display anger or hostility, regardless of any hos-tile remarks the employee may make—remain calm and professional.
10. If the employee gets angry, listen. Do not expect to convince the employee of anything while he or she is angry.
11. Allow the employee his or her self-respect. Nothing is gained by “proving” the employee wrong, being sarcastic, overbearing, or unduly stern.
12. Develop and cultivate the employee’s commitment on specific steps for improvement and any follow-up activity. This commitment should be documented.
Steps to close the interview include
1. Summarize the discussion and the employee’s plan(s) for improvement. 2. Schedule a follow-up interview, if necessary. 3. End the interview on a positive, constructive note.
After the interview, the manager should consider the following questions. If “yes” has been answered to each question, the appraisal interview has been successful.
1. Does the employee clearly understand the goals and objectives of his or her position?
2. Does the employee clearly understand the reason for any unsatisfactory ratings?
3. Does the employee have a clear understanding of what and how performance improvements can be made?
4. Is the employee motivated to improve? 5. Does the employee understand the repercussion of what will happen if his or
her performance does not improve? 6. Were plans for performance follow-up made clear to the employee? 7. As a result of the interview, did a better relationship occur between the man-
ager and employee?
The manager should record the essential points of the interview and note anything that could have been done differently to make the next interview more effective. It should be remembered that the interview is part of a continuing process of communi-cation between the manager and employee. The final step is follow-up.

82 Managing it PerforManCe to Create Business Value
Automated Appraisal Tools
Employers are increasingly using automated tools to monitor employees’ workplace efforts. Hitherto the domain of sales managers, these data-crunching tools now allow white-collar jobs, such as programmers, project managers, and so on, to be tracked, monitored, and managed. Banks, wounded by the financial crisis and Madoff-type scandals, are turning to firms such as Paxata (http://www.paxata.com/), Red Owl Analytics (http://redowlanalytics.com/), and Palantir (http://www.palantir.com/) to monitor in real time everything from employees’ social media, how often they send e-mails on personal accounts, withdraw money from automated teller machines (ATMs), when they enter and leave the building, and what they do on the deep web. At what cost, however?
Tracking professional, often creative, employees comes with its own set of ques-tions. Though workplace tracking programs can promote enhanced connections and, sometimes, increased productivity among geographically dispersed employees, one wonders how much management can ratchet up intensity. Further, how does the data redefine who is valuable? In the end, if this form of measurement is done in the wrong way, employees will feel pressured or micromanaged.
BetterWorks is one of the new breed of products that promotes the connectivity side of the equation. Facebook-like, and geared for millennials and mobile workers, it promises to help better align teams, set clear goals, measure progress, and promote effective execution, as shown in Figure 5.1.
Capco (http://www.capco.com/), a financial services company, is one of BetterWorks’ customers. Three thousand Capco employees, many of whom are spread out geographically, use BetterWorks to post their goals for the year for all colleagues
Figure 5.1 The Betterworks interface. (From http://www.betterworks.com/press/.)

83Designing PeoPle iMProVeMent systeMs
and management to review. This results in either “nudges” or “cheers.” The goal is toward transparency and continuous, spontaneous feedback (Streitfeld 2015.)
The most controversial user of these sorts of measurement technologies is Amazon. Amazon uses an internal tool they call Anytime Feedback, which allows employees to submit praise or criticism to management. Many Amazon employees complain that the process can be quite hidden and harsh, some referring to a “river of intrigue and scheming.” This is just the tip of the Amazon data iceberg, however. A lengthy and far-reaching article in the New York Times (Kantor and Streitfeld 2015), which detailed how Amazon collects more data than any other retail operation in history, generated thousands of comments on the New York Times website and a response from Jeff Bezos himself. Amazon employees are held accountable for what seems like an infinite number of metrics, which are reviewed in weekly and/or monthly team meetings. Many Amazon employees say that these are anxiety-producing sessions, and understandably so. At these meetings, employees are pop-quizzed on any of these numbers and it is simply not acceptable to answer with an “I’ll get back to you.” The response to this just might be “you’re stupid.” Employees talk about the often hostile language used in these meetings.
Customary 80-h work weeks are also a concern, with the feeling that unless you give Amazon your absolute all, you are perceived as a weak performer. The Kanter and Streitfeld (2015) article documented vacationless 80/85 h work weeks; and a woman who had breast cancer being put on a “performance improvement plan,” a euphemism for “you’re in danger of being fired.”
As mentioned earlier, the article was met with a flurry of indignation. As I write this, close to 6000 comments can be found in response to this article, with many saying they will not shop at Amazon ever again, and some lambasting employees who would put up with this sort of toxic atmosphere. Obviously, this is a public rela-tions disaster for Amazon. More importantly, health, morale, and productivity will be negatively impacted if not now, then, at some point.
Perhaps the biggest criticism of this sort of constant employee monitoring and mea-surement is that it might contribute to wage inequality (Cowen 2015). If measurement pinpoints only the best of the best and everyone else is given a pink slip, then there are going to be a whole lot of people on unemployment or taking lower-wage jobs. Working under constant threat of being fired can be unfriendly and quite discourag-ing. We might end up favoring only certain personality types and bypassing others who might bring more creativity to the table.
Dealing with Burnout
A joint Stanford and Harvard study (Goh et al. 2015) found that workplace stress is about as dangerous as secondhand smoke. The study examined 10 workplace condi-tions, of which the following 5 were asserted to harm health: long working hours, shift work, work–family conflict, high job demands, and low job control. An additional
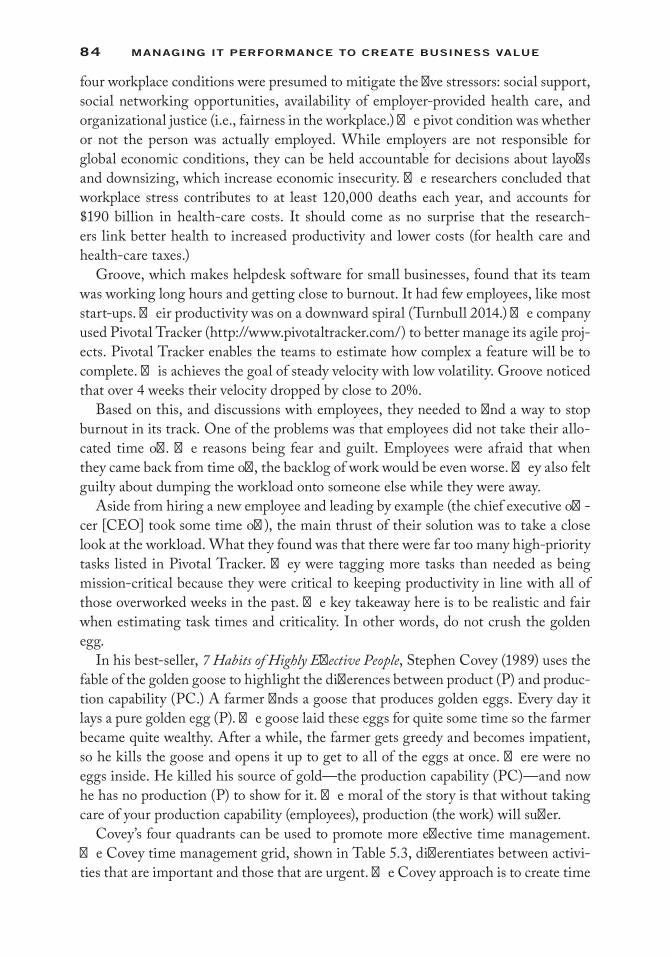
84 Managing it PerforManCe to Create Business Value
four workplace conditions were presumed to mitigate the five stressors: social support, social networking opportunities, availability of employer-provided health care, and organizational justice (i.e., fairness in the workplace.) The pivot condition was whether or not the person was actually employed. While employers are not responsible for global economic conditions, they can be held accountable for decisions about layoffs and downsizing, which increase economic insecurity. The researchers concluded that workplace stress contributes to at least 120,000 deaths each year, and accounts for $190 billion in health-care costs. It should come as no surprise that the research-ers link better health to increased productivity and lower costs (for health care and health-care taxes.)
Groove, which makes helpdesk software for small businesses, found that its team was working long hours and getting close to burnout. It had few employees, like most start-ups. Their productivity was on a downward spiral (Turnbull 2014.) The company used Pivotal Tracker (http://www.pivotaltracker.com/) to better manage its agile proj-ects. Pivotal Tracker enables the teams to estimate how complex a feature will be to complete. This achieves the goal of steady velocity with low volatility. Groove noticed that over 4 weeks their velocity dropped by close to 20%.
Based on this, and discussions with employees, they needed to find a way to stop burnout in its track. One of the problems was that employees did not take their allo-cated time off. The reasons being fear and guilt. Employees were afraid that when they came back from time off, the backlog of work would be even worse. They also felt guilty about dumping the workload onto someone else while they were away.
Aside from hiring a new employee and leading by example (the chief executive offi-cer [CEO] took some time off), the main thrust of their solution was to take a close look at the workload. What they found was that there were far too many high-priority tasks listed in Pivotal Tracker. They were tagging more tasks than needed as being mission-critical because they were critical to keeping productivity in line with all of those overworked weeks in the past. The key takeaway here is to be realistic and fair when estimating task times and criticality. In other words, do not crush the golden egg.
In his best-seller, 7 Habits of Highly Effective People, Stephen Covey (1989) uses the fable of the golden goose to highlight the differences between product (P) and produc-tion capability (PC.) A farmer finds a goose that produces golden eggs. Every day it lays a pure golden egg (P). The goose laid these eggs for quite some time so the farmer became quite wealthy. After a while, the farmer gets greedy and becomes impatient, so he kills the goose and opens it up to get to all of the eggs at once. There were no eggs inside. He killed his source of gold—the production capability (PC)—and now he has no production (P) to show for it. The moral of the story is that without taking care of your production capability (employees), production (the work) will suffer.
Covey’s four quadrants can be used to promote more effective time management. The Covey time management grid, shown in Table 5.3, differentiates between activi-ties that are important and those that are urgent. The Covey approach is to create time

85Designing PeoPle iMProVeMent systeMs
to focus on the important things before they become urgent. Often, this means trying to do things a bit earlier, more quickly, or automatically.
Employees are wired as never before: 24 × 7 via phone, e-mail, text, and social media. This requires a very high degree of multitasking. One would think that employees who multitask are far more productive than other employees. That would be wrong thinking. Researchers used a driving simulator to compare the performance of drivers who were chatting on mobile phones with drivers who exceeded the blood-alcohol limit. What the researchers found was that drivers who were using mobile phones were just as dangerous as drunk drivers. Drivers who use the phone while they drive took much longer to respond to events outside of the car and failed to notice a lot of the visual cues around them. Essentially, doing two complex things at one time results in a shortage of mental bandwidth.
Sanbonmatsu et al. (2013) found that people are also very poor judges of their abil-ity to multitask. If you have people who are multitasking a lot, you might come to the conclusion that they are good at multitasking. The study found that the more likely they are to do it, the more likely they are to be bad at it. The data showed that people multitask because they have difficulty focusing on one task at a time. They get drawn into secondary tasks—they get bored and want a secondary form of stimulation.
Multitasking really consists of four practices—multitasking, task switching, get-ting distracted, and managing multiple projects. It turns out that the highly produc-tive practice of having multiple projects, typical for a normal IT employee, invites the use of rapid task switching, which is considered nonproductive. Interestingly, it has been found that people have a better recollection of uncompleted tasks. Known as the Zeigarnik effect, for psychologist Bertha Zeigarnik who first identified the effect in the 1920s, employees with multiple responsibilities tend to engage in rapid task switching. We jump from task to task because we just cannot forget about all of those tasks left on the “to do” list. So, how do we encourage employees to deal with all of these tasks toward enhancing performance and productivity? One technique,
Table 5.3 Time Management Matrix
URGENT NOT URGENT
Important 1. ACTIVITIES• Crises• Pressing problems• Deadline-driven projects
2. ACTIVITIES• Prevention, capabilities improvement• Relationship building• Recognizing new opportunities• Planning, recreation
Notimportant
3. ACTIVITIES• Interruptions, some callers• Some mail, some reports, some
e-mail, some social media• Some meetings• Proximate, pressing matters• Popular activities
4. ACTIVITIES• Trivia, busy work• Some mail, some reports, some e-mail,
some social media• Some phone calls• Time wasters• Pleasant activities
Source: Based on Covey, S., 7 Habits of Highly Effective People, Free Press, New York, 1989.

86 Managing it PerforManCe to Create Business Value
quite natural for IT staff, is to create lists of what you need to do and to review the list frequently enough to make sure you do not miss anything.
Give that multitasking can slow things down a bit, it does have a benefit. Some suggest that this switching back and forth between tasks primes people for creativity (White and Shah 2011). Psychologists use the term low latent inhabitation to describe the filter that allows people to tune out irrelevant stimuli. These filters let us get on with what we are doing without being overwhelmed by all of the different stimuli we are subjected to. It seems that people whose filters are a bit porous have a creative edge because letting more information into one’s cognitive workspace lets that information be consciously or unconsciously applied. Essentially, it is easier to think outside the box if the box is leaky. Additionally, a plethora of tasks (or things to do) just might help us forget bad ideas.
There are several suggestions for dealing with multitasking. First, only multitask when it is appropriate. Sometimes it is appropriate just to focus on one task (keep that in mind the next time you have surgery). Agile development techniques talk about development in short sprints. The same is true for dealing with a large number of tasks. Focus in short sprints, say 25 min, breaking for 5 min and so on. Finally, and this is something the organization can help with, cross-fertilize. Be creative by work-ing across different organizational units or across many projects. Those unexpected connections can lead to the next aha moment.
Deming (2015) found that the labor market increasingly rewards social skills. Since 1980, jobs with high social skill requirements have experienced great wage growth. Deming also found that employment and wage growth are most pronounced in jobs that require high levels of both cognitive skill and social skills. He developed a model of team production where workers “trade tasks” to exploit their comparative advantage.
Letting team members trade tasks, a version of the leaderful and holacratic meth-ods discussed earlier, could also go a long way toward ameliorating the lack of engage-ment found across workers. Gallup’s 2013 study found that 90% of workers were either “not engaged” with or “actively disengaged” from their jobs. However, when given the chance to make their work meaningful and engaging, employees jump at it even if it means they have to work harder. Pfeffer (1998) found that companies that placed a high value on human resources were more likely to survive for at least 5 years than those that did not. Pfeffer also found that sales growth was more than 50% higher in companies with enlightened management practices than in those that did things the old-fashioned way.
In Conclusion
So, how can we better engage employees? Of course, compensation is a key driving factor. However, employees want to have more of a say in how they do their jobs. They want opportunities to learn and grow as well. Encouraging them to suggest improve-ments to the work process is important as well. Also key to increased engagement

87Designing PeoPle iMProVeMent systeMs
is making the employee understand how his or her work makes other people’s lives better.
People are influenced by the consequences of their actions. When establishing goals and improvement plans, consider the informal and formal rewards that are in place. Besides money, people work for things such as achievement, influence, advancement, job satisfaction, autonomy, and recognition.
ReferencesCovey, S. (1989). 7 Habits of Highly Effective People. New York: Free Press.Cowen, T. (2015). The measured worker. MIT Technology Review, September 28. Retrieved
from http://www.technologyreview.com/news/541531/the-measured-worker/.Deming, D. J. (2015). The growing importance of social skills in the labor market (Working
Paper Number 21473), August. The National Bureau of Economic Research. Retrieved from http://ww.nber.org/papers/w21473.
Fernández-Aráoz, C. (2014). 21st century talent spotting. Harvard Business Review, 92(6), 46–56.
Goh, J., Pfeffer, J., and Zenios, S. (2015). Behavioral, workplace stressors & health outcomes: Health policy for the workplace. Behavioral Science & Policy Association, 1(1), Spring. Retrieved from https://behavioralpolicy.org/article/workplace-stressors-health-outcomes/.
Gray, E. (2015). Questions to answer in the age of optimized hiring. Time, June 11. Retrieved from http://time.com/3917703/questions-to-answer-in-the-age-of-optimized-hiring/.
Jacksonville University. (2010). Performance appraisal interview guide. Retrieved from http://www.ju.edu/humanresources/Employment%20Documents/Performance%20Appraisal%20Interview%20Guide.pdf.
Kantor, J. and Streitfeld, D. (2015). Inside Amazon: Wrestling big ideas in a bruising work-place. New York Times, August 15. Retrieved from http://www.nytimes.com/2015/08/16/technology/inside-amazon-wrestling-big-ideas-in-a-bruising-workplace.html?_r=0.
Pfeffer, J. (1998). The Human Equation: Building Profits by Putting People First. Cambridge, MA: Harvard Business Review Press.
Raelin, J. A. (2008). Work-Based Learning: Bridging Knowledge and Action in the Workplace. San Francisco: Jossey-Bass.
Sanbonmatsu, D. M., Strayer, D. L., Medeiros-Ward, N., and Watson, J. M. (2013). Who multi-tasks and why? Multi-tasking ability, perceived multi-tasking ability, impulsivity, and sensation seeking. PLoS ONE, 8(1): e54402.
Streitfeld, D. (2015). Data-crunching is coming to help your boss management your time. New York Times, August 17. Retrieved from http://www.nytimes.com/2015/08/18/technology/data-crunching-is-coming-to-help-your-boss-manage-your-time.html?_r=0.
Turnbull, A. (2014). How our startup beat burnout, March 19. Retrieved from https://www.groovehq.com/blog/burnout.
White, H. and Shah, P. (2011). Creative style and achievement in adults with attention-deficit/hyperactivity disorder. Journal of Personality and Individual Differences, 50, 73–677.

89
6KnowleDge anD social
enterPrising Performance measurement anD management
Social enterprising is based on effective knowledge management. Knowledge management can be defined as the processes that support knowledge collection, sharing, and dissemination. The expectations for knowledge management are that it should be able to improve growth and innovation, productivity and efficiency reflected in cost savings, customer relationships, decision-making, innovation, corporate agility, rapid development of new product lines, employee learning, satisfaction and retention, and management decision. Interestingly, these are the same expectations for social enterprising.
Many senior managers emphasize knowledge management as an important means of innovation. In organizations, it is essential to address effective knowledge flow among employees, as well as knowledge collaboration across organizational boundar-ies, while limiting knowledge sharing.
It is estimated that an organization with 1000 workers might easily incur a cost of more than $6 million per year in lost productivity when employees fail to find existing knowledge and recreate knowledge that was available but could not be located. On average, 6% of revenue, as a percentage of budget, is lost from failure to exploit avail-able knowledge. Since knowledge is a key strategic asset for organizations of all sizes, it follows that knowledge management is critically important as it is the set of tools and processes that manages organizational knowledge.
Siemens is an example of a company that has fully adopted knowledge manage-ment as a strategic tool. At Siemens, knowledge is regarded as the means for effective action. At companies such as Siemens, knowledge management systems are considered socio-technical systems. These systems encompass competence building; emphasis on collaboration; ability to support diverse technology infrastructures; use of partner-ships; and knowledge codification for all documents, processes, and systems.
Siemens is widely known as a company built on technology and was an early adopter of knowledge management. The company’s goal is to share existing knowledge in a better way and to create new knowledge more quickly. Siemens’ holistic approach clearly demonstrates the importance of people, collaboration, culture, leadership, and support.

90 Managing it PerforManCe to Create Business Value
Using Balanced Scorecards to Manage Knowledge-Based Social Enterprising
Figure 6.1 should serve to refresh your memories of the four perspectives of the balanced scorecard.
In the scorecard scenario, a company organizes its business goals into four discrete, all-encompassing perspectives: financial, customer, internal process, and learning/growth. The company then determines cause–effect relationships—for example, satisfied customers buy more goods, which increases revenue. Next, the company lists measures for each goal, pinpoints targets, and identifies projects and other initiatives to help reach those targets.
Departments create scorecards tied to the company’s targets, and employees and projects have scorecards tied to their department’s targets. This cascading nature pro-vides a line of sight between each individual, the project they are working on, the unit they support, and how that impacts on the strategy of the enterprise as a whole.
We are going to presume that most enterprise uses of knowledge-based social enter-prising will be project based (e.g., software development projects, marketing projects). For project managers, the balanced scorecard is an invaluable tool that allows them to link a project to the business side of the organization using a “cause-and-effect” approach. Some have likened the balanced scorecard to a new language, which enables the project manager and business line managers to think together about what can be done to support and/or improve business performance.
Objectives Measures
FinancialHow do we look to shareholders?
Targets Initiatives
Objectives Measures
CustomerHow do customers see us?
Targets Initiatives Objectives Measures
Internal business processesWhat must we excel at?
Targets Initiatives
Objectives Measures
Learning and growth
Vision and strategy
How can we sustain our ability to change and improve
Targets Initiatives
Figure 6.1 The balanced scorecard.

91KnowleDge anD soCial enterPrising PerforManCe
A beneficial side effect of the use of the balanced scorecard is that, when all measures are reported, one can calculate the strength of relations between the vari-ous value drivers. For example, if the relation between high implementation costs and high profit levels is weak for a long time, it can be inferred that the project, as implemented, does not sufficiently contribute to results as expressed by the other (e.g., financial) performance measures.
Adopting the Balanced Scorecard
Kaplan and Norton (2001) provide a good overview of how a typical company adapts to the balanced scorecard approach:
Each organization we studied did it a different way, but you could see that, first, they all had strong leadership from the top. Second, they translated their strategy into a balanced scorecard. Third, they cascaded the high-level strategy down to the operating business units and the support departments. Fourth, they were able to make strategy everybody’s everyday job, and to reinforce that by setting up personal goals and objectives and then linking variable compensation to the achievement of those target objectives. Finally, they integrated the balanced scorecard into the organization’s processes, built it into the plan-ning and budgeting process, and developed new reporting frameworks as well as a new structure for the management meeting.
The key, then, is to develop a scorecard that naturally builds in cause-and-effect relationships, includes sufficient performance drivers and, finally, provides a linkage to appropriate measures, as shown in Table 6.1.
At the very lowest level, a discrete project can also be evaluated using a balanced scorecard. The key here is the connectivity between the project and the objectives of the organization as a whole, as shown in Table 6.2. Possible goals related to knowledge-based social enterprising have been italicized.
The internal processes perspective maps neatly to the traditional triple con-straint of project management, using many of the same measures traditionally used. For example, we can articulate the quality constraint using the ISO 10006:2003 standard. This standard provides guidance on the application of quality management in projects. It is applicable to projects of varying complexity, small or large, of short or long duration, in different environments, and irrespective of the kind of product or process involved.
Quality management of projects in this international standard is based on eight quality management principles:
1. Customer focus 2. Leadership 3. Involvement of people 4. Process approach

92 Managing it PerforManCe to Create Business Value
Table 6.1 Typical Departmental Sample Scorecard
OBJECTIVE MEASURE/METRICS END OF FY 2010 (PROJECTED)
FINANCIAL Long-term corporate profitability % Change in stock price attributable to
earnings growth+25% per year for next 10 years+20% per year for next 10 years
Short-term corporate profitability 1. New products 2. Enhance existing products 3. Expand client-base 4. Improve efficiency and
cost-effectiveness
Revenue growth% Cost reduction
+20% related revenue growthCut departmental costs by 35%
CUSTOMERCustomer satisfaction 1. Customer-focused products 2. Improve response time 3. Improve security
Quarterly and annual customer surveys satisfaction index
Satisfaction ratio based on customer surveys
+35%: Raise satisfaction level from current 60% to 95%
+20%Customer retention % of customer attrition −7%: Reduce from current 12% to 5%Customer acquisition % of increase in number of customers +10%
INTERNALComplete M&A transitional processes
Establish connectivityImprove qualityEliminate errors and system failures
% of work completed% of workforce full access to corporate
resources% Saved on reduced work% Reduction of customer complaints% Saved on better quality
100%
100%+35%+25%+25%
Increase ROIReduce TCO
% Increase in ROI% Reduction of TCO
+20% to 40%−10% to 20%
Increase productivity % Increase in customer orders% Increase in production/employee
+25+15%
Product and services enhancements
Number of new products and services introduced
Five new products
Improve response time Average number of hours to respond to customer
−20 min. Reduce from current level of 30–60 min to only10 min or less
LEARNING AND INNOVATIONSDevelopment of skillsLeadership development and training
% Amount spent on training% Staff with professional certificatesNumber of staff attending colleges
+10%+ 2018
Innovative productsImproved processR&D
% Increase in revenueNumber of new products% Decrease in failure, complaints
+20%+5−10%
Performance measurement % Increase in customer satisfaction—survey results
% Projects to pass ROI test% Staff receiving bonuses on
performance enhancement% Increase in documentation
+20+%25
+25%+20%

93KnowleDge anD soCial enterPrising PerforManCe
5. System approach to management 6. Continual improvement 7. Factual approach to decision-making 8. Mutually beneficial supplier relationships
Sample characteristics of these principles can be seen in Table 6.3. Those characteris-tics with a tie-in to social enterprising have been italicized.
Characteristics of a variable (e.g., quality, time) are used to create the key perfor-mance indicators (KPIs), or metrics, used to measure the “success” of the project. Thus, as you can see from Tables 6.1 through 6.3, we have got quite a few choices in terms of measuring the quality dimension of any particular project, as well as the direct tie-in to the social enterprising aspects of all of this. More specifically, the per-spective that best fits the knowledge-based social enterprising paradigm is learning and growth. Possible metrics are shown in Table 6.4.
Attributes of Successful Project Management Measurement Systems
There are certain attributes that set apart successful performance measurement and management systems, including:
1. A conceptual framework is needed for the performance measurement and manage-ment system. A clear and cohesive performance measurement framework that is understood by all managers and staff, and that supports objectives and the collection of results is needed.
2. Effective internal and external communications are the keys to successful perfor-mance measurement. Effective communication with stakeholders is vital to the successful development and deployment of performance measurement and management systems.
Table 6.2 A Simple Project Scorecard Approach
PERSPECTIVE GOALS
Customer Fulfill project requirementsControl cost of the projectSatisfying project end usersEliciting information from end usersCollaborating with end users
Financial Provides business value (e.g., ROI, ROA)Project contributing to organization as a wholeReduction in costs due to enhanced communications
Internal processes Adheres to triple constraint: time, cost, quality including a reduction in the time it takes to complete projects
Learning and growth Maintaining currencyAnticipate changesAcquired skillsetsPromote collaboration and knowledge sharing

94 Managing it PerforManCe to Create Business Value
3. Accountability for results must be clearly assigned and well understood. Managers must clearly identify what it takes to determine success and make sure that staff understand what they are responsible for in achieving these goals.
4. Performance measurement systems must provide intelligence for decision-makers, not just compile data. Performance measures should relate to strategic goals and objectives, and provide timely, relevant, and concise information for use by decision-makers at all levels to assess progress toward achieving predeter-mined goals. These measures should produce information on the efficiency with which resources (i.e., people, hardware, software, etc.) are transformed
Table 6.3 ISO 10006 Definition of Quality Management for Projects
QUALITY CHARACTERISTIC SUBCHARACTERISTIC
Customer focus 1. Understanding future customer needs 2. Meet or exceed customer requirements
Social enterprising promotes close collaboration with the various stakeholder groupsLeadership 1. By setting the quality policy and identifying the objectives (including the quality
objectives) for the project 2. By empowering and motivating all project personnel to improve the project
processes and product
Social enterprising might promote leaderful teamsInvolvement of people 1. Personnel in the project organization have well-defined responsibility and authority
2. Competent personnel are assigned to the project organization
The use of collaborative social technologies is naturally evolving, which will hopefully lead to improved product and process
Process approach 1. Appropriate processes are identified for the project 2. Interrelations and interactions among the processes are clearly identified
Social enterprising environments enable the team to more effectively and quickly articulate business processes and provide an excellent means for documenting those processes
System approach to management
1. Clear division of responsibility and authority between the project organization and other relevant interested parties
2. Appropriate communication processes are defined
Social enterprising provides a systematized method for more effective management of a project, as well as enhanced communication among the various stakeholder groups
Continual improvement 1. Projects should be treated as a process rather than as an isolated task 2. Provision should be made for self-assessments
Social enterprising provides the means for constant assessment via the group workspaces
Factual approach to decision-making
1. Effective decisions are based on the analysis of data and information 2. Information about the project’s progress and performance are recorded
Social enterprising provides the ability to easily track project progress and performanceMutually beneficial supplier relationships
1. The possibility of a number of projects using a common supplier is investigated
Social enterprising provides the ability to work more collaboratively with suppliers
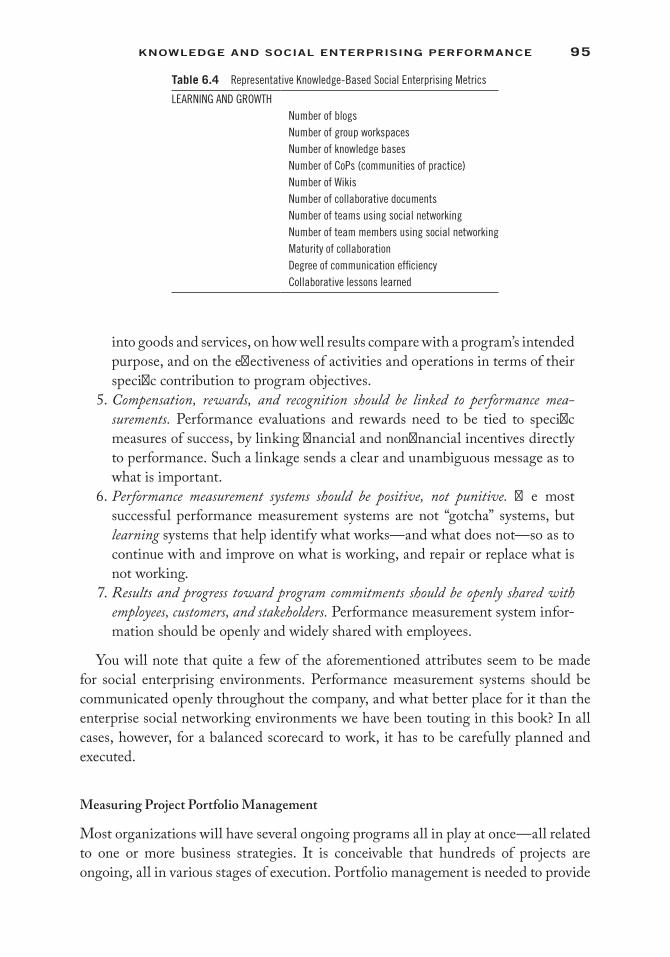
95KnowleDge anD soCial enterPrising PerforManCe
into goods and services, on how well results compare with a program’s intended purpose, and on the effectiveness of activities and operations in terms of their specific contribution to program objectives.
5. Compensation, rewards, and recognition should be linked to performance mea-surements. Performance evaluations and rewards need to be tied to specific measures of success, by linking financial and nonfinancial incentives directly to performance. Such a linkage sends a clear and unambiguous message as to what is important.
6. Performance measurement systems should be positive, not punitive. The most successful performance measurement systems are not “gotcha” systems, but learning systems that help identify what works—and what does not—so as to continue with and improve on what is working, and repair or replace what is not working.
7. Results and progress toward program commitments should be openly shared with employees, customers, and stakeholders. Performance measurement system infor-mation should be openly and widely shared with employees.
You will note that quite a few of the aforementioned attributes seem to be made for social enterprising environments. Performance measurement systems should be communicated openly throughout the company, and what better place for it than the enterprise social networking environments we have been touting in this book? In all cases, however, for a balanced scorecard to work, it has to be carefully planned and executed.
Measuring Project Portfolio Management
Most organizations will have several ongoing programs all in play at once—all related to one or more business strategies. It is conceivable that hundreds of projects are ongoing, all in various stages of execution. Portfolio management is needed to provide
Table 6.4 Representative Knowledge-Based Social Enterprising Metrics
LEARNING AND GROWTHNumber of blogsNumber of group workspacesNumber of knowledge basesNumber of CoPs (communities of practice)Number of WikisNumber of collaborative documentsNumber of teams using social networkingNumber of team members using social networkingMaturity of collaborationDegree of communication efficiencyCollaborative lessons learned

96 Managing it PerforManCe to Create Business Value
the business and technical stewardship of all of these programs and their projects, as shown in Figure 6.2.
Portfolio management requires the organization to manage multiple projects at one time, creating several thorny issues; the most salient ones are shown in Table 6.5.
Many of the issues listed in Table 6.5 can be resolved using a variety of knowledge management and social enterprising techniques. Inter- and intra-project communica-tions would be quite possible, as would maintaining motivation across project teams. Maintaining all of the project documentation online means that it would be possible to record lessons learned. Thus, the knowledge gleaned during past projects would no
ContinuouslearningLevel 5
Managed atcorporate
levelLevel 4
Managed atproject
levelLevel 3
PlannedLevel 2
Ad hocLevel 1
Continuous PM processimprovement
Integrated multi-projectplanning and control
Systematic projectplanning and control
Individual projectplanning
Basic PM process
Figure 6.2 Portfolio management.
Table 6.5 Multiple Project Management Issues
RESPONSIBILITY ISSUE
Alignment management • Balancing individual project objectives with the organization’s objectivesControl and communication • Maintaining effective communications within a project and across multiple projects
• Maintaining motivation across project teams• Resource allocation
Learning and knowledge management
• Inability to learn from past projects• Failure to record lessons learned for each project• Lack of timely information
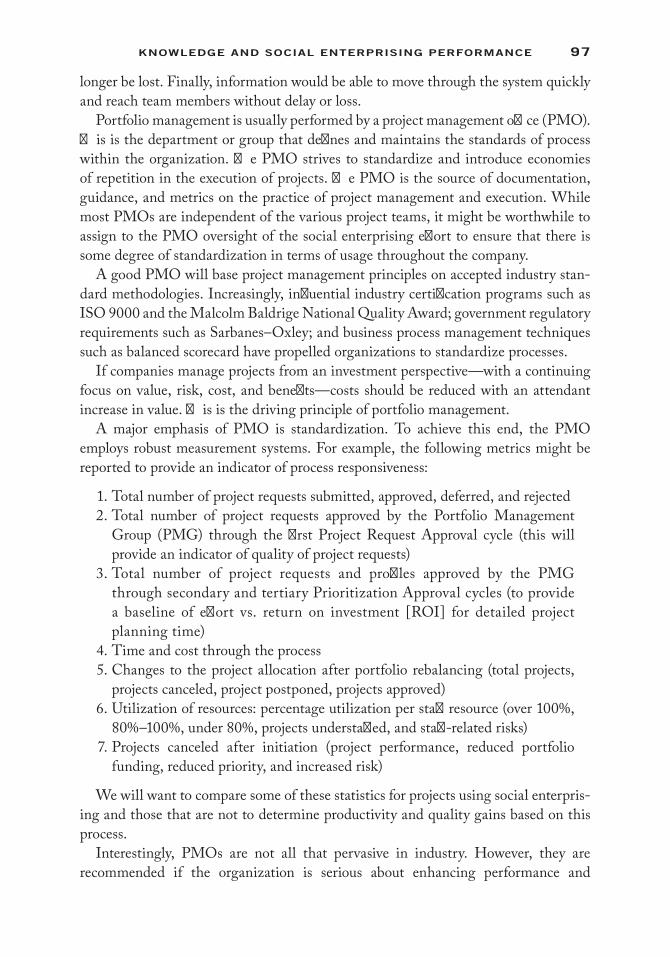
97KnowleDge anD soCial enterPrising PerforManCe
longer be lost. Finally, information would be able to move through the system quickly and reach team members without delay or loss.
Portfolio management is usually performed by a project management office (PMO). This is the department or group that defines and maintains the standards of process within the organization. The PMO strives to standardize and introduce economies of repetition in the execution of projects. The PMO is the source of documentation, guidance, and metrics on the practice of project management and execution. While most PMOs are independent of the various project teams, it might be worthwhile to assign to the PMO oversight of the social enterprising effort to ensure that there is some degree of standardization in terms of usage throughout the company.
A good PMO will base project management principles on accepted industry stan-dard methodologies. Increasingly, influential industry certification programs such as ISO 9000 and the Malcolm Baldrige National Quality Award; government regulatory requirements such as Sarbanes–Oxley; and business process management techniques such as balanced scorecard have propelled organizations to standardize processes.
If companies manage projects from an investment perspective—with a continuing focus on value, risk, cost, and benefits—costs should be reduced with an attendant increase in value. This is the driving principle of portfolio management.
A major emphasis of PMO is standardization. To achieve this end, the PMO employs robust measurement systems. For example, the following metrics might be reported to provide an indicator of process responsiveness:
1. Total number of project requests submitted, approved, deferred, and rejected 2. Total number of project requests approved by the Portfolio Management
Group (PMG) through the first Project Request Approval cycle (this will provide an indicator of quality of project requests)
3. Total number of project requests and profiles approved by the PMG through secondary and tertiary Prioritization Approval cycles (to provide a baseline of effort vs. return on investment [ROI] for detailed project planning time)
4. Time and cost through the process 5. Changes to the project allocation after portfolio rebalancing (total projects,
projects canceled, project postponed, projects approved) 6. Utilization of resources: percentage utilization per staff resource (over 100%,
80%–100%, under 80%, projects understaffed, and staff-related risks) 7. Projects canceled after initiation (project performance, reduced portfolio
funding, reduced priority, and increased risk)
We will want to compare some of these statistics for projects using social enterpris-ing and those that are not to determine productivity and quality gains based on this process.
Interestingly, PMOs are not all that pervasive in industry. However, they are recommended if the organization is serious about enhancing performance and
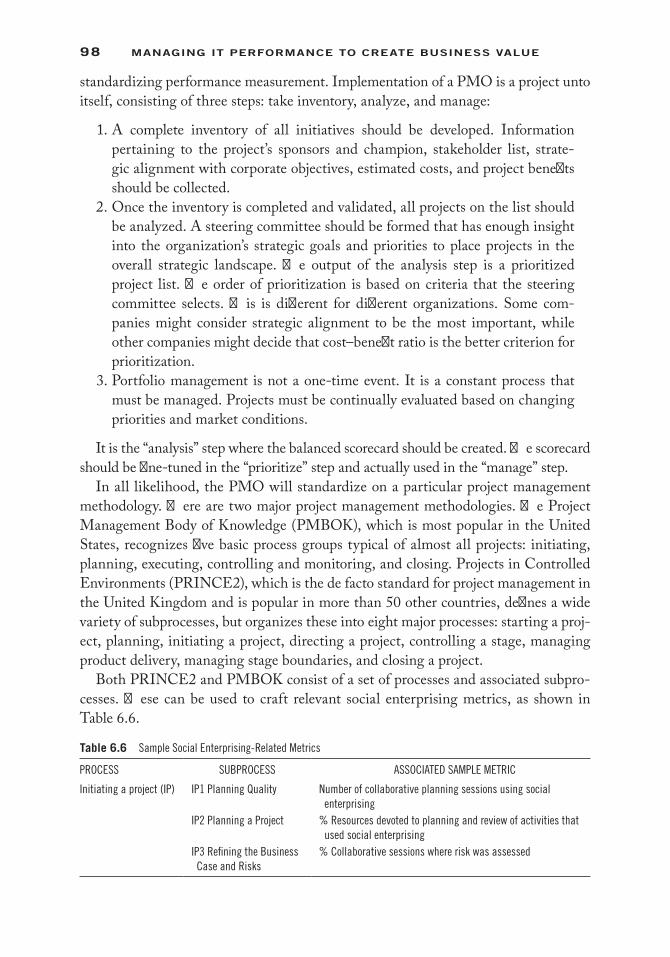
98 Managing it PerforManCe to Create Business Value
standardizing performance measurement. Implementation of a PMO is a project unto itself, consisting of three steps: take inventory, analyze, and manage:
1. A complete inventory of all initiatives should be developed. Information pertaining to the project’s sponsors and champion, stakeholder list, strate-gic alignment with corporate objectives, estimated costs, and project benefits should be collected.
2. Once the inventory is completed and validated, all projects on the list should be analyzed. A steering committee should be formed that has enough insight into the organization’s strategic goals and priorities to place projects in the overall strategic landscape. The output of the analysis step is a prioritized project list. The order of prioritization is based on criteria that the steering committee selects. This is different for different organizations. Some com-panies might consider strategic alignment to be the most important, while other companies might decide that cost–benefit ratio is the better criterion for prioritization.
3. Portfolio management is not a one-time event. It is a constant process that must be managed. Projects must be continually evaluated based on changing priorities and market conditions.
It is the “analysis” step where the balanced scorecard should be created. The scorecard should be fine-tuned in the “prioritize” step and actually used in the “manage” step.
In all likelihood, the PMO will standardize on a particular project management methodology. There are two major project management methodologies. The Project Management Body of Knowledge (PMBOK), which is most popular in the United States, recognizes five basic process groups typical of almost all projects: initiating, planning, executing, controlling and monitoring, and closing. Projects in Controlled Environments (PRINCE2), which is the de facto standard for project management in the United Kingdom and is popular in more than 50 other countries, defines a wide variety of subprocesses, but organizes these into eight major processes: starting a proj-ect, planning, initiating a project, directing a project, controlling a stage, managing product delivery, managing stage boundaries, and closing a project.
Both PRINCE2 and PMBOK consist of a set of processes and associated subpro-cesses. These can be used to craft relevant social enterprising metrics, as shown in Table 6.6.
Table 6.6 Sample Social Enterprising-Related Metrics
PROCESS SUBPROCESS ASSOCIATED SAMPLE METRIC
Initiating a project (IP) IP1 Planning Quality Number of collaborative planning sessions using social enterprising
IP2 Planning a Project % Resources devoted to planning and review of activities that used social enterprising
IP3 Refining the Business Case and Risks
% Collaborative sessions where risk was assessed

99KnowleDge anD soCial enterPrising PerforManCe
Since the PMO is the single focal point for all things related to project management, it is natural that the project management balanced scorecard should be within the purview of this department.
Project Management Process Maturity Model (PM)2 and Collaboration
The Project Management Process Maturity Model (PM)2 model determines and positions an organization’s relative project management level with other organiza-tions. There are a variety of project management process maturity models, and they are all based on work done by the Software Engineering Institute at Carnegie Mellon, which focuses on improving the quality of the software development process.
The PM2 model defines five steps, as shown in Figure 6.3.Unfortunately, quite a large number of organizations are still hovering some-
where between the ad hoc level and planned levels. Companies that are serious about improving performance strive to achieve Level 5—continuous learning. To do this, a company is required to compare itself with others in its peer grouping, the goal of a model such as PM2.
In the PM2 model, key processes, organizational characteristics, and key focus areas are defined, as shown in Table 6.7. Each maturity level is associated with a set of key project management processes, characteristics of those processes, and key areas on which to focus. When mapped to the four balanced scorecard perspectives, PM2 becomes a reference point or yardstick for best practices and processes.
Portfolio management
Program management
Project management
Figure 6.3 The PM2 model.

100 Managing it PerforManCe to Create Business Value
Tabl
e 6.
7 Ke
y Com
pone
nts
of th
e PM
2 Mod
el
MAT
URIT
Y LE
VEL
KEY
PM P
ROCE
SSES
MAJ
OR O
RGAN
IZAT
IONA
L CH
ARAC
TERI
STIC
SKE
Y FO
CUS
AREA
S
Leve
l 5 (c
ontin
uous
lear
ning
)PM
pro
cess
es a
re c
ontin
uous
ly im
prov
edPr
ojec
t-dr
iven
org
aniza
tion
Inno
vativ
e id
eas
to im
prov
e PM
pro
cess
es
and
prac
tices
PM p
roce
sses
are
fully
und
erst
ood
Dyna
mic
, ene
rget
ic, a
nd fl
uid
orga
niza
tion
PM d
ata
are
optim
ized
and
sust
aine
dCo
ntin
uous
impr
ovem
ent o
f PM
pro
cess
es
and
prac
tices
Leve
l 4 (m
anag
ed a
t cor
pora
te le
vel)
Mul
tiple
PM
(pro
gram
man
agem
ent)
Stro
ng te
amwo
rkPl
anni
ng a
nd c
ontro
lling
mul
tiple
pro
ject
s in
a p
rofe
ssio
nal m
anne
rPM
dat
a an
d pr
oces
ses
are
inte
grat
edFo
rmal
PM
trai
ning
for p
roje
ct te
am
PM d
ata
are
quan
titat
ivel
y ana
lyzed
, mea
sure
d,
and
stor
edLe
vel 3
(man
aged
at p
roje
ct le
vel)
Form
al p
roje
ct p
lann
ing
and
cont
rol s
yste
ms
are
man
aged
Team
orie
nted
(med
ium
)Sy
stem
atic
and
stru
ctur
ed p
roje
ct p
lann
ing
and
cont
rol f
or in
divi
dual
pro
ject
Form
al P
M d
ata
are
man
aged
Info
rmal
trai
ning
of P
M s
kills
and
pra
ctic
es
Leve
l 2 (p
lann
ed)
Info
rmal
PM
pro
cess
es a
re d
efine
dTe
am o
rient
ed (w
eak)
Indi
vidu
al p
roje
ct p
lann
ing
Info
rmal
PM
pro
blem
s ar
e id
entifi
edOr
gani
zatio
ns p
osse
ss s
treng
ths
in d
oing
si
mila
r wor
kIn
form
al P
M d
ata
are
colle
cted
Leve
l 1 (a
d ho
c)No
PM
pro
cess
es o
r pra
ctic
es a
re c
onsi
sten
tly
avai
labl
eFu
nctio
nally
isol
ated
Unde
rsta
nd a
nd e
stab
lish
basi
c PM
pr
oces
ses
No P
M d
ata
are
cons
iste
ntly
colle
cted
or a
nalyz
edLa
ck o
f sen
ior m
anag
emen
t sup
port
Proj
ect s
ucce
ss d
epen
ds o
n in
divi
dual
ef
forts

101KnowleDge anD soCial enterPrising PerforManCe
Thus, measurement across collaborative, distributed partners must be considered in any measurement program. Several interest groups and partnerships in the automo-tive industry were formed to develop new project management methods and processes that worked effectively in a collaborative environment. The German Organization for Project Management (GPM e.V.), the PMI automotive special interest group, the automotive industry action group (AIAG), and others have embarked on proj-ects to develop methods, models, and frameworks for collaborative product develop-ment, data exchange, quality standards, and project management. One recent output from this effort was the ProSTEP-iViP reference model to manage time, tasks, and communications in cross-company automotive product development projects (http://www.prostep.org/en/).
A set of drivers and KPIs for a typical stand-alone project can be seen in Table 6.8.Using guidelines from the ProSTEP reference model, Niebecker et al. (2008) have
reoriented the drivers and KPIs in Table 6.8 to account for the extra levels of complex-ity found in a project worked on by two or more companies in a networked collabora-tive environment. This suits the social enterprising construct quite nicely, as shown in Table 6.9.
Appendix I provides an extensive set of scorecard metrics, which incorporate the collaborative aspects of social enterprising.
Table 6.8 Representative Drivers and KPIs for a Standard Project
BALANCED SCORECARD PERSPECTIVE DRIVERS KPIS
Finances Project budgetIncrease of business valueMultiproject categorizationProject management
Human resourcesShare of salesProfit marginSavingsROIExpenditure
Customer Customer satisfaction Cost overrunNumber of customer auditsChange managementProcess stability
Process Adherence to schedulesInnovation enhancementMinimizing risksOptimization of project structureQuality
Adherence to delivery datesLessons learnedNumber of patent applicationsExternal laborQuality indicesDuration of change managementProduct maturityPercentage of overheadNumber of internal auditsProject risk analysis
Development Employee satisfactionEmployee qualification enhancement
Rate of employee fluctuationTravel costsOvertimeIndex of professional experienceContinuing education costs

102 Managing it PerforManCe to Create Business Value
In Conclusion
Niebecker et al. (2008) provide an approach for monitoring and controlling cross-company projects by aligning collaborative project objectives with the business strat-egies and project portfolio of each company. The ultimate goal here is to enhance performance management and measurement.
ReferencesKaplan, R.S. and Norton, D.P. (2001). On balance (Interview). CFO, Magazine for Senior
Financial Executives. February.Niebecker, K., Eager, D., and Kubitza, K. (2008). Improving cross-company management
performance with a collaborative project scorecard. International Journal of Managing Projects in Business, 1(3), 368–386.
Table 6.9 Drivers and KPIs for a Collaborative Project (CP)
BALANCED SCORECARD PERSPECTIVE DRIVERS KPIS
Finances/project Project costIncrease of business valueCategorization into CP managementProject maturity
Product costsProduction costsCost overrunsSavingsProductivity indexTurnoverRisk distributionProfit marginFeature stabilityProduct maturity index
Process Adherence to schedulesInnovation enhancementMinimizing risksAdherence to collaboration processQuality
Variance to scheduleChanges before and after design freezeDuration until defects removedNumber and duration of product changesNumber of post-processing changesContinuous improvement processProject risk analysisMaturity of collaboration processFrequency of product testsDefect frequencyQuality indices
Collaboration CommunicationCollaboration
Number of team workshopsChecklistsDegree of communication efficiencyCollaborative lessons learnedMaturity of collaborationDegree of lessons-learned realization
Development Team satisfactionTeam qualification enhancementTrust between team members
Employee fluctuationProject focused continuing educationEmployee qualification

103
7Designing Performance-BaseD
risK management systems
Research engineers at MIT have created a prototype machine that eliminates the need for human intuition in big data analysis. At some point in the future, this “Data Science Machine” will obviate the need to create risk management plans and then execute those plans. The machine will perform the risk analysis and then measure its own success. Until that happens, humans will still need to develop risk strategies, determine risk and each risk’s mitigation, and then measure the process and its success.
Risk Strategy
A proactive risk strategy should always be adopted, as shown in Figure 7.1. It is better to plan for possible risk then have to react to it in a crisis.
Sound risk assessment and risk management planning throughout project implementation can have a big payoff. The earlier a risk is identified and dealt with, the less likely it is to negatively affect project outcomes. Risks are both more probable and more easily addressed early in a project. By contrast, risks can be more difficult to deal with and more likely to have significant negative impact if they occur later in a project. Risk probability is simply the likelihood that a risk event will occur. Conversely, risk impact is the result of the probability of the risk event occurring plus the consequences of the risk event. Impact, in laymen’s terms, is telling you how much the realized risk is likely to hurt.
The propensity (or probability) of project risk depends on the project’s life cycle, which includes five phases: initiating, planning, executing, controlling, and closing. While problems can occur at any time during a project’s life cycle, problems have a greater chance of occurring earlier due to unknown factors.
The opposite can be said for risk impact. At the beginning of the project, the impact of a problem, assuming it is identified as a risk, is likely to be less severe than it is later in the project life cycle. This is in part because at this early stage there is much more flexibility in making changes and dealing with the risk, assuming it is recognized as a risk. Additionally, if the risk cannot be prevented or mitigated, the resources invested—and potentially lost—at the earlier stages are significantly lower than later in the project. Conversely, as the project moves into the later phases, the consequences become much more serious. This is attributed to the fact that as time passes, there is

104 Managing it PerforManCe to Create Business Value
less flexibility in dealing with problems, significant resources have likely been already spent, and more resources may be needed to resolve the problem.
Risk Analysis
One method of risk analysis requires modularizing the project into measurable parts. Risk can then be calculated as follows:
1. Exposure Factor (EF) = Percentage of asset loss caused by identified threat. 2. Single Loss Expectancy (SLE) = Asset Value × EF. 3. Annualized Rate of Occurrence (ARO) = Estimated frequency a threat will
occur within a year and is characterized on an annual basis. A threat occur-ring 10 times a year has an ARO of 10.
4. Annualized Loss Expectancy (ALE) = SLE × ARO. 5. Safeguard cost/benefit analysis = (ALE before implementing safeguard) −
(ALE after implementing safeguard) − (annual cost of safeguard) == value of safeguard to the company.
Scenario planning has proved itself to be very useful as a tool for making decisions under uncertainty, a hallmark of risk analysis. Because scenario planning is unde-rutilized and often delegated to subordinates, its implementation has had some shortcomings. Erdmann et al. (2015), all of McKinsey, stress that those new to this practice can get caught up in the details or become hampered by some deep-seated
Risk management
Risk analysis
Riskidentification
Riskevaluation
Risktreatment
Contentanalysis
Communication
Risk assessment
Riskmonitoringand review
Figure 7.1 Risk management feedback loop.

105Designing PerforManCe-BaseD risK ManageMent systeMs
planning biases. Thus, they have come up with what they refer to as a “cheat sheet” for the successful use of scenario planning, as shown in Table 7.1.
Risk Identification
Properly identifying risks is critically important. Risk management has many objectives; primary among them are safety, environment, and reputation. In ferret-ing out the risks for these three generic categories, we must examine the downside of uncertain events, the upside of uncertain events, the downside of general uncertain-ties, and the upside of general uncertainties.
One method is to create a risk item checklist. A typical project plan might list the following risks:
1. Customer will change or modify requirements. 2. Lack of sophistication of end users. 3. Delivery deadline will be tightened. 4. End users resist system. 5. Server may not be able to handle larger number of users simultaneously. 6. Technology will not meet expectations. 7. Larger number of users than planned. 8. Lack of training of end users. 9. Inexperienced project team. 10. System (security and firewall) will be hacked.
One way to identify software project risks is by interviewing experienced software project managers in different parts of the world. Create a set of questions and then order them by their relative importance to the ultimate success of a project. For example:
1. Have top software and customer managers formally committed to support the project?
2. Are end users enthusiastically committed to the project and the system/prod-uct to be built?
3. Are requirements fully understood by the software engineering team and their customers?
4. Have customers been involved fully in the definition of requirements? 5. Do end users have realistic expectations? 6. Is the project scope stable? 7. Does the software engineering team have the right mix of skills? 8. Are project requirements stable? 9. Does the project team have experience with the technology to be implemented? 10. Is the number of people on the project team adequate to do the job? 11. Do all customer/user constituencies agree on the importance of the project
and on the requirements for the system/product to be built?

106 Managing it PerforManCe to Create Business Value
Tabl
e 7.
1 Do
s an
d Do
n’ts
of S
cena
rio P
lann
ing
CHEA
T SH
EET
ON S
CENA
RIO
PLAN
NING
Figh
t the
urg
e to
mak
e de
cisi
ons
on
what
you
alre
ady k
now
Bewa
re g
ivin
g to
o m
uch
weig
ht to
un
likel
y eve
nts
Do n
ot a
ssum
e th
e fu
ture
will
lo
ok li
ke th
e pa
stCo
mba
t ove
rcon
fiden
ce a
nd e
xces
sive
op
timis
mEn
cour
age
free
and
open
deb
ate
WHA
T TO
DO
WHA
T TO
DO
WHA
T TO
DO
WHA
T TO
DO
WHA
T TO
DO
Figh
t the
urg
e to
mak
e de
cisi
ons
base
d on
wha
t you
alre
ady k
now
Eval
uate
and
prio
ritize
tren
ds u
sing
fir
st q
ualit
ativ
e, q
uant
itativ
e ap
proa
ches
.
Build
sce
nario
s ar
ound
crit
ical
un
certa
intie
s, e
ngag
ing
top
exec
utiv
es th
roug
h ex
perie
ntia
l te
chni
ques
Asse
ss th
e im
pact
of e
ach
scen
ario
and
de
velo
p st
rate
gic
alte
rnat
ives
for e
ach,
as
well
as a
cle
ar u
nder
stan
ding
of t
he
orga
niza
tiona
l, op
erat
iona
l, an
d fin
anci
al
requ
irem
ents
of e
ach.
Inst
ill th
e di
scip
line
of s
cena
rio-
base
d th
inki
ng w
ith s
yste
ms,
pr
oces
ses,
and
cap
abili
ties
that
su
stai
n it.
Star
t with
inte
llige
nce
gath
erin
g;
iden
tify e
mer
ging
tech
nolo
gica
l, ec
onom
ic, d
emog
raph
ic, a
nd c
ultu
ral
trend
s wi
thin
and
out
side
your
co
untry
and
pot
entia
l dis
rupt
ions
.
Build
sce
nario
s ar
ound
the
hand
ful o
f re
sidu
al u
ncer
tain
ties
that
typi
cally
em
erge
from
this
pro
cess
.
The
impl
icat
ions
for e
ach
unce
rtain
ty a
re e
xtra
pola
ted
into
th
e fu
ture
to p
roje
ct d
iffer
ent
outc
omes
. The
com
bina
tion
of
thes
e ou
tcom
es b
ecom
es th
e ba
sis
for s
cena
rios.
Cont
inge
ncy p
lans
mus
t als
o be
dev
elop
ed
for e
ach
stra
tegi
c al
tern
ativ
e.Or
gani
zatio
n m
ust e
ncou
rage
new
m
enta
l hab
its a
nd w
ays
of w
orki
ng.
Som
etim
es e
valu
atin
g th
e un
certa
intie
s’ re
lativ
e m
ater
ialit
y to
the
busi
ness
can
be
valu
able
. Kee
p in
min
d th
at th
ere
are
diffe
rent
le
vels
of u
ncer
tain
ty.
The
goal
is to
per
ceiv
e al
tern
ativ
e fu
ture
s an
d in
spire
us
to a
ct in
re
spon
se to
them
.
Top
man
ager
s sh
ould
free
ly ac
know
ledg
e th
eir s
usce
ptib
ility
to
bias
and
cre
ate
an o
pen
envi
ronm
ent t
hat w
elco
mes
dis
sent
.
WHA
T TO
AVO
IDW
HAT
TO A
VOID
WHA
T TO
AVO
IDW
HAT
TO A
VOID
WHA
T TO
AVO
IDRe
lying
on
read
ily a
cces
sibl
e in
form
atio
n or
eva
luat
ing
trend
s on
ly wi
thin
the
sam
e ge
ogra
phy o
r in
dust
ry c
onte
xt
Focu
sing
on
num
eric
al p
reci
sion
ear
ly in
the
proc
ess
Outs
ourc
ing
or d
eleg
atin
g th
e cr
eatio
n of
sce
nario
s to
juni
or
team
mem
bers
Plan
ning
for a
sce
nario
dee
med
mos
t lik
ely,
to th
e ex
clus
ion
of a
ll ot
hers
Usin
g sc
enar
io p
lann
ing
as a
one
-off
exer
cise
or i
gnor
ing
soci
al d
ynam
ics
such
as
grou
p th
ink
Atte
mpt
s to
qua
ntify
wha
t is
intri
nsic
ally
unce
rtain
ofte
n le
ad to
ov
er-s
crut
iny a
nd a
nalys
is p
aral
ysis
. Lo
w pr
obab
ility
eve
nts
can
be e
asily
di
smis
sed
as o
utlie
rs o
r ov
erem
phas
ized
crea
ting
a fa
lse
sens
e of
pre
cisi
on.
Man
y ini
tiativ
es fa
il be
caus
e un
certa
inty
and
th
e ch
ance
of f
ailu
re a
re u
nder
estim
ated
. M
any o
rgan
izatio
ns re
info
rce
this
kin
d of
be
havi
or b
y rew
ardi
ng m
anag
ers
who
spea
k co
nfide
ntly
abou
t the
ir pl
ans
mor
e ge
nero
usly
than
man
ager
s wh
o po
int o
ut
that
thin
gs c
an g
o wr
ong.
With
out i
nstit
utio
nal s
uppo
rt, b
iase
s wi
ll be
rein
forc
ed a
nd a
mpl
ified
.
Avai
labi
lity b
ias
Prob
abili
ty n
egle
ctSt
abili
ty b
ias
Optim
ism
ove
rcon
fiden
ce b
iase
sSo
cial
bia
ses
Sour
ce:
Base
d on
Erd
man
n, D
., et
al.,
Ove
rcom
ing
Obst
acles
to E
ffect
ive S
cena
rio P
lann
ing,
June
. McK
inse
y Ins
ight
s &
Publ
icat
ions
, 201
5. W
ith p
erm
issi
on.

107Designing PerforManCe-BaseD risK ManageMent systeMs
Based on the information uncovered from this questionnaire, we can begin to categorize risks. Software risks generally include project risks, technical risks, and business risks.
Project risks can include budgetary, staffing, scheduling, customer, requirement, and resource problems. Risks are different for each project, and risks change as a project progresses. Project-specific risks could include, for example, the following: lack of staff buy-in, loss of key employees, questionable vendor availability and skills, insuf-ficient time, inadequate project budgets, funding cuts, and cost overruns.
Technical risks can include design, implementation, interface, ambiguity, technical obsolescence, and leading-edge problems. An example of this is the development of a project around a leading-edge technology that has not yet been proved.
Business risks include building a product or system that no one wants (market risk), losing the support of senior management (management risk), building a product that no longer fits into the strategic plan (strategic risk), losing budgetary support (budget risks), and building a product that the sales staff does not know how to sell.
Risks can also be categorized as known, predictable, or unpredictable risks. Known risks are those that can be uncovered on careful review of the project plan and the environment in which the project is being developed (e.g., lack of development tools, unrealistic delivery date, or lack of knowledge in the problem domain). Predictable risks can be extrapolated from past experience. For example, your past experience with the end users has not been good so it is reasonable to assume that the current project will suffer from the same problem. Unpredictable risks are hard, if not impossible, to identify in advance. For example, no one could have predicted the events of September 11, but this one event affected computers worldwide.
Once risks have been identified, most managers project these risks in two dimen-sions: likelihood and consequences. As shown in Table 7.2, a risk table is a simple tool for risk projection. First, based on the risk item checklist, list all risks in the first col-umn of the table. Then, in the following columns, fill in each risk’s category, probability
Table 7.2 A Typical Risk Table
RISKS CATEGORY PROBABILITY (%) IMPACT
Risk 1 PS 70 2Risk 2 CU 60 3Impact values: 1: Catastrophic 2: Critical 3: Marginal 4: NegligibleCategory abbreviations: BU: business impact risk CU: customer characteristics risk PS: process definition risk ST: staff size and experience risk TE: technology risk

108 Managing it PerforManCe to Create Business Value
of occurrence, and assessed impact. Afterward, sort the table by probability and then by impact, study it, and define a cutoff line (i.e., the line demarking the threshold of acceptable risk).
Table 7.3 describes the generic criteria used for assessing the likelihood that a risk will occur. All risks above the designated cutoff line must be managed and discussed. Factors influencing their probability and impact should be specified.
A risk mitigation, monitoring, and management plan (RMMM) is a tool to help avoid risks. The causes of the risks must be identified and mitigated. Risk monitoring activities take place as the project proceeds and should be planned early. Table 7.4 describes typical criteria that can be used for determining the con-sequences of each risk.
Sample Risk Plan
An excerpt of a typical RMMM follows:
1.1 Scope and intent of RMMM activities
This project will be uploaded to a server and this server will be exposed to the outside world, so we need to develop security protection. We will need to configure a firewall and restrict access to only “authorized users” through the linked faculty database. We will have to know how to deal with load balance if the amount of visits to the site is very large at one time.
We will need to know how to maintain the database in order to make it more efficient, what type of database we should use, who should have the responsibility to maintain it, and who should be the administrator. Proper training of the aforementioned personnel is very important so that the database and the system contain accurate information.
1.2 Risk management organizational role
The software project manager must maintain track of the efforts and schedules of the team. They must anticipate any “unwelcome” events that may occur during the develop-ment or maintenance stages and establish plans to avoid these events or minimize their consequences.
Table 7.3 Criteria for Determining Likelihood of Occurrence
LIKELIHOOD: WHAT IS THE PROBABILITY THAT THE SITUATION OR CIRCUMSTANCE WILL HAPPEN?
5 (very high) Very likely to occur. The project’s process cannot prevent this event, no alternate approaches or processes are available. Requires immediate management attention.
4 (high) Highly likely to occur. The project’s process cannot prevent this event, but a different approach or process might. Requires management’s attention.
3 (moderate) Likely to occur. The project’s process may prevent this event, but additional actions will be required.2 (low) Not likely to occur. The project’s process is usually sufficient to prevent this type of event.1 (very low) Very unlikely. The project’s process is sufficient to prevent this event.

109Designing PerforManCe-BaseD risK ManageMent systeMs
Tabl
e 7.
4 Cr
iteria
for D
eter
min
ing
Cons
eque
nces
1 (V
ERY
LOW
)2
(LOW
)3
(MOD
ERAT
E)4
(HIG
H)5
(VER
Y HI
GH)
Tech
nica
lM
inim
al o
r no
impa
ct to
mis
sion
or
tech
nica
l suc
cess
/exit
cr
iteria
or m
argi
ns. S
ame
appr
oach
reta
ined
.
Min
or im
pact
to m
issi
on o
r te
chni
cal s
ucce
ss/e
xit c
riter
ia,
but c
an h
andl
e wi
thin
es
tabl
ishe
d m
argi
ns. S
ame
appr
oach
reta
ined
.
Mod
erat
e im
pact
to m
issi
on o
r te
chni
cal s
ucce
ss/e
xit c
riter
ia,
but c
an h
andl
e wi
thin
es
tabl
ishe
d m
argi
ns.
Wor
karo
unds
ava
ilabl
e.
Maj
or im
pact
to m
issi
on o
r te
chni
cal s
ucce
ss c
riter
ia, b
ut
still
mee
t min
imum
mis
sion
su
cces
s/ex
it cr
iteria
, thr
eate
ns
esta
blis
hed
mar
gins
. W
orka
roun
ds a
vaila
ble.
Maj
or im
pact
to m
issi
on o
r te
chni
cal s
ucce
ss c
riter
ia,
cann
ot m
eet m
inim
um m
issi
on
or te
chni
cal s
ucce
ss/e
xit
crite
ria. N
o al
tern
ativ
es e
xist.
Sche
dule
Min
imal
or n
o sc
hedu
le im
pact
, bu
t can
han
dle
with
in
sche
dule
rese
rve;
no
impa
ct to
cr
itica
l pat
h.
Min
or s
ched
ule
impa
ct, b
ut c
an
hand
le w
ithin
sch
edul
e re
serv
e; n
o im
pact
to c
ritic
al
path
.
Impa
ct to
crit
ical
pat
h, b
ut c
an
hand
le w
ithin
sch
edul
e re
serv
e, n
o im
pact
to
mile
ston
es.
Sign
ifica
nt im
pact
to c
ritic
al
path
, and
can
not m
eet
esta
blis
hed
lowe
r-lev
el
mile
ston
e.
Maj
or im
pact
to c
ritic
al p
ath
and
cann
ot m
eet m
ajor
mile
ston
e.
Cost
Min
imal
or n
o co
st im
pact
or
incr
ease
ove
r tha
t allo
cate
d,
and
can
be h
andl
ed w
ithin
av
aila
ble
rese
rves
.
Min
or c
ost i
mpa
ct, b
ut c
an b
e ha
ndle
d wi
thin
ava
ilabl
e re
serv
es.
Caus
es c
ost i
mpa
ct a
nd u
se o
f al
loca
ted
rese
rves
. Ca
uses
cos
t im
pact
, may
ex
ceed
allo
cate
d re
serv
es, a
nd
may
requ
ire re
sour
ces
from
an
othe
r sou
rce.
Caus
es m
ajor
cos
t im
pact
and
re
quire
add
ition
al b
udge
t re
sour
ces
from
ano
ther
sou
rce.
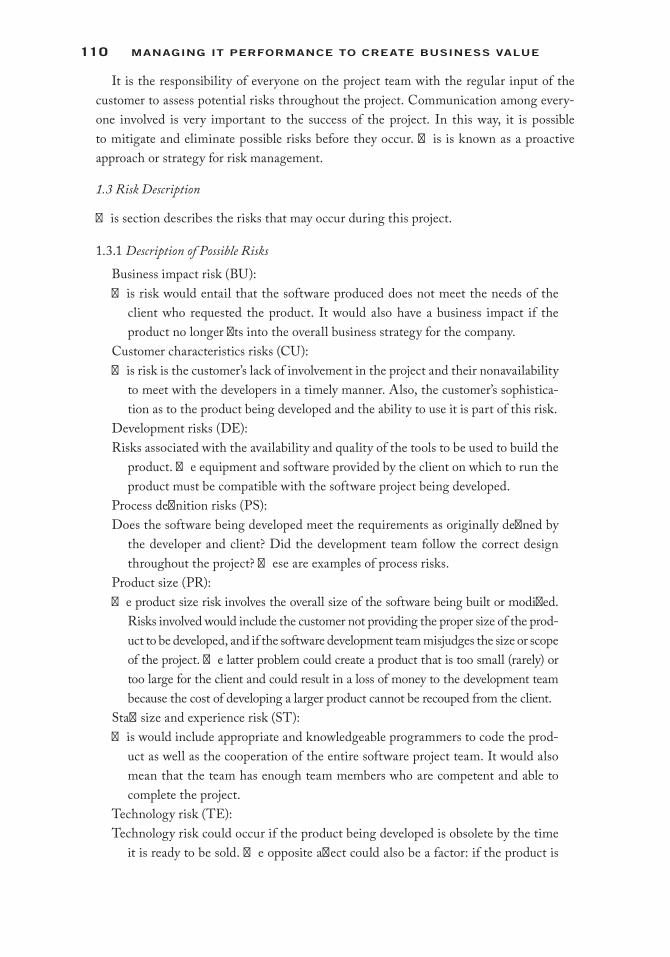
110 Managing it PerforManCe to Create Business Value
It is the responsibility of everyone on the project team with the regular input of the customer to assess potential risks throughout the project. Communication among every-one involved is very important to the success of the project. In this way, it is possible to mitigate and eliminate possible risks before they occur. This is known as a proactive approach or strategy for risk management.
1.3 Risk Description
This section describes the risks that may occur during this project.
1.3.1 Description of Possible Risks
Business impact risk (BU): This risk would entail that the software produced does not meet the needs of the
client who requested the product. It would also have a business impact if the product no longer fits into the overall business strategy for the company.
Customer characteristics risks (CU): This risk is the customer’s lack of involvement in the project and their nonavailability
to meet with the developers in a timely manner. Also, the customer’s sophistica-tion as to the product being developed and the ability to use it is part of this risk.
Development risks (DE): Risks associated with the availability and quality of the tools to be used to build the
product. The equipment and software provided by the client on which to run the product must be compatible with the software project being developed.
Process definition risks (PS): Does the software being developed meet the requirements as originally defined by
the developer and client? Did the development team follow the correct design throughout the project? These are examples of process risks.
Product size (PR): The product size risk involves the overall size of the software being built or modified.
Risks involved would include the customer not providing the proper size of the prod-uct to be developed, and if the software development team misjudges the size or scope of the project. The latter problem could create a product that is too small (rarely) or too large for the client and could result in a loss of money to the development team because the cost of developing a larger product cannot be recouped from the client.
Staff size and experience risk (ST):This would include appropriate and knowledgeable programmers to code the prod-
uct as well as the cooperation of the entire software project team. It would also mean that the team has enough team members who are competent and able to complete the project.
Technology risk (TE): Technology risk could occur if the product being developed is obsolete by the time
it is ready to be sold. The opposite affect could also be a factor: if the product is

111Designing PerforManCe-BaseD risK ManageMent systeMs
so “new” that the end users would have problems using the system and resisting the changes made. A “new” technological product could also be so new that there may be problems using it. It would also include the complexity of the design of the system being developed.
1.4 Risk Table
The risk table provides a simple technique to view and analyze the risks associated with the project. The risks were listed and then categorized using the description of risks listed in section 1.3.1. The probability of each risk was then estimated and its impact on the development process was assessed. A key to the impact values and categories appear at the end of the table.
Probability and impact for Risk
RISKS CATEGORY PROBABILITY (%) IMPACT
Customer will change or modify requirements PS 70 2Lack of sophistication of end users CU 60 3Users will not attend training CU 50 2Delivery deadline will be tightened BU 50 2End users resist system BU 40 3Server may not be able to handle larger number of users simultaneously PS 30 1Technology will not meet expectations TE 30 1Larger number of users than planned PS 30 3Lack of training of end users CU 30 3Inexperienced project team ST 20 2System (security and firewall) will be hacked BU 15 2
Impact values:1: Catastrophic2: Critical3: Marginal4: Negligible
Category abbreviations:BU: business impact riskCU: customer characteristics riskPS: process definition riskST: staff size and experience riskTE: technology risk
RMMM Strategy
Each risk or group of risks should have a corresponding strategy associated with it. The RMMM strategy discusses how risks will be monitored and dealt with. Risk plans

112 Managing it PerforManCe to Create Business Value
(i.e., contingency plans) are usually created in tandem with end users and managers. An excerpt of an RMMM strategy follows:
Project Risk RMMM Strategy
The area of design and development that contributes the largest percentage to the overall project cost is the database subsystem. Our estimate for this portion does provide a small degree of buffer for unexpected difficulties (as do all estimates). This effort will be closely monitored, and coordinated with the customer to ensure that any impact, either posi-tive or negative, is quickly identified. Schedules and personnel resources will be adjusted accordingly to minimize the effect, or maximize the advantage as appropriate.
Schedule and milestone progress will be monitored as part of the routine project management with appropriate emphasis on meeting target dates. Adjustments to par-allel efforts will be made as appropriate should the need arise. Personnel turnover will be managed through use of internal personnel matrix capacity. Our organization has a large software engineering base with sufficient numbers to support our potential demand.
Technical Risk RMMM Strategy
We are planning for two senior software engineers to be assigned to this project, both of whom have significant experience in designing and developing web-based applications. The project progress will be monitored as part of the routine project management with appropriate emphasis on meeting target dates, and adjusted as appropriate.
Prior to implementing any core operating software upgrades, full parallel testing will be conducted to ensure compatibility with the system as developed. The application will be developed using only public application programming interfaces (APIs), and no ‘hidden’ hooks. While this does not guarantee compatibility, it should minimize any potential conflicts. Any problems identified will be quantified using cost–benefit and trade-off analysis; then coordinated with the customer prior to implementation.
The database subsystem is expected to be the most complex portion of the appli-cation, however it is still a relatively routine implementation. Efforts to minimize potential problems include the abstraction of the interface from the implementation of the database code to allow changing the underlying database with minimal impact. Additionally, only industry-standard SQL calls will be used, avoiding all proprietary extensions available.
Business Risk RMMM Strategy
The first business risk, lower than expected success, is beyond the control of the develop-ment team. Our only potential impact is to use the current state-of-the-art tools to ensure that performance, in particular database access, meets user expectations; and graphics are designed using industry-standard look-and-feel styles.
Likewise, the second business risk, loss of senior management support, is really beyond the direct control of the development team. However, to help manage this risk, we will

113Designing PerforManCe-BaseD risK ManageMent systeMs
strive to impart a positive attitude during meetings with the customer, as well as present very professional work products throughout the development period.
Table 7.5 is an example of a risk information sheet.
Risk Avoidance
Risk avoidance can be accomplished by evaluating the critical success factors (CSF) of a business or business line. Managers are intimately aware of their missions and goals, but they do not necessarily define the processes they require to achieve these goals. In other words, “how are you going to get there?” In these instances, technologists must depart from their traditional venue of top-down methodologies and employ a bottom-up approach. They must work with the business units to discover the goal and work their way up through the policies, procedures, and technologies that will be necessary to arrive at that particular goal. For example, the goal of a fictitious business line is to be able to cut down the production/distribution cycle by a factor of 10, providing a customized product at no greater cost than that of the generic product in the past. To achieve this goal, the technology group needs to get the business managers to walk through the critical processes that need to be invented or changed. It is only at this point that any technology solutions are introduced.
Table 7.5 A Sample Risk Information Sheet
RISK INFORMATION SHEET
Risk id: PO2-4-32Date: March 4, 2017Probability: 80%Impact: HighDESCRIPTION:Over 70% of the software components scheduled for reuse will be integrated into the application. The remaining functionality will have to be custom developed.
REFINEMENT/CONTEXT: 1. Certain reusable components were developed by a third party with no knowledge of internal design standards 2. Certain reusable components have been implemented in a language that is not supported on the target
environment
MITIGATION/MONITORING: 1. Contact third party to determine conformance to design standards 2. Check to see if language support can be acquired
MANAGEMENT/CONTINGENCY PLAN/TRIGGER:Develop a revised schedule assuming that 18 additional components will have to be builtTrigger: Mitigation steps unproductive as of March 30, 2017
CURRENT STATUS:In processOriginator: Jane Manager

114 Managing it PerforManCe to Create Business Value
One technique, called process quality management or PQM, uses the CSF concept. IBM originated this approach, which combines an array of methodolo-gies to solve a persistent problem: how do you get a group to agree on goals and ultimately deliver a complex project efficiently, productively, and with a minimum of risk?
PQM is initiated by gathering, preferably off-site, a team of essential staff. The team’s components should represent all facets of the project. Obviously, all teams have leaders and PQM teams are no different. The team leader chosen must have a skill mix closely attuned to the projected outcome of the project. For example, in a PQM team where the assigned goal is to improve plan productivity, the best team leader just might be an expert in process control, albeit the eventual solution might be in the form of enhanced automation.
Assembled at an off-site location, the first task of the team is to develop, in writ-ten form, specifically what the team’s mission is. With such open-ended goals as, “determine the best method of employing technology for competitive advantage,” the determination of the actual mission statement is an arduous task—best tackled by segmenting this rather vague goal into more concrete subgoals.
In a quick brainstorming session, the team lists the factors that might inhibit the mission from being accomplished. This serves to develop a series of one-word descrip-tions. Given the 10-min time frame, the goal is to get as many of these inhibitors as possible without discussion and without criticism.
It is at this point that the team turns to identifying the CSF, which are the specific tasks that the team must perform to accomplish its mission. It is vitally important that the entire team reaches a consensus on the CSFs.
The next step in the PQM process is to make a list of all tasks necessary to accomplish the CSF. The description of each of these tasks, called business processes, should be declarative. Start each with an action word such as study, measure, reduce, negotiate, eliminate.
Table 7.6 and Figure 7.2 show the resulting project chart and priority graph, respectively, that illustrate this PQM technique. The team’s mission, in this example, is to introduce just-in-time (JIT) inventory control, a manufacturing technique that fosters greater efficiency by promoting stocking inventory only to the level of need. The team, in this example, identified six CSFs and 11 business processes labeled P1 through P11.
The project chart is filled out by first ranking the business process by importance to the project’s success. This is done by comparing each business process to the set of CSFs. A check is made under each CSF that relates significantly to the business process. This procedure is followed until each of the business processes have been analyzed in the same way.
The final column of the project chart permits the team to rank each business process relative to current performance, using a scale of A = excellent, to D = bad, and E = not currently performed.

115Designing PerforManCe-BaseD risK ManageMent systeMs
The priority graph, when completed, will steer the mission to a successful and prioritized conclusion. The two axes to this graph are quality, using the A through E grading scale, and priority, represented by the number of checks noting each busi-ness process received. These can be easily lifted from the project chart for the quality and count columns, respectively.
The final task as a team is to decide how to divide the priority graph into different zones representing first priority, second priority, and so on. In this example, the team has chosen as a first priority all business processes, such as “negotiate with suppliers” and “reduce number of parts,” which are ranked from a quality of fair degrading to a quality of not currently performed and having a ranking of three or greater. Most groups employing this technique will assign priorities in a similar manner.
Determining the right project to pursue is one factor in the push for competitive technology. It is equally as important to be able to “do the project right,” which can greatly reduce risk.
Table 7.6 CSF Project Chart
CRITICAL SUCCESS FACTORS
# BUSINESS PROCESS 1 2 3 4 5 6 COUNT QUALITYP1 Measure delivery performance by suppliers x x 2 BP2 Recognize/reward workers x x 2 DP3 Negotiate with suppliers x x x 3 BP4 Reduce number of parts x x x x 4 DP5 Train supervisors x x 2 CP6 Redesign production line x x x 3 AP7 Move parts inventory x 1 EP8 Eliminate excessive inventory buildups x x 2 CP9 Select suppliers x x 2 BP10 Measure x x x 3 EP11 Eliminate defective parts x x x 3 D
E
5
4
3
2
1 P7
D
P4
P10, 11
P2 P5,8P3
P1,9
P6
First priority
Second priority
�ird priority
C B A
Figure 7.2 CSF priority graph.

116 Managing it PerforManCe to Create Business Value
Quantitative Risk Analysis
Many methods and tools are available for quantitatively combining and assessing risks. The selected method will involve a trade-off between the sophistication of the analysis and its ease of use. There are at least five criteria to help select a suitable quan-titative risk technique:
1. The methodology should be able to include the explicit knowledge of the project team members about the site, design, political conditions, and project approach.
2. The methodology should allow quick response to changing market factors, price levels, and contractual risk allocation.
3. The methodology should help determine project cost and schedule contingency. 4. The methodology should help foster clear communication among the project
team members and between the team and higher management about project uncertainties and their impacts.
5. The methodology should be easy to use and understand.
Three basic risk analyses can be conducted during a project risk analysis: technical performance risk analysis (will the project work?), schedule risk analysis (when will the project be completed?), and cost risk analysis (what will the project cost?). Technical performance risk analysis can provide important insights into technology-driven cost and schedule growth for projects that incorporate new and unproven technol-ogy. Reliability analysis, failure modes and effects analysis (FMEA), and fault tree analysis are just a few of the technical performance analysis methods commonly used. However, for the purposes of brevity, this discussion of quantitative risk analysis will concentrate on cost and schedule risk analysis only.
At a computational level there are two considerations about quantitative risk analy-sis methods. First, for a given method, what input data are required to perform the risk analysis? Second, what kinds of data, outputs, and insights does the method pro-vide to the user?
The most stringent methods are those that require as inputs probability distribu-tions for the various performance, schedule, and costs risks. Risk variables are differ-entiated based on whether they can take on any value in a range (continuous variables) or whether they can assume only certain distinct values (discrete variables). Whether a risk variable is discrete or continuous, two other considerations are important in defin-ing an input probability: its central tendency and its range or dispersion. An input variable’s mean and mode are alternative measures of central tendency; the mode is the most likely value across the variable’s range. The mean is the value when the vari-able has a 50% chance of taking a value that is greater and a 50% chance of taking a value that is lower.
The other key consideration when defining an input variable is its range or disper-sion. The common measure of dispersion is the standard deviation, which is a measure

117Designing PerforManCe-BaseD risK ManageMent systeMs
of the breadth of values possible for the variable. Normally, the larger the standard deviation, the greater the relative risk. Finally, its shape or the type of distribution may distinguish a probability variable. Distribution shapes that are commonly continuous distributions used in project risk analysis are the normal distribution, the lognormal distribution, and the triangular distribution.
All four distributions have a single high point (the mode) and a mean value that may or may not equal the mode. Some of the distributions are symmetrical about the mean while others are not. Selecting an appropriate probability distribution is a mat-ter of which distribution is most like the distribution of actual data. In cases where insufficient data are available to completely define a probability distribution, one must rely on a subjective assessment of the needed input variables.
The type of outputs a technique produces is an important consideration when selecting a risk analysis method. Generally speaking, techniques that require greater rigor, demand stricter assumptions, or need more input data generally produce results that contain more information and are more helpful. Results from risk analyses may be divided into three groups according to their primary output:
1. Single parameter output measures 2. Multiple parameter output measures 3. Complete distribution output measures
The type of output required for an analysis is a function of the objectives of the analysis. If, for example, a project manager needs approximate measures of risk to help in project selection studies, simple mean values (a single parameter) or a mean and a variance (multiple parameters) may be sufficient. On the other hand, if a project manager wishes to use the output of the analysis to aid in assigning contingency to a project, knowledge about the precise shape of the tails of the output distribution or the cumulative distribution is needed (complete distribution measures). Finally, when identification and subsequent management of the key risk drivers are the goals of the analysis, a technique that helps with such sensitivity analyses is an important selection criterion.
Sensitivity analysis is a primary modeling tool that can be used to assist in valuing individual risks, which is extremely valuable in risk management and risk allocation support. A “tornado diagram” is a useful graphical tool for depicting risk sensitivity or influence on the overall variability of the risk model. Tornado diagrams graphically show the correlation between variations in model inputs and the distribution of the outcomes; in other words, they highlight the greatest contributors to the overall risk. Figure 7.3 shows a tornado diagram for a sample project. The length of the bars on the tornado diagram corresponds to the influence of the items on the overall risk.
The selection of a risk analysis method requires an analysis of what input risk mea-sures are available and what types of risk output measures are desired. These methods range from simple, empirical methods to computationally complex, statistically based methods.

118 Managing it PerforManCe to Create Business Value
Traditional methods for risk analysis are empirically developed procedures that concentrate primarily on developing cost contingencies for projects. The method assigns a risk factor to various project elements based on historical knowledge of the relative risk of various project elements. For example, documentation costs may exhibit a low degree of cost risk, whereas labor costs may display a high degree of cost risk. Project contingency is determined by multiplying the estimated cost of each element by its respective risk factors. This method profits from its simplicity and does produce an estimate of cost contingency. However, the project team’s knowledge of risk is only implicitly incorporated in the various risk factors. Because of the historical or empiri-cal nature of the risk assessments, traditional methods do not promote communica-tion of the risk consequences of the specific project risks. Likewise, this technique does not support the identification of specific project risk drivers. These methods are not well adapted to evaluating project schedule risk.
Analytical methods, sometimes called second-moment methods, rely on the calculus of probability to determine the mean and standard deviation of the output (i.e., project cost). These methods use formulas that relate the mean value of individual input variables to the mean value of the variables’ output. Likewise, there are formulas that relate the variance (standard deviation squared) to the variance of the variables’ output. These methods are most appropriate when the output is a simple sum or prod-uct of the various input values. The following formulas show how to calculate the mean and variance of a simple sum.
For sums of risky variables, Y = x1 + x2; the mean value is E(Y) = [E(x1) + E(x2)] and the variance is sigma sub Y squared = sigma sub x1 squared + sigma sub x2 squared.
For products of risky variables, Y = x1 * x2; the mean value is E(Y) = [E(x1) * E(x2)] and the variance is sigma sub Y squared = (E(x1) squared * sigma sub x2 squared) + (E(x2) squared * sigma sub x1 squared) + ( sigma sub x1 squared * sigma sub x2 squared).
Analytical methods are relatively simple to understand. They require only an estimate of the individual variable’s mean and standard deviation. They do not require precise knowledge of the shape of a variable’s distribution. They allow specific
Software prices
Labor cost
Hardware costs
Factors with thegreatest impact
on total costvariation
Figure 7.3 A tornado diagram.

119Designing PerforManCe-BaseD risK ManageMent systeMs
knowledge of risk to be incorporated into the standard deviation values. They provide for a practical estimate of cost contingency. Analytical methods are not particularly useful for communicating risks; they are difficult to apply and are rarely appropriate for scheduled risk analysis.
Simulation models, also called Monte Carlo methods, are computerized probabi-listic calculations that use random number generators to draw samples from prob-ability distributions. The objective of the simulation is to find the effect of multiple uncertainties on a value quantity of interest (such as the total project cost or project duration). Monte Carlo methods have many advantages. They can determine risk effects for cost and schedule models that are too complex for common analytical methods. They can explicitly incorporate the risk knowledge of the project team for both cost and schedule risk events. They have the ability to reveal, through sensitivity analysis, the impact of specific risk events on the project cost and schedule.
However, Monte Carlo methods require knowledge and training for their success-ful implementation. Input to Monte Carlo methods also requires the user to know and specify exact probability distribution information, mean, standard deviation, and dis-tribution shape. Nonetheless, Monte Carlo methods are the most common for project risk analysis because they provide detailed, illustrative information about risk impacts on the project cost and schedule.
Monte Carlo analysis histogram information is useful for understanding the mean and standard deviation of analysis results. The cumulative chart is useful for determin-ing project budgets and contingency values at specific levels of certainty or confidence. In addition to graphically conveying information, Monte Carlo methods produce numerical values for common statistical parameters, such as the mean, standard devia-tion, distribution range, and skewness.
Probability trees are simple diagrams showing the effect of a sequence of multiple events. Probability trees can also be used to evaluate specific courses of action (i.e., deci-sions), in which case they are known as decision trees. Probability trees are especially useful for modeling the interrelationships between related variables by explicitly modeling conditional probability conditions among project variables. Historically, probability trees have been used in reliability studies and technical performance risk assessments. However, they can be adapted to cost and schedule risk analysis quite easily. Probability trees have rigorous requirements for input data. They are powerful methods that allow the examination of both data and model risks. Their implementa-tion requires a significant amount of expertise; therefore, they are used only on the most difficult and complex projects.
Risk Checklists
Table 7.7, Framework for a Project Plan, sets forth the key aspects of project imple-mentation that need to be addressed and the important issues that need to be consid-ered for each aspect. To help managers consider the wide variety of risks any project

120 Managing it PerforManCe to Create Business Value
could face, Table 7.8, Examples of Common Project-Level Risks, sets forth examples of major areas in which risks can occur and examples of key risks that could arise in each area.
Monitoring will be most effective when managers consult with a wide range of team members and, to the maximum extent possible, use systematic, quantitative data on both implementation progress and project objectives. Table 7.9, Ongoing Risk Management Monitoring for Projects, provides a useful framework for ongoing risk management mon-itoring of individual projects. Table 7.10, To Ensure Risks Are Adequately Addressed in Project Plan, is useful for ensuring that risks are discussed in detail.
IT Risk Assessment Frameworks
A variety of IT risk assessment frameworks have been developed to deal with the increasingly difficult business of mitigating security problems. It is useful to review these frameworks as the process of identifying, assessing, and mitigating security risks is quite similar to identifying, assessing, and mitigating general project-related IT risks.
Table 7.7 Framework for Project Plan
PROJECT
RESPONSIBLE MANAGERMission Articulate clearly the mission or goal/vision for the project.Objectives Ensure that the project is feasible and will achieve the project mission. Clearly
define what you hope to achieve by executing the project and make sure project objectives are clear and measurable.
Scope Ensure that an adequate scope statement is prepared that documents all the work of the project.
Deliverables Ensure that all deliverables are clearly defined and measurable.Milestones/costs Ensure that realistic milestones are established and costs are properly supported.Compliance Ensure that the project meets legislative requirements and that all relevant laws
and regulations have been reviewed and considered.Stakeholders Identify team members, project sponsor, and other stakeholders. Encourage senior
management support and buy-in from all stakeholders.Roles and responsibilities Clarify and document roles and responsibilities of the project manager and other
team members.Work breakdown structure (WBS) Make sure that a WBS has been developed and that key project steps and
responsibilities are specified for management and staff.Assumptions Articulate clearly any important assumptions about the project.Communications Establish main channels of communications and plan for ways of dealing with
problems.Risks Identify high-level risks and project constraints and prepare a risk management
strategy to deal with them.Documentation Ensure that project documentation will be kept and is up to date.Boundaries Document specific items that are NOT within the scope of the project and any
outside constraints to achieving goals and objectives.Decision-making process Ensure that the decision-making process or processes for the project are
documented.Signatures Key staff signature sign off.

121Designing PerforManCe-BaseD risK ManageMent systeMs
Table 7.8 Examples of Common Project-Level Risks
CATEGORY RISK
Scope Unrealistic or incomplete scope definitionScope statement not agreed to by all stakeholders
Schedule Unrealistic or incomplete schedule developmentUnrealistic or incomplete activity estimates
Project management Inadequate skills and ability of the project managerInadequate skills and ability of business users or subject-matter expertsInadequate skills and ability of vendorsPoor project management processesLack of or poorly designed change management processesLack of or poorly designed risk management processesInadequate tracking of goals/objectives throughout the implementation process
Legal Lack of legal authority to implement projectFailure to comply with all applicable laws and regulations
Personnel Loss of key employeesLow availability of qualified personnelInadequate skills and training
Financial Inadequate project budgetsCost overrunsFunding cutsUnrealistic or inaccurate cost estimates
Organizational/business Lack of stakeholder consensusChanges in key stakeholdersLack of involvement by project sponsorLoss of project sponsor during projectChanges in office leadershipOrganizational structure
Business Poor timing of product releasesUnavailability of resources and materialsPoor public image
External Congressional input or interestChanges in related systems, programs, etc.Labor strikes or work stoppages Seasonal or cyclical eventsLack of vendor and supply availabilityFinancial instability of vendors and suppliersContractor or grantee mismanagement
Internal Unavailability of business or technical expertsTechnical Complex technology
New or unproven technology Unavailability of technology
Performance Unrealistic performance goalsImmeasurable performance standards
Cultural Resistance to change Cultural barriers or diversity issues
Quality Unrealistic quality objectives Quality standards unmet
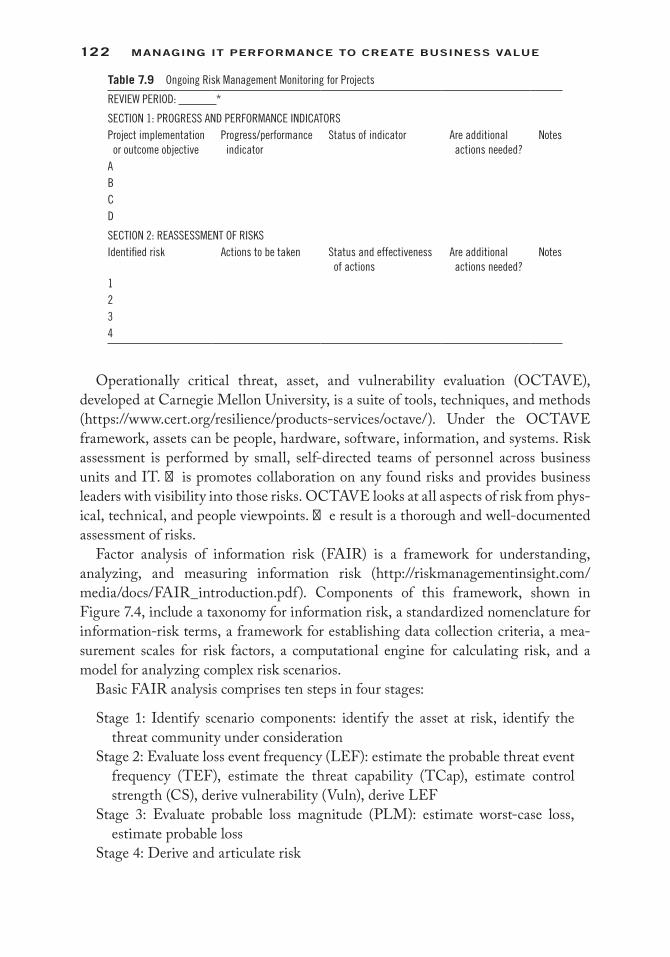
122 Managing it PerforManCe to Create Business Value
Operationally critical threat, asset, and vulnerability evaluation (OCTAVE), developed at Carnegie Mellon University, is a suite of tools, techniques, and methods (https://www.cert.org/resilience/products-services/octave/). Under the OCTAVE framework, assets can be people, hardware, software, information, and systems. Risk assessment is performed by small, self-directed teams of personnel across business units and IT. This promotes collaboration on any found risks and provides business leaders with visibility into those risks. OCTAVE looks at all aspects of risk from phys-ical, technical, and people viewpoints. The result is a thorough and well-documented assessment of risks.
Factor analysis of information risk (FAIR) is a framework for understanding, analyzing, and measuring information risk (http://riskmanagementinsight.com/media/docs/FAIR_introduction.pdf). Components of this framework, shown in Figure 7.4, include a taxonomy for information risk, a standardized nomenclature for information-risk terms, a framework for establishing data collection criteria, a mea-surement scales for risk factors, a computational engine for calculating risk, and a model for analyzing complex risk scenarios.
Basic FAIR analysis comprises ten steps in four stages:
Stage 1: Identify scenario components: identify the asset at risk, identify the threat community under consideration
Stage 2: Evaluate loss event frequency (LEF): estimate the probable threat event frequency (TEF), estimate the threat capability (TCap), estimate control strength (CS), derive vulnerability (Vuln), derive LEF
Stage 3: Evaluate probable loss magnitude (PLM): estimate worst-case loss, estimate probable loss
Stage 4: Derive and articulate risk
Table 7.9 Ongoing Risk Management Monitoring for Projects
REVIEW PERIOD: *
SECTION 1: PROGRESS AND PERFORMANCE INDICATORSProject implementation
or outcome objectiveProgress/performance
indicatorStatus of indicator Are additional
actions needed?Notes
ABCD
SECTION 2: REASSESSMENT OF RISKSIdentified risk Actions to be taken Status and effectiveness
of actionsAre additional
actions needed?Notes
1234

123Designing PerforManCe-BaseD risK ManageMent systeMs
FAIR uses dollar estimates for losses and probability values for threats and vulnerabilities. Combined with a range of values and levels of confidence, it allows for true mathematical modeling of loss exposures (e.g., very high [VH] equates to the top 2% when compared against the overall threat population.)
Risk Process Measurement
The process of risk identification, analysis, and mitigation should be measured. Toward this end, this final section will list a variety of risk-related metrics. Any of the checklists in the prior sections can actually be converted into performance metrics—for example, from Table 7.7, “ensure that all deliverables are clearly defined and
Table 7.10 To Ensure Risks Are Adequately Addressed in Project Plan
RISK MANAGEMENT ACTIONPROJECT DESIGN
PROJECT IMPLEMENTATION COMMENTS
YES NO YES NO
In developing the project plan, were stakeholders and experts outside the responsible project office consulted about their needs?
Does the project plan address both internal and external hazards that could impede implementation or performance (see Checklist 7.8)?• Have all relevant laws and regulations been considered?• Have all safety/security concerns been considered (patient safety,
animal safety, data and property security, etc.)?Has a strategy been implemented to prevent or mitigate all identified risks?
Is reliable, up-to-date data available to allow tracking of project implementation and performance so that problems can be identified early? • If not, has an expectation been set that this will be done?
Are expectations clear and reasonable for the project and for each team member (what, when, and how) and consistent with available resources?
Are mechanisms in place to ensure effective communication with responsible officials—both within the team and with other stakeholders as necessary?
If problems occur, can decisions be made quickly? Does the project have clear goals and objectives that are being continually tracked to ensure they are being achieved?
Is there a clear statement of how the new process/system will be an improvement over the current process/system?
Is there clear and accurate baseline data for comparing the new process with the old process?
Is there a lessons-learned component so we will be able to use and share the good and bad lessons from the project?

124 Managing it PerforManCe to Create Business Value
Risk
Loss
eve
ntfr
eque
ncy
�re
at e
vent
freq
uenc
y
�re
atca
pabi
lity
Vuln
erab
ility
�re
at lo
ssfa
ctor
sA
sset
loss
fact
ors
Prim
ary
loss
fact
ors
Prob
able
loss
mag
nitu
de
Exte
rnal
loss
fact
ors
Seco
ndar
ylo
ss fa
ctor
s
Org
aniz
atio
nal
loss
fact
ors
Con
tact
Act
ion
Con
trol
stre
ngth
Figu
re 7
.4
FAIR
fram
ewor
k.

125Designing PerforManCe-BaseD risK ManageMent systeMs
measurable” can be converted to the metrics “what percentage of metrics are clearly defined?” and “what percentage of deliverables have corresponding metrics?”
Other risk-related metrics include
1. Number of systemic risks identified. 2. Percentage of process areas involved in risk assessments. 3. Percentage of key risks mitigated. 4. Percentage of key risks monitored. 5. How often the individual risk owners manage and update their risk information. 6. Timeliness metrics for mitigation plans. 7. How long risks are worked in the system before closure. 8. Metrics for type and quantity of open risks in the system broken down by
organization. 9. Time it takes from input to be elevated to the appropriate decision-maker. 10. Conformity to standard risk-statement format and size; clarity. 11. Top N risks compared with original input. 12. Percentage of risks that are correlated. 13. Percentage of business strategy objectives mapped to enterprise risk manage-
ment strategy. 14. Percentage of business value drivers mapped to risk management value drivers. 15. Number of times audit committee reviews risk management strategy. 16. Number of times board discusses risk management strategy in board meetings. 17. Number of times board reviews risk appetite of the organization. 18. Number of times CEO invites risk management teams to participate in
business strategy formation and proactively identify business risks. 19. Number of times business strategy implementation failed due to improper risk
mitigation. Compare this with the number of times timely intervention of risk managers resulted in faster implementation.
20. Number of times improper risk mitigation delayed business strategy imple-mentation. Judge this against the number of times timely intervention of risk managers resulted in faster implementation.
21. Number of times the organization received negative media coverage due to improper risk mitigation. Evaluate against the number of times timely risk mitigation strategy prevented a media disaster.
22. Number of times the organization faced legal problems due to improper risk mitigation with the number of times risk departments prevented legal problems.
23. Number of times the actual risk level of the organization exceeded the risk appetite of the organization. Analyze this against the number of times risk departments controlled risks from exceeding risk appetite of the organization.
24. Amount of financial losses incurred due to ineffective risk management. Balance this with the amount of financial losses prevented due to effective risk management.

126 Managing it PerforManCe to Create Business Value
In Conclusion
Risk is inherent in all projects. The key to success is to identify risk and then deal with it. Doing this requires the project manager to identify as many risks as possible, categorize those risks, and then develop a contingency plan to deal with each risk. The risk process should always be measured.
ReferenceErdmann, D., Sichel, B., and Yeung, L. (2015). Overcoming obstacles to effective scenario
planning, June. McKinsey Insights & Publications. Retrieved from http://www.mckinsey.com/insights/strategy/overcoming_obstacles_to_effective_scenario_planning.

127
8Designing Process control
anD imProvement systems
A company used data analytics to identify unprofitable customers not worth keeping. Despite this, they ultimately decided to keep those customers anyway. Why? Because Wall Street analysts use customer turnover as a key metric and dropping too many customers, no matter what the benefit to the bottom line, would likely lead to a decrease in market capitalization and a lack of confidence in the company. The story illustrates two points: that metrics are sometimes misguided, and coordinating balanced goals with actions can prevent businesses from making critical errors. Ultimately, business perfor-mance management is about improving corporate performance in the right direction.
IT Utility
There are literally hundreds of business processes taking place simultaneously in an organization, each creating value in some way. The art of strategy is to identify and excel at the critical few processes that are the most important to the customer value proposition.
Both private companies and governmental agencies have outsourced some of their computer processing systems to third parties. Processes commonly outsourced include
1. Asset management 2. Help desk 3. Infrastructure maintenance 4. Systems management and administration 5. Network management 6. Integration and configuration
These outsourced information technology (IT) services have come to be known as the “IT utility.” The larger IT utilities are typically ISO 9001/9002 certified and offer large pools of IT talent and experience. However, processes must be measured, regardless of whether or not they are outsourced.
Unisys (2003), a provider of such services, recommends the following metrics:
1. Customer satisfaction 2. Standardization 3. Incident rates

128 Managing it PerforManCe to Create Business Value
4. Security audit 5. Incident prevention rates 6. Security awareness 7. Availability 8. Reliability/quality of service 9. Call volume 10. First pass yields 11. Cycle times 12. Architecture accuracy 13. IT employee satisfaction 14. Root-cause analysis 15. Change modification cycle times 16. Change modification volume by type 17. Research and development (R&D) presentation/information flow rate 18. Volume of technology pilots 19. Business opportunity generation rate 20. Strategic IT project counts
Unisys uses these metrics to establish the foundation for management review, trend analysis, and causal analysis. Management review provides insight into current perfor-mance and forms the basis for taking corrective action. Trend and root-cause analyses identify opportunities for continuous improvement.
Based on its analysis and industry experience, Unisys states that a performance-based environment is anywhere from 10% to 40% more cost-effective than a non-performance-based environment. When deciding how best to optimize the IT infrastructure, organizations need verifiable performance and trend data. While cus-tomer satisfaction is usually touted as the key metric for IT improvement, it is actually an outcome metric dependent on several lower-level activities, as shown in Figure 8.1. Understanding the relationship between these codependent performance metrics is important in effecting sustainable positive performance.
Essentially, the IT department should consider itself an IT utility for the purposes of aligning itself to the organization’s business process objectives. In this way, IT can more effectively track performance using a balanced scorecard and make appropriate performance improvements as a result.
Wright et al. (1999) did an extrapolation of Compaq’s (now Hewlett-Packard) balanced scorecard based on research and publicly available information. As a com-puter company, this case history is interesting from an IT perspective, particularly if a corporate IT department thinks of itself as an IT utility.
Compaq had a number of business process objectives:
Operations cycle: 1. Optimized distribution model 2. Just-in-time (JIT) manufacturing

129Designing ProCess Control anD iMProVeMent systeMs
3. Outsourcing 4. Build-to-order 5. Reduced cycle times 6. Order process linked to production, supplies 7. Global production optimization
Innovation cycle: 1. Under $1000 PCs 2. Products preconfigured with SAP and other business software 3. Pricing innovations 4. Design to market requirements—workstations, laptops 5. High-performance desktops
The business process perspective is linked downward to the learning and growth perspective by quality improvements, improved coordination, and integrated informa-tion. The business process perspective is linked upward to the customer and financial perspectives by lower operating costs, improved use of resources, reduced waste, new product capabilities, and better service programs.
For Compaq, the chief component of the business process perspective is its operations cycle. This encompasses sourcing parts, components, manufacturing, marketing, distributing, and after-sale services. This cycle had been the major focus of a reengineering effort—the goal of which was to bring them to a higher level of customer focus.
Compaq’s reengineering effort required them to change their business processes first and then their information systems to support the reengineered processes. The company relied heavily on enterprise-level IT, and by the late 1990s had begun
Financial
Customer
Customersatisfaction
IT/employeesatisfaction
First passyields
Cycle times
Setting customerexpectation
Infrastructurediversity
Availablebudget/value
Internal
Learning and growth
Figure 8.1 Cause and effect in the IT utility.
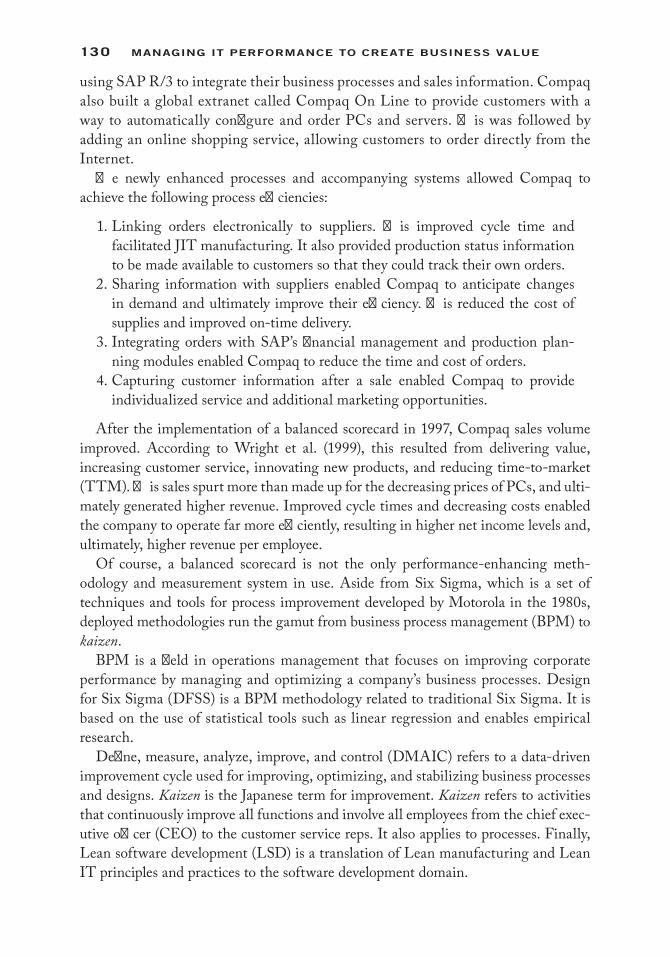
130 Managing it PerforManCe to Create Business Value
using SAP R/3 to integrate their business processes and sales information. Compaq also built a global extranet called Compaq On Line to provide customers with a way to automatically configure and order PCs and servers. This was followed by adding an online shopping service, allowing customers to order directly from the Internet.
The newly enhanced processes and accompanying systems allowed Compaq to achieve the following process efficiencies:
1. Linking orders electronically to suppliers. This improved cycle time and facilitated JIT manufacturing. It also provided production status information to be made available to customers so that they could track their own orders.
2. Sharing information with suppliers enabled Compaq to anticipate changes in demand and ultimately improve their efficiency. This reduced the cost of supplies and improved on-time delivery.
3. Integrating orders with SAP’s financial management and production plan-ning modules enabled Compaq to reduce the time and cost of orders.
4. Capturing customer information after a sale enabled Compaq to provide individualized service and additional marketing opportunities.
After the implementation of a balanced scorecard in 1997, Compaq sales volume improved. According to Wright et al. (1999), this resulted from delivering value, increasing customer service, innovating new products, and reducing time-to-market (TTM). This sales spurt more than made up for the decreasing prices of PCs, and ulti-mately generated higher revenue. Improved cycle times and decreasing costs enabled the company to operate far more efficiently, resulting in higher net income levels and, ultimately, higher revenue per employee.
Of course, a balanced scorecard is not the only performance-enhancing meth-odology and measurement system in use. Aside from Six Sigma, which is a set of techniques and tools for process improvement developed by Motorola in the 1980s, deployed methodologies run the gamut from business process management (BPM) to kaizen.
BPM is a field in operations management that focuses on improving corporate performance by managing and optimizing a company’s business processes. Design for Six Sigma (DFSS) is a BPM methodology related to traditional Six Sigma. It is based on the use of statistical tools such as linear regression and enables empirical research.
Define, measure, analyze, improve, and control (DMAIC) refers to a data-driven improvement cycle used for improving, optimizing, and stabilizing business processes and designs. Kaizen is the Japanese term for improvement. Kaizen refers to activities that continuously improve all functions and involve all employees from the chief exec-utive officer (CEO) to the customer service reps. It also applies to processes. Finally, Lean software development (LSD) is a translation of Lean manufacturing and Lean IT principles and practices to the software development domain.

131Designing ProCess Control anD iMProVeMent systeMs
Getting to Process Improvements
Process improvements can be thought of in two dimensions. There are those process improvements that are internal to the IT department and there are process improve-ments that are quite visible to end users and senior management. For the purposes of this discussion, we will refer to the former as engineering process improvements and the latter as business process improvements.
Table 8.1 defines five levels in terms of continuous improvement.
Table 8.1 Using a Continuous Improvement Framework
CAPABILITY LEVEL DEFINITION CRITICAL DISTINCTIONS
5—Optimizing A quantitatively managed process that is improved based on an understanding of the common causes of variation inherent in the process. A process that focuses on continually improving the range of process performance through both incremental and innovative improvements.
The process is continuously improved by addressing common causes of process variation.
4—Quantitatively Managed
A defined process that is controlled using statistical and other quantitative techniques. The product quality, service quality, and process performance attributes are measurable and controlled throughout the project.
Using appropriate statistical and other quantitative techniques to manage the performance of one or more critical subprocesses of a process so that future performance of the process can be predicted. Addresses special causes of variation.
3—Defined A managed process that is tailored from the organization’s set of standard processes according to the organization’s tailoring guidelines, and contributes work products, measures, and other process-improvement information to the organizational process assets.
The scope of application of the process descriptions, standards, and procedures (organizational rather than project specific). Described in more detail and performed more rigorously. Understanding interrelationships of process activities and details measures of the process, its work products, and its services.
2—Repeatable A performed process that is also planned and executed in accordance with policy; employs skilled people having adequate resources to produce controlled outputs; involves relevant stakeholders; is monitored, controlled, and reviewed; and is evaluated for adherence to its process description.
The extent to which the process is managed. The process is planned and the performance of the process is managed against the plan. Corrective actions are taken when the actual results and performance deviate significantly from the plan. The process achieves the objectives of the plan and is institutionalized for consistent performance.
1—Initial A process that accomplishes the needed work to produce identified output work products using identified input work products. The specific goals of the process area are satisfied.
All of the specific goals of the process area are satisfied.
0—Incomplete A process that is not performed or is only performed partially. One or more of the specific goals of the process area are not satisfied.
One or more of the specific goals of the process area are not satisfied.

132 Managing it PerforManCe to Create Business Value
Enhancing IT Processes
The Boston Consulting Group (Brock et al. 2015) report on large-scale IT projects paints an ugly picture. For projects over $10 million in investment, the chances of delivering on time and on budget is just one in ten. Projects fail for a myriad of rea-sons: chief among them is overly complex requirements, inexperienced teams, a lack of buy-in from influential stakeholders, insufficient attention to major risks, lack of testing, and a failure to manage the project plan effectively.
A report by the Hackett Group (2015) stresses that chief information officers (CIOs) must respond far more quickly to shifts in business demands, while decreasing expenses through greater efficiencies. They recommend that CIOs overhaul the ser-vice delivery model to better support the convergence of business and tech. The goal here is to introduce greater agility and flexibility so that IT can “turn on a dime” to support the changing needs of the business and create real strategic advantage.
Today’s fluid marketplace requires technology that can drive innovation, automa-tion, and personalization much more quickly (Desmet et al. 2015). As a result, some organizations are moving to a two-speed IT model that enables rapid development of customer-facing programs while evolving core systems designed for stability and high-quality data management more slowly.
This translates to the use of high-speed IT teams that are charged with rapidly iterating software, releasing updates in beta, fixing problems in near real time, then rereleasing. One European bank created a new team that used concurrent design tech-niques (in which multiple development tasks are completed in parallel) to create a prototype of an account registration process, while using existing technology where it could. By testing this process with real customers in a live environment, the team was able to make constant refinements until it succeeded in cutting the process down to 5 steps from the original 15. The key here is knowing what questions to ask as one goes about improving a process, as shown in Table 8.2.
New Methods
DevOps (the integration of technical development and operations) and continuous delivery (the automation of testing, deployment, and infrastructure processes) have introduced capabilities that radically increase speed to market and lower costs. An international travel company used these approaches to reduce TTM by moving to the cloud, fully automating its testing, and rolling out a one-click deployment process (Desmet et al., 2015).
The concept of continuous development is closely linked to the Lean/agile concept of kaizen-continuous improvement. For some teams, kaizen can lead to continuous delivery and continuous deployment. Intuit’s accounting software runs on a wide vari-ety of platforms, so it is obvious that Intuit’s development team has many technical challenges in maintaining the infrastructure that supports continuous development.

133Designing ProCess Control anD iMProVeMent systeMs
Intuit’s method is known as infrastructure as code, a fully automated development, test, and production infrastructure (Denman 2015). Continuous development allows development teams to test every code and commit and deliver the working code as soon as it is ready, with a minimum of manual testing. Essentially, every code gets automated unit tests, smoke tests, and so on to catch any defects.
At this time, only a few of Intuit projects have fully achieved continuous deploy-ment, where changes go into production without any manual intervention. Some projects have continuous delivery, meaning the code is pushed out to a staging envi-ronment where it is reviewed and approved before being sent into production. Other projects require manual tests by quality engineers before they can be deployed. But, the ultimate goal is complete automation and full continuous deployment, and infra-structure as code is the software that runs all that.
A push toward continuous development, which includes continuous integration; continuous testing; automated configuration management (CM) and testing; use of
Table 8.2 Process Improvement Interview Questions
HOW DOES THE PROCESS START?
What event triggers the process to start? Is there more than one way the process could start?How do you know when the process is complete? (What are the determining factors?)Are there different end states for the process? For example, one that signifies successful completion and others that indicate failed or aborted attempts.
How does the process get from Point A to Point B? Where else might the process go and why?How do you know when one part is done? Are all changes documented? How many changes are done each month?What are the normal end states and what are the exceptions? Are there rules that govern the process, states, and completion status?What parts of the process do you seek to eliminate, and why? Where do you spend most of your time, and why? Where in the process do you repeat work? How often, and why? What does your manager think happens in the process? What really happens? How does management assess the process and how it is performing?When pressed for time, what steps in the process do you skip or work around?What is your role?What are your assigned duties?What are the tasks required for you to perform your duties according to your role?List each task—estimate of hours per week, estimate of total hours per each term? How often do you perform each task? (daily, weekly, each term, annually)How many people in your office or area are involved in this process? Where do cycle time delays exist? Where do handoffs take place? Do people actually hand something off, or is it submitted to a system with the assumption that it is handed off? What data points are put into systems? What data points are taken out? What pains does the process cause? What do people want or desire from the process?

134 Managing it PerforManCe to Create Business Value
agile methods, including use of patterns; and application performance monitoring, needs to be handled with care. There really needs to be a culture shift within the development teams, including project managers, programmers, database designers, web designers, quality assurance (QA), and operations and management, toward enhanced collaboration.
Process Quality
Solano et al. (2003) have developed a model for integrating systematic quality—that is, a balance between product and process effectiveness and efficiency—within systems development organizations through the balanced scorecard. Table 8.3 shows the four balanced scorecard perspectives oriented toward systemic quality integration.
This quality-oriented strategy is a daily, ongoing process that needs to be “bought into” by staff members. Solano et al. (2003) provide an example of a company, VenSoft C.A., which did just this by relating organizational goals to employee remuneration. Table 8.4 shows employee incentives, based on the balanced scorecard. Each perspec-tive and indicator was given a weight that depended on the organization’s mission. Yearly bonuses depended on the goals being totally or partially attained.
How is the process (or product) quality index calculated? One of the goals of soft-ware engineering is to produce a defect-free product. A module’s quality profile is the metric used to predict if a module will be defect free. A quality profile is predictive in that its value is known immediately after a module has completed its developer’s unit test. It is suggestive, in that it can suggest potential quality issues and thus mecha-nisms to redress those issues. Quality profiles adhere to software engineering dogmas that design is good, technical reviews are necessary for quality, and that high-defect density in a test phase is predictive of high-defect density in later test phases. Finally, early empirical evidence suggests that quality profiles do predict if a module is defect free. As seen in Table 8.5, a quality profile is composed of five dimensions:
The process quality index (PQI) is calculated by multiplying the five dimensions together. The Software Engineering Institute (SEI) has presented preliminary data that indicate that PQI values between 0.4 and 1 predict that the module will have zero subsequent defects.
With this model, Solano et al. (2003) tried to close the gap between software engineering projects and organizational strategy. In their view, the systemic vision of the organization, and the balance between the forces of the organization, coincide quite nicely with the balanced scorecard approach.
Philips Electronics (Gumbus and Lyons 2002) implemented a balanced scorecard predicated on the belief that quality should be a central focus of their performance measurement effort. The Philips Electronics balanced scorecard has four levels. The very highest level is the strategy review card, next is the operations review scorecard, the third is the business unit card, and the fourth level is the individual employee card.

135Designing ProCess Control anD iMProVeMent systeMs
Tabl
e 8.
3 In
tegr
atin
g Qu
ality
with
the
Bala
nced
Sco
reca
rd
PERS
PECT
IVE
STRA
TEGI
C TO
PICS
STRA
TEGI
C OB
JECT
IVES
STRA
TEGI
C IN
DICA
TORS
Fina
ncia
lGr
owth
F1 In
crea
se s
hare
hold
er v
alue
Shar
ehol
der v
alue
F2 N
ew s
ourc
es o
f rev
enue
from
out
stan
ding
qua
lity p
rodu
cts
and
serv
ices
Grow
th ra
te o
f vol
ume
com
pare
d wi
th g
rowt
h ra
te o
f sec
tor
F3 In
crea
se c
usto
mer
val
ue th
roug
h im
prov
emen
ts to
pro
duct
s an
d se
rvic
esRa
te o
f pro
duct
rene
wal c
ompa
red
with
tota
l cus
tom
ers
Prod
uctiv
ityF4
Cos
t lea
der i
n th
e se
ctor
Com
parin
g ex
pens
es w
ith th
e se
ctor
s:F5
Max
imize
util
izatio
n of
exis
ting
asse
ts
Fre
e ca
sh fl
ow
Ope
ratin
g m
argi
nCu
stom
erCh
arm
the
cust
omer
sC1
Con
tinua
lly s
atis
fy th
e cu
stom
er c
hose
n as
the
obje
ctiv
eSh
are
of s
elec
ted
key m
arke
tsC2
Val
ue fo
r mon
eyCo
mpa
ring
valu
e fo
r mon
ey w
ith th
e se
ctor
C3 R
elia
ble
oper
atio
nsPe
rcen
tage
of e
rrors
with
cus
tom
ers
C4 Q
ualit
y ser
vice
Inte
rnal
pro
cess
Grow
thI1
Cre
ate
and
deve
lop
inno
vativ
e pr
oduc
ts a
nd s
ervi
ces
Profi
tabi
lity o
f new
pro
duct
inve
stm
ent
I2 Im
plem
ent a
sys
tem
s pr
oduc
t qua
lity m
odel
with
a s
yste
mic
ap
proa
chRa
te o
f new
pro
duct
acc
epta
nce
Rate
or p
rodu
ct q
ualit
yIn
crea
se c
usto
mer
val
ueI3
Tech
nolo
gica
l im
prov
emen
ts to
pro
duct
sT im
elin
ess
I4 A
pply
flexib
le d
evel
opm
ent m
etho
dolo
gies
Prod
uct a
vaila
bilit
yI5
Adv
isor
y ser
vice
sOp
erat
iona
l exc
elle
nce
I6 P
rovi
de a
flex
ible
glo
bal i
nfra
stru
ctur
eCo
st re
duct
ion
I7 M
eet s
peci
ficat
ions
on
time
Fixe
d as
set p
rodu
ctio
nI8
Cos
t lea
der i
n th
e se
ctor
Impr
oved
yiel
dI9
Impl
emen
t a q
ualit
y sys
tem
dev
elop
men
t mod
el p
roce
ssRa
te o
f com
plia
nce
with
spe
cific
atio
nsRa
te o
f pro
cess
qua
lity
I10
Deve
lop
outs
tand
ing
rela
tions
hip
with
sup
plie
rsGo
od n
eigh
borli
ness
I11
Impr
ove
heal
th, s
afet
y, an
d en
viro
nmen
tNu
mbe
r of s
afet
y inc
iden
tsRa
te o
f abs
ente
eism
Lear
ning
and
gro
wth
Mot
ivat
ed a
nd w
ell-p
repa
red
staf
fL1
Clim
ate
for a
ctio
nEm
ploy
ee s
urve
yL2
Fun
dam
enta
l ski
lls a
nd c
ompe
tenc
ies
Staf
f hie
rarc
hy ta
ble
(%)
L3 Te
chno
logy
Avai
labi
lity o
f stra
tegi
c in
form
atio
n

136 Managing it PerforManCe to Create Business Value
The corporate quality department created very specific guidelines for how metrics should link the cascaded scorecards. These guidelines indicate that all top-level score-card critical success factors (CSFs) for which the department is responsible must link metrically to lower-level cards. Three criteria were established to accomplish this:
1. Inclusion: Top-level CSFs must be addressed by lower-level CSFs to achieve top-level metric goals.
2. Continuity: CSFs must be connected through all levels. Lower-level measure-ments should not have longer cycle times than higher-level measurements.
3. Robustness: Meeting a lower-level CSF goal must assure that high-level CSF goals will be met or even surpassed.
As you can see, the goals in all card levels align with the goals in the next level above, and the goals become fewer and less complex as you drill down through the organization.
The CSFs, selected by the departments that had a major controlling responsibility, were the key balanced scorecard indicators. The management team of each business unit selected CSFs that would distinguish the business unit from the competition. They used a value map to assist in determining the customer CSFs and then derived the process CSFs by determining how process improvements can deliver customer requirements. Competence CSFs were identified by figuring out what human resource competencies were required to deliver the other three perspectives of the card. Standard financial reporting metrics were used for the financial perspective.
Table 8.5 A Software Quality Profile
QUALITY PROFILE DIMENSION CRITERIA
Design/code time Design time should be greater than coding timeDesign review time Design review time should be at least half of design timeCode review time Code review time should be at least half of coding timeCompile defect density Compile defects should be <10 defects per thousand lines of codeUnit test defect density Unit test defects should be <5 defects per thousand lines of code
Table 8.4 Balanced Scorecard Related Incentives
CATEGORY INDICATORS WEIGHTING (%)
Financial (60%) Shareholder value 18Return on capital employed (ROCE) 13Economic value added (EVA) 13Free cash flow 10Operating costs 6
Client (10%) Client satisfaction index 7Rate of growth of market 3
Internal processes (10%) Process quality index 3Product quality index 3Productivity 4
Training and growth (20%) Employee quality index 20

137Designing ProCess Control anD iMProVeMent systeMs
At this point, each business unit was charged with figuring out what key indicators could best measure the CSFs. The business units had to make some assumptions about the relationships between the processes and results to derive performance drivers and targets. These targets were set based on the gap between current performance and what was desired 2 and 4 years into the future. The criteria for these targets were that the targets had to be specific, measurable, realistic, and time phased. The targets themselves were derived from an analysis of market size, customer base, brand equity, innovation capability, and world-class performance.
Indicators selected included
1. Financial: Economic profit realized, income from operations, working capital, operational cash flow, inventory turns
2. Customers: Rank in customer survey, market share, repeat order rate, com-plaints, brand index
3. Processes: Percentage reduction in process cycle time, number of engineering changes, capacity utilization, order response time, process capability
4. Competence: Leadership competence, percentage of patent-protected turn-over, training days per employee, quality improvement team participation
In cascading the scorecard throughout its different levels, six indicators were key for all business units:
1. Profitable revenue growth 2. Customer delight 3. Employee satisfaction 4. Drive to operational excellence 5. Organizational development 6. IT support
In one of the business units, Philips Medical Systems North America, results are tracked in real time. Data are automatically transferred to internal reporting systems and fed into the online balanced scorecard report with the results made immediately accessible to management. The results are then shared with employees using an online reporting system they call Business Balanced Scorecard On-Line. To share metrics with employees, they use an easy-to-understand traffic-light reporting system. Green indi-cates that the target was met, yellow indicates inline performance, and red warns that performance is not up to par.
Process Performance Metrics
Some researchers contend that organizations are shooting themselves in the foot by ignoring web analytics. Swamy (2002) states that without this link, a major portion of the organization’s contributions to success and/or failure is missing. He contends that most online initiatives have a dramatic impact on offline performance. Therefore,

138 Managing it PerforManCe to Create Business Value
excluding web analytics, as immature as these statistics are, precludes senior executives from seeing the whole picture.
Swamy recommends adding two new perspectives to the balanced scorecard, as shown in Figure 8.2.
IT processes are project oriented. Stewart (2001) makes the following metric recommendations when establishing project-specific balanced scorecards:
Financial 1. On time 2. Within budget 3. Variance from original baselined budget and final budget
1. Page visit analysis 2. ROI per visit 3. Click through rates 4. Conversion rates 5. Acquisition cost 6. Average cost per customer 7. Percent of online sales 8. Number of online customers 9. Visit length and activity statistics10. Customer service calls11. Cost per contact12. Customer retention rate13. Online market share14. Customer survey results
1. Employee turnover 2. Intranet searches 3. Number of net meetings 4. Number of documents published 5. Site availability 6. System performance 7. Proxy server analysis 8. System errors 9. Wait time per request10. Stickiness11. Frequency12. Duration13. Focus
16. Top search engine leads15. Abandonment14. Site path
Vision andstrategy
Customer Financial
E-Business
Objectives include:
Sample metrics
Objectives include:
User“How can we leverage
the power of theinternet?”
1. Increase revenue 1. Increase employee knowledge2. Improve technology performance
2. Decrease transaction costs3. Increase market penetration
“How must ourtechnology assets workto enrich the experience
of our end users”
Internal Learningand growth
Figure 8.2 Web analytics added to the balanced scorecard.

139Designing ProCess Control anD iMProVeMent systeMs
4. Project costs as compared with industry standard and organizational standards for similar projects
5. Earned valueCustomer
1. Project meeting intended objectives 2. Customer satisfaction (including account payment history) 3. Economic value added (strategic benefits rather than financial benefits
achieved—referability, increased venture capital support, etc.)Project/internal business
1. Project resource requirements management a. Average management time of project manager related to total effort 2. Project portfolio comparatives a. Project cancellation rate b. Project backlog—awaiting start-up c. Risk management statistics d. Contingency time allotted and used 3. Change management statistics (number of change records per designated
period of time can show whether proper project scope has been set, per-centage change to customer/vendor environment impact to scope)
4. Quality management statistics (rework, issues, etc.) 5. Project team member satisfaction
Growth and innovation 1. Average capabilities per team member and improvement over course of project 2. Development or ongoing improvement of templates, procedures, tools,
and so on 3. The rate that innovative ideas are developed (new ways of doing things) 4. Best practices identified 5. Lessons learned and applied 6. Positive achievements/impacts to the organization 7. Evaluate quantitative statistics a. Examine true costs of operation, evaluating impact of project slippage
and inadequate support and nonsupport infrastructure costs 8. Evaluate organizational change a. Evaluate how the change has impacted the organization’s business 9. Reduce to lowest common denominator a. Review support costs versus costs of delay per person b. Review actual project costs versus plans (net present value) 10. Review strategic objectives achieved a. Review qualitative statistics b. Identify unanticipated benefits accrued c. Review attainment or contribution to organizational objectives versus
time commitment

140 Managing it PerforManCe to Create Business Value
11. Review overall business value improvement a. Revenue increase/decrease b. Team retention and promotion c. Increased market share, references
Shared First
The goal of the “shared-first,” which is an approach recommended by the U.S. fed-eral government’s CIO Council (2013) is to improve performance, increase return on investment (ROI), and promote innovation. Through shared services, separate depart-ments within an organization may eliminate duplication of cost structures, reduce risk, procure needed services, implement new capabilities, and innovate in a rapid and cost-efficient manner. The specific goals for implementing shared services include
1. Improve the ROI through the coordinated use of approved interdepartmental shared services
2. Close productivity gaps by implementing integrated governance processes and innovative shared service solutions
3. Increase communications with stakeholders as managing partners, customers, and shared service providers work together to ensure value for quality services delivered, accountability, and ongoing collaboration in the full life cycle of interdepartmental shared services activities
“Shared first” principles will produce a number of beneficial outcomes, which include the following:
1. Eliminate inefficient spending that results from duplicative service offerings and systems
2. Enhance awareness and adoption of available shared services across the orga-nization; promote agility and innovation by improving speed, flexibility, and responsiveness to provisioning services through a “shared-first” approach
3. Focus more resources on core mission requirements rather than administra-tive support services
4. Spur the adoption of best practices and best-in-class ideas and innovations 5. Reduce the support costs of redundant IT resources 6. Improve cost-efficiencies through shared commodity IT
There are two general categories of shared services: commodity IT and support. These may be delivered through cloud-based or other shared platforms. Commodity IT shared services opportunities include IT infrastructure (e.g., data centers, networks, workstations, laptops, software applications, and mobile devices), and enterprise IT services (e.g., e-mail, web infrastructure, collaboration tools, security, identity, and access management). Commodity IT is asset oriented, while enterprise IT services may, at times, be more utility oriented (defined as purchasing-by-usage rate). Support

141Designing ProCess Control anD iMProVeMent systeMs
services are defined by the capabilities that support common business functions. These include functional areas such as budgeting, financial, human resources, asset, and property and acquisition management.
The following steps indicate tasks and activities, best practices, and risk areas with mitigations to consider and prepare for when implementing shared services.
Step 1: Inventory, Assess, and Benchmark Internal Functions and Services
This task focuses on determining the best set of candidate services to consider for potential migration to shared services. Each business unit should have an existing inventory of applications and systems mapped to functions and processes as part of their enterprise architecture. Business units should start with this list to identify the gaps and redundancies in capabilities to identify shared services candidates.
Tasks 1. Create an analysis team consisting of business, technology management, and
subject-matter experts (SMEs) to build participation and consensus. 2. Review the organization’s business and technology architectures to identify
opportunities to improve service delivery quality and/or reduce cost structures in existing services. Identify specific data and process flows used in the busi-ness unit(s). The degree to which a shared service is compatible with internal processes and data flows will dictate the effort needed to transition to shared services. Large mismatches between the shared service and internal processes/data indicate significant change management issues will need to be addressed before the shared service can be implemented successfully.
3. Document what is required and what is not. This will involve listing business functions, their supporting systems and applications, and talking with their owners, sponsors, and users. Key areas to consider include
a. Redundant systems and applications b. Business processes that are manual or paper-driven or only partially
automated c. Old systems that are due for replacement or redevelopment for reasons
such as functionality enhancement, expansion to meet increased usage, or new architectural platforms
d. Unmet needs or new mandates 4. Estimate the costs to provide the existing service internally for the selected
legacy functions or services. Cost savings will be a significant driver, but not the only factor, in the decision to transition to a shared service. Other fac-tors that may be considered include quality of service, enabling additional functionality and capabilities, more efficient processes, and improvement to management information and decision-making capabilities. If actual data are not available, the best possible estimates should be used. This step should take

142 Managing it PerforManCe to Create Business Value
days or weeks, at most, to complete. Both IT and business unit costs should be included. This is especially important for candidate legacy services that currently do not employ technology automation. Include the human resources costs (e.g., for employees and contractors) that exist in both the business and IT organizations.
5. Identify the major functions (e.g., capabilities) of the current and candidate services and processes. The list should address required as well as desired functionality, and include processing, servicing, data ownership, security, work flow, and similar requirements. Create a function and features check-list and an initial statement of work (SOW) for evaluating shared service providers.
6. Translate costs into per transaction or annual per user costs. This may provide a baseline for comparisons to similar systems in smaller or larger agencies or shared services.
7. If the service and supporting system is extensive and involves several integrated components, attempt to decouple the components. Decoupling identifies inte-gration points and makes a modular approach possible, reducing risk expo-sure. Review the costing information. Determine the estimated cost of each component, if possible, and translate those costs into per transaction or annual per user costs.
8. Create a change readiness evaluation checklist to assess your organization’s readiness to transition from today’s environment to a shared services solu-tion. Research and document the answers to checklist questions such as the following:
a. Does a sponsor or champion exist on the business side who is willing to lead the transition? What is his or her level of involvement and commitment?
b. Are there multiple user groups or business areas impacted by the transition? c. Is the organization ready to give up the “we are unique” point of view? d. Is there organizational leadership to push organization subunits to get
onboard? e. Have users been involved in considering the change? f. Have specific resistance issues and concerns been documented? g. Do technical resources exist to plan and execute the transition; and if not,
how can they be obtained? h. What are the annual costs for each function being considered (e.g., per
person, per transaction, or fixed fee)? i. Has funding been committed (or is it available) to cover the transition
costs? j. What is required of the vendor or third party to ensure a successful transi-
tion to the shared service? k. Does a strategic communication plan exist to ensure that participants and
other stakeholders are engaged in the process?

143Designing ProCess Control anD iMProVeMent systeMs
Step 2: Identify Potential Shared Services Providers
Service catalogs should be created that list all functions and services supported throughout the organization. This catalog can be used to locate and contact shared service providers that align with a prioritized list of candidate opportunities for transition. Business units should compare their internal shared service offerings and assessments of internally supported functions and services with the service catalog offerings to determine which internal functions and services may be viable candidates for migration to shared services. The results of the search should be a “short list” of potential service providers. Specific activities within this step include
Tasks 1. Create a customer/user team to conduct market research. Cultural resistance
to the transition may be overcome by including stakeholders in the decision-making process. The team’s buy-in to the endeavor will make the change easier.
2. Conduct market research by using the shared services catalog. Meet with each shared service provider to understand the capabilities and functionality of their services and then evaluate their capabilities against the set of require-ments, functions, processes, and criteria that was created in Step 1. Track each provider’s ability to meet the required and desired services and service levels. If a shared service does not exist in the shared service catalog, contact shared service providers to see if they would be willing to develop one.
3. Create or obtain a shared service cost model for each potential provider that meets the requirements of your candidate system. Elements to be included in the model are shown in Table 8.6.
Step 3: Compare Internal Services versus Shared Services Providers
The selection of the best value shared service is guided by, among other criteria, a comparison of internal legacy service costs with those of the potential shared services and the performance quality they deliver to end users. In the transition year(s), costs may be higher due to the support of two services—legacy and shared. However, in the out years, cost savings should accumulate. The resulting cost comparison forms the financial basis of a business case to inform the leadership team on whether or not to proceed with a shared service. Other aspects of the business case include stra-tegic alignment; qualitative value, such as cost avoidance, improved management information, quality of service, and risk analysis. Ultimately, the shared services that business units implement are based on their own unique business model, culture, organizational structure, and risk tolerance. The business case should address what, when, and how to move business capability and its delivery into the shared services environment.

144 Managing it PerforManCe to Create Business Value
Step 4: Make the Investment Decision
Using the results of the function and features checklist, change readiness evaluation checklist, and legacy and shared service pricing comparison and analysis, the lead-ership team determines whether or not to proceed with the transition to a shared service. If a decision to transition to a shared service is made, then formalize a project team and proceed with developing a project plan and negotiating the service-level agreement (SLA). Both business and IT staff should participate in this effort. If the decision is made not to transition to a shared service, then document the rationale for not proceeding or for deferring the transition.
Step 5: Determine Funding Approach
There are several methods that consuming business units may use to fund shared services. These methods are determined in part by the type of service being procured and the provider’s offering.
Step 6: Establish Service-Level Agreements
The organization and shared service provider need to negotiate, agree, and formally document the services and service levels to be provided. The agreement needs to
Table 8.6 Shared Service Cost Model
YEAR 1 YEAR 2 YEAR 3 TOTAL
HARDWARE• Production/dev/test• Disaster recovery
SOFTWARE SERVICES• OS and database• COTs• Requirements management• Application development• Database administration• Testing management• Project management
ONGOING SUPPORT• Hosting costs• Data conversion• Development/enhancement labor• Maintenance labor• Help desk• HW maintenance• SW maintenance• Information security• Network & telecom• Training• Communication

145Designing ProCess Control anD iMProVeMent systeMs
include, at a minimum, a project title, names of the parties to the agreement, the purpose of the agreement, the duration of the agreement, a termination provision, a dispute resolution provision, and a return path or exit strategy if things do not work out as per expectations.
Step 7: Postdeployment Operations and Management
Once a process, capability, and supporting system(s) have transitioned to a shared services provider, ownership and management of the service does not end. Active daily management from a contractual and performance perspective must still be maintained. Organizations need to remain actively engaged with the service provider to ensure the long-term success of the transition and achieve the benefits identified in the business case.
Configuration Management
CM provides the means to manage technology-related processes in a structured, orderly, and productive manner. As an engineering discipline, CM provides a level of support, control, and service to the organization. CM is a support function in that it supports the program, the corporation, and, in a number of situations, the customer.
The process of CM has not really changed much during the past 20–30 years. However, the environment that CM operates within has changed significantly and is likely to continue to change. Regardless of the fast-paced changes in the technology arena, the process of CM is basically immutable—that is, the process does not change, only what is being managed changes. The key is in the process.
CM and Process Improvement
Improvement depends on changing current processes along with the accompanying environment. CM, then, provides the underlying structure for change and process improvement. We refer to this as process-based CM.
For example, the first step to improve the product is to know how the product is currently produced. The second step for improvement is to foster an atmosphere in which change can be readily accommodated. If change does not appear possible, then improvement is also unlikely. CM measurements of current practices and their associated metrics can help identify where processes are working and where they need to be improved. Such change efforts should lead to increased productivity, integrity, conformance, and customer satisfaction.
CM can be defined as the process of managing the full spectrum of an organization’s products, facilities, and processes by managing all requirements, including changes, and assuring that the results conform to those requirements. By this definition, CM

146 Managing it PerforManCe to Create Business Value
can also be called process configuration management because it includes the process of managing an organization’s processes and procedures.
Many organizations can be characterized as Level 1 organizations as defined in the SEI’s software capability maturity model. These Level 1 organizations rely heavily on “heroes” to accomplish the work. The organization’s processes are not documented, and few people know how the work is accomplished, how things are organized, and even where things might be located. The process is characterized as ad hoc, and occa-sionally even chaotic.
An effective CM program organizes all of this. Any changes, updates, and needed additions are tracked and documented. Adhering to these policies and procedures will reduce the likelihood of problems with employees using unapproved hardware, software, and processes.
Implementing CM in the Organization
One of the first steps in successfully implementing CM is to obtain management sponsorship. This means public endorsement for CM, and making sure the resources needed for success are allocated to the project. Management also needs to establish CM as a priority and help facilitate implementation.
An organization can maintain management sponsorship by identifying and resolv-ing risks, reporting progress, managing CM implementation details, and communi-cating with all members of the organization.
The next step is to assess current CM processes. Every organization is practic-ing some type of CM. This may not be a formal process or even thought of as CM. After assessing your current processes, the next step is to analyze your require-ments. What is it that your organization wants to accomplish? The requirement may be an ISO 9000 certification, some other standard or certification, or simply to improve.
Document the requirements for your organization, how you will implement them, and how you will measure success. Depending on the requirements of your organi-zation, the various roles and formality of the CM team may differ. At a minimum, there should be a point of contact for CM. Other recommended roles and functions include
1. A control and review board should be in place to analyze and approve changes.
2. Managers and leaders also play a role in CM in establishing or following a CM plan, ensuring requirements are properly allocated, ensuring adequate tools are available to support activities, and conducting regular reviews.
3. A librarian is also necessary to track baselines and versions of files included in each release. A CM tool can assist in those activities.
4. QA can be used to verify that documented CM processes and procedures are followed.

147Designing ProCess Control anD iMProVeMent systeMs
In Conclusion
Organizations are composed of systems, which are composed of individual processes. For an organization to improve its performance, it must embark on a systematic approach to optimize its underlying processes to achieve more efficient results.
ReferencesBrock, J., Saleh, T., and Iyer, S. (2015). Large-scale IT projects: From nightmare to value
creation. BCG Perspectives, May 20. Retrieved from https://www.bcgperspectives.com/content/articles/technology-business-transformation-technology-organization-large-scale-it-projects/.
CIO Council. (2013). Federal shared services implementation guide, April 16. Retrieved from https://cio.gov/wp-content/uploads/downloads/2013/04/CIOC-Federal-Shared-Services-Implementation-Guide.pdf.
Denman, J. (2015). Continuous development carries continuous improvement into 2015. Software Quality Insights, January 12. Retrieved from http://itknowledgeexchange.techtarget.com/software-quality/continuous-development-carries-continuous-improvement-into-2015/.
Desmet, D., Duncan, E, Scanlan, J., and Singer, M. (2015). Six building blocks for creat-ing a high-performing digital enterprise. McKinsey & Company Insights & Publications, September. Retrieved from http://www.mckinsey.com/insights/organization/six_build-ing_blocks_for_creating_a_high_performing_digital_enterprise?cid=other-eml-nsl-mip-mck-oth-1509.
Gumbus, A. and Lyons, B. (2002). The balanced scorecard at Philips Electronics. Strategic Finance, pp. 45–49, November.
The Hackett Group. (2015). The CIO agenda: Key issues for IT in 2015. Retrieved from http://www.thehackettgroup.com/research/2015/keyissuesit15/.
Solano, J., Perez de Ovalles, M., Rojas, T., Griman Padua, A., and Mendoza Morales, L. (2003). Integration of systemic quality and the balanced scorecard. Information Systems Management, pp. 66–81, Winter.
Stewart, W. (2001). Balanced scorecard for projects. Project Management Journal, pp. 38–52, March.
Swamy, R. (2002). Strategic performance measurement in the new millennium: Fitting web-based initiatives into a company’s balanced scorecard is critical. Here is a guide on how to do it. CMA Management, 76(3), 44(4), May.
Unisys. (2003). Performance-based contracting: Measuring the performance in the information technology utility. White Paper.
Wright, W., Smith, R., Jesser, R., and Stupeck, M. (1999). Information technology, process reengineering and performance measurement: A balanced scorecard analysis of Compaq Computer Corporation. Communications of AIS, 1, Article 8, January.

149
9Designing anD measuring
the it ProDuct strategy
All companies must continually develop new products to compete effectively in today’s complex and rapidly changing marketplace. There are a variety of strategies that may be used to maintain the momentum and include the following:
• Discontinuous innovation: New products that create an entirely new market• New offering category: These enable new market entry into an existing market• Extensions: Either the product line, a service line, or the brand• Incremental improvements: Styling, performance, or even price changes
The iPod is an example of discontinuous innovation: creating an entirely new market for downloadable music, providing an after-market for iPod attachments, and even spurring the invention of podcasting.
Consumers and organizations are constantly looking for fresh ideas to add convenience and comfort to their lives. However, new product failure rates are high: some estimate an astonishing 70% failure rate. So, how do we ensure success and avoid being part of this failure statistic? Market pioneers (“first movers”) gain competitive advantage and develop market dominance. However, some ask whether it is always a good idea to be a pioneer. The first-mover advantage may be overwhelmed by copycat profit-taking.
Most products are actually in the maturity stage of their life cycle. When sales slow down, overcapacity in the industry intensifies competition. Some companies will abandon weaker products and concentrate on profitable products and the develop-ment of new offerings. The company may try to expand the number of brand users by converting nonusers, entering new market segments, or winning competitors’ custom-ers. Product modification might also be employed but can backfire if proper market research is not performed. If the product is modified to the point where loyal users are upset, then the market share will be further eroded. Coca-Cola is a good example of this. Their much-hyped New Coke product introduction fizzled. There was such an uproar in the marketplace that Coca-Cola was forced to reintroduce the original Coke back into the marketplace as Classic Coke.
Product Life Cycle
The idealized life cycle of an idea, information technology (IT) or otherwise, within an organization is called the P-cycle, so named because each of its stages starts with the

150 Managing it PerforManCe to Create Business Value
letter p: progenitor, pilot, project, program, perspective, and pervasiveness. Successful idea practitioners understand each idea’s life cycle so that they might know where it might move next. There is an internal life cycle (i.e., within a company) as well as an external life cycle (i.e., the product as it is adopted by the public), and these cycles might differ for many environmental reasons.
The P-cycle is somewhat similar to the traditional systems development life cycle (SDLC) because both cycles start with someone’s bright idea—the progenitor. The bright idea may come based on an employee’s or another stakeholder’s idea (McDonald’s popular Big Mac hamburger stemmed from a franchisee’s idea) or might be the result of a company’s research and development (R&D) efforts. After a feasibil-ity study has been performed, the next stage that the idea (or system) enters is pilot. This stage is usually a scaled-down version of the grand idea so that stakeholders can determine if the idea is a good fit for the company and whether it will work. Once the idea’s potential has been proved to be true, we enter the project stage. At this point, a project plan is created and funded, other resources allocated, and work can begin. If successful, the idea (or system) can be implemented and is now referred to as an ongoing program. The program may spawn additional projects that are related to the original idea. The program is usually part of a strategic plan so that its goals can be cascaded down throughout the organization and, thus, used within many depart-ments. Over time, the program is embedded within the corporate psyche and becomes firmly entrenched within the operating methods and controls of the company. At the beginning of this rootedness, the idea can be said to be gaining perspective. By the time everyone in the company uses the idea on a daily basis, we reach the end state for the P-cycle—pervasiveness.
The external P-cycle of an idea is similar to the internal P-cycle. Some IT innovators talk about five stages in the external life cycle of an idea: discovery, wild acceptance, digestion, decline, and hardcore. In other words, when a product is introduced to the public, it first has to be discovered and then accepted. Early adopters buy the product, like it, and tell others about it. Soon, there is a great buzz about the product and others start adopting it. One can say that the product has now been digested by the marketplace. After a time, the product’s use either declines and is replaced or becomes a commodity (i.e., hardcore). We have discussed in earlier chapters the concept of the IT utility, where most of the software we use currently resides.
The P-cycle articulates itself in the product life cycle (PLC). The PLC describes the stages through which a product idea goes from the beginning to the end, as shown in Figure 9.1. The PLC consists of four stages:
1. Introduction is experienced at the beginning of the product’s life, immediately after launch.
2. Growth is the product’s growth in the competitive landscape where there is strong product awareness. The Apple iPod is an example of a product that moved quickly from the introductory stage to the growth stage. Once in

151Designing anD Measuring the it ProDuCt strategy
the growth stage of its very popular product, Apple introduced a lower-cost version, the iPod Shuffle, to counter moves by competitors. Apple quickly introduced its iPod Nano and upgraded its original iPod product with video capabilities. These moves were a reaction to competitive pressures (i.e., lower-cost competitors and the introduction of cell phones with similar capabilities) and the company’s desire to maintain its first-mover position.
3. Maturation is the product’s maturity in the competitive landscape. While sales will begin to level off, there is still strong product awareness. There is also usu-ally a need to reduce costs in response to pricing pressures. Most PC makers are in this stage of growth. Hewlett-Packard and Dell both have strong prod-uct awareness. However, cutthroat competition has forced these manufactur-ers to reduce their prices and to differentiate themselves in some other way (e.g., customer service, high-end video).
4. Decline is hallmarked by the slippage of sales. Good strategists will use this time to rejuvenate and jump-start the life cycle by introducing new versions of the product or product enhancements. Dell Computers may continually lower its prices, but it also is aggressive in introducing new versions of its PC. Apple is famous for its strategy of introducing new versions of its iPhone product as sales of prior versions decline.
Xerox Corporation has long been a leader in office copiers. Its emphasis on manufacturing efficiency enabled the company to reduce the price of its copiers and, thus, reduce the cost to the customer. However, this class of product is straddling the maturation-decline boundary. By reengineering their product, they were able to make key components more accessible and replaceable and, hence, easier to repair in the field. This move enables service technicians to more quickly complete service calls. Therefore, Xerox can be said to have incorporated the design-for-manufacturing approach with the design-for-service mind-set, a current trend in maturing indus-tries with declining products. Interestingly, the design-for-service mind-set has global implications. With a bit of advance planning, a product designed in this manner might need only some minor adjustments to be marketable in different countries.
How long the PLC takes and the length of each stage varies by product. The cycle may vary from 90 days to 100 years or more. However, there are some definite knowns:
Introductorystage
Growthstage
Maturitystage Decline stage
Time
Totalmarket
sales
Figure 9.1 The PLC.

152 Managing it PerforManCe to Create Business Value
1. PLCs are getting shorter. 2. The first mover makes the (initial) profits. 3. Fads move quickly through the life cycle.
As the product moves to market maturity, the firm must have a competitive advantage. Types of competitive advantage are
1. Quality 2. Low-cost producer 3. Promotional success.
Product Life-Cycle Management
We can define PLC management as a solution that offers essential requirements and skills a company require to manage the life cycle of their product from its develop-ment stage until its withdrawal. The PLC management is a significant part of any organization whether small or large and whether the product is for external or internal consumption.
All of the products and services offered or consumed internally by any organization have definite life cycles. The life cycle of a product/service can be split into different phases in order to understand the changes the product or service made in the market. Strategic planning is used to analyze the market trends and the success of a product. As the market is so flexible, the life cycle of the product varies. Every company is on the hunt to develop successful and innovative products to boost their growth, profitability, and performance. It is proved that the success of a new product entirely depends on the product development phase including the cost-effectiveness and the market demand.
The life cycle of a product or service passes through different phases as we men-tioned previously. It is a very complex procedure and it needs special skills and tools to measure up the market. The responsibility of the PLC management is to manage the life cycle of the product from the business perspective. PLC includes four different stages as follows:
1. Launching of a product is one of the initial stages of the PLC. Trends, cost, sales survey, demand for the product, and so on, are evaluated in this stage.
2. It is in the second stage where the cost-effectiveness and need for sales increase are evaluated. As the demand and competition increase in the market, public awareness and the newer strategies are discussed and analyzed.
3. In the third stage of the PLC, competitive offerings and the competing prod-ucts have to be analyzed and examined closely. Product and market analysis are so vital in this stage.
4. Declination of product from the market is the fourth stage of the PLC. As the profit of the product reduces, the company will have no other option to cut costs except the withdrawal of product.

153Designing anD Measuring the it ProDuCt strategy
PLC management was first introduced in the fields of medical devices, aerospace, nuclear industries, and the military as quality and safety are the top priorities in these fields. But now almost all industries, including electronics, packaged goods, industrial machinery, and so on, practice PLC management. Effective PLC management will enable the company to ascertain the suitable time to introduce and withdraw a product by analyzing the marketing strategies of competitors and the methodologies they use to develop a new product.
PLM systems enable marketing managers to better communicate and share infor-mation. In doing so, effective communication not only reduces costs but also increases efficiency. Errors in product design and marketing can be corrected through effective teamwork facilitated by PLC management-oriented teams.
Product Development Process
New product development is a specialty in and of itself. There are several key steps necessary to develop a new product or to reposition an existing product, and Table 9.1 highlights these steps.
The following methodology can be used to bring a product or service to market:
1. Prior to ever developing a product, a market analysis should be done to see what is “out there” as well as what you think the market would actually want and/or need within a window of opportunity. Here, the goal is value creation and capture, the tenets of which are pervasive throughout the entire methodology.
Table 9.1 Steps for Developing a New Product
STEPS DESCRIPTION
Idea generation and screening The search for ideas. Often developed through market research, environment scanning, or customer wants/needs analysis.
Concept development and testing If the team uncovers potential concepts, the ideas will be refined into testable product concepts.
Marketing strategy development Once a product concept has been tested and determined to be worth pursuing, initial marketing strategies are developed including the target market, size, structure, behavior, positioning, sales expectations, market share expectations, and profitability goals.
Business analysisa This stage capitalizes on the initial marketing strategy concepts and incorporates operational and development costs, more realistic profitability projections, revenue projections, and risk analysis.
Product development Once an acceptable business plan has been approved, R&D or engineering will then develop the actual, physical product. It can take months (extremely short) to a decade to complete the process.
Market testingb Once developed, a product will be test marketed. In the technology industry, these tests are also called alpha or beta trials.
Commercialization or launch The product has made it through testing, has been changed, and is now available to the general public with all the appropriate marketing support required.
a In some organizations, this step may come prior to marketing strategy development.b Not all companies do this.

154 Managing it PerforManCe to Create Business Value
Value creation and capture involve a range of activities by which products and services are developed and delivered to the marketplace.
2. Assess strengths and weaknesses of competitors in the marketplace. Assess possible phantom competitors. These are companies not in the cur-rent marketplace that have the potential to enter the market. For example, Amazon.com was originally just a seller of books. When they entered the e-store business by selling hardware, it was an unexpected move that pro-duced additional competition for an entrenched industry.
3. Product conceptualization. This is where you create the idea for the actual product and then execute that idea.
4. Financial analysis. Most companies utilize break-even analysis by first prepar-ing a spreadsheet of anticipated costs (e.g., development, marketing, support). This will enable you to calculate when you will ultimately achieve profitability. This analysis also enables you to “play” with the projected cost of the prod-uct although you are often constrained by what the market will bear as well as what competitors charge for their product. Interestingly, sometimes the “innovation” is in the cost of the product as much as it in the feature-set. During the Y2K panic, my company developed a set of analytical tools for programmers needing to find references to dates in their program code. There were many other tools out there. We created a tool that did about 90% of what the other tools did but priced it about 50% lower. We did quite well. The innovation of this product, then, was in the price.
5. Alternatives. Consider other methods of moving a product to market through external means, including seeking venture capital, working with partners, and even suppliers.
Moving products into the marketplace has a number of management determinants, including (a) use of multi-functional teams, (b) transfer of professionals, (c) early market test, (d) senior sponsors, (e) stronger managerial accountability, (f) total qual-ity management, and (g) simultaneous engineering.
Most companies subscribe to most of these determinants (i.e., a through f). The Defense Advanced Research Project Agency (DARPA) defines the remaining determinant, simultaneous (a.k.a. concurrent) engineering, as
a systematic approach to the integrated current design of products and their related processes, including manufacturing and supports. This approach is intended to cause the developers from the outset to consider all the elements of the product life cycle from conception through disposal, including quality, cost, schedule, and other user equipment.
The technique was also used successfully by Ford in the 1980s, when the company was developing the Saturn model of automobile.

155Designing anD Measuring the it ProDuCt strategy
Continuous Innovation
A recent Women in the Enterprise of Science and Technology (WEST; http://www.westorg.org/) panel discussed several strategies for increasing innovation:
1. Culture is the number one job for leaders. Leaders bring people around a core set of ideas and ask foundation questions such as: What motivates us as an organization and why are we here? What are our core values and what do we stand for? Who are we striving to serve? Culture is dynamic, not static. However, as an organization grows, there is a need to impose greater formality in how work is accomplished.
2. Failure is a part of success. Innovation has long been equated with increased risk because innovative ideas do not follow the typical path. Leaders need to ask themselves whether they ennoble or criticize failure. The answer to this question greatly influences how employees experience the work culture and their propensity to think creatively.
3. Innovation is the promise of something. Steve Jobs did not just communicate his ideas. He painted a compelling picture of what can be. Innovation is about stretching our thinking and combining things that may be familiar in new and unexpected ways. A leader asking “what if ” inspires employees.
4. Creating safety is important. It has been found that people relate more to their struggles, failures, and humiliations than their successes. This is a result of negative evaluation that only serves to force an employee to continually self-sensor. Leadership must play a pivotal role in creating a safe culture by modeling authenticity and candor.
5. Reaching out and listening are critical. One method for creating safety is by being a leader who genuinely wants to hear it all—the good and the bad. Leaders model inclusion by listening deeply, building on ideas, and rewarding employees for their input. This mosaic of ideas drawn from diverse perspec-tives leads to more creative, innovative outcomes.
6. Broadly sharing credit. Today’s successes are usually the result of team effort. One way to engender innovation is by broadly sharing credit.
Other techniques for generating innovation include
1. Brainstorming: This technique is perhaps the most familiar of all the techniques discussed here. It is used to generate a large quantity of ideas in a short period of time. My company often brings in consulting experts, part-ners, and others to brainstorm along with us.
2. Blue slip: Ideas are individually generated and recorded on a 3″ × 5″ sheet of blue paper. Done anonymously to make people feel more at ease, people readily share ideas. Since each idea is on a separate piece of blue paper, the sorting and grouping of like ideas is facilitated.

156 Managing it PerforManCe to Create Business Value
3. Extrapolation: A technique or approach, already used by the organization, is stretched to apply to a new problem.
4. Progressive abstraction technique: By moving through progressively higher levels of abstraction, it is possible to generate alternative problem definitions from an original problem. When a problem is enlarged in a systematic way, it is possible to generate many new definitions that can then be evaluated for their usefulness and feasibility. Once an appropriate level of abstraction is reached, possible solutions are more easily identified.
5. 5Ws and H technique: This is the traditional journalistic approach of who-what-where-when-why-how. Use of this technique serves to expand a person’s view of the problem and to assist in making sure that all related aspects of the problem have been addressed and considered.
6. Force field analysis technique: The name of this technique comes from its ability to identify forces contributing to, or hindering, a solution to a problem. This technique stimulates creative thinking in three ways: (a) it defines direc-tion, (b) it identifies strengths that can be maximized, and (c) it identifies weaknesses that can be minimized.
7. Problem reversal: Reversing a problem statement often provides a different framework for analysis. For example, in attempting to come up with ways to improve productivity, try considering the opposite, how to decrease productivity.
8. Associations/Image technique: Most of us have played the game, at one time or another, where a person names a person, place, or thing and asks for the first thing that pops into the second person’s mind.
9. Wishful thinking: This technique enables people to loosen analytical parameters to consider a larger set of alternatives than they might ordinarily consider. By permitting a degree of fantasy into the process, the result just might be a new and unique approach.
To promote innovation also requires the successful management of conflict between team members. Organizations tend to exhibit distinct, unit-wide, conflict-resolution styles with some styles leading to better outcomes according to a study by Leslie et al. (2015). The three styles are dominating, collaborative, and avoidant. Digital Equipment Corp. (now defunct) typifies the dominating culture, where organizational members collectively seek competition and victory and try to outwit others. Southwest Airlines and Hewlett-Packard typify the collaborative conflict culture, where resolu-tion is reached through dialogue, teamwork, and negotiation. In conflict-avoidant cultures, employees suppress their differences and withdraw from situations that put them in opposition to colleagues, often agreeing with others’ points of view for the sake of harmony. These styles usually emanate from the top down and are perpetuated by hiring practices.

157Designing anD Measuring the it ProDuCt strategy
The study found that collaborative cultures ranked at the top in such measures as employee satisfaction, low burnout, and productivity. On the flip side, dominating cultures scored lowest in these measures. In terms of creativity and innovation, the study found that conflict-avoidant cultures discouraged the discussions necessary for generating creative ideas and solutions.
The S-curve, a quantitative trend extrapolation technique used in forecasting, has long been used in the technology industry. Many argue that this analysis is actually more useful to see where you have been rather than where you should go. The S-curve, which describes a sigmoid function, is most often used to compare two competitive products in two dimensions: usually time and performance.
An excellent example of an S-curve can be found by examining the ubiquitous automobile. In 1900, the automobile was first introduced to the public and became the plaything of the rich. Between 1900 and 1914, the automobile went through the lower curve of the cycle, or the innovation phase, at the end of which Henry Ford introduced the assembly line. Between 1914 and 1928, the automobile went through its growth phase. It was during this phase that the automobile caught on and was adopted by the general public. By 1928, the automobile was in its maturity phase (the top part of the S-curve), and Ford was seeing leaner, meaner competition.
Essentially, the S-curve is best at defining at what point a new rival has the potential for gaining market share from an established company. Many companies, particularly smaller companies competing with larger, more dominant rivals, use the S-curve to determine if, when, and where they might gain entry to a mar-ketplace. Attackers enjoy important advantages over established rivals: undivided focus, ability to attack talent, freedom from tyranny of those service markets who want your product to stay as is, little bureaucracy, and no need to protect invest-ments in unrelated skills or assets.
The S-curve can unleash unparalleled creativity when the time is realized for the company to make its entry into the marketplace: It is at this point that the product needs to be exposed in a way that effectively competes with the established giant. This stage often translates to reverse engineering the competitive product and determining which features to adopt into your own product and then, essentially, one-upping them by adding new and novel features and/or services.
For a company who is a defender of an established technology, the S-curve predicts at what point their leadership position might decline, as shown in Figure 9.2. Avoiding this point should become the chief focus. Some companies (e.g., Microsoft) prac-tice what I like to call “continuous innovation.” They practice numerous innovation-enhancing techniques, such as including operating skunkworks, acquiring small companies that might become rivals (e.g., Hotmail), and leapfrogging the attacker’s technology.
Organizations strive to create an innovative culture where opportunities that meet customer needs and address market trends can become reality.

158 Managing it PerforManCe to Create Business Value
Companies such as IBM are not only looking for product opportunities (e.g., physical goods such as software) but also have successfully added new services (e.g., nonphysical goods such as support services or consulting) to their palette of offerings over the past 20 years, shaping the evolution of the corporation from a products company to an e-business provider. This change required years of strate-gic planning to ensure that evolving core competencies were aligned with evolv-ing market trends. This effort was worthwhile for IBM as it might have saved the company from collapsing.
Drucker (2002) identifies seven sources (four internal to the company and three external) of innovation:
1. Unexpected occurrences (internal): Drucker considers unexpected successes and failures to be excellent sources of innovation because most businesses usually ignore them. IBM’s first accounting machines, ignored by banks but later sold to libraries, is an example.
2. Incongruities (internal): The disconnection between expectations and results often provides opportunities for innovation. The growing market for the steel industry, coupled with falling profits margins, enabled the invention of the mini-mill.
3. Process needs (internal): Modern advertising permitted the newspaper industry to distribute newspapers at a very low cost and dramatically increase reader-ship (process need).
4. Industry and market changes (internal): Deregulation of the telecommunica-tions industry created havoc in the industry but provided ample opportunity for innovation.
5. Demographic changes (external): Japanese businesses surveyed changing demo-graphics and made the determination that the number of people available for blue-collar work is decreasing. They have taken a leadership position in the area of robotics as a result. However, they are not stopping at robotics for manufacturing. Sony’s QRIO robot is an example of the future of robotics.
Time
Bell curve
Sales per time period
Time
S-curve
Cumulative penetration or sales
Figure 9.2 The S-curve. It is theorized that innovations would spread through society in an S-curve, as the early adopters select the technology first, followed by the majority, until a technology or innovation is common.

159Designing anD Measuring the it ProDuCt strategy
6. Changes in perception (external): Although people are healthier than ever before, according to Drucker they worry more about their health. This change in perception has been exploited for innovative opportunity. An example is the proliferation of health-related websites.
7. New knowledge (external): The traditional source of innovation: the first car, the first computer, the printing press. This source of information usu-ally leads to more radical innovations than the other six sources men-tioned by Drucker. There are two types of innovation based on new knowledge: incremental and disruptive. An example of incremental innovation is the Pentium chip. There have been many iterations of this technology (e.g., Pentium III, Pentium 4, Pentium D, and Pentium Dual-Core). The current iteration, therefore, represents just a slight increment of innovation over its precursor. On the other hand, a radical innova-tion is something totally new to the world, such as transistor technology. However, technological innovation does have one drawback: it takes much longer to effect. For example, while computing machines were available in the early 1900s, it was not until the late 1960s that they were commonly used in business.
Measuring Product Development
When I worked for the New York Stock Exchange, one of the areas I was in charge of was IT R&D. There were just two measures that we used to track performance: R&D spending and R&D headcount. Of course, our R&D department was charged with developing technologies useful for internal services only. Nowadays, many IT departments are examining ways to make IT into a profitable service center with an eye toward developing products for external use. Toward this end, two additional R&D metrics are useful. The percentage of sales due to new product introduction was first introduced by 3M, but has been proven to be useful across a diversity of industries. A metric associated with new product sales is the number of new products released. One final R&D metric worth mentioning is the number of new patents.
Mascarenhas Hornos da Costa et al. (2014) studied the academic literature on the use of Lean metrics for R&D and discovered that 153 different metrics were com-monly used. The most used metrics were certified process, program/project met revenue goals, percentage growth in sales from new products, labor relations climate between R&D personnel, and exploitation of relationships with partners. The researchers also found that companies would like to use the following metrics, although they are not using them at the present time: number and nature of bottlenecks, accuracy of inter-pretation of customer requirements, rate of successful product development projects, quality/frequency of meeting with customers, and time spent on changes to original product specification.

160 Managing it PerforManCe to Create Business Value
In Conclusion
IT has evolved toward a manufacturing paradigm. Therefore, it is possible to use traditional manufacturing performance metrics to measure IT product development performance and innovation. There are three different types of measures to consider. One is input measures—e.g., labor hours or person-years per product developed, unit costs for each product developed, value-added per worker, or total factor productiv-ity (labor and capital.) Additionally, how many engineering hours and how long of a lead time a firm requires to introduce a new product from concept to pilot should be considered.
Output measures include design quality, design manufacturability, and the total number of new or replacement products a company completes within a certain period of time. Design quality includes everything about a product that is perceivable by the customer. Design manufacturability refers to the efficiency of the design from the viewpoint of the production department (e.g., programmers.) The total number of new or replacement products is modified by other variables such as project complexity and scope. A final set of measures relate to market performance. Typical measures here are production share or growth in share and profit per unit.
ReferencesDrucker, P. F. (2002). The discipline of innovation. Harvard Business Review, 80(8), 95–102.Leslie, L. M., Gelfand, M. J., Keller, K. M., and de Dreu, C. (2015). Accentuate the positive.
STERNbusiness, Spring, 20–21. Mascarenhas Hornos da Costa, J., Oehmen, J., Rebentisch, E., and Nightingale, D. (2014).
Toward a better comprehension of Lean metrics for research and product development management. R&D Management, 44(4), 370–383.

161
10Designing customer
value systems
The voice of the customer (VOC) is a process used to capture a customer’s expectations, preferences, and aversions. Traditionally, it has been used as a market research technique, although it is currently gaining traction through information technology (IT) service management. VOC produces a detailed set of customer wants and needs, organized into a hierarchical structure, and then prioritized in terms of relative impor-tance and satisfaction with current alternatives. VOC studies are generally conducted at the start of any new product, process, or service design initiative in order to better understand the customer’s wants and needs.
Customer Intimacy and Operational Excellence
Most customers want their products and services delivered with the following four characteristics:
1. Reliability: Customers want dependability, accuracy, and consistency. 2. Responsiveness: Prompt delivery and continuous communication. 3. Assurance: The customer wants to be assured that the project team will deliver
its project on time, with quality, within budget, and within scope. 4. Empathy: Customers want the project team to listen to and understand them.
The customer really wants to be treated like a team member.
The goal is to select or develop and then deploy initiatives and accompanying metrics that fulfill these four requirements.
An 8% drop in quarterly profits accompanied by a 10% rise in service costs does not tell a customer service team what its service technicians should do differently on their service calls. However, knowing that several new technician hires dropped the average skill level such that the average time spent per service call rose 15%—and that, as a result, the number of late calls rose 10%—would explain why service costs had gone up and customer satisfaction and profits had gone down. The key, then, is to select metrics wisely.
The U.S. government uses an interesting variety of customer-centric measures as part of their e-services initiative:
1. Customer satisfaction index 2. Click count

162 Managing it PerforManCe to Create Business Value
3. Attrition rate 4. Complaints 5. Customer frustration (abandoned transactions divided by total completed
transactions) 6. Visibility into the government process 7. Efficient use of taxpayer dollars 8. Effective sharing of information 9. Trust 10. Consistent quality of services 11. Compliance with Section 508 (handicapped access) 12. Compliance with security and privacy policies 13. Partner satisfaction 14. Political image 15. Community awareness 16. Negative/positive publicity
The balanced scorecard “customer perspective” might be better served by replacing it with the more familiar, IT-specific “user” perspective. This more aptly broadens the customer perspective to include the internal as well as external customers that are using the IT application or its output. From an end-user’s perspective, the value of a software system is based largely on the extent to which it helps the user do the job more effi-ciently and productively. Indicators such as tool utilization rate, availability of training, and technical support and satisfaction with the tool are useful indicators of satisfaction. Table 10.1 summarizes a variety of indicators and metrics for a typical IT system.
Customer Satisfaction Survey
The easiest and most typical way to find out what your customers think about your organization, products/services, and/or systems is to ask them. The instrument that performs this task is the customer satisfaction survey.
Those doing business on the Internet will find it rather easy to deploy a customer survey. It can be brief, such as the one in Figure 10.1.
There are quite a few survey hosting services available on a pay-per-use basis. KeySurvey (keysurvey.com) and Zoomerang (zoomerang.com) are just two. If a web-based or e-mail-based survey is not practical then you can opt for either doing your survey via traditional mail or phone. Since traditional mail surveys suffer from a comparatively low return rate—1%–3%—it is recommended that you utilize the telephone approach.
The steps to successful customer survey include
1. Assemble the survey team: The makeup of the survey team depends on the type of survey and the target customer base. If you are going to be calling external customers, then the best people for the job are to be found in the marketing, sales, or customer services departments. If this is an IT-derived

163Designing CustoMer Value systeMs
Table 10.1 Customer-Driven Indicators and Metrics for a Computer System
PERFORMANCE INDICATOR KEY ASPECTS PERFORMANCE MEASURE
Facilitate document transfer and handling
Staff are proficient with the use of IT-based handling procedures
1. Percentage of users proficient with IT-based procedures
2. Percentage of documents transferred using IT tools
Enhance coordination between staff
Improved coordination 1. No. of conflicts resulting from lack of coordination reduced by a percentage
More efficient utilization of contractors and subcontractors
2. Time spent on rework arising from lack of coordination reduced by a percentage
Reduce response time to answer queries
IT application/tool facilitates quicker response to project queries
1. Response time to answer design queries reduced by a percentage
Empower staff to make decisions
Better and faster decision-making 1. Time taken to provide information needed to arrive at decision reduced by a percentage
Enable immediate reporting and receive feedback
Information is made available to the project team as soon as it is ready
1. Time taken to report changes to management 2. Time spent on reporting to total time at work,
reduced by a percentageIdentify errors or inconsistencies
Reduced number of QA nonconformances through IT
1. The ratio of the no. of QA nonconformances for the IT-based system to the no. of QA nonconformances for the traditional system
Figure 10.1 Brief customer satisfaction survey.
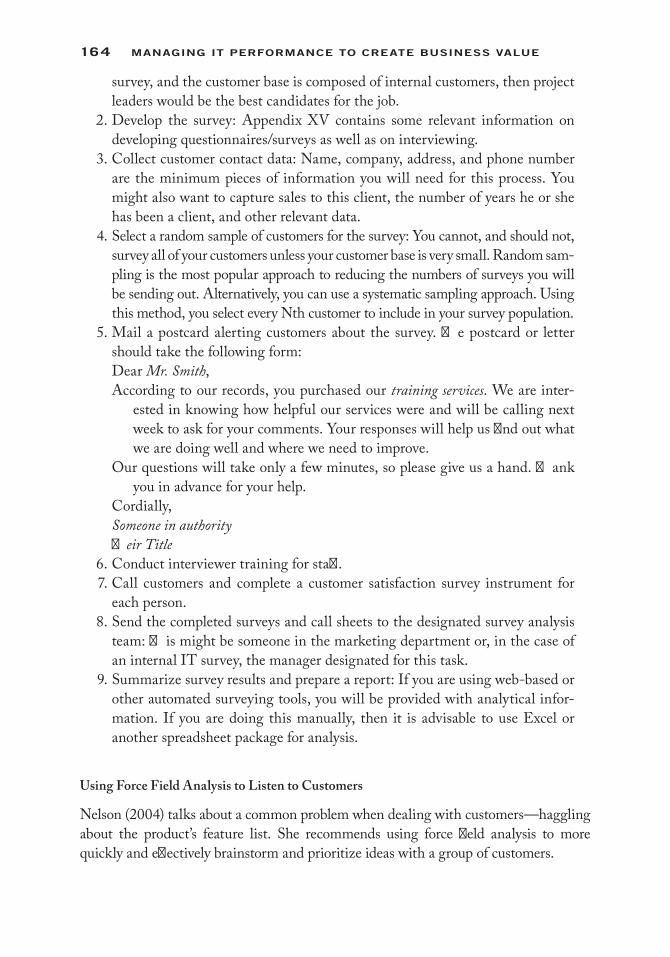
164 Managing it PerforManCe to Create Business Value
survey, and the customer base is composed of internal customers, then project leaders would be the best candidates for the job.
2. Develop the survey: Appendix XV contains some relevant information on developing questionnaires/surveys as well as on interviewing.
3. Collect customer contact data: Name, company, address, and phone number are the minimum pieces of information you will need for this process. You might also want to capture sales to this client, the number of years he or she has been a client, and other relevant data.
4. Select a random sample of customers for the survey: You cannot, and should not, survey all of your customers unless your customer base is very small. Random sam-pling is the most popular approach to reducing the numbers of surveys you will be sending out. Alternatively, you can use a systematic sampling approach. Using this method, you select every Nth customer to include in your survey population.
5. Mail a postcard alerting customers about the survey. The postcard or letter should take the following form:Dear Mr. Smith,According to our records, you purchased our training services. We are inter-
ested in knowing how helpful our services were and will be calling next week to ask for your comments. Your responses will help us find out what we are doing well and where we need to improve.
Our questions will take only a few minutes, so please give us a hand. Thank you in advance for your help.
Cordially,Someone in authorityTheir Title
6. Conduct interviewer training for staff. 7. Call customers and complete a customer satisfaction survey instrument for
each person. 8. Send the completed surveys and call sheets to the designated survey analysis
team: This might be someone in the marketing department or, in the case of an internal IT survey, the manager designated for this task.
9. Summarize survey results and prepare a report: If you are using web-based or other automated surveying tools, you will be provided with analytical infor-mation. If you are doing this manually, then it is advisable to use Excel or another spreadsheet package for analysis.
Using Force Field Analysis to Listen to Customers
Nelson (2004) talks about a common problem when dealing with customers—haggling about the product’s feature list. She recommends using force field analysis to more quickly and effectively brainstorm and prioritize ideas with a group of customers.

165Designing CustoMer Value systeMs
The power of this technique, usable in small as well as in large groups, is in uncovering the driving as well as restraining forces for your products and/or services. Driving forces can be: features, services, a website, and so on—anything that helps customers drive toward success. Restraining forces can be quality issues, complex implementation, convoluted processes, support, unclear procedures—anything that prevents your customers from being successful.
The procedure is simple to follow:
1. State the problem, goal, or situation where you want feedback. 2. Divide your customer feedback group into smaller groups of 8–10. Sit them
around a table and elect a scribe. A facilitator should also be appointed for each table.
3. Each discussion should take no longer than 30 min. 4. The table facilitator goes around the table asking each person to contribute
one force. The table scribe records each new force. 5. Go around the table one or two more times until everyone is in agreement
that their top three forces have been listed. 6. Review the list with the group. 7. Each person gets three votes for their top three forces. 8. The scribe will tally the votes for each force. 9. A meeting moderator should go around the room soliciting the top three
driving forces from each table. 10. A meeting scribe should document the forces in a spreadsheet projected at the
front of the room. 11. Each person in the room gets three votes for their top three forces. 12. The meeting scribe should enter the number of votes for each driving force. 13. When done, sort the list by votes to rank them.
The process is then repeated for the restraining forces. A sample list follows:
Driving forces: 1. Integration across modules 50 votes 2. Excellent tech support 45 votes 3. Standards-based technology 38 votesRestraining forces: 1. Product quality not always consistent 70 votes 2. Difficult to migrate from release to release 60 votes 3. User security is inadequate 30 votes
Force field analysis enables you to really listen to your customers, which should lead to increased customer satisfaction and, perhaps, an improvement in the quality and competitiveness of your products and/or services.

166 Managing it PerforManCe to Create Business Value
Customer Economy
MacRae (2002) discards the idea of the new economy in favor of what he refers to as the customer economy. In this model, the customer is firmly in control. The key indicator in this economy is “easy to do business with” (ETDBW). In this economy, the customary metrics of profit and loss and return on assets are much less important than customer loyalty. The new customer-friendly manager focuses on the following metrics:
1. Retention 2. Satisfaction 3. Growth 4. Increases in customer spending 5. Rate of defection and/or predicted rate of defection
MacRae recommends going to the source to maintain customer loyalty. One way to do this is to create a customer advisory council. This is most effective when the leaders of the organization participate as well.
The customer advisory council can be used to help in answering the following questions:
1. What are the customer’s needs? 2. How has the customer’s behavior toward the enterprise changed since the
customer was acquired? 3. How does the customer use these products, and what products could the cus-
tomer own? 4. Which channels does the customer use most and for what types of transactions? 5. What channels should each customer be using? 6. What kind of web-based experience does the customer have? 7. How much does it cost to service each customer’s transaction?
There are also two customer-focused metrics that can be used for the IT scorecard. The quality of experience (QoE) provided by IT services impacts employee productivity, channel revenue as well as customer satisfaction. The metric assesses the user’s experi-ence with IT in terms of responsiveness and availability. Responsiveness is a measure of how long the user is waiting for information to be displayed. This is usually referred to as response time or download time. QoE expands on this definition to address everyone’s experiences with IT—customers, employees, partners, and so on.
The quality of customer experience (QCE) is a set of metrics that allow the orga-nization to assess, monitor, and manage the customer experience. The customer experience, according to this definition, is far more expansive than just accessing the company website. It also might include
• Phone interactions.• E-mails.• Visits to your offices.

167Designing CustoMer Value systeMs
• Direct-mail marketing.• Advertising.• Employee behavior.• How the product actually performs.• How the service is performed.• How the company is perceived by the community. Alternatively, how the
department is perceived by the rest of the company.
The heart of QCE is customer outcomes and resulting moments of truth. A customer measures the success of his or her experience in terms of reaching his or her desired outcome. Moments of truth are those points in the customer’s experience where the quality of your company’s execution substantially affects his or her loyalty to your company and its products or services. In other words, moments of truth signify key points in the customer’s experience where he or she is judging the quality of the experience. Therefore, the heart of the QCE assessment is measuring the customer’s success in executing the steps necessary within your system(s) to achieve his or her desired outcomes.
For QCE to work properly, these moments of truth (or key success metrics) have to be determined. They can be different for different people, so the best way to tackle this exercise is to develop a case study or scenario and run through it, pinpointing the moments of truth for each stakeholder involved in the scenario. Consider the scenario of a company that needs a replacement motor—fast. The maintenance engineer needs to get production back up by 6 a.m. the next morning. His “moments of truth” are: (a) the motor is right for the job, (b) he has all the parts and tools he needs, and (c) he finishes before the shift supervisor shows up to bug him. The maintenance engineer must order his motor through his company’s purchasing agent. The purchasing agent has his own “moments of truth”: (a) find and order a motor in 15 min, delivery con-firmed; (b) best choice for motor was in the first page of search results; (c) enough information was offered to enable a decision; (d) order department quickly confirmed delivery without making the purchasing agent wait or repeat himself; and (e) invoicing is correct.
Some of the metrics derived from this mapping are shown in Table 10.2.
Innovation for Enhanced Customer Support
We started this chapter by discussing the VOC. Strategyn (https://strategyn.com/), an innovation consulting firm, tightly couples innovation with targeting customer needs and enhancing customer value. However, they insist that the traditional VOC method is unsuitable for sustainable innovation. Their outcome-driven innovation (ODI) framework, while somewhat similar to VOC, is based on eight guiding principles:
1. When it comes to innovation, the job, not the product, must be the unit of analysis.
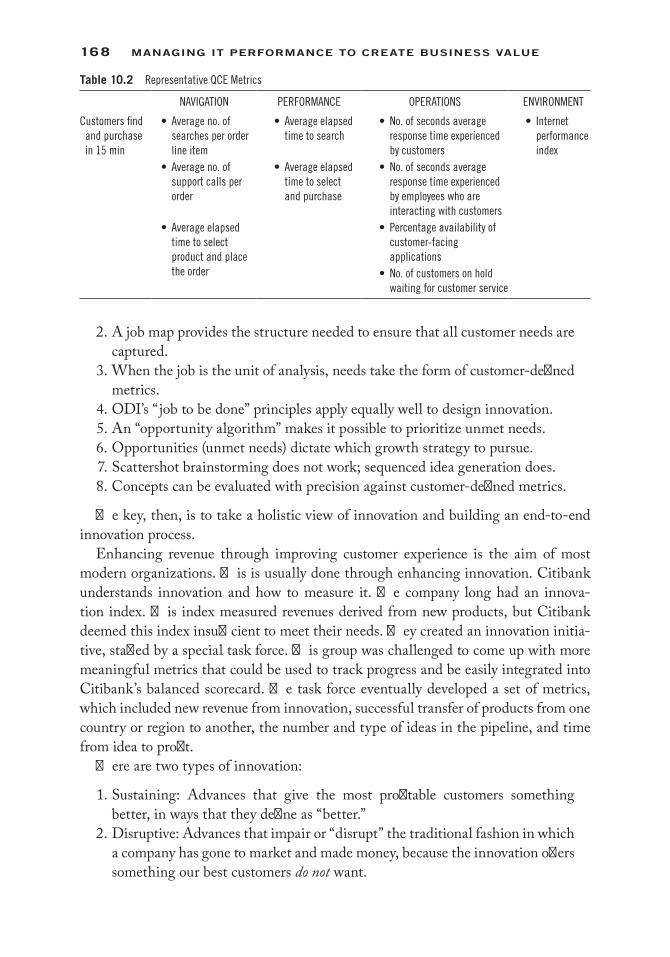
168 Managing it PerforManCe to Create Business Value
2. A job map provides the structure needed to ensure that all customer needs are captured.
3. When the job is the unit of analysis, needs take the form of customer-defined metrics.
4. ODI’s “ job to be done” principles apply equally well to design innovation. 5. An “opportunity algorithm” makes it possible to prioritize unmet needs. 6. Opportunities (unmet needs) dictate which growth strategy to pursue. 7. Scattershot brainstorming does not work; sequenced idea generation does. 8. Concepts can be evaluated with precision against customer-defined metrics.
The key, then, is to take a holistic view of innovation and building an end-to-end innovation process.
Enhancing revenue through improving customer experience is the aim of most modern organizations. This is usually done through enhancing innovation. Citibank understands innovation and how to measure it. The company long had an innova-tion index. This index measured revenues derived from new products, but Citibank deemed this index insufficient to meet their needs. They created an innovation initia-tive, staffed by a special task force. This group was challenged to come up with more meaningful metrics that could be used to track progress and be easily integrated into Citibank’s balanced scorecard. The task force eventually developed a set of metrics, which included new revenue from innovation, successful transfer of products from one country or region to another, the number and type of ideas in the pipeline, and time from idea to profit.
There are two types of innovation:
1. Sustaining: Advances that give the most profitable customers something better, in ways that they define as “better.”
2. Disruptive: Advances that impair or “disrupt” the traditional fashion in which a company has gone to market and made money, because the innovation offers something our best customers do not want.
Table 10.2 Representative QCE Metrics
NAVIGATION PERFORMANCE OPERATIONS ENVIRONMENT
Customers find and purchase in 15 min
• Average no. of searches per order line item
• Average elapsed time to search
• No. of seconds average response time experienced by customers
• Internet performance index
• Average no. of support calls per order
• Average elapsed time to select and purchase
• No. of seconds average response time experienced by employees who are interacting with customers
• Average elapsed time to select product and place the order
• Percentage availability of customer-facing applications
• No. of customers on hold waiting for customer service

169Designing CustoMer Value systeMs
Most software companies continually enhance their line of software products to provide their customers with the features that they have stated they truly desired. This is sustaining innovation. These companies might also strive to come up with products that are radically different from what their customers want in order to expand their base of customers, compete with the competition, or even jump into a completely new line of business. This is disruptive innovation.
Most people equate innovation with a new invention, but it can also refer to a process improvement, continuous improvement, or even new ways to use existing things. Innovation can, and should, occur within every functional area of the enter-prise. Good managers are constantly reviewing the internal and external landscape for clues and suggestions about what might come next.
1. Research results from research and development (R&D): One of the chal-lenges is being alert to market opportunities that might be very different from the inventor’s original vision.
2. Competitors’ innovations: Microsoft leveraged Apple’s breakthrough graphi-cal user interface and ultimately became far more dominant and commercially successful than Apple.
3. Breakthroughs outside industry. 4. Customer requests: A “customer-focused” organization’s products and services
will reflect a coherent understanding of customer needs. 5. Employee suggestions. 6. Newsgroups and trade journals. 7. Trade shows and networking.
Some experts argue that a company’s product architecture mirrors and is based on their organizational structure. This is because companies approach their first project or cus-tomer opportunity a certain way, and if it works they look to repeat the process and this repetition evolves into a company’s “culture.” So when we say a company is “bureaucratic,” what we are really saying is that it is incapable of organizing itself differently to address different customer challenges, because it has been so successful at the original model.
There are a variety of workplace structures that promote innovation:
1. Cross-functional teams: Selecting a representative from the various functional areas and assigning him or her to solve a particular problem can be an effec-tive way to meld quickly a variety of relevant perspectives and also efficiently pass the implementation stress test, avoiding for example the possibility that a particular functional group will later try to block a new initiative. Some variations include
a. “Lightweight project manager” system: Each functional area chooses a person to represent it on the project team. The project manager serves pri-marily as a coordinator. This function is “lightweight” in that the project manager does not have the power to reassign people or reallocate resources.

170 Managing it PerforManCe to Create Business Value
b. “Tiger team”: Individuals from various areas are assigned and are completely dedicated to the project team, often physically moving into shared office space together. This does not necessarily require permanent reassignment, but is obviously better suited for longer-term projects with a high level of urgency within the organization.
2. Cross-company teams or industry coalitions: Some companies have developed innovative partnership models to share the costs and risks of these high-pro-file investments, such as
a. Customer advisory boards b. Executive retreats c. Joint ventures d. Industry associations
There are several managerial techniques that can be utilized to spur innovation, as shown in Table 10.3.
Managing for Innovation
At a very high level, every R&D process will consist of
1. Generation of ideas: From the broadest visioning exercises to specific functionality requirements, the first step is to list the potential options.
2. Evaluation of ideas: Having documented everything from the most practical to the far-fetched, the team can then coolly and rationally analyze and priori-tize the components, using agreed-on metrics.
3. Product/service design: These “ideas” are then converted into “requirements,” often with very specific technical parameters.
There are two core elements of this longer-term competency-enhancing work. The first is the generation of ideas. Most companies utilize a standard process to make sure that everyone has time and motivation to contribute. The second element is to promote an environment conductive to innovation. This includes
1. Cultural values and institutional commitment 2. Allocation of resources 3. Linkage with the company’s business strategy
Creating an “innovation-friendly” environment is time-consuming and will require the manager to forego focusing on the “here and how.” When there is constant pres-sure to “hit the numbers” or “make something happen,” it is difficult to be farsighted and build in time for you and your team to “create an environment.”
Managing innovation is a bit different from creating an environment that promotes innovation. This refers to the service- or product-specific initiative, whether it is a new car or a streamlined manufacturing process. The big question is how do we make

171Designing CustoMer Value systeMs
this process come together on time and under budget? There are two main phases to the successful management of innovation:
The first phase seeks to stress test the proposal with a variety of operational and financial benchmarks, such as
1. Is the innovation “real?” Is this “next great thing” dramatic enough to justify the costs, financial and otherwise? Does it clearly and demonstrably distance you from your competitors? And can it be easily duplicated once it becomes public knowledge?
Table 10.3 Promoting Innovation
TECHNIQUE DEFINITION/EXAMPLES
Commitment to problem-solving • Ability to ask the “right questions”• Build in time for research and analysis
Commitment to openness • Analytical and cultural flexibilityAcceptance of “out-of-box” thinking • Seek out and encourage different viewpoints, even radical ones!Willingness to reinvent products and processes that are already in place
• Create a “blank slate” opportunity map, even for processes that appear to be battle-tested and comfortable
Willingness to listen to everyone (employees, customers, vendors)
• “Open door”• Respect for data and perspective without regard to seniority or insider
statusKeeping informed of industry trends • Constantly scanning business publications/trade journals, and clipping
articles of interest• “FYI” participation with fellow managers
Promotion of diversity, cross-pollination • Forward-thinking team formation, which also attempts to foster diversity• Sensitive to needs of gender, race, even work style
Change of management policies • Instill energy and “fresh start” by revising established rulesProvision of incentives for all employees, not just researchers/engineers
• Compensation schemes to align individual performance with realization of company goals
Use of project management • Clear goals and milestones• Tracking tools• Expanded communication
Transfer of knowledge within an organization
• Commitment to aggregating and reformatting key data for “intelligence” purposes
Provision for off-site teaming • Structured meetings and socialization outside the office to reinforce bonds between key team members
Provision for off-site training • Development of individuals through education and experiential learning to master new competencies
Use of simple visual models • Simple but compelling frameworks and schematics to clarify core beliefsUse of the Internet for research • Fluency and access to websites (e.g., competitor home pages)Development of processes for implementing new products and ideas
• Structured ideation and productization process• Clear release criteria• Senior management buy-in
Champion products • Identify and prioritize those products that represent the best possible chance for commercial success
• Personally engage and encourage contributors to strategic initiatives

172 Managing it PerforManCe to Create Business Value
2. Can the innovation actually be done? Does the organization have the resources? This is where you figure out whether the rubber meets the road. You need to ask whether you have the capabilities and functional expertise to realize this vision. Many organizations come up with a multitude of ideas. On further examination, they often find that they simply do not have the resources to do the vast majority of them. This might lead them to become innovative in a different way as they search for partners. In other words, some organizations try to couple their brains with someone else’s brawn!
3. Is the innovation worth it? Does the innovation fit into the organization’s mission and strategic plan? Return on investment (ROI) is the most frequently used quantitative measure to help us plan and assess new initiatives. Probably more useful, however, is return on management (ROM), which poses a fundamen-tal question: what should the CEO and his or her management team focus on? Research extending over a period of 10 years led to the concept of ROM. This ratio is calculated by first isolating the management value-added of a company, and then dividing it by the company’s total management costs:
Return-on-management F management value-added, management c= oosts( ) Management value-added is what remains after every contributor to a
firm’s inputs gets paid. If management value-added is greater than manage-ment costs, you can say that managerial efforts are productive because the managerial outputs exceed managerial inputs.
Another way of looking at the ROM ratio (ROM™ productivity index) is to view it as a measure of productivity. It answers the question of how many surplus dollars you get for every dollar paid for management.
4. The second phase, design, is the process by which these ideas and concepts get distilled into an actual product design, for example, a website map or a prototype. Many mistakes are made by delegating this process to lower-level functional experts, when in fact some of these decisions go a long way toward determining the product’s ultimate acceptance in the marketplace!
Most of the outward signs of excellence and creativity that we associate with the most innovative companies are the result of a culture and its related values, which encourage and support managers who use their specific initiatives to reinforce and strengthen the com-pany’s processes. When these processes become “repeatable,” they become the rule instead of the exception, which of course makes it easier for the next manager to “be innovative.”
Capital One is a company that uses a model based on continuous innovation. They utilize a patented information-based strategy (IBS) that enables the company to expand its mature credit card business by tailoring more than 16,000 different prod-uct combinations to customers’ needs. They are able to embrace high degrees of risk because they base their innovations on customer needs. The company tests new ideas against existing customers or possibly a separate grouping of prospects.

173Designing CustoMer Value systeMs
In Conclusion
A wealth of metrics can be derived from the preceding discussions. Other innovation metrics to consider include
1. Return on innovation investment: Number of customers who view the brand as innovative, divided by the total number of potential customers
2. Brand innovation quotient: Number of repeat purchasers divided by total number of purchasers
3. Pipeline process flow: Measures number of products at every stage of develop-ment (i.e., concept development, business analysis, prototype, test, launch)
4. Innovation loyalty: Number of repeat purchases made before switching to a competitor
ReferencesMacRae, D. (2002). Welcome to the ‘Customer Economy’. Business Week Online, May 10.Nelson, B. (2004). Using force field analysis to listen to customers. productmarketing.com: The
Marketing Journal for High-Tech Product Managers, 2(3), May/June.

175
Appendix I: IT Interview Questions
Basic Interview Questions
1. Tell me about yourself. 2. What are your strengths? 3. What are your weaknesses? 4. Why do you want this job? 5. Where would you like to be in your career 5 years from now? 6. What’s your ideal company? 7. What attracted you to this company? 8. Why should we hire you? 9. What did you like least about your last job? 10. When were you most satisfied in your job? 11. What can you do for us that other candidates can’t? 12. What were the responsibilities of your last position? 13. Why are you leaving your present job? 14. What do you know about this industry? 15. What do you know about our company? 16. Are you willing to relocate? 17. Do you have any questions for me?
Behavioral Interview Questions
1. What was the last project you headed up, and what was its outcome? 2. Give me an example of a time that you felt you went above and beyond the call
of duty at work. 3. Can you describe a time when your work was criticized?

176 aPPenDix i
4. Have you ever been on a team where someone was not pulling their own weight? How did you handle it?
5. Tell me about a time when you had to give someone difficult feedback. How did you handle it?
6. What is your greatest failure, and what did you learn from it? 7. What irritates you about other people, and how do you deal with it? 8. If I were your supervisor and asked you to do something that you disagreed
with, what would you do? 9. What was the most difficult period in your life, and how did you deal with it? 10. Give me an example of a time you did something wrong. How did you
handle it? 11. Tell me about a time where you had to deal with conflict on the job. 12. If you were at a business lunch and you ordered a rare steak and they brought
it to you well done, what would you do? 13. If you found out your company was doing something against the law, like
fraud, what would you do? 14. What assignment was too difficult for you, and how did you resolve the issue? 15. What’s the most difficult decision you’ve made in the last 2 years and how did
you come to that decision? 16. Describe how you would handle a situation if you were required to finish
multiple tasks by the end of the day, and there was no conceivable way that you could finish them.
Salary Questions
1. What salary are you seeking? 2. What’s your salary history? 3. If I were to give you this salary you requested but let you write your job
description for the next year, what would it say?
Career Development Questions
1. What are you looking for in terms of career development? 2. How do you want to improve yourself in the next year? 3. What kind of goals would you have in mind if you got this job? 4. If I were to ask your last supervisor to provide you with additional training or
exposure, what would she suggest? 5. How would you go about establishing your credibility quickly with the team? 6. How long will it take for you to make a significant contribution? 7. What do you see yourself doing within the first 30 days of this job? 8. If selected for this position, can you describe your strategy for the first 90 days?

177aPPenDix i
9. How would you describe your work style? 10. What would be your ideal working environment? 11. What do you look for in terms of culture—structured or entrepreneurial? 12. Give examples of ideas you’ve had or implemented. 13. What techniques and tools do you use to keep yourself organized? 14. If you had to choose one, would you consider yourself a big-picture person or
a detail-oriented person? 15. Tell me about your proudest achievement. 16. Who was your favorite manager and why? 17. What do you think of your previous boss? 18. Was there a person in your career who really made a difference? 19. What kind of personality do you work best with and why? 20. What are you most proud of? 21. What do you like to do? 22. What are your lifelong dreams? 23. What do you ultimately want to become? 24. What is your personal mission statement? 25. What are three positive things your last boss would say about you? 26. What negative thing would your last boss say about you? 27. What three character traits would your friends use to describe you? 28. What are three positive character traits you don’t have? 29. If you were interviewing someone for this position, what traits would you
look for? 30. List five words that describe your character. 31. Who has impacted you most in your career and how? 32. What is your greatest fear? 33. What is your biggest regret and why? 34. What’s the most important thing you learned in school? 35. Why did you choose your major? 36. What will you miss about your present/last job? 37. What is your greatest achievement outside of work? 38. What are the qualities of a good leader? A bad leader? 39. Do you think a leader should be feared or liked? 40. How do you feel about taking no for an answer? 41. How would you feel about working for someone who knows less than you? 42. How do you think I rate as an interviewer? 43. Tell me one thing about yourself you wouldn’t want me to know. 44. Tell me the difference between good and exceptional. 45. What kind of car do you drive? 46. There’s no right or wrong answer, but if you could be anywhere in the world
right now, where would you be?
178 aPPenDix i
47. What’s the last book you read? 48. What magazines do you subscribe to? 49. What’s the best movie you’ve seen in the last year? 50. What would you do if you won the lottery? 51. Who are your heroes? 52. What do you like to do for fun? 53. What do you do in your spare time? 54. What is your favorite memory from childhood?
Brainteaser Questions
1. How many times do a clock’s hands overlap in a day? 2. How would you weigh a plane without scales? 3. Tell me 10 ways to use a pencil other than writing. 4. Sell me this pencil. 5. If you were an animal, which one would you want to be? 6. Why is there fuzz on a tennis ball? 7. If you could choose one superhero power, what would it be and why? 8. If you could get rid of any one of the US states, which one would you get rid
of and why? 9. With your eyes closed, tell me step-by-step how to tie my shoes.
Most Common Interview Questions
1. What are your strengths? 2. What are your weaknesses? 3. Why are you interested in working for [insert company name here]? 4. Where do you see yourself in 5 years? 10 years? 5. Why do you want to leave your current company? 6. Why was there a gap in your employment between [insert date] and
[insert date]? 7. What can you offer us that someone else cannot? 8. What are three things your former manager would like you to improve on? 9. Are you willing to relocate? 10. Are you willing to travel? 11. Tell me about an accomplishment you are most proud of. 12. Tell me about a time you made a mistake. 13. What is your dream job? 14. How did you hear about this position? 15. What would you look to accomplish in the first 30 days/60 days/90 days on
the job? 16. Discuss your resume.

179aPPenDix i
17. Discuss your educational background. 18. Describe yourself. 19. Tell me how you handled a difficult situation. 20. Why should we hire you? 21. Why are you looking for a new job? 22. Would you work holidays/weekends? 23. How would you deal with an angry or irate customer? 24. What are your salary requirements? (Hint: If you’re not sure what’s a fair
salary range and compensation package, research the job title and/or company on Glassdoor.)
25. Give a time when you went above and beyond the requirements for a project. 26. Who are our competitors? 27. What was your biggest failure? 28. What motivates you? 29. What’s your availability? 30. Who’s your mentor? 31. Tell me about a time when you disagreed with your boss. 32. How do you handle pressure? 33. What is the name of our CEO? 34. What are your career goals? 35. What gets you up in the morning? 36. What would your direct reports say about you? 37. What were your bosses’ strengths/weaknesses? 38. If I called your boss right now and asked him what is an area that you could
improve on, what would he say? 39. Are you a leader or a follower? 40. What was the last book you’ve read for fun? 41. What are your co-worker pet peeves? 42. What are your hobbies? 43. What is your favorite website? 44. What makes you uncomfortable? 45. What are some of your leadership experiences? 46. How would you fire someone? 47. What do you like the most and least about working in this industry? 48. Would you work 40+ h a week? 49. What questions haven’t I asked you? 50. What questions do you have for me? 51. If we’re sitting here a year from now, celebrating what a great year it’s been for
you in this role, what did we achieve together? 52. When have you been most satisfied in your life? 53. If you got hired, loved everything about this job, and are paid the salary
you asked for, what kind of offer from another company would you consider?

180 aPPenDix i
54. Who is your role model, and why? 55. What things do you not like to do? 56. Tell me about a project or accomplishment that you consider to be the most
significant in your career. 57. Why have you had x amount of jobs in y years? 58. Tell me about a recent project or problem that you made better, faster, smarter,
more efficient, or less expensive. 59. Discuss a specific accomplishment you’ve achieved in a previous position that
indicates you will thrive in this position. 60. So, (insert name), what’s your story? 61. What questions do you have for me?
Software Engineer
1. What is something substantive that you’ve done to improve as a developer in your career?
2. Would you call yourself a craftsman (craftsperson) and what does that word mean to you?
3. Implement a <basic data structure> using <some language> on paper/whiteboard/notepad.
4. What is SOLID? 5. Why is the Single Responsibility Principle important? 6. What is Inversion of Control? How does that relate to dependency injection? 7. How does a 3 tier application differ from a 2 tier one? 8. Why are interfaces important? 9. What is the Repository pattern? The Factory Pattern? Why are patterns
important? 10. What are some examples of anti-patterns? 11. Who are the Gang of Four? Why should you care? 12. How do the MVP, MVC, and MVVM patterns relate? When are they
appropriate? 13. Explain the concept of separation of concerns and its pros and cons. 14. Name three primary attributes of object-oriented design. Describe what they
mean and why they’re important. 15. Describe a pattern that is not the Factory Pattern. How is it used and when? 16. You have just been put in charge of a legacy code project with maintainability
problems. What kind of things would you look to improve to get the project on a stable footing?
17. Show me a portfolio of all the applications you worked on, and tell me how you contributed to design them.
18. What are some alternate ways to store data other than a relational database? Why would you do that, and what are the trade-offs?

181aPPenDix i
19. Explain the concept of convention over configuration, and talk about an example of convention over configuration you have seen in the wild.
20. Explain the differences between stateless and stateful systems, and the impacts of state on parallelism.
21. Discuss the differences between mocks and stubs/fakes and where you might use them (answers aren’t that important here, just the discussion that would ensue).
22. Discuss the concept of YAGNI and explain something you did recently that adhered to this practice.
23. Explain what is meant by a sandbox, why you would use one, and identify examples of sandboxes in the wild.
24. What’s the difference between Locking and Lockless (Optimistic and Pessimistic) concurrency models?
25. What kinds of problems can you hit with a locking model? And a lockless model?
26. What trade offs do you have for resource contention? 27. How might a task-based model differ from a threaded model? 28. What’s the difference between asynchrony and concurrency? 29. Are you still writing code? Do you love it? 30. You’ve just been assigned to a project in a new technology, how would you get
started? 31. How does the addition of Service Orientation change systems? When is it
appropriate to use? 32. What do you do to stay abreast of the latest technologies and tools? 33. What is the difference between “set” logic and “procedural” logic. When
would you use each one and why? 34. What source control systems have you worked with? 35. What is Continuous Integration? Have you used it and why is it important? 36. Describe a software development life cycle that you’ve managed. 37. How do you react to people criticizing your code/documents? 38. Whose blogs or podcasts do you follow? Do you blog or podcast? 39. Tell me about some of your hobby projects that you’ve written in your off
time. 40. What is the last programming book you read? 41. Describe, in as much detail as you think is relevant, as deeply as you can, what
happens when I type “cnn.com” into a browser and press “go.” 42. Describe the structure and contents of a design document, or a set of design
documents, for a multi-tiered web application. 43. What’s so great about <cool web technology of the day>? 44. How can you stop your DBA from making off with a list of your users’
passwords? 45. What do you do when you get stuck with a problem you can’t solve?

182 aPPenDix i
46. If your database was under a lot of strain, what are the first few things you might consider to speed it up?
47. What is SQL injection? 48. What’s the difference between unit test and integration test? 49. Tell me about three times you failed. 50. What is Refactoring? Have you used it and is it important? Name three
common refactorings. 51. You have two computers, and you want to get data from one to the other. How
could you do it? 52. Left to your own devices, what would you create? 53. Given time, cost, client satisfaction, and best practices, how will you prioritize
them for a project you are working on? Explain why. 54. What’s the difference between a web server, web farm, and web garden? How
would your web application need to change for each? 55. What value do daily builds, automated testing, and peer reviews add to a
project? What disadvantages are there? 56. What elements of OO design are most prone to abuse? How would you
mitigate that? 57. When do you know your code is ready for production? 58. What’s YAGNI? Is this list of questions an example? 59. Describe to me some bad code you’ve read or inherited lately.
Software Developers: Requirements
1. Can you name a number of non-functional (or quality) requirements? 2. What is your advice when a customer wants high performance, high usability,
and high security? 3. Can you name a number of different techniques for specifying requirements?
What works best in which case? 4. What is requirements tracing? What is backward tracing vs. forward tracing? 5. Which tools do you like to use for keeping track of requirements? 6. How do you treat changing requirements? Are they good or bad? Why? 7. How do you search and find requirements? What are possible sources? 8. How do you prioritize requirements? Do you know different techniques? 9. Can you name the responsibilities of the user, the customer, and the developer
in the requirements process? 10. What do you do with requirements that are incomplete or incomprehensible?
Software Developers: Functional Design
1. What are metaphors used for in functional design? Can you name some successful examples?

183aPPenDix i
2. How can you reduce the user’s perception of waiting when some functions take a lot of time?
3. Which controls would you use when a user must select multiple items from a big list, in a minimal amount of space?
4. Can you name different measures to guarantee correctness of data entry? 5. Can you name different techniques for prototyping an application? 6. Can you name examples of how an application can anticipate user behavior? 7. Can you name different ways of designing access to a large and complex list of
features? 8. How would you design editing 20 fields for a list of 10 items? And editing
3 fields for a list of 1000 items? 9. What is the problem of using different colors when highlighting pieces
of a text? 10. Can you name some limitations of a web environment vs. a Windows
environment?
Software Developers: Technical Design
1. What do low coupling and high cohesion mean? What does the principle of encapsulation mean?
2. How do you manage conflicts in a web application when different people are editing the same data?
3. Do you know about design patterns? Which design patterns have you used, and in what situations?
4. Do you know what a stateless business layer is? Where do long-running transactions fit into that picture?
5. What kinds of diagrams have you used in designing parts of an architecture, or a technical design?
6. Can you name the different tiers and responsibilities in an N-tier architecture? 7. Can you name different measures to guarantee the correctness and robustness
of data in an architecture? 8. Can you name any differences between object-oriented design and component-
based design? 9. How would you model user authorization, user profiles, and permissions in a
database? 10. How would you model the animal kingdom (with species and their behavior)
as a class system?
Software Developers: Construction
1. How do you make sure that your code can handle different kinds of error situations?

184 aPPenDix i
2. Can you explain what Test-Driven Development is? Can you name some principles of Extreme Programming?
3. What do you care about most when reviewing somebody else’s code? 4. When do you use an abstract class and when do you use an interface? 5. Apart from the IDE, which other favorite tools do you use that you think are
essential to you? 6. How do you make sure that your code is both safe and fast? 7. When do you use polymorphism and when do you use delegates? 8. When would you use a class with static members and when would you use a
Singleton class? 9. Can you name examples of anticipating changing requirements in your code? 10. Can you describe the process you use for writing a piece of code, from
requirements to delivery?
Software Developers: Algorithms
1. How do you find out if a number is a power of 2? And how do you know if it is an odd number?
2. How do you find the middle item in a linked list? 3. How would you change the format of all the phone numbers in 10,000 static
html web pages? 4. Can you name an example of a recursive solution that you created? 5. Which is faster: finding an item in a hashtable or in a sorted list? 6. What is the last thing you learned about algorithms from a book, magazine,
or website? 7. How would you write a function to reverse a string? And can you do that
without a temporary string? 8. What type of language do you prefer for writing complex algorithms? 9. In an array with integers between 1 and 1,000,000, one value is in the array
twice. How do you determine which one? 10. Do you know about the Traveling Salesman Problem?
Software Developers: Data Structures
1. How would you implement the structure of the London underground in a computer’s memory?
2. How would you store the value of a color in a database, as efficiently as possible?
3. What is the difference between a queue and a stack? 4. What is the difference between storing data on the heap vs. on the stack? 5. How would you store a vector in N dimensions in a data table? 6. What type of language do you prefer for writing complex data structures?

185aPPenDix i
7. What is the number 21 in binary format? And in hex? 8. What is the last thing you learned about data structures from a book,
magazine, or website? 9. How would you store the results of a soccer/football competition (with teams
and scores) in an XML document? 10. Can you name some different text file formats for storing unicode characters?
Software Developers: Testing
1. Do you know what a regression test is? How do you verify that new changes have not broken existing features?
2. How can you implement unit testing when there are dependencies between a business layer and a data layer?
3. Which tools are essential to you for testing the quality of your code? 4. What types of problems have you encountered most often in your products
after deployment? 5. Do you know what code coverage is? What types of code coverage are there? 6. Do you know the difference between functional testing and exploratory
testing? How would you test a web site? 7. What is the difference between a test suite, a test case, and a test plan? How
would you organize testing? 8. What kind of tests would you include for a smoke test of an ecommerce
web site? 9. What can you do to reduce the chance that a customer finds things that he
doesn’t like during acceptance testing? 10. Can you tell me something that you have learned about testing and quality
assurance in the last year?
Software Developers: Maintenance
1. What kinds of tools are important to you for monitoring a product during maintenance?
2. What is important when updating a product that is in production and is being used?
3. How do you find an error in a large file with code that you cannot step through? 4. How can you make sure that changes in code will not affect any other parts of
the product? 5. How do you create technical documentation for your products? 6. What measures have you taken to make your software products more easily
maintainable? 7. How can you debug a system in a production environment, while it is
being used?

186 aPPenDix i
8. Do you know what load balancing is? Can you name different types of load balancing?
9. Can you name reasons why maintenance of software is the biggest/most expensive part of an application’s life cycle?
10. What is the difference between re-engineering and reverse engineering?
Software Developers: Configuration Management
1. Do you know what a baseline is in configuration management? How do you freeze an important moment in a project?
2. Which items do you normally place under version control? 3. How can you make sure that team members know who changed what in a
software project? 4. Do you know the differences between tags and branches? When do you use
which? 5. How would you manage changes to technical documentation, like the
architecture of a product? 6. Which tools do you need to manage the state of all digital information in a
project? Which tools do you like best? 7. How do you deal with changes that a customer wants in a released product? 8. Are there differences in managing versions and releases? 9. What is the difference between managing changes in text files vs. managing
changes in binary files? 10. How would you treat simultaneous development of multiple RfC’s or
increments and maintenance issues?
Project Management
1. How many of the three variables scope, time, and cost can be fixed by the customer?
2. Who should make estimates for the effort of a project? Who is allowed to set the deadline?
3. Do you prefer minimization of the number of releases or minimization of the amount of work-in-progress?
4. Which kind of diagrams do you use to track progress in a project? 5. What is the difference between an iteration and an increment? 6. Can you explain the practice of risk management? How should risks be
managed? 7. Do you prefer a work breakdown structure or a rolling wave planning? 8. What do you need to be able to determine if a project is on time and within
budget? 9. Can you name some differences between DSDM, Prince2, and Scrum?
187aPPenDix i
10. How do you agree on scope and time with the customer, when the customer wants too much?
11. What is most important to you as a PM: finishing a project on time, on scope, or on budget?
12. Can you give me a redacted copy of the most recent “lessons-learned” document you created?
13. You’re leading a project that must be planned, executed, and closed in 10 days. The work itself will take nine days to complete. How will you conduct your project planning?
14. What industry experience do you have besides [insert your industry here]. Tell me about a project you led in that industry.
15. How do you handle non-productive team members? 16. How do you motivate team members who are burned out, or bored? 17. How do you handle team members who come to you with their personal
problems? 18. What are your career goals? How do you see this job affecting your goals? 19. Explain how you operate interdepartmentally. 20. Tell me how you would react to a situation where there was more than one
way to accomplish the same task, and there were very strong feelings by others on each position.
21. Consider that you are in a diverse environment, out of your comfort zone. How would you rate your situational leadership style?
22. Give me an example of your leadership involvement where teamwork played an important role.
23. Tell me about a situation where your loyalty was challenged. What did you do? Why?
24. In what types of situations is it best to abandon loyalty to your manager? 25. In today’s business environment, when is loyalty to your manager particularly
important? 26. Why are you interested in this position? 27. Describe what you think it would be like to do this job every day. 28. What do you believe qualifies you for this position? 29. What have you learned from your failures? 30. Of your previous jobs, which one did you enjoy the most? What did you like
the most/least? Why? What was your major accomplishment? What was your biggest frustration?
31. Tell me about special projects or training you have had that would be relevant to this job.
32. What are some things that you would not like your job to include? 33. What are your current work plans? Why are you thinking about leaving your
present job? 34. Describe an ideal job for you.
188 aPPenDix i
35. What would you do if you found out that a contractor was in a conflict of interest situation?
36. If I were to contact your former employee, what would he say about your decision-making abilities?
37. Give me an example of a win-win situation you have negotiated. 38. Tell me about your verbal and written communication ability. How well do
you represent yourself to others? What makes you think so? 39. Give me an example of a stressful situation you have been in. How well did
you handle it? If you had to do it over again, would you do it differently? How do you deal with stress, pressure, and unreasonable demands?
40. Tell me about a tough decision you had to make? 41. Describe what you did at your work place yesterday. 42. How would you solve the following technical problem? (Describe a typical
scenario that could occur in the new position.) 43. What strengths did you bring to your last position? 44. Describe how those contributions impacted results? 45. What are the necessary steps to successful project management? 46. How do you plan for a project? 47. What is important to consider when planning a (your type of project)? 48. What are things that you have found to be low priority when planning for
(your type of project)? 49. What distinguishes a project from routine operations? 50. What are the three constraints on a project? 51. What are the five control components of a project? 52. What qualifications are required to be an effective project manager? 53. What experience have you had in project management? 54. Name five signs that indicate your project may fail. 55. Tell us about a project in which you participated and your role in that project. 56. When you are assigned a project, what steps do you take to complete the
project? 57. As you begin your assignment as a project manager, you quickly realize that
the corporate sponsor for the project no longer supports the project. What will you do?
58. Your 3 month project is about to exceed the projected budget after the first month. What steps will you take to address the potential cost overrun?
59. Tell us about a successful project in which you participated and how you contributed to the success of that project.
60. You are given the assignment of project manager and the team members have already been identified. To increase the effectiveness of your project team, what steps will you take?
61. You have been assigned as the project manager for a team comprised of new employees just out of college and “entry-level” consulting staff. What steps

189aPPenDix i
can you take to insure that the project is completed against a very tight time deadline?
62. What is a “project milestone”? 63. What is “project float”? 64. Your project is beginning to exceed budget and to fall behind schedule due to
almost daily user change orders and increasing conflicts in user requirements. How will you address the user issues?
65. You’ve encountered a delay on an early phase of your project. What actions can you take to counter the delay? Which actions will have the most effect on the result?
66. Describe what you did in a difficult project environment to get the job done on time and on budget.
67. What actions are required for successful executive sponsorship of a project? 68. How did you get your last project? 69. What were your specific responsibilities? 70. What did you like about the project and dislike about the project? 71. What did you learn from the project? 72. Tell me about a time when you ran into any difficult situations. How did you
handle them? 73. Tell me about the types of interaction you had with other employees. 74. Tell me of an accomplishment you are particularly proud of and what it
entailed. 75. Do you have people from your past consulting services who would provide
a professional reference? 76. What other similar consulting or independent contractor services have you
rendered? 77. Discuss how you would envision working as an independent contractor or
consultant for us. 78. What conflicting responsibilities will you have? 79. What would be your specific goals for this new role as a consultant or
independent contractor? 80. What experience do you have that you think will be helpful? 81. This assignment will require a lot of [describe]. Will that be a problem for you? 82. This assignment will require interacting with [describe the types of people].
What experience do you have working with such people? 83. What would you like to get from this new assignment? 84. What are two common but major obstacles for a project like this? What would
you do in the face of these obstacles to keep your team on schedule? 85. What is a project charter? What are the elements in a project charter? 86. Which document will you refer to for future decisions? 87. How will you define scope? 88. What is the output of the scope definition process?

190 aPPenDix i
89. What is quality management? 90. Do you inspect or plan for quality? 91. What is EVM? How will you use it in managing projects? 92. What is a project? And what is a program? 93. What are project selection methods? 94. Which tool would you use to define, manage, and control projects? 95. What is risk management and how will you plan risk response? 96. What are outputs of project closure? 97. What are the methods used for project estimation? 98. What methods have you used for estimation? 99. How would you start a project? 100. If you were to deliver a project to a customer, and timely delivery depended
upon a subsupplier, how would you manage the supplier? What contractual agreements would you put in place?
101. In this field (the field you are interviewing for), what are three critically important things you must do well as a project manager in order for the project to succeed?
102. What metrics would you expect to use to determine the ongoing success of your project?
103. How are your soft skills? Can you “sell” the project to a team? 104. You have a team member who is not meeting his commitments, what do you do? 105. How many projects have you handled in the past? Deadlines met? On time/
within budget? Obstacles you had to overcome? 106. Do you understand milestones, interdependencies? Resource allocation? 107. Do you know what Project Software the new company uses and is there
training for it? 108. How would your current (or last) boss describe you? 109. What were your boss’s responsibilities? 110. What’s your opinion of them? 111. How would your co-workers or subordinates describe you professionally? 112. Why do you want to work for us? 113. Why do you want to leave your present employer? 114. Why should we hire you over the other finalists? 115. What qualities or talents would you bring to the job? 116. Tell me about your accomplishments. 117. What is your most important contribution to your last (or current) employer? 118. How do you perform under deadline pressure? Give me an example. 119. How do you react to criticism? (You try to learn from it, of course!) 120. Describe a conflict or disagreement at work in which you were involved. How
was it resolved? 121. What are two of the biggest problems you’ve encountered at your job and how
did you overcome them?

191aPPenDix i
122. Think of a major crisis you’ve faced at work and explain how you handled it. 123. Give me an example of a risk that you took at your job (past or present) and
how it turned out. 124. What’s your managerial style like? 125. Have you ever hired employees; and, if so, have they lived up to your
expectations? 126. What type of performance problems have you encountered in people who
report to you, and how did you motivate them to improve? 127. Describe a typical day at your present (or last) job. 128. What do you see yourself doing 5 years from now? 129. What is project management? 130. Is spending in IT projects constant throughout the project? 131. Who is a stakeholder? 132. Can you explain project life cycle? 133. Are risks constant throughout the project? 134. Can you explain different software development life cycles? 135. What is the triple constraint triangle in project management? 136. What is a project baselines? 137. What is effort variance? 138. How is a project management plan document usually organized? 139. How do you estimate a project? 140. What is a fish bone diagram? 141. Twist: What is an Ishikawa diagram? 142. What is the Pareto principle? 143. How do you handle change requests? 144. What is an internal change request? 145. What is the difference between SITP and UTP in testing? 146. What software have you used for project management? 147. What are the metrics followed in project management? 148. Twist: What metrics will you look at in order to see the project is moving
successfully? 149. You have people in your team who do not meet their deadlines or do not
perform. What actions will you take? 150. Two of your resources have conflicts between them how would you sort it out? 151. What is black box testing and White box testing? 152. What’s the difference between Unit testing, Assembly testing and Regression
testing? 153. What is a V model in testing? 154. How do you start a project? 155. How did you do resource allocations? 156. How will you do code reviews? 157. What is CMMI?
192 aPPenDix i
158. What are the five levels in CMMI? 159. What is continuous and staged representation? 160. Can you explain the process areas? 161. What is Six Sigma? 162. What is DMAIC and DMADV? 163. What are the various roles in Six Sigma implementation? 164. What are function points? 165. Can you explain the steps in function points? 166. What is the FP per day in your current company? 167. What is your company’s productivity factor? 168. Do you know Use Case points? 169. How do you estimate maintenance project and change requests? 170. What are all the skills you will be looking at if you have to hire a project
manager? 171. Why are you looking out for a job? 172. What is your current role and responsibilities? What did you like most in your
current job? 173. How does your day normal look? What are some of the challenges you face on
a daily basis? 174. What makes you excited about Project management? 175. Why should we hire you as a Project manager? 176. How do you handle pressure and stress? 177. Your team is following agile practices. You have to hire a resource for your
team. What are all the skills to consider when you hire a new resource? 178. You are starting a new project, which includes offshore/onsite development.
How do you manage communications? 179. Your project team does not have a hierarchy. You have a couple of good techies
in your project that have the same skills and experience. There is a conflict between the two of them. Both are good technically and very important to the project. How do you handle conflict between them?
180. Have you done performance appraisals before? If yes, how do you appraise people?
181. How do you estimate? What kind of estimation practices do you follow? 182. Your customer is asking for an estimate. You do not have time do FP. But you
do not want to give a ballpark estimate. What kind of estimation will you give?
183. Your company is expert in providing solutions for a particular domain. You are appointed as a project manager for a new project. You have to do Risk management. What will be your approach?
184. How do you improve your team’s efficiency? 185. You are joining as project manager for a team, which already exists. How do
you gain the respect and loyalty of your team members?

193aPPenDix i
186. You are going to be the project manager for a web-based application, which is targeted towards insurance. Your gut feeling is that it would take 5 resources and 8 months to deliver this application.
187. What kind of resources will you hire for this project? 188. If you are asked to deliver the project in 6 months, can you accelerate the
development and deliver it in 6 months? What will be your approach? 189. What kind of release management practices do you follow? 190. Your application is in testing for the last 2 weeks and you are supposed to
deliver the application at the EOD. Your testing team has found a major flaw in your application in the afternoon. You cannot miss the deadline and your developers cannot fix the bug in a couple of hours. How do you handle this situation?
191. You have a resource manager who is not happy with his job and complains all the time. You have noticed that because of this, the team morale is getting spoiled. How do you handle that resource?
192. Your team is into the 6th Iteration of 8 Iteration project. It’s been really hec-tic for the team for the last couple of months as this project is very impor-tant for your customer and to your company. You have started noticing that some of your key resources are getting burnt out. How do you motivate these resources?
193. Yours is a dedicated team for a customer and it has been a dull period for you and your team. You are not actively involved in any development activi-ties. Your team is providing support to the application, which you have deliv-ered earlier. Your team is getting bored as the application is stabilized now. Due to budget issues, the customer is not going to give you work for another 3 months. How do you motivate the resources?
194. There was a situation where there was more than one way to accomplish the same task. Your onsite tech lead and offshore tech lead had different opinions about doing this and the feelings were very strong. Both are very important to you. How do you react to this?
195. What are the practices you follow for project close out? Assume you are into a product customization for a customer and the application has gone live. How do you close this project?
196. Your team is in between iteration. Your customer wants a few more items to be delivered in the iteration that you are currently working on. How do you react to your customer?
197. You are at the customer’s place and your application is in UAT/stabilization phase. Your customer comes up with a change request and says that it is a minor one and he wants to see it in the next release. What will be your response/approach to your customer?
198. What is velocity? How do you estimate your team’s velocity? 199. What is earned value management? Why do you need it?

194 aPPenDix i
200. Describe the type of manager you prefer. 201. What are your team-player qualities? Give examples. 202. How do you prioritize your tasks when there isn’t time to complete them all? 203. How do you stay focused when faced with a major deadline? 204. Are you able to cope with more than one job at a time? 205. In your opinion, why do software projects fail? 206. Your customer wants a bug to be delivered at EOD. You have got the
BUG/CR information in the morning. It will not be possible to develop, completely regress this issue, and deliver it at EOD. How do you approach this issue?
207. You are following Waterfall as your development methodology and you have estimated X days for the design phase. Your customer is not ready to accept this. How do you convince your customer to have X number of days for the design phase?
208. You have to sell agile practices (XP/Scrum) to your organization. Your management is very reluctant to change. You are sure that if you do not change to agile, it will be very tough to survive. What will be your approach?
209. How do you set and manage expectations (with customers, your manager, and your team)?
210. For some reason, you’ve encountered a delay on an early phase of your project. What actions can you take to counter the delay?
211. What is function point analysis? Why do you need it? 212. What is the difference between EO and EQ? What is FTR? 213. You are estimating using function point analysis for a distributed n-tier
application. How do you factor the complexity for distributed n-tier application? Does FP provide support for it?
214. You are getting an adjusted function point count. How do you convert it into effort?
215. How do you manage difficult people/problem employees? 216. How do you build your team’s morale? 217. How do you estimate your SCRUM/XP projects? How do you define velocity
for the first couple of iterations? What is a load factor? 218. What is team building? What are the stages in team building? Do you consider
it as an important thing? Why? 219. What are some of your lessons learnt with your previous iteration delivered?
How do you use your lessons learnt in your iteration planning? 220. Can you describe this position to me in detail, why you believe you are
qualified for this position, and why you are interested in it? 221. Can you describe this company to me as if I were an investor? 222. How do you get your team working on the same project goal? 223. What do you do when a project is initiated and given to you and you have a
gut feeling the scope is too large for the budget and the timeline?

195aPPenDix i
224. What formal project management training have you received, where did you attend, and what have you learned from it?
225. We are very siloed; can you explain how you operate interdepartmentally? 226. Consider that you are in a diverse environment, out of your comfort zone.
How would you rate your situational leadership style? Give me examples. 227. You may also be presented with a couple of case studies. For instance, “What
if a key employee falls sick at a critical time of project delivery?” and etc. 228. How stakeholder expectation is managed? 229. How internal and external project risk is managed (quantitatively if
possible)? 230. How organizational change is managed (involving the stakeholders that will
experience change in their lives as a result of the project)? 231. How “scope management” is done, when the project has not been scoped
properly? 232. What needs to be reported to stakeholders, when and how the data is
collected? 233. How does delegation work? How does the interface between line management
and the project work—can the PM negotiate with Middle and Senior resource managers when interests conflict?
234. How is project progress measured? 235. How project team communications, stress, and conflict are managed. 236. Describe a time when you had to give bad news on a project to a customer. 237. What did you learn from your first job (such as flipping burgers at McD’s?) 238. How good are you at MS Project (or whatever tool you use?) 239. Describe how you motivate and manage a matrixed team—where the people
on your team do not work for you. 240. How would you go about organizing a project that had enterprise-wide
implications? 241. What is your approach to managing projects and how does it vary based on
the size and complexity or the project? 242. Who should lead projects? 243. Who should be accountable for the project’s outcome? 244. What was the budget for the largest project you have managed? 245. What is the project management structure in your project? Is a PL assigned to
the project? 246. How do you know that a particular individual is the project leader (or) how do
you know that you are the project leader? 247. What and where are the policy statements for software project planning? 248. Explain the various activities you do (as a PL) when the project is started up. 249. How do you know what you need to deliver or do in your project? 250. How do you create the software project management plan (SPMP)? 251. What training have you undergone in project planning?

196 aPPenDix i
252. How do you ensure that your project plan is available for others to see? Where will you find the plans of other projects executed (in the past or currently) in the center?
253. How did you choose the appropriate lifecycle for your project? 254. What are the documents that you will refer to in order to create the plan? 255. How do you estimate the effort for your project? Where is the estimation
procedure documented? 256. What procedures do you follow to arrive at the project schedule? 257. Where and how are the risks associated with your project identified and
documented? 258. When you come in to the office, how do you know what you have to do during
the day? 259. How do you report the status of your project? 260. How are team members kept informed about the current status of the project? 261. How do the audits cover planning activities? 262. How does the senior management review your project’s progress? 263. How do you track the technical activities in your project? How is the status of
the project communicated to the team? 264. How do you track the size or changes to the size of the work products in your
project? 265. When do you revise your project plan? When do you know you have to revise
your project plan? Where is the plan revision frequency documented? 266. How do you ensure that you and all the other team members in your project
have the required technical skills to execute the project? 267. How do you assign tasks to your team members? 268. What is the document that should be consulted to know about your project,
the activities you do, your schedules and milestones? 269. How do you handle disruptive team members? 270. How do you handle non-productive team members? 271. How do you motivate team members who are burned out or bored? 272. How do you motivate people? 273. How do you handle team members who come to you with their personal
problems? 274. How do you start a project? 275. If you are teaching the ropes to a new Project Manager, what would you say
are the most important things he needs to look for? 276. What would be the key artifacts needed in a project? 277. How do you manage change? 278. How do you manage conflict in the project team? 279. How do you deal with a difficult team member? 280. What qualifications are required to be an effective project manager? 281. What is the difference between a project plan and a project schedule?

197aPPenDix i
282. What do you include in a project schedule? 283. How do you track a project? 284. How do you track risks? Tell me about the risks that your last project had. 285. What is the difference between a risk and an issue? 286. How do you define quality in project management? 287. What would you say if a team member asks why project management is
needed? Why do we have to do all this documentation ahead of the real work? 288. What have you learned in obtaining your PMP that you are using in real-life
projects? 289. What do you do if a team member presents a work product that you know for
a fact is flawed or incomplete, but the team member insists it is completed and sound?
290. What would you do if a manager whose resources you are using keeps saying that all the documentation required by the project is getting in the way of actual progress?
291. What was your role in your last project? 292. What was the most interesting role you played in a project? 293. What do you do when a team member does not complete his/her assignment
and has gone to another project? 294. Have you used Microsoft Project? How do you like it? 295. How do you verify that the requirements identified for a project are actually
included in the final delivery to the users? 296. How do you verify that the requirements are correct and that they reflect what
the users want? 297. What are your greatest strengths and weaknesses in the Project Management
areas of knowledge? 298. What are the risks you had in your last project? 299. What are the main objects of a project manager? 300. How do you perform Function Point Analysis? 301. What are project management tools? Mention some of them. 302. What are the main attributes that a project manager should possess? 303. How must the project manager react under pressured projects? 304. In what percentage or ratio must a project manager possess technical and
managerial skills? 305. How often is a learning process important for a project manager and why? 306. Explain the managerial features that must be possessed by a project manager. 307. Mention some of the steps to be taken by a project manager to reduce stress in
the project and among team members. 308. What are the induction processes a project manager must plan for team
members? 309. How will you define a project? 310. Provide some examples of projects you’ve worked on.

198 aPPenDix i
311. What is your view of project management? 312. Are there distinct kinds of activities in a project? 313. What do you think is the difference between projects, programs, and a
portfolio? 314. Who is a stakeholder? 315. What are organizational influences? 316. Can you explain project life cycle? 317. What do you understand by a project charter? 318. What do you understand by plan baselines? 319. What qualifications are required to be an effective project manager? 320. What are processes and process groups? 321. What are the knowledge areas relevant to doing a project? 322. What is RAID as it relates to project management? 323. What are the important processes for project integration management? 324. What is a SOW? 325. What does scope management involve? 326. How should changes be controlled? 327. What is Work Breakdown Structure (WBD) and how does it affect the work
estimates of tasks/activities? 328. How do you define a milestone? 329. What are some techniques used for defining scope? 330. How does project scheduling help achieve project execution? 331. How are “activity time” estimates done? 332. How do you estimate in the three point estimating method? 333. How is the project time schedule represented most often? 334. What is a critical path in a schedule network diagram? 335. What are the ways a project time schedule can be compressed? 336. What is effort variance? 337. What is earned value management (EVM)? 338. What is quality control? 339. What’s the need for process improvement plans? 340. What is the tool used for arriving at improvements in processes? 341. What are the important aspects of a HR plan for the project team? 342. Why is the performance management process in the HR management plan
important? 343. How do you determine the communication needs of stakeholders? 344. What are the types of risks you may encounter in a project? 345. What is a risk register? 346. Are there any positive aspects of the risk identification process? 347. What is risk impact and probability? 348. What is the role of Ishikawa/Fishbone diagrams in determining root causes
of risks?

199aPPenDix i
349. What are fixed type contracts in procurement processes? 350. What are time and material contracts? 351. What is the primary purpose of a procurement management plan? 352. What does the role of the procurement administrator involve? 353. Why does a PM need to be very proactive? 354. Forming a team, developing the team, and improving knowledge are direct
responsibilities of the project manager, do you agree? 355. Do you think professionalism and integrity are essential qualities of a PM? 356. Explain the team forming process?
Tough Interview Questions
1. Tell me about yourself. 2. What are your greatest strengths? 3. What are your greatest weaknesses? 4. Tell me about something you did—or failed to do—that you now feel a little
ashamed of. 5. Why are you leaving (or did you leave) this position? 6. Why should I hire you? 7. Aren’t you overqualified for this position? 8. Where do you see yourself 5 years from now? 9. Describe your ideal company, location, and job. 10. Why do you want to work at our company? 11. What are your career options right now? 12. Why have you been out of work so long? 13. Tell me honestly about the strong points and weak points of your boss
(company, management team, etc.)… 14. What good books have you read lately? 15. Tell me about a situation when your work was criticized. 16. What are your outside interests? 17. How do you feel about reporting to a younger person (minority, woman, etc.)? 18. Would you lie for the company? 19. Looking back, what would you do differently in your life? 20. Could you have done better in your last job? 21. Can you work under pressure? 22. What makes you angry? 23. Why aren’t you earning more money at this stage of your career? 24. Who has inspired you in your life and why? 25. What was the toughest decision you ever had to make? 26. Tell me about the most boring job you’ve ever had. 27. Have you been absent from work more than a few days in any previous
position?
200 aPPenDix i
28. What changes would you make if you came on board? 29. How do you feel about working nights and weekends? 30. Are you willing to relocate or travel? 31. Do you have the stomach to fire people? Have you had experience firing
many people? 32. Why have you had so many jobs? 33. What do you see as the proper role/mission of… 34. What would you say to your boss if he’s crazy about an idea, but you think
it stinks? 35. How could you have improved your career progress? 36. What would you do if a fellow executive on your own corporate level wasn’t
pulling his/her weight…and this was hurting your department? 37. You’ve been with your firm a long time. Won’t it be hard switching to a
new company? 38. May I contact your present employer for a reference? 39. Give me an example of your creativity (analytical skill managing ability, etc.) 40. Where could you use some improvement? 41. What do you worry about? 42. How many hours a week do you normally work? 43. What’s the most difficult part of being a (job title)? 44. What was the toughest challenge you’ve ever faced? 45. Have you considered starting your own business? 46. What are your goals? 47. What do you look for when you hire people? 48. Sell me this stapler… (this pencil, this clock, or some other object on the
interviewer’s desk). 49. How much money do you want? 50. What was the toughest part of your last job? 51. How do you define success… and how do you measure up to your own
definition? 52. If you won a $10 million lottery, would you still work? 53. Looking back on your last position, have you done your best work? 54. Why should I hire you from the outside when I could promote someone
from within? 55. Tell me something negative you’ve heard about our company… 56. On a scale of one to ten, rate me as an interviewer.
Questions Rumored to Have Been Asked at Google Interviews
Product Marketing Manager
1. Why do you want to join Google? 2. What do you know about Google’s product and technology?

201aPPenDix i
3. If you are Product Manager for Google’s Adwords, how do you plan to market this?
4. What would you say during an AdWords or AdSense product seminar? 5. Who are Google’s competitors, and how does Google compete with them? 6. Have you ever used Google’s products? Gmail? 7. What’s a creative way of marketing Google’s brand name and product? 8. If you are the product marketing manager for Google’s Gmail product, how
do you plan to market it so as to achieve 100 million customers in 6 months? 9. How much money do you think Google makes daily from Gmail ads? 10. Name a piece of technology you’ve read about recently. Now tell me your own
creative execution for an ad for that product. 11. Say an advertiser makes $0.10 every time someone clicks on their ad. Only
20% of people who visit the site click on their ad. How many people need to visit the site for the advertiser to make $20?
12. Estimate the number of students who are college seniors, attend 4-year schools, and graduate with a job in the United States every year.
Product Manager
1. How would you boost the GMail subscription base? 2. What is the most efficient way to sort a million integers? 3. How would you re-position Google’s offerings to counteract competitive
threats from Microsoft? 4. How many golf balls can fit in a school bus? 5. You are shrunk to the height of a nickel and your mass is proportionally
reduced so as to maintain your original density. You are then thrown into an empty glass blender. The blades will start moving in 60 s. What do you do?
6. How much should you charge to wash all the windows in Seattle? 7. How would you find out if a machine’s stack grows up or down in memory? 8. Explain a database in three sentences to your 8-year-old nephew. 9. How many times a day does a clock’s hands overlap? 10. You have to get from point A to point B. You don’t know if you can get there.
What would you do? 11. Imagine you have a closet full of shirts. It’s very hard to find a shirt. So what
can you do to organize your shirts for easy retrieval? 12. Every man in a village of 100 married couples has cheated on his wife. Every
wife in the village instantly knows when a man other than her husband has cheated, but does not know when her own husband has. The village has a law that does not allow for adultery. Any wife who can prove that her husband is unfaithful must kill him that very day. The women of the village would never disobey this law. One day, the queen of the village visits and announces that at least one husband has been unfaithful. What happens?

202 aPPenDix i
13. In a country in which people only want boys, every family continues to have children until they have a boy. If they have a girl, they have another child. If they have a boy, they stop. What is the proportion of boys to girls in the country?
14. If the probability of observing a car in 30 min on a highway is 0.95, what is the probability of observing a car in 10 min (assuming constant default probability)?
15. If you look at a clock and the time is 3:15, what is the angle between the hour and the minute hands? (The answer to this is not zero!)
16. Four people need to cross a rickety rope bridge to get back to their camp at night. Unfortunately, they only have one flashlight and it only has enough light left for 17 min. The bridge is too dangerous to cross without a flashlight, and it’s only strong enough to support two people at any given time. Each of the campers walks at a different speed. One can cross the bridge in 1 min, another in 2 min, the third in 5 min, and the slow poke takes 10 min to cross. How do the campers make it across in 17 min?
17. You are at a party with a friend and 10 people are present including you and the friend. Your friend makes you a wager that for every person you find that has the same birthday as you, you get $1; for every person he finds that does not have the same birthday as you, he gets $2. Would you accept the wager?
18. How many piano tuners are there in the entire world? 19. You have eight balls, all of the same size. Seven of them weigh the same, and
one of them weighs slightly more. How can you find the ball that is heavier by using a balance and only two weighings?
20. You have 5 pirates, ranked from 5 to 1 in descending order. The top pirate has the right to propose how 100 gold coins should be divided among them. But the others get to vote on his plan, and if fewer than half agree with him, he gets killed. How should he allocate the gold in order to maxi-mize his share but live to enjoy it? (Hint: One pirate ends up with 98% of the gold.)
21. You are given two eggs. You have access to a 100-storey building. Eggs can be very hard or very fragile, meaning they may break if dropped from the first floor or may not even break if dropped from 100th floor. Both eggs are identical. You need to figure out the highest floor of a 100-storey building an egg can be dropped from without it breaking. The question is how many drops you need to make. You are allowed to break two eggs in the process.
22. Describe a technical problem you had and how you solved it. 23. How would you design a simple search engine? 24. Design an evacuation plan for San Francisco.

203aPPenDix i
25. There is a latency problem in South Africa. Diagnose it. 26. What are three long-term challenges facing Google? 27. Name three non-Google websites that you visit often and like. What do you
like about the user interface and design? Choose one of the three sites and comment on what new feature or project you would work on. How would you design it?
28. If there is only one elevator in the building, how would you change the design? How about if there are only two elevators in the building?
29. How many vacuums are made per year in the USA?
Software Engineer
1. Why are manhole covers round? 2. What is the difference between a mutex and a semaphore? Which one would
you use to protect access to an increment operation? 3. A man pushed his car to a hotel and lost his fortune. What happened? 4. Explain the significance of “dead beef.” 5. Write a C program that measures the speed of a context switch on a UNIX/
Linux system. 6. Given a function that produces a random integer in the range 1 to 5, write a
function that produces a random integer in the range 1 to 7. 7. Describe the algorithm for a depth-first graph traversal. 8. Design a class library for writing card games. 9. You need to check that your friend, Bob, has your correct phone number, but
you cannot ask him directly. You must write a question on a card and give it to Eve who will take the card to Bob and return the answer to you. What must you write on the card, besides the question, to ensure Bob can encode the message so that Eve cannot read your phone number?
10. How are cookies passed in the HTTP protocol? 11. Design the SQL database tables for a car rental database. 12. Write a regular expression that matches an email address. 13. Write a function f(a, b) that takes two character string arguments and returns
a string containing only the characters found in both strings in the order of a. Write a version that is order N-squared and one that is order N.
14. You are given the source to an application that is crashing during run time. After running it 10 times in a debugger, you find it never crashes in the same place. The application is single threaded, and uses only the C standard library. What programming errors could be causing this crash? How would you test each one?
15. Explain how congestion control works in the TCP protocol. 16. In Java, what is the difference between final, finally, and finalize? 17. What is multithreaded programming? What is a deadlock?

204 aPPenDix i
18. Write a function (with helper functions if needed) called to Excel that takes an excel column value (A,B,C,D…AA,AB,AC,… AAA…) and returns a corresponding integer value (A = 1,B = 2,… AA = 26…).
19. You have a stream of infinite queries (i.e.: real-time Google search queries that people are entering). Describe how you would go about finding a good estimate of 1000 samples from this never-ending set of data and then write code for it.
20. Tree search algorithms. Write BFS and DFS code, explain run time and space requirements. Modify the code to handle trees with weighted edges and loops with BFS and DFS, make the code print out path to goal state.
21. You are given a list of numbers. When you reach the end of the list, you will come back to the beginning of the list (a circular list). Write the most efficient algorithm to find the minimum # in this list. Find any given # in the list. The numbers in the list are always increasing but you don’t know where the circu-lar list begins, i.e.: 38, 40, 55, 89, 6, 13, 20, 23, 36.
22. Describe the data structure that is used to manage memory (stack). 23. What’s the difference between local and global variables? 24. If you have 1 million integers, how would you sort them efficiently? (Modify
a specific sorting algorithm to solve this.) 25. In Java, what is the difference between static, final, and const. (if you don’t
know Java, they will ask something similar for C or C++). 26. Talk about your class projects or work projects (pick something easy)…
then describe how you could make them more efficient (in terms of algorithms).
27. Suppose you have an N × N matrix of positive and negative integers. Write some code that finds the submatrix with the maximum sum of its elements.
28. Write some code to reverse a string. 29. Implement division (without using the divide operator, obviously). 30. Write some code to find all permutations of the letters in a particular string. 31. What method would you use to look up a word in a dictionary? 32. Imagine you have a closet full of shirts. It’s very hard to find a shirt. So what
can you do to organize your shirts for easy retrieval? 33. You have eight balls all of the same size. Seven of them weigh the same, and
one of them weighs slightly more. How can you find the ball that is heavier by using a balance and only two weighings?
34. What is the C-language command for opening a connection with a foreign host over the internet?
35. Design and describe a system/application that will most efficiently produce a report of the top 1 million Google search requests. These are the particulars: (a) You are given 12 servers to work with. They are all dual-processor machines with 4 GB of RAM, 4 × 400 GB hard drives and net-worked together (basically, nothing more than high-end PCs). (b) The log

205aPPenDix i
data has already been cleaned for you. It consists of 100 billion log lines, bro-ken down into 12 320 GB files of 40-byte search terms per line. (c) You can use only custom-written applications or available free open-source software.
36. There is an array A[N] of N numbers. You have to compose an array Output [N] such that Output[i] will be equal to a multiplication of all the elements of A[N] except A[i]. For example, Output[0] will be a multiplication of A[1] to A[N – 1] and Output[1] will be a multiplication of A[0] and from A[2] to A[N – 1]. Solve it without division operator and in O(n).
37. Find or determine the nonexistence of a number in a sorted list of N numbers where the numbers range over M, M ≫ N and N is large enough to span multiple disks.
38. You are given a game of Tic Tac Toe. You have to write a function in which you pass the whole game and name of a player. The function will return whether the player has won the game or not. First you have to decide which data structure you will use for the game. You need to tell the algorithm first and then need to write the code. Note: Some positions may be blank in the game| So your data structure should consider this condition also.
39. You are given an array [a1 to an] and you have to construct another array [b1 to bn] where bi =a1*a2*…*an/ai. You are allowed to use only constant space and the time complexity is O(n). No divisions are allowed.
40. How do you put a binary search tree in an array in an efficient manner. Hint: If the node is stored at the ith position and its children are at 2i and 2i + 1 (I mean level order-wise), it is not the most efficient way.
41. How do you find out the fifth maximum element in a binary search tree in an efficient manner. Note: You should not use any extra space. That is, sorting binary search tree and storing the results in an array and listing out the fifth element.
42. Given a data structure having first n integers and next n chars. A = i1 i2 i3…iN c1 c2 c3…cN. Write an in-place algorithm to rearrange the elements of the array as A = i1 c1 i2 c2… in cN.
43. Given two sequences of items, find the items whose absolute number increases or decreases the most when comparing one sequence with the other by reading the sequence only once.
44. Given that one of the strings is very, very long, and the other one could be of various sizes. Windowing will result in O(N + M) solution but could it be better? May be NlogM or even better?
45. How many lines can be drawn in a 2D plane such that they are equidistant from 3 non-collinear points?
46. Let’s say you have to construct Google maps from scratch and guide a person standing on the Gateway of India (Mumbai) to India Gate (Delhi). How do you do the same?

206 aPPenDix i
47. Given that you have one string of length N and M small strings of length L. How do you efficiently find the occurrence of each small string in the larger one?
48. Given a binary tree, programmatically you need to prove it is a binary search tree.
49. You are given a small sorted list of numbers, and a very long sorted list of numbers—so long that it had to be put on a disk in different blocks. How would you find those short list numbers in the bigger one?
50. Suppose you have given N companies, and we want to eventually merge them into one big company. How many ways are there to merge?
51. Given a file of 4 billion 32-bit integers, how to find one that appears at least twice?
52. Write a program for displaying the 10 most frequent words in a file such that your program should be efficient in all complexity measures.
53. Design a stack. We want to push, pop, and also, retrieve the minimum element in constant time.
54. Given a set of coin denominators, find the minimum number of coins to give a certain amount of change.
55. Given an array, (a) find the longest continuous increasing subsequence; (b) find the longest increasing subsequence.
56. Write a function to find the middle node of a single link list. 57. Given two binary trees, write a compare function to check if they are equal or
not. Being equal means that they have the same value and same structure. 58. Implement put/get methods of a fixed size cache with an LRU replacement
algorithm. 59. You are given three sorted arrays (in ascending order); you are required to find
a triplet (one element from each array) such that distance is minimum. 60. Distance is defined like this: If a[i], b[j], and c[k] are three elements then
distance = max (abs(a[i] − b[j]),abs(a[i] − c[k]),abs(b[j] − c[k])). Please give a solution in O(n) time complexity.
61. How does C++ deal with constructors and deconstructors of a class and its child class?
62. Write a function that flips the bits inside a byte (either in C++ or Java). Write an algorithm that take a list of n words, and an integer m, and retrieves the nth most frequent word in that list.
63. What is 2 to the power of 64? 64. Given that you have one string of length N and M small strings of length
L. How do you efficiently find the occurrence of each small string in the larger one?
65. How do you find out the fifth maximum element in a binary search tree in the most efficient manner?
66. Suppose we have N companies, and we want to eventually merge them into one big company. How many ways are there to merge?

207aPPenDix i
67. There is a linked list of millions of node and you do not know the length of it. Write a function that will return a random number from the list.
68. How long would it take to sort 1 trillion numbers? Come up with a good estimate. 69. Order the functions in order of their asymptotic performance: (1) 2^n,
(2) n^100, (3) n!, (4) n^n. 70. There are some data represented by(x, y, z). Now we want to find the Kth
least data. We say (x1, y1, z1) > (x2, y2, z2) when value(x1, y1, z1) > value(x2, y2, z2) where value(x, y, z) = (2^x)*(3^y)*(5^z). Now we cannot get it by calculating value(x, y, z) or through other indirect calculations as lg (value(x, y, z). How to solve it?
71. How many degrees are there in the angle between the hour and minute hands of a clock when the time is a quarter past three?
72. Given an array whose elements are sorted, return the index of the first occurrence of a specific integer. Do this in sublinear time. That is, do not just go through each element searching for that element.
73. Given two linked lists, return the intersection of the two lists: that is, return a list containing only the elements that occur in both of the input lists.
74. What is the difference between a hashtable and a hashmap? 75. If a person dials a sequence of numbers on the telephone, what possible words/
strings can be formed from the letters associated with those numbers? 76. How would you reverse the image on an n by n matrix where each pixel is
represented by a bit? 77. Create a fast cached storage mechanism that, given a limitation on the
amount of cache memory, will ensure that only the least recently used items are discarded when the cache memory is reached when inserting a new item. It supports 2 functions: String get(T t) and void put(String k, T t).
78. Create a cost model that Google can make purchasing decisions based on to compare the cost of purchasing more RAM memory for their servers vs. buying more disk space.
79. Design an algorithm to play a game of Frogger and then code the solution. The object of the game is to direct a frog to avoid cars while crossing a busy road. You may represent a road lane via an array. Generalize the solution for an N-lane road.
80. What sort would you use if you had a large data set on disk and a small amount of RAM to work with?
81. What sort would you use if you required tight max time bounds and wanted highly regular performance?
82. How would you store 1 million phone numbers? 83. Design a 2D dungeon crawling game. It must allow for various items in the
maze—walls, objects, and computer-controlled characters. (The focus is on the class structures, and how to optimize the experience for the user as s/he travels through the dungeon.)

208 aPPenDix i
84. What is the size of the C structure below on a 32-bit system? On a 64-bit? struct foo { char a; char* b; };
Software Engineering Test
1. Efficiently implement three stacks in a single array. 2. Given an array of integers that is circularly sorted, how do you find a given integer? 3. Write a program to find the depth of a binary search tree without using
recursion. 4. Find the maximum rectangle (in terms of area) under a histogram in linear
time. 5. Most phones now have full keyboards. Before that, there were three letters
mapped to a number button. Describe how you would go about implementing spelling and word suggestions as people type.
6. Describe recursive mergesort and its runtime. Write an iterative version in C++/Java/Python.
7. How would you determine if someone has won a game of tic-tac-toe on a board of any size?
8. Given an array of numbers, replace each number with the product of all the numbers in the array except the number itself *without* using division.
9. Create a cache with fast look up that only stores the N most recently accessed items.
10. How would you design a search engine? If each document contains a set of keywords, and is associated with a numeric attribute, how would you build indices?
11. Given two files that have a list of words (one per line), write a program to show the intersection.
12. What kind of data structure would you use to index anagrams of words? For example, if there exists the word “top” in the database, the query for “pot” should list that.
Quantitative Compensation Analyst
1. What is the yearly standard deviation of a stock given the monthly standard deviation?
2. How many resumes does Google receive each year for software engineering? 3. Anywhere in the world, where would you open up a new Google office and
how would you figure out compensation for all the employees at this new office?

209aPPenDix i
4. What is the probability of breaking a stick into three pieces and forming a triangle?
Engineering Manager
1. You are the captain of a pirate ship, and your crew gets to vote on how the gold is divided up. If fewer than half of the pirates agree with you, you die. How do you recommend apportioning the gold in such a way that you get a good share of the booty, but still survive?
Weird Questions
1. If you could throw a parade of any caliber through the office, what type of parade would it be?
2. If you were a pizza delivery man, how would you benefit from scissors? 3. Are you more of a hunter or a gatherer? 4. If you were on an island and could only bring three things, what would you
bring? 5. What is your least favorite thing about humanity? 6. How honest are you? 7. What would you do if you were the one survivor in a plane crash? 8. If you woke up and had 2000 unread emails and could only answer 300 of
them, how would you choose which ones to answer? 9. Who would win in a fight between Spiderman and Batman? 10. If you had a machine that produced $100 dollars for life, what would you be
willing to pay for it today? 11. Describe the color yellow to somebody who is blind. 12. If you were asked to unload a 747 full of jelly beans, what would you do?
Performance Manager
1. What do you consider your strengths and weaknesses as a performance manager?
2. Are you planning to continue your studies and training for performance manager?
3. Who was your favorite manager and why? 4. When were you most satisfied in your job? 5. What motivates you to do your best on the job? 6. Did you ever make a risky decision? How did you handle it? 7. What is the most difficult situation you have faced? 8. What was the most difficult period in your life, and how did you deal with it? 9. How do you handle failures? Provide examples.

210 aPPenDix i
10. Describe your ideal performance manager job. 11. What questions do you have for me? 12. What will you miss about your present or last job? 13. Give me an example of when you involved others in making a decision. 14. Describe some ideas that were implemented. 15. How would you define success for someone in your chosen performance
manager career? 16. Give an example of risk that you had to take. Why did you decide to take
the risk? 17. What type of management style do you thrive under? 18. What kind of events cause you stress on the job? 19. What do you do if you disagree with a co-worker? 20. What were the steps you needed to take to achieve goals? 21. What personal qualities or characteristics do you most value? 22. What was your best learning experience? 23. Why do you believe you are qualified for this performance manager position? 24. What do you think of your previous boss? 25. What major challenges and problems did you face? 26. Can you describe a time when your work as performance manager was
criticized? 27. Give an example of how you set goals and achieve them. 28. Have you ever challenged, shaken old work methods? 29. Tell me about a time where you had to deal with conflict on the job. 30. What is the highest-level job one can hold in this career? 31. Describe your ideal performance manager job. 32. Tell me about an important goal that you set in the past. 33. What did you like least about your last job? 34. How did you prepare for this performance manager job? 35. What are your strengths? 36. Are you good at working in a team? 37. Why are you leaving your present job? 38. What do you think is the greatest challenge facing performance manager
today? 39. Describe a time you were faced with stresses that tested your coping skills. 40. What motivates you to do your best on the job? 41. What are you expecting from the performance manager job in the future? 42. How did you get work assignments at your most recent employer?
Performance Measurement Manager
1. What is benchmarking? 2. What experience have you had in benchmarking?

211aPPenDix i
3. Discuss the advantages and disadvantages of benchmarking a government agency to the public sector and benchmarking to the private sector.
4. What are the keys for implementing a performance measurement program? 5. What are some of the means by which performance can be measured? 6. What requirements should be met in order to measure performance? 7. What does “best practices” mean? 8. How would you communicate the implementation of performance measure-
ments so as to not panic staff? 9. How do you measure people’s performance? 10. How do you set meaningful KPIs and performance measures? 11. Where can I find example KPIs and measures for my industry/business? 12. How do you get started with performance measurement and KPIs? 13. How do you use KPIs and performance measures to improve performance? 14. How do you align KPIs to strategy and cascade throughout the organization? 15. How do you get buy-in from people (staff) for performance measurement
and KPIs? 16. How do I become a KPI expert and lead others to measure performance
meaningfully? 17. How can I get training in KPIs and performance measurement? 18. How do you get leadership support for KPIs and performance measures? 19. What is Six Sigma?
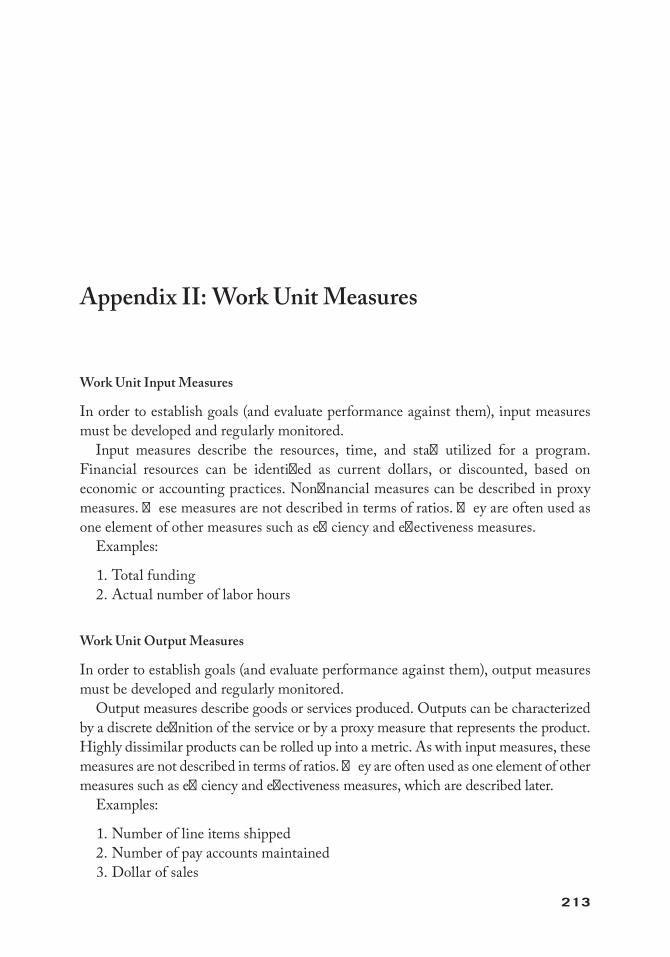
213
Appendix II: Work Unit Measures
Work Unit Input Measures
In order to establish goals (and evaluate performance against them), input measures must be developed and regularly monitored.
Input measures describe the resources, time, and staff utilized for a program. Financial resources can be identified as current dollars, or discounted, based on economic or accounting practices. Nonfinancial measures can be described in proxy measures. These measures are not described in terms of ratios. They are often used as one element of other measures such as efficiency and effectiveness measures.
Examples:
1. Total funding 2. Actual number of labor hours
Work Unit Output Measures
In order to establish goals (and evaluate performance against them), output measures must be developed and regularly monitored.
Output measures describe goods or services produced. Outputs can be characterized by a discrete definition of the service or by a proxy measure that represents the product. Highly dissimilar products can be rolled up into a metric. As with input measures, these measures are not described in terms of ratios. They are often used as one element of other measures such as efficiency and effectiveness measures, which are described later.
Examples:
1. Number of line items shipped 2. Number of pay accounts maintained 3. Dollar of sales

214 aPPenDix ii
4. Net operating result 5. Total number of transactions for the period
Work Unit Efficiency Measures
In order to establish goals (and evaluate performance against them), efficiency measures must be developed and regularly monitored.
Efficiency is the measure of the relationship of outputs to inputs and is usually expressed as a ratio. These measures can be expressed in terms of actual expenditure of resources as compared with expected expenditure of resources. They can also be expressed as the expenditure of resources for a given output.
Examples:
1. Unit cost per output total cost of operations of complete
=# dd transactions or units produced( )
2. Labor productivity of completed transactions or units pr
=# ooduced
actual labor hours( )
#
3. Cycle time days to complete job order job orders comple
= ## tted
Work Unit Effectiveness Measures
In order to establish goals (and evaluate performance against them), effectiveness measures must be developed and regularly monitored.
Effectiveness measures are measures of output conformance to specified characteristics.
Examples:
1. Quantity computers repaired computers requiring repair
= ##
2. Timeliness transactions completed by target timetotal tr
= ## aansactions for period
3. Quality defect-free products received by customers prod
= ## uucts received by customers
4. Customer satisfaction a. Customer satisfaction survey results b. Complaint rates
Work Unit Direct Outcomes
In order to establish goals (and evaluate performance against them), direct outcome measures must be developed and regularly monitored. Direct outcome measures assess the effect of output against given objective standard.

215aPPenDix ii
Examples:
1. System-readiness rate 2. System-literacy status of eligible population
Work Unit Impact Measures
In order to establish goals (and evaluate performance against them), impact measures must be developed and regularly monitored. Impact measures describe how the out-come of a program affects strategic organization or mission objectives.
Example:
1. Impact of system on productivity of workers
Diagnosis
In order to implement a customer-driven strategy in an organization, you must first learn what you are (and are not) doing now that will drive or impede the quality improvement process. An internal evaluation, or diagnosis, of key areas and pro-cesses in the organization can help you determine what you are doing right and where improvement is needed. Doing things right means
• Defining customer requirements• Turning customer requirements into specifications• Identifying key indicators that can be tracked to learn which requirements are
being met and which are not
Warranties/Guarantees
Warranties and guarantees demonstrate the organization’s commitments to customers. Whether explicit or implicit, they are promises made to customers about products or services. These commitments should promote trust and confidence among customers in the organization’s products, services, and relationships. Make sure that the orga-nization’s commitments
• Address the principal concerns of customers• Are easily understandable• Are specific and concise• Are periodically revisited to ensure that quality improvements are reflected• Compare favorably with those of competing companies
Supplier Activities
Quality results demand that supplies, materials, commodities, and services required by the organization meet quality specifications. One of the best ways to ensure this is

216 aPPenDix ii
to develop long-term relationships with suppliers. The purchase of supplies should not be made on the basis of price tag alone. The development of a long-term relationship requires that the supplier also be concerned with quality and work with the organiza-tion as part of a team effort to reduce costs and improve quality. Some ways to involve suppliers as part of your team include
• Having suppliers review a product or service throughout the development cycle
• Making sure your suppliers know how you define quality requirements• Working with suppliers to agree on quality goals
Cost-Effectiveness
This is an evaluation process to assess changes in the relationship of resources to (1) an outcome, (2) an efficiency rate, or (3) an effectiveness rate.
Examples:
1. Outcome: Is it cost effective to spend 10% more resources to improve base security by 5%?
2. Efficiency: Will an investment in equipment whose depreciation increases unit cost by 5% reduce operating costs by more than that amount?
3. Effectiveness: Will a change in the process result in the same efficiency rate but at a much improved effectiveness rate, as measured by quality, timeliness, and so on?
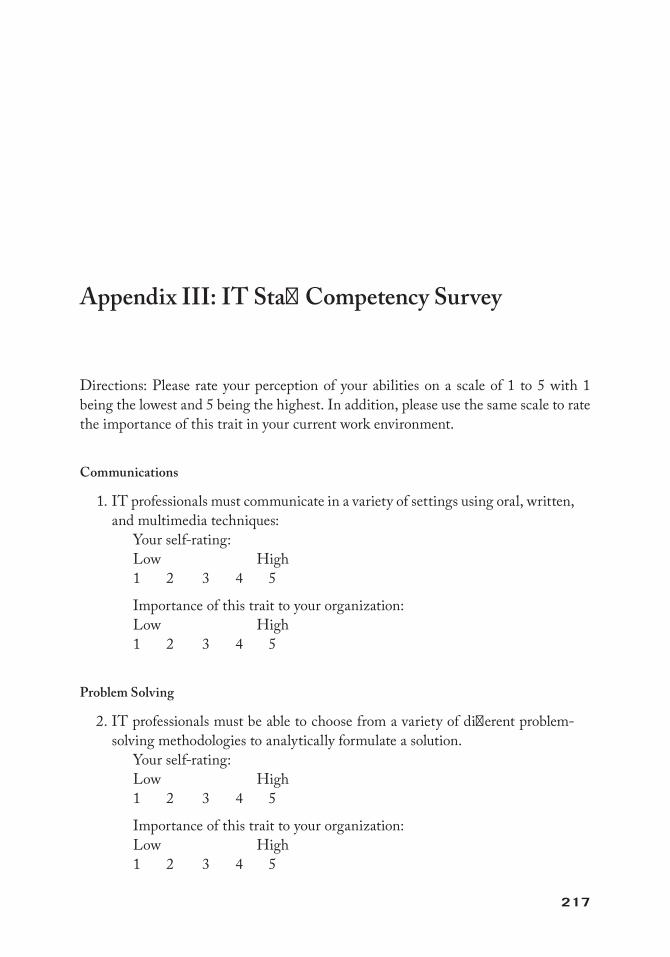
217
Appendix III: IT Staff Competency Survey
Directions: Please rate your perception of your abilities on a scale of 1 to 5 with 1 being the lowest and 5 being the highest. In addition, please use the same scale to rate the importance of this trait in your current work environment.
Communications
1. IT professionals must communicate in a variety of settings using oral, written, and multimedia techniques: Your self-rating: Low High 1 2 3 4 5
Importance of this trait to your organization: Low High 1 2 3 4 5
Problem Solving
2. IT professionals must be able to choose from a variety of different problem-solving methodologies to analytically formulate a solution. Your self-rating: Low High 1 2 3 4 5
Importance of this trait to your organization: Low High 1 2 3 4 5
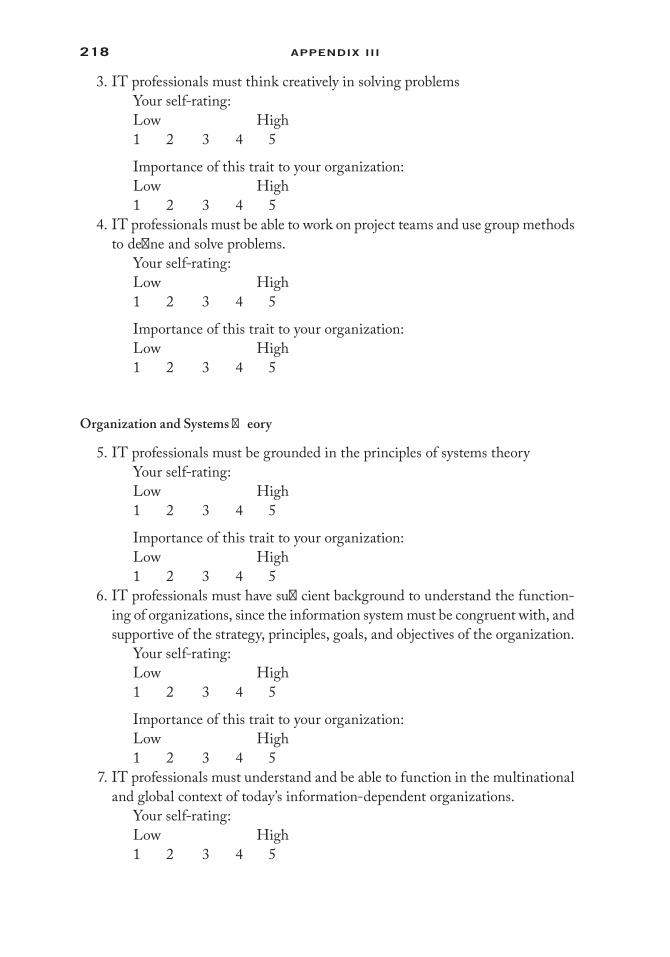
218 aPPenDix iii
3. IT professionals must think creatively in solving problems Your self-rating: Low High 1 2 3 4 5
Importance of this trait to your organization: Low High 1 2 3 4 5
4. IT professionals must be able to work on project teams and use group methods to define and solve problems. Your self-rating: Low High 1 2 3 4 5
Importance of this trait to your organization: Low High 1 2 3 4 5
Organization and Systems Theory
5. IT professionals must be grounded in the principles of systems theory Your self-rating: Low High 1 2 3 4 5
Importance of this trait to your organization: Low High 1 2 3 4 5
6. IT professionals must have sufficient background to understand the function-ing of organizations, since the information system must be congruent with, and supportive of the strategy, principles, goals, and objectives of the organization. Your self-rating: Low High 1 2 3 4 5
Importance of this trait to your organization: Low High 1 2 3 4 5
7. IT professionals must understand and be able to function in the multinational and global context of today’s information-dependent organizations. Your self-rating: Low High 1 2 3 4 5

219aPPenDix iii
Importance of this trait to your organization: Low High 1 2 3 4 5
Quality
8. IT professionals must understand quality, planning, steps in the continuous improvement process as it relates to the enterprise, and tools to facilitate qual-ity development. Your self-rating: Low High 1 2 3 4 5
Importance of this trait to your organization: Low High 1 2 3 4 5
9. As the IT field matures, increasing attention is being directed to problem avoidance and to process simplification through reengineering. Error control, risk management, process measurement, and auditing are areas that IT pro-fessionals must understand and apply. Your self-rating: Low High 1 2 3 4 5
Importance of this trait to your organization Low High 1 2 3 4 5
10. IT professionals must possess a tolerance for chance and skills for managing the process of change. Your self-rating: Low High 1 2 3 4 5
Importance of this trait to your organization: Low High 1 2 3 4 5
11. Given the advancing technology of the IT field, education must be continuous. Your self-rating: Low High 1 2 3 4 5
Importance of this trait to your organization: Low High 1 2 3 4 5

220 aPPenDix iii
12. IT professionals must understand mission-directed, principle-centered mechanisms to facilitate aligning group as well as individual missions with organizational missions. Your self-rating: Low High 1 2 3 4 5
Importance of this trait to your organization: Low High 1 2 3 4 5
Groups
13. IT professionals must interact with diverse user groups in team and project activities. Your self-rating: Low High 1 2 3 4 5
Importance of this trait to your organization: Low High 1 2 3 4 5
14. IT professionals must possess communication and facilitation skills with team meetings and other related activities. Your self-rating: Low High 1 2 3 4 5
Importance of this trait to your organization: Low High 1 2 3 4 5
15. IT professionals must understand the concept of empathetic listening and utilize it proactively to solicit synergistic solutions in which all parties to an agreement can benefit. Your self-rating: Low High 1 2 3 4 5
Importance of this trait to your organization: Low High 1 2 3 4 5

221aPPenDix iii
16. IT professionals must be able to communicate effectively with a changing work force. Your self-rating: Low High 1 2 3 4 5
Importance of this trait to your organization: Low High 1 2 3 4 5
ReferenceMcGuire, E. G. and Randall, K. A. (1998). Process Improvement Competencies for IS
Professionals: A Survey of Perceived Needs. Proceedings of the 1998 ACM SIGCPR Conference on Computer Personnel Research, New York, ACM, pp. 1–8.
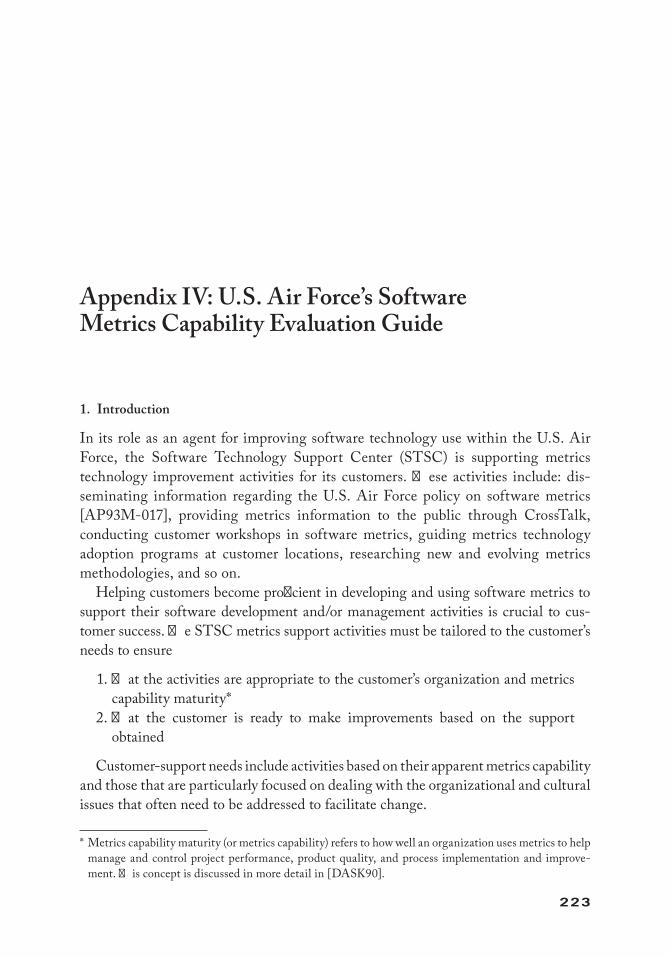
223
Appendix IV: U.S. Air Force’s Software Metrics Capability Evaluation Guide
1. Introduction
In its role as an agent for improving software technology use within the U.S. Air Force, the Software Technology Support Center (STSC) is supporting metrics technology improvement activities for its customers. These activities include: dis-seminating information regarding the U.S. Air Force policy on software metrics [AP93M-017], providing metrics information to the public through CrossTalk, conducting customer workshops in software metrics, guiding metrics technology adoption programs at customer locations, researching new and evolving metrics methodologies, and so on.
Helping customers become proficient in developing and using software metrics to support their software development and/or management activities is crucial to cus-tomer success. The STSC metrics support activities must be tailored to the customer’s needs to ensure
1. That the activities are appropriate to the customer’s organization and metrics capability maturity*
2. That the customer is ready to make improvements based on the support obtained
Customer-support needs include activities based on their apparent metrics capability and those that are particularly focused on dealing with the organizational and cultural issues that often need to be addressed to facilitate change.
* Metrics capability maturity (or metrics capability) refers to how well an organization uses metrics to help manage and control project performance, product quality, and process implementation and improve-ment. This concept is discussed in more detail in [DASK90].

224 aPPenDix iV
This guide covers the following:
1. It defines a metrics capability evaluation method that deals specifically with defining a customer’s metrics capability.
2. It presents metrics capability questionnaires that help gather metrics capability data.
3. It outlines a metrics capability evaluation report that provides the basis for developing a metrics customer project plan.
4. It provides a metrics customer profile form used to determine the initial infor-mation required to prepare for a metrics capability evaluation.
5. It provides a customer organization information form that helps guide the STSC in gathering cultural information about the organization that will help with developing and implementing the metrics customer project plan.
2. Evaluation Approach
2.1 Background
The foundation for the evaluation method is “A Method for Assessing Software Measurement Technology” [DASK90].* Metrics capability maturity consists of five maturity levels that are analogous to the software capability maturity model (CMM) levels defined by the Software Engineering Institute (SEI) [PAUL93]. This guide has been designed to cover metrics capability maturity Levels 1 through 3. When metrics capability evaluations show a strong percentage (e.g., 25% or more) of organizations at metrics capability maturity Level 3, the scope of the evaluation (and this guide) will be expanded to cover metrics capability maturity Levels 4 and 5.
This guide defines a set of questions to elicit information that will help characterize an organization’s metrics capability. The themes used in the questionnaire and their relationships to an organization’s metrics capability maturity (for Levels 1 through 3) are shown in Appendix A.
The guide contains two metrics capability questionnaires (one for acquisition organizations and one for software development/maintenance organizations). The questions in the questionnaires are used as the basis for interviews with an organiza-tion’s representative(s) to help determine their metrics capability maturity. After the interviews are complete, the results are collated and reported in a evaluation report that is delivered to the evaluated organization. Additional work with the evaluated orga-nization will depend on the organization’s needs. Section 2.2 discusses the evaluation process. Appendix B contains a brief metrics customer profile form, which is filled out as a precursor to the metrics capability evaluation. Appendix C is an annotated outline
* The assessment method defined in [DASK90] was based on the Software Engineering Institute (SEI) process assessment methodology, which is currently exemplified in the Capability Maturity Model (CMM) for Software, Version 1.1 [PAUL93].

225aPPenDix iV
of the metrics capability evaluation report, and Appendix D contains the customer organization information form.
2.2 Software Metrics Capability Evaluation Process
The software metrics capability evaluation process consists of three basic parts:
1. An initial contact, which is performed when it is determined that an organi-zation needs and wants assistance with its metrics capability.
2. The evaluation interview, which is the central activity in the software metrics capability evaluation process.
3. Collating and analyzing the results, which are the transition activities that occur between the evaluation interview and evaluation follow-up.
These sets of activities are discussed in Sections 2.2.1 through 2.2.3.In addition to evaluation, there may be follow-up activities. These include more
detailed work with the customer that will provide a metrics capability improvement strategy and plan when applicable. Section 2.3 discusses the follow-up activities.
2.2.1 Initial ContactThe initial contact with a customer generally is set up through an STSC customer consultant. The customer consultant briefs an assigned member of the STSC metrics team regarding a customer’s need for a metrics capability evaluation and provides a contact for the metrics team member at the customer’s site.
The metrics team member contacts the customer by phone to gain an initial under-standing of the customer’s organization and to set up the evaluation interview. The metrics customer profile form is used to help gather that information. Information collected during this initial contact will be used to help determine the proper approach for the introduction briefing presented during the evaluation interview visit. Only the point of contact information must be completed at this time; however, it is highly desirable to include the STSC business information. When the profile is not com-pleted during the initial contact, it needs to be completed prior to (or as an introduc-tion to) the evaluation interview at the customer’s site.
2.2.2 Evaluation InterviewTwo STSC metrics team members conduct the interviews as a metrics evaluation team. On the same day as the evaluation interview, an introduction briefing is pro-vided to key people within the organization (to be determined jointly by the evalu-ation team members, the customer consultant assigned to the organization, and the organization’s primary point of contact). The purpose of the briefing is to manage customer expectations. This is accomplished, in part, by providing education with respect to

226 aPPenDix iV
1. The concepts of metrics maturity. 2. The approach of the metrics evaluation team. 3. What to expect when evaluation results are provided.
The interviews are conducted with the manager most closely associated with the software development activities for the program (or project) under question.* One other representative from the program (or project) should participate in the inter-view (a staff member responsible for metrics analysis and reporting would be most appropriate). The first part of the interview is to complete the metrics customer pro-file. When this is completed, the metrics capability questionnaire most related to the organization (either acquirer or development/maintenance organization) is used as the input to the remainder of the evaluation process. The questionnaire sections for both Levels 2 and 3 are used regardless of the customer’s perceived metrics capability.
The questions in the metrics capability evaluation questionnaires have been formalized to require answers of yes, no, not applicable (NA), or don’t know (?). If an answer is yes, the customer needs to relate examples or otherwise prove performance that fulfills the question. If the answer is no, comments may be helpful but are not required. (If the answer is don’t know, a no answer is assumed.) If the answer is NA and it can be shown to be NA, the question is ignored and the answer is not counted as part of the score. The chosen metrics capability evaluation questionnaires need to be completed before the interview is considered complete.
An evaluation interview should not take more than one day for one program (or software project). If an organization is to be assessed, a representative sample of pro-grams (or software projects) need to be assessed and each requires a separate interview.
2.2.3 Collating and Analyzing the ResultsThe metrics capability questionnaires completed during the interview(s) and their associated examples (or other evidence of metrics capability maturity, see Section B.1) are collated and returned to STSC for analysis. The metrics capability evaluation team that conducted the interview(s) is responsible for analyzing and reporting the results. An assessed program (or software project) is at Level 2 if at least 80% of all Level 2 questions are answered yes. Otherwise, the organization is at Level 1, and so on [DASK90]. (Scoring is discussed in more detail in Section B.1. The contents of the metrics capability evaluation report are outlined in Appendix C.)
The questions in the metrics capability questionnaires are organized by metrics capability maturity themes to help focus the interviews and the results analysis. (The themes, as defined in [DASK90], and their characteristics at metrics capabil-ity maturity Levels 2 and 3 are reported in Appendix A.) The customer’s strengths
* In the case of the acquirer, this will be the individual responsible for overseeing the software develop-ment organization. In the case of a development or maintenance organization, this will be the software project manager.

227aPPenDix iV
and weaknesses can be addressed directly with the information gathered during the interview session(s). In addition, activities for becoming more effective in implement-ing and using metrics can be highlighted in the metrics capability evaluation report and in the project plan.
2.3 Software Metrics Capability Evaluation Follow-Up
Software metrics capability evaluation follow-up includes two sets of activities:
1. The metrics capability evaluation report. 2. The project plan and implementation.
The report details the evaluation results and provides recommendations for an initial set of improvement activities.
The project plan consists of a customer-approved, detailed plan to improve the customer’s metrics capability (which may include other aspects of support to the customer such as software process definition, project management support, or require-ments management workshops, etc.).
The customer’s organizational culture is important in developing the content and phasing of the project plan. Issues such as ability to incorporate change into the orga-nization, management commitment to software technology improvement, and so on, often need to be addressed in developing a success-oriented plan.*
Metrics capability improvement implementation consists of the physical implemen-tation of the project plan and a periodic evaluation of the customer’s status to deter-mine the program’s improvement and any required modifications to the plan. The project plan and implementation are described in Section 2.3.2.
2.3.1 Metrics Capability Evaluation ReportThe metrics capability evaluation report consists of two parts:
1. The analyzed results of the evaluation. 2. Recommendations for a set of activities that will help improve the customer’s
metrics capability.
The results portion of the report is organized to discuss the customer’s overall software metrics capability and to define the areas of strengths and weaknesses based on each of the measurement themes. The recommendations portion of the report describes an overall improvement strategy that provides a balanced approach toward metrics capability improvement based on the customer’s current evaluation results. Appendix C contains an annotated outline of the report.
* Appendix D contains an organization information form that the STSC uses to help define cultural issues that need to be addressed in the project plan.
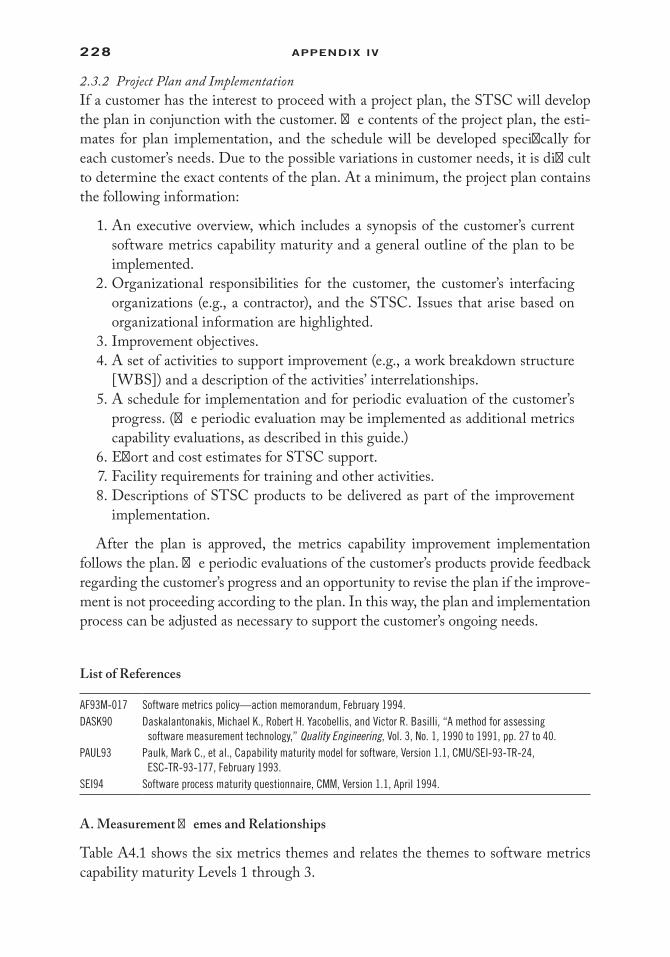
228 aPPenDix iV
2.3.2 Project Plan and ImplementationIf a customer has the interest to proceed with a project plan, the STSC will develop the plan in conjunction with the customer. The contents of the project plan, the esti-mates for plan implementation, and the schedule will be developed specifically for each customer’s needs. Due to the possible variations in customer needs, it is difficult to determine the exact contents of the plan. At a minimum, the project plan contains the following information:
1. An executive overview, which includes a synopsis of the customer’s current software metrics capability maturity and a general outline of the plan to be implemented.
2. Organizational responsibilities for the customer, the customer’s interfacing organizations (e.g., a contractor), and the STSC. Issues that arise based on organizational information are highlighted.
3. Improvement objectives. 4. A set of activities to support improvement (e.g., a work breakdown structure
[WBS]) and a description of the activities’ interrelationships. 5. A schedule for implementation and for periodic evaluation of the customer’s
progress. (The periodic evaluation may be implemented as additional metrics capability evaluations, as described in this guide.)
6. Effort and cost estimates for STSC support. 7. Facility requirements for training and other activities. 8. Descriptions of STSC products to be delivered as part of the improvement
implementation.
After the plan is approved, the metrics capability improvement implementation follows the plan. The periodic evaluations of the customer’s products provide feedback regarding the customer’s progress and an opportunity to revise the plan if the improve-ment is not proceeding according to the plan. In this way, the plan and implementation process can be adjusted as necessary to support the customer’s ongoing needs.
List of References
AF93M-017 Software metrics policy—action memorandum, February 1994.DASK90 Daskalantonakis, Michael K., Robert H. Yacobellis, and Victor R. Basilli, “A method for assessing
software measurement technology,” Quality Engineering, Vol. 3, No. 1, 1990 to 1991, pp. 27 to 40.PAUL93 Paulk, Mark C., et al., Capability maturity model for software, Version 1.1, CMU/SEI-93-TR-24,
ESC-TR-93-177, February 1993.SEI94 Software process maturity questionnaire, CMM, Version 1.1, April 1994.
A. Measurement Themes and Relationships
Table A4.1 shows the six metrics themes and relates the themes to software metrics capability maturity Levels 1 through 3.

229aPPenDix iV
B. Software Metrics Capability Questionnaires
This appendix contains scoring information for the software metrics capability evaluations along with copies of the metrics customer profile form and the two soft-ware metrics capability evaluation questionnaires.
The metrics customer profile form helps gather general customer information for choosing the metrics capability evaluation questionnaire and for defining the contents of the project plan. The two software metrics capability evaluation questionnaires are as follows:
a. An acquisition organization questionnaire. The focus of this questionnaire is to determine the metrics capability level of a software acquisition organization.
b. A software development/maintenance organization questionnaire. The focus of this questionnaire is to determine the metrics capability level of software development or maintenance organizations.
B.1 Use of Questionnaires and Scoring
B.1.1 Use of QuestionnairesThese two metrics capability evaluation questionnaires provide the contents of the evaluation interviews described in Section 2.2.2. The questions from the question-naires are asked as written. The questions for Levels 2 and 3 are used for all interviews.
Table A4.1 Themes and Levels of Software Metrics Capability Maturity*
THEME INITIAL (LEVEL 1) REPEATABLE (LEVEL 2) DEFINED (LEVEL 3)
1. Formalization of development process
Process unpredictableProject depends on
seasoned professionals
No/poor process focus
Projects repeat previously mastered tasks
Process depends on experienced people
Process characterized and reasonably understood
2. Formalization of metrics process
Little or no formalization
Formal procedures establishedMetrics standards exist
Documented metrics standardsStandards applied
3. Scope of metrics
Occasional use on projects with seasoned people or not at all
Used on projects with experienced people
Project estimation mechanisms exist
Metrics have project focus
Goal/question/metric package development and some use
Data collection and recordingSpecific automated tools exist
in the environmentMetrics have product focus
4. Implementation support
No historical data or database
Data (or database) available on a per project basis
Product-level databaseStandardized database used
across projects 5. Metrics
evolutionLittle or no metrics
conductedProject metrics and
management in placeProduct-level metrics and
management in place 6. Metrics support
for mgmt control
Management not supported by metrics
Some metrics support for management
Basic control of commitments
Product-level metrics and control
* The information in this table has been extracted directly from [DASK90].

230 aPPenDix iV
The comments for each question are used to point to examples and other evidence of metrics capability maturity based on the activities referred to in the question. The answers to the questions and the examples and comments are the inputs to the scoring activity presented in Section B.1.2.
B.1.2 ScoringScoring from the two metrics capability evaluation questionnaires is relatively simple:
1. If the answer to a question is yes, then proof of conformance needs to be shown to ensure that the customer has performed the activity(ies) indicated in the question. Proof of conformance includes
a. Metrics standards for the organization. b. Software acquisition plans, development plans, or contract statements that
incorporate metrics requirements. c. Meeting minutes or other items that indicate use of metrics. d. Examples of database outputs. e. Concurrence given by two or more individuals from the same organization
who are interviewed separately. f. Informal notes. g. Briefing charts from management evaluations. h. And so on. 2. If the answer is no, or don’t know, then the answer is scored as no. 3. If the answer is NA, then the question is subtracted from the total number of
questions for that maturity level and the answer is not included in the overall score.
4. When 80% or more of the Level 2 questions are answered yes (with proof), then the organization is considered to be a Level 2. Otherwise, the organiza-tion is considered to be a Level 1.
5. If the organization is a Level 2 and also answers 80% or more of the Level 3 questions yes (with proof), then the organization is considered to be a Level 3. Otherwise, the organization is considered to be a Level 1 or 2 as indicated in Item 4.
The organization’s metrics capability level, as indicated from the scoring process, the proofs of conformance, and comments are all used as inputs to the metrics capabil-ity evaluation report. Appendix C contains an annotated outline of a metrics capabil-ity evaluation report.
B.2 Metrics Customer Profile Form
1. Point of Contact information: a. Name: b. Position:

231aPPenDix iV
c. Office symbol: d. Location: e. Phone #: DSN: f. Fax number: g. E-mail address: h. Organization name: i. Products: 2. Environment information: a. Hardware platform: b. Languages used: c. Tools used for metrics: 3. Organization information: a. Major command (ACC, AFMC, AETC, AMC, other: ) b. Copy of organization chart (at least name and rank of commanding
officer): c. Type(s) of software (real time, communication, command & control, MIS,
other): d. Type(s) of activity (development, acquisition, maintenance, combination,
other): e. Are project teams comprised of members from more than one organization?
(If yes, please give examples) f. Typical size of development organization for a particular program (or
project) (less than 10, 10–40, more than 40 personnel): g. Typical length of project (<6 mo, 6–18 mo, 18 mo–3 yr, >3 yr): 4. General background: a. What are the organization’s strengths? b. Can you demonstrate these strengths through measurements or other
objective means? (if yes, examples?): c. What are the organization’s biggest challenges? d. Have measurements or other objective means been used to understand or
to help manage these challenges? (if yes, examples?):

232 aPPenDix iV
5. Metrics background: a. Does your organization require software development plans to be developed
and used? b. Are project management tools used? (examples?): c. How is project status reported? (examples?): d. How is product quality reported? (examples?): e. What forces are driving metrics interest in your organization (SAF/AQ ,
CO, self, etc.)? 6. STSC business information: a. Has the organization received STSC information or services? 1. CrossTalk? 2. Technology reports? 3. Workshops? 4. Consulting? b. Does the organization need help? c. Does the organization want help? d. The organization would like help with (describe): e. How well is the organization funded for new technology adoption
(including training)? 1. Are there funds to pay for STSC products and services? 2. Is the organization willing to pay? f. Are their needs/wants a match to STSC products and services?

233aPPenDix iV
B.3 Acquisition Organization Questionnaire*
B.3.1 Questions for Metrics Capability Level 2B.3.1.1 Theme 1: Formalization of Source Selection and Contract Monitoring Process
# QUESTION YES NO NA ?
1a Is a software capability evaluation (SCE) or software development capability evaluation (SDCE) for developers part of your source selection process?a
□ □ □ □
Comments:
1b Is proof of a specific CMM level required from developers as part of your source selection process?
□ □ □ □
Comments:
2 Does your organization require and evaluate developers’ draft software development plans as part of the source selection process?
□ □ □ □
Comments:
3 Are software metrics required as part of developers’ software development plans (or other contractually binding metrics plans)?
□ □ □ □
Comments:
a Score only one correct for a yes response to either 1a or 1b. If neither is a yes answer, score only one no.
# QUESTION YES NO NA ?
4 Are software costs and schedule estimates required from the developer as part of the source selection process?
□ □ □ □
Comments:
* Throughout these questionnaires, acquirer refers to an organization that acquires software or systems. Developer refers to an organization that develops or maintains software or systems for an acquirer. (For example, a developer could refer to a nonmilitary organization (e.g., a defense contractor, a university) that works under the terms of a legal contract; an external government or military organization that works under the terms of a memorandum of agreement (MOA); or an organic organization tasked with developing or maintaining software under an informal agreement.) Contract refers to an agreement between the acquirer and the contractor, regardless of its actual form (e.g., an MOA).

234 aPPenDix iV
# QUESTION YES NO NA ?
5 Is the developer’s project performance monitored based on the cost and schedule estimates?
□ □ □ □
Comments:
6 Are the acquirers’ management plans developed, used, and maintained as part of managing a program?
□ □ □ □
Comments:
B.3.1.2 Theme 2: Formalization of Metrics Process# QUESTION YES NO NA ?
1 Is there a written organizational policy for collecting and maintaining software metrics for this program?
□ □ □ □
Comments:
2 Is each program required to identify and use metrics to show program performance?
□ □ □ □
Comments:
3 Is the use of software metrics documented? □ □ □ □Comments:
# QUESTION YES NO NA ?
4 Are developers required to report a set of standard metrics? □ □ □ □Comments:
B.3.1.3 Theme 3: Scope of Metrics# QUESTION YES NO NA ?
1 Are internal measurements used to determine the status of the activities performed for planning a new acquisition program?
□ □ □ □
Comments:

235aPPenDix iV
# QUESTION YES NO NA ?
2 Are measurements used to determine the status of software contract management activities?
□ □ □ □
Comments:
3 Do(es) your contract(s) require metrics on the developer’s actual results (e.g., schedule, size, and effort) compared to the estimates?
□ □ □ □
Comments:
4 Can you determine whether the program is performing according to plan based on measurement data provided by the developer?
□ □ □ □
Comments:
5 Are measurements used to determine your organization’s planned and actual effort applied to performing acquisition planning and program management?
□ □ □ □
Comments:
# QUESTION YES NO NA ?
6 Are measurements used to determine the status of your organization’s software configuration management activities?
□ □ □ □
Comments:
B.3.1.4 Theme 4: Implementation Support# QUESTION YES NO NA ?
1 Does the program (or project) have a database of metrics information? □ □ □ □Comments:
2 Do you require access to the contractor’s metrics data as well as completed metrics reports?
□ □ □ □
Comments:
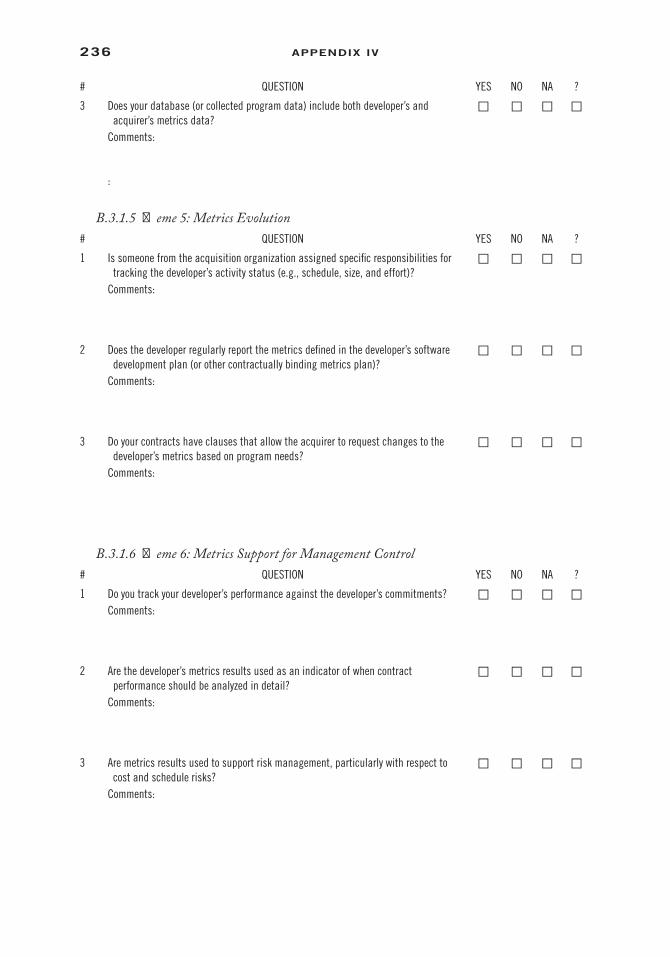
236 aPPenDix iV
# QUESTION YES NO NA ?
3 Does your database (or collected program data) include both developer’s and acquirer’s metrics data?
□ □ □ □
Comments:
:
B.3.1.5 Theme 5: Metrics Evolution# QUESTION YES NO NA ?
1 Is someone from the acquisition organization assigned specific responsibilities for tracking the developer’s activity status (e.g., schedule, size, and effort)?
□ □ □ □
Comments:
2 Does the developer regularly report the metrics defined in the developer’s software development plan (or other contractually binding metrics plan)?
□ □ □ □
Comments:
3 Do your contracts have clauses that allow the acquirer to request changes to the developer’s metrics based on program needs?
□ □ □ □
Comments:
B.3.1.6 Theme 6: Metrics Support for Management Control# QUESTION YES NO NA ?
1 Do you track your developer’s performance against the developer’s commitments? □ □ □ □Comments:
2 Are the developer’s metrics results used as an indicator of when contract performance should be analyzed in detail?
□ □ □ □
Comments:
3 Are metrics results used to support risk management, particularly with respect to cost and schedule risks?
□ □ □ □
Comments:

237aPPenDix iV
# QUESTION YES NO NA ?
4 Are program acquisition and/or program management metrics used to help determine when changes should be made to your plans (e.g., changes to schedules for completion of planning activities and milestones)?
□ □ □ □
Comments:
5 Are measurements used to determine the status of verification and validation activities for software contracts?
□ □ □ □
Comments:
B.3.2 Questions for Metrics Capability Level 3B.3.2.1 Theme 1: Formalization of Source Selection and Contract Monitoring Process
# QUESTION YES NO NA ?
1 Do you require developers to show proof of software development maturity at a minimum of CMM Level 3?
□ □ □ □
Comments:
2 Is your software acquisition process reviewed for improvement periodically? □ □ □ □
Comments:
3 Does your organization have a standard software acquisition process? □ □ □ □
Comments:
4 Do one or more individuals have responsibility for maintaining the organization’s standard software acquisition processes?
□ □ □ □
Comments:
5 Does the organization follow a written policy for developing and maintaining the acquisition process and related information (e.g., descriptions of approved tailoring for standards based on program attributes)?
□ □ □ □
Comments:

238 aPPenDix iV
B.3.2.2 Theme 2: Formalization of Metrics Process# QUESTION YES NO NA ?
1 Do you have documented standards for metrics definitions and for reporting formats you require from developers?
□ □ □ □
Comments:
2 Are these standards tailorable to the size, scope, and type of the software to be acquired?
□ □ □ □
Comments:
3 Are specific metrics requested for each new acquisition based on your organization’s metrics standards?
□ □ □ □
Comments:
4 Is someone from your organization assigned specific responsibilities for maintaining and analyzing the contractor’s metrics regarding the status of software work products and activities (e.g., effort, schedule, quality)?
□ □ □ □
Comments:
B.3.2.3 Theme 3: Scope of Metrics# QUESTION YES NO NA ?
1 Do you collect, maintain, and report metrics data for all new (in the last 3 years) contracts?
□ □ □ □
Comments:
# QUESTION YES NO NA ?
2 Do you use automated tools that support metrics collection, maintenance, and reporting?
□ □ □ □
Comments:
3 Do you and your developer(s) use automated metrics tools that allow you to share contract metrics data?
□ □ □ □
Comments:

239aPPenDix iV
# QUESTION YES NO NA ?
4 During contract negotiations, do the program goals drive the metrics required for the contract?
□ □ □ □
Comments:
5 Do the metrics collected include specific product metrics (e.g., quality, reliability, maintainability)?
□ □ □ □
# QUESTION YES NO NA ?
Comments:
6 Do you require metrics summary reports that show general program trends as well as detailed metrics information?
□ □ □ □
Comments:
B.3.2.4 Theme 4: Implementation Support# QUESTION YES NO NA ?
1 Does your program metrics database include information on specific product metrics (e.g., quality, reliability, maintainability)?
□ □ □ □
Comments:
2 Do you share metrics data across programs? □ □ □ □Comments:
3 Is the metrics data shared through a common organizational database? □ □ □ □Comments:
4 Does your organization have a standard length of time that you retain metrics data?
□ □ □ □
Comments:
5 Does the organization verify the metrics data maintained in the metrics database? □ □ □ □Comments:

240 aPPenDix iV
# QUESTION YES NO NA ?
6 Does your organization manage and maintain the metrics database? □ □ □ □Comments:
B.3.2.5 Theme 5: Metrics Evolution# QUESTION YES NO NA ?
1 Do you use product metrics in making management decisions (e.g., a decision is made to delay schedule because of known defects)?
□ □ □ □
Comments:
2 Are product metrics reported during program management reviews (e.g., defects by severity, or defects by cause)?
□ □ □ □
Comments:
3 Are both project and product metrics used in making management decisions regarding contract performance?
□ □ □ □
Comments:
4 Does your organization review the current metrics set periodically for ongoing usefulness?
□ □ □ □
Comments:
5 Does your organization review the current metrics set periodically to determine if new metrics are needed?
□ □ □ □
Comments:
B.3.2.6 Theme 6: Metrics Support for Management Control# QUESTION YES NO NA ?
1 Are measurements used to determine the status of the program office activities performed for managing the software requirements?
□ □ □ □
Comments:

241aPPenDix iV
# QUESTION YES NO NA ?
2 Are product metrics used as an indicator for renegotiating the terms of contract(s) when necessary?
□ □ □ □
Comments:
3 Are product metrics used in reports forwarded to higher-level management concerning contract performance?
□ □ □ □
# QUESTION YES NO NA ?
Comments:
4 Are measurements used to forecast the status of products during their development?
□ □ □ □
Comments:
5 Are product metrics used as inputs to award fee calculations for cost plus award fee contracts?
□ □ □ □
Comments:
6 Do metrics serve as inputs for determining when activities need to be initiated (or modified) to mitigate technical program risks?
□ □ □ □
Comments:
B.4 Software Development/Maintenance Organization Questionnaire
B.4.1 Questions for Metrics Capability Level 2B.4.1.1 Theme 1: Formalization of the Development Process
# QUESTION YES NO NA ?
1a Has your organization been assessed via the SEI CMM?a (This could be an independent assessment or an internal assessment supported by an SEI authorized source.)
□ □ □ □
Comments:
1b Has your organization been assessed via some vehicle other than the SEI CMM? □ □ □ □Comments:
a Score only one correct for a yes response to either 1a or 1b. If neither is a yes answer, score only one no.
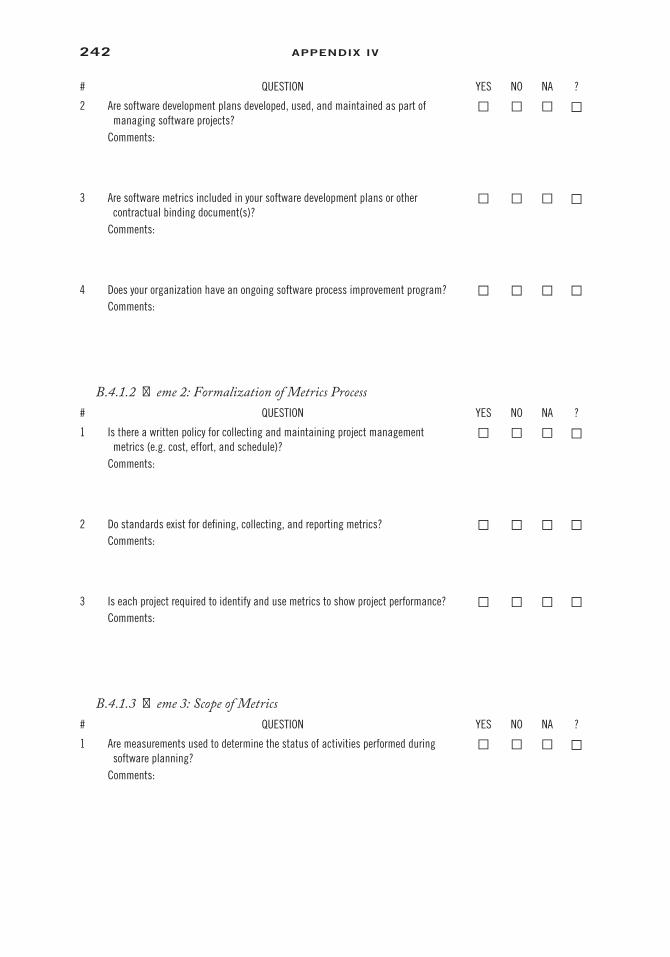
242 aPPenDix iV
# QUESTION YES NO NA ?
2 Are software development plans developed, used, and maintained as part of managing software projects?
□ □ □ □
Comments:
3 Are software metrics included in your software development plans or other contractual binding document(s)?
□ □ □ □
Comments:
4 Does your organization have an ongoing software process improvement program? □ □ □ □Comments:
B.4.1.2 Theme 2: Formalization of Metrics Process# QUESTION YES NO NA ?
1 Is there a written policy for collecting and maintaining project management metrics (e.g. cost, effort, and schedule)?
□ □ □ □
Comments:
2 Do standards exist for defining, collecting, and reporting metrics? □ □ □ □Comments:
3 Is each project required to identify and use metrics to show project performance? □ □ □ □Comments:
B.4.1.3 Theme 3: Scope of Metrics# QUESTION YES NO NA ?
1 Are measurements used to determine the status of activities performed during software planning?
□ □ □ □
Comments:

243aPPenDix iV
# QUESTION YES NO NA ?
2 Are measurements used to determine and track the status of activities performed during project performance?
□ □ □ □
Comments:
3 Does the project manager establish cost and schedule estimates based on prior experience?
□ □ □ □
Comments:
B.4.1.4 Theme 4: Implementation Support# QUESTION YES NO NA ?
1 Is there a project database of metrics information? □ □ □ □Comments:
2 Is the project manager reponsible for implementing metrics for the project? □ □ □ □Comments:
3 Do you keep metrics from project to project (historical data)? □ □ □ □Comments:
B.4.1.5 Theme 5: Metrics Evolution# QUESTION YES NO NA ?
1 Do you report the project’s actual results (e.g., schedule and cost) compared to estimates?
□ □ □ □
Comments:
2 Is someone on the staff assigned specific responsibilities for tracking software project activity status (e.g., schedule, size, cost)?
□ □ □ □
Comments:

244 aPPenDix iV
# QUESTION YES NO NA ?
3 Do you regularly report the metrics defined in the software development plan or other contractually required document(s)?
□ □ □ □
Comments:
B.4.1.6 Theme 6: Metrics Support for Management Control# QUESTION YES NO NA ?
1 Do metrics results help the project manager manage deviations in cost and schedule?
□ □ □ □
Comments:
2 Are measurements used to determine the status of software configuration management activities on the project?
□ □ □ □
Comments:
3 Are measurements used to determine the status of software quality assurance activities on the project?
□ □ □ □
Comments:
4 Are measurements used to determine the status of the activities performed for managing the allocated requirements (e.g., total number of requirements changes that are proposed, open, approved, and incorporated into the baseline)?
□ □ □ □
Comments:
5 Are cost and schedule estimates documented and used to refine the estimation process?
□ □ □ □
Comments:
6 Do you report metrics data to the customer based on customer requirements? □ □ □ □Comments:

245aPPenDix iV
B.4.2 Questions for Metrics Capability Level 3B.4.2.1 Theme 1: Formalization of the Development Process
# QUESTION YES NO NA ?
1 Is your software development process reviewed for improvement periodically? □ □ □ □Comments:
2 Does your organization’s standard software process include processes that support both software management and software engineering?
□ □ □ □
Comments:
3 Are your processes tailorable to the size/scope of the project? □ □ □ □Comments:
B.4.2.2 Theme 2: Formalization of Metrics Process# QUESTION YES NO NA ?
1 Do you have documented organizational standards for metrics (e.g., metrics definitions, analysis, reports, and procedures)?
□ □ □ □
Comments:
2 Are these standards tailorable to the size and scope of the software project? □ □ □ □
Comments:
3 Are there standards established for the retention of metrics? □ □ □ □
Comments:
# QUESTION YES NO NA ?
4 Are specific project and product metrics proposed for each software project based on the organization’s metrics standards?
□ □ □ □
Comments:

246 aPPenDix iV
# QUESTION YES NO NA ?
5 Is someone assigned specific responsibilities for maintaining and analyzing metrics regarding the status of software work products and activities (e.g., size, effort, schedule, quality)?
□ □ □ □
Comments:
6 Does the organization collect, review, and make available information related to the use of the organization’s standard software process (e.g., estimates and actual data on software size, effort, and cost; productivity data; and quality measurements)?
□ □ □ □
Comments:
B.4.2.3 Theme 3: Scope of Metrics# QUESTION YES NO NA ?
1 Do the project/organization management and technical goals drive the metrics required?
□ □ □ □
Comments:
2 Do you collect, maintain, and report project and product metrics data for all projects? □ □ □ □Comments:
# QUESTION YES NO NA ?
3 Do you use automated tools that support metrics collection, maintenance, and reporting?
□ □ □ □
Comments:
4 Do the metrics collected include specific product metrics (e.g., quality, reliability, maintainability)?
□ □ □ □
Comments:
5 Do you report product metrics (e.g., problem/defect density by product; amount of rework; and/or status of allocated requirements) throughout the development life cycle?
□ □ □ □
Comments:

247aPPenDix iV
B.4.2.4 Theme 4: Implementation Support# QUESTION YES NO NA ?
1 Does your metrics database include information on specific product metrics (e.g., quality, reliability, maintainability)?
□ □ □ □
Comments:
2 Do you share metrics data across software projects? □ □ □ □Comments:
3 Is the metrics data shared through a common organizational database? □ □ □ □Comments:
# QUESTION YES NO NA ?
4 Does your organization have a standard length of time that you retain metrics data? □ □ □ □Comments:
5 Does your organization verify the metrics data maintained in the metrics database? □ □ □ □Comments:
6 Does your organization manage and maintain the metrics database? □ □ □ □Comments:
7 Have normal ranges been established for project metrics reported (e.g., the difference between planned and actual schedule commitments)?
□ □ □ □
Comments:
B.4.2.5 Theme 5: Metrics Evolution# QUESTION YES NO NA ?
1 Do you use product metrics as well as project metrics in making management decisions?
□ □ □ □
Comments:

248 aPPenDix iV
# QUESTION YES NO NA ?
2 Are product metrics as well as project metrics reported during program management reviews (e.g., the number of defects per SLOC)?
□ □ □ □
Comments:
# QUESTION YES NO NA ?
3 Do you report metrics to your internal manager? □ □ □ □Comments:
4 Do you report metrics to your customer? □ □ □ □Comments:
B.4.2.6 Theme 6: Metrics Support for Management Control# QUESTION YES NO NA ?
1 Are product metrics as well as project metrics used as indicators for renegotiating the terms of contract(s) when necessary (e.g., you decide to extend a schedule based on the known number of defects in the product)?
□ □ □ □
Comments:
2 Do metric results help isolate technical problems? □ □ □ □Comments:
3 Are improvements to the metrics process (including metrics standards, procedures, definitions, etc.) based on analysis and lessons learned?
□ □ □ □
Comments:
4 Are measurements used to determine the quality of the software products (i.e., numbers, types, and severity of defects identified)?
□ □ □ □
Comments:

249aPPenDix iV
# QUESTION YES NO NA ?
5 Do you maintain metrics specifically to help you manage your project? □ □ □ □Comments:
6 Are management decisions made as a result of metrics reported (e.g., is corrective action taken when actual results deviate significantly from the project’s software plans)?
□ □ □ □
Comments:
7 Are metrics that are reported to the customer consistent with internally reported metrics?
□ □ □ □
Comments:
C. Software Metrics Capability Evaluation Report: Annotated Outline
The goals of the software metrics capability evaluation report are as follows:
1. Report the results of the evaluation. The results have two components: a. General results (i.e., metrics capability level and an overview of the
organization’s metrics-related strengths and weaknesses). b. Discussion of the organization’s strengths and weaknesses based on each
of the six measurement themes identified in Appendix A. 2. Discuss recommendations for improvement. These recommendations will be
based on the results of the evaluation and may include one or more of several elements, such as:
a. A recommended set of high-payback activities that the organization could use to implement metrics capability improvements.
b. Recommendations to implement a metrics improvement program that would be tailored to meet the specific organization’s goals based on follow-up consulting and plan preparation. These recommendations would include a brief description of the areas to be covered in the metrics improve-ment program to help open communication with the organization.
c. Recommendations to implement other management and/or engineering improvement activities that would be tailored to meet the specific organiza-tion’s objective based on follow-up consulting and plan preparation. These recommendations would include a brief description of the areas to be cov-ered in the program to help open communication with the organization.
Box C.1 is the annotated outline for the software metrics capability evaluation report.

250 aPPenDix iV
BOX C.1 SOFTWARE METRICS CAPABILITY EVALUATION RESULTS AND RECOMMENDATIONS
REPORT: ANNOTATED OUTLINE
1. INTRODUCTION1.1 IdentificationUse the following sentence to identify the evaluation report: “This report provides the results of a software metrics capability evaluation given on (review dates, in mm/dd/yy format) for,” then provide the organization’s name, office symbol, location, and address. In addition, provide the approximate size of the organiza-tion appraised, the names and office symbols for any branches or sections that were represented from within a larger organization, the basic “type” of organi-zation (i.e., acquisition, software development, software maintenance), and the number of individuals interviewed.
1.2 Introduction to the DocumentIdentify the document’s organization and provide a summary of the information contained in each major section.
2. APPRAISAL RESULTS2.1 General ResultsGive the metrics capability level for the organization, and provide backup for that result.
2.1.1 General Metrics StrengthsProvide a listing of general areas within the six metrics themes represented in the evaluation where the organization showed strengths, for example, establish-ment and general use of a metrics database or general examples of management decision-making based on metrics results.
2.1.2 General Metrics WeaknessesProvide a listing of general areas within the six measurement themes represented in the evaluation where the organization showed weaknesses, for example, no metrics database or identification of metrics from the Air Force metrics mandate that are not being collected or used.
2.2 Specific Areas for Improvement2.2.1 Level 2 Areas for Improvement2.2.1.X Theme X Areas for ImprovementFor each of the six measurement themes, provide a description of the weakness(es) for that theme. Include the following topics in that description:

251aPPenDix iV
Appendix D. Organization Information Form
It has been determined that the organization’s culture often is extremely important in determining how best to work for any type of software process improvement, including establishing a working metrics program. This appendix has been devel-oped to elicit cultural information about the metrics customer that will help STSC
a. Weakness(es) b. Discussion c. Recommended action
2.2.2 Level 3 Areas for Improvement2.2.2.X Theme X Areas for ImprovementFor each of the six measurement themes, provide a description of the weakness(es) for that theme. Include the following topics in that description: a. Weakness(es) b. Discussion c. Recommended action
3. RECOMMENDATIONSProvide any general recommendations that resulted from analyzing the appraisal results, for example, need to determine general management approach and com-mitment to change before charting a detailed metrics improvement plan, and so on.
Give the background and rationale for the recommendations, and provide a set of positive steps the organization could take to improve their metrics capabil-ities. This section should be used as a place to recommend (or propose) possible first steps that the metrics customer and the STSC could explore to determine whether an ongoing relationship would be mutually beneficial. (In the case of metrics capability Level 1 organizations, examples are: to undertake a study of the organization’s culture to determine the easy and high-payback activities that would give the organization some positive results for minimal effort, to work with the organization’s management to determine their commitment to change, and so on. Other recommendations could include working with the STSC or another support organization to develop a project plan.)
APPENDICESAppendix A contains the measurement theme and relationships table (Table A4.1 herein). Also, if necessary, starting with Appendix B, provide back-ground information (e.g., the customer profile) that would be difficult to incor-porate in the main body of the report or that would interfere with the readability and understandability of the evaluation results.

252 aPPenDix iV
develop the project plan and work with the customer for their metrics capability improvement.
Credibility:
1. How would you characterize the organization’s customer satisfaction? □ Excellent □ Good □ Fair □ Poor Please explain:
2. How would you characterize the organization’s ability to meet schedule commitments?
□ Excellent □ Good □ Fair □ Poor Please explain:
3. How would you characterize the organization’s ability to meet budget commitments?
□ Excellent □ Good □ Fair □ Poor Please explain:
4. How would you characterize the organization’s product quality? □ Excellent □ Good □ Fair □ Poor Please explain:
5. How would you characterize the organization’s staff productivity? □ Excellent □ Good □ Fair □ Poor Please explain:
6. How would you characterize the organization’s staff morale/job satisfaction? □ Excellent □ Good □ Fair □ Poor Please explain:
7. How frequently do the development projects have to deal with changes in customer requirements?
□ Weekly or Daily □ Monthly □ Less Often □ Rarely if Ever Please explain:
Motivation:
1. To what extent are there tangible incentives or rewards for successful metrics use? □ Substantial □ Moderate □ Some □ Little if any □ Don’t know Please explain:
2. To what extent do technical staff members feel that metrics get in the way of their real work?
□ Substantial □ Moderate □ Some □ Little if any □ Don’t know Please explain:
3. To what extent have managers demonstrated their support for rather than compliance to organizational initiatives or programs?
□ Substantial □ Moderate □ Some □ Little if any □ Don’t know Please explain:

253aPPenDix iV
4. To what extent do personnel feel genuinely involved in decision-making? □ Substantial □ Moderate □ Some □ Little if any □ Don’t know Please explain:
5. What does management expect from implementing metrics? Please explain:
Culture/Change History
1. To what extent has the organization used task forces, committees, and special teams to implement projects?
□ Substantial □ Moderate □ Some □ Little if any □ Don’t know Please explain:
2. To what extent does “turf guarding” inhibit the operation of the organization? □ Substantial □ Moderate □ Some □ Little if any □ Don’t know Please explain:
3. To what extent has the organization been effective in implementing organiza-tion initiatives (or improvement programs)?
□ Substantial □ Moderate □ Some □ Little if any □ Don’t know Please explain:
4. To what extent has previous experience led to much discouragement or cyni-cism about metrics?
□ Substantial □ Moderate □ Some □ Little if any □ Don’t know Please explain:
5. To what extent are lines of authority and responsibility clearly defined? □ Substantial □ Moderate □ Some □ Little if any □ Don’t know Please explain:
Organization Stability
1. To what extent has there been turnover in key senior management? □ Substantial □ Moderate □ Some □ Little if any □ Don’t know Please explain:
2. To what extent has there been a major reorganization(s) or staff down-sizing? □ Substantial □ Moderate □ Some □ Little if any □ Don’t know Please explain:
3. To what extent has there been growth in staff size? □ Substantial □ Moderate □ Some □ Little if any □ Don’t know Please explain:
4. How much turnover has there been among middle management? □ Substantial □ Moderate □ Some □ Little if any □ Don’t know Please explain:

254 aPPenDix iV
5. How much turnover has there been among the technical staff? □ Substantial □ Moderate □ Some □ Little if any □ Don’t know Please explain:
Organizational Buy-In
1. To what extent are organizational goals clearly stated and well understood? □ Substantial □ Moderate □ Some □ Little if any □ Don’t know Please explain:
2. What level of management participated in the goal setting? □ Senior □ Middle □ First Line Mgt □ Don’t Know Please explain:
3. What is the level of buy-in to the goals within the organization? □ Senior Mgt □ Middle Mgt □ First Line Mgt □ Individual Contributor □ Don’t know Please explain:
4. To what extent does management understand the issues faced by the practitioners?
□ Substantial □ Moderate □ Some □ Little if any □ Don’t know Please explain:
5. To what extent have metrics been used for improving processes? □ Substantial □ Moderate □ Some □ Little if any □ Don’t know Please explain:
6. To what extent has there been involvement of the technical staff in metrics? □ Substantial □ Moderate □ Some □ Little if any □ Don’t know Please explain:
8. To what extent do individuals whose work is being measured understand how the metrics are/will be used in the management process?
□ Substantial □ Moderate □ Some □ Little if any □ Don’t know Please explain:
Measurement Knowledge/Skills
1. How widespread is metrics knowledge/training? □ Substantial □ Moderate □ Some □ Little if any □ Don’t know Please explain:
2. What type of metrics training have members of the organization participated in? □ Statistical Process Control □ Data Analysis □ Metrics Application □ Basics □ Don’t know Other:
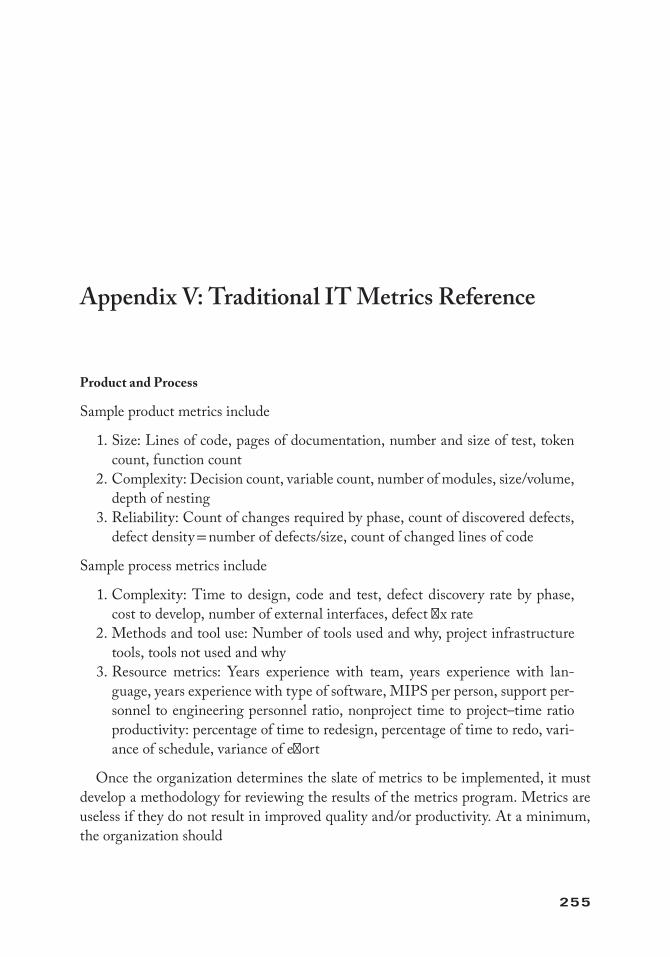
255
Appendix V: Traditional IT Metrics Reference
Product and Process
Sample product metrics include
1. Size: Lines of code, pages of documentation, number and size of test, token count, function count
2. Complexity: Decision count, variable count, number of modules, size/volume, depth of nesting
3. Reliability: Count of changes required by phase, count of discovered defects, defect density = number of defects/size, count of changed lines of code
Sample process metrics include
1. Complexity: Time to design, code and test, defect discovery rate by phase, cost to develop, number of external interfaces, defect fix rate
2. Methods and tool use: Number of tools used and why, project infrastructure tools, tools not used and why
3. Resource metrics: Years experience with team, years experience with lan-guage, years experience with type of software, MIPS per person, support per-sonnel to engineering personnel ratio, nonproject time to project–time ratio productivity: percentage of time to redesign, percentage of time to redo, vari-ance of schedule, variance of effort
Once the organization determines the slate of metrics to be implemented, it must develop a methodology for reviewing the results of the metrics program. Metrics are useless if they do not result in improved quality and/or productivity. At a minimum, the organization should

256 aPPenDix V
1. Determine the metric and measuring technique 2. Measure to understand where you are 3. Establish worst, best, planned cases 4. Modify the process or product depending on the results of measurement 5. Remeasure to see what has changed 6. Reiterate
Traditional Configuration Management Metrics
The following metrics are typically used by those measuring the configuration management (CM) process:
1. Average rate of variance from scheduled time. 2. Rate of first pass approvals. 3. Volume of deviation requests by cause. 4. The number of scheduled, performed, and completed configuration manage-
ment audits by each phase of the life cycle. 5. The rate of new changes being released and the rate that changes are being
verified as completed. History compiled from successive deliveries is used to refine the scope of the expected rate.
6. The number of completed versus scheduled (stratified by type and priority) actions.
7. Man-hours per project. 8. Schedule variances. 9. Tests per requirement. 10. Change category count. 11. Changes by source. 12. Cost variances. 13. Errors per thousand lines of code (KSLOC). 14. Requirements volatility.
Process Maturity Framework Metrics
The set of metrics in this section is based on a process maturity framework developed at the Software Engineering Institute (SEI) at Carnegie Mellon University. The SEI framework divides organizations into five levels based on how mature (i.e., orga-nized, professional, aligned to software tenets) the organization is. The five levels range from initial, or ad hoc, to an optimizing environment. Using this framework, metrics should be divided into five levels as well. Each level is based on the amount of information made available to the development process. As the development process matures and improves, additional metrics can be collected and analyzed, as shown in Table A5.1.

257aPPenDix V
Level 1: Initial process. This level is characterized by an ad hoc approach to software development. Inputs to the process are not well defined but the outputs are as expected. Preliminary baseline project metrics should be gathered at this level to form a basis for comparison as improvements are made and maturity increases. This can be accomplished by comparing new project measurements with the baseline ones.
Level 2: Repeatable process. At this level, the process is repeatable in much the same way that a subroutine is repeatable. The requirements act as input, the code as output, and constraints are such things as budget and schedule. Even though proper inputs produce proper outputs, there is no means to easily discern how the outputs are actually produced. Only project-related metrics make sense at this level since the activities within the actual transitions from input to output are not available to be measured. Measures at this level can include
1. Amount of effort needed to develop the system 2. Overall project cost 3. Software size: noncommented lines of code, function points, object and
method count 4. Personnel effort: actual person-months of effort, report 5. Person months of effort 6. Requirements volatility: number of requirements changes
Level 3: Defined process. At this level, the activities of the process are clearly defined. This additional structure means that the input to and output from each well-defined functional activity can be examined, which permits a measurement of the intermediate products. Measures include
1. Requirements complexity: number of distinct objects and actions addressed in requirements
2. Design complexity: number of design modules, cyclomatic complexity
Table A5.1 Relationship of Software Measures to Process Maturity
MATURITY LEVEL MEASUREMENT FOCUS APPLICABLE CORE MEASURES
1 Establish baselines for planning and estimating project resources and tasks
Effort, schedule progress (pilot or selected projects)
2 Track and control project resources and tasks
Effort, schedule progress (project by project basis)
3 Define and quantify products and processes within and across projects
Products: size, defectsProcesses: effort, schedule(compare above across projects)
4 Define, quantify, and control subprocesses and elements
Set upper and lower statistical control boundaries for core measures. Use estimated vs actual comparisons for projects and compare across projects.
5 Dynamically optimize at the project level and improve across projects
Use statistical control results dynamically within the project to adjust processes and products for improved success.

258 aPPenDix V
3. Code complexity: number of code modules, cyclomatic complexity 4. Test complexity: number of paths to test, of object-oriented development then
number of object interfaces to test 5. Quality metrics: defects discovered, defects discovered per unit size (defect
density), requirements faults discovered, design faults discovered, fault density for each product
6. Pages of documentation
Level 4: Managed process. At this level, feedback from early project activities is used to set priorities for later project activities. Activities are readily compared and contrasted, and the effects of changes in one activity can be tracked in the others. At this level, measurements can be made across activities and are used to control and stabilize the process so that productivity and quality can match expectation. The fol-lowing types of data are recommended to be collected. Metrics at this stage, although derived from the following data, are tailored to the individual organization. 1. Process type: What process model is used and how is it correlating to positive
or negative consequences? 2. Amount of producer reuse: How much of the system is designed for reuse?
This includes reuse of requirements, design modules, test plans, and code. 3. Amount of consumer reuse: How much does the project reuse components
from other projects? This includes reuse of requirements, design modules, test plans, and code. (By reusing tested, proven components effort can be mini-mized and quality can be improved).
4. Defect identification: How and when are defects discovered? Knowing this will indicate whether those process activities are effective.
5. Use of defect density model for testing: To what extent does the number of defects determine when testing is complete? This controls and focuses testing as well as increases the quality of the final product.
6. Use of configuration management: Is a configuration management scheme imposed on the development process? This permits traceability, which can be used to assess the impact of alterations.
7. Module completion over time: At what rates are modules being completed? This reflects the degree to which the process and development environment facilitate implementation and testing.
Level 5: Optimizing process. At this level, measures from activities are used to change and improve the process. This process change can affect the organization and the project as well.
IEEE-Defined Metrics
The Institute of Electrical and Electronics Engineers (IEEE) standards were writ-ten with the objective to provide the software community with defined measures

259aPPenDix V
currently used as indicators of reliability. By emphasizing early reliability assessment, this standard supports methods through measurement to improve product reliability.
This section presents a subset of the IEEE standard easily adaptable by the general IT community.
1. Fault density. This measure can be used to predict remaining faults by compar-ison with expected fault density, determine if sufficient testing has been com-pleted, and establish standard fault densities for comparison and prediction.
F F KSLOCd = /
where: F = total number of unique faults found in a given interval resulting in
failures of a specified severity level KSLOC = number of source lines of executable code and nonexecutable data
declarations in thousands 2. Defect density. This measure can be used after design and code inspections of
new development or large block modifications. If the defect density is outside the norm after several inspections, it is an indication of a problem.
DD
D
KSLOD1= =
∑ i
i
I
where: Di = total number of unique defects detected during the ith design or
code inspection process I = total number of inspections KSLOD = in the design phase, this is the number of source lines of executable
code and nonexecutable data declarations in thousands
3. Cumulative failure profile. This is a graphical method used to predict reli-ability, estimate additional testing time to reach an acceptable reliable system, and identify modules and subsystems that require additional testing. A plot is drawn of cumulative failures versus a suitable time base.
4. Fault-days number. This measure represents the number of days that faults spend in the system from their creation to their removal. For each fault detected and removed, during any phase, the number of days from its creation to its removal is determined (fault-days). The fault-days are then summed for all faults detected and removed, to get the fault-days number at system level, including all faults detected and removed up to the delivery date. In those cases where the creation date of the fault is not known, the fault is assumed to have been created at the middle of the phase in which it was introduced.
5. Functional or modular test coverage. This measure is used to quantify a soft-ware test coverage index for a software delivery. From the system’s functional

260 aPPenDix V
requirements, a cross-reference listing of associated modules must first be created.
functional modular test FE
coverage index FT
( ) =
where: FE = number of software functional (modular) requirements for which all test
cases have been satisfactorily completed FT = total number of software functional (modular) requirements
6. Requirements traceability. This measure aids in identifying requirements that are either missing from, or in addition to, the original requirements.
TM
RR
= ×12
100%
where: R1 = number of requirements met by the architecture R2 = number of original requirements
7. Software maturity index. This measure is used to quantify the readiness of a software product. Changes from a previous baseline to the current baselines are an indication of the current product stability.
SMI M F F F
MT a c del
T= − + +( )
where: SMI = software maturity index MT = number of software functions (modules) in the current delivery Fa = number of software functions (modules) in the current delivery that are
additions to the previous delivery Fc = number of software functions (modules) in the current delivery that
include internal changes from a previous delivery Fdel = number of software functions (modules) in the previous delivery that are
deleted in the current delivery
The software maturity index may be estimated as:
SMI M F
MT c
T= −
8. Number of conflicting requirements. This measure is used to determine the reliability of a software system resulting from the software architecture

261aPPenDix V
under consideration, as represented by a specification based on the entity-relationship-attributed model. What is required is a list of the systems inputs, its outputs, and a list of the functions performed by each program. The mappings from the software architecture to the requirements are identi-fied. Mappings from the same specification item to more than one differing requirement are examined for requirements inconsistency. Additionally, map-pings from more than one spec item to a single requirement are examined for spec inconsistency.
9. Cyclomatic complexity. This measure is used to determine the structured com-plexity of a coded module. The use of this measure is designed to limit the complexity of the module, thereby promoting understandability of the module.
C E N= − + 1
where: C = complexity N = number of nodes (sequential groups of program statements) E = number of edges (program flows between nodes)
10. Design structure. This measure is used to determine the simplicity of the detailed design of a software program. The values determined can be used to identify problem areas within the software design.
DSM W Di i=
=∑i 1
6
where: DSM = design structure measure P1 = total number of modules in program P2 = number of modules dependent on input or output P3 = number of modules dependent on prior processing (state) P4 = number of database elements P5 = number of nonunique database elements P6 = number of database segments P7 = number of modules not single entrance/single exit
The design structure is the weighted sum of six derivatives determined by using the aforementioned primitives.
D1 = designed organized top-down D2 = module dependence (P2/P1) D3 = module dependent on prior processing (P3/P1) D4 = database size (P5/P4) D5 = database compartmentalization (P6/P4) D6 = module single entrance/exit (P7/P1)

262 aPPenDix V
The weights (Wi) are assigned by the user based on the priority of each associated derivative. Each Wi has a value between 0 and 1.
11. Test coverage. This is a measure of the completeness of the testing process from both a developer and user perspective. The measure relates directly to the development, integration, and operational test stages of product development.
TC
implemented capabilities
required capabilities
prog%( ) = ( )
( ) ×rram primitives tested
total program primitives( )( ) × 100%
where program functional primitives are either modules, segments, state-ments, branches, or paths; data functional primitives are classes of data; and requirement primitives are test cases or functional capabilities.
12. Data or information flow complexity. This is a structural complexity or proce-dural complexity measure that can be used to evaluate: the information flow structure of large-scale systems, the procedure and module information flow structure, the complexity of the interconnections between modules, and the degree of simplicity of relationships between subsystems, and to correlate total observed failures and software reliability with data complexity.
weighted IFC length fanin fanout= × ×( )2
where: IFC = information flow complexity fanin = local flows into a procedure + number of data structures from which
the procedures retrieves data fanout = local flows from a procedure + number of data structures that the
procedure updates length = number of source statements in a procedure (excluding comments)
The flow of information between modules and/or subsystems needs to be determined either through the use of automated techniques or charting mech-anisms. A local flow from module A to B exists if one of the following occurs:
a. A calls B b. B calls A and A returns a value to B that is passed by B c. Both A and B are called by another module that passes a value from A to B.
13. Mean time to failure. This measure is the basic parameter required by most software reliability models. Detailed record keeping of failure occurrences that accurately tracks time (calendar or execution) at which the faults manifest themselves is essential.
14. Software documentation and source listings. The objective of this measure is to collect information to identify the parts of the software maintenance

263aPPenDix V
products that may be inadequate for use in a software maintenance envi-ronment. Questionnaires are used to examine the format and content of the documentation and source code attributes from a maintainability perspective.
The questionnaires examine the following product characteristics: a. Modularity b. Descriptiveness c. Consistency d. Simplicity e. Expandability f. Testability
Two questionnaires, the software documentation questionnaire and the software source listing questionnaire, are used to evaluate the software prod-ucts in a desk audit.
For the software documentation evaluation, the resource documents should include those that contain the program design specifications, program testing information and procedures, program maintenance information, and guide-lines used in the preparation of the documentation. Typical questions from the questionnaire include
a. The documentation indicates that data storage locations are not used for more than one type of data structure.
b. Parameter inputs and outputs for each module are explained in the documentation.
c. Programming conventions for I/O processing have been established and followed.
d. The documentation indicates the resource (storage, timing, tape drives, disks, etc.) allocation is fixed throughout program execution.
e. The documentation indicates that there is a reasonable time margin for each major time-critical program function.
f. The documentation indicates that the program has been designed to accommodate software test probes to aid in identifying processing performance.
The software source listings evaluation reviews either high-order language or assembler source code. Multiple evaluations using the questionnaire are conducted for the unit level of the program (module). The modules selected should represent a sample size of at least 10% of the total source code. Typical questions include
a. Each function of this module is an easily recognizable block of code. b. The quantity of comments does not detract from the legibility of the source
listings. c. Mathematical models as described/derived in the documentation corre-
spond to the mathematical equations used in the source listing.

264 aPPenDix V
d. Esoteric (clever) programming is avoided in this module. e. The size of any data structure that affects the processing logic of this mod-
ule is parameterized. f. Intermediate results within this module can be selectively collected for
display without code modification.
Selected Performance Metrics
There are a wide variety of performance metrics that companies use. In this section, we will list some actual metrics from selected organizations surveyed and/or researched for this book. The reader is urged to review Appendix III, which lists a wealth of standard IT metrics, and Appendix XII, which discusses how to establish a software measure program within your organization.
Distribution Center
1. Average number of orders per day 2. Average number of lines (SKUs) per order 3. Picking rate by employee (order lines/hour) by storage zone [picking off some
of the automated equip is different than off shelves] 4. Average freight cost 5. Number of errors by employee
On a monthly basis:
1. Volume of inbound freight (SKUs and $ cost) by week 2. Volume of outbound freight (SKUs and $ cost) by week 3. Volume of repackaged goods (work orders) by week 4. Comparison of in-house repackaged goods versus outsourced to compare
efficiencies 5. Cycle count $ cost variance (to check if things are disappearing at a higher rate
than normal) 6. Average Shipping time to customer (these reports are provided by trucking
carriers) 7. Number of returns versus shipments 8. Transcontinental shipments (we have two warehouses; the California
warehouse should ship to Western customers and East Coast to eastern customers—this tells us when inventory is not balanced)
For bonuses, employees track (monthly):
1. Expense control 2. Revenue 3. Accounts receivable turns 4. Inventory turns

265aPPenDix V
Software Testing
1. Number of projects completed. 2. Number of projects cancelled during testing. 3. Number of defects found. This is further broken down into categories of
defects, such as major defects (software will not install or causes blue screen) and minor/cosmetic defects (text in message box is missing). These numbers are put into a calculation that shows how much money we saved the company by catching defects before they were found in production.
4. Number of new projects started. (Shows expected workload for next month.) 5. Number of projects not completed/carried over to next month. (This shows
if we are staying current with work. For example, if we started 50 new projects this month, and completed 20, we are carrying 30 projects to next month. Typically, this number is constant each month, but will increase if we encounter a number of difficult projects. The value of this metric is only meaningful compared with the number of new requests, number of projects completed, and number of requests carried forward in previous months.)
Product Marketing
1. New customers over multiple periods 2. Lost customers over multiple periods 3. Customer retention percentage 4. Product quality: total defects 5. Technical support: number of calls per product 6. Product life cycle: time from requirements to finished product, percentage of
original requirements implemented, number of out-of-scope requirements 7. Sales support: number of nonsales resources supporting the channel, number
of resources time hours/week 8. Product revenue: actual versus planned revenue by channel, region, market
segment 9. Product profit: revenue and expense by product, net profit, or contribution 10. Market share: graph trends over multiple years, market share by key players in
your segment 11. Marketing programs: lead quality (leads to close ratio), ROI for marketing
programs, cost per lead closed
Enterprise Resource Planning
Reduction of operational problems:
1. Number of problems with customer order processing 2. Percentage of problems with customer order processing 3. Number of problems with warehouse processes

266 aPPenDix V
4. Number of problems with standard reports 5. Number of problems with reports on demand
Availability of the ERP system:
1. Average system availability 2. Average downtime 3. Maximum downtime
Avoidance of operational bottlenecks:
1. Average response time in order processing 2. Average response time in order processing during peak time 3. Average number of OLTP transactions 4. Maximum number of OLTP transactions
Actuality of the system:
1. Average time to upgrade the system release levels behind the actual level
Improvement in system development:
1. Punctuality index of system delivery 2. Quality index
Avoidance of developer-bottlenecks:
1. Average workload per developer 2. Rate of sick leave per developer 3. Percentage of modules covered by more than two developers
Project Management
CATEGORY MEASUREMENT (HOW) METRIC (WHAT)
Costs Actual vs. budget • Labor (costs)• Materials (hardware/software)• Other (office space, telecom)
Schedule Actual vs. planned • Key deliverables completed• Key deliverables not completed• Milestones met• Milestones not met
Risks Anticipated vs. actual • Event (actual occurrence)• Impact (effect on project)
Quality Actual vs. planned activities • Number of reviews (peer, structured walkthrough)
• Number of defects (code, documentation)• Type of defect (major/minor)• Origin of defect (coding, testing,
documentation)
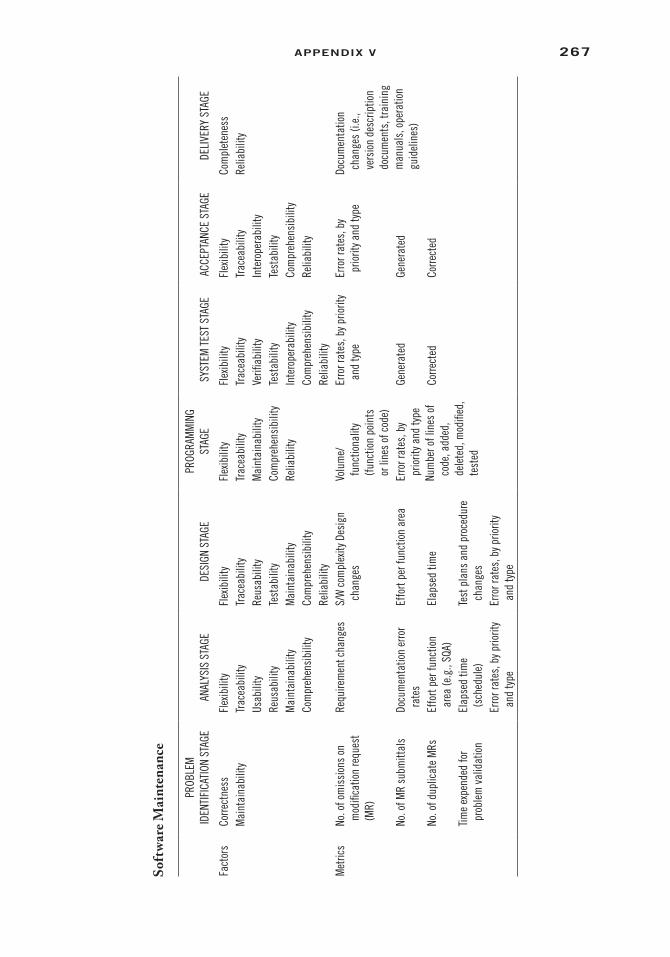
267aPPenDix V
Soft
war
e Mai
nten
ance
PROB
LEM
ID
ENTI
FICA
TION
STA
GEAN
ALYS
IS S
TAGE
DESI
GN S
TAGE
PROG
RAM
MIN
G ST
AGE
SYST
EM T
EST
STAG
EAC
CEPT
ANCE
STA
GEDE
LIVE
RY S
TAGE
Fact
ors
Corre
ctne
ssFl
exib
ility
Flex
ibili
tyFl
exib
ility
Flex
ibili
tyFl
exib
ility
Com
plet
enes
sM
aint
aina
bilit
yTr
acea
bilit
yTr
acea
bilit
yTr
acea
bilit
yTr
acea
bilit
yTr
acea
bilit
yRe
liabi
lity
Usab
ility
Reus
abili
tyM
aint
aina
bilit
yVe
rifiab
ility
Inte
rope
rabi
lity
Reus
abili
tyTe
stab
ility
Com
preh
ensi
bilit
yTe
stab
ility
Test
abili
tyM
aint
aina
bilit
yM
aint
aina
bilit
yRe
liabi
lity
Inte
rope
rabi
lity
Com
preh
ensi
bilit
yCo
mpr
ehen
sibi
lity
Com
preh
ensi
bilit
yCo
mpr
ehen
sibi
lity
Relia
bilit
yRe
liabi
lity
Relia
bilit
yM
etric
sNo
. of o
mis
sion
s on
m
odifi
catio
n re
ques
t (M
R)
Requ
irem
ent c
hang
esS/
W c
ompl
exity
Des
ign
chan
ges
Volu
me/
func
tiona
lity
(func
tion
poin
ts
or li
nes
of c
ode)
Erro
r rat
es, b
y prio
rity
and
type
Erro
r rat
es, b
y pr
iorit
y and
type
Docu
men
tatio
n ch
ange
s (i.
e.,
vers
ion
desc
riptio
n do
cum
ents
, tra
inin
g m
anua
ls, o
pera
tion
guid
elin
es)
No. o
f MR
subm
ittal
sDo
cum
enta
tion
erro
r ra
tes
Effo
rt pe
r fun
ctio
n ar
eaEr
ror r
ates
, by
prio
rity a
nd ty
peNu
mbe
r of l
ines
of
code
, add
ed,
dele
ted,
mod
ified
, te
sted
Gene
rate
dGe
nera
ted
No. o
f dup
licat
e M
RsEf
fort
per f
unct
ion
area
(e.g
., SQ
A)El
apse
d tim
eCo
rrect
edCo
rrect
ed
Time
expe
nded
for
prob
lem
val
idat
ion
Elap
sed
time
(sch
edul
e)Te
st p
lans
and
pro
cedu
re
chan
ges
Erro
r rat
es, b
y prio
rity
and
type
Erro
r rat
es, b
y prio
rity
and
type

268 aPPenDix V
General IT Measures
CATEGORY FOCUS PURPOSE MEASURE OF SUCCESS
Schedule performance
Tasks completed vs. tasks planned at a point in time.
Assess project progress. Apply project resources.
100% completion of tasks on critical path; 90% all others
Major milestones met vs. planned.
Measure time efficiency. 90% of major milestones met.
Revisions to approved plan. Understand and control project “churn.”
All revisions reviewed and approved.
Changes to customer requirements.
Understand and manage scope and schedule.
All changes managed through approved change process.
Project completion date. Award/penalize (depending on contract type).
Project completed on schedule (per approved plan).
Budget performance
Revisions to cost estimates. Assess and manage project cost.
100% of revisions are reviewed and approved.
Dollars spent vs. dollars budgeted.
Measure cost efficiency. Project completed within approved cost parameters.
Return on investment (ROI). Track and assess performance of project investment portfolio.
ROI (positive cash flow) begins according to plan.
Acquisition cost control. Assess and manage acquisition dollars.
All applicable acquisition guidelines followed.
Product quality Defects identified through quality activities.
Track progress in, and effectiveness of, defect removal.
90% of expected defects identified (e.g., via peer reviews, inspections).
Test case failures vs. number of cases planned.
Assess product functionality and absence of defects.
100% of planned test cases execute successfully.
Number of service calls. Track customer problems. 75% reduction after three months of operation.
Customer satisfaction index. Identify trends. 95% positive rating.Customer satisfaction trend. Improve customer satisfaction. 5% improvement each quarter.Number of repeat customers. Determine if customers are
using the product multiple times (could indicate satisfaction with the product).
“X”% of customers use the product “X” times during a specified time period.
Number of problems reported by customers.
Assess quality of project deliverables.
100% of reported problems addressed within 72 h.
Compliance Compliance with enterprise architecture model requirements.
Track progress towards department-wide architecture model.
Zero deviations without proper approvals.
Compliance with interoperability requirements.
Track progress toward system interoperability.
Product works effectively within system portfolio.
Compliance with standards. Alignment, interoperability, consistency.
No significant negative findings during architect assessments.
For website projects, compliance with style guide.
To ensure standardization of website.
All websites have the same “look and feel.”
Compliance with Section 508.
To meet regulatory requirements.
Persons with disabilities may access and utilize the functionality of the system.

269aPPenDix V
(Continued )
CATEGORY FOCUS PURPOSE MEASURE OF SUCCESS
Redundancy Elimination of duplicate or overlapping systems.
Ensure return on investment. Retirement of 100% of identified systems
Decreased number of duplicate data elements.
Reduce input redundancy and increase data integrity.
Data elements are entered once and stored in one database.
Consolidate help desk functions.
Reduce $ spent on help desk support.
Approved consolidation plan by fill-in-date
Cost avoidance System is easily upgraded. Take advantage of e.g., COTS upgrades.
Subsequent releases do not require major “glue code” project to upgrade.
Avoid costs of maintaining duplicate systems.
Reduce IT costs. 100% of duplicate systems have been identified and eliminated.
System is maintainable. Reduce maintenance costs. New version (of COTS) does not require “glue code.”
Customer satisfaction
System availability (up time). Measure system availability. 100% of requirement is met (e.g., 99% M-F, 8 a.m. to 6 p.m., and 90% S & S, 8 a.m. to 5 p.m.).
System functionality (meets customer’s/user’s needs).
Measure how well customer needs are being met.
Positive trend in customer satisfaction survey(s).
Absence of defects (that impact customer).
Number of defects removed during project life cycle.
90% of defects expected were removed.
Ease of learning and use. Measure time to becoming productive.
Positive trend in training survey(s).
Time it takes to answer calls for help.
Manage/reduce response times. 95% of severity one calls answered within 3 h.
Rating of training course. Assess effectiveness and quality of training.
90% of responses of “good” or better.
Business goals/mission
Functionality tracks reportable inventory.
Validate system supports program mission.
All reportable inventory is tracked in system.
Turnaround time in responding to congressional queries.
Improve customer satisfaction and national interests.
Improve turnaround time from 2 days to 4 h.
Maintenance costs. Track reduction of costs to maintain system.
Reduce maintenance costs by 2/3 over 3-year period.
Standard desktop platform. Reduce costs associated with upgrading user’s systems.
Reduce upgrade costs by 40%.
Productivity Time taken to complete tasks.
To evaluate estimates. Completions are within 90% of estimates.
Number of deliverables produced.
Assess capability to deliver products.
Improve product delivery 10% in each of the next 3 years.
Business Performance
1. Percentage of processes where completion falls within ±5% of the estimated completion
2. Average process overdue time 3. Percentage of overdue processes

270 aPPenDix V
4. Average process age 5. Percentage of processes where the actual number of assigned resources is less
than the planned number of assigned resources 6. Sum of costs of “killed”/stopped active processes 7. Average time to complete task 8. Sum of deviation of time (e.g., in days) against planned schedule of all active
projects 9. Service level agreement (SLA)—Key performance indicators (KPIs)
SLA Performance
1. Percentage of service requests resolved within an agreed-on/acceptable period of time
2. Cost of service delivery as defined in SLA based on a set period such as month or quarter
3. Percentage of outage (unavailability) due to implementation of planned changes, relative to the service hours
4. Average time (e.g., in hours) between the occurrence of an incident and its resolution
5. Downtime: The percentage of the time that service is available 6. Availability − the total service time = the mean time between failure (MTBF)
and the mean time to repair (MTTR) 7. Number of outstanding actions against last SLA review 8. The deviation of the planned budget (cost) is the difference in costs between
the planned baseline against the actual budget of the SLA 9. Percentage of correspondence replied to on time 10. Percentage of incoming service requests of customers that have to be com-
pletely answered within x amount of time 11. Number of complaints received within the measurement period 12. Percentage of customer issues that were solved by the first phone call 13. Number of operator activities per call—maximum possible, minimum pos-
sible, and average. (e.g., take call, log call, attempt dispatch, retry dispatch, escalate dispatch, reassign dispatch)
14. The number of answered phone calls per hour 15. Total calling time per day or week. 16. Average queue time of incoming phone calls 17. Cost per minute of handle time 18. Number of unresponded e-mails 19. Average after call work time (work done after call has been concluded) 20. Costs of operating a call center/service desk, usually for a specific period such
as month or quarter
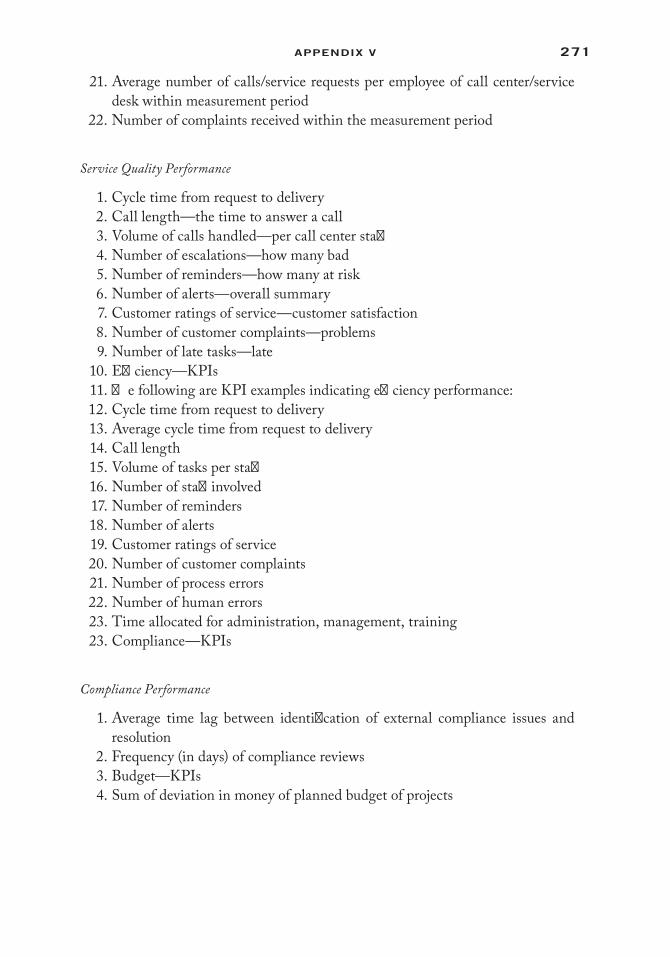
271aPPenDix V
21. Average number of calls/service requests per employee of call center/service desk within measurement period
22. Number of complaints received within the measurement period
Service Quality Performance
1. Cycle time from request to delivery 2. Call length—the time to answer a call 3. Volume of calls handled—per call center staff 4. Number of escalations—how many bad 5. Number of reminders—how many at risk 6. Number of alerts—overall summary 7. Customer ratings of service—customer satisfaction 8. Number of customer complaints—problems 9. Number of late tasks—late 10. Efficiency—KPIs 11. The following are KPI examples indicating efficiency performance: 12. Cycle time from request to delivery 13. Average cycle time from request to delivery 14. Call length 15. Volume of tasks per staff 16. Number of staff involved 17. Number of reminders 18. Number of alerts 19. Customer ratings of service 20. Number of customer complaints 21. Number of process errors 22. Number of human errors 23. Time allocated for administration, management, training 23. Compliance—KPIs
Compliance Performance
1. Average time lag between identification of external compliance issues and resolution
2. Frequency (in days) of compliance reviews 3. Budget—KPIs 4. Sum of deviation in money of planned budget of projects

273
Appendix VI: Behavioral Competencies
Companies interested in stimulating learning and growth among employees will be interested in this list of behavioral competencies for employees and managers.
For Employees
Communicates Effectively
1. Listens to others in a patient, empathetic, and nonjudgmental way; acknowl-edges their ideas in a respectful manner; questions appropriately.
2. Is straightforward and direct; behavior is consistent with words. 3. Discusses concerns and conflict directly and constructively. 4. Communicates in a timely fashion.
Promotes Teamwork
1. Networks with other employees within and outside of one’s area; makes inter-nal referrals to connect people with each other.
2. Readily volunteers to be on teams. 3. Is a participating and equal partner on teams; has the same purpose as the
team; encourages cohesion and trust. 4. Is receptive to and solicits other team member’s advice and ideas. 5. Keeps supervisor/team informed of status of work so that surprises are
minimized. 6. Verbally and nonverbally supports established decisions and actions; repre-
sents the collective stance.

274 APPENDIX VI
Presents Effectively
1. Understands the makeup of the audience and is sensitive to their values, back-grounds, and needs.
2. Presents ideas clearly so that others can easily understand their meaning. 3. Delivers presentations with the appropriate level of expression and confidence. 4. Incorporates humor when appropriate and in good taste.
Makes Sound Decisions
1. Knows when a decision is necessary and makes decisions in a timely manner. 2. Connects decisions to strategic plans; separates essential from nonessential
information considering all logical alternatives when generating conclusions. 3. Seeks and considers input from others who are close to the situation before
establishing a course of action. 4. Considers the relevance and impact of decisions on others prior to making
decisions.
Uses Resources Wisely
1. Considers need and cost prior to making resource-related requests and decisions.
2. Makes maximum use of available resources through the efficient and creative use of people, time, material, and equipment.
3. Reduces waste, reuses materials, and recycles appropriate materials. 4. Functions within the budget.
Takes Initiative and Accepts Accountability
1. Is proactive; plans ahead; sees things that need to be done and accomplishes them on own initiative and on time.
2. Accepts responsibility and consequences for one’s decisions and actions. 3. Follows through on commitments; does what one says one will do—the first
time. 4. Acknowledges, accepts, and learns from mistakes.
Lives Company’s Values
1. Demonstrates the organizational and professional code of ethics including honesty, respect, dignity, caring, and confidentiality.
2. Demonstrates and consistently applies organizational principles, policies, and values to all employees and situations.

275APPENDIX VI
3. Respects and operates within the boundaries established for one’s job and personal boundaries set by others.
4. Promotes a positive work environment.
Demonstrates a Customer-First Approach (Internal Partners and External Customers)
1. Anticipates customers’ needs; facilitates customers to express their needs; lis-tens to customers and hears what they say.
2. Promptly attends to customers’ needs (e.g., answers phone and returns phone calls within a reasonable amount of time).
3. Treats customers with respect, politeness, and dignity while maintaining appropriate boundaries.
4. When appropriate, provides customers with options for action in response to their needs.
Generates New Ideas
1. Generates imaginative and original ideas that will bring about positive change. 2. Seizes opportunities to expand on other people’s ideas to create something
new and add value. 3. Encourages others to create new ideas, products, and/or solutions that will
add value to the organization.
Demonstrates Flexibility
1. Adapts to and accepts changing work schedules, priorities, challenges, and unpredictable events in a positive manner.
2. Is visible and accessible; is approachable even when interruptions are inconvenient.
3. Is receptive to new ideas that are different from one’s own ideas. 4. Offers to help others when circumstances necessitate sharing the workload.
Demonstrates a Professional Demeanor
1. Demonstrates acceptable hygiene and grooming; dresses appropriately for one’s job.
2. Uses proper verbal and nonverbal communications and tones with internal partners and external customers and patients.
3. Places work responsibilities and priorities before personal needs while at work. 4. Maximizes positive and professional communication with internal partners
and external customers and patients; minimizes complaining and nonfactual communication.

276 APPENDIX VI
Stimulates and Adapts to Change
1. Stimulates positive attitudes about change; pushes the change process along. 2. Takes personal responsibility for adapting to and coping with change. 3. Commits quickly when change reshapes one’s area of work. 4. Accepts ambiguity and uncertainty, is able to improvise and still add value.
Continually Improves Processes
1. Anticipates and looks for opportunities to improve steps in the development and delivery of one’s products or services; takes logical risks that may lead to improvement and change.
2. Examines one’s work for conformance to predetermined plans, specifications, and standards.
3. Freely shares and promotes new ideas that may lead to improvement and posi-tive change, even when the idea may be unpopular.
4. Seeks input from others who are closest to the situation in making improvements.
For Managers
Organizational Acumen
1. Demonstrates a thorough knowledge of the company model, organizational history, and values.
2. Applies knowledge of services, products, and processes to understand key issues within own division and work unit.
3. Demonstrates understanding of and ability to influence organizational cul-ture, norms, and expectations.
4. Contributes to, fosters, and supports changes resulting from organizational decisions and initiatives.
Strategic Direction
1. Integrates own work and that of one’s work unit with the organization’s mis-sion, values, and objectives.
2. Analyzes and utilizes customer, industry, and stakeholder inputs in strategic and operating plan processes.
3. Establishes work group priorities to support strategic objectives. 4. Gathers input from internal and external resources to analyze business unit needs. 5. Promotes and embraces innovation and creativity to achieve organizational
and work unit goals. 6. Develops work unit plans and measures that are aligned with division and
organization strategic objectives.

277APPENDIX VI
7. Defines operational goals for work unit. 8. Integrates strategies and plans with other areas. 9. Promotes and supports the use of corporate and cross-functional teams. 10. Ensures customer and employee confidentiality through the monitoring of
access to information to individuals who have need, reason, and permission for such access.
Systems Improvement
1. Demonstrates understanding of the “big picture”—interrelationships of divi-sions, departments, and work units.
2. Incorporates a broad range of internal and external factors in problem solving and decision-making.
3. Solicits and incorporates customer and stakeholder needs and expectations into work unit planning.
4. Applies and encourages the use of process improvement methods and tools. 5. Encourages and supports innovative and creative problem solving by others. 6. Integrates process thinking into the management of daily operations to
enhance quality, efficiency, and ethical standards. 7. Utilizes data in decision-making and managing work units.
Communication
1. Communicates the mission, values, structure, and systems to individuals, groups, and larger audiences.
2. Provides leadership in communicating “up,” “down,” and “across” the organization.
3. Reinforces the organization’s key messages. 4. Creates a work environment for and models open expression of ideas and
diverse opinions. 5. Routinely includes a communications plan in work and project planning. 6. Applies, communicates, and educates others about organizational policies and
procedures. 7. Keeps employees informed of industry trends and implications. 8. Understands, communicates, and administers compensation and benefits to
employees.
Employee and Team Direction
1. Anticipates and assesses staffing needs. 2. Maintains and updates staff job descriptions, linking employee job descrip-
tions and projects to unit, division, and corporate strategies.

278 APPENDIX VI
3. Recruits, selects, and retains high-performing individuals. 4. Provides information, resources, and coaching to support individual/team
professional and career development. 5. Applies knowledge of team dynamics to enhance group communication, syn-
ergy, creativity, conflict resolution, and decision-making. 6. Assures staff has training to fully utilize the technological tools necessary for
job performance. 7. Delegates responsibilities to, coaches, and mentors employees to develop their
capabilities. 8. Involves staff in planning and reporting to ensure integration with operational
activities and priorities. 9. Coaches employees by providing both positive and constructive feedback and
an overall realistic picture of their performance. 10. Ensures that core functions in areas of responsibility can be continued in the
absence of staff members—either short term or long term. 11. Recognizes and acknowledges successes and achievements of others.
Financial Literacy
1. Partners with financial specialists in planning and problem solving. 2. Develops and meets financial goals using standard budgeting and reporting
processes. 3. Continually finds ways to improve revenue, reduce costs, and leverage assets
in keeping with the organization’s strategic direction and objectives. 4. Uses financial and quantitative information in work unit management. 5. Communicates unit budget expectations and status to employees. 6. Coaches employees on financial implications of work processes.
Professional Development
1. Keeps up to date with external environments through professional associa-tions, conferences, journals, and so on.
2. Nurtures and maintains working relationships with colleagues across the organization.
3. Demonstrates commitment to professional development, aligning that devel-opment with current and future needs of the organization whenever possible.
4. Models self-development and healthy work/life balance for employees.
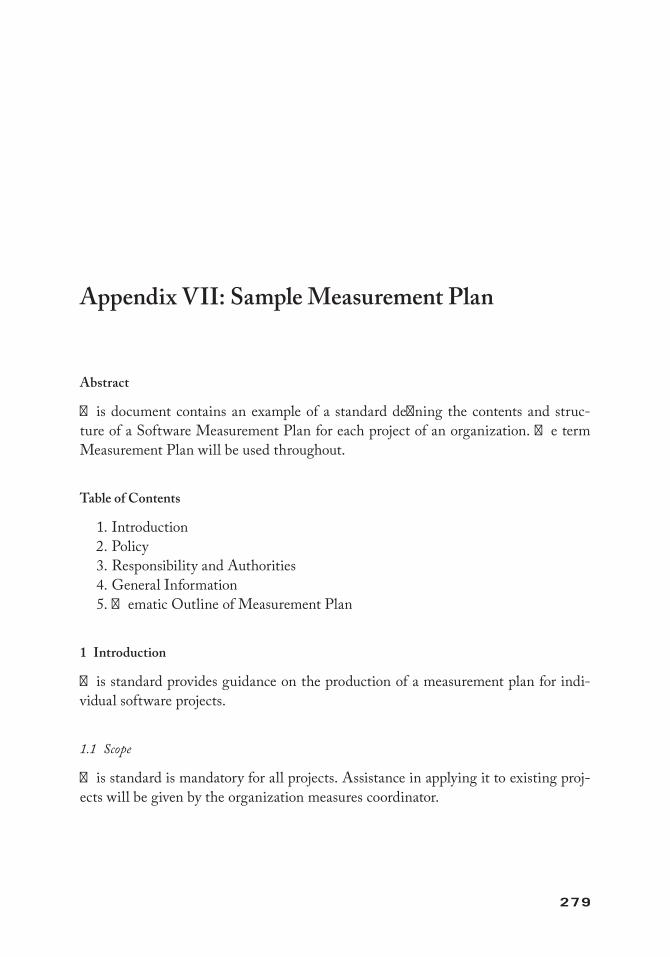
279
Appendix VII: Sample Measurement Plan
Abstract
This document contains an example of a standard defining the contents and struc-ture of a Software Measurement Plan for each project of an organization. The term Measurement Plan will be used throughout.
Table of Contents
1. Introduction 2. Policy 3. Responsibility and Authorities 4. General Information 5. Thematic Outline of Measurement Plan
1 Introduction
This standard provides guidance on the production of a measurement plan for indi-vidual software projects.
1.1 Scope
This standard is mandatory for all projects. Assistance in applying it to existing proj-ects will be given by the organization measures coordinator.

280 APPENDIX VII
2 Policy
It is policy to collect measures to assist in the improvement of
• The accuracy of cost estimates• Project productivity• Product quality• Project monitoring and control
In particular, each project will be responsible for identifying and planning all activ-ities associated with the collection of these measures. The project is responsible for the definition of the project’s objectives for collecting measures, analyzing the measures to provide the required presentation results, and documenting the approach in an internally approved measurement plan. The project is also responsible for capturing the actual measurement information and analysis results. The form of this actual mea-surement information could be appended to the measurement plan or put in a separate document called a measurement case.
3 Responsibility and Authorities
The project leader/manager shall be responsible for the production of the project mea-surement plan at the start of the project. Advice and assistance from the organization measures coordinator shall be sought when needed. The measurement plan shall be approved by the project leader/manager (if not the author), product manager, organi-zation measures coordinator, and project quality manager.
4 General Information
4.1 Overview of Project Measures Activities
The collection and use of measures must be defined and planned into a project during the start-up phase. The haphazard collection of measures is more likely to result in the collection of a large amount of inconsistent data that will provide little useful informa-tion to the project management team, or for future projects.
The following activities shall be carried out at the start of the project:
• Define the project’s objectives for collecting measures.• Identify the users of the measures-derived information, as well as any particu-
lar requirements they may have.• Identify the measures to meet these objectives or provide the information.
Most, if not all, of these should be defined at the organization level.• Define the project task structure, for example, work breakdown structure
(WBS).• Define when each measure is to be collected, in terms of the project task
structure.

281APPENDIX VII
• Define how each measure is to be collected, in terms of preprinted forms/tools, who will collect it, and where/how it will be stored.
• Define how the data will be analyzed to provide the required information, including the specification of any necessary algorithms, and the frequency with which this will be done.
• Define the organization, including the information flow, within the project required to support the measures collection and analyses activities.
• Identify the standards and procedures to be used.• Define which measures will be supplied to the organization.
4.2 Purpose of the Measurement Plan
The project’s measurement plan is produced as one of the start-up documents to record the project’s objectives for measures collection and how it intends to carry out the program. The plan also
• Ensures that activities pertinent to the collection of project measures are con-sidered early in the project and are resolved in a clear and consistent manner.
• Ensures that project staff are aware of the measures activities and provides an easy reference to them.
The measurement plan complements the project’s quality and project plans, high-lighting matters specifically relating to measures. The measurement plan information can be incorporated into the quality and/or project plans. Information and instruc-tions shall not be duplicated in these plans.
4.3 Format
Section 5 defines a format for the measurement plan in terms of a set of headings that are to be used, and the information required to be given under each heading. The front pages shall be the minimum requirements for a standard configurable document.
4.4 Document Control
The Measurement Plan shall be controlled as a configurable document.
4.5 Filing
The measurement plan shall be held in the project filing system.
4.6 Updating
The measurement plan may require updating during the course of the project. Updates shall follow any changes in requirements for collecting measures or any change to the

282 APPENDIX VII
project which results in change to the project WBS. The project leader/manager shall be responsible for such updates or revisions.
5 Contents of Measurement Plan
This section details what is to be included in the project’s measurement plan. Wherever possible, the measurement plan should point to existing organization standards, and so on, rather than duplicating the information.
For small projects, the amount of information supplied under each topic may amount to only a paragraph or so and may not justify the production of the mea-surement plan as a separate document. Instead, the information may form a separate chapter in the quality plan, with the topic headings forming the sections/paragraphs in that chapter. On larger projects a separate document will be produced, with each topic heading becoming a section in its own right. The information required in the plan is detailed under appropriate headings.
THEMATIC OUTLINE FOR A MEASUREMENT PLAN
Section 1 Objectives for Collecting MeasuresThe project’s objectives for collecting measures shall be described here. These will also include the relevant organization objectives. Where the author of the measurement plan is not the project leader/manager, project management agree-ment to these objectives will be demonstrated by the fact that the project man-ager is a signatory to the plan.
Section 2 Use and Users of InformationProvide information that includes
• Who will be the users of the information to be derived from the measures.• Why the information is needed.• Required frequency of the information.
Section 3 Measures to be CollectedThis section describes the measures to be collected by the project. As far as pos-sible, the measures to be collected should be a derivative of the core measures. If organizational standards are not followed, justification for the deviation should be provided. Project specific measures shall be defined in full here in terms of the project tasks.
A goal-question-metric (GQM) approach should be used to identify the measures from the stated project objectives. The results of the GQM approach should also be documented.

283APPENDIX VII
Section 4 Collection of MeasuresProvide information that includes
• Who will collect each measure.• The level within the project task against which each measure is to be
collected.• When each measure is to be collected in terms of initial estimate,
re-estimates and actual measurement.• How the measures are to be collected, with reference to proformas, tools
and procedures as appropriate.• Validation to be carried out, including details of the project specific
techniques if necessary, and by whom.• How and where the measures are to be stored—including details of elec-
tronic database/spreadsheet/filing cabinet as appropriate, how the data is amalgamated and when it is archived, who is responsible for setting up the storage process, who is responsible for inserting the data into the database.
• When, how and which data is provided to the organization measures database.
Section 5 Analysis of MeasuresProvide information that includes
• How the data is to be analyzed, giving details of project specific tech-niques if necessary, any tools required, and how frequently it is to be carried out.
• The information to be provided by the analysis.• Who will carry out the analysis.• Details of project specific reports, frequency of generation, how they are
generated and by whom.
Section 6 Project OrganizationDescribe the organization within the project that is required to support the mea-surement activities. Identify roles and the associated tasks and responsibilities. These roles may be combined with other roles within the project to form com-plete jobs for individual people. The information flow between these roles and the rest of the project should also be described.
Section 7 Project Task StructureDescribe or reference the project’s the project task structure. It should be noted that the project’s measurement activities should be included in the project task structure.

284 APPENDIX VII
Section 8 StandardsA description of the measurement standards and procedures to be used by the project must be given, indicating which are organization standards and which are project specific. These standards will have been referenced throughout the plan, as necessary. If it is intended not to follow any of the organization stan-dards in full, this must be clearly indicated in the relevant section of the mea-surement plan, and a note made in this section.

285
Appendix VIII: Value Measuring Methodology*
The purpose of the value measuring methodology (VMM) is to define, capture, and measure value associated with electronic services unaccounted for in traditional return-on-investment (ROI) calculations, to fully account for costs, and to identify and consider risk. Developed in response to the changing definition of value brought on by the advent of the Internet and advanced software technology, VMM incorpo-rates aspects of numerous traditional business analysis theories and methodologies, as well as newer hybrid approaches.
VMM was designed to be used by organizations across the federal government to steer the development of an e-government initiative, assist decision-makers in choos-ing among investment alternatives, provide the information required to manage effec-tively, and to maximize the benefit of an investment to the government.
VMM is based on public and private sector business and economic analysis theories and best practices. It provides the structure, tools, and techniques for comprehensive quantitative analysis and comparison of value (benefits), cost, and risk at the appropri-ate level of detail.
This appendix provides a high-level overview of the four steps that form the VMM framework. The terminology used to describe the steps should be familiar to those involved in developing, selecting, justifying, and managing an information technol-ogy (IT) investment
Step 1: Develop a decision frameworkStep 2: Alternatives analysisStep 3: Pull the information togetherStep 4: Communicate and document
* This appendix is based on the Value Measuring Methodology—How-To-Guide. The U.S. Chief Information Officers Council.

286 APPENDIX VIII
Step 1: Develop a Decision Framework
A decision framework provides a structure for defining the objectives of an initiative, analyzing alternatives, and managing and evaluating ongoing performance. Just as an outline defines a paper’s organization before it is written, a decision framework creates an outline for designing, analyzing, and selecting an initiative for investment, and then managing the investment. The framework can be a tool that management uses to communicate its agency government-wide, or focus-area priorities.
The framework facilitates establishing consistent measures for evaluating current and/or proposed initiatives. Program managers may use the decision framework as a tool to understand and prioritize the needs of customers and the organization’s busi-ness goals. In addition, it encourages early consideration of risk and thorough plan-ning practices directly related to effective e-government initiative implementation.
The decision framework should be developed as early as possible in the development of a technology initiative. Employing the framework at the earliest phase of develop-ment makes it an effective tool for defining the benefits that an initiative will deliver, the risks that are likely to jeopardize its success, and the anticipated costs that must be secured and managed.
The decision framework is also helpful later in the development process as a tool to validate the direction of an initiative, or to evaluate an initiative that has already been implemented.
The decision framework consists of value (benefits), cost, and risk structures, as shown in Figure A8.1. Each of these three elements must be understood to plan, jus-tify, implement, evaluate, and manage an investment.
The tasks and outputs involved with creating a sound decision framework include
Tasks:
1. Identify and define value structure 2. Identify and define risk structure 3. Identify and define cost structure 4. Begin documentation
Value Risk
Results
Cost
Figure A8.1 The decision framework.
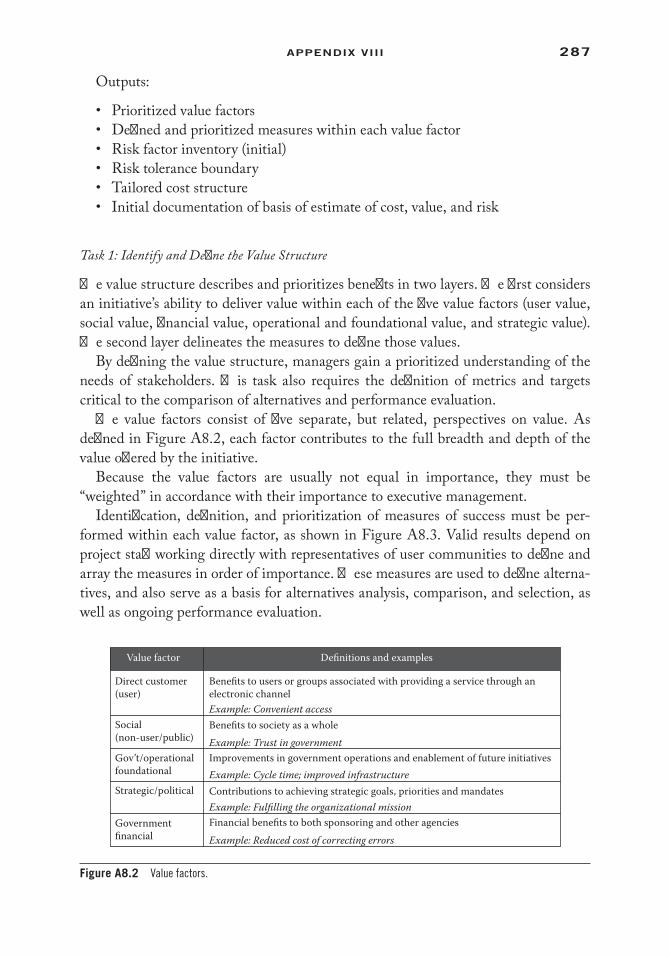
287APPENDIX VIII
Outputs:
• Prioritized value factors• Defined and prioritized measures within each value factor• Risk factor inventory (initial)• Risk tolerance boundary• Tailored cost structure• Initial documentation of basis of estimate of cost, value, and risk
Task 1: Identify and Define the Value Structure
The value structure describes and prioritizes benefits in two layers. The first considers an initiative’s ability to deliver value within each of the five value factors (user value, social value, financial value, operational and foundational value, and strategic value). The second layer delineates the measures to define those values.
By defining the value structure, managers gain a prioritized understanding of the needs of stakeholders. This task also requires the definition of metrics and targets critical to the comparison of alternatives and performance evaluation.
The value factors consist of five separate, but related, perspectives on value. As defined in Figure A8.2, each factor contributes to the full breadth and depth of the value offered by the initiative.
Because the value factors are usually not equal in importance, they must be “weighted” in accordance with their importance to executive management.
Identification, definition, and prioritization of measures of success must be per-formed within each value factor, as shown in Figure A8.3. Valid results depend on project staff working directly with representatives of user communities to define and array the measures in order of importance. These measures are used to define alterna-tives, and also serve as a basis for alternatives analysis, comparison, and selection, as well as ongoing performance evaluation.
Benefits to users or groups associated with providing a service through anelectronic channelExample: Convenient access
Example: Trust in government
Example: Cycle time; improved infrastructure
Example: Fulfilling the organizational mission
Example: Reduced cost of correcting errors
Direct customer(user)
Value factor Definitions and examples
Social(non-user/public)
Gov’t/operationalfoundational
Strategic/political
Governmentfinancial
Benefits to society as a whole
Improvements in government operations and enablement of future initiatives
Contributions to achieving strategic goals, priorities and mandates
Financial benefits to both sponsoring and other agencies
Figure A8.2 Value factors.

288 APPENDIX VIII
In some instances, measures may be defined at a higher level to be applied across a related group of initiatives, such as organization-wide or across a focus-area portfo-lio. These standardized measures then facilitate “apples-to-apples” comparison across multiple initiatives. This provides a standard management “yardstick” against which to judge investments.
Whether a measure has been defined by project staff or at a higher level of man-agement, it must include the identification of a metric, a target, and a normalized scale. The normalized scale provides a method for integrating objective and subjective measures of value into a single decision metric. The scale used is not important; what is important is that the scale remains consistent.
The measures within the value factors are prioritized by representatives from the user and stakeholder communities during facilitated group sessions.
Task 2: Identify and Define Risk Structure
The risk associated with an investment in a technology initiative may degrade per-formance, impede implementation, and/or increase costs. Risk that is not identified cannot be mitigated or managed, causing a project to fail either in the pursuit of fund-ing or, more dramatically, during implementation. The greater the attention paid to mitigating and managing risk, the greater the probability of success.
The risk structure serves a dual purpose. First, the structure provides the starting point for identifying and inventorying potential risk factors that may jeopardize an initiative’s success and ensures that plans for mitigating their impact are developed and incorporated into each viable alternative solution.
Second, the structure provides the information management needs to communi-cate their organization’s tolerance for risk. Risk tolerance is expressed in terms of cost (what is the maximum acceptable cost “creep” beyond projected cost) and value (what is the maximum tolerable performance slippage).
Direct user value factor
24/7 access to real-time information and services, anytime and anywhere
Percentage of remote access attempts that are successful (10 points for every 10%)
10 points = 25%90 points = 75% (threshold requirement)
Is data updated in the system in real time?No = 0 Yes = 100
100 points = 100%
Percentage of travel services available electronically
Are customers able to access real-time electronic travel services and policyinformation from any location 24 hours a day?
Concise, illustrative name
Brief description
Metrics and scales
Figure A8.3 A value factor with associated metrics.
289APPENDIX VIII
Risks are identified and documented during working sessions with stakeholders. Issues raised during preliminary planning sessions are discovered, defined, and docu-mented. The result is an initial risk inventory.
To map risk tolerance boundaries, selected knowledgeable staff are polled to iden-tify at least five data points that will define the highest acceptable level of risk for cost and value.
Task 3: Identify and Define the Cost Structure
A cost structure is a hierarchy of elements created specifically to accomplish the devel-opment of a cost estimate, and is also called a cost element structure (CES).
The most significant objective in the development of a cost structure is to ensure a complete, comprehensive cost estimate and to reduce the risk of missing costs or double counting. An accurate and complete cost estimate is critical for an initiative’s success. Incomplete or inaccurate estimates can result in exceeding the budget for implementation requiring justification for additional funding or a reduction in scope. The cost structure developed in this step will be used during Step 2 to estimate the cost for each alternative.
Ideally, a cost structure will be produced early in development, prior to defining alternatives. However, a cost structure can be developed after an alternative has been selected or, in some cases, in the early stage of implementation. Early structuring of costs guides refinement and improvement of the estimate during the progress of plan-ning and implementation.
Task 4: Begin Documentation
Documentation of the elements leading to the selection of a particular alternative above all others is the “audit trail” for the decision. The documentation of assump-tions, the analysis, the data, the decisions, and the rationale behind them are the foundation for the business case and the record of information required to defend a cost estimate or value analysis.
Early documentation will capture the conceptual solution, desired benefits, and attendant global assumptions (e.g., economic factors such as the discount and infla-tion rates). The documentation also includes project-specific drivers and assumptions, derived from tailoring the structures.
The basis for the estimate, including assumptions and business rules, should be organized in an easy-to-follow manner that links to all other analysis processes and requirements. This will provide easy access to information supporting the course of action, and will also ease the burden associated with preparing investment justification documents. As an initiative evolves through the life cycle, becoming better defined and more specific, the documentation will also mature in specificity and definition.

290 APPENDIX VIII
Step 2: Alternative Analysis—Estimate Value, Costs, and Risk
An alternatives analysis is an estimation and evaluation of all value, cost, and risk factors (Figure A8.4) leading to the selection of the most effective plan of action to address a specific business issue (e.g., service, policy, regulation, business process or system). An alternative that must be considered is the “base case.” The base case is the alternative where no change is made to current practices or systems. All other alterna-tives are compared against the base case, as well as with each other.
An alternatives analysis requires a disciplined process to consider the range of pos-sible actions to achieve the desired benefits. The rigor of the process to develop the information on which to base the alternatives evaluation yields the data required to justify an investment or course of action. It also provides the information required to support the completion of the budget justification documents. The process also pro-duces a baseline of anticipated value, costs, and risks to guide the management and ongoing evaluation of an investment.
An alternatives analysis must consistently assess the value, cost, and risk associated with more than one alternative for a specific initiative. Alternatives must include the base case and accommodate specific parameters of the decision framework. VMM, properly used, is designed to avoid “analysis paralysis.”
The estimation of cost and the projection of value use ranges to define the indi-vidual elements of each structure. Those ranges are then subject to an uncertainty analysis (see Note 1). The result is a range of expected values and cost. Next, a sensitiv-ity analysis (see Note 2) identifies the variables that have a significant impact on this
Defining risk
In the assessment of an e-Travel initiative, risks were bundled into five categories: cost, technical,schedule, operational, and legal.
�e following sample table demonstrates how a single “risk factor” is likely to impact multiple riskcategories. Note the level of detail provided in the description. Specificity is critical to distinguish amongrisks and avoid double counting.
Selected e-Travel initiative risks by risk category
Cos
t
Shc.
Op.
Tech
Lega
l
Different agencies have different levels and quality of security mechanisms,which may leave government data vulnerable. Web-enabled system willhave increased points of entry for unauthorized internal or external users andpose greater security risks.
�e e-Travel concept relies heavily on technology. Although, the privatesector has reduced travel fees and operational costs by implementinge-Travel services, the commercial sector has not yet widelyadopted/developed end-to-end solutions that meet the broad needs (singleend-to-end electronic system) articulated by the e-Travel initiative. �etechnology and applications may not be mature enough to provide all of thefunctionality sought by the e-Travel initiative managers.
Resistance to change may be partially due to fear of job loss, which maylead to challenges from unions.
X X
X X X X
X X X
Figure A8.4 Risk can be bundled across categories.

291APPENDIX VIII
expected value and cost. The analyses will increase confidence in the accuracy of the cost and predicted performance estimates (Figure A8.5). However, a risk analysis is critical to determine the degree to which other factors may drive up expected costs or degrade predicted performance.
An alternatives analysis must be carried out periodically throughout the life cycle of an initiative. The following list provides an overview of how the business value resulting from an alternatives analysis changes, depending on where in the life cycle the analysis is conducted.
1. Strategic planning (predecisional) a. How well will each alternative perform against the defined value measures? b. What will each alternative cost?
VMM in action
Analysts projected the low, expected, and high performance for that measure.
Average no. of hours from receipt of customer feedback message toresponse
�e model translated those projections onto the normalized scale.
Low
38 24 18
Expected High
Average no. of hoursfrom receipt ofcustomer feedbackmessage toresponse
Average no. of hoursfrom receipt ofcustomer feedbackmessage toresponse
Example 1: �is measure was established for an e-Travel initiative in the direct user value factor.
Example 2: �is measure was established for alternative 2 in the direct user value factor. �enormalized scale set for this measure was binary.
Value points
Duplicative entryof data
Predicting performance
Normalized value scale
Value
Value
10
10
48.00 44.67 41.33 38.00 34.67 31.33 28.00 24.67 21.33 18.00
48.00
Low = 38.00
High = 18.00
Expected = 24.00
44,67 41.33 38.00 34.67 31.33 28.00 24.67 21.33 18.00
20
20
30
30
40
40
40 82 100
50
50
60
60
70
70
80
80
90
90
100
100
NOYes
0 10 20 30 40 50 60 70 80 90
Figure A8.5 Predicting performance.

292 APPENDIX VIII
c. What is the risk associated with each alternative? d. What will happen if no investment is made at all (base case)? e. What assumptions were used to produce the cost estimates and value
projections? 2. Business modeling and pilots a. What value is delivered by the initiative? b. What are the actual costs to date? Do estimated costs need to be
reexamined? c. Have all risks been addressed and managed? 3. Implementation and evaluation a. Is the initiative delivering the predicted value? What is the level of value
delivered? b. What are the actual costs to date? c. Which risks have been realized, how are they affecting costs and perfor-
mance, and how are they being managed?
The tasks and outputs involved with conducting an alternatives analysis include
Tasks:
1. Identify and define alternatives 2. Estimate value and cost 3. Conduct risk analysis 4. Ongoing documentation
Outputs:
• Viable alternatives• Cost and value analyses• Risk analyses• Tailored basis of estimate documenting value, cost, and risk economic factors
and assumptions
Task 1: Identify and Define Alternatives
The challenge of this task is to identify viable alternatives that have the potential to deliver an optimum mix of both value and cost-efficiency. Decision-makers must be given, at a minimum, two alternatives plus the base case to make an informed invest-ment decision.
The starting point for developing alternatives should be the information in the value structure and preliminary drivers identified in the initial basis of estimate (see Step 1).
Using this information will help to ensure that the alternatives and, ultimately, the solution chosen, accurately reflect a balance of performance, priorities, and

293APPENDIX VIII
business imperatives. Successfully identifying and defining alternatives requires cross-functional collaboration and discussion among the stakeholders.
The base case explores the impact of identified drivers on value and cost if an alter-native solution is not implemented. That may mean that current processes and sys-tems are kept in place or that organizations will build a patchwork of incompatible, disparate solutions. There should always be a base case included in the analysis of alternatives.
Task 2: Estimate Value and Cost
Comparison of alternatives, justification for funding, creation of a baseline against which ongoing performance may be compared, and development of a foundation for more detailed planning require an accurate estimate of an initiative’s cost and value. The more reliable the estimated value and cost of the alternatives, the greater confi-dence one can have in the investment decision.
The first activity to pursue when estimating value and cost is the collection of data. Data sources and detail will vary based on an initiative’s stage of development. Organizations should recognize that more detailed information may be available at a later stage in the process and should provide best estimates in the early stages, rather than delaying the process by continuing to search for information that is likely not available.
To capture cost and performance data, and conduct the VMM analyses, a VMM model should be constructed. The model facilitates the normalization and aggrega-tion of cost and value, as well as the performance of uncertainty, sensitivity, and risk analyses.
Analysts populate the model with the dollar amounts for each cost element and projected performance for each measure. These predicted values, or the underlying drivers, will be expressed in ranges (e.g., low, expected, or high). The range between the low and high values will be determined based on the amount of uncertainty asso-ciated with the projection.
Initial cost and value estimates are rarely accurate. Uncertainty and sensitivity analyses increase confidence that likely cost and value have been identified for each alternative.
Task 3: Conduct Risk Analysis
The only risks that can be managed are those that have been identified and assessed. A risk analysis considers the probability and potential negative impact of specific factors on an organization’s ability to realize projected benefits or estimated cost, as shown in Figure A8.6.
Even after diligent and comprehensive risk mitigation during the planning stage, some level of residual risk will remain that may lead to increased costs and decreased performance. A rigorous risk analysis will help an organization better understand the

294 APPENDIX VIII
Syst
em p
lann
ing
and
deve
lopm
ent
Tota
l cos
t sav
ings
to in
vest
men
t
Tota
l cos
t sav
ings
to in
vest
men
t
Low
Low
Low
Low
Tota
l cos
t avo
idan
ce to
inve
stm
ent
Tota
l cos
t avo
idan
ce to
inve
stm
ent
Low
Low
Hig
hM
ediu
m
Hig
h
Hig
h
Cos
t of l
ost i
nfor
mat
ion/
data
Cos
t of l
ost i
nfor
mat
ion/
data
Har
dwar
e/so
ftwar
e fa
ilure
and
repl
acem
ent
Cos
t ove
rrun
s
Cos
t ove
rrun
s
Risk Risk
Prob
abili
ty
Prob
abili
ty
Cos
t im
pact
ed
Valu
e im
pact
ed
Alte
rnat
ive
1: D
iscre
te e
-Aut
hent
icat
ion
Alte
rnat
ive
1: D
iscre
te e
-Aut
hent
icat
ion
Impa
ct
Impa
ct
Med
ium M
ediu
m
Med
ium
Med
ium
Med
ium
Syst
em a
cqui
sitio
n an
d im
plem
enta
tion
Syst
em m
aint
enan
ce a
nd o
pera
tions
3.0
2.0
1.0
Syst
em p
lann
ing
and
deve
lopm
ent
Syst
em a
cqui
sitio
n an
d im
plem
enta
tion
Syst
em m
aint
enan
ce a
nd o
pera
tions
3.0
2.0
1.0
VM
M in
act
ion Ass
essin
g pr
obab
ility
and
impa
ct
Belo
w a
re e
xcer
pts f
rom
tabl
es d
evel
oped
for t
he ri
sk a
naly
sis o
f an
e-A
uthe
ntic
atio
n in
itiat
ive.
Not
eth
at th
e im
pact
and
pro
babi
lity
of ri
sk w
ere
asse
ssed
for b
oth
cost
and
val
ue.
�e
prob
abili
ty o
f asp
ecifi
c ris
k oc
curr
ing
rem
ains
con
stan
tth
roug
h ou
t the
anal
ysis
of a
spec
ific
alte
rnat
ive,
rega
rdle
ssof
whe
re it
impa
cts
the
valu
e or
cos
t of a
part
icul
ar a
ltern
ativ
e
�e
impa
ct o
f asi
ngle
risk
fact
orm
ay d
iffer
inm
agni
tude
at e
ach
poin
t whe
re it
inte
ract
s with
cos
tan
d va
lue
Figu
re A
8.6
Asse
ssin
g pr
obab
ility
and
impa
ct.

295APPENDIX VIII
probability that a risk will occur and the level of impact the occurrence of the risk will have on both cost and value. Additionally, risk analysis provides a foundation for building a comprehensive risk-management plan.
Task 4: Ongoing Documentation
Inherent in these activities is the need to document the assumptions and research that compensate for gaps in information or understanding. For each alternative, the initial documentation of the high-level assumptions and risks will be expanded to include a general description of the alternative being analyzed, a comprehensive list of cost and value assumptions, and assumptions regarding the risks associated with a specific alternative. This often expands the initial risk inventory.
Step 3: Pull Together the Information
As shown in Figure A8.7, the estimation of cost, value, and risk provide important data points for investment decision-making. However, when analyzing an alterna-tive and making an investment decision, it is critical to understand the relationships among them.
Tasks:
1. Aggregate the cost estimate 2. Calculate the ROI
Direct Customer (user)1.
1. ... etc.
2.3.4.5.
Inputs
Leve
l 1Le
vel 2
Risk
tole
ranc
ebo
unda
ry
Value factors
Analysis
Risk and cost-benefitanalysis
Riskadjusted
Riskadjusted
Expected cost
Expected ROI
Riskscores
Expectedvalue and
costscores Expected
ROI
Outputs
Expected value score
SocialGov’t operational
Gov’t financial
Risk inventory
Project value definitions(measures)
Risk scale
Customized CES1.0 System planning and development
2.0 system acquisition
3.0 System maintenance
1.1 Hardware1.2 Software, etc.
2.1 Procurement2.2 Personnel, etc.
3.1 O and M Support3.2 Recurring training, etc.
Strategic/political
Valu
e
Unc
ertia
nty
and
sens
itivi
tyan
alys
is
Unc
ertia
nty
and
sens
itivi
tyan
alys
is
Risk
Cos
t
Figure A8.7 Risk and cost benefit analysis.

296 APPENDIX VIII
3. Calculate the value score 4. Calculate the risk scores (cost and value) 5. Compare value, cost, and risk
Outputs:
_ Cost estimate_ ROI metrics_ Value score_ Risk scores (cost and value)_ Comparison of cost, value, and risk
Task 1: Aggregate the Cost Estimate
A complete and valid cost estimate is critical to determining whether or not a spe-cific alternative should be selected. It also is used to assess how much funding must be requested. Understating cost estimates to gain approval, or not considering all costs, may create doubt as to the veracity of the entire analysis. An inaccurate cost estimate might lead to cost overruns, create the need to request additional funding, or reduce scope.
The total cost estimate is calculated by aggregating expected values for each cost element.
Task 2: Calculate the Return-On-Investment
ROI metrics express the relationship between the funds invested in an initiative and the financial benefits the initiative will generate. Simply stated, it expresses the finan-cial “bang for the buck.” Although it is not considered the only measure on which an investment decision should be made, ROI is, and will continue to be, a critical data point for decision-making.
Task 3: Calculate the Value Score
The value score quantifies the full range of value that will be delivered across the five value factors as defined against the prioritized measures within the decision frame-work. The interpretation of a value score will vary based on the level from which it is being viewed. At the program level, the value score will be viewed as a representation of how alternatives performed against a specific set of measures. They will be used to make an “apples-to-apples” comparison of the value delivered by multiple alternatives for a single initiative.
For example, the alternative that has a value score of 80 will be preferred over the alternative with a value score of 20, if no other factors are considered. At the orga-nizational or portfolio level, value scores are used as data points in the selection of

297APPENDIX VIII
initiatives to be included in an investment portfolio. Since the objectives and measures associated with each initiative will vary, decision-makers at the senior level use value scores to determine what percentage of identified value an initiative will deliver. For example, an initiative with a value score of 75 is providing 75% of the possible value the initiative has the potential to deliver. In order to understand what exactly is being delivered, the decision-maker will have to look at the measures of the value structure.
Consider the value score as a simple math problem. The scores projected for each of the measures within a value factor should be aggregated according to their established weights. The weighted sum of these scores is a factor’s value score. The sum of the fac-tors’ value scores, aggregated according to their weights, is the total value score.
Task 4: Calculate the Risk Scores
After considering the probability and potential impact of risks, risk scores are calcu-lated to represent a percentage of overall performance slippage or cost increase.
Risk scores provide decision-makers with a mechanism to determine the degree to which value and cost will be negatively affected and whether that degree of risk is acceptable based on the risk tolerance boundaries defined by senior staff. If a selected alternative has a high cost and/or high-value risk score, program management is alerted to the need for additional risk mitigation, project definition, or more detailed risk-management planning. Actions to mitigate the risk may include the establish-ment of a reserve fund, a reduction of scope, or a refinement of the alternative’s defi-nition. Reactions to excessive risk may also include reconsideration of whether it is prudent to invest in the project at all, given the potential risks, the probability of their occurrence, and the actions required to mitigate them.
Task 5: Compare Value, Cost, and Risk
Tasks 1–4 of this step analyze and estimate the value, cost, and risk associated with an alternative. In isolation, each data point does not provide the depth of information required to ensure sound investment decisions.
Previous to the advent of VMM, only financial benefits could be compared with investment costs through the development of an ROI metric. When comparing alter-natives, the consistency of the decision framework allows the determination of how much value will be received for the funds invested. Additionally, the use of risk scores provides insight into how all cost and value estimates are affected by risk.
By performing straightforward calculations, it is possible to model the relationships among value, cost, and risk
1. The effect risk will have on estimated value and cost 2. The financial ROI 3. If comparing alternatives, the value “bang for the buck” (total value returned
compared with total required investment)

298 APPENDIX VIII
4. If comparing initiatives to be included in the investment portfolio, senior managers can look deeper into the decision framework, moving beyond over-all scores to determine the scope of benefits through an examination of the measures and their associated targets.
Step 4: Communicate and Document
Regardless of the projected merits of an initiative, its success will depend heavily on the ability of its proponents to generate internal support, to gain buy-in from tar-geted users, and to foster the development of active leadership supporters (champions). Success or failure may depend as much on the utility and efficacy of an initiative as it does on the ability to communicate its value in a manner that is meaningful to stake-holders with diverse definitions of value. The value of an initiative can be expressed to address the diverse definitions of stakeholder value in funding justification documents and in materials designed to inform and enlist support.
Using VMM, the value of a project is decomposed according to the different value factors. This gives project-level managers the tools to customize their value proposition according to the perspective of their particular audience. Additionally, the structure provides the flexibility to respond accurately and quickly to project changes requiring analysis and justification.
The tasks and outputs associated with Step 4:
Tasks:
1. Communicate value to customers and stakeholders 2. Prepare budget justification documents 3. Satisfy ad hoc reporting requirements 4. Use lessons learned to improve processes
Outputs:
• Documentation, insight, and support:• To develop results-based management controls• For Exhibit 300 data and analytical needs• For communicating initiatives value• For improving decision-making and performance measurement through
“lessons learned”• Change and ad hoc reporting requirements
Task 1: Communicate the Value to Customers and Stakeholders
Leveraging the results of VMM analysis can facilitate relations with customers and stakeholders. VMM makes communication to diverse audiences easier by incorporat-ing the perspectives of all potential audience members from the outset of analysis.
299APPENDIX VIII
Since VMM calculates the potential value that an investment could realize for all stakeholders, it provides data pertinent to each of those stakeholder perspectives that can be used to bolster support for the project. It also fosters substantive discussion with customers regarding the priorities and detailed plans of the investment. These stronger relationships not only prove critical to the long-term success of the project, but can also lay the foundation for future improvements and innovation.
Task 2: Prepare Budget Justification Documents
Many organizations require comprehensive analysis and justification to support fund-ing requests. IT initiatives may not be funded if they have not proved:
1. Their applicability to executive missions 2. Sound planning 3. Significant benefits 4. Clear calculations and logic justifying the amount of funding requested 5. Adequate risk identification and mitigation efforts 6. A system for measuring effectiveness 7. Full consideration of alternatives 8. Full consideration of how the project fits within the confines of other govern-
ment entities and current law
After completion of the VMM, one will have data required to complete or support completion of budget justification documents.
Task 3: Satisfy Ad Hoc Reporting Requirements
Once a VMM model is built to assimilate and analyze a set of investment alternatives, it can easily be tailored to support ad hoc requests for information or other reporting requirements. In the current, rapidly changing political and technological environment, there are many instances when project managers need to be able to perform rapid analy-sis. For example, funding authorities, agency partners, market pricing fluctuations, or portfolio managers might impose modifications on the details (e.g., the weighting factors) of a project investment plan; many of these parties are also likely to request additional investment-related information later in the project life cycle. VMM’s customized decision framework makes such adjustments and reporting feasible under short time constraints.
Task 4: Use Lessons Learned to Improve Processes
Lessons learned through the use of VMM can be a powerful tool when used to improve overall organizational decision-making and management processes. For example, in the process of identifying metrics, one might discover that adequate mechanisms are not in place to collect critical performance information. Using this lesson to improve measurement

300 APPENDIX VIII
mechanisms would give an organization better capabilities for (a) gauging the project’s success and mission-fulfillment, (b) demonstrating progress to stakeholders and funding authorities, and (c) identifying shortfalls in performance that could be remedied.
Note 1: Uncertainty Analysis
Conducting an uncertainty analysis requires the following:
1. Identify the variables: Develop a range of values for each variable. This range expresses the level of uncertainty about the projection. For example, an ana-lyst may be unsure whether an Internet application will serve a population of 100 or 100,000. It is important to be aware of and express this uncertainty in developing the model in order to define the reliability of the model in predict-ing results accurately.
2. Identify the probability distribution for the selected variables: For each vari-able identified, assign a probability distribution. There are several types of probability distributions (see “Technical Definitions”). A triangular prob-ability distribution is frequently used for this type of analysis. In addition to establishing the probability distribution for each variable, the analyst must also determine whether the actual amount is likely to be high or low.
3. Run the simulation: Once the variables’ level of uncertainty is identified and each one has been assigned a probability distribution, run the Monte Carlo simula-tion. The simulation provides the analyst with the information required to deter-mine the range (low to high) and “expected” results for both the value projection and cost estimate. As shown in Figure A8.8, the output of the Monte Carlo
VMM in action
Below is a sample generated by running an automated monte carlo simulation on the VMM model.
Uncertainty results
.026500 Trials Frequency chart 500 Displayed
.020
.013
.007
.000$16,918,710 $19,484,805 $22,050,900 $24,616,995 $27,183,090
FrequencyProb
abili
ty
13
9.75
6.5
3.25
0
Figure A8.8 Output of Monte Carlo simulation.

301APPENDIX VIII
simulation produces a range of possible results and defines the “mean,” the point at which there is an equal chance that the actual value or cost will be higher or lower. The analyst then surveys the range and selects the expected value.
Note 2: Sensitivity Analysis
Sensitivity analysis is used to identify the business drivers that have the greatest impact on potential variations of an alternative’s cost and its returned value. Many of the assumptions made at the beginning of a project’s definition phase will be found inaccurate later in the analysis. Therefore, one must consider how sensitive a total cost estimate or value projection is to changes in the data used to produce the result. Insight from this analysis allows stakeholders not only to identify variables that require additional research to reduce uncertainty, but also to justify the cost of that research.
The information required to conduct a sensitivity analysis is derived from the same Monte Carlo simulation used for the uncertainty analysis.
Figure A8.9 is a sample sensitivity chart. Based on this chart, it is clear that “Build 5/6 Schedule Slip” is the most sensitive variable.
Definitions
Analytic hierarchy process (AHP): AHP is a proven methodology that uses comparisons of paired elements (comparing one against the other) to deter-mine the relative importance of criteria mathematically.
Benchmark: A measurement or standard that serves as a point of reference by which process performance is measured.
Benefit: A term used to indicate an advantage, profit, or gain attained by an individual or organization.
Build 5/6 schedule slip .95
.17
.12
.07
.04
–.03
.03
.02
.02
.02
.02
.00
Build 4.0/4.1 schedule slip
Development-application S/W OSD contra
Development: Support contractors
Development-PRC CLIN 0004 FTE
OSO-NCF
L82
Development-tech support: OSD
Development-application S/W: OSD
Deployment-PRC PM
Deployment: Support contractors
CLIN 0101
Figure A8.9 Sensitivity chart.

302 APPENDIX VIII
Benefit-to-cost ratio (BCR): The computation of the financial benefit/cost ratio is done within the construct of the following formula: Benefits ÷ Cost.
Cost element structure (CES): A hierarchical structure created to facilitate the development of a cost estimate. May include elements that are not strictly products to be developed or produced, for example, travel, risk, program man-agement reserve, life-cycle phases, and so on. Samples include
1. System planning and development 1.1. Hardware 1.2. Software 1.2.1. Licensing fees 1.3. Development support 1.3.1. Program management oversight 1.3.2. System engineering architecture design 1.3.3. Change management and risk assessment 1.3.4. Requirement definition and data architecture 1.3.5. Test and evaluation 1.4. Studies 1.4.1. Security 1.4.2. Accessibility 1.4.3. Data architecture 1.4.4. Network architecture 1.5. Other 1.5.1. Facilities 1.5.2. Travel 2. System acquisition and implementation 2.1. Procurement 2.1.1. Hardware 2.1.2. Software 2.1.3. Customized software 2.2. Personnel 2.3. Training 3. System maintenance and operations 3.1. Hardware 3.1.1. Maintenance 3.1.2. Upgrades 3.1.3. Life-cycle replacement 3.2. Software 3.2.1. Maintenance 3.2.2. Upgrades 3.2.3. License fees 3.3. Support
303APPENDIX VIII
3.3.1. Helpdesk 3.3.2. Security 3.3.3. Training
Cost estimate: The estimation of a project’s life-cycle costs, time-phased by fiscal year, based on the description of a project or system’s technical, program-matic, and operational parameters. A cost estimate may also include related analyses such as cost–risk analyses, cost–benefit analyses, schedule analyses, and trade studies.
Commercial cost estimating tools:PRICE S—is a parametric model used to estimate software size, development
cost, and schedules, along with software operations and support costs. Software size estimates can be generated for source lines of code, func-tion points, or predictive objective points. Software development costs are estimated based on input parameters reflecting the difficulty, reliability, productivity, and size of the project. These same parameters are used to generate operations and support costs. Monte Carlo risk simulation can be generated as part of the model output. Government agencies (e.g., NASA, IRS, U.S. Air Force, U.S. Army, U.S. Navy) as well as private companies have used PRICE S.
PRICE H, HL, M—is a suite of hardware parametric cost models used to estimate hardware development, production and operations, and sup-port costs. These hardware models provide the capability to generate a total ownership cost to support program management decisions. Monte Carlo risk simulation can be generated as part of the model output. Government agencies (e.g., NASA, U.S. Air Force, U.S. Army, U.S. Navy) as well as private companies have used the PRICE suite of hard-ware models.
SEER-SEM (system evaluations and estimation of resources-software esti-mating model)—is a parametric modeling tool used to estimate software development costs, schedules, and manpower resource requirements. Based on the input parameters provided, SEER-SEM develops cost, schedule, and resource requirement estimates for a given software devel-opment project.
SEER-H (system evaluations and estimation of resources-hybrid)—is a hybrid cost-estimating tool that combines analogous and parametric cost-estimating techniques to produce models that accurately estimate hardware development, production, and operations and maintenance cost. SEER-H can be used to support a program manager’s hardware life-cycle cost estimate or provide an independent check of vendor quotes or estimates developed by third parties. SEER-H is part of a family of models from Galorath Associates, including SEER SEM
304 APPENDIX VIII
(which estimates the development and production costs of software) and SEER-DFM (used to support design for manufacturability analyses).
Data sources (by phase of development):
1. Strategic planning 1.1. Strategic and performance plans 1.2. Subject-matter expert input 1.3. New and existing user surveys 1.4. Private/public sector best practices, lessons learned, and benchmarks 1.5. Enterprise architecture 1.6. Modeling and simulation 1.7. Vendor market survey 2. Business modeling and pilots 2.1. Subject-matter expert input 2.2. New and existing user surveys 2.3. Best practices, lessons learned, and benchmarks 2.4. Refinement of modeling and simulation 3. Implementation and evaluation 3.1. Data from phased implementation 3.2. Actual spending/cost data 3.3. User group/stakeholder focus groups 3.4. Other performance measurement
Internal rate of return (IRR): The IRR is the discount rate that sets the net present value of the program or project to zero. While the internal rate of return does not generally provide an acceptable decision criterion, it does pro-vide useful information, particularly when budgets are constrained or there is uncertainty about the appropriate discount rate.
Life-cycle costs: The overall estimated cost for a particular program alternative over the time period corresponding to the life of the program, including direct and indirect initial costs plus any periodic or continuing costs of operation and maintenance.
Monte Carlo simulation: A simulation is any analytical method that is meant to imitate a real-life system, especially when other analyses are too mathemati-cally complex or too difficult to reproduce. Spreadsheet risk analysis uses both a spreadsheet model and simulation to analyze the effect of varying inputs on outputs of the modeled system. One type of spreadsheet simulation is Monte Carlo simulation, which randomly generates values for uncertain variables over and over to simulate a model. (Monte Carlo simulation was named for Monte Carlo, Monaco, where the primary attractions are casinos containing games of chance.) Analysts identify all key assumptions for which the out-come is uncertain. For the life cycle, numerous inputs are each assigned one of

305APPENDIX VIII
several probability distributions. The type of distribution selected depends on the conditions surrounding the variable. During simulation, the value used in the cost model is selected randomly from the defined possibilities:
Net present value (NPV): NPV is defined as the difference between the pres-ent value of benefits and the present value of costs. The benefits referred to in this calculation must be quantified in cost or financial terms in order to be included.
Net Present Value PV Internal Project Cost Savings Operati= , oonal
PV Mission Cost Savings PV Initial Investment
( )
+ ( ) − ( ))
Polling tools:Option finder: A real-time polling device, which permits participants, using
handheld remotes, to vote on questions and have the results displayed immediately with statistical information such as “degree of variance” and topics discussed.
Group systems: A tool that allows participants to answer questions using indi-vidual laptops. The answers to these questions are then displayed to all participants anonymously, in order to spur discussion and the free flowing exchange of ideas. Group systems also have a polling device.
Return on investment (ROI): A financial management approach used to explain how well a project delivers benefits in relationship to its cost. Several methods are used to calculate a return on investment. Refer to Internal Rate of Return (IRR), Net Present Value (NPV), and Savings to Investment Ratio (SIR).
Risk: A term used to define the class of factors that (a) have a measurable probability of occurring during an investment’s life cycle, (b) have an asso-ciated cost or effect on the investment’s output or outcome (typically an adverse effect that jeopardizes the success of an investment), and (c) have alternatives from which the organization may chose.
Risk categories: 1. Project resources/financial: Risk associated with “cost creep,” misestimat-
ing life-cycle costs, reliance on a small number of vendors without cost controls, and (poor) acquisition planning.
2. Technical/technology: Risk associated with immaturity of commercially available technology; reliance on a small number of vendors; risk of techni-cal problems/failures with applications and their ability to provide planned and desired technical functionality.
3. Business/operational: Risk associated with business goals; risk that the proposed alternative fails to result in process efficiencies and stream-lining; risk that business goals of the program or initiative will not be

306 APPENDIX VIII
achieved; risk that the program effectiveness targeted by the project will not be achieved.
4. Organizational and change management: Risk associated with organiza-tional/agency/government-wide cultural resistance to change and stan-dardization; risk associated with bypassing, lack of use or improper use or adherence to new systems and processes due to organizational structure and culture; inadequate training planning.
5. Data/information: Risk associated with the loss/misuse of data or infor-mation, risk of increased burdens on citizens and businesses due to data collection requirements if the associated business processes or the proj-ect requires access to data from other sources (federal, state, and/or local agencies).
6. Security: Risk associated with the security/vulnerability of systems, web-sites, information, and networks; risk of intrusions and connectivity to other (vulnerable) systems; risk associated with the misuse (criminal/fraudulent) of information; must include level of risk (high, medium, basic) and what aspect of security determines the level of risk, for exam-ple, need for confidentiality of information associated with the project/system, availability of the information or system, or reliability of the information or system.
7. Strategic: Risk that the proposed alternative fails to result in the achieve-ment of those goals or in making contributions to them.
8. Privacy: Risk associated with the vulnerability of information collected on individuals, or risk of vulnerability of proprietary information on businesses.
Risk analysis: A technique to identify and assess factors that may jeopardize the success of a project or achieving a goal. This technique also helps define preventive measures to reduce the probability of these factors from occurring and identify countermeasures to successfully deal with these constraints when they develop.
Savings to investment ratio (SIR): SIR represents the ratio of savings to invest-ment. The “savings” in the SIR computation are generated by internal opera-tional savings and mission cost savings. The flow of costs and cost savings into the SIR formula is as shown in Figure A8.10.
Sensitivity analysis: Analysis of how sensitive outcomes are to changes in the assumptions. The assumptions that deserve the most attention should depend largely on the dominant benefit and cost elements and the areas of greatest uncertainty of the program or process being analyzed.
Stakeholder: An individual or group with an interest in the success of an orga-nization in delivering intended results and maintaining the viability of the organization’s products and services. Stakeholders influence programs, prod-ucts, and services.
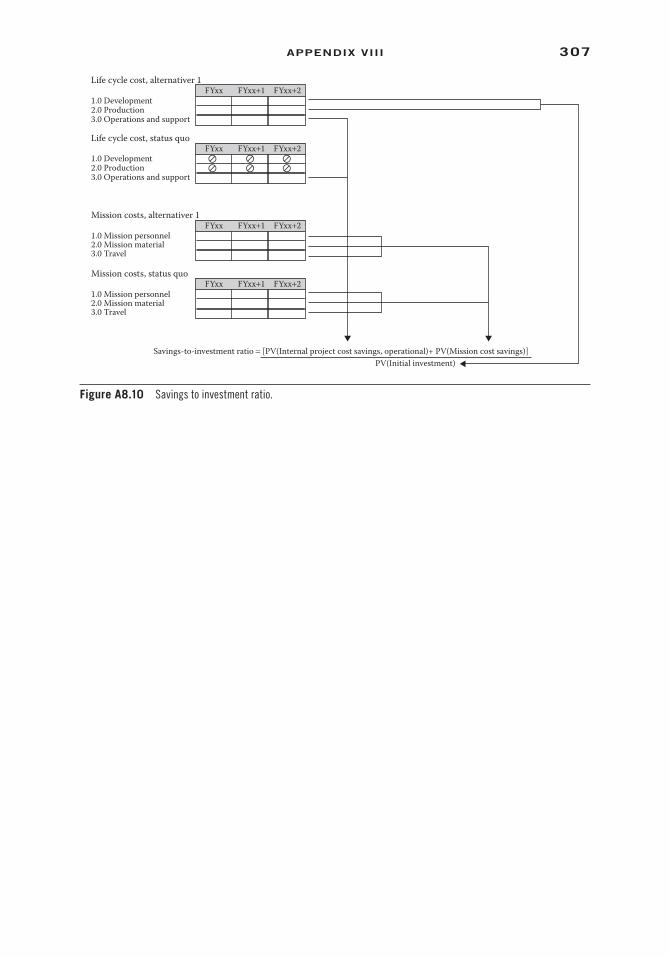
307APPENDIX VIII
FYxx FYxx+1 FYxx+2
FYxx FYxx+1 FYxx+2
FYxx FYxx+1 FYxx+2
FYxx FYxx+1 FYxx+2
Life cycle cost, alternativer 1
Mission costs, alternativer 1
Mission costs, status quo
Savings-to-investment ratio = [PV(Internal project cost savings, operational)+ PV(Mission cost savings)]PV(Initial investment)
Life cycle cost, status quo
1.0 Development2.0 Production3.0 Operations and support
1.0 Development
1.0 Mission personnel
3.0 Travel2.0 Mission material
1.0 Mission personnel
3.0 Travel2.0 Mission material
2.0 Production3.0 Operations and support
⊘ ⊘ ⊘⊘ ⊘ ⊘
Figure A8.10 Savings to investment ratio.
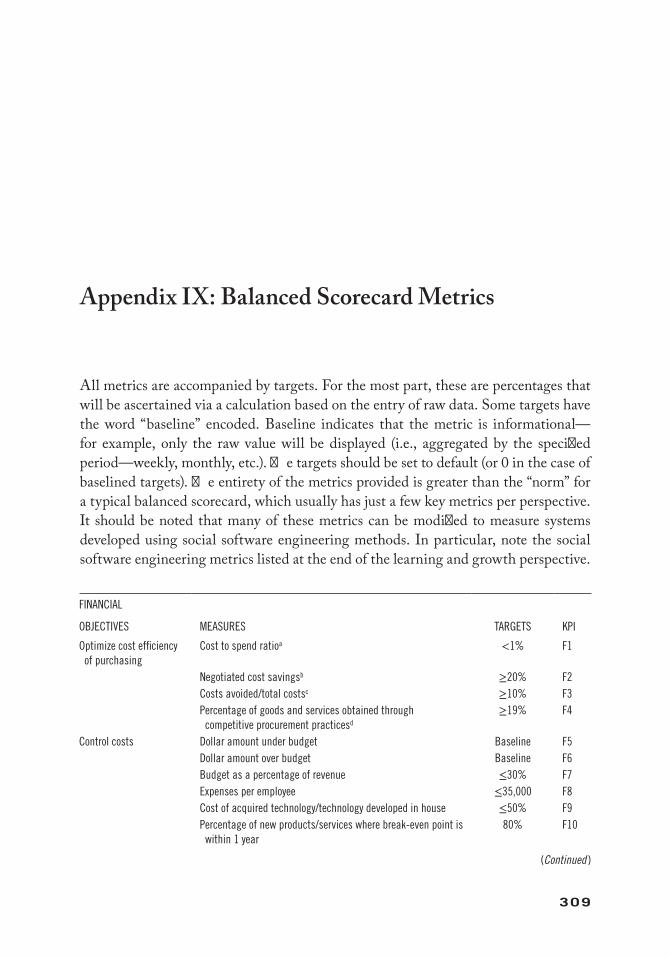
309
Appendix IX: Balanced Scorecard Metrics
All metrics are accompanied by targets. For the most part, these are percentages that will be ascertained via a calculation based on the entry of raw data. Some targets have the word “baseline” encoded. Baseline indicates that the metric is informational—for example, only the raw value will be displayed (i.e., aggregated by the specified period—weekly, monthly, etc.). The targets should be set to default (or 0 in the case of baselined targets). The entirety of the metrics provided is greater than the “norm” for a typical balanced scorecard, which usually has just a few key metrics per perspective. It should be noted that many of these metrics can be modified to measure systems developed using social software engineering methods. In particular, note the social software engineering metrics listed at the end of the learning and growth perspective.
FINANCIAL
OBJECTIVES MEASURES TARGETS KPI
Optimize cost efficiency of purchasing
Cost to spend ratioa <1% F1
Negotiated cost savingsb ≥20% F2Costs avoided/total costsc ≥10% F3Percentage of goods and services obtained through
competitive procurement practicesd
≥19% F4
Control costs Dollar amount under budget Baseline F5Dollar amount over budget Baseline F6Budget as a percentage of revenue ≤30% F7Expenses per employee ≤35,000 F8Cost of acquired technology/technology developed in house ≤50% F9Percentage of new products/services where break-even point is
within 1 year80% F10
(Continued )

310 APPENDIX IX
(Continued )
FINANCIAL
OBJECTIVES MEASURES TARGETS KPI
Overtime ratiof ≤25% F12Cost performance indexg ≥1 F13Average break-even pointh ≤1.5 years F14Schedule performance indexi ≥1 F15Total cost reductions due to use of technology ≥33% F16Workforce reduction due to use of new products ≥10% F17Contractor utilizationj ≤35% F18
Increase business value Revenue from new products or servicesk Baseline F19Average ROIl ≥1 F20Percentage of resources devoted to strategic projects ≥55% F21Percentage of favorable rating of project management by top
management≥93% F22
Average cost/benefit ratio ≥22% F23Net present valuem ≥1 F24Assets per employee Baseline F25Revenues per employee Baseline F26Profits per employee Baseline F27
Improve technology acquisition process
Total expenditures Baseline F28
Total expenditures/industry average expenditures ≥1 F29Amount of new technology acquired through M&A Baseline F30
a Operational costs/purchasing obligations (goods and services purchased).b Cost savings compared with total costs.c Costs avoided compared with total costs. You can avoid costs by reusing hardware/software, utilizing a partner, etc.d Difference between average qualified bid and the cost of the successful bid. The sum of each calculation is aggregated
into a new savings ratio for all transactions.e Additional capital costs—software, IT support, software, and network infrastructure. Technical support costs—hardware and software deployment, help desk staffing, system maintenance. Administration costs—financing, procurement, vendor management, user training, asset management. End-user operations costs—the costs incurred from downtime and in some cases, end users supporting other end
users as opposed to help desk technicians supporting them.f Overtime hours/regular hours worked.g Ratio of earned value to actual cost. EV, often called the budgeted cost of work performed, is an estimate of the value of
work actually completed. It is based on the original planned costs of a project.h Break-even analysis. All projects have associated costs. All projects will also have associated benefits. At the outset of a
project, costs will far exceed benefits. However, at some point the benefits will start outweighing the costs. This is called the break-even point. The analysis that is done to figure out when this break-even point will occur is called break-even analysis.
i SPI is the ratio of earned value to planned value and is used to determine whether or not the project is on target. (See cost performance index for a definition of earned value—EV).
j Cost of external contractors/cost of internal resources.k Use real dollars if systems are external customer facing. Use internal budget dollars if these are internal customer-facing
systems.l Return on investment. Most organizations select projects that have a positive return on investment. The return on invest-
ment, or ROI as it is most commonly known, is the additional amount earned after costs are earned back. The formula for ROI is
ROI
Benefit Cost
Cost=
( )–
Organizations want the ROI to be positive.

311APPENDIX IX
m NPV is a method of calculating the expected monetary gain or loss by discounting all expected future cash inflows and outflows to the present point in time. If financial value is a key criterion, organizations should only consider projects with a positive NPV. This is because a positive NPV means that the return from the project exceeds the cost of capital—the return available by investing elsewhere. Higher NPVs are more desirable than lower NPVs.
Formula for NPV:
NPV II sum of OCF 1 R r t TCF 1 R r n= − + ( ) +( ) + +( ) / ( ) / ( )
where: II = initial investment OFC = operating cash flows in year t t = year n = life span (in years) of the project R(r) = project required rate of return
from http://www.mtholyoke.edu/~aahirsch/howvalueproject.htmln Use research from a company such as http://www.infotech.com/
CUSTOMER
OBJECTIVES MEASURES TARGETS KPI
Increase customer satisfaction
Percentage of customers satisfied with system timeliness (speed)
≥92% C1
Percentage of customers satisfied with responsiveness to questions
≥92% C2
Percentage of customers satisfied with quality ≥92% C3Percentage of customers satisfied with sales/customer service
representatives≥92% C4
Length of time to resolve disputes ≤4 hours C5Conformance with customer requests
Percentage of baselined projects with a plan ≥90% C6
Percentage of customer requests satisfied ≥90% C7Increase customer base Customer lifetime value ($) Baseline C8
Share of wallet (%)a ≥25% C9Retention % ≥80% C10Win-back percent ≥85% C11New acquisitions/current number of customers ≥10% C12Rate of defection ≤3% C13
Enhance customer-facing systems
Avg number of searches per order/query Baseline C14
Avg number of support calls per order/query Baseline C15Avg elapsed time to select product and select an order Baseline C16Avg elapsed time to search website Baseline C17Number of steps required to select and purchase Baseline C18Avg time to answer incoming phone call Baseline C19Percentage of availability of customer facing applications ≥98% C20Avg cost to service each customer’s transaction Baseline C21
Support internal customers Percentage of better decisions ≥90% C22Percentage of time reduction in making decisions ≥90% C23Avg time to answer a support phone call Baseline C24
a Compare with competition using service such as http://www.lexisnexis.com/marketintelligence/

312 APPENDIX IX
INTERNAL BUSINESS PROCESSES
OBJECTIVES MEASURES TARGETS KPI
Improve data quality Forms inputted Baseline I1Data entry error rate ≤3% I2Age of current data Baseline I3Percentage of employees who have up-to-date data ≥98% I4
Improve balance between technical and strategic activities
Percentage of time devoted to maintenance ≤20 I5
Strategic project counts Baseline I6Percentage of time devoted to ad hoc activities ≤15% I7
Increase product quality and reliability
Percentage reduction in demand for customer support ≥25% I8
Number of end-user queries handled Baseline I9Average time to address an end-user problem ≤4 hours I10Equipment downtime ≤1% I11Mean time to failure ≤1000 hours I12Percent remaining known product faults ≤5% I13Percentage of projects with lessons learned in database ≥95% I14Fault densitya ≤3% I15Defect densityb ≤3% I16Cumulative failurec Baseline I17Fault days numberd ≤1 I18Functional test coveragee ≥95% I19Requirements traceabilityf ≥98% I20Maturity indexg ≥1 I21Percentage of conflicting requirements ≤5% I22Test coverageh ≥92% I23Cyclomatic complexityi ≤20 I24Percentage of project time allocated to quality testing ≥15% I25
Reduce risk Percentage of definitional uncertainty riskj ≤10% I26Percentage technological riskk ≤45% I27Percentage of developmental riskl <10% I28Percentage of nonalignment riskm ≤4% I29Percentage of service delivery riskn ≤5% I30Number of fraudulent transactions ≤1% I31Percentage of systems that have risk contingency plans ≥95% I32Percentage of systems that have been assessed for security
breaches≥95% I33
Improve processes Percentage of resources devoted to planning and review of product development activities
≥25% I34
Percentage of resources devoted to R&D Baseline I35Average time required to develop a new product/service Baseline I36Person-months of effort/project Baseline I37Percentage of requirements fulfilled ≥90% I38Pages of documentation Baseline I39Percentage of on-time implementations ≥97% I40Percentage of expected features delivered >98% I41

313APPENDIX IX
(Continued )
INTERNAL BUSINESS PROCESSES
OBJECTIVES MEASURES TARGETS KPI
Average time to provide feedback to the project team ≤1 day I42Project development time ≥50% I43Percentage of project backlog ≤10% I44Percentage of project cancellation rate ≤20% I45Support personnel to development personnel ratio ≥35% I56
Enhance resource planning Number of supplier relationships Baseline I47Decision speed <5 days I48Paperwork reduction ≥10% I49
Monitor change management
Number of change requests per month Baseline I50
Percentage of change to customer environment Baseline I51Changes released per month Baseline I52
Enhance applications portfolio
Age distribution of projects Baseline I53
Technical performance of project portfolioo Baseline I54Rate of product acceptance ≥95% I55
a Faults of a specific severity/thousand.b Total number of unique defects detected.c Failures per period.d Number of days that faults spend in the system from their creation to their removal.e Number of requirements for which test cases have been completed/total number of functional requirements.f Number of requirements met/number of original requirements.g Number of functions in current delivery—(adds + changes + deletes)/number of functions in current delivery.h (implemented capabilites/required capabilities) * (capabilities tested)/total capabilities)* 100%.i Cyclomatic complexity equals the number of decisions plus one. Cyclomatic complexity, also known as V(G) or the graph theoretic number, is calculated by simply counting the number
of decision statements. A high cyclomatic complexity denotes a complex procedure that’s hard to understand, test, and maintain. There is a
relationship between cyclomatic complexity and the “risk” in a procedure.j Low degree of project specification. Rate risk probability from 0% to 100%.k Use of bleeding edge technology. Rate risk probability from 0% to 100%.l Lack of development skill sets.m Resistance of employees or end-users to change. Rate probability of risk from 0% to 100%.n Problems with delivering system—for example, interface difficulties. Rate risk probability from 0% to 100%.o Rate on a scale of 1 to 2 with 1 being unsatisfactory and 2 being satisfactory.
LEARNING AND GROWTH
OBJECTIVES MEASURES TARGETS KPI
Create a quality workforce
Percentage of employees meeting mandatory qualification standards ≥95% L1
Percentage of voluntary separations ≥98% L2Percentage of leaders time devoted to mentoring ≥45% L3Percentage of employees with certifications ≥54% L4Percentage of employees with degrees ≥75% L5Percentage of employees with three or more years of experience ≥75% L6
(Continued )

314 APPENDIX IX
(Continued )
LEARNING AND GROWTH
OBJECTIVES MEASURES TARGETS KPI
Average appraisal rating Baseline L7Number of employee suggestions Baseline L8Percentage expert in currently used technologies ≥95% L9Rookie ratioa ≤10% L10Percentage expert in emerging technologies ≥75% L11Proportion of support staff ≥35% L12Availability of strategic information ≥100% L13Intranet searches Baseline L14Average years of experience with team Baseline L15Average years of experience with language Baseline L16Average years of experience with software Baseline L17Percentage of employees whose performance evaluation plans are
aligned with organizational goals and objectives≥98% L18
Percentage of conformity with HR roadmap as a basis for resource allocation
≥95% L19
Percentage of critical positions with current competency profiles and succession plans in place
≥98% L20
Percentage number of net meetings ≥20% L21Number of new templates, procedures tools to increase productivity Baseline L22
Increase employee satisfaction
Percentage of employees satisfied with the work environment ≥98% L23
Percentage of employees satisfied with the professionalism, culture, values, and empowerment
≥98% L24
Employee overtime Baseline L25Employee absenteeism Baseline L26Discrimination charges Baseline L27Employee grievances Baseline L28Tardiness Baseline L29Number of employee suggestions implemented Baseline L30Percentage of in-house promotions ≥90% L31
Enhance employee training
Percentage of technical training goals met ≥90% L32
Number of training sessions attended per employee Baseline L33Training budget as a percentage of overall budget ≥20% L34Frequency of use of new skills ≥85% L35
Enhance R&D Research budget as a percentage of budget ≥35% L36Number of quality improvements Baseline L37Number of innovative processes deployed Baseline L38Percentage of R&D directly in line with business strategy ≥98% L39Number of technologies owned or possessed by company Baseline L40Number of new patents generated by R&D Baseline L41Number of patentable innovations not yet patented Baseline L42Number of patents protecting the core of a specific technology or
business areaBaseline L43
Number of entrepreneurs in companyb Baseline L44

315APPENDIX IX
(Continued )
LEARNING AND GROWTH
OBJECTIVES MEASURES TARGETS KPI
Percentage of workforce that is currently dedicated to innovation projects
≥5% L45
Number of new products, services, and businesses launched Baseline L46Percentage of employees who have received training in innovation ≥5% L47
Social software engineering
Number of wikis Baseline L48
Number of blogs Baseline L49Number of group workspaces Baseline L50Number of collaborative project plans Baseline L51Number of collaborative spreadsheets Baseline L52Number of teams using social software engineering Baseline L53Number of team members using social software engineering Baseline L54Maturity of collaboration Baseline L55Degree of communication efficiency Baseline L56Collaborative lessons learned Baseline L57
a Rookie means new, inexperienced or untrained personnel.b Number of individuals who previously started a business.

317
Appendix X: Metrics Guide for Knowledge Management Initiatives
The key control over operations (KCO) model uses three types of specific measures to monitor the knowledge management (KM) initiative from different perspectives. Outcome metrics concern the overall organization and measure large-scale charac-teristics such as increased productivity or revenue for the enterprise. Output metrics measure project-level characteristics such as the effectiveness of lessons-learned infor-mation in solving problems. System metrics monitor the usefulness and responsive-ness of the supporting technology tools.
• System measures relate the performance of the supporting information tech-nologies to the KM initiative. They give an indirect indication of knowledge sharing and reuse, but can highlight which assets are the most popular and any usability problems that might exist and limit participation. For example, the Virtual Naval Hospital uses measures of the number of successful accesses, pages read, and visitors to monitor the viability of the information provided.
• Output measures measure direct process output for users and give a picture of the extent to which personnel are drawn to and actually using the knowledge system. For example, some companies evaluate “lesson reuse” to ensure that the lessons they are maintaining are valuable to users.
• Outcome measures determine the impact of the KM project on the orga-nization and help determine if the knowledge base and knowledge transfer processes are working to create a more effective organization. Outcome mea-sures are often the hardest measures to evaluate, particularly because of the intangible nature of knowledge assets. Some of the best examples of outcome measures are in the private sector. For example, energy giant Royal Dutch/Shell Group reports that ideas exchanged in their community of practice for

318 APPENDIX X
engineers saved the company $200 million in 2000 alone. In one example, communication on the community message board led to approximately $5 million in new revenue when the engineering teams in Europe and the Far East helped a crew in Africa solve a problem they had previously attempted to resolve.
How Should We Collect and Analyze the Measures?
As you identify the measures that you will use for your KM initiative, you will also need to identify a process for collecting these measures. The important element is to structure information gathering and to probe deep enough to understand how deci-sions are made and the information that measures can provide to help decisions.
For system measures, look for automated data collection systems, such as tools that measure website accesses and “wait times.” System performance logs will also provide valuable system measures.
For output and outcome measures, you may end up relying on manual counts, esti-mates, or surveys. Though surveys are considered a source of soft data because they measure perceptions and reactions, they can be quantitative. For example, a survey might ask the user to respond to a statement using a “1 to 5” Likert scale (where 1 means “strongly disagree” and 5 means “strongly agree”). Survey data can also be useful to capture and summarize qualitative information such as comments and anecdotes. One consulting firm used contests with prizes to encourage members of communities of practice to contribute anecdotes describing how being a member of the community helped them accomplish a measurable objective for the firm (such as saving time or money, or generating new revenue). Surveys can be conducted in person, by telephone, and/or in written form. Written surveys can be transmitted by mail, e-mail, or on a website. Surveys can have a dual purpose: they not only collect useful information but they also help educate the survey taker by raising his or her awareness of key issues or critical success factors for the initiative.
Other techniques that can be useful include the following:
• Interviews or workshops Stakeholders can be interviewed individually or through a group setting
in a facilitated workshop to draw out opinions and generate group consensus. The best choice depends on the people, organizational culture, the informa-tion needed, and people’s availability. In each case, it is important to structure the sessions proactively. Merely asking people what information they would like is unlikely to yield useful results. Facilitation of any session is recom-mended to urge managers to talk about the type of decisions they commonly make and what decision-making information would be useful by asking “what if ” questions.
• Structured program flows

319APPENDIX X
Tracing the flow of the program capabilities, the uses of these capa-bilities by direct users, and the benefits to the end user is another way to identify the information desired from performance measures. This flow-tracing technique is particularly useful for programs for which it is dif-ficult to directly identify or calculate measures for the ultimate end-user benefits.
• Organization documents Documents contain useful information regarding an organization’s goals,
priorities, measures, problems, and business operations.• Meetings involving the performing organization and stakeholders Many organizations comprise steering committees of representative
internal and external stakeholders. Observing the interchange at meet-ings can yield the priorities and issues that the stakeholders believe are important.
Once the measures have been collected, they should be analyzed within the frame-work chosen earlier. This will ensure that the measures are correlated to the objectives of the initiative and aligned with the strategic goals of the organization. In particular, explicitly note whether the measures give a direct or indirect indication of effects so that your team and stakeholders do not misconstrue or have unrealistic expectations of performance.
What Do the Measures Tell Us and How Should We Change?
This is one of the most critical steps in the measurement process as well as in the entire KCO implementation process. The complex and dynamic nature of KM makes it extremely difficult to devise a plan in the preplanning phase that will not later need to be changed. Use the framework to help elucidate what you can discover about the effectiveness and participation of stakeholders in the KM project. Are they using the knowledge? Are people sharing meaningful knowledge openly? Have people partici-pated during the rollout while there was a great deal of fanfare and then stopped? Are there any anecdotes showing that people became more efficient or solved a problem faster because of the knowledge?
For all of these questions and your other indicators, ask why it happened or had that response. Even without a firm answer, the search for an answer will most likely yield valuable insights and ideas on how to improve your KM project. Collect and prioritize these new ideas and go back to your original plans and assumptions to see if they need to be changed. It is normal that several measures will need to be modi-fied. This is a good time to assemble your team and build a consensus on what should be changed, how to change it, and when to introduce the changes. Also, you should update the measures and framework to make sure they are tightly coupled to your new KM plans.

320 APPENDIX X
Program and Process Management
This section discusses classes of business objectives that share a common need for under-standing the current and future performance of programs relating to their require-ments. These requirements span a range of development objectives and milestone dates, financial constraints, resource needs and usage, alignment with organizational strate-gic plans, and adherence to legal, environmental, and safety regulations and laws.
Business Applications
The program and process management business area concerns monitoring and guiding business tasks to ensure they achieve development, financial, and resource objectives. In addition, this area includes business development activities where people need to identify and assess opportunities, determine their customers’ key interests and fund-ing levels, and obtain business intelligence on competitor capabilities and plans. You should read this section if you are applying KM to the following or similar activities
• Program management• Project control• Business process reengineering• Quality management• Strategic planning• Policy and standards definition• Integrated product teams• Architecture design and review• Plan of action and milestones (POAM)• Budgeting• Business development• Business intelligence• Enterprise resource planning (ERP)• Customer relationship management (CRM)
The primary KM objectives of these types of activities are to
• Create a consistent understanding across the organization of key issues, such as standardized methods, policies, and goals and objectives
• Improve business development• Increase effectiveness, productivity, and quality• Implement best practices• Share and reuse lessons learned
Some examples of KM initiatives for program and process management are
• Experienced program managers have learned how to substantially reduce the time they spend reporting their programs to different sponsors, each of which has a different format and set of regulations. This knowledge can help junior

321APPENDIX X
program managers be more efficient and provide a higher level of service to their customers. A community of practice is established to enable junior and senior program managers to informally interact and share information on their projects and methods. A special component is the mentor’s corner, which includes a series of video interviews in which the experienced managers explain their key insights and methods.
• Near the end of every fiscal year, key leaders must stop working on their daily projects for 5 days to answer urgent requests for consolidated status reports by Congress. Most of this time is spent finding the proper people who can explain current and projected data. This serious disruption to operations can be reduced to one half day with a current listing of points of contact for key projects. Thus, an experts’ directory that is validated and kept up to date is developed.
Performance Measures
KM metrics should be extensively correlated to as many factors influencing the results as possible. Since there are many forces within an organization affecting people’s learning, sharing, and efficiency, it is difficult to separate the effects of the KM pro-cesses from other processes. The KM measures should be used as a body of evidence to support analysis and decision-making. As much as possible, the KM measures should be related to, or the same as, existing measures in the organization that are used to monitor the success of performing mission objectives.
Outcome measures
Examples of possible outcome measures include
• Measure the change in resource costs (funds, time, personnel) used in a busi-ness process over time. To tie to the KM initiative, gauge this change against when the KM asset was made available and its usage, and to other business processes that are not part of the KM initiative. Also, include surveys of user attitudes and practices. For example, do the groups who regularly use and maintain a lessons-learned database spend less overhead funds than other groups? Do they say the lessons learned helped them?
• Measure the success and failure rate of programs linked to the KM assets over time. For example, has the number of programs completed on time and within cost increased? For all groups, or mostly for groups actively engaged in the KM initiative?
• Determine the number of groups meeting best practices criteria, and how long it took them to achieve this status versus the existence and use of the KM system. For example, did any groups entering a new business area reach

322 APPENDIX X
an expert level much faster than usual by using the collected best practices and associated corporate learnings from the beginning of their project?
• Gauge the “smartness” of the organization, that is, are more customers com-menting on the high level of expertise of different groups, or are more indus-try awards being won? Are these comments based on the ability of individual work groups presenting the capabilities of their colleagues as well as their own? How did these groups get the information?
Output Measures
Examples of possible output measures include
• Conduct a survey to find out how useful people find the KM initiative. How have people used the collected knowledge? Was it valuable? Did it answer their questions and help solve their problems or was it merely another set of information to read and digest? How do they suggest improving the KM system?
• Find examples of specific mistakes or problems that were avoided or quickly solved because of KM. These are typically uncovered by talking to people and collecting anecdotes. For example, did the lessons-learned database help someone immediately find out how to compute future estimated resource costs according to new regulations?
• Determine how much new business is connected to using the sharing of expertise. For example, did someone win a new contract with a new customer because they watched the video interviews of business development experts in the mentor’s corner of the community of practice?
• Measure the decrease in time required to develop program status reports. For example, do all managers of cross-functional programs have the same information on resource usage and development progress, as well as all problems encountered, with the responsible point of contact and its resolution?
System Measures
Examples of possible system measures include
• Measure the statistics from the KM system. For example, how many times has the website been accessed? How many times have lessons learned or best practices files been downloaded?
• Measure the activity of a community of practice. For example, how many members are in the community and how often do they interact? How long has it been since the last contribution to a shared repository or threaded discus-sion? What percentage of total members are active contributors?

323APPENDIX X
• How easy is it for people to find the information they want? Conduct a survey and test the site yourself. Find out how many responses are typically generated from a search. If this number is too high (greater than approximately 50), peo-ple may be giving up the search and not making use of the knowledge assets. Are the responses what the user wants to see? Check to see if the site is easy to navigate with an organizational structure consistent with the way users work and think about the information. What is the system latency, that is, the wait time between a user requesting something and when the system delivers it?
• Measure how frequently the knowledge assets are updated. Are the best prac-tices outdated and superseded by new versions? Are the points of contact no longer working on the project? Is there a listed update time that has been exceeded? Are a large number of links to experts no longer valid?
Program Execution and Operations
This section discusses classes of business objectives that share a common need for efficiently performing work tasks in a timely manner. These tasks commonly require extensive training and experience, are complex, and can be dangerous.
Business Applications
The program execution and operations business area concerns the activities involved in performing a program’s Statement of Work; designing, building, testing, evaluating, installing, and maintaining systems; controlling real-time operations; and other tasks focused on developing and performing tangible products and services. This knowl-edge must be implementable and practical, and typically includes highly detailed pro-cedures, facts, and analyses. Consequently, this business area involves a substantial amount of tacit knowledge—that is, the unspoken knowledge people build through experience, which is not always easy to articulate. For example, a master electrician knows many characteristics of power systems that a novice electrician does not, mak-ing the master electrician many times more productive and efficient on complex tasks. This knowledge is commonly transferred during apprentice, mentoring, and educa-tional relationships. You should read this section if you are applying KM to the fol-lowing or similar activities:
• Maintenance• Engineering design• Research and development• Manufacturing• Test and evaluation• Logistics• Operations management

324 APPENDIX X
• Software development• Hardware and software installation• Construction• Demolition
The primary KM objectives of these types of activities are to
• Increase effectiveness, productivity, and quality• Implement best practices• Share and reuse lessons learned• Accelerate learning• Maintain, share, and leverage expertise• Facilitate team collaboration
Some examples of KM initiatives for program execution and operations are
• An engineering design team includes members from many organizations located globally. The entire team is only able to meet in person twice a year at the formal program reviews. In order to avoid redundant efforts and wast-ing the team’s high level of complementary expertise, a distributed collab-orative web-based work environment is created where all project information is posted and informal online work sessions occur with file sharing, white-boards, video, and speech. Since this is the team’s official news source and work center, everyone is confident that they will find valuable information whenever they enter the environment.
• A construction organization is faced with many of their senior members retiring in the next couple of years. A great deal of the organization’s expertise and success depends on the workers’ knowledge built over their long careers. A lessons-learned database is created where the senior experts are asked to describe their key thoughts on doing their work. The lessons learned are collected in both text and video formats and posted on the organization’s intranet.
Performance Measures
KM metrics should be extensively correlated to as many factors influencing the results as possible. Since there are many forces within an organization affecting people’s learn-ing, sharing, and efficiency, it is difficult to separate the effects of the KM processes from other processes. Thus, the KM measures should be used as a body of evidence to support analysis and decision-making. As much as possible, the KM measures should be related to or the same as existing measures in the organization that are used to monitor the success of performing mission objectives.
325APPENDIX X
Outcome Measures
Examples of possible outcome measures include
• Measure the change in resource costs (funds, time, personnel) used in a pro-gram over time. To tie this to the KM initiative, gauge this against when the KM asset was made available and its usage, and to other programs that are not part of the KM initiative. Also include surveys of user attitudes and practices. For example, have maintenance costs decreased and have average readiness rates increased? Do the technicians say that the lessons-learned database and the community of practice help them get answers? How have they used these lessons to affect their work? Remember that collecting these experience sto-ries serves the dual purpose of performance measurement and “advertising” the KM initiative.
• Calculate the total life-cycle cost. Has it decreased more than other projects that are not using KM?
• Assess risks to changes in business environment or mission objectives. Is the organization aware of its risks and does it have contingency plans prepared? Have these included the expertise of the workers as well as management? Have the KM processes and systems helped develop and review these plans?
• Measure the number of cross-functional teams, both formal and informal. Are the teams working together and sharing? Are the teams ahead of schedule and do they have fewer mistakes? What do the team members say about their ability and willingness to openly share critical knowledge? Is there knowledge hoarding because of internal competition?
Output Measures
Examples of possible output measures include
• Conduct a survey to find out how useful people find the KM initiative. How have people used the collected knowledge? Was it valuable? Did it answer their questions and help solve their problems, or was it merely another set of information to read and digest? How do they suggest improving the KM system?
• Find examples of specific mistakes or problems that were avoided or quickly solved because of KM. These are typically uncovered by talking to people and collecting anecdotes. Was a costly or time-consuming manufacturing prob-lem fixed by using the lessons-learned database? Have experts been contacted from the expertise directory? Were they consulted during a task to answer detailed questions?
• Measure how quickly and precisely people can find information on the KM system. Do people have to sort through a large volume of information or are

326 APPENDIX X
there succinct prepackaged synopses available? Is there active and continuous content management that distills and validates critical information into syn-opses? Was an engineering team able to find, fill out, and submit all required regulatory forms within 10 min, 1 h, 1 day, 1 week, and so on, and was this faster or slower than before the KM system was implemented?
System Measures
Examples of possible system measures include:
• Measure the statistics from the KM system. How many times has the website been accessed? How many times have lessons learned or best practices files been downloaded?
• Measure the activity of a community of practice. How many members are in the community, and how often do they interact? How long has it been since the last contribution to a shared repository or threaded discussion? What per-centage of total members are active contributors?
• How easy is it for people to find the information they want? Conduct a survey and test the site yourself. How many responses are typically generated from a search? If this number is too high (greater than approximately 50), then people may be giving up the search and not making use of the knowledge assets. Are the responses what the user wants to see? Is the site easy to navi-gate with an organizational structure consistent with the way they do work and think about the information? What is the system latency, that is, the wait time between a user requesting something and when the system delivers it?
• Measure how frequently the knowledge assets are updated. Are the best prac-tices outdated and superseded by new versions? Are the points of contact no longer working on the project? Is there a listed update time that has been exceeded? Are a large number of links to experts no longer valid?
Personnel and Training
This section describes classes of business objectives that share a common focus on helping people coordinate and decide professional and personal issues that affect their income, jobs, careers, retirement, education, and families, and other quality of life topics.
Business Applications
The personnel and training business area concerns activities for human resources, con-tinuing education, personal life issues, and quality of life. These applications focus on helping people improve the effectiveness or quality of their work life and helping

327APPENDIX X
organizations attract and retain talent. These activities share a common need for peo-ple to determine what options are available from various programs, how they impact their personal finances and families, what experiences other people have had (good and bad) with these options, who to contact to make arrangements, and what they are required to do for the programs. You should read this section if you are applying KM to the following or similar activities:
• Human resources• Distance or e-learning and continuing education• Fringe benefits management• Career planning• Employee retention• Relocation
The primary KM objectives of these types of activities are to
• Provide retirement, health, and financial services• Arrange for moving jobs and families to new locations• Plan career growth• Enhance learning opportunities• Improve quality of life• Retain and attract employees
Some examples of KM initiatives for personnel and training are
• An employee is relocating to a new area. Without an opportunity to visit the new location, the Marine’s family has to find a home, change banks, arrange for daycare and school, and notify the utility, telephone, and cable companies in both locations. Logging into the relocation community of practice website, the employee finds links to local information and directories at the new base, and suggestions from people who live there on the best places to live, local daycare centers, and how to enroll children for school and how to sign up for utilities.
• Employees are encouraged to take continuing education courses through the Internet offered by several authorized institutions. They can access their per-sonnel records to see what courses they need for various job positions and pro-motions. As they take an online course, their progress is automatically noted in their personnel records and sent to their supervisor to be included in their performance reviews.
• Employees can access their fringe benefit plans through the human resources department’s website. They can change their options during open season and compare the cost and benefits offered by retirement and health plans using the website’s interactive feature comparison application. In addition, a lessons-learned database includes key issues discussed by experts on these plans.

328 APPENDIX X
Performance Measures
KM metrics should be extensively correlated to as many factors influencing the results as possible. Since there are many forces within an organization affecting people’s learn-ing, sharing, and efficiency, it is difficult to separate the effects of the KM processes from other processes. Thus, the KM measures should be used as a body of evidence to support analysis and decision-making. As much as possible, the KM measures should be related to, or the same as, existing measures in the organization that are used to monitor the success of performing mission objectives.
Outcome Measures
Examples of possible outcome measures include
• Measure the change in resource costs (funds, time, personnel) used in a business process over time. To tie this to the KM initiative, gauge this against when the KM asset was made available and its usage, and to other business processes that are not part of the KM initiative. Also include sur-veys of user attitudes and practices. Has the cost of administering human resource programs decreased? Have user surveys shown a higher level of satisfaction?
• Conduct a survey to find out how satisfied people are in their job. Are people happy with their health and retirement plans? Do they feel they have good opportunities to learn new skills and subjects? Are they satisfied with their career advancement opportunities? Have these values changed since the KM initiative started?
Measure retention rates and the cost of attracting new people. Are fewer people leaving the organization for other jobs? Are starting salaries stable or are they and other benefits rising to compete with other organizations?
Output Measures
Examples of possible output measures include
• Conduct a survey to find out how useful people find the KM initiative. How have people used the collected knowledge? Was it valuable? Did it answer their questions and help solve their problems, or was it merely another set of information to read and digest? How do they suggest improving the KM system?
• Find examples of specific mistakes or problems that were avoided or quickly solved because of KM. These are typically uncovered by talking to people and collecting anecdotes. Have fewer people needed help properly filing their change orders? Are people able to easily locate new housing and services in

329APPENDIX X
their new locations? Are people able to find people through the KM systems to help them with local details?
• Measure the usage of distance learning system. Are employees taking only required courses or courses for career advancement as well?
System Measures
Examples of possible system measures include:
• Measure the statistics from the KM system. How many times has the website been accessed?
• Measure the activity of a community of practice. How many members are in the community, and how often do they interact? How long has it been since the last contribution to a shared repository or threaded discussion? What per-centage of total members are active contributors?
• How easy is it for people to find the information they want? Conduct a sur-vey and test the site yourself. How many responses are typically generated from a search? If this number is too high (greater than approximately 50), then people may be giving up the search and not making use of the knowl-edge assets. Are the responses what the user wants to see? Is the site easy to navigate with an organizational structure consistent with the way they do work and think about the information? What is the system latency, that is, the wait time between a user requesting something and when the system delivers it?
• Measure how frequently the knowledge assets are updated. Are the best prac-tices out of date and superseded by new versions? Are the points of contact no longer available? Is there a listed update time that has been exceeded? Are a large number of links to experts no longer valid?
Appendix A: Summary of KM Performance Measures
COMMON MEASURES: THESE MEASURES CAN BE USED FOR ALL KM INITIATIVES:
Outcome• Time, money, or personnel time saved as a result of
implementing initiative• Percentage of successful programs compared to
those before KM implementation
Output• Usefulness surveys where users evaluate how useful
initiatives have been in helping them accomplish their objectives
• Usage anecdotes where users describe (in quantitative terms) how the initiative has contributed to business objectives
System• Latency (response times)• Number of downloads• Number of site accesses• Dwell time per page or section• Usability survey• Frequency of use• Navigation path analysis• Number of help desk calls• Number of users• Frequency of use• Percentage of total employees using system

330 APPENDIX X
KM INITIATIVE KEY SYSTEM MEASURES KEY OUTPUT MEASURES KEY OUTCOME MEASURES
Best practice directory
• Number of downloads• Dwell time• Usability survey• Number of users• Total number of contributions• Contribution rate over time
• Usefulness survey• Anecdotes• User ratings of
contribution value
• Time, money, or personnel time saved by implementing best practices
• Number of groups certified in the use of the best practice
• Rate of change in operating costs
Lessons-learned database
• Number of downloads• Dwell time• Usability survey• Number of users• Total number of contributions• Contribution rate over time
• Time to solve problems
• Usefulness survey• Anecdotes• User ratings of
contribution value
• Time, money, or personnel time saved by applying lessons learned from others
• Rate of change in operating costs
Communities of practice or special interest groups
• Number of contributions• Frequency of update• Number of members• Ratio of the number of
members to the number of contributors (conversion rate)
• Number of “apprentices” mentored by colleagues
• Number of problems solved
• Savings or improvement in organizational quality and efficiency
• Captured organizational memory
• Attrition rate of community members versus non-member cohort
Expert or expertise directory
• Number of site accesses• Frequency of use• Number of contributions• Contribution/update rate over
time• Navigation path analysis• Number of help desk calls
• Time to solve problems
• Number of problems solved
• Time to find expert
• Savings or improvement in organizational quality and efficiency
• Time, money, or personnel time saved by leveraging expert’s knowledge or expertise knowledge base
KM INITIATIVEKEY SYSTEM MEASURES KEY OUTPUT MEASURES KEY OUTCOME MEASURES
Portal • Searching precision and recall
• Dwell time• Latency• Usability survey
• Common awareness within teams
• Time spent “gathering” information
• Time spent “analyzing” information
• Time, money, or personnel time saved as a result of portal use
• Reduced training time or learning curve as a result of single access to multiple information sources
• Customer satisfaction (based on the value of self-service or improved ability for employees to respond to customer needs)
Lead tracking system
• Number of contributions
• Frequency of update
• Number of users• Frequency of use• Navigation path
analysis
• Number of successful leads• Number of new customers
and value from these customers
• Value of new work from existing customers
• Proposal response times• Proposal “win” rates• Percentage of business
developers who report finding value in the use of the system
• Revenue and overhead costs• Customer demographics• Cost and time to produce
proposals• Alignment of programs with
strategic plans
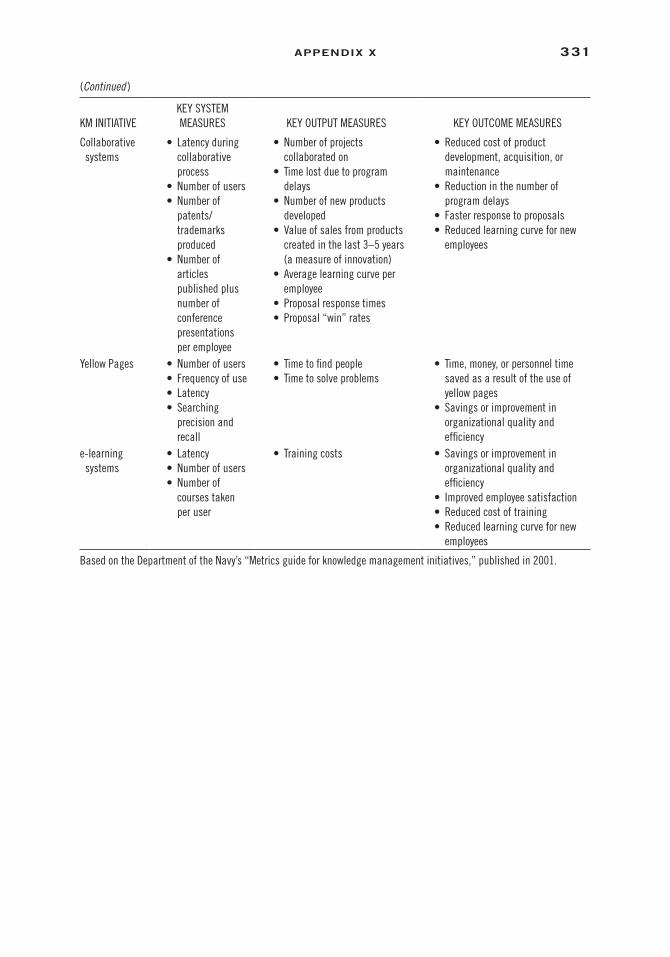
331APPENDIX X
(Continued )
KM INITIATIVEKEY SYSTEM MEASURES KEY OUTPUT MEASURES KEY OUTCOME MEASURES
Collaborative systems
• Latency during collaborative process
• Number of users• Number of
patents/trademarks produced
• Number of articles published plus number of conference presentations per employee
• Number of projects collaborated on
• Time lost due to program delays
• Number of new products developed
• Value of sales from products created in the last 3–5 years (a measure of innovation)
• Average learning curve per employee
• Proposal response times• Proposal “win” rates
• Reduced cost of product development, acquisition, or maintenance
• Reduction in the number of program delays
• Faster response to proposals• Reduced learning curve for new
employees
Yellow Pages • Number of users• Frequency of use• Latency• Searching
precision and recall
• Time to find people• Time to solve problems
• Time, money, or personnel time saved as a result of the use of yellow pages
• Savings or improvement in organizational quality and efficiency
e-learning systems
• Latency• Number of users• Number of
courses taken per user
• Training costs • Savings or improvement in organizational quality and efficiency
• Improved employee satisfaction• Reduced cost of training• Reduced learning curve for new
employees
Based on the Department of the Navy’s “Metrics guide for knowledge management initiatives,” published in 2001.
333
Appendix XI: Knowledge and Information Management Competencies*
This competencies survey is specifically related to knowledge and information management (K&IM). They are required at some level by everyone in knowledge-sharing organizations but the depth and level required is dependent on their role. They are defined in three “team” levels (strategic leader, team leader, team member) plus a fourth level that covers the K&IM competencies required by everyone working in such an organization.
To find the description of each competency match A to I in Table A11.1 with the team and employee Levels 1 to 4 for example, A3, C4, and so on.
General leadership and management competencies are summarized as J to U in Table A11.2.
* This appendix is based on the New Zealand Ministry of Justice’s Guide to Knowledge and Information Management Competencies.

334 aPPenDix xi
Tabl
e A1
1.1
Know
ledg
e an
d In
form
atio
n M
anag
emen
t (K&
IM) C
ompe
tenc
ies—
Fram
ewor
k
STRA
TEGI
C LE
ADER
TE
AM L
EADE
R TE
AM M
EMBE
R AL
L EM
PLOY
EES
12
34
A En
gage
s wi
th th
ough
t lea
ders
with
in
and
outs
ide
the
orga
niza
tion
in o
rder
to
iden
tify t
he v
alue
of k
nowl
edge
and
in
form
atio
n to
the
orga
niza
tion
and
deve
lop
a kn
owle
dge-
base
d vi
sion
Dem
onst
rate
s aw
aren
ess
of K
&IM
mar
ket
trend
s, d
evel
opm
ents
, exp
erie
nce,
and
goo
d pr
actic
e
Scan
s an
d re
view
s K&
IM m
arke
t op
portu
nitie
s/de
velo
pmen
ts
Awar
e of
the
know
ledg
e an
d in
form
atio
n re
leva
nt to
thei
r rol
es a
nd th
e va
lue
this
br
ings
to th
e or
gani
zatio
n
B Id
entifi
es, d
evel
ops,
and
arti
cula
tes
K&IM
stra
tegi
es th
at w
ill a
dd v
alue
to
the
orga
niza
tion
Iden
tifies
bus
ines
s op
portu
nitie
s to
del
iver
va
lue
thro
ugh
impr
oved
K&I
M
Rese
arch
es o
ppor
tuni
ties,
met
hods
, and
ap
proa
ches
for d
eliv
erin
g va
lue
thro
ugh
impr
oved
K&I
M
Revi
ews
and
com
mun
icat
es g
aps
in
know
ledg
e an
d in
form
atio
n th
at h
inde
r th
e ac
hiev
emen
t of o
bjec
tives
C
Ensu
res
that
K&I
M s
trate
gies
are
em
bedd
ed w
ithin
cor
pora
te s
trate
gies
an
d ke
y bus
ines
s pr
oces
ses
Deve
lops
K&I
M p
roce
sses
that
can
be
embe
dded
in k
ey b
usin
ess
proc
esse
s an
d en
sure
s th
at K
&IM
act
iviti
es a
re c
oord
inat
ed
acro
ss th
e or
gani
zatio
n
Supp
orts
and
faci
litat
es th
e de
velo
pmen
t and
im
plem
enta
tion
of K
&IM
pro
cess
es a
cros
s or
gani
zatio
nal s
ilos
Uses
K&I
M p
roce
sses
to h
elp
achi
eve
obje
ctiv
es
D Id
entifi
es a
nd d
evel
ops
stra
tegi
es to
en
cour
age
and
enab
le c
olla
bora
tive
work
ing
for t
he o
rgan
izatio
n an
d pa
rtner
s
Iden
tifies
, dev
elop
s, a
nd n
urtu
res
netw
orks
an
d co
mm
uniti
es
Supp
orts
and
dev
elop
s ne
twor
ked
and
com
mun
ity w
orki
ng
Parti
cipa
tes
in a
nd le
arns
from
net
work
ed
and
com
mun
ity a
ppro
ache
s
E Fo
ster
s a
know
ledg
e, a
nd in
form
atio
n-ric
h cu
lture
and
ens
ures
that
K&I
M
com
pete
ncie
s ar
e re
cogn
ized
as c
ore
com
pete
ncie
s of
the
orga
niza
tion
in
orde
r to
deve
lop
indi
vidu
al a
nd
orga
niza
tiona
l cap
abili
ty
a.
Dev
elop
s K&
IM c
ompe
tenc
ies
thro
ugho
ut
the
orga
niza
tion
b.
Insp
ires
know
ledg
e sh
arin
g an
d ca
ptur
e to
ena
ble
cont
inuo
us le
arni
ng a
nd
know
ledg
e cr
eatio
n
c. C
ham
pion
s co
llabo
rativ
e wo
rkin
g
d. D
evel
ops
mot
ivat
iona
l app
roac
hes
a.
Tra
ins,
or f
acili
tate
s th
e tra
inin
g of
, all
empl
oyee
s in
app
ropr
iate
K&I
M
com
pete
ncie
s
b. S
uppo
rts a
nd fa
cilit
ates
kno
wled
ge a
nd
info
rmat
ion
shar
ing
c.
Dev
elop
s ap
prop
riate
rewa
rd a
nd
reco
gniti
on s
yste
ms
a.
Dev
elop
s an
d us
es a
ppro
pria
te K
&IM
co
mpe
tenc
ies
b.
Sha
res
know
ledg
e an
d in
form
atio
n an
d pa
rtici
pate
s in
act
iviti
es to
fa
cilit
ate
shar
ing
c.
Wor
ks c
olla
bora
tivel
y
d. U
nder
stan
ds a
nd a
ppre
ciat
es re
ward
an
d re
cogn
ition
sys
tem
s

335aPPenDix xi
F Fo
ster
s th
e de
velo
pmen
t of a
ppro
pria
te
know
ledg
e an
d in
form
atio
n as
sets
an
d th
e ad
optio
n of
effe
ctiv
e K&
IM
proc
esse
s, to
ols,
and
sta
ndar
ds
a.
Iden
tifies
and
dev
elop
s kn
owle
dge
and
info
rmat
ion
asse
ts a
nd in
trodu
ces
proc
esse
s to
impr
ove
thei
r lev
erag
e
a.
Aud
its, m
aps
and
mon
itors
kno
wled
ge
and
info
rmat
ion
asse
ts a
nd th
eir u
se
b.
Aud
its, m
aps,
and
mon
itors
kno
wled
ge
and
info
rmat
ion
flows
c.
Dev
elop
s an
d su
ppor
ts p
roce
sses
, too
ls,
and
stan
dard
s fo
r kno
wled
ge s
harin
g an
d ca
ptur
e
d. T
rain
s st
aff a
t all
leve
ls in
the
use
of
K&IM
tool
s, s
tand
ards
, and
pro
cess
es
e.
Dev
elop
s ta
ilore
d K&
IM a
ppro
ache
s al
igne
d to
spe
cific
bus
ines
s pr
oces
ses
a.
Bui
lds
and
man
ages
app
ropr
iate
kn
owle
dge
and
info
rmat
ion
asse
ts
b. U
nder
stan
ds th
e kn
owle
dge
and
info
rmat
ion
flows
rele
vant
to th
eir r
ole
c.
Use
s th
e K&
IM p
roce
sses
, too
ls, a
nd
stan
dard
s pr
ovid
ed
d. C
ontri
bute
s to
the
deve
lopm
ent o
f K&
IM p
roce
sses
, too
ls, a
nd s
tand
ards
b.
Iden
tifies
and
bui
lds
on s
ocia
l net
work
s th
at e
nabl
e kn
owle
dge
and
info
rmat
ion
flow
c.
Fac
ilita
tes
the
acqu
isiti
on o
r de
velo
pmen
t of a
ppro
pria
te K
&IM
pr
oces
ses,
tool
s, a
nd s
tand
ards
G En
able
s an
effe
ctiv
e K&
IM a
rchi
tect
ure
a.
Dev
elop
s an
d im
plem
ents
info
rmat
ion
and
com
mun
icat
ions
tech
nolo
gy (I
CT)
polic
ies
b.
Dev
elop
s an
d im
plem
ents
info
rmat
ion
man
agem
ent p
olic
ies
c.
Dev
elop
s an
d im
plem
ents
con
tent
m
anag
emen
t pol
icie
s
d. D
evel
ops
and
impl
emen
ts d
ocum
ent a
nd
reco
rds
man
agem
ent p
olic
ies
e.
Dev
elop
s an
d im
plem
ents
acc
ess
and
diss
emin
atio
n po
licie
s
a.
Inco
rpor
ates
web
-ena
bled
opp
ortu
nitie
s
b. D
evel
ops
softw
are
prog
ram
in
appr
opria
te la
ngua
ges
and
leve
ls
c. D
evel
ops
info
rmat
ion
man
agem
ent
stan
dard
s an
d gu
idel
ines
d. Id
entifi
es a
nd a
cqui
res
exte
rnal
sou
rces
e.
Iden
tifies
and
acq
uire
s in
tern
al
know
ledg
e an
d in
form
atio
n so
urce
s
f. De
velo
ps to
ols
and
prot
ocol
s fo
r cre
atio
n,
inte
grat
ion,
and
pub
lishi
ng
g. D
evel
ops
corp
orat
e co
ding
and
tagg
ing
tool
s
h. P
lans
and
man
ages
reco
rds
cent
ers
and
docu
men
t man
agem
ent s
tora
ge
i. De
velo
ps re
triev
al c
apab
ilitie
s
j. De
sign
s pr
oces
ses
and
syst
ems
for
effe
ctiv
e kn
owle
dge
and
info
rmat
ion
diss
emin
atio
n
a.
Is a
ware
of i
nter
nal a
nd e
xter
nal w
eb
deve
lopm
ents
b.
Und
erst
ands
and
com
plie
s wi
th
info
rmat
ion
man
agem
ent s
tand
ards
an
d gu
idel
ines
c. U
nder
stan
ds th
e sc
ope
and
rele
vanc
e of
inte
rnal
and
ext
erna
l sou
rces
d.
Com
plie
s wi
th re
cord
s an
d do
cum
ent
man
agem
ent p
olic
ies
e.
Effe
ctiv
ely u
ses
stan
dard
retri
eval
an
d di
ssem
inat
ion
tool
s
f. Co
mpl
ies
with
kno
wled
ge a
nd
info
rmat
ion
diss
emin
atio
n po
licie
s
(Con
tinue
d)

336 aPPenDix xi
Tabl
e A1
1.1
(Con
tinue
d) K
nowl
edge
and
Info
rmat
ion
Man
agem
ent (
K&IM
) Com
pete
ncie
s—Fr
amew
ork
STRA
TEGI
C LE
ADER
TE
AM L
EADE
R TE
AM M
EMBE
R AL
L EM
PLOY
EES
12
34
H En
able
s kn
owle
dge
and
info
rmat
ion
serv
ices
a. D
esig
ns a
nd im
plem
ents
kno
wled
ge a
nd
info
rmat
ion
serv
ices
a. E
nsur
es th
e av
aila
bilit
y of s
elec
ted
reso
urce
s
a. U
ses
appr
opria
te k
nowl
edge
and
in
form
atio
n re
sour
ces
b.
Util
izes
tool
s an
d pr
oces
ses
prov
ided
to
ena
ble
cont
ent c
reat
ion
c.
Und
erst
ands
and
com
mun
icat
es th
e ne
ed fo
r kno
wled
ge a
nd in
form
atio
n se
rvic
es
d. U
ses
a va
riety
of k
nowl
edge
and
in
form
atio
n fo
rmat
sCo
mpl
ies
with
feed
back
requ
irem
ents
b.
Des
igns
and
impl
emen
ts c
onte
nt
crea
tion
serv
ices
b.
Ena
bles
sta
ff m
embe
rs to
find
rele
vant
kn
owle
dge
and
info
rmat
ion
c.
Ena
bles
util
izatio
n of
kno
wled
ge a
nd
info
rmat
ion
sour
ces
c.
Pro
vide
s jo
urna
listic
ser
vice
s
d. A
pplie
s m
ark-
up la
ngua
ges
e.
Und
erta
kes
know
ledg
e an
alys
is a
nd
eval
uatio
n
f. Us
es m
ost a
ppro
pria
te m
ix of
kno
wled
ge
and
info
rmat
ion
sour
ces
g.
Del
iver
s re
leva
nt k
nowl
edge
and
in
form
atio
n in
app
ropr
iate
form
sI
Driv
es v
alue
and
con
stan
tly re
view
s th
e im
pact
of K
&IM
stra
tegi
es
a.
Inco
rpor
ates
mea
sure
men
t sys
tem
s
b. B
ench
mar
ks K
&IM
stra
tegi
es
a. C
olle
cts,
mon
itors
, and
ana
lyzes
ap
prop
riate
dat
a
b. B
ench
mar
ks k
nowl
edge
and
info
rmat
ion
activ
ities

337aPPenDix xi
Tabl
e A1
1.2
Gene
ral L
eade
rshi
p an
d M
anag
emen
t Com
pete
ncie
s—Fr
amew
ork
K&IM
STR
ATEG
IC L
EADE
R K&
IM T
EAM
LEA
DER
K&IM
TEA
M M
EMBE
R AL
L EM
PLOY
EES
12
34
J De
mon
stra
tes
brea
dth
of v
isio
n De
mon
stra
tes
anal
ysis
and
judg
men
t Us
es in
form
atio
n ef
fect
ivel
y Us
es a
ppro
pria
te in
form
atio
n so
urce
s K
Gene
rate
s id
eas
Inno
vate
s De
mon
stra
tes
crea
tivity
and
sol
utio
ns o
rient
atio
n De
mon
stra
tes
inno
vativ
e pr
oble
m s
olvi
ng
L Ge
nera
tes
optio
ns fo
r cha
nge
a.
Dev
elop
s an
d de
liver
s ch
ange
a. A
dapt
s to
cha
nge
Adap
ts to
new
and
cha
ngin
g ci
rcum
stan
ces
and
com
mits
to li
felo
ng le
arni
ng
b.
Dem
onst
rate
s co
mm
erci
al a
ware
ness
b. S
cans
and
revi
ews
mar
ket o
ppor
tuni
ties
M
Dem
onst
rate
s a
high
leve
l of
inte
rper
sona
l ski
lls
Dem
onst
rate
s cu
stom
er/c
olle
ague
focu
s W
orks
with
oth
ers
Supp
orts
col
leag
ues
N Fa
cilit
ates
team
wor
king
De
velo
ps th
e te
am
Take
s re
spon
sibi
lity f
or te
am ta
sks
Cont
ribut
es to
team
obj
ectiv
es
O De
velo
ps p
eopl
e De
velo
ps te
am m
embe
rs
Deve
lops
sel
f Su
ppor
ts tr
aini
ng a
nd d
evel
opm
ent o
bjec
tives
P
Influ
ence
s
a. M
anag
es re
latio
nshi
ps
a. D
emon
stra
tes
impa
ct
Build
s po
sitiv
e re
latio
nshi
ps
b.
Neg
otia
tes
b.
Val
ues
othe
rs
Q In
spire
s ot
hers
Bu
ilds
confi
denc
e in
dec
isio
ns
Enge
nder
s su
ppor
t Ta
kes
the
lead
whe
n ap
prop
riate
R
Com
mun
icat
es d
irect
ion
of th
e or
gani
zatio
n Co
mm
unic
ates
dire
ctio
n to
the
team
In
terp
rets
and
pre
sent
s th
e ke
y mes
sage
s Co
mm
unic
ates
effe
ctiv
ely
S Le
ads
impl
emen
tatio
n
a. U
nder
take
s ef
fect
ive
reso
urce
and
bu
sine
ss p
lann
ing
a.
Und
erta
kes
task
pla
nnin
g
b. P
ays
atte
ntio
n to
det
ail
Unde
rtake
s pe
rson
al p
lann
ing
b.
Ach
ieve
s re
sults
c. M
anag
es p
roje
cts
effe
ctiv
ely
T Se
eks
cont
inuo
us im
prov
emen
t Ac
hiev
es q
ualit
y out
com
es
Intro
duce
s im
prov
emen
ts
Dem
onst
rate
s qu
ality
awa
rene
ss
USe
cure
s re
sour
ces
a.
Iden
tifies
reso
urce
requ
irem
ents
En
sure
s pr
oduc
tive
utili
zatio
n of
reso
urce
s De
mon
stra
tes
awar
enes
s of
reso
urce
pla
nnin
g
b. D
evel
ops
budg
ets
and
finan
cial
bus
ines
s ca
ses
c.
Pla
ns a
nd m
akes
a c
ase
for h
uman
re
sour
ces
339
Appendix XII: Project QA and Collaboration Plan for <project name>
Note: Text displayed in italics is included to provide guidance to the author and should be deleted or hidden before publishing the document.
This template can be used at it is, or to complete and improve an already existing template.
Project QA and Collaboration Planfor
<project name>
Distribution:<Org., Name>
Help: The purpose of the Project QA and Collaboration Plan is to document all activi-ties and collaboration procedures that are required to execute the project successfully within its constraints.

340 aPPenDix xii
Contents*
1. Organization ..........................................................................................................31.1 Project-Internal Functions ................................................................................31.2 Change Control Board (CCB) .........................................................................3
2. Schedule and Budget ..............................................................................................32.1 Schedule and Milestones ..................................................................................32.2 Budget ..............................................................................................................42.3 Execution Process ............................................................................................52.4 Collaboration Environment .............................................................................5
3. Communication and Reporting .............................................................................54. Quality Assurance ..................................................................................................6
4.1 Standards and Procedures ................................................................................64.2 Quality Audits .................................................................................................74.3 Verification and Validation Activities ..............................................................7
5. Configuration and Change Management ...............................................................85.1 Configuration Management .............................................................................8
5.1.1 Configuration Items ................................................................................85.1.2 Baselines ..................................................................................................85.1.3 CM Tools and Resources ........................................................................9
5.2 Change Management .......................................................................................95.2.1 Change Procedure ...................................................................................95.2.2 Change Management Support ................................................................9
6. Abbreviations and Definitions.............................................................................. 107. References ............................................................................................................. 108. Revision ................................................................................................................ 10
* Please note that the page numbers in this contents list reflect the page numbering of the original document.

341aPPenDix xii
1 Organization
1.1 Project-Internal Functions
Help: Since the project manager has the overall project responsibility, he/she is also responsible for the project-internal functions. But he/she can delegate the manage-ment of these functions to project team members. In this case list the functions and individuals responsible for
Example:
FUNCTION ORGANIZATION: NAME COMMENT
Quality AssuranceSystem Test LeadValidation LeadConfiguration ManagementChange Managementetc.
1.2 Change Control Board (CCB)
Help: Released work products and baselines can only be changed on agreement of the responsible change control board (CCB). In complex projects different levels of CCBs may be defined (see help text in Section 5.2 Change Management).
Example:
A change control board (CCB) is responsible for reviewing and approving all change requests on baselined plans and work products, for example, project plan, project requirements specification, design, etc. Two CCBs are defined in this project:
CCB: for reviewing and approving all changes within the project that affect the project goals and scope. It consists of:
ORGANIZATION NAME

342 aPPenDix xii
2 Schedule and Budget
2.1 Schedule and Milestones
Help: Estimate the effort for the project activities and plan the activity sequencing. Then prepare the schedule that supports all of the required activities and complies with the resource plan.
Define project milestones based on the chosen development strategy and on critical events in the project schedule.
List the milestones and define clear milestone criteria to make milestones measurable.
MILESTONES DESCRIPTION MILESTONE CRITERIA PLANNED DATE
M0 Start Project Budget Release <yyyy-mm-dd>Project goals and scope defined PRS or SRS reviewed
Stakeholders identified Impl. proposal reviewed
<yyyy-mm-dd>
M1 Start Planning <yyyy-mm-dd><milestone description, e.g.,
Life Cycle Objectives LCO defined>
Scope and concept described <yyyy-mm-dd>
M2 Start Execution <yyyy-mm-dd><milestone description, e.g.,
Life Cycle Architecture LCA defined>
Requirements agreed, project plan reviewed, resources committed
<yyyy-mm-dd>
M3 Confirm Execution <yyyy-mm-dd><milestone description, e.g.,
alpa version>Architecture reviewed and
stable<yyyy-mm-dd>
M4 Start Introduction <yyyy-mm-dd><milestone description, e.g.,
system test passed>Coding of new functionality
finished, draft documentation<yyyy-mm-dd>
M5 Release Product <yyyy-mm-dd><milestone description> Product system tested,
documentation reviewed<yyyy-mm-dd>
M6 Close Project <yyyy-mm-dd>
A detailed project schedule is available in 0. The project schedule is updated monthly by the project manager.

343aPPenDix xii
2.2 Resources
Help: List the required project resources based on estimates for project activities, subcontracts, training, etc. Present the distribution of the resources over the whole project life.
CATEGORY
BUDGET FOR PERIOD IN KUS$
M0-M1 M1-M2 M2-M3 M3-M4 M4-M5 M5-M6
Human resources (internal)Human resources (external)Travel (for internal people)Travel (for external people)Equipment and tools (internal)Equipment and tools (external)
Help: Prepare a resource plan specifying the project’s need for human resources, as well as for other resources (equipment, tools, licenses, etc.).
2.3 Execution Process
Help: If available and applicable refer to the organizational development process and describe deviations from this standard process. Otherwise describe the execution process applied in this project and agreed with your outsourcing partner.
Explain why this execution process has been selected. Describe how the selected execution process is tailored to the needs of the project.
2.4 Collaboration Environment
Help: Define methods, tools, languages, etc. to be employed for design, implementation, test, and documentation, and when they (or knowledge) should be available.
Example:
ITEM APPLIED FOR AVAILABILITY BY
METHODSUse case Requirements capturing M0
TOOLSRational rose Design M2
LANGUAGESUML Design M2Java Web interface M2C++ … M2

344 aPPenDix xii
3 Communication and Reporting
3.1 Recurring Project Communication
Help: State the principles for reporting and distributing information among the stakeholders within the project (internal, i.e., own project team and outsourc-ing partners) or outside the project (external, e.g., project sponsor). Include, for example, how often the reporting will take place, the type of reports or informa-tion, the type of media in which it is presented, and the type of meetings that will take place.a) Internal communication and reporting: ensure that all information is available to
those who need it.– Plan project meetings, how often they take place, and who will participate– Define how project information will be made available to the internal stake-
holders (e.g., project library)– Define how and how often subprojects and subcontractors report to the project
manager– Define who participates in milestone meetings– Define how events will be communicated
b) External communication and reporting:– Define what information will be provided to which stakeholders– Define how and how often information will be provided to which stakeholders
(e.g., project report)– Plan regular meetings with external stakeholders (e.g., SteCo meetings)
Example:
TYPE OF COMMUNICATION METHOD/TOOL
FREQUENCY/SCHEDULE INFORMATION
PARTICIPANTS/RESPONSIBLES
RECURRING COMMUNICATION ACTIVITIES PROJECT INTERNAL:Project Meetings Teleconference Weekly and on
eventProject status, problems,
risks, changed requirements
Project MgrProject TeamSub-contractor
Sharing of project data
Shared Project DB When available All project documentation and reports
Project Mgr(s)Project Team
MembersSub-contract
ReportsWord document Bi-weekly Sub-project status
- progress- forecast- risks
Sub-contractors
Milestone Meetings Teleconference Before milestones
Project status (progress) Project MgrSub-project MgrSub-contractor
SteCo Meetings Teleconference with SameTime
Monthly Project Manager, SteCo
Final Project Meeting
Teleconference MS6 Wrap-upExperiences
Project MgrProject TeamSub-contractor

345aPPenDix xii
COMMUNICATION ACTIVITIES PROJECT EXTERNAL:Project Report Excel sheet Monthly Project status
- progress- forecast- risks
Project ManagerSub-Project
ManagersSub-contractors
SteCo Meetings Teleconference with SameTime
Monthly Project Manager, SteCo
3.2 Problem Escalation and Resolution
Help: Describe how problems and conflicts within the project team and the outsourcing part-ner shall be resolved (different conflicts, different levels of management involvement).
4 Quality Assurance
Help: The quality assurance plan (QA Plan) can be either a separate document or included in the project plan. If the QA Plan is a separate document refer to it in this chapter. If not, the subchapters below should be used.
4.1 Standards and Procedures
Help: List the policies, standards, and directives as well as externally imposed standards that shall be taken into account in the project. Refer to the relevant descriptions.
Describe any special agreements that have been made with the customer.
POLICY/DIRECTIVE/STANDARD/ETC. REFERENCE COMMENT
Special Agreements: <None or description>
4.2 Quality Audits
Help: Specify all quality audits to objectively verify compliance to policies, standards, and defined procedures.
Also plan quality audits on subprojects and subcontracts (e.g., contract audits, etc.). Define the responsibility for calling the audits and how they are being coordinated
and reported.
SUBJECT OF Q-AUDIT TIME RESPONSIBILITY/COMMENT

346 aPPenDix xii
4.3 Verification and Validation Activities
Help: Specify all verification and Validation (V&V) activities to be performed in the project.
Verification aims at evaluating a work product or a deliverable to determine whether it satisfies all demands and conditions defined for its development. Verification answers the question: are we developing the thing right?
Verification procedures are typically reviews, inspections, and tests. Validation aims at evaluating a work product or project deliverable during or
at the end of the execution process to determine whether it satisfies the specified requirements and expectations. Validation answers the question: are we devel-oping the right thing?
Validation activities are typically assessment of prototypes, review of project requirements with the customer, acceptance test of sub-contractor deliverables or acceptance test of the project deliverables with the customer or end user.
Specify all work products and deliverables to be verified and/or validated and define the verification/validation procedure to be used. For each verification activity, define the responsibilities.
Examples:
WORK PRODUCTS
V & V ACTIVITY
RESPONSIBLE REFERENCEACTIVITY TYPE
<Requirements Specification> <Review> Ver Author, Reference Group ID
Review procedure [x]
<Functional and Design Description>
<Review> Ver Author, Reference Group ID
Review procedure [x]
<Sub-system x>> <Subsystem test> Ver Sub-contractor x Techn. Proj. Mgr.<Alpha Release> <System Test> Ver Test lead Project Manager<Beta Release> <onsite test> Val Beta Test Group Test Plan [x],Test Spec [y]<Release> <acceptance test> Val Techn. Proj. Mgr. End User
5 Configuration and Change Management
5.1 Configuration Management
Help: The configuration management plan (CM Plan) can be either a separate docu-ment or included in the project plan. If the CM Plan is a separate document refer to it in this chapter. If not, the subchapters below should be used.
It is assumed that configuration management (CM) is supported by a dedicated CM Tool. The tool mainly influences the CM procedure, Library structure, iden-tification scheme, access rights, etc.
Therefore only the following information has to be included in the CM section of the project plan• Which CM Tool is used

347aPPenDix xii
• Which resources for CM are needed• Which work products are taken under CM control• Which baselines should be built
5.1.1 Configuration ItemsHelp: Identify all Configuration Items (CI) to be taken under CM control. A configu-
ration Item is a work product that is designated as a single entity for configura-tion management. CIs are developed in the project or received from suppliers and sub-contractors.
CIs are typically• Source files (code, makefiles, scripts, etc.)• Binary files• Technical documentation (specifications, design documents, test cases, etc.)• Project documentation (plans, reports, etc.)• Etc.
5.1.2 BaselinesHelp: Define major baselines for this project, their purpose and their relation to the
project’s milestones.
BASELINE
AT MILESTONEID PURPOSE/DESCRIPTION
5.1.3 CM Tools and ResourcesHelp: Identify all resources (human resources, equipment, tool, training) required for
performing CM. Required CM equipment and support persons should be identi-fied in the resource plan and commitments for their time obtained from the ‘resource owners’. Identify the budget required for CM in the Budget section, and training needs in the training plan section.
Example:
CM TOOL
NUMBER OF LICENSESIDENTIFICATION DESCRIPTION

348 aPPenDix xii
RESOURCES DESCRIPTION
CM Equipment <None or see Section 5.1 (Resource Plan)>CM Training <None or see Section 5.2 (Training Plan)>
5.2 Change Management
Help: Two levels of changes should be distinguished:• Changes on the project management level affecting goals and scope of the project
(e.g., requirements, budget, release date)• Changes on the execution layer not affecting goals and scope of the project (e.g.,
design, code)Typically a special CCB is established for each level of changes. However the same change procedure can be applied to both levels.
5.2.1 Change ProcedureHelp: If available refer to the organizational change procedure and add project specific
aspects only. Otherwise define the change management procedure (and tools) applied in this project. It should specify the steps for handling changes and the roles involved in the change management process. It should also define how approved changes are communicated to the affected stakeholders.
Example: Change requests are used to track changes to baselines. Any stakeholder
can submit change requests. Change requests can describe identified defects or demands to change goals and the scope of the project. The authorized CCB has to accept a change requests before work on it is initi-ated, and also accept all resulting changes before a new baseline is created. Approved changes are communicated directly after the CCB decision to the affected stakeholders and in the project meetings to the whole develop-ment team.
5.2.2 Change Management SupportHelp: Describe how change management is supported, e.g., a dedicated tool, templates,
email based system, etc. Example: The organizational change request management tool (CRM tool) is used
for the documentation and management of change requests. Stakeholders without access to the CRM tool submit change requests via email to the project member responsible for change management who will take them over into the CRM tool.
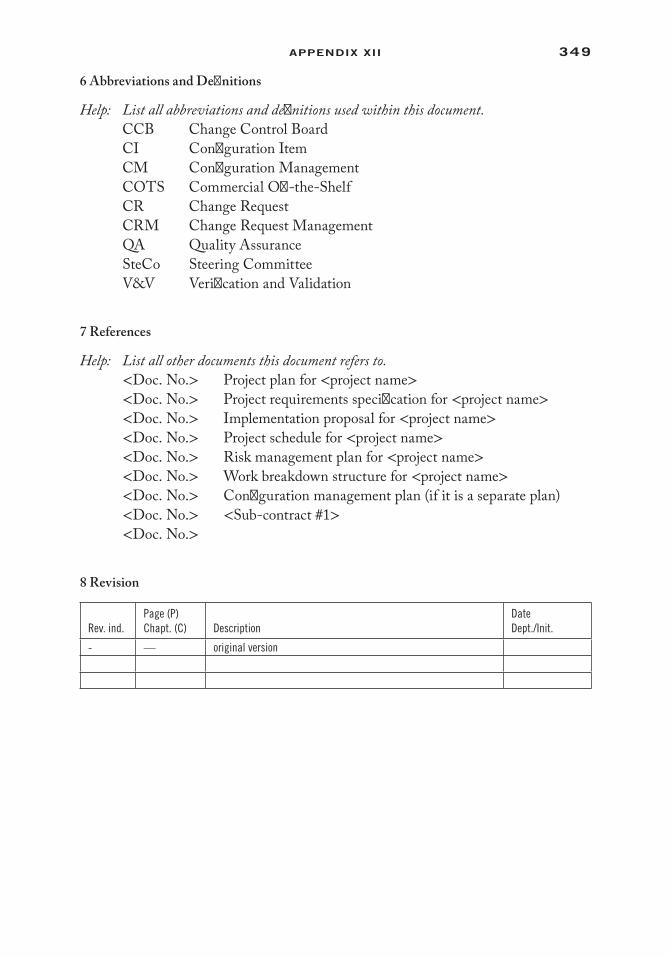
349aPPenDix xii
6 Abbreviations and Definitions
Help: List all abbreviations and definitions used within this document.CCB Change Control BoardCI Configuration ItemCM Configuration ManagementCOTS Commercial Off-the-ShelfCR Change RequestCRM Change Request ManagementQA Quality AssuranceSteCo Steering CommitteeV&V Verification and Validation
7 References
Help: List all other documents this document refers to.<Doc. No.> Project plan for <project name><Doc. No.> Project requirements specification for <project name><Doc. No.> Implementation proposal for <project name><Doc. No.> Project schedule for <project name><Doc. No.> Risk management plan for <project name><Doc. No.> Work breakdown structure for <project name><Doc. No.> Configuration management plan (if it is a separate plan)<Doc. No.> <Sub-contract #1><Doc. No.>
8 Revision
Rev. ind.Page (P)Chapt. (C) Description
DateDept./Init.
- — original version

351
Appendix XIII: Project Quality Management Plan
<PROJECT NAME>PROJECT QUALITY MANAGEMENT PLAN
Version <1.0><mm/dd/yyyy>
VERSION HISTORY[Provide information on how the development and distribution of the Project Quality Management Plan, up to the final point of approval, was controlled and tracked. Use the following table to provide the version number, the author implementing the version, the date of the version, the name of the person approving the version, the date that particular version was approved, and a brief description of the reason for creating the revised version.]
VERSION# IMPLEMENTED BY REVISION DATE APPROVED BY APPROVAL DATE REASON
1.0 <Author name> <mm/dd/yy> <name> <mm/dd/yy> <reason>
Contents*
1 Introduction ............................................................................................................51.1 Purpose of the Project Quality Management Plan ..........................................5
2 Project Quality Management Overview..................................................................52.1 Organization, Responsibilities, and Interfaces .................................................5
* Please note that the page numbers in this contents list reflect the page numbering of the original document.

352 aPPenDix xiii
2.2 Tools, Environment, and Interfaces .................................................................53 Project Quality Management ..................................................................................5
3.1 Quality Planning ..............................................................................................63.1.1 Define Project Quality ............................................................................63.1.2 Measure Project Quality .........................................................................6
3.2 Quality Assurance ............................................................................................63.2.1 Analyze Project Quality .........................................................................63.2.2 Improve Project Quality .........................................................................6
3.3 Quality Control ................................................................................................6Appendix A: Project Quality Management Plan Approval .......................................7Appendix B: References .............................................................................................8Appendix C: Key Terms .............................................................................................9
1 Introduction
1.1 Purpose of the Project Quality Management Plan
[Provide the purpose of the Project Quality Management Plan. This document should be tailored to fit the particular project needs. Identify which project(s), product(s), and/or the portion of the project life cycle that are covered by this plan and the overall quality objectives for this project.]
The project quality management plan documents the necessary information required to effectively manage project quality from project planning to delivery. It defines a project’s quality policies; procedures; criteria for and areas of application; and roles, responsibilities, and authorities.
The project quality management plan is created during the planning phase of the proj-ect. Its intended audience is the project manager, project team, project sponsor, and any senior leaders whose support is needed to carry out the plan.
2 Project Quality Management Overview
2.1 Organization, Responsibilities, and Interfaces
[Describe the primary roles and responsibilities of the project staff as it relates to the prac-tice of Project Quality Management. Indicate responsibilities for activities such as men-toring or coaching, auditing work products, auditing processes, participating in project reviews, etc.]
NAME ROLE QUALITY RESPONSIBILITY
[John Doe] Project Manager Quality mentoring & coaching[Jane Doe] Team Lead Quality audits<Name> <Role> <Responsibility>
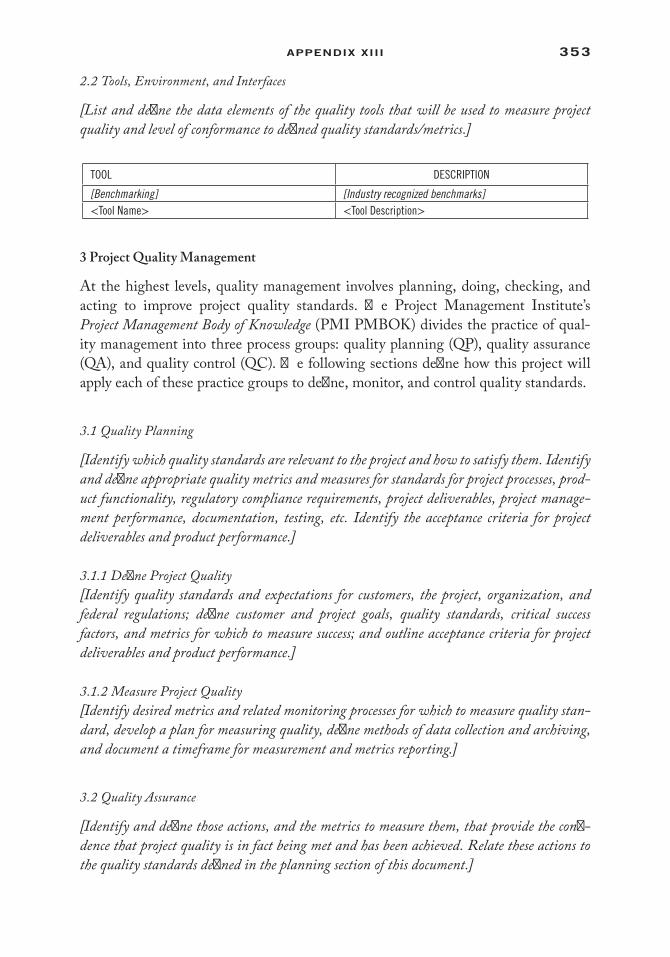
353aPPenDix xiii
2.2 Tools, Environment, and Interfaces
[List and define the data elements of the quality tools that will be used to measure project quality and level of conformance to defined quality standards/metrics.]
TOOL DESCRIPTION
[Benchmarking] [Industry recognized benchmarks]<Tool Name> <Tool Description>
3 Project Quality Management
At the highest levels, quality management involves planning, doing, checking, and acting to improve project quality standards. The Project Management Institute’s Project Management Body of Knowledge (PMI PMBOK) divides the practice of qual-ity management into three process groups: quality planning (QP), quality assurance (QA), and quality control (QC). The following sections define how this project will apply each of these practice groups to define, monitor, and control quality standards.
3.1 Quality Planning
[Identify which quality standards are relevant to the project and how to satisfy them. Identify and define appropriate quality metrics and measures for standards for project processes, prod-uct functionality, regulatory compliance requirements, project deliverables, project manage-ment performance, documentation, testing, etc. Identify the acceptance criteria for project deliverables and product performance.]
3.1.1 Define Project Quality[Identify quality standards and expectations for customers, the project, organization, and federal regulations; define customer and project goals, quality standards, critical success factors, and metrics for which to measure success; and outline acceptance criteria for project deliverables and product performance.]
3.1.2 Measure Project Quality[Identify desired metrics and related monitoring processes for which to measure quality stan-dard, develop a plan for measuring quality, define methods of data collection and archiving, and document a timeframe for measurement and metrics reporting.]
3.2 Quality Assurance
[Identify and define those actions, and the metrics to measure them, that provide the confi-dence that project quality is in fact being met and has been achieved. Relate these actions to the quality standards defined in the planning section of this document.]

354 aPPenDix xiii
3.2.1 Analyze Project Quality[Analyze quality data, document opportunities for improvement, and apply what was learned from quality analysis to eliminate gaps between current and desired levels of performance.]
3.2.2 Improve Project Quality[Identify ways of doing things better, cheaper, and/or faster. For projects, identify ways of eliminating unsatisfactory performance.]
3.3 Quality Control
[Identify those monitoring and controlling actions that will be conducted to control quality throughout the project’s life. Define how it will be determined that quality standards comply with the defined standards outlined earlier in this document. Identify owners of ongoing monitoring and improvement of project processes.]
Appendix A: Project Quality Management Plan Approval
The undersigned acknowledge they have reviewed the <Project Name> project quality management plan and agree with the approach it presents. Changes to this project quality management plan will be coordinated with and approved by the undersigned or their designated representatives.
[List the individuals whose signatures are desired. Examples of such individuals are Business Steward, Project Manager or Project Sponsor. Add additional lines for signature as neces-sary. Although signatures are desired, they are not always required to move forward with the practices outlined within this document.]
Signature: Date:
Print Name:
Title:
Role:
Signature: Date:
Print Name:
Title:
Role:

355aPPenDix xiii
Signature: Date:
Print Name:
Title:
Role:
Appendix B: References
[Insert the name, version number, description, and physical location of any documents refer-enced in this document. Add rows to the table as necessary.]
The following table summarizes the documents referenced in this document.
DOCUMENT NAME AND VERSION DESCRIPTION LOCATION
<Document Name and Version Number>
[Provide description of the document] <URL or Network path where document is located>
Appendix C: Key Terms
[Insert terms and definitions used in this document. Add rows to the table as necessary.]
The following table provides definitions for terms relevant to this document.
TERM DEFINITION
<term> <definition>
<term> <definition>
<term> <definition>

357
Appendix XIV
PROJECT QUALITY PLAN
Create links to referenced documents (e.g., Link_To_… ) by using Insert → Hyperlink on your toolbar.
Project Name:Prepared by:Date (MM/DD/YYYY):
1. Quality Policy Provide a link to the <ORGANIZATION> Quality Policy (or insert it into the space below).
Link_To_Quality_Policy
2. Project Scope Describe the project, either by creating a link to the Project Scope document or by inserting the Project Scope Statement.
Link_To_Project_Scope
3. Deliverables and Acceptance Criteria List project deliverables, including contract deliverables and milestone checklist. For each deliverable, describe the acceptance criteria that will be used in product acceptance testing. List relevant quality standards where applicable. (Add rows as needed.)
Deliverables Acceptance Criteria / Applicable Standards
1.2.3.

358 aPPenDix xiV
4. Quality Assurance Activities Define Quality Assurance (QA) activities for the project. Include at least the items listed below:
▪ Describe Test and Acceptance processes:
▪ List Test Team staff and specify responsibilities:
▪ Milestone checklist (or provide Link_To_Project_Milestone_Schedule ):
▪ Describe the Requirements Verification process:
▪ Describe the Requirements to Specification Verification process:
▪ Describe how Requirement – Specification – Test Plan traceability is managed (or provide Link_To_ Requirements_Traceability_Matrix ):
▪ List communication activities (or provide Link_To_ Project_Communication_Plan ):
▪ Describe Continuous Improvement processes:
5. Project Monitoring and Control Define the following:
▪ What audits and reviews are required and when they will be held:
▪ How variance to acceptable criteria will be reported and resolved:
▪ In-process control plans which address quality assurance activity areas:
▪ How control information will be collected:
▪ How information will be used to control processes and deliverables:
6. Project Team Quality Responsibilities Describe quality-related responsibilities of the Project Team including specific tasks such as acceptance test, audit, review and checklist responsibility assignments:

359aPPenDix xiV
7. Project Quality Plan / SignaturesProject Name:Project Manager:I have reviewed the information contained in this Project Quality Plan and agree:
Name Role Signature Date
The signatures above indicate an understanding of the purpose and content of this document by those signing it. By signing this document, they agree to this as the for-mal Project Quality Plan document.

361
Appendix XV: Benchmarking Tutorial
Without proper information it is difficult, if not impossible, to initiate a proper benchmarking effort. Information gathered in this process—called data collection by planners and requirements elicitation by software developers—will enable the organiza-tion to develop valid measures against which it should be measured.
Interviewing
The most common method of gathering information is by interviewing people. Interviewing can serve two purposes at the same time. The first is a fact-finding mission to discover what each person’s goals and objectives are with respect to the project; and the second is to begin a communications process that enables one to set realistic expectations for the project.
There are a wide variety of stakeholders that can and should be interviewed. Stakeholders are those that have an interest in seeing this project successfully completed—that is, they have a stake in the project. Stakeholders include employees, management, clients, and benchmarking partners.
Employees
Interviews have some major obstacles to overcome. The interviewees may resist giving information out of fear, they may relate their perception of how things should be done rather than how they really do them, or they may have difficulty in expressing themselves. On the other hand, the analyst’s own mind-set may also act as a filter too. Interviewers sometimes have to set aside their own technical orientation and make the best effort that they can to put themselves in the position that the interviewee is in. This requires that the analyst develops a certain amount of empathy.

362 aPPenDix xV
An interview outline should contain the following information:
1. Name of interviewee 2. Name of interviewer 3. Date and time 4. Objectives of interview—that is, what areas you are going to explore and what
data you are going to collect 5. General observations 6. Unresolved issues and topics not covered 7. Agenda—that is, introduction, questions, summary of major points, closing
Recommended guidelines for handling the employee interview process include:
1. Determine the process type to be analyzed (tactical, strategic, hybrid). 2. Make a list of departments involved in the process. 3. For each department, either request or develop an organization chart that
shows the departmental breakdown along with the name, extension, and list of responsibilities of each employee.
4. Meet with the department head to request recommendations and then for-mulate a plan that details which employees are the best interview prospects. The “best” employees to interview are those (a) who are very experienced (i.e., senior) in performing their job function; (b) who may have come from a competing company and, thus, have a unique perspective; (c) who have had a variety of positions within the department or company.
5. Plan to meet with employees from all units of the department. In some cases, you may find that interviewing several employees at a time is more effective than dealing with a single employee, as interviewing a group of employees permits them to bounce ideas off each other.
6. If there are many employees within a departmental unit, it is not optimum to interview every one. It would be wrong to assume that the more people in a department, the higher the number of interviewees. Instead, sampling should be used. Sampling is used to (a) contain costs; (b) improve effective-ness; (c) speed up the data gathering process; and (d) reduce bias. Systems ana-lysts often use a random sample. However, calculating a sample size based on population size and your desired confidence interval is more accurate. Rather than provide a formula and instructions on how to calculate a sample size, I direct the reader to the sample-size calculator that is located at http://www.surveysystem.com/sscalc.htm.
7. Carefully plan your interview sessions. Prepare your interview questions in advance. Be familiar with any technical vocabulary your interview subjects might use.
8. No meeting should last longer than an hour. A half hour is optimum. There is a point of diminishing returns with the interview process. Your interviewees are

363aPPenDix xV
busy and usually easily distracted. Keep in mind that some of your interviewees may be doing this against their will.
Customers
Customers often have experiences with other vendors or suppliers and can offer insight into the processes that other companies use or that they have experienced.
Guidelines for interviewing customers include
1. Work with the sales and/or marketing departments to select knowledgeable and cooperative customers.
2. Prepare an adequate sample size as discussed in the prior section. 3. Carefully plan your interview sessions. Prepare your interview questions in
advance.
Companies and Consultants
Another source of potentially valuable information is from other companies in the industry and consultants who specialize in the process areas being examined. While consultants can be easily located and paid for their expert advice, it is wise to tread slowly when working with other companies that are current or potential competitors.
Guidelines for interviewing other companies include
1. Work with senior management and marketing to create a list of potential companies to interview. This list should contain the names of trading part-ners, vendors (companies that your companies buy from), and competitors.
2. Attend industry trade shows to meet and mingle with competitor employees and listen to speeches made by competitive companies.
3. Attend trade association meetings; sit on policy and standards committees.
Suppliers
Suppliers of the products you are considering are also an important source of ideas. These suppliers know a great deal about how their products are being used in the processes you are examining.
Types of Questions
When interviewing anyone, it is important to be aware of how to ask questions properly. Open-ended questions are the best for gaining the most information because they do not limit the individuals to predefined answers. Other benefits of using open-ended questions include: puts the interviewee at ease, provides more detail, induces spontaneity, and it is far more interesting for the interviewee. Open-ended questions

364 aPPenDix xV
require more than a yes or no answer. An example of an open-ended question is “What types of problems do you see on a daily basis with the current process?” These ques-tions allow individuals to elaborate on the topics and potentially uncover the hidden problems at hand that might not be discoverable with a question that requires a yes or no answer.
One disadvantage of open-ended questions is that they create lengthier interviews. Another disadvantage is that it is easy for the interview to get off track, and it takes an interviewer with skill to maintain the interview in an efficient manner.
Closed-ended questions are, by far, the most common questions in interviewing. They are questions that have yes and no answers and are utilized to elicit definitive responses.
Past-performance questions can be useful to determine past experiences with similar problems and issues. An example of how a past-performance question is used is, “In your past job how did you deal with these processes?”
Reflexive questions are appropriate for closing a conversation or moving it forward to a new topic. Reflexive questions are created with a statement of confirmation and adding a phrase such as: Don’t you? Couldn’t you? Or wouldn’t you?
Mirror questions are a subtle form of probing and are useful in obtaining additional detail on a subject. After the interviewee makes a statement, pause and repeat his or her statement back with an additional or leading question: “So, when this problem occurs, you simply move on to more pressing issues?”
Often, answers do not give the interviewer enough detail, so one follows the question with additional questions to prod the interviewee to divulge more details on the subject. For example:
1. Can you give some more details on that? 2. What did you learn from that experience?
Another, more subtle, prodding technique can be used by merely sitting back and saying nothing. The silence will feel uncomfortable, causing the interviewee to expand on his or her last statement.
Questionnaires/Surveys
If there are large numbers of people to interview, one might start with a questionnaire and then follow up with certain individuals that present unusual ideas or issues in the questionnaires. Survey development and implementation are composed of the follow-ing tasks, according to Creative Research Systems, makers of a software solution for survey creation (surveysolutions.com):
1. Establish the goals of the project—what you want to learn 2. Determine your sample—whom you will interview 3. Choose interviewing methodology—how you will interview

365aPPenDix xV
4. Create your questionnaire—what you will ask 5. Pretest the questionnaire, if practical—test the questions 6. Conduct interviews and enter data—ask the questions 7. Analyze the data—produce the reports
Similar to interviews, questionnaires may contain closed-end or open-ended questions or a hybrid, which is a combination of the two.
Survey creation is quite an art form. Guidelines for the creation of a survey include
1. Provide an introduction to the survey. Explain why it is important that par-ticipants respond to it. Thank them for their time and effort.
2. Put all important questions first. It is rare that all questions will be responded to. Those filling out the survey often become tired or bored of the process.
3. Use plenty of “white space.” Use an appropriate sized font (i.e., Arial), font size (i.e., at least 12), and do skip lines.
4. Use nominal scales if you wish to classify things (i.e., What make is your computer? 1 = Dell, 2 = Gateway, 3 = IBM).
5. Use ordinal scales to imply rank (i.e., How helpful was this class? 3 = not helpful at all, 2 = moderately helpful, 1 = very helpful).
6. Use interval scales when you want to perform some mathematical calculations on the results (i.e., How helpful was this class?)
Not useful at all Very useful1 2 3 4 5
Survey questions must be carefully worded. Ask yourself the following questions when reviewing each question:
1. Will the words be uniformly understood? In general, use words that are part of the commonly shared vocabulary of the
customers. For example, a. (poor) Rate the proficiencies of the personnel. b. (better) Personnel are knowledgeable. 2. Do the questions contain abbreviations or unconventional phrases?
Avoid these to the extent possible, unless they are understood by everyone and are the common way of referring to something. For example,
a. (poor) Rate our walk-in desk. b. (better) Personnel at our front desk are friendly. 3. Are the questions too vague?
Survey items should be clear and unambiguous; if they are not, the outcome is difficult to interpret. Make sure you ask something that can truly be mea-sured. For example,
a. (poor) This library should change its procedures. b. (better) Did you receive the information you needed?

366 aPPenDix xV
4. Are the questions too precise? Sometimes, the attempt to avoid vagueness results in items being too precise
and customers may be unable to answer them. For example, a. (poor) Each time I visit the library, the waiting line is long. b. (better) Generally, the waiting line in the library is long. 5. Are the questions biased?
Biased questions influence the customer to respond in a manner that does not correctly reflect his/her opinion. For example,
a. (poor) How much do you like our library? b. (better) Would you recommend our library to a friend? 6. Are the questions objectionable?
Usually, this problem can be overcome by asking the question in a less direct way.
For example, a. (poor) Are you living with someone? b. (better) How many people, including yourself, are in your household? 7. Are the questions double-barreled?
Two separate questions are sometimes combined into one. The customer is forced to give a single response and this, of course, would be ambiguous. For example,
a. (poor) The library is attractive and well maintained. b. (better) The library is attractive. 8. Are the answer choices mutually exclusive?
The answer categories must be mutually exclusive and the respondent should not feel forced to choose more than one. For example,
a. (poor) Scale range: 1, 2–5, 5–9, 9–13, 13 or over b. (better) Scale range: 0, 1–5, 6–10, 11–15, 16 or over 9. Are the answer choices mutually exhaustive?
The response categories provided should be exhaustive. They should include all the possible responses that might be expected. For example,
a. (poor) Scale range: 1–5, 6–10, 11–15, 16–20 b. (better) Scale range: 0, 1–5, 6–10, 11–15, 16 or over
Tallying the responses will provide a “score” that assists in making a decision that requires the use of quantifiable information. When using interval scales, keep in mind that not all questions will carry the same weight. Hence, it is a good idea to use a weighted average formula during calculation. To do this, assign a “weight” or level of importance to each question. For example, the aforementioned question might be assigned a weight of 5 on a scale of 1 to 5 meaning that this is a very important ques-tion. On the other hand, a question such as “Was the training center comfortable” might carry a weight of only 3. The weighted average is calculated by multiplying the weight by the score (w * s) to get the final score. Thus, the formula is snew = w * s.

367aPPenDix xV
There are several problems that might result in a poorly constructed questionnaire. Leniency is caused by respondents who grade nonsubjectively—in other words, too easily. Central tendency occurs when respondents rate everything as average. The halo effect occurs when the respondent carries his or her good or bad impression from one question to the next.
There are several methods that can be used to successfully deploy a survey. The easiest and most accurate is to gather all respondents in a conference room and hand out the survey. For the most part, this is not realistic, so other approaches would be more appropriate. E-mail and traditional mail are two methodologies that work well, although you often have to supply an incentive (i.e., prize) to get respondents to fill out those surveys on a timely basis. Web-based surveys (Internet and intranet) are becom-ing increasingly popular as they enable the inclusion of demos, audio, and video. For example, a web-based survey on what type of user interface is preferable could have hyperlinks to demos or screen shots of the choices.
Observation
Observation is an important tool that can provide a wealth of information. There are several forms of observation: silent and directed. In silent observation, the analyst merely sits on the sidelines, pen and pad, and observes what is happening. If it is suit-able, a tape recorder or video recorder can record what is being observed. However, this is not recommended if the net result will be several hours of random footage.
Silent observation is best used to capture the spontaneous nature of a particular process or procedure. For example,
1. When customers will be interacting with staff 2. During group meetings 3. On the manufacturing floor 4. In the field
Directed observation provides the analyst with a chance to micro-control a process or procedure so that it is broken down into its observable parts. At one accounting firm, a tax system was being developed. The analysts requested that several senior tax accountants be coupled with a junior staff member. The group was given a problem as well as all the manuals and materials they needed. The junior accountant sat at one end of the table with the pile of manuals and forms while the senior tax accountants sat at the other end. A tough tax problem was posed. The senior tax accountants were directed to think through the process and then direct the junior member to follow through on their directions to solve this problem. The catch was that the senior mem-bers could not walk over to the junior person nor touch any of the reference guides. This whole exercise had to be verbal and use just their memories and expertise. The entire process was videotaped. The net result was that the analyst had a complete record of how to perform one of the critical functions of the new system.
368 aPPenDix xV
Participation
The flip side of observation is participation. Actually becoming a member of the staff, and thereby learning exactly what it is that the staff does so that it might be auto-mated, is an invaluable experience.
Documentation
It is logical to assume that there will be a wide variety of documentation available to the analyst. This includes, but is not limited to the following:
1. Documentation from existing systems. This includes requirements and design specifications, program documentation, user manuals, and help files. This also includes whatever “wish lists” have been developed for the existing system.
2. Archival information. 3. Policies and procedures manuals. 4. Reports. 5. Memos. 6. Standards. 7. E-mail. 8. Minutes from meetings. 9. Government and other regulatory guidelines and regulations. 10. Industry or association manuals, guidelines, standards (e.g., accountants are
guided not only by in-house “rules and regulations,” but also by industry and other rules and regulations).
Brainstorming
In a brainstorming session, you gather together a group of people, create a stimulating and focused atmosphere, and let people come up with ideas without risk of being ridiculed. Even seemingly stupid ideas may turn out to be “golden.”
Focus Groups
Focus groups are derived from marketing. These are structured sessions where a group of stakeholders are presented with a solution to a problem and then are closely ques-tioned on their views about that solution.

369
Index
A
AHP, see Analytic hierarchy process (AHP)AIAG, see Automotive industry action group
(AIAG)Analytic hierarchy process (AHP), 33–36Anytime Feedback, 83APIs, see Application programming
interfaces (APIs)Application programming interfaces
(APIs), 112Automated appraisal tools, 82–83Automotive industry action group
(AIAG), 101
B
Balanced scorecards, 18–20, 90–93metrics, 309–315
BCR, see Benefit–cost ratio (BCR)Behavioral competencies, 273–278Benchmarking, 22–25
and brainstorming, 368and documentation, 368and focus groups, 368and interviewing, 361–364of metrics, 32–36and observation, 367and participation, 368and questionnaires/surveys, 364–367
Benefit–cost ratio (BCR), 46BetterWorks, 82BPM, see Business process management
(BPM)Brainstorming, and benchmarking, 368Break-even analysis, 46Break-even point, 46Business Balanced Scorecard On-Line, 137Business process improvements, 131Business process management (BPM), 130Business risk RMMM strategy, 112–113Business risks, 107
C
Capability maturity model (CMM), 61Capco, 82CES, see Cost element structure (CES)Chief information officers (CIOs), 2, 39, 132CIOs, see Chief information officers (CIOs)CM, see Configuration management (CM)CMM, see Capability maturity model
(CMM)Comcast Interactive, 6Competitive analysis, 26–27Configuration management (CM), 133,
145–146metrics, 256
Continuous improvement, 131Continuous innovation, 155–159

370 inDex
Cost–benefit analysis, 45Cost element structure (CES), 289Covey, Stephen, 84Critical success factors (CSFs), 113–115, 136CSFs, see Critical success factors (CSFs)Customer economy, 166–167Customer intimacy, and operational
excellence, 161–162Customer satisfaction survey, 162–164
D
DARPA, see Defense Advanced Research Project Agency (DARPA)
Data analytics, 77Data collection, 361Decision trees, 119Defense Advanced Research Project Agency
(DARPA), 154Define, measure, analyze, improve, and
control (DMAIC), 130Design for Six Sigma (DFSS), 130DevOps, 132DFSS, see Design for Six Sigma (DFSS)Direct software measurement program, 59DirectTV, 6DMAIC, see Define, measure, analyze,
improve, and control (DMAIC)Documentation, and benchmarking, 368
E
Earned-value management (EVM), 52“Easy to do business with” (ETDBW), 166Economic value added (EVA), 48Employee appraisal, 78–81Engineering process improvements, 131Enterprise resource planning (ERP), 41–44,
265–266ERP, see Enterprise resource planning (ERP)ETDBW, see “Easy to do business with”
(ETDBW)EVA, see Economic value added (EVA)EVM, see Earned-value management (EVM)
F
Factor analysis of information risk (FAIR), 122
FADE, see Focus, analyze, develop, execute, and evaluate (FADE)
Failure modes and effects analysis (FMEA), 116
FAIR, see Factor analysis of information risk (FAIR)
Financial metrics, 45–52Five Forces model, 5FMEA, see Failure modes and effects analysis
(FMEA)Focus, analyze, develop, execute, and evaluate
(FADE), 17Focus groups, and benchmarking, 368Force field analysis, and VOC, 164–165
G
Goal-question-metric (GQM) paradigm, 63–64
GQM, see Goal-question-metric (GQM) paradigm
H
Holacracy, 71
I
IBS, see Information-based strategy (IBS)IDEAL model, see Initiate, diagnose,
establish, act, and leverage (IDEAL) model
IEEE, see Institute of Electrical and Electronics Engineers (IEEE)
Indirect software measurement program, 59Information-based strategy (IBS), 172Infrastructure as code, 133Initiate, diagnose, establish, act, and leverage
(IDEAL) model, 61Innovation
continuous, 155–159for enhanced customer support, 167–170managing for, 170–172
Institute of Electrical and Electronics Engineers (IEEE), 258–264
Intelligence quotient (IQ ), 77Interviewing, and benchmarking, 361–364IQ , see Intelligence quotient (IQ )

371inDex
IT risk assessment frameworks, 120–123IT-specific metrics, 36–41, 255–271IT staff competency survey, 217–221IT utility, 127–130
J
JIT, see Just-in-time (JIT)Just-in-time (JIT), 114
K
Kaizen, 132KCO, see Key control over operations (KCO)
modelKey control over operations (KCO)
model, 317Key performance indicators (KPIs), 93K&IM, see Knowledge and information
management (K&IM)KM, see Knowledge management (KM)Knowledge and information management
(K&IM), 333–337Knowledge-based social enterprising
and balanced scorecards, 90–93measuring project portfolio management,
95–99overview, 89project management measurement
systems, 93–95Project Management Process Maturity
Model (PM)2 model, 99–102Knowledge management (KM), 317–331KPIs, see Key performance indicators (KPIs)
L
Lean software development (LSD), 130LSD, see Lean software development (LSD)
M
Malcolm Baldrige National Quality Award, 97
Measurement case, 66Measurement plan, 66–68, 279–284Metrics
balanced scorecard, 309–315benchmarking initiative of, 32–36configuration management, 256
examples of performance measures, 52–54
financial, 45–52Institute of Electrical and Electronics
Engineers (IEEE) defined, 258–264
IT-specific measures, 36–41, 255–271for knowledge management (KM),
317–331overview, 31–32process maturity framework, 256–258product and process, 255–256selected performance, 264Software Technology Support Center
(STSC), 223–254system-specific, 41–45
Monte Carlo methods, 119Motivation, 75–76
N
National Consumer Electronics, 6Net present value (NPV), 51–52New product development, 153–154New York Times, 83NPV, see Net present value (NPV)
O
Observation, and benchmarking, 367OCTAVE, see Operationally critical threat,
asset, and vulnerability evaluation (OCTAVE)
ODI, see Outcome-driven innovation (ODI)OLTP, see Online transaction processing
(OLTP)Online transaction processing (OLTP), 44Operationally critical threat, asset,
and vulnerability evaluation (OCTAVE), 122
Organization software measurement, 61–62Outcome-driven innovation (ODI), 167
P
Participation, and benchmarking, 368PC, see Production capability (PC)People improvement systems

372 inDex
automated appraisal tools, 82–83employee appraisal, 78–81impact of positive leadership, 73–75motivation, 75–76overview, 71–73recruitment, 76–78and workplace stress, 83–86
Performance-based strategic planning systemsoverview, 1–2strategic planning, 2–5strategy implementation, 5–11technology roadmap, 2
Performance management and measurement systems
balanced scorecard, 18–20competitive analysis, 26–27developing benchmarks, 22–25developing QI plan, 15–18establishing, 20–22overview, 13–15process mapping, 27–29
PMBOK, see Project Management Body of Knowledge (PMBOK)
PMG, see Portfolio Management Group (PMG)
PM2 model, see Project Management Process Maturity Model (PM)2 model
PMO, see Project management office (PMO)Portfolio Management Group (PMG), 97Positive leadership, 73–75PQI, see Process quality index (PQI)PQM, see Process quality management (PQM)PRINCE2, see Projects in Controlled
Environments (PRINCE2)Probability trees, 119Process configuration management, 146, see
Configuration management (CM)Process mapping, 27–29Process maturity framework metrics, 256–258Process performance metrics, 137–140Process quality, 134–137Process quality index (PQI), 134Process quality management (PQM), 114,
351–355Product development
measuring, 159process, 153–154
Production capability (PC), 84
Product life cycle (PLC), 149–152management, 152–153
Project Management Body of Knowledge (PMBOK), 98
Project management measurement systems, 93–95
Project management office (PMO), 97–98Project Management Process Maturity
Model (PM)2 model, 99–102Project portfolio management, measuring,
95–99Project QA and collaboration plan, 339–349Project quality plan, 357–359Project risk RMMM strategy, 112Project risks, 107Projects in Controlled Environments
(PRINCE2), 98Project software measurement, 62ProSTEP-iViP reference model, 101
Q
QA, see Quality assurance (QA)QCE, see Quality of customer experience
(QCE)QI, see Quality improvement (QI)QoE, see Quality of experience (QoE)Quality assurance (QA), 134Quality improvement (QI), 13–15
developing plan, 15–18Quality of customer experience (QCE),
166–167Quality of experience (QoE), 166Quantitative risk analysis, 116–119Questionnaires/surveys, 364–367
R
Recruitment, 76–78Requirements elicitation, 361Return on attitude (ROA), 10Return on excitement (ROE), 10Return on intellect (ROI), 10Return on investment (ROI), 45–51, 73, 97,
140, 172, 285Return on management (ROM), 172Risk analysis, 104–105
quantitative, 116–119Risk avoidance, 113–115

373inDex
Risk checklists, 119–120Risk identification, 105–108Risk mitigation, monitoring, and
management plan (RMMM), 108business strategy, 112–113project strategy, 112technical strategy, 112
Risk process measurement, 123–125Risk strategy, 103–104RMMM, see Risk mitigation, monitoring,
and management plan (RMMM)ROA, see Return on attitude (ROA)ROE, see Return on excitement (ROE)ROI, see Return on intellect (ROI); Return
on investment (ROI)ROM, see Return on management (ROM)Rosemann–Wiese approach, 43
S
7 Habits of Highly Effective People (Covey), 84Sample measurement plan, 279–284Sample risk plan, 108–111SDLC, see Systems development life cycle
(SDLC)SEI, see Software Engineering Institute (SEI)SEI CMM, see Software Engineering
Institute Capability Maturity Model (SEI CMM)
Selected performance metrics, 264Service-level agreement (SLA), 144Shared first approach, 140–145Simulation models, see Monte Carlo methodsSLA, see Service-level agreement (SLA)SLOC, see Source lines of code (SLOC)SMART, see Specific, measurable,
achievable, relevant, and time-framed (SMART)
SMEs, see Subject-matter experts (SMEs)Software Engineering Institute Capability
Maturity Model (SEI CMM), 62–63Software Engineering Institute (SEI), 134Software measurement program
developing software measurement plan, 64–65
direct and indirect, 59goal-question-metric (GQM) paradigm,
63–64
measurement plan standard, 66–68, 279–284
overview, 57–58Software Engineering Institute Capability
Maturity Model (SEI CMM), 62–63software objects, 59software process improvement model,
61–62thematic outline, 68–70views of core measures, 60
Software process improvement model, 61–62Software Technology Support Center
(STSC), 223–254Source lines of code (SLOC), 59SOW, see Statement of work (SOW)Specific, measurable, achievable, relevant,
and time-framed (SMART), 16Statement of work (SOW), 142Strategic planning, 2–5Strengths, weaknesses, opportunities, and
threats (SWOT), 5STSC, see Software Technology Support
Center (STSC)Subject-matter experts (SMEs), 141Surveys/questionnaires, 364–367SWOT, see Strengths, weaknesses,
opportunities, and threats (SWOT)Systems development life cycle (SDLC), 150System-specific metrics, 41–45
T
TCO, see Total cost of ownership (TCO)Technical risk RMMM strategy, 112Technical risks, 107Technology roadmap, 2TIME magazine, 77Time-to-market (TTM), 130TiVo, 6–7Total cost of ownership (TCO), 48Total quality control (TQC), 18TQC, see Total quality control (TQC)TTM, see Time-to-market (TTM)
V
Value measuring methodology (VMM), 52, 285–307

374 inDex
VMM, see Value measuring methodology (VMM)
VOC, see Voice of the customer (VOC)Voice of the customer (VOC)
customer economy, 166–167customer intimacy and operational
excellence, 161–162customer satisfaction survey, 162–164force field analysis, 164–165innovation for enhanced customer support,
167–170managing for innovation, 170–172
W
WEST, see Women in the Enterprise of Science and Technology (WEST)
Women in the Enterprise of Science and Technology (WEST), 155
Workplace stress, 83–86Work unit measures, 213–216
X
X quotient (XQ ), 77
Y
Y2K panic, 154
Z
Zeigarnik effect, 85