management's discussion and analysis of - XPEL
16
1 MANAGEMENT’S DISCUSSION AND ANALYSIS OF FINANCIAL CONDITION AND RESULTS OF OPERATIONS This management’s discussion and analysis (“MD&A”) describes the operating and financial results of XPEL, Inc., (“XPEL” or “Company”) for the nine months ended September 30, 2018. The MD&A, prepared as of November 14, 2018, should be read in conjunction with the accompanying condensed consolidated unaudited financial statements. These condensed consolidated interim financial statements have been prepared in accordance with International Financial Reporting Standards ("IFRS") and its interpretations adopted by the International Accounting Standards Board ("IASB"). These condensed consolidated unaudited interim financial statements should be read in conjunction with our 2017 annual financial statements prepared in accordance with IFRS. Non-IFRS Measures In addition to disclosing results in accordance with IFRS as issued by IASB, the Company also provides supplementary non-IFRS measures as a method of evaluating the Company’s performance. Management uses EBITDA as a measure of company-wide performance. EBITDA is defined as earnings before interest, taxes, depreciation, and amortization. Management believes EBITDA is a useful measure to allow period-to-period comparison of the Company’s operating performance. EBITDA does not have a standardized meaning under IFRS and is not necessarily comparable to measures presented by other Companies. EBITDA excludes components that are significant in understanding and assessing our results of operations and cash flows. EBITDA does not represent funds available for Management's discretionary use and is not intended to represent cash flow from operations. EBITDA should not be considered a substitute for Net Income prepared in accordance with IFRS as issued by the IASB. Constant Currency The Company reports results in U.S. Dollars, but does business on a global basis. Exchange rate fluctuations affect the U.S. Dollar value for foreign currency revenue and expenses and may have a significant effect on reported results. Comparisons are made to the prior year in constant currency terms, which Management believes is helpful in understanding the Company’s performance. Constant currency is calculated by converting current period results using the prior year currency exchange rates. Forward-Looking Disclaimer Certain statements in this MD&A contain forward-looking information within the meaning of applicable securities laws including, among others, statements made or implied under the headings “Strategic Overview”, “Results of Operations”, “Liquidity and Capital Resources”, “Accounting Estimates”, and “Risk Factors” relating to the Company’s objectives, strategies to
-
Upload
khangminh22 -
Category
Documents
-
view
3 -
download
0
Transcript of management's discussion and analysis of - XPEL

1
MANAGEMENT’S DISCUSSION AND ANALYSIS OF FINANCIAL CONDITION AND RESULTS OF OPERATIONS
This management’s discussion and analysis (“MD&A”) describes the operating and financial results of XPEL, Inc., (“XPEL” or “Company”) for the nine months ended September 30, 2018.
The MD&A, prepared as of November 14, 2018, should be read in conjunction with the accompanying condensed consolidated unaudited financial statements. These condensed consolidated interim financial statements have been prepared in accordance with International Financial Reporting Standards ("IFRS") and its interpretations adopted by the International Accounting Standards Board ("IASB"). These condensed consolidated unaudited interim financial statements should be read in conjunction with our 2017 annual financial statements prepared in accordance with IFRS. Non-IFRS Measures In addition to disclosing results in accordance with IFRS as issued by IASB, the Company also provides supplementary non-IFRS measures as a method of evaluating the Company’s performance. Management uses EBITDA as a measure of company-wide performance. EBITDA is defined as earnings before interest, taxes, depreciation, and amortization. Management believes EBITDA is a useful measure to allow period-to-period comparison of the Company’s operating performance. EBITDA does not have a standardized meaning under IFRS and is not necessarily comparable to measures presented by other Companies. EBITDA excludes components that are significant in understanding and assessing our results of operations and cash flows. EBITDA does not represent funds available for Management's discretionary use and is not intended to represent cash flow from operations. EBITDA should not be considered a substitute for Net Income prepared in accordance with IFRS as issued by the IASB. Constant Currency The Company reports results in U.S. Dollars, but does business on a global basis. Exchange rate fluctuations affect the U.S. Dollar value for foreign currency revenue and expenses and may have a significant effect on reported results. Comparisons are made to the prior year in constant currency terms, which Management believes is helpful in understanding the Company’s performance. Constant currency is calculated by converting current period results using the prior year currency exchange rates. Forward-Looking Disclaimer
Certain statements in this MD&A contain forward-looking information within the meaning of applicable securities laws including, among others, statements made or implied under the headings “Strategic Overview”, “Results of Operations”, “Liquidity and Capital Resources”, “Accounting Estimates”, and “Risk Factors” relating to the Company’s objectives, strategies to

2
achieve those objectives, beliefs, plans, estimates, projections and intentions; and similar statements concerning anticipated future events, results, circumstances, performance or expectations that are not historical facts including, but not limited to: the ability to oversee and mange the delivery model for our products and services; the ability to leverage our distribution channels; enhancement of dealership opportunities; expansion of our presence in Europe; investments in research and development; evaluation of our risk management strategies. Forward-looking statements generally can be identified by words such as “outlook”, “believe”, “expect”, “may”, “anticipate”, “should”, “intend”, “estimates” and similar expressions. With respect to forward looking statements contained in this MD&A, assumptions have been made regarding among other things: currency exchange rates, interest rates, expected revenue from operations, the economic in which we operate, results of our customer initiatives and brand focus and continued customer demand.
This MD&A contains certain forward-looking statements in respect of various matters including upcoming events that involve known and unknown risks and uncertainties that are beyond the control of Management. Those risks and uncertainties include, among other things, risks related to: share prices, liquidity, creditworthiness, currency, lease rollover, insurance, dilution, ability to access capital markets, interest rates, dependence on key personnel and environmental matters. Management believes that the expectations reflected in forward-looking statements are based upon reasonable assumptions and information currently available; however, Management can give no assurance that actual results will be consistent with these forward-looking statements. Factors and assumptions that were applied in drawing conclusions and could cause actual results, performance, or achievements to differ materially from those expressed or implied by forward-looking statements, include, but are not limited to, general economic conditions, changes in interest rates, changes in governmental regulations and the Company’s ability to obtain adequate insurance and financing. Readers are cautioned that the foregoing list of factors that may affect future results is not exhaustive. When relying on forward-looking statements to make decisions with respect to the Company, investors and others should carefully consider the foregoing factors and other uncertainties and potential events. Except as required by law, the Company disclaims any obligation to update or revise any forward-looking statements, whether as a result of new information, future events or otherwise. These forward-looking statements are made as of November 14, 2018.
Company Overview
XPEL Inc. (formerly XPEL Technologies Corp., “XPEL”), a Nevada corporation, based in San Antonio, Texas, USA is a Canadian reporting issuer whose common shares trade on the TSX Venture Exchange (“TSXV”) under the symbol DAP.U.
The Company manufactures, sells and distributes, and installs after-market automotive products, including automotive paint protection film, headlight protection film, automotive window films and other related products. In addition, the Company began selling commercial and residential window film and security film in 2018.

3
In the United States, Canada and parts of Europe, the Company operates primarily by selling a complete turn-key solution directly to independent installers and new car dealerships which includes XPEL protection films, installation training, access to the Company’s proprietary design software, marketing support and lead generation. Additionally, the Company operates six Company-owned installation centers in the United States as well as three in Canada and one installation center in the United Kingdom. These locations serve wholesale and/or retail customers in their respective markets. In Mexico and the Netherlands, the company operates as a distributor. In other parts of the world, the Company operates primarily through third party distributors, who operate under agreement with the Company to develop a market or a region under the Company’s supervision and direction. The Company operates through 100% owned subsidiaries in Canada, the Netherlands, and Mexico and through an 85% owned subsidiary in the United Kingdom. Strategic Overview The Company is currently executing on several key strategic initiatives to drive continued growth. Our global expansion strategy centers around the need to establish a local presence where possible which allows us to better control the delivery of our products and services. We established our European headquarters in early 2017 to leverage a localized approach to capture market share in this under-penetrated region. We are continuing to add locally based regional sales personnel to leverage local knowledge and relationships to expand the markets in which we operate. We continue to drive global brand awareness in strategically important areas. We seek high visibility at premium events such as major car shows. We also seek out high value placement in advertising media consumed by car enthusiasts to help further expand the Company’s premium brand. The Company also continues to expand its delivery channels by acquiring select installation facilities in key markets and/or acquiring international partners to enhance its global reach. We are agnostic in terms of the distribution model as we expand globally. We believe this flexibility allows us to penetrate and grow market share more efficiently. The Company also continues to drive expansion of its non-automotive product portfolio. The Company recently launched its new commercial/residential window film product line which opens up a large, addressable new market for the company and represents the first non-automotive product line in the Company’s history. While there is some overlap with the Company’s existing customers, this new product line exposes the Company to several new channels. The Company competes mainly against other product companies. We believe we are highly differentiated by the suite of services that surrounds our leading protective films. Our state of

4
the art software leads the industry with over 70,000 patterns. This design software is updated daily with new vehicle patters often before the vehicle is offered to the public. This software ensures a superior quality installation with minimal film waste which is highly valuable for our customers. Our customer service center is available 24 hours per day, 7 days a week and can answer any support question regarding our products and services. We also provide substantial marketing and lead generation for our customers by supporting them at various shows and events and advertising their locations on our company web site. Results of Operations Three Months Ended September 30, 2018
Revenues. Revenues increased approximately $11.5 million to $29.3 million, or 64.3% over the prior year period. On a constant currency basis, revenues grew 65.4% to $29.5 million. The following is a breakdown of our components of revenue:
Three Months Ended % % of Total Revenue September
30, 2018 September
30, 2017 Inc
(Dec) September
30, 2018 September
30, 2017 Paint Protection film $ 23,679,536 $ 13,399,480 76.7% 80.8% 75.1% Window film 2,125,910 1,840,607 15.5% 7.3% 10.4% Film installation 1,683,721 1,233,389 36.5% 5.8% 6.9% Software 972,624 909,525 6.9% 3.3% 5.1% Other products 831,660 450,248 84.6% 2.8% 2.5%
Total $ 29,293,451 $ 17,833,249 64.3% 100.0% 100.0% Revenue from our paint protection film product line increased 76.7% representing strong growth across all our operating regions, particularly in Asia which was 27.3% of total revenue. Our window film product line grew 15.5% vs prior year quarter while installation revenue grew 36.5%. Other product revenue, which is comprised mainly of ancillary products to support the application and installation of paint protection film and window film, grew 84.6% vs prior year quarter. Cost of Sales. Cost of Sales increased approximately $6.9 million over the prior year period and decreased as a percentage of revenues from 76.2% to 69.9%. Direct costs include the costs of our physical goods, the costs related to our Design Access Program software, and the costs of labor directly associated with the production of product.
Gross Margin. Gross margin for the quarter was 30.1% vs 23.8% for the prior year quarter. This margin improvement was primarily attributable to improved product margins, production efficiencies achieved as a result of our margin enhancement initiatives undertaken in late 2017, and reductions in our warranty costs.

5
The following is the gross margin component contribution expressed as a percentage of revenues:
Expenses. Selling, general and administrative (SG&A) expenses grew 63.8% vs prior year quarter and was flat at 19.9% of sales vs 19.9% of sales compared to the prior year period. This increase was due mainly to increases in personnel, occupancy, sales and marketing, professional fees and information technology related costs to support the ongoing growth of the business.
EBITDA. EBITDA increased $2.2 million to $3.4 million. On a constant currency basis, EBITDA was minimally impacted. This increase was due mainly to improvements in overall gross margin and gains in SG&A operating leverage.
Net income. Net income before tax increased to $2.9 million. Net income increased to $2.2 million. On a constant currency basis, net income was minimally impacted.
Nine Months Ended September 30, 2018 MD
Revenues. Revenues increased approximately $35.8 million, or 75.4% over the prior year-to-date period. On a constant currency basis, revenues grew 74.0% to $82.7 million.
Nine Months Ended % % of Total Revenue September
30, 2018 September
30, 2017 Inc
(Dec) September
30, 2018 September
30, 2017 Paint Protection film $ 67,583,659 $ 35,900,951 88.3% 81.1% 75.6% Window film 5,662,725 4,034,255 40.4% 6.8% 8.5% Film installation 4,698,872 3,462,434 35.7% 5.6% 7.3% Software 2,986,035 2,715,501 10.0% 3.6% 5.7% Other products 2,425,866 1,399,067 73.4% 2.9% 2.9%
Total $ 83,357,157 $ 47,512,208 75.4% 100.0% 100.0% Revenue from our paint protection film product line increased 88.3% representing strong growth across all our operating regions, particularly in Asia which represented 30.1% of total revenue. Our window film product line grew 40.4% vs prior year-to-date period. Installation revenue grew 35.7% including same store sales growth of 27.9%. Other product revenue, which is comprised mainly of ancillary products to support the application and installation of paint protection film and window film, grew 73.4% vs prior year-to-date period.
6
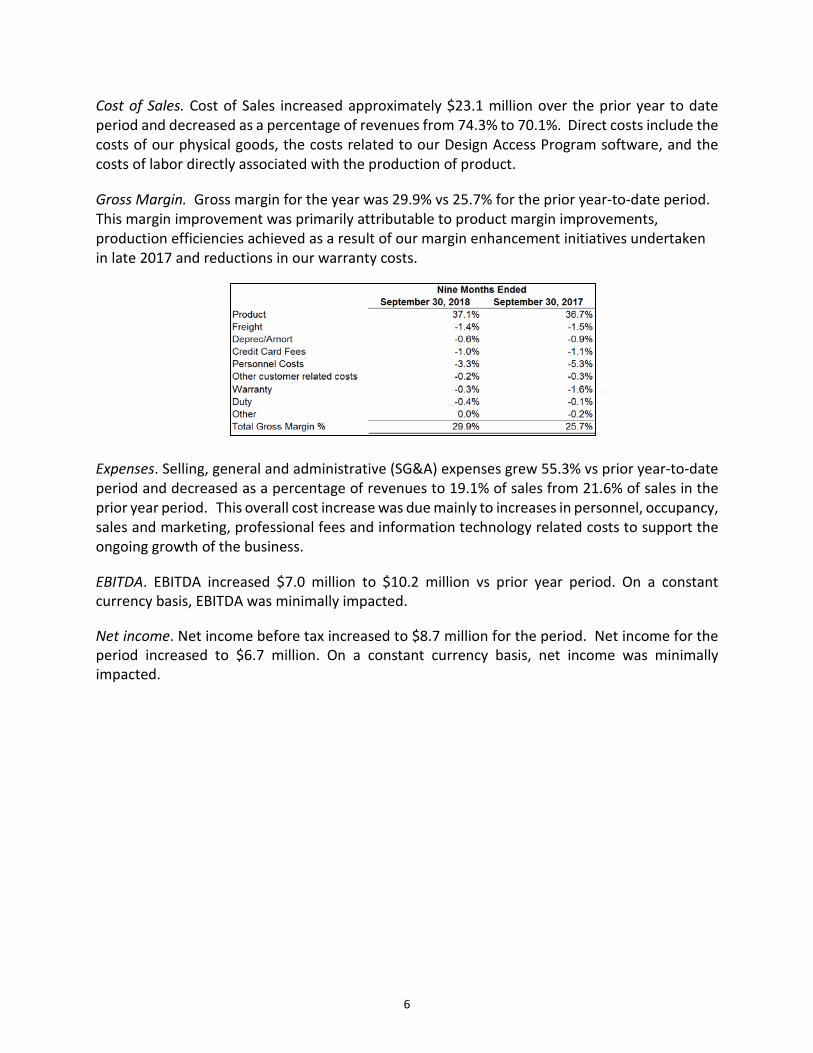
Cost of Sales. Cost of Sales increased approximately $23.1 million over the prior year to date period and decreased as a percentage of revenues from 74.3% to 70.1%. Direct costs include the costs of our physical goods, the costs related to our Design Access Program software, and the costs of labor directly associated with the production of product.
Gross Margin. Gross margin for the year was 29.9% vs 25.7% for the prior year-to-date period. This margin improvement was primarily attributable to product margin improvements, production efficiencies achieved as a result of our margin enhancement initiatives undertaken in late 2017 and reductions in our warranty costs.
Expenses. Selling, general and administrative (SG&A) expenses grew 55.3% vs prior year-to-date period and decreased as a percentage of revenues to 19.1% of sales from 21.6% of sales in the prior year period. This overall cost increase was due mainly to increases in personnel, occupancy, sales and marketing, professional fees and information technology related costs to support the ongoing growth of the business.
EBITDA. EBITDA increased $7.0 million to $10.2 million vs prior year period. On a constant currency basis, EBITDA was minimally impacted.
Net income. Net income before tax increased to $8.7 million for the period. Net income for the period increased to $6.7 million. On a constant currency basis, net income was minimally impacted.

7
EBITDA The Company has provided a reconciliation of IFRS net income to EBITDA in the following table. EBITDA is defined as net income before interest, taxes, depreciation and amortization. Management believes that EBITDA is a useful measure that facilitates period to period operating comparisons.
Three Months Ended
September 30 2018
Three Months Ended
September 30 2017
Nine Months Ended
September 30 2018
Nine Months Ended
September 30 2017
Net Income (Loss) $ 2,180,451 $ 444,835 $ 6,690,896 $ 1,130,092 Interest 43,514 86,701 151,294 194,755 Taxes 688,873 214,527 2,001,173 694,367 Depreciation 200,512 186,955 539,379 523,701 Amortization 285,941 240,866 846,391 706,999 EBITDA $ 3,399,291 $ 1,173,884 $ 10,229,133 $ 3,249,914
• Depreciation and amortization amounts are translated for foreign currency purposes at average
exchange rates for their respective periods. Summary of Quarterly Results
The financial information set out below presents the required financial information for the eight most recently completed fiscal quarters of the Company. Quarterly information below has been prepared under IFRS.
Q3 2018 Q2 2018 Q1 2018 Q4 2017 Q3 2017 Q2 2017 Q1 2017 Q4 2016
Revenues 29,293.5 28,864.7 25,198.7 20,237.4 17,833.2 17,048.5 12,630.5 13,248.8
Net Income (Loss) Before Taxes
2,869.3 3,313.5 2,616.0 339.4 659.3 1,204.7
(39.6) (249.6)
Net (Loss) Income
2,180.5 2,493.6 2,016.6 4.3 444.8 750.1 (64.8) (22.9)
Net Income (Loss) per Share
.079 .090 .073 .0002 .016 .027 (0.002) (0.001)
Amounts in thousands, except per share amounts
8
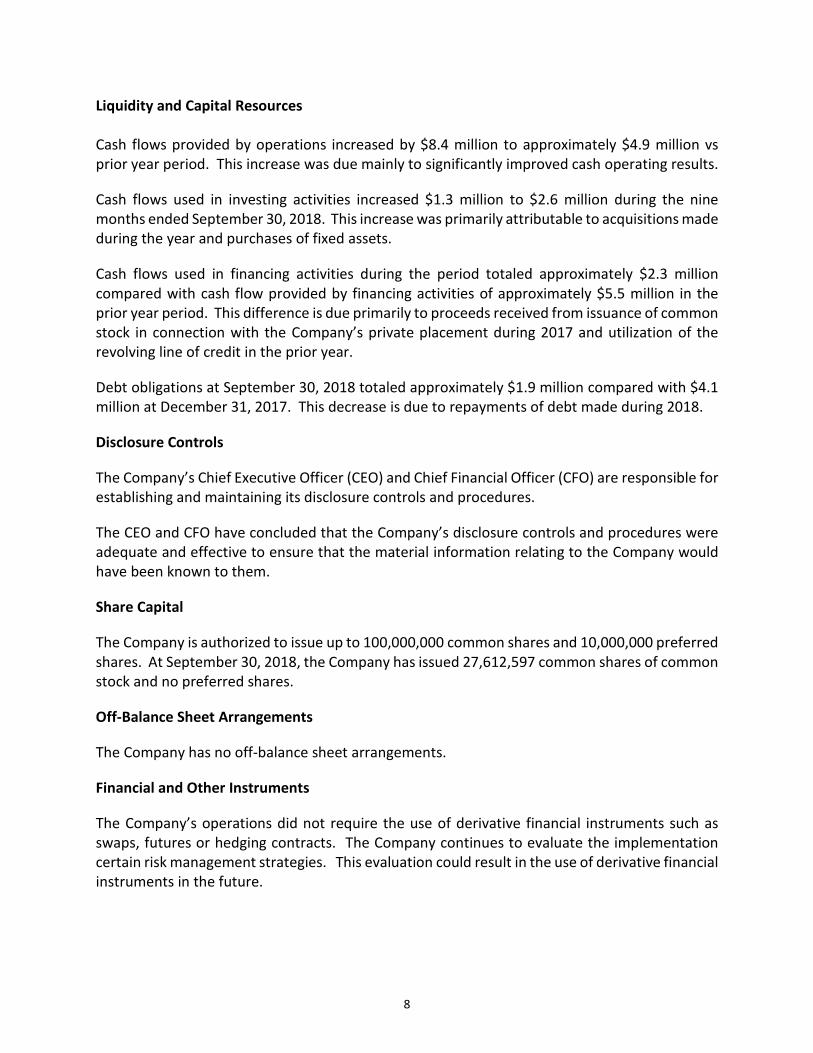
Liquidity and Capital Resources Cash flows provided by operations increased by $8.4 million to approximately $4.9 million vs prior year period. This increase was due mainly to significantly improved cash operating results.
Cash flows used in investing activities increased $1.3 million to $2.6 million during the nine months ended September 30, 2018. This increase was primarily attributable to acquisitions made during the year and purchases of fixed assets.
Cash flows used in financing activities during the period totaled approximately $2.3 million compared with cash flow provided by financing activities of approximately $5.5 million in the prior year period. This difference is due primarily to proceeds received from issuance of common stock in connection with the Company’s private placement during 2017 and utilization of the revolving line of credit in the prior year.
Debt obligations at September 30, 2018 totaled approximately $1.9 million compared with $4.1 million at December 31, 2017. This decrease is due to repayments of debt made during 2018.
Disclosure Controls
The Company’s Chief Executive Officer (CEO) and Chief Financial Officer (CFO) are responsible for establishing and maintaining its disclosure controls and procedures.
The CEO and CFO have concluded that the Company’s disclosure controls and procedures were adequate and effective to ensure that the material information relating to the Company would have been known to them.
Share Capital
The Company is authorized to issue up to 100,000,000 common shares and 10,000,000 preferred shares. At September 30, 2018, the Company has issued 27,612,597 common shares of common stock and no preferred shares.
Off-Balance Sheet Arrangements
The Company has no off-balance sheet arrangements.
Financial and Other Instruments
The Company’s operations did not require the use of derivative financial instruments such as swaps, futures or hedging contracts. The Company continues to evaluate the implementation certain risk management strategies. This evaluation could result in the use of derivative financial instruments in the future.
9
Accounting Estimates
The preparation of these condensed consolidated interim financial statements requires management to make judgments and estimates and form assumptions that affect the reported amounts of assets and liabilities at the date of the financial statements and reported amounts of revenues and expenses during the reporting period. Estimates and underlying assumptions are reviewed on an ongoing basis. Actual outcomes may differ from these estimates under different assumptions and conditions.
Significant estimates made by the Company include determination of the useful life of property, plant and equipment and intangible assets, measurement of warranty provision, recognition of deferred tax assets and liabilities, valuation of intangible assets for impairment, fair value of financial instruments and the determination of the fair value of assets and liabilities relating to acquisition of certain assets.
Significant judgments in connection with these condensed consolidated interim financial statements include the determination of the acquisition assets meet the definition of a business combination and determination of functional currency.
Recent Accounting Pronouncements
The following accounting pronouncements became effective on January 1, 2018:
(a) IFRS 9 Financial Instruments was issued by the IASB on July 24, 2014 as a complete standard including the requirements previously issued and the additional amendments to introduce a new expected loss impairment model and limited changes to the classification and measurement requirements for financial assets and liabilities. This new standard completes the IASB's financial instruments project and the standard is effective for reporting periods beginning on or after January 1, 2018, with early adoption permitted. The Company has determined the impact of the adoption of this new standard is minimal.
(b) The Company has adopted IFRS 15 Revenue from Contracts with Customers effective January 1, 2018. The Company recognizes revenue upon the shipment of product, upon the completion and delivery of installation to the customer, and upon the access to the Company’s software by the customer. These have been determined to be the performance obligations that are distinct and the point at which control of the assets pass to the customer. Revenue is measured at the fair value of the consideration received. The Company has determined the impact of the adoption of this new standard is minimal.

10
Recent Accounting Pronouncements Issued and Not Yet Applied
Certain pronouncements were issued by the IASB or the IFRIC that are mandatory for accounting periods after December 15, 2018 or later periods. Many are not applicable or do not have a significant impact to the Company and have been excluded from the list below. The following have not yet been adopted and are being evaluated to determine their impact on the Company. IFRS 16 Leases was issued by the IASB in January 2016 and will replace IAS 17 Leases. It is effective for annual periods beginning on or after January 1, 2019. IFRS 16 introduces a single accounting model for lessees and for all leases with a term of more than 12 months, unless the underlying asset is of low value. A lessee will be required to recognize a right-of-use asset, representing its right to use the underlying asset, and a lease liability, representing its obligation to make lease payments. The accounting treatment for lessors will remain largely the same as under IAS 17. Earlier application is permitted only if the Company early adopts IFRS 15. The Company is in the process of assessing the impact of the adoption of this interpretation on its consolidated financial statements.
Risk Factors
The Company’s risk exposures and the impact on the Company’s financial instruments are summarized below:
Fair Value
The carrying value of the Company's cash and cash equivalents, accounts receivable, bank indebtedness, and accounts payable and accrued liabilities, approximate fair values due to the relatively short term maturities of the instruments. The bank loan payable approximates its fair value as the contract rate approximates current market rates. The fair value of other notes payable as of September 30, 2018 is $1,874,751 (December 31, 2017 - $1,619,675).
Credit Risk
Credit risk is the risk of financial loss to the Company if a counterparty fails to meet its contractual obligations, and arises principally from the Company’s receivables from customers. Management has established a credit policy under which each new customer is analyzed individually for creditworthiness before the Company’s standard payment and delivery terms and conditions are offered. The Company’s review includes external ratings, where available, and vendor and bank references. While the Company does not require collateral in respect of trade and other receivables, on certain product lines, the Company requires a valid credit card as back-up for any amount purchased on terms. The Company has no significant concentration of credit risk arising from customers.
The Company has cash and cash equivalents. The Company’s current policy is to invest excess cash in money market accounts in credit worthy banking institutions. The Company periodically monitors the accounts and is satisfied with the credit ratings of its banks.

11
Interest Rate Risk
The Company is exposed to interest rate risk since the Company's credit facilities are bearing interest at a variable rate. Interest rates for notes payable, bank loan payable and notes payable - acquisitions are fixed.
Currency Risk
The Company’s functional currency is the US dollar. Through its subsidiaries with foreign functional currencies, the Company is exposed to foreign currency risk. In respect of the monetary assets and liabilities denominated in foreign currencies, the Company ensures that its net exposure is kept to an acceptable level.
Additional Financing
Our ability to continue to maintain operating profitability and growth is dependent upon our ability to generate sufficient cash flows to meet our obligations on a timely basis and our ability to secure long-term financing as required. Additional financing may be required to develop the Company’s products and services.
Liquidity
Liquidity risk is the risk that the Company will not be able to meet its financial obligations as they fall due. The Company’s approach to managing liquidity is to ensure, to the extent possible, that it will always have sufficient liquidity to meet its liabilities when due, under both normal and stressed conditions, without incurring unacceptable losses or risking damage to the Company’s reputation.
Litigation In the normal course of the Company’s operations, it may become involved in, be named as a party to, or be the subject of various legal proceedings, including regulatory proceedings, tax proceedings and legal actions, related to personal injuries, property damage, property tax, land rights, the environment and contract disputes. The outcome of outstanding, pending or future proceedings cannot be predicted with certainty and may be determined adversely to the Company and as a result, could have a material adverse effect on the Company’s assets, liabilities, business, financial condition and results of operations. Even if the Company prevails in any such legal proceeding, the proceeding could be costly and time-consuming and may divert the attention of management and key personnel from the Company’s business operations. For specific disclosure of current legal proceedings, see “Legal Proceedings” in this MD&A.
12
Additional Risk Factors
There are various risks associated with investing in the business of the Company including those described below that should be considered in conjunction with the other information included in this MD&A. There may be additional risks and uncertainties in addition to those listed below, including those that are unknown to the Company at this time or believed by the Company to be unimportant at this time that could, in the future, have a material adverse effect on the business, financial condition or results of operations of the Company.
Market Penetration
There can be no assurance that the Company can generate sufficient interest in its products to permit the Company to achieve its required level of market penetration. There are many products competing for the consumer’s aftermarket products dollars and the Company may not be able to make its products a priority for consumers.
Demand for Company’s Products
There can be no assurance that the Company will be able to maintain or increase demand for its products. Any significant shortfall of demand in relation to expectation for the Company’s products would have an adverse impact on the Company.
Economic
The Company’s sales are partially tied to the success of the automotive industry, specifically new car sales. While new car sales have recovered off their low during the recession, there is no guarantee current sales levels will continue. A decline in new car sales globally could negatively impact the Company’s performance.
Competition
The Company is experiencing competition for its products. The Company continues to see new entrants in to the paint protection market and increased emphasis on the paint protection film marketplace from existing competitors. The Company believes it has significant competitive advantages through its database of products, proprietary product distribution software, training curriculum and facilities, and established sales channels; however, the Company must continually upgrade and improve its products, or develop new products. The Company will be negatively affected if other products similar to those of the Company with similar or superior features at lower prices become available.

13
Vulnerability to Substitutes
The Company’s products, once installed, are generally virtually invisible and without branding, allowing for substitution and bait-and-switch tactics by the installer base not known to the consumer. This could create a false negative perception of the Company’s products if the substitutes are inferior in quality or reduce the return on the Company’s sales and marketing activities if the quality is acceptable.
The Company’s revenue is derived primarily from the sale of automotive paint protection film. Should alternative technologies provide suitable paint protection in another manner, or should automotive paint technology improve in a material fashion so as to not need protection, the market for the Company’s products may diminish.
Reliance on Suppliers
The Company is dependent on its suppliers and partners, their knowledge, ability and equipment to continue to manufacture its paint protection film at sufficient quantities and of acceptable quality. The manufacture of paint protection film requires the use of equipment and facilities and other supply chain elements that are highly specialized and not widely available. As the Company’s products advance technologically, the Company is increasingly more reliant on these suppliers and partners and their specialized technology. Any disruption to these facilities, relationships or to the supply chain could adversely affect the Company’s ability to produce product. Any disruption in the source of supplies, internally or externally, could adversely affect the Company’s business.
Reliance on Raw Materials or Indirect Suppliers
The Company’s suppliers are reliant on raw and finished materials from other suppliers that may be discontinued, on allocation, of questionable quality or suffer wild price fluctuations. These components may have few alternate suppliers. Due to the indirect nature of these suppliers, the Company may have limited visibility to these problems and may have limited ability to mitigate them. Additionally, due the indirect nature of the supplier, the Company may have little advance notice regarding supply disruptions or any other problems that ultimately affect the Company’s business.
Susceptibility to Fluctuations and Structural Changes to the Automotive Industry
The majority of the Company’s sales are ultimately targeted towards new cars. Should the sale of new cars decline for any temporary reason, such as: supply disruption, lack of credit availability or for any longer term reason such as: structure changes to the transportation industry due to self-driving cars, ride-sharing services or changing consumer preferences, the Company’s sales may be impacted. If such changes are dramatic enough, it could materially impact the Company’s sales or profitability.
14
Risk Associated with Intellectual Property
The Company sells a variety of products (both physical and electronic) that are applied and used in a variety of ways. The products sold, the manner in which they are used and the mechanisms by which they are applied may all potentially infringe on other’s intellectual property. While the Company attempts to monitor such intellectual property filings and, where appropriate, protect its own, given the broad scope and nature of the products and their uses, it is not possible to guarantee perfect knowledge or interpretation of all intellectual property risks.
Reliance on Ability to Forecast and Manage Supply Chain
The company must accurately forecast and schedule production of its products. Due to lack of personnel, historical data or for other unforeseen circumstances it may not be possible to forecast demand accurately. This could result in the Company having incorrect inventory levels to meet demand, including inventory levels higher than needed which could create cash-flow challenges for the Company or inventory levels lower than needed which could inhibit the Company’s ability to make sales and deliver product on-time and at the quantity requested. If the Company fails to meet customer demand for products, it may lose customers to competitors.
UK/European Union
As a result of the U.K.’s decision to leave the European Union in 2017 through a negotiated exit over a period of time, it is possible there will be increased regulatory complexities, as well as potential referenda in the U.K. and/or European Union countries that could cause uncertainty in European or worldwide economic conditions. In the short term, the decision created volatility in certain foreign currency exchange rates, which may continue. Any of these effects, and others we cannot anticipate, could adversely affect our business, results of operations, financial condition and cash flows.
15
Information Technology System Failures
We are increasingly reliant on technological systems as well as technologies which facilitate communication and collaboration internally, with affiliated entities, or with independent third parties to conduct our business, including technology-enabled solutions provided to us by third parties. Any failure of these systems and solutions could significantly impact our operations and customer perception. Despite the implementation of security measures, those technology systems and solutions could become vulnerable to damage, disability or failures due to theft, fire, power loss, telecommunications failure or other catastrophic events. The third party solutions also present the risks faced by the third party’s business. If those systems or solutions were to fail or otherwise be unavailable, and we were unable to recover in a timely way, we could experience an interruption in our operations. Furthermore, security breaches involving our systems, the systems of the parties we communicate or collaborate with or those of third party providers may occur, such as unauthorized access, denial of service, computer viruses and other disruptive problems caused by hackers. Our information technology systems contain personal, financial and other information that is entrusted to us by our customers and employees as well as financial, proprietary, and other confidential information related to our business. An actual or alleged security breach could result in system disruptions, shutdowns, theft or unauthorized disclosure of confidential information. The occurrence of any of these incidents could result in adverse publicity, loss of customer confidence, reduced sales and profits and criminal penalties or civil liabilities.
Increasing Legal Complexity
Increasing legal complexity will continue to affect our operations and results in material ways. We could be subject to legal proceedings that may adversely affect our business, including class actions, administrative proceedings, government investigations, employment and personal injury claims, landlord/tenant disputes, disputes with current or former suppliers and intellectual property claims. Inconsistent standards imposed by governmental authorities can adversely affect our business and increase our exposure to litigation.
Key Personnel
The Company is currently heavily reliant on the experience and expertise of its senior management. If any of these should cease to be available to manage the affairs of the Company, its activities and operations could be adversely affected. In addition, the Company may require additional management employees to develop its business.
Dividends
The Company does not anticipate paying dividends in the foreseeable future.
16
Additional Information
Additional information relating to the Company may be accessed on the Internet at www.sedar.com.
Cautionary Note
Some of the statements contained in this report are forward-looking statements, such as estimates and statements that describe the Company’s future plans, objectives or goals, including words to the effect that the Company or management expects a stated condition or result to occur. Since forward-looking statements address future events and conditions, by their very nature, they involve inherent risks and uncertainties. Actual results in each case could differ materially from those currently anticipated in such statements