Management analysis of wastewater capital improvement programs in large cities
13
MANAGEMENT ANALYSIS OF WASTEWATER CAPITAL IMPROVEMENT PROGRAMS IN LARGE CITIES REZA IRANPOUR 1 * M , MICHAEL K. STENSTROM 2M , JIIN JEN LEE 3 , DAVID MILLER 4 , MASSOUD TAJRISHI 5 , AHMAD ABRISHAMCHI 6 , EDWARD D. SCHROEDER 7 and GEORGE TCHOBANOGLOUS 7M 1 Applied Research, Hyperion Plant, 229 21st Street, Santa Monica, CA 90402, USA; 2 Department of Civil and Environmental Engineering, University of California, Los Angeles, PO Box 24894, Los Angeles, CA 90024, USA; 3 Department of Civil and Environmental Engineering, University of Southern California, CA 90089-2531, USA; 4 Tech RCT, PO Box 34543, Los Angeles, CA 90034, USA; 5 Department of Civil and Environmental Engineering, Sharif University, Tehran, Iran; 6 Department of Civil and Environmental Engineering, Sharif University, Tehran, Iran and 7 Department of Civil and Environmental Engineering, University of California, Davis One Shield Avenue, Davis, CA 95616-5294, USA (First received 1 July 1998; accepted in revised form 1 July 1999) Abstract—Major environmental engineering programs are typically organized into a large number of individual projects grouped into one or more higher levels of classification. Managing such programs is challenging because of their sizes, long duration, diuse activities, and vulnerability to change due to unforeseen conditions. Often, individual projects are canceled, delayed, or changed in scope, so that assessing the progress and eciency of the overall program is not easy with conventional project- oriented software. In many cases current economic trends make raising additional revenues dicult, and regulatory agencies often set deadlines that are not likely to change, so that there is increasing pressure to control the costs and schedule of a program. Also, in many places important facilities are already years past their planned dates for repair or replacement, because of past neglect. This paper describes methods of aggregating, transforming, and displaying information about program progress that potentially have value for managers of a wide range of programs. These methods are demonstrated by a hypothetical example that contains simulated statistics for a major city wastewater system improvement program. The paper also considers some issues of data storage and communication between oces that would increase the convenience of performing such analyses and of other tasks of managing large programs. # 2000 Published by Elsevier Science Ltd. All rights reserved Key words—management, capital, wastewater program, eciency, planning, progress NOMENCLATURE ACT also denoted Act, for actual (real) data CA canceled, projects terminated before or after incurring any costs CAT also denoted Cat, for category CM construction management (costs after project award date) CONS construction CP completed, projects with all phases completed CTCM consultant construction management CTP consultant plan (consultant design work up to award date) CUM cumulative DES design DIFF dierential DOC document EXP expenditures FA force account (design work up to award date) FAP force account plan FACM force account construction management FU future, projects planned to begin in future FY fiscal year(s) IP in progress, projects in progress under some phase or ready for the next phase WCIP Wastewater Capital Improvement Program OH on hold TAE total actual expenditures TOT total TPEF total planned expenditures for projects when they first appeared in WCIP documents TPEL total planned expenditures for projects when they last appeared in WCIP documents YRLY yearly document, referring to a WCIP planning document published in each Fiscal Year. Wat. Res. Vol. 34, No. 5, pp. 1714–1726, 2000 # 2000 Published by Elsevier Science Ltd. All rights reserved Printed in Great Britain 0043-1354/00/$ - see front matter 1714 www.elsevier.com/locate/watres PII: S0043-1354(99)00289-4 *Author to whom all correspondence should be addressed. Tel.: +1-310-393-8750; fax: +1-310-393- 8750; e-mail: [email protected]
-
Upload
independent -
Category
Documents
-
view
3 -
download
0
Transcript of Management analysis of wastewater capital improvement programs in large cities
MANAGEMENT ANALYSIS OF WASTEWATER CAPITAL
IMPROVEMENT PROGRAMS IN LARGE CITIES
REZA IRANPOUR1*M, MICHAEL K. STENSTROM2M, JIIN JEN LEE3,
DAVID MILLER4, MASSOUD TAJRISHI5, AHMAD ABRISHAMCHI6, EDWARDD. SCHROEDER7 and GEORGE TCHOBANOGLOUS7M
1Applied Research, Hyperion Plant, 229 21st Street, Santa Monica, CA 90402, USA; 2Department ofCivil and Environmental Engineering, University of California, Los Angeles, PO Box 24894,
Los Angeles, CA 90024, USA; 3Department of Civil and Environmental Engineering, University ofSouthern California, CA 90089-2531, USA; 4Tech RCT, PO Box 34543, Los Angeles, CA 90034, USA;5Department of Civil and Environmental Engineering, Sharif University, Tehran, Iran; 6Department ofCivil and Environmental Engineering, Sharif University, Tehran, Iran and 7Department of Civil and
Environmental Engineering, University of California, Davis One Shield Avenue, Davis,CA 95616-5294, USA
(First received 1 July 1998; accepted in revised form 1 July 1999)
AbstractÐMajor environmental engineering programs are typically organized into a large number ofindividual projects grouped into one or more higher levels of classi®cation. Managing such programs ischallenging because of their sizes, long duration, di�use activities, and vulnerability to change due tounforeseen conditions. Often, individual projects are canceled, delayed, or changed in scope, so thatassessing the progress and e�ciency of the overall program is not easy with conventional project-oriented software. In many cases current economic trends make raising additional revenues di�cult,and regulatory agencies often set deadlines that are not likely to change, so that there is increasingpressure to control the costs and schedule of a program. Also, in many places important facilities arealready years past their planned dates for repair or replacement, because of past neglect. This paperdescribes methods of aggregating, transforming, and displaying information about program progressthat potentially have value for managers of a wide range of programs. These methods are demonstratedby a hypothetical example that contains simulated statistics for a major city wastewater systemimprovement program. The paper also considers some issues of data storage and communicationbetween o�ces that would increase the convenience of performing such analyses and of other tasks ofmanaging large programs. # 2000 Published by Elsevier Science Ltd. All rights reserved
Key wordsÐmanagement, capital, wastewater program, e�ciency, planning, progress
NOMENCLATURE
ACT also denoted Act, for actual (real) dataCA canceled, projects terminated before or after
incurring any costsCAT also denoted Cat, for categoryCM construction management (costs after project
award date)CONS constructionCP completed, projects with all phases completedCTCM consultant construction managementCTP consultant plan (consultant design work up to
award date)CUM cumulativeDES design
DIFF di�erentialDOC documentEXP expendituresFA force account (design work up to award date)FAP force account planFACM force account construction managementFU future, projects planned to begin in futureFY ®scal year(s)IP in progress, projects in progress under some
phase or ready for the next phaseWCIP Wastewater Capital Improvement ProgramOH on holdTAE total actual expendituresTOT totalTPEF total planned expenditures for projects when they
®rst appeared in WCIP documentsTPEL total planned expenditures for projects when they
last appeared in WCIP documentsYRLY yearly document, referring to a WCIP planning
document published in each Fiscal Year.
Wat. Res. Vol. 34, No. 5, pp. 1714±1726, 2000# 2000 Published by Elsevier Science Ltd. All rights reserved
Printed in Great Britain0043-1354/00/$ - see front matter
1714
www.elsevier.com/locate/watres
PII: S0043-1354(99)00289-4
*Author to whom all correspondence should beaddressed. Tel.: +1-310-393-8750; fax: +1-310-393-8750; e-mail: [email protected]
INTRODUCTION
Questions about how long a major environmental en-gineering program or its components will take, andhow much they will cost, are easy to ask, but may be
hard to answer accurately, because plans must oftenbe made when much important information is notknown (Langford and Male, 1995; Retik et al., 1992).
Geological conditions may have never been tested inplaces where construction is desired, equipment thatis to be refurbished may be in worse condition thaninitially known, and regulatory requirements may
change years after a program has begun.Issues of human relationships and organizational
de®ciencies may also be involved, since such pro-
grams employ large numbers of people. Planners,contractors, and engineers each may have their owngroup biases or institutional pressures to over- or
underestimate durations and costs, or to departfrom plans and estimates made by others. Theremay also be organizational de®ciencies in communi-
cation and integration of information that lead toduplication of e�orts and working at cross-pur-poses.Nevertheless, it is important that decisions to
allocate resources should be made on the best poss-ible information (Wilkinson, 1996; Jergeas et al.,1989). This is because underestimates lead to crises
and failures, and overestimates lead to more subtlebut not necessarily less signi®cant losses of actions(Ichniowski, 1995) that could have been performed
if it had been known that resources for them wouldbe available.The need for accuracy in estimating durations
and costs applies to both public and private entities.Moreover, major environmental engineering pro-grams will be conducted for the foreseeable future.From metropolitan areas in poorer countries with
no sewage treatment systems to toxic waste site pro-grams in many countries to the disposal of danger-ous relics of the cold war, there is a vast number
and range of major engineering programs needed toprotect or improve the environment.For all of these reasons, we anticipate increased
needs for analysis methods to aid management.Statistical methods for business management toassess the progress of individual projects are nowwell established, and have been incorporated into
software tools (e.g., Primavera Systems, Inc., 1997;Gottlieb, 1997; ASTA, 1997). However, a large pro-gram involves coordinating many projects, with in-
teractions that may not be considered by thesemethods. Larger questions of putting program per-formance into the context of comparable programs
de®nitely go beyond the scopes of generally avail-able software, although it is possible that suchissues may be addressed to some extent by proprie-
tary systems such as PowrTrak (Denning, 1997) orCOMANDS (Coles and Reinschmidt, 1994). Themethods in this article are the results of attempts todeal with these lacks.
The present methodology must be regarded aspreliminary, since often there is more than one
possible reason, positive as well as negative, forvalues like those shown in the exposition of ourapproach. Nevertheless, even in their present state
these kinds of statistics have the potential to showthat management attention should be paid toanomalies. We hope that this discussion stimulates
additional development along these lines.
MATERIALS AND METHODS
Progress and e�ciency assessment
The term planning is used here to cover the whole pro-cess by which the overall goals of a project are convertedinto operations performed by engineers, contractors, tech-nicians or laborers. Thus, it includes formulating projects,preliminary work for rough estimates of costs, durations,or other aspects of feasibility, and decisions on whether tocommit to proposed projects, as well as specifying sche-dules and other details to implement projects for whichcommitments have been made (Galinsky and Hartman,1996).The viewpoint in this article is also in¯uenced by experi-
ence with wastewater system capital improvement pro-grams (CH2M Hill, 1986±1994). This is a ®eld where mostof the technologies are mature in the sense that good prac-tice consists of applying technologies with known capabili-ties and limitations, and there are reliable methods foraccomplishing established types of tasks. Thus, manyaspects of uncertainty can be reduced by suitable prelimi-nary examination of facilities and terrain (Alkass andJergeas, 1992). Hence, in this environment a frequent needto change projects substantially while they are in progressis taken to re¯ect some de®ciency in planning or ex-ecution. This assumption does not apply in many otherareas of engineering, where technology is changing morerapidly, and the only way to eliminate many uncertaintiesis by experimentation during projects. However, since it issuited for the wastewater program described in theexample, numerous project cancellations and large changesin the scopes or schedules of projects are viewed negativelyas instability in the program.At any time during a program it is reasonable to classify
projects according to whether they are being planned ordesigned, or are being carried out, or have been com-pleted, or perhaps have been delayed or postponed.Projects may even be canceled, or initially proposed, butremoved after preliminary consideration, and for programassessment it is valuable to know if this happens. We maysay that this approach classi®es projects by status.From another viewpoint, grouping projects according to
their subject area or geographical location is appropriatein a program that involves coordinated activities in morethan one such area. For the present discussion, it is con-venient to call such project groups categories, and it iscommon for such groupings to be recognized in the pro-gram management structure. Thus, category managers areoften designated to take responsibility for coordinatingprojects in their own categories or for monitoring the pro-gress of relevant projects in other categories. In short,there is a natural two-way classi®cation of the individualprojects in a program: by status and by category; andmuch can be learned about the progress of a program byexamining the progress of the projects in each categoryfrom one status to another, with comparisons betweenexpected and actual costs.Tables and ®gures displaying speci®c comparisons and
progress measures for an extended example appear in thefollowing sections. They show statistics describing large
Analysis of wastewater upgrade and expansion programs 1715
cities in the United States. The dates have been changed,and the absolute numbers have been changed by a rela-tively simple transformation, but the resulting percentagesare little di�erent from actual experience, and hence theexample has a substantial degree of realism. The exampleuses a wastewater program with six status classes and sixcategories, involving a collection system and treatmentplants, but the methods are not speci®c to a particularnumber of categories or to wastewater systems.
A few strategies were used in constructing the tablesand ®gures. Results may be aggregated for the whole pro-gram, or divided into individual categories. Likewise,some tables or parts of them show simple project counts,and thus treat all projects the same, regardless of size,while others present expenditures, and hence contain manyaverages that primarily re¯ect a relatively small number of
large projects. Also, some table entries describe eventsonly up to the time of the analysis, and others includeplanned future values with adjustment for in¯ation. Stillanother form of analysis is to compare predictions in plan-ning documents from previous years with the actual devel-opments, both in expenditures (City of LA, 1986±1994)and project completions (City of LA, 1984±1994). In par-ticular, to see whether the program was falling behindschedule, programs planned to be completed by 30 June1996 (the end of ®scal year 1995/1996) are examined to seehow many actually were completed by the report cuto�time of 1 January 1996. The tables and ®gures aredesigned to facilitate answering such questions as:
. How do the planned and actual numbers of completedprojects compare?
. How do the planned and actual expenditures compare?
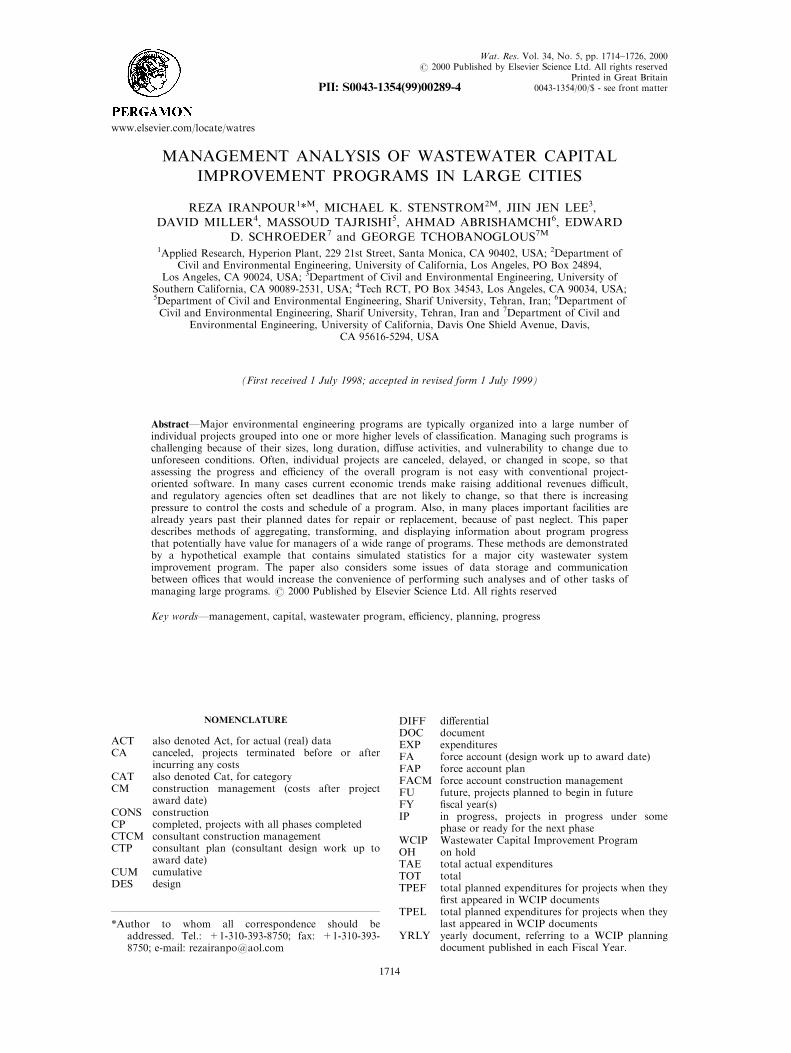
Fig. 1. Overall summary of WCIP 10 year planned projects and the actual status.
Reza Iranpour et al.1716
. How do the planned and actual completion dates com-pare?
. Is each category behind or ahead of schedule? over orunder budget?
. Is the program as a whole behind or ahead of schedule?over or under budget?
. What is the ratio between design and constructioncosts?
. How stable is the planning process?
Figures 1 and 2 are aggregate values for the whole pro-
gram, while Tables 1 and 2 o�er breakdowns by cat-egories; conversely, Table 1 and Fig. 1 consider allprojects while Table 2 and Fig. 2 consider only projectsscheduled for completion by the end of FY 1995/1996.Table 3 shows successive yearly planning documents' pro-jections, from the document dates to the end of the pro-gram, of counts and expenditures by category, while Table4 shows the documents' aggregate projections for futureyears. Figure 3 compares planned and actual costs anddurations for the projects completed by January, 1996,aggregated over the whole program, while Table 5 breaks
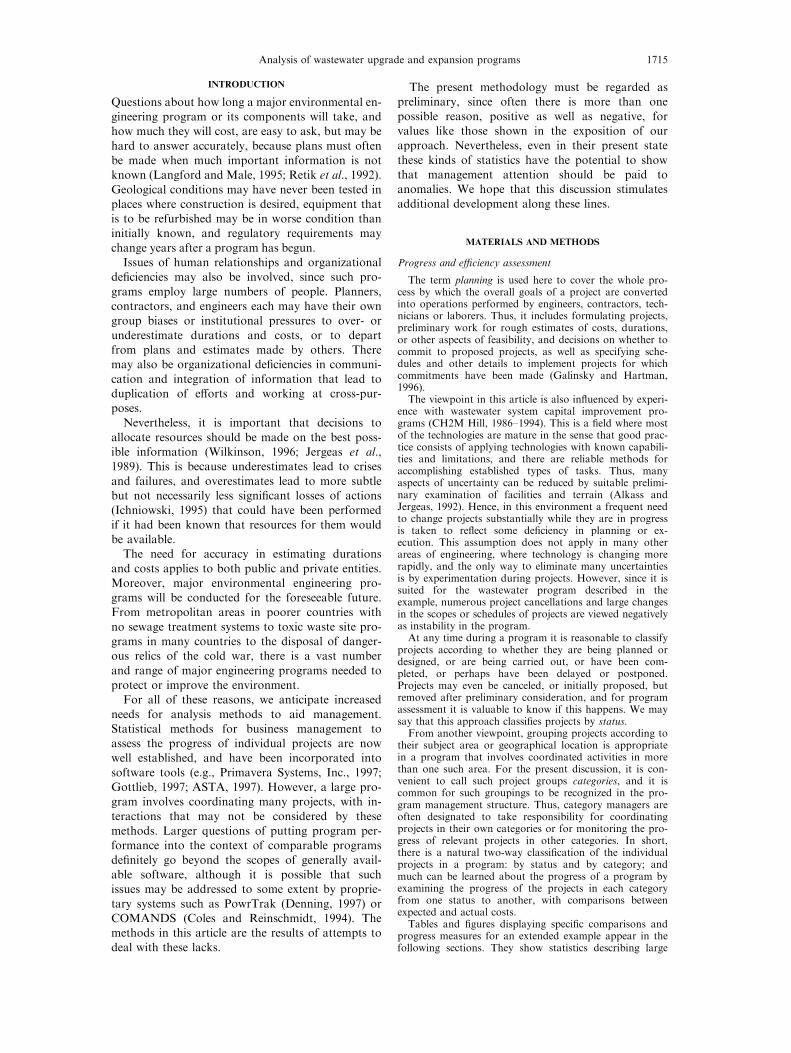
Fig. 2. Overall summary of WCIP projects planned for completion by 30 June 1996, compared withactual status as of 1 January 1996.
Analysis of wastewater upgrade and expansion programs 1717
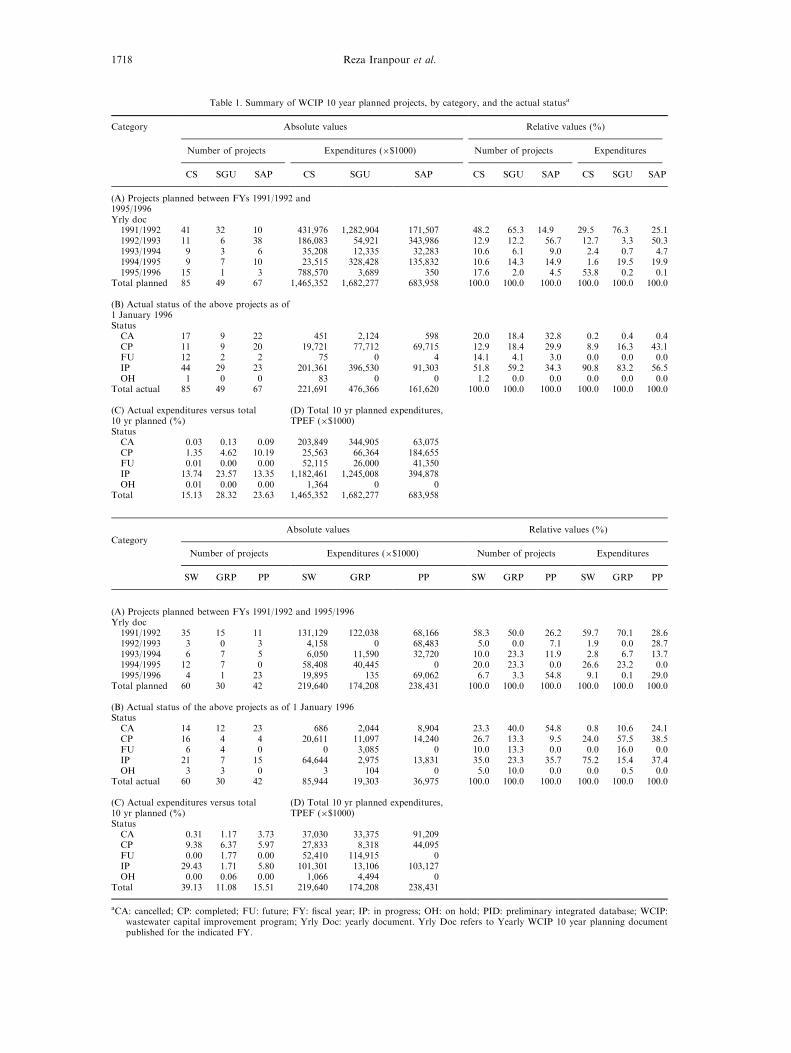
Table 1. Summary of WCIP 10 year planned projects, by category, and the actual statusa
Category Absolute values Relative values (%)
Number of projects Expenditures (�$1000) Number of projects Expenditures
CS SGU SAP CS SGU SAP CS SGU SAP CS SGU SAP
(A) Projects planned between FYs 1991/1992 and1995/1996Yrly doc1991/1992 41 32 10 431,976 1,282,904 171,507 48.2 65.3 14.9 29.5 76.3 25.11992/1993 11 6 38 186,083 54,921 343,986 12.9 12.2 56.7 12.7 3.3 50.31993/1994 9 3 6 35,208 12,335 32,283 10.6 6.1 9.0 2.4 0.7 4.71994/1995 9 7 10 23,515 328,428 135,832 10.6 14.3 14.9 1.6 19.5 19.91995/1996 15 1 3 788,570 3,689 350 17.6 2.0 4.5 53.8 0.2 0.1
Total planned 85 49 67 1,465,352 1,682,277 683,958 100.0 100.0 100.0 100.0 100.0 100.0
(B) Actual status of the above projects as of1 January 1996StatusCA 17 9 22 451 2,124 598 20.0 18.4 32.8 0.2 0.4 0.4CP 11 9 20 19,721 77,712 69,715 12.9 18.4 29.9 8.9 16.3 43.1FU 12 2 2 75 0 4 14.1 4.1 3.0 0.0 0.0 0.0IP 44 29 23 201,361 396,530 91,303 51.8 59.2 34.3 90.8 83.2 56.5OH 1 0 0 83 0 0 1.2 0.0 0.0 0.0 0.0 0.0
Total actual 85 49 67 221,691 476,366 161,620 100.0 100.0 100.0 100.0 100.0 100.0
(C) Actual expenditures versus total10 yr planned (%)
(D) Total 10 yr planned expenditures,TPEF (�$1000)
StatusCA 0.03 0.13 0.09 203,849 344,905 63,075CP 1.35 4.62 10.19 25,563 66,364 184,655FU 0.01 0.00 0.00 52,115 26,000 41,350IP 13.74 23.57 13.35 1,182,461 1,245,008 394,878OH 0.01 0.00 0.00 1,364 0 0
Total 15.13 28.32 23.63 1,465,352 1,682,277 683,958
CategoryAbsolute values Relative values (%)
Number of projects Expenditures (�$1000) Number of projects Expenditures
SW GRP PP SW GRP PP SW GRP PP SW GRP PP
(A) Projects planned between FYs 1991/1992 and 1995/1996Yrly doc1991/1992 35 15 11 131,129 122,038 68,166 58.3 50.0 26.2 59.7 70.1 28.61992/1993 3 0 3 4,158 0 68,483 5.0 0.0 7.1 1.9 0.0 28.71993/1994 6 7 5 6,050 11,590 32,720 10.0 23.3 11.9 2.8 6.7 13.71994/1995 12 7 0 58,408 40,445 0 20.0 23.3 0.0 26.6 23.2 0.01995/1996 4 1 23 19,895 135 69,062 6.7 3.3 54.8 9.1 0.1 29.0
Total planned 60 30 42 219,640 174,208 238,431 100.0 100.0 100.0 100.0 100.0 100.0
(B) Actual status of the above projects as of 1 January 1996StatusCA 14 12 23 686 2,044 8,904 23.3 40.0 54.8 0.8 10.6 24.1CP 16 4 4 20,611 11,097 14,240 26.7 13.3 9.5 24.0 57.5 38.5FU 6 4 0 0 3,085 0 10.0 13.3 0.0 0.0 16.0 0.0IP 21 7 15 64,644 2,975 13,831 35.0 23.3 35.7 75.2 15.4 37.4OH 3 3 0 3 104 0 5.0 10.0 0.0 0.0 0.5 0.0
Total actual 60 30 42 85,944 19,303 36,975 100.0 100.0 100.0 100.0 100.0 100.0
(C) Actual expenditures versus total10 yr planned (%)
(D) Total 10 yr planned expenditures,TPEF (�$1000)
StatusCA 0.31 1.17 3.73 37,030 33,375 91,209CP 9.38 6.37 5.97 27,833 8,318 44,095FU 0.00 1.77 0.00 52,410 114,915 0IP 29.43 1.71 5.80 101,301 13,106 103,127OH 0.00 0.06 0.00 1,066 4,494 0
Total 39.13 11.08 15.51 219,640 174,208 238,431
aCA: cancelled; CP: completed; FU: future; FY: ®scal year; IP: in progress; OH: on hold; PID: preliminary integrated database; WCIP:wastewater capital improvement program; Yrly Doc: yearly document. Yrly Doc refers to Yearly WCIP 10 year planning documentpublished for the indicated FY.
Reza Iranpour et al.1718
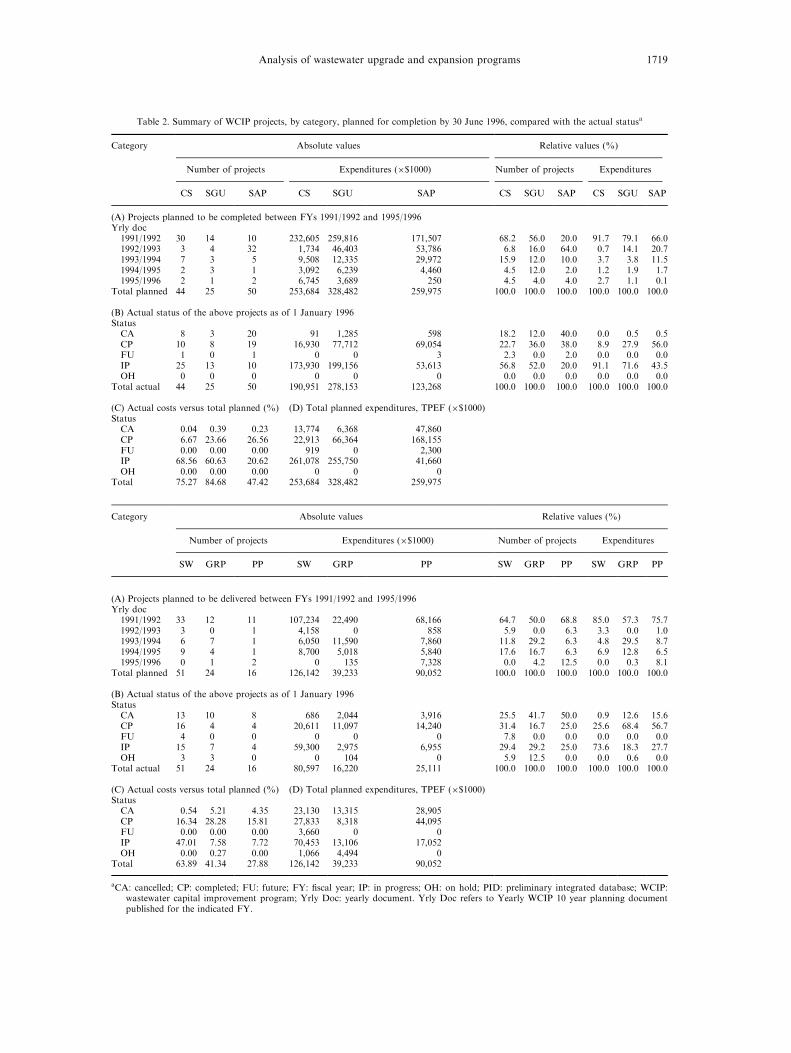
Table 2. Summary of WCIP projects, by category, planned for completion by 30 June 1996, compared with the actual statusa
Category Absolute values Relative values (%)
Number of projects Expenditures (�$1000) Number of projects Expenditures
CS SGU SAP CS SGU SAP CS SGU SAP CS SGU SAP
(A) Projects planned to be completed between FYs 1991/1992 and 1995/1996Yrly doc1991/1992 30 14 10 232,605 259,816 171,507 68.2 56.0 20.0 91.7 79.1 66.01992/1993 3 4 32 1,734 46,403 53,786 6.8 16.0 64.0 0.7 14.1 20.71993/1994 7 3 5 9,508 12,335 29,972 15.9 12.0 10.0 3.7 3.8 11.51994/1995 2 3 1 3,092 6,239 4,460 4.5 12.0 2.0 1.2 1.9 1.71995/1996 2 1 2 6,745 3,689 250 4.5 4.0 4.0 2.7 1.1 0.1
Total planned 44 25 50 253,684 328,482 259,975 100.0 100.0 100.0 100.0 100.0 100.0
(B) Actual status of the above projects as of 1 January 1996StatusCA 8 3 20 91 1,285 598 18.2 12.0 40.0 0.0 0.5 0.5CP 10 8 19 16,930 77,712 69,054 22.7 36.0 38.0 8.9 27.9 56.0FU 1 0 1 0 0 3 2.3 0.0 2.0 0.0 0.0 0.0IP 25 13 10 173,930 199,156 53,613 56.8 52.0 20.0 91.1 71.6 43.5OH 0 0 0 0 0 0 0.0 0.0 0.0 0.0 0.0 0.0
Total actual 44 25 50 190,951 278,153 123,268 100.0 100.0 100.0 100.0 100.0 100.0
(C) Actual costs versus total planned (%) (D) Total planned expenditures, TPEF (�$1000)StatusCA 0.04 0.39 0.23 13,774 6,368 47,860CP 6.67 23.66 26.56 22,913 66,364 168,155FU 0.00 0.00 0.00 919 0 2,300IP 68.56 60.63 20.62 261,078 255,750 41,660OH 0.00 0.00 0.00 0 0 0
Total 75.27 84.68 47.42 253,684 328,482 259,975
Category Absolute values Relative values (%)
Number of projects Expenditures (�$1000) Number of projects Expenditures
SW GRP PP SW GRP PP SW GRP PP SW GRP PP
(A) Projects planned to be delivered between FYs 1991/1992 and 1995/1996Yrly doc1991/1992 33 12 11 107,234 22,490 68,166 64.7 50.0 68.8 85.0 57.3 75.71992/1993 3 0 1 4,158 0 858 5.9 0.0 6.3 3.3 0.0 1.01993/1994 6 7 1 6,050 11,590 7,860 11.8 29.2 6.3 4.8 29.5 8.71994/1995 9 4 1 8,700 5,018 5,840 17.6 16.7 6.3 6.9 12.8 6.51995/1996 0 1 2 0 135 7,328 0.0 4.2 12.5 0.0 0.3 8.1
Total planned 51 24 16 126,142 39,233 90,052 100.0 100.0 100.0 100.0 100.0 100.0
(B) Actual status of the above projects as of 1 January 1996StatusCA 13 10 8 686 2,044 3,916 25.5 41.7 50.0 0.9 12.6 15.6CP 16 4 4 20,611 11,097 14,240 31.4 16.7 25.0 25.6 68.4 56.7FU 4 0 0 0 0 0 7.8 0.0 0.0 0.0 0.0 0.0IP 15 7 4 59,300 2,975 6,955 29.4 29.2 25.0 73.6 18.3 27.7OH 3 3 0 0 104 0 5.9 12.5 0.0 0.0 0.6 0.0
Total actual 51 24 16 80,597 16,220 25,111 100.0 100.0 100.0 100.0 100.0 100.0
(C) Actual costs versus total planned (%) (D) Total planned expenditures, TPEF (�$1000)StatusCA 0.54 5.21 4.35 23,130 13,315 28,905CP 16.34 28.28 15.81 27,833 8,318 44,095FU 0.00 0.00 0.00 3,660 0 0IP 47.01 7.58 7.72 70,453 13,106 17,052OH 0.00 0.27 0.00 1,066 4,494 0
Total 63.89 41.34 27.88 126,142 39,233 90,052
aCA: cancelled; CP: completed; FU: future; FY: ®scal year; IP: in progress; OH: on hold; PID: preliminary integrated database; WCIP:wastewater capital improvement program; Yrly Doc: yearly document. Yrly Doc refers to Yearly WCIP 10 year planning documentpublished for the indicated FY.
Analysis of wastewater upgrade and expansion programs 1719
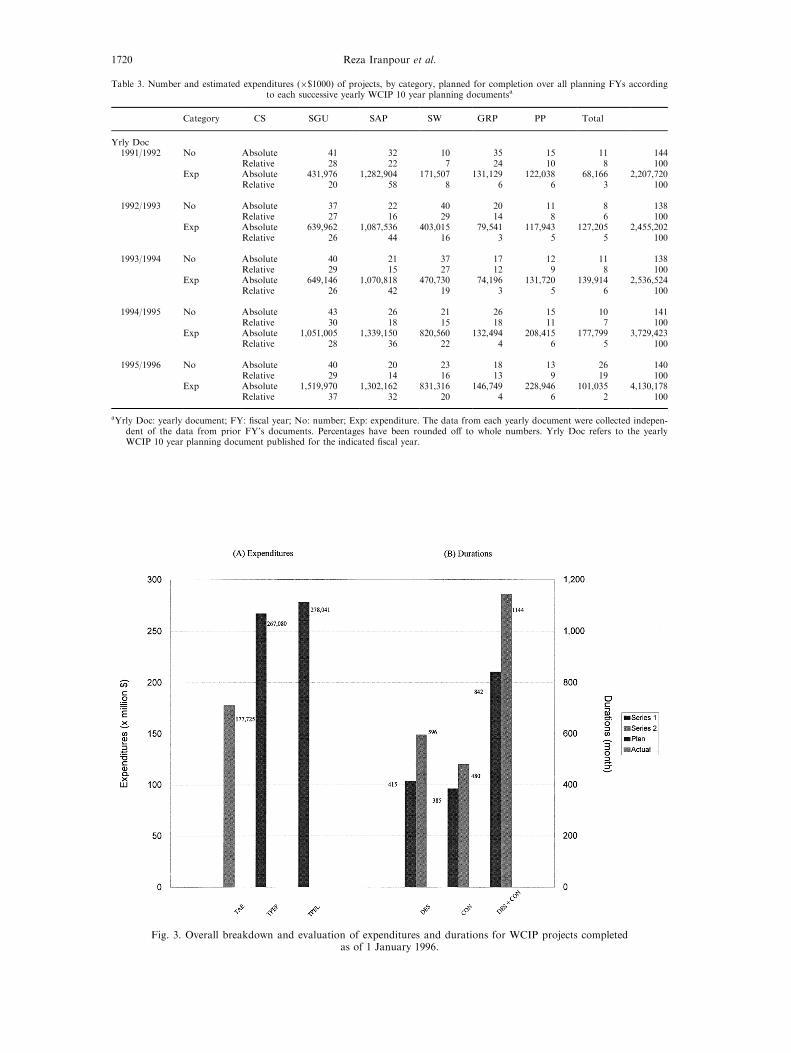
Table 3. Number and estimated expenditures (�$1000) of projects, by category, planned for completion over all planning FYs accordingto each successive yearly WCIP 10 year planning documentsa
Category CS SGU SAP SW GRP PP Total
Yrly Doc1991/1992 No Absolute 41 32 10 35 15 11 144
Relative 28 22 7 24 10 8 100Exp Absolute 431,976 1,282,904 171,507 131,129 122,038 68,166 2,207,720
Relative 20 58 8 6 6 3 100
1992/1993 No Absolute 37 22 40 20 11 8 138Relative 27 16 29 14 8 6 100
Exp Absolute 639,962 1,087,536 403,015 79,541 117,943 127,205 2,455,202Relative 26 44 16 3 5 5 100
1993/1994 No Absolute 40 21 37 17 12 11 138Relative 29 15 27 12 9 8 100
Exp Absolute 649,146 1,070,818 470,730 74,196 131,720 139,914 2,536,524Relative 26 42 19 3 5 6 100
1994/1995 No Absolute 43 26 21 26 15 10 141Relative 30 18 15 18 11 7 100
Exp Absolute 1,051,005 1,339,150 820,560 132,494 208,415 177,799 3,729,423Relative 28 36 22 4 6 5 100
1995/1996 No Absolute 40 20 23 18 13 26 140Relative 29 14 16 13 9 19 100
Exp Absolute 1,519,970 1,302,162 831,316 146,749 228,946 101,035 4,130,178Relative 37 32 20 4 6 2 100
aYrly Doc: yearly document; FY: ®scal year; No: number; Exp: expenditure. The data from each yearly document were collected indepen-dent of the data from prior FY's documents. Percentages have been rounded o� to whole numbers. Yrly Doc refers to the yearlyWCIP 10 year planning document published for the indicated ®scal year.
Fig. 3. Overall breakdown and evaluation of expenditures and durations for WCIP projects completedas of 1 January 1996.
Reza Iranpour et al.1720
Table
4.Number
andestimatedexpenditures(�
$1000)ofprojectsbyFY
planned
forcompletionover
allcategories
accordingto
each
successiveyearlyWCIP
10yearplanningdocumentsa
Fiscalyear
1991/1992
1992/1993
1993/1994
1994/1995
1995/1996
1996/1997
1997/1998
1998/1999
1999/2000
2000/2001
2001/2002
2002/2003
2003/2004
2004/2005
YrlyDoc
1991/1992
Di�
No
28
22
32
18
17
27
Exp
162,959
81,387
214,635
157,465
402,703
1,173,272
Cum
No
50
82
100
117
144
Exp
244,345
458,984
616,445
1,037,148
2,210,420
1992/1993
Di�
No
23
33
30
18
13
21
Exp
96,292
171,504
180,879
333,777
287,773
1,384,956
Cum
No
56
86
104
117
138
Exp
267,796
448,675
782,472
1,070,246
2,455,202
1993/1994
Di�
No
31
42
23
19
914
Exp
160,267
136,209
427,934
282,453
74,615
1,459,143
Cum
No
73
96
145
124
138
Exp
296,476
724,410
1,006,863
1,081,478
2,540,621
1994/1995
Di�
No
33
33
22
13
931
Exp
191,534
281,938
371,925
351,537
173,282
2,359,562
Cum
No
66
88
101
110
141
Exp
473,472
845,397
1,196,935
1,370,216
3,729,778
1995/1996
Di�
No
31
34
29
89
29
Exp
250,252
283,646
457,620
72,264
452,011
2,614,386
Cum
No
65
94
102
111
140
Exp
533,898
991,577
1,063,781
1,575,792
4,130,178
aYrlyDoc:
yearlydocument;
FY:®scalyear;
No:number;Exp:expenditure.Thedata
from
each
yearlydocumentwerecollectedindependentofthedata
from
priorFY's
documents.Thereare
fourrowsforeach
YrlyDoc.
The®rstrow
represents
projectsto
bedelivered
within
aFY.Thesecondrow
indicatesthetotalnumber
ofprojectsfrom
theyearofthatdocumentto
theindicatedFY.Thethirdandfourthrowsare
corresponded
expenditures.
YrlyDocrefers
totheyearlyWCIP
10yearplanningdocumentpublished
fortheindicated®scalyear.
Analysis of wastewater upgrade and expansion programs 1721
down these cost data by categories, and Table 6 does thesame for the durations.
The hypothetical situation
Pseud City, Nevazona, is a city of two million people,with another million in suburbs in the metropolitan area.The whole area's wastewater is processed by the SunsetCreek Treatment Plant, which performs primary and sec-
ondary treatment and discharges the treated e�uent intothe Wyomaho River. The Sunset Creek Plant is quite oldand has been enlarged a number of times. Now it needsextensive repairs, and has been approaching its capacity aspeople kept moving to Pseud City to enjoy its great cli-mate. In the middle eighties the Wyomaho River BasinAlliance, a group of governmental units whose citizens usethe river in various ways, agreed that the nutrient contentof the e�uent must be reduced to allow additional use of
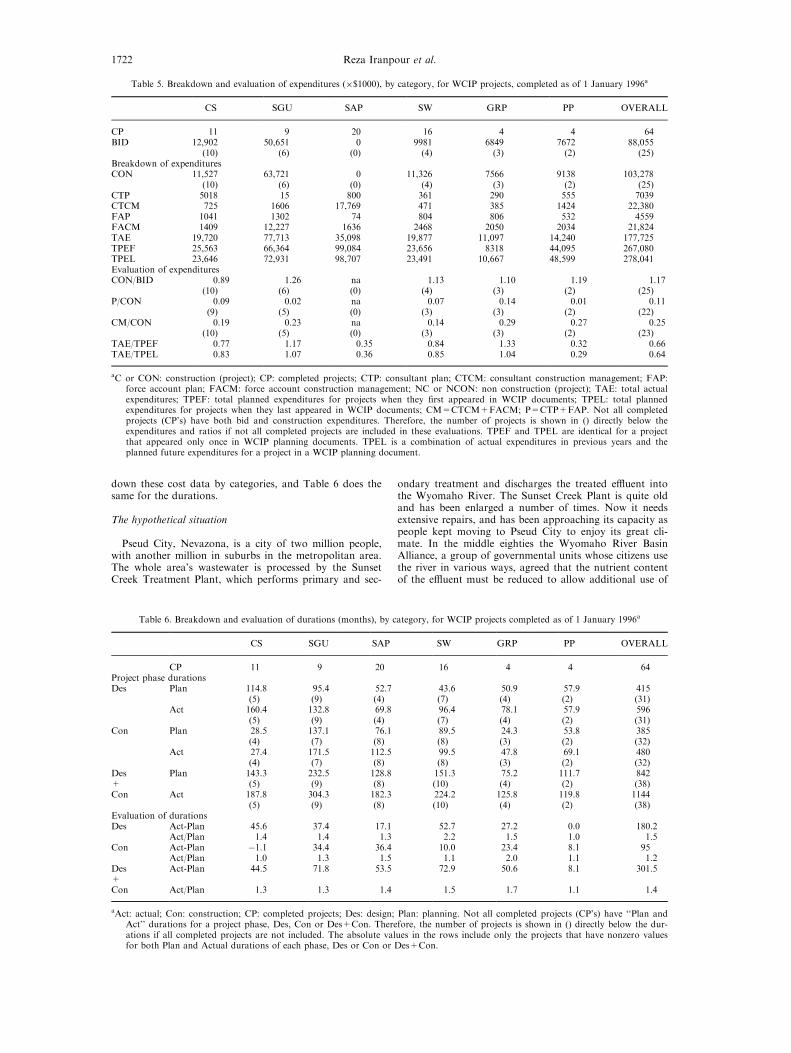
Table 5. Breakdown and evaluation of expenditures (�$1000), by category, for WCIP projects, completed as of 1 January 1996a
CS SGU SAP SW GRP PP OVERALL
CP 11 9 20 16 4 4 64BID 12,902 50,651 0 9981 6849 7672 88,055
(10) (6) (0) (4) (3) (2) (25)Breakdown of expendituresCON 11,527 63,721 0 11,326 7566 9138 103,278
(10) (6) (0) (4) (3) (2) (25)CTP 5018 15 800 361 290 555 7039CTCM 725 1606 17,769 471 385 1424 22,380FAP 1041 1302 74 804 806 532 4559FACM 1409 12,227 1636 2468 2050 2034 21,824TAE 19,720 77,713 35,098 19,877 11,097 14,240 177,725TPEF 25,563 66,364 99,084 23,656 8318 44,095 267,080TPEL 23,646 72,931 98,707 23,491 10,667 48,599 278,041Evaluation of expendituresCON/BID 0.89 1.26 na 1.13 1.10 1.19 1.17
(10) (6) (0) (4) (3) (2) (25)P/CON 0.09 0.02 na 0.07 0.14 0.01 0.11
(9) (5) (0) (3) (3) (2) (22)CM/CON 0.19 0.23 na 0.14 0.29 0.27 0.25
(10) (5) (0) (3) (3) (2) (23)TAE/TPEF 0.77 1.17 0.35 0.84 1.33 0.32 0.66TAE/TPEL 0.83 1.07 0.36 0.85 1.04 0.29 0.64
aC or CON: construction (project); CP: completed projects; CTP: consultant plan; CTCM: consultant construction management; FAP:force account plan; FACM: force account construction management; NC or NCON: non construction (project); TAE: total actualexpenditures; TPEF: total planned expenditures for projects when they ®rst appeared in WCIP documents; TPEL: total plannedexpenditures for projects when they last appeared in WCIP documents; CM=CTCM+FACM; P=CTP+FAP. Not all completedprojects (CP's) have both bid and construction expenditures. Therefore, the number of projects is shown in () directly below theexpenditures and ratios if not all completed projects are included in these evaluations. TPEF and TPEL are identical for a projectthat appeared only once in WCIP planning documents. TPEL is a combination of actual expenditures in previous years and theplanned future expenditures for a project in a WCIP planning document.
Table 6. Breakdown and evaluation of durations (months), by category, for WCIP projects completed as of 1 January 1996a
CS SGU SAP SW GRP PP OVERALL
CP 11 9 20 16 4 4 64Project phase durationsDes Plan 114.8 95.4 52.7 43.6 50.9 57.9 415
(5) (9) (4) (7) (4) (2) (31)Act 160.4 132.8 69.8 96.4 78.1 57.9 596
(5) (9) (4) (7) (4) (2) (31)Con Plan 28.5 137.1 76.1 89.5 24.3 53.8 385
(4) (7) (8) (8) (3) (2) (32)Act 27.4 171.5 112.5 99.5 47.8 69.1 480
(4) (7) (8) (8) (3) (2) (32)Des Plan 143.3 232.5 128.8 151.3 75.2 111.7 842+ (5) (9) (8) (10) (4) (2) (38)Con Act 187.8 304.3 182.3 224.2 125.8 119.8 1144
(5) (9) (8) (10) (4) (2) (38)Evaluation of durationsDes Act-Plan 45.6 37.4 17.1 52.7 27.2 0.0 180.2
Act/Plan 1.4 1.4 1.3 2.2 1.5 1.0 1.5Con Act-Plan ÿ1.1 34.4 36.4 10.0 23.4 8.1 95
Act/Plan 1.0 1.3 1.5 1.1 2.0 1.1 1.2Des Act-Plan 44.5 71.8 53.5 72.9 50.6 8.1 301.5+Con Act/Plan 1.3 1.3 1.4 1.5 1.7 1.1 1.4
aAct: actual; Con: construction; CP: completed projects; Des: design; Plan: planning. Not all completed projects (CP's) have ``Plan andAct'' durations for a project phase, Des, Con or Des+Con. Therefore, the number of projects is shown in () directly below the dur-ations if all completed projects are not included. The absolute values in the rows include only the projects that have nonzero valuesfor both Plan and Actual durations of each phase, Des or Con or Des+Con.
Reza Iranpour et al.1722
the river water downstream of Pseud City. Also, theGlenville Reclamation Plant is to be built on a large sewerrunning from an area of suburbs and factories east of thecity, to reclaim water for irrigation and to reduce the ¯owinto the Sunset Creek Plant, The rising population also isforcing an upgrade of the collection system, including newpumping stations and new pumps for many old ones thatwere established because the city's subdivisions do not fol-low the natural drainage basins.
In 1991 the Pseud City Sewage Bureau, for a combi-nation of historical and technical reasons, organized thecurrent system of six categories of projects within what itcalls the Wastewater Capital Improvement Program(WCIP). These categories are:
1. Sunset advanced processing (SAP) Ð installing theequipment to reduce nutrients, and also fermenters toget methane from sludge to cut energy costs;
2. Sunset general upgrade (SGU) Ð many repairs andimprovements, including new aeration basins andrebuilding some old ones that have su�ered serious cor-rosion over more than 50 years;
3. Glenville reclamation plant (GRP) Ð building theplant, including full tertiary treatment and a pipeline tothe East Valley Irrigation Network;
4. pumping plants (PP) Ð not only improved capacityand greater e�ciency, but the number of types ofpumps is being reduced to cut future maintenance costs;
5. collection system (CS) Ð rebuilding parts of the systemprovides an opportunity to deal with the corrosion pro-blems in the area around Alkali Hot Springs;
6. system-wide (SW) Ð projects that do not ®t into any ofthe other categories, mostly involving measurement,communication, and computer equipment.
RESULTS AND DISCUSSION: ANALYSIS OF THEPROGRAM
Actual projects vs planning
Overall program. Figure 1 shows the overall sum-mary of the WCIP. The projects are assigned to ®vestatus classi®cations. Future projects (FU) are those
that were deferred to some later time before theywere begun, while projects on hold (OH) are thosethat have been postponed from their previously
planned times after some work had been done. It ishoped that most of the other labeling and titling isself explanatory.
Figure 1 shows that nearly one third of the pro-jects (29.1%) were canceled. Although the morethan twenty million dollars spent on them is only asmall fraction of the billion dollars spent already, it
is likely that nearly all of this expenditure must beconsidered to have been wasted.Figure 2 shows that, as of 1 January 1996, only
29.5% of the projects scheduled for completion by30 June 1996 had actually been completed. Asanother 29.5% of the projects had been canceled,
approximately three sevenths of the projects stillincluded in the program had been completed. Thisincludes all the projects completed in the four pre-
vious ®scal years. Thus, with only six months left inthe ®scal year to complete more than half thescheduled projects and two thirds of the scheduledexpenditures, it appears likely that the schedule has
slipped substantially. Not only are the present pro-jects later than expected, but other projects that
depend on them will be later, too.By category. Tables 1 and 2 respectively break
down the data in Figs 1 and 2. These tables allow
the reader to see the impact of various programchanges during the history to the time of the data.Thus, in Table 1, the large number of new projects
and new planned expenditures for SAP (corre-sponding to more than 50% of the total for thiscategory) in the 1992/1993 Fiscal Year (FY) corre-
sponds to the time when the methane processingwas added to the Sunset Advanced Processing cat-egory. This previously consisted of the installationof the nutrient reduction equipment. Likewise, the
various new projects and increased costs in the1994/1995 FY mark the point when rebuilding oldaeration basins was added to the Sunset General
Upgrade. The great expense of replacing parts ofthe collection system and modifying the associatedpumping plants in the area where the subsoil con-
tains residues from the alkali hot springs (for whicha suburb was named) was not recognized until1995/1996 FY.
Evidently, the fraction of projects canceled variedgreatly, from approximately 18% for SGU to ap-proximately 55% for PP. Except for GRP and PP,a small percentage of the money was spent on can-
celed projects compared to the expenditures on theother status classes. In part, however, this propor-tionate expenditure on the canceled projects may be
understood because very little of the work in GRPand PP has been completed, or even put in pro-gress. Table 2 shows that these are the categories in
which the smallest number of projects were donethat had been planned for completion by 30 June1996. There was also little expenditure in GRP andPP on work in progress as of 1 January 1996.
Hence, these are the categories that are making theleast progress.For comparison to Fig. 1(B), adding up the
``Total'' and ``CA'' rows for all six categories inTable 1(D) shows that around one ®fth of the fourand a third billion had been budgeted to carry out
these projects that turned out to be unnecessary orunfeasible. This means that the costs of the pro-gram were signi®cantly overestimated. As in Table
1(D), Table 2(D) shows that the budget for can-celled projects was a signi®cant fraction of the totalbudget for the projects analyzed in this table,although it is closer to one tenth than one ®fth.
Stability of program planning
By category. Table 3 lists, by category, measuresof all the subsequent work speci®ed in each yearlyplanning document. It shows the substantial change
in the fractions of program cost devoted to CS,SGU, and SAP, the three large categories, and thesmall amount of expenditure in each of the otherthree categories. This table provides insight into the
Analysis of wastewater upgrade and expansion programs 1723
near doubling of the program's planned costsduring the ®ve ®scal years listed, from $2.2 to $4.3
billion. The numbers of projects varied only mod-estly, so the growth in planned costs was primarilythe result of enlarging the existing projects or repla-
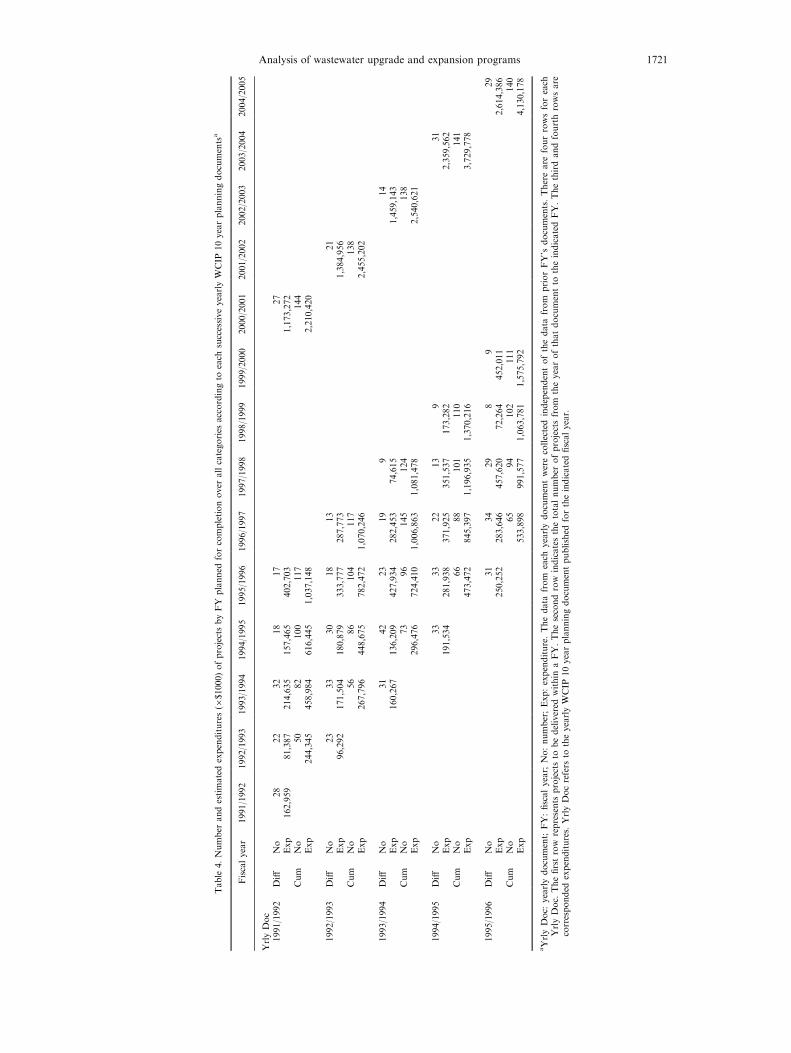
cing them with larger new ones.Fiscal year. Table 4 presents the varying projec-
tions of project counts and expenditures in planning
documents from successive ®scal years. The lastentry in each row is the sum for the last ®ve ®scalyears in the ten-year period, an arrangement that
mimics some real city planning documents that donot give yearly values for times further in thefuture. The numbers not only show responses to theprogram changes described above, but also show
that it has always been expected that the greatestactivity and expenditure would come in the last halfof the program.
Table 4 provides some insight into the magnitudeof the management tasks provided by the plans forthe future. The planned yearly expenditures in each
document for the years up to 1996/1997 havealways been below 460 million dollars per year. Onthe other hand, the average expenditure for the last
half of the decade in the 1994/1995 document isover 470 million dollars per year, and the 1995/1996 document raises this to more than 520 milliondollars per year. Since the listings in the Di�erential
(Di�) rows for the earlier ®scal years show substan-tial variation, it is reasonable to expect that one ormore of the years later in the decade will actually
have planned expenditures above 550 million dol-lars. Evidently the program will continue to grow,imposing heavier burdens on WCIP sta� than those
provided by the present level of work.
Analysis of completed projects
Overall program. Figure 3 summarizes the expen-ditures and schedules of all the completed projects.Total actual expenditures average roughly two-
thirds of planned expenditures, but there is a con-sistent tendency to take longer than planned inboth design and construction: 40% longer in design
and 20% longer in construction. As the aggregatevalues obscure the true range of variation amongthe categories, a subdivision by category is per-formed in Tables 5 and 6.
Expenditures by category. In Table 5 the expendi-ture totals in the rightmost columns are the pro-gram aggregate numbers, including those
corresponding to the bars in Fig. 3, and the othercolumns are the values by categories; 64 projectswere completed out of 333 that were included in all
the planning documents from FY 1991/1992through FY 1995/1996. SAP had not yet incurredany construction costs, but for the other categories
except CS, construction costs are higher than bids.Substantial variations among the categories
appear in TAE/TPEF and TAE/TPEL, the ratios ofthe total actual expenditures to the total planned
expenditures when they ®rst and last appeared inthe WCIP. Costs were usually underestimated for
GRP and SGU, but overestimated for the othercategories, especially for PP and SAP. This explainsthe aggregate TAE/TPEF and TAE/TPEL ratios in
Fig. 3; SAP and PP typically overestimated theircosts by a factor of three or more. Furthermore, inall the categories but SGU and GRP, the agreement
between planned and actual costs does not improvewith time.A more subtle point is that since the average con-
struction management (CM) cost for the publicworks industry is about 0.15 of the construction(CON) costs, the aggregate CM/CON ratio of 0.25is high. The data suggest that further investigation
might be justi®ed.Schedules by category. In Table 6 scheduling data
for completed projects have been studied both in
terms of delays of starting and completion dates ofphases of projects and by comparing actual andplanned durations. According to this table, there is
a high frequency of schedule slippage for the com-pleted projects.For comparisons between categories, the ratios,
which cancel out the greatly di�ering sizes of thecategories, are more informative than the di�er-ences. Evidently SW and GRP have the greatesttendencies toward schedule slippage. The overall
durations of projects (design and construction) inthese categories average 50 and 70%, respectively,longer than planned.
CONCLUSIONS
The example and the analysis
If there really were a Pseud City Wastewater
Capital Improvement Program, it would have roomfor improvement of its management. It is likely thatthe planners, contractors, and engineers all bear
some responsibility for the results, and there alsomay be a contribution from poor organization.Probably it is better to overestimate costs than to
underestimate them, since overestimation avoids thecost overrun scandals that have erupted from timeto time in military procurement, but overestimatingcosts prompts an unjusti®ed pessimism about what
can be accomplished. Everyone involved, includingthe public at large, would bene®t from more accu-rate scheduling and budgeting.
The forms of data aggregation and presentationin this article seem su�ciently adaptable to beapplied to a wide range of large programs.
Although the comparisons are simple, they appearuseful for detecting patterns of incompatibilitybetween the e�orts of various groups that must co-
operate to complete such a program. These com-parison methods seem relevant for various types oflarge construction programs, not merely for waste-water systems like those in the example.
Reza Iranpour et al.1724
Information systems and consistency
These comparisons display patterns of inconsis-
tencies between predicted and actual results, but do
not provide explanations for them. We suggest that
an information system and o�ce environment could
emphasize maintenance of consistency among the
activities of the major groups involved in a pro-
gram. Then it would be expected to detect incom-
patibilities between planning and reality before they
had become as numerous and pervasive as in our
example, and might help prevent their development.
The rise of networked o�ce systems, particularly
the client-server structure, has greatly changed the
situation that existed in the era of paper record-
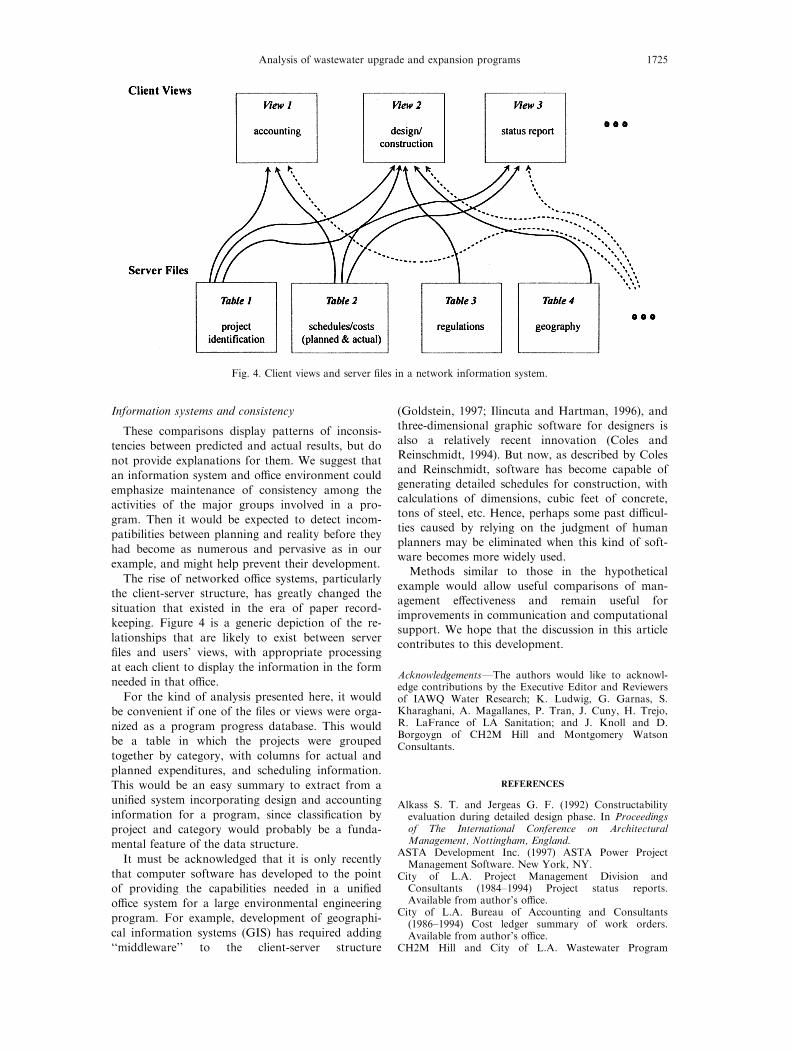
keeping. Figure 4 is a generic depiction of the re-
lationships that are likely to exist between server
®les and users' views, with appropriate processing
at each client to display the information in the form
needed in that o�ce.
For the kind of analysis presented here, it would
be convenient if one of the ®les or views were orga-
nized as a program progress database. This would
be a table in which the projects were grouped
together by category, with columns for actual and
planned expenditures, and scheduling information.
This would be an easy summary to extract from a
uni®ed system incorporating design and accounting
information for a program, since classi®cation by
project and category would probably be a funda-
mental feature of the data structure.
It must be acknowledged that it is only recently
that computer software has developed to the point
of providing the capabilities needed in a uni®ed
o�ce system for a large environmental engineering
program. For example, development of geographi-
cal information systems (GIS) has required adding
``middleware'' to the client-server structure
(Goldstein, 1997; Ilincuta and Hartman, 1996), andthree-dimensional graphic software for designers is
also a relatively recent innovation (Coles andReinschmidt, 1994). But now, as described by Colesand Reinschmidt, software has become capable ofgenerating detailed schedules for construction, with
calculations of dimensions, cubic feet of concrete,tons of steel, etc. Hence, perhaps some past di�cul-ties caused by relying on the judgment of human
planners may be eliminated when this kind of soft-ware becomes more widely used.Methods similar to those in the hypothetical
example would allow useful comparisons of man-agement e�ectiveness and remain useful forimprovements in communication and computationalsupport. We hope that the discussion in this article
contributes to this development.
AcknowledgementsÐThe authors would like to acknowl-edge contributions by the Executive Editor and Reviewersof IAWQ Water Research; K. Ludwig, G. Garnas, S.Kharaghani, A. Magallanes, P. Tran, J. Cuny, H. Trejo,R. LaFrance of LA Sanitation; and J. Knoll and D.Borgoygn of CH2M Hill and Montgomery WatsonConsultants.
REFERENCES
Alkass S. T. and Jergeas G. F. (1992) Constructabilityevaluation during detailed design phase. In Proceedingsof The International Conference on ArchitecturalManagement, Nottingham, England.
ASTA Development Inc. (1997) ASTA Power ProjectManagement Software. New York, NY.
City of L.A. Project Management Division andConsultants (1984±1994) Project status reports.Available from author's o�ce.
City of L.A. Bureau of Accounting and Consultants(1986±1994) Cost ledger summary of work orders.Available from author's o�ce.
CH2M Hill and City of L.A. Wastewater Program
Fig. 4. Client views and server ®les in a network information system.
Analysis of wastewater upgrade and expansion programs 1725

Management Division (1986±1994) Wastewater capitalimprovement program, ®ve year/ten year -yearly plan-ning documents. Available from author's o�ce.
Coles B. C. and Reinschmidt K. F. (1994) Computer-inte-grated construction. ASCE Civil Engr., June, 50±53.
Denning J. (1997) Who's Sur®ng? We're Working! ASCECivil Engr., June, 40±43.
Galinsky G. and Hartman F. T. (1996) A new resourcebased project planning and scheduling tool. InProceedings of Fifth International Conference onManagement of Technology, Miami, Florida.
Goldstein H. (1997) Mapping convergence: GIS joins theenterprise, ASCE Civil Engr., June, 36±39.
Gottlieb M. (1997) Construction contract manager.Windows application software. E-mail:[email protected].
Ichniowski T. (1995) Budget squeezes construction. Eng.News-Rec. 234, 6.
Ilincuta A. and Hartman F. T. (1996) Possible revolutionin software industry. In Proceedings of PMI '96 AnnualSymposium/Seminar, October, Boston.
Jergeas G. F., Tyler A. and McCa�er R. (1989) Detaileddesign and constructability. In Proceedings of CIVILCOMP '89, London, England.
Langford D. and Male S. (1995) Strategic Management inConstruction. Ashgate Pub. Co.
Primavera Systems Inc. (1997) Primavera Project PlannerP3, Windows 2.0. Bala Cynwyd, PA.
Retik A., Marston V. K. and Skitmore M. (1992)Knowledge based simulation as a planning tool for pro-jects. In Proceedings of ARCOM-92 Conference.
Wilkinson L. R. (1996) Economics. Water Envir. Research68, 4.
Reza Iranpour et al.1726