Making Markets Work for the Rural Poor: A Symposium
121
Faith & Economics—Number 50—Fall 2007—Pages 1–121. Making Markets Work for the Rural Poor: A Symposium Timothy O. Williams and Iheanacho Okike; Ruerd Ruben and Koos van Eyk; Duncan Boughton, David Mather, Christopher B. Barrett, Rui Benfica, Danilo Abdula, David Tschirley, and Benedito Cunguara; Paul N. Wilson and John E. Stapleford © 2007 Association of Christian Economists Introduction to a Special Issue on Making Markets Work for the Rural Poor Christopher B. Barrett, Cornell University, and Thomas Reardon, Michigan State University T he Bible clearly directs believers to care for the poor. But with an estimated 1.3 billion people living in “destitution” (below $1 a day), another 1.6 billion in “extreme poverty” (above $1 a day but below $2 dollar a day), and 2.5 billion more in “global poverty” (more than $2 a day but less than $10 a day), 1 the scope of the task appears daunting. It often seems that the poor will indeed always be with us (Deut. 15:11, Matt. 26:11, Mark 14:7, John 12:8). Surely no individual, no government, no congregation can feasibly care for all these poor people. So if we are to heed the biblical call to aid the poor, other mechanisms are necessary. This is where economists often invoke Adam Smith and the capacity of decentralized markets to advance social objectives. Markets can be a powerful force for good. By aggregating demand and supply across actors at different spatial and temporal scales, well-functioning markets underpin important opportunities at the micro level for welfare improvements that aggregate into sustainable macro-level growth. For example, without good Authors’ Note: We thank Jennifer Brinkerhoff, Paul Glewwe, Michael Kevane, John Larrivee, Paul McNamara, Cal Miller, Bart Minten, Nigel Poole, Maren Radeny, Ruerd Ruben, Julie Schaffner, Denise Stanley, Dawn Thilmany, Alex Winter-Nelson, Steve Vosti, and Bruce Wydick for their outstanding services as reviewers of papers submitted for this special issue. We likewise express our gratitude to the Seminars in Christian Scholarship staff and the leadership, faculty, and staff of Calvin College for the gracious hospitality shown to us and our fellow seminar participants and their families.
-
Upload
wageningen-ur -
Category
Documents
-
view
1 -
download
0
Transcript of Making Markets Work for the Rural Poor: A Symposium
�Faith & Economics—Number 50—Fall 2007—Pages 1–121.
Making Markets Work for the Rural Poor: A Symposium
Timothy O. Williams and Iheanacho Okike;Ruerd Ruben and Koos van Eyk;
Duncan Boughton, David Mather, Christopher B. Barrett,Rui Benfica, Danilo Abdula, David Tschirley,
and Benedito Cunguara;Paul N. Wilson and John E. Stapleford
© 2007 Association of Christian Economists
Introduction to a Special Issue on Making Markets Work for the Rural PoorChristopher B. Barrett, Cornell University, and Thomas Reardon, Michigan State University
T he Bible clearly directs believers to care for the poor. But with an estimated 1.3 billion people living in “destitution” (below $1 a day), another 1.6 billion in “extreme poverty” (above $1 a day but below $2 dollar a day), and 2.5 billion more in “global poverty” (more than $2 a day but less than $10 a day),1 the scope of the task appears daunting. It often seems that the poor will indeed always be with us (Deut. 15:11, Matt. 26:11, Mark 14:7, John 12:8). Surely no individual, no government, no congregation can feasibly care for all these poor people. So if we are to heed the biblical call to aid the poor, other mechanisms are necessary.
This is where economists often invoke Adam Smith and the capacity of decentralized markets to advance social objectives. Markets can be a powerful force for good. By aggregating demand and supply across actors at different spatial and temporal scales, well-functioning markets underpin important opportunities at the micro level for welfare improvements that aggregate into sustainable macro-level growth. For example, without good
Authors’ Note: We thank Jennifer Brinkerhoff, Paul Glewwe, Michael Kevane, John Larrivee, Paul McNamara, Cal Miller, Bart Minten, Nigel Poole, Maren Radeny, Ruerd Ruben, Julie Schaffner, Denise Stanley, Dawn Thilmany, Alex Winter-Nelson, Steve Vosti, and Bruce Wydick for their outstanding services as reviewers of papers submitted for this special issue. We likewise express our gratitude to the Seminars in Christian Scholarship staff and the leadership, faculty, and staff of Calvin College for the gracious hospitality shown to us and our fellow seminar participants and their families.
� FAITH & ECONOMICS
access to distant markets that can absorb excess local supply, the adoption of more productive technologies typically leads to a drop in product prices, erasing all or many of the gains to producers from technological change and thereby dampening incentives to adopt new technologies that can stimulate economic growth. Markets also play a fundamental role in managing risk associated with demand and supply shocks by facilitating adjustment in net export flows across space and in storage over time, thereby reducing the price variability faced by consumers and producers. Markets can also induce socially beneficial innovation to relieve binding factor constraints on production. Markets thus perform multiple valuable functions: distribution of inputs and outputs across space and time, transformation of raw commodities into value-added products, transmission of information and risk, and inducement of desirable innovation. Per the first welfare theorem, competitive market equilibria help ensure an efficient allocation of resources so as to maximize aggregate welfare. Yet a vast literature chronicles the many ways in which the poor can be systematically excluded from or disadvantaged by market exchange when information asymmetries, transactions costs, risk, insecure property rights, or other regular sources of market imperfections disturb the appealing fiction of a first-best world. The beneficent power of markets too often appears to bypass the poor, perhaps especially in rural areas where more than three-quarters of the world’s extreme poor live, and market failures loom especially large (World Bank 2007). Such failures often motivate government intervention in markets, although interventions have often done more harm than good, either by distorting incentives or by creating public sector market power. Indeed, the history of rural markets in developing countries reflects evolving thinking on the appropriate role for government in trying to address the inefficiencies created by incomplete institutional and physical infrastructure and imperfect competition. The emphasis in the 1960s and 1970s on government intervention to resolve market failures gave way in the 1980s to market-oriented liberalization to “get prices right” and, more recently, to a focus on “getting institutions right.” Of particular interest to the contributing authors to this special issue, recent years have brought substantial growth in interest around the question of how to make markets work more effectively for the rural poor. Indeed, many low-income nations’ Poverty Reduction Strategy Papers and associated economic development strategies have placed high priority on stimulating increased market participation among the rural poor, and church-based and secular non-governmental organizations (NGOs) around the world have vigorously taken up this challenge.
�Barrett and Reardon
This special issue originates with a three-week Seminar in Christian Scholarship that Calvin College graciously hosted in July 2005 on the topic “Making Markets Work for the Rural Poor: Christian Mission and Global Enterprise.” This seminar involved fourteen participants from ten different colleges and universities and two non-academic research institutions in the United States and Europe, as well as a visiting speaker from the Rockefeller Foundation. It was an exceptionally talented group with a wealth of energy, experience, and skills. This made for rich interactions within the group, drawing on practical as well as technical expertise, a range of spiritual traditions, and a variety of domestic and international experiences. The seminar not only fostered networking and fellowship among Christian development economists, it also sparked original research, includ-ing new collaborations such as those reflected in the Boughton et al. and Wilson and Stapleford contributions to this special issue. We organized an Association of Christian Economists session at the January 2007 meetings in Chicago based on a selection of papers submitted for this special issue. Following rigorous peer review, we now introduce this set of four papers.
Smallholder Market Participation and Rapidly Evolving Value Chains The first step in answering the question of how to make markets work for the rural poor involves establishing clearly their patterns of participation in markets. The Williams and Okike (hereafter W&O) and Boughton et al. papers explore this issue in detail using micro-level survey data, W&O with respect to livestock producers and traders operating in the borderlands of Burkina Faso, Côte d’Ivoire, Ghana, and Mali in interior Sahelian west Africa, and Boughton et al. concerning farm households growing cotton, maize, or tobacco in rural Mozambique. These authors find that institutional and physical infrastructure markets as well as the social underpinnings of market lead to differential access to and outcomes for producers and traders of different size and initial wealth. The data hint at locally increasing returns to more remunerative forms of market participation that can impede the poor’s access to better market opportunities and foster growing inequality. Even where markets appear to transmit information well across space and time through price signals, many smaller-scale producers remain incapable of taking up market-based opportunities due to familiar problems of access to capital, infrastructural obstacles, etc. Ruben and van Eyk (hereafter R&vE) echo this message in their description of the dynamics of global fruit and vegetable value chains. They argue that, as these distribution channels have focused more on product quality and food safety attributes and less on price as the determining factor
� FAITH & ECONOMICS
in procurement decisions, that a premium has emerged to supply chain coordination and has induced many downstream wholesalers and retailers to drop smaller-scale producers unless specific governance arrangements are in place to enable smallholders to function as if they were larger suppliers. Like Boughton et al., they find that in markets characterized by more complex contracts involving quality control and therefore requiring skilled labor and other valuable private inputs, poorer households are falling behind. They document this at the aggregate level of developing countries’ market shares in fruit and vegetable exports, which declined over the course of the 1990s, as well as at more disaggregated levels of farmer groups and individual growers. A root explanation of these patterns appears to lie in market structure. W&O describe livestock marketing channels in west Africa where mobility barriers sharply constrain enterprise growth and only the better capitalized traders are able to enter the higher-return, higher-cost long-haul, cross-border market (Caves and Porter 1980, Barrett 1997). R&vE similarly report how the complex web of interlinked contracts that increasingly characterize cross-border fresh fruit and vegetable trade have generated intra- and inter-firm coordination mechanisms that effectively crowd out many small growers and producers groups. This is a new variant on an old theme. For decades, the higher value major export and domestic staple food crops were heavily regulated by state-run marketing boards, leaving only smaller-scale and lower-value food commodities for domestic consumption to operate on a truly free market basis, with little price regulation and few barriers to entry or exit. These markets are characterized by many cash, spot market transfers of product between intermediaries en route from producer to consumer, many small, non-specialized and unorganized buyers and sellers, few if any grades or standards, one-on-one (dyadic) price negotiations, poor market information systems, and mostly informal contracts, largely enforced through social networks (Fafchamps 2004). Such marketing channels depend disproportionately on rural periodic markets prevalent in most of the developing world, arguably the closest one ever gets to a true “free market”: free of government regulation, subsidies and taxes, and lacking public goods such as physical infrastructure, contract law, public market price information systems, or codified product grades and standards. Indeed, they have been termed the “flea market economy” by Fafchamps and Minten (2001). The livestock markets W&O describe in west Africa fit this description reasonably well as do the low-value, bulk commodity maize markets that Boughton et al. study.
�Barrett and Reardon
State control of the higher value-added agricultural markets largely ended with market-oriented agricultural policy reforms and economic liberalization in developing countries in the 1980s and 1990s. The new focus was on re-establishing a close correspondence between local and world market prices, so-called border parity pricing. The withdrawal of the state from agricultural market intermediation, specifically price discovery, was seen as a necessary condition in getting prices right, itself a necessary condition for improving market efficiency and stimulating investment and productivity growth (Timmer 1986). The net result of these reforms typically turned on the balance between the pro-competitive effects of reduced government interference in marketing operations—what Lipton (1993) termed “market relaxation”—and the anti-competitive effects of reduction of public goods and services that underpin private market transactions—what Lipton (1993) termed “state compression.” Since the two phenomena were typically inextricable in agricultural liberalization initiatives, experiences varied markedly. The empirical evidence suggests that commodity prices generally increased after market reforms, often stimulating an increase in production, especially of export crops. These price increases also facilitated the emergence of supermarket chains, export-oriented outgrower schemes and export processing zones, and a generalized stimulus to agro-industrialization in developing countries (Reardon and Barrett 2000). Increased investment in the downstream marketing channel has transformed the orientation of many agricultural markets from raw commodity towards processed product markets, and with this increased investment came increased competition. In middle-income countries such as Chile, India, and South Africa, private firms now play a leading role in development of improved seed varieties, producing and distributing inputs, post-harvest processing, and modern retailing through supermarkets and restaurant chains, and that influence is rapidly spreading to lower-income countries (Reardon et al. 2003, Reardon and Timmer 2007). Both formal and informal traders entered agricultural commodity marketing channels as government controls fell away, from rural periodic markets all the way through urban retail markets. However, market entry has tended to be limited to certain marketing niches not protected by capital, information, or relationship barriers, with substantial bottlenecks in other areas such as inter-seasonal storage and motorized transportation, as W&O document. Neither widespread entry into market intermediation activities nor workably competitive markets emerged everywhere, let alone quickly. For example, because long-haul motorized transportation in rural markets tends to involve considerable
� FAITH & ECONOMICS
sunk costs and some economies of scale due to poor road conditions and high vehicle maintenance costs, entry into this sector of the markets has often been limited after the removal of legal and policy barriers to entry (Barrett 1997). Meanwhile, the end of pan-seasonal and pan-territorial administrative pricing has brought increased price risk, with consequences for investment incentives facing both producers and market intermediaries (Barrett and Carter 1999). The elimination of input subsidies and removal of government monopsony power in crop marketing has also often led to reduced access to input financing and increased input prices. The withdrawal of parastatals from core input marketing activities created a void that the private sector often failed to fill due to underdeveloped physical communications, power and transport infrastructure, credit constraints, and continued bureaucratic impediments that increased transactions costs for input suppliers. In addition, periodic state and donor-funded input programs have often reduced profitability and frustrated private investments. Input credit schemes by processors have sometimes been used in the post-reform period in an attempt to overcome the low input use resulting from these access problems. As the weaknesses of reformed agricultural markets in developing countries became evident, development agencies’ and governments’ focus began to shift from merely “getting prices right” to “getting institutions right” so as to address market failures arising from imperfect information, contract enforcement, and property rights, and insufficient provision of public goods. Such reforms have used non-price measures in an attempt to develop the public and private institutions necessary for efficient market operations and to reduce transactions costs and business risk. The post-structural adjustment era has also coincided with international market deregulation through the GATT and its successor, the WTO. Bilateral, regional, and global trade agreements have reduced tariff and non-tariff barriers to cross-border flows of raw and processed agricultural commodities, and increased the openness of financial markets, leading to increased capital flow into developing countries, especially in the form of foreign direct investment (FDI). Where structural adjustment reforms had substantially reduced state control over input and output markets, trade and FDI liberalization has paved the way for major investment in post-harvest processing and retailing in developing countries since the 1990s. This “new” capital investment differs from the structural adjustment era reforms in that whereas the focus previously was upstream, in the input, production, and wholesale sectors, more recent emphasis, especially in
�Barrett and Reardon
private investment, has tended to be downstream, in food processing, retail and restaurant markets. The exceptionally rapid diffusion of supermarkets in developing countries, in particular, has also been driven by improved coordination and communication technologies in addition to increased urbanization, lower prices of processed goods, increased per capita incomes in developing countries, as well as saturation and intense competition in foreign firms’ home markets (Reardon and Barrett 2000, Reardon et al. 2003). In Latin America, for example, supermarkets currently account for 50–60 per cent of national food retail sale, compared with only 10–20 per cent in the 1980s (Reardon et al. 2003, Reardon and Timmer 2007). The rise of supermarket and restaurant chains has changed the fundamental structure and operations of agricultural markets significantly, directing far more market power downstream, often to chains wholly or partly owned by multinational corporations. As R&vE document in the case of fruit and vegetable exports, retailers capture 34–46 percent of final retail prices versus only 4–14 percent for growers. Commodity procurement by retailers has become more centralized, with consolidated buying points at a regional, even global, level. It is not uncommon for a major supermarket chain located in three different countries to consolidate its procurement in a few large growers in just one of those countries. Global food chains have also established regional procurement nodes and in-country commodity procurement for regional firms has often been centralized from individual store level to provincial systems (Reardon et al. 2003). These structural shifts in value chains have increased contract farming and outgrower schemes between agro-industrial firms and farmers in developing countries, and production of non-staple foods has increased. Increased foreign investment in agricultural markets in developing countries, however, has produced conflicting results. Increased industrialization of agricultural markets has fostered improved market efficiency and competitiveness, integration of formerly fragmented markets, product diversification through differentiation, and value addition and technology transfer. However, the rapid pace of structural change, with some developing countries accomplishing in a few years what developed countries accomplished over decades, has left limited room for adjustment by smaller, less well-informed, and poorly capitalized market actors to new ways of doing business. There is thus growing concern that market openness may lead to the replacement of traditional processors by oligopsonistic multinationals, accentuating the latent dualism of a modern, efficient marketing sector accessible only to those with adequate scale and capital, alongside a traditional, inefficient marketing channel to
� FAITH & ECONOMICS
which the poor are effectively restricted. The tendency towards selection of a few medium- to large-scale firms or producers capable of delivering consistent quality product at large volumes has toughened competition for structurally inefficient producers, and seems to have led to some crowding out of smaller producers (Reardon and Timmer 2007). Local informal wholesalers and retailers have found themselves having to compete with bigger firms, both for the more efficient producers offering consistent product quality and throughput volumes, and for consumers seeking more services. The emergence of big, concentrated downstream private marketing intermediaries could also potentially lead, once again, to non-competitive agricultural marketing channels, effectively replacing government with private market power.
What Roles for Governments and NGOs in Making Markets Work for the Rural Poor? Markets plainly play a crucial role in the process of economic development. Yet, by virtue of the spatial dispersion of producers and consumers, the temporal lags between input application and harvest, the variable perishability and storability of commodities, and the political sensitivity of basic food staples, rural markets are prone to high transactions costs, significant risks, and frequent government interference. The relative power of developing country governments and private domestic or multinational firms in agricultural markets has varied over time. But the fundamental functions of input and output distribution, post-harvest processing and storage, as well as the persistent challenges of liquidity constraints, contract enforcement, and imperfect information, continue to challenge small farmers and herders, limiting their access to market opportunities, much less on favorable terms and in more remunerative niches such as livestock, fruits and vegetables and high quality export crops. The papers in this special issue document these patterns clearly and carefully. So what are governments and NGOs, including faith-based organizations, to do? One thread of the arguments offered in these papers, clearly articulated by W&O and R&vE, is to identify market failures that retard private innovation and investment and to aim for interventions likely to crowd-in private investment. By fostering the creation and operation of effective producer groups, improving marketing infrastructure, enforcing private property rights and contracts, and helping foster rural credit delivery, these authors argue, smaller-scale producers might be able to climb up onto what appears a decidedly unlevel playing field. But as
�Barrett and Reardon
Boughton et al. caution, if the impact of public goods and services in inducing market participation is perhaps limited and that it is more private wealth that fosters market participation in a reinforcing feedback loop—it takes money to make money—then this conventional prescription may prove unsuccessful, like so many past development interventions. Here Wilson and Stapleford (hereafter W&S) offer a more provocative and original prescription based on the emergent concept of “transformational development” (TD). TD offers an alternative approach to rural development by focusing holistically on individuals, recognizing their sinful nature, and striving to transform their beliefs and behaviors and thereby to end the hopelessness that so often characterizes the extreme poor. As W&S describe it, “rather than a ‘big push’ to alleviate poverty…TD channels consistent programming to relatively small microeconomic units in the difficult or hard places of the world.” Aggregating such individual transformative experiences across many persons, the objective is to build community and thereby to transform local cultures and thereby usher in institutional frameworks hospitable to market functioning, individual liberty, and economic growth, very much in the spirit of Bauer (1976), Landes (1998) and de Soto (2000). This perspective on the importance of individuals’ views of themselves and others and on social networks as the foundation of market transactions in low-income rural settings characterized by weak rule of law is quite consistent with much of the cutting-edge economics research on market transactions in developing countries (Platteau 2000, Fafchamps 2004). These are messages dear to the hearts of many Christian economists who seek to restore the place of the cultural and spiritual to the study of economic phenomena (Dean et al. 2005). Together, the set of four original papers that comprise this special issue offer an engaging set of ideas and arguments surrounding the current state of poor rural peoples’ relation to markets in the developing world and strategies for improving those relationships. The topic is plainly of considerable and growing importance to policymakers in a world in which more than five out of six people live on $10/day or less and in which the reach of markets appears to be growing and changing on a nearly daily basis. For them and for Christians answering the scriptural call to care for the least among us, the economic riddle of how to make markets work for the rural poor remains quite incompletely answered.
Endnote
1 Estimates from Pritchett (2006).
�0 FAITH & ECONOMICS
References
Barrett, C.B. 1997. “Food Marketing Liberalization and Trader Entry: Evidence from Madagascar.” World Development 25: 763–777.
Barrett, C.B. and Carter, M.R. 1999. “Microeconomically Coherent Agricultural Policy Reform in Africa.” In African Economies in Transition, Volume 2: The Reform Experiences, ed. J. Paulson. London: Macmillan.
Bauer, Peter T. 1976. Dissent on Development. Cambridge, MA: Harvard University Press.
Caves, Richard E. and Michael E. Porter. 1977. “From Entry Barriers to Mobility Barriers: Conjectural Decisions and Contrived Deterrence to New Competition.” Quarterly Journal of Economics 91: 241–261.
Dean, Judith M., J.A. Schaffner, and S.L.S. Smith. 2005. Poverty Reduction in the Developing World. Carlisle, UK: Authentic Media.
De Soto, Hernando. 2000. The Mystery of Capital: Why Capitalism Triumphs in the West and Fails Everywhere Else. New York: Basic Books.
Fafchamps, M. 2004. Market Institutions in Sub-Saharan Africa. Cambridge, MA: MIT Press.
Fafchamps, M. and B. Minten. 2001. “Property Rights in a Flea Market Economy.” Economic Development and Cultural Change 49: 229–268.
Landes, David. 1998. The Wealth and Poverty of Nations. New York: Norton and Company.
Lipton, M. 1993. “Market Relaxation and Agricultural Development.” In States and Markets: Neo-liberalism and the Development Policy Debate, eds. C. Colclough and J. Manor. Oxford: Oxford University Press.
Platteau, J.P. 2000. Institutions, Social Norms, and Economic Development. London: Harwood Academic Publishers.
Pritchett, Lant. 2006. “Who is Not Poor? Dreaming of a World Truly Free of Poverty.” World Bank Research Observer 21(1):1–23.
Reardon, T. and Barrett, C.B. 2000. “Agroindustrialization, Globaliza-tion, and International Development: An Overview of Issues, Patterns, and Determinants.” Agricultural Economics 23(3): 195–205.
Reardon, T. and C.P. Timmer. 2007. “Transformation of Markets for Agricultural Output in Developing Countries Since 1950: How Has Thinking Changed?” in Handbook of Agricultural Economics, Vol. 3: Agricultural Development: Farmers, Farm Production and Farm Markets, eds. R.E. Evenson and P. Pingali, 2808–2855. Amsterdam: Elsevier Press.
��Barrett and Reardon
Reardon, T., P.C. Timmer, C. Barrett, and J. Berdegue. 2003. “The Rise of Supermarket Chains in Africa, Asia and Latin America.” American Journal of Agricultural Economics 85: 1140–1146.
Timmer, P.C. 1986. Getting Prices Right–The Scope and Limits of Agricultural Price Policy. Ithaca, NY: Cornell University Press.
World Bank. 2007. World Development Report 2008: Agriculture for Development. Washington, D.C.: World Bank. n
�� FAITH & ECONOMICS
Livestock Markets in West Africa: Potential Tools for Poverty Reduction?Timothy O. Williams, Special Advisory Services Division, Commonwealth Secretariat, United Kingdom, and Iheanacho Okike, International Livestock Research Institute (ILRI), Nigeria
I
Abstract: Drawing on surveys of traders and weekly sales transactions data collected from January 2000 – June 2001 in three frontier markets linking four countries, this paper evaluates how livestock markets currently function in relation to poor livestock producers and traders in the central corridor of West Africa. Empirical analysis indicates that although market preferences appear to be well transmitted through prices to small-scale livestock producers, they are still largely unable to supply in sufficient quantity top quality animals demanded by buyers. Limited own financial resources and access to external finance prevent small-scale livestock traders from expanding their business activities at the same time that high transport and handling costs and taxes hinder the performance of large-scale traders engaged in cross-border trade. This information provides insights into the challenges confronting market participants and how they can be assisted through program and policy interventions to take advantage of market opportunities.
n West Africa, as in other parts of the developing world, livestock represent the main marketable assets held by rural people. In this setting, livestock markets act as critical institutions through which rural people recurrently convert wealth stores to food staples and cash to finance other basic needs, inputs, and services. They also act as transmission mechanisms through which growth in the wider economy is transmitted to rural areas via the linkages they offer to national and regional economies. Livestock markets in rural communities are typically embedded in cultural and social institutions and the way in which people,
Authors’ Note: Research for this paper was conducted while the first author worked for the International Livestock Research Institute. Funding support from the Common Fund for Commodities (CFC) and collaboration of Comité Permanent Inter-États de Lutte contre la Sechéresse dans le Sahel (CILSS) in executing this research are gratefully acknowledged. We also wish to thank two anonymous reviewers and the coordinating editor for this submission for their comments and suggestions which have helped to improve the manuscript. Author contact information: Timothy O. Williams, Special Advisory Services Division, Commonwealth Secretariat, Marlborough House, Pall Mall, London, SW1Y 5HX, United Kingdom; e-mail: [email protected]; Iheanacho Okike, International Livestock Research Institute (ILRI), PMB 5320, Oyo Road, Ibadan, Nigeria; e-mail: [email protected].
© 2007 Association of Christian Economists
��Williams and Okike
particularly the poor, participate in these markets is conditioned by economic, social, and cultural factors. At least 100 million poor people in West Africa rely on livestock as part of their livelihood strategy (Thornton et al. 2002, Kristjanson et al. 2004). In the semi-arid areas of the region, livestock rearing provides the main source of employment for the majority of the people and is by far the most important source of revenue. For these people, access to well-functioning markets could potentially provide a way out of poverty by giving them better returns on marketed livestock products and opportunity to build and acquire other assets to reduce vulnerability. The link between improved livestock marketing and poverty reduction is recognized in the Poverty Reduction Strategy papers of countries in the study region, particularly livestock exporting countries such as Burkina Faso, Mali, and Niger (Blench et al. 2003), where it has been argued that, due to the large number of people involved, targeted programs in the livestock sector, including livestock marketing, can provide opportunity to increase incomes directly, generate capital for use in alternative income generating activities, and reduce poverty levels. But there is clear evidence that agricultural markets, including livestock markets, may fail to function as effectively as the neoclassical model of perfect market competition will suggest. In the specific context of the poor, transaction costs and risk of participation in markets may be too high due to poor infrastructure and imperfect, asymmetric information. In other cases, social or economic barriers (e.g., restricted access to commercial finance) may exclude them from markets. In poor rural areas or in the development of new products or services, markets may be too thin. The possibility of market failure implies that market outcomes may not be pro-poor. Livestock market failure, in particular, will undermine the ability of the rural poor, as producers, to grow out of poverty through the sale of their major wealth stores—livestock. It will also impair the performance of other market actors (e.g., traders) due to the high cost and risk of carrying out transactions. In this paper, we investigate livestock market functioning as it affects poor rural livestock producers and traders in the central corridor of West Africa. We are particularly interested in examining how livestock markets operate under the institutional, social, and infrastructural conditions that exist in rural areas and how the functioning of markets under such conditions affect the economic vulnerability of poor households. In doing this, the aim is to identify interventions which could change the structure and characteristics of markets to expand the choices available to the poor

�� FAITH & ECONOMICS
and lead to market outcomes that benefit them. We draw on surveys of livestock traders and weekly market transactions data collected over an eighteen-month period in three markets in Burkina Faso and Mali to empirically examine the following questions:• What factors determine cattle prices received by producers? How well
do markets transmit, through prices, information that producers can use to improve their production and marketing strategies?
• What barriers exist within the marketing channel for different categories of livestock traders?
• How do the markets studied fit into supply and value chains? How do these chains operate?
By focusing on these questions, we are able to evaluate how livestock markets currently function and are also able to identify where the potential lies for pro-poor market development. Although previous studies of livestock marketing in West Africa (Ariza-Nino et al. 1980, Delgado and Staatz 1980, Francis 1990, Jabbar 1998, Turner and Williams 2002) have examined various strands of the questions posed above, they have done so either by focusing on markets at a particular level in the marketing chain or by investigating a single continuum from point of purchase in a primary market to point of sale in a terminal market, without due consideration to the various segments that exist within the marketing channel. These approaches mask important differences in the degree of market concentration and competition at different levels in the marketing chain. Furthermore, none of the past studies combined an investigation of the determinants of livestock prices with an analysis of traders’ activities to obtain a comprehensive picture of the impact of livestock market functioning on two major actors (producers and traders) in the marketing chain. Given this context, the contributions of this paper are threefold. First, it offers a detailed look at livestock marketing in West Africa, a case of considerable interest to policy makers and donor agencies, given the importance of livestock to many economies in the region. Second, unlike past studies, the paper combines an analysis of livestock price formation with an exploration of traders’ commercial activities at different market levels, while explicitly recognizing the main segments (domestic and cross-border) that exist within the marketing chain. Third, the comparative analysis of three different marketing channels linking four countries adds a further rich dimension to the discussion presented below and to the literature on livestock marketing in West Africa. The remainder of the paper is organized as follows. The next section reviews the expected and actual roles of livestock markets and the likely
��Williams and Okike
impacts on the poor. This is followed by a description of livestock markets in West Africa. The study area and research methods are then described followed by two sections that address the questions posed above. We then discuss our results, and a final section offers concluding remarks.
Livestock Markets in Theory and Practice Livestock markets, when they work, can perform multiple valuable functions: serving as efficient mechanisms for the allocation of resources and transmission of information and risk, and facilitating the exchange, coordination, and distribution of livestock, livestock products, and services. There has been a long-standing research interest in the role livestock markets can play in stabilizing livestock prices and adjusting stocking rates to a temporally and spatially fluctuating resource base. A number of studies have emphasized the efficiency and flexibility of unregulated livestock markets and point to these features as characteristics that could be harnessed to stabilize local prices and facilitate adjustments of livestock stocking rates to local forage resources across time and space (Sandford 1983, Scoones 1994, Fafchamps and Gavian 1996). Given that rainfall in any one year is spatially heterogeneous, regionally-integrated markets could, except in years of widespread drought, work to stabilize local prices (Torry 1986, Kates and Millman 1990). Similarly, by regulating local livestock densities through facilitation of movement of animals from areas of forage scarcity, livestock markets are seen as institutions that could play an important ecological role, particularly in dryland areas (Fafchamps, Udry, and Czukas 1998). In this way, livestock markets could play important roles in sustaining rural livelihoods and the environment. However, the reality of imperfect information, insecure property rights, poor road and transport infrastructure, limited rule of law, and contract enforcement suggests that markets may not function as well as stylized, abstract models of perfect market competition will imply. Livestock market failure could occur as a result of any of the above-listed factors, a combination of them, or as a consequence of failure in other markets (e.g., financial markets). Empirical analyses of price movements have shown that livestock market integration is incomplete, with evidence of market segmentation and lack of price transmission (Arnould 1985, Fafchamps and Gavian 1996). Local livestock prices may be destabilized by trade policies, shifts in urban demand for livestock products, and weather shocks (Williams 1993, Williams et al. 1995, Fafchamps and Gavian 1997). Price formation in village livestock markets has been shown not to be determined solely by economic forces of demand and supply, but also by
�� FAITH & ECONOMICS
sociopolitical factors (gender, wealth endowments, and village location), reflecting the differential access and powers of people and the social embeddedness of local livestock markets (Turner and Williams 2002). Political economic analyses have consistently argued that the functioning of real grain and livestock markets within drought-prone regions has often increased the vulnerability of the rural poor (Watts 1983, Clough 1986, Watts and Bohle 1993). Markets are shown as working differently for the poor and rich due to seasonal and inter-annual differences in the poor’s dependence on and participation in formal markets. People near the subsistence floor sell their livestock to purchase grain in periods when local grain reserves are low and prices high. Also, dramatic livestock price volatility due to informational disparities between buyers and sellers, low market density, and imperfect spatial arbitrage tend to dampen market participation rates by poor pastoralists, as observed in Northern Kenya livestock markets by Barrett and Luseno (2004). Other studies have addressed the microeconomic behavior of market actors, such as livestock traders. These studies have highlighted the high transaction costs faced by these economic agents, and their reliance on social networks to enforce contracts and reduce risk (Ariza-Nino et al. 1980, Delgado and Staatz 1980, Holtzman and Kulibaba 1994, Fafchamps 2004). Furthermore, the persistence of firm size heterogeneity reported in some studies of food marketing in Africa focuses attention on barriers to enterprise expansion and mobility of firms from one category to the next within the marketing chain. Prominent among these barriers are substantial start-up costs, inadequate access to working capital, market information, bulk storage and transport, and a reliable network of buyers and suppliers (Bauer 1965, Caves and Porter 1977, Fafchamps 1994, Barrett 1997). The picture that emerges from this brief review is that the institutional, infrastructural, and social conditions under which livestock markets operate lead to market outcomes that are decidedly non-neutral in their impact on different categories of livestock producers and traders. A deeper understanding of how livestock markets function for the poor will contribute to contemporary policy debates on how to design more effective policies and programs to make markets work better for the poor.
Background on Livestock Markets and Marketing Channels in the Central Corridor of West Africa In the central corridor of West Africa, livestock markets and trade have historically linked the Sahelian countries in the semi-arid zone—Burkina Faso, Mali and Niger—with coastal countries in the humid zone—Côte

��Williams and Okike
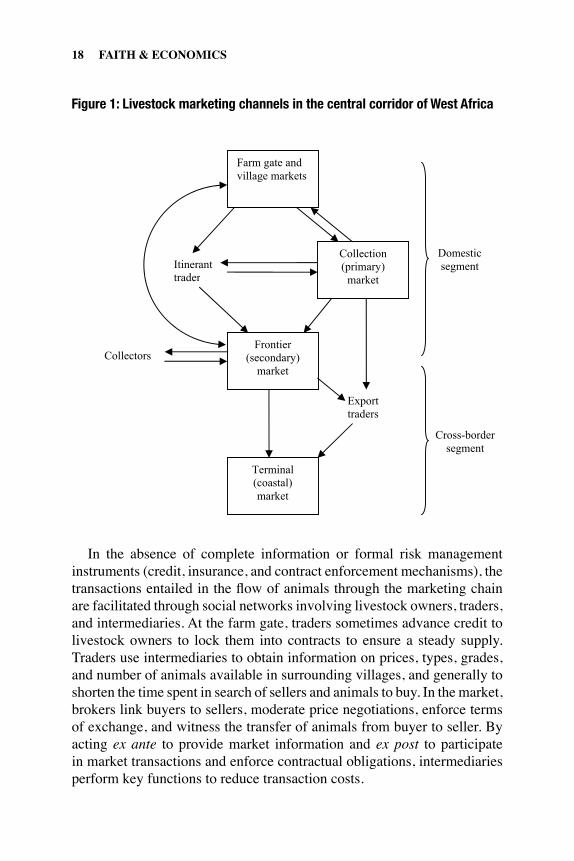
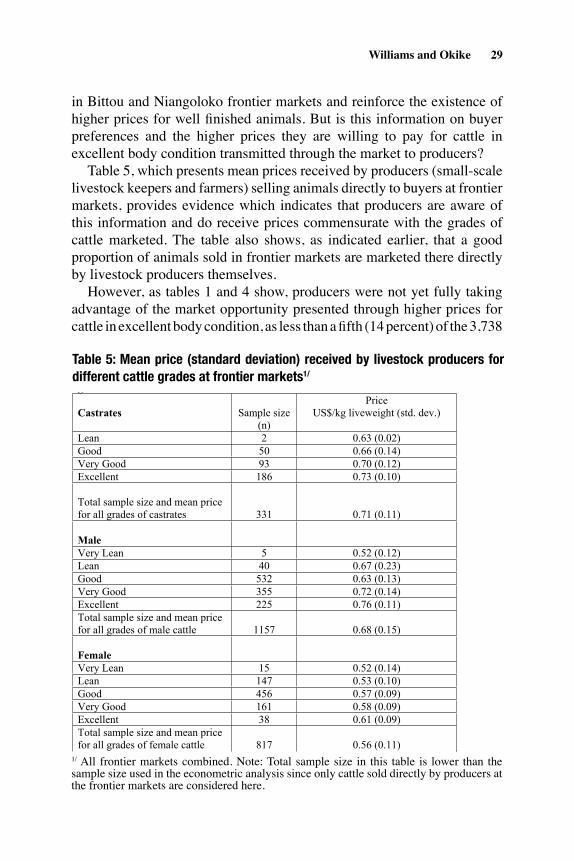
d’Ivoire, Ghana and Nigeria. The biophysical environment in the Sahel which favors livestock production enables countries in this zone to produce surplus animals which are exported to the coastal countries. The trade is dominated by live animals, particularly cattle, with trade in processed livestock products quite negligible. Although livestock markets predate the colonial period, livestock marketing fundamentally changed during the colonial era. Commercial circulation of livestock deepened with the imposition of taxes in currency (Dupire 1962, Okediji 1972), and the orientation of marketing channels changed to supply not only domestic markets in the Sahel, but also large urban centers in coastal countries. The marketing channel consists of three segments (figure 1). Trade in live animals generally starts at the farm gate and centrally located rural markets that serve groups of villages, i.e., primary or collection markets. Frontier markets—markets that are strategically located along the border of neighboring countries to facilitate cross-border trade—provide a location for regrouping animals purchased upstream destined for export, but non-export transactions also take place in these secondary markets. Animals bought at collection markets are usually transported on-the-hoof to the frontier markets. Domestic livestock marketing ends at this point. Livestock keepers1 and smallholder crop-livestock farmers have three options in selling their animals within this marketing channel: (1) sell to itinerant livestock traders at the farm gate, (2) sell at a collection market, and (3) directly at a frontier market. In reality, they make use of all the three options, albeit to varying degrees, depending on household characteristics (urgency of need, availability of a person to trek animals to the market) and proximity to markets. Also, the flow of animals to collection and frontier markets is not strictly unidirectional as pastoralists and farmers also buy animals for breeding, fattening, and draft power from these markets. The cross-border segment of the marketing channel extends to terminal markets in Côte d’Ivoire, Ghana, and Nigeria. This segment is largely operated by export traders. Transportation of animals from frontier to terminal markets at the coast is now mainly by truck following the collapse of the rail system that was previously used in the 1970s and 1980s. Livestock markets are regulated by the state with government livestock agents checking animal vaccination records and traders’ licenses, and collecting market fees on behalf of local governments and municipal authorities. The degree of state oversight generally increases with the size of the market and value of livestock species with cattle sales, for instance, attracting more attention than small ruminants’ sales.
�� FAITH & ECONOMICS
In the absence of complete information or formal risk management instruments (credit, insurance, and contract enforcement mechanisms), the transactions entailed in the flow of animals through the marketing chain are facilitated through social networks involving livestock owners, traders, and intermediaries. At the farm gate, traders sometimes advance credit to livestock owners to lock them into contracts to ensure a steady supply. Traders use intermediaries to obtain information on prices, types, grades, and number of animals available in surrounding villages, and generally to shorten the time spent in search of sellers and animals to buy. In the market, brokers link buyers to sellers, moderate price negotiations, enforce terms of exchange, and witness the transfer of animals from buyer to seller. By acting ex ante to provide market information and ex post to participate in market transactions and enforce contractual obligations, intermediaries perform key functions to reduce transaction costs.
Figure 1: Livestock marketing channels in the central corridor of West Africa
Farm gate and village markets
Frontier(secondary)
market
Terminal (coastal)market
Collection (primary)
market Itinerant trader
Collectors
Exporttraders
Cross-bordersegment
Domestic segment
Figure 1: Livestock marketing channels in the central corridor of West Africa
��Williams and Okike
Study Area The livestock marketing study reported in this paper was a component of a larger project funded by the Common Fund for Commodities and jointly implemented by Comité Permanent Inter-États de Lutte contre la Sechéresse dans le Sahel (CILSS), an intergovernmental organization, and the International Livestock Research Institute (ILRI). The main objective of the project was to improve livestock marketing and intra-regional trade in West Africa by addressing infrastructural, institutional, and policy constraints confronting livestock producers and traders. CILSS handled the market infrastructure development work, while ILRI focused on livestock marketing research. Three frontier markets located at Sikasso in southern Mali, Niangoloko in southern Burkina Faso, and Bittou in eastern Burkina Faso, where trading used to take place in open unsecured areas, were selected for upgrading. In each of these locations, CILSS fenced the market area, constructed animal holding pens, watering troughs, feeding stalls, sick bays, meeting and store rooms, and installed weighing scales. The three frontier markets were, therefore, purposively selected as the main sites of investigation for the analysis reported in this paper, although the entire marketing channel extending over the three levels described above was studied. The Sikasso market is located about 100 km from the Malian border with Côte d’Ivoire and handles cattle destined for export, local slaughter, and other uses on a daily basis. This market had feeding stalls, water troughs, a feed storage room, and a truck loading ramp, but no facility for weighing animals at the time of the market surveys. To estimate the weight of animals, heart-girth measurements were taken by trained enumerators and then converted to liveweight using conversion factors derived from a regression model (details available from the authors on request). About 10 percent of the animals traded during the survey period were brought directly to this market by producers from surrounding villages. Along this marketing channel, the bulk of the cattle destined for export are purchased by traders at farm gates and upstream primary markets and are only trekked to the Sikasso frontier market for loading into trucks to be transported to Côte d’Ivoire. Most of the animals that actually changed hands in the Sikasso market were purchased for local slaughter. The Niangoloko market is located right on the border between Burkina Faso and Côte d’Ivoire and operates mainly on Saturdays, although animals may be brought to the market for sale and resale any day of the week. Over 70 percent of the animals traded in this market during the survey period were supplied by producers. The market had holding pens, water troughs,
Figure 1: Livestock marketing channels in the central corridor of West Africa
Farm gate and village markets
Frontier(secondary)
market
Terminal (coastal)market
Collection (primary)
market Itinerant trader
Collectors
Exporttraders
Cross-bordersegment
Domestic segment
�0 FAITH & ECONOMICS
feed storage and meeting rooms, truck loading facilities, and weighing scales that worked throughout the survey period except for a three-week period in August 2000. Veterinary officials regularly visited the market to vaccinate and check the health of animals during the survey period. The Bittou livestock market is at the border between Burkina Faso, Ghana, and Togo and is open every third day for livestock transactions, with animals exported from this market going mostly to Ghana. Approximately 40 percent of cattle traded over the survey period were brought directly to this market by producers and sold to buyers through brokers. The market had facilities similar to those in Niangoloko, but the weighing scale was at a short distance from the central part of the market, which necessitated moving animals through a poorly maintained corridor which becomes impassable during the rainy season. As a result, it was not possible to weigh all the cattle traded in this market. Information on activities in other markets in the supply chain was captured through weekly market transactions and traders’ surveys described in more detail below.
Research MethodsData Collection Preliminary investigation to establish sampling frames, profiles of market participants, and major features of each market started in June 1999, but regular market surveys on a weekly basis commenced in December 1999 and ended in June 2001. Data collected through weekly market transactions surveys by trained enumerators included information on the geographic origin of the sale animal, price at the point of origin, mode and cost of transportation to the market, weight, sex, age, condition, breed, color, purpose of purchase, type of seller, type of buyer, arbitrage functions performed by different marketing agents, sale price at the frontier market, total number of animals presented for sale on a market day, and number actually sold.2 In all, 19,001 transactions involving 11,419 cattle, 3,612 sheep and 3,970 goats were recorded in the three frontier markets with the following specific breakdown: Sikasso (7,404 cattle), Niangoloko (2,230 cattle) and Bittou (1,785 cattle, 3,612 sheep and 3,970 goats). Only a subset of the cattle data was utilized in the analysis presented below due to incomplete information on some of the transactions (e.g., no recorded or estimated weight, missing farm gate price, or indeterminate animal age). As a result, only 3,738 observations involving cattle with actual or estimated weights and other relevant transactional details were utilized in our analysis.3
In addition to weekly market transactions data collected in each of the three frontier markets, traders in these markets were also surveyed
Williams and Okike ��
using structured questionnaires. Two sets of interviews were conducted at different periods during the study to capture seasonal variations in trading activities. The first occurred from July to November 2000 during the rainy season, while the second was conducted in the dry season from March to June 2001. The questionnaire used consisted of three parts. Part one focused on traders’ profiles, including level of education, equipment, assets and financial resources, trading history, trading practices, and economic activities other than livestock trading. Part two dealt with the purchase of animals and transport to the frontier market, while the third part addressed issues related to export trade. Information was collected on volume of trade, costs, taxes, levies, credit, interest rates, transport regulations, and enterprise development initiatives by local and central governments and their effects on domestic and cross-border livestock trade.
Analytical Methods To identify factors influencing cattle prices and address the question of how well information on buyer preferences is transmitted through prices to producers, a hedonic price model was fitted to the cattle transactions data. The underlying hypothesis is that traded cattle have utility bearing attributes and the values of those attributes contribute to the price of the animal. In the marketplace, utility maximizing buyers and sellers interact to establish the market value for a given attribute. The observed price of an animal is therefore a composite of the implicit values of the animal’s attributes. If buyers show systematic preferences for specific cattle attributes and are willing to pay prices consistent with their preferences, farmers can use such price signals to alter their production and marketing strategies to increase the benefits obtainable from marketing animals. In this paper, an animal’s price is hypothesized to be affected by its biological and physical characteristics, seller and buyer characteristics, purpose and season of purchase, and market location. Characteristics that are likely to influence the price of an animal include its age, sex, breed, weight, and body condition. The price of an animal may also be affected by the purpose of buying (slaughter, fattening, breeding, draft power, domestic resale, export) and the type of seller or buyer (trader, farmer, livestock keeper, or butcher). The marketing factors considered as affecting prices were season and location of market. Sales occurring in a given year were divided into four seasons: cool dry (January 1–March 31), hot dry (April 1–June 30), rainy (July 1–September 30) and harvest (October 1–December 31). After some specification testing, we settled on the log livestock price as the dependent variable of the hedonic price function. A separate model
�� FAITH & ECONOMICS
was estimated for each of the three frontier markets, and for all markets combined. The models were estimated using the AnCov procedures of SAS. To address the question of what barriers exist within the market channel for different categories of livestock traders (or firms) and to gain an understanding of the marketing chain operations, we utilized data collected through the traders’ surveys. First, we used traders’ assets and trading practices to categorize them into three mutually exclusive groups. We then analyzed each group’s start-up capital requirements, sunk costs, access to working capital, and network of suppliers and buyers to investigate what mobility or enterprise expansion barriers, if any, exist within the marketing chain. Second, we linked traders’ assets and business practices to evidence on traders’ net margins using data on marketing, operating, and transaction costs. By investigating the relationship between costs faced by individual traders and their margins, we are able to evaluate how efficient traders’ marketing activities are. A livestock trader’s assets in the study area will include human capital (level of education, years of experience in livestock marketing), physical capital (equipment, transport vehicles), financial resources (working capital, loans), and social capital. Business practices include a trader’s search behavior, inspection of animals before purchase, reliance on networks, use of intermediaries such as agents and brokers, methods of payments, and investment behavior. Traders’ assets and trading practices, together with infrastructure (roads, communication and market facilities) and government policy on taxation, business registration, and incentive measures, directly influence the extent of traders’ commercial activities viewed in terms of purchases, sales, transport, and arbitrage functions. The framework utilized in this investigation therefore allows the analysis of barriers to mobility from one trader’s category to the next within the marketing chain, as well as the impact of trading practices on the efficiency of market activities performed by traders. Results and DiscussionLivestock Producers Our study did not find any regulation compelling livestock producers to sell or buy animals from any particular market or through particular traders. The sale of animals through specific outlets reflected efforts by producers to sell their animals at market levels and channels that provided them the best deal subject to information, transport, and other constraints they might have to grapple with.
��Williams and Okike
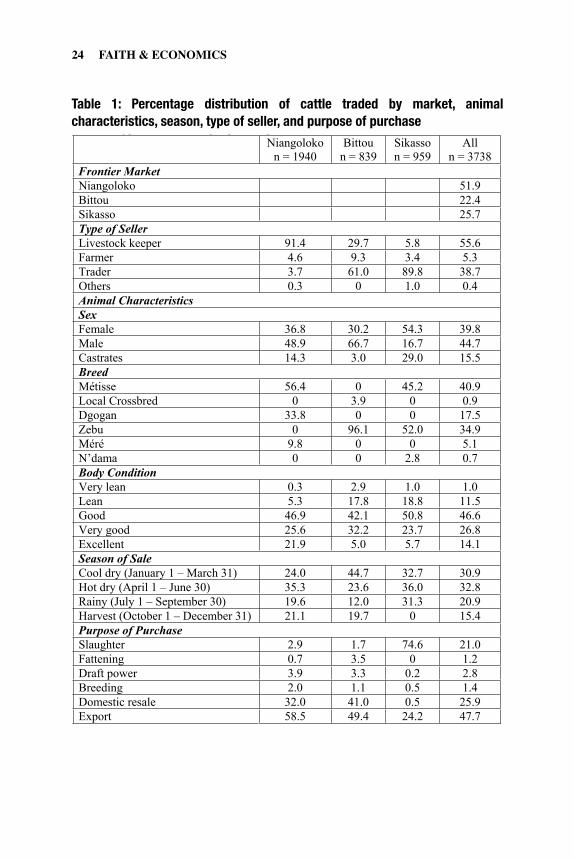
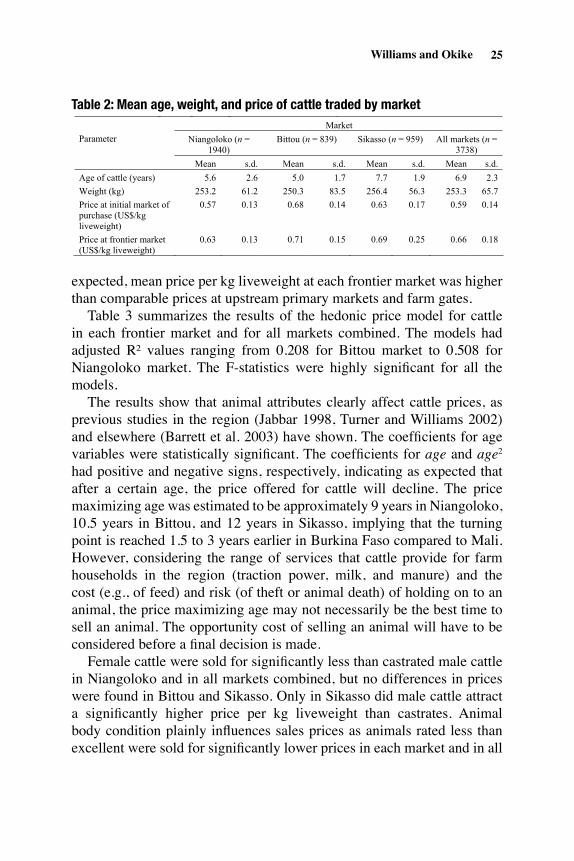
The livestock producers were uniformly small-scale, poor livestock breeders (pastoralists) and crop-livestock farmers offering individually one to four animals for sale at a time, usually at the farm gate but also at collection and frontier markets, where prices are often higher than the farm gate. Traders perform the function of assembling these animals, sorting and grouping them for sale at all three market levels shown in figure 1. Table 1 shows the distribution of weighed cattle traded in the three frontier markets. Livestock keepers alone supplied about 91 percent of the cattle traded in Niangoloko market, while livestock keepers together with farmers supplied almost 40 percent of the cattle sold in Bittou market. The situation was different in Sikasso where traders constituted the single most important group of sellers. More male than female cattle were traded in Niangoloko and Bittou, but the reverse was the case in Sikasso, where more than half (54 percent) of the animals sold were females. The latter market also recorded the largest proportion of traded castrates. Cattle breeds found in the markets include the humped zebu, humpless taurines—N’Dama and shorthorns (e.g., Méré)—and various crosses of zebu and shorthorns and zebu and N’dama collectively called Métisse. The taurines generally display trypanotolerance, i.e., varied levels of adaptation to the tsetse fly transmitted disease, trypanosomiasis, while zebus possess little or no trypanotolerance but have a bigger body frame compared to the taurines. Zebu breed accounted for 96 percent and 52 percent of the animals traded in Bittou and Sikasso markets, respectively. This breed was not recorded in Niangoloko, where Métisse accounted for 56 percent of the total number of cattle traded, followed by another crossbred called Dgogan (34 percent). The majority of cattle sold in the three markets were in good body condition (i.e., median in the body condition classification utilized), but the highest proportion (22 percent) of traded cattle in excellent body condition was recorded in Niangoloko. More than half of the cattle were sold in the dry season from January-June in all of the markets. In Niangoloko and Bittou markets most cattle were bought for export, but in Sikasso (as explained earlier) most of the cattle actually traded in that market (75 percent) were destined for local slaughter. Table 2 shows that cattle were generally marketed at about seven years of age, weighing approximately 250kg. Cattle from Burkina Faso (i.e., Bittou and Niangoloko) were marketed at five to six years of age (i.e., two to three years earlier than in Sikasso, Mali). Since it is normal for cattle in this region to attain a liveweight of 250kg from about four years of age, the lower age at marketing in Bittou and Niangoloko suggests that the offtake rate may be higher in Burkina Faso than in Mali. As would be
�� FAITH & ECONOMICS
Table 1: Percentage distribution of cattle traded by market, animal characteristics, season, type of seller and purpose of purchase
Niangolokon = 1940
Bittoun = 839
Sikasson = 959
Alln = 3738
Frontier MarketNiangoloko 51.9Bittou 22.4Sikasso 25.7Type of SellerLivestock keeper 91.4 29.7 5.8 55.6Farmer 4.6 9.3 3.4 5.3Trader 3.7 61.0 89.8 38.7Others 0.3 0 1.0 0.4Animal Characteristics SexFemale 36.8 30.2 54.3 39.8Male 48.9 66.7 16.7 44.7Castrates 14.3 3.0 29.0 15.5BreedMétisse 56.4 0 45.2 40.9Local Crossbred 0 3.9 0 0.9Dgogan 33.8 0 0 17.5Zebu 0 96.1 52.0 34.9Méré 9.8 0 0 5.1N’dama 0 0 2.8 0.7Body ConditionVery lean 0.3 2.9 1.0 1.0Lean 5.3 17.8 18.8 11.5Good 46.9 42.1 50.8 46.6Very good 25.6 32.2 23.7 26.8Excellent 21.9 5.0 5.7 14.1Season of SaleCool dry (January 1 – March 31) 24.0 44.7 32.7 30.9Hot dry (April 1 – June 30) 35.3 23.6 36.0 32.8Rainy (July 1 – September 30) 19.6 12.0 31.3 20.9Harvest (October 1 – December 31) 21.1 19.7 0 15.4Purpose of PurchaseSlaughter 2.9 1.7 74.6 21.0Fattening 0.7 3.5 0 1.2Draft power 3.9 3.3 0.2 2.8Breeding 2.0 1.1 0.5 1.4Domestic resale 32.0 41.0 0.5 25.9Export 58.5 49.4 24.2 47.7
Table 1: Percentage distribution of cattle traded by market, animal characteristics, season, type of seller, and purpose of purchase
��Williams and Okike
Table 1: Percentage distribution of cattle traded by market, animal characteristics, season, type of seller and purpose of purchase
Niangolokon = 1940
Bittoun = 839
Sikasson = 959
Alln = 3738
Frontier MarketNiangoloko 51.9Bittou 22.4Sikasso 25.7Type of SellerLivestock keeper 91.4 29.7 5.8 55.6Farmer 4.6 9.3 3.4 5.3Trader 3.7 61.0 89.8 38.7Others 0.3 0 1.0 0.4Animal Characteristics SexFemale 36.8 30.2 54.3 39.8Male 48.9 66.7 16.7 44.7Castrates 14.3 3.0 29.0 15.5BreedMétisse 56.4 0 45.2 40.9Local Crossbred 0 3.9 0 0.9Dgogan 33.8 0 0 17.5Zebu 0 96.1 52.0 34.9Méré 9.8 0 0 5.1N’dama 0 0 2.8 0.7Body ConditionVery lean 0.3 2.9 1.0 1.0Lean 5.3 17.8 18.8 11.5Good 46.9 42.1 50.8 46.6Very good 25.6 32.2 23.7 26.8Excellent 21.9 5.0 5.7 14.1Season of SaleCool dry (January 1 – March 31) 24.0 44.7 32.7 30.9Hot dry (April 1 – June 30) 35.3 23.6 36.0 32.8Rainy (July 1 – September 30) 19.6 12.0 31.3 20.9Harvest (October 1 – December 31) 21.1 19.7 0 15.4Purpose of PurchaseSlaughter 2.9 1.7 74.6 21.0Fattening 0.7 3.5 0 1.2Draft power 3.9 3.3 0.2 2.8Breeding 2.0 1.1 0.5 1.4Domestic resale 32.0 41.0 0.5 25.9Export 58.5 49.4 24.2 47.7
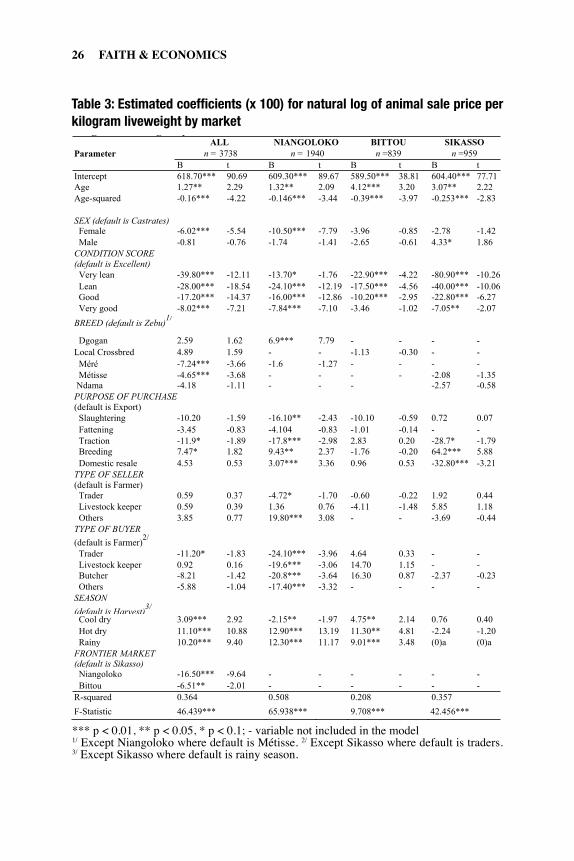
expected, mean price per kg liveweight at each frontier market was higher than comparable prices at upstream primary markets and farm gates. Table 3 summarizes the results of the hedonic price model for cattle in each frontier market and for all markets combined. The models had adjusted R² values ranging from 0.208 for Bittou market to 0.508 for Niangoloko market. The F-statistics were highly significant for all the models. The results show that animal attributes clearly affect cattle prices, as previous studies in the region (Jabbar 1998, Turner and Williams 2002) and elsewhere (Barrett et al. 2003) have shown. The coefficients for age variables were statistically significant. The coefficients for age and age2 had positive and negative signs, respectively, indicating as expected that after a certain age, the price offered for cattle will decline. The price maximizing age was estimated to be approximately 9 years in Niangoloko, 10.5 years in Bittou, and 12 years in Sikasso, implying that the turning point is reached 1.5 to 3 years earlier in Burkina Faso compared to Mali. However, considering the range of services that cattle provide for farm households in the region (traction power, milk, and manure) and the cost (e.g., of feed) and risk (of theft or animal death) of holding on to an animal, the price maximizing age may not necessarily be the best time to sell an animal. The opportunity cost of selling an animal will have to be considered before a final decision is made. Female cattle were sold for significantly less than castrated male cattle in Niangoloko and in all markets combined, but no differences in prices were found in Bittou and Sikasso. Only in Sikasso did male cattle attract a significantly higher price per kg liveweight than castrates. Animal body condition plainly influences sales prices as animals rated less than excellent were sold for significantly lower prices in each market and in all
Table 2: Mean age, weight and price of cattle traded by market Market
Niangoloko (n = 1940)
Bittou (n = 839) Sikasso (n = 959) All markets (n = 3738)
Parameter
Mean s.d. Mean s.d. Mean s.d. Mean s.d.
Age of cattle (years) 5.6 2.6 5.0 1.7 7.7 1.9 6.9 2.3
Weight (kg) 253.2 61.2 250.3 83.5 256.4 56.3 253.3 65.7
Price at initial market of purchase (US$/kg liveweight)
0.57 0.13 0.68 0.14 0.63 0.17 0.59 0.14
Price at frontier market (US$/kg liveweight)
0.63 0.13 0.71 0.15 0.69 0.25 0.66 0.18
Table 2: Mean age, weight, and price of cattle traded by market
�� FAITH & ECONOMICS
Table 3: Estimated coefficients (x 100) for natural log of animal sale price per kilogram liveweight by market
ALL NIANGOLOKO BITTOU SIKASSOParameter n = 3738 n = 1940 n =839 n =959
B t B t B t B tIntercept 618.70*** 90.69 609.30*** 89.67 589.50*** 38.81 604.40*** 77.71Age 1.27** 2.29 1.32** 2.09 4.12*** 3.20 3.07** 2.22Age-squared -0.16*** -4.22 -0.146*** -3.44 -0.39*** -3.97 -0.253*** -2.83
SEX (default is Castrates) Female -6.02*** -5.54 -10.50*** -7.79 -3.96 -0.85 -2.78 -1.42 Male -0.81 -0.76 -1.74 -1.41 -2.65 -0.61 4.33* 1.86CONDITION SCORE (default is Excellent) Very lean -39.80*** -12.11 -13.70* -1.76 -22.90*** -4.22 -80.90*** -10.26 Lean -28.00*** -18.54 -24.10*** -12.19 -17.50*** -4.56 -40.00*** -10.06 Good -17.20*** -14.37 -16.00*** -12.86 -10.20*** -2.95 -22.80*** -6.27 Very good -8.02*** -7.21 -7.84*** -7.10 -3.46 -1.02 -7.05** -2.07
BREED (default is Zebu)1/
Dgogan 2.59 1.62 6.9*** 7.79 - - - -Local Crossbred 4.89 1.59 - - -1.13 -0.30 - - Méré -7.24*** -3.66 -1.6 -1.27 - - - - Métisse -4.65*** -3.68 - - - - -2.08 -1.35 Ndama -4.18 -1.11 - - - -2.57 -0.58PURPOSE OF PURCHASE(default is Export) Slaughtering -10.20 -1.59 -16.10** -2.43 -10.10 -0.59 0.72 0.07 Fattening -3.45 -0.83 -4.104 -0.83 -1.01 -0.14 - - Traction -11.9* -1.89 -17.8*** -2.98 2.83 0.20 -28.7* -1.79 Breeding 7.47* 1.82 9.43** 2.37 -1.76 -0.20 64.2*** 5.88 Domestic resale 4.53 0.53 3.07*** 3.36 0.96 0.53 -32.80*** -3.21TYPE OF SELLER(default is Farmer) Trader 0.59 0.37 -4.72* -1.70 -0.60 -0.22 1.92 0.44 Livestock keeper 0.59 0.39 1.36 0.76 -4.11 -1.48 5.85 1.18 Others 3.85 0.77 19.80*** 3.08 - - -3.69 -0.44TYPE OF BUYER
(default is Farmer)2/
Trader -11.20* -1.83 -24.10*** -3.96 4.64 0.33 - - Livestock keeper 0.92 0.16 -19.6*** -3.06 14.70 1.15 - - Butcher -8.21 -1.42 -20.8*** -3.64 16.30 0.87 -2.37 -0.23 Others -5.88 -1.04 -17.40*** -3.32 - - - -SEASON
(default is Harvest)3/
Cool dry 3.09*** 2.92 -2.15** -1.97 4.75** 2.14 0.76 0.40 Hot dry 11.10*** 10.88 12.90*** 13.19 11.30** 4.81 -2.24 -1.20 Rainy 10.20*** 9.40 12.30*** 11.17 9.01*** 3.48 (0)a (0)aFRONTIER MARKET(default is Sikasso) Niangoloko -16.50*** -9.64 - - - - - - Bittou -6.51** -2.01 - - - - - -R-squared 0.364 0.508 0.208 0.357
F-Statistic 46.439*** 65.938*** 9.708*** 42.456***
***p < 0.01, ** p < 0.05, * p < 0.1; - variable not included in the model; 1/
Except Niangoloko where default is Meti; 2/
Except Sikasso where default is traders;3/
Except Sikasso where default is rainy season.
Table 3: Estimated coefficients (x 100) for natural log of animal sale price per kilogram liveweight by market
*** p < 0.01, ** p < 0.05, * p < 0.1; - variable not included in the model 1/ Except Niangoloko where default is Métisse. 2/ Except Sikasso where default is traders. 3/ Except Sikasso where default is rainy season.
��Williams and Okike
markets combined. The only exception was in Bittou, where no significant price difference was observed between cattle rated to be in very good and excellent body conditions. Also in Niangoloko, the discount for lean condition was higher in magnitude than that for very lean. This could be due to the subjectivity of categorical descriptions and a failure to clearly distinguish between two proximate body conditions (e.g., very lean vs. lean or very good vs. excellent). Nonetheless, the overall results for the body condition variable suggest that cattle prices are likely to increase with improvement in body condition. With regard to breed, the combined all market model results show that Méré and Métisse breeds attracted significantly lower prices per kg liveweight compared with zebu, though such significant differences were not found in Bittou and Sikasso markets. In Niangoloko market, where no zebu breed was traded, the Métisse breed was the default and here the Dgogan breed attracted significantly higher price per kg liveweight compared with Métisse, though both breeds are crossbred variants. Compared to prices offered for export cattle, those purchased for traction and slaughter in Niangoloko and for domestic resale and traction in Sikasso attracted significantly lower prices. Although not statistically significant, animals purchased for fattening in each of the three frontier markets attracted lower prices. The higher price for cattle purchased for export is not surprising given the open knowledge that when these animals are sold in external urban terminal markets in coastal countries, with relatively higher income consumers, they will fetch even higher prices. With the exception of Bittou market, breeding cattle in other markets attracted significantly higher prices than export cattle, possibly reflecting the value attached to the reproductive functions they are expected to perform to ensure herd growth and continuity.4 Sellers’ primary vocation did not appear to be especially important in price determination in the markets studied, except in Niangoloko where occasional sellers grouped in the “others” category tend to obtain higher prices than farmers. Also, in Niangoloko all other categories of buyers paid significantly lower prices for cattle compared to farmers. In the combined markets model, the results show that traders in particular paid a significantly lower price per kg liveweight for cattle purchased compared to farmers. This could be due to traders’ bargaining skills or market power that they possess through the volume of their transactions. With regard to seasonality, prices obtained during the hot dry and rainy seasons were significantly higher compared with the harvest season,
�� FAITH & ECONOMICS
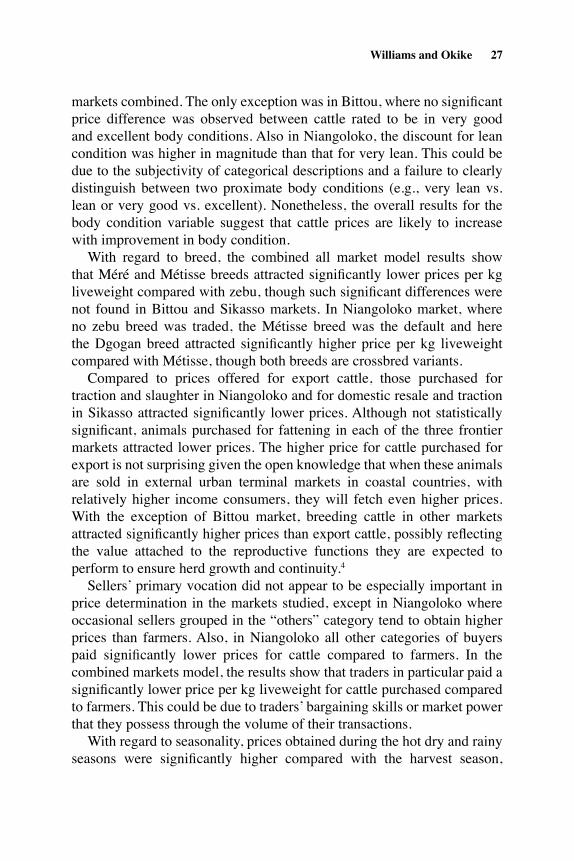
except in Sikasso where there was no clear pattern. The higher prices during the hot dry and rainy seasons could have been due to fewer animals being presented for sale due to lack of adequate forage/ pasture in the dry season or poor road infrastructure that makes access to markets difficult in the rainy season. Assuming these and other constraints could be overcome, livestock producers can take advantage of higher prices during these two seasons to bring their animals to the market at these periods. When the three market locations are considered, Niangoloko and Bittou recorded significantly lower prices per kg liveweight compared with Sikasso market. Cattle were cheapest in Niangoloko. Possible reasons for the difference in prices include variations in the structure of the marketing channels and the degree of integration of frontier markets with primary and tertiary markets. In sum, the model results indicate that animal age, sex, breed, body condition, purpose of purchase, season of sale, and market location are the most significant factors influencing shortrun cattle prices in the study region, even though the relative effects of these variables on prices differ from one market to another. The results of the price formation models which indicated significantly higher prices for cattle in excellent body condition elicited further analysis to determine prices actually paid per kg liveweight for the five grades of cattle included in this study. As table 4 shows, there was a gradual increase in price paid as body condition improved from “very lean” to “excellent.” Price per kg liveweight in all markets combined increased from $0.52 (±0.18) for very lean cattle to $0.75 (±0.12) for cattle in excellent body condition, with the widest range in prices occurring in Sikasso where very lean cattle only attracted $0.36 (±0.06) compared to $0.86 (±0.18) for cattle in excellent body condition. Similar patterns were found generally
Table 4: Mean price (US$/kg liveweight) by grade of cattle and by marketBody condition score
Market Verylean
Lean Good Very Good
Excellent Allcattle
Price/kg liveweight (US$) 0.49 0.48 0.59 0.65 0.73 0.63 Std. deviation 0.11 0.14 0.11 0.13 0.11 0.13
Niangoloko
% of cattle in category 0.3 5.3 46.9 25.6 21.9 100 Price/kg liveweight (US$) 0.59 0.65 0.70 0.76 0.78 0.71 Std. deviation 0.18 0.17 0.15 0.13 0.12 0.16
Bittou
% of cattle in category 2.9 17.7 42.1 32.2 5.0 100 Price/kg liveweight (US$) 0.36 0.55 0.67 0.79 0.86 0.69 Std. deviation 0.06 0.12 0.30 0.16 0.18 0.25
Sikasso
% of cattle in category 1.0 18.0 49.9 24.5 6.6 100 Price/kg liveweight (US$) 0.52 0.57 0.63 0.72 0.75 0.66 Std. deviation 0.18 0.16 0.20 0.15 0.12 0.18
All markets
% of cattle in category 1.0 11.5 46.6 26.8 14.1 100
Table 4: Mean price (US$/kg liveweight) by grade of cattle and by market
��Williams and Okike
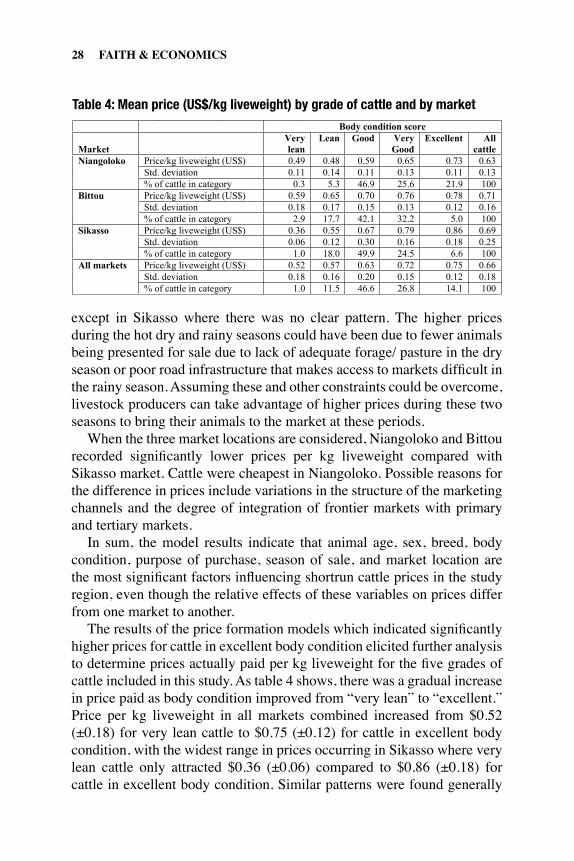
in Bittou and Niangoloko frontier markets and reinforce the existence of higher prices for well finished animals. But is this information on buyer preferences and the higher prices they are willing to pay for cattle in excellent body condition transmitted through the market to producers? Table 5, which presents mean prices received by producers (small-scale livestock keepers and farmers) selling animals directly to buyers at frontier markets, provides evidence which indicates that producers are aware of this information and do receive prices commensurate with the grades of cattle marketed. The table also shows, as indicated earlier, that a good proportion of animals sold in frontier markets are marketed there directly by livestock producers themselves. However, as tables 1 and 4 show, producers were not yet fully taking advantage of the market opportunity presented through higher prices for cattle in excellent body condition, as less than a fifth (14 percent) of the 3,738
Table 5: Mean price (std. dev.) received by livestock producers for different cattle grades at frontier markets1/
Castrates Sample size (n)
PriceUS$/kg liveweight (std. dev.)
Lean 2 0.63 (0.02)Good 50 0.66 (0.14) Very Good 93 0.70 (0.12) Excellent 186 0.73 (0.10)
Total sample size and mean price for all grades of castrates 331 0.71 (0.11)
MaleVery Lean 5 0.52 (0.12) Lean 40 0.67 (0.23)Good 532 0.63 (0.13) Very Good 355 0.72 (0.14) Excellent 225 0.76 (0.11)Total sample size and mean price for all grades of male cattle 1157 0.68 (0.15)
FemaleVery Lean 15 0.52 (0.14) Lean 147 0.53 (0.10)Good 456 0.57 (0.09) Very Good 161 0.58 (0.09) Excellent 38 0.61 (0.09)Total sample size and mean price for all grades of female cattle 817 0.56 (0.11) 1/All frontier markets combinedNote: Total sample size in this table is lower than the sample size used in the econometric analysis since only cattle sold directly by producers at the frontier markets are considered here.
Table 5: Mean price (standard deviation) received by livestock producers for different cattle grades at frontier markets1/
1/ All frontier markets combined. Note: Total sample size in this table is lower than the sample size used in the econometric analysis since only cattle sold directly by producers at the frontier markets are considered here.
�0 FAITH & ECONOMICS
cattle considered in our analysis possessed the characteristics preferred by buyers. A significant proportion of the cattle sold (74 percent) were in the median range of “good” (47 percent) to “very good” (27 percent). Many reasons could be adduced for the inability of smallholders to capitalize on this favorable market condition, but we focus on only three. First, producers may be more inclined to retain animals in excellent body condition in their own herds for several reasons including breeding, provision of traction power, supply of milk and manure, and fulfillment of social obligations (e.g., dowry or slaughter during major festivals). Evidence to support or disprove this assumption can only come from household level investigation of livestock production goals of smallholders, which we did not cover in this study. However, findings from other livestock marketing studies conducted at the household level in the region (Turner and Williams 2002) indicate that the animals of choice for slaughter during festivals are small ruminants. Also, evidence presented in tables 1 and 4 point to a significant proportion (74 percent) of animals in categories next to excellent (i.e., good and very good) being sold. Taken together, these points plausibly suggest that retention of excellent animals in the herd may not be the principal reason for not selling animals in this category. A second possible reason for the inability of producers to take advantage of higher prices for cattle in excellent body condition could be due to constraints such as lack of feed, credit, and good rural road and transport infrastructure dampening supply response even in the face of favorable prices. Impassable rural roads during the rainy season, reliance on feed from rangelands, feed shortages in the dry season, and lack of credit to buy supplementary feeds are some of the constraints commonly encountered in the study area and were cited as impediments to livestock production and marketing by both producers and traders alike during our surveys. Thirdly, even when these constraints are non-binding, the cost of fattening and finishing animals to excellent body condition may outweigh the benefits. But there is evidence of financial and economic profitability of cattle fattening in the region. Metzel et al. (1997) reviewed various fattening programs in Mali and estimated benefit/cost ratios averaging 1.85 for large-scale and 4.08 for small-scale cattle fattening. This implies that efforts to finish animals properly through fattening before marketing will be well compensated. In sum, what this discussion points to is that constraints that tend to lower supply response should be tackled in order to assist producers to market animals that will fetch higher prices and ultimately increase their incomes.
��Williams and Okike
Traders’ Activities With respect to livestock traders, table 6 provides information on human capital (education and experience), trading history, and sources of start-up and working capital. Thirty-three percent of all the traders had no formal education. More than half have been operating as livestock traders for more than ten years. Eleven percent of the traders worked as an agent (assisting full-fledged traders in buying and transferring animals from one market to another) or as a broker in the same market prior to initiating their current trading operation. Working as an agent or broker is viewed as a means of acquiring experience. But more importantly, and as will be seen in table 7, livestock trading involves substantial start-up capital (about $832 –$2,653 for a small-scale trader) when compared to the average national income per capita, which in the study countries in 2002 ranged from $220 in Burkina Faso to $610 in Côte d’Ivoire. As a result, some traders initially act as agents or brokers to build up financial capital and social capital (reputation, trust, network) or enter into partnership with established traders before launching their own business. Start-up and working capital mostly comes from own sources. External finance is extremely limited, and loans from financial institutions are rare and heavily concentrated on a small fraction of large traders. With reliance on own funding and the meager level of income of most traders, partnership will appear to be an appropriate strategy to pool funds and operate as a large trading enterprise. However, as table 6 shows, most of the traders operate as sole proprietors. Fear of losing money and conflicts with partners were cited as the main reason for operating sole proprietorships, and partly reflect the limited applicability of formal market instruments such as commercial law and dispute settlement mechanisms in rural areas. Table 7 shows the three categories of traders found in the study markets, together with the corresponding start-up capital and average number of animals purchased per trading trip. Small-, medium-, and large-scale traders correspond to itinerant-, collector-, and export-traders, respectively. Itinerant traders are usually small traders with similar socio-cultural backgrounds and close relationships with livestock producers. They use the social capital built up over the years to enter into special buying arrangements with producers (e.g., buying on credit). Collectors have weaker ties with livestock producers and mostly operate the livestock marketing channels between the collection and frontier markets. At the top of the ladder are export traders operating mainly between the frontier and terminal markets (i.e., in the cross-border segment of the marketing
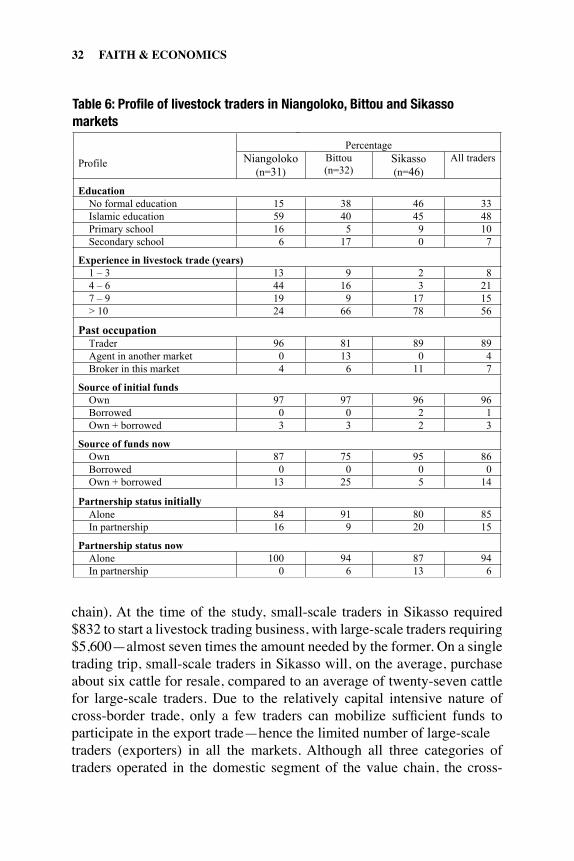
�� FAITH & ECONOMICS
chain). At the time of the study, small-scale traders in Sikasso required $832 to start a livestock trading business, with large-scale traders requiring $5,600—almost seven times the amount needed by the former. On a single trading trip, small-scale traders in Sikasso will, on the average, purchase about six cattle for resale, compared to an average of twenty-seven cattle for large-scale traders. Due to the relatively capital intensive nature of cross-border trade, only a few traders can mobilize sufficient funds to participate in the export trade—hence the limited number of large-scale traders (exporters) in all the markets. Although all three categories of traders operated in the domestic segment of the value chain, the cross-
Table 6: Profile of livestock traders in Niangoloko, Bittou and Sikasso markets
Percentage
Profile Niangoloko(n=31)
Bittou(n=32)
Sikasso(n=46)
All traders
EducationNo formal education 15 38 46 33Islamic education 59 40 45 48Primary school 16 5 9 10Secondary school 6 17 0 7
Experience in livestock trade (years) 1 – 3 13 9 2 84 – 6 44 16 3 217 – 9 19 9 17 15> 10 24 66 78 56
Past occupationTrader 96 81 89 89Agent in another market 0 13 0 4Broker in this market 4 6 11 7
Source of initial funds Own 97 97 96 96Borrowed 0 0 2 1Own + borrowed 3 3 2 3
Source of funds now Own 87 75 95 86Borrowed 0 0 0 0Own + borrowed 13 25 5 14
Partnership status initiallyAlone 84 91 80 85In partnership 16 9 20 15
Partnership status now Alone 100 94 87 94In partnership 0 6 13 6
Table 6: Profile of livestock traders in Niangoloko, Bittou and Sikasso markets
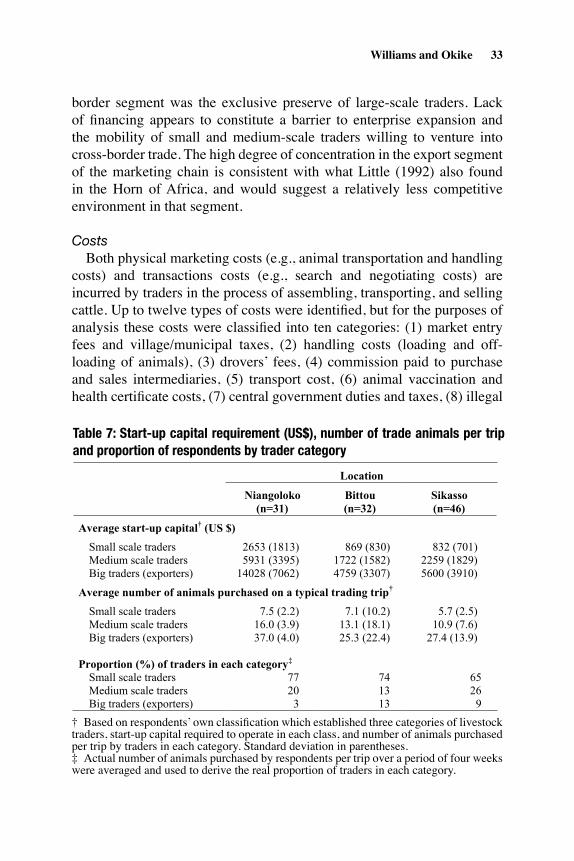
��Williams and Okike
border segment was the exclusive preserve of large-scale traders. Lack of financing appears to constitute a barrier to enterprise expansion and the mobility of small and medium-scale traders willing to venture into cross-border trade. The high degree of concentration in the export segment of the marketing chain is consistent with what Little (1992) also found in the Horn of Africa, and would suggest a relatively less competitive environment in that segment.
Costs Both physical marketing costs (e.g., animal transportation and handling costs) and transactions costs (e.g., search and negotiating costs) are incurred by traders in the process of assembling, transporting, and selling cattle. Up to twelve types of costs were identified, but for the purposes of analysis these costs were classified into ten categories: (1) market entry fees and village/municipal taxes, (2) handling costs (loading and off-loading of animals), (3) drovers’ fees, (4) commission paid to purchase and sales intermediaries, (5) transport cost, (6) animal vaccination and health certificate costs, (7) central government duties and taxes, (8) illegal
Table 6: Profile of livestock traders in Niangoloko, Bittou and Sikasso markets
Percentage
Profile Niangoloko(n=31)
Bittou(n=32)
Sikasso(n=46)
All traders
EducationNo formal education 15 38 46 33Islamic education 59 40 45 48Primary school 16 5 9 10Secondary school 6 17 0 7
Experience in livestock trade (years) 1 – 3 13 9 2 84 – 6 44 16 3 217 – 9 19 9 17 15> 10 24 66 78 56
Past occupationTrader 96 81 89 89Agent in another market 0 13 0 4Broker in this market 4 6 11 7
Source of initial funds Own 97 97 96 96Borrowed 0 0 2 1Own + borrowed 3 3 2 3
Source of funds now Own 87 75 95 86Borrowed 0 0 0 0Own + borrowed 13 25 5 14
Partnership status initiallyAlone 84 91 80 85In partnership 16 9 20 15
Partnership status now Alone 100 94 87 94In partnership 0 6 13 6
Table 7: Start-up capital requirement (US $), number of trade animals per trip and proportion of respondents by trader category
Location
Niangoloko
(n=31)
Bittou
(n=32)
Sikasso
(n=46)
Average start-up capital† (US $)
Small scale traders 2653 (1813) 869 (830) 832 (701) Medium scale traders 5931 (3395) 1722 (1582) 2259 (1829) Big traders (exporters) 14028 (7062) 4759 (3307) 5600 (3910)
Average number of animals purchased on a typical trading trip†
Small scale traders 7.5 (2.2) 7.1 (10.2) 5.7 (2.5) Medium scale traders 16.0 (3.9) 13.1 (18.1) 10.9 (7.6) Big traders (exporters) 37.0 (4.0) 25.3 (22.4) 27.4 (13.9)
Proportion (%) of traders in each category‡
Small scale traders 77 74 65Medium scale traders 20 13 26Big traders (exporters) 3 13 9
† Based on respondents’ own classification which established three categories of livestock traders, start-up capital required to operate in each class and number of animals purchased per trip by traders in each category. Standard deviation in parentheses.
‡ Actual number of animals purchased by respondents per trip over a period of four weeks were averaged and used to derive the real proportion of traders in each category.
Table 7: Start-up capital requirement (US$), number of trade animals per trip and proportion of respondents by trader category
† Based on respondents’ own classification which established three categories of livestock traders, start-up capital required to operate in each class, and number of animals purchased per trip by traders in each category. Standard deviation in parentheses.‡ Actual number of animals purchased by respondents per trip over a period of four weeks were averaged and used to derive the real proportion of traders in each category.
Table 7: Start-up capital requirement (US $), number of trade animals per trip and proportion of respondents by trader category
Location
Niangoloko
(n=31)
Bittou
(n=32)
Sikasso
(n=46)
Average start-up capital† (US $)
Small scale traders 2653 (1813) 869 (830) 832 (701) Medium scale traders 5931 (3395) 1722 (1582) 2259 (1829) Big traders (exporters) 14028 (7062) 4759 (3307) 5600 (3910)
Average number of animals purchased on a typical trading trip†
Small scale traders 7.5 (2.2) 7.1 (10.2) 5.7 (2.5) Medium scale traders 16.0 (3.9) 13.1 (18.1) 10.9 (7.6) Big traders (exporters) 37.0 (4.0) 25.3 (22.4) 27.4 (13.9)
Proportion (%) of traders in each category‡
Small scale traders 77 74 65Medium scale traders 20 13 26Big traders (exporters) 3 13 9
† Based on respondents’ own classification which established three categories of livestock traders, start-up capital required to operate in each class and number of animals purchased per trip by traders in each category. Standard deviation in parentheses.
‡ Actual number of animals purchased by respondents per trip over a period of four weeks were averaged and used to derive the real proportion of traders in each category.
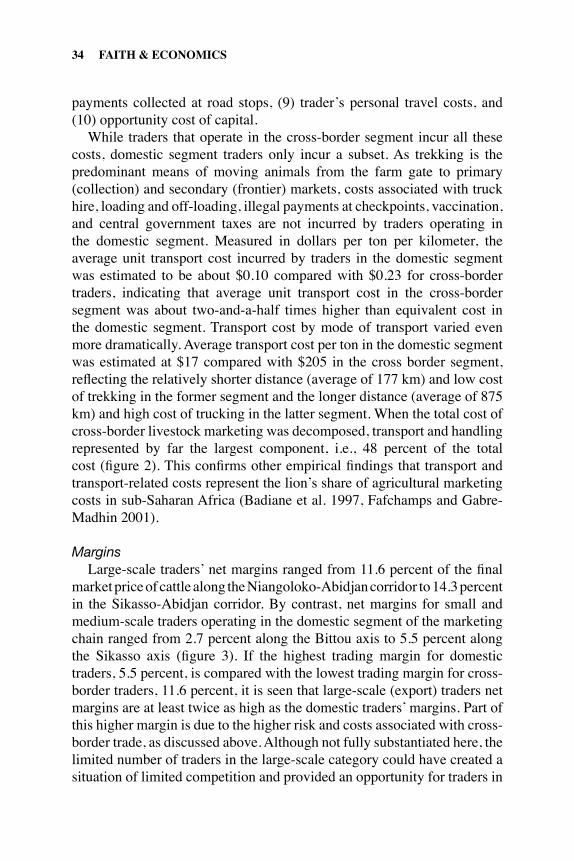
�� FAITH & ECONOMICS
payments collected at road stops, (9) trader’s personal travel costs, and (10) opportunity cost of capital. While traders that operate in the cross-border segment incur all these costs, domestic segment traders only incur a subset. As trekking is the predominant means of moving animals from the farm gate to primary (collection) and secondary (frontier) markets, costs associated with truck hire, loading and off-loading, illegal payments at checkpoints, vaccination, and central government taxes are not incurred by traders operating in the domestic segment. Measured in dollars per ton per kilometer, the average unit transport cost incurred by traders in the domestic segment was estimated to be about $0.10 compared with $0.23 for cross-border traders, indicating that average unit transport cost in the cross-border segment was about two-and-a-half times higher than equivalent cost in the domestic segment. Transport cost by mode of transport varied even more dramatically. Average transport cost per ton in the domestic segment was estimated at $17 compared with $205 in the cross border segment, reflecting the relatively shorter distance (average of 177 km) and low cost of trekking in the former segment and the longer distance (average of 875 km) and high cost of trucking in the latter segment. When the total cost of cross-border livestock marketing was decomposed, transport and handling represented by far the largest component, i.e., 48 percent of the total cost (figure 2). This confirms other empirical findings that transport and transport-related costs represent the lion’s share of agricultural marketing costs in sub-Saharan Africa (Badiane et al. 1997, Fafchamps and Gabre-Madhin 2001).
Margins Large-scale traders’ net margins ranged from 11.6 percent of the final market price of cattle along the Niangoloko-Abidjan corridor to 14.3 percent in the Sikasso-Abidjan corridor. By contrast, net margins for small and medium-scale traders operating in the domestic segment of the marketing chain ranged from 2.7 percent along the Bittou axis to 5.5 percent along the Sikasso axis (figure 3). If the highest trading margin for domestic traders, 5.5 percent, is compared with the lowest trading margin for cross-border traders, 11.6 percent, it is seen that large-scale (export) traders net margins are at least twice as high as the domestic traders’ margins. Part of this higher margin is due to the higher risk and costs associated with cross-border trade, as discussed above. Although not fully substantiated here, the limited number of traders in the large-scale category could have created a situation of limited competition and provided an opportunity for traders in
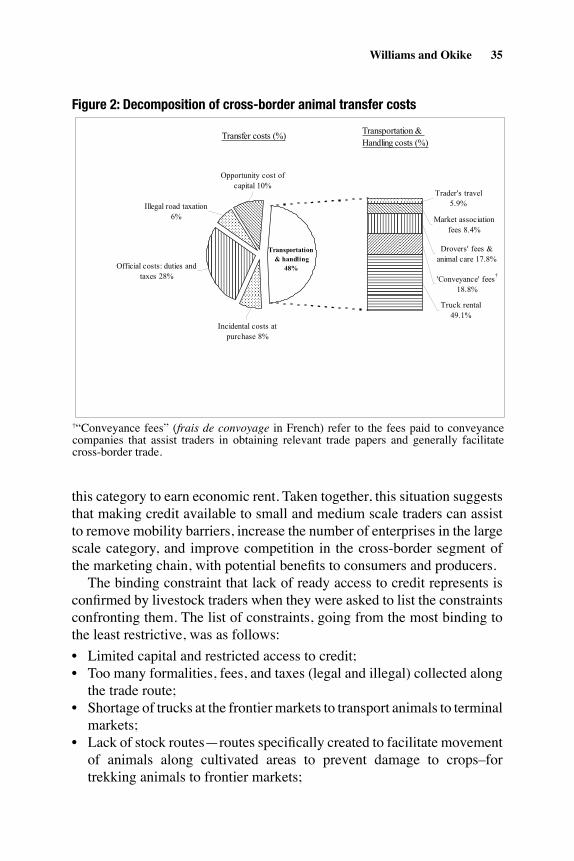
��Williams and Okike
this category to earn economic rent. Taken together, this situation suggests that making credit available to small and medium scale traders can assist to remove mobility barriers, increase the number of enterprises in the large scale category, and improve competition in the cross-border segment of the marketing chain, with potential benefits to consumers and producers. The binding constraint that lack of ready access to credit represents is confirmed by livestock traders when they were asked to list the constraints confronting them. The list of constraints, going from the most binding to the least restrictive, was as follows:• Limited capital and restricted access to credit;• Too many formalities, fees, and taxes (legal and illegal) collected along
the trade route;• Shortage of trucks at the frontier markets to transport animals to terminal
markets;• Lack of stock routes—routes specifically created to facilitate movement
of animals along cultivated areas to prevent damage to crops–for trekking animals to frontier markets;
Figure 2: Decomposition of cross-border animal transfer costs
Transportation & handling
48%
Truck rental 49.1%
'Conveyance' fees†
18.8%
Drovers' fees & animal care 17.8%
Trader's travel 5.9%
Market association fees 8.4%
Illegal road taxation6%
Opportunity cost of capital 10%
Official costs: duties and taxes 28%
Incidental costs at purchase 8%
Transfer costs (%) Transportation & Handling costs (%)
† “Conveyance fees” (frais de convoyage in French) refer to the fees paid to conveyance companies that assist traders in obtaining relevant trade papers and generally facilitate cross-border trade.
Figure 2: Decomposition of cross-border animal transfer costs
†“Conveyance fees” (frais de convoyage in French) refer to the fees paid to conveyance companies that assist traders in obtaining relevant trade papers and generally facilitate cross-border trade.

�� FAITH & ECONOMICS
• Shortage of feed at frontier markets;• System of selling animals on credit to buyers, which lengthens the time
to recover capital outlay;• Lack of security (risk of losing animals and money) along the trade
route.
Conclusions and Policy Options We have provided evidence to demonstrate that poor, small-scale livestock producers and traders in the central corridor of West Africa are not yet fully taking advantage of the opportunities that domestic and regional markets offer, due to a number of constraints facing them. Many of these constraints, some of which we have highlighted, are well known—a shortage of feed resources in the dry season, poor rural access roads, limited financial capital base, and restricted access to commercial finance and high transport costs. Other constraints—the huge differential in the net margins of small-scale and large-scale traders—are less well-appreciated. The persistence and continuing relevance of these constraints poses a serious challenge to policy makers.
Figure 3: Net margins of domestic and cross-border traders by market
Sikasso Bittou Niangoloko
14 .3
11.6
13 .9
5 .5
3 .62 .7
0
2
4
6
8
10
12
14
16
% final cattle price
Domestic traders' margin Export traders' margin
Figure 3: Net margins of domestic and cross-border traders by market
. .
��Williams and Okike
Although information on market preferences appeared to be well transmitted through prices to small-scale livestock producers, they are still largely unable to alter production and marketing decisions to supply in sufficient quantity top quality animals demanded by buyers. The consequence is that they continue to miss out on the market opportunity to earn higher prices and increase profitability and income. Limited personal financial capital and access to external finance, together with a trading system that relied on social networks, prevented small-scale livestock traders from broadening their business activities. At another level, high transport and handling costs and high taxes hindered the performance of large-scale traders engaged in cross-border livestock trade. While further research will certainly be helpful to confirm the results of our analysis and better understand the marketing decisions of producers and traders, the information presented in this paper provides some insight into how livestock producers and traders can be assisted to take advantage of market opportunities. Improvements in rural physical infrastructure, and policy interventions to make credit available to small-scale producers for cattle fattening operations and to small-scale traders to expand their business activities will improve access to markets, promote competition in livestock trading, and ensure rapid response to new market opportunities. Reducing cross-border transport costs through reduction of legal and illegal taxes will improve performance in the cross-border segment of the livestock trade. These measures, apart from enhancing the competitiveness of small-scale livestock producers and traders, will also enable them to improve their income base and will ultimately contribute to poverty reduction. This will bring succor to this group of people, who constitute the most numerous but poorest economic agents in the livestock sector in West Africa.
Endnotes
1 Livestock keepers refer to sedentary pastoralists with livestock rearing backgrounds but who keep relatively smaller herds (compared to full-fledged pastoralists) and no longer practice transhumance. They often engage in part-time farming.
2 Although some of the information collected (e.g., price of animal at point of origin) was based on traders’ recall, the short interval between the actual transaction and the reporting, which was less than a week in all cases, reduces but does not entirely eliminate concern about the reliability of recall data.
Figure 3: Net margins of domestic and cross-border traders by market
Sikasso Bittou Niangoloko
14 .3
11.6
13 .9
5 .5
3 .62 .7
0
2
4
6
8
10
12
14
16
% final cattle price
Domestic traders' margin Export traders' margin
�� FAITH & ECONOMICS
3 We have no reason to believe that the utilized observations are not representative of the entire dataset, but the possibility of selection bias due to the utilization of only a subset of the data should be borne in mind when the results and conclusions are considered.
4 There is a likelihood that the type of buyer and purpose of purchase may correlate with unmeasured features of livestock, i.e., animals purchased for a specific purpose may be systematically different from other animals in a way not captured in the data. Thus, significant differences by type of buyer or by purpose of purchase may reflect unaccounted differences in animals bought.
References
Ariza-Nino, E.J., L. Herman, M. Makinen, and C. Steedman. 1980. Livestock and Meat Marketing in West Africa, Volume I. Synthesis, Upper Volta. Ann Arbor, MI: Center for Research on Economic Development, University of Michigan.
Arnould, E.J. 1985. “Evaluating Regional Economic Development: Results of a Marketing Systems Analysis in Zinder Province, Niger Republic.” Journal of Developing Areas 19: 209–244.
Badiane, O., F. Goletti, M. Kherallah, P. Berry, K. Govindan, P. Gruhn, and M. Mendoza. 1997. Agricultural Input and Output Marketing Reforms in African Countries. Final Donor Report. Washington, DC: International Food Policy Research Institute (IFPRI).
Barrett, C.B. 1997. “Food Marketing Liberalization and Trader Entry: Evidence from Madagascar.” World Development 25: 763–777.
Barrett, C.B., F. Chabari, D. Bailey, P. Little, and L. Coppock. 2003. “Livestock Pricing in the Northern Kenyan Rangelands.” Journal of African Economies 12: 127–155.
Barrett, C.B. and W.K. Luseno. 2004. “Decomposing Producer Price Risk: a Policy Analysis Tool with an Application to Northern Kenyan Livestock Markets.” Food Policy 29: 393–405.
Bauer, P.T. 1965. West African Trade: A Study of Competition, Oligopoly, and Monopoly in a Changing Economy. London: Routledge and K. Paul.
Blench, R., R. Chapman, and T. Slaymaker. 2003. “A Study of the Role of Livestock in Poverty Reduction Strategy Papers.” Pro-Poor Livestock Policy Initiative Working Paper, FAO. Rome.
��Williams and Okike
Caves, R.E. and M.E. Porter. 1977. “From Entry Barriers to Mobility Barriers: Conjectural Decisions and Contrived Deterrence to New Competition.” Quarterly Journal of Economics 91: 241–261.
Clough, P. 1986. “The Social Relations of Grain Marketing in Northern Nigeria.” Review of African Political Economy 34: 16–34.
Delgado, C. and J. Staatz. 1980. Livestock and Meat Marketing in West Africa, Volume III. Ivory Coast and Mali. Ann Arbor, MI: Center for Research on Economic Development, University of Michigan.
Dupire, M. 1962. “Trade and Markets in the Economy of the Nomadic Fulani of Niger (Bororo).” In Markets in Africa, eds. P. Bohannan G. and Dalton, 335–362. Evanston, IL: Northwestern University Press.
Fafchamps, M. 1994. “Industrial Structure and Microenterprises in Africa.” Journal of Developing Areas 29: 1–30.
_____. 2004. Market Institutions in Sub-Saharan Africa: Theory and Evidence. Cambridge, MA: MIT Press.
Fafchamps, M. and S. Gavian. 1996. “The Spatial Integration of Livestock Markets in Niger.” Journal of African Economies 5: 366–405.
_____. 1997. “The Determinants of Livestock Prices in Niger.” Journal of African Economies 6: 255–295.
Fafchamps, M., C. Udry, and K. Czukas. 1998. “Drought and Saving in West Africa: Are Livestock a Buffer Stock?” Journal of Development Economics 55: 273–305.
Fafchamps, M. and E. Gabre-Madhin. 2001. “Agricultural Markets in Benin and Malawi: The Operation and Performance of Traders.” Policy Research Working Paper 2734, World Bank. Washington, DC.
Francis, P. 1990. “Small Ruminant Marketing in Southwest Nigeria.” Agricultural Economics 4: 193–208.
Holtzman, J.S. and N.P. Kulibaba. 1994. “Livestock Marketing in Pastoral Africa: Policies to Increase Competitiveness, Efficiency and Flexibility.” In New Directions in Pastoral Development in Africa: Living with Uncertainty, ed. I. Scoones, 79–94. London: Intermediate Technology Publications Ltd.
Jabbar, M. 1998. “Buyer Preferences for Sheep and Goats in Southern Nigeria: A Hedonic Price Analysis.” Agricultural Economics 18: 21–30.
Kristjanson, P., P.K. Thornton, R.L. Kruska, R.S. Reid, N. Henninger, T.O. Williams, S.A. Tarawali, J. Niezen, and P. Hiernaux. 2004. “Mapping Livestock Systems and Changes to 2050: Implications for
�0 FAITH & ECONOMICS
West Africa.” In Sustainable Crop-Livestock Production for Improved Livelihoods and Natural Resource Management in West Africa, eds. T.O. Williams, S.A. Tarawali, P. Hiernaux, and S. Fernández-Riveria, 19–22. Nairobi, Kenya: International Institute of Tropical Agriculture.
Kates, R. and S. Millman. 1990. “Toward Understanding Hunger.” In Hunger in History, ed. L. Newman, 3–24. Oxford: Basil Blackwell.
Little, P. D. 1992. “Traders, Brokers and Market ‘Crisis’ in Southern Somalia.” Africa 62: 94–124.
Metzel, J., A. Doumbia, L. Diakite, and A.N. Diarra. 1997. Can Mali Increase Red Meat Exports? Prospects for Developing Malian Livestock Exports. Cambridge, MA: Associates for International Resources and Development.
Okediji, F. 1972. An Economic History of Hausa-Fulani Emirates of Northern Nigeria : 1900–1939. Unpublished PhD dissertation. University of Indiana, Bloomington.
Sandford, S. 1983. Management of Pastoral Development in the Third World. Chichester: Wiley.
Scoones, I., ed. 1994. Living With Uncertainty: New Directions in Pastoral Development in Africa. London: Intermediate Technology Publications Ltd.
Thornton, P.K., R.L. Kruska, N. Henninger, P.M. Kristjanson, R.S. Reid, F. Atieno, A. Odero, and T. Ndegwa. 2002. Mapping Poverty and Livestock in the Developing World. Nairobi: International Livestock Research Institute.
Torry, W. 1986. “Economic Development, Drought and Famines.” GeoJournal 12: 5–18.
Turner, M.D. and T.O. Williams. 2002. “Livestock Market Dynamics and Local Vulnerabilities in the Sahel.” World Development 30: 683–705.
Watts, M.J. 1983. Silent Violence: Food, Famine and Peasantry in Northern Nigeria. Berkeley: University of California Press.
Watts, M.J. and H.G. Bohle. 1993. “The Space of Vulnerability: The Causal Structure of Hunger and Famine.” Progress in Human Geography 17: 43–67.
Williams, T.O. 1993. “Livestock Pricing Policy in Sub-Saharan Africa: Objectives, Instruments, and Impact in Five Countries.” Agricultural Economics 8: 139–159.
��Williams and Okike
Williams, T.O., D.A. DeRosa, and O. Badiane. 1995. “Macroeconomic, International Trade and Sectoral Policies in Livestock Development: An Analysis with Particular Reference to Low Income Countries.” In Livestock Development Strategies for Low Income Countries, eds. R.T. Wilson, S. Ehui, and S. Mack, 47–69. Nairobi, Kenya: FAO/ILRI. n
�� FAITH & ECONOMICS
The Dynamics of the Global Fruit and Vegetable Chains: Export-Oriented Agriculture as a Pro-Poor Strategy?Ruerd Ruben, Radboud University, and Koos van Eyk, Wageningen University, The Netherlands
Y
Abstract: Exports of high-value fruits and vegetables are increasingly considered a key strategy for economic development. While favorable climate conditions and low labor costs provide promising opportunities for subcontracting production to developing countries, stable access to markets also depends on options for quality upgrading that determine dynamic comparative advantage. This article addresses the question whether fruit and vegetable exports also have potential as a sustainable pro-poor development strategy. We analyze the trade and value-added structure within global fruit and vegetable chains, focusing attention on the governance regimes and the role of smallholders. After initial growth in market shares, the participation of the least-developed countries decreased in recent years. The replacement of outgrowing arrangements by supply chain coordination with integrated quality management poses major constraints to smallholder involvement, unless specific arrangements are in place. In such more integrated supply chains, cost motives are less relevant while strategic sourcing and functional upgrading become increasingly important. ear-round production possibilities and cost advantages give rise to subcontracting of the production and processing of fruits and vegetables to developing countries (Jaffee 1994, Friedland 1994). Governmental incentives schemes are put in place to stimulate high- value export-oriented fruit and vegetable production, receiving wide support from international donor agencies. Contrary to the neglect of agriculture during the last few decades, agriculture is now considered again as a key sector for economic development (World Bank 2007, Owens and Wood 1997). The particular advantage of high-value export-oriented agriculture is its generation of revenues and employment that is accompanied by spillovers to other sectors. Earlier experiences with staple exports proved to be rather disappointing in this respect. The question is now whether emerging exports of fruit and vegetables have a better potential for generating domestic growth and employment in developing countries. This article analyzes some recent tendencies in trade
Authors’ Note: Ruerd Ruben (email [email protected]) is chair of development studies and director of the Centre for International Development Issues Nijmegen (CIDIN) at Radboud University Nijmegen, The Netherlands. Koos van Eyk is research assistant at the Development Economics Group at Wageningen University, The Netherlands.
© 2007 Association of Christian Economists

��Ruben and van Eyk
flows and distribution of value added within fruit and vegetables (F&V) supply chains. The main attention is given to the organization of the F&V commodity chain, the critical factors underlying competitive advantage, and the opportunities and constraints for equitable participation of poor countries and smallholder producers. Market access and competitiveness are strongly related to the technological, organizational, and managerial options for linking producers with consumers through integrated supply chains and networks (Porter 1990). In a world of constantly changing and increasingly demanding consumer preferences, innovations are required to strengthen the firm’s market position (UNCTAD 2000, Kaplinsky 2000, Gwynne 1999). Upgrading, defined as “the capacity of a firm to innovate to increase the value added of its product and processes” (Giuliani et al. 2005, p. 550), is rapidly becoming a key element in competition. Humphrey and Schmitz (2000) distinguish three alternative pathways for upgrading: (1) process upgrading—transforming inputs into outputs more efficiently by re-organizing the production system; (2) product upgrading—a movement into more sophisticated categories of products; and (3) functional upgrading—the acquisition of new functions, such as design, branding, or marketing. We analyze the existing abilities of and opportunities for smallholders in developing countries to participate in each of these competitive strategies—particularly in the latter, more rewarding pathway of functional upgrading.1 Special attention is given to the role of dynamic partnerships between supply chain agents and changes in governance of supply chains that could give rise to the inclusion or exclusion of rural smallholders. The analysis is based on the Global Commodity Chain (GCC) approach that has been introduced originally by Gereffi and Korzeniewicz (1994) and further elaborated by Gibbon (2001) as a constructive method for creating insight into the possibilities that high-value export agriculture offers to developing countries. GCC analysis is increasingly used as a general method for analyzing vertical relations within value chains, focusing on the growth potential and the distributive implications of vertically integrated F&V commodity chains. The combination of macroeconomic evidence on the evolution of F&V market shares with microeconomic data regarding value added distribution, together with more qualitative information on the changes in production systems and governance regimes, provides a comprehensive picture of the opportunities and constraints for inclusive development.
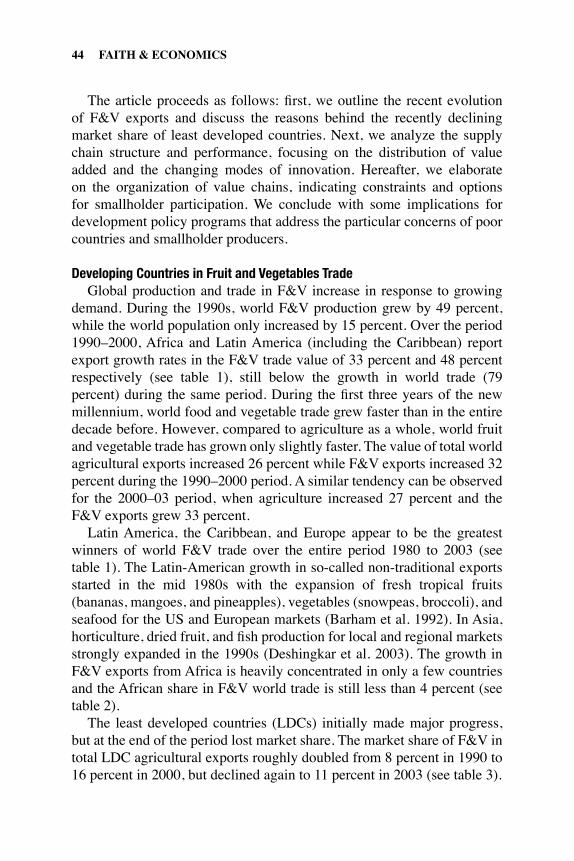
�� FAITH & ECONOMICS
The article proceeds as follows: first, we outline the recent evolution of F&V exports and discuss the reasons behind the recently declining market share of least developed countries. Next, we analyze the supply chain structure and performance, focusing on the distribution of value added and the changing modes of innovation. Hereafter, we elaborate on the organization of value chains, indicating constraints and options for smallholder participation. We conclude with some implications for development policy programs that address the particular concerns of poor countries and smallholder producers.
Developing Countries in Fruit and Vegetables Trade Global production and trade in F&V increase in response to growing demand. During the 1990s, world F&V production grew by 49 percent, while the world population only increased by 15 percent. Over the period 1990–2000, Africa and Latin America (including the Caribbean) report export growth rates in the F&V trade value of 33 percent and 48 percent respectively (see table 1), still below the growth in world trade (79 percent) during the same period. During the first three years of the new millennium, world food and vegetable trade grew faster than in the entire decade before. However, compared to agriculture as a whole, world fruit and vegetable trade has grown only slightly faster. The value of total world agricultural exports increased 26 percent while F&V exports increased 32 percent during the 1990–2000 period. A similar tendency can be observed for the 2000–03 period, when agriculture increased 27 percent and the F&V exports grew 33 percent. Latin America, the Caribbean, and Europe appear to be the greatest winners of world F&V trade over the entire period 1980 to 2003 (see table 1). The Latin-American growth in so-called non-traditional exports started in the mid 1980s with the expansion of fresh tropical fruits (bananas, mangoes, and pineapples), vegetables (snowpeas, broccoli), and seafood for the US and European markets (Barham et al. 1992). In Asia, horticulture, dried fruit, and fish production for local and regional markets strongly expanded in the 1990s (Deshingkar et al. 2003). The growth in F&V exports from Africa is heavily concentrated in only a few countries and the African share in F&V world trade is still less than 4 percent (see table 2). The least developed countries (LDCs) initially made major progress, but at the end of the period lost market share. The market share of F&V in total LDC agricultural exports roughly doubled from 8 percent in 1990 to 16 percent in 2000, but declined again to 11 percent in 2003 (see table 3).
Table 1: Growth rates in fruit and vegetable export value (1980-2003)1)
Year/ Period 1980-1990
1990-2000
2000-2003
1980-2003
Africa 2) 10 33 36 98
Latin America,Caribbean 144 48 19 332
Asia 74 23 27 173
Europe 3) 91 23 49 249
USA 77 48 11 189
World 89 32 33 232
LDCs 47 117 -31 120
Source: FAO Stat and WDI World Export of Goods and Services Notes: 1) FAO commodity code 1189 ;
2) 37 % of exports from South Africa (2003) ; 3) FAO region code 361.
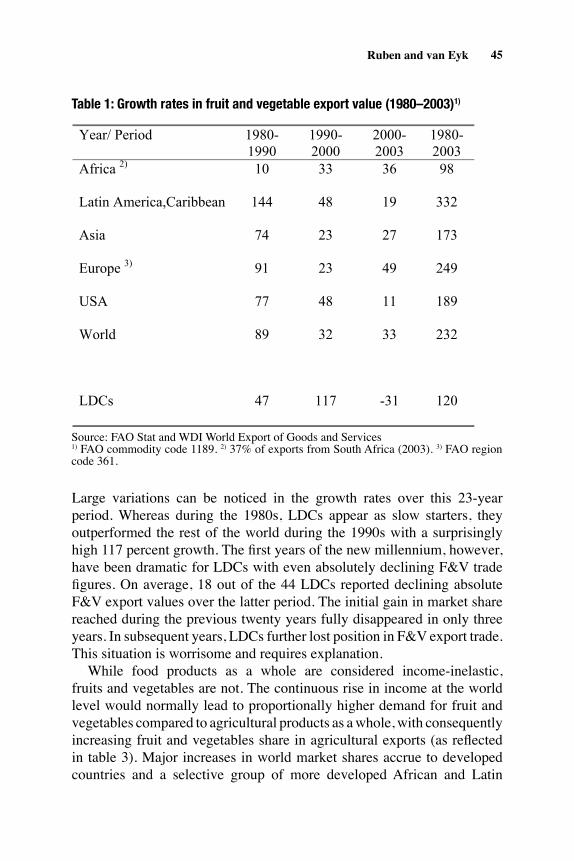
��
Large variations can be noticed in the growth rates over this 23-year period. Whereas during the 1980s, LDCs appear as slow starters, they outperformed the rest of the world during the 1990s with a surprisingly high 117 percent growth. The first years of the new millennium, however, have been dramatic for LDCs with even absolutely declining F&V trade figures. On average, 18 out of the 44 LDCs reported declining absolute F&V export values over the latter period. The initial gain in market share reached during the previous twenty years fully disappeared in only three years. In subsequent years, LDCs further lost position in F&V export trade. This situation is worrisome and requires explanation. While food products as a whole are considered income-inelastic, fruits and vegetables are not. The continuous rise in income at the world level would normally lead to proportionally higher demand for fruit and vegetables compared to agricultural products as a whole, with consequently increasing fruit and vegetables share in agricultural exports (as reflected in table 3). Major increases in world market shares accrue to developed countries and a selective group of more developed African and Latin
Table 1: Growth rates in fruit and vegetable export value (1980-2003)1)
Year/ Period 1980-1990
1990-2000
2000-2003
1980-2003
Africa 2) 10 33 36 98
Latin America,Caribbean 144 48 19 332
Asia 74 23 27 173
Europe 3) 91 23 49 249
USA 77 48 11 189
World 89 32 33 232
LDCs 47 117 -31 120
Source: FAO Stat and WDI World Export of Goods and Services Notes: 1) FAO commodity code 1189 ;
2) 37 % of exports from South Africa (2003) ; 3) FAO region code 361.
Table 1: Growth rates in fruit and vegetable export value (1980–2003)1)
Ruben and van Eyk
Source: FAO Stat and WDI World Export of Goods and Services 1) FAO commodity code 1189. 2) 37% of exports from South Africa (2003). 3) FAO region code 361.
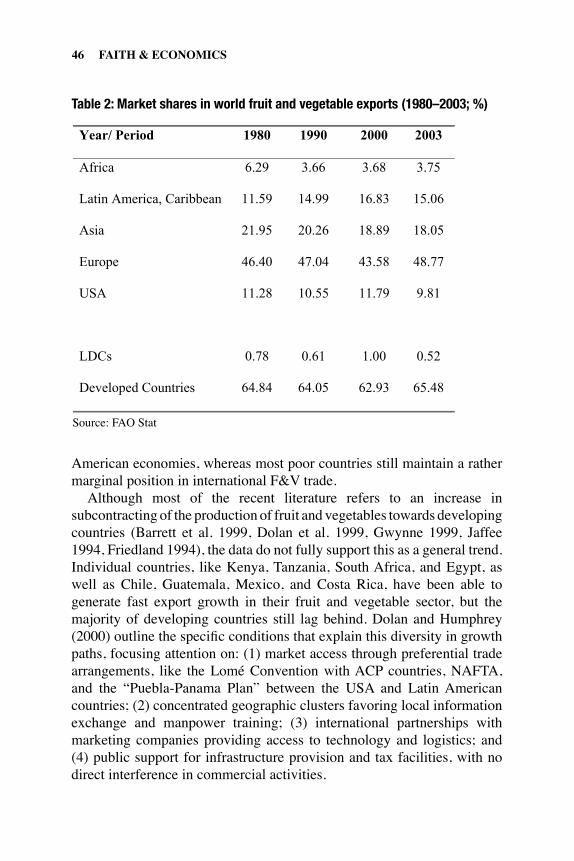
�� FAITH & ECONOMICS
Table 2: Market shares in world fruit and vegetable exports (1980-2003; %)
Year/ Period 1980 1990 2000 2003
Africa 6.29 3.66 3.68 3.75
Latin America, Caribbean 11.59 14.99 16.83 15.06
Asia 21.95 20.26 18.89 18.05
Europe 46.40 47.04 43.58 48.77
USA 11.28 10.55 11.79 9.81
LDCs 0.78 0.61 1.00 0.52
Developed Countries 64.84 64.05 62.93 65.48
Source: FAO Stat
Table 2: Market shares in world fruit and vegetable exports (1980–2003; %)
American economies, whereas most poor countries still maintain a rather marginal position in international F&V trade. Although most of the recent literature refers to an increase in subcontracting of the production of fruit and vegetables towards developing countries (Barrett et al. 1999, Dolan et al. 1999, Gwynne 1999, Jaffee 1994, Friedland 1994), the data do not fully support this as a general trend. Individual countries, like Kenya, Tanzania, South Africa, and Egypt, as well as Chile, Guatemala, Mexico, and Costa Rica, have been able to generate fast export growth in their fruit and vegetable sector, but the majority of developing countries still lag behind. Dolan and Humphrey (2000) outline the specific conditions that explain this diversity in growth paths, focusing attention on: (1) market access through preferential trade arrangements, like the Lomé Convention with ACP countries, NAFTA, and the “Puebla-Panama Plan” between the USA and Latin American countries; (2) concentrated geographic clusters favoring local information exchange and manpower training; (3) international partnerships with marketing companies providing access to technology and logistics; and (4) public support for infrastructure provision and tax facilities, with no direct interference in commercial activities.
Table 3: Share of fruit and vegetables exports in total agricultural export value
Source:
FAO StatYear/ Period 1980 1990 2000 2003
Africa 12.02 15.37 18.00 19.19
Latin America, Caribbean 9.78 21.87 23.15 21.34
Asia 19.61 22.27 19.76 20.25
Europe 13.64 15.12 15.41 17.00
USA 7.1 11.9 14.08 14.14
World 11.54 15.64 16.37 17.20
LDCs 4.71 8.03 16.36 11.41
Developed Countries 10.86 13.81 14.57 15.95Source: FAO Stat
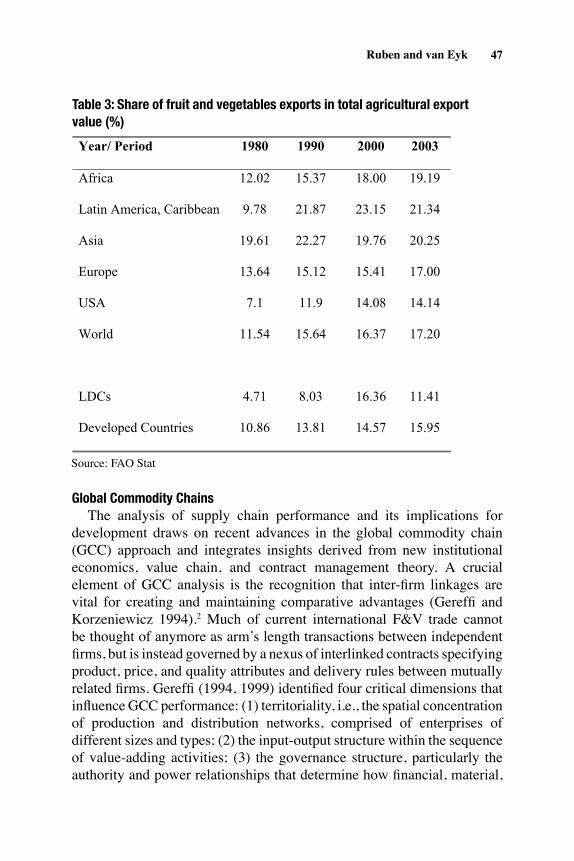
��
Table 2: Market shares in world fruit and vegetable exports (1980-2003; %)
Year/ Period 1980 1990 2000 2003
Africa 6.29 3.66 3.68 3.75
Latin America, Caribbean 11.59 14.99 16.83 15.06
Asia 21.95 20.26 18.89 18.05
Europe 46.40 47.04 43.58 48.77
USA 11.28 10.55 11.79 9.81
LDCs 0.78 0.61 1.00 0.52
Developed Countries 64.84 64.05 62.93 65.48
Source: FAO Stat
Global Commodity Chains The analysis of supply chain performance and its implications for development draws on recent advances in the global commodity chain (GCC) approach and integrates insights derived from new institutional economics, value chain, and contract management theory. A crucial element of GCC analysis is the recognition that inter-firm linkages are vital for creating and maintaining comparative advantages (Gereffi and Korzeniewicz 1994).2 Much of current international F&V trade cannot be thought of anymore as arm’s length transactions between independent firms, but is instead governed by a nexus of interlinked contracts specifying product, price, and quality attributes and delivery rules between mutually related firms. Gereffi (1994, 1999) identified four critical dimensions that influence GCC performance: (1) territoriality, i.e., the spatial concentration of production and distribution networks, comprised of enterprises of different sizes and types; (2) the input-output structure within the sequence of value-adding activities; (3) the governance structure, particularly the authority and power relationships that determine how financial, material,
Table 3: Share of fruit and vegetables exports in total agricultural export value
Source:
FAO StatYear/ Period 1980 1990 2000 2003
Africa 12.02 15.37 18.00 19.19
Latin America, Caribbean 9.78 21.87 23.15 21.34
Asia 19.61 22.27 19.76 20.25
Europe 13.64 15.12 15.41 17.00
USA 7.1 11.9 14.08 14.14
World 11.54 15.64 16.37 17.20
LDCs 4.71 8.03 16.36 11.41
Developed Countries 10.86 13.81 14.57 15.95
Table 3: Share of fruit and vegetables exports in total agricultural export value (%)
Ruben and van Eyk
Source: FAO Stat
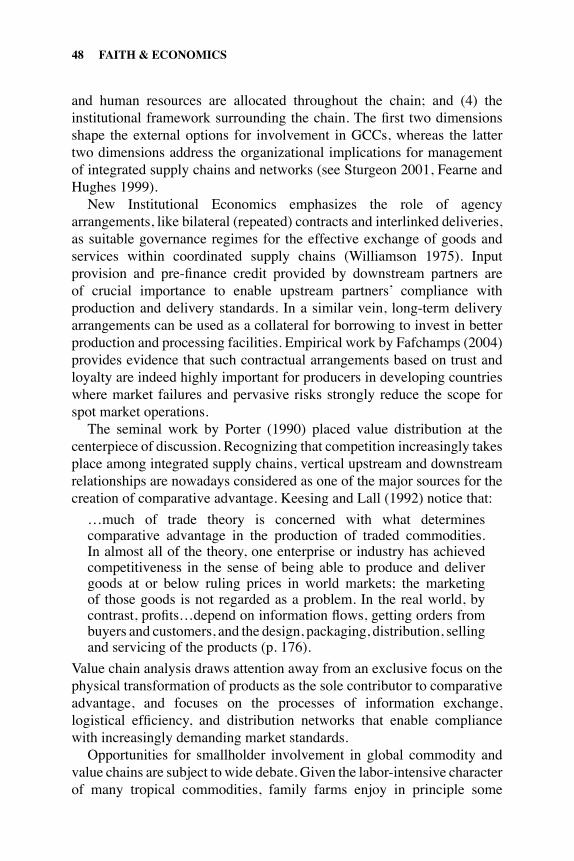
�� FAITH & ECONOMICS
and human resources are allocated throughout the chain; and (4) the institutional framework surrounding the chain. The first two dimensions shape the external options for involvement in GCCs, whereas the latter two dimensions address the organizational implications for management of integrated supply chains and networks (see Sturgeon 2001, Fearne and Hughes 1999). New Institutional Economics emphasizes the role of agency arrangements, like bilateral (repeated) contracts and interlinked deliveries, as suitable governance regimes for the effective exchange of goods and services within coordinated supply chains (Williamson 1975). Input provision and pre-finance credit provided by downstream partners are of crucial importance to enable upstream partners’ compliance with production and delivery standards. In a similar vein, long-term delivery arrangements can be used as a collateral for borrowing to invest in better production and processing facilities. Empirical work by Fafchamps (2004) provides evidence that such contractual arrangements based on trust and loyalty are indeed highly important for producers in developing countries where market failures and pervasive risks strongly reduce the scope for spot market operations. The seminal work by Porter (1990) placed value distribution at the centerpiece of discussion. Recognizing that competition increasingly takes place among integrated supply chains, vertical upstream and downstream relationships are nowadays considered as one of the major sources for the creation of comparative advantage. Keesing and Lall (1992) notice that:
…much of trade theory is concerned with what determines comparative advantage in the production of traded commodities. In almost all of the theory, one enterprise or industry has achieved competitiveness in the sense of being able to produce and deliver goods at or below ruling prices in world markets; the marketing of those goods is not regarded as a problem. In the real world, by contrast, profits…depend on information flows, getting orders from buyers and customers, and the design, packaging, distribution, selling and servicing of the products (p. 176).
Value chain analysis draws attention away from an exclusive focus on the physical transformation of products as the sole contributor to comparative advantage, and focuses on the processes of information exchange, logistical efficiency, and distribution networks that enable compliance with increasingly demanding market standards. Opportunities for smallholder involvement in global commodity and value chains are subject to wide debate. Given the labor-intensive character of many tropical commodities, family farms enjoy in principle some
��
cost advantages. However, in buyer-driven chains where retailers have a predominant position, demands from the product design and marketing stages become increasingly important. Whereas sourcing activities can be easily subcontracted—with the chain leaders focusing on those stages where barriers to entry are high and profits are concentrated—product development and differentiation require further alignment with local producers. The latter process is frequently accompanied with adjustments in sourcing and shifts towards medium-size farmers as preferred suppliers (Reardon and Timmer 2007).
Structure of Fruit and Vegetables Supply Chains Global F&V supply chains include at least five typical agents that fulfill specific functions, namely: (large and small) growers, exporters, international traders, importers, and retailers (see figure 1). In more integrated supply chains, the role of exporters is substantially reduced. In some cases, reported by Barrett et al. (1999), African growers are working directly under contract with importers or retailers from Europe. In other situations, importers still source from exporters, but direct relationships with selected growers are increasingly favored. Supermarkets in the developed world—responding to rising demands for high quality and safe F&Vs—become directly involved in sourcing, tracking, tracing, and product upgrading activities. Traditionally, F&V were a side-activity for supermarkets, but nowadays they occupy a central position in the store. Fresh F&V have become a destination category for which customers are willing to switch stores (Fearne and Hughes 1998). The F&V supply chain can be divided into different core functions that include a number of specific tasks (see table 4). Each of these functions requires a particular technology that changes over time. This also implies that some functions may be shifted to other agents. Depending on the level of supply chain integration, different tasks can be outsourced to upstream partners. The tighter the degree of supply chain coordination, the more advanced tasks can be undertaken upstream. This implies that increasing demands are put on developing country agents to perform food quality and safety control measures and to guarantee continuous sourcing of F&V of a stable and consistent quality. A number of major shifts have recently occurred in the internal organization and the distribution of tasks within F&V supply chains: • Importers and retailers make large efforts to shorten delivery times
(thus extending shelf life), to enhance quality control and surveillance at reduced costs, and to improve the variety in supply of fresh F&Vs;
Ruben and van Eyk
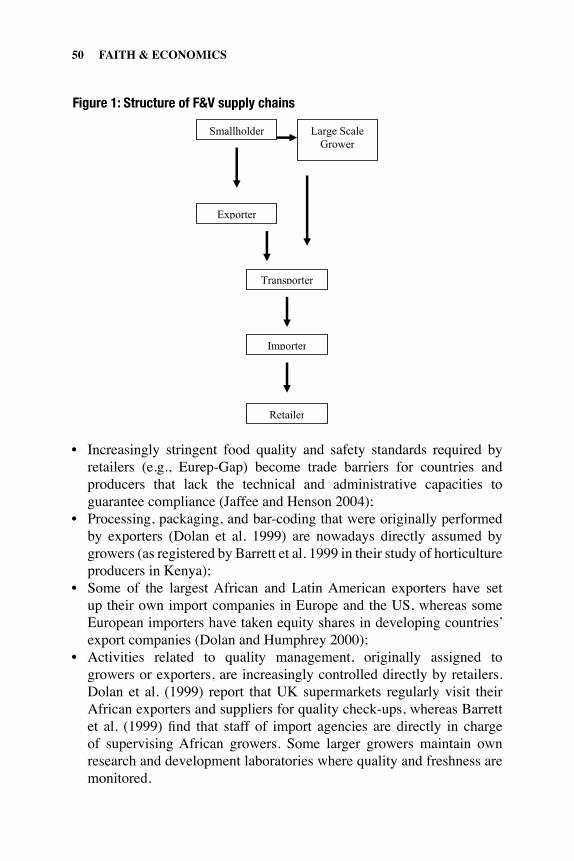
�0 FAITH & ECONOMICS
Figure 1: Structure of F&V supply chains
Exporter
Smallholder Large Scale Grower
Transporter
Importer
Retailer
Figure 1: Structure of F&V supply chains
• Increasingly stringent food quality and safety standards required by retailers (e.g., Eurep-Gap) become trade barriers for countries and producers that lack the technical and administrative capacities to guarantee compliance (Jaffee and Henson 2004);
• Processing, packaging, and bar-coding that were originally performed by exporters (Dolan et al. 1999) are nowadays directly assumed by growers (as registered by Barrett et al. 1999 in their study of horticulture producers in Kenya);
• Some of the largest African and Latin American exporters have set up their own import companies in Europe and the US, whereas some European importers have taken equity shares in developing countries’ export companies (Dolan and Humphrey 2000);
• Activities related to quality management, originally assigned to growers or exporters, are increasingly controlled directly by retailers. Dolan et al. (1999) report that UK supermarkets regularly visit their African exporters and suppliers for quality check-ups, whereas Barrett et al. (1999) find that staff of import agencies are directly in charge of supervising African growers. Some larger growers maintain own research and development laboratories where quality and freshness are monitored.
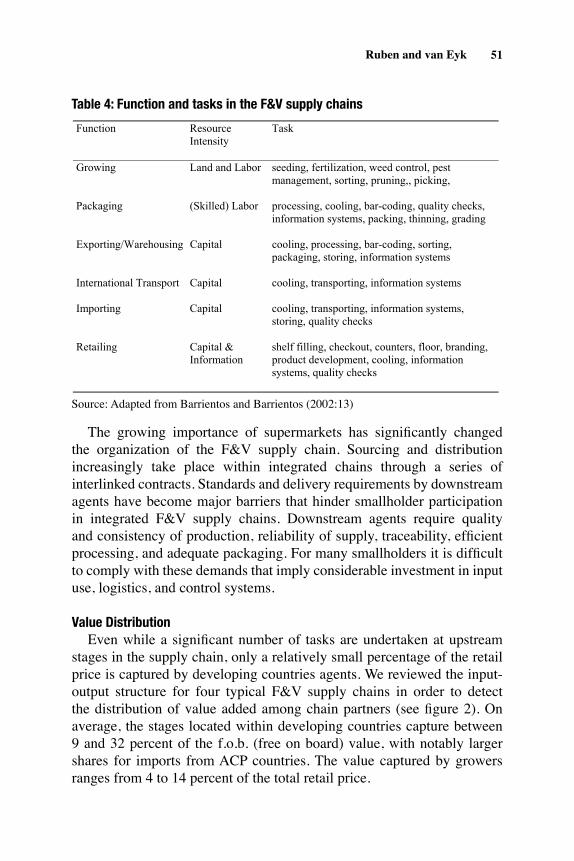
��
The growing importance of supermarkets has significantly changed the organization of the F&V supply chain. Sourcing and distribution increasingly take place within integrated chains through a series of interlinked contracts. Standards and delivery requirements by downstream agents have become major barriers that hinder smallholder participation in integrated F&V supply chains. Downstream agents require quality and consistency of production, reliability of supply, traceability, efficient processing, and adequate packaging. For many smallholders it is difficult to comply with these demands that imply considerable investment in input use, logistics, and control systems.
Value Distribution Even while a significant number of tasks are undertaken at upstream stages in the supply chain, only a relatively small percentage of the retail price is captured by developing countries agents. We reviewed the input-output structure for four typical F&V supply chains in order to detect the distribution of value added among chain partners (see figure 2). On average, the stages located within developing countries capture between 9 and 32 percent of the f.o.b. (free on board) value, with notably larger shares for imports from ACP countries. The value captured by growers ranges from 4 to 14 percent of the total retail price.
Table 4.: Function and tasks in the F&V supply chains
Function ResourceIntensity
Task
Growing Land and Labor seeding, fertilization, weed control, pest management, sorting, pruning,, picking,
Packaging (Skilled) Labor processing, cooling, bar-coding, quality checks, information systems, packing, thinning, grading
Exporting/Warehousing Capital cooling, processing, bar-coding, sorting, packaging, storing, information systems
International Transport Capital cooling, transporting, information systems
Importing Capital cooling, transporting, information systems, storing, quality checks
Retailing Capital &Information
shelf filling, checkout, counters, floor, branding, product development, cooling, information systems, quality checks
Source: Adapted from Barrientos and Barrientos (2002:13)
Table 4: Function and tasks in the F&V supply chains
Source: Adapted from Barrientos and Barrientos (2002:13)
Ruben and van Eyk
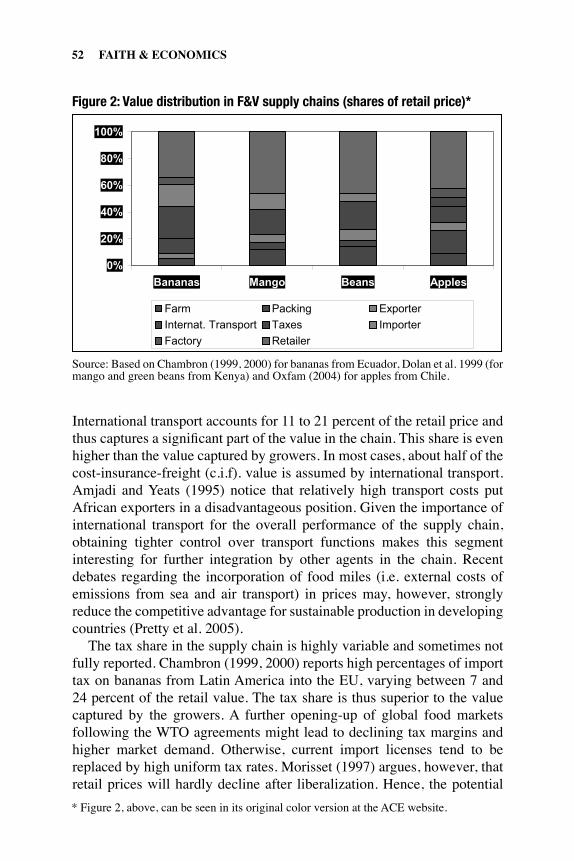
�� FAITH & ECONOMICS
International transport accounts for 11 to 21 percent of the retail price and thus captures a significant part of the value in the chain. This share is even higher than the value captured by growers. In most cases, about half of the cost-insurance-freight (c.i.f). value is assumed by international transport. Amjadi and Yeats (1995) notice that relatively high transport costs put African exporters in a disadvantageous position. Given the importance of international transport for the overall performance of the supply chain, obtaining tighter control over transport functions makes this segment interesting for further integration by other agents in the chain. Recent debates regarding the incorporation of food miles (i.e. external costs of emissions from sea and air transport) in prices may, however, strongly reduce the competitive advantage for sustainable production in developing countries (Pretty et al. 2005). The tax share in the supply chain is highly variable and sometimes not fully reported. Chambron (1999, 2000) reports high percentages of import tax on bananas from Latin America into the EU, varying between 7 and 24 percent of the retail value. The tax share is thus superior to the value captured by the growers. A further opening-up of global food markets following the WTO agreements might lead to declining tax margins and higher market demand. Otherwise, current import licenses tend to be replaced by high uniform tax rates. Morisset (1997) argues, however, that retail prices will hardly decline after liberalization. Hence, the potential
Figure 2: Value distribution in F&V supply chains (shares of retail price)
0%
20%
40%
60%
80%
100%
Bananas Mango Beans Apples
Farm Packing Exporter
Internat. Transport Taxes Importer
Factory Retailer
Source: based on Chambron (1999, 2000) for bananas from Ecuador, Dolan et al 1999 (for mango and green beans from Kenya) and Oxfam (2004) for apples from Chile
Figure 2: Value distribution in F&V supply chains (shares of retail price)*
Source: Based on Chambron (1999, 2000) for bananas from Ecuador, Dolan et al. 1999 (for mango and green beans from Kenya) and Oxfam (2004) for apples from Chile.
* Figure 2, above, can be seen in its original color version at the ACE website.
��
advantages of further liberalization of F&V trade will not necessarily accrue to producers in developing countries. The value captured by importers is subject to much debate. Fair Trade agencies like Max Havelaar argue that 20 percent of the retail value is captured by transnational companies in the form of profits. In addition, they receive part of the factory value. Chambron (1999, 2000), Dolan et al. (1999), and Oxfam (2004) report importers’ margins from 8 to 26 percent. Particularly in this stage of the supply chain, there is wide variation. In the banana chain, importers still play a very dominant role (partly due to their control over import licenses and ripening facilities), while in supply chains of pre-cut and packed vegetables, importers perform few value-adding functions (Barrett et al. 1999). Finally, retailers clearly capture most value in the F&V chain, ranging from 34 to 46 percent of the consumer price. This implies that from every dollar of banana or mango imports, about 40 cents accrues to the retailer. Since retailers also assume significant costs in terms of shelf space, wastage and loss, and non-sales, their net profit margin is about 20 percent (Fisher et al. 2000). Considering the value captured by growers and developing countries as a whole, retailers undoubtedly receive the highest value share in the supply chain. In summary, we note that export-oriented F&V producers in developing countries receive on average about 10 percent of the total value generated throughout the supply chain. This is quite similar to what European F&V producers tend to receive, but is below the share that can be captured from local sales (albeit at a substantially lower market price). This can be partly attributed to the high investment costs for qualifying for deliveries towards international outlets. Direct costs of compliance with Eurep-Gap standards range from 4-10 percent of export value, but intangible costs for accessing information are high. Given the already small margins and high risks involved in the export production, it is rather unlikely that only cost motives could trigger downstream agents to further vertical coordination. Other factors influencing dynamic competitive advantage are therefore far more important to enhance their interest in overall supply chain control.
Governance Regimes The allocation of tasks and the distribution of value added within the F&V chain reflect power relations throughout the chain. Governance regimes shape the abilities of certain agents to control and direct the behavior of other chain partners. We already noticed that F&V supply chains became shorter and increasingly vertically integrated. This integration has
Ruben and van Eyk
�� FAITH & ECONOMICS
developed gradually. During the 1970s and 1980s, the public sector was still considered as the key agent guiding agricultural development in most developing countries. Gradually, however, traders and exporters, followed by processors and retailers, began to integrate the F&V export chain. For tropical commodities such as fruit and vegetables, entire-channel control is required to guarantee efficiency and competitiveness. The perishable character of the commodities, the handling technologies and associated knowledge levels largely invalidate reliance on spot markets. Due to the complexity of securing access to consumer markets in developed countries, importers and retailers exercise control over the whole supply chain (van der Laan 1993). The same holds for the growing internal market for fresh F&V, where national retailers prefer engagements with selective suppliers to guarantee frequency of deliveries and stable quality performance (Ruben et al. 2007, Berdegue et al. 2005). Dolan et al. (1999) notice a similar shift in the governance structure and control relations in F&V chains from importers towards retailers, resulting from the increasing integration of F&V markets. F&V markets used to be fairly fragmented, which gave most power to the importers. With the centralization of the fruit and vegetables trade in the retailing stage, bargaining power has shifted in favor of the supermarkets. European supermarkets, for example, account nowadays for 80 percent of the fresh F&V sales and source about a quarter from African countries (Dolan et al. 1999). Transnational corporations (mainly importers, but some also owning plantations and shipping facilities) still maintain a dominant position in the F&V supply chain, particularly in the fruit trade. In a study of the German banana market, Deodhar and Sheldon (1995) found evidence that leading importers such as United Brands and Del Monte fully control the German banana chain. Their ability to mark up prices above marginal costs sustains this argument. Morisset (1997) estimates that international trading companies have significantly increased their margins during the last twenty-five years, occasioning more than $100 billion a year in losses for exporting countries. Agents that exercise larger governance control thus capture a growing share of the value added created in the supply chain. A major implication of this tendency towards greater vertical coordina-tion is the possible exclusion of smallholders. Even while smallholders still play a dominant role in the production of fruit and vegetables, they find it increasingly difficult to export their produce. In the case of Kenya, Harris (1992) reports that in the early 1990s almost 75 percent of the fruit and vegetables were grown by smallholders. A few years later, Dolan et
��
al. (1999) find that only 18 percent of the exported fruit and vegetables from Kenya to the UK were delivered by smallholders. Dolan and Sutherland (2002) reported an even lower figure of 11 percent in 2001. The marginalization of smallholders is well documented in the literature (Takane 2004, Gwynne and Ortiz 1997, Barrett et al. 1999, Dolan et al. 1999, Dolan and Sutherland 2002), even while some producers remain integrated in the supply chain as subcontractors of large-scale growers or exporters. The tendency towards shorter and more integrated chains may seriously hinder smallholder participation in F&V exports and could eventually lead to the reduction of the supply chain to only two or three main agents. The main competitive advantage of farmers is their ample availability of labor resources. Primary production requires mainly unskilled labor. Due to the outsourcing of more advanced tasks related to quality control and research and development, however, the F&V sector increasingly needs skilled labor. Vertical integration is thus usually accompanied by higher human and financial capital demands and requires competent management skills (van der Meer 2007). Most value is nowadays added beyond the growers’ stage. Customer demands and legal requirements create new and more complex tasks that need to be carried out along the chain. Product differentiation, labeling, as well as tracking and tracing regimes, require large investments in upstream stages of the supply chain. These resources become key in shaping dynamic competitive advantages through long-term relationships between producers and retailers.
Export Agriculture as a Pro-Poor Strategy? What are the prospects for smallholder producers to engage in these rapidly evolving and dynamic F&V supply chains? The trends discussed in this article show a picture of gradual substitution from subcontracting arrangements (initially with low-cost countries and producers) toward strategic sourcing contracts that tend to be far more exclusive and biased in favor of selected countries and types of producers. Given the higher demands for human capital and management skills, many smallholders located in less-developed economies will be unable to comply with the requirements involved in strategic cooperation. Owens and Wood (1997) therefore conclude that industrialization through upgrading of primary products is only possible for countries with a reasonably skilled labor force (mostly in Latin America and Southeast Asia), but is fairly complicated for most African economies. Once F&V chains become more integrated and critical tasks of food quality and safety surveillance are strategically
Ruben and van Eyk
�� FAITH & ECONOMICS
sourced upstream, new barriers for poor countries and resource-poor smallholders located in somewhat better developed countries are imposed. These barriers limit their integration in export-oriented F&V supply chains. Some typical examples of new exclusionary mechanisms within such integrated F&V chain include the following.
• The shortening of supply chains is accompanied by outsourcing of more demanding tasks to upstream agents, such as packaging, bar-coding, processing, and sometimes even research and development for quality control. This form of outsourcing is compulsory for producers that are linked to Western retailers. Growers and processors have to comply with stringent handling requirements set by importers and supermarkets to remain eligible for exports. These requirements of functional upgrading imply that downstream agents put new tasks on the shoulders of their upstream suppliers, and tend to exclude the least qualified agents from access to higher value market segments;
• International demands for more consistent F&V deliveries and reduced post-harvest losses may induce a shift in seed material. This is, for example, the case with pineapple, where many export producers had to replant with MD22 varieties that can be better transported (even while the taste is inferior to the traditional varieties);
• Local changes in procurement systems, toward supply to large regional distribution centers, give priority to producers that are able to maintain pre-scheduled deliveries and sometimes have to organize their own transport facilities;
• Strict compliance (with frequent supervision) of agreed production practices, usually at high costs to guarantee adequate nutrient applications (especially for organic produce that requires much compost and manure) and to avoid excessive pesticide use (to fulfill the norms on maximum residue levels);
• Imposition of stringent quality and safety standards according to uniform rules (Eurep-Gap for retail, FLO for Fair Trade, EKO for ecological agriculture) with direct supervision by private inspection agencies.
All together, these changes tend to increase the requirement for capital- and knowledge-intensity of upstream producers and result in the progressive exclusion of smallholder farms as regular suppliers in high-value F&V chains.
��
Strategic Options Policymakers, business agents, and practitioners involved in market development and smallholder engagement have to face many dilemmas and challenges to overcome the exclusionary mechanisms that seem to be inherent to F&V supply chain integration. We outline some typical roles and functions that can be successfully performed by state, market, and civil society agents to enhance pro-poor supply chain integration. Current state involvement in F&V trade is limited to legal measures for assuring minimum labor standards and food safety grades and standards, as well as fiscal regimes and regulatory measures for opening-up the market to domestic and international actors. In countries such as Ecuador, Panama, and Costa Rica, the government sets minimum producer prices for bananas in order to “protect” domestic producers (UNCTAD 2000). There are, however, significant risks that such interventions introduce unequal competition and cause resistance. A similar attempt by the Panama government in 1992 to increase the minimum wage of plantation workers resulted in a political crisis: the government had to step down after Chiquita threatened to terminate their contact with domestic producers (Chambron 2000). Because of charges of reducing the “freedom of enterprise,” there is a general trend to reduce state interventions. In 1990, the Costa Rican government launched the “Banana Promotion Plan” to attract foreign direct investment by providing international companies ownership rights over land. The seventy percent increase in the value of total exports of bananas during the ten years that followed can be considered an indicator of the success of the Plan.3 In Chile, the “laissez faire” approach of the government with respect to land ownership is said to have contributed positively to economic growth in the agricultural export sector (Gwynne and Ortiz 1997). Whereas governments in some developing countries still tend to protect their smallholders, the before-mentioned countries relied on market liberalization as a driving force towards growth. Although results in terms of growth rates tend to be favorable, the growing exclusion of rural smallholders inevitably leads to larger income inequality. Most governments have found it difficult thus far to develop policies that constructively strengthen the position of domestic agents. The dualistic position of the state, on the one hand trying to protect the weaker parties in the supply chain by imposing minimum wages and codes of conduct (Barrientos and Barrientos 2002), while on the other hand opening-up the market for domestic and international investors, cannot be easily reconciled.
Ruben and van Eyk

�� FAITH & ECONOMICS
Moreover, organization of smallholders is frequently forwarded as a strategy for improving economies of scale and scope in market competition. Takane (2004) reports an attempt made by the Ghanaian government in cooperation with the World Bank to strengthen the position of smallholders for inclusion into pineapple export chains. The creation of Farmapine Ghana Limited, an export cooperative, seemed at first quite effective. The arrangement was able to overcome the usual problems of lack of information and limited uniformity in farming practices. Since costs for input distribution and extension cost were high, farmers associated with Farmapine received 10–20 percent lower prices compared to those paid by commercial exporters, but higher than those paid by local processors and itinerant traders (Takane 2004). Kaplinsky (2000) concludes, therefore, that direct support in terms of human capital training and institutional development (e.g., establishment of farmers’ associations and cooperatives) is required to overcome such initial constraints. International competition also requires that local producers be able to assure quality through tracking and tracing systems. These systems, and other upgrading of production and management, will increase outlays for capital and make that the scarce factor—and the distribution of rents in the supply chain flow toward the scarce factor. Downstream agents could consider providing pre-finance credit or co-investment funds to enable upstream partners to comply with increasingly strict quality and delivery standards. This may have profound implications for the governance structure within the F&V supply chain. In some alternative trade plantations in Ghana (VREL) and South Africa (Zebediela Estates), private capital providers participate as (temporary) shareholders in order to facilitate the farmers learning advanced management processes. Even in such estate-type production systems, major benefits may accrue to poor landless households through increasing local employment and higher wages (Maertens and Swinnen 2006). In some occasions, smallholder producers may have better options when producing for local market outlets. Given the strong growth of internal market outlets for fresh F&V that are increasingly demanded by local supermarket chains (Reardon and Timmer 2007), local sourcing is the best path to procuring fresher produce. The challenging experience of the South African Freshmark company—in charge of sourcing for Shoprite with activities in eleven countries—shows that joint production planning and coordinated deliveries can be maintained with selected smallholders (van Deventer 2006). Key for their success is the availability of pre-investment facilities necessary to enhance the competitiveness of smallholders in F&V supply chains (Page and Slater 2003).
��
Even while recent growth in global F&V trade is impressive, overall growth rates are only slightly higher that those of agriculture as a whole and still lag behind growth rates of world trade in general. It is therefore rather exaggerated to refer to “a booming sector,” even while some countries experienced exceptionally high growth rates. The increased concentration of F&V exports at the global level is paralleled by the growing exclusion of smallholder producers. While delivery contracts provided occasionally a good starting point for entering export markets, maintaining their market share in an era of functional upgrading requires closer alliances and resource-cum-risk sharing partnerships. Where private agents are not capable of bridging these interests, public agencies or voluntary organizations (NGOs) can provide useful support for overcoming the transaction costs involved in the process of functional upgrading.
Endnotes
1 Hvolby et al. (2000) introduce the difference between outsourcing and strategic sourcing, where the former is driven by cost-reduction motives and focused on core competencies, whereas the latter is motivated by the search for optimization of the value chain through innovation transfers and complementarities of functions. Subcontrac-ting is thus mainly based on relational competition and compliance with demands, while under strategic sourcing inter-company interdependencies become stronger and a much greater emphasis is placed on human capital transfers.
2 This marks a clear shift away from neo-classical economic theory where trade between independent countries is considered as source for welfare, independently from social relations between the trading parties.
3 The export value increased from 316.9 million in 1990 to 546.4 million $US in 2000 (FAO Statistics 2005).
References
Amjadi, A. and A.J. Yeats. 1995. “Have Transport Costs Contributed to the Relative Decline of Sub-Saharan African Exports?” Policy Research Working Paper 1559, World Bank. Washington, D.C.
Barham, B., M. Clark, E. Katz, and R. Schurman. 1992. “Nontraditional Agricultural Exports in Latin America.” Latin American Research Review 27 (2): 43–82.
Ruben and van Eyk
�0 FAITH & ECONOMICS
Barrett, H.R., B.W. Ilbery, A.W. Browne, and T. Binns. 1999. “Globalization and the Changing Network of Food Supply: The Importation of Fresh Horticultural Produce from Kenya into the UK.” Trans Institute British Geographers 24: 159–174.
Barrientos, A. and S.W. Barrientos. 2002. “Extending Social Protection to Informal Workers in the Horticulture Global Value Chain.” Social Protection Discussion Paper Series 0216, World Bank. Washington, D.C.
Berdegue, J.A., F. Balsevich, L. Flores and T. Reardon. 2005. “Central American Supermarkets’ Private Standards and Quality and Safety Procurement of Fresh Fruits and Vegetables.” Food Policy 30 (3): 254–269.
Chambron, A.C. 2000. “Straightening the Bent World of Banana.” European Free Trade Association. Brussels.
Chambron, A.C. 1999. Bananas: The Green Gold of the TNCs. London: UK Food Group.
Deodhar, S.Y. and I.M. Sheldon. 1995. “Is Foreign Trade (Im)Perfectly Competitive? An Analysis of the German market for Banana Imports. Journal of Agricultural Economics 46 (3): 336–348.
Deshingkar, D., U. Kulkarni, L. Rao, and S. Rao. 2005. “Changing Food Systems in India: Resource-Sharing and Marketing Arrangements for Vegetable Production in Andhra Pradesh.” Development Policy Review 21 (5–6): 627–639.
Dolan, C.S. and K. Sutherland. 2002. “Gender and Employment in the Kenya Horticulture Value Chain.” Globalisation and Poverty Discussion Paper 8, University of East Anglia. East Anglia, UK.
Dolan, C. and J. Humphrey. 2000. “Governance and Trade in Fresh Vegetables: the Impact of UK Supermarkets on the African Horticulture Industry.” Journal of Development Studies 37 (2): 147–176.
Dolan, D., J. Humphrey, and C. Harris-Pascal. 1999. “Horticulture Commodity Chains: The Impact of the UK Market on the African Fresh Vegetable Industry.” Institute of Development Studies working paper 96, University of Sussex. Sussex, UK.
Fafchamps, M. 2004. Market Institutions in Sub-Saharan Africa: Theory and Evidence. Cambridge, MA: MIT Press.
FAO. 2004. FAOSTAT data. http://faostat.fao.org/ (accessed December 7, 2004).
Fearne, A. and D. Hughes. 1999. “Success Factors in the Fresh Produce Supply Chain: Insights From the UK.” Supply Chain Management 4 (3): 120–131.
��
Fisher, M. L., A. Raman, and A. McClelland. 2000. “Rocket-Science Retailing is Almost Here: Are You Ready?” Harvard Business Review 78(4): 115–124.
Friedland, W. 1994. “The New Globalization: the Case of Fresh Produce.” In From Columbus to Conagra, eds. A. Bonnano et al., 210–238. Lawrence, KS: University Press of Kansas.
Gereffi, G. 1999. “The Organization of Buyer-driven Global Commodity Chains: How US Retailers Shape Overseas Production Networks.” In Commodity Chains and Global Capitalism, eds. G. Gereffi and M. Korzeniewicz, 95–122. Westport, CT: Praeger.
Gereffi, G. and M. Korzeniewicz. 1994. Commodity Chains and Global Capitalism. Westport, CT: Praeger.
Gereffi, G. 1994. “The Organization of Buyer-Driven Global Commodity Chains: How U.S. Retailers Shape Overseas Production Networks.” In Commodity Chains and Global Capitalism, eds. G. Gereffi and M. Korzeniewicx. Westport, CT: Praeger.
Gibbon, P. 2001. “Upgrading Primary Production: A Global Commodity Chain Approach.” World Development 29 (2): 345–363.
Giuliani, E., C. Pietrobelli, and R. Rabellotti. 2005. “Upgrading in Global Value Chains: Lessons from Latin American Clusters.” World Development 33 (4): 549–573.
Gwynne, R.N. 1999. “Globalisation, Commodity Chains and Fruit Exporting Regions in Chile.” Tijdschrift voor Economische en Sociale Geografie 90 (2): 211–225.
Gwynne, R.N. and J. Ortiz. 1997. “Export Growth and Development in Poor Rural Regions: a Meso-Scale Analysis of the Upper Limari.” Bulletin of Latin American Research 16 (1): 25–41.
Harris, S. 1992. “Kenya Horticultural Subsector Survey.” Nairobi: Kenya Export Development Support Project. cited from Dolan and Sutherland (2002).
Humphrey, J. and H. Schmitz. 2000. “Governance and Upgrading: Linking Industrial Cluster and Global Value Chain Research.” Institute of Development Studies Working Paper 120, University of Sussex. Brighton, UK.
Hvolby, H.H., J. Momme, and J. Trienekens. 2000. “Planning and Control in Industrial Networks: An Outsourcing Perspective.” Proceedings of the Third Conference on Stimulating Manufacturing Excellence in Small and Medium Enterprises. Coventry, UK.
Jaffee, S. 1994. “Exporting High-Value Food Commodities: Success Stories from Developing Countries.” Discussion Paper 198, World Bank. Washington, DC.
Ruben and van Eyk
�� FAITH & ECONOMICS
Jaffee, S. and S. Henson. 2004. “Standards and Agro-Food Exports from Developing Countries: Rebalancing the Debate.” Policy Research Working Paper 3348, World Bank. Washington D.C.
Kaplinsky, R. 2000. “Spreading the Gains from Globalization: What Can be Learned from Value Chain Analysis.” Institute of Development Studies Working Paper 110, University of Sussex. Sussex, UK.
Keesing, D. and S. Lall. 1992. “Marketing Manufactured Export from Developing Countries: Learning Sequences and Public Support.” In Trade Policy Industrialization, and Development, New Perspectives, ed. G.K. Helleiner, 176–193. Oxford: Clarendon Press.
Maertens, M. and J.F.M. Swinnen. 2006. “Trade, Standards and Poverty: Evidence from Senegal.” LICOS Discussion Paper 177, Katholieke Universiteit Leuven. Leuven.
Morisset, J. 1997. “Unfair Trade? Empirical Evidence in World Commodity Markets over the Past 25 Years.” Policy Research Working Paper 1815, World Bank. Washington, D.C.
Owens, T. and A. Wood. 1997. “Export Oriented Industrialization through Primary Processing?” World Development 25 (9): 1453–1470.
Oxfam. 2004. Trading Away Our Rights: Women Working in Global Supply Chains. London: Oxfam International.
Page, S. and R. Slater. 2003. “Small Producer Participation in Global Food Systems: Policy Opportunities and Constraints.” Development Policy Review 21 (5–6): 641–654.
Porter, M.E. 1990. The Competitive Advantage of Nations. New York: The Free Press.
Pretty, J.N., A.S. Ball, T. Lang, and J.I.L. Morison. 2005. “Farm Costs and Food Miles: An Assessment of the Full Cost of the UK Weekly Food Basket.” Food Policy 30 (1): 1–19.
Reardon, T. and C.P. Timmer. 2007. “Transformation of Markets for Agricultural Output in Developing Countries since 1950: How has Thinking Changed?” In Handbook of Agricultural Economics, Vol. 3A, eds. R. Evenson and P. Pingali. Amsterdam: Elsevier Press.
Ruben, R., M. van Boekel, A. van Tilburg, and J. Trienekens. 2007. Tropical Food Chains: Governance Regimes for Quality Management. Wageningen: Wageningen Academic Publishers.
Sturgeon, T. J. 2001. “How Do We Define Value Chains and Production Networks?” IDS Bulletin 32 (3): 1–10.
Takane, T. 2004. “Smallholders and Non-traditional Exports Under Economic Liberalization: The Case of Pineapples in Ghana.” African Study Monographs 25 (1): 29–43.

��
UNCTAD. 2000. “Strategies for Diversification and Adding Value to Food Exports: A Value Chain Perspective.” Geneva: United Nations Conference on Trade and Development.
Van Deventer, J. 2006. “Vegetables Sourcing in Africa: The Experience of Freshmark.” In Agro-food Chains and Networks for Development, eds. R. Ruben, M. Slingerland, and H. Nijhoff, 57–62. Dordrecht: Springer.
Van der Laan, H.L. 1993. “Boosting Agricultural Export? A Marketing Channel Perspective on an African Dilemma.” African Affairs 92: 173–201.
Van der Meer, K. 2007. “Building Capacity for Compliance with Evolving Food Safety and Agricultural Health Standards.” In Global Supply Chains, Standards and the Poor, ed. J.F.M. Swinnen, 281–294. Wallingford: CAB International.
Williamson, O.E. 1975. Markets and Hierarchies: Analysis and Anti-Trust Implications. New York: Free Press.
World Bank. 2007. World Development Report 2008: Agriculture for Development. Washington D.C.: World Bank. n
Ruben and van Eyk
�� FAITH & ECONOMICS
Market Participation by Rural Households in a Low-Income Country: An Asset-Based Approach Applied to MozambiqueDuncan Boughton, David Mather, Christopher B. Barrett, Rui Benfica, Danilo Abdula, David Tschirley, and Benedito Cunguara
Abstract: The transformation from a subsistence-oriented agricultural sector to one where farmers are integrated into product, input, and service markets is at the heart of many poverty reduction strategies. But this transformation is occurring painfully slowly in Africa. To speed up the process, significant investments are being made in public goods such as roads and market information to promote farmer-to-market linkages. This paper examines the relationship between assets and market access for different types of crop market in Mozambique using a Heckman two-stage regression model and data from a nationally representative rural household survey conducted in 2002. Evidence of increasing returns to household assets in all crop market types is explored further using a non-parametric approach. The evidence indicates that only a small proportion of Mozambican smallholders currently have a sufficient asset base to participate profitably in crop markets. We conclude that while investment in public goods is a necessary condition for transformation to occur, attention must also be given to facilitate growth in household assets.
arket participation is both a cause and a consequence of economic development. Markets offer households the opportunity to specialize according to comparative advantage and thereby enjoy welfare gains from trade. Recognition of the potential of markets as engines of economic development and structural transformation gave rise to a market-led paradigm of agricultural development during the 1980s (Reardon and Timmer 2006) that was
Authors’ Note: Duncan Boughton is Associate Professor of International Development, Department of Agricultural Economics, Michigan State University; David Mather is an Agricultural Economist and private consultant; Christopher B. Barrett is International Professor, Department of Applied Economics and Management, Cornell University; David Tschirley is Professor of International Development, Department of Agricultural Economics, Michigan State University; Rui Benfica is Poverty Economist, World Bank Country Mission in Mozambique; Danilo Abdula is a Policy Advisor with the Ministry of Agriculture, Mozambique; Benedito Cunguara is a Graduate Research Assistant, Department of Agricultural Economics, Michigan State University. The authors gratefully acknowledge the financial support of the United States Agency for International Development through the Food Security III Cooperative Agreement, the Calvin College Seminars in Christian Scholarship Program, and the valuable comments of two anonymous referees.© 2007 Association of Christian Economists
M
��
accompanied by widespread promotion of market liberalization policy agendas in Sub-Saharan Africa (SSA) and other low-income regions. Furthermore, as households’ disposable income increases, so does demand for variety in goods and services, thereby inducing increased demand-side market participation, which further increases the demand for cash and thus supply-side market participation. The standard process of agrarian and rural transformation thus involves households’ transition from a subsistence mode, where most inputs are provided and most outputs consumed internally, to a market engagement mode, with inputs and products increasingly purchased and sold off the farm (Timmer 1988, Staatz 1994). Despite two decades of experience with market liberalization in SSA, structural transformation is progressing agonizingly slowly and with very unequal distribution of the limited welfare gains (Barrett et al. 2007). Part of this appears due to sharp differences in the apparent returns to participation in different markets, differentiated by commodity, function (e.g., storage, transport, retailing), and barriers to entry (Barrett 1997, Barrett et al. 2005, Haggblade et al. 2005). Individual household members, if not entire households, often move out of agriculture altogether rather than move from subsistence agriculture to commercialized agriculture (Mazumdar 1987, Lucas 1994). But with rapid outmigration, urban areas may not be able to provide adequate employment or social services fast enough to support their rapidly growing unskilled labor forces, with the risk of increasing urban (absolute, as well as relative to rural) poverty and squalor. Since investments in services to encourage people to remain in rural areas often meet with at best partial success, the identification of ways to increase the returns to agriculture through market participation, and thereby provide incentives for more households to remain in rural areas while their children build up the necessary human capital to facilitate a socially viable transition into other sectors, is a research challenge of critical importance. This paper explores patterns of household agricultural market participation in Mozambique, a country at an early stage in the structural transformation of its rural economy. We take an asset-based approach, hypothesizing that household participation in crop markets will be associated with asset endowments, and that participation in higher return markets may require different asset portfolios (amount and types of asset) than does participation in less remunerative markets. Toward that end, we study three distinct types of crop market: (1) spot markets for a basic food staple, maize (characterized by low barriers to entry, high transactions costs
Boughton et al.
�� FAITH & ECONOMICS
and low returns); (2) contract production of a relatively undifferentiated commodity—cotton—for a known buyer (characterized by potential barriers to entry, moderate risk of financial loss, low transactions costs); and (3) contract production of a quality-differentiated product, tobacco (similar characteristics to (2) but with higher potential financial returns and risk). Since endogeneity is an intrinsic problem when studying the relationships between assets and market participation we cannot infer causality. But if asset stocks are strongly associated with smallholder market entry, especially into more remunerative markets, this carries potentially important implications for governments and their private sector, civil society, and donor partners who make investments and design programs that seek to increase smallholder market participation. Simply put, if the asset-poor are unlikely to participate actively in commercial markets, especially contract markets which offer greater expected returns, then efforts to stimulate increased smallholder agricultural commercialization may fail without complementary efforts to increase household wealth. Our study adds to a small but growing literature that raises this possibility (Cadot et al. 2006, Barrett 2007). The paper’s principal finding is that private household assets, especially land, but also livestock, labor and equipment, are strongly positively associated with crop market participation. Furthermore, earnings increase at a sharply increasing rate as one moves into the upper tail of the land distribution in Mozambique, for all crops, not just cash crops. Another important finding is that, while public goods such as infrastructure and market information are positively correlated with cash crop market participation, private asset holdings are even more strongly correlated. In contrast to cash crops, public goods are surprisingly insignificantly correlated with maize market participation. While the nature of the data limit the inferences one can make, these findings are consistent with recent evidence from Madagascar (Cadot et al. 2006) that private asset accumulation may be a prerequisite for smallholders’ escape from subsistence production. Furthermore, female-headed households appear to be at significant risk of exclusion from cash crop contract farming opportunities even when controlling for differences in asset endowments, signaling that there are more than mere wealth barriers to taking advantage of the opportunities afforded by liberalized agricultural markets. Three important policy and policy research implications arise from these findings. First, more attention needs to be given to policies and programs that address missing rural financial markets and other factors, such as limited access to animal traction, that seem to constrain smallholder private
��Boughton et al.
asset accumulation. Second, investments in roads and market information to improve crop market access for smallholders may not be sufficient by themselves to result in broad-based increases in crop market participation at this early stage of Mozambique’s smallholder agricultural development. However, increased investment in the complementary public good of agricultural research may be very important to raise crop productivity and thereby reduce minimum asset thresholds for crop market participation. This is an important hypothesis that is not presently testable given available data. Finally, given the importance of land access and utilization for crop market participation and the difficulty of changing the institutions that govern smallholders’ land access, not all smallholders are likely to be commercially viable in the short to medium term (Carrillho et al. 2003).1 For those households that cannot build the necessary asset portfolios to escape poverty through crop market participation, there will need to be policies and programs that enable more remunerative household participation in off-farm labor markets and non-farm entrepreneurial opportunities. The rest of the paper is organized as follows. The next section reviews the relevant literature that guides the conceptual framework presented in section 2. Sections 3 and 4 present empirical results. The final section identifies, within the limits of the data, implications for development policy and programs, as well as for future research.
1 Literature Review In this section we review three recent strands in the literature concerned with the determinants of market participation and poverty. Although private asset holdings have been recognized as a key determinant of market participation or exclusion, systematic assessment of the relationship between household asset portfolios and participation in different types of product market is an under-explored seam of policy-relevant knowledge. Our purpose here is not to attempt an exhaustive review, but rather to inform the conceptual framework and choice of econometric model for an asset-based approach to understanding market participation by smallholders that can address this gap in the literature. The first and historically richest strand of literature concerns the determinants of small farmer participation in markets in semi-subsistence agrarian economies. This strand has focused primarily on (1) understanding the role of transactions costs and market failure in smallholder decision making and (2) resolving the econometric challenges to testing hypotheses concerning smallholder market participation in the presence of possible selection bias. Landmark theoretical contributions by de Janvry et al.
�� FAITH & ECONOMICS
(1991) and Fafchamps (1992) develop formal household models to explain low smallholder supply response in the presence of food or labor market failure. A key conclusion of their work, empirically confirmed in a range of situations by von Braun et al. (1989), is that low productivity in food crop production, in the presence of food market failure, is a constraint to participation in cash crop markets. A corollary of this is that a wide spread between food purchase and sale prices makes cash crops relatively more profitable for net food sellers than net food buyers (Jayne 1994). Thus if net marketable food surplus is causally related to household endowments of productive assets such as land and labor, better endowed households should be more likely than poorer households to participate in cash crop markets because the returns to cash crops are then directly related to household endowments (e.g., land, livestock) that typically have a strong, positive effect on the likelihood of being a net seller of basic staples (Barrett and Dorosh 1996). Empirical analysis of the determinants of smallholder market participation has to deal with the econometric hazard of selection bias (Heckman 1979). The problem arises because households (or individuals) face different types of decisions in relation to market participation—a discrete decision over whether or not to participate in a given market as either a buyer or a seller, and a continuous decision as to how much to buy or sell conditional on market participation. Variables affecting the latter, continuous decision may affect the discrete participation decision while some factors—e.g., fixed costs of market participation due to transport costs or vendor license fees—that affect the discrete participation decision will not, in theory at least, affect the continuous decision. If unobserved preferences (e.g., risk aversion) or characteristics (e.g., liquidity constraints) affect both decisions, then regression estimates of the continuous choice will yield biased estimates absent correction for the first-stage participation choice. To avoid the potential problem of selection bias, Goetz (1992) first estimated a reduced form probit model of market participation (as either buyer or seller) and then an endogenous switching regression model of purchase/sales behavior allowing for households to select themselves into buying and/or selling states. An alternative approach used by Key et al. (2000) estimates the structural supply functions and production threshold functions based on a censoring model with an unobserved censoring threshold. Either of these approaches allows for market nonparticipation without conflating the participation decision with the continuous decision of sales (or purchase) volume conditional on participation. They differ, however, as to whether households make simultaneous participation and
��
volume decisions—which might imply they are vulnerable to exploitation by traders—or if they make these decisions sequentially. Bellemare and Barrett (2006) offer a general model and corresponding econometric method that enables testing between these competing formulations. Two recent studies of smallholder market participation in Mozambique are Heltberg and Tarp (2002) and Benfica et al. (2006). Heltberg and Tarp (2002) use Goetz’s approach to estimate reduced form equations for market participation and value sold of food crops (as a group), cash crops (as a group), and total value of crops sales, using data from a 1996-97 Living Standards Measurement Survey (LSMS). Factors significantly affecting market participation included farm size per household worker, animal traction, mean maize yield, age of household head, climatic risk, transport ownership, and infrastructure. Explaining variation in the value of sales for food crops or cash crops was much less conclusive, and the authors recognize that aggregation of sales into food or cash crop groups may mask underlying causal mechanisms related to individual crop decisions. Benfica et al. (2006) use the same approach to investigate the determinants of participation of cotton and tobacco contract farmers in the Zambezi valley of Mozambique, and test for the existence of threshold effects in land holdings and educational attainment on smallholder earnings from tobacco. Participation in contract farming schemes was statistically significantly linked to household factor endowments and alternative income opportunities. A second strand of the literature on smallholder market participation relates to contract farming schemes. Dorward et al. (1998) provide a comprehensive conceptual framework and set of empirical studies on the motivation and performance of interlocked credit and output markets as an induced institutional innovation in response to widespread rural financial market failure following market liberalization in SSA. Benfica et al. (2002) provide a similar conceptual framework and analysis for recent agro-industrial investments in Mozambique. Two important distinctions affecting farmer participation in interlinked credit and output markets that emerge from this research are: 1) the potential for involuntary exclusion of smallholders from participation in contract schemes; and 2) the potential for monopsony power on the part of a buyer in return for access to technology (inputs, credit and extension), resulting in lower financial returns and increased risk of financial loss for farmers. A key criterion for selection into contract farming schemes is whether a grower can signal the availability of complementary production assets to enable effective use of expensive inputs.2
Boughton et al.
�0 FAITH & ECONOMICS
The same concerns about exclusion have been raised about the rapid expansion of Foreign Direct Investment (FDI) in integrated value chains that are often, but not exclusively, driven by supermarkets and urbanization (Reardon and Barrett 2000, Reardon and Timmer 2005). The apparent exclusionary effects of FDI in integrated value chains implies that innovation in marketing channels does not necessarily resolve problems of market access for poorer farmers; obstacles can arise from economies of scale in production, since the fewer the number of producers needed to supply the chain the lower the transaction costs for the buyer. Or quality control requirements may require sunk costs beyond the reach of poorer suppliers. A third strand of the literature relevant to smallholder market participation is the recent literature on poverty dynamics and poverty traps related to minimum asset thresholds. Carter and Barrett (2006) lay out the conceptual foundations for a dynamic asset poverty threshold that potentially separates those able to rise above the asset threshold and escape poverty from those caught in a low-level equilibrium, a “poverty trap.” While examples of such poverty traps in agricultural systems are many and diverse, the interaction of markets and assets is often a common thread among them. In highly populated and land-scarce western Kenya, for example, farmers who have sufficient assets to be able to invest in tea as a cash crop are able to finance fertilizer to maintain soil fertility on their maize fields. But tea is a perennial that takes several growing seasons to become productive. Those farmers who cannot afford to forego income from the land tea occupies until the tea bushes reach maturity find themselves in a downward spiral of soil nutrient depletion, with maize yields declining over time (Barrett et al. 2006). A different type of poverty trap emerges in Madagascar, where a high proportion of poor rural households have to sell rice at low prices soon after harvest, only to purchase again later at much higher prices, due to lack of access to secure storage and credit in rural areas (Barrett 1996, Barrett et al. 2006, Moser et al. 2006), and where remunerative technologies do not get adopted by poorer farmers who lack adequate assets to self-provision for a few months, and who cannot take on the added risk associated with increased expected yields of nearly 80 percent (Moser and Barrett 2006). Another example of a poverty trap is the vicious cycle of forced ganyu labor in Malawi (Dorward et al. 2004). The majority of rural households in Malawi lack sufficient land and capital to produce and/or store enough maize to see them through the hungry season. Since the hungry season coincides with the growing season, food-insecure households must divert
��
labor from their own production to work for the minority of households willing and able to hire them in return for food. The system is self-perpetuating as the same households find themselves food insecure in the next hungry season as a result of neglect of their maize fields. Despite recognition in the recent literature of the potential role of minimum asset thresholds to escape from poverty, and the recognition that lack of assets may result in the exclusion of smallholders from new, remunerative market opportunities, such as contract production of high-value crops, little research has explicitly and systematically explored the relationship between smallholder asset portfolios and participation in different types of markets. In the next section we lay out a conceptual approach to the relationships between different asset portfolios and the ability of households to generate earnings from participation in different types of crop market, and then formulate specific questions to be explored in the subsequent empirical section using recent data from Mozambique.
2 Conceptual Framework and Empirical Questions A simple model of household choice captures the core issues surrounding the impact of asset endowments on market participation. Consider a household that maximizes its utility, defined over consumption of a staple food, s, and a Hicksian composite of other tradables, x. It earns income from production, and possibly sale, of any or all of three crops—the staple and two cash crops, c1 and c2, respectively—and from off-farm sources, Y, which could be earned or unearned. Production of each crop is a function of flows of services provided by privately held quasi-fixed assets, including land, labor (both quantity and quality, as reflected in education and experience), livestock and other productive capital (e.g., irrigation, tractor), reflected in the vector A. Public goods and services, such as extension services and farmer associations that provide information or inputs, represented by the vector G, may likewise affect output. The focus of this paper is the farmer’s choice as to whether or not to participate in crop markets as a seller. We represent that choice by the indicator variable M, which takes value one if the household enters the market for a crop, and zero otherwise. Thus Mss=1 if the household sells the staple crop (=0 if it does not), Msb=1 if the household buys the staple crop, Mc1=1 if the household sells the first cash crop, and Mc2=1 if the household sells the second cash crop.3 These choices will be guided by net returns to market participation. Each household faces a parametric market price for each crop—psm, pc1m, and pc2m, respectively—and transactions costs τ(Z,A,G,Y) that may depend on both public goods and services G
Boughton et al.
�� FAITH & ECONOMICS
(e.g., radio broadcast of prices that affects search costs, extension service information on crop marketing strategies, distance to market), household-specific characteristics reflected in the vector Z (e.g., educational attainment, gender, age, all of which might affect search costs, negotiating skills, etc.), its assets A, and liquidity Y. We can represent the household’s choice problem as follows:
subject to a cash budget constraint
and an asset allocation constraintA = As + Ac1 + Ac2,and with the staple price determined by the household’s net market position:
where pa is the autarkic (i.e., non-tradable) shadow price that exactly equates household demand and supply. Note that the transactions costs of market participation create a kinked price schedule reflecting the price band defined by market prices plus and minus those costs, reflecting the net prices for buyers and sellers, respectively (de Janvry et al. 1991). Solving the resulting optimization problem therefore requires evaluating the utility function under the optimal choices prevailing at the autarkic, buyer and seller prices under each of the twelve feasible combinations of Mss, Msb, Mc1, and Mc2. Based on the structural model above, each of the choice variables can be represented in reduced form as a function of the exogenous variables A, G, Z, Y, psm, pc1m, and pc2m.4 The question of interest to us is how participation in crop sales markets varies with private assets A and public goods and services G, so as to address the core policy questions: (1) whether market access depends fundamentally on households’ initial endowments, in which case market-based development strategies may favor initially wealthier households unless policy interventions simultaneously or previously provide asset transfers to poorer households, and (2) whether one can reasonably expect increased smallholder market participation on the basis of increased provision of public goods and services, so that even
pxx + (Msb + Mss)ps*s = (Msb + Mss)ps*fs (As,G) + Mci pci fci (Aci,G) + Y∑2
i=1
ps* = psm + τ(Z,A,G,Y) if s < fs
ps* = psm - τ(Z,A,G,Y) if s < fs
and ps* = pa if s = f
Max U (s,x)Mi,s,x,Ai
��
those with meager initial private asset endowments can be drawn into the market through improved public goods provision. We might expect that the costs and returns of market participation, and thus the marginal response of participation and sales volumes to household asset endowments, to vary by market types. Smallholder farmers in SSA are primarily involved in two types of market: spot markets and markets for which credit and output markets are linked through some form of contract. Spot markets involve no contractual obligations prior to or after sale of a commodity, and generally have few requirements in relation to quality or quantity. The flexibility of such markets implies low barriers to entry, but also high transactions costs due to search and, because of uncertainty related to quantity and quality, the need for buyers to inspect individual lots. The combination of high transactions costs and low barriers to entry often implies low unit returns for smallholders. Contract markets for crops in SSA have arisen primarily as a response to rural credit and input market failures rather than in response to transactions costs arising from uncertain quantities and/or quality. Consequently, input provision on credit is typically linked to purchase of output under monopsony conditions enforced by private contracts, market regulation, or both. The provision of inputs to smallholder growers on credit by the product buyer is motivated by buyers’ investments in dedicated fixed assets and/or contract obligations that necessitate reliable access to raw material, often meeting a minimum quality standard. The need for the product buyer to ensure that costly inputs are well used by growers results in barriers to entry for smallholders. Those lacking requisite complementary inputs—adequate land, human capital, irrigation, machinery, etc.—may be poor risks for buyers. Contract markets can be further differentiated by quality requirements and other marketing conditions that may further increase the potential returns, but also increase the risk of financial loss for smallholders who participate. We hypothesize that the need for smallholders to overcome the barriers to entry in contract markets, and to manage the risk associated with quality-differentiated products, may imply a different portfolio or scale of assets than that required for participation in spot markets. In the next section we explore the extent to which smallholder participation in different crop markets is associated with different asset holdings using data on rural household participation in three crop markets in Mozambique. Mozambique is relevant for four key reasons: (1) it is a highly liberalized market economy with minimal government intervention in markets and few market distortions compared to other countries in the region; (2) income from crop production represents 80 percent of total
Boughton et al.
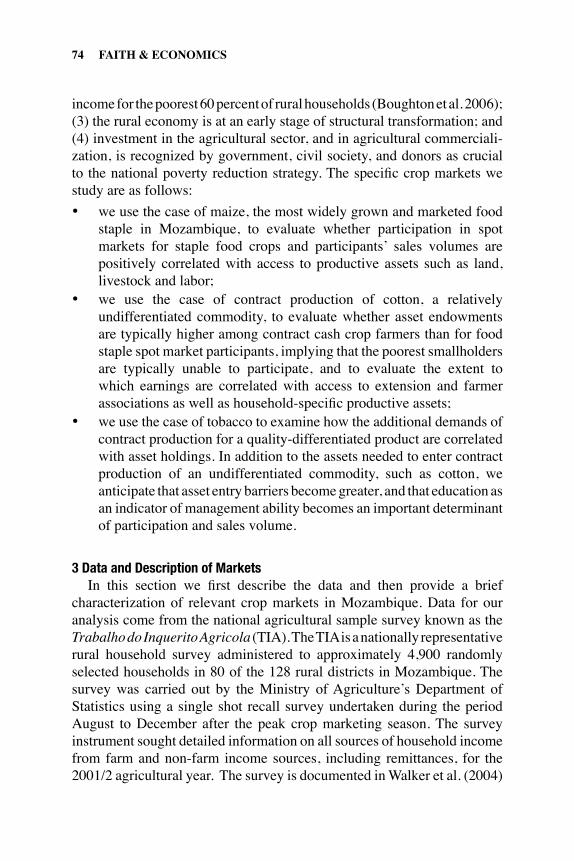
�� FAITH & ECONOMICS
income for the poorest 60 percent of rural households (Boughton et al. 2006); (3) the rural economy is at an early stage of structural transformation; and(4) investment in the agricultural sector, and in agricultural commerciali-zation, is recognized by government, civil society, and donors as crucial to the national poverty reduction strategy. The specific crop markets we study are as follows:• we use the case of maize, the most widely grown and marketed food
staple in Mozambique, to evaluate whether participation in spot markets for staple food crops and participants’ sales volumes are positively correlated with access to productive assets such as land, livestock and labor;
• we use the case of contract production of cotton, a relatively undifferentiated commodity, to evaluate whether asset endowments are typically higher among contract cash crop farmers than for food staple spot market participants, implying that the poorest smallholders are typically unable to participate, and to evaluate the extent to which earnings are correlated with access to extension and farmer associations as well as household-specific productive assets;
• we use the case of tobacco to examine how the additional demands of contract production for a quality-differentiated product are correlated with asset holdings. In addition to the assets needed to enter contract production of an undifferentiated commodity, such as cotton, we anticipate that asset entry barriers become greater, and that education as an indicator of management ability becomes an important determinant of participation and sales volume.
3 Data and Description of Markets In this section we first describe the data and then provide a brief characterization of relevant crop markets in Mozambique. Data for our analysis come from the national agricultural sample survey known as the Trabalho do Inquerito Agricola (TIA). The TIA is a nationally representative rural household survey administered to approximately 4,900 randomly selected households in 80 of the 128 rural districts in Mozambique. The survey was carried out by the Ministry of Agriculture’s Department of Statistics using a single shot recall survey undertaken during the period August to December after the peak crop marketing season. The survey instrument sought detailed information on all sources of household income from farm and non-farm income sources, including remittances, for the 2001/2 agricultural year. The survey is documented in Walker et al. (2004)
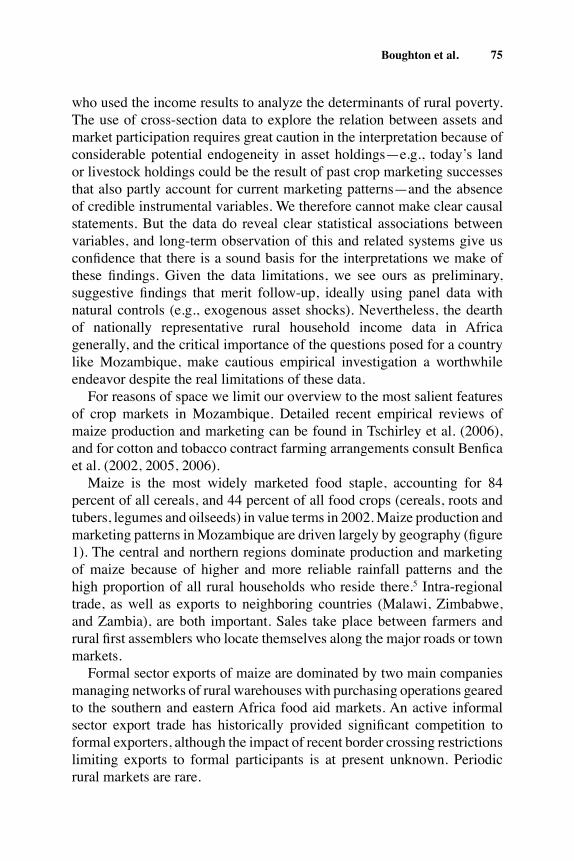
��
who used the income results to analyze the determinants of rural poverty. The use of cross-section data to explore the relation between assets and market participation requires great caution in the interpretation because of considerable potential endogeneity in asset holdings—e.g., today’s land or livestock holdings could be the result of past crop marketing successes that also partly account for current marketing patterns—and the absence of credible instrumental variables. We therefore cannot make clear causal statements. But the data do reveal clear statistical associations between variables, and long-term observation of this and related systems give us confidence that there is a sound basis for the interpretations we make of these findings. Given the data limitations, we see ours as preliminary, suggestive findings that merit follow-up, ideally using panel data with natural controls (e.g., exogenous asset shocks). Nevertheless, the dearth of nationally representative rural household income data in Africa generally, and the critical importance of the questions posed for a country like Mozambique, make cautious empirical investigation a worthwhile endeavor despite the real limitations of these data. For reasons of space we limit our overview to the most salient features of crop markets in Mozambique. Detailed recent empirical reviews of maize production and marketing can be found in Tschirley et al. (2006), and for cotton and tobacco contract farming arrangements consult Benfica et al. (2002, 2005, 2006). Maize is the most widely marketed food staple, accounting for 84 percent of all cereals, and 44 percent of all food crops (cereals, roots and tubers, legumes and oilseeds) in value terms in 2002. Maize production and marketing patterns in Mozambique are driven largely by geography (figure 1). The central and northern regions dominate production and marketing of maize because of higher and more reliable rainfall patterns and the high proportion of all rural households who reside there.5 Intra-regional trade, as well as exports to neighboring countries (Malawi, Zimbabwe, and Zambia), are both important. Sales take place between farmers and rural first assemblers who locate themselves along the major roads or town markets. Formal sector exports of maize are dominated by two main companies managing networks of rural warehouses with purchasing operations geared to the southern and eastern Africa food aid markets. An active informal sector export trade has historically provided significant competition to formal exporters, although the impact of recent border crossing restrictions limiting exports to formal participants is at present unknown. Periodic rural markets are rare.
Boughton et al.
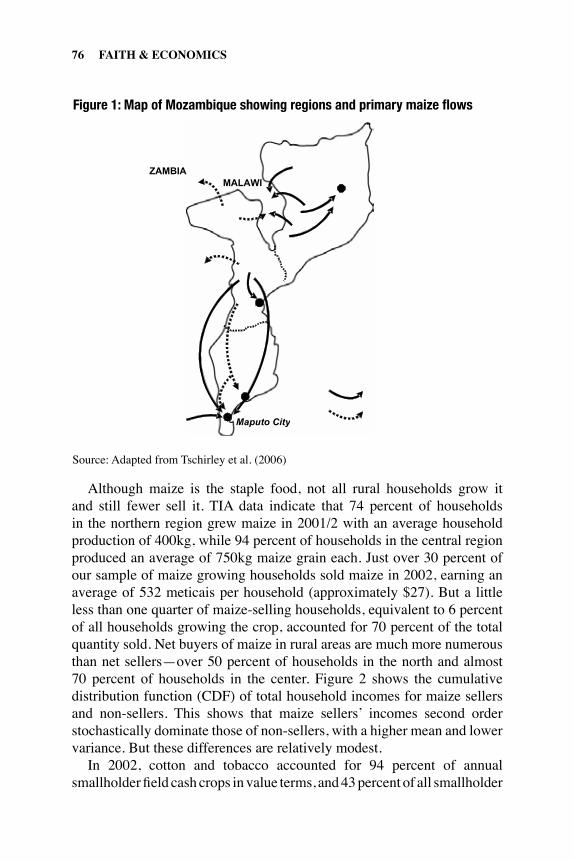
�� FAITH & ECONOMICS
Although maize is the staple food, not all rural households grow it and still fewer sell it. TIA data indicate that 74 percent of households in the northern region grew maize in 2001/2 with an average household production of 400kg, while 94 percent of households in the central region produced an average of 750kg maize grain each. Just over 30 percent of our sample of maize growing households sold maize in 2002, earning an average of 532 meticais per household (approximately $27). But a little less than one quarter of maize-selling households, equivalent to 6 percent of all households growing the crop, accounted for 70 percent of the total quantity sold. Net buyers of maize in rural areas are much more numerous than net sellers—over 50 percent of households in the north and almost 70 percent of households in the center. Figure 2 shows the cumulative distribution function (CDF) of total household incomes for maize sellers and non-sellers. This shows that maize sellers’ incomes second order stochastically dominate those of non-sellers, with a higher mean and lower variance. But these differences are relatively modest. In 2002, cotton and tobacco accounted for 94 percent of annual smallholder field cash crops in value terms, and 43 percent of all smallholder
Figure 1: Map of Mozambique Showing Regions and Primary Maize Flows
Maputo City
MALAWIZAMBIA
Source: Adapted from Tschirley et al. (2006)
Figure 1: Map of Mozambique showing regions and primary maize flows
Source: Adapted from Tschirley et al. (2006)
��
cash crop sales (tree crops, fruit, vegetables, and field cash crops). Yet smallholder access to markets for cotton and tobacco is restricted to contract farming schemes, with only 7 percent of the national sample of rural households participating in cotton and almost 4 percent in tobacco schemes in 2001/2. Even in those districts where cotton companies operate contract farming schemes, only a little more than 17 percent of sample households participated in cotton markets in 2001/2, with average earnings of 1,342 meticais ($67) after repayment of input costs excluding hired labor. Tobacco contract farming is likewise somewhat spatially limited. Only 7 percent of the sample households who lived in districts where tobacco contract farming schemes operate participated in tobacco contracts in the 2001/2 season, earning an average of 3,331 meticais (approximately $167) per household after repayment of inputs but excluding payments to hired labor. Thus average household crop earnings appears inversely related to extent of market participation, suggesting higher entry barriers associated with higher expected earnings in contract schemes than in spot markets. Moreover, the differences between seller and non-seller total household incomes is even greater than that for maize, as shown by the CDFs of total household income for cotton market participants and non-participants
Figure 2: Household Total Income Cumulative Density Functions for Maize Seller and Non-Seller Households
0
.2
.4
.6
.8
1
% h
ouse
hold
s
0 5000 10000 15000 20000
Income (Meticais)
non-maize seller maize seller
Figure 2: Household total income cumulative density functions for maize seller and non-seller households
Boughton et al.
�� FAITH & ECONOMICS
(figure 3) and tobacco market participants and non-participants(figure 4). Note that the household income gaps between market participants and non-participants grows as one moves from the spot market crop, maize, to the undifferentiated contract crop, cotton, to the quality-differentiated contract crop, tobacco. This ordering of household incomes and income differences between market participants and non-participants suggests a wealth bias in market access that motivates the more nuanced econometric work in the next section. Smallholder cotton production in Mozambique has a long history dating back to colonial times. Production plummeted with the nationalization of commercial cotton companies following independence in 1975, and continued to decline during the civil war that followed. During the late 1980s, in anticipation of peace, joint-venture companies (JVCs) with geographical monopsonies (concessions) were formed between the government and private companies to promote the recovery of the sector and provide security, infrastructure maintenance, and income opportunities to isolated rural communities, especially in the northern region. Many cotton JVCs have experienced financial trouble since the mid-1990s
Figure 3: Household Total Income Cumulative Density Functions for Cotton Seller and Non-Seller Households
0
.2
.4
.6
.8
1
% h
ouse
hold
s
0 5000 10000 15000 20000
Income (Meticais)
non-cotton seller cotton seller
Figure 3: Household total income cumulative density functions for cotton seller and non-seller households
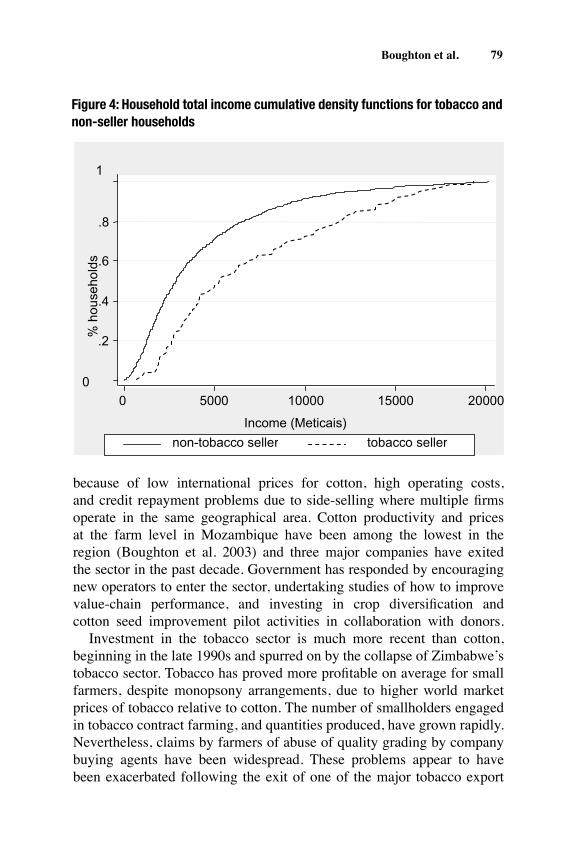
��
because of low international prices for cotton, high operating costs, and credit repayment problems due to side-selling where multiple firms operate in the same geographical area. Cotton productivity and prices at the farm level in Mozambique have been among the lowest in the region (Boughton et al. 2003) and three major companies have exited the sector in the past decade. Government has responded by encouraging new operators to enter the sector, undertaking studies of how to improve value-chain performance, and investing in crop diversification and cotton seed improvement pilot activities in collaboration with donors. Investment in the tobacco sector is much more recent than cotton, beginning in the late 1990s and spurred on by the collapse of Zimbabwe’s tobacco sector. Tobacco has proved more profitable on average for small farmers, despite monopsony arrangements, due to higher world market prices of tobacco relative to cotton. The number of smallholders engaged in tobacco contract farming, and quantities produced, have grown rapidly. Nevertheless, claims by farmers of abuse of quality grading by company buying agents have been widespread. These problems appear to have been exacerbated following the exit of one of the major tobacco export
Figure 4: Household Total Income Cumulative Density Functions for Tobacco and Non-Seller Households
0
.2
.4
.6
.8
1
% h
ouse
hold
s
0 5000 10000 15000 20000
Income (Meticais)
non-tobacco seller tobacco seller
Figure 4: Household total income cumulative density functions for tobacco and non-seller households
Boughton et al.
�0 FAITH & ECONOMICS
companies following allegations of political interference in the allocation of company geographical areas of operation.
4 Econometric Results Because maize, tobacco, and cotton sales are only observed for a subset of the sample population, the potential exists for the sample selection problem referred to as incidental truncation, i.e., households with sales observations are likely not to be a random sub-sample of the population. To address this concern, we employ the standard Heckman sample selection model (two-step version) first applied to these problems by Goetz (1992), and previously used in the Mozambican context by Benfica et al. (2006).6 With a Heckman two-step approach, one first estimates a probit model of participation in the relevant market as a function of both those variables that likely also determine crop sales volumes, conditional on market participation, as well as one or more exclusion restriction variables (Wooldridge 2006). Our exclusion restriction variables focus on factors affecting a household’s level of dependence on crop income as an income source and factors that might affect perceptions of risk relating to market participation. These variables include access to non-crop income sources associated with livestock revenues, off-farm salary, and wage earnings, and earnings from natural resource extraction activities. The exclusion restrictions we employ are similar to those used by Benfica et al. (2006) in their analysis of the determinants of contract farming participation in the Zambezi River Valley region of Mozambique. The second step is an OLS regression of the log of net crop sales value on the reduced form regressors plus the inverse Mills ratio (IMR) derived from the first-stage probit regression, which controls for the probability of market participation so that the remaining regressors are explaining sales volumes conditional on a given probability of market participation. As motivated by the model developed in section 2, we estimate the reduced form equations for market participation and log of sales revenues conditional on market participation, focusing on household assets and characteristics, public goods, and prices as explanatory variables. For cotton and tobacco, however, we do not include price as an explanatory variable because farmers working with same company face the same announced price for any given grade—thus there is no variation within sites in these data—and farmers have no alternative market for their production. Descriptive results (means and standard errors) for all variables included in the regressions, as well as the significance level of tests of difference between means for each variable for sellers and non-sellers, are presented in table 1.
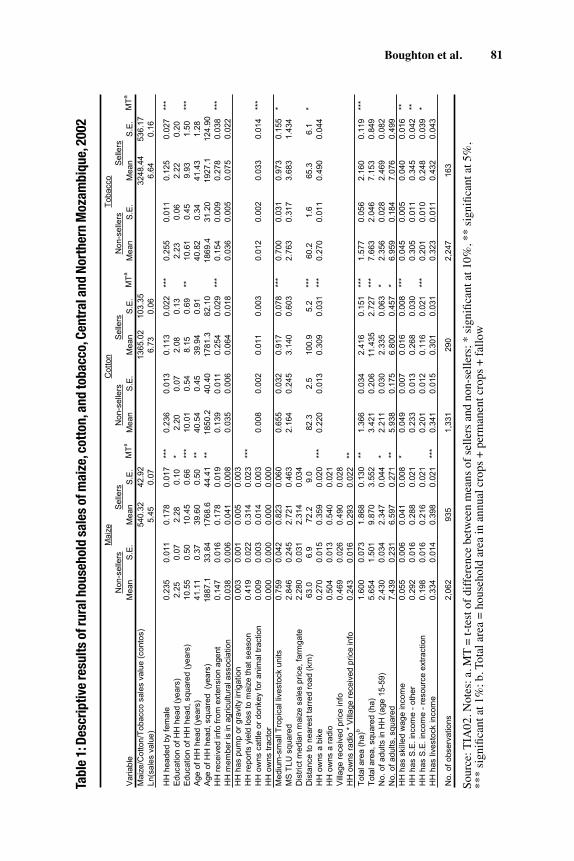
��
Var
iabl
eM
ean
S.E
.M
ean
S.E
.M
Ta
Mea
nS
.E.
Mea
nS
.E.
MT
aM
ean
S.E
.M
ean
S.E
.M
Ta
Mai
ze/C
otto
n/T
obac
co s
ales
val
ue (
cont
os)
540.
3242
.92
1365
.02
103.
3532
48.4
453
6.17
Ln(s
ales
val
ue)
5.45
0.07
6.73
0.06
6.64
0.16
HH
hea
ded
by f
emal
e0.
235
0.01
10.
178
0.01
7**
*0.
236
0.01
30.
113
0.02
2**
*0.
255
0.01
10.
125
0.02
7**
*E
duca
tion
of H
H h
ead
(yea
rs)
2.25
0.07
2.28
0.10
*2.
200.
072.
080.
132.
230.
062.
220.
20E
duca
tion
of H
H h
ead,
squ
ared
(ye
ars)
10.5
50.
5010
.45
0.66
***
10.0
10.
548.
150.
69**
10.6
10.
459.
931.
50**
*A
ge o
f H
H h
ead
(yea
rs)
41.1
10.
3739
.60
0.50
**40
.54
0.45
39.9
40.
9140
.82
0.34
41.4
31.
28A
ge o
f H
H h
ead,
squ
ared
(ye
ars)
1887
.133
.84
1768
.644
.41
**18
50.2
40.4
017
81.3
82.1
018
69.4
31.2
019
27.1
124.
90H
H r
ecei
ved
info
fro
m e
xten
sion
age
nt0.
147
0.01
60.
178
0.01
90.
139
0.01
10.
254
0.02
9**
*0.
154
0.00
90.
278
0.03
8**
*H
H m
embe
r is
in a
gric
ultu
ral a
ssoc
iatio
n0.
038
0.00
60.
041
0.00
80.
035
0.00
60.
064
0.01
80.
036
0.00
50.
075
0.02
2H
H h
as p
ump
or g
ravi
ty ir
rigat
ion
0.00
30.
001
0.00
50.
003
HH
rep
orts
yie
ld lo
ss to
mai
ze th
at s
easo
n0.
419
0.02
20.
314
0.02
3**
*H
H o
wns
cat
tle o
r do
nkey
for
ani
mal
trac
tion
0.00
90.
003
0.01
40.
003
0.00
80.
002
0.01
10.
003
0.01
20.
002
0.03
30.
014
***
HH
ow
ns tr
acto
r0.
000
0.00
00.
000
0.00
0M
ediu
m-s
mal
l Tro
pica
l liv
esto
ck u
nits
0.75
90.
042
0.82
30.
060
0.65
50.
032
0.91
70.
078
***
0.70
00.
031
0.97
30.
155
*M
S T
LU s
quar
ed2.
846
0.24
52.
721
0.46
32.
164
0.24
53.
140
0.60
32.
763
0.31
73.
683
1.43
4D
istr
ict m
edia
n m
aize
sal
es p
rice,
far
mga
te
2.28
00.
031
2.31
40.
034
Dis
tanc
e to
nea
rest
tarr
ed r
oad
(km
)63
.06.
972
.29.
082
.32.
510
0.9
5.2
***
60.2
1.6
65.3
6.1
*H
H o
wns
a b
ike
0.27
00.
015
0.35
90.
020
***
0.22
00.
013
0.30
90.
031
***
0.27
00.
011
0.49
00.
044
HH
ow
ns a
rad
io0.
504
0.01
30.
540
0.02
1V
illag
e re
ceiv
ed p
rice
info
0.46
90.
026
0.49
00.
028
HH
ow
ns r
adio
* V
illag
e re
ceiv
ed p
rice
info
0.24
30.
016
0.29
30.
022
**T
otal
are
a (h
a)b
1.60
00.
073
1.86
80.
130
**1.
366
0.03
42.
416
0.15
1**
*1.
577
0.05
62.
160
0.11
9**
*T
otal
are
a, s
quar
ed (
ha)
5.65
41.
501
9.87
03.
552
3.42
10.
206
11.4
352.
727
***
7.66
32.
046
7.15
30.
849
No.
of
adul
ts in
HH
(ag
e 15
-59)
2.43
00.
034
2.34
70.
044
*2.
211
0.03
02.
335
0.06
3*
2.35
60.
028
2.46
90.
082
No.
of
adul
ts, s
quar
ed7.
439
0.23
16.
597
0.27
1**
5.93
80.
175
6.80
00.
457
*6.
959
0.18
47.
076
0.49
9H
H h
as s
kille
d w
age
inco
me
0.05
50.
006
0.04
10.
008
*0.
049
0.00
70.
016
0.00
8**
*0.
045
0.00
50.
040
0.01
6**
HH
has
S.E
. inc
ome
- ot
her
0.29
20.
016
0.28
80.
021
0.23
30.
013
0.26
80.
030
0.30
50.
011
0.34
50.
042
**H
H h
as S
.E. i
ncom
e -
reso
urce
ext
ract
ion
0.19
80.
016
0.21
60.
021
0.20
10.
012
0.11
60.
021
***
0.20
10.
010
0.24
80.
039
*H
H h
as li
vest
ock
inco
me
0.33
40.
014
0.39
80.
021
***
0.34
10.
015
0.30
10.
031
0.32
30.
011
0.43
20.
043
No.
of
obse
rvat
ions
2,06
293
51,
331
290
2,24
716
3Sel
lers
So
urce
: T
IA02
. N
ote
s: a
. M
T =
t-t
est
of d
iffe
ren
ce b
etw
een
me
ans
of s
elle
rs a
nd
non-
selle
rs;*
sig
nific
ant
at
10%
; **
sign
ifica
nt a
t 5%
; ***
sig
nifi
cant
at
1%;
b. T
ota
l are
a =
ho
useh
old
are
a in
ann
ual c
rop
s +
p
erm
ane
nt c
rop
s +
fallo
w.
Tab
le 1
. D
escr
ipti
ve
resu
lts
of
rura
l ho
use
ho
ld s
ales
of
mai
ze, c
ott
on
, an
d t
ob
acco
, Cen
tral
an
d N
ort
her
n M
oza
mb
iqu
e, 2
002.
Non
-sel
lers
Sel
lers
Mai
zeC
otto
nN
on-s
elle
rsS
elle
rsT
obac
coN
on-s
elle
rs
Tabl
e 1:
Des
crip
tive
resu
lts o
f rur
al h
ouse
hold
sal
es o
f mai
ze, c
otto
n, a
nd to
bacc
o, C
entr
al a
nd N
orth
ern
Moz
ambi
que,
200
2
Sour
ce: T
IA02
. Not
es: a
. MT
= t-t
est o
f diff
eren
ce b
etw
een
mea
ns o
f sel
lers
and
non
-sel
lers
; * si
gnifi
cant
at 1
0%, *
* si
gnifi
cant
at 5
%,
***
sign
ifica
nt a
t 1%
; b. T
otal
are
a =
hous
ehol
d ar
ea in
ann
ual c
rops
+ p
erm
anen
t cro
ps +
fallo
w
Boughton et al.
�� FAITH & ECONOMICS
Household assets included as explanatory variables are total land area (under annual crops, permanent crops, and fallow), labor, ownership of animal traction, ownership of equipment (tractor, bike, radio, irrigation), and years of education of the household head.7 For household characteristics we include whether the household is headed by a female, the age of the household head, and whether any household member belongs to an agricultural association. We allow for simple nonlinear effects by including quadratic terms of the continuous variables land, labor, age and education. We also control for unobserved location-specific effects using district dummy variables. Since maize is a primary food crop that is susceptible to drought, we include a dummy variable to indicate whether the household reported maize yield loss due to climatic shock. Public goods included as explanatory variables are farmers’ self-reported access to information from an extension agent, access to market price information, distance to the nearest paved road, and membership in an agricultural association. Extension coverage is very limited in Mozambique, with less than one in six households having access to an extension agent (whether public, NGO, or cotton/tobacco company). In principle, access to an extension agent provides access to information that can increase crop productivity, although the specific type of information received is not recorded by the TIA survey instrument. Note that we do not include access to extension in the probit model for cash crops as company extension workers are often involved in the identification of participants. Similarly, access to market price information in principle may help reduce price risk and/or improve farmer returns through bargaining power. Distance to the nearest tarred road is a relevant proxy for the transport costs to terminal markets as the sparse major road network in Mozambique means that transport to the main road is a large proportion of the total transport costs. Membership in an association is an additional channel of relevant information for increased returns to crop production and marketing, and tobacco and cotton companies often pay a small price premium for association members. Although membership in an association might be viewed as a club good rather than a public good, at this stage of Mozambique’s development farmer associations commonly have public good characteristics since their establishment and operations require considerable external support due to literacy and capital constraints.
4.1 Maize Spot Market Participation Results First stage probit model results (table 2) indicate that some private household assets have a positive and statistically significant effect on
��
the probability of household maize market participation as a seller. The coefficients on available land area are highly significant for both the linear (positive) and quadratic (negative) terms, indicating a diminishing marginal effect on maize market participation as land area increases over the whole range of the data. Income from livestock is also strongly positively and statistically significantly correlated with maize market participation. One possible explanation is that the ownership of livestock reduces the risk of food insecurity (recall that maize is the primary cereal staple) since the household has an asset that can be traded for food if an unforeseen shortage occurs. Livestock income may also proxy for greater access to and incorporation of organic manure into plots, thereby increasing maize productivity and the probability of generating a marketable surplus. Local maize prices also had a strong positive and highly significant effect on the probability of market participation as a seller. Among the non-asset household characteristics, female-headed households and households with older heads were significantly less likely to sell. As might be expected for a key food staple, households that experienced maize yield loss are significantly less likely to sell maize. The joint tests of regressors for demographic and private assets are highly significant, while the joint test for those representing public goods and services is insignificant. For the second-stage OLS estimates (table 2), the inverse Mills ratio (IMR) is not significant, signaling that the covariates that condition sales volumes operate independently of the probability of spot market participation. A broader range of private assets is positively and significantly associated with the value of net maize sales than for the discrete decision to sell. Land area and ownership of a bike are both positively and significantly associated with value of sales at higher than the .01 level, with land having a more pronounced effect on sales volume conditional on maize market participation than on the probability of market participation. Ownership of animal traction is significant at the .05 level. Animal traction increases the amount of land that can be cultivated with a given amount of labor and, like bike ownership, can reduce the cost of transporting maize to a tarred road or the point of sale. The price of maize also has a strongly and significantly positive effect on maize sales at the one percent level. Higher maize prices can be expected to lead to a higher volume of maize sales both because cultivation effort responds positively to expected prices and because most households have the capability to substitute own-produced cassava for maize in their diet when the terms of trade encourage such substitution. Just as female-headed households are significantly less likely than male-headed households to sell maize, so also is the expected sales
Boughton et al.
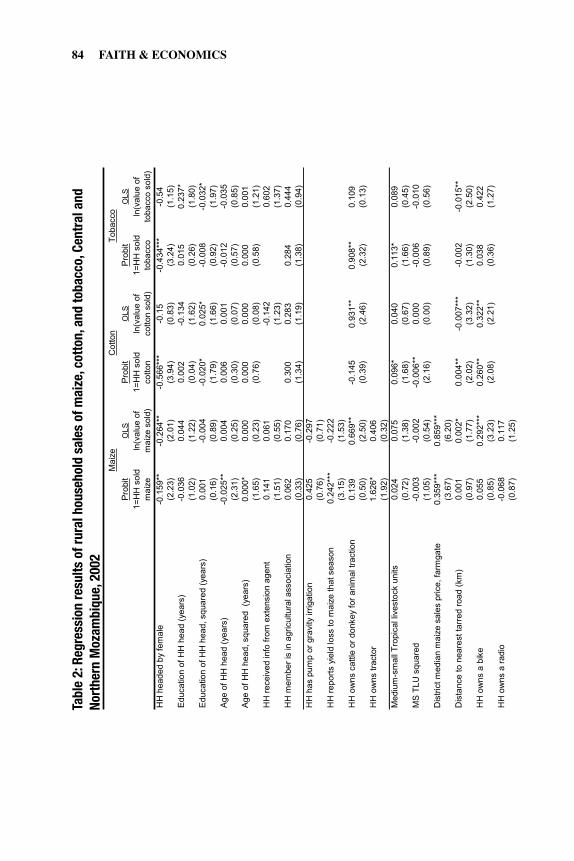
�� FAITH & ECONOMICS
Pro
bit
OLS
Pro
bit
OLS
Pro
bit
OL
S
1=H
H s
old
mai
zeln
(val
ue o
f m
aize
sol
d)1=
HH
sol
d co
tton
ln(v
alue
of
cotto
n so
ld)
1=H
H s
old
toba
cco
ln(v
alue
of
toba
cco
sold
)
HH
hea
ded
by f
emal
e-0
.159
**-0
.264
**-0
.566
***
-0.1
5-0
.434
***
-0.5
4(2
.23)
(2.0
1)(3
.94)
(0.8
3)(3
.24)
(1.1
5)E
duca
tion
of H
H h
ead
(yea
rs)
-0.0
360.
044
0.00
2-0
.134
0.01
50.
237*
(1.0
2)(1
.22)
(0.0
4)(1
.62)
(0.2
6)(1
.80)
Edu
catio
n of
HH
hea
d, s
quar
ed (
year
s)0.
001
-0.0
04-0
.020
*0.
025*
-0.0
08-0
.032
*(0
.16)
(0.8
9)(1
.79)
(1.6
6)(0
.92)
(1.9
7)A
ge o
f H
H h
ead
(yea
rs)
-0.0
25**
0.00
40.
006
0.00
1-0
.012
-0.0
35(2
.31)
(0.2
5)(0
.30)
(0.0
7)(0
.57)
(0.8
5)A
ge o
f H
H h
ead,
squ
ared
(ye
ars)
0.00
0*0.
000
0.00
00.
000
0.00
00.
001
(1.6
5)(0
.23)
(0.7
6)(0
.08)
(0.5
8)(1
.21)
HH
rec
eive
d in
fo f
rom
ext
ensi
on a
gent
0.14
10.
061
-0.1
420.
602
(1.5
1)(0
.55)
(1.2
3)(1
.37)
HH
mem
ber
is in
agr
icul
tura
l ass
ocia
tion
0.06
20.
170
0.30
00.
283
0.28
40.
444
(0.3
3)(0
.76)
(1.3
4)(1
.19)
(1.3
8)(0
.94)
HH
has
pum
p or
gra
vity
irrig
atio
n0.
425
-0.2
97(0
.76)
(0.7
1)H
H r
epor
ts y
ield
loss
to m
aize
that
sea
son
0.2
42**
*-0
.222
(3.1
5)(1
.53)
HH
ow
ns c
attle
or
donk
ey f
or a
nim
al tr
actio
n0.
139
0.66
9**
-0.1
450.
931*
*0.
908*
*0.
109
(0.5
0)(2
.50)
(0.3
9)(2
.46)
(2.3
2)(0
.13)
HH
ow
ns tr
acto
r1.
626*
0.40
6(1
.92)
(0.3
2)M
ediu
m-s
mal
l Tro
pica
l liv
esto
ck u
nits
0.02
40.
075
0.09
6*0.
040
0.11
3*0.
089
(0.7
2)(1
.38)
(1.6
8)(0
.67)
(1.6
6)(0
.45)
MS
TLU
squ
ared
-0.0
03-0
.002
-0.0
06**
0.00
0-0
.006
-0.0
10(1
.05)
(0.5
4)(2
.16)
(0.0
0)(0
.89)
(0.5
6)D
istr
ict m
edia
n m
aize
sal
es p
rice,
far
mga
te
0.35
9***
0.85
9***
(3.6
7)(6
.20)
Dis
tanc
e to
nea
rest
tarr
ed r
oad
(km
)0.
001
0.00
2*0.
004*
*-0
.007
***
-0.0
02-0
.015
**(0
.97)
(1.7
7)(2
.02)
(3.3
2)(1
.30)
(2.5
0)H
H o
wns
a b
ike
0.05
50.
292*
**0.
260*
*0.
322*
*0.
038
0.42
2(0
.85)
(3.2
3)(2
.08)
(2.2
1)(0
.36)
(1.2
7)H
H o
wns
a r
adio
-0.0
680.
117
(0.8
7)(1
.25)
Tab
le 2
. Reg
ress
ion
res
ult
s o
f ru
ral h
ou
seh
old
sal
es o
f m
aize
, co
tto
n, a
nd
to
bac
co, C
entr
al a
nd
No
rth
ern
Mo
zam
biq
ue,
200
2.
Mai
zeC
otto
nT
obac
co
Tabl
e 2:
Reg
ress
ion
resu
lts o
f rur
al h
ouse
hold
sal
es o
f mai
ze, c
otto
n, a
nd to
bacc
o, C
entr
al a
nd
Nort
hern
Moz
ambi
que,
200
2
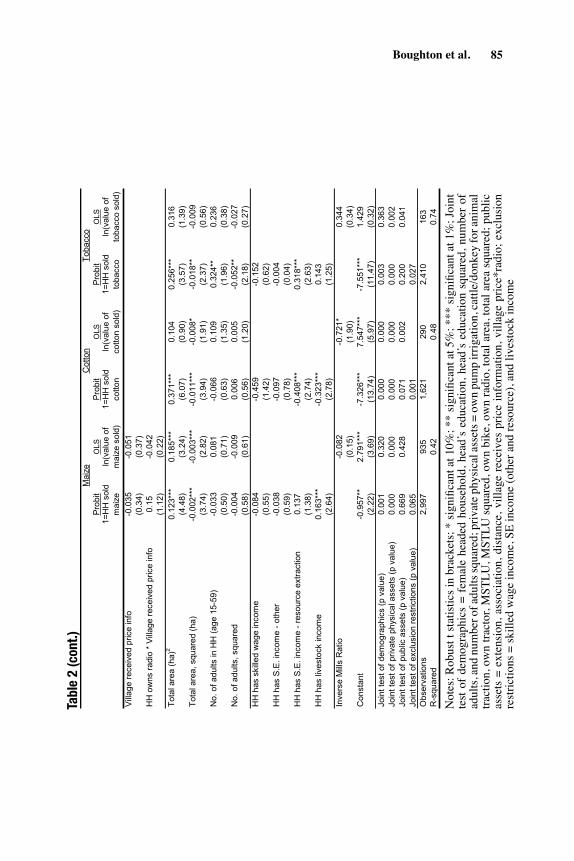
��
Pro
bit
OL
SP
robi
tO
LSP
robi
tO
LS
1=H
H s
old
mai
zeln
(val
ue o
f m
aize
sol
d)1=
HH
sol
d co
tton
ln(v
alue
of
cotto
n so
ld)
1=H
H s
old
toba
cco
ln(v
alue
of
toba
cco
sold
)
Vill
age
rece
ived
pric
e in
fo-0
.035
-0.0
51(0
.34)
(0.3
7)H
H o
wns
rad
io *
Vill
age
rece
ived
pric
e in
fo0.
15-0
.042
(1.1
2)(0
.22)
Tot
al a
rea
(ha)
20.
123*
**0.
185*
**0.
371*
**0.
104
0.25
6***
0.31
6(4
.48)
(3.2
4)(6
.07)
(0.9
0)(3
.57)
(1.3
9)T
otal
are
a, s
quar
ed (
ha)
-0.0
02**
*-0
.003
***
-0.0
11**
*-0
.008
*-0
.018
**-0
.009
(3.7
4)(2
.82)
(3.9
4)(1
.91)
(2.3
7)(0
.56)
No.
of
adul
ts in
HH
(ag
e 15
-59)
-0.0
330.
081
-0.0
660.
109
0.32
4**
0.23
6(0
.50)
(0.7
1)(0
.63)
(1.3
5)(1
.96)
(0.3
8)N
o. o
f ad
ults
, squ
ared
-0.0
04-0
.009
0.00
60.
005
-0.0
52**
-0.0
27(0
.58)
(0.6
1)(0
.56)
(1.2
0)(2
.18)
(0.2
7)H
H h
as s
kille
d w
age
inco
me
-0.0
84-0
.459
-0.1
52(0
.55)
(1.4
2)(0
.62)
HH
has
S.E
. inc
ome
- ot
her
-0.0
38-0
.097
-0.0
04(0
.59)
(0.7
8)(0
.04)
HH
has
S.E
. inc
ome
- re
sour
ce e
xtra
ctio
n0.
137
-0.4
08**
*0.
318*
**(1
.38)
(2.7
4)(2
.63)
HH
has
live
stoc
k in
com
e0.
163*
**-0
.323
***
0.14
3(2
.64)
(2.7
8)(1
.25)
Inve
rse
Mill
s R
atio
-0.0
82-0
.721
*0.
344
(0.1
5)(1
.90)
(0.3
4)C
onst
ant
-0.9
57**
2.79
1***
-7.3
26**
*7.
547*
**-7
.551
***
1.42
9(2
.22)
(3.6
9)(1
3.74
)(5
.97)
(11.
47)
(0.3
2)Jo
int t
est o
f de
mog
raph
ics
(p v
alue
)0.
001
0.32
00.
000
0.00
00.
003
0.36
3Jo
int t
est o
f pr
ivat
e ph
ysic
al a
sset
s (p
val
ue)
0.00
00.
000
0.00
00.
000
0.00
00.
002
Join
t tes
t of
publ
ic a
sset
s (p
val
ue)
0.66
90.
428
0.07
10.
002
0.20
00.
041
Join
t tes
t of
excl
usio
n re
stric
tions
(p
valu
e)0.
065
0.00
10.
027
Obs
erva
tions
2,99
793
51,
621
290
2,41
016
3R
-squ
ared
0.42
0.48
0.74
No
tes:
Rob
ust
t s
tatis
tics
in b
rack
ets;
* s
ign
ifica
nt a
t 10
%;
** s
ign
ifica
nt a
t 5%
; ***
sig
nific
ant
at 1
%;
Join
t te
st o
f de
mo
gra
phi
cs =
fe
ma
le h
ea
ded
ho
use
hold
, he
ad's
edu
catio
n, h
ead
's e
duca
tion
squa
red,
num
ber
of
adu
lts,
and
nu
mbe
r o
f ad
ults
squ
are
d;
priv
ate
phys
ical
ass
ets
= o
wn
pu
mp
irrig
atio
n,
cattl
e/do
nkey
for
anim
al tr
actio
n,
own
trac
tor,
MS
TL
U, M
ST
LU s
quar
ed, o
wn
bike
, ow
n ra
dio,
tota
l are
a, to
tal a
rea
squa
red;
pub
lic a
sse
ts =
ext
en
sio
n,
asso
ciat
ion,
dis
tanc
e, v
illag
e re
ceiv
es p
rice
info
rmat
ion,
vill
age
pric
e*ra
dio;
exc
lusi
on r
estr
ictio
ns =
ski
lled
wag
e in
com
e, S
E in
com
e (
oth
er a
nd
re
sour
ce),
and
live
stoc
k in
com
e.
Tab
le 2
(co
nt.
)M
aize
Cot
ton
Tob
acco
Tabl
e 2
(con
t.)
Not
es: R
obus
t t st
atis
tics i
n br
acke
ts; *
sign
ifica
nt a
t 10%
; **
sign
ifica
nt a
t 5%
; ***
sign
ifica
nt a
t 1%
; Joi
nt
test
of
dem
ogra
phic
s =
fem
ale
head
ed h
ouse
hold
, hea
d’s
educ
atio
n, h
ead’
s ed
ucat
ion
squa
red,
num
ber
of
adul
ts, a
nd n
umbe
r of a
dults
squa
red;
priv
ate p
hysi
cal a
sset
s = o
wn
pum
p irr
igat
ion,
cattl
e/do
nkey
for a
nim
al
tract
ion,
ow
n tra
ctor
, MST
LU, M
STLU
squa
red,
ow
n bi
ke, o
wn
radi
o, to
tal a
rea,
tota
l are
a sq
uare
d; p
ublic
as
sets
= e
xten
sion
, ass
ocia
tion,
dis
tanc
e, v
illag
e re
ceiv
es p
rice
info
rmat
ion,
vill
age
pric
e*ra
dio;
exc
lusi
on
rest
rictio
ns =
skill
ed w
age
inco
me,
SE
inco
me
(oth
er a
nd re
sour
ce),
and
lives
tock
inco
me
Boughton et al.

�� FAITH & ECONOMICS
quantity lower (by 26 percent) for female-headed households. The joint tests of regressors for private asset variables are highly significant, while those for demographic variables and public goods that can potentially facilitate market access are not. The policy and programmatic implication of these results is not that public investments in market access have no role to play in increasing market participation, but that, with current levels of production technology, increased private asset endowments appear necessary for households to be able to take advantage of the reasonably open-access maize markets in Mozambique and any associated public investments in improving market information flow or physical access to markets. 4.2 Cotton Contract Farming Participation Results As in the case of maize market participation, first stage probit results for cotton (table 2) indicate that private asset endowments are positively and significantly correlated with cotton market participation. Like maize, the coefficients on available land area are highly significant for both the linear (positive) and quadratic (negative) terms, indicating a diminishing marginal effect on participation over the range of the data. Land’s marginal effect on cotton market participation is more than twice that on maize market participation over the whole land distribution, indicating that land holdings are far more important to diversification into higher-return cash crops than to sales of maize staple crop surpluses. Ownership of a bike is also positively correlated with cotton market participation at the .05 level. Female-headed households are significantly less likely to participate in cotton contract farming than male-headed households. The positive and highly significant coefficient estimate on distance between the village and a tarred road may appear counterintuitive at first glance. Why should farmer propensity to participate in cotton contract farming increase with remoteness? Benfica et al. (2006) find that participation in cotton farming is negatively correlated with off-farm income opportunities. Such opportunities become less remunerative as the cost of market access increases. This explanation is also consistent with the negative and significant coefficients on household access to livestock income and income from natural resource extraction activities. The joint tests of regressors for demographic and private assets are highly significant, while the joint test for those representing public goods and services is significant only at the .10 level. For the second-stage OLS results, the IMR is significant at the 10 percent level, indicating that selection effects are important. Household ownership of animal traction or a bicycle are positively correlated with
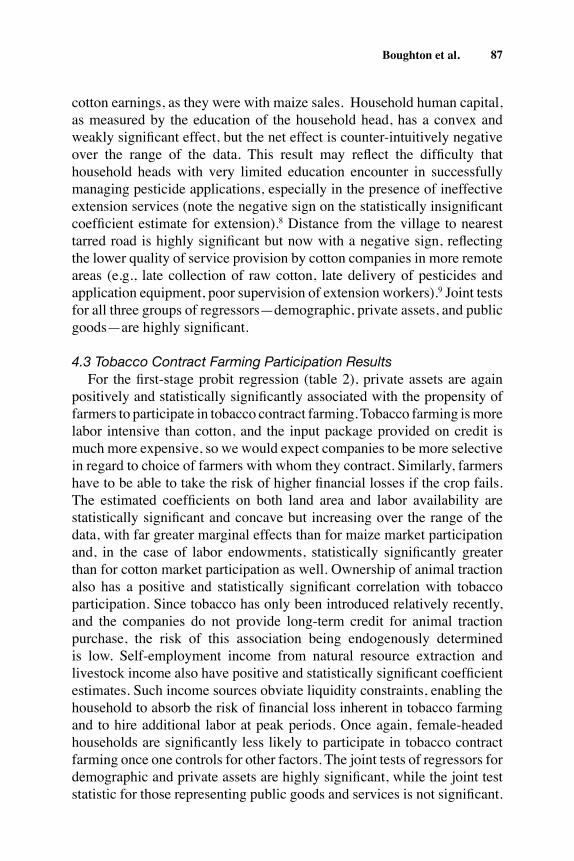
��
cotton earnings, as they were with maize sales. Household human capital, as measured by the education of the household head, has a convex and weakly significant effect, but the net effect is counter-intuitively negative over the range of the data. This result may reflect the difficulty that household heads with very limited education encounter in successfully managing pesticide applications, especially in the presence of ineffective extension services (note the negative sign on the statistically insignificant coefficient estimate for extension).8 Distance from the village to nearest tarred road is highly significant but now with a negative sign, reflecting the lower quality of service provision by cotton companies in more remote areas (e.g., late collection of raw cotton, late delivery of pesticides and application equipment, poor supervision of extension workers).9 Joint tests for all three groups of regressors—demographic, private assets, and public goods—are highly significant.
4.3 Tobacco Contract Farming Participation Results For the first-stage probit regression (table 2), private assets are again positively and statistically significantly associated with the propensity of farmers to participate in tobacco contract farming. Tobacco farming is more labor intensive than cotton, and the input package provided on credit is much more expensive, so we would expect companies to be more selective in regard to choice of farmers with whom they contract. Similarly, farmers have to be able to take the risk of higher financial losses if the crop fails. The estimated coefficients on both land area and labor availability are statistically significant and concave but increasing over the range of the data, with far greater marginal effects than for maize market participation and, in the case of labor endowments, statistically significantly greater than for cotton market participation as well. Ownership of animal traction also has a positive and statistically significant correlation with tobacco participation. Since tobacco has only been introduced relatively recently, and the companies do not provide long-term credit for animal traction purchase, the risk of this association being endogenously determined is low. Self-employment income from natural resource extraction and livestock income also have positive and statistically significant coefficient estimates. Such income sources obviate liquidity constraints, enabling the household to absorb the risk of financial loss inherent in tobacco farming and to hire additional labor at peak periods. Once again, female-headed households are significantly less likely to participate in tobacco contract farming once one controls for other factors. The joint tests of regressors for demographic and private assets are highly significant, while the joint test statistic for those representing public goods and services is not significant.
Boughton et al.
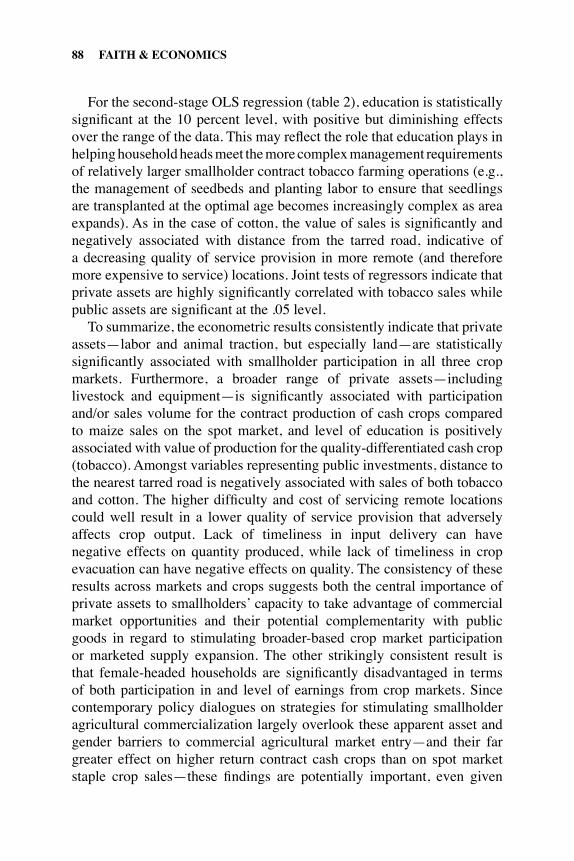
�� FAITH & ECONOMICS
For the second-stage OLS regression (table 2), education is statistically significant at the 10 percent level, with positive but diminishing effects over the range of the data. This may reflect the role that education plays in helping household heads meet the more complex management requirements of relatively larger smallholder contract tobacco farming operations (e.g., the management of seedbeds and planting labor to ensure that seedlings are transplanted at the optimal age becomes increasingly complex as area expands). As in the case of cotton, the value of sales is significantly and negatively associated with distance from the tarred road, indicative of a decreasing quality of service provision in more remote (and therefore more expensive to service) locations. Joint tests of regressors indicate that private assets are highly significantly correlated with tobacco sales while public assets are significant at the .05 level. To summarize, the econometric results consistently indicate that private assets—labor and animal traction, but especially land—are statistically significantly associated with smallholder participation in all three crop markets. Furthermore, a broader range of private assets—including livestock and equipment—is significantly associated with participation and/or sales volume for the contract production of cash crops compared to maize sales on the spot market, and level of education is positively associated with value of production for the quality-differentiated cash crop (tobacco). Amongst variables representing public investments, distance to the nearest tarred road is negatively associated with sales of both tobacco and cotton. The higher difficulty and cost of servicing remote locations could well result in a lower quality of service provision that adversely affects crop output. Lack of timeliness in input delivery can have negative effects on quantity produced, while lack of timeliness in crop evacuation can have negative effects on quality. The consistency of these results across markets and crops suggests both the central importance of private assets to smallholders’ capacity to take advantage of commercial market opportunities and their potential complementarity with public goods in regard to stimulating broader-based crop market participation or marketed supply expansion. The other strikingly consistent result is that female-headed households are significantly disadvantaged in terms of both participation in and level of earnings from crop markets. Since contemporary policy dialogues on strategies for stimulating smallholder agricultural commercialization largely overlook these apparent asset and gender barriers to commercial agricultural market entry—and their far greater effect on higher return contract cash crops than on spot market staple crop sales—these findings are potentially important, even given

��
the natural caveats associated with such estimation using cross-sectional data.
4.4 Is There Evidence for a Land Access Threshold for Crop Market Participation? Because a household’s arable land assets, defined as area under annual crops, permanent crops, and fallow, were positively and highly significantly associated with market participation in all three crops and had a significantly stronger effect on participation in higher return cotton and tobacco contract markets than in maize spot markets, we now explore further how market participation and/or the value of sales for each of the three crop market types varies over the range of land assets. We explore these using non-parametric (kernel) regression of the indicator variable for market participation (=1 if the household sells) or of the logarithm of net sales revenue for the crop in question on land holdings. Unlike the preceding multivariate regressions, this simple bivariate regression does not control for variation in other assets and attributes of households. Although these regressions thus suffer obvious omitted variable bias, they provide a consistent estimation of the unconditional relation between land holdings and crop marketing patterns and, moreover, by relaxing the parametric specification restrictions of the selection models just estimated, they permit less restrictive identification of regions of potential locally increasing returns, i.e., where one might look for especially sharp increases in the likelihood of market participation or in marketed sales volumes. We first look at the relationship between land assets and market participation. Figure 5 shows the Rosenblatt-Parzen nonparametric kernel density estimates of the distribution of land holdings. The overwhelming majority of households have four or fewer hectares, with the mode, median, and mean all under two hectares, and a long right tail reflecting positive skewness in the land distribution in Mozambique, as in most countries. Less than one percent of households operate eight or more hectares in this sample. This is important to note for comparison with the next two graphics, which depict the Nadaraya-Watson nonparametric regression of the two dependent variables on land holdings, shown over the same conditioning domain. Figure 6 shows a clear ordering of market accessibility among the three crops, with maize having the highest level of household participation at all levels of land holdings, followed by cotton, with tobacco the least accessible. For all three crops, the probability of household participation is very modestly increasing over the bulk of the land distribution, but at
Boughton et al.
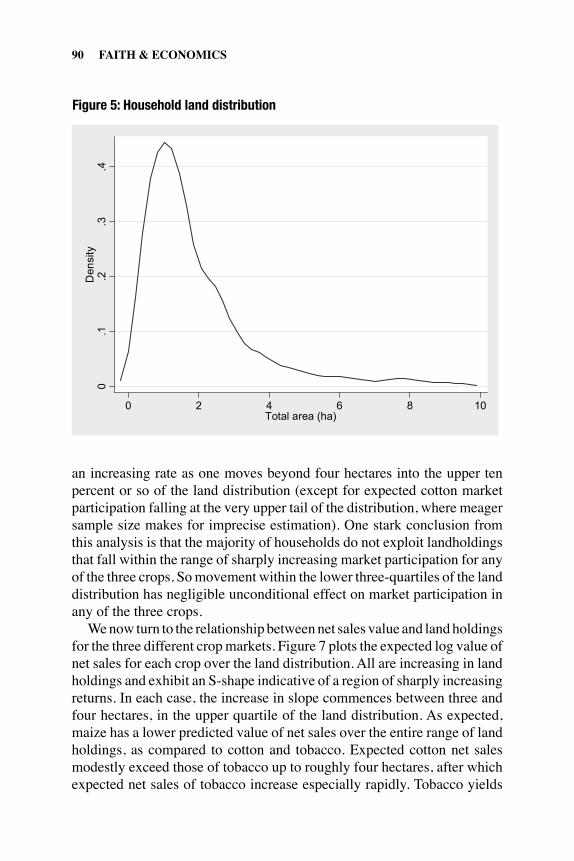
�0 FAITH & ECONOMICS
an increasing rate as one moves beyond four hectares into the upper ten percent or so of the land distribution (except for expected cotton market participation falling at the very upper tail of the distribution, where meager sample size makes for imprecise estimation). One stark conclusion from this analysis is that the majority of households do not exploit landholdings that fall within the range of sharply increasing market participation for any of the three crops. So movement within the lower three-quartiles of the land distribution has negligible unconditional effect on market participation in any of the three crops. We now turn to the relationship between net sales value and land holdings for the three different crop markets. Figure 7 plots the expected log value of net sales for each crop over the land distribution. All are increasing in land holdings and exhibit an S-shape indicative of a region of sharply increasing returns. In each case, the increase in slope commences between three and four hectares, in the upper quartile of the land distribution. As expected, maize has a lower predicted value of net sales over the entire range of land holdings, as compared to cotton and tobacco. Expected cotton net sales modestly exceed those of tobacco up to roughly four hectares, after which expected net sales of tobacco increase especially rapidly. Tobacco yields
Figure 5: Household Land Distribution 0
.1.2
.3.4
Den
sity
0 2 4 6 8 10Total area (ha)
Figure 5: Household land distribution

��
the greatest income per hectare for the largest farms; cotton yields most for the smallest farms. Maize earnings per hectare are sharply lower than cash crop net earnings over the entire land distribution. What might account for increasing returns among households with land holdings greater than the three to four hectare range? A recent participatory rapid appraisal conducted by the authors with groups of cotton farmers in Nampula and Cabo Delgado provinces of Mozambique provides some insights. Farmers were asked to divide themselves into groups based on cotton yields, and groups with higher yields also tended to cultivate larger areas of cotton. The main reason given for different yields among groups was the ability to weed on time, especially first weeding. In Mozambique, weed control is primarily performed using a hand hoe and therefore requires high labor inputs per hectare. Farmers who are able to hire additional labor for weeding at the right time by paying laborers in cash achieved the highest yields, while others relied on hiring labor for payment in kind or reciprocal labor assistance. The lowest yielding groups were often unable to hire labor at all. Some farmers who were unable to weed on time, and could see that the yield potential of their crop was low, reported that they also cut back on the recommended number of pesticide applications to avoid ending the season further indebted to the cotton company. These
Boughton et al.
Figure 6: Probability of Selling Crops, by Household Land Holdings
0
.1
.2
.3
.4
.5
0 2 4 6 8 10Total area (ha)
maize cottontobacco
Pro
babi
lity
of s
ellin
g
Figure 6: Probability of selling crops, by household land holdings
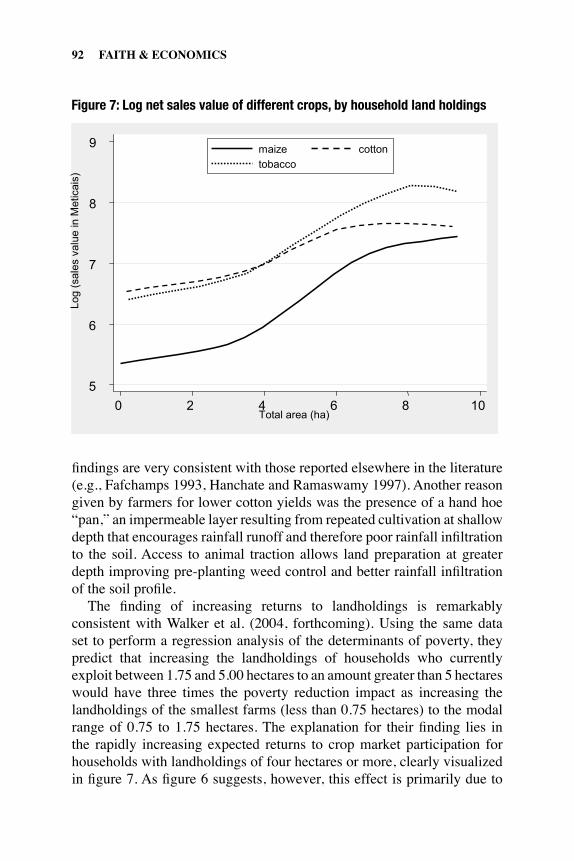
�� FAITH & ECONOMICS
findings are very consistent with those reported elsewhere in the literature (e.g., Fafchamps 1993, Hanchate and Ramaswamy 1997). Another reason given by farmers for lower cotton yields was the presence of a hand hoe “pan,” an impermeable layer resulting from repeated cultivation at shallow depth that encourages rainfall runoff and therefore poor rainfall infiltration to the soil. Access to animal traction allows land preparation at greater depth improving pre-planting weed control and better rainfall infiltration of the soil profile. The finding of increasing returns to landholdings is remarkably consistent with Walker et al. (2004, forthcoming). Using the same data set to perform a regression analysis of the determinants of poverty, they predict that increasing the landholdings of households who currently exploit between 1.75 and 5.00 hectares to an amount greater than 5 hectares would have three times the poverty reduction impact as increasing the landholdings of the smallest farms (less than 0.75 hectares) to the modal range of 0.75 to 1.75 hectares. The explanation for their finding lies in the rapidly increasing expected returns to crop market participation for households with landholdings of four hectares or more, clearly visualized in figure 7. As figure 6 suggests, however, this effect is primarily due to
Figure 7: Log Net Sales Value of Different Crops, by Household Land Holdings
5
6
7
8
9
0 2 4 6 8 10Total area (ha)
maize cottontobacco
Log
(sal
es v
alue
in M
etic
ais)
Figure 7: Log net sales value of different crops, by household land holdings
��
increased sales conditional on market participation, as the probability of market participation itself is only modestly increasing in area over most of the land distribution. So much of the effect comes through increased quantity and quality of output associated with greater farmer productive assets.
5 Conclusions This paper set out a conceptual framework for analyzing smallholder asset requirements in relation to participation in different types of crop market. The motivation for the paper was the potential to raise farmer incomes and reduce poverty through smallholder participation in crop markets. Markets can only stimulate wealth creation among those who can afford to participate given production constraints and the costs of market participation. If poorer households are unable to participate effectively, then interventions to build up either their private stocks of productive assets, or the public goods that support agricultural production and marketing, or both, may be necessary. Drawing conclusions from the empirical analysis undertaken in this paper requires caution because of the unavoidable challenges of endogeneity in a cross-section analysis of this sort and limitations in the availability of public good variables. Nevertheless, evidence from three crop markets in Mozambique, one food crop spot market and two cash crop contract markets, suggests the presence of household asset-related barriers to entry in each crop market. Among variables representing public goods, remoteness as measured by distance from the village to the nearest tarred road was negatively associated with cash crop sales. The consistent pattern of these results across crops indicates that, to achieve broad-based increases in crop market participation at this stage of Mozambique’s smallholder agricultural development, private asset accumulation is necessary. Public investments in roads (and perhaps unobserved public goods and services, such as agricultural research) and increased private asset endowments may well be complements. This in turn raises important questions about the relative costs and benefits of public investments that are beyond the scope of this study.10 In the case of all three crop markets in Mozambique, both parametric and nonparametric regression analysis finds that land holdings are strongly positively correlated with the discrete decision to participate in crop markets as well as with the value of net sales. Animal traction is another significant factor affecting participation in tobacco contract farming, and is positively correlated with maize and cotton earnings for smallholders
Boughton et al.

�� FAITH & ECONOMICS
who participate in those markets. Income sources other than crops are relevant to participation in both maize and tobacco markets. Education of the household head is important in tobacco contract farming. Initiatives to increase farmer incomes through participation in specific crop markets need to take account of the asset portfolios necessary for smallholders to enter and expand net sales in those markets. Non-parametric (kernel) regression analysis suggests the presence of land thresholds, reflected in increasing marginal rates of earnings per hectare, in the upper quartile of the land distribution for all three crop markets. This helps explain the tremendous concentration of sales earnings among a relatively small share of the country’s agricultural households. In the specific case of Mozambique, more research is needed to understand the reasons for constrained land exploitation in an apparently land-abundant setting given the apparent increasing returns to additional land in cultivation. In the TIA 2001/2 survey, most households claimed that they could obtain additional land for cultivation (Walker et al. 2004). So why don’t they? Clearly one factor is very limited access to animal traction because of a combination of historical and disease-related factors. Resolving the animal draught power constraint will require a concerted effort to provide rural finance for farm capitalization as well as public goods in the form of animal disease prevention and animal management extension. Since the costs of public and private asset provision to enable profitable crop market participation are likely to be high in relation to available government resources, it is unlikely that most smallholders will become commercially viable in the medium term, especially in more remunerative cash crops such as cotton and tobacco. The findings from the earlier work by Walker et al. (2004) are confirmed by the analysis in this paper: scarce resources are likely to have a higher payoff in poverty reduction if invested in helping better endowed (but still poor) smallholders increase their cultivated area to the point of increasing returns than if invested in helping the least well-endowed households, who may be better served through labor markets than through direct participation as sellers in crop markets. These findings, if confirmed through further analysis—ideally, in a multi-country study with panel data to control for some of the econometric identification problems associated with cross-sectional analysis of this sort—are potentially relevant for agricultural development policy in Sub-Saharan Africa more broadly. Jayne et al. (2003), in a cross-country study involving Mozambique and three other African countries, found that land access was statistically significantly and positively associated
��
with smallholder household incomes. An important complementary finding from our analysis is that increased access to land, and the set of assets necessary to cultivate it, appears necessary to enable farmers to benefit from emerging market opportunities. The key development policy message thus relates to the first-order importance of private productive asset holdings and their potential complementarity with public goods investments necessary to unlock the poverty reduction potential of the commercial agricultural sector. When new market opportunities open up, smallholders must either already be endowed with the necessary set of assets to cultivate enough area to surmount the relevant—if often latent—land thresholds or must be provided those assets as part of a deliberate agricultural market development strategy. If the complementarity between different kinds of private and public investments in achieving broad-based poverty reduction is valid, then two key implications follow. First, ensuring coordination between the public and private sectors to identify and facilitate access to the correct asset mix could be a valuable public good in its own right. Second, because of the high multiplier effects from increased smallholder market-generated incomes, public investments that help leverage smallholders’ private investment to attain the necessary land thresholds (e.g., through appropriate financial market interventions) may be justified. An important set of empirical research questions concerns the targeting of, and social returns to, smallholder investment subsidies for different types of market opportunities. Recent evidence that smallholder farm size is declining in several Sub-Saharan African countries (Jayne et al. 2006) lends greater urgency to this research agenda. Additional research similar to that undertaken here is clearly needed to ascertain the extent to which these findings are specific to the case of Mozambique versus being of more general application to other countries in the region and/or countries at different stages of structural transformation.
Endnotes
1 Even in those parts of Mozambique where expanded access to land is feasible, the limited availability of animal traction often prevents its exploitation. Increasing the availability of animal traction to small-holders is a difficult challenge because of the high investment cost, the need for access to veterinary inputs to treat for trypanosomiasis, and the lack of tradition of maintaining animals in many areas.
Boughton et al.
�� FAITH & ECONOMICS
2 The inability to signal, or the distortion of signals about the ability of contract growers to use inputs effectively (e.g., as a result of gender bias or rent seeking behavior by company extension agents), raises unit costs and, in the presence of monopsony power, can adversely affect grower returns.
3 Households will not both buy and sell the staple in this simple, one-period model because of the price wedge created by transactions costs, so there exists a complementary slackness condition, MsbMss = 0 at any optimum. Because the household does not consume the cash crops, it can only participate in those markets as a seller.
4 While assets are represented by continuous variables in the simple theoretical model used to illustrate our analytical framework, in prac-tice the data often contain dichotomous values (e.g., ownership of ani-mal traction, access to market information). The model is sufficiently general to be valid for binary as well as continuous metrics of asset holdings.
5 Because the characteristics of maize production and marketing are so different in the three southern provinces of Mozambique compared to rest of the country we only include households from the seven prov-inces in the central and northern regions of the country for the em-pirical analysis of maize market participation that follows. In the case of cotton and tobacco, we only include households in districts where contract farming schemes are in operation.
6 We chose not to employ the Tobit model due to its restriction that par-ticipation and the extent of participation are determined by the same variables, and that a variable that increases the probability of partici-pation also increases the extent of participation.
7 In Mozambique, all land is owned by the state under the constitution. The 1994 Land Law recognizes traditional land use rights that are al-located or adjudicated by traditional authorities, usually village chiefs. The land area variable is the sum of the area of annual crops, perma-nent crops, and fallow that the household reports having access to. A correction factor is applied to reported area based on a sub-sample of measured fields.
8 Pitoro et al. (2001) discuss the weakness of cotton extension services provided by three companies based on a survey of cotton farmers in Nampula province.
9 In an interview with the authors in April 2007, the Managing Direc-tor of the sole cotton company operating in Cabo Delgado province reported that the poor condition of rural roads was a major constraint to the company’s effectiveness.
��
10 A recent draft public agricultural research investment plan to improve livestock and crop production technology to increase the productivity of household assets and/or reduce the risk of crop production proj-ects an internal rate of return of 22 percent assuming only 10 percent of rural households benefit through adoption (Ministry of Agriculture 2006). The returns on such programs would obviously expand with greater adoption and/or market participation rates, thus the benefit/cost profile of public investments may well be endogenous to the pri-vate asset holdings of the target subpopulations.
References
Barrett, C.B. 1996. “Urban Bias in Price Risk: The Geography of Food Price Distributions in Low-Income Economies.” Journal of Development Studies 32(6): 830–849.
_____. 1997. “Food Marketing Liberalization and Trader Entry: Evidence from Madagascar.” World Development. 25(5): 763–777.
_____. 2007. “Smallholder Market Participation: Concepts and Evidence from Eastern and Southern Africa.” Manuscript, Cornell University. Ithaca, NY.
Barrett, C.B, M. Bezuneh, D.C. Clay, and T. Reardon. 2005. “Hetrogeneous Constraints, Incentives and Income Diversification Strategies in Rural Africa.” Quarterly Journal of International Agriculture 44(1): 37–60.
Barrett, C.B., M.R. Carter, and P.D. Little, eds. 2006. Understanding and Reducing Persistent Poverty in Africa. London: Routledge.
Barrett, C.B. and P. Dorosh. 1996. “Farmers’ Welfare and Changing Food Prices: Nonparametric Evidence From Rice In Madagascar.” American Journal of Agricultural Economics 78(3): 656–669.
Barrett, C.B., P.P. Marenya, J.G. McPeak, B. Minten, F.M. Murithi, W. Oluoch-Kosura, F. Place, J.C. Randrianarisoa, J. Rasambainarivo, and J. Wangila. 2006. “Welfare Dynamics in Rural Kenya and Madagascar.” Journal of Development Studies 42: 248–277.
Benfica, R., D. Tschirley, and L. Sambo. 2002. “The Impact of Alternative Agro-Industrial Investments on Poverty Reduction in Rural Mozambique.” Research Report No. 51E, Ministry of Agriculture and Rural Development. Mozambique. http://www.aec.msu.edu/fs2/mozambique/wps51e.pdf (accessed September 26, 2007).
Benfica, R., A. Miguel, J. Zandamela, and N. Sousa. 2005. “The Economics of Smallholder Households in Tobacco and Cotton Growing Areas of the Zambezi Valley of Mozambique.” Research
Boughton et al.

�� FAITH & ECONOMICS
Report No. 59E, Ministry of Agriculture and Rural Development. Mozambique. http://www.aec.msu.edu/fs2/mozambique/wps59E.pdf (accessed September 26, 2007).
Benfica, R., D. Tschirley, and D. Boughton. 2006. “Interlinked Transactions in Cash Cropping Economies: The Determinants of Farmer Participation and Performance in the Zambezi River Valley of Mozambique.” Manuscript, Michigan State University. Lansing, Michigan.
_____. Forthcoming. “Contract Farming in Cotton Economies: The Determinants of Farmer Participation and Performance in Rural Mozambique.” Research Report, Ministry of Agriculture and Rural Development. Mozambique.
Boughton, D., D.L. Tschirley, A.O. Ofiço, H.M. Marrule, and B. Zulu. 2003. “Cotton Sector Policies and Performance in Sub-Saharan Africa: Lessons Behind the Numbers in Mozambique and Zambia.” Manuscript, Michigan State University. East Lansing, Michigan.
Boughton, D., D. Mather, D. Tschirley, T. Walker, B. Cunguara, and E. Payongayong. 2006. “What’s Driving Mozambique’s Rural Income Growth? A Comparative Analysis of the 1996 and 2002 National Agricultural Sample Surveys.” Research Report No. 61E, Ministry of Agriculture and Rural Development. Mozambique. http://www.aec.msu.edu/fs2/mozambique/wps61E.pdf (accessed September 26, 2007).
Cadot, O., L. Dutoit, and M. Olarreaga. 2006. “How Costly Is It for Poor Farmers to Lift Themselves Out of Subsistence?” Policy Research Working Paper 3881, World Bank. Washington, D.C.
Carrilho, J., R. Benfica, D. Tschirley, and D. Boughton. 2003. “Qual o Papel da Agricultura Familiar Comercial no Desenvolvimento Rural e Redução da Pobreza em Moçambique.” Research Report No. 53P, Ministry of Agriculture and Rural Development. Mozambique. http://www.aec.msu.edu/fs2/mozambique/wps53P.pdf (accessed September 26, 2007).
Carter, M.R. and C.B. Barrett. 2006. “The Economics of Poverty Traps and Persistent Poverty: An Assets-Based Approach.” Journal of Development Studies 42(2): 178–199.
de Janvry, Alain, Marcel Fafchamps, and Elisabeth Sadoulet. 1991. “Peasant Household Behaviour with Missing Markets: Some Paradoxes Explained.” The Economic Journal 101(409): 1400–1417.
Dorward, A., J. Kydd, and C. Poulton. 1998. Smallholder Cash Crop Production Under Market Liberalization: A New Institutional Economics Perspective. Wallingford, UK: CAB International.
��
Dorward, A., S. Fan, J. Kydd, H. Lofgren, J. Morrison, C. Poulton, N. Rao, L. Smith, H. Tchale, S. Thorat, I. Urey, and P. Wobst. 2004. “Institutions and Economic Policies for Pro-Poor Agricultural Growth.” Development Strategy and Governance Division Discussion paper 15, International Food Policy Research Institute. Washington, DC.
Fafchamps, M. 1992. “Cash Crop Production, Food Price Volatility, and Rural Market Integration in the Third World.” American Journal of Agricultural Economics 74(1): 90–99.
_____. 1993. “Sequential Labor Decisions Under Uncertainty: An Estimable Model of West African Farmers.” Econometrica 61(5): 1173–1197.
Goetz, S.J. 1992. “A Selectivity Model of Household Food Marketing behavior in Sub-Saharan Africa.” American Journal of Agricultural Economics 74(2): 444–452.
Haggblade, S., T. Reardon, and P. Hazell. 2005. “The Rural Nonfarm Economy: Pathway Out of Poverty or Pathway In?” Manuscript, Michigan State University. East Lansing, MI.
Hanchate, A.D. and K.V. Ramaswamy. 1997. “New Agricultural Technology, Timeliness, and Wages for Labor: A Longitudinal Study of Rural Wages in India.” Applied Economic Letters 1997(4): 267–270.
Heckman, J. 1979. “Sample Selection Bias as a Specification Error.” Econometrica 47(1): 153–162.
Heltberg, R. and F. Tarp. 2002. “Agricultural Supply Response and Poverty in Mozambique.” Food Policy 27(1): 103–124.
Jayne, T.S. 1994. “Do High Food Marketing Costs Constrain Cash Crop Production? Evidence from Zimbabwe.” Economic Development and Cultural Change 42(2): 387–402.
Jayne, T.S., T. Yamano, M. Weber, D. Tschirley, R. Benfica, A. Chapoto, and B. Zulu. 2003. “Smallholder Income and Land Distribution in Africa: Implications for Poverty Reduction Strategies.” Food Policy 28(3): 253–275.
Jayne, T.S., D. Mather, and E. Mghenyi. 2006. “Smallholder Farming Under Increasingly Difficult Circumstances: Policy and Public Investment Priorities for Africa.” Department of Agricultural Economics International Development Working Paper 86, Michigan State University. East Lansing, MI.
Key, N., E. Sadoulet, and A. de Janvry. 2000. “Transactions Costs And Agricultural Household Supply Response.” American Journal of Agricultural Economics 82(2): 245–259.
Boughton et al.
�00 FAITH & ECONOMICS
Lucas, R.E.B. 1994. “Internal Migration in Developing Countries.” In Handbook of Population and Family Economics, Vol. 1A, eds. M.R. Rosenzweig and O. Stark. Amsterdam: Elsevier Press.
Mazumdar, D. 1987. “Rural-urban migration in developing countries.” In Handbook of Regional and Urban Economics, Vol. 2, ed. E.S. Mills. Amsterdam: Elsevier Press.
Ministry of Agriculture. 2006. “Institute of Agricultural Research of Mozambique Draft Investment Plan 2007–2011.” Unpublished draft report. Mozambique.
Moser, C.M. and C.B. Barrett. 2006. “The Complex Dynamics of Smallholder Technology Adoption: The Case of SRI in Madagascar.” Agricultural Economics 35( 3): 373–388.
Moser, Christine, C.B. Barrett, and B. Minten. 2006. “Spatial Integration at Multiple Scales: Rice Markets in Madagascar.” Manuscript, Cornell University. Ithaca, NY.
Pitoro, R., O. Govene, H. De Marrule, D. Tschirley, and D. Boughton. 2001. “Desempenho do Sector Algodoeiro ao Nível da Machamba em Nampula: Situação Actual e Perspectivas Para o Seu Melhoramento.” Research Report 47, Ministry of Agriculture and Rural Development/Directorate of Economics. Maputo, Mozambique.
Reardon, T. and C. B. Barrett. 2000. “Agroindustrialization, Globalization, and International Development: An Overview of Issues, Patterns, and Determinants.” Agricultural Economics 23(2): 195–205.
Reardon, T. and C.P. Timmer. 2005. “Transformation of Markets for Agricultural Output in Developing Countries Since 1950: How Has Thinking Changed?” In Handbook of Agricultural Economics Volume 3, eds. R.E. Evenson, P. Pingali, and T.P. Schultz. Amsterdam: Elsevier Press.
Staatz, John M. 1994. “The Strategic Role of Food and Agriculture Systems In Fighting Hunger Through Fostering Sustainable Economic Growth.” Staff Paper 94–39, Department of Agricultural Economics, Michigan State University. East Lansing, MI.
Timmer, C.P. 1988. “The Agricultural Transformation.” In Handbook of Development Economics, Vol 1. eds. H. Chenery and T.N. Srinivasan, 275–331. Amsterdam: North-Holland.
Tschirley, D., D. Abdula, and M.T. Weber. 2006. “Toward Improved Maize Marketing and Trade Policies to Promote Household Food Security in Central and Southern Mozambique.” Research Report No. 60E, Ministry of Agriculture and Rural Development. Mozambique. http://www.aec.msu.edu/fs2/mozambique/wps60e.pdf (accessed September 26, 2007).
�0�
von Braun, J., E. Kennedy, and H. Bouis. 1989. “Comparative Analyses of the Effects of Increased Commercialization of Subsistence Agriculture on Production, Consumption and Nutrition.” Washington, DC: International Food Policy Research Institute.
Walker, T., D. Tschirley, J. Low, M. Tanque, D. Boughton, E. Payongayong, and M. Weber. 2004. “Determinants of Rural Income in Mozambique in 2001-2002.” Research Report No. 57E, Ministry of Agriculture and Rural Development. Mozambique. http://www.aec.msu.edu/fs2/mozambique/wps57e.pdf (accessed September 26, 2007).
Walker, T., R. Pitoro, A. Tomo, I. Sitoe, C. Salência, R. Mahanzule, C. Donovan, and F. Mazuze. 2006. “Priority Setting for Public-Sector Agricultural Research in Mozambique with the National Agricultural Survey Data.” Research Report No. 3E, Ministry of Agriculture and Rural Development. Mozambique.
Walker, T., D. Boughton, D. Tschirley, R. Pitoro, and A. Tomo. Forthcoming. “Using Rural Household Income Survey Data to Inform Poverty Analysis: An Example from Mozambique.” Agricultural Economics.
Wooldridge, Jeffrey. 2006. Introductory Econometrics: A Modern Approach. Mason, OH: South-Western College Publishing. n
Boughton et al.

�0� FAITH & ECONOMICS
Transformational Development: Mitigating Rural Poverty with the PoorPaul N. Wilson, University of Arizona, and John E. Stapleford, Eastern University
Abstract: Foreign aid programs have come under increasing scrutiny in recent years as policy makers and analysts question the efficiency and effectiveness of government to government programs. The biblical command to care for the poor has led some Christian non-governmental organizations to develop transformational development programs directed at both the physical and spiritual needs of the poor. This development approach confronts locally-accepted world- and life-views, builds positive community networks, and promotes political and economic entrepreneurship while working directly with the beneficiaries in a manner that promotes mutual accountability. Transformational development program experience indicates that personal morality, project scale, and human relationships matter as the poor struggle to escape their poverty trap.
oncern for human poverty represents a consistent thread of teaching throughout the Bible. God’s “heart for the poor,” His commands for His people to take care of the poor, and His judgment on those who ignore the poor represent a common poverty-mitigation theme in the Hebrew (Old Testament) and Greek (New Testament) scriptures. In the Old Testament, the poor are those people with incomes below the poverty line (Dal), those who have no hope and lack any social or economic power (Ani), dependent people with extreme needs (Ebyon), persons who have made poor personal choices (Astel, sluggard, and Caba, drunkard), and mothers vulnerable to human injustice (Rus). Hourly laborers (Penes) and people who are dependent on others for their physical survival (Ptochos) are the New Testament poor. Historically the Church, and more recently para-church organizations, have provided a wide range of ministries of mercy to the poor, both domestically and internationally. During the past century, concerned peoples turned increasingly to government’s enlightened self-interest to assist the poor. With the objective to improve the poor’s wellbeing, sectarian and non-sectarian aid programs have attempted to free people from poverty traps. These traps, often beyond the control of the poor themselves, impede escape from poverty. Figure 1 illustrates a dynamic poverty trap equilibrium (Lybbert et. al. 2004, Barrett and Swallow 2006). Household wellbeing for time period t and t +1 are measured on the horizontal and vertical axes, respectively. The diagonal line represents equal wellbeing in both periods. The S-shaped
C
© 2007 Association of Christian Economists
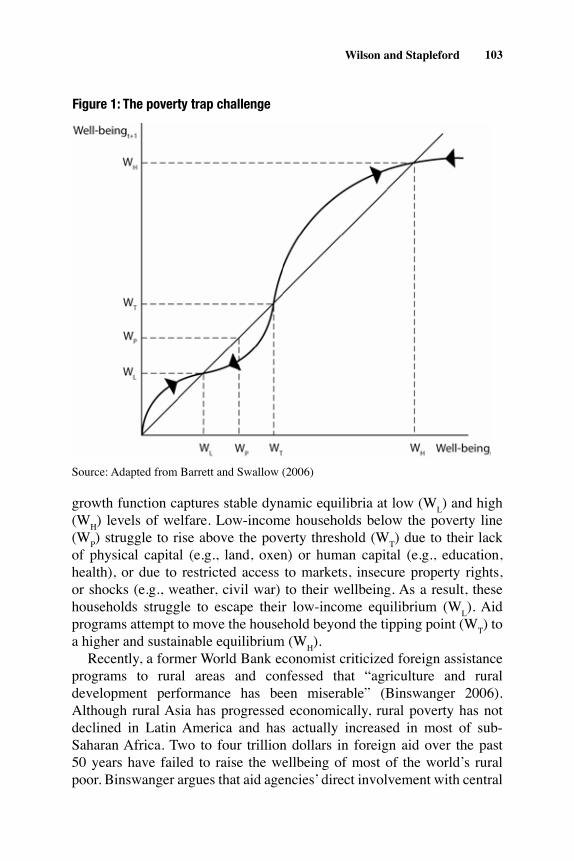
�0�
growth function captures stable dynamic equilibria at low (WL) and high (WH) levels of welfare. Low-income households below the poverty line (WP) struggle to rise above the poverty threshold (WT) due to their lack of physical capital (e.g., land, oxen) or human capital (e.g., education, health), or due to restricted access to markets, insecure property rights, or shocks (e.g., weather, civil war) to their wellbeing. As a result, these households struggle to escape their low-income equilibrium (WL). Aid programs attempt to move the household beyond the tipping point (WT) to a higher and sustainable equilibrium (WH). Recently, a former World Bank economist criticized foreign assistance programs to rural areas and confessed that “agriculture and rural development performance has been miserable” (Binswanger 2006). Although rural Asia has progressed economically, rural poverty has not declined in Latin America and has actually increased in most of sub-Saharan Africa. Two to four trillion dollars in foreign aid over the past 50 years have failed to raise the wellbeing of most of the world’s rural poor. Binswanger argues that aid agencies’ direct involvement with central
Figure 1: The Poverty Trap Challenge
Adapted from Barrett and Swallow (2006).
Figure 1: The poverty trap challenge
Source: Adapted from Barrett and Swallow (2006)
Wilson and Stapleford
�0� FAITH & ECONOMICS
governments has failed and argues for more decentralized assistance programs through local governments (e.g., village, town, and city). Rural people—not government officials in the capital city or aid practitioners in Washington or London—should design, plan, and implement their own rural development programs,. Similarly, Sen (1997) calls for more “people friendly” development programs. Easterly (2006), another former World Bank economist, pleads for fewer central government officials (“planners”) and more entrepreneurs (“searchers”) in the development process. Here we present the fundamental design of transformational development (TD), an alternative approach to rural development and poverty mitigation. TD responds to the agriculture, health, education, and governance needs of the rural poor, not unlike mainstream government-to-government foreign aid programs. However, the recognition of the sinful nature of man sets TD programs apart from most mainstream development strategies. We first review several current and powerful critiques of mainstream foreign aid programs. Then we briefly discuss several efforts by the development community to overcome the challenging issues facing rural development practitioners. This discussion leads us into a presentation of TD, a holistic Christian model for mitigating rural poverty that represents an alternative to traditional development programs. Short development cases are associated with our five characteristics of TD: world and life view, positive networks, entrepreneurship, incarnational assistance, and mutual commitment. We conclude with a discussion of the implications for the mainstream development community.
Critical Views of the Mainstream From its beginnings after World War II, the economic development community has been marked by several common characteristics. First, mainstream development programs have been dominated by persons of good will who want to make life better for the poor. Second, it has generally been assumed that economic growth will eventually bring (relative) poverty alleviation. Third, the economic development movement has assumed that those who “have” are obligated to those who “have not.” We can argue about the first characteristic, claiming that many rent-seeking development practitioners and politicians have enriched themselves in the economic development industry. Although there is some truth to this claim, it does not characterize the majority of development practitioners in the trenches. With regard to the second characteristic, research and case studies (e.g., Taiwan, South Korea) have disproved the claim that economic growth alone reduces poverty while demonstrating that only with effective
�0�
redistribution of the gains of growth through public social spending will poverty alleviation accompany economic growth. The third characteristic, although disputed by libertarians, generally has widespread public support. Serious problems have persisted over time, however, regarding the most effective means for meeting this moral or ethical obligation. The success of the Marshall Plan propelled economic development policy for developing countries into decades of top-down, macro-driven solutions. Domar, Lewis, and Rostow saw investment spending as the key to growth, with foreign aid filling the gap between a poor country’s meager savings and an appropriate capital-output ratio. Easterly (2002) labels this strategy the “financing gap approach.” After more than a trillion dollars of aid, filling the financing gap was recognized by the development community as a necessary but not sufficient condition for economic development. Easterly goes on to say that individuals “invest in the future when they get a high return to their investments” and without the incentives that encourage investment (e.g., secure property rights, patents, honest courts enforcing contracts), “aid will not cause its recipients to increase their investment, they will use aid to buy more consumption goods” (Easterly 2002, p. 38). Despite its failure to produce economic growth and poverty alleviation in many countries, the financing gap is still in vogue with some leading aid advocates today (Sachs 2005). With financing gap programs floundering, the next driving force used to sustain foreign aid was guilt. Some analysts claim that colonialism and then multinational corporations who expropriated the resources of developing countries kept many countries in a state of dependency. Dependency produced dualistic agricultural sectors and dualistic economies. In addition, emerging economic disparities within the population implied the need for redistribution programs. “The moral case is sustained not so much because aid can be proved always to succeed in helping to alleviate Third World poverty but because alternative methods of helping find no general support and because the need to help is so urgent” (Riddell 1987, p. 268). Guilt does effectively motivate redistribution but spending must be focused on critical needs like infrastructure, education (human capital), birth control, and health care. Except for some notable gains in health care, the economic development benefits associated with rural and agricultural development programs have been negligible, particularly in sub-Saharan Africa and regions in Latin America. Rural roads and solar water pumps are built with foreign assistance, but they must be maintained by government agencies or by the beneficiaries. However, there is little incentive for individuals to maintain common property or produce public
Wilson and Stapleford

�0� FAITH & ECONOMICS
goods unless community cooperation is realized (Wilson and Thompson 1993). Therefore, these programs require effective government, and effective government requires democracy where voters select and reject their leaders. Ethnic diversity also hampers public good provision (Alesina and La Ferrara 2005). Moreover, a principal-agent problem prevails, with no one aid agency or donor country held accountable for the lofty goals set by well-meaning planners (Easterly 2006). The lack of success associated with macro-economic programs and guilt-induced aid led policymakers to turn to markets as a stimulus for economic development. Privatization, elimination of price distortions across markets, facilitation of free trade, and the rest of the structural-adjustment policy package became popular. Loans and foreign aid flowed freely to nations that balanced their currency, lowered their tariffs, and made urban dwellers pay the market price for coffee and maize. However, free markets did not take root in most of the aid recipient nations because free markets require social capital and trust. Trust is a function of culture, and culture matters (e.g., Weber 1905, Harrison 1992, Landes 1998, McCleary and Barro 2006). Culture, “those customary beliefs and values that ethnic, religious, and social groups transmit fairly unchanged from generation to generation,” impacts economic outcomes (Guiso et al. 2006, p. 23). The institutional framework necessary for the functioning of markets—such values as honesty, thrift, respect for others, social networks, and the work ethic—springs from the soil of culture. Easterly (2006) argues that the legal framework required for markets must evolve from the bottom-up through case law, a view supported by de Soto (2000) in his investigation of the origin of property rights in the United States. But are Easterly and other current development thinkers on to something new? Thirty years ago P.T. Bauer (1976) wrote, “Preoccupation with aid, with planning and with investment expenditure has encouraged the facile belief that economic development is possible without cultural change. It has inhibited the exploration of ways to promote institutional change” (p. 110). Foreign aid, notes Bauer, promotes centralized and closely controlled economies and leaves the poorest and most backward groups unaffected. Michael Maren’s The Road To Hell: The Ravaging Effects of Foreign Aid and International Charity (Maren 1997) presents a strong indictment of “business as usual” in foreign assistance programs. The case study is Somalia where Maren spent almost two decades. By the end of his tenure as a development practitioner, the relief industry accounted for nearly two-thirds of the Somalian economy. Military dictators drove citizens off of
�0�
their ancestral lands into refugee camps creating a starvation crisis that then turned on the foreign assistance faucets of donated food and other relief operations. The dictators then, according to the author, steal and resell the food to pay for military hardware and for beautiful homes and Land Rovers that they turn around and rent to expatriate relief workers at exorbitant rates. The economy, dependent on foreign aid, becomes even more centralized and politicized. Expatriates meet nightly over drinks to bemoan the corruption and futility, and to support the local prostitution industry. According to Maren, aid is a self-serving industry that sacrifices its own practitioners and intended beneficiaries in order that it may survive and grow. Similar views are echoed by Robert Calderisi (2006) who finds that African culture, corruption, and foreign aid combine to keep tyrants and thugs in power. Foreign aid advocates have a genuine concern for the poor. Runge et al. (2003) call for a doubling of development aid from public and private sources in order to end hunger in our lifetime. These authors recognize that weak, corrupt, and despotic governments in developing countries guarantee that little progress will result from foreign aid, but rest their optimistic outlook on the promise of new technologies and on improved governance at all levels in the economic development community. Burnside and Dollar (2000) assert that foreign aid facilitates economic growth in developing countries with sound governments and a good economic policy environment. Subsequent research, however, using more complete data, refutes the finding of Burnside and Dollar, concluding that there is no evidence that aid raises growth in countries with good governance, and that when aid increases relative to GDP it reaches a point where its impact on economic growth is negative (Easterly 2006). There also are bureaucratic incentives within donor agencies for keeping the aid flowing. Raymond Martin, a committed Mennonite, comments from twenty-five years with USAID and a current position at the World Bank:
At USAID, we aggressively marketed our aid. The bigger our programs and the more money we spent, the better our performance evaluations and the faster our promotions. At the World Bank, despite denials by management, there is pressure to lend…. I think we have underestimated the corrupting influences and perverse incentives that result from giving money free to Third-World bureaucracies (Yoder et al. 2004, pp. 164, 166).
Traveling by bus and truck from Cairo to Cape Town, Paul Theroux observes that “governments in Africa depend on underdevelopment to
Wilson and Stapleford
�0� FAITH & ECONOMICS
survive—bad schools, poor communications, a feeble press and ragged people. They need poverty to obtain foreign aid, they need ignorance and uneducated and passive people to keep themselves in office for decades” (Theroux 2002, p. 333). Unlike three decades before, when Theroux worked as a teacher in rural Africa, the business of Africa is philanthropy and the pursuit of aid dollars. Theroux (2002) concludes that only Africans can define their problems and only Africans can fix them, a similar argument to that of Binswanger mentioned earlier.
Partial Glimpses of Reform In all fairness, the donor community and aid practitioners constantly seek a clearer understanding of poverty and a confident grasp of those mechanisms or programs that alleviate or mitigate hunger. Although the nature of poverty is heterogeneous from the village to the national level throughout the world, the development community understands the critical importance of a healthy lifestyle, a fundamental education, low-cost and effective governance institutions, accessible markets, and appropriate technologies. Yet each of these fundamental socioeconomic needs does not stand alone as a solution to rural poverty. As noted in the previous section, mainstream attempts to solve one need at a time have failed to lift the rural poor out of the trap of poverty. In fact, the tendency to shift from one urgent need to another irrespective of their interdependencies or jump from one development strategy to another depending on the latest development fad (e.g., structural adjustment) has produced an environment of short-term opportunism rather than long-term sustainability in rural communities. Throughout the 1970s, integrated rural development programs were regarded as a viable approach to meet the interdependencies in poverty mitigation (Wilson 1983). These strategies, working through central government agencies or establishing new, more responsive agencies, contained assistance packages that eased the health, education, credit, agriculture, and governance constraints in rural areas. Although conceptually attractive, integrated rural development programs proved to be politically, financially, and managerially unsustainable at the donor and government levels. Participatory development strategies have been an ongoing effort to engage beneficiaries in the design and implementation of development programs (Chambers 1983, Wilson and Wise 1984, Aslam and Wilson 1995). Many non-governmental organizations (NGOs) rely on this delivery approach in their rural development programs. Unfortunately, sincere plans to engage the rural poor in their own economic development
�0�
on behalf of central governments, and even in the case of some NGOs, have stumbled over a host of challenging issues ranging from limited travel budgets to social class discrimination and arrogance. The importance of social capital in economic development attracted the attention of development practitioners in the late 1990s (Grootaert and Bastelaer 2002). The development community recognized that people participate in social networks and these relationships produce a wide variety of mutual benefits and costs. Family and village networks create a safety net in response to family emergencies and economic crises. Yet these same networks, or other community networks, may block entrepreneurial innovation, access to markets, and participation in governance structures (Barrett 2003). So in recent years, the “good, bad, and ugly” of social networks has increasingly become a central feature of our understanding of rural poverty. Institutional capital, how a society governs interpersonal transactions, currently occupies the development limelight as a determinant of economic growth. From de Soto’s (2000) emphasis on the role of property rights to the literature on effective governance, the formal and informal rules that govern a society matter. For example, the Millennium Development Goals recognize the need to improve the security of property ownership in the economy and reduce the societal costs of corruption. Finally, the role of cultural/spiritual capital in economic development has had an on and off again role in understanding the uneven performance of economic development (Harrison and Huntington 2000). Harrison (1985) argued that the world and life view of people, the analytical framework they use to explain their living and working environment, partially determines their economic success. Landes (1998) has gone so far to claim the world and life view of an individual, community, or nation makes all the difference between development and underdevelopment.
An Alternative Paradigm: Transformational Development�,�
A distinguishing characteristic of transformational development (TD) is its holistic approach to economic progress. TD recognizes poverty as a material, social, and spiritual condition where hopelessness reigns in the lives of people. Contrary to current, dualistic foreign aid programs where spiritual and material concerns are kept separate, TD openly discusses and works with the spiritual issues embedded in the animistic, materialistic, and biblical world and life views of the poor while delivering traditional health, agriculture, micro-finance, and water development programs. The poor, created in the image of God (Gen. 1:26) and co-creators on earth
Wilson and Stapleford
��0 FAITH & ECONOMICS
(Gen. 1:28), are valued as bearers of God’s image in the TD paradigm. As a result, TD maintains Jesus Christ as a focal point in economic development programming (e.g., incarnational witness, Bible studies, and church support). Market access, universal education, modern health care, and appropriate technologies—all components of God’s creation—are necessary but not sufficient conditions for sustainable economic development. Western donor governments readily express concern that TD promotes a belief system that has no place in economic development programs. TD practitioners respond with the observations that (1) all people have beliefs and values (i.e., faith) that cannot be ignored in development and (2) western governments actively promote a materialistic world and life view in their development programs by ignoring or discounting matters of faith. The phrase “one at a time” captures the micro-development focus of TD. Rather than focus on aggregate impacts as a measure of success, TD organizations efficiently direct human and financial resources towards the individual (particularly women and children), family, and community. TD’s unit of analysis is the individual over time as he or she makes choices that improve individual, family, and community wellbeing. Rather than a “big push” to alleviate poverty, as proposed recently by Sachs (2005), TD channels consistent programming to relatively small microeconomic units in the difficult or hard places of the world. TD’s individual- and community-focused programming builds on, rather than substituting for, the important responsibility of government policy and governance in reducing rural poverty. Access to education, health care, infrastructure (e.g., roads, potable water), and trustworthy public organizations (e.g., police, courts) complement the activities in the TD paradigm. Without a fair and just public sector, many TD programs experience frustration and fail to meet their objectives. Amy Sherman’s analysis of economic transformation in Guatemala represents one of the most detailed analyses of a TD-like approach to development (Sherman 1997). Sherman visited fifteen villages extensively, and directed formal interviews with 1,000 Guatemalans in five different villages. She also conducted in-depth, informal interviews with 100 Guatemalans during six month-long site visits. Sherman found that a person’s religious world and life view was correlated with his or her political beliefs and participation. Individuals with orthodox Christian convictions tended to be more sympathetic toward the institutions and norms of democratic capitalism than did individuals with animist or pagan beliefs.
���
She notes that religion is the heart of culture and can be an independent variable, an agent of change. Guatemalan converts’ (if conversion is genuine and profound) escape from belief in gods (animism), and their new belief in God (orthodox Christianity) helped them climb out of their poverty traps. Sherman reports that orthodox Roman Catholics do just as well or better economically than orthodox evangelicals, because they hold similar modern attitudes on important variables related to development (e.g., openness to change, merit, innovation, equality, rejection of fatalism, innovation, personal responsibility, self-discipline, cooperativeness, political participation, and the importance of education). Cristo-pagans, unsympathetic to a merit-based economy and unenthusiastic about the free market, have a zero-sum mentality, revealed by their hostility to profit-making, lack of individual initiative, and dislike for competition.
World and Life View A world and life view is a mental model by which people process information about their environment and personal circumstances to facilitate making choices. World and life views infiltrate society to the point that national laws, organizations, and lifestyles reflect the predominant societal values and beliefs. Animistic and materialistic world and life views either leave God out of development or see God as disengaged or a capricious influence on economic affairs. TD practitioners believe that the root problem of poverty is in people’s minds, regardless of such factors as a lack of capital or foreign aid, government corruption, unfavorable geography, or a lack of technology. Poor people, it is argued, often believe a web of lies that keep them trapped in poverty (Miller and Allen 2005). These lies include, but are not limited to, (1) women are inferior to men, (2) work is a curse, (3) my tribe is superior to your tribe, (4) we are poor and there is nothing we can do about it, (5) individual life is not significant, and (6) resources are fixed and limited. The holistic approach of TD presents a frame of reference (i.e., a biblical world and life view) that favorably impacts the economic future of individuals, families and communities. For example, the biblical emphasis of man as a steward and co-creator can dramatically change attitudes towards work, from drudgery and hardship to sacredness and dignity. World and life views of the poor constrain decision making in a bounded rationality sense (Simon 1972). Choices associated with welfare enhancing opportunities fall short of their potential because the “web of lies” creates an environment of incomplete information. Likewise, world and life views become part of the individual’s analytical mental framework
Wilson and Stapleford
��� FAITH & ECONOMICS
that may prevent rational choice (Tversky and Kahneman 1979, 1981). Decisions are made that reduce the probability that the individual, family or community will escape the poverty trap illustrated in figure 1. The biblical world and life view, an integral part of TD, bounds decision making within a scriptural framework but releases the individual from lies that constrain his or her role as steward and co-creator. The truth that women are made in the image of God and have equal worth with men, that work is part of human dignity, that each tribe is of equal value in God’s eyes, that God created humans with freedom and personal responsibility, that individual life is significant, and that wealth can be created, all release a productive energy that breaks the bounds of traditional thinking. By proclaiming and teaching the Gospel within the community, TD attempts to produce passionate Christian disciples, not just believers (Matt. 28: 18–20).
Case Study: The Pokomchi Indians and Arturo�
The Pokomchi Indians are among the poorest people in the poorest state of Guatemala. Many years ago, missionaries came to evangelize and plant churches in Pokomchi communities. Many people accepted Christ as their savior, yet they remained desperately poor. Community development organizations came to work with the Pokomchi, interested in helping them improve their impoverished living conditions. These organizations brought in money and technical assistance from non-poor nations and completed many projects, labeling them successful. Now there were latrines in the community, but they were largely unused. There were school buildings, but very few children attended or graduated. There was no transformation in Pokomchi lives and communities. Arturo, a young Peruvian pastor and TD employee began his ministry to the Pokomchi in the early 1990s. Arturo understood the importance of a biblical world and life view for individual and community transformation. Through incarnational ministry and Bible study, Arturo began to see transformed mindsets leading to transformed lives. When inadequate crop storage was identified as a cause of food insecurity in the communities, Arturo asked “Who is smarter, you or the rats?” Arturo pointed out to the farmers that men and women have been given dominion over creation (Gen. 1:27–28; 2:15; 9:1–2; Ps. 8:3–9). The farmers developed a design for simple, elevated corncribs. When constructed, the food supply increased as did the overall health of the children in the community. Likewise, Arturo’s teaching that (1) children were a gift from God (Ps. 127:3) encouraged school attendance, (2) husbands are to love their wives and treat them
���
with respect and dignity (Eph. 5:25–28; 1 Pet. 3:7) motivated husbands to encourage their wives to learn to read and to build small mud stoves in the kitchens to reduce smoke pollution, (3) people are called by God to be stewards of what God has provided (Prov. 10:4; 13:11) encouraged the men to adopt productivity-enhancing farming practices and women to build small pantries to keep insects and vermin out of their food supply.
Positive Networks Social networks are bilateral or multilateral associations where interaction between individuals or groups produces mutual value. In non-poor and poor nations alike, social networks in business can produce goodwill, flexibility, mutual forbearance, reduced transaction costs, and trust (Wilson 2000). However, social networks also can produce abuse, discrimination, and even violence. TD practitioners argue that people often are poor because they participate in social networks that produce many more costs than benefits (e.g., resistance to change). The poor’s current relationships do not work to their benefit—rather, the networks in their families and communities are characterized by brokenness and dysfunction. As a result, relationships between (1) themselves and God,(2) with others in their realm of influence, and (3) with the natural environment must be transformed, for without relational transformation all development programs (e.g., credit, road maintenance, cooperative marketing) will fail the sustainability test. In a sense, the poor have structural holes in their social networks (Burt 1992). They are vulnerable to exploitation by the one individual that connects them to a wider set of relationships. Structural holes leave the poor more vulnerable to greed, shocks to their productive environment (e.g., weather disasters, death), poor medical advice, and political manipulation, to name just a few dangers. Healthier networks have fewer structural holes and thereby create more opportunities for welfare enhancing relationships (e.g., business partnerships, community safety nets) due to widespread connectivity in the network that increases the probability of higher quality social capital. TD recognizes the importance of building community (i.e., improved social networks) as a key driver to poverty mitigation. The church can play a critical role in social network development. People come together to worship and fellowship and in the process develop mutually beneficial network capital. The church, as a visible community, serves a servant and encourager role within its social network. As church members live a biblical world and life view in their secular lives, community bonds
Wilson and Stapleford
��� FAITH & ECONOMICS
are strengthened. TD organizations encourage local church development through pastor training conferences, seed money for small-scale development projects, and training and mentoring for church leaders.
Case Study: Bintou�
Bintou was devastated when her husband died suddenly. Though grief-ridden, she was left to run his small goods shop in Mali and to care for their five children. Overwhelmed and without resources or business experience, Bintou asked her husband’s former trading partners for a loan. They agreed, but their loan had outrageous strings attached. Preying on her vulnerability, they forced her to pay an unreasonably high interest rate or else provide them with sexual favors. Fortunately, Bintou’s elder sister helped her pay off the debt including the higher interest payment. Soon thereafter, Bintou learned about Nomsombougou Community Bank (NCB)—a TD microfinance institution. NCB assists clients like Bintou who struggle to operate small businesses alongside their subsistence farming operations. Bintou has successfully repaid several NCB loans and is expanding her shop. She now has the financial resources to pay her children’s school fees and provide all her family’s food, medical and clothing needs.
Entrepreneurship Above, we noted William Easterly’s call to non-poor Western governments to direct more development assistance to the “searchers,” not “planners,” in poor nations. “Searchers” are entrepreneurs who see opportunities to improve economic efficiency and effectiveness either within an existing organization (i.e., intrapreneur) or by establishing a new organization to deliver their innovation to the customer. In this manner, development programs emerge from within the community, not from outside experts, and have a higher probability of long-term economic success. TD organizations invest significant resources in leadership training and development, both within the church and the community. They recognize that most community members are followers, not leaders. So as leaders are transformed in their thinking, these changed leaders alter the world and life view of the community. TD practitioners come alongside local leaders, teaching them the importance of integrity (Job 27:4), responsibility (Luke 12:48), commitment (Mark 10: 43–44), vision (Prov. 29:18), communication (Eph. 4:29), conflict resolution (James 1:2–3) and courage (Rom. 12:2). Entrepreneurial leaders are trained to identify their community’s problems, gather input from members of the community,
���
develop alternative solutions, reach a decision, implement the chosen solution, and finally, evaluate what is working and what is not working in the community. Leaders are taught to see the image of God in everyone and to facilitate individual free will by providing each person with the opportunities and resources to participate as a dignified member of the community in the development process.
Case Study: Phall Nam�
Quarreling, gambling, and fighting were common occurrences in Phall Nam’s home in the small village of Tro Meng, Cambodia. The total absence of peace and hope overwhelmed her each day. As a widow with little education to help her participate in society, Phall Nam was an outcast. She sank into deeper despair, plagued by the real source of her problems, the very thing that still kept her connected to society—being controlled by evil spirits. These spirits forced her to sacrifice the little food she had, leaving her unable to provide for her and her children. Yet one day, TD staff began a long-term relationship with Phall Nam. They had heard about her association with witchcraft and demonic practices so they shared the Gospel with her and prayed with her. Soon thereafter the TD organization facilitated a church plant in Tro Meng and Phall Nam began to attend on a regular basis. Phall Nam soon made a personal commitment to Jesus Christ, her life was changed, and she began to attend monthly training meetings for church leaders. Through this equipping, Phall Nam grew stronger in her faith and in her ability to lead other members of the church. The church continues to grow, and many adults and children from the community have started coming, pooling their gifts and resources together to help the neediest in their area.
Incarnational Assistance In principal-agent theory, the principal hires the agent to act in the principal’s best interest. TD clearly establishes the poor as the principal and the development worker as the agent. Practitioners invest their lives in order to transform other lives. TD development personnel develop personal relationships with the poor—listening, learning, talking, and loving them. In this approach, people are more important than ideas and relationships; people come before programs. Incarnational assistance distinguishes TD from mainstream, secular approaches to economic development where most experts do not invest their own lives, at least not incarnationally, in the lives of the poor. TD starts inside a mud hut not in a government ministry office. TD practitioners live a seamless life, fully integrating their spiritual life
Wilson and Stapleford
��� FAITH & ECONOMICS
and their professional career. The TD practitioner must be a disciple of Christ (i.e., becoming more like Christ each day), a person of Christian character demonstrating the fruits of the Spirit (Gal. 5:22–26), a professional humbly performing assigned tasks with integrity, in excellence and with a street smart mind (Matt. 10:16), and finally, the TD practitioner is an on-going learner (Rom. 12:2). This incarnational process impacts not only the poor but the development practitioner as well. God works to transform all involved in TD towards a greater sense of community. “Working and walking with the poor” more accurately reflects TD than “helping the poor.”
Case Study: Mary�
Dark storm clouds were forming as TD staff drove down the bumpy, red dirt road to the village of Buntaba in southern Uganda. Their entire day had been devoted to visiting the homes of HIV/AIDS victims. Buntaba was their last visit for the day. The rain began to fall as they walked to a mud-brick house. As they stepped over the threshold onto the uneven dirt floor, their eyes, slowly adjusting to the darkness, saw Mary curled up on a straw mat under a blanket. Mary, a young woman in her mid-twenties, was weak, emaciated and near death. She could barely sit up, her body ravaged by the disease. As the staff members came near, Mary attempted to smile. Beside Mary’s straw mat was a friend holding Mary’s small child. The staff members knelt next to Mary’s mat, and as downpour pounded on the tin roof, they wept and prayed for God’s mercy.
Mutual Commitment TD programs commit to a community for a relatively long period of time (e.g., ten years) or until the community transformation is self-sustaining, whichever is shorter. Not wanting to create dependence on external assistance, an exit strategy is developed in cooperation with the community. Initially, TD practitioners learn the community’s story by listening to the people. Practitioners start with the capital and human resources the people have, and then teach them how they can use these local resources to actively transform their current economic situation for a better future. Constant evaluation is preferred to constant planning in the TD paradigm. Participatory evaluation (i.e., all parties are involved) is constant at all stages of project development and implementation. Two-way evaluation is a unique feature of this approach. The community evaluates the TD organization and practitioners and the TD practitioners evaluate the community and its leaders. All parties are accountable to one another.
���
Case Study: The Tomoyo Story�
The community of Yoroca in the altiplano of Bolivia was poor, tired, and characterized by a sense of hopelessness. Although the Tomoyo River flowed almost through their backyards, community leaders had failed repeatedly to develop a plan for harnessing the river for irrigation. Yet over an eight-year period, TD practitioners worked with local village and church leaders in Yoroca and other communities to make the Tomoyo irrigation project a reality. The first problem addressed was the animistic world and life view of the people that bound them into a fatalistic mindset. The people believed that they were powerless to improve their lives. They believed that their economic and social conditions could not be changed. Leaders were taught the biblical principal that God wants people to have dominion over the land while being responsible stewards of the land. Education programs on soil erosion, water management, land restoration, and community cooperation motivated local leaders to organize a valley-wide effort to bring a dependable, high quality water supply to the communities. Although the project implementation phase was not without its problems (e.g., free-riding, tail-ender dilemmas in irrigation systems), meetings in local churches and leadership by local pastors maintained the coalition of communities. TD practitioners estimate that 12,000 people in 37 small communities now live a better life due to the Tomoyo project. The community of Yoroca alone now generates additional annual sales of $450,000 from their agricultural lands due to their ability to double crop their irrigated lands. The total cost of the project was $1.25 million which included partial funding from a USAID grant.
So What? TD shares many of the same economic and human challenges faced by traditional development agencies and their programs. What is revealing, however, is how the current interests and concerns of many mainstream development practitioners are integrated, on a day-to-day basis, into TD programs: a healthier lifestyle (both physically and spiritually), basic education, appropriate technology, and honest governance holistically delivered at the household and community levels. Several key insights from the TD experience should influence and encourage mainstream development programs and practitioners. Morality Matters. World and life views towards work, gender relations, honesty, and cooperation can determine the success or failure of the most well-designed rural development program. Yet even Christian economists
Wilson and Stapleford
��� FAITH & ECONOMICS
fail to emphasize the cultural and spiritual phenomena that constrain economic development (Dean et al. 2005). Scale Matters. In danger of over-generalizing, mainstream agricultural and rural development programs and their designers often demonstrate a predilection towards aggregate outcomes at the regional and national levels. In contrast, TD recognizes that sustainable economic development begins with individuals, families, and communities. Aggregate, measurable outcomes will occur when the rural poor take ownership of their own economic development, not relying totally on outside agencies or governments alone for guidance and direct aid. Solving small-scale rural development problems together, enjoying success together, and actively learning together produce the social capital for more complex economic development projects in the future, with and without government assistance. Relationships Matter. Many regard health care programs as the most successful mainstream development projects over the last twenty years. The personal relationships mothers establish with health care workers produces an environment of openness, vulnerability, and learning. We recognize that incarnational development assistance in the “hard places” of the world is difficult, time consuming, and expensive, but this two-way investment in people (the poor and practitioners) provides hope for rural poverty mitigation.
Endnotes
1 Wayne Bragg of the Wheaton Hunger Center first defined the term “transformational development” in 1983 (Myers 1999). The U.S. Agency for International Development (USAID) recently has used this phrase in its new strategic framework for Africa (USAID 2006). Although there are similarities between the two approaches (e.g., em-phasis on children and communities), the spiritual and incarnational components of Bragg’s transformational development is absent in the USAID framework.
2 This paper relies on the work of Miller (1998), Moffit and Tesch (2004) and Myers (1999) as useful sources for capturing the unique-ness of transformational development in contrast to mainstream secu-lar approaches to poverty mitigation. The transformational approach, to various degrees, can be seen “on the ground” through the relief and development programs of Compassion International, Food for the Hungry, and World Vision. Our analytical summary of transforma-
���
tional development does not represent an official statement of the poli-cies of any of these Christian non-governmental organizations, nor are these organizations associated in any way with the ideas and analysis contained in this paper.
3 Excerpted from the Volunteer Ministry Initial Training Course Manual of Food for the Hungry, Phoenix, Arizona.
4 Excerpted from the World Vision website, www.worldvision.org.5 Excerpted from the Food for the Hungry 2003 Annual Report.6 Excerpted from the Food for the Hungry 2003 Annual Report.7 Summary of the Food for the Hungry DVD “The Tomoyo Story: A
Tale of Transformation in Bolivia.”
References
Aslam, Mohamed and Paul N. Wilson. 1995. “A Participatory Methodol-ogy for Development Projects: Applicability to SCARPs.” International Commission on Irrigation and Drainage Journal 44: 41–52.
Alesina, Alberto and Eliana La Ferrara. 2005. “Ethnic Diversity and Eco-nomic Performance.” Journal of Economic Literature 43(3): 762–800.
Barrett, Christopher B. 2003. “On Social Networks and Economic De-velopment.” Faith & Economics 41 (Spring): 1–8.
Barrett, Christopher B. and Brent M. Swallow. 2006. “Fractal Poverty Traps.” World Development 34(1): 1–15.
Bauer, P.T. 1976. Dissent on Development. Cambridge, MA: Harvard University Press.
Binswanger, Hans. 2006. “Empowering Rural People for Their Own De-velopment.” In Contributions of Agricultural Economics to Critical Issues, Proceedings of the Twenty-Sixth International Conference of Agricultural Economists, eds. Keijiro Otsuka and Kaliapa Kalirajan. London: Blackwell Publishers.
Burnside, Craig and David Dollar. 2000. “Aid, Policies, and Growth.” American Economic Review 90:4, 847–868.
Burt, Ronald S. 1992. Structural Holes. Cambridge, MA: Harvard Uni-versity Press.
Caldersis, Robert. 2006. Why Foreign Aid Isn’t Working: The Trouble with Africa. New York: Palgrave MacMillan.
Chambers, Robert. 1983. Rural Development: Putting the Last First. New York: Longman.
de Soto, Hernando. 2000. The Mystery of Capital: Why Capitalism Tri-umphs in the West and Fails Everywhere Else. New York: Basic Books.
Wilson and Stapleford
��0 FAITH & ECONOMICS
Dean, Judith M., J.A. Schaffner, and S.L.S. Smith. 2006.”Global Pov-erty: Academics and Practitioners Respond.” The Review of Faith & International Affairs 4(1): 13–20.
Easterly, William. 2002. The Elusive Quest for Growth: Economists’ Adven-tures and Misadventures in the Tropics. Cambridge, MA: MIT Press.
_____. 2006. The White Man’s Burden: Why The West’s Efforts To Aid The Rest Have Done So Much Ill and So Little Good. New York: Penguin Press.
Grootaert, C. and T.V. Bastelaer. 2002. Understanding and Measuring Social Capital. Washington, D.C.: World Bank.
Guiso, Luigi, P. Sapienza, and L. Zingales. 2006. “Does Culture Af-fect Economic Outcomes?” Journal of Economic Perspectives 20(2): 23–48.
Harrison, Larry E. 1985. Underdevelopment is a State of Mind: The Latin American Case. Lanham, Maryland: Madison Books.
_____. 1992. Who Prospers? How Cultural Values Shape Economic and Political Success. New York: Basic Books.
Harrison, Larry E. and Samuel P. Huntington (eds). 2000. Culture Mat-ters: How Values Shape Human Progress. New York: Basic Books.
Kahneman, Daniel and Amos Tversky. 1979. “Prospect Theory: An Analysis of Choices Involving Risk.” Econometrica 47: 263–291.
Landes, David. 1998. The Wealth and Poverty of Nations. NY: Norton & Company, Inc.
Lybbert, Travis J., C.B. Barrett, S. Desta and D.L. Coppock. 2004. “Stochastic Wealth Dynamics and Risk Management Among a Poor Population.” The Economic Journal 114 (October): 750–777.
Maren, Michael. 1997. The Road to Hell: The Ravaging Effects of Foreign Aid and International Charity. New York: The Free Press.
Martin, David. 1990. Tongues of Fire: The Explosion of Protestantism in Latin America. Cambridge, MA: Basil Blackwell.
McCleary, Rachel M. and Robert J. Barro. 2006. “Religion and Economy.” Journal of Economic Perspectives 20(2): 49–72.
Miller, Darrow L. 1998. Discipling Nations: The Power of Truth to Transform Cultures. Seattle, WA: YWAM.
Miller, Darrow L. and Scott Allen. 2005. Against All Hope: Hope for Africa. Nairobi, Kenya: Samaritan Strategy Africa Working Group.
Moffitt, Bob and Karla Tesch. 2004. If Jesus Were Mayor. Phoenix, AZ: Harvest.
Myers, Bryant L. 1999. Walking with the Poor: Principles and Practices of Transformational Development. Maryknoll, NY: Orbis Books.
���
Riddell, Roger C. 1987. Foreign Aid Reconsidered. Baltimore, MD: Johns Hopkins University Press.
Runge, C. Ford, B. Senauer, P.G. Pardey, and M.W. Rosegrant. 2003. Ending Hunger In Our Lifetime: Food Security And Globalization. Baltimore, MD: Johns Hopkins University Press.
Sachs, Jeffrey D. 2005. The End of Poverty: Economic Possibilities for Our Time. New York: Penguin Books.
Sherman, Amy L. 1997. The Soul of Development: Biblical Christianity and Economic Transformation in Guatemala. New York: Oxford University Press.
Simon, Herbert A. 1972. “Theories of Bounded Rationality.” In Decision and Organization, eds. C.B. McGuire and R. Radner, 161–176. New York: American Elsevier.
Theroux, Paul. 2002. Dark Star Safari: Overland from Cairo to Cape Town. New York: Penguin Books.
Tversky, Amos and Daniel Kahneman. 1981. “The Framing of Decisions and the Psychology of Choice.” Science 211: 453–458.
United States Agency for International Development. 2006. Strategic Framework for Africa. Washington, D.C.: USAID.
Weber, Max. 1905 (1976). The Protestant Ethic and the Spirit of Capitalism. London: Unwin Paperbacks.
Wilson, Paul N. 1983. “Integrated Rural Development: Additional Lessons from Nicaragua.” Agricultural Administration 14: 137–149.
_____. 2000. “Social Capital, Trust and the Agribusiness of Economics.” Journal of Agricultural and Resource Economics 25: 179–193.
Wilson, Paul N. and Gary D. Thompson. 1993. “Common Property and Uncertainty: Compensating Coalitions by Mexico’s Pastoral Ejidatarios.” Economic Development and Cultural Change 41:299–318.
Wilson, Paul N., and Michael L. Wise. 1984. “Collaborative Style in Agricultural Project Design.” Agricultural Administration 16: 45–51.
Yoder, Richard A., C.W. Redekop, and V.E. Jantzi. 2004. Development to a Different Drummer: Anabaptist/Mennonite Experiences and Perspectives. Intercourse, PA: Good Books. n
Wilson and Stapleford