
Making it quantitative: early phases of development of a new taxonomy for levels of automation
11
In D. de Waard, G.R.J. Hockey, P. Nickel, and K.A. Brookhuis (Eds.) (2007), Human Factors Issues in Complex System Performance (pp. 313 - 323). Maastricht, the Netherlands: Shaker Publishing. Making it quantitative: early phases of development of a new taxonomy for levels of automation Michela Terenzi, Marco Camilli, & Francesco Di Nocera University of Rome “La Sapienza” Italy Abstract The classic approach to the concept of “Level Of Automation” (LOA) is qualitative in nature: it simply describes the trading of system control between humans and computers. Since Sheridan’s seminal work many taxonomies have been proposed, but they are all domain- and task-dependent. This makes it difficult to compare results from different studies. A different approach (that will eventually allow defining LOA quantitatively) has been introduced here. The basic idea was to characterize LOA in terms of the number of processes traded by humans and machines. For example, at the information-acquisition level, LOA may be defined in terms of number of features of an object that has to be identified. Automation providing reliable information on 1 out of 4 possible features was set at LOA=.25, whereas for a system providing aid on 2 out of 4 features LOA=.50. In order to start a research program aimed at devising a general model, two experiments were run on 36 participants who were requested to perform a visual search task. Three LOA were tested: 0 (manual), .25 (intermediate), and .50 (high). These first studies were a necessary step in order to study the mathematical relation between LOA and human performance. Introduction In general, implementing automation support in a complex system implies the introduction an additional element that needs to be managed: humans and automation working together pose several problems in terms of authority for decision and action. As reported by Miller and Parasuraman (2007), in order to discuss alternative forms of automation, it is helpful to have a scheme for characterising roles and responsibilities. Such characterisations have been often made in terms of levels of automation (LOA) that define a spectrum of possible relationships ranging from full human to full automation control. However, the classic approach to the concept of LOA is qualitative in nature: it simply describes the trading of system control between humans and computers. For example, the 10-point scale proposed in Sheridan’s seminal work (Sheridan & Verplank, 1978) only describes the degree of human (or machine) involvement in system control. Consequently, it expresses the level of computer aiding to the human
Transcript of Making it quantitative: early phases of development of a new taxonomy for levels of automation
In D. de Waard, G.R.J. Hockey, P. Nickel, and K.A. Brookhuis (Eds.) (2007), Human Factors Issues in Complex System Performance (pp. 313 - 323). Maastricht, the Netherlands: Shaker Publishing.
Making it quantitative: early phases of development of a new taxonomy for levels of automation
Michela Terenzi, Marco Camilli, & Francesco Di Nocera University of Rome “ La Sapienza”
Italy
Abstract
The classic approach to the concept of “Level Of Automation” (LOA) is qualitative in nature: it simply describes the trading of system control between humans and computers. Since Sheridan’s seminal work many taxonomies have been proposed, but they are all domain- and task-dependent. This makes it difficult to compare results from different studies. A different approach (that will eventually allow defining LOA quantitatively) has been introduced here. The basic idea was to characterize LOA in terms of the number of processes traded by humans and machines. For example, at the information-acquisition level, LOA may be defined in terms of number of features of an object that has to be identified. Automation providing reliable information on 1 out of 4 possible features was set at LOA=.25, whereas for a system providing aid on 2 out of 4 features LOA=.50. In order to start a research program aimed at devising a general model, two experiments were run on 36 participants who were requested to perform a visual search task. Three LOA were tested: 0 (manual), .25 (intermediate), and .50 (high). These first studies were a necessary step in order to study the mathematical relation between LOA and human performance.
Introduction
In general, implementing automation support in a complex system implies the introduction an additional element that needs to be managed: humans and automation working together pose several problems in terms of authority for decision and action. As reported by Miller and Parasuraman (2007), in order to discuss alternative forms of automation, it is helpful to have a scheme for characterising roles and responsibilities. Such characterisations have been often made in terms of levels of automation (LOA) that define a spectrum of possible relationships ranging from full human to full automation control.
However, the classic approach to the concept of LOA is qualitative in nature: it simply describes the trading of system control between humans and computers. For example, the 10-point scale proposed in Sheridan’s seminal work (Sheridan & Verplank, 1978) only describes the degree of human (or machine) involvement in system control. Consequently, it expresses the level of computer aiding to the human
314 Terenzi, Camilli, & Di Nocera
(e.g. showing all alternatives vs. narrowing alternatives). Parasuraman, Sheridan, and Wickens (2000) extended this approach including it within a four stage information-processing model, thus providing a framework to better designing automated systems. Albeit this qualitative approach is useful for function allocation in the design phase, a more formal model would be necessary for experimentation. Indeed, it is currently impossible to compare results from different studies, because each author characterises LOA in different ways.
To our knowledge, the only attempt to develop a universal LOA measure was made by Wei, Macwan, and Wieringa (1998), who proposed a model to quantify what they called “degree of automation” (DofA). Using this model, they showed that, when DofA increases above a certain threshold, performance improvements become very small. The most important aspect of this approach is its focus on the quantification of LOA, and the tentative to provide descriptive model (a representation of how humans and automation actually work) as opposed to a normative model (a representation of how humans and automation should work, see Sheridan, 2002).
The concept of DofA is very appealing, but two aspects of the model significantly limit its use. First, it is based on a detailed task definition, meaning that a lot of work has to be done to compute parameters and weightings. Second, it needs to include a workload parameter that is difficult to estimate prior experimentation, so that a task load measure is used instead. Both reasons might be the cause that -to date- the DofA approach has not gained much support in the field.
With that in mind, in the present paper, LOA has been defined in terms of the amount of information traded by humans and machines. For example, at the information-acquisition level, LOA may be defined in terms of number of features of an object that has to be identified. Consequently, automation providing reliable information about 1 out of 4 possible features has LOA equal to .25, whereas for a system providing specific aid about 2 out of 4 features, LOA is equal to .50. This might seem a very simple-minded model. Indeed, the point is that more complicated models might be not as useful as a simple one. Only accounting for the number of features (or alternatives, in case of a decision-making process) has its advantages: 1) it can be easily applied to any type of task, 2) it can be applied to design experiments as well as to compare results of experiments that have already been carried out, and 3) does not require complex calculations.
Of course, the scheme introduced here is not a normative model of human-automation interaction. This is rather a (basis for a) descriptive model aimed at explaining the effects of automation on human performance.
a new taxonomy for levels of automation 315
Study 1
Method
Subjects Twenty students (mean age = 25.3, SD = 3.0, 10 females) volunteered in this study. All participants were right-handed, with normal or corrected to normal sight. No cases of Daltonism were reported.
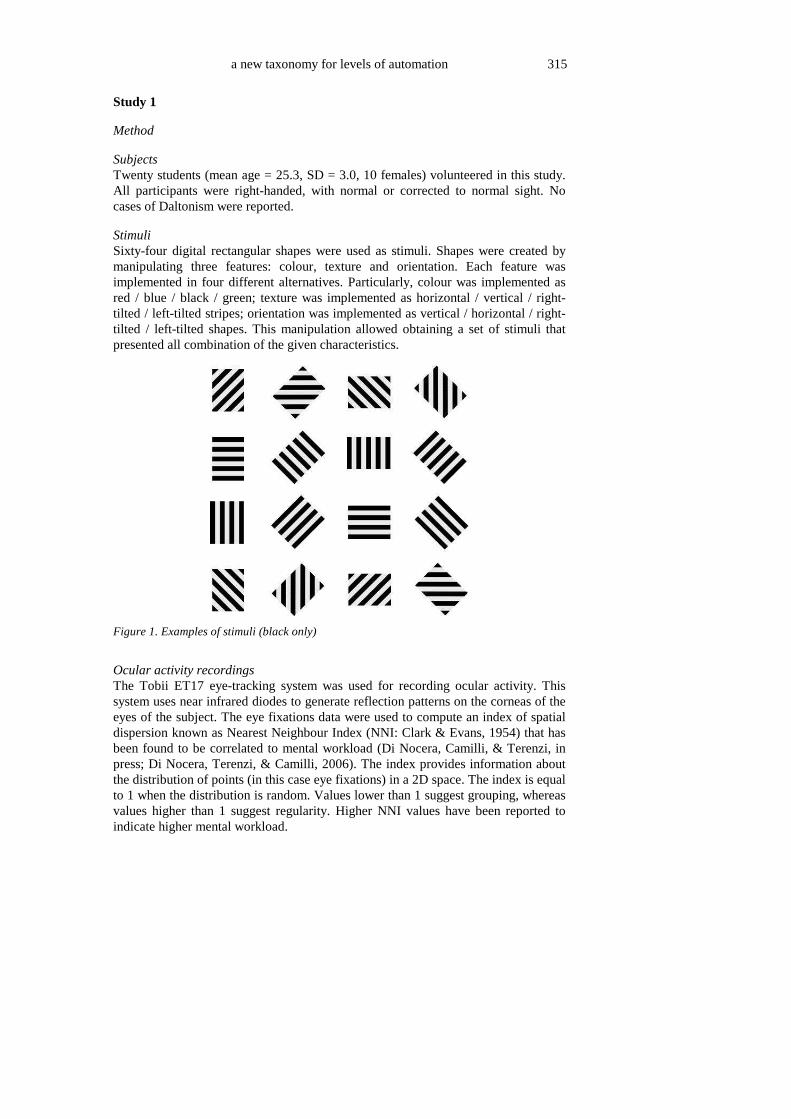
Stimuli Sixty-four digital rectangular shapes were used as stimuli. Shapes were created by manipulating three features: colour, texture and orientation. Each feature was implemented in four different alternatives. Particularly, colour was implemented as red / blue / black / green; texture was implemented as horizontal / vertical / right-tilted / left-tilted stripes; orientation was implemented as vertical / horizontal / right-tilted / left-tilted shapes. This manipulation allowed obtaining a set of stimuli that presented all combination of the given characteristics.
Figure 1. Examples of stimuli (black only)
Ocular activity recordings
The Tobii ET17 eye-tracking system was used for recording ocular activity. This system uses near infrared diodes to generate reflection patterns on the corneas of the eyes of the subject. The eye fixations data were used to compute an index of spatial dispersion known as Nearest Neighbour Index (NNI: Clark & Evans, 1954) that has been found to be correlated to mental workload (Di Nocera, Camilli, & Terenzi, in press; Di Nocera, Terenzi, & Camilli, 2006). The index provides information about the distribution of points (in this case eye fixations) in a 2D space. The index is equal to 1 when the distribution is random. Values lower than 1 suggest grouping, whereas values higher than 1 suggest regularity. Higher NNI values have been reported to indicate higher mental workload.
316 Terenzi, Camilli, & Di Nocera
Procedure Participants sat in a dark and sound-attenuated room, underwent a calibration procedure for the eye-tracker, and received instructions for the execution of the task. The target was always presented at the screen centre, followed by a screenshot containing 63 distractors and the target (set size = 64 stimuli). Across trials, targets were evenly scattered among 16 positions within a 4x4 ideal grid dividing the screen space in 16 quadrants (not visible to participants). Stimuli were presented on a 17” computer screen (screen resolution = 1024 x 768) with uniform grey background. Participants were required 1) to inspect the target as long as they wanted to 2) to press a key to perform a visual search task, and 3) clicking over the target shape as soon as they found it. Target inspection times, number of correct responses and search times were collected for successive analyses. Participants were instructed to prefer accuracy over speed, and performed the same task in three different blocks:
a. Manual control: a visual search task, with targets presented at each trial; b. Moderate automation support: same task, but subjects received automation
support consisting of the highlighting of those shapes sharing at least one out of four characteristics with the target (e.g., all red-coloured shapes were highlighted if the target were red);
c. High automation support: same tasks, but subjects received automation support consisting of the highlight of those shapes sharing two out of four characteristics with the target (e.g., all red horizontal shapes were highlighted if the target were red and horizontally oriented).
The highlighted stimuli were positioned approximately at the same distance from the centre of the screen. Participants were requested to perform six experimental blocks. Each block consisted of a sequence of 15 search trials, and no feeedback was provided for the correct response. The LOA sequence (manual-moderate-high vs. manual-high-moderate) was balanced across blocks. Automation was 100% reliable, but subjects were instructed to pay attention anyway, because (they were told) the system could occasionally provide unreliable information.
Data analysis and results
Performance and ocular data were analyzed by repeated measures ANOVA designs using LOA (manual vs. moderate vs. high) as repeated factor. Number of correct responses, target inspection time, and target detection time were used as dependent variables. Results showed a main effect of LOA on target detection time (F2,38=12.86, p<.0001). Duncan post-hoc testing showed that all conditions were significantly different one from each other (p<.05).
Number of correct responses in the visual search task showed a main effect of LOA (F2,38=6.12, p<01). Particularly, the high LOA led to a higher number of correct detections than the other two LOA (p<.01). No significant differences were found between manual control and the moderate LOA (p>.05).
A significant effect of LOA on target inspection time (F2,38=12.36, p<0001) was found. Post-hoc testing showed that time dedicated to target inspection was
a new taxonomy for levels of automation 317
significantly longer during manual control than the other two automation conditions (p<.001).
Nearest Neighbour Index values computed for each LOA were analyzed by a repeated measures ANOVA design using LOA (manual vs. moderate vs. high) as repeated factor. One participant, whose ocular data contained artifacts (no valid eyes position in over 30% of the trials), was excluded from the analysis.
Results showed a significant effect of LOA (F2, 36=4.8, p=.01). Post-hoc testing showed that NNI values computed from manual control condition were significant lower than those computed from the other two automation conditions (p<.05).
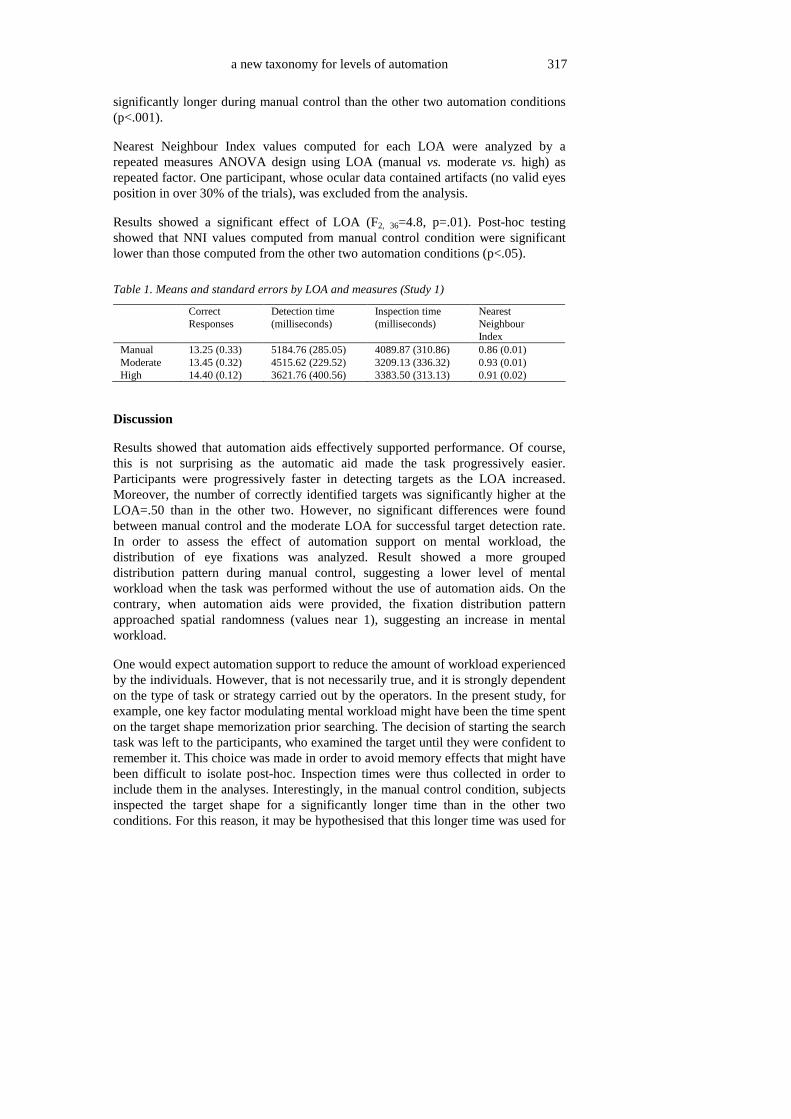
Table 1. Means and standard errors by LOA and measures (Study 1)
Correct Responses
Detection time (milliseconds)
Inspection time (milliseconds)
Nearest Neighbour Index
Manual 13.25 (0.33) 5184.76 (285.05) 4089.87 (310.86) 0.86 (0.01) Moderate 13.45 (0.32) 4515.62 (229.52) 3209.13 (336.32) 0.93 (0.01) High 14.40 (0.12) 3621.76 (400.56) 3383.50 (313.13) 0.91 (0.02)
Discussion
Results showed that automation aids effectively supported performance. Of course, this is not surprising as the automatic aid made the task progressively easier. Participants were progressively faster in detecting targets as the LOA increased. Moreover, the number of correctly identified targets was significantly higher at the LOA=.50 than in the other two. However, no significant differences were found between manual control and the moderate LOA for successful target detection rate. In order to assess the effect of automation support on mental workload, the distribution of eye fixations was analyzed. Result showed a more grouped distribution pattern during manual control, suggesting a lower level of mental workload when the task was performed without the use of automation aids. On the contrary, when automation aids were provided, the fixation distribution pattern approached spatial randomness (values near 1), suggesting an increase in mental workload.
One would expect automation support to reduce the amount of workload experienced by the individuals. However, that is not necessarily true, and it is strongly dependent on the type of task or strategy carried out by the operators. In the present study, for example, one key factor modulating mental workload might have been the time spent on the target shape memorization prior searching. The decision of starting the search task was left to the participants, who examined the target until they were confident to remember it. This choice was made in order to avoid memory effects that might have been difficult to isolate post-hoc. Inspection times were thus collected in order to include them in the analyses. Interestingly, in the manual control condition, subjects inspected the target shape for a significantly longer time than in the other two conditions. For this reason, it may be hypothesised that this longer time was used for
318 Terenzi, Camilli, & Di Nocera
better “memorising the target” and led subjects to be more confident with the task when they had to carry it out manually. Nevertheless, as reported above, performance was better when automation support was provided both in terms of correctly identified targets and in target detection times.
In order to verify this interpretation, a further study has been run. Moreover, in order to gather additional information, this second study featured a concurrent measure of mental workload.
Study 2
The scope of this second study was to further investigate the effect on mental workload arose in study 1. To this aim, the same experimental task was used, but target inspection time was kept constant between trials (5 seconds, which was the average inspection time employed by participants in study 1). This change in the procedure should allow disentangling the effects of memorisation and LOA on mental workload. Moreover, in order to not rely on the ocular measure only, a concurrent measure of mental workload (subjective estimates) was implemented.
Method
Subjects Sixteen students (mean age = 22.4, SD = 1.5, 12 females) volunteered in this study. All participants were right-handed, with normal or corrected to normal sight. Participants have not reported Daltonism.
Stimuli and ocular activity recording The same set of stimuli and the same eye-tracking systems of study 1 were used.
Procedure Participants sat in a dark and sound-attenuated room, underwent a calibration procedure for the eye-tracker, and received instructions for the execution of the task. As in study 1, target shapes were presented on each trial, followed by a screenshot containing 63 distractors and the target. Participants were requested to inspect the target (presented at the centre of the screen) for 5 seconds, then automatically switched to the search screen and were required to click over the target shape as soon as they found it. During the experimental session 6 blocks of trials were presented. Each block consisted of 3 sub-blocks supported by three different LOA (manual, moderate, and high) whose order was randomized across blocks. Each sub-block consisted of 15 search trials. At the end of each sub-block, participants were requested to fill the NASA – Task Load index (NASA-TLX; Hart & Staveland, 1986). Search times, number of corrects responses and NASA-TLX scores were collected for the successive analyses. The NNI was computed as in study 1. Also in this case subjects were told that the system could occasionally provide unreliable information (nevertheless, the system was 100% reliable).
a new taxonomy for levels of automation 319
Data analysis and results
Performance and ocular data were analyzed by repeated measures ANOVA designs using LOA (manual vs. moderate vs. high) as repeated factor. Number of correct responses and target detection time were used as dependent variables. Results showed a main effect of LOA on target detection time (F2,30=28.17, p<.0001). Particularly, high-LOA detection times were shorter then those recorded from moderate-LOA and manual control (p<.001). Number of correct responses in the visual search task showed a main effect of LOA (F2,30=7.65, p<.01). Particularly, the high LOA led to the highest number of correct detections (p<.05). No significant difference was found between manual control and the moderate LOA (p>.05).
NASA-TLX scores were analyzed by repeated measures ANOVA designs using LOA (manual vs. moderate vs. high) as repeated factor. Results showed only a tendency towards statistical significance (F2,30=3.16, p=.06). Post-hoc testing showed that high-LOA led to significantly lower mental workload that manual control (p<.05).
Nearest Neighbour Index values computed for each LOA were analyzed by repeated measures ANOVA design using LOA (manual vs. moderate vs. high) as repeated factor. Results showed no significant differences between the three LOA (F2,30=1.36, p>.05).
Finally, in order to compare the fixation distributions arose from the two studies, an ANOVA design was run on NNI values, using LOA (manual vs. moderate vs. high) as repeated factor and Target Inspection (self-paced vs. 5-second) as fixed factor. Results showed a main effect of LOA (F2,66=5.2735, p<.01). An interaction between LOA and Target inspection showed only a tendency toward a significance (F2,66=1.83, p=.16). Duncan post-hoc testing showed a tendency toward significance comparing the manual control condition from the two studies (p=.08).
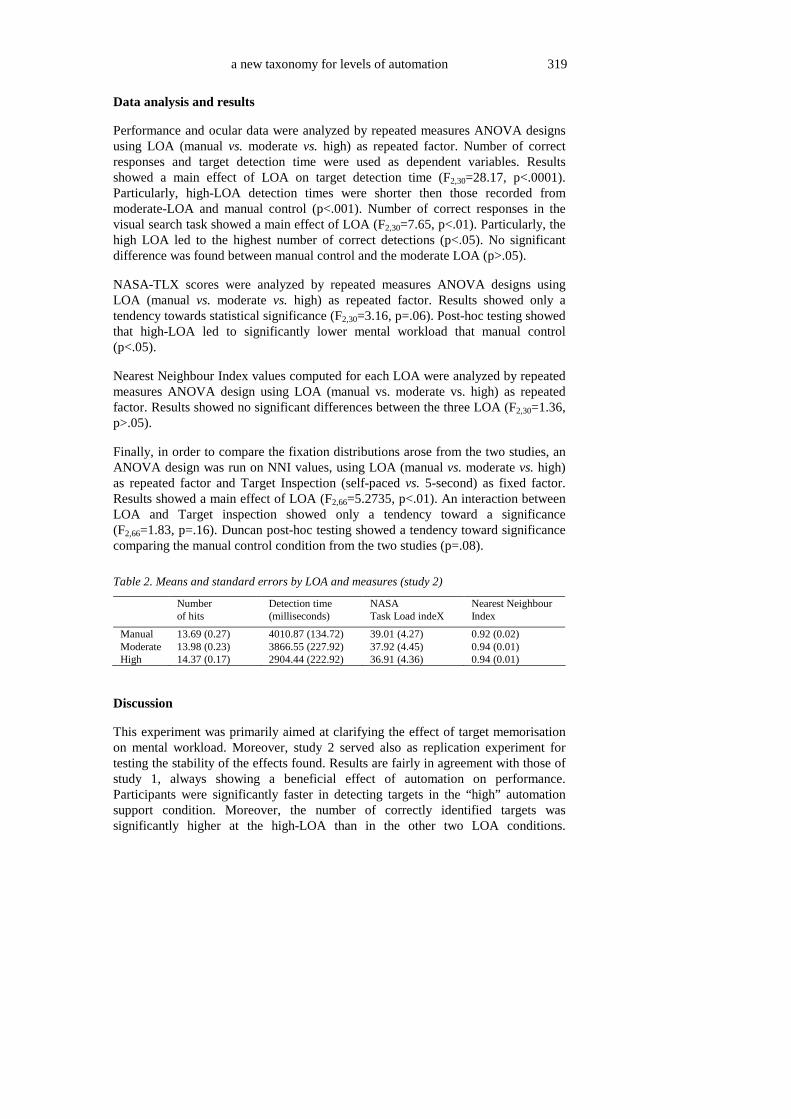
Table 2. Means and standard errors by LOA and measures (study 2)
Number of hits
Detection time (milliseconds)
NASA Task Load indeX
Nearest Neighbour Index
Manual 13.69 (0.27) 4010.87 (134.72) 39.01 (4.27) 0.92 (0.02) Moderate 13.98 (0.23) 3866.55 (227.92) 37.92 (4.45) 0.94 (0.01) High 14.37 (0.17) 2904.44 (222.92) 36.91 (4.36) 0.94 (0.01)
Discussion
This experiment was primarily aimed at clarifying the effect of target memorisation on mental workload. Moreover, study 2 served also as replication experiment for testing the stability of the effects found. Results are fairly in agreement with those of study 1, always showing a beneficial effect of automation on performance. Participants were significantly faster in detecting targets in the “high” automation support condition. Moreover, the number of correctly identified targets was significantly higher at the high-LOA than in the other two LOA conditions.

320 Terenzi, Camilli, & Di Nocera
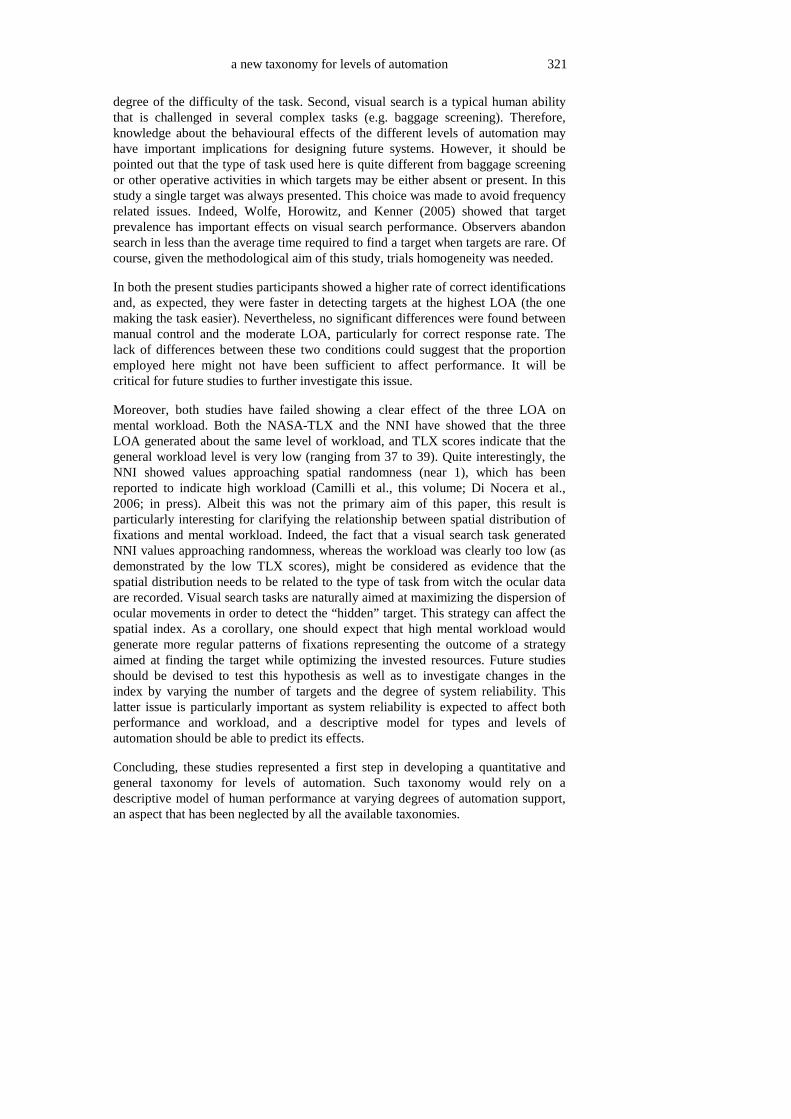
Nevertheless, no significant differences were found between manual control and the moderate LOA. Also in this second study, the distribution of eye fixations was analyzed to assess the effects of automation support on mental workload. The interpretation suggested for results of study 1 (namely, that low workload in the manual condition was due to longer target inspection time), was supported by results of this study. Implementing a fixed target inspection time resulted in no significant differences in the level of mental workload across the three LOA. This result was also confirmed by NASA-TLX scores, which were unavailable in study 1.
Figure 2. NNI values by study and LOA
General discussion and conclusions
The great variety of LOA taxonomies discussed in literature (e.g., Billings, 1991; Sheridan and Verkplant, 1978; Parasuraman et al, 2000; Endsley and Kaber 1997, Endsley and Kaber, 1999) suggest the need to develop a common theoretical platform in order to compare human performance across different LOA in different tasks and environments. One possible step in this direction is to migrate the LOA definition (and meaning) from qualitative to quantitative.
The general idea underlying the present paper was that automation could be defined in terms of the amount of information traded by humans and machines, thus allowing simple coding for identifying one particular LOA. Of course, this simplicity should be shown useful for discriminating between levels of performance and workload. The studies reported here only represent the initial phases of development and, although the research agenda includes the generalization to different stages of processing, only the “acquisition” level (see Parasuraman, Sheridan, & Wickens, 2000) was taken into consideration. Particularly, acquisition automation has been implemented in a visual search task. The use of this type of task has two main advantages. First, visual search is a very common task in experimental psychology and much is known about the changes in performance one should expect varying the
a new taxonomy for levels of automation 321
degree of the difficulty of the task. Second, visual search is a typical human ability that is challenged in several complex tasks (e.g. baggage screening). Therefore, knowledge about the behavioural effects of the different levels of automation may have important implications for designing future systems. However, it should be pointed out that the type of task used here is quite different from baggage screening or other operative activities in which targets may be either absent or present. In this study a single target was always presented. This choice was made to avoid frequency related issues. Indeed, Wolfe, Horowitz, and Kenner (2005) showed that target prevalence has important effects on visual search performance. Observers abandon search in less than the average time required to find a target when targets are rare. Of course, given the methodological aim of this study, trials homogeneity was needed.
In both the present studies participants showed a higher rate of correct identifications and, as expected, they were faster in detecting targets at the highest LOA (the one making the task easier). Nevertheless, no significant differences were found between manual control and the moderate LOA, particularly for correct response rate. The lack of differences between these two conditions could suggest that the proportion employed here might not have been sufficient to affect performance. It will be critical for future studies to further investigate this issue.
Moreover, both studies have failed showing a clear effect of the three LOA on mental workload. Both the NASA-TLX and the NNI have showed that the three LOA generated about the same level of workload, and TLX scores indicate that the general workload level is very low (ranging from 37 to 39). Quite interestingly, the NNI showed values approaching spatial randomness (near 1), which has been reported to indicate high workload (Camilli et al., this volume; Di Nocera et al., 2006; in press). Albeit this was not the primary aim of this paper, this result is particularly interesting for clarifying the relationship between spatial distribution of fixations and mental workload. Indeed, the fact that a visual search task generated NNI values approaching randomness, whereas the workload was clearly too low (as demonstrated by the low TLX scores), might be considered as evidence that the spatial distribution needs to be related to the type of task from witch the ocular data are recorded. Visual search tasks are naturally aimed at maximizing the dispersion of ocular movements in order to detect the “hidden” target. This strategy can affect the spatial index. As a corollary, one should expect that high mental workload would generate more regular patterns of fixations representing the outcome of a strategy aimed at finding the target while optimizing the invested resources. Future studies should be devised to test this hypothesis as well as to investigate changes in the index by varying the number of targets and the degree of system reliability. This latter issue is particularly important as system reliability is expected to affect both performance and workload, and a descriptive model for types and levels of automation should be able to predict its effects.
Concluding, these studies represented a first step in developing a quantitative and general taxonomy for levels of automation. Such taxonomy would rely on a descriptive model of human performance at varying degrees of automation support, an aspect that has been neglected by all the available taxonomies.
322 Terenzi, Camilli, & Di Nocera
This objective is quite ambitious and it is clear that the development of a general model may take years. Nevertheless, even at this early stage, the benefits in terms of comparability of results from different studies are large.
References
Bainbridge, L. (1983). Ironies of automation. Automatica, 19, 775–779. Billings, C.E. (1991). Human-centred aircraft automation: A concept and guidelines
(NASA Tech. Memo. No. 103885). Moffet Field, CA, USA: NASA-Ames Research Center.
Clark, P.J., & Evans F.C. (1954). Distance to nearest neighbor as a measure of spatial relationships in populations. Ecology, 35, 445-453.
Di Nocera, F., Camilli, M., & Terenzi, M. (in press). A random glance at the flight deck: pilot’s scanning strategies and the real-time assessment of mental workload. Journal of Cognitive Engineering and Decision Making.
Di Nocera, F., Terenzi, M., & Camilli, M. (2006). Another look at scanpath: distance to nearest neighbour as a measure of mental workload. In D. de Waard, K.A. Brookhuis, A. Toffetti (Eds.), Developments in Human Factors in Transportation, Design, and Evaluation (pp. 295-303). Maastricht, the Netherlands: Shaker Publishing.
Endsley, M. R. & Kaber, D. B. (1997). The use of level of automation as a means of alleviating out-of-the-loop performance problems: a taxonomy and empirical analysis. In P. Seppala, T. Luopajarvi, C. H. Nygard, and M. Mattila (Eds), 13th Triennial Congress of the International Ergonomics Association, Vol. 1 (pp. 168–170). Helsinki: Finish Institute of Occupational Health.
Endsley, M.R. & Kaber, D.B. (1999). Level of automation effects on performance, situation awareness and workload in a dynamic control task, Ergonomics, 42, 462–492.
Lorenz, B., Nocera, F., Rottger, S., & Parasuraman, R. (2002). Automated fault management in a simulated space flight micro-world. Aviation, Space, and Environmental Medicine, 73, 886–897.
Milewski, A., & Lewis, S. (1999). When people delegate (Tech. Memorandum). Murray Hill, NJ: AT&T Laboratories.
Miller, C. & Parasuraman, R. (2007). Designing For Flexible Interaction Between Humans and Automation: Delegation Interfaces for Supervisory Control. Human Factors, 49, 1, 57-75.
Parasuraman, R., Mouloua, M., & Hilburn, B. (1999). Adaptive aiding and adaptive task allocation enhance human-machine interaction. In M. W. Scerbo & M. Mouloua (Eds.), Automation technology and human performance: Current research and trends (pp. 119–123). Mahwah, NJ: Erlbaum.
Parasuraman, R., Sheridan, T.B., & Wickens, C.D. (2000). A model for types and levels of human interaction with automation. IEEE Transactions on Systems, Man, and Cybernetics. Part A: Systems and Humans, 30, 286-297.
Sheridan, T.B. (2002). Humans and Automation: System Design and Research Issues. New York, NY: Wiley & Sons.

a new taxonomy for levels of automation 323
Sheridan, T.B., & Verplank, W. (1978). Human and Computer Control of Undersea Teleoperators. Cambridge, MA: Man-Machine Systems Laboratory, Department of Mechanical Engineering, MIT.
Wei, Z., Macwan, A.P., & Wieringa, P.A. (1998). A quantitative measure for degree of automation and its relation to system performance and mental load. Human Factors, 40, 277-295.
Wolfe, J.M., Horowitz, T.S., & Kenner, N.M. (2005). Rare items often missed in visual searches. Nature, 435, 439-440.