Making better use of the visual medium in educational videos (2014 version)
13
1 © Arnold Wentzel [email protected] Tapping the educational potential of visual media Arnold Wentzel The power of the visual medium is usually wasted in educational efforts. Next time you watch a television documentary, an educational DVD or a lecture on the internet, close your eyes and you will soon realise that you can gather just about all the information from just listening. Most of the time we see 'talking heads', slides full of text that are read or clips and pictures that contain little additional information. Most of the visuals are used purely to decorate, perhaps to justify why the content appears in a visual medium rather than a simple audio recording. Of course, we like things that are pretty, but there is little point in spending so much effort on decoration and let the immense potential of the visual medium to add to the learning experience go unfulfilled. Making an audio recording in such cases would have been much cheaper. Greene (2004) created a theory of informative video to increase our awareness of how we can use the visual medium better. Unfortunately his sometimes cryptic explanations are often difficult to grasp and there is a fair amount of repetition. His ideas are nevertheless eye-opening. In this paper, I will develop my own theory that is perhaps not as tidy and rich as Greene's theory, but has the advantage of being simpler. For more information on Greene's ideas see Appendix B. The question that drives this paper is: why use visual media in educational efforts? In the process I tried to uncover how the addition of the visual medium enhances the learning experience in ways that a simple audio recording cannot do. If this is understood then educational programmes that are viewed on television, DVDs and the internet can be designed that will double the value of those programmes. 1 Elements that interact through visual media Visual (or perhaps more accurately audio-visual) educational recordings should have an event-like quality – it should have the feel that something happened that left the audience changed in some way. Most lectures don't have this quality, yet recordings (which can achieve so much more than a lecture) often merely replicate dysfunctional lectures (except perhaps for some added visual decoration). Figure 1: What creates an event-like quality? As can be seen from the diagram above, for something to have an event-like quality there needs to be interaction between ideas and an environment made up of people and things – moving forward on a journey towards a purpose. The people could be the presenter, those who play other roles during the recording and the audience, the things are usually non-human physical objects or representations, and ideas are the abstract entities that are necessary to achieve the purpose. In educational recordings Things People Ideas Presenter Purpose (answer to essential question) Environment
Transcript of Making better use of the visual medium in educational videos (2014 version)

1
© Arnold Wentzel [email protected]
Tapping the educational potential of visual media Arnold Wentzel
The power of the visual medium is usually wasted in educational efforts. Next time you watch a
television documentary, an educational DVD or a lecture on the internet, close your eyes and you will
soon realise that you can gather just about all the information from just listening. Most of the time we
see 'talking heads', slides full of text that are read or clips and pictures that contain little additional
information. Most of the visuals are used purely to decorate, perhaps to justify why the content
appears in a visual medium rather than a simple audio recording. Of course, we like things that are
pretty, but there is little point in spending so much effort on decoration and let the immense potential
of the visual medium to add to the learning experience go unfulfilled. Making an audio recording in
such cases would have been much cheaper.
Greene (2004) created a theory of informative video to increase our awareness of how we can use the
visual medium better. Unfortunately his sometimes cryptic explanations are often difficult to grasp
and there is a fair amount of repetition. His ideas are nevertheless eye-opening. In this paper, I will
develop my own theory that is perhaps not as tidy and rich as Greene's theory, but has the advantage
of being simpler. For more information on Greene's ideas see Appendix B.
The question that drives this paper is: why use visual media in educational efforts? In the process I
tried to uncover how the addition of the visual medium enhances the learning experience in ways that
a simple audio recording cannot do. If this is understood then educational programmes that are
viewed on television, DVDs and the internet can be designed that will double the value of those
programmes.
1 Elements that interact through visual media
Visual (or perhaps more accurately audio-visual) educational recordings should have an event-like
quality – it should have the feel that something happened that left the audience changed in some way.
Most lectures don't have this quality, yet recordings (which can achieve so much more than a lecture)
often merely replicate dysfunctional lectures (except perhaps for some added visual decoration).
Figure 1: What creates an event-like quality?
As can be seen from the diagram above, for something to have an event-like quality there needs to be
interaction between ideas and an environment made up of people and things – moving forward on a
journey towards a purpose. The people could be the presenter, those who play other roles during the
recording and the audience, the things are usually non-human physical objects or representations, and
ideas are the abstract entities that are necessary to achieve the purpose. In educational recordings
Things People
Ideas Presenter
Purpose (answer to essential question)
Environment
2
© Arnold Wentzel [email protected]
ideas are primary, but without interaction with people or things they remain lifeless. Ideas will
interact with ideas, but they should also interact with people and things, and facilitate interactions
between people, between things and between people and things.
Too often in recordings the only thing is the text on a slide (or maybe some decorations), and the only
person is the presenter. There is little interaction especially if the presenter simply verbalises the text
on the slide. One rarely finds recordings where one sees how ideas clash and connect with other
ideas, or where one sees how these ideas bring about interactions between people, between things and
between people and things. In such recordings one also does not get a sense of a journey towards a
purpose – it feels like the presenter is just trying to cover as much content as possible in the limited
time. Little change took place in the audience as a result.
The purpose of a recording should not be to cover content – it should primarily focus on the core ideas
(usually three or less) from which the other content grows – let's call them seed ideas. Making the
seed ideas clear is the priority and only if there is time should additional detail be covered. Any detail
covered should grow directly from the seed ideas. These seed ideas can be converted into essential
questions and the purpose of the recording becomes the answering of these questions.
It is much better to focus on a very few seed ideas or essential questions, because if these are
understood the audience will think differently and be able to understand the detail that grows from it
much better. Covering as much content as possible leaves an audience overwhelmed, with little
understanding and even less memory of what was covered.
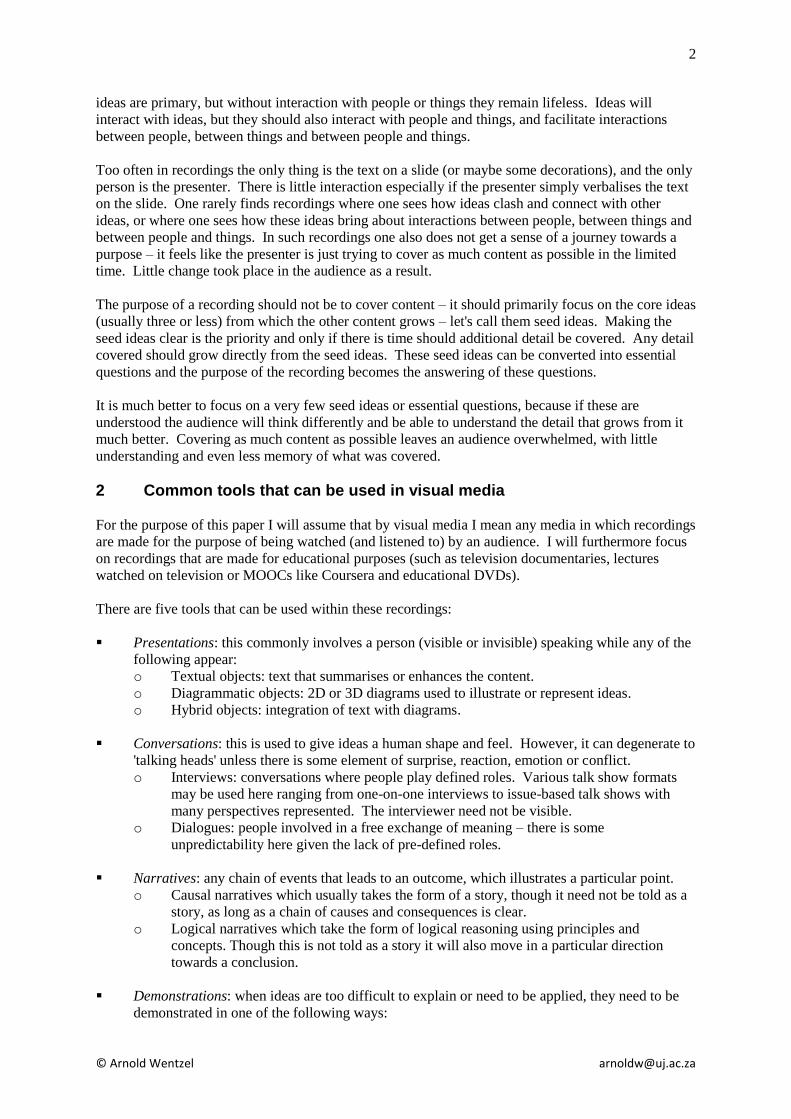
2 Common tools that can be used in visual media
For the purpose of this paper I will assume that by visual media I mean any media in which recordings
are made for the purpose of being watched (and listened to) by an audience. I will furthermore focus
on recordings that are made for educational purposes (such as television documentaries, lectures
watched on television or MOOCs like Coursera and educational DVDs).
There are five tools that can be used within these recordings:
Presentations: this commonly involves a person (visible or invisible) speaking while any of the
following appear:
o Textual objects: text that summarises or enhances the content.
o Diagrammatic objects: 2D or 3D diagrams used to illustrate or represent ideas.
o Hybrid objects: integration of text with diagrams.
Conversations: this is used to give ideas a human shape and feel. However, it can degenerate to
'talking heads' unless there is some element of surprise, reaction, emotion or conflict.
o Interviews: conversations where people play defined roles. Various talk show formats
may be used here ranging from one-on-one interviews to issue-based talk shows with
many perspectives represented. The interviewer need not be visible.
o Dialogues: people involved in a free exchange of meaning – there is some
unpredictability here given the lack of pre-defined roles.
Narratives: any chain of events that leads to an outcome, which illustrates a particular point.
o Causal narratives which usually takes the form of a story, though it need not be told as a
story, as long as a chain of causes and consequences is clear.
o Logical narratives which take the form of logical reasoning using principles and
concepts. Though this is not told as a story it will also move in a particular direction
towards a conclusion.
Demonstrations: when ideas are too difficult to explain or need to be applied, they need to be
demonstrated in one of the following ways:

3
© Arnold Wentzel [email protected]
o Visual representation of a procedure and its consequences.
o Coaching involving interactions between a coach and learners.
Division of the visual space: an underutilised tool to increase the complexity of the watching
experience (if there is too little variety or stimulation) or to make what is unheard or unseen
visible. This may include the following:
o Thinking bubbles or reaction shots that appear next to the objects or subjects involved in
the presentation, conversation, demonstration or story
o Commentary that appear at appropriate points in the presentation, conversation,
demonstration or story – similar to subtitles
In most recordings one sees presentations usually involving a 'talking head' alternating with some text
(which is redundant .if the talking head simply repeats it). If pictures are shown they are often
decorative. Inserted video clips can usually be listened to with eyes closed without missing much.
Limited and inadequate use is made of the other four. There are many recordings that use the other
four quite well, but they are the minority.
The table below shows the kinds of interactions each of the tools facilitate. An asterisk indicates that
it is suitable to facilitating an interaction, and a double asterisk indicates that it is exceptionally good
at it. The interactions are between people (P), ideas (I) and things (T).
Table 1: Interactions enabled by each tool
P-P I-I T-T P-I P-T T-I P-I-T
Presentations ** * Conversations ** * Narratives (causal) * * ** ** * ** Narratives (logical) ** Demonstration (procedure) * ** * Demonstration (coaching) * * * ** Division of visual space * ** *
3 Objectives that can be achieved through visual media
Educational recordings should aim to achieve two main objectives: learning and engagement. If there
is no learning, then the recording is not educational, and if it is not engaging then it will not keep the
attention of the audience. The objectives can be subdivided as follows:
Learning is achieved if:
o The recording leads to an improved understanding of the ideas.
o The ideas in the recording are remembered.
Engagement: is evident if:
o The audience is stimulated sensually and mentally.
o The audience experiences a sense of participation with the content.
Decorating a visual space certainly helps with engagement, but it is a rather weak method to ensure
engagement. Engagement should serve learning – it does so by directing the attention of the audience
to the learning and keeping it there. Too much decoration can easily distract the audience from the
learning.

4
© Arnold Wentzel [email protected]
4 How the visual medium helps to achieve the objectives
Audio can fulfill most of the functions of the visual medium, albeit much less efficiently. This section
tries to identify some of the areas where the visual medium is superior, and relates it to the objectives.
The next table summarises the discussion to follow.
Table 2: How the objectives are achieved
Understanding Remembering Stimulation Participation
Detail Difference Change Relation
Context Attention Short-term memory Long-term memory
Fun Fumbling Fascination
Vicarious Direct
4.1 Functions that promote understanding
If one understands something it should be possible to chunk it up, down and across as shown in the
next diagram. The visual medium is particularly well suited at exhibiting each type of chunking, and
more.
Figure 2: Chunking towards understanding
The four functions the visual medium fulfills well when it comes to promoting understanding are:
Detail: If one can explain what something is part of, what it is made up of and what examples
of it are, that suggests some grasp of the idea. The visual medium is very good at zooming in
and out (in 2D and 3D), showing different levels of detail in a person, a thing or an idea.
o Zoom out: showing a visual representation of the ever bigger picture of ideas, people or
things.
o Zoom in: showing a visual representation of the increasingly minute details of ideas,
people or things.
o Zoom across: showing the various different kinds and examples visually.
Difference: Understanding also requires being able to differentiate and find commonalities.
The visual medium is effective at highlighting this very quickly.
o Contrast: showing where people, things and ideas are different.

5
© Arnold Wentzel [email protected]
o Commonality: showing what people, things and ideas have in common.
o Analogy: providing visual analogies.
Change: Very few people, things and ideas stay constant, so part of understanding is the ability
to explain how and why they change. The visual medium shows change very easily.
o Movement: showing how one idea leads to another, or how and where people and things
move from one state to another.
o Reaction: showing how people, ideas and things react to other people, ideas or things.
o Evolution: showing how the same set of people, ideas or things change over time.
Relation: Possibly the best indicator of understanding is when one can place an idea, person or
thin in relation to other ideas by explaining its relative importance relative to other ideas, how it
is connected to other ideas or where it is located.
o Hierarchy: this overlaps with the "detail" function. All ideas are found within a
hierarchy of ideas, and it easy to show a hierarchy visually. The same apply to people
and things.
o Connection: all ideas are derived from, and lead to, other ideas. Visual representations
can show the chain of connection easily.
o Location: visual techniques enable one to quickly show the location of an idea, person or
thing within a hierarchy or network of connections.
In most recordings one does not see the visual medium being used to convey any of these effectively.
If any of these functions are employed it is normally done verbally, and so the power of the visual
medium remains underutilised.
4.2 Functions that enhance memory
Something that cannot be recalled when needed has not yet been learned. The visual medium makes
it easier to remember since visual memory is near perfect as researchers have shown. Memory of the
ideas can be facilitated in the following ways:
Context: Unless ideas are situated in the known, they are quickly forgotten. Ideas can be
situated as follows:
o Environmental alignment: we remember ideas fastest when we encounter them in an
environment (of people and things) that is aligned with such ideas. Visual techniques
employing 'green screens' can easily change the environment to suit the ideas being
taught.
o Prior ideas: we remember ideas best when they are connected to our prior knowledge.
Such prior knowledge is easy to display visually and so show where the new ideas are
located.
Attention: For ideas to be transferred to long-term memory, they must first attract attention and
only then be placed in the short-term memory. Visual tools are good at attracting and
maintaining attention in the following ways:
o Emotion: emotions are most powerfully evoked when one sees the actual emotion, and as
Plato once argued, we do not pay attention to anything unless it evokes some emotion.
o Surprise and novelty: events that are expected are barely registered, but even a little of
the unexpected attracts attention. The visual medium can be used to create many small
surprises and novel appearances throughout the recording.
o Credibility: we pay attention to ideas if we think the source is credible. The visual
medium can establish the credibility of a person faster than the audio medium alone.
Short-term memory: Once ideas attract attention, they may be placed in the short-term memory
if it such a transfer is facilitated. Visual tools aid short-term memory in the following ways:

6
© Arnold Wentzel [email protected]
o Keeping track: when a recording covers a lot of information that the audience needs to
keep track of to understand subsequent ideas, those ideas can be displayed visually to
prevent overload of the short-term memory
o Integration: it is much easier to keep something in mind if it comes to you in more than
one way. Senses should be integrated rather than separated. Integration is easy in the
visual medium because it allows verbal, textual and visual stimuli to be presented
simultaneously.
o Mnemonics: many of the most powerful mnemonic techniques are visual, so the visual
medium is most suitable to show how to use these mnemonic techniques.
Long-term memory: ideas are held in the long-term memory only if we are forced to think about
what is in the short-term memory. We will only think if motivated to do so.
o Concreteness: ideas are best remembered when they have some concrete quality –
somehow connected to the real-world or help us to make sense of the world. Seeing this
real-world connection visually certainly makes it more concrete and gets us thinking.
o Story-telling: as explained in the previous sub-section, narratives help us make
connections. The more connections we can make to an idea the longer we will remember
it. The visual medium excels at making especially causal narratives vivid, but it can also
help to show logical connections. It is natural for humans to engage their thoughts when
watching a flow of ideas or events
o Perspectives: more perspectives allow one to make more connections. Perspective is
mainly a visual phenomenon, so the visual medium can easily show different
perspectives (on ideas or of people or things) and switch between them. Different
perspectives also force us to think in order to make sense of them.
Figure 3: Summary of memory theory
Memory theory is summarised in the diagram above. Many of these principles are explained in Caine
and Caine (1994) and Heath and Heath (2007).
Most recordings pay scant attention to whether the audience will ever remember the ideas, hoping that
by covering as much content as possible somehow some of it will stick. Merely providing a recap of
the main points rarely help people remember if it is merely a talking head reading through a bullet
point list of main ideas. The reality is that we remember very little unless the presenter designs the
recording to achieve this.

7
© Arnold Wentzel [email protected]
4.3 Functions that provide stimulation
We are more engaged when stimulated – mentally or through the senses or emotions. We are
stimulated when we find something interesting, so this section is based on the F3 theory of what
makes something interesting. It combines Koster's (2005) theory of fun, Thaler's ideas about optimal
perturbation (fumbling) and Hogshead's (2010) triggers of fascination. It overlaps quite a bit with the
functions that make ideas easier to remember.
As the diagram below shows, we are stimulated by something which is fun. We have fun when we
find and master new patterns, where patterns refer to particular ways of thinking or doing that seem to
work. But we are generally happy to stick to existing patterns, so something has to disrupt us to
motivate us to look for new patterns (fumbling). We will pay particular attention to those patterns
that fascinate us. We will play with these patterns until we master them.
Figure 4: The F3 theory of how something becomes interesting
Fun: this requires visuals that show different patterns.
o Variety and novelty: a regular change in scenes or appearances, and unexpected colours,
textures or shapes.
o Complexity: more than one stimulus at a time appearing. An example might be a
combination of talking, facial expression, coloured moving text as commentary
combined and a diagram. If the mind does not have sufficient complexity to keep
engaged it starts to drift.
o Application: showing how the audience can try out different patterns.
Fumbling: this involves disrupting the audience's existing patterns (ideas about how to think or
act) in the following ways:
o Showing where conventional patterns don't work.
o Showing different perspectives that are different from pre-existing ones, but equally or
more effective, or maybe just more interesting.
Fascination: In the search for new patterns we are directed towards those we find fascinating.
Hogshead (2010) argues that there are seven triggers of fascination as summarised in the table
below. The visual medium can be used to trigger one or more them by showing what happens
when using or not using the ideas.
Fun
Fumbling Fascinate

8
© Arnold Wentzel [email protected]
Table 3: Hogshead's triggers of fascination
Trigger Description
Lust Feeling, senses, anticipation of pleasure
Mystique Puzzling, unanswered question, part of a secret
Alarm Fear, loss of possibilities, respond now
Prestige Achievement, ahead of others, respect, admiration
Power Control, command over others or over environment
Vice Rebel against rules, being different
Trust Comfort, certainty, predictability
In most recordings one sees an attempt at creating fun, but usually in a decorative sense (focusing on
variety and novelty) but not much more. But variety and novelty alone does not aid the learning
experience if it is not used in conjunction with fumbling and fascination. Sometimes fun, fumbling
and fascination can be achieved verbally, so the visual medium may not always play such an
important role in stimulation.
4.4 Functions that create a sense of participation
When we feel separate from something, we pay it little attention. But the more we feel part of
something, the more we engage.
Vicarious participation: we do not have the actually participate to feel that we are participating
as Ramachandran (2011) has shown with his research on mirror neurons. Some ways in which
we can participate through other people are:
o Emotion: the visual medium can easily evoke emotions in us which make us experience
an event as if we are there. Ideas can be shown to be in response to certain emotions
(maybe anger about injustice) or lead to emotions (maybe the joy of discovery).
Emotions can be shown by the presenter, an audience or people involved in using the
ideas.
o Games: when watching others play games we get involved by giving advice on the side
(even if it cannot be heard) and choosing sides. Game shows with visual educational
content can be very effective as seen in Season 3 of Open Varsity (even though its
execution was not quite so good).
o Application: seeing how others apply knowledge makes us feel that we are involved too
– this is part of the reason cooking shows are so popular.
Direct participation: The audience can participate in the recording through the use of external
media that allow participation either in real-time or with a delay.
o Real-time: as used in some television shows, the audience may participate by calling in,
sending sms's or e-mail messages. This can be used to add content to the show or even
influence the direction of the show. The same is possible with live educational
recordings.
o Delayed: The audience may be enabled to participate through social media, and
participating through discussion groups, uploading their own videos or obtaining
certificates by completing quizzes. The results of this can be shared through the visual
medium – either online or in subsequent recordings.
Except for the limited Open Varsity experiment with game shows, or the discussion forums and
quizzes on some MOOCs, the participation dimension remains largely unexplored, especially those
aspects that are well suited to the visual medium.

9
© Arnold Wentzel [email protected]
Appendix A: Tool used to plan recordings
Based on this paper one can see that there are at least 130 ways (13 sub-objectives x 10 types of tools) in which the visual medium can be used more
effectively in educational programmes. If the finer detail of every sub-objective is taken into account, this extends to 400 ways.
The table below shows the sub-objectives against the types of tools. It can be used when planning a recording to generate ideas for improving the use of the
visual medium, and also to evaluate existing recordings.
Tools
Objectives
Presentation Conversation Narrative Demonstration Division
Textual Diagram Interview Dialogue Causal Logical Procedure Coaching Comment Bubbles
Understanding
Detail
Difference
Change
Relation
Remembering
Context
Attention
Short-term
Long-term
Stimulation
Fun
Fumbling
Fascination
Participation Vicarious
Direct

10
© Arnold Wentzel [email protected]
Appendix B: Greene's Theory of Informative Video
The diagram below is Greene's own diagrammatic summary of his theory. I refer the reader to the full
text of Greene (2004) that is available on the web. What I will do here is simply explain how to
understand the diagram below.
Figure 1: Greene's theory summarised
Source: Greene (2004)
Greene has explained this approach in a number of self-published books available on Scribd. In this
paper I will focus on one specific tool (fractal diagrams) that form part of his overall approach he calls
'structural cognition' (see Greene, 2006).
The assumption behind structural cognition is that social reality can be categorised and that those
categories can be placed in symmetrical hierarchies. So, a particular phenomenon may be categorised
into four kinds, and those four kinds further categorised into four sub-types. The diagram below
shows how this would look like visually.

11
© Arnold Wentzel [email protected]
Figure 2: Hierarchical structure of ideas
A different, but similar, representation is given below. In both diagrams you can see that
phenomenon A consists of four categories and that each of those four categories can be further
categorised into four sub-categories. It is hierarchical since categories are nested within other
categories. It is symmetrical since at every act of categorisation always leads to the same number of
categories. In this case, there were four categories, and for every category, four sub-categories.
Figure 3: An alternative hierarchical structure of ideas
Whether this way of representing social reality is a true reflection of it is beside the point – what is
important is whether it helps us to think better about this reality. As Greene suggests, there are a
number of benefits to our thinking.
Firstly, the hierarchical structure allows us to distinguish the more important ideas from the less
important ideas. The more important ideas are those that are the most generative – in our example A
A A1
A1a
A1b
A1c
A1d
A2
A2a
A2b
A2c
A2d
A3
A3a
A3b
A3c
A3d
A4
A4a
A4b
A4c
A4d
A
A1
A1a
A1b
A1c
A1d
A2
A2a
A2b
A2c
A2d
A3
A3a
A3b
A3c
A3d
A4
A4a
A4b
A4c
A4d

12
© Arnold Wentzel [email protected]
ultimately leads us to sixteen ideas (A1a through to A4d), A1 only leads us to four ideas (A1a through
to A1d) whereas A1a is just one idea.
Secondly, the symmetrical structure makes it all easier to remember. It is easier to remember a
balanced hierarchical list and also makes it immediately obvious when you are forgetting or missing
something.
This is related to the most important benefit – it helps us to create the content inside the categories
because it is clear where the categorisation is incomplete. To see this benefit better, we need to
consider Greene's way of representing hierarchical-symmetrical relationships between ideas. Greene
would show figures 2 and 3 as displayed in the next diagram.
Figure 4: A fractal diagram
Greene's fractal diagram has
the advantage of being more
compact, so it can convey
more information with less
space. If the diagram lacks
symmetry it is more obvious
– for example above where
A4d is missing.
Psychologists tell us that the
mind instinctively sees
patterns, and when a pattern is
incomplete, it tries to fill in
what is missing. The fractal
diagram harnesses this
tendency to provoke the mind
into generating or searching
for what is missing. This
simple technique virtually
forces one into generating
ideas until symmetry and
completion is achieved
This is the method Greene used to develop his theory of informative video. After much reading and
observation he determined that there were eight main functions through which the visual medium can
inform the audience (rather than just making the verbal presentation more attractive). Once he had
eight functions, he searched for eight sub-functions or ways for each of the eight main functions. This
led him to 64 functions (8 x 8). His fractal diagram is an octagon since he needed a geometrical shape
with eight sides (for the eight functions) and is earlier in this Appendix. It looks more complicated,
but works exactly in the same way as figure 3.
I did not understand everything in Greene's theory, yet this does not detract from its usefulness. Even
if only a fraction is understood it remains fruitful and eye-opening, and if only a fraction of this is
implemented we will see the quality of documentaries and various other visual presentations improve
significantly.

13
© Arnold Wentzel [email protected]
References
Caine, R. and Caine, G. 1994. Making connections.
Greene, R.T. 2004. A Theory of Informative Video: 64 Functions and How to Implement Them.
Greene, R.T. 2006. Powers from Brain Training: Mind, Language-Art, Mind Extensions, Structure,
Theory, Reflection, Happiness, Social Automata, Evidence, Career, Culture, Theories, & Design.
Heath, C. and Heath, D. 2007. Made to stick.
Hogshead, S. 2010. Fascinate. HarperCollins.
Koster, R. 2005. A theory of fun for game design. Paraglyph Press.
Ramachandran, V.S. 2011. The tell-tale brain. London: Willaim Heinemann.
Thaler, S.L. Various papers on www.imagination-engines.com