Mainstreaming Equity in Education - FHI 360
26
Mainstreaming Equity in Education Issues Paper Commissioned by the International Education Funders Group September 2017 Carina Omoeva FHI 360 Education Policy and Data Center / Education Equity Research Initiative Photo credit: Leanne Gray, FHI 360
-
Upload
khangminh22 -
Category
Documents
-
view
1 -
download
0
Transcript of Mainstreaming Equity in Education - FHI 360
Mainstreaming Equity in Education Issues Paper Commissioned by the International Education Funders Group
September 2017
Carina Omoeva
FHI 360 Education Policy and Data Center /
Education Equity Research Initiative
Photo credit: Leanne Gray, FHI 360

Mainstreaming Equity: Issues Paper
2
Acknowledgements This paper was commissioned by the International Education Funders Group (IEFG) as a framing document on mainstreaming data and evidence building around equity in education. It builds on prior foundational and framing documents developed under the Education Equity Research Initiative, and the many discussions among its members. Thanks are due to the Equity Initiative team, as well as the IEFG. Eric Eversmann reviewed and provided feedback on earlier versions of the draft, around the framing of the key arguments in the paper. Rachel Hatch researched and developed Annex A. Wael Moussa provided the graphs (as well as the analysis behind them). Jane Sullivan assisted with formatting and layout. Megan Haggerty and Bronwen Magrath of the IEFG provided comments on overall clarity and structure. Finally, many thanks to the IEFG members for verbal comments, helpful critique and feedback. Learn more about the Education Equity Research Initiative at www.educationequity2030.org.
Mainstreaming Equity: Issues Paper
3
Contents
Acknowledgements ....................................................................................................................................... 2
Background and Context ............................................................................................................................... 4
What is equity? ......................................................................................................................................... 5
What are we missing (by not looking at equity)? ......................................................................................... 6
Blind Spots ................................................................................................................................................ 7
Evidence building: Do we know what works (and for whom)? ................................................................ 9
Enabling and mainstreaming equity: The way forward .............................................................................. 10
Before grantmaking: Incorporating equity into funding strategy and programming ............................. 11
Clarity of outcomes: What does equity look like? .............................................................................. 12
The dimensions of inequity: Who is left behind? ............................................................................... 13
What are the underlying causes and systemic drivers? ..................................................................... 14
Investing for equity ............................................................................................................................. 14
During grantmaking: Establishing strong learning systems .................................................................... 15
Integrating an equity lens into monitoring ......................................................................................... 15
Adaptive program management ......................................................................................................... 17
Characteristics of an equity-oriented M&E system ............................................................................ 18
Setting priorities .................................................................................................................................. 19
Closing: Field-building around educational equity ..................................................................................... 19
Annex A: Illustrative Analyses of Known Disparities in Education ............................................................. 21
References .............................................................................................................................................. 26

Mainstreaming Equity: Issues Paper
4
Background and Context
Equity is at the heart of Sustainable Development Goal 4: “Ensure inclusive and equitable quality
education and promote lifelong learning opportunities for all”, and the Incheon Declaration of the 2015
World Education Forum, which calls inclusion and equity “the cornerstone of a transformative education
agenda”1. Broad-based expansion of opportunity in education, with particular emphasis on those that are
facing disadvantages due to their socioeconomic background, disability, ethnic identity, gender, effects of
displacement, or other characteristics and forms of adversity, becomes an important element of
understanding success in educational development – indeed, of success in development at large. A
transformative education agenda seeks to build equity in and through education, both changing
experiences in the classroom and improving the potential of schooling to shift life trajectories for those
facing adversity.
In addition to affirming high-level commitment to education and the importance of equity through
educational opportunity, the Incheon Declaration was important in setting a new set of requirements on
tracking progress against SDG 4. With equity at the center of the international policy framework, it is no
longer acceptable to gauge progress in education using population-wide averages in school participation
and learning. Rather, one is pushed to examine the extent to which reform efforts in education are serving
to improve inclusion and ease the path to greater equality for those that are facing disadvantage due to
social and demographic characteristics. In stating that “no education target should be considered met
unless met by all”2, the Declaration calls on education systems to confront head-on the challenge of
identifying, documenting, and measuring education opportunity (and lack thereof) for a much broader set
of dimensions that characterize the school-aged population. Just as gender became a mandatory
reporting dimension in education since the start of the Education for All era in Jomtien, Thailand in 1990,
so is Incheon ushering a new order, calling for greater depth in the provision of educational opportunity,
and greater breadth in understanding and closing disparities in participation and learning.
The real challenge, as always, lies in the realization of the promise of Incheon. Convened by UN agencies
and governments, the Education 2030 declaration justly places the burden of realizing this promise on
national governments. A number of global initiatives and mechanisms are being put in place by
multilateral agencies to support and enable this process. However, it is incumbent on the international
education community – including international agencies, civil society, private sector, and independent
funders and educators – to do their part in creating a culture where an equity lens is increasingly applied
to all processes of strategy, program design, implementation, data generation, and evidence building.
As education practitioners and stakeholders in the realization of these goals, it is the responsibility of
every funding, implementing and research organization in education internationally to be asking
questions about our own contributions to building equity. While a great amount of data gets produced
in the course of education development projects, only a fraction provides the depth that is needed to
assess intervention impact on the different equity dimensions. At the technical and implementation level,
organizations need to capture and use the necessary evidence to understand and respond to inequity in
education provision and outcomes. To do that, we need to be deliberate in building M&E and learning
systems that generate the depth of data and analysis that helps answer the question: are we improving
1 http://en.unesco.org/world-education-forum-2015/incheon-declaration 2 Ibid.
Mainstreaming Equity: Issues Paper
5
education equity through our programming and policy? Data and research evidence are the first step to
understanding who is left behind in obtaining a quality education for successful and productive adulthood.
Without such information, policy makers, funders, and implementing organizations are blind to the
disparities they may be missing, or worse, to inequities they may be contributing to. Programming and
policy that seeks to address inequity and create broad-based progress in education must be deliberate in
using data to identify disparities, generating evidence on effective equity-building solutions, and scaling
them for impact.
This document is intended to help establish some of the key issues and challenges that need to be
addressed around equity in education, and provide a way forward to mainstreaming equity-oriented
programming and data analysis.
What is equity?
As the terms equity and equality are often used interchangeably in the context of educational
development, it is useful to clarify the slight semantic and conceptual differences that determine their
usage in this paper3. Here, we use the term equality as an empirically verifiable state of being equal. In
education, equality in outcomes, such as school participation, learning, or outcomes beyond schooling, is
a desired end goal and objective of many policies and programs. At the same time, equality in inputs – as
in equal resource allocation, for example – may not always be desirable or fair, given inequality of starting
conditions and opportunities. In such cases, the relevant concept is equity, rather than equality.
Equity in this context is defined as a reassessment and redistribution of resources (human, institutional,
and financial) in education with the goal of reducing or eliminating systematic inequality in outcomes. In
this sense, equity is a path to achieving equality. In the simplest terms, equity is fairness, or equal
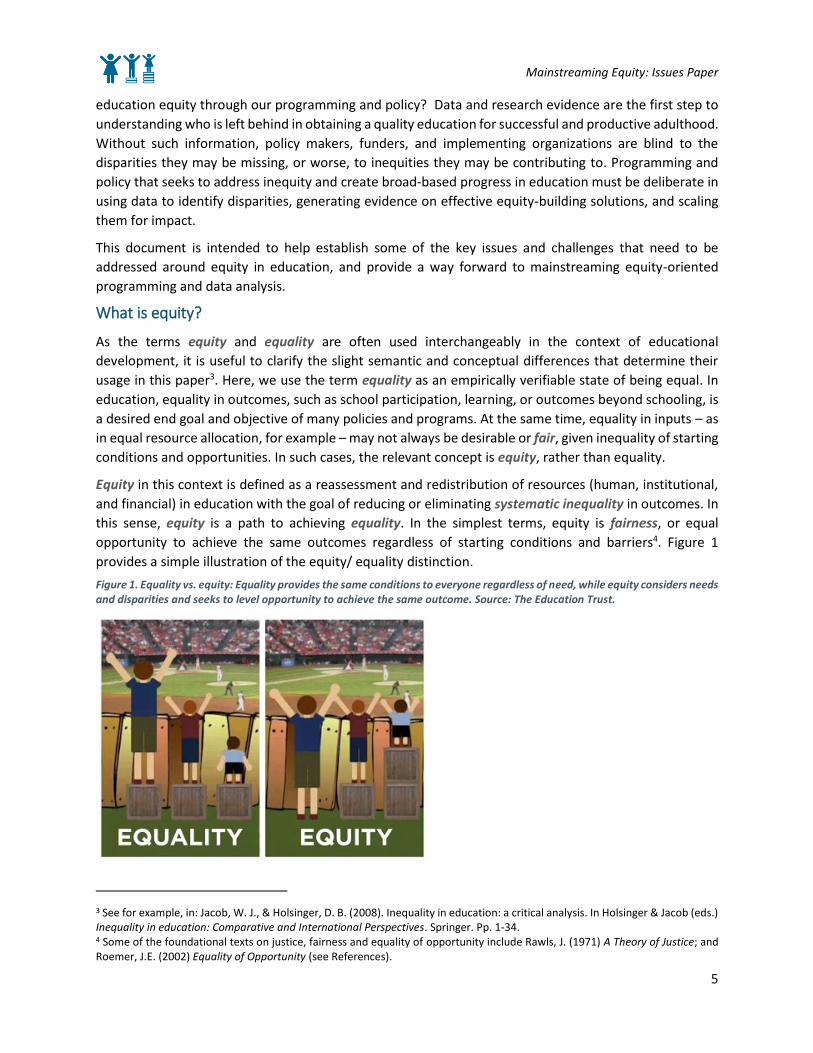
opportunity to achieve the same outcomes regardless of starting conditions and barriers4. Figure 1
provides a simple illustration of the equity/ equality distinction.
Figure 1. Equality vs. equity: Equality provides the same conditions to everyone regardless of need, while equity considers needs and disparities and seeks to level opportunity to achieve the same outcome. Source: The Education Trust.
3 See for example, in: Jacob, W. J., & Holsinger, D. B. (2008). Inequality in education: a critical analysis. In Holsinger & Jacob (eds.) Inequality in education: Comparative and International Perspectives. Springer. Pp. 1-34. 4 Some of the foundational texts on justice, fairness and equality of opportunity include Rawls, J. (1971) A Theory of Justice; and Roemer, J.E. (2002) Equality of Opportunity (see References).
Mainstreaming Equity: Issues Paper
6
Systematic inequality in education can either be a product of active and deliberate discrimination within
the context of broader social injustice, or a result of failure of the education system to recognize the
different starting conditions and challenges facing individuals. It follows that inequity is a failure of a
program, policy, or intervention to provide every child with an equal opportunity to obtain a quality
education.
Equity dimensions denote the social and demographic characteristics of subpopulations that predict –
due to discrimination or unequal access to resources –inequality in outcomes. The equity dimensions
noted in the Education 2030 Declaration include gender, poverty, ethnicity, disability, and refugee status.
Finally, a concept that is growing in usage alongside discussions of equity in education is intersectionality.
As the term suggests, it refers to intersections of equity dimensions that often predict higher levels of
disadvantage. Examples of intersectionality that create disadvantage greater than the sum-total of its
elements may include gender and ethnic minority status, or disability and poverty.
Equity-oriented programming and policy addresses the underlying causes and drivers of inequality in
education. It is continuously assessing disparities against known social and demographic factors, and
seeks to minimize the magnitude of their effects on outcomes. One can consider a program or policy to
be equity-building if the resulting gains in outcomes – school participation, learning, or skills for successful
workforce transition – are greater for individuals and groups that started out with a disadvantage.
In the rest of the document, we discuss the current status and blind spots of data and evidence when it
comes to equity in education, and offer a way of applying an equity lens towards funding strategy and
programming.
What are we missing (by not looking at equity)?
One of the greatest accomplishments of the Education for All forum in Jomtien, Thailand in 1990 and the
following decade was the recognition of the severe gender inequality in education. The resulting near-
universal mandate for sex-disaggregated reporting from funders and multilateral agencies led to the
proliferation of data on dramatic disparities between male and female learners in their access to
education, and in later years, their learning outcomes; which in turn created the demand for programming
focused on building gender equity. Twenty-seven years after Jomtien, gender disparities have not gone
away, but there is a substantial, and growing, amount of evidence on solutions that build gender equity
in education, and on how education systems need to adapt to help girls and boys overcome gender-
related institutional barriers.
The same cannot be said for other dimensions of inequity in education. With the exception of poverty,
many other known socio-demographic characteristics of learners are not routinely collected, and are
frequently overlooked in analysis. Datasets with equity dimensions are largely limited to outcomes on
school participation, and to a lesser extent, learning achievement, although coverage of learning
outcomes data remains scattered. Program-level datasets are often under-powered with samples too
small to reliably conduct analysis, and most are not longitudinal, which makes it difficult to reliably track
change in school progression and learning over time. Both at the system level, and at the level of
programs, consistency and comparability of definitions and metrics are a challenge, making it virtually
impossible to pool data and zoom out of the confines of a given dataset.
Mainstreaming Equity: Issues Paper
7
This section offers a sense of the extent of knowledge gaps that are created by a lack of a consistent
integration of equity into systems and programs, drawing from a review of existing data sources and
insights on current practice in routine program effectiveness analysis.
Blind Spots
To get an initial gauge of where our blind spots are in terms of equality in key education outcomes, the
Education Equity Research Initiative carried out a landscape review in 20165. The review covered all major
global and regional data sources, including administrative data reported by the UNESCO Institute for
Statistics (UIS), household survey data, student achievement databases, as well as a selection of
instruments and survey tools from implementing Equity Initiative partner organizations. Two key
questions drove the analysis as part of this review: 1) what equity dimensions are being measured, and
how consistently? and 2) how is equity information that is collected being used, if at all?
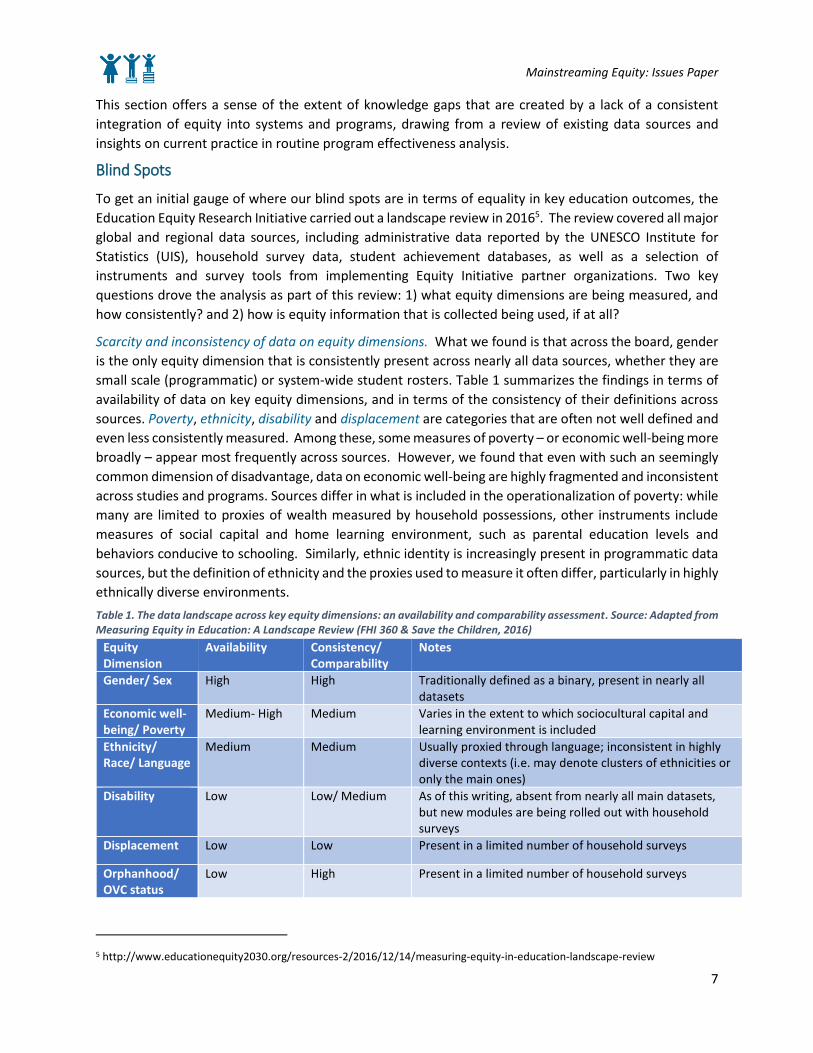
Scarcity and inconsistency of data on equity dimensions. What we found is that across the board, gender
is the only equity dimension that is consistently present across nearly all data sources, whether they are
small scale (programmatic) or system-wide student rosters. Table 1 summarizes the findings in terms of
availability of data on key equity dimensions, and in terms of the consistency of their definitions across
sources. Poverty, ethnicity, disability and displacement are categories that are often not well defined and
even less consistently measured. Among these, some measures of poverty – or economic well-being more
broadly – appear most frequently across sources. However, we found that even with such an seemingly
common dimension of disadvantage, data on economic well-being are highly fragmented and inconsistent
across studies and programs. Sources differ in what is included in the operationalization of poverty: while
many are limited to proxies of wealth measured by household possessions, other instruments include
measures of social capital and home learning environment, such as parental education levels and
behaviors conducive to schooling. Similarly, ethnic identity is increasingly present in programmatic data
sources, but the definition of ethnicity and the proxies used to measure it often differ, particularly in highly
ethnically diverse environments.
Table 1. The data landscape across key equity dimensions: an availability and comparability assessment. Source: Adapted from Measuring Equity in Education: A Landscape Review (FHI 360 & Save the Children, 2016)
Equity Dimension
Availability Consistency/ Comparability
Notes
Gender/ Sex High High Traditionally defined as a binary, present in nearly all datasets
Economic well-being/ Poverty
Medium- High Medium Varies in the extent to which sociocultural capital and learning environment is included
Ethnicity/ Race/ Language
Medium Medium Usually proxied through language; inconsistent in highly diverse contexts (i.e. may denote clusters of ethnicities or only the main ones)
Disability Low Low/ Medium As of this writing, absent from nearly all main datasets, but new modules are being rolled out with household surveys
Displacement Low Low Present in a limited number of household surveys
Orphanhood/ OVC status
Low High Present in a limited number of household surveys
5 http://www.educationequity2030.org/resources-2/2016/12/14/measuring-equity-in-education-landscape-review

Mainstreaming Equity: Issues Paper
8
As the table shows, disability is by far the most challenging equity dimension to find, making children and
youth with disabilities “invisible” when it comes to data on education programming, learning outcomes
measurement, and resource allocation. The complexity of measurement of disability can be daunting, as
there is a wide spectrum of both physical and cognitive disabilities that can affect school access,
participation, learning achievement, and successful transition into adulthood. There is reason to hope
this will soon change: UNICEF is leading the charge in defining key metrics for child functioning disability6,
and tools are being adapted by members of the Education Equity Research Initiative to use with both
children and their caregivers.
Other equity dimensions, such as displacement, orphanhood or other vulnerability characteristics, have
been scarce and generally poorly defined. Large-scale household surveys were most likely to contain
information on migration, but even then this information was extremely uneven and limited. With
displacement affecting vast swaths of the populations of the Middle East, Sub-Saharan Africa, South Asia,
and other parts of the world, migration status is bound to become a core dimension of equity across both
system-level and programmatic data sources.
Limited utilization of equity data. While availability and presence of equity dimensions is the first step
towards an understanding of disparities in education, we found that even when such data are available,
they are often left outside the main focus of analysis. Wealth, ethnicity, and gender are regularly included
as explanatory, or “control” variables that help reduce variation and increase precision in analyses of
impact of policies or interventions, but rarely are used to examine differences in impact effects, or to
model trajectories of learning acquisition from different starting points.
The program implementing organizations interviewed during the review indicated that while gender
disaggregation was present for many descriptive data, child characteristics, such as their socioeconomic
status, language spoken in the home, and their rural or urban residence were helpful but secondary
elements of the analysis. In many cases, the small number of observations within a dataset made it
difficult to run analyses just on the subgroup that is defined by an equity dimension. In instances where
the disadvantage is compounded by several such factors, the subgroup that suffers multiple
disadvantages is even smaller, rendering the analysis unreliable, and therefore less than useful from the
program monitoring standpoint. Thus, the cycle of limited data production leading to low utilization, and
consequently, to an even lower incentive to generate equity-friendly data, is perpetuated across the
program implementation landscape.
A near absence of equity dimensions to education inputs data. The situation with data availability and
utilization is even more dire when it comes to data on resource allocation. In developed contexts, means
testing, such as qualification for school nutrition programs, or eligibility for support programs makes it
possible to identify schools with higher concentrations of needy students. In low-resource systems, such
markers often do not exist. Whether it is system-level data on teacher deployment, teacher quality, pupil/
teacher ratios, and per student expenditure; or program-level data on costs and resource allocation per
school or student, equity dimensions generally do not enter the framework for resource allocation
analysis.
6 https://data.unicef.org/resources/module-child-functioning/

Mainstreaming Equity: Issues Paper
9
Evidence building: Do we know what works (and for whom)?
The lack of depth and consistency in the measurement of equity dimensions places limitations on the
utility of evidence on education interventions. Figure 2 is borrowed from a recent review of evidence in
education by the International Initiative for Impact Evaluation (3ie), which covered a wide range of
systematic reviews and evaluations at different levels7. While the state of the evidence is far from
comprehensive, the review found a couple of modalities that were effective across most contexts, a few
promising approaches that have shown to be effective in some contexts, and some that had limited
success. Unfortunately, even when the modalities were well-researched and supported by a wealth of
research evidence and data, the equity dimensions were not addressed. The second research question of
the 3ie review: do the effects differ across subpopulations (due to sex, age, or socioeconomic
determinants)? remained largely unanswered, as researchers struggled to identify equity-relevant
variables in the analysis, and bring together the disparate sets of evidence under a common framework.
Figure 2 The state of the evidence of education: A summary from a 3ie systematic review. Source: 3ie
Structured pedagogy, for example, may be highly effective for all students, and even more effective for
struggling readers who are placed in unfamiliar language environments. Or on the contrary, it may be
effective on average, but it may be the most capable learners who benefit most from structure and the
additional challenge it creates. Similarly, we learn little about whether school-based management support
programs were more ineffective in lower resource contexts, where capacity is lacking, or equally
ineffective regardless of school type and population characteristics.
It is certainly true that even if data on equity dimensions within the underlying studies that went into the
systematic review were available, reliable estimates for subgroups and sub-contexts could often be
difficult to generate, due to sample size constraints within many studies. Unfortunately, the missed
opportunity for 3ie to generate real insights of what works for whom is reflective of the overall state of
7 Snilstveit, B, Stevenson, J, Phillips, D, Vojtkova, M, Gallagher, E, Schmidt, T, Jobse, H, Geelen, M, Pastorello, M, and Eyers, J, 2015. Interventions for improving learning outcomes and access to education in low- and middle- income countries: a systematic review. 3ie Systematic Review 24. London: International Initiative for Impact Evaluation (3ie). Note: the 3ie snapshot provides an illustration of the challenge in obtaining subpopulation-specific estimates and integrating equity into analysis of impact. It is not intended as a criticism of 3ie, nor do we interpret it to represent the ultimate and comprehensive review of all evidence – only that from rigorous quantitative impact evaluations.

Mainstreaming Equity: Issues Paper
10
things when it comes to monitoring and evaluation of program-level data. As we learned in our program-
level equity measurement landscape analysis, this level of depth is simply not a common, accepted
practice for analysis and reporting. Meanwhile, leaving socioeconomic and demographic predictors out
of the main analysis often conceals important insights about how interventions affect the learning and life
trajectories of children and youth.
Figure 3 offers an illustration: a recent example from a program-level analysis that explicitly examines
program effect by the equity dimensions available in the data. As the figure shows, the overall positive
program impact effect – which would have been sufficient to identify and report in most cases – masks
the fact that there are substantial differences in how different types of learners responded to the
program. While the gender gap appears to have been closed, indeed slightly reversed, a
disproportionately larger share of the gains accrued to the relatively better-off students, who had already
started out with a substantial advantage. In other words, the program, while creating a positive treatment
effect across the board, exacerbated inequality in outcomes along the wealth equity dimension.
Figure 3. Equity-oriented program impact analysis unveils differences in impact size. Source: FHI 360
The analysis in Figure 3 was possible because data on equity dimensions were present in the dataset. This
analysis is limited in that it does not look at outcomes for children not speaking the language of instruction
at home, nor at migrant children. However, it does provide insights that are directly actionable within the
confines of the program, and contributes to a broader knowledge base on the effectiveness of reading
interventions for children at the lower end of the socioeconomic spectrum. Ideally, this is the type of
analysis that every program and education system should be able to do, and the type of data and evidence
that should inform funding, programming, and policy decisions. In the next section, we offer a process
for realizing this vision.
Enabling and mainstreaming equity: The way forward
Addressing equity, or combatting inequality, is already a key motivating factor for many funders and
development organizations in education. Education interventions supported by public and private donors
across the developing world support access to education for girls, children and youth living in poverty,
Mainstreaming Equity: Issues Paper
11
and offer alternative approaches to provide schooling for marginalized communities. Solutions supported
by private foundations and individuals bring technology into classrooms in low-resourced environments,
offer school feeding to support students in high poverty households, and offer leadership training for
youth in rural and remote communities.
At different levels, a careful review of data on a variety of education indicators will help organizations to
assess where investments are most appropriate, and how effective they may be in institutionalizing
equitable solutions. At the strategy level, data analyses may capture the magnitude of inequality in the
system as a whole, measure its effects on outcomes for countries and societies at large, identify who is
left behind, and examine the root causes and underlying drivers of perpetuating social and economic
disparities in education. These analyses can serve to inform strategic priority setting for funding allocation
to an emphasis on equity. At the program level, iterative data analyses seek to understand who is falling
behind and why, within the boundaries of target populations, unpack the mechanism by which programs
succeed or fail to meet the needs of specific or subgroups, and build evidence on implementation
solutions that help advance equity-oriented teaching and learning practices.
The challenge of equity in and through education cannot be resolved without a consistent and deliberate
application of an equity lens in program design, monitoring and program implementation, impact analysis,
and evidence building, which in turn is used to strengthen programming. Collaborative action by groups
of organizations, jointly applying a common set of tools and processes to address equity, and agreeing on
a key set of challenges that can be consistently addressed and examined through a range of programs at
different levels can be a powerful way of advancing the field towards the promise of Incheon. Through
the Education Equity Research Initiative, implementing and research organizations have already begun to
reach agreement on key equity dimensions that must be consistently identified, and approaches that
increase the availability and quality of data needed to assess progress. A similar approach by funders
would strengthen field-building around equity in education, and help mainstream data production and
evidence building, creating the foundation for system-wide change.
Incorporating equity into strategy and programming
Incorporating equity into a strategy involves a review of data and a deliberate process of recognizing
relevant equity dimensions, drivers of perpetuating disparities, and identification of key stages and levels
of engagement that address them.
This process can be guided by a series of questions:
1) What outcomes are crucial for equity and equality, both within the education system and beyond?
In other words, what does equity and equality look like?
2) Relative to the outcomes desired, who is left behind? What subpopulations or groups are
systematically denied opportunity to advance their life trajectories?
3) What are the underlying causes of inequity and inequality? And what system-level, resource, or
cultural factors can be affected through programming or policy?
4) Given all of the above, what is the appropriate scope and level of investment for an organization?
Starting from the outcomes and working down to the operational level of scope and level of engagement
allows funders and mission-driven organizations to establish a vision of what it means to achieve equity
in and through education, and focus on identifying the right metrics for success, target resources to those

Mainstreaming Equity: Issues Paper
12
who need them most, and help find effective ways to eliminate the root causes or institutional barriers of
inequity.
Clarity of outcomes: What does equity look like?
Focusing on outcomes as a first step is essential: it addresses the question, in the minds of the funder and
implementer, of what the end goal of equality should look like – how do we know if we have achieved it?
It also triggers an exploration of what is needed to reach equity, in terms of the relevant solutions and
resource allocation decisions, at different levels and stages of the education system. So, what are the
appropriate outcomes in which to seek equality?
Participation. School access and meaningful attendance and participation in basic education, measured in
school enrollment and completion rates, remain relevant in many parts of the world. Educational
attainment is a strong determinant of future productivity and wage earnings in most parts of the world,
and increasing the proportions of youth completing basic cycles of schooling therefore continues to be a
central goal for governments and donors around the world. Depending on the context, the equity debate
around attainment may be focused on getting more learners to transition to the secondary and tertiary
levels, on the one hand, and on expanding access to early childhood education, on the other.
Learning. In recent years, much of emphasis in international education has shifted to the need for a more
consistent set of measures of learning achievement at every stage. SDG 4 calls for indicators of minimum
proficiency at three points of the basic education cycle: end of second grade, end of primary, and end of
secondary schooling. Assessments of learning outcomes vary, from fluency-based reading assessments of
early literacy and tests of early numeracy, to sophisticated assessments of subject-matter knowledge
applied following completion of primary schooling.
Noncognitive (“soft”) skills. Alongside learning achievement, a growing area of study is noncognitive
outcomes, or “soft skills”, such as persistence and resilience, self-control, positive self-concept, or social
and communication skills, which have been found to be predictive of a range of positive outcomes in
youth.8 While the jury is still out on whether these correlation mechanisms are causal, there is a strong
argument to be made that soft skills lie at the heart of internalized inequity for many children and young
adults. Poverty and discrimination can be detrimental to positive self-concept and individual ambition.
Low “soft skills”, in turn, can perpetuate a lack of engagement that dampens the potential for academic
achievement and later life outcomes.
What does equality in outcomes look like? In a purely mathematical sense, it is the absence of a noticeable
gap in individual or average group outcomes. For most measures of interest in education, some variation
is normal and expected. Equality is attained when disparities are no longer predicted by systematic bias
imposed on individuals by their social and economic constraints. Equality can be measured through a
simple difference in means (simple averages) between groups identified by equity dimensions, or through
a ratio of one group’s mean to the other. In instances where there are more than two units and the
distribution of the underlying indicator is continuous and linear (in the case of assessments scores), one
may examine the overall variability (variance or standard deviation) in the outcome. Finally, more
complex measures such as Gini and Theil indices can be applied to continuous outcomes that are also
8 USAID (2016) YouthPower Soft skills review http://www.youthpower.org/resources.

Mainstreaming Equity: Issues Paper
13
cumulative (such as years of schooling, or dollars spent on schooling).9 Table 2 provides some illustrative
examples of indicators and equity metrics.
Table 2. Illustrative outcomes, equity metrics, and sources of data
Illustrative indicator Class of outcomes
Applicable Equity Metric Possible data sources Diff. in means
Ratio Vari-ance
Gini/Theil Index
Enrollment ratio Participation X X Administrative records Attendance Participation X X X* Administrative records, surveys
Completion rate Participation X X Administrative records
Retention/ dropout rate Participation X X
Words read per minute Learning X X Student learning assessments
% Correct answers (of total) Learning X X X X Student learning assessments % at learning benchmark Learning X X Student learning assessments
Scaled assessment score Learning X* X* X X* Student learning assessments
% With high perseverance Soft skills X X Soft skills tests
% With high self-control Soft skills X X Soft skills tests
% Employed within 3 mos Post-educ X X Tracer surveys, employer surveys
Note: the asterisk (*) denotes that the scale of the indicator must be continuous; i.e. days attendance rather than attendance rate. For learning
assessment, the scale of the assessment score needs to be on a linear scale for differences and ratios to be applicable.
The dimensions of inequity: Who is left behind?
It follows that the key question for equity is, in attaining important outcomes both within and outside the
education system, who is left behind? In an ideal world, life outcomes are determined solely by personal
choices and motivations, and are independent of one’s background and social and economic constraints.
It is known that education systems are far from this ideal, and they often fail to reverse the effects of
broader social, demographic, and economic barriers affecting learners; in fact, they often reinforce them.
Thus, an equity-oriented analysis in education seeks to uncover the systematic relationships between key
outcomes, on the one hand, and the demographic and social characteristics of subgroups that may predict
disparities over and above individual choice and motivation, on the other.
The answer to the question of “who is left behind” may differ depending on the choice of outcome and
the measure chosen to capture it. The equity dimensions – the social and demographic characteristics that
predict inequality – may play out differently in different contexts: a gender gap in learning outcomes may
not appear in an analysis of early grade reading scores, but in many cases the girls’ disadvantage may
emerge dramatically when the outcome of interest is secondary school completion. Collecting and
analyzing data on different dimensions across a range of outcomes and indicators will give a more detailed
picture of the relevant gaps and how they change over time. At the same time, it is important to recognize
the persistent negative effects of such factors as poverty, disability, ethnicity of the minority group, and
migration status in post-conflict and fragile environments.
An in-depth analysis of who is left behind on a range of outcomes may point to a specific group, perhaps
categorized by one or more equity dimensions, that is then identified as a target for an equity-building
funding strategy. Once such choices are made, it is important to keep the focus on the outcome(s) of
9 More information on these equity metrics, and other statistical approaches to measuring equity can be found in the forthcoming UNESCO Institute for Statistics Handbook for Measuring Equity in Education (UIS, forthcoming).

Mainstreaming Equity: Issues Paper
14
interest for the selected target population, while maintaining a broader reference point – as with a
population average, or with the average for more advantaged groups, for equity comparison.
What are the underlying causes and systemic drivers?
Disparities in outcomes are the manifestations of the underlying dynamics of inequity that are at play in
any given context. Many of these dynamics are rooted in broader imbalances in power and social structure
that affect an individual or group’s access to a broad range of services. Others stem from cultural beliefs
and practices that place a low value on education and cause individuals to internalize a limited set of
expectations for their own life trajectories. It is useful to distinguish these causes of uneven starting
conditions from systemic drivers of inequity, or deep disparities in the levels of educational quality and
resources that often reflect and reinforce social divisions.
Some of these institutional and systemic drivers are known and well-documented: children from poor
households and ethnic minorities tend to be clustered in lower-resourced schools where the quality of
resources and instruction is markedly different from those available to their wealthier peers. Teacher
deployment and retention patterns often show higher quality, experienced teachers placed in high-
functioning schools, thus expanding the potential for inequity in learning trajectories of students. For
other equity dimensions, the institutional drivers are less visible: girls may be socialized through
curriculum and classroom interaction to assume traditional gender roles, while students with disabilities
are prevented from fully participating in classroom activities. For each context, studies and analyses of
available data (albeit limited) may help determine the relative magnitude of the different factors and their
malleability through targeted interventions. Annex A: Illustrative Analyses of Known Disparities in
Educationprovides an illustrative set of disparities that can be identified through data on education
outcomes, along with their known underlying causes and institutional drivers, and attempted solutions.
Understanding the lived experience of children and youth, with the underlying causes and institutional
drivers that generate and perpetuate inequity in education, can inform decisions on a range of approaches
to address them. Whether to focus on the underlying root causes of unequal starting conditions, or to
address a range of institutional drivers of inequity within the education system, depends on the scope and
scale of engagement, including the time horizon for funding, that is feasible for a given funder. Even for
small-scale interventions, however, the potential impact can be dramatic if they are linked to a broader
framework for building equity, coordinated, and consistent in generating evidence with the potential for
further institutionalization.
Investing for equity
In addressing the root causes and the institutional drivers to inequity, solutions may differ, and the scope
and scale of the impact that an individual funder can make may vary dramatically across programs and
geographic contexts. Individual funders with a commitment to equity can magnify their imprint on the
field through a coordinated, deliberate approach across a community of funders to address a set of known
challenges and reduce the prominence of known equity dimensions, such as gender, poverty, ethnicity,
disability, and displacement in key outcomes. Such an approach would include agreement on key
outcomes and indicators of school participation and learning, sharing knowledge and evidence on the
drivers of inequality, and a consistent process for using a set of core equity dimensions in identifying
disparities and measuring progress against them. Finally, this would require a commitment to generating
consistent data and evidence on equity in education, allowing a broader and ever-increasing circle of
education stakeholders to witness the diminishing effect of gender, race, ethnicity, disability, poverty, and

Mainstreaming Equity: Issues Paper
15
refugee status on the way children and youth attend school, engage in the learning process, and move on
to productive adulthood.
Coordination and consistency in applying an equity lens towards identifying gaps, developing funding
strategies, and tracking progress in outcomes achieves the important objective of institutionalizing equity
within the education system.
Establishing strong learning systems
Even as decisions on strategic funding priorities are made, funders and their implementing partners need
a better understanding of why programs may fall short in meeting the needs of the most disadvantaged,
and how interventions can be best designed to strengthen equity in education. Within subpopulations of
children and youth targeted for a known disadvantage, there is variability and range in the level of
adversity faced by individual learners. Those characterized by multiple layers and dimensions of
disadvantage (aka intersectionality) are likely to be at greater risk of falling behind, even when a
mechanism is intended to help them overcome the most visible barriers. Learners starting at lower levels
due to the constraints they are facing will likely need proportionately more support than their peers close
to the average in learning, just to remain in school, and an even greater push in order to succeed. Equity-
oriented programming recognizes the multiple factors that affect the starting conditions and progress
trajectories of children and youth, and provides the necessary, targeted support mechanisms to
compensate for their effect on school outcomes.
Integrating an equity lens into monitoring
The diversity of funding portfolios for many grant-makers means that program implementation offers
multiple avenues to generate data and evidence, both on the magnitude and nature of disparities –
whether they are based on ethnicity, gender, poverty, or all of the above – and on how learners respond
to a given policy or program. Establishing data and monitoring systems that allow funders and
implementers to identify these challenges, analyze impact differentially across equity dimensions, and
provide timely feedback loops back into program implementation would make it possible for programs to
make substantial headway in understanding who is not helped by an intervention and why, as well as
generating evidence on what does work in closing equity gaps. Extending the question we posed earlier
at the strategy level, the challenge here is to identify who is being left behind, and how can we accelerate
their progress?
As an example of a process that can help guide this analysis and set up data and monitoring systems with
a focus on equity, the Education Equity Research Initiative offers a set of Structured Questions10 that are
intended to help program implementing and research organizations apply an equity lens to the analysis
of program effectiveness. While originally designed as a framework for a statistical analysis tool, this set
of questions can be adapted to guide the thought process for funders and grantees in establishing data
systems.
10 http://www.educationequity2030.org/resources-2/2016/12/14/structured-approach-to-equity-analysis, and by request at [email protected].
Mainstreaming Equity: Issues Paper
16
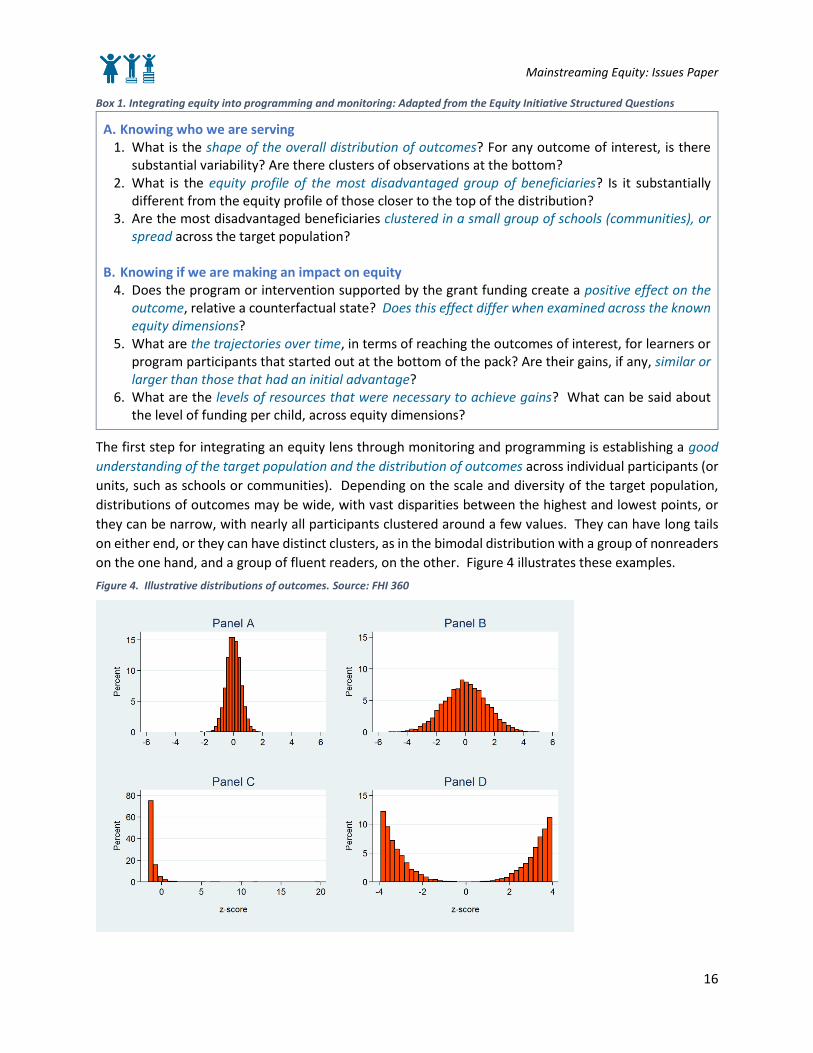
Box 1. Integrating equity into programming and monitoring: Adapted from the Equity Initiative Structured Questions
A. Knowing who we are serving 1. What is the shape of the overall distribution of outcomes? For any outcome of interest, is there
substantial variability? Are there clusters of observations at the bottom? 2. What is the equity profile of the most disadvantaged group of beneficiaries? Is it substantially
different from the equity profile of those closer to the top of the distribution? 3. Are the most disadvantaged beneficiaries clustered in a small group of schools (communities), or
spread across the target population?
B. Knowing if we are making an impact on equity 4. Does the program or intervention supported by the grant funding create a positive effect on the
outcome, relative a counterfactual state? Does this effect differ when examined across the known equity dimensions?
5. What are the trajectories over time, in terms of reaching the outcomes of interest, for learners or program participants that started out at the bottom of the pack? Are their gains, if any, similar or larger than those that had an initial advantage?
6. What are the levels of resources that were necessary to achieve gains? What can be said about the level of funding per child, across equity dimensions?
The first step for integrating an equity lens through monitoring and programming is establishing a good
understanding of the target population and the distribution of outcomes across individual participants (or
units, such as schools or communities). Depending on the scale and diversity of the target population,
distributions of outcomes may be wide, with vast disparities between the highest and lowest points, or
they can be narrow, with nearly all participants clustered around a few values. They can have long tails
on either end, or they can have distinct clusters, as in the bimodal distribution with a group of nonreaders
on the one hand, and a group of fluent readers, on the other. Figure 4 illustrates these examples.
Figure 4. Illustrative distributions of outcomes. Source: FHI 360

Mainstreaming Equity: Issues Paper
17
Particularly in instances where there are distinct clusters at the lower end, it is important to know who
those participants are, and what equity issues they may be facing. Whether or not one has the opportunity
to do that depends on how consistent and deliberate he or she was in integrating background and
demographic measures into the data. Assuming the metrics on key equity dimensions are present, an
equity profile for low-performers (as distinct from the higher-performing learners, for example) may
provide insights on what the underlying dynamics may be that can prevent them from fully benefitting
from the offered program or policy. This information may be crucial if the program is able to offer
additional support, or find complementary efforts to build equity in the amount of resources provided to
achieve equal outcomes. Similarly, as implementation is often focused at the school or community as a
unit, knowing whether the most disadvantaged beneficiaries are clustered within a smaller number of
units, or spread out across all, can be useful in directing resources where they are most needed.
In examining impact, organizations want to know if the programs they support are making a substantive
change in outcomes, compared to the counterfactual of what would have happened otherwise. In
rigorous evaluations, randomized or quasi-experimental designs allow for causal attribution and provide
a gauge of the magnitude of program effect. Equity-oriented impact analysis examines treatment effects
for each relevant equity dimension, and notes the relative magnitude of each. In Figure 3 above we
provided an example of how such a deliberate examination reveals insights about how the same
intervention may be successful on average, and detrimental for closing equity gaps. Thus, understanding
whether the effect differs for key subgroups is central to building evidence on equity in education.
While not every program currently does longitudinal tracking of participants, we recommend that this be
attempted whenever interventions are offered for a known cohort. Rather than the before/ after cross-
sectional samples, longitudinal tracking strengthens the validity of assessing change over time, and offers
the unique opportunity of building evidence around the dynamics of that change. Because equity-building
is an inherently iterative, extended and persistent process focused on lifting the trajectories of growth for
disadvantaged students, seeing a more rapid improvement over time for those who started at a
disadvantage can be very powerful. Conversely, a substantially more rapid upward trajectory for better-
off learners than the low-performing peers can be a sign that more attention is needed to ensure that
program objectives are met.
Adaptive program management
Of course, such equity-oriented data systems are limited in their utility if programmatic approaches are
designed and implemented as package “treatments”, and cannot be adapted or modified in response to
a dynamic, iterative monitoring process. Knowing who is being left behind and how interventions may be
missing learners facing the most disadvantage is not helpful if resources cannot be targeted to provide
additional support. A persistent cluster of nonreaders in a classroom may be useful to know about, but
this knowledge adds little value to the program if no additional support is provided to them, and program
implementation moves on to another cohort. If programs are to build equity, they must be adaptive, and
allow for continuous learning to inform adjustments and support mechanisms. Depending on the main
program design, such support mechanisms can include additional resource materials, targeted remedial
education, focused mentoring, supplementary cash transfers, or infrastructure adjustments (e.g. ramps).
Teacher training can include provisions and modules for identifying those at risk of falling behind, and
targeting wrap-around support that engages the family, community, and additional school-level support.
Flexible and adaptive program design and management requires a substantial change to the current
models. Different levels of intensity have to be thought out from the start, and assumptions must be made

Mainstreaming Equity: Issues Paper
18
about the proportions of children and youth beneficiaries likely to require additional support. Decisions
have to be made on what those mechanisms are, and how they will be rolled out. Importantly, a strong
monitoring and evaluation system must be put in place, to carry out continuous analyses and ensure that
programs are informed about who and how they are serving, and generate evidence on what works and
what doesn’t, for whom, and in what context.
Characteristics of an equity-oriented M&E system
As we explain above, an equity-oriented M&E and learning system around a program or set of
interventions has an essential purpose not just to produce data on scope and coverage, but to allow for
depth of understanding around who benefits and doesn’t, and offer actionable information on what to do
about it. Below are the characteristics that describe such a learning system.
Consistency in inclusion of key dimensions. A commitment to equity means a commitment to consistency
in measuring equity-relevant demographic and social characteristics. The Education Equity Research
Initiative recommends that the “Big 5” dimensions be included in all micro-level surveys: gender, ethnicity,
socioeconomic status, disability, and migration status. The Practical Recommendations for Equity
Analysis11 provide the modules that can be included in questionnaires to ensure comparability of such
information. Disability modules are currently being piloted and will likely be adapted, but the set of tools
developed by UNICEF12 will provide a strong foundation for making progress on this.
Strong instruments for outcome measurement. An M&E system is only as good as the quality of the data
it collects. For each outcome of interest, there should be a validated instrument that measures change
with a high degree of reliability. A growing number of tools are available for measuring learning outcomes,
and a range of instruments is now being developed for noncognitive skills13. Beyond student learning
assessment, instruments can include surveys that track employment or other life outcomes beyond
schooling. A valid instrument with proven scales would make it possible to reliably separate group-level
values and identify disparities, which is necessary for equity analysis.
Comparison points. Even when a program is targeted at a subgroup characterized by equity dimensions,
progress is difficult to gauge when no comparison point exists for groups that are not marked by the same
characteristics. For some outcomes, population-based averages, or data from other program and policy
monitoring may provide a valid comparison point. For others, having a control or comparison point within
the program design will strengthen the quality of the evidence.
Adequately powered samples. Equity analysis involves breaking down the data on the target populations
in order to see disparities along a range of dimensions and subgroups. While not all dimensions of equity
will always require separate descriptive and impact analysis, it is likely that intersections of such
dimensions will become the focus of a program or policy intervention. The reliability of the estimates
around specific subgroups depends on the sample size for that cell. Intersections of two or more
dimensions can create particularly small units that are difficult to include reliably in analysis (Figure 5).
11http://www.educationequity2030.org/resources-2/2017/3/8/practical-recommendations-for-equity-analysis-in-education 12 http://www.educationequity2030.org/resources-2/2017/4/14/module-on-child-functioning 13 A range of learning outcomes measurement tools are publicly available. Some of the most widely used public instruments include Early Grade Reading Assessments and Early Grade Mathematics Assessments (EGRA/EGMA, available for adaptation and use through https://globalreadingnetwork.net/tools), a range of citizen-led assessments (CLA), which can be accessed at www.palnetwork.org . Noncognitive skills assessments are catalogued at http://www.youthpower.org/resources/measuring-soft-life-skills-international-youth-development-programs-review-and-inventory
Mainstreaming Equity: Issues Paper
19
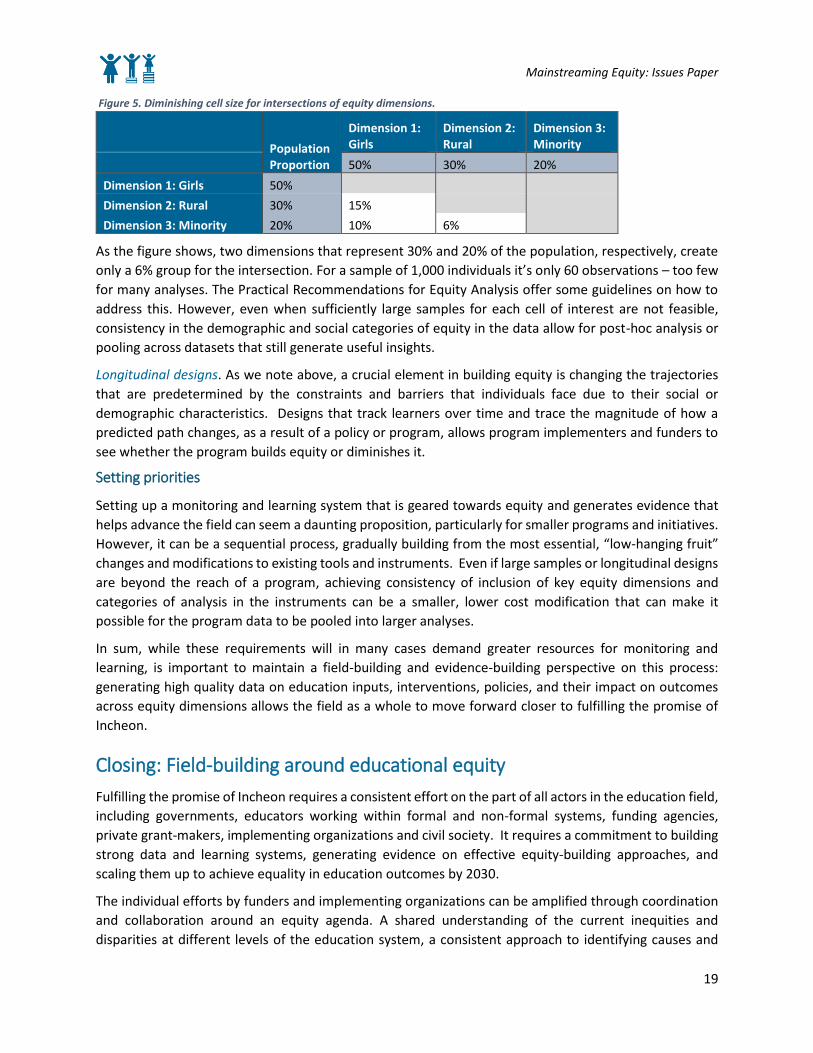
Figure 5. Diminishing cell size for intersections of equity dimensions.
Population Proportion
Dimension 1: Girls
Dimension 2: Rural
Dimension 3: Minority
50% 30% 20%
Dimension 1: Girls 50% Dimension 2: Rural 30% 15% Dimension 3: Minority 20% 10% 6%
As the figure shows, two dimensions that represent 30% and 20% of the population, respectively, create
only a 6% group for the intersection. For a sample of 1,000 individuals it’s only 60 observations – too few
for many analyses. The Practical Recommendations for Equity Analysis offer some guidelines on how to
address this. However, even when sufficiently large samples for each cell of interest are not feasible,
consistency in the demographic and social categories of equity in the data allow for post-hoc analysis or
pooling across datasets that still generate useful insights.
Longitudinal designs. As we note above, a crucial element in building equity is changing the trajectories
that are predetermined by the constraints and barriers that individuals face due to their social or
demographic characteristics. Designs that track learners over time and trace the magnitude of how a
predicted path changes, as a result of a policy or program, allows program implementers and funders to
see whether the program builds equity or diminishes it.
Setting priorities
Setting up a monitoring and learning system that is geared towards equity and generates evidence that
helps advance the field can seem a daunting proposition, particularly for smaller programs and initiatives.
However, it can be a sequential process, gradually building from the most essential, “low-hanging fruit”
changes and modifications to existing tools and instruments. Even if large samples or longitudinal designs
are beyond the reach of a program, achieving consistency of inclusion of key equity dimensions and
categories of analysis in the instruments can be a smaller, lower cost modification that can make it
possible for the program data to be pooled into larger analyses.
In sum, while these requirements will in many cases demand greater resources for monitoring and
learning, is important to maintain a field-building and evidence-building perspective on this process:
generating high quality data on education inputs, interventions, policies, and their impact on outcomes
across equity dimensions allows the field as a whole to move forward closer to fulfilling the promise of
Incheon.
Closing: Field-building around educational equity
Fulfilling the promise of Incheon requires a consistent effort on the part of all actors in the education field,
including governments, educators working within formal and non-formal systems, funding agencies,
private grant-makers, implementing organizations and civil society. It requires a commitment to building
strong data and learning systems, generating evidence on effective equity-building approaches, and
scaling them up to achieve equality in education outcomes by 2030.
The individual efforts by funders and implementing organizations can be amplified through coordination
and collaboration around an equity agenda. A shared understanding of the current inequities and
disparities at different levels of the education system, a consistent approach to identifying causes and

Mainstreaming Equity: Issues Paper
20
institutional drivers of inequity, a common framework for producing strong, equity-oriented data and
evidence, and continuous learning through sharing evidence and data will ultimately result in more
equitable, fair, and progressive education systems. Through mainstreaming and institutionalization of
equity-oriented practices, processes, and data within the programs that they fund, grant-makers can help
create broad-based change, making it possible for education systems to recognize and address the
diversity of needs and lived experiences of individual learners.

Annex A: Illustrative Analyses of Known Disparities in Education
Type of disparity Examples of disparities14
Underlying causes Institutional drivers Policy solutions Policy examples
Ethnic, religious, or linguistic minorities at disadvantage
In Ghana, young adults aged 20-24 from the Gurma ethnic group have, on average, only 5.8 years of education—6 years less than young adults from the Akan group, which has, on average, 11.8 years (2014). In Paraguay, on the LLECE15 primary school reading assessment, only 2% of students speaking the language of the assessment (and, likely, of instruction) at home reached the highest reading level compared to 13% of primary school students who do speak the language at home. This is a difference of 11 percentage points (2013).
Discrimination; cultural or social biases
Bias in admission to schools or universities; teacher bias; language of instruction, e.g., where some groups do not speak the language of instruction outside of school and, therefore, are at a disadvantage in school or where use of a former colonial language gives elite groups an educational advantage; history or social studies curricula that privilege the narratives of some groups over others
Direct: Affirmative action or education quotas; revision of curricula; revision of language policy (e.g., in some contexts, provision of instruction in mother tongue, especially in early grades, coupled with teaching of a lingua franca or a language of business may alleviate linguistic disadvantage) Indirect: Anti-discrimination laws; legal recognition of minority rights
In the 1970s, Malaysia introduced quotas in public education institutions reflective of the relative populations of indigenous groups from Malaysia and Chinese to stem inequality between these groups. To avoid the challenges of providing mother tongue instruction in a deeply multilingual environment, Tanzania uses Kiswahili, which is widely spoken across the country, as a language of instruction in primary grades; however, until recently, English, which is less widely known, was the official language of instruction at the secondary level, a policy
14 Unless otherwise noted, estimates cited in examples come from the World Inequality Database on Education (WIDE), accessed September 2017, http://www.education-inequalities.org/. 15 Laboratorio Latinoamericano de Evaluación de la Calidad de la Educación

Mainstreaming Equity: Issues Paper
22
Type of disparity Examples of disparities14
Underlying causes Institutional drivers Policy solutions Policy examples
In Tanzania, the lower secondary completion rate for youth from the richest quintile, who tend to have a stronger background in English, is 35 percentage points higher than for those from the poorest quintile (2010).
decision criticized for maintaining advantages to the elite.
Poorer households at disadvantage (certain ethnic, religious, or linguistic minorities often disproportionately poor where discrimination is a factor)
In Peru, the out of school rate for youth of upper secondary school age from the poorest households is 18% points higher than from the richest households, (27% versus 9%, 2012). In South Africa, 20-24 year olds from the richest quintile have 1.2 additional years of education compared to those from the poorest quintile (10.8 years versus 9.6 years, 2013).
Poverty; legacies of discrimination or cultural or social biases
Inadequate infrastructure and resources in historically neglected areas; expense of school fees and other schooling costs prohibitive to poorer families
Direct: Investment in infrastructure; elimination or reduction of school fees and other financial barriers to education Indirect: Economic strengthening programs, pro-poor policies
Apartheid-era policies discriminated against black South Africans and led to starkly unequal investment in education infrastructure in their communities. In modern South Africa, these racial inequalities have largely translated into economic inequalities. One recent policy that aims to reduce the burden of school fees on poorer communities in South Africa can be considered pro-poor, though greater investment would be needed for it to close gaps in educational inequality.

Mainstreaming Equity: Issues Paper
23
Type of disparity Examples of disparities14
Underlying causes Institutional drivers Policy solutions Policy examples
Gender disparities
In Ethiopia, the percentage of 15-to-24-year-old women with basic literacy skills is 21 points lower than men (44% versus 65%, 2011). In Tajikistan, 49% percent of women of upper secondary school age are out of school, compared to 26% of men, a difference of 23 percentage points (2012).
Attitudes towards gender; social biases
Unsafe travel to school; lack of adequate latrines and other WASH facilities; teacher bias; cultural expectations in schools or at home that privilege education for boys over girls (or for girls over boys)
Direct: Ensure school environment is friendly to both girls and boys; gender sensitivity training for teachers and school staff; offering incentives for educating the disadvantaged gender Indirect: Legal recognition of the right to education for girls and boys; gender sensitization campaigns; equal representation of women in the teaching force and workforce (with female teachers and workers serving as role models for girls)
Bhutan has aimed to reduce educational disparities for girls, including by building more schools in rural areas so that parents’ concerns over safe access to schools and time spent away from home, which had been a deterrent to girls’ education in particular, are diminished. To incentivize girls’ education, Cambodia has offered scholarships for girls.
Geographical disparities (regional or urban/rural)
In Laos, 21% of children aged 9-12 in rural areas have never been to school compared to 6% in urban areas, a difference of 15 percentage points (2011). In Mali, 66% of primary-age children are out of school in Mopti compared to 14% in
Heavier development of some regions than others due to historical priorities or environmental barriers; violent conflict impacts certain regions more than others
Better education infrastructure available in more developed or peaceful regions; more developed or peaceful regions attract stronger teaching staff
Direct: Greater allocation of education funds to disadvantaged regions; incentivize teaching in more disadvantaged regions Indirect: Economic strengthening programs; pro-poor policies in disadvantaged regions
In Ghana, investment and development was historically focused in southern regions, leaving northern regions at a disadvantage, including in terms of education infrastructure. To address this, efforts to improve educational provision, for example by building additional
Mainstreaming Equity: Issues Paper
24
Type of disparity Examples of disparities14
Underlying causes Institutional drivers Policy solutions Policy examples
Bamako. This is a difference of 52 percentage points (2012).
schools, have sometimes targeted northern regions.
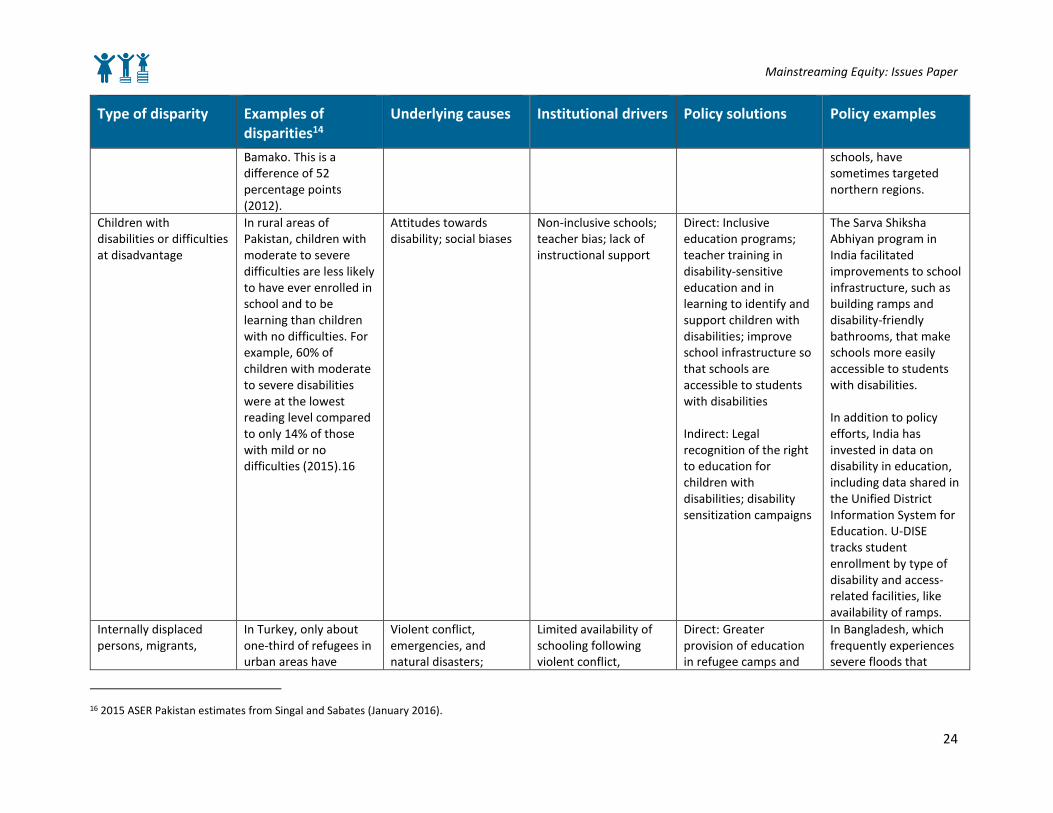
Children with disabilities or difficulties at disadvantage
In rural areas of Pakistan, children with moderate to severe difficulties are less likely to have ever enrolled in school and to be learning than children with no difficulties. For example, 60% of children with moderate to severe disabilities were at the lowest reading level compared to only 14% of those with mild or no difficulties (2015).16
Attitudes towards disability; social biases
Non-inclusive schools; teacher bias; lack of instructional support
Direct: Inclusive education programs; teacher training in disability-sensitive education and in learning to identify and support children with disabilities; improve school infrastructure so that schools are accessible to students with disabilities Indirect: Legal recognition of the right to education for children with disabilities; disability sensitization campaigns
The Sarva Shiksha Abhiyan program in India facilitated improvements to school infrastructure, such as building ramps and disability-friendly bathrooms, that make schools more easily accessible to students with disabilities. In addition to policy efforts, India has invested in data on disability in education, including data shared in the Unified District Information System for Education. U-DISE tracks student enrollment by type of disability and access-related facilities, like availability of ramps.
Internally displaced persons, migrants,
In Turkey, only about one-third of refugees in urban areas have
Violent conflict, emergencies, and natural disasters;
Limited availability of schooling following violent conflict,
Direct: Greater provision of education in refugee camps and
In Bangladesh, which frequently experiences severe floods that
16 2015 ASER Pakistan estimates from Singal and Sabates (January 2016).

Mainstreaming Equity: Issues Paper
25
Type of disparity Examples of disparities14
Underlying causes Institutional drivers Policy solutions Policy examples
immigrants at disadvantage
participated in formal schooling. In Iraq, only 45% of 78,000 internally displaced children and youth living in camps were enrolled in school. Of 730,000 internally displaced children and youth not living in camps, only 30% could access schooling (2014). In China, 1 in 5 (or 24 million) internal migrants attained less than a primary school education (2004). 17
limited local employment opportunities
emergencies, and natural disasters; difficulty in accessing and registering at schools in refugee camps or in new communities; social or cultural biases against migrant children in new school environments
temporary settlements; building resilient schools in areas prone to natural disasters Indirect: Legal recognition of the right of all children to education; economic strengthening in areas with limited employment opportunities
displace populations, the Solar-Powered Floating Schools program supports boat-schools that provide education even during periods of flooding.
17 These examples and supporting data are taken from UNESCO (2016).
Mainstreaming Equity: Issues Paper
26
References
Brown, G. K. (2011). The influence of education on violent conflict and peace: Inequality, opportunity and
the management of diversity. Prospects: UNESCO Quarterly Review of Comparative Education, 41(2),
pp. 191-204.
Garcia, O. (2009). Bilingual education in the 21st century: A global perspective. Malden, MA: John Wiley &
Sons.
Jacob, W. J., & Holsinger, D. B. (2008). Inequality in education: a critical analysis. In Holsinger & Jacob
(eds.) Inequality in education: Comparative and International Perspectives. Springer. Pp. 1-34.
Mehta, Arun C. (2007). Elementary education in India: Where do we stand? State report cards 2005-06.
New Delhi: National University of Educational Planning and Administration.
http://udise.in/Downloads/Publications/Publications%202005-06/SRC0506/SRC%2005-06.pdf
Rawls, J. (1971) A Theory of Justice. Cambridge, Mass: Harvard University Press.
Roemer, J. E. (2002). Equality of opportunity: A progress report. Social Choice and Welfare, 19(2), 455–
471.
Singal, N. and Sabates, R. (January 2016). Access and learning are equally important for children with
disabilities. Global Partnership for Education blog. http://www.globalpartnership.org/blog/access-
and-learning-are-equally-important-children-disabilities
Stewart, F., Brown, G., and Langer, A. (2007). Policies towards horizontal inequalities [CRISE Working
Paper No. 42]. Oxford: CRISE.
National University for Education Planning and Administration (NUEPA). United District Information
System for Education (U-DISE). Accessed September 2017. http://udise.in/
UNESCO. (2011). Education for All Global Monitoring Report 2011: The hidden crisis: Armed conflict and
education. Paris: UNESCO.
UNESCO. (2016). Global Education Monitoring Report 2016: Education for people and planet: Creating
sustainable futures for all. Paris: UNESCO.