Climatic forcing of asymmetric orogenic evolution in the Eastern Cordillera of Colombia
Upload
facultescienceCategory
view
0download
0
1 23
Journal of Seismology ISSN 1383-4649 J SeismolDOI 10.1007/s10950-013-9385-0
Main features of the deep structure bylocal earthquake tomography and activetectonics: case of Rif Mountain (morocco)and Betic Cordillera (Spain)
Y. Timoulali, Y. Hahou, N. Jabour,R. Merrouch & A. El Kharrim

1 23
Your article is protected by copyright and all
rights are held exclusively by Springer Science
+Business Media Dordrecht. This e-offprint
is for personal use only and shall not be self-
archived in electronic repositories. If you wish
to self-archive your article, please use the
accepted manuscript version for posting on
your own website. You may further deposit
the accepted manuscript version in any
repository, provided it is only made publicly
available 12 months after official publication
or later and provided acknowledgement is
given to the original source of publication
and a link is inserted to the published article
on Springer's website. The link must be
accompanied by the following text: "The final
publication is available at link.springer.com”.

ORIGINAL ARTICLE
Main features of the deep structure by local earthquaketomography and active tectonics: case of Rif Mountain(morocco) and Betic Cordillera (Spain)
Y. Timoulali &Y. Hahou &N. Jabour &R.Merrouch &
A. El Kharrim
Received: 5 February 2013 /Accepted: 30 July 2013# Springer Science+Business Media Dordrecht 2013
Abstract Within the Spain and Moroccan networks, alarge volume of seismic data has been collected and usedfor investigating the lithosphere in the Betic–RifCordillera. The present study has two main goals: (1)Use the most actual seismological data from recentearthquakes in the Betic–Rif arc for investigating thelithosphere through the application of seismic local to-mography techniques. (2) Define the possible structuralblocks and explain the GPS velocities perturbation in thisregion. The resolution tests results indicate that the cal-culated images gave a close true structure for the studiedregions from 5- to 60-km depth. The resulting tomo-graphic image shows that the presence of two upper crustbody (velocity 6.5 km/s) at 3- to 13-km depth betweenIberian Betic and Moroccan Rif in the western and in themiddle of Alboran Sea also shows the low velocityfavoring the presence of melt in the base of these twobodies. The crustal bodies forms tectonic blocks in theCentral Rif and in the Central Betic Cordillera.
Keywords Betic–Rif Cordillera . Earthquakestomography . Crustal velocity . Tectonics blocks
1 Introduction
The Betic–Rif Cordillera is located in the area of inter-action between the Eurasian and African plates in thewestern part of the alpine orogenic belt. A number ofgeological, seismic, gravimetric, and magnetometricstudies have contributed to a better knowledge of thedeep structure of this region. The seismic refractionprofile made in the area (Working Group for deep seis-mic sounding in Spain 1974–1975, 1977; Ansorge et al.1978; Working Group for deep seismic sounding in theAlboran Sea 1974-1975, 1978; Banda and Ansorge1980; Banda et al. 1993) indicate that while the BeticCordillera crust is somewhat thick (35 to 38 km). Thecrust thins progressively towards the Iberian Massif(near 30 km). The crustal thickness beneath theAlboran Sea range from 10- to 20-km and in the RifMountain is approximately 25- to 35-km. The crustalseismicity is scattered in West Alboran especially underthe Rif and the Betic. The intermediate-depth earth-quake are concentrated in N–S line at 4.5°W also inthe central part of the Alboran Sea (Buforn et al. 1995;Seber et al. 1996; Calvert et al. 2000). Seismic studieshave determined P and S wave velocities in the crust andmantle, as well as their principal structural features(Marillier and Mueller 1985; Krishna et al. 1992;Blanco and Spakman 1993; Paulssen and Visser 1993;Plomerova et al. 1993; Calvert et al. 2000). These stud-ies show the presence of an anomalous mantle below the
J SeismolDOI 10.1007/s10950-013-9385-0
Y. Timoulali (*) :Y. Hahou :N. Jabour : R. Merrouch :A. El KharrimCentre National pour la Recherche Scientifique etTechnique, Rabat, Moroccoe-mail: [email protected]
Author's personal copy

Betic–Rif cordillera and Alboran Sea. The gravimetrystudy confirmed this anomalous in the Betic–Rif cordil-lera (Hatzfeld 1976; Torné and Banda 1992). TheWestern Mediterranean evolution has been explainedby a variety of geodynamic from break-off ofsubducting ocean plate (Royden 1993; Zeck 1996;Lonergan and white 1997) to convective removal ordelamination model (Platt and Vissers 1989; Visserset al. 1995; Seber et al. 1996; Mezcua and Rueda1997). Calvert et al. 2000, proposing extension wasinitiated by detachment of over-thickened continentallithosphere during late Oligocene–Early Miocene. Thepresent-day movements of tectonic blocks in the Betic–Rif Arc from GPS velocities measurements shows thatthe convergence between the African (Nubian) and theEurasian plates normally NW–SE is perturbed in thecentral part of the Rif Mountain in northern Moroccoand the in the Central Betic cordillera in southern Spain.A south–westward motion is recorded in the central partof the Rif with respect to Africa and west–southwestmotion is recorded in the south-western part of theCentral Betic with respect to Iberia (Fadil et al. 2006;Tahayt et al. 2008; Vernant et al. 2010; Kouali et al.2011).
The recent development of seismic networks in thenorth of Morocco and south of Spain allows the re-cording of new seismic data that can be used to inves-tigate the lithospheric structure in the Betic and RifCordillera. In this paper, we first present the tectoniccontext, seismic data selection, and methods necessaryfor the 3-D structure velocity. We used the EuropeanPM2 model (Spakman et al. 1993) to perform reloca-tion secondly. After the database preparation, we uselocal earthquake tomography to accurately obtain thevelocity map and crustal structure in the Rif and Beticcordillera. The P arrival times are inverted to defineand image the main features of the deep structure in thecrust and hyper mantle. The interpretation of images isdiscussed and compared to the present-day blocks de-formation in the Central Betic and Central Rif definedfromGPS velocities measurements. Finally, we discussthe implication of new results carried out by this studyin the comprehension of Betic–Rif tectonic structures
2 Geological setting
The western Alboran Sea corresponds to the westernpart of the plate boundary between Eurasia and Africa.
The Betic–Rif Cordillera has been interpreted as acollisional orogen bounded by The Betic–Rif arcuatemountain belt. The Betic and the Rif chain form thenorthern and the southern branch of the Betic–Rifarcuate orocline (Fig. 1). The convergence betweenAfrica and Eurasia began in the Cretaceous (Deweyet al. 1989). The convergence directions were initiallyNNE–SSW to N–S before shifting to NW–SE obliqueconvergence during the Late Miocene time (Deweyet al. 1989). The convergence between the two platesinvolved northward subduction of the Tethyan oceaniccrust that resulted in a NE–SW striking collisionalorogenic system (Dewey et al. 1989; Zeck 1999). Inthe Late Oligocene to Early Miocene, a large exten-sional basin began forming on the overriding Eurasianplate (Jolivet and Faccenna 2000). The crustal thick-ness is approximately ∼35 km beneath the Betic andthe Rif. Beneath the center of the Alboran Sea, thethickness is ∼15 km (Watts et al. 1993). Many of therocks appear to have undergone significant exhuma-tion (Platt et al. 1998; Zeck 1999). With this crustalthickness the heat flow reading in the Alboran Seaincreases (Polyak et al. 1996). Both the Betic and Riforogenic systems have three principal tectonic zones:(1) the internal zones; (2) the flysch nappes; and (3) theexternal zones (Gomez et al. 2000; Lonergan andWhite 1997). The internal zone mainly composed ofmetamorphic rocks containing high pressure, low-temperature units (Torres-Roldan 1979; Gómez-Pugnaire and Fernández-Soler 1987; Goffé et al.1989; Bakker et al. 1989; Jolivet et al. 2003). Thesecond section is the external zone, mainly formed bysedimentary rocks. Between the external and internalzones are the flysch units that were folded and thrustedduring the westward migration of the internal zones.
3 Tomography study
3.1 Data selection and methodology
The arrival time data used in this study were obtained bytheMoroccan and Spanish seismic networks from 1988–2008. In order to determine hypocentral parameters andfind the local velocity structure of epicentral area, the Pand S arrivals at 52 stations located at north of Morocco(National Institute of Geophysics, CNRST, Rabat), andSpain (Instituto Geografico National, Madrid) are used(Fig. 2). We used the travel times of 58,774 P arrivals
J Seismol
Author's personal copy

collected from over 5,972 earthquakes from hypocentraldepths of 0, 5, 15, 30, 45, 60, and 100 km. The prelim-inary estimate of origin times and hypocentral coordi-nates is determined by the HYPOCENTER 3.2 program(Lienert 1994) and the epicentral distribution (Fig. 3)includes all events from 1988 to 2008.
We used in this study the linearized inversion proce-dure that includes the following two steps: (1) findingthe minimal 1-D model using VELEST (Kissling et al.1994), and (2) simultaneous relocation of hypocenters
and determination of local velocity structure using line-arized inversion (Thurber 1983; Eberhart 1990). Theminimum 1-D model estimation by VELEST: Kisslinget al. (1994) defines the minimum 1-D model. The 1-Dvelocity represents the least squares solution of therelated equation to the coupled hypocenter-velocitymodel. In this model, the layer velocities are approxi-mately equal to the average velocity in the 3-D tomo-graphic solution within the same range. In the linearizedapproach, we use the SIMULPS program originally
Fig. 1 Simplified geologicmap of the Betic–RifCordilleras
Fig. 2 Locations of stations in north of Morocco (triangle) andSouth of Spain (square)
Fig. 3 The epicentral distribution is determined by Hypocenter3.2 and includes all events from 1988 to 2008 (catalog ofCNRST, Rabat and IGN Spain). The background topography isSRTM 3-arc-second digital elevation model
J Seismol
Author's personal copy
developed by Thurber (1983) using approximate raytracing (ART) and pseudo-bending algorithms. Thismethod was further improved by Eberhart (1990) forforward modeling of P and S wave arrival times initerative, damped, least squares inversion for hypo- cen-ters, and 3-D velocity structure. In this approach, themodel parameterization assumes a continuous velocityfield by linearly interpolating between velocities valuesdefined at the nodes of a 3-D grid (Foulger and Toomey1989). Nodal locations are fixed prior to an inversion.The earth structure is represented in three dimensions byvelocity at discrete points, and the velocity at any inter-vening point is determined by linear interpolationamong the surrounding 8-grid points. Values at thevelocity nodes are systematically perturbed during theinversion. Except for the outermost nodes, which arealways fixed, every node can either be kept fixed orincluded in the inversion. The ARTalgorithm selects thepath with the least travel time from a suite of circulararcs connecting the source and the receiver. The iterativepseudo-bendingmethod fine-tunes the ray path obtainedby ART to better approximate the true path dictated bythe local velocity gradients (Um and Thurber 1987). TheP velocities (VP) are assigned in a grid point interval(25, 25 km) at each layer of the crust and in the uppermantle in depth (0, 5, 15, 30, 45, 60, 100 km), thenumber of points are 20 and18 in longitude and latitude,respectively
3.2 Relocation of local events
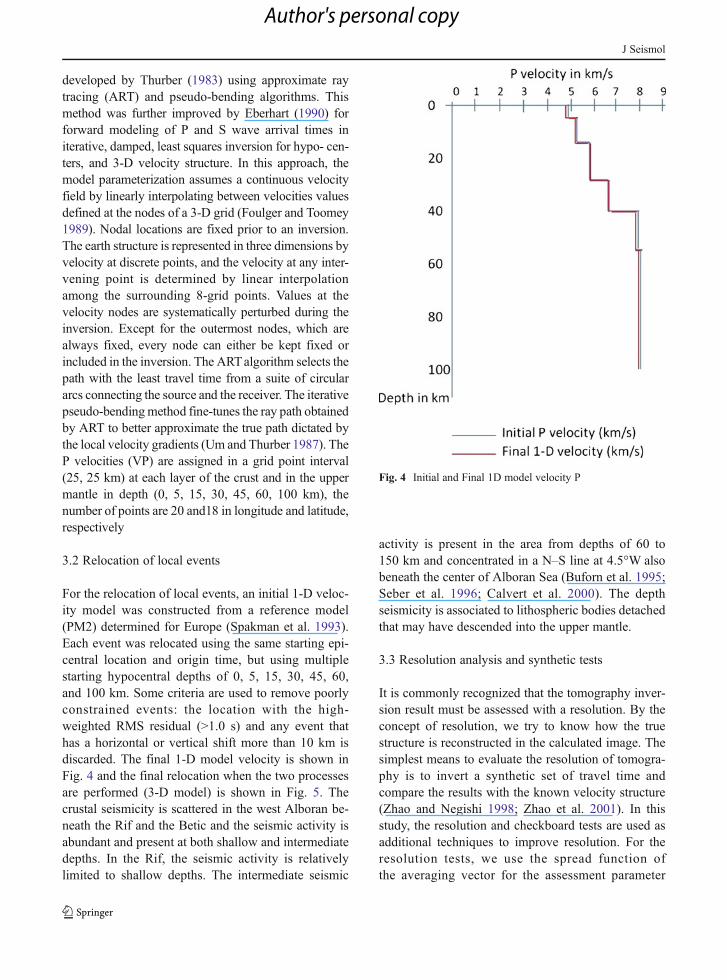
For the relocation of local events, an initial 1-D veloc-ity model was constructed from a reference model(PM2) determined for Europe (Spakman et al. 1993).Each event was relocated using the same starting epi-central location and origin time, but using multiplestarting hypocentral depths of 0, 5, 15, 30, 45, 60,and 100 km. Some criteria are used to remove poorlyconstrained events: the location with the high-weighted RMS residual (>1.0 s) and any event thathas a horizontal or vertical shift more than 10 km isdiscarded. The final 1-D model velocity is shown inFig. 4 and the final relocation when the two processesare performed (3-D model) is shown in Fig. 5. Thecrustal seismicity is scattered in the west Alboran be-neath the Rif and the Betic and the seismic activity isabundant and present at both shallow and intermediatedepths. In the Rif, the seismic activity is relativelylimited to shallow depths. The intermediate seismic
activity is present in the area from depths of 60 to150 km and concentrated in a N–S line at 4.5°W alsobeneath the center of Alboran Sea (Buforn et al. 1995;Seber et al. 1996; Calvert et al. 2000). The depthseismicity is associated to lithospheric bodies detachedthat may have descended into the upper mantle.
3.3 Resolution analysis and synthetic tests
It is commonly recognized that the tomography inver-sion result must be assessed with a resolution. By theconcept of resolution, we try to know how the truestructure is reconstructed in the calculated image. Thesimplest means to evaluate the resolution of tomogra-phy is to invert a synthetic set of travel time andcompare the results with the known velocity structure(Zhao and Negishi 1998; Zhao et al. 2001). In thisstudy, the resolution and checkboard tests are used asadditional techniques to improve resolution. For theresolution tests, we use the spread function ofthe averaging vector for the assessment parameter
Fig. 4 Initial and Final 1D model velocity P
J Seismol
Author's personal copy
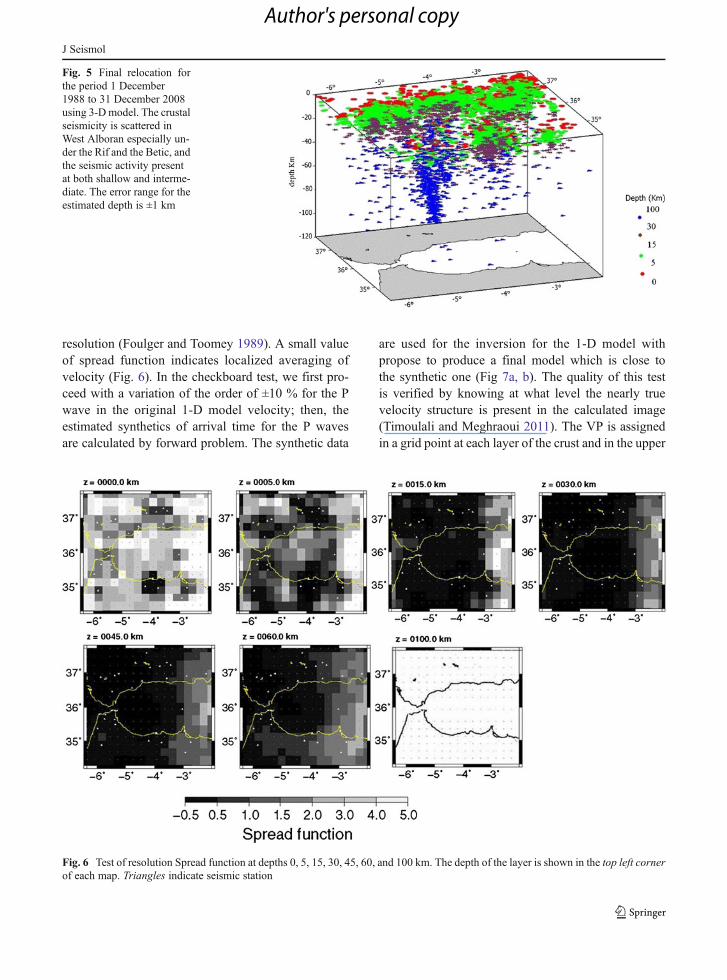
resolution (Foulger and Toomey 1989). A small valueof spread function indicates localized averaging ofvelocity (Fig. 6). In the checkboard test, we first pro-ceed with a variation of the order of ±10 % for the Pwave in the original 1-D model velocity; then, theestimated synthetics of arrival time for the P wavesare calculated by forward problem. The synthetic data
are used for the inversion for the 1-D model withpropose to produce a final model which is close tothe synthetic one (Fig 7a, b). The quality of this testis verified by knowing at what level the nearly truevelocity structure is present in the calculated image(Timoulali and Meghraoui 2011). The VP is assignedin a grid point at each layer of the crust and in the upper
Fig. 5 Final relocation forthe period 1 December1988 to 31 December 2008using 3-Dmodel. The crustalseismicity is scattered inWest Alboran especially un-der the Rif and the Betic, andthe seismic activity presentat both shallow and interme-diate. The error range for theestimated depth is ±1 km
Fig. 6 Test of resolution Spread function at depths 0, 5, 15, 30, 45, 60, and 100 km. The depth of the layer is shown in the top left cornerof each map. Triangles indicate seismic station
J Seismol
Author's personal copy
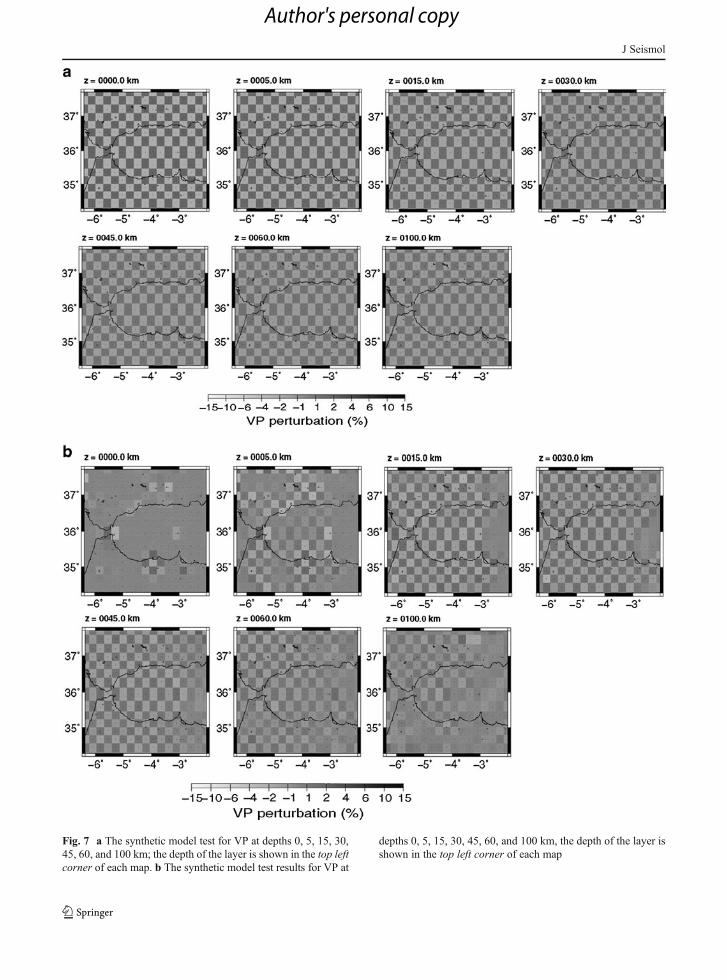
Fig. 7 a The synthetic model test for VP at depths 0, 5, 15, 30,45, 60, and 100 km; the depth of the layer is shown in the top leftcorner of each map. b The synthetic model test results for VP at
depths 0, 5, 15, 30, 45, 60, and 100 km, the depth of the layer isshown in the top left corner of each map
J Seismol
Author's personal copy
mantle. The initial velocity calculated for grid isassigned to be +15 % faster or −15 % slower at thesame depth. The resolution test result shows that thecalculated images give a nearly true velocity structurefrom 0- to 60-km depth in the Alboran region.
4 Synthesis of result and implicationfor lithospheric structure
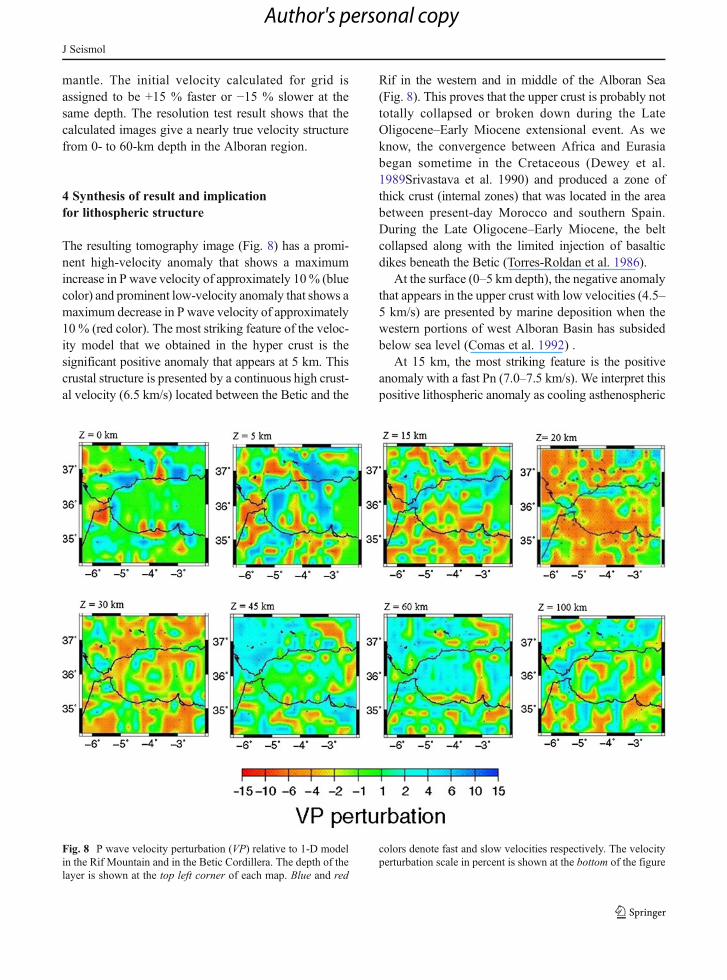
The resulting tomography image (Fig. 8) has a promi-nent high-velocity anomaly that shows a maximumincrease in P wave velocity of approximately 10% (bluecolor) and prominent low-velocity anomaly that shows amaximum decrease in P wave velocity of approximately10 % (red color). The most striking feature of the veloc-ity model that we obtained in the hyper crust is thesignificant positive anomaly that appears at 5 km. Thiscrustal structure is presented by a continuous high crust-al velocity (6.5 km/s) located between the Betic and the
Rif in the western and in middle of the Alboran Sea(Fig. 8). This proves that the upper crust is probably nottotally collapsed or broken down during the LateOligocene–Early Miocene extensional event. As weknow, the convergence between Africa and Eurasiabegan sometime in the Cretaceous (Dewey et al.1989Srivastava et al. 1990) and produced a zone ofthick crust (internal zones) that was located in the areabetween present-day Morocco and southern Spain.During the Late Oligocene–Early Miocene, the beltcollapsed along with the limited injection of basalticdikes beneath the Betic (Torres-Roldan et al. 1986).
At the surface (0–5 km depth), the negative anomalythat appears in the upper crust with low velocities (4.5–5 km/s) are presented by marine deposition when thewestern portions of west Alboran Basin has subsidedbelow sea level (Comas et al. 1992) .
At 15 km, the most striking feature is the positiveanomaly with a fast Pn (7.0–7.5 km/s). We interpret thispositive lithospheric anomaly as cooling asthenospheric
Fig. 8 P wave velocity perturbation (VP) relative to 1-D modelin the Rif Mountain and in the Betic Cordillera. The depth of thelayer is shown at the top left corner of each map. Blue and red
colors denote fast and slow velocities respectively. The velocityperturbation scale in percent is shown at the bottom of the figure
J Seismol
Author's personal copy
material. In the west Alboran Sea, a combination ofisostatic surface/topographic uplift and erosion inducea rapid exhumation and cooling of deep crustal rocks(Platt et al. 1998).
In 20- and 30-km depth, the most striking feature isthe negative anomaly with a slower Pn (7.0–7.5 km/s).We interpret this negative lithospheric anomaly as a hotasthenospheric material coming from depth to replacethe part of crust detached. These anomalies are associ-ated with region warm or absent mantle lithosphere orthe presence of melt (Hearn T. 1996). The high-heatflow reading in the Alboran basin (Polyak et al. 1996)can be explained by the presence of hot ductile material.In the geodynamic model this extrusion of hot astheno-sphere material is interpreted as an uplift and extensionin the Alboran area (Thompson et al. 1997a, b).
At 45 and 60 km, the most striking feature is thepositive anomalies with fast Pn (7.5–8.0 km/s) associ-ated to the lithospheric body that has descended intothe upper mantle. The profile in the Alboran basinindicates that the crust thickness is relatively thin(15–20 km) in agreement with previous proposals thatthe continental crust beneath the Alboran is thin (e.g.,
Working Group for Deep Seismic Sounding in theAlboran Sea 1978). The profile in the south-easternBetic show the thickness of crust is relatively thin(∼24 km) also in agreement with the work of (Bandaand Ansorge 1980).
4.1 Crust and upper mantle velocity in the RifMountain
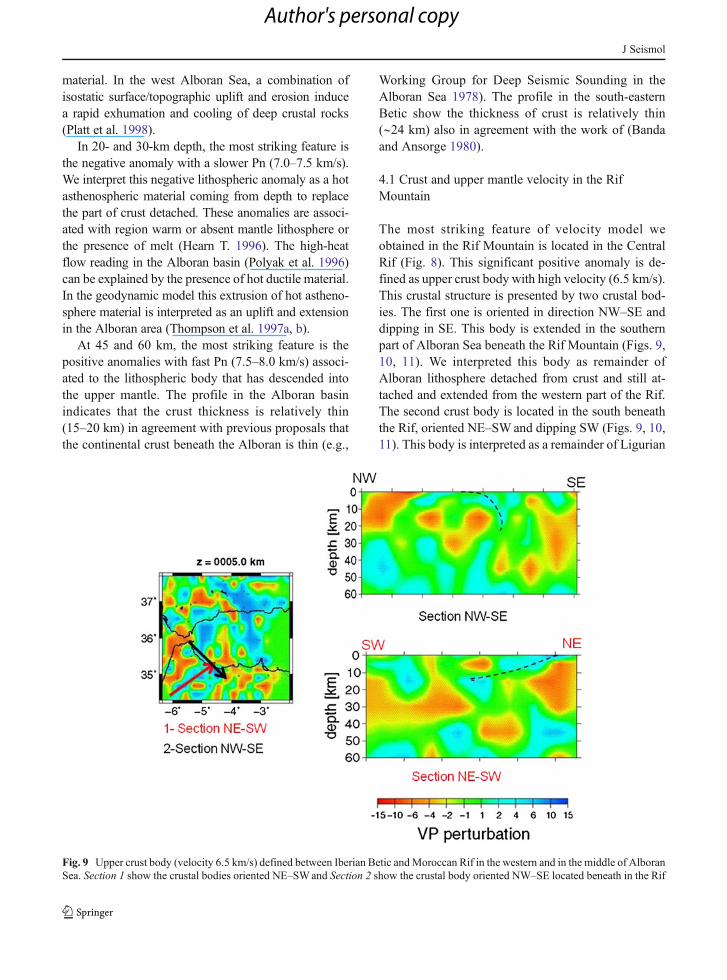
The most striking feature of velocity model weobtained in the Rif Mountain is located in the CentralRif (Fig. 8). This significant positive anomaly is de-fined as upper crust body with high velocity (6.5 km/s).This crustal structure is presented by two crustal bod-ies. The first one is oriented in direction NW–SE anddipping in SE. This body is extended in the southernpart of Alboran Sea beneath the Rif Mountain (Figs. 9,10, 11). We interpreted this body as remainder ofAlboran lithosphere detached from crust and still at-tached and extended from the western part of the Rif.The second crust body is located in the south beneaththe Rif, oriented NE–SWand dipping SW (Figs. 9, 10,11). This body is interpreted as a remainder of Ligurian
Fig. 9 Upper crust body (velocity 6.5 km/s) defined between Iberian Betic andMoroccan Rif in the western and in the middle of AlboranSea. Section 1 show the crustal bodies oriented NE–SWand Section 2 show the crustal body oriented NW–SE located beneath in the Rif
J Seismol
Author's personal copy
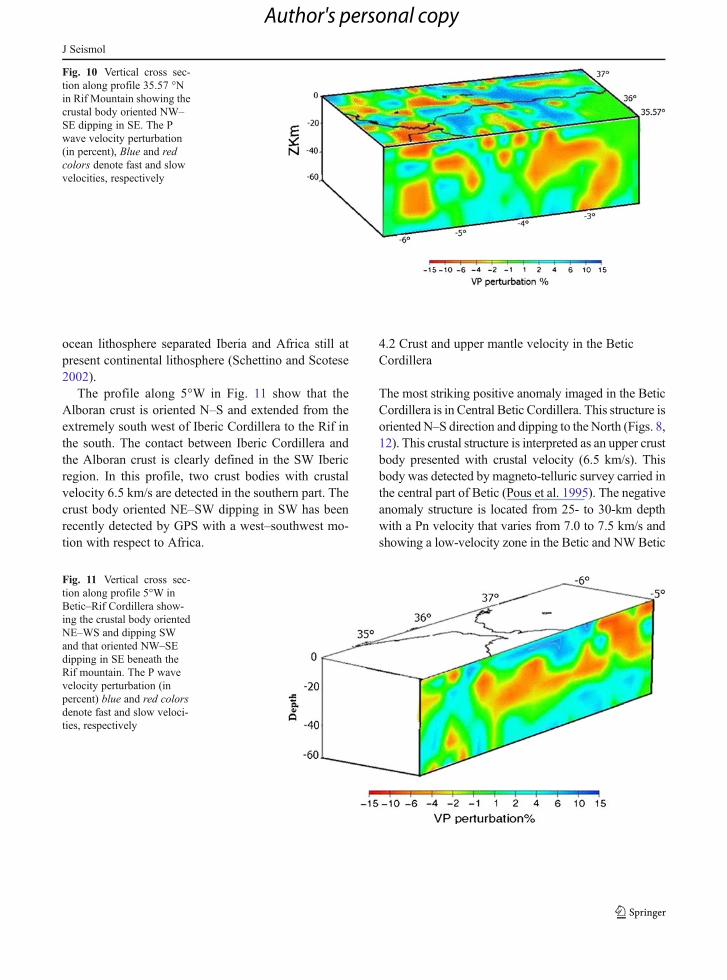
ocean lithosphere separated Iberia and Africa still atpresent continental lithosphere (Schettino and Scotese2002).
The profile along 5°W in Fig. 11 show that theAlboran crust is oriented N–S and extended from theextremely south west of Iberic Cordillera to the Rif inthe south. The contact between Iberic Cordillera andthe Alboran crust is clearly defined in the SW Ibericregion. In this profile, two crust bodies with crustalvelocity 6.5 km/s are detected in the southern part. Thecrust body oriented NE–SW dipping in SW has beenrecently detected by GPS with a west–southwest mo-tion with respect to Africa.
4.2 Crust and upper mantle velocity in the BeticCordillera
The most striking positive anomaly imaged in the BeticCordillera is in Central Betic Cordillera. This structure isorientedN–S direction and dipping to the North (Figs. 8,12). This crustal structure is interpreted as an upper crustbody presented with crustal velocity (6.5 km/s). Thisbody was detected by magneto-telluric survey carried inthe central part of Betic (Pous et al. 1995). The negativeanomaly structure is located from 25- to 30-km depthwith a Pn velocity that varies from 7.0 to 7.5 km/s andshowing a low-velocity zone in the Betic and NW Betic
Fig. 10 Vertical cross sec-tion along profile 35.57 °Nin Rif Mountain showing thecrustal body oriented NW–SE dipping in SE. The Pwave velocity perturbation(in percent), Blue and redcolors denote fast and slowvelocities, respectively
Fig. 11 Vertical cross sec-tion along profile 5°W inBetic–Rif Cordillera show-ing the crustal body orientedNE–WS and dipping SWand that oriented NW–SEdipping in SE beneath theRif mountain. The P wavevelocity perturbation (inpercent) blue and red colorsdenote fast and slow veloci-ties, respectively
J Seismol
Author's personal copy
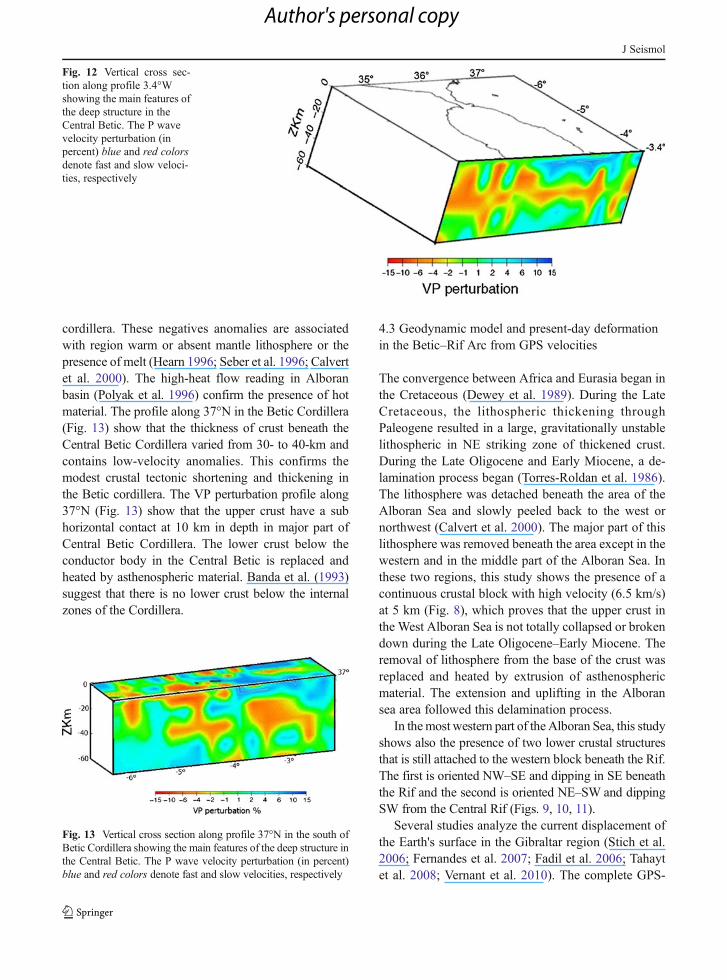
cordillera. These negatives anomalies are associatedwith region warm or absent mantle lithosphere or thepresence of melt (Hearn 1996; Seber et al. 1996; Calvertet al. 2000). The high-heat flow reading in Alboranbasin (Polyak et al. 1996) confirm the presence of hotmaterial. The profile along 37°N in the Betic Cordillera(Fig. 13) show that the thickness of crust beneath theCentral Betic Cordillera varied from 30- to 40-km andcontains low-velocity anomalies. This confirms themodest crustal tectonic shortening and thickening inthe Betic cordillera. The VP perturbation profile along37°N (Fig. 13) show that the upper crust have a subhorizontal contact at 10 km in depth in major part ofCentral Betic Cordillera. The lower crust below theconductor body in the Central Betic is replaced andheated by asthenospheric material. Banda et al. (1993)suggest that there is no lower crust below the internalzones of the Cordillera.
4.3 Geodynamic model and present-day deformationin the Betic–Rif Arc from GPS velocities
The convergence between Africa and Eurasia began inthe Cretaceous (Dewey et al. 1989). During the LateCretaceous, the lithospheric thickening throughPaleogene resulted in a large, gravitationally unstablelithospheric in NE striking zone of thickened crust.During the Late Oligocene and Early Miocene, a de-lamination process began (Torres-Roldan et al. 1986).The lithosphere was detached beneath the area of theAlboran Sea and slowly peeled back to the west ornorthwest (Calvert et al. 2000). The major part of thislithosphere was removed beneath the area except in thewestern and in the middle part of the Alboran Sea. Inthese two regions, this study shows the presence of acontinuous crustal block with high velocity (6.5 km/s)at 5 km (Fig. 8), which proves that the upper crust inthe West Alboran Sea is not totally collapsed or brokendown during the Late Oligocene–Early Miocene. Theremoval of lithosphere from the base of the crust wasreplaced and heated by extrusion of asthenosphericmaterial. The extension and uplifting in the Alboransea area followed this delamination process.
In themost western part of the Alboran Sea, this studyshows also the presence of two lower crustal structuresthat is still attached to the western block beneath the Rif.The first is oriented NW–SE and dipping in SE beneaththe Rif and the second is oriented NE–SW and dippingSW from the Central Rif (Figs. 9, 10, 11).
Several studies analyze the current displacement ofthe Earth's surface in the Gibraltar region (Stich et al.2006; Fernandes et al. 2007; Fadil et al. 2006; Tahaytet al. 2008; Vernant et al. 2010). The complete GPS-
Fig. 12 Vertical cross sec-tion along profile 3.4°Wshowing the main features ofthe deep structure in theCentral Betic. The P wavevelocity perturbation (inpercent) blue and red colorsdenote fast and slow veloci-ties, respectively
Fig. 13 Vertical cross section along profile 37°N in the south ofBetic Cordillera showing the main features of the deep structure inthe Central Betic. The P wave velocity perturbation (in percent)blue and red colors denote fast and slow velocities, respectively
J Seismol
Author's personal copy
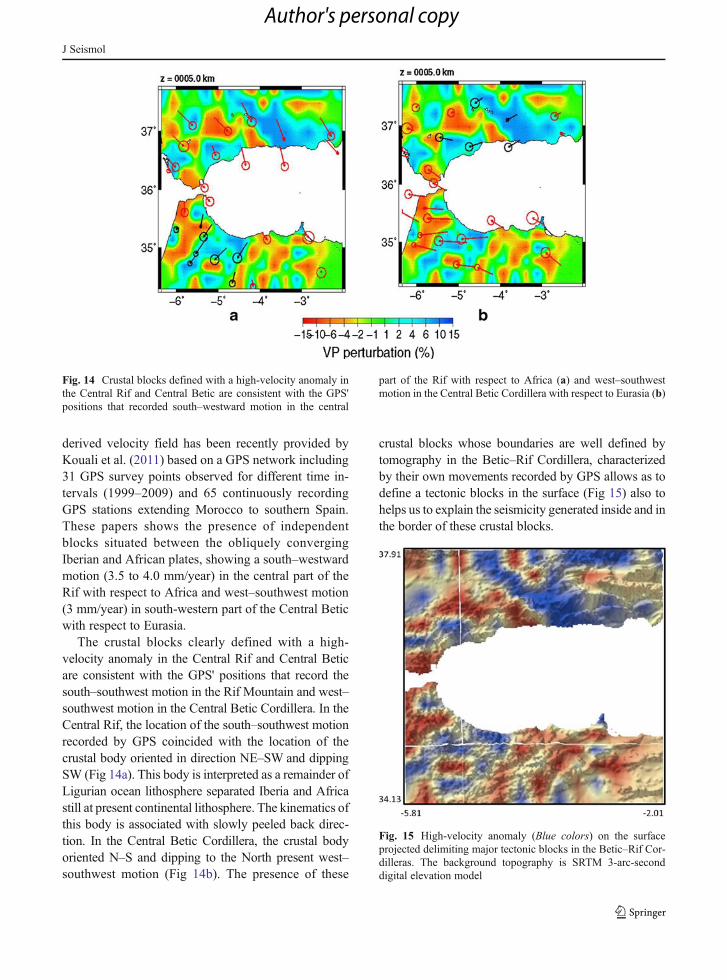
derived velocity field has been recently provided byKouali et al. (2011) based on a GPS network including31 GPS survey points observed for different time in-tervals (1999–2009) and 65 continuously recordingGPS stations extending Morocco to southern Spain.These papers shows the presence of independentblocks situated between the obliquely convergingIberian and African plates, showing a south–westwardmotion (3.5 to 4.0 mm/year) in the central part of theRif with respect to Africa and west–southwest motion(3 mm/year) in south-western part of the Central Beticwith respect to Eurasia.
The crustal blocks clearly defined with a high-velocity anomaly in the Central Rif and Central Beticare consistent with the GPS' positions that record thesouth–southwest motion in the Rif Mountain and west–southwest motion in the Central Betic Cordillera. In theCentral Rif, the location of the south–southwest motionrecorded by GPS coincided with the location of thecrustal body oriented in direction NE–SW and dippingSW (Fig 14a). This body is interpreted as a remainder ofLigurian ocean lithosphere separated Iberia and Africastill at present continental lithosphere. The kinematics ofthis body is associated with slowly peeled back direc-tion. In the Central Betic Cordillera, the crustal bodyoriented N–S and dipping to the North present west–southwest motion (Fig 14b). The presence of these
crustal blocks whose boundaries are well defined bytomography in the Betic–Rif Cordillera, characterizedby their own movements recorded by GPS allows as todefine a tectonic blocks in the surface (Fig 15) also tohelps us to explain the seismicity generated inside and inthe border of these crustal blocks.
Fig. 14 Crustal blocks defined with a high-velocity anomaly inthe Central Rif and Central Betic are consistent with the GPS'positions that recorded south–westward motion in the central
part of the Rif with respect to Africa (a) and west–southwestmotion in the Central Betic Cordillera with respect to Eurasia (b)
Fig. 15 High-velocity anomaly (Blue colors) on the surfaceprojected delimiting major tectonic blocks in the Betic–Rif Cor-dilleras. The background topography is SRTM 3-arc-seconddigital elevation model
J Seismol
Author's personal copy
5 Conclusion
Based on the analysis of local P waves travel times andprofiles, we can find that the crustal structure in theBetic–Rif cordillera is complex. The tomography re-sult shows the following:
– A continuous high velocity demarcates two crustalblocks located between the Betic and the Rif in thewestern and middle part of the Alboran Sea whichproves that the upper crust in theWest Alboran Seais not totally collapsed or broken down during theLate Oligocene–Early Miocene. The major part ofthe lithosphere was removed beneath the area bydelamination process except in the western andmiddle part of the Alboran Sea.
– The removal of lithosphere from the base of thecrust was replaced and heated by extrusion ofasthenospheric material.
– A part of the lithosphere was detached beneath thearea of the Alboran Sea and slowly peeled back tothe west, still attached to the western block be-neath the Rif. The most obvious are the lowercrustal structures beneath the Rif oriented NW–SE and dipping in SE beneath the Rif.
– The crustal blocks clearly defined with a high-velocity anomaly in the Central Rif and inCentral Betic are consistent with the GPS' posi-tions that record the south–southwest motion inthe Rif Mountains and west–southwest motion inthe Central Betic Cordillera.
– In the Central Rif, the location of the south–south-west motion recorded by GPS coincided with thelocation of the crustal body oriented in directionNE–SW and dipping SW. This south–southwestmotion put this crustal body in evidence in presentday. This body is interpreted as remainder ofLigurian ocean lithosphere separated Iberia andAfrica still at present continental lithosphere.
– In the Central Betic Cordillera, the crustal bodyoriented N–S direction and dipping to the northpresent west–southwest motion.
– The presence of these crustal blocks withboundaries are well defined in the AlboranSea and in the Betic–Rif Cordillera, allowingus to explain better the seismicity generatedinside and in the border of these crustal blocks,since the area with high-velocity values couldrepresent brittle and competent parts of the
crust and lithosphere which sustain seismogenicstress where asperities along the faults couldexist and probably more with the Iberia–Africaplate convergence.
Acknowledgments I thank the Instituto Geografico National(IGN, Madrid–Spain) and the Centre National pour la RechercheScientifique et Technique (CNRST, Rabat–Morocco). This studywas supported by the CNRST- PROTARS D15/41 project.
References
Ansorge J, Banda E, Mueller St, Udias A and Mezcura J (1978)Crustal structure under the Cordillera Betica. Preliminaryresults In Reunion sobre la geodinamica de la CordilleraBetica y Mar de Alboran Universidad de Granada, 1978, pp.59–78
Bakker HE, de Jong K, Helmers H, Biermann C (1989) Thegeodynamic evolution of the internal zone of the BeticCordilleras (south-east Spain): a model based on structuralanalysis and geothermobarometry. J Metamorph Geol7:359–381
Banda E, Ansorge J (1980) Crustal structure under the centraland eastern part of Betic Cordilleras. Geophys J Roy AstronSoc 63:515–532
Banda E, Gallart J, Garcia-Dueñas V, Dañobeitia JJ,Markis J (1993)Lateral variation of the crust in the Iberian Peninsula: newevidence from the Betic Cordillera. Tectonophysics 221:53–66
Blanco MJ, Spakman W (1993) The P-wave velocity structure ofthemantle below the Iberian Peninsula: evidence for subductedlithosphere below southern Spain. Tectonophysiscs 221:13–34
Buforn E, De Galdeano S, Udias A (1995) Seismotectonics ofthe Ibero-Maghrebian region. Tectonophysics 248:247–261
Calvert A, Sandoval E, Seber D, Barazangi M, Roecker S,Mourabit T, Vidal F, Alguacil G, Jabour N (2000)Geodynamic evolution of the lithosphere and the uppermantle beneath the Alboran region of the westernMediterranean: Constraints from travel time tomography.J Geophys Res 105(B5):10871–10898
Comas MC, Garcia-Duenas V, Jurado MJ (1992) Neogene tec-tonic evolution of the Alboran Sea from MCS data. Geo-Marine Lett 12:157–164
Dewey JF, HelmanML, Turco E, Hutton DHW, Knott SD (1989)Kinematics of the western Mediterranean. In: Coward MP,Dietrich D, Park RG (eds) Alpine tectonics, vol 45, SpecialPublications. The Geological Society, London, pp 265–283
Eberhart-Phillips D (1990) Three-dimensional P and S velocitystructure in the Coalinga region, California. J Geophys Res95:15343–15363
Fadil A, Vernant P, McClusky S, Reilinger R, Gomez F, Ben SD,Mourabit T, Feigl KL, Barazangi M (2006) Active tectonicsof the western Mediterranean: GPS evidence for roll back ofa delaminated subcontinental lithospheric slab beneath theRif Mountains, Morocco. Geology 34:529–532
Fernández-Ibáñez F, Soto JI, Zoback MD, Morales J (2007)Present-day stress field in the Gibraltar Arc (western
J Seismol
Author's personal copy
Mediterranean). J Geophys Res 112, B08404. doi:10.1029/2006JB004683
Foulger GR, Toomey DR (1989) Structure and evolution of theHengill–Grensdalur central volcano complex, Iceland: ge-ology, geophysics and seismic tomography. J Geophys Res94:17511–22
Goffé B,Michard A, García-Dueñas V, Gozález-Lodeiro F, MoniéP, Campos J, Galindo-Zaldívar J, Jabaloy A, Martínez JM,Simancas JF (1989) First evidence of high-pressure, low-temperature metamorphism in the Alpujarride nappes, BeticCordilleras (SE Spain). Eur J Mineral 1:139–142
Gomez F, Barazangi M, Demnati A (2000) Structure and evolu-tion of the Neogene Guercif Basin at the junction of theMiddle Atlas mountains and the Rif thrust belt. Morocco:AAPG Bulletin 84:1340–1364
Gómez-Pugnaire MT, Fernández-Soler JM (1987) High pressuremetamorphism in metabasites from the Betic Cordilleras(SE Spain) and its evolution during the Alpine orogeny.Contr Miner Petrol 95(582):231–244
Hatzfeld D (1976) Etude sismologique et gravimétrique de lastructure profonde de la mer d’Alboran: mise en évidenced’un manteau anormal. C R Acad Sci Paris 283:1021–1024
Hearn T (1996) Anisotropic Pn tomography in the westernUnited States. Jgeopphys Res 101:8403–8414
Jolivet L, Faccenna C (2000) Mediterranean extension and theAfrican-Eurasia collision. Tectonics 19:1095–1106
Jolivet L, Faccenna C, Goffé B, Burov E, Agard P (2003)Subduction tectonics and exhumation of high-pressuremetamorphic rocks in the Mediterranean orogens. Am JSci 303:353–409
Kissling E, Ellsworth WL, Eberhart-Phillips D, Kradolfer U(1994) Initial reference models in local earthquake tomog-raphy. J Geophys Res 99:19635–19646
Kouali A, Ouazar D, Tahayt A, King RW, Vernant P, Reilinger RE,McClusky S, Mourabit T, Davila JM, Amraoui N (2011) NewGPS constrants on active deformation along the Africa- Iberiaplate boundary. Earth Planet Sci Lett 308:211–217
Krishna VG, Kalia KL, Khandekar G (1992) Upper mantle veloc-ity structure in the Mediterranean and surrounding regionsfrom seismological data. Tectonophysics 201:277–301
Lienert BR (1994) A computer Program for locating Earthquakeslocally, regionally and globally, Hawaii Institute of Geophysics/SOEST
Lonergan L, White N (1997) Origin of the Betic-Rif mountainbelt. Tectonics 16:504–522
Marillier F, St M (1985) The western Mediterranean region as anupper-mantle transition zone between two lithosphericplates. Tectonophysics 118:113–130
Mezcua J, Rueda J (1997) Seismological evidence for a delam-ination process in the lithosphere under the Alboran Sea.Geophysl J Int 129:F1–F8
Paulssen H, Visser J (1993) The crustal structure in Iberia in-ferred from P-wave coda. Tectonophysics 221:111–123
Platt JP, Vissers RLM (1989) Extensional collapse of thickenedcontinental lithosphere: A working hypothesis for theAlboran Sea and Gibraltar arc. Geology 17:540–543
Platt JP, Soto JI, Whitehouse MJ, Hurford AJ, Kelley SP (1998)Thermal evolution, rat of exhumation, and tectonic signifi-cance of metamorphic rocks from the floor of the Alboranextensional basin, western Mediterranean. Tectonics 17:671–689
Plomerova J, Payo G, Babuska V (1993) Teleseismic P-residualstudy in the Iberian Peninsula. Tectonophysics 221:1–12
Polyak BG, Fernàndez M, Khutorskoy MD, Soto JI, Basov IA,Comas MC, Ye Khain V, Alonso B, Agapova GV,Mazurova IS, Negredo A, Tochitsky VO, De la Linde J,Bogdanov NA, Banda E (1996) Heat flow in the AlboranSea, western Mediterranean. Tectonophysics 263:191–218
Pous J, Queralt P, Ledo JJ, Roca E, Garcia X, Marcuello A (1995)Electrical conductive structure of the central Betics frommagnetotelluric data. Rev Soc Geol España 8(4):513–517
Royden LH (1993) Evolution of retreating subduction boundariesformed during continental collision. Tectonics 12:629–638
Schettino A, Scotese C (2002) Global kinematic constraints tothe tectonic history of the Mediterranean region and sur-rounding areas during the Jurassic and Cretaceous, In:Rosenbaum G, Lister GS (Eds), Reconstruction of the evo-lution of the Alpine-Himalayan orogen, J Virtual Explorer,8, pp 149–168
Seber D, Barazangi M, Ibenbrahim A, Demnati A (1996)Geophysical evidence for lithospheric delamination be-neath the Alboran Sea and Rif-Betic mountains. Nature379:785–790
Spakman WS, der Lee V, der Hilst V (1993) Travel-time tomog-raphy of the European-Mediterranean mantle down to 1400km. Phys Earth Planet Inter 79:3–74
Stich D, Serpelloni E, Mancilla F, Morales J (2006) Kinematicsof the Iberia- Maghreb plate contact from seismic momenttensors and GPS observations. Tectonophysics 426:295–317
Tahayt A, Mourabit T, Rigo A., Kurl L, Feigl, Fadil A, McClusyS, Reilinger R, Serroukh M, Ouazani-Touhami A, BensariD, Vernant P (2008) Present-day movements of tectonicblocks in the Western Mediterranean from GPS measure-ments 1999–2005. Comptes Rendus de l’Académie desSciences, doi:10.1016/j.crte.2008.02.003 (in French withabridged English Version)
Thompson AB, Schlmann K, Jezek J (1997a) Thermal evolutionand exhumation in obliquely convergent (transpressive)orogens. Tectonophysics 280:171–184
Thompson AB, Schlmann K, Jezek J (1997b) Extrusion tecton-ics and elevation of lower crustal metamorphic rocks inconvergent orogens. Geology 25:491–494
Thurber CH (1983) Earthquake locations and three-dimensionalcrustal structure in the Coyote Lake area, central California.J Geophys Res 88:8226–8236
Timoulali Y, Meghraoui M (2011) 3-D crustal structure in theAgadir region (SW High Atlas, Morocco). J Seismol15:625–635
Torné M, Banda E (1992) Crustal thinning from the BeticCordillera to Alboran Sea. Geo-Mar Lett 12:76–81
Torres-Roldan RL (1979) The tectonic subdivision of the BeticZone (Betic Cordilleras, southern Spain): its significanceand one possible geotectonic scenario for the westernmostAlpine belt. Amer J Sci 279:19–51
Torres-Roldan RL, Poli G, Pecerillo A (1986) An early Miocenearc-tholeitic magmatic dyke event from the Alboran Sea.Evidence for precollisional subduction and back-arc crustalextension in the westernmost Mediterranean. GeolRundschau 751:219–234
Um J, Thurber C (1987) A fast algorithm for two-point seismicray tracing. Bull Seism Soc Am 1987(77):972–986
J Seismol
Author's personal copy

Vernant P, Fadil A, Mourabit T, Ouazar D, Koulali A, Davila JM,Garate J, McClusky S, Reilinger RE (2010) Geodetic con-straints on active tectonics of the Western Mediterranean:implications for the kinematics and dynamics of the Nubia-Eurasia plate boundary zone. J Geodyn 49:123–129
Vissers RLM, Platt JP, van der Wal D (1995) Late orogenicextension of the Betic Cordillera and the AlboranDomain: a lithospheric view. Tectonics 14:786–803
Watts AB, Platt JP, Buhl P (1993) Tectonic evolution of theAlboran Sea basin. Basin Res 5:153–177
Working Group for deep seismic sounding in Spain 1974–1975(1977) Deep seismic sounding in the southern Spain. PureAppl Geophys 115:721–735
Working Group for deep seismic sounding in the AlboranSea 1974–1975 (1978) Crustal seismic profiles in theAlboran Sea—preliminary results. Pure Appl Geophys116:167–180
Zeck HP (1996) Betic-Rif orogeny: subduction of MesozoicTethys under E-ward Drifting Iberia, slab detachment short-ly before 22 Ma and subsequent uplift and extensionaltectonics. Tectonophysics 254:1–16
Zeck HP (1999) Alpine plate kinematics in the westernMediterranean: a westward directed subduction regimefollowed by slab rollback and slab detachment. In: DurandB (ed) The Mediterranean basins: tertiary extension withinthe Alpine orogen, vol 156, Special Publication. GeologicalSociety, London, pp 109–120
Zhao D, Negishi H (1998) The 1995 Kobe Earthquake: seismicof the source zone and its implication for the rupture nucle-ation. J Geophys Res 103:9967–9985
Zhao D, Wang K, Rogers GC, Peacock SM (2001) Tomographicimage of low P velocity anomalies above slab in northernCascadia subduction zone. Earth Planets Space 53:285–293, 2001
J Seismol
Author's personal copy
Copyright © 2022 FDOKUMEN