Magnitudes of Prehistoric Earthquakes at the Hollywood, South Carolina, Site
11
Page 1 Magnitudes of Prehistoric Earthquakes at the Hollywood, South Carolina Site Emad Gheibi 1 , S.M. ASCE and Sarah L. Gassman 2 , M. ASCE, Ph.D. 1 Ph.D Candidate, Dept. of Civil Engineering, University of South Carolina, Columbia, SC, 29208 2 Associate Professor, Dept. of Civil Engineering, University of South Carolina, Columbia, SC, 29208 ABSTRACT: Pleistocene soil deposits show an increase in liquefaction resistance compared to younger deposits; thus, semi-empirical procedures for evaluating liquefaction potential that are derived from databases of young Holocene soils may not be applicable to aged soils. In this study, the minimum earthquake magnitude and peak ground acceleration required to initiate liquefaction were computed for soils estimated to be about 120,000 to 130,000 years old at the Hollywood site located in the South Carolina Coastal Plain. Discovered sandblows at this site are associated with earthquakes that date back to 11,000 years before present. In-situ geotechnical data, including SPT and CPT with pore water pressure measurements, were used with empirical methods that account for the age of the soil deposit to back analyse the minimum earthquake magnitude and peak ground acceleration at the time of the prehistoric earthquakes. When the age of the earthquake was not considered, the magnitude ranged from 7 to 7.2 and the corresponding acceleration ranged from 0.23 to 0.35g. The earthquake magnitude at the time of earthquake was found to be lower when accounting for age; for the most recent prehistoric earthquake with the age of 546±17, the magnitude was reduced and ranged from 5.7 to 6.7 with corresponding acceleration ranging from 0.17 to 0.30g. INTRODUCTION The South Carolina Coastal Plain (SCCP) experiences infrequent earthquakes and paleoliquefaction analysis plays an important role in studying the paleoseismicity of this region. As an example, over 160 paleoliquefaction features have been discovered at a site near Hollywood, South Carolina (Obermeier et al., 1987) that have been associated with earthquakes dating from 500 to 11,000 years B.P. (Talwani and Cox (1985) and Weems et al. (1986)). From studies of these paleoliquefaction features, at least seven, large, prehistoric earthquakes have occurred within the last 6000 years in the SCCP with an average occurrence rate, based on the three most recent events, of about 500 years (Talwani and Schaeffer, 2001). To estimate the minimum values of magnitudes (M) and peak ground accelerations (a max ) needed for liquefaction to occur from these prehistoric earthquakes, Hu et al. (2002a, 2002b) used site-specific geotechnical data (penetration resistance and shear wave velocity) in the vicinity of paleoliquefaction features studied by Talwani and Schaeffer (2001) at two sites (Gapway and Sampit) near Georgetown, South Carolina
-
Upload
artsandsciences-sc -
Category
Documents
-
view
1 -
download
0
Transcript of Magnitudes of Prehistoric Earthquakes at the Hollywood, South Carolina, Site

Page 1
Magnitudes of Prehistoric Earthquakes at the Hollywood, South Carolina Site
Emad Gheibi1, S.M. ASCE and Sarah L. Gassman
2, M. ASCE, Ph.D.
1Ph.D Candidate, Dept. of Civil Engineering, University of South Carolina, Columbia, SC, 29208
2Associate Professor, Dept. of Civil Engineering, University of South Carolina, Columbia, SC, 29208
ABSTRACT: Pleistocene soil deposits show an increase in liquefaction resistance
compared to younger deposits; thus, semi-empirical procedures for evaluating
liquefaction potential that are derived from databases of young Holocene soils may
not be applicable to aged soils. In this study, the minimum earthquake magnitude and
peak ground acceleration required to initiate liquefaction were computed for soils
estimated to be about 120,000 to 130,000 years old at the Hollywood site located in
the South Carolina Coastal Plain. Discovered sandblows at this site are associated
with earthquakes that date back to 11,000 years before present. In-situ geotechnical
data, including SPT and CPT with pore water pressure measurements, were used with
empirical methods that account for the age of the soil deposit to back analyse the
minimum earthquake magnitude and peak ground acceleration at the time of the
prehistoric earthquakes. When the age of the earthquake was not considered, the
magnitude ranged from 7 to 7.2 and the corresponding acceleration ranged from 0.23
to 0.35g. The earthquake magnitude at the time of earthquake was found to be lower
when accounting for age; for the most recent prehistoric earthquake with the age of
546±17, the magnitude was reduced and ranged from 5.7 to 6.7 with corresponding
acceleration ranging from 0.17 to 0.30g.
INTRODUCTION
The South Carolina Coastal Plain (SCCP) experiences infrequent earthquakes and
paleoliquefaction analysis plays an important role in studying the paleoseismicity of
this region. As an example, over 160 paleoliquefaction features have been discovered
at a site near Hollywood, South Carolina (Obermeier et al., 1987) that have been
associated with earthquakes dating from 500 to 11,000 years B.P. (Talwani and Cox
(1985) and Weems et al. (1986)). From studies of these paleoliquefaction features, at
least seven, large, prehistoric earthquakes have occurred within the last 6000 years in
the SCCP with an average occurrence rate, based on the three most recent events, of
about 500 years (Talwani and Schaeffer, 2001).
To estimate the minimum values of magnitudes (M) and peak ground accelerations
(amax) needed for liquefaction to occur from these prehistoric earthquakes, Hu et al.
(2002a, 2002b) used site-specific geotechnical data (penetration resistance and shear
wave velocity) in the vicinity of paleoliquefaction features studied by Talwani and
Schaeffer (2001) at two sites (Gapway and Sampit) near Georgetown, South Carolina

Page 2
and two sites near the Ten Mile Hill Air Force Base north of Charleston, South
Carolina. The back-calculations were based on empirical correlations using Seed’s
Simplified Method (Seed and Idriss, 1971) as reported in Youd and Idriss (1997) that
are extensively used to determine liquefaction resistance of sand deposits from in-situ
soil indices (e.g. (N1)60 from the standard penetration test (SPT) and qc1 from the cone
penetration test (CPT)). Similarly, Martin and Clough (1994) used the Seed et al.
(1984) method, as well as the Ishihara (1985) method, to back-calculate the peak
ground accelerations at the Hollywood site.
The correlations between in-situ geotechnical data and cyclic resistance ratio used
in these studies are primarily based on studies of recent earthquakes in Japan, China
and the west coast region of the U.S. where the soil deposits are of Holocene age
(<10,000 years old). Therefore, Leon et al. (2005) developed a method to account for
the effect of time-dependent mechanisms (“aging”) on the back-calculated
magnitudes and peak ground accelerations for the sand deposits in the SCCP that are
older than 100,000 years and obtained an approximately 0.9 unit reduction in
magnitude and 15% reduction in peak ground acceleration. Neglecting the effect of
aging resulted in a 60% underestimation of CRR (Leon et al. 2006).
Furthermore, since the time of the earlier back-calculations, Idriss and Boulanger
(2008) have reexamined Seed’s original method and have proposed new relations for
the stress reduction factor (rd), earthquake magnitude scaling factor for cyclic stress
ratios (MSF), overburden correction factor for cyclic stress ratios (Kσ), and the
overburden normalization factor for penetration resistances (CN). In general, Gheibi
and Gassman (2014) found that using the newer method reduces the acceleration
values about 50% for M=5 and 23% for M=7.5 for the Gapway and Sampit sites
when compared to using Seed’s original method.
Therefore, the purpose of this paper is to back-calculate the minimum magnitude
and acceleration required to initiate liquefaction and form the paleoliquefaction
features associated with prehistoric earthquakes at the Hollywood site using the
newer semi-empirical method of Idriss and Boulanger (2008) and time-dependent
approach of Leon et al. (2005). The results will be compared to earlier back-
calculations by Martin and Clough (1994).
SITE STUDIED
The Hollywood site is located 0.8 km northeast of the town of Hollywood, South
Carolina. Obermeier et al. (1987) reported finding 162 liquefaction features along the
side walls of two flood control channels excavated at the site. Many of the observed
features are sandblows as large as 8 feet diameter from prehistoric earthquakes and
some are minor fissures related to the Charleston earthquake of 1886. Talwani and
Cox (1985) and Weems et al. (1986) have used radiocarbon dates of the trapped
organic material in and around sandblows to estimate the times of formation of the
sandblows. Based on calibrated ages described in Talwani and Schaeffer (2001),
times of sandblow formation range from 500 to 11,000 years B.P. and have been
associated with four episodes: Episode A occurring 546±17 years B.P., Episode B
1021±30 years B.P., Episode E 3548±66 years B.P. and Episode F 5038±166 years
B.P.

Page 3
The in-situ data used in this study were obtained along an east-west exploration
alignment that is parallel to one of the flood control channels and lies along the flank
of a Pleistocene beach deposit with soils estimated to be about 120,000 to 130,000
years old (Weems et al., 1986). The alignment includes three CPTs (HWD-CPT-4,
HWD-CPT-5 and HWD-CPT-6) and one SPT with energy measurements (HWD-
SPTE-1) that were performed as part of a larger study to investigate the effect of
aging on the liquefaction potential of SCCP soils (e.g. Hasek (2014), Williamson and
Gassman (2014), and Hayati et al. (2008)). Fig. 1 shows the CPT tip resistance and
the SPT blow count profiles obtained at the site. Note that HWD-SPTE-1 is located
near HWD-CPT-4. The water table depth was in the range of 1.7 to 2.3 m below the
ground surface from 2007 to 2010. Laboratory index tests were performed on the SPT
split spoon samples to characterize the soil and obtain the fines content.
FIG. 1. CPT and SPT profiles at the Hollywood site.
The soil classification chart of Robertson (1990) was used to obtain the soil profiles
shown in Fig. 2. Samples from the SPT split spoon, near HWD-CPT-4, were used to
classify the soil according to USCS. The general soil profile along the testing
alignment consists of about 2.30 m of silty sand with average CPT tip resistance as
shown in Fig. 1 of about 15 MPa (maximum of 18 to 24 MPa) and blow counts
between 4 and 17. The underlying layer is the source sand layer and consists of 1.4 to
2 m of clean sand to silty sand with an average tip resistance value of 6 MPa and
average blow count of 6. This layer is underlain by a mixture of clayey silt to sandy
silt and silty sand.
The source sand layer identified in Fig. 2 is the layer most prone to liquefaction.
This layer was identified using the interpretation of SPT blow counts, CPT tip
resistance, excess pore water pressure, fines content and soil type. The fines content is
in the range of 8 to 13% and excess pore pressures did not develop during the CPT
push at any of the test locations. The equivalent clean sand tip resistance, (qc1N)cs, and
SPT blow counts, (N1)60, are less than 160 and 30 in the source sand which are the
boundaries for liquefiable/nonliquefiable soils per Robertson and Wride (1998) and
Youd and Idriss (1997).
Earlier studies by Martin (1990) included eleven CPTs, eight SPTs and twelve
auger borings. The soil profile was described to consist of about 2.6 m of clean, fine
dense sand underlain by 2.3 m of clean, fine loose sand which was identified as the

Page 4
source of liquefied materials (Martin and Clough, 1994) and is in general agreement
with the study herein. All fines were non-plastic silts.
FIG. 2. Soil profile at Hollywood
FRAMEWORK FOR AGE AND DISTURBANCE CORRECTION
The methodology of Leon et al. (2005) was used to correct the cone penetration tip
resistance, qc1, and SPT blow count, (N1)60, for 1) aging of the soil and 2) disturbance
due to post-liquefaction consolidation (primary) and densification (or loosening). The
method is based on the idea that the empirical correlations for liquefaction evaluation
applicable for young or freshly deposited soils can be used for the older soil deposits
as long as the currently measured penetration resistances are modified to account for
the effect of aging. By correcting the currently recorded in situ geotechnical data for
aging, the corresponding data immediately after the earthquake for the sites that
liquefied are determined and termed “post-earthquake”. These data are further
corrected for disturbance from the earthquake to obtain the “pre-earthquake” data.
The method accounts for disturbance due to the liquefaction event and post-
liquefaction aging using two different approaches. Approach 1 is based on the
relations offered by Mesri et al. (1990) for both the age and disturbance correction
and Approach 2 is based on work by Kulhawy and Mayne (1990) for the age
correction and Seed et al. (1988) for the disturbance correction. As suggested by Ellis
and De Alba (1999) and Stark et al. (2002), Leon et al (2005) considered the change
in relative density (∆DR) to be 5% and 10% between the pre- (qc1 (pre) and (N1)60 (pre))
and post- (qc1 (post) and (N1)60 (post)) earthquake state.
The average qc1 (pre) and qc1 (post) values of tip resistance found using this method for
the ages associated with earthquake Episodes A, B, E and F from Talwani and
Schaeffer (2001) are summarized in Table 1. As shown, qc1 (post) is less than qc1 (pre) for
Approach 1; whereas, qc1 (post) is greater than or equal to qc1 (pre) for Approach 2. In

Page 5
both cases the average values of tip resistance corrected for both age and disturbance
are less than current measurements.
Table 1. Average values of age-corrected tip resistance for source sand layer.
Ep
iso
de
Age,
years
B.P.
qc1 (post) (MPa) / qc1 (pre) (MPa)
HWD-CPT-4 HWD-CPT-5 HWD-CPT-6
qc1
(cu
rren
t)
(MP
a)
1 2
qc1
(cu
rren
t)
(MP
a)
1 2
qc1
(cu
rren
t)
(MP
a)
1 2
ΔD
R 5
%
ΔD
R 1
0%
ΔD
R 5
%
ΔD
R 1
0%
ΔD
R 5
%
ΔD
R 1
0%
ΔD
R 5
%
ΔD
R 1
0%
ΔD
R 5
%
ΔD
R 1
0%
ΔD
R 5
%
ΔD
R 1
0%
A 546±17
10
4/7 3/4 8/8 8/7
9
3/6 3/4 7/7 7/7
10
4/7 3/5 8/8 8/8
B 1021±30 3/6 3/4 8/8 8/7 3/6 2/4 7/7 7/7 4/7 3/4 8/8 8/8
E 3548±66 3/5 2/3 8/7 8/7 3/5 2/3 7/7 7/7 3/6 2/4 8/8 8/8
F 5038±166 3/5 2/3 8/7 8/7 3/5 2/3 7/7 7/7 3/6 2/3 8/8 8/8
The average (N1)60 (pre) and (N1)60 (post) values found using the blow count data from
HWD-SPTE-1 are summarized in Table 2. In addition, blow counts obtained through
correlations to the CPT data obtained at HWD-CPT-4, -5 and -6 using Lunne et al.
(1997) are also shown. The blow counts obtained in the field at HWD-SPTE-1 differ
from those obtained through correlation at HWD-CPT-4, the CPT closest to the SPTE
test, by 7 units.
Table 2. Average values of age-corrected blow counts for source sand layer
Ep
iso
de
Age,
years
B.P.
(N1)60 (post) / (N1)60 (pre)
HWD-SPTE-1 HWD-CPT-4 HWD-CPT-5 HWD-CPT-6
(N1) 6
0 (
curr
ent) 1 2
(N1) 6
0 (
curr
ent) 1 2
(N1) 6
0 (
curr
ent) 1 2
(N1) 6
0 (
curr
ent) 1 2
ΔD
R 5
%
ΔD
R 1
0 %
ΔD
R 5
%
ΔD
R 1
0 %
ΔD
R 5
%
ΔD
R 1
0 %
ΔD
R 5
%
ΔD
R 1
0 %
ΔD
R 5
%
ΔD
R 1
0 %
ΔD
R 5
%
ΔD
R 1
0 %
ΔD
R 5
%
ΔD
R 1
0 %
ΔD
R 5
%
ΔD
R 1
0 %
A 546±17
11
4/7 3/5 8/6 8/5
18
7/12 5/8 14/11 14/9
17
6/11 5/7 13/11 13/8
19
7/13 6/8 15/12 15/10
B 1021±30 4/7 3/4 8/6 8/5 6/11 5/7 14/11 14/9 6/11 4/7 13/11 13/8 7/12 5/8 15/12 15/10
E 3548±66 3/6 2/4 8/6 8/5 5/10 4/6 14/11 14/9 5/9 4/6 13/10 13/8 6/11 4/6 15/12 15/10
F 5038±166 3/6 2/3 8/6 8/4 5/10 4/6 14/11 14/9 5/9 4/5 13/10 13/8 6/10 4/6 15/12 15/10
Back-Calculation of Earthquake Magnitude
The earthquake magnitude was back-calculated using the Energy Stress method (Hu
et al. (2002b)) which relates the seismic intensity at the site in terms of magnitude, M,
in Richter, hypocentral distance, Rh, in km, and liquefaction susceptibility represented
by (N1)60 in the following equation:
M =2
3∗ log[1.445 ∗ Rh
2 ∗ (N1)606.06] (1)
This relationship is assumed to be applicable for world-wide tectonic conditions,
recognizing that the magnitude could be constrained further knowing localized
information such as stress drop, focal depth, the degree of liquefaction susceptibility
on the extent of liquefaction, and the attenuation of bedrock shaking (Obermeier and
Page 6
Pond, 1999). Uncertainties regarding back-calculation of earthquake magnitudes and
peak ground accelerations are presented in Olson et al. (2005).
Two possible earthquake sources: 1) the NE trending Wood Stock Fault (WF) and
2) NW trending Sawmill Branch Fault (SBF) identified by Dura-Gomez and Talwani
(2009) were considered to obtain the epicentral and hypocentral distances. Epicentral
distances from WF and SBF are considered to be 25 km for Hollywood and
hypocentral distances, rounded to the nearest km are one more km than the epicentral
distances.
Back Analysis of Peak Ground Acceleration
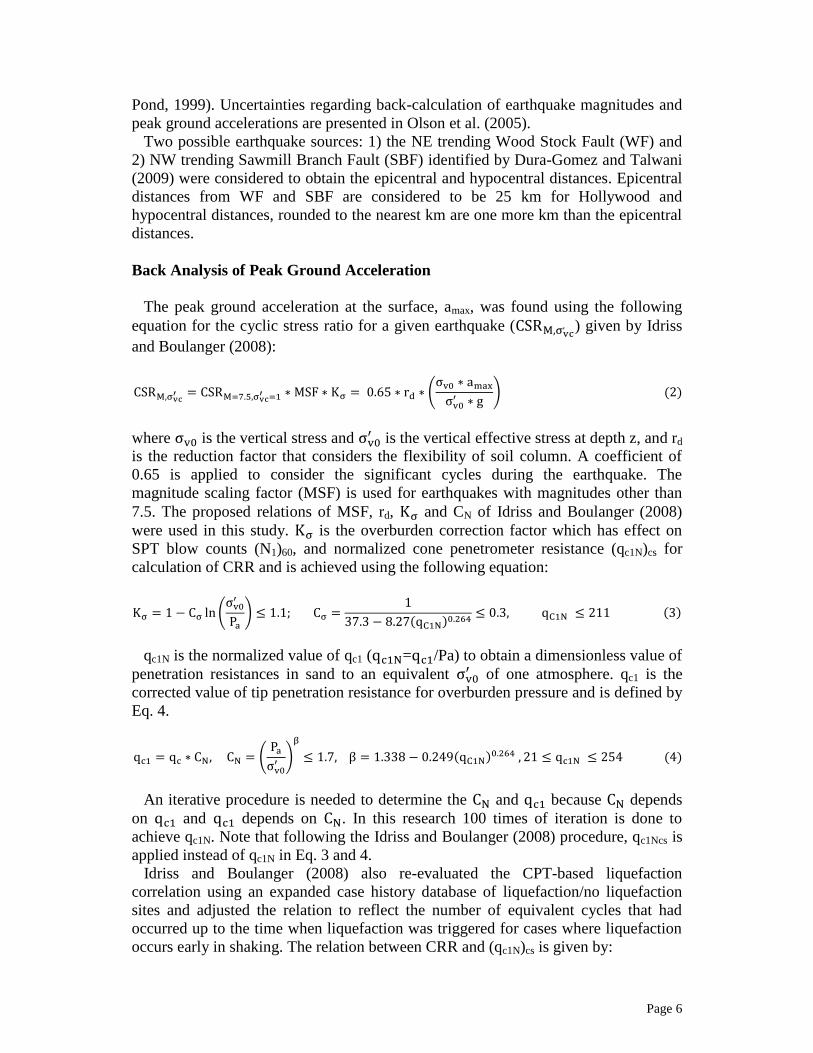
The peak ground acceleration at the surface, amax, was found using the following
equation for the cyclic stress ratio for a given earthquake (CSRM,σvc, ) given by Idriss
and Boulanger (2008):
CSRM,σvc′ = CSRM=7.5,σvc
′ =1 ∗ MSF ∗ Kσ = 0.65 ∗ rd ∗ (σv0 ∗ amax
σv0′ ∗ g
) (2)
where σv0 is the vertical stress and σv0′ is the vertical effective stress at depth z, and rd
is the reduction factor that considers the flexibility of soil column. A coefficient of
0.65 is applied to consider the significant cycles during the earthquake. The
magnitude scaling factor (MSF) is used for earthquakes with magnitudes other than
7.5. The proposed relations of MSF, rd, Kσ and CN of Idriss and Boulanger (2008)
were used in this study. Kσ is the overburden correction factor which has effect on
SPT blow counts (N1)60, and normalized cone penetrometer resistance (qc1N)cs for
calculation of CRR and is achieved using the following equation:
Kσ = 1 − Cσ ln (σv0
′
Pa
) ≤ 1.1; Cσ =1
37.3 − 8.27(qC1N)0.264≤ 0.3, qC1N ≤ 211 (3)
qc1N is the normalized value of qc1 (qc1N=qc1/Pa) to obtain a dimensionless value of
penetration resistances in sand to an equivalent σv0′ of one atmosphere. qc1 is the
corrected value of tip penetration resistance for overburden pressure and is defined by
Eq. 4.
qc1 = qc ∗ CN, CN = (Pa
σv0′ )
β
≤ 1.7, β = 1.338 − 0.249(qC1N)0.264 , 21 ≤ qc1N ≤ 254 (4)
An iterative procedure is needed to determine the CN and qc1 because CN depends
on qc1 and qc1 depends on CN. In this research 100 times of iteration is done to
achieve qc1N. Note that following the Idriss and Boulanger (2008) procedure, qc1Ncs is
applied instead of qc1N in Eq. 3 and 4.
Idriss and Boulanger (2008) also re-evaluated the CPT-based liquefaction
correlation using an expanded case history database of liquefaction/no liquefaction
sites and adjusted the relation to reflect the number of equivalent cycles that had
occurred up to the time when liquefaction was triggered for cases where liquefaction
occurs early in shaking. The relation between CRR and (qc1N)cs is given by:

Page 7
CRRM=7.5,σvc, =1 = exp {
(qc1N)cs
540+ (
(qc1N)cs
67)
2
− ((qc1N)cs
80)
3
+ ((qc1N)cs
114)
4
− 3} (5)
where (qc1N)cs is the equivalent clean-sand value of the corrected tip resistance and is
computed from:
(qc1N)cs = qc1N + ∆qc1N , ∆qc1N = (5.4 +qC1N
16) ∗ exp {1.63 +
9.7
FC + 0.01− (
15.7
FC + 0.01)
2
} (6)
where FC is the fines content percentage which was about 10% at the Hollywood site.
The (qc1N)cs values that correspond to the qc1(pre) values in Table 1 are shown in Table
3.
Table 3. Average values of (qc1N)cs (pre) corresponding to qc1(pre)
Ep
iso
de
Age,
years
B.P.
HWD-CPT-4 HWD-CPT-5 HWD-CPT-6
(qc1
N) c
s (c
urr
ent)
Average (qc1N)cs (pre) (q
c1N) c
s (c
urr
ent)
Average (qc1N)cs (pre)
(qc1
N) c
s (c
urr
ent)
Average (qc1N)cs (pre)
1 2 1 2 1 2
ΔDR
5%
ΔDR
10%
ΔDR
5%
ΔDR
10%
ΔDR
5%
ΔDR
10%
ΔDR
5%
ΔDR
10%
ΔDR
5%
ΔDR
10%
ΔDR
5%
ΔDR
10%
A 546±17
11
0
78 52 88 86
10
2
73 48 82 80
12
1
86 58 97 95
B 1021±30 74 48 87 85 68 45 81 79 81 53 96 94
E 3548±66 65 42 86 84 60 39 79 78 72 46 94 92
F 5038±166 63 40 85 83 58 37 79 77 69 44 93 92
RESULTS
Earthquake Magnitude
The minimum estimated magnitudes obtained from the Energy Stress method are
shown in Table 4. Using the current in-situ soil properties ((N1)60 current in Table 2) the
results range from 6.3 (using HWD-SPTE-1) to an average of 7.1 (using HWD-CPT-
4, -5 and -6). When the soil properties are corrected ((N1)60 pre in Table 2) for age and
disturbance of each earthquake episode, the magnitude is reduced. The reduction
ranges from 0.5 to 1.3 units for Episode A and is greater for older earthquakes (e.g.
reduction of 0.7 to 1.8 units for Episode F). Note that the magnitudes obtained from
the Energy Stress Method (Eq. 1) using the SPT data (HWD-SPTE-1) are 0.5 to 1
units less than when obtaining (N1)60 from the CPT data (HWD-CPT-4, -5 and -6) via
the Lunne et al. (1997) correlation.
Table 4. Earthquake magnitudes
Ep
iso
de
Age,
years
B.P.
Earthquake Magnitude (M)
HWD-SPTE-1 HWD-CPT-4 HWD-CPT-5 HWD-CPT-6
Current Aged Current Aged Current Aged Current Aged
A 546±17
6.3
5.1 to 5.7
7.1
5.8 to 6.5
7
5.7 to 6.4
7.2
6 to 6.7
B 1021±30 5 to 5.6 5.7 to 6.4 5.5 to 6.3 5.8 to 6.5
E 3548±66 4.8 to 5.5 5.4 to 6.3 5.3 to 6.2 5.6 to 6.5
F 5038±166 4.7 to 5.5 5.3 to 6.3 5.2 to 6.2 5.5 to 6.5

Page 8
Peak Ground Acceleration
Using the age-corrected (qc1N)cs(pre) values from Table 3, the CRRM=7.5 values found
from Eq. 2, representing those at the time of the earthquake at each episode for
HWD-CPT-4, -5, and -6, are presented in Table 5.
Table 5. Average values of CRRM=7.5
Episode Age, years
B.P.
CRR M=7.5 (Average of Approach 1 and 2)
HWD-CPT-4 HWD-CPT-5 HWD-CPT-6
ΔDR 5% ΔDR 10% ΔDR 5% ΔDR 10% ΔDR 5% ΔDR 10%
A 546±17 0.12 0.11 0.11 0.10 0.14 0.12
B 1021±30 0.12 0.11 0.11 0.09 0.13 0.11
E 3548±66 0.12 0.10 0.10 0.09 0.12 0.11
F 5038±166 0.11 0.10 0.10 0.09 0.12 0.11
The peak ground acceleration, amax, found using Eq. 2 and the CRR values in Table
5 are summarized for earthquake magnitudes M=5, M=6 and M=7 in Table 6.
Stronger earthquakes need less acceleration for the soil to be liquefied; e.g., for
Episode A, the peak ground accelerations range from 0.25 to 0.34g for M=5 which
are greater than the range of 0.15 to 0.21g for M=7. Also, for a given earthquake
magnitude, the peak ground accelerations decrease as the soil age increases. For
instance, when M=5, acceleration in Episode A for the HWD-CPT-4 is in the range of
0.27 to 0.32g while, with increase in the soil age in Episode F, acceleration ranges
from 0.25g to 0.29g. For the cases when relative density changes more during the
earthquake (i.e. more disturbance is assumed to occur when ΔDR=10% compared to ΔDR=5%) around 15% less acceleration is needed for the soil to be liquefied.
Table 6. Peak ground acceleration for source sand layer Episode,
years
B.P.
Location
Peak Ground Acceleration (g)
M=5 M=6 M=7
ΔDR 5% ΔDR 10% ΔDR 5% ΔDR 10% ΔDR 5% ΔDR 10%
A
546±17
HWD-CPT-4 0.32 0.27 0.26 0.22 0.20 0.17
HWD-CPT-5 0.29 0.25 0.23 0.20 0.18 0.15
HWD-CPT-6 0.34 0.29 0.28 0.23 0.21 0.18
B
1021±30
HWD-CPT-4 0.31 0.26 0.25 0.21 0.19 0.16
HWD-CPT-5 0.28 0.24 0.22 0.19 0.17 0.15
HWD-CPT-6 0.33 0.28 0.27 0.22 0.20 0.17
E
3548±66
HWD-CPT-4 0.29 0.25 0.24 0.20 0.18 0.15
HWD-CPT-5 0.26 0.23 0.21 0.19 0.16 0.14
HWD-CPT-6 0.31 0.26 0.25 0.21 0.19 0.16
F
5038±166
HWD-CPT-4 0.29 0.25 0.23 0.20 0.18 0.15
HWD-CPT-5 0.26 0.23 0.21 0.18 0.16 0.14
HWD-CPT-6 0.30 0.26 0.24 0.21 0.18 0.16
Note that the Youd and Idriss (1997) method that was used in the Leon et al. (2005)
results in higher values of acceleration. The increase is greater for lower magnitudes.
As was shown for the Gapway and Sampit sites in the SCCP (Gheibi and Gassman,

Page 9
2014), the accelerations found from the Idriss and Boulanger (2008) method are about
50% for M=5 and 23% for M=7.5 lower than found using Youd and Idriss (1997).
It is also important to note that when correcting for both age and disturbance (using
qc1 (pre) and (N1)60 (pre) per Leon et al 2005) the results for acceleration are up to 0.04g
higher (based on HWD-5 data and Episodes A and B) than when a correction is made
for age only (using qc1 (post) and (N1)60 (post)); the results for magnitude are up to 0.6
units higher (range from 5.1 to 6.6 for Episode A and from 5.0 to 6.6 for Episode B).
The Energy Intensity equation (Pond and Martin, 1997) used in the Energy Stress
method (Hu et al 2002b) and the Simplified Method stress boundary curves are based
on field data measured after earthquakes and thus using these methods may inherently
account for disturbance. However, it is unknown if time dependent mechanisms were
present at these sites prior to liquefaction. The minimum earthquake magnitude and peak ground acceleration at the time of
earthquake were calculated for each episode and the range of values for all test
locations are summarized in Table 7. As shown, an increase in the soil age leads to a
decrease in the required magnitude and peak ground acceleration for liquefaction
initiation at time of earthquake. For instance the range of earthquake magnitude is 5.7
to 6.7 with the corresponding acceleration range of 0.17 to 0.3 g when the soil age is
546 years B.P.; whereas, the earthquake magnitude and accelerations are in the range
of 5.2 to 6.5 and 0.16 to 0.29 when the soil age is 5038 years B.P.
The magnitudes and peak ground accelerations for the range of parameters
examined in this study are compared to those previously found by Martin and Clough
(1994) in Table 7. Assuming the whole source sand layer to be liquefied, Martin and
Clough (1994) back calculated the peak ground acceleration at the Hollywood site to
be 0.3g based on the Seed et al. (1984) method and 0.2g from the Ishihara (1985)
method. They combined the Seed and Ishihara procedures and found amax equal to
0.25g for M=7.5. In this study, when M=7.5 and the current in-situ data are used, the
acceleration ranges from 0.21 to 0.3g which is in a good agreement with the
accelerations from Martin and Clough (1994). For a magnitude in the range of 7 to
7.2, as was found from the Energy Stress method in this work, the corresponding
acceleration ranges from 0.23 to 0.35g which is slightly greater than the accelerations
for M=7.5.
Table 7. Estimated peak ground accelerations
Episode,
years B.P.
This study Martin and Clough (1994)
Age Corrected Current Current
M amax (g) M amax (g) M
amax (g)
Seed et al
(1984)
Ishihara
(1985)
Martin Clough
(1994)
A (546±17) 5.7~6.7 0.17~0.30
7 ~7.2 0.23 ~0.35 7.5 0.3 0.2 0.25 B (1021±30) 5.5~6.5 0.17~0.30
E (3548±66) 5.3~6.5 0.17~0.29
F (5038±166) 5.2~6.5 0.16~0.29
CONCLUSIONS
The earthquake magnitudes and peak ground accelerations associated with four
episodes of prehistoric earthquakes at the Hollywood site in the South Carolina

Page 10
Coastal Plain were back analysed using in-situ geotechnical data and time-dependent
procedures to correct for the age of the earthquake. For the most recent episode
(546±17 years B.P.), the magnitude ranged from 5.7 to 6.7 and for the oldest
earthquake (5038±166 years B.P.) was found to decrease to the range of 5.2 to 6.5.
The corresponding accelerations ranged from 0.16 to 0.30g. When the age of the
earthquake was not considered, the magnitude was greater and ranged from 7 to 7.2
with corresponding peak ground accelerations of 0.23 to 0.35g which is in good
agreement with earlier studies that did not consider age.
ACKNOWLEDGEMENTS
The SPT and CPT data used in this study were obtained with funds from the National
Science Foundation, under grant number CMS-0556006. Any opinions, findings, and
conclusions or recommendations expressed in this material are those of the author and
do not necessarily reflect the views of the National Science Foundation.
REFERENCES
Ambraseys, N.N. (1988). “Engineering seismology.” J. Earthquake Engrg and Structural Dynamics.,
Vol 17 (1): 1-105.
Dura-Gomez, I. and Talwani, P. (2009). “Finding faults in the Charleston area, South Carolina: 1,
Seismological data.” Seismological Res. Letters., Vol 80 (5): 883-900.
Ellis, C. and De Alba. P. (1999). “Acceleration distribution and epicentral location of the 1755 Cape
Ann earthquake from case histories of ground failure.” Seismological Res. Letters., Vol 70 (6):
758-773.
Gheibi, E. and Gassman, S.L. (2014). “Reassessment of prehistoric earthquake accelerations at Sampit
and Gapway sites in the South Carolina Coastal Plain.” Proc. 10NCEE, doi:
10.4231/D3PV6B73Z.
Gheibi, E., Gassman, S. L., and Tavakoli, A. (2014). "Using regression model to predict cyclic
resistance ratio at South Carolina Coastal Plain (SCCP)." Proc., 22nd Annual Southeast SAS
Users Group Conference (SESUG 2014), Institute for Advanced Analytics. doi:
10.13140/2.1.4893.4081
Hasek, M.J. (2014). “Liquefaction potential as related to the aging of SC outer coastal plain sands.”
Ph.D. Dissertation to be Submitted to the University of South Carolina, Columbia. SC.
Hayati, H., Andrus, R.D., Gassman, S.L., Hasek, M.J., Camp, W.M., and Talwani, P. (2008).
“Characterizing the liquefaction resistance of aged soils.” GEESD IV, Sacramento, CA.
Hu, K., Gassman, S.L., and Talwani, P. (2002a). “In-situ properties of soils at paleoliquefaction sites in
the South Carolina Coastal Plain.” Seismological Res. Letters, Vol 73 (6): 964-978.
Hu, K., Gassman, S.L., and Talwani, P. (2002b). “Magnitudes of prehistoric earthquakes in the South
Carolina Coastal Plain from geotechnical data.” Seismological Res. Letters, Vol 73 (6): 979-991.
Idriss, I.M., and Boulanger, R.W. (2008). “Soil liquefaction during earthquakes.” Monograph MNO-
12, Earthquake Engrg Research Institute., Oakland, CA.
Ishihara, K. (1985). “Stability of natural soil deposits during earthquakes.” Proc, 11th
Conference on
Soil Mechanics and Foundation Engrg. International Society of Soil Mechanics and Foundation
Engineers San Francisco, CA: 321-376.
Kulhawy, F.H., and Mayne, P.W. (1990). “Manual on estimating soil properties for foundation
design.” Final Report, EL-6800, Electric Power Research Institute: 1439-6.
Leon, E., Gassman, S. L., and Talwani, P. (2005). “Accounting for soil aging on assessing magnitudes
and accelerations of prehistoric earthquakes.” Earthquake Spectra, Vol 21 (3): 737-759.
Leon, E., Gassman, S.L., and Talwani, P. (2006). “Accounting for soil age when assessing liquefaction
potential.” J. Geotechnical and Geoenvironmental Engrg, Vol 132(3): 363-377.

Page 11
Lunne, T., Robertson, P.K., and Powell, J.J. (1997). “Cone penetration testing in geotechnical
practice.” EF Spou/Blackie Academic, Routledge Publishers., London, UK.
Martin, J.R. (1990). “Implications from a geotechnical investigation of liquefaction phenomena
associated with seismic events in the Charleston, SC area” PhD Dissertation, Virginia
Polytechnic Institute and State University.
Martin, J.R., and Clough, G.M. (1994). “Seismic Parameters from Liquefaction Evidence.” J.
Geotechnical Engrg., Vol 120 (8): 1345-1361.
Mesri, G., Feng, T. W., and Banek, J. M. (1990). “Post densification penetration resistance of clean
sands.” J. Geotechnical Engrg., Vol 116 (7): 1095-1115.
Obermeier, S.F., and Pond, E.C. (1999). “Issues in using liquefaction features for paleoseismic
analysis.” Seismological Res. Letters., Vol 70 (1): 34-58.
Obermeier, S.F., Weems, R.E., and Jacobson, R.B. (1987). “Earthquake-induced liquefaction features
in the coastal South Carolina region.” US Geological Survey Open File Report, 87, 504.
Olson, S.M., Green, R.A., and Obermeier, S.F. (2005). “Geotechnical analysis of paleoseismic shaking
using liquefaction features: a major updating.” J. of Engrg Geology, Vol 76: 235-261.
Pond, E.C., and Martin, J.R. (1997). “Estimated magnitudes and accelerations associated with
prehistoric earthquakes in the Wabash Valley region of the central United States.” Seismological
Res Letters, Vol 68(4): 611-623.
Robertson, P.K. (1990). “Soil classification using the cone penetration test.” Canadian Geotechnical
J., Vol 27: 151-158.
Robertson, P.K., and Wride, C.E. (1998). “Evaluating cyclic liquefaction potential using the cone
penetration test.” Canadian Geotechnical J., Vol 35 (3): 442-459.
Seed, H.B., and Idriss, I.M. (1971). “Simplified procedure for evaluating soil liquefaction potential.”
J. Soil Mechanics and Foundations Division., Vol 97 (9): 1249-1273.
Seed, H.B., Harder, L.F., and Jong, H. (1988). “Re-evaluation of the slide in the lower San Fernando
dam in the earthquake of February 9, 1971.” Report No. UCB/EERC-88/04. University of
California, Berkeley.
Seed, H.B., Tokimatsu, K., Harder, L.F., and Chung, R.M. (1984). “The Influence of SPT procedures
in soil liquefaction resistance evaluations.” Report No. UBC/EERC-84/15. University of
California. Berkeley, Earthquake Engrg Research Center.
Stark, D., Obermeier, S. F., Newman, E. J., and Stark, J. M. (2002). “Interpretation of ground shaking
from paleoliquefaction features.” http://erp-web.er.usgs.gov/reports/annsum/vol43/cu/g0030.pdf,
(2/08/03).
Talwani, P., and Cox, J. (1985). “Paleoseismic evidence for recurrence of earthquakes near Charleston,
South Carolina.” Science., Vol 229 (4711): 379-381.
Talwani, P., and Schaeffer, W.T. (2001). “Recurrence rates of large earthquakes in the South Carolina
Coastal Plain based on the paleoliquefaction data.” J. Geophysical Research., Vol 106 (B4):
6621-6642.
Weems, R.E., Obermeier, S.F., Pavich, M.J., Gohn, G.S., and Rubin, M. (1986). “Evidence for three
moderate to large prehistoric Holocene earthquakes near Charleston, South Carolina.” Proc. 3rd
U.S. National Conference on Earthquake Engineering Charleston, South Carolina, Earthquake
Engineering Research Institute, Oakland, CA., Vol 1: 3-13.
Williamson, J.R. and Gassman, S.L. (2014). “Identification of liquefiable coastal plain soils using
DMT, SPT and CPT profiles.” Proc. ASCE GeoCongress Special Publication, Atlanta, GA.
Youd, T.L., and Idriss, I.M. (1997). “Proc. NCEER workshop on evaluation of liquefaction resistance
of soils.” National Center for Earthquake Engineering Research Technical Report NCEER-97-
0022: 276.p.

![EXHIBIT "A-1" [Hollywood Inventory] - Internet Archive](https://static.fdokumen.com/doc/165x107/63364472e687b37e4f0611b6/exhibit-a-1-hollywood-inventory-internet-archive.jpg)