Magnetic circular dichroism for the study of the magnetization and the magnetic moments of the atoms...
10
Magnetic circular dichroism for the study of the magnetization and the magnetic moments of the atoms in Nd3Fe27.5Ti1.5 C Sarafidis 1 , F Wilhelm 2 , A Rogalev 2 , M Gjoka 3 and O Kalogirou 1 1 Dept. of Physics, Aristotle University of Thessaloniki, 54 124 Thessaloniki, Greece 2 European Synchrotron Radiation Facility (ESRF) BP 220, 38043 Grenoble Cedex, France 3 NCSR Demokritos, Institute for Materials Science, 153 10 Ag. Paraskevi, Athens, Greece Abstract An element specific study of the Nd3Fe27.5Ti1.5 compound with the hard X-ray Magnetic Circular Dichroism (XMCD) technique is presented. The Nd L2- and L3-edge XMCD as well as the Fe K edge XMCD were measured in a magnetically oriented sample, parallel and perpendicular to its alignment direction. The XMCD spectra were recorded in three different temperatures, above, below and in between the characteristic peaks that the specific compound presents in AC susceptibility measurements. By probing the Nd L-edges and the Fe K-edge XMCD, we found that the dipolar R(5d) – Fe(3d) exchange interaction behaves differently with the temperature than the Fe-Fe magnetic interaction. Those differences appear to be within the vicinity of the AC susceptibility characteristic peaks. An XMCD signal was recorded at the Ti K-edge revealing a small orbital polarization due to the hybridization with Fe atomic states. This demonstrates the existence of a small finite magnetic moment in Ti atoms. Keywords: R-TM intermetallics; magnetic anisotropy; XMCD; electronic interactions
Transcript of Magnetic circular dichroism for the study of the magnetization and the magnetic moments of the atoms...
Magnetic circular dichroism for the study of the magnetization
and the magnetic moments of the atoms in Nd3Fe27.5Ti1.5
C Sarafidis1, F Wilhelm2, A Rogalev2, M Gjoka3 and O Kalogirou1
1 Dept. of Physics, Aristotle University of Thessaloniki, 54 124 Thessaloniki, Greece 2 European Synchrotron Radiation Facility (ESRF) BP 220, 38043 Grenoble Cedex, France 3 NCSR Demokritos, Institute for Materials Science, 153 10 Ag. Paraskevi, Athens, Greece
Abstract
An element specific study of the Nd3Fe27.5Ti1.5 compound with the hard X-ray Magnetic
Circular Dichroism (XMCD) technique is presented. The Nd L2- and L3-edge XMCD as well as
the Fe K edge XMCD were measured in a magnetically oriented sample, parallel and
perpendicular to its alignment direction. The XMCD spectra were recorded in three different
temperatures, above, below and in between the characteristic peaks that the specific compound
presents in AC susceptibility measurements. By probing the Nd L-edges and the Fe K-edge
XMCD, we found that the dipolar R(5d) – Fe(3d) exchange interaction behaves differently with
the temperature than the Fe-Fe magnetic interaction. Those differences appear to be within the
vicinity of the AC susceptibility characteristic peaks. An XMCD signal was recorded at the Ti
K-edge revealing a small orbital polarization due to the hybridization with Fe atomic states. This
demonstrates the existence of a small finite magnetic moment in Ti atoms.
Keywords: R-TM intermetallics; magnetic anisotropy; XMCD; electronic interactions

1. Introduction
The R3(Fe,M)29-type family of compounds (3:29) present various interesting phenomena due to
their complex monoclinic structure. They have been studied systematically for their potential permanent
magnet applications and their intrinsic magnetic properties [1-13]. The Nd3(Fe,Ti)29-type compounds
crystallize in the A2/m space group [1]. The monoclinic 3:29 structure has a high complexity; it
contains 11 non-equivalent iron crystallographic sites and the fact that it can be considered as an
intermediate phase between 1:12 and 2:17R type structures provide a bright study field for the exchange
interactions in rare earth transition metal intermetallic compounds. Nd3Fe27.5Ti1.5 presents two
transitions in the AC susceptibility curves, at 233 Κ and 160 Κ respectively [1,2]. The lower
temperature transition is attributed to first order magnetization phenomena (FOMP). However, there are
contradicting explanations for the transition at 233 Κ. It has been reported to arise due to a Spin
Reorientation Transition (SRT) [2] although there is strong experimental evidence that a SRT doesn’t
exist at that temperature [1,3,4]. Using point-charge calculations, H.S. Li et a1. [5] have reported that in
3:29 there are two opposing rare-earth sublattices which may result in a canted magnetic structure. In
the 3:29 compounds the magnetocrystalline anisotropy is due to the competing contributions of the two
sublattices, the rare earth and the transition metal sublattice. In Nd3Fe27.5Ti1.5 the nature of the
magnetocrystalline anisotropy was initially considered to have planar character with the easy
magnetization direction (EMD) lying on the basal plane of the underlying 1:5 structure [2] while later
studies have revealed the presence of a more complex tilted structure [1,3,4,9]. In those references it has
been shown that an easy cone type anisotropy is present, the cone-axis being the [4 0 -2]
crystallographic direction of the monoclinic structure. The [4 0 -2] direction is related to the c-axis of
the 1:12 phase and lies perpendicular to the [2 0 4] direction, which is related to the c-axis of the 2:17
phase, and to the [0 4 0] direction, which lies in the basal plane of the 2:17 phase [1]. Thus, the [2 0 4]
and [0 4 0] directions are considered to be the hard directions of the compound.
The XMCD technique has been proven to be a very important tool in the research of magnetism.
It is as an element-specific and shell-selective magnetic probe, since the XMCD intensity is
quantitatively related to the local spin and orbital magnetic moments. In the rare earth – transition metal
intermetallic compounds the rare earth conduction band electrons (5d) are very important, since they
participate in the exchange interactions between the rare earth and the transition metal sublattice. Their
observation with the XMCD technique through experiments in the L2 and L3 edges of the rare – earth
atoms can provide valuable information on these interactions, although they cannot be explained with
simple sum rules [14]. With the development of time dependent density functional theory (TDDFT) and
its subsequent refinements, the prediction of the electronic absorption (EA), electronic circular
dichorism (ECE) and magnetic dichroism (MCD) spectra are now feasible, not only in the gas
phase/isolated state, but also in solution using the continuum solvent (environment) approach. The
Dalton ab initio and DFT code has implemented the simulation of the EA, ECD and MCD spectra [15].
Up to now, concerning rare earth iron intermetallic compounds, XMCD results are limited to the
systematic study of the R2Fe14B and the RFe11Ti series [16-20]. These results indicate that there is a
rare-earth contribution to the Fe K-edge XMCD, and that this contribution reflects the magnetic state of
the R atoms. Hence, it is necessary to extend previous research to different R-Fe intermetallic series to
establish a better understanding of the characteristics of the XMCD signals in R-Fe intermetallic
compounds. In the present work we present an investigation of the Nd3Fe27.5Ti1.5 compound with X-ray
Magnetic Circular Dichroism (XMCD) technique in order to extend the study of the magnetic
interactions in this compound and to further clarify the nature of the magnetic transitions observed at
low temperatures.
2. Experimental
Alloys with Nd3Fe27.5Ti1.5 nominal stoichiometry were prepared by arc-melting appropriate
amounts of high purity metals, under Ar atmosphere. The samples were melted twice in order to
achieve better homogenization. Then the samples were wrapped in tantalum foil, encapsulated in
evacuated quartz tubes, annealed for 72 hours at 1373 – 1473 Κ followed by water quenching. X-ray
powder diffraction (XRD) with CuKα radiation and magnetization versus temperature measurements
carried out at a field of 100 mT using a vibrating sample magnetometer were used for a first
characterization of the samples. Most of the samples were found to be practically single phase with the
6.20 6.22 6.24 6.72 6.74 6.76-1
0
1
2
3
0.0
0.5
1.0
1.5
2.0
Photon Energy (keV)
Nd L2-edge
Nd L3-edge
XM
CD
sig
na
l x
10
2
RT
3T
easy axis
hard axis
Flu
ore
scen
ce I
nte
nsi
ty (
a.u
.)
monoclinic 3:29 structure and very small amounts of α-Fe. One sample was chosen for further analysis,
with α-Fe content less than 1.5 wt. % and crystallographic parameters a = 10.645(2) Å, b = 8.592(1) Å,
c = 9.752(2) Å, β = 96.93(1)° and V = 885.41 Å3. The crystallographic parameters were calculated with
Rietveld analysis and the Curie temperature of the material was found to be 420 Κ, from the
thermomagnetic measurements. All these values are typical for the Nd3Fe27.5Ti1.5 compound [1]. The
bulk material was pulverized to fine powder with average particle size less than 37 μm and magnetic
oriented samples were prepared under magnetic field of 1T. The powder was mixed with epoxy resin at
RT and during the alignment process the sample was rotating with the rotational axis perpendicular to
the external magnetic field, thus the rotational axis corresponded to the hard magnetization direction.
The sample was carefully cut in order to be fixed on the sample holder of the XMCD apparatus. XMCD
measurements were conducted in the beamline ID12 [21], which is dedicated to polarization dependent
spectroscopies, at the European Synchrotron Radiation Facility (ESRF). The x-ray absorption near-edge
structure (XANES) spectra at Nd L3,2-edges, Fe K-edge and Ti K-edge were measured in the total
fluorescence yield mode, using Si photodiode in a back-scattering geometry. A magnetic field of up to 3
T was applied parallel to the incident beam direction, using a superconducting cryomagnet. The XMCD
spectra were obtained as a direct difference of two XANES spectra recorded successively with right and
left circularly polarized x-rays (by reversing the helicity of the incoming beam). Moreover, to ensure
that the measured XMCD spectra are free of any experimental artefact, the data were collected for both
directions of the external applied magnetic field (parallel and antiparallel to the incoming x-ray beam).
The XMCD spectra were recorded at the Nd L2 and L3 edges, Fe K edge and at the Ti Κ edge, parallel
and perpendicular in the magnetic alignment direction. The spectra were recorded at three different
temperatures, room temperature, liquid nitrogen temperature and in the interval between the two AC
susceptibility transitions, i.e., at 180 K. The Ti K edge spectra was recorded only in room temperature
in order to study the possible existence of induced magnetic moment in Ti atom due to the polarization
of the surrounding electronic density.
3. Results and Discussion
This section is divided into four parts. The first part deals with the XMCD measurements at the
Nd L3,2-edges recorded along the easy magnetization axis (parallel to the magnetically aligned direction
of Nd3Fe27.5Ti1.5) and along the hard magnetization axis (perpendicular to the magnetically aligned
direction of the Nd3Fe27.5Ti1.5), whereas the second part deals with the XMCD measurements at the Fe
K-edge along both easy and hard magnetization axis (hereafter easy- and hard-axis). In the third part,
the thermal dependence of both Nd and Fe is presented. Finally, the fourth part deals with the XMCD
measurements at the Ti K-edge.
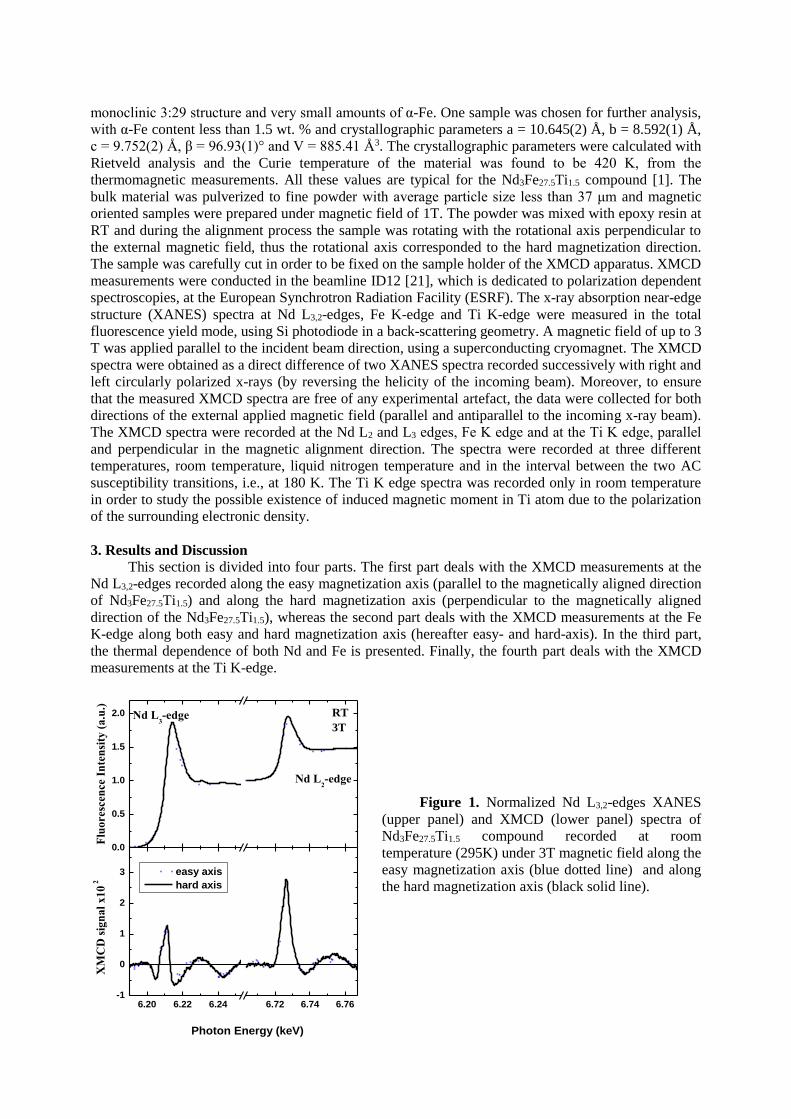
Figure 1. Normalized Nd L3,2-edges XANES
(upper panel) and XMCD (lower panel) spectra of
Nd3Fe27.5Ti1.5 compound recorded at room
temperature (295K) under 3T magnetic field along the
easy magnetization axis (blue dotted line) and along
the hard magnetization axis (black solid line).

3. 1 Nd L3,2-edges XMCD
In figure 1 the XANES and XMCD spectra recorded at the Nd L2 and L3 edges along the easy
and hard magnetization axis measured at room temperature (RT), that is 295K, and under 3T magnetic
field are presented. The most obvious feature is a main positive peak at both Nd L3 and L2 edges. The
sign and the shape of the XMCD spectra are similar to the corresponding ones at Nd L-edges in other
rare-earth transition metal intermetallic compounds like Nd-Fe-B [16-19]. The L2 peak at around 6.725
keV is stronger, while the L3 peak is centered around 6.21 keV. It has been previously shown by
combining XMCD, x-ray resonant magnetic scattering and resonant inelastic x-ray scattering that those
peaks correspond to dipolar transitions (2p5d), whereas the features located at lower energies (6.205
keV and 6.209 keV for the L3-edge, and 6.718keV for the L2-edge) correspond to quadrupolar
transitions (2p4f) [22]. We can first observe that the XANES spectra along the easy and hard
magnetization axis are anisotropic since they do not have the same amplitude. This anisotropy in the
XANES reflects the charge anisotropy mainly between the (a,b) plane and (c,a)/(c,b) plane of the
unoccupied electronic density of states of the 5d-shell of the Nd atoms. This effect arises for non-cubic
crystallographic structure. The XMCD spectra are similar in shape and amplitude for both easy and
hard magnetization axis. Similar to Nd-Fe-B, the Nd and Fe magnetic moments are ferromagnetically
coupled.
Figure 2. Temperature dependence of
the Nd L3,2-edges XMCD spectra of
Nd3Fe27.5Ti1.5 compound measured along the
easy magnetization axis under 3T magnetic
field at 295K (red solid line), 180K (green
doted line) and 77K (blue dashed line).
In figure 2 is shown the XMCD spectra of the Nd L3,2-edges measured along the easy
magnetization axis at three different temperatures, 77 K, 180 K and RT. For these three temperatures
we did not observe any sizeable changes in the XANES spectra compared to the RT one. In the
following discussion we will focus essentially on the temperature dependence of the dipolar transition
of the L2-edge of Nd, which probes the 5d–states. These states are strongly polarized due to the
presence of a localized 4f magnetic moment at the Nd atoms via the Nd(4f)-Nd(5d) exchange
interaction. Along the easy magnetization axis, we observe a sizeable dependence of the main peak with
temperature. The main peak intensity increases with decreasing temperature. The signal increases at 180
K by ~39% compared to the one recorded at RT, whereas it increases by 49% at 77 K. Generally
speaking, the XMCD intensity is proportional to the atomic magnetization projection along the incident
x-ray beam direction. Since the XMCD technique is a vectorial magnetometry tool, changes in the
XMCD intensity with temperature may reflect a corresponding change in the direction of the atomic
magnetization and/or the temperature dependence of the magnetization. That increase with lowering the
temperature may be due, at a first glance, to the temperature dependence of the magnetization (the
Curie temperature is 437 K), however at this stage it cannot be excluded safely that the difference
reveals the existence of a Spin Reorientation Transition (SRT). It is of importance to notice that the
shape and the sign of the whole spectra are not modified showing that the Nd magnetic exchange
coupling is the same in all temperatures.
If one looks to the XMCD signal of the L2-edge corresponding to the quadrupolar transitions, the
negative peak has practically a stable intensity. For the L3-edge spectra the negative and positive peaks
6.20 6.22 6.24 6.72 6.74 6.76-1
0
1
2
3
4
Photon Energy (keV)
RT
180 K
77 K
Nd L2-edge
Nd L3-edge
XM
CD
sig
nal
x10
2
easy axis
3T

are weaker at room temperature in accordance with the L2-edge dipolar transition. In a detailed study of
the well known Nd2Fe14B rare earth transition metal compound which certainly exhibits a Spin
Reorientation Transition, Chaboy J et al. have noticed that the negative peak corresponding to
quadrupolar interaction weakens significantly above the SRT, both for the L2 and the L3 spectra [16].
They have indeed ascertained the multipolar nature of the different features in the XMCD spectra of Nd
L3,2-edges and verified that across the SRT, the dipolar and quadrupolar transitions possess different
angular dependence as expected theoretically [23]. In our case, at the L3-edge, the temperature
dependence of the XMCD signal, both dipolar and quadrupolar parts, scales linearly well with the
dipolar transition observed at the L2-edge. Since the L3-edge quadrupolar and dipolar transitions and the
L2-edge dipolar transitions exhibit the same temperature dependence within the experimental accuracy,
it means clearly that there is no SRT within the temperature range from RT to 77K. It follows the
temperature dependence of the macroscopic magnetization. The situation for the quadrupolar transitions
at the L2-edge is more ambiguous since they do not change with temperature.
Figure 3. Temperature dependence
of the Nd L3,2-edges XMCD spectra of
Nd3Fe27.5Ti1.5 compound measured along
the hard magnetization axis under 3T
magnetic field at 295K (red solid line),
180K (green doted line) and 77K (blue
dashed line).
The XMCD spectra recorded at Nd L3,2-edges measured along the hard magnetization axis at
three different temperatures, 77 K, 180 K and RT are presented in figure 3. The main characteristics of
the XMCD spectra are the same as those corresponding to the easy magnetization axis. The most
notable feature is the less pronounced increase of the L2 main positive peak (dipolar transition) at low
temperature compared to the easy-axis. At low temperature, the XMCD intensity for the hard- and easy-
axis are 3.2x10⁻² and 4.1x10⁻², respectively, compared to the edge jump. This difference may be due to
the non-saturation of the magnetization under 3 T external magnetic field. We observe the same
tendency within the measurement’s accuracy at the L3-edge of Nd. A small temperature variation in the
XMCD spectra at both L3 and L2 –edges is observed. Like for the easy-axis, the quadrupolar and dipolar
transitions follow the same temperature variation that confirms that there is no SRT. In figure 4 the
field dependence of the maximum XMCD intensity at the Nd L2-edge along the easy- and hard-axis is
shown. This field dependence of the Nd magnetization follows the macroscopic magnetization curve.
Along the easy-axis, the curvature of the Nd magnetization curve is the same for the three temperatures.
No peculiarity is observed. Both Nd magnetization curves at RT correspond to the macroscopic ones
measured by SQUID [2].
Figure 4. Magnetic field dependence of
the XMCD signal at the Nd L2-edge
(E=6.726keV) recorded along the easy
magnetization axis at 295K (full red circle), at
180K (full green triangle) and 77K (full blue
square). For comparison, is also plotted the
magnetic field dependence of the XMCD
signal at the Nd L2-edge recorded along the
hard magnetization axis at 295K (open red
circle).
6.20 6.22 6.24 6.72 6.74 6.76-1
0
1
2
3
4
RT
180 K
77 Khard axis
3T
Nd L2 edge
Nd L3 edge
XM
CD
x1
02
Photon Energy (keV)
-3 -2 -1 0 1 2 3
-4
-2
0
2
4
hard axis
295K
easy axis
295K
180 K
77 K
XM
CD
x 1
0-2
Magnetic Field (Tesla)
Nd L2-edge
E=6.726keV
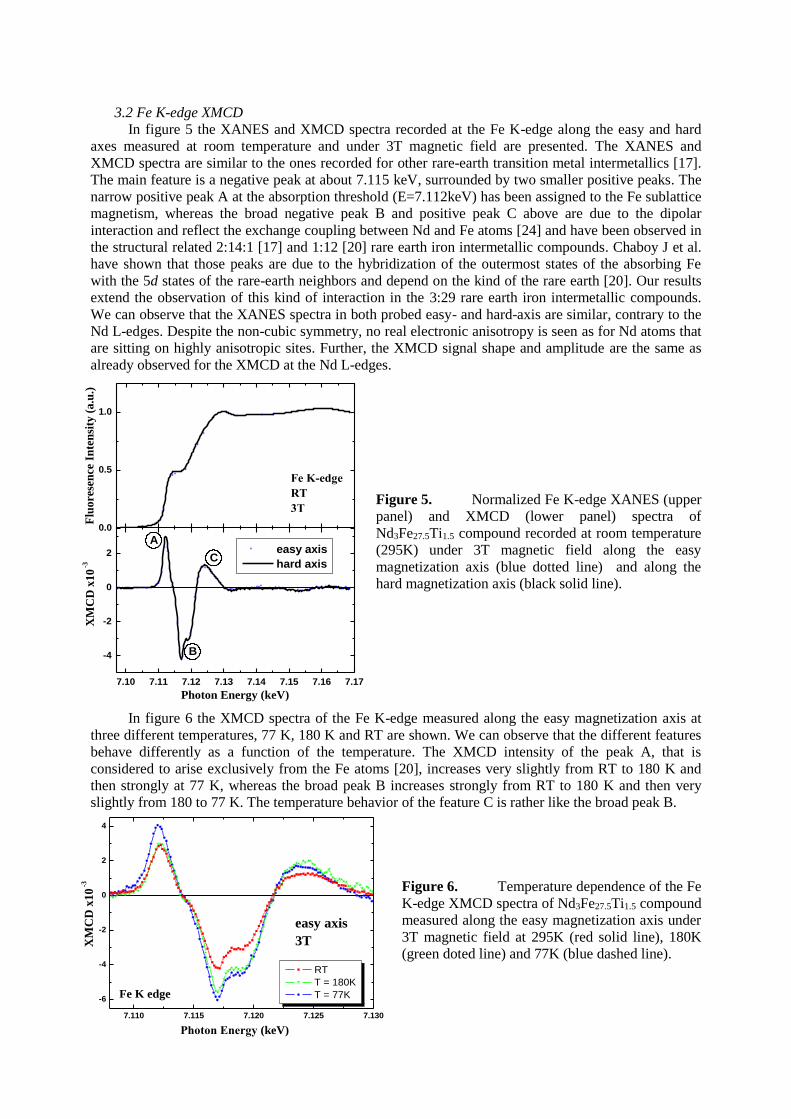
3.2 Fe K-edge XMCD
In figure 5 the XANES and XMCD spectra recorded at the Fe K-edge along the easy and hard
axes measured at room temperature and under 3T magnetic field are presented. The XANES and
XMCD spectra are similar to the ones recorded for other rare-earth transition metal intermetallics [17].
The main feature is a negative peak at about 7.115 keV, surrounded by two smaller positive peaks. The
narrow positive peak A at the absorption threshold (E=7.112keV) has been assigned to the Fe sublattice
magnetism, whereas the broad negative peak B and positive peak C above are due to the dipolar
interaction and reflect the exchange coupling between Nd and Fe atoms [24] and have been observed in
the structural related 2:14:1 [17] and 1:12 [20] rare earth iron intermetallic compounds. Chaboy J et al.
have shown that those peaks are due to the hybridization of the outermost states of the absorbing Fe
with the 5d states of the rare-earth neighbors and depend on the kind of the rare earth [20]. Our results
extend the observation of this kind of interaction in the 3:29 rare earth iron intermetallic compounds.
We can observe that the XANES spectra in both probed easy- and hard-axis are similar, contrary to the
Nd L-edges. Despite the non-cubic symmetry, no real electronic anisotropy is seen as for Nd atoms that
are sitting on highly anisotropic sites. Further, the XMCD signal shape and amplitude are the same as
already observed for the XMCD at the Nd L-edges.
Figure 5. Normalized Fe K-edge XANES (upper
panel) and XMCD (lower panel) spectra of
Nd3Fe27.5Ti1.5 compound recorded at room temperature
(295K) under 3T magnetic field along the easy
magnetization axis (blue dotted line) and along the
hard magnetization axis (black solid line).
In figure 6 the XMCD spectra of the Fe K-edge measured along the easy magnetization axis at
three different temperatures, 77 K, 180 K and RT are shown. We can observe that the different features
behave differently as a function of the temperature. The XMCD intensity of the peak A, that is
considered to arise exclusively from the Fe atoms [20], increases very slightly from RT to 180 K and
then strongly at 77 K, whereas the broad peak B increases strongly from RT to 180 K and then very
slightly from 180 to 77 K. The temperature behavior of the feature C is rather like the broad peak B.
Figure 6. Temperature dependence of the Fe
K-edge XMCD spectra of Nd3Fe27.5Ti1.5 compound
measured along the easy magnetization axis under
3T magnetic field at 295K (red solid line), 180K
(green doted line) and 77K (blue dashed line).
0.0
0.5
1.0
7.10 7.11 7.12 7.13 7.14 7.15 7.16 7.17
-4
-2
0
2
Photon Energy (keV)
A easy axis
hard axis
Flu
ore
sen
ce I
nte
nsi
ty (
a.u
.)X
MC
D x
10
-3
Fe K-edge
RT
3T
B
C
7.110 7.115 7.120 7.125 7.130
-6
-4
-2
0
2
4
RT
T = 180K
T = 77K
Photon Energy (keV)
Fe K edge
XM
CD
x1
0-3
easy axis
3T
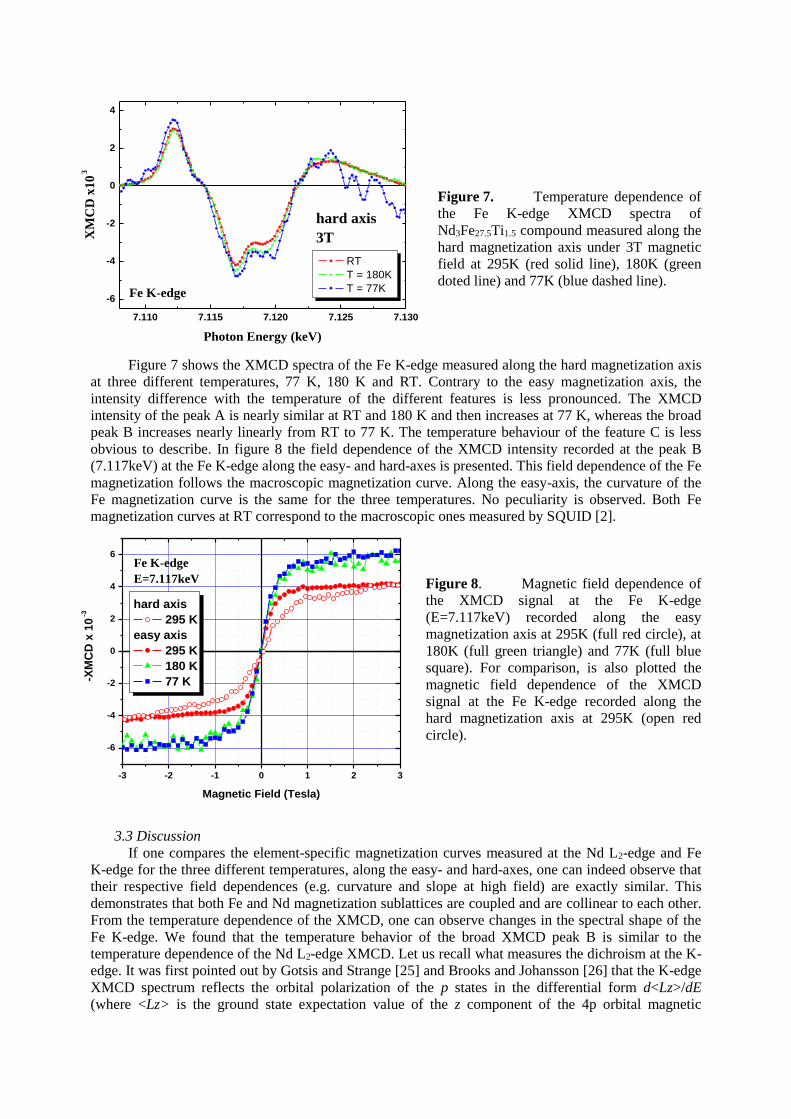
Figure 7. Temperature dependence of
the Fe K-edge XMCD spectra of
Nd3Fe27.5Ti1.5 compound measured along the
hard magnetization axis under 3T magnetic
field at 295K (red solid line), 180K (green
doted line) and 77K (blue dashed line).
Figure 7 shows the XMCD spectra of the Fe K-edge measured along the hard magnetization axis
at three different temperatures, 77 K, 180 K and RT. Contrary to the easy magnetization axis, the
intensity difference with the temperature of the different features is less pronounced. The XMCD
intensity of the peak A is nearly similar at RT and 180 K and then increases at 77 K, whereas the broad
peak B increases nearly linearly from RT to 77 K. The temperature behaviour of the feature C is less
obvious to describe. In figure 8 the field dependence of the XMCD intensity recorded at the peak B
(7.117keV) at the Fe K-edge along the easy- and hard-axes is presented. This field dependence of the Fe
magnetization follows the macroscopic magnetization curve. Along the easy-axis, the curvature of the
Fe magnetization curve is the same for the three temperatures. No peculiarity is observed. Both Fe
magnetization curves at RT correspond to the macroscopic ones measured by SQUID [2].
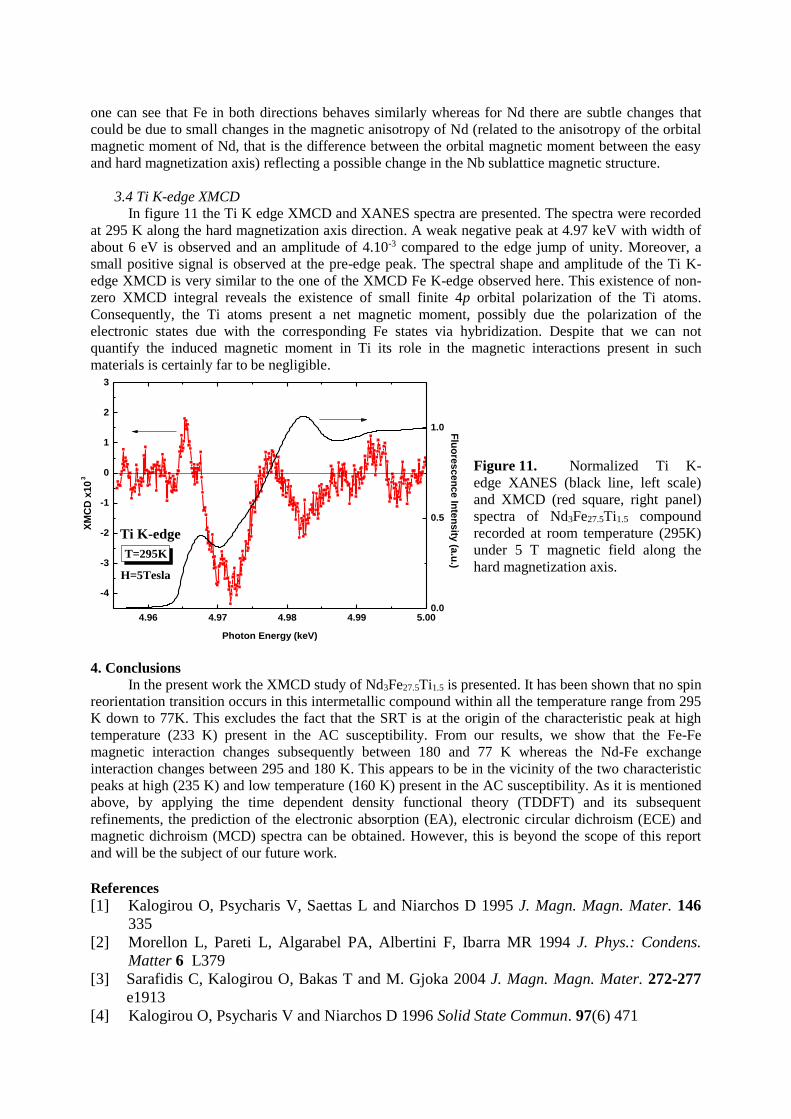
Figure 8. Magnetic field dependence of
the XMCD signal at the Fe K-edge
(E=7.117keV) recorded along the easy
magnetization axis at 295K (full red circle), at
180K (full green triangle) and 77K (full blue
square). For comparison, is also plotted the
magnetic field dependence of the XMCD
signal at the Fe K-edge recorded along the
hard magnetization axis at 295K (open red
circle).
3.3 Discussion
If one compares the element-specific magnetization curves measured at the Nd L2-edge and Fe
K-edge for the three different temperatures, along the easy- and hard-axes, one can indeed observe that
their respective field dependences (e.g. curvature and slope at high field) are exactly similar. This
demonstrates that both Fe and Nd magnetization sublattices are coupled and are collinear to each other.
From the temperature dependence of the XMCD, one can observe changes in the spectral shape of the
Fe K-edge. We found that the temperature behavior of the broad XMCD peak B is similar to the
temperature dependence of the Nd L2-edge XMCD. Let us recall what measures the dichroism at the K-
edge. It was first pointed out by Gotsis and Strange [25] and Brooks and Johansson [26] that the K-edge
XMCD spectrum reflects the orbital polarization of the p states in the differential form d<Lz>/dE
(where <Lz> is the ground state expectation value of the z component of the 4p orbital magnetic
7.110 7.115 7.120 7.125 7.130
-6
-4
-2
0
2
4
hard axis
3T
Fe K-edge
XM
CD
x10
3
Photon Energy (keV)
RT
T = 180K
T = 77K
-3 -2 -1 0 1 2 3
-6
-4
-2
0
2
4
6
hard axis
295 K
easy axis
295 K
180 K
77 K
-XM
CD
x 1
0-3
Magnetic Field (Tesla)
Fe K-edge
E=7.117keV

moment). In its integral form, the XMCD at the K-edge is then a measure of the orbital magnetism of
the 4p-shell of Fe (considering only dipolar transitions). This leads to a rather simple and
straightforward interpretation of the Fe XMCD spectrum at the K edge [27,28]. The orbital polarization
in the p symmetric states is in our case induced by the spin polarization in the p symmetric states
through the spin-orbit interaction, and also by the orbital polarization at neighbouring sites through
hybridization [27]. In figure 9, we have plotted the normalized (to RT) XMCD intensity as a function of
the temperature of peak A (7.112eV), peak B (7.117eV) and the XMCD integral at the Fe K-edge in
comparison to the maximum XMCD intensity at the Nd L2-edge along the easy magnetization axis. We
can observe that the intensity variation with temperature of the XMCD peak B at the Fe K-edge XMCD
and the maximum XMCD signal at the Nd L2-edge are similar. Since the origin of the peak B in the Fe
K-edge XMCD is mainly due to the orbital polarization of the neighbouring Nd sites via the Fe(3d)-
Nd(5d) hybridization, it is therefore not surprising that it follows the same thermal dependence of the
Nd sublattice magnetization. The temperature dependence of the peak A in the XMCD at the Fe K-edge
does not follow the Nd sublattice magnetization. The origin of the peak A in the Fe K-edge XMCD, as
mentioned above, is essentially due to the 3d orbital polarization at neighboring Fe sites that induces the
orbital polarization through the p-d hybridization [27]. We have then also represented the integral of the
Fe K-edge XMCD since it reflects the orbital magnetization. There we see that the 4p orbital
polarization (and consequently the magnetization) of the Fe sublattice follows similarly the temperature
dependence of the Nd sublattice magnetization. We can notice that a change in the Nd-Fe exchange
interaction appears between RT and 180 K whereas a change in the Fe-Fe magnetic interaction appears
below, between 180 and 77 K. Those modifications appear in the vicinity of the two characteristic
temperature peaks in the AC susceptibility.
Figure 9. Temperature dependence of the
normalized ratio to 295K of the XMCD intensity
recorded at the Fe K-edge at peak A (triangle up),
peak B (triangle down) and the Fe K-edge XMCD
integral (open circle) in comparison to normalized
ratio to 295K of the XMCD signal at the Nd L2-
edge measured along the easy magnetization axis
under 3T.
Figure 10. Temperature dependence of the
normalized ratio to 295K of the XMCD intensity
recorded at the Fe K-edge at peak A (triangle up),
peak B (triangle down) and the Fe K-edge XMCD
integral (open circle) in comparison to normalized
ratio to 295K of the XMCD signal at the Nd L2-
edge measured along the hard magnetization axis
under 3T.
The same observations also apply for the spectra recorded along the hard magnetization axis
(figure 10). If one compares both temperature dependences along the easy and hard magnetization axis,
50 100 150 200 250 300
0.8
1.0
1.2
1.4
1.6
1.8
2.0
Fe K-edge
Integral
Peak A
Peak B
Nd L2-edge
E=6.726eV
rati
o X
MC
D/X
MC
D(2
95
K)
Temperature (K)
easy axis
50 100 150 200 250 300
0.8
1.0
1.2
1.4
1.6
1.8
2.0
Fe K-edge
Integral
Peak A
Peak B
Nd L2-edge
E=6.726eV
rati
o X
MC
D/X
MC
D(2
95
K)
Temperature (K)
hard axis
one can see that Fe in both directions behaves similarly whereas for Nd there are subtle changes that
could be due to small changes in the magnetic anisotropy of Nd (related to the anisotropy of the orbital
magnetic moment of Nd, that is the difference between the orbital magnetic moment between the easy
and hard magnetization axis) reflecting a possible change in the Nb sublattice magnetic structure.
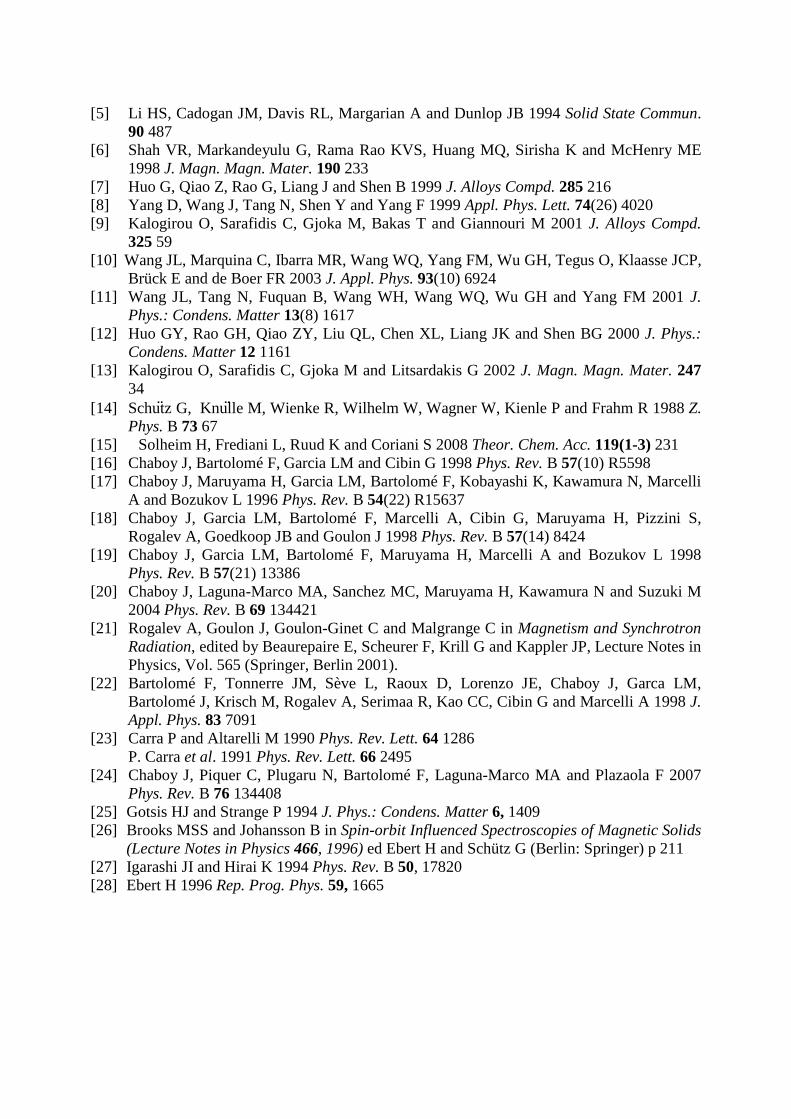
3.4 Ti K-edge XMCD
In figure 11 the Ti K edge XMCD and XANES spectra are presented. The spectra were recorded
at 295 K along the hard magnetization axis direction. A weak negative peak at 4.97 keV with width of
about 6 eV is observed and an amplitude of 4.10-3 compared to the edge jump of unity. Moreover, a
small positive signal is observed at the pre-edge peak. The spectral shape and amplitude of the Ti K-
edge XMCD is very similar to the one of the XMCD Fe K-edge observed here. This existence of non-
zero XMCD integral reveals the existence of small finite 4p orbital polarization of the Ti atoms.
Consequently, the Ti atoms present a net magnetic moment, possibly due the polarization of the
electronic states due with the corresponding Fe states via hybridization. Despite that we can not
quantify the induced magnetic moment in Ti its role in the magnetic interactions present in such
materials is certainly far to be negligible.
Figure 11. Normalized Ti K-
edge XANES (black line, left scale)
and XMCD (red square, right panel)
spectra of Nd3Fe27.5Ti1.5 compound
recorded at room temperature (295K)
under 5 T magnetic field along the
hard magnetization axis.
4. Conclusions
In the present work the XMCD study of Nd3Fe27.5Ti1.5 is presented. It has been shown that no spin
reorientation transition occurs in this intermetallic compound within all the temperature range from 295
K down to 77K. This excludes the fact that the SRT is at the origin of the characteristic peak at high
temperature (233 K) present in the AC susceptibility. From our results, we show that the Fe-Fe
magnetic interaction changes subsequently between 180 and 77 K whereas the Nd-Fe exchange
interaction changes between 295 and 180 K. This appears to be in the vicinity of the two characteristic
peaks at high (235 K) and low temperature (160 K) present in the AC susceptibility. As it is mentioned
above, by applying the time dependent density functional theory (TDDFT) and its subsequent
refinements, the prediction of the electronic absorption (EA), electronic circular dichroism (ECE) and
magnetic dichroism (MCD) spectra can be obtained. However, this is beyond the scope of this report
and will be the subject of our future work.
References
[1] Kalogirou O, Psycharis V, Saettas L and Niarchos D 1995 J. Magn. Magn. Mater. 146
335
[2] Morellon L, Pareti L, Algarabel PA, Albertini F, Ibarra MR 1994 J. Phys.: Condens.
Matter 6 L379
[3] Sarafidis C, Kalogirou O, Bakas T and M. Gjoka 2004 J. Magn. Magn. Mater. 272-277
e1913
[4] Kalogirou O, Psycharis V and Niarchos D 1996 Solid State Commun. 97(6) 471
4.96 4.97 4.98 4.99 5.00
-4
-3
-2
-1
0
1
2
3
Photon Energy (keV)
XM
CD
x1
03
H=5Tesla
Ti K-edge
T=295K
0.0
0.5
1.0 Flu
ore
sc
en
ce
Inte
ns
ity (a
.u.)
[5] Li HS, Cadogan JM, Davis RL, Margarian A and Dunlop JB 1994 Solid State Commun.
90 487
[6] Shah VR, Markandeyulu G, Rama Rao KVS, Huang MQ, Sirisha K and McHenry ME
1998 J. Magn. Magn. Mater. 190 233
[7] Huo G, Qiao Z, Rao G, Liang J and Shen B 1999 J. Alloys Compd. 285 216
[8] Yang D, Wang J, Tang N, Shen Y and Yang F 1999 Appl. Phys. Lett. 74(26) 4020
[9] Kalogirou O, Sarafidis C, Gjoka M, Bakas T and Giannouri M 2001 J. Alloys Compd.
325 59
[10] Wang JL, Marquina C, Ibarra MR, Wang WQ, Yang FM, Wu GH, Tegus O, Klaasse JCP,
Brück E and de Boer FR 2003 J. Appl. Phys. 93(10) 6924
[11] Wang JL, Tang N, Fuquan B, Wang WH, Wang WQ, Wu GH and Yang FM 2001 J.
Phys.: Condens. Matter 13(8) 1617
[12] Huo GY, Rao GH, Qiao ZY, Liu QL, Chen XL, Liang JK and Shen BG 2000 J. Phys.:
Condens. Matter 12 1161
[13] Kalogirou O, Sarafidis C, Gjoka M and Litsardakis G 2002 J. Magn. Magn. Mater. 247
34
[14] Schu tz G, Knulle M, Wienke R, Wilhelm W, Wagner W, Kienle P and Frahm R 1988 Z.
Phys. B 73 67
[15] Solheim H, Frediani L, Ruud K and Coriani S 2008 Theor. Chem. Acc. 119(1-3) 231
[16] Chaboy J, Bartolomé F, Garcia LM and Cibin G 1998 Phys. Rev. B 57(10) R5598
[17] Chaboy J, Maruyama H, Garcia LM, Bartolomé F, Kobayashi K, Kawamura N, Marcelli
A and Bozukov L 1996 Phys. Rev. B 54(22) R15637
[18] Chaboy J, Garcia LM, Bartolomé F, Marcelli A, Cibin G, Maruyama H, Pizzini S,
Rogalev A, Goedkoop JB and Goulon J 1998 Phys. Rev. B 57(14) 8424
[19] Chaboy J, Garcia LM, Bartolomé F, Maruyama H, Marcelli A and Bozukov L 1998
Phys. Rev. B 57(21) 13386
[20] Chaboy J, Laguna-Marco MA, Sanchez MC, Maruyama H, Kawamura N and Suzuki M
2004 Phys. Rev. B 69 134421
[21] Rogalev A, Goulon J, Goulon-Ginet C and Malgrange C in Magnetism and Synchrotron
Radiation, edited by Beaurepaire E, Scheurer F, Krill G and Kappler JP, Lecture Notes in
Physics, Vol. 565 (Springer, Berlin 2001).
[22] Bartolomé F, Tonnerre JM, Sève L, Raoux D, Lorenzo JE, Chaboy J, Garca LM,
Bartolomé J, Krisch M, Rogalev A, Serimaa R, Kao CC, Cibin G and Marcelli A 1998 J.
Appl. Phys. 83 7091
[23] Carra P and Altarelli M 1990 Phys. Rev. Lett. 64 1286
P. Carra et al. 1991 Phys. Rev. Lett. 66 2495
[24] Chaboy J, Piquer C, Plugaru N, Bartolomé F, Laguna-Marco MA and Plazaola F 2007
Phys. Rev. B 76 134408
[25] Gotsis HJ and Strange P 1994 J. Phys.: Condens. Matter 6, 1409
[26] Brooks MSS and Johansson B in Spin-orbit Influenced Spectroscopies of Magnetic Solids
(Lecture Notes in Physics 466, 1996) ed Ebert H and Schütz G (Berlin: Springer) p 211
[27] Igarashi JI and Hirai K 1994 Phys. Rev. B 50, 17820
[28] Ebert H 1996 Rep. Prog. Phys. 59, 1665