Magnetic and structural studies on nanostructured Gd/Cr multilayer films
7
Magnetic and structural studies on nanostructured Gd/Cr multilayer films G.Z. Gadioli a , F.P. Rouxinol b, ⁎ ,1 , R.V. Gelamo c , L.P. Cardoso a , S. Gama d , M.A. Bica de Moraes a a Instituto de Física “Gleb Wataghin”, Universidade Estadual de Campinas, Campinas, SP 13083-970, Brazil b Center of Semiconductor Components, Universidade Estadual de Campinas, Campinas, SP 13083-970, Brazil c Instituto de Ciências Tecnológicas e Exatas, UFTM, Uberaba, MG 38064-200, Brazil d Universidade Federal de São Paulo, Diadema, SP 09972-270, Brazil abstract article info Article history: Received 9 August 2012 Received in revised form 22 July 2013 Accepted 24 July 2013 Available online 2 August 2013 Keywords: A. Magnetic intermetallics A. Nanostructured intermetallics B. Magnetic properties B. Texture C. Nanocrystals C. Thin films D. Microstructure G. Magnetic applications Investigations of magnetic phases, transition temperatures and coercivity were performed in multilayered Gd/Cr films as a function of the crystalline state and morphology of the Gd layers. The films were deposited by dc mag- netron sputtering at three substrate temperatures, T s , (room temperature, 300 and 500 °C). The Gd and Cr thick- nesses were of 10 and 30 nm, respectively. Two series of three films were prepared. In one of the series, the films had a single Gd/Cr bilayer; in the other, 15 bilayers. The discontinuous or granular nature of the Gd layers was revealed by scanning electron microscopy Grazing incidence angle x-ray diffraction was used to investigate the crystalline state of the Gd and Cr layers. These techniques revealed that grain average size and crystalline order increase with increasing T s . From dc magnetic measurements, the co-existence of ferromagnetic and superferromagnetic phases in the Gd layers was observed, and Curie transition temperatures, T C , were deter- mined. High coercive fields at low temperature (2 K) were measured in hysteresis cycles. Field-cooled and zero field-cooled magnetizations as functions of temperature curves exhibited, for some of the samples, a low temperature peak suggesting a freezing transition to a cluster glass state. This was confirmed by complementary ac-susceptibility measurements carried out as a function of temperature, for various frequencies of the ac field. Some results of this work – the decline in T C for decreasing Gd grain size, the high coercive field and its depen- dence on particle size, and the behavior of the magnetization at low temperatures for the sample deposited at room temperature – are discussed in terms of finite size and surface effects in nanosized particles. Published by Elsevier B.V. 1. Introduction In granular magnetic materials whose grain sizes are in the nanome- ter range, finite-size effects play an important role, as properties such as spontaneous magnetization, critical temperatures, and coercivity are different than those of the same material in bulk [1,2]. Below a critical size, nanoparticles may become single-domain, exhibiting unique phe- nomena such as superparamagnetism [3], superferromagnetism [4], quantum tunneling of the magnetization [5], and giant magnetoresis- tance [6]. Surface effects, on the other hand, usually contribute to the magnetic behavior of nanoparticles. Owing to symmetry breaking in the particle boundary region, the surface atoms experience an environ- ment different than that in the core of the particles and one of the con- sequences can be an anisotropy of the surface layer that by far exceeds the core anisotropy [7,8]. Furthermore, structural distortions in the boundary layer may lead to antiferromagnetic coupling and frustration giving rise to spin-glass [9] and cluster-glass [10] states and decreases in the Curie transition temperature [11]. Clearly, the contribution of the surface effects to the particle magnetism is more important in small par- ticles because the fraction of the atoms at the surface increases as parti- cle size is reduced. To investigate the magnetic properties of nanostructured densely packed granular Gd and their dependence on grain, or particle size and crystalline order, we have deposited Gd/Cr multilayer films by mag- netron sputtering with Gd layer thickness of 10 nm at various substrate temperatures, T s . The reason for performing this study in such multilay- er structures is linked to the difficulty, often encountered, to investigate extremely thin single-layer granular Gd films because of their weak sig- nal in magnetic measurements due to the low sample magnetic mo- ment. Attempts to deposit thicker single-layer granular films and at the same time keeping their grains under some predetermined sizes are extremely difficult. The Gd grain size increases with layer thickness, and above some given thickness a continuous layer is formed. These dif- ficulties can be avoided employing a Gd/Me multilayer film structure where Me is another metal. In such a structure, the Gd mass can be in- creased according to the number of Gd layers, while grain size is kept under control by the adjustment of the Gd layer thickness. As for Me, we have chosen Cr, as it is mutually insoluble with Gd under equilibri- um conditions, thus avoiding changes in the Gd magnetic properties due to alloying with Cr. It should be remembered that Cr is an antiferro- magnetic metal whose Néel temperature is 34.9 °C. However, as Thin Solid Films 545 (2013) 496–502 ⁎ Corresponding author. Tel.: +1 315 7067991. E-mail address: rouxinol@ifi.unicamp.br (F.P. Rouxinol). 1 Present address: Department of Physics, Syracuse University, Syracuse, NY 13244, USA. 0040-6090/$ – see front matter. Published by Elsevier B.V. http://dx.doi.org/10.1016/j.tsf.2013.07.066 Contents lists available at ScienceDirect Thin Solid Films journal homepage: www.elsevier.com/locate/tsf
Transcript of Magnetic and structural studies on nanostructured Gd/Cr multilayer films

Thin Solid Films 545 (2013) 496–502
Contents lists available at ScienceDirect
Thin Solid Films
j ourna l homepage: www.e lsev ie r .com/ locate / ts f
Magnetic and structural studies on nanostructured Gd/Cr multilayer films
G.Z. Gadioli a, F.P. Rouxinol b,⁎,1, R.V. Gelamo c, L.P. Cardoso a, S. Gama d, M.A. Bica de Moraes a
a Instituto de Física “Gleb Wataghin”, Universidade Estadual de Campinas, Campinas, SP 13083-970, Brazilb Center of Semiconductor Components, Universidade Estadual de Campinas, Campinas, SP 13083-970, Brazilc Instituto de Ciências Tecnológicas e Exatas, UFTM, Uberaba, MG 38064-200, Brazild Universidade Federal de São Paulo, Diadema, SP 09972-270, Brazil
⁎ Corresponding author. Tel.: +1 315 7067991.E-mail address: [email protected] (F.P. Rouxino
1 Present address: Department of Physics, Syracuse UUSA.
0040-6090/$ – see front matter. Published by Elsevier B.Vhttp://dx.doi.org/10.1016/j.tsf.2013.07.066
a b s t r a c t
a r t i c l e i n f oArticle history:Received 9 August 2012Received in revised form 22 July 2013Accepted 24 July 2013Available online 2 August 2013
Keywords:A. Magnetic intermetallicsA. Nanostructured intermetallicsB. Magnetic propertiesB. TextureC. NanocrystalsC. Thin filmsD. MicrostructureG. Magnetic applications
Investigations of magnetic phases, transition temperatures and coercivity were performed inmultilayered Gd/Crfilms as a function of the crystalline state andmorphology of the Gd layers. The films were deposited by dcmag-netron sputtering at three substrate temperatures, Ts, (room temperature, 300 and 500 °C). The Gd and Cr thick-nesseswere of 10 and 30 nm, respectively. Two series of three films were prepared. In one of the series, the filmshad a single Gd/Cr bilayer; in the other, 15 bilayers. The discontinuous or granular nature of the Gd layers wasrevealed by scanning electron microscopy Grazing incidence angle x-ray diffraction was used to investigate thecrystalline state of the Gd and Cr layers. These techniques revealed that grain average size and crystallineorder increase with increasing Ts. From dc magnetic measurements, the co-existence of ferromagnetic andsuperferromagnetic phases in the Gd layers was observed, and Curie transition temperatures, TC, were deter-mined. High coercive fields at low temperature (2 K) were measured in hysteresis cycles. Field-cooled andzero field-cooled magnetizations as functions of temperature curves exhibited, for some of the samples, a lowtemperature peak suggesting a freezing transition to a cluster glass state. This was confirmed by complementaryac-susceptibility measurements carried out as a function of temperature, for various frequencies of the ac field.Some results of this work – the decline in TC for decreasing Gd grain size, the high coercive field and its depen-dence on particle size, and the behavior of the magnetization at low temperatures for the sample deposited atroom temperature – are discussed in terms of finite size and surface effects in nanosized particles.
Published by Elsevier B.V.
1. Introduction
In granularmagneticmaterials whose grain sizes are in the nanome-ter range, finite-size effects play an important role, as properties such asspontaneous magnetization, critical temperatures, and coercivity aredifferent than those of the same material in bulk [1,2]. Below a criticalsize, nanoparticles may become single-domain, exhibiting unique phe-nomena such as superparamagnetism [3], superferromagnetism [4],quantum tunneling of the magnetization [5], and giant magnetoresis-tance [6]. Surface effects, on the other hand, usually contribute to themagnetic behavior of nanoparticles. Owing to symmetry breaking inthe particle boundary region, the surface atoms experience an environ-ment different than that in the core of the particles and one of the con-sequences can be an anisotropy of the surface layer that by far exceedsthe core anisotropy [7,8]. Furthermore, structural distortions in theboundary layer may lead to antiferromagnetic coupling and frustrationgiving rise to spin-glass [9] and cluster-glass [10] states and decreases inthe Curie transition temperature [11]. Clearly, the contribution of the
l).niversity, Syracuse, NY 13244,
.
surface effects to the particlemagnetism ismore important in small par-ticles because the fraction of the atoms at the surface increases as parti-cle size is reduced.
To investigate the magnetic properties of nanostructured denselypacked granular Gd and their dependence on grain, or particle sizeand crystalline order, we have depositedGd/Crmultilayer films bymag-netron sputteringwith Gd layer thickness of 10 nm at various substratetemperatures, Ts. The reason for performing this study in suchmultilay-er structures is linked to the difficulty, often encountered, to investigateextremely thin single-layer granular Gd films because of their weak sig-nal in magnetic measurements due to the low sample magnetic mo-ment. Attempts to deposit thicker single-layer granular films and atthe same time keeping their grains under some predetermined sizesare extremely difficult. The Gd grain size increases with layer thickness,and above some given thickness a continuous layer is formed. These dif-ficulties can be avoided employing a Gd/Me multilayer film structurewhere Me is another metal. In such a structure, the Gd mass can be in-creased according to the number of Gd layers, while grain size is keptunder control by the adjustment of the Gd layer thickness. As for Me,we have chosen Cr, as it is mutually insoluble with Gd under equilibri-um conditions, thus avoiding changes in the Gd magnetic propertiesdue to alloyingwith Cr. It should be remembered that Cr is an antiferro-magnetic metal whose Néel temperature is 34.9 °C. However, as

Fig. 1. SEM pictures of the Gd layer of double-layered Gd/Cr films deposited at roomtemperature (a), 300 °C (b), and 500 °C (c).
497G.Z. Gadioli et al. / Thin Solid Films 545 (2013) 496–502
demonstrated in this investigation, there is no contribution of the Crlayers to the magnetization of the samples or to interfacial effects suchas exchange anisotropy.
The investigations were carried out in a number of samples deposit-ed at temperatures ranging from near-room temperature (about 30 °C)to 500 °C. Scanning electron microscopy (SEM) and grazing incidenceangle x-ray diffraction (GIAXRD) were used for morphological andstructural characterizations, respectively, while static (dc) and ac mag-netometries were employed for the magnetic measurements.
2. Experimental details
Filmswere grown by dcmagnetron sputtering fromGd (99.9% pure)and Cr (99.95% pure) targets in an ultrahigh vacuum chamber, at an Arpressure of 0.67 Pa (5 mTorr). All depositions were carried out at thesame target voltages (−338 and −367 V for the Gd and Cr targets,respectively). During deposition, the substrates (Si (001), 0.5 mmthick)were kept onto a resistively heated sample holderwhose temper-ature could be controlled to ±1 °C from ambient to 550 °C. Film thick-nesses were measured using a quartz crystal microbalance. Two sets ofGd/Cr films whose Gd and Cr layer thicknesses were 10 and 30 nm, re-spectively, were prepared. The first set was used for morphological in-vestigations. It was composed of films of a single Gd/Cr bilayer withthe uppermost layer of Gd, deposited with the substrate at nearlyroom temperature and at the temperatures of 300 and 500 °C. The sec-ond set consisted of three films of 15 Gd/Cr bilayers with the uppermostlayer of Cr. As in the first set, depositions were carried out at room tem-perature, and at Ts = 300 and 500 °C. The samples of this second setwill be termed GC030, GC300 and GC500, where the three digits specifythe substrate temperature in °C. The crystalline structure characteriza-tion and the magnetic measurements were performed in this latter set.
The film microstructure was characterized by SEM. To determineparticle average sizes of the samples, a software [12] has been used.The measurements were made using the SEM digital files. In the SEMimages in the monitor screen, a number of particles were chosen, andtheir sizes were individually measured and stored. From these data,the average particle size and their standard deviation were determined.
The crystalline structure was investigated by GIAXRD (θ ≈ 5°)employing CuKα radiation (λ = 0.15418 nm). The reflected beam in-tensity was measured in the 2θ-interval ranging from 25 to 80° insteps of 0.02° with counting time of 3 s.
A superconducting quantum-interference device (SQUID)magnetom-eter was employed for measurements of magnetization,M, as a functionof applied field, H, and temperature, T. For the ac-susceptibility measure-ments, a physical property measurement system (PPMS) was used. Thereal part of the ac susceptibility was thus measured as a function oftemperature for various frequencies of an ac driving field of 0.1 kA/m(1 Oe) amplitude. Both SQUID and PPMSmeasurementswere performedwith applied magnetic fields parallel to the film surface, thus avoidingdemagnetizing corrections. The data were corrected for the magneticmoments of substrate and sample holders.
3. Results and discussion
3.1. Film morphology
The SEM micrographs of the Gd surface of the three Gd/Cr bilayerfilms are shown in Fig. 1. The granular nature of the Gd layer is clearlyseen in the micrographs that also reveal the dependence of the filmmorphology on Ts.
A densely packed system of Gd particles is seen in the film depositedat room temperature (RT) and at 500 °C. For the film grown at 300 °C,packing is not as dense, but the particles show some coalescence,forming “string-like” patterns. Particle average sizes, da, and their stan-dard deviations were determined from 30 particles. The da-values forfilms deposited at room temperature and 500 °C are 21 ± 2 and
66 ± 11 nm, respectively. For the film deposited at 300 °C, if individualparticles aremeasured, a da-value of 17 ± 2 nm is found, a figure lowerthan that of the film grown at RT. However, due to coalescence, theindividual particles in the “300 °C-film” compose systems that may betaken as large particles. Thus, the actual particle average what wehave considered, although difficult to determine, is greater than that

498 G.Z. Gadioli et al. / Thin Solid Films 545 (2013) 496–502
of the film deposited at RT, as we can readily see comparing Fig. 1a andb.
Finally, as Fig. 1c shows, there is a dramatic increase in particle sizeas Ts changes from 300 to 500 °C. Furthermore, a broad particle size dis-tribution is revealed in the latter micrograph.
The morphologies of Gd layer in the Gd/Cr bilayer films are notexpected to be identical to those in the 15-bilayer samples even whendepositions are performed under the same conditions (target voltages,Ar pressure and substrate temperature). In the 15 bilayer films, suchmi-crostructures may vary from the first to the uppermost Gd layer as thefilm is grown. Nevertheless, the micrographs of Fig. 1 show that a gran-ular Gd layer is formed when deposition is carried out at the above-specified parameters of Ar pressure and Gd target voltage.
3.2. Crystalline structure
The GIAXRD patterns of samples GC030, GC300 and GC500 areshown in Fig. 2. The pronounced peak at 2θ = 44.4° is assigned to Crwhereas the peaks in the 2θ-range of 28 to 33° are assigned to Gd.Other less intense Gd and Cr peaks are indicated in the figure.
Since the depositionswere carried out onto a single crystal substrate[Si (100)], it is interesting to speculate on the possibility of epitaxialgrowth of the Gd and Cr layers. In all films a Gd layer is the undermostlayer, i.e., the layer interfacing with the Si substrate. Consequently,some epitaxial growth may occur in it. However, the diffractograms ofFig. 2 do not show any evidence of such a growth, as the relative peakintensities and positions of Fig. 2 are according to those given in tablesfor polycrystalline Gd and Cr [PDF 00-002-0864 and 00-006-0694(ICDD, 2009)]. Furthermore, when metals are epitaxially grown on topof Si (100), relatively high intensity can occur in the metal peak around69.12°, due to the (400) reflection contribution of the Si substrate [13].However, under epitaxial growth it is also possible to observe a peak at32.96°, which is at the same angular position for the (200) Si reflection,through the secondary (111) strong intensity, under adequate substrateazimuthal positioning, due to x-ray multiple diffraction phenomenon[14]. The absence of these features in Fig. 2 is one more indication thatepitaxy does not exist, or it is not significant in our films.
In a material composed by nanoparticles, a highly disordered phaseassociated to the particle surfaces [15] and interfaces [16] is usuallypresent. Since the Gd layers are formed, at least in part, by nano-sizedparticles, such a phase is certainly present, contributing to the enlarge-ment and poor definition of theGd peaks as seen in Fig. 2. Since the frac-tion of the surface and interface atoms in the disordered phase dependson particle size, the contribution of the disordered phase to the GIAXRDpattern is expected to decreasewith increasing particle size. The data on
Fig. 2. GIAXRD patterns for Gd/Cr multilayer films. The 2θ-reflections of Gd and Cr areindicated by their Miller indices.
Fig. 2 is consistentwith these ideas that the Gd peaks become sharper asthe average particle size increases.
The broad feature in the interval 28–33° for GC030 indicates a lack oflong-range order in the Gd layer, i.e., an amorphous, or nearly amor-phous, state. However, the broad peak at 28–33° of sample GC030 splitsinto others whose sharpness are seen to increase from sample GC030 toGC500, evidencing that an increase of the long range order in the Gdlayers occurs with increasing substrate temperature.
3.3. Magnetization isotherms
Some representative magnetization isotherms, M × T, for samplesGC030, GC300 and GC500 are shown in Fig. 3. Ferromagnetism is indi-cated for GC300 and GC500 by the sharp increase of M with H at lowH in the low temperature isotherms. However, since saturation is notobserved even at a field of 40 kA/m (50 kOe) at least two magnetic
Fig. 3.Magnetization as a function of appliedfield for Gd/Cr samples at various temperatures.
499G.Z. Gadioli et al. / Thin Solid Films 545 (2013) 496–502
phases exist in the Gd layers. One is a true ferromagnetic (FM) phase,whose saturation at 40 kA/m (50 kOe) is highly probable. The other ispossibly a superferromagnetic (SFM) phase, formed by single-domainnanosized particles, coexisting with larger multidomain particles inthe Gd layers. In fact, the gentle curvatures of the high temperatureisotherms for GC300 and GC500 suggest the participation of single do-main particles in the magnetization process. A system of single domainmagnetic particles may show either a superparamagnetic (SPM) or asuperferromagnetic (SFM) behavior. In SPM there is nomagnetic inter-action between particles, while in SFM such an interaction (dipole and/or exchange) is present, giving rise to alignment of the magnetic mo-ments associated with the particles [4,17,18]. The close proximity ofthe Gd particles, as revealed by the SEM pictures of Fig. 1, strongly sug-gests that our Gd/Cr systems are superferromagnetic. In fact, a SFM be-havior has been attributed to films consisting of a Gd matrix withincorporated Gd oxide that can be described as a system of closely-spaced Gd clusters separated by the oxide [19]. It should, however, benoted that even in a SFM system, at high enough temperatures, thermalagitation may overcome the magnetic interaction energy, and the sys-tem becomes SPM.
As for sample GC030, at low fields, magnetization rises slowly withapplied field, a behavior that strongly indicates that a phase, otherthan the FM, is dominant in the Gd layers. However, we may speculateon the existence of a ferromagnetic phase in the sample, although notclearly indicated in Fig. 3a. Regarding this point, it is interesting toexamine a high temperature isotherm for GC030 such as that shownin Fig. 4. The existence of a FM phase is evidenced by the strong increaseof M with H for low H-values. However, the volume fraction of theFM phase is rather low, because the low temperature isothermsfor GC030, unlike those for GC300 and GC500, do not suggest a FMbehavior.
As previously discussed, the average size of the Gd particles in-creases with increasing deposition temperature. In larger particles, thedomain wall mobility is higher, implying that a greater magnetizationcan be attained at relatively low fields. In fact, comparing the M × Hisotherms for the three samples (Fig. 3), we can readily see that, forfields of a few kA/m (Oe), higher magnetization values are favored forsamples prepared at higher substrate temperatures.
3.4. Magnetization as a function of temperature
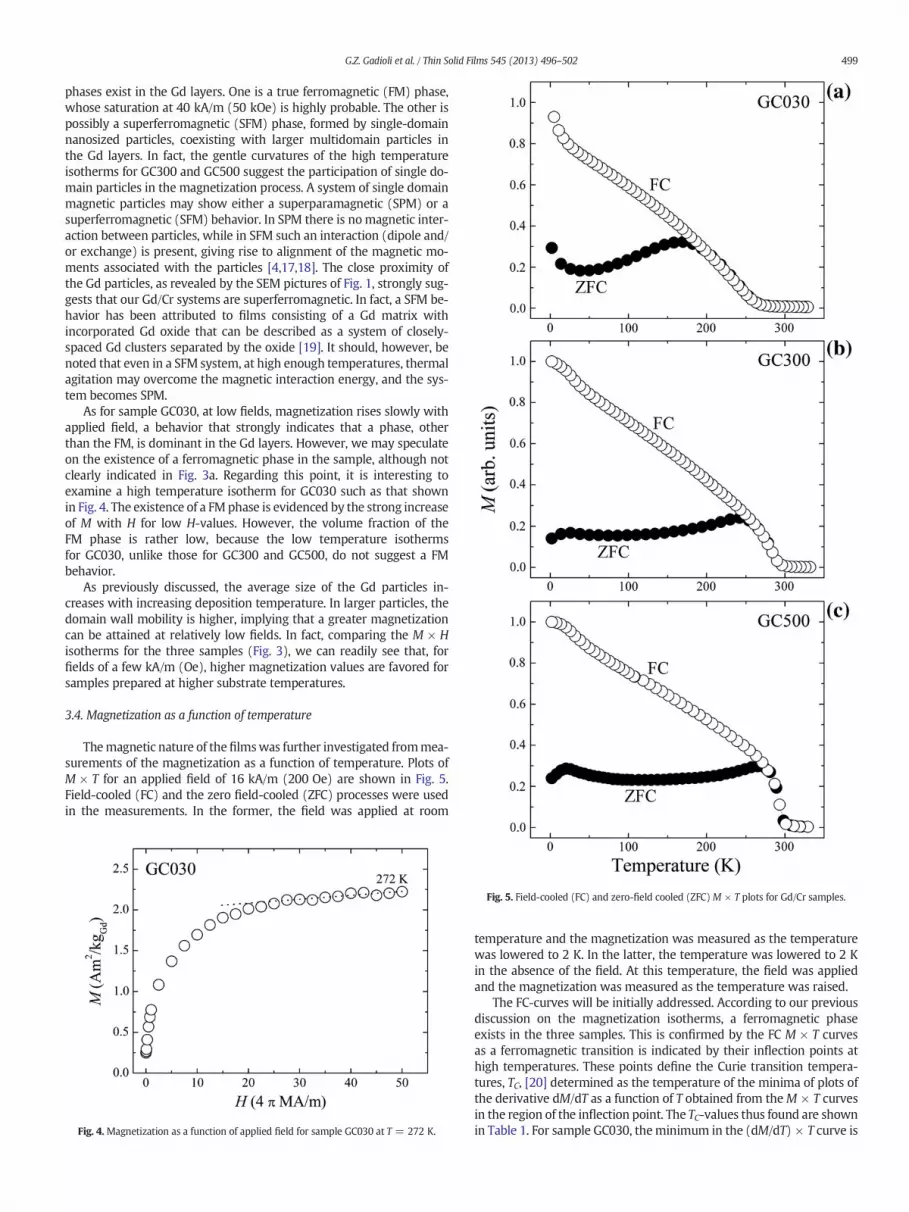
Themagnetic nature of the filmswas further investigated frommea-surements of the magnetization as a function of temperature. Plots ofM × T for an applied field of 16 kA/m (200 Oe) are shown in Fig. 5.Field-cooled (FC) and the zero field-cooled (ZFC) processes were usedin the measurements. In the former, the field was applied at room
Fig. 4.Magnetization as a function of applied field for sample GC030 at T = 272 K.
Fig. 5. Field-cooled (FC) and zero-field cooled (ZFC)M × T plots for Gd/Cr samples.
temperature and the magnetization was measured as the temperaturewas lowered to 2 K. In the latter, the temperature was lowered to 2 Kin the absence of the field. At this temperature, the field was appliedand the magnetization was measured as the temperature was raised.
The FC-curves will be initially addressed. According to our previousdiscussion on the magnetization isotherms, a ferromagnetic phaseexists in the three samples. This is confirmed by the FC M × T curvesas a ferromagnetic transition is indicated by their inflection points athigh temperatures. These points define the Curie transition tempera-tures, TC, [20] determined as the temperature of the minima of plots ofthe derivative dM/dT as a function of T obtained from theM × T curvesin the region of the inflection point. The TC-values thus found are shownin Table 1. For sample GC030, theminimum in the (dM/dT) × T curve is

Fig. 6. Plots of the real part of the ac-susceptibility as a function of temperature for Gd/Crsamples. The insets are expanded views of the peaks.
500 G.Z. Gadioli et al. / Thin Solid Films 545 (2013) 496–502
very broad, implying that TC is determined with a large error. The poorprecision in the determination of TC is a consequence of the previouslydiscussed weak ferromagnetic character of the sample.
The Curie point for GC500 is in excellent agreement with that forbulk Gd [21], but for samples GC030 and GC300 the TC-values arelower. Such a decrease can be readily interpreted as a consequence ofthe reduced size of the Gd particles. A system of nanometer-sized parti-cles, as that existing in the Gd layers of our samples, differ from bulk Gdin that the former has a much larger fraction of surface and interfaceatoms between grains. To these atoms, a less regular configuration is as-sociated, characterized by broken bonds and fluctuations in interatomicdistances and a lower number of nearest neighbors, Z. Since TC is pro-portional to Z [2], this is a reason for the decline of the Curie tempera-ture. The distribution of interatomic distances in the boundary layersmay also lead to another reason for the reduction in TC, as the couplingof magnetic moments of Gd is mediated by the RKKY interaction [22].Since such an interaction strongly depends on the interatomic distances,a significant decrease in TC is possible. The higher TC decrease for sampleGC030 is consistent with the above-discussed finite-size and surfaceeffects as it is the film with the highest fraction of surface atoms.
Aside from their usefulness in the determination of the Curie points,thus revealing the existence of ferromagnetic phases, the FCM × T plotsalso reveal the existence of the SFM phase as they exhibit a steep de-crease in M with T at low temperatures. This behavior is different fromthat of a simple ferromagnet, for which dependence of magnetizationon temperature at low temperatures is weak, as can be seen fromBloch's T3/2 law [23]. Thus, the magnetism of sample GC030, GC300and GC500, at low temperatures, is dominated by the SFM phase. Thisimplies that the volume fraction of the SFM phase is significant in allsamples.
As for the ZFCM × T curves of Fig. 5, it can be seen that they coincidewith the FC ones at high temperatures, but for decreasing temperaturesthey separate fromeach other at a given point, Tirr, thus evidencing ther-mal irreversibility. For T b Tirr the FC and ZFC magnetization difference,ΔM = MFC − MZFC, shows an overall increase as T decreases. Thisbehavior and the existence of low temperature (LT) peaks, as seen inthe ZFC curves of Fig. 5b and c, are typical of magnetic glasses (spinglasses (SG) or cluster glasses (CG)) [24,18] whose freezing points arethe peak temperatures. Thewell-separated temperature interval betweenTirr and the temperature at the LT maxima, T1, reveal a wide particle sizedistribution in our films. It should be noted that the ZFC M × T curvesfor SFM systems may also show a low temperature peak, indicating ablocking process [25]. Fortunately, from ac susceptibility measurementsin the regionswhere the peaks occur, it is possible to distinguish blockingfrom freezing, as it will be later discussed.
3.5. ac susceptibility measurements
Plots of the real part of the ac susceptibility, χ′, as a function of T forvarious frequencies, ν, of the driving field are shown in Fig. 6. Data wereacquired using the ZFC process. As can be seen in the curves, the intensi-ties of the peaks and the peak temperatures vary with frequency, imply-ing in the existence of relaxation effects in the three samples.
For each sample, the χ′ × T and the ZFC M × T plots are similar,as both exhibit the same number of peaks which occur at nearly thesame temperatures implying that the same physical effects are
Table 1Curie transition temperatures of Gd/Cr samples from FC M x T and χ′ x T plots.
Sample TC (K)a TC (K)b
GC030 250 ± 20 247 ± 2GC300 279 ± 4 280 ± 1GC500 292 ± 3 293 ± 1
a From field-cooledM × T plots.b From χ′ × T plots.
responsible for the appearance of low and high temperature (HT) max-ima. Thus, the HT peaks are associated to a ferromagnetic transition,while the LT peaks are assigned either to freezing or to blockingprocesses.
Theχ′ × T plots of Fig. 6 were used for another determination of theCurie temperatures, defined by the inflection point at the high temper-ature side of the HT peaks. The same procedure previously used in theFC M × T curves to determine TC was employed, and the results aregiven in Table 1. For samples GC300 andGC500, the agreement betweenthe Tc-values from theχ′ × T and FCM × T plots is excellent. It is inter-esting to note thatwhile a Curie point could only be obtainedwith large

Fig. 7.Hysteresis loops for Gd/Cr samples at the temperature of 2 K. An expanded view ofthe curves at low applied fields is shown in the inset.
501G.Z. Gadioli et al. / Thin Solid Films 545 (2013) 496–502
error from the FC M × T plot for GC030 (Fig. 5), it was, for this sample,determined with a much higher precision from the ac susceptibilitydata. From these results it can be seen that the measurements of χ′ asa function of T can be very useful in the determination of Curie temper-atures even in samples inwhich the content ofmaterial in the ferromag-netic phase is very low.
To verify if the LT peaks are associated to blocking or freezingprocesses, we have used a criterion based on the relative shift of theLT peak for a change in the frequency of the driving field. Such a shiftis defined by the well-known equation [25]
F ¼ ΔT1.
T mð Þ1 Δ log υð Þ½ � ð1Þ
where ΔT1 is the peak shift as the frequency changes from νi to νf,Δ(logν) = logνf − logνi, and T1
(m) is the arithmetic mean of the peaktemperatures between νi and νf. For spin glass or spin glass-like freez-ing, F is typically in the range 5 × 10⁻³ to 5 × 10⁻², while for blocking,F is of the order of 0.1.
For samples GC300 and GC500 the parameter F calculated from thedata displayed in the graphs of Fig. 6 was 0.011 and 0.053, respectively.Thus, the LT peak temperatures for these samples are freezing temper-atures revealing magnetic glass transitions. A similar behavior wasseen in our previous investigation in films of Gd particles embeddedin tungsten [26]. The peak shapes of Fig. 6, however, do not indicate aspin glass transition. Transitions of this kind are characterized bysharp peaks [27,28]whereas those for GC300 andGC500 are broad, con-sistent with a cluster glass transition. In fact, in Fig. 5 we can see that fortemperatures lower than the irreversible point, Tirr, an overall growth inΔM (the magnetization difference between the FC and ZFC curves for agiven temperature) occurs for the field-cooled process. This result canreadily be interpreted in terms of a cluster size distribution. At T = Tirrthe larger clusters begin to freeze and, as temperature is decreased,more and more clusters become frozen as their sizes decrease.
Clearly, the analysis above does not necessarily apply to the GC030sample, as itsχ′ × T plot, unlike the other two samples, does not exhibita low temperature peak in the range of temperatures investigated inthis work. However, in the latter plot, as in the ZFC M × T curve(Fig. 5a), a sharp increase in magnetization with decreasing tempera-ture is noted at low temperatures. It seems that, if the measurementswere carried out at temperatures below 2 K (the lowest temperatureof our measurements) a peak, necessarily very narrow, would ap-pear characterizing a spin glass transition. Very narrow peaks atlow temperatures have been observed for cobalt and cobalt-covered[9] nanoparticles and they are assigned to freezing of a spin glass asso-ciated to disordered spins at the particle surfaces and interfaces. It isthus possible that such a spin phase exists in GC030, being responsiblefor the steep branch of their χ′ × T and ZFC M × T curves seen at lowtemperatures. It should be remembered that, amongst the three sam-ples, GC030 is the one having the lowest order/disorder phase ratio inthe Gd layers and, consequently, is where the surface-phase effectmust be the most significant. This would explain the different shapesof the χ′ × T or ZFC M × T curves for GC030 with respect to those ofthe other samples.
3.6. Coercive fields
The coercivity of the Gd/Cr films was investigated from the M × Hisotherm cycles at 2 K. The FC process was used, i.e., a 40 kA/m(50 Oe) field was applied at room temperature, the sample was cooledto 2 K under this field, and subsequentially the field was cycled in therange−40 (−50) to 40 (50) kA/m (Oe). The results are shown in Fig. 7.
The absolute values of the coercive field,Hc− andHc
+, obtained fromthe upper and lower branches of the isotherms, respectively, are givenin Table 2, which also shows the average coercive field, Hc. Differencesbetween Hc
− and Hc+ for each sample are within experimental error
(3%). Furthermore, there is no systematic predominance of one ofthese latter values over the other. There is thus no mensurable shift ofthe hysteresis loop along the H-axis, implying that exchange couplingbetween the Gd an Cr layers is either very weak or absent in our sam-ples. This result is in contrast with our previous work in films of Gd par-ticles embedded in Cr [29] in which significant exchange bias fields, He,were observed. The results for He in the present work, however, are notunexpected. Exchange bias is an interfacial effect, depending stronglyon the spin structure at the antiferromagnetic (AFM)–ferromagnetic(FM) interface. Factors such as crystalline state and orientation at thesurface, interfacial disorder, and particle size are extremely important,as they significantly contribute to the interfacial spin configuration[30]. Since these factors are very sensitive on the substrate materialand temperature, layer thickness, deposition rate, etc., different ex-change bias fields can be observed in films of the same AFM–FM layerpair (e.g. FeF2/Fe multilayers [31]) when different deposition proce-dures are used.
A possible cause for our results regarding He relies in the very prob-able intermixing of the Gd and Cr layers. The atomic volume ratio Cr/Gdis relatively large, about 0.35 [32], favoring intermixing fromdiffusion ofthe lowest atomic volume atom (Cr) into the Gd layers. Owing to suchan effect, the Gd/Cr interfaces would not be sharply defined, or abrupt,because the layers would now be intercalated by atomic layers withmixed Gd and Cr atoms. As it is widely accepted, exchange bias is ashort-range interaction [33,34], limited to the AFM and FM spins atthe interface. Clearly, such an interaction would be seriously reduced,or even nullified, if between the Gd and Cr layers, the heterogeneousGd–Cr layers are interposed.
As can be seen in Table 2, the Hc− values are high, as usually ob-
served in systems of nanoparticles [24,29,35]. In general, variousforms of anisotropy contribute to coercivity. Regarding crystalline an-isotropy, it should be noted that there is a continuous increase in thecrystalline order of the Gd layers as Ts increases. However, Hc does notmonotonically increase with increasing Ts, implying that crystalline an-isotropy is not directly related to the crystalline order of our films. It isthus very likely that the anisotropies arising from the reduced dimen-sion of the particles, i.e., from their core and surfaces, are predominantover all other anisotropies.
The former, i.e., “core anisotropy”, can be very high, and bears astrong dependence on particle size, D, [3]. For a single-domain particle,so small that it is magnetically unstable (spin rotation by thermaleffect), the coercivity is zero. AsD is increased, the particle becomes sta-ble, and the change in magnetization is due to spin rotation— a processof relatively high energy. Consequently, Hc increases with D. If D keepsrising, the particle goes over a critical size, Dc, above which it becomesmulti-domain. The number of domains grows as D increases. Since it

Table 2Absolute values of the coercive fields of Gd/Cr films. Themeaning of symbolsHc
+,Hc− and
Hc, is explained in the text.
Sample Hc+ (4π kA/m) Hc
− (4π kA/m) Hc (4π kA/m)
GC030 196 ± 5 199 ± 6 198 ± 4GC300 831 ± 7 848 ± 5 840 ± 4GC500 475 ± 6 469 ± 8 472 ± 5
502 G.Z. Gadioli et al. / Thin Solid Films 545 (2013) 496–502
takes less energy for domain wall displacement than for spin rotation,Hc has its maximum around Dc and decreases thereafter.
As for surface anisotropy of nanoparticles, it has been shown that itcan widely differ from that of particle core. Measurements in NiO [7]particle systems and theoretical calculations [8] revealed that the coer-civity due to surface spins can be extremely large and increaseswith de-creasing particle size. On the other hand, for γ-Fe2O3 nanoparticles thecoercivity decreases as particle size is reduced [36].
From Table 2,Hc increases as the substrate temperature changes from30 to 300 °C, anddecreases at 500 °C. Since particle size increaseswith in-creasing Ts, the dependence ofHc on Tswould be consistentwith the latterdiscussion on the coercivity of core spins. However, it should be remem-bered that, particularly forGC030 andGC300, themagnetization data pre-viously discussed (reduced TC of both samples and the ac-susceptibilitydependence on T at low temperatures) strongly suggest that surfaceand interface spins play a role on the magnetization process.
4. Conclusions
Owing to the granular nature of Gd layers in the Gd/Cr films, the de-pendence of magnetization on temperature and external field widelydiffers from that of bulk Gd.
In all samples, ferromagnetic and superferromagnetic phases coex-ist, the latter formed by single-domain Gd particles. The volume fractionof the ferromagnetic phase increases with increasing substrate temper-ature due to the rise in average particle size and crystalline order. Thetemperature of the Curie transition was the same as that for bulk Gdfor sample GC500, but decreases with decreasing substrate tempera-ture. For sample GC030, the Curie point was as low as 247 ± 2 K. Themuch higher precision with which TC was obtained from the lattersample from χ′ × T plots is a clear indication of the advantage of theac-susceptibility technique for the determination of Curie points in ma-terials of weak ferromagnetic character.
The low temperature peaks, observed in the FC M × T and χ′ × Tplots for samples GC300 and GC500, were interpreted as freezing tem-peratures of cluster glass systems. The sharp low temperature increasein χ′ for decreasing temperatures for sample GC030, was discussedregarding the possible existence of a spin glass associated to the disor-dered spins at the boundary layer of the Gd particles.
No exchange anisotropy was observed from the hysteresis loops asthey were not shifted along the H-axis. This result was interpreted interms of the possible intermixing of Gd and Cr. The coercive field, de-duced from the hysteresis loops, varied between 15.8 (198) to 66.8(840) kA/m (Oe), thus revealing high anisotropies.
The close agreement between the Curie points for GC500 andbulk Gd, and the absence of exchange anisotropy can be taken asevidences that only the Gd layers contribute to the magnetism ofthe Gd/Cr films.
Acknowledgments
The authors acknowledge funding by FAPESP, CAPES and CNPq. Thecooperation of Dr. Stanislav A. Moshkalev and Dr. Alfredo Vaz, from theCenter for Semiconductor Devices — UNICAMP, for the SEM images, isalso greatly acknowledged.
References
[1] A.P. Guimarães, Principles of Nanomagnetism, Springer, Heidelberg [Germany];New York, 2009.
[2] In: D.J. Sellmyer, R. Skomski (Eds.), Advanced Magnetic Nanostructures, Springer,New York, 2006.
[3] B.D. Cullity, Introduction to Magnetic Materials, 2nd ed. IEEE/Wiley, Hoboken, NewJersey, 2009.
[4] S. Mørup, G. Christiansen, J. Appl. Phys. 73 (1993) 6955.[5] E.M. Chudnovsky, L. Gunther, Phys. Rev. Lett. 60 (1988) 661.[6] A.E. Berkowitz, J.R. Mitchell, M.J. Carey, A.P. Young, S. Zhang, F.E. Spada, F.T. Parker,
A. Hutten, G. Thomas, Phys. Rev. Lett. 68 (1992) 3745.[7] E. Winkler, R.D. Zysler, M.V. Mansilla, D. Fiorani, Phys. Rev. B 72 (2005) 132409.[8] D.A. Garanin, H. Kachkachi, Phys. Rev. Lett. 90 (2003) 065504.[9] P. Poddar, S. Srinath, J. Gass, B.L.V. Prasad, H. Srikanth, J. Phys. Chem. C 111 (2007)
14060.[10] J. Satooka, A. Ito, J. Phys. Condens. Matter 10 (1998) L711.[11] M.J. O'Shea, P. Perera, J. Appl. Phys. 85 (1999) 4322.[12] C.D. Wilcox, S.B. Dove, W.D. McDavid, D.B. Greer, UTHSCSA Image Tool, Health Sci-
ence Center — University of Texas, 2002.[13] S. Ino, T. Yamanaka, S. Ito, Surf. Sci. 283 (1993) 319.[14] S.L. Chang, X-ray Multiple-wave Diffraction: Theory and Applications, Springer
Series in Solid-State Sciences, Vol. 143, Springer-Verlag, Berlin, Germany, 2004,ISBN 3-540-21196-9.
[15] E. De Biasi, C.A. Ramos, R.D. Zysler, H. Romero, Phys. Rev. B 65 (2002) 144416.[16] C.E. Krill, F. Merzoug, W. Krauss, R. Birringer, Nanostruct. Mater. 9 (1997) 455.[17] Y. Shao, J. Zhang, J.K.L. Lai, C.H. Shek, J. Appl. Phys. 80 (1996) 76.[18] A. Giguere, M. Foldeaki, R.A. Dunlap, R. Chahine, Phys. Rev. B 59 (1999) 431.[19] O. Bostanjoglo, K. Röhkel, Phys. Stat. Sol. (a) 11 (1972) 161.[20] Z.M. Wang, T. Tang, Y.P. Wang, S.Y. Zhang, Y.W. Du, J. Magn. Magn. Mater. 246
(2002) 254.[21] S.Y. Dan'kov, A.M. Tishin, V.K. Pecharsky, K.A. Gschneidner, Phys. Rev. B 57 (1998)
3478.[22] J.A. Sobota, D. Tanasković, V. Dobrosavljević, Phys. Rev. B 76 (2007) 245106.[23] In: H. Kronmüller, S.S.P. Parkin (Eds.), Handbook of Magnetism and Advanced Mag-
netic Materials, John Wiley & Sons, Hoboken, New Jersey, 2007.[24] B. Martínez, X. Obradors, L. Balcells, A. Rouanet, C. Monty, Phys. Rev. Lett. 80 (1998)
181.[25] J.A. Mydosh, Spin Glasses: An Experimental Introduction, Taylor & Francis, London;
Washington, DC, 1993.[26] G.Z. Gadioli, F.P. Rouxinol, R.V. Gelamo, A.O. dos Santos, L.P. Cardoso, M.A.B. de
Moraes, J. Appl. Phys. 103 (2008) 093916.[27] V. Cannella, J.A. Mydosh, Phys. Rev. B 6 (1972) 4220.[28] C.A.M. Mulder, A.J. van Duyneveldt, J.A. Mydosh, Phys. Rev. B 23 (1981) 1384.[29] F.P. Rouxinol, G.Z. Gadioli, R.V. Gelamo, A.O. dos Santos, L.P. Cardoso, S. Gama, M.A.
Bica de Moraes, J. Magn. Magn. Mater. 323 (2011) 2005.[30] J. Nogués, I.K. Schuller, J. Magn. Magn. Mater. 192 (1999) 203.[31] J. Nogués, T.J. Moran, D. Lederman, I.K. Schuller, K.V. Rao, Phys. Rev. B (1999) 6984.[32] G.A. Bertero, T.C. Hufnagel, B.M. Clemens, R. Sinclair, J. Mater. Res. 8 (1993) 771.[33] M. Tsunoda, Y. Tsuchiya, M. Konoto, M. Takahashi, J. Magn.Magn. Mater. 171 (1997)
29.[34] D.H. Han, J.G. Zhu, J.H. Judy, J.M. Silverstein, J. Appl. Phys. 81 (1997) 4996.[35] N.S. Gajbhiye, S. Prasad, G. Blaji, IEEE Trans. Magn. 35 (1999) 2155.[36] Ò. Iglesias, A. Labarta, Phys. Rev. B 63 (2001) 184416.