Machine Vision based Sample-Tube Localization for Mars ...
12
To appear in IEEE AeroConf, 2021. This copy is for personal use only. c 2021 IEEE. Prints shortly available at http://ieeexplore.ieee.org. Machine Vision based Sample-Tube Localization for Mars Sample Return Shreyansh Daftry, Barry Ridge, William Seto, Tu-Hoa Pham, Peter Ilhardt ⇤ , Gerard Maggiolino ⇤ , Mark Van der Merwe ⇤ , Alex Brinkman, John Mayo, Eric Kulczyski and Renaud Detry Jet Propulsion Laboratory, California Institute of Technology Pasadena, CA, USA [email protected] Abstract—A potential Mars Sample Return (MSR) architecture is being jointly studied by NASA and ESA. As currently envi- sioned, the MSR campaign consists of a series of 3 missions: sample cache, fetch and return to Earth. In this paper, we focus on the fetch part of the MSR, and more specifically the problem of autonomously detecting and localizing sample tubes deposited on the Martian surface. Towards this end, we study two machine-vision based approaches: First, a geometry- driven approach based on template matching that uses hard- coded filters and a 3D shape model of the tube; and second, a data-driven approach based on convolutional neural networks (CNNs) and learned features. Furthermore, we present a large benchmark dataset of sample-tube images, collected in rep- resentative outdoor environments and annotated with ground truth segmentation masks and locations. The dataset was ac- quired systematically across different terrain, illumination con- ditions and dust-coverage; and benchmarking was performed to study the feasibility of each approach, their relative strengths and weaknesses, and robustness in the presence of adverse environmental conditions. TABLE OF CONTENTS 1. I NTRODUCTION ...................................... 1 2. RELATED WORK .................................... 2 3. SAMPLE- TUBE LOCALIZATION ..................... 2 4. TEMPLATE- BASED OBJECT DETECTION ........... 3 5. DATA- DRIVEN SEGMENTATION ..................... 3 6. BENCHMARKING DATASET .......................... 4 7. EXPERIMENTS AND RESULTS ....................... 5 8. CONCLUSION AND FUTURE WORK ................. 7 ACKNOWLEDGMENTS .................................. 9 REFERENCES ........................................... 9 BIOGRAPHY .......................................... 11 1. I NTRODUCTION Determining the habitability of past and present martian environments continues to be the focus of current and future missions to Mars. Indeed, studying the geological history of Mars holds the key to both understanding the origins of life on Earth and in the Solar System. While recent and ongoing robotic missions have revolutionized our understanding of the red planet [1], [2], the results from orbital and in-situ surface robotic missions alone are not sufficient to fully answer the major questions about the potential for life, past climate, and ⇤ P. Ilhardt, G. Maggiolino and M. Merwe were interns at JPL during this work, and are currently affiliated with Capgemini, Carnegie Mellon University and University of Michigan, respectively. 978-1-7281-7436-5/21/$31.00 c 2021 IEEE Figure 1. NASA’s Mars Perseverance rover, which serves as the first stage of the MSR campaign, will store rock and soil samples in sealed tubes on the planet’s surface for future missions to retrieve, as seen in this illustration. the geological history of Mars. Even if an orbital or in situ mission were to discover putative evidence for the existence of past or present life on Mars, confirming these results would necessitate that samples be collected, returned to Earth, and verified by multiple rigorous laboratory analyses on Earth. As a result, returning samples from Mars back to Earth was identified as the highest priority planetary science objective in the Planetary Science Decadal Survey [3]. In response to that, a potential concept for a Mars Sample Return (MSR) architecture is being jointly studied by NASA and ESA [4]. As currently envisioned, the MSR campaign consists of a series of 3 missions: sample cache, fetch and return to Earth. First, NASA’s Perseverance Rover, launched in 2020, will collect scientifically selected samples and store them in sealed tubes on the planet’s surface (see Figure1), for possible return to Earth. Then, a potential future mission, with a Sample Retrieval Lander (SRL), would collect the sample tubes and load them into an Orbiting Sample (OS) payload in a Mars Ascent Vehicle (MAV). The MAV would release the OS into Martian orbit. The third mission, an Earth Return Orbiter (ERO), would rendezvous with the samples in Mars orbit and ferry them back to Earth. This work focuses on the SRL mission concept [5] to collect and retrieve the sample tubes. The SRL mission would deploy a lander in the vicinity of Jezero Crater, where the Mars 1
-
Upload
khangminh22 -
Category
Documents
-
view
2 -
download
0
Transcript of Machine Vision based Sample-Tube Localization for Mars ...
To appear in IEEE AeroConf, 2021. This copy is forpersonal use only. c�2021 IEEE. Prints shortly available at http://ieeexplore.ieee.org.
Machine Vision based Sample-Tube Localization forMars Sample Return
Shreyansh Daftry, Barry Ridge, William Seto, Tu-Hoa Pham, Peter Ilhardt⇤, Gerard Maggiolino⇤,Mark Van der Merwe⇤, Alex Brinkman, John Mayo, Eric Kulczyski and Renaud Detry
Jet Propulsion Laboratory, California Institute of TechnologyPasadena, CA, USA
Abstract—A potential Mars Sample Return (MSR) architectureis being jointly studied by NASA and ESA. As currently envi-sioned, the MSR campaign consists of a series of 3 missions:sample cache, fetch and return to Earth. In this paper, wefocus on the fetch part of the MSR, and more specificallythe problem of autonomously detecting and localizing sampletubes deposited on the Martian surface. Towards this end, westudy two machine-vision based approaches: First, a geometry-driven approach based on template matching that uses hard-coded filters and a 3D shape model of the tube; and second, adata-driven approach based on convolutional neural networks(CNNs) and learned features. Furthermore, we present a largebenchmark dataset of sample-tube images, collected in rep-resentative outdoor environments and annotated with groundtruth segmentation masks and locations. The dataset was ac-quired systematically across different terrain, illumination con-ditions and dust-coverage; and benchmarking was performed tostudy the feasibility of each approach, their relative strengthsand weaknesses, and robustness in the presence of adverseenvironmental conditions.
TABLE OF CONTENTS
1. INTRODUCTION . . . . . . . . . . . . . . . . . . . . . . . . . . . . . . . . . . . . . . 12. RELATED WORK . . . . . . . . . . . . . . . . . . . . . . . . . . . . . . . . . . . . 23. SAMPLE-TUBE LOCALIZATION . . . . . . . . . . . . . . . . . . . . . 24. TEMPLATE-BASED OBJECT DETECTION . . . . . . . . . . . 35. DATA-DRIVEN SEGMENTATION . . . . . . . . . . . . . . . . . . . . . 36. BENCHMARKING DATASET . . . . . . . . . . . . . . . . . . . . . . . . . . 47. EXPERIMENTS AND RESULTS . . . . . . . . . . . . . . . . . . . . . . . 58. CONCLUSION AND FUTURE WORK . . . . . . . . . . . . . . . . . 7ACKNOWLEDGMENTS . . . . . . . . . . . . . . . . . . . . . . . . . . . . . . . . . . 9REFERENCES . . . . . . . . . . . . . . . . . . . . . . . . . . . . . . . . . . . . . . . . . . . 9BIOGRAPHY . . . . . . . . . . . . . . . . . . . . . . . . . . . . . . . . . . . . . . . . . . 11
1. INTRODUCTIONDetermining the habitability of past and present martianenvironments continues to be the focus of current and futuremissions to Mars. Indeed, studying the geological history ofMars holds the key to both understanding the origins of lifeon Earth and in the Solar System. While recent and ongoingrobotic missions have revolutionized our understanding of thered planet [1], [2], the results from orbital and in-situ surfacerobotic missions alone are not sufficient to fully answer themajor questions about the potential for life, past climate, and
⇤P. Ilhardt, G. Maggiolino and M. Merwe were interns at JPL duringthis work, and are currently affiliated with Capgemini, Carnegie MellonUniversity and University of Michigan, respectively.978-1-7281-7436-5/21/$31.00 c�2021 IEEE
Figure 1. NASA’s Mars Perseverance rover, which serves asthe first stage of the MSR campaign, will store rock and soil
samples in sealed tubes on the planet’s surface for futuremissions to retrieve, as seen in this illustration.
the geological history of Mars. Even if an orbital or in situmission were to discover putative evidence for the existenceof past or present life on Mars, confirming these results wouldnecessitate that samples be collected, returned to Earth, andverified by multiple rigorous laboratory analyses on Earth.As a result, returning samples from Mars back to Earth wasidentified as the highest priority planetary science objectivein the Planetary Science Decadal Survey [3].
In response to that, a potential concept for a Mars SampleReturn (MSR) architecture is being jointly studied by NASAand ESA [4]. As currently envisioned, the MSR campaignconsists of a series of 3 missions: sample cache, fetch andreturn to Earth. First, NASA’s Perseverance Rover, launchedin 2020, will collect scientifically selected samples and storethem in sealed tubes on the planet’s surface (see Figure1), forpossible return to Earth. Then, a potential future mission,with a Sample Retrieval Lander (SRL), would collect thesample tubes and load them into an Orbiting Sample (OS)payload in a Mars Ascent Vehicle (MAV). The MAV wouldrelease the OS into Martian orbit. The third mission, an EarthReturn Orbiter (ERO), would rendezvous with the samples inMars orbit and ferry them back to Earth.
This work focuses on the SRL mission concept [5] to collectand retrieve the sample tubes. The SRL mission would deploya lander in the vicinity of Jezero Crater, where the Mars
1

Perseverance rover plans to land and collect and cache sam-ples during its 1.25-Mars-year primary surface mission. Keypayloads on SRL would include an ESA-provided SampleFetch Rover (SFR) and Sample Transfer Arm (STA), anda NASA-provided OS and MAV. Once on the surface, theSFR would egress from SRL and begin its surface missionto retrieve samples previously cached by Mars PerseveranceRover at one or more depot locations. The solar-poweredSRL mission would then carry out its surface activities duringMartian spring and summer, maximizing available power, andwould complete its surface mission and launch the retrievedsamples into orbit before start of northern hemisphere fall,prior to significant decrease in available solar power and inadvance of the potential for global dust storms. According tothe currently envisioned surface mission timeline, this wouldallocate ⇠ 150 sols for SFR to complete this retrieval andreturn to SRL. With a nominal 4-km SRL landing dispersion,this drives the need for high levels of SFR autonomy andmobility, with support for drive distances of up to ⇠ 500m/sol, and with efficient operations during tube pickup at thedepot site(s) and tube transfer to SRL.
In this paper, we study the problem of autonomously de-tecting and localizing sample tubes deposited on the Martiansurface directly from camera images. In Section 4 we discussthe first of two machine-vision approaches that we studied,a geometry-driven approach based on template matching thatuses hard-coded filters and a 3D shape model of the tube; andin Section 5 we discuss the second, a data-driven approachbased on convolutional neural networks (CNNs) and learnedfeatures. In Section 6, we present a large benchmark datasetof sample-tube images, collected in representative outdoorenvironments and annotated with ground truth segmentationmasks and locations. The dataset was acquired systematicallyacross different terrain, illumination conditions and dust-coverage. Finally, in Section 7, we describe the bench-marking evaluations that were performed using well-knownmetrics to compare and assess the two methods using thisdata.
2. RELATED WORKMars Sample ReturnSeveral studies have been conducted over the last few decadeswith the goal of defining science objectives for Mars Sam-ple Return [3], [6], [7], [8] and potential mission conceptarchitectures [9], [10], [11], [12]. Furthermore, to enablethis vision, several research and technology developmentefforts [13] have been under way - from autonomous rovertechnology [14], [15] to OS design and capture-systems [16],[17]. Our work is closely related to, and a continuation of,the efforts to demonstrate robust localization and autonomousretrieval of sample-tubes from a Mars-like environment forpotential Mars Sample Return. While [18] served as aninitial proof-of-concept, subsequent work [19], [20], [21]further studied the problem of direct and indirect sample-tubelocalization in an analog indoor testbed. In this work, we doa comprehensive study on the performance of sample-tubedetection algorithms on a benchmark dataset collected in arepresentative outdoor environment.
Image-based Object Detection and LocalizationObject detection and localization, as of one the most fun-damental and challenging problems in machine vision, hasreceived great attention in recent years - see [22] for a review.Traditionally, the problem of object detection and localization
is tackled by matching feature points between 3D models andimages [23], [24]. However, these methods require that thereare rich textures on the objects in order to detect features formatching. As a result they are unable to handle texture-lessobjects like sample-tubes. More recently, with the advent ofdeep learning, CNNs by comparison, have made significantprogress in object classification [25], detection [26], [27],semantic segmentation [28] and instance segmentation [29],including their application to Mars rover autonomy [30], [31].
For texture-less object detection, the taxonomy of approachescan be broadly classified into three categories: feature-based,view-based and shape-based. The feature-based approaches[32], [33], [34] match 2D image features like edges or linesegments to the corresponding 3D model points. The view-based approaches [35], [36], [37] compare a given image ofthe object with its pre-computed 2D views. Lastly, shape-based approaches [38], [39], [40], [41], [42] are based ontemplate matching of edge-segments. Furthermore, end-to-end learning based methods [43], [44], [45] have alsobeen proposed that utilize deep learning for the task of 6Dpose estimation directly from RGB images as the only inputmodality.
3. SAMPLE-TUBE LOCALIZATIONThe operational context assumed is as follows. The Persever-ance rover will place sample tubes on the ground at one ormultiple (presently-unknown) sites referred to as tube depots.Within each tube depot, the sample-tubes will be placedseveral meters apart in areas where sand is not abundantand that have a relatively flat ground with slopes less than25�. It is to be noted that Perseverance has little controlover precise tube placement: tubes will be released from therover’s underbelly, and may bounce and roll on the groundbefore coming to a halt. Furthermore, it is anticipated thatSFR is capable of autonomously driving from tube to tube – acapability addressed in a separate paper [46]. For the contextof this paper, this implies that SFR can drive itself to a posethat places a tube within its field of view.
Based on these assumptions, our understanding of the Mar-tian conditions (weather, geology, etc.) and through qualita-tive observation of past lander and rover images, we can con-servatively hypothesize the following constraints: (a) tubeswill not move, (b) sand or dust may, with low probability,pile up next to tube or rocks, forming drifts, and (c) dust willdeposit everywhere, creating a dust layer that will not exceed0.25mm in thickness. Rovers typically operate between10am and 4pm, yielding a large range of lighting conditions,including shadows incurred by rocks or by the rover itself.
Our goal is to then to study the robustness for image-baseddetection and localization of sample-tubes under these con-straints. More specifically, we quantify the performance oftwo object localizers for sample-tube detection in a variety ofof conditions that include clear, non-occluded tubes, partialocclusions by rocks or sand, or partial or complete shadows.We focus on the detection and localization only from asingle images for two reasons: first, it allows the proposedalgorithms to be applicable to a diverse set of scenarios (e.g.if we want to detect using either a mast-mounted stereocamera or a wrist-mounted monocular camera), and second,based on our preliminary analysis we expect depth data on thesample-tubes to be noisy and thereby not very helpful for thedetection task. Extensive analysis on the usefulness of stereorange data is beyond the scope of this paper.
2

……T =
Figure 2. Sample set of templates T generated usingdifferent viewpoints sampled around the sample-tube.
The two localizers considered in this paper are a template-based object detector [38], and a region-proposal network[29]. Template-based object detection has more industrialmaturity, and it shares building blocks with methods that ranon spacecrafts [47], [48]. Template matching lends itself tointrospection and ad-hoc treatment of edge cases. By con-trast, convolutional networks have almost no flight heritage,and their design is harder to validate, but their performance isoften substantially better than template matching.
4. TEMPLATE-BASED OBJECT DETECTIONOur approach is based on Line2D [38], [39], an efficienttemplate-matching based method that exploits color imagesto capture the appearance of the object in a set of templatescovering different views. Because the viewpoint of eachtemplate is known, it also provides a coarse estimate of the6D pose of the object when it is detected. In the remainder ofthis section, we give an overview of the Line2D method andhow we use it to detect and localize sample-tubes.
Generating Templates using a 3D ModelGiven a 3D CAD model of the sample-tube, a library of2D templates are automatically generated that covers a fullview hemisphere by regularly sampling viewpoints of the3D model, as illustrated in Figure 2. During the generationof template library, it is important to balance the trade-offbetween the coverage of the object for reliability and thenumber of templates for efficiency. This is solved by re-cursively dividing an icosahedron, the largest convex regularpolyhedron. The vertices of the resulting polyhedron giveus the two out-of-plane rotation angles for the samples posewith respect to the coordinate center. In our experiments, twoadjacent vertices are set to be approximately 10 degrees apart.In addition to the these two out of plane rotations, templatesfor different in-plane rotations are also created. Furthermore,templates at different scales are generated by using differentsized polyhedrons, using a step size of 10 cm.
Gradient Orientation FeaturesFor each sampled pose generated by the method describedabove, the sample-tube’s silhouette is first computed by pro-jecting its 3D model under this pose. The silhouette contouris then quickly obtained by subtracting the eroded silhouettefrom its original version. Next, all the color gradients thatlie on the silhouette contour are computed. Image gradientsare chosen as features because they have been proved to be
more discriminant than other forms of representation [49].Additionally, image gradients are often the only reliable im-age cue when it comes to texture-less objects. Furthermore,considering only the orientation of the gradients and not theirnorms makes the measure robust to contrast changes, andtaking the absolute value of cosine between them allows itto correctly handle object occluding boundaries: It will notbe affected if the object is over a dark background, or a brightbackground.
Template MatchingTemplate matching is done by measuring the similarity be-tween an input image I, and a reference image O of thesample-tube centered on a location c in the image I bycomparing the gradient orientation features. A model ortemplate T is defined as a pair T = (O, P), where P specifiesa region in O. The template can then be compared with aregion at location c in a test image I based on a modifiedversion of the similarity measure proposed by Steger [50]:
" =X
r2P
⇣max
t2R(c+r)
�� cos�ori(O, r)� ori(I, t)
���⌘
(1)
where ori(O, r) is the gradient orientation at location r andR(c + r) defines the neighbourhood of size T centered onlocation c + r.
In order to avoid evaluating the max operator in Equation1 every time a new template must be evaluated against animage location, a binary representation of the feature space isused [51]. First, the gradient orientation map is quantized bydividing it into n0 equal spacing. To make the quantizationrobust to noise, we assign to each location the gradient whosequantized orientation occurs most often in a 3x3 neighbor-hood. Next, the possible combination of orientation spreadsto a given location m is encoded using a binary string. Thesestrings are then used as indices to access lookup tables for fastpre-computation of the similarity measure. Since the lookuptables are computed offline and shared between the templates,matching several templates against the input image can bedone very fast once the maps are computed.
5. DATA-DRIVEN SEGMENTATIONRegion Proposal CNNsModern CNNs are powerful models that leverage large la-beled datasets in order to automatically derive visual featurehierarchies directly from the data such that a learning task,e.g. object classification, can be solved. In this section wedescribe our use of the popular CNN-based object instancesegmentation model known as Mask R-CNN [29] for tubelocalization. The “R” in “R-CNN” stands for “region-based”and refers to a class of CNN networks that typically extendthe classification capabilities of their forebears (e.g. [52],[53], [54]) by adding a regression head to the architecturesuch that they can predict continuous values for object regionproposal as well as object class labels. This can be usedto predict bounding box parameters of the objects underconsideration, for example, such that the objects may belocalized within images as opposed to solely having theirpresence detected [55].
Instance Segmentation with Mask R-CNNMask R-CNN builds on its predecessors Fast R-CNN [26]and Faster R-CNN [27], which were limited to bounding
3
box prediction, by additionally allowing for segmentationmasks to be predicted. While related models like the FullyConvolutional Network (FCN) [28] have dealt with semanticsegmentation, that is segmenting an image and associating thesegments to the object classes to which they belong, MaskR-CNN tackles the more challenging problem of instancesegmentation whereby individual instances of objects fromthose classes must be identified and segmented. For ourpurposes in solving the task of sample tube localization,all of these methods are viable candidates, but the instancesegmentation provided by Mask-RCNN enables candidatetube instances to be directly identified and segmented withoutneeding to further process the bounding box or segmentationresults provided by the other methods.
Mask-RCNN uses the architecture of Faster R-CNN to bothpredict the class label and to regress the bounding boxparameters, but it augments this with an FCN-based maskprediction branch in order to additionally predict the regionalsegmentation masks in parallel. There is some generalityto the architecture in that a number of possible CNN back-bones can be used for the convolutional feature detectioncomponent of the Faster R-CNN branch, e.g. ResNet [52],ResNeXt [53] or Feature Pyramid Networks (FPN) [54]. Inour experiments for this work we used ResNet-50 exclusively[52]. For training, Mask R-CNN makes use of a multi-task loss L = Lcls + Lbox + Lmask that is comprised of theclassification loss Lcls and the bounding-box loss Lbox from[26], as well as a segmentation mask loss Lmask. Lmask isdefined by taking the average binary cross-entropy loss overthe per-pixel sigmoid-activated output of the mask predictionbranch which is made up of K m⇥m resolution output masksfor each predicted region of interest, where K is the numberof ground-truth classes.
Using Mask R-CNN for Tube LocalizationAs is typical, the Mask R-CNN model we employ uses modelweights pre-trained on the ImageNet dataset [25], [56] andtransfer learning is used to fine-tune the weights for ourparticular task. The tube localization problem presented hereis relatively simple in terms of the classification componentsince we need only detect the presence or absence of tubes inthe scene, so we make use of only a single “tube” class labelalongside the background class. With regard to localizing thetube, given the fetch rover grasping requirements, as well asfor a direct comparison with the template matching methoddescribed in the previous section, we are less interested in thebounding box output than we are in obtaining the segmen-tation masks. Thus, although we annotate the training datawith each of the class, bounding box and segmentation maskground truth labels and train our Mask R-CNN model withall three of them, for the purposes of this paper, at inferencetime we discard the bounding box output and we restrict oursubsequent experimental analyses to the segmentation masks.
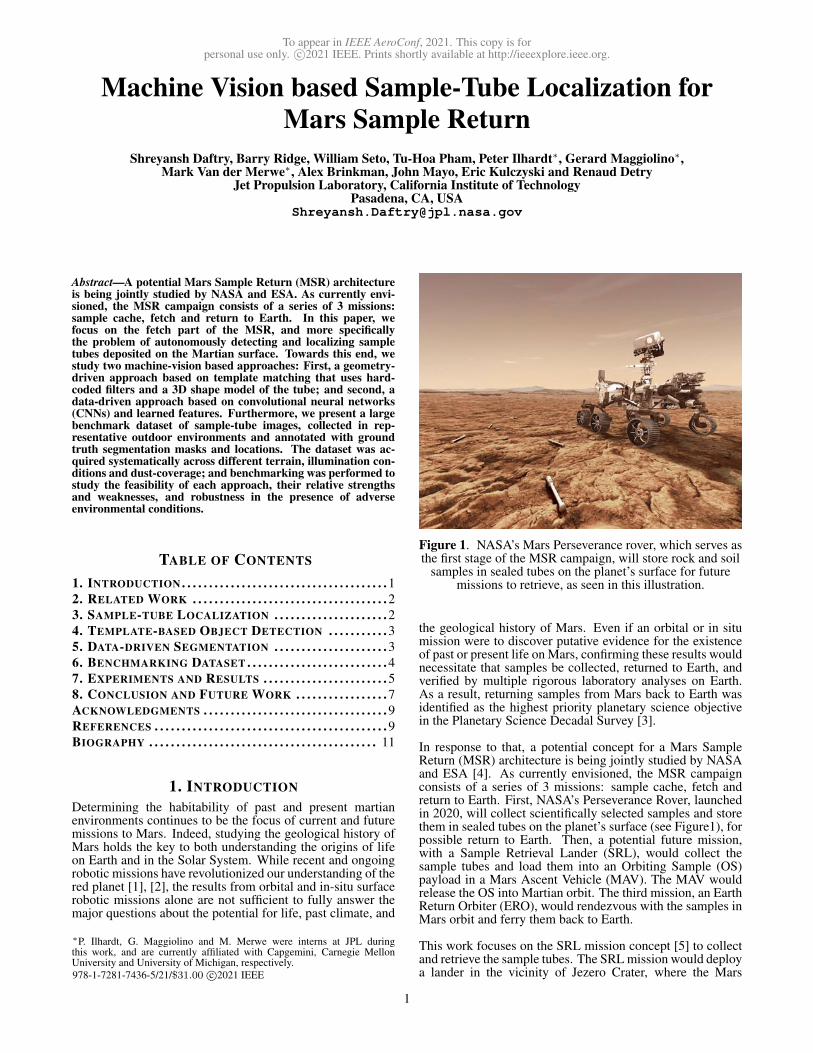
6. BENCHMARKING DATASETCamera Acquisition SetupWe constructed a camera acquisition setup made up of fourFLIR BlackFly S cameras (5472 ⇥ 3648, color, 77� field ofview) that form two stereo pairs with baselines of 20cm and40cm. The cameras, optics and the overall acquisition setup(baselines and heights) are representative of the Perseverancerover’s onboard cameras - EECAMs [57]. During imageacquisition, we set the camera tripod at two different heights
(a) Camera setup at theMars Yard at JPL.
(b) Camera positioning around tubes.
(c) Sample images on flagstone (left) and CFA 6 rocks (right).
(d) Sample images on ditch (left) and riverbed (right).
(e) Sample images with tag-mounted tube: flagstone (left) and CFA 2 (right).
Figure 3. Outdoor dataset: (a) testbed, (b) capture grid,(c-d) sample images.
of 1m and 2m to simulate images acquired by HazCams andNavCams, respectively. Also, the cameras were covered byan aluminum plate serving as heat shield for extended useunder sunlight (as shown in Fig 3a).
Data CollectionTo evaluate the performance and robustness of our methods,we captured a dataset of outdoor images in JPL’s MarsYard. The curated set of images represents both nominaland adverse environmental conditions we expect SFR to faceon Mars. An outdoor dataset provides us images of realisticscenes that contain: 1) diverse and varying terrain, informedby discussions with Mars geologists who plan where sampletubes could be dropped; 2) natural shadows and lighting thatcreate appearance variation for the tube we are detecting. Ad-ditionally, we further vary the tube appearance by consideringanother adverse condition, object occlusion. Specifically, weachieve this by positioning tubes next to rocks or terrain fea-tures to induce varying levels of occlusion, and also covering
4

tubes with dust. We vary the amount of dust coverage in afew ways: 1) sprinkling a light layer of dust; 2) building upa “dune” on the side of a tube; 3) totally covering a partialsection of the tube with a mound of sand.
Ground Truth Annotations—Finally, we enable quantitativeevaluation of detection results against the dataset by provid-ing ground truth segmentation masks with associated bound-ing boxes for 2D object detection benchmarking and 6DOFposes for a subset of the data, for pose estimation evaluation.The segmentation masks are manually annotated using thecoco-annotator tool [58]. Ground truth 6D poses are obtainedby rigidly mounting a pair of AprilTags [59] to one of thetubes. Two tags (see Fig-3e) were chosen for robustnesssince the occurrence of shadows sometimes hindered the tagdetection algorithm. The tags are also mounted a sufficientdistance away from the tube to not interfere with detection.During construction of the scene, care was also taken to coverthe mount with sand so the tube appears as an isolated object.
The dataset comprises the following:
• One subset of images that does not contain the ground-truth tube with the mounted AprilTags (no-tags dataset). Thisset of images contains four terrain types: two terrain typesconstructed with consultation from the Mars geologists, andtwo extra ones we created based on other interesting featureswe saw in the Mars Yard to add more scene diversity (seeFigs. 3c and 3d):– “Flagstone”: broken stone slabs covered with a thin layer
of dust emulating fractured bedrock on Mars.– “CFA6”: a rock distribution of cumulative fractional area
(CFA – a measure of rock density) equal to 6%. These arethe smallest rocks that are still visible from orbit to guidethe choice of depot location. Rocks encountered in practicewould only be this big or smaller.– “Ditch”, and “Riverbed”: These 2 terrain types were
simply named for the varying levels of surface depression weobserved in the terrain.• Another of subset of images that contains the tube mountedwith AprilTags (with-tags dataset). This set of images con-tains the three terrain types we expect to experience on Mars:– “Flagstone” and “CFA6”: same as in the other set.– “CFA2”: small pebbles that are only visible from rover
surface imagery and not orbit.• Capture conditions common to both sets of images:– images taken in one of two different capture times: “am”
(10am to 12pm), or “pm” (3pm to 5pm)– 5 or 6 sample tubes with variable visibility: unoccluded,
or partially occluded by rocks and/or sand and dust.– images taken in one of 8 camera tripod positions on a
circle around the scene, see Fig. 3b)– 2 camera heights at each stop (1m and 2m)– 4 cameras: 2 stereo pairs of baseline 20 and 40 cm
The dataset in total contains 824 images (256 with the tag-mounted tube and 568 without), and 4852 annotated instancesof tubes, out of which 256 of those have an associated 6Dpose. These images were collected over 2 separate days.
7. EXPERIMENTS AND RESULTSIn this section, we present experiments for both quantita-tive and qualitative performance analysis of the two objectlocalizers for sample-tube localization on a Mars-like en-
Figure 4. Precision Recall curves for the (a) no-tags and (b)with-tags datasets using the Line2D object detector.
[5pt]
Dataset Method AP [.5] AR [.5:.05:.95]no-tags Line2D 0.345 0.184
with-tags Line2D 0.255 0.153
Table 1. Quantitative results using the Line2D objectdetector. AP and AR IoU thresholds are shown in square
brackets.
vironment. All the experiments were conducted using thebenchmark dataset described in Section 6.
Evaluation MetricsIn order to evaluate and compare the template matchingand data-driven segmentation methods presented here, wemake use of some of the de facto standard statistical metricspopularized in the literature and in computer vision contests,namely average precision (AP) and average recall (AR) val-ues and precision-recall (PR) curves.
Average Precision—Various interpretations of the AP met-ric have been proposed over the years, particularly in the
5

Figure 5. Example true positive results for sample-tube detection using the Line2D detector.
Figure 6. Examples of failure cases for sample-tube detection using the the Line2D detector.
PASCAL VOC [60] and MS COCO [61] challenges. In allcases, given an intersection-over-union (IoU) threshold fordetermining whether a prediction should be scored as a truepositive (TP) or a false positive (FP) based on the amountof overlap between the predicted mask and the ground truthmask, cumulative precision and recall values are collated ina confidence-score-ranked PR table. These values may theneither be used to produce PR curves or to calculate the AP.The variation between the PASCAL VOC and MS COCOmetrics lies in how the AP is calculated using these values.
The PASCAL VOC 2008 AP metric divided the recall di-mension into 11 points, interpolated the precision values andaveraged them, whereas PASCAL VOC 2010-2012 estimatedthe area under the curve. The MS COCO metric by com-parison, which we use for our evaluations here, takes a 101-point AP interpolation while also evaluating the AP acrossmultiple IoU threshold values and/or averaging over a rangeof thresholds. Unless otherwise stated, in the analyses below,we use the MS COCO AP at IoU = 0.5 with all area sizesand maximum 100 detections, and we use the MS COCOAR averaged over a range of 10 IoU thresholds between 0.5and 0.95 with a step size of 0.05 with the same area andmax detection criteria. With regard to the mission goals,since we plan to use a 6D pose estimator to refine the tubelocalization post-detection, we can afford to use a looser APoverlap criterion so long as precision is maximized: we wouldrather avoid falsely labeling tubes on the first pass than highlyaccurately segmenting those tubes that we do correctly detect.
Precision-Recall Curves—In the figures presented below, PRcurves are shown where the interpolated precision values areused for the 101 recall points used by the MS COCO APmetric. Plots are shown for PR curves for a range of 10 IoUthresholds between 0.5 and 0.95 with a step size of 0.05.
Performance Analysis of Template MatchingThe Line2D detector was trained using 7000 templatesgenerated from the 3D model of the sample-tube. Thetest data consisted of images from the benchmark dataset,down-scaled to half-resolution and randomly cropped to1024x1024. The reasons to generate cropped images weretwo-fold. First, to match the input dimensions of the learning-based localizer for a fair comparison. Second, larger imagesize also increases the computational complexity of the al-gorithm. Table 1 shows the quantitative performance of thetemplate matching based object localizer on the benchmarkdataset using the AP and AR metrics. Furthermore, we alsoplot the PR curve in Figure 4 to demonstrate the inherenttradeoff between the precision and recall of our detectoras a function of different threshold values. The overallquantitative performance of the template-based matching isencouraging, especially given the challenging and adversarialscenarios presented in our dataset. The low AP and AR valuescan be explained by the large number of false positives andfalse negatives, typical of most model-based algorithms.
Next, we qualitatively analyze the the performance of thedetector as a function of different terrain types and environ-mental conditions. Some example results from successfuldetections using the Line2D detector are presented in Figure5. It can be observed that the template matching algorithmis able to robustly detect sample-tubes in a wide variety ofterrain (flat ground vs. cracks of bedrock) and illumina-tion conditions (well-lit vs partial-shadow vs completely inshadow). The shape-based similarity measure also allowsthe template matching to be robust to partial occlusions (seeexamples where tubes are places next to a rock).
Finally we also look at some of the systematic failure caseswhere the template matching based detector’s performance
6

Figure 7. Precision-recall curves for the (a) no-tags and (b)with-tags datasets using the Mask R-CNN object detector.
Train Test AP [.5] AR [.5:.05:.95]with-tags no-tags 0.911 0.555no-tags with-tags 0.918 0.575
Table 2. Quantitative results using the Mask R-CNN objectdetector. AP and AR IoU thresholds are shown in square
brackets.
degrades. The most notable failure mode that degradesthe performance of template matching was observed in thepresence of other entities in the scene that have similarcontour features compared to the sample-tubes. Two specificexamples of this that can be observed in Figure 6, whereobject shadows and bedrocks - both have long edges withsimilar feature response to that of the long edges of thesample-tube. Another failure mode is related to occlusions.Template matching based algorithms perform poorly in thepresence of significant occlusions - either from dust coverageor object occlusions.
Performance Analysis of Data-driven SegmentationTwo Mask R-CNN models were trained. One was trainedon the with-tags dataset and evaluated on the no-tags dataset,
while the other was trained on the no-tags dataset and eval-uated on the with-tags dataset. In each case the trainingdata consists of 1200 ⇥ 1200 images that are converted tograyscale, box-filtered and randomly cropped to 1024⇥1024to match the input size expected by the network and to allowfor data augmentation. Our decision to use grayscale imagesreflects the intuition that color is less important for this taskthan edge and texture features and that the network mightstruggle to learn color invariance. In addition, the likelihoodthat the tubes would be coated with a thin layer of dust onMars would mean that the tubes may acquire a more yellowhue than their original grey coloring that the network wouldbe trained on. As for the box filtering, given the limitedquantity of training data available, it may be helpful to primethe input to de-emphasize intensity over edge features. Thetest data consisted of 1024 ⇥ 1024 images, also convertedto grayscale and box filtred, in which a whole single tube ispresent within the image boundaries. When the no-tags datawas used for training, the with-tags data was used for testing,and vice versa.
Quantitative AP and AR results are presented in Table 2,PR curves are presented in Figure 7, and qualitative resultssamples are presented in Figures 8 and 9. As was ex-pected, the data-driven learning approach of Mask R-CNNprovides a substantial average increase in performance overthe template-matching method both in terms of precision andrecall. The PR curves also demonstrate that if we can toleratedetection overlap with ground-truth in the 0.5 � 0.6 IoUthreshold range, we can expect reasonably optimal precision-recall. The results samples in Figures 8 and 9 show that MaskR-CNN can cope well even in difficult situations where objectshadows overlap the tubes. Conversely, it can also producefalse positives in cases where there is not enough overlapbetween the detection and the ground-truth or sometimes failcompletely in cases where features from non-tube objectsseem tube-like.
Performance Analysis of 6D Pose EstimationUsing the with-tags dataset with ground-truth 6D pose infor-mation, we can evaluate the pose estimation accuracy of theLine2D detector. Figure 10 shows histograms of the orienta-tion and translation error magnitudes. Since the detector doesnot know which is the tag-mounted tube, we only considerdetections with IOU > 0.5 for evaluation of the 6D poseaccuracy. If there is indeed a detection in the neighborhood,there should only be one since additional ones will have beenremoved by non-max suppression. Moreover, we considerthe orientation error in a couple of ways. First, we focuson in-plane rotation and report error along the main axis ofthe tube since this is the most relevant for the downstreamtask of tube pickup. Also, from the histograms, we see thatthere are a few outliers with large orientation errors. Theseare likely detections where the matched template is “flipped”180� due to the most prominent object features being the twoparallel edges that define the body of the tube. Ignoring theseinstances allows us to observe the nominal orientation errors.Furthermore, in practice an orientation flip should not affectability for tube pickup.
8. CONCLUSION AND FUTURE WORKAutonomous localization and retrieval of sample-tubes forthe Mars Sample Return mission is a challenging task, butone that is necessarily to accommodate the mission time-line for the Sample Fetch Rover. In this work, we stud-ied two machine-vision based approaches to autonomously
7

Figure 8. Example true positive results for sample-tube detection using the Mask R-CNN detector. The top row shows resultsfrom the no-tags test set; the bottom row shows results from the with-tags test set.
Figure 9. Example false positive cases for the Mask R-CNN detector. The first three images are from the no-tags test set; thelast two images are from the with-tags test set.
Figure 10. 6D pose estimation results using Line2D
detect and localize sample-tubes. Our top-level goal wasto understand the trade-off between the different classes ofalgorithms: model-based and data-driven. Towards this end,we also collected a large benchmark dataset of sample-tubeimages, in a representative outdoor environment and anno-tated it with ground truth segmentation masks and locationsfor performance analysis. In summary, both methods havecomplimentary advantages. While, learning-based methodsare considerably superior in terms of performance, they arefundamentally black-box from a design perspective. This
presents a major challenge for Verification and Validation(V&V) and difficulty in flight infusion. On the other hand,classical methods such as Template matching do not matchthe performance of their learning based counterparts, but areeasier to design, implement and V&V. In future work, weplan to validate the performance of autonomous tube-pickupthrough end-to-end demonstration on an analog Fetch rover.
8

ACKNOWLEDGMENTSThe research described in this paper was carried out at theJet Propulsion Laboratory, California Institute of Technology,under a contract with the National Aeronautics and Space Ad-ministration. Note: The information provided about possibleMars sample return architectures and concepts is for planningand discussion purposes only. NASA and ESA have made noofficial decisions to implement Mars Sample Return.
REFERENCES[1] S. W. Squyres, R. E. Arvidson, D. L. Blaney, B. C.
Clark, L. Crumpler, W. H. Farrand, S. Gorevan, K. E.Herkenhoff, J. Hurowitz, A. Kusack et al., “Rocks ofthe columbia hills,” Journal of Geophysical Research:Planets, vol. 111, no. E2, 2006.
[2] J. P. Grotzinger, “Analysis of surface materials by thecuriosity mars rover: Introduction,” Science, vol. 341,no. 6153, pp. 1475–1475, 2013.
[3] S. S. Board, N. R. Council et al., Vision and voyages forplanetary science in the decade 2013-2022. NationalAcademies Press, 2012.
[4] B. K. Muirhead, A. K. Nicholas, J. Umland, O. Suther-land, and S. Vijendran, “Mars sample return missionconcept status,” Acta Astronautica, 2020.
[5] B. Muirhead, C. Edwards, A. Eremenko, A. Nicholas,A. Farrington, A. Jackman, S. Vijendran, L. Duvet,F. Beyer, and S. Aziz, “Sample retrieval lander conceptfor a potential mars sample return campaign,” LPICo,vol. 2089, p. 6369, 2019.
[6] M. N. D. S. A. Group, “Science priorities for marssample return,” 2008.
[7] S. McLennan, M. Sephton, D. Beaty, M. Hecht,B. Pepin, I. Leya, J. Jones, B. Weiss, M. Race, J. Rum-mel et al., “Planning for mars returned sample science:final report of the msr end-to-end international scienceanalysis group (e2e-isag),” Astrobiology, vol. 12, no. 3,pp. 175–230, 2012.
[8] D. Beaty, M. Grady, H. McSween, E. Sefton-Nash,B. Carrier, F. Altieri, Y. Amelin, E. Ammannito,M. Anand, L. Benning et al., “The potential scienceand engineering value of samples delivered to earth bymars sample return,” Meteoritics and Planetary Sci-ence, vol. 54, no. 3, 2019.
[9] B. Sherwood, D. B. Smith, R. Greeley, W. Whit-taker, G. R. Woodcock, G. Barton, D. W. Pearson,and W. Siegfried, “Mars sample return: Architectureand mission design,” in Proceedings, IEEE AerospaceConference, vol. 2. IEEE, 2002, pp. 2–536.
[10] R. Mattingly, S. Matousek, and F. Jordan, “Continu-ing evolution of mars sample return,” in 2004 IEEEAerospace Conference Proceedings (IEEE Cat. No.04TH8720), vol. 1. IEEE, 2004.
[11] R. Mattingly and L. May, “Mars sample return as acampaign,” in IEEE Aerospace Conference, 2011.
[12] B. K. Muirhead, A. K. Nicholas, J. Umland, O. Suther-land, and S. Vijendran, “Mars sample return campaignconcept status,” Acta Astronautica, vol. 176, pp. 131–138, 2020.
[13] R. Volpe, E. Baumgartner, P. Scheaker, and S. Hay-ati, “Technology development and testing for en-hanced mars rover sample return operations,” in 2000
IEEE Aerospace Conference. Proceedings (Cat. No.00TH8484), vol. 7. IEEE, 2000, pp. 247–257.
[14] R. Weisbin, G. Rodriguez, S. Schenker, H. Das, S. Hay-ati, T. Baumgartner, M. Maimone, I. Nesnas, andA. Volpe, “Autonomous rover technology for marssample return,” in Artificial Intelligence, Robotics andAutomation in Space, vol. 440, 1999, p. 1.
[15] G. R. Osinski, M. Battler, C. M. Caudill, R. Francis,T. Haltigin, V. J. Hipkin, M. Kerrigan, E. A. Pilles,A. Pontefract, L. L. Tornabene et al., “The canmarsmars sample return analogue mission,” Planetary andSpace Science, vol. 166, pp. 110–130, 2019.
[16] P. Younse, C. Y. Chiu, J. Cameron, M. Dolci, E. Elliot,A. Ishigo, D. Kogan, E. Marteau, J. Mayo, J. Mungeret al., “Concept for an on-orbit capture and orientmodule for potential mars sample return,” in 2020 IEEEAerospace Conference. IEEE, 2020, pp. 1–22.
[17] S. Perino, D. Cooper, D. Rosing, L. Giersch, Z. Ous-namer, V. Jamnejad, C. Spurgers, M. Redmond, M. Lob-bia, T. Komarek et al., “The evolution of an orbitingsample container for potential mars sample return,” in2017 IEEE Aerospace Conference. IEEE, 2017, pp.1–16.
[18] K. Edelberg, J. Reid, R. McCormick, L. DuCharme,E. Kulczycki, and P. Backes, “Autonomous localizationand acquisition of a sample tube for mars sample re-turn,” in AIAA SPACE 2015 Conference and Exposition,2015, p. 4483.
[19] J. Papon, R. Detry, P. Vieira, S. Brooks, T. Srinivasan,A. Peterson, and E. Kulczycki, “Martian fetch: Findingand retrieving sample-tubes on the surface of mars,” inIEEE Aerospace Conference, 2017.
[20] B. Lee, R. Detry, J. Moreno, D. D. Lee, and E. Kul-czycki, “Monocular visual pose estimation via onlinesampling for mars sample-tube pickup,” in 2018 IEEEAerospace Conference. IEEE, 2018, pp. 1–8.
[21] T.-H. Pham, W. Seto, S. Daftry, A. Brinkman, J. Mayo,Y. Cheng, C. Padgett, E. Kulczycki, and R. Detry,“Rover localization for tube pickup: Dataset, methodsand validation for mars sample return planning,” in 2020IEEE Aerospace Conference. IEEE, 2020, pp. 1–11.
[22] Z. Zou, Z. Shi, Y. Guo, and J. Ye, “Object detection in20 years: A survey,” arXiv preprint arXiv:1905.05055,2019.
[23] D. G. Lowe, “Object recognition from local scale-invariant features,” in Proceedings of the seventh IEEEinternational conference on computer vision, vol. 2.Ieee, 1999, pp. 1150–1157.
[24] F. Rothganger, S. Lazebnik, C. Schmid, and J. Ponce,“3d object modeling and recognition using local affine-invariant image descriptors and multi-view spatial con-straints,” International journal of computer vision,vol. 66, no. 3, pp. 231–259, 2006.
[25] A. Krizhevsky, I. Sutskever, and G. E. Hinton, “Ima-genet classification with deep convolutional neural net-works,” in Advances in Neural Information ProcessingSystems, 2012, pp. 1097–1105.
[26] R. Girshick, “Fast R-CNN,” in Proceedings of the IEEEInternational Conference on Computer Vision, 2015,pp. 1440–1448.
[27] S. Ren, K. He, R. Girshick, and J. Sun, “Faster R-CNN:Towards Real-Time Object Detection with Region Pro-posal Networks,” in Advances in Neural Information
9

Processing Systems 28, C. Cortes, N. D. Lawrence,D. D. Lee, M. Sugiyama, and R. Garnett, Eds. CurranAssociates, Inc., 2015, pp. 91–99.
[28] J. Long, E. Shelhamer, and T. Darrell, “Fully convolu-tional networks for semantic segmentation,” in Proceed-ings of the IEEE Conference on Computer Vision andPattern Recognition, 2015, pp. 3431–3440.
[29] K. He, G. Gkioxari, P. Dollar, and R. Girshick, “MaskR-CNN,” in Proceedings of the IEEE InternationalConference on Computer Vision, 2017, pp. 2961–2969.
[30] M. Ono, B. Rothrock, K. Otsu, S. Higa, Y. Iwashita,A. Didier, T. Islam, C. Laporte, V. Sun, K. Stacket al., “Maars: Machine learning-based analytics forautomated rover systems,” in 2020 IEEE AerospaceConference. IEEE, 2020, pp. 1–17.
[31] N. Abcouwer, S. Daftry, S. Venkatraman, T. del Sesto,O. Toupet, R. Lanka, J. Song, Y. Yue, and M. Ono,“Machine learning based path planning for improvedrover navigation (pre-print version),” in 2021 IEEEAerospace Conference. IEEE, 2021.
[32] M. S. Costa and L. G. Shapiro, “3d object recognitionand pose with relational indexing,” Computer Visionand Image Understanding, vol. 79, no. 3, pp. 364–407,2000.
[33] P. David and D. DeMenthon, “Object recognition inhigh clutter images using line features,” in TenthIEEE International Conference on Computer Vision(ICCV’05) Volume 1, vol. 2. IEEE, 2005, pp. 1581–1588.
[34] I. Weiss and M. Ray, “Model-based recognition of 3dobjects from single images,” IEEE Transactions on Pat-tern Analysis and Machine Intelligence, vol. 23, no. 2,pp. 116–128, 2001.
[35] C. M. Cyr and B. B. Kimia, “A similarity-based aspect-graph approach to 3d object recognition,” InternationalJournal of Computer Vision, vol. 57, no. 1, pp. 5–22,2004.
[36] D. W. Eggert, K. W. Bowyer, C. R. Dyer, H. I. Chris-tensen, and D. B. Goldgof, “The scale space aspectgraph,” IEEE Transactions on Pattern Analysis andMachine Intelligence, vol. 15, no. 11, pp. 1114–1130,1993.
[37] M. Ulrich, C. Wiedemann, and C. Steger, “Combiningscale-space and similarity-based aspect graphs for fast3d object recognition,” IEEE transactions on patternanalysis and machine intelligence, vol. 34, no. 10, pp.1902–1914, 2011.
[38] S. Hinterstoisser, C. Cagniart, S. Ilic, P. Sturm,N. Navab, P. Fua, and V. Lepetit, “Gradient responsemaps for real-time detection of textureless objects,”IEEE transactions on pattern analysis and machineintelligence, vol. 34, no. 5, pp. 876–888, 2011.
[39] S. Hinterstoisser, V. Lepetit, S. Ilic, S. Holzer, G. Brad-ski, K. Konolige, and N. Navab, “Model based training,detection and pose estimation of texture-less 3d objectsin heavily cluttered scenes,” in Asian conference oncomputer vision. Springer, 2012, pp. 548–562.
[40] H. Cai, T. Werner, and J. Matas, “Fast detection ofmultiple textureless 3-d objects,” in International Con-ference on Computer Vision Systems. Springer, 2013,pp. 103–112.
[41] F. Tombari, S. Salti, and L. Di Stefano, “Unique sig-natures of histograms for local surface description,” in
European Conference on Computer Vision, 2010, pp.356–369.
[42] C.-Y. Tsai, C.-C. Yu et al., “Real-time textureless ob-ject detection and recognition based on an edge-basedhierarchical template matching algorithm,” Journal ofApplied Science and Engineering, vol. 21, no. 2, pp.229–240, 2018.
[43] T.-T. Do, M. Cai, T. Pham, and I. Reid, “Deep-6dpose:Recovering 6d object pose from a single rgb image,”arXiv preprint arXiv:1802.10367, 2018.
[44] W. Kehl, F. Manhardt, F. Tombari, S. Ilic, and N. Navab,“Ssd-6d: Making rgb-based 3d detection and 6d poseestimation great again,” in Proceedings of the IEEEInternational Conference on Computer Vision, 2017,pp. 1521–1529.
[45] Y. Xiang, T. Schmidt, V. Narayanan, and D. Fox,“Posecnn: A convolutional neural network for 6d objectpose estimation in cluttered scenes,” arXiv preprintarXiv:1711.00199, 2017.
[46] T.-H. Pham, W. Seto, S. Daftry, B. Ridge, J. Hansen,T. Thrush, J. Mayo, Y. Cheng, C. Padgett, E. Kulczy-cki, and R. Detry, “Rover Navigation for Mars SampleReturn Planning: Relocalization in Changing Environ-ments by Virtual Template Synthesis and Matching,” in2021 IEEE International Conference on Robotics andAutomation (ICRA), Xi’an, China, May 2021 (UnderReview).
[47] R. Francis, T. Estlin, G. Doran, S. Johnstone, D. Gaines,V. Verma, M. Burl, J. Frydenvang, S. Montano,R. Wiens et al., “Aegis autonomous targeting for chem-cam on mars science laboratory: Deployment and re-sults of initial science team use,” Science Robotics,vol. 2, no. 7, 2017.
[48] W. Kim, R. Steele, A. Ansar, K. Ali, and I. Nesnas,“Rover-based visual target tracking validation and mis-sion infusion,” in Space 2005, 2005.
[49] D. G. Lowe, “Distinctive image features from scale-invariant keypoints,” International journal of computervision, vol. 60, no. 2, pp. 91–110, 2004.
[50] C. Steger, “Occlusion, clutter, and illumination invari-ant object recognition,” International Archives of Pho-togrammetry Remote Sensing and Spatial InformationSciences, vol. 34, no. 3/A, pp. 345–350, 2002.
[51] R. Rios-Cabrera and T. Tuytelaars, “Discriminativelytrained templates for 3d object detection: A real timescalable approach,” in Proceedings of the IEEE interna-tional conference on computer vision, 2013, pp. 2048–2055.
[52] K. He, X. Zhang, S. Ren, and J. Sun, “Deep ResidualLearning for Image Recognition,” in Proceedings ofthe IEEE Conference on Computer Vision and PatternRecognition, 2016, pp. 770–778.
[53] S. Xie, R. Girshick, P. Dollar, Z. Tu, and K. He,“Aggregated Residual Transformations for Deep NeuralNetworks,” in Proceedings of the IEEE Conference onComputer Vision and Pattern Recognition, 2017, pp.1492–1500.
[54] T.-Y. Lin, P. Dollar, R. Girshick, K. He, B. Hariharan,and S. Belongie, “Feature Pyramid Networks for ObjectDetection,” in Proceedings of the IEEE Conference onComputer Vision and Pattern Recognition, 2017, pp.2117–2125.
[55] R. Girshick, J. Donahue, T. Darrell, and J. Malik, “Rich
10

Feature Hierarchies for Accurate Object Detection andSemantic Segmentation,” in 2014 IEEE Conference onComputer Vision and Pattern Recognition (CVPR), Jun.2014, pp. 580–587.
[56] O. Russakovsky, J. Deng, H. Su, J. Krause, S. Satheesh,S. Ma, Z. Huang, A. Karpathy, A. Khosla, M. Bernstein,A. C. Berg, and L. Fei-Fei, “ImageNet Large ScaleVisual Recognition Challenge,” International Journalof Computer Vision, vol. 115, no. 3, pp. 211–252, Dec.2015.
[57] J. Maki, C. McKinney, R. Sellar, D. Copley-Woods,D. Gruel, D. Nuding, M. Valvo, T. Goodsall,J. McGuire, and T. Litwin, “Enhanced engineering cam-eras (eecams) for the mars 2020 rover,” LPICo, vol.1980, p. 4132, 2016.
[58] J. Brooks, “COCO Annotator,”https://github.com/jsbroks/coco-annotator/, 2019.
[59] E. Olson, “Apriltag: A robust and flexible visual fidu-cial system,” 2011 IEEE International Conference onRobotics and Automation, 2011.
[60] M. Everingham, L. V. Gool, C. K. I. Williams, J. Winn,and A. Zisserman, “The Pascal Visual Object Classes(VOC) Challenge,” International Journal of ComputerVision, vol. 88, no. 2, pp. 303–338, Jun. 2010.
[61] T.-Y. Lin, M. Maire, S. Belongie, J. Hays, P. Perona,D. Ramanan, P. Dollar, and C. L. Zitnick, “MicrosoftCOCO: Common Objects in Context,” in ComputerVision – ECCV 2014, ser. Lecture Notes in ComputerScience, D. Fleet, T. Pajdla, B. Schiele, and T. Tuyte-laars, Eds. Springer International Publishing, 2014,pp. 740–755.
BIOGRAPHY[
Shreyansh Daftry is a Robotics Tech-nologist at NASA Jet Propulsion Labora-tory, California Institute of Technology.He received his M.S. degree in Roboticsfrom the Robotics Institute, CarnegieMellon University in 2016, and his B.S.degree in Electronics and Communica-tion Engineering in 2013. His researchinterest lies is at intersection of spacetechnology and autonomous robotic sys-
tems, with an emphasis on machine learning applicationsto perception, planning and decision making. At JPL, hehas worked on mission formulation for Mars Sample Return,and technology development for autonomous navigation ofground, airborne and subterranean robots.
Barry Ridge is a postdoctoral scholarat the NASA Jet Propulsion Laboratory(JPL), California Institute of Technol-ogy. He has previously held postdoctoralpositions at the Advanced Telecommuni-cations Research Institute International,Kyoto, Japan, and the Jozef Stefan In-stitute, Ljubljana, Slovenia. He receiveda B.Sc. in Computer Applications fromDublin City University, Ireland, in 2002
and went on to study pure mathematics at the University of StAndrews, Scotland, where he received an M.Phil. in 2006.After being awarded a Marie Curie Fellowship to pursuedoctoral studies at the University of Ljubljana, Slovenia, with
a focus on robotic learning of object affordances, he defendedhis Ph.D. in 2014. His research interests include cognitiverobotics, computer vision, and machine learning, and at JPLhe is currently working on robot vision and simulation capa-bilities for the Mars Sample Return and InVADER missions.
William Seto is a Robotics Technologistat NASA’s Jet Propulsion Laboratory.He joined JPL in 2017 after receiving hisM.S. in Robotic Systems Developmentfrom Carnegie Mellon’s Robotics Insti-tute. He develops software to enable au-tonomous capabilities in maritime andterrestrial environments. His outside in-terests include soccer and chicken ten-ders.
Tu-Hoa Pham is a Robotics Technol-ogist at the NASA Jet Propulsion Lab-oratory, Caltech Institute of Technol-ogy, currently working on machine vi-sion for Mars Sample Return. He holdsa Diplome d’Ingenieur in Aerospace En-gineering from ISAE-SUPAERO (2013),an M.Sc. in Applied Mathematics fromUniversite Paul Sabatier (2013) and aPh.D. in Robotics from Universite de
Montpellier (2016), which he conducted at the CNRS-AISTJoint Robotics Laboratory on the topic of force sensing fromvision. Prior to joining JPL in 2018, he spent two yearsas a research scientist at IBM Research Tokyo, where heworked on deep reinforcement learning for robot vision andmanipulation in the real-world.
Peter Ilhardt received his B.A. in Earthand Planetary Sciences from Northwest-ern University in 2013 and M.S. in Geo-sciences from Penn State University in2016. He is currently a data scienceconsultant at Capgemini and M.C.S. stu-dent at the University of Illinois. Hisprevious work focused on spectroscopicanalysis and chemical imaging of com-plex biogeochemical systems at Pacific
Northwest National Laboratory and Penn State University.Before starting his current role, Peter interned with thePerception Systems Group at NASA JPL working on machinevision for Mars Sample Return.
11

Gerard Maggiolino received a B.S. inMath-Computer Science from the Uni-versity of California, San Diego in 2020and will be attending Carnegie Mel-lon University for a Masters in Com-puter Vision in 2021. He has previ-ously interned at NASA JPL (Pasadena),Accel Robotics (San Diego), and Ele-mentary Robotics (Los Angeles) workingon primarily Computer Vision, Machine
Learning, and Software Development projects.
Mark Van der Merwe is a Robotics PhDstudent at the University of Michigan,Ann Arbor. He received his B.Sc. degreein Computer Science from the Universityof Utah in 2020. He interned at NASAJPL during the Summer of 2020, wherehe worked with the Perception Systemsteam on tube and rover localization forMars Sample Return. His current re-search interests lie at the intersections of
perception and action for robot manipulation.
Alexander Brinkman received his M.Sin Robotic Systems Development fromCarnegie Mellon’s Robotic Institute,then joined the Robotic Manipulationand Sampling group at Jet PropulsionLaboratory in 2017. He develops ma-nipulation software and autonomous ca-pabilities to enable future sampling mis-sions to Europa, Enceladus, Mars, andcomets.
John Mayo is a robotics mechanicalengineer in the Robotic Climbers andGrippers Group at JPL. John received aBachelor of Science in Mechanical En-gineering from Texas A&M in 2014 andMaster of Science of the same from theMassachusetts Institute of Technology in2016. As part of his graduate stud-ies, John worked on hardware for theHERMES humanoid robot, developing a
hybrid hand-foot device under direction of Sangbae Kim.Additionally, John co-founded and led the MIT HyperloopTeam to design and build a magnetically levitated vehicle andparticipated as a mentor in the new student-led shop, MITMakerworks.
Eric Kulczycki received a dual B.Sdegree in Mechanical Engineering andAeronautical Science and Engineeringfrom the University of California, Davis,in 2004. He received his M.S. degree inMechanical and Aeronautical Engineer-ing also from the University of Califor-nia, Davis in 2006. He is a member ofthe engineering staff at the Jet Propul-sion Laboratory, California Institute of
Technology, where he is currently involved in Mars sampletransfer chain technology development, sampling technologydevelopment for extreme environments, Mars 2020 SampleCaching Subsystem, and mechanical design of various mo-bility platforms. He has worked at JPL for over 15 years.
Renaud Detry is the group leader forthe Perception Systems group at NASA’sJet Propulsion Laboratory (JPL). De-try earned his Master’s and Ph.D. de-grees in computer engineering and robotlearning from ULiege in 2006 and 2010.He served as a postdoc at KTH andULiege between 2011 and 2015. Hejoined the Robotics and Mobility Sectionat JPL in 2016. His research interests
are perception and learning for manipulation, robot grasp-ing, and mobility, for terrestrial and planetary applications.At JPL, Detry leads the machine-vision team of the MarsSample Return surface mission, and he conducts researchin autonomous robot manipulation and mobility for Mars,Europa, Enceladus, and terrestrial applications.
12