mac 213 course title: foundations of communication research
167
2 NATIONAL OPEN UNIVERSITY OF NIGERIA SCHOOL OF ARTS AND SOCIAL SCIENCES COURSE CODE: MAC 213 COURSE TITLE: FOUNDATIONS OF COMMUNICATION RESEARCH
-
Upload
khangminh22 -
Category
Documents
-
view
0 -
download
0
Transcript of mac 213 course title: foundations of communication research

2
NATIONAL OPEN UNIVERSITY OF NIGERIA
SCHOOL OF ARTS AND SOCIAL SCIENCES
COURSE CODE: MAC 213
COURSE TITLE: FOUNDATIONS OF COMMUNICATION
RESEARCH

3
COURSE
GUIDE
MAC 213
FOUNDATIONS OF COMMUNICATION RESEARCH
COURSE TEAM
Chidinma H. Onwubere (PhD) Course Developer (NOUN)
COURSE WRITERS
Mr Myke Esiri
Department of Mass Communication Redeemerr’s University, Ogun State
Chidinma H. Onwubere (PhD)
School of Arts and Social Sciences
National Open University of Nigeria,
Victoria Island, Lagos
EDITOR
Dr. Olubunmi Ajibade
Department of Mass Communication
University of Lagos
Jonathan E. Aliede, Ph.D. (HOU)
School of Arts and Social Sciences
National Open University of Nigeria,
Victoria Island, Lagos
NATIONAL OPEN UNIVERSITY OF NIGERIA

COURSE GUIDE
National Open University of Nigeria
Headquarters 14/16 Ahmadu Bello Way
Victoria Island Lagos
Abuja Office
National Open University of Nigeria 5, Dar Es Salaam Street,
Off Aminu Kano Crescent
Wuse II, Abuja
Nigeria
e-mail: [email protected]
URL: www.nou.edu.ng
Published by
National Open University of Nigeria
Printed
ISBN:
All Rights Reserved
iii

COURSE GUIDE
iv
CONTENTS PAGE
Introduction………………………………………………. 1
What You will Learn in this Course……………………… 1
Course Aims……………………………………………… 2 Course Objectives………………………………………… 2
Working Through This Course…………………………… 2 Course Materials……………………………………….…. 3
Study Units……………………………………………. … 3 Textbooks and References……………………………. … 4
Assessment ………………..………………………………. 4 Assignment File …………………………………………… 4
Tutor-Marked Assignment………………………………… 4 Final Examinations and Grading…………………………. 5
Course Marking Scheme………………………………….. 5 Presentation Schedule……………………………………… 5
Course Overview………………………………………….. 6 How to get the Most from this Course…………………….. 7
Facilitators/Tutors and Tutorials…………………………… 8 Summary ….......................................................................... 9

COMMUNICATION RESEARCH
ii
Introduction Welcome to MAC 213: Communication Research
This is a 2 credit unit course whose primary focus is to introduce
undergraduate students of Mass Communication to the data gathering methods in
Journalism and Mass Communication. The essence i s t o i m p r o v e y o u r
skill for analyzing data and prepare you for the critical evaluation of any piece of
writing in Mass Communication. More importantly, this course will help you
to apply the learnt methods while carrying out your research projects.
This course treats the fundamental principles required for gathering and collecting
data, both for qualitative and quantitative research modes at any level of your
academic pursuit. It particularly highlights the types of, and approaches to
research. That is, the general concept of research and it looks at the sources of
data. It then, generally examines the areas of Communication research from which
students may readily access interesting research topics or from where they can
get good clues for stimulating research topics. The course is developed
essentially for Nigerian students hence, the sample presented and examples used
are typically Nigerian in orientation and setting. It takes into consideration, the
professional and academic needs of the undergraduate students of Journalism and
Mass Communication.
This course guide is meant to give you basic information about this course. Hence,
it specifies the amount of time you are required to spend on each assignment. It
equally directs you on how to go about your Tutor-Marked Assignments (TMAs).
It advises you on how to make the best out of your course materials; through:
reading them, attending tutorial classes and actively participating at these tutorials.
What You will Learn in this Course
This course is meant to expose you to the basic concepts in data gathering
and analysis through: the identification of research problems; setting meaningful
objectives and selecting the appropriate methods of carrying out the research.
The course examines both from the practical and critical perspectives, a range of
qualitative and quantitative research methods relevant to professional and
academic needs in Mass communication. Hence it effectively takes you through
methods such as, content analysis, survey, focus group discussion, and in-depth
interviews.
The thorough understanding of this course will help you appreciate the
differences between Communication Research and other types of researches.
It will equally empower you to face the challenges of analyzing the data for
your research project without many problems. In studying this course, you stand a
good chance of evaluating any piece of work statistically. Your adequate
exposure to Communication Research will empower you not only to
effectively analyse your data but to equally do a good report of your research
proceedings.

COMMUNICATION RESEARCH
iii
This course guide is meant to help you accomplish the aims and objectives of this course.
Hence you are advised to read it carefully so as to get the best out of your course.
Course Aims The primary aim of this course is to inculcate in you the appropriate skill for: gathering,
and analyzing data as well as, write good reports for any research investigation in
Journalism and Mass Communication.
Course Objectives
Certain objectives must be achieved from the study of this course. So at the end of this
course, you should be able to:
(i) Define “research” and discuss its nature
(ii) Discuss the scope and concerns of media research.
(iii) Identify the different elements of research e.g. concepts, hypothesis, variables,
measurement
(iv) Identify and discuss the major communication research methods. (v) Discuss the different areas of communication research.
Working through this Course To maximally benefit from this course, you should read the study units provided through
your course material. You equally do the self assessment exercises which you will find under
every unit of this course.
Try as much as you can to locate the texts recommended for further readings. Please read
some of them to complement what you already have in your course materials.
There are also Tutor Marked Assignments at the end of each unit which constitute your
Continuous Assessment for the course. At the appropriate time the School will
inform you on which of the TMAs to do and when to submit them.
Remember, all the components of this course are very important as they all contribute to
your total scores and eventually your success.

COMMUNICATION RESEARCH
iv
Course Materials
The major materials you will need for this course are:
(i) Course guide
(ii) Study units (iii) Assignments file (iv) Relevant textbooks including the ones listed under each unit.
Study Units
There are 16 units in this course. They are listed below:
MODUULE 1 INTRODUCTION
Unit 1 The concept of research
Unit 2 Classification of research
Unit 3 The scientific method and the development of mass media research
MODULE 2 ELEMENTS OF RESEARCH
Unit 1 Concepts, Constructs, hypotheses and instrumentation
Unit 2 Variables
Unit 3 Measurement, scales and Indexes
MODULE 3 MAJOR COMMUNICATION RESEARCH METHODS
Unit 1 Experimental research
Unit 2 Survey research
Unit 3 Content analysis
Unit 4 Other research methods
MODULE 4 SAMPLING
Unit 1 Meaning and types of sampling
Unit 2 Population and sample
Unit 3 Sampling size and sampling error
MODULE 5 THE RESEARCH PROCESS
Unit 1 The research procedure
Unit 2 Data analysis in communication research
Unit 3 Documentation in communication research.

COMMUNICATION RESEARCH
v
Textbooks and References
Certain books have been recommended in the course. You may wish to purchase them
for further reading.
Assessment An assessment file and a marking scheme will be made available to you. In the
assessment file, you will find details of the works you must submit to your tutor
for marking. There are two aspects of the assessment of this course; the tutor
marked and the written examination. The marks you obtain in these two areas will make
up your final marks.
Assignment File The assignment must be submitted to your tutor for formal assessment in accordance
with the deadline stated in the presentation schedule and the Assignment file.
The work you submit to your tutor for assessment will count for 30% of your total
score.
Tutor-Marked Assignment You will have to submit a specified number of the TMAs. Every unit in this course has
a tutor marked assignment. You will be assessed on four of them but the best three
performances from the TMAs will be used for your 30% grading. When you have
completed each assignment, send it together with a Tutor Marked Assignment form, to
your tutor.
Make sure each assignment reaches your tutor on or before the deadline for
submissions. If for any reason, you cannot complete your work on

COMMUNICATION RESEARCH
v
time, contact your tutor for a discussion on the possibility of an extension.
Extensions will not be granted after the due date unless under exceptional
circumstances.
Final Examinations and Grading The final examination will be a test of three hours. All areas of the
course will be examined. Find time to read the units all over before your
examination. The final examination will attract 70% of the total course
grade. The examination will consist of questions, which reflect the kinds of
self assessment exercises and tutor marked assignment you have previously
encountered. And all aspects of the course will be assessed.
You should use the time between completing the last unit, and taking the
examination to revise the entire course.
Course Marking Scheme
The following table lays out how the actual course mark allocation is
broken down.
Assessment Marks
Assignments (Best Three Assignments out of four
marked)
= 30%
Final Examination = 70%
Total 100%
Presentation Schedule The dates for submission of all assignments will be communicated to
you. You will also be told the date of completing the study units and
dates for examinations.

COMMUNICATION RESEARCH
vi
Course Overview
Title of work Weeks
Activity
Number of
Assignment
Course Guide
Module 1
Unit 1 The concept of research
Week 1 Assignment 1
Unit 2 Classification of research. Week 2 Assignment 1
Unit 3 The scientific method and the
development of mass media
research
Week 3 Assignment 1
Module 2
Unit 1 Concepts, Constructs, hypotheses
and instrumentation
Week 4 Assignment 1
Unit 2 Variables Week 5 Assignment 1
Unit 3 Measurement, Scales and
Indexes.
Week 6 Assignment 1
Module 3
Unit 1 Experimental Research Week 7 Assignment 1
Unit 2 Survey Research Week 8 Assignment 1
Unit 3 Content Analysis Week 9 Assignment 1
Unit 4 Other research methods
Week 10 Assignment 1
Module 4
Unit 1 Meaning and Types of
Sampling
Week 11 Assignment 1
Unit 2 Population, and Sample size Week 12 Assignment 1
Unit 3 Sampling size and sampling error Week 12 Assignment 1
Module 5
Unit 1 The research procedure Week 13 Assignment 1
Unit 2 Data Analysis in Comm. Res Week 14 Assignment 1
Unit 3 Documentation in Comm. Res Week 14 Assignment 1
Total 14
W
W
W
Weeks
22

COMMUNICATION RESEARCH
vii
How to Get the Most from this Course
In distance learning, the study units replace the university lecture. This
is one of the great advantages of distance learning; you can read and
work through specially designed study materials at your own pace, and
at a time and place that suits you best. Think of it as reading the lecture
instead of listening to the lecturer. In the same way a lecturer might give
you some reading to do, the study units tell you where to read, and
which are your text materials or set books. You are provided exercises
to do at appropriate points, just as a lecturer might give you an in-class
exercise. Each of the study units follows a common format. The first
item is an introduction to the subject matter of the unit, and how a
particular unit is integrated with the other units and the course as a
whole. Next to this is a set of learning objectives. These objectives let
you know what you should be able to do by the time you have
completed the unit. These learning objectives are meant to guide your
study. The moment a unit is finished, you must go back and check
whether you have achieved the objectives. If you make this a habit, then
you will significantly improve your chances of passing the course. The
main body of the unit guides you through the required reading from
other sources. This will usually be either from your set books or from a
Reading section. The following is a practical strategy for working
through the course. If you run into any trouble, telephone your tutor.
Remember that your tutor’s job is to help you. When you need
assistance, do not hesitate to call and ask your tutor to provide it.
1. Read this Course Guide thoroughly, it is your first assignment.
2. Organize a Study Schedule. Design a ‘Course Overview’ to guide
you through the Course. Note the time you are expected to spend on
each unit and how the Assignments relate to the units. Whatever
method you choose to use, you should decide on and write in your
own dates and schedule of work for each unit.
3. Once you have created your own study schedule, do everything to
stay faithful to it. The major reason why students fail is that they
get behind with their course work if you get into difficulties with
your schedule, please, let your tutor know before it is too late to
help.

COMMUNICATION RESEARCH
vii
4. Turn to Unit 1, and read the introduction and the objectives for
the unit.
5. Assemble the study materials. You will need your set books and the
unit you are studying at any point in time. As you work through the
unit, you will know what sources to consult for further information.
6. Keep in touch with your study centre. Up-to-date course information
will be continuously available there.
7. Well before the relevant due dates (about 4 weeks before due dates),
keep in mind that you will learn a lot by doing the assignment
carefully. They have been designed to help you meet the objectives
of the course and, therefore, will help you pass the examination.
Submit all assignments not later than the due date.
8. Review the objectives for each study unit to confirm that you have
achieved them. If you feel unsure about any of the objectives, review
the study materials or consult your tutor.
9. When you are confident that you have achieved a unit’s objectives,
you can start on the next unit. Proceed unit by unit through the
course and try to pace your study so that you keep yourself on
schedule.
10. When you have submitted an assignment to your tutor for marking,
do not wait for its return before starting on the next unit. Keep to
your schedule. When the assignment is returned, pay particular
attention to your tutor’s comments, both on the tutor-marked
assignment form and also the written comments on the ordinary
assignments.
11. After completing the last unit, review the course and prepare yourself
for the final examination. Check that you have achieved the unit
objectives (listed at the beginning of each unit) and the course
objectives (listed in the Course Guide).
Facilitators/Tutors and Tutorials
Information relating to the tutorials will be provided at the appropriate
time. Your tutor will mark and comment on your assignments, keep a
close watch on your progress and on any difficulties you might
encounter and provide assistance to you during the course. You must
take your tutor-marked assignments to the study centre well before the
due date (at least two working days are required). They will be marked
by your tutor and returned to you as soon as possible.
2
Do not hesitate to contact your tutor if you need help. Contact your tutor
if:
you do not understand any part of the study units or the assigned
readings
you have difficulty with the exercises
you have a question or problem with an assignment or with your
tutor’s comments on an assignment or with the grading of an
assignment.
You should try your best to attend the tutorials. This is the only chance
to have face-to-face contact with your tutor and ask questions which are
answered instantly. You can raise any problem encountered in the
course of your study. To gain the maximum benefit from course
tutorials, prepare a question list before attending them. You will learn a
lot from participating in discussion actively.
Summary The course guide gives you an overview of what to expect in the course
of this study. The course teaches you the basic principles of
Communication Research and how these principles can be applied. It
also acquaints you with the basic communication researches in
journalism and mass communication.
We wish you success in the course and hope that you will find it both
interesting and useful.

3
MAIN
WORK
MAC 213
FOUNDATIONS OF COMMUNICATION RESEARCH
COURSE TEAM
Chidinma H. Onwubere (PhD) Course Developer (NOUN)
COURSE WRITERS Mr Myke Esiri
Department of Mass Communication Redeemerr’s University, Ogun State
Chidinma H. Onwubere (PhD)
School of Arts and Social Sciences
National Open University of Nigeria,
Victoria Island, Lagos
EDITOR
Dr. Olubunmi Ajibade
Department of Mass Communication
University of Lagos
Jonathan E. Aliede, Ph.D. (HOU)
School of Arts and Social Sciences
National Open University of Nigeria,
Victoria Island, Lagos
NATIONAL OPEN UNIVERSITY OF NIGERIA

4
MAIN WORK
National Open University of Nigeria
Headquarters 14/16 Ahmadu Bello Way
Victoria Island Lagos
Abuja Office
National Open University of Nigeria 5, Dar Es Salaam Street, Off
Aminu Kano Crescent Wuse II,
Abuja
Nigeria
e-mail: [email protected]
URL: www.nou.edu.ng
Published by
National Open University of Nigeria
Printed
ISBN:
All Rights Reserved

5
CONTENTS
MODUULE 1 INTRODUCTION
Unit 1 The concept of research
Unit 2 Classification of research
Unit 3 The scientific method and the development of mass media research
MODULE 2 ELEMENTS OF RESEARCH
Unit 1 Concepts, Constructs, hypotheses and instrumentation
Unit 2 Variables
Unit 3 Measurement, scales and Indexes
MODULE 3 MAJOR COMMUNICATION RESEARCH METHODS
Unit 1 Experimental research
Unit 2 Survey research
Unit 3 Content analysis
Unit 4 Other research methods
MODULE 4 SAMPLING
Unit 1 Meaning and types of sampling
Unit 2 Population and sample
Unit 3 Sampling size and sampling error
MODULE 5 THE RESEARCH PROCESS
Unit 1 The research procedure
Unit 2 Data analysis in communication research
Unit 3 Documentation in communication research.
MODULE 1 INTRODUCTION

6
Unit 1 The meaning of research
Unit 2 Classification of research
Unit 3 The scientific method and mass media research.
Unit 4 Development of mass media research
UNIT 1 THE MEANING OF RESEARCH
CONTENTS
1.0 Introduction
2.0 Objectives
3.0 Main content
3.1 The concept of research
3.2 Characteristics of research
3.3 Objectives of research
3.4 Attributes of the researcher
3.5 Significance of research
3.6 Relationship between theory and research
3.7 Steps in conducting research
4.0 Conclusion
5.0 Summary
6.0 Tutor – marked assignment
7.0 References/Further reading
1.0 INTRODUCTION
Welcome to the research class. Research is one of the essential activities you must undertake for
you to earn your degree at the National Open University of Nigeria (NOUN). You cannot wish it
away; so you better be prepared to study research as meticulously as possible. As you will find
out, research is both an interesting and rigorous endeavour. This is because it has some
technicalities or procedures that must be strictly adhered to before you can successfully conduct
a research project. In this class you will be exposed to the fundamentals or basics of
communication research. This is with a view to prepare you towards carrying out a research
project of your own as part of the requirements for the award of a degree at NOUN.
2.0 OBJECTIVES
On successful completion of this unit, you should be able to:
Define the concept of research
Understand the characteristics and objectives of research
Know the significance of research
Know the attributes of a researcher
Understand the relationship between theory and research
Have an idea of the research procedure.

7
3.0 MAIN CONTENT
3.1 The Concept of Research
Research is a term you are probably familiar with. In other words, this is probably not your first
time of hearing or coming across the term “research”. For instance, you are aware that those in
the academic community (universities, polytechnics, monotechnics and colleges of education)
regularly engage in one form of research or the other. You are also probably aware that there are
several research institutions in Nigeria like the National Institute of Social Economic Research
(NISER) Ibadan, Nigerian Institute for Oceanography and Marine Research, Lagos, and National
Vertinary Research Institute, Jos, among many others that were established by the Federal
Government to engage in various forms of research. You may also be aware that in most
multinational corporations, they have what is known as Research and Development (R&D)
departments whose major responsibility is research and product development. Since you are
aware of some, if not all of these facts, the question therefore arises: what is research?
Some students were asked the above question and some of the responses obtained include the
following:
“Research is what we do when our lecturers give us assignments.”
“Research is part of what we do in our final year to earn our degrees.”
“Research is the thing we do when we want to find something out.”
While the above responses do indeed possess some utility as we shall later on explain, they are
nevertheless over simplification of the concept of research. Accordingly, they cannot be accepted
as valid definitions of research.
It is generally agreed scholars that the term “research” has its etymological derivation from the
French word “recherché” which means “to investigate thoroughly” or “to go about seeking”. The
term itself is derived from another old French word “recerchier” from the compound word “re” +
“cerchier” which means to search really hard. In other words, it means to investigate thoroughly;
to search for knowledge again and again.
In the English language, the word research is composed of two syllables; re and search. While re
is a prefix meaning again, anew or over again, search is a verb which means to examine closely
and carefully, to test and try, or to probe. Therefore, research means to search for knowledge
again and again. Some synonyms for research are inquiry, investigation and study.
The quest for knowledge is probably an innate attribute of man. Having found himself in a
complex world full of puzzles and problems it is only natural for man to seek for knowledge
about the complex world in which he lives. Obviously, man needs knowledge about the world
around him so that he can live a meaningful life on planet Earth. This is where research comes
in.
SELF ASSESMENT EXERCISE 1
List 10 research institutions in Nigeria and indicate their focus of research.

8
Definitions of research
In the broadest sense of the word, research includes any gathering of data, information and facts
for the advancement of knowledge (Shuttleworth, 2008). Similarly, research in common parlance
refers to a search for knowledge on the investigation of a particular topic using a variety of
reliable, scholarly resources.
Some other people consider it as a movement from the known to the unknown; a voyage of
discovery. Human beings possess the vital instinct of inquisitiveness for when the unknown
confronts them, they wonder and their inquisitiveness makes them probe and attain full and
better understanding of the unknown. This inquisitiveness is the mother of all knowledge and the
method which man employs for obtaining the knowledge of whatever is the unknown, can be
referred to as research.
The Oxford Advanced Learners Dictionary 7th
Edition (2005) defines research as “a careful
study of a subject, especially in order to discover new facts or information about it”. Although
the discovery of new facts is the ultimate aims of most research endeavours, some are undertaken
to prove whether the outcomes of a previous research are valid or not.
The Chambers Dictionary 11th
Edition (2009) defines research as “careful search; investigation;
systematic investigation towards increasing the sum of knowledge”. Similarly, the Merriam –
Webster Online Dictionary defines research as “a studious inquiry or examination; investigation
or experimentation aimed at the discovery and interpretation of facts, revision of accepted
theories or laws in the light of new facts or practical application of such new or revised theories
or laws”.
Having examined some broad and dictionary definitions, we now turn to some more scholarly,
technical or academic definitions of research. These definitions capture the essence of scientific
research more than the previous ones.
According to Crosswell (2008) “research is a process of steps used to collect and analyze
information to increase our understanding of a topic or issue.” The important thing about this
definition is that if emphasizes the fact that scientific research is conducted in stages. In other
words, it is a step-by-step process.
Shuttleworth (2008) asserts that, “the strict definition of scientific research is performing a
methodological study in order to prove a hypothesis or answer a specific (research) question”.
He further explains that finding a definitive answer to a problem is the central goal of most
scientific research.
The Demilicious blog (2013) defines research as the scientific investigation of phenomena which
includes collection, analysis, interpretation and presentation of facts that lines an individual’s
speculation with reality. This definition is very useful in that if captures the essence of what is
done in social science research.
To Kerlinger and Lee (2000:14), “scientific research is systematic, controlled and critical
investigation of hypothetical propositions about the presumed relations among natural
phenomenal”. Although, this is a very useful definition of research, it should be pointed out that

9
much of the research conducted in the Humanities and Social Sciences have little or nothing to
do with natural phenomena.
Osuala (2005:1) defines research as “the process of arriving at dependable solutions to problems
through the planned and systematic collection, analysis and interpretation of data.” He further
adds that research is oriented towards the discovery of the relationship that exist among the
phenomena of the world in which we live.
Research can also be defined as a structured enquiry that utilized acceptable scientific
methodology to solve problems and create new knowledge that is generally applicable. Another
acceptable definition of research is the systematic method consisting of enunciating the problem,
formulating a hypothesis or research question, collecting the facts or data, analyzing the facts and
reaching certain conclusions either in the form of solution(s) towards the concerned problem or
in certain generalizations for some theoretical formulation. Research can also be defined as an
endeavour to discover answers to intellectual and practical problems through the application of
scientific method.
With the above definitions, it is obvious that we have examined the concept of research from
various perspectives and can make some comments, elaboration or explanations.
Research is an original contribution to the existing stock of knowledge making for its
advancement. It is the search for knowledge through objective and systematic method of finding
solution to a problem. It is also the systematic approach concerning generalization and the
formulation of a theory.
Research is knowledge that can be explained or verified through some procedure. For one to
engage in any research, the expected outcome of that research must be important otherwise there
will be no need for the research. Consequently, all research activities start from problems that
require solutions. This may sometime originate from an idea, a puzzle or simple the wish to
explore our knowledge about simple issue, phenomena, situations or societies.
Most research endeavours started with problems which were puzzles. A puzzle is not just a lack
of understanding but a gap in our understanding of a phenomenon, issue or situation. (Des
Wilson, Esiri and Onwubere, 2008).
Research is devoted to finding conditions under which a certain phenomenon occurs and the
conditions under which it does not occur in what might appear to be similar circumstances.
According to Ajala (1996:1), the research attitude presumes that the first look and every later
look may be prone to error so we must look again and again differently and thoroughly each
time. Research also minimizes the role of chance in knowledge acquisition and scientific
investigation. Research also allows for accumulation of knowledge and make improvement
without discarding old but valid knowledge in favour of new facts.
Research is also a way of thinking; examining critically the various aspects of any professional
work. It is also a habit of questioning what is done and a systematic examination of the observed

10
information to find answers with a view to instituting appropriate changes for a more effective
academic or professional service.
Research is also used to establish or confirm facts, reaffirm the result of previous work, solve
new or existing problems, support theories or develop new theories. A research project may also
be an expansion on past work in a particular field.
A scholarly research is the product of a knowledge-gathering process through the use of
academically accepted fact-finding methods and tools and the ultimate presentation of the
empirical findings in a professional manner (often through conferences, seminars, journals and
books) to the academic community and the public at large.
Research is undertaken within most professions and disciplines. Since the disciplines differ,
the meaning and conduct of research tend to differ from one academic discipline to another.
Those who do, conduct or carry out research are known as researchers.
SELF ASSESSMENT EXERCISE
Distinguish between broad, dictionary and technical definitions of research.
3.2 Characteristics of research
It is obvious from our discussion so far that some academic activities are not research in the true
meaning of the concept. These include randomly surfing the internet or selection of books from
the library to read. Similarly, our day-to-day observation and interpretation of such observation
is not research because it lacks formality, verifiability and validity of research.
Research is a rigorous and verifiable academic/scientific endeavour with the following
characteristics:
Systematic – This means that the procedure utilized in conducting the research follows a rigid
standard protocol or logical sequence. The different steps cannot be undertaken in a haphazard
manner. Some steps must follow others
Empirical – This implies that any conclusion drawn from a research work is based on hard
evidence gathered from data collected from field work or real life experiences.
Valid and verifiable - This implies that whatever conclusions reached are on the basis of the
findings being correct and can be verified by other researchers.
Critical – This implies that research exhibits careful and precise judgment. This also means that
the process of investigation must be foolproof and free from drawbacks. The process adopted
and the procedure used must also be able to withstand critical thinking.
Rigorous – This implies that the researcher must be scrupulous in ensuring that the procedures
followed to find answers to questions are relevant, appropriate and justified. It should be noted,
however, that the degree of rigour varies markedly between the physical and social sciences.

11
Organized - Research endeavour is not carried out haphazardly but planned including literature
review and evaluating what questions need to be answered.
Analytical – Research utilized proven analytical procedures in gathering the data.
Replicable – The research design and procedures can be repeated to enable the researcher to
arrive at valid and conclusive results.
Other characteristics of research according to the Indiana State University’s website
(www.indiana.edu) are as follows:
The goal is inference
The procedures are public
The conclusions are uncertain
3.3 Purpose of research
The major purpose of research is to discover answers to questions through the application of
scientific procedures. Furthermore, the aim is to find out the truth which is hidden and which has
not been discovered. Though each research work has its own specific objective, Kotham (2009),
states that research objectives fall into a number of the following broad groupings:
i. To contribute to knowledge in a given discipline, issue, situation or provide practical
solutions to problems.
ii. To gain familiarity with a phenomenon or to achieve new insights into it
iii. To portray accurately the characteristics of a particular individual, situation or a group
iv. To determine the frequency with which something occurs or which it is associated with
something else
v. To test a hypothesis of a casual relationship between variables
In addition to the above, Collis and Hussey (2003) add the following objectives of research:
i. Review or synthesize existing situations or problems.
ii. Investigate existing situations or problems.
iii. Provide solutions to problems.
iv. Explore or analyze more general issues.
v. Construct or create new procedures or systems.
vi. Explain new phenomenon.
vii. Generate new knowledge.
3.4 Attributes of the researcher
A good researcher should possess some attributes or characteristics if he most succeed in his
endeavour. Although, the list of such attributes is much, the following are the salient ones:
Intellectual curiosity – This implies that the researcher undertakes a deep thinking and inquiry
of the things and situations around him.
Prudence – This means that the researcher should be careful to conduct his research at the right
time and place wisely efficiently and economically.

12
Healthy criticism – This implies that the researcher seeks to be absolutely sure of the results of
his study.
Intellectual honesty – This means that an intelligent researcher is honest to collect or gather
data or facts in order to arrive at honest conclusion.
Intellectual creativity – A productive and resourceful investigation always strives to create new
researches.
3.5 Significance of Research
The values of research to mankind include the following:
Research makes progress possible. This is based on the maxim which states that, “All
progress is born of inquiry. Doubt is often better than over-confidence for it leads to
inquiry and inquiry leads to invention.”
Research inculcates scientific and inductive thinking and it promotes the development of
logical habits of thinking and organization.
Research leads to the discovery of truth
Research leads to improvement in the quality of life
Research leads to new product development
Research improves students’ achievement
Research improves teachers’ competence and career advancement
Research leads to the abandonment of obsolete and invalid ideas and the adoption of new
line of thinking.
SELF ASSESSMENT EXERCISE
Do you consider research indispensable to man’s existence on Earth?
3.6 Relationship between theory and research.
Theory and research are two sides of a coin. However, although intimately related yet they are
completely interdependent.
Simply defined, theory is a way of making sense out of the world, a way of explaining things that
seem puzzling. According to Heimenstine (2013), “in the context of science, a theory is a well-
established explanation for scientific data.” The Merriam – Webster Online Dictionary defines
theory as “a plausible or scientifically acceptable principle or body of principles offered to
explain phenomenon.
Severin and Tankard (2001), define a theory as a set of ideas or systematic generalizations based
on scientific observation leading to further empirical observation.” This means that we can use
theories to make predictions about the outcomes of certain events.
Essentially, theory performs the following roles in research:
i. It serves as a critical guide to research
ii. It sets problems for research
iii. It identifies new subjects for research

13
iv. It directs research inquiry
Research on the other hand performs the following roles in theory
i. Research findings suggests new problems for theory
ii. It invites new theoretical formulations
iii. It leads to the final retirement of theories themselves
According to Onabajo, (2010), theory and research are closely related through the scientific
method. He explains that theory and research are mutual in the sense that they both use the
scientific method. Also both theory and research exist in the origin of each other. A well research
subject forms a theory and a theory can also spring up from a hypothesis that begins a research.
In essence, theory provides the logical support while research provides the empirical support.
But the Siamese link between social theory and social research goes deeper. In practice, they
both interact through a never-ending circle of two approaches to scientific inquiry, known as
deduction and induction. The deduction approach means using research to test theories while the
induction approach is simply developing theories from analysis of research data. Hence, both
theory and research are interwoven and work hand in hand. One cannot do without the other. The
existence of one depends on the other. This is what Onabajo (2010) refers to as the mutuality of
research and theory.
3.7 Steps in Conducting Research
We have previously explained that one of the characteristics of research is its systematic nature.
This implies that it follows a logical sequence or steps. The various stages generally represent the
overall research process. It should, however, be noted that differences in the disciplines tend to
affect the various stages hence the stages presented below cannot represent a fixed set of steps.
Nevertheless, the following are the general steps in conducting mass media research.
Identification or formulation of research problem
Specifying the specific purpose or objectives of the research
Specifying specific research questions or hypotheses
Literature review
Specifying data collecting method (s)
Analyzing and interpreting data
Drawing conclusions and making recommendations
Reporting the research
More on the research procedure in Module 5.
4.0 Conclusion
Research is one of the essential components of any scientific endeavour. It offers the researcher a
measure of control and autonomy over what is being studied. It also presents an opportunity for
the researcher to confirm, clarify, pursue or even discover new aspects of a subject or topic.. you
should be thinking of a research idea, you will like to investigate for your degree project.

14
5.0 Summary
Among other things, you have learnt the following from this unit:
The concept of research
The characteristics of research
The purpose of research
The importance of research
The essential qualities of a researcher
The relationship between theory and research.
6.0 Tutor-Marked Assignment
Discuss the mutuality between theory and research.
7.0 References/Further Reading
Ajala, O.V. (1996) Scholarly writing guide for researchers. Ibadan: MayBest publishers

15
Collis, J and Hussey, R. (2003) Business research: A practical guide for undergraduate and
postgraduate students. (2nd
edition) Basingstoke: Palgrave Macmillan
Crosswell, J.W. (2008) Educational research: Planning, conducting and evaluative quantitative
and qualitative research (2nd
edition) Upper-Saddle Rower N.J: Prentice Hall
Des Wilson, Esiri, M and Onwubere, C.H. (2008) JLS 714: Communication research. Lagos:
National Open University of Nigeria
Kerlinger, F.N. and Lee, B.H. (2000) Foundations of behavioural research. New York:
Harcourt College Publishers.
Osuala, E.C. (2005) Introduction to research methodology. Onitsha: Africana First Publishers
Onabajo, O (2011) Foundations of communication research Lagos: Sibon Books Ltd.
Oxford Advanced Learners Dictionary 7th edition (2005) Oxford: Oxford University Press
Severin, W.J. and Tankard, J.W. (2001).Communication theories, origins, methods and uses in
mass media (5th edition). New York: Longman
The Chambers Dictionary 11th
edition (2009) Edinburgh: Chambers Harrup Publishers Ltd
Internet Sources
Domilicious Blog (2013) Meaning and characteristics of research. Accessed at
www.analyst.091.blogspot.com on April 4, 2013
Helmenstine, A.M. (2013) Theory definition. Accessed at www.about.com on April 3, 2013
Indiana State University (2013) Characteristics of research. Accessed at www.indiana.edu on
April 2, 2013
Kotham, C.R. (2009) Research Methodology: methods and techniques. Accessed at
www.limit.org on April 3, 2013.
Shuttleworth, M (2008) Definition of research. Accessed at http:.//www.experiment-
resources.com on April 2, 2013
Merriam Webster Online Dictionary. Accessed at http://www.merriam-webster.com
Research Methodology. Accessed at www.hmgwaliarpdfresearch on March 29, 2013

16

17
UNIT 2 CLASSIFICATION OF RESEARCH
CONTENTS
1.0 Introduction
2.0 Objectives
3.0 Main Contents
3.1 Classification by philosophical approach
3.2 Classification of purpose
3.3 Classification by design
3.4 Classification by evidence
3.5 Classification by discipline
3.6 Other classifications
4.0 Conclusion
5.0 Summary
6.0 Tutor marked assignment
7.0 References / Further Reading
1.0 Introduction
Now that you have understood the concept and significance of communication research, the next
step is to classify research. This is crucial because research is not a monolithic enterprise but
comes in various types or formats. We have earlier indicated that even the steps in the research
procedure differ slightly from discipline to discipline and from one researcher to another.
Therefore, it is obvious that classification of research is not an easy exercise. Researchers are not
agreed on the classification of research. Indeed, there is no hard and fast rule for classifying
research. This means that one type of research can overlap and fit into more than one category at
the same time. For the convenience of this unit, research has been classified according to
philosophical approach, purpose, design, data approach, level of data analysis as well as
“others”.
2.0 Objectives
On successful completion of this unit, you should be able to:
identify the various types and formats of research in mass communication and the social
sciences
describe the content and context of the various research formats
adopt them for use in your own research project.
3.0 MAIN CONTENT
3.1 Classification by philosophical approach
There are two main research philosophies or approaches in the social sciences. These are
positivistic and phenomenological perspectives. Positivistic approach also known as quantitative
approach is founded on the belief that the study of human behaviour or social phenomenon
should be conducted in the same way as studies conducted in the natural or physical sciences.
Positivistic approach seeks to identify, measure (calculate) and evaluate phenomena and provide
rational explanations for them.

18
Phenomenological approach also known as qualitative approach is founded on the belief that
human behaviour is not easily measured as phenomena in the natural or physical sciences. This
approach is particularly concerned with understanding behaviour from the participant’s own
subjective frame of reference.
Kothan (2009) further explains that quantitative research is based on the measurement of
quantity or amount (numeric data) while quanlitative research is concerned with qualitative
phenomena, that is, phenomena relating to or involving quality or kind (non-numeric data).
Qualitative research is especially important in the behavioural sciences where the aim is to
discover the underlying motives of human behavior.
Data analysis in quantitative research is mainly statistical or deductive approach. As noted by
Des Witson, Esiri and Onwubere (2008), qualitative research is designed primarily to yield non-
quantitative or non-numerical data. It involves the collection of extensive narrative data in order
to gain insights into the phenomena of interest. Data analysis involves the coding of data and
production of a verbal synthesis or inductive process. In other words, it does not depend on the
measurement of variables or research elements.
3.2 Classification by Purpose
Research can also be classified according to its purpose. In this regard, research can either be
basic (fundamental) or applied (action).
According to Kotham (2009), applied research aims at finding solutions for immediate problems
facing a society, business or industrial organizations whereas basic or fundamental research in its
purest term is conducted solely for the purpose of theory development or refinement. This is why
it is also referred to as academic research or “gathering knowledge for knowledge sake”. In other
words, basic research is conducted for academic purposes rather than for its intrinsic value for
the society. For example, the type of research you will conduct of the end of your studies at
NOUN is most likely to be basic or fundamental research.
Research studies concerning human behaviour or social phenomena conducted with a view to
make generalizations about human behaviour are examples of fundamental or basic research.
They have little or no practical value or application. They are the dominant types of research
conducted mostly by the academia (i.e. scholars in university faculties and other tertiary
institutions).
Research aimed at finding certain solutions facing a concrete social or business problem is a
good example of applied research. Similarly, research to identify social, economic or political
trends that may affect a particular organization or research to find out whether certain media
content will be read and understood by the target audience are examples of applied research.
Therefore, the main aim of applied research is to discover or find a solutions for some pressing
practical problems whereas fundamental or basis research is directed towards finding
information that here a broad base of applications and thereby adds to the already existing
organized body of knowledge in that discipline.
SELF ASSESSMENT EXERCISE
Visit the NOUN or any other library and read four Mass Communication related projects and
identify their philosophical approaches.

19
CLASSIFICATION BY DESIGN
A very convenient way of classifying research is by design, which has been defined by De Vaus
(2001) as “a logical structure of inquiry or research.” Frankfurt-Nachmias and Machics (2009)
cited in Popoola (2012) state that a research design is the programme that guides the researcher
as he/she collects, analyses and interprets observations. Popoola (2012) states that research
design is a plan of action or specification for collecting data necessary and suitable for testing
hypotheses and provide answers to research questions under specified conditions.
Research design is different from the methods by which data are collected. De Vaus (2001)
clarifies this point when he states that there is nothing intrinsic about any research design that
requires a particular method of data collection. He explains that data for any research design can
be collected with any data collection method and how the data are collected is irrelevant to the
logic of the design.
Popoola (2002) explains that there are three basic types of research designs namely analytical,
experimental and descriptive. According to him, analytical research involves mathematical,
linguistic, historical and philosophical analysis as well as any deductive system that can be
adopted to derive relationships not necessarily of empirical nature. Experimental research design
involves conducting experiments while descriptive research design represents an attempt to
provide an accurate description or picture of a particular situation or phenomenon at one or more
points in time.
Kothan(2009) explains that the major purpose of descriptive research design is description of the
state of affairs as it exists at present. In the social and management sciences, the term ex post
facto research is used for descriptive research designs. He explains that the main characteristic of
this design is that the researcher has no control over the variables, he can only report what has
happened or what is happening. Most ex post facto research studies are used for descriptive
studies in which the researcher seeks to measure such items as for example frequency of
television viewership or radio listening. Ex post facto studies also include attempts by
researchers to discover causes even when they cannot control the variables. The methods of
quantitative research utilized in descriptive research are survey research of all kinds and causal-
comparative and correlational designs.
The above notwithstanding researchers talk of two basic research designs- quantitative and
qualitative. Quantitative research designs include experimental research, survey research and
content analysis.:
Experimental research design. According to Severin and Tankard (2001) cited in Des-Wilson,
Esiri and Onwubere, (2008), experimental research design is the “classic method of dealing with
the question of causality, that is, the relationship between something that happened and the
reason for it happening or cause and effect”. Popoola (2012) corroborates this fact when he states
that experimental research is the most frequently used research design to study cause and effect
relationship between and among variables or the studied subjects/participants .He explains that in
experimental research, the researcher manipulates one or more variables in an attempt to
influence the characteristics of the subjects/participants. The investigator has the responsibility of
making his/her groups equivalent and of controlling all other variables that are capable of
influencing the outcome except the one the researcher is interested in manipulating.
Experimental research is the dominant design in the natural or physical sciences hence some
researchers from that discipline assert that there are only two types of research designs—
experimental and non experimental. It is important to state, however, that there are several types
of experimental research designs but these can be grouped into three basic types –classical, pre-

20
experimental and quasi-experimental. Classical experimental designs include pretest-posttest
control group, posttest only control group, the Solomon four groups, multiple experimental
groups and factorial designs. Pre-experimental designs include the one-group pretest-posttest,
one-group post-test only and static comparison/posttest only with nonequivalent group designs.
Quasi-experimental designs include the nonequivalent control group, time series/interrupted time
series and multiple time series designs.
Survey research design. This is about the most popular research design among social and
management sciences researchers. There is hardly any area or topic of interest in these
disciplines that has not been investigated or studied at some time with survey research. Also,
most people have had one form of experience or the other with survey research.
Basically, survey research design is quantitative social research in which a researcher asks
respondents the same questions, records and analyses their responses or answers. In other words,
survey research involves the collection of social data from a sample of individuals through their
responses to questions. It is an efficient method for systematically collecting social data from a
broad spectrum of individuals.
The popularity of survey research derives from its versatility, efficiency and generalizability.
Versatility means that it is used to investigate diverse areas in various disciplines. Survey
research is efficient in the sense that several variables can be measured without substantially
increasing the time or cost. Generalizability means that the results obtained from a sample survey
can be applied to the larger population.
Survey research is often the most appropriate design for developing a representative picture of
the attitudes, opinions and characteristics of a large population. In fact, its purpose is for a
researcher to describe the attitudes, opinions, behavior or characteristics of the population based
on data collected from a sample of a population. Des Wilson, Esiri and Onwabere (2008)
corroborate this point when they noted that survey research focuses on people; their vital facts
which include beliefs, opinions, attitudes, motivations and behavior. Survey research is
conducted to collect and analyze social, economic, psychological and other types of social data.
There are different types of survey research designs. Descriptive survey documents current
conditions or attitudes while analytical survey explains why situations exist. Longitudinal survey
is conducted over time; cross sectional survey is conducted at one point in time while
correlational survey attempts to determine to what extent a relationship exists between two or
more variables.
Content analysis is a research design that used to be peculiar to communication researchers but
now utilized by researchers from other disciplines. When researchers want to investigate the
manifest content of recorded communication, the appropriate research approach is content
analysis. Kerlinger(2000) defines content analysis as “a method of studying and analyzing
communication in a systematic, objective and quantitative manner for the purpose of measuring
variables.” McQuail (2010) defines it as “the systematic, quantitative and objective description
of media text; that is useful for certain purposes of classifying output; looking for effects and
making comparisons between media and over time or between content and reality.

21
The major concepts in content analysis are systematic, objective and quantitative. Systematic
means that the content to be analyzed is selected according to explicit and consistently applied
rules. Objective means that the researcher’s personal idiosyncrasies and biases should not enter
the findings while quantitative means that content analysis is designed to yield numeric data
because it involves the measurement of variables.
.
As stated by Des Wilson, Esiri and Onwubere (2008) the objectives of content analysis include
the following:
To describe trends in communication content.
To disclose international differences in communication content
To audit communication content against objectives
To expose propaganda techniques
To discover stylistic features
SELF ASSESSMENT EXERCISE
A researcher is considering the following topic for his research project:”Attitudes of Lagos State
residents toward Nigerian home videos.” What research design will be most appropriate for this
study and why?
Having discussed quantitative research designs we now examine qualitative designs. As
already explained qualitative research involves the collection of extensive narrative data in order
to gain an insight into the phenomenon of interest and is also planned primarily to yield non-
numerical data. Qualitative research designs are many and include intensive interview, focus
group discussion, ethnography, observation, case study, philosophical/discursive, literature
review, evaluation, phenomenology and grounded theory.
Intensive (in-depth) interview according to Onabajo (2010), is really an extended
conversation but it has a different purpose from that of an ordinary conversation. Unlike a typical
conversation in in-depth interview is highly focused. It is conducted to get at particular issues
such as hidden feelings or attitudes and beliefs to which a respondent may not be aware of or that
are only dimly in his or her conscience. According to Wimmer and Dominick (2011:139)
intensive or in-depth interviews are unique in that they generally use small samples; provide
detailed background about the reasons why respondents give specific answers; allow for
lengthily observation of respondents nonverbal responses and are usually very long.
Focus group discussion (FGD) also known as group discussion is a research design for
understanding people’s attitudes and behaviour. According to Wimmer and Dominic
(2011:132), in a focus group, 6 to 12 people are interviewed simultaneously in an unstructured
discussion about the topic under investigation. Krueger and Casey (2000) cited in Wimmer and
Dominick (2001:133) state that FGD has some defining characteristics- participants selected
should posses certain characteristics and are recruited to share a quality of interest to the
researcher. In addition, focus group has a focused discussion.
Onabajo (2011) adds that the aim of FGD is not to build consensus but to elicit from each
participant his or her opinion and description of the behavior of interest. It is mostly conducted

22
by marketers who want to find out how people feel about a product, service or issue. FGD then
is a kind of probe to find out how people think and act.
Observational research is based on things seen. It is the classic method of scientific
inquiry. It involves not only the ability to perceive events as they occur but also to nose for fine
details that others may take for granted. According to Sctizet et al (1976) citied in Des Wildon,
Esiri and Onwubere (2008), the basic principle of observational research is that it is an attempt to
summarize, systematize and simplify the representation of an event rather than provide an exact
representative of it.
Observational research is commonly applied in the behavioural sciences and is also
regarded as the gathering of primary data by the researcher’s own direct experience (observation)
of relevant people, actions and situations without necessarily asking from the respondents.
Observation can yield information which people may be unwilling or unable to provide. There
are different types of observational research which include structured, unstructured, participant,
non-participant and disguised or covert observation.
Historical research design comprises the techniques and guidelines by which historians
use primary and other secondary sources to present accounts of the past. It relies on records,
diaries, oral tradition, photographs and other artifacts to describe, analyze and explain past
events, movement, philosophies and such like. Popoopla (2012) adds that historical research
design is a systematic and objective location, evaluation and synthesis of evidence in order to
establish facts and draw conclusions about past events with a view to explain the occurrence of
past events and predict that of the future. Historical research relies significantly on inductive,
logical reasoning.
Ethnography is the study of an intact group, logically defined in its natural context for a
sustained time interval. In other words, it involves any study of a group of people for the purpose
of describing their socio-cultural activities and patterns. Ethnographic researchers use a variety
of data collection techniques including intensive interview, diary keeping, analysis of exiting
documents, video recording among others. The researcher in ethnographic research is typically
an observer or a participant observer.
In case study research design, a single person, event, process, institution, organization
and such like is combination of appropriate data collection techniques and often stresses the
experiences and interpretations of those involved. It usually generates new understand,
explanations or hypothesis. Care studies are routinely utilized in business, medicine and law.
Philosophical/discursive design may cover a variety of approaches but drawn primarily
on existing literature rather than new data. A discursive study could examine a particular issue,
perhaps from alternative perspectives. It can also put forward a particular argument or examine a
methodological issue.
The literature review design is basically an attempt to summarize or comment on what
is already known about a particular topic. However, it is defined as a systematic, explicit and
reproducible way of identifying, evaluating and interpreting all of the research findings and
scholarly works available on a topic. A high quality review is not haphazard but consists of all
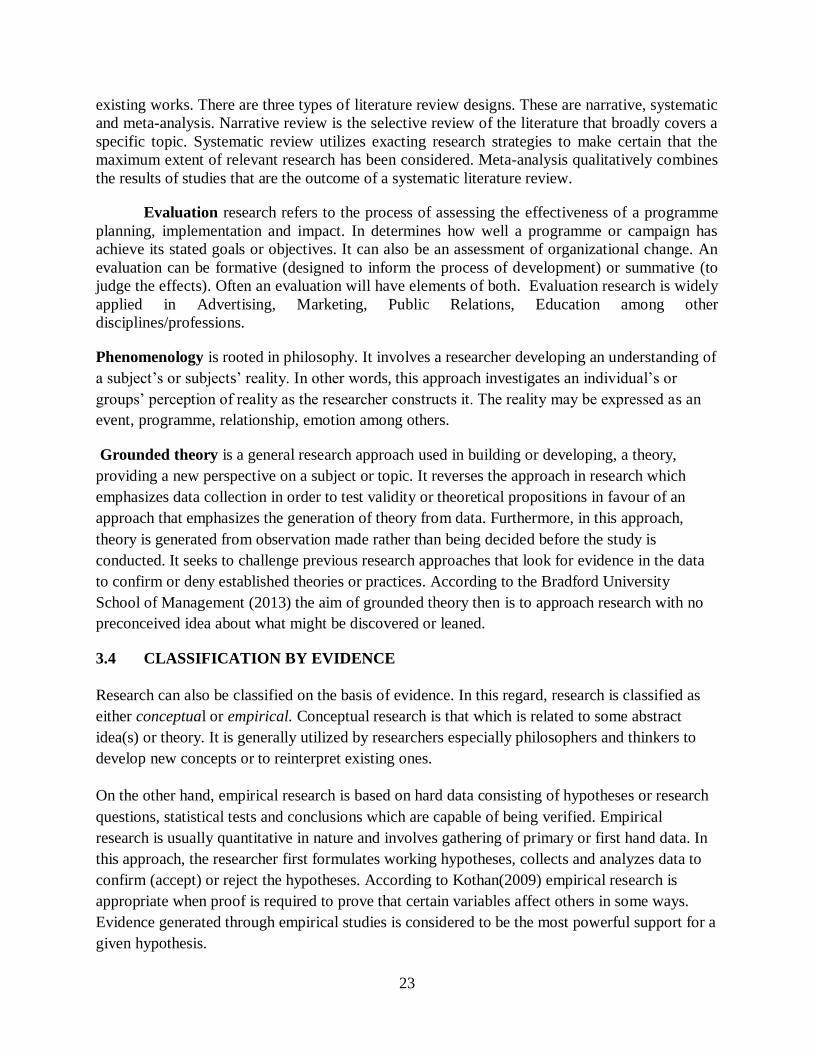
23
existing works. There are three types of literature review designs. These are narrative, systematic
and meta-analysis. Narrative review is the selective review of the literature that broadly covers a
specific topic. Systematic review utilizes exacting research strategies to make certain that the
maximum extent of relevant research has been considered. Meta-analysis qualitatively combines
the results of studies that are the outcome of a systematic literature review.
Evaluation research refers to the process of assessing the effectiveness of a programme
planning, implementation and impact. In determines how well a programme or campaign has
achieve its stated goals or objectives. It can also be an assessment of organizational change. An
evaluation can be formative (designed to inform the process of development) or summative (to
judge the effects). Often an evaluation will have elements of both. Evaluation research is widely
applied in Advertising, Marketing, Public Relations, Education among other
disciplines/professions.
Phenomenology is rooted in philosophy. It involves a researcher developing an understanding of
a subject’s or subjects’ reality. In other words, this approach investigates an individual’s or
groups’ perception of reality as the researcher constructs it. The reality may be expressed as an
event, programme, relationship, emotion among others.
Grounded theory is a general research approach used in building or developing, a theory,
providing a new perspective on a subject or topic. It reverses the approach in research which
emphasizes data collection in order to test validity or theoretical propositions in favour of an
approach that emphasizes the generation of theory from data. Furthermore, in this approach,
theory is generated from observation made rather than being decided before the study is
conducted. It seeks to challenge previous research approaches that look for evidence in the data
to confirm or deny established theories or practices. According to the Bradford University
School of Management (2013) the aim of grounded theory then is to approach research with no
preconceived idea about what might be discovered or leaned.
3.4 CLASSIFICATION BY EVIDENCE
Research can also be classified on the basis of evidence. In this regard, research is classified as
either conceptual or empirical. Conceptual research is that which is related to some abstract
idea(s) or theory. It is generally utilized by researchers especially philosophers and thinkers to
develop new concepts or to reinterpret existing ones.
On the other hand, empirical research is based on hard data consisting of hypotheses or research
questions, statistical tests and conclusions which are capable of being verified. Empirical
research is usually quantitative in nature and involves gathering of primary or first hand data. In
this approach, the researcher first formulates working hypotheses, collects and analyzes data to
confirm (accept) or reject the hypotheses. According to Kothan(2009) empirical research is
appropriate when proof is required to prove that certain variables affect others in some ways.
Evidence generated through empirical studies is considered to be the most powerful support for a
given hypothesis.

24
3.5 Classification by Discipline
Another classification of research is by discipline. Some research studies are classified according
to subject matters. In this regard, researchers talk of Medical research, Marketing research,
Advertising research, Public Relations research, Legal research, Sociological research, Political
Science research, Mass Media research among others.
3.6 Other Classifications of research
Other classification of research not yet mentioned so far in this unit includes the following:
Triangulation
This is also referred to a “mixed methods.” Johnson and Onwuegbuzie (2004) cited in the
Harwell (2011) define this approach as the class of research where the researcher mixes or
combines quantitative and qualitative research techniques, methods, approaches, concepts or
language into a single study. They further explain that mixed methods research also is an attempt
to legitimize the use of multiple approaches in answering research questions rather than
restricting or constraining researchers choices to either quantitative or qualitative designs. The
fundamental principle of mixed methods according to John and Turner (2003) cited in Harwell
(2013) is that multiple kinds of data should be collected with different strategies and methods in
ways that reflect complementary strengths and non-overlapping weaknesses, allowing mixed
methods to provide insight not possible when only qualitative or quantitative data are collected.
Wimmer and Dominick (2011:49) add that triangulation helps researchers to fully understand the
nature of a research problem.
Strategic Research
This type of research is used primarily in Public relations, Advertising, Marketing among others
to determine programme objectives, develop message strategies or establish benchmark or
standards. It often examines programme tools and techniques. For instance, an organisation that
wants to know how employees rate its image in internal publications would first conduct
strategic research to find our where it stands.
Monitoring research.
In this type of research conducted mostly be Public Relations practitioners, a constant eye is kept
on media houses and journalists to fund our any information that is likely to damage their
organisations or client’s reputation if it is published. Different strategies are utilized to ensure
that such damaging information is not published.

25
Research can also be classified from the point of view of time. In this regard, we talk of one-time
or longitudinal research. The former is confined to a single time period whereas in the latter case,
the research is carried on over several time periods.
Research can also be classified in terms of environment or setting. In this regard, research can
field-setting or laboratory research or simulation research. Research may also be exploratory or
formalized. The objective of exploratory research is the development of hypotheses rather than
their testing whereas formalized research is that with substantial structure and with specific
hypotheses to be tested.
There is also primary or secondary research. Primary research in involves first hand observation
and investigation by a researcher such as conducting a survey, carrying out an experiment or
analyzing newspaper content. On the other hand, secondary research involves the examination of
studies that other researchers have made of a subject. It is also known as library or desk research.
Research can also be classified as conclusion-oriented or decision-oriented research. The former
allows a researcher to pick a problem, redesign the enquiry as he proceeds and is prepared to
conceptualize as he wishes. However, decision-oriented research is always for the need of
decision maker and the researcher in this case is not free to embark upon research according to
his own inclination. Operations research is an example of decision oriented research since it is a
scientific method of providing executive departments with a quantitative basis for decision
regarding operations under their control.
4.0 CONCLUSION
In this unit. we have represented a wide variety of research methods which are available to the
communication researcher. These methods may go by various names or labels but essentially the
labels remain what they are but their descriptions refer to similar strategies. We have by no
means exhausted all that an be said on the subject but any student who diligently follows this
presentation should be able to familiarize himself or herself with the various methods of social
science research of which communication research is a component.
5.0 SUMMARY
In this unit you have learnt that:
Research studies are variously classified by researchers. These groupings are labels based on
some common traits.
The major classifications are philosophical approach purpose, design and evidence.
The most important classification however is by design.
Choice of a particular research method for any study will depend on the nature of the study
and purpose. of the researcher

26
6.0 TUTOR-MARKED ASSIGNMENT
Consider the following researchable topics
i. Attitudes of Lagos State residents towards Nigerian home videos
ii. Portrayal of women in Nigeria’s print media advertisements.
iii. Nigerian newspaper coverage of the 2012 Dana air crash
iv. Evolution of soft sell journalism in Nigeria.
v. An expose of corruption in the Nigeria Police Force.
Which research design will be most appropriate to study each of the topics? Justify your answers.

27
7.0 References/Further Reading
De Vaus, D. A. (2001) Research designs in social research. London: Sage
Des Wilson, Esiri, M and Onwubere, C.H. (2008) JLS 714: Communication research. Lagos:
National Open University of Nigeria
Harwell, M.R. (2011) Research design: Qualitative, quantitative, and mixed methods. In C.
Conrad and R.C. Serlin (Eds.), The Sage handbook for research in education: Pursuing ideas as
the keystone of exemplary inquiry (Second Edition). Thousand Oaks, CA: Sage
Kerlinger, F.N. and Lee, B.H. (2000) Foundations of behavioural research. New York:
Harcourt College Publishers. Mc Quail, D. (2010) Mc Quail’s Mass Communication Theory (6th Edition) London: Sage. Onabajo, O (2011) Foundations of communication research Lagos: Sibon Books Ltd. Mc Quail, D. (2010) Mc Quail’s Mass Communication Theory (6th Edition) London: Sage. Popoola, S. O. (2012) Conceptual model building and research design. Being a paper presented on research methods at Chapel seminar series of School of Postgraduate Studies, Babcock University, Ilishan-Remo, Ogun State, on 3rd December, 2012. Wimmer R.D. and Dominick J.R. (2011) Mass Media Research: An Introduction. Wadsworth Cengage Learning.
Internet Sources
Bradford University of Management(2012) Introduction to research and research methods.
Accessed at www.brad.ac.uk
Kotham, C.R. (2009) Research Methodology: methods and techniques. Accessed at
www.limit.org on April 3, 2013.
Research Methodology (For private circulation only) Accessed at www.hmgwaliarpdfresearch

28
UNIT 3 SCIENTIFIC METHOD AND DEVELOPMENT OF MASS MEDIA
RESEARCH
CONTENTS
1.0 Introduction
2.0 Objectives
3.0 Main Contents
3.1 Definitions of Science
3.2 Tenets of Science
3.3 Definitions of the scientific method
3.4 Steps of the scientific method
3.5 Scientific method and mass media research
3.6 Stages in the development of mass media research
3.7 Factors that contributed to the growth of mass media research.
4.0 Conclusion
5.0 Summary
6.0 Tutor marked assignment
7.0 References/further reading
1.0 INTRODUCTION
There are several ways that Man has utilized to know or understand things about the world
around him or even himself. One is through direct experience which is sometimes referred to as
empiricism. According to Starks and Roberts (2002), experience is often a very reliable way of
knowledge. Another way of knowing is to rely on authority. Wimmer and Dominick (2011) state
that this method promotes a belief in something because a trusted source says it is true. Tenacity
as a method of knowing follows the logic that something is true because it has always been true.
In the method of intuition or the a priori approach a person assumes that something is true
because it is “self-evident” or “stand to reason”. The next approach, the scientific method is now
regarded as the principal method of knowing especially in the academic or scientific community.
This is because it is considered more reliable than other methods of knowing identified so far.
OBJECTIVES
On successful completion of this unit, you should be able to:
Define the concepts of science and scientific method
Explain the tenets of science and the scientific method
Explain the major areas of mass media research
Discuss the major phases in the development of mass media research.

29
3.0 MAIN CONTENT
3.1 Definitions of Science
The word ‘science’ is derived from the Latin word scientia which literally means knowledge.
However, according to the Wikipedia (2013) science refers to the body of reliable knowledge
that can be logically and rationally explained. It is used in a broad sense to denote reliable and
objective knowledge. The term science is often treated as synonymous with the natural and
physical world hence most definitions of science reflect the natural or physical sciences.
The Chambers Dictionary 7th Edition (2009) defines science as knowledge ascertained by
observation and experiment critically tested, systematized and brought under general principles,
especially in relation to the physical world.
The National Academy of Science (2008) defines science as the use of evidence to construct
explanations and predictions of natural phenomena as well as knowledge generated through that
process.
However, a broader definition offered by the Science Council (2013) that encompasses both the
physical and social sciences states that “science is the pursuit and application of knowledge and
understanding of the natural and social world following a systematic methodology based on
evidence.
Science can also be described as any systematic field of study or knowledge gained from it.
To be scientific, a method of inquiry or knowledge must be based on an empirical and
measurable evidence subject to specific principles of reasoning. Science as it applies to the
natural sciences uses mostly observation and experimentation to describe and explain natural
phenomena.
SELF ASSESSMENT EXERCISE
Type “what is science”? in Google search engine and single out seven other sensible definitions
of science.
3.2 Tenets of Science
According to Wimmer and Dominick (2011) there are five basic tenets or characteristics that
distinguish the scientific from other methods of knowing. They are as follows:
i. Science is collective and public knowledge. Scientific advancement depends on freely
available information. Scientists cannot plead private knowledge, methods or data in
arguing for the accuracy of their findings; scientific information must be freely
communicated within the scientific community.
ii. Science is objective. Science tries to rule out eccentricities of judgement by scientists.
When a study is undertaken, explicit rules and procedures are constructed and the
scientist is bound to follow them.
iii. Science is empirical. This means that scientists are concerned with a world that is
knowable and potentially measurable. In other words, it is based on evidence

30
iv. Science is systematic and cumulative. This means that no single scientific study stands
alone, nor does it rise or fall by itself. Scientists use previous studies as building blocks
for their present work.
v. Science is predictive. This means that science is concerned with relating the present to
the future.
In addition to the above tenets identified by Wimmer and Domonick (2011) we can also add the
following:
vi. Science is universal. This means that scientific truths are intended to apply everywhere
and not tied to individuals or group of individuals. It follows that a new finding will
frequently supersede and invalidate on existing result, but this can only happen if it is
consistent with previously established elements of science.
vii. Scientists seek to let reality speak for itself, supporting a theory when its predictions are
confirmed and challenging it when its predictions are false.
3.3 Definitions of the scientific method
Having offered some broad definitions of science, we can now proceed to state some specific
definitions of the scientific method as a body of techniques for investigating phenomena,
acquiring new knowledge, or correcting and integrating previous knowledge. That is why it was
previously stated that to be deemed scientific, a method of inquiry must be based on empirical
and measurable evidence subject to specific principles of reasoning.
The scientific method has also been defined as “the principles and empirical processes of
discovery and demonstrating considered characteristics of or necessary for scientific
investigation, generally involving the observation of phenomena, the formulation of hypotheses,
concerning the phenomena, experimentation to demonstrate the truth or falseness of the
hypotheses and a conclusion that validates or modifies the hypotheses.” (cited in answers.com).
it can also be defined as the principles and procedures for the systematic pursuit of knowledge
involving the recognition and formulation of a problem, the collection of data through
observation and experiment, the formulation and testing of hypothesis.
The scientific method emphasizes quantification, logical exposition, empirical evidence, utilized
relevant concepts, controlled empirical testing, replicability of findings, inter-subjectivity among
other postulations.
Consequently, the scientific method is the most assured technique man has devised for
controlling the flux of things and establishing stable beliefs. The method does not seek to impose
the desires and hopes of man upon the flux of things in a capricious manner. It aims to discover
what the facts truly are, and the use of the method must be guided by the discovered facts.
What forms the core of the scientific method is the process of inquiry. Inquiry is the systematic
study of experience that leads to understanding and knowledge. People engage in inquiry when
they attempt to find out something in an orderly way.
SELF ASSESSMENT EXERCISE
Why is the scientific method better than other methods of knowing?

31
3 4 Steps of the scientific method
A careful observation of our discussion so far will reveal a close connection between the terms
“science” “research” and “scientific method”. They are all intricately interwoven. That is why
some scholars have stated that “at the moment, the terms scientific method and research are sued
interchange. This is true as the steps utilized in research are the same as those of the scientific
method particularly as they apply to the physical and social sciences.
They steps of the scientific method vary from discipline to discipline and to some extent from
researcher to researcher. However, the following steps are usually part of most formal scientific
research:
i. Observation and formulation of topic
ii. Statement of objectives
iii. Formulation of hypothesis
iv. Operational definition
v. Review of literature
vi. Data collection
vii. Analysis of data
viii. Data interpretation
ix. Conclusion, replication if necessary
x. Publication of the study.
3.5 Scientific method and mass media research
As earlier indicated, the scientific method initially applied to the physical or natural sciences. It
was much later that the term was applied to the study of social phenomena including
communication. This explains why there are faculties of social sciences in most universities
across the world.
According to Des Wilson, Esiri and Onwubere (2008), media research is the application of
scientific method to the study of the the mass media. These include radio, TV, newspapers,
magazines, digital media among others. One thing with media research is that it is intrusively
interwoven with other disciplines. This is because the media are linked with other phenomena of
life. Despite the growing complexity of media research, some areas of attention can still be
clearly delineated.
Mass media research is part of the social science research tradition that was influenced by
research in the natural sciences. It has, however, expanded into a discipline and field of study
that deals with media content, history, media effects, new media among others. It is important to
state that mass media research draws from both the quantitative and qualitative traditions of
social science research.
The scientific method has been applied to several areas of mass media research but the major
areas as stated by Wimmer and Dominick (2011) are as follows:
Research in print media
Research in electronic media
Research in advertising and Public Relations
Research in media effects

32
Mass media research and the internet
Other areas include the following:
Media influence
Creative industries
Cultural studies
Media production (Television and film production)
Media psychology
Media literacy
Media history
Contemporary media studies which include analysis of new media with emphasis on the
internet, video games, mobile devices, interactive television and other forms of mass
media which developed in the 1990s.
Media messages and their origins
Functions and purposes of media messages
Media channels, languages and codes
Media content, references and information types
Media audiences
Effects of media messages, intended and unintended
Media noise and feedback
Media regulation
Media ownership and control
Media management
Indeed, the application of the scientific method to the study of communication has led Berger
and Chaffe (1987) cited in Mc Quail (2010) to propose a new discipline referred to as
“communication science” which they define as “a science which seems to understand the
production, processing and effects of symbols and signal system by developing testable theories
containing lawful generalizations that explain phenomena associated with production, processing
and effects”.
Recent conceptions of media research, however, have now broadened the scope of the field to
include, for instance, perceptions of the media as instruments of power that some nations use to
exploit, oppress or dominate others. This notion of media is concerned with issues such as the
implications of the persistent negative portrayals of certain nations or how because of the media
technology, some nations wield unfair advantages in trade, cultural and military affairs. It is also
from this notion of media research that has arisen the concept of media imperialism which
describes the process by which modern communication media have operated to create, maintain
and expand systems of domination and dependence on a global scale.

33
SELF ASSESSMENT EXERCISE
Visit any university library (conventional or virtual) and examine two projects each from the
physical or natural sciences and mass communication. Compare the research procedure utilized
in the two disciplines.
3.6 Stages in the development of mass media research
According to Wimmer and Dominick (2011: 6-9) mass media research has evolved in four
definable stages and similar patterns have been followed in each medium’s needs for research.
These four stages are illustrated in the diagram below:
Research Phases in Mass Media
PHASE 1
The medium
itself
PHASE 4 PHASE 2
How the medium Uses and users of
can be improved the medium
PHASE 3
Effects of the
medium
Source: Wimmer, R.W. and Dominick J. R. (2011) Mass Media Research An Introduction. Wadsworth Cengage
Learning
In phase 1 of the research, there was an interest in the medium itself. What is it? How does it
work? What technology does it involve? How is it similar to or different from what we already
have? What functions or services does it provide? Who will have access to the new medium?
How much will it cost? Specific information is accumulated about the uses and the users of the
medium. How do people use the medium in real life? Do they use it for information only, to save
time, for entertainment, or for some other reason? Do children use it? Do adults use it? Why?
What gratifications does the new medium provide? What other types of information and
entertainment does the new medium replace? Were original projections about the use of the
medium correct? What uses are evident other than those that were predicted from initial
research?
Phase 2 included investigations into the social, psychological, and physical effects of the
medium. How much time do people spend with the medium? Does it change people’s
perspectives about anything? What do the users of the medium want and expect to hear or see?
Are there any harmful effects related to using the medium? Does the technology cause any

34
harm? How does the medium help in people’s lives? Can the medium be combined with other
media or technology to make it even more useful?
In phase 3 researches were conducted to determine how the medium can be improved, either in
its use or through technological developments. Can the medium provide information or
entertainment to more types of people? How can new technology be used to perfect or enhance
the sight or sound of the medium? Is there a way to change the content (programming) to be
more valuable or entertaining?
In phase 4 studies were conducted to determine how the medium can be improved, either in its
use or through technological developments.. Can the medium provide information or
entertainment to more types of people? How can technology be used to perfect or enhance the
sight or sound of the medium? Is there a way to change the content (programming) to be more
valuable or entertaining?
3.7 Factors that contributed to the growth of mass media research
There are four major contributed to the growth of mass media research. According to Wimmer
and Dominick (2011: 8-10) they are as follows:
The first was World War1 which promoted a need to understand the nature of propaganda.
Researchers working from a stimulus – response attempted to uncover the effects of the media
on people.
The second factor was the realization by advertisers in the 1950s and 1960s that research data are
useful in devising ways to persuade potential customers to buy products and services.
Consequently, advertisers encouraged studies of message effectiveness, audience demographics
and size, placement of advertising to achieve the highest level of exposure, frequency of
advertising necessary to persuade potential consumers and selection of the medium that offered
the best chance of reaching the target audience.
The third factor was the increasing interest of citizens in the effects of the media on the public,
especially on children. The direct result was an interest in research related to audience and sexual
content on television programmes. The fourth factor was the increased competition among the
media for advertising revenue. Media managers are now sophisticated and use long range plans,
management by objectives and an increasing dependency on data to support the decision-making
process.
4.0 CONCLUSION
The scientific method is now widely applied in mass media research because of its reliability and
objectivity. Accordingly, mass communication students must know how to apply it in their own
research projects. However, as reliable as it is, it should be noted that it is not infallible.
5.0 SUMMARY
In this unit, you have learnt about the following:
Science and its characteristics
The scientific method and its basic postulates
Steps of the scientific method
Application of scientific method to mass media research
Areas of mass media research

35
The four definable stages of mass media research.
6.0 TUTOR MARKED ASSIGNMENT
What is communication research? State the factors that led to its development as well as ten
areas of communication research.

36
REFERENCES/FURTHER READING
Des Wilson, Esiri, M. and Onwubere, C. (2008) JLS 714 Communication Research. Lagos: National Open University. Mc Quail, D. (2010) Mc Quail’s Mass Communication Theory (6th Edition) London: Sage. Starks, R. and Roberts L. (2002) Contemporary Social Research Methods. Belmont, C.A. : Wadsworth Tomson Learning. The Chambers Dictionary 11th edition (2009). Edinburgh: Chambers Harrap Publishers Ltd. Wimmer R.D. and Dominick J.R. (2011) Mass Media Research: An Introduction. Wadsworth Cengage Learning. Internet Sources The Wikipedia (2013) “Science” Accessed on April 5, 2013 at http://en.wikipedia. org. National Academy of Sciences (2008) cited in Hohenberg, P.C. (2013) “What is science?” Accessed at http://physics.nyu.edu on April 5, 2013. The Science Council (2013) “What is Science?” Accessed at http://wwwmsciencecouncil.org on April 5, 2013. Answers.com (2013) “The scientific method” Accessed at www.answers.com on April 5, 2013.

37
MODULE 2 ELEMENTS OF RESEARCH
Unit 1 Concepts, Constructs, Hypotheses/Research Questions
Unit 2 Variables
Unit 3 Measurement, Scales and Indexes
UNIT 1 CONCEPTS, CONSTRUCTS,
HYPOTHESES/RESEARCH QUESTIONS AND INSTRUMENTATION
CONTENTS
1.0 Introduction
2.0 Objectives
3.0 Main Content
3.1 Concepts
3.2 Constructs
3.3 Research Questions/Hypotheses
3.3.1 Research Questions
3.3.2 Hypotheses
3.3.3 Differences between Research Questions and
Hypotheses
3.3.4 Advantages of Hypotheses
3.3.5 Characteristics of Hypotheses
3.3.6 Types of Hypotheses
3.4 Instrumentation
4.0 Conclusion

38
5.0 Summary
6.0 Tutor-Marked Assignment
7.0 References/Further Readings
1.0 INTRODUCTION
In any research and most especially communication research, there are some issues, ideas or
terms that are common. These elements are indispensable to research endeavour. Without them it
will be difficult to embark on any research.
2.0 OBJECTIVES
The major objective of this unit is to expose the student to the various research elements
available. Ability to understand these elements will help you to appreciate the value of the
research work you are conducting. Also, the knowledge of what a concept means will enable you
determine and explain these elements in your own research work.
By the time you are through with this unit you should be able to define and explain the
following:
Concepts;
Constructs;
Research Questions;
Hypotheses; and
Research instruments.
3.0 MAIN CONTENT
3.1 Concepts
Some scholars have defined and described the term concept in different ways. Some of them see
it as the basic building block or idea of theory and research. According to Kerlinger, (2000) cited
in Des Wilson, Esiri and Onwumere (2008), a concept is “a term that expresses an abstraction
(abstract idea) formed by generalizations from particulars”. According to him, a concept is
formed by summarizing related observations. He gives examples of concepts as “weight”,
“height”, “length” and “achievement”. Similarly, LeRoy and Corbet (2006) define concept as
"an abstraction based on characteristics of perceived reality”. Concept can also be described as
mental boxes into which we throw things that we think have important things in common—
categories.

39
From the above definitions, a concept may be described as a way of ascribing meanings to
observed phenomenon in the society. Concepts are important because according to Wimmer and
Dominick (2011: 43) they facilitate communication among those who have a shared
understanding of them. Researchers use concepts to organize their observations into meaningful
summaries and to transmit this information to the academic community. In addition, since
concepts are abstracted from observations, they enable researchers to look for general
explanations or patterns in observations.
In the field of mass communication there several concepts some of which include media
broadcasting, advertising, image, media relations, editorial, news, feature, junk journalism,
celebrity journalism, citizen journalism, brand, cultural imperialism, audience among others. In
fact, mass communication can be described as a discipline that is filled with concepts.
White (1990) probably has mass communication in mind when he stated that concept is a label
we put on a phenomenon that enables us to link separate observations and to make
generalizations… a name we give to observations and events.
SELF-ASSESSMENT EXERCISE
List 20 concepts and in mass communication and explain what they mean.
3.2 CONSTRUCT
Construct has been described as higher concept. According to Wimmer and Dominick (2011), a
construct is a combination of concepts created for a particular scientific purpose. Constructs are
generally difficult to observe directly; their existence therefore must be inferred from related
behaviour patterns. Therefore, the difference between concepts and constructs lie in their
observable properties. A construct provides an efficient and convenient method for labeling a
number of similar behaviors. Through the use of constructs, the observer can begin to classify
and group instances of similar behavior and communicate its impact in terms of what has been
observed.
In philosophy, a construct is regarded as an ideal object, where the existence of the thing may be
said to depend upon a subject's mind. In other words, existence of a construct is in the mind of
the person who is making the construct no body else can see it or feel it except, the originator of
the constructs. This is opposed to a "real" object, where existence does not seem to depend on
the existence of a mind because everybody can see it or experience it.
For example, media imperialism is a construct that depend on the creator for its explanation for
others to understand what is been said, otherwise, nobody can see what is called media
imperialism.

40
The main difference between concepts and constructs are as follows:
Concepts are mental representations and are typically based on experience
concepts can be of real phenomena (a radio set, magazine, advertisement)
Concepts can be of agreed-upon phenomena (truth, beauty, justice, prejudice, value
among others.)
Constructs are theoretical creations that are based on observations but which cannot be
seen either directly or indirectly; things such as IQ, leisure job satisfaction, edutainment,
infotainment among others
For example, in mass communication research, the term media hegemony represents a construct
specifically created to describe how mass media business is concentrated in the hands of few
powerful interests. Media hegemony itself cannot be seen, but its manifestations in the
conglomeration of global mass media business are evidenced around Western countries.
It is important to note that the major difference between concepts and constructs is that
constructs are higher concepts.
SELF-ASSESSMENT EXERCISE
Enumerate five other constructs in mass communication and state how they can be measured.
3.3 RESEARCH QUESTIONS/HYPOTHESES
The pillar upon which any research work stands upon is research questions. In every research
endeavors, the aim is to accomplish either/or, and these two things:
i) Answer questions or
ii) Test hypotheses
It is generally said that no research can exist without a problem and to solve this problem is to
ask relevant questions or formulate hypothesis that will help provide basis for arriving at
solutions. The bedrock of research is to answer as many questions as possible. To begin a
research without research questions or hypotheses is like starting a journey without a defined
place to begin the journey (Wilson, Esiri and Onwumere, 2011).
Research utilizes a variety of approaches to help answer questions. While some researchers seek
to solve relatively simple problems, some are based on theory and they require formally worded
questions. Similarly, research generally starts with some tentative generalizations regarding a
relationship between two or more variables. These generalizations may either be research
questions and/or hypotheses.

41
3.3.1 Research question
A research question is stated as a question that explores the relationship between two or more
variables/concepts. Researchers abbreviate research questions as RQ.
According to Ajala (1996:20), research questions are generally used in situations where a
researcher is unsure about the nature of the problem under investigation. Therefore, research
questions have the widest application and can best be employed in dealing with problems of a
non-experimental nature. When research questions are posed, the intent is merely to gather
preliminary data from which testable hypotheses are often developed.
3.3.2 Hypothesis
There are several ways of defining hypothesis. It can be defined as “ a tentative prediction about
the nature of the relationship between two or more variables.” Sarantakos (1993) defines it as a
“tentative explanation of the research problem, a possible outcome of the research, or an
educated guess about the research outcome.” Similarly, Macleod and Hockey (1981), define
hypothesis as a statement or explanation that is suggested by knowledge or observation but has
not yet been proved or disproved. Hypotheses are always in declarative sentence form, and they
relate either generally or specifically to variables.
Hypothesis states a predicted relationship between two or more variables or concepts.
Researchers abbreviate hypotheses as H. Hypothesis can further be described as statements
concerning two or more variables to find out their relationship. Hypotheses could be a fact or
body of facts which a researcher wants to find out their relationships. Des Wilson, Esiri and
Onwubere, (20o8) assert that the hypothesis is a clear statement of what is intended to be
investigated. It should be specified before research is conducted and openly stated in reporting
the results. This helps to:
1. Identify the research objectives
2. Identify the key abstract concepts involved in the research
3. Identify its relationship to both the problem statement and the literature review
The nature of hypothesis include the following:
A problem cannot be scientifically solved unless it is reduced to hypothesis form
It is a powerful tool of advancement of knowledge, consistent with existing knowledge
and conducive to further enquiry
It can be tested –verifiable or falsifiable
Hypotheses are not moral or ethical questions
Hypothesis is neither too specific nor too general
It is a prediction of consequences
It is considered valuable even if proven false

42
A well-crafted hypothesis most often suggests the best way to perform the research and gives the
researcher clues as to his research design. Hypotheses can either be deductive or inductive.
Research Hypothesis can also be either non-directional or directional. There is also hypothesis
that is opposite of the positively stated one known as the null hypothesis.
A null hypothesis represents the traditional approach: it makes a prediction that in the general
population, no relationship or no significant difference exists between groups of a variable. The
wording is, “There is no difference (or relationship)” between the groups.” Usually, a null
hypothesis is always written like this: There is no significant difference between the effects of
watching television and exhibiting violent behaviour”.
Once the null hypothesis is known, the alternative hypothesis will be discarded. According to
Kerlinger (2000) “ the hypothesis is perhaps the most powerful tool, man has invented to achieve
dependable knowledge”
Differences between research questions and hypotheses
Though research question and hypothesis serve the same purpose, their differences necessitate
using either in a particular research type. In general, quantitative research favors the hypothesis
while research question is preferred in qualitative research (Prasad, 2001). Below are other
differences between hypothesis and research questions:
1. Hypothesis is predictive in nature and predicts relationship between variables
2. Hypothesis is more specific than research question
3. Research question poses a question while hypothesis predicts the outcome of the research
Research questions and hypotheses are like “signposts” for explaining the purpose of the study
and guiding the research directions.
Advantages of hypotheses
In almost all situations, hypotheses provide researchers with the following advantages:
1) They provide direction for a study.
2) They eliminate trial and error i. e. uncoordinated investigation of a topic
3) Hypotheses help rule out intervening and confounding variables i. e. they focus
research to precise testable statements.
4) Hypotheses allow for quantification of variable i.e. they make
operationalization of concepts easier and words incapable of quantification are
excluded.

43
Characteristics of useful hypotheses
According to Wimmer and Dominick (2011), a useful hypothesis should possess four
characteristics. These are:
(1) Compatible with current knowledge in the area
(2) Should follow logical consistency
(3) Should be in parsimonious (simple) form
(4) Should be testable.
When they say a hypothesis must be compatible with current knowledge, it means that the
researchers who develop hypotheses must provide basis to support the hypothesis, else, he/she
slows down the development of that area. On logical consistency, this means that if a hypothesis
suggests that A = B and B = C, then A must be equal to C. For instance, if watching violence
movie regularly implies the exhibition of violence behaviour, then, those who watched violence
prone movies should exhibit greater violent behaviour.
On the criterion of parsimony, because of the complex and the complicated nature of research,
the formulation of hypothesis should be simple and presented in a straight forward manner.
Therefore, it is better to state hypotheses in simple form and contribute to making the research
process simpler than to write hypothesis in complicated form. Developing untestable hypotheses
is unproductive and such adds nothing to knowledge.
Types of hypotheses
There are three types of hypotheses. These are:
(1) Descriptive hypotheses
(2) Comparative hypotheses
(3) Relational hypotheses
In descriptive hypothesis, there is just one variable and it merely describes an action. For
example: more female will watch tele-novena. This hypothesis only describes what female

44
audience will watch on television. Comparative hypotheses look at the similarities or differences
between variables being tested. For example, male readers read football magazines than female
readers. Relational hypotheses examine the relationship between the variables being tested i.e. it
examines whether the variables are directly or inversely related (see Figure 1 below):
HRS MARKS
1 49
1 50
2 80 3
Figure 1: Hours of books read and marks scored
Key: HRS – Hours
Under normal circumstances, he who spends more time reading should score more marks (Direct
relationship). But where he who spends less time reading had more marks (inverse relationship).
The variables being tested are hours spent reading and marks scored.
Hypotheses are given different names. These are:
1) Research hypotheses H
2) Alternative hypotheses H1
3) Null hypotheses HO
Note that each is put into different but related uses. For example:
HI: People with low level of education will have low credibility in the media.
HA: People with high level of education will have high credibility in the media.
HO: There is no relationship between education and media credibility.

45
Note that it is the null hypotheses (HO) that is tested. HO is either accepted or rejected. In
practice, researchers rarely state the null hypotheses, since every research hypothesis does have
its logical alternatives. Therefore, stating the null hypothesis is redundant. However, the HO is
always present and it plays important role in the rationale underlying hypotheses testing. In
testing hypothesis or what can otherwise be called significance test, the researcher either rejects
or accepts the HO. Note that if HO is accepted (supported) H1 is rejected; and if HO is rejected,
H1 is accepted.
Ajala (1996:21) advises beginners to employ research questions rather than hypotheses. The
questions must be designed in such a way that findings can be measured so that conclusions can
be drawn from the study.
Hypothesis testing involves a four-step procedure:
1. Stating the hypothesis (Null or Alternative)
2. Setting the criteria for a decision
3. Collecting data
4. Evaluate the Null hypothesis
SELF-ASSESSMENT EXERCISE
Consider the following research topic and formulate four hypotheses; “Perception of Nigerian
videos among Nigerian academics.”
Instrumentation
One of the most important aspects of research design is the research instrument to be used. The
goal of research is to obtain appropriate data, interpret same and point out implications. The
instruments are ways of gathering data to be used in the research work, without which there can

46
be no data for the research work. The instrument or tool chosen should be adequate in providing
the needed data.
Among the available instruments for data collections in communication research are:
1. Questionnaire: this is the most common research instrument for obtaining data. It could
be close ended or open ended.
2. Interview: is an oral form of questionnaire
3. Coding sheets (for content analysis)
What ever instrument is adopted, it is important to know that it must be appropriate for the
purpose and objectives of the study.
CONCLUSION
The first step is making a success of your research endeavour is to understand the various
elements of research discussed in this unit. Irrespective of the textbook you pick up, you’ll find
each of them. Your effort to embark on research will fail if you do not master all the topic treated
in this unit.
5.0 SUMMARY
In this unit, you have learnt that:
A concept is a term that expresses an abstraction formed by generalization from particulars;
A construct is a higher concept deliberately invented for a specific scientific purpose;
·A research question is stated as a question that explores the relationship between two or more
variables while hypothesis is a measurable and testable statement about the relationship between
variables;
Instrumentation is the device or method used to collect data.
.
·
.6.0 TUTOR-MARKED ASSIGNMENT
Distinguish between research questions and hypotheses and develop three research questions and
three hypotheses in any area of mass communication.

47
7.0 REFERENCES/FURTHER READINGS
Ajala, O. V. (1996). Scholarly Writing Guide For Researchers. Ibadan: MayBest Publishers
Des Wilson, Esiri, M. and Onwubere, C. (2008) JLS 714 Communication Research. Lagos: National Open University. Wimmer R.D. and Dominick J.R. (2011 ) Mass Media Research: An Introduction. Wadsworth Cengage Learning. Kerlinger, F. N. (2000). Foundations of Behavioural Research. New York: Holt, Rinehart and
Winston Inc
White, L.G.(1990) Political Analysis California: Brooks Cole
.

48
UNIT 2
VARIABLES
CONTENTS
1.0 Introduction
2.0 Objectives
3.0 Main Content
3.1 Definition and Meaning of Variable
3.2 Major Classification of Variables
3.3 Other categories of Variables
3.4 Defining variables operationally (operational Definitions)
4.0 Conclusion
5.0 Summary
6.0 Tutor-Marked Assignment 7.0 References/Further Readings
1.0 INTRODUCTION
Variable is a term constantly used in research and more specific communication research. It
represents concept or construct that can be measured or calculated in research. The opposite of
variable is constant as it has only one attribute and does not change in value. A variable on the
other hand has attributes, that is. characteristics used to describe the unit of observation.
2.0 OBJECTIVES
By the end of this unit, you should understand the following:
the definition and meaning of variables;
types of variables;
the importance of variables in research; and
how to define variables operationally.
3.1 Definition and Meaning of Variable
One term that you will hear being used quite frequently in research is variable. A variable is a
concept or construct that can vary or have more than one value. Some variables can be quite
concrete such as gender, birth order, weight, or shoe size. Others can be considerably more
abstract, vague, and squishy. For example, sense of well being, self-esteem, strength of belief in
religion, or IQ (University of New England, 2000). Also, the National Service-Learning clearing
house (2013) opines that the important step in designing all quantitative research projects is
defining or identifying the variables that will be manipulated, measured, described, or controlled.
Although qualitative researchers do not define variables to the same extent that quantitative
researchers do, they still must outline what kinds of phenomena they are studying.

49
A variable can be defined as anything that varies or changes in value. Variables take on two or
more values .A variable is a measurable characteristics that varies. It may change from group to
group, person to person or within one person over time].
3.2 Major Classification of Variables
Variables could be classified into various forms. The major types of variables, or phenomena of
interest, are described briefly, with common examples from service-learning research provided.
They are as follows:
Independent Variable (IV): A variable that is selected or controlled by the researcher, to
determine its relationship to the observed outcome of the research (this can also be
known as explanatory, predictor, or manipulated variable). A common example is
whether or not a course section involves service-learning pedagogy. The nature of what is
varied should be carefully described so that the attributes of the different interventions or
experiences are clear. It is also important to note that in statistical analysis a variable is
identified by the symbol (X) for independent variable
Dependent Variable (DV): The variable being measured as an outcome. It shows the
effect of manipulating or introducing the independent variables. This "control" may
involve manipulating existing variables (e.g., modifying existing methods of instruction)
or introducing new variables (e.g., adopting a totally new method for some sections of a
class) in the research setting. Whatever the case may be, the researcher expects that the
independent variable(s) will have some effect on (or relationship with) the dependent
variables.
Intervening Variables: also known as Mediating variable. Is an ideal that seeks to
explain the relationship between the independent and dependent variables. Mediating
variables, also called process variables, explore why the independent variable is linked to
the dependent variable [National Service-Learning clearing house].
3.3 Other categories of Variables
Moderator Variable: A variable that is related to the direction or strength of the
relationship between the independent and dependent variables (Baron & Kenny, 1986). A
moderator variable may be qualitative (such as student gender, type of community
organization, or type of college) or quantitative (e.g., number of service visits). In
addition, it may be related to the strength or the direction of a correlation, or it may
interact with the independent variable and the dependent variable. In either case, a
moderator variable describes an "it depends" relationship (e.g., the strength of the
correlation between two variables depends on the past volunteer experience of the
student). Generally, moderator variables are variables that exist prior to data collection,
as opposed to mediating variables that are assumed to occur during the phenomena being
studied.

50
Continuous and Discontinuous variables Variables have different properties and to these properties we assign numerical values. If the
values of a variable can be divided into fractions then we call it a continuous variable. Such a
variable can take infinite number of values. Income, temperature, age, or a test score are
examples of continuous variables. These variables may take on values within a given range or, in
some cases, an infinite set.
Any variable that has a limited number of distinct values and which cannot be divided into
fractions, is a discontinuous variable. Such a variable is also known as categorical variable or
classificatory variable, or discrete variable [Research Methods STA 630, n.d].
SELF-ASSESSMENT EXERCISE 1
Why is the understanding of variables important in communication research?
3.4 Defining variables operationally (operational Definitions)
An operational definition describes exactly what the variables are and how they are measured
within the context of your study (Cherry, 2013). There are two types of operational definition as
stated by Wimmer and Dominick citing Kerlinger (2010)- measured and experimental. A
measured operational definition specifies how to measure a variable. An experimental
operational definition explains how an investigator has manipulated a variable.
The way one research defines variables is likely to be different from the way another researcher
will use that same variable.
4.0 Conclusion
An understanding of variables is important for the success of any research. It is also important to
differentiate between the dependent and independent variables and to understand that the
intervening variables could be a hindrance between the dependent and independent variables.
5.0 Summary
In this unit you have learnt about the two major variables in research- dependent and
independent variables and also other variable types.
You have also learnt that is it important to define your variables in relation to your research
work.
6.0 Tutor-Marked Assignment
Choose a research title; write an operational definition for each variable on your list of
independent and dependent variables.
51
7.0 References/Further Readings
Wimmer, R. D. and Dominick, J. R. (2011). Mass Media Research. An Introduction. (9th Ed).
Wadsworth Cengage Learning.
Internet sources
Cherry, K. (2013). How to Conduct a Psychology Experiment.
http://psychology.about.com/od/researchmethods/ss/conducting-psychology-experiments_3.htm.
Independent & Dependent Variables. http://www.uncp.edu/home/collierw/ivdv.htm.
National Service-Learning clearing house. http://www.servicelearning.org/service-learning-
research-primer/defining-research-variables-operationalization.
Research Methods STA 630. Variables And Types Of Variables: Moderating Variables. http://www.zeepedia.com/read.php?variables_types_of_variables_moderating_variables_research_me
thods&b=71&c=6.
Variables . http://linguistics.byu.edu/faculty/henrichsenl/ResearchMethods/RM_2_14.
Siegle, D. (2013.).Principles and methods in educational research.
http://www.gifted.uconn.edu/siegle/research/variables/IVDV.htm.
Variables in Research http://changingminds.org/explanations/research/measurement/variables.htm.
Price, I. (2000). Chapter 1- Behavioural Science and Research.
http://www.une.edu.au/WebStat/unit_materials/c1_behavioural_science_research/variables.html.

52
UNIT 3
MEASUREMENT
CONTENTS
1.0 Introduction
2.0 Objectives
3.0 Main Content
3.1 Definitions / Meaning of Measurement
3.2 What is Measured in Communication Research
3.3 Levels of Measurement
3.4 Scales and Indexes
3.5 Types of Scales
3.6 Indexes
3.7 Reliability and Validity
4.0 Conclusion
5.0 Summary
6.0 Tutor-Marked Assignment 7.0 References/Further Readings
1.0. Introduction This unit focuses on measurement in research. Our life is full of measurements at one point or
the other- when we go to the hospital we measure our height, weight, temperature as the case
may be. In order to wear what fits us appropriately, we also undergo measurement. To get the
right clothes for our body type and size, we check our body measurement and to get the right size
of shoe we also have to measure different ones to get the perfect fit.
There are other aspects of life in which we must take measurements- even when purchasing food
items we must take measurements.
2.0. Objectives
At the end of this unit, you should know the following:
the meaning of measurement in communication research;
the elements that are measured in communication research;
the four levels of measurement that can be undertaken by researchers;
various scales of measurement; and
what is meant by scales and indexes in communication research

53
3.0 MAIN CONTENT
3.1 Definitions/Meaning of Measurement
In research, it is imperative for respondents to communicate their feelings, attitudes, opinions,
among others in measurable form.
As stated in ZSeepedia.com, to measure “is to discover the extent, dimensions, quantity, or
capacity of something, especially by comparison with a standard.”
Tejumaiye (2003 :20) asserts that measurement is the assignment of numerals to objects, events,
or properties according to certain rules. According to Zeepedia.com, “objects include things that
are not as concrete, such as genes, attitudes, neutrons, and peer group pressures. Properties are
the characteristics of the objects. A person's physical properties may be stated in terms of weight,
height, and posture. Psychological properties include attitudes, intelligence, motivation,
perceptions, etc. Social properties include leadership ability, class affiliation, or status.”
Tejumaiye (2003) adds however that, researchers usually measure indicators of the properties or
objects rather than the individuals or objects themselves. For example the term motivation can
hardly be measured, also authoritarianism, but there can be observed and measured from
presumed indicators.
While it is easy to measure some properties, some others are not easy to measure.
According to Wimmer and Dominick (2011) in measurement, a researcher assigns numerals to
objects, events or properties according to certain rules. Three concepts can be found here-
numerals, assignment, and rules. Numerals have no direct quantitative meaning, but when
meaning is assigned to them, they are subject to statistical computation. Assignment is the
designation of numerals or numbers to certain objects or events for example assigning 1 to
respondents that fall between 15-20 years, 2 for those between 21-30 years and 3 for those
between 31-40 years and so on.
Rules have to do with the way the numerals or numbers are assigned.
3.2 What is Measured in Communication Research
Communication is classified in the behavioural sciences and as such one of the concepts usually
measured is attitude, perception etc. That is a researcher might want to find out the attitude of
respondents to programmes on television if it is positive as in that they like it or negative,
meaning they do not like it or they are indifferent, neither here nor there.
3.3 Levels of Measurement
Trochim (2006) gives reasons why it is important to know the level of measurements. First he
posits that knowing the level of measurement helps you decide how to interpret the data from
that variable. Second, knowing the level of measurement helps you decide what statistical
analysis is appropriate on the values that were assigned.
There are four levels of measurement as follows:
Nominal
Ordinal
Interval

54
Ratio
Nominal Level
According to Wimmer and Dominick (2011) this is the weakest form of measurement. Nominal
scale classifies people, objects, events based on certain characteristics. Here the numeral used to
classify objects are arbitrary and do not have any mathematical value.
Nominal data deals with names, categories, or labels. It has to do with classifying case
unordered groups. This means that it is not because a person or something is classified as 1 then
it is higher than the one classified with 5. For example using beverages as example, we have
Milo, Bournvita, Richoco, Vitali, Cowbell chocolate etc. a researcher to find out the one most
preferred by respondents could assign the number 1 to Milo, 2 to Bournvita, 3 to Richoco, 4 to
Vitali, 5 to Cowbell chocolate, he or she could also decide to arrange it another way maybe
alphabetically and assign numbers. It does not mean that because Milo is given 1 then it is better
than Cowbell choco neither does it mean that because Cowbell choco is number 5 then it is 5
times better than Milo that is 1. Some examples of nominal measurement according to Wimmer
and Dominick (2011) are numbers on football jerseys, car plate numbers, social security
numbers, and Tejumaiye (2003) adds that classifying respondents according to the medium they
depend on for information could also be nominal. Other examples are religious preference,
political orientation).
Some characteristics of nominal data are that it has properties of equivalence this means that all
objects placed in one category are equal. Another property is that all categories are exhaustive
and mutually exclusive that is that each object is appropriate to only one category for example
somebody cannot be old and young at the same time, male and female at the same time,
Christian and Muslim at the same time, one must belong to only one category.
Ordinal level
Ordinal is similar to nominal but it is different in that it has an ordering scheme. Objects are
usually ranked along some dimension, from smallest to largest. While data at this level is
ordered, it cannot be determined the difference between the given data. Ordinal has to do with
ranking. Here the numbers have some mathematical value meaning that when an object is placed
at 1 it could be higher than an object placed in category 5. For example using educational
attainment- primary=1, secondary=2, bachelors=3, Masters=4, post-masters=5 etc. While we can
determine which is highest we cannot say the distance between 1 and 2 or 4 and 5. Ordinal
measurement is also likened to a horse race without stop watch where you can determine who
came first and second but cannot determine the difference in time between the winner and the
runner-up.
Some characteristics of the ordinal scale are that it has the property of equivalence in that all
objects or persons placed in one category are equal and treated equally. It also possesses the
property of order among categories. Some examples of ordinal scale are rankings of football
teams, military ranks, beauty pageant results etc.
Interval level
The interval scale of measurement includes all the characteristics of the ordinal level and also
specifies the difference between values is a constant size. It has all the scales of an ordinal

55
measurement and the intervals between adjacent points are of equal value. The most common
example of an interval scale is temperature, according to Wimmer and Dominick (2011) the
same amount of heat required to warm an object from 30 to 40 degrees is the same needed to
warm it from 50 to 60 degrees.
One of the shortfalls of the interval scale is that it lacks a true zero point or a condition of
nothingness.
Ratio level
This has all the properties of an interval scale and has an absolute zero that is meaningful. This is
the highest level of measurement. Time and distance are examples of ratio measure.
As stated in FAO corporate document repository, some examples of variables which are ratio
scaled include weights, lengths and times. Ratio scales permit the researcher to compare both
differences in scores and the relative magnitude of scores.
3.4 Scales and Indexes
Crossman (2013) defines a scale as “a type of composite measure that is composed of several
items that have a logical or empirical structure among them.” An index on the other hand as
defined by Crossman (2013) is “a type of composite measure that summarizes and rank-orders
several specific observations and represents some more general dimension.” “It is an
accumulation of scores from a variety of individual items” (Crossman, 2013).
As defined in wikibooks.org, a scale “is a measure of the intensity of an attitude or emotion.
Usually scales are constructed using the ordinal level of measurement, which organizes items in
an order in order to determine degrees of favor or disfavor, but does not provide any meaning of
distance between degrees
to Wimmer and Dominick (2011 :53), measurement of variables such as attitude toward TV
news or gratification received from going to a movie theatre require the use of scales.
Crossman (2013) further explains the similarities between scales and indexes. A scale is similar
to index in that they are both ordinal measures of variables. That is, they both rank-order the
units of analysis in terms of specific variables. Both scales and indexes are composite measures
of variables, meaning that the measurements are based on more than one data item. For example,
to test a person’s motivation, it will be determined by his or her responses to many questions, not
simply one question. (Crossman, 2013).
There are different types of scales but the most commonly used is the Likert scale.
3.5 Types of Scales
Some scales used in social science research include the Likert scale, Thurstone scale, Guttman
scale, Bogardus social distance scale, and the semantic differential scale among others.

56
Likert scale
This is the most commonly used scale in mass media research and is also called summated rating
approach (Wimmer and Dominick, 2011). This technique assesses the extent of the subject’s
agreement with items that have been judged (by some method) to have content validity with the
construct being measured..
“The scale consists of assigning a numerical value to intensity (or neutrality) of emotion about a
specific topic, and then attempts to standardize these response categories to provide an
interpretation of the relative intensity of items on the scale.” Responses such as “strongly agree,”
“moderately agree,” “moderately disagree,” and “strongly disagree” are responses that would
likely be found in a Likert scale, or a survey based upon the scale.
Example: Adolescents prefer sexual contents in Nigerian home videos
Response Score assigned
Strongly agree 5
Agree 4
Indifferent/Neutral 3
Disagree 2
Strongly Disagree 1
This technique can be used to ask many questions in a short amount of space (mailed survey) or
time (telephone survey). It is also intuitively appealing to most persons. However, it can become
tiresome if used too extensively on a questionnaire
Guttman scale
This is also called scalogram analysis. It is a technique of mixing questions up in the sequence
they are asked so that respondents do not see that several questions are related. Many irrelevant
questions surround the important questions
Wimmer and Dominick (2011:55) assert that it is based on the idea that items can be arranged
along a continuum in such a way that a person who agrees with an item or finds an item
acceptable will also agree with or find acceptable all other items expressing a less extreme
position.”
It is based upon the assumption that the agreement with the strongest indicators also signifies
agreement with weaker indicators. It uses a simple “agree” or “disagree” scale, without any
variation in the intensities of preference. The scoring system is based on how closely they follow
a pattern of ever-increasing hardened attitude toward some topic in the important questions.
Guttman scaling is very appealing, but it's not all that well received by the scientific community
(www.uky.edu/~kdbrad2/EDP656/Handouts/Chapter6B.doc ).
Thurston scale
This is used for measuring a core attitude when you have multiple dimensions or concerns
around that attitude. This scale is a format that seeks to use respondents both to answer survey
questions, and to determine the importance of the questions. One group of respondents, a group

57
of “judges,” assigns various weights to different variables, while another group actually answers
the questions on the survey.
Wimmer and Dominick (2011) asserts that it is also called equal-appearing interval scales
because the technique used to develop them are typically used to measure the attitude toward a
given concept or construct.
The procedure for Thurstone is illustrated below according to
www.uky.edu/~kdbrad2/EDP656/Handouts/Chapter6B.doc
In Thurstone scaling, the researcher would obtain a panel of
judges (say 100 of them) and then dream up every
conceivable question you can ask about gun control (say 100
questions). By administering that questionnaire to the panel,
the researcher can analyze inter-item agreement among the
judges, and then use the discrimination index to weed out
what are called the non-homogenous items. Scaling is all
about homogeneity, a term sometimes used as synonymous
with being unidimensional. Using Thurstone scaling, you
actually want to favor your brighter respondents and look
for higher-scoring items. You will most likely end up with a
scale of 15-20 homogeneous and unidimensional items.
One of the advantages of this type is that it is an interval measurement scale; on the other hand, it
is time consuming and labour intensive.
Semantic differential scale
This technique assesses the extent of the subject’s agreement with items, where the response for
each item is shown on a continuum). This technique is used to measure the meaning an item has
for an individual (Wimmer and Dominick, 2011 p.56). It is developed to deal with emotions and
feelings. It's based on the idea that people think dichotomously or in terms of polar opposites
such as good-bad, right-wrong, strong-weak among others.
As adapted from www.uky.edu/ below is an example of a scale intending to measure feelings
toward rap music as a cause of crime:
On each line below and between each extreme, place a slash closest to your first impression:
HOW DO YOU FEEL ABOUT THE ARGUMENT THAT RAP MUSIC CAUSES CRIME?
Bad--------------------------------------------------------------------------Good
Deep------------------------------------------------------------------------Shallow
Weak-----------------------------------------------------------------------Strong
Quiet-----------------------------------------------------------------------Loud
Modern--------------------------------------------------------------------Traditional
Simple---------------------------------------------------------------------Complex
Fast------------------------------------------------------------------------Slow
Dirty-----------------------------------------------------------------------Clean
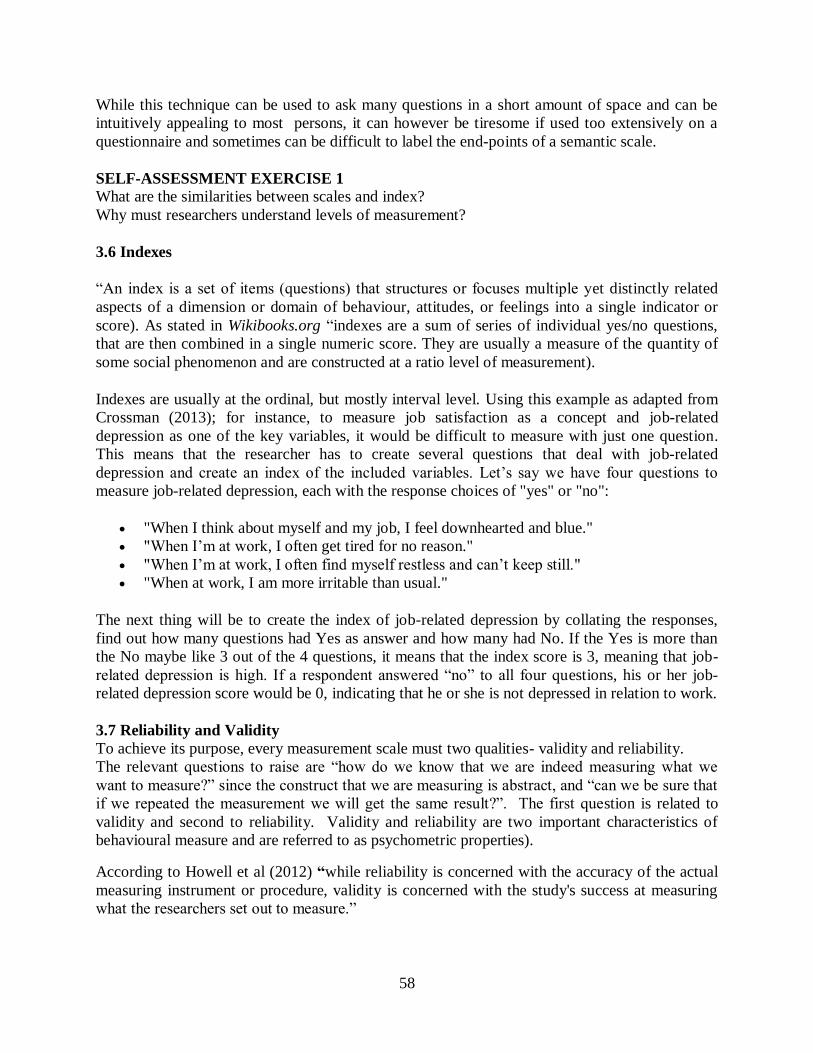
58
While this technique can be used to ask many questions in a short amount of space and can be
intuitively appealing to most persons, it can however be tiresome if used too extensively on a
questionnaire and sometimes can be difficult to label the end-points of a semantic scale.
SELF-ASSESSMENT EXERCISE 1
What are the similarities between scales and index?
Why must researchers understand levels of measurement?
3.6 Indexes
“An index is a set of items (questions) that structures or focuses multiple yet distinctly related
aspects of a dimension or domain of behaviour, attitudes, or feelings into a single indicator or
score). As stated in Wikibooks.org “indexes are a sum of series of individual yes/no questions,
that are then combined in a single numeric score. They are usually a measure of the quantity of
some social phenomenon and are constructed at a ratio level of measurement).
Indexes are usually at the ordinal, but mostly interval level. Using this example as adapted from
Crossman (2013); for instance, to measure job satisfaction as a concept and job-related
depression as one of the key variables, it would be difficult to measure with just one question.
This means that the researcher has to create several questions that deal with job-related
depression and create an index of the included variables. Let’s say we have four questions to
measure job-related depression, each with the response choices of "yes" or "no":
"When I think about myself and my job, I feel downhearted and blue."
"When I’m at work, I often get tired for no reason."
"When I’m at work, I often find myself restless and can’t keep still."
"When at work, I am more irritable than usual."
The next thing will be to create the index of job-related depression by collating the responses,
find out how many questions had Yes as answer and how many had No. If the Yes is more than
the No maybe like 3 out of the 4 questions, it means that the index score is 3, meaning that job-
related depression is high. If a respondent answered “no” to all four questions, his or her job-
related depression score would be 0, indicating that he or she is not depressed in relation to work.
3.7 Reliability and Validity
To achieve its purpose, every measurement scale must two qualities- validity and reliability.
The relevant questions to raise are “how do we know that we are indeed measuring what we
want to measure?” since the construct that we are measuring is abstract, and “can we be sure that
if we repeated the measurement we will get the same result?”. The first question is related to
validity and second to reliability. Validity and reliability are two important characteristics of
behavioural measure and are referred to as psychometric properties).
According to Howell et al (2012) “while reliability is concerned with the accuracy of the actual
measuring instrument or procedure, validity is concerned with the study's success at measuring
what the researchers set out to measure.”

59
Reliability
An instrument can be said to be reliable if it constantly gives the same answer to an issue.
According to Wimmer and Dominick (2011 p.58) reliability consists of three different
components- stability, internal consistency and equivalency. Stability refers to the consistency of
a result or of a measure at different points in time. Internal consistency involves examining the
consistency of performance among the items that compose a scale. Equivalency sometimes
referred to as cross-test reliability assesses the relative correlation between two parallel forms of
a test.
“Measurements are reliable to the extent that they are repeatable and that any random influence
which tends to make measurements different from occasion to occasion or circumstance to
circumstance is a source of measurement error.” It is also “the degree to which a test consistently
measures whatever it measures.” Errors of measurement that affect reliability are random errors
and errors of measurement that affect validity are systematic or constant errors.
Validity An instrument is valid when it measures what it is supposed to measure. There are four major
types of validity- face validity, predictive validity, construct validity, and concurrent validity.
Face validity is examining the measuring instrument to see whether on the face it measures what
it appears to measure. Predictive Validity also called Criterion-Oriented validity is checking a
measurement instrument against some future outcome. It is when you are expecting a future
performance based on the scores obtained currently by the measure, correlate the scores obtained
with the performance. The later performance is called the criterion and the current score is the
prediction. This is an empirical check on the value of the test – a criterion-oriented or predictive
validation). For Concurrent validity the measuring instrument is checked against some present
criterion (Wimmer and Dominick, 2011). It is the degree to which the scores on a test are related
to the scores on another, already established, test administered at the same time, or to some other
valid criterion available at the same time.
Construct validity is adjudged the most complex (Wimmer and Dominick, 2011). Construct
validity is the degree to which a test measures an intended hypothetical construct. It involves
relating a measuring instrument to some overall theoretical framework to ensure that the
measurement is logically related to other concepts in the framework (Wimmer and Dominick,
2011 p.60). Howell et al (2012) further assert that “construct validity seeks agreement between a
theoretical concept and a specific measuring device or procedure. For example, a researcher
inventing a new IQ test might spend a great deal of time attempting to "define" intelligence in
order to reach an acceptable level of construct validity.”
There is also content validity, and this is “based on the extent to which a measurement reflects
the specific intended domain of content (Howell et al, 2012).
4.0 Conclusion
Concepts, constructs and variables must be understood in the context of the research if it must
accomplish its purpose. While taking an appropriate measurement scale and instrument, it is also
important that the instrument is reliable and measures what it purports to measure.

60
5.0 Summary
In this unit, you have learnt about the four levels of measurement- nominal, ordinal, interval and
ratio and why it is important to understand measurement. Also the different scales of
measurements used in social science research- Likert, Thurston, Guttman, Semantic differential.
6.0 Tutor-Marked Assignment
1. Develop a measurement technique to examine each of these concepts:
Television viewing
Newspaper reading
2. What type of data is associated with each of the following concepts:
Beauty pageants
Basket ball standings
Dress size
Time and distance
Football jerseys

61
7.0 References/Further Readings
Tejumaiye, A. (2003). Mass Communication Research: An Introduction. Ibadan: Sceptre Prints
Ltd
Wimmer, R. D. & Dominick, J. R. (2011). Mass Media Research. An Introduction. (9th Ed).
Wadsworth Cengage Learning.
Internet sources
Crossman, A. (2013). Indexes and Scales. http://sociology.about.com/od/Research-
Tools/a/indexes-scales.htm.
FAO corporate document repository. (n. d). Chapter 3: Levels of Measurement and Scaling.
http://www.fao.org/docrep/W3241E/w3241e04.htm.
Howell, J., Miller, P., Park, H. H., Sattler, D., Schack, T., Spery, E., Widhalm, S. and Palmquist,
M. (2012). Reliability and Validity. Writing@CSU. Colorado State University. Available at
http://writing.colostate.edu/guides/guide.cfm?guideid=66.
Levels of measurement. Accessed at
http://psychology.ucdavis.edu/sommerb/sommerdemo/scaling/levels.htm
Social Research Methods/Indexes, Scales, Typologies (2010).
http://en.wikibooks.org/wiki/Social_Research_Methods/Indexes,_Scales,_Typologies.
Taylor, C. (n. d). Levels of Measurement.
http://statistics.about.com/od/HelpandTutorials/a/Levels-Of-Measurement.htm.
Trochim, W. M. K. (2006). Levels of Measurement.
http://www.socialresearchmethods.net/kb/measlevl.php. Research Methods Knowledge Base.

62
MODULE 3: MAJOR COMMUNICATION RESEARCH METHODS
Unit 1 Experimental Research
Unit 2 Survey Research
Unit 3 Content Analysis
Unit 4 Other Methods
UNIT 1 EXPERIMENTAL RESEARCH
CONTENTS
1.0 Introduction
The experimental method of research is one of the oldest research designs used in the field of
mass media research and it serves as a means of providing a wealth of information for
researchers and critics alike. Despite the fact that it is the oldest, it is used infrequently in mass
media research; however, its popularity has risen in recent years (Wimmer & Dominick,
2011:239). Hence, the need for students of mass communication to know what this research
design/approach is all about.
2.0 Objectives
This unit is written so that at the end, you should be able to:
Know, define and explain what experimental research is;
Identify the purpose(s) of experimental research;
Know the experimental research designs and the structure of an experiment; and
Identify and understand the types of experimental research.
3.0 MAIN CONTENT
3.1 Definition of Experimental Research
Whenever the word ‘experiment’ comes up, it is usually thought of as something that is done in
the natural sciences or in a scientific setting. However, it is something that is carried out even in
non-scientific setting and something we do on a regular basis in our natural setting. The word
“experimentation” is derived from the Latin word experiri which means “to try” and since we
all try out different things in our day-to-day lives, this implies that we are consciously or
unconsciously involved in the experimentation process. For instance, in preparing stew or any
kind of food in general, we add salt, taste, add more salt and taste again to determine whether or
not we have achieved the desired result (Babbie, 2010:231).
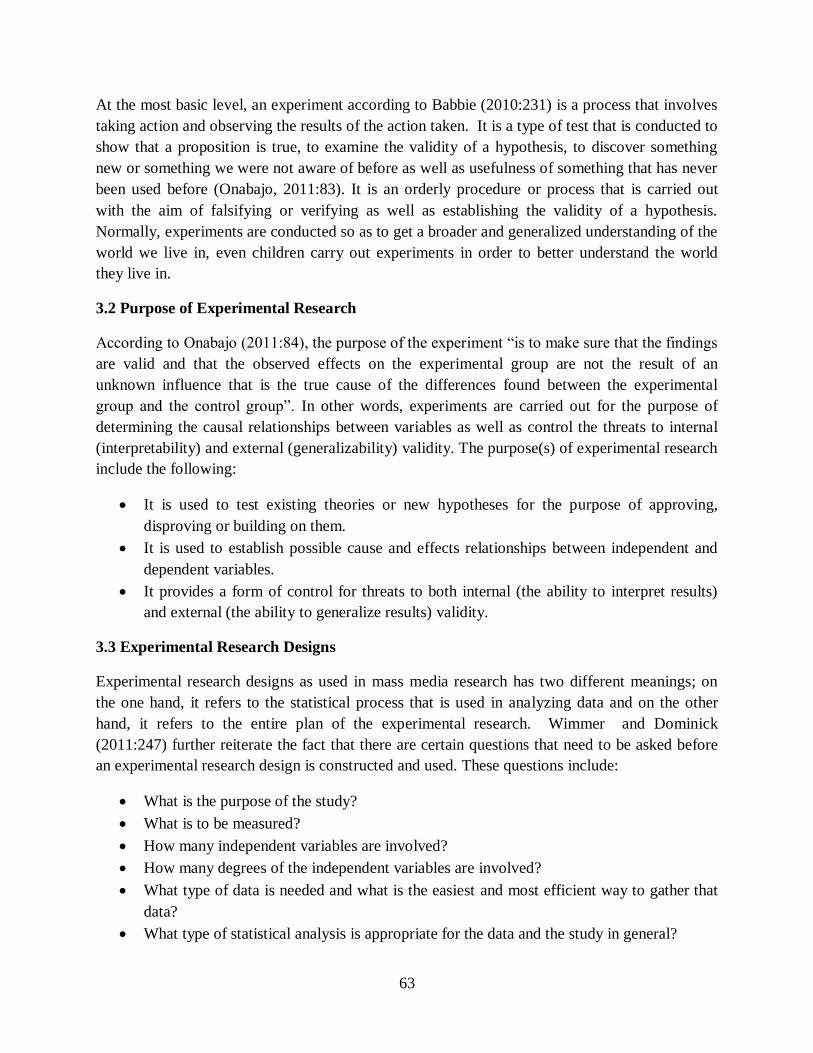
63
At the most basic level, an experiment according to Babbie (2010:231) is a process that involves
taking action and observing the results of the action taken. It is a type of test that is conducted to
show that a proposition is true, to examine the validity of a hypothesis, to discover something
new or something we were not aware of before as well as usefulness of something that has never
been used before (Onabajo, 2011:83). It is an orderly procedure or process that is carried out
with the aim of falsifying or verifying as well as establishing the validity of a hypothesis.
Normally, experiments are conducted so as to get a broader and generalized understanding of the
world we live in, even children carry out experiments in order to better understand the world
they live in.
3.2 Purpose of Experimental Research
According to Onabajo (2011:84), the purpose of the experiment “is to make sure that the findings
are valid and that the observed effects on the experimental group are not the result of an
unknown influence that is the true cause of the differences found between the experimental
group and the control group”. In other words, experiments are carried out for the purpose of
determining the causal relationships between variables as well as control the threats to internal
(interpretability) and external (generalizability) validity. The purpose(s) of experimental research
include the following:
It is used to test existing theories or new hypotheses for the purpose of approving,
disproving or building on them.
It is used to establish possible cause and effects relationships between independent and
dependent variables.
It provides a form of control for threats to both internal (the ability to interpret results)
and external (the ability to generalize results) validity.
3.3 Experimental Research Designs
Experimental research designs as used in mass media research has two different meanings; on
the one hand, it refers to the statistical process that is used in analyzing data and on the other
hand, it refers to the entire plan of the experimental research. Wimmer and Dominick
(2011:247) further reiterate the fact that there are certain questions that need to be asked before
an experimental research design is constructed and used. These questions include:
What is the purpose of the study?
What is to be measured?
How many independent variables are involved?
How many degrees of the independent variables are involved?
What type of data is needed and what is the easiest and most efficient way to gather that
data?
What type of statistical analysis is appropriate for the data and the study in general?

64
What is the cost for conducting the study and how can it be reduced?
What are the facilities and structures available for conducting the study?
What types of studies have been conducted in the area before?
What are the benefits that will be received from the results of the study?
The types of experimental designs available to a social scientist or researcher conducting an
experiment include the following:
Group Experimental Design: This refers to an experiment that is conducted on a group
and it can take two different forms: single variable designs and factorial design.
a) Single Variable Designs: This design is used when there is only one independent
variable that can be manipulated or controlled by the researcher. This design can
further be divided into three main headings depending on the level of control the
researcher has on other variables.
i. Pre-experimental designs (low degree of control): Under this kind of
experimental design, we have one-shot case studies, one-group pretest-
posttest design, and static group comparison design.
ii. True Experimental designs (high degree of control): It has the highest
level of control out of all the single variable designs and this is due to the
fact that the subjects within the groups are randomly assigned for each
group. This design can further be classified into the posttest-only control
group design, the pretest-posttest control group design and Solomon four-
group design.
iii. Quasi-experimental design (medium degree of control): This design takes
three forms and they are non-equivalent control groups design, time-series
design, and counterbalanced design.
b) Factorial Design: This kind of experimental design is conducted for the purpose
of finding out if the independent variable can be generalized. In other words, its
aim is to point out the relationships between variables.
Single Subject Experimental Design: This kind of experimental design is used when
there is only one subject involved in the study. There are three types of single subject
experimental design and they are:
a) A-B-A Withdrawal Design: This design is further divided into three types and they are
the A-B design, the A-B-A design and the A-B-A-B design.
b) Multiple-baseline design: This design is put to use when the conditions cannot be
reversed; the treatment can be withdrawn, but the effects of the treatment continue.
c) Alternating treatments design: This design is used to determine the effects of two or
more treatments within a single-subject and in when using this design, no form of
withdrawal is necessary.

65
3.4 Structure of an Experiment
The structure of an experiment refers to the stages that are involved in conducting an experiment.
According to Wimmer and Dominick (2011:241), there are eight steps to be followed when
conducting an experiment. These eight steps are:
The researcher should select the setting in which the study will be conducted. The setting
could be in a laboratory (where the researcher has a direct control) or in a natural
environment (where the researcher has little or no control).
Select the experimental design that is the most appropriate for the kind of research that
wants to be conducted.
Operationalize all the variables both independent and dependent variables. Independent
variables are operationalized on the basis of the manipulation done to create them while
dependent variables are operationalized on the basis of constructing the rules that are
used for categorizing observations of behavior.
Decide how to manipulate the independent variable either by using the straightforward
manipulation or the staged manipulation.
Select and assign subjects to experimental conditions.
Conduct a pilot study.
Administer the experiment.
Analyze and interpret the results.
3.5 Two basic types of experimental research
For the purpose of this unit, we will be discussing two basic types of experimental research and
they are laboratory and field experimentation.
3.5.1 Laboratory Experimentation
Laboratory experiment is one of the oldest approaches in mass media research and it provides a
wealth of information for researchers (Wimmer and Dominick, 2011:239). They refer to
experiments that are conducted under controlled situations in a special place (such as a building
or laboratory) for scientific purposes or research. The laboratory experiment is subject to the
jurisdiction of the researcher because he/she controls to a very large extent the rules and
procedures that control the conditions in the laboratory. By controlling the conditions in the
laboratory, the researcher is able to establish, calculate and measure the causal relationship
amongst variables. The uses of laboratory experiment in mass media research include testing
existing theories or new hypotheses, establishing possible cause and effects relationships
between independent and dependent variables and providing a form of control for threats to both
internal (the ability to interpret results) and external (the ability to generalize results) validity
(Wimmer and Dominick, 2011).

66
3.5.2 Advantages and Disadvantages of Laboratory Research
Wimmer and Dominick suggests some of the advantages and disadvantages of laboratory
research; the advantages on the one hand include the following:
They help to establish cause and effects relationship between variables.
Researchers to a very large extent have control over the environment, the variables and
the subjects.
Laboratory experiments are inexpensive when compared to other research methods.
It allows for replication i.e. the study can be repeated again by other researchers.
The disadvantages on the other hand include:
The artificial nature of the laboratory makes it difficult to apply the results gotten from
laboratory experiments to real life settings or situations.
Laboratory experiments can be affected by the researcher’s bias due to the amount of
control the researcher has on the environment, subjects and variables.
Some research questions and many interesting research topic in the mass media that deals
with the collective behavior of a large number of people cannot be answered or
researched using the laboratory experiment, hence making the method very limited in
scope.
3.5.3 Communication Issues Investigated through Laboratory Research
Laboratory experimentation has been used widely in the field of mass media research especially
in the area of media effects research in the 1940s and 1950s. It has been used to study and
investigate the pro-social or positive effects of educational and children programming on
children’s behavior as well as the antisocial or negative effects of both the traditional and new
media especially the possible effect of TV violence on human behavior.
3.5.4 Field Experimentation
Unlike the laboratory experiment where the subjects come to the laboratory to meet the
researcher, the field experiment is the opposite because the researcher goes to the subject’s
natural environment to conduct his/her research. Here, the subjects function and carry on with
their normal daily activities with little or no interference from the researcher or a change in the
structure of the environment. Unlike in the laboratory where the researcher has control over the
experiment, here, the researcher has little or no control over the experiment and the study at
large. There are two categories of field experiments: there is one in which the researcher
manipulates the independent variable(s) and the other is one in which the manipulation of the
independent variable occurs naturally as a result of other circumstances.

67
3.5.5 Advantages and Disadvantages of Field Experimentation
Wimmer and Dominick (2011:254) posits some of the advantages and disadvantages of field
experiments. The advantages include:
The major advantage of field experiment is its external validity i.e. the ability to
generalize and apply its results to real life situations since the experiment was conducted
in the natural environment of the subjects.
They are non-reactive in the sense that they do not lead to a change in the subject’s
behavior that comes from the awareness of being measured or observed.
They are very useful for studying complex social processes and situations.
They are very inexpensive to conduct because it requires no special equipment or
facilities.
The disadvantages include the following:
Sometimes, ethical considerations such as airing violent programmes to children makes it
difficult to conduct filed experiments.
They often encounter external hindrances that are not anticipated by the researcher.
Researcher cannot control all the intervening variables in a field experiment.
3.5.6 Communication Issues Investigated through Field Experimentation
According to Wimmer and Dominick (2011:256), some of the communication issues studied
using field experimentation includes the following:
The positive and negative effects of television on people or a community.
The impact of the media on politics.
The negative effects of pornographic content on people.
What people would do without television
The impact of a PR campaign
3.6 A Classic Example of Experiment in Communication Research
A classic example of experiment conducted in communication research that will be given in this
unit as cited by Wimmer and Dominick (2011:257) is the one conducted by Smith and Hand
(1987) on the effects of viewing pornography. An XXX rated film was shown yearly at the small
college that was selected as the site for the research. About one-third of the male students on
campus attended the annual showing of the film. One week before the film was shown, the
researchers did a survey of 230 female students to find out about their contact with aggression
and the same survey was conducted the Monday after the film has been aired and the week after.
The researchers then analyzed the amount of violence that females whose partners watched the
68
film had contact with as compared to females whose partners had not seen the film. The study
recorded no differences in the amount of violence experienced by the two groups of females.
4.0 Conclusion
Unlike the general opinion or assumption that the experimentation research method has to do
with the natural sciences, this research method is also used in the social sciences by social
scientists, researchers and critics to understand the cause and effect relationship between
variables. For an undergraduate student like yourself, this method may seem difficult and very
cumbersome for you to use in conducting a study, hence the need to understand and comprehend
the limitations and strengths of the method in order to know how to effectively and efficiently
use it in a study.
5.0 Summary
In this unit, we have learnt the following:
Experimentation method is an old research method that was used in the earlier stages of
mass media research and it is used to establish causal relationships between variables.
There are two major experimental designs and they are group experimental design and
single-subject experimental design.
The two major types of experiments are field and laboratory experiments.
Experiments are not conducted anyhow but they are subjected to certain procedures and
rules.
6.0 Tutor-Marked Assignment
What are the advantages and disadvantages of field and laboratory experiments?
List and discuss the experimental designs that are available to a researcher when
conducting an experiment.

69
7.0 References/Further Readings
Babbie, E. (2010). The practice of social research (12th Edition). Wadsworth: Cengage Learning.
Onabajo, O. (2011). Foundations of communication research. Lagos: Sibon Books Limited.
Wimmer, R.D. and Dominick, J.R. (2011). Mass media research: An introduction (9th Edition).
Wadsworth: Cengage Learning.

70
UNIT 2 THE SURVEY RESEARCH METHOD
CONTENTS
1.0 Introduction
The survey research method is one of the most frequently used research methods in the social
sciences and in the field of mass media research. In fact, most undergraduate and postgraduate
students in Nigerian universities make use of the survey method when carrying out their
undergraduate project; decision makers in all spheres including in the media make use of the
survey research method in their daily routines. It is one of the most important areas of
measurement and a frequently used mode of observation in the social sciences. Hence, the need
to have an in-depth understanding of what it is all about.
2.0 Objectives
Reading this unit will afford you the opportunity to:
Define and know the survey research method;
Get an understanding of descriptive and analytical surveys;
Identify the advantages and disadvantages of surveys;
Have a knowledge of the methods of gathering survey data;
Know how to construct a survey questionnaire as well as the types of survey questions to
be included therein; and
Achieve a high response rate when using a survey method as well as know the general
problems that are associated with survey research.
3.0 Main Content
3.1 Definitions of the Survey Research Method
Survey research is a non-experimental, descriptive research method that has to do with
asking people questions and finding out what people think and do. It can be referred to as
one of the best methods that are available to researchers who want to collect original data
that describes a population that is too large to be observed directly, hence the need to get
a smaller population (i.e. sample) that is representative of the larger population. Surveys
may be used for descriptive, explanatory and exploratory purposes and they are most
importantly used in studies where individual people are the units of analysis.
According to Simon (1969) as cited in Onabajo (2010:50), a survey research method is
used to gather data on what people say and about variables as they are found in the world.
It may also be defined as a method of primarily collecting data based on a form of
communication or rapport with a representative sample of individuals (called

71
respondents). It can take the form of a short paper-and-pencil feedback or an intensive
one-on-one in-depth interview depending on the nature and scope of the research study.
3.2 Purpose of Survey Research
Surveys are mostly used for descriptive, explanatory and exploratory purposes. One of
the major purposes of the survey research is to describe the attitudes, opinions, behaviors
or characteristics of the sample population based on the data gathered from that
population. Most times, surveys draw a sample that is representative of the large
population from which it is drawn. Surveys are used to provide as well as produce
reliable and useful information especially on audiences and readership (Wimmer and
Dominick, 2011:185).
As stated by Babbie (2010:254), survey is probably the most widely used method
available to every social researcher who is interested in collecting original data for
describing a population that is too large to be observed directly.
3.3 Descriptive and Analytical Surveys
There are two major types of surveys and they are descriptive and analytical surveys. A
descriptive survey as the name implies makes an attempt to describe or explain what
exists at the moment. This kind of survey entails discovering the current situation of
things in the area that is being studied. For example, undergraduate students of a
University can carry out descriptive survey to find out the opinion of Lagos residents on
Governor Fashola’s second term in office. On the other hand, an analytical survey deals
with the ‘why’ i.e. it seeks to describe or explain why situations exist. It has to do with
examining two or more variables to investigate research questions or test research
hypothesis (Wimmer and Dominick, 2011:185). The results gotten from analytical
surveys are used to examine and determine the relationships between variables as well as
to make explanatory inferences. For example, NTA could decide to carry out an
analytical that seeks to investigate the relationship between the lifestyle of their audience
and their viewing patterns or habits.
3.4 Advantages and Disadvantages of Surveys
As cited by Onabajo (2011:52) and Wimmer and Dominick (2011:185), the advantages
of survey research include the following:
It is relatively inexpensive when considered in terms of the amount of information
it generates.
Using this research method, a large amount of information is gathered from
different people with ease as compared with other research methods.

72
They are not limited by geographic constraints or boundaries and can be
conducted anywhere.
Survey research methods are reasonably accurate especially when the sampling is
correct.
Results gotten from surveys can be generalized because the sample population is
large ad very representative of the entire research population.
Surveys can be used to investigate problems in a realistic setting i.e. the problems
can be examined where they exist or happen rather than in a laboratory or under
an artificial condition.
The disadvantages on the other hand include (Wimmer and Dominick, 2011:186) and
Onabajo (2011:53):
Getting a representative sample can be very difficult and expensive.
Respondents may not give honest answers hence distorting the validity and
accuracy of the results.
Inappropriate wording or placement of questions within a questionnaire can bias
the results.
Some survey research is becoming difficult to conduct because response rates
continue to decline.
3.5 Methods of Gathering Survey Data
According to Wimmer and Dominick (2011:201), there are five basic methods for
gathering survey data and they are mail survey, telephone survey, personal interview,
group administration, and internet survey. Other methods include mall interviews and
computer-assisted personal interviewing (CAPI). A researcher can use any of these
methods in isolation or can combine two or more together to achieve a desired result.
However, it is important that you are acquainted with the advantages and disadvantages
of each method so as to know how to appropriately use the method(s).
Mail Surveys
This has to do with sending out self-administered questionnaires accompanied by a letter
of explanation and a self-addressed stamped reply envelope for returning the
questionnaire. The stamped reply envelopes are usually included in the mail so as to
encourage respondents to return their completed questionnaires to the researcher. Once
the researcher has done his or her own part by sending the mail, it is the duty of the
respondent(s) to complete the questionnaire, put in the stamped envelope and return it to
the researcher. Mail surveys are used by certain businesses like consumer panels to
secure a substantial amount of information about the purchasing behaviors of consumers.
However, this method can be very difficult and tedious for undergraduates who don’t

73
have the ability to efficiently and effectively handle the low response rate that
characterizes mail surveys (Wimmer and Dominick, 2011: 201 and Babbie, 2010:270).
Telephone Surveys
This method of gathering data has to do with making use of trained interviewers who ask
questions as well as record the answers or responses gotten on a computer. This kind of
survey is only limited to those who have telephones, hence, a decline in the way it is
often used in the field of mass communication. This method of gathering survey data
creates a form of balance between mail surveys and personal interviews; this is because it
gives the researcher a form of higher control and a higher response rate. Interviewers are
very important to the success of telephone surveys, they are the neutral link between the
respondents and the researchers; they are the ones that communicate the respondents’
answers back to the researcher for further analysis.
Personal Interviews
They are also referred to as one-on-one or face-to-face interviews and unlike the normal
method of asking respondents to read the questionnaires and enter in their own answers,
this method of survey data collection involves sending interviewers to orally ask the
questions and record the responses. There are two basic types of interviews: structured
and unstructured interview. In a structured interview, the questions are formed before
the interview and arranged in the order in which they will be asked i.e. the questions are
standardized and asked in a predetermined order. An unstructured interview however
has to do with asking broad questions that allows as well as gives the researcher control
over determining further questions tobe asked that will generate the needed information.
Structured interviews are very easy to analyze and tabulate but there is a limit to the
amount of information it generates, however, unstructured interviews can generate a large
amount of information which becomes very difficult and cumbersome for the researcher
to analyze and tabulate.
Group Administration
Group administered surveys involve gathering a group of respondents together to fill
individual copies of a questionnaire or asked to participate in a group interview. This
method combines features of both mail surveys and personal interviews. It requires the
presence of more than one interviewer so that problems can be resolved individually
without having to disturb the entire group. Group administered surveys are not only about
filling questionnaires, it could also take the form of gathering respondents together to
analyze video and audio materials. For instance, a group administered survey can be
carried out in this form by gathering together married women who will analyze
advertising videos of how women are portrayed in adverts.

74
Internet Survey
With the advent of the new media, and the internet generally, virtually any form of
research can be done on the internet. Internet survey has to do with asking respondent(s)
through email, letters or telephone to participate in a survey or research project online by
either sending the questionnaires to their emails or giving them a link to access the
questionnaire online. When the respondents are done with the questionnaires, they click
on submit or send the questionnaire back to the researcher. One of the online tools used
in internet survey is ‘Survey Monkey’, an online tool that allows researchers to create
questionnaires online and send them to the respondents.
Mall Interviews
Mall interviews is a form of personal interview, it has to do with interviewing
respondents on a face-to-face level in an already pre-determined mall. For instance, a
student-researcher that wants to research into the buying habits of Lagosians can decide
to go to Shoprite (a mall in Lagos) and conduct a mall interview. This method makes use
of convenience sampling, is gaining popularity and has become the standard for many
researchers.
Computer-Assisted Personal Interviewing (CAPI)
This is a survey method that involves an interviewer conducting a one-on-one interview
and entering the data obtained directly into a computer and the results are later uploaded
into a master computer for further analysis (Wimmer & Dominick, 2011:208).
3.6 Constructing Survey Questionnaires
The data collection instrument for the survey research method is a questionnaire. The
questionnaire according to Babbie (2010:255) is an instrument that is designed to gather
or elicit information that will be subjected to further analysis. Survey questionnaires have
to be constructed in the right format, if not; the essence of the entire research might be
distorted. Good questionnaires should have the following characteristics:
It should be spread out and uncluttered.
It should be short and concise.
They are clear and not ambiguous.
They avoid double-barreled questions.
They ask questions that are relevant and that the respondents can answer.
They ask questions that are easy and simple to answer.
The questions in it are usually arranged in a logical order.
All instructions necessary to complete the questionnaire should be clearly stated
in it.

75
3.7 Types of Survey Questions
In the process of asking survey questions, researchers have two options and these options
make up the two basic types of questions in the survey research method. They are: open-
ended and close-ended questions.
When asking open-ended questions, the respondent is asked to provide his or her own
answers to the questions asked. For example:
Why do you read
newspapers?..………………………………………………………………………
……………...
What radio station do you listen to the
most?.....................................................................
Advantages of Open-ended Questions
According to Wimmer and Dominick (2011:187), the advantages of open-ended
questions are:
It gives the respondents freedom in answering their questions and it allows them
to provide in-depth responses.
It gives the researcher much room to follow up on questions that will give
information about the respondents’ feelings and motives.
It allows for answers that the researcher did not foresee when designing the
questionnaire.
They are useful in a pilot test of a study.
Disadvantages of Open-ended Questions
Its disadvantages include:
The process of analyzing the data gotten from open-ended questions is
rigorous and difficult.
A large amount of time is required to gather and analyze the data.
Ambiguous answers given by respondents could lead to misinterpretation of
data on the part of the researcher.
Close-ended questions on the other hand refer to survey questions that the researcher
provides a list of possible answers to from which the respondent is supposed to choose
from. According to Babbie (2010:256), “close-ended questions are survey questions in
which the respondent is asked to select an answer from among a list provided by the
researcher”. For example:

76
What is your educational qualification? a) SSCE b) HND or OND c) B.Sc d)
M.Sc e) Ph.D
Strengths of Close-ended Questions
They provide a greater uniformity of responses.
The answers are easier to code and analyze statistically.
They minimize the risk of misinterpretation on the part of the respondents.
They keep the questionnaire to a reasonable length that will encourage the
respondents to fill and return the questionnaires, hence increasing validity.
Replication is easier.
Weaknesses of Close-ended Questions
They force respondents to give simplistic responses to complex issues.
It can lead to misleading conclusions because of the limited range of options.
It doesn’t give in-depth information as compared to open-ended questions.
Sometimes, researchers fail to include important responses in the provided list of
responses.
3.8 Training of Interviewers
Training interviewers is a very important aspect of the survey research process especially
for surveys that use a large sample such that the researcher cannot administer the
questionnaires by himself/herself. There is a need for the researcher to either hire
experienced interviewers or research assistants or train inexperienced interviewers in
order to make them familiar with the items, response options and instructions on the
questionnaire.The interviewer’s training session should begin with a detailed description
of what the study is about, followed by a discussion of the general guidelines and
procedures involved in conducting a survey, going through the questionnaire together,
conducting one or two demonstration interviews, and then finally conducting a real
interview under the actual condition that will pertain to the final survey. According to
Babbie (2010:276), interviewers should be trained to do the following:
To dress and appear in a manner similar to that of the people they will be
interviewing.
To get familiar with the questionnaire by studying it carefully.
To follow the wording of the questions exactly as it is in the questionnaire.
In the case of an open-ended question, the interviewer must be trained to record
the answers to such questions exactly as given by the respondent.

77
3.9 Questionnaire design
The questionnaire design or format is a very important aspect to consider when
constructing the questionnaire. The questionnaire design has to do with the physical
appearance of the questionnaire, the wordings of the questions as well as other items in
the questionnaire. The questionnaire design is very important because to a very large
extent, it determines and can affect the response rate. To create a very good questionnaire
design, Wimmer and Dominick (2011:195) give the following suggestions for the
requirements of a good questionnaire:
Introduction: A good and persuasive introduction is one way to increase the
response rate in surveys. The characteristics of a good introduction according to
Backstrom and Hursh-Cesar (1986) as cited by Wimmer and Dominick
(2011:195) include the following: the introduction should be short; it should be
realistically worded, nonthreatening, serious, neutral, and pleasant but firm. Most
times the introduction gives a brief summary of what the research is all about; it
introduces the organization or individual carrying out the research, states the
purpose for the research and gives a statement assuring the respondents of
confidentiality.
Instructions: A good questionnaire design should include clearly stated
instructions that will guide the would-be respondents in filling the questionnaire.
Question Order: The questions used in a survey should be arranged in such a
manner that encourages the respondents to fill the questionnaire. The researcher
could start with warm-up or preliminary questions and end with the more serious
and sensitive ones. Whatever the case may be, the questionnaire should be
arranged in a logical order proceeding from the general to the more specific.
Layout:The layout and physical appearance of the questionnaire also matters. The
questionnaire should not be badly typed or reproduced; the responses should be
stated clearly and spaced adequately so as to avoid confusing the respondents.
Questionnaire Length: The questionnaire should not be too long; the researcher
should try and make it as short as possible.
Once the questionnaire is completed, the researcher subjects it to a process of
validation that seeks to find out whether or not it has been adequately designed. The
researcher does this by pre-testing the instrument i.e. sampling it amongst the type of
respondents that will actually be studied, taking down their comments and using it to
create the final draft of the questionnaire.
3.10 Achieving High Response Rate in Survey Research
Response rate which is also known as completion rate or return rate refers to the
“number of people participating in a survey divided by the number selected in the

78
sample, in the form of a percentage”. It could also be referred to as the numbers of
questionnaires sent out that are returned. (Babbie, 2010:272). For instance, let’s assume
you sampled 500 respondents in a survey and 400 questionnaires were returned, the
response rate is calculated as follows:
(400 ÷ 500) × (100 ÷ 1) = 80%
For a survey to be valid, a very high response rate is needed. This signifies the
representativeness of the results as well as its ability to be generalized. To achieve a high
response rate in surveys, researchers do any of the following:
Give incentives and gifts to respondents e.g. pens to fill the questionnaire or gift
cards.
Make the questionnaire as short and brief as possible.
Make the questionnaire attractive and easy to fill out.
Clarify the question format and make it as simple as can be.
3.11 General Problems in Survey Research
Despite the fact that the survey research is a very important research method in the field
of mass communication, there are some general problems encountered when using this
method. These problems or difficulties according to Wimmer & Dominick (2011:214)
include:
The ability of respondents to deceive researchers on purpose by giving an
incorrect answer.
Due to feelings of inadequacy or lack of knowledge, some respondents can tend
towards giving prestigious answers on topics they know nothing about instead of
just admitting that they do not know it.
Respondents sometimes give elaborate answers to simple questions especially
when trying to voice out all their opinions.
Surveys are complicated due to the fact that sometimes, it could be difficult for
respondents to explain their true feelings, perceptions and beliefs in their own
words.
Sometimes, respondents may be unable to recall certain information about
themselves or their activities due to certain factors ranging from memory failure
to nervousness that comes with filling questionnaires.
4 Conclusion
Survey research is a very important method of data collection that is useful in the social sciences
and also one of the most widely used methods of media research due to its flexible nature.
However, when using the survey research method, researcher should take into cognizance the
sample selection, questionnaire design as well as the error rates.
79
5 Summary
In this unit so far, we have learnt the following:
The survey research method is an invaluable too and an important method in the field of
media research.
Survey research could be either descriptive or analytical in nature depending on the form
that suits the study being undertaken.
There are different methods of gathering survey data that are available to a researcher and
they include mail survey, telephone survey, mall interview, group administration,
personal interview amongst others.
The questionnaire design is a major step in any survey research ad must be done properly
to avoid any form of bias or errors.
To increase the response rates in surveys, researchers should include incentives that
would encourage the respondents to fill and return the questionnaires.
6 Tutor-Marked Assignment
Look for a questionnaire that has been used for a survey, consider at least five of the
questions in it and critique each one.
Identify the methods that are used in gathering data in survey research.

80
7
7. 0 References/Further Readings
Babbie, E. (2010). The practice of social research (12th Edition). Wadsworth: Cengage
Learning.
Wimmer, R.D. & Dominick, J.R. (2011). Mass media research: An introduction (9th Edition).
Wadsworth: Cengage Learning.

81
UNIT 3 CONTENT ANALYSIS
CONTENTS
1.0 Introduction
2.0 Objectives
3.0 Main Content
3.1 Definition of Content Analysis
3.2 Origin of Content Analysis
3.3 Procedure of Content Analysis
3.4 Key Procedural Concepts of Content Analysis
3.5 Analyzing Content Analysis Data
3.6 Strengths and Weaknesses of Content Analysis
4.0 Conclusion
5.0 Summary
6.0 Tutor-Marked Assignment
7.0 References/Further Readings
1.0 Introduction
This unit will be considering the content analysis research method which is one research
approach that is frequently used in all areas of the media.
2.0 Objectives
This unit will expose the students to the following:
The definition and origin of content analysis;
The process or steps involved in conducting content analysis;
The advantages/strengths and disadvantages/weaknesses of content analysis; and

82
The key procedural concepts that are used in content analysis.
3.0 MAIN CONTENT
3.1 Definition of Content Analysis
Content analysis has to do with the study of recorded human communication that exist in
different forms such as books, magazines, web pages, newspapers, speeches, films etc. It is a
research method that is very popular with mass media researchers because it has an efficient way
of investigating as well as measuring the content of the media .According to Kerlinger (2000) as
cited in Wimmer and Dominick (2011:156), “content analysis is a method of studying and
analyzing communication in a systematic, objective and quantitative manner for the purpose of
measuring variables”. From this definition, we see that there are three very important concepts
that need to be discussed in details. The first is the fact that content analysis is systematic; this
implies that it is a scientific process that is subjected to certain explicit and consistently applied
rules and procedures. Secondly, content analysis isobjective; in other words, this means that it is
free of any bias or input on the part of the researcher. The research should be void of the
researcher’s personal biases and should yield the same result if replicated by another researcher.
Finally, the third concept is the fact that content analysis is quantitative; this implies that it has to
do with quantification i.e. “the goal of content analysis is an accurate representation of a body of
messages” (Wimmer and Dominick, 2011:157).
According to Zito (1975) as cited in Onabajo (2011:79), “content analysis may be defined as a
methodology by which the researcher seeks to determine the manifest content of written, spoken,
or published communications by systematic, objective, and quantitative analysis”. From this
definition, content analysis has to do with interpreting and seeking out the hidden meanings in
written, spoken or published communications.
3.2 Origin of Content Analysis
The first kind of content analysis carried out probably dates back to 1743 when 90 hymns
published in Sweden were examined to determine whether dangerous ideas were being
disseminated through the hymns. However, modern content analysis dates back to World War II
when Allied Intelligence units the number and types of popular songs that were played on
European radio stations and compared them with the kind of music played on German stations
with the aim of measuring the degree of changes in troop concentration on the continent.
Over the years content analysis has been used to conduct studies that verify the authorship of
both historical and current documents. These studies were carried out by counting words in
questionable authenticity and comparing their frequencies with words in documents whose
authors are known (Wimmer & Dominick, 2011:156). Since after the war, researchers have used
83
content analysis to study propaganda in newspapers and radio and with the advent of the new
media, it is now being used to study new media content also. Content analysis is widely used in
mass media research and remains a useful tool for social scientists and communication
researchers.
3.3 Procedure of Content Analysis
As earlier stated, the content analysis research method is one that is systematic in nature i.e. it
involves following rules that are consistently applied. This shows that the process of conducting
a content analysis is in several discrete stages and steps. A summary of the steps taken in a
content analysis according to Wimmer and Dominick (2011:160) include the following:
Identification and definition of problem.
Formulate the research question or hypotheses.
Define the universe in question.
Selecting an appropriate sample from the population.
Construct the categories of content to be analyzed.
Establish a quantification system.
Train coders and conduct a pilot study.
Code the content according to established and predetermined definitions.
Analyze the collected data.
Draw conclusions and search for indications.
3.4 Key Procedural Concepts of Content Analysis
There are certain procedural concepts that are very important and must be understood by every
researcher when conducting a content analysis. These are:units of analysis, content categories,
sampling and coding.
Units of Analysis: It is the most basic and smallest element of a content analysis; it refers
to the ‘who’ or ‘what’ (subject of the study) that is being studied or analyzed in a content
analysis from which the researcher wants to generalize from. In a written content, the unit
of analysis might be a single word or symbol, a theme or an entire article or story. For TV
and films, it could be the characters, acts or entire programs. For example, when studying
a newspaper, you can decide that your unit of analysis is the headlines, the editorials, all
the crime stories featured in it, the adverts or the pictures in the newspaper.
Content Categories: Content categories refer to words that have the same meanings and
are used to classify media content into categories that are mutually exhaustive and
exclusive. Content categories differ based on the study that is being carried out. For
instance, in a study conducted by Okoro&Nnaji (2012:42) on the press coverage of

84
environmental pollution in the Niger-Delta in Nigerian newspapers, the content
categories used were:
i. The nature of the story i.e. checking if the story on environmental pollution is
categorized as news, features, editorials, pictures or cartoons.
ii. Frequency of coverage: This has to do with the number of times that the stories on
environmental pollution are covered by the selected newspapers.
iii. Placement of stories: This has to do whether the story is on the front page, inside
page or on the back page.
On a general note, the following are major requirements of content categories:
They must be mutually exhaustive such that all the relevant contents are
categorized.
They must be mutually exclusive such that data/content can only be placed in one
category alone.
They must be independent such that the assignment of one content/data to a
category will not affect the placement of another.
Sampling: Sampling is the process of taking a subset that is representative of the entire
population. Sampling occurs throughout all the levels of content analysis and any of the
sampling techniques could be used such as stratified sampling, systematic sampling,
cluster sampling amongst others. Most of the content analysis in mass media research
makes use of multistage sampling which is in two or more stages. The first stage has to
do with selecting/sampling from the content sources and the second step has to do with
selecting dates. Using the example stated earlier, Okoro and Nnaji (2012) made use of the
multistage sampling method. They made use of the purposive sampling method in
selecting the four newspapers used based on their high circulation, widely diffused
market and the coverage of major interest groups in the country. After using purposive
sampling to select the newspapers, systematic sampling was used to select the editions
and issues of each newspaper.
Coding: This is the process of placing a unit of analysis into a content category and
reducing the data gathered into a manageable form. It also has to do with assigning
numbers and codes to content categories. This is the aspect of content analysis that makes
it very time-consuming. According to Babbie (2010:338), “coding is the process of
transforming raw data into a standardized form”. The coding process has to do with
recording the observations made during the course of the study in a form that can be
analyzed and understood. The instrument used for this is called the ‘coding sheet’ and it
should be very standardized to make the researcher/coder’s work easier. For the purpose
of this unit, we shall consider an example cited by Sobowale (2008:21), using crime rate
as an example; he constructed content categories and designed a coding sheet.
The content categories were constructed using police records and they include: date,
types of crime, place of occurrence, sex of suspects, sex of victims, nature of crime, cost

85
arrests, prosecution and convictions. Using the aforementioned content categories, a
coding sheet was created as illustrated below:
Date Types
of
Crim
e
Place
of
Occurr
ence
Sex of
Suspe
cts
Sex of
Victim
s
Nature of
Crime
Cost Arrest
s
Prosecu
tion
Convi
ctions
The above is an example of a coding sheet that is done manually. Along with a coding sheet
comes a coding guide which gives a set of instructions as to how the coding sheet is to be used.
With the advent of digitalization, coding can also be done through the use of computers and
software that help to analyze data especially when performing a content analysis of the new
media such as twitter, Facebook etc.
3.5 Analyzing Content Analysis Data
Descriptive statistics such as percentages, means, modes, medians, interquartile range and
standard deviation are appropriate for analyzing content analysis data. Inferential statistics could
also be used when testing hypothesis. You will learn more about the analysis of data in Module
five. The same statistical rules and principles that apply to other areas of mass media research
and other research methods also apply to content analysis.
3.6 Strengths and Weaknesses of Content Analysis
The following are the strengths/advantages of content analysis:
It is inexpensive and requires a little amount of time as compared to other research
methods.
It is flexible and allows for the correction of errors.
The researcher has little or no effect on the subject being studied i.e. it is unobtrusive in
nature.
It allows the researcher to study processes or phenomenon occurring over a long period
of time.
It can provide valuable historical/cultural insights over time through analysis of text.
It can quantify large data.
On the other hand, its weaknesses/disadvantages are:
It is limited and restricted to only recorded forms of communication that may be oral,
written or graphic and must be recorded in a manner that permits analysis.

86
The problem of representativeness is a major disadvantage in content analysis
It can be very time-consuming.
It can pose reliability and validity problems.
4.0 Conclusion
Content analysis is a major research method in mass media research that is used for studying
human communications and other aspects of social behavior. It has the same basic features with
other research methods; it is only the way it is carried out that is different.
5.0 Summary
At the end of this unit, we have learnt and understood the following:
Content analysis is a popular technique in mass media research and it systematic in
nature.
The key procedural concepts in content analysis include the content categories, sampling,
coding and units of analysis.
In constructing the content categories, the researcher must take note of the fact that they
must be mutually exhaustive, mutually exclusive and independent in nature.
The strengths and weaknesses of content analysis.
6.0 Tutor-Marked Assignment
Briefly discuss the process of conducting a content analysis.

87
7.0 References/Further Readings
Babbie, E. (2010). The practice of social research (12th Edition). Wadsworth: Cengage
Learning.
Okoro, N. and Nnaji, G.O. (2012). Press coverage of environmental pollution in the Niger Delta
region of Nigeria: A content analysis of the Guardian, Vanguard, Daily Sun and Thisday
newspaper. In Journal of Humanities and Social Science, 3(2), pp.34-46.
Onabajo, O. (2011). Foundations of communication research. Lagos: Sibon Books Limited.
Sobowale, I. (2008). Scientific Journalism (2nd
Edition).Gbagada, Lagos: IdosaKonsult.
Wimmer, R.D. & Dominick, J.R. (2011). Mass media research: An introduction (9th Edition).
Wadsworth: Cengage Learning.

88
UNIT 4: OTHER METHODS
CONTENTS
1.0 Introduction
2.0 Objectives
3.0 Main Content
3.1 Case Studies
3.2 Observational Research
3.3 Ethnographic Research
3.4 Longitudinal Research
3.5 Focus Group Research
3.6 In-depth Interview
4.0 Conclusion
5.0 Summary
6.0 Tutor-Marked Assignment
7.0 References/Further Readings
1.0 Introduction
Apart from the aforementioned research methods, there are other forms of research methods that
are used in communication research. These methods include Case Studies, Observational
Research, Ethnographic Research, Longitudinal Research and Focus Group Research. These
research methods refer to the techniques used by communication researchers to obtain data about
the research they are carrying out. It is important to note that the methods discussed in this unit
are as important as the ones already discussed in units 1-3.
2.0 Objectives
At the end of this unit, students will be able to adequately explain the following:

89
The case study method, its advantages and disadvantages as well as the process involved
in conducting a case study;
Observational research and all that it entails;
Longitudinal research, its advantages and disadvantages;
Focus group research and the process involved in conducting one; and
In-depth interview, its characteristics, weaknesses and strengths.
3.0 Main Content
3.1 Case Studies
Case study is a research method that is qualitative in nature. According to Wimmer and
Dominick (2011:141), case study is a method that “uses as many data sources as possible to
systematically investigate individuals, groups, organizations or events”. Case studies are very
useful to a researcher when he/she wants to explain a phenomenon. The use of many sources of
data or multiple sources of evidence is what differentiates case studies from other research
methods. There are five stages that are involved in the process of conducting a case study and
they are: design, pilot study, data collection, data analysis and report writing.
Merriam (1988) as cited in Wimmer and Dominick (2011: 141) lists four essential characteristics
of case study research and they are:
Case studies are particularistic in nature i.e. they focus on a particular event, situation or
phenomenon. This makes it a very good and efficient method for studying real life and
practical situations or problems.
Case studies are descriptive because the final product of the research is usually a detailed
description of the topic or phenomenon being studied.
Case studies are also heuristic in nature i.e. it helps people to understand what is being
studied by giving new interpretations, perspectives, meaning and fresh insights to the
topic being studied.
Finally, case studies are inductive in nature because they have to do with inductive
reasoning; a situation whereby the researcher seeks to discover new relationships rather
than verify existing hypotheses.
The Advantages of Case Studies
These advantages include:
It is very useful when a researcher wants to obtain a lot of information and detail(s) about
a research topic.
It is very helpful for a researcher to wants ideas for further research.
This research technique has the ability to give possible suggestions as to why something
has occurred.

90
Case studies give researchers the ability to deal with a large spectrum of evidence.
The Disadvantages of Case Studies
It lacks scientific rigor.
The results gotten from case study research cannot be generalized.
Case studies are time consuming and the large quantity of data might become too
cumbersome for the researcher to summarize.
3.2 Observational Research
This research method has to do with studying people, things or situations around us by means of
observation. The observation research method is used to seek answers to questions that
questionnaires and direct reports couldn’t provide answers to. It is more concerned with
description and explanation than with measurement and quantification. It is the basic method for
getting information on anything.There are six stages involved in the process of conducting an
observational research and they are choosing the research site, gaining access, sampling,
collecting data, analyzing data and exiting.
The advantages of observational research method include:
It is a very direct method used for collecting data.
It is less demanding and less cumbersome in nature.
It enhances and improves the precision of the research results.
It helps the researcher to build up the basic background that will be used to frame the
hypothesis as well as identify dependent and independent variables.
Sometimes, it can be the only appropriate research method to use especially when
quantification and measurement becomes difficult.
It provides access to groups that would ordinarily be difficult to observe.
It requires less cost and expenses.
The disadvantages of this research method are:
It does not allow for external validity due to the fact that the representativeness of the
observations made could be potentially questionable.
It might involve bias on the part of the researcher.
It leads to reactivity which is a process whereby the subjects being observed alter their
behavior because they are aware of the fact that they are being observed, hence distorting
the validity of the results.
3.3 Ethnographic Research

91
This research method is a form of qualitative research and it entails ‘spending long periods of
time living with and observing other cultures in a natural setting’ (Wimmer & Dominick,
2011:145). It was first practiced by anthropologists and sociologists and now with the advent of
the new media, it is becoming a popular method used for studying online or web-based
communities. The ultimate goal of this research method is to examine how a particular group
perceives a phenomenon. This research method has the following characteristics (Wimmer &
Dominick, 2011:145):
It uses different research techniques such as observation, interviews, diary keeping,
analysis of existing documents (content analysis), photography, videotaping amongst
others.
It is time consuming as a considerable amount of time has to be spent doing fieldwork.
It is a participatory form of research as the researcher needs to go to the data to obtain it
instead of the other way round.
It emphasizes studying the research topic from the participants’ frame of reference.
What distinguishes this research method from others is the fact that it can use several research
techniques such as focus groups, case studies, in-depth interview, and field observations.
3.4 Longitudinal Research
This kind of research has to do with collecting and gathering data at different points in time.
There are three main forms of longitudinal research and they are trend study, cohort analysis and
panel study:
Trend Studies: Here, different groups of people from the same population are sampled at
different times. Its advantages include the fact they are very useful in describing long-
term changes in a population, it is less expensive and saves time, and it allows
researchers to understand long-term change. Its major disadvantage on the other hand is
the fact that if data gathered are unreliable, false trends will show up in the results, hence,
jeopardizing the validity of the research.
Cohort Analysis:It is a form of longitudinal research that is focused on studying the
activities of a particular cohort group (i.e. a group of people who share a common
characteristic at a point in time or over a period of time). This analysis enables the
researcher to identify the relationship between the characteristics and behavior of a
population. One of its many advantages is that it is highly flexible, another is the fact that
it provides insight into the effects of different forms of changes (such as cultural,
political, social) and it can be used with either primary or secondary data.On the other
hand, its disadvantages are sample mortality especially in a situation where the specific
sample group is difficult to reach and a major disadvantage is the fact that specific effects
of age, cohort and period are very difficult to analyze using pure statistical analysis of a
standard cohort table.

92
Panel Study: Panel studies measure a sample of respondents at different points in time.
Depending on the purpose of the study, researchers can either use a continuous panel
(they report specific attitudes or behaviors on a regular basis) or an interval panel(the
members of this panel complete questionnaire(s) only when the information is needed).
This form of longitudinal research is different from the others because it helps to identify
shifting attitudes and behavioral patterns that could go unnoticed while using other
research approaches. Panel studies make use of mail questionnaires, telephone
interviews, personal interviews and the internet via web panels to gather necessary data
(Wimmer & Dominick, 2011:226). One of the advantages of panel studies is its
usefulness in answering questions about the dynamics and patterns of change; also,
repeated visits and contacts with the respondents helps to build their trust in the research
thereby enabling them to yield more information. Disadvantages include the difficulty
experienced in recruiting members that are willing to fill out questionnaire(s) or report
interviews a number of times and finally sample mortality which is a situation whereby a
member of the panel drops out for one reason or the other hence, eliminating the
probability of interviewing the same person at another time.
3.5 Focus Group Discussion
The focus group research method is also referred to as group interviewing; it is a qualitative
method that involves a moderator interviewing 6 -12 people simultaneously and leading them in
a structured, semi-structured or unstructured discussion/interview about the topic being
discussed. ‘It is a group interview that is held to find out how people feel about a product, service
or issue’ (Onabajo, 2011:75). The participants in a focus group do not necessarily go through
rigorous probability-sampling methods due to the fact that the purpose of the study is to explore
rather than to describe or explain in any definitive sense (Babbie, 2010:323). The steps required
in conducting a focus group are: define the problem, select a sample, determine the number of
groups necessary, prepare the study mechanics, prepare the focus group materials, conduct the
session and analyze the data and prepare a summary report.
According to Krueger & Casey (2000) as cited in Wimmer & Dominick (2011:132), the focus
group research method has four characteristics and they are:
It involves people i.e. participants.
All the participants must possess and share certain characteristics that are of interest to
the researcher.
This research method usually provides qualitative data that enhances understanding and
reveals a wide range of opinion.
It makes use of focused discussions where most of the questions to be asked are
determined beforehand, the order in which the questions to be asked are determined and
the questions are structured in a manner that will achieve the purpose for the research.

93
The advantages of the focus group research method as cited by Babbie (2010:323) are:
It is a research method that is socially oriented and captures real-life data in a social
environment.
It has flexible in terms of the flexibility in the question design and follow up.
It has high face validity.
It has speedy results.
It is not expensive.
Its disadvantages on the other hand include the following:
It gives the researcher lesser control as compared to individual interviews.
The data obtained using this research method is very difficult to analyze.
The moderators of focus group discussions require special skills. The success of any
focus group is heavily dependent on the skills of the moderator.
Focus groups can be very difficult to assemble.
The discussion must be conducted in a very conducive environment.
3.6 In-depth Interview
In-depth interview could also be called intensive or depth interview. It is a form of one-on-one
interview that is highly focused and conducted to get at or bring out hidden feelings, attitudes
and beliefs that a respondent is unaware of. Just like the name implies it can last for one hour or
more. In-depth interviews have the following characteristics as cited by Wimmer & Dominick
(2011:139):
This method makes use of smaller samples.
It allows the researcher to be able to observe the respondents’ non-verbal responses for a
long period of time.
They are usually long and may last several hours or may even require more than one
session.
It provides a detailed background about the reasons respondents give specific answers.
In-depth interviews can be customized to suit individual respondents i.e. the interviewer
can phrase and structure questions based on the respondent’s answer.
The strengths of this kind of interview are:
The major advantage of this research method is the detailed wealth of information it
provides the researcher with.
It enables the researcher to ask follow-up questions on topics of interest over a long
period of time.
94
The kind of rapport between respondents and the researcher makes it easy to obtain
unexpected information and approach certain topics that might be difficult to approach
using other research methods.
The researcher can adapt or improvise the questions to suit the situation as it changes.
The weaknesses of this research method on the other hand include(Wimmer & Dominick,
2011:139):
The difficulty involved in analyzing the bulk of data gathered using this research method
could be a problem.
Transcribing the interview from the tape recorder used to record it can be very time-
consuming.
The researcher might not be able to generalize his/her results due to the non-random
sampling used as well as the non-standard form the interview takes.
In-depth interviews are always sensitive to interviewer’s bias because interviewers may
unknowingly communicate their attitudes through loaded questions or non-verbal cues.
The Procedure for Conducting In-depth Interview
The process involved in conducting in-depth interviews as suggested by Onabajo (2011:73):
Create a preliminary list of the questions you want to ask during the interview.
Record beforehand some demographic information about your respondents so as to
ascertain if any relationship can be drawn between certain characteristics such as
educational status, gender etc.
Be very sensitive and lookout for non-verbal clues such as feelings or attitudes that might
seem irrelevant or unimportant.
During the course of the interview, do an audio recording and take notes on important
matters while you interview each respondent.
4.0 Conclusion
Most of the research methods discussed in this unit are qualitative research methods that are used
in obtaining or gathering data as well as answering questions that quantitative research methods
cannot provide answers to. These research methods like the experimental and content analysis
are very important and useful to a social scientist. They can be used individually or can also be
used to complement other research methods depending on the phenomenon being studied and the
ability of the researcher to recognize research situations that requires putting them to use.
5.0 Summary
In this unit, you have learnt the following:

95
What Case Studies, Observational Research, Ethnographic Research, Longitudinal
Research, Focus Group Research and In-depth Interview is all about.
Their characteristics and procedure.
Their strengths/advantages and weaknesses/disadvantages.
6.0 Tutor-Marked Assignment
Discuss the characteristics, strengths and weaknesses of case study, observational research, focus
group research and in-depth interview.

96
7.0 References/Further Readings
Babbie, E. (2010). The practice of social research (12th Edition). Wadsworth: Cengage Learning.
Onabajo, O. (2011). Foundations of communication research. Lagos: Sibon Books Limited.
Wimmer, R.D. & Dominick, J.R. (2011). Mass media research: An introduction (9th Edition).
Wadsworth: Cengage Learning.
97
MODULE 4 SAMPLING
Unit 1 Meaning and types of Sampling
Unit 2 Population and Sample
Unit 3 Sampling Size and Sampling Error
UNIT 1 MEANING AND TYPES OF SAMPLING
1.0 Introduction
Any good research answers the questions: Who? What? Where? When? Why? and How? This
shows that research is a systematic attempt or endeavour that seeks to provide answers to
questions. The focus of this section is on the How? How will the research be carried out that is
the plan of action?
The ‘How’ of the research can also be called the methodology. After determining what to do and
the methodology to adopt, the next thing is to find out those that will make up the research that is
the population. Population is the totality of items or objects in a universe under study. Sometimes
the word population in research is interchanged with universe.
Unless the sampling procedure is carefully planned, the conclusions of the researcher are likely
to be distorted. This means that for a research to make generalizations about the entire
population, the sample must be truly representative of the population. This underscores a key
word in research sampling which is representativeness.
Wimmer and Dominick (2011 p.87) defines population as a group or class of subjects, variables,
concepts, or phenomena. Population can be studying the entire undergraduates in a university, all
daily newspapers in the country, private radio stations in the South-west, cable television
subscribers and so on. A population where you know everyone is called a determinant or finite
population; this means that the population is known and accessible. It is almost impossible to
study an entire population except the population is actually small. This underscores the
importance of sampling. When the entire members of a population are examined for a study, it is
called Census or Total Enumeration method. This is covering all elements in a population when
the population is small and minimal.
In sampling, it is imperative that the population of any given research be known and their
characteristics so that the sample must be representative enough to generalize the findings to the
entire population.
2.0 Objectives
By the end of this unit, you should be able to:
define the term Sampling;
identify at least three reasons for sampling;
discuss the sapling techniques;
design a sampling frame; and

98
3.0 Main Content
3.1 Meaning of Sampling
Leedy and Ormrod (2005 p.199) asserts that “the sample of any research should be carefully
chosen that, through it, the researcher is able to see all the characteristics of the total population
in the same relationship that they would be seen were the researcher, in fact, to examine the total
population.
A sample is a fractional or subset of the population selected for study. Fridah (2002 : 1) defines
sample as a finite part of a statistical population whose properties are studied to gain information
about the whole. The process of taking samples is known as sampling. Sampling
MacDonald and Headlam (1986) define sampling as “the process by which you reduce the total
research population for a research project to a number which is practically feasible and
theoretically acceptable.”
Fridah (2002:1) goes further to define sampling as the act, process, or technique of selecting a
suitable sample, or a representative part of a population for the purpose of determining
parameters or characteristics of the whole population.
Sampling is also a technique of drawing samples, i.e., collecting data from a part of the
population to reveal the characteristics of the entire population.
For example, if one prepares a pot of stew and wants to know whether the stew needs more salt
or seasoning, one would not need to gulp the entire stew to find out but only needs to take a little
to taste for salt or seasoning. This shows that a little spoon of the stew can help the cook know
how the entire pot of stew tastes. This means that the sample can help a researcher determine the
characteristics of the entire population. This also underscores the importance of appropriate
selection of the sample for any research.
Sampling calls for three decisions- who will be surveyed that is the sample, how many people
will be surveyed that is the sample size and how the sample should be chosen that is the
sampling or sampling technique. For the sample, the researcher has to determine what type of
information is needed and who is most likely to supply it. For the sampling size, it should be
noted that larger samples most times give reliable results though in most cases the entire
population cannot be studied. For the sampling technique, the researcher is to consider whether
the sample members will be chosen at random (probability) or if the researcher will select people
who are easier to obtain information from (non-probability).
3.2 Reasons for Sampling
Since it is not possible to study an entire population, it is important to take samples for the
following reasons:
i. Cost/economy: Austin and Pinkleton (2006 p.97) opine that sampling helps researchers
get accurate information quickly at a relatively low cost and provides them with cost-
effective ways to collect information from a relatively small number of target
audience members and draw conclusion s about an entire target audience. It is
cheaper to observe a part of the population rather than the whole.
ii. Timeliness: to study an entire population will be time consuming as compared to
drawing a sample.
99
iii. The large size of the population: the big size of a population makes it physically
impossible to conduct a census or total enumeration.
iv. Accuracy: taking samples will make the work accurate in that it will be thorough as
compared to studying an entire population that might be very large. The goal of a
researcher is to accurately represent a population.
v. The partly accessible populations: there are populations that are difficult to access like
those in prisons, crashed planes in oceans etc.
Self-assessment exercise
1. What is sampling and what are some of the reasons for taking a sample?
2. Sampling calls for three decisions, what are they?
3.3 Sampling Technique
Sampling techniques is defined as the scientific procedure of drawing samples from a given
population. There are two broad sampling techniques- probability and non-probability sampling
techniques. The nature of the research determines which technique to adopt, for instance, if a
researcher wants to study a population because of some peculiar characteristics, he/she adopts a
purposive sampling technique, and where he/she needs to sample a population because of their
availability, then the convenience or accidental sampling technique is used. Sampling is done to
access hidden or hard to reach populations like prostitutes, drug addicts etc., in such situation,
snowball sampling is imperative because once one person has been reached, he/she could give a
lead on how to meet others in that category.
3.4 Sampling Frame
A sampling frame is also a document or record that contains all the items or objects in a universe
of study. Wimmer and Dominick (2011) define sampling frame as the complete list of members
in the population. Austin and Pinkleton (2006 p.101) define sampling frame as “a list of
members of a population.” Sampling frame is used by researchers to determine who will be
included in the sample.
MacDonald and Headlam (1986) assert that sampling frame is the listing of the accessible
population from which a sample is drawn.
Example of a sample frame can be telephone book, voters list, house addresses, names of
individuals. MacDonald and Headlam (1986) opine that a “sampling frame needs to be accurate,
complete, up-to-date and relevant to the purposes of the survey for which it is to be used.” It is
from the sample frame that the sample is drawn. The procedure of listing all accessible members
of the population is the sampling frame.
4.0 Conclusion Thus we can say that the importance of sampling in research is inestimable. It is almost
impossible to study an entire population so it is important to do sampling. The researcher has to
determine who will be surveyed, what the sample size will be and how the sample size will be
drawn that is the technique; they should also determine where the sample size will be drawn
from (sample frame).

100
5.0 Summary
This unit looked at what sampling is and discussed the reasons for sampling in research. It also
talked about what a sampling frame is and the technique to be adopted in choosing a sample.
6.0 Tutor-Marked Assignment
. What is a sampling frame and why is it important?

101
7.0 References/Further Readings
Austin, E. W. and Pinkleton, B. E. (2006). Strategic Public Relations Management: Planning
and Managing Effective Communication Programs. 2nd
Ed. New Jersey: Lawrence
Erlbaum Associates, Inc.
Fridah, M. W. (2002). Sampling in Research.
http://trochim.human.cornell.edu/tutorial/mugo/tutorial.htm.
MacDonald, S. and Headlam, N. (1986). Research Methods Handbook: Introductory guide to
research methods for social research. Manchester: Centre for Local Economic Strategies.
http://www.cles.org.uk/wp-content/uploads/2011/01/Research-Methods-Handbook.pdf.
Research Methodology (For Private Circulation Only).
http://www.ihmgwalior.net/pdf/research_methodology.pdf.
Wimmer, R. D. & Dominick, J. R. (2011). Mass Media Research: An Introduction (9th ed.).
Australia: Wadsworth Publishing.
102
UNIT 2 POPULATION AND SAMPLE
CONTENTS
1.0 Introduction This unit looks at the types of sampling techniques and the differences. It also explains when it is
appropriate to use any of them. The population of a study are the units or objects the researcher
is interested in studying. Population can be animate as in humans and inanimate as in objects,
institutions or organisations etc. Samples are draw to ease the stress of studying an entire
population and also to save time and cost.
2.0 Objectives
By the end of this unit, students should be able to:
define some key terms such as: population, Sample, Probability and non-probability
techniques;
differentiate between Probability and Non-Probability Samples; and
Identify at least 3 each, of probability and non-probability samples;
3.0 Main Content
3.1 Definition of Key Terms
A population is a group of individuals, persons, objects, or items from which samples are taken
for measurement. Austin and Pinkleton (2006 p.98) define population also called universe as
members of a group or an entire collection of objects.”
A population can be animate or inanimate objects. Animate population as in humans and
inanimate population as in newspapers, music clips, video clips, and other media content. Austin
and Pinkleton (2006 p.98) assert that when researchers conduct a census they collect information
from all members of a population to measure their attitudes, opinions, behaviours and other
characteristics.
As stated in http://dissertation.laerd.com/sampling-the-basics.php, population stands for the
units that a researcher is interested in studying. The units could be people, cases and pieces of data.
3.2 Types of Sampling
There are many methods by which researchers draw samples from the population. The type of
research also determines which sampling method to use. When researchers draw samples, their
goal is to represent a population and make inferences of that population based on the information
they get from the sample.
There are two main types of sampling method namely- Probability and non-probability sampling.
Some researchers say probability sampling is more ideal in that it gives everyone in the
population a chance of been selected and it also increases the likelihood of obtaining samples
that are representative of the population. Probability sampling methods include:

103
Simple random sampling
Stratified sampling
Cluster sampling
Systematic sampling
Non-probability sampling methods are:
Purposive sampling (judgment sampling)
Convenience sampling (available/accidental sampling)
Snowball sampling
Quota sampling
These will be discussed elaborately below.
3.2.1 Probability Sampling
Probability sampling is the sampling method that increases the likelihood of obtaining samples
that are representative of the population. They provide credible results because they reflect the
characteristics of the select population. According to O'Connor (2011), researchers are to use a
probabilistic sampling approach if the purpose of the research is to draw conclusions or make
predictions affecting the population as a whole. In using the probability sampling method, all
units of the population must be identified and must have a chance of being selected into the
sample.
Techniques under the probability sample are as follows:
1. Simple random sampling
2. Stratified sampling
3. Cluster sampling
4. Systematic sampling
1. Simple random sample: a simple random sampling is one in which every member of a
population is identified and given an equal chance of being included in the sample. To
obtain a simple random sampling, names can be put on slips of paper and drawn from a
hat, one after the other. Selection of one unit does not affect the chances of any other
unit).
According to http://dissertation.laerd.com/simple-random-sampling.php to create a simple
random sampling, there are six steps to follow:
a. Define the population
b. Choose your sample size
c. List the population
d. Assign numbers to the units
e. Find random numbers
f. Select your sample
For instance, if a researcher is to study National Open University students’ newspaper readership
habits, the first thing to do is to determine the population of students in the school. If the
population is 5,000 then the sampling frame is all 5,000 students in the school. Population is

104
usually expressed as N while sample is expressed as n. The next step is to choose the sample
size; the budget and time period of the research can determine what the sample size will be. The
next thing to do is to list the members of the population. To get the list of the population for our
example above, one would need to go to the University Registry that is the students’ records unit
to get the list of students. The next thing to do is to assign numbers to the students on the list that
is from 1-5,000. After which they are picked randomly. To pick sample, one can make use of the
table of random tables or pick randomly from a hat after writing all numbers on slips of paper.
After this is done, then the sample is selected. A table of random numbers consists of numbers
that are unrelated to each other or to anything else. The first number can be 00, then 01, 02, 03...
5000. The researcher starts by picking a first number then go on picking till he/she has got the
sample size required for the research.
The following are advantages and disadvantages of the simple random sampling technique as
stated in http://dissertation.laerd.com/simple-random-sampling.php:
Advantages of simple random sampling
It provides a sample that is highly representative of the population being studied. It also reduces
the potential for human bias in the selection of units to be included in the sample. The simple
random sampling also allows for making generalizations that is, statistical inferences from the
sample to the population. This is regarded a major advantage because such generalizations are
considered to have external validity.
Disadvantages of simple random sampling
In carrying out a research using the simple random sample technique, the list of the population
must be available and complete. This poses a difficulty because the list of the population might
not be available and also accessible. Other challenges in getting the list can be because even if
the list is available, there might be a challenge in accessing it because those involved refuse to
release it for reasons known to them. Another difficulty is that there might be no single list
detailing the target population. It will be difficult and time-consuming to get the list together
when there is no detailed list. Also, in terms of human population, reaching or contacting some
of the members of the population that is if the list contains their contact information can be
expensive and time-consuming and also when they are scattered in different locations.
2. Systematic random sampling: according to Patten (2007 p.47) in systematic sampling,
every nth individual is selected. The number n can be any number for instance three,
using the systematic sampling will be selecting every 3rd
person or number in the
population. In systematic sampling, rather than referring to random number tables to
select the cases that will be included in the sample, units are selected directly from the
sample frame..
This method is useful for selecting large samples and is less cumbersome than a simple
random sample using either a table of random numbers or a lottery method.

105
As stated in http://dissertation.laerd.com/systematic-random-sampling.php there are seven steps
to do a systematic sampling:
a. Define the population
b. Choose your sample size
c. List the population
d. Assign numbers to cases
e. Calculate the sampling fraction
f. Select the first unit
g. Select your sample
Using the example above, we have a population of 5,000 students. For the purpose of this
research, our sample is 200. The list of the population will then be got from the Students’ records
department. Numbers will then be assigned to each unit in the population. The sample fraction
will then be worked out that is the sample size selected (n) divided by the population size (N).
n/N= 200/5000= 1/25 (i.e. 1 in 25)
From the calculation we need to select 1 in every 25 students from the population of 5,000
students. This will be done 200 times for us to get a sample of 200 respondents. After this, the
first unit will be selected; in this case, we can now use the table of random numbers to select the
first object. Assuming the first number on the table of random numbers is 0007; we delete the
first three digits and stick to 7, and 7 falls within 1-25. The first person to be picked is 7th
out of
the population. After first person is chosen, the other 199 remain to complete the 200 sample
size. Since we are choosing 1 in every 25 persons, with 7th
as the first unit, then we select every
25th person in the population. This means we select 7
th, 32
nd, 55
th, 80
th, till we get the entire 200
for the research sample.
According to http://dissertation.laerd.com/systematic-random-sampling.php the advantages of
the systematic random sampling are similar to that of the simple random sampling which is
making generalizations to the entire population and that the sample is highly representative of the
population however the systematic techniques improves the potential for the units to be more
evenly spread over the population.
The disadvantages (limitations) of systematic random sampling are also similar to the simple
random sampling in that a systematic random sample can only be carried out if a complete list of
the population is available. Also the way a list is arranged can give room for bias because the list
can be arranged in a way that for instance only males will be chosen, this can however be
avoided.
3. Stratified random sampling: in using a stratified sampling, the population is divided
up into groups with similar characteristics then members are selected randomly from
within these groups. O'Connor (2011) asserts that “this method is appropriate when a
researcher is interested in correcting for gender, race, or age disparities in your
population.
106
A stratified sample is also defined as “a sampling technique in which the researcher divided
the entire target population into different subgroups, or strata, and then randomly selects the
final subjects proportionally from the different strata” (Crossman, 2013). In using a stratified
sampling, the researcher could be interested in studying a particular group(s) within the
population that is the reason why the population is divided in groups according to the interest
of the researcher(s). For instance the population of the students of NOUN could be divided
into male and female, according to level, age etc. Using gender as the basis for stratification,
after dividing them in groups, there would be an equal chance that each male or female will be
selected.
According to Patten (2007 p.49) when using the stratified sampling technique, researchers
usually draw the same percentage of participants not the same number of participants from
each stratum. For example if in NOUN there are 3,000 women and 2,000 men in the
population and the researcher wants a sample size of 500, the researcher will draw 10% of the
women (i.e. 10% of 3000= 300) and 10% 0f the men (i.e. 10% 0f 2000= 200) totalling 500.
In using a stratified sampling technique, there are also some steps to follow:
The first step is to define the population which from our example is 5,000 students. The next is
to choose the relevant stratification which for our example is gender- male and female. After
choosing the basis for stratification, the next is to list the population or get it from the relevant
quarters. The population should then be listed according to the chosen stratification. Using
gender, we will then have a list for males and have a list for females. From there the sample
size is chosen. Since in stratified we are concerned with equal percentage from the groups, we
then calculate a proportionate stratification as we did above, 10% of males and 10% of
females. Finally, we use a simple random or systematic sample to select the sample.
Patten (2007 p.50) states that the primary purpose of stratification is to ensure that different sub-
groups are represented in the correct proportions. He further states that goal in stratification is
not to make comparisons across sub-groups but to obtain a single sample that is representative in
terms of the stratification variables (p.50).
One advantage of the stratified random sample according to
http://dissertation.laerd.com/stratified-random-sampling.php is that it “improves the
representation of particular strata (groups) within the population, as well as ensuring that these
strata are not over-represented.”
For the disadvantage, clearly delineating the population into each stratum can be challenging
depending on the stratification criteria. For instance dividing the population into male and female
can be easy where the list is also very available and accessible, but when the list is hardly
accessible and one needs to break students down into undergraduates and postgraduates- it can
be tasking and time-consuming.
4. Cluster sampling: with this technique, the population is divided into mutually exclusive groups such from which the researcher draws a sample of the groups. ‘Cluster sampling is used when researchers recognise that some populations are distributed in pockets of settlement and the researcher wants to use the cluster as basis for selection’ (Tejumaiye 2003 p.45). ‘A cluster sample is one in which you have elements of population dispersed geographically’ (Adeyemi & Odebunmi 2005 p. 85). Cluster sample is selection of samples in groups or categories.

107
Patten (2007 p.51) opines that in cluster sampling, researchers draw groups or clusters of
participants instead of drawing individuals. Austin and Pinkleton (2006 p.109) corroborates
Patten (2007) assertion that the sample frame in cluster sampling consists of clusters instead of
individuals. They further state that the clusters are pre-existing natural groups or administrative
groups of the population. Examples are: neighbourhoods, cities, countries, schools, hospitals.
Herek (2012) asserts that in cluster sampling, a researcher selects the sample in stages- first
selecting groups of elements, or clusters (e.g., city blocks, census tracts, schools), and then
selecting individual elements from each cluster (e.g., randomly or by systematic sampling). To
avoid bias, the clusters need to be selected at random. Cluster sampling is used in large
geographic samples where no list is available of all the units in the population but the population
boundaries can be well-defined.
The major drawback of cluster sampling according to Patten (2002:51) is the fact that each
cluster tends to be more homogenous in a variety of ways than the population as a whole.
For instance, if one wants to carry out a research on Ogun state public servants, the first thing to do is to
divide them in clusters. There are twenty local governments in Ogun state; therefore to get the sample
population the local governments would be divided into clusters using the four major ethnic entities in
the state, that is, Yewa, Ijebu, Egba and Remo. The simple random technique will then be used to select
a local government from each cluster. Let us say we select Ipokia from Yewa, Ijebu from Ijebu, Ifo from
Egba, and Ikenne from Remo. From there, one can know the population of the chosen groups and from
there draw a sample.
Self Assessment Exercise
What is the difference between cluster and stratified sampling?
3.2.2 Non-Probability Sampling
Non-probability (non-random) samples Non-probability sampling is sampling selected based on the researchers judgment. One
characteristic of the method is that samples are selected based on the subjective judgement of
the researcher, rather than the random selection of the probabilistic sampling methods. For this
reason some researchers especially from the quantitative school think the non-probability
sampling methods are inferior and unscientific compared to their probability counterparts.
O'Connor (2011) opines that the non-probabilistic sampling approach is used if researchers are
only interested in seeing how a small group, perhaps even a representative group, is doing for
purposes of illustration or explanation.
These samples focus on volunteers, easily available units, or those that just happen to be present
when the research is done. Non-probability samples are useful for quick and cheap studies, for
case studies, for qualitative research, for pilot studies, and for developing hypotheses for future
research
Sampling techniques under the non-probability sampling method are:

108
1. Convenience sampling
2. Purposive sampling
3. Snowball sampling
4. Quota sampling
These samples focus on volunteers, easily available units, or those that just happen to be present
when the research is done. Non-probability samples are useful for quick and cheap studies, for
case studies, for qualitative research, for pilot studies, and for developing hypotheses for future
research.
1. Convenience sample: this is reliance on available subjects. It is also called accidental,
available or opportunity sampling. It is a technique used by researchers to select easy –to-
reach samples.
Using our earlier example of studying newspaper readership habits of NOUN students with our
N as 5,000, to access the samples for the study, one can stand at strategic points in the school to
reach the students. It could be at the cafeteria, students lodge etc. The researcher will keep
administering or interviewing the students he/she gets the required sample size for the research.
Some advantages of this technique according to dissertation.laerd.com/convenience-
sampling.php are that: it is very easy to carry out with few rules governing how the sample
should be collected; the time and cost of the research are small and inexpensive and the required
sample size can be reached in a relatively fast and inexpensive way. Some disadvantages are
that: the convenience sample often suffers from biases; in the absence of a sampling frame and
samples are not chosen at random then the findings of the study cannot be generalisable to the
population. Also according to Crossman (2013), it does not allow the researcher to have any
control over the representativeness of the sample.
2. Purposive sample: also known as judgmental, selective or subjective sampling. This type of technique is where a researcher selects a sample based on his judgment. Crossman (2013) defines this technique as one that is selected based on the knowledge of
a population and the purpose of the study. Patten (2007 p.51) opines that purposive is
used when researchers select individuals whom they believe will be good sources of
information. Samples are selected based on their specific characteristics.
According to Wimmer and Dominick (2011 p.94) purposive samples are used frequently in mass
media when researchers select respondents who use a specific medium and are asked specific
questions about that medium. Purposive sample can be researcher bias as the sampling procedure is based on the judgement of the researcher.
3. Snowball Sample: this is useful when attempting to locate participants who are hard to
find. These could include populations such as drug addicts, homeless people, people
109
living with HIV/AIDS, prostitutes, migrant workers, or undocumented immigrants. Such
populations can be hard-to-reach and/or hidden because they exhibit some kind of social
stigma, illicit or illegal behaviours, or other trait that makes them atypical and/or socially
marginalized.
Crossman (2013) asserts that “a snowball sample is one in which the researcher collects data on
the few members of the target population he or she can locate, then asks those individuals to
provide information needed to locate other members of that population whom they know. “
For instance, suppose a researcher wants to study heroine addicts who have received treatment
and now leading normal lives, how can they be found? The first thing to do is to find one person,
if the researcher can convince that one person on the importance of his research and promise
confidentiality then there is tendency that this one person can lead the researcher to others like
him/her.
According to Wimmer and Dominick (2011 p.94) this approach is known as referrals in private
sector research. This technique according to Patten (2007 p.51) is based on trust. This means that
if the first set of participants trusts the researcher, they may identify and convince other potential
participants to trust the researcher also.
4. Quota sample: Austin and Pinkleton (2006 p.103) state that when researchers use this
method, they are often interested in the subgroups that exist in a population and draw
their samples so that it contains the same proportion of subgroups. Quotas can be based
on a small number of characteristics such as age, sex, education, gender, race, type of
employment, education etc. Crossman (2013) states that a quota sample is one in which
units are selected into a sample on the basis of pre-specified characteristics so that the
total sample has the same distribution of characteristics assumed to exist in the
population being studied. For example a researcher might want to know what proportion
of the population is male and what proportion is female and what proportion of both fall
into other categories such as age, education, race etc.
As stated in http://www.csulb.edu/~msaintg/ppa696/696sampl.htm the differences between
Probability sampling and Non-Probability sampling methods is illustrated below:
Probability sampling non-probability sampling
1. Allows use of statistics, tests
hypotheses
Exploratory research, generates
hypotheses
2. Can estimate population
parameters
Population parameters are not of interest
3. Eliminates bias Adequacy of the sample can't be known
4. Must have random selection of
units
Cheaper, easier, quicker to carry out

110
3.2.3 Other Sampling Techniques
Other sampling techniques are- multi-stage sampling,
4.0 Conclusion
This unit looked at the two broad sampling techniques- probability and non-probability sampling
techniques and the techniques under the two. Probability technique gives an equal chance to
every member of the population to be selected while non-probability samples are chosen
purposively or according to the convenience of the researcher(s).
6.0 Summary
This unit looked at the two broad categories of sampling and explained techniques under both
and when they are appropriate for any research.
7.0 Tutor-Marked Assignment
1. What are some differences between probability and non-probability sampling?
2. When are non-probabilistic samples best used?

111
7.0 References/Further Readings
Adeyemi, J. A. & Odebunmi, A. O. (2005). Studies in Comprehension, Correspondence &
Research Methodologies. Osogbo: Popad Publishers.
Austin, E. W. and Pinkleton, B. E. (2006). Strategic Public Relations Management: Planning
and Managing Effective Communication Programs. 2nd
Ed. New Jersey: Lawrence
Erlbaum Associates, Inc.
Tejumaiye, A. J. (2003). Mass Communication Research: An introduction. Lagos: Dapson Int’l
Nigeria Ltd.
Wimmer, R. D. & Dominick, J. R. (2011). Mass Media Research: An Introduction (9th ed.).
Australia: Wadsworth Publishing.
Crossman, A. (2013). Types of Sampling Designs.
http://sociology.about.com/od/Research/a/sampling-designs.htm.
Fridah, M. W. (2002). Sampling in Research.
http://trochim.human.cornell.edu/tutorial/mugo/tutorial.htm.
Herek, G. M. (2012). A Brief Introduction to Sampling.
http://psychology.ucdavis.edu/rainbow/html/fact_sample.html
MacDonald, S. and Headlam, N. (1986). Research Methods Handbook: Introductory guide to
research methods for social research. Manchester: Centre for Local Economic Strategies.
http://www.cles.org.uk/wp-content/uploads/2011/01/Research-Methods-Handbook.pdf.
O'Connor, T. (2011). Sampling. MegaLinks in Criminal Justice. Retrieved from
http://www.drtomoconnor.com/3760/3760lect03.htm.
Patten, M. L. (2007). Understanding research methods: An Overview of the Essentials. 6th
Ed.
USA: Pyrczak Publishers.
PPA 696: Sampling. http://www.csulb.edu/~msaintg/ppa696/696sampl.htm

112
Research Methodology (For Private Circulation Only).
http://www.ihmgwalior.net/pdf/research_methodology.pdf.
.
UNIT 3 SAMPLE SIZE AND SAMPLING ERROR
CONTENTS
1.0 Introduction
2.0 Objectives
3.0 Main Contents
3.1 Determining the sample size
3.2 Sample size
3.3 Sampling error
4.0 Conclusion
5.0 Summary
6.0 Tutor marked assignment
7.0 References/ Further Reading
1.0 Introduction
As established in subsequent units of this module, sample is important in research as the entire
universe or population can be hardly studied especially where the population is large. This
underscores the reason for sampling where only a sizable and representative number of the
population will be chosen for the research.
2.0 Objectives
By the end of this unit you should be able to:
· identify a truly representative sample;
· determine how large a given research sample should be;
· define sampling error; and
· identify the causes of sampling error.
3.0 Main Content
3.1 Determining the Sample Size
Determining the sample size is a very important aspect of the research because the sample could
determine how valid the result of the research will be. Some people will say that to get a sample,
one can use 10% or 20% of the population of study to get the sample size. At the undergraduate
level, students choose whatever sample is convenient for them but at a more advanced level,
some formulae have been provided to solve for the appropriate sample for a given population.
Whatever the case, the process of sampling can be a tedious one but it is important as the size of
the sample can affect the results of the study and its ability to be generalisable to the entire
population of study; it can also ensure the reduction of bias and errors when sampling.

113
3.2 Sample Size
The sample size is simply the number of units in your sample. One cannot say exactly what
sample size is appropriate; the sample size depends on the size of the population and the purpose
of the research. The key word in sampling as established is representativeness; Cohen, Manion
and Morrison (2000) assert that to ensure validity of the research, the researcher must ensure the
sample represents the whole population in question. The sample size selected for a study can
have a significant impact on the quality of the results/findings of the research. At the
undergraduate level, sample size for a research can be constrained by time and also cost.
Researchers should also understand that the nature of the research whether quantitative or
qualitative will determine how large or small the sample size will be. In a quantitative research
which gives more to statistical analysis, the sample size needs to be large enough to be
meaningful while for a qualitative study, the sample size needs to be smaller to enable the
researcher gather more in-depth data.
Just as no one can determine what sample is appropriate, some researchers tend to use sample
size calculations to be able to come up with samples representative of the population under
study. To this end, a formula was provided by Yamane (1974) as cited by Evborokhai (2009).
The formula is illustrated as:
n= (N)
1+N (0.05)2
Where
n = sample size
N = population
1 is constant
E= level of significance chosen (0.05)2
Tejumaiye (2003:50) lists some principles that guide researchers in determining an acceptable
sample size:
1. Methodology to be used: in the event that the methodology is survey, the sample will be
larger but if it is a focus group, panel studies then the sample will be smaller.
2. Cost and time: especially for undergraduate research, using a larger sample might be
expensive so the sample size is usually smaller maybe from 150 and above.
3. Attrition: it is assumed that members of the sample may drop out of the research at any
time so there is need to make allowance for this drop when planning the sample.
3.3 Sampling Error

114
Sample error can only occur where you draw a sample from the population but where you do a
census or use the total enumeration method, there would be no sample error because everyone in
the population was asked the question.
Castillo (2009) elucidates that “sampling error is the deviation of the selected sample from the
true characteristics, traits, behaviours, qualities or figures of the entire population.”
According to Herek (2012), the sampling error is a number that describes the precision of an
estimate from any one of those samples. It is usually expressed as a margin of error associated
with a statistical level of confidence. Tejumaiye (2003 p.51) says sampling error is the degree to
which measurement obtained from a sample differs from the measurement hat would be obtained
from the population. Error in sampling is considered because a sample does not provide the exact
data a population would.
On the reason why error could occur in sampling, Castillo (2009) further posits that it happens
because researchers draw different subjects from the same population and subjects have
individual differences. He further adds that there could be a difference between the sample and
the population from which the sample was drawn.
According to Castillo (2009) the most frequent cause of error in sampling is bias in the sampling
procedure. This means that when choosing a sample, the researcher must endeavour to select a
sample free from bias and that is representative of the population. It should be noted that increase
in the sample size approaches the size of the entire population thus portraying all characteristics
of the sample size; this decreases the sampling process error. Herek (2012) corroborates that
smaller sample e.g., those with fewer than 1,000 respondents have greater sampling error than
larger samples. It is also called margin of error and is associated with a statistical level of
confidence.
Level of confidence or significance is the maximum probability with which we would be willing
to risk a Type 1 error in testing a given hypothesis. Some researchers give a 95% level of
confidence to their work and are willing to use 5% as the error margin to test the results of their
research. One way to eliminate sampling error is to test the entire population though this is
impossible. This means that the process of selecting a sample must be unbiased and the sample
should be larger.
4.0 Conclusion
Except in the event of a census, it is important to take samples of a study population. When
taking samples it is important to take into consideration that the sample must be generalisable to
the entire population. However when choosing samples, it is important t to choose a larger
sample as this will help to reduce the sampling error that could invalidate the result of the
research.
5.0 Summary
This unit looked at sample size and sampling error as two very important aspects of the research
process. Sampling is important primarily because it helps save time and reduces cost. When
choosing the sample size from the research, it is important to take into consideration the fact that
the results of the research especially for a probability sample must be generalised to stand for the
entire population of study. In choosing the sample size, error must be taken into consideration
and as such the researcher must try to eliminate bias from the process.

115
6.0 Tutor-Marked Assignment
1. What do you understand by representativeness in sampling?
2. What is one way to reduce error in sampling?
7.0 References/Further Readings
Castillo, J. J. (2009). Sampling Error. http://explorable.com/sampling-error.
Cohen, L., Manion, L. & Morrison, K. (2000). Research Methods in Education. London.
Routledge Farmer. Retrieved from
http://www.brainboxx.co.uk/a3_aspects/pages/sample.htm.
Evborokhai, J . (2009). A practical guide to research writing for Tertiary Institutions (2nd
ed.).
Bida, Niger: Evans Books & Publications.
Herek, G. M. (2012). A Brief Introduction to Sampling.
http://psychology.ucdavis.edu/rainbow/html/fact_sample.html.
Cohen, L., Manion, L. & Morrison, K. (2000). Research Methods in Education. London.
Routledge Farmer. Retrieved from http://www.brainboxx.co.uk/a3_aspects/pages/sample.htm.

116
MODULE 5 THE RESEARCH PROCEDURE
Unit 1: The Research Proposal
Unit 2: Data Analysis in Communication Research
Unit 3: Documentation in Communication Research
UNIT 1: THE RESEARCH PROPOSAL
CONTENTS
1.0 Introduction
2.0 Objectives
3.0 Main Content
3.1 Meaning of the Research Proposal
3.2 Parts of the Research Proposal
3.2.1 Selection of a researchable topic
3.2.2 Chapter 1: Introduction
3.2.3 Chapter 2: Literature Review/Theoretical Framework
3.2.4 Chapter 3: Method of Study
3.2.5 Bibliography
4.0 Conclusion
5.0 Summary
6.0 Tutor-Marked Assignment
7.0 References/Further Readings
1.0 INTRODUCTION
The undergraduate project is often the first major piece of independent research that a student
will undertake. In every Nigerian University and other Universities of the world, one of the basic
requirements for every final year undergraduate student is writing and submitting a standard

117
research project. Without fulfilling this requirement, an undergraduate student cannot graduate
from the University hence the need to have adequate knowledge of what it entails. In order to
fulfill and meet this requirement, there is a need for students to know and understand what a
research proposal is all about, the different parts of a research proposal and how to go about
writing a standard research proposal. The process of writing a research proposal will help you to
think carefully about many aspects of your proposed research. If you embark on a research
project without adequate preparation, you run the risk of discovering as you go along that what
you have decided to research on is too large, too small, impossible, or full of contradictions and
very confusing.
2.0 Objectives
By the time you are through with this unit, you should be able to explain the following:
The meaning of the research proposal;
The different essential parts of the research proposal; and
How to write the research proposal.
3.0 Main Content
3.1 Meaning of the Research Proposal
Undertaking a research project at the undergraduate level entails taking series of steps. The first
and most important amongst these various steps after the topic selection is writing a research
proposal. As a student-researcher, you are expected to present a research proposal to the project
supervisor you have been assigned to. Undertaking your research project is subject to your
supervisor’s approval of your research proposal, hence, the need to be able to write a standard
research proposal. The research proposal helps you to sit down and clarify your own thinking
about the research project you want to write as well as enable the department to determine
whether or not your research project is viable and can be carried out successfully.
.A research proposal (also known as “pre-field”) is an intention of what you want to do; it is a
plan put forward by the student-researcher for acceptance (Tejumaiye, 2003). According to
Oluyombo (2011:57), “a research proposal is an outline prepared by a research student or
researcher which states the main issue to be covered in the research such as the topic, research
objectives, research questions, research proposition and/or hypothesis and methods to be adopted
in data collection and analyses”. Just as lecturers prepare course outlines for their students, a
research proposal is also an outline that students who want to engage in academic research in
order to meet the requirement for graduation prepare for their project supervisors. It is very
important to note that your research process is incomplete without a research proposal.
Some research proposals are in-depth and elaborate while others are not, some are within 3-5
pages and others could be more. Irrespective of the depth or number of pages, a standard
research proposal is made up of three chapters. However, before we discuss these three chapters,
it is important that we talk about the first step in the whole research process – Selection of a
researchable topic.
There are certain indicators to look out to determine whether or not your research proposal is a
success. These success indicators according to Olayinka and Owumi (2006:79) include:
118
A clearly stated and defined research question(s);
Appropriate and relevant literature which provides a background to the problem;
Clearly stated conceptual framework and theoretical framework or assumptions;
The use of the right design and methodology;
The use of other sources or works to identify/support the problem being researched;
Clearly stated and specified objectives; and
Enhances and aids further research.
3.2 Parts of the Research Proposal
3.2.1 Selection of a Researchable Topic
One of the major challenges you will face as an undergraduate writing a research project for the
first time is how to choose a good researchable topic. By researchable topic, we mean a topic that
is feasible, a research topic that is relevant to the student’s course of study and can be carried out
within the approved time frame or deadline. Being a first-timer in this regard, the question that
probably keeps coming to mind is: how can I generate a researchable topic or idea .However,
there are sources that have been made available for students like you when searching for a
researchable topic. According to Tejumaiye (2003), these sources include:
Academic journals e.g. Unilag Communication Review, Journal of Mass Communication
and Journalism, Nordicom Review, Journalism and Mass Communication Quarterly etc.
Magazines and Periodicals – weekly publications, monthlies etc.
Reading daily newspapers, watching television or listening to the radio
Everyday encounters e.g. while talking with friends or colleagues
Data archives e.g. Research and Marketing Services (RMS), ZUS Bureau, the Gallup and
Roper organizations, libraries etc.
Interacting with your supervisor or experienced professionals or academics in the chosen
field of research
Once you have access to any of these sources, selecting a researchable topic is not so difficult
anymore; however, it is not enough to have a knowledge of the sources available to you as a
student-researcher, it is also important that you ensure that the topic you have selected is
researchable and relevant. Tejumaiye (2003) and Wimmer & Dominick (2000)positthat you can
determine whether or not a topic is researchable and relevant by asking the following questions:
Is the topic too broad? As a beginning researcher, avoid a topic that is too broad
because you might end up having more data than you can handle or eventually find out
that you cannot go on with the research either because you are stuck or the cost/time
needed to carry out the research is more than you can handle. For example, a topic such
as ‘the effects of the social media on students’ is too broad because the social media is a
very broad field. It is better written as ‘the effects of Facebook/Twitter/Blackberry on
students’. It is important that your topic is not too broad so that you would be able to
handle and manage it efficiently and effectively.
Can the problem really be investigated? This has to do with ensuring that there are
answers to the questions that your research problem has generated. Here you ask yourself
whether or not the information and facilities you have at your disposal is sufficient to

119
provide a solution to your research problem. For instance, a researcher that wants to find
out how students use their blackberry would encounter a problem if he finds out that a
larger percentage of students do not use blackberry. Also, in ensuring that the problem is
researchable, there is a need for you to ensure that all the terms to be used in your study
can be operationally defined to suit the purpose of the study.
Is the problem significant? This has to do with ensuring that the topic is relevant to
man, to the society and to the addition of knowledge to information already available in
the field of study. You must determine whether or not the proposed study has merit i.e.
whether the results will have practical or theoretical value.
Can the results of the study be generalized? i.e. does the research work have external
validity such that you can generalize from it and relate it to other situations? A positive
answer to this question shows that that the proposed research is one that adds value.
Is the planned approach/methodology appropriate? Using the right and appropriate
methodology is very important; it’s so important that it can either make or mar the
research. Let the nature of the research determine the methodology that will be used. For
example, a study on the use of blackberry by students will require sharing a questionnaire
and using the survey method; deciding to use content analysis for this kind of study will
be highly inappropriate.
What costs and time are involved in the analysis? Before carrying out the research,
you have to count your cost by preempting beforehand whether or not you would be able
to bear the cost needed for the research. This is done in order to ensure that the research
does not become an abandoned project. Time is also a very important factor that needs to
be put into consideration. You must ensure that the research you are undertaking will be
completed within the timeframe or deadline provided.
Chapter One: Introduction
This particular chapter of an undergraduate research project takes different titles which includes
the following:
Background to the study
Introduction
Statement of problem
Background and Statement
The problem
Research background etc.
However, on a general note, using the title ‘introduction’ is more appropriate because it
implies that you are introducing the research subject or topic to the readers thereby
summarizing the whole purpose of the chapter. The outlines/sections in chapter one includes
the following:
Chapter One: Introduction
Background to the Study
Statement of the Research Problem
Research Questions/Hypotheses

120
Purpose of Study
Significance of Study
Scope (De-limitation) of Study
Limitations of Study
Operational Definition of Terms
1. Background to the Study
The background to the study is the section that enables you to give underground
information about the research problem you want to study; it helps to introduce your
readers to the study proper. Here, you give a comprehensive summary of what your
research problem is all about such that your readers would want to know more about the
research problem. The background to the study most times entails documenting the
historical perspective of the research problem being studied.
2. Statement of the Research Problem
This section has to do with stating the research problem that is to be studied. Here the
student-researcher has to state in clear terms, what exactly he/she is studying. Usually,
this section should be very concise and straight to the subject of interest. According to
Soyombo (1996), the statement of the research problem has to do with the researcher
introducing the research topic to the reader by stating the problem, and explaining why
he/she considers it to be a problem that is worthy of attention or study The statement of
research problem usually ends in three forms: a statement, question or hypothesis. Let’s
consider the following examples/samples:
Example 1
Topic: Zenith Bank Plc. and Corporate Social Responsibility by Ogene, A.M. (2010)
Statement of Research Problem
Against the backdrop of Zenith Bank Plc. being one of the biggest and profitable banks in
Nigeria, this study seeks to investigate their commitment to corporate social
responsibility (CSR). One of the catch phrases of public relations (of which corporate
social responsibility is a component) is doing good and getting credits for it. In this
regard, this study seeks to investigate whether the investment of Zenith bank plc. in CSR
is appropriately communicated to its target publics. In a nut shell, the problem which this
study seeks to investigate is this: Is Zenith bank Plc. socially responsible to its host
communities? If it is, how much has it invested in CSR from 2005-2009?
N.B.: The above is an example of a statement of research problem that takes the question
format.
Example 2
Topic: Radio Listenership among Redeemer’s University and Babcock University
Students by Folasade, A.O. (2011).
Statement of Research Problem
Most radio stations have various strategies in promoting and attracting listeners to listen
to their news with the growing competition from different stations and programmes
coupled with the advent of the internet, getting students to news is very difficult, if not
impossible. These days, it is however common to see students of higher institutions who

121
know little or nothing about what is going on in their environment. Many of them prefer
to plug their ears with ear phones listening to music or watching movies on their mobile
phones and laptops.
Since students are one of the most important audiences of radio stations, this study
therefore sought to ascertain whether or not the students of Redeemer’s University and
Babcock University listen to radio news.
3. Research Questions/Hypotheses
Research questions or hypotheses are generated from the research problem; they are the
questions that the research being undertaken seeks to answer. Research questions are
similar to hypotheses except that a hypothesis is a statement about how two or more
variables related to the research problem are expected to be related. Both research
questions and hypotheses can be used in a research project but as beginners, it is
advisable that you use only one of them.
4. Purpose of Study
Every researcher including a beginner like you always have a clear-cut reason(s) or
objectives for carrying out a research. The purpose or objectives of study states the
reason why the research is being carried out and it must be stated clearly and in a concise
manner. Here, you convince your readers/supervisor by giving justifications for carrying
out the research as well as stating clearly the results you seek to achieve by undertaking
the research.
5. Significance of Study
According to Oluyombo (2011:63), ‘the significance of study in any research is the
selling point of that research because it enables the prospective reader(s) of your proposal
and your project supervisor to develop interest in reading the proposal/project’. It has to
do with clearly stating what makes the research you want to undertake unique and
important. The significance of the study could be that the student-researcher is
undertaking a research that is entirely new or has not been done before; it could be that
the student-researcher is improving on another person’s research or study or adding more
knowledge to the existing information in a field of study. The researcher must state the
significance of the study to communication research, policy/decision makers, to students
and academics in the field of study and to the society at large.
6. Scope (De-limitation) of Study
The scope of study is very important for beginners because it enables you delimit and
reduce how much you would have to cover in your research. Your scope of study allows
your supervisor know where your research starts and where it ends, thus allowing your
supervisor guide you appropriately such that when you begin to go off track, he/she
points you back to your scope of study. Delimiting your study allows you to capture the
focus and the whole essence of your research accurately. For instance, if your study is
‘the coverage of corruption by Nigerian newspapers’, there is a need for you to delimit
your study by selecting the number of months/years you would like to study/analyze in
your research.

122
7. Limitations of Study
Limitations of study have to do with the problems encountered by the researcher in the
process of conducting the research. Such limitations include: lack of sufficient time and
financial resources, inability to access reliable data, refusal of the respondents to supply
the data needed for the study etc. Most times, it is advisable to write this section after the
study must have been carried out.
8. Operational Definition of Terms
Operational definition of terms or concepts has to do with giving working definitions for
the concepts or terms in the research project such that it suits the purpose for the research.
This implies that the researcher has to explain the usage and meaning of certain concepts
as it relates to the research being carried out.
From all that has been explained thus far, we can see that chapter one is all about introducing the
research problem to the reader(s) or project supervisor. In this chapter, the researcher gives a
background of what the research is all about, indicates the purpose for carrying out the research,
states the importance or value of the research to the society at large, specifies the time frame for
carrying out the research and indicates and identifies the variables in the study and gives
operational definitions to the concepts identified in the study. In summary, this chapter is the
foundational chapter for subsequent chapters in the research project. If the researcher does not
get this chapter right, every other chapter and the research project would suffer for it.
3.2.3 Chapter Two: Literature Review/Theoretical Framework
Chapter two also goes by different titles as is the case in chapter one. These titles include:
Literature review
Literature review and theoretical framework
Review of relevant literature
Conceptual/theoretical framework
Theoretical framework
Review of pertinent literature
Of all these titles listed above, literature review and theoretical framework is considered the best
title to be used for chapter two. This is because the title captures the whole purpose of the
chapter.
According to Agostino as cited in Tejumaiye (2003), there are certain questions a researcher
must bear in mind when conducting a literature review. These questions are:
What type of research has been done in that particular area of study in the past?
What has been found or revealed in previous studies?
What suggestions have previous researchers provided for future studies?
What are the areas that have not been investigated in the field of study?
What research methods were used in previous studies?

123
How can your proposed study add to already existing knowledge in the chosen field of
study?
This chapter has to do with reviewing all existing and relevant works that have been done by
other scholars in that particular field of study and it entails a detailed critique of such works,
indicating their strengths and weaknesses. The literature review is usually written as summaries
indicating the sources i.e. the names of the authors, titles of books/journals, titles of articles,
publishers, year of publication, page number etc. (Soyombo, 1996). According to Olayinka and
Owumi (2006:61), the literature review serves the following purposes:
It provides a conceptual framework for the research
It provides an integrated overview or summary of the field of study
It helps to establish the reason why the research has to be carried out
It may help to shed more light on the research problem
It helps to demonstrate the researcher’s familiarity with the area under consideration
(theory and/or methods).
Most times, researchers present this chapter in three parts and they are as follows:
Conceptual review/clarification
Theoretical review/framework
Empirical review/findings
In this chapter, the researcher should clearly define and give operational definitions to the major
concepts used in the research. The researcher does this by reviewing existing works where such
concepts have been used especially as it relates to the study being carried out. It is also very
important that the researcher locates his study within one or more of the theories that he/she is
familiar with. Locating the study within a theory would enable the researcher link his/her study
to earlier theories or models in terms of explanations or interpretations which have been offered
by previous studies (Soyombo, 1996). On a general note, this chapter must capture and
summarize most of, if not all of the work already done in the area of the study being carried out.
3.2.4 Chapter Three: Method of Study
Just like the preceding chapters, this chapter can also be presented using different titles and they
include:
Research methodology
Method of study
Research design
Methodology
Method
Procedure of study
Any of the aforementioned titles can be used but the most appropriate is ‘method of study’. This
chapter of the research work provides answers to the questions of whom/what is being studied
(i.e. the sample population)? What research methodology will be used? Why will that method be
used? How will the method be employed or used? When will the method be used (the period of

124
study)? etc. in this chapter, the student-researcher is expected to provide information on how the
research is going to be carried out, how the respondents or sample size will be selected, the
research instruments that will be used, the measurement procedure, the research design that will
be used, the data analysis procedure etc.
This section of your research project is very important because at this stage if you get the
methodology wrong, the results you will get from the research will be wrong or you could even
get stuck in between and the entire research work will be a failure. The designs and methods of
study available to you as a communication researcher include the following:
Content analysis
Survey research method
Historical study
Experimentation method
Field studies
Case study
In-depth interview
Focus group discussions etc.
Chapter three of a research project is further divided in sections which include identification and
justification of research design/method, research population, sampling procedure (i.e. sampling
unit, sampling size, sampling technique), data collection instrument, data collection procedure
and data analysis procedure.
Having highlighted the types of research methods/designs that are available to you as a student-
researcher, let’s move on to understanding what a research population is all about. The research
population refers to the group of elements or the population from which the researcher will draw
his/her samples. For instance, a research population could be all Nigerian university students and
the researcher could decide to draw out a sample of students who attend private universities.It is
important to note that the samples that are drawn from the research population must be
representative of that population. A sample that is not representative of the population regardless
of its size is inadequate because the results cannot be generalized (Tejumaiye, 2003). When
using the survey method, the members of the sample population are referred to as ‘respondents’
while for the experimentation method, they are referred to as ‘subjects’.
The sampling procedure has to do with the process of selecting a sample out of the total
population to be researched on. There are several sampling techniques that are available to a
student-researcher such as simple random sampling, systematic sampling, stratified sampling,
multistage cluster sampling, purposive sampling, quota sampling, convenience sampling etc.
Whatever sampling technique you decide to use must be stated clearly under the heading:
sampling procedure.
The data collection instrument or instrumentation has to do with the process by which data
are to be obtained or gathered. The instruments used for data collection available to a student-
researcher include:
Questionnaire for survey method
Coding sheet for content analysis

125
Telephone interview
In-depth interview
Data collection procedure/Administration of research instrument: Because we are talking
about a research proposal, under this heading the researcher has to clearly state how the research
instrument will be administered and how the data will be collected or gathered. In the case of
using the questionnaire instrument for instance, the student-researcher has to indicate whether
he/she would personally administer the research instrument, employ research assistants to do the
work, state clearly whether or not he/she would read the questions out to the respondents or just
distribute it etc. All of these have to be clearly stated in this section.
After the administration of research instrument, the next step we are going to talk about is the
data analysis procedure. Finally, the student-researcher has to indicate how the data gathered
will be analyzed using any of the methods of analysis available.Some researchers especially
beginners (undergraduates) analyze the data they have gathered using tables, percentage,
measures of dispersion (range, variance, standard deviation etc), measures of central tendency
(mean, median, mode) etc while researchers at the more advanced stage of their studies (Masters,
Ph.D.) make use of statistical tests such as Chi-square, analysis of variance (ANOVA),
regression analysis etc.
In summary, chapter three is all about providing a blueprint of how you are going to carry out the
research. However, the procedure described above may not apply to all kinds of research
especially historical and legal research.
3.2.5 Bibliography/References
It is a norm that at the end of each chapter in a research project a reference page is presented and
at the end of the entire research project, a bibliography is also presented. The reference page at
the end of a chapter contains a list of all the works used in that particular chapter indicating the
name of the authors, the title of the books/journals/articles used, dates, name of publisher etc.
The bibliography on the other hand is a list and combination of all the works used in the research
project arranged in alphabetical order. The bibliography is usually arranged in this format:
books, journal articles, magazines, newspapers, online publications unpublished works (Theses,
dissertations) etc. It is very important that you include your references and bibliography in your
research project so as to avoid plagiarism because it is believed that there is nothing new that you
would ever write in your research project that has not been written before.
(More on this in Module 3)
4.0 CONCLUSION
The research proposal is a very important phase in research project writing. A good research
proposal is the foundation of a research project, hence the need for it to be handled with care and
taken seriously. A student-researcher who fails at the research proposal writing stage will not be
able to handle writing the research project as a whole.
5.0 SUMMARY
In this unit, you have learnt that:

126
A research proposal is an outline/blueprint prepared by a research student stating the
study/ research that is to be carried out and how it is to be carried out.
A research proposal contains three chapters; chapter one is titled ‘Introduction’, chapter
two is titled ‘Literature review and theoretical framework’ and chapter three is titled
‘method of study’.
It also includes a bibliography and each chapter is accompanied with a reference page.
6.0 TUTOR-MARKED ASSIGNMENT
Formulate a researchable topic in journalism and write a proposal following all the guidelines
stated in this unit. The research proposal should be between 10-15 pages double line spacing.

127
7.0 REFERENCES/FURTHER READINGS
Folasade, A.O. (2011). Radio news listenership among Redeemer’s University and Babcock
University students (Unpublished undergraduate project).Redeemer’s University, Mowe,
Ogun State.
Ogene, A.M. (2010). Zenith Bank Plc and corporate social responsibility (Unpublished
undergraduate project).Redeemer’s University, Mowe, Ogun State.
Olayinka, A.I. &Owumi, B.E. (2006).Preparing a research proposal. In A.I. Olayinka,
V.O.Taiwo, A. Raji-Oyelade& I.P. Farai (Eds.), Methodology of basic and applied
research (pp. 53-82). Ibadan: Dabfol Printers.
Oluyombo, O. (2011). Research companion for students and professionals: A step by step guide.
Ogun: Treasure Land Academy.
Soyombo, O. (1996). Writing a research report.In B. Ahonsi& O. Soyombo (Eds.), Readings in
social research methods and applications (pp. 347-390). Ibadan: Caltop Publications
(Nigeria) Limited.
Tejumaiye, A. (2003). Mass communication research: An introduction. Ibadan: Sceptre Prints
Limited.

128
UNIT 2: DATA ANALYSIS IN COMMUNICATION RESEARCH
CONTENTS
1.0 Introduction
2.0 Objectives
3.0 Main Content
3.1 Meaning of Data
3.2 Types of Data
3.3 Sources of Data
3.4 Measurement of Data
3.5 Meaning of Data Analysis
3.6 Types of Data Analysis
3.7 Major Descriptive Statistical Tools and How to Apply Them
3.8 Inferential Statistical Tools and How to Apply Them
3.9 General Procedure for Test of Hypothesis
4.0 Conclusion
5.0 Summary
6.0 Tutor-Marked Assignment
7.0 References/Further Reading
1.0 Introduction
This unit is going to give you an understanding of what to do once you have gathered your data.
Data sets in themselves convey little or no meaning to researchers hence the need to make
meaningful meanings out of them. Thus, this unit will introduce you to certain tools that you can
use to make meanings out of the data you have collected or gathered.
2.0 Objectives
At the end of this unit, you should be able to explain the following:
the meaning of data;
the types of data;
the different levels of measurement;
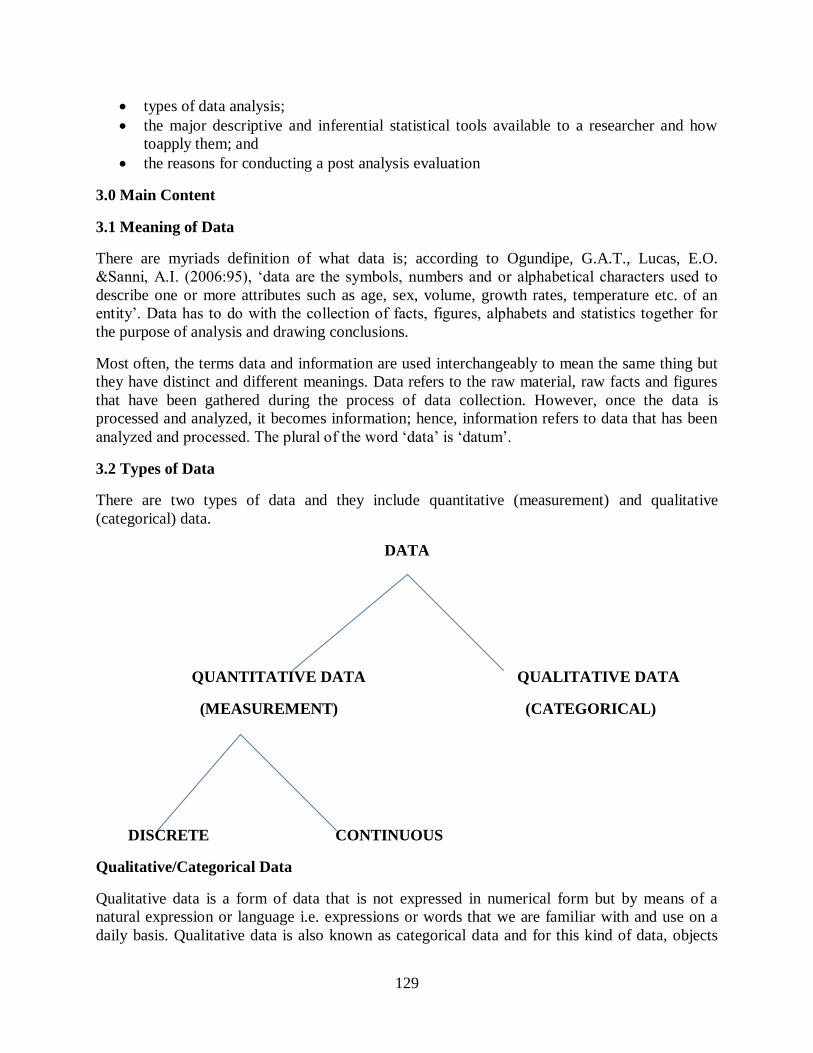
129
types of data analysis;
the major descriptive and inferential statistical tools available to a researcher and how
toapply them; and
the reasons for conducting a post analysis evaluation
3.0 Main Content
3.1 Meaning of Data
There are myriads definition of what data is; according to Ogundipe, G.A.T., Lucas, E.O.
&Sanni, A.I. (2006:95), ‘data are the symbols, numbers and or alphabetical characters used to
describe one or more attributes such as age, sex, volume, growth rates, temperature etc. of an
entity’. Data has to do with the collection of facts, figures, alphabets and statistics together for
the purpose of analysis and drawing conclusions.
Most often, the terms data and information are used interchangeably to mean the same thing but
they have distinct and different meanings. Data refers to the raw material, raw facts and figures
that have been gathered during the process of data collection. However, once the data is
processed and analyzed, it becomes information; hence, information refers to data that has been
analyzed and processed. The plural of the word ‘data’ is ‘datum’.
3.2 Types of Data
There are two types of data and they include quantitative (measurement) and qualitative
(categorical) data.
DATA
QUANTITATIVE DATA QUALITATIVE DATA
(MEASUREMENT) (CATEGORICAL)
DISCRETE CONTINUOUS
Qualitative/Categorical Data
Qualitative data is a form of data that is not expressed in numerical form but by means of a
natural expression or language i.e. expressions or words that we are familiar with and use on a
daily basis. Qualitative data is also known as categorical data and for this kind of data, objects
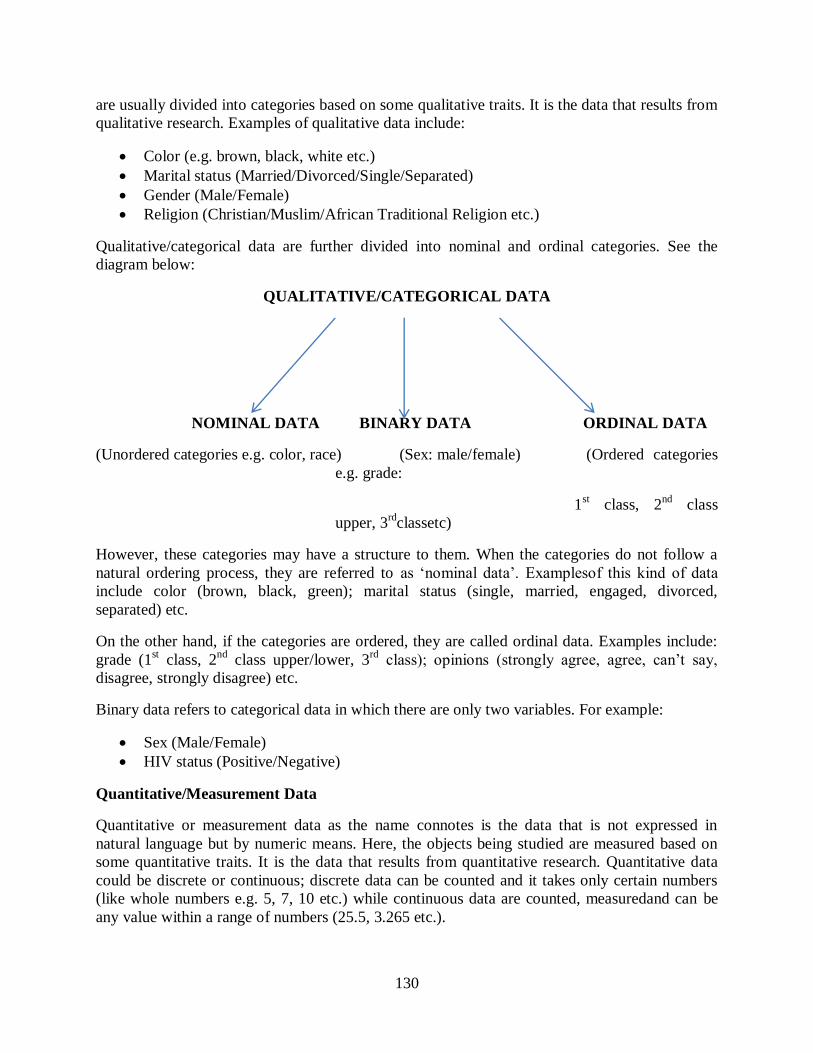
130
are usually divided into categories based on some qualitative traits. It is the data that results from
qualitative research. Examples of qualitative data include:
Color (e.g. brown, black, white etc.)
Marital status (Married/Divorced/Single/Separated)
Gender (Male/Female)
Religion (Christian/Muslim/African Traditional Religion etc.)
Qualitative/categorical data are further divided into nominal and ordinal categories. See the
diagram below:
QUALITATIVE/CATEGORICAL DATA
NOMINAL DATA BINARY DATA ORDINAL DATA
(Unordered categories e.g. color, race) (Sex: male/female) (Ordered categories
e.g. grade:
1st class, 2
nd class
upper, 3rd
classetc)
However, these categories may have a structure to them. When the categories do not follow a
natural ordering process, they are referred to as ‘nominal data’. Examplesof this kind of data
include color (brown, black, green); marital status (single, married, engaged, divorced,
separated) etc.
On the other hand, if the categories are ordered, they are called ordinal data. Examples include:
grade (1st class, 2
nd class upper/lower, 3
rd class); opinions (strongly agree, agree, can’t say,
disagree, strongly disagree) etc.
Binary data refers to categorical data in which there are only two variables. For example:
Sex (Male/Female)
HIV status (Positive/Negative)
Quantitative/Measurement Data
Quantitative or measurement data as the name connotes is the data that is not expressed in
natural language but by numeric means. Here, the objects being studied are measured based on
some quantitative traits. It is the data that results from quantitative research. Quantitative data
could be discrete or continuous; discrete data can be counted and it takes only certain numbers
(like whole numbers e.g. 5, 7, 10 etc.) while continuous data are counted, measuredand can be
any value within a range of numbers (25.5, 3.265 etc.).

131
QUANTITATIVE/MEASUREMENT DATA
DISCRETE DATA CONTINUOUS DATA
3.3 Sources of Data
Data can be gathered through two sources: primary and secondary sources.
Primary Sources: Primary sources of data refer to data that is collected by the researcher
directly in its raw state i.e. data that has not been processed yet. It includes data collected
through questionnaires, interviews etc. Primary sources of data include direct field
measurement, questionnaires, interviewing, focus group discussions, participant
observation, content analysis etc. The advantages of primary sources of data are:
i. It allows access to direct information from participants or respondents.
ii. It helps and gives opportunity to clarify ambiguous information given by
respondents.
iii. The richness of the data collected through primary sources makes it very valuable.
On the other hand, the disadvantages include the following:
i. This kind of data is more expensive to collect as compared to secondary data.
ii. Gathering this kind of data takes a longer period of time
iii. An element of bias or manipulation may be present in the data.
Secondary Sources: This refers to the data that are not directly collected or gathered by
the researcher. This kind of data has been processed and is usually collected and gathered
by another group or organization. It is the kind of data that is gathered during literature
review and these secondary sources of data include: annual reports of companies,
registers, census, books, journals, surveys, maps, photographs etc. Advantages of
secondary sources of data include:
i. It is less expensive to gather.
ii. Gathering this kind of data requires less time.
Its disadvantages also include:
i. The data may be outdated or stale.
ii. The data may not be the same one needed by the student-researcher.
3.4 Measurement of Data
As explained earlier in Module 2 Unit 2, four levels of measurement exist in communication
research. These levels of measurement are nominal, ordinal, interval and ratio. In addition, the

132
elements that are measured in communication research are variables, concepts and occasionally
constructs.
SELF-ASSESSMENT EXERCISE 1
A. Differentiate between the following:
i. Quantitative and qualitative data
ii. Discrete and continuous data
iii. Primary and secondary sources of data
B. Give four examples each of quantitative and qualitative data
C. What are the four levels of measurement in communication research?
3.5 MEANING OF DATA ANALYSIS
Data in itself has no meaning until it is analyzed and scientifically processed, hence, the process
of making meanings and sense out of the data gathered is known as data analysis. The purpose of
data analysis is so as to ensure that the collected data are analyzed, processed and summarized in
such a way that they give answers to the research questions or hypotheses formulated for the
research project (Ajala, 1996:38). The process of data analysis begins with sorting out the data or
observations gathered, the data is then coded (i.e. it is transformed into numerical symbols that
can be counted) and the coded data is tabulated manually or entered into the computer for
analysis.
N.B.:The reason for coding data is to make it very easy to analyze. We will talk about this while
treating levels of measurement. Please read up data measurement in Module 2, Unit 3.
3.6 TYPES OF DATA ANALYSIS
There are two broad types of data analyses and they are descriptive and inferential data analyses.
Descriptive analysis has to do with summarizing the main features of the data gathered as well as
offering physical explanations whenever possible. Descriptive analysis of data allows the
researcher to take random data and organize them into some type of ordered manner that can be
easily understood. The tools which are used in descriptive data analysis are called descriptive
statistics. Descriptive statistical tools include the measures of central tendency (mean,
median,and mode), graphs (bar charts, pie charts, histograms, scatter plots etc.), measures of
dispersion (e.g. standard deviations, range, variance) etc. Most importantly, descriptive data
analysis is used to process and analyze data when the researcher wants to answer the research
questions.
On the other hand, inferential statistics is used when the researcher wants to do more than just
describe the samples. Inferential data analysis is used when the student-researcher wants to make
assertions or inferences about the larger population from which the sample population was
selected (Tejumaiye, 2003:215).According to Onabajo (2011:151), inferential data analysis is
“the process of using data collected from samples to make inferences about a larger population
or populations”. The tools which are used in inferential data analysis are called inferential
statistical tools. These tools include chi-square, the student t-test, analysis of variance (ANOVA),
regression analysis, contingency table analysis etc. This form of data analysis is used for testing
hypotheses and making inferential decisions in the research process.

133
3.7 MAJOR DESCRIPTIVE STATISTICAL TOOLS AND HOW TO APPLY THEM
After data has been organized for analysis, there are certain descriptive statistical tools that can
be used for the appropriate analysis of such data.According to Tejumaiye (2003:1950), there are
generally two methods used in descriptive statistics and they include: data distribution and
summary statistics.
Data Distribution
Data is usually gathered and collected in large sets and numbers, hence, the need to analyze them
and organize them in such a way that they would be easily understood.One of the descriptive
statistical tools used under the data distribution method istabulation. For example: Number of
students that read newspapers in four selected Nigerian universities.
Table 1
Universities No of Students
University of Lagos 160
Redeemer’s University 80
University of Ilorin 120
Covenant University 75
Total 435
Data that are too complex in nature can also be tabulated. See the example below:

134
Table 2: Attention paid to radio news programme by students in four selected Nigerian
universities.
Universities
Frequency of Response to Items
Total A Lot of
Attention
Some
Attention
Little
Attention
No
Attention
University of
Lagos
40 36 15 7 98
Redeemer’s
University
36 26 27 6 95
University of
Ilorin
39 28 20 9 96
Covenant
University
31 26 25 4 86
Total 146 116 87 26 375
Another way to represent data using the tabulation format is to compare percentages; see the
example given below.
Table 3: Age Distribution of Respondents
Age Range Number of Respondents % of Total
15-19 years 91 51%
20-24 years 77 44%
25-29 years 8 5%
Total 176 100%
In a situation where the research requires many respondents giving several possible responses to
many items, the researcher can also present the data in an easy-to-understand way by making use
of cross breaks as well as frequencies and percentages. Consider table 4 below.

135
Table 4: Attitude of Redeemer’s University and University of Lagos Students towards
Nigerian Home Videos
Universities
Direction of Attitudes
Total Positive Negative Neutral
Redeemer’s
University
35 (41.17%) 37 (46.25%) 13 (15.29%) 85 (100%)
University of
Lagos
33 (41.25)) 37 (46.25%) 13 (12.5%) 80 (100%)
Data can also be represented using bar charts which can be drawn either horizontally or
vertically. Most times, bar charts are used to make comparisons between two or more items. Bar
charts/graphs are discrete bars that are used to represent different categories of data. The height
of the bar (i.e. how tall or short it is) is equal to the quantity within that category of data. Let us
consider the example given below.
A survey/census was conducted to determine the number of male and female students that study
Mass Communication in Nigeria from 2011 – 2013 and it revealed that in 2011, there were
15,000 females and 10,000 males; in 2012, there were 25,000 females and 22,000 males and in
2013, there were 28,000 females and 30,000 males.
The above data is represented in the bar chart below:
Number of male and female students studying Mass Communication in Nigeria from 2011-2013

136
Also, a pie chart (circle graph, round graph or pie graph) is also used to present data. It is called
a pie chart because it is cut into slices (just like a pie) of varying sizes that add up to 100%. A pie
chart usually shows the differences in frequencies and percentages. See the example given
below.
Figure: Chart showing how often students watch Nigerian home videos
Summary Statistics
Summary statistics is aimed at breaking down data such that the data is more manageable. The
statistical tools used to analyze descriptive data using the summary statistics method can be
divided into two broad categories: measures of central tendency and measures of dispersion.
Measures of Central Tendency
Measures of central tendency have to do with presenting your data in the summarized form of an
average ad they tell what the data looks like on the average.They determine the typical score of a
distribution. The three common measures or quantities for measuring average or central
tendencies or location are the mean, median, mode.
The Mean
The mean is the most widely used in research and the most important measure of central
tendency in summary statistics. Mathematically speaking, it is the sum of all scores divided by
N, the total number of scores (Wimmer & Dominick, 2000: 239). In a layman’s term, the mean is
the average of the entire data distribution. The formula for calculating the mean is: X = Σx ÷ N.
Where Σ means the sum; N is the total number of scores in the distribution and x is any scores in

137
the series of distribution and X is the mean.Let’s consider the example given in Onabajo
(2011:147):
If we interview a group of people numbering 10 and ask each of them to tell their age, the mean
age of the group will be the sum total of their ages divide by the number of the persons
interviewed (10 in this case). For example, if their ages are 18, 20, 22, 24,26, 28, 30, 32, 34 and
36 respectively, the mean will be the total number of their ages divided by the number of persons
interviewed. In other words, the total number of ages will be 270, hence, the mean will be 270 ÷
10 = 27.
The Median
The media is the middle value or midpoint of any distribution. It is important to note that when
determining the median of any distribution, the values in that distribution must be arranged in
order from the smallest to the largest value. When the distribution has an odd number of values,
the median is usually the middle value. For example, the values in a distribution are 4, 10, 3, 7,
and 2. To get the middle value, the distribution has to be arranged in an ordered manner from the
smallest value to the largest value. The distribution becomes 2. 3, 4, 7 and 10, hence, the median
is 4 because it is the middle value. However, when the distribution has an even number of values,
the median is the sum of the two values in the middle divided by two. For example, the
distribution could be 1, 2, 3, 4, 5, 6, 7, 8, 9 and 10. The two middle values here are 5 and 6,
hence the median would be 5 + 6 = 11; 11 ÷ 2 = 5.5. Therefore, the median is 5.5.
Mode
The mode is the value that occurs most frequently than other values in a distribution. The mode
most times does not require any form of calculation. In some distributions, just one value will
occur more frequently than others while in other distributions, two values can occur more
frequently than others. A distribution that has just one value occurring more frequently than
others is called a unimodal distribution while a distribution that has two values occurring more
often than other values is called a bimodal distribution. For example: 4, 2, 3, 10, 4, 6, 4, 5, 4, 11,
4, 2, 3, 7, 4 – in this distribution, the mode is 4 because it is the value with the highest frequency.
Measures of Dispersion
It is also known as the measure of variation. They are particularly useful when comparing the
variations between values in different distributions. Measures of dispersion or variation are
usually used to indicate how values are spread or scattered in a distribution of values. The three
measures of dispersion or variation are the range, the variance and the standard deviation.
The Range
This is the simplest measure of them all and it is the difference between the highest and lowest
values in a set of distribution.Mathematically, the formula used for calculating or determining
the range is:
R = Xh1 – Xh0; where Xh1 stands for the highest value and Xh0 stands for the lowest value.

138
Let’s consider the example used in Tejumaiye (2003:209): 4, 10, 14, 20, 26, 40, 60, 70, 75, 90,
100Calculating the range, you have Xh1 – Xh0= 100 – 4 = 96. Hence, the range is 96.
The Variance
The variance is used to indicate the degree to which values or scores deviate from or at a
variance with the mean (Wimmer & Dominick, 2000:241). The first step in calculating the
variance is to calculate the mean, then subtract the mean from each value or score in the
distribution, the values gotten from the subtraction (known as deviation scores) are then squared
and the squares are summed up together and divided by N where N is the total number of scores
in the distribution. The mathematical formula is written thus: S2 = Σ (xi - X)
2
N
Let’s consider the following example as cited in Tejumaiye (2003:212): Assuming the values are
– 2, 4, 6, 8, 10.
The formula is S2 = Σ (xi - X)2
N The mean will be the sum of all the values divided by 5 i.e. 30 ÷ 5 = 6.
To calculate the variance in an easy to understand manner, we will present the data in a tabular
form:
x x – X (xi – X)2
2 2 – 6 (-4) 16
4 4 – 6 (-2) 4
6 6 – 6 (0) 0
8 8 – 6 (2) 4
10 10 – 6 (4) 16
S2 = 40 ÷ 5 = 8
Standard Deviation
The standard deviation has already been solved to an extent by the variance. This is because it is
the positive square root of the variance. The standard deviation represents a given distance of the
scores from the mean of the given distribution. To get the standard deviation, solve the variance
with the formula given for it and whatever value you get, square it. For instance, variance in the
example given above is 8, hence, the standard deviation will be the square root of 8 = 2.83.
3.8. Inferential Statistical Tools and How to Apply Them
The term inferential statistics refers to the “process of using data collected from samples to make
inferences about a larger population(s)” (Onabajo, 2011:151). In other words, inferential
statistics are statistical tools that are used to draw conclusions about the relationship between
variables in a sample population.Inferential statistics is used and expressed through hypothesis
testing.

139
Hypothesis Testing
Onabajo (2011:152) defines hypothesis as ‘a proposition which the researcher wants to verify’.
In using hypothesis testing, you specify the null and alternative hypothesis.
Null Hypothesis
It is the hypothesis of no change/difference; no effect;
It is denoted by H0
It is always stated in this form:
H0: Babcock University is equal to University of Ibadan.
This means that there is no difference between the two schools.
Alternative Hypothesis
This is hypothesis of change/difference.
It is denoted by H1
It is the researcher who determines the H1
It could be in the form of:
a. H1: Babcock University is > University of Ibadan
b. H1: BU < UI
c. BU ≠ UI
All these statements must be taken one at a time; the researcher must determine whether
these “assumptions”/statements are true or not.
The null hypothesis is usually not tested because there is no difference. The different tests used
in hypothesis testing include the following:
One-tailed Test
This is where H1 is well specified.
H0: Maclean = Close Up
H1: Maclean > Close Up
One-sided to the right
Acceptance region Rejection region
(1 – α)
α
Z = 0

140
Rejection region
Acceptance region
α
Or
a. H0: Maclean = Close up
b. H1: Maclean < Close up
Rejection region
Acceptance Region
α
Alpha should not be too large. A higher level of significance affects the number of casualties. IF
CALCULATED IS LESS THAN TABULATED – IT FALLS IN THE ACCEPTANCE
REGION: ACCEPT.
IF CALCULATED IS GREATER THAN TABULATED – IT FALLS IN THE REJECTION
REGION: REJECT.
Two-tailed Test
It has two tails.
It is the one where the H1 (alternative hypothesis) is not well specified.
a. H0: Mac = Close Up
b. H1: Mac ≠ Close Up
Rejection region Rejection region
Acceptance Region
N.B. Pls. note that in social sciences, the ‘alpha’ is 5% and 0.1% in other areas.

141
Hypothesis Errors
Type I and Type II Errors
DECISION H0 True H0 False
Reject H0 Type I error Correct decision
Accept H0 Correct decision Type II error
Type I Error: Although it is unlikely that a test statistic would fall in the critical region when H0
is true. In this case we reject H0 and make an error in doing so. This is called TYPE I ERROR
(i.e. rejecting H0 when it is true).
Example – rejecting the truth that ‘normally men commit more crime than women’. The truth is
that men commit more crime than women.
Type II Error: This occurs when one fails to reject H0 when it is false. A Type II error will
occur if a test statistics does not fall in the critical region, when H0 is in fact false.
Critical region: This is a subset of the sample the rejection of the null hypothesis under
consideration.
Significance level: It is the probability of taking a wrong decision (i.e. probability of making an
error).
3.9 General Procedure for Test of Hypothesis
a. Formulate the null and alternative hypothesis.
This is the first thing to be done after the data has been collected. H0 and H1 must be
specified/set. H1 is picked from the objectives of the study. H1 is the research
hypothesis.
b. Determine the appropriate test statistic and compute its value.
Determine whether it is Z or t.
Z means it is normal.
When n is larger than 30, i.e. n ≥ 30, we use Z.
When n is small, that is, n< 30, we use the t distribution.
c. Choose the level of significance i.e. α.
Generally, 5% is used for management sciences.
d. Determine the critical region.
e. Make a statistical decision.
f. Interpret results.
Interpret statistical statements.
Explain in simple terms why H0 or H1 has to be accepted or rejected.

142
4.0 Conclusion
Data and its analysis are a very important component of communication research. Data that is not
processed or analyzed is of no use to the researcher hence the need to analyze and check for the
relationship between variables so as to make sense of the gathered data.
5.0 Summary
This unit has improved your understanding of the following:
The meaning of data;
The types of data and sources of data;
Measurement of data;
The meaning and types of data analysis;
Major descriptive statistical tools and how to apply them;
Inferential statistical tools and how to apply them; and
The general procedure for hypothesis testing.
6.0 Tutor-Marked Assignment
List the measures of central tendency ad dispersion.
A female psychologist claims that female journalists have a higher intelligence quotient
than other women in general who have an average intelligence quotient of 64. To study
this claim, she obtained a random sample of 40 female journalists and their intelligence
quotients were recorded; and their mean is given as 65.6. The standard deviation is 3.3.
Using this result, test the claim at the 5% level of significance.

143
7.0 References/Further Reading
Ajala, V.O. (1996). Scholarly writing guide for researchers. Ibadan: MayBest Publishers.
Ogundipe, G.A.T., Lucas, E.O. &Sanni, A.I. (2006).Systematic collection of data. In A.I.
Olayinka, V.O. Taiwo, A. Raji-Oyelade& I.P. Farai (Eds.), Methodology of basic and
applied research (pp. 95 - 112). Ibadan: Dabfol Printers.
Onabajo, O. (2011). Foundations of communications research.Festac, Lagos: Sibon Books
Limited.
Tejumaiye, A. (2003). Mass communication research: An introduction. Ibadan: Sceptre Prints
Limited.
Wimmer, R. D. and Dominick J. R. (2000). Mass media research: An introduction. Belmont,
California: Wadsworth Publishing Company.

144
UNIT 3 DOCUMENTATION
CONTENTS
1.0 Introduction
2.0 Objectives
3.0 Main Content
3.1 Meaning of Documentation
3.2 The APA Style
3.3 Aspects of the APA Style
3.3.1 Quotation of Sources
3.3.2 Bibliography/References List Entries
3.3.3 Book Citation
3.3.4 Journal Citation
3.3.5 Citation of Proceedings of Meetings and Symposia
3.3.6 Citation of Unpublished Works
3.3.7 Citation of Internet Sources
3.4 The Appendix
3.5 The Preliminary Pages
4.0 Conclusion
5.0 Summary
6.0 Tutor-Marked Assignment
7.0 References/Further Readings
1.0 INTRODUCTION
One of the highlighting factors that make a research project exceptional is the proper
documentation of its references and bibliography. The documentation of references and
bibliography indicates that the student-researcher has done a good job of reading wide and
getting information from every available literature such as books, journals, articles etc.; this
in turn proves that the research work is authentic and has gone through the rigor of scientific
research. Every work that has been consulted during the process of carrying out the research

145
must be documented. This part of research writing is very important because if haphazardly
done, it could lead to the student-researcher committing the crime labeled ‘plagiarism’ which
is a crime that is taken seriously by academics.
2.0 OBJECTIVES
At the end of this unit, you should be able to carry out the following:
Explain the meaning of documentation;
Understand and explain the APA referencing style and its different parts;
Compile a list of bibliography and references using the APA style referencing; and
Write the preliminary pages of an undergraduate research project.
3.0 MAIN CONTENT
3.1 MEANING OF DOCUMENTATION
Tejumaiye (2003:239) describes documentation as the generally accepted way(s) of
giving credit or recognition to the scholars whose works you have consulted in the
process of writing your research project..The works consulted or used could include
books, journal articles, magazines, newspapers, tables, charts, unpublished
thesis/dissertation/research project, websites, academic working papers, advanced
textbooks or monographs, encyclopedias, handbooks among others. .Soyombo
(1996:362) defined documentation ‘as the acknowledgment and identification of
materials such as data, quotations and opinions from various sources which have in
one way or the other contributed to the quality and content of the literature review’. It
is very important to note that documentation does not only apply to the literature
review but to other chapters in your research project and other forms of academic
writings such as term papers, articles, conference papers among others..Documenting
your sources or the works you consulted gives credit to your research project, makes
it credible and authentic.
Documentation takes three different forms: citations, references and bibliographies.
For instance, in the paragraph above, the writer cited another scholar by including the
name of the author and the year of publication as well as the page i.e. Tejumaiye
(2003:239); this form of documentation is called a ‘citation’. Citations refer to the
short information given about the author, the year of publication as well as the page
and they are often found within the text of your research work.
References on the other hand contain a list of all the works consulted and arranged in
alphabetical order. Every chapter in your research project must be accompanied by a
reference page stating all the works that you have consulted to build that chapter.
References appear at the end of an article, book, or chapter. In the process of
compiling your references, you must ensure that all the works cited in your project
are included in your reference page.
Bibliographies however refers to the list containing ‘all the relevant items you
consulted for your project including those not directly referred to in the text’
(Saunders, 2009 as cited in Oluyombo, 2011:139).It includes both cited references
(i.e. those works from which ideas or materials were used) and un-cited references

146
(i.e. those works that were useful but which the writer did not quote or use the data in
it directly). A bibliography lists all the works you have found useful and relevant in
the process of writing your research project.
3.2 THE APA STYLE
The APA referencing style is the most simplest and popular style used by academic
researchers and scholars in the social sciences when including reference citations in a
research project or in an academic work. Other referencing styles include the Harvard
and the Chicago referencing styles but for the purpose of this unit, we will be
discussing the APA referencing style at length because that is the referencing style
you would use for your research project.
The acronym APA stands for the American Psychological Association (APA); it is
the association responsible for the establishment of the rules and conventions that
guide the documentation of sources used in a research work or paper.The APA
referencing style requires you to create a list of all the works you have used in your
research project, arrange them in alphabetical order of the author(s) surnames, and
then chronologically (earliest publication date first) for each author especially in a
situation where more than one work by a particular author is cited. The author(s)
surname is placed first, followed by initials or first name, and then the year of
publication is given. See examples 1 and 2 below.
Example 1: According to Tejumaiye (2003), there are generally two types of variables
and they are the independent and dependent variable.
Example 2: The literature review is usually written as summaries indicating the sources
i.e. the names of the authors, titles of books/journals, titles of articles, publishers, year of
publication, page number etc. (Olatunde, 1996:38).
Another peculiarity of the APA referencing style is that the title of the work and the place of
publishing are usually left for the reference/bibliography page. The APA style for the reference
list/bibliography consists of the following elements: the author(s) surname and initials, the year
of publication, the title of the work, the place of publishing and the name of the publisher.
For example: Tejumaiye, A. (2003). Mass communication research: An introduction.
Ibadan: Sceptre Prints Limited.
From the example given above, ‘Tejumaiye, A.’ represents the surname and initials of the author,
‘2003’ stands for the year the book was published, ‘Mass communication research: An
introduction’ is the title of the book, ‘Ibadan’ is the place/location where the book was published
and ‘Sceptre Prints Limited’ is the name of the publisher.
The documentation of sources using the APA referencing style is very important because it
clears doubts concerning the authenticity of the research project, enhances the reader(s)
confidence in the researcher’s work and most importantly, it provides all the necessary
information about the sources especially for readers who would like read more about the issue
discussed in the research project.

147
3.3 ASPECTS OF THE APA STYLE
Here we are going to be examining the important aspects of the APA referencing
style
3.2.1 QUOTATION OF SOURCES
On a general note, the APA style has certain rules and guidelines that will
help guide you when quoting sources. For instance, the APA manual
provides that when quoting a source (it could be another author’s work or
even the researcher’s previously published work) verbatim or word for
word, the material used should be reproduced and quoted word for word.
If the quotation is not up to 40 words or three lines, it should be enclosed
with double quotation marks within the body of the research work.
Example 1: “Citations are a crucial part of academic writing and appear at points in your
text where reference is made to others’ work, called in-text referencing” (Onabajo,
2011:174).
On the other hand, if the quotation is more than three lines or 40 words,
the researcher should display the quotation (without quotation marks) in a
block of typewritten lines that is standing alone from the rest of the text.
The block should be started on a new line and the researcher should indent
the block 1.3cm or five spaces from the left margin. See example two
below as cited in Tejumaiye (2003:137)
Example 2: Charles R. Wright (1975) defined content analysis thus:
A research technique for the systematic classification and
description of communication content according to certain usually
predetermined categories. It may involve quantitative or qualitative
analysis or both. Technical objectivity requires that the categories
of classification and analysis be clearly and operationally defined
so that other researchers can follow them reliably. For example,
analysis of the social class membership of television character
requires clear specification of the criteria by which class is
identified and classified.
Also, when quoting from a secondary source (i.e. a source that quotes another author), the
citation can be written in any of the following ways:
As Hall (1977) asserts “culture also defines boundaries of different groups” (as cited in
Samovar & Porter, 1997:14).
It has been said that “culture also defines boundaries of different groups” (Hall, 1977 as
cited in Samovar & Porter, 1997:14).

148
According to Hall (1977) as cited in Samovar & Porter (1997:14), “culture also defines
boundaries of different groups”.
It is very important to note that direct quotation of sources must be accurate. The wording,
spelling, and interior punctuation of the original source must be the same with the one quoted
even if the source is incorrect. Peradventure any incorrect spelling, punctuation or grammar in
the original source might be confusing to the reader, it is imperative to insert the word SIC (a
Latin word that means ‘thus was it written’) in italics and put it in a bracket immediately after the
error in the quotation.
3.2.3 BIBLIOGRAPHY/REFERENCES LIST ENTRIES
At this point, it is important to note that the APA referencing style states that the
reference page should always be double-spaced and the first line of each reference should
be flush-left with the margin of the page. Each subsequent line of your reference should
be indented too.As earlierstated in this unit, the APA referencing format has to do with
creating and providing a reference list and bibliography in your research project. Hence,
we will be discussing how different works can be entered into the bibliography and
reference list as well as the format that is applicable to each work. We will be starting
with the book.
3.2.4 BOOK CITATION
The elements of citation in a book include the author(s) surname and initials, the year of
publication, the title of the book, the place where the book was published and the name of
the publisher.
Examples of different boo citations
Books with one author
Tejumaiye, A. (2003). Mass communication research: An introduction. Ibadan: Sceptre
Prints Limited.
Name ofAuthor: Tejumaiye, A.
Year of publication: 2003
Title of book: Mass communication research: An introduction
Publication information: Ibadan: Sceptre Prints Limited
Books with more than one author
Anaeto, S.G., Onabajo, O.S., and Osifeso, J.B. (2008).Models and theories of
communication. Maryland, USA: African Renaissance Books Incorporated.
Name of authors: Anaeto, S.G., Onabajo, O.S., and Osifeso, J.B.
Year of publication: 2008
Title of book: Models and theories of communication
Publication information: Maryland, USA: African Renaissance Books Incorporated
According to the APA style, if a book has more than six authors, abbreviate the
remaining authors as et al. in the first and subsequent text citations.
N.B. Use &between authors’ names except when paraphrasing in text. When a work has
three, four or five authors, cite all authors the first time, and in subsequent citations
include only the first author followed by et al.
Book Chapter in Edited Books

149
The elements of citation for citing a book chapter in an edited book in the right order
include: the name of the author for the book chapter, the year of publication, the title of
the chapter, the name of the editors, the title of the book (in italics), the page numbers of
the chapter in bracket, the place of publication and the name of the publisher. For
example:
Soyombo, O. (1996). Writing a research report. In Ahonsi, B. and Soyombo, O. (Eds.),
Readings in social research methods and applications (pp. 347-390). Ibadan:
Caltop Publications (Nigeria) Limited.
N.B. Make sure you always include the page numbers of the chapter after the book title.
Edited Books with no author
Edited books with no author(s) should list the last name and first initials of the editor(s),
followed by ‘Ed(s).’ in parentheses. The remainder of the reference should follow
the basic structure and include the publication year, book title in italics, location
and publisher. See the example below:
Duncan, G.J., & Brooks-Gunn, J. (Eds.).(1997). Consequences of growing up poor. New
York, NY: Russell Sage Foundation.
Editors’ names: Duncan, G.J., & Brooks-Gunn, J.
Year of publication: 1997
Title of book: Consequences of growing up poor
Publication information: New York, NY: Russell Sage Foundation
Edited books with author(s)
Edited books with one or more authors should follow the basic structure of a book
reference and include the initials, last name, and ‘Ed(s).’ in parentheses after the book
title.
Plath, S. (2000). The unabridged journals.(K.V. Kukil, Ed.). New York, NY: Anchor.
Adler, A. (1956). The individual psychology of Alfred Adler: A systematic presentation of
selections from his writings. (H.L. Ansbacher and R.R. Ansbacher, Eds.). New
York: Basic Books.
Books with corporate authors
Books with corporate authors consist of the following elements in the order listed: name
of the author (i.e. the name of the corporation/organization), the year of publication, the
title of the book, place of publication, and name of publisher. See the example given
below:
Nigerian Institute of Journalism. (2001). An introduction to journalism. Ikeja: John West
Publishers.

150
N.B. when the author and publisher are the same, use author in the publisher field. For
example:
University of Waikato.(1967). First hall of residence. Hamilton, New Zealand: Author.
3.3.4 JOURNAL CITATION
A journal is a term for a scholarly publication that is published periodically either monthly or
quarterly. Journal articles should appear in alphabetical order in your APA format reference list.
Generally, for journal articles, the APA style dictates that the author(s) last name followed by
initials comes first and the publication year goes between parentheses, followed by a period. The
title of the article follows and it is in sentence-case meaning only the first word and the proper
nouns in the title are capitalized. The title of the journal is run in title case and is followed by the
volume number which is italicized with the title. If a DOI has been assigned to the article that
you are using, you should include this after the page numbers for the article. If no DOI has been
assigned and you are accessing the journal online, use the URL of the website from which you
are retrieving the periodical. See examples below:
For print journal articles with doi
Hohepa, M., Schofield, G., and Kolt, G.S. (2006). Physical activity: What do high school
students think? Journal of Adolescent Health, 39(3), 328-336.
doi: 10.1016/j.jadohealth.2005.12.024
N.B. Electronic journal articles with doi are cited using the format used above.
For printjournal articles with nodoi
Wadee, A.A., Kuschke, R.H., Kometz, S. and Berk, M. (2001).Personality factors, stress and
immunity.Stress & Health: Journal of the International Society for the Investigation of
Stress, 17(1), 25-40.
For electronic journals
Harrison, B., and Papa, R. (2005).The development of an indigenous knowledge program in a
New Zealand Maori-language immersion school.Anthropology and Education Quarterly,
36(1), 57-72. Retrieved from ProQuest Education Journals database.
N.B. Undergraduates give the name of the database while researchers give the URL of the
journal’s homepage. E.g. retrieved from http://ucpressjournals.com/journal.asp?j=aeq
On a general note, there are a few general notes to take note of when citing journal articles using
the APA style and some of them include:

151
Always include the following citation elements: the surname and initials of the
author(s), year of publication, article title, journal title, volume and issue of the
journal as well as the page numbers.
If no author exists for the journal article and it is not signed as anonymous, do not
use anonymous as the author. Rather, use the title of the journal in place of the
author.
After a doi or URL in a citation, there is no ending punctuation.
For newspaper articles
Okpara, R.N. “Boko Haram strikes again in Kano”.The Guardian on Sunday, May 6,2008, p. A7.
SELF-ASSESSMENT EXERCISE 1
Get two undergraduate research projects in any communication relateddiscipline and critically
assess the method of documentation. Do theyconform to the APA referencing format? List the
observed errors.
3.3.5 CITATION OF PROCEEDINGS OF MEETINGS AND SYMPOSIA
According to the APA citation style, the rules guiding the citation of proceedings of meetings
and symposia include the following:
Proceedings published in an edited book
McKay, G. (1999). Self-determination in Aboriginal education. In L.B. Muller (Ed.), Changing
the climate: Proceedings of the 1998 Conference for Graduate Students in the Social
Sciences and Humanities (pp. 1-11). Saskatoon, Canada: University of Saskatchewan.
Proceedings published regularly
APA advises that proceedings published regularly should be referenced using the format for
journals and in practice, annual proceedings are often published and cited as edited books.
Proceedings of a symposium
A symposium is a situation whereby several authors come together under the coordination and
leadership of a chair to pool together their knowledge about a topic. Example of how to cite
proceedings of a symposium is given below:
Krinsky-McHale, S.J., ZIgman, W.B. & Silverman, W. (2012, August). Are neuropsychiatric
symptoms markers of prodromal Alzheimer’s disease in adults with Down syndrome? In
W.B. Zigman (Chair), Predictors of mild cognitive impairment, dementia, and mortality
in adults with Down syndrome.Symposium conducted at the meeting of the American
Psychological Association, Orlando, FL.
N.B. Increasingly, proceedings are being made available on CD, if that is the case with your
source, just add (CD) after the title. If the proceedings are published online, substitute “Retrieved
from URL” for the publisher and location.

152
3.3.6 CITATION OF UNPUBLISHED WORKS
Unpublished works refer to works or information sources that have not been officially released
or published by an individual, a publishing house or organization. Examples of unpublished
works include manuscripts accepted for publication but still ‘in-press’, data from an unpublished
study, raw data etc. the citation elements in their right order are the name of author(s) of paper or
manuscript, year written, title of paper or manuscript, and publication process information. The
relevant format for citation of unpublished works according to the APA manual includes the
following:
Unpublished manuscripts with a university cited
Blackwell, E., & Conrod, P.J. (2003).A five dimensional measure of drinking
motives.Unpublished manuscript, Department of Psychology, University of British
Columbia, Vancouver, Canada.
Manuscript in progress or submitted for publication
Adeniji, M.O. (2012). Online propaganda and social media. Manuscript submitted for
publication (or ‘manuscript in preparation).
Unpublished thesis or dissertation
For print
Adeniji, M.O. (2012). Online propaganda and social media.(Unpublished master’s
thesis).University of Lagos, Lagos.
For electronic
Linn, J.A. (2003). Active or avoidant: Two methods of resisting persuasion. (Doctoral
dissertation).University of Arkansas, Fayetteville.Available from ProQuest Dissertations
and Theses database. (UMI No. 31-2381)
3.3.7 CITATION OF INTERNET SOURCES
Internet article
Wiltshire, R.D. (2006, May 5). Changing thinking patterns to reduce depression. Psychology for
the Future, 3, Article 0012. Retrieved March 15, 2007, from
http://www.psychologyforthefuture.org/articles/art0012.html
Newspaper article
Parker-Pope, T. (2008, May 6). Psychiatry handbook linked to drug industry. The New York
Times. Retrieved from http://well.blogs.nytimes.com
Electronic books

153
They are books that are found on personal websites, databases or even in audio form and it takes
the format given below.
De Huff, E.W. (n.d.). Taytay’s tales: Traditional Pueblo Indian tales. Retrieved from
http://digital.library.upenn.edu/women/dehuff/taytay.html
N.B.The format given above is used when the work is available in digital format and it is
difficult to find in print. If the work is available online or must be purchased, use ‘available
from’ instead of ‘retrieved from’ and point readers to where they can find it.The abbreviation
‘n.d.’ means no date and it is used when a publication’s date is not available.
Online encyclopedias and dictionaries
Very often encyclopedias and dictionaries do not provide author(s) name, hence, move the entry
name to the front of the citation. See the example below.
Feminism.(n.d.).In Encyclopedia Britannica online.Retrieved from
http://www.britannica.com/EBchecked/topic/724633/feminism
3.3 THE APPENDIX
According to Ajala (1996), the appendix is an important part of the reference materials and it
comes after the text of the entire research project. It contains materials or works used in the
research project but not included in it because they are too lengthy or they are not directly
important such that they should be included in the main body of the research work. Examples of
materials that fall in this category include:
Coding sheet ad coders’ instruction guide (for content analysis).
Maps, advert copies, photographs etc.
Sample questionnaires/structured interviews and cover letters
Transcript of a video, recording etc.
There are certain rules guiding the citation of appendices using the APA style and they
include:
The appendix comes immediately after the reference/bibliography page.
They are lettered A, B, C, D etc.
Figures and tables in the appendices are labeled A1, A2, B1 and so forth.
3.4 THE PRELIMINARY PAGES
The preliminary pages refer to the pages that come before the main research report/text and they
are: the title page, certification page, dedication page, acknowledgments page, abstract page,
table of contents, list of tables and list of figures or illustrations.
Title page
The title page is usually the first page in your research project and the format varies from one
institution to the other. The format will be given by the institution awarding the degree. The
154
title page contains the title of the research work, the name and matriculation number of the
student-researcher, the degree and the date. For example:
Public Image of Nigerian Journalists
By
Wazobia, John Musa
Matric No. 09/01/07/2007
Being a research project submitted to the Faculty of Social Sciences,National Open
University in partial fulfillment of the requirements forthe award of the Bachelor of Science
(B.Sc) degree in Journalism
June, 2007
Certification page
Most universities have their format or model printed for this purpose. The certification page
is the page that carries the signatures of approval from the supervisor, the Head of
Department and the external examiner.
Dedication page
The dedication page is the page that indicates the person/individual to whom the work is
dedicated to. Usually, such persons are usually family members of the student-researcher.
Abstract
The abstract page is the page that gives readers a summary of the entire research work in 1-2
pages.
Acknowledgments page
This page is for the purpose of recognizing all the individuals, organizations etc. that have
contributed to the success of the research work. It includes persons to whom the researcher is
indebted for guidance and assistance in the course of doing the research project.
Table of contents
This page provides the readers with the contents in the research project in the order they have
been written or arranged. It lists the chapters into which the research project has been
divided, the main headings and subdivisions in each chapter with their page numbers.
List of tables and figures
The list of tables comes after the table of contents and it consists of all the tables used in the
research project with their exact captions/titles as used within the text. Table captions or titles

155
should be separated by double spacing but each caption that is more than one line in length
should be single-spaced.
List of figures on the other hand contains a list of all the figures or illustrations such as
charts, graphs, pictures etc. used in the research work.
4.0 CONCLUSION
So far, we have discussed documentation extensively and I hope you have enjoyed yourself
and have been able to put your documentation skills into practice. Documentation in research
is very important hence, the need to have a good grasp of it. You could read more books on
research to have a better understanding.
5.0 SUMMARY
In this unit, we have learnt the following:
What documentation is all about and entails;
That the APA style is the most popular referencing style used by researchers in the social
sciences; and
A major aspect of the APA format involves handling quotations within the text (body of
the research) and compilation of references list/bibliography.
6.0 TUTOR-MARKED ASSIGNMENT
What is documentation and why is it important in communication research?
Discuss the main features of the APA style of referencing.
What are the components of the preliminary pages

156
7.0 REFERENCES/FURTHER READINGS
Ajala, O. V. (1996). Scholarly Writing Guide For Researchers. Ibadan:MayBest Publishers.
Olayinka, A.I. &Owumi, B.E. (2006).Preparing a research proposal. In A.I. Olayinka, V.O.
Taiwo, A. Raji-
Oluyombo, O. (2011). Research companion for students and professionals: A step by step guide.
Ogun: Treasure Land Academy.
Oyelade& I.P. Farai (Eds.), Methodology of basic and applied research (pp. 53-82). Ibadan:
Dabfol Printers.
Publication Manual of the American Psychological Association. (5th ed) (2002). Washington,
D.C: American Psychological Association.
Soyombo, O. (1996). Writing a research report.In B. Ahonsi& O. Soyombo (Eds.), Readings in
social research methods and applications (pp. 347-390). Ibadan: Caltop Publications
(Nigeria) Limited.
Tejumaiye, A. (2003). Mass communication research: An introduction. Ibadan: Sceptre Prints
Limited.
Wimmer, R. D. and Dominick J. R. (2000).Mass media research: An introduction. Belmont,
California: Wadsworth Publishing Company.