LUNISOLAR TIDAL SIGNATURES IN THE ~1.9 GA POKEGAMA FORMATION, NORTHEASTERN MINNESOTA: IMPLICATIONS...
16
MINNESOTA GEOLOGICAL SURVEY Harvey Thorleifson, Director LUNISOLAR TIDAL SIGNATURES IN THE ~1.9 GA POKEGAMA FORMATION, NORTHEASTERN MINNESOTA: IMPLICATIONS FOR THE LUNAR ORBIT Gregory W. Ojakangas Richard W. Ojakangas Drury University University of Minnesota Duluth Report of Investigations 67 ISSN 0076-9177 Saint Paul — 2010
Transcript of LUNISOLAR TIDAL SIGNATURES IN THE ~1.9 GA POKEGAMA FORMATION, NORTHEASTERN MINNESOTA: IMPLICATIONS...
MINNESOTA GEOLOGICAL SURVEYHarvey Thorleifson, Director
LUNISOLAR TIDAL SIGNATURES IN THE ~1.9 GA POKEGAMA FORMATION, NORTHEASTERN MINNESOTA: IMPLICATIONS FOR THE LUNAR ORBIT
Gregory W. Ojakangas Richard W. Ojakangas Drury University University of Minnesota Duluth
Report of Investigations 67ISSN 0076-9177
Saint Paul — 2010
LUNISOLAR TIDAL SIGNATURES IN THE ~1.9 GA POKEGAMA FORMATION,
NORTHEASTERN MINNESOTA: IMPLICATIONS FOR THE LUNAR ORBIT
Minnesota Geological Survey2642 University Avenue WestSaint Paul, Minnesota 55114-1057
Telephone: 612-627-4780Fax: 612-627-4778E-mail address: [email protected] site: http://www.geo.umn.edu/mgs
©2010 by the Regents of the University of MinnesotaAll rights reserved.
ISSN 0076-9177
The University of Minnesota is committed to the policy that all persons shall have equal access to its programs, facilities, and employment without regard to race, color, creed, religion, national origin, sex, age, marital status, disability, public assistance status, veteran status, or sexual orientation.
Recommended citationOjakangas, G.W., and Ojakangas, R.W., 2010, Lunisolar tidal signatures in the ~1.9 Ga Pokegama Formation, northeastern Minnesota: Implications for the lunar orbit: Minnesota Geological Survey Report of Investigations 67, 11 p.
This publication is accessible from the home page of the Minnesota Geological Survey (http://www.geo.umn.edu/mgs) as a PDF file readable with Acrobat Reader 5.0.
Date of release: June, 2010
iii
CONTENTS page
ABSTRACT ........................................................................................................................................... 1INTRODUCTION ................................................................................................................................ 1GEOLOGIC SETTING ........................................................................................................................ 1ENVIRONMENT OF DEPOSITION ............................................................................................... 2EVIDENCE OF A DIURNAL INEQUALITY ................................................................................. 4PETROGRAPHY .................................................................................................................................. 5MEASUREMENT AND ANALYSIS: JUSTIFICATION FOR A NEW METHOD OF LAMINA MEASUREMENT .................................................................................................... 5 Application to siltstone bed 2 of the Pokegama Formation ............................................... 6 Interpretation and harmonic analysis .................................................................................... 6CONCLUSIONS .................................................................................................................................. 9ACkNOWLEDGEMENT ................................................................................................................... 10REFERENCES ....................................................................................................................................... 10APPENDIX: A NEW IMAGE PROCESSING METHOD ............................................................. 11
FIGURES
Figure 1 Siltstone bed 1 ........................................................................................................................................ 3Figure 2 Siltstone bed 2 ........................................................................................................................................ 4Figure 3 Rectified and averaged image of siltstone bed 2 .............................................................................. 7Figure 4 Lamina sequence of siltstone bed 2 .................................................................................................... 8Figure 5 Power spectrum of siltstone bed 2 ...................................................................................................... 8Figure 6 Relationship between tidal maxima per neap-spring cycle and lunar semi-major axis ............. 9
NOTE ON MEASUREMENTS USED IN THIS REPORT
Although the metric system is preferred in scientific writing, certain measurements are still routinely made in English customary units; for example, distances on land are measured in miles and depths in drill holes are measured in feet. Preference was given in this report to retaining the units in which measurements were made. To assist readers, conversion factors for some of the common units of measure are provided below.
English units to metric units:
To convert from to multiply by
inch millimeter 25.40inch centimeter 2.450foot meter 0.3048mile kilometer 1.6093
Metric units to English units:
To convert from to multiply by
millimeter inch 0.03937centimeter inch 0.3937meter foot 3.2808kilometer mile 0.6214
iv
1
LunisoLar TidaL signaTures in The ~1.9 ga Pokegama FormaTion, norTheasTern minnesoTa: imPLicaTions For The Lunar orbiT
gregory W. ojakangas, drury universityrichard W. ojakangas, university of minnesota duluth
absTracT
Specimens of siltstone beds from a roadcut in the lower member of the ~1.9 Ga Pokegama Formation at the village of Midway near Virginia, Minnesota contain laminae that record possible neap-spring cycles and a strong diurnal inequality. These laminae provide support for the tidal origin of the formation proposed by R. Ojakangas (1983) on the basis of other sedimentary structures. In order to enhance observed cyclicities in the presence of significant diagenetic alteration, a new algorithm was developed that transforms digital images of lamina sequences to horizontal uniformity, and then averages them horizontally to reduce noise and enhance lamina boundaries. Although too short and noisy to provide results of appreciable confidence, spectral analysis of a lamina sequence from the Pokegama Formation suggests minimum values for the lunar orbit radius (greater than 30 earth radii) and length of day (greater than 10 hours) at the time of deposition, consistent with theoretical expectations and extrapolation of other cyclic tidal data. The analysis presented here illustrates the potential value of identifying well-preserved tidal sequences in Proterozoic sedimentary rocks of the Lake Superior region.
inTroducTionIn recent decades , rhythmic sequences
(successions of thin layers or laminae) of tidally-generated sedimentary deposits, termed tidal rhythmites, have received considerable attention as potential sources of information regarding the ancient lunar orbit (Williams, 1989; Sonett and others, 1996; Bills and Ray, 1999; Kvale and others, 1999). The laminae in such deposits are generally inferred to correlate with individual tidal maxima, with lamina thickness directly related to the height of the tide. Thus, because tide height is modulated by the gravitational influences of the moon and sun, information concerning the geometry of the lunar orbit at the time of deposition is potentially encoded within these sequences.
Until recently, the oldest such deposits analyzed were from the Neoproterozoic Big Cottonwood Formation of Utah (Sonett and others, 1996), which dates at approximately 0.9 Ga. On the basis of their measurements, Sonett and others (1996) reported a lunar orbit radius of approximately 54 earth radii at 0.9 Ga (the current distance is approximately 60 earth radii). More recently, Eriksson and Simpson (2000) described cyclicities recorded in a tidal sand wave deposit in the Barberton Greenstone Belt, South
Africa, with an age of 3.2 Ga. They reported that the anomalistic month was 18 to 20 days long if the tidally deposited cross-strata they studied contain a complete record. Although not stated in their paper, this result suggests a lunar orbit radius of no less than 23 to 25 earth radii at the time of deposition, using the relationship between tidal maxima per neap-spring cycle and lunar semi-major axis as discussed in this paper.
Herein we describe rhythmic tidal sequences of intermediate age (~1.9 Ga), observed in the Paleoproterozoic Pokegama Formation from northeastern Minnesota. These sequences, exposed in a roadcut at the village of Midway on U.S. Highway 53 near Virginia, are analyzed to illustrate the potential use of such sequences in deriving constraints on the ancient lunar orbit. Because of difficulties in identification of lamina boundaries, a new method of image analysis was developed, and is presented in this paper.
geoLogic seTTingThe Pokegama Formation on the Mesabi
Iron Range of northeastern Minnesota is the basal Paleoproterozoic rock unit of the region. It unconformably overlies Neoarchean (2.7 Ga)
2
greenstones, volcanogenic metasedimentary rocks, and granitic rocks, and is gradational with the overlying Biwabik Iron Formation.
Quartz veins in the Pokegama Formation have been dated at 1,930 ± 25 Ma by the Pb/Pb method (Hemming and others, 1990). However, a better age constraint is provided by a U-Pb date of 1,878 ± 2 Ma on euhedral zircons from a slightly reworked tuff bed in the lower Gunflint Iron Formation, about 250 kilometers to the east–northeast in Ontario, Canada (Fralick and others, 1998). The Gunflint Iron Formation has long been interpreted as being on depositional strike with the Biwabik Iron Formation and was likely continuous with it before the 1.1 Ga Duluth Complex intruded and assimilated about 100 kilometers of strike-length of the intervening iron-formation.
The Biwabik and the Gunflint Iron Formations are interpreted to have been deposited on the peripheral bulge on the northern edge of the northward-migrating Animikie foreland basin that formed to the north of the Penokean fold-and-thrust belt (Ojakangas, 1994). The application of Walther's Law to the members of the Pokegama Formation and to the members of the overlying Biwabik Iron Formation indicates that the Pokegama Formation is the same age as the iron-formation, about 1,878 Ma.
The Gunflint Iron Formation is essentially unmetamorphosed, and the same is true of the Biwabik Iron Formation, except where it is in proximity to the intrusive 1.1 Ga Duluth Complex, where metamorphism is locally as high as pyroxene grade. However, diagenetic alteration of the Biwabik Iron Formation is extensive, with cementation by chert and development of minnesotaite, stilpnomelane, and magnetite from primary iron silicate and iron carbonate. The Pokegama Formation, which is dominantly a quartzose siliciclastic unit, is also unmetamorphosed, but has undergone diagenetic alteration in the form of silica cementation and the growth of fine-grained microcline crystals. Both the Biwabik Iron Formation and the Pokegama Formation generally dip to the southeast at about ten degrees. This is a regional tilt probably related to deposition on the foreland bulge of the Animikie Foreland Basin. The Thomson Formation, exposed 90 kilometers to the south of the Mesabi Iron Range, has been metamorphosed to low greenschist facies by the Penokean orogeny.
environmenT oF dePosiTionThe depositional environment of the Pokegama
Formation has been interpreted as tidal and subtidal
in a sea that transgressed northward onto the eroded surface of Archean bedrock (Ojakangas, 1983). In the region of study, the paleoshoreline trended east–northeast, with the sea to the south, but in the immediate vicinity of the studied exposure on the Virginia horn, it had a nearly north–south trend. The Pokegama Formation has three members: a lower, dominantly argillaceous member interpreted as an upper tidal flat deposit; a middle, argillaceous-silty-sandy, well-laminated member interpreted as a middle tidal flat deposit; and an upper, coarser-grained, sandy member interpreted as a lower tidal flat or subtidal deposit.
There are limited exposures of the Pokegama Formation, but a few drill holes have penetrated the entire formation and give the depositional column. Field evidence for a tidal influence during deposition includes opposite paleocurrent directions of some cross-beds, and some sandier channels interpreted as tidal channels cut into more argillaceous sediments (Ojakangas, 1983). Rare, minor, recumbent folds about 10 to 15 centimeters thick are interpreted to be soft-sediment slumps on the sides of tidal channels. The upper sandy member is texturally and mineralogically mature, as illustrated by the well-rounded quartz grains. A tidally dominated environment is known to be one in which extensive reworking of sand occurs.
Detailed work on the studied roadcut in the argillaceous (lower) member yielded a total of 57 paleocurrent indicators. Most (31) are bi-directional sole marks, 10 are sensical flute casts, and 16 are cross-beds. Whereas most of the indicators parallel the paleoshoreline, the trend of which was interpreted on the basis of local paleogeography of the Archean basement rocks, some flute casts and cross-beds plot normal to the shoreline. We think that this paleocurrent pattern, although not indicative of a specific environment, is compatible with a near-shore, tidally influenced location. Additional evidence of a tidal influence is provided by the overlying Biwabik Iron Formation. In the Minorca taconite pit, 6.5 kilometers along strike to the east–northeast, rare herringbone cross-beds are present and 102 cross-bed measurements yielded a bimodal-bipolar paleocurrent plot, albeit with the flood tide very dominant. In addition, a study of nearly 200 elongated stromatolite mounds in the LTV 2E pit, about 34 kilometers to the northeast, indicated elongations both parallel and perpendicular to the inferred paleoshoreline. These are interpreted to have resulted from longshore and tidal currents affecting the stromatolites during growth (Ojakangas and others, 2005).
3
Better field evidence of a tidal environment is present in the correlative well-exposed Palms Formation on the Gogebic Range in Wisconsin and Michigan. The Gogebic Range is located about 200 kilometers southeast of the Mesabi Range, but during deposition was probably only about 100 kilometers distant (Ojakangas, 1983). Paleocurrent indicators in the Palms Formation (N=250) are strongly bimodal-bipolar at several localities, and tidal bedding (mud drapes, sand lenses, and wavy bedding), as well as uncommon mudcracks and flat-topped ripples are present. The Palms Formation is certainly a lithologic correlative of the Pokegama Formation, and has
been interpreted as a slightly older diachronous correlative of the Pokegama Formation, deposited in the same northward-transgressing sea in the northward-migrating marine Animikie Foreland Basin. The Palms Formation may have even been continuous with the Pokegama Formation prior to the development of the 1.1 Ga Midcontinent Rift System (Ojakangas, 1994). The three members described above in the Pokegama Formation are also present in the Palms Formation.
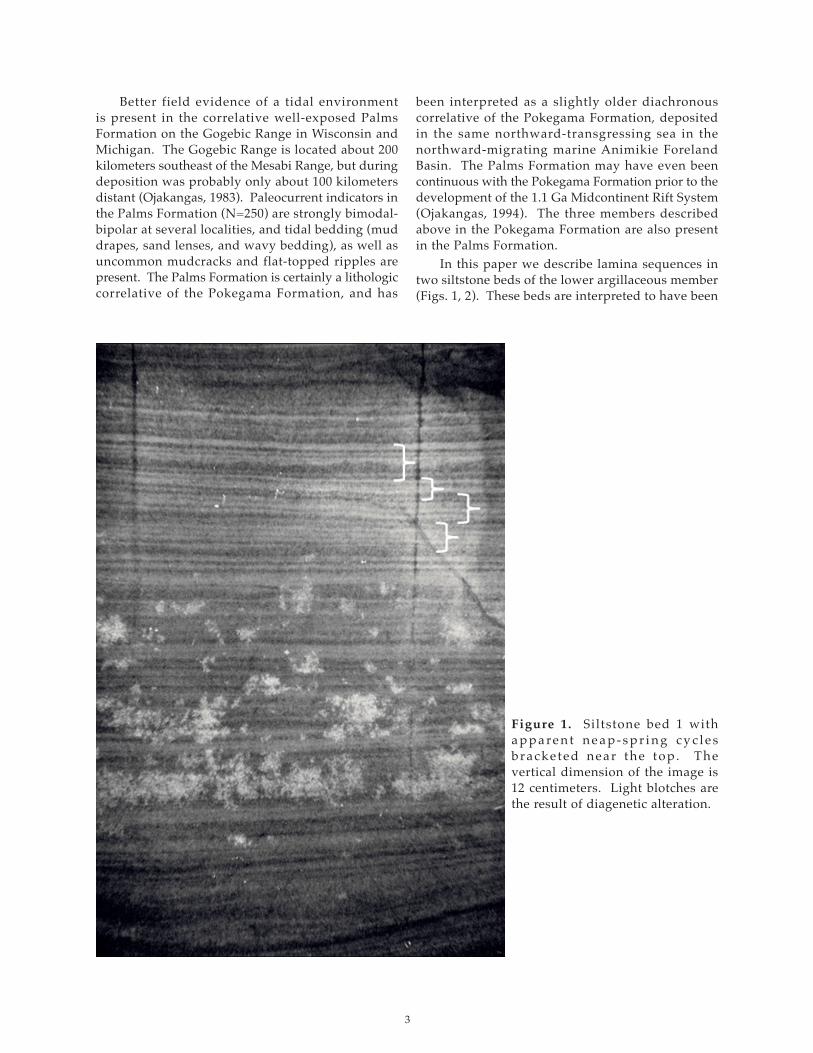
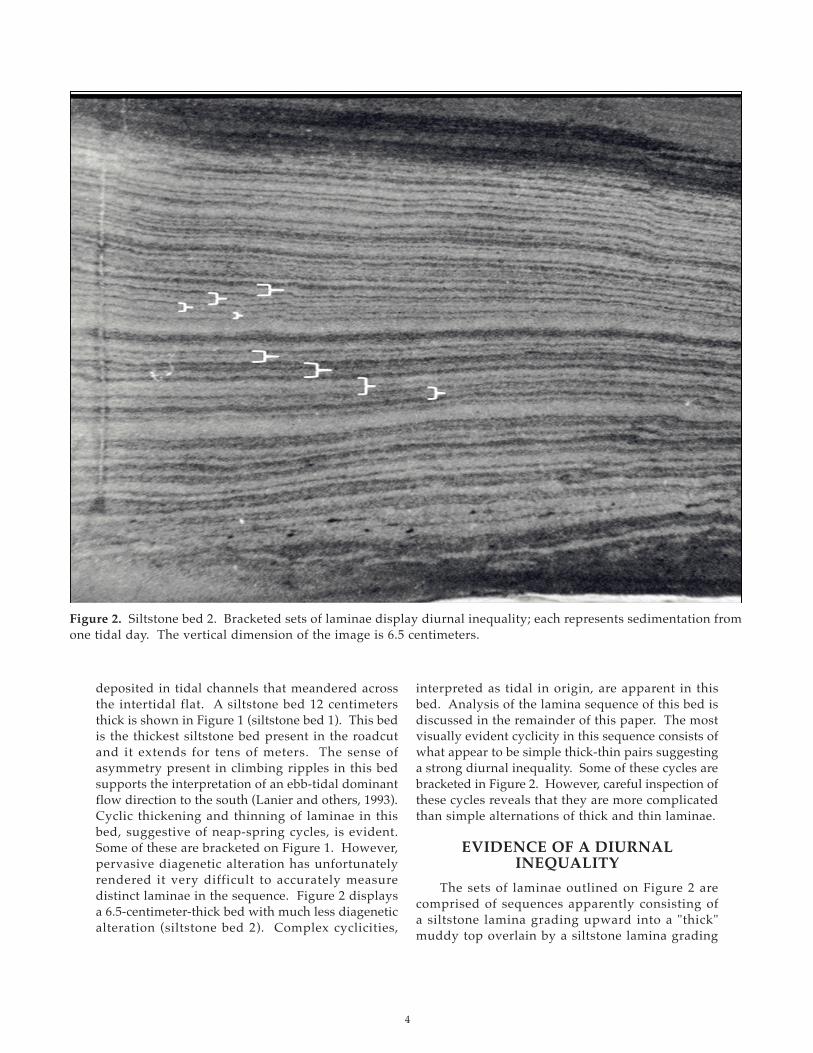
In this paper we describe lamina sequences in two siltstone beds of the lower argillaceous member (Figs. 1, 2). These beds are interpreted to have been
Figure 1. Siltstone bed 1 with a p p a re n t n e a p - s p r i n g c y c l e s bracketed near the top . The vertical dimension of the image is 12 centimeters. Light blotches are the result of diagenetic alteration.
4
deposited in tidal channels that meandered across the intertidal flat. A siltstone bed 12 centimeters thick is shown in Figure 1 (siltstone bed 1). This bed is the thickest siltstone bed present in the roadcut and it extends for tens of meters. The sense of asymmetry present in climbing ripples in this bed supports the interpretation of an ebb-tidal dominant flow direction to the south (Lanier and others, 1993). Cyclic thickening and thinning of laminae in this bed, suggestive of neap-spring cycles, is evident. Some of these are bracketed on Figure 1. However, pervasive diagenetic alteration has unfortunately rendered it very difficult to accurately measure distinct laminae in the sequence. Figure 2 displays a 6.5-centimeter-thick bed with much less diagenetic alteration (siltstone bed 2). Complex cyclicities,
interpreted as tidal in origin, are apparent in this bed. Analysis of the lamina sequence of this bed is discussed in the remainder of this paper. The most visually evident cyclicity in this sequence consists of what appear to be simple thick-thin pairs suggesting a strong diurnal inequality. Some of these cycles are bracketed in Figure 2. However, careful inspection of these cycles reveals that they are more complicated than simple alternations of thick and thin laminae.
evidence oF a diurnaL inequaLiTy
The sets of laminae outlined on Figure 2 are comprised of sequences apparently consisting of a siltstone lamina grading upward into a "thick" muddy top overlain by a siltstone lamina grading
Figure 2. Siltstone bed 2. Bracketed sets of laminae display diurnal inequality; each represents sedimentation from one tidal day. The vertical dimension of the image is 6.5 centimeters.
5
upward into a thinner muddy top. The cycle is most easily recognized by the alternation of thick and thin muddy tops, rather than by alternation in the total thickness of the siltstone laminae. Furthermore, the thick muddy tops commonly contain a separate, distinct, upper muddy lamina. By contrast, the thin muddy tops are less commonly composed of two laminae. Thus, while not uniformly the case, this sequence commonly is composed of three laminae. This pattern is recognizable in the power spectra presented in the "Interpretation and Harmonic Analysis" section as a strong peak with a period of approximately three laminae. Assuming the laminae are generated by ebb currents in a tidal regime with a strong diurnal inequality, the sequence can be understood as follows: a silt lamina is generated as a large ebb-current wanes, and hence it grades upward into a muddy top. The following lower high-tide generally produces no silt lamina during its flood stage (due to ebb-dominance), but adds more mud to the top of the previous lamina during the slackwater period as the tide reaches its maximum (the slackwater period is when current speed is low enough to allow the deposition of mud). Although silt is typically only deposited by the dominant tide, the water is assumed to carry sufficient mud so that some is available for deposition during each slackwater period. Because of its relatively greater thickness due to a longer slackwater period, this mud is usually distinguishable as a separate dark lamina. The slackwater period is longer between smaller extrema in tide height (and vice-versa), because the current velocity must vary relatively less rapidly in order to achieve the required difference in tide height during one-half of a tidal day. Next a thinner silt lamina is deposited as the tide recedes, grading into a thin muddy top because of the shorter slackwater period just before a high high-tide. Another thin muddy lamina is deposited as the next high tide reaches its maximum and slackwater ensues again. This last muddy lamina is usually indistinguishable from the previous graded top because of its slight thickness as well as a lack of silt between them. Occasionally this sequence has four laminae because a high flood tide at times may deposit a lamina. The three-lamina pattern of rhythmic deposition described here is similar to that described by Archer and others (1995). Using an equilibrium tidal model, the presence of a diurnal inequality suggests a non-equatorial depositional environment (Stacey, 1992), although diurnal inequalities may be generated by non-equilibrium tides even in an equatorial environment.
PeTrograPhyExamination of the 12-centimeter bed (Fig. 1)
both in hand specimen and in thin section under a petrographic polarizing microscope revealed that it is comprised of alternating laminae of lighter-colored, fine-grained siltstone and darker-colored, finer-grained, muddy siltstone. The lighter silt laminae vary from 0.5 to 2.0 millimeters in thickness, whereas the finer-grained, darker laminae have thicknesses of 0.25 to 1.0 millimeter. Many silt laminae grade upward into mud laminae. Where this is seen, the sum is taken to be a single lamina. This grading is easier to recognize in the digital images discussed below, rather than under the microscope, where the lamina boundaries are difficult to discern with great accuracy due to the protrusion of grains into adjacent laminae. Blotchy diagenesis, mainly the addition of silica, has rendered such determinations even more difficult.
A point count was accomplished on one thin section of the 6.5-centimeter-thick bed (siltstone bed 2), with traverses perpendicular to laminae. Five traverses were counted for a total of 600 points with 346 in the lighter and coarser-grained laminae and 254 in the darker and finer-grained laminae. The components were ascertained to be either detrital (deposited as sediment) or authigenic (products of later chemical alteration or recrystallization of in situ components), and some minerals had both origins. The primary components of the light laminae are detrital quartz and authigenic K-feldspar, and those of the dark laminae are detrital quartz and authigenic chlorite. Other detrital minerals present are muscovite, biotite, plagioclase, zircon, iron silicate granules, sphene, and large grains of chlorite. Other authigenic minerals present are sericite-illite, sericite-chlorite, K-feldspar overgrowths on rounded feldspar grains, tourmaline overgrowths on rounded tourmaline grains, pyrite, and very fine-grained apatite. Present as both detrital and authigenic minerals are hematite, tourmaline, and epidote. The minerals present are nearly the same in both the light and dark laminae, but the proportions differ. The darker and finer-grained laminae contain an order of magnitude more chlorite than is found in the lighter and coarser-grained laminae, and this is the main reason for the color difference.
measuremenT and anaLysis: JusTiFicaTion For a neW meThod
oF Lamina measuremenTA number of hand specimens, including those of
Figures 1 and 2, were slabbed and polished, coated
6
nm = √G(M + m)
a3
with oil to enhance contrast, and then digitally imaged. The following sections describe the application of new methods developed for analysis of these specimens.
In order to determine the spectral content of a sequence of laminae, researchers typically measure them along a chosen vertical line perpendicular to the layers in a cross-sectional view. The spectral content of the resulting data is then extracted with a suitable method such as the Fast Fourier Transform. Uncertainties arise in such analyses because: 1. The lamina boundaries may be difficult to precisely define due to a lack of sharp contrast in the source sequence; and 2. Layers are always, to some degree, variable in thickness, so that the measurements may be significantly affected by the choice of the line along which measurements are taken. However, if lateral variations in thickness are negligible, pixel brightnesses in a digital image of the sequence may be averaged in a direction parallel to the layers, thereby reducing random noise and enhancing contrast at true lamina boundaries. In most cases lamina sequences do exhibit significant lateral variations in thickness, due to primary depositional variations or post-depositional deformation. We have developed a method of processing digital images of non-uniform lamina sequences that removes lateral variations in lamina thickness and then averages the images laterally, to enhance the ability to identify faint lamina boundaries (see Appendix).
application to siltstone bed 2 of the Pokegama Formation
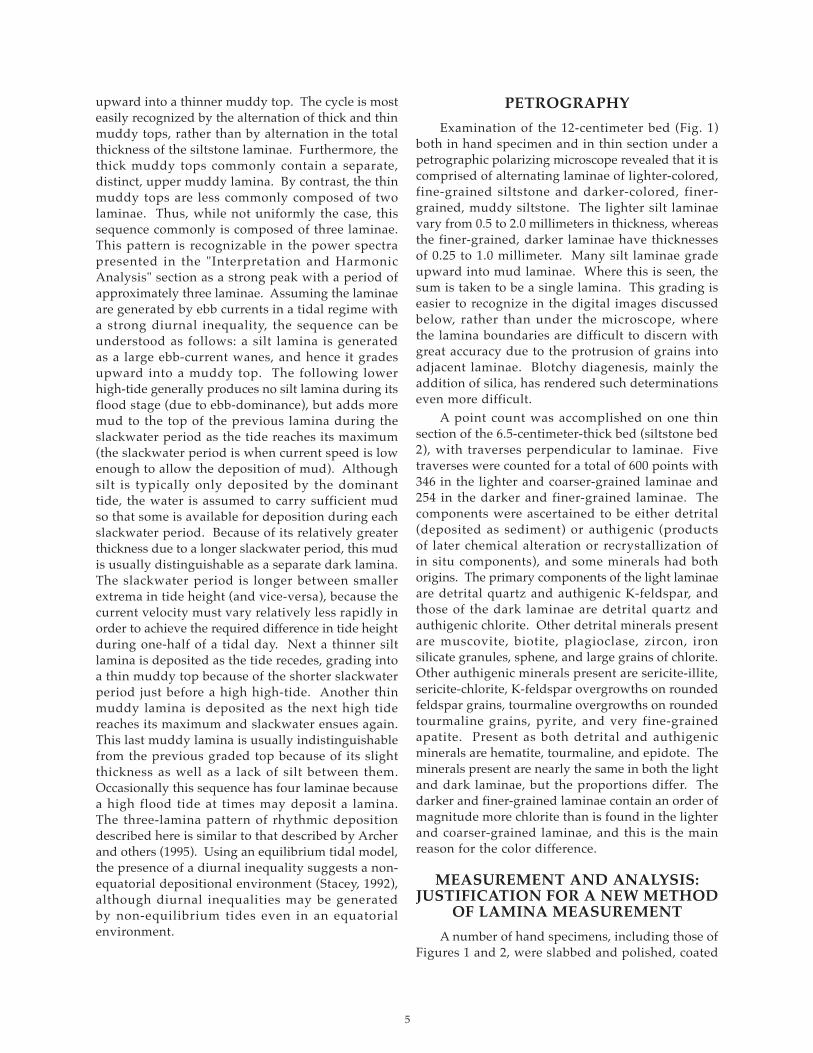
The siltstone bed shown in Figure 2 displays a variability in the thickness as well as warping of layers across the image. These are due to primary depositional variations across the interpreted narrow tidal channel, as well as from soft-sediment deformation that may have resulted from loading by overlying sediment. However, measurements reveal that ratios of lamina thicknesses within each column of pixels are well preserved across the entire image. Thus, the vertical lines contain lamina thickness sequences that are nearly self-similar—a necessary condition for our method to provide meaningful results. Figure 3 represents the resulting rectified image.
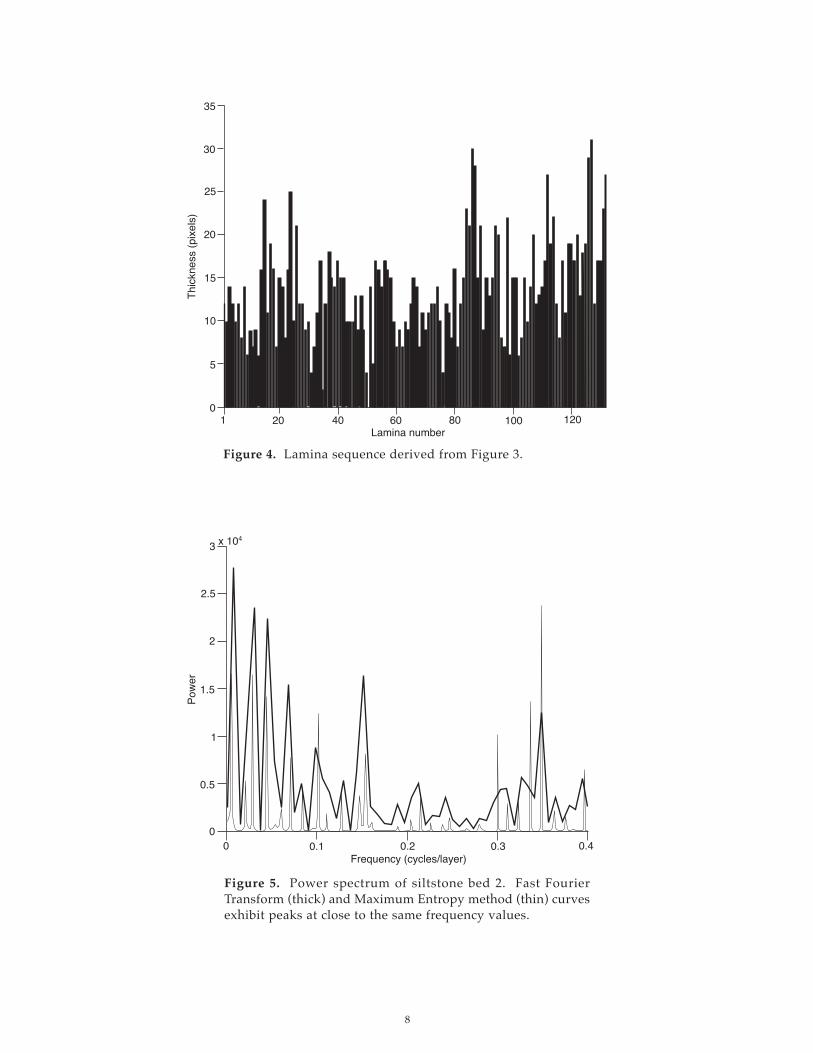
interpretation and harmonic analysisFigure 4 displays a sequence of thicknesses for
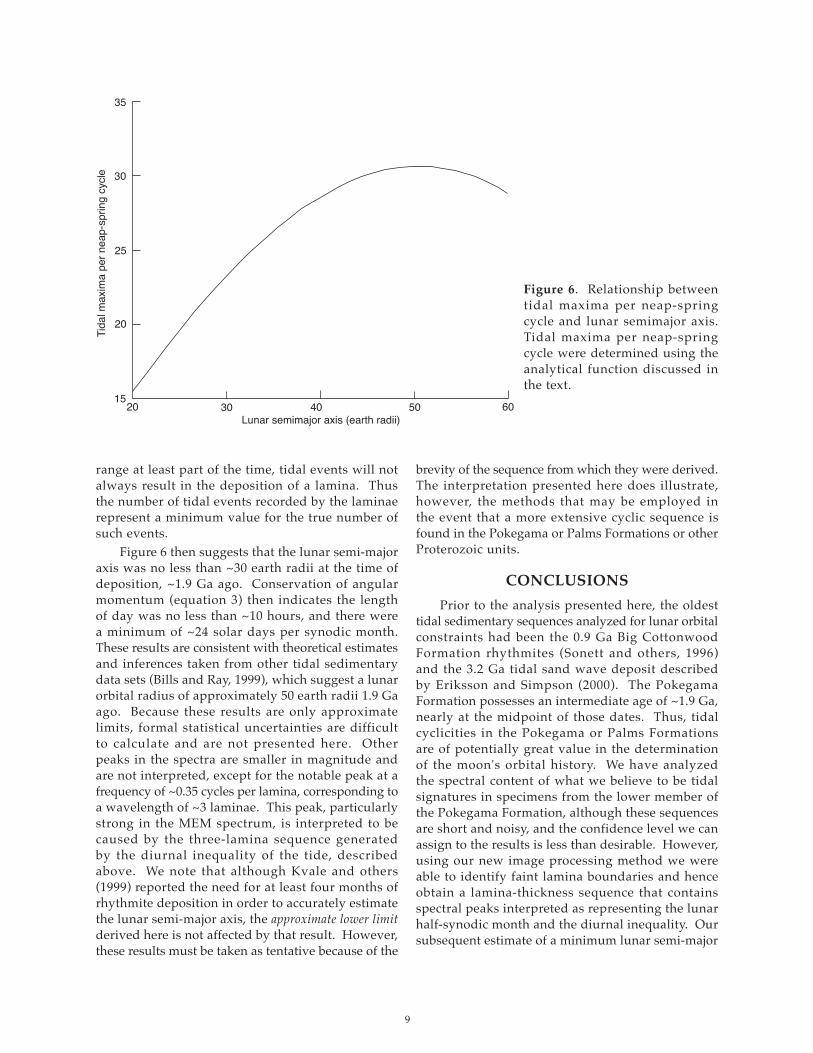
132 laminae measured from the image reproduced in Figure 3. The sequence is short, complex, and noisy. Figure 5 displays the power spectrum of the data sequence, computed with the Fast Fourier
Transform (FFT) method where the zero-frequency (average thickness) peak has been removed. Also shown is the power spectrum computed with the Maximum Entropy (MEM) method, where the order of the calculation is 100. High order was required in the MEM approach in order to resolve the closely spaced frequency components of the complex data. Because of inherent uncertainties in applying these methods to short and noisy sequences, the use of both approaches together aids in the identification of legitimate frequency components. Several waveforms with low frequencies are seen to comprise the data set. Large peaks present in both spectra are the most likely to be physically meaningful. The lowest-frequency peak represents a wavelength (reciprocal of the frequency) with a period of 132 or 181 laminae in the FFT and MEM spectra, respectively. This may be due to a portion of the semi-yearly tidal cycle, but its frequency value is clearly not reliable and consistent in both spectra because of the lack of multiple cycles in the data. The second largest peak has a period of 33 and 35 laminae in the FFT and MEM spectra, respectively. If this frequency component is of tidal origin, it most likely represents the tidal neap-spring cycle—the most commonly recorded cycle in tidal sediments.
The number of tidal maxima per neap-spring cycle, NTF , is ideally equal to the ratio of the length of the synodic month to that of the tidal day, or
(1)
where Ω, nm , and ns are the rotation rate of the earth, and the orbital angular speeds of the moon and the earth. ns is assumed to be constant, and the value of nm is a direct function of the lunar semi-major axis, a, through Kepler's second law: (2)
Ω is related to a through the angular momentum L of the earth–moon system. If we make the approximation that the moon's orbit is a circle in the earth's equatorial plane, and we ignore the solar tidal torque, L is a constant given by
where C, G, M, and m are the earth's principal moment of inertia, the universal gravitational constant, and the masses of the earth and moon, respectively. Although a full treatment of the earth–moon dynamical history
NTF = Ω - nmnm - ns
L = CΩ + GMa √mM(m + M)
(3)
7
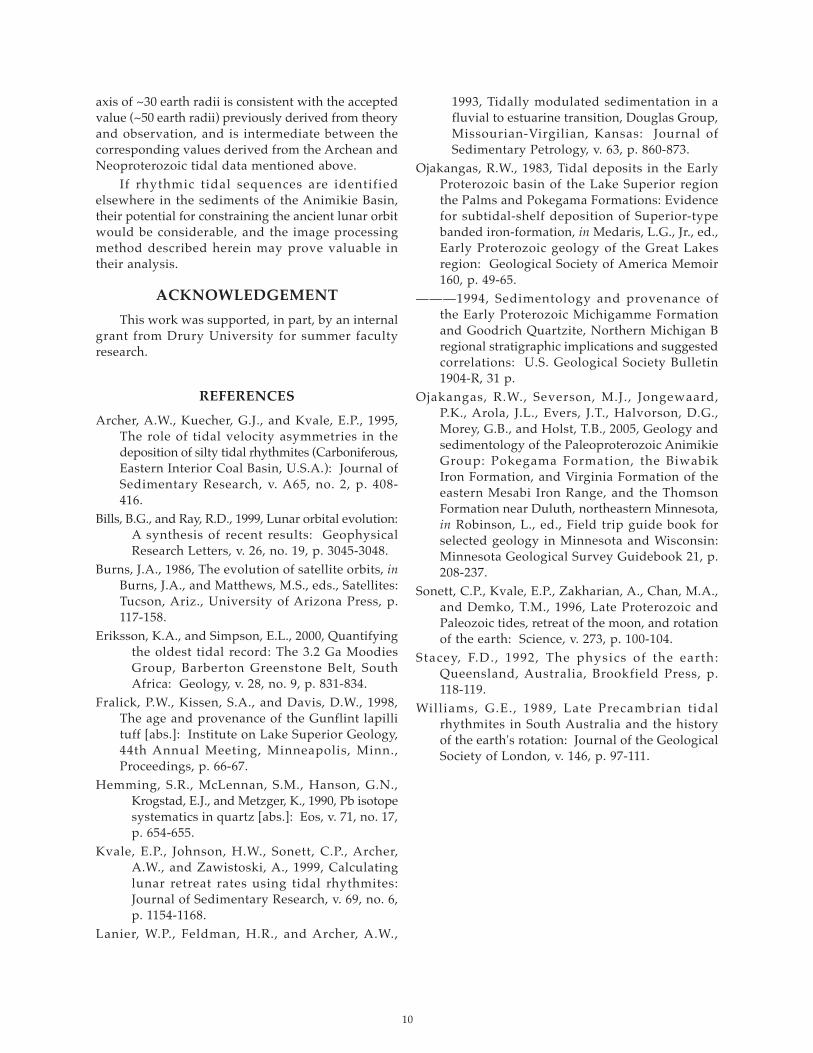
is very complex and requires consideration of the earth's obliquity, the moon's orbital eccentricity and the solar tidal torque (all of which were less important in the last few billion years, Burns, 1986), our approximations lead to a difference of only a few percent in the results. Solving for Ω using equation 3 and inserting the result and equation 2 into equation 1 yields an expression for NTF in terms of the lunar semi-major axis. Figure 6 is a plot of the result, illustrating that a complete tidal record of one lamina per tidal maximum could produce at most
approximately 30 laminae per lunar half-synodic month. Our values of between 33 and 35 laminae per neap-spring cycle suggest that, on average, more than one lamina must have been deposited per tidal maximum. As described previously, we believe there were typically three recognizable laminae deposited during two successive high tides, or ~1.5 laminae per tidal maximum. Thus we may estimate a minimum number of high tides per half-synodic month of ~2/3 of the numbers described above, or ~23. Because most depositional settings fall outside of the tidal
Figure 3. Rectified and horizontally averaged image of siltstone bed 2. The vertical dimension of the image is 6.5 centimeters.
8
1 20 40 60 80
5
0
10
15
20
Thic
knes
s (p
ixel
s)
Lamina number
30
25
100 120
35
Figure 4. Lamina sequence derived from Figure 3.
0 0.1 0.2 0.3 0.4
0.5
0
1
1.5
2
Pow
er
Frequency (cycles/layer)
3 x 10⁴
2.5
Figure 5. Power spectrum of siltstone bed 2. Fast Fourier Transform (thick) and Maximum Entropy method (thin) curves exhibit peaks at close to the same frequency values.
9
20 30 40 50 60
20
15
25
30
35Ti
dal m
axim
a pe
r nea
p-sp
ring
cycl
e
Lunar semimajor axis (earth radii)
Figure 6. Relationship between tidal maxima per neap-spring cycle and lunar semimajor axis. Tidal maxima per neap-spring cycle were determined using the analytical function discussed in the text.
range at least part of the time, tidal events will not always result in the deposition of a lamina. Thus the number of tidal events recorded by the laminae represent a minimum value for the true number of such events.
Figure 6 then suggests that the lunar semi-major axis was no less than ~30 earth radii at the time of deposition, ~1.9 Ga ago. Conservation of angular momentum (equation 3) then indicates the length of day was no less than ~10 hours, and there were a minimum of ~24 solar days per synodic month. These results are consistent with theoretical estimates and inferences taken from other tidal sedimentary data sets (Bills and Ray, 1999), which suggest a lunar orbital radius of approximately 50 earth radii 1.9 Ga ago. Because these results are only approximate limits, formal statistical uncertainties are difficult to calculate and are not presented here. Other peaks in the spectra are smaller in magnitude and are not interpreted, except for the notable peak at a frequency of ~0.35 cycles per lamina, corresponding to a wavelength of ~3 laminae. This peak, particularly strong in the MEM spectrum, is interpreted to be caused by the three-lamina sequence generated by the diurnal inequality of the tide, described above. We note that although Kvale and others (1999) reported the need for at least four months of rhythmite deposition in order to accurately estimate the lunar semi-major axis, the approximate lower limit derived here is not affected by that result. However, these results must be taken as tentative because of the
brevity of the sequence from which they were derived. The interpretation presented here does illustrate, however, the methods that may be employed in the event that a more extensive cyclic sequence is found in the Pokegama or Palms Formations or other Proterozoic units.
concLusionsPrior to the analysis presented here, the oldest
tidal sedimentary sequences analyzed for lunar orbital constraints had been the 0.9 Ga Big Cottonwood Formation rhythmites (Sonett and others, 1996) and the 3.2 Ga tidal sand wave deposit described by Eriksson and Simpson (2000). The Pokegama Formation possesses an intermediate age of ~1.9 Ga, nearly at the midpoint of those dates. Thus, tidal cyclicities in the Pokegama or Palms Formations are of potentially great value in the determination of the moon's orbital history. We have analyzed the spectral content of what we believe to be tidal signatures in specimens from the lower member of the Pokegama Formation, although these sequences are short and noisy, and the confidence level we can assign to the results is less than desirable. However, using our new image processing method we were able to identify faint lamina boundaries and hence obtain a lamina-thickness sequence that contains spectral peaks interpreted as representing the lunar half-synodic month and the diurnal inequality. Our subsequent estimate of a minimum lunar semi-major
10
axis of ~30 earth radii is consistent with the accepted value (~50 earth radii) previously derived from theory and observation, and is intermediate between the corresponding values derived from the Archean and Neoproterozoic tidal data mentioned above.
If rhythmic tidal sequences are identified elsewhere in the sediments of the Animikie Basin, their potential for constraining the ancient lunar orbit would be considerable, and the image processing method described herein may prove valuable in their analysis.
acknoWLedgemenTThis work was supported, in part, by an internal
grant from Drury University for summer faculty research.
reFerences
Archer, A.W., Kuecher, G.J., and Kvale, E.P., 1995, The role of tidal velocity asymmetries in the deposition of silty tidal rhythmites (Carboniferous, Eastern Interior Coal Basin, U.S.A.): Journal of Sedimentary Research, v. A65, no. 2, p. 408-416.
Bills, B.G., and Ray, R.D., 1999, Lunar orbital evolution: A synthesis of recent results: Geophysical Research Letters, v. 26, no. 19, p. 3045-3048.
Burns, J.A., 1986, The evolution of satellite orbits, in Burns, J.A., and Matthews, M.S., eds., Satellites: Tucson, Ariz., University of Arizona Press, p. 117-158.
Eriksson, K.A., and Simpson, E.L., 2000, Quantifying the oldest tidal record: The 3.2 Ga Moodies Group, Barberton Greenstone Belt, South Africa: Geology, v. 28, no. 9, p. 831-834.
Fralick, P.W., Kissen, S.A., and Davis, D.W., 1998, The age and provenance of the Gunflint lapilli tuff [abs.]: Institute on Lake Superior Geology, 44th Annual Meeting, Minneapolis, Minn., Proceedings, p. 66-67.
Hemming, S.R., McLennan, S.M., Hanson, G.N., Krogstad, E.J., and Metzger, K., 1990, Pb isotope systematics in quartz [abs.]: Eos, v. 71, no. 17, p. 654-655.
Kvale, E.P., Johnson, H.W., Sonett, C.P., Archer, A.W., and Zawistoski, A., 1999, Calculating lunar retreat rates using tidal rhythmites: Journal of Sedimentary Research, v. 69, no. 6, p. 1154-1168.
Lanier, W.P., Feldman, H.R., and Archer, A.W.,
1993, Tidally modulated sedimentation in a fluvial to estuarine transition, Douglas Group, Missourian-Virgilian, Kansas: Journal of Sedimentary Petrology, v. 63, p. 860-873.
Ojakangas, R.W., 1983, Tidal deposits in the Early Proterozoic basin of the Lake Superior region the Palms and Pokegama Formations: Evidence for subtidal-shelf deposition of Superior-type banded iron-formation, in Medaris, L.G., Jr., ed., Early Proterozoic geology of the Great Lakes region: Geological Society of America Memoir 160, p. 49-65.
———1994, Sedimentology and provenance of the Early Proterozoic Michigamme Formation and Goodrich Quartzite, Northern Michigan B regional stratigraphic implications and suggested correlations: U.S. Geological Society Bulletin 1904-R, 31 p.
Ojakangas, R.W., Severson, M.J., Jongewaard, P.K., Arola, J.L., Evers, J.T., Halvorson, D.G., Morey, G.B., and Holst, T.B., 2005, Geology and sedimentology of the Paleoproterozoic Animikie Group: Pokegama Formation, the Biwabik Iron Formation, and Virginia Formation of the eastern Mesabi Iron Range, and the Thomson Formation near Duluth, northeastern Minnesota, in Robinson, L., ed., Field trip guide book for selected geology in Minnesota and Wisconsin: Minnesota Geological Survey Guidebook 21, p. 208-237.
Sonett, C.P., Kvale, E.P., Zakharian, A., Chan, M.A., and Demko, T.M., 1996, Late Proterozoic and Paleozoic tides, retreat of the moon, and rotation of the earth: Science, v. 273, p. 100-104.
Stacey, F.D., 1992, The physics of the earth: Queensland, Australia, Brookfield Press, p. 118-119.
Williams, G.E., 1989, Late Precambrian tidal rhythmites in South Australia and the history of the earth's rotation: Journal of the Geological Society of London, v. 146, p. 97-111.
11
aPPendix: a neW image Processing meThod
Our image analysis begins with a digital gray-scale image of a lamina sequence such as one of those presented in this paper (Figs. 1, 2). The image is then converted to color, and "reference" lines of a chosen color, not present in the original image, are carefully drawn directly over as many clear lamina boundaries as possible. A FORTRAN program reads this image and searches for the colored lines, storing their pixel coordinates in an external file. A second program reads the original gray-scale image and the coordinates of the reference lines. The user specifies a particular column of the original image to which the rest of the image is to be rectified. Brightness values of pixels that lie directly on one of the reference lines are re-mapped to the vertical position of the same line where it intersects the column to which the image is to be rectified. Those that lie between the reference lines are re-mapped to new vertical positions using a cubic spline interpolation algorithm, such that the re-mapping distance is a smooth third-order-polynomial function of the original vertical positions. Thus a new image is created for which there is virtually no variation in thickness or vertical position of any of the layers, and they all are nearly perfectly horizontal. The brightnesses in this "unwarped"
image are averaged horizontally, enhancing lamina boundaries and minimizing random noise. The new image can then be analyzed to extract the locations of individual lamina boundaries and hence lamina thicknesses. Lamina thickness sequences so derived have effectively used redundant information in the original image. A total of 17 reference lines were drawn on the image of Figure 2 prior to applying the rectifying algorithms. In order to enhance true lamina boundaries, the brightness of each pixel was then replaced by the average over the nearest 100 pixels of the same row. This allowed statistical reduction of noise locally in the image, even though some variability in lamina thickness still remained in the rectified image (Fig. 3). The use of more reference lines would have reduced this variability. Finally, lamina boundaries were identified by careful analysis of both Figure 3 and the same image (not illustrated) without the horizontal averaging. In this manner many new lamina boundaries were located. Figure 3 had to be used cautiously because arbitrary large dark grains, smeared laterally by the averaging, can be misinterpreted as lamina boundaries. Such false boundaries are identifiable because of their limited lateral extent (close to 100 pixels), and because the grains that cause them are visible in the image without the averaging.