Blue-Pelican Java Textbook, ver 1.10 - Carlisle Area School ...
Upload
khangminh22Category
view
1download
0
Appendices
115
Appendix-1.1 (Referred to in Paragraph 1.9, 1.10 and Paragraph No. 1.13)
Summarised financial results of Power Sector Undertakings for the latest year for which accounts were finalised (` in crore)
Sl. No.
Name of PSU Year of finalised Account
Net Profit/Loss
before interest and Tax
Net Profit/Loss
after interest and Tax
Turnover Paid up Capital
including share
application money
Capital Employed1
Net Worth/ Shareholder
Fund2
Accumulated profit/ loss
A Generation 1 Uttar Pradesh Rajya Vidyut Utpadan Nigam
Limited 2017-18 1257.79 128.95 9991.01 10796.79 21283.25 11595.58 1049.92
2 Uttar Pradesh Jal Vidyut Nigam Limited 2015-16 14.05 -8.48 93.73 434.53 251.11 99.03 -335.50 3 Yamuna Power Generation Company Limited
(Associates of Sl. No. 15) 2015-16 0.00 0.003 0 0.05 -2.46 -2.46 -2.51
4 Sonebhadra Power Generation Company Limited (Subsidiary of Sl. No. 15)
2015-16 -1.17 -1.17 0 0.07 -6.12 -6.12 -6.19
5 UCM Coal Company Limited (Joint Venture of Sl. No. 1)
2016-17 -0.24 -0.24 0 0.16 0.34 -0.16 -0.32
6 UPSIDC Power Company Limited (Subsidiary of UPSIDC)
2013-14 -0.02 -0.02 0 0.05 -0.20 -0.20 -0.25
7 Jawaharpur Vidyut Utpadan Nigam Limited (Subsidiary of Sl. No.1)
2017-18 0.51 0.51 0 251.05 906.60 250.79 -0.26
Sub Total (A) 1270.92 119.55 10084.74 11482.70 22432.52 11936.46 704.89 B Transmission 8 Uttar Pradesh Power Transmission Corporation
Limited 2015-16 507.07 -27.13 1682.64 10091.20 16993.23 9154.56 -901.46
9 Southern UP Power Transmission Company Limited (Subsidiary of Sl. No. 15)
2015-16 0.00 0.004 0 0.05 -1.52 -1.52 -1.57
Sub Total (B) 507.07 -27.13 1682.64 10091.25 16991.71 9153.04 -903.03
1 Capital employed is the sum total of Shareholder fund and Long Term Loans. 2 Net worth is the sum total of paid-up capital and free reserves and surplus minus accumulated losses and deferred revenue expenditure. DRE of ` 35.18 crore was deducted
in case Uttar Pradesh Power Transmission Corporation Limited to arrive at the net worth figure. 3 Incurred loss of ` 91,611 only. 4 Earned profit of ` 682.02 only.

Audit Report on Economic Sector and Public Sector Undertakings for the year ended 31 March 2018
116
Sl. No.
Name of PSU Year of finalised Account
Net Profit/Loss
before interest and
Tax
Net Profit/Loss
after interest and Tax
Turnover Paid up Capital
including share
application money
Capital Employed
Net Worth/ Shareholder
Fund
Accumulated profit/ loss
C Distribution 10 Purvanchal Vidyut Vitaran Nigam Limited
(Subsidiary of Sl. No. 15) 2016-17 -446.74 -867.32 9320.19 13646.98 5790.76 -3899.27 -17546.25
11 Paschimanchal Vidyut Vitaran Nigam Limited (Subsidiary of Sl. No. 15)
2016-17 -302.77 -468.00 13161.10 10995.20 4465.39 -2424.07 -13419.27
12 Madhyanchal VidyutVitaran Nigam Limited (Subsidiary of Sl. No. 15)
2016-17 -622.71 -722.80 7980.60 12553.30 6746.43 -989.42 -13542.72
13 Dakshinanchal Vidyut Vitaran Nigam Limited (Subsidiary of Sl. No. 15)
2016-17 -766.80 -1443.48 7731.75 14084.31 4754.85 -9183.29 -23267.6
14 Kanpur Electricity Supply Company Limited (Subsidiary of Sl. No. 15)
2016-17 423.72 319.55 2330.62 1568.77 380.86 -1612.7 -3181.47
15 Uttar Pradesh Power Corporation Limited 2015-16 -15444.99 -15444.99 0 66429.38 -42497.71 -42497.71 -62483.53 Sub Total (C) -17160.29 -18627.04 40524.26 119277.94 -20359.42 -60606.46 -133440.84
Grand Total (A+B+C) -15382.30 -18534.62 52291.64 140851.895 19064.81 -39516.96 -133638.98
5 Paid up capital of ` 1,40,851.89 crore includes an amount of ` 46,694.69 crore in holding companies at Sl. No. 1 (` 251.13 crore) and Sl. No. 15 (` 46,443.56 crore) which
was given by the Government for their subsidiary/associates/joint venture companies at Sl. No. 3,4,5,7,9,10,11,12,13 and 14. Therefore, the amount of ` 46,694.69 crore has been excluded for calculation of net worth and capital employed.

Appendices
117
Appendix-1.2 (Referred to in Paragraph 1.9)
Investment made by Government and others in 15 Power Sector PSUs as on 31 March 2018
(` in crore)
Equity Long Terms Loans Sl. No.
Name of the PSUs Number of PSU State Govt. Others
Total Equity State Govt.
loan Central
Govt. Loan Holding
Company/ Other
Financial Institutions
loan
Total Long Terms Loans
Total Investment (Equity and Long term
loans)
1. UP Rajya Vidyut Utpadan Nigam Ltd. (including subsidiary Jawaharpur VUNL)
2 10796.79 0.00 10796.79 0.00 0.00 10343.48 10343.48 21140.27
2. Yamuna Power Generation Company Ltd.
1 0.00 0.05 0.05 0.00 0.00 0.00 0.00 0.05
3. UPSIDC Power Co. Ltd. (Accounts Received. Upto 2013-14 only)
1 0.00 0.05 0.05 0.00 0.00 0.00 0.00 0.05
4. UP Jal Vidyut Nigam Ltd. (Accounts Received Upto 2016-17 only)
1 435.33 0.00 435.33 64.65 0.00 85.21 149.86 585.19
5. UP Power Transmission Corporation Ltd.
1 12494.42 0.00 12494.42 0.00 0.00 10762.29 10762.29 23256.71
6. UPPCL (including subsidiaries i.e. PuVVNL, PVVNL, DVVNL, MVVNL, KESCO. SPGCL and SUPPTCL)
8 82991.49 0.20 82991.69 9783.44 0.00 45444.18 55227.62 13821 9.31
7. UCM Coal Company Limited 1 0.00 0.16 0.16 0.00 0.00 1.19 1.19 1.35 Total 15 106718.03 0.46 106718.49 9848.09 0.00 66636.35 76484.44 183202.93
Note: (i) Total investment in Power Sector PSUs = (Equity in PSUs) + (Loan in PSUs) = ` 1,06,718.49 crore + ` 76484.44 crore = ` 1,83,202.93 crore.
(ii) Total Govt. investment in Power Sector PSUs = (GoUP Equity in PSUs) + (GoUP Loan in PSUs) = ` 1,06,718.03 crore + ` 9,848.09 crore = ` 1,16,566.12 crore.

Audit Report on Economic Sector and Public Sector Undertakings for the year ended 31 March 2018
118
Appendix 1.3 (Referred to in Paragraph 1.7)
Statement showing position of State Government investment in State PSUs (Power Sector) accounts of which are in arrears during the period of arrears
(` in crore)
Investment made by State Government during the period for which accounts were in arrear (` in crore)
Sl. No.
Name of PSU Period upto
which Accounts finalised
Period for which accounts are in
arrear
Paid up Capital
including share
application money
Equity Loans Grant Subsidy Total
1 Uttar Pradesh Power Corporation Limited (including five subsidiaries PuVVNL, PVVNL, DVVNL, MVVNL and KESCO )
2015-16 2016-17 to 2017-18 66429.38 16562.10 3700.32 9788.26 12609.03 42659.71
2
Uttar Pradesh Jal Vidyut Nigam Limited
2015-16 2016-17 to 2017-18 434.53 0.80 0.00 0.00 0.00 0.80
3 UP Power Transmission Corporation Limited
2015-16 2016-17 to 2017-18 10091.20 2403.22 0.00 13.56 0.00 2416.78
Total 18966.12 3700.32 9801.82 12609.03 45077.29

Appendices
119
Appendix-1.4 (Referred to in Paragraph 1.10)
Details of Top Profit/Loss making PSUs during 2017-18 (` in crore)
Sl. No. Name of PSUs Year of Account Amount Top profit making PSUs
1 Kanpur Electricity Supply Company Limited 2016-17 319.55 2 UP Rajya Vidyut UtpadanNigam Limited 2017-18 128.95 3 Jawaharpur Vidyut Utpadan Nigam Limited 2017-18 0.51
Total 449.01 Top loss making PSUs
1 Uttar Pradesh Power Corporation Limited 2015-16 15444.99 2 Dakshinanchal Vidyut Vitran Nigam Limited 2016-17 1443.48 3 Purvanchal Vidyut Vitran Nigam Limited 2016-17 867.32 4 Madhyanchal Vidyut Vitran Nigam Limited 2016-17 722.80 5 Paschimanchal Vidyut Vitran Nigam Limited 2016-17 468.00 6 Uttar Pradesh Power Transmission Corporation Limited 2015-16 27.13 7 Uttar Pradesh Jal Vidyut Nigam Limited 2015-16 8.48 8 Sonebhadra Power Generation Company Limited 2015-16 1.17 9 UCM Coal Company Limited 2016-17 0.24
10 UPSIDC Power Company Limited 2013-14 0.02 Total 18983.63
Details of marginal/ no Profit/Loss making PSUs during 2017-18
Sl. No. Name of PSUs Year of Account Amount 1 Yamuna Power Generation Company Limited 2015-16 0.006 2 Southern UP Power Transmission Company Limited 2015-16 0.007
Total 0.00
6 Incurred loss of ` 91,611 only. 7 Earned profit of ` 682.02 only.

Audit Report on Economic Sector and Public Sector Undertakings for the year ended 31 March 2018
120
Appendix-1.5
(Referred to in Paragraph 1.12) Statement showing State Government funds infused in the four Power Sector Undertakings from the year 2000-2001 to 2017-18
(` in crore) UPJVNL UPRVUNL UPPTCL UPPCL Grand Total Year
Equity CG IFL IBL Equity CG IFL IBL Equity CG IFL IBL Equity CG IFL IBL Equity CG IFL IBL
Up to 2000-01
372.88 20.00 3.55 62.60 1764.25 0.00 0.00 187.00 0.00 0.00 0.00 0.00 4199.34 7.02 0.00 1562.09 6336.47 27.02 3.55 1811.69
2001-02 0.00 4.82 0.00 -1.50 32.82 24.59 0.00 24.59 0.00 0.00 0.00 0.00 282.21 173.23 0.00 152.23 315.03 202.64 0.00 175.32
2002-03 0.00 0.00 0.00 0.00 0.00 0.00 7.50 0.00 0.00 0.00 0.00 225.90 143.57 0.00 281.90 225.90 143.57 0.00 289.40
2003-04 21.06 0.00 0.00 335.85 0.00 0.00 0.00 0.00 0.00 0.00 0.00 5694.39 140.62 0.00 -1673.23 6051.30 140.62 0.00 -1673.23
2004-05 10.50 0.00 0.00 1.00 0.00 0.00 0.00 0.00 0.00 0.00 0.00 895.30 172.27 0.00 209.06 906.80 172.27 0.00 209.06
2005-06 10.65 0.00 0.00 389.89 0.00 0.00 0.00 0.00 0.00 0.00 0.00 394.06 67.82 0.00 89.91 794.60 67.82 0.00 89.91
2006-07 9.16 0.00 0.00 407.00 0.00 0.00 0.00 0.00 0.00 0.00 0.00 2697.37 25.00 0.00 0.00 3113.53 25.00 0.00 0.00
2007-08 1.00 0.00 0.00 1006.00 0.00 0.00 0.00 2213.34 0.00 0.00 99.71 4039.91 99.48 0.00 -99.71 7260.25 99.48 0.00 0.00
2008-09 2.00 0.00 0.00 778.00 0.00 0.00 0.00 428.55 0.00 0.00 0.00 5013.79 315.94 0.00 0.00 6222.34 315.94 0.00 0.00
2009-10 3.50 0.00 0.00 812.20 0.00 0.00 0.00 891.57 0.00 0.00 0.00 3615.10 0.00 0.00 0.00 5322.37 0.00 0.00 0.00
2010-11 1.00 0.00 0.00 775.00 0.00 0.00 0.00 500.00 0.00 0.00 0.00 3107.52 0.00 0.00 -100.00 4383.52 0.00 0.00 -100.00
2011-12 0.00 0.00 0.00 555.75 0.00 0.00 -219.09 409.05 0.00 0.00 0.00 3349.56 0.00 0.00 0.00 4314.36 0.00 0.00 -219.09
2012-13 1.39 0.00 0.00 865.35 0.00 0.00 0.00 800.00 0.00 0.00 0.00 2158.79 17.00 0.00 0.00 3825.53 17.00 0.00 0.00
2013-14 1.39 0.00 0.00 117.89 0.00 0.00 0.00 1394.08 0.00 0.00 0.00 5067.59 69.77 0.00 -422.25 6580.95 69.77 0.00 -422.25
2014-15 0.00 0.00 0.00 351.90 0.00 0.00 0.00 2004.61 0.00 0.00 -99.71 9189.65 83.02 0.00 0.00 11546.16 83.02 0.00 -99.71
2015-16 0.00 0.00 0.00 1129.51 0.00 0.00 0.00 1450.00 0.00 0.00 0.00 16498.92 0.00 6083.12 0.00 19078.43 0.00 6083.12 0.00
2016-17 0.00 0.00 0.00 788.00 0.00 0.00 0.00 1695.00 0.00 0.00 0.00 9722.97 75.00 3700.32 0.00 12205.97 75.00 3700.32 0.00
2017-18 0.80 0.00 0.00 686.38 0.00 0.00 0.00 708.22 0.00 0.00 0.00 6839.12 83.40 0.00 0.00 8234.52 83.40 0.00 0.00
Total 435.33 24.82 3.55 61.1 10796.79 24.59 0.0 0.0 12494.42 0.0 0.0 0.0 82991.49 1473.14 9783.44 0.0 106718.03 1522.55 9786.99 61.10
Note: CG = Capital Grant, IFL = Interest Free Loan, IBL = Interest Bearing defaulted Loan.

Appendices
121
Appendix-1.6 (Referred to in Paragraph 1.12)
Statement showing details of investment by the State Government and present value (PV) of Government funds without considering defaulted interest bearing loan
(` in crore) Financial year Present
value of total investment
at the beginning of
the year
Equity infused by the
state government during the
year
Total of Interest free Loans and
capital grants given by the
state government during the
year
Total investment during the year
Average rate of
interest on government borrowings (in per cent)
Total investment at the end of the
year
Present value of total investment at the end of the year
Minimum expected return to
recover cost of funds for
the year
Total Earnings for
the year
1 2 3 4 5 (Col. 3 + Col. 4 )
6 7 (Col. 2 + Col. 5)
8 Col 7 * (1+ Col 6
/100)
9 (Col. 7 * Col.
6/100)
10
up to 2000-01 6336.47 30.57 6367.04 9.58 6367.04 6977.00 609.96 2001-02 6977.00 315.03 202.64 517.67 9.49 7494.67 8205.92 711.24 -1562.66 2002-03 8205.92 225.90 143.57 369.47 7.22 8575.39 9194.53 619.14 -1453.67 2003-04 9194.53 6051.30 140.62 6191.92 9.13 15386.45 16791.23 1404.78 -1420.28 2004-05 16791.23 906.80 172.27 1079.07 9.47 17870.30 19562.62 1692.32 -2404.25 2005-06 19562.62 794.60 67.82 862.42 6.49 20425.04 21750.63 1325.59 -3146.92 2006-07 21750.63 3113.53 25.00 3138.53 6.74 24889.16 26566.68 1677.53 -4288.59 2007-08 26566.68 7260.25 99.48 7359.73 6.43 33926.41 36107.88 2181.47 -7931.01 2008-09 36107.88 6222.34 315.94 6538.28 6.29 42646.16 45328.61 2682.44 -10585.24 2009-10 45328.61 5322.37 0.00 5322.37 6.16 50650.98 53771.08 3120.10 -8916.25 2010-11 53771.08 4383.52 0.00 4383.52 6.67 58154.60 62033.51 3878.91 -8682.32 2011-12 62033.51 4314.36 0.00 4314.36 6.62 66347.87 70740.10 4392.23 -11914.56 2012-13 70740.10 3825.53 17.00 3842.53 6.73 74582.63 79602.04 5019.41 -13151.15 2013-14 79602.04 6580.95 69.77 6650.72 6.43 86252.76 91798.81 5546.05 -17719.95 2014-15 91798.81 11546.16 83.02 11629.18 6.40 103427.99 110047.38 6619.39 -19110.96 2015-16 110047.38 19078.43 6083.12 25161.55 6.35 135208.93 143794.70 8585.77 -18127.40 2016-17 143794.70 12205.97 3775.32 15981.29 6.82 159775.99 170672.71 10896.72 -17986.14 2017-18 170672.71 8234.52 83.40 8317.92 6.54 178990.63 190696.62 11705.99 -18534.62
Total 106718.03 11309.54 118027.57

Audit Report on Economic Sector and Public Sector Undertakings for the year ended 31 March 2018
122
Appendix-2.1 (Referred to in Paragraph 2.4)
Statement showing role of various wings of the Company

Appendices
123
Appendix 2.2 {Referred to in Paragraph 2.8 (i)}
Statement showing details of physical position of Sub-stations and Lines at the beginning of 2013-14 and additions during 2013-14 to 2017-18
Status of sub-stations (SSs) (in MVA) 765 KV SSs 400 KVSSs 220 KV SSs 132 KV SSs Total
No. Capacity No. Capacity No. Capacity No. Capacity No. Capacity Nos. and capacity of SSs at the
beginning of 2013-14
1 1000 14 9010 71 22050 274 26590 360 58650 Construction of new sub-station during 2013-14 to 2017-18
Year No. of
SSs
Capacity added
during the year in MVA
No. of
SSs
Capacity added during
the year in MVA
No. of
SSs
Capacity added
during the year in MVA
No. of
SSs
Capacity added during
the year in MVA
No. of S/s
Capacity added during
the year in MVA
2013-14 0 0 0 0 4 1000 13 740 17 1740 2014-15 0 0 0 0 8 1380 31 1550 39 2930 2015-16 0 0 2 980 5 1100 25 1220 32 3300 2016-17 1 3000 1 315 10 1640 38 1952 50 6907 2017-18 0 0 3 1545 8 2040 23 1583 34 5168
Total new constructed 1 3000 6 2840 35 7160 130 7045 172 20045 Total sub-stations at the end of 2017-18
532
Augmentation of capacity of existing sub-station 2013-14 1 1000 1 185 8 520 53 1519 63 3224 2014-15 0 0 1 500 4 260 47 1239 52 1999 2015-16 0 0 4 1280 24 1760 60 1599 88 4639 2016-17 0 0 2 685 16 990 136 3783 154 5458 2017-18 1 1000 10 1980 33 2690 85 2648 129 8318
Total augmented 2 2000 18 4630 85 6220 381 10788 486 23638 Total SSs and Transformation capacity addition in 2013-14 to 2017-18
5000 7470 13380 17833 43683
Capacity at the end of 2017-18 6000 16480 35430 44423 102333 Status of Lines (in Ckm)
765 KV 400 KV 220 KV 132 KV Total Length of lines upto 2012-13 (at the beginning of TA period)
410.93 4259.42 8090.77 13913 26674.12
Construction of new lines (Added during TA period i.e. 2013-14 to 2017-18) 2013-14 0 518.312 84.434 351.167 953.913 2014-15 2.63 136.1 558.558 691.672 1388.96 2015-16 0 71.6 522.55 1013.29 1607.44 2016-17 336.81 233.74 730.216 1136.049 2436.815 2017-18 335 343.38 601.408 1810.959 3090.747
Total lines constructed 674.44 1303.132 2497.166 5003.137 9477.875 Total length of lines as on March 2018
1085.37 5562.552 10587.936 18916.137 36151.995

Audit Report on Economic Sector and Public Sector Undertakings for the year ended 31 March 2018
124
Appendix 2.3 (Referred to in Paragraph 2.10)
Statement showing the position of the construction of new SSs and augmentation of existing SSs planned during 2013-14 to 2017-18
Details of New substations Details of augmentation of existing substations
Status of newly planned SSs
(in No.)
Status of SSs planned for
augmentation (in No.)
Year Capacity of SS No. of
new SSs
planned
Capacity of newly planned
SSs (in
MVA) Completed WIP
No. of SSs planned for
augmentation
Capacity of newly
augmented SSs
(in MVA) Completed WIP
2013-14
765 - - - - 1 1000 1 -
400 - - - - - - - 220 2 720 1 1 9 355 9 - 132 12 720 11 1 28 728 28 2014-15
765 - - - - - - - -
400 3 3240 - 3 1 150 1 - 220 18 6220 9 9 9 752 8 1 132 31 2658 20 11 18 487 18 - 2015-16
765 - - - - - - - -
400 2 2350 - 2 6 1165 6 - 220 16 4000 7 9 37 2659 33 4 132 16 1206 13 3 99 2802 96 3 2016-17
765 - - - - - - - -
400 4 4910 - 4 5 840 4 1 220 3 1180 - 3 26 1976 21 5 132 14 1304 1 13 63 1813 59 4 2017-18
765 - - - - - - - -
400 1 1000 - 1 7 1925 - 7 220 11 3626 - 11 17 1512 1 16 132 22 1886 - 22 57 1643 12 45 Total 155 35020 62 93 383 19807 297 86
Audit Report on Economic Sector and Public Sector Undertakings for the year ended 31 March 2018
125
Appendix 2.4 {(Referred to in Paragraph 2.14 (i)}
Statement showing the connected load of new SSs which were overloaded within a year of construction
Statement showing the position of new SSs (220 KV) overloaded within an year of construction Sl. No.
Name of Division Name of SS Capacity (in MVA)
Date of approval by
TWC
Date of commissioning
Sanctioned Cost
(` in crore)
80 per cent of
the installed capacity
Connected load up to November
2018
Percentage of connected load against 80 per cent
of the installed capacity
1 ETD-I,Kanpur 220 KV, Sikandara 100 09.07.2011 28.05.2018 33.12 80 90 112.50 2 ETC-Kanpur (ETD-Fatehgarh) 220 KV, Neebkarori 200 02.02.2015 31.03.2018 109.00 160 200 125.00
Total 142.12
Statement showing the position of new SSs (132 KV) overloaded within an year of construction Sl. No.
Name of Division Name of SS Capacity (in MVA)
Date of TWC
DOC Sanctioned Cost (` in
crore)
80 per cent of
the installed capacity
Connected load
Percentage of connected load against 80 per cent
of the installed capacity
1 ETD-II, Agra 132 KV, Bichpuri 80 08.04.2013 19.06.2017 16.17 64 65 101.56 2 ETD-Robertsganj 132 KV, Pasahi 40 08.07.2015 18.05.2018 28.90 32 38 118.75 3 ETD-Basti 132 KV, Nathnagar 40 27.08.2008 Mar-16 12.57 32 40 125.00 4 ETC-Kanpur (ETD-Fatehgarh) 132 KV, Talegram 80 05.05.2016 16.03.2018 34.00 64 80 125.00 5 ETD-I,Kanpur 132 KV, Rasoolabad 80 13.02.2014 04.03.2016 32.94 64 80 125.00 6 ETD, Sitapur 132 KV, Neri 60 06.07.2012 09.03.2016 12.00 48 75 156.25 7 ETC, Kanpur (ETD-Etawah) 132 KV, Takha 40 06.07.2012 08.06.2016 10.30 32 50 156.25 8 ETD-Jhansi 132 KV, Gurusarai 40 07.09.2011 02.12.2016 18.54 32 63 196.88 9 ETD, Sitapur 132 KV, Mahmoodabad 20 06.07.2012 23.03.2017 12.00 16 45 281.25
Total 177.42

Audit Report on Economic Sector and Public Sector Undertakings for the year ended 31 March 2018
126
Appendix 2.5 {(Referred to in Paragraph 2.14 (ii)}
(A) Statement showing the position of the overloaded 220 KV SSs Sl. No.
Name of the division
Name of the SS
Installed capacity
(in MVA)
80 per cent of the
installed capacity
(in MVA)
Connected load upto November
2018 (in MVA)
Overload in MVA
Percentage of overload
(against 80 per cent Capacity)
1 ETD-Basti 220 KV, Basti
360 288 370 82 28
2 ETD-II, Gorakhpur 220 KV, Barahuwa
520 416 569 153 37
3 ETD-Sitapur 220 KV, Sitapur
300 240 479 239 100
4 ETD-II, Prayagraj 220 KV, Rewa Road
520 416 831 415 100
5 ETD-Sitapur 220 KV, Sitapur
143 114 145 31 27
(B) Statement showing the position of the overloaded 132 KV SSs
Sl. No.
Name of the division
Name of the SS Installed capacity
(in MVA)
80 per cent of the installed capacity (in
MVA)
Connected load
(in MVA)
Overload in MVA
Percentage of overload (against
80 per cent Capacity)
1 ETD-Basti 132 KV, Naugarh 60 48 60 12 25
2 ETD-Basti 132 KV, Dumariaganj 80 64 80 16 25
3 ETD-Basti 132 KV, Nathnagar 40 32 40 8 25
4 ETD-I, Gorakhpur
132 KV, Rajapakar 80 64 85 21 33
5 ETD-Basti 132 KV, Bansi 60 48 65 17 35
6 ETD-II, Gorakhpur
132 KV, Kauriram 103 82 113 31 38
7 ETD-Sitapur 132 KV, Sidhauli 60 48 66 18 38
8 ETD-I, Lucknow 132 KV,TRT 189 151 210 59 39
9 ETD-I, Gorakhpur
132 KV, FCI, Gorakhpur
166 133 185 52 39
10 ETD, Aligarh 132 KV, Aligarh-III 120 96 135 39 41
11 ETD-Basti 132 KV, Khalilabad 80 64 90 26 41
12 ETD-Basti 132 KV, Mehdawal 40 32 45 13 41
13 ETD-Jhansi 132 KV, Lalitpur 100 80 116 36 45
14 ETD-Jhansi 132 KV, Hansari 143 114 170 56 49
15 ETD-Jhansi 132 KV, Mehrauni 40 32 48 16 50
16 ETD-Sitapur 132 KV, Neri 60 48 75 27 56
17 ETD-Sitapur 132 KV, Biswan 40 32 50 18 56
18 ETD, Aligarh 132 KV, Aligarh-V 80 64 104 40 63

Appendices
127
Sl. No.
Name of the division
Name of the SS Installed capacity
(in MVA)
80 per cent of the installed capacity (in
MVA)
Connected load
(in MVA)
Overload in MVA
Percentage of overload (against
80 per cent Capacity)
19 ETD-I, Gorakhpur
132 KV, Kasia, Kushinagar
166 133 218 85 64
20 ETD-II, Lucknow 132 KV, Khurram Nagar
120 96 160 64 67
21 ETD, Aligarh 132 KV, Jattari 80 64 108 44 69
22 ETD, Aligarh 132 KV, Boner 120 96 163 67 70
23 ETD-II, Lucknow 132 KV, NKN 120 96 166 70 73
24 ETD, Aligarh 132 KV, Sarsol 143 114 215 101 89
25 ETD-III, Lucknow
132 KV, Barabanki 126 101 193 92 91
26 ETD-Jhansi 132 KV, Gurusarai 40 32 63 31 100
27 ETD-Sitapur 132 KV, Laherpur 20 16 35 19 119
28 ETD-I, Lucknow 132 KV, Mohan Road 80 64 168 104 163
29 ETD-Sitapur 132 KV, Mahmoodabad
20 16 45 29 181

Audit Report on Economic Sector and Public Sector Undertakings for the year ended 31 March 2018
128
Appendix 2.6 (Referred to in Paragraph 2.16)
Statement showing the position of procurement of material without synchronising with erection activities Sl. No.
Name of the division
Name of the project Name of the material
Quantity of material
Date of receipt of supply
Value of the
material (` in
crore)
Date of utilisation
Period (months) for
which the material was
lying idle leaving three months from
the date of receipt up to November
2018
Loss of interest on 70
per cent of the
value of the
Material (` in
crore)
Augmentation of 132 KV S/s Mau New
63 MVA transformer 1 Nos. Nov-15 1.8 Sep-16 6 0.07 1 ETD-Mau
132 KV Dohright-Kathmanglahroo Line
Panther Conductor 24.322 Km Mar-18 0.38 Not used till date 4 0.01
132 KV Anand Nagar-Naugarh Line
ACSR Panther Conductor
116.16 Km Oct-17 1.14 Not used till date 8 0.05
220 KV Gola Line Zebra Condoctor 250.757 Km
Sep-17 5.26 Apr-18 3 0.10
132 KV Kauriram- dohrighat line ACSR Panther Conductor
82.495 Km Mar-18 1.06 Not used till date 4 0.01
2 ETD-II,Gorakhpur
132 KV Bansi-Nautanwa Line ACSR Panther Conductor
195.95 Km Feb-18 2.4 Not used till date 4 0.04
220 KV SC line, Aligarh-Boner Zebra Conductor 23.998 Dec-15 0.52 Not used till date 32 0.10 3 ETD-Aligarh 132 KV SC Line Khair-Iglas Panther Conductor 83.519 May-16 1.04 Not used till date 27 0.17
ACSR Panther Conductor
106.979 Km
Dec-15 1.4 Not used till date 31 0.26 4 ETD-II, Varanasi 132 KV Bhadaura-Kundeshar Line
Other materials Till May 2016 2.54 Not used till date 26 0.40 5 ETD-II, Agra Augmentation of 220 KV S/s
Sikandara 60 MVA transformer 1 nos. Dec-14 2.74 Feb-16 10 0.17
63 MVA transformer 1 No. Jul-13 1.73 Nov-14 12 0.13 132 KV Azamgarh 63 MVA transformer 1 No. Oct-16 1.73 Apr-17 2 0.02
6 ETD- Azamgarh
220 KV Azamgarh 160 MVA transformer 1 No. May-17 5.74 Jan-18 5 0.18 40 MVA transformer 1 No. Jun-16 1.47 Jan-17 3 0.03 7 ETD-Baharaich 132 KV Begampur 40 MVA transformer 1 No. Jun-16 1.47 Jan-17 8 0.07
8 ETD-Banda 220 KV Banda 40 MVA transformer 1 No. Aug-12 1.67 Jan-16 37 0.38
Appendices
129
Sl. No.
Name of the division
Name of the project Name of the material
Quantity of material
Date of receipt of supply
Value of the
material (` in
crore)
Date of utilisation
Period (months) for
which the material was
lying idle leaving three months from
the date of receipt up to November
2018
Loss of interest on 70
per cent of the
value of the
Material (` in
crore)
220 KV PGCIL Sohawal –New Tanda DC line
ACSR Zebra conductor 425.88 kms. Up to July 2013 7.71 Aug-14 9 0.43 9 ETD-Faizabad
132 KV Akbarpur 63 MVA transformer 1 No. Feb-17 1.89 Jul-17 1 0.01 132 KV Neebu Park 63 MVA transformer 1 No. Jul-14 1.9 Feb-15 3 0.03 220 KV SS, Hardoi Road 200 MVA transformer 1 No. Jul-15 4.77 Jan-16 2 0.06
10 ETD-I, Lucknow
132 KV SS, TRT 63 MVA transformer 1 No. Mar-16 1.75 Dec-16 5 0.05 132 KV GIS, Old power House 63 MVA transformer 2 No. May-14 5.66 Mar-16 18 0.62 220 KV SS, Rewa Road 40 MVA transformer 1 No. Dec-16 1.46 Jul-18 15 0.13
11 ETD-II,Allahabad
132 KV SS, Salaykhurd 40 MVA transformer 1 No. Aug-16 1.46 Jul-18 19 0.17 220 KV SS, Sarh 40 MVA transformer 1 No. May-17 1.35 Mar-18 6 0.05 12 ETD II Kanpur 132 KV SS, Krishna Nagar 63 MVA transformer 1 No. Apr-17 1.74 Sep-17 1 0.01 220 KV SS Sahupuri 200 MVA transformer 1 No. Aug-17 4.5 Feb-18 2 0.06 13 ETD-III, Varanasi 132 KV Jeonathpur (Mughalsarai)
40 MVA transformer 2 No. Apr-12 4.76 May-14 21 0.61
220 KV Sitapur Nighasan line ACSR Zebra conductor 367.51 kms. Up to February 2012 6.67 Dec-13 18 0.74 132 KV lakhimpur-Laharpur line ACSR Panther conductor 99.05 kms. Up to Nov 2012 1.18 May-16 38 0.27
14 ETD-Sitapur
220 KV SS Sitapur 200 MVA transformer 1 No. Jul-17 4.37 Dec-17 1 0.03 Total 85.26 5.45

Audit Report on Economic Sector and Public Sector Undertakings for the year ended 31 March 2018
130
Appendix 2.7 {(Referred to in Paragraph 2.17 (i)}
Statement showing the details of Transformers of various capacities procured through TKCs
Sl. No.
Name of SSs LoI No. and date
Trans-former
capacity (in MVA)
No. of trans-former
Rate awarded to TKC per
trans-former (` in crore)
Total awarded value of trans-former
(` in crore)
Date of supply of transformer
by TKC
Date of procu-
rement of transformer
by the Company
(independent Supply)
Rate per trans- former
(independent supply)
(` in crore)
Difference in rate (` in
crore)
Rate of TKC
higher by (in
per cent)
Total excess exp. (` in
crore)
1 2 3 4 5 6 7 8 9 10 11 (col 6- col 10)
12 (11* 100/10)
13 (col
11*col 5) 1 Chhata 64/4.3.14 160 2 5.49 10.98 15.3.16, 20.10.18 30.12.13 3.69 1.80 49 3.60 2 Sikandrarahathras 69/10.4.15 160 2 5.48 10.96 28.4.16, 23.7.16 7.1.15 3.47 2.01 58 4.02 3 Partapur 126/13.7.15 160 2 5.83 11.66 16.2.17, 25.3.17 7.1.15 3.47 2.36 68 4.72 4 Sultanpur road
Lucknow 151/22.3.16 60 5 3.37 16.85 5.2017, 8.2017 27.2.16 2.71 0.66 24 3.30
Total 50.45 15.64

Audit Report on Economic Sector and Public Sector Undertakings for the year ended 31 March 2018
131
Appendix 3.1 (Referred to in Paragraph 3.1)
Statement showing loss of revenue due to incorrect billing to the Consumer
Sl. No. Month Recorded demand in
(kVA)
Amount of bill raised by the Division
(in `)
Amount of bill verified by the Lift Division
(in `)
Bill to be raised as per provision of
Tariff Order (in `)
Short (+)/Excess (-) charged by the Division (in `)
Remarks for incorrect billing
1 2 3 4 5 6 7 (col 6-col 5)
8
1 January 15 1800 1193132 864409 2066625 1202216 Minimum charge 2 February 15 1240 1474193 1216079 2066625 850546 Minimum charge 3 March 15 1040 1066379 711393 2066625 1355232 Minimum charge 4 April 15 120 1027802 829511 2066625 1237114 Minimum charge 5 May 15 480 1523792 1452315 2066625 614310 Minimum charge 6 June 15 920 1821386 1774455 2066625 292170 Minimum charge 7 July 15 1440 2480094 2480094 2311914 -168180 Billable Demand 8 August 15 1680 3433339 3433339 3265159 -168180 Billable Demand 9 September 15 1960 7688022 7520337 7188220 -332117 Billable Demand 10 October 15 2760 4877769 4771379 4966141 194762 Excess demand 11 November 15 2200 1191360 745598 2242400 1496802 Minimum charge 12 December 15 280 2052615 2007845 2242400 234555 Minimum charge 13 January 16 960 1659239 1623049 2242400 619351 Minimum charge 14 February 16 880 2124138 2077808 2242400 164592 Minimum charge 15 March 16 1640 1414869 1414869 2242400 827531 Minimum charge 16 April 16 560 2240369 2032738 2242400 209662 Minimum charge 17 May 16 1720 1656259 1656259 2242400 586141 Minimum charge 18 June 16 920 2301103 2142400 2139922 -2478 Billable Demand 19 July 16 920 3018954 2142400 2859957 717557 Billable Demand 20 August 16 2240 8474042 2142400 8910522 6768122 Billable Demand &
Tariff change 21 September 16 8480 6294332 2142400 12075792 9933392 Excess demand 22 October 16 2560 2847484 2142400 3190590 1048190 Excess demand 23 November 16 1800 1469907 1469907 2185600 715693 Minimum charge

Audit Report on Economic Sector and Public Sector Undertakings for the year ended 31 March 2018
132
Sl. No. Month Recorded demand in
(kVA)
Amount of bill raised by the Division
(in `)
Amount of bill verified by the Lift Division
(in `)
Bill to be raised as per provision of
Tariff Order (in `)
Short (+)/Excess (-) charged by the Division (in `)
Remarks for incorrect billing
1 2 3 4 5 6 7 (col 6-col 5)
8
24 December 16 280 2481292 2142400 2548082 405682 Tariff change 25 January 17 1080 1761348 1761348 2185600 424252 Minimum charge 26 February 17 1040 1391438 1391438 2185600 794162 Minimum charge 27 March 17 760 1467095 1464095 2185600 721505 Minimum charge 28 April 17 560 2355858 2085600 2164618 79018 Billable Demand 29 May 17 640 2704461 2085600 2513221 427621 Billable Demand 30 June 17 600 2546005 2085600 2354765 269165 Billable Demand 31 July 17 1280 2973837 2085600 2782596 696996 Billable Demand 32 August 17 1200 11262618 2085600 10819485 8733885 Billable Demand 33 September 17 9480 8633664 2085600 14485137 12399537 Excess demand 34 October 17 14302 2532935 2085600 12696628 10611028 Excess demand 35 November 17 1640 1622040 1622040 2185600 563560 Minimum charge 36 December 17 200 2383820 2383820 2590994 207174 Minimum charge 37 January 18 1560 1599348 1599348 2732000 1132652 Minimum charge 38 February 18 1120 1340019 1340019 2732000 1391981 Minimum charge 39 March 18 NA 1310844 1310844 2732000 1421156 Minimum charge 40 April 18 0 1288153 1288153 2732000 1443847 Minimum charge 41 May 18 640 1210353 1210353 2732000 1521647 Minimum charge 42 June 18 600 2075867 2075867 2732000 656133 Minimum charge 43 July 18 1320 3038258 2607000 2732000 125000 Minimum charge 44 August 18 2280 1647973 1647973 2732000 1084027 Minimum charge 45 September 18 880 2503761 2503761 2732000 228239 Minimum charge
Total 123461566 89741043 163476292.8 73735250

Appendices
133
Appendix 3.2(a) {Referred to in paragraph 3.1(i)}
Statement showing loss of revenue due to non- applying provision of Minimum charges in Bills
Sl. No. Month Amount of bill raised by the Division (in `)
Amount of bill to be raised by applying Minimum charges8 (in `)
Short charged in billed amount against Minimum charges(in `)
1 2 3 4 5 (col 4-col 3) 1 January 15 1193132 2066625 873493 2 February 15 1474193 2066625 592432 3 March 15 1066379 2066625 1000246 4 April 15 1027802 2066625 1038823 5 May 15 1523792 2066625 542833 6 June 15 1821386 2066625 245239 7 November 15 1191360 2242400 1051040 8 December 15 2052615 2242400 189785 9 January 16 1659239 2242400 583161
10 February 16 2124138 2242400 118262 11 March 16 1414869 2242400 827531 12 April 16 2240369 2242400 2031 13 May 16 1656259 2242400 586141 14 November 16 1469907 2185600 715693 15 January 17 1761348 2185600 424252 16 February 17 1391438 2185600 794162 17 March 17 1467095 2185600 718505 18 November 17 1622040 2185600 563560 19 December 17 2383820 2590994 207174 20 January 18 1599348 2732000 1132652 21 February 18 1340019 2732000 1391981 22 March 18 1310844 2732000 1421156 23 April 18 1288153 2732000 1443847 24 May 18 1210353 2732000 1521647 25 June 18 2075867 2732000 656133 26 August 18 1647973 2732000 1084027 27 September 18 2503761 2732000 228239
Total 43517499 63471544 19954045
8 Minimum charges are computed at the rate of ` 750 per kVA ` 800 per kVA and ` 1000 per kVA w.e.f. 12.10.2014, 28.06.2015 and 09.12.2017 respectively on contracted
load of 2500 kVA and further added on Electricity duty at the rate of 5 per cent and Regulatory surcharge at the rate of 5.22 per cent, 7.12 per cent and 4.28 per cent are applicable w.e.f. 12.10.14, 28.06.15 and 10.08.16 respectively.

Audit Report on Economic Sector and Public Sector Undertakings for the year ended 31 March 2018
134
Appendix 3.2(b) {Referred to in paragraph 3.1(ii)}
Statement showing loss of revenue due to short verification of billed amount by the Consumer
Sl. No. Month Amount of bill raised by the Division (in `)
Amount of bill verified by the Lift Division (in `)
Short verified by Consumer against billed amount (in `)
1 2 3 4 5 (col 3-col 4) 1 January 15 1193132 864409 328723 2 February 15 1474193 1216079 258114 3 March 15 1066379 711393 354986 4 April 15 1027802 829511 198291 5 May15 1523792 1452315 71477 6 June 15 1821386 1774455 46931 7 September 15 7688022 7520337 167685 8 October 15 4877769 4771379 106390 9 November 15 1191360 745598 445762 10 December 15 2052615 2007845 44770 11 January 16 1659239 1623049 36190 12 February 16 2124138 2077808 46330 13 April 16 2240369 2032738 207631 14 June 16 2301103 2142400 158703 15 July 16 3018954 2142400 876554 16 August 16 8474042 2142400 6331642 17 September 16 6294332 2142400 4151932 18 October 16 2847484 2142400 705084 19 December 16 2481292 2142400 338892 20 March 17 1467095 1464095 3000 21 April 17 2355858 2085600 270258 22 May 17 2704461 2085600 618861 23 June 17 2546005 2085600 460405 24 July 17 2973837 2085600 888237 25 August 17 11262618 2085600 9177018 26 September 17 8633664 2085600 6548064 27 October 17 2532935 2085600 447335 28 July 18 3038258 2607000 431258
Total 92872134 59151611 33720523
Appendices
135
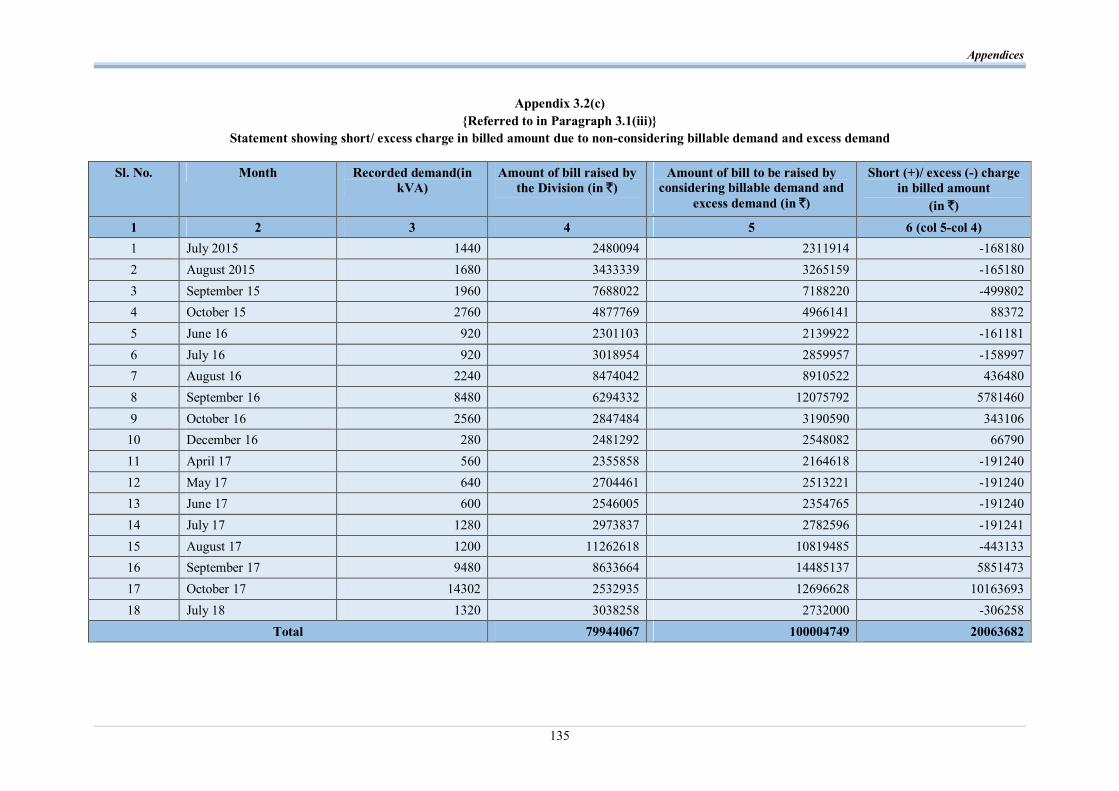
Appendix 3.2(c) {Referred to in Paragraph 3.1(iii)}
Statement showing short/ excess charge in billed amount due to non-considering billable demand and excess demand
Sl. No. Month Recorded demand(in kVA)
Amount of bill raised by the Division (in `)
Amount of bill to be raised by considering billable demand and
excess demand (in `)
Short (+)/ excess (-) charge in billed amount
(in `) 1 2 3 4 5 6 (col 5-col 4) 1 July 2015 1440 2480094 2311914 -168180 2 August 2015 1680 3433339 3265159 -165180 3 September 15 1960 7688022 7188220 -499802 4 October 15 2760 4877769 4966141 88372 5 June 16 920 2301103 2139922 -161181 6 July 16 920 3018954 2859957 -158997 7 August 16 2240 8474042 8910522 436480 8 September 16 8480 6294332 12075792 5781460 9 October 16 2560 2847484 3190590 343106
10 December 16 280 2481292 2548082 66790 11 April 17 560 2355858 2164618 -191240 12 May 17 640 2704461 2513221 -191240 13 June 17 600 2546005 2354765 -191240 14 July 17 1280 2973837 2782596 -191241 15 August 17 1200 11262618 10819485 -443133 16 September 17 9480 8633664 14485137 5851473 17 October 17 14302 2532935 12696628 10163693 18 July 18 1320 3038258 2732000 -306258
Total 79944067 100004749 20063682

Audit Report on Economic Sector and Public Sector Undertakings for the year ended 31 March 2018
136
Appendix-4.1 (Referred to in paragraph 4.1, 4.12 and 4.13)
Summarised financial results of PSUs (other than Power Sector) covered in this Chapter for the latest year for which accounts were finalised
(` in crore) Sl. No.
Sector & Name of the PSU Period of accounts
Year in which
finalised
Net profit/ loss before dividend, interest &
tax
Net profit/ loss after dividend, interest &
tax
Turn over
Paid up capital
(including share
application)
Capital employed
Net Worth
Accumulated Profit/ loss
1 2 3 4 5 6 7 8 9 10 11 I. PSUs working in Monopolistic environment A Government Companies 1 Lucknow Metro Rail Corporation Limited 2017-18 2017-18 -24.57 -25.38 5.55 1897.92 4580.72 1826.67 -71.25 2 NOIDA Metro Rail Corporation Limited 2017-18 2017-18 -4.94 -4.94 9.81 987.67 2104.14 974.14 -13.53
Sub Total -29.51 -30.32 15.36 2885.59 6684.86 2800.81 -84.78 B Other Government controlled companies 3 Almora Magnesite Limited (as per Sec 2 (45) read with
2 (27)) 2017-18 2017-18 3.61 2.47 35.89 2.00 7.52 7.47 5.53
4 Lucknow Smart City Limited 2016-17 2017-18 -0.22 -0.22 0.00 0.50 0.28 0.28 -0.22 Sub Total 3.39 2.25 35.89 2.50 7.80 7.75 5.31 C. Statutory Corporations 5 Uttar Pradesh Avas Evam Vikas Parishad 2016-17 2017-18 160.01 158.95 911.24 0.00 4906.20 4906.20 4906.20 6 Uttar Pradesh Forest Corporation 2016-17 2017-18 32.62 31.92 330.28 0.00 1478.19 1459.22 1459.22 7 Uttar Pradesh State Road Transport Corporation 2016-17 2017-18 108.80 97.19 3903.65 826.19 -229.32 -379.20 -1205.39 8 Uttar Pradesh State Warehousing Corporation 2015-16 2017-18 75.18 51.23 395.98 13.37 481.04 481.04 473.00
Sub Total 376.61 339.29 5541.15 839.56 6636.11 6467.26 5633.03 II. PSUs with Assured Source of Income from centage,
commission, revenue grants/subsidies, etc.
Government Companies 9 U.P. Projects Corporation Limited 2015-16 2017-18 35.86 23.08 790.29 6.40 93.32 93.32 86.92
10 Uttar Pradesh State Construction & Infrastructure Development Corporation Limited (formely known as Uttar Pradesh Samaj Kalyan Nirman Nigam Limited)
2016-17 2017-18 2.42 1.62 692.29 0.15 73.31 73.31 73.16
11 Shreetron India Limited (Subsidiary of Uttar Pradesh Electronics Corporation Limited)
2016-17 2017-18 1.11 0.76 36.91 7.12 12.72 10.09 2.97

Appendices
137
Sl. No.
Sector & Name of the PSU Period of accounts
Year in which
finalised
Net profit/ loss before dividend, interest &
tax
Net profit/ loss after dividend, interest &
tax
Turn over
Paid up capital
(including share
application)
Capital employed
Net Worth
Accumulated Profit/ loss
1 2 3 4 5 6 7 8 9 10 11 12 Uptron Powertronics Ltd. (subsidiary of Uttar Pradesh
Electronics Corporation) 2016-17 2017-18 2.02 1.46 28.22 4.07 2.83 2.83 -1.24
13 Uttar Pradesh Electronics Corporation Limited 2016-17 2017-18 1.75 0.89 79.65 91.54 145.03 34.61 6.18 14 Uttar Pradesh Development Systems Corporation Limited 2016-17 2017-18 7.64 4.35 153.17 1.00 12.02 12.02 11.02 15 Uttar Pradesh Purva Sainik Kalyan Nigam Limited 2016-17 2017-18 38.73 38.73 321.59 0.43 219.22 219.22 218.79 16 Uttar Pradesh (Madhya) Ganna Beej EvamVikas Nigam
Limited 2017-18 2017-18 0.04 0.04 0.18 0.25 1.97 -0.51 -0.76
17 Uttar Pradesh Bhumi Sudhar Nigam 2015-16 2017-18 0.08 0.08 0.21 1.50 2.32 2.32 0.82 18 Uttar Pradesh Police Avas Nigam Limited 2015-16 2016-17 16.50 10.53 26.98 3.00 28.24 28.24 25.24 19 Uttar Pradesh Export Promotion Council 2017-18 2017-18 0.22 0.22 0.66 0.05 0.49 0.49 0.44
Sub Total 106.37 81.76 2130.15 115.51 591.47 475.94 423.54
III. PSUs working in competitive environment A. Government Companies
20 Uttar Pradesh State Spinning Company Limited 2016-17 2017-18 -8.52 -11.69 0.17 93.24 -28.05 -167.53 -260.77 21 The Pradeshiya Industrial and Investment Corporation of UP
Limited 2015-16 2017-18 0.16 -14.35 2.56 135.58 170.47 -233.97 -369.55
Sub Total -8.36 -26.04 2.73 228.82 142.42 -401.50 -630.32
Grand Total 448.50 366.94 7725.28 4071.989 14062.66 9350.2610 5346.78
9 Paid up capital of ` 4,071.98 crore includes an amount of ` 63.11 crore in holding Companies at SI No. 13 which was given by the Government for their subsidiary
companies. Therefore, the amount of ` 63.11 crore has been excluded for calculation of net worth and capital employed. 10 Net worth is the sum total of the paid-up capital and free reserves and surplus minus accumulated losses and deferred revenue expenditure. DRE of ` 5.39 crore was
deducted in case of Uttar Pradesh State Warehousing Corporation (` 5.33) and Almora Magnesite Limited (` 0.06 crore) to arrive at the net worth figure.

Audit Report on Economic Sector and Public Sector Undertakings for the year ended 31 March 2018
138
Appendix-4.2 (Referred to in paragraph 4.1)
Details of State PSUs (other than Power Sector) not covered in this Chapter (` in crore)
Sl. No.
Sector & Name of the PSU Period of latest finalised
accounts
Year in which
finalised
Net profit/ loss after tax
Turn over Paid up capital
1 2 3 4 5 6 7 I Functional PSUs with arrears of accounts for three or more years/first accounts
not received/not due
A Government Companies 1 Uttar Pradesh State Industrial Development Corporation Limited 2013-14 2017-18 95.22 193.45 24.08 2 Uttar Pradesh Alpsankhyak Vittya Avam Vikas Nigam Limited 2005-06 2017-18 -1.10 3.32 30.00 3 Uttar Pradesh Pichhara Varg Vitta Evam Vikas Nigam Limited 2011-12 2014-15 -0.01 2.94 8.10 4 Uttar Pradesh Scheduled Castes Finance and Development Corporation Limited 2014-15 2017-18 -13.25 87.11 230.42 5 Uttar Pradesh Food and Essential Commodities Corporation Limited 2009-10 2017-18 9.97 1512.06 5.50 6 Uttar Pradesh Mahila Kalyan Nigam Limited 2013-14 2014-15 0.36 0.60 5.19 7 Uttar Pradesh Waqf Vikas Nigam Limited 2003-04 2016-17 -0.21 0.38 5.25 8 Uttar Pradesh State Agro Industrial Corporation Limited 2010-11 2016-17 10.26 793.26 46.30 9 Uttar Pradesh Rajkiya Nirman Nigam Limited 2012-13 2016-17 98.48 2588.10 1.00 10 Uttar Pradesh State Bridge Corporation Limited 2014-15 2016-17 27.91 1375.68 15.00 11 Uttar Pradesh Small Industries Corporation Limited 2007-08 2016-17 4.39 175.48 5.96 12 Uttar Pradesh Beej Vikas Nigam Limited 2012-13 2015-16 3.51 272.59 6.92 13 Uttar Pradesh Matsya Vikas Nigam Limited 2011-12 2017-18 1.10 5.94 1.07 14 Uttar Pradesh Drugs and Pharmaceuticals Limited 2009-10 2012-13 -8.53 0.33 1.10 15 Uttar Pradesh Rajya Chini Avam Ganna Vikas Nigam Limited (Subsidiary of Uttar
Pradesh State Sugar Corporation Limited) 2014-15 2017-18 1.24 0.00 880.13
16 Uttar Pradesh State Sugar Corporation Limited 2014-15 2017-18 -26.95 82.26 1648.31 17 Uttar Pradesh Handicraft & Marketing Development Corporation Limited(Formerly
Uttar Pradesh Export Corporation Limited) 2007-08 2017-18 -0.13 10.65 7.24
18 Uttar Pradesh State Tourism Development Corporation Limited 2014-15 2016-17 -5.13 31.08 18.60 19 Lucknow City Transport Services Limited** - - - - - 20 Meerut City Transport Services Limited 2010-11 2012-13 0.00 0.00 0.05 21 Allahabad City Transport Services Limited 2014-15 2017-18 -7.21 16.11 0.05 22 Agra Mathura City Transport Services Limited** - - - - - 23 Kanpur City Transport Services Limited** - - - - - 24 Varanasi City Transport Services Limited** - - - - -
Sub Total 189.92 7151.34 2940.27
Appendices
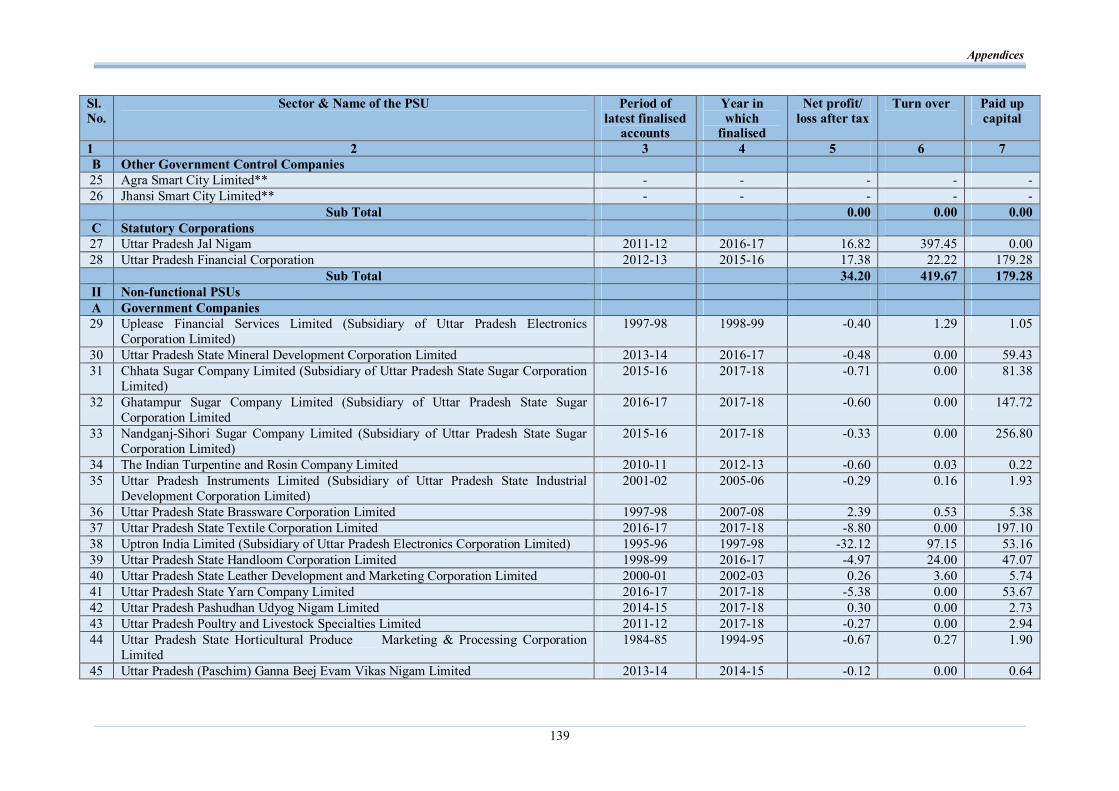
139
Sl. No.
Sector & Name of the PSU Period of latest finalised
accounts
Year in which
finalised
Net profit/ loss after tax
Turn over Paid up capital
1 2 3 4 5 6 7 B Other Government Control Companies 25 Agra Smart City Limited** - - - - - 26 Jhansi Smart City Limited** - - - - - Sub Total 0.00 0.00 0.00 C Statutory Corporations 27 Uttar Pradesh Jal Nigam 2011-12 2016-17 16.82 397.45 0.00 28 Uttar Pradesh Financial Corporation 2012-13 2015-16 17.38 22.22 179.28 Sub Total 34.20 419.67 179.28
II Non-functional PSUs A Government Companies 29 Uplease Financial Services Limited (Subsidiary of Uttar Pradesh Electronics
Corporation Limited) 1997-98 1998-99 -0.40 1.29 1.05
30 Uttar Pradesh State Mineral Development Corporation Limited 2013-14 2016-17 -0.48 0.00 59.43 31 Chhata Sugar Company Limited (Subsidiary of Uttar Pradesh State Sugar Corporation
Limited) 2015-16 2017-18 -0.71 0.00 81.38
32 Ghatampur Sugar Company Limited (Subsidiary of Uttar Pradesh State Sugar Corporation Limited
2016-17 2017-18 -0.60 0.00 147.72
33 Nandganj-Sihori Sugar Company Limited (Subsidiary of Uttar Pradesh State Sugar Corporation Limited)
2015-16 2017-18 -0.33 0.00 256.80
34 The Indian Turpentine and Rosin Company Limited 2010-11 2012-13 -0.60 0.03 0.22 35 Uttar Pradesh Instruments Limited (Subsidiary of Uttar Pradesh State Industrial
Development Corporation Limited) 2001-02 2005-06 -0.29 0.16 1.93
36 Uttar Pradesh State Brassware Corporation Limited 1997-98 2007-08 2.39 0.53 5.38 37 Uttar Pradesh State Textile Corporation Limited 2016-17 2017-18 -8.80 0.00 197.10 38 Uptron India Limited (Subsidiary of Uttar Pradesh Electronics Corporation Limited) 1995-96 1997-98 -32.12 97.15 53.16 39 Uttar Pradesh State Handloom Corporation Limited 1998-99 2016-17 -4.97 24.00 47.07 40 Uttar Pradesh State Leather Development and Marketing Corporation Limited 2000-01 2002-03 0.26 3.60 5.74 41 Uttar Pradesh State Yarn Company Limited 2016-17 2017-18 -5.38 0.00 53.67 42 Uttar Pradesh Pashudhan Udyog Nigam Limited 2014-15 2017-18 0.30 0.00 2.73 43 Uttar Pradesh Poultry and Livestock Specialties Limited 2011-12 2017-18 -0.27 0.00 2.94 44 Uttar Pradesh State Horticultural Produce Marketing & Processing Corporation
Limited 1984-85 1994-95 -0.67 0.27 1.90
45 Uttar Pradesh (Paschim) Ganna Beej Evam Vikas Nigam Limited 2013-14 2014-15 -0.12 0.00 0.64

Audit Report on Economic Sector and Public Sector Undertakings for the year ended 31 March 2018
140
Sl. No.
Sector & Name of the PSU Period of latest finalised
accounts
Year in which
finalised
Net profit/ loss after tax
Turn over Paid up capital
1 2 3 4 5 6 7 46 Uttar Pradesh Panchayati Raj Vitta Evam Vikas Nigam Limited 1995-96 2012-13 -0.16 0.45 1.46 47 Agra Mandal Vikas Nigam Limited 1988-89 2007-08 -0.09 3.91 1.00 48 Allahabad Mandal Vikas Nigam Limited 1983-84 1992-93 -0.11 2.74 0.55 49 Bareilly Mandal Vikas Nigam Limited 1988-89 2011-12 -0.39 3.33 1.00 50 Gorakhpur Mandal Vikas Nigam Limited 1988-89 2013-14 -0.07 0.25 1.26 51 Lucknow Mandaliya Vikas Nigam Limited 1981-82 1992-93 0.01 1.70 0.50 52 Meerut Mandal Vikas Nigam Limited 2008-09 2010-11 -0.03 0.00 1.00 53 Moradabad Mandal Vikas Nigam Limited 1991-92 2011-12 -0.19 0.85 0.25 54 Tarai Anusuchit Janjati Vikas Nigam Limited 1982-83 1990-91 -0.04 0.01 0.25 55 Uttar Pradesh Bundelkhand Vikas Nigam Limited 2010-11 2016-17 0.09 0.00 1.23 56 Uttar Pradesh Chalchitra Nigam Limited 2009-10 2011-12 -0.38 0.12 8.18 57 Uttar Pradesh Poorvanchal Vikas Nigam Limited 1987-88 1994-95 -0.14 1.30 1.15 58 Varanasi Mandal Vikas Nigam Limited 1987-88 1993-94 -0.03 1.47 0.70 Sub Total -54.32 143.16 937.39 B Other Government Control Companies 59 Command Area Poultry Development Corporation Limited (as per Sec 2 (45) read with
2 (27) ) 1994-95 - 0.01 0.96 0.24
Sub Total 0.01 0.96 0.24 III PSUs under liquidation A Government Companies 60 Uttar Pradesh (Poorva) Ganna Beej Evam Vikas Nigam Limited 2002-03
(UL from 01-07-03)
2004-05 -0.18 0.04 0.31
61 Uttar Pradesh (Rohilkhand Tarai) Ganna Beej Evam Vikash Nigam Limited 2006-07 (UL from 01-07-03)
2008-09 -1.05 0.11 0.71
62 Uttar Pradesh Cement Corporation Limited 1995-96 (UL from
08-02-1999)
1996-97 -47.75 113.01 68.28
63 Vindhyachal Abrasives Limited (Subsidiary of Uttar Pradesh State Mineral Development Corporation Limited)
1987-88 (UL from
28-11-2002)
1995-96 -0.12 0.00 0.00

Appendices
141
Sl. No.
Sector & Name of the PSU Period of latest finalised
accounts
Year in which
finalised
Net profit/ loss after tax
Turn over Paid up capital
1 2 3 4 5 6 7 64 Auto Tractors Limited 1991-92
(UL from 14-02-2003)
1995-96 0.11 6.31 7.50
65 Bhadohi Woollens Limited (Subsidiary of Uttar Pradesh State Textile Corporation Ltd.)
1994-95 (UL from 20-02-96)
0 -1.66 0.27 3.76
66 Continental Float Glass Limited (Subsidiary of Uttar Pradesh State Mineral Development Corporation Limited)
1997-98 (UL from
01-04-2002)
2002-03 0.00 0.00 46.24
67 Kanpur Components Limited (Subsidiary of Uttar Pradesh Electronics Corporation Ltd.)
(UL from 10-06-1996)
- 0.00 0.05 0.00
68 Uttar Pradesh Abscott Private Limited (Subsidiary of Uttar Pradesh Small Industries Corporation Limited)
1975-76 (UL from
19-04-1996)
- -0.02 0.00 0.05
69 Uttar Pradesh Carbide and Chemicals Limited (Subsidiary of Uttar Pradesh State Mineral Development Corporation Limited)
1992-93 (UL from 19-02-94)
- -6.18 2.26 6.58
70 Uttar Pradesh Plant Protection Appliances (Private) Limited (Subsidiary of Uttar Pradesh Small Industries Corporation Limited)
1974-75 (UL from 11/2003)
1984-85 -0.01 0.04 0.01
Sub Total -56.86 122.09 133.44 B Other Government Control Companies 71 Electronics and Computers (India) Limited (as per Sec 2 (45) read with 2 (27) ) (UL from
14-07-1981) - 0.00 0.00 0.00
Sub Total 0.00 0.00 0.00 Total of all sectors 112.95 7837.22 4190.62 Note: ** indicate PSUs which have not submitted their first accounts.
Audit Report on Economic Sector and Public Sector Undertakings for the year ended 31 March 2018
142
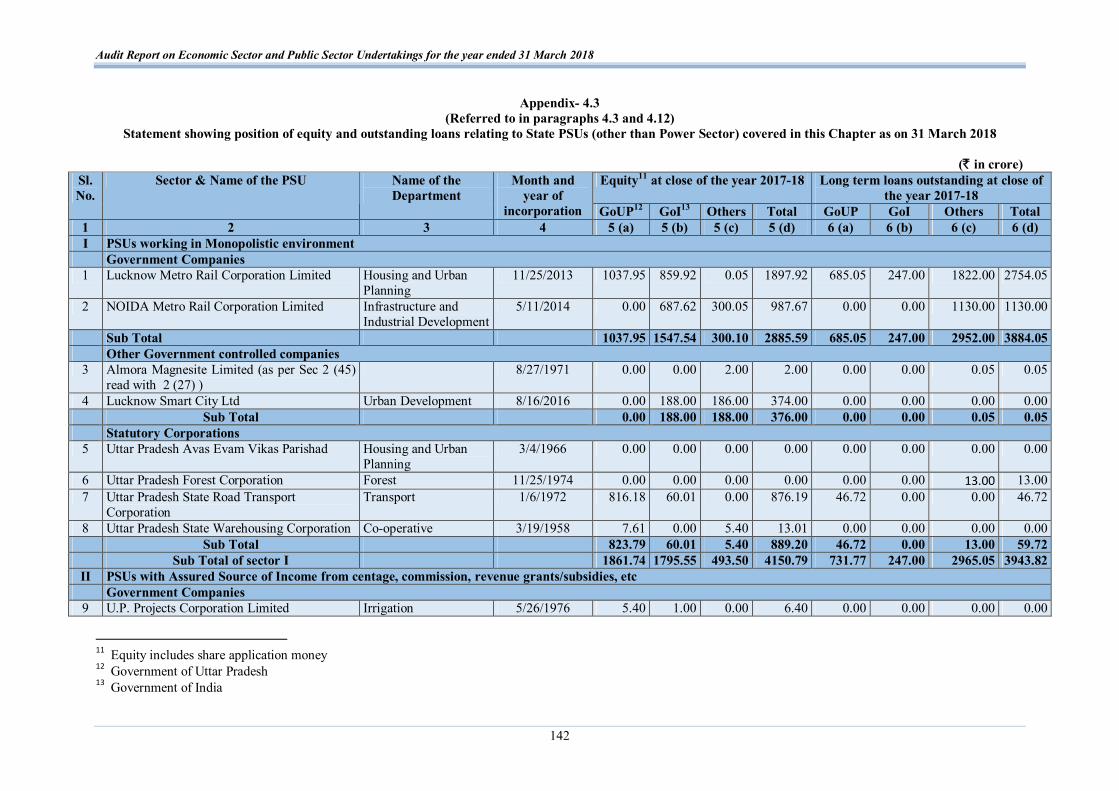
Appendix- 4.3 (Referred to in paragraphs 4.3 and 4.12)
Statement showing position of equity and outstanding loans relating to State PSUs (other than Power Sector) covered in this Chapter as on 31 March 2018
(` in crore) Equity11 at close of the year 2017-18 Long term loans outstanding at close of
the year 2017-18 Sl. No.
Sector & Name of the PSU Name of the Department
Month and year of
incorporation GoUP12 GoI13 Others Total GoUP GoI Others Total 1 2 3 4 5 (a) 5 (b) 5 (c) 5 (d) 6 (a) 6 (b) 6 (c) 6 (d) I PSUs working in Monopolistic environment Government Companies
1 Lucknow Metro Rail Corporation Limited Housing and Urban Planning
11/25/2013 1037.95 859.92 0.05 1897.92 685.05 247.00 1822.00 2754.05
2 NOIDA Metro Rail Corporation Limited Infrastructure and Industrial Development
5/11/2014 0.00 687.62 300.05 987.67 0.00 0.00 1130.00 1130.00
Sub Total 1037.95 1547.54 300.10 2885.59 685.05 247.00 2952.00 3884.05 Other Government controlled companies
3 Almora Magnesite Limited (as per Sec 2 (45) read with 2 (27) )
8/27/1971 0.00 0.00 2.00 2.00 0.00 0.00 0.05 0.05
4 Lucknow Smart City Ltd Urban Development 8/16/2016 0.00 188.00 186.00 374.00 0.00 0.00 0.00 0.00 Sub Total 0.00 188.00 188.00 376.00 0.00 0.00 0.05 0.05 Statutory Corporations
5 Uttar Pradesh Avas Evam Vikas Parishad Housing and Urban Planning
3/4/1966 0.00 0.00 0.00 0.00 0.00 0.00 0.00 0.00
6 Uttar Pradesh Forest Corporation Forest 11/25/1974 0.00 0.00 0.00 0.00 0.00 0.00 13.00 13.00 7 Uttar Pradesh State Road Transport
Corporation Transport 1/6/1972 816.18 60.01 0.00 876.19 46.72 0.00 0.00 46.72
8 Uttar Pradesh State Warehousing Corporation Co-operative 3/19/1958 7.61 0.00 5.40 13.01 0.00 0.00 0.00 0.00 Sub Total 823.79 60.01 5.40 889.20 46.72 0.00 13.00 59.72 Sub Total of sector I 1861.74 1795.55 493.50 4150.79 731.77 247.00 2965.05 3943.82
II PSUs with Assured Source of Income from centage, commission, revenue grants/subsidies, etc Government Companies
9 U.P. Projects Corporation Limited Irrigation 5/26/1976 5.40 1.00 0.00 6.40 0.00 0.00 0.00 0.00
11 Equity includes share application money 12 Government of Uttar Pradesh 13 Government of India

Appendices
143
Equity11 at close of the year 2017-18 Long term loans outstanding at close of the year 2017-18
Sl. No.
Sector & Name of the PSU Name of the Department
Month and year of
incorporation GoUP12 GoI13 Others Total GoUP GoI Others Total 1 2 3 4 5 (a) 5 (b) 5 (c) 5 (d) 6 (a) 6 (b) 6 (c) 6 (d) 10 Uttar Pradesh State Construction &
Infrastructure Development Corporation Limited (formerly known as Uttar Pradesh Samaj Kalyan Nirman Nigam Limited)
Samaj Kalyan 6/25/1976 0.15 0.00 0.00 0.15 0.00 0.00 0.00 0.00
11 Shreetron India Limited (Subsidiary of Uttar Pradesh Electronics Corporation Limited)
Information Technology and Electronics
10/2/1979 0.00 0.00 7.12 7.12 0.00 0.00 2.63 2.63
12 Uptron Powertronics Ltd. (subsidiary of Uttar Pradesh Electronics Corporation)
Information Technology and Electronics
10/4/1974 0.00 0.00 4.07 4.07 0.00 0.00 0.00 0.00
13 Uttar Pradesh Electronics Corporation Limited.
Information Technology and Electronics
3/20/1974 91.54 0.00 0.00 91.54 112.88 0.00 0.00 112.88
14 Uttar Pradesh Development Systems Corporation Limited
Information Technology and Electronics
3/15/1977 1.00 0.00 0.00 1.00 0.00 0.00 0.00 0.00
15 Uttar Pradesh Purva Sainik Kalyan Nigam Limited
Samaj Kalyan 5/23/1989 0.43 0.00 0.00 0.43 0.00 0.00 0.00 0.00
16 Uttar Pradesh (Madhya) Ganna Beej Evam Vikas Nigam Limited
Sugar Industry and Cane Development
8/27/1975 0.15 0.00 0.10 0.25 0.00 0.00 2.48 2.48
17 Uttar Pradesh Bhumi Sudhar Nigam Agriculture 3/30/1978 1.50 0.00 0.00 1.50 0.00 0.00 0.00 0.00 18 Uttar Pradesh Police Avas Nigam Limited Home 3/27/1987 3.00 0.00 0.00 3.00 0.00 0.00 0.00 0.00 19 Uttar Pradesh Export Promotion Council Laghu Udyog evam
Niryat Protsahan 8/11/2016 0.05 0.00 0.00 0.05 5.00 0.00 0.00 5.00
Sub Total 103.22 1.00 11.29 115.51 117.88 0.00 5.11 122.99 Sub Total of sector II 103.22 1.00 11.29 115.51 117.88 0.00 5.11 122.99
III PSUs working in Competitive environment Government Companies
20 Uttar Pradesh State Spinning Company Limited
Hathkargha evam Vastra Udhyog
8/20/1976 93.24 0.00 0.00 93.24 139.20 0.00 0.00 139.20
21 The Pradeshiya Industrial and Investment Corporation of UP Limited
Infrastructure and Industrial Development
3/29/1972 110.58 0.00 25.00 135.58 706.13 0.00 0.00 706.13
Sub Total 203.82 0.00 25.00 228.82 845.33 0.00 0.00 845.33 Sub Total of Sector III 203.82 0.00 25.00 228.82 845.33 0.00 0.00 845.33 Grand Total 2168.78 1796.55 529.79 4495.12 1694.98 247.00 2970.16 4912.14

Audit Report on Economic Sector and Public Sector Undertakings for the year ended 31 March 2018
144
Appendix-4.4 (Referred to in paragraph 4.7)
Statement showing difference between Finance Accounts of Government of Uttar Pradesh and Accounts of the State PSUs (other than Power Sector) in respect of balances of Equity, Loans and Guarantees as on 31 March 2018
(` in crore) As per records of State PSUs As per Finance Accounts of
Government of Uttar Pradesh Difference Sl.
No. Name of the PSU
Paid up Capital
Loan Outstanding
Guarantee outstanding
Paid up Capital
Loan Outstanding
Guarantee outstanding
Paid up Capital
Loan Outstanding
Guarantee outstanding
1 2 3 4 5 6 7 8 9=3-6 10=4-7 11=5-8 1 Lucknow Metro Rail Corporation Limited 1037.95 685.05 0 955.05 774.05 0 82.9 -89 0 2 NOIDA Metro Rail Corporation Limited 0.00 0.00 0.00 0 0 0 0 0 0 3 Almora Magnesite Limited (as per Sec 2 (45)
read with 2 (27) ) 0.00 0.00 0.00 0 0 0 0 0 0
4 Lucknow Smart City Limited 0.00 0.00 0.00 0 0 0 0 0 0 5 Uttar Pradesh Avas Evam Vikas Parishad 0.00 0.00 0.00 0 0 0 0 0 0 6 Uttar Pradesh Forest Corporation 0.00 0.00 0.00 0 0 0 0 0 0 7 Uttar Pradesh State Road Transport
Corporation 816.18 46.72 0.00 766.18 54.18 0 50 -7.46 0
8 Uttar Pradesh State Warehousing Corporation 7.61 0.00 0.00 7.79 0 0 -0.18 0 0 9 U.P. Projects Corporation Limited 5.40 0.00 0.00 5.40 0 0 0 0 0 10 Uttar Pradesh State Construction &
Infrastructure Development Corporation Limited (formerly known as Uttar Pradesh Samaj Kalyan Nirman Nigam Limited)
0.15 0 0 0.15 0 0 0 0 0
11 Shreetron India Limited (Subsidiary of Uttar Pradesh Electronics Corporation Limited)
0.00 0 0 0 0 0 0 0 0
12 Uptron Powertronics Ltd. (subsidiary of Uttar Pradesh Electronics Corporation)
0.00 0 0 0 0 0 0 0 0
13 Uttar Pradesh Electronics Corporation Limited.
91.54 112.88 0 91.54 34.08 0 0 78.8 0
14 Uttar Pradesh Development Systems Corporation Limited
1.00 0.00 0.00 1.00 0.00 0.00 0.00 0.00 0.00
15 Uttar Pradesh Purva Sainik Kalyan Nigam Limited
0.43 0 0 0.43 0 0 0 0 0
16 Uttar Pradesh (Madhya) Ganna Beej Evam Vikas Nigam Limited
0.15 0 0 0.15 0 1.8 0 0 -1.8

Appendices
145
As per records of State PSUs As per Finance Accounts of Government of Uttar Pradesh
Difference Sl. No.
Name of the PSU
Paid up Capital
Loan Outstanding
Guarantee outstanding
Paid up Capital
Loan Outstanding
Guarantee outstanding
Paid up Capital
Loan Outstanding
Guarantee outstanding
1 2 3 4 5 6 7 8 9=3-6 10=4-7 11=5-8 17 Uttar Pradesh Bhumi Sudhar Nigam 1.50 0 0 1.5 0 0 0 0 0 18 Uttar Pradesh Police Avas Nigam Limited 3.00 0 0 3 0 0 0 0 0 19 Uttar Pradesh Export Promotion Council 0.05 5 0 0 0 0 0.05 5 0 20 Uttar Pradesh State Spinning Company
Limited 93.24 139.20 0 93.24 10.42 0 0 128.78 0
21 The Pradeshiya Industrial and Investment Corporation of UP Limited
110.58 706.13 0 135.58 467.33 5.09 -25 238.8 -5.09
22 Uttar Pradesh State Industrial Development Corporation Limited
24.08 1.98 0 24.08 143.45 0 0 -141.47 0
23 Uttar Pradesh Alpsankhyak Vittya Avam Vikas Nigam Limited
30.00 0 0 30 15.18 0 0 -15.18 0
24 Uttar Pradesh Pichhara Varg Vitta Evam Vikas Nigam Limited
12.23 0 52.65 12.23 0 52.65 0 0 0
25 Uttar Pradesh Scheduled Castes Finance and Development Corporation Limited
126.55 0 0 126.55 0 0 0 0 0
26 Uttar Pradesh Food and Essential Commodities Corporation Limited
12.34 0.73 0 12.34 -7.31 0 0 8.04 0
27 Uttar Pradesh Mahila Kalyan Nigam Limited 4.71 0 0 4.71 0 0 0 0 0 28 Uttar Pradesh Waqf Vikas Nigam Limited 10.00 0 0 10 0 0 0 0 0 29 Uttar Pradesh State Agro Industrial
Corporation Limited 59.01 5 0 59.01 4.69 0 0 0.31 0
30 Uttar Pradesh Rajkiya Nirman Nigam Limited 1.00 0 0 1 0 0 0 0 0 31 Uttar Pradesh State Bridge Corporation
Limited 15.00 0 0 15 0 0 0 0 0
32 Uttar Pradesh Small Industries Corporation Limited
5.96 6.32 0 5.96 0.42 0 0 5.9 0
33 Uttar Pradesh Beej Vikas Nigam Limited 6.25 0 0 6.25 0 0 0 0 0 34 Uttar Pradesh Matsya Vikas Nigam Limited 1.07 0 0 1.07 0 0 0 0 0 35 Uttar Pradesh Drugs and Pharmaceuticals
Limited 1.10 0 0 1.1 0 0 0 0 0

Audit Report on Economic Sector and Public Sector Undertakings for the year ended 31 March 2018
146
As per records of State PSUs As per Finance Accounts of Government of Uttar Pradesh
Difference Sl. No.
Name of the PSU
Paid up Capital
Loan Outstanding
Guarantee outstanding
Paid up Capital
Loan Outstanding
Guarantee outstanding
Paid up Capital
Loan Outstanding
Guarantee outstanding
1 2 3 4 5 6 7 8 9=3-6 10=4-7 11=5-8 36 Uttar Pradesh Rajya Chini Avam Ganna Vikas
Nigam Limited (Subsidiary of Uttar Pradesh State Sugar Corporation Limited)
0.00 0 0 880.13 0 0 -880.13 0 0
37 Uttar Pradesh State Sugar Corporation Limited
1648.31 166.8 73.96 1648.31 944.05 0 0 -777.25 73.96
38 Uttar Pradesh Handicraft & Marketing Development Corporation Limited (Formerly Uttar Pradesh Export Corporation Limited)
6.34 12.44 0 6.34 5.77 0 0 6.67 0
39 Uttar Pradesh State Tourism Development Corporation Limited
32.60 0.66 0 32.6 2.76 0 0 -2.1 0
40 Lucknow City Transport Services Limited* 17.84 0 0 0 0 0 17.84 0 0 41 Meerut City Transport Services Limited 0.05 0 0 0 0 0 0.05 0 0 42 Allahabad City Transport Services Limited 0.05 0 0 0 0 0 0.05 0 0 43 Agra Mathura City Transport Services
Limited* 0.05 0 0 0 0 0 0.05 0 0
44 Kanpur City Transport Services Limited* 0.05 0 0 0 0 0 0.05 0 0 45 Varanasi City Transport Services Limited* 0.05 0 0 0 0 0 0.05 0 0 46 Agra Smart City Limited* 0.00 0 0 0 0 0 0 0 0 47 Jhansi Smart City Limited* 0.00 0 0 0 0 0 0 0 0 48 Uttar Pradesh Jal Nigam 0.00 1196.19 0 0 88.77 0 0 1107.42 0 49 Uttar Pradesh Financial Corporation 114.17 292.99 27.46 114.17 13.81 27.46 0 279.18 0 Sub Total of Functional PSUs 4297.59 3378.09 154.07 5051.86 2551.65 87 -754.27 826.44 67.07 Non-functional PSUs
50 Uplease Financial Services Limited (Subsidiary of Uttar Pradesh Electronics Corporation Limited)
0.00 0 0 0 0 0 0 0 0
51 Uttar Pradesh State Mineral Development Corporation Limited
59.43 18.24 0 59.43 6.83 0 0 11.41 0
52 Chhata Sugar Company Limited (Subsidiary of Uttar Pradesh State Sugar Corporation Limited)
0.00 0 0 0 0 0 0 0 0
53 Ghatampur Sugar Company Limited (Subsidiary of Uttar Pradesh State Sugar Corporation Limited
0.00 0 0 0 0 0 0 0 0

Appendices
147
As per records of State PSUs As per Finance Accounts of Government of Uttar Pradesh
Difference Sl. No.
Name of the PSU
Paid up Capital
Loan Outstanding
Guarantee outstanding
Paid up Capital
Loan Outstanding
Guarantee outstanding
Paid up Capital
Loan Outstanding
Guarantee outstanding
1 2 3 4 5 6 7 8 9=3-6 10=4-7 11=5-8 54 Nandganj-Sihori Sugar Company Limited
(Subsidiary of Uttar Pradesh State Sugar Corporation Limited)
0.00 0 0 0 0 0 0 0 0
55 The Indian Turpentine and Rosin Company Limited
0.19 5.33 0 0.19 1.9 1.76 0 3.43 -1.76
56 Uttar Pradesh Instruments Limited (Subsidiary of Uttar Pradesh State Industrial Development Corporation Limited)
0.09 5.55 0 0.09 0 0 0 5.55 0
57 Uttar Pradesh State Brassware Corporation Limited
5.28 1.94 0 5.28 0.15 0 0 1.79 0
58 Uttar Pradesh State Textile Corporation Limited
197.10 88.52 0 160.79 202.76 0 36.31 -114.24 0
59 Uptron India Limited (Subsidiary of Uttar Pradesh Electronics Corporation Limited)
0.00 0 0 0 0 0 0 0 0
60 Uttar Pradesh State Handloom Corporation Limited
36.44 123.71 0 36.44 12.53 0 0 111.18 0
61 Uttar Pradesh State Leather Development and Marketing Corporation Limited
5.74 1.91 0 5.74 1.4 0 0 0.51 0
62 Uttar Pradesh State Yarn Company Limited 53.67 66.12 0 31.91 13.17 0 21.76 52.95 0 63 Uttar Pradesh Pashudhan Udyog Nigam
Limited 2.10 0.71 0 2.73 1.1 0 -0.63 -0.39 0
64 Uttar Pradesh Poultry and Livestock Specialties Limited
2.88 0 0 0.44 0 0 2.44 0 0
65 Uttar Pradesh State Horticultural Produce Marketing & Processing Corporation Limited
6.41 3.34 0.55 8.72 0 0.55 -2.31 3.34 0
66 Uttar Pradesh (Paschim) Ganna Beej Evam Vikas Nigam Limited
0.51 0 0 0.51 0 0.7 0 0 -0.7
67 Uttar Pradesh Panchayati Raj Vitta Evam Vikas Nigam Limited
0.78 0 0 0.78 0 0 0 0 0
68 Agra Mandal Vikas Nigam Limited 1.00 0.05 0 1 0 0 0 0.05 0 69 Allahabad Mandal Vikas Nigam Limited 0.67 0.66 0 0.67 0 0 0 0.66 0 70 Bareilly Mandal Vikas Nigam Limited 1.25 0 0 1.25 0 0 0 0 0 71 Gorakhpur Mandal Vikas Nigam Limited 0.94 0.65 0 0.93 0 0 0.01 0.65 0

Audit Report on Economic Sector and Public Sector Undertakings for the year ended 31 March 2018
148
As per records of State PSUs As per Finance Accounts of Government of Uttar Pradesh
Difference Sl. No.
Name of the PSU
Paid up Capital
Loan Outstanding
Guarantee outstanding
Paid up Capital
Loan Outstanding
Guarantee outstanding
Paid up Capital
Loan Outstanding
Guarantee outstanding
1 2 3 4 5 6 7 8 9=3-6 10=4-7 11=5-8 72 Lucknow Mandaliya Vikas Nigam Limited 0.70 0.86 0 0.7 0 0 0 0.86 0 73 Meerut Mandal Vikas Nigam Limited 1.00 0 0 1 0 0 0 0 0 74 Moradabad Mandal Vikas Nigam Limited 0.25 0.65 0 0.25 0 0 0 0.65 0 75 Tarai Anusuchit Janjati Vikas Nigam Limited 0.45 1.25 0 0.45 0 0 0 1.25 0 76 Uttar Pradesh Bundelkhand Vikas Nigam
Limited 1.23 0.05 0 1.23 0 0 0 0.05 0
77 Uttar Pradesh Chalchitra Nigam Limited 8.18 2.47 0 8.18 0.31 0 0 2.16 0 78 Uttar Pradesh Poorvanchal Vikas Nigam
Limited 1.30 0.35 0 1.3 0 0 0 0.35 0
79 Varanasi Mandal Vikas Nigam Limited 0.70 0 0 0.7 0 0 0 0 0 80 Command Area Poultry Development
Corporation Limited (as per Sec 2 (45) read with 2 (27) )
0.00 0 0 0 0 0 0 0 0
Sub Total 388.29 322.36 0.55 330.71 240.15 3.01 57.58 82.21 -2.46 PSUs under liquidation Government Companies
81 Uttar Pradesh (Poorva) Ganna Beej Evam Vikas Nigam Limited
0.23 1.7 0 0.23 1.7 0 0 0 0
82 Uttar Pradesh (Rohilkhand Tarai) Ganna Beej Evam Vikash Nigam Limited
0.38 6.55 0 0.38 0 0 0 6.55 0
83 Uttar Pradesh Cement Corporation Limited 68.28 124.77 0 68.28 37.45 0 0 87.32 0 84 Vindhyachal Abrasives Limited (Subsidiary of
Uttar Pradesh State Mineral Development Corporation Limited)
0.00 0 0 0 0 0 0 0 0
85 Auto Tractors Limited 5.63 0.38 0 5.63 14.89 0 0 -14.51 0 86 Bhadohi Woollens Limited (Subsidiary of
Uttar Pradesh State Textile Corporation Ltd.) 0.00 0 0 0 0 0 0 0 0
87 Continental Float Glass Limited (Subsidiary of Uttar Pradesh State Mineral Development Corporation Limited)
0.00 0 0 0 0 0 0 0 0
88 Kanpur Components Limited (Subsidiary of Uttar Pradesh Electronics Corporation Ltd.)
0.00 0 0 0 0 0 0 0 0

Appendices
149
As per records of State PSUs As per Finance Accounts of Government of Uttar Pradesh
Difference Sl. No.
Name of the PSU
Paid up Capital
Loan Outstanding
Guarantee outstanding
Paid up Capital
Loan Outstanding
Guarantee outstanding
Paid up Capital
Loan Outstanding
Guarantee outstanding
1 2 3 4 5 6 7 8 9=3-6 10=4-7 11=5-8 89 Uttar Pradesh Abscott Private Limited
(Subsidiary of Uttar Pradesh Small Industries Corporation Limited)
0.00 0 0 0 0 0 0 0 0
90 Uttar Pradesh Carbide and Chemicals Limited (Subsidiary of Uttar Pradesh State Mineral Development Corporation Limited)
0.00 11.02 0 0 0 0 0 11.02 0
91 Uttar Pradesh Plant Protection Appliances (Private) Limited (Subsidiary of Uttar Pradesh Small Industries Corporation Limited)
0.00 0 0 0 0 0 0 0 0
92 Electronics and Computers (India) Limited (as per Sec 2 (45) read with 2 (27) )
0.00 0 0 0 0 0 0 0 0
Sub Total 74.52 144.42 0.00 74.52 54.04 0.00 0.00 90.38 0.00
Sub Total of Non-Functional PSUs 462.81 466.78 0.55 405.23 294.19 3.01 57.58 172.59 -2.46 Grand Total 4760.40 3844.87 154.62 5457.09 2845.84 90.01 -696.69 999.03 64.61

Audit Report on Economic Sector and Public Sector Undertakings for the year ended 31 March 2018
150
Appendix-4.5 (Referred to in paragraph 4.8.1)
Statement showing position of State Government investment in State PSUs (other than Power Sector) accounts of which were in arrears (` in crore)
Investment made by the State Government during the year for which Accounts are in arrears
S. No.
Name of the PSU Period upto which accounts
finalised
Period for which accounts are in
arrears
Paid up capital as per latest accounts finalised
Equity Loans Capital grant/ Other
Grant
Subsidy Total
1 2 3 4 5 6 7 8 9 10 A. Functional PSUs
I. Arrears up to 1 years 1 Uttar Pradesh State Spinning Company
Limited 2016-17 2017-18 93.24 0.00 7.99 0.00 0.00 7.99
2 Uttar Pradesh Development Systems Corporation Limited
2016-17 2017-18 1.00 0.00 0.00 1.00 0.00 1.00
3 Uttar Pradesh State Road Transport Corporation
2016-17 2017-18 826.19 50.00 0.00 0.00 0.00 50.00
Sub Total-I 920.43 50.00 7.99 1.00 0.00 58.99 II. Arrears up to 02 years
4 The Pradeshiya Industrial and Investment Corporation of U P Limited
2015-16 2016-17 & 2017-18 135.58 0.00 30.27 0.00 30.27
Sub Total-II 135.58 0.00 30.27 0.00 0.00 30.27 III. Arrears 03 years or more
5 Uttar Pradesh Alpsankhyak Vittya Avam Vikas Nigam Limited
2005-06 2006-07 to 2017-18 30.00 0.00 0.00 64.22 0.00 64.22
6 Uttar Pradesh Scheduled Caste Finance and Development Corporation Limited
2014-15 2015-16 to 2017-18 230.42 3.31 0.00 0.25 0.00 3.56
7 Uttar Pradesh Food & Essential Corporation Limited
2009-10 2010-11 to 2017-18 5.50 6.83 0.00 0.00 0.00 6.83
8 Uttar Pradesh Waqf Vikas Nigam Limited
2003-04 2004-05 to 2017-18 5.25 4.75 0.00 0.00 0.00 4.75
9 Uttar Pradesh State Agro Industrial Corporation Limited
2010-11 2011-12 to 2017-18 46.30 10.41 0.00 0.00 0.00 10.41
10 Uttar Pradesh State Sugar Corporation Limited
2014-15 2015-16 to 2017-18 1648.31 0.00 180.00 0.00 0.00 180.00
11 Uttar Pradesh Matsya Vikas Nigam Limited
2011-12 2012-13 to 2017-18 1.07 0.00 0.00 0.08 0.00 0.08

Appendices
151
Investment made by the State Government during the year for which Accounts are in arrears
S. No.
Name of the PSU Period upto which accounts
finalised
Period for which accounts are in
arrears
Paid up capital as per latest accounts finalised
Equity Loans Capital grant/ Other
Grant
Subsidy Total
1 2 3 4 5 6 7 8 9 10 12 U.P. Handicrafts & Marketing
Development Corporation Limited 2007-08 2008-09 to 2017-18 7.24 0.00 5.00 13.19 0.00 18.19
13 Uttar Pradesh Mahila Kalyan Nigam Limited
2013-14 2014-15 to 2017-18 5.19 0.00 0.00 15.14 0.00 15.14
14 Lucknow City Transport Services Limited
Incorporated on 01-02-2010
2009-10 to 2017-18 0.00 17.84 0.00 19.30 0.00 37.14
15 Meerut City Transport Services Limited 2010-11 2012-13 to 2017-18 0.05 0.00 0.00 11.38 0.00 11.38 16 Allahabad City Transport Services
Limited 2014-15 2015-16 to 2017-18 0.05 0.00 0.00 15.73 0.00 15.73
17 Agra Mathura City Transport Services Limited
Incorporated w.e.f. 08-07-10
2010-11 to 2017-18 0.00 0.05 0.00 22.57 0.00 22.62
18 Kanpur City Transport Services Limited Incorporated w.e.f. 28-04-10
2010-11 to 2017-18 0.00 0.05 0.00 27.50 0.00 27.55
19 Varanasi City Transport Services Limited
Incorporated on 15-06-2010
2010-11 to 2017-18 0.00 0.05 0.00 22.66 0.00 22.71
20 Uttar Pradesh Jal Nigam 2011-12 2012-13 to 2017-18 0.00 0.00 440.61 10613.67 0.00 11054.28 Sub Total-III 1979.38 43.29 625.61 10825.69 0.00 11494.59
Total A 3035.39 93.29 663.87 10826.69 0.00 11583.85 B. Non-Functional PSUs
I. Arrears up to 1 years 21 Uttar Pradesh State Yarn Company 2016-17 2017-18 53.67 0.00 4.01 0.00 0.00 4.01
Sub Total-I 53.67 0.00 4.01 0.00 0.00 4.01 II. Arrears 03 years or more
22 The Indian Turpentine and Rosin Company Limited
2010-11 2011-12 to 2017-18 0.22 0.00 0.34 0.00 0.00 0.34
23 Uttar Pradesh State Handloom Corporation Limited
1998-1999 1999-2000 to 2017-18 47.07 0.00 106.55 0.00 0.00 106.55
Sub Total-II 47.29 0.00 106.89 0.00 0.00 106.89 Total B 100.96 0.00 110.90 0.00 0.00 110.90
Grand Total 3136.35 93.29 774.77 10826.69 0.00 11694.75

Audit Report on Economic Sector and Public Sector Undertakings for the year ended 31 March 2018
152
Appendix-4.6 (Referred to in Paragraph 4.15)
Statement showing State Government fund infused in State PSUs (other than Power Sector) during the period from 2000-01 to 2017-18
(` in crore) 1. Lucknow Metro Rail Corporation Limited 2. Uttar Pradesh State Road Transport
Corporation 3. Uttar Pradesh State Warehousing
Corporation Year
Equity Interest
free Loans Loans on
which interest
payment has been
defaulted
Capital Grants
Equity Interest free Loans
Loans on which
interest payment has been defaulted
Capital Grants
Equity Interest free
Loans
Loans on which
interest payment has been defaulted
Capital Grants
Up to 1999-2000 0.00 0.00 0 0.00 252.11 0.00 0.00 7.79 0.00 2000-01 0.00 0.00 0.00 0.00 0.00 0.00 0.00 0.00 0.00 0.00 0.00 0.00 2001-02 0.00 0.00 0.00 0.00 0.00 0.00 0.00 0.00 0.00 0.00 0.00 0.00 2002-03 0.00 0.00 0.00 0.00 0.00 0.00 0.00 0.00 0.00 0.00 0.00 0.00 2003-04 0.00 0.00 0.00 0.00 0.00 0.00 0.00 0.00 0.00 0.00 0.00 0.00 2004-05 0.00 0.00 0.00 0.00 0.00 0.00 0.00 0.00 0.00 0.00 0.00 0.00 2005-06 0.00 0.00 0.00 0.00 0.00 0.00 0.00 0.00 0.00 0.00 0.00 0.00 2006-07 0.00 0.00 0.00 0.00 47.00 0.00 0.00 0.00 0.00 0.00 0.00 0.00 2007-08 0.00 0.00 0.00 0.00 0.00 0.00 0.00 0.00 0.00 0.00 0.00 0.00 2008-09 0.00 0.00 0.00 0.00 10.00 0.00 0.00 0.00 0.00 0.00 0.00 0.00 2009-10 0.00 0.00 0.00 0.00 0.00 0.00 0.00 0.00 0.00 0.00 0.00 0.00 2010-11 0.00 0.00 0.00 0.00 0.00 0.00 0.00 0.00 0.00 0.00 0.00 0.00 2011-12 0.00 0.00 0.00 0.00 39.52 0.00 0.00 0.00 0.00 0.00 0.00 0.00 2012-13 0.00 0.00 0.00 0.00 6.00 0.00 0.00 0.00 0.00 0.00 0.00 0.00 2013-14 20.00 0.00 0.00 27.00 3.43 0.00 0.00 0.00 0.00 0.00 0.00 0.00 2014-15 60.00 35.00 0.00 115.00 151.32 0.00 0.00 0.00 -0.18 0.00 0.00 0.00 2015-16 475.00 150.00 0.00 73.29 158.47 0.00 0.00 0.00 0.00 0.00 0.00 0.00 2016-17 400.00 350.00 0.00 20.46 98.33 0.00 0.00 0.00 0.00 0.00 0.00 0.00 2017-18 82.95 150.05 0.00 0.00 50.00 0.00 0.00 0.00 0.00 0.00 0.00 0.00
Total 1037.95 685.05 0 235.75 816.18 0.00 0.00 0.00 7.61 0.00 0.00 0.00

Audit Report on Economic Sector and Public Sector Undertakings for the year ended 31 March 2018
153
4. U.P. Projects Corporation Limited 5. Uttar Pradesh State Construction & Infrastructure Development Corporation
Limited (formerly known as Uttar Pradesh Samaj Kalyan Nirman Nigam Limited)
6. Uttar Pradesh Electronics Corporation Limited
Year
Equity Interest free Loans
Loans on which
interest payment has been defaulted
Capital Grants
Equity Interest free
Loans
Loans on which
interest payment has been defaulted
Capital Grants
Equity Interest free
Loans
Loans on which
interest payment has been defaulted
Capital Grants
Up to 1999-2000 5.40 0.00 0.00 0.00 0.15 0.00 0.00 0.00 77.51 24.99 10.45 0.00 2000-01 0.00 0.00 0.00 0.00 0.00 0.00 0.00 0.00 0.00 17.75 0.00 0.00 2001-02 0.00 0.00 0.00 0.00 0.00 0.00 0.00 0.00 0.00 0.00 0.00 0.00 2002-03 0.00 0.00 0.00 0.00 0.00 0.00 0.00 0.00 10.15 18.75 0.00 0.00 2003-04 0.00 0.00 0.00 0.00 0.00 0.00 0.00 0.00 0.00 6.25 0.00 0.00 2004-05 0.00 0.00 0.00 0.00 0.00 0.00 0.00 0.00 0.00 5.34 -0.42 0.00 2005-06 0.00 0.00 0.00 0.00 0.00 0.00 0.00 0.00 0.00 0.00 0.00 0.00 2006-07 0.00 0.00 0.00 0.00 0.00 0.00 0.00 0.00 0.00 0.00 0.00 0.00 2007-08 0.00 0.00 0.00 0.00 0.00 0.00 0.00 0.00 0.00 0.00 0.00 0.00 2008-09 0.00 0.00 0.00 0.00 0.00 0.00 0.00 0.00 3.88 0.00 0.00 0.00 2009-10 0.00 0.00 0.00 0.00 0.00 0.00 0.00 0.00 0.00 0.00 0.00 0.00 2010-11 0.00 0.00 0.00 0.00 0.00 0.00 0.00 0.00 0.00 32.70 0.00 0.00 2011-12 0.00 0.00 0.00 0.00 0.00 0.00 0.00 0.00 0.00 0.00 0.00 0.00 2012-13 0.00 0.00 0.00 0.00 0.00 0.00 0.00 0.00 0.00 0.00 0.00 0.00 2013-14 0.00 0.00 0.00 0.00 0.00 0.00 0.00 0.00 0.00 0.00 0.00 0.00 2014-15 0.00 0.00 0.00 0.00 0.00 0.00 0.00 0.00 0.00 0.00 0.00 0.00 2015-16 0.00 0.00 0.00 0.00 0.00 0.00 0.00 0.00 0.00 0.00 0.00 0.00 2016-17 0.00 0.00 0.00 0.00 0.00 0.00 0.00 0.00 0.00 -0.28 0.00 0.00 2017-18 0.00 0.00 0.00 0.00 0.00 0.00 0.00 0.00 0.00 0.00 0.00 0.00
Total 5.40 0.00 0.00 0.00 0.15 0.00 0.00 0.00 91.54 105.50 10.03 0.00

Audit Report on Economic Sector and Public Sector Undertakings for the year ended 31 March 2018
154
7. Uttar Pradesh Development Systems Corporation Limited
8. Uttar Pradesh Purva Sainik Kalyan Nigam Limited
9. Uttar Pradesh (Madhya) Ganna Beej Evam Vikas Nigam Limited
Year
Equity Interest free Loans
Loans on which
interest payment has been defaulted
Capital Grants
Equity Interest free
Loans
Loans on which
interest payment has been defaulted
Capital Grants
Equity Interest free
Loans
Loans on which
interest payment has been defaulted
Capital Grants
Up to 1999-2000 1.00 0.00 0.00 0.00 0.43 0.00 0.00 0.15 0.00 0.00 0.00 2000-01 0.00 0.00 0.00 0.00 0.00 0.00 0.00 0.00 0.00 0.00 0.00 0.00 2001-02 0.00 0.00 0.00 0.00 0.00 0.00 0.00 0.00 0.00 0.00 0.00 0.00 2002-03 0.00 0.00 0.00 0.00 0.00 0.00 0.00 0.00 0.00 0.00 0.00 0.00 2003-04 0.00 0.00 0.00 0.00 0.00 0.00 0.00 0.00 0.00 0.00 0.00 0.00 2004-05 0.00 0.00 0.00 0.00 0.00 0.00 0.00 0.00 0.00 0.00 0.00 0.00 2005-06 0.00 0.00 0.00 0.00 0.00 0.00 0.00 0.00 0.00 0.00 0.00 0.00 2006-07 0.00 0.00 0.00 0.00 0.00 0.00 0.00 0.00 0.00 0.00 0.00 0.00 2007-08 0.00 0.00 0.00 0.00 0.00 0.00 0.00 0.00 0.00 0.00 0.00 0.00 2008-09 0.00 0.00 0.00 0.00 0.00 0.00 0.00 0.00 0.00 0.00 0.00 0.00 2009-10 0.00 0.00 0.00 0.00 0.00 0.00 0.00 0.00 0.00 0.00 0.00 0.00 2010-11 0.00 0.00 0.00 0.00 0.00 0.00 0.00 0.00 0.00 0.00 0.00 0.00 2011-12 0.00 0.00 0.00 0.00 0.00 0.00 0.00 0.00 0.00 0.00 0.00 0.00 2012-13 0.00 0.00 0.00 0.00 0.00 0.00 0.00 0.00 0.00 0.00 0.00 0.00 2013-14 0.00 0.00 0.00 0.00 0.00 0.00 0.00 0.00 0.00 0.00 0.00 0.00 2014-15 0.00 0.00 0.00 0.00 0.00 0.00 0.00 0.00 0.00 0.00 0.00 0.00 2015-16 0.00 0.00 24.71 0.00 0.00 0.00 0.00 0.00 0.00 0.00 0.00 0.00 2016-17 0.00 0.00 -24.71 0.00 0.00 0.00 0.00 0.00 0.00 0.00 0.00 0.00 2017-18 0.00 0.00 0.00 0.00 0.00 0.00 0.00 0.00 0.00 0.00 0.00 0.00
Total 1.00 0.00 0.00 0.00 0.43 0.00 0.00 0.00 0.15 0.00 0.00 0.00

Appendices
155
10. Uttar Pradesh Bhumi Sudhar Nigam 11. Uttar Pradesh Police Avas Nigam Limited 12. Uttar Pradesh Export Promotion Council Year Equity Interest
free Loans Loans on
which interest payment has been defaulted
Capital Grants
Equity Interest free
Loans
Loans on which
interest payment has been defaulted
Capital Grants
Equity Interest free
Loans
Loans on which
interest payment has been defaulted
Capital Grants
Up to 1999-2000 1.50 0.00 0.00 0.00 3.00 0.00 0.00 0.00 0.00 0.00 0.00 0.00 2000-01 0.00 0.00 0.00 0.00 0.00 0.00 0.00 0.00 0.00 0.00 0.00 0.00 2001-02 0.00 0.00 0.00 0.00 0.00 0.00 0.00 0.00 0.00 0.00 0.00 0.00 2002-03 0.00 0.00 0.00 0.00 0.00 0.00 0.00 0.00 0.00 0.00 0.00 0.00 2003-04 0.00 0.00 0.00 0.00 0.00 0.00 0.00 0.00 0.00 0.00 0.00 0.00 2004-05 0.00 0.00 0.00 0.00 0.00 0.00 0.00 0.00 0.00 0.00 0.00 0.00 2005-06 0.00 0.00 0.00 0.00 0.00 0.00 0.00 0.00 0.00 0.00 0.00 0.00 2006-07 0.00 0.00 0.00 0.00 0.00 0.00 0.00 0.00 0.00 0.00 0.00 0.00 2007-08 0.00 0.00 0.00 0.00 0.00 0.00 0.00 0.00 0.00 0.00 0.00 0.00 2008-09 0.00 0.00 0.00 0.00 0.00 0.00 0.00 0.00 0.00 0.00 0.00 0.00 2009-10 0.00 0.00 0.00 0.00 0.00 0.00 0.00 0.00 0.00 0.00 0.00 0.00 2010-11 0.00 0.00 0.00 0.00 0.00 0.00 0.00 0.00 0.00 0.00 0.00 0.00 2011-12 0.00 0.00 0.00 0.00 0.00 0.00 0.00 0.00 0.00 0.00 0.00 0.00 2012-13 0.00 0.00 0.00 0.00 0.00 0.00 0.00 0.00 0.00 0.00 0.00 0.00 2013-14 0.00 0.00 0.00 0.00 0.00 0.00 0.00 0.00 0.00 0.00 0.00 0.00 2014-15 0.00 0.00 0.00 0.00 0.00 0.00 0.00 0.00 0.00 0.00 0.00 0.00 2015-16 0.00 0.00 0.00 0.00 0.00 0.00 0.00 0.00 0.00 0.00 0.00 0.00 2016-17 0.00 0.00 0.00 0.00 0.00 0.00 0.00 0.00 0.05 0.05 0.00 0.00 2017-18 0.00 0.00 0.00 0.00 0.00 0.00 0.00 0.00 0.00 0.00 0.00 0.00
Total 1.50 0.00 0.00 0.00 3.00 0.00 0.00 0.00 0.05 0.05 0.00 0.00

Audit Report on Economic Sector and Public Sector Undertakings for the year ended 31 March 2018
156
13. Uttar Pradesh State Spinning Company Limited 14. The Pradeshiya Industrial and Investment Corporation of UP Limited
Year
Equity Interest free Loans
Loans on which interest
payment has been defaulted
Capital Grants
Equity Interest free Loans
Loans on which interest payment
has been defaulted
Capital Grants
Up to 1999-2000 88.65 17.58 0.00 0.00 110.58 33.53 10.00 0.00 2000-01 0.00 0.00 0.00 0.00 0.00 0.00 0.00 0.00 2001-02 0.00 0.00 0.00 0.00 0.00 -33.53 0.00 0.00 2002-03 0.00 0.00 0.00 0.00 0.00 0.00 7.50 0.00 2003-04 0.00 0.00 0.00 0.00 0.00 0.00 0.00 0.00 2004-05 4.59 5.83 0.00 0.00 0.00 0.00 0.00 0.00 2005-06 0.00 8.66 0.00 0.00 0.00 59.88 0.00 0.00 2006-07 0.00 13.57 0.00 0.00 0.00 68.65 0.00 0.00 2007-08 0.00 0.00 0.00 0.00 0.00 0.00 0.00 0.00 2008-09 0.00 -0.44 0.00 0.00 0.00 0.00 0.00 0.00 2009-10 0.00 0.00 2.00 0.00 0.00 0.00 0.00 0.00 2010-11 0.00 9.74 2.00 0.00 0.00 9.08 0.00 0.00 2011-12 0.00 33.11 2.07 0.00 0.00 0.00 0.00 0.00 2012-13 0.00 9.88 2.11 0.00 0.00 0.00 0.00 0.00 2013-14 0.00 -0.94 2.40 0.00 0.00 0.00 -7.50 0.00 2014-15 0.00 0.00 0.55 0.00 0.00 0.00 0.00 0.00 2015-16 0.00 11.79 1.78 0.00 0.00 0.00 0.00 0.00 2016-17 0.00 0.00 1.92 0.00 0.00 0.00 0.00 0.00 2017-18 0.00 4.19 2.38 0.00 0.00 30.27 0.00 0.00
Total 93.24 112.97 17.21 0.00 110.57 167.88 10.00 0.00

Audit Report on Economic Sector and Public Sector Undertakings for the year ended 31 March 2018
157
Appendix 5.1 (Referred to in Paragraph 5.3)
Statement showing loss to Parishad due to incorrect fixation of reserve price
SI. No.
Plot No. Date of Auction
Area (in
sqm)
Reserve price fixed
(in ` per Sqm)
Reserve price to be
fixed (in ` per Sqm)
Auctioned rate
(in ` per Sqm)
Difference in rate
(in ` per Sqm)
Loss to Parishad
(in `)
1 2 3 4 5 6 7 8 (col 6 –col 5)
9 (col 8* col 4)
1 16/Com-5 22.07.2016 442.00 35840 59500 41502 17998 7955116 2 16/Com-6 22.07.2016 372.76 35840 59500 40545 18955 7065666 3 16/Com-7 22.07.2016 450.00 35840 59500 42501 16999 7649550
Total 22670232
Appendix 5.2
(Referred to in Paragraph 5.4) Statement showing loss to Parishad due to allowing interest free mobilisation advance without assessing
its requirement
Sl. No. Amount of Mobilisation Advance
(in `)
Date of release
Period (in months) till
September 2016
Rate of interest
in per cent
Loss of interest (in `)
1 2 3 4 5 6 (col 2* col 4/12*5 per cent) 1 245176000 17.02.2016 6 8 9807040.00 2 143019800 30.03.2016 5 8 4767326.67 3 20432438 19.05.2016 3 8 408648.76
408628238 14983015.43

Audit Report on Economic Sector and Public Sector Undertakings for the year ended 31 March 2018
158
Appendix 5.3 (Referred to in Paragraph 5.7)
Statement showing detail of excess payment made on execution of extra items
Particulars Qty. executed
(Sqm)
Rate paid
(` per Sqm)
Amount paid (in `)
Rate to be paid (` per Sqm)
Amount to be paid (in `)
Excess payment
(in `)
Remarks
1 2 3 4 (col.2*col.3)
5 6 (col.2*col 5)
7 (col 4-col 6)
8
Close timbering in 0 to 3.0 m depth
68661.054 482 33094628 170 11672379 21422249 As per the contract, the rate for close timbering in 3.0 to 6.0 m depth was ` 170 per sqm, hence, the rate for close timbering in 0 to 3.0 m depth cannot be in excess of that payable for 3.0 to 6.0 m depth.
Close timbering in 3 to 6.0 m depth left in trench with used timbering
1934.774 1981 3832787 910 1760644 2072143 As per the contract, the rate for close timbering in depth >6 m was ` 910 per sqm, hence, the rate for close timbering in 3.0 to 6.0 m depth cannot be in excess of that payable for depth >6 m.
Close timbering in 0 to 3.0 m depth left in trench with used timbering
2626.651 1206 3167741 910 2390252 777489 As per the contract, the rate for close timbering in depth >6 m was ` 910 per sqm, hence, the rate for close timbering in 0 to 3.0 m depth cannot be in excess of that payable for depth >6 m.
Total 40095156 15823275 24271881 Less: Rate of Contractor after discount of 0.20 per cent 48544 Net excess payment 24223337

Appendices
159
Appendix 5.4 (Referred to in Paragraph 5.7)
Statement showing detail of excess payment made on account of new timber as an extra item
Particulars Qty. executed
(Sqm)
Rate paid
(` per Sqm)
Amount paid (in `)
Rate to be paid (` per Sqm)
Amount to be paid (in `)
Excess payment
(in `)
Remarks
1 2 3 4 (col.2*col. 3)
5 6 (col 2*col 5)
7 (col.4-col.6)
8
Close timbering in 0 to 3.0 m depth left in trench with unused timber
5308.799 2975 15793677 910 4831007 10962670 As per the contract, the rate for close timbering in depth >6 m left in trench was ` 910 per sqm, hence, the rate for close timbering in 0 to 3.0 m depth cannot be in excess of that payable for depth >6 m.
Close timbering in 3 to 6.0 m depth left in trench with unused timber
1939.411 3690 7156427 910 1764864 5391563 As per the contract, the rate for close timbering in depth >6 m left in trench was ` 910 per sqm, hence, the rate for close timbering in 3.0 to 6.0 m depth cannot be in excess of that payable for depth >6 m.
Total 22950104 6595871 16354233 Less: Rate of Contractor after discount of 0.20 per cent 32708 Net excess payment 16321525

Audit Report on Economic Sector and Public Sector Undertakings for the year ended 31 March 2018
160
Appendix-7.1 (Referred to in Paragraph 7.1.1)
Statement showing loss due to not levy of land use conversion charges from Hi-tech Township developers
A. Uppal Chaddha Hi-tech Township Developers Private limited Sl. No.
Name of village Area (in acres)
Effective DM circle rate from August 2010 to 27 September 2011
and during 2013 (` per acre)
Factor14 (0.65*0.50)
= 0.325
Total Land use conversion charges
(in `)
1 2 3 4 5 6 (Col.3*Col.4*Col.5)
(i) As per layout dated 19.10.2010 1 Mehrauli 202.978 10000000 0.325 659678500 2 Sadiqpur Kajipur 154.716 4000000 0.325 201130800 3 Naiphal 367.779 4000000 0.325 478112700 4 Kacherabarshabad 13.363 3238866 0.325 14066314 5 Duryai 401.283 3441296 0.325 448803414 6 Dasna 17.455 10000000 0.325 56728750 7 Bayana 343.889 2500000 0.325 279409813 8 Shahpur Bamheta 142.545 8000000 0.325 370617000
Total 1644.008 2508547291 (ii) As per layout dated 27.09.2011
1 Mehrauli 3.687 10000000 0.325 11982750 2 Kacherabarshabad 476.835 3238866 0.325 501931518 3 Duryai 353.393 3441296 0.325 395242223 4 Dujana 280.502 3238866 0.325 295265227 5 Talabpur Hathipur 87.164 3441296 0.325 97486065 6 Girdharpur Sunarshi 66.106 3441296 0.325 73934352
Total 1267.687 1375842135 (iii) As per layout dated 07.10.2013
1 Shadat Nagar Ekla 7.083 7085020 0.325 16309539 2 Kacherabarshabad 37.16 5263158 0.325 63563159 3 Dujana 14.3 5263158 0.325 24460527 4 Talabpur Hathipur 14.79 5060729 0.325 24325659
Total 73.333 128658884 Total-A {(i)+(ii)+(iii)} 2985.028 4013048310
14 Net Area {Total area – (Green belt+Roads)} x factor for conversion of agricultural land to residential land i.e. 50 per cent.

Appendices
161
B. Suncity Hi-tech Infra Developers Private Limited
(iv) as per layout dated 12.07.2011 Sl. No.
Name of village Area (in
acres)
Effective DM circle rate 2011
(` per acre)
Factor15 (0.59*0.50)= 0.295
Total Land use conversion charges
(in `)
1 2 3 4 5 6 (Col.3*Col.4*Col.5)
1 Dasna 507.457 10000000 0.295 1496998150 2 Naiphal 89.142 4000000 0.295 105187560 3 Bayana 94.056 2500000 0.295 69366300
4 Shadat Nagar Ekla 27.284 5000000 0.295 40243900
Total 717.939 1711795910 Total-B 717.939 1711795910
Grand Total- A+B 3702.967 5724844220
15 Net Area {Total area – (Green belt+Roads)} x factor for conversion of agricultural land to residential land i.e. 50 per cent.

Audit Report on Economic Sector and Public Sector Undertakings for the year ended 31 March 2018
162
Appendix-7.2 (Referred to in paragraph 7.1.2)
Statement showing non-levying of additional land use conversion charges on Uppal Chaddha Hi-tech Township Developers Private limited
Sl. No.
Name of Village
Area (in
acre)
Area (in
hectare)
DM circle rate of land at
the time of approval of DPR in July
2011 (` in lakh per
hectare)
Land use conversion charges as
calculated by Authority at the time of approval of DPR in July
201116 (` in lakh)
Effective DM circle rate of land at the
time of approval of revised DPR in October
2013 (` in lakh per
hectare)
Additional Land use
conversion charges to be levied by the Authority at the time of approval of revised DPR in October
201317 (` in lakh)
1 2 3 4 5 6 7 8 1 Dujana 530.70 214.77 80.00 5379.56 130.00 335.04 2 Kachera
Barshabad 222.17 89.91 80.00 2252.07 130.00 140.26
3 Talabpur Hathipur
13.26 5.37 85.00 142.91 125.00 8.06
4 Talabpur Hathipur
63.62 25.75 85.00 685.30 125.00 38.63
5 Sadatnagar Ekla
189.47 76.68 123.55 2966.25 175.00 161.03
Total 1019.22 412.48 11426.09 683.02
16 As per DPR dated 12.07.2011(Area x 0.6262 x 0.5 x Rate) 17 As per revised DPR on difference of factor {Area x 0.024 (0.6502-0.6262) x 0.5 x Rate}

Appendices
163
Appendix-7.3 (Referred to in paragraph 7.1.3)
Statement showing non-revision and recovery of CDC from Uppal Chaddha Hi-tech Township Developers Private Limited
(` in lakh)
Sl. No. Date of approval of
layout
Total area of approved
layout
Incremental area of
layout above 1500 acre18
(in acre)
Area for CDC
charges19 (in acre)
Cost index applicable
Rate of CDC per
acre20
Rate of CDC per acre to be
recovered21
Amount of Short levy
on account of CDC charges
1 2 3 4 5=4*0.65024 6 7 8 9=(8*4) 1 19.10.2010 1671.08 171.08 111.24 136 3.58 0.58 64.52 2 21.10.2011 2911.70 1240.62 806.70 151 3.97 0.97 782.50 3 20.09.2013 4004.25 1092.55 710.42 170 4.47 1.47 1044.32
Total 1628.36 1891.34
18 Original approved area of the Developer was 1500 acre. In April 2010, GoUP decided not to levy CDC on
the original approved area of the developers, who were selected under the Policy, 2003 and executed Memorandum of Undertakings in 2005.
19 After deducting green and road area factor as per GoUP Order of April 2010 20 Considering cost index on 114 (in August 2008) for ` 3.00 lakh. 21 After deducting CDC already recovered at the rate of ` 3.00 lakh per acre.

Audit Report on Economic Sector and Public Sector Undertakings for the year ended 31 March 2018
164
Appendix-7.4 (Referred to in paragraph 7.3.1)
Statement showing loss to the Authority due to not fixing reserve price of group housing plot as per allowed FAR
Name of Scheme
Area (sqm)
Date of Auction
Applicable sector rate (` per sqm)
Allowed Basic FAR
Reserve price fixed (` per sqm)
Reserve price to be fixed (` per sqm)
Final auction price (` per sqm)
Difference (` per sqm)
Loss to the Authority
(in `)
1 2 3 4 5 6 (Col 4*1.5)
7 (Col 4* Col 5)
8 9 (Col 7 - Col 6)
10 (Col 2 * Col 9)
Karpuripuram 12620.00 18.12.2014 22000 2.0 33000 44000 34400 9600 121152000 Vaishali 7766.00 18.12.2014 50000 2.5 75000 125000 77000 48000 372768000 Govindpuram 14675.00 23.08.2012 20000 2.0 30000 40000 35600 4400 64570000 Indrapuram 2811.88 08.02.2011 15000 2.5 22500 37500 30670 6830 19205140 Kaushambi 3136.00 13.12.2010 16000 2.5 24000 40000 25500 14500 45472000 Indrapuram 12148.92 18.11.2010 15000 2.5 22500 37500 30570 6930 84192015
Total 707359155

Appendices
165
Appendix-7.5 (Referred to in paragraph 7.3.2)
Statement showing loss due to non-inclusion of corner charges in the reserve price of auction of corner assets
Sl. No.
Name of the Scheme
Plot No. Date of Auction
Area (in sqm)
Reserve price (` per sqm)
Reserve Price to be fixed (including
corner charges at the rate of 10 per cent) (` per sqm)
Actual auctioned price
(` per sqm)
Difference of reserve price to
be fixed and actual auctioned
price (` per sqm)
Loss due to not levy of corner charges
(in `)
1 2 3 4 5 6 7 (Col.6*1.10)
8 9 (Col.7-Col.8)
10 (Col.9*Col.5)
1 Vaishali GH-18A 18.12.14 7766.00 75000.00 82500.00 77000.00 5500.00 42713000 2 Karpuripuram ML-1 18.12.14 12620.00 33000.00 36300.00 34400.00 1900.00 23978000 3 Tulasi Niketan* - 17.08.13 1252.05 11000.00 12100.00 11500.00 600.00 751230 4 Nehru Vikas Minar
at GT Road^ - 12.07.06 45936.00 14000.00 15400.00 14530.00 870.00 39964320
Total 107406550
*As per the sale brochure 1331.33 sqm area was available for auction at Tulasi Nikatan Scheme where as in actual measurement, 1252.05 sqm was measured. ^As per the sale brochure Nehru Vikas Minar Commercial Complex situated on GT road was available for auction. However, as per the Costing Guidelines corner charges
was calculated only on the approx plot area i.e. 45936.00 sqm.

Audit Report on Economic Sector and Public Sector Undertakings for the year ended 31 March 2018
166
Appendix-7.6 {Referred to in Paragraph 7.3.3(i)}
Statement showing loss due to non-levy and non-recovery of Infrastructure Surcharge
Sl. No.
Name of the Scheme
Plot No. Date of Auction Area (in sqm)
Final auction rate
(` per sqm)
Value of plot (in `)
Amount of Infrastructure surcharge at the rate of 10 per cent of plot value (in `)
1 2 3 4 5 6 7 (Col.5*Col.6)
8 (Col.7*10 per cent)
(A) Plots Auctioned after Board decision (October 2014) to June 2018 1 Pratap Vihar P Block Convenient Shopping
Plot 22.10.2016 3212.22 38500 123670470 12367047
2 Indirapuram School Plot Shakti Khand-4 11.08.2016 5269 50500 266084500 26608450 3 Vaishali GH-1 (18A) 18.12.2014 7768 77000 598136000 59813600 4 Koyal Enclave GH-7A 18.12.2014 6400 28551 182726400 18272640 5 Karpuripuram ML-01 18.12.2014 12620 34400 434128000 43412800 6 Koyal Enclave GH-3A 22.11.2014 5250 28525 149756250 14975625
Total (A) 1754501620 175450162 (B) Plots Auctioned before Board decision (October 2014)
7 Indraprashth D Block
4 23.08.2012 4500 18000 81000000 8100000
8 Govindpuram CP 1/A 23.08.2012 14675 35600 522430000 52243000 9 Govindpuram CP 1/B 23.08.2012 5273.22 42000 221475240 22147524
10 Indirapuram Vistar GH-2 24.12.2011 17507.095 40050 701159155 70115915 11 Indirapuram Vistar GH-3 23.12.2011 16350 40050 654817500 65481750 12 Vaishali RC-1/2 20.10.2011 24462 40300 985818600 98581860 13 Indirapuram Vistar GH-1 25.05.2011 7607 30750 233915250 23391525 14 Kaushambi GH plot near Neelam
Cooperative Awas Samiti 20.12.2010 3136 25500 79968000 7996800
15 Kaushambi Commercial Plot no1 29.06.2010 598.71 104250 62415518 6241551 16 G.T Road Nehru Vikas Minar 12.07.2006 45936 14529.77 667439515 66743951
Total (B) 4210438777 421043876 Grand Total (A)+(B) 180564.245 5964940397 596494038

Appendices
167
Appendix-7.7 {Referred to in paragraph 7.3.3(ii)}
Statement showing loss due to non-levy of Infrastructure Surcharge
Sl. No.
Name of the Scheme Plot No./ Type Date of Auction/ Lottery
Area (in sqm.)
Final auction rate
(` per sqm.)
Value of plot (in `)
Amount of Infrastructure Surcharge at the rate of 10 per cent on plot value (in `)
1 2 3 4 5 6 7 (Col.5*Col.6)
8 (Col.7*10 per cent)
1 Dr. Ram Manohar Loiya Nagar Scheme, Pocket-D
DC-04/ Commercial 31-01-2017 1041 27150 28263150 2826315
2 Rakshapuram Yojna Sec-1 R-01/ Residential 21-09-2016 300 21350 6405000 640500 3 Sports Goods Complex
(Major Dhyanchand Nagar) Scheme Pocket-A
PC-01/ Commercial 28-06-2016 420 25250 10605000 1060500
4 Shradha Puri Phase-II, Pocket-D
BP-05 / Residential 22-06-2016 200 26850 5370000 537000
5 Sports Goods Complex (Major Dhyanchand Nagar) Scheme Pocket-A
PC-03/ Commercial 21-06-2016 420 25000 10500000 1050000
6 Sports Goods Complex (Major Dhyanchand Nagar) Scheme Pocket-A
PC-02/ Commercial 24-05-2016 420 25100 10542000 1054200
7 Shradha Puri Phase-II, Pocket-D
C-01/ Commercial 24-05-2016 325.42 28100 9144302 914430
8 Shradha Puri Phase-II, Pocket-D
BP-01/ Residential 17-05-2016 200 24700 4940000 494000
9 Shradha Puri Phase-II, Pocket-D
BP-04/ Residential 17-05-2016 200 22500 4500000 450000
10 Shradha Puri Phase-II, Pocket-D
BP-03/ Residential 17-05-2016 200 20901 4180200 418020
11 Shradha Puri Phase-II, Pocket-D
BP-02/ Residential 17-05-2016 200 22500 4500000 450000

Audit Report on Economic Sector and Public Sector Undertakings for the year ended 31 March 2018
168
Sl. No.
Name of the Scheme Plot No./ Type Date of Auction/ Lottery
Area (in sqm.)
Final auction rate
(` per sqm.)
Value of plot (in `)
Amount of Infrastructure Surcharge at the rate of 10 per cent on plot value (in `)
1 2 3 4 5 6 7 (Col.5*Col.6)
8 (Col.7*10 per cent)
12 Shradha Puri Phase-II, Pocket-D
BP-06/ Residential 17-05-2016 200 27200 5440000 544000
13 Shradha Puri Phase-II, Pocket-D
BP-07/ Residential 17-05-2016 200 28600 5720000 572000
14 Shradha Puri Phase-II, Pocket-D
C-02/ Commercial 16-05-2016 405 28200 11421000 1142100
15 Sports Goods Complex (Major Dhyanchand Nagar) Scheme Pocket-A
PC-04/ Commercial 16-05-2016 420 25100 10542000 1054200
16 Dr. Ram Manohar Loiya Nagar Scheme, Pocket-E
ES-25/ Commercial 26-04-2016 253.88 23900 6067732 606773
17 Pallavpuram scheme Pocket-J C-24/ Commercial 09-06-2015 200 23250 4650000 465000 Total 5611.30 142790384 14279038

Appendices
169
Appendix-7.8 {Referred to in paragraph 7.3.3(iii)}
Statement showing non-levy of Infrastructure Surcharge on sale of Commercial Plots
Sl. No. Plot No. and Name of the Scheme Date of Auction Area of Plot (Sq. Meter)
Rate of Auction (per Sq. Meter)
Value of Plot (in `)
Amount of Infrastructure
Surcharge @10 per cent to be
levied (in `)
1 2 3 4 5 6 (Col.4*Col.5)
7 (Col.6*10 per cent)
1 CP-2, Vastu Khand, Gomati Nagar Scheme 04.05.2016 1010.00 48000.00 48480000.00 4848000.00
2 1/41, Vardan Khand, Gomati Nagar Extn. Scheme 04.05.2016 1490.00 50000.00 74500000.00 7450000.00
3 4/17, Basant Khand, Gomti Nagar Extn. Scheme 04.05.2016 5103.84 47142.00 240605225.28 24060522.53
4 C.P. -228, Viraj Khand, Gomati Nagar Scheme 20.07.2016 447.90 60700.00 27187530.00 2718753.00
5 CP-47-A, Sitapur, Road Scheme 20.07.2016 600.00 40000.00 24000000.00 2400000.00
6 CP-225, Viraj Khand, Gomati Nagar Scheme 20.07.2016 447.90 51895.00 23243770.50 2324377.05
7 CP-16, Sec. D-1, Kanpur Road Scheme 20.07.2016 478.50 30000.00 14355000.00 1435500.00
8 K.V.C.-30, Kanpur Road Scheme 06.10.2016 726.00 31500.00 22869000.00 2286900.00
9 C-7, Kanpur Road Scheme 06.10.2016 864.00 36005.00 31108320.00 3110832.00
10 TC-49-V-XVII, Vibhuti Khand, Gomati Nagar Scheme 06.10.2016 1159.00 80250.00 93009750.00 9300975.00
11 4/31-C, Basant Khand Sec-4, Gomati Nagar Extn. Scheme 09.01.2018 2326.50 41200.00 95851800.00 9585180.00
12 CP-222, Viraj Khand, Gomti Nagar Scheme 09.01.2018 447.90 54000.00 24186600.00 2418660.00
13 4/4, Basant Khand, Gomti Nagar Extn Scheme 11.04.2018 4843.04 46188.94 223694907.00 22369490.70
Total 943091902.78 94309190.28
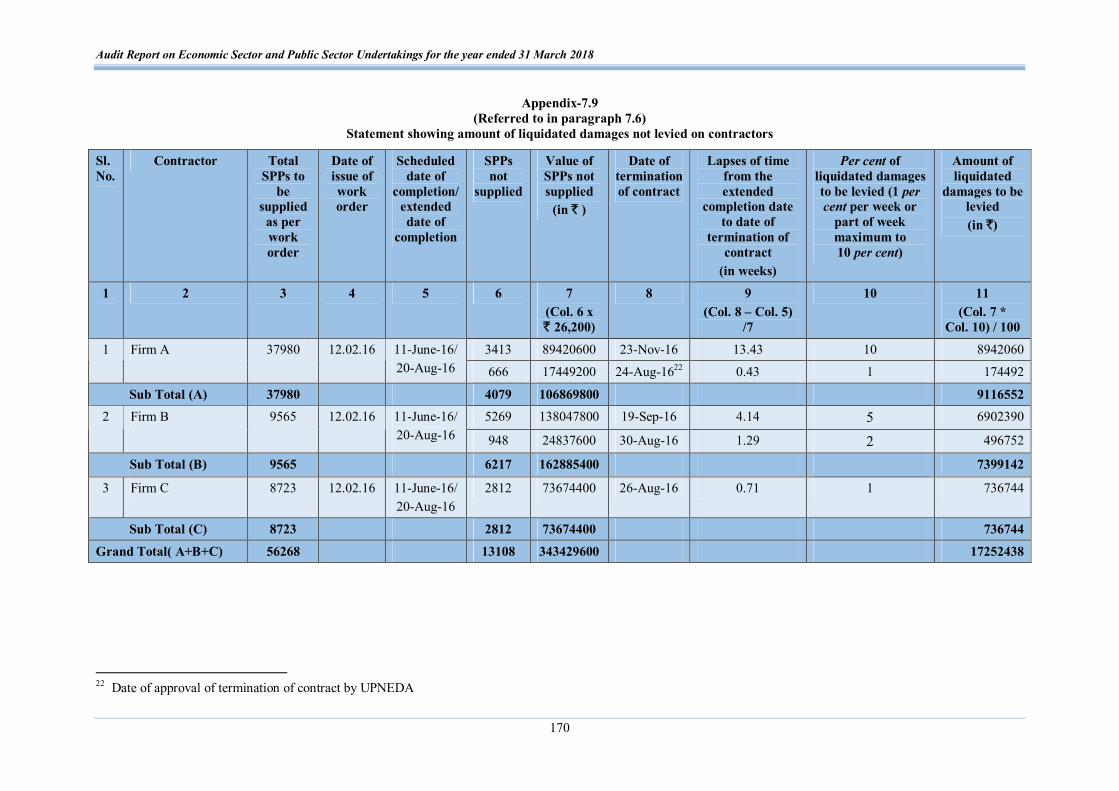
Audit Report on Economic Sector and Public Sector Undertakings for the year ended 31 March 2018
170
Appendix-7.9 (Referred to in paragraph 7.6)
Statement showing amount of liquidated damages not levied on contractors
Sl. No.
Contractor Total SPPs to
be supplied as per work order
Date of issue of work order
Scheduled date of
completion/ extended date of
completion
SPPs not
supplied
Value of SPPs not supplied
(in ` )
Date of termination of contract
Lapses of time from the extended
completion date to date of
termination of contract
(in weeks)
Per cent of liquidated damages to be levied (1 per cent per week or
part of week maximum to 10 per cent)
Amount of liquidated
damages to be levied (in `)
1 2 3 4 5 6 7 (Col. 6 x ` 26,200)
8 9 (Col. 8 – Col. 5)
/7
10 11 (Col. 7 *
Col. 10) / 100
3413 89420600 23-Nov-16 13.43 10 8942060 1 Firm A 37980 12.02.16 11-June-16/ 20-Aug-16 666 17449200 24-Aug-1622 0.43 1 174492
Sub Total (A) 37980 4079 106869800 9116552 5269 138047800 19-Sep-16 4.14 5 6902390 2 Firm B 9565 12.02.16 11-June-16/
20-Aug-16 948 24837600 30-Aug-16 1.29 2 496752
Sub Total (B) 9565 6217 162885400 7399142
3 Firm C 8723 12.02.16 11-June-16/ 20-Aug-16
2812 73674400 26-Aug-16 0.71 1 736744
Sub Total (C) 8723 2812 73674400 736744
Grand Total( A+B+C) 56268 13108 343429600 17252438
22 Date of approval of termination of contract by UPNEDA
Copyright © 2022 FDOKUMEN