Characterizing severe obesity in children and youth referred for weight management
9
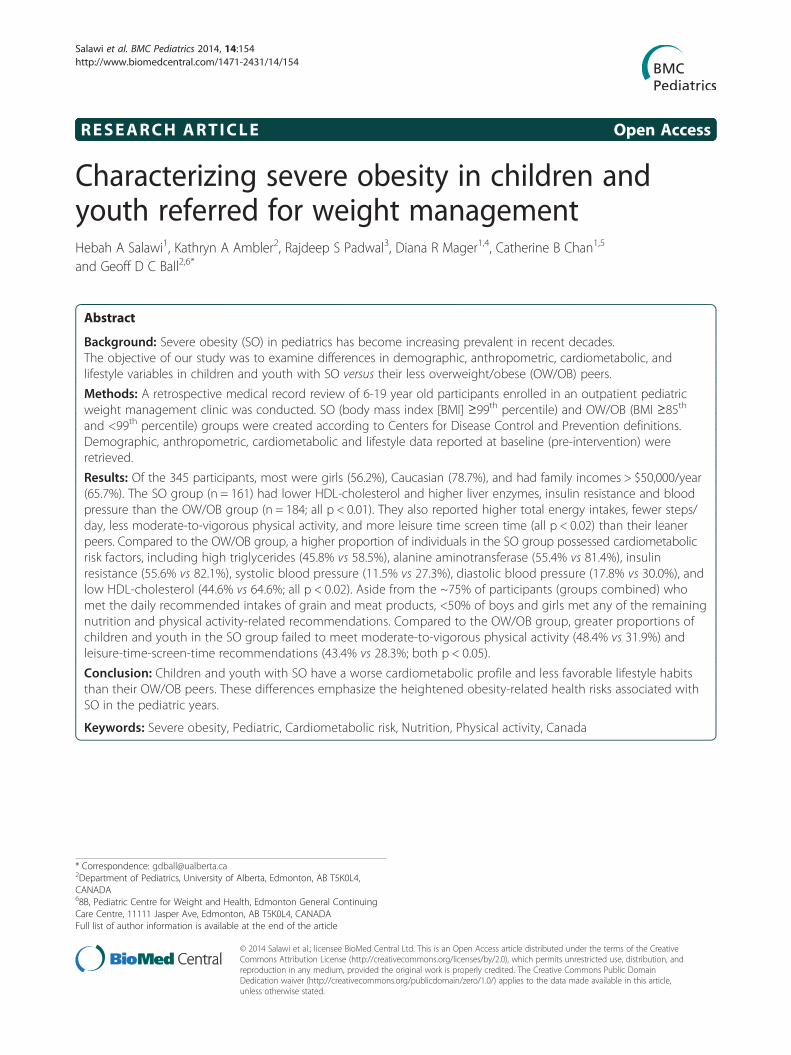
RESEARCH ARTICLE Open Access Characterizing severe obesity in children and youth referred for weight management Hebah A Salawi 1 , Kathryn A Ambler 2 , Rajdeep S Padwal 3 , Diana R Mager 1,4 , Catherine B Chan 1,5 and Geoff D C Ball 2,6* Abstract Background: Severe obesity (SO) in pediatrics has become increasing prevalent in recent decades. The objective of our study was to examine differences in demographic, anthropometric, cardiometabolic, and lifestyle variables in children and youth with SO versus their less overweight/obese (OW/OB) peers. Methods: A retrospective medical record review of 6-19 year old participants enrolled in an outpatient pediatric weight management clinic was conducted. SO (body mass index [BMI] ≥99 th percentile) and OW/OB (BMI ≥85 th and <99 th percentile) groups were created according to Centers for Disease Control and Prevention definitions. Demographic, anthropometric, cardiometabolic and lifestyle data reported at baseline (pre-intervention) were retrieved. Results: Of the 345 participants, most were girls (56.2%), Caucasian (78.7%), and had family incomes > $50,000/year (65.7%). The SO group (n = 161) had lower HDL-cholesterol and higher liver enzymes, insulin resistance and blood pressure than the OW/OB group (n = 184; all p < 0.01). They also reported higher total energy intakes, fewer steps/ day, less moderate-to-vigorous physical activity, and more leisure time screen time (all p < 0.02) than their leaner peers. Compared to the OW/OB group, a higher proportion of individuals in the SO group possessed cardiometabolic risk factors, including high triglycerides (45.8% vs 58.5%), alanine aminotransferase (55.4% vs 81.4%), insulin resistance (55.6% vs 82.1%), systolic blood pressure (11.5% vs 27.3%), diastolic blood pressure (17.8% vs 30.0%), and low HDL-cholesterol (44.6% vs 64.6%; all p < 0.02). Aside from the ~75% of participants (groups combined) who met the daily recommended intakes of grain and meat products, <50% of boys and girls met any of the remaining nutrition and physical activity-related recommendations. Compared to the OW/OB group, greater proportions of children and youth in the SO group failed to meet moderate-to-vigorous physical activity (48.4% vs 31.9%) and leisure-time-screen-time recommendations (43.4% vs 28.3%; both p < 0.05). Conclusion: Children and youth with SO have a worse cardiometabolic profile and less favorable lifestyle habits than their OW/OB peers. These differences emphasize the heightened obesity-related health risks associated with SO in the pediatric years. Keywords: Severe obesity, Pediatric, Cardiometabolic risk, Nutrition, Physical activity, Canada * Correspondence: [email protected] 2 Department of Pediatrics, University of Alberta, Edmonton, AB T5K0L4, CANADA 6 8B, Pediatric Centre for Weight and Health, Edmonton General Continuing Care Centre, 11111 Jasper Ave, Edmonton, AB T5K0L4, CANADA Full list of author information is available at the end of the article © 2014 Salawi et al.; licensee BioMed Central Ltd. This is an Open Access article distributed under the terms of the Creative Commons Attribution License (http://creativecommons.org/licenses/by/2.0), which permits unrestricted use, distribution, and reproduction in any medium, provided the original work is properly credited. The Creative Commons Public Domain Dedication waiver (http://creativecommons.org/publicdomain/zero/1.0/) applies to the data made available in this article, unless otherwise stated. Salawi et al. BMC Pediatrics 2014, 14:154 http://www.biomedcentral.com/1471-2431/14/154
-
Upload
independent -
Category
Documents
-
view
1 -
download
0
Transcript of Characterizing severe obesity in children and youth referred for weight management
Salawi et al. BMC Pediatrics 2014, 14:154http://www.biomedcentral.com/1471-2431/14/154
RESEARCH ARTICLE Open Access
Characterizing severe obesity in children andyouth referred for weight managementHebah A Salawi1, Kathryn A Ambler2, Rajdeep S Padwal3, Diana R Mager1,4, Catherine B Chan1,5
and Geoff D C Ball2,6*
Abstract
Background: Severe obesity (SO) in pediatrics has become increasing prevalent in recent decades.The objective of our study was to examine differences in demographic, anthropometric, cardiometabolic, andlifestyle variables in children and youth with SO versus their less overweight/obese (OW/OB) peers.
Methods: A retrospective medical record review of 6-19 year old participants enrolled in an outpatient pediatricweight management clinic was conducted. SO (body mass index [BMI] ≥99th percentile) and OW/OB (BMI ≥85th
and <99th percentile) groups were created according to Centers for Disease Control and Prevention definitions.Demographic, anthropometric, cardiometabolic and lifestyle data reported at baseline (pre-intervention) wereretrieved.
Results: Of the 345 participants, most were girls (56.2%), Caucasian (78.7%), and had family incomes > $50,000/year(65.7%). The SO group (n = 161) had lower HDL-cholesterol and higher liver enzymes, insulin resistance and bloodpressure than the OW/OB group (n = 184; all p < 0.01). They also reported higher total energy intakes, fewer steps/day, less moderate-to-vigorous physical activity, and more leisure time screen time (all p < 0.02) than their leanerpeers. Compared to the OW/OB group, a higher proportion of individuals in the SO group possessed cardiometabolicrisk factors, including high triglycerides (45.8% vs 58.5%), alanine aminotransferase (55.4% vs 81.4%), insulinresistance (55.6% vs 82.1%), systolic blood pressure (11.5% vs 27.3%), diastolic blood pressure (17.8% vs 30.0%), andlow HDL-cholesterol (44.6% vs 64.6%; all p < 0.02). Aside from the ~75% of participants (groups combined) whomet the daily recommended intakes of grain and meat products, <50% of boys and girls met any of the remainingnutrition and physical activity-related recommendations. Compared to the OW/OB group, greater proportions ofchildren and youth in the SO group failed to meet moderate-to-vigorous physical activity (48.4% vs 31.9%) andleisure-time-screen-time recommendations (43.4% vs 28.3%; both p < 0.05).
Conclusion: Children and youth with SO have a worse cardiometabolic profile and less favorable lifestyle habitsthan their OW/OB peers. These differences emphasize the heightened obesity-related health risks associated withSO in the pediatric years.
Keywords: Severe obesity, Pediatric, Cardiometabolic risk, Nutrition, Physical activity, Canada
* Correspondence: [email protected] of Pediatrics, University of Alberta, Edmonton, AB T5K0L4,CANADA68B, Pediatric Centre for Weight and Health, Edmonton General ContinuingCare Centre, 11111 Jasper Ave, Edmonton, AB T5K0L4, CANADAFull list of author information is available at the end of the article
© 2014 Salawi et al.; licensee BioMed Central Ltd. This is an Open Access article distributed under the terms of the CreativeCommons Attribution License (http://creativecommons.org/licenses/by/2.0), which permits unrestricted use, distribution, andreproduction in any medium, provided the original work is properly credited. The Creative Commons Public DomainDedication waiver (http://creativecommons.org/publicdomain/zero/1.0/) applies to the data made available in this article,unless otherwise stated.
Salawi et al. BMC Pediatrics 2014, 14:154 Page 2 of 9http://www.biomedcentral.com/1471-2431/14/154
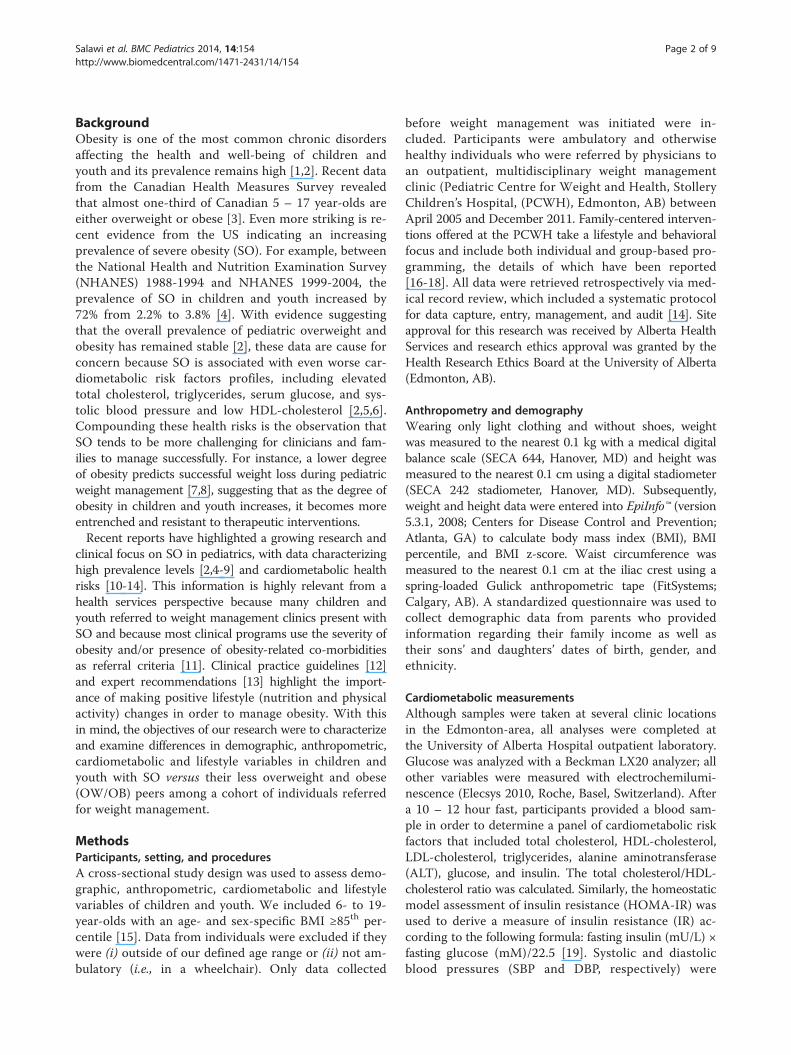
BackgroundObesity is one of the most common chronic disordersaffecting the health and well-being of children andyouth and its prevalence remains high [1,2]. Recent datafrom the Canadian Health Measures Survey revealedthat almost one-third of Canadian 5 – 17 year-olds areeither overweight or obese [3]. Even more striking is re-cent evidence from the US indicating an increasingprevalence of severe obesity (SO). For example, betweenthe National Health and Nutrition Examination Survey(NHANES) 1988-1994 and NHANES 1999-2004, theprevalence of SO in children and youth increased by72% from 2.2% to 3.8% [4]. With evidence suggestingthat the overall prevalence of pediatric overweight andobesity has remained stable [2], these data are cause forconcern because SO is associated with even worse car-diometabolic risk factors profiles, including elevatedtotal cholesterol, triglycerides, serum glucose, and sys-tolic blood pressure and low HDL-cholesterol [2,5,6].Compounding these health risks is the observation thatSO tends to be more challenging for clinicians and fam-ilies to manage successfully. For instance, a lower degreeof obesity predicts successful weight loss during pediatricweight management [7,8], suggesting that as the degree ofobesity in children and youth increases, it becomes moreentrenched and resistant to therapeutic interventions.Recent reports have highlighted a growing research and
clinical focus on SO in pediatrics, with data characterizinghigh prevalence levels [2,4-9] and cardiometabolic healthrisks [10-14]. This information is highly relevant from ahealth services perspective because many children andyouth referred to weight management clinics present withSO and because most clinical programs use the severity ofobesity and/or presence of obesity-related co-morbiditiesas referral criteria [11]. Clinical practice guidelines [12]and expert recommendations [13] highlight the import-ance of making positive lifestyle (nutrition and physicalactivity) changes in order to manage obesity. With thisin mind, the objectives of our research were to characterizeand examine differences in demographic, anthropometric,cardiometabolic and lifestyle variables in children andyouth with SO versus their less overweight and obese(OW/OB) peers among a cohort of individuals referredfor weight management.
MethodsParticipants, setting, and proceduresA cross-sectional study design was used to assess demo-graphic, anthropometric, cardiometabolic and lifestylevariables of children and youth. We included 6- to 19-year-olds with an age- and sex-specific BMI ≥85th per-centile [15]. Data from individuals were excluded if theywere (i) outside of our defined age range or (ii) not am-bulatory (i.e., in a wheelchair). Only data collected
before weight management was initiated were in-cluded. Participants were ambulatory and otherwisehealthy individuals who were referred by physicians toan outpatient, multidisciplinary weight managementclinic (Pediatric Centre for Weight and Health, StolleryChildren’s Hospital, (PCWH), Edmonton, AB) betweenApril 2005 and December 2011. Family-centered interven-tions offered at the PCWH take a lifestyle and behavioralfocus and include both individual and group-based pro-gramming, the details of which have been reported[16-18]. All data were retrieved retrospectively via med-ical record review, which included a systematic protocolfor data capture, entry, management, and audit [14]. Siteapproval for this research was received by Alberta HealthServices and research ethics approval was granted by theHealth Research Ethics Board at the University of Alberta(Edmonton, AB).
Anthropometry and demographyWearing only light clothing and without shoes, weightwas measured to the nearest 0.1 kg with a medical digitalbalance scale (SECA 644, Hanover, MD) and height wasmeasured to the nearest 0.1 cm using a digital stadiometer(SECA 242 stadiometer, Hanover, MD). Subsequently,weight and height data were entered into EpiInfo™ (version5.3.1, 2008; Centers for Disease Control and Prevention;Atlanta, GA) to calculate body mass index (BMI), BMIpercentile, and BMI z-score. Waist circumference wasmeasured to the nearest 0.1 cm at the iliac crest using aspring-loaded Gulick anthropometric tape (FitSystems;Calgary, AB). A standardized questionnaire was used tocollect demographic data from parents who providedinformation regarding their family income as well astheir sons’ and daughters’ dates of birth, gender, andethnicity.
Cardiometabolic measurementsAlthough samples were taken at several clinic locationsin the Edmonton-area, all analyses were completed atthe University of Alberta Hospital outpatient laboratory.Glucose was analyzed with a Beckman LX20 analyzer; allother variables were measured with electrochemilumi-nescence (Elecsys 2010, Roche, Basel, Switzerland). Aftera 10 – 12 hour fast, participants provided a blood sam-ple in order to determine a panel of cardiometabolic riskfactors that included total cholesterol, HDL-cholesterol,LDL-cholesterol, triglycerides, alanine aminotransferase(ALT), glucose, and insulin. The total cholesterol/HDL-cholesterol ratio was calculated. Similarly, the homeostaticmodel assessment of insulin resistance (HOMA-IR) wasused to derive a measure of insulin resistance (IR) ac-cording to the following formula: fasting insulin (mU/L) ×fasting glucose (mM)/22.5 [19]. Systolic and diastolicblood pressures (SBP and DBP, respectively) were

Salawi et al. BMC Pediatrics 2014, 14:154 Page 3 of 9http://www.biomedcentral.com/1471-2431/14/154
measured manually while participants were seated, after a5-minute rest, by a clinician using a sphygmomanometerand an appropriately-sized arm cuff, all of which were inaccordance with Canadian guidelines [20]. Five minuteslater, another measure was taken; when SBP differed ≥10mm Hg between the two measurements, the lower valueof the two was recorded.
Nutrition and physical activity assessmentsProspective measurements of dietary intake were madeusing 4-day food records, which included 1-2 weekenddays. Families completed the records, which were reviewedby the clinic dietitian in order to reduce the likelihood offood and beverage omissions and to verify brand namesand portion sizes. The Food Processor Diet Analysis SoftwareSQL (version 10.0.0, ESHA Research; Salem, OR) programwas used to analyze the data and calculate average daily in-takes. The software was not able to provide food group datain accordance with Canada’s Food Guide [21], so the clinicdietitian manually calculated the number of daily servings ofVegetables and Fruit, Grain Products, Milk and Alternatives,and Meat and Alternatives.The New Lifestyles Digi-Walker SW-200 pedometer
(Lee’s Summit, MO) was used to assess physical activityover a 7-day period including 1-2 weekend days. Duringthe first visit, the PCWH exercise specialist instructed par-ticipants and parents on correct pedometer placement,calibration, and data-monitoring procedures. In advance,all pedometers underwent a 100 step accuracy test. Onlythose units that recorded ≥99% accuracy were used forphysical activity assessment. On the second visit, pedom-eter log books were reviewed with families for accuracyand completeness. Since pedometers provide an overall
Table 1 Cardiometabolic risk factor cut-offs and lifestyle reco
Variable Cut-off
WC ≥90th percentile [28]
TC ≥5.2 mmol/L [30]
TG ≥1.24 mmol/L [28]
HDL-C ≤1.03 mmol/L [28]
LDL-C ≥3.4 mmol/L [31]
ALT <20 U/L [33]
HOMA-IR ≥3.16 mmol/L [19]
SBP ≥90th percentile [36]
DBP ≥90th percentile [36]
WC (waist circumference), TC (total cholesterol), TG (triglycerides), HDL-C (high dens(alanine aminotransferase), HOMA-IR (homeostatic model assessment of insulin resi(Vegetables & Fruit), Grains (Grain Products), Milk (Milk & Alternatives), Meat (Meat &(leisure time screen time), Sleep (sleep duration).
estimate of physical activity that does not include inten-sity, the 7-day physical activity recall interview [22] wasused to assess the amount of time participants spent en-gaged in moderate -to- vigorous physical activity (MVPA);MVPA represents higher- intensity physical activities (e.g.,brisk, walking, skating, bike riding, running, basketball,soccer), which may be particularly important for pediatricweight management [23,24]. Accordingly, moderate, hard,and very hard physical activity were calculated for eachparticipant and summed to derive MVPA. The exercisespecialist conducted all interviews, during which informa-tion regarding screen time (including leisure time televi-sion viewing, movie rental and (or) theatre viewing, videogame playing, and computer time) as a proxy measure ofsedentary activity and sleep duration over the previousseven days was also collected. Children and parents wereinterviewed together, whereas adolescents completed theinterviews independently. The exercise specialist reviewedall records with families after they were completed to ver-ify responses and ensure the accuracy of the informationthey contained.
Weight status, cardiometabolic risk factor, and lifestylehabit definitionsOverweight/obesity (OW/OB) was defined as an age- andsex-specific BMI ≥85th to <99th percentile whereas SO wasdefined as an age- and sex-specific BMI ≥99th percentile[15]. A number of recent reports have used the same cri-teria to define SO in children and adolescents [4,25-27].Criteria for dichotomizing cardiometabolic risk factorsand lifestyle habits to determine relatively high/low healthrisk are summarized in Table 1.
mmendations
Variable Recommendation
V & F 5-8 servings/day [29]
Grains 4-7 servings/day [29]
Milk 2-4 servings/day [29]
Meat 1-3 servings/day [29]
Steps Children [32]:
Boys: 13,000-15,000 steps/d
Girls: 11,000-12,000 steps/d
Adolescents [30]:
10,000-11,700 steps/d
MVPA ≥60 minutes/day [34]
LTST ≤2 hours/day [35]
Sleep Children: ≥10 hr/night [37]
Adolescents: ≥9 hr/night [37]
ity lipoprotein cholesterol), LDL-C (low density lipoprotein cholesterol), ALTstance), SBP (systolic blood pressure), DBP (diastolic blood pressure), V & FAlternatives), Steps, MVPA (moderate-to-vigorous physical activity), LTST
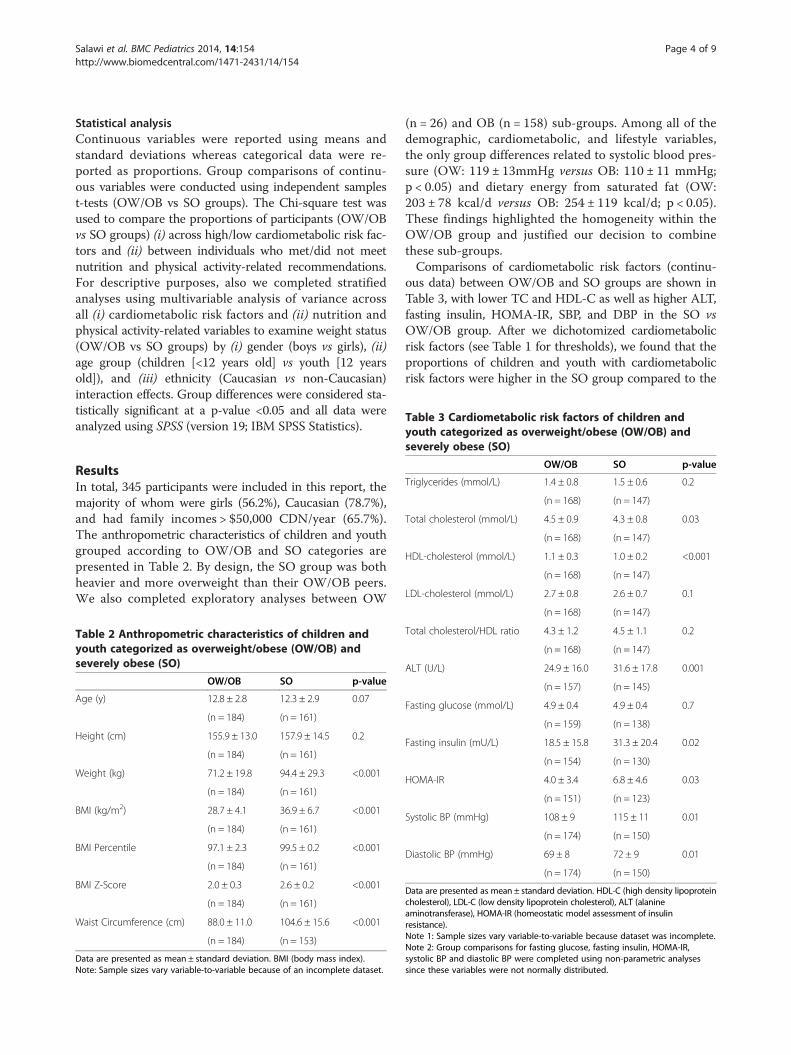
Table 3 Cardiometabolic risk factors of children andyouth categorized as overweight/obese (OW/OB) and
Salawi et al. BMC Pediatrics 2014, 14:154 Page 4 of 9http://www.biomedcentral.com/1471-2431/14/154
Statistical analysisContinuous variables were reported using means andstandard deviations whereas categorical data were re-ported as proportions. Group comparisons of continu-ous variables were conducted using independent samplest-tests (OW/OB vs SO groups). The Chi-square test wasused to compare the proportions of participants (OW/OBvs SO groups) (i) across high/low cardiometabolic risk fac-tors and (ii) between individuals who met/did not meetnutrition and physical activity-related recommendations.For descriptive purposes, also we completed stratifiedanalyses using multivariable analysis of variance acrossall (i) cardiometabolic risk factors and (ii) nutrition andphysical activity-related variables to examine weight status(OW/OB vs SO groups) by (i) gender (boys vs girls), (ii)age group (children [<12 years old] vs youth [12 yearsold]), and (iii) ethnicity (Caucasian vs non-Caucasian)interaction effects. Group differences were considered sta-tistically significant at a p-value <0.05 and all data wereanalyzed using SPSS (version 19; IBM SPSS Statistics).
severely obese (SO)
OW/OB SO p-value
Triglycerides (mmol/L) 1.4 ± 0.8 1.5 ± 0.6 0.2
(n = 168) (n = 147)
Total cholesterol (mmol/L) 4.5 ± 0.9 4.3 ± 0.8 0.03
(n = 168) (n = 147)
HDL-cholesterol (mmol/L) 1.1 ± 0.3 1.0 ± 0.2 <0.001
(n = 168) (n = 147)
LDL-cholesterol (mmol/L) 2.7 ± 0.8 2.6 ± 0.7 0.1
ResultsIn total, 345 participants were included in this report, themajority of whom were girls (56.2%), Caucasian (78.7%),and had family incomes > $50,000 CDN/year (65.7%).The anthropometric characteristics of children and youthgrouped according to OW/OB and SO categories arepresented in Table 2. By design, the SO group was bothheavier and more overweight than their OW/OB peers.We also completed exploratory analyses between OW
Table 2 Anthropometric characteristics of children andyouth categorized as overweight/obese (OW/OB) andseverely obese (SO)
OW/OB SO p-value
Age (y) 12.8 ± 2.8 12.3 ± 2.9 0.07
(n = 184) (n = 161)
Height (cm) 155.9 ± 13.0 157.9 ± 14.5 0.2
(n = 184) (n = 161)
Weight (kg) 71.2 ± 19.8 94.4 ± 29.3 <0.001
(n = 184) (n = 161)
BMI (kg/m2) 28.7 ± 4.1 36.9 ± 6.7 <0.001
(n = 184) (n = 161)
BMI Percentile 97.1 ± 2.3 99.5 ± 0.2 <0.001
(n = 184) (n = 161)
BMI Z-Score 2.0 ± 0.3 2.6 ± 0.2 <0.001
(n = 184) (n = 161)
Waist Circumference (cm) 88.0 ± 11.0 104.6 ± 15.6 <0.001
(n = 184) (n = 153)
Data are presented as mean ± standard deviation. BMI (body mass index).Note: Sample sizes vary variable-to-variable because of an incomplete dataset.
(n = 26) and OB (n = 158) sub-groups. Among all of thedemographic, cardiometabolic, and lifestyle variables,the only group differences related to systolic blood pres-sure (OW: 119 ± 13mmHg versus OB: 110 ± 11 mmHg;p < 0.05) and dietary energy from saturated fat (OW:203 ± 78 kcal/d versus OB: 254 ± 119 kcal/d; p < 0.05).These findings highlighted the homogeneity within theOW/OB group and justified our decision to combinethese sub-groups.Comparisons of cardiometabolic risk factors (continu-
ous data) between OW/OB and SO groups are shown inTable 3, with lower TC and HDL-C as well as higher ALT,fasting insulin, HOMA-IR, SBP, and DBP in the SO vsOW/OB group. After we dichotomized cardiometabolicrisk factors (see Table 1 for thresholds), we found that theproportions of children and youth with cardiometabolicrisk factors were higher in the SO group compared to the
(n = 168) (n = 147)
Total cholesterol/HDL ratio 4.3 ± 1.2 4.5 ± 1.1 0.2
(n = 168) (n = 147)
ALT (U/L) 24.9 ± 16.0 31.6 ± 17.8 0.001
(n = 157) (n = 145)
Fasting glucose (mmol/L) 4.9 ± 0.4 4.9 ± 0.4 0.7
(n = 159) (n = 138)
Fasting insulin (mU/L) 18.5 ± 15.8 31.3 ± 20.4 0.02
(n = 154) (n = 130)
HOMA-IR 4.0 ± 3.4 6.8 ± 4.6 0.03
(n = 151) (n = 123)
Systolic BP (mmHg) 108 ± 9 115 ± 11 0.01
(n = 174) (n = 150)
Diastolic BP (mmHg) 69 ± 8 72 ± 9 0.01
(n = 174) (n = 150)
Data are presented as mean ± standard deviation. HDL-C (high density lipoproteincholesterol), LDL-C (low density lipoprotein cholesterol), ALT (alanineaminotransferase), HOMA-IR (homeostatic model assessment of insulinresistance).Note 1: Sample sizes vary variable-to-variable because dataset was incomplete.Note 2: Group comparisons for fasting glucose, fasting insulin, HOMA-IR,systolic BP and diastolic BP were completed using non-parametric analysessince these variables were not normally distributed.
Salawi et al. BMC Pediatrics 2014, 14:154 Page 5 of 9http://www.biomedcentral.com/1471-2431/14/154
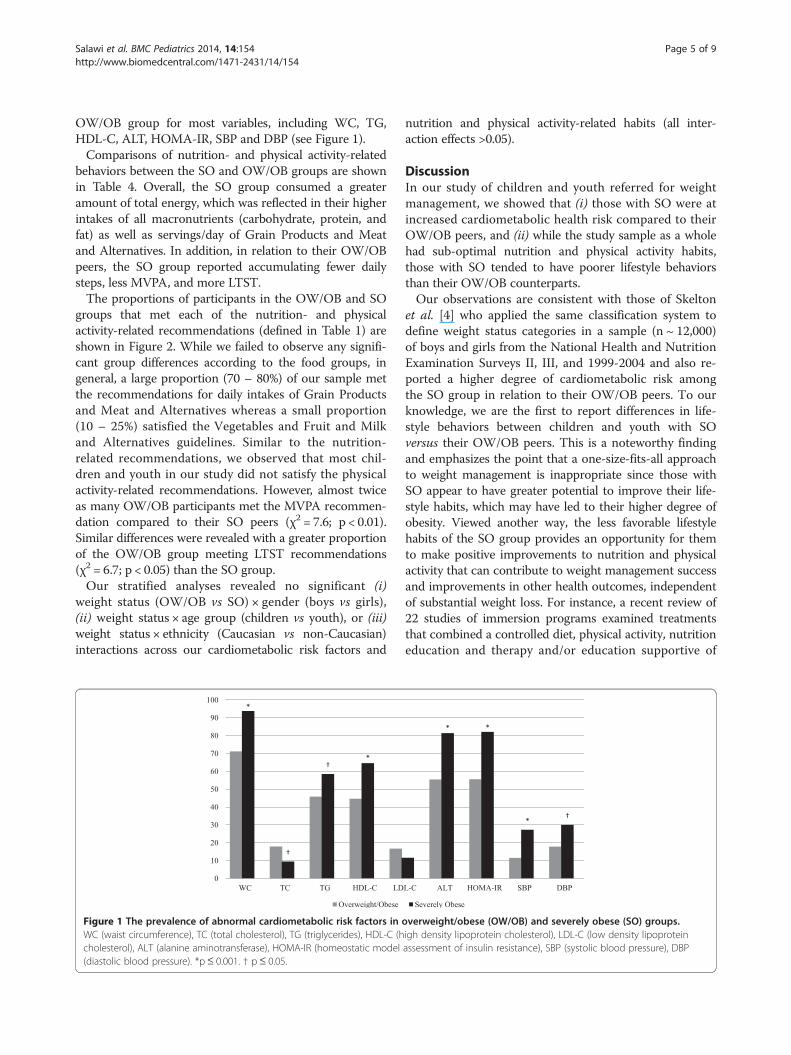
OW/OB group for most variables, including WC, TG,HDL-C, ALT, HOMA-IR, SBP and DBP (see Figure 1).Comparisons of nutrition- and physical activity-related
behaviors between the SO and OW/OB groups are shownin Table 4. Overall, the SO group consumed a greateramount of total energy, which was reflected in their higherintakes of all macronutrients (carbohydrate, protein, andfat) as well as servings/day of Grain Products and Meatand Alternatives. In addition, in relation to their OW/OBpeers, the SO group reported accumulating fewer dailysteps, less MVPA, and more LTST.The proportions of participants in the OW/OB and SO
groups that met each of the nutrition- and physicalactivity-related recommendations (defined in Table 1) areshown in Figure 2. While we failed to observe any signifi-cant group differences according to the food groups, ingeneral, a large proportion (70 – 80%) of our sample metthe recommendations for daily intakes of Grain Productsand Meat and Alternatives whereas a small proportion(10 – 25%) satisfied the Vegetables and Fruit and Milkand Alternatives guidelines. Similar to the nutrition-related recommendations, we observed that most chil-dren and youth in our study did not satisfy the physicalactivity-related recommendations. However, almost twiceas many OW/OB participants met the MVPA recommen-dation compared to their SO peers (χ2 = 7.6; p < 0.01).Similar differences were revealed with a greater proportionof the OW/OB group meeting LTST recommendations(χ2 = 6.7; p < 0.05) than the SO group.Our stratified analyses revealed no significant (i)
weight status (OW/OB vs SO) × gender (boys vs girls),(ii) weight status × age group (children vs youth), or (iii)weight status × ethnicity (Caucasian vs non-Caucasian)interactions across our cardiometabolic risk factors and
Figure 1 The prevalence of abnormal cardiometabolic risk factors inWC (waist circumference), TC (total cholesterol), TG (triglycerides), HDL-C (hcholesterol), ALT (alanine aminotransferase), HOMA-IR (homeostatic model(diastolic blood pressure). *p≤ 0.001. † p≤ 0.05.
nutrition and physical activity-related habits (all inter-action effects >0.05).
DiscussionIn our study of children and youth referred for weightmanagement, we showed that (i) those with SO were atincreased cardiometabolic health risk compared to theirOW/OB peers, and (ii) while the study sample as a wholehad sub-optimal nutrition and physical activity habits,those with SO tended to have poorer lifestyle behaviorsthan their OW/OB counterparts.Our observations are consistent with those of Skelton
et al. [4] who applied the same classification system todefine weight status categories in a sample (n ~ 12,000)of boys and girls from the National Health and NutritionExamination Surveys II, III, and 1999-2004 and also re-ported a higher degree of cardiometabolic risk amongthe SO group in relation to their OW/OB peers. To ourknowledge, we are the first to report differences in life-style behaviors between children and youth with SOversus their OW/OB peers. This is a noteworthy findingand emphasizes the point that a one-size-fits-all approachto weight management is inappropriate since those withSO appear to have greater potential to improve their life-style habits, which may have led to their higher degree ofobesity. Viewed another way, the less favorable lifestylehabits of the SO group provides an opportunity for themto make positive improvements to nutrition and physicalactivity that can contribute to weight management successand improvements in other health outcomes, independentof substantial weight loss. For instance, a recent review of22 studies of immersion programs examined treatmentsthat combined a controlled diet, physical activity, nutritioneducation and therapy and/or education supportive of
overweight/obese (OW/OB) and severely obese (SO) groups.igh density lipoprotein cholesterol), LDL-C (low density lipoproteinassessment of insulin resistance), SBP (systolic blood pressure), DBP
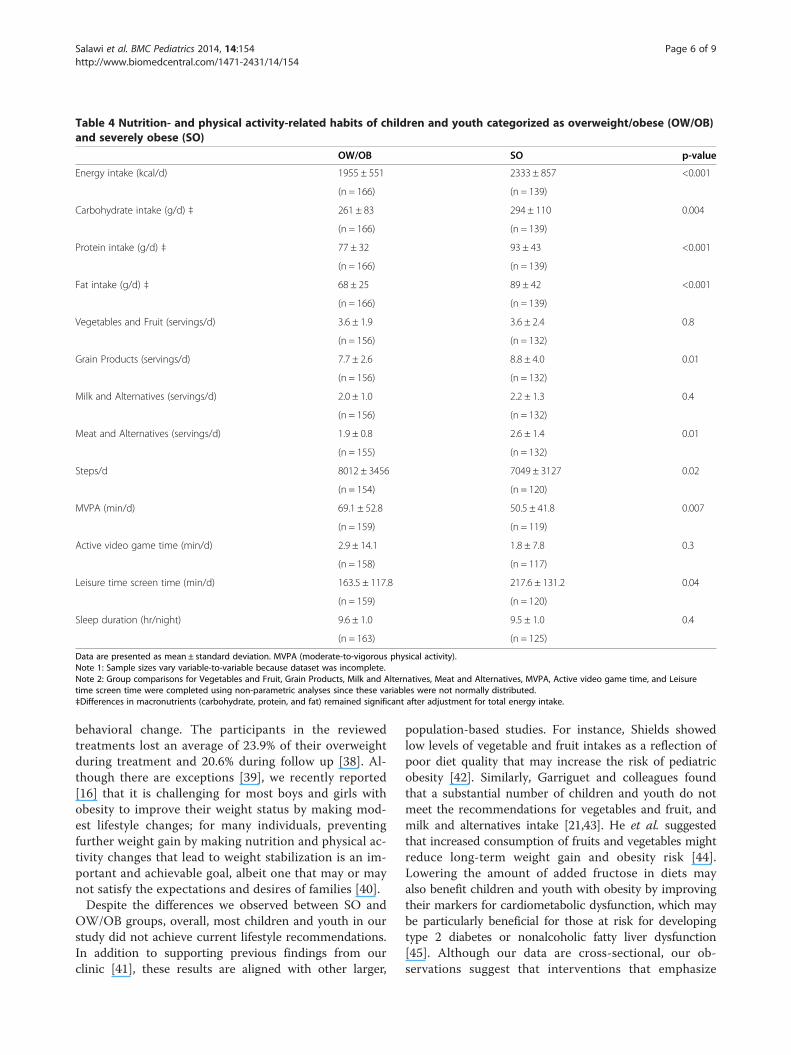
Table 4 Nutrition- and physical activity-related habits of children and youth categorized as overweight/obese (OW/OB)and severely obese (SO)
OW/OB SO p-value
Energy intake (kcal/d) 1955 ± 551 2333 ± 857 <0.001
(n = 166) (n = 139)
Carbohydrate intake (g/d) ‡ 261 ± 83 294 ± 110 0.004
(n = 166) (n = 139)
Protein intake (g/d) ‡ 77 ± 32 93 ± 43 <0.001
(n = 166) (n = 139)
Fat intake (g/d) ‡ 68 ± 25 89 ± 42 <0.001
(n = 166) (n = 139)
Vegetables and Fruit (servings/d) 3.6 ± 1.9 3.6 ± 2.4 0.8
(n = 156) (n = 132)
Grain Products (servings/d) 7.7 ± 2.6 8.8 ± 4.0 0.01
(n = 156) (n = 132)
Milk and Alternatives (servings/d) 2.0 ± 1.0 2.2 ± 1.3 0.4
(n = 156) (n = 132)
Meat and Alternatives (servings/d) 1.9 ± 0.8 2.6 ± 1.4 0.01
(n = 155) (n = 132)
Steps/d 8012 ± 3456 7049 ± 3127 0.02
(n = 154) (n = 120)
MVPA (min/d) 69.1 ± 52.8 50.5 ± 41.8 0.007
(n = 159) (n = 119)
Active video game time (min/d) 2.9 ± 14.1 1.8 ± 7.8 0.3
(n = 158) (n = 117)
Leisure time screen time (min/d) 163.5 ± 117.8 217.6 ± 131.2 0.04
(n = 159) (n = 120)
Sleep duration (hr/night) 9.6 ± 1.0 9.5 ± 1.0 0.4
(n = 163) (n = 125)
Data are presented as mean ± standard deviation. MVPA (moderate-to-vigorous physical activity).Note 1: Sample sizes vary variable-to-variable because dataset was incomplete.Note 2: Group comparisons for Vegetables and Fruit, Grain Products, Milk and Alternatives, Meat and Alternatives, MVPA, Active video game time, and Leisuretime screen time were completed using non-parametric analyses since these variables were not normally distributed.‡Differences in macronutrients (carbohydrate, protein, and fat) remained significant after adjustment for total energy intake.
Salawi et al. BMC Pediatrics 2014, 14:154 Page 6 of 9http://www.biomedcentral.com/1471-2431/14/154
behavioral change. The participants in the reviewedtreatments lost an average of 23.9% of their overweightduring treatment and 20.6% during follow up [38]. Al-though there are exceptions [39], we recently reported[16] that it is challenging for most boys and girls withobesity to improve their weight status by making mod-est lifestyle changes; for many individuals, preventingfurther weight gain by making nutrition and physical ac-tivity changes that lead to weight stabilization is an im-portant and achievable goal, albeit one that may or maynot satisfy the expectations and desires of families [40].Despite the differences we observed between SO and
OW/OB groups, overall, most children and youth in ourstudy did not achieve current lifestyle recommendations.In addition to supporting previous findings from ourclinic [41], these results are aligned with other larger,
population-based studies. For instance, Shields showedlow levels of vegetable and fruit intakes as a reflection ofpoor diet quality that may increase the risk of pediatricobesity [42]. Similarly, Garriguet and colleagues foundthat a substantial number of children and youth do notmeet the recommendations for vegetables and fruit, andmilk and alternatives intake [21,43]. He et al. suggestedthat increased consumption of fruits and vegetables mightreduce long-term weight gain and obesity risk [44].Lowering the amount of added fructose in diets mayalso benefit children and youth with obesity by improvingtheir markers for cardiometabolic dysfunction, which maybe particularly beneficial for those at risk for developingtype 2 diabetes or nonalcoholic fatty liver dysfunction[45]. Although our data are cross-sectional, our ob-servations suggest that interventions that emphasize
Figure 2 The proportion of participants in overweight/obese (OW/OB) and severely obese (SO) groups that achieved recommendations fornutrition and physical activity behaviours. V & F (Vegetables and Fruit), MVPA (moderate-to-vigorous physical activity), LTST (leisure timescreen time). *p ≤ 0.01. † p ≤ 0.05.
Salawi et al. BMC Pediatrics 2014, 14:154 Page 7 of 9http://www.biomedcentral.com/1471-2431/14/154
improvements in diet quality and quantity are likely to beimportant strategies for managing pediatric obesity [12].It is clear that a physically active lifestyle has numerous
health promoting benefits (beyond weight management)[46], but it remains a challenge for most boys and girls toachieve current recommendations. The Canadian PhysicalActivity and Sedentary Behaviour Guidelines [34] suggestthat children and youth should accumulate ≥60 minutesof daily MVPA and limit their sedentary time to <2 hoursdaily [47]. Following these guidelines can help improvebody composition, cardiorespiratory and musculoskeletalhealth, social behaviors, self-esteem and academic success[48]. A relatively high proportion (30 – 40% according tothe self-reported data) of our sample met the physical ac-tivity recommendations; however, based on objectivephysical activity data collected using accelerometers, <10%of Canadian children and youth accumulate ≥60 minutesof daily MVPA [49]. The difference in the proportion ofindividuals meeting MVPA recommendations in our sam-ple versus national normative data suggests boys and girlsin our study may have overestimated their physical activitylevels. Our observation that a lower percentage of oursample achieved the daily steps recommendation versusself-reported MVPA provides indirect evidence in supportof this point, but is validated by other data showing thatyoung individuals may overestimate their physical activityusing self-report tools [50].Our study has several limitations to acknowledge.
First, since all of the participants were referred by physi-cians to a weight management clinic, our findings maynot apply to all children and youth with SO, especiallythose who do not enroll in health services for obesitymanagement. Notably, our clinic is one of eight that isparticipating in a new Canadian multi-center study tocharacterize children, youth and families receiving health
services for managing pediatric obesity [51]. Evidencegenerated from this registry of ~1,600 participants willshow whether our findings are generalizable to othersimilar settings. Second, given our cross-sectional studydesign, we cannot comment on whether our observeddifferences between SO and OW/OB groups remain con-sistent over time or whether changes in response to ther-apy are similar across groups. Third, while our analysesincluded objective measurements of anthropometric vari-ables and cardiometabolic risk factors, self-reported nutri-tion and physical activity data are subjective in nature,which can reduce measurement reliability and accuracy.The fact that we still observed group differences based onthese self-reported data provides some confidence thatreal differences exist between SO and OW/OB groups.Finally, a recent report [52] highlighted the need for con-sistent terms and definitions of SO in pediatrics. Whilethe current manuscript applied one of several differentdefinitions of SO in the literature, applying the newer rec-ommended criteria in future studies is needed to establishits superiority.
ConclusionsIn conclusion, our study revealed that children and youthwith SO were at increased cardiometabolic health risk andtended to have less healthy nutrition and physical activityhabits compared to their OW/OB counterparts. In theirdiscussions with families, clinicians can use this informa-tion to highlight the health risks associated with a higherdegree of obesity. By applying family- and client-centeredcounseling strategies [53,54], they can also emphasize thepotential that exists for boys and girls with obesity tomake healthy changes since most do not satisfy currentlifestyle recommendations.
Salawi et al. BMC Pediatrics 2014, 14:154 Page 8 of 9http://www.biomedcentral.com/1471-2431/14/154
Competing interestThe authors declare that they have no competing interest.
Authors’ contributionsHS analyzed the data and co-authored the first draft of the manuscript withGDCB; KAA assisted with data collection and management; RSP, DRM, andCC provided critical feedback and edits on data analysis, data interpretation,and manuscript presentation; GDCB conceived the study, assisted with dataanalysis and interpretation, and co-authored the first draft of the manuscriptwith HS. All authors contributed to writing the manuscript. All authorsreviewed and approved the final draft of the manuscript prior to submission.
AcknowledgementsThe authors wish to thank the children and youth whose data are includedin this report as well as the team of professionals at the Pediatric Centre forWeight and Health (Stollery Children’s Hospital, Edmonton, AB), Mr. RickWatts (Clinical Research Informatics Core, Women and Children’s HealthResearch Institute, University of Alberta), and Ms. Alli Rasquinha (ResearchAssistant, Department of Pediatrics, University of Alberta) for theiradministrative and research support. HS was supported by a scholarshipawarded by the King Abdullah Scholarship Program (Saudi Arabia).
Author details1Department of Agricultural, Food and Nutritional Science, University ofAlberta, Edmonton, AB T6G 2R3, CANADA. 2Department of Pediatrics,University of Alberta, Edmonton, AB T5K0L4, CANADA. 3Department ofMedicine, University of Alberta, Edmonton, AB T6G 2R7, CANADA.4Department of Pediatrics, University of Alberta, Edmonton, AB T6G 2R3,CANADA. 5Department of Physiology, University of Alberta, Edmonton, ABT6G 2R3, CANADA. 68B, Pediatric Centre for Weight and Health, EdmontonGeneral Continuing Care Centre, 11111 Jasper Ave, Edmonton, AB T5K0L4,CANADA.
Received: 3 February 2014 Accepted: 12 June 2014Published: 19 June 2014
References1. Reilly JJ, Methven E, McDowell ZC, Hacking B, Alexander D, Stewart L, Kelnar CJ:
Health consequences of obesity. Arch Dis Child 2003, 88(9):748–752.2. Ogden CL, Carroll MD, Kit BK, Flegal KM: Prevalence of obesity and trends
in body mass index among US children and adolescents, 1999-2010.JAMA 2012, 307(5):483–490.
3. Roberts KC, Shields M, de Groh M, Aziz A, Gilbert JA: Overweight andobesity in children and adolescents: results from the 2009-2011Canadian Health Measures Survey. Health Rep 2012, 23(3):37–41.
4. Skelton JA, Cook SR, Auinger P, Klein JD, Barlow SE: Prevalence and trendsof severe obesity among US children and adolescents. Acad Pediatr 2009,9(5):322–329.
5. Hannon TS, Rofey DL, Ryan CM, Clapper DA, Chakravorty S, Arslanian SA:Relationships among obstructive sleep apnea, anthropometric measures,and neurocognitive functioning in adolescents with severe obesity.J Pediatr 2012, 160(5):732–735.
6. Ratcliff MB, Jenkins TM, Reiter-Purtill J, Noll JG, Zeller MH: Risk-takingbehaviors of adolescents with extreme obesity: normative or not?Pediatrics 2011, 127(5):827–834.
7. Moens E, Braet C, Van Winckel M: An 8-year follow-up of treated obesechildren: children’s, process and parental predictors of successfuloutcome. Behav Res Ther 2010, 48(7):626–633.
8. Braet C: Patient characteristics as predictors of weight loss after anobesity treatment for children. Obesity 2006, 14(1):148–155.
9. Wang YC, Gortmaker SL, Taveras EM: Trends and racial/ethnic disparities insevere obesity among US children and adolescents, 1976–2006.Int J Pediatr Obes 2011, 6(1):12–20.
10. van Emmerik NM, Renders CM, van de Veer M, van Buuren S, van derBaan-Slootweg OH, Kist-van Holthe JE, HiraSing RA: High cardiovascular riskin severely obese young children and adolescents. Arch Dis Child 2012,97(9):818–821.
11. Ball GD, Ambler KA, Chanoine JP: Pediatric weight management programsin Canada: where, what and how? Int J Pediatr Obes 2011,6(2Part2):e58–e61.
12. Lau DC, Douketis JD, Morrison KM, Hramiak IM, Sharma AM, Ur E: 2006Canadian clinical practice guidelines on the management andprevention of obesity in adults and children [summary]. CMAJ 2007,176(8):S1–S13.
13. Barlow SE, Expert Committee: Expert Committee RecommendationsRegarding the Prevention, Assessment, and Treatment of Child andAdolescent Overweight and Obesity: Summary Report. Pediatrics 2007,120 Suppl 4(120 Suppl 4):S164–S192.
14. Gearing RE, Mian IA, Barber J, Ickowicz A: A methodology for conductingretrospective chart review research in child and adolescent psychiatry.J Can Acad Child Adolesc Psychiatry 2006, 15(3):126.
15. Kuczmarski RJ, Ogden CL, Guo SS, Grummer-Strawn LM, Flegal KM, Mei Z,Wei R, Curtin LR, Roche AF, Johnson CL: 2000 CDC Growth Charts for theUnited States: methods and development. Vital Health Stat 11 2002,246:1–190.
16. Avis J, Ambler KA, Jetha MM, Boateng H, Ball G: Modest treatment effectsand high program attrition: The impact of interdisciplinary, individualizedcare for managing paediatric obesity. Paediatr Child Health 2013,18(10):e59–e63.
17. Ball GD, Ambler KA, Keaschuk RA, Rosychuk RJ, Holt NL, Spence JC, Jetha MM,Sharma AM, Newton AS: Parents as Agents of Change (PAC) in pediatricweight management: The protocol for the PAC randomized clinical trial.BMC Pediatr 2012, 12(1):114.
18. Ball GD, Mackenzie-Rife KA, Newton MS, Alloway CA, Slack JM, Plotnikoff RC,Goran MI: One-on-one lifestyle coaching for managing adolescentobesity: Findings from a pilot, randomized controlled trial in areal-world, clinical setting. Paediatr Child Health 2011, 16(6):345.
19. Keskin M, Kurtoglu S, Kendirci M, Atabek ME, Yazici C: Homeostasis modelassessment is more reliable than the fasting glucose/insulin ratio andquantitative insulin sensitivity check index for assessing insulinresistance among obese children and adolescents. Pediatrics 2005,115(4):e500–e503.
20. Canadian Society for Exercise Physiology (CSEP): Canadian Physical Activity,Fitness & Lifestyle Approach: CSEP-Health & Fitness Program’s Health-RelatedAppraisal and Counselling Strategy. 3rd edition. Ottawa: Sport Informationand Resource Centre (SIRC); 2003.
21. Garriguet D: Canadians’ eating. Health Rep 2007, 18(2):17.22. Sallis JF, Buono MJ, Roby JJ, Micale FG, Nelson JA: Seven-day recall and
other physical activity self-reports in children and adolescents.Med Sci Sports Exerc 1993, 25(1):99.
23. Gordon‐Larsen P, Adair LS, Popkin BM: Ethnic differences in physicalactivity and inactivity patterns and overweight status. Obes Res 2002,10(3):141–149.
24. Trost SG, Kerr L, Ward DS, Pate RR: Physical activity and determinants ofphysical activity in obese and non-obese children. Int J Obes Relat MetabDisord 2001, 25(6):822–829.
25. Selewski DT, Collier DN, MacHardy J, Gross HE, Pickens EM, Cooper AW,Bullock S, Earls MF, Pratt KJ, Scanlon K: Promising insights into the healthrelated quality of life for children with severe obesity. Health Qual LifeOutcomes 2013, 11(1):29.
26. Madsen KA, Weedn AE, Crawford PB: Disparities in peaks, plateaus, anddeclines in prevalence of high BMI among adolescents. Pediatrics 2010,126(3):434–442.
27. Lenders CM, Wright JA, Apovian CM, Hess DT, Shukla RR, Adams WG, Lee K:Weight loss surgery eligibility according to various BMI criteria amongadolescents. Obesity 2009, 17(1):150–155.
28. Fernández JR, Redden DT, Pietrobelli A, Allison DB: Waist circumferencepercentiles in nationally representative samples of African-American,European-American, and Mexican-American children and adolescents.J Pediatr 2004, 145(4):439–444.
29. Health Canada: Eating well with Canada’s Food Guide. http://www.hc-sc.gc.ca/fn-an/food-guide-aliment/order-commander/eating_well_bien_manger-eng.php.
30. Lauer R, Barness L, Clark R, Deckelbaum R, Finberg L, Kwiterovich P, McBride P,Schieken R, Scott L, Strong J: National Cholesterol Education Program(NCEP)-Highlights of the Report of the Expert Panel on blood cholesterollevels in children and adolescents. Am Acad Pediatrics 1992, 89(3):495–501.
31. O’Loughlin J, Lauzon B, Paradis G, Hanley J, Levy E, Delvin E, Lambert M:Usefulness of the American Academy of Pediatrics recommendationsfor identifying youths with hypercholesterolemia. Pediatrics 2004,113(6):1723–1727.
Salawi et al. BMC Pediatrics 2014, 14:154 Page 9 of 9http://www.biomedcentral.com/1471-2431/14/154
32. Tudor-Locke C, Craig CL, Cameron C, Griffiths JM: Canadian children’s andyouth’s pedometer-determined steps/day, parent-reported TV watchingtime, and overweight/obesity: The CANPLAY Surveillance Study.Int J Behav Nutr Phys Act 2011, 8:1–10.
33. Wu WC, Wu CY, Wang YJ, Hung HH, Yang HI, Kao WY, Su CW, Wu JC, Chan WL,Lin HC: Updated thresholds for serum alanine aminotransferase levelin a large‐scale population study composed of 34 346 subjects.Aliment Pharmacol Ther 2012, 36(6):560–568.
34. CSEP: Canadian physical activity guidelines: 2011 science statements. www.csep.ca/CMFiles/Guidelines/CanadianPhysicalActivityGuidelinesStatements_E.pdf.
35. Tremblay MS, Warburton DE, Janssen I, Paterson DH, Latimer AE, Rhodes RE,Kho ME, Hicks A, LeBlanc AG, Zehr L: New Canadian physical activityguidelines. Appl Physiol Nutr Metab 2011, 36(1):36–46.
36. National high blood pressure education program working group onhypertension control in children and adolescents: Update on the 1987Task Force Report on High Blood Pressure in Children and Adolescents:a working group report from the National High Blood PressureEducation Program. Pediatrics 1996, 98:649. 658.c.
37. Owens JA, Witmans M: Sleep Problems. Curr Probl Pediatr Adolesc 2004,34:154–179.
38. Kelly K, Kirschenbaum D: Immersion treatment of childhood andadolescent obesity: the first review of a promising intervention.Obes Rev 2011, 12(1):37–49.
39. Reinehr T, Temmesfeld M, Kersting M, De Sousa G, Toschke A: Four-yearfollow-up of children and adolescents participating in an obesityintervention program. Int J Obes 2007, 31(7):1074–1077.
40. Skelton JA, Irby MB, Geiger AM: A Systematic Review of Satisfaction andPediatric Obesity Treatment: New Avenues for Addressing Attrition.Health Qual Life Outcomes 2013. http://dx.doi.org/10.1111/jhq.12003.
41. Ball GD, Lenk JM, Barbarich BN, Plotnikoff RC, Fishburne GJ, Mackenzie KA,Willows ND: Overweight children and adolescents referred for weightmanagement: are they meeting lifestyle behaviour recommendations?Appl Physiol Nutr Metab 2008, 33(5):936–945.
42. Shields M: Measured obesity: overweight Canadian children andadolescents. Nutrition: findings from the Canadian Community HealthSurvey 2005, 1:1–34.
43. Garriguet D: Nutrition: Findings from the Canadian CommunityHealth Survey-Overview of Canadians’ Eating Habits.http://www.statcan.gc.ca/pub/82-620-m/82-620-m2006002-eng.pdf.
44. He K, Hu F, Colditz G, Manson J, Willett W, Liu S: Changes in intake of fruitsand vegetables in relation to risk of obesity and weight gain amongmiddle-aged women. Int J Obes 2004, 28(12):1569–1574.
45. Mager DR, Iñiguez IR, Gilmour S, Yap J: The Effect of a Low Fructose andLow Glycemic Index/Load (FRAGILE) Dietary Intervention on Indices ofLiver Function, Cardiometabolic Risk Factors, and Body Composition inChildren and Adolescents With Nonalcoholic Fatty Liver Disease(NAFLD). JPEN J Parenter Enteral Nutr 2013. http://dx.doi.org/10.1177/0148607113501201.
46. Reinehr T, Schaefer A, Winkel K, Finne E, Toschke A, Kolip P: An effectivelifestyle intervention in overweight children: findings from a randomizedcontrolled trial on “Obeldicks light”. Clin Nutr 2010, 29(3):331–336.
47. Ekelund U, Luan JA, Sherar LB, Esliger DW, Griew P, Cooper A, InternationalChildren’s Accelerometry Database (ICAD) Collaborators: Moderate tovigorous physical activity and sedentary time and cardiometabolic riskfactors in children and adolescents. JAMA 2012, 307(7):704–712.
48. Tremblay MS, LeBlanc AG, Janssen I, Kho ME, Hicks A, Murumets K, Colley RC,Duggan M: Canadian sedentary behaviour guidelines for children and youth.Appl Physiol Nutr Metab 2011, 36(1):59–64.
49. Colley RC, Garriguet D, Janssen I, Craig CL, Clarke J, Tremblay MS:Physical activity of Canadian children and youth: accelerometerresults from the 2007 to 2009 Canadian Health Measures Survey.Health Rep 2011, 22(1):15–23.
50. Adamo KB, Prince SA, Tricco AC, Connor-Gorber S, Tremblay M: A comparisonof indirect versus direct measures for assessing physical activity in thepediatric population: a systematic review. Int J Pediatr Obes 2009, 4(1):2–27.
51. Morrison KM, Damanhoury S, Berall G, Hamilton J, Buchholz A, Chanoine JP,Lambert M, Ambler KA, Tremblay MS, Ball GDC: The CANadian pediatricweight management registry (CANPWR): study protocol. BMC Pediatrics.(In Press).
52. Kelly AS, Barlow SE, Rao G, Inge TH, Hayman LL, Steinberger J, Urbina EM,Ewing LJ, Daniels SR: Severe obesity in children and adolescents:
Identification, associated health risks, and treatment approaches. Ascientific statement from the American Heart Association. Circulation 2013,128(15):1689–1712.
53. Keaschuk RA, Ball GD: Tailoring health services for managing pediatricobesity: A proposed, practice-based framework for working with families.Curr Nutr Rep 2013, 2(4):243–250.
54. Farnesi B-C, Newton AS, Holt NL, Sharma AM, Ball GD: Exploring collaborationbetween clinicians and parents to optimize pediatric weight management.Patient Educ Couns 2012, 87(1):10–17.
doi:10.1186/1471-2431-14-154Cite this article as: Salawi et al.: Characterizing severe obesity inchildren and youth referred for weight management. BMC Pediatrics2014 14:154.
Submit your next manuscript to BioMed Centraland take full advantage of:
• Convenient online submission
• Thorough peer review
• No space constraints or color figure charges
• Immediate publication on acceptance
• Inclusion in PubMed, CAS, Scopus and Google Scholar
• Research which is freely available for redistribution
Submit your manuscript at www.biomedcentral.com/submit