Luminescence spectra of matrix isolated N2 at high pressure and low temperature
10
Luminescence spectra of matrix isolated N 2 at high pressure and low temperature M. Semling and M. Jordan Universita ¨t Kaiserslautern, Fachbereich Physik, Erwin-Schro ¨dinger-Strasse, D-67663, Kaiserslautern, Germany K. Syassen Max-Planck-Institut fu ¨r Festko ¨rperforschung, Heisenbergstr. 1, D-70569 Stuttgart, Germany H. J. Jodl Universita ¨t Kaiserslautern, Fachbereich Physik, Erwin-Schro ¨dinger-Strasse, D-67663, Kaiserslautern, Germany G. F. Signorini Laboratorio di Spettroscopia Molecolare, Dipartimento di Chimica, Universita ` di Firenze, via G. Capponi 9, 50121 Firenze, Italy ~Received 11 July 1996; accepted 14 October 1996! N 2 molecules with a concentration of ca. 1% were isolated in Xe, Kr, and Ar. X-ray stimulated luminescence ( A 3 S u 1 →X 1 S g 1 ) was investigated as a function of pressure ~,30 GPa!, temperature ~300 K and 77 K!, and matrix material. Observed UV transitions were interpreted as rovibronic transitions of the impurity molecule along with phonon sidebands as lattice excitations. Spectra were analyzed due to band maxima of vibron progressions, bandwidth, and bandshape, Franck– Condon profiles, and molecule constants, each as a function of pressure. The main result was a shift of band maxima with pressure to lower energies at a rate of 100 cm 21 /GPa in Xe, 50 cm 21 /GPa in Kr, and 10 cm 21 /GPa in Ar. We modeled and explained these pressure-induced shifts of electronic bands by two mechanisms: a dielectric effect and a volume effect. © 1997 American Institute of Physics. @S0021-9606~97!00704-6# INTRODUCTION The technique of matrix isolation is applied successfully to almost any kind of spectroscopy and it deals either with physical or chemical oriented questions since it was devel- oped in 1954. 1,2 If a guest particle is isolated in the host matrix, the deformation of the first shell of neighboring rare- gas atoms is of the order of 1% or less compared to the undistorted configuration. This volume or cage effect is part of the contribution to the matrix shift, defined as D n m 5n mi 2n gas and n the energy of any kind of transition in the guest. If ultra high pressure ~less than 10 GPa at T ,20 K! is applied, the crystal shrinks additionally and the lattice constant is reduced by 10%–30%. Since high pressure meth- ods, especially the diamond anvil cell ~DAC!, are available ~;1980! and are also successfully linked to almost any kind of spectroscopy 3,4 it is straightforward to combine matrix isolation to high pressure techniques to raise the following questions: ~i! This type of condensed matter consisting of molecu- lar crystals, mixtures, or diluted systems occurs in comets ~Halley! or in moons of Uranus; it is challenging to model the IR spectra of these astrophysical objects by N 2 , CO, ice, methane, etc. ~ii! Because it is feasible to now study individual par- ticles in Paul-traps 5 or detect the light of individual particles in solids, 6 it might be interesting to study now quasi-free or matrix isolated molecules under extreme conditions such as ultra high pressure; then we expect the bondlength of the molecule to be changed remarkably by ca. 10 23 . ~iii! Applying pressure will change the strength of guest–host interaction, because all the potential parameters, such as potential depth, equilibrium distance, and polariz- ability, are heavily pressure sensitive. In addition by varying pressure the interaction distance between lattice particles is altered and the potential will be tested on a larger scale and not only around the potential minimum. ~iv! Since the theoretical matrix shift D n m consists of different contributions—such as electrostatic interaction, in- duction and dispersion, short range repulsion 7 —which are difficult to be determined by spectroscopy or scattering ex- periments, the additional pressure shift D n ( p ) by volume decrease will mainly help to get a deeper insight into this guest–host interaction. Possible candidates which can easily be loaded into a DAC from respective gas mixtures are N 2 ,O 2 , CO 2 , CS 2 , etc. in rare gases Ne, Ar, Kr, Xe. We expect forbidden rovi- bronic transitions to be partially allowed by pressure, that bending progressions are altered, etc. As a first example of a series of measurements of matrix isolated molecules at high pressure, we investigated the x-ray stimulated optical lumi- nescence spectra of N 2 isolated in rare-gas matrices ~Ar, Kr, Xe! at high pressure ~p ,30 GPa! and varying temperature ~T 577–300 K! in the region of the Vegard–Kaplan bands A 3 S u 1 →X 1 S g 1 . Characteristics of these rovibronic bands, such as band maxima, bandshapes, bandwidths, and intensi- ties, are determined as a function of temperature, pressure, and matrix material. We will analyze these data due to stan- dard methods of molecular spectroscopy and discuss them in 1336 J. Chem. Phys. 106 (4), 22 January 1997 0021-9606/97/106(4)/1336/10/$10.00 © 1997 American Institute of Physics Downloaded¬11¬Sep¬2007¬to¬150.217.154.21.¬Redistribution¬subject¬to¬AIP¬license¬or¬copyright,¬see¬http://jcp.aip.org/jcp/copyright.jsp
Transcript of Luminescence spectra of matrix isolated N2 at high pressure and low temperature

Luminescence spectra of matrix isolated N 2 at high pressureand low temperature
M. Semling and M. JordanUniversitat Kaiserslautern, Fachbereich Physik, Erwin-Schro¨dinger-Strasse, D-67663,Kaiserslautern, Germany
K. SyassenMax-Planck-Institut fu¨r Festkorperforschung, Heisenbergstr. 1, D-70569 Stuttgart, Germany
H. J. JodlUniversitat Kaiserslautern, Fachbereich Physik, Erwin-Schro¨dinger-Strasse, D-67663,Kaiserslautern, Germany
G. F. SignoriniLaboratorio di Spettroscopia Molecolare, Dipartimento di Chimica, Universita` di Firenze,via G. Capponi 9, 50121 Firenze, Italy
~Received 11 July 1996; accepted 14 October 1996!
N2 molecules with a concentration of ca. 1% were isolated in Xe, Kr, and Ar. X-ray stimulatedluminescence (A 3Su
1→X 1Sg1) was investigated as a function of pressure~,30 GPa!, temperature
~300 K and 77 K!, and matrix material. Observed UV transitions were interpreted as rovibronictransitions of the impurity molecule along with phonon sidebands as lattice excitations. Spectrawere analyzed due to band maxima of vibron progressions, bandwidth, and bandshape, Franck–Condon profiles, and molecule constants, each as a function of pressure. The main result was a shiftof band maxima with pressure to lower energies at a rate of 100 cm21/GPa in Xe, 50 cm21/GPa inKr, and 10 cm21/GPa in Ar. We modeled and explained these pressure-induced shifts of electronicbands by two mechanisms: a dielectric effect and a volume effect. ©1997 American Institute ofPhysics.@S0021-9606~97!00704-6#
llyitvestethas
icee
ind
in
cueel
r-sor
th
ofters,riz-ngs isand
in-
ex-
his
o a
vi-atof aighmi-
ss,ensi-ure,an-m in
INTRODUCTION
The technique of matrix isolation is applied successfuto almost any kind of spectroscopy and it deals either wphysical or chemical oriented questions since it was deoped in 1954.1,2 If a guest particle is isolated in the homatrix, the deformation of the first shell of neighboring rargas atoms is of the order of 1% or less compared toundistorted configuration. This volume or cage effect is pof the contribution to the matrix shift, defined aDnm5nmi2ngasandn the energy of any kind of transition inthe guest. If ultra high pressure~less than 10 GPa atT,20K! is applied, the crystal shrinks additionally and the lattconstant is reduced by 10%–30%. Since high pressure mods, especially the diamond anvil cell~DAC!, are available~;1980! and are also successfully linked to almost any kof spectroscopy3,4 it is straightforward to combine matrixisolation to high pressure techniques to raise the followquestions:
~i! This type of condensed matter consisting of molelar crystals, mixtures, or diluted systems occurs in com~Halley! or in moons of Uranus; it is challenging to modthe IR spectra of these astrophysical objects by N2, CO, ice,methane, etc.
~ii ! Because it is feasible to now study individual paticles in Paul-traps5 or detect the light of individual particlein solids,6 it might be interesting to study now quasi-freematrix isolated molecules under extreme conditions suchultra high pressure; then we expect the bondlength ofmolecule to be changed remarkably by ca. 1023.
1336 J. Chem. Phys. 106 (4), 22 January 1997 0021-9606/9
Downloaded¬11¬Sep¬2007¬to¬150.217.154.21.¬Redistribution¬subject
hl-
-ert
th-
g
-ts
ase
~iii ! Applying pressure will change the strengthguest–host interaction, because all the potential paramesuch as potential depth, equilibrium distance, and polaability, are heavily pressure sensitive. In addition by varyipressure the interaction distance between lattice particlealtered and the potential will be tested on a larger scalenot only around the potential minimum.
~iv! Since the theoretical matrix shiftDnm consists ofdifferent contributions—such as electrostatic interaction,duction and dispersion, short range repulsion7—which aredifficult to be determined by spectroscopy or scatteringperiments, the additional pressure shiftDn(p) by volumedecrease will mainly help to get a deeper insight into tguest–host interaction.
Possible candidates which can easily be loaded intDAC from respective gas mixtures are N2, O2, CO2, CS2,etc. in rare gases Ne, Ar, Kr, Xe. We expect forbidden robronic transitions to be partially allowed by pressure, thbending progressions are altered, etc. As a first exampleseries of measurements of matrix isolated molecules at hpressure, we investigated the x-ray stimulated optical lunescence spectra of N2 isolated in rare-gas matrices~Ar, Kr,Xe! at high pressure~p,30 GPa! and varying temperature~T577–300 K! in the region of the Vegard–Kaplan bandA 3Su
1→X 1Sg1. Characteristics of these rovibronic band
such as band maxima, bandshapes, bandwidths, and intties, are determined as a function of temperature, pressand matrix material. We will analyze these data due to stdard methods of molecular spectroscopy and discuss the
7/106(4)/1336/10/$10.00 © 1997 American Institute of Physics
¬to¬AIP¬license¬or¬copyright,¬see¬http://jcp.aip.org/jcp/copyright.jsp
.
s
thn
tuy
regatr1
u
inles
ec
.,
a
-verpaim
itf
le
re
o
epd
cted.to
oneline
ert tool-re-on-tricwen
ransi-s
1337Semling et al.: Luminescence spectra of matrix isolated N2
terms of pressure induced cage effect and matrix effectsConsidering published literature~;1970–1995! there
are very few publications on matrix isolation at high presure: IR studies up to 1.5 GPa at 5 K in H2/rare-gasmixtures;8 Raman studies up to 1 GPa at 77 K in N2/Armixtures;9 absorption measurements in Xe to determinepressure dependence of the gap energy in the UV regio10
pressure dependent fluorescence investigations on Cr31 ionsin Al2O3;
11 Raman studies up to 40 GPa at room temperaon H2 in He, Ne, Ar, and D2;
12 synchrotron IR spectroscopat megabar pressures in o/p hydrogen.13
EXPERIMENT AND RESULTS
Nitrogen and rare gases~Ar, Kr, Xe! of standard puritywere premixed~0.5 to 1 bar N2 and rare gas at final pressuof 60 bar! and the sealed DAC was loaded by use of aloading apparatus. Therefore, the concentration of maisolated molecules—due to partial pressure—was aboutor less. The luminescence of N2 moleculesA
3Su1→X 1Sg
1
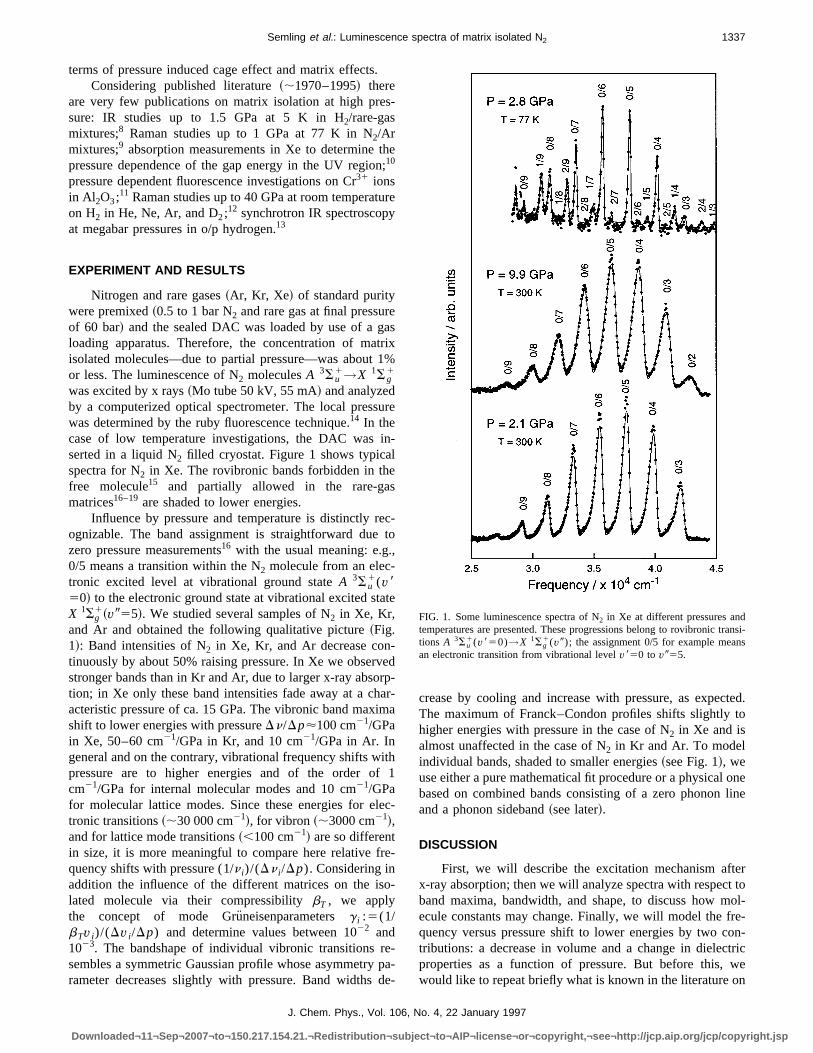
was excited by x rays~Mo tube 50 kV, 55 mA! and analyzedby a computerized optical spectrometer. The local presswas determined by the ruby fluorescence technique.14 In thecase of low temperature investigations, the DAC wasserted in a liquid N2 filled cryostat. Figure 1 shows typicaspectra for N2 in Xe. The rovibronic bands forbidden in thfree molecule15 and partially allowed in the rare-gamatrices16–19are shaded to lower energies.
Influence by pressure and temperature is distinctly rognizable. The band assignment is straightforward duezero pressure measurements16 with the usual meaning: e.g0/5 means a transition within the N2 molecule from an elec-tronic excited level at vibrational ground stateA 3Su
1(v850! to the electronic ground state at vibrational excited stX 1Sg
1~v955!. We studied several samples of N2 in Xe, Kr,and Ar and obtained the following qualitative picture~Fig.1!: Band intensities of N2 in Xe, Kr, and Ar decrease continuously by about 50% raising pressure. In Xe we obserstronger bands than in Kr and Ar, due to larger x-ray absotion; in Xe only these band intensities fade away at a chacteristic pressure of ca. 15 GPa. The vibronic band maxshift to lower energies with pressureDn/Dp'100 cm21/GPain Xe, 50–60 cm21/GPa in Kr, and 10 cm21/GPa in Ar. Ingeneral and on the contrary, vibrational frequency shifts wpressure are to higher energies and of the order ocm21/GPa for internal molecular modes and 10 cm21/GPafor molecular lattice modes. Since these energies for etronic transitions~;30 000 cm21!, for vibron ~;3000 cm21!,and for lattice mode transitions~,100 cm21! are so differentin size, it is more meaningful to compare here relative fquency shifts with pressure (1/n i)/(Dn i /Dp). Considering inaddition the influence of the different matrices on the islated molecule via their compressibilitybT , we applythe concept of mode Gru¨neisenparametersg i :5(1/bTv i)/(Dv i /Dp) and determine values between 1022 and1023. The bandshape of individual vibronic transitions rsembles a symmetric Gaussian profile whose asymmetryrameter decreases slightly with pressure. Band widths
J. Chem. Phys., Vol. 106,
Downloaded¬11¬Sep¬2007¬to¬150.217.154.21.¬Redistribution¬subject
-
e;
re
six%
re
-
-to
te
d-r-a
h1
c-
-
-
-a-e-
crease by cooling and increase with pressure, as expeThe maximum of Franck–Condon profiles shifts slightlyhigher energies with pressure in the case of N2 in Xe and isalmost unaffected in the case of N2 in Kr and Ar. To modelindividual bands, shaded to smaller energies~see Fig. 1!, weuse either a pure mathematical fit procedure or a physicalbased on combined bands consisting of a zero phononand a phonon sideband~see later!.
DISCUSSION
First, we will describe the excitation mechanism aftx-ray absorption; then we will analyze spectra with respecband maxima, bandwidth, and shape, to discuss how mecule constants may change. Finally, we will model the fquency versus pressure shift to lower energies by two ctributions: a decrease in volume and a change in dielecproperties as a function of pressure. But before this,would like to repeat briefly what is known in the literature o
FIG. 1. Some luminescence spectra of N2 in Xe at different pressures andtemperatures are presented. These progressions belong to rovibronic ttions A 3Su
1(v850)→X 1Sg1(v9); the assignment 0/5 for example mean
an electronic transition from vibrational levelv850 to v955.
No. 4, 22 January 1997
¬to¬AIP¬license¬or¬copyright,¬see¬http://jcp.aip.org/jcp/copyright.jsp

.
1338 Semling et al.: Luminescence spectra of matrix isolated N2
Down
FIG. 2. Left part: Excitation mechanism~details see text, Discussion!. Right part: Energy gap as a function of pressure in solid Xe
-
ar-ueio
aaidheo-omalyyinevnd
y
eeloo
o
b.
ise,
m
nceese
ap
e
u-ens
in
00
iedwernic
e
ls.er
s
vibrational relaxation in theA 3Su1 state of N2 in rare-gas
matrices at low temperature and zero pressure.Tinti and Robinson16 investigated x-ray stimulated lumi
nescence of N2 isolated in Ne, Ar, Kr, and Xe atT55 K andzero pressure. They proposed an assignment of the VegKaplan band system (A→X), determined molecular constants of matrix isolated in comparison to gas phase valand studied in detail decay times of the vibrational relaxatin the A 3Su
1 state of N2 ~t50.4–3 s.!. Jodl and Bruno19
extended those investigations to different temperaturesto various N2 concentrations. All individual bands showdistinct fine structure and temperature dependent bandwwhich was attributed to vibron–phonon coupling. Tmatrix-shiftDnm from experiment was explained by a theretical model based on guest–host interaction due to cbined Lennard–Jones type potential between the N-atomrare-gas atom. Ku¨hle et al.18 excited selectively individuaelectronic statesA 3Su
1 of N2 molecules embedded in Xe bsynchrotron radiation and detected total luminescence. Stematic investigations of relative band intensities gavesight into competitive depopulation channels of excited lels like radiative or nonradiative vibrational relaxation aelectronic energy transfer within N2 aggregates. Panet al.
17
excited N2 molecules isolated in Ne, Ar, and Kr matrices ban electron beam. All bands exhibit a doublet~spacing35–70 cm21! due to two distinct emitting crystal sites of thN2 molecules in these matrices. By adding different furthsmall molecules~CO, NO, etc.!, a further relaxation channeof vibrational energy of N2 molecules by energy transfer tsuitable acceptors is opened, besides the one already knand described above.
Excitation mechanism and relaxation channels
X rays are absorbed by the rare-gas bulk material; min Xe than Kr and Ar, due to theZ dependence of x-rayabsorption. This behavior obviously explains why we oserve a stronger N2 luminescence in Xe than in Kr or Ar
J. Chem. Phys., Vol. 106,
loaded¬11¬Sep¬2007¬to¬150.217.154.21.¬Redistribution¬subject
d–
s,n
nd
th
-nd
s---
r
wn
re
-
From the isolator conduction band the excitation energydeposited into bulk exciton levels, lying at 8.4 eV for X10.0 eV for Kr, and 11.6 eV for Ar.20 The isolated N2 mol-ecule is probably excited mainly by energy transfer frothese lowest exciton bands~see Fig. 2!. Then vibrationalrelaxation in the electronically excited stateA 3Su
1 of N2
molecules follows. At the end of this process, luminescefrom the molecule is radiated within seconds, because thvibronic transitionsA 3Su
1(v850)→X 1Sg1(v9), known as
Vegard–Kaplan bands, are spin forbidden.Now, if we apply pressure it is known that the band g
energy of the rare-gas matrix material is lowered~right partof Fig. 2 for Xe due to Refs. 10 and 21!. If the exciton levelsin Xe are lying below the pure electronic transition of thmolecule~for N2-gas atp50 T0056.2 eV!, no energy can betransferred from the matrix to the impurity and the total lminescence intensity will suddenly decrease. This happhere for Xe atT5300 K at aboutp*;15 GPa; due to Fig. 2this means a gap energy at 6.0 eV. This formal differenceenergies~T00 of N2 at p50 andEgap of Xe at p* ! can beinterpreted as a frequency shift to lower energies of 1cm21/GPa in Xe ~see discussion later!. We observed thisdrastic decrease in intensity in Xe only, since our applpressure range of less than 20 GPa was too small to loalso the band gap energy in Kr and Ar below the electrotransitionT00 of N2 molecule.
Cooling the sample toT577 K, we observe a decreasin vibronic band width as expected~Fig. 1!. In addition, weobserve transitions from vibrational excited leveA 3Su
1(v850,1,2) to X 1Sg1(v9), so-called hot bands
Former investigations were performed at different lowtemperatures with the following result: atT55 K Tintiet al.16 observed transitions A 3Su
1(v850–6) toX 1Sg
1(v957–15), atT577 K Jodlet al.19 registered tran-sitions A 3Su
1(v850–3) to X 1Sg1(v952–12), and in
these experiments atT5300 K we assigned vibron band
No. 4, 22 January 1997
¬to¬AIP¬license¬or¬copyright,¬see¬http://jcp.aip.org/jcp/copyright.jsp
tiolax
e
a
offiso
hi
lin
of
ce,
etotiiterixoar
u
ete-suole
ce
ted
hen’s
ntt
all
-vi-
of
li-chherthel isbe-
dysurece in
of
1339Semling et al.: Luminescence spectra of matrix isolated N2
A 3Su1(v850) toX 1Sg
1(v952–9) only. Therefore, due totemperature there is a competition between two relaxachannels: radiative and nonradiative transitions. Thisprocess, i.e., vibrational relaxation in the electronically ecited state~vibrational energy inve;1460 cm21 of N2* !,must be much shorter than the radiative emission lifetimThe strong temperature dependence~T55 K to 300 K! fa-vors a phonon assisted process@vD ~rare-gas solids!;45 to65 cm21#.
Further relaxation channels must be discussed butimprobable to our mind:
~i! Absorption of x-ray energy may dissociate N2 mol-ecules to produce N-atoms~energy at dissociation 9.8eV!—or even N2-ions. We could not register any emissionN-atoms~known in literature16!, which should be orders omagnitude weaker than this luminescence intensity oflated N2 molecules.
~ii ! Traces of impurities may act as a quencher of tradiative emission: from electronically excited N2 via elec-tronic levels of impurity molecules~e.g., O2 in the gas phaseT0054 eV! or from vibrationally excited N2 ~Dn952330cm21, Dn851460 cm21! to impurity vibrations ~CO:Dn952100 cm21, O2: Dn951550 cm21, NO: Dn951900cm21!. Since we evacuated and purged the sample gaswe expected impurities of this type to be less than 1%.
~iii ! There is a certain possibility for depopulationvibrational excitation in theA-state of the molecule via N2aggregates, if the concentration is high enough~few percentof N2!. Kuhle et al.18 observed that relaxation takes plaexclusively in steps ofDn852, seen in the intensity patternand this is strongly dependent on N2 concentration. We ob-served a regular Frank–Condon pattern~see Fig. 1!; conse-quently, we can assume a N2 concentration of less than 1%and well separated matrix isolated molecules.
Frequency shifts by pressure and matrix material
Since the N2 molecules are isolated in Xe, Kr, or Ar wcan basically use the model of a simple harmonic oscillain a cage along with the following three extensions: starelaxation of the molecular geometry at a substitutional smodified dielectric properties due to the surrounding matand dynamical coupling of the oscillator motion to the phnon bath due to temperature. Therefore, it is straightforwto evaluate the luminescence spectra~Fig. 1! according toprinciples of molecular physics.
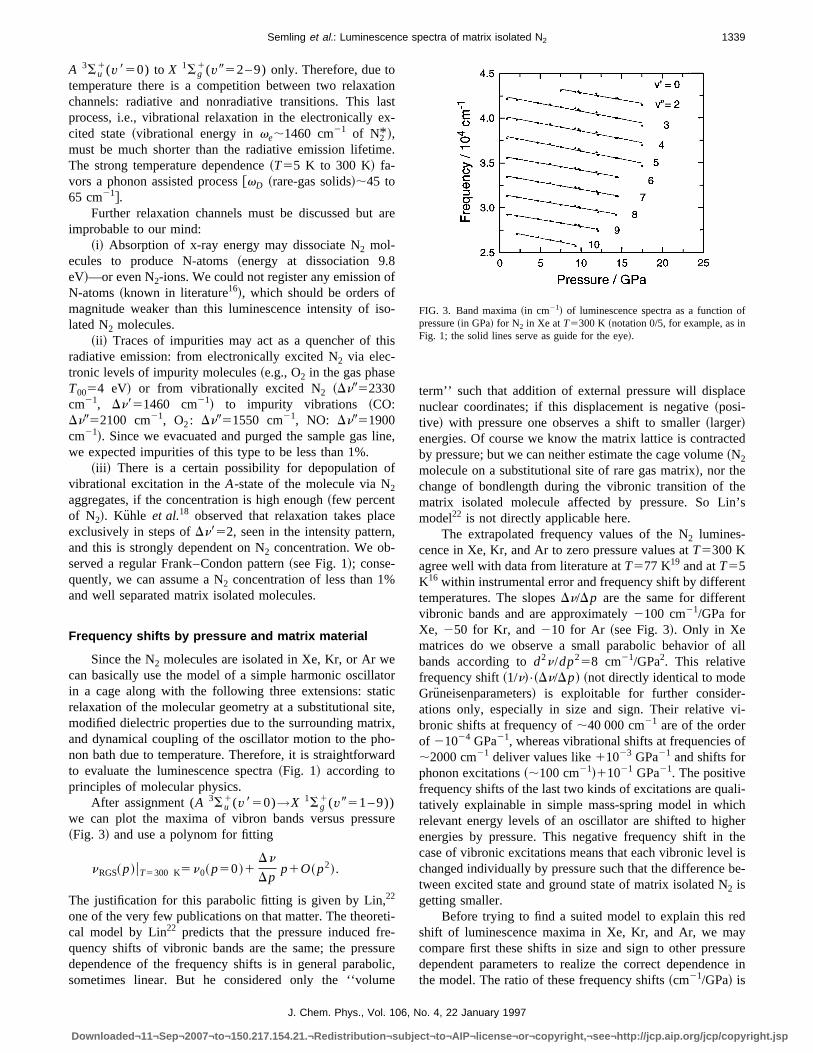
After assignment (A 3Su1(v850)→X 1Sg
1(v951–9))we can plot the maxima of vibron bands versus press~Fig. 3! and use a polynom for fitting
nRGS~p!uT5300 K5n0~p50!1Dn
Dpp1O~p2!.
The justification for this parabolic fitting is given by Lin,22
one of the very few publications on that matter. The theorcal model by Lin22 predicts that the pressure induced frquency shifts of vibronic bands are the same; the presdependence of the frequency shifts is in general parabsometimes linear. But he considered only the ‘‘volum
J. Chem. Phys., Vol. 106,
Downloaded¬11¬Sep¬2007¬to¬150.217.154.21.¬Redistribution¬subject
nst-
.
re
-
s
e,
rc,,-d
re
i-
reic,
term’’ such that addition of external pressure will displanuclear coordinates; if this displacement is negative~posi-tive! with pressure one observes a shift to smaller~larger!energies. Of course we know the matrix lattice is contracby pressure; but we can neither estimate the cage volume~N2molecule on a substitutional site of rare gas matrix!, nor thechange of bondlength during the vibronic transition of tmatrix isolated molecule affected by pressure. So Limodel22 is not directly applicable here.
The extrapolated frequency values of the N2 lumines-cence in Xe, Kr, and Ar to zero pressure values atT5300 Kagree well with data from literature atT577 K19 and atT55K16within instrumental error and frequency shift by differetemperatures. The slopesDn/Dp are the same for differenvibronic bands and are approximately2100 cm21/GPa forXe, 250 for Kr, and210 for Ar ~see Fig. 3!. Only in Xematrices do we observe a small parabolic behavior ofbands according tod2n/dp258 cm21/GPa2. This relativefrequency shift~1/n!•~Dn/Dp! ~not directly identical to modeGruneisenparameters! is exploitable for further considerations only, especially in size and sign. Their relativebronic shifts at frequency of;40 000 cm21 are of the orderof 21024 GPa21, whereas vibrational shifts at frequencies;2000 cm21 deliver values like11023 GPa21 and shifts forphonon excitations~;100 cm21!11021 GPa21. The positivefrequency shifts of the last two kinds of excitations are quatatively explainable in simple mass-spring model in whirelevant energy levels of an oscillator are shifted to higenergies by pressure. This negative frequency shift incase of vibronic excitations means that each vibronic levechanged individually by pressure such that the differencetween excited state and ground state of matrix isolated N2 isgetting smaller.
Before trying to find a suited model to explain this reshift of luminescence maxima in Xe, Kr, and Ar, we macompare first these shifts in size and sign to other presdependent parameters to realize the correct dependenthe model. The ratio of these frequency shifts~cm21/GPa! is
FIG. 3. Band maxima~in cm21! of luminescence spectra as a functionpressure~in GPa! for N2 in Xe atT5300 K ~notation 0/5, for example, as inFig. 1; the solid lines serve as guide for the eye!.
No. 4, 22 January 1997
¬to¬AIP¬license¬or¬copyright,¬see¬http://jcp.aip.org/jcp/copyright.jsp

ms-
w
ilit
remf
intripoul
rsitye,ia
rmie
hwdekssit
inre
mds-ret lanabde
e
erthtrile
d
a-ro
--
is
rea-oeia-
esreureues:
e
u-
y
n
ofinto
1340 Semling et al.: Luminescence spectra of matrix isolated N2
~2100!:~250!:~210! for Xe, Kr, and Ar, respectively. If wedo not consider the cage, i.e., the first shell of matrix atoaround a N2 molecule, but only the bulk behavior with presure in the quasi-harmonic approximation~n}V2g!, we canexplain the red frequency shift by a volume decrease ifraise pressureDn/Dp}2DV}bT . Now, comparing the dif-ferent rare-gas solids via the isothermal compressibbT~GPa
21!, we get 0.27:0.29:0.34 for Xe, Kr, and Ar,23
which conducts to a reverse order from Xe to Ar. Therefothis red shift cannot merely be explained by a bulk terdescribing the compressed bulk material. A second termcomparison may be the matrix-shift,Dnm5nSolid2ngasof thepure electronic transition of the N2 molecule atp50 andT55 K [A 3Su
1(v850)→X 1Sg1(v950)]. Theratio of ma-
trix shifts ~cm21! are~2342!:~2238!:~2131! in Xe, Kr, andAr,19 showing the right size and trend as the pressureduced frequency shift of luminescence maxima. This mashift in general is formed by several parameters like thetential parameters of the free and isolated molec~Lennard–Jones type of potentiale,s! and the interaction ofimpurity with matrix described by dielectric parameteTherefore, we suggest a third comparison via polarizabilThe ratio of the bulk polarizabilities are 4.0:2.5:1.6 of XKr, and Ar.24 Consequently the trend Xe, Kr, and Ar vmatrix shift and polarizability are the same.
Bandshapes and bandwidth
Each vibron band of N2 luminescence in Xe, Kr, and Aat room temperature and small pressure is strongly asymric as measured from band maximum toward lower energto be 750–900 cm21 in comparison to bandwidth~;600cm21! and resolution~;200–300 cm21! ~see Fig. 1!. Cool-ing the sample toT577 K this red tail and the bandwidtdecreased by a factor of 3 roughly; a general trend asexpected. Raising pressure within cell this asymmetrycreased clearly in Xe by a factor of 2, whereas in Kr it looto be constant and in Ar we observed a slight increawhereas bandwidths of vibron bands increased linearly wpressure in all matrices~see Fig. 4!.
To perform a more quantitative analysis for physicalterpretation of this asymmetry in bandshape we considetwo kinds of fit procedures:
~i! All bands in one spectrum were fitted by one asymetry parameter~of course, in addition, background anslope! by individual asymmetric Gauss-fit functions. The jutification for this physical model is twofold: this fit proceduis usually applied and well tested in pressure dependenminescence studies of semiconductors. On the other hLin22 derived bandshape functions of vibronic bands insorption and emission for molecular crystals, which arescribed by an asymmetric Gaussian function.
~ii ! Each individual vibron band is modeled by onGaussian profile as the zero phonon line~pure vibronic tran-sition within molecule! and another Gaussian at the lowenergetic side in spectrum as the phonon sideband. Bycombination band we can model the relaxation of the mamaterial to an electronic transition of the impurity molecu
J. Chem. Phys., Vol. 106,
Downloaded¬11¬Sep¬2007¬to¬150.217.154.21.¬Redistribution¬subject
s
e
y
,,or
-x-e
..
et-s
e-
e,h
-d
-
u-d,--
isx.
This dynamic interaction must obviously be temperature anpressure dependent.~For general purposes see Ref. 25!.
The justification for this second model~ii ! is as follows:In emission these so-called Vegard–Kaplan bands showred tail16,19as in our spectra; in absorption this phonon sideband must be situated at the higher energetic side of the zephonon line.18 The spacingDE between the maxima of thesetwo Gaussian bands in one vibronic transition[A 3Su
1(v850)→X 1Sg1(v9)] is about 350 cm21 atT5300
K ~kT5210 cm21! and 120 cm21 at 77 K ~kT560 cm21!,which meansDE;2 kT. Considering a Debye frequency formatrix material of about 50 cm21, about,10 bath phononsare excited during the relaxation of the bulk to a pure electronic transition in the impurity. For comparison the nonradiative vibrational transition in theA 3Su
1 state~Dn851460cm21! requires about 30 bath phonons. The bandwidth of thphonon sideband is~at low pressures! about 800 cm21 at 300K and 400 cm21 at 77 K. Due to the relaxation process onehas to sum up and weigh according to sample temperatuthe multi-phonon density of states leading to such broad fetures. This deconvolution of one asymmetric band into twGaussian curves delivers the bandwidth of zero phonon linand phonon sideband which are reasonable in size and vartion with pressure~see later!. In Xe we stated a decrease inasymmetry parameter with pressure. Since all featurbroaden by pressure—the zero phononline due to pressuinhomogeneities and the phonon sideband due to pressdependence—details of the fit function are smeared out. Dto literature similar values at zero pressure are as followTinti et al.16 report a red tail 300–400 cm21 in emission at 5K and Kuhle et al.18 a blue tail 150–200 cm21 in absorptionat 7 K. The bandwidth of zero phononline is reported to b;40 cm21 by both authors. Ku¨hle et al.18 determined aHuang–Rhys factor to describe this electron–phonon copling ~see for instructions also Ref. 25!: they found a me-dium size electron–phonon coupling strength from intensit
FIG. 4. Bandwidth as a function of pressure for one specific transition as aexample: N2 [A
3Su1(v850)→X 1Sg
1(v956)] in Xe atT577 K. At smallpressure resolution is limited by bandpass of monochromator becauseweak signal; at high pressure bands are broadened and deconvolutionindividual bands is problematic.
No. 4, 22 January 1997
¬to¬AIP¬license¬or¬copyright,¬see¬http://jcp.aip.org/jcp/copyright.jsp

an
atohora
vi-
dfo
eioo
dho
o
ch
foto
o
trauidts
e
d-
aul
i-ge
gas
erial.omwel-
sionx-ence
m
l-
plot
f N
n-ten-
the
orluesboutres-
e
ate
e,
lefortly
1341Semling et al.: Luminescence spectra of matrix isolated N2
ratios in spectra and they modeled the bandwidth of sidebfeature by 4–5 bath phonons with an average bath phono;32 cm21 at T55 K.
Since electron–phonon coupling is much stronger thphonon–phonon coupling, in principle, this gives risemulti-phonon excitations. Consequently, bandwidth and pnon sideband are much broader than in pure vibrational tsitions: here bandwidth of vibronic transition;30 cm21,whereas bandwidth of pure vibration,0.1 cm21.26
Other possibilities to describe this asymmetry inbronic bands are briefly discussed now:~i! polymer featuresnext to monomer transitions~spacing,1 cm21! are reportedby Kiefte et al.27 for N2 in Ar and ~ii ! transitions fromv8.0levels, observed atT577 K ~see Fig. 1!, may also be pos-sible, atT5300 K. These hot bands, lying close tov850transitions, are much weaker in intensity and may misleaasymmetry. But due to Fig. 1 this may be an explanationthe v850 to v957 asymmetry~sum of v850 to v957 andv852 to v959 transitions!; but there is no counterpartv8.0to v9 for the v850 to v955 transition.~iii ! Since N2 mol-ecules may rotate in the matrix cage, we can apply the wknown rotor model too. Due to temperature and selectrules we expectP andR branches which are symmetric tthe QJ branch ~here called zero phonon line! delivering abandwidth of 150–200 cm21 at rotationsJ510 to 12. ~iv!Since this asymmetry is clearly temperature and pressurependent, as described above, we cannot justify this by inmogeneous broadening. Part of the ZPL is certainly inhomgeneous due to crystal quality and local stress.~v! Inliterature about matrix isolated molecules, site splittingvibron transition are reported to be;40 cm21 ~mainly in Armatrices!.
From our spectra extrapolated to zero pressure, weextract the temperature dependence of vibron bandwidtbe 400–500 cm21 at 300 K and;200 cm21 at 77 K ~Fig. 4!.In combination with data from literature, such asG~T55K!;30 cm21 in emission19 and G~T57 K!;40 cm21 inabsorption,18 these values at three different temperatureslow a linear relation. Since bandwidth is directly relatedphonon occupation number,26 G(T)}n(T,v) is proportionalto T in the high temperature case. Similarly bandwidthphonon sideband evolves:G~T55 K!;160 cm21,19 G~T577K!;200 cm21, andG~T5300 K!;300 cm21.
All bandwidth at a given temperature broaden duepressure, as presented in Fig. 4 for Xe at 77 K. The erropretty large, since the luminescence signal was weakdeconvalution into two Gaussian profiles produced somecertainty. Nevertheless, this linear increase of bandwwith pressure can be explained analog to considerationbroadening of bandwidth in NaNO3
28 briefly as follows: bypressure the phonon density of states will be broadentherefore more transitions in this combination band~vibronand bath phonon! are accessible, lowering lifetime or broaening bandwidth of this specific transition, as expected.
Change in molecule constants by pressure
Since matrix isolated nitrogen molecule can be treatedan anharmonic oscillator we can deduce molec
J. Chem. Phys., Vol. 106,
Downloaded¬11¬Sep¬2007¬to¬150.217.154.21.¬Redistribution¬subject
ndof
n
-n-
tor
lln
e-o--
f
anto
l-
f
oisndn-hof
d,
se
constants—such as fundamental frequencyv0 ~or vRaman!,anharmonicityvexe and Franck–Condon factors—from vbronic spectra in a straightforward manner. Variation of cadiameter~N2 on a substitutional site!, of potential parameterby matrix material~Xe, Kr, and Ar!, and by pressure mayalso alter these molecule constants. Comparing those todata, to pure solid N2 data, and to data of N2 in Xe, Kr, andAr at p50, we may reach more insight on how the fremolecule has to be changed in a compressed bulk mate
Unfortunately, these derived molecule constants frour spectra exhibit large errors and uncertainties: e.g.,find v0 andvexe from differences in band frequencies, vaues which scatter already appreciably~Fig. 3!. Finally, some-times we can use all data together~8 samples, 150 spectra! orsometimes we can choose one set only. The transmisfrom diamonds in the DAC changes from one to other eperiment and due to applied pressure; as a consequDI;10%.
If we plot the difference in band frequenciesDG fromv850 to v9 transitions as a function of vibrational quantunumbers for a given pressure, we can derivev0 from inter-section andvexe from the slope@Fig. 5~a!#; from differencesof hot bandsv850,1,2 tov95const. we also get analog moecule constants for the electronically excited state (A 3Su
1).Performing this procedure for several pressures, we canv0(p) andvexe(p).
The pressure dependence of the fundamental mode o2in the Xe matrix behaves like the one of pure solid N2, as ageneral trend@Fig. 5~b!#. The error bars increase substatially, because vibron bands broaden and decrease in insity raising pressure. For Xe atT577 K andp52.8 GPa thefundamental mode of the N2 molecule in the electronicallyexcited state is 143165 cm21 ~;1420 cm21 at p50!,whereas the gas phase value is reported to be 145360.8cm21.16 It seems to be that theA state of matrix isolated N2is more perturbed by the matrix under pressure thanground stateX 1Sg
1.In Fig. 5~c! we present the anharmonicityvexe of N2
(X 1Sg1) in Xe, giving the right size as in the gas phase
matrix isolated case at zero pressure. Because their vaare too uncertain at higher pressure, we cannot decide aan increase or decrease of molecule anharmonicity with psure. From overtone band differences in theA 3Su
1 state~such asv850 to v954 andv852 to v954! in comparison tofundamental band differences~such asv850 to v954 andv851 to v954! we can determine the anharmonicity in thelectronically excited statevexe* ; 102 cm21 which is muchlarger thanvexe* 5 14.02 cm21 in the gas phase.16This mightbe a further hint that the excited stateA 3Su
1 of matrix iso-lated N2 is much more perturbed than the ground stX 1Sg
1 at elevated pressure.In general, from Franck–Condon factors~intensity dis-
tribution Fig. 1! and from their change with applied pressurone can estimate how much the two potential curvesA 3Su
1
and X 1Sg1 are shifted relative to each other in molecu
bondlength, varying matrix material and pressure. In Xeexample the maximum of this vibron progression is slighshifted fromv850 to v955 atp52.1 GPa tov850 to v954
No. 4, 22 January 1997
¬to¬AIP¬license¬or¬copyright,¬see¬http://jcp.aip.org/jcp/copyright.jsp

ve
i-
-ck
h to
ol-tain-itedd
r-
tededofente-alates
nndth.ngeg-the
ap-isa
itases ofctric
erotricn-ane
ure
lec-
r
1342 Semling et al.: Luminescence spectra of matrix isolated N2
FIG. 5. Molecular constants of N2 in Xe as a function of pressure.~a!.Difference in band frequencies as a function of vibrational quantum numb~details see text!. ~b!. The fundamental mode of N2, gained by extrapolationof ~a!, in Xe as a function of pressure. Some literature values for compason:m zero pressure values,29 extrapolated to room temperature fromv(T)studies;1 pure N2 at T5300 K by Raman studies30 and j pure N2 atT5300 K by Raman studies.31 Above 8 GPa the error in our values in-creases, because we determined this Raman frequency indirectly from thluminescence spectra.~c!. Molecule anharmonityvexe as a function of pres-sure and in addition gas phase value~1!, N2 in Xe ~n! and N2 in Ar ~s! atp50 by Ref. 16.
J. Chem. Phys., Vol. 106,
Downloaded¬11¬Sep¬2007¬to¬150.217.154.21.¬Redistribution¬subject
at p59.96 GPa; i.e., the minimum of one potential curwith respect to the other is shifted to larger bondlength~Dr;15%!.
Finally, well known selection rules for vibronic transtions due to symmetry of vibrational states~v851,2 to v9gerade or ungerade! are well reproduced by our investigations ~Fig. 1!, spectra at 77 K and spectra by Ref. 16; chefor example the missingv851 to v956 transition. Maybeapplied pressure on matrix material was not large enougbrake the symmetry in molecule transitions as hoped.
The conclusive observation is that, due to measured mecule constants from our spectra, despite the large uncerties, we can derive a trend such that the electronically excstateA 3Su
1 of N2 in Xe is more perturbed than the grounstateX 1Sg
1 at elevated pressure~p,20 GPa!; the groundstate of matrix isolated N2 behaves like pure solid pressuized N2.
Frequency shifts: application of Drude–MSA– pDVmodel of Agnew and Swanson
Pressure induced shifts of electronic bands of an isolamolecule in a host material have been traditionally explainby two mechanisms: a dielectric effect, i.e., a perturbationthe molecule’s transition dipole due to the density-drivchange in the dielectric properties of the surrounding marial, and a volume effect, i.e., the coupling to the externpressure of the volume change between two electronic stof the molecule.
After recognizing that neither of the two effects cacompletely explain all the available data, Agnew aSwanson32 have proposed a model which incorporates boIn their approach, the volume term accounts for short-rarepulsive effects, while the dielectric term accounts for lonrange dispersive effects. This latter term is modeled afterquantum statistical treatment of Schweizer and Chandler33,34
in the mean spherical approximation~MSA! with moleculardipoles being represented by Drude oscillators. With anpropriate choice of the few parameters involved, th‘‘Drude–MSA–pDV’’ model has been able to reproducenumber of experimental observations.32
Although the Agnew–Swanson~A–S! model was origi-nally developed for absorption bands in liquids, we foundinteresting to try to extend its application to the present cof luminescence bands in crystals. In fact, pressure shiftN2 bands in rare gases appear to consist of both a dieleand a volume contribution. The observed negative~red! shiftwith negative slope with respect to pressure, and a nonzvalue at zero pressure, is a strong indication of a dieleceffect ~positive shifts are predicted only for the rather uusual case of an impurity transition at a higher energy ththe matrix typical frequency!. The approximate scaling of thmatrix ~p50! shift with the matrix polarizability~see above!is also consistent with dielectric models.32 On the other side,a pDV term is expected to better reproduce the pressdependence of the shift, which is almost perfectly linear.
In the A–S model, the pressure dependence of the etronic transition frequencyn of an impurity i in a host ma-
er
i-
ese
No. 4, 22 January 1997
¬to¬AIP¬license¬or¬copyright,¬see¬http://jcp.aip.org/jcp/copyright.jsp

1343Semling et al.: Luminescence spectra of matrix isolated N2
Downloaded¬11¬S
TABLE I. Agnew–Swanson model parameters for N2 in rare-gas matrices~n/cm21, a/Å3, s/Å3, DV/Å3!.
nia ai ~Ref. 38!
N2 38 408 1.76
RGM n0 ~Ref. 33! a0 ~Ref. 24! s~p50!b sb DVXe 97 835 4.0 4.50 4.4:3.7 22.5Kr 112 912 2.5 4.18 4.0:3.3 20.5Ar 127 108 1.6 3.95 3.5:3.1 0
aPresent work, 0/4 transition.bSee the text for a discussion ofs values.
n
el,iv
si
at
iofo
e
la
keennrto
sde
rixds
pu
--r. 6
ofe
el
eol-
el--
-int
inine
ityheon
terial is given by n(p)5n(p50)1pDV1Dn(n i ,a i ,n0 ,a0 ,s,r(p)) ~Ref. 32! wherepDV is the volume term,Dn isthe polarization~dielectric! term, and the parameters owhich Dn depends are defined as follows:ni ,n0 are the im-purity and matrix frequency, respectively,ai ,a0 are the im-purity and matrix polarizability, ands is the hard shell di-ameter of both the impurity and the matrix molecules.
The polarization term also depends on the number dsity r(p) of the matrix. In our implementation of the modedensity values for the observed pressures were derthrough a Birch–Murnaghan equation of state,35 which fitsXe data atT50 andp52.40 GPa. TheT-dependent contri-bution can be calculated in the Mie–Gru¨neisen and Debyeapproximations.35 An equally good fit topV data of Ar~andalso of Xe! in the same pressure range can be obtained umolar volume~V0! and bulk modulus~B0! values obtainedby piston displacement techniques.36 Values reported in thesame work were used in the case of Kr, for which no pV dare available above 2 GPa.
Parameters used in our calculation for the 0/4 transitare reported in Table I. Experimental values were usedni , ai , anda0. The Drude oscillator frequencyn0 was setequal to the ionization energy of the matrix material.33 Thevalue ofs for Xe, Kr, and Ar was initially chosen as to givthe best fit to thep50 shifts. These values~Table I! are ingood agreement with nearest neighbor distances in thetice, even though the corresponding reduced densityrs3 isabout 10% above the theoretical value for a close-pacstructure~&!. In the pressure range of our experiments, dsity increases by more than a factor of 2, and it seems ualistic to let the reduced density increase of the same facConsequently, the value ofs was varied with density suchthat rs3 was fixed at thep50 value for each element. Thiprocedure was used in other implementations of the DruMSA model.32,35
To check the validity and consistency of parametersa0,s, andr, we calculated the dielectric constant of the matmaterial following the classical treatment for nonpolar fluiin the MSA approximation.37 With our values ofa0 and ofs~r!, curves are obtained fore~r! which are in very goodagreement with dielectric constant measurements on therare-gas solids.34,40–42
Finally, the parameterDV was adjusted to fit our spectroscopic data. A negativeDV was found, decreasing in absolute value in the series Xe, Kr, Ar, with a null value for A~Table I!. Some of the resulting functions are plotted: Fig
J. Chem. Phys., Vol. 106,
ep¬2007¬to¬150.217.154.21.¬Redistribution¬subject
n-
ed
ng
a
nr
t-
d-e-r.
–
re
shows as an example for the 0/4 transition the influenceboth contributions to the matrix shift; whereas in Fig. 7 thexperimental frequency shift of the N2 transition in Xe~sym-bols! is compared to the theoretical values due to this mod~straight lines!.
Although, in principle, it should represent the volumchange between the excited and ground state of the mecule, the parameterDV has no simple physical interpreta-tion. It has been observed that this effect involves the volumof the complex molecule solvent, rather than that of the moecule alone.32 In fact, if nitrogen alone were to be considered, an increase in volume would be expected~see Fig. 2!.Furthermore, a differentDV for the three matrix materialswould be difficult to explain. According to the proposed excitation and relaxation mechanisms, the excited state isequilibrium. Thus, in our opinion, our results indicate thathe equilibrium value of the N2-matrix cage diameter issmaller for the excited state than for the ground state,analogy with what has been suggested for benzenepropane.43 This is consistent with a softening of the repulsivpotential in the excited state, which, according toDV values,is most effective in Xe, while it is absent in Ar. Actually, theinteraction with the excited N2 state is maximum for Xe, as
FIG. 6. Frequency shift~cm21! of N2 0/4 transition in rare-gas matrices,calculated with the Agnew–Swanson model as a function of number densr @Å23# curves: dashed, Xe; dotted, Kr; dash-dot, Ar. For each matrix, tlower curve is the total frequency, while the upper curve is the polarizatieffect alone~DV50!. Experimental points:L, Xe;1, Kr; h, Ar; 3, matrixshift ~p50! for Xe, Kr, Ar in order of increasing density.
No. 4, 22 January 1997
¬to¬AIP¬license¬or¬copyright,¬see¬http://jcp.aip.org/jcp/copyright.jsp

ra
triudntu
n-
rgatioe
re
nnaitean-isisix
te
ot
edwonce; allh as
re
.
v.
ys.
.
7
J.
s.
1344 Semling et al.: Luminescence spectra of matrix isolated N2
is shown also by the magnitude of the change in the vibtional frequency with respect to the gas phase~see Table I!.
CONCLUSION
Our general aim was to combine the technique of maisolation with high pressures; the specific task was to stN2 molecules isolated in Xe, Kr, and Ar under extreme coditions, i.e., pressure at several GPa and low temperaThe diamond anvil cell was loaded with a gas mixture. Wexcited luminescence of Vegard–Kaplan bands in N2 mol-ecules by x rays and analyzed rovibronic transitioA 3Su
1(v850)→X 1Sg1(v9) as a function of pressure, tem
perature, and matrix material.The excitation of the electronically excited N2 is
achieved by x-ray absorption of the bulk material and enetransfer via bulk excitons. The transition to the ground stof the impurity molecule embedded in a rare-gas matrixpossible through different relaxation channels, radiativenonradiative. We consider this excitation model to be corrbecause if we apply pressure the UV energy gap in Xelowered below the pure electronic transition (A→X) in N2and the luminescence signal disappeared at a critical psure.
We discussed the characteristics of these rovibrospectra, such as bandwidth, bandshape, Franck–Condotensity distributions, term values, in the model of an anhmonic oscillator embedded in a solid with static and dynamcoupling between nitrogen atom and rare-gas atom. Of inest is the large pressure induced frequency shift of bmaxima to lower energies of N2 molecule luminescence matrix isolated in rare-gas solids. Comparing qualitatively thenergy shift by pressure in Xe to Kr to Ar, we found thtrend again confirmed in the different respective matrshifts @i.e., pure electronic transition of N2 (A→X) in Xe,Kr, and Ar in comparison to gas phase values#. Comparingthis energy shift to simple solid parameters of matrix ma
FIG. 7. Frequency shift of N2 ~v850, v952,...,7! transition in Xe, calculatedwith the Agnew–Swanson model as a function of pressure.
J. Chem. Phys., Vol. 106,
Downloaded¬11¬Sep¬2007¬to¬150.217.154.21.¬Redistribution¬subject
-
xy-re.e
s
yesrctis
s-
icin-r-cr-d
-
-
rial, such as lattice constant or compressibility, could ndescribe the expected trend.
A quantitative model to describe the pressure inducfrequency shift of band maxima must contain therefore tterms: a dielectric term and a volume term. The coincidebetween measured values and theory is very satisfyingmodel parameters necessary for this fit procedure, sucionization energy and polarizability of N2 molecule and ofXe, Kr, and Ar and hard shell diameter~equivalent to impu-rity cage!, are altogether realistic with respect to literatudata.
1D. A. Dows, G. C. Pimentel, and E. Whittle, J. Chem. Phys.22, 1943~1954!.
2Chemistry and Physics of Matrix Isolated Species, edited by L. Andrewsand M. Moskovits~North-Holland, Amsterdam, 1989!.
3A. Jayaraman, Rev. Mod. Phys.55, 65 ~1983!; A. Jayaraman, Rev. SciInstrum.57, 1013~1986!.
4D. J. Dunstan and I. L. Spain, J. Phys. E22, 913 ~1989!.5W. Paul and H. Steinwedel, Z. Naturf.8a, 448 ~1953!.6W. E. Moerner and L. Kador, Phys. Rev. Lett.62, 2535~1989!.7H. E. Hallam,Vibration Spectroscopy of Trapped Species~Wiley, NewYork, 1973!.
8M. Jean-Louis, Chem. Phys. Lett.51, 254 ~1977!.9H. J. Jodl and F. Bolduan, J. Chem. Phys.76, 3352~1982!.10K. Syassen, Phys. Rev. B25, 6548~1982!.11J. H. Eggert, K. A. Goettel, and I. F. Silvera, Phys. Rev. B40, 5733
~1989!.12R. Loubeyre, R. LeToullec, and J. P. Pinceaux, Phys. Rev. B45, 12844
~1992!.13M. Hanfland, R. J. Hemley, H. K. Mao, and G. P. Williams, Phys. ReLett. 69, 1129~1992!.
14G. J. Piermarini, S. Block, J. D. Barnett, and R. A. Forman, J. Appl. Ph46, 2774~1975!.
15G. Herzberg,Spectra of Diatomic Molecules~Van Nostrand Rheinhold,New York, 1950!.
16D. S. Tinti and G. W. Robinson, J. Chem. Phys.49, 3229~1968!.17S. L. Pan, G. Zumofen, and K. Dressler, J. Chem. Phys.87, 3482~1987!.18H. Kuhle, J. Bahrdt, R. Fro¨hling, N. Schwentner, and H. Wilcke, PhysRev. B31, 4854~1985!.
19H. J. Jodl and R. Bruno, Phys. Status Solidi B67, 191 ~1975!; R. Brunoand H. J. Jodl, Phys. Status Solidi B67, 539 ~1975!.
20N. Schwentner, E.-E. Koch, and J. Jortner,Electronic Excitations in Con-densed Rare-Gases, Springer Tracts in Modern Physics Vol. 10~Springer-Verlag, Berlin, 1985!.
21M. Ross and A. K. McMahan, Phys. Rev. B21, 1658~1980!.22S. H. Lin, J. Chem. Phys.59, 4458~1973!.23M. Klein and V. Venables,Rare Gas Solids I and II~Academic, NewYork, 1977!.
24H. J. Jodl, G. Theyson, and R. Bruno, Phys. Status Solidi B94, 161~1979!.
25D. B. Fitchen,Physics of Color Centers, edited by W. B. Fowler~Aca-demic, New York, 1968!.
26S. Califano, V. Schettino, and N. Neto,Lattice Dynamics of MolecularCrystals, Lecture Notes in Chemistry, Vol. 26~Springer, Berlin 1981!.
27H. Kiefte, M. J. Clouter, N. N. Rich, and S. F. Ahmad, Can. J. Phys.60,1204 ~1982!.
28M. Jordan, A. Schuch, R. Righini, G. F. Signorini, and H.-J. Jodl,Chem. Phys.101, 3436~1994!.
29R. Ouillon, C. Turc, J. Lemaistre, and P. Ranson, J. Chem. Phys.93, 3005~1990!.
30H. Schneider, W. Ha¨fner, A. Wokaun, and H. Olijnyk, J. Chem. Phys.96,8046 ~1992!.
31R. Reichlin, D. Schiferl, S. Martin, C. Vanderborgh, and R. L. Mills, PhyRev. Lett.55, 1464~1985!.
32S. F. Agnew and B. I. Swanson, J. Phys. Chem.94, 995 ~1990!.33K. S. Schweizer and D. Chandler, J. Chem. Phys.78, 4118~1983!.34D. Chandler, K. S. Schweizer, and P. G. Wolynes, Phys. Rev. Lett.49,1100 ~1983!.
No. 4, 22 January 1997
¬to¬AIP¬license¬or¬copyright,¬see¬http://jcp.aip.org/jcp/copyright.jsp

ofD
s.
ev.
1345Semling et al.: Luminescence spectra of matrix isolated N2
35K. Asaumi, Phys. Rev. B29, 7026~1984!.36M. S. Anderson, C. A. Swenson, J. Phys. Chem. Solids36, 145 ~1975!.37M. S. Wertheim, Mol. Phys.25, 211 ~1973!.38H. L. Kramer and D. R. Herschbach, J. Chem. Phys.53, 2792~1970!.39C. E. Moore, Analysis of Optical Spectra, NSRDS-NBS 34, OfficeStandard Reference Data, National Bureau of Standards, Washington~1970!.
J. Chem. Phys., Vol. 106,
Downloaded¬11¬Sep¬2007¬to¬150.217.154.21.¬Redistribution¬subject
.C.
40M. Grimsditch, R. LeToullec, A. Polian, and M. Gauthier, J. Appl. Phy60, 3479~1986!.
41I. Makarenko, G. Weill, J. P. Itie, and J. M. Besson, Phys. Rev. B26, 7113~1982!.
42A. Polian, J. M. Besson, M. Grimsditch, and W. A. Grosshand, Phys. RB 39, 1332~1989!.
43R. Nowak and E. R. Bernstein, J. Chem. Phys.86, 3197~1987!.
No. 4, 22 January 1997
¬to¬AIP¬license¬or¬copyright,¬see¬http://jcp.aip.org/jcp/copyright.jsp