
{lr\\r' - Alaska Fish and Game
37
State of Alaska Department of Fish and Game Division of Sport Fish SCN Nomination Form Anadromous Waters Catalog Kenai A-3, A-4 {- ;t Region USGS Quad(s) Anadromous Waters Catalog Number of Waterway €-sf Ca- n USGS Name S Lo.ulNu-. E Conection fl Backup Information 43655 Kalifornsky Beach Road 244-30-10050- Name of Waterway [] Addition n For Oftice Use OBSERVATION INFORMATION Gomments: Individual coho salmon were radio-tagged and tracked to spawning locations (USF&WS Report, Run Timing, Abundance, and Distribution of ndult Coho Salmon in the Kasilof River Watershed, Alaska, 2008, Alaska Fisheries Data Series Number 2009-14) ?-e'l 1,ror9.- $ lZ -rl7l Name of Observer (please print): Ken Gates Signature: Agency: Address: USF&WS Soldotna. AK99669 Date: 12 - 6lg 2013 Catalog )c cocie:@z Nomination # Revision Year: rr /4t> Dat2 I tr/ p/tL iate I {lr\\r' Date tr Q t?-- Date Atlas to: Soecies Date(s) Observed Soawnins Rearine Presenl Anadromous coh salmon (7) 2008 X E ! n n ! IMPORTANT: Provide all supporting documentation that this water body is important for the spawning, rearing or rigr"tion or "nlilr*Jffiiling |}[,fj::i*:1.-ll"^.S9::^:?:^"::1jl141s^i11"1?t"Tp!l!gdurationandareasampred;copies-orfierd-nores;!tc. Attachacopyoramapshowins location of mouth and observed upper extent of each species, as well as other information such as: specific stream reacnes ouse-rvei!-|ipjr*".iiigt;'i"l;i.'g habital; locations, types, and heights of any barners; etc. This certifies that in my best professional judgment and belief the above information is evidence tnat tnis *aterOoOy snoutOG included in or deleted from the Anadromous Waters Catalog. Signature of Area Biologist: Name of Area Biologist (please print): Date:-- Revision 05/08
-
Upload
khangminh22 -
Category
Documents
-
view
3 -
download
0
Transcript of {lr\\r' - Alaska Fish and Game

State of AlaskaDepartment of Fish and GameDivision of Sport Fish
SCN
Nomination FormAnadromous Waters Catalog
Kenai A-3, A-4
{-;t
Region USGS Quad(s)
Anadromous Waters Catalog Number of Waterway
€-sf Ca- n USGS Name S Lo.ulNu-.
E Conection fl Backup Information
43655 Kalifornsky Beach Road
244-30-10050-
Name of Waterway
[] Addition nFor Oftice Use
OBSERVATION INFORMATION
Gomments: Individual coho salmon were radio-tagged and tracked to spawninglocations (USF&WS Report, Run Timing, Abundance, and Distribution of ndultCoho Salmon in the Kasilof River Watershed, Alaska, 2008, Alaska FisheriesData Series Number 2009-14)
?-e'l 1,ror9.- $ lZ -rl7lName of Observer (please print): Ken Gates
Signature:
Agency:
Address:
USF&WS
Soldotna. AK99669
Date:
12 - 6lg
2013
Catalog
)c
cocie:@z
Nomination #
Revision Year:
rr /4t>Dat2 I
tr/ p/tLiate I
{lr\\r'Date
tr Q t?--Date
Atlasto:
Soecies Date(s) Observed Soawnins Rearine Presenl Anadromous
coh salmon (7) 2008 X E!nn!
IMPORTANT: Provide all supporting documentation that this water body is important for the spawning, rearing or rigr"tion or "nlilr*Jffiiling|}[,fj::i*:1.-ll"^.S9::^:?:^"::1jl141s^i11"1?t"Tp!l!gdurationandareasampred;copies-orfierd-nores;!tc. Attachacopyoramapshowinslocation of mouth and observed upper extent of each species, as well as other information such as: specific stream reacnes ouse-rvei!-|ipjr*".iiigt;'i"l;i.'ghabital; locations, types, and heights of any barners; etc.
This certifies that in my best professional judgment and belief the above information is evidence tnat tnis *aterOoOy snoutOGincluded in or deleted from the Anadromous Waters Catalog.
Signature of Area Biologist:Name of Area Biologist (please print):
Date:-- Revision 05/08

State of AlaskaDepartment of Fish and @meDivbion of Spon Fbh
Nomination FormArndromous Waters Catabg
USGS Quad(s) tA(kr=N) Kena; ,+-3Anadrornous Waters Catalog Number of
Name of Wateruvay r. fl uSGS Nanre.)- ff Local t'tanre
ddition LjDeletion Icorl."tl* n Backrp Information
:PBvideattsupportingdoor.ncntdixthatlhbwat rbodybimportantbrlttespawning,rearhgormigrdtimdamdromoBtbh,lncludltg: numbcrdlt3h
nb $8g€s obseiled; 3ampfqg rethods. sanding dffdixr ard ar€a eafiryled; copies of ff6H odes; etc. Alleh a copy of a m4 shoning location of mouth and obsen €d
€xf6nt of each spsj€s, I vr€lt I odEr hiormation srch a: spccific atMm teaoh6 obserwd s spawning or rEarhg habit t locatbnG, ttPes, ard helgttts d any
:e!tc.
Nanre of Observer (pbme print):
S(lnature:
AgeftcY:
Address:
Ile,n Ga*e s
IT,S F WSt/ 7h{{ k Bea<,h RJ.
+C n
AWC Project Biologist Date
to: Atlas Catalog
Hffift" 1 non;a-(;oa o^ behalF oF Rl',n Go-(eJ lqsFb'rR'"/cget'Rrir.^*- Rnn'l,^,ng t kb'nd'a,ace, and D'sl-;b'''ta't ',1
ftdu,'! lo1"r,fte-terene" lftl.n t trattrj l FOvnaotcL/ ci-^^ Lrt)t'
f*Lumol rh {\c K;,:/"f R,;; UJat+.she4, A hsko , )o.rs (see a ?lacA'-e'/)
F[*f* Fsl'te'rteJ Oc'-tc- S.erl<s. n utonfi7 ??!1-'A; * -ii$i;''--;;;; *t;;17 , \":'/*"t br ces:n- ':f
certifies that in my besthduded in or delcted from
of Area Biologist:
%1,rffi ;.-u Ma, otrtr' 7/ZOl, >

State of AlaskaDepartment of Filsh and GameDivbion of Sport Fish
Nomination FormAnadromous Waters Catabg
r.I-.l usesru"tr*')- ff' t-o""tt't.tt*
o.t"' Thdtz
USGS Quad(s)
Name of Watorway
$aoiti* floetetion f]corection Backrp lnformation
Anadromor.rs Waters Catalog Nurnbor of
Name ol Obs€rver (pbse print):
Signature:
AgencY:
Address: 411"<-{ R Atar}n P.r,l.
:Povidea[$ppodngddmdtliimfratthiswrtcrMybimpodailbrths3paming.rErhgdmlgratbnofanadmFfbh.lnctjdkq: numbqo{tlf,tlilb sfags. ob€rued; ffiplng ffithodc. smplirg durstir and a.!a srmpH; codcs of 6eH ndss; etc, Afrach ! copy d a map 3hfling locatim d mourh tnd obsarvcd
of cach sp€ds, '' rcll as ofts infomation sh as: spccfrc stcan rE c-h6 oboerFd
'3 spavnhg tr Garhg h8br'trq lca0onE, typca, and hdghtr d fy
clc.
ltSFwS
n+
HaUtat Operations Manager
AWC Proj€ct Biologist Dats
to: Atlss catalog
ffi*r*r, q (\arni:1*f,6,1 o^ ,behaiF oF Ken Go.*eJ lqsFLtsiB,1agr't
fr.&..rrO- R*n't ,n,n3 i ftbunclctc(, anal D,sttibut,brr oF fr"{vt* COhO
Sc,r.mo.1 rvr Nir lo",/"i R,vu lla*.sAer1, 4hSko,rods'(see c'1-/acA'-e'l)"fL"; 'i,snl-',u
Oc.-t:- f:.j"r, !:*: 7?!-?.'a;*.-[iitiar'--;;;; 7t ^*7 , +r*.J.ol 47 cess'n <- ' :
t-
certifies that in my bestbe incltded in or delcted from
Signature of Area Biologist:
%r|"ffi ,4y^ lAa,urr€ 7/a\l, >


I-IOt-t-lu)lrilq)lirIGlFlr.lo)t>l.-ItVl-ItHt-l.rl0IGlvlqrIAt-l+,It-til.-ItrIFIIIIl-IGlaI
t-t-IA
leIt-l9tc)lb0lb!IG| *.1ll
l.-tEl\JIGlrrIthl-
E
c)'lJIq)
-o)00-I
.l{JaI
-q0-I.---Fcg
-aII
..1 €
trNFAH.Ff-. -- ---
=oq.Ycl

b0
U)
a
o>>-(J .tr>a-eEe.l o0
"xo p
€€ >?.j ?a
=44,irrnrn q)
NN=dd trarn o
eO|.lr992$.+ q.)
tv !n6tN =
I
ra
t
?.jIs
=t\a
()LaBc)

Alast<n Fisheries Datq Series Report Number 2009-14, September 2009
Il.S. Fish and ltildlife Service
by changes in the relative abundance of tributary and mainstem spawners early and late in the
run (Table 3).
TABLE 3. -Fates
assigned to coho salmon radio-tagged in the Kasilof River between 18 August and 13
October,200E.
Fate 1 Total
TributaryShantatalik CreekNikoilai Creeklndian CreekFox CreekWest CreekGlacier CreekClear Creek
Mainstem Spawners above rkm 24 (Refuge)
Other SpawnersMaintstem below rkm 24
Crooked CreekCoal Creek
Dead/Regurgitated
Harvested
Back Out
Unknown
53
131
I2
1
22
1
1
7
3I
31 30
171
7
1
2
0
2.51.78.30.43.83.80.4
39.2
193.80.4
10.0
1.3
3.3
2.1
64
201
I91
94
46o
1
24
3
I5
22
I4
6
2
?
3
p156pB 6. -gp"r"nirrg
lo""tions selected by radio-tagged coho salmon in the Kasilof River watershed
during 2008
t2
1'*",-i1rel
t-i ",
i
-r* =,,i'-- *"
,; }, Ti/
*{ 1"{'*
ffif" r;r'il" 'EF
""fWi..,rni 1..rj
r";{'-..F"*n,
' a*'
{€
;*.i
:!
4,;.t , ,, .''.s:',; .;{v
':*'
O

u)C,)
d.ov
-*.,nHT;.Ear0)cgo>'-h € (,ovG cEEUEs,> s !.9.9 g trH c) (s€€EeFFH.H;FE:9-.itH
-;iJLShif 9"9E.q E7 H-o cd6;S>9Jts € oHE(')F x cd'tr=ln€C)lE r€9F9.H? C) (|)H"'ii E (|i14.:3eOG a-C+.8.: gpFEEiFE 9€;E.E c c9383.:1 c a'E*o999i* s€.EC U) cg -i.its-lvA-€i
-Ei=,E aCS X >Z tr
€=.agfi RR H> tr 5 \FttE il ]
'= =*E5
vEEESE R8.8 H A= B3t e E ? i: s.: E 3 Ig.E E; i sE E g ii AiXrtrtFH5H€i t,-1 E Fo': \*:,EE a sm f,,ia Z ..)E'E'; 9 ! S*39tr H EeE:;*; sts€€ 9-l s-; e;5* FxE'<8tr ^:r
5 s;#i s€,i'o.h.; dHE€Ef
=iEqiE sF€ xE E SI Hq9=E q);3dEE tqPgtHe S=€
Z 50? E.-r a>..HqE u
E g;#E$ t
r5i'olcl
,U)l.El@j. (rlol9l,(ol.9l_cl9l;Ol-l. oJlrvl9t=El< ,' E):l o fl tE59 JI Eet
= .:l^ 6
EIg EIE E,.El N ;l v E
gsH* F:laA: #
Elf; El H s
:'i elg E,t.FEsH
.9#
n66-O=(o;e(^>
=,FEEooc9>(o=(!(!u-clgOaL5o-cE';>a-o-ctr(oA-
E3(oi.t, Pdt(!Edo)Uu==6<cL.eB-YAO{:9s9EP(!rh^g;5coqi9hoLFE,=5!Ee;(o&,PebDo.go-
EEE L.=oEvlo:oP-(),==sv >
6 .cooF:
EdEe€boo-(.)(u-LL.-
€€r.gOocLcEh,ra PEP-y vrgLaE o)
-v€9oii olA!iiPib(o(u3E>o(lJv!F -Y'
=U;oc X>(J+:
Eo-dE
(-t)
(UC0)EEo=FgEo-$r
fL -9OE FXbI ; sl5^EEp'-SP E.s.Qeo5g"r3o ,9 t6--F O_
EgFEg6.t c..A-at EE==3F;tr>
ti#-oiiE
EE.e=E.L(/,l- o <
troocEo-)

ui.u5 9fio hEEE B€'ct(o .96c ooE(g.e ;e.E CFE E=€ toI €fc.<Po =ETt >>c';
=go to-o$+,gstoo: !eo dfE 9;rt. R' ;6 F^ I- tt(!b EE3 P e;E'E es
E ES S.Eg €. E€2 Hg -8.8E '- (1' (o-E :; i;E E3 Eg,3 =P 9r; 2E 6EE ;E -=s F5 :{a -p _9€gE 9lE;-Es ggE.
EE a -*,L:9E F E>6GE c .=Ei; H € n oE== + z.? 3I P H o'do55E H aE=e RFE # = rl; S
f s ! ; iiE t:F s I E.it N
*: t B F fiig S
=E 3 i( E #!; sa .. q s9 6 bi= Neg x E: -
-EE € -e-b=H E'FP So i l=Hg E€.9 !i=; i Hf,€E EIE sbE 7bE iEs * qF;ti i=I *!H ; EfiflS F EHF :f E g EEFA = EEE- E
>lboal}Iql
\:9Iol(ul
ou
-lol
C)l+tl
Aoocdlirlal
EI(sD
CgI
HIolhlol>l
'51(ql
ooFo
'irt;lA, :Iil iil
EI EIql=il
+J F8 !El €€l I., 3I EFI Rf; g E#l
=8; El = v o
rE F *Ia,d> o,? #l&E-'99 V'EE 85{s:-
BF=;};F5EgE: A *;X€iE,l * E5 H E
gsEg;sE#

Run Timing, Abundance, and Distribution ofAdult Goho salmon in the Kasilof RiverWatershed, Alaska, 2008
Alaska Fisheries Data Series l,{umber 2009-14
*{$[:-.. l@l Kenai Fish and Wildlife Field Officeifi lMJl soldotna, Alaska# W September,20O9

CON$ERVINgITTERIGA'Sil,t6ft1s)
The Alaska Region Fisheries Program of the U.S. Fish and Wildlife Service conducts
fisheries monitoring and population assessment studies throughout many areas of
Alaska. Dedicated professional staff located in Anchorage, Juneau, Fairbanks and
Kenai Fish and Wildlife Offices and the Anchorage Conservation Genetics Laboratory
Serve aS the core of the Program's fisheries management study efforts'
Administrative and technicafsupport is provided by staff in the Anchorage Regional
Office. Our program works closely with the Alaska Department of Fish and Game
and other partners to conserve and restore Alaska's fish populations and aquatic
habitats. Additional information about the Fisheries Program and work conducted by
our field offices can be obtained at:
http://alaska.fws. gov/fisheries/index. htm
The Alaska Region Fisheries Program reports its study findings through two regional
pubtication s"r'6". The Alaska Fisheries Data Series was established to provide
iimety dissemination of data to local managers and for inclusion in agency databases.
The Alaska Fisheries Technical Reports publishes scientific findings from single
and multi-year studies that have undergone more extensive peer review and
statisticaliesting. Additionally, some sludy results are published in a variety of
professional fi sheries journals.
Disclaimer: The use of trade names of commercial products in this report does not
constitute endorsement or recommendation for use by the federal government.

Alasko Fisheries Data Series Report Number 2009-14, September 2009
LJ.S. Fish and Wildlife Sen:ice
Run Timing, Abundance, and Distribution of Adult Coho Salmon
in the Kasilof River Watershedo Alaska' 2008
Kenneth S. Gatesl, Douglas E. Palmert, and Jeffrey F. Bromaghin
Abstract
Run timing, abundance, and distribution information was collected on coho
salmon Oncorhynchus kisutch in the upper Kasilof River watershed during
2008 using fish weirs equipped with underwater video systems and radio
telemetry. A combined total of 1,315 coho salmon was counted past the
Nikolai (N:721) and Shantatalik (N:594) creek weirs between2T August and
2 November. Peak weekly passage occurred between 7 and 13 September for
both creeks. Radio-transmitters were implanted in 240 coho salmon captured -"in the Kasilof River between 18 August and 1 3 October. Seventy-two percent
(N:144) of the radio-tagged coho salmon designated as spawners (lf:20!)selected locations in the study area upstream of the Kenai National WildlifeRefuge boundary at Silver Salmon Rapids (rkm 24). Of those fish, 94
spawned in the upper mainstem Kasilof River and 50 selected spawning
locations in tributaries of Tustumena Lake. Tustumena Lake tributary streams
included Shantatalik (N:6), Nikolai (N:4),Indian (i/:20), Fox (N:l), West
(N:9), Glacier (N:9) and Clear (N:1) creeks. Other radio-tagged fish
spawned outside the study area in Crooked Creek (N:9), Coal Creek (N:1)und th" mainstem Kasilof River downstream of the refuge boundary (N:46).
All remaining radio-tagged fish (N:40) were determined to not have spawned
and were classified as "Dead/Regurgitated", "Hafvested", "Back Out", ort'Unknown".
Introduction
The Kasilof River watershed provides spawning and rearing habitat for Chinook
Oncorl4tnchus tshawytscha, coho O. kisutch, sockeye O. nerka, and pink salmon O'
gorbusiha (Johnson and Daigneault 2008). Sockeye salmon are targeted primarily by
Iommercial fisheries in Cook Inlet and have been the focus of numerous research,
enhancement, and assessment projects within the Kasilof River watershed for nearly 30 years
(Kyle 1992;Burger et al. 1995,1997; Finn et ai'.1997; Woody et al. 2000; Shields 2006).
donrrersely, little research and monitoring effort has been directed toward understanding
coho salmon within the watershed.
Coho salmon return to the Kasilof River beginning in late July. Returns to Crooked Creek, a
lower Kasilof River tributary, were monitored by the U.S. Fish and Wildlife Service
(Service) and the Alaska Department of Fish and Game (Department) using a weir between
2004 and2007. Estimates of annual escapement during this period ranged ftom2,756to
5.703 fish 1g.S. Fish and Wildlife Service and Alaska Department of Fish and Game,
unpublished data). Coho salmon begin returning to Crooked Creek in early August and the
run peaks in early September. Most fish passed the weir by early October. Monitoring
efforts prior to 2007 ior coho salmon in the upper Kasilof River watershed were limited to
ground-and aerial survey counts in Tustumena Lake tributaries (Faurot and Jones1990l
Authors: 'U.S. Fish and Wildlife Service, Kenai Fish and Wildlife Field Office,43655 Kalifomsky Beach
Road, Soldotna, Alaska, 99669;2U.S. Geological Survey, Marine and Freshwater Ecology Branch, 4210
University Drive, Anchorage, Alaska, 99508.
,Lirr',, rqtb'4bu

Alaska Fisheries Data Series Report Number 2009-14, September 2009(J.5. Fish and Wildlife Service
Palmer and Gates 2007). Coho salmon were observed by Faurot and Jones (1990) in four ofthe eleven streams surveyed during 1987: Pipe, Indian, Glacier, and Seepage creeks. Index
counts for all streams during 1987 were less than 50 fish, except for Indian Creek which had
a peak count of 931 coho salmon on 9 November. Similar results were observed during
ground and aerial surveys conducted for the same streams in 2006 by Palmer and Gates
(ZOOI). Coho salmon were found in only three streams during 2006: Glacier, Indian, and
Shantatalik creeks. Peak counts during 2006 occurred between 17 and 30 October and
ranged from 44 to 195 coho salmon. The greatest numbers were observed in Indian Creek.
Coho salmon are also known to be present in Fox and Nikolai creeks (Johnson and
Daigneault 2008), but were not observed in surveys conducted during 1987 or 2006. More
recently in2007, weirs equipped with underwater video systems and radio telemetry were
used to further describe the run timing, abundance, and distribution of coho salmon in the
upper Kasilof River watershed. Weirs were installed and operated in Nikolai and Shantatalik
creeks to enumerate coho salmon between 4 August and l6 November (Palmer et al. 2008).
A total of 1,556 coho salmon was counted past the Nikolai (N:837) and Shantatalik (N:719)
creek weirs between 19 August and l5 November. Peak counts were observed between 16
and22 September for both creeks. Results from radio-tagging identified four spawning
locations in the upper Kasilof River watershed which included the mainstem Kasilof River,
and Nikolai, Shantatalik, and Indian creeks.
Coho salmon returning to the Kasilof River watershed are harvested primarily in sport and
personal use fisheries. Annual sport harvest in the Kasilof River has averaged 3,185 coho
ialmon between 1996 and2003 (Howe et al.200la-d; Jennings etaI.2004,2006a,2006b;Walker et al. 2003). During the same period, estimated harvest of coho salmon in the
personal use dip net fishery has averaged 625 fish annually (Reimer and Sigurdsson 2004).
Harvest of coho salmon in federal subsistence fisheries has been minimal to date, but could
increase in the near future. Ninilchik residents were granted a customary and traditional use
designation for salmon, trout, Dolly Varden and other char on federal waters within the
Kasilof River watershed by the Federal Subsistence Board in January 2006. In addition, new
regulations implemented during 2007 and 2008 expanded the methods and means, seasons,
and harvest limits for coho salmon and other fish species in the federal subsistence fisheries.
These regulations include the use of a fish wheel to harvest salmon in the upper KasilofRiver, but the organization approved to operate the fish wheel has not yet completed its
construction.
The development of federal subsistence fisheries in the Kasilof River watershed has created a
need for more detailed information on the abundance and distribution of coho salmon. To
address this need, fish weirs equipped with underwater video systems and radio telemetry
were used to estimate the abundance and run-timing of adult coho salmon in two tributaries
of Tustumena Lake and to identify additional spawning areas upstream of the KenaiNationalWildlife Refuge (Refuge) boundary at Silver Salmon Rapids. Project objectives during 2008
were to (l) determine the abundance and run-timing of adult coho salmon entering Nikolaiand Shantatalik creeks, (2) identifu the ultimate spawning destination upstream of Silver
Salmon rapids (rkm24),via the presence of at least one tagged fish, of a population
comprising 5o/o or more of all the coho salmon passing the capture site during each temporal
stratum with probability 0.95, (3) test the hypothesis that the distributions of spawners among
temporal strata are equal, and (4) estimate the abundance of each identified spawning
componenr upsueam of Silver Salmon rapids using a maximum likelihood estimator. This
report will document results for the first three objectives, while results for the fourth

Alaska Fisheries Data Series Report Number 2009-14, September 2009
U.S. Fish andWildlife Semice
objective will be published in a separate report. Information collected from this project will
provide fisheries managers with a better understanding of spawning distribution and
abundance for coho salmon throughout the upper Kasilof River watershed'
StudY Area
The Kasilof River drains a watershed of 2,150 km2 of mountains, glaciers and forests,
making it the second largest watershed on the Refuge. The Kasilof River is 31 km long and
drains Tustumena Lake,lhe Kenai Peninsula's largest lake, which has a surface area of29,450 hectares, a maximum depth of 287 m, and a mean depth of 124m. All tributary
streams in the watershed that drain refuge lands enter Tustumena Lake except Crooked Creek
(Figure l). Several species of fish use this watershed for spawning and rearing habitat
iJof,nron'und Daigneault 2008), including Chinook, coho, sockeye' and pink salmon,
rainbow/steelhead trout O. *ykitt,Dolly Varden Salvelinus malma,lake trout S. namoycush,
and round whitefish Prosopium cylindraceum.
Nikolai Creek enters the south shore of Tustumena Lake approximately 8 km SE of the lake
outlet (60. 11.43'N and 15lo 0.36'W; NADS3). Its waterihed is approximately 95 km2 and
falls within the Refuge boundary and a designated wilderness area (Moser 1998). Nikolai
Creek has a relatively steep gradient, low sinuosity, and predominately cobble substrate.
Shantatalik Creek is a tributary on the north shore of Tustumena Lake (60"17.54'N and
150.59.12'W; NAD83), approximately l2km NE of the lake outlet (Figure l). The creek is
approximately 7 km tong anO can be described as having low gradient, moderate sinuosity,
a'ni a mixture of gravel and mud substrate. Shantatalik Creek provides spawning habitat for
coho and sockeye salmon (Johnson and Daigneault 2008).
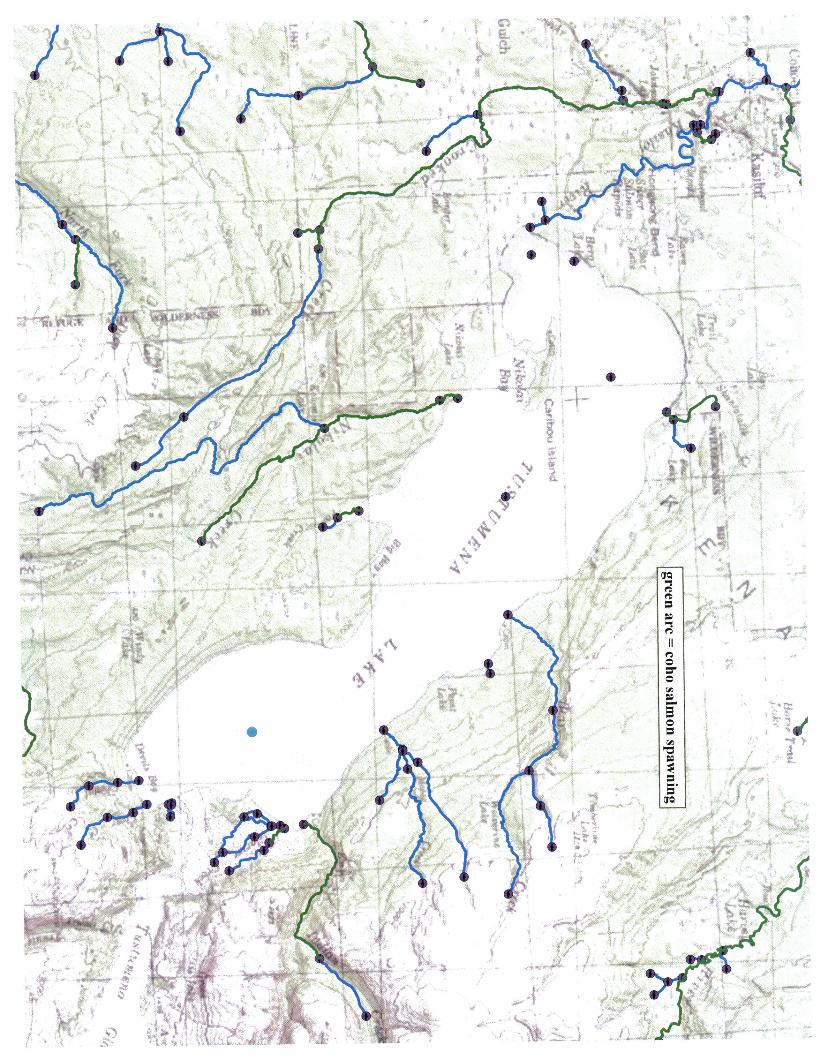
FIGURE l.-Map of the Kasilof Riverwatershed.

Alaska Fisheries Data Series Report Number 2009- I 4, September 2009
IJ.S. Fish and llildlife Senice
Methods
Weir and Video Operations and Design
Weirs equipped with video systems were operated in Nikolai and Shantatalik creeks to
determine the abundan." und run-timing of coho salmon (Figure 2). Both weirs were
installed by 28 August. The weir in Nikolai Creek was operated through 23 October, and the
weir in Shantatalik Creek was operated through 4 November'
The Nikolai Creek weir has been used since 2005 to enumerate steelhead trout during the
spring season. This weir is approximately 200 m upstream from Tustumena Lake and is
ctnstiucted using a combination of floating resistance board panels (Tobin 1994) and
flexible-picket panels (Gates and Palmer 2004). The floating resistance board panels are
construcied using specifications outlined by Tobin (1994), with minor changes to some
materials, panel width, and resistance boards. The panels are attached to a steel rail anchored
to the river bottom und ur" configured to pass fish near the deepest part ofthe channel
through a fish passage panel. Thi flexibli-picket panelg are installed between the banks and
bulkhiads of the resistance board weir to create a fish-tight weir. The flexible-picket panels
are constructed from 2.5-cm inside diameter polyvinyl chloride (PVC) electrical conduit.
panel dimensions are 3-m long by 1.5-m high with I .9-cm spacing between pickets. Panels
are held together by 3-mm stainless wire rope. The weir was unmanned, except when
maintenance was required, and outfitted with a video and microwave system'
N
+ Kenai NationalWildlife Refuge
\.i.
CrystalCreek >,
f ''.tooi"n-llt cieek'
!.- \Glacier
i. \reer
Clear
tII
Fixed receiver sites
Video vveirs
Microwave signals
Microwave relay station
Digital video recorder
FIGURE 2.-Map of the Kasilof River watershed illustrating the locations of the fixed receivers,
microwave relay station and transmission routes, video weirs, and the location of the digital video
recorder during 2008.
A rigid picket weir was installed on Shantatalik Creek approximately 100 m upstream from
Tustumena Lake. The creek is approximately 4-m wide at the weir site. The weir framework
4
Alaskn Fisheries Data Series Report Number 2009-14, September 2009
U.S. Fish and lVildlife Seruice
consisted of several pieces of 6.4-cm aluminum angle bolted together forming a self-standing
frame. The weir piclets were made from 25-mm schedule 40 aluminum pipe. Each picket
measured 1.8-m in length and attached to the frame by individually sliding throug-h 28.6-mm
holes drilled in two 6-i-r pieces of aluminum angle bolted to the front of the weir frame.
Weir pickets were ,pu."d 3.2 cmapart. Like Nikolai Creek, the weir was unmanned and
outfitted with a video and microwave system.
Setup and design of the video systems used to monitor fish passage is described by Gates and
palmer (2006) and was similar to that used by Anderson et al. (2004) on Big creek during
2003. One underwater video camera was located inside a sealed video box attached to the
fish passage chute. The video box was constructed of 3.2-mm aluminum sheeting and filled
with filtered water. Safety glass was installed on the front of the video box to allow for a
scratch-free, clear surface tf,.ough which video images were captured. The passage chute
was constructed from aluminum-angle and was enclosed in plywood isolating it from exterior
light. The backdrop of the pusrug"ihute from which video images were captured could be
ajjusted laterally to timit the number of fish passing through the chute at one time. The
backdrop could-be easily removed from the video chute when dirty and replaced with a new
one. Thi video box and fish passage chute were artificially lit using a pair of 12-V
underwater pond lights equipped *ittr tO-W bulbs. This system provided a consistent light
source during day and night-hours and allowed recording of good quality images.
Video images from the Nikolai Creek weir site were transmitted via a2.4 GHz microwave
frequency iignal to a digital video recorder (DVR) located at a private residence near the
Steiling ifigh*uy. A combination of 1.8 and 2.4 GHz microwave transmitters were used at
Strantatatik C...k b.ruure a relay station was necessary to transmit the video images from
the creek to the DVR (Figure 2). The relay station was co-located with the Nikolai Creek
microwave equipment. Microwave transmission of video signals reduced the power
requirements at iach remote site and allowed the field crew to remotely monitor fish passage'
A pair of 80-W solar panels wired in parallel and one 54-W thermoelectric generator (TEG)
provided power to four 400 Ah 6-volt batteries wired in series and parallel at each weir site.
The batteiies supplied 12-VDC power to the underwater camera, microwave transmitter, and
underwater pond'lightr at Shantatalik Creek and only to the underwater pond lights at Nikolai
Creek. One additional 80-W solar panel and two 100 Ah 12-V batteries powered the
underwater camera and microwave equipment located on a hill near Nikolai Creek' All
video images were recorded on a r"rno'uubl.500 gigabyte hard drive at 20 frames-per-second
using a coitputer-based DVR. Fish passage was recorded 24 hours per day seven days each
*""k. Stored video files were generally reviewed every two or three days' The DVR was
equipped with motion detection to reduce the amount of blank video footage and review
time.'Appendix I provides a list of video and microwave equipment model numbers and
manufacturers used with the project.
Radio Telemetry
Radio telemetry was used to uniquely identify and track individual coho salmon. Movements
of radio-tagged coho salmon were documented using a combination of fixed data-logging
receiver stations located throughout the Kasilof River watershed and mobile tracking using
boats and fixed-wing aircraft.
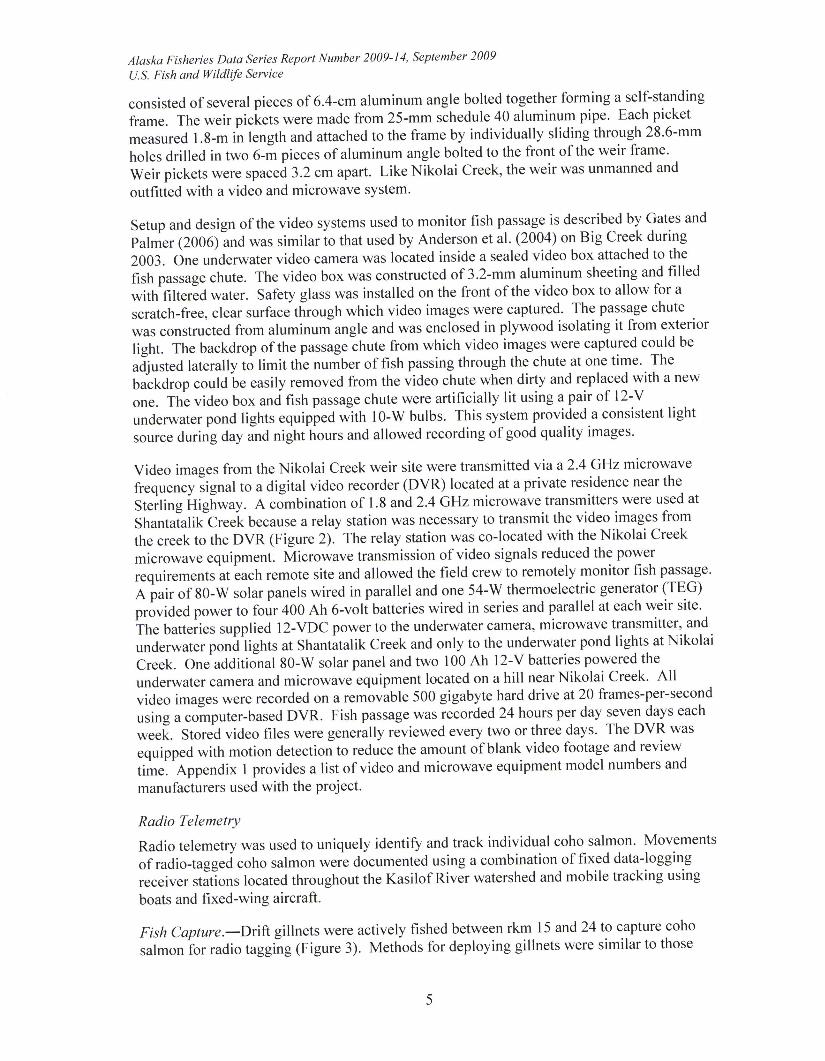
Fish Capture.-Driftgillnets were actively fished between rkm 1 5 and24 to capture coho
salmon for radio tagging (Figure 3). Methods for deploying gillnets were similar to those

Alaska Fisheries Data Series Report Number 2009-14, September 2009
U.S. Fish and Wildlde Semice
used to capture coho salmon for radio telemetry studies in the Holitna, Kenai, and Kasilofrivers (Chythlook and Evenson 2003; Carlon and Evans 2007; Palmer et al. 2008). A three
person crew would deploy a single gillnet using a 5.5-m boat. One crew member piloted the
boat while two crewmembers positioned on the bow of the boat tended the net. Gillnets had
11.4-cm stretched mesh constiucted from Miracle@ ltrrtS-30) brand twisted nylon webbing.
Each gillnet fished was 12.2-m long and 29 meshes deep. Drift gillnets were fished until
either the end of the fishing area was reached or a fish became entangled in the net. Once a
fish became entangled in the net, the net was immediately pulled from the water. The portion
of net containing the fish was placed in a large tote filled with river water, and the fish was
disentangled or cut from the net. Once freed from the net, the condition of each coho salmon
was examined and, based on physical appearance; it was either released or fitted with a radio-
tag. Each tagged fish was immediately placed in a submerged fish cradle to measure its mid-
"yi to fork length. These methods were used to reduce stress associated with capture and
handling.
FIGURE 3.-Map of the Kasilof River illustrating the fixed receiver locations and fish capture area
during 2008.
Radio Tagging.-Coho salmon were radio-tagged using radio transmitters developed by
Lotek Wireless Incorporated@. Each radio transmitter (Model SR-M 16-25) measured 16 x51 mm, was digitally encoded, equipped with a motion sensor, and outfitted with a 1,100-d
battery which was programmed to shut off after 200 days. These radio transmitters were
similar to those used by Ramstad and Woody (2003) when they examined transmitter
retention and tag-related mortality in adult sockeye salmon. Each transmitter weighed 17 g
in air and did not exceed ZYo of the fish's body weight (Winter 1983). Radio transmitters
were dispersed over eight radio frequencies between 162 and 166 MHz. Radio transmitters
were gastrically implanted through the esophagus using methods similar to Burger et al.
(1985). Radio-tagged fish were immediately released into the river after the tagging process.
6

Alaska Fisheries Data Series Report Number 2009-14, September 2009
U.S. Fish and lVildlife Senice
Radio transmitters were scheduled to be deployed every other day over four l5-d strata
between 17 August and 15 October (Table 1). Eight to nine radio transmitters were to be
deployed during each tagging event and if the daily allocation was not met, the remaining
tags were deployed the following day. Deploying radio transmitters every other day in a
syitematic fashion reduced the possibility of disproportionately representing a single group
of fish moving through the tagging area. We assumed that l7 August to 15 October would
encompass nearly the entire migration past Silver Salmon Rapids (rkm2\ based on previous
radio-tigging by Palmer et al. (2003) during 2007. We also assumed that (1) capture and
taggingof coho salmon did not cause them to change their ultimate spawning locations, (2)
fistr deitined for the various spawning locations had an equal probability of capture within
each stratum, and (3) tagged fish behaved independently. Sixty radio transmitters were
allocated to each of the four strata to satisfy the criteria of Objective 2 using a multinomialprobabil ity model (Agresti 2002) of spawning distribution.
TABLE l.-Schedule for deploying radio transmitters in coho salmon during 2008. -, .
Strata 3 Strata 4
-"ss-ii=Te- ffiffiDates Allocation Dates Allocation Dates Allocation Dates Allocation
Radio Tracking.-Radio telemetry receivers manufactured by Lotek Wireless Incorporated@
were used for all mobile and fixed station tracking. Fixed receiver stations were used to
automatically identify and record fish movements at the mouths of Nikolai, Glacier, Indian,
Shantatalik and Crooked creeks, the lake outlet, and Hong Kong bend (rkm22.5) (Figure 2).
Fixed receiver stations were similar to those used on the Kenai River to monitor rainbow
trout movements (Palmer 1998). Each station was a strongbox and antenna mast comprised
of a single data-logging receiver, two Yagi antennas, antenna switch box, three l2-V deep
cycle batteries, solar panel, and voltage regulator. Mobile boat tracking was conducted each
week from early September through mid November on the Kasilof River between the lake
outlet and tidewater. Aerial surveys were conducted once during September, October, and
December and twice during November using a PA- 18 and Cessna I 85 fixed-wing aircraft.
Aerial surveys were conducted at approximately 300-400 m above ground for each tributary
stream and the perimeter of Tustumena Lake. A portable global positioning system (GPS)
was used during all mobile tracking surveys to accurately identify the latitude and longitude
of each located fish.
Data Analysis
Daily counts of coho salmon passing the video weirs on Nikolai and Shantatalik creeks were
entered into an Excel@ spreadsheet to track the abundance and run-timing in each stream.
Sex composition was estimated from external characteristics during the review of video
records. Radio telemetry information collected with the various tracking methods was
integrated into one Excei@ database to archive the location and date for each encounter, as
welf as the fate of each radio-tagged coho salmon. Locations were recorded as latitude and
18-Aug20-Aug22-Aug24-Aug26-Aug28-Aug
IvII88
8
2-Sep I4-Sep I6-Sep 9
8-Sep 910-Sep 812-Sep 8
14-Seo 8
16-Sep I18-Sep 9
20-Sep I22-Sep 924-Sep I26-Sep I28-Seo 8
1-Oct 93-Oct IS-Oct I7-Oct I9-Oct 8
11-Oct I13-Oct 8
Total 60 60 60 60

Alaska Fisheries Data Series Report Number 2009-l 1, September 2009
U.S. Fish and Wildlife Service
longitude coordinates (WGS84) and displayed on a geographic coverage of the Kasilof River
watershed using ArcMap@ software.
Each radio-tagged fish was assigned one of seven possible fates based on information
collected from mobile and fixed radio receivers (Table 2). The collection of tagged fish
known to enter the study area, any water upstream of rkm 24, constituted the sample forpurposes of estimating spawning distribution from each stratum. Fish assigned a fate ofharvested or dead/regurgitated were censored from the sample. Fish whose spawning
location could not be determined with reasonable certainty were placed into an unknown
category.
Spawning locations were defined based on the tracking results. A tagged fish that migrated
to a particular location and remained in the area for an extended period of time withoutactivating the mortality sensor was considered to have identified a potential spawning
location. Potential spawning locations are considered to be the tributaries to Tustumena Lake
and the Kasilof River mainstem between the lake and tkm24.
TABLE 2.-Possible fates of radio-tagged coho salmon in the Kasilof River watershed during 2008.
Fate Description
Tributary Spawner A fish that spawns in a tributary to Tustumena Lake
Mainstem Spawner A fish that spawns in the Kasilof River upstream of rkm 24.
Other Spawner A fish that spawns in waters below rkm 24.
Dead/Regurgitated A fish that did not complete its spa,vning migration because it has either died or regurgitated
its radb transmitter.A fish that is harvested in either subsistence or sport fbheries.
A fish that has dropped out ofthe KasilofRiver watershed,
A fish that has a loss ofcontrct with mobile or fixed radb receivers or cannot be assigned another fate
with reasonable cert ainty.
Htrvested
Back OutUnknown
The assumption that coho salmon destined for the various spawning locations had an equal
probability of capture within each stratum was tested using chi-square tests of homogeneity
(Greenwood and Nikulin 1996). Given the relatively small stratum sample size and the
potential existence of small spawning aggregations, the stratum-by-location contingency
iable was expected to be sparse and the distribution of the Pearson test statistic for a test ofhomogeneity may not be well approximated by a chi-square distribution. For that reason, an
exact chi-square test (Agresti 2002) was conducted using the function "chisq.test" of Rversion 2.9.0 (RDCT 2009), with 100,000 replications to estimate test significance.
Methods used to determine the abundance of each spawning component, based on the results
of radio telemetry findings and information collected at each weir location using a maximum
likelihood estimator, will be reported in a separate publication.
Results
Weir and Video Operations
The weir and video systems at Nikolai and Shantatalik creeks were installed on26 and 28
August and operated through 23 October and 4 November, respectively. Both weirs and
video systems were installed before large numbers of coho salmon entered either stream.
Each video system functioned well except for periodic interruptions caused by floodingevents and power failures. High water periodically rendered the Nikolai Creek weirinoperable on 1 1, 14, and 15 September. Low voltage in batteries supplying power to parts
of the video system at Nikolai Creek and the microwave relay station resulted in a loss of

Alaska Fisheries Data Series Report Number 2009-14, september 2009
IJ.S. Fish and lVildlife Semice
video from both sites sporadically during September and October. The low voltage in
batteries was a direct risult of decreased sunlight during the fall period'
Biological Data
A total of 721coho salmon was counted passing the video system at Nikolai Creek between
27 August and22october (Figure 2; Appendix 2). The total escapement estimate did not
include 41 coho salmon thai passed downstream through the video system. Peak weekly
passage (N:367) occurred between 7 and 13 September, and the median cumulative passage
iate ias'9 September. The highest daily count (N:348) also occurred on 9 September. The
number of coho salmon counted after 30 September only represented 87o (N:60) of the total
escapement.
Sex was visually estimated for all but two of the coho salmon counted on Nikoli Creek video
recordings. Overall about 48% of the total coho salmon return was estimated to be females,
although weekly estimates ranged from about 3}Yoto 57% (Figure 3).
"t" "S"-t'
FIGURE 2. -Weekly
escapement of coho salmon in Nikolai Creek, Alaska during 2008' Counts were
made between 26 August and 23 October.
400
350
300
fr 25oLl-
b 2oo(l'
E 1so
z100
50
0
5,-" *tt" "rS .rO "tS "t"" "$sO' sS' ".$' *-"' sO' sir,"' o,t$' "*
--f- Males * Females
Alaslu Fisheries Data series Report Number 2009-14, September 2009
IJ.S. Fish and Wildlife Sewice
100
80
z. 60oI840
20
drt"" ef "tO *Ss0' *$' eoo' do$'
"tS"r""e-t' "".S' 5,8'
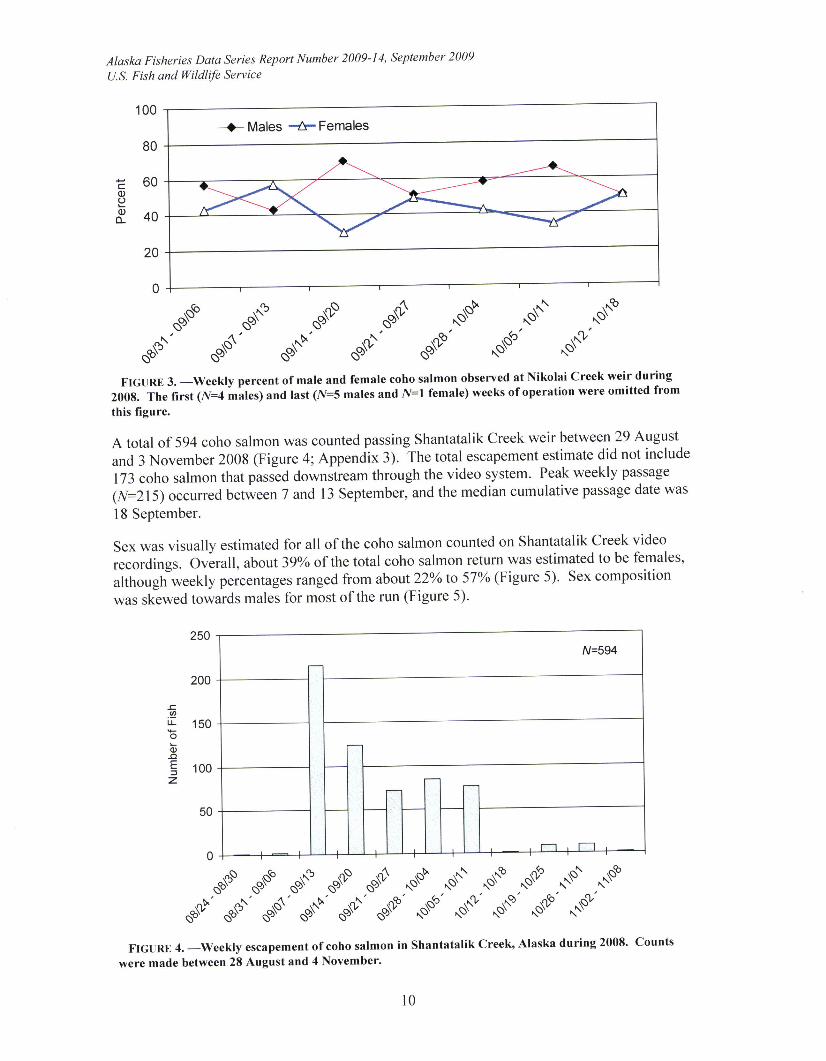
FIGURE 3. -Weekly
percent of male and female coho salmon observed at Nikolai Creek weir during
2008. The first (N=4 mates; and last (N=5 males and N=l female) weeks of operation were omitted from
this figure.
A total of 594 coho salmon was counted passing Shantatalik Creek weir between 29 August
and 3 November 200g (Figure 4; Append-ix 3). The total escapement estimate did not include
173 coho salmon that passed downitieam through the video system. Peak weekly passage
(N:215) occurred between 7 and 13 September, and the median cumulative passage date was
18 September.
Sex was visually estimated for all of the coho salmon counted on Shantatalik Creek video
recordings. Overall, about 39Yo of thetotal coho salmon return was estimated to be females,
althougtiweekly percentages ranged from about 22%oto 57% (Figure 5)' Sex composition
was skewed towards males for most of the run (Figure 5)'
6,€ 6,ttt "rS 6'(l,s *S ..t"" ."$ ..a" ^"€ ,at$ .."to"
s0'"s0'-*$ -**
eO' "rS' "ts' "*' **t' *S' o*'
FIGURE 4. -Weekly
escapement of coho salmon in Shantatalik Creek, Alaska during 2008' Counts
were made between 28 August and 4 November.
E.9.r-L 150oo-oE 4^^=
rvvz
10

Alaslra Fisheries Data Series Report Number 2009-14, september 2009
II.S. Fish and Wildlife Semice
100
80
E60oIor40
-i- Males '#Females
_/-
20
do\s
..$"$"a""
so *oo.$n' s0 s-" *rs'
FIGURE 5. -Weekly
percent of male and female coho salmon observed at Shantatalik Creek during
2008. Six weeks of operations were omitted from this figure because passage (N=22) was less than 10 fish
during each week
Radio Telemetry
A total of 240 coho salmon (97 females and 143 males) was radio-tagged in the Kasilof River
between 18 August and 13 dctober 2008 (Appendix 4). Radio transmitters were deployed
over four tempJral strata, containing equal numbers of radio-tagged coho salmon. All radio-
tagged fish wire captured in an approximate 8-km section of river immediately downstream
fr6il the refuge boundary at Silvii Salmon Rapids. Coho salmon receiving a transmitter
ranged in length from 465 to 770 mm.
Eighty-three percent (N:200) of all radio-tagged coho salmon were assigned to a spawning
tocation based on information collected from mobile and fixed radio receivers (Table 3).
Sixty percent (N:144) of the radio-tagged fish selected spawning locations upstream of the
."n g" boundary at Siiver Salmon napids. Of those fish, 94 spawned in the upper mainstem
Kasilof River between rl<rn24 and the Tustumena Lake boat ramp (Figure 6). Fifty radio-
tagged coho salmon spawned in tributaries of Tustumena Lake including Shantatalik (N:6),
Ni"fotai (N:4),Indian(N:20), Fox (N:l), West (N:9), Glacier (N:9) and Clear (lr:tlcreeks. Other radio-tagged fish spawned outside the study area in Crooked Creek (N:9)'
Coal Creek (N:l) andi[e mainstem Kasilof River downstream of the refuge boundary
(N:46). No'spawning destination could be determined for lTYo of the radio-tagged fish
il,t=+Oj. These fish iere assigned fates of "Dead/Regurgitated" (N:24), "Bu9! Out" (N:8),iunknown" (N:5), and "Harvested (N:3). Radio-tagged fish that were classified as
.,Unknown" were last detected either below the study area (N:3) or in Tustumena Lake
(N:2).
Spawners were classified into three categories for the exact chi-square procedure used to test
the hypothesis that the distributions of spawners were equal among all temporal strata:
tribuiary spawners (N:50), mainstem."fuge spawners (N:91)'and other spawners (N:56)'
The tesi was signifit aft (t = 79.79,p-value < 0.0001), indicating that the distributions of
spawners were not equal'among all itrata. The significance of the test was primarily driven
1l

Ataska Fisheries Data series Report Number 2009-14, September 2009
IJ.S. Fish and Wildlife Service
by changes in the relative abundance of tributary and mainstem spawners early and late in the
run (Table 3).
Total
TABLE 3. -Fates
assigned to coho salmon radio-tagged in the Kasilof River between 18 August and 13
Tributary SpawnersShantatalik CreekNikoilai Creeklndian CreekFox CreekWest CreekGlacier CreekClear Creek
Mainstem Spawners above rkm 24 (Refuge)
Other SpawnersMaintstem below rkm 24
E
313
1
82
I
22
1
1
7
?
1
31 30
171
7
4
2
0
2.51.78.30.43.83.80.4
39.2
193.80.4
10.0
1.3
3.3
2.1
A
420
1
991
94
46I1
24
3
I5
22
Crooked CreekCoal Creek
Dead/Regurgitated
Harvested
Back Out
Unknown
I1
6
2
3
3
"r"oing lo""tions selected by raOio-tagged coho salmon in the Kasilof River watershed
during 200E
t2

Alaska Fisheries Data series Report Number 2009-14, September 2009
U.S. Fish and lVildlife Service
Discussion
A combined total of 1,315 coho salmon was counted past the Nikolai (N:721) and
Shantatalik (N:594) creek weirs between 27 August and 2 November. These estimates of
abundance represent the relative strength of the coho salmon return to each of these streams;
however, estimates from each creek may be conservative because of periodic interruptions of
video images. lnterruptions in video signals were caused by a flooding event and power
failures reiulting in 8 days of lost video at Nikolai Creek and 6 days of lost video at
Shantatalik Creek (Appendices 2 and 3).
Our findings show that the upper mainstem Kasilof River is an important spawning area for
coho salmon and are generaliy consistent with the Department's Anadromous Water's
Catalog (Johnson und Duign.uult 2008) and previous studies conducted by the Service on
Tustumena Lake in 1987 (Faurot and Jones 1990), 2006 (Palmer and Gates 2007), and2007
(palmer et al. 2008). The primary difference between observations made in 2008 and
previous studies was that radio-tagged coho salmon were found in two additional streams,
West and Clear creeks. This makes a total of seven Tustumena Lake tributary streams that
have been identified as coho salmon spawning habitat: Shantatalik, Nikolai, Indian, Fox,
West, Glacier, and Clear creeks.
We also observed differences in run-timing between mainstem and tributary spawners similar
to that reported during 2007 (Palmer et al. 2003). Differences in run timing between
tributary and mainstem spawners are commonin Onchorhychus spp', especially in Streams,
where timing of upstream migration extends over a period of several weeks (Groot and
Margolis f q-9f ). Although mainstem spawners were represented in all four of our tagging
strati during 2008, most mainstem spawners (69%) were tagged in strata 3 ayd !'-Conversely, almost all tributary spawners (90%) were tagged in strata I and2' However'
there was one exception to this putt"*. Radio-tagged coho salmon returning to Glacier
Creek to spawn were represented in all four strata, which suggest this population could have
alaterrun-timing than other tributary spawning populations. This could be a result of
temperature conditions in Glacier creek since it is spring fed'
Our efforts during 2008 provided the most inclusive and representative spawning and
distribution information available for coho salmon in the upper Kasilof River watershed' We
were able to assign spawning destinations to a greater percentage of tagged fish in 2008 than
Palmer et al. (2008) were able to do in 2007. In 2008, only 17o/o of radio-tagged coho
salmon could not be assigned a spawning destination, which was a 34o/o teduction from what
palmer et al. (2008) obseived in2007. This was due to a much lower percentage of tagged
coho salmon that backed out of the system in 2008 (3%)thanin2007 (22%) as well as much
smaller percentage of tagged coho salmon that either died or regurgitated their transmitters in
200g (10%) than in 200i 06w. The remainder of the radio-tagged coho salmon were
assigned a iate of "Unknown" (lf:S) for which no spawning destination could be determined.
TwJof these fish entered Tustumena Lake but did not select a spawning tributary. While the
ultimate fates of these fish are unclear, it is possible that handling stress may have altered
their behavior eventually leading to delayed mortality or these fish could have selected a
spawning location within the lake.
Much of our success in 2008 is a result of being able to reduce handling effects on radio-
tagged fish through use of the different tagging strategy. During 2007 , tadio transmitters
w6ie Aeptoyed in as short a time period as possible to help ensure that all allocated tags were
t3

Alaska Fisheries Data Series Report Number 2009-14, September 2009
IJ.S. Fish and lVildlife Service
deployed in each stratum (Palmer et al. 2008). In contrast, we radio-tagged coho salmon
every other day during ZOO8 in an attempt to get a more representative sample of the fish
avaiiable within eachitrata. This also allowed tagging crews to capture greater numbers of
fish and, therefore, to be more selective in choosing fish to tag. High rates of handling-
induced mortality have been observed by other researchers that have captured and handled
adult coho salmon during their transition from marine to freshwater habitats. For example,
Carlon and Evans (200Tf observed "failure" rates as high as 40o/o for coho salmon radio-
tagged in the Kenai River.
Acknowledgements
Special appreciation is extended to those who participated in project setup, data.c_ollection'
and video review including Chad Whaley, James Boersma, Haley Ohms, and Bill Carter. We
also thank Michael and Linda Sipes for providing us access to their property to operate the
microwave equipment and DVR for Nikolai and Shantatalik creeks.
The U.S. Fish and Wildlife Service, Office of Subsistence Management provided funds for
this project through the Fisheries Resource Monitoring Program, Project FIS 08-502.
References
Agresti, A. 2002. Categorical data analysis, 2nd edition. John Wiley & Sons, Hoboken, New
Jersey.
Anderson, J. L., K. S. Whitton, K. K. Cornum, and T. D. Auth. 2004. Abundance and run
timing of adult Pacific salmon in Big Creek, Becharof National Wildlife Refuge,
2003. U. S. Fish and Wildlife Service, Alaska Fisheries Data Series Report Number
2004-7, King Salmon, Alaska.
Burger, C.V., R. L. Wilmot, and D. B. Wangaard. 1985. Comparison of spawning areas and
times for two runs of Chinook salmon Oncorhynchus tshawytscha inthe Kenai River,
Alaska. Canadian Journal of Fisheries and Aquatic Sciences 42:693-700.
Burger, C.V., J. E. Finn, and L. Holland-Bartels. 1995. Pattern of shoreline spawning by- .sockeye
salmon in a glacially turbid lake: Evidence for subpopulation differentiation.
Transactions of the American Fisheries Society 124:l-15'
Burger, C.V., W. J. Spearman, and M. A. Cronin. 1997. Genetic differentiation of sockeye
salmon subpopulations from a geologically young Alaskan lake system. Transactions
of the American Fisheries Society 126:926-938.
Carlon, J. A., and D. Evans. 2007. Abundance of adult coho salmon in the Kenai River,
Alaska, 1999-2003. Alaska Department of Fish and Game, Fishery Data Series
Number 07-81, Anchorage, Alaska.
Chythlook, J. S., and M. J. Evenson. 2003. Assessment of Chinook, chum, and coho salmon
escapements in the Holitna River drainage using radio telemetry, 2002. Alaska
Department of Fish and Game, Fishery Data Series Number 03-23, Anchorage,
Alaska.
14

Alaska Fisheries Data Series Report Number 2009-14, September 2009
U.S. Fish and llildlife Senice
Faurot, D., and R. N. Jones. 1990. Run timing and spawning distribution of coho and late
run Chinook salmon in the Kasilof River watershed, Alaska, 1987. U.S. Fish and
Wildlife Service, Alaska Fisheries Technical Report Number 9, Kenai, Alaska.
Finn, J. E., C.V. Burger, and L. Holland-Bartels. 1997. Discrimination among populations
of sockeye salmon fry with fourier analysis of otolith banding patterns formed during
incubation. Transactions of the American Fisheries Society 126:559-578.
Gates. K. S.. and D. E. Palmer. 2004. Estimation of the sockeye salmon escapement into
Mclees Lake, Unalaska Island, Alaska, 2003. U.S. Fish and Wildlife Service, Alaska
Fisheries Data Series Report Number 2004-1, Kenai, Alaska.
Gates, K. S., and D. E. Palmer. 2006. Abundance and run timing of adult steelhead trout in
Crooked and Nikolai Creeks, Kenai Peninsula, Alaska, 2006. U.S. Fish and WildlifeService, Alaska Fisheries Data Series Report Number 2006-13, Kenai, Alaska.
Greenwood, P. E., and M. S. Nikulin. 1996. A guide to chi-square testing. John Wiley &Sons, New York, New York.
Groot, C., and L. Margolis. 1991. Pacific salmon life histories. University of BritishColumbia Press. Vancouver. British Columbia.
Howe, A. L., R. J. Walker, C. Olnes, K. Sundet, and A. E. Bingham. 2001a. Revised
Edition: Harvest, catch, and participation in Alaska sport fisheries during 1996.
Alaska Department of Fish and Game, Fishery Data Series Number 97-29 (revised),
Anchorage, Alaska.
Howe, A.L., R. J. Walker, C. Olnes, K. Sundet, and A. E. Bingham. 200lb. Revised
Edition: Harvest, catch, and participation in Alaska sport fisheries during 1997.
Alaska Department of Fish and Game, Fishery Data Series Number 98-25 (revised),
Anchorage, Alaska.
Howe. A. L., R. J. Walker, C. Olnes, K. Sundet, and A. E. Bingham. 2001c. Revised
Edition: Participation, catch, and harvest in Alaska sport fisheries during 1998.
Alaska Department of Fish and Game, Fishery Data Series Number 99-41 (revised),
Anchorage, Alaska.
Howe, A.L.,R. J. Walker, C. Olnes, K. Sundet, and A. E. Bingham. 2001d. Participation,
catch, and harvest in Alaska sport fisheries during 1999. Alaska Department of Fish
and Game, Fishery Data Series Number 01-8, Anchorage, Alaska.
Jennings, G. B., K. Sundet, A. E. Bingham, and D. Sigurdsson. 2004. Participation, catch,
and harvest in Alaska sport fisheries during 2001. Alaska Department of Fish and
Game, Fishery Data Series Number 04-11, Anchorage, Alaska.
Jennings, G. B., K. Sundet, A. E. Bingham, and D. Sigurdsson. 2006a. Participation, catch,
and harvest in Alaska sport fisheries during 2002. Alaska Department of Fish and
Game, Fishery Data Series Number 06-34, Anchorage, Alaska.
Jennings, G. 8., K. Sundet, A. E. Bingham, and D. Sigurdsson. 2006b. Participation, catch,
and harvest in Alaska sport fisheries during 2003. Alaska Department of Fish and
Game, Fishery Data Series Number 06-44, Anchorage, Alaska.
Johnson, J., and M. Daigneault. 2008. Catalog of waters important for spawning, rearing, or
migration of anadromous fishes - Southcentral Region, Effective June 2, 2008.
15

Alaska Fisheries Data series Report Number 2009-14, September 2009
U.S. Fish and Wildlife Semice
Alaska Department of Fish and Game, Special Publication Number 08-05,
Anchorage, Alaska.
Kyle, G. B. 1992. Summary of sockeye salmon (Oncorhynchus nerkn) investigations in
Tustumena Lake. 19-81-1991. Alaska Department of Fish and Game, Fisheries
Rehabi litation and Enhancement D ivi sion, Report 122, Juneau, Al aska.
Moser, E. 1998. Water resource inventory and assessment, Kenai National Wildlife Refuge,
1997 stream discharge gaging data. U.S. Fish and Wildlife Service, Water Resource
Branch, WRB 98-01, Anchorage, Alaska.
palmer, D. E. 1998. Migratory behavior and seasonal distribution of radio-tagged rainbow
trout in the KenaiRivei, Alaska. U.S. Fish and Wildlife Service, Alaska Fisheries
Technical Report Number 46,Kenai, Alaska.
palmer, D.E., and K. S. Gates. 2007. Coho salmon spawning assessment inTustumena
Lake tributaries, 2006. U.S. Fish and Wildlife Service, Alaska Fisheries Data Series
Report Number 2007 -10, Kenai, Alaska.
Palmer, D.E., K. S. Gates, and J. F. Bromaghin.2008. Run timing, abundance, and
distribution of adult coho salmon inihe Kasilof River watershed, Alaska, 2007. U.S.
Fish and Wildlife Service, Alaska Fisheries Data Series Report Number 2008-19'
Soldotna, Alaska.
Ramstad, K.M., and C. A. Woody. 2003. Radio tag retention and tag-related mortality
among adult sockeye salmon. North American Journal of Fisheries Management
23:978-982.
RDCT (R Development Core Team). 2009. R: A language and environment for statistical
computing. R Foundation for Statistical Computing, Vienna, Austria. ISBN 3-
90005 I -07-0, URL http ://www.R-proj ect.org'
Reimer, A.M., and D. Sigurdsson. 2004. Upper Cook Inlet personal use salmon fisheries,
1996-2003. Alaska Department of Fish and Game, Fishery Data Series Number 04-
31, Anchorage, Alaska.
Shields, p. 2006. Upper Cook Inlet commercial fisheries annual management report, 2005.
Alaska Department of Fish and Game, Fishery Management Report Number 06-42,
Anchorage, Alaska.
Tobin, J. H. 1994. Construction and perforrnance of a portable resistance board weir for
counting migrating adult salmon in rivers. U.S. Fish and Wildlife Service, Alaska
F i sheries Technical Report Number 22, Kenai, Alaska'
Walker, R. J., C. Olnes, K. Sundet, A. L. Howe, and A. E. Bingham. 2003' Participation,
catch, and harvest in Alaska sport fisheries during 2000. Alaska Department of Fish
and Game, Fishery Data Series Number 03-05, Anchorage, Alaska.
Winter, J. D. 1983. Underwater biotelemetry. Pages 37I -395 in L.A' Nielsen and D'L'
Johnson, editors. Fisheries techniques. American Fisheries Society, Bethesda,
Maryland.
Woody, C.A., J. Olsen, J. Reynolds, and P. Bentzen. 2000. Temporal variation in-
phenotypic and genotypic traits in two sockeye salmon populations, Tustumena Lake,
Alaska. Transaclions of the American Fisheries Society 129 1031-1043.
t6

Alaska Fisheries Data series Report Number 2009-14, september 2009
II.S. Fish and Wildlife Semice
APPENDIX 1. -List of video and microwave equipment used to monitor coho salmon abundance at
Nikolai and Shantatalik c Alaska 2008.
Model # Manufacturer ContactItemDieital Video Recorder
Underwater Camera
Underwater LightsExtemal Harddrive
2.4 GHz Microwave Transmtfter
1.8 GHz Microwave Transmitter
2.4 GHz Microwave Receiver
1.8 GHz Microwave Receiver
2.4 GHz Parabolic Antennas
1.8 GHz Parabolic Antennas
80 W Solar Module400 Ah 6 Volt Battery
100 Ah l2 Volt Battery
Charge ControllerCharee Controller
DVSM 4.I20Model 10
Lunaqua2 l2-vOne Touch 500 GB
Veltek Intemational, Inc.
Applied Micro VideoOASEMaxtor.comPremier Wireless, IncPremier Wireless, IncPremier Wireless, Inc
Premier Wireless, IncCalifornia AmplifierCalifornia AmPlifierSharp
RollsExide Technologies
Specialty Concepts, lnc.
Specialty ConcePts, Inc.
http ://www. veltekcctv. conv
http://www.appliedmicrovideo. com/
http ://www.pondusa. com
http ://www. maxstore.com
http://www. prem ierwirelessinc.comhttp:/Aivww. premienrvirelessinc. com
http://www.prem ierwirelessinc.comhft p:/Arww. premierwirelessinc.comhftp://www.calamP.comhttp :/Awww. calamP.comhttp://solar.sharPusa.comhttp ://www. rollsbattery. com/
http ://www. exide. com/
http ://www. specialtyconcepts. com/
http ://www. specialtyconcepts. com/
BE.53OTBE-7OOT
BE-322RBE-7OOR
130135
ABt0227NE-SOEJEAs-s30ESZT
ASC8-12ASCI6-125060L-12-sI-RSThermoelectric Global Thermoelectric
t7

Alast<a Fisheries Data series Report Number 2009-14, september 2009
U.S. Fish and Wildlife Service
APPENDIX 2. -Daily
counts and cumulative proportion of coho salmon passing through Nikolai Creek
weir during 2008. Boxed areas represent the second and third quartile and median passage dates'
Shaded areas with no video because of ll!gh-I4!gl and
Male F Female Sex T Gumulative00.00420.00420.00550.00550.09430.14150.14290.1456
0.14560.14700.14840.1720
3344
68102103105
0301
06434
1
2
00000000
0010501106011070 17 124
0 348 472
0 -7 465
00000004
0000
-5-5
00000
-1
0-1
00
-20
-8-3
00000
2716
'l
'l
001021107
155 20610
3
01
03719
0a
8/31911
-1
-1
000000000000000000000000
00
-200
-1
000000
-l
-200
-2000
-20
-1
000
60 24537175347341034110 18
30224252220110513353623064510231
9/19t1
9t1
0.78920.80580.81550.82940.83630.84050.84880.88770.89180.89740.90430.91120.91680.91820.9'1680.92510.93340.94450.95280.95700.96950.97780.98060.9861
0.
0.98750.98890.99030.9917
0.99580.99581.00001.0000
0 83 55607563065690 12 581
075881 10 5980560303606166120 28 640
0364304647056520565704661016620 -1 661
066670667308681066870369009699067050270704711
9/1 89/19
9t21
9t27
10t1
10/31014
1
1
1
1
1
10111
10t11011
1011
10/181 1
712713714715
1
1
I
1
03000300
0000
0000
0000
0,|
1
0
1
00
2030
71871872'l721
0000
0000
I
00
472473
0701
0-1
-1
0
l8

Alaska Fisheries Data Series Report Number 2009-14, September 2009
IJ.S. Fish and lVildlife Senice
AppENDIx 3. -Daily
counts and cumulative proportion of coho salmon passing through Shantatalik
Creek weir during 20ti8. noxed areas represent the second and third quartile and median passage dates.
Shaded areas represent davs with no video because of
Male Female Male Female Sex Total Cumulative04
0.00000.0017
9/39t4
8t31911
9t19t119l'129t19t149t1
:i9t9t19/1
9t1
10t110t2
o o o o o 0 1 0'0017
o o o o 0 0 1 0'0017
lli:lilrl*i*r{l,i$;:f!tii$a:ii:iliillid$iiilil'iiii*lilriti$:ro.i:li$i*ii$oilitil$'1lilTii.if$*ljl{ $:1l$:i'-'-o-"'"---'o --'0" o o 0 1 0'0017
1000012000340 0 2 0.0034o 1 3 0.0051
o"l o-1 00100001
00
00
0U
20I6
000020-'t0 3 0.0051
U.UUO/
0.02364
14134
9167 57146
26tz4
0-?-'t -2
110-10
-1I
0010-1 0 120
0I
-4I
-4-4
-1
-z-1
I
:lll:l:i;l.l
ra{i,o/1712
?
-zu-tz
-70
23-1 0
11006100 1
11 10 0 0
284
12A
30-112-140002-2
9t219t229t239t24
01-2-120-1 0
32004316-30
713036-168-514-1
13 3 0
41-443-532-102-2I I -l
44 17 -1
65-2
-2 0 14 499 0.84011 500 0.8418-2 498 0.83842 500 0.8418-3 497 0.8367
510
I
10t4
1
1
1
1
1011't0t11
0040-zu-30
10t110r1310t1410t1 40-'l1 10-1-310t11011
10t1
0-1-20
410-2035780'9731j1{.,,;1$$::1;|i,ii:$oa;i!$$*i$tili*ii:itiijii r:$ii:*,$iri'$i{lo,li$i:,ti..*l$!li;rti*iil!r9S$
o o -- " o -- -2 0 -2 576 0'9697
0 0 13
-4056009
-1 0-1 0-zu00
0.8586566 0.9529575 0.9680
-2015770.9714o -3 574 0.9663
1 575 0.96801 576 0.96972 578 0.9731
0 578 0.9731-3 s75 0.9680
t9
0.2256
0.55390.57580.58420.59090.59430.61950.65490.68690.69700.71040.71550.71210.7'1380.72220.8'165
10121-contin

Alaska Fisheries Datq Series Report Number 2009-14, September 2009
IJ.S. Fish and Wildlife Service
APPENDIX 3. 2of
Male Female Female Total Cumulative-l 574 9663
10t27
2002000001
00
5432321
2
n'l
4
-1
-200
-1
-2-1
00
-1
0
00000
000000U
00000n
0n
0n
0
A
3I
431
-,|
1
01
0U
581584585589592593592593s93594594594
0.97810.98320.98480.99160.99660.99830.99660.99830.99831.00001.00001.0000
1
1
1
10/311111't'l11t311
-1 15Total
20

Alaska Fisheries Data Series Report Number 2009-14, September 2009
U.S. Fish and Wildlife Service
AppENDIx 4. -Tagging
and fate summaries for coho salmon radio-tagged in the Kasilof River during
2008.to Tagging Location
Transmifternumber Stratum
83314
234
13233363
43533663
73
fork length TaggingSex olte
595 M 26-Aug 60.30098 -151.21331
510 F 26-Aug 60.30382 -151'22542
Tributary SPawner (lndian Cr')
595 M 18-Aua 60.30884-151.23684 Tributaryspawner(Foxcr')
364 1 650 M 20-AUg 6U.3UYz6 -'I51.Z5OZC I lluutitly oPawrrsr \rrrurarr vr.,
44 1 545 M 20-Aug 60'30825 -151 '23751 Unknown
534 1 610 F 2O-Aug 60.30860 -151 .23759 Tributary spawner (lndian cr.)
6641635F20-Aug60.30934.'|51.23576Dead/Regurgitated74 1 650 M 20-Aug 60.30649 -151.24022 Tributary spawner (Nikolai_cr')
834 1 605 M 2O-Aug 60.30371 -',151.22948 TributarySpawner(westcr.)
15 1 590 F 20-Aug 60.30851 -151 .23755 Tributary Spawner (Shantatalik Cr')
235 .l 590 M 20-Aug 60.30894 -151 .23607 Tributary spawner (lndian cr')
3651640F22-Aug60.28676-151.21406Dead/Regurgitated45 1 575 F 22-Aug 60.28880 -151.22023 other spawner (crooked cr.)
5351685M22.Aug60.30871-151.23636SportHarvest665 1 465 M 22-Aug 60.30896 -151.23558 TributarySpawner(Glaciercr')
75 1 475 F 22-Aug 60'30834 -151'23709 Unknown
835 1 725 M 22-Aug 60.30765 -'151.23808 Mainstem spawners above rkm 24
16 1 695 M 22-Aug 60.31606 -151.23187 Tributaryspawner(lndiancr.)
236 1 5BO M 22-Aua 60.30713 -151.23281 Other Spawner (Crooked Cr')
366 1 680 M 22-Aug 60.30852 -151 .23685 Tributary Spawner (Nikolai Cr')
46 1 OIO M 24-Aua 60.30749 -151.24026 Tributary Spawner (lndian Cr.)
536 1 615 F 2a-Aug 60.30782 -151.23783 Mainstem Spawners above rkm 24
666 1 630 F 2a-Aug 60.30899 -151.29577 Mainstem spawners above rkm 24
76 1 620 M 24-Aug 60.30854 -151.23657 Tributary spawner (shantatalik cr.)
836 1 585 M 24-Aua 60.30791 -151 .23804 Tributary Spawner (lndian Cr.)
17 1 600 M 24-Aug 60.30727 -151.23924 Tributary spawner (west cr")
2371620F24-Aug60.30552-151.240'|TSportHarvest367 1 625 F 2a-AuS 60.30675 -151.24166 Mainstem Spawners above rkm 24
47 1 635 M 24-Aug 60.30693 -151.24210 Tributary spawner west cr.)
537 1 660 F 26-Aug 60.30858 -151.23326 TributarySpawner(lndiancr').
667 1 S8S M 26-Aug 60.30805 -151 .23880 Tributary Spawner (Shantatalik Cr.)
77 1 670 M 26-Aug 60.30790 -151.23901 TributarySpawner(GlacierCr.)
837 1 650 M 26-Aug 60.30755 -15'l '23968 Back Out
18 1 685 M 26-Aug 60.30752 -151 .23979 Tributary spawner (west cr.)
238 1 665 F 26-Au9 60.30098 -151.21331 Tributary spawner (west cr.)
368 1 595 M 26-Aug 60.30098 -151.21331 Tributary spawner (west 9r.l48 1 510 F 26-Aug 60.30382 -151.22542 other spawner (crooked cr.)
538 1 555 F 28-Aug 60.28103 -151'2'1299 Back Out
668 1 540 F 28-Aug 60.28103 -15'1.21299 other spawner (crooked cr')
781650M28-Aug60.30632.151.24210Dead/Regurgitated838 1 575 M 28-Aug 60.30509 -151.24195 Tributary Spawner (lndian cr')
620 M 18-Aug 60.30 821 -151 .23765 Other Spawner (Crooked Cr')
660 F 18-Aug 60.30910 -151.23657 BackOut
585F18-Aug6o.3os72-151.23712TributarySpawner(Shantata|ikCr.)680 F 18-Aug 60.30793 -151 .23845 Tributary Spawner (lndian Cr')
635 M 18-Aug 60.30772 -'151 .23799 Tributary Spawner (lndian Cr')
490 F 18-Aug 60.30747 -151.23860 Dead/Regurgitated
640F18-Aug60.30872-151.23642TributarySpawner(NikolaiCr')600 F 20-Aug 60.30934 -151.23538 Tributary Spavrner (West C-r')
650 M 2O-Aug 60'30928 -151.23625 Tributary Spawner (lndian Cr')
545 M 20-Aug 60.30825 -151 .23751 Unknown
610 F 20-Aug 60.30860 -151 '23759 Tributary Spawner (lndian Cr')
635 F 20-Aug 60.30934 -'151.23576 Dead/Regurgitated
650M20-Aug60.30649-151.24022TributarySpawner(Niko|aiCr.)605 M 2O-Aug 60.30371 -'151.22948 TributarySpawner(WestCr')
590F20-Aug60.30851-151'23755TributarySpawner(Shantata|ikcr')590 M 20-Aug 60.30894 -151 .23607 Tributary Spawner (lndian Cr')
640 F 22-Aug 60.28676 -151.21406 Dead/Regurgitated
575 F 22-Aug 60.28880 -151.22023 Other Spawner (Crooked Cr')
685 M 22-Aug 60.30871 -151.23636 SportHarvest
465 M 22-Aug 60.30896 -151.23558 TributarySpawner(GlacierCr')
475 F 22-Aug 60.30834 -151.23709 Unknown
725M22-Aug60.30765-.tsl.23SoSMainstemSpawnersaboverkm24695 M 22-Aug 60.31606 -151.23187 TributarySpawner(lndian Cr')
580 M 22-Aua 60.30713 -151.23281 Other Spawner (Crooked Cr')
680M22-Aug60.30852-151.23685TributarySpawner(Niko|aiCr')610 M 24-Aua 60.30749 -151.24026 Tributary Spawner (lndian Cr')
615F2a-Aug60.30782-151.23783MainstemSpawnersaboverkm24630F24-Aug60.30899-151.29577MainstemSpawnersaboverkm24620M24-Aug60.30854-151.23657TributarySpawner(shantata|ikcr.)585 M 24-Aug 60.30791 -151 .23804 Tributary Spawner (lndian Cr')
600 M 24-Aug 60.30727 -151.23924 Tributary Spawner (West Cr")
3E 1 c/c M zo-r{ug ou.ouovv - rJ t''+ trr r rrvursry vrur!'|rvr *rrYrs!! v"'
19 .f 653 M 28-Aug 60.304',10 -151.24184 Mainstem spawners above rkm 2419 1 bcJ M zo-Aug ouovalu -rrr'41 rsr vverr"v'|e
239 1 660 M 28-Aua 60.30 513 -151 .24156 Other Spawner (Crooked Cr')239 1 660 M 28-Aug 60.30513 -151.24156 other spawner (crooked cr')
369 1 650 F 28-Aug 60.30891 -151.23614 other Spawner (crooked cr.)69 1 650 F 28-Aug 60.30891 -151.23614 Other Spawner (urooKeo ur.,
49 1 505 F 28-Aug 60.31706 -151.25904 other spawner (crooked cr.)
539 1 625 M 30-Aug 60.31706 -151'25904 Unknown
669 1 580 F 30-Aug 60.30675 -151 .24177 Tributary Spawner (Shantatalik Cr.)
791595F30-Aug60.30893-151.23604TributarySpawnerwestc_r.)839 'l 620 F 3O-Aug 60.30899 -151 .23565 Tributary Spawner (lndian cr')
110 1 655 M 30-Aug 60.30913 -15',1.23475 otherspawner(coal cr.)
240 1 530 M 3O-Aug 60.30883 -151.23623 TributarySpawner(lndiancr')
3701590M30-Aug60.28577-151.21445Dead/Regurgitatedcontinued-
21

Alaska Fisheries Data seies Report Number 2009-14, September 2009
U.S. Fish and llildlife Senice
Transmitternumber
fork length Taggingdate Final fate
Spawner cr.)
6707',10
84011124',!
37',!
411541412542671711841112242372672712842113243373413543673713843114244374414544674714844115245375415545675715845116246376416546676716846117247377417547677717
Stratum22
222
22
222
22
22
22
222
22
22
22
22
22
22
22222
22
22
22
22
22
222
22
22
22
222
22
665540560610615590685630660565600700615660575710680535630620730630675720640730670615675580720720655690550650630660645560675660655510655
SexM
MMMFM
FFMMMMF
FF
MFMFF
MF
MM
FM
FM
FM
MMMFM
MF
MF
MM
FFMM
M
FFFM
MF
MMMMM
MM
M
560595580600595640545585635560700615
60.30804 -151
2-Sep 60.30756 -151.23961 TributarySpawner(GlacierCr')
2-Sep 60.30756 -151 .23961 Tributary Spawner (lndian Cr')
2-Sep 60.28028 -15'1.21351 Mainstem Spawners above rkm 24
2-Sep 60.28535 -151.21981 Mainstem Spawners above rkm 24
2-Sep 60.30767 -151.23940 Mainstem Spawners above rkm 24
2-Sep 60.30842 -151 .23697 Other Spawner (Maintstem Below rkm 24)
2-Sep 60.30779 -151 .23918 Tributary Spawner (Nikolai Cr')
4-Sep 60.30621 -'151.24210 Mainstem Spawners above rkm 24
4-Sep 60.30770 -151 '23951 Tributary Spawner (lndian Cr')
4-Sep 60.30761 -151.23962 Mainstem Spawners above rkm 24
4-Sep 60.30728 -151'24010 Tributary Spawner (lndian Cr')
4-Sep 60.30723 -15'1.24040 Mainstem Spawners above rkm 24
4-Sep 60.30368 -151'22896 Mainstem Spawners above rkm 24
4-Sep 60.28111 -15'1.21258 Tributary Spawner (lndian Cr')
4-Sep 60.30817 -'151-23721 Other Spawner (Maintstem Below rkm 24)
4-Sep 60.30817 -151.23721 Dead/Regurgitated
6-Seo 60.30658 -151.24002 Mainstem Spawners above rkm 24
6-Sep 60.30543 -151'24202 Mainstem Spawners above rkm 24
6-Sep 60.30766 -151.23956 Mainstem Spawners above rkm 24
6-Sep 60.30738 -151.24015 Dead/Regurgitated
6-Sep 60.30714 -151.24087 Tributary Spawner (Shantatalik Cr')
6-Sep 60.28137 -151.21299 TributarySpawner(GlacierCr')6-Sep 60.28517 -151.22007 Dead/Regurgitated
6-Sep 60.28990 -151.2'1730 Tributary Spawner (lndian Cr')
6-Sep 60.30748 -151 .23988 Tributary Spawner (Glacier Cr')
8-Sep 60.30703 -151.24100 Unknown
8-Sep 60.28583 -151.21393 Dead/Regurgitated
8-Sep 60.30366 -15'1.22727 Mainstem Spawners above rkm 24
9-Sep 60.30602 -151.24256 Mainstem Spawners above rkm 24
9-Sep 60.30701 -151.24141 Mainstem Spawners above rkm 24
9-Sep 60.30453 -151.24710 Mainstem Spawners above rkm 24
9-Sep 60.30363 -'151.2296'l Back Out
9-Sep 60.28652 -151.21738 Mainstem Spawners above rkm 24
9-Sep Other Spawner (Maintstem Below rkm 24)
10-Sep 60.28552 -151.22057 Mainstem Spawners above rkm 24
10-Sep 60.28552 -151.22057 BackOut
1O-Sep 60.28548 -151.22018 Mainstem Spawners above rkm 24
10-Sep 60.28550 -'151.22190 Dead/Regurgitated
10-Sep 60.28514 -151.22034 Dead/Regurgitated
10-Sep 60.30101 -151 .21298 Mainstem Spawners above rkm 24
1O-Sep 60.30101 -151 21298 Mainstem Spawners above rkm 24
10-Sep 60.30911 -15'l .22000 Mainstem Spawners above rkm 24
12-Sep 60.28661 -151.21568 Other Spawner (Maintstem Below rkm 24)
12-Sep 60.286'lg -151.21870 Other Spawner (Maintstem Below rkm 24)
12-Sep 60.28659 -151.21634 Mainstem Spawners above rkm 24
12-Sep 60.28632 -151.21439 Mainstem Spawners above rkm 24
12-Sep 60.28 527 -151 .21348 Mainstem Spawners above rkm 24
12-Sep 60.28601 -151.21384 Mainstem Spawners above rkm 24
12-Sep 60.28601 -151.21384 Mainstem Spawners above rkm 24
12-Sep 60.28632 -151.21468 Other Spawner (Maintstem Below rkm 24)
14-Sep 60.28655 -151.21664 Mainstem Spawners above rkm 24
14-Sep 60.28655 -'151.21664 Mainstem Spawners above rkm 24
14-Sep 60.285gg -151'21421 Mainstem Spawners above rkm 24
14-Sep 60.28648 -151.21538 Tributary Spawner (Clear Cr')
14-Sep 60.28613 -151.2'1443 Tributary Spawner (lndian Cr')
2-Sep 60.30755 -15'1.29928 Mainstem Spawners above rkm 24
14-Sep 60.28580 -151.21385 Mainstem Spawners above rkm 24
14-Sep 60.28634 -151.21468 Mainstem Spawners above rkm 24
10 -151
22
Other

Alastra Fisheies Data Series Report Number 2009-14, September 2009
U.S. Fish and Wildlife Senice
APPENDX 4. {Page 3 of 4)Mid-eye to Tagging Location
Transmitter fork length TaggingFinal fateSex date Latitude
740 .28585 -151 .21389 above rkm 24
650 F 16-Sep 60.28608 -151.21420 Mainstem Spawners above rkm 24
720 M 16-Sep 60.28586 -151.21383 Mainstem Spawners above rkm 24
655 M 16-Sep 60.28'146 -151.21217 Sport Harvest
730 M 16-Sep 60.28160 -151.21 193 TributarySpawner(GlacierCr.)670 F 16-Sep 60.28170 -151.21173 Mainstem Spawners above rkm 24
655 M 16-Sep 60.28324 -151.20949 Mainstem Spawners above rkm 24
630 F 16-Sep 60.30662 -151 .24165 Other Spawner (Maintstem Below rkm 24)
673 M 16-Sep 60.28239 -151.20886 Mainstem Spawners above rkm 24
615 F 18-Sep 60.28610 -151.21409 Mainstem Spawners above rkm 24
615 F 18-Sep 60.28602 -15'1.21424 Dead/Regurgitated
690 F 18-Sep 60.28626 -151 .21438 Mainstem Spawners above rkm 24
685 M 18-Sep 60.28606 -151.21443 Mainstem Spawners above rkm 24
615 M 18-Sep 60.28650 -151.21596 Mainstem Spawners above rkm 24
640 M 1 8-Sep 60.28 482 -151 .21293 Other Spawner (Maintstem Below rkm 24)
655 F 18-Sep 60.30363 -151.22809 BackOut605 F 18-Sep 60.30375 -151 .22941 Other Spawner (Maintstem Below rkm 24)
530 M 18-Sep 60.307'16 -151.24079 Mainstem Spawners above rkm 24
640 F 20-Sep 60.30709 -151 .24086 Other Spawner (Maintstem Below rkm 24)
610 M 20-Sep 60.30671 -151.24144 Mainstem Spawners above rkm 24
615 F 20-Sep 60.28924 -'151 .21928 Mainstem Spawners above rkm 24
540 F 20-Sep 60.30744 -151.22259 Mainstem Spawners above rkm 24
665 M 2O-Sep 60.30420 -151.24666 Mainstem Spawners above rkm 24
645 M 20-Sep 60.30674 -151.24489500 F 20-SeD 60.30537 -151.24643
Dead/RegurgitatedTributary Spawner (Glacier Cr.)
620 F 22-Sep 60.28627 -151.21424 Other Spawner (Maintstem Below rkm 24)
645 M 22-Sep 60.28666 -151.21621 Other Spawner (Maintstem Below rkm 24)
595 M 22-Sep 60.30582 -151.22239 Other Spawner (Maintstem Below rkm 24)
655 M 22-Sep 60.30386 -151.23207 Back Out
610 F 22-Sep 60.30378 -151 .23142 Mainstem Spawners above rkm 24
630 F 22-Sep 60.30602 -151.2420A Mainstem Spawners above rkm 24
590 F 22-Sep 60.30601 -151.24216 Other Spawner (Crooked Cr.)
640 M 22-Sep 60.30682 -'151.24452 Other Spawner (Maintstem Below rkm 24)
615 F 22-Sep 60.30/.27 -151.24163 Dead/Regurgitated
525 F 22-Sep 60.30396 -151.22488 Mainstem Spawners above rkm 24
630 M 22-Sep 60.30456 -151 .24685 Other Spawner (Maintstem Below rkm 24)
680 M 24-Sep 60.30365 -151.22830 Mainstem Spawners above rkm 24
670 M 24-Sep 60.30365 -151 .22919 Other Spawner (Maintstem Below rkm 24)
675 M 24-Sep 60.29194 -151.21391 Dead/Regurgitated
665 F 24-Sep 60.29129 -15'1.21424 Mainstem Spawners above rkm 24
675 M 25-Sep 60.286'19 -15'1.2'1434 Other Spawner (Maintstem Below rkm 24)
690 M 25-Sep 60.28533 -151.21972 Other Spawner (Maintstem Below rkm 24)
595 F 25-Sep 60.28205 -151.21045 Mainstem Spawners above rkm 24
640 F 25-Sep 60.29104 -15'1.21426 Mainstem Spawners above rkm 24
535 M 25-Sep 60.27893 -151.21520 Mainstem Spawners above rkm 24
680 F 25-Sep 60.28648 -151.22315 Other Spawner (Maintstem Below rkm 24)
560 M 25-Sep 60.28645 -151 .22391 Other Spawner (Maintstem Below rkm 24)
675 M 25-Sep 60.28749 -151.22398 Mainstem Spawners above rkm 24
680 M 26-Sep 60.30599 -151.23409 Mainstem Spawners above rkm 24
680 M 26-Sep 60.30729 -151.24028 Mainstem Spawners above rkm 24
655 M 26-Sep 60.28615 -151 .214'17 Other Spawner (Maintstem Below rkm 24)
645 M 26-Sep 60.28538 -151.22156 Dead/Regurgitated
640 M 26-Sep 60.28623 -'15'1.21423 Mainstem Spawners above rkm 24
645 F 26-Sep 60.28590 -151.21392 Dead/Regurgitated
635 M 26-Sep 60.28555 -151 .21970 Other Spawner (Maintstem Below rkm 24)
630 M 26-Sep 60.28633 -151.21467 Other Spawner (Maintstem Below rkm 24)
600 M 28-Sep 60.28610 -15'1.2'1452 Mainstem Spawners above rkm 24
665 M 28-Sep 60.28688 -151.22408 Mainstem Spawners above rkm 24
630 M 28-SeP 60.28795 -151.22266 Dead/Regurgitated
Stratum118248
333378
418548678718848119249379419549679719849't20250380420550680720850't2'l251381
421551681721
851
122252382422552682722852123253383423553723683853124254384424554684724854125255385
?
33I
333
333
3
333,l
3333
3333?2
333
3333,l
3333J333,l
333a
3331
3333
425 3 655 M 28-Sep 60.28668 -151.22416 Mainstem Spawners above rkm 24-continued-
23
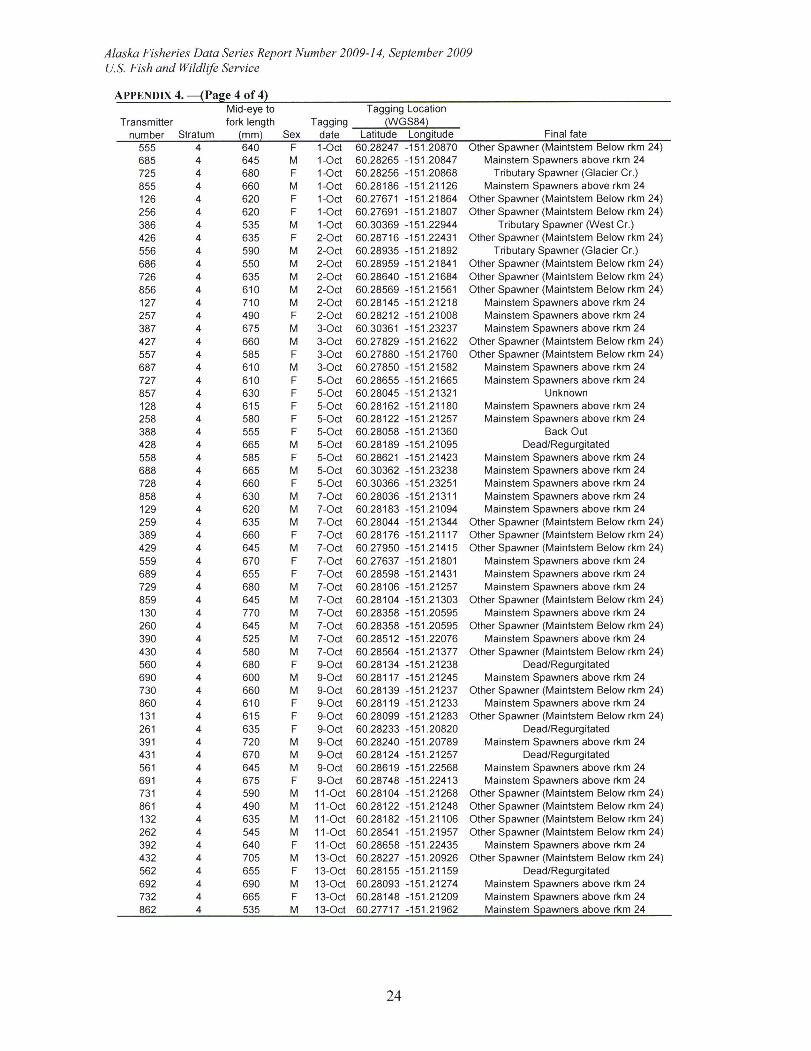
Alaska Fisheries Data Series Report Number 2009-14, September 2009U.S. Fish and lt/ildlife Service
APPENDIX 4.{Pase 4 of 4)
TransmitterMid-eye tofork length
Tagging LocationTagging (WGSB4)
number Stratum (mm) Sex date Latitude Longitude Final fate555 4 640 F 1-Oct 60.28247 -151 .20870 Other Spawner (Maintstem Below rkm 24)
685 4 645 M 1-Oct 60.28265 -151 .20847 Mainstem Spawners above rkm 24680 F 1-Oct 60.28256 -151.20868 Tributary Spawner (Glacier Cr.)660 M 1-Oct 60.28186 -15'1.21126 Mainstem Soawners above rkm 24620 F 1-Oct 60.27671 -15'1.21864 Other Spawner (Maintstem Below rkm 24)620 F 1-Oct 60.27691 -151.21807 Other Spawner (Maintstem Below rkm 24)535 M 'l-Oct 60.30369 -151.22944 Tributary Spawner (West Cr.)635 F 2-Oct 60.28716 -15'1.22431 Other Spawner (Maintstem Below rkm 24)590 M 2-Oct 60.28935 -'151 .21892 Tributary Spawner (Glacier Cr.)
550 M 2-Oct 60.28959 -151 .21841 Other Spawner (Maintstem Below rkm 24)
635 M 2-Oct 60.28640 -151 .21684 Other Spawner (Maintstem Below rkm 24)
610 M 2-Oct 60.28569 -151 .21561 Other Spawner (Maintstem Below rkm 24)710 M 2-Ocl 60.28145 -151 .21218 Mainstem Spawners above rkm 24490 F 2-Oct 60.28212 -151 .21008 Mainstem Spawners above rkm 24675 M 3-Oct 60.30361 -151 .23237 Mainstem Soawners above rkm 24660 M 3-Oct 60.27829 -151 .21622 Other Spawner (Maintstem Below rkm 24)
585 F 3-Oct 60.27880 -151 .21760 Other Spawner (Maintstem Below rkm 24)
610 M 3-Oct 60.27850 -151 .21582 Mainstem Soawners above rkm 24610 F s-Oct 60.28655 -1 51 .21665 Mainstem Soawners above rkm 24630 F S-Oct 60.28045 -151 .21321 Unknown615 F 5-Oct 60.28162 -151 .21180 Mainstem Spawners above rkm 24580 F 5-Oct 60.28122 -151.21257 Mainstem Spawners above rkm 24
725855126256J60426
686726856127257387427557687727857128258388428
688728858129259389429559odY729859130260390430560690730860131
261?o1
431561691
731861
132262392432562692732862
555 F S-Oct 60.28058 -151 .21360665 M S-Oct 60.28189 -151.21095
Back OutDead/Regurgitated
585 F s-Oct 60.28621 -151.21423 Mainstem Spawners above rkm 24665 M S-Oct 60.30362 -151.23238 Mainstem Spawners above rkm 24660 F S-Oct 60.30366 -151.23251 Mainstem Spawners above rkm 24630 M 7-Oct 60.28036 -'15'1.21311 Mainstem Spawners above rkm 24620 M 7-Oct 60.28183 -151.21094 Mainstem Spawners above rkm 24635 M 7-Oct 60.28044 -15'1.21344 Other Spawner (Maintstem Below rkm 24)660 F 7-Oct 60.28176 -15'1.21117 Other Spawner (Maintstem Below rkm 24)645 M 7-Oct 60.27950 -151.21415 Other Spawner (Maintstem Below rkm 24)670 F 7-Oct 60.27637 -'151.21801 Mainstem Spawners above rkm 24655 F 7-Oct 60.28598 -'151.2143'l Mainstem Spawners above rkm 24680 M 7-Oct 60.28106 -151 .21257 Mainstem Spawners above rkm 24645 M 7-Oct 60.28104 -151.21303 Other Spawner (Maintstem Below rkm 24)770 M 7-Oct 60.28358 -151.20595 Mainstem Spawners above rkm 24645 M 7-Oct 60.28358 -151 .20595 Other Spawner (Maintstem Below rkm 24)525 M 7-Oct 60.28512 -151 .22076 Mainstem Spawners above rkm 24580 M 7-Oct 60.28564 -'151 .2'1377 Other Spawner (Maintstem Below rkm 24)680 F g-Oct 60.28134 -151.21238 Dead/Regurgitated600 M 9-Oct 60.28117 -151 .21245 Mainstem Spawners above rkm 24660 M 9-Oct 60.28139 -151 .2'1237 Other Spawner (Maintstem Below rkm 24)610 F 9-Oct 60.281 19 -151 .2'1233 Mainstem Soawners above rkm 24615 F g-Oct 60.28099 -151 .21283 Other Spawner (Maintstem Below rkm 24)635 F 9-Oct 60.28233 -151.20820 Dead/Regurgitated720 M 9-Oct 60.28240 -151 .20789 Mainstem Spawners above rkm 24670 M 9-Oct 60.28124 -151 .21257 Deadi Regurgitated645 M g-Oct 60.28619 -151 .22568 Mainstem Spawners above rkm 24675 F g-Oct 60.28748 -151 .22413 Mainstem Spawners above rkm 24590 M 1 1-Oct 60.281 04 -151 .21268 Other Spawner (Maintstem Below rkm 24)490 M 1 'l -Oct 60.281 22 -151 .21248 Other Spawner (Maintstem Below rkm 24)635 M 11-Oct 60.28182 -151 .21106 Other Spawner (Maintstem Below rkm 24)545 M 1 1-Oct 60.28541 -151 .21957 Other Spawner (Maintstem Below rkm 24)640 F 't 't -Oct 60.28658 -151 .22435 Mainstem Spawners above rkm 24705 M 13-Oct 60.28227 -151 .20926 Other Spawner (Maintstem Below rkm 24)655 F 13-Oct 60.28155 -151.21159 Dead/Regurgitated690 M 13-Oct 60.28093 -151.21274 Mainstem Spawners above rkm 24665 F 13-Oct 60.28148 -151 .21209 Mainstem Spawners above rkm 24535 M 13-Oct 60.27717 -15'1.21962 Mainstem Spawners above rkm 24
24

irFyi
I*
*:r*. tt: :-!*ff t turt
:-'T'.1.1 i_ J,, I !'
t;t :***1{
.?
+
Ii
F'r"*'+s-f] I- *
i.diIt
f?.*
*i3r F, ll+.1
!11irJ
r t9(!RF
=**us xr!=+?ESE€
=?! gtE.$EEEoqrlp
'? :{
i i: