
Lowest Electronic States of the CP47 Antenna Protein Complex of Photosystem II: Simulation of...
15
Lowest Electronic States of the CP47 Antenna Protein Complex of Photosystem II: Simulation of Optical Spectra and Revised Structural Assignments † Mike Reppert, Khem Acharya, Bhanu Neupane, and Ryszard Jankowiak* Department of Chemistry, Kansas State UniVersity, Manhattan, Kansas 66506 ReceiVed: May 2, 2010; ReVised Manuscript ReceiVed: July 12, 2010 In this work, we present simulated steady-state absorption, emission, and nonresonant hole burning (HB) spectra for the CP47 antenna complex of photosystem II (PS II) based on fits to recently refined experimental data (Neupane et al. J. Am. Chem. Soc. 2010, 132, 4214). Excitonic simulations are based on the 2.9 Å resolution structure of the PS II core from cyanobacteria (Guskov et al. Nat. Struct. Mol. Biol. 2009, 16, 334), and allow for preliminary assignment of the chlorophylls (Chls) contributing to the lowest excitonic states. The search for realistic site energies was guided by experimental constraints and aided by simple fitting algorithms. The following experimental constraints were used: (i) the oscillator strength of the lowest- energy state should be approximately e0.5 Chl equivalents; (ii) the excitonic structure must explain the experimentally observed red-shifted (∼695 nm) emission maximum; and (iii) the excitonic interactions of all states must properly describe the broad (non-line-narrowed, NLN) HB spectrum (including its antihole) whose shape is extremely sensitive to the excitonic structure of the complex, especially the lowest excitonic states. Importantly, our assignments differ significantly from those previously reported by Raszewski and Renger (J. Am. Chem. Soc. 2008, 130, 4431), due primarily to differences in the experimental data simulated. In particular, we find that the lowest state localized on Chl 526 possesses too high of an oscillator strength to fit low-temperature experimental data. Instead, we suggest that Chl 523 most strongly contributes to the lowest excitonic state, with Chl 526 contributing to the second excitonic state. Since the fits of nonresonant holes are more restrictive (in terms of possible site energies) than those of absorption and emission spectra, we suggest that fits of linear optical spectra along with HB spectra provide more realistic site energies. Introduction Oxygenic photosynthesis involves a variety of pigment-protein complexes embedded in the photosynthetic thylakoid mem- branes of plants, green algae, and cyanobacteria. Among these complexes, photosystem II (PS II) plays a central role because it catalyzes the oxidation of water, leading to the production of four protons, four electrons, and dioxygen, the prerequisite for all aerobic life. 1,2 Very recently, several medium-resolution (2.9-3.8 Å) crystal structures of cyanobacterial PS II have been elucidated, providing unprecedented insight into the relationship between the structure of this multiprotein complex and the function of the various chlorophylls (Chls) and other cofactors which it binds. 3-5 It has been shown that the membrane-intrinsic part of PS II from the cyanobacterium Thermo-synechococcus elongatus comprises (in each monomer) the antenna proteins CP47 and CP43, the reaction center (RC), and 13 small subunits. 3,4 CP43 and CP47 (approximately 43 and 47 kDa, respectively) function as core antennas; they harvest excitation energy both by directly absorbing solar radiation and by accepting energy from peripheral antenna complexes associated with the system that are not part of the core. 6 Both complexes are structurally related and bind just over a dozen Chl pigments (13 in CP43 and 16 in CP47 according to the most recent structures of Guskov et al. 3 and Loll et al. 4 ), along with several -carotenes. The availability of relatively higH-Resolution X-ray struc- tural data 3,4 has led to several attempts by various groups, including our group, to link the structure of the PS II complex with experimentally determined spectral properties 7-13 via excitonic calculations, 8,14,15 providing insight into the electronic structure and excitation energy transfer (EET) dynamics within PS II. One of the primary challenges in these calculations is the determination of accurate pigment site energies, i.e., the transition energy of each isolated pigment in the complex in the absence of interaction with other pigments. It is well- known 16,17 that pigment site energies are strongly affected by specific interactions between the pigment and its protein environment, an effect which may be considered analogous to the solvent shift frequently observed for chromophores in solution. As a result, excitonic simulations usually rely on pigment site energies extracted from fits to experimental spectra such as absorption, emission, circular dichroism (CD), linear dichroism (LD), or hole burning (HB). Although various simulations suggest that extracted site energies are in basic agreement with kinetic models, 9,14,18 the electronic structure and EET dynamics in many photosynthetic complexes are not well understood, 9,14,19 with extracted site energies often varying significantly from publication to publication. 14,15 † Abbreviations: chlorophyll (Chl); circular dichroism (CD); coupling constants (V nm ); delocalization (N del ); number of states per energy interval (d R (ω)); energy (E); excitation energy transfer (EET); exciton states Chl distribution (d n (ω)); fluorescence line narrowing (FLN); Franck-Condon factors (FC); full width at half-maximum (fwhm); Huang-Rhys (H-R); H-R factor (S); inhomogeneous broadening (Γ inh ); kilodalton (kD); linear dichroism (LD); non-line-narrowed (NLN); nonphotochemical hole burning (NPHB); photochemical hole burning (PHB); phonon sideband (PSB); photosystem I (PSI); photosystem II (PS II); photosynthetic complexes (PC); reaction center (RC); single site fluorescence (SSF); site distribution function (SDF); spectral hole burning (SHB); temperature (T); transition dipole moments (TDM); zero-phonon line (ZPL). * Corresponding author. E-mail: [email protected]. J. Phys. Chem. B 2010, 114, 11884–11898 11884 10.1021/jp103995h 2010 American Chemical Society Published on Web 08/19/2010
Transcript of Lowest Electronic States of the CP47 Antenna Protein Complex of Photosystem II: Simulation of...

Lowest Electronic States of the CP47 Antenna Protein Complex of Photosystem II:Simulation of Optical Spectra and Revised Structural Assignments†
Mike Reppert, Khem Acharya, Bhanu Neupane, and Ryszard Jankowiak*Department of Chemistry, Kansas State UniVersity, Manhattan, Kansas 66506
ReceiVed: May 2, 2010; ReVised Manuscript ReceiVed: July 12, 2010
In this work, we present simulated steady-state absorption, emission, and nonresonant hole burning (HB)spectra for the CP47 antenna complex of photosystem II (PS II) based on fits to recently refined experimentaldata (Neupane et al. J. Am. Chem. Soc. 2010, 132, 4214). Excitonic simulations are based on the 2.9 Åresolution structure of the PS II core from cyanobacteria (Guskov et al. Nat. Struct. Mol. Biol. 2009, 16,334), and allow for preliminary assignment of the chlorophylls (Chls) contributing to the lowest excitonicstates. The search for realistic site energies was guided by experimental constraints and aided by simplefitting algorithms. The following experimental constraints were used: (i) the oscillator strength of the lowest-energy state should be approximately e0.5 Chl equivalents; (ii) the excitonic structure must explain theexperimentally observed red-shifted (∼695 nm) emission maximum; and (iii) the excitonic interactions of allstates must properly describe the broad (non-line-narrowed, NLN) HB spectrum (including its antihole) whoseshape is extremely sensitive to the excitonic structure of the complex, especially the lowest excitonic states.Importantly, our assignments differ significantly from those previously reported by Raszewski and Renger(J. Am. Chem. Soc. 2008, 130, 4431), due primarily to differences in the experimental data simulated. Inparticular, we find that the lowest state localized on Chl 526 possesses too high of an oscillator strength tofit low-temperature experimental data. Instead, we suggest that Chl 523 most strongly contributes to thelowest excitonic state, with Chl 526 contributing to the second excitonic state. Since the fits of nonresonantholes are more restrictive (in terms of possible site energies) than those of absorption and emission spectra,we suggest that fits of linear optical spectra along with HB spectra provide more realistic site energies.
Introduction
Oxygenic photosynthesis involves a variety of pigment-proteincomplexes embedded in the photosynthetic thylakoid mem-branes of plants, green algae, and cyanobacteria. Among thesecomplexes, photosystem II (PS II) plays a central role becauseit catalyzes the oxidation of water, leading to the production offour protons, four electrons, and dioxygen, the prerequisite forall aerobic life.1,2 Very recently, several medium-resolution(2.9-3.8 Å) crystal structures of cyanobacterial PS II have beenelucidated, providing unprecedented insight into the relationshipbetween the structure of this multiprotein complex and thefunction of the various chlorophylls (Chls) and other cofactorswhich it binds.3-5 It has been shown that the membrane-intrinsicpart of PS II from the cyanobacterium Thermo-synechococcuselongatus comprises (in each monomer) the antenna proteinsCP47 and CP43, the reaction center (RC), and 13 smallsubunits.3,4 CP43 and CP47 (approximately 43 and 47 kDa,respectively) function as core antennas; they harvest excitationenergy both by directly absorbing solar radiation and by
accepting energy from peripheral antenna complexes associatedwith the system that are not part of the core.6 Both complexesare structurally related and bind just over a dozen Chl pigments(13 in CP43 and 16 in CP47 according to the most recentstructures of Guskov et al.3 and Loll et al.4), along with several�-carotenes.
The availability of relatively higH-Resolution X-ray struc-tural data3,4 has led to several attempts by various groups,including our group, to link the structure of the PS II complexwith experimentally determined spectral properties7-13 viaexcitonic calculations,8,14,15 providing insight into the electronicstructure and excitation energy transfer (EET) dynamics withinPS II. One of the primary challenges in these calculations isthe determination of accurate pigment site energies, i.e., thetransition energy of each isolated pigment in the complex inthe absence of interaction with other pigments. It is well-known16,17 that pigment site energies are strongly affected byspecific interactions between the pigment and its proteinenvironment, an effect which may be considered analogous tothe solvent shift frequently observed for chromophores insolution. As a result, excitonic simulations usually rely onpigment site energies extracted from fits to experimental spectrasuch as absorption, emission, circular dichroism (CD), lineardichroism (LD), or hole burning (HB). Although varioussimulations suggest that extracted site energies are in basicagreement with kinetic models,9,14,18 the electronic structure andEET dynamics in many photosynthetic complexes are not wellunderstood,9,14,19 with extracted site energies often varyingsignificantly from publication to publication.14,15
† Abbreviations: chlorophyll (Chl); circular dichroism (CD); couplingconstants (Vnm); delocalization (Ndel); number of states per energy interval(dR(ω)); energy (E); excitation energy transfer (EET); exciton states Chldistribution (dn(ω)); fluorescence line narrowing (FLN); Franck-Condonfactors (FC); full width at half-maximum (fwhm); Huang-Rhys (H-R);H-R factor (S); inhomogeneous broadening (Γinh); kilodalton (kD); lineardichroism (LD); non-line-narrowed (NLN); nonphotochemical hole burning(NPHB); photochemical hole burning (PHB); phonon sideband (PSB);photosystem I (PSI); photosystem II (PS II); photosynthetic complexes (PC);reaction center (RC); single site fluorescence (SSF); site distribution function(SDF); spectral hole burning (SHB); temperature (T); transition dipolemoments (TDM); zero-phonon line (ZPL).
* Corresponding author. E-mail: [email protected].
J. Phys. Chem. B 2010, 114, 11884–1189811884
10.1021/jp103995h 2010 American Chemical SocietyPublished on Web 08/19/2010

In the case of CP47, this confusion is at least in part due tosignificant variations in the experimental data reported bydifferent groups. For example, as recently discussed in ref 20,the low-temperature emission peak of isolated CP47 reportedby various groups over the years has ranged from 690 to 693nm, while the CP47 emission peak in intact PS II corecomplexes has been consistently reported at 695 nm. Onlyrecently20 has experimental data been published for an isolatedCP47 preparation showing low-temperature emission at 695 nm,in agreement with the emission of CP47 from intact PS II corecomplexes. Indeed, it has been demonstrated that the variousemission peaks reported by different groups over the years canbe interpreted as a result of emission from multiple CP47subpopulations within a single sample preparation and/orpreparations in which the lowest-energy state has been satu-rated.20 Given the strong dependence of EET transfer dynamicson excitonic transition energies, such dramatic shifts can beexpected to have a strong impact on calculated optical spectrain both the time and frequency domains. To explore theseeffects, we have carried out a series of excitonic simulations ofthe steady-state absorption, emission, and persistent HB spectraof isolated CP47 complexes based on the new experimental datareported in ref 20. In addition, to strengthen the argumentsprovided in ref 20, we present here new experimental evidencethat the optical spectra modeled in this work indeed correspondto the intact CP47 complex. We emphasize that many parametersused in our excitonic calculations, in particular the electron-phonon coupling strength of the lowest excitonic state and thespectral density of phonon states, were obtained experimentallyfor the CP47 complex.20 Also, the Franck-Condon (FC) factorsrequired to fit both emission and absorption spectra have beenobtained on the basis of a deconvolution/fitting procedure usingour experimental spectra (Vide infra). As discussed above, themost challenging set of parameters needed to describe both theexcitonic structure and the dynamics of Chls in any photosyn-thetic complex is the set of Chl site energies; in this work, thesearch for site energies is guided by experimental constraintsand accomplished by a fitting algorithm that is based on randomgeneration of site energy sets, “tweaking” of particular param-eters, or “switching” of the site energies of particular Chls withinthe set. The final set of parameters obtained simultaneouslyaccounts for the absorption spectrum (with a red-shifted low-energy trap near 693 nm), the relatively narrow 695 nm emissionorigin band, and the shape of the persistent HB spectrum,including the complex antihole structure observed at high energydue to excitonic interactions. CD and LD spectra were notincluded in our modeling studies, as such data have not yet beenobtained for intact samples. We also briefly address the originof the 691 and 685 nm emission bands observed in refs 10, 12,and 20-22; in ref 20, we have proposed that the 691 nm (FT1)and 685 nm (FT2) trap emission bands originate from subpopu-lations of partially destabilized complexes with lowest-energyabsorption traps located near 689 nm (AT1) and 683.8 nm(AT2), respectively. This analysis is consistent with refs 10 and11 where the heterogeneity of CP47 was also revealed viaobservation of different fluorescence decay components. Therelative contribution of specific Chls to various exciton states,the presence or absence of hydrogen bonding, as well as thelikelihood of quenching by nearby carotenoids (present in thevicinity of Chls contributing to the lowest-energy states) is alsobriefly discussed.
Importantly, the site energies of pigments contributing to thelowest excitonic states in our calculations are significantlydifferent from those recently reported in ref 14, which it should
be emphasized were based on fits to very different experimentaldata. Most importantly, we find that Chl 526 is an unlikelycandidate for the lowest energy excitonic state (as has beensuggested by several groups, including ref 14), since theinteractions of this Chl with its neighboring pigments are muchtoo weak to accurately account for either the low oscillatorstrength observed in the absorption spectrum or the complexantihole structure observed in HB spectra. Instead, we suggestthat Chl 526 most likely contributes strongly to the second-lowest excitonic state while Chl 523slocated in the middlebetween the lumenal and stromal domains of CP47 Chlssmoststrongly contributes to the lowest state. We anticipate that theseassignments can be further tested and refined by more advancedexcitonic calculations (research in progress) when experimentalCD, LD, and time-resolved data are available for intact CP47samples, paving the way to a more complete understanding ofEET dynamics in this system.
Materials and Methods
Structural Data and Coupling Constants. Figure 1 showsthe arrangement of CP47 Chls and carotenoids, based on thestructure of Guskov et al.,3 on the stromal and lumenal side ofthe membrane along with pigments that belong to the RC (seefigure caption for details; all numbering follows the nomencla-ture of ref 3). One of the main differences between the CP47structure obtained by Loll et al.4 and Guskov et al.3 which is
Figure 1. Frame A shows the arrangement of CP47 Chls and carotenes(in orange) on the stromal and lumenal side of the membrane alongwith pigments that belong to the RC. The pigments of CP47 arenumbered as in ref 3. Chls 521, 523, 524, and 526 are shown in red.Chls 511, 514, and 517 are in blue. Pheophytins (PheoD1 and PheoD2)are shown in black, and the remaining Chls are in green. See Table 3for the correspondence between the Loll et al.4 and Guskov et al.3
numbering systems. Frame B shows the same structure in a differentorientation.
CP47 Antenna Protein Complex of Photosystem II J. Phys. Chem. B, Vol. 114, No. 36, 2010 11885

relevant to this work is that in the structure of Guskov et al. thetransition dipole moment of Chl 511 is rotated by ∼180° incomparison to that of Loll et al.; however, as expected for a180° dipole moment reversal, this change has almost no effecton the calculated inter-Chl couplings (see Table 1). The Chlsin CP47 are arranged in two layers, with Chl 523 between thelayers with Mg-Mg distances ranging between 8.1 and 13.6Å, allowing for fast equilibration of excitation energy.6 A singleChl (i.e., Chl 523) is located in the middle of the two pigmentlayers, and has been suggested to be important in mediatingfast energy equilibration.6 The crystal structure of Guskov etal. (Brookhaven Protein Data Bank, file 3BZ1)3 was used tocalculate the coupling matrix elements, Vnm, in several differentapproximations: (i) point dipole, (ii) extended dipole, and (iii)the transition charges from electrostatic potential (TrEsp) methodof Madjet et al.23 (using the transition partial charges in thereference’s Supporting Information). As in ref 24, an effectiveoscillator strength of 4.3 D was used for all Chl a. Only theVnm values obtained with the TrEsp method were used inthe Monte Carlo simulations presented here. The transitiondipole moments (TDM) were also calculated using the newstructure and the TrEsp methodology.23 Since, in agreementwith24 the calculated orientations of TDM were similar (with a
maximum deviation of about 5°) to the standard assumption(where the Qy transition dipole moment orientation pointsdirectly from the ring I nitrogen (N-B) to the ring III nitrogen(N-D)), the TDM were taken to extend from N-B to N-D,and the center of the Chl molecule was taken to be at theaveraged position of the four ring nitrogen atoms, rather thanat the central magnesium (which is in most cases significantlyout of the molecular plane).
Theoretical Methods and Qy-Excitonic Hamiltonians. Ex-citonic calculations for the Qy states were performed using theFrenkel Hamiltonian (static lattice approximation)
where |n⟩ denotes the localized Qy state of Chl n, εn is theaverage Chl monomer transition energy, and ∆n is the offsetenergy due to diagonal site excitation energy disorder that stemsfrom the intrinsic structural disorder of CP47 protein complex.The neglect of the electron-exchange coupling contribution toVnm is reasonable given that the center-to-center distancesbetween the great majority of Chls are greater than 9 Å (the
TABLE 1: Calculated Coupling Constants Vnm (in cm-1) for the Chls of CP47 Complex Using the Structure of Guskov et al.(3BZ1 File in the PDB)3 and the TrEsp Methodology23 a
a The partial charges for Chl a are given in the Supporting Information of ref 23. The partial charges were rescaled to yield an effectivedipole moment of 4.3 D for Chl a. Bold numbers label Chls using the nomenclature of ref 3. Vnm are calculated with the center of the Chlchosen as the average of the four ring nitrogen positions. The coupling constants are similar to those reported in ref 14 and its SupportingInformation (see Vnm parameters in parentheses) with the exception that the coupling constant for Chls 521 and 519 is only 8 cm-1 (inagreement with the point-dipole and extended dipole approximations; data not shown) and not 99 cm-1 as reported (see text) in the SupportingInformation of ref 14.
H ) ∑n
(εn + ∆n)|n⟩⟨n| + ∑n,m
Vnm|n⟩⟨m| (1)
11886 J. Phys. Chem. B, Vol. 114, No. 36, 2010 Reppert et al.

minimum distance is ∼8.4 Å). The model Hamiltonian for theQy states is defined by the numbers in Table 1. Diagonal energydisorder was taken into account by Monte Carlo simulationswith random disorder at each Chl described by a Gaussian sitedistribution function (SDF). The same SDF width was assumedfor all pigments in the complex and was determined by the bestfit to the experimental spectra. For each realization of Chl siteenergies, the Hamiltonian matrix was diagonalized to obtainthe excitonic energies (ER) and wave functions
Since overlap is neglected, ∑n |cn(R)|2 ) 1. The excitonic transition
dipoles were calculated using
where µbn is the transition dipole of Chl n. The optical propertiesof each CP47 complex were calculated using the eigenvaluesand eigenvectors. Absorbance spectra and the contributing bandsfrom the 16 exciton states were obtained by an ensembleaveraging with energetically sorted eigenvalues and correspond-ing eigenvectors. Neglecting phonons and vibrational modes(which are added later by convolution with a single-site spectrumas described below), the absorption spectrum of the Rth excitonstate is given by
where ωR0 is the energy of the Rth exciton state and ⟨...⟩dis
denotes an average over disorder in site energies. The netabsorption spectrum is given as the sum over the absorptionfor all excitonic states after convolution with the appropriatesingle-site absorption spectra (see below). The emission spec-trum is likewise calculated as the convolution of d1(ω) withthe single-site fluorescence spectrum (emission from higherexcitonic states is entirely negligible for the 5 K spectrasimulated here). The excitonic state absorption spectra can becompared with the excitonic Chl distributions given by
where |cn(R)|2 is the probability that Chl n is excited in the Rth
exciton state.Simulations. Excitonic Monte Carlo simulations (using
MathCad 12.0 and Scilab 4.1.1) of various optical spectra werecarried out using methods similar to those employed in ref 24.The methods employed here, however, differ in two importantways. First, in ref 24, in each iteration of the Monte Carloprocedure, NPHB was assumed to occur on the pigment whichmost strongly contributed to the lowest-energy excitonic state;the approach here is different in that the burned pigment isselected randomly using the excitonic eigenvector coefficientsc1,n
2 (the probability that the lowest excitonic state resides onpigment n) as the probability that the nth pigment is burned.Practically, this can be carried out by generating a sequence
from the eigenvector coefficients for the lowest state. A randomnumber r is then generated from a flat distribution between 0and 1, and the pigment n satisfying sn-1 < r e sn is selected forburning; the probability of burning pigment n is thus c1,n
2 . Wemake this change as we believe the present model moreaccurately reflects the true quantum mechanical nature of theNPHB process. As in ref 24, a new “postburn” site energy isthen generated randomly for the selected pigment from the“photoproduct” distribution function, and the absorption andemission spectra are recalculated with the site energy of all otherpigments fixed at their preburn values; thus, for each iterationof the Monte Carlo procedure, one preburn and one postburnspectrum is calculated. Finally, the bulk NPHB spectrum iscalculated as the difference between the averaged preburn andpostburn spectra. Importantly, in calculating the persistent HBspectrum, the photoproduct distribution for all pigments wasassumed to be identical to the original (preburn) SDF for thecorresponding pigment; i.e., no SDF shift, broadening, ornarrowing was assumed in the NPHB calculations. This too issomewhat different from the calculations of ref 24 wheresomewhat arbitrary (although rather moderate) distributionfunction shifts were assumed in order to fit the experimentalHB data.
The second major difference between our calculations andthose of ref 24 is that, in the present work, coupling to phononsand vibrational modes is partially accounted for by convolutingthe excitonic state zero-phonon spectra with an “effective”single-site spectrum (consisting of a sharp zero-phonon line anda broad phonon sideband function) for the system obtained fromexperimental data as described below. As described in greaterdetail in the Results and Discussion section, the present approachwas chosen as a compromise between rapid computation timesand the relative theoretical completeness provided by transfor-mation to an exciton basis (as employed for CP47 in ref 14).Briefly, while the approach of ref 14 allows for a more precisetreatment of electron-phonon interactions (including excitoniclowering of the effective Huang-Rhys (H-R) factor forindividual excitonic states), it requires the calculation andsummation of a single-site spectrum for each excitonic state ineach iteration of the Monte Carlo procedure. Our approach wasinstead to estimate the average H-R factor from experimentaldata and assume this value to be constant for all realizations ofdisorder. Thus, for the ith excitonic state, the assumed H-Rfactor is assumed to be identical in both absorption and emissionin all complexes; electron-phonon coupling can then beaccounted for by a single convolution carried out after the MonteCarlo procedure is already complete. This simplification leadsto a drastic decrease in computation time, allowing a much largernumber of data sets to be tested (see the Results and Discussion).Since the electron-phonon coupling strength (S) of the lowest-energy state in CP47 is relatively strong (S ≈ 1, as determinedin ref 20), it is probably not reasonable to assume the samevalue for all pigments in the system. Indeed, from the temper-ature dependence of the CP47 absorption spectrum, a H-Rfactor of S ≈ 0.5 was inferred14 (note that this method can beexpected to produce an effective S factor for the entire complex,while the spectroscopic methods employed in ref 20 selectivelyprobe the S factor of only the lowest excitonic state). As a result,in our calculations, the absorption (and emission) spectrum forthe lowest excitonic state was convoluted with a single-sitespectrum with S ) 1, while the absorption spectra for higher
|R⟩ ) ∑n
cn(R)|n⟩ (2)
µfR ) ∑n
cn(R) µfn (3)
dR(ω) ) ⟨|µfR|2δ(ω - ωR0)⟩dis (4)
dn(ω) ) ⟨ ∑R
|cn(R)|2δ(ω - ωR0)⟩dis (5)
sn ) ∑i)1
n
c1,i2 (6)
CP47 Antenna Protein Complex of Photosystem II J. Phys. Chem. B, Vol. 114, No. 36, 2010 11887

excitonic states were convoluted with a single-site spectrum withS ) 0.5 (a value in the range more frequently observed inphotosynthetic systems)14,21,22,25 We note that the effectiveelectron-phonon coupling strength for various pigments (orexcitonic states) in a given complex need not be the same: thismay result both from differences in site-specific pigment-proteininteractions and from excitonic delocalization, which tends tolower the effective electron-phonon coupling in linear spectra.26,27
As in ref 25, the shape of the phonon-sideband (PSB) functionis based on direct measurement from site-selective spectroscopy,although, in our calculations, the PSB is based on fits to theresonant HB spectrum reported in ref 20 rather than thefluorescence line narrowed (FLN) spectrum. More importantly,whereas in ref 25 the Franck-Condon factors for vibrationalmodes are based on their measured FLN spectra, our vibrationalmode intensities are obtained from a “deconvolution” fittingprocedure based on the vibrational frequencies of ref 28 andour experimentally measured bulk absorption and emissionspectra (Vide infra).
Experimental Absorption, Emission, and Persistent HBSpectra. Aside from the new data for the PS II core complexshown in Figure 2, all experimental data were taken from ref20. The details of the low temperature HB setup used aredescribed in ref 29-31. Briefly, the absorption (at a resolutionof 4 cm-1) and HB spectra (0.5 cm-1 resolution) for CP47 andPS II core (in the S1(QA
-) state) were recorded with a BrukerHR125 Fourier transform spectrometer. The experimentalconditions to measure absorption and HB spectra in the S1(QA
-)state are described in detail in refs 32 and 33. The nonresonantburning source was performed with the green light at 496.5 nmfrom a Coherent Innova 200 Ar+ ion laser. Fluorescence wasdispersed by a 300 mm focal length spectrograph (PI Acton)and detected by a PI Acton Spec-10 (1340 × 400) CCD (backilluminated) camera. The spectral resolution for fluorescencespectra was 0.1 nm. The persistent nonphotochemical hole-burned (NPHB) spectra reported correspond to the postburnabsorption spectrum minus the preburn absorption spectrum.
Deconvolution Procedure for Vibrational Mode Huang-Rhys Factors. The deconvolution procedure employed hererelies on the convolution theorem
where f and g are two appropriately “well-behaved” functions,F{} denotes the Fourier transform, / denotes a convolution,and · denotes point-wise multiplication. Our assumption is thatthe bulk absorption spectrum can be approximated as theconvolution of an effective single-site spectrum with the zero-phonon line (ZPL) distribution function. In this case, if f and gare the single-site spectrum and ZPL distribution function,respectively, then the bulk absorption spectrum is obtained asthe convolution f/g; given the bulk absorption spectrum andthe single-site spectrum, on the other hand, we can obtain theZPL distribution function by a “deconvolution” calculation bydividing both sides of the convolution theorem equation by F{f}and taking the inverse Fourier transform. The essential featuresof the deconvolution procedure employed here are as follows:
(1) The first step in our procedure is identical for absorptionand emission spectra. A simplified single-site absorption/emission spectrum consisting of a sharp ZPL and PSB function(obtained from fitting the 693 nm persistent HB spectrum) isgenerated using an assumed electron-phonon coupling strengthof S ) 0.5 for absorption (Vide supra) and S ) 1.0 for emission(Vide infra). As obtained from HB data in ref 20, the spectrumconsists of a sharp zero-phonon line (fwhm less than 0.5 cm-1)and an asymmetric phonon sideband function peaked at 20 cm-1
from the ZPL and consisting of a Gaussian on the low-energyside (in absorption) with a fwhm of 23 cm-1 and a Lorentzianon the high-energy side with a fwhm of 60 cm-1. This spectrumis then deconvolved from the bulk absorption/emission spectrumto obtain an approximation of the phonon-free absorption/emission spectrum. In other words, if the PSB of each single-site spectrum in the system did, in fact, consist of the PSBfunction used here, then the “phonon-free” spectrum wouldrepresent the absorption/emission spectrum due to the ZPL andvibronic modes alone (i.e., without phonons). In reality, ofcourse, this is an approximation, especially since the lowest statemost likely has a higher value of S as discussed above and sinceexcitonic interactions will produce somewhat different PSBsfor each state, but since the bulk absorption spectrum does notallow us to distinguish between excitonic states, and theoscillator strength of the lowest state is very low, this is as goodan approximation as we believe is possible at present.
(2) Next, a set of “effective” vibrational mode Huang-Rhysfactors is obtained separately for absorption and emission spectraby a fitting procedure using the vibrational mode frequenciesof ref 28. The fitting algorithm is again based on a numericaldeconvolution procedure; we begin with a calculated single-site spectrum (including vibrational modes but not includingphonons) using the vibrational H-R factors of ref 28 as an initialguess. This single-site vibrational spectrum is then deconvolvedfrom the phonon-free spectrum obtained above to produce aVibration-free spectrum; if our assumed single-site spectrumwere, in fact, the single-site absorption/emission spectrum forevery state in the system, this would produce an exact ZPLdistribution function. This allows us to evaluate the validity ofour assumed single-site spectrum: for example, if the vibrationalmode at frequency Vi is too strong (i.e., has too large a H-Rfactor), the vibration-free spectrum will have a negative featureshifted by ∼Vi from the peak of the absorption/emission band;on the other hand, if the mode is too weak (i.e., the H-R factoris too small), the vibration-free spectrum will have a positivefeature shifted by ∼Vi from the peak. By automatically adjustingthe intensities of the assumed H-R factors according to thesefeatures, we can then iteratively produce a single-site spectrum
Figure 2. Low temperature (5 K) absorption spectrum of the PS IIcore in the S1(QA
-) state. HB spectra for the latter sample (noisy redcurve), compared with the sum of HB spectra obtained for the intactCP43 and CP47 complexes, are shown in the top inset. The lower insetshows the Qx absorption region for the PS II core in the S1(QA
-) (dottedcurve) and S1(QA) (solid line) states; see text for details.
F{f/g} ) F{f} ·F{g} (7)
11888 J. Phys. Chem. B, Vol. 114, No. 36, 2010 Reppert et al.
which will produce neither positive nor negative features in thedeconvolved spectrum.
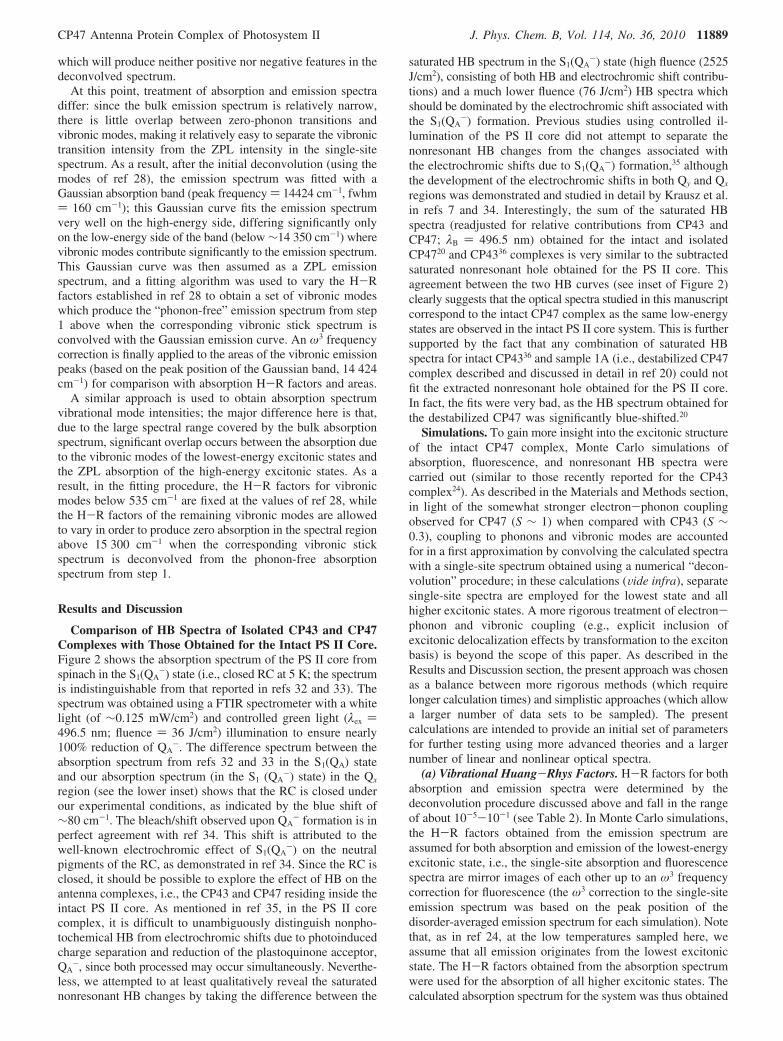
At this point, treatment of absorption and emission spectradiffer: since the bulk emission spectrum is relatively narrow,there is little overlap between zero-phonon transitions andvibronic modes, making it relatively easy to separate the vibronictransition intensity from the ZPL intensity in the single-sitespectrum. As a result, after the initial deconvolution (using themodes of ref 28), the emission spectrum was fitted with aGaussian absorption band (peak frequency ) 14424 cm-1, fwhm) 160 cm-1); this Gaussian curve fits the emission spectrumvery well on the high-energy side, differing significantly onlyon the low-energy side of the band (below ∼14 350 cm-1) wherevibronic modes contribute significantly to the emission spectrum.This Gaussian curve was then assumed as a ZPL emissionspectrum, and a fitting algorithm was used to vary the H-Rfactors established in ref 28 to obtain a set of vibronic modeswhich produce the “phonon-free” emission spectrum from step1 above when the corresponding vibronic stick spectrum isconvolved with the Gaussian emission curve. An ω3 frequencycorrection is finally applied to the areas of the vibronic emissionpeaks (based on the peak position of the Gaussian band, 14 424cm-1) for comparison with absorption H-R factors and areas.
A similar approach is used to obtain absorption spectrumvibrational mode intensities; the major difference here is that,due to the large spectral range covered by the bulk absorptionspectrum, significant overlap occurs between the absorption dueto the vibronic modes of the lowest-energy excitonic states andthe ZPL absorption of the high-energy excitonic states. As aresult, in the fitting procedure, the H-R factors for vibronicmodes below 535 cm-1 are fixed at the values of ref 28, whilethe H-R factors of the remaining vibronic modes are allowedto vary in order to produce zero absorption in the spectral regionabove 15 300 cm-1 when the corresponding vibronic stickspectrum is deconvolved from the phonon-free absorptionspectrum from step 1.
Results and Discussion
Comparison of HB Spectra of Isolated CP43 and CP47Complexes with Those Obtained for the Intact PS II Core.Figure 2 shows the absorption spectrum of the PS II core fromspinach in the S1(QA
-) state (i.e., closed RC at 5 K; the spectrumis indistinguishable from that reported in refs 32 and 33). Thespectrum was obtained using a FTIR spectrometer with a whitelight (of ∼0.125 mW/cm2) and controlled green light (λex )496.5 nm; fluence ) 36 J/cm2) illumination to ensure nearly100% reduction of QA
-. The difference spectrum between theabsorption spectrum from refs 32 and 33 in the S1(QA) stateand our absorption spectrum (in the S1 (QA
-) state) in the Qx
region (see the lower inset) shows that the RC is closed underour experimental conditions, as indicated by the blue shift of∼80 cm-1. The bleach/shift observed upon QA
- formation is inperfect agreement with ref 34. This shift is attributed to thewell-known electrochromic effect of S1(QA
-) on the neutralpigments of the RC, as demonstrated in ref 34. Since the RC isclosed, it should be possible to explore the effect of HB on theantenna complexes, i.e., the CP43 and CP47 residing inside theintact PS II core. As mentioned in ref 35, in the PS II corecomplex, it is difficult to unambiguously distinguish nonpho-tochemical HB from electrochromic shifts due to photoinducedcharge separation and reduction of the plastoquinone acceptor,QA
-, since both processed may occur simultaneously. Neverthe-less, we attempted to at least qualitatively reveal the saturatednonresonant HB changes by taking the difference between the
saturated HB spectrum in the S1(QA-) state (high fluence (2525
J/cm2), consisting of both HB and electrochromic shift contribu-tions) and a much lower fluence (76 J/cm2) HB spectra whichshould be dominated by the electrochromic shift associated withthe S1(QA
-) formation. Previous studies using controlled il-lumination of the PS II core did not attempt to separate thenonresonant HB changes from the changes associated withthe electrochromic shifts due to S1(QA
-) formation,35 althoughthe development of the electrochromic shifts in both Qy and Qx
regions was demonstrated and studied in detail by Krausz et al.in refs 7 and 34. Interestingly, the sum of the saturated HBspectra (readjusted for relative contributions from CP43 andCP47; λB ) 496.5 nm) obtained for the intact and isolatedCP4720 and CP4336 complexes is very similar to the subtractedsaturated nonresonant hole obtained for the PS II core. Thisagreement between the two HB curves (see inset of Figure 2)clearly suggests that the optical spectra studied in this manuscriptcorrespond to the intact CP47 complex as the same low-energystates are observed in the intact PS II core system. This is furthersupported by the fact that any combination of saturated HBspectra for intact CP4336 and sample 1A (i.e., destabilized CP47complex described and discussed in detail in ref 20) could notfit the extracted nonresonant hole obtained for the PS II core.In fact, the fits were very bad, as the HB spectrum obtained forthe destabilized CP47 was significantly blue-shifted.20
Simulations. To gain more insight into the excitonic structureof the intact CP47 complex, Monte Carlo simulations ofabsorption, fluorescence, and nonresonant HB spectra werecarried out (similar to those recently reported for the CP43complex24). As described in the Materials and Methods section,in light of the somewhat stronger electron-phonon couplingobserved for CP47 (S ∼ 1) when compared with CP43 (S ∼0.3), coupling to phonons and vibronic modes are accountedfor in a first approximation by convolving the calculated spectrawith a single-site spectrum obtained using a numerical “decon-volution” procedure; in these calculations (Vide infra), separatesingle-site spectra are employed for the lowest state and allhigher excitonic states. A more rigorous treatment of electron-phonon and vibronic coupling (e.g., explicit inclusion ofexcitonic delocalization effects by transformation to the excitonbasis) is beyond the scope of this paper. As described in theResults and Discussion section, the present approach was chosenas a balance between more rigorous methods (which requirelonger calculation times) and simplistic approaches (which allowa larger number of data sets to be sampled). The presentcalculations are intended to provide an initial set of parametersfor further testing using more advanced theories and a largernumber of linear and nonlinear optical spectra.
(a) Vibrational Huang-Rhys Factors. H-R factors for bothabsorption and emission spectra were determined by thedeconvolution procedure discussed above and fall in the rangeof about 10-5-10-1 (see Table 2). In Monte Carlo simulations,the H-R factors obtained from the emission spectrum areassumed for both absorption and emission of the lowest-energyexcitonic state, i.e., the single-site absorption and fluorescencespectra are mirror images of each other up to an ω3 frequencycorrection for fluorescence (the ω3 correction to the single-siteemission spectrum was based on the peak position of thedisorder-averaged emission spectrum for each simulation). Notethat, as in ref 24, at the low temperatures sampled here, weassume that all emission originates from the lowest excitonicstate. The H-R factors obtained from the absorption spectrumwere used for the absorption of all higher excitonic states. Thecalculated absorption spectrum for the system was thus obtained
CP47 Antenna Protein Complex of Photosystem II J. Phys. Chem. B, Vol. 114, No. 36, 2010 11889
by convoluting the lowest-energy excitonic band with thelowest-state single-site spectrum and adding it to the convolutionof the higher-energy excitonic bands with the higher-energysingle-site spectrum. Calculations were carried out at a resolutionof 5 cm-1 (with extra care taken to ensure that the limitedspectral resolution did not alter the relative areas of the ZPLand PSB contributions in the single-site spectrum).
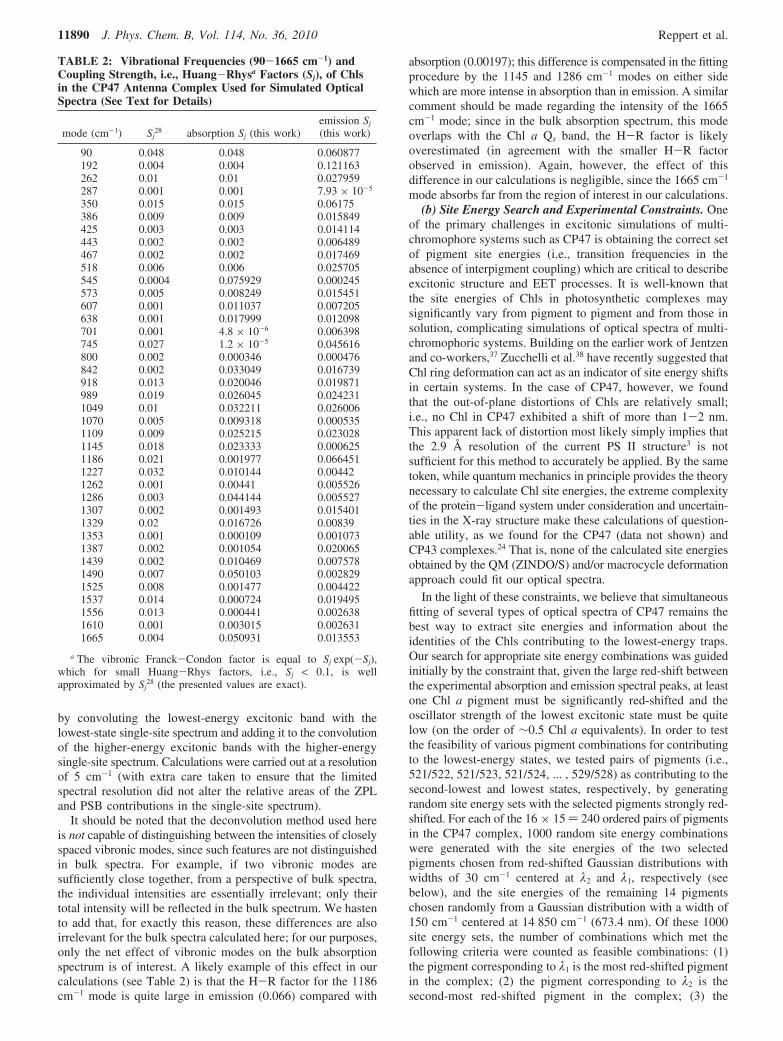
It should be noted that the deconvolution method used hereis not capable of distinguishing between the intensities of closelyspaced vibronic modes, since such features are not distinguishedin bulk spectra. For example, if two vibronic modes aresufficiently close together, from a perspective of bulk spectra,the individual intensities are essentially irrelevant; only theirtotal intensity will be reflected in the bulk spectrum. We hastento add that, for exactly this reason, these differences are alsoirrelevant for the bulk spectra calculated here; for our purposes,only the net effect of vibronic modes on the bulk absorptionspectrum is of interest. A likely example of this effect in ourcalculations (see Table 2) is that the H-R factor for the 1186cm-1 mode is quite large in emission (0.066) compared with
absorption (0.00197); this difference is compensated in the fittingprocedure by the 1145 and 1286 cm-1 modes on either sidewhich are more intense in absorption than in emission. A similarcomment should be made regarding the intensity of the 1665cm-1 mode; since in the bulk absorption spectrum, this modeoverlaps with the Chl a Qx band, the H-R factor is likelyoverestimated (in agreement with the smaller H-R factorobserved in emission). Again, however, the effect of thisdifference in our calculations is negligible, since the 1665 cm-1
mode absorbs far from the region of interest in our calculations.(b) Site Energy Search and Experimental Constraints. One
of the primary challenges in excitonic simulations of multi-chromophore systems such as CP47 is obtaining the correct setof pigment site energies (i.e., transition frequencies in theabsence of interpigment coupling) which are critical to describeexcitonic structure and EET processes. It is well-known thatthe site energies of Chls in photosynthetic complexes maysignificantly vary from pigment to pigment and from those insolution, complicating simulations of optical spectra of multi-chromophoric systems. Building on the earlier work of Jentzenand co-workers,37 Zucchelli et al.38 have recently suggested thatChl ring deformation can act as an indicator of site energy shiftsin certain systems. In the case of CP47, however, we foundthat the out-of-plane distortions of Chls are relatively small;i.e., no Chl in CP47 exhibited a shift of more than 1-2 nm.This apparent lack of distortion most likely simply implies thatthe 2.9 Å resolution of the current PS II structure3 is notsufficient for this method to accurately be applied. By the sametoken, while quantum mechanics in principle provides the theorynecessary to calculate Chl site energies, the extreme complexityof the protein-ligand system under consideration and uncertain-ties in the X-ray structure make these calculations of question-able utility, as we found for the CP47 (data not shown) andCP43 complexes.24 That is, none of the calculated site energiesobtained by the QM (ZINDO/S) and/or macrocycle deformationapproach could fit our optical spectra.
In the light of these constraints, we believe that simultaneousfitting of several types of optical spectra of CP47 remains thebest way to extract site energies and information about theidentities of the Chls contributing to the lowest-energy traps.Our search for appropriate site energy combinations was guidedinitially by the constraint that, given the large red-shift betweenthe experimental absorption and emission spectral peaks, at leastone Chl a pigment must be significantly red-shifted and theoscillator strength of the lowest excitonic state must be quitelow (on the order of ∼0.5 Chl a equivalents). In order to testthe feasibility of various pigment combinations for contributingto the lowest-energy states, we tested pairs of pigments (i.e.,521/522, 521/523, 521/524, ... , 529/528) as contributing to thesecond-lowest and lowest states, respectively, by generatingrandom site energy sets with the selected pigments strongly red-shifted. For each of the 16 × 15 ) 240 ordered pairs of pigmentsin the CP47 complex, 1000 random site energy combinationswere generated with the site energies of the two selectedpigments chosen from red-shifted Gaussian distributions withwidths of 30 cm-1 centered at λ2 and λ1, respectively (seebelow), and the site energies of the remaining 14 pigmentschosen randomly from a Gaussian distribution with a width of150 cm-1 centered at 14 850 cm-1 (673.4 nm). Of these 1000site energy sets, the number of combinations which met thefollowing criteria were counted as feasible combinations: (1)the pigment corresponding to λ1 is the most red-shifted pigmentin the complex; (2) the pigment corresponding to λ2 is thesecond-most red-shifted pigment in the complex; (3) the
TABLE 2: Vibrational Frequencies (90-1665 cm-1) andCoupling Strength, i.e., Huang-Rhysa Factors (Sj), of Chlsin the CP47 Antenna Complex Used for Simulated OpticalSpectra (See Text for Details)
mode (cm-1) Sj28 absorption Sj (this work)
emission Sj
(this work)
90 0.048 0.048 0.060877192 0.004 0.004 0.121163262 0.01 0.01 0.027959287 0.001 0.001 7.93 × 10⁻⁵
350 0.015 0.015 0.06175386 0.009 0.009 0.015849425 0.003 0.003 0.014114443 0.002 0.002 0.006489467 0.002 0.002 0.017469518 0.006 0.006 0.025705545 0.0004 0.075929 0.000245573 0.005 0.008249 0.015451607 0.001 0.011037 0.007205638 0.001 0.017999 0.012098701 0.001 4.8 × 10⁻⁶ 0.006398745 0.027 1.2 × 10⁻⁵ 0.045616800 0.002 0.000346 0.000476842 0.002 0.033049 0.016739918 0.013 0.020046 0.019871989 0.019 0.026045 0.0242311049 0.01 0.032211 0.0260061070 0.005 0.009318 0.0005351109 0.009 0.025215 0.0230281145 0.018 0.023333 0.0006251186 0.021 0.001977 0.0664511227 0.032 0.010144 0.004421262 0.001 0.00441 0.0055261286 0.003 0.044144 0.0055271307 0.002 0.001493 0.0154011329 0.02 0.016726 0.008391353 0.001 0.000109 0.0010731387 0.002 0.001054 0.0200651439 0.002 0.010469 0.0075781490 0.007 0.050103 0.0028291525 0.008 0.001477 0.0044221537 0.014 0.000724 0.0194951556 0.013 0.000441 0.0026381610 0.001 0.003015 0.0026311665 0.004 0.050931 0.013553
a The vibronic Franck-Condon factor is equal to Sj exp(-Sj),which for small Huang-Rhys factors, i.e., Sj < 0.1, is wellapproximated by Sj
28 (the presented values are exact).
11890 J. Phys. Chem. B, Vol. 114, No. 36, 2010 Reppert et al.

oscillator strength of the lowest excitonic state is less than 0.5;and (4) the oscillator strength of the second-lowest state is lessthan 1.0. This procedure was repeated for values of λ1 and λ2
(in units of nm) equal to (λ1, λ2) ) (684, 684), (684, 685), ... ,(684, 693), (685, 685), (685, 686), ... , (685, 693), (686,686), ... , (693, 693), i.e., 10 + 9 + 8 + ... + 2 + 1 ) 55combinations, for a total of 55 × 1000 × 240 ) 1.32 × 10⁷
site energy combinations sampled. We hasten to note that, inthis preliminary search, disorder-averaged optical spectra werenot calculated in order to allow for more combinations to betested; only the oscillator strengths and frequencies of the lowestenergy states were calculated and considered in the selectionprocess.
The results of this low oscillator strength “search” arepresented in Figure 3, where the number of “feasible” combina-tions found (per pigment pair as defined above) is plotted foreach pigment pair. Many of these pairs (the ∼40 producing thelargest number of feasible combinations) were used in subse-quent Monte Carlo simulation to fit optical spectra. The mostobvious feature of the results is that combinations involvingChl 523 are strongly favored. While a few other combinations(especially those involving Chls 521 (Chl 24 in Loll et al.nomenclature) did produce a number of feasible combinations,the great majority of feasible combinations involve Chl 523 (i.e.,Chl 26)4 as the pigment with either the lowest or second-lowestsite energy in the complex. However, the best combinationswere with Chl 523 as the lowest-energy pigment. On the basisof these observations, we focused the bulk of our site energysearches on combinations involving a strongly red-shifted Chl523. A variety of automated search routines similar to thoseemployed in ref 24 were employed, using the least-squaresdeviation between calculated optical spectra and experimentaldata as a test for suitability. Briefly, these fitting procedureswere built on three basic steps: (1) generation of new site energysets by selecting pigment site energies from either a flatdistribution between 14 400 and 15 400 cm-1 or from a Gaussiandistribution centered near either 675 nm (for blue-shiftedpigments) or near 690 nm (for red-shifted pigments); (2) alteringthe site energies of n randomly selected pigments (with 1 e ne 16) by generating new site energies from a flat distribution(as above) or from a Gaussian distribution around the pigment’sprevious site energy while keeping the parameters of the other16 - n pigments unchanged; and (3) interchanging the site
energies of n randomly selected pigments within a givenparameter set (so that the n site energies are unchanged but areassigned to different pigments). The algorithm was written soas to allow limited control over the site energies of selectedpigments. For example, in our calculations, we often wished toconstrain two selected pigments to be strongly red-shifted; thiswas accomplished by avoiding step 3 for these pigments andby always choosing new site energies from a relatively narrow(∼10 cm-1) Gaussian distribution around the original siteenergy, limiting the size of change that could occur in a givenstep. The total number of site energy parameter sets tested usingthese algorithms was on the order of 106, although since ourmethod is based on “tweaking” of previous parameter sets, thevarious sets tested are not, of course, independent of each other.Although for combinations involving a strongly red-shifted Chl523 these procedures were quite effective at fitting absorptionand emission spectra, the automated fits to the persistent HBspectrum were generally less satisfactory when all three typesof experimental spectra were fitted simultaneously. For thisreason, the best parameter sets from the automatic algorithmswere finally fine-tuned manually to provide a single set of siteenergies which is optimized for all three types of experimentalspectra. Site energy combinations not involving a strongly red-shifted Chl 523 were generally unable to provide good fits evento the absorption and emission spectrum due to the lowest statepossessing too much oscillator strength.
(c) Site Energies and Coupling Constants of Chls in CP47.The site energies and corresponding wavelengths of Chls thatprovided the best fits to absorption, emission, and HB spectraare listed in red in Table 3. The site energies from ref 14 areshown in blue for comparison. The numbering of Guskov etal.3 is used throughout this paper, but the numbering of Loll etal.4 is shown in parentheses in Table 3. None of the previouslypublished sets of Chl site energies14,15,39 could fit our data;however, we hasten to add that the authors of ref 14 were fittingoptical spectra (i.e., 77 K absorption/emission and 293 K CDspectra) of a CP47 preparation that we consider to be a mixtureof intact and irreversibly destabilized complexes as discussedin ref 20. On the basis of our work, the lowest energy pigmentsare Chls 523, 526, and 521 with site energies at 691.1, 686.7,and 679.9 nm, respectively (see Table 3 for details). Thesevalues are quite different from the results of ref 14 where thesite energies for Chls 526, 511, and 521 were located at 688,681, and 680 nm, respectively. For clarity, it should be notedthat the site energies from ref 14 (in blue in Table 3) correspondto vertical transition energies, and for a direct comparison withour values (which correspond to zero-phonon transitions), theymust be corrected by the reorganization energy (of ∼42 cm-1)used in ref 14 (this is still only an approximate comparison,since the exact reorganization energy shift in ref 14 dependson the excitonic interactions in each realization of disorder).Thus, the site energies from ref 14 should be red-shifted byabout 2 nm for comparison with our site energies. Thedifferences in site energies were expected and are caused, atleast in part, by the fact that our experimental data and theoptical spectra fitted in ref 14 are significantly different. Inparticular, the red-shifted and much narrower emission spec-trum20 precluded the use of parameters from ref 14 in ourcalculations. Coupling constants calculated using the more recentstructure of Guskov et al.3 are in general quite similar to thevalues reported in the Supporting Information of ref 14 withthe exception that the coupling between Chls 521 and 519 isonly 8 cm-1 in our calculations, rather than 99 cm-1 (apparentlya simple typographical error in the Supporting Information;
Figure 3. Number of “feasible” fits per pigment pair (as defined inthe text) obtained in a low-oscillator-strength search. The most feasiblepairs were used in subsequent Monte Carlo simulation to fit opticalspectra.
CP47 Antenna Protein Complex of Photosystem II J. Phys. Chem. B, Vol. 114, No. 36, 2010 11891

comparison of our calculations with those of ref 14 demonstratethat the authors of that work used the correct value in theircalculations). Coupling constants Vnm for CP47 used in thiswork, and for comparison Vnm from ref 14, are shown in Table1. Although our calculations do not require division of pigmentsinto separate domains, such a division (important for the detaileddescription of EET dynamics) would be essentially the sameas described in ref 14 for time-domain calculations, since therelevant coupling constants are quite similar.
(d) Fits of Absorption, Fluorescence, and Nonresonant HBSpectra. The best calculated absorption, fluorescence, and non-line-narrowed HB spectra (dashed blue curves) are shown inFigure 4 along with the experimental data (black curves). Thefinal calculated spectra were obtained by a combination ofautomatic and manual site energy adjustments. As mentionedabove, manual site energy changes were found to be necessaryto fit the finer structure of the persistent HB spectrum,particularly the two-peak feature of the HB antihole region. Wefound that the shape of the persistent (nonresonant) HB spectrumis extremely sensitive to the relative site energies of the variouspigments in the complex. In particular, it should be noted thatthe second ∼14 800 cm-1 “photoproduct” peak in the calculatedHB spectrum (see Figure 4) is a result not of low-energypigments being shifted to the high energy region but of excitonicinteractions between lowest-state Chl 523 and higher-energypigments Chls 521 and 524. Thus, the shape of the persistentHB spectrum is largely determined by a combination of themutually strong excitonic interactions within this group of three
pigments and the relatively weak interactions of Chl 526 (thesecond-most red-shifted pigment) with the rest of the complex.The strong interactions of the Chl 521/523/524 group producethe strong double-peak feature of the spectrum (especially the∼14 730 cm-1 hole and corresponding 14 800 cm-1 antihole),while the presence of a weakly interacting second excitonic state
TABLE 3: Site Energies and Corresponding Wavelengths of Chl in the CP47 Complex Used to Calculate Absorption,Emission, and HB Spectra in This Work (in Red) and in ref 14 (in Blue)a
a The numbering of Guskov et al. (3BZ1 file in the PDB)3 is used throughout the paper (the Chl numbering shown in parentheses is basedon the numbering of ref 4). The site energies of Chls shown in this table are very different from the calculated values using QM (ZINDO/S)and macrocycle deformation approach from ref 38 (data not shown), indicating that for the current structural resolution of CP47 the siteenergies can only be obtained from various fitting algorithms; see text for details. b Note that the site energies from ref 14 (in blue) correspondto vertical energies and have to be decreased by the reorganization energy (less than ∼43 cm-1 or ∼2 nm) to be directly compared with oursite energies (in red).
Figure 4. Best fits (blue dashed curves) to the experimental absorption,emission, and NLN hole burned spectra (black curves). In the fit shown,the lowest state resides mainly on Chl 523 while Chl 526 contributesstrongly to the second lowest state; see text.
11892 J. Phys. Chem. B, Vol. 114, No. 36, 2010 Reppert et al.
(with its unique composition of contributing pigments; seeFigure 5) produces much of the lower energy ∼14 630 cm-1
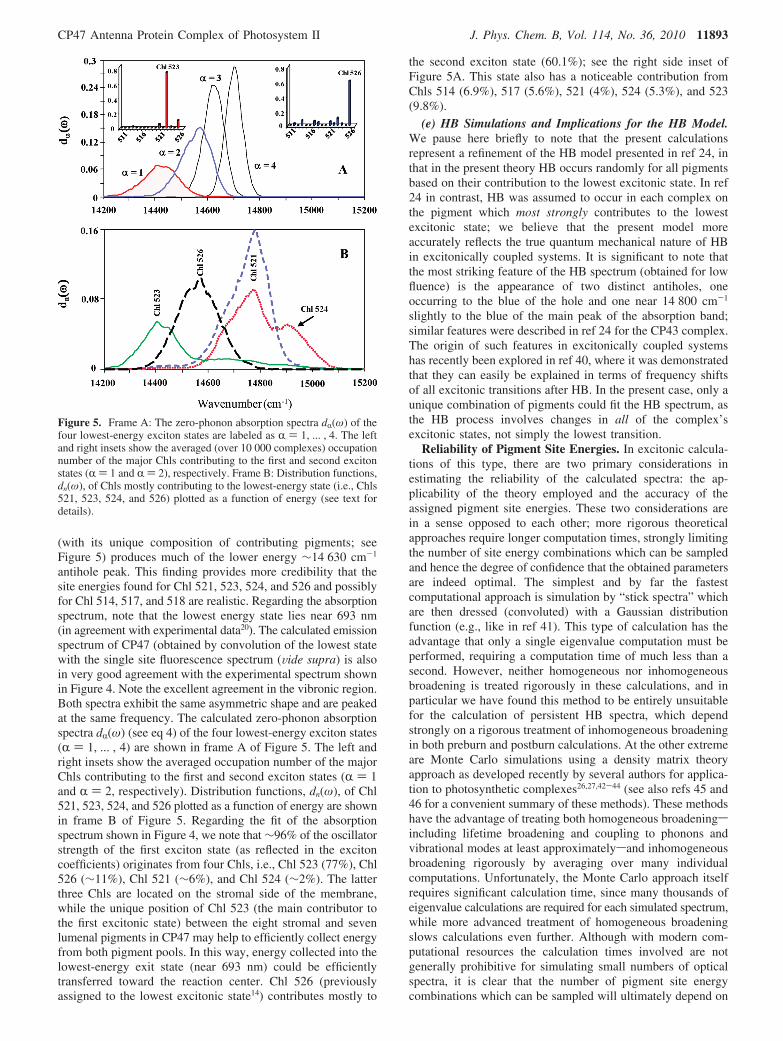
antihole peak. This finding provides more credibility that thesite energies found for Chl 521, 523, 524, and 526 and possiblyfor Chl 514, 517, and 518 are realistic. Regarding the absorptionspectrum, note that the lowest energy state lies near 693 nm(in agreement with experimental data20). The calculated emissionspectrum of CP47 (obtained by convolution of the lowest statewith the single site fluorescence spectrum (Vide supra) is alsoin very good agreement with the experimental spectrum shownin Figure 4. Note the excellent agreement in the vibronic region.Both spectra exhibit the same asymmetric shape and are peakedat the same frequency. The calculated zero-phonon absorptionspectra dR(ω) (see eq 4) of the four lowest-energy exciton states(R ) 1, ... , 4) are shown in frame A of Figure 5. The left andright insets show the averaged occupation number of the majorChls contributing to the first and second exciton states (R ) 1and R ) 2, respectively). Distribution functions, dn(ω), of Chl521, 523, 524, and 526 plotted as a function of energy are shownin frame B of Figure 5. Regarding the fit of the absorptionspectrum shown in Figure 4, we note that ∼96% of the oscillatorstrength of the first exciton state (as reflected in the excitoncoefficients) originates from four Chls, i.e., Chl 523 (77%), Chl526 (∼11%), Chl 521 (∼6%), and Chl 524 (∼2%). The latterthree Chls are located on the stromal side of the membrane,while the unique position of Chl 523 (the main contributor tothe first excitonic state) between the eight stromal and sevenlumenal pigments in CP47 may help to efficiently collect energyfrom both pigment pools. In this way, energy collected into thelowest-energy exit state (near 693 nm) could be efficientlytransferred toward the reaction center. Chl 526 (previouslyassigned to the lowest excitonic state14) contributes mostly to
the second exciton state (60.1%); see the right side inset ofFigure 5A. This state also has a noticeable contribution fromChls 514 (6.9%), 517 (5.6%), 521 (4%), 524 (5.3%), and 523(9.8%).
(e) HB Simulations and Implications for the HB Model.We pause here briefly to note that the present calculationsrepresent a refinement of the HB model presented in ref 24, inthat in the present theory HB occurs randomly for all pigmentsbased on their contribution to the lowest excitonic state. In ref24 in contrast, HB was assumed to occur in each complex onthe pigment which most strongly contributes to the lowestexcitonic state; we believe that the present model moreaccurately reflects the true quantum mechanical nature of HBin excitonically coupled systems. It is significant to note thatthe most striking feature of the HB spectrum (obtained for lowfluence) is the appearance of two distinct antiholes, oneoccurring to the blue of the hole and one near 14 800 cm-1
slightly to the blue of the main peak of the absorption band;similar features were described in ref 24 for the CP43 complex.The origin of such features in excitonically coupled systemshas recently been explored in ref 40, where it was demonstratedthat they can easily be explained in terms of frequency shiftsof all excitonic transitions after HB. In the present case, only aunique combination of pigments could fit the HB spectrum, asthe HB process involves changes in all of the complex’sexcitonic states, not simply the lowest transition.
Reliability of Pigment Site Energies. In excitonic calcula-tions of this type, there are two primary considerations inestimating the reliability of the calculated spectra: the ap-plicability of the theory employed and the accuracy of theassigned pigment site energies. These two considerations arein a sense opposed to each other; more rigorous theoreticalapproaches require longer computation times, strongly limitingthe number of site energy combinations which can be sampledand hence the degree of confidence that the obtained parametersare indeed optimal. The simplest and by far the fastestcomputational approach is simulation by “stick spectra” whichare then dressed (convoluted) with a Gaussian distributionfunction (e.g., like in ref 41). This type of calculation has theadvantage that only a single eigenvalue computation must beperformed, requiring a computation time of much less than asecond. However, neither homogeneous nor inhomogeneousbroadening is treated rigorously in these calculations, and inparticular we have found this method to be entirely unsuitablefor the calculation of persistent HB spectra, which dependstrongly on a rigorous treatment of inhomogeneous broadeningin both preburn and postburn calculations. At the other extremeare Monte Carlo simulations using a density matrix theoryapproach as developed recently by several authors for applica-tion to photosynthetic complexes26,27,42-44 (see also refs 45 and46 for a convenient summary of these methods). These methodshave the advantage of treating both homogeneous broadeningsincluding lifetime broadening and coupling to phonons andvibrational modes at least approximatelysand inhomogeneousbroadening rigorously by averaging over many individualcomputations. Unfortunately, the Monte Carlo approach itselfrequires significant calculation time, since many thousands ofeigenvalue calculations are required for each simulated spectrum,while more advanced treatment of homogeneous broadeningslows calculations even further. Although with modern com-putational resources the calculation times involved are notgenerally prohibitive for simulating small numbers of opticalspectra, it is clear that the number of pigment site energycombinations which can be sampled will ultimately depend on
Figure 5. Frame A: The zero-phonon absorption spectra dR(ω) of thefour lowest-energy exciton states are labeled as R ) 1, ... , 4. The leftand right insets show the averaged (over 10 000 complexes) occupationnumber of the major Chls contributing to the first and second excitonstates (R ) 1 and R ) 2), respectively. Frame B: Distribution functions,dn(ω), of Chls mostly contributing to the lowest-energy state (i.e., Chls521, 523, 524, and 526) plotted as a function of energy (see text fordetails).
CP47 Antenna Protein Complex of Photosystem II J. Phys. Chem. B, Vol. 114, No. 36, 2010 11893

the computation time of an individual simulation. Unfortunately,neither the computation times involved nor the number ofparameter sets sampled is generally reported in the literature,making it difficult to weigh the advantages and disadvantagesof various methods. With regard to the present work, it is worthnoting here that a HB spectrum generally requires significantlymore calculation time than the corresponding absorption oremission spectrum: first, because each iteration of the methodrequires two eigenvalue computations (preburn and postburn)instead of only one and, second, because the nature of HB as adifference between two calculated spectra tends to lower thesignal-to-noise level of the resulting spectrum. More specifically,with our current method and programs, an average over 5000random samples (which provides a reasonable signal-to-noiseratio for absorption and emission spectra) requires approximately5 s on a typical laptop or desktop computer. The equivalentHB spectrum requires approximately double the time for thesame number of iterations. However, as discussed in more detailin ref 40, the number of iterations required to obtain a goodsignal-to-noise ratio in HB spectra depends strongly on thespacing of excitonic states in the absorption spectrum. Often amuch larger number of samples (50 000 or more) is requiredfor calculating HB spectra, increasing the computation timeproportionally (50 000 samples requires approximately 100 s).
In light of these considerations, we chose to adopt anintermediate method which, although somewhat approximate,allowed us to sample quite a large number of different parametersets (on the order of 106 for absorption and emission, fewer forthe more time-consuming HB spectra). In our calculations,inhomogeneous broadening is treated rigorously via Monte Carlomethods (which we found could not be neglected for calculatingnonphotochemical hole burning spectra), while homogeneousbroadening is treated approximately by convoluting the calcu-lated spectrum with an assumed single site spectrum forabsorption or emission. As discussed in the Materials andMethods section, the assumed single site spectrum is obtainedfrom experimental HB data for the lowest excitonic state. Themost important approximation in our approach compared withthe various density matrix theories is the neglect of lifetimebroadening effects on homogeneous linewidths, since in ourcalculations each state is modeled with the same single sitespectrum consisting of a sharp zero-phonon line and broadphonon sideband (with the exception that the Huang-Rhysfactor S is set to 1.0 for the lowest state and 0.5 for higherexcitonic states; see the Materials and Methods section). Thisapproximation can be expected to have a significant impact onthe homogeneous single site spectrum for higher energyexcitonic states which are broadened by EET; however, in theinhomogeneously broadened spectra calculated here, such effectscan be expected to be relatively mild. Indeed, for the FMOcomplex, Adolphs and Renger47 found in comparing variousmethods that, while such effects do have a significant impacton the exact site energies of specific pigments, the overallranking of pigment transition energies in the complex was thesame for all theories. In the present case, this approximationcan be additionally justified in that our present concern isprimarily with the lowest energy pigments in the complex,whose transitions are expected to experience minimal lifetimebroadening.
With regard to the reliability of the site energies presentedin this paper (and in others), we wish to emphasize that even ifa given set of site energies provides an excellent fit toexperimental spectra, it does not necessarily follow that this isin fact the correct set of parameters for the system. In principle,
it is entirely possible that there are multiple site energy setswhich may give essentially equivalent fits to experimentalspectra; in cases of symmetry (e.g., an excitonically coupleddimer or symmetric trimer), calculated spectra will even beidentical when pigment site energies are exchanged. Thisrealization should necessarily lead to additional caution ininterpreting the results of excitonic “fitting” calculations, sincewithout sampling the entire range of possible pigment site energycombinations for a system, one cannot definitively say that theoptimal set of site energies has been obtained. Indeed, in ourcalculations, we were able to locate many very differentparameter sets which provided excellent fits to the absorptionand emission spectra alone (or the absorption and persistent HBspectra alone). Although only a few (rather similar) sets ofparameters provided reasonable fits to all three spectra simul-taneously, we can in no way exclude the possibility that theremay be other combinations which provide good fits whichsimply were not located in our search.
The ideal solution, to the problem of course, would be a tourde force study in which all possible site energy combinationswere sampled within some given range; e.g., if the experimentalabsorption spectrum is contained in the region 14 400-15 200cm-1, one could take the sample space for the site energy ofeach pigment to be {14 400, 14 410, 14 420, ... , 15 200} andthen systematically sample all such possible pigment siteenergies. Assuming that site energy differences less than 10cm-1 are negligible, one could then definitively select the siteenergy combination which gave the best fit. For a small system(e.g., a dimer or trimer), such an approach could be feasiblegiven the relatively small number of possible combinations; fora large system such as CP47, however, the sheer number ofsuch combinations makes the prospect unworkable. For theexample given, each of the 16 pigment site energies of CP47would have 81 possible values, giving the total number ofcombinations to be sampled as 8116 ≈ 3.4 × 1030. Assumingthat a Monte Carlo simulation of the type reported here takesat minimum 1 s, this would lead to a computation time ofapproximately 1023years! Obviously, such brute force calcula-tions are not feasible, at least with the present computationalcapabilities. We do not mean to suggest that the task of locatingfeasible pigment site energies is impossible; indeed, the vastmajority of the site energy combinations in the sample spacejust mentioned can be disregarded from the start (for example,a combination in which all pigments have site energy 14 400cm-1 will obviously not fit the experimental data), and thevarious algorithms which have been employed by differentgroups for this problem are intentionally designed to work injust such a situation. However, given the truly vast number ofpotential site energy combinations, we feel that a healthy doseof skepticism is in order concerning any claim that the single“true” set of pigment site energies has been located. For ourcalculations, in particular, it should be noted that while HBspectra are extremely sensitive to the site energies and excitonicproperties of red-shifted pigments, the site energies of blue-shifted pigments in particular should be regarded as rathertentative. This is both because of the approximations involvedin our simulation method (i.e., neglect of EET broadening) andbecause of the lower sensitivity of HB spectra to high-energypigments which do not interact strongly with the lowest-energystate. When experimental CD, LD, and time-resolved spectraare available for intact CP47 samples, we anticipate that moreadvanced computational methods can be combined with allavailable experimental data to produce a refined set of CP47site energies for all pigments (research in progress).
11894 J. Phys. Chem. B, Vol. 114, No. 36, 2010 Reppert et al.

Hydrogen Bonding in CP47. In light of our low-energy Chlassignments and due to some degree of confusion in theliterature, a few comments on the presence or absence ofhydrogen (H-) bonding to the low-energy Chl states in CP47are in order. The presence of strong H-bonding to the low-energytrap of CP47 was first suggested by de Weerd et al.48 based onthe appearance of a 1633 cm-1 vibrational mode in fluorescenceline narrowing (FLN) spectra. De Weerd’s interpretation of thismode was in large part based on previous work by Krawczyk49
in which it was demonstrated for Chl embedded in a variety oforganic solvents that both the vibrational frequency of the 131
carbonyl stretch mode and the pigment transition energydecrease systematically as the H-bonding nature of the solventincreases. De Weerd et al. therefore interpreted the 1633 cm-1
mode as indicative of an extremely strong H-bond between the131 carbonyl group and the protein which in turn produces thestrong red-shift of the CP47 lowest energy state. It is worthnoting that the lowest 131 carbonyl frequency observed byKrawczyk for any organic solvent (phenol) was ∼1662 cm-1
(compared with the free 131 carbonyl stretch near ∼1690 cm-1);a shift of this mode to 1633 cm-1 would then represent a strongH-bond indeed and, it might be suggested, rather outside of thecalibration range of the experimental data on which Krawczyk49
based his model. Indeed, the assignment of H-bonding in CP47was essentially reversed in a 2004 paper by Groot et al.50 inwhich femtosecond visible/visible and visible/mid-IR experi-ments on isolated CP47 found no strong evidence for a 1633cm-1 mode, although due to the overlap of several excited statebands in this region it was not possible to discern unambiguouslywhether such a mode does indeed exist and, if so, whether itbelongs to the lowest-state pigment. Indeed, based on theappearance of a 131 CdO band near 1686 cm-1, it wasconcluded that the red-most states in CP47 most likely eitherreside in a polar environment (with no H-bond present) or havea relatively weak H-bond.
Hydrogen bonding in CP47 was also addressed by Raszewskiand Renger in light of their site energy assignments based onfitting calculated spectra to experimental data.14 These authorsappear to have followed the original conclusions of de Weerdet al.48 in that they assign a strong H-bond to their selectedlowest-energy pigment, Chl 526 (the later results of Groot etal.50 are not addressed by these authors). Indeed, both the 3.0Å crystal structure (2AXT) of Loll et al. and the 2.9 Å structure(3BZ1) of Guskov et al. show Thr H5 within H-bonding distanceof the Chl 526 131 carbonyl group, although, given the currentstructural resolution, any definite assignment of H-bonding tothe Chls in PS II is speculative at best. It is interesting to observethat (as noted without comment by Raszewski and Renger14)this residue is located on chain H of the PS II complex, not onCP47 itself. This immediately raises the question of whetheror not the assumed H-bond would be present in isolated CP47complexes, aside from whether or not it exists in ViVo. Althoughit is possible that the small chain H peptide (66 residues areresolved in the 3BZ1 crystal structure) could remain associatedwith the larger CP47 protein (510 residues in the 3BZ1 structure)during the isolation process as evidently assumed by Raszewskiand Renger, this scenario seems rather unlikely and indeed isnot supported by SDS-PAGE gel analysis of our CP47preparation.
In light of the various and contradictory assignments in theliterature along with the relatively poor resolution of the currentcrystal structure of PS II, we feel that it is best for the presentto refrain from any specific assignments of structural or spectralfeatures to H-bonding in CP47. Although the crystal structures
of Loll et al. and Guskov et al. have revealed a tremendousamount of structural information, we feel that specific H-bondingcan only be rather tentatively suggested in a crystal structurein which, for example, water molecules are not resolved. It isworth noting that, in the higher resolution crystal structures ofPS II and the FMO complex, water molecules often play crucialroles in both ligating Chl molecules and in forming andfacilitating H-bonds with various pigment CdO groups. Certainquestions of ligation (such as the ligation status of Chl 517, forexample, which seems possibly to be hexa-coordinated) probablymust likewise await the appearance of a higher resolutionstructure for unambiguous answers. We only note that, in thecurrent structure, no strong H-bond appears to be formedbetween Chl 523 and its surrounding environment; although weemphasize that such results should be interpreted cautiously,these observations do appear to be in agreement with thespectroscopic assignments of Groot et al.50 discussed above.
Comparison with Mutational Studies. An important ques-tion still to be addressed is the consistency of our findings withthe mutational studies reported a number of years ago by Shenand Vermaas.51 In this study, a number of conserved His residuesin CP47 were mutated to Tyr, Gln, or Asn in a photosystem I(PSI)-less mutant of Synechocystis sp. PCC 6803. As a resultof this work, it was assumed in ref 52 (and in many subsequentpublications) that Chl 526 is responsible for the 695 nm emissionpeak in intact PS II core complexes; this conclusion was basedon a 2 nm blue shift of the 77 K 695 nm peak in thylakoidmembranes of strains in which His114 (which subsequent crystalstructures showed to be the ligand of Chl 526) had beenconverted to Asn or Gln. It is worth noting that, to ourunderstanding, in their original paper,51 Shen and Vermaas didnot actually claim that the Chl bound by His114 was solelyresponsible for the 695 nm emission of PS II; instead, theirprimary conclusion regarding the 695 nm peak intensity/positionwas that the pigments bound by His114 and by His23 (latershown to be Chl 522) were essential for the stable assembly ofthe PS II complex, since mutation of either of these residues toTyr led to complete loss of 695 nm emission. Indeed, the Tyrmutants of either of these His residues were incapable ofevolving oxygen, strongly suggesting that the Chls involved mayplay a structural role in the assembly of the complex (whetheror not they are directly involved in producing the 695 nmemission). Interestingly, in a subsequent HB study of the H114Qmutant22 (the only published data of which we are aware whichshow spectra of the isolated CP47 mutant or rather the CP47-D1-D2-Cyt b559 complex), it was concluded that the Chl boundby His114 was responsible for a separate emission band near688 nm, rather than for the lowest-state emission near 695 nm.
In light of these observations, together with our presentresults, we suggest that the most consistent explanation for thepublished data is that Chl 526 contributes strongly to the secondlowest state, i.e., near 688 nm, and has a significant role in thestable organization and assembly of the PS II core complex,while the lowest state is mostly contributed to by Chl 523.Perturbation of the complex, either by mutation of ligand His114or by incidental damage in the protein isolation procedure maythen lead to interruption of energy transfer between Chl 526(which is located at the periphery of CP47 and only very weaklycoupled to other pigments even in the intact protein) and/ordestabilization of the entire complex. Interruption of EETbetween Chl 526 and the rest of the complex could of itselfproduce a new emission peak in the vicinity of the second loweststate (688 nm); moreover, since it appears that Chl 526 mayplay a structural role for the complex, it is very possible that
CP47 Antenna Protein Complex of Photosystem II J. Phys. Chem. B, Vol. 114, No. 36, 2010 11895

perturbation of this pigment could lead to changes in theconformation of the entire polypeptide, affecting the site energiesof not only Chl 526 but of all pigments in the complex. Onecould speculate that the proposed H-bond between Chl 526 andchain H of the PS II complex could help to facilitate the stabilityof the complex, thus providing at least one example of astructural role for Chl 526, although as above we hasten to addthat the feasibility of this argument can be addressed only byfurther studies.
Regarding our assignment of Chl 523 as the lowest-energytrap, it should be noted that, in the mutation studies of Shenand Vermaas, replacement of its ligand with Tyr resulted inonly a 29% decrease in the intensity of the 695 nm emissionpeak relative to 685 nm emission (assumed to originate fromCP43 and the RC), a decrease which we admit is rather moderatecompared with those observed for other mutations. (Do not failto differentiate the latter emission from a similar ∼685 nmemission (FT2 band) observed in partly destabilized CP47, asdiscussed in ref 20). However, for several reasons, we do notfeel that this observation excludes Chl 523 as a candidate forthe lowest energy trap. First, the results of ligand replacementon a protein-bound Chl cannot a priori be predicted withcertainty. Thus, we believe that it is possible that in at least asignificant fraction of complexes Chl 523 could remain boundto the protein (as a Chl, rather than a Pheo) even after conversionof its ligand to Tyr. Indeed, Chl 1119 in the 1JB0 structure ofPSI53 is ligated by a water molecule which appears to be fixedin place by the side chain OH of a Tyr residue (Tyr 315A),providing a convenient example of how this His-less bindingmight take place via Tyr. Although it is of course merelyspeculation, it might even be argued that the apparent H-bondbetween the phytyl tail ester of Chl 523 and His 9B (the ligandof Chl 524) might facilitate the tight binding of Chl 523 in itsprotein pocket, despite the mutation of its ligand.
A second point to consider is that the fact that the fluorescencemeasurements of Shen and Vermaas were conducted on thyla-koid membranes, rather than on the isolated CP47 protein, makesthe data somewhat difficult to interpret in a straightforwardmanner. The most obvious difficulty is that it is impossible totell whether the CP47 complex has even folded properly, leadingto ambiguities as to whether observed spectral changes are dueto specific changes in the lowest-energy state or simply todestabilization of the entire complex (see above). While themutant strain in which Shen and Vermaas prepared their sampleswas free of PSI complexes (which simplifies the measuredspectra), this does not eliminate the complex interactions of PSII with various other antenna complexes which absorb and emit(or transfer energy) close to the probed spectral range. Giventhe complexity of this system, we feel that a direct interpretationof the F695/F685 ratio as an accurate reflection of the intensityof the 695 nm state in the isolated CP47 complex is somewhatquestionable. Indeed, the ratio of the 695 nm/685 nm emissionpeak intensities has recently been employed as a tool to studythe effects of UV-A radiation on PS II supercomplex structureand energy transfer efficiency in various (nonmutant) species,54
clearly demonstrating that this ratio is sensitive to a variety ofchanges in the intact thylakoid membrane structure and orga-nization (e.g., EET between various complexes) and not simplyto the actual intensities of CP47, CP43, and RC emission peaks fromthe respective isolated complexes. Finally, we note that none of thepapers discussing emission spectra of the CP47,21,22,55 PS II core,56,57
PS II particles,58 and/or thylakoid membranes59 report the irradia-tion dose (i.e., laser intensity times the integration time used togenerate fluorescence spectra36). The latter, along with our
findings20 that the fluorescence maximum of native CP47 (andPS II core; unpublished observation) shifts blue at higherirradiation doses, further complicates a clear-cut interpretationof the previously published emission spectra discussed above.
In summary, while we do not mean to dispute the results ofShen and Vermaas, we feel that there is room for a somewhatdifferent interpretation of their data than has been made in thepast. Indeed, we feel that the mutational study results are inlarge part quite consistent with the interpretation we providehere. It would be very interesting to see a new series of mutationstudies performed on the CP47 complex in which each of the16 Chl ligands in CP47 (possibly excepting Chl 517 which doesnot have a clearly assignable ligand) were mutated. Such a studywould be especially useful in that, since Shen and Vermaas werelimited by the lack of a crystal structure to guide them in theirselection of ligands for mutation, a number of CP47 Chl ligandshave never to our knowledge been selectively mutated (namely,those corresponding to Chls 511, 514, 517, 518, 521, and 522).
Possible Implications of Our Findings on the Structure-Function Relationship of Chls in the CP47 Complex. Perhapsthe most significant question raised by our findings in the presentwork and in ref 20 is the physiological significance of themultiple low-energy traps in CP47 which give rise to multiplefluorescence bands in various samples (see ref 20 for a detaileddiscussion). As demonstrated in this work and in ref 20, withproper handling, CP47 samples can be prepared with only onefluorescing trap state at low temperature. The presence ofadditional emission bands near 685 and 691 nm in many samplesraises the question of whether these variably emitting states areever present in “native” CP47 complexes (and therefore maybe relevant for EET in ViVo, e.g., indicating a conformational“switch” between two forms) or whether they are simplyartifacts due to destabilization or denaturation of the complexduring isolation. In this regard, it is interesting to note thedifferent conclusions reached by groups studying emissionheterogeneity using time-resolved fluorescence for isolatedantenna complexes10 (including CP47) and for PS II corepreparations.12 Huyer et al.10 suggested that the two fluorescencebands they observed in isolated CP47 complexes (near 685 and690 nm, respectively; most likely the third band at 695 nm wasnot resolved) can be assigned to different conformations of theCP47 protein within a sample. In contrast, Komura et al.12
tentatively assigned all three bands (685, 689, and 695 nm) tonative complexes in the PS II core, either CP43 or CP47 (i.e.,a given CP47 complex possesses low energy traps at both 695nm and either 689 or 685 nm). In either case, unfortunately, itis still unclear whether these bands are relevant in ViVo or aresimply artifacts of sample isolation and handling. In the end,only further experimental work can answer this question.
As a result, although a detailed analysis of the structure-function relationship in CP47 must await further work andconfirmation of the results presented here, a few comments arein order. As discussed above, although our studies do notconfirm the finding of ref 14 that Chl 526 is the red-mostpigment with a localized excited state, we do find that thispigment is significantly red-shifted (to 686.7 nm) and plays animportant role in this complex, as also suggested by mutationalstudies.51,52 Instead, we propose that Chl 523 residing betweenthe stromal and lumenal layers shows the largest contribution(77%) to the lowest-energy state along with Chl 526 (11.2%)and two Chls located in the near vicinity of the RC, i.e., Chl521 (5.6%) and Chl 524, (2.2%). Instead, Chl 526 contributesmost strongly to the second excitonic state (60.1%). This Chlcould still account for the absence of transient holes near
11896 J. Phys. Chem. B, Vol. 114, No. 36, 2010 Reppert et al.

688-693 nm,20 as previously suggested by Raszewski andRenger,14 although the lowest state pigment Chl 523 is also inreasonably close proximity to carotenoids. Our results suggestthat Chl 523 is likely the energy sink for transfer to the RC atlow temperatures, while Chl 526 (which is on the edge of thecomplex, quite far from the RC) could facilitate energy transferfrom the peripheral antenna; of course, the connection of theselow-temperature assignments to function in ViVo must beconfirmed by room temperature studies. It is interesting tospeculate that, if there is in fact a conformational “switch”regulating fluorescence from the lowest energy states, it isfeasible that fluorescence from Chl 526 could indicate a slow-down of EET to the RC. If such a mechanism were active atecological temperatures, it could provide a convenient meansof dissipating excess energy safely under conditions of highlight intensity. Although feasible, this tentative proposal needsto be tested by both experimental and modeling studies.
Concluding Remarks
We have demonstrated that HB spectra obtained for theisolated CP4336 and CP47 complex20 are in excellent agreementwith HB spectra obtained in the intact PS II core complex (whichconsists of CP43, CP47, and the RC). This strongly indicatesthat the spectra presented in ref 20 and modeled in thismanuscript correspond to intact CP47 as argued in ref 20. Usingthis experimental data, the excitonic structure of the intact CP47complex was probed by Monte Carlo simulations using a fittingalgorithm that provided very good fits to absorption, emission,and persistent HB spectra. CD and LD spectra have not beenincluded in simultaneous fitting, as such spectra have not yetbeen obtained for intact CP47 complexes. A new set of siteenergies for the CP47 Chls is provided, and implications forthe excitonic structure of intact CP47 complexes are discussed.
Extensive calculations suggest that the lowest energy state(A1) in native CP47 is not localized exclusively on Chl 526(Chl 29),4 although this pigment partially contributes (∼11%);it appears instead that Chl 523 (Chl 26)4 provides a largecontribution (∼77%) to this state. We hasten to add that,although our model provides a reasonable explanation of ourdata, we do not assert that our site energies are perfect. Theseparameters, especially for the Chls contributing to the highenergy of the absorption spectrum, have to be further testedand optimized to provide a good description of both static anddynamic spectra/data; in particular, we caution that, althoughwe have tested hundreds of thousands of site energy combina-tions, the entire space of parameters has not been nearlyexhausted. On the basis of our extensive calculations, in fact,we believe that without a large number of experimentalconstraints it will be impossible to unequivocally determinepigment site energies from spectra alone; only in combinationwith experimental constraints (as begun in this work) can onehope to determine realistic pigment site energies. Nevertheless,on the basis of our data, we believe that we can conclude thefollowing (in order of increasing strength of argument): (1) itis very likely that Chl 523 contributes strongly to the lowestenergy state in order to provide the proper oscillator strengthfor the first excitonic band; (2) if Chl 526 contributes to thelowest energy region (as suggested previously14 in conjunctionwith mutation data), then it most likely contributes to the secondexcitonic state which has a much higher oscillator strength thanthe lowest state; in any case, it is unlikely that Chl 526contributes solely to the lowest energy state, since it is tooweakly coupled to other pigments to produce either the lowoscillator strength needed to fit the absorption and red-shifted
emission spectra or the excitonic features of the persistent HBspectrum; (3) regardless of these specific assignments, the Chlscontributing to the lowest state must be strongly coupled topigments absorbing near the absorption maximum in order toexplain the HB spectrum (not to mention its low oscillatorstrength), suggesting that the lowest state belongs to the“stromal” domain of strongly coupled pigments. We anticipatethat these assignments can be further refined and tested by acombination of more advanced theory with new CD, LD, andtime-resolved spectra, along with mutation studies and furtherbiochemical characterization of intact isolated CP47 complexes.
Acknowledgment. This work was supported by a U.S.Department of Energy (US-DOE) EPSCoR grant (DE-FG02-08ER46504) and in part by the supplements provided by theOffice of Basic Energy Sciences (US-DOE) and the KansasTechnology Enterprise Corporation (KTEC). Partial support forK.A. was also provided by the Kansas State University CSEGraduate Assistantship Award. Samples of PS II core werekindly provided by Dr. Elmars Krausz (Australian NationalUniversity, Canberra, Australia).
References and Notes
(1) Photosystem II: The Light-DriVen Water: Plastoquinone Oxi-doreductase; Wydrzynski, T., Satoh, K., Eds.; Springer: Dordrecht, TheNetherlands, 2005.
(2) Kern, J.; Renger, G. Photosynth. Res. 2007, 94, 183–202.(3) Guskov, A.; Kern, J.; Gabdulkhakov, A.; Broser, M.; Zouni, A.;
Saenger, W. Nat. Struct. Mol. Biol. 2009, 16, 334–342.(4) Loll, B.; Kern, J.; Saenger, W.; Zouni, A.; Biesiadka, J. Nature
2005, 438, 1040–1044.(5) Muh, F.; Renger, T.; Zouni, A. Plant Physiol. Biochem. 2008, 46,
238–264.(6) Shen, J.-R.; Henmi, T.; Kamiya, N. In Photosynthetic Protein
Complexes; Fromme, P., Ed.; Wiley-VCH: Germany, 2008; Chapter 4, pp83-106.
(7) Årskold, S. P.; Prince, B. J.; Krausz, E.; Smith, P. J.; Pace, R. J.;Picorel, R.; Seibert, M. J. Lumin. 2004, 108, 97–100, 131-136.
(8) Groot, M.; Frese, R. N.; de Weerd, F. L.; Bromek, K.; Pettersson,Å.; Peterman, E. J. G.; van Stokkum, I. H. M.; van Grondelle, R.; Dekker,J. P. Biophys. J. 1999, 77, 3328–3340.
(9) Andrizhiyevskaya, E. G.; Frolov, D.; van Grondelle, R.; Dekker,J. P. Phys. Chem. Chem. Phys. 2004, 6, 4810–4819.
(10) Huyer, J.; Eckert, H.-J.; Irrgang, K.-D.; Miao, J.; Eichler, H.-J.;Renger, G. J. Phys. Chem. B 2004, 108, 3326–3334.
(11) de Paula, J. C.; Liefshitz, A.; Hinsley, S.; Lin, W.; Chopra, V.;Long, K.; Williams, S. A.; Betts, S.; Yocum, C. F. Biochemistry 1994, 33,1455–1466.
(12) Komura, M.; Shibata, Y.; Itoh, S. Biochim. Biophys. Acta, Bioenerg.2006, 1757, 1657–1668.
(13) Miloslavina, Y.; Szczepaniak, M.; Muller, M. G.; Sander, J.;Nowaczyk, M.; Rogner, M.; Holzwarth, A. R. Biochemistry 2006, 45, 2436–2442.
(14) Raszewski, G.; Renger, T. J. Am. Chem. Soc. 2008, 130, 4431–4446.
(15) de Weerd, F. L.; Van Stokkum, I. H. M.; Van Amerongen, H.;Dekker, J. P.; van Grondelle, R. Biophys. J. 2002, 82, 1586–1597.
(16) Adolphs, J.; Muh, F.; Madjet, M. E.-A.; Renger, T. Photosynth.Res. 2008, 95, 197–209.
(17) Eccles, J.; Honig, B. Proc. Natl. Acad. Sci. U.S.A. 1983, 80, 4959–4962.
(18) Vasil’ev, S.; Orth, P.; Zouni, A.; Owens, T. G.; Bruce, D. Proc.Natl. Acad. Sci. U.S.A. 2001, 98, 8602–8607.
(19) Holzwarth, A. R.; Muller, M. G.; Reus, M.; Nowaczyk, M.; Sander,J.; Rogner, M. Proc. Natl. Acad. Sci. U.S.A. 2006, 103, 6895. Holzwarth,A. R.; Muller, M. G.; Reus, M.; Nowaczyk, M.; Sander, J.; Rogner, M.Chem. Soc. 2010, 132, 4214–4229, 6900.
(20) Neupane, B.; Dang, N. C.; Acharya, K.; Reppert, M.; Zazubovich,V.; Picorel, R.; Seibert, M.; Jankowiak, R. J. Am. Chem. Soc. 2010, 132,4214–4229.
(21) den Hartog, F. T. H.; Dekker, J. P.; van Grondelle, R.; Volker, S.J. Phys. Chem. B 1998, 102, 11007–11016.
(22) Polıvka, T.; Kroh, P.; Psencik, J.; Engst, D.; Komenda, J.; Hala, J.J. Lumin. 1997, 72-74, 600–602.
(23) Madjet, M. E.; Abdurahman, A.; Renger, T. J. Phys. Chem. B 2006,110, 17268–17281.
CP47 Antenna Protein Complex of Photosystem II J. Phys. Chem. B, Vol. 114, No. 36, 2010 11897

(24) Reppert, M.; Zazubovich, V.; Dang, N. C.; Seibert, M.; Jankowiak,R. J. Phys. Chem. B 2008, 112, 9934–9947.
(25) Wendling, M.; Pullerits, T.; Przyjalgowski, M. A.; Vulto, S. I. E.;Aartsma, T. J.; van Grondelle, R.; van Amerongen, H. J. Phys. Chem. B2000, 104, 5825–5831.
(26) Novoderezhkin, V. I.; Palacios, M. A.; van Amerongen, H.; vanGrondelle, R. J. Phys. Chem. B 2004, 108, 10363–10375.
(27) Renger, T.; Marcus, R. A. J. Phys. Chem. B 2002, 116, 9997–10019.
(28) Raetsep, M.; Pieper, J.; Irrgang, K.; Freiberg, A. J. Phys. Chem. B2008, 112, 110–118.
(29) Jankowiak, R.; Tang, D.; Small, G. J.; Seibert, M. J. Phys. Chem.1989, 93, 1649–1654.
(30) Tang, D.; Jankowiak, R.; Seibert, M.; Small, G. J. Photosynth. Res.1991, 27, 19–29.
(31) Chang, H.-C.; Jankowiak, R.; Reddy, N. R. S.; Small, G. J. Chem.Phys. 1995, 197, 307–321.
(32) Hughes, J. L.; Prince, B. J.; Krausz, E.; Smith, P. J.; Pace, R. J.;Riesen, H. J. Phys. Chem. B 2004, 108, 10428–10439.
(33) Hughes, J. L.; Krausz, E. J. Lumin. 2007, 127, 239–244.(34) Hughes, J. L.; Smith, P. J.; Pace, R. J.; Krausz, E. Biochim. Biophys.
Acta 2006, 1757, 841–851.(35) Hughes, J. L.; Picorel, R.; Seibert, M.; Krausz, E. Biochemistry
2006, 45, 12345–12357, and references therein.(36) Dang, N. C.; Zazubovich, V.; Reppert, M.; Neupane, B.; Picorel,
R.; Seibert, M.; Jankowiak, R. J. Phys. Chem. B 2008, 112, 9921–9933.(37) Jentzen, W.; Song, X.; Shelnutt, J. A. J. Phys. Chem. B 1997, 101,
1684–1699.(38) Zucchelli, G.; Brogioli, D.; Casazza, A. P.; Garlaschi, F. M.;
Jennings, R. C. Biophys. J. 2007, 93, 2240–2254.(39) Saito, K.; Kikuchi, T.; Nakayama, M.; Mukai, K.; Sumi, H. J.
Photochem. Photobiol., A 2006, 178, 271–280.(40) Reppert, M.; Naibo, V.; Jankowiak, R. J. Chem. Phys. 2009, 131,
234104/1–234104/11.(41) Vulto, S. I. E.; de Baat, M. A.; Louwe, R. J. W.; Permentier, H. P.;
Neef, T.; Miller, M.; van Amerongen, H.; Aartsma, T. J. J. Phys. Chem. B1998, 102, 9577–9582.
(42) Renger, T.; Trostmann, I.; Theiss, C.; Madjet, M. E.; Richter, M.;Paulsen, H.; Eichler, H. J.; Knorr, A.; Renger, G. J. Phys. Chem. B 2007,111, 10487–10501.
(43) Zhang, W. M.; Meier, T.; Chernyak, V.; Mukamel, S. J. Chem.Phys. 2008, 108, 7763–7774.
(44) Schroder, J. Chem. Phys. 2006, 124, 084903.(45) Ishizaki, A.; Fleming, G. R. J. Chem. Phys. 2009, 130, 234110/
1–234110/8.(46) Ishizaki, A.; Fleming, G. R. J. Chem. Phys. 2009, 130, 234111/
1–234111/10.(47) Adolphs, J.; Renger, T. Biophys. J. 2006, 91, 2778–2797.(48) de Weerd, F. L.; Palacios, M. A.; Andrizhiyevskaya, E. G.; Dekker,
J. P.; van Grondelle, R. Biochemistry 2002, 41, 15224–15233.(49) Krawczyk, S. Biochim. Biophys. Acta, Bioenerg. 1989, 976, 140–
149.(50) Groot, M.; Breton, J.; van Wilderen, L.; Dekker, J. P.; van
Grondelle, R. J. Phys. Chem. B 2004, 108, 8001–8006.(51) Shen, G.; Vermaas, W. F. J. Biochemistry 1994, 33, 7379–7388.(52) Manna, P.; Vermaas, W. Eur. J. Biochem. 1997, 247, 666–672.(53) Jordan, P.; Fromme, P.; Witt, H. T.; Klukas, O.; Seanger, W.;
Krauss, N. Nature 2001, 411, 909–917.(54) Ivanova, P. I.; Dobrikova, A. G.; Taneva, S. G.; Apostolova, E. L.
Radiat. EnViron. Biophys. 2008, 47, 169–177.(55) Van Dorssen, R. J.; Breton, J.; Plijter, J. J.; Satoh, K.; van Gorkom,
H. J.; Amesz, J. Biochim. Biophys. Acta, Bioenerg. 1987, 893, 267–274.(56) Krausz, E.; Hughes, J. L.; Smith, P.; Pace, R.; Årskold, S. P.
Photochem. Photobiol. Sci. 2005, 4, 744–753.(57) Krausz, E.; Hughes, J. L.; Smith, P. J.; Pace, R. J.; Årskold, S. P.
Photosynth. Res. 2005, 84, 193–199.(58) Dekker, J. P.; Hassoldt, A.; Pettersson, Å.; van Roon, H.; Groot,
M.; van Grondelle, R. In Photosynthesis: from light to biosphere; Mthis,P., Ed.; Kluwer Academic Publishers: Dordrecht, The Netherlands, 1995;Vol. III, pp 53-56.
(59) van Dorssen, R. J.; Plijter, J. J.; Dekker, J. P.; Den Ouden, A.;Amesz, J.; van Gorkom, H. J. Biochim. Biophys. Acta, Bioenerg. 1987,890, 134–143.
JP103995H
11898 J. Phys. Chem. B, Vol. 114, No. 36, 2010 Reppert et al.