Creating the Best Medical Result at the Lowest Necessary Cost
26
Creating the Best Medical Result at the Lowest Necessary Cost Brent C. James, M.D., M.Stat. Chief Quality Officer and Executive Director Intermountain Institute for Healthcare Leadership Intermountain Healthcare Healthy Dialogues Marriott City Center, Salt Lake City, Utah Tuesday, 29 March 2016
-
Upload
khangminh22 -
Category
Documents
-
view
1 -
download
0
Transcript of Creating the Best Medical Result at the Lowest Necessary Cost
Creating the Best Medical Resultat the Lowest Necessary Cost
Brent C. James, M.D., M.Stat.Chief Quality Officer and Executive DirectorIntermountain Institute for Healthcare Leadership
Intermountain HealthcareHealthy Dialogues
Marriott City Center, Salt Lake City, UtahTuesday, 29 March 2016
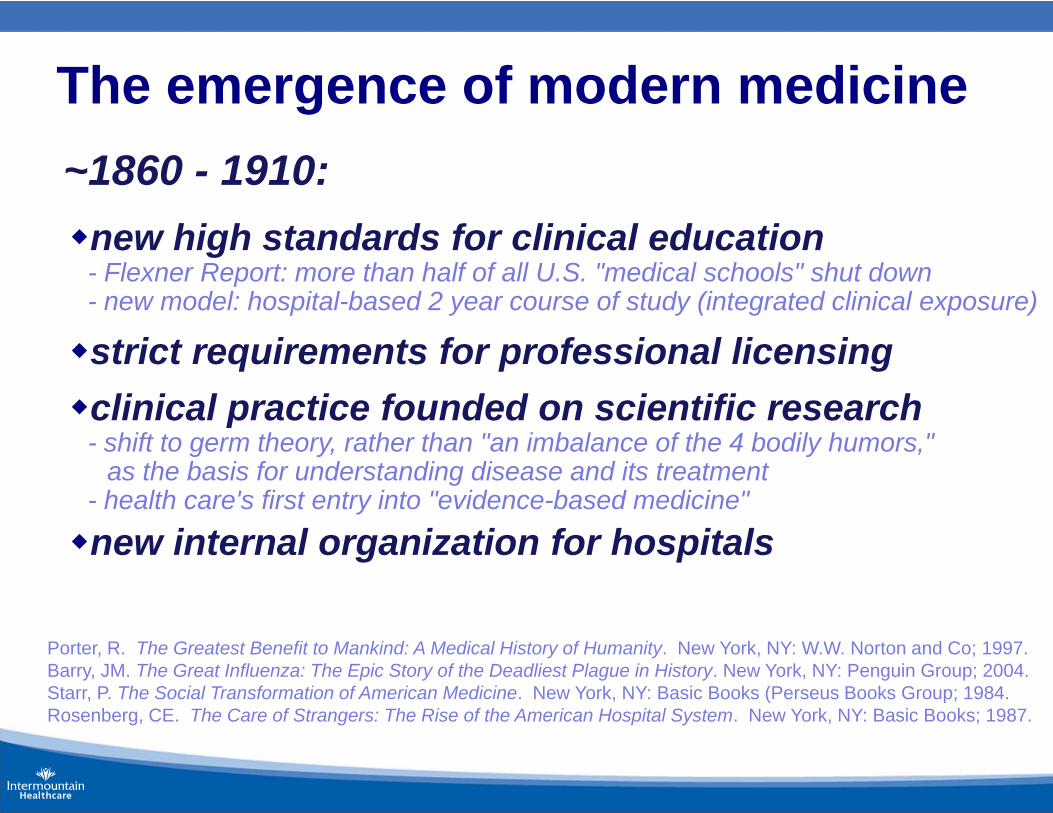
The emergence of modern medicine~1860 - 1910:new high standards for clinical education
- Flexner Report: more than half of all U.S. "medical schools" shut down- new model: hospital-based 2 year course of study (integrated clinical exposure)
strict requirements for professional licensingclinical practice founded on scientific research
- shift to germ theory, rather than "an imbalance of the 4 bodily humors,"as the basis for understanding disease and its treatment
- health care's first entry into "evidence-based medicine"
new internal organization for hospitals
Porter, R. The Greatest Benefit to Mankind: A Medical History of Humanity. New York, NY: W.W. Norton and Co; 1997.Barry, JM. The Great Influenza: The Epic Story of the Deadliest Plague in History. New York, NY: Penguin Group; 2004.Starr, P. The Social Transformation of American Medicine. New York, NY: Basic Books (Perseus Books Group; 1984.Rosenberg, CE. The Care of Strangers: The Rise of the American Hospital System. New York, NY: Basic Books; 1987.
0
25
50
75
100
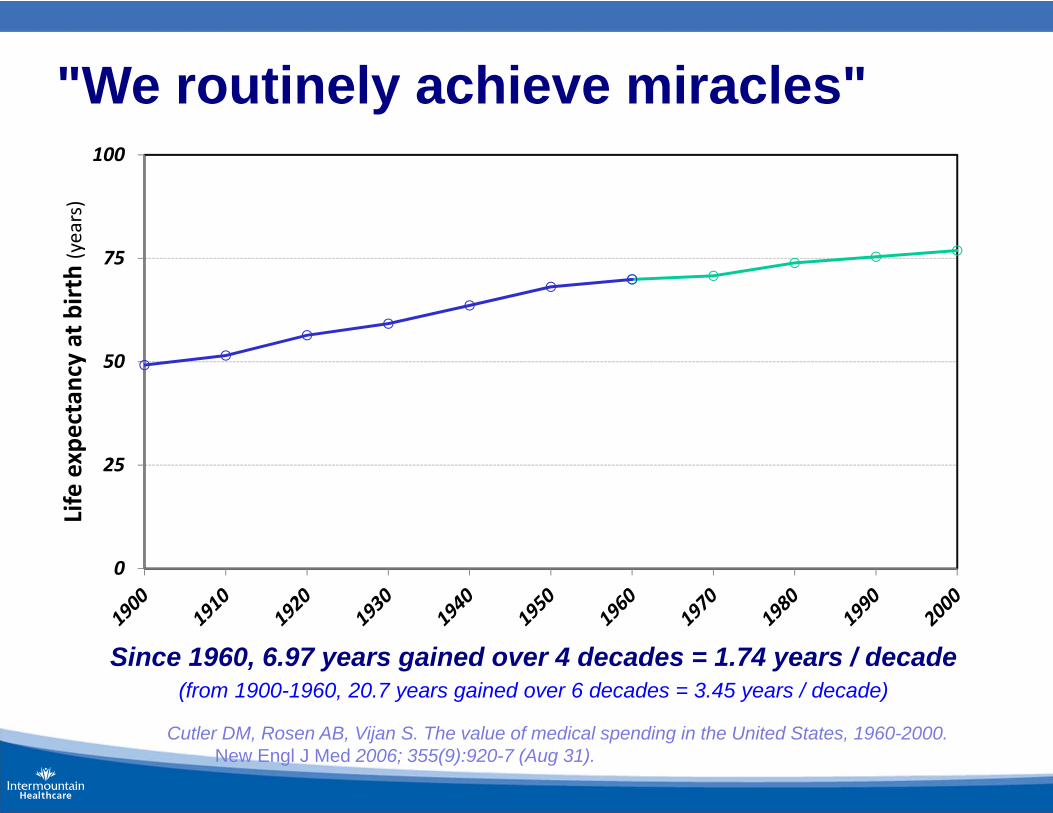
Life expectancy at birth (years)
Since 1960, 6.97 years gained over 4 decades = 1.74 years / decade(from 1900-1960, 20.7 years gained over 6 decades = 3.45 years / decade)
"We routinely achieve miracles"
Cutler DM, Rosen AB, Vijan S. The value of medical spending in the United States, 1960-2000. New Engl J Med 2006; 355(9):920-7 (Aug 31).
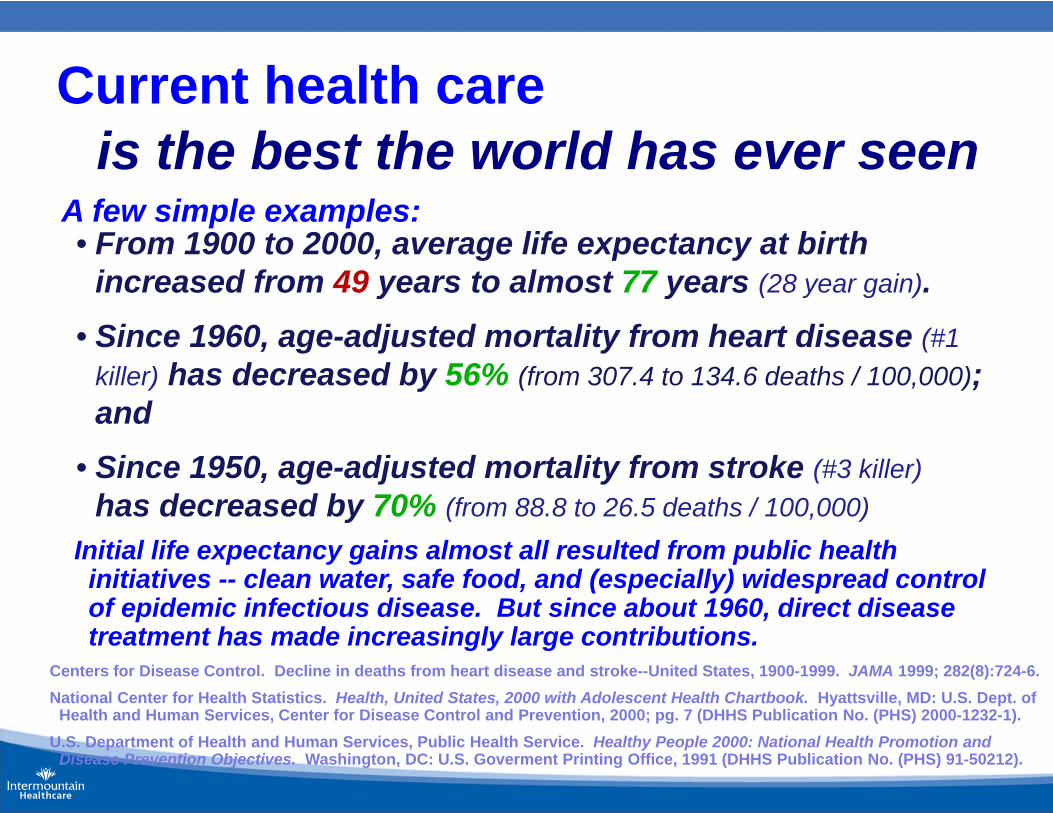
Current health careis the best the world has ever seen
A few simple examples:• From 1900 to 2000, average life expectancy at birth
increased from 49 years to almost 77 years (28 year gain).• Since 1960, age-adjusted mortality from heart disease (#1
killer) has decreased by 56% (from 307.4 to 134.6 deaths / 100,000); and
• Since 1950, age-adjusted mortality from stroke (#3 killer)has decreased by 70% (from 88.8 to 26.5 deaths / 100,000)
Initial life expectancy gains almost all resulted from public health initiatives -- clean water, safe food, and (especially) widespread control of epidemic infectious disease. But since about 1960, direct disease treatment has made increasingly large contributions.
Centers for Disease Control. Decline in deaths from heart disease and stroke--United States, 1900-1999. JAMA 1999; 282(8):724-6.National Center for Health Statistics. Health, United States, 2000 with Adolescent Health Chartbook. Hyattsville, MD: U.S. Dept. of
Health and Human Services, Center for Disease Control and Prevention, 2000; pg. 7 (DHHS Publication No. (PHS) 2000-1232-1).U.S. Department of Health and Human Services, Public Health Service. Healthy People 2000: National Health Promotion and
Disease Prevention Objectives. Washington, DC: U.S. Goverment Printing Office, 1991 (DHHS Publication No. (PHS) 91-50212).
Core idea behind variation research
Apply rigorous measurement tools developed for clinical research
to
routine care delivery performance
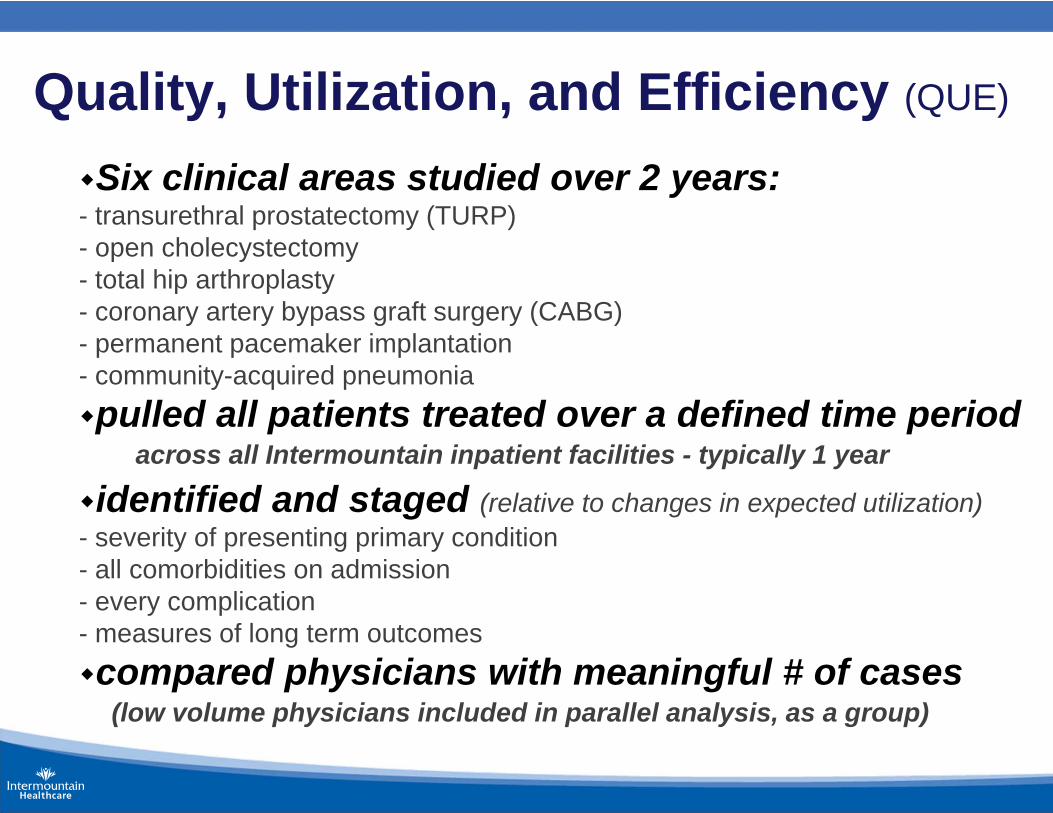
Quality, Utilization, and Efficiency (QUE)
Six clinical areas studied over 2 years:- transurethral prostatectomy (TURP)- open cholecystectomy- total hip arthroplasty- coronary artery bypass graft surgery (CABG)- permanent pacemaker implantation- community-acquired pneumoniapulled all patients treated over a defined time period
across all Intermountain inpatient facilities - typically 1 year
identified and staged (relative to changes in expected utilization)- severity of presenting primary condition- all comorbidities on admission- every complication- measures of long term outcomescompared physicians with meaningful # of cases
(low volume physicians included in parallel analysis, as a group)
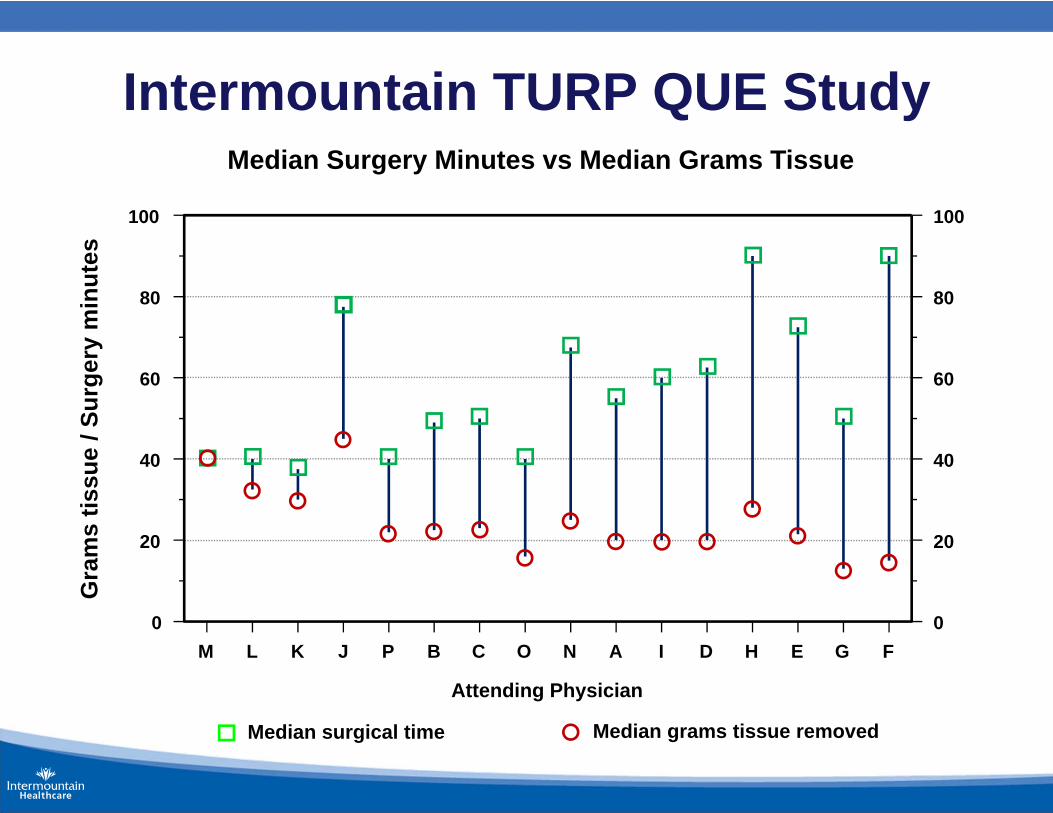
Intermountain TURP QUE StudyMedian Surgery Minutes vs Median Grams Tissue
M L K J P B C O N A I D H E G F0
20
40
60
80
100
0
20
40
60
80
100
Attending Physician
Median surgical time Median grams tissue removed
Gra
ms
tissu
e / S
urge
ry m
inut
es
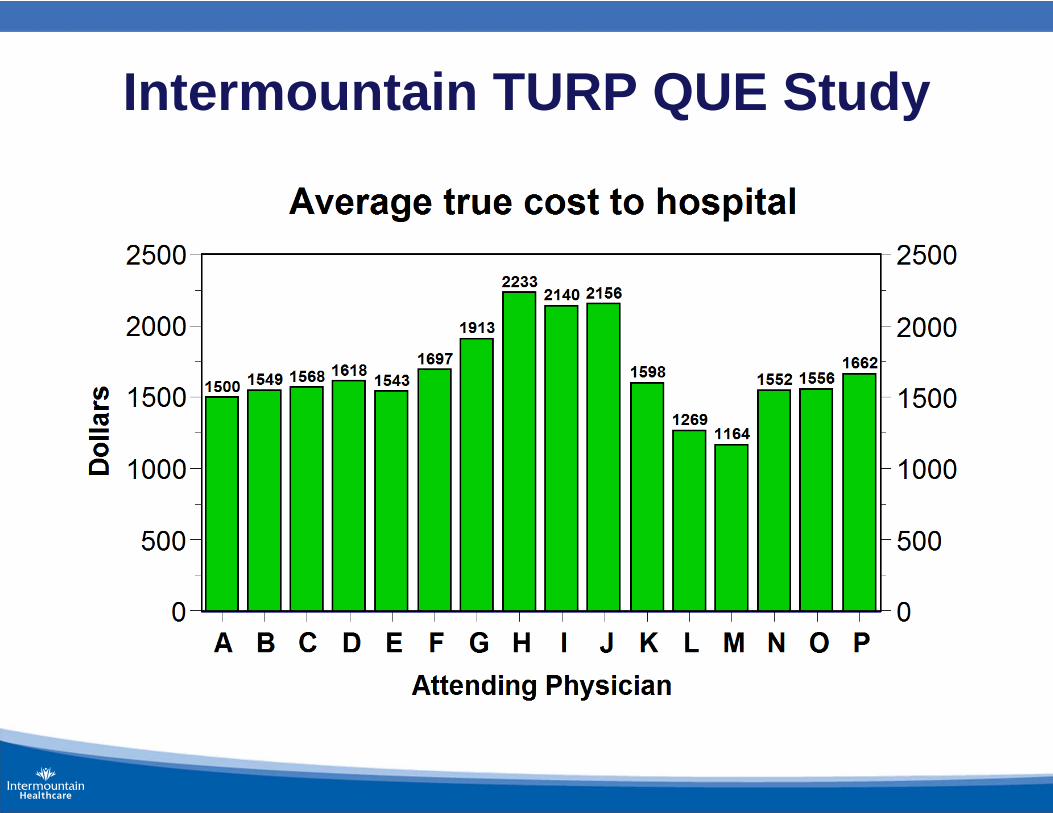
Intermountain TURP QUE Study
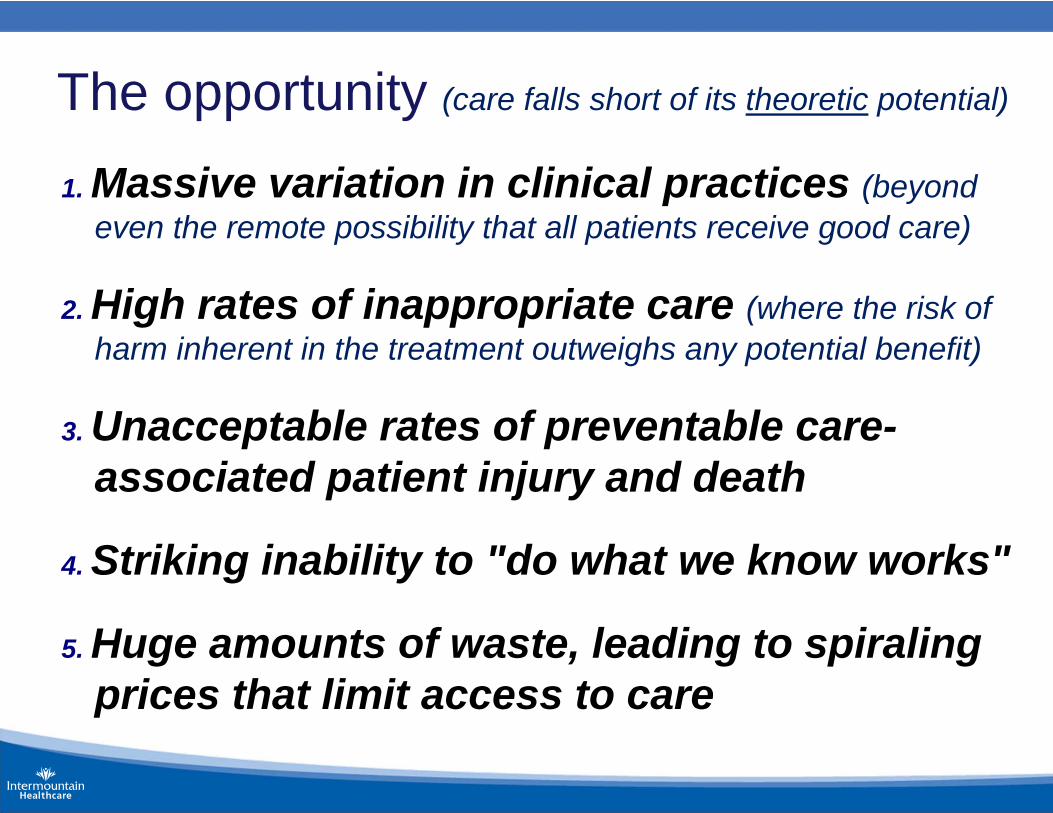
The opportunity (care falls short of its theoretic potential)
1. Massive variation in clinical practices (beyond even the remote possibility that all patients receive good care)
2. High rates of inappropriate care (where the risk of harm inherent in the treatment outweighs any potential benefit)
3. Unacceptable rates of preventable care-associated patient injury and death
4. Striking inability to "do what we know works"
5. Huge amounts of waste, leading to spiraling prices that limit access to care

We routinely achieve miracles butas healing professionals,
we could be much better

We have found proven solutions
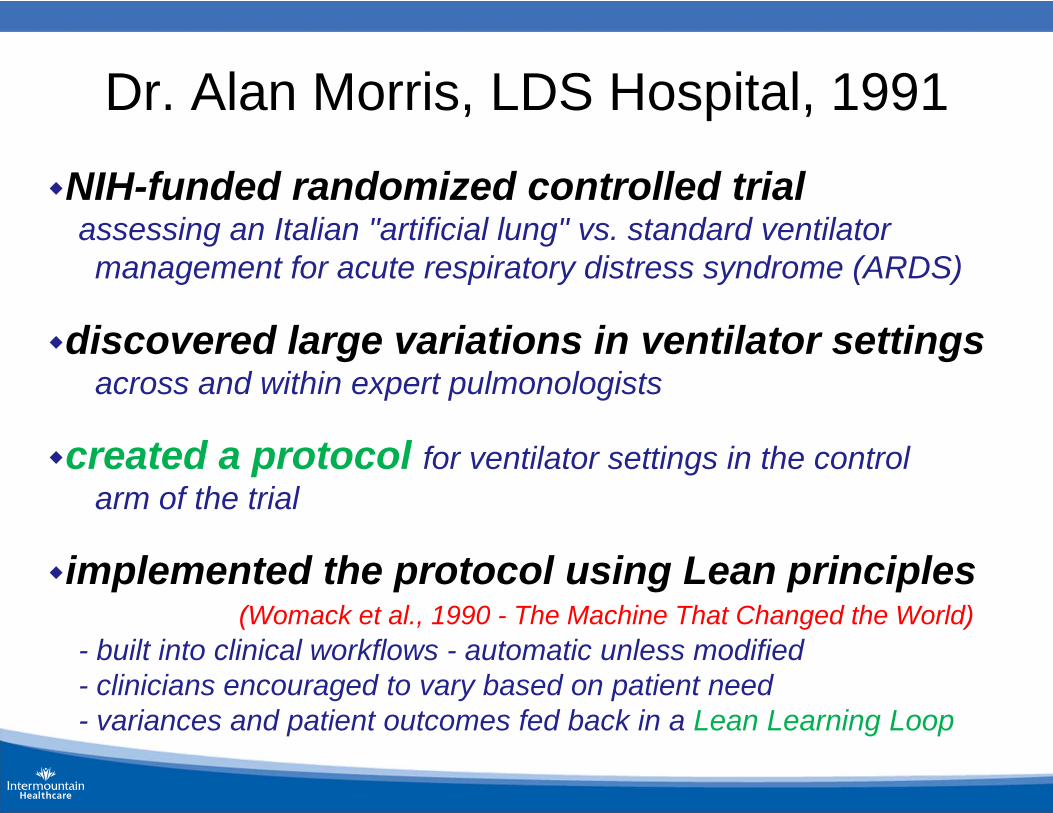
Dr. Alan Morris, LDS Hospital, 1991
NIH-funded randomized controlled trialassessing an Italian "artificial lung" vs. standard ventilator management for acute respiratory distress syndrome (ARDS)
discovered large variations in ventilator settingsacross and within expert pulmonologists
created a protocol for ventilator settings in the controlarm of the trial
implemented the protocol using Lean principles(Womack et al., 1990 - The Machine That Changed the World)
- built into clinical workflows - automatic unless modified- clinicians encouraged to vary based on patient need- variances and patient outcomes fed back in a Lean Learning Loop
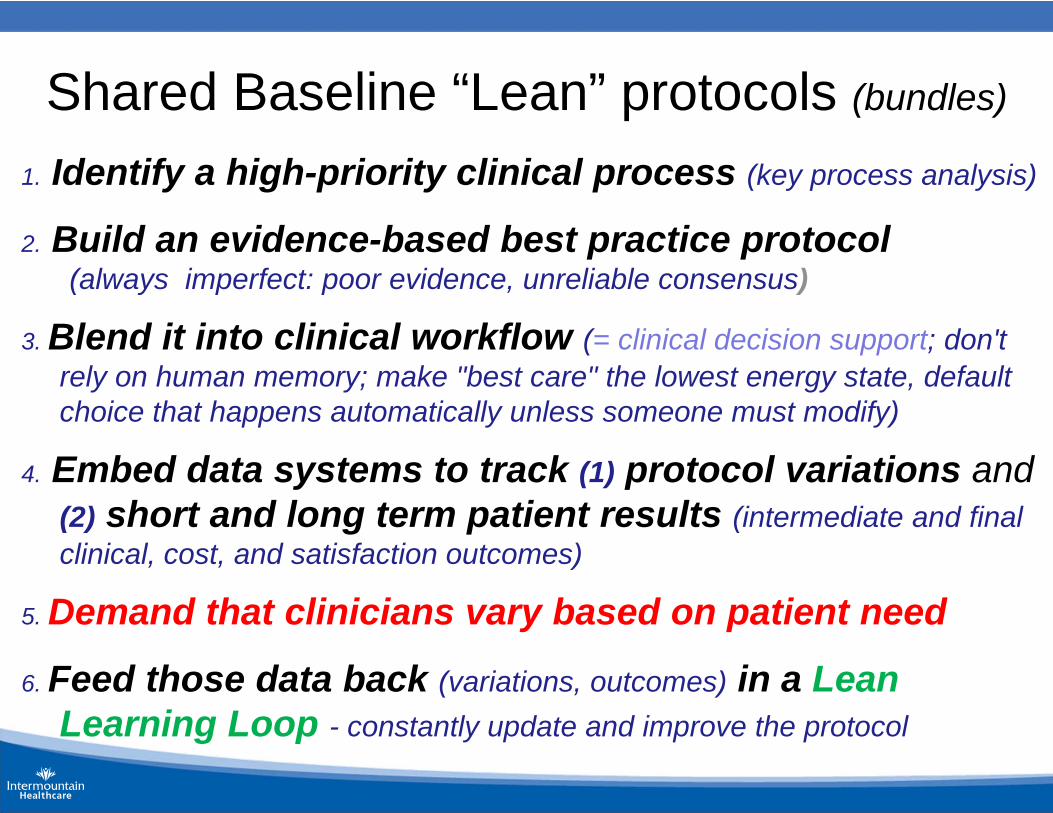
Shared Baseline “Lean” protocols (bundles)
1. Identify a high-priority clinical process (key process analysis)
2. Build an evidence-based best practice protocol(always imperfect: poor evidence, unreliable consensus)
3. Blend it into clinical workflow (= clinical decision support; don't rely on human memory; make "best care" the lowest energy state, default choice that happens automatically unless someone must modify)
4. Embed data systems to track (1) protocol variations and(2) short and long term patient results (intermediate and final clinical, cost, and satisfaction outcomes)
5. Demand that clinicians vary based on patient need
6. Feed those data back (variations, outcomes) in a Lean Learning Loop - constantly update and improve the protocol
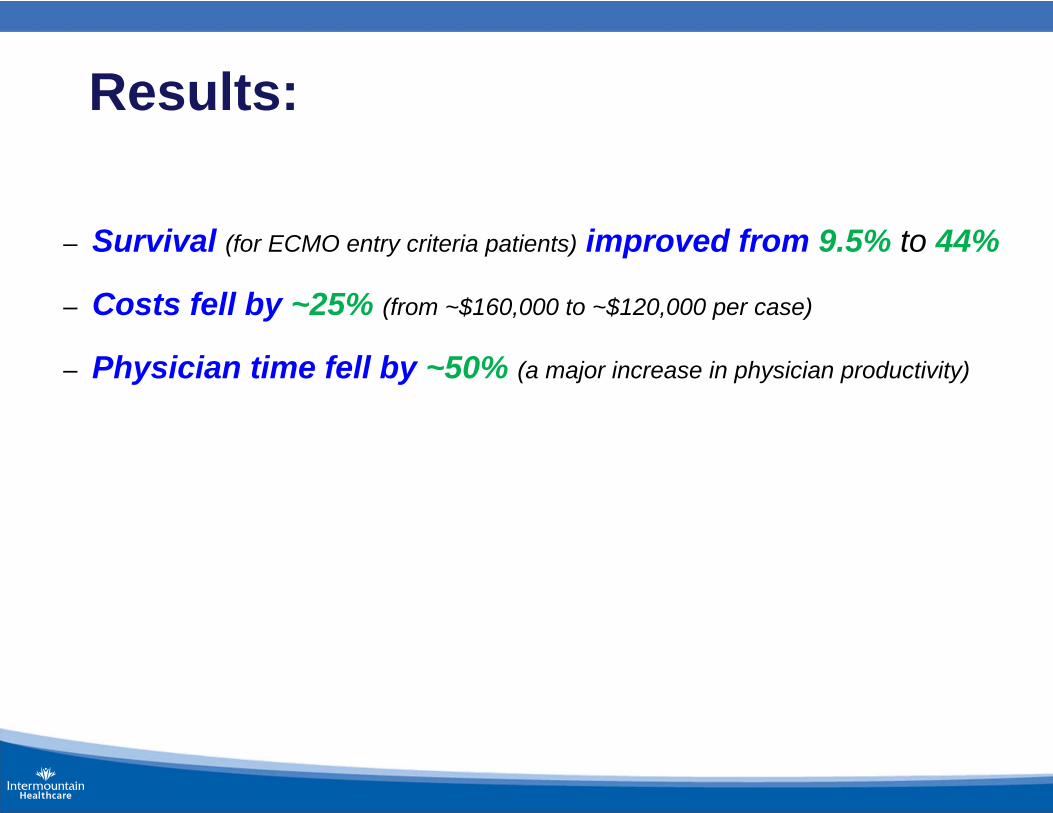
Results:
– Survival (for ECMO entry criteria patients) improved from 9.5% to 44%
– Costs fell by ~25% (from ~$160,000 to ~$120,000 per case)
– Physician time fell by ~50% (a major increase in physician productivity)
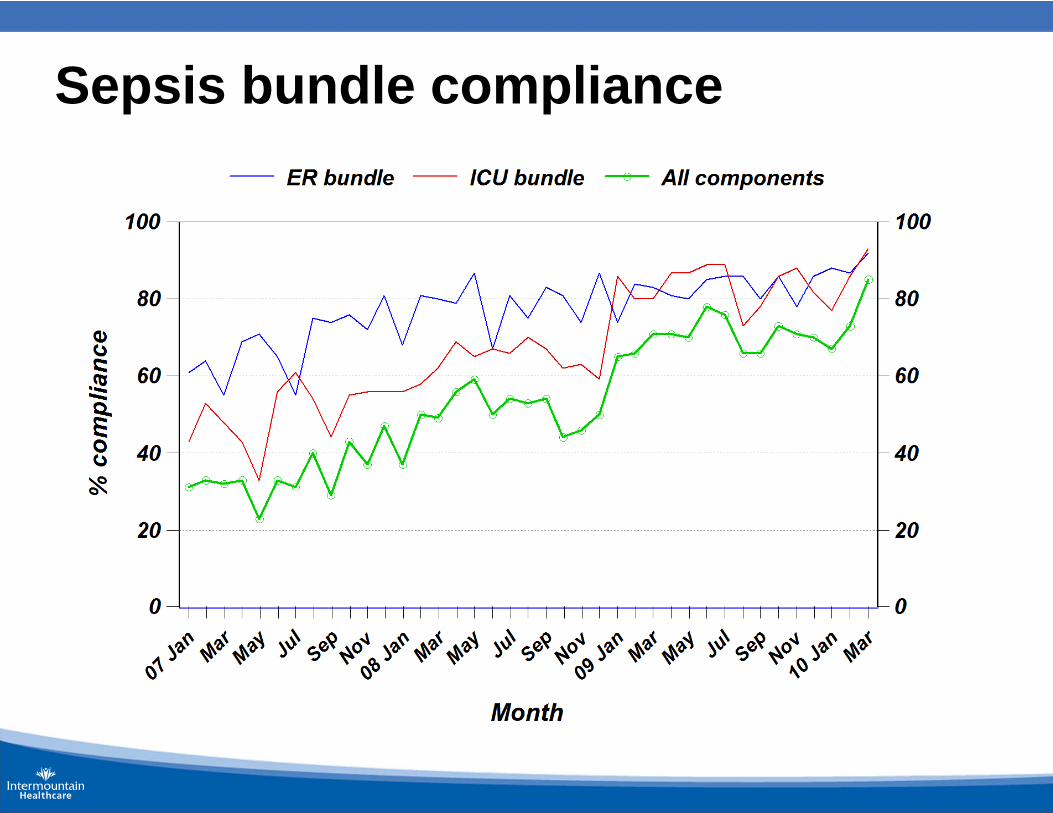
Sepsis bundle compliance
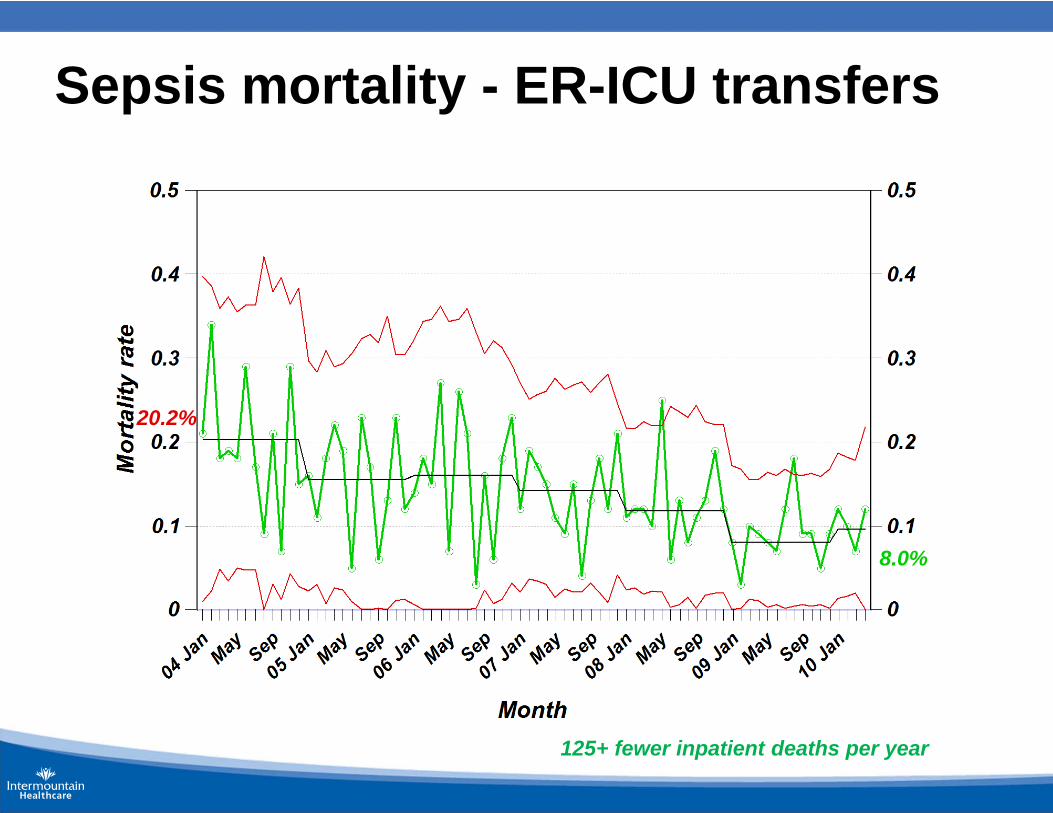
Sepsis mortality - ER-ICU transfers
20.2%
8.0%
125+ fewer inpatient deaths per year

We count our successes in lives
Lesson 1
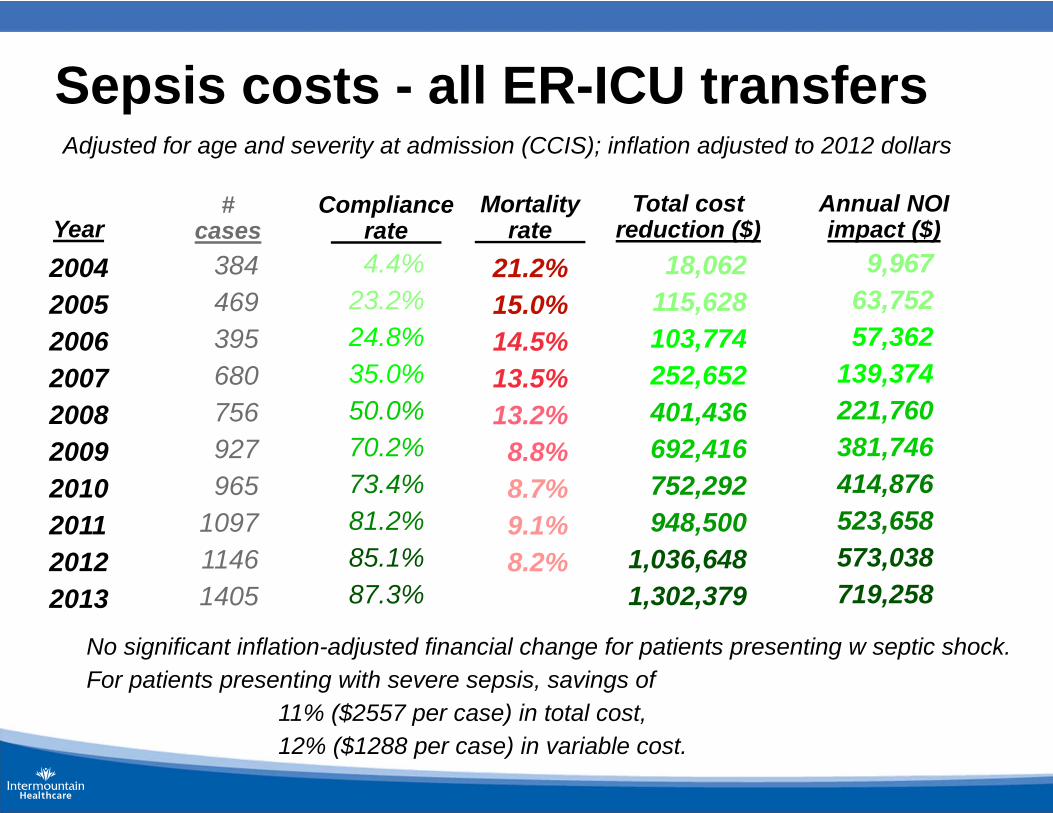
Sepsis costs - all ER-ICU transfers
2004200520062007200820092010201120122013
384469395680756927965
109711461405
4.4%23.2%24.8%35.0%50.0%70.2%73.4%81.2%85.1%87.3%
18,062115,628103,774252,652401,436692,416752,292948,500
1,036,6481,302,379
9,96763,75257,362
139,374221,760381,746414,876523,658573,038719,258
Year#
casesCompliance
rate Total cost
reduction ($)Annual NOI impact ($)
No significant inflation-adjusted financial change for patients presenting w septic shock.For patients presenting with severe sepsis, savings of
11% ($2557 per case) in total cost,12% ($1288 per case) in variable cost.
Adjusted for age and severity at admission (CCIS); inflation adjusted to 2012 dollars
21.2%15.0%14.5%13.5%13.2%
8.8%8.7%9.1%8.2%
Mortalityrate
Most often(but not always)
better care is cheaper care
Lesson 2
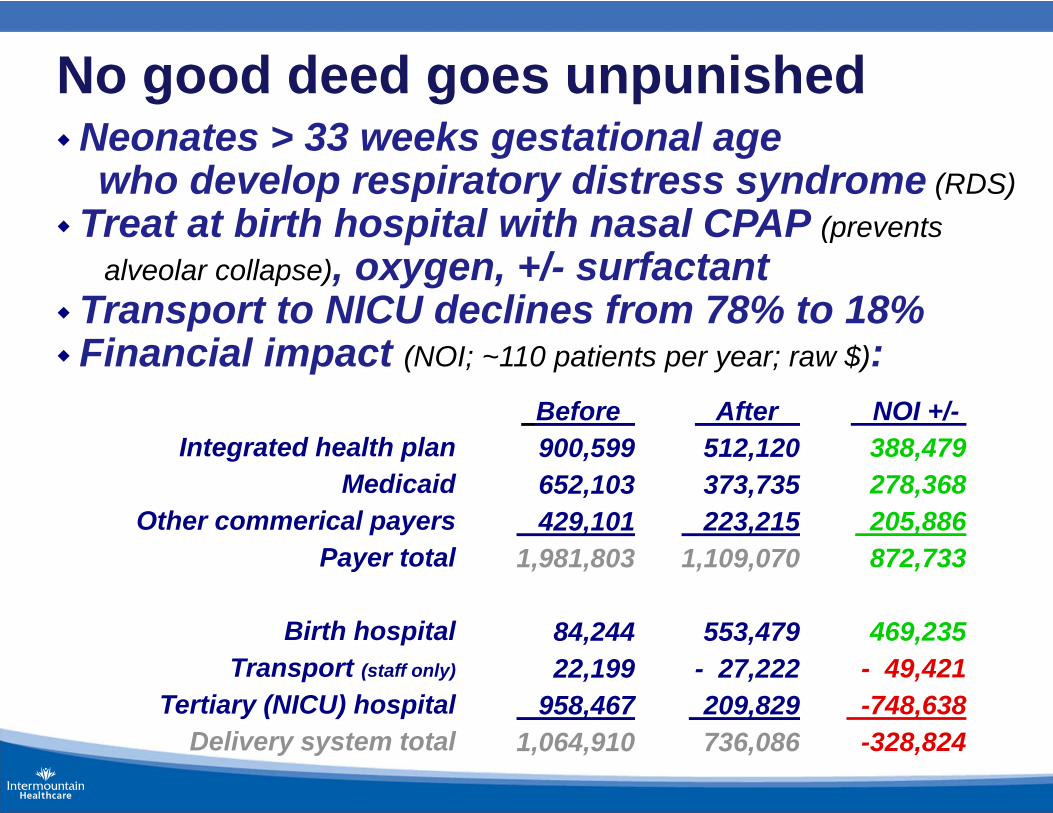
No good deed goes unpunishedNeonates > 33 weeks gestational age
who develop respiratory distress syndrome (RDS)Treat at birth hospital with nasal CPAP (prevents
alveolar collapse), oxygen, +/- surfactantTransport to NICU declines from 78% to 18%Financial impact (NOI; ~110 patients per year; raw $):
Integrated health planMedicaid
Other commerical payersPayer total
Birth hospitalTransport (staff only)
Tertiary (NICU) hospitalDelivery system total
Before 900,599652,103429,101
1,981,803
84,24422,199
958,4671,064,910
After 512,120373,735223,215
1,109,070
553,479- 27,222209,829736,086
NOI +/-388,479278,368205,886872,733
469,235- 49,421-748,638-328,824
Lesson 3
The long-term organizational viability ofclinical quality improvement strategies
requires aligned financial incentives
Without access,“quality” is meaningless;
“Accessible” means “Affordable”
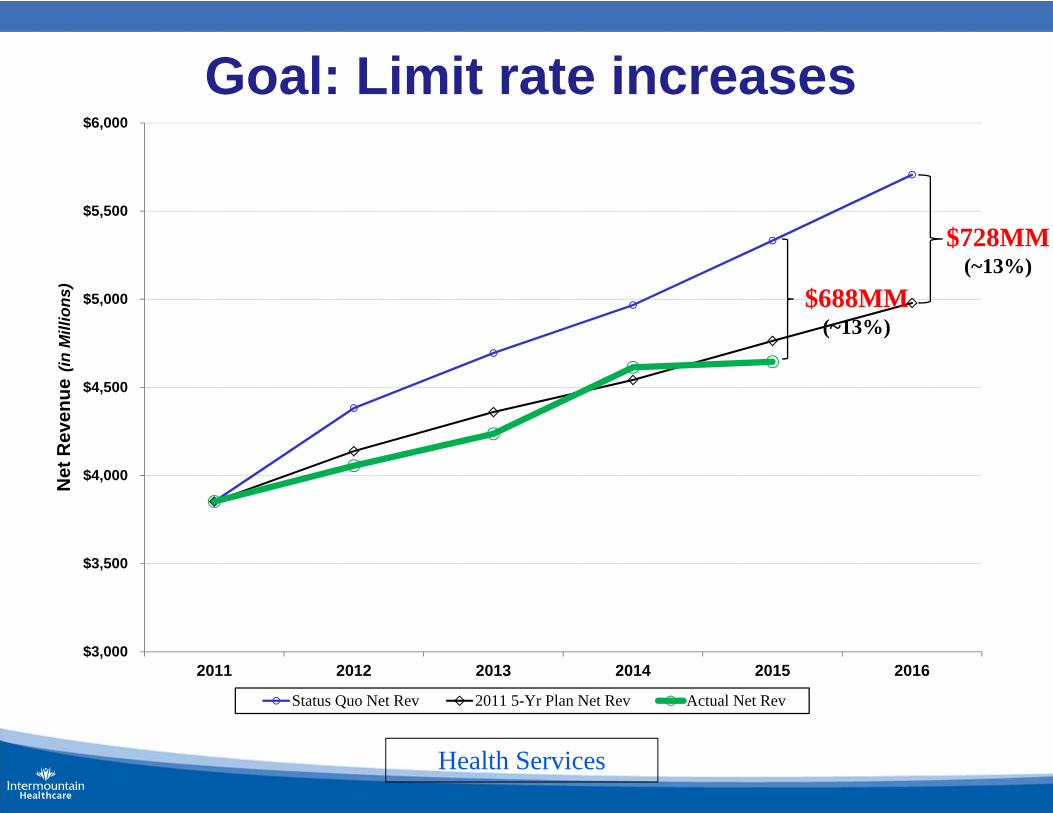
Goal: Limit rate increases
$3,000
$3,500
$4,000
$4,500
$5,000
$5,500
$6,000
2011 2012 2013 2014 2015 2016
Net
Rev
enue
(in M
illio
ns)
Status Quo Net Rev 2011 5-Yr Plan Net Rev Actual Net Rev
Health Services
$728MM(~13%)
$688MM(~13%)
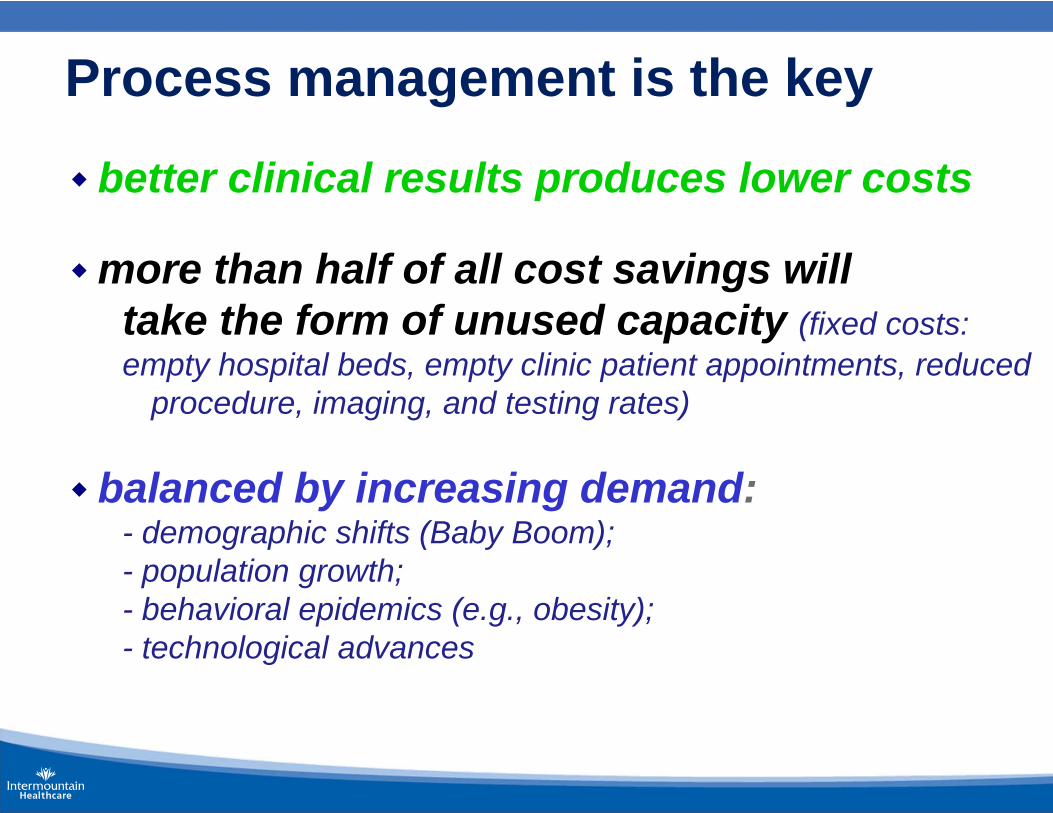
Process management is the key
better clinical results produces lower costs
more than half of all cost savings willtake the form of unused capacity (fixed costs:empty hospital beds, empty clinic patient appointments, reduced
procedure, imaging, and testing rates)
balanced by increasing demand:- demographic shifts (Baby Boom);- population growth;- behavioral epidemics (e.g., obesity);- technological advances
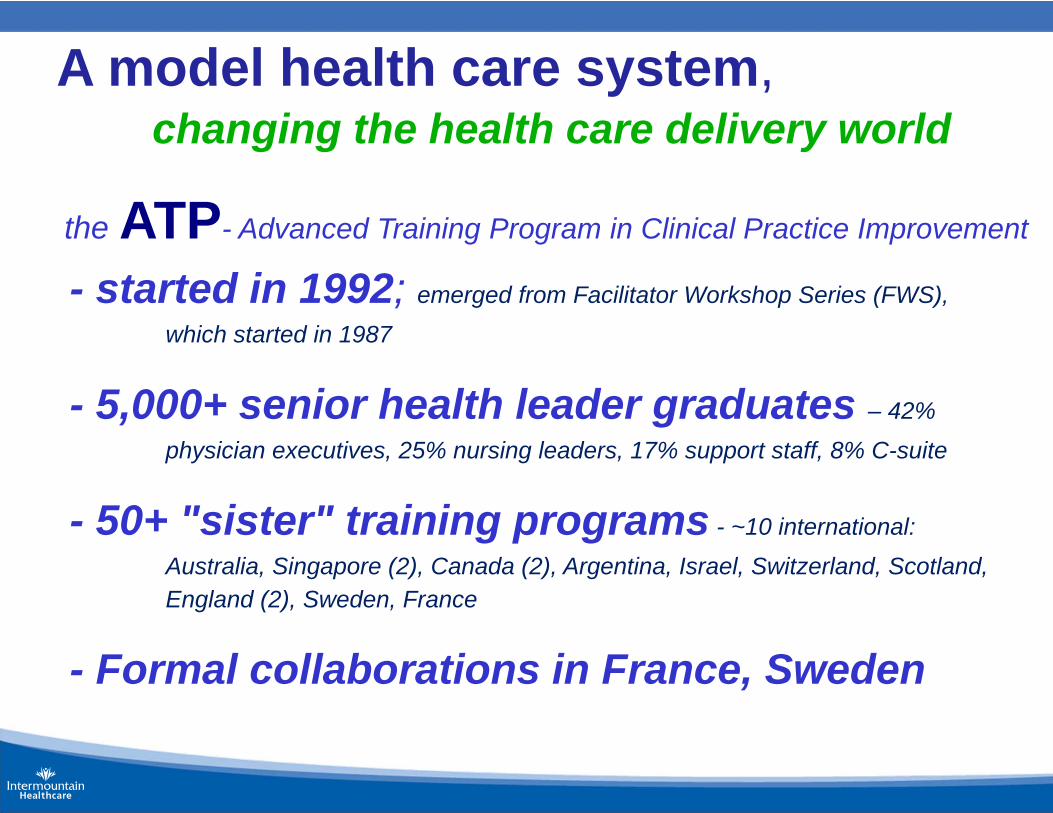
A model health care system,changing the health care delivery world
- started in 1992; emerged from Facilitator Workshop Series (FWS),which started in 1987
- 5,000+ senior health leader graduates – 42% physician executives, 25% nursing leaders, 17% support staff, 8% C-suite
- 50+ "sister" training programs - ~10 international:Australia, Singapore (2), Canada (2), Argentina, Israel, Switzerland, Scotland, England (2), Sweden, France
- Formal collaborations in France, Sweden
the ATP- Advanced Training Program in Clinical Practice Improvement

Better has no limit ...an old Yiddish proverb