2013 result presentation - Wärtsilä
39
© Wärtsilä BJÖRN ROSENGREN, PRESIDENT & CEO 29 JANUARY 2014 2013 RESULT PRESENTATION
-
Upload
khangminh22 -
Category
Documents
-
view
2 -
download
0
Transcript of 2013 result presentation - Wärtsilä

© Wärtsilä
BJÖRN ROSENGREN, PRESIDENT & CEO
29 JANUARY 2014
2013 RESULT PRESENTATION
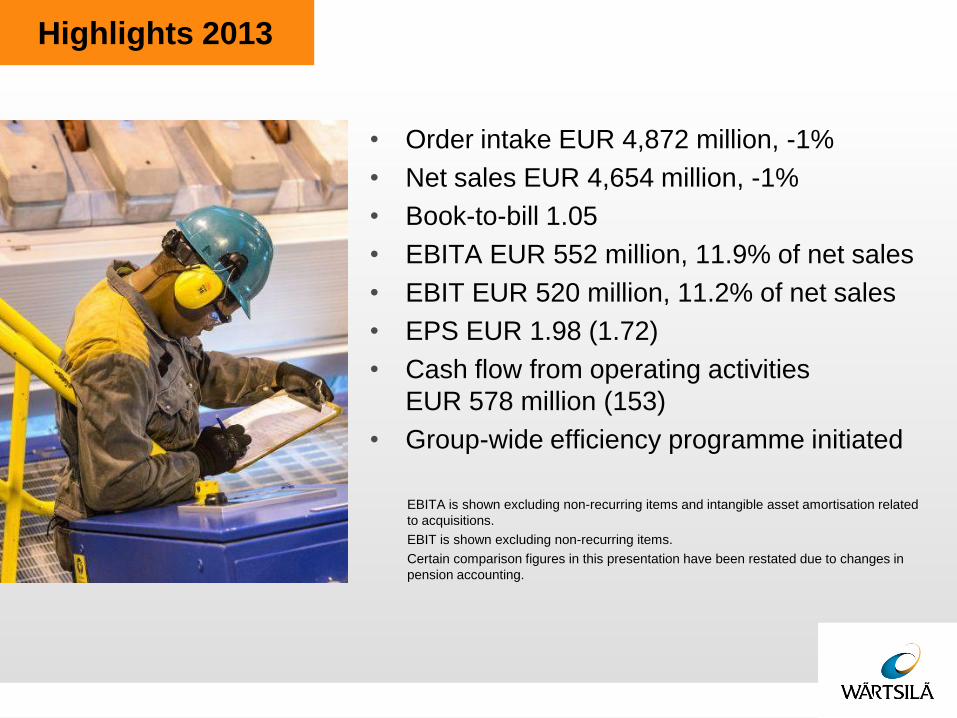
• Order intake EUR 4,872 million, -1%
• Net sales EUR 4,654 million, -1%
• Book-to-bill 1.05
• EBITA EUR 552 million, 11.9% of net sales
• EBIT EUR 520 million, 11.2% of net sales
• EPS EUR 1.98 (1.72)
• Cash flow from operating activities
EUR 578 million (153)
• Group-wide efficiency programme initiated
EBITA is shown excluding non-recurring items and intangible asset amortisation related
to acquisitions.
EBIT is shown excluding non-recurring items.
Certain comparison figures in this presentation have been restated due to changes in
pension accounting.
Highlights 2013
NEW
PIC

© Wärtsilä
0
200
400
600
800
1000
1200
1400
Q4/2012 Q4/2013
0%
-13%
36%
-16%
1,357
MEUR
Fourth quarter development
MEUR
3
Order intake development
0
500
1000
1500
2000
2500
3000
3500
4000
4500
5000
5500
2009 2010 2011 2012 2013
1,351
Q1-Q3 Q4
Power Plants
Ship Power
Services

© Wärtsilä
0
200
400
600
800
1000
1200
1400
1600
Q4/2012 Q4/2013
Net sales in line with our expectations
0
500
1000
1500
2000
2500
3000
3500
4000
4500
5000
5500
2009 2010 2011 2012 2013
-7.6%
-13%
12%
-8%
-5%
0%
-18%
1,533
MEUR
Fourth quarter development
MEUR
1,411
4
Net sales decreased due to unfavourable exchange rates
and delayed deliveries
Power Plants
Ship Power
Services
Q1-Q3 Q4
-1%

© Wärtsilä
Net sales by business 1-3/2012
Ship Power
28% (28)
Power Plants
31% (32)
Services
40% (40)
5
Net sales by business 2013

© Wärtsilä
0.63
0.88
1.07 1.05 1.05
0,0
0,2
0,4
0,6
0,8
1,0
1,2
0
500
1000
1500
2000
2500
3000
3500
4000
4500
5000
5500
6000
2009 2010 2011 2012 2013
Order intake Net sales Book-to-bill
MEUR
6
Book-to-bill ratio remains above one

© Wärtsilä
Order book distribution
0
1000
2000
3000
4000
Delivery next year Delivery after next year
31.12.2012 31.12.2013
MEUR
7
Order book distribution

© Wärtsilä
12.1%
10.7% 11.1% 10.9% 11.2%
12.8%
11.0% 11.5% 11.7% 11.9%
0%
2%
4%
6%
8%
10%
12%
14%
16%
0
50
100
150
200
250
2009 2010 2011 2012 2013
EBIT%
target:
10-14%
MEUR
Q2 Q1 Q3 Q4
Yearly EBIT% (operating result before non-recurring items)
Yearly EBITA% (operating result before non-recurring items
and intangible asset amortisation related to acquisitions)
8
Resilient profitability

Moderate activity in
power generation
markets

Power Plants – quoted MW per fuel type
10 © Wärtsilä
0
2000
4000
6000
8000
10000
12000
14000
16000
Q1
Q2
Q3
Q4
Q1
Q2
Q3
Q4
Q1
Q2
Q3
Q4
Q1
Q2
Q3
Q4
Q1
Q2
Q3
Q4
Q1
Q2
Q3
Q4
Q1
Q2
Q3
Q4
Q1
Q2
Q3
Q4
Q1
Q2
Q3
Q4
2005 2006 2007 2008 2009 2010 2011 2012 2013
MW
Others
Natural gas
Heavy fuel oil
The share of natural gas is consistently increasing.

© Wärtsilä
0
100
200
300
400
500
600
2006 2007 2008 2009 2010 2011 2012 2013
MEUR
Q2 Q1 Q3 Q4
11
Power Plants quarterly order intake

© Wärtsilä
0
200
400
600
800
1000
1200
1400
1600
1800
2000
2009 2010 2011 2012 2013
MEUR Review period development
Total EUR 1,292 million (1,515)
IPP’s*
Utilities
Industrials
Oil
18%
Gas
82%
Review period order intake by fuel in MW
x%
12
Power Plants order intake by customer segment
46%
23%
31%
Q1-Q3 Q4
*IPP = Independent Power Producer

© Wärtsilä
• Turnkey order for 200 MW dual-fuel power plant
awarded by PT Indonesia Power
• The plant will be constructed by a consortium
with Wärtsilä as the lead partner
• The new power plant will ensure greater
reliability in the supply of electricity in Bali
• Key in the contract award was the ability to
deliver high quality, extremely efficient, and
flexible energy solutions on a fast-track basis
13
Wärtsilä to supply Indonesia’s largest ever engine
based power plant
NEW
PIC

© Wärtsilä
314
122
Order intake 2013: 2,401 MW (3,146)
18
268
131
Americas 418 (919)
Europe 320 (89)
Asia 1,083 (869)
Africa and Middle East 581 (1,269)
181
113 303
114
Utilities
IPP’s
Industrials
14
Power Plants global order intake Good demand in Asia
26
145
666

© Wärtsilä
Siemens
GE
MHI
Wärtsilä
Alstom
15
6.4%
H1 2013
34.6%
26.1%
5.9%
12.8%
Total market 18.8 GW (28.8)
5.9%
8.0%
Other GTs
Ansaldo
15
Market for gas and liquid based power plants
Includes all Wärtsilä power plants and other manufacturers’ gas and liquid fuelled power plants with prime
movers above 5 MW, as well as estimated output of steam turbines for combined cycles.
The data is gathered from the McCoy Power Report.
Other combustion engines not included. In engine technology Wärtsilä has a leading position.

Improvement in
marine market
activity

© Wärtsilä 17
Vessel contracting continues strong
Source: Clarkson Research Services
* CGT= gross tonnage compensated with workload
*
*

© Wärtsilä
0
300
600
900
1200
1500
1800
2009 2010 2011 2012 2013
MEUR
Review period development Total EUR 1,662 million (1,453)
Offshore
42%
Merchant
34%
Special
vessels
7%
Cruise
& ferry
8% Navy
6%
18
Ship Power order intake by segment
Other
3%
Q1-Q3 Q4

© Wärtsilä
• Order for EPC delivery of 62 MW power module
solution for an FPSO vessel placed by Bumi
Armada
• Vessel to be deployed in the Kraken oil field in the
U.K. sector of the North Sea
• Scope of supply:
– 2 power generation modules, consisting of 16-
cylinder Wärtsilä 50DF engines with generators
– Waste heat recovery units
– Related fuel, oil and air and other utility systems
• Key in receiving the contract were the fuel
flexibility and the high levels of efficiency and
availability of Wärtsilä’s integrated power module
solutions
19
Wärtsilä power modules for North Sea FPSO

© Wärtsilä
• Order intake in Wärtsilä Hyundai
Engine Company Ltd in South
Korea, and Wärtsilä Qiyao
Diesel Company Ltd in China
totalled EUR 222 million (242)
during the review period January-
December 2013
• Wärtsilä’s share of ownership in
these companies is 50%, and the
results are reported as a share of
result of associates and joint
ventures
MEUR
Ship Power order intake
Joint venture order intake
20
Joint venture ordering activity
0
50
100
150
200
250
300
350
400
450
500
550
600
Q1/2
010
Q2/2
010
Q3/2
010
Q4/2
010
Q1/2
011
Q2/2
011
Q3/2
011
Q4/2
011
Q1/2
012
Q2/2
012
Q3/2
012
Q4/2
012
Q1/2
013
Q2/2
013
Q3/2
013
Q4/2
013

© Wärtsilä
Ship Power order book 31 December 2012
21
Cruise & Ferry
7%
Offshore
45%
Special
vessels
6%
Navy
7%
Bulkers
3%
Cargo
3%
Tankers
15%
Containers
4%
LNG*
5%
Merchant
32%
Others
1%
* Excluding order book from South Korean joint venture
Ship Power order book 31 December 2013
RoRo
1%

© Wärtsilä
Wärtsilä’s market shares are calculated on a 12 months rolling basis, numbers in brackets are from the end of the
previous quarter. The calculation is based on Wärtsilä’s own data portal.
Wärtsilä
52%(49)
Others
19%(18)
MAN D&T
25%(21)
Caterpillar
4%(12)
MAN D&T
88%(88)
Wärtsilä
10%(10)
Mitsubishi
2%(2)
Low-speed main engines
Total market volume last 12 months:
22,935 MW (20,540)
Total market volume last 12 months:
4,137 MW (4,438)
Medium-speed main engines
Wärtsilä
4%(5)
Auxiliary engines
Total market volume last 12 months:
5,966 MW (5,024)
Others
96%(95)
22
Ship Power market Market position of Wärtsilä’s marine engines

Stable
development in
the service
markets

© Wärtsilä
0
200
400
600
800
1000
1200
1400
1600
1800
2000
2009 2010 2011 2012 2013
-3%
0
100
200
300
400
500
600
Q4/2012 Q4/2013
MEUR
Fourth quarter development
MEUR
531 -5% 507
0% 0%
24
Services net sales development
5%
Q1-Q3 Q4

© Wärtsilä
0
100
200
300
400
500
600
2006 2007 2008 2009 2010 2011 2012 2013
Q1 Q2 Q3 Q4
MEUR
25
Services net sales by quarter
© Wärtsilä
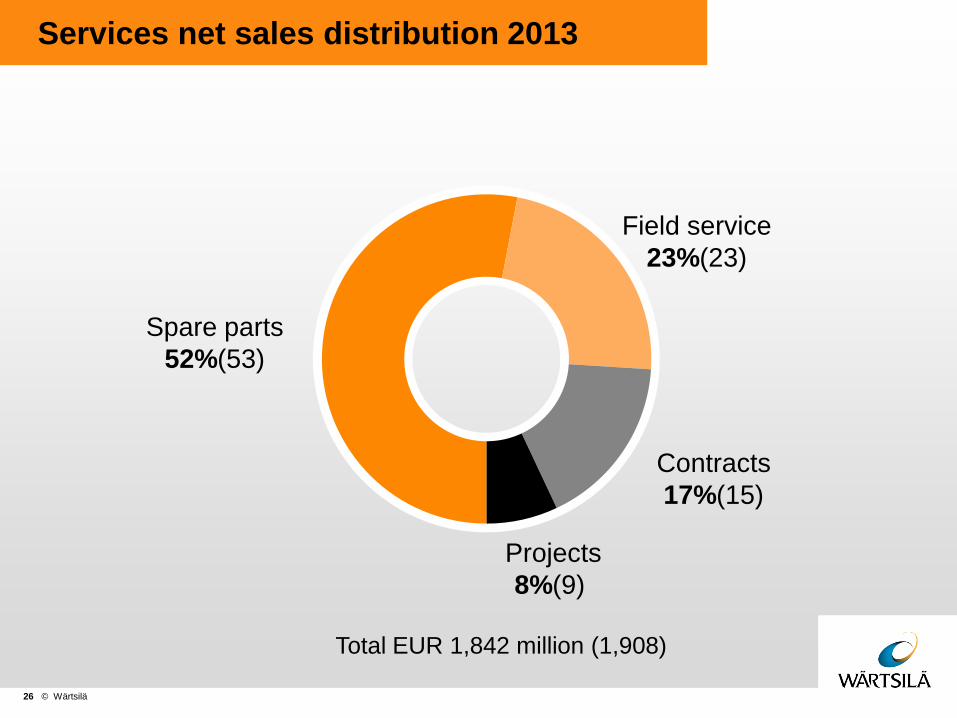
Spare parts
52%(53)
Field service
23%(23)
Contracts
17%(15)
Projects
8%(9)
26
Total EUR 1,842 million (1,908)
Services net sales distribution 2013

© Wärtsilä
Services distribution per business 2013
27
Net sales Total EUR 1,842 million
Installed base Total 182,000 MW
Ship
Power Power
Plants
Ship
Power
Power
Plants

© Wärtsilä
• Serveral services agreements signed with marine and power plant customers in 2013:
– 10-year agreement with Portland General Electric Company in the USA
– 10-year maintenance agreement with Energy Developments Ltd of Australia
– 10-year Operations & Maintenance agreement with Ndola Energy Company Ltd in Zambia
– 5-year maintenance agreement for world’s largest LNG fuelled passenger ferry Viking Grace with Finnish Viking Line
• Agreements guarantee full performance and operational accountability, enabling customers to reduce operating expenses and focus on their core business
• Over 17 GW of generating capacity in marine and land based installations covered by service agreements
28
Strategic focus on long-term service agreements
continues
NEW
PIC
© Wärtsilä
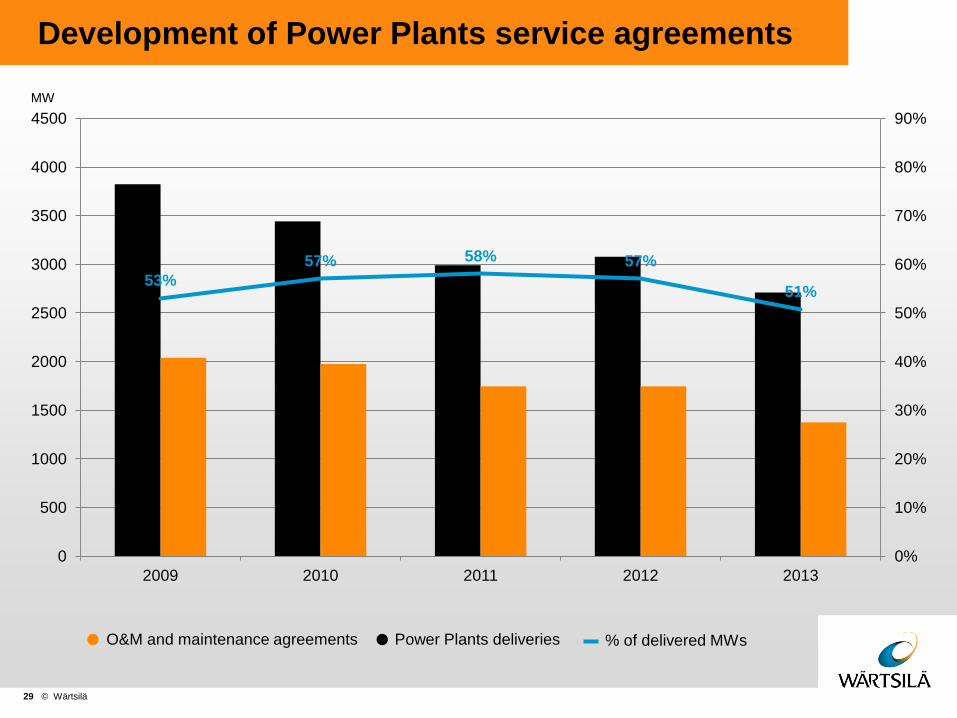
O&M and maintenance agreements Power Plants deliveries % of delivered MWs
MW
29
Development of Power Plants service agreements
53%
57% 58% 57%
51%
0%
10%
20%
30%
40%
50%
60%
70%
80%
90%
0
500
1000
1500
2000
2500
3000
3500
4000
4500
2009 2010 2011 2012 2013

© Wärtsilä
Fleet utilisation
* Source Bloomberg. Sample of more than 25 000 vessels (>299 GT) covered by IHS AIS Live.
** Source Bloomberg
30
Fleet utilisation
Fleet Average Speed, knots**
Anchored Vessels & Fleet Development*
20000
20500
21000
21500
22000
22500
15%
20%
25%
30%
35%
06.1
1
09.1
1
12.1
1
03.1
2
06.1
2
09.1
2
12.1
2
03.1
3
06.1
3
09.1
3
12.1
3
Nr
of
Active V
essels
Perc
ent A
nchore
d
Anchored Active Fleet
8,0
8,5
9,0
9,5
10,0
10,5
07.1
1
10.1
1
01.1
2
04.1
2
07.1
2
10.1
2
01.1
3
04.1
3
07.1
3
10.1
3
01.1
4

Solid financial
standing

© Wärtsilä
0
100
200
300
400
500
600
700
2009 2010 2011 2012 2013
MEUR
32
Strong development in cash flow from operating activities

© Wärtsilä
Working capital Total inventories Advances received Working capital / Net sales
MEUR
33
Working capital Good development in advances received
267
486
118
235
465
313
5.8%
9.2%
3.7%
6.8%
9.8%
6.7%
0%
5%
10%
15%
20%
25%
0
200
400
600
800
1000
1200
1400
1600
1800
2000
2008 2009 2010 2011 2012 2013

© Wärtsilä
Solvency Gearing
0%
5%
10%
15%
20%
25%
30%
35%
40%
45%
50%
2009 2010 2011 2012 2013 -0,10
0,00
0,10
0,20
0,30
0,40
0,50
2009 2010 2011 2012 2013
34
Financial position

© Wärtsilä
EPS and
35
0,00
0,50
1,00
1,50
2,00
2,50
EPS Dividend Extra dividend
EUR
2009 2010 2011
*Dividend 2013 - Proposal of the Board
2012 2013*
1.98
1.05
EPS and dividend per share

© Wärtsilä
• Power Plants: Based on the forecasted GDP
growth in 2014, the overall market for liquid and
gas fuelled power generation is expected improve
slightly. Ordering activity remains focused on
emerging markets, which continue to invest in
new power generation capacity.
• Ship Power: The main drivers supporting activity
in shipping and offshore are in place. Overall
contracting is expected to remain on improved
levels, keeping in mind the prevailing
overcapacity and the market’s limited capacity to
absorb new tonnage.
• Services: The overall service market outlook
remains stable.
36
Market outlook
NEW
PIC

© Wärtsilä
• Process started to realign organisation to secure
future profitability and competitiveness in a
challenging business environment
• Planned reductions of approx. 1,000 jobs globally,
impacting all businesses and support functions
• Expected annual savings of EUR 60 million are
estimated to materialise fully by the end of 2014
• The non-recurring costs related to the
restructuring measures are EUR 50 million, of
which EUR 11 million was recognised in 2013
Group-wide efficiency programme initiated
37

Wärtsilä expects its net sales
for 2014 to grow by 0-10% and
its operational profitability
(EBIT% before non-recurring
items) to be around 11%.
Prospects for 2014

IR Contact:
Natalia Valtasaari
Director, Investor Relations
Tel. +358 (0) 40 187 7809
E-mail: [email protected]