Using LDGM Codes and Sparse Syndromes to Achieve Digital Signatures
Upload
khangminh22Category
view
0download
0
How To Achieve The Lowest Specific Water Consumption (SWC) In Hinterland Coal Based Thermal Power Stations
Mr Soumitra Banerjee will share his experience the process of achieving SWC 20 litres per unit of power without having CW
blowdown recycling (With CW Blowdown recycling he estimated it to be 174 litres per unit of power)
He will also hand hold you to implement Water Management System at your power stations Analytics play an important role
Juschem Solutions Pvt Ltd
Presents
Visit us at wwwjust-chemicalscom
Water Consumption Scenario
bull About 51 of 156 thermal plants across 12 states whose data could be obtained declared themselves compliant with water norms early 2019 (source RTI response received by the Manthan Adhyayan Kendra a research centre that analyses water and energy issues in India)
bull Up to 19 of the remaining plants declared themselves noncompliant as per the RTI responses
bull The others either did not supply any data or offered insufficient information
bull As of August 30 2019 there were 269 thermal power plants in India according to the Central Electricity Authority
bull Taken together these 269 plants consume 878 of the total amount of water consumed by the industrial sector according to a study conducted by The Energy and Resources Institute (TERI)
bull To put this in perspective such amounts of water could fulfil the water needs of four cities for two days
Visit us at wwwjust-chemicalscom
Water Consumption Scenario
Visit us at wwwjust-chemicalscom
Water Consumption Scenario
bull Between 2013-17 61 coal plants were shut down because of water shortages resulting in a loss of 17000 gigawatt-hours of electricity according to a report by the Institute for Energy Economics and Financial Analysis (IEEFA)
bull ldquoNational Thermal Power Corporationrsquos Super Thermal Power Plant in Farakka West Bengal and Rihand Super Thermal Power Project in Uttar Pradesh Parali Thermal Power Plant in Maharashtra Raichur Thermal Power Plant in Karnataka and Ennore Thermal Power Station in Tamil Nadu are all located in water-stressed areas and have been shut-down because of water storagesrdquo said Deepak Krishnan manager with the energy programme at the WRI India
bull Until December 2015 there were no norms to monitor water usage of thermal power plants
bull Then on December 7 2015 the Ministry of Environment Forest and Climate Change (MoEFCC) issued a notification which declared that old plants could use 35 cubic meters of water per megawatt-hour and those installed after January 1 2017 could use 25 cubic meters of water per megawatt-hour
bull In October 2017 the government eased the water consumption norms for even plants that started operations on or after January 1 2017--they are now allowed to consume up to 20 more water than permitted earlier Passed as amendments to the Environment (Protection) Rules 1986 the new rules allow plants to use up to 3 cubic metres per megawatt-hour This additional amount is enough to irrigate 700 hectares of land a year
Visit us at wwwjust-chemicalscom
How to lower the specific water consumption
bull Create a water balance for your power station as accurate as possible populate data every day
bull Have meters installed (smart meters and implementation of IoT is the best solution)
bull Cleanse and Analyse the data you will arrive at
bull Points where the consumption is high
bull Points where collection and recycling is possible
bull Monitor continuously
bull MACRO CONTROL AHS and recovery of ash water and the clarifiers for Ash water should work perfectly
bull MACRO CONTROL Get the storm water collection pond it helps a lot in reduction of SWC but it should not have contamination from RO reject or DM Plant effluent
bull MACRO CONTROL CW makeup will be always the highest consumer get the COC up it saves a lot methods and real examples are given in subsequent slides There is a method of increasing COC with appropriate understanding of water chemistry
bull MACRO CONTROL Try to get lower evaporation by not operating turbine at (Phase transition zone) PTZ limiting vacuum to 09 only this will help in getting good heat rate by allowing condensate not to supercool and helps reduce CW evaporation by switching few fans (avoid stopping CW pumps)
bull MICRO CONTROL Get EDI installed in place of MB (RO-EDI is the best solution for making DM Water of lt008 microscm
bull Review the process on daily basis apply CAPAVisit us at wwwjust-chemicalscom
How to lower the specific water consumption
Audit criteria ndash what should be and what is
Audit finding ndash what is compared with what should be
Determine the causes and effects of the finding ndash recommend in audit report
Training on aspects How What why When Where WhoWhom on area of concern
Defining process SWOT and Planning improvement projects
Estimate likely DELTA of Improvements KIZEN
Audit ndash Efficiency effectiveness of water management process contributes significantly to power plant economics
Visit us at wwwjust-chemicalscom
How to lower the specific water consumption
Measure Manage
Improve
Define the
Process
Establish the
metrics
DesignMeasure and check the
performance
Stabilise
Eliminate Variation
Execute
improvement
Action Plans
Analyse amp Plan
Improvement
Set Improvement
Goals
Follow the Process Management Model in Audits-improvement projects (JURANrsquoS TRILOGY)
Feedback to Design Process
Fee
db
ack
to
ho
ld g
ain
Visit us at wwwjust-chemicalscom
How to lower the specific water consumption
DataWhat is being
supplied
Key Process Steps
What is the output of
Water Management
Target machine process system
What is being Measured
Efficiency (In-Process) Effectiveness (Output)
Measure TargetPredictability
amp Prescription
Measure TargetPerformance improvement
bull Designbull Commissioni
ngbull Real-time
meter data
Plant Operation
bull Lag Indicators of efficiency and effectiveness
bull Quality parameters
bull Process parameter
bull Breakdown Info
bull Eqpt Infobull Overhaul
info
bull Create a water balance
bull Have meters installed Cleanse and Analyze the data
bull Monitor continuously
bull MACROamp MICRO CONTROLS CONTROL
bull Control on SWC it should come down to 20 liters per KWHr
Reduction of SWC to 20 liters per unit of power (KWHR)
reduction in SWC
33 min 90 adherence to Quality amp Quantity of
output (meeting demand)
100 30 minimum on Efficiency and large on effectiveness
Quantifiable in improvement trends of lead and lag indicators
2 Identify the Output of the Process that will meet requirement
4 Who will provide those
Inputs
6 Identify the Measures that will reflect if Customer Needs are
being met
11 Asset life predictability and prescription writing
1 Identify the Purpose
3 What and how inputs are required to start the
activities
7 Set Target for the identified Measure
8 Impact on performance Measurable
9 Identify the Measures that will reflect is
efficient
5 What are the key steps
10 Set Target for the Efficiency Measures
Visit us at wwwjust-chemicalscom
What are the bottlenecks in reducing Specific Water Consumption
Technicalbull Non-availability of As built Water Balance Diagram
bull Non-availability of water meters (smart metering with IOT will work well as it works with Energy Management Systems)
Skillsbull Not understanding water chemistry of Cooling water thus due to fear of scalingcorrosion do not take risk of Reaching
high COCrdquo Subsequent slides will take you through the journey of excellence in this matter
bull Lack of awareness on performing analytics on data received from meters or work fatigue to do the analytics
bull Lack of Awareness of Troubleshooting the problems
bull Unable to manage Ash-Water system
bull Unable to operate turbine in pre PTZ unable to avoid supercooling and thus transfers sensible heat to towers
bull Switching of CWS Pump and not CT fans
Systembull Lack of CAPEX for the water recycle project(s)
bull Lack of funds to implement projects for reduction of evaporation from Reservoirs (Example of methods in subsequent slides)
Regulatory system implementationbull Government not forcing penalties and not shutting down the plants exceeding water consumption as they due in Water
and Air acts It remains somehow unmonitored and untouched except for the CESS collection
bull Government Granting CTO to new state owned plant on old 2015 SWC norms
Visit us at wwwjust-chemicalscom
What is the Typical Water Consumption points in a power plant
Expected SWC with 91 accuracy In m3day For 1980 MW Super Critical Power Station
SWC SWC At 100 PLF SWC
CW Evap 80648 170 CW Evap 70262 148 CW Evap 61097 129
BD at 8 COC 11521 024 BD at 8 COC 10037 021 BD at 8 COC 8728 018
CWMake-UP 92169 194 CWMake-UP 80299 169 CWMake-UP 69825 147
Fire+Service 2321 005 Fire+Service 2321 005 Fire+Service 2321 005
DM+Potable 2134 004 DM+Potable 2134 004 DM+Potable 2134 004
TOTAL 96624 203 TOTAL 84754 178 TOTAL 74280 156
Summer Yearly Winters
Visit us at wwwjust-chemicalscom
What is the Typical Water Consumption points in a power plant
Expected SWC with 91 accuracy In m3day For 1980 MW Super Critical Power Station
With BD Re-cycle 8814 7679 6677
SWC SWC At 100 PLF SWC
CW Evap 80648 170 CW Evap 70262 148 CW Evap 61097 129
BD at 8 COC 11521 024 BD at 8 COC 10037 021 BD at 8 COC 8728 018
CWMake-UP 83356 175 CWMake-UP 72621 153 CWMake-UP 63148 133
Fire+Service 2321 005 Fire+Service 2321 005 Fire+Service 2321 005
DM+Potable 2134 004 DM+Potable 2134 004 DM+Potable 2134 004
TOTAL 87811 185 TOTAL 77076 162 TOTAL 67603 142
Summer Yearly Winters
Visit us at wwwjust-chemicalscom
Go with the Flow
bull One of the best ways that a plant can manage its water resources more effectively is to develop a plantwide water management plan
bull A water management plan is a comprehensive site-wide strategy for maximizing water use efficiency minimizing wastewater discharge and encouraging a policy of sustainability and reuserecycle to the maximum extent practical to control a plantrsquos water footprint
bull The first step in developing a plan is to construct an overall plant water balance depicting the current plant water picture
bull The water balance should identify all water consumers and wastewater producers throughout the facility and indicate all the flow routes and distribution pathways
Visit us at wwwjust-chemicalscom
Go with the Flowbull Get the full picture Portable flow monitors and sample collection devices can be used to monitor inlet and outlet
flows and collect water samples from locations that are not typically instrumented to capture this data
bull Tracking plant water and wastewater flows and developing a mass balance can be as simple as developing an Excel spreadsheet to log and analyze the data (next slides) We have developed specialized tools based on IoT to aid in this process
bull The flow rates and the water quality constituents for individual plant water and wastewater streamsmdashsuch as cooling tower makeup boiler and cooling tower blowdown equipment drains and washdown pretreatment system wastewaters captured storm waters strainer and filter backwash waters dewatering equipment filtrate and many other plant sources and users are assessed and tabulated to enable tracking throughout the plant
bull Once the plant water balance is developed and the mass balance of contaminants is tracked throughout the plant staff can use this tool in conjunction with the water balance to assess how operational changes or stream redirection might allow the plant to reuse some internal wastewater streams and reduce its water footprint or reduce the level of contaminants that are discharged or that need to be removed
Visit us at wwwjust-chemicalscom
Water Balance Table 100 PLF
Design 2016-17 2017-18 with ETP-UF-RO Avgerage
Intake Mn CWST 134268 94592 91930 83017 2017-18 Proposed
251 HRSCC 2849 2134 2134 2134 Achieved Further Scope
Total Intake 137117 96726 94064 85151
SWC 2885 2035 1979 1792 1994 1774
Use CW MU 120660 91476 89609 80696 9526 9477
Service 13608 2321 2321 2321 247 273
Fire 0 795 0 0 000 000
WTP in 2729 2119 2119 2119 225 249
WTP use Breakup RO-MB 1857 1011 1011 1011 107 119
Potable 520 410 410 410 044 048
CW Use Breakup CW Evap 95328 78408 78408 78408 8336 9208
CW BD 23832 13068 11201 11201 1191 1315
BD Re-cycled 8913 000 1047
Intermediate Effluent Mn Clf 3360 20 20 20 002 002
HRSCC 120 15 15 15 002 002
DMF-RO-MB 417 633 633 633 067 074
CW BD 23832 13068 11201 11201 1191 1315Visit us at wwwjust-chemicalscom
Water Balance Table 100 PLF
Design 2016-17 2017-18 with ETP-UF-RO Avgerage
Recoverable Effluent WTPPlant dr 2377 2323 2323 1750 247 206
HRSCC+Mn Clf 3240 35 35 35 004 004
CWBD to CHP 6336 0 0 0 000 000
CW BD in AHP 17496 13068 11201 11201 1191 1315
Recovered Effluent WTP Plant dr 2377 2323 2323 2323 247 273
HRSCC+Mn Clf 3240 95 95 95 010 011
CWBD to CHP 6336 0 0 0 000 000
CW BD in Ash Water 17496 13068 11201 11201 1191 1315
AHP Requirement ETP and TT rejects 4584 4584 4584 4584 487 538
Excess CWBD to be drained out 15289 10807 8940 0 950 000
Sludge Clf+HRSCC Drain 360 0 0 0 000 000
COC 5 75 8 8 001 001
Water Balance Analytics at 100
PLF - synopsisVisit us at wwwjust-chemicalscom
Water Balance ndash Design and initial
SWC = 28940
Visit us at wwwjust-chemicalscom
Water Balance Improved by monitoring and control
SWC = 2064
Visit us at wwwjust-chemicalscom
Analytics
bull This requires that the water management team perform its monitoring activities at several different times over the course of a year to capture the various plant operating scenarios of interest and collect the desired data
bull Off-design operating conditions especially at multi-unit sites with integrated water and wastewater systems often can produce the most challenging water operating scenarios and can drive decisions related to equipment sizing
Chart Contaminants
bull Once all flows have been charted the second step is to understand the mass balance of contaminants present in the plant water and wastewater streams This will likely involve sampling and testing the internal streams that are not normally monitored in order to paint a true picture of
Where the plant is adding contaminants to the water streams or concentrating existing contaminants
What contaminants are being added or concentrated
In what concentration the contaminants are present in each stream
Portable flow monitors and sample collection devices can be employed to monitor inlet and outlet flows and collect water samples from locations that are not instrumented to capture this data currently
Visit us at wwwjust-chemicalscom
Analytics
bull Obvious examples of internal recyclereuse opportunities include recycling reverse osmosis reject as cooling tower makeup collecting and reprocessing boiler or heat recovery steam generator blowdown water and recycling cooling tower blowdown as flue gas desulfurization makeup water
bull However a close review of the plant water and mass balances can reveal quite a few opportunities for water reuse or water conservation
bull Many of these internal recyclereuse opportunities can be inexpensive and relatively simple to implement involving only piping and valving modifications though some may involve the addition of treatment equipment such as clarification or filtration to reprocess the wastewater streams to make them suitable for reuse
bull Determining the water quality of the wastewater stream contaminants therefore is a crucial early step in evaluating wastewaters for reuse opportunities and performing a cost-benefit analysis
Visit us at wwwjust-chemicalscom
Analytics
bull Development of water and mass balances will also prepare a plant to intelligently evaluate the impact of and reaction to potential modifications to the plant water balance that may occur due to regulations changes
bull The new proposed regulations may affect a plantrsquos cooling water systems material-handling and conveyance systems and wastewater discharges
bull Potential changes such as the addition of wastewater treatment systems or the rerouting of wastewater streams can be simulated to assess their effects on overall plant operations
Visit us at wwwjust-chemicalscom
Water Balance Analytics at 100 PLF
Water Balance Analytics at 85
PLF
Water Balance Analytics at 70
PLF
Analytics
Visit us at wwwjust-chemicalscom
Improvement Project to further reduce SWC
Note For Approval Visit us at wwwjust-chemicalscom
Water Balance after measuring monitoring controlling + Recycling
SWC = 1799
Visit us at wwwjust-chemicalscom
Challenges
bull The most difficult challenge in developing an accurate site water balance is collecting adequate data to model the plant water and wastewater streams precisely
bull Using smart water meters and IoT with Analytics is the necessary system creation for sustainability
bull Inclusion of seasonal and historical data and its impact on the plant water balance is desirable such as periodic degradations in water supply qualities that reduce cooling tower operating cycles
bull This water balance should include average daily usage rates as well as peak and minimum flows to create an accurate picture of the plantrsquos water footprint
bull Reduced load operations (if they are relevant for a unit) partial plant operations (for instance single-unit operation in a two-unit plant) as well as other off-design operating scenarios should be evaluated as appropriate to determine how they will affect water consumption rates and wastewater production
Visit us at wwwjust-chemicalscom
REACHING HIGH COC
In Cooling Water Systems
Visit us at wwwjust-chemicalscom
Operating recirculating cooling systems at higher COC helps us to gain many economic and environmental benefits viz
bull Reduction in pumping cost
bull Reducing depletion of natural resource Reducing specific water consumption and water cost Stationrsquos requirement to lower the operating costincrease profitability
bull Abiding environmental regulations
bull Demonstration of corporate responsibility by conserving water
Elevating COC can minimize operating costs through water savings and energy savings
While planning to operate at high COC we need to study various technical issues in order to prevent waterside problems
Visit us at wwwjust-chemicalscom
Study on Water Chemistry
To understand the chemistry of our
cooling water system we studied the
present system and operating
parameters for Calcium Hardness TDS
alkalinity and associated pH
bull LSI below 05 is corrosive and above 15 is scale
forming 05-15 controllable
bull RSI above 64 is corrosive and Below 54 is scale
forming 54-64 controllable
Make up Water ParameterParameters As Min Max Avg
pH 66 82 75
Total Hardness PPM 30 50 40
Calcium Harness PPM 18 30 24
Magnesium Hardness PPM 12 20 16
M-Alk PPM 20 40 30
Chlorides PPM 15 25 20
Silica PPM 8 13 11
Conductivity microscm 100 150 120
Total Dissolved solids PPM 67 101 80
Turbidity NTU 4 20 7
Iron PPM 01 02 015
pHs (Saturation) 93 88 90
LSI Indices -27 -06 -15
RSI Indices 120 94 105
CW MAKE-UP WATER ANALYSIS CONSIDERED
Visit us at wwwjust-chemicalscom
Relationship of Various parameters
bull Evaporation Loss
E = 00018 x delta T x R x TF (Tower Factor)(T expressed in oC)
Tower factor is based on (a) humidity and (b) Tower Height (Considered during designing of the tower)
bull Blowdown
B = Evaporation
COC-1
bull Cycles Of Concentration
COC = Concentration in Recirculation
Concentration In Make-up
Question What is Best Elementchemical parameter
Visit us at wwwjust-chemicalscom
Scalingcorrosion Propensity on Average ValuesAt Average Values
Parameters 5 COC 6 COC 7 COC 8 COC 9 COC 10 COC 11 COC 12 COCpH 783 794 804 813 82 83 84 85Total Hardness 200 240 280 320 360 400 440 480Calcium Harness 120 144 168 192 216 240 264 288MagnesiumHardness 80 96 112 128 144 160 176 192M-Alk 150 180 210 240 270 300 330 360Chlorides 100 120 140 160 180 200 220 240Silica 55 66 77 88 99 110 121 132Conductivity 600 720 840 960 1080 1200 1320 1440Total Dissolvedsolids 402 4824 5628 6432 7236 804 8844 9648Turbidity 35 42 49 56 63 70 77 84Iron 075 09 105 12 135 15 165 18pHs (Saturation) 74 72 71 70 69 68 67 67
LSI 05 07 09 11 13 15 17 18
RSI 69 65 62 58 56 53 51 48
LSI below 05 is corrosive and above 15 is scale forming 05-15 controllable RSI above 64 is corrosive and Below 54 is scale forming 54-64 controllable
For Make up with high Chlorides
use LaI
Visit u
s at w
ww
just-ch
em
icalsco
m
For Make up with high Chlorides
use LaI
At Maximum Values
Parameters 5 COC 6 COC 7 COC 8 COC 9 COC 10 COC 11 COC 12 COCpH
82 83 84 85 85 86 87 88Total Hardness
250 240 280 320 360 400 440 480Calcium Harness
150 144 168 192 216 240 264 288Magnesium Hardness
100 96 112 128 144 160 176 192M-Alk
200 180 210 240 270 300 330 360Chlorides
125 120 140 160 180 200 220 240Silica
65 66 77 88 99 110 121 132Conductivity
750 720 840 960 1080 1200 1320 1440Total Dissolved solids
5025 4824 5628 6432 7236 804 8844 9648Turbidity
100 42 49 56 63 70 77 84Iron
1 09 105 12 135 15 165 18pHs (Saturation) 72 72 71 70 69 68 67 67
LSI 10 11 13 15 16 18 20 21
RSI 62 62 58 55 52 50 48 45
LSI below 05 is corrosive and above 15 is scale forming 05-15 controllable RSI above 64 is corrosive and Below 54 is scale forming 54-64 controllable
Scalingcorrosion Propensity on Maximum Values
Visit us at wwwjust-chemicalscom
RSI amp LSI
All Saturation indices
Chemistry and
scaling indices
Visit us at wwwjust-chemicalscom
Study Outcome Analysis
Considering the above we shall always be in the range of 7 - 10 COC Assuming that the system will
have max values (only in summers) also a COC of 80 is ideal
RSI below 54 is scale forming but controllable till 4 RSI (Controllable with Chemical Treatment) above
64 is corrosive but controllable till 6 (Controllable with Chemical Treatment) Only It is always better to
operate system in slight scale forming tendency than corrosive because scale can be removed but
corroded metal cannot be put back
For CW where water velocity is gt06 ms RSI should only be used
Refer Nalco Water handbook Page 417
Visit us at wwwjust-chemicalscom
Study on Environmental Impact
bull We will be complying by EC and Consent conditions by operating the CW
system above 5 COC as it says ldquoCOC of not less than 5 shall be adoptedrdquo
bull The water saving will be
bull The Energy Savings will be
bull Reduction in CO2 emission will be 125 tons per year
Station Parameters for CW
System-
AT CYCLES OF
CONCENTARTION 6
AT CYCLES OF
CONCENTARTION 7
CT blow down m3year 3120938 2600781
CT Make Up Water Rate in
m3year
18725626 18205470
Water Saving in M3 year - 520156
Energy savings (KwH)Clarified
water
- 95709
Energy Saving (KwH) CT
Pumping
- 52016
Total energy Saving(KwH) 147724
Visit us at wwwjust-chemicalscom
Further Analysis
Hydraulic factors1 Hydraulic factor (CH) of a tower is used to determine the efficiency of water use It is represented as
CH = sumMURsumBDR
Where MUR = Total make-up rate and BDR = Total blow-down rate
1 Both the makeup and blow-down flow rates are comprised of controlled and unintentional components The effective blow-down loss rate is the metered blow-down and unmetered streams such as drift leaks filter backwash and removal of CW from the system for other uses Our CW systems have almost negligible unintentional water losses to limit the COC thus COC of 14 is achievable
2 Drift is the water lost from the tower as a liquid droplets entrained in the exhaust air This loss is not dependent on evaporation rate Drift loss rate is normally expressed in percentage of the recirculation rate (ranging 01 to 002) The drift loss rate depends on the system-specific factors like design of the tower age of the tower types and age of the drift eliminators Our drift loss is around 002
3 Unintentional and uncontrolled water losses could be the SS filter backwash leakages from pump(s) glands or other equipment(s) cooling tower basin overflows water tapping from return line for other usepurpose etc
Visit us at wwwjust-chemicalscom
Further Analysis
Time-related factors
Increase in Holding time index (HTI) is one of the major problem associated with high COC The HTI is defined as the
half-life of an ion in the system This is equated as
HTI = 0693 VT BT
Where VT is the system volume and BT is total water loss
Above figure illustrates the impact of increased cycling on the HTI of a typical cooling tower system Increasing the COC
from 5 to 15 effectively triples the HTI increasing the average time a molecule spends in the system by a factor of three
This can affect the efficacy of the scale and corrosion inhibitors
The HTI in our system at 6 COC is 217 Hours at 7 COC is 261 Hours and at 8 COC is 305 Hours
As the HTI increases the stress on the organic portion (polymer phosphonates azoles) of the treatment regime
increases In this case the treatment-program active components must stay active for longer periods of time before
being replaced With current treatment regime HTI of 300 Hrs is achievable For going beyond 300 hrs HTI advanced
high stress polymers may be used
HTI Vs Cycles
0
100
200
300
2 4 6 8 10 12 14 16 18 20 22
Cycles
HT
I in
hrs
HTI
Visit us at wwwjust-chemicalscom
Further Analysis
Weighing of credits and debits
bull Some of the credits will be less water usage reduced blowdown and decrease in energy consumption
bull At 8 COC or below there is no debit
bull Going beyond 8 COC may call for advanced high stress polymers and advanced phosphonates
Setting rational goals
bull In the beginning detailed water balance and inventory of the water consumption in the system was performed
bull This includes makeup to cooling tower evaporation losses and blowdown
bull By far the biggest problems which may hinder the rising of CoC is unintentional losses or use with tapping from
ACWCW system
bull After this a plan is formulated with a review plans for gains necessary to evaluate the success of this upgrade After this
is complete (1 yr) increasing COC to 8 was evaluated
bull As the progress should be evaluated on a stepwise basis the system were to go to 8 cycles from a starting point of 6
cycles a reasonable goal for the first one year would be operate successfully at 7 COC
bull If corrosion and scale are well controlled an increase to 8 cycles can follow with evaluation of success again after a
significant period of time
Visit us at wwwjust-chemicalscom
Further Analysis
Choosing a compatible treatment program
This includes a combination of stress tolerant treatment actives and heat transfer monitoring (viz TTD LMTD CT efficiency
Approach etc) The treatment programs may be based on a stabilized phosphate or alkaline phosphate approach the
current treatment regime satisfies this condition
Above 8 COC Stress compatible inhibitor technology
The best approach should be to design on-site the specific inhibitors need through a flexible product addition regime
Recently developed stress-tolerant inhibitors are part of this approach New dispersants have been shown to work under a
variety of stress conditions like high Ca (gt1500 ppm as CaCO3) higher water temperature extended HTI (gt 350 hrs) etc
These dispersants allow operation at lower dosages and provide better performance New corrosion inhibitors have also
been found that are stress-tolerant Some materials demonstrate high halogen resistance and remain stable under long
HTI (gt350 h) conditions
Diagnostic tools
At high COC and stressed conditions treatment programs and cooling water systems is to be used within recommended
guidelines For this the cooling water system is properly characterized This involves evaluating the following key
operating parameters
bull Total blow-down rates (including drift loss)
bull Holding time index
bull True COC based on Mg or Na (not SilicaChlorideTH)
bull Heat exchanger performance (TTD LMTD amp lsquoUrsquo values) Visit us at wwwjust-chemicalscom
Further Analysis
Measurement and control
In addition to measuring and adjusting system-operating parameters online monitoring and control of
treatment dosages may be installed to operate at high COC at optimal cost and performance
Monitoring process
Once desired COC is achieved maintenance of high COC is required to realize water and energy
savings Routine evaluation of the system control equipment and monthly logs are important to monitor
and document water quality and usage over time and through seasonal variations
Visit us at wwwjust-chemicalscom
Further Analysis
Measurement and control
In addition to measuring and adjusting system-operating parameters online monitoring and control of
treatment dosages may be installed to operate at high COC at optimal cost and performance
Monitoring process
Once desired COC is achieved maintenance of high COC is required to realize water and energy
savings Routine evaluation of the system control equipment and monthly logs are important to monitor
and document water quality and usage over time and through seasonal variations
Visit us at wwwjust-chemicalscom
CW Monitoring Tools
bull Online Chemistry Analyzers like (This can be developed in an Economical Solution)
bull Corrator inbuilt in Online AnalyzerCorrosion meter
bull Deposit monitor - visual indication of deposit formation and heat transfer loss indication
bull Bio-fouling monitor - indicate loss of pressure due to biofilm or slime build-up
bull Test heat exchanger
Visit us at wwwjust-chemicalscom
CW Monitoring Tools
bull Online Chemistry Analyzers like (This can be developed in an Economical Solution)
bull Corrosion coupons - indicate corrosion rate in mils (thousandth of an inch) per year (MPY)
bull Corrator inbuilt in Online Analyzer
bull Deposit monitor - visual indication of deposit formation and heat transfer loss indication
bull Bio-fouling monitor - indicate loss of pressure due to biofilm or slime build-up
bull Corrosion meter
bull Test heat exchanger
Visit us at wwwjust-chemicalscom
Interlinked Process Flow
Cooling Tower
Water Chemistry
Heat Exchanger
Visit us at wwwjust-chemicalscom
Interlinked Process Flow
Cooling Tower
Water Chemistry
Heat Exchanger
CWT Design Methedology and
guidelines
Visit us at wwwjust-chemicalscom
Impoundments and Storm Water
bull Operators and owners tend to focus primarily on the quality of water coming into the plant and the wastewater quality going out of the plant as required to meet their plant discharge permits
bull In contrast knowing exactly what is going on within the power plant boundaries in impoundments and process sumps is not always as clear especially in older facilities where upgrades and plant modifications have considerably altered the plant water picture over the years
bull Also in many coal-fired power plants coal combustion waste ponds and impoundments are utilized for equalization and treatment of numerous plant wastewater streams complicating the plantrsquos ability to easily assess the potential for reuse of each individual stream
bull However with some of the proposed regulation changes coal-fired power plants may be required to do just that Segregation and separation of plant wastewaters can minimize the volumetric flow rate that requires additional treatment to meet the proposed regulations
bull For instance at one facility where we been assisting with water and mass balance activities in preparation for expected Pollutant Discharge Elimination System permit changes the engineering team was able to reconfigure portions of the wastewater collection system
bull It segregated storm waters into contact and noncontact storm waters and separated mixed process water streams allowing the plant to reuse a fair portion of its previously discharged wastewater
bull As a result the facility significantly reduced the potential treatment costs associated with meeting new permit requirements and realized an overall cost savings Visit us at wwwjust-chemicalscom
Get Preparedbull Especially in light of the upcoming regulation changes and the expectation that additional levels of
wastewater treatment will be necessary to meet some of the new discharge limits any plant likely to be affected should explore the potential for internal recycling or reuse of plant wastewaters and minimizing water waste in order to keep wastewater treatment costs as low as possible
bull Starting now evaluating the current plant water and wastewater conditions conducting sampling and flow measurement programs and assessing current wastewater treatment systems are key to development of a baseline and plan of attack for dealing with the impending regulation changes
bull Knowing exactly where your plantrsquos starting point is and developing a solid data history is crucial to determining what you may need to do to meet changes in regulatory requirements
Visit us at wwwjust-chemicalscom
Replace conventional Side Stream Filtration
bull Use side Stream filter with continuous filtration
bull 2 - 5 of circulating water
bull Saves manpower
bull Continuous ndash no infringement
bull Saves water ndash water wastage down to 3 against 10 in
conventional filters
bull Down to 51020 microns against 50 microns with
conventional filters
bull Polymers used as dispersants
Discussion Decide whether you want engineering control or Chemistry Control
Visit us at wwwjust-chemicalscom
Given the following benefits itrsquos easy to see why self-cleaning filters are the overwhelming choice of consulting engineers property management companies and building owners
bull Self-cleaninghelliprequires no regular maintenance
bull Self-cleaninghellipassures optimal filtration efficiency
bull Self-cleaninghellipreduces energy cost
bull No monitoring ndash No manpower
bull Only 3 water wastage
bull As filter media accumulates suspended contaminants the pressure drop across the filter increases and flow rate decreases The filter consumes the same power but does less work
bull Self-cleaninghellipextends media life (five to ten years typical)
bull Our experience indicates that the necessary disciplined routine maintenance required for manual filters is the exception not the rule As a consequence the filter media overloads with contaminants and thereafter backwashing is less effective in removing accumulated solids
bull Self-cleaning hellipis cost effective No manpower required for backwashing
bull The retrofit fit cost is more than the initial incremental cost for self-cleaning
Visit us at wwwjust-chemicalscom
Reduction of Evaporation loss from Reservoirs
The floating discs were discs of 02m diameter and 002m thickness that covered 91 of the water surface The results have shown that evaporation from the covered reservoir was reduced by about 80 relative to the uncovered water surface
Shade balls are plastic Eco-friendly balls that could be used in lakes ponds stream and dams The Department of Water and Power (LADWP) has first used these balls in California to prevent the evaporation A study was conducted in the Nehru pond at Namakkal district They used 4 inch black balls from high density polyethylene (HDPE) and carbon black to cover the reservoir This study showed that the shade balls reduced 43-45 of evaporation in the reservoir
Shade-cloth are suspended structures installed over water surfaces with supporting poles and steel cables This cover reduces the action of wind and blocks incoming solar radiation therefore it reduces the evaporation rates from water surfaces Shade-cloth is economically used for small reservoirs that are less than 10 hectares in area The main disadvantage of this method is the relatively high capital cost for construction but this has now been overridden in Malaysia owing to a new shade-cloth knitting machine which will produce wider rolls and therefore reduce the number of installed cables
A study carried out under summer conditions in Southern Spain shown that shading covers led to decrease the evaporation by about 80 for the colored-polyethylene covers Another study was conducted in Australia to estimate the benefits of shade-cloth covers for water reservoirs The study has shown that evaporation rate was reduced by about 90 and the shade-cloth reduced maintenance costs because they delay the growth of aquatic plants at the bottom of the storages Visit us at wwwjust-chemicalscom
Floating Solar Plant ldquoEuropersquos largest floating solar plant opens in Francerdquo
French
English Case of USA
Visit us at wwwjust-chemicalscom
Visit us at wwwjust-chemicalscom
Reach us
Juschem Solutions Pvt LtdA108 SV Heights Whitefield Bangalore ndash 560066 KA
Email sbanerjeejust-chemicalscomPhoneWhatsApp +91 7985635683website wwwjust-chemicalscom
Follow us at httpswwwfacebookcompowerplantchem
httpswwwlinkedincominjuschem-solutions-private-ltd-63a997165
httpswwwyoutubecomchannelUC1Jt3imL-WtfkiRgI01sGZg
YouTube Channel Juschem Solutions Pvt Ltd
Visit us at wwwjust-chemicalscom

Water Consumption Scenario
Visit us at wwwjust-chemicalscom
Water Consumption Scenario
bull Between 2013-17 61 coal plants were shut down because of water shortages resulting in a loss of 17000 gigawatt-hours of electricity according to a report by the Institute for Energy Economics and Financial Analysis (IEEFA)
bull ldquoNational Thermal Power Corporationrsquos Super Thermal Power Plant in Farakka West Bengal and Rihand Super Thermal Power Project in Uttar Pradesh Parali Thermal Power Plant in Maharashtra Raichur Thermal Power Plant in Karnataka and Ennore Thermal Power Station in Tamil Nadu are all located in water-stressed areas and have been shut-down because of water storagesrdquo said Deepak Krishnan manager with the energy programme at the WRI India
bull Until December 2015 there were no norms to monitor water usage of thermal power plants
bull Then on December 7 2015 the Ministry of Environment Forest and Climate Change (MoEFCC) issued a notification which declared that old plants could use 35 cubic meters of water per megawatt-hour and those installed after January 1 2017 could use 25 cubic meters of water per megawatt-hour
bull In October 2017 the government eased the water consumption norms for even plants that started operations on or after January 1 2017--they are now allowed to consume up to 20 more water than permitted earlier Passed as amendments to the Environment (Protection) Rules 1986 the new rules allow plants to use up to 3 cubic metres per megawatt-hour This additional amount is enough to irrigate 700 hectares of land a year
Visit us at wwwjust-chemicalscom
How to lower the specific water consumption
bull Create a water balance for your power station as accurate as possible populate data every day
bull Have meters installed (smart meters and implementation of IoT is the best solution)
bull Cleanse and Analyse the data you will arrive at
bull Points where the consumption is high
bull Points where collection and recycling is possible
bull Monitor continuously
bull MACRO CONTROL AHS and recovery of ash water and the clarifiers for Ash water should work perfectly
bull MACRO CONTROL Get the storm water collection pond it helps a lot in reduction of SWC but it should not have contamination from RO reject or DM Plant effluent
bull MACRO CONTROL CW makeup will be always the highest consumer get the COC up it saves a lot methods and real examples are given in subsequent slides There is a method of increasing COC with appropriate understanding of water chemistry
bull MACRO CONTROL Try to get lower evaporation by not operating turbine at (Phase transition zone) PTZ limiting vacuum to 09 only this will help in getting good heat rate by allowing condensate not to supercool and helps reduce CW evaporation by switching few fans (avoid stopping CW pumps)
bull MICRO CONTROL Get EDI installed in place of MB (RO-EDI is the best solution for making DM Water of lt008 microscm
bull Review the process on daily basis apply CAPAVisit us at wwwjust-chemicalscom
How to lower the specific water consumption
Audit criteria ndash what should be and what is
Audit finding ndash what is compared with what should be
Determine the causes and effects of the finding ndash recommend in audit report
Training on aspects How What why When Where WhoWhom on area of concern
Defining process SWOT and Planning improvement projects
Estimate likely DELTA of Improvements KIZEN
Audit ndash Efficiency effectiveness of water management process contributes significantly to power plant economics
Visit us at wwwjust-chemicalscom
How to lower the specific water consumption
Measure Manage
Improve
Define the
Process
Establish the
metrics
DesignMeasure and check the
performance
Stabilise
Eliminate Variation
Execute
improvement
Action Plans
Analyse amp Plan
Improvement
Set Improvement
Goals
Follow the Process Management Model in Audits-improvement projects (JURANrsquoS TRILOGY)
Feedback to Design Process
Fee
db
ack
to
ho
ld g
ain
Visit us at wwwjust-chemicalscom
How to lower the specific water consumption
DataWhat is being
supplied
Key Process Steps
What is the output of
Water Management
Target machine process system
What is being Measured
Efficiency (In-Process) Effectiveness (Output)
Measure TargetPredictability
amp Prescription
Measure TargetPerformance improvement
bull Designbull Commissioni
ngbull Real-time
meter data
Plant Operation
bull Lag Indicators of efficiency and effectiveness
bull Quality parameters
bull Process parameter
bull Breakdown Info
bull Eqpt Infobull Overhaul
info
bull Create a water balance
bull Have meters installed Cleanse and Analyze the data
bull Monitor continuously
bull MACROamp MICRO CONTROLS CONTROL
bull Control on SWC it should come down to 20 liters per KWHr
Reduction of SWC to 20 liters per unit of power (KWHR)
reduction in SWC
33 min 90 adherence to Quality amp Quantity of
output (meeting demand)
100 30 minimum on Efficiency and large on effectiveness
Quantifiable in improvement trends of lead and lag indicators
2 Identify the Output of the Process that will meet requirement
4 Who will provide those
Inputs
6 Identify the Measures that will reflect if Customer Needs are
being met
11 Asset life predictability and prescription writing
1 Identify the Purpose
3 What and how inputs are required to start the
activities
7 Set Target for the identified Measure
8 Impact on performance Measurable
9 Identify the Measures that will reflect is
efficient
5 What are the key steps
10 Set Target for the Efficiency Measures
Visit us at wwwjust-chemicalscom
What are the bottlenecks in reducing Specific Water Consumption
Technicalbull Non-availability of As built Water Balance Diagram
bull Non-availability of water meters (smart metering with IOT will work well as it works with Energy Management Systems)
Skillsbull Not understanding water chemistry of Cooling water thus due to fear of scalingcorrosion do not take risk of Reaching
high COCrdquo Subsequent slides will take you through the journey of excellence in this matter
bull Lack of awareness on performing analytics on data received from meters or work fatigue to do the analytics
bull Lack of Awareness of Troubleshooting the problems
bull Unable to manage Ash-Water system
bull Unable to operate turbine in pre PTZ unable to avoid supercooling and thus transfers sensible heat to towers
bull Switching of CWS Pump and not CT fans
Systembull Lack of CAPEX for the water recycle project(s)
bull Lack of funds to implement projects for reduction of evaporation from Reservoirs (Example of methods in subsequent slides)
Regulatory system implementationbull Government not forcing penalties and not shutting down the plants exceeding water consumption as they due in Water
and Air acts It remains somehow unmonitored and untouched except for the CESS collection
bull Government Granting CTO to new state owned plant on old 2015 SWC norms
Visit us at wwwjust-chemicalscom
What is the Typical Water Consumption points in a power plant
Expected SWC with 91 accuracy In m3day For 1980 MW Super Critical Power Station
SWC SWC At 100 PLF SWC
CW Evap 80648 170 CW Evap 70262 148 CW Evap 61097 129
BD at 8 COC 11521 024 BD at 8 COC 10037 021 BD at 8 COC 8728 018
CWMake-UP 92169 194 CWMake-UP 80299 169 CWMake-UP 69825 147
Fire+Service 2321 005 Fire+Service 2321 005 Fire+Service 2321 005
DM+Potable 2134 004 DM+Potable 2134 004 DM+Potable 2134 004
TOTAL 96624 203 TOTAL 84754 178 TOTAL 74280 156
Summer Yearly Winters
Visit us at wwwjust-chemicalscom
What is the Typical Water Consumption points in a power plant
Expected SWC with 91 accuracy In m3day For 1980 MW Super Critical Power Station
With BD Re-cycle 8814 7679 6677
SWC SWC At 100 PLF SWC
CW Evap 80648 170 CW Evap 70262 148 CW Evap 61097 129
BD at 8 COC 11521 024 BD at 8 COC 10037 021 BD at 8 COC 8728 018
CWMake-UP 83356 175 CWMake-UP 72621 153 CWMake-UP 63148 133
Fire+Service 2321 005 Fire+Service 2321 005 Fire+Service 2321 005
DM+Potable 2134 004 DM+Potable 2134 004 DM+Potable 2134 004
TOTAL 87811 185 TOTAL 77076 162 TOTAL 67603 142
Summer Yearly Winters
Visit us at wwwjust-chemicalscom
Go with the Flow
bull One of the best ways that a plant can manage its water resources more effectively is to develop a plantwide water management plan
bull A water management plan is a comprehensive site-wide strategy for maximizing water use efficiency minimizing wastewater discharge and encouraging a policy of sustainability and reuserecycle to the maximum extent practical to control a plantrsquos water footprint
bull The first step in developing a plan is to construct an overall plant water balance depicting the current plant water picture
bull The water balance should identify all water consumers and wastewater producers throughout the facility and indicate all the flow routes and distribution pathways
Visit us at wwwjust-chemicalscom
Go with the Flowbull Get the full picture Portable flow monitors and sample collection devices can be used to monitor inlet and outlet
flows and collect water samples from locations that are not typically instrumented to capture this data
bull Tracking plant water and wastewater flows and developing a mass balance can be as simple as developing an Excel spreadsheet to log and analyze the data (next slides) We have developed specialized tools based on IoT to aid in this process
bull The flow rates and the water quality constituents for individual plant water and wastewater streamsmdashsuch as cooling tower makeup boiler and cooling tower blowdown equipment drains and washdown pretreatment system wastewaters captured storm waters strainer and filter backwash waters dewatering equipment filtrate and many other plant sources and users are assessed and tabulated to enable tracking throughout the plant
bull Once the plant water balance is developed and the mass balance of contaminants is tracked throughout the plant staff can use this tool in conjunction with the water balance to assess how operational changes or stream redirection might allow the plant to reuse some internal wastewater streams and reduce its water footprint or reduce the level of contaminants that are discharged or that need to be removed
Visit us at wwwjust-chemicalscom
Water Balance Table 100 PLF
Design 2016-17 2017-18 with ETP-UF-RO Avgerage
Intake Mn CWST 134268 94592 91930 83017 2017-18 Proposed
251 HRSCC 2849 2134 2134 2134 Achieved Further Scope
Total Intake 137117 96726 94064 85151
SWC 2885 2035 1979 1792 1994 1774
Use CW MU 120660 91476 89609 80696 9526 9477
Service 13608 2321 2321 2321 247 273
Fire 0 795 0 0 000 000
WTP in 2729 2119 2119 2119 225 249
WTP use Breakup RO-MB 1857 1011 1011 1011 107 119
Potable 520 410 410 410 044 048
CW Use Breakup CW Evap 95328 78408 78408 78408 8336 9208
CW BD 23832 13068 11201 11201 1191 1315
BD Re-cycled 8913 000 1047
Intermediate Effluent Mn Clf 3360 20 20 20 002 002
HRSCC 120 15 15 15 002 002
DMF-RO-MB 417 633 633 633 067 074
CW BD 23832 13068 11201 11201 1191 1315Visit us at wwwjust-chemicalscom
Water Balance Table 100 PLF
Design 2016-17 2017-18 with ETP-UF-RO Avgerage
Recoverable Effluent WTPPlant dr 2377 2323 2323 1750 247 206
HRSCC+Mn Clf 3240 35 35 35 004 004
CWBD to CHP 6336 0 0 0 000 000
CW BD in AHP 17496 13068 11201 11201 1191 1315
Recovered Effluent WTP Plant dr 2377 2323 2323 2323 247 273
HRSCC+Mn Clf 3240 95 95 95 010 011
CWBD to CHP 6336 0 0 0 000 000
CW BD in Ash Water 17496 13068 11201 11201 1191 1315
AHP Requirement ETP and TT rejects 4584 4584 4584 4584 487 538
Excess CWBD to be drained out 15289 10807 8940 0 950 000
Sludge Clf+HRSCC Drain 360 0 0 0 000 000
COC 5 75 8 8 001 001
Water Balance Analytics at 100
PLF - synopsisVisit us at wwwjust-chemicalscom
Water Balance ndash Design and initial
SWC = 28940
Visit us at wwwjust-chemicalscom
Water Balance Improved by monitoring and control
SWC = 2064
Visit us at wwwjust-chemicalscom
Analytics
bull This requires that the water management team perform its monitoring activities at several different times over the course of a year to capture the various plant operating scenarios of interest and collect the desired data
bull Off-design operating conditions especially at multi-unit sites with integrated water and wastewater systems often can produce the most challenging water operating scenarios and can drive decisions related to equipment sizing
Chart Contaminants
bull Once all flows have been charted the second step is to understand the mass balance of contaminants present in the plant water and wastewater streams This will likely involve sampling and testing the internal streams that are not normally monitored in order to paint a true picture of
Where the plant is adding contaminants to the water streams or concentrating existing contaminants
What contaminants are being added or concentrated
In what concentration the contaminants are present in each stream
Portable flow monitors and sample collection devices can be employed to monitor inlet and outlet flows and collect water samples from locations that are not instrumented to capture this data currently
Visit us at wwwjust-chemicalscom
Analytics
bull Obvious examples of internal recyclereuse opportunities include recycling reverse osmosis reject as cooling tower makeup collecting and reprocessing boiler or heat recovery steam generator blowdown water and recycling cooling tower blowdown as flue gas desulfurization makeup water
bull However a close review of the plant water and mass balances can reveal quite a few opportunities for water reuse or water conservation
bull Many of these internal recyclereuse opportunities can be inexpensive and relatively simple to implement involving only piping and valving modifications though some may involve the addition of treatment equipment such as clarification or filtration to reprocess the wastewater streams to make them suitable for reuse
bull Determining the water quality of the wastewater stream contaminants therefore is a crucial early step in evaluating wastewaters for reuse opportunities and performing a cost-benefit analysis
Visit us at wwwjust-chemicalscom
Analytics
bull Development of water and mass balances will also prepare a plant to intelligently evaluate the impact of and reaction to potential modifications to the plant water balance that may occur due to regulations changes
bull The new proposed regulations may affect a plantrsquos cooling water systems material-handling and conveyance systems and wastewater discharges
bull Potential changes such as the addition of wastewater treatment systems or the rerouting of wastewater streams can be simulated to assess their effects on overall plant operations
Visit us at wwwjust-chemicalscom
Water Balance Analytics at 100 PLF
Water Balance Analytics at 85
PLF
Water Balance Analytics at 70
PLF
Analytics
Visit us at wwwjust-chemicalscom
Improvement Project to further reduce SWC
Note For Approval Visit us at wwwjust-chemicalscom
Water Balance after measuring monitoring controlling + Recycling
SWC = 1799
Visit us at wwwjust-chemicalscom
Challenges
bull The most difficult challenge in developing an accurate site water balance is collecting adequate data to model the plant water and wastewater streams precisely
bull Using smart water meters and IoT with Analytics is the necessary system creation for sustainability
bull Inclusion of seasonal and historical data and its impact on the plant water balance is desirable such as periodic degradations in water supply qualities that reduce cooling tower operating cycles
bull This water balance should include average daily usage rates as well as peak and minimum flows to create an accurate picture of the plantrsquos water footprint
bull Reduced load operations (if they are relevant for a unit) partial plant operations (for instance single-unit operation in a two-unit plant) as well as other off-design operating scenarios should be evaluated as appropriate to determine how they will affect water consumption rates and wastewater production
Visit us at wwwjust-chemicalscom
REACHING HIGH COC
In Cooling Water Systems
Visit us at wwwjust-chemicalscom
Operating recirculating cooling systems at higher COC helps us to gain many economic and environmental benefits viz
bull Reduction in pumping cost
bull Reducing depletion of natural resource Reducing specific water consumption and water cost Stationrsquos requirement to lower the operating costincrease profitability
bull Abiding environmental regulations
bull Demonstration of corporate responsibility by conserving water
Elevating COC can minimize operating costs through water savings and energy savings
While planning to operate at high COC we need to study various technical issues in order to prevent waterside problems
Visit us at wwwjust-chemicalscom
Study on Water Chemistry
To understand the chemistry of our
cooling water system we studied the
present system and operating
parameters for Calcium Hardness TDS
alkalinity and associated pH
bull LSI below 05 is corrosive and above 15 is scale
forming 05-15 controllable
bull RSI above 64 is corrosive and Below 54 is scale
forming 54-64 controllable
Make up Water ParameterParameters As Min Max Avg
pH 66 82 75
Total Hardness PPM 30 50 40
Calcium Harness PPM 18 30 24
Magnesium Hardness PPM 12 20 16
M-Alk PPM 20 40 30
Chlorides PPM 15 25 20
Silica PPM 8 13 11
Conductivity microscm 100 150 120
Total Dissolved solids PPM 67 101 80
Turbidity NTU 4 20 7
Iron PPM 01 02 015
pHs (Saturation) 93 88 90
LSI Indices -27 -06 -15
RSI Indices 120 94 105
CW MAKE-UP WATER ANALYSIS CONSIDERED
Visit us at wwwjust-chemicalscom
Relationship of Various parameters
bull Evaporation Loss
E = 00018 x delta T x R x TF (Tower Factor)(T expressed in oC)
Tower factor is based on (a) humidity and (b) Tower Height (Considered during designing of the tower)
bull Blowdown
B = Evaporation
COC-1
bull Cycles Of Concentration
COC = Concentration in Recirculation
Concentration In Make-up
Question What is Best Elementchemical parameter
Visit us at wwwjust-chemicalscom
Scalingcorrosion Propensity on Average ValuesAt Average Values
Parameters 5 COC 6 COC 7 COC 8 COC 9 COC 10 COC 11 COC 12 COCpH 783 794 804 813 82 83 84 85Total Hardness 200 240 280 320 360 400 440 480Calcium Harness 120 144 168 192 216 240 264 288MagnesiumHardness 80 96 112 128 144 160 176 192M-Alk 150 180 210 240 270 300 330 360Chlorides 100 120 140 160 180 200 220 240Silica 55 66 77 88 99 110 121 132Conductivity 600 720 840 960 1080 1200 1320 1440Total Dissolvedsolids 402 4824 5628 6432 7236 804 8844 9648Turbidity 35 42 49 56 63 70 77 84Iron 075 09 105 12 135 15 165 18pHs (Saturation) 74 72 71 70 69 68 67 67
LSI 05 07 09 11 13 15 17 18
RSI 69 65 62 58 56 53 51 48
LSI below 05 is corrosive and above 15 is scale forming 05-15 controllable RSI above 64 is corrosive and Below 54 is scale forming 54-64 controllable
For Make up with high Chlorides
use LaI
Visit u
s at w
ww
just-ch
em
icalsco
m
For Make up with high Chlorides
use LaI
At Maximum Values
Parameters 5 COC 6 COC 7 COC 8 COC 9 COC 10 COC 11 COC 12 COCpH
82 83 84 85 85 86 87 88Total Hardness
250 240 280 320 360 400 440 480Calcium Harness
150 144 168 192 216 240 264 288Magnesium Hardness
100 96 112 128 144 160 176 192M-Alk
200 180 210 240 270 300 330 360Chlorides
125 120 140 160 180 200 220 240Silica
65 66 77 88 99 110 121 132Conductivity
750 720 840 960 1080 1200 1320 1440Total Dissolved solids
5025 4824 5628 6432 7236 804 8844 9648Turbidity
100 42 49 56 63 70 77 84Iron
1 09 105 12 135 15 165 18pHs (Saturation) 72 72 71 70 69 68 67 67
LSI 10 11 13 15 16 18 20 21
RSI 62 62 58 55 52 50 48 45
LSI below 05 is corrosive and above 15 is scale forming 05-15 controllable RSI above 64 is corrosive and Below 54 is scale forming 54-64 controllable
Scalingcorrosion Propensity on Maximum Values
Visit us at wwwjust-chemicalscom
RSI amp LSI
All Saturation indices
Chemistry and
scaling indices
Visit us at wwwjust-chemicalscom
Study Outcome Analysis
Considering the above we shall always be in the range of 7 - 10 COC Assuming that the system will
have max values (only in summers) also a COC of 80 is ideal
RSI below 54 is scale forming but controllable till 4 RSI (Controllable with Chemical Treatment) above
64 is corrosive but controllable till 6 (Controllable with Chemical Treatment) Only It is always better to
operate system in slight scale forming tendency than corrosive because scale can be removed but
corroded metal cannot be put back
For CW where water velocity is gt06 ms RSI should only be used
Refer Nalco Water handbook Page 417
Visit us at wwwjust-chemicalscom
Study on Environmental Impact
bull We will be complying by EC and Consent conditions by operating the CW
system above 5 COC as it says ldquoCOC of not less than 5 shall be adoptedrdquo
bull The water saving will be
bull The Energy Savings will be
bull Reduction in CO2 emission will be 125 tons per year
Station Parameters for CW
System-
AT CYCLES OF
CONCENTARTION 6
AT CYCLES OF
CONCENTARTION 7
CT blow down m3year 3120938 2600781
CT Make Up Water Rate in
m3year
18725626 18205470
Water Saving in M3 year - 520156
Energy savings (KwH)Clarified
water
- 95709
Energy Saving (KwH) CT
Pumping
- 52016
Total energy Saving(KwH) 147724
Visit us at wwwjust-chemicalscom
Further Analysis
Hydraulic factors1 Hydraulic factor (CH) of a tower is used to determine the efficiency of water use It is represented as
CH = sumMURsumBDR
Where MUR = Total make-up rate and BDR = Total blow-down rate
1 Both the makeup and blow-down flow rates are comprised of controlled and unintentional components The effective blow-down loss rate is the metered blow-down and unmetered streams such as drift leaks filter backwash and removal of CW from the system for other uses Our CW systems have almost negligible unintentional water losses to limit the COC thus COC of 14 is achievable
2 Drift is the water lost from the tower as a liquid droplets entrained in the exhaust air This loss is not dependent on evaporation rate Drift loss rate is normally expressed in percentage of the recirculation rate (ranging 01 to 002) The drift loss rate depends on the system-specific factors like design of the tower age of the tower types and age of the drift eliminators Our drift loss is around 002
3 Unintentional and uncontrolled water losses could be the SS filter backwash leakages from pump(s) glands or other equipment(s) cooling tower basin overflows water tapping from return line for other usepurpose etc
Visit us at wwwjust-chemicalscom
Further Analysis
Time-related factors
Increase in Holding time index (HTI) is one of the major problem associated with high COC The HTI is defined as the
half-life of an ion in the system This is equated as
HTI = 0693 VT BT
Where VT is the system volume and BT is total water loss
Above figure illustrates the impact of increased cycling on the HTI of a typical cooling tower system Increasing the COC
from 5 to 15 effectively triples the HTI increasing the average time a molecule spends in the system by a factor of three
This can affect the efficacy of the scale and corrosion inhibitors
The HTI in our system at 6 COC is 217 Hours at 7 COC is 261 Hours and at 8 COC is 305 Hours
As the HTI increases the stress on the organic portion (polymer phosphonates azoles) of the treatment regime
increases In this case the treatment-program active components must stay active for longer periods of time before
being replaced With current treatment regime HTI of 300 Hrs is achievable For going beyond 300 hrs HTI advanced
high stress polymers may be used
HTI Vs Cycles
0
100
200
300
2 4 6 8 10 12 14 16 18 20 22
Cycles
HT
I in
hrs
HTI
Visit us at wwwjust-chemicalscom
Further Analysis
Weighing of credits and debits
bull Some of the credits will be less water usage reduced blowdown and decrease in energy consumption
bull At 8 COC or below there is no debit
bull Going beyond 8 COC may call for advanced high stress polymers and advanced phosphonates
Setting rational goals
bull In the beginning detailed water balance and inventory of the water consumption in the system was performed
bull This includes makeup to cooling tower evaporation losses and blowdown
bull By far the biggest problems which may hinder the rising of CoC is unintentional losses or use with tapping from
ACWCW system
bull After this a plan is formulated with a review plans for gains necessary to evaluate the success of this upgrade After this
is complete (1 yr) increasing COC to 8 was evaluated
bull As the progress should be evaluated on a stepwise basis the system were to go to 8 cycles from a starting point of 6
cycles a reasonable goal for the first one year would be operate successfully at 7 COC
bull If corrosion and scale are well controlled an increase to 8 cycles can follow with evaluation of success again after a
significant period of time
Visit us at wwwjust-chemicalscom
Further Analysis
Choosing a compatible treatment program
This includes a combination of stress tolerant treatment actives and heat transfer monitoring (viz TTD LMTD CT efficiency
Approach etc) The treatment programs may be based on a stabilized phosphate or alkaline phosphate approach the
current treatment regime satisfies this condition
Above 8 COC Stress compatible inhibitor technology
The best approach should be to design on-site the specific inhibitors need through a flexible product addition regime
Recently developed stress-tolerant inhibitors are part of this approach New dispersants have been shown to work under a
variety of stress conditions like high Ca (gt1500 ppm as CaCO3) higher water temperature extended HTI (gt 350 hrs) etc
These dispersants allow operation at lower dosages and provide better performance New corrosion inhibitors have also
been found that are stress-tolerant Some materials demonstrate high halogen resistance and remain stable under long
HTI (gt350 h) conditions
Diagnostic tools
At high COC and stressed conditions treatment programs and cooling water systems is to be used within recommended
guidelines For this the cooling water system is properly characterized This involves evaluating the following key
operating parameters
bull Total blow-down rates (including drift loss)
bull Holding time index
bull True COC based on Mg or Na (not SilicaChlorideTH)
bull Heat exchanger performance (TTD LMTD amp lsquoUrsquo values) Visit us at wwwjust-chemicalscom
Further Analysis
Measurement and control
In addition to measuring and adjusting system-operating parameters online monitoring and control of
treatment dosages may be installed to operate at high COC at optimal cost and performance
Monitoring process
Once desired COC is achieved maintenance of high COC is required to realize water and energy
savings Routine evaluation of the system control equipment and monthly logs are important to monitor
and document water quality and usage over time and through seasonal variations
Visit us at wwwjust-chemicalscom
Further Analysis
Measurement and control
In addition to measuring and adjusting system-operating parameters online monitoring and control of
treatment dosages may be installed to operate at high COC at optimal cost and performance
Monitoring process
Once desired COC is achieved maintenance of high COC is required to realize water and energy
savings Routine evaluation of the system control equipment and monthly logs are important to monitor
and document water quality and usage over time and through seasonal variations
Visit us at wwwjust-chemicalscom
CW Monitoring Tools
bull Online Chemistry Analyzers like (This can be developed in an Economical Solution)
bull Corrator inbuilt in Online AnalyzerCorrosion meter
bull Deposit monitor - visual indication of deposit formation and heat transfer loss indication
bull Bio-fouling monitor - indicate loss of pressure due to biofilm or slime build-up
bull Test heat exchanger
Visit us at wwwjust-chemicalscom
CW Monitoring Tools
bull Online Chemistry Analyzers like (This can be developed in an Economical Solution)
bull Corrosion coupons - indicate corrosion rate in mils (thousandth of an inch) per year (MPY)
bull Corrator inbuilt in Online Analyzer
bull Deposit monitor - visual indication of deposit formation and heat transfer loss indication
bull Bio-fouling monitor - indicate loss of pressure due to biofilm or slime build-up
bull Corrosion meter
bull Test heat exchanger
Visit us at wwwjust-chemicalscom
Interlinked Process Flow
Cooling Tower
Water Chemistry
Heat Exchanger
Visit us at wwwjust-chemicalscom
Interlinked Process Flow
Cooling Tower
Water Chemistry
Heat Exchanger
CWT Design Methedology and
guidelines
Visit us at wwwjust-chemicalscom
Impoundments and Storm Water
bull Operators and owners tend to focus primarily on the quality of water coming into the plant and the wastewater quality going out of the plant as required to meet their plant discharge permits
bull In contrast knowing exactly what is going on within the power plant boundaries in impoundments and process sumps is not always as clear especially in older facilities where upgrades and plant modifications have considerably altered the plant water picture over the years
bull Also in many coal-fired power plants coal combustion waste ponds and impoundments are utilized for equalization and treatment of numerous plant wastewater streams complicating the plantrsquos ability to easily assess the potential for reuse of each individual stream
bull However with some of the proposed regulation changes coal-fired power plants may be required to do just that Segregation and separation of plant wastewaters can minimize the volumetric flow rate that requires additional treatment to meet the proposed regulations
bull For instance at one facility where we been assisting with water and mass balance activities in preparation for expected Pollutant Discharge Elimination System permit changes the engineering team was able to reconfigure portions of the wastewater collection system
bull It segregated storm waters into contact and noncontact storm waters and separated mixed process water streams allowing the plant to reuse a fair portion of its previously discharged wastewater
bull As a result the facility significantly reduced the potential treatment costs associated with meeting new permit requirements and realized an overall cost savings Visit us at wwwjust-chemicalscom
Get Preparedbull Especially in light of the upcoming regulation changes and the expectation that additional levels of
wastewater treatment will be necessary to meet some of the new discharge limits any plant likely to be affected should explore the potential for internal recycling or reuse of plant wastewaters and minimizing water waste in order to keep wastewater treatment costs as low as possible
bull Starting now evaluating the current plant water and wastewater conditions conducting sampling and flow measurement programs and assessing current wastewater treatment systems are key to development of a baseline and plan of attack for dealing with the impending regulation changes
bull Knowing exactly where your plantrsquos starting point is and developing a solid data history is crucial to determining what you may need to do to meet changes in regulatory requirements
Visit us at wwwjust-chemicalscom
Replace conventional Side Stream Filtration
bull Use side Stream filter with continuous filtration
bull 2 - 5 of circulating water
bull Saves manpower
bull Continuous ndash no infringement
bull Saves water ndash water wastage down to 3 against 10 in
conventional filters
bull Down to 51020 microns against 50 microns with
conventional filters
bull Polymers used as dispersants
Discussion Decide whether you want engineering control or Chemistry Control
Visit us at wwwjust-chemicalscom
Given the following benefits itrsquos easy to see why self-cleaning filters are the overwhelming choice of consulting engineers property management companies and building owners
bull Self-cleaninghelliprequires no regular maintenance
bull Self-cleaninghellipassures optimal filtration efficiency
bull Self-cleaninghellipreduces energy cost
bull No monitoring ndash No manpower
bull Only 3 water wastage
bull As filter media accumulates suspended contaminants the pressure drop across the filter increases and flow rate decreases The filter consumes the same power but does less work
bull Self-cleaninghellipextends media life (five to ten years typical)
bull Our experience indicates that the necessary disciplined routine maintenance required for manual filters is the exception not the rule As a consequence the filter media overloads with contaminants and thereafter backwashing is less effective in removing accumulated solids
bull Self-cleaning hellipis cost effective No manpower required for backwashing
bull The retrofit fit cost is more than the initial incremental cost for self-cleaning
Visit us at wwwjust-chemicalscom
Reduction of Evaporation loss from Reservoirs
The floating discs were discs of 02m diameter and 002m thickness that covered 91 of the water surface The results have shown that evaporation from the covered reservoir was reduced by about 80 relative to the uncovered water surface
Shade balls are plastic Eco-friendly balls that could be used in lakes ponds stream and dams The Department of Water and Power (LADWP) has first used these balls in California to prevent the evaporation A study was conducted in the Nehru pond at Namakkal district They used 4 inch black balls from high density polyethylene (HDPE) and carbon black to cover the reservoir This study showed that the shade balls reduced 43-45 of evaporation in the reservoir
Shade-cloth are suspended structures installed over water surfaces with supporting poles and steel cables This cover reduces the action of wind and blocks incoming solar radiation therefore it reduces the evaporation rates from water surfaces Shade-cloth is economically used for small reservoirs that are less than 10 hectares in area The main disadvantage of this method is the relatively high capital cost for construction but this has now been overridden in Malaysia owing to a new shade-cloth knitting machine which will produce wider rolls and therefore reduce the number of installed cables
A study carried out under summer conditions in Southern Spain shown that shading covers led to decrease the evaporation by about 80 for the colored-polyethylene covers Another study was conducted in Australia to estimate the benefits of shade-cloth covers for water reservoirs The study has shown that evaporation rate was reduced by about 90 and the shade-cloth reduced maintenance costs because they delay the growth of aquatic plants at the bottom of the storages Visit us at wwwjust-chemicalscom
Floating Solar Plant ldquoEuropersquos largest floating solar plant opens in Francerdquo
French
English Case of USA
Visit us at wwwjust-chemicalscom
Visit us at wwwjust-chemicalscom
Reach us
Juschem Solutions Pvt LtdA108 SV Heights Whitefield Bangalore ndash 560066 KA
Email sbanerjeejust-chemicalscomPhoneWhatsApp +91 7985635683website wwwjust-chemicalscom
Follow us at httpswwwfacebookcompowerplantchem
httpswwwlinkedincominjuschem-solutions-private-ltd-63a997165
httpswwwyoutubecomchannelUC1Jt3imL-WtfkiRgI01sGZg
YouTube Channel Juschem Solutions Pvt Ltd
Visit us at wwwjust-chemicalscom

Water Consumption Scenario
bull Between 2013-17 61 coal plants were shut down because of water shortages resulting in a loss of 17000 gigawatt-hours of electricity according to a report by the Institute for Energy Economics and Financial Analysis (IEEFA)
bull ldquoNational Thermal Power Corporationrsquos Super Thermal Power Plant in Farakka West Bengal and Rihand Super Thermal Power Project in Uttar Pradesh Parali Thermal Power Plant in Maharashtra Raichur Thermal Power Plant in Karnataka and Ennore Thermal Power Station in Tamil Nadu are all located in water-stressed areas and have been shut-down because of water storagesrdquo said Deepak Krishnan manager with the energy programme at the WRI India
bull Until December 2015 there were no norms to monitor water usage of thermal power plants
bull Then on December 7 2015 the Ministry of Environment Forest and Climate Change (MoEFCC) issued a notification which declared that old plants could use 35 cubic meters of water per megawatt-hour and those installed after January 1 2017 could use 25 cubic meters of water per megawatt-hour
bull In October 2017 the government eased the water consumption norms for even plants that started operations on or after January 1 2017--they are now allowed to consume up to 20 more water than permitted earlier Passed as amendments to the Environment (Protection) Rules 1986 the new rules allow plants to use up to 3 cubic metres per megawatt-hour This additional amount is enough to irrigate 700 hectares of land a year
Visit us at wwwjust-chemicalscom
How to lower the specific water consumption
bull Create a water balance for your power station as accurate as possible populate data every day
bull Have meters installed (smart meters and implementation of IoT is the best solution)
bull Cleanse and Analyse the data you will arrive at
bull Points where the consumption is high
bull Points where collection and recycling is possible
bull Monitor continuously
bull MACRO CONTROL AHS and recovery of ash water and the clarifiers for Ash water should work perfectly
bull MACRO CONTROL Get the storm water collection pond it helps a lot in reduction of SWC but it should not have contamination from RO reject or DM Plant effluent
bull MACRO CONTROL CW makeup will be always the highest consumer get the COC up it saves a lot methods and real examples are given in subsequent slides There is a method of increasing COC with appropriate understanding of water chemistry
bull MACRO CONTROL Try to get lower evaporation by not operating turbine at (Phase transition zone) PTZ limiting vacuum to 09 only this will help in getting good heat rate by allowing condensate not to supercool and helps reduce CW evaporation by switching few fans (avoid stopping CW pumps)
bull MICRO CONTROL Get EDI installed in place of MB (RO-EDI is the best solution for making DM Water of lt008 microscm
bull Review the process on daily basis apply CAPAVisit us at wwwjust-chemicalscom
How to lower the specific water consumption
Audit criteria ndash what should be and what is
Audit finding ndash what is compared with what should be
Determine the causes and effects of the finding ndash recommend in audit report
Training on aspects How What why When Where WhoWhom on area of concern
Defining process SWOT and Planning improvement projects
Estimate likely DELTA of Improvements KIZEN
Audit ndash Efficiency effectiveness of water management process contributes significantly to power plant economics
Visit us at wwwjust-chemicalscom
How to lower the specific water consumption
Measure Manage
Improve
Define the
Process
Establish the
metrics
DesignMeasure and check the
performance
Stabilise
Eliminate Variation
Execute
improvement
Action Plans
Analyse amp Plan
Improvement
Set Improvement
Goals
Follow the Process Management Model in Audits-improvement projects (JURANrsquoS TRILOGY)
Feedback to Design Process
Fee
db
ack
to
ho
ld g
ain
Visit us at wwwjust-chemicalscom
How to lower the specific water consumption
DataWhat is being
supplied
Key Process Steps
What is the output of
Water Management
Target machine process system
What is being Measured
Efficiency (In-Process) Effectiveness (Output)
Measure TargetPredictability
amp Prescription
Measure TargetPerformance improvement
bull Designbull Commissioni
ngbull Real-time
meter data
Plant Operation
bull Lag Indicators of efficiency and effectiveness
bull Quality parameters
bull Process parameter
bull Breakdown Info
bull Eqpt Infobull Overhaul
info
bull Create a water balance
bull Have meters installed Cleanse and Analyze the data
bull Monitor continuously
bull MACROamp MICRO CONTROLS CONTROL
bull Control on SWC it should come down to 20 liters per KWHr
Reduction of SWC to 20 liters per unit of power (KWHR)
reduction in SWC
33 min 90 adherence to Quality amp Quantity of
output (meeting demand)
100 30 minimum on Efficiency and large on effectiveness
Quantifiable in improvement trends of lead and lag indicators
2 Identify the Output of the Process that will meet requirement
4 Who will provide those
Inputs
6 Identify the Measures that will reflect if Customer Needs are
being met
11 Asset life predictability and prescription writing
1 Identify the Purpose
3 What and how inputs are required to start the
activities
7 Set Target for the identified Measure
8 Impact on performance Measurable
9 Identify the Measures that will reflect is
efficient
5 What are the key steps
10 Set Target for the Efficiency Measures
Visit us at wwwjust-chemicalscom
What are the bottlenecks in reducing Specific Water Consumption
Technicalbull Non-availability of As built Water Balance Diagram
bull Non-availability of water meters (smart metering with IOT will work well as it works with Energy Management Systems)
Skillsbull Not understanding water chemistry of Cooling water thus due to fear of scalingcorrosion do not take risk of Reaching
high COCrdquo Subsequent slides will take you through the journey of excellence in this matter
bull Lack of awareness on performing analytics on data received from meters or work fatigue to do the analytics
bull Lack of Awareness of Troubleshooting the problems
bull Unable to manage Ash-Water system
bull Unable to operate turbine in pre PTZ unable to avoid supercooling and thus transfers sensible heat to towers
bull Switching of CWS Pump and not CT fans
Systembull Lack of CAPEX for the water recycle project(s)
bull Lack of funds to implement projects for reduction of evaporation from Reservoirs (Example of methods in subsequent slides)
Regulatory system implementationbull Government not forcing penalties and not shutting down the plants exceeding water consumption as they due in Water
and Air acts It remains somehow unmonitored and untouched except for the CESS collection
bull Government Granting CTO to new state owned plant on old 2015 SWC norms
Visit us at wwwjust-chemicalscom
What is the Typical Water Consumption points in a power plant
Expected SWC with 91 accuracy In m3day For 1980 MW Super Critical Power Station
SWC SWC At 100 PLF SWC
CW Evap 80648 170 CW Evap 70262 148 CW Evap 61097 129
BD at 8 COC 11521 024 BD at 8 COC 10037 021 BD at 8 COC 8728 018
CWMake-UP 92169 194 CWMake-UP 80299 169 CWMake-UP 69825 147
Fire+Service 2321 005 Fire+Service 2321 005 Fire+Service 2321 005
DM+Potable 2134 004 DM+Potable 2134 004 DM+Potable 2134 004
TOTAL 96624 203 TOTAL 84754 178 TOTAL 74280 156
Summer Yearly Winters
Visit us at wwwjust-chemicalscom
What is the Typical Water Consumption points in a power plant
Expected SWC with 91 accuracy In m3day For 1980 MW Super Critical Power Station
With BD Re-cycle 8814 7679 6677
SWC SWC At 100 PLF SWC
CW Evap 80648 170 CW Evap 70262 148 CW Evap 61097 129
BD at 8 COC 11521 024 BD at 8 COC 10037 021 BD at 8 COC 8728 018
CWMake-UP 83356 175 CWMake-UP 72621 153 CWMake-UP 63148 133
Fire+Service 2321 005 Fire+Service 2321 005 Fire+Service 2321 005
DM+Potable 2134 004 DM+Potable 2134 004 DM+Potable 2134 004
TOTAL 87811 185 TOTAL 77076 162 TOTAL 67603 142
Summer Yearly Winters
Visit us at wwwjust-chemicalscom
Go with the Flow
bull One of the best ways that a plant can manage its water resources more effectively is to develop a plantwide water management plan
bull A water management plan is a comprehensive site-wide strategy for maximizing water use efficiency minimizing wastewater discharge and encouraging a policy of sustainability and reuserecycle to the maximum extent practical to control a plantrsquos water footprint
bull The first step in developing a plan is to construct an overall plant water balance depicting the current plant water picture
bull The water balance should identify all water consumers and wastewater producers throughout the facility and indicate all the flow routes and distribution pathways
Visit us at wwwjust-chemicalscom
Go with the Flowbull Get the full picture Portable flow monitors and sample collection devices can be used to monitor inlet and outlet
flows and collect water samples from locations that are not typically instrumented to capture this data
bull Tracking plant water and wastewater flows and developing a mass balance can be as simple as developing an Excel spreadsheet to log and analyze the data (next slides) We have developed specialized tools based on IoT to aid in this process
bull The flow rates and the water quality constituents for individual plant water and wastewater streamsmdashsuch as cooling tower makeup boiler and cooling tower blowdown equipment drains and washdown pretreatment system wastewaters captured storm waters strainer and filter backwash waters dewatering equipment filtrate and many other plant sources and users are assessed and tabulated to enable tracking throughout the plant
bull Once the plant water balance is developed and the mass balance of contaminants is tracked throughout the plant staff can use this tool in conjunction with the water balance to assess how operational changes or stream redirection might allow the plant to reuse some internal wastewater streams and reduce its water footprint or reduce the level of contaminants that are discharged or that need to be removed
Visit us at wwwjust-chemicalscom
Water Balance Table 100 PLF
Design 2016-17 2017-18 with ETP-UF-RO Avgerage
Intake Mn CWST 134268 94592 91930 83017 2017-18 Proposed
251 HRSCC 2849 2134 2134 2134 Achieved Further Scope
Total Intake 137117 96726 94064 85151
SWC 2885 2035 1979 1792 1994 1774
Use CW MU 120660 91476 89609 80696 9526 9477
Service 13608 2321 2321 2321 247 273
Fire 0 795 0 0 000 000
WTP in 2729 2119 2119 2119 225 249
WTP use Breakup RO-MB 1857 1011 1011 1011 107 119
Potable 520 410 410 410 044 048
CW Use Breakup CW Evap 95328 78408 78408 78408 8336 9208
CW BD 23832 13068 11201 11201 1191 1315
BD Re-cycled 8913 000 1047
Intermediate Effluent Mn Clf 3360 20 20 20 002 002
HRSCC 120 15 15 15 002 002
DMF-RO-MB 417 633 633 633 067 074
CW BD 23832 13068 11201 11201 1191 1315Visit us at wwwjust-chemicalscom
Water Balance Table 100 PLF
Design 2016-17 2017-18 with ETP-UF-RO Avgerage
Recoverable Effluent WTPPlant dr 2377 2323 2323 1750 247 206
HRSCC+Mn Clf 3240 35 35 35 004 004
CWBD to CHP 6336 0 0 0 000 000
CW BD in AHP 17496 13068 11201 11201 1191 1315
Recovered Effluent WTP Plant dr 2377 2323 2323 2323 247 273
HRSCC+Mn Clf 3240 95 95 95 010 011
CWBD to CHP 6336 0 0 0 000 000
CW BD in Ash Water 17496 13068 11201 11201 1191 1315
AHP Requirement ETP and TT rejects 4584 4584 4584 4584 487 538
Excess CWBD to be drained out 15289 10807 8940 0 950 000
Sludge Clf+HRSCC Drain 360 0 0 0 000 000
COC 5 75 8 8 001 001
Water Balance Analytics at 100
PLF - synopsisVisit us at wwwjust-chemicalscom
Water Balance ndash Design and initial
SWC = 28940
Visit us at wwwjust-chemicalscom
Water Balance Improved by monitoring and control
SWC = 2064
Visit us at wwwjust-chemicalscom
Analytics
bull This requires that the water management team perform its monitoring activities at several different times over the course of a year to capture the various plant operating scenarios of interest and collect the desired data
bull Off-design operating conditions especially at multi-unit sites with integrated water and wastewater systems often can produce the most challenging water operating scenarios and can drive decisions related to equipment sizing
Chart Contaminants
bull Once all flows have been charted the second step is to understand the mass balance of contaminants present in the plant water and wastewater streams This will likely involve sampling and testing the internal streams that are not normally monitored in order to paint a true picture of
Where the plant is adding contaminants to the water streams or concentrating existing contaminants
What contaminants are being added or concentrated
In what concentration the contaminants are present in each stream
Portable flow monitors and sample collection devices can be employed to monitor inlet and outlet flows and collect water samples from locations that are not instrumented to capture this data currently
Visit us at wwwjust-chemicalscom
Analytics
bull Obvious examples of internal recyclereuse opportunities include recycling reverse osmosis reject as cooling tower makeup collecting and reprocessing boiler or heat recovery steam generator blowdown water and recycling cooling tower blowdown as flue gas desulfurization makeup water
bull However a close review of the plant water and mass balances can reveal quite a few opportunities for water reuse or water conservation
bull Many of these internal recyclereuse opportunities can be inexpensive and relatively simple to implement involving only piping and valving modifications though some may involve the addition of treatment equipment such as clarification or filtration to reprocess the wastewater streams to make them suitable for reuse
bull Determining the water quality of the wastewater stream contaminants therefore is a crucial early step in evaluating wastewaters for reuse opportunities and performing a cost-benefit analysis
Visit us at wwwjust-chemicalscom
Analytics
bull Development of water and mass balances will also prepare a plant to intelligently evaluate the impact of and reaction to potential modifications to the plant water balance that may occur due to regulations changes
bull The new proposed regulations may affect a plantrsquos cooling water systems material-handling and conveyance systems and wastewater discharges
bull Potential changes such as the addition of wastewater treatment systems or the rerouting of wastewater streams can be simulated to assess their effects on overall plant operations
Visit us at wwwjust-chemicalscom
Water Balance Analytics at 100 PLF
Water Balance Analytics at 85
PLF
Water Balance Analytics at 70
PLF
Analytics
Visit us at wwwjust-chemicalscom
Improvement Project to further reduce SWC
Note For Approval Visit us at wwwjust-chemicalscom
Water Balance after measuring monitoring controlling + Recycling
SWC = 1799
Visit us at wwwjust-chemicalscom
Challenges
bull The most difficult challenge in developing an accurate site water balance is collecting adequate data to model the plant water and wastewater streams precisely
bull Using smart water meters and IoT with Analytics is the necessary system creation for sustainability
bull Inclusion of seasonal and historical data and its impact on the plant water balance is desirable such as periodic degradations in water supply qualities that reduce cooling tower operating cycles
bull This water balance should include average daily usage rates as well as peak and minimum flows to create an accurate picture of the plantrsquos water footprint
bull Reduced load operations (if they are relevant for a unit) partial plant operations (for instance single-unit operation in a two-unit plant) as well as other off-design operating scenarios should be evaluated as appropriate to determine how they will affect water consumption rates and wastewater production
Visit us at wwwjust-chemicalscom
REACHING HIGH COC
In Cooling Water Systems
Visit us at wwwjust-chemicalscom
Operating recirculating cooling systems at higher COC helps us to gain many economic and environmental benefits viz
bull Reduction in pumping cost
bull Reducing depletion of natural resource Reducing specific water consumption and water cost Stationrsquos requirement to lower the operating costincrease profitability
bull Abiding environmental regulations
bull Demonstration of corporate responsibility by conserving water
Elevating COC can minimize operating costs through water savings and energy savings
While planning to operate at high COC we need to study various technical issues in order to prevent waterside problems
Visit us at wwwjust-chemicalscom
Study on Water Chemistry
To understand the chemistry of our
cooling water system we studied the
present system and operating
parameters for Calcium Hardness TDS
alkalinity and associated pH
bull LSI below 05 is corrosive and above 15 is scale
forming 05-15 controllable
bull RSI above 64 is corrosive and Below 54 is scale
forming 54-64 controllable
Make up Water ParameterParameters As Min Max Avg
pH 66 82 75
Total Hardness PPM 30 50 40
Calcium Harness PPM 18 30 24
Magnesium Hardness PPM 12 20 16
M-Alk PPM 20 40 30
Chlorides PPM 15 25 20
Silica PPM 8 13 11
Conductivity microscm 100 150 120
Total Dissolved solids PPM 67 101 80
Turbidity NTU 4 20 7
Iron PPM 01 02 015
pHs (Saturation) 93 88 90
LSI Indices -27 -06 -15
RSI Indices 120 94 105
CW MAKE-UP WATER ANALYSIS CONSIDERED
Visit us at wwwjust-chemicalscom
Relationship of Various parameters
bull Evaporation Loss
E = 00018 x delta T x R x TF (Tower Factor)(T expressed in oC)
Tower factor is based on (a) humidity and (b) Tower Height (Considered during designing of the tower)
bull Blowdown
B = Evaporation
COC-1
bull Cycles Of Concentration
COC = Concentration in Recirculation
Concentration In Make-up
Question What is Best Elementchemical parameter
Visit us at wwwjust-chemicalscom
Scalingcorrosion Propensity on Average ValuesAt Average Values
Parameters 5 COC 6 COC 7 COC 8 COC 9 COC 10 COC 11 COC 12 COCpH 783 794 804 813 82 83 84 85Total Hardness 200 240 280 320 360 400 440 480Calcium Harness 120 144 168 192 216 240 264 288MagnesiumHardness 80 96 112 128 144 160 176 192M-Alk 150 180 210 240 270 300 330 360Chlorides 100 120 140 160 180 200 220 240Silica 55 66 77 88 99 110 121 132Conductivity 600 720 840 960 1080 1200 1320 1440Total Dissolvedsolids 402 4824 5628 6432 7236 804 8844 9648Turbidity 35 42 49 56 63 70 77 84Iron 075 09 105 12 135 15 165 18pHs (Saturation) 74 72 71 70 69 68 67 67
LSI 05 07 09 11 13 15 17 18
RSI 69 65 62 58 56 53 51 48
LSI below 05 is corrosive and above 15 is scale forming 05-15 controllable RSI above 64 is corrosive and Below 54 is scale forming 54-64 controllable
For Make up with high Chlorides
use LaI
Visit u
s at w
ww
just-ch
em
icalsco
m
For Make up with high Chlorides
use LaI
At Maximum Values
Parameters 5 COC 6 COC 7 COC 8 COC 9 COC 10 COC 11 COC 12 COCpH
82 83 84 85 85 86 87 88Total Hardness
250 240 280 320 360 400 440 480Calcium Harness
150 144 168 192 216 240 264 288Magnesium Hardness
100 96 112 128 144 160 176 192M-Alk
200 180 210 240 270 300 330 360Chlorides
125 120 140 160 180 200 220 240Silica
65 66 77 88 99 110 121 132Conductivity
750 720 840 960 1080 1200 1320 1440Total Dissolved solids
5025 4824 5628 6432 7236 804 8844 9648Turbidity
100 42 49 56 63 70 77 84Iron
1 09 105 12 135 15 165 18pHs (Saturation) 72 72 71 70 69 68 67 67
LSI 10 11 13 15 16 18 20 21
RSI 62 62 58 55 52 50 48 45
LSI below 05 is corrosive and above 15 is scale forming 05-15 controllable RSI above 64 is corrosive and Below 54 is scale forming 54-64 controllable
Scalingcorrosion Propensity on Maximum Values
Visit us at wwwjust-chemicalscom
RSI amp LSI
All Saturation indices
Chemistry and
scaling indices
Visit us at wwwjust-chemicalscom
Study Outcome Analysis
Considering the above we shall always be in the range of 7 - 10 COC Assuming that the system will
have max values (only in summers) also a COC of 80 is ideal
RSI below 54 is scale forming but controllable till 4 RSI (Controllable with Chemical Treatment) above
64 is corrosive but controllable till 6 (Controllable with Chemical Treatment) Only It is always better to
operate system in slight scale forming tendency than corrosive because scale can be removed but
corroded metal cannot be put back
For CW where water velocity is gt06 ms RSI should only be used
Refer Nalco Water handbook Page 417
Visit us at wwwjust-chemicalscom
Study on Environmental Impact
bull We will be complying by EC and Consent conditions by operating the CW
system above 5 COC as it says ldquoCOC of not less than 5 shall be adoptedrdquo
bull The water saving will be
bull The Energy Savings will be
bull Reduction in CO2 emission will be 125 tons per year
Station Parameters for CW
System-
AT CYCLES OF
CONCENTARTION 6
AT CYCLES OF
CONCENTARTION 7
CT blow down m3year 3120938 2600781
CT Make Up Water Rate in
m3year
18725626 18205470
Water Saving in M3 year - 520156
Energy savings (KwH)Clarified
water
- 95709
Energy Saving (KwH) CT
Pumping
- 52016
Total energy Saving(KwH) 147724
Visit us at wwwjust-chemicalscom
Further Analysis
Hydraulic factors1 Hydraulic factor (CH) of a tower is used to determine the efficiency of water use It is represented as
CH = sumMURsumBDR
Where MUR = Total make-up rate and BDR = Total blow-down rate
1 Both the makeup and blow-down flow rates are comprised of controlled and unintentional components The effective blow-down loss rate is the metered blow-down and unmetered streams such as drift leaks filter backwash and removal of CW from the system for other uses Our CW systems have almost negligible unintentional water losses to limit the COC thus COC of 14 is achievable
2 Drift is the water lost from the tower as a liquid droplets entrained in the exhaust air This loss is not dependent on evaporation rate Drift loss rate is normally expressed in percentage of the recirculation rate (ranging 01 to 002) The drift loss rate depends on the system-specific factors like design of the tower age of the tower types and age of the drift eliminators Our drift loss is around 002
3 Unintentional and uncontrolled water losses could be the SS filter backwash leakages from pump(s) glands or other equipment(s) cooling tower basin overflows water tapping from return line for other usepurpose etc
Visit us at wwwjust-chemicalscom
Further Analysis
Time-related factors
Increase in Holding time index (HTI) is one of the major problem associated with high COC The HTI is defined as the
half-life of an ion in the system This is equated as
HTI = 0693 VT BT
Where VT is the system volume and BT is total water loss
Above figure illustrates the impact of increased cycling on the HTI of a typical cooling tower system Increasing the COC
from 5 to 15 effectively triples the HTI increasing the average time a molecule spends in the system by a factor of three
This can affect the efficacy of the scale and corrosion inhibitors
The HTI in our system at 6 COC is 217 Hours at 7 COC is 261 Hours and at 8 COC is 305 Hours
As the HTI increases the stress on the organic portion (polymer phosphonates azoles) of the treatment regime
increases In this case the treatment-program active components must stay active for longer periods of time before
being replaced With current treatment regime HTI of 300 Hrs is achievable For going beyond 300 hrs HTI advanced
high stress polymers may be used
HTI Vs Cycles
0
100
200
300
2 4 6 8 10 12 14 16 18 20 22
Cycles
HT
I in
hrs
HTI
Visit us at wwwjust-chemicalscom
Further Analysis
Weighing of credits and debits
bull Some of the credits will be less water usage reduced blowdown and decrease in energy consumption
bull At 8 COC or below there is no debit
bull Going beyond 8 COC may call for advanced high stress polymers and advanced phosphonates
Setting rational goals
bull In the beginning detailed water balance and inventory of the water consumption in the system was performed
bull This includes makeup to cooling tower evaporation losses and blowdown
bull By far the biggest problems which may hinder the rising of CoC is unintentional losses or use with tapping from
ACWCW system
bull After this a plan is formulated with a review plans for gains necessary to evaluate the success of this upgrade After this
is complete (1 yr) increasing COC to 8 was evaluated
bull As the progress should be evaluated on a stepwise basis the system were to go to 8 cycles from a starting point of 6
cycles a reasonable goal for the first one year would be operate successfully at 7 COC
bull If corrosion and scale are well controlled an increase to 8 cycles can follow with evaluation of success again after a
significant period of time
Visit us at wwwjust-chemicalscom
Further Analysis
Choosing a compatible treatment program
This includes a combination of stress tolerant treatment actives and heat transfer monitoring (viz TTD LMTD CT efficiency
Approach etc) The treatment programs may be based on a stabilized phosphate or alkaline phosphate approach the
current treatment regime satisfies this condition
Above 8 COC Stress compatible inhibitor technology
The best approach should be to design on-site the specific inhibitors need through a flexible product addition regime
Recently developed stress-tolerant inhibitors are part of this approach New dispersants have been shown to work under a
variety of stress conditions like high Ca (gt1500 ppm as CaCO3) higher water temperature extended HTI (gt 350 hrs) etc
These dispersants allow operation at lower dosages and provide better performance New corrosion inhibitors have also
been found that are stress-tolerant Some materials demonstrate high halogen resistance and remain stable under long
HTI (gt350 h) conditions
Diagnostic tools
At high COC and stressed conditions treatment programs and cooling water systems is to be used within recommended
guidelines For this the cooling water system is properly characterized This involves evaluating the following key
operating parameters
bull Total blow-down rates (including drift loss)
bull Holding time index
bull True COC based on Mg or Na (not SilicaChlorideTH)
bull Heat exchanger performance (TTD LMTD amp lsquoUrsquo values) Visit us at wwwjust-chemicalscom
Further Analysis
Measurement and control
In addition to measuring and adjusting system-operating parameters online monitoring and control of
treatment dosages may be installed to operate at high COC at optimal cost and performance
Monitoring process
Once desired COC is achieved maintenance of high COC is required to realize water and energy
savings Routine evaluation of the system control equipment and monthly logs are important to monitor
and document water quality and usage over time and through seasonal variations
Visit us at wwwjust-chemicalscom
Further Analysis
Measurement and control
In addition to measuring and adjusting system-operating parameters online monitoring and control of
treatment dosages may be installed to operate at high COC at optimal cost and performance
Monitoring process
Once desired COC is achieved maintenance of high COC is required to realize water and energy
savings Routine evaluation of the system control equipment and monthly logs are important to monitor
and document water quality and usage over time and through seasonal variations
Visit us at wwwjust-chemicalscom
CW Monitoring Tools
bull Online Chemistry Analyzers like (This can be developed in an Economical Solution)
bull Corrator inbuilt in Online AnalyzerCorrosion meter
bull Deposit monitor - visual indication of deposit formation and heat transfer loss indication
bull Bio-fouling monitor - indicate loss of pressure due to biofilm or slime build-up
bull Test heat exchanger
Visit us at wwwjust-chemicalscom
CW Monitoring Tools
bull Online Chemistry Analyzers like (This can be developed in an Economical Solution)
bull Corrosion coupons - indicate corrosion rate in mils (thousandth of an inch) per year (MPY)
bull Corrator inbuilt in Online Analyzer
bull Deposit monitor - visual indication of deposit formation and heat transfer loss indication
bull Bio-fouling monitor - indicate loss of pressure due to biofilm or slime build-up
bull Corrosion meter
bull Test heat exchanger
Visit us at wwwjust-chemicalscom
Interlinked Process Flow
Cooling Tower
Water Chemistry
Heat Exchanger
Visit us at wwwjust-chemicalscom
Interlinked Process Flow
Cooling Tower
Water Chemistry
Heat Exchanger
CWT Design Methedology and
guidelines
Visit us at wwwjust-chemicalscom
Impoundments and Storm Water
bull Operators and owners tend to focus primarily on the quality of water coming into the plant and the wastewater quality going out of the plant as required to meet their plant discharge permits
bull In contrast knowing exactly what is going on within the power plant boundaries in impoundments and process sumps is not always as clear especially in older facilities where upgrades and plant modifications have considerably altered the plant water picture over the years
bull Also in many coal-fired power plants coal combustion waste ponds and impoundments are utilized for equalization and treatment of numerous plant wastewater streams complicating the plantrsquos ability to easily assess the potential for reuse of each individual stream
bull However with some of the proposed regulation changes coal-fired power plants may be required to do just that Segregation and separation of plant wastewaters can minimize the volumetric flow rate that requires additional treatment to meet the proposed regulations
bull For instance at one facility where we been assisting with water and mass balance activities in preparation for expected Pollutant Discharge Elimination System permit changes the engineering team was able to reconfigure portions of the wastewater collection system
bull It segregated storm waters into contact and noncontact storm waters and separated mixed process water streams allowing the plant to reuse a fair portion of its previously discharged wastewater
bull As a result the facility significantly reduced the potential treatment costs associated with meeting new permit requirements and realized an overall cost savings Visit us at wwwjust-chemicalscom
Get Preparedbull Especially in light of the upcoming regulation changes and the expectation that additional levels of
wastewater treatment will be necessary to meet some of the new discharge limits any plant likely to be affected should explore the potential for internal recycling or reuse of plant wastewaters and minimizing water waste in order to keep wastewater treatment costs as low as possible
bull Starting now evaluating the current plant water and wastewater conditions conducting sampling and flow measurement programs and assessing current wastewater treatment systems are key to development of a baseline and plan of attack for dealing with the impending regulation changes
bull Knowing exactly where your plantrsquos starting point is and developing a solid data history is crucial to determining what you may need to do to meet changes in regulatory requirements
Visit us at wwwjust-chemicalscom
Replace conventional Side Stream Filtration
bull Use side Stream filter with continuous filtration
bull 2 - 5 of circulating water
bull Saves manpower
bull Continuous ndash no infringement
bull Saves water ndash water wastage down to 3 against 10 in
conventional filters
bull Down to 51020 microns against 50 microns with
conventional filters
bull Polymers used as dispersants
Discussion Decide whether you want engineering control or Chemistry Control
Visit us at wwwjust-chemicalscom
Given the following benefits itrsquos easy to see why self-cleaning filters are the overwhelming choice of consulting engineers property management companies and building owners
bull Self-cleaninghelliprequires no regular maintenance
bull Self-cleaninghellipassures optimal filtration efficiency
bull Self-cleaninghellipreduces energy cost
bull No monitoring ndash No manpower
bull Only 3 water wastage
bull As filter media accumulates suspended contaminants the pressure drop across the filter increases and flow rate decreases The filter consumes the same power but does less work
bull Self-cleaninghellipextends media life (five to ten years typical)
bull Our experience indicates that the necessary disciplined routine maintenance required for manual filters is the exception not the rule As a consequence the filter media overloads with contaminants and thereafter backwashing is less effective in removing accumulated solids
bull Self-cleaning hellipis cost effective No manpower required for backwashing
bull The retrofit fit cost is more than the initial incremental cost for self-cleaning
Visit us at wwwjust-chemicalscom
Reduction of Evaporation loss from Reservoirs
The floating discs were discs of 02m diameter and 002m thickness that covered 91 of the water surface The results have shown that evaporation from the covered reservoir was reduced by about 80 relative to the uncovered water surface
Shade balls are plastic Eco-friendly balls that could be used in lakes ponds stream and dams The Department of Water and Power (LADWP) has first used these balls in California to prevent the evaporation A study was conducted in the Nehru pond at Namakkal district They used 4 inch black balls from high density polyethylene (HDPE) and carbon black to cover the reservoir This study showed that the shade balls reduced 43-45 of evaporation in the reservoir
Shade-cloth are suspended structures installed over water surfaces with supporting poles and steel cables This cover reduces the action of wind and blocks incoming solar radiation therefore it reduces the evaporation rates from water surfaces Shade-cloth is economically used for small reservoirs that are less than 10 hectares in area The main disadvantage of this method is the relatively high capital cost for construction but this has now been overridden in Malaysia owing to a new shade-cloth knitting machine which will produce wider rolls and therefore reduce the number of installed cables
A study carried out under summer conditions in Southern Spain shown that shading covers led to decrease the evaporation by about 80 for the colored-polyethylene covers Another study was conducted in Australia to estimate the benefits of shade-cloth covers for water reservoirs The study has shown that evaporation rate was reduced by about 90 and the shade-cloth reduced maintenance costs because they delay the growth of aquatic plants at the bottom of the storages Visit us at wwwjust-chemicalscom
Floating Solar Plant ldquoEuropersquos largest floating solar plant opens in Francerdquo
French
English Case of USA
Visit us at wwwjust-chemicalscom
Visit us at wwwjust-chemicalscom
Reach us
Juschem Solutions Pvt LtdA108 SV Heights Whitefield Bangalore ndash 560066 KA
Email sbanerjeejust-chemicalscomPhoneWhatsApp +91 7985635683website wwwjust-chemicalscom
Follow us at httpswwwfacebookcompowerplantchem
httpswwwlinkedincominjuschem-solutions-private-ltd-63a997165
httpswwwyoutubecomchannelUC1Jt3imL-WtfkiRgI01sGZg
YouTube Channel Juschem Solutions Pvt Ltd
Visit us at wwwjust-chemicalscom

How to lower the specific water consumption
DataWhat is being
supplied
Key Process Steps
What is the output of
Water Management
Target machine process system
What is being Measured
Efficiency (In-Process) Effectiveness (Output)
Measure TargetPredictability
amp Prescription
Measure TargetPerformance improvement
bull Designbull Commissioni
ngbull Real-time
meter data
Plant Operation
bull Lag Indicators of efficiency and effectiveness
bull Quality parameters
bull Process parameter
bull Breakdown Info
bull Eqpt Infobull Overhaul
info
bull Create a water balance
bull Have meters installed Cleanse and Analyze the data
bull Monitor continuously
bull MACROamp MICRO CONTROLS CONTROL
bull Control on SWC it should come down to 20 liters per KWHr
Reduction of SWC to 20 liters per unit of power (KWHR)
reduction in SWC
33 min 90 adherence to Quality amp Quantity of
output (meeting demand)
100 30 minimum on Efficiency and large on effectiveness
Quantifiable in improvement trends of lead and lag indicators
2 Identify the Output of the Process that will meet requirement
4 Who will provide those
Inputs
6 Identify the Measures that will reflect if Customer Needs are
being met
11 Asset life predictability and prescription writing
1 Identify the Purpose
3 What and how inputs are required to start the
activities
7 Set Target for the identified Measure
8 Impact on performance Measurable
9 Identify the Measures that will reflect is
efficient
5 What are the key steps
10 Set Target for the Efficiency Measures
Visit us at wwwjust-chemicalscom
What are the bottlenecks in reducing Specific Water Consumption
Technicalbull Non-availability of As built Water Balance Diagram
bull Non-availability of water meters (smart metering with IOT will work well as it works with Energy Management Systems)
Skillsbull Not understanding water chemistry of Cooling water thus due to fear of scalingcorrosion do not take risk of Reaching
high COCrdquo Subsequent slides will take you through the journey of excellence in this matter
bull Lack of awareness on performing analytics on data received from meters or work fatigue to do the analytics
bull Lack of Awareness of Troubleshooting the problems
bull Unable to manage Ash-Water system
bull Unable to operate turbine in pre PTZ unable to avoid supercooling and thus transfers sensible heat to towers
bull Switching of CWS Pump and not CT fans
Systembull Lack of CAPEX for the water recycle project(s)
bull Lack of funds to implement projects for reduction of evaporation from Reservoirs (Example of methods in subsequent slides)
Regulatory system implementationbull Government not forcing penalties and not shutting down the plants exceeding water consumption as they due in Water
and Air acts It remains somehow unmonitored and untouched except for the CESS collection
bull Government Granting CTO to new state owned plant on old 2015 SWC norms
Visit us at wwwjust-chemicalscom
What is the Typical Water Consumption points in a power plant
Expected SWC with 91 accuracy In m3day For 1980 MW Super Critical Power Station
SWC SWC At 100 PLF SWC
CW Evap 80648 170 CW Evap 70262 148 CW Evap 61097 129
BD at 8 COC 11521 024 BD at 8 COC 10037 021 BD at 8 COC 8728 018
CWMake-UP 92169 194 CWMake-UP 80299 169 CWMake-UP 69825 147
Fire+Service 2321 005 Fire+Service 2321 005 Fire+Service 2321 005
DM+Potable 2134 004 DM+Potable 2134 004 DM+Potable 2134 004
TOTAL 96624 203 TOTAL 84754 178 TOTAL 74280 156
Summer Yearly Winters
Visit us at wwwjust-chemicalscom
What is the Typical Water Consumption points in a power plant
Expected SWC with 91 accuracy In m3day For 1980 MW Super Critical Power Station
With BD Re-cycle 8814 7679 6677
SWC SWC At 100 PLF SWC
CW Evap 80648 170 CW Evap 70262 148 CW Evap 61097 129
BD at 8 COC 11521 024 BD at 8 COC 10037 021 BD at 8 COC 8728 018
CWMake-UP 83356 175 CWMake-UP 72621 153 CWMake-UP 63148 133
Fire+Service 2321 005 Fire+Service 2321 005 Fire+Service 2321 005
DM+Potable 2134 004 DM+Potable 2134 004 DM+Potable 2134 004
TOTAL 87811 185 TOTAL 77076 162 TOTAL 67603 142
Summer Yearly Winters
Visit us at wwwjust-chemicalscom
Go with the Flow
bull One of the best ways that a plant can manage its water resources more effectively is to develop a plantwide water management plan
bull A water management plan is a comprehensive site-wide strategy for maximizing water use efficiency minimizing wastewater discharge and encouraging a policy of sustainability and reuserecycle to the maximum extent practical to control a plantrsquos water footprint
bull The first step in developing a plan is to construct an overall plant water balance depicting the current plant water picture
bull The water balance should identify all water consumers and wastewater producers throughout the facility and indicate all the flow routes and distribution pathways
Visit us at wwwjust-chemicalscom
Go with the Flowbull Get the full picture Portable flow monitors and sample collection devices can be used to monitor inlet and outlet
flows and collect water samples from locations that are not typically instrumented to capture this data
bull Tracking plant water and wastewater flows and developing a mass balance can be as simple as developing an Excel spreadsheet to log and analyze the data (next slides) We have developed specialized tools based on IoT to aid in this process
bull The flow rates and the water quality constituents for individual plant water and wastewater streamsmdashsuch as cooling tower makeup boiler and cooling tower blowdown equipment drains and washdown pretreatment system wastewaters captured storm waters strainer and filter backwash waters dewatering equipment filtrate and many other plant sources and users are assessed and tabulated to enable tracking throughout the plant
bull Once the plant water balance is developed and the mass balance of contaminants is tracked throughout the plant staff can use this tool in conjunction with the water balance to assess how operational changes or stream redirection might allow the plant to reuse some internal wastewater streams and reduce its water footprint or reduce the level of contaminants that are discharged or that need to be removed
Visit us at wwwjust-chemicalscom
Water Balance Table 100 PLF
Design 2016-17 2017-18 with ETP-UF-RO Avgerage
Intake Mn CWST 134268 94592 91930 83017 2017-18 Proposed
251 HRSCC 2849 2134 2134 2134 Achieved Further Scope
Total Intake 137117 96726 94064 85151
SWC 2885 2035 1979 1792 1994 1774
Use CW MU 120660 91476 89609 80696 9526 9477
Service 13608 2321 2321 2321 247 273
Fire 0 795 0 0 000 000
WTP in 2729 2119 2119 2119 225 249
WTP use Breakup RO-MB 1857 1011 1011 1011 107 119
Potable 520 410 410 410 044 048
CW Use Breakup CW Evap 95328 78408 78408 78408 8336 9208
CW BD 23832 13068 11201 11201 1191 1315
BD Re-cycled 8913 000 1047
Intermediate Effluent Mn Clf 3360 20 20 20 002 002
HRSCC 120 15 15 15 002 002
DMF-RO-MB 417 633 633 633 067 074
CW BD 23832 13068 11201 11201 1191 1315Visit us at wwwjust-chemicalscom
Water Balance Table 100 PLF
Design 2016-17 2017-18 with ETP-UF-RO Avgerage
Recoverable Effluent WTPPlant dr 2377 2323 2323 1750 247 206
HRSCC+Mn Clf 3240 35 35 35 004 004
CWBD to CHP 6336 0 0 0 000 000
CW BD in AHP 17496 13068 11201 11201 1191 1315
Recovered Effluent WTP Plant dr 2377 2323 2323 2323 247 273
HRSCC+Mn Clf 3240 95 95 95 010 011
CWBD to CHP 6336 0 0 0 000 000
CW BD in Ash Water 17496 13068 11201 11201 1191 1315
AHP Requirement ETP and TT rejects 4584 4584 4584 4584 487 538
Excess CWBD to be drained out 15289 10807 8940 0 950 000
Sludge Clf+HRSCC Drain 360 0 0 0 000 000
COC 5 75 8 8 001 001
Water Balance Analytics at 100
PLF - synopsisVisit us at wwwjust-chemicalscom
Water Balance ndash Design and initial
SWC = 28940
Visit us at wwwjust-chemicalscom
Water Balance Improved by monitoring and control
SWC = 2064
Visit us at wwwjust-chemicalscom
Analytics
bull This requires that the water management team perform its monitoring activities at several different times over the course of a year to capture the various plant operating scenarios of interest and collect the desired data
bull Off-design operating conditions especially at multi-unit sites with integrated water and wastewater systems often can produce the most challenging water operating scenarios and can drive decisions related to equipment sizing
Chart Contaminants
bull Once all flows have been charted the second step is to understand the mass balance of contaminants present in the plant water and wastewater streams This will likely involve sampling and testing the internal streams that are not normally monitored in order to paint a true picture of
Where the plant is adding contaminants to the water streams or concentrating existing contaminants
What contaminants are being added or concentrated
In what concentration the contaminants are present in each stream
Portable flow monitors and sample collection devices can be employed to monitor inlet and outlet flows and collect water samples from locations that are not instrumented to capture this data currently
Visit us at wwwjust-chemicalscom
Analytics
bull Obvious examples of internal recyclereuse opportunities include recycling reverse osmosis reject as cooling tower makeup collecting and reprocessing boiler or heat recovery steam generator blowdown water and recycling cooling tower blowdown as flue gas desulfurization makeup water
bull However a close review of the plant water and mass balances can reveal quite a few opportunities for water reuse or water conservation
bull Many of these internal recyclereuse opportunities can be inexpensive and relatively simple to implement involving only piping and valving modifications though some may involve the addition of treatment equipment such as clarification or filtration to reprocess the wastewater streams to make them suitable for reuse
bull Determining the water quality of the wastewater stream contaminants therefore is a crucial early step in evaluating wastewaters for reuse opportunities and performing a cost-benefit analysis
Visit us at wwwjust-chemicalscom
Analytics
bull Development of water and mass balances will also prepare a plant to intelligently evaluate the impact of and reaction to potential modifications to the plant water balance that may occur due to regulations changes
bull The new proposed regulations may affect a plantrsquos cooling water systems material-handling and conveyance systems and wastewater discharges
bull Potential changes such as the addition of wastewater treatment systems or the rerouting of wastewater streams can be simulated to assess their effects on overall plant operations
Visit us at wwwjust-chemicalscom
Water Balance Analytics at 100 PLF
Water Balance Analytics at 85
PLF
Water Balance Analytics at 70
PLF
Analytics
Visit us at wwwjust-chemicalscom
Improvement Project to further reduce SWC
Note For Approval Visit us at wwwjust-chemicalscom
Water Balance after measuring monitoring controlling + Recycling
SWC = 1799
Visit us at wwwjust-chemicalscom
Challenges
bull The most difficult challenge in developing an accurate site water balance is collecting adequate data to model the plant water and wastewater streams precisely
bull Using smart water meters and IoT with Analytics is the necessary system creation for sustainability
bull Inclusion of seasonal and historical data and its impact on the plant water balance is desirable such as periodic degradations in water supply qualities that reduce cooling tower operating cycles
bull This water balance should include average daily usage rates as well as peak and minimum flows to create an accurate picture of the plantrsquos water footprint
bull Reduced load operations (if they are relevant for a unit) partial plant operations (for instance single-unit operation in a two-unit plant) as well as other off-design operating scenarios should be evaluated as appropriate to determine how they will affect water consumption rates and wastewater production
Visit us at wwwjust-chemicalscom
REACHING HIGH COC
In Cooling Water Systems
Visit us at wwwjust-chemicalscom
Operating recirculating cooling systems at higher COC helps us to gain many economic and environmental benefits viz
bull Reduction in pumping cost
bull Reducing depletion of natural resource Reducing specific water consumption and water cost Stationrsquos requirement to lower the operating costincrease profitability
bull Abiding environmental regulations
bull Demonstration of corporate responsibility by conserving water
Elevating COC can minimize operating costs through water savings and energy savings
While planning to operate at high COC we need to study various technical issues in order to prevent waterside problems
Visit us at wwwjust-chemicalscom
Study on Water Chemistry
To understand the chemistry of our
cooling water system we studied the
present system and operating
parameters for Calcium Hardness TDS
alkalinity and associated pH
bull LSI below 05 is corrosive and above 15 is scale
forming 05-15 controllable
bull RSI above 64 is corrosive and Below 54 is scale
forming 54-64 controllable
Make up Water ParameterParameters As Min Max Avg
pH 66 82 75
Total Hardness PPM 30 50 40
Calcium Harness PPM 18 30 24
Magnesium Hardness PPM 12 20 16
M-Alk PPM 20 40 30
Chlorides PPM 15 25 20
Silica PPM 8 13 11
Conductivity microscm 100 150 120
Total Dissolved solids PPM 67 101 80
Turbidity NTU 4 20 7
Iron PPM 01 02 015
pHs (Saturation) 93 88 90
LSI Indices -27 -06 -15
RSI Indices 120 94 105
CW MAKE-UP WATER ANALYSIS CONSIDERED
Visit us at wwwjust-chemicalscom
Relationship of Various parameters
bull Evaporation Loss
E = 00018 x delta T x R x TF (Tower Factor)(T expressed in oC)
Tower factor is based on (a) humidity and (b) Tower Height (Considered during designing of the tower)
bull Blowdown
B = Evaporation
COC-1
bull Cycles Of Concentration
COC = Concentration in Recirculation
Concentration In Make-up
Question What is Best Elementchemical parameter
Visit us at wwwjust-chemicalscom
Scalingcorrosion Propensity on Average ValuesAt Average Values
Parameters 5 COC 6 COC 7 COC 8 COC 9 COC 10 COC 11 COC 12 COCpH 783 794 804 813 82 83 84 85Total Hardness 200 240 280 320 360 400 440 480Calcium Harness 120 144 168 192 216 240 264 288MagnesiumHardness 80 96 112 128 144 160 176 192M-Alk 150 180 210 240 270 300 330 360Chlorides 100 120 140 160 180 200 220 240Silica 55 66 77 88 99 110 121 132Conductivity 600 720 840 960 1080 1200 1320 1440Total Dissolvedsolids 402 4824 5628 6432 7236 804 8844 9648Turbidity 35 42 49 56 63 70 77 84Iron 075 09 105 12 135 15 165 18pHs (Saturation) 74 72 71 70 69 68 67 67
LSI 05 07 09 11 13 15 17 18
RSI 69 65 62 58 56 53 51 48
LSI below 05 is corrosive and above 15 is scale forming 05-15 controllable RSI above 64 is corrosive and Below 54 is scale forming 54-64 controllable
For Make up with high Chlorides
use LaI
Visit u
s at w
ww
just-ch
em
icalsco
m
For Make up with high Chlorides
use LaI
At Maximum Values
Parameters 5 COC 6 COC 7 COC 8 COC 9 COC 10 COC 11 COC 12 COCpH
82 83 84 85 85 86 87 88Total Hardness
250 240 280 320 360 400 440 480Calcium Harness
150 144 168 192 216 240 264 288Magnesium Hardness
100 96 112 128 144 160 176 192M-Alk
200 180 210 240 270 300 330 360Chlorides
125 120 140 160 180 200 220 240Silica
65 66 77 88 99 110 121 132Conductivity
750 720 840 960 1080 1200 1320 1440Total Dissolved solids
5025 4824 5628 6432 7236 804 8844 9648Turbidity
100 42 49 56 63 70 77 84Iron
1 09 105 12 135 15 165 18pHs (Saturation) 72 72 71 70 69 68 67 67
LSI 10 11 13 15 16 18 20 21
RSI 62 62 58 55 52 50 48 45
LSI below 05 is corrosive and above 15 is scale forming 05-15 controllable RSI above 64 is corrosive and Below 54 is scale forming 54-64 controllable
Scalingcorrosion Propensity on Maximum Values
Visit us at wwwjust-chemicalscom
RSI amp LSI
All Saturation indices
Chemistry and
scaling indices
Visit us at wwwjust-chemicalscom
Study Outcome Analysis
Considering the above we shall always be in the range of 7 - 10 COC Assuming that the system will
have max values (only in summers) also a COC of 80 is ideal
RSI below 54 is scale forming but controllable till 4 RSI (Controllable with Chemical Treatment) above
64 is corrosive but controllable till 6 (Controllable with Chemical Treatment) Only It is always better to
operate system in slight scale forming tendency than corrosive because scale can be removed but
corroded metal cannot be put back
For CW where water velocity is gt06 ms RSI should only be used
Refer Nalco Water handbook Page 417
Visit us at wwwjust-chemicalscom
Study on Environmental Impact
bull We will be complying by EC and Consent conditions by operating the CW
system above 5 COC as it says ldquoCOC of not less than 5 shall be adoptedrdquo
bull The water saving will be
bull The Energy Savings will be
bull Reduction in CO2 emission will be 125 tons per year
Station Parameters for CW
System-
AT CYCLES OF
CONCENTARTION 6
AT CYCLES OF
CONCENTARTION 7
CT blow down m3year 3120938 2600781
CT Make Up Water Rate in
m3year
18725626 18205470
Water Saving in M3 year - 520156
Energy savings (KwH)Clarified
water
- 95709
Energy Saving (KwH) CT
Pumping
- 52016
Total energy Saving(KwH) 147724
Visit us at wwwjust-chemicalscom
Further Analysis
Hydraulic factors1 Hydraulic factor (CH) of a tower is used to determine the efficiency of water use It is represented as
CH = sumMURsumBDR
Where MUR = Total make-up rate and BDR = Total blow-down rate
1 Both the makeup and blow-down flow rates are comprised of controlled and unintentional components The effective blow-down loss rate is the metered blow-down and unmetered streams such as drift leaks filter backwash and removal of CW from the system for other uses Our CW systems have almost negligible unintentional water losses to limit the COC thus COC of 14 is achievable
2 Drift is the water lost from the tower as a liquid droplets entrained in the exhaust air This loss is not dependent on evaporation rate Drift loss rate is normally expressed in percentage of the recirculation rate (ranging 01 to 002) The drift loss rate depends on the system-specific factors like design of the tower age of the tower types and age of the drift eliminators Our drift loss is around 002
3 Unintentional and uncontrolled water losses could be the SS filter backwash leakages from pump(s) glands or other equipment(s) cooling tower basin overflows water tapping from return line for other usepurpose etc
Visit us at wwwjust-chemicalscom
Further Analysis
Time-related factors
Increase in Holding time index (HTI) is one of the major problem associated with high COC The HTI is defined as the
half-life of an ion in the system This is equated as
HTI = 0693 VT BT
Where VT is the system volume and BT is total water loss
Above figure illustrates the impact of increased cycling on the HTI of a typical cooling tower system Increasing the COC
from 5 to 15 effectively triples the HTI increasing the average time a molecule spends in the system by a factor of three
This can affect the efficacy of the scale and corrosion inhibitors
The HTI in our system at 6 COC is 217 Hours at 7 COC is 261 Hours and at 8 COC is 305 Hours
As the HTI increases the stress on the organic portion (polymer phosphonates azoles) of the treatment regime
increases In this case the treatment-program active components must stay active for longer periods of time before
being replaced With current treatment regime HTI of 300 Hrs is achievable For going beyond 300 hrs HTI advanced
high stress polymers may be used
HTI Vs Cycles
0
100
200
300
2 4 6 8 10 12 14 16 18 20 22
Cycles
HT
I in
hrs
HTI
Visit us at wwwjust-chemicalscom
Further Analysis
Weighing of credits and debits
bull Some of the credits will be less water usage reduced blowdown and decrease in energy consumption
bull At 8 COC or below there is no debit
bull Going beyond 8 COC may call for advanced high stress polymers and advanced phosphonates
Setting rational goals
bull In the beginning detailed water balance and inventory of the water consumption in the system was performed
bull This includes makeup to cooling tower evaporation losses and blowdown
bull By far the biggest problems which may hinder the rising of CoC is unintentional losses or use with tapping from
ACWCW system
bull After this a plan is formulated with a review plans for gains necessary to evaluate the success of this upgrade After this
is complete (1 yr) increasing COC to 8 was evaluated
bull As the progress should be evaluated on a stepwise basis the system were to go to 8 cycles from a starting point of 6
cycles a reasonable goal for the first one year would be operate successfully at 7 COC
bull If corrosion and scale are well controlled an increase to 8 cycles can follow with evaluation of success again after a
significant period of time
Visit us at wwwjust-chemicalscom
Further Analysis
Choosing a compatible treatment program
This includes a combination of stress tolerant treatment actives and heat transfer monitoring (viz TTD LMTD CT efficiency
Approach etc) The treatment programs may be based on a stabilized phosphate or alkaline phosphate approach the
current treatment regime satisfies this condition
Above 8 COC Stress compatible inhibitor technology
The best approach should be to design on-site the specific inhibitors need through a flexible product addition regime
Recently developed stress-tolerant inhibitors are part of this approach New dispersants have been shown to work under a
variety of stress conditions like high Ca (gt1500 ppm as CaCO3) higher water temperature extended HTI (gt 350 hrs) etc
These dispersants allow operation at lower dosages and provide better performance New corrosion inhibitors have also
been found that are stress-tolerant Some materials demonstrate high halogen resistance and remain stable under long
HTI (gt350 h) conditions
Diagnostic tools
At high COC and stressed conditions treatment programs and cooling water systems is to be used within recommended
guidelines For this the cooling water system is properly characterized This involves evaluating the following key
operating parameters
bull Total blow-down rates (including drift loss)
bull Holding time index
bull True COC based on Mg or Na (not SilicaChlorideTH)
bull Heat exchanger performance (TTD LMTD amp lsquoUrsquo values) Visit us at wwwjust-chemicalscom
Further Analysis
Measurement and control
In addition to measuring and adjusting system-operating parameters online monitoring and control of
treatment dosages may be installed to operate at high COC at optimal cost and performance
Monitoring process
Once desired COC is achieved maintenance of high COC is required to realize water and energy
savings Routine evaluation of the system control equipment and monthly logs are important to monitor
and document water quality and usage over time and through seasonal variations
Visit us at wwwjust-chemicalscom
Further Analysis
Measurement and control
In addition to measuring and adjusting system-operating parameters online monitoring and control of
treatment dosages may be installed to operate at high COC at optimal cost and performance
Monitoring process
Once desired COC is achieved maintenance of high COC is required to realize water and energy
savings Routine evaluation of the system control equipment and monthly logs are important to monitor
and document water quality and usage over time and through seasonal variations
Visit us at wwwjust-chemicalscom
CW Monitoring Tools
bull Online Chemistry Analyzers like (This can be developed in an Economical Solution)
bull Corrator inbuilt in Online AnalyzerCorrosion meter
bull Deposit monitor - visual indication of deposit formation and heat transfer loss indication
bull Bio-fouling monitor - indicate loss of pressure due to biofilm or slime build-up
bull Test heat exchanger
Visit us at wwwjust-chemicalscom
CW Monitoring Tools
bull Online Chemistry Analyzers like (This can be developed in an Economical Solution)
bull Corrosion coupons - indicate corrosion rate in mils (thousandth of an inch) per year (MPY)
bull Corrator inbuilt in Online Analyzer
bull Deposit monitor - visual indication of deposit formation and heat transfer loss indication
bull Bio-fouling monitor - indicate loss of pressure due to biofilm or slime build-up
bull Corrosion meter
bull Test heat exchanger
Visit us at wwwjust-chemicalscom
Interlinked Process Flow
Cooling Tower
Water Chemistry
Heat Exchanger
Visit us at wwwjust-chemicalscom
Interlinked Process Flow
Cooling Tower
Water Chemistry
Heat Exchanger
CWT Design Methedology and
guidelines
Visit us at wwwjust-chemicalscom
Impoundments and Storm Water
bull Operators and owners tend to focus primarily on the quality of water coming into the plant and the wastewater quality going out of the plant as required to meet their plant discharge permits
bull In contrast knowing exactly what is going on within the power plant boundaries in impoundments and process sumps is not always as clear especially in older facilities where upgrades and plant modifications have considerably altered the plant water picture over the years
bull Also in many coal-fired power plants coal combustion waste ponds and impoundments are utilized for equalization and treatment of numerous plant wastewater streams complicating the plantrsquos ability to easily assess the potential for reuse of each individual stream
bull However with some of the proposed regulation changes coal-fired power plants may be required to do just that Segregation and separation of plant wastewaters can minimize the volumetric flow rate that requires additional treatment to meet the proposed regulations
bull For instance at one facility where we been assisting with water and mass balance activities in preparation for expected Pollutant Discharge Elimination System permit changes the engineering team was able to reconfigure portions of the wastewater collection system
bull It segregated storm waters into contact and noncontact storm waters and separated mixed process water streams allowing the plant to reuse a fair portion of its previously discharged wastewater
bull As a result the facility significantly reduced the potential treatment costs associated with meeting new permit requirements and realized an overall cost savings Visit us at wwwjust-chemicalscom
Get Preparedbull Especially in light of the upcoming regulation changes and the expectation that additional levels of
wastewater treatment will be necessary to meet some of the new discharge limits any plant likely to be affected should explore the potential for internal recycling or reuse of plant wastewaters and minimizing water waste in order to keep wastewater treatment costs as low as possible
bull Starting now evaluating the current plant water and wastewater conditions conducting sampling and flow measurement programs and assessing current wastewater treatment systems are key to development of a baseline and plan of attack for dealing with the impending regulation changes
bull Knowing exactly where your plantrsquos starting point is and developing a solid data history is crucial to determining what you may need to do to meet changes in regulatory requirements
Visit us at wwwjust-chemicalscom
Replace conventional Side Stream Filtration
bull Use side Stream filter with continuous filtration
bull 2 - 5 of circulating water
bull Saves manpower
bull Continuous ndash no infringement
bull Saves water ndash water wastage down to 3 against 10 in
conventional filters
bull Down to 51020 microns against 50 microns with
conventional filters
bull Polymers used as dispersants
Discussion Decide whether you want engineering control or Chemistry Control
Visit us at wwwjust-chemicalscom
Given the following benefits itrsquos easy to see why self-cleaning filters are the overwhelming choice of consulting engineers property management companies and building owners
bull Self-cleaninghelliprequires no regular maintenance
bull Self-cleaninghellipassures optimal filtration efficiency
bull Self-cleaninghellipreduces energy cost
bull No monitoring ndash No manpower
bull Only 3 water wastage
bull As filter media accumulates suspended contaminants the pressure drop across the filter increases and flow rate decreases The filter consumes the same power but does less work
bull Self-cleaninghellipextends media life (five to ten years typical)
bull Our experience indicates that the necessary disciplined routine maintenance required for manual filters is the exception not the rule As a consequence the filter media overloads with contaminants and thereafter backwashing is less effective in removing accumulated solids
bull Self-cleaning hellipis cost effective No manpower required for backwashing
bull The retrofit fit cost is more than the initial incremental cost for self-cleaning
Visit us at wwwjust-chemicalscom
Reduction of Evaporation loss from Reservoirs
The floating discs were discs of 02m diameter and 002m thickness that covered 91 of the water surface The results have shown that evaporation from the covered reservoir was reduced by about 80 relative to the uncovered water surface
Shade balls are plastic Eco-friendly balls that could be used in lakes ponds stream and dams The Department of Water and Power (LADWP) has first used these balls in California to prevent the evaporation A study was conducted in the Nehru pond at Namakkal district They used 4 inch black balls from high density polyethylene (HDPE) and carbon black to cover the reservoir This study showed that the shade balls reduced 43-45 of evaporation in the reservoir
Shade-cloth are suspended structures installed over water surfaces with supporting poles and steel cables This cover reduces the action of wind and blocks incoming solar radiation therefore it reduces the evaporation rates from water surfaces Shade-cloth is economically used for small reservoirs that are less than 10 hectares in area The main disadvantage of this method is the relatively high capital cost for construction but this has now been overridden in Malaysia owing to a new shade-cloth knitting machine which will produce wider rolls and therefore reduce the number of installed cables
A study carried out under summer conditions in Southern Spain shown that shading covers led to decrease the evaporation by about 80 for the colored-polyethylene covers Another study was conducted in Australia to estimate the benefits of shade-cloth covers for water reservoirs The study has shown that evaporation rate was reduced by about 90 and the shade-cloth reduced maintenance costs because they delay the growth of aquatic plants at the bottom of the storages Visit us at wwwjust-chemicalscom
Floating Solar Plant ldquoEuropersquos largest floating solar plant opens in Francerdquo
French
English Case of USA
Visit us at wwwjust-chemicalscom
Visit us at wwwjust-chemicalscom
Reach us
Juschem Solutions Pvt LtdA108 SV Heights Whitefield Bangalore ndash 560066 KA
Email sbanerjeejust-chemicalscomPhoneWhatsApp +91 7985635683website wwwjust-chemicalscom
Follow us at httpswwwfacebookcompowerplantchem
httpswwwlinkedincominjuschem-solutions-private-ltd-63a997165
httpswwwyoutubecomchannelUC1Jt3imL-WtfkiRgI01sGZg
YouTube Channel Juschem Solutions Pvt Ltd
Visit us at wwwjust-chemicalscom

What is the Typical Water Consumption points in a power plant
Expected SWC with 91 accuracy In m3day For 1980 MW Super Critical Power Station
SWC SWC At 100 PLF SWC
CW Evap 80648 170 CW Evap 70262 148 CW Evap 61097 129
BD at 8 COC 11521 024 BD at 8 COC 10037 021 BD at 8 COC 8728 018
CWMake-UP 92169 194 CWMake-UP 80299 169 CWMake-UP 69825 147
Fire+Service 2321 005 Fire+Service 2321 005 Fire+Service 2321 005
DM+Potable 2134 004 DM+Potable 2134 004 DM+Potable 2134 004
TOTAL 96624 203 TOTAL 84754 178 TOTAL 74280 156
Summer Yearly Winters
Visit us at wwwjust-chemicalscom
What is the Typical Water Consumption points in a power plant
Expected SWC with 91 accuracy In m3day For 1980 MW Super Critical Power Station
With BD Re-cycle 8814 7679 6677
SWC SWC At 100 PLF SWC
CW Evap 80648 170 CW Evap 70262 148 CW Evap 61097 129
BD at 8 COC 11521 024 BD at 8 COC 10037 021 BD at 8 COC 8728 018
CWMake-UP 83356 175 CWMake-UP 72621 153 CWMake-UP 63148 133
Fire+Service 2321 005 Fire+Service 2321 005 Fire+Service 2321 005
DM+Potable 2134 004 DM+Potable 2134 004 DM+Potable 2134 004
TOTAL 87811 185 TOTAL 77076 162 TOTAL 67603 142
Summer Yearly Winters
Visit us at wwwjust-chemicalscom
Go with the Flow
bull One of the best ways that a plant can manage its water resources more effectively is to develop a plantwide water management plan
bull A water management plan is a comprehensive site-wide strategy for maximizing water use efficiency minimizing wastewater discharge and encouraging a policy of sustainability and reuserecycle to the maximum extent practical to control a plantrsquos water footprint
bull The first step in developing a plan is to construct an overall plant water balance depicting the current plant water picture
bull The water balance should identify all water consumers and wastewater producers throughout the facility and indicate all the flow routes and distribution pathways
Visit us at wwwjust-chemicalscom
Go with the Flowbull Get the full picture Portable flow monitors and sample collection devices can be used to monitor inlet and outlet
flows and collect water samples from locations that are not typically instrumented to capture this data
bull Tracking plant water and wastewater flows and developing a mass balance can be as simple as developing an Excel spreadsheet to log and analyze the data (next slides) We have developed specialized tools based on IoT to aid in this process
bull The flow rates and the water quality constituents for individual plant water and wastewater streamsmdashsuch as cooling tower makeup boiler and cooling tower blowdown equipment drains and washdown pretreatment system wastewaters captured storm waters strainer and filter backwash waters dewatering equipment filtrate and many other plant sources and users are assessed and tabulated to enable tracking throughout the plant
bull Once the plant water balance is developed and the mass balance of contaminants is tracked throughout the plant staff can use this tool in conjunction with the water balance to assess how operational changes or stream redirection might allow the plant to reuse some internal wastewater streams and reduce its water footprint or reduce the level of contaminants that are discharged or that need to be removed
Visit us at wwwjust-chemicalscom
Water Balance Table 100 PLF
Design 2016-17 2017-18 with ETP-UF-RO Avgerage
Intake Mn CWST 134268 94592 91930 83017 2017-18 Proposed
251 HRSCC 2849 2134 2134 2134 Achieved Further Scope
Total Intake 137117 96726 94064 85151
SWC 2885 2035 1979 1792 1994 1774
Use CW MU 120660 91476 89609 80696 9526 9477
Service 13608 2321 2321 2321 247 273
Fire 0 795 0 0 000 000
WTP in 2729 2119 2119 2119 225 249
WTP use Breakup RO-MB 1857 1011 1011 1011 107 119
Potable 520 410 410 410 044 048
CW Use Breakup CW Evap 95328 78408 78408 78408 8336 9208
CW BD 23832 13068 11201 11201 1191 1315
BD Re-cycled 8913 000 1047
Intermediate Effluent Mn Clf 3360 20 20 20 002 002
HRSCC 120 15 15 15 002 002
DMF-RO-MB 417 633 633 633 067 074
CW BD 23832 13068 11201 11201 1191 1315Visit us at wwwjust-chemicalscom
Water Balance Table 100 PLF
Design 2016-17 2017-18 with ETP-UF-RO Avgerage
Recoverable Effluent WTPPlant dr 2377 2323 2323 1750 247 206
HRSCC+Mn Clf 3240 35 35 35 004 004
CWBD to CHP 6336 0 0 0 000 000
CW BD in AHP 17496 13068 11201 11201 1191 1315
Recovered Effluent WTP Plant dr 2377 2323 2323 2323 247 273
HRSCC+Mn Clf 3240 95 95 95 010 011
CWBD to CHP 6336 0 0 0 000 000
CW BD in Ash Water 17496 13068 11201 11201 1191 1315
AHP Requirement ETP and TT rejects 4584 4584 4584 4584 487 538
Excess CWBD to be drained out 15289 10807 8940 0 950 000
Sludge Clf+HRSCC Drain 360 0 0 0 000 000
COC 5 75 8 8 001 001
Water Balance Analytics at 100
PLF - synopsisVisit us at wwwjust-chemicalscom
Water Balance ndash Design and initial
SWC = 28940
Visit us at wwwjust-chemicalscom
Water Balance Improved by monitoring and control
SWC = 2064
Visit us at wwwjust-chemicalscom
Analytics
bull This requires that the water management team perform its monitoring activities at several different times over the course of a year to capture the various plant operating scenarios of interest and collect the desired data
bull Off-design operating conditions especially at multi-unit sites with integrated water and wastewater systems often can produce the most challenging water operating scenarios and can drive decisions related to equipment sizing
Chart Contaminants
bull Once all flows have been charted the second step is to understand the mass balance of contaminants present in the plant water and wastewater streams This will likely involve sampling and testing the internal streams that are not normally monitored in order to paint a true picture of
Where the plant is adding contaminants to the water streams or concentrating existing contaminants
What contaminants are being added or concentrated
In what concentration the contaminants are present in each stream
Portable flow monitors and sample collection devices can be employed to monitor inlet and outlet flows and collect water samples from locations that are not instrumented to capture this data currently
Visit us at wwwjust-chemicalscom
Analytics
bull Obvious examples of internal recyclereuse opportunities include recycling reverse osmosis reject as cooling tower makeup collecting and reprocessing boiler or heat recovery steam generator blowdown water and recycling cooling tower blowdown as flue gas desulfurization makeup water
bull However a close review of the plant water and mass balances can reveal quite a few opportunities for water reuse or water conservation
bull Many of these internal recyclereuse opportunities can be inexpensive and relatively simple to implement involving only piping and valving modifications though some may involve the addition of treatment equipment such as clarification or filtration to reprocess the wastewater streams to make them suitable for reuse
bull Determining the water quality of the wastewater stream contaminants therefore is a crucial early step in evaluating wastewaters for reuse opportunities and performing a cost-benefit analysis
Visit us at wwwjust-chemicalscom
Analytics
bull Development of water and mass balances will also prepare a plant to intelligently evaluate the impact of and reaction to potential modifications to the plant water balance that may occur due to regulations changes
bull The new proposed regulations may affect a plantrsquos cooling water systems material-handling and conveyance systems and wastewater discharges
bull Potential changes such as the addition of wastewater treatment systems or the rerouting of wastewater streams can be simulated to assess their effects on overall plant operations
Visit us at wwwjust-chemicalscom
Water Balance Analytics at 100 PLF
Water Balance Analytics at 85
PLF
Water Balance Analytics at 70
PLF
Analytics
Visit us at wwwjust-chemicalscom
Improvement Project to further reduce SWC
Note For Approval Visit us at wwwjust-chemicalscom
Water Balance after measuring monitoring controlling + Recycling
SWC = 1799
Visit us at wwwjust-chemicalscom
Challenges
bull The most difficult challenge in developing an accurate site water balance is collecting adequate data to model the plant water and wastewater streams precisely
bull Using smart water meters and IoT with Analytics is the necessary system creation for sustainability
bull Inclusion of seasonal and historical data and its impact on the plant water balance is desirable such as periodic degradations in water supply qualities that reduce cooling tower operating cycles
bull This water balance should include average daily usage rates as well as peak and minimum flows to create an accurate picture of the plantrsquos water footprint
bull Reduced load operations (if they are relevant for a unit) partial plant operations (for instance single-unit operation in a two-unit plant) as well as other off-design operating scenarios should be evaluated as appropriate to determine how they will affect water consumption rates and wastewater production
Visit us at wwwjust-chemicalscom
REACHING HIGH COC
In Cooling Water Systems
Visit us at wwwjust-chemicalscom
Operating recirculating cooling systems at higher COC helps us to gain many economic and environmental benefits viz
bull Reduction in pumping cost
bull Reducing depletion of natural resource Reducing specific water consumption and water cost Stationrsquos requirement to lower the operating costincrease profitability
bull Abiding environmental regulations
bull Demonstration of corporate responsibility by conserving water
Elevating COC can minimize operating costs through water savings and energy savings
While planning to operate at high COC we need to study various technical issues in order to prevent waterside problems
Visit us at wwwjust-chemicalscom
Study on Water Chemistry
To understand the chemistry of our
cooling water system we studied the
present system and operating
parameters for Calcium Hardness TDS
alkalinity and associated pH
bull LSI below 05 is corrosive and above 15 is scale
forming 05-15 controllable
bull RSI above 64 is corrosive and Below 54 is scale
forming 54-64 controllable
Make up Water ParameterParameters As Min Max Avg
pH 66 82 75
Total Hardness PPM 30 50 40
Calcium Harness PPM 18 30 24
Magnesium Hardness PPM 12 20 16
M-Alk PPM 20 40 30
Chlorides PPM 15 25 20
Silica PPM 8 13 11
Conductivity microscm 100 150 120
Total Dissolved solids PPM 67 101 80
Turbidity NTU 4 20 7
Iron PPM 01 02 015
pHs (Saturation) 93 88 90
LSI Indices -27 -06 -15
RSI Indices 120 94 105
CW MAKE-UP WATER ANALYSIS CONSIDERED
Visit us at wwwjust-chemicalscom
Relationship of Various parameters
bull Evaporation Loss
E = 00018 x delta T x R x TF (Tower Factor)(T expressed in oC)
Tower factor is based on (a) humidity and (b) Tower Height (Considered during designing of the tower)
bull Blowdown
B = Evaporation
COC-1
bull Cycles Of Concentration
COC = Concentration in Recirculation
Concentration In Make-up
Question What is Best Elementchemical parameter
Visit us at wwwjust-chemicalscom
Scalingcorrosion Propensity on Average ValuesAt Average Values
Parameters 5 COC 6 COC 7 COC 8 COC 9 COC 10 COC 11 COC 12 COCpH 783 794 804 813 82 83 84 85Total Hardness 200 240 280 320 360 400 440 480Calcium Harness 120 144 168 192 216 240 264 288MagnesiumHardness 80 96 112 128 144 160 176 192M-Alk 150 180 210 240 270 300 330 360Chlorides 100 120 140 160 180 200 220 240Silica 55 66 77 88 99 110 121 132Conductivity 600 720 840 960 1080 1200 1320 1440Total Dissolvedsolids 402 4824 5628 6432 7236 804 8844 9648Turbidity 35 42 49 56 63 70 77 84Iron 075 09 105 12 135 15 165 18pHs (Saturation) 74 72 71 70 69 68 67 67
LSI 05 07 09 11 13 15 17 18
RSI 69 65 62 58 56 53 51 48
LSI below 05 is corrosive and above 15 is scale forming 05-15 controllable RSI above 64 is corrosive and Below 54 is scale forming 54-64 controllable
For Make up with high Chlorides
use LaI
Visit u
s at w
ww
just-ch
em
icalsco
m
For Make up with high Chlorides
use LaI
At Maximum Values
Parameters 5 COC 6 COC 7 COC 8 COC 9 COC 10 COC 11 COC 12 COCpH
82 83 84 85 85 86 87 88Total Hardness
250 240 280 320 360 400 440 480Calcium Harness
150 144 168 192 216 240 264 288Magnesium Hardness
100 96 112 128 144 160 176 192M-Alk
200 180 210 240 270 300 330 360Chlorides
125 120 140 160 180 200 220 240Silica
65 66 77 88 99 110 121 132Conductivity
750 720 840 960 1080 1200 1320 1440Total Dissolved solids
5025 4824 5628 6432 7236 804 8844 9648Turbidity
100 42 49 56 63 70 77 84Iron
1 09 105 12 135 15 165 18pHs (Saturation) 72 72 71 70 69 68 67 67
LSI 10 11 13 15 16 18 20 21
RSI 62 62 58 55 52 50 48 45
LSI below 05 is corrosive and above 15 is scale forming 05-15 controllable RSI above 64 is corrosive and Below 54 is scale forming 54-64 controllable
Scalingcorrosion Propensity on Maximum Values
Visit us at wwwjust-chemicalscom
RSI amp LSI
All Saturation indices
Chemistry and
scaling indices
Visit us at wwwjust-chemicalscom
Study Outcome Analysis
Considering the above we shall always be in the range of 7 - 10 COC Assuming that the system will
have max values (only in summers) also a COC of 80 is ideal
RSI below 54 is scale forming but controllable till 4 RSI (Controllable with Chemical Treatment) above
64 is corrosive but controllable till 6 (Controllable with Chemical Treatment) Only It is always better to
operate system in slight scale forming tendency than corrosive because scale can be removed but
corroded metal cannot be put back
For CW where water velocity is gt06 ms RSI should only be used
Refer Nalco Water handbook Page 417
Visit us at wwwjust-chemicalscom
Study on Environmental Impact
bull We will be complying by EC and Consent conditions by operating the CW
system above 5 COC as it says ldquoCOC of not less than 5 shall be adoptedrdquo
bull The water saving will be
bull The Energy Savings will be
bull Reduction in CO2 emission will be 125 tons per year
Station Parameters for CW
System-
AT CYCLES OF
CONCENTARTION 6
AT CYCLES OF
CONCENTARTION 7
CT blow down m3year 3120938 2600781
CT Make Up Water Rate in
m3year
18725626 18205470
Water Saving in M3 year - 520156
Energy savings (KwH)Clarified
water
- 95709
Energy Saving (KwH) CT
Pumping
- 52016
Total energy Saving(KwH) 147724
Visit us at wwwjust-chemicalscom
Further Analysis
Hydraulic factors1 Hydraulic factor (CH) of a tower is used to determine the efficiency of water use It is represented as
CH = sumMURsumBDR
Where MUR = Total make-up rate and BDR = Total blow-down rate
1 Both the makeup and blow-down flow rates are comprised of controlled and unintentional components The effective blow-down loss rate is the metered blow-down and unmetered streams such as drift leaks filter backwash and removal of CW from the system for other uses Our CW systems have almost negligible unintentional water losses to limit the COC thus COC of 14 is achievable
2 Drift is the water lost from the tower as a liquid droplets entrained in the exhaust air This loss is not dependent on evaporation rate Drift loss rate is normally expressed in percentage of the recirculation rate (ranging 01 to 002) The drift loss rate depends on the system-specific factors like design of the tower age of the tower types and age of the drift eliminators Our drift loss is around 002
3 Unintentional and uncontrolled water losses could be the SS filter backwash leakages from pump(s) glands or other equipment(s) cooling tower basin overflows water tapping from return line for other usepurpose etc
Visit us at wwwjust-chemicalscom
Further Analysis
Time-related factors
Increase in Holding time index (HTI) is one of the major problem associated with high COC The HTI is defined as the
half-life of an ion in the system This is equated as
HTI = 0693 VT BT
Where VT is the system volume and BT is total water loss
Above figure illustrates the impact of increased cycling on the HTI of a typical cooling tower system Increasing the COC
from 5 to 15 effectively triples the HTI increasing the average time a molecule spends in the system by a factor of three
This can affect the efficacy of the scale and corrosion inhibitors
The HTI in our system at 6 COC is 217 Hours at 7 COC is 261 Hours and at 8 COC is 305 Hours
As the HTI increases the stress on the organic portion (polymer phosphonates azoles) of the treatment regime
increases In this case the treatment-program active components must stay active for longer periods of time before
being replaced With current treatment regime HTI of 300 Hrs is achievable For going beyond 300 hrs HTI advanced
high stress polymers may be used
HTI Vs Cycles
0
100
200
300
2 4 6 8 10 12 14 16 18 20 22
Cycles
HT
I in
hrs
HTI
Visit us at wwwjust-chemicalscom
Further Analysis
Weighing of credits and debits
bull Some of the credits will be less water usage reduced blowdown and decrease in energy consumption
bull At 8 COC or below there is no debit
bull Going beyond 8 COC may call for advanced high stress polymers and advanced phosphonates
Setting rational goals
bull In the beginning detailed water balance and inventory of the water consumption in the system was performed
bull This includes makeup to cooling tower evaporation losses and blowdown
bull By far the biggest problems which may hinder the rising of CoC is unintentional losses or use with tapping from
ACWCW system
bull After this a plan is formulated with a review plans for gains necessary to evaluate the success of this upgrade After this
is complete (1 yr) increasing COC to 8 was evaluated
bull As the progress should be evaluated on a stepwise basis the system were to go to 8 cycles from a starting point of 6
cycles a reasonable goal for the first one year would be operate successfully at 7 COC
bull If corrosion and scale are well controlled an increase to 8 cycles can follow with evaluation of success again after a
significant period of time
Visit us at wwwjust-chemicalscom
Further Analysis
Choosing a compatible treatment program
This includes a combination of stress tolerant treatment actives and heat transfer monitoring (viz TTD LMTD CT efficiency
Approach etc) The treatment programs may be based on a stabilized phosphate or alkaline phosphate approach the
current treatment regime satisfies this condition
Above 8 COC Stress compatible inhibitor technology
The best approach should be to design on-site the specific inhibitors need through a flexible product addition regime
Recently developed stress-tolerant inhibitors are part of this approach New dispersants have been shown to work under a
variety of stress conditions like high Ca (gt1500 ppm as CaCO3) higher water temperature extended HTI (gt 350 hrs) etc
These dispersants allow operation at lower dosages and provide better performance New corrosion inhibitors have also
been found that are stress-tolerant Some materials demonstrate high halogen resistance and remain stable under long
HTI (gt350 h) conditions
Diagnostic tools
At high COC and stressed conditions treatment programs and cooling water systems is to be used within recommended
guidelines For this the cooling water system is properly characterized This involves evaluating the following key
operating parameters
bull Total blow-down rates (including drift loss)
bull Holding time index
bull True COC based on Mg or Na (not SilicaChlorideTH)
bull Heat exchanger performance (TTD LMTD amp lsquoUrsquo values) Visit us at wwwjust-chemicalscom
Further Analysis
Measurement and control
In addition to measuring and adjusting system-operating parameters online monitoring and control of
treatment dosages may be installed to operate at high COC at optimal cost and performance
Monitoring process
Once desired COC is achieved maintenance of high COC is required to realize water and energy
savings Routine evaluation of the system control equipment and monthly logs are important to monitor
and document water quality and usage over time and through seasonal variations
Visit us at wwwjust-chemicalscom
Further Analysis
Measurement and control
In addition to measuring and adjusting system-operating parameters online monitoring and control of
treatment dosages may be installed to operate at high COC at optimal cost and performance
Monitoring process
Once desired COC is achieved maintenance of high COC is required to realize water and energy
savings Routine evaluation of the system control equipment and monthly logs are important to monitor
and document water quality and usage over time and through seasonal variations
Visit us at wwwjust-chemicalscom
CW Monitoring Tools
bull Online Chemistry Analyzers like (This can be developed in an Economical Solution)
bull Corrator inbuilt in Online AnalyzerCorrosion meter
bull Deposit monitor - visual indication of deposit formation and heat transfer loss indication
bull Bio-fouling monitor - indicate loss of pressure due to biofilm or slime build-up
bull Test heat exchanger
Visit us at wwwjust-chemicalscom
CW Monitoring Tools
bull Online Chemistry Analyzers like (This can be developed in an Economical Solution)
bull Corrosion coupons - indicate corrosion rate in mils (thousandth of an inch) per year (MPY)
bull Corrator inbuilt in Online Analyzer
bull Deposit monitor - visual indication of deposit formation and heat transfer loss indication
bull Bio-fouling monitor - indicate loss of pressure due to biofilm or slime build-up
bull Corrosion meter
bull Test heat exchanger
Visit us at wwwjust-chemicalscom
Interlinked Process Flow
Cooling Tower
Water Chemistry
Heat Exchanger
Visit us at wwwjust-chemicalscom
Interlinked Process Flow
Cooling Tower
Water Chemistry
Heat Exchanger
CWT Design Methedology and
guidelines
Visit us at wwwjust-chemicalscom
Impoundments and Storm Water
bull Operators and owners tend to focus primarily on the quality of water coming into the plant and the wastewater quality going out of the plant as required to meet their plant discharge permits
bull In contrast knowing exactly what is going on within the power plant boundaries in impoundments and process sumps is not always as clear especially in older facilities where upgrades and plant modifications have considerably altered the plant water picture over the years
bull Also in many coal-fired power plants coal combustion waste ponds and impoundments are utilized for equalization and treatment of numerous plant wastewater streams complicating the plantrsquos ability to easily assess the potential for reuse of each individual stream
bull However with some of the proposed regulation changes coal-fired power plants may be required to do just that Segregation and separation of plant wastewaters can minimize the volumetric flow rate that requires additional treatment to meet the proposed regulations
bull For instance at one facility where we been assisting with water and mass balance activities in preparation for expected Pollutant Discharge Elimination System permit changes the engineering team was able to reconfigure portions of the wastewater collection system
bull It segregated storm waters into contact and noncontact storm waters and separated mixed process water streams allowing the plant to reuse a fair portion of its previously discharged wastewater
bull As a result the facility significantly reduced the potential treatment costs associated with meeting new permit requirements and realized an overall cost savings Visit us at wwwjust-chemicalscom
Get Preparedbull Especially in light of the upcoming regulation changes and the expectation that additional levels of
wastewater treatment will be necessary to meet some of the new discharge limits any plant likely to be affected should explore the potential for internal recycling or reuse of plant wastewaters and minimizing water waste in order to keep wastewater treatment costs as low as possible
bull Starting now evaluating the current plant water and wastewater conditions conducting sampling and flow measurement programs and assessing current wastewater treatment systems are key to development of a baseline and plan of attack for dealing with the impending regulation changes
bull Knowing exactly where your plantrsquos starting point is and developing a solid data history is crucial to determining what you may need to do to meet changes in regulatory requirements
Visit us at wwwjust-chemicalscom
Replace conventional Side Stream Filtration
bull Use side Stream filter with continuous filtration
bull 2 - 5 of circulating water
bull Saves manpower
bull Continuous ndash no infringement
bull Saves water ndash water wastage down to 3 against 10 in
conventional filters
bull Down to 51020 microns against 50 microns with
conventional filters
bull Polymers used as dispersants
Discussion Decide whether you want engineering control or Chemistry Control
Visit us at wwwjust-chemicalscom
Given the following benefits itrsquos easy to see why self-cleaning filters are the overwhelming choice of consulting engineers property management companies and building owners
bull Self-cleaninghelliprequires no regular maintenance
bull Self-cleaninghellipassures optimal filtration efficiency
bull Self-cleaninghellipreduces energy cost
bull No monitoring ndash No manpower
bull Only 3 water wastage
bull As filter media accumulates suspended contaminants the pressure drop across the filter increases and flow rate decreases The filter consumes the same power but does less work
bull Self-cleaninghellipextends media life (five to ten years typical)
bull Our experience indicates that the necessary disciplined routine maintenance required for manual filters is the exception not the rule As a consequence the filter media overloads with contaminants and thereafter backwashing is less effective in removing accumulated solids
bull Self-cleaning hellipis cost effective No manpower required for backwashing
bull The retrofit fit cost is more than the initial incremental cost for self-cleaning
Visit us at wwwjust-chemicalscom
Reduction of Evaporation loss from Reservoirs
The floating discs were discs of 02m diameter and 002m thickness that covered 91 of the water surface The results have shown that evaporation from the covered reservoir was reduced by about 80 relative to the uncovered water surface
Shade balls are plastic Eco-friendly balls that could be used in lakes ponds stream and dams The Department of Water and Power (LADWP) has first used these balls in California to prevent the evaporation A study was conducted in the Nehru pond at Namakkal district They used 4 inch black balls from high density polyethylene (HDPE) and carbon black to cover the reservoir This study showed that the shade balls reduced 43-45 of evaporation in the reservoir
Shade-cloth are suspended structures installed over water surfaces with supporting poles and steel cables This cover reduces the action of wind and blocks incoming solar radiation therefore it reduces the evaporation rates from water surfaces Shade-cloth is economically used for small reservoirs that are less than 10 hectares in area The main disadvantage of this method is the relatively high capital cost for construction but this has now been overridden in Malaysia owing to a new shade-cloth knitting machine which will produce wider rolls and therefore reduce the number of installed cables
A study carried out under summer conditions in Southern Spain shown that shading covers led to decrease the evaporation by about 80 for the colored-polyethylene covers Another study was conducted in Australia to estimate the benefits of shade-cloth covers for water reservoirs The study has shown that evaporation rate was reduced by about 90 and the shade-cloth reduced maintenance costs because they delay the growth of aquatic plants at the bottom of the storages Visit us at wwwjust-chemicalscom
Floating Solar Plant ldquoEuropersquos largest floating solar plant opens in Francerdquo
French
English Case of USA
Visit us at wwwjust-chemicalscom
Visit us at wwwjust-chemicalscom
Reach us
Juschem Solutions Pvt LtdA108 SV Heights Whitefield Bangalore ndash 560066 KA
Email sbanerjeejust-chemicalscomPhoneWhatsApp +91 7985635683website wwwjust-chemicalscom
Follow us at httpswwwfacebookcompowerplantchem
httpswwwlinkedincominjuschem-solutions-private-ltd-63a997165
httpswwwyoutubecomchannelUC1Jt3imL-WtfkiRgI01sGZg
YouTube Channel Juschem Solutions Pvt Ltd
Visit us at wwwjust-chemicalscom

What is the Typical Water Consumption points in a power plant
Expected SWC with 91 accuracy In m3day For 1980 MW Super Critical Power Station
With BD Re-cycle 8814 7679 6677
SWC SWC At 100 PLF SWC
CW Evap 80648 170 CW Evap 70262 148 CW Evap 61097 129
BD at 8 COC 11521 024 BD at 8 COC 10037 021 BD at 8 COC 8728 018
CWMake-UP 83356 175 CWMake-UP 72621 153 CWMake-UP 63148 133
Fire+Service 2321 005 Fire+Service 2321 005 Fire+Service 2321 005
DM+Potable 2134 004 DM+Potable 2134 004 DM+Potable 2134 004
TOTAL 87811 185 TOTAL 77076 162 TOTAL 67603 142
Summer Yearly Winters
Visit us at wwwjust-chemicalscom
Go with the Flow
bull One of the best ways that a plant can manage its water resources more effectively is to develop a plantwide water management plan
bull A water management plan is a comprehensive site-wide strategy for maximizing water use efficiency minimizing wastewater discharge and encouraging a policy of sustainability and reuserecycle to the maximum extent practical to control a plantrsquos water footprint
bull The first step in developing a plan is to construct an overall plant water balance depicting the current plant water picture
bull The water balance should identify all water consumers and wastewater producers throughout the facility and indicate all the flow routes and distribution pathways
Visit us at wwwjust-chemicalscom
Go with the Flowbull Get the full picture Portable flow monitors and sample collection devices can be used to monitor inlet and outlet
flows and collect water samples from locations that are not typically instrumented to capture this data
bull Tracking plant water and wastewater flows and developing a mass balance can be as simple as developing an Excel spreadsheet to log and analyze the data (next slides) We have developed specialized tools based on IoT to aid in this process
bull The flow rates and the water quality constituents for individual plant water and wastewater streamsmdashsuch as cooling tower makeup boiler and cooling tower blowdown equipment drains and washdown pretreatment system wastewaters captured storm waters strainer and filter backwash waters dewatering equipment filtrate and many other plant sources and users are assessed and tabulated to enable tracking throughout the plant
bull Once the plant water balance is developed and the mass balance of contaminants is tracked throughout the plant staff can use this tool in conjunction with the water balance to assess how operational changes or stream redirection might allow the plant to reuse some internal wastewater streams and reduce its water footprint or reduce the level of contaminants that are discharged or that need to be removed
Visit us at wwwjust-chemicalscom
Water Balance Table 100 PLF
Design 2016-17 2017-18 with ETP-UF-RO Avgerage
Intake Mn CWST 134268 94592 91930 83017 2017-18 Proposed
251 HRSCC 2849 2134 2134 2134 Achieved Further Scope
Total Intake 137117 96726 94064 85151
SWC 2885 2035 1979 1792 1994 1774
Use CW MU 120660 91476 89609 80696 9526 9477
Service 13608 2321 2321 2321 247 273
Fire 0 795 0 0 000 000
WTP in 2729 2119 2119 2119 225 249
WTP use Breakup RO-MB 1857 1011 1011 1011 107 119
Potable 520 410 410 410 044 048
CW Use Breakup CW Evap 95328 78408 78408 78408 8336 9208
CW BD 23832 13068 11201 11201 1191 1315
BD Re-cycled 8913 000 1047
Intermediate Effluent Mn Clf 3360 20 20 20 002 002
HRSCC 120 15 15 15 002 002
DMF-RO-MB 417 633 633 633 067 074
CW BD 23832 13068 11201 11201 1191 1315Visit us at wwwjust-chemicalscom
Water Balance Table 100 PLF
Design 2016-17 2017-18 with ETP-UF-RO Avgerage
Recoverable Effluent WTPPlant dr 2377 2323 2323 1750 247 206
HRSCC+Mn Clf 3240 35 35 35 004 004
CWBD to CHP 6336 0 0 0 000 000
CW BD in AHP 17496 13068 11201 11201 1191 1315
Recovered Effluent WTP Plant dr 2377 2323 2323 2323 247 273
HRSCC+Mn Clf 3240 95 95 95 010 011
CWBD to CHP 6336 0 0 0 000 000
CW BD in Ash Water 17496 13068 11201 11201 1191 1315
AHP Requirement ETP and TT rejects 4584 4584 4584 4584 487 538
Excess CWBD to be drained out 15289 10807 8940 0 950 000
Sludge Clf+HRSCC Drain 360 0 0 0 000 000
COC 5 75 8 8 001 001
Water Balance Analytics at 100
PLF - synopsisVisit us at wwwjust-chemicalscom
Water Balance ndash Design and initial
SWC = 28940
Visit us at wwwjust-chemicalscom
Water Balance Improved by monitoring and control
SWC = 2064
Visit us at wwwjust-chemicalscom
Analytics
bull This requires that the water management team perform its monitoring activities at several different times over the course of a year to capture the various plant operating scenarios of interest and collect the desired data
bull Off-design operating conditions especially at multi-unit sites with integrated water and wastewater systems often can produce the most challenging water operating scenarios and can drive decisions related to equipment sizing
Chart Contaminants
bull Once all flows have been charted the second step is to understand the mass balance of contaminants present in the plant water and wastewater streams This will likely involve sampling and testing the internal streams that are not normally monitored in order to paint a true picture of
Where the plant is adding contaminants to the water streams or concentrating existing contaminants
What contaminants are being added or concentrated
In what concentration the contaminants are present in each stream
Portable flow monitors and sample collection devices can be employed to monitor inlet and outlet flows and collect water samples from locations that are not instrumented to capture this data currently
Visit us at wwwjust-chemicalscom
Analytics
bull Obvious examples of internal recyclereuse opportunities include recycling reverse osmosis reject as cooling tower makeup collecting and reprocessing boiler or heat recovery steam generator blowdown water and recycling cooling tower blowdown as flue gas desulfurization makeup water
bull However a close review of the plant water and mass balances can reveal quite a few opportunities for water reuse or water conservation
bull Many of these internal recyclereuse opportunities can be inexpensive and relatively simple to implement involving only piping and valving modifications though some may involve the addition of treatment equipment such as clarification or filtration to reprocess the wastewater streams to make them suitable for reuse
bull Determining the water quality of the wastewater stream contaminants therefore is a crucial early step in evaluating wastewaters for reuse opportunities and performing a cost-benefit analysis
Visit us at wwwjust-chemicalscom
Analytics
bull Development of water and mass balances will also prepare a plant to intelligently evaluate the impact of and reaction to potential modifications to the plant water balance that may occur due to regulations changes
bull The new proposed regulations may affect a plantrsquos cooling water systems material-handling and conveyance systems and wastewater discharges
bull Potential changes such as the addition of wastewater treatment systems or the rerouting of wastewater streams can be simulated to assess their effects on overall plant operations
Visit us at wwwjust-chemicalscom
Water Balance Analytics at 100 PLF
Water Balance Analytics at 85
PLF
Water Balance Analytics at 70
PLF
Analytics
Visit us at wwwjust-chemicalscom
Improvement Project to further reduce SWC
Note For Approval Visit us at wwwjust-chemicalscom
Water Balance after measuring monitoring controlling + Recycling
SWC = 1799
Visit us at wwwjust-chemicalscom
Challenges
bull The most difficult challenge in developing an accurate site water balance is collecting adequate data to model the plant water and wastewater streams precisely
bull Using smart water meters and IoT with Analytics is the necessary system creation for sustainability
bull Inclusion of seasonal and historical data and its impact on the plant water balance is desirable such as periodic degradations in water supply qualities that reduce cooling tower operating cycles
bull This water balance should include average daily usage rates as well as peak and minimum flows to create an accurate picture of the plantrsquos water footprint
bull Reduced load operations (if they are relevant for a unit) partial plant operations (for instance single-unit operation in a two-unit plant) as well as other off-design operating scenarios should be evaluated as appropriate to determine how they will affect water consumption rates and wastewater production
Visit us at wwwjust-chemicalscom
REACHING HIGH COC
In Cooling Water Systems
Visit us at wwwjust-chemicalscom
Operating recirculating cooling systems at higher COC helps us to gain many economic and environmental benefits viz
bull Reduction in pumping cost
bull Reducing depletion of natural resource Reducing specific water consumption and water cost Stationrsquos requirement to lower the operating costincrease profitability
bull Abiding environmental regulations
bull Demonstration of corporate responsibility by conserving water
Elevating COC can minimize operating costs through water savings and energy savings
While planning to operate at high COC we need to study various technical issues in order to prevent waterside problems
Visit us at wwwjust-chemicalscom
Study on Water Chemistry
To understand the chemistry of our
cooling water system we studied the
present system and operating
parameters for Calcium Hardness TDS
alkalinity and associated pH
bull LSI below 05 is corrosive and above 15 is scale
forming 05-15 controllable
bull RSI above 64 is corrosive and Below 54 is scale
forming 54-64 controllable
Make up Water ParameterParameters As Min Max Avg
pH 66 82 75
Total Hardness PPM 30 50 40
Calcium Harness PPM 18 30 24
Magnesium Hardness PPM 12 20 16
M-Alk PPM 20 40 30
Chlorides PPM 15 25 20
Silica PPM 8 13 11
Conductivity microscm 100 150 120
Total Dissolved solids PPM 67 101 80
Turbidity NTU 4 20 7
Iron PPM 01 02 015
pHs (Saturation) 93 88 90
LSI Indices -27 -06 -15
RSI Indices 120 94 105
CW MAKE-UP WATER ANALYSIS CONSIDERED
Visit us at wwwjust-chemicalscom
Relationship of Various parameters
bull Evaporation Loss
E = 00018 x delta T x R x TF (Tower Factor)(T expressed in oC)
Tower factor is based on (a) humidity and (b) Tower Height (Considered during designing of the tower)
bull Blowdown
B = Evaporation
COC-1
bull Cycles Of Concentration
COC = Concentration in Recirculation
Concentration In Make-up
Question What is Best Elementchemical parameter
Visit us at wwwjust-chemicalscom
Scalingcorrosion Propensity on Average ValuesAt Average Values
Parameters 5 COC 6 COC 7 COC 8 COC 9 COC 10 COC 11 COC 12 COCpH 783 794 804 813 82 83 84 85Total Hardness 200 240 280 320 360 400 440 480Calcium Harness 120 144 168 192 216 240 264 288MagnesiumHardness 80 96 112 128 144 160 176 192M-Alk 150 180 210 240 270 300 330 360Chlorides 100 120 140 160 180 200 220 240Silica 55 66 77 88 99 110 121 132Conductivity 600 720 840 960 1080 1200 1320 1440Total Dissolvedsolids 402 4824 5628 6432 7236 804 8844 9648Turbidity 35 42 49 56 63 70 77 84Iron 075 09 105 12 135 15 165 18pHs (Saturation) 74 72 71 70 69 68 67 67
LSI 05 07 09 11 13 15 17 18
RSI 69 65 62 58 56 53 51 48
LSI below 05 is corrosive and above 15 is scale forming 05-15 controllable RSI above 64 is corrosive and Below 54 is scale forming 54-64 controllable
For Make up with high Chlorides
use LaI
Visit u
s at w
ww
just-ch
em
icalsco
m
For Make up with high Chlorides
use LaI
At Maximum Values
Parameters 5 COC 6 COC 7 COC 8 COC 9 COC 10 COC 11 COC 12 COCpH
82 83 84 85 85 86 87 88Total Hardness
250 240 280 320 360 400 440 480Calcium Harness
150 144 168 192 216 240 264 288Magnesium Hardness
100 96 112 128 144 160 176 192M-Alk
200 180 210 240 270 300 330 360Chlorides
125 120 140 160 180 200 220 240Silica
65 66 77 88 99 110 121 132Conductivity
750 720 840 960 1080 1200 1320 1440Total Dissolved solids
5025 4824 5628 6432 7236 804 8844 9648Turbidity
100 42 49 56 63 70 77 84Iron
1 09 105 12 135 15 165 18pHs (Saturation) 72 72 71 70 69 68 67 67
LSI 10 11 13 15 16 18 20 21
RSI 62 62 58 55 52 50 48 45
LSI below 05 is corrosive and above 15 is scale forming 05-15 controllable RSI above 64 is corrosive and Below 54 is scale forming 54-64 controllable
Scalingcorrosion Propensity on Maximum Values
Visit us at wwwjust-chemicalscom
RSI amp LSI
All Saturation indices
Chemistry and
scaling indices
Visit us at wwwjust-chemicalscom
Study Outcome Analysis
Considering the above we shall always be in the range of 7 - 10 COC Assuming that the system will
have max values (only in summers) also a COC of 80 is ideal
RSI below 54 is scale forming but controllable till 4 RSI (Controllable with Chemical Treatment) above
64 is corrosive but controllable till 6 (Controllable with Chemical Treatment) Only It is always better to
operate system in slight scale forming tendency than corrosive because scale can be removed but
corroded metal cannot be put back
For CW where water velocity is gt06 ms RSI should only be used
Refer Nalco Water handbook Page 417
Visit us at wwwjust-chemicalscom
Study on Environmental Impact
bull We will be complying by EC and Consent conditions by operating the CW
system above 5 COC as it says ldquoCOC of not less than 5 shall be adoptedrdquo
bull The water saving will be
bull The Energy Savings will be
bull Reduction in CO2 emission will be 125 tons per year
Station Parameters for CW
System-
AT CYCLES OF
CONCENTARTION 6
AT CYCLES OF
CONCENTARTION 7
CT blow down m3year 3120938 2600781
CT Make Up Water Rate in
m3year
18725626 18205470
Water Saving in M3 year - 520156
Energy savings (KwH)Clarified
water
- 95709
Energy Saving (KwH) CT
Pumping
- 52016
Total energy Saving(KwH) 147724
Visit us at wwwjust-chemicalscom
Further Analysis
Hydraulic factors1 Hydraulic factor (CH) of a tower is used to determine the efficiency of water use It is represented as
CH = sumMURsumBDR
Where MUR = Total make-up rate and BDR = Total blow-down rate
1 Both the makeup and blow-down flow rates are comprised of controlled and unintentional components The effective blow-down loss rate is the metered blow-down and unmetered streams such as drift leaks filter backwash and removal of CW from the system for other uses Our CW systems have almost negligible unintentional water losses to limit the COC thus COC of 14 is achievable
2 Drift is the water lost from the tower as a liquid droplets entrained in the exhaust air This loss is not dependent on evaporation rate Drift loss rate is normally expressed in percentage of the recirculation rate (ranging 01 to 002) The drift loss rate depends on the system-specific factors like design of the tower age of the tower types and age of the drift eliminators Our drift loss is around 002
3 Unintentional and uncontrolled water losses could be the SS filter backwash leakages from pump(s) glands or other equipment(s) cooling tower basin overflows water tapping from return line for other usepurpose etc
Visit us at wwwjust-chemicalscom
Further Analysis
Time-related factors
Increase in Holding time index (HTI) is one of the major problem associated with high COC The HTI is defined as the
half-life of an ion in the system This is equated as
HTI = 0693 VT BT
Where VT is the system volume and BT is total water loss
Above figure illustrates the impact of increased cycling on the HTI of a typical cooling tower system Increasing the COC
from 5 to 15 effectively triples the HTI increasing the average time a molecule spends in the system by a factor of three
This can affect the efficacy of the scale and corrosion inhibitors
The HTI in our system at 6 COC is 217 Hours at 7 COC is 261 Hours and at 8 COC is 305 Hours
As the HTI increases the stress on the organic portion (polymer phosphonates azoles) of the treatment regime
increases In this case the treatment-program active components must stay active for longer periods of time before
being replaced With current treatment regime HTI of 300 Hrs is achievable For going beyond 300 hrs HTI advanced
high stress polymers may be used
HTI Vs Cycles
0
100
200
300
2 4 6 8 10 12 14 16 18 20 22
Cycles
HT
I in
hrs
HTI
Visit us at wwwjust-chemicalscom
Further Analysis
Weighing of credits and debits
bull Some of the credits will be less water usage reduced blowdown and decrease in energy consumption
bull At 8 COC or below there is no debit
bull Going beyond 8 COC may call for advanced high stress polymers and advanced phosphonates
Setting rational goals
bull In the beginning detailed water balance and inventory of the water consumption in the system was performed
bull This includes makeup to cooling tower evaporation losses and blowdown
bull By far the biggest problems which may hinder the rising of CoC is unintentional losses or use with tapping from
ACWCW system
bull After this a plan is formulated with a review plans for gains necessary to evaluate the success of this upgrade After this
is complete (1 yr) increasing COC to 8 was evaluated
bull As the progress should be evaluated on a stepwise basis the system were to go to 8 cycles from a starting point of 6
cycles a reasonable goal for the first one year would be operate successfully at 7 COC
bull If corrosion and scale are well controlled an increase to 8 cycles can follow with evaluation of success again after a
significant period of time
Visit us at wwwjust-chemicalscom
Further Analysis
Choosing a compatible treatment program
This includes a combination of stress tolerant treatment actives and heat transfer monitoring (viz TTD LMTD CT efficiency
Approach etc) The treatment programs may be based on a stabilized phosphate or alkaline phosphate approach the
current treatment regime satisfies this condition
Above 8 COC Stress compatible inhibitor technology
The best approach should be to design on-site the specific inhibitors need through a flexible product addition regime
Recently developed stress-tolerant inhibitors are part of this approach New dispersants have been shown to work under a
variety of stress conditions like high Ca (gt1500 ppm as CaCO3) higher water temperature extended HTI (gt 350 hrs) etc
These dispersants allow operation at lower dosages and provide better performance New corrosion inhibitors have also
been found that are stress-tolerant Some materials demonstrate high halogen resistance and remain stable under long
HTI (gt350 h) conditions
Diagnostic tools
At high COC and stressed conditions treatment programs and cooling water systems is to be used within recommended
guidelines For this the cooling water system is properly characterized This involves evaluating the following key
operating parameters
bull Total blow-down rates (including drift loss)
bull Holding time index
bull True COC based on Mg or Na (not SilicaChlorideTH)
bull Heat exchanger performance (TTD LMTD amp lsquoUrsquo values) Visit us at wwwjust-chemicalscom
Further Analysis
Measurement and control
In addition to measuring and adjusting system-operating parameters online monitoring and control of
treatment dosages may be installed to operate at high COC at optimal cost and performance
Monitoring process
Once desired COC is achieved maintenance of high COC is required to realize water and energy
savings Routine evaluation of the system control equipment and monthly logs are important to monitor
and document water quality and usage over time and through seasonal variations
Visit us at wwwjust-chemicalscom
Further Analysis
Measurement and control
In addition to measuring and adjusting system-operating parameters online monitoring and control of
treatment dosages may be installed to operate at high COC at optimal cost and performance
Monitoring process
Once desired COC is achieved maintenance of high COC is required to realize water and energy
savings Routine evaluation of the system control equipment and monthly logs are important to monitor
and document water quality and usage over time and through seasonal variations
Visit us at wwwjust-chemicalscom
CW Monitoring Tools
bull Online Chemistry Analyzers like (This can be developed in an Economical Solution)
bull Corrator inbuilt in Online AnalyzerCorrosion meter
bull Deposit monitor - visual indication of deposit formation and heat transfer loss indication
bull Bio-fouling monitor - indicate loss of pressure due to biofilm or slime build-up
bull Test heat exchanger
Visit us at wwwjust-chemicalscom
CW Monitoring Tools
bull Online Chemistry Analyzers like (This can be developed in an Economical Solution)
bull Corrosion coupons - indicate corrosion rate in mils (thousandth of an inch) per year (MPY)
bull Corrator inbuilt in Online Analyzer
bull Deposit monitor - visual indication of deposit formation and heat transfer loss indication
bull Bio-fouling monitor - indicate loss of pressure due to biofilm or slime build-up
bull Corrosion meter
bull Test heat exchanger
Visit us at wwwjust-chemicalscom
Interlinked Process Flow
Cooling Tower
Water Chemistry
Heat Exchanger
Visit us at wwwjust-chemicalscom
Interlinked Process Flow
Cooling Tower
Water Chemistry
Heat Exchanger
CWT Design Methedology and
guidelines
Visit us at wwwjust-chemicalscom
Impoundments and Storm Water
bull Operators and owners tend to focus primarily on the quality of water coming into the plant and the wastewater quality going out of the plant as required to meet their plant discharge permits
bull In contrast knowing exactly what is going on within the power plant boundaries in impoundments and process sumps is not always as clear especially in older facilities where upgrades and plant modifications have considerably altered the plant water picture over the years
bull Also in many coal-fired power plants coal combustion waste ponds and impoundments are utilized for equalization and treatment of numerous plant wastewater streams complicating the plantrsquos ability to easily assess the potential for reuse of each individual stream
bull However with some of the proposed regulation changes coal-fired power plants may be required to do just that Segregation and separation of plant wastewaters can minimize the volumetric flow rate that requires additional treatment to meet the proposed regulations
bull For instance at one facility where we been assisting with water and mass balance activities in preparation for expected Pollutant Discharge Elimination System permit changes the engineering team was able to reconfigure portions of the wastewater collection system
bull It segregated storm waters into contact and noncontact storm waters and separated mixed process water streams allowing the plant to reuse a fair portion of its previously discharged wastewater
bull As a result the facility significantly reduced the potential treatment costs associated with meeting new permit requirements and realized an overall cost savings Visit us at wwwjust-chemicalscom
Get Preparedbull Especially in light of the upcoming regulation changes and the expectation that additional levels of
wastewater treatment will be necessary to meet some of the new discharge limits any plant likely to be affected should explore the potential for internal recycling or reuse of plant wastewaters and minimizing water waste in order to keep wastewater treatment costs as low as possible
bull Starting now evaluating the current plant water and wastewater conditions conducting sampling and flow measurement programs and assessing current wastewater treatment systems are key to development of a baseline and plan of attack for dealing with the impending regulation changes
bull Knowing exactly where your plantrsquos starting point is and developing a solid data history is crucial to determining what you may need to do to meet changes in regulatory requirements
Visit us at wwwjust-chemicalscom
Replace conventional Side Stream Filtration
bull Use side Stream filter with continuous filtration
bull 2 - 5 of circulating water
bull Saves manpower
bull Continuous ndash no infringement
bull Saves water ndash water wastage down to 3 against 10 in
conventional filters
bull Down to 51020 microns against 50 microns with
conventional filters
bull Polymers used as dispersants
Discussion Decide whether you want engineering control or Chemistry Control
Visit us at wwwjust-chemicalscom
Given the following benefits itrsquos easy to see why self-cleaning filters are the overwhelming choice of consulting engineers property management companies and building owners
bull Self-cleaninghelliprequires no regular maintenance
bull Self-cleaninghellipassures optimal filtration efficiency
bull Self-cleaninghellipreduces energy cost
bull No monitoring ndash No manpower
bull Only 3 water wastage
bull As filter media accumulates suspended contaminants the pressure drop across the filter increases and flow rate decreases The filter consumes the same power but does less work
bull Self-cleaninghellipextends media life (five to ten years typical)
bull Our experience indicates that the necessary disciplined routine maintenance required for manual filters is the exception not the rule As a consequence the filter media overloads with contaminants and thereafter backwashing is less effective in removing accumulated solids
bull Self-cleaning hellipis cost effective No manpower required for backwashing
bull The retrofit fit cost is more than the initial incremental cost for self-cleaning
Visit us at wwwjust-chemicalscom
Reduction of Evaporation loss from Reservoirs
The floating discs were discs of 02m diameter and 002m thickness that covered 91 of the water surface The results have shown that evaporation from the covered reservoir was reduced by about 80 relative to the uncovered water surface
Shade balls are plastic Eco-friendly balls that could be used in lakes ponds stream and dams The Department of Water and Power (LADWP) has first used these balls in California to prevent the evaporation A study was conducted in the Nehru pond at Namakkal district They used 4 inch black balls from high density polyethylene (HDPE) and carbon black to cover the reservoir This study showed that the shade balls reduced 43-45 of evaporation in the reservoir
Shade-cloth are suspended structures installed over water surfaces with supporting poles and steel cables This cover reduces the action of wind and blocks incoming solar radiation therefore it reduces the evaporation rates from water surfaces Shade-cloth is economically used for small reservoirs that are less than 10 hectares in area The main disadvantage of this method is the relatively high capital cost for construction but this has now been overridden in Malaysia owing to a new shade-cloth knitting machine which will produce wider rolls and therefore reduce the number of installed cables
A study carried out under summer conditions in Southern Spain shown that shading covers led to decrease the evaporation by about 80 for the colored-polyethylene covers Another study was conducted in Australia to estimate the benefits of shade-cloth covers for water reservoirs The study has shown that evaporation rate was reduced by about 90 and the shade-cloth reduced maintenance costs because they delay the growth of aquatic plants at the bottom of the storages Visit us at wwwjust-chemicalscom
Floating Solar Plant ldquoEuropersquos largest floating solar plant opens in Francerdquo
French
English Case of USA
Visit us at wwwjust-chemicalscom
Visit us at wwwjust-chemicalscom
Reach us
Juschem Solutions Pvt LtdA108 SV Heights Whitefield Bangalore ndash 560066 KA
Email sbanerjeejust-chemicalscomPhoneWhatsApp +91 7985635683website wwwjust-chemicalscom
Follow us at httpswwwfacebookcompowerplantchem
httpswwwlinkedincominjuschem-solutions-private-ltd-63a997165
httpswwwyoutubecomchannelUC1Jt3imL-WtfkiRgI01sGZg
YouTube Channel Juschem Solutions Pvt Ltd
Visit us at wwwjust-chemicalscom

Water Balance Table 100 PLF
Design 2016-17 2017-18 with ETP-UF-RO Avgerage
Recoverable Effluent WTPPlant dr 2377 2323 2323 1750 247 206
HRSCC+Mn Clf 3240 35 35 35 004 004
CWBD to CHP 6336 0 0 0 000 000
CW BD in AHP 17496 13068 11201 11201 1191 1315
Recovered Effluent WTP Plant dr 2377 2323 2323 2323 247 273
HRSCC+Mn Clf 3240 95 95 95 010 011
CWBD to CHP 6336 0 0 0 000 000
CW BD in Ash Water 17496 13068 11201 11201 1191 1315
AHP Requirement ETP and TT rejects 4584 4584 4584 4584 487 538
Excess CWBD to be drained out 15289 10807 8940 0 950 000
Sludge Clf+HRSCC Drain 360 0 0 0 000 000
COC 5 75 8 8 001 001
Water Balance Analytics at 100
PLF - synopsisVisit us at wwwjust-chemicalscom
Water Balance ndash Design and initial
SWC = 28940
Visit us at wwwjust-chemicalscom
Water Balance Improved by monitoring and control
SWC = 2064
Visit us at wwwjust-chemicalscom
Analytics
bull This requires that the water management team perform its monitoring activities at several different times over the course of a year to capture the various plant operating scenarios of interest and collect the desired data
bull Off-design operating conditions especially at multi-unit sites with integrated water and wastewater systems often can produce the most challenging water operating scenarios and can drive decisions related to equipment sizing
Chart Contaminants
bull Once all flows have been charted the second step is to understand the mass balance of contaminants present in the plant water and wastewater streams This will likely involve sampling and testing the internal streams that are not normally monitored in order to paint a true picture of
Where the plant is adding contaminants to the water streams or concentrating existing contaminants
What contaminants are being added or concentrated
In what concentration the contaminants are present in each stream
Portable flow monitors and sample collection devices can be employed to monitor inlet and outlet flows and collect water samples from locations that are not instrumented to capture this data currently
Visit us at wwwjust-chemicalscom
Analytics
bull Obvious examples of internal recyclereuse opportunities include recycling reverse osmosis reject as cooling tower makeup collecting and reprocessing boiler or heat recovery steam generator blowdown water and recycling cooling tower blowdown as flue gas desulfurization makeup water
bull However a close review of the plant water and mass balances can reveal quite a few opportunities for water reuse or water conservation
bull Many of these internal recyclereuse opportunities can be inexpensive and relatively simple to implement involving only piping and valving modifications though some may involve the addition of treatment equipment such as clarification or filtration to reprocess the wastewater streams to make them suitable for reuse
bull Determining the water quality of the wastewater stream contaminants therefore is a crucial early step in evaluating wastewaters for reuse opportunities and performing a cost-benefit analysis
Visit us at wwwjust-chemicalscom
Analytics
bull Development of water and mass balances will also prepare a plant to intelligently evaluate the impact of and reaction to potential modifications to the plant water balance that may occur due to regulations changes
bull The new proposed regulations may affect a plantrsquos cooling water systems material-handling and conveyance systems and wastewater discharges
bull Potential changes such as the addition of wastewater treatment systems or the rerouting of wastewater streams can be simulated to assess their effects on overall plant operations
Visit us at wwwjust-chemicalscom
Water Balance Analytics at 100 PLF
Water Balance Analytics at 85
PLF
Water Balance Analytics at 70
PLF
Analytics
Visit us at wwwjust-chemicalscom
Improvement Project to further reduce SWC
Note For Approval Visit us at wwwjust-chemicalscom
Water Balance after measuring monitoring controlling + Recycling
SWC = 1799
Visit us at wwwjust-chemicalscom
Challenges
bull The most difficult challenge in developing an accurate site water balance is collecting adequate data to model the plant water and wastewater streams precisely
bull Using smart water meters and IoT with Analytics is the necessary system creation for sustainability
bull Inclusion of seasonal and historical data and its impact on the plant water balance is desirable such as periodic degradations in water supply qualities that reduce cooling tower operating cycles
bull This water balance should include average daily usage rates as well as peak and minimum flows to create an accurate picture of the plantrsquos water footprint
bull Reduced load operations (if they are relevant for a unit) partial plant operations (for instance single-unit operation in a two-unit plant) as well as other off-design operating scenarios should be evaluated as appropriate to determine how they will affect water consumption rates and wastewater production
Visit us at wwwjust-chemicalscom
REACHING HIGH COC
In Cooling Water Systems
Visit us at wwwjust-chemicalscom
Operating recirculating cooling systems at higher COC helps us to gain many economic and environmental benefits viz
bull Reduction in pumping cost
bull Reducing depletion of natural resource Reducing specific water consumption and water cost Stationrsquos requirement to lower the operating costincrease profitability
bull Abiding environmental regulations
bull Demonstration of corporate responsibility by conserving water
Elevating COC can minimize operating costs through water savings and energy savings
While planning to operate at high COC we need to study various technical issues in order to prevent waterside problems
Visit us at wwwjust-chemicalscom
Study on Water Chemistry
To understand the chemistry of our
cooling water system we studied the
present system and operating
parameters for Calcium Hardness TDS
alkalinity and associated pH
bull LSI below 05 is corrosive and above 15 is scale
forming 05-15 controllable
bull RSI above 64 is corrosive and Below 54 is scale
forming 54-64 controllable
Make up Water ParameterParameters As Min Max Avg
pH 66 82 75
Total Hardness PPM 30 50 40
Calcium Harness PPM 18 30 24
Magnesium Hardness PPM 12 20 16
M-Alk PPM 20 40 30
Chlorides PPM 15 25 20
Silica PPM 8 13 11
Conductivity microscm 100 150 120
Total Dissolved solids PPM 67 101 80
Turbidity NTU 4 20 7
Iron PPM 01 02 015
pHs (Saturation) 93 88 90
LSI Indices -27 -06 -15
RSI Indices 120 94 105
CW MAKE-UP WATER ANALYSIS CONSIDERED
Visit us at wwwjust-chemicalscom
Relationship of Various parameters
bull Evaporation Loss
E = 00018 x delta T x R x TF (Tower Factor)(T expressed in oC)
Tower factor is based on (a) humidity and (b) Tower Height (Considered during designing of the tower)
bull Blowdown
B = Evaporation
COC-1
bull Cycles Of Concentration
COC = Concentration in Recirculation
Concentration In Make-up
Question What is Best Elementchemical parameter
Visit us at wwwjust-chemicalscom
Scalingcorrosion Propensity on Average ValuesAt Average Values
Parameters 5 COC 6 COC 7 COC 8 COC 9 COC 10 COC 11 COC 12 COCpH 783 794 804 813 82 83 84 85Total Hardness 200 240 280 320 360 400 440 480Calcium Harness 120 144 168 192 216 240 264 288MagnesiumHardness 80 96 112 128 144 160 176 192M-Alk 150 180 210 240 270 300 330 360Chlorides 100 120 140 160 180 200 220 240Silica 55 66 77 88 99 110 121 132Conductivity 600 720 840 960 1080 1200 1320 1440Total Dissolvedsolids 402 4824 5628 6432 7236 804 8844 9648Turbidity 35 42 49 56 63 70 77 84Iron 075 09 105 12 135 15 165 18pHs (Saturation) 74 72 71 70 69 68 67 67
LSI 05 07 09 11 13 15 17 18
RSI 69 65 62 58 56 53 51 48
LSI below 05 is corrosive and above 15 is scale forming 05-15 controllable RSI above 64 is corrosive and Below 54 is scale forming 54-64 controllable
For Make up with high Chlorides
use LaI
Visit u
s at w
ww
just-ch
em
icalsco
m
For Make up with high Chlorides
use LaI
At Maximum Values
Parameters 5 COC 6 COC 7 COC 8 COC 9 COC 10 COC 11 COC 12 COCpH
82 83 84 85 85 86 87 88Total Hardness
250 240 280 320 360 400 440 480Calcium Harness
150 144 168 192 216 240 264 288Magnesium Hardness
100 96 112 128 144 160 176 192M-Alk
200 180 210 240 270 300 330 360Chlorides
125 120 140 160 180 200 220 240Silica
65 66 77 88 99 110 121 132Conductivity
750 720 840 960 1080 1200 1320 1440Total Dissolved solids
5025 4824 5628 6432 7236 804 8844 9648Turbidity
100 42 49 56 63 70 77 84Iron
1 09 105 12 135 15 165 18pHs (Saturation) 72 72 71 70 69 68 67 67
LSI 10 11 13 15 16 18 20 21
RSI 62 62 58 55 52 50 48 45
LSI below 05 is corrosive and above 15 is scale forming 05-15 controllable RSI above 64 is corrosive and Below 54 is scale forming 54-64 controllable
Scalingcorrosion Propensity on Maximum Values
Visit us at wwwjust-chemicalscom
RSI amp LSI
All Saturation indices
Chemistry and
scaling indices
Visit us at wwwjust-chemicalscom
Study Outcome Analysis
Considering the above we shall always be in the range of 7 - 10 COC Assuming that the system will
have max values (only in summers) also a COC of 80 is ideal
RSI below 54 is scale forming but controllable till 4 RSI (Controllable with Chemical Treatment) above
64 is corrosive but controllable till 6 (Controllable with Chemical Treatment) Only It is always better to
operate system in slight scale forming tendency than corrosive because scale can be removed but
corroded metal cannot be put back
For CW where water velocity is gt06 ms RSI should only be used
Refer Nalco Water handbook Page 417
Visit us at wwwjust-chemicalscom
Study on Environmental Impact
bull We will be complying by EC and Consent conditions by operating the CW
system above 5 COC as it says ldquoCOC of not less than 5 shall be adoptedrdquo
bull The water saving will be
bull The Energy Savings will be
bull Reduction in CO2 emission will be 125 tons per year
Station Parameters for CW
System-
AT CYCLES OF
CONCENTARTION 6
AT CYCLES OF
CONCENTARTION 7
CT blow down m3year 3120938 2600781
CT Make Up Water Rate in
m3year
18725626 18205470
Water Saving in M3 year - 520156
Energy savings (KwH)Clarified
water
- 95709
Energy Saving (KwH) CT
Pumping
- 52016
Total energy Saving(KwH) 147724
Visit us at wwwjust-chemicalscom
Further Analysis
Hydraulic factors1 Hydraulic factor (CH) of a tower is used to determine the efficiency of water use It is represented as
CH = sumMURsumBDR
Where MUR = Total make-up rate and BDR = Total blow-down rate
1 Both the makeup and blow-down flow rates are comprised of controlled and unintentional components The effective blow-down loss rate is the metered blow-down and unmetered streams such as drift leaks filter backwash and removal of CW from the system for other uses Our CW systems have almost negligible unintentional water losses to limit the COC thus COC of 14 is achievable
2 Drift is the water lost from the tower as a liquid droplets entrained in the exhaust air This loss is not dependent on evaporation rate Drift loss rate is normally expressed in percentage of the recirculation rate (ranging 01 to 002) The drift loss rate depends on the system-specific factors like design of the tower age of the tower types and age of the drift eliminators Our drift loss is around 002
3 Unintentional and uncontrolled water losses could be the SS filter backwash leakages from pump(s) glands or other equipment(s) cooling tower basin overflows water tapping from return line for other usepurpose etc
Visit us at wwwjust-chemicalscom
Further Analysis
Time-related factors
Increase in Holding time index (HTI) is one of the major problem associated with high COC The HTI is defined as the
half-life of an ion in the system This is equated as
HTI = 0693 VT BT
Where VT is the system volume and BT is total water loss
Above figure illustrates the impact of increased cycling on the HTI of a typical cooling tower system Increasing the COC
from 5 to 15 effectively triples the HTI increasing the average time a molecule spends in the system by a factor of three
This can affect the efficacy of the scale and corrosion inhibitors
The HTI in our system at 6 COC is 217 Hours at 7 COC is 261 Hours and at 8 COC is 305 Hours
As the HTI increases the stress on the organic portion (polymer phosphonates azoles) of the treatment regime
increases In this case the treatment-program active components must stay active for longer periods of time before
being replaced With current treatment regime HTI of 300 Hrs is achievable For going beyond 300 hrs HTI advanced
high stress polymers may be used
HTI Vs Cycles
0
100
200
300
2 4 6 8 10 12 14 16 18 20 22
Cycles
HT
I in
hrs
HTI
Visit us at wwwjust-chemicalscom
Further Analysis
Weighing of credits and debits
bull Some of the credits will be less water usage reduced blowdown and decrease in energy consumption
bull At 8 COC or below there is no debit
bull Going beyond 8 COC may call for advanced high stress polymers and advanced phosphonates
Setting rational goals
bull In the beginning detailed water balance and inventory of the water consumption in the system was performed
bull This includes makeup to cooling tower evaporation losses and blowdown
bull By far the biggest problems which may hinder the rising of CoC is unintentional losses or use with tapping from
ACWCW system
bull After this a plan is formulated with a review plans for gains necessary to evaluate the success of this upgrade After this
is complete (1 yr) increasing COC to 8 was evaluated
bull As the progress should be evaluated on a stepwise basis the system were to go to 8 cycles from a starting point of 6
cycles a reasonable goal for the first one year would be operate successfully at 7 COC
bull If corrosion and scale are well controlled an increase to 8 cycles can follow with evaluation of success again after a
significant period of time
Visit us at wwwjust-chemicalscom
Further Analysis
Choosing a compatible treatment program
This includes a combination of stress tolerant treatment actives and heat transfer monitoring (viz TTD LMTD CT efficiency
Approach etc) The treatment programs may be based on a stabilized phosphate or alkaline phosphate approach the
current treatment regime satisfies this condition
Above 8 COC Stress compatible inhibitor technology
The best approach should be to design on-site the specific inhibitors need through a flexible product addition regime
Recently developed stress-tolerant inhibitors are part of this approach New dispersants have been shown to work under a
variety of stress conditions like high Ca (gt1500 ppm as CaCO3) higher water temperature extended HTI (gt 350 hrs) etc
These dispersants allow operation at lower dosages and provide better performance New corrosion inhibitors have also
been found that are stress-tolerant Some materials demonstrate high halogen resistance and remain stable under long
HTI (gt350 h) conditions
Diagnostic tools
At high COC and stressed conditions treatment programs and cooling water systems is to be used within recommended
guidelines For this the cooling water system is properly characterized This involves evaluating the following key
operating parameters
bull Total blow-down rates (including drift loss)
bull Holding time index
bull True COC based on Mg or Na (not SilicaChlorideTH)
bull Heat exchanger performance (TTD LMTD amp lsquoUrsquo values) Visit us at wwwjust-chemicalscom
Further Analysis
Measurement and control
In addition to measuring and adjusting system-operating parameters online monitoring and control of
treatment dosages may be installed to operate at high COC at optimal cost and performance
Monitoring process
Once desired COC is achieved maintenance of high COC is required to realize water and energy
savings Routine evaluation of the system control equipment and monthly logs are important to monitor
and document water quality and usage over time and through seasonal variations
Visit us at wwwjust-chemicalscom
Further Analysis
Measurement and control
In addition to measuring and adjusting system-operating parameters online monitoring and control of
treatment dosages may be installed to operate at high COC at optimal cost and performance
Monitoring process
Once desired COC is achieved maintenance of high COC is required to realize water and energy
savings Routine evaluation of the system control equipment and monthly logs are important to monitor
and document water quality and usage over time and through seasonal variations
Visit us at wwwjust-chemicalscom
CW Monitoring Tools
bull Online Chemistry Analyzers like (This can be developed in an Economical Solution)
bull Corrator inbuilt in Online AnalyzerCorrosion meter
bull Deposit monitor - visual indication of deposit formation and heat transfer loss indication
bull Bio-fouling monitor - indicate loss of pressure due to biofilm or slime build-up
bull Test heat exchanger
Visit us at wwwjust-chemicalscom
CW Monitoring Tools
bull Online Chemistry Analyzers like (This can be developed in an Economical Solution)
bull Corrosion coupons - indicate corrosion rate in mils (thousandth of an inch) per year (MPY)
bull Corrator inbuilt in Online Analyzer
bull Deposit monitor - visual indication of deposit formation and heat transfer loss indication
bull Bio-fouling monitor - indicate loss of pressure due to biofilm or slime build-up
bull Corrosion meter
bull Test heat exchanger
Visit us at wwwjust-chemicalscom
Interlinked Process Flow
Cooling Tower
Water Chemistry
Heat Exchanger
Visit us at wwwjust-chemicalscom
Interlinked Process Flow
Cooling Tower
Water Chemistry
Heat Exchanger
CWT Design Methedology and
guidelines
Visit us at wwwjust-chemicalscom
Impoundments and Storm Water
bull Operators and owners tend to focus primarily on the quality of water coming into the plant and the wastewater quality going out of the plant as required to meet their plant discharge permits
bull In contrast knowing exactly what is going on within the power plant boundaries in impoundments and process sumps is not always as clear especially in older facilities where upgrades and plant modifications have considerably altered the plant water picture over the years
bull Also in many coal-fired power plants coal combustion waste ponds and impoundments are utilized for equalization and treatment of numerous plant wastewater streams complicating the plantrsquos ability to easily assess the potential for reuse of each individual stream
bull However with some of the proposed regulation changes coal-fired power plants may be required to do just that Segregation and separation of plant wastewaters can minimize the volumetric flow rate that requires additional treatment to meet the proposed regulations
bull For instance at one facility where we been assisting with water and mass balance activities in preparation for expected Pollutant Discharge Elimination System permit changes the engineering team was able to reconfigure portions of the wastewater collection system
bull It segregated storm waters into contact and noncontact storm waters and separated mixed process water streams allowing the plant to reuse a fair portion of its previously discharged wastewater
bull As a result the facility significantly reduced the potential treatment costs associated with meeting new permit requirements and realized an overall cost savings Visit us at wwwjust-chemicalscom
Get Preparedbull Especially in light of the upcoming regulation changes and the expectation that additional levels of
wastewater treatment will be necessary to meet some of the new discharge limits any plant likely to be affected should explore the potential for internal recycling or reuse of plant wastewaters and minimizing water waste in order to keep wastewater treatment costs as low as possible
bull Starting now evaluating the current plant water and wastewater conditions conducting sampling and flow measurement programs and assessing current wastewater treatment systems are key to development of a baseline and plan of attack for dealing with the impending regulation changes
bull Knowing exactly where your plantrsquos starting point is and developing a solid data history is crucial to determining what you may need to do to meet changes in regulatory requirements
Visit us at wwwjust-chemicalscom
Replace conventional Side Stream Filtration
bull Use side Stream filter with continuous filtration
bull 2 - 5 of circulating water
bull Saves manpower
bull Continuous ndash no infringement
bull Saves water ndash water wastage down to 3 against 10 in
conventional filters
bull Down to 51020 microns against 50 microns with
conventional filters
bull Polymers used as dispersants
Discussion Decide whether you want engineering control or Chemistry Control
Visit us at wwwjust-chemicalscom
Given the following benefits itrsquos easy to see why self-cleaning filters are the overwhelming choice of consulting engineers property management companies and building owners
bull Self-cleaninghelliprequires no regular maintenance
bull Self-cleaninghellipassures optimal filtration efficiency
bull Self-cleaninghellipreduces energy cost
bull No monitoring ndash No manpower
bull Only 3 water wastage
bull As filter media accumulates suspended contaminants the pressure drop across the filter increases and flow rate decreases The filter consumes the same power but does less work
bull Self-cleaninghellipextends media life (five to ten years typical)
bull Our experience indicates that the necessary disciplined routine maintenance required for manual filters is the exception not the rule As a consequence the filter media overloads with contaminants and thereafter backwashing is less effective in removing accumulated solids
bull Self-cleaning hellipis cost effective No manpower required for backwashing
bull The retrofit fit cost is more than the initial incremental cost for self-cleaning
Visit us at wwwjust-chemicalscom
Reduction of Evaporation loss from Reservoirs
The floating discs were discs of 02m diameter and 002m thickness that covered 91 of the water surface The results have shown that evaporation from the covered reservoir was reduced by about 80 relative to the uncovered water surface
Shade balls are plastic Eco-friendly balls that could be used in lakes ponds stream and dams The Department of Water and Power (LADWP) has first used these balls in California to prevent the evaporation A study was conducted in the Nehru pond at Namakkal district They used 4 inch black balls from high density polyethylene (HDPE) and carbon black to cover the reservoir This study showed that the shade balls reduced 43-45 of evaporation in the reservoir
Shade-cloth are suspended structures installed over water surfaces with supporting poles and steel cables This cover reduces the action of wind and blocks incoming solar radiation therefore it reduces the evaporation rates from water surfaces Shade-cloth is economically used for small reservoirs that are less than 10 hectares in area The main disadvantage of this method is the relatively high capital cost for construction but this has now been overridden in Malaysia owing to a new shade-cloth knitting machine which will produce wider rolls and therefore reduce the number of installed cables
A study carried out under summer conditions in Southern Spain shown that shading covers led to decrease the evaporation by about 80 for the colored-polyethylene covers Another study was conducted in Australia to estimate the benefits of shade-cloth covers for water reservoirs The study has shown that evaporation rate was reduced by about 90 and the shade-cloth reduced maintenance costs because they delay the growth of aquatic plants at the bottom of the storages Visit us at wwwjust-chemicalscom
Floating Solar Plant ldquoEuropersquos largest floating solar plant opens in Francerdquo
French
English Case of USA
Visit us at wwwjust-chemicalscom
Visit us at wwwjust-chemicalscom
Reach us
Juschem Solutions Pvt LtdA108 SV Heights Whitefield Bangalore ndash 560066 KA
Email sbanerjeejust-chemicalscomPhoneWhatsApp +91 7985635683website wwwjust-chemicalscom
Follow us at httpswwwfacebookcompowerplantchem
httpswwwlinkedincominjuschem-solutions-private-ltd-63a997165
httpswwwyoutubecomchannelUC1Jt3imL-WtfkiRgI01sGZg
YouTube Channel Juschem Solutions Pvt Ltd
Visit us at wwwjust-chemicalscom

Analytics
bull Obvious examples of internal recyclereuse opportunities include recycling reverse osmosis reject as cooling tower makeup collecting and reprocessing boiler or heat recovery steam generator blowdown water and recycling cooling tower blowdown as flue gas desulfurization makeup water
bull However a close review of the plant water and mass balances can reveal quite a few opportunities for water reuse or water conservation
bull Many of these internal recyclereuse opportunities can be inexpensive and relatively simple to implement involving only piping and valving modifications though some may involve the addition of treatment equipment such as clarification or filtration to reprocess the wastewater streams to make them suitable for reuse
bull Determining the water quality of the wastewater stream contaminants therefore is a crucial early step in evaluating wastewaters for reuse opportunities and performing a cost-benefit analysis
Visit us at wwwjust-chemicalscom
Analytics
bull Development of water and mass balances will also prepare a plant to intelligently evaluate the impact of and reaction to potential modifications to the plant water balance that may occur due to regulations changes
bull The new proposed regulations may affect a plantrsquos cooling water systems material-handling and conveyance systems and wastewater discharges
bull Potential changes such as the addition of wastewater treatment systems or the rerouting of wastewater streams can be simulated to assess their effects on overall plant operations
Visit us at wwwjust-chemicalscom
Water Balance Analytics at 100 PLF
Water Balance Analytics at 85
PLF
Water Balance Analytics at 70
PLF
Analytics
Visit us at wwwjust-chemicalscom
Improvement Project to further reduce SWC
Note For Approval Visit us at wwwjust-chemicalscom
Water Balance after measuring monitoring controlling + Recycling
SWC = 1799
Visit us at wwwjust-chemicalscom
Challenges
bull The most difficult challenge in developing an accurate site water balance is collecting adequate data to model the plant water and wastewater streams precisely
bull Using smart water meters and IoT with Analytics is the necessary system creation for sustainability
bull Inclusion of seasonal and historical data and its impact on the plant water balance is desirable such as periodic degradations in water supply qualities that reduce cooling tower operating cycles
bull This water balance should include average daily usage rates as well as peak and minimum flows to create an accurate picture of the plantrsquos water footprint
bull Reduced load operations (if they are relevant for a unit) partial plant operations (for instance single-unit operation in a two-unit plant) as well as other off-design operating scenarios should be evaluated as appropriate to determine how they will affect water consumption rates and wastewater production
Visit us at wwwjust-chemicalscom
REACHING HIGH COC
In Cooling Water Systems
Visit us at wwwjust-chemicalscom
Operating recirculating cooling systems at higher COC helps us to gain many economic and environmental benefits viz
bull Reduction in pumping cost
bull Reducing depletion of natural resource Reducing specific water consumption and water cost Stationrsquos requirement to lower the operating costincrease profitability
bull Abiding environmental regulations
bull Demonstration of corporate responsibility by conserving water
Elevating COC can minimize operating costs through water savings and energy savings
While planning to operate at high COC we need to study various technical issues in order to prevent waterside problems
Visit us at wwwjust-chemicalscom
Study on Water Chemistry
To understand the chemistry of our
cooling water system we studied the
present system and operating
parameters for Calcium Hardness TDS
alkalinity and associated pH
bull LSI below 05 is corrosive and above 15 is scale
forming 05-15 controllable
bull RSI above 64 is corrosive and Below 54 is scale
forming 54-64 controllable
Make up Water ParameterParameters As Min Max Avg
pH 66 82 75
Total Hardness PPM 30 50 40
Calcium Harness PPM 18 30 24
Magnesium Hardness PPM 12 20 16
M-Alk PPM 20 40 30
Chlorides PPM 15 25 20
Silica PPM 8 13 11
Conductivity microscm 100 150 120
Total Dissolved solids PPM 67 101 80
Turbidity NTU 4 20 7
Iron PPM 01 02 015
pHs (Saturation) 93 88 90
LSI Indices -27 -06 -15
RSI Indices 120 94 105
CW MAKE-UP WATER ANALYSIS CONSIDERED
Visit us at wwwjust-chemicalscom
Relationship of Various parameters
bull Evaporation Loss
E = 00018 x delta T x R x TF (Tower Factor)(T expressed in oC)
Tower factor is based on (a) humidity and (b) Tower Height (Considered during designing of the tower)
bull Blowdown
B = Evaporation
COC-1
bull Cycles Of Concentration
COC = Concentration in Recirculation
Concentration In Make-up
Question What is Best Elementchemical parameter
Visit us at wwwjust-chemicalscom
Scalingcorrosion Propensity on Average ValuesAt Average Values
Parameters 5 COC 6 COC 7 COC 8 COC 9 COC 10 COC 11 COC 12 COCpH 783 794 804 813 82 83 84 85Total Hardness 200 240 280 320 360 400 440 480Calcium Harness 120 144 168 192 216 240 264 288MagnesiumHardness 80 96 112 128 144 160 176 192M-Alk 150 180 210 240 270 300 330 360Chlorides 100 120 140 160 180 200 220 240Silica 55 66 77 88 99 110 121 132Conductivity 600 720 840 960 1080 1200 1320 1440Total Dissolvedsolids 402 4824 5628 6432 7236 804 8844 9648Turbidity 35 42 49 56 63 70 77 84Iron 075 09 105 12 135 15 165 18pHs (Saturation) 74 72 71 70 69 68 67 67
LSI 05 07 09 11 13 15 17 18
RSI 69 65 62 58 56 53 51 48
LSI below 05 is corrosive and above 15 is scale forming 05-15 controllable RSI above 64 is corrosive and Below 54 is scale forming 54-64 controllable
For Make up with high Chlorides
use LaI
Visit u
s at w
ww
just-ch
em
icalsco
m
For Make up with high Chlorides
use LaI
At Maximum Values
Parameters 5 COC 6 COC 7 COC 8 COC 9 COC 10 COC 11 COC 12 COCpH
82 83 84 85 85 86 87 88Total Hardness
250 240 280 320 360 400 440 480Calcium Harness
150 144 168 192 216 240 264 288Magnesium Hardness
100 96 112 128 144 160 176 192M-Alk
200 180 210 240 270 300 330 360Chlorides
125 120 140 160 180 200 220 240Silica
65 66 77 88 99 110 121 132Conductivity
750 720 840 960 1080 1200 1320 1440Total Dissolved solids
5025 4824 5628 6432 7236 804 8844 9648Turbidity
100 42 49 56 63 70 77 84Iron
1 09 105 12 135 15 165 18pHs (Saturation) 72 72 71 70 69 68 67 67
LSI 10 11 13 15 16 18 20 21
RSI 62 62 58 55 52 50 48 45
LSI below 05 is corrosive and above 15 is scale forming 05-15 controllable RSI above 64 is corrosive and Below 54 is scale forming 54-64 controllable
Scalingcorrosion Propensity on Maximum Values
Visit us at wwwjust-chemicalscom
RSI amp LSI
All Saturation indices
Chemistry and
scaling indices
Visit us at wwwjust-chemicalscom
Study Outcome Analysis
Considering the above we shall always be in the range of 7 - 10 COC Assuming that the system will
have max values (only in summers) also a COC of 80 is ideal
RSI below 54 is scale forming but controllable till 4 RSI (Controllable with Chemical Treatment) above
64 is corrosive but controllable till 6 (Controllable with Chemical Treatment) Only It is always better to
operate system in slight scale forming tendency than corrosive because scale can be removed but
corroded metal cannot be put back
For CW where water velocity is gt06 ms RSI should only be used
Refer Nalco Water handbook Page 417
Visit us at wwwjust-chemicalscom
Study on Environmental Impact
bull We will be complying by EC and Consent conditions by operating the CW
system above 5 COC as it says ldquoCOC of not less than 5 shall be adoptedrdquo
bull The water saving will be
bull The Energy Savings will be
bull Reduction in CO2 emission will be 125 tons per year
Station Parameters for CW
System-
AT CYCLES OF
CONCENTARTION 6
AT CYCLES OF
CONCENTARTION 7
CT blow down m3year 3120938 2600781
CT Make Up Water Rate in
m3year
18725626 18205470
Water Saving in M3 year - 520156
Energy savings (KwH)Clarified
water
- 95709
Energy Saving (KwH) CT
Pumping
- 52016
Total energy Saving(KwH) 147724
Visit us at wwwjust-chemicalscom
Further Analysis
Hydraulic factors1 Hydraulic factor (CH) of a tower is used to determine the efficiency of water use It is represented as
CH = sumMURsumBDR
Where MUR = Total make-up rate and BDR = Total blow-down rate
1 Both the makeup and blow-down flow rates are comprised of controlled and unintentional components The effective blow-down loss rate is the metered blow-down and unmetered streams such as drift leaks filter backwash and removal of CW from the system for other uses Our CW systems have almost negligible unintentional water losses to limit the COC thus COC of 14 is achievable
2 Drift is the water lost from the tower as a liquid droplets entrained in the exhaust air This loss is not dependent on evaporation rate Drift loss rate is normally expressed in percentage of the recirculation rate (ranging 01 to 002) The drift loss rate depends on the system-specific factors like design of the tower age of the tower types and age of the drift eliminators Our drift loss is around 002
3 Unintentional and uncontrolled water losses could be the SS filter backwash leakages from pump(s) glands or other equipment(s) cooling tower basin overflows water tapping from return line for other usepurpose etc
Visit us at wwwjust-chemicalscom
Further Analysis
Time-related factors
Increase in Holding time index (HTI) is one of the major problem associated with high COC The HTI is defined as the
half-life of an ion in the system This is equated as
HTI = 0693 VT BT
Where VT is the system volume and BT is total water loss
Above figure illustrates the impact of increased cycling on the HTI of a typical cooling tower system Increasing the COC
from 5 to 15 effectively triples the HTI increasing the average time a molecule spends in the system by a factor of three
This can affect the efficacy of the scale and corrosion inhibitors
The HTI in our system at 6 COC is 217 Hours at 7 COC is 261 Hours and at 8 COC is 305 Hours
As the HTI increases the stress on the organic portion (polymer phosphonates azoles) of the treatment regime
increases In this case the treatment-program active components must stay active for longer periods of time before
being replaced With current treatment regime HTI of 300 Hrs is achievable For going beyond 300 hrs HTI advanced
high stress polymers may be used
HTI Vs Cycles
0
100
200
300
2 4 6 8 10 12 14 16 18 20 22
Cycles
HT
I in
hrs
HTI
Visit us at wwwjust-chemicalscom
Further Analysis
Weighing of credits and debits
bull Some of the credits will be less water usage reduced blowdown and decrease in energy consumption
bull At 8 COC or below there is no debit
bull Going beyond 8 COC may call for advanced high stress polymers and advanced phosphonates
Setting rational goals
bull In the beginning detailed water balance and inventory of the water consumption in the system was performed
bull This includes makeup to cooling tower evaporation losses and blowdown
bull By far the biggest problems which may hinder the rising of CoC is unintentional losses or use with tapping from
ACWCW system
bull After this a plan is formulated with a review plans for gains necessary to evaluate the success of this upgrade After this
is complete (1 yr) increasing COC to 8 was evaluated
bull As the progress should be evaluated on a stepwise basis the system were to go to 8 cycles from a starting point of 6
cycles a reasonable goal for the first one year would be operate successfully at 7 COC
bull If corrosion and scale are well controlled an increase to 8 cycles can follow with evaluation of success again after a
significant period of time
Visit us at wwwjust-chemicalscom
Further Analysis
Choosing a compatible treatment program
This includes a combination of stress tolerant treatment actives and heat transfer monitoring (viz TTD LMTD CT efficiency
Approach etc) The treatment programs may be based on a stabilized phosphate or alkaline phosphate approach the
current treatment regime satisfies this condition
Above 8 COC Stress compatible inhibitor technology
The best approach should be to design on-site the specific inhibitors need through a flexible product addition regime
Recently developed stress-tolerant inhibitors are part of this approach New dispersants have been shown to work under a
variety of stress conditions like high Ca (gt1500 ppm as CaCO3) higher water temperature extended HTI (gt 350 hrs) etc
These dispersants allow operation at lower dosages and provide better performance New corrosion inhibitors have also
been found that are stress-tolerant Some materials demonstrate high halogen resistance and remain stable under long
HTI (gt350 h) conditions
Diagnostic tools
At high COC and stressed conditions treatment programs and cooling water systems is to be used within recommended
guidelines For this the cooling water system is properly characterized This involves evaluating the following key
operating parameters
bull Total blow-down rates (including drift loss)
bull Holding time index
bull True COC based on Mg or Na (not SilicaChlorideTH)
bull Heat exchanger performance (TTD LMTD amp lsquoUrsquo values) Visit us at wwwjust-chemicalscom
Further Analysis
Measurement and control
In addition to measuring and adjusting system-operating parameters online monitoring and control of
treatment dosages may be installed to operate at high COC at optimal cost and performance
Monitoring process
Once desired COC is achieved maintenance of high COC is required to realize water and energy
savings Routine evaluation of the system control equipment and monthly logs are important to monitor
and document water quality and usage over time and through seasonal variations
Visit us at wwwjust-chemicalscom
Further Analysis
Measurement and control
In addition to measuring and adjusting system-operating parameters online monitoring and control of
treatment dosages may be installed to operate at high COC at optimal cost and performance
Monitoring process
Once desired COC is achieved maintenance of high COC is required to realize water and energy
savings Routine evaluation of the system control equipment and monthly logs are important to monitor
and document water quality and usage over time and through seasonal variations
Visit us at wwwjust-chemicalscom
CW Monitoring Tools
bull Online Chemistry Analyzers like (This can be developed in an Economical Solution)
bull Corrator inbuilt in Online AnalyzerCorrosion meter
bull Deposit monitor - visual indication of deposit formation and heat transfer loss indication
bull Bio-fouling monitor - indicate loss of pressure due to biofilm or slime build-up
bull Test heat exchanger
Visit us at wwwjust-chemicalscom
CW Monitoring Tools
bull Online Chemistry Analyzers like (This can be developed in an Economical Solution)
bull Corrosion coupons - indicate corrosion rate in mils (thousandth of an inch) per year (MPY)
bull Corrator inbuilt in Online Analyzer
bull Deposit monitor - visual indication of deposit formation and heat transfer loss indication
bull Bio-fouling monitor - indicate loss of pressure due to biofilm or slime build-up
bull Corrosion meter
bull Test heat exchanger
Visit us at wwwjust-chemicalscom
Interlinked Process Flow
Cooling Tower
Water Chemistry
Heat Exchanger
Visit us at wwwjust-chemicalscom
Interlinked Process Flow
Cooling Tower
Water Chemistry
Heat Exchanger
CWT Design Methedology and
guidelines
Visit us at wwwjust-chemicalscom
Impoundments and Storm Water
bull Operators and owners tend to focus primarily on the quality of water coming into the plant and the wastewater quality going out of the plant as required to meet their plant discharge permits
bull In contrast knowing exactly what is going on within the power plant boundaries in impoundments and process sumps is not always as clear especially in older facilities where upgrades and plant modifications have considerably altered the plant water picture over the years
bull Also in many coal-fired power plants coal combustion waste ponds and impoundments are utilized for equalization and treatment of numerous plant wastewater streams complicating the plantrsquos ability to easily assess the potential for reuse of each individual stream
bull However with some of the proposed regulation changes coal-fired power plants may be required to do just that Segregation and separation of plant wastewaters can minimize the volumetric flow rate that requires additional treatment to meet the proposed regulations
bull For instance at one facility where we been assisting with water and mass balance activities in preparation for expected Pollutant Discharge Elimination System permit changes the engineering team was able to reconfigure portions of the wastewater collection system
bull It segregated storm waters into contact and noncontact storm waters and separated mixed process water streams allowing the plant to reuse a fair portion of its previously discharged wastewater
bull As a result the facility significantly reduced the potential treatment costs associated with meeting new permit requirements and realized an overall cost savings Visit us at wwwjust-chemicalscom
Get Preparedbull Especially in light of the upcoming regulation changes and the expectation that additional levels of
wastewater treatment will be necessary to meet some of the new discharge limits any plant likely to be affected should explore the potential for internal recycling or reuse of plant wastewaters and minimizing water waste in order to keep wastewater treatment costs as low as possible
bull Starting now evaluating the current plant water and wastewater conditions conducting sampling and flow measurement programs and assessing current wastewater treatment systems are key to development of a baseline and plan of attack for dealing with the impending regulation changes
bull Knowing exactly where your plantrsquos starting point is and developing a solid data history is crucial to determining what you may need to do to meet changes in regulatory requirements
Visit us at wwwjust-chemicalscom
Replace conventional Side Stream Filtration
bull Use side Stream filter with continuous filtration
bull 2 - 5 of circulating water
bull Saves manpower
bull Continuous ndash no infringement
bull Saves water ndash water wastage down to 3 against 10 in
conventional filters
bull Down to 51020 microns against 50 microns with
conventional filters
bull Polymers used as dispersants
Discussion Decide whether you want engineering control or Chemistry Control
Visit us at wwwjust-chemicalscom
Given the following benefits itrsquos easy to see why self-cleaning filters are the overwhelming choice of consulting engineers property management companies and building owners
bull Self-cleaninghelliprequires no regular maintenance
bull Self-cleaninghellipassures optimal filtration efficiency
bull Self-cleaninghellipreduces energy cost
bull No monitoring ndash No manpower
bull Only 3 water wastage
bull As filter media accumulates suspended contaminants the pressure drop across the filter increases and flow rate decreases The filter consumes the same power but does less work
bull Self-cleaninghellipextends media life (five to ten years typical)
bull Our experience indicates that the necessary disciplined routine maintenance required for manual filters is the exception not the rule As a consequence the filter media overloads with contaminants and thereafter backwashing is less effective in removing accumulated solids
bull Self-cleaning hellipis cost effective No manpower required for backwashing
bull The retrofit fit cost is more than the initial incremental cost for self-cleaning
Visit us at wwwjust-chemicalscom
Reduction of Evaporation loss from Reservoirs
The floating discs were discs of 02m diameter and 002m thickness that covered 91 of the water surface The results have shown that evaporation from the covered reservoir was reduced by about 80 relative to the uncovered water surface
Shade balls are plastic Eco-friendly balls that could be used in lakes ponds stream and dams The Department of Water and Power (LADWP) has first used these balls in California to prevent the evaporation A study was conducted in the Nehru pond at Namakkal district They used 4 inch black balls from high density polyethylene (HDPE) and carbon black to cover the reservoir This study showed that the shade balls reduced 43-45 of evaporation in the reservoir
Shade-cloth are suspended structures installed over water surfaces with supporting poles and steel cables This cover reduces the action of wind and blocks incoming solar radiation therefore it reduces the evaporation rates from water surfaces Shade-cloth is economically used for small reservoirs that are less than 10 hectares in area The main disadvantage of this method is the relatively high capital cost for construction but this has now been overridden in Malaysia owing to a new shade-cloth knitting machine which will produce wider rolls and therefore reduce the number of installed cables
A study carried out under summer conditions in Southern Spain shown that shading covers led to decrease the evaporation by about 80 for the colored-polyethylene covers Another study was conducted in Australia to estimate the benefits of shade-cloth covers for water reservoirs The study has shown that evaporation rate was reduced by about 90 and the shade-cloth reduced maintenance costs because they delay the growth of aquatic plants at the bottom of the storages Visit us at wwwjust-chemicalscom
Floating Solar Plant ldquoEuropersquos largest floating solar plant opens in Francerdquo
French
English Case of USA
Visit us at wwwjust-chemicalscom
Visit us at wwwjust-chemicalscom
Reach us
Juschem Solutions Pvt LtdA108 SV Heights Whitefield Bangalore ndash 560066 KA
Email sbanerjeejust-chemicalscomPhoneWhatsApp +91 7985635683website wwwjust-chemicalscom
Follow us at httpswwwfacebookcompowerplantchem
httpswwwlinkedincominjuschem-solutions-private-ltd-63a997165
httpswwwyoutubecomchannelUC1Jt3imL-WtfkiRgI01sGZg
YouTube Channel Juschem Solutions Pvt Ltd
Visit us at wwwjust-chemicalscom
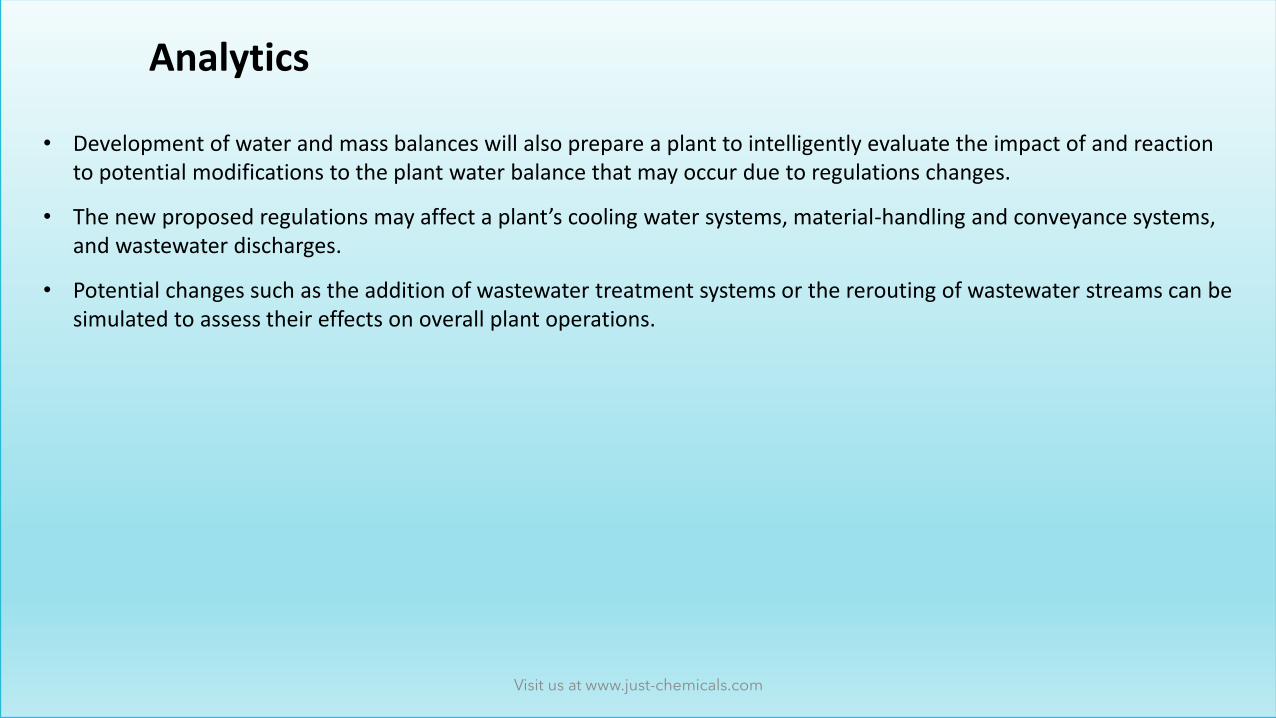
Analytics
bull Development of water and mass balances will also prepare a plant to intelligently evaluate the impact of and reaction to potential modifications to the plant water balance that may occur due to regulations changes
bull The new proposed regulations may affect a plantrsquos cooling water systems material-handling and conveyance systems and wastewater discharges
bull Potential changes such as the addition of wastewater treatment systems or the rerouting of wastewater streams can be simulated to assess their effects on overall plant operations
Visit us at wwwjust-chemicalscom
Water Balance Analytics at 100 PLF
Water Balance Analytics at 85
PLF
Water Balance Analytics at 70
PLF
Analytics
Visit us at wwwjust-chemicalscom
Improvement Project to further reduce SWC
Note For Approval Visit us at wwwjust-chemicalscom
Water Balance after measuring monitoring controlling + Recycling
SWC = 1799
Visit us at wwwjust-chemicalscom
Challenges
bull The most difficult challenge in developing an accurate site water balance is collecting adequate data to model the plant water and wastewater streams precisely
bull Using smart water meters and IoT with Analytics is the necessary system creation for sustainability
bull Inclusion of seasonal and historical data and its impact on the plant water balance is desirable such as periodic degradations in water supply qualities that reduce cooling tower operating cycles
bull This water balance should include average daily usage rates as well as peak and minimum flows to create an accurate picture of the plantrsquos water footprint
bull Reduced load operations (if they are relevant for a unit) partial plant operations (for instance single-unit operation in a two-unit plant) as well as other off-design operating scenarios should be evaluated as appropriate to determine how they will affect water consumption rates and wastewater production
Visit us at wwwjust-chemicalscom
REACHING HIGH COC
In Cooling Water Systems
Visit us at wwwjust-chemicalscom
Operating recirculating cooling systems at higher COC helps us to gain many economic and environmental benefits viz
bull Reduction in pumping cost
bull Reducing depletion of natural resource Reducing specific water consumption and water cost Stationrsquos requirement to lower the operating costincrease profitability
bull Abiding environmental regulations
bull Demonstration of corporate responsibility by conserving water
Elevating COC can minimize operating costs through water savings and energy savings
While planning to operate at high COC we need to study various technical issues in order to prevent waterside problems
Visit us at wwwjust-chemicalscom
Study on Water Chemistry
To understand the chemistry of our
cooling water system we studied the
present system and operating
parameters for Calcium Hardness TDS
alkalinity and associated pH
bull LSI below 05 is corrosive and above 15 is scale
forming 05-15 controllable
bull RSI above 64 is corrosive and Below 54 is scale
forming 54-64 controllable
Make up Water ParameterParameters As Min Max Avg
pH 66 82 75
Total Hardness PPM 30 50 40
Calcium Harness PPM 18 30 24
Magnesium Hardness PPM 12 20 16
M-Alk PPM 20 40 30
Chlorides PPM 15 25 20
Silica PPM 8 13 11
Conductivity microscm 100 150 120
Total Dissolved solids PPM 67 101 80
Turbidity NTU 4 20 7
Iron PPM 01 02 015
pHs (Saturation) 93 88 90
LSI Indices -27 -06 -15
RSI Indices 120 94 105
CW MAKE-UP WATER ANALYSIS CONSIDERED
Visit us at wwwjust-chemicalscom
Relationship of Various parameters
bull Evaporation Loss
E = 00018 x delta T x R x TF (Tower Factor)(T expressed in oC)
Tower factor is based on (a) humidity and (b) Tower Height (Considered during designing of the tower)
bull Blowdown
B = Evaporation
COC-1
bull Cycles Of Concentration
COC = Concentration in Recirculation
Concentration In Make-up
Question What is Best Elementchemical parameter
Visit us at wwwjust-chemicalscom
Scalingcorrosion Propensity on Average ValuesAt Average Values
Parameters 5 COC 6 COC 7 COC 8 COC 9 COC 10 COC 11 COC 12 COCpH 783 794 804 813 82 83 84 85Total Hardness 200 240 280 320 360 400 440 480Calcium Harness 120 144 168 192 216 240 264 288MagnesiumHardness 80 96 112 128 144 160 176 192M-Alk 150 180 210 240 270 300 330 360Chlorides 100 120 140 160 180 200 220 240Silica 55 66 77 88 99 110 121 132Conductivity 600 720 840 960 1080 1200 1320 1440Total Dissolvedsolids 402 4824 5628 6432 7236 804 8844 9648Turbidity 35 42 49 56 63 70 77 84Iron 075 09 105 12 135 15 165 18pHs (Saturation) 74 72 71 70 69 68 67 67
LSI 05 07 09 11 13 15 17 18
RSI 69 65 62 58 56 53 51 48
LSI below 05 is corrosive and above 15 is scale forming 05-15 controllable RSI above 64 is corrosive and Below 54 is scale forming 54-64 controllable
For Make up with high Chlorides
use LaI
Visit u
s at w
ww
just-ch
em
icalsco
m
For Make up with high Chlorides
use LaI
At Maximum Values
Parameters 5 COC 6 COC 7 COC 8 COC 9 COC 10 COC 11 COC 12 COCpH
82 83 84 85 85 86 87 88Total Hardness
250 240 280 320 360 400 440 480Calcium Harness
150 144 168 192 216 240 264 288Magnesium Hardness
100 96 112 128 144 160 176 192M-Alk
200 180 210 240 270 300 330 360Chlorides
125 120 140 160 180 200 220 240Silica
65 66 77 88 99 110 121 132Conductivity
750 720 840 960 1080 1200 1320 1440Total Dissolved solids
5025 4824 5628 6432 7236 804 8844 9648Turbidity
100 42 49 56 63 70 77 84Iron
1 09 105 12 135 15 165 18pHs (Saturation) 72 72 71 70 69 68 67 67
LSI 10 11 13 15 16 18 20 21
RSI 62 62 58 55 52 50 48 45
LSI below 05 is corrosive and above 15 is scale forming 05-15 controllable RSI above 64 is corrosive and Below 54 is scale forming 54-64 controllable
Scalingcorrosion Propensity on Maximum Values
Visit us at wwwjust-chemicalscom
RSI amp LSI
All Saturation indices
Chemistry and
scaling indices
Visit us at wwwjust-chemicalscom
Study Outcome Analysis
Considering the above we shall always be in the range of 7 - 10 COC Assuming that the system will
have max values (only in summers) also a COC of 80 is ideal
RSI below 54 is scale forming but controllable till 4 RSI (Controllable with Chemical Treatment) above
64 is corrosive but controllable till 6 (Controllable with Chemical Treatment) Only It is always better to
operate system in slight scale forming tendency than corrosive because scale can be removed but
corroded metal cannot be put back
For CW where water velocity is gt06 ms RSI should only be used
Refer Nalco Water handbook Page 417
Visit us at wwwjust-chemicalscom
Study on Environmental Impact
bull We will be complying by EC and Consent conditions by operating the CW
system above 5 COC as it says ldquoCOC of not less than 5 shall be adoptedrdquo
bull The water saving will be
bull The Energy Savings will be
bull Reduction in CO2 emission will be 125 tons per year
Station Parameters for CW
System-
AT CYCLES OF
CONCENTARTION 6
AT CYCLES OF
CONCENTARTION 7
CT blow down m3year 3120938 2600781
CT Make Up Water Rate in
m3year
18725626 18205470
Water Saving in M3 year - 520156
Energy savings (KwH)Clarified
water
- 95709
Energy Saving (KwH) CT
Pumping
- 52016
Total energy Saving(KwH) 147724
Visit us at wwwjust-chemicalscom
Further Analysis
Hydraulic factors1 Hydraulic factor (CH) of a tower is used to determine the efficiency of water use It is represented as
CH = sumMURsumBDR
Where MUR = Total make-up rate and BDR = Total blow-down rate
1 Both the makeup and blow-down flow rates are comprised of controlled and unintentional components The effective blow-down loss rate is the metered blow-down and unmetered streams such as drift leaks filter backwash and removal of CW from the system for other uses Our CW systems have almost negligible unintentional water losses to limit the COC thus COC of 14 is achievable
2 Drift is the water lost from the tower as a liquid droplets entrained in the exhaust air This loss is not dependent on evaporation rate Drift loss rate is normally expressed in percentage of the recirculation rate (ranging 01 to 002) The drift loss rate depends on the system-specific factors like design of the tower age of the tower types and age of the drift eliminators Our drift loss is around 002
3 Unintentional and uncontrolled water losses could be the SS filter backwash leakages from pump(s) glands or other equipment(s) cooling tower basin overflows water tapping from return line for other usepurpose etc
Visit us at wwwjust-chemicalscom
Further Analysis
Time-related factors
Increase in Holding time index (HTI) is one of the major problem associated with high COC The HTI is defined as the
half-life of an ion in the system This is equated as
HTI = 0693 VT BT
Where VT is the system volume and BT is total water loss
Above figure illustrates the impact of increased cycling on the HTI of a typical cooling tower system Increasing the COC
from 5 to 15 effectively triples the HTI increasing the average time a molecule spends in the system by a factor of three
This can affect the efficacy of the scale and corrosion inhibitors
The HTI in our system at 6 COC is 217 Hours at 7 COC is 261 Hours and at 8 COC is 305 Hours
As the HTI increases the stress on the organic portion (polymer phosphonates azoles) of the treatment regime
increases In this case the treatment-program active components must stay active for longer periods of time before
being replaced With current treatment regime HTI of 300 Hrs is achievable For going beyond 300 hrs HTI advanced
high stress polymers may be used
HTI Vs Cycles
0
100
200
300
2 4 6 8 10 12 14 16 18 20 22
Cycles
HT
I in
hrs
HTI
Visit us at wwwjust-chemicalscom
Further Analysis
Weighing of credits and debits
bull Some of the credits will be less water usage reduced blowdown and decrease in energy consumption
bull At 8 COC or below there is no debit
bull Going beyond 8 COC may call for advanced high stress polymers and advanced phosphonates
Setting rational goals
bull In the beginning detailed water balance and inventory of the water consumption in the system was performed
bull This includes makeup to cooling tower evaporation losses and blowdown
bull By far the biggest problems which may hinder the rising of CoC is unintentional losses or use with tapping from
ACWCW system
bull After this a plan is formulated with a review plans for gains necessary to evaluate the success of this upgrade After this
is complete (1 yr) increasing COC to 8 was evaluated
bull As the progress should be evaluated on a stepwise basis the system were to go to 8 cycles from a starting point of 6
cycles a reasonable goal for the first one year would be operate successfully at 7 COC
bull If corrosion and scale are well controlled an increase to 8 cycles can follow with evaluation of success again after a
significant period of time
Visit us at wwwjust-chemicalscom
Further Analysis
Choosing a compatible treatment program
This includes a combination of stress tolerant treatment actives and heat transfer monitoring (viz TTD LMTD CT efficiency
Approach etc) The treatment programs may be based on a stabilized phosphate or alkaline phosphate approach the
current treatment regime satisfies this condition
Above 8 COC Stress compatible inhibitor technology
The best approach should be to design on-site the specific inhibitors need through a flexible product addition regime
Recently developed stress-tolerant inhibitors are part of this approach New dispersants have been shown to work under a
variety of stress conditions like high Ca (gt1500 ppm as CaCO3) higher water temperature extended HTI (gt 350 hrs) etc
These dispersants allow operation at lower dosages and provide better performance New corrosion inhibitors have also
been found that are stress-tolerant Some materials demonstrate high halogen resistance and remain stable under long
HTI (gt350 h) conditions
Diagnostic tools
At high COC and stressed conditions treatment programs and cooling water systems is to be used within recommended
guidelines For this the cooling water system is properly characterized This involves evaluating the following key
operating parameters
bull Total blow-down rates (including drift loss)
bull Holding time index
bull True COC based on Mg or Na (not SilicaChlorideTH)
bull Heat exchanger performance (TTD LMTD amp lsquoUrsquo values) Visit us at wwwjust-chemicalscom
Further Analysis
Measurement and control
In addition to measuring and adjusting system-operating parameters online monitoring and control of
treatment dosages may be installed to operate at high COC at optimal cost and performance
Monitoring process
Once desired COC is achieved maintenance of high COC is required to realize water and energy
savings Routine evaluation of the system control equipment and monthly logs are important to monitor
and document water quality and usage over time and through seasonal variations
Visit us at wwwjust-chemicalscom
Further Analysis
Measurement and control
In addition to measuring and adjusting system-operating parameters online monitoring and control of
treatment dosages may be installed to operate at high COC at optimal cost and performance
Monitoring process
Once desired COC is achieved maintenance of high COC is required to realize water and energy
savings Routine evaluation of the system control equipment and monthly logs are important to monitor
and document water quality and usage over time and through seasonal variations
Visit us at wwwjust-chemicalscom
CW Monitoring Tools
bull Online Chemistry Analyzers like (This can be developed in an Economical Solution)
bull Corrator inbuilt in Online AnalyzerCorrosion meter
bull Deposit monitor - visual indication of deposit formation and heat transfer loss indication
bull Bio-fouling monitor - indicate loss of pressure due to biofilm or slime build-up
bull Test heat exchanger
Visit us at wwwjust-chemicalscom
CW Monitoring Tools
bull Online Chemistry Analyzers like (This can be developed in an Economical Solution)
bull Corrosion coupons - indicate corrosion rate in mils (thousandth of an inch) per year (MPY)
bull Corrator inbuilt in Online Analyzer
bull Deposit monitor - visual indication of deposit formation and heat transfer loss indication
bull Bio-fouling monitor - indicate loss of pressure due to biofilm or slime build-up
bull Corrosion meter
bull Test heat exchanger
Visit us at wwwjust-chemicalscom
Interlinked Process Flow
Cooling Tower
Water Chemistry
Heat Exchanger
Visit us at wwwjust-chemicalscom
Interlinked Process Flow
Cooling Tower
Water Chemistry
Heat Exchanger
CWT Design Methedology and
guidelines
Visit us at wwwjust-chemicalscom
Impoundments and Storm Water
bull Operators and owners tend to focus primarily on the quality of water coming into the plant and the wastewater quality going out of the plant as required to meet their plant discharge permits
bull In contrast knowing exactly what is going on within the power plant boundaries in impoundments and process sumps is not always as clear especially in older facilities where upgrades and plant modifications have considerably altered the plant water picture over the years
bull Also in many coal-fired power plants coal combustion waste ponds and impoundments are utilized for equalization and treatment of numerous plant wastewater streams complicating the plantrsquos ability to easily assess the potential for reuse of each individual stream
bull However with some of the proposed regulation changes coal-fired power plants may be required to do just that Segregation and separation of plant wastewaters can minimize the volumetric flow rate that requires additional treatment to meet the proposed regulations
bull For instance at one facility where we been assisting with water and mass balance activities in preparation for expected Pollutant Discharge Elimination System permit changes the engineering team was able to reconfigure portions of the wastewater collection system
bull It segregated storm waters into contact and noncontact storm waters and separated mixed process water streams allowing the plant to reuse a fair portion of its previously discharged wastewater
bull As a result the facility significantly reduced the potential treatment costs associated with meeting new permit requirements and realized an overall cost savings Visit us at wwwjust-chemicalscom
Get Preparedbull Especially in light of the upcoming regulation changes and the expectation that additional levels of
wastewater treatment will be necessary to meet some of the new discharge limits any plant likely to be affected should explore the potential for internal recycling or reuse of plant wastewaters and minimizing water waste in order to keep wastewater treatment costs as low as possible
bull Starting now evaluating the current plant water and wastewater conditions conducting sampling and flow measurement programs and assessing current wastewater treatment systems are key to development of a baseline and plan of attack for dealing with the impending regulation changes
bull Knowing exactly where your plantrsquos starting point is and developing a solid data history is crucial to determining what you may need to do to meet changes in regulatory requirements
Visit us at wwwjust-chemicalscom
Replace conventional Side Stream Filtration
bull Use side Stream filter with continuous filtration
bull 2 - 5 of circulating water
bull Saves manpower
bull Continuous ndash no infringement
bull Saves water ndash water wastage down to 3 against 10 in
conventional filters
bull Down to 51020 microns against 50 microns with
conventional filters
bull Polymers used as dispersants
Discussion Decide whether you want engineering control or Chemistry Control
Visit us at wwwjust-chemicalscom
Given the following benefits itrsquos easy to see why self-cleaning filters are the overwhelming choice of consulting engineers property management companies and building owners
bull Self-cleaninghelliprequires no regular maintenance
bull Self-cleaninghellipassures optimal filtration efficiency
bull Self-cleaninghellipreduces energy cost
bull No monitoring ndash No manpower
bull Only 3 water wastage
bull As filter media accumulates suspended contaminants the pressure drop across the filter increases and flow rate decreases The filter consumes the same power but does less work
bull Self-cleaninghellipextends media life (five to ten years typical)
bull Our experience indicates that the necessary disciplined routine maintenance required for manual filters is the exception not the rule As a consequence the filter media overloads with contaminants and thereafter backwashing is less effective in removing accumulated solids
bull Self-cleaning hellipis cost effective No manpower required for backwashing
bull The retrofit fit cost is more than the initial incremental cost for self-cleaning
Visit us at wwwjust-chemicalscom
Reduction of Evaporation loss from Reservoirs
The floating discs were discs of 02m diameter and 002m thickness that covered 91 of the water surface The results have shown that evaporation from the covered reservoir was reduced by about 80 relative to the uncovered water surface
Shade balls are plastic Eco-friendly balls that could be used in lakes ponds stream and dams The Department of Water and Power (LADWP) has first used these balls in California to prevent the evaporation A study was conducted in the Nehru pond at Namakkal district They used 4 inch black balls from high density polyethylene (HDPE) and carbon black to cover the reservoir This study showed that the shade balls reduced 43-45 of evaporation in the reservoir
Shade-cloth are suspended structures installed over water surfaces with supporting poles and steel cables This cover reduces the action of wind and blocks incoming solar radiation therefore it reduces the evaporation rates from water surfaces Shade-cloth is economically used for small reservoirs that are less than 10 hectares in area The main disadvantage of this method is the relatively high capital cost for construction but this has now been overridden in Malaysia owing to a new shade-cloth knitting machine which will produce wider rolls and therefore reduce the number of installed cables
A study carried out under summer conditions in Southern Spain shown that shading covers led to decrease the evaporation by about 80 for the colored-polyethylene covers Another study was conducted in Australia to estimate the benefits of shade-cloth covers for water reservoirs The study has shown that evaporation rate was reduced by about 90 and the shade-cloth reduced maintenance costs because they delay the growth of aquatic plants at the bottom of the storages Visit us at wwwjust-chemicalscom
Floating Solar Plant ldquoEuropersquos largest floating solar plant opens in Francerdquo
French
English Case of USA
Visit us at wwwjust-chemicalscom
Visit us at wwwjust-chemicalscom
Reach us
Juschem Solutions Pvt LtdA108 SV Heights Whitefield Bangalore ndash 560066 KA
Email sbanerjeejust-chemicalscomPhoneWhatsApp +91 7985635683website wwwjust-chemicalscom
Follow us at httpswwwfacebookcompowerplantchem
httpswwwlinkedincominjuschem-solutions-private-ltd-63a997165
httpswwwyoutubecomchannelUC1Jt3imL-WtfkiRgI01sGZg
YouTube Channel Juschem Solutions Pvt Ltd
Visit us at wwwjust-chemicalscom
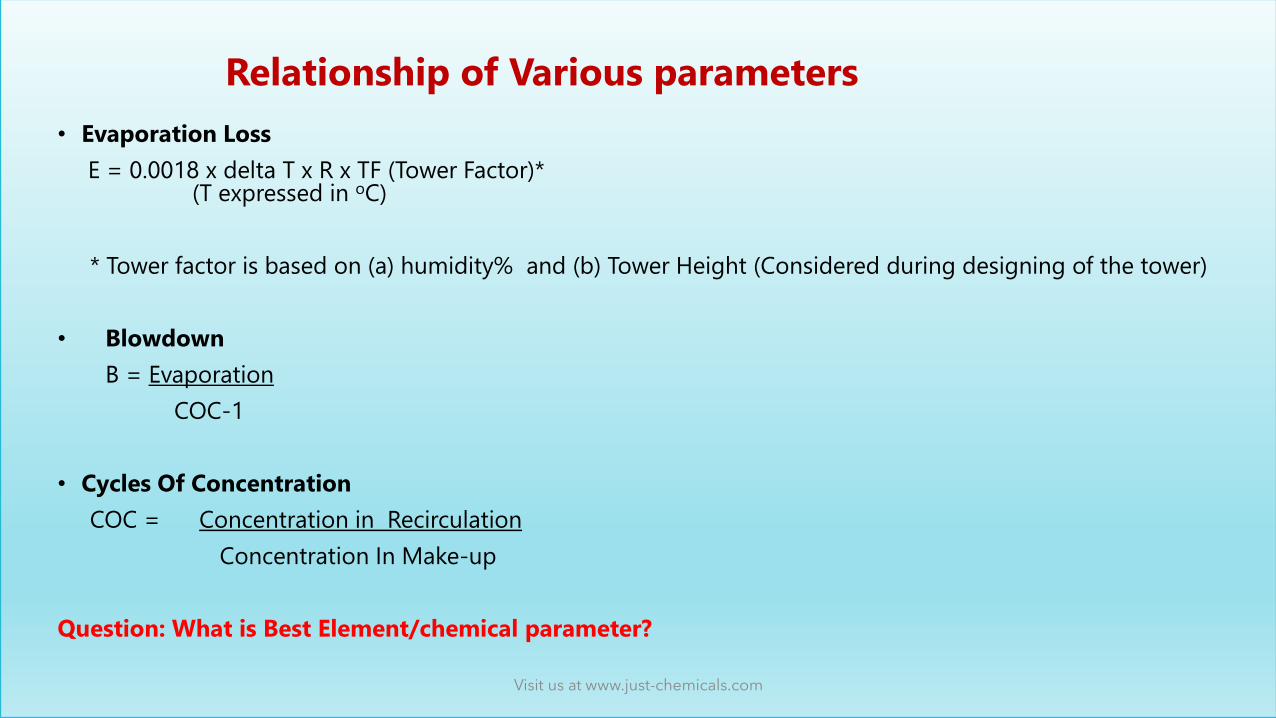
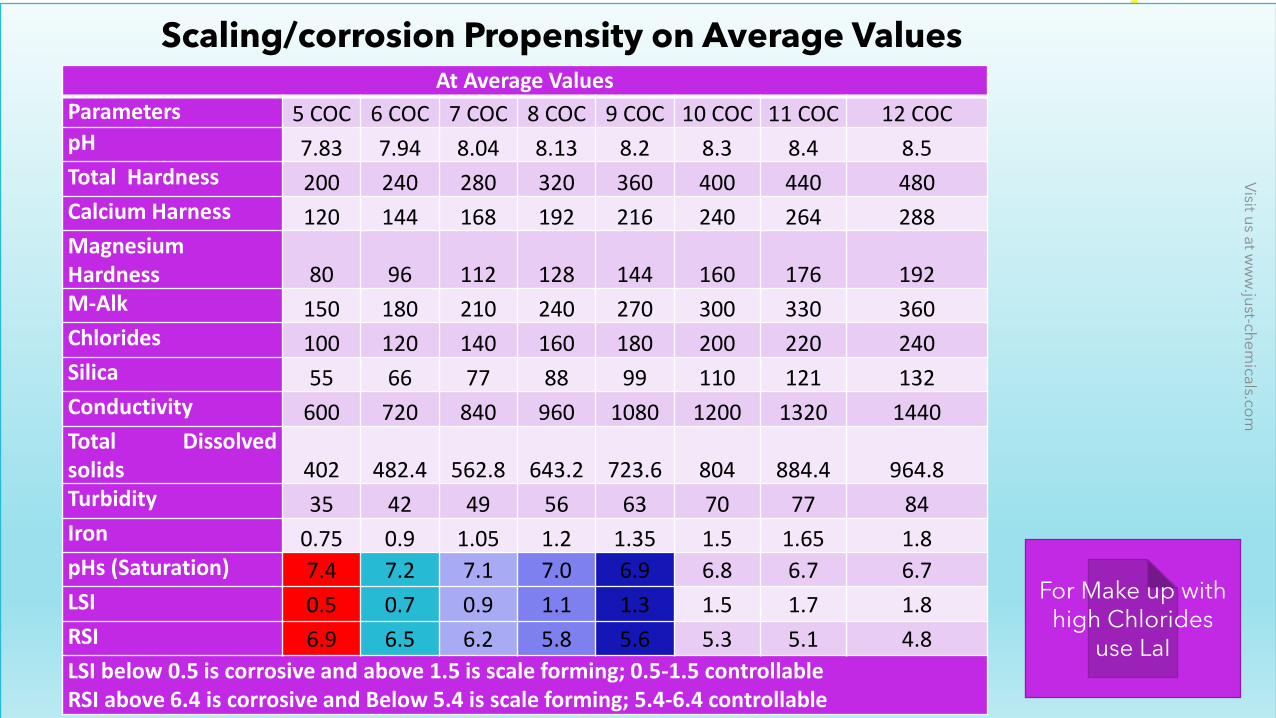
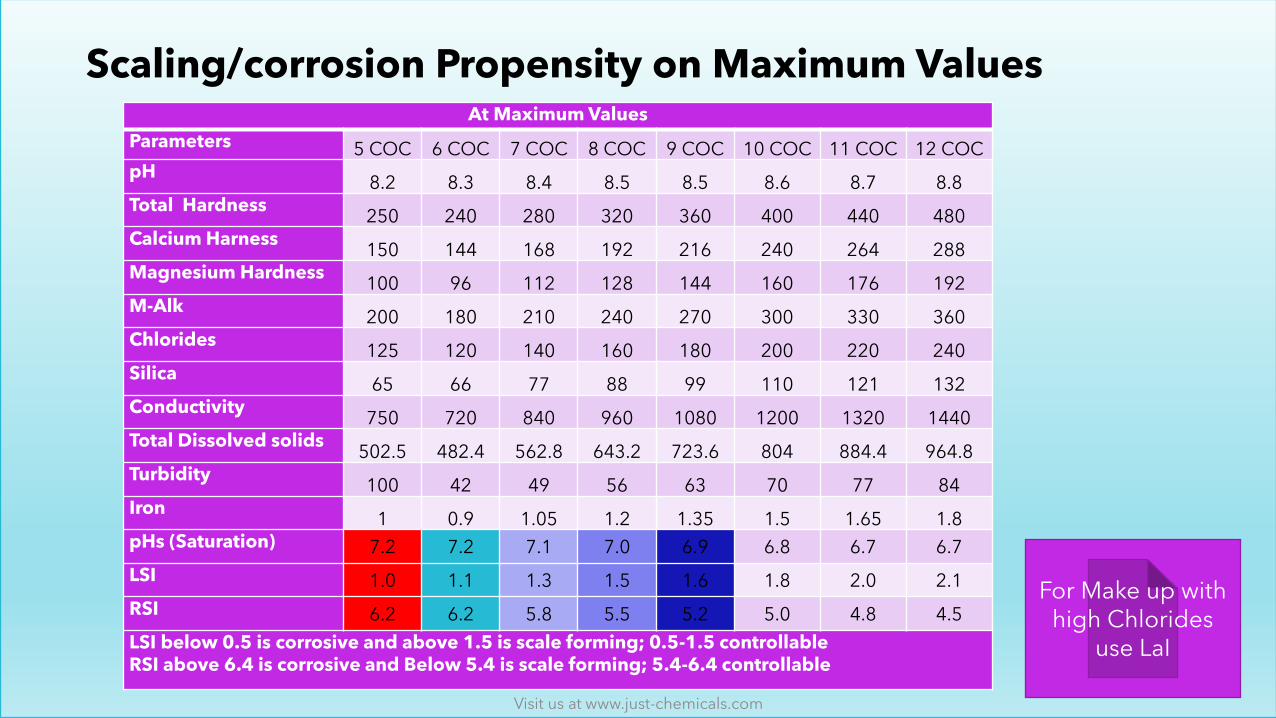

Further Analysis
Measurement and control
In addition to measuring and adjusting system-operating parameters online monitoring and control of
treatment dosages may be installed to operate at high COC at optimal cost and performance
Monitoring process
Once desired COC is achieved maintenance of high COC is required to realize water and energy
savings Routine evaluation of the system control equipment and monthly logs are important to monitor
and document water quality and usage over time and through seasonal variations
Visit us at wwwjust-chemicalscom
CW Monitoring Tools
bull Online Chemistry Analyzers like (This can be developed in an Economical Solution)
bull Corrator inbuilt in Online AnalyzerCorrosion meter
bull Deposit monitor - visual indication of deposit formation and heat transfer loss indication
bull Bio-fouling monitor - indicate loss of pressure due to biofilm or slime build-up
bull Test heat exchanger
Visit us at wwwjust-chemicalscom
CW Monitoring Tools
bull Online Chemistry Analyzers like (This can be developed in an Economical Solution)
bull Corrosion coupons - indicate corrosion rate in mils (thousandth of an inch) per year (MPY)
bull Corrator inbuilt in Online Analyzer
bull Deposit monitor - visual indication of deposit formation and heat transfer loss indication
bull Bio-fouling monitor - indicate loss of pressure due to biofilm or slime build-up
bull Corrosion meter
bull Test heat exchanger
Visit us at wwwjust-chemicalscom
Interlinked Process Flow
Cooling Tower
Water Chemistry
Heat Exchanger
Visit us at wwwjust-chemicalscom
Interlinked Process Flow
Cooling Tower
Water Chemistry
Heat Exchanger
CWT Design Methedology and
guidelines
Visit us at wwwjust-chemicalscom
Impoundments and Storm Water
bull Operators and owners tend to focus primarily on the quality of water coming into the plant and the wastewater quality going out of the plant as required to meet their plant discharge permits
bull In contrast knowing exactly what is going on within the power plant boundaries in impoundments and process sumps is not always as clear especially in older facilities where upgrades and plant modifications have considerably altered the plant water picture over the years
bull Also in many coal-fired power plants coal combustion waste ponds and impoundments are utilized for equalization and treatment of numerous plant wastewater streams complicating the plantrsquos ability to easily assess the potential for reuse of each individual stream
bull However with some of the proposed regulation changes coal-fired power plants may be required to do just that Segregation and separation of plant wastewaters can minimize the volumetric flow rate that requires additional treatment to meet the proposed regulations
bull For instance at one facility where we been assisting with water and mass balance activities in preparation for expected Pollutant Discharge Elimination System permit changes the engineering team was able to reconfigure portions of the wastewater collection system
bull It segregated storm waters into contact and noncontact storm waters and separated mixed process water streams allowing the plant to reuse a fair portion of its previously discharged wastewater
bull As a result the facility significantly reduced the potential treatment costs associated with meeting new permit requirements and realized an overall cost savings Visit us at wwwjust-chemicalscom
Get Preparedbull Especially in light of the upcoming regulation changes and the expectation that additional levels of
wastewater treatment will be necessary to meet some of the new discharge limits any plant likely to be affected should explore the potential for internal recycling or reuse of plant wastewaters and minimizing water waste in order to keep wastewater treatment costs as low as possible
bull Starting now evaluating the current plant water and wastewater conditions conducting sampling and flow measurement programs and assessing current wastewater treatment systems are key to development of a baseline and plan of attack for dealing with the impending regulation changes
bull Knowing exactly where your plantrsquos starting point is and developing a solid data history is crucial to determining what you may need to do to meet changes in regulatory requirements
Visit us at wwwjust-chemicalscom
Replace conventional Side Stream Filtration
bull Use side Stream filter with continuous filtration
bull 2 - 5 of circulating water
bull Saves manpower
bull Continuous ndash no infringement
bull Saves water ndash water wastage down to 3 against 10 in
conventional filters
bull Down to 51020 microns against 50 microns with
conventional filters
bull Polymers used as dispersants
Discussion Decide whether you want engineering control or Chemistry Control
Visit us at wwwjust-chemicalscom
Given the following benefits itrsquos easy to see why self-cleaning filters are the overwhelming choice of consulting engineers property management companies and building owners
bull Self-cleaninghelliprequires no regular maintenance
bull Self-cleaninghellipassures optimal filtration efficiency
bull Self-cleaninghellipreduces energy cost
bull No monitoring ndash No manpower
bull Only 3 water wastage
bull As filter media accumulates suspended contaminants the pressure drop across the filter increases and flow rate decreases The filter consumes the same power but does less work
bull Self-cleaninghellipextends media life (five to ten years typical)
bull Our experience indicates that the necessary disciplined routine maintenance required for manual filters is the exception not the rule As a consequence the filter media overloads with contaminants and thereafter backwashing is less effective in removing accumulated solids
bull Self-cleaning hellipis cost effective No manpower required for backwashing
bull The retrofit fit cost is more than the initial incremental cost for self-cleaning
Visit us at wwwjust-chemicalscom
Reduction of Evaporation loss from Reservoirs
The floating discs were discs of 02m diameter and 002m thickness that covered 91 of the water surface The results have shown that evaporation from the covered reservoir was reduced by about 80 relative to the uncovered water surface
Shade balls are plastic Eco-friendly balls that could be used in lakes ponds stream and dams The Department of Water and Power (LADWP) has first used these balls in California to prevent the evaporation A study was conducted in the Nehru pond at Namakkal district They used 4 inch black balls from high density polyethylene (HDPE) and carbon black to cover the reservoir This study showed that the shade balls reduced 43-45 of evaporation in the reservoir
Shade-cloth are suspended structures installed over water surfaces with supporting poles and steel cables This cover reduces the action of wind and blocks incoming solar radiation therefore it reduces the evaporation rates from water surfaces Shade-cloth is economically used for small reservoirs that are less than 10 hectares in area The main disadvantage of this method is the relatively high capital cost for construction but this has now been overridden in Malaysia owing to a new shade-cloth knitting machine which will produce wider rolls and therefore reduce the number of installed cables
A study carried out under summer conditions in Southern Spain shown that shading covers led to decrease the evaporation by about 80 for the colored-polyethylene covers Another study was conducted in Australia to estimate the benefits of shade-cloth covers for water reservoirs The study has shown that evaporation rate was reduced by about 90 and the shade-cloth reduced maintenance costs because they delay the growth of aquatic plants at the bottom of the storages Visit us at wwwjust-chemicalscom
Floating Solar Plant ldquoEuropersquos largest floating solar plant opens in Francerdquo
French
English Case of USA
Visit us at wwwjust-chemicalscom
Visit us at wwwjust-chemicalscom
Reach us
Juschem Solutions Pvt LtdA108 SV Heights Whitefield Bangalore ndash 560066 KA
Email sbanerjeejust-chemicalscomPhoneWhatsApp +91 7985635683website wwwjust-chemicalscom
Follow us at httpswwwfacebookcompowerplantchem
httpswwwlinkedincominjuschem-solutions-private-ltd-63a997165
httpswwwyoutubecomchannelUC1Jt3imL-WtfkiRgI01sGZg
YouTube Channel Juschem Solutions Pvt Ltd
Visit us at wwwjust-chemicalscom

CW Monitoring Tools
bull Online Chemistry Analyzers like (This can be developed in an Economical Solution)
bull Corrosion coupons - indicate corrosion rate in mils (thousandth of an inch) per year (MPY)
bull Corrator inbuilt in Online Analyzer
bull Deposit monitor - visual indication of deposit formation and heat transfer loss indication
bull Bio-fouling monitor - indicate loss of pressure due to biofilm or slime build-up
bull Corrosion meter
bull Test heat exchanger
Visit us at wwwjust-chemicalscom
Interlinked Process Flow
Cooling Tower
Water Chemistry
Heat Exchanger
Visit us at wwwjust-chemicalscom
Interlinked Process Flow
Cooling Tower
Water Chemistry
Heat Exchanger
CWT Design Methedology and
guidelines
Visit us at wwwjust-chemicalscom
Impoundments and Storm Water
bull Operators and owners tend to focus primarily on the quality of water coming into the plant and the wastewater quality going out of the plant as required to meet their plant discharge permits
bull In contrast knowing exactly what is going on within the power plant boundaries in impoundments and process sumps is not always as clear especially in older facilities where upgrades and plant modifications have considerably altered the plant water picture over the years
bull Also in many coal-fired power plants coal combustion waste ponds and impoundments are utilized for equalization and treatment of numerous plant wastewater streams complicating the plantrsquos ability to easily assess the potential for reuse of each individual stream
bull However with some of the proposed regulation changes coal-fired power plants may be required to do just that Segregation and separation of plant wastewaters can minimize the volumetric flow rate that requires additional treatment to meet the proposed regulations
bull For instance at one facility where we been assisting with water and mass balance activities in preparation for expected Pollutant Discharge Elimination System permit changes the engineering team was able to reconfigure portions of the wastewater collection system
bull It segregated storm waters into contact and noncontact storm waters and separated mixed process water streams allowing the plant to reuse a fair portion of its previously discharged wastewater
bull As a result the facility significantly reduced the potential treatment costs associated with meeting new permit requirements and realized an overall cost savings Visit us at wwwjust-chemicalscom
Get Preparedbull Especially in light of the upcoming regulation changes and the expectation that additional levels of
wastewater treatment will be necessary to meet some of the new discharge limits any plant likely to be affected should explore the potential for internal recycling or reuse of plant wastewaters and minimizing water waste in order to keep wastewater treatment costs as low as possible
bull Starting now evaluating the current plant water and wastewater conditions conducting sampling and flow measurement programs and assessing current wastewater treatment systems are key to development of a baseline and plan of attack for dealing with the impending regulation changes
bull Knowing exactly where your plantrsquos starting point is and developing a solid data history is crucial to determining what you may need to do to meet changes in regulatory requirements
Visit us at wwwjust-chemicalscom
Replace conventional Side Stream Filtration
bull Use side Stream filter with continuous filtration
bull 2 - 5 of circulating water
bull Saves manpower
bull Continuous ndash no infringement
bull Saves water ndash water wastage down to 3 against 10 in
conventional filters
bull Down to 51020 microns against 50 microns with
conventional filters
bull Polymers used as dispersants
Discussion Decide whether you want engineering control or Chemistry Control
Visit us at wwwjust-chemicalscom
Given the following benefits itrsquos easy to see why self-cleaning filters are the overwhelming choice of consulting engineers property management companies and building owners
bull Self-cleaninghelliprequires no regular maintenance
bull Self-cleaninghellipassures optimal filtration efficiency
bull Self-cleaninghellipreduces energy cost
bull No monitoring ndash No manpower
bull Only 3 water wastage
bull As filter media accumulates suspended contaminants the pressure drop across the filter increases and flow rate decreases The filter consumes the same power but does less work
bull Self-cleaninghellipextends media life (five to ten years typical)
bull Our experience indicates that the necessary disciplined routine maintenance required for manual filters is the exception not the rule As a consequence the filter media overloads with contaminants and thereafter backwashing is less effective in removing accumulated solids
bull Self-cleaning hellipis cost effective No manpower required for backwashing
bull The retrofit fit cost is more than the initial incremental cost for self-cleaning
Visit us at wwwjust-chemicalscom
Reduction of Evaporation loss from Reservoirs
The floating discs were discs of 02m diameter and 002m thickness that covered 91 of the water surface The results have shown that evaporation from the covered reservoir was reduced by about 80 relative to the uncovered water surface
Shade balls are plastic Eco-friendly balls that could be used in lakes ponds stream and dams The Department of Water and Power (LADWP) has first used these balls in California to prevent the evaporation A study was conducted in the Nehru pond at Namakkal district They used 4 inch black balls from high density polyethylene (HDPE) and carbon black to cover the reservoir This study showed that the shade balls reduced 43-45 of evaporation in the reservoir
Shade-cloth are suspended structures installed over water surfaces with supporting poles and steel cables This cover reduces the action of wind and blocks incoming solar radiation therefore it reduces the evaporation rates from water surfaces Shade-cloth is economically used for small reservoirs that are less than 10 hectares in area The main disadvantage of this method is the relatively high capital cost for construction but this has now been overridden in Malaysia owing to a new shade-cloth knitting machine which will produce wider rolls and therefore reduce the number of installed cables
A study carried out under summer conditions in Southern Spain shown that shading covers led to decrease the evaporation by about 80 for the colored-polyethylene covers Another study was conducted in Australia to estimate the benefits of shade-cloth covers for water reservoirs The study has shown that evaporation rate was reduced by about 90 and the shade-cloth reduced maintenance costs because they delay the growth of aquatic plants at the bottom of the storages Visit us at wwwjust-chemicalscom
Floating Solar Plant ldquoEuropersquos largest floating solar plant opens in Francerdquo
French
English Case of USA
Visit us at wwwjust-chemicalscom
Visit us at wwwjust-chemicalscom
Reach us
Juschem Solutions Pvt LtdA108 SV Heights Whitefield Bangalore ndash 560066 KA
Email sbanerjeejust-chemicalscomPhoneWhatsApp +91 7985635683website wwwjust-chemicalscom
Follow us at httpswwwfacebookcompowerplantchem
httpswwwlinkedincominjuschem-solutions-private-ltd-63a997165
httpswwwyoutubecomchannelUC1Jt3imL-WtfkiRgI01sGZg
YouTube Channel Juschem Solutions Pvt Ltd
Visit us at wwwjust-chemicalscom

Interlinked Process Flow
Cooling Tower
Water Chemistry
Heat Exchanger
Visit us at wwwjust-chemicalscom
Interlinked Process Flow
Cooling Tower
Water Chemistry
Heat Exchanger
CWT Design Methedology and
guidelines
Visit us at wwwjust-chemicalscom
Impoundments and Storm Water
bull Operators and owners tend to focus primarily on the quality of water coming into the plant and the wastewater quality going out of the plant as required to meet their plant discharge permits
bull In contrast knowing exactly what is going on within the power plant boundaries in impoundments and process sumps is not always as clear especially in older facilities where upgrades and plant modifications have considerably altered the plant water picture over the years
bull Also in many coal-fired power plants coal combustion waste ponds and impoundments are utilized for equalization and treatment of numerous plant wastewater streams complicating the plantrsquos ability to easily assess the potential for reuse of each individual stream
bull However with some of the proposed regulation changes coal-fired power plants may be required to do just that Segregation and separation of plant wastewaters can minimize the volumetric flow rate that requires additional treatment to meet the proposed regulations
bull For instance at one facility where we been assisting with water and mass balance activities in preparation for expected Pollutant Discharge Elimination System permit changes the engineering team was able to reconfigure portions of the wastewater collection system
bull It segregated storm waters into contact and noncontact storm waters and separated mixed process water streams allowing the plant to reuse a fair portion of its previously discharged wastewater
bull As a result the facility significantly reduced the potential treatment costs associated with meeting new permit requirements and realized an overall cost savings Visit us at wwwjust-chemicalscom
Get Preparedbull Especially in light of the upcoming regulation changes and the expectation that additional levels of
wastewater treatment will be necessary to meet some of the new discharge limits any plant likely to be affected should explore the potential for internal recycling or reuse of plant wastewaters and minimizing water waste in order to keep wastewater treatment costs as low as possible
bull Starting now evaluating the current plant water and wastewater conditions conducting sampling and flow measurement programs and assessing current wastewater treatment systems are key to development of a baseline and plan of attack for dealing with the impending regulation changes
bull Knowing exactly where your plantrsquos starting point is and developing a solid data history is crucial to determining what you may need to do to meet changes in regulatory requirements
Visit us at wwwjust-chemicalscom
Replace conventional Side Stream Filtration
bull Use side Stream filter with continuous filtration
bull 2 - 5 of circulating water
bull Saves manpower
bull Continuous ndash no infringement
bull Saves water ndash water wastage down to 3 against 10 in
conventional filters
bull Down to 51020 microns against 50 microns with
conventional filters
bull Polymers used as dispersants
Discussion Decide whether you want engineering control or Chemistry Control
Visit us at wwwjust-chemicalscom
Given the following benefits itrsquos easy to see why self-cleaning filters are the overwhelming choice of consulting engineers property management companies and building owners
bull Self-cleaninghelliprequires no regular maintenance
bull Self-cleaninghellipassures optimal filtration efficiency
bull Self-cleaninghellipreduces energy cost
bull No monitoring ndash No manpower
bull Only 3 water wastage
bull As filter media accumulates suspended contaminants the pressure drop across the filter increases and flow rate decreases The filter consumes the same power but does less work
bull Self-cleaninghellipextends media life (five to ten years typical)
bull Our experience indicates that the necessary disciplined routine maintenance required for manual filters is the exception not the rule As a consequence the filter media overloads with contaminants and thereafter backwashing is less effective in removing accumulated solids
bull Self-cleaning hellipis cost effective No manpower required for backwashing
bull The retrofit fit cost is more than the initial incremental cost for self-cleaning
Visit us at wwwjust-chemicalscom
Reduction of Evaporation loss from Reservoirs
The floating discs were discs of 02m diameter and 002m thickness that covered 91 of the water surface The results have shown that evaporation from the covered reservoir was reduced by about 80 relative to the uncovered water surface
Shade balls are plastic Eco-friendly balls that could be used in lakes ponds stream and dams The Department of Water and Power (LADWP) has first used these balls in California to prevent the evaporation A study was conducted in the Nehru pond at Namakkal district They used 4 inch black balls from high density polyethylene (HDPE) and carbon black to cover the reservoir This study showed that the shade balls reduced 43-45 of evaporation in the reservoir
Shade-cloth are suspended structures installed over water surfaces with supporting poles and steel cables This cover reduces the action of wind and blocks incoming solar radiation therefore it reduces the evaporation rates from water surfaces Shade-cloth is economically used for small reservoirs that are less than 10 hectares in area The main disadvantage of this method is the relatively high capital cost for construction but this has now been overridden in Malaysia owing to a new shade-cloth knitting machine which will produce wider rolls and therefore reduce the number of installed cables
A study carried out under summer conditions in Southern Spain shown that shading covers led to decrease the evaporation by about 80 for the colored-polyethylene covers Another study was conducted in Australia to estimate the benefits of shade-cloth covers for water reservoirs The study has shown that evaporation rate was reduced by about 90 and the shade-cloth reduced maintenance costs because they delay the growth of aquatic plants at the bottom of the storages Visit us at wwwjust-chemicalscom
Floating Solar Plant ldquoEuropersquos largest floating solar plant opens in Francerdquo
French
English Case of USA
Visit us at wwwjust-chemicalscom
Visit us at wwwjust-chemicalscom
Reach us
Juschem Solutions Pvt LtdA108 SV Heights Whitefield Bangalore ndash 560066 KA
Email sbanerjeejust-chemicalscomPhoneWhatsApp +91 7985635683website wwwjust-chemicalscom
Follow us at httpswwwfacebookcompowerplantchem
httpswwwlinkedincominjuschem-solutions-private-ltd-63a997165
httpswwwyoutubecomchannelUC1Jt3imL-WtfkiRgI01sGZg
YouTube Channel Juschem Solutions Pvt Ltd
Visit us at wwwjust-chemicalscom

Interlinked Process Flow
Cooling Tower
Water Chemistry
Heat Exchanger
CWT Design Methedology and
guidelines
Visit us at wwwjust-chemicalscom
Impoundments and Storm Water
bull Operators and owners tend to focus primarily on the quality of water coming into the plant and the wastewater quality going out of the plant as required to meet their plant discharge permits
bull In contrast knowing exactly what is going on within the power plant boundaries in impoundments and process sumps is not always as clear especially in older facilities where upgrades and plant modifications have considerably altered the plant water picture over the years
bull Also in many coal-fired power plants coal combustion waste ponds and impoundments are utilized for equalization and treatment of numerous plant wastewater streams complicating the plantrsquos ability to easily assess the potential for reuse of each individual stream
bull However with some of the proposed regulation changes coal-fired power plants may be required to do just that Segregation and separation of plant wastewaters can minimize the volumetric flow rate that requires additional treatment to meet the proposed regulations
bull For instance at one facility where we been assisting with water and mass balance activities in preparation for expected Pollutant Discharge Elimination System permit changes the engineering team was able to reconfigure portions of the wastewater collection system
bull It segregated storm waters into contact and noncontact storm waters and separated mixed process water streams allowing the plant to reuse a fair portion of its previously discharged wastewater
bull As a result the facility significantly reduced the potential treatment costs associated with meeting new permit requirements and realized an overall cost savings Visit us at wwwjust-chemicalscom
Get Preparedbull Especially in light of the upcoming regulation changes and the expectation that additional levels of
wastewater treatment will be necessary to meet some of the new discharge limits any plant likely to be affected should explore the potential for internal recycling or reuse of plant wastewaters and minimizing water waste in order to keep wastewater treatment costs as low as possible
bull Starting now evaluating the current plant water and wastewater conditions conducting sampling and flow measurement programs and assessing current wastewater treatment systems are key to development of a baseline and plan of attack for dealing with the impending regulation changes
bull Knowing exactly where your plantrsquos starting point is and developing a solid data history is crucial to determining what you may need to do to meet changes in regulatory requirements
Visit us at wwwjust-chemicalscom
Replace conventional Side Stream Filtration
bull Use side Stream filter with continuous filtration
bull 2 - 5 of circulating water
bull Saves manpower
bull Continuous ndash no infringement
bull Saves water ndash water wastage down to 3 against 10 in
conventional filters
bull Down to 51020 microns against 50 microns with
conventional filters
bull Polymers used as dispersants
Discussion Decide whether you want engineering control or Chemistry Control
Visit us at wwwjust-chemicalscom
Given the following benefits itrsquos easy to see why self-cleaning filters are the overwhelming choice of consulting engineers property management companies and building owners
bull Self-cleaninghelliprequires no regular maintenance
bull Self-cleaninghellipassures optimal filtration efficiency
bull Self-cleaninghellipreduces energy cost
bull No monitoring ndash No manpower
bull Only 3 water wastage
bull As filter media accumulates suspended contaminants the pressure drop across the filter increases and flow rate decreases The filter consumes the same power but does less work
bull Self-cleaninghellipextends media life (five to ten years typical)
bull Our experience indicates that the necessary disciplined routine maintenance required for manual filters is the exception not the rule As a consequence the filter media overloads with contaminants and thereafter backwashing is less effective in removing accumulated solids
bull Self-cleaning hellipis cost effective No manpower required for backwashing
bull The retrofit fit cost is more than the initial incremental cost for self-cleaning
Visit us at wwwjust-chemicalscom
Reduction of Evaporation loss from Reservoirs
The floating discs were discs of 02m diameter and 002m thickness that covered 91 of the water surface The results have shown that evaporation from the covered reservoir was reduced by about 80 relative to the uncovered water surface
Shade balls are plastic Eco-friendly balls that could be used in lakes ponds stream and dams The Department of Water and Power (LADWP) has first used these balls in California to prevent the evaporation A study was conducted in the Nehru pond at Namakkal district They used 4 inch black balls from high density polyethylene (HDPE) and carbon black to cover the reservoir This study showed that the shade balls reduced 43-45 of evaporation in the reservoir
Shade-cloth are suspended structures installed over water surfaces with supporting poles and steel cables This cover reduces the action of wind and blocks incoming solar radiation therefore it reduces the evaporation rates from water surfaces Shade-cloth is economically used for small reservoirs that are less than 10 hectares in area The main disadvantage of this method is the relatively high capital cost for construction but this has now been overridden in Malaysia owing to a new shade-cloth knitting machine which will produce wider rolls and therefore reduce the number of installed cables
A study carried out under summer conditions in Southern Spain shown that shading covers led to decrease the evaporation by about 80 for the colored-polyethylene covers Another study was conducted in Australia to estimate the benefits of shade-cloth covers for water reservoirs The study has shown that evaporation rate was reduced by about 90 and the shade-cloth reduced maintenance costs because they delay the growth of aquatic plants at the bottom of the storages Visit us at wwwjust-chemicalscom
Floating Solar Plant ldquoEuropersquos largest floating solar plant opens in Francerdquo
French
English Case of USA
Visit us at wwwjust-chemicalscom
Visit us at wwwjust-chemicalscom
Reach us
Juschem Solutions Pvt LtdA108 SV Heights Whitefield Bangalore ndash 560066 KA
Email sbanerjeejust-chemicalscomPhoneWhatsApp +91 7985635683website wwwjust-chemicalscom
Follow us at httpswwwfacebookcompowerplantchem
httpswwwlinkedincominjuschem-solutions-private-ltd-63a997165
httpswwwyoutubecomchannelUC1Jt3imL-WtfkiRgI01sGZg
YouTube Channel Juschem Solutions Pvt Ltd
Visit us at wwwjust-chemicalscom

Visit us at wwwjust-chemicalscom
Reach us
Juschem Solutions Pvt LtdA108 SV Heights Whitefield Bangalore ndash 560066 KA
Email sbanerjeejust-chemicalscomPhoneWhatsApp +91 7985635683website wwwjust-chemicalscom
Follow us at httpswwwfacebookcompowerplantchem
httpswwwlinkedincominjuschem-solutions-private-ltd-63a997165
httpswwwyoutubecomchannelUC1Jt3imL-WtfkiRgI01sGZg
YouTube Channel Juschem Solutions Pvt Ltd
Visit us at wwwjust-chemicalscom
Copyright © 2022 FDOKUMEN