Potentials and challenges for Egypt to achieve blue growth
79
World Maritime University World Maritime University The Maritime Commons: Digital Repository of the World Maritime The Maritime Commons: Digital Repository of the World Maritime University University World Maritime University Dissertations Dissertations 11-3-2019 Potentials and challenges for Egypt to achieve blue growth: an Potentials and challenges for Egypt to achieve blue growth: an SDG 14 perspective SDG 14 perspective Mamdouh Awad Abdelrahman Shahhat Follow this and additional works at: https://commons.wmu.se/all_dissertations Digital Commons Network Logo Part of the Natural Resource Economics Commons, and the Place and Environment Commons Recommended Citation Recommended Citation Shahhat, Mamdouh Awad Abdelrahman, "Potentials and challenges for Egypt to achieve blue growth: an SDG 14 perspective" (2019). World Maritime University Dissertations. 1179. https://commons.wmu.se/all_dissertations/1179 This Dissertation is brought to you courtesy of Maritime Commons. Open Access items may be downloaded for non-commercial, fair use academic purposes. No items may be hosted on another server or web site without express written permission from the World Maritime University. For more information, please contact [email protected].
-
Upload
khangminh22 -
Category
Documents
-
view
0 -
download
0
Transcript of Potentials and challenges for Egypt to achieve blue growth

World Maritime University World Maritime University
The Maritime Commons: Digital Repository of the World Maritime The Maritime Commons: Digital Repository of the World Maritime
University University
World Maritime University Dissertations Dissertations
11-3-2019
Potentials and challenges for Egypt to achieve blue growth: an Potentials and challenges for Egypt to achieve blue growth: an
SDG 14 perspective SDG 14 perspective
Mamdouh Awad Abdelrahman Shahhat
Follow this and additional works at: https://commons.wmu.se/all_dissertations
Digital
Commons
Network
Logo
Part of the Natural Resource Economics Commons, and the Place and Environment Commons
Recommended Citation Recommended Citation Shahhat, Mamdouh Awad Abdelrahman, "Potentials and challenges for Egypt to achieve blue growth: an SDG 14 perspective" (2019). World Maritime University Dissertations. 1179. https://commons.wmu.se/all_dissertations/1179
This Dissertation is brought to you courtesy of Maritime Commons. Open Access items may be downloaded for non-commercial, fair use academic purposes. No items may be hosted on another server or web site without express written permission from the World Maritime University. For more information, please contact [email protected].

WORLD MARITIME UNIVERSITY Malmö, Sweden
Potentials and Challenges for Egypt to Achieve Blue Growth: An SDG 14 Perspective
By
MAMDOUH AWAD ABDEL RAHMAN SHAHHAT
EGYPT
A dissertation submitted to the World Maritime University in partial fulfilment of the requirement for the award of the degree of
MASTER OF SCIENCE In
MARITIME AFFAIRS
(OCEAN SUSTAINABILITY, GOVERNANCE AND MANAGEMENT)
2019
Copyright: Mamdouh Awad Abdel Rahman, 2019

ii
Dissertation Declaration I certify that all material in this dissertation that is not my work has been
demonstrated, and the contents of this dissertation show my view in analysis and
demonstrated issues that discussed in the whole dissertation chapters.
Name: Mamdouh Shahhat
Signature: ______________
Date:
Supervised by: Professor Ronan Long
Co-supervised by: Dr. Tafsir Matin Johansson
Specialization: (Ocean Sustainability Governance and Management)
Assessor:
Institution/ Organization: World Maritime University
iii
Acknowledgements In the beginning, I would like to thank the almighty Allah, who inspired and helped
me to achieve this dissertation.
I owe my sincere gratitude to the Sasakawa Peace Foundation and its president,
Dr. Yohei Sasakawa, for providing me this unique opportunity to study at World
Maritime University.
I would like to extend my sincere gratitude to the supervisor of my dissertation, Prof.
Ronan Long and co-supervisor, Dr. Tafsir Matin Johansson, for their valuable
encouragement and support throughout writing this dissertation.
I wish to express my sincere thanks and appreciation to Prof Anne Pazaver, who has
supported me since ESSP classes and contributed her time and effort.
I would like to convey my sincere heartfelt thanks and gratitude to my dear mother,
my father soul, and family members.
Special and highest gratitude to my dear wife, my son Mohamed and my daughters
Rana and Rahma who have tolerated my absence from the home during my studies
and the successful completion of this dissertation.

iv
Abstract
Title of Dissertation: Potentials and Challenges for Egypt to Achieve Blue
Growth: An SDG 14 Perspective.
Degree: Master of Science In recent years, climate change is considered a hot spot topic. Because it has severe
negative impacts especially on the marine environment where it raises the average
temperature of the arctic region which helping on thawing the sea ice, therefore, it
opens new navigation lines such as the Northern Sea Route NSR. The NSR decreases
navigating time between East Asia countries particularly China and Europe
subsequently causes negative impacts on the Suez Canal, which is deemed as the most
effective waterway in the globe and one of the main resources of the Egyptian
economy. As a result of coming challenges in the near future of climate change and at
the same time to achieve the SDGs, the Egyptian government has established the Suez
Canal Corridor Project (SCCP). Moreover, development of the SCCP aims to attain
economic improvement, social wellbeing, and sustain the marine environment
resources. Therefore, the Egyptian government has declared in the Egyptian vision in
relation to the UN 2030 Agenda for Sustainable Development (UN 2030 Agenda) that
industrial and logistics areas and the port of East Port-Said and Ain Sokhna Port in
development the Suez Canal zone will depend on renewable energy to decrease GHGs
emissions and replace fossil fuels. Egypt is suffering of poor planning and lack of
optimal use of resources overland in the past. Therefore, the Egyptian government is
relying on and harnessing its blue economy to face coming challenges such as the
NSR, to compete with promising projects in the region, and to attain the SDGs.
Keywords: Climate Change, the SCCP, Suez Canal, NSR, MSP, Blue Growth, SDGs,
MPAs, ICZM, Egypt, Greening Port, the port of East Port-Said, GHGs, ISO 14001,
EnMS, PERS, SDM, Echo ports, EMAS.

v
Table of Contents
Dissertation Declaration .............................................................................................. ii
Acknowledgements ..................................................................................................... iii
Abstract ....................................................................................................................... iv
Table of Figures ......................................................................................................... vii
Table of Tables ......................................................................................................... viii
List of Abbreviations .................................................................................................. ix
1.1: Background ........................................................................................................... 1
1.2: Aim ....................................................................................................................... 4
1.3: Objectives ............................................................................................................. 4
1.4: Research Questions ............................................................................................... 4
1.5: Methodology ......................................................................................................... 5
1.6: Research Objectives .............................................................................................. 6
1.7: Limitations ............................................................................................................ 6
1.8: Delimitations ......................................................................................................... 7
CH. II: The Suez Canal Corridor Project ..................................................................... 8
2.1: Brief Historical Overview: ................................................................................... 8
2.2: The Importance of the Suez Canal for Seaborne Trade: ....................................... 9
2.3: The Importance of the New Suez Canal for Egypt: ............................................ 12
2.4: Challenges for the New Suez Canal: .................................................................. 15 2.4.1: Cape of Good Hope ..................................................................................... 15 2.4.2: Land-bridge Red-Med Railway ................................................................... 15 2.4.3: The NSR as an Alternative Route to the SCR ............................................. 16
2.5: Egypt’s Vision to Overcome Challenges ............................................................ 18
Chapter III: The Importance of Green Port ............................................................... 22
3.1 East Port-Said Port as greening port: ................................................................... 22
3.1.1: Port specifications: .................................................................................... 22
3.1.2: EPS Port SWOT Analysis .............................................................................. 24
3.2: Green Port Policy ................................................................................................ 25 3.2.1: The IMO’s role in decreasing GHGs emissions .......................................... 25
3.3: The Objectives of Transfer EPS from Seaport to Green Port ............................. 28

vi
3.3.1: Steps to Transfer EPS to become a Green Port ........................................... 28
3.4: Environmental Performance for Seaports Assessment Methods ........................ 29
3.4.1: SDM ................................................................................................................. 29
3.4.2: EnMS ............................................................................................................... 30 3.4.2.2: Benefits of EnMS ................................................................................. 31
3.4.3: EnMS Standards .............................................................................................. 32
3.4.4: The European Code of Action to Achieve PERS Certification ....................... 33
3.4.5: Indicators for a Green Port .............................................................................. 33 3.4.5.1: Mapping the port of EPS ...................................................................... 34
3.5: Specific Recommendations ................................................................................ 35 3.5.1: Reduction of GHG Emissions ..................................................................... 36 3.5.2: LED Light .................................................................................................... 36
3.6: Case study: Port of Rotterdam in the Netherlands .............................................. 36
Chapter IV: Untapped Blue Growth in Egypt ........................................................... 39
4.1: The SCCP Mega Project ..................................................................................... 39
4.2: Challenges for the Blue Growth in Egypt: ......................................................... 40 4.2.1: Marine pollution: ......................................................................................... 40 4.2.2: Non-Indigenous Species: ............................................................................. 40 4.2.3 IUU Fishing: ................................................................................................. 41 4.2.4 Climate Change: ........................................................................................... 42
4.2.4.1 Sea Level Rise (SLR) ............................................................................ 42 4.2.4.2: Coastal Erosion ..................................................................................... 43 4.2.4.3 Ocean Acidification ............................................................................... 43
4.3: Techniques for the Achievement of Blue Growth .............................................. 44 4.3.1: Integrated Coastal Zone Management (ICZM) ........................................... 44 4.3.2: Marine Protected Areas (MPAs) ................................................................. 46 4.3.3: Marine spatial planning (MSP) .................................................................... 48
4.4: The Blue Economy Role in Achieving the SDG 14 in Egypt: ........................... 48
4.5: challenges for Egypt in Achieving the SDGs: A Summary Overview ............... 49
4.6: Egypt’s Potentials to Achieve the SDGs ............................................................ 50
Chapter V: Conclusion and Recommendations ......................................................... 52
5.1: Conclusion .......................................................................................................... 52
5.2: Recommendations ............................................................................................... 54
References .................................................................................................................. 56

vii
Table of Figures Figure 1. The Suez Canal opening in 1869 .................................................................. 8 Figure 2. Suez Canal Vs Cape of Good Hope ........................................................... 10 Figure 4. SUMED Pipelines ...................................................................................... 11 Figure 5. The New Suez Canal. ................................................................................. 12 Figure 6. The NSR Vs SCR ....................................................................................... 16 Figure 7.The SCCP Ports. .......................................................................................... 19 Figure 8. SCCT at East Port-Said port ....................................................................... 22 Figure 9. Multi Model Transport .............................................................................. 23 Figure 10. PDCA Management Cycle ....................................................................... 31 Figure 11. Port of Rotterdam ..................................................................................... 37 Figure 12. NIS invade the Mediterranean via the Suez Canal ................................... 41 Figure 13. SLR in Egypt North Coast as IPCC report ............................................... 42 Figure 14. El Bardwell Lake ...................................................................................... 46

viii
Table of Tables Table 1 Research Methodology ................................................................................... 5 Table 2. Number of Ships Crossing the New Suez Canal. ........................................ 13 Table 3. SWOT Analysis for the Port of EPS. ........................................................... 24 Table 4. Comparisons on the Quality of Fuel Onboard Ships. .................................. 27 Table 5. East Port-Said Port Environmental Management Checklist ....................... 34 Table 6. Overview of the Port of Rotterdam ............................................................. 37

ix
List of Abbreviations
ABNJ Areas Beyond National Jurisdiction AFS Anti Fouling System AHD Aswan High Dam BWM Ballast Water Management CCS Capture and Sequestrate of Carbone Dioxide CO2 Carbon Dioxide EEAA Egyptian Environmental Affairs Agency EEDI Energy Efficiency Design Index EMAS Eco-Management and Audit Scheme EnMS Environmental Management System EPS The port of East Port-Said ESPO European Seaports Organization GDP Gross Domestic Product GERD Grand Ethiopian Renaissance Dam GHG Greenhouse Gas HFO Heavy Fuel Oil HPS High Pressure Sodium ICZM Integrated Coastal Zone Management ILO International Labour Organization IMO International Maritime Organization IPCC Intergovernmental Panel on Climate Change ISO International Standards Organization IUCN International Union for Conservation of Nature IUU Illegal, Unregulated and Unreported Fishing LC London Dumping Convention LED Light Emitting Diode LNG Liquefied Natural Gas LULC Land Use/ Land Cover MARPOL The International Convention for the Prevention of Pollution from ships MBI Market-Based Instrument MEPC Marine Environmental Protection Committee MPAs Marine Protected Areas MSC Maritime Safety Committee MSP Marine Spatial Planning NGOs Non-Governmental Organizations NIS Non-Indigenous Species NSR Northern Sea Route OCED Organization for Economic Co-operation and Development OPRC International Convention on Oil Pollution Preparedness, Response and
Cooperation OPS Onshore Power Supply

x
PERS Port Environmental Review System PM Particular Matter PV Photovoltaics RCI Rotterdam Climate Initiative RTG Rubber Tired Gantry SCA Suez Canal Authority SCCP Suez Canal Corridor Project SCCT Suez Canal Container Terminal SCR Suez Canal Route SDGs Sustainable Development Goals SDM Self-Diagnosis Method SEAs Significant Environmental Aspects SEEMP Ship Energy Efficiency Management Plan SLR Sea Level Rise SOLAS Safety of Life at Sea SRS Ship Reporting System SUMMED Suez-Mediterranean pipeline TEU Twenty-Foot Equivalent Units U.N United Nations ULCC Ultra Large Crude Carrier VLCC Very Large Crude Carrier VMS Vessel Monitoring System VTS Vessel Traffic Services
1
Title: Potentials and Challenges for Egypt to Achieve Blue Growth: An SDG 14 Perspective
1.1: Background
In the last three decades, climate change has been deemed as highly topical due to its
impact on the ecosystem. According to the latest report by IPCC published on
24/09/2019 established that the globe is on the verge of disaster because ocean
temperature and marine heatwaves have increased by more than double since the end
of the last century. Moreover, ocean acidification has increased, and the amount of
oxygen has decreased from sea surface to different depths as well. Therefore, it causes
negative impacts of marine species communities, biodiversity, production, and
fisheries catch possibility. In addition, increasing the mean air temperature by 2°C
more than preindustrial levels will increase the possibility of the Arctic ice-free in
September to approximately 35%. Also, increasing the average air temperature to
1.5°C will cause degradation of seagrass meadows and kelp forests, while 2°C will
destroy all coral reefs. Furthermore, ocean warming causes sea level rise, raises
permafrost temperature, and salinity intrusion as a result of anthropogenic impact at
sea and overland (IPCC, 2019).
There is a persisting argument between ecologists in relation to the origins of climate
change, which could either be due to human activity by burning fossil fuel, or due to
natural changes in this context. Most ecologists believe that human activity is
responsible for climate change, especially after the industrial revolution. The increased
reliance on fossil fuel in the industry has generated the growth of carbon dioxide (CO2)
and greenhouse gas emissions (GHG) in the air. Moreover, the annual average raise in
the Arctic upper latitude 60° N is almost double the Earth’s mean which causes the
Arctic ice thaw to increase and raise the number of warm days (Overland et al., 2018).
Industrial countries rely on burning fossil fuels such as coal, gas and oil in both social
and industrial development. As a result, the Arctic is warming quite rapidly, and more
spacious areas of the Arctic seas will become areas of navigation (Stevenson, Davies,

2
Huntington, & Sheard, 2018). On this basis, the United Nations has been trying to
solve the global warming issue by holding the first Earth Summit in Rio de Janeiro in
June 1992 and adopted the United Nation Framework Convention on Climate Change
(UNFCCC) to reduce GHG emissions, and to make the average increase in the air
temperature within 2°C by the end of 21st century as compared to pre-industrial levels.
In addition, the International Maritime Organization (IMO) has adopted measures to
reduce Greenhouse Gas (GHG) emissions in MARPOL Annex VI. Moreover, on
January 2020, IMO imposed new rules to prohibit vessels from using fuel with a
Sulphur content of more than 0.5 % m/m as compared with 3.5 % m/m in 2012. This
will be enforced by the States’ governments as paying a tax unless vessels have
scrubbers to filter Sulphur emissions (Halff, Younes, & Boersma, 2019).
Motor vessel Venta Maersk was the first container ship navigating in the Northern Sea
Route (NSR) after it departed from the harbour of Vladivostok in Russia on 22 August
2018 and arrived at the port of Saint Petersburg on 28 September 2018. Moreover, the
container ship is deemed as an ice-class type and has a capacity of 3600 TEU (Twenty-
Foot Equivalent). Since the company declared the first navigation voyage, all the
international media and the shipping companies are dealing with a number of
questions: Will the Northern Sea Route become a commercial and navigational
alternative to the Suez Canal Route? In short, the world has witnessed the melting of
snow at an accelerated pace and a simultaneous decrease in sea ice in the Arctic region
in the last years (H. Park, Walsh, Kim, Nakai, & Ohata, 2013).
According to the majority of ecologists, climate change has negative impacts not only
in the Arctic Sea but also to the entire globe. Some States in the upper northern
latitudes and navigation shipping lines deem it as a “grace” which will erase the sea
ice and become a way to increase trade and the economy (Rashid, 2009). Given the
fact that the NSR connects the Atlantic and the Pacific Ocean, this will inevitably
connect the East (Far East Countries) and the West (Europe Countries) so seaborne
trade volume will increase in this region firstly since the distance will be shorter than
the Suez Canal Route and, secondly, bunker consumption will reduce. Based on this

3
presupposition, the voyage costs are likely to decrease. Moreover, with melting the
ice, there will be new explorations for gas and oil in the Arctic sea (Ermida, 2014).
As a result, the economy and trade will increase in the Arctic area.
The NSR causes negative impacts in Egypt because is create new competition for the
Suez Canal Route (SCR) concerning the shortest distance. The majority of vessels
which come from the Far East will alter their courses to pass over Russia instead of
using the SCR and Russia supports using the NSR (H. Wang, Zhang, & Meng, 2018).
In particular, the SCR profits will decrease, so the Egyptian economy will suffer
because the Suez Canal revenue is considered to be a vital source for the Egyptian
economy. In addition, the Arab Spring Revolution in 2011 generated a negative
influence on the tourism sector revenue which was a vital source of foreign exchange
earnings in the Egyptian economy (Haddad, Nasr, & Ghida, n.d.).
Egypt is considered one of the highest five states vulnerable to the impact of sea-level
rise due to the low-lying level of the Nile Delta (Batisha, 2012). Furthermore, the
global warming impact will threaten the coastal states in Egypt, for instance,
Alexandria will be exposed to the sea level rise impact (Kamh, Khalifa, & El-
Bahrawy, 2016). Moreover, climate change impact will affect fish farms along Egypt’s
North Coast, where aquaculture is considered an alternative source to fisheries. For
example, Egypt’s production from aquaculture is more than one million tons annually
and first place in Africa (Shaalan, El-Mahdy, Saleh, & El-Matbouli, 2018). Also,
agriculture in the Nile Delta will reduce due to the scarcity of fresh water as a result
of global warming impacts (Abdelkader et al., 2018).
Furthermore, climate change impacts such as direct impacts of salt water intrusion, sea
level rise, marine environment degradation, and land subsidence which causes
negative impacts of sustainable development in Egypt (Cramer et al., 2018). In
addition, indirect impacts such as the opening of the NSR in coming years. Thus, Egypt
will have to increasingly depend on the blue economy to assure the resources are
sustainable for coming generations and to achieve the SDGs.

4
1.2: Aim
The proposed research proceeds with the following aims:
This research aims to come up with attainable short-term and medium-term
development of the New Suez Canal Corridor Project. To become a logistics
and industrial area with the target of increasing job opportunities and
developing the Egyptian economy in the existence of anticipated competition
with the NSR in the near future; and
Transfer seaports to green ports to attract investors, shipping lines, and mitigate
negative climate change.
Critically analyze the concept of “blue economy” and its role in achieving
sustainable development from an Egyptian perspective. To this end, this
research aims to tackle environmental and commercial impacts on Egypt, with
specific reference to the UN 2030 Agenda for Sustainable Development.
1.3: Objectives
The fundamental objectives of this research are provided in the following:
To illustrate how transforming the port of East Port Said to green port will
attract investors, shipping lines, and mitigate GHGs emissions from the port;
To examine the positive attributes of the Suez Canal Development Project on
the marine environment by relying on renewable energy and cut down
emissions;
To identify the impact of the NSR on the SCR as an alternative route.
1.4: Research Questions
1- What are the expected impacts of the SCCP and how challenging it could be
in the coming years when there is increased regional competition, especially
climate change?

5
2- A) How will the optimization of the Suez Canal Zone project; especially by
greening the port of East Port-Said can mitigate potential environment
degradation?
B) How can the SCCP megaproject help in achieving SDGs according to the
UN agenda 2030 especially increasing economic and save new jobs for people?
And protect marine resources - SDG14
3- What are the potentials and challenges for Egypt to achieve sustainable
development for its marine resources?
1.5: Methodology
The research methodology comprises both qualitative analysis in the following
manner:
Table 1 Research Methodology
Step
Number Description
Research
Approaches
Data Collection
Methods
1
- Utilizing some statistics from the last
few decades to anticipate how many
months in the year the NSR will be
available to vessels. Gathering and
confirmation of data.
- Choice of annual reports to the Suez
Canal Authority and references of the
NSR concerning the quantity and
kinds of vessels to assess to what range
will there be a competition between the
SCR and NSR and when,
- The anticipation by inspecting and
implementing the statistical way of data
gathered.
- Qualitative
- Quantitative
- Data given by
competent authority
- Suez Canal Authority
(annual report)
- By using trustworthy
online references
2
- Determination services of
development and optimization
-Comparative
study Applied
Case study: for example
the harbour of Rotterdam
as a green port

6
1.6: Research Objectives
To highlight the required steps to transform the Suez Canal Axis into an
industrial and logistics region on a global scale.
To illustrate ways through which the Suez Canal ports can compete with the
largest and important hub-ports.
To distinguish difficulties to attain the UN 2030 Agenda as stated in the Egypt
vision.
To what extend is the accumulative impacts of poor land use plan and past
planning affected on the Egyptian economy and marine environment and all
ways of life in Egypt.
To determine the proper use of the blue growth to attain economic
developments, job opportunities, and concurrently sustain marine environment
resources, either living or non-living, which attain direct or indirect benefits
for the coming generation.
1.7: Limitations
Accessible pertinent data and report regarding to both environmental reports
for Egyptian ports, and the NSR and the range of future variables in the Arctic
Sea ice.
The range of progress achieved in the Suez Canal Corridor Project optimization
and the extent of new investments and private sector involvement.
Challenges and obstacles that may hinder required outcomes in the Suez Canal
optimization megaproject.
The response of the EPS authority for inquiry regarding the environmental
impact assessment report and port environmental performance.

7
1.8: Delimitations
To what extent can the future reading and using IPCC reports and statistic
methods to identify how many months per year the Arctic will be ice free then
will determine when and how long the Northern Sea Route will be an
alternative shipping line to the Suez Canal strait.
The fundamental focus is on developing the infrastructure in the Sinai
Peninsula and the Suez Canal cities.
This research focuses only on ports optimization and harnessing blue growth,
along with how these changes will affect the Egyptian economy.
8
CH. II: The Suez Canal Corridor Project
2.1: Brief Historical Overview:
The idea of establishing the first Canal on earth goes back to the reign of Egyptian
pharaoh Senorist III in 1874 BC, approximately 40 centuries ago when the pharaohs
established a Canal connecting the Red Sea with the Mediterranean via the River Nile.
The Canal subsequently closed several times as a result of the River Nile alluvium
(Hossain, 2018).
In modern times, the idea of constructing a new canal harks back to the leader of the
French expedition Napoleon Bonaparte in 1798. When a team of experts tried to
address the possibility of constructing a new canal, the explorer’s team found that the
Red Sea sea-level was higher than the Mediterranean Sea by about ten meters.
Therefore, according to their result, if the canal was dredged the Red Sea would drown
the River Nile Delta and cause a disaster (Hamza & Abdel-Latif, 2003).
However, after a while and in the era of Said Pasha in 1854, a second team of experts
led by Ferdinand de Lesseps, discovered that there was no a big variance between the
two seas and the Red Sea was higher by approximately 3 feet. Therefore, the canal
construction continued for a decade and it was finally opened for international
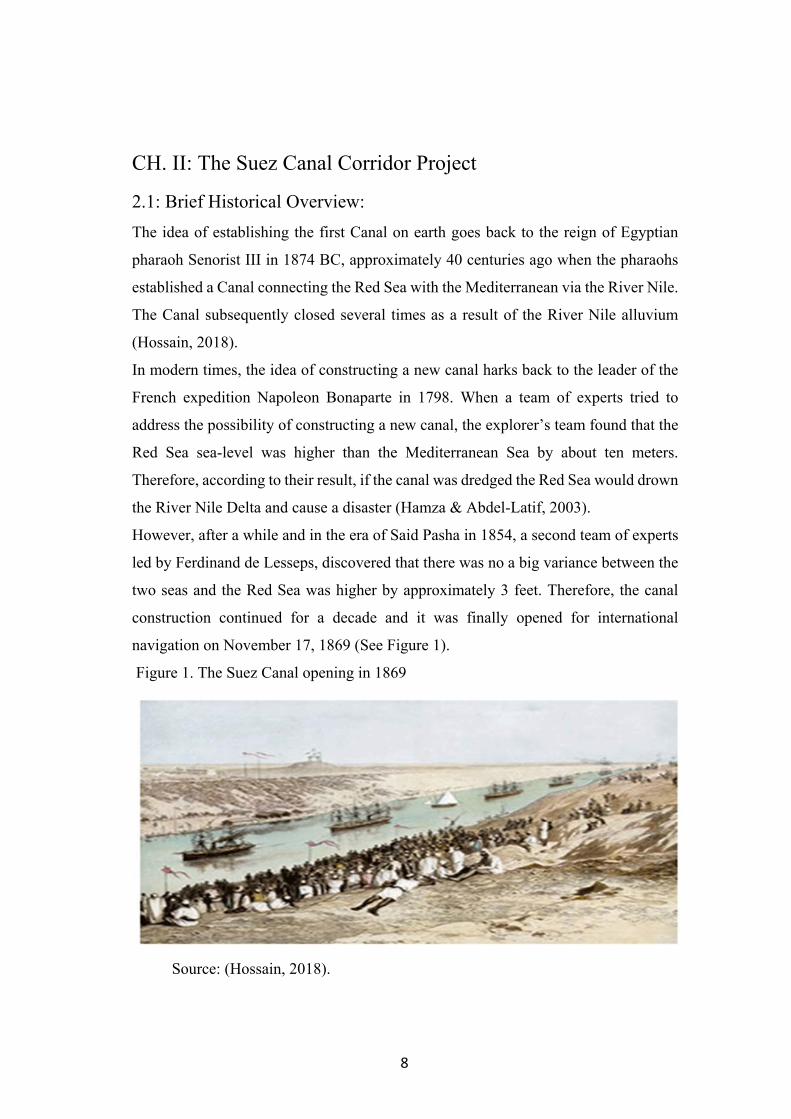
navigation on November 17, 1869 (See Figure 1).
Figure 1. The Suez Canal opening in 1869
Source: (Hossain, 2018).

9
Egyptian peasants constructed the artificial Suez Canal (SC), using shovels and picks
to dig it out. Furthermore, when the canal was completed, its length was approximately
equal to 164 Kilometres with an 8-meter depth, and a width of 53-meters at its
narrowest point above the seabed, which starts from Port Tewfik in the Suez terminus
in the South to Port Said terminus in the North (SRM & ALexBank, 2018). Moreover,
the outbreak of pandemic diseases in that time such as Cholera killed thousands of
workers (approximately 120,000 died) because there was not enough food, water or
suitable medical attention to accommodate all of the sick people, and they were
working for a decade under forced power as well (SCA, n.d).
Foreign ships transited the Canal pursuant to the Constantinople Treaty of the Suez
Canal in 1888, where according to article 1, "The Suez Maritime Canal shall always
be free and of commerce or war, without distinction of the flag."(Hossain, 2018).
The SC was nationalized in July 1956, and became one hundred percent Egyptian
under the reign of the late leader Gamal Abdel Nasser (McDermott, 2001). Moreover,
the Canal was closed several times and was the longest running for eight years because
of wars in the region until it opened in under era of the late President Sadat in 1975
(Lahav, 2015).
The main objective for digging the SC, known as (Qanat Al-Swiss in Arabic) was to
facilitate international trade and connect the West (Canada, Europe, and the USA) and
the East, especially China, Japan, and South Korea, according to the trade volume
between them. In addition, the SC is considered the link between three continents
specifically, Africa, Asia, and Europe. Furthermore, the entire world is benefiting from
the SC merits due to its geographical and strategic location. The SC is currently
possessed and managed through the Suez Canal Authority (SCA) (SCA, n.d).
2.2: The Importance of the Suez Canal for Seaborne Trade:
The Suez Canal represents a vital role in international seaborne trade. It is considered
one of the most significant thoroughfares in the globe where according to the Suez
Canal Authorities 2018 report, 18,174 ships have passed through with a daily average

10
of 50 ships and a total cargo of approximately 1,139,630 thousand tons about (1.14
billion tons), representing about 10 percent of the total globe seaborne trade (“Suez
Canal Traffic Statastics,” 2018). The SC facilitates transfer cargoes between countries,
especially Asian and European countries. Furthermore, the SC reduced the distance
between emerging countries in Asia and Europe by providing a surrogate to the route
around the Cape of Good Hope at the Southern edge of Africa to arrive in Europe.
Moreover, it has reduced voyage cost operations, and the amount of fuel used (See
Figure 2).
Figure 2. Suez Canal Vs Cape of Good Hope
Source: (Hossain, 2018).
According to the SC’s official web-site, the SC is considered as one of the safest
navigation routes, where the rate of accidents is almost negligible in comparison with
other routes. Moreover, it does not contain locks or docks, but it is an open waterway,
monitored with modern surveillance devices.
The SC accommodates giant containers (gigantism thanks to the economy of scale);
therefore, it facilitates transferring goods from Asia, especially China, to Europe with
the lowest time and cost. The SC’s draft and width can accommodate all container
ships, approximately 60% of tankers, and more than 90% of bulk carriers (U.S. Energy
Information Administration (EIA), 2017) (See Figure 3).

11
Figure 3. Bulk Carrier & Giant Container ship passing through the Suez Canal.
Source: (Hossain, 2018).
In addition, The SC is used as a transit to transfer oil and natural gas from the Arabian
Peninsula to the Westerns countries through partially loaded oil tankers because fully
loaded VLCCs and ULCCs cannot pass through the SC due to their bigger draft.
Therefore, they use the SUMED pipelines (Suez and Mediterranean) to offload some
of the oil and retake it after transiting the SC in the Mediterranean before proceeding
to the Western countries with about 6 million barrels’ daily (U.S. Energy Information
Administration (EIA), 2017) (See Figure 4).
Figure 3. SUMED Pipelines
Source: (U.S. Energy Information Administration (EIA), 2017)

12
The SC plays a crucial role as a focal point in the belt and road initiative (such as the
ancient Silk Road) launched by China in 2013, due to its strategic position between
Africa, Asia, Middle East, and Europe (L. Wang, Zheng, Ducruet, & Zhang, 2019).
2.3: The Importance of the New Suez Canal for Egypt:
The Egyptian government in August, 2014 announced that the establishment of a
parallel canal 37 km and the deepening and widening of the current canal by 35 km
(See Figure 5). A year later, in August 2015, the New Suez Canal enlargement project
was accomplished with a new depth of 25 m, width of 225m, and length of 194 Km.
Therefore, the new expansion in the SC reduced the average transit time from 16 to 11
hours and reduced the waiting time from 18 to 3 hours. In addition, the new expansion
allows ships to pass in both directions along most of the canal’s length at transit time
(Kenawy, 2012).
Figure 4. The New Suez Canal.
Source: (Atvur, 2019)
The Suez Canal is a key pillar in the Egyptian economy. The annual revenue of the SC
is approximately 6 billion USD, which represents about 5% of the Egyptian GDP, and
it is considered a key source of foreign currency. Moreover, it coming in third place
after tourism (by approximately 11.4 billion USD which accounts for about 12% of

13
the Egyptian GDP in 2018) which was affected because of the 2011 revolution, and
expatriate labour remittance (approximately 26 billion USD) (Fibich, Bed, Haindorfer,
& Wiesböck, 2018). Moreover, the SC revenues are expected to double by 2023. This
expectation is linked to the annual growth of world seaborne trade in the last five years
(See Table 2).
Table 2. Number of Ships Crossing the New Suez Canal.
Jan Feb Mar Apr May Jun Jul Aug Sep Oct Nov Dec
2016 1,424 1300 1,454 1393 1,404 1350 1,420 1462 1,406 1440 1,366 1414
2017 1,369 1,286 1,524 1,449 1,484 1,384 1453 1528 1457 1552 1534 1530
2018 1405 1319 1450 1483 1605 1544 1540 1605 1501 1657 1528 1537
1,000
1,100
1,200
1,300
1,400
1,500
1,600
1,700
Ships
Months
Number of Ships
2016 2017 2018
Jan Feb Mar Apr May Jun Jul Aug Sep Oct Nov Dec
2016 81 78 80 76 82 80 85 88 82 82 78 83
2017 79 75 85 86 88 85 88 92 88 93 91 92
2018 88 83 89 92 99 97 100 101 94 103 96 97
0
20
40
60
80
100
120
Million Ton
Net Ton
2016 2017 2018

14
Source:(Suez Canal Traffic Statistics, 2018).
Overall, these bar charts show an upward trend and gradual increase in both the
number of ships and quantity of cargo passing through the New Suez Canal after its
last expansion in August 2015. Moreover, this increase is due to the increase in the
2016 2017 2018
Net Ton 974,185 1,041,576 1,139,630
100,000
300,000
500,000
700,000
900,000
1,100,000
1,300,000TO
N
YEARS
NET TON
2016 2017 2018
No of Ships 16833 17550 18174
0
2
4
6
8
10
12
14
16
18
20
Thousands
No of ships

15
amount of cargo transported by sea, and the last expansion in the SC, which facilitated
the relocation process for cargo.
2.4: Challenges for the New Suez Canal:
The challenges for the New SC as follow:
2.4.1: Cape of Good Hope
Tankers VLCC/ ULCC choose the Cape of Good Hope as a replacement route to the
SC when they proceed from the Arabian Peninsula to the USA in back and forth
voyages. Even though it is longer than the SC in terms of distance because the SC’s
narrow width and shallow depth cannot accommodate fully loaded (VLCC/ ULCC)
two tankers in both direction, and the maximum permissible load is 240,000 MT.
Therefore, fuel consumption and operation voyage costs are higher. If the SC can
accommodate tankers with 350,000 MT or approximately eighty percent of fully
loaded VLCC, the SC revenues will increase by six times. On the other hand, SCA
presents discounts of approximately thirty percent to attract tankers to proceed through
the SC instead of the Cape of Good Hope. Furthermore, some ships use the Cape of
Good Hope in South-South seaborne trade such as the trade between south Africa-
South America- Australia and the SC has no effect on this shipping line (Kenawy,
2012).
2.4.2: Land-bridge Red-Med Railway
In light of the period of political instability that Egypt witnessed after the uprising
events of the 2011 revolution, the Israeli government cooperated with China in 2014
to construct a land-bridge train that would connect the port of Eilat in the Gulf of
Aqaba and the harbours of Ashdod and Haifa in the Mediterranean to transfer
containers with a length of 350 km as a surrogate route to the Suez Canal, which is
considered as the regional competitor (Lakhal & H’Mida, 2017).

16
2.4.3: The NSR as an Alternative Route to the SCR
The Northern Sea Route (NSR) is deemed to be the quickest link between the Far
East (China, South Korea, and Japan) and Europe and the majority of it runs across
Russia. The NSR represents a strong competitor to the SCR in the coming years
since; the NSR will reduce ships’ voyage time (See Figure 6). So that, it will save
time, fuel costs, and labourers’ salaries. The total distance, for example, from
Shanghai, one of the biggest port in China and the world in container handling, to
Europe, it will be less than approximately one third of the SCR (Comer, Olmer,
Mao, Roy, & Rutherford, 2017).
Figure 5. The NSR Vs SCR
Source: (Verny & Grigentin, 2009)

17
Shipping in the Arctic sea has increased in the last decade because of the melting of
ice, which opens new navigation lines. The NSR is considered the most promising
route between the transarctic routes and approximately 252 ships passed through the
NSR from 2010 to 2016 with a yearly average of 42 ships (H. Wang et al., 2018).
The importance of time will increase and play a vital role in the seaborne trade industry
to compete with other methods of transport such as air and overland transportation,
where nowadays approximately 90 percent of the globe trade quantity transfers by sea.
The maritime transport is the cheapest means of transportation. It is approximately 50
times less expensive than air transport and 4 to 6 times less than trains. In addition,
cargoes that have a high value such as gold, or some kinds of cargoes that are quickly
damaged, are not transported by sea. Moreover, according to Kitagawa “Time is the
determining factor in advanced relocation processes in shipping” (Kitagawa, 2008).
The NSR is ice-free for two or three months during the summertime and ships can
navigate without icebreakers. In addition, the infrastructure in the Arctic area has been
improved by Russia and Norway in recent years.
Moreover, this is considered an excellent opportunity for shipping companies,
especially containers shipping lines, to use the NSR because container handling has
increased in recent years between East Asia and Europe and North America. In
addition, using the NSR is important for shipping companies because it will decrease
the voyage time; therefore, it will decrease fuel consumption. Furthermore, the NSR
will take ships away from any piracy attacks regions. Moreover, ships will avoid likely
heavy shipping traffic and extra fees in the Suez Canal (Benedyk & Peeta, 2016).
Finally, ships navigating in the NSR have a large opportunity to supply LNG fuel as
an alternative source of energy for HFO. Since constructing a first LNG plant in the
Arctic region, ships will be able to supply LNG with costs and emissions less than
HFO.
18
On the other hand, nowadays ships vulnerable to many challenges and challenges
during navigating in the NSR because, for instance, ship and cargo damages, insurance
premium, costs for accompanying icebreaker and pilot and weather conditions
inhospitable waters (Benedyk & Peeta, 2016).
Until now there has been a shortage in infrastructure and a quick response in the case
of oil spill operations in the Arctic. Moreover, oil slicks in cold water are difficult to
disperse and degrade while the IMO prohibits using HFO on board ships in August
2011 as a fuel, ballast and cargo in the Antarctica continent and in turn did not apply
the same condition in the fragile Arctic environment (Roy & Comer, 2017).
Moreover, the safety of navigation in the Arctic Sea still represents an obstacle in the
shipping lines and voyage cost is higher than the SCR and not available all year long.
Ships must navigate with the assistance of expensive icebreakers and navigation
hazards such as drifting icebergs while navigating in remote areas. On the other hand,
if the impact of global warming on the Arctic region continues as business as usual
(with the same annual rate), the NSR will be ice free and ships could navigate without
icebreaker assistance by 2040 (Åtland, 2010).
2.5: Egypt’s Vision to Overcome Challenges
In recent years, SC revenues have decreased by approximately 20 % due to two crises.
First, the piracy attacks on ships in the Gulf of Aden forced vessels to change their
course to pass via the Cape of Good Hope (Bendall, 2010), and at the same time, the
global economic crisis from 2008 to 2010 decreased freight rates for shipping and
many ships were sold as scrap (Kalgora & Christian, 2016). The two aforementioned
issues reduced the number of ships transiting the SC. This trend was exacerbated by
the 2011 uprising, known as the Arab spring revolution, which caused period of unrest
that, affected Egypt politically, economically, and socially. The SC route remained
safe over this period.
19
Pursuant to Egypt’s vision in 2016 to achieve the UN 2030 Agenda, the Suez Canal
Corridor Project (SCCP) considered to perform a vital role in attaining sustainable
development goals. The political stabilization in the last years supported the Egyptian
government to establish a megaproject such as the SCCP to attract foreign and local
investors to invest in Egypt to achieve this megaproject. Moreover, the principal
purpose of the fundamental target of the SCCP is for Egypt to benefit economically,
but at the same time, this project will be environmentally friendly. Therefore, the
Egyptian government should accelerate the completion of the SCCP to turn the SC
Zone into a global logistics area, and to act in a vital role in the new Belt and Road
project, particularly with the competition from many countries in the region.
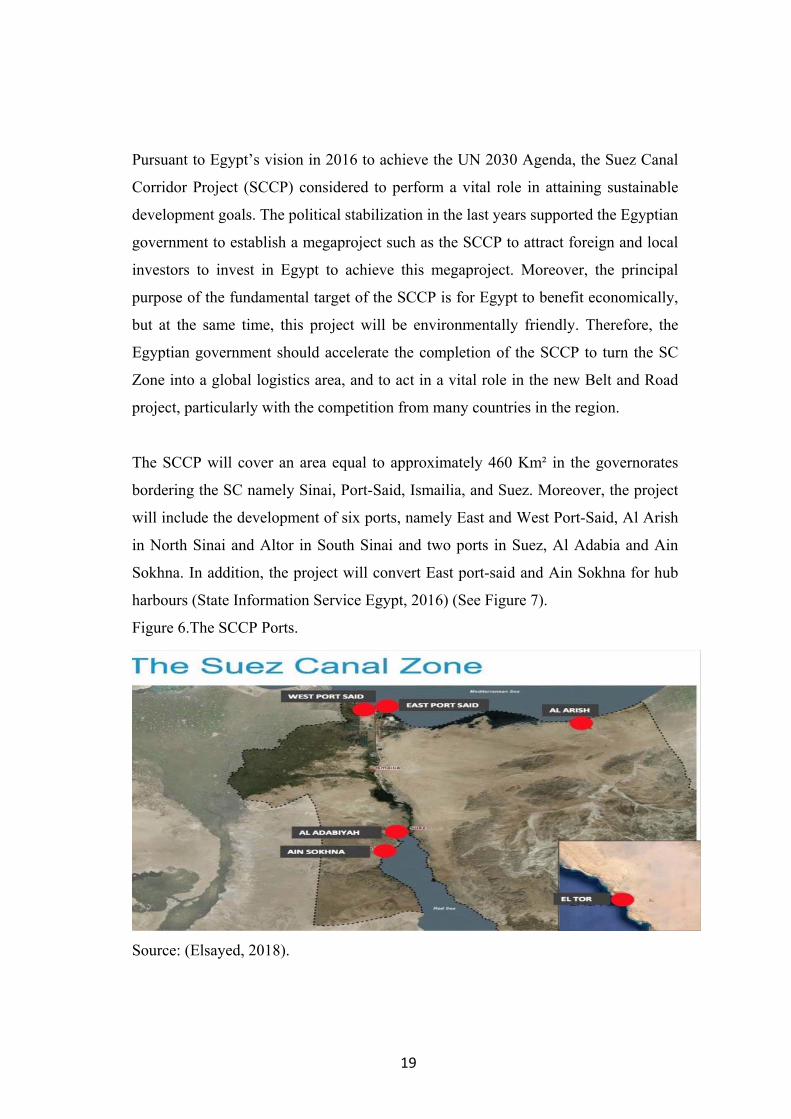
The SCCP will cover an area equal to approximately 460 Km² in the governorates
bordering the SC namely Sinai, Port-Said, Ismailia, and Suez. Moreover, the project
will include the development of six ports, namely East and West Port-Said, Al Arish
in North Sinai and Altor in South Sinai and two ports in Suez, Al Adabia and Ain
Sokhna. In addition, the project will convert East port-said and Ain Sokhna for hub
harbours (State Information Service Egypt, 2016) (See Figure 7).
Figure 6.The SCCP Ports.
Source: (Elsayed, 2018).

20
Egypt’s government is attempting to exploit the strategic position of the SC by
establishing the megaproject so it will contain on ships services stations such as
bunkering, maintenance, and recycling because approximately 18,000 ships pass
through the canal annually. Furthermore, the project depends on renewable energy
such as solar panels and power plants from gas and wind farms to generate clean
energy and to reduce climate change impacts in the SC Zone, and as a clean source for
electricity, which will reduce burdens on conventional electricity sources.
Moreover, the project will include desalination plants to increase the amount of
required drinking water due to the expected increase in population and industries in
the SCCP area. Furthermore, Egypt’s portion from the River Nile water is
approximately 56 billion m³ per year and represents approximately 97% of the water
resources in Egypt. To bridge the gap between the available and required water, Egypt
is relying on desalination plants, reuse drainage, and ground water. Egypt will suffer
in the future from water scarcity because of many reasons, such as the disposing of
untreated industrial wastes and agriculture sewage in the River Nile. Moreover,
climate change impacts on the rain rate in Ethiopia (upstream country). Furthermore,
constructing Ethiopia the Grand Ethiopia Renaissance Dam (GERD) on the River Nile
which affects the Egyptian’s portion of water. Meanwhile, there is an astounding
increase in the Egyptian population and the amount of potable water over time
deceases (Yihdego, Khalil, & Salem, 2017).
The SCCP aims to attain fast economic and sustainable development in Egypt.
Therefore, the optimal exploitation of land and urbanization (Land use and land cover
change LULCC) is essential to attain these goals. Furthermore, more than one hundred
million people inhabit in a region that almost equals to six percent of Egypt whole
area, and more than ninety percent of the total of Egypt's area is desert (Aliyu, Modu,
& Tan, 2018). The project area is divided into four categories desert, water,
agriculture, and urban. So, Egypt dredged tunnels under the SC to connect Sinai
Peninsula in the East of the SC with Port Said, Ismailia, and Suez cities in the west of
the SC and in order to decrease population congestion by the optimal exploiting of the
SC Zone.

21
The SCCP will increase Egypt's GDP by one hundred billion USD and will save a
million jobs, which means five million families will benefit from this project since one
person can support five. On the other hand, according to the ILO report in 2018,
approximately one-third of the young people (15-24 years) in Egypt are unemployed,
which equals four times the older adults, and the majority of unemployed are women
and educated persons, and the total unemployment persons are 11 percent. So,
unemployment is an obstacle to achieving sustainable development (Abdel Ghafar,
2018).
The development of six ports in the SCCP is considered a key factor in implementation
of the project because the port is a connection between the international and national
economy. In addition, Egypt has fifteen commercial ports, six of which are positioned
in the Mediterranean and nine in the Red Sea (Egypt Maritime Transport Sector, n.d.).
To make these ports attract shipping companies and, therefore, increase cargo-
handling operations transfer, transforming some of them to hub ports is required. As a
result, the SCCP will transform East-Port-Said in the Mediterranean and Ain Sokhna
in the Red Sea into hub ports.
The next chapter illustrates how the port of East Port-Said as a hub port, will depend
on renewable energy to become a green port on the long run, like Rotterdam port as a
successful case study. In addition, it will address reasons for choosing the port of EPS
as a promising example to help Egypt in achieving sustainable development goals.

22
Chapter III: The Importance of Green Port
3.1 East Port-Said Port as greening port:
3.1.1: Port specifications:
The Port of East Port-Said (EPS) is 12.4 Km² whereby the maximum draft is 22 meter.
EPS is located in the Sinai Peninsula and separated from Port-Said city by the Suez
Canal and approximately 185 km Northeast of Cairo. Moreover, the Suez Canal
Container Terminal (SCCT) (See Figure 8) in the EPS port is considered the largest
terminal in Egypt and Africa and one of the fifty biggest container terminals on the
globe.
The main idea of establishing the EPS port is to exploit the merits of SC, where
approximately ten percent of the world trade, and a quarter of the globe’s containers,
transit yearly.
There were two objectives of constructing the EPS port, first to increase containers
transhipments because of its strategic locations, so it can compete with Jabil Ali in the
UAE and Singapore port, and second to enhance Egyptian economic growth.
Figure 7. SCCT at East Port-Said port
Source: (“Suez Canal Container Terminal Set To Reinstate Connectivity and
Competitiveness,” n.d.)

23
However, the objectives of establishing the EPS port were not attained until nearly two
decades ago. Operations commenced in 2004, due to the Suez Canal convoy time,
which hindered ships from entering and poor hinterland connections by train or
container trucks ferries crossing the Suez Canal (poor supply chain) to transfer
containers trucks from or to the EPS port.
Eventually, the two barriers were removed by first, establishing a new channel
dedicated to ships entering the EPS port in 2016. Second, establishing three tunnels,
one for rail and two road tunnels. Therefore, tunnels have facilitated the container
transfer process between the SCCT terminal and hinterlands. In addition, tunnels have
decreased the dependence on passing over the swing bridge which cross over the SC,
and to decrease the use of ferry boats to transfer containers trucks between EPS port
and the other side (See Figure 9) (Arvis, Vesin, Carruthers, Ducruet, & de Langen,
2019).
Figure 8. Multi Model Transport
Source: (Arvis et al., 2019).
In recent years, the competition between ports has increased in terms of both deep
water and greenness as a result of the vast growth of seaborne trade handled in ports.

24
According to UNCTAD (2018), seaborne trade was 2.6 billion tonnes in 1970 and has
reached 12.1 billion tonnes in 2019 (Clarksons Research, 2019) which means it
increased by approximately five times in a half century. Furthermore, container ship
capacity is expected to increase to 30,000 TEU after one or 2 decades according to
fuel prices and to 50,000 TEU after a half century to gain from low operation cost
merits (Saxon & Stone, 2017). Moreover, port policies have changed and ports have
become wider and deeper to accommodate Triple E ships (Economies of scale,
Environmentally improved and Energy efficient). On that basis, the EPS port has
increased its depth to 22 meters to accommodate current and future drafts of container
ships. Hence, as long as the port's depth and width have increased, the environmental
awareness should increase too. To maintain both the port and its environmental
sustainability for years to come, environmentally friendly ports have become
unavoidable.
3.1.2: EPS Port SWOT Analysis
The SWOT analysis shows the importance of the port of East Port Said in achieving
economic growth which is the main pillar in the SCCP Megaproject.
Table 3. SWOT Analysis for the Port of EPS.
Strengths Weaknesses
S1 Strategic location WI Environmental impacts due to heavy
shipping traffic
S2 Adjacent to logistics and industrial
areas
W2 Suez Canal strait as a water barrier
and poor supply chain
S3 Government and Suez Canal port
authority interests and support to
achieve the SDGs
W3 Absent state of art technology in
monitoring process
S4 Zero tax and customs W4 Applying and implementing
environmental laws and regulations
S5 The maximum draft is 22 meter
Opportunities Threats
O1 Improvement of the Egyptian
economy
T1 Piracy attacks in the Gulf of Aden

25
O2 Foreign and national investors T2 Competition from other ports in the
East of the Mediterranean region
O3 Greening port T3 International economic crises
O4 The Chinese Belt and Road
Initiative (BRI)
Source: (Based on data collected by the author).
3.2: Green Port Policy
The EPS port aims to decrease the adverse impacts of harbour operations via this green
port policy. So, the Green Port Policy adoption serves as a guide for environmentally
friendly harbour operations. Meanwhile, the EPS port in the SC Zone has assigned
contract in December 2018, with SISCO Saudi industrial company to transfer the EPS
port to become the first green port in Egypt and Africa (“Egypt, SISCO ink 1st green
port contract - Egypt Today,” n.d.). Moreover, the competent authority tries to improve
the environmental performance for all ports (“Egypt government calls for port
development – PortSEurope,” n.d.).
The ESP port is experiencing expansion and development operations to achieve the
economic growth. Therefore, an increase in activities and operations can be found
inside the port. As a result, environmental and climate pollution are increasing in the
port region. Subsequently, sustainable development and greening of ports is required.
The greening of the port is considered an optimal solution to attract both foreign and
local investors, shipping lines, and to mitigate climate change impacts by reducing
GHGs emissions. Therefore, the port should evaluate and determine the environmental
aspects and should be supported by the civil society (KAYA, Bitiktaş, & Çelik, 2018).
A port with an excellent environmental performance also with public support, is
highly recommended (Lam & Notteboom, 2014).
3.2.1: The IMO’s role in decreasing GHGs emissions
The transportation of international commodities by sea is the most efficient means of
transport in comparison with air and land (trucks and trains) in terms of GHG

26
emissions and prices (Bouman, Lindstad, Rialland, & Strømman, 2017). However, the
UN assigned the IMO to deal with environmental protection such as GHG emissions,
due to the absence of the port authorities’ role in enforcing the applicable law and
environmental regulations in ports. This because the need for port activities and
operations to continue and to satisfy the shipping lines visits (Romero, Asmus,
Milanelli, Buruaem, & Abessa, 2014).
The IMO is responsible for approximately fifty global conventions and agreements
and some of them deal with environmental issues, such as the London Convention
(LC) 1972, MARPOL 73/78, OPRC 1990, AFS 2001, BWM 2004, and the HONG
KONG convention 2009 (Duran Puig, 2016). Furthermore, the IMO applied a Market-
Based Instrument (MBI) to mitigate and reduce GHGs emission in international
seaborne trade and to become more energy-efficient consumption. (KAYA et al.,
2018).
In addition, the IMO has focused on improving energy efficiency on board vessels to
decrease climate change impacts through MARPOL Annex 6 resolution
MEPC.203(62), making EEDI obligatory for new vessels and SEEMP mandatory for
all vessels. Furthermore, the IMO imposed a sulphur cap 0.5% m/m from January 2020
to decrease GHGs emissions like Sox, NOx, CO2 and PM, by improving the quality
of fuel used on board ships, to decrease climate change impacts, and to lower the
impacts on human health especially near to ports (See Table 4).

27
Table 4. Comparisons on the Quality of Fuel Onboard Ships.
Source: (BRS, 2019).
The Egyptian government is said to increase the dependence on renewable energy in
the coming years as a primary source of electricity in ports to decrease negative
environmental impacts in order to keep up with increasing port operations,
development, and new requirements for international and national regulations. In
addition, to increase the dependence on Onshore Power Supply (OPS) (electricity
from port’s berth to ships instead of using auxiliary ships’ engine which is considered
as a main source for air pollution) (Doudounakis & Kanellos, 2014) will help to
decrease climate change impacts. The goal is to reach 20 percent renewable energy
by 2022 in the order of 6% hydropower, 12% wind, 2% solar, and 80 % fossil fuel. It
is further expected that renewable energy use will reach 42% by 2035 as compared to
2014 when 2% of energy came from renewable sources, 8% from Aswan High Dam,
and 90% from fossil fuel (Investment & Financing, n.d.).
0
20
40
60
80
100
120
HFO 3.5% HFO + Scrubber LSFO 0.1% LNG
Observation of pollutants in various types of fuel
SOX NOX CO2 PM

28
3.3: The Objectives of Transfer EPS from Seaport to Green Port
The importance of transferring the EPS port to green port is to enable the EPS to
compete with other ports in the region, decrease GHG emissions, to assist Egypt in
achieving sustainable development goals, improve the Egyptian GDP via attracting
investors and shipping companies, and to face the challenges of the NSR.
3.3.1: Steps to Transfer EPS to become a Green Port
There are 5 pillars in relation to the development of a “Green Port”
1- Technology;
2- Policy;
3- Standardized EnMS (PERS, ISO, and EMAS);
4- Awareness; and
5- The circular economy approach i.e. for instance how to reuse (emissions,
garbage and wastes)
The port occupies a critical location, and to attain this, the sustainable development
for ports through stabilization between social and economic interests, the
environmental impacts are required (Zdravev, 2017). On the other hand, port
operations cause adverse consequences on the environment and local community, such
as air and water pollution, which affects the health of people who are working in or
living close to the port.
Water pollution in the port can be generated from:
Ballast water
Sewage
Sludge and bilge wastes
Oil spill accidentally or deliberately
Dredging activities

29
Air pollution in the port can be generated from:
Cargo dust from bulk carriers’ ships
GHGs emissions from trucks, ships
Shore cranes
Fumigation gases
3.4: Environmental Performance for Seaports Assessment Methods
To transform the EPS port into a green port, the port authority, or an environmental
manager, must focus on cutting down energy consumptions, either from the port
facilities or from ships, thereby, decreasing emissions. Moreover, decreasing energy
consumption is considered a key element in greening the port (Wan, Zhang, Yan, &
Yang, 2018). Thereafter, the port authority, or the environmental manager, will assess
all activities and operations inside the port to detect important environmental aspects
which cause contradictory influences in the atmosphere, and will detect the baseline
and the goals, finally allocate finance to improve and develop the environmental
performances of the port (Elzarka & Elgazzar, 2015). However, the greening port
analysis is considered an unclear, complicated, and vague process (J. Y. Park & Yeo,
2012).
3.4.1: SDM
SDM (Self-Diagnosis Method) is the first step for ports to become green ports and it
is prepared by ECOPORTS as the lead of European Seaports Organization (ESPO),
which tries to combine the economic and environmental necessities. SDM is a simple
checklist produced by an environmental manager or port authority, where the
environmental manager defines all the environmental aspects for the port during
construction and operation conditions such as activities that cause negative impacts on
the water, air, and soil. After this the significant environmental aspects (SEAs) that
have great influence on the environment are determined and the port authority focuses
their efforts on mitigating and reducing these impacts on the environment. Therefore,
this review can detect both supporting agents and obstacles to implementing a

30
satisfactory EnMS. Furthermore, SDM is adaptable to special port conditions and quite
important in environmental planning (Romero et al., 2014).
After the port manager completes the checklist, then the port can join the ECOPORTS
networks and get access to ESPO services.
The steps to attain an efficient EnMS are as follows:
Comparison between port environmental performance and the European
benchmark according to ISO 14001 or PERS requirements.
Gap analysis between ESPO benchmark requirement and the port checklist.
SWOT analysis for the port by an expert,
Advice and recommendations to fill the gaps (ESPO Green Guide, 2012).
3.4.2: EnMS
The Environmental Management System (EnMS) is a tool for port managers to
decrease and mitigate environmental impacts of the port operations and to protect both
the environment (marine and terrestrial) and the people who work or live near the port
(Romero et al., 2014).
Even though the important role of EnMS, the Egyptian ESP, Alexandria, and Ain
Sokhna ports, according to a study carried out to assess and improve green ports
performance indicators, were found to lack efficient and proper energy and
management systems. The significant externalities causing negative impacts were:
1- Air pollution;
2- CO2 emission;
3- Oil spill emergency plan;
4- Dangerous cargo management.
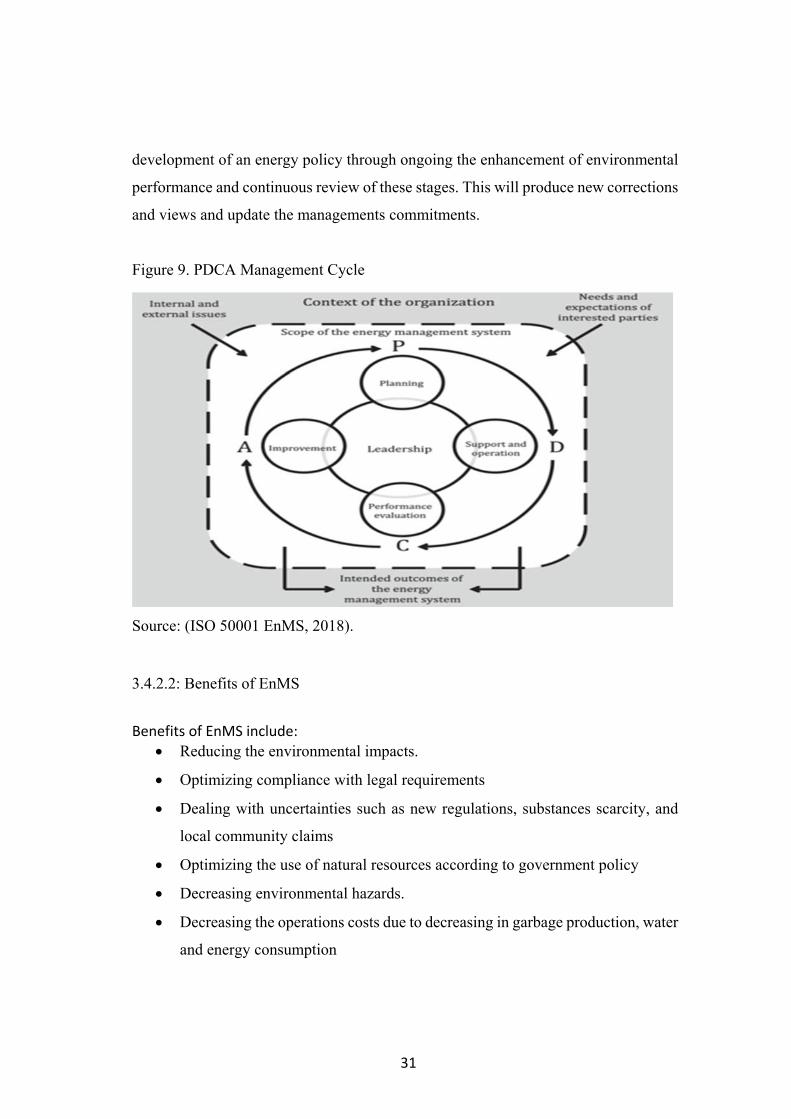
EnMS involves ongoing development of the environmental performance through a
circle of Plan-Do-Check-Act and the process that builds up the EnMS and to maintain
ongoing developments (See Figure 10). Therefore, the main objective of the
management cycle is the proper use of own resources in an effective way and a
31
development of an energy policy through ongoing the enhancement of environmental
performance and continuous review of these stages. This will produce new corrections
and views and update the managements commitments.
Figure 9. PDCA Management Cycle
Source: (ISO 50001 EnMS, 2018).
3.4.2.2: Benefits of EnMS
Benefits of EnMS include:
Reducing the environmental impacts.
Optimizing compliance with legal requirements
Dealing with uncertainties such as new regulations, substances scarcity, and
local community claims
Optimizing the use of natural resources according to government policy
Decreasing environmental hazards.
Decreasing the operations costs due to decreasing in garbage production, water
and energy consumption

32
Implementing formal EnMS which are attractive and increase the confidence
of banks and insurance companies
The environmental performance indicator pointing at the efficiency of EnMS.
Creating optimum communication between the local community, stakeholders,
and port authorities
Granting market and competitive power for the port (Duran Puig, 2016).
3.4.3: EnMS Standards
There are three standards of EnMS that ports can use to manage sustainability
measures in the particular ports:
1- ISO 14001 the International Organization for Standardization by:
Creating a self-measurement and self-notification,
Requesting approval from consumers and stakeholders,
Demanding recognition of its self-declaration by an external
organization
Asking certification/recording of its EnMS by an outer organization.
2- EMAS the Eco-Management and Audit Scheme: It is an optional environmental
management tool and is a sort of ISO 14001; the organizations must meet with the
provisions of the EU EMAS Regulation.
3- PERS (the Port Environmental Review System) recently developed specific
for ports Once the port becomes an Eco-port it can obtain on PERS and the port can
take 3 or 4 years to ensure the EnMS is running and been reviewed several times. The
certificate includes the principal provisions of identified environmental management
standards, which are produced and specified by the ports to assist in achieving their
targets in regarding sustainability developments (Duran Puig, 2016).
The port should follow these steps to obtain the PERS certificate:
1- connect the network
2- Create an own SDM

33
3- Get on the Eco-Port Status
4- Match the port’s SDM score with the average European benchmark of
environmental performance
5- Evaluate the port’s SDM score
6- Receive expert advice and SWOT analysis for the port.
7- Get on the PERS certification.
3.4.4: The European Code of Action to Achieve PERS Certification
The port of EPS to get the PERS certificate should follow the five Es:
1. Exemplifying: Choosing a perfect model in achieving efficient environmental
performance in all port operation for civil society.
2. Enabling: Provide good potential in the port facilities to gain the confidence of
stakeholders.
3. Encouraging: Give rewards for port users, for example, discounts from port
dues, to boost them to enhance their environmental performance.
4. Engaging: Train the people in the port and users to achieve the aim of
improving the particular environmental performance in the harbour, logistics
building, and industrial area.
5. Enforcing: Assure a proper implementation for environmental requirements by
the harbour users to maintain an excellent environmental performance (ESPO
Green Guide, 2012)
3.4.5: Indicators for a Green Port
The primary purpose of using the Environmental Performance Indicators (EnPIs) is to
evaluate and determine the status of the environment in the port for the port authority,
to know whether it is satisfactory or unsatisfactory, which is important for port
stakeholders in developing and supporting port operations and activities in order to
ensure sustainable developments for the port due to the expansion of port operations
(Puig, Wooldridge, & Darbra, 2014).
34
According to ISO 14031 there are three classifications of EnPIs management and
operational performance indicator and environmental condition indicator.
The environmental indicators are categorized for lagging and leading indicators in
civil society and where the regulators generally prefer lagging indicators. Examples of
lagging indicators are fines or complaints such as the amount of toxic gases emitted in
the port.
A leading indicator deal with uncertainties issues such as environmental agenda or
policy.
The balance between lagging and leading indicators is required to a proper
measurement for port indicators. In addition , OCED divided indicators to state,
pressure and response indicators (Duran Puig, 2016).
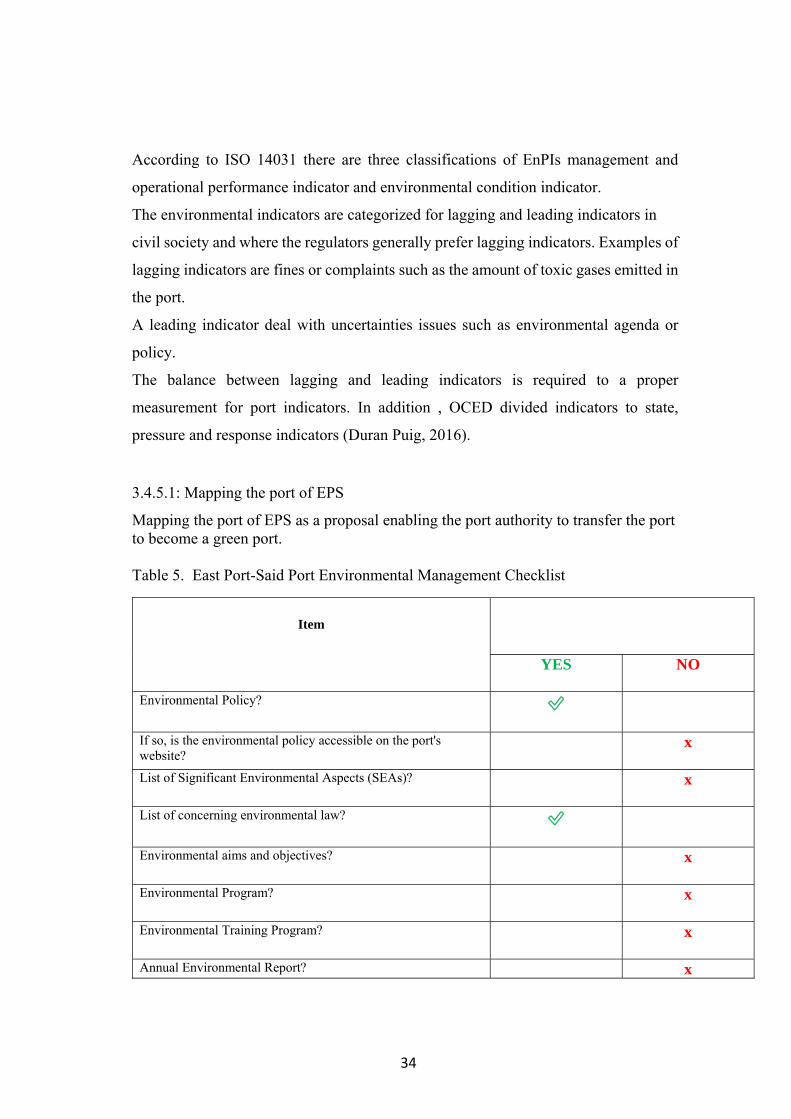
3.4.5.1: Mapping the port of EPS
Mapping the port of EPS as a proposal enabling the port authority to transfer the port to become a green port. Table 5. East Port-Said Port Environmental Management Checklist
Item
YES
NO
Environmental Policy? ✅
If so, is the environmental policy accessible on the port's website?
x
List of Significant Environmental Aspects (SEAs)? x
List of concerning environmental law? ✅
Environmental aims and objectives? x
Environmental Program? x
Environmental Training Program? x
Annual Environmental Report? x

35
Contingency Response Plan? ✅
Environmental Monitoring Program? x
Internal environmental review? ✅
External environmental review? x
Environmental Management System (EnMS)? x
Source: (Duran Puig, 2016) and the assessment based on data collected from different
resources.
According to the data collected related to environmental performance, the port of EPS
has a good opportunity to become a green port when attaining major nonconformity
measures.
3.5: Specific Recommendations
In order to transfer the port of EPS to an environmental friendly port, the port authority
should depend on renewable energy (wind turbines, PV, and biofuel) as the primary
source for energy-generating to reduce GHGs emissions in the port area from ships,
trucks, light masts, and cranes. Furthermore, this select ISO 14001 as an EnMS
standard.
Moreover, transfer diesel -RTG (Rubber Tired Gantry) to fully Electric RTG and
afforestation in the port area, are all mentioned solutions, which will reduce depending
on fossil fuel consumption and GHGs emissions. Therefore, the air, water, noise
pollution and the impact of dredging operation impacts, will decrease in the port region
(Yahya, 2019).

36
3.5.1: Reduction of GHG Emissions
Ships can achieve through this first via, technical standards, optimization in ship
construction such as hull, machinery and propulsion systems, and using non-
conventional
fuels such as bio-diesel, batteries, Bio-alcohol, fuel cells, and scrubbers, all to mitigate
exhaust emissions from ships engines, and using an onshore power supply or cold
ironing.
Secondly, MBI could present incentives for ships to decrease GHG emissions such as
decreasing port dues. MBI is divided into two types, price instruments such as a carbon
tax, and quantity instruments, for example, government permits. Therefore, ship
owners should invest in more modern technological ships.
Lastly, operational options, for example, ships with a Master choosing a proper ship
route, low steaming, and optimizing logistics services (KAYA et al., 2018).
3.5.2: LED Light
LED lamps are one more easy effective measure to put in place on the light mast in
the port of EPS because it has a low cost and low maintenance, with a long lifespan
average of approximately 15 years. It has reduction consumed energy in the harbour,
and a low carbon footprint compared to High Pressure Sodium (HPS) lamps and
working in several weather conditions with high durability (Iris & Lam, 2019). In
addition, energy effective measure can apply through depending on an automatic
ventilation system in summer and winter and automatic a lighting system that can save
the energy by approximately two-thirds, therefore, reducing the emissions in the port
of EPS building (Popa & Popa, 2018).
3.6: Case study: Port of Rotterdam in the Netherlands
The port of Rotterdam won the European Seaports Organization award (ESPO) as a
clean and proper working environment port in the world in 2018. Rotterdam port is
the pioneer in terms of dealing with decreasing the climate change impacts and using

37
renewable energy (wind turbines, solar panels (photovoltaics PV), and biofuel) as
alternative source for fossil fuel (See Figure 11).
Figure 10. Port of Rotterdam
Source: ( GIZ, 2018).
Table 6. Overview of the Port of Rotterdam
The port of Rotterdam
Ranking of the port in terms of productivity
Total Cargo by million tons
469.0 million tons and the tenth on the world
and the largest in Europe
Handled Container (million TEU)
14.5 million TEU and eleventh on the world
Maximum depth 24 meters
Port Area 12,713 Hectare
Number of ships visited the port Seagoing 29,476 ships.
Inland 123,859 ships.
Number of Employees 385,000 people direct and indirect jobs
Dominant Goods Liquid and dry bulk 211.8, 77.6 million tons
respectively with total 289.4 million tons
represents approximately 62% of the total cargo
handled.
GDP 45.6 billion Euro which represent 6.2 percent of
the Dutch GDP
Source: (Port of Rotterdam, 2018).

38
The Rotterdam Climate Initiative (RCI) is the world’s pioneer in the biofuel initiative.
The objective of the port of Rotterdam strategy is to decrease the carbon dioxide
emission to half in 2025 as compared with 1990. The intension is to reduce the
dependence on fossil fuels as a prime source for energy and to decrease climate change
impacts. Through improving both transport and energy efficiency in the port by using
clean energy.
So trucks, cranes, and ships with use clean energy with low sulphur emissions.
Eventually, all vehicles in the cities will use low polluting engines and service stations
will provide biofuels for all vehicles.
In addition, it will capture and sequestrate carbon dioxide (CCS) under the North Sea
(Samadi, Schneider, & Lechtenböhmer, 2018). Furthermore, reuse of carbon dioxide,
steam, and heat from the factories and decrease in carbon dioxide footprint by relying
on Natural liquefied gas, and establishing the expert centre in the harbour for energy
efficiency technology (Bosman, Loorbach, Rotmans, & van Raak, 2018). The
International Maritime Organization (IMO) intends to decrease
the emissions by 2050 to 50% as compared to 2008 while the Rotterdam port target
is 90% (“Zero carbon at sea? Rotterdam port eyes a greener future - Environment -
The Jakarta Post,” n.d.).
The port of Rotterdam has approved the ISO 14001 as the standard for their EnMS.
Moreover, air and water quality, energy consumption, and waste management have
been involved in the EnMS. Furthermore, by monitoring and controlling water and
air conditions and improving polices, the port can maintain a suitable performance
indicator and can modify aims and objectives and measure environmental impacts such
as shipping traffic, dredging operations, and port expansion on wetlands and migratory
birds (Lam & Notteboom, 2014).

39
Chapter IV: Untapped Blue Growth in Egypt
4.1: The SCCP Mega Project
Egypt is aiming to renovate its depleted and exhausted economy through establishing
mega projects such as the SCCP in order to achieve (SDG 9) and to attain economic
growth (SDG 8) and at the same time, protect the marine environment and its resources
according to (SDG 14) perspective. Therefore, the SCCP enables Egypt to compete
with expected projects in the region, coming challenges from the NSR, and overcome
the impact of climate change.
The SCCP aims to support establishing industrial areas in the Suez Canal Zone, to
enhance the supply chain, to establish renewable energy projects, and to decrease the
impact on the environment of establishing industrial areas (Ezzat, 2018).
Furthermore, there is a strong link between achieving the SDGs and the blue
economy, which indicates the importance of proper usage of marine resources in the
present and in years to come. The achievement of SDGs will result in economic
growth, and wellbeing, as well as reducing impacts on the environment. Without a
blooming, clean and healthy environment no SDGs can be attained (Rickels, Weigand,
Grasse, Schmidt, & Voss, 2019).
Oceans play an important role in countries’ economic strategies. In recent years,
countries’ claims over sea zones have increased in order to benefit from resources such
as seabed mining, fishing, hydrocarbons materials, and marine biotechnology. This is
why UNCLOS plays a focal role in protecting developing countries’ rights over their
continental shelves, exclusive economic zones, and contiguous zones, especially after
increasing claims on maritime zones among states because the dependence on the
state-of-art technology has increased to benefiting from ocean resources, both living
and non-living resources, in the water column and under the seabed.

40
Blue growth includes both living resources such as blue biotechnology, aquaculture
and fisheries and non-living resources such as clean energy (wind farms, tide, and
wave), shipping lines, oil and gas and indirect benefits services such as marine species
biodiversity, coastal erosion protection, fresh water, and carbon sequestration through
which oceans absorb approximately one-third of CO2 emissions.
4.2: Challenges for the Blue Growth in Egypt:
4.2.1: Marine pollution:
In the past, ocean onboard some ships were dubbed by “the big store” which is
considered as a place to dispose wastes. Nowadays, the pollution sources are
many and varied such as oil spills from ships either accidently or deliberate
inside ports or on shorelines, untreated sewage from ships and recreation
facilities, agriculture, chemical wastes from chemical tankers or from chemical
industries, garbage, dredging, and port development. All of these cause
negative impacts on marine ecosystem services, biodiversity, and sustainable
developments for ocean resources.
4.2.2: Non-Indigenous Species:
There are approximately one thousand NIS in the Mediterranean. Furthermore,
there are three main sources of invasive species in Egypt. First, non-indigenous
species that travel from the Indian Ocean to the East Mediterranean through
the Suez Canal. Second, invasive species coming from ballast water
operations, bilge water, and ships’ hulls. Third, NIS generated from fish farms.
The invasive species cause negative impacts on the fisheries sector, habitat loss
and biodiversity, recreation facilities, and human health (Katsanevakis et al.,
2014).
The increase in NIS in the Mediterranean from the Red Sea is due to the
reduction in salinity of the Bitter Lakes (See Figure 12) which are located in
the Suez Canal and serve as a barrier between the Mediterranean and Red Sea.

41
However, as a result of the extensive agricultural drainage in the Bitter Lakes’
over years, the water has diluted and it was permitted for NIS to invade the
Mediterranean. and another indirect impact helped on increasing invasive
species due to establishing the Aswan High Dam in the 1960s reduced the
amount of both the flow of fresh water and alluvium in the Eastern
Mediterranean. Subsequently, the Mediterranean water salinity increased and
became similar to the Red Sea salinity (Zakaria, 2015).
Figure 11. NIS invade the Mediterranean via the Suez Canal
Source: (Zakaria, 2015)
4.2.3 IUU Fishing:
In recent years, fisheries stocks have depleted due to fishers using illegal
methods for fishing, such as mesh nets and poisons and due to the absence of
continual surveillance and fishing during prohibited times. Moreover, there is
no Vessel Monitoring System (VMS). Climate change is also a factor. In
addition, fishers are targeting some kind of marine species such as sharks fins,

42
shrimps, and sea turtles and according to a IUCN report those are the 3 most
endangered marine species (Öztürk, 2015).
4.2.4 Climate Change:
Egypt is one of the states most exposed to global warming impacts (Brown, Kebede,
& Nicholls, 2011).
4.2.4.1 Sea Level Rise (SLR) Climate change increases seawater temperature and changes water salinity. Therefore,
the sea level has increased, causing gust surges, heavy precipitation rate and severe
heavy weather on the Egyptian North coast. According to an IPCC report the sea level
is anticipated to increase by approximately 60 CM by 2100 (See Figure 13) (Ali &
El-Magd, 2016).
Figure 12. SLR in Egypt North Coast as IPCC report
Source : (Ali & El-Magd, 2016)
Moreover, the sea level is increasing by approximately three centimetres every decade
(Frihy & El-Sayed, 2013) and at the same time land subsidence changes by 2.5
centimetres (Raey, Dewidar, & Hattab, 1999), which doubles the negative impacts of

43
SLR. Subsequently, if the sea level increases by 0.5 meters, it is expected to ruin and
damage one third of Alexandria and Port Said’s governorates, which are located in the
Egyptian North coast, and approximately six million people will be displaced. The
Egyptian GDP will decrease by approximately six percent and many people will lose
their jobs (Abubakr et al., 2018). Moreover, the SLR will cause negative impacts on
the agriculture sector and fisheries stocks will decrease from the Egyptian North
coastal lakes, namely Edku, Marriott, El Brulus, Al Manzalah, El Mallaha, and El
Bardwell lakes, which will be inundated by sea water (Ali & El-Magd, 2016).
4.2.4.2: Coastal Erosion
Coastal erosion on the Egyptian North coast was first caused by the establishment of
the Aswan High Dam just over half century ago. The dam construction prevented
drought and was a main source for electricity generation; however, the dam also
reduced the quantity of fresh water in the Mediterranean, which decreased fisheries
stocks and the amount of alluvium, which was protecting the shoreline from erosion
(Abd-El Monsef, Smith, & Darwish, 2015).
In addition, coastal erosion causes mixed seawater with groundwater sources along
the Egyptian North coast, and when seawater inundates the River Nile delta, it may
lead to a disaster. Subsequently, coastal erosion will cause negative impacts on
agriculture, tourism, and the fisheries sectors and many more (Ali & El-Magd, 2016).
4.2.4.3 Ocean Acidification
Climate change and ocean acidification are two sides of the same coin. Ocean
acidification takes place as a result of increased burning of fossil fuel, and oceans
soaking up about one-third of CO2. Subsequently, the dissolved CO2 in the water
increases water acidity (Anthony, Kline, & Dove, 2008). In addition to the global
warming impact, which increases in the Red Sea’s, average temperature, which causes
the bleaching of coral reefs. Therefore, it creates adverse impacts on marine ecosystem
services and biodiversity. Coral reefs represent economic, bioprospecting, and
environmental values for Egypt because they protect the coasts of the Red Sea from
erosion, storm waves, and tourism activities such as snorkelling and diving. Egypt has
44
one of the most impressive coral reefs which attracts millions of tourists annually from
all over the world (Hilmi, Safa, Reynaud, & Allemand, 2018).
4.3: Techniques for the Achievement of Blue Growth
The blue economy concept has grown quickly since the United Nations Conference
on Sustainable Development in Rio De Janiero, 2012, and has become essential in
marine sustainable development in many states. Moreover, the blue economy concept
has been backed by the FAO and completed for MDGs (Maria et al., 2018).
4.3.1: Integrated Coastal Zone Management (ICZM)
ICZM was established under the declaration of Rio 1992 in the Earth Summit, which
encouraged Egypt to issue environmental law number 4 and ICZM in 1994.
Moreover, ICZM is considered as a tool in decision-making and an ongoing process
to manage the interaction between land and sea, to decrease cumulative impacts, and
to ensure resources remain for future generations (Forrest, 2006).
Implementing the ICZM in Egypt is essential because of the paucity of marine
resources and the increasing pressure on coasts because of climate change impacts,
which increases the sea level and causes coastal erosion on the Mediterranean coast
by bleaching coral reefs and mangrove retreats in the Red Sea. Furthermore, for the
ICZM it is more important to decrease the cumulative impacts of marine pollution
from recreation facilities along the Egyptian coast, where shipping has increased
exploration for oil and gas is excavating in both the Red Sea and the Mediterranean
and the poor land-use planning, along Egyptian coasts which expand to more than
3200 km totally both the Red Sea and the Mediterranean (Abdul-Azm, Abdel-Gelil, &
Trumbic, 2003).
The objectives of ICZM are to maintain marine resources for the long term to achieve
economic growth, people’s wellbeing, and to protect the environment through

45
appropriate use of marine resources (sustainable development). However, in Egypt,
there are some deficiencies in implementing a proper ICZM. The role of the Egyptian
Environmental Affair Agency (EEAA) is absent for two reasons: first, there is a
conflict with the Ministry of Tourism regarding the establishment projects along the
coasts without an Environmental Impact Assessment (EIA) process for recreation
facilities and urban development, which attain economic benefits at the expense of
damage to the marine environment; second the participation of stakeholders and civil
society in the ICZM are limited (Tabet & Fanning, 2012).
Moreover, the implementation of ICZM in Egypt is suffering from the lack of capacity
improvement and trained persons to execute the ICZM initiatives (Ibrahim & Hegazy,
2015). The two most significant failures of applying the ICZM in Egypt are, first,
Bardwell Lake, which is located between Al Arish and Port Said in the North part of
the Sinai Peninsula (See Figure 14). Bardwell Lake is one of the most significant
wetlands in Egypt and a suitable place for migratory birds. In addition, it also produces
high quality fish, which are exported to the European market. However, anthropogenic
impacts from recreation facilities, agriculture sewage, and fresh water leakage from El
Salaam canal, are all a result of the low-lying level of the lake which helps on changing
its water density and quality, all because of negative impacts on fisheries, biodiversity,
and migratory birds because there is no ICZM technique or proper land use plan
(Clark, 2018).

46
Figure 13. El Bardwell Lake
Source (El-aiatt, Shalloof, & Saber, 2019).
Second, the Gulf of Suez in the Northern Red Sea is one of the most important pillars
that Egypt depends on to achieve sustainable development goals. The gulf produces
approximately 85 percent of the total petroleum products in Egypt (Alsharhan, 2003)
and provides a suitable region for continuous and renewable energy (EL-Shimy, 2010).
However, the Gulf of Suez suffers from high condensation of heavy metals such as
lead, nickel, zinc, and cadmium due to intensive recreation facilities, oil spills,
desalination plants, phosphate factories, shipping lines, untreated sewage, ports,
mining, and fishing harbours all of which produce negative impacts on marine species,
people health, and the marine environment. So, there is no a high integral level
between the shore and ocean to mitigate adverse impacts (Abouhend & El-moselhy,
2015).
4.3.2: Marine Protected Areas (MPAs)
Egypt has 6 MPAs; only one of them is in the Mediterranean and the rest are in the
Red Sea. Among these, one of the remarkable MPAs in the world is Ras-
Mohamed, a protected area in the south Sinai Peninsula, which was established in
1983 and is dedicated for tourists’ activities, scientific research and no take zone.
Moreover, there are three proposed MPAs, 2 in the Mediterranean and one in the

47
Red Sea, to become in total 9, which will exceed the 10 percent recommended
(Samy, Sánchez Lizaso, & Forcada, 2011).
MPAs in Egypt play a vital role in protecting approximately five thousand marine
species that are vulnerable because of human impacts such as sewage,
eutrophication, oil and plastic pollution from ships, recreation facilities, and
tourist’ activities. In addition, MPAs protect mangroves and coral reefs in the Red
Sea from global warming impacts. Moreover, according to the IUCN report, there
are many endangered marine species in Egypt such as sea turtles, and sharks
because of bycatch from fishers and marine pollution and underwater noise
pollution, which obliges marine mammals to migrate or become stranded on the
beach (Mahrous et al., 2019). Therefore, the effective MPAs are important to
protect endangered species, biodiversity, and enhance livelihood and attain
wellbeing for Egyptians in the long-run. So, making MPAs no take zones,
increasing surveillance, increasing government funding, increasing awareness, and
implementing the environmental law No 4/94 are required (Samy et al., 2011).
On the other hand, there are some pitfalls and shortcomings in applying MPAs in
the countries’ territorial waters. Specifically, the MPA size is more important
because small areas will not protect ecosystem services, biodiversity, and are
environmentally inadequate. In addition, establishing MPAs will force fishers to
fish out the protected area; therefore, conflicts among fishers will increase over
scarce and limited resources. Thus, they will fish far away and will try to
compensate the extra time and money by using illegal methods and techniques
such as poisons, explosive substances, and mesh nets in fishing, destroying
ecosystem services and decreasing ocean health and biodiversity outside the
MPAs.
Moreover, establishing a MPA does not mean that it is an isolated island, but is
inevitably affected by the degradation in adjacent marine areas, so planning and
managing the MPA is quite important to decrease negative impacts from the
surrounding areas and because there is no link between MPAs and coastal and

48
offshore locations. Hence, the MSP is the proper solution to excellent management
and enhanced sustainable development, and maintains marine resources. To
improve MPAs is the marine spatial planning where it depends on ICZM and the
ecosystem based management and more comprehensive processes (Agardy,
Notarbartolo, & Christie, 2011).
4.3.3: Marine spatial planning (MSP) MSP is deemed as a means for the government to accomplish a balance between
attaining people’s wellbeing, economic growth, and concurrently protecting the
sustainability of the marine environment resources. Moreover, MSP is used as a
remedy for depleted marine ecosystem services through solving the chronic issues
between stakeholders and users from different sectors such as fishers, fish farms,
institutions, institutes, scientists, shipping lines, renewable energy, tourism
development, military, and industrial activities such as oil and gas explorations in the
specific marine areas (Law, Law, & Young, 2015).
Egypt has very sensitive marine locations such as the Gulf of Suez and the North coast.
Moreover, there are many blue economy resources in Egypt such as fisheries, fish
farms, renewable energy, oil and gas exploration, sea bed mining, coastal
development, shipping, and recreation facilities. Therefore, applying effective MSP to
make a reform for poor planning and integration between ocean maritime zones and
to achieve sustainable development are required.
4.4: The Blue Economy Role in Achieving the SDG 14 in Egypt:
The blue economy is a critical factor to achieving the sustainable development of
Egypt. This is because of the following reasons: the poor land use plan in the past, the
limited resources over land, the astonishing increase in population yearly, and the
drainage of coastal lakes wetlands of coastal development. Thus, Egypt is searching
for new resources to attain the economic development and people wellbeing. The blue
growth resources such as:

49
Ocean biotechnology: as a result of increasing the dependence on modern
technology in the coming years as a tool to harness and exploit untapped
resources by using marine species in biofuels and pharmaceuticals, and to
improve the GDP.
Aquaculture:
Aquaculture uses an alternative resource for the fisheries sector which
decreases the pressure and sustains the fish stock.
Renewable energy:
Renewable energy uses an alternative and clean resource for fossil fuel and at the
same time decreases GHG emissions.
Recreation facilities and activities:
Recreation facilities save millions of jobs and develop the GDP of the tourism
sector.
Deep sea mining resources:
In recent years, the dependence on deep sea mining resources has increased
because of the limited resources of raw materials on land and the increasing
demand of emerging countries of raw materials (European Commission.,
2017).
4.5: challenges for Egypt in Achieving the SDGs: A Summary Overview The following is a summary of challenges identified by the author:
1- Education and capacity improvement are considered the main pillars to achieve
sustainable development and strategic plans, where there are approximately
seventeen million illiterate persons in Egypt and the majority of them are
women. This increasing illiteracy of women in rural regions is because their
parents prefer them to get married rather than educated; extra money burdens
poor people, and there are low job opportunities in rural areas as compared to
cities. Subsequently, illiteracy represents a great barrier to achieve sustainable
development goals (Sywelem, 2015).

50
2- High unemployment, especially among educated people, is because there is no
link between education system and market requirements, which causes
negative impacts on economic growth and human wellbeing.
3- Water scarcity is considered a great barrier in Egypt to achieve sustainable
development goals. There are many reasons which cause water scarcity crises
in Egypt such as global warming, staggering annual increases in population,
disposal of wastes in the River Nile, establishing the Grand Ethiopia
Renaissance Dam (GERD), and the limited depending on aquifers to bridge the
shortage between the growing water demand in industries and the available
natural water resources (Abubakr et al., 2018)
4- Improper infrastructure in the petroleum sector is considered as a barrier to
import and export hydrocarbons because there are no adequate pipelines nets.
Moreover, the tourism sector has a poor means of transport in connecting
tourist spots and places, and in the education sector, the schools need
maintenance and refurbishment.
5- There are quite poor land use plans where approximately 90 percent of the total
Egypt land areas are desert and people crammed into 8 percent of the total area
and the River Nile accounts for approximately two percent.
The inflation rate in banks has increased because of the pound’s devaluation
or liberalization as a result of decreasing the production rate, and the political
unrest especially after the Arab spring revolution in 2011. (Ministry of
Planning, 2015)
4.6: Egypt’s Potentials to Achieve the SDGs
Based on the challenges, the author has identified potential areas for improvement,
which will in turn help Egypt attain its vision with respect to the SDG:
1- Egypt has a strategic location between three continents Africa, Asia, and
Europe. In addition, the Suez Canal connects the entire world and facilitates
international trade.

51
2- Egypt is considered as a young state where more than sixty percent of the
population is in the under thirty years’ age group. Moreover, Egypt is one of
the largest population States in the Middle East, which is deemed to have
untapped and unexploited wealth.
3- Egypt has a variety of economic source such as tourism, the Suez Canal, and
agriculture.
4- Egypt has oil and gas fields, which is considered low if compared with the
other States in the Middle East; however, by depending on the modern
technology there will be explorations in oil and gas in the near future.
5- Egypt has many kinds of tourism activities, where Luxor city has one third of
the total world monuments, and has monuments from the stone age in addition
to remedial, cultural, and maritime tourism.
6- Egypt has a lot of unexploited places such as the coasts of the gulf of Aqaba
and the North Sinai Peninsula.
7- Egypt has deserts accounting for approximately 90% of the total area which
includes all the unexploited raw materials from different kinds of minerals such
as steel, phosphate, uranium, and zinc. Nowadays, the Egyptian government is
establishing new cities to decrease population congestion and to achieve
sustainable development.
8- Egypt has a gradual increase in aquaculture production and comes in the sixth
place globally and first place in Africa (FAO, 2018).
9- Egypt has moderate weather. Therefore, Egypt can generate clean energy from
solar panels where the sun radiation average rate is more than 2500 kilowatt
hour/m2. Moreover, the Gulf of Suez is a suitable place for generating
renewable energy where the wind speed average rate is ten meters per second.
The new SCCP megaproject will save one million job opportunities and attain
an annual revenue of approximately one hundred billion USD for the Egypt
GDP (Ministry of Planning, 2015).

52
Chapter V: Conclusion and Recommendations
5.1: Conclusion
Egypt is making a great effort to attain fast economic development through
megaprojects to meet the Egyptian needs and to attain the UN agenda 2030 for the
sustainable development goals. Therefore, the SCCP is a promising project as Egypt’s
vision 2030 where the SCCP transforms the Suez Canal area from just a waterway to
an industrial and economic zone to face current and upcoming challenges such as
climate change impacts and expected competition from other countries in the region,
and the NSR.
In this regard, there is an argument between economists and scientists regarding mega
projects as to whether economic growth comes first or mitigating climate change
impacts and marine environment degradation. Economists insist that economic growth
enables Egypt to invest in education and health to attain wellbeing for its citizens.
Scientists, on the other hand, focus on coming challenges from climate change, which
will cause negative impacts on marine resources, coastal Eco services, and sustainable
development. Furthermore, these challenges incur Egypt’s budget extra wages such as
coastal nourishment, and seawalls constructions to prevent the marine environment
degradations.
Egypt has suffered from poor land use planning in the past as a result of establishing
projects without proper environmental impact assessments incurring Egypt heavy
GDP losses. Moreover, the country suffers from the improper use of its resources in
the sea and on land such as deep-sea mining, and oil and gas explorations, and raw
materials.
Nowadays, as a result of the annual increase in population, and poor planning in the
past, and the coming challenges in the near future, the Egyptian government plans to
explore and exploit new projects and resources such as renewable energy, building
new cities in the desert, modern technology, and ocean resources.

53
The seaport is one of the most vital indicators on renaissance of countries and is a link
between supply and demand or import and export and the location where land, sea,
and air meet. Therefore, maintaining air and water status is essential in the harbor area.
To this end, Egypt’s government concentrates on port developments and expansions
such as the ports of East Port-Said in the Mediterranean and Ain Sokhna in the Red
Sea.
Moreover, Egypt tries to transform its ports to green ports to decrease negative
impacts from GHG emissions on the environment and human’s health, and to attract
foreign and local investors. Furthermore, by converting seaports to green ports, Egypt
will compete with ports in the Middle East and will become ports on a global scale.
While decreasing its dependence on fossil fuels by using clean energy is an optimal
alternative. Also, decreasing GHG emissions and their negative influences on the
marine environment and the populations’ health. Moreover, energy is considered as a
burden on Egyptian government’s annual budget because the government pays for
both subsidiaries, the difference between national and international fuel prices, and for
hydrocarbons negative impacts on the environment as well.
In recent years, Egypt has witnessed political and economic stabilization, which
helping on improvement in all walks of life, through a comprehensive economic
reform, and education and healthcare optimization. Thus, a proper participation, and
awareness of the community and civil society in decision-making and long-term and
mid-term strategic plans is required. Therefore, in this case, to attain Egypt SDGs will
become attainable.
To sum up, Egypt is trying to harness its blue economy to achieve SDGs and improve
its GDP. So, Egypt would overcome on poor planning in the past and coming
challenges of climate change through depending on the state of art technology in
monitoring megaprojects and renewable energy.
54
5.2: Recommendations
For a better method to achieve the SDGs and to face future impacts of climate change
the author wishes to put forward the following recommendations:
Recommendation 1: To achieve sustainable development goals and strategic
plans, the Egyptian government should improve the education system,
especially for women in remote areas and capacity development both are the
main pillars to achieving desirable outcomes.
Recommendation 2: To achieve cooperation between EEAA, tourism, and
industry ministries to decrease GHG emissions and mitigate the cumulative
impacts of coastal urban development, climate change and ocean acidification.
Moreover, assure the value of marine environment resources to attain
economic growth and human wellbeing.
Recommendation 3: To achieve proper planning for land-use where the
Ministry of Planning should construct new cities and use solar panels to
generate electricity for new factories and residential buildings because
achieving sustainable development requires the exploitation of every land span
just like developed countries (e.g. the USA and Japan).
Recommendation 4: To transform all Egyptian ports to green ports and
determine targets to reduce GHG emissions. For example, by 2030 reduce the
CO2 percentage by 50% and improve the quality of the fuel used. Hence, it
will decrease diseases such as asthma and lung cancer, especially for people
living or working in the port areas, and to attract and acquire shipping lines
confidence and compete with other harbors in the region.
Recommendation 5: The SCCP is an important megaproject, so people, civil
societies, and stakeholders’ participation with decision makers should be on a
high level because this project will save more than one million jobs, increase
the GDP by 100 billion USD annually, and reconstruct the Sinai Peninsula and
the Suez Canal cities namely Port-Said, Ismailia, and Suez.
Recommendation 6: To apply the practice in Egypt of sustaining marine
resources, as a comprehensive approach to improve MPAs. This since the

55
SCCP is located in susceptible marine areas where climate change impacts,
shipping lines, renewable energy, fish farms, and hydrocarbons explorations.
Recommendation 7: To importance of two ports, East Port-Said in the
Mediterranean and Ain Sokhna in the Red Sea. These ports are located
strategically and should be oriented to become environmentally friendly ports
to attract customers and to support global competition, and not only among the
Middle East ports.
Recommendation 8: Water scarcity in Egypt is a life or death issue where
water plays an essential role in achieving the SDGs. Subsequently, Egypt
should find optimum solutions to complete the shortage between available
resources and the increasing need for water as a result of population increase,
mega projects, and global warming. Therefore, the Egyptian government
should reuse agriculture and sewage after treatment in farm land irrigation.
Moreover, using the state of art technology to search for water in the deep land.
In addition, establishing new desalination plants especially for water used in
industry, after taking into consideration its environmental impacts.
Furthermore, the cooperation between Egypt and the Nile Basin countries to
solve the scarcity of water issue.
Recommendation 9: To play an essential role in achieving SDGs and the
people’s wellbeing in ocean resources. The scarcity of resources and poor uses
of available resources on land have resulted in the decision makers to choose
the ocean resources as a proper alternative such as the Suez Canal, aquaculture,
oil and gas explorations at the maritime zones. Subsequently, the proper
governance and management of marine resources is required to achieve
sustainable development.

56
References
1H 2019 Seaborne Trade Update 1H 2019 Seaborne Trade Update. (2019), (July), 1–
10.
Abd-El Monsef, H., Smith, S. E., & Darwish, K. (2015). Impacts of the Aswan High
Dam After 50 Years. Water Resources Management, 29(6), 1873–1885.
https://doi.org/10.1007/s11269-015-0916-z
Abdel Ghafar, A. (2018). A stable Egypt for a stable region: Socio-economic
challenges and prospects. the European Parliament’s Committee on Foreign
Affairs. https://doi.org/10.2861/262760 (PDF)
Abdelkader, A., Elshorbagy, A., Tuninetti, M., Laio, F., Ridolfi, L., Fahmy, H., &
Hoekstra, A. Y. (2018). National water, food, and trade modeling framework:
The case of Egypt. Science of The Total Environment, 639, 485–496.
https://doi.org/10.1016/J.SCITOTENV.2018.05.197
Abdul-Azm, A. ., Abdel-Gelil, I., & Trumbic, I. (2003). Integrated Coastal Zone
Management in Egypt : The Fuka-Matrouh project, 5–12.
Abouhend, A. S., & El-moselhy, K. M. (2015). Spatial and Seasonal Variations of
Heavy Metals in Water and Sediments at the Northern Red Sea Coast. American
Journal of Water Resources, 3(3), 73–85. https://doi.org/10.12691/ajwr-3-3-2
Abubakr, K., Abutaleb, A., Hassan, A., Sayed, E., Mahmoud, M., & Ahmed, H. M.
(2018). Climate Change Impacts , Vulnerabilities and Adaption Measures for
Egypt ’ s Climate Change Impacts , Vulnerabilities and Adaption Measures for
Egypt ’ s Nile Delta. Earth Systems and Environment, (April).
https://doi.org/10.1007/s41748-018-0047-9
Agardy, T., Notarbartolo, G., & Christie, P. (2011). Mind the gap : Addressing the
shortcomings of marine protected areas through large scale marine spatial
planning, 35, 226–232. https://doi.org/10.1016/j.marpol.2010.10.006
Ali, E. M., & El-Magd, I. A. (2016). Impact of human interventions and coastal
processes along the Nile Delta coast, Egypt during the past twenty-five years.
Egyptian Journal of Aquatic Research, 42(1), 1–10.
https://doi.org/10.1016/j.ejar.2016.01.002

57
Aliyu, A. K., Modu, B., & Tan, C. W. (2018). A review of renewable energy
development in Africa: A focus in South Africa, Egypt and Nigeria. Renewable
and Sustainable Energy Reviews, 81(June 2017), 2502–2518.
https://doi.org/10.1016/j.rser.2017.06.055
Alsharhan, A. S. (2003). Petroleum geology and potential hydrocarbon plays in the
Gulf of Suez rift basin, Egypt. AAPG Bulletin.
Anthony, K. R. N., Kline, D. I., & Dove, S. (2008). Anthony et al 2008_coral reef
bleaching, 2008. https://doi.org/10.1073/pnas.0804478105
Arvis, J.-F., Vesin, V., Carruthers, R., Ducruet, C., & de Langen, P. (2019).
Maritime Networks, Port Efficiency, and Hinterland Connectivity in the
Mediterranean. Maritime Networks, Port Efficiency, and Hinterland
Connectivity in the Mediterranean. https://doi.org/10.1596/978-1-4648-1274-3
Åtland, K. (2010). Security implications of climate change in the Arctic Keywords.
Atvur, S. (2019). The need for international environmental regulations on artificial
waterways : The Suez Canal case The need for international environmental
regulations on artificial waterways : The Suez Canal case, (December 2018).
Batisha, A. F. (2012). Adaptation of Sea Level Rise in Nile Delta Due to Climate
Change. Journal of Earth Science & Climatic Change, 03(02).
https://doi.org/10.4172/2157-7617.1000114
Bendall, H. B. (2010). Cost of piracy: A comparative voyage approach. Maritime
Economics and Logistics, 12(2), 178–195. https://doi.org/10.1057/mel.2010.1
Benedyk, I. V, & Peeta, S. (2016). A binary probit model to analyze freight
transportation decision-maker perspectives for container shipping on the
Northern Sea Route. Maritime Economics & Logistics, 20.
https://doi.org/10.1057/s41278-016-0046-4
Bosman, R., Loorbach, D., Rotmans, J., & van Raak, R. (2018). Carbon lock-out:
Leading the fossil port of rotterdam into transition. Sustainability (Switzerland),
10(7). https://doi.org/10.3390/su10072558
Bouman, E. A., Lindstad, E., Rialland, A. I., & Strømman, A. H. (2017). State-of-
the-art technologies, measures, and potential for reducing GHG emissions from

58
shipping – A review. Transportation Research Part D: Transport and
Environment, 52, 408–421. https://doi.org/10.1016/j.trd.2017.03.022
Brown, S., Kebede, A. S., & Nicholls, R. J. (2011). Sea-Level Rise and Impacts in
Africa 2000 to 2100. Retrieved from
https://wedocs.unep.org/bitstream/handle/20.500.11822/18242/9_Sea_Level_Ri
se_Report_Jan_2010.pdf?sequence=1
BRS, B. R. S. (2019). Shipping and Shipbuilding Markets: Annual Review, 110.
Retrieved from http://www.brs-paris.com/annual/annual-
2013/pdf/annual_review_2013-a.pdf%5Cnhttp://www.brs-
paris.com/index.php?page=annualreview
Clark, J. R. (2018). Coastal Zone Management Handbook. Coastal Zone
Management Handbook. https://doi.org/10.1201/9781315139654
Comer, B., Olmer, N., Mao, X., Roy, B., & Rutherford, D. (2017). Prevalence of
heavy fuel oil and black carbon in Arctic shipping, 2015 to 2025. Retrieved
from [email protected]
Cramer, W., Guiot, J., Fader, M., Garrabou, J., Gattuso, J. P., Iglesias, A., …
Xoplaki, E. (2018). Climate change and interconnected risks to sustainable
development in the Mediterranean. Nature Climate Change, 8(11), 972–980.
https://doi.org/10.1038/s41558-018-0299-2
Deutsche Gesellschaft für Internationale Zusammenarbeit (GIZ) GmbH, Meister, R.,
& Wagner, M. (2018). Current Status and Environmental Incentive Policies of
Seaports and Inland Ports in Europe Current Status and Environmental
Incentive Policies of Seaports and Inland Ports in Europe On behalf of.
Doudounakis, M. ., & Kanellos, F. D. (2014). ACTIVE POWER MANAGEMENT
IN “GREEN” PORTS, 1–14.
Duran Puig, M. (2016). Methodology for the selection and implementation of
environmental aspects and performance indicators in ports, 487.
Egypt, SISCO ink 1st green port contract - Egypt Today. (n.d.). Retrieved July 15,
2019, from https://www.egypttoday.com/Article/3/61744/Egypt-SISCO-ink-1st-
green-port-contract

59
Egypt government calls for port development – PortSEurope. (n.d.). Retrieved July
23, 2019, from https://www.portseurope.com/egypt-government-calls-for-port-
development/
El-aiatt, A. A. O., Shalloof, K. A. S., & Saber, M. M. (2019). Bio-economic studies
on the catch of Bardawil Lagoon , North Sinai , Egypt. The Egyptian Journal of
Aquatic Research, 45(1), 59–65. https://doi.org/10.1016/j.ejar.2019.03.001
EL-Shimy, M. (2010). Optimal site matching of wind turbine generator: Case study
of the Gulf of Suez region in Egypt. Renewable Energy, 35(8), 1870–1878.
https://doi.org/10.1016/j.renene.2009.12.013
Elsayed, A. (2018). RECENT AND FUTURE EFFICIENCY OF THE NEW SUEZ
CANAL PORTS PROJECT USING DEA-, (April), 0–11.
Elzarka, S., & Elgazzar, S. (2015). Green Port Performance Index for Sustainable
Ports in Egypt : a Fuzzy AHP Green Port Performance Index for Sustainable
Ports in Egypt : a Fuzzy AHP Approach, (July).
Ermida, G. (2014). Strategic decisions of international oil companies: Arctic versus
other regions. Energy Strategy Reviews, 2, 265–272.
https://doi.org/10.1016/j.esr.2013.11.004
ESPO Green Guide. (2012). ESPO GREEN GUIDE.
European Commission. (2017). COMMISSION STAFF WORKING DOCUMENT
Report on the Blue Growth Strategy Towards more sustainable growth and jobs
in the blue economy. Retrieved from
https://ec.europa.eu/maritimeaffairs/sites/maritimeaffairs/files/swd-2017-
128_en.pdf
Ezzat, A. M. (2018). Sustainable Development of Seaport Cities Through Circular
Economy: a Comparative Study With Implications To Suez Canal Corridor
Project. European Journal of Sustainable Development, 5(4), 509–522.
https://doi.org/10.14207/ejsd.2016.v5n4p509
FAO. (2018). WORLD FISHERIES AND AQUACULTURE.
Fibich, T., Bed, B. a, Haindorfer, M. R., & Wiesböck, L. (2018). MIGRATION
AND REMITTANCES, (December). Retrieved from

60
http://www.ifad.org/events/gc/30/roundtable/migration/proceedings.pdf
Forrest, C. (2006). Integrated coastal zone management: A critical overview. WMU
Journal of Maritime Affairs, 5(2), 207–222.
https://doi.org/10.1007/BF03195105
Frihy, O. E., & El-Sayed, M. K. (2013). Vulnerability risk assessment and adaptation
to climate change induced sea level rise along the Mediterranean coast of Egypt.
Mitigation and Adaptation Strategies for Global Change, 18(8), 1215–1237.
https://doi.org/10.1007/s11027-012-9418-y
Haddad, C., Nasr, A., & Ghida, E. (n.d.). How to Re-emerge as a Tourism
Destination after a Period of Political Instability. Retrieved from
http://www3.weforum.org/docs/TT15/WEF_TTCR_Chapter1.3_2015.pdf
Halff, A., Younes, L., & Boersma, T. (2019). The likely implications of the new
IMO standards on the shipping industry. Energy Policy, 126, 277–286.
https://doi.org/10.1016/J.ENPOL.2018.11.033
Hamza, M., & Abdel-Latif, M. (2003). The construction of the Suez Canal. First
International Conference on Maritime Heritage, Maritime Heritage 2003,
March 24, 2003 - March 26, 2003, 65, 121–131.
Hilmi, N., Safa, A., Reynaud, S., & Allemand, D. (2018). Coral-based tourism in
Egypt’s Red Sea. In Coral Reefs: Tourism, Conservation and Management.
https://doi.org/10.4324/9781315537320
Hossain, K. A. (2018). Suez Canal : The Modern Maritime Wonder, 1–10.
Ibrahim, H. S., & Hegazy, I. (2015). Capacity Development for Integrated Coastal
Zone Management in Egypt. Coastal Management, 43(5), 539–554.
https://doi.org/10.1080/08920753.2015.1075281
Investment, E. P., & Financing, C. (n.d.). Enabling Private Investment and
Commercial Financing in Infrastructure.
IPCC. (2019). Special Report: The Ocean and Cryosphere in a Changing Climate,
(September), in preparation. https://doi.org/https://www.ipcc.ch/report/srocc/
Iris, Ç., & Lam, J. S. L. (2019). A review of energy efficiency in ports: Operational
strategies, technologies and energy management systems. Renewable and
61
Sustainable Energy Reviews, 112(May), 170–182.
https://doi.org/10.1016/j.rser.2019.04.069
Kalgora, B., & Christian, T. M. (2016). The Financial and Economic Crisis, Its
Impacts on the Shipping Industry, Lessons to Learn: The Container-Ships
Market Analysis. Open Journal of Social Sciences, 04(01), 38–44.
https://doi.org/10.4236/jss.2016.41005
Kamh, Y. Z., Khalifa, M. A., & El-Bahrawy, A. N. (2016). Comparative Study of
Community Resilience in Mega Coastal Cities Threatened by Sea Level Rise:
The Case of Alexandria and Jakarta. Procedia - Social and Behavioral Sciences,
216, 503–517. https://doi.org/10.1016/j.sbspro.2015.12.007
Katsanevakis, S., Coll, M., Piroddi, C., Steenbeek, J., Ben Rais Lasram, F., Zenetos,
A., & Cardoso, A. C. (2014). Invading the Mediterranean Sea: biodiversity
patterns shaped by human activities. Frontiers in Marine Science,
1(September), 1–11. https://doi.org/10.3389/fmars.2014.00032
KAYA, A. Y., Bitiktaş, F., & Çelik, M. S. (2018). Conference on Social. In Green
Port Concept and Its Legal Backround: An Investigation on Practices in Turkey
and California.
Kenawy, E. (2012). The Economic Impacts of the New Suez Canal.
Kitagawa, H. (2008). Arctic Routing : Challenges and Opportunities, 7(2), 485–503.
Lahav, P. (2015). The Suez crisis of 1956 and its aftermath: A comparative study of
constitutions, use of force, diplomacy and international relations. Boston
University Law Review, 95(4), 1297–1354.
Lakhal, S. Y., & H’Mida, S. (2017). Author the red-med railway project a serious
competitor to the suez canal for cargo containers? Independent Journal of
Management & Production, 8(3), 898. https://doi.org/10.14807/ijmp.v8i3.619
Lam, J. S. L., & Notteboom, T. (2014). The Greening of Ports: A Comparison of
Port Management Tools Used by Leading Ports in Asia and Europe. Transport
Reviews, 34(2), 169–189. https://doi.org/10.1080/01441647.2014.891162
Law, E., Law, P., & Young, M. (2015). Building the Blue Economy : The Role of
Marine Spatial Planning in Facilitating Offshore Renewable Energy

62
Development, 30, 148–173. https://doi.org/10.1163/15718085-12341339
Mahrous, M., Farrag, S., Ahmed, H. O., Mohamed, M., Toutou, M., & Eissawi, M.
M. (2019). Marine Mammals on the Egyptian Mediterranean Coast " Records
and Vulnerability ". International Journal of Ecotoxicology and Ecobiology,
4(1), 8–16. https://doi.org/10.11648/j.ijee.20190401.12
Maria, A., Mazzarella, A. B., Davíðsdóttir, B., Klinger, D. H., Levin, S. A.,
Rovenskaya, E., & Chr, N. (2018). What is blue growth ? The semantics of “
Sustainable Development ” of marine environments. Marine Policy, 87(October
2017), 177–179. https://doi.org/10.1016/j.marpol.2017.10.019
McDermott, R. (2001). The 1956 Suez Crisis. Risk Taking in International Politics,
135–164.
Ministry of Planning, M. and A. R. (2015). Egypt’s Vision 2030. Retrieved from
http://planipolis.iiep.unesco.org/sites/planipolis/files/ressources/egypt_vision_2
030.pdf
Overland, J., Dunlea, E., Box, J. E., Corell, R., Forsius, M., Kattsov, V., … Wang,
M. (2018). The urgency of Arctic change. Polar Science.
https://doi.org/10.1016/J.POLAR.2018.11.008
Öztürk, B. (2015). Nature and extent of the illegal , unreported and unregulated (
IUU ) fishing in the Mediterranean Sea, 21(1), 67–91.
Park, H., Walsh, J. E., Kim, Y., Nakai, T., & Ohata, T. (2013). The role of declining
Arctic sea ice in recent decreasing terrestrial Arctic snow depths. Polar Science,
7(2), 174–187. https://doi.org/10.1016/J.POLAR.2012.10.002
Park, J. Y., & Yeo, G. T. (2012). An evaluation of greenness of major korean ports :
A fuzzy set approach. Asian Journal of Shipping and Logistics, 28(1), 67–82.
https://doi.org/10.1016/j.ajsl.2012.04.004
Popa, V., & Popa, L. (2018). Study on designing an automated system of efficient
HVAC control for energy saving in industrial buildings. IOP Conference
Series: Materials Science and Engineering, 400(2), 0–14.
https://doi.org/10.1088/1757-899X/400/2/022047
Port of Rotterdam Authority. (2019). ROOM FOR TODAY AND TOMORROW .

63
MAKE IT HAPPEN .
Puig, M., Wooldridge, C., & Darbra, R. M. (2014). Identification and selection of
Environmental Performance Indicators for sustainable port development.
Marine Pollution Bulletin, 81(1), 124–130.
https://doi.org/10.1016/J.MARPOLBUL.2014.02.006
Raey, M. El, Dewidar, K., & Hattab, M. El. (1999). Adaptation to the impacts of sea
level rise in Egypt, 12(3), 117–128.
Rashid, A. (2009). Transarctic routes : impact and opportunities for ports. World
Maritime University Dissertations.
Rickels, W., Weigand, C., Grasse, P., Schmidt, J., & Voss, R. (2019). Does the
European Union achieve comprehensive blue growth ? Progress of EU coastal
states in the Baltic and North Sea , and the Atlantic Ocean against sustainable
development goal 14. Marine Policy, 106(September 2018), 103515.
https://doi.org/10.1016/j.marpol.2019.103515
Romero, A. F., Asmus, M. L., Milanelli, J. C. C., Buruaem, L., & Abessa, D. M. S.
(2014). Self-diagnosis method as an assessment tool for environmental
management of Brazilian ports. Revista de Gestão Costeira Integrada, 14(4),
637–644. https://doi.org/10.5894/rgci520
Roy, B., & Comer, B. (2017). Alternatives to heavy fuel oil use in the Arctic:
Economic and environmental tradeoffs. Retrieved from
https://www.theicct.org/sites/default/files/publications/Arctic-HFO-
alternatives_ICCT_Working-Paper_04182017_vF.pdf
Samadi, S., Schneider, C., & Lechtenböhmer, S. (2018). Deep decarbonisation
pathways for the industrial cluster of the Port of Rotterdam. Eceee Industrial
Summer Study Proceedings, 2018-June, 399–409.
Samy, M., Sánchez Lizaso, J. L., & Forcada, A. (2011). Status of marine protected
areas in Egypt. Animal Biodiversity and Conservation, 34(1), 165–177.
Saxon, S., & Stone, M. (2017). Container shipping : The next 50 years, (September).
Shaalan, M., El-Mahdy, M., Saleh, M., & El-Matbouli, M. (2018). Aquaculture in
Egypt: Insights on the Current Trends and Future Perspectives for Sustainable

64
Development. Reviews in Fisheries Science & Aquaculture, 26(1), 99–110.
https://doi.org/10.1080/23308249.2017.1358696
SRM, & ALexBank. (2018). The Suez Canal after the expansion Analysis of the
traffic , competitiveness indicators , the challenges of the BRI and the role of
the Free Zone.
State Information Service Egypt. (2016). State Information Service. State
Information Service. Retrieved from http://www.sis.gov.eg/En/Default.aspx
Statistics, S. T. (2018). Annual Report. Retrieved from https://www.sec.gov/cgi-
bin/viewer?action=view&cik=1310067&accession_number=0001310067-18-
000006&xbrl_type=v#
Stevenson, T. C., Davies, J., Huntington, H. P., & Sheard, W. (2018). An
examination of trans-Arctic vessel routing in the Central Arctic Ocean. Marine
Policy. https://doi.org/10.1016/J.MARPOL.2018.11.031
Suez Canal Container Terminal Set To Reinstate Connectivity And Competitiveness.
(n.d.). Retrieved July 22, 2019, from
https://www.apmterminals.com/en/news/news-releases/2019/190508-Suez-
Canal-Container-Terminal-set-to-reinstate-connectivity-and-competitiveness
Sywelem, M. M. G. (2015). Literacy and Adult Education in Egypt: Achievements
and Challenges. American Journal of Educational Research, 3(7), 793–799.
https://doi.org/10.12691/education-3-7-1
Tabet, L., & Fanning, L. (2012). Integrated coastal zone management under
authoritarian rule: An evaluation framework of coastal governance in Egypt.
Ocean and Coastal Management, 61, 1–9.
https://doi.org/10.1016/j.ocecoaman.2012.01.006
U.S. Energy Information Administration (EIA). (2017). World Oil Transit
Chokepoints, 2014, 14. Retrieved from
http://www.eia.gov/countries/analysisbriefs/World_Oil_Transit_Chokepoints/w
otc.pdf
Verny, J., & Grigentin, C. (2009). Container shipping on the Northern Sea Route.
International Journal of Production Economics, 122(1), 107–117.

65
https://doi.org/10.1016/j.ijpe.2009.03.018
Wan, C., Zhang, D., Yan, X., & Yang, Z. (2018). A novel model for the quantitative
evaluation of green port development – A case study of major ports in China.
Transportation Research Part D: Transport and Environment, 61, 431–443.
https://doi.org/10.1016/j.trd.2017.06.021
Wang, H., Zhang, Y., & Meng, Q. (2018). How will the opening of the Northern Sea
Route influence the Suez Canal Route? An empirical analysis with discrete
choice models. Transportation Research Part A: Policy and Practice, 107, 75–
89. https://doi.org/10.1016/j.tra.2017.11.010
Wang, L., Zheng, Y., Ducruet, C., & Zhang, F. (2019). Investment strategy of
Chinese terminal operators along the “21st-Century Maritime Silk Road.”
Sustainability (Switzerland), 11(7). https://doi.org/10.3390/su1102066
Yahya, N. (2019). Adopting a Green Port Standard for World ’ s Sustainability, 2(2),
1–11.
Yihdego, Y., Khalil, A., & Salem, H. S. (2017). Nile River ’ s Basin Dispute :
Perspectives of the Grand Ethiopian Renaissance Dam ( GERD ). Global
Journal of Environmental Science and Management, 17(2).
Zakaria, H. Y. (2015). Article Review: Lessepsian migration of zooplankton through
Suez Canal and its impact on ecological system. Egyptian Journal of Aquatic
Research, 41(2), 129–144. https://doi.org/10.1016/j.ejar.2015.04.001
Zdravev, A. Z. (2017). Port Sustainability Practices: A Case Study of Port of
Rotterdam and Port of Los Angeles.
Zero carbon at sea? Rotterdam port eyes a greener future - Environment - The
Jakarta Post. (n.d.). Retrieved July 21, 2019, from
https://www.thejakartapost.com/life/2018/10/23/zero-carbon-at-sea-rotterdam-
port-eyes-a-greener-future.html

66

67

68