Small-polaron resistivity of the narrow band molecular chain: The influence of phonon hardening
Upload
independentCategory
view
1download
0
arX
iv:0
904.
3630
v1 [
cond
-mat
.mtr
l-sc
i] 2
3 A
pr 2
009
Low temperature and high pressure Raman and x-ray studies of
pyrochlore Tb2Ti2O7 : phonon anomalies and possible phase
transition
Surajit Saha,1 D. V. S Muthu,1 Surjeet Singh,2 B. Dkhil,3 R.
Suryanarayanan,2 G. Dhalenne,2 H. K. Poswal,4 S. Karmakar,4
Surinder M. Sharma,4 A. Revcolevschi,2 and A. K. Sood1∗
1Department of Physics, Indian Institute of Science, Bangalore - 560012, India.
2Laboratoire de Physico-Chimie de l’Etat Solide,
ICMMO, CNRS, UMR8648, Bat 414,
Universite Paris-Sud, 91405 Orsay, France.
3Laboratoire Structures, Proprietes et Modelisation des Solides,
Ecole Centrale Paris, CNRS-UMR8580, Grande voie des vignes,
92295 Chatenay-Malabry Cedex, France and
4Synchrotron Radiation Section, Bhabha Atomic Research Centre, Mumbai 400085, India
(Dated: April 23, 2009)
Abstract
We have carried out temperature and pressure-dependent Raman and x-ray measurements on
single crystals of Tb2Ti2O7. We attribute the observed anomalous temperature dependence of
phonons to phonon-phonon anharmonic interactions. The quasiharmonic and anharmonic contri-
butions to the temperature-dependent changes in phonon frequencies are estimated quantitatively
using mode Gruneisen parameters derived from pressure-dependent Raman experiments and bulk
modulus from high pressure x-ray measurements. Further, our Raman and x-ray data suggest a
subtle structural deformation of the pyrochlore lattice at ∼ 9 GPa. We discuss possible implications
of our results on the spin-liquid behaviour of Tb2Ti2O7.
PACS numbers: 78.30.-j, 61.05.cp, 61.50.Ks, 63.20.kg
∗Electronic address: [email protected], Phone: +91-80-22932964
1
I. INTRODUCTION
Insulating rare-earth titanate pyrochlores (A2Ti2O7, where A is tri-positive rare-earth
ion) are known to show complex magnetic behaviors, arising from the geometrical frustra-
tion of exchange interaction between the rare-earth spins located on an infinite network of
corner-sharing tetrahedrons [1]. Theoretically, for antiferromagnetically coupled classical or
Heisenberg spins on the pyrochlore lattice the magnetic ground state should be infinitely
degenerate [2]. However, the ubiquitous presence of residual terms, like next near-neighbor
interactions, crystal field and dipolar interactions can remove this macroscopic degeneracy ei-
ther completely or partially leading often to complex spin structures at low temperatures [3].
The only member of the A2Ti2O7 series where the presence of residual terms has apparently
no significant influence on the spin-dynamics is Tb2Ti2O7. In this pyrochlore, the strength
of antiferromagnetic exchange is of the order of 20 K, however despite this, the Tb3+ spins
show no signs of freezing or long-range ordering down to a temperature of at least 70 mK
[4]. It has been shown, however, that this “collective paramagnetic” or the so-called “spin-
liquid” state of Tb3+ moments is instable under high-pressure [5]. Using powder neutron
diffraction experiments, Mirebeau et al. [5] showed that application of iso-static pressure
of about 8.6 GPa in Tb2Ti2O7 induces a long-range order of Tb spins coexisting with the
spin-liquid. Since no indication of pressure induced structural deformation was observed in
this study, the spin-crystallization, under pressure, was believed to have resulted from the
break-down of a delicate balance among the residual terms.
Recently, the vibrational properties of some of these pyrochlores have been investigated
by several groups [6, 7, 8, 9, 10, 11, 12, 13, 14]. These studies not only show that phonons
in the titanate pyrochlores are highly anomalous, but also indicate the extreme sensitivity
of vibrational spectroscopy towards probing subtle structural and electronic features not
observed. In the pyrochlore Dy2Ti2O7, Raman spectroscopy revealed a subtle structural
deformation of the pyrochlore lattice upon cooling below T = 100 K [6]. In the pyrochlore
Tb2Ti2O7, new crystal-field (CF) excitations were identified using Raman data at T = 4
K [7]. In the temperature-dependent studies, signature of highly anomalous phonons (i.e.,
decrease of phonon frequency upon cooling; also referred to as phonon softening) has been
witnessed in the pyrochlores Er2Ti2O7 [8], Gd2Ti2O7 [8, 9] and Dy2Ti2O7 [6, 8, 9, 10]. The
effect of pressure, at ambient temperature, has also been studied recently for several of these
2
titanate pyrochlores. Sm2Ti2O7 and Gd2Ti2O7 pick up anion disorder above 40 GPa and
become amorphous above 51 GPa [11, 12]. Gd2Ti2O7 exhibits a structural deformation near
9 GPa [13].
In this paper we present Raman and powder x-ray diffraction studies on the pyrochlore
Tb2Ti2O7. These studies were carried out in the temperature range between room temper-
ature and 27 K; and pressure varying from ambient pressure to 25 GPa. Our study reveals
highly anomalous softening of the phonons upon cooling. To understand this anomalous
behavior, we have estimated the quasiharmonic contribution to the temperature-dependent
shift of the frequencies of different Raman phonons using the mode Gruneisen parameters
obtained from high-pressure Raman data; and bulk modulus and thermal expansion co-
efficient obtained from high-pressure and temperature-dependent powder x-ray diffraction
data, respectively. These analyses allow us to extract the changes in the phonon frequencies
arising solely due to anharmonic interactions. We also bring out the effect of pressure on
phonons manifesting a subtle structural deformation of the lattice near 9 GPa which is cor-
roborated by a change in the bulk modulus by ∼ 62%. This observation may have relevance
to the observations of powder neutron scattering study [5] mentioned above. While this
paper was being written, we came across a very recent temperature-dependent study [7]
on this system revealing phonon softening behavior and the coupling of phonons with the
crystal field transitions. We shall compare below our results on the temperature dependence
of phonons with those of this recent study and quantify the quasiharmonic and anharmonic
contributions to the change in phonon frequencies.
II. EXPERIMENTAL TECHNIQUES
A. Crystal growth
Stoichiometric amounts of Tb2O3 (99.99 %) and TiO2 (99.99 %) were mixed thoroughly
and heated at 1200 ◦C for about 15 h. The resulting mixture was well ground and isostati-
cally pressed into rods of about 6 cm long and 5 mm diameter. These rods were sintered at
1400 ◦C in air for about 72 h. This procedure was repeated until the compound Tb2Ti2O7
was formed, as revealed by powder x-ray diffraction analysis, with no traces of any secondary
phase. These rods were then subjected to single crystal growth by the floating-zone method
3
in an infrared image furnace under flowing oxygen. X-ray diffraction measurement was
carried out on the powder obtained by crushing part of a single crystalline sample and en-
ergy dispersive x-ray analysis in a scanning electron microscope indicated a pure pyrochlore
Tb2Ti2O7 phase. The Laue back-reflection technique was used to orient the crystal along
the principal crystallographic directions.
B. Raman measurements
Raman spectroscopic measurements on a (111) cut thin single-crystalline slice (0.5 mm
thick and 3 mm in diameter, polished down to a roughness of almost 10 µm) of Tb2Ti2O7
were performed at low temperatures in back-scattering geometry, using the 514.5 nm line of
an Ar+ ion laser (Spectra-Physics) with ∼ 20 mW of power falling on the sample. Temper-
ature scanning was done using a CTI-Cryogenics Closed Cycle Refrigerator. Temperature
was measured and controlled (with a maximum error of 0.5 K) using a calibrated Pt-sensor
and a CRYO-CON 32B temperature controller. The scattered light was collected by a lens
and was analyzed using a computer controlled SPEX Ramalog spectrometer having two
holographic gratings (1800 groves/mm) coupled to a Peltier-cooled photo multiplier tube
connected to a digital photon counter.
High-pressure Raman experiments were carried out at room temperature up to ∼ 25 GPa
in a Mao-Bell type diamond anvil cell (DAC). A single crystalline Tb2Ti2O7 sample (size
∼ 50 µm) was placed with a ruby chip (size ∼ 10 µm) in a hole of ∼ 200 µm diameter
drilled in a preindented stainless-steel gasket with a mixture of 4:1 methanol and ethanol
as the pressure-transmitting medium. Pressure was calibrated using the ruby fluorescence
technique [15].
C. X-ray diffraction
High resolution x-ray diffraction measurements were performed between 10-300 K (with
temperature accuracy better than 0.5 K) using a highly accurate two-axis diffractometer in
a Bragg-Brentano geometry (focalization circle of 50 µm) using the Cu-Kβ line (λ=1.39223
A) of a 18 kW rotating anode.
For high-pressure x-ray experiments, single crystalline Tb2Ti2O7 samples were crushed
4
into fine powder which was loaded along with a few particles of copper, in a hole of ∼ 120
µm diameter drilled in a preindented (∼ 70 µm thick) tungsten gasket of a Mao-Bell-type
diamond-anvil cell (DAC). The pressure-transmitting medium was methanol-ethanol-water
(16:3:1) mixture, which remains hydrostatic until a pressure of ∼ 15 GPa. Pressure was
determined from the known equation of state of copper [16]. High-pressure angle dispersive
x-ray diffraction experiments were carried out up to ∼ 25 GPa on Tb2Ti2O7 at the 5.2R
(XRD1) beamline of the Elettra Synchrotron source (Italy) with monochromatized x-rays
(λ= 0.69012 A). The diffraction patterns were recorded using a MAR345 imaging plate
detector kept at a distance of ∼ 20 cm from the sample. Two-dimensional (2D) imaging plate
records were transformed into one-dimensional (1D) diffraction profiles by radial integration
of the diffraction rings using the FIT2D software [17].
III. RESULTS
A. Raman spectrum of Tb2Ti2O7
Pyrochlores belong to the space group Fd3m(Oh7 ) with an A2B2O6O
′ stoichiometry, where
A3+ occupies the 16d and B4+ occupies the 16c Wyckoff positions and the oxygen atoms O
and O′ occupy the 48f and 8b sites, respectively. Factor group analysis for this family of
structures gives six Raman active modes (A1g + Eg + 4F2g) and seven infrared active modes
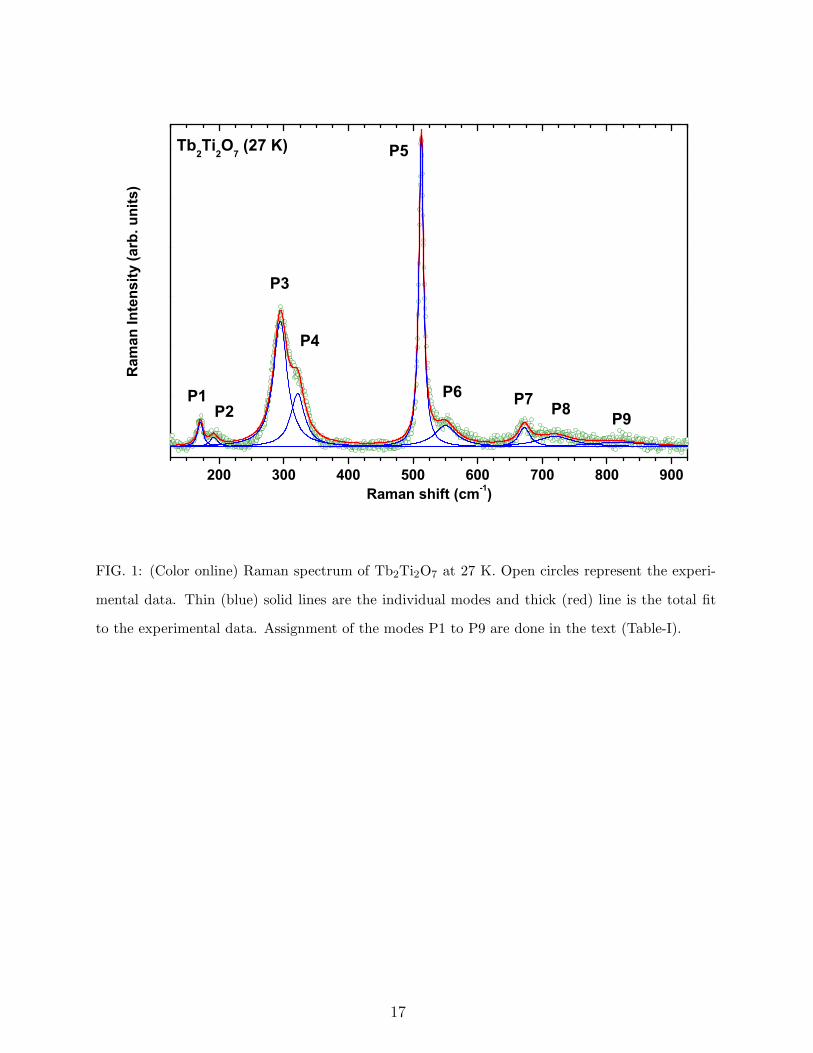
(7F1u). Raman spectra of Tb2Ti2O7 have been recorded between 125 to 925 cm−1 from room
temperature down to 27 K. A strong Rayleigh contribution made the signal to noise ratio
poor below 125 cm−1. Fig. 1 shows the Raman spectrum at 27 K, fitted with Lorentzians
and labeled as P1 to P9. Following previous reports [6, 7, 8, 9, 11, 12, 18, 19, 20], the modes
can be assigned as follows: P3 (294 cm−1, F2g), P4 (325 cm−1, Eg), P5 (513 cm−1, A1g) and
P6 (550 cm−1, F2g). One F2g mode near 425 cm−1 (observed in other pyrochlore titanates
[6, 7, 8]) could not be observed due to weak signal. The mode P1 (170 cm−1) has been
assigned to be the fourth F2g mode by refs. [6, 7, 8, 9, 11, 12, 18, 19, 20]. However, there
has been a controversy on the assignment of the P1 mode [21, 22, 23] and we, therefore,
assign the mode P7 (672 cm−1) as the fourth F2g mode. We support this assignment for the
following reason: it is well established that the symmetry-allowed six Raman active modes
(A1g +Eg +4F2g) in pyrochlore involve only the vibrations of oxygen atoms. This will imply
5
that isotopic substitution by O18 in pyrochlore should lower the phonon frequencies by ∼ 5 %.
This has, indeed, been seen in our recent experiments [21] on Dy2Ti2O7 and Lu2Ti2O7 for the
modes P3 to P9 but not for P1 and P2. Another argument against P7 being a combination
mode is the pressure dependence of the modes presented later (Fig. 7). Possible candidates
for the combination are ωP7 ≈ ωP3 + ωP4 and ωP7 ≈ ωP1 + ωP5. The pressure derivative
of frequency of the mode P7 (dωP7
dP) does not agree with the sum of the pressure derivatives
of the individual modes. Next, the question arises on the origin of the modes P1 and P2.
Since these modes are also seen in Gd2Ti2O7 and in non-magnetic Lu2Ti2O7, their crystal
field (CF) origin can be completely ruled out. We, therefore, attribute these low frequency
modes to disorder induced Raman active modes. The high frequency modes (P8 and P9)
are possibly second-order Raman modes [6, 7, 8].
B. Temperature dependence of phonons
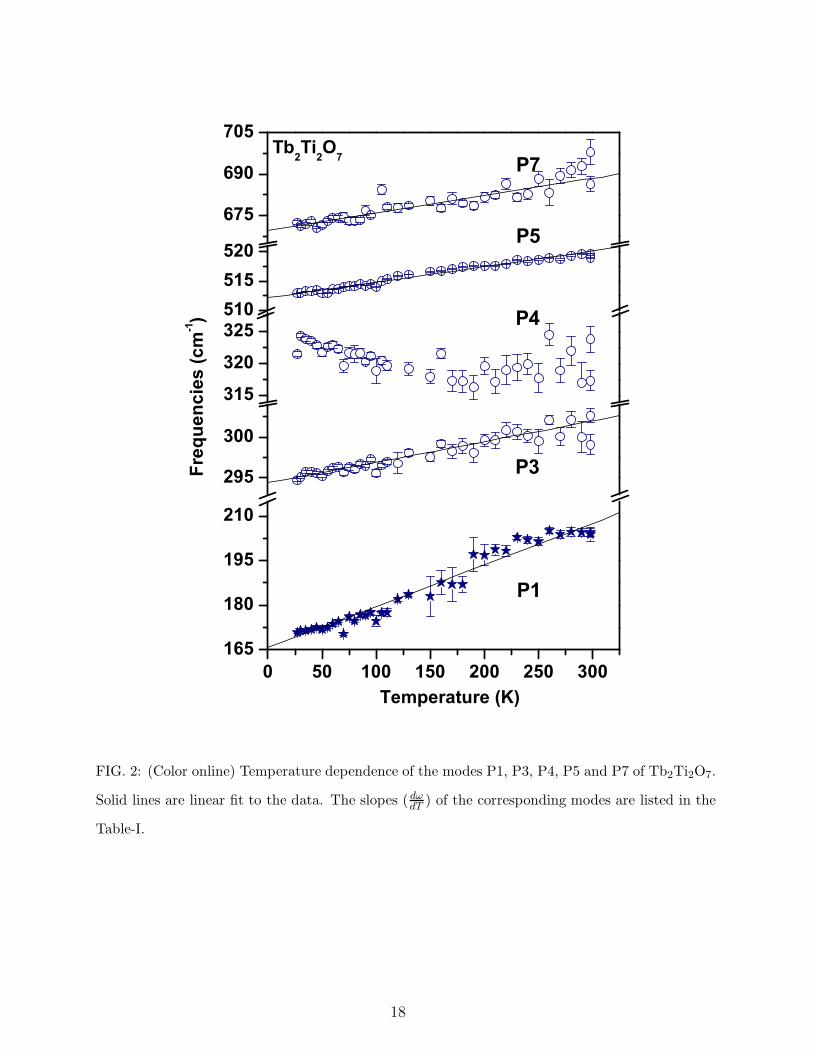
We have recorded Raman spectra of Tb2Ti2O7 from room temperature down to 27 K and
followed the temperature dependence of the modes P1, P3, P4, P5 and P7. As shown in
Fig. 2, the modes P1, P3, P5 and P7 soften with decreasing temperature. Since the Raman
bands P2 and P6 are weak near room temperature, their temperature dependence is not
shown. It needs to be mentioned that temperature-dependent anomalies of the modes P1,
P5 and P7 have also been reported in other pyrochlore titanates [6, 8, 9] and attributed
to phonon-phonon anharmonic interactions. However, anomalous behavior of the F2g(P3)
mode near 300 cm−1 has been reported only in the non-magnetic Lu2Ti2O7 pyrochlore [6].
We evidence a similar anomaly in P3 in Tb2Ti2O7 with unusually broad linewidth. Recently,
Maczka et al. [7] have also reported this unusually broad linewidths in Tb2Ti2O7 which has
been explained in terms of coupling between phonon and crystal field transition.
Temperature dependence of a phonon mode (i) of frequency ωi(T ) can be expressed as
[24],
ωi(T ) = ωi(0) + (∆ωi)total(T )
where, (∆ωi)total(T ) = (∆ωi)qh(T ) + (∆ωi)anh(T )
+(∆ωi)el−ph(T ) + (∆ωi)sp−ph(T ) (1)
The term ωi(0) corresponds to the phonon frequency at absolute zero. In eqn. 1 above, the
6
first term on the right hand side corresponds to quasiharmonic contribution to the frequency
change. The second term corresponds to the intrinsic anharmonic contribution to phonon
frequency that comes from the real part of the self-energy of the phonon decaying into two
phonons (cubic anharmonicity) or three phonons (quartic anharmonicity). The third term
(∆ωi)el−ph is the renormalisation of the phonon energy due to coupling of phonons with
charge carriers in the system which is absent in insulating pyrochlore titanates. The last
term, (∆ωi)sp−ph, is the change in phonon frequency due to spin-phonon coupling arising
from modulation of the spin exchange integral by the lattice vibration. Recently, we have
shown [6] that the magnitude of phonon anomalies is comparable in both magnetic and non-
magnetic pyrochlore titanates, thus ruling out any contribution from spin-phonon coupling.
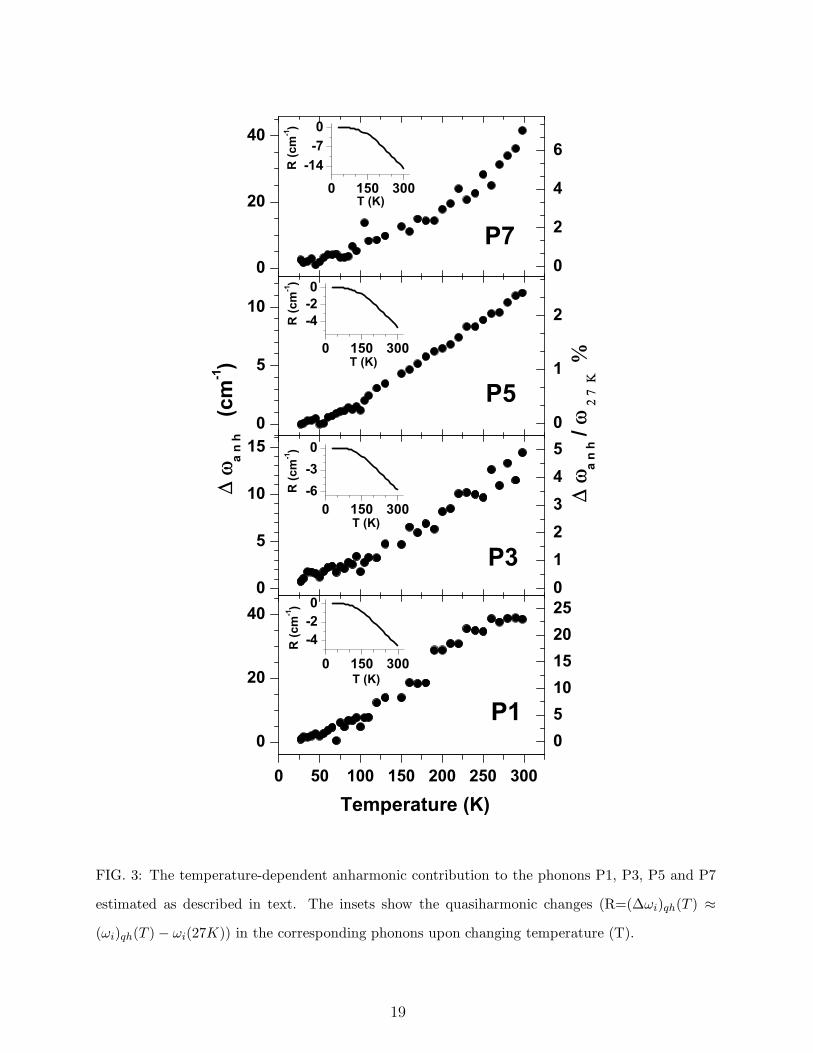
Therefore, the change in phonon frequency is solely due to quasiharmonic and intrinsic
anharmonic effects whose temperature variations, as estimated below for the modes P1, P3,
P5 and P7, are shown in Fig. 3.
The change in phonon frequency due to quasiharmonic effects ((∆ωi)qh(T )) comes from
the change in the unit cell volume. This change can be expressed as [25],
(ωi)qh(T ) − ωi(0) = (∆ωi)qh(T ) = ωi(0) exp
(∫ T
0
γi(T′)αv(T
′) dT ′
)
(2)
where ωi(0) is the frequency of the ith phonon mode at 0 K, γi(T′) is the temperature-
dependent Gruneisen parameter of that phonon and αv(T′) is the temperature-dependent
coefficient of the volume expansion. Since our lowest temperature is 27 K, the quasiharmonic
change can be approximated as,
(∆ωi)qh(T ) ≈ ωi(27K) γi exp
(∫ T
27K
αv(T′) dT ′
)
(3)
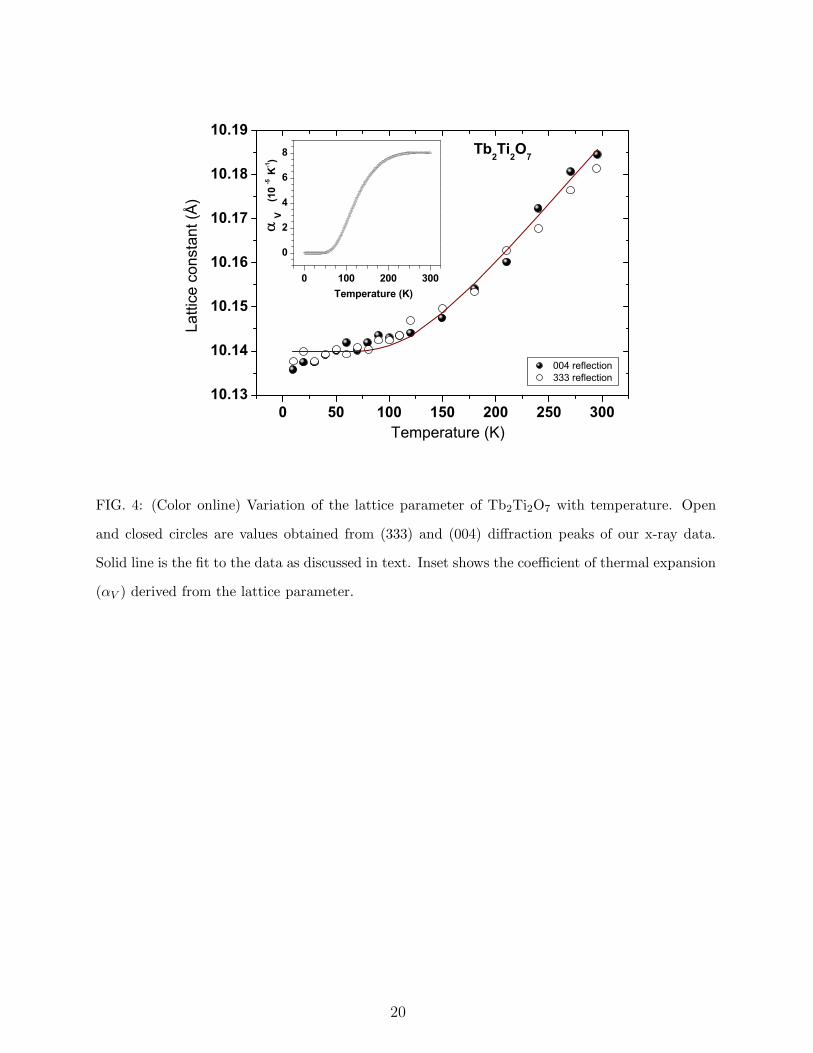
assuming the Gruneisen parameter to be temperature independent. To measure the αv(T ),
we have recorded x-ray diffraction patterns of Tb2Ti2O7 from room temperature to 10 K.
We present the temperature-dependent lattice parameter in Fig. 4. Our data agree with the
recent data by Ruff et al. [26]. The solid line in Fig. 4 is a fit to our data by the relation
a(T ) = a0[1 + bec/T
T (ec/T−1)2], where a0=10.14 A is the lattice constant at 0 K and b=9.45 K
and c=648.5 K are fitting parameters [27]. In a recent study by Ruff et al. [26], it was
shown that the lattice undergoes an anomalous expansion along with broadening of allowed
Bragg peaks as temperature is reduced below ∼ 10 K. This was attributed to structural fluc-
tuation from cubic-to-tetragonal lattice that consequently coincides with the development
7

of correlated spin-liquid ground state in Tb2Ti2O7. Our data are up to 10 K and hence,
we could not observe this feature at low temperatures. We have derived the temperature-
dependent coefficient of thermal expansion (αv = 3a0
dadT
) from the temperature-dependent
lattice parameter which is shown in the inset of Fig. 4. The αv at 300 K for Tb2Ti2O7 is
(∼ 8 × 10⁻⁵K−1), slightly higher than those of Dy2Ti2O7 (∼ 6 × 10⁻⁵K−1) and Lu2Ti2O7
(∼ 4 × 10⁻⁵K−1), estimated from the temperature-dependent x-ray diffraction results re-
ported in ref. [6]. We note that αv(300K) for Tb2Ti2O7 is about 10 times higher than that of
Si [28] and nearly 7 times higher than that of Gd2Zr2O7 [29], implying that the anharmonic
interactions in Tb2Ti2O7 are strong. The mode Gruneisen parameter for ith phonon mode
is γi = Bωi
dωi
dP, where B is the bulk modulus, dωi
dPis the frequency change with pressure P .
Taking B=154 GPa, obtained from our high pressure x-ray diffraction data discussed later,
we find the values of the Gruneisen parameter for the various modes as listed in Table-I. The
change in phonon frequency due to quasiharmonic effect, (∆ωi)qh(T ), has been estimated
for the modes P1, P3, P5 and P7, and is shown in the insets of Fig. 3. The anharmonic
contribution, (∆ωi)anh(T ) = (∆ωi)total(T ) − (∆ωi)qh(T ), for the modes P1, P3, P5 and P7
are shown in Fig. 3. We note that the temperature-dependent (∆ωi)anh(T ) for these four
modes is anomalous. Further, upon changing the temperature from 27 K to 300 K, we find
that for the mode P1, the percentage change in frequency due to anharmonic interactions,
(∆ωi)anh(T )/ωi(27K), is exceptionally high. It is customary to fit the (∆ωi)anh(T ) data by
the expression [24],
(∆ωi)anh(T ) = C
(
1 +2
ehωi(0)
2kBT − 1
)
(4)
where the ith phonon decays into two phonons of equal energy (ωi → ωi
2+ ωi
2). The parameter
“C” can be positive (for normal behavior of phonon) or negative (anomalous phonon) [6, 30].
We have seen that eqn. 4 does not fit to our data of (∆ωi)anh(T ) (fitting not shown in
Fig. 3). This may be because, in the expression for (∆ωi)anh(T ) (eqn. 4), all the decay
channels for the phonons are not taken into account. Therefore, a full calculation for the
anharmonic interactions considering all the possible decay channels is required to understand
the (∆ωi)anh(T ) data, shown in Fig. 3.
Considering only the cubic phonon-phonon anharmonic interactions where a phonon
decays into two phonons of equal energy, the temperature-dependent broadening of the
8
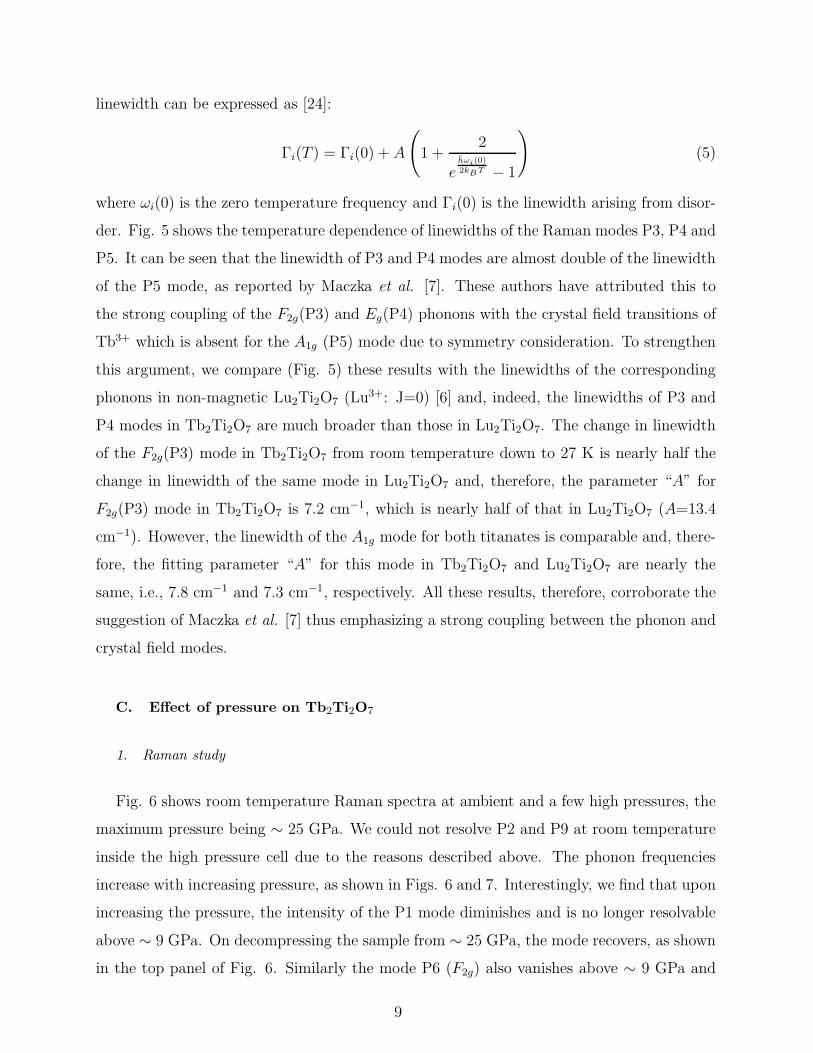
linewidth can be expressed as [24]:
Γi(T ) = Γi(0) + A
(
1 +2
ehωi(0)
2kBT − 1
)
(5)
where ωi(0) is the zero temperature frequency and Γi(0) is the linewidth arising from disor-
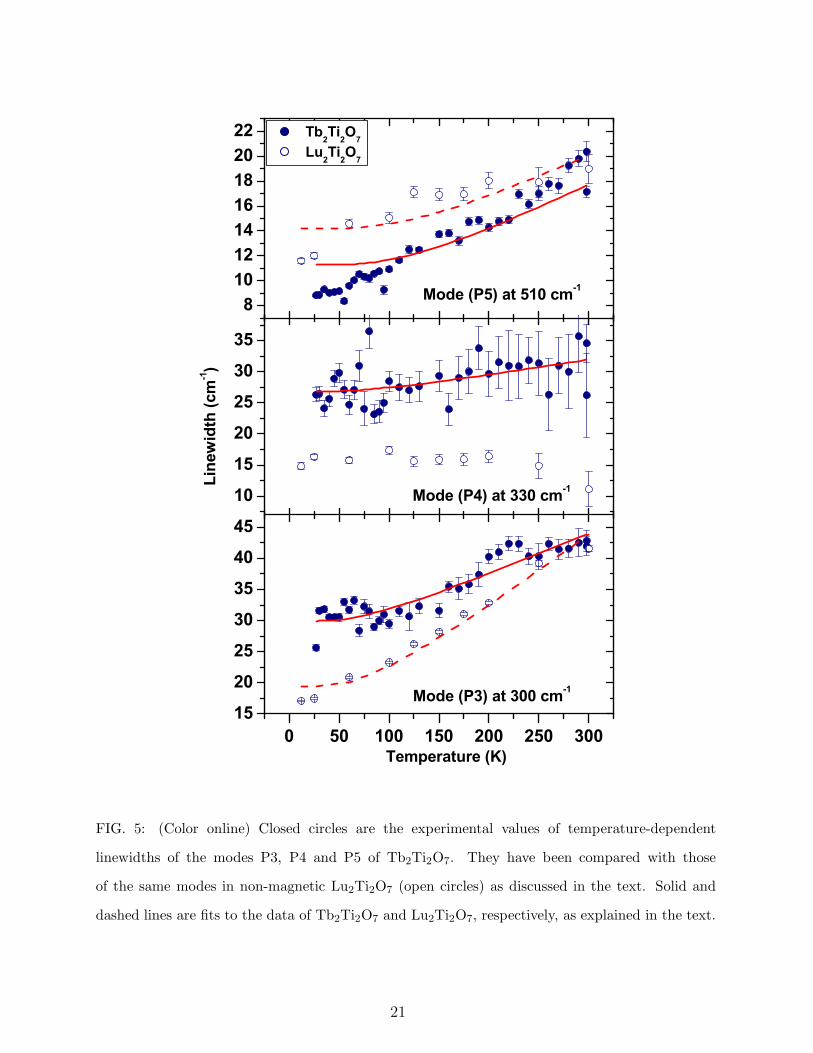
der. Fig. 5 shows the temperature dependence of linewidths of the Raman modes P3, P4 and
P5. It can be seen that the linewidth of P3 and P4 modes are almost double of the linewidth
of the P5 mode, as reported by Maczka et al. [7]. These authors have attributed this to
the strong coupling of the F2g(P3) and Eg(P4) phonons with the crystal field transitions of
Tb3+ which is absent for the A1g (P5) mode due to symmetry consideration. To strengthen
this argument, we compare (Fig. 5) these results with the linewidths of the corresponding
phonons in non-magnetic Lu2Ti2O7 (Lu3+: J=0) [6] and, indeed, the linewidths of P3 and
P4 modes in Tb2Ti2O7 are much broader than those in Lu2Ti2O7. The change in linewidth
of the F2g(P3) mode in Tb2Ti2O7 from room temperature down to 27 K is nearly half the
change in linewidth of the same mode in Lu2Ti2O7 and, therefore, the parameter “A” for
F2g(P3) mode in Tb2Ti2O7 is 7.2 cm−1, which is nearly half of that in Lu2Ti2O7 (A=13.4
cm−1). However, the linewidth of the A1g mode for both titanates is comparable and, there-
fore, the fitting parameter “A” for this mode in Tb2Ti2O7 and Lu2Ti2O7 are nearly the
same, i.e., 7.8 cm−1 and 7.3 cm−1, respectively. All these results, therefore, corroborate the
suggestion of Maczka et al. [7] thus emphasizing a strong coupling between the phonon and
crystal field modes.
C. Effect of pressure on Tb2Ti2O7
1. Raman study
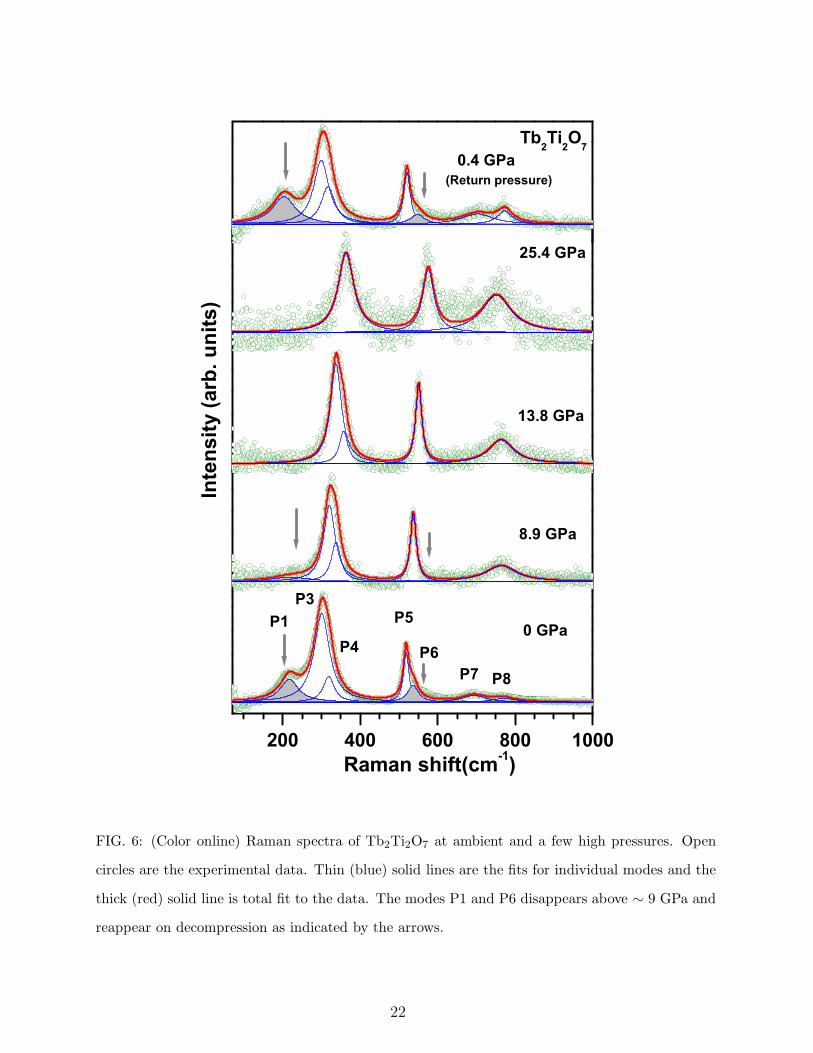
Fig. 6 shows room temperature Raman spectra at ambient and a few high pressures, the
maximum pressure being ∼ 25 GPa. We could not resolve P2 and P9 at room temperature
inside the high pressure cell due to the reasons described above. The phonon frequencies
increase with increasing pressure, as shown in Figs. 6 and 7. Interestingly, we find that upon
increasing the pressure, the intensity of the P1 mode diminishes and is no longer resolvable
above ∼ 9 GPa. On decompressing the sample from ∼ 25 GPa, the mode recovers, as shown
in the top panel of Fig. 6. Similarly the mode P6 (F2g) also vanishes above ∼ 9 GPa and
9
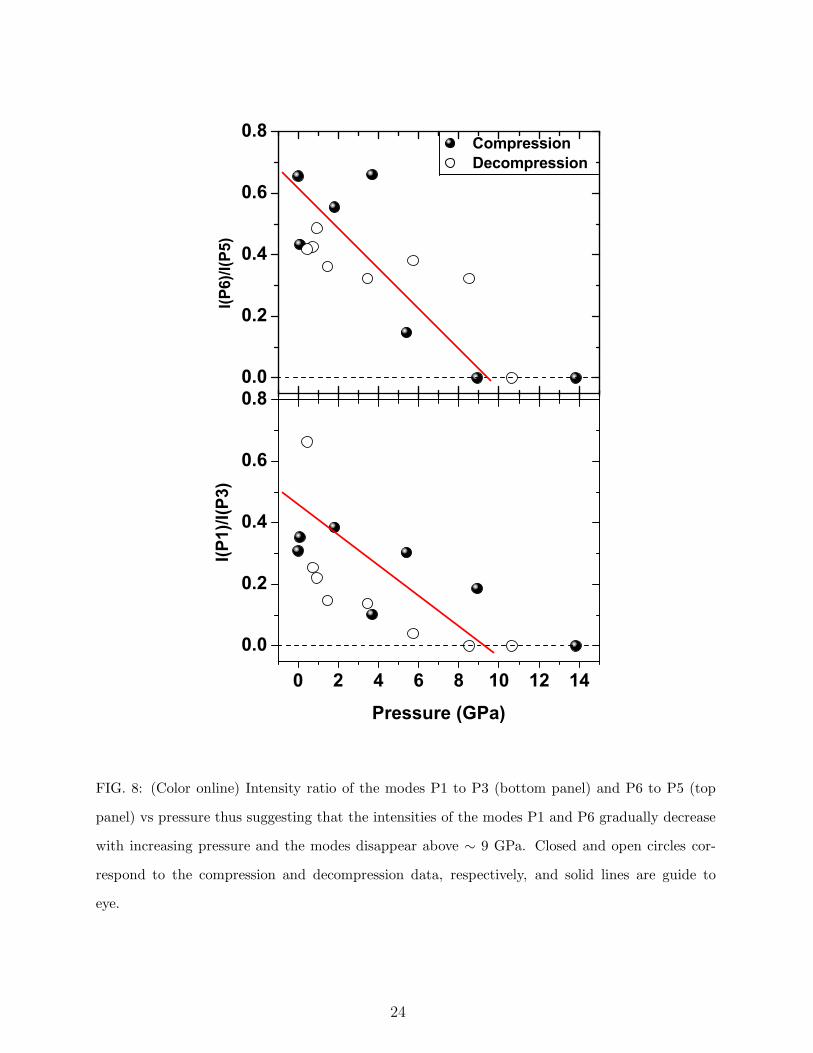
reappears on decompression. The intensity ratios of the modes P1 to P3 and P6 to P5, as
shown in Fig. 8, gradually decrease with increasing pressure and become zero near 9 GPa.
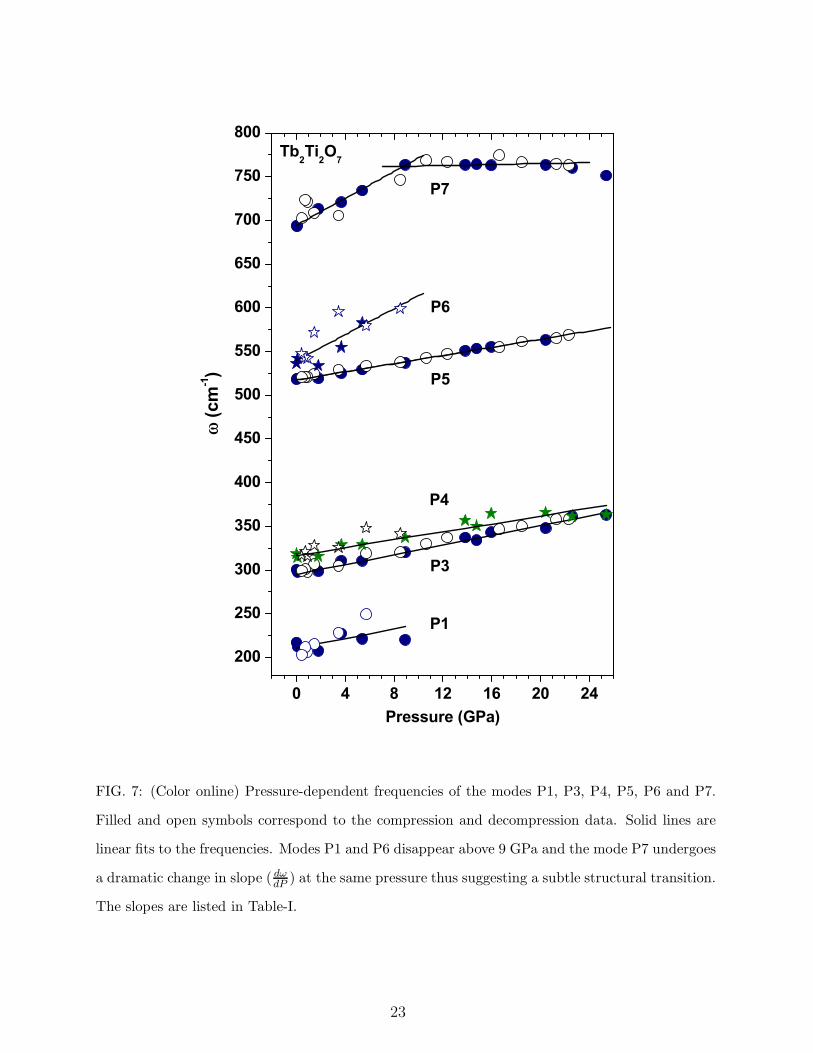
As shown in Fig. 7, the maximum change in phonon frequency is seen in mode P7 (F2g),
which shows a dramatic change in the rate of change of frequency with pressure at a pressure
of ∼ 9 GPa. In sharp contrast, the other modes P3, P4 and P5 do not show any change in
slope till the maximum pressure applied. The changes seen in the modes P1, P6 and P7 near
9 GPa are indicative of a structural transition of the Tb2Ti2O7 lattice. In order to ascertain
the structural transition we have performed high pressure x-ray diffraction measurements
and the results are discussed below.
2. X-ray diffraction
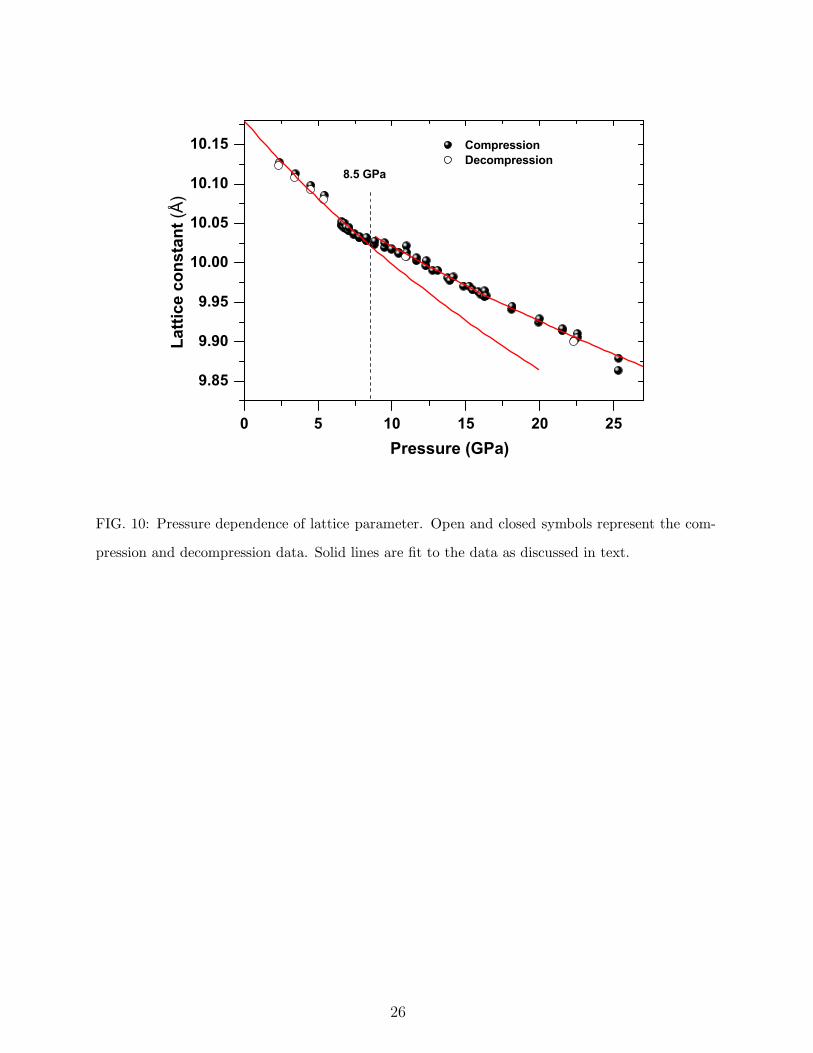
Fig. 9 shows the x-ray diffraction patterns of Tb2Ti2O7 at a few high pressures. The
(hkl) values are marked on the corresponding diffraction peaks. As we increase the pressure,
we find that the diffraction peaks shift to higher angles but no signature of new peak or peak
splitting could be observed. However, the change in lattice parameter with pressure, shown
in Fig. 10, shows a change in slope near 9 GPa implying a structural deformation, thus
corroborating the transition observed in the Raman data. The transition possibly involves
just a local rearrangement of the atoms retaining the cubic symmetry of the crystal. Fitting
the pressure-dependent volume to the third order Birch-Murnaghan equation of state [31], we
find that B = 154 GPa and B′=6.6 when the applied pressure is below 9 GPa. But, when the
applied pressure is above this transition pressure, these values change to B = 250 GPa and
B′ = 7.1 thus implying an increment of the bulk modulus by ∼ 62% after the transition. A
similar transition had also been observed [13] in Gd2Ti2O7 at ∼ 9 GPa and was attributed
to the TiO6 octahedral rearrangement. It needs to be mentioned here that the pressure
transmitting medium (methanol-ethanol mixture, used in our Raman experiments) remains
hydrostatic up to 10 GPa which is close to the transition pressure, thus implying that the
possibility of a contribution from non-hydrostaticity of the medium cannot be completely
ruled out. However, experiments in a non-hydrostatic medium (water) has as well revealed
the transition at ∼ 9 GPa in Gd2Ti2O7 [13]. We, therefore, believe that the transition near
9 GPa is an intrinsic property of Tb2Ti2O7 and also that performing this experiment with
helium as the pressure transmitting medium, will further strengthen our suggestion of a
10
possible transition at ∼ 9 GPa.
IV. SUMMARY AND DISCUSSION
We have performed temperature and pressure-dependent Raman and x-ray diffraction
studies on pyrochlore Tb2Ti2O7 and the main results can be summarised as follows: (1) The
phonon frequencies show anomalous temperature dependence, (2) the linewidths of the F2g
and Eg modes near 300 cm−1 are unusually broad in comparison to those of non-magnetic
Lu2Ti2O7 phonons, thus corroborating the suggestion [7] of a possible coupling between
phonons and crystal field transitions, (3) intensities of two phonon modes (P1 and P6) de-
crease to zero as the applied pressure approaches 9 GPa. Another Raman band P7 near
672 cm−1 (F2g) shows a large change in slope ( dωdP
) at ∼ 9 GPa, thus indicating a possi-
ble transition, (4) x-ray diffraction study as a function of pressure reveals an increase in
bulk modulus by ∼ 62% when the applied pressure is above 9 GPa thus corroborating the
transition suggested by Raman data. The phonons in Tb2Ti2O7 show anomalous tempera-
ture dependence which has been attributed to the phonon-phonon anharmonic interactions
[6]. Using the required parameters (γ, B and αv), derived from our high pressure and
temperature-dependent Raman and x-ray experiments, we have estimated the contributions
of quasiharmonic and anharmonic effects (Fig. 3) to the phonon frequencies. We note that
the anharmonicity of the mode P1 (mode near 200 cm−1) is unusually high as compared to
other modes. P1 is a phonon mode which do not involve oxygen but includes the vibrations
of Ti4+ ions [21]. This can be qualitatively understood by examining how Ti4+ and Tb3+
ions are coordinated. There are tetrahedra in the unit cell which are occupied by Ti4+ ions
at the vertices with a vacant 8a-site inside. The later will tend to make the vibrational
amplitudes of Ti4+ ions larger and thus contributing to the high anharmonic nature of the
P1 mode. The high anharmonic behavior of the Raman modes involving 48f -oxygen ions
arises due to the fact that the O48f anions are off centered towards the 8a-vacant site from
their ideal position 38a to (3
8−x)a inside the tetrahedra [32] whose two vertices are occupied
by Ti4+ and other two by Tb3+. Here a is the lattice parameter and x is the O48f positional
parameter. This anharmonicity is reflected in the high root mean squared displacement
(√
〈u2〉) of O48f atoms :
√〈u2〉
dTb−O≈ 3% [33], where dTb−O is the Tb-O bond length.
Pressure-dependent Raman data show that two Raman modes, P1 and P6, cannot be seen
11
above Pc ∼ 9 GPa and the P7 (F2g) Raman band shows a significant change in the slope
( dωdP
) at Pc. These results suggest a subtle stuctural deformation which gets corroborated
by a change in bulk modulus seen in pressure-dependent x-ray experiments. However, the
pressure-dependent x-ray data do not reveal any new diffraction peak or splitting of line.
This implies that the structural deformation near 9 GPa, as inferred from the Raman study,
is a local distortion of the lattice. It may be possible that as pressure increases, due to the
vacancies at the 8a-sites, the Ti4+-ions adjust their local coordinates with a concomitant
relocation of other atoms in the lattice. At this instant, we would like to recall the results of a
neutron scattering experiment on Tb2Ti2O7 by Mirebeau et al. with a simultaneous change
in pressure and temperature [5]. It was seen that at 1.5 K, antiferromagnetic correlations
develop in Tb2Ti2O7 at a pressure of 8.6 GPa. This was attributed to the delicate balance
among the exchange coupling, crystal field and dipolar interactions that gets destroyed under
high pressure. Our high pressure Raman and x-ray experiments on Tb2Ti2O7 suggest a local
rearrangement of the atoms near 9 GPa retaining the cubic symmetry which, we believe, may
contribute to the antiferromagnetic correlations observed in neutron scattering experiments
[5]. The possibility of a structural transition in Tb2Ti2O7 at low temperatures has recently
been relooked. As discussed in section III(B), Ruff et al. [26] suggested an onset of cubic-to-
tetragonal structual fluctuations below 20 K. A simultaneous presence of a CF mode at ∼ 13
cm−1 in Raman and infrared spectrosopic measurements led Lummen et al. [9] to propose
a broken inversion symmetry in Tb2Ti2O7 at low temperatures. The authors suggested the
presence of a second Tb3+ site with different site symmetry at low temperatures. Followed
by this, Curnoe [34] has proposed that a structural transition can occur at low temperatures
with an A2u lattice distortion resulting in a change of the point group symmetry, leaving
the cubic lattice unchanged. Our Raman spectroscopic observations of a transition near 9
GPa may be related to the above discussion and can contribute to the increase in magnetic
correlation observed by Mirebeau et al. [5]. It will be relevant to do high pressure Raman
experiments at helium temperatures to strengthen our suggestion.
V. CONCLUSION
To conclude, our Raman spectroscopic and x-ray diffraction experiments on single crys-
tals of pyorhclore Tb2Ti2O7, with temperature, reveal highly anomalous temperature-
12
dependent phonons attributed to strong phonon-phonon anharmonic interactions. Our
pressure-dependent Raman and x-ray diffraction experiments suggest a local deformation
of the pyrochlore lattice near 9 GPa. We believe that our experimental results play an im-
portant role in enriching the understanding of pyrochlore titanates, especially the spin-liquid
Tb2Ti2O7, thus motivating further experimental and theoretical studies on these exotic sys-
tems.
Acknowledgments
We thank the Indo-French Centre for Promotion of Advanced Research (IFCPAR), Centre
Franco-Indien pour la Promotion de la Recherche Avancee (CEFIPRA) for financial support
under Project No. 3108-1. AKS thanks the Department of Science and Technology (DST),
India, for partial financial support.
[1] A. P. Ramirez, Annu. Rev. Mater. Sci. 24, 453 (1994).
[2] R. Moessner and A. P. Ramirez, Phys. Today 59 (2), 24 (2006).
[3] John E. Greedan, J. Alloys and Compounds 408-412, 444 (2006).
[4] J. S. Gardner, S. R. Dunsiger, B. D. Gaulin, M. J. P. Gingras, J. E. Greedan, R. F. Kiefl,
M. D. Lumsden, W. A. MacFarlane, N. P. Raju, J. E. Sonier, I. Swainson, and Z. Tun, Phys.
Rev. Lett. 82, 1012 (1999).
[5] I. Mirebeau, I. N. Goncharenko, P. Cadavez-Peres, S. T. Bramwell, M. J. P. Gingras, and J.
S. Gardner, Nature 420, 54 (2002).
[6] Surajit Saha, Surjeet Singh, B. Dkhil, S. Dhar, R. Suryanarayanan, G. Dhalenne, A.
Revcolevschi, and A. K. Sood, Phys. Rev. B 78, 214102 (2008).
[7] M. Maczka, M. L. Sanjuan, A. F. Fuentes, K. Hermanowicz, and J. Hanuza, Phys. Rev. B 78,
134420 (2008).
[8] M. Maczka, J. Hanuza, K. Hermanowicz, A. F. Fuentes, K. Matsuhira and Z. Hiroi, J. Raman
Spectrosc. 39, 537 (2008).
[9] T. T. A. Lummen, I. P. Handayani, M. C. Donker, D. Fausti, G. Dhalenne, P. Berthet, A.
Revcolevschi, and P. H. M. van Loosdrecht, Phys. Rev. B 77, 214310 (2008).
13
[10] C. Z. Bi, J. Y. Ma, B. R. Zhao, Z. Tang, D. Yin, C. Z. Li, D. Z. Yao, J. Shi, and X. G. Qiu,
J. Phys.: Condens. Matter 17, 5225 (2005).
[11] F. X. Zhang, B. Manoun, S. K. Saxena, and C. S. Zha, Appl. Phys. Lett. 86, 181906 (2005).
[12] F. X. Zhang and S. K. Saxena, Chem. Phys. Lett. 413, 248 (2005).
[13] Surajit Saha, D. V. S. Muthu, C. Pascanut, N. Dragoe, R. Suryanarayanan, G. Dhalenne, A.
Revcolevschi, Sukanta Karmakar, Surinder M. Sharma, and A. K. Sood, Phys. Rev. B 74,
064109 (2006).
[14] Surjeet Singh, Surajit Saha, S. K. Dhar, R. Suryanarayanan, A. K. Sood, and A. Revcolevschi,
Phys. Rev. B 77, 054408 (2008)
[15] Richard A. Forman, Gasper J. Piermarini, J. Dean Barnett, and Stanley Block, Science 176,
284 (1972).
[16] Agnes Dewaele, Paul Loubeyre, and Mohamed Mezouar, Phys. Rev. B 70, 094112 (2004).
[17] A. P. Hammersley, S. O. Svensson, M. Hanfland, A. N. Fitch, and D. Hauserman, High Press.
Res. 14, 235 (1996).
[18] N. J. Hess, B. D. Begg, S. D. Conradson, D. E. McCready, P. L. Gassman, and W. J. Weber,
J. Phys. Chem. B 106, 4663 (2002).
[19] M. T. Vandenborre, E. Husson, J. P. Chatry, and D. Michel, J. Raman Spectrosc. 14, 63
(1983).
[20] H. C. Gupta, Sonal Brown, Neelima Rani, and V. B. Gohel, J. Raman Spectrosc. 32, 41
(2001).
[21] Surajit Saha, Surjeet Singh, R. Suryanarayanan, A. Revcolevschi, and A. K. Sood (Unpub-
lished).
[22] A. J. H. Macke and G. Blasse, J. Inorg. Nucl. Chem. 38, 1407 (1975).
[23] C. Rocchiccioli-Deltcheff and R. Franck, Ann. Chim. 9, 43 (1974).
[24] M. Balkanski, R. F. Wallis, and E. Haro, Phys. Rev. B 28, 1928 (1983).
[25] M. Born and K. Huang, Dynamical theory of crystal lattices, 1st Ed. (Oxford University Press,
Oxford, 1954).
[26] J. P. C. Ruff, B. D. Gaulin, J. P. Castellan, K. C. Rule, J. P. Clancy, J. Rodriguez, and H. A.
Dabkowska, Phys. Rev. Lett. 99, 237202 (2007).
[27] C. Kittel, Introduction to Solid State Physics, 7th Ed. (Wiley, New York, 2003).
[28] Okada, Y. and Y. Tokumaru, J. Appl. Phys. 56, 314 (1984).
14
[29] P. K. Schelling, S. R. Phillpot, and R. W. Grimes, Philos. Mag. Lett. 84, 127 (2004).
[30] M. Cardona, T. Ruf, Sol. Stat. Comm. 117, 201 (2001).
[31] F. Birch, J. Geophys. Res. 83, 1257 (1978).
[32] M. A. Subramanian, G. Aravamudan and G. V. Subba Rao, Prog. Solid Stat. Chem. 15, 55
(1983).
[33] S.-W. Han, J. S. Gardner, and C. H. Booth, Phys. Rev. B 69, 024416 (2004).
[34] S. H. Curnoe, Phys. Rev. B78, 094418 (2008).
15
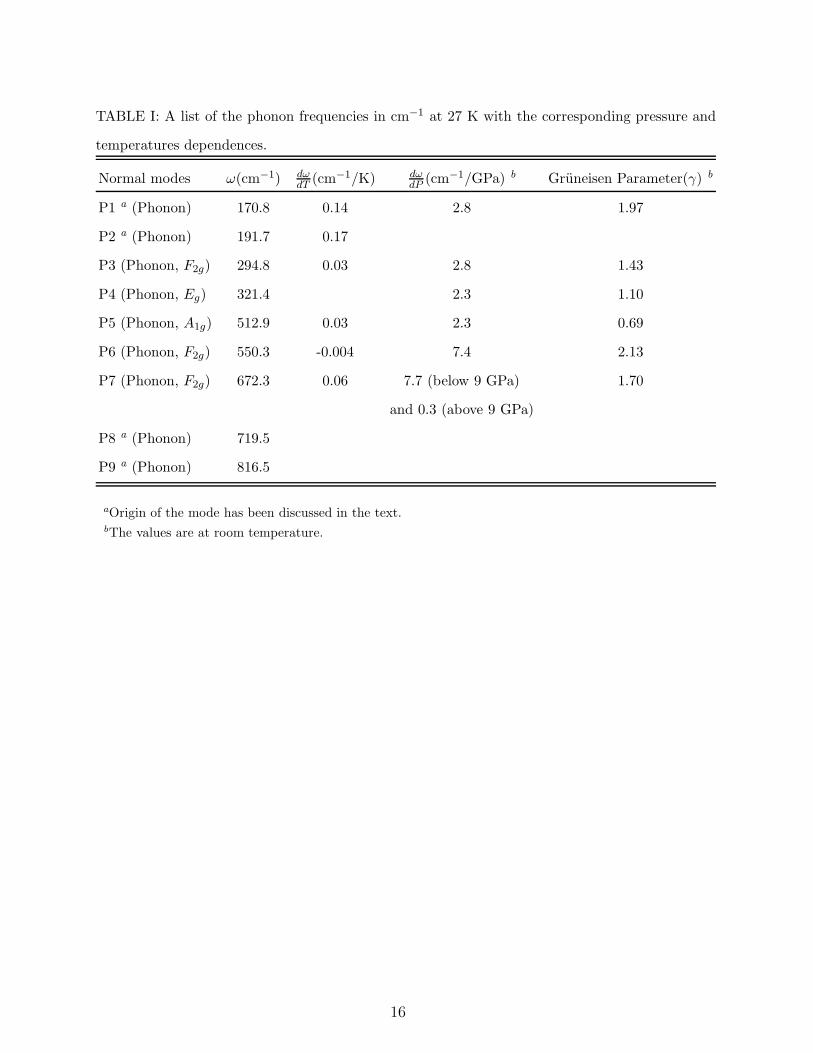
TABLE I: A list of the phonon frequencies in cm−1 at 27 K with the corresponding pressure and
temperatures dependences.
Normal modes ω(cm−1) dωdT
(cm−1/K) dωdP
(cm−1/GPa) b Gruneisen Parameter(γ) b
P1 a (Phonon) 170.8 0.14 2.8 1.97
P2 a (Phonon) 191.7 0.17
P3 (Phonon, F2g) 294.8 0.03 2.8 1.43
P4 (Phonon, Eg) 321.4 2.3 1.10
P5 (Phonon, A1g) 512.9 0.03 2.3 0.69
P6 (Phonon, F2g) 550.3 -0.004 7.4 2.13
P7 (Phonon, F2g) 672.3 0.06 7.7 (below 9 GPa) 1.70
and 0.3 (above 9 GPa)
P8 a (Phonon) 719.5
P9 a (Phonon) 816.5
aOrigin of the mode has been discussed in the text.bThe values are at room temperature.
16
200 300 400 500 600 700 800 900
P9P8P7P6
P5
P4
P3
P2P1
Tb2Ti2O7 (27 K)
Ram
an In
tens
ity (a
rb. u
nits
)
Raman shift (cm-1)
FIG. 1: (Color online) Raman spectrum of Tb2Ti2O7 at 27 K. Open circles represent the experi-
mental data. Thin (blue) solid lines are the individual modes and thick (red) line is the total fit
to the experimental data. Assignment of the modes P1 to P9 are done in the text (Table-I).
17
0 50 100 150 200 250 300165
180
195
210
295
300
315
320
325510515520
675
690
705
P3
P7
P5
P4
P1
Freq
uenc
ies
(cm
-1)
Temperature (K)
Tb2Ti
2O
7
FIG. 2: (Color online) Temperature dependence of the modes P1, P3, P4, P5 and P7 of Tb2Ti2O7.
Solid lines are linear fit to the data. The slopes ( dωdT
) of the corresponding modes are listed in the
Table-I.
18
0 50 100 150 200 250 300
0
20
40
05101520250123450
1
2
0
2
4
6
0 150 300
-4-20
0 150 300-6-30
0 150 300
-4-20
0 150 300-14
-70
P1
a n
h /
a n
h (c
m-1)
0
5
10
15
P3
0
5
10
P5
0
20
40
P7
R (c
m-1)
T (K)
R (c
m-1)
T (K)
R (c
m-1)
T (K)
Temperature (K)
R (c
m-1)
T (K)
FIG. 3: The temperature-dependent anharmonic contribution to the phonons P1, P3, P5 and P7
estimated as described in text. The insets show the quasiharmonic changes (R=(∆ωi)qh(T ) ≈
(ωi)qh(T ) − ωi(27K)) in the corresponding phonons upon changing temperature (T).
19
0 50 100 150 200 250 30010.13
10.14
10.15
10.16
10.17
10.18
10.19
0 100 200 300
0
2
4
6
8
Latti
ce c
onst
ant (
Å)
Temperature (K)
Tb2Ti2O7
004 reflection 333 reflection
(10
-5 K
-1)
Temperature (K)
V
FIG. 4: (Color online) Variation of the lattice parameter of Tb2Ti2O7 with temperature. Open
and closed circles are values obtained from (333) and (004) diffraction peaks of our x-ray data.
Solid line is the fit to the data as discussed in text. Inset shows the coefficient of thermal expansion
(αV ) derived from the lattice parameter.
20
0 50 100 150 200 250 30015
20
25
30
35
40
45
10
15
20
25
30
35
810121416182022
Temperature (K)
Line
wid
th (c
m-1)
Mode (P3) at 300 cm-1
Mode (P4) at 330 cm-1
Mode (P5) at 510 cm-1
Tb2Ti
2O
7 Lu
2Ti
2O
7
FIG. 5: (Color online) Closed circles are the experimental values of temperature-dependent
linewidths of the modes P3, P4 and P5 of Tb2Ti2O7. They have been compared with those
of the same modes in non-magnetic Lu2Ti2O7 (open circles) as discussed in the text. Solid and
dashed lines are fits to the data of Tb2Ti2O7 and Lu2Ti2O7, respectively, as explained in the text.
21
200 400 600 800 1000
8.9 GPa
13.8 GPa
25.4 GPa
(Return pressure)
0.4 GPa
Inte
nsity
(arb
. uni
ts)
P8P7
Tb2Ti2O7
P6
P5
P4
P3P1 0 GPa
Raman shift(cm-1)
FIG. 6: (Color online) Raman spectra of Tb2Ti2O7 at ambient and a few high pressures. Open
circles are the experimental data. Thin (blue) solid lines are the fits for individual modes and the
thick (red) solid line is total fit to the data. The modes P1 and P6 disappears above ∼ 9 GPa and
reappear on decompression as indicated by the arrows.
22
200
250
300
350
400
450
500
550
600
650
700
750
800
0 4 8 12 16 20 24
P5
P3
P1
Tb2Ti2O7
(cm
-1)
P7
P6
P4
Pressure (GPa)
FIG. 7: (Color online) Pressure-dependent frequencies of the modes P1, P3, P4, P5, P6 and P7.
Filled and open symbols correspond to the compression and decompression data. Solid lines are
linear fits to the frequencies. Modes P1 and P6 disappear above 9 GPa and the mode P7 undergoes
a dramatic change in slope ( dωdP
) at the same pressure thus suggesting a subtle structural transition.
The slopes are listed in Table-I.
23
0 2 4 6 8 10 12 14
0.0
0.2
0.4
0.6
0.8
I(P1)
/I(P3
)
Pressure (GPa)
0.0
0.2
0.4
0.6
0.8 Compression Decompression
I(P6)
/I(P5
)
FIG. 8: (Color online) Intensity ratio of the modes P1 to P3 (bottom panel) and P6 to P5 (top
panel) vs pressure thus suggesting that the intensities of the modes P1 and P6 gradually decrease
with increasing pressure and the modes disappear above ∼ 9 GPa. Closed and open circles cor-
respond to the compression and decompression data, respectively, and solid lines are guide to
eye.
24

FIG. 9: X-ray diffraction patterns of pyrochlore Tb2Ti2O7 at a few high pressures. (h k l) values
are marked for each of the diffraction peaks. Stars (*) and open circles (O) represent tungsten
gasket and Cu (pressure marker) peaks, respectively.
25
0 5 10 15 20 25
9.85
9.90
9.95
10.00
10.05
10.10
10.15 Compression Decompression
8.5 GPa
Latti
ce c
onst
ant (
Å)
Pressure (GPa)
FIG. 10: Pressure dependence of lattice parameter. Open and closed symbols represent the com-
pression and decompression data. Solid lines are fit to the data as discussed in text.
26
Copyright © 2022 FDOKUMEN


![Two-phonon coupling to the antiferromagnetic phase transition in multiferroic BiFeO[sub 3]](https://static.fdokumen.com/doc/165x107/6337905e65077fe2dd04246f/two-phonon-coupling-to-the-antiferromagnetic-phase-transition-in-multiferroic-bifeosub.jpg)