
Dynamic links between financial development and 〖CO〗_2 emissions in Nigeria: evidence from ARDL...
474
POSTGRADUATE CONFERENCE ON ECONOMICS, PUBLIC ADMINISTRATION AND BUSINESS (PCEPAB)-5TH SEPTEMBER, 2015 [Type here] PROCEEDINGS Editors: Assoc. Prof. Dr. VGR Chandran Govindaraju Mohammad Nourani Keshminder Singh Jit Singh Md Aslam Mia Shujaat Mubarik
Transcript of Dynamic links between financial development and 〖CO〗_2 emissions in Nigeria: evidence from ARDL...

POSTGRADUATE CONFERENCE ON ECONOMICS, PUBLIC ADMINISTRATION AND
BUSINESS (PCEPAB)-5TH SEPTEMBER, 2015
[Type here]
PROCEEDINGS
Editors:
Assoc. Prof. Dr. VGR Chandran Govindaraju Mohammad Nourani Keshminder Singh Jit Singh Md Aslam Mia Shujaat Mubarik

POSTGRADUATE CONFERENCE ON ECONOMICS, PUBLIC ADMINISTRATION AND
BUSINESS (PCEPAB)-5TH SEPTEMBER, 2015
i
Proceedings of the Postgraduate Conference on Economics, Public
Administration and Business (PCEPAB), 2015
Published by Faculty of Economics and Administration,
University of Malaya
Copyright @ Faculty of Economics and Administration, University of Malaya
All rights reserved.
ISBN 978-967-0380-70-4
Faculty of Economics and Administration
University of Malaya
50603 Kuala Lumpur Malaysia
Tel: +603 7967 3749
Fax: +603 7967 3719
Disclaimer
The views and recommendations expressed by the authors are entirely their own and do not
necessarily reflect the views of the editors, the faculty or the university. While every attempt has
been made to ensure consistency of the format and the layout of the proceedings, the editors are
not responsible for the content of the papers appearing in the proceedings.

POSTGRADUATE CONFERENCE ON ECONOMICS, PUBLIC ADMINISTRATION AND
BUSINESS (PCEPAB)-5TH SEPTEMBER, 2015
ii
Table of Contents
Preface ............................................................................................................................................ iv
Conference Themes......................................................................................................................... v
Message from the Dean ................................................................................................................. vi
Message from the Chairman......................................................................................................... vii
Conference Committee ................................................................................................................ viii
Session 1
Determinants of a Multidimensional Poverty Measurement in Malaysia: An Islamic
Perspective ............................................................................................................................. 1
Financing Higher Education through Waqf Institution: An Alternative Approach .................. 11
Theory of Giving from an Islamic Perspective ........................................................................... 21
An analysis of the reasons behind abuse of Murabaha Contracts in disguised Riba in modern
practices ............................................................................................................................... 31
Session 2
Determinants of board size and independence during the Chinese state enterprises reform: A
comparison between controlling shareholder categories .................................................. 44
Knowledge Creation: The Mediator Effect Between Customer Knowledge Exploration and
Firm Knowledge Exploitation in Product-Service Design ............................................... 65
Risk Management Committee’s Characteristics, its Prestige and Efficiency Performance ..... 90
The Performance and Earnings Management of ASEAN Banks in the Liberalization Era ... 117
Session 3
A Review of Information System-based Decision Making on Prosperous Relationship
Marketing ........................................................................................................................... 135
Investors’ vulnerability to anchoring and adjustment, representativeness and availability
heuristics: A comparative analysis of Malaysian and Pakistani Stock Markets ........... 143
Government Expenditure Policy Analysis in Malaysia: A Social Accounting Matrix Approach
............................................................................................................................................ 164
Impact of Information and Communication Technology on Remittance Flow: A Developing
Countries’ Perspective ...................................................................................................... 180
Session 4
Deconstructing the Narratives of Security State and the Role of Power Elite ........................ 196
Market Dynamics and Multiple Borrowing in Microfinance: The Case of Bangladesh ........ 208
The Role of Professionalism, Leadership, and Trust to Promote Organizational Justice ...... 230
The Impact of Human Values and Organizational Citizenship Behaviors on Service Quality
............................................................................................................................................ 271
Session 5
System Dynamics Analysis of the Biodiesel and CPO Productions in Malaysia..................... 272

POSTGRADUATE CONFERENCE ON ECONOMICS, PUBLIC ADMINISTRATION AND
BUSINESS (PCEPAB)-5TH SEPTEMBER, 2015
iii
Dynamic links between financial development and 𝑪𝑶𝟐 emissions in Nigeria: evidence from
ARDL bound test framework ........................................................................................... 282
Bell-Metal Industry of Assam: Some Problems and an Alternative Operating Framework 292
The Mechanics Behind Environmental Strategies in Chemical Manufacturing Firms .......... 308
Exploring Motivational Factors towards Sustainable Consumption: An empirical study in
Malaysia ............................................................................................................................. 309
Session 6
The Economic Impact of Terrorism: A new Model and is Application .................................. 320
Linear and Nonlinear Causal Relationship Between Energy Consumption and Economic
Growth in China: New Evidence Based on Wavelet Analysis ...................................... 321
Steering and Coordinating Society in Urban Governance........................................................ 343
Clustering, Cooperation and Innovation in Developing Countries: Evidence from a Large
Footwear Cluster in Nigeria ............................................................................................. 354
Session 7
Does Terrorism Affect The Economic Performance? The Empirical Analysis Of Islamic
States In Iraq And Syria (ISIS) And Pakistan ................................................................. 370
Aquaculture: A Source of Health and Wealth of Bangladesh .................................................. 371
Women Empowerment through Entrepreneurship: a Case Study of Hulu Terengganu,
Malaysia ............................................................................................................................. 372
Impact of Increasing Marginal Cost on Recreational Visits: Case of Lake View Park in
Pakistan .............................................................................................................................. 402
Session 8
Impacts of Goods and Services Tax on the Income Distribution............................................. 412
The Influence of Host Country National Support on Expatriate Success in Malaysia ........... 426
Does Government Investment Crowd-in Or Crowd-out Private Investment in Malaysia?.... 448
External Debt Financing of Public Capital Formation: Empirical Evidence from Nigeria ... 456

POSTGRADUATE CONFERENCE ON ECONOMICS, PUBLIC ADMINISTRATION AND
BUSINESS (PCEPAB)-5TH SEPTEMBER, 2015
iv
Preface
PCEPAB 2015 is the first conference of its kind that aims to provide a strategic platform for
postgraduate students to enhance their research core competency. Over the past 10 years, the
research field has been on the verge of innovation starting from the emergence of advanced
research methodologies to top-notch publication requirements. This change has posed a
dilemma for many students looking for a way to survive in an excellent intellectual
environment. Therefore, it is essential to develop a strong collaboration and network among
postgraduates. Universities around the globe also recognize that in spite of the superior
experience of academic staff in research activities, postgraduate students as members of the
major research body of any university have very high motivation to create research networks.
With the theme ‘Promoting Growth, Excellence and Sustainability’, PCEPAB 2015 aspires:
1. To provide a research environment for postgraduate students to disseminate their ideas
with others and to create ‘research networks’.
2. To enhance and encourage the ‘research culture’ among the postgraduate students.
3. To provide opportunities for postgraduate students in Malaysia and overseas to
exchange their knowledge in research.
4. To provide a platform for new students to develop research abilities and to carry out
research work more effectively.
5. To increase the confidence level of postgraduate students.
This gathering of research minds is expected to thrust research into a more sophisticated arena
whereby strategic networking will be the key to solve growing research problems.
September 2015

POSTGRADUATE CONFERENCE ON ECONOMICS, PUBLIC ADMINISTRATION AND
BUSINESS (PCEPAB)-5TH SEPTEMBER, 2015
v
Conference Themes
Theme 1: Emerging Trends in Economics
The first theme of the conference encapsulates the emerging trends in economics. These
trends are entrenched from new methodologies to new economic theories and application. The
interesting point of this theme is that it combines both theoretical and applied research on one
platform. Importantly, this theme covers the areas from industrial organization, development
economics, financial economics, and Islamic economics to economic systems with special
attention to the modern trends in research.
Theme 2: Business Management
This theme carries with it research papers from the field of business management. The
conference brings forth researches in contemporary management styles and business
practices. It encapsulates topics ranging from management information system to leadership
styles and their application. In particular, special attention has been given to the research on
the management of small & medium enterprises.
Theme 3: Public Administration
In the theme of public administration, researches proposing new policies for effective
management of government-run institutions are put on top of the list. Special focus has been
given to research related to the role and management of key government institutions. Along
with it, some of the researches have been commended revealing the role of Islamic
institutions in public policy.
In short, the conference combines topics on economics, public administration and business
management to bring forth innovative ideas to cope with challenges in these fields.

POSTGRADUATE CONFERENCE ON ECONOMICS, PUBLIC ADMINISTRATION AND
BUSINESS (PCEPAB)-5TH SEPTEMBER, 2015
vi
Message from the Dean
It gives me immense pleasure and honor to welcome the participants of PCEPAB-2015.
Ladies and Gentlemen,
In this present era of globalization, research has shown pivotal significance. A flood of
inventions and discoveries in every field of life has shown favorable results due to research
and development. Although the pace of inventions, discoveries and technological
advancement in developed nations is spectacular, developing nations are still striving to
imitate these advancements in the right way. Because of its important role, research students
and new researchers need to be provided with a platform to engage together in order to share
and learn emerging trends in research and development. PCEPAB-2015 is an effort anchored
by the Faculty of Economics and Administration, University of Malaya to gather postgraduate
students to share and learn research trends. I believe that this conference will serve this
purpose.
I indeed acknowledged that we owe the success of the conference to many stakeholders. As
such, I sincerely extend my gratitude to the organizing committee for their efforts to design
and organize this conference. I also thank all session chairs for extending their cooperation to
make this conference successful. Also, a warm ‘thank you’ to all the learned scholars for
being with us as discussants. I am sure the way they give their opinions during the PCEPAB-
2015 will be a source of inspiration for scholars, particularly to the postgraduate students who
are new in the field. The success of any event depends on the participants; hence, I convey my
sincere thanks to the participants of this conference who I’m sure will really make it a
memorable knowledge-sharing and learning event.
To all the postgraduate students, I hope that you will spread the light of knowledge to every
corner of the world.
May God bless all of you with health, wealth, name and fame.
Professor Dr. Azina Binti Ismail
Dean

POSTGRADUATE CONFERENCE ON ECONOMICS, PUBLIC ADMINISTRATION AND
BUSINESS (PCEPAB)-5TH SEPTEMBER, 2015
vii
Message from the Chairman
It is a great pleasure to welcome all of you to the first postgraduate conference, PCEPAB
2015, organized solely by the students of the Faculty of Economics and Administration,
University of Malaya. I believe that this will be the right platform for you, as postgraduate
students, to share your research outcomes as well as to have intellectual debates to further
improve your research work.
The theme of the conference emphasizes on issues related to economics, business,
development studies, public administration and management. It provides a great avenue to
share ideas on a wide range of disciplines whereby the opportunity for multidisciplinary
research work in the future will be made possible. An added advantage is that our discussants,
mostly from our own academic staff, will be able to provide the postgraduate students with
constructive comments that will further help improve their work. As a conference chair, I
would also like to thank the organizing committee and the administrative and academic staff
of the Faculty of Economics and Administration for their great help and support.
I hope that you will find the conference enjoyable and valuable. I am sure that you will share
a most pleasant, interesting and fruitful conference.
VGR Chandran
Deputy Dean (Higher Degree)

POSTGRADUATE CONFERENCE ON ECONOMICS, PUBLIC ADMINISTRATION AND
BUSINESS (PCEPAB)-5TH SEPTEMBER, 2015
viii
Conference Committee
Advisor
Professor Dr. Noor Azina Ismail
Dean
Faculty of Economics and Administration, University of Malaya, Malaysia
Chairman
Associate Professor Dr. VGR Chandran Govindaraju
Deputy Dean (higher degree)
Faculty of Economics and Administration, University of Malaya, Malaysia
Organizing Committee
Mohammad Nourani
Department of Economics, Faculty of Economics and Administration
University of Malaya, Malaysia
Organizing Committee
Keshminder Singh Jit Singh
Department of Economics, Faculty of Economics and Administration
University of Malaya, Malaysia
Organizing Committee
Md Aslam Mia
Department of Development Studies, Faculty of Economics and
Administration
University of Malaya, Malaysia
Organizing Committee
Shujaat Mubarik
Department of Economics, Faculty of Economics and Administration,
University of Malaya, Malaysia

POSTGRADUATE CONFERENCE ON ECONOMICS, PUBLIC ADMINISTRATION AND
BUSINESS (PCEPAB)-5TH SEPTEMBER, 2015
PROMOTING GOWTH, EXCELENT AND SUSTAINABILITY - 1
Determinants of a Multidimensional Poverty Measurement in
Malaysia: An Islamic Perspective
Mohamed Saladin Abdul Rasool, Ariffin Md Salleh
Universiti Teknologi MARA (UiTM)
Melaka Branch, Malaysia
Email: [email protected]
Abstract
In practice, most Islamic institutions in Malaysia use the monetary approach in measuring poverty through the
conventional Poverty Line Income (PLI) method. From an Islamic perspective, scholars outline the self-
sufficiency for an individual as the availability of basic food and drinks, shelter and other basic needs as defined
by the society in which he or she belongs to. This broad definition gives room to researchers to examine and
deliberate various components of basic needs of an individual or household to attain certain standard of living.
The objective of the paper is to present a non-monetary poverty measurement, an Islamic Poverty Index (IPI),
calculated using the weighted index method which is expected to exemplify poverty from a multidimensional
perspective. Specifically, the paper would identify factors that determine poverty according to the IPI and also
the PLI method using the regression method. The present study consisted of two stages. Firstly, the expert
review was conducted to formulate the IPI. Secondly, a survey aided by a structured questionnaire developed
using the expert review was carried out on 258 selected head of households in the state of Selangor, the most
populated state in Malaysia. The study revealed that the factors that influenced poverty according to each of
the method were different.
Keywords: Poverty, measurements, multidimensional, monetary indicators
1. Introduction
In practice, government agencies and Islamic institutions in Malaysia use the monetary
approach in measuring poverty through the conventional Poverty Line Income (PLI) method.
From an Islamic perspective, scholars outline the self-sufficiency for an individual as the
availability of basic food and drinks, shelter and other basic needs as defined by the society in
which he or she belongs to. In addition, Al Sabai explains that the minimum living standard is
inclusive of having family, housing and transportation (Monzer Kahf, 1982). Failure to attain
this stipulated needs qualifies individuals to be poor. Poverty is not only complex and multi-
dimensional in nature, it goes beyond the notion of income and encompasses social,
economic and political derivations (Shirazi, 2006).
The objective of the present paper is to present a non-monetary poverty measurement from an
Islamic perspective. The proposed Islamic Poverty Index (IPI) consists of maqasid-al sharia
(objective of the religion) principles namely religion, knowledge, physical-self, offspring and
wealth. The IPI, calculated using the weighted index method is expected to exemplify
poverty from a multidimensional perspective. In addition, determinants of poverty would be
identified. Furthermore, comparison would be made with the existing PLI method. This
paper is organized as follows. The next section outlines the literature review whereas the

POSTGRADUATE CONFERENCE ON ECONOMICS, PUBLIC ADMINISTRATION AND
BUSINESS (PCEPAB)-5TH SEPTEMBER, 2015
PROMOTING GOWTH, EXCELENT AND SUSTAINABILITY - 2
methodology undertaken in this study is deliberated in section 3. Section 4 present the
findings of the study. Finally, the conclusion of the study is highlighted in section 5.
2. Literature Review
Presently, policy makers and Islamic institutions in Malaysia use the monetary method such
as PLI to measure poverty. However, many studies in developed nations have adopted the
non-monetary poverty measurement in recent years.The UNDP developed the Human
Poverty Index (HPI) and Human Development Index (HDI) through the studies by Sen
(1992) and recently introduced the Multidimensional Poverty Index (MPI) developed by
Alkire and Santos (2010). Muslim scholars have used the MPI and HDI to develop human
development and poverty measurement from an Islamic view. Maqasid Shariah
Muldimensional Poverty Index (MSMPI) developed by Kasri (2014) who utilized health,
education, economic, religion and social to represent the five maqasid al-shariah dimensions.
These dimensions were chosen as the author was in the opinion that these are the most
suitable dimension as they are commonly used by economist in the mainstream economy.
However, other scholars such as Seman and Dzolkarnain (2014) used strictly the five
dimensions of the maqasid al-shariah established by Al-Ghazalli and Shatibi. They developed
the Maqasid shariah based Index of Socio-Economic Development using physical-self,
religiosity, knowledge, offspring and wealth. Similarly, Rafi (2014) used the same five
dimensions in developing the Maqasid ash Shariah Index (MSI) with the following
indicators: role of religion. Salat, fasting, pilgrimage and zakat representing religiosity,
average life expectancy, freedom from maltnutrition representing physical-self, survival of
children, safety of person, environmental safety representing offspring, education
representing knowledge and freedom from poverty representing wealth. Rasool and Salleh
(2014) concurs that the five dimensions of maqasid al-shariah as complete and holistic to
exemplify a multidimensional poverty measurement
A key point related to the the the method of poverty measurement is factors that determined
poverty. Literature have highlighted various determinants of poverty. Shireen (1998)
estimated various regression equations, each using poverty incidence as the dependant
variable Her results show that the average number of years of schooling has the strongest
relationship to poverty, suggestingt that an additional year of schooling reduced the incidence
of poverty. Rupasingha and Goetz (2007) studied the social and political forces as
determinants of poverty using spatial analysis. And found out that social capital, ethnic and
income inequality, local political competition, federal grants, foreign-born population, and
spatial effects are found to be important determinants of poverty in US. In a study on the
determinants of poverty in Mexico by Rodriguez (2010), he highlighted that poverty is
related positively to household size, the number of illiterate adults in the household and
location of the household. A study conducted by Awan and Iqbal (2010) using socio-
economics analysis shows that education, family size, nature of occupation and public
amenities play important role in poverty alleviation. Study by Awan et al (2011) revealed
that education is negatively related with the poverty status of individual which implies
education of poor is necessary in breaking the vicious circle of poverty. In general, factors
such as age of the household head, gender of household head, household size, education
level, employment type and amneties are significant variables related to poverty.

POSTGRADUATE CONFERENCE ON ECONOMICS, PUBLIC ADMINISTRATION AND
BUSINESS (PCEPAB)-5TH SEPTEMBER, 2015
PROMOTING GOWTH, EXCELENT AND SUSTAINABILITY - 3
3. Methodology
The study utilizes both the monetary and non-monetary poverty measurement as shown by
Figure 1. The monetary poverty measurement adopted in this study is based on the poverty
gap approach using the PLI method with z as poverty gap, z’ as adequacy of income, y as
household income and k as the poverty line income or necessities of the household, explained
by (1). The PLI basically is calculated by comparing the income and the basic needs outlined
by the poverty line. The gap of poverty is denoted by PLI Sufficency.
%100*)/('
%100*)}/(1{
kyz
or
ykz
--------- (1)
The non-monetary method would be represented by IPI. The dimensions in the IPI would be
based on human needs (maqasid al-shariah) principles. The main difference between the
proposed IPI and the MPI developed by Alkire is the weightage in IPI is not equal in
accordance to the maqasid al shariah principles as suggested by Shatibi (Kamali, 2009). This
is because according to Shatibi, human needs are in a hierarchy as follows: religion, physical,
wealth, knowledge and offspring. The overall process of the IPI formulation consist of
deciding the dimensions, weightage of each of the dimensions and finally, IPI computation
and interpretation together with threshold determination. The IPI would be formulated in
accordance to maqasid al-shariah principles, incorporating the methods by Alkire and Santos
(2010). The formula for IPI is as below:
IP1w = ( W1PS + W2WE +W3OS+W4KN + W5RE ) X 100% ------- (2)
where PS- physical self, WE-wealth, OS-offspring, KN-knowledge, RE-religosity and
W1, W2,…W5 - weightage
This quantitative research study employed data derived from a random survey of households
in Selangor, the most populated state in Malaysia. The population in the study were poor and
destitute households. The data comprised on a variety of household well-being issues
gathered through interviews, using structured questionnaire with head of household or other
knowledgeable members. It delves on households’ economic, social and demographic data
using simple random sampling technique. A representative sample was selected using
proportionate stratified random sampling technique with the household heads as the
respondents. 258 respondents were selected from the sampling unit. A close-ended
questionnaire was used as a research instrument to aid five enumerators employed to collect
data from the respondents identified for this study. The data of the study were run through
Statistical Package for Social Science (SPSS).
Multiple linear regression (MLR) analysis was used to determine the contributions of each of
the significant predictors or independent variables towards the variance in the criterion or
dependent variable. This study used stepwise regression method to determine those
independent variables that contributed most significantly to the prediction of the criterion
variable. The independent variables included in the analysis are demographic variables

POSTGRADUATE CONFERENCE ON ECONOMICS, PUBLIC ADMINISTRATION AND
BUSINESS (PCEPAB)-5TH SEPTEMBER, 2015
PROMOTING GOWTH, EXCELENT AND SUSTAINABILITY - 4
comprising of household based and the household’s information. They consist of continuos
and categorial type of data. Dummy variables were created for qualitative or categorical
predictors.This section discusses the procedure of regression analysis using enter method
with PLI Sufficiency and IPI as the dependent variable. It has been used to determine the
best predictor in explaining dependent variable. The procedures involved the F-test,
coefficient of determination, analyzing residuals, homoscadicity and multicollinearity.
Equation (3) represent the initial multiple linear regression model with twenty one predictors
for PLI Sufficiency and also IPI.
yi = β0 + β1X1 + β2X2 + β3X3 + β4X4 + β5X5 + β6X6 + β7X7 + β8X8 + β9X9
+ β10X10 + β11X11 + β12X12 + β13X13 + β14X14 + β15X15 + β16X16 + β17X17
+ β18X18 + β19X19 +β20X20 +β21X21 + εi --------------- (3)
where y = PLI Sufficiency and IPI,
X1 = Age, X2 = Gender (1 – Male, 0 – Female), X3 = Marital status (1- Married, 0-
Separated), X4 = Marital status (1- Bachelor, 0- Separated), X5 = Marital status (1-
Widow/widower, 0- Separated), X6 = Marital status (1- Divorced, 0- Separated), X7 = Job
status (1-Self-employed, 0-others), X8 = Job status (1-Permanent job, 0-others), X9 = Job
status (1-Unemployed, 0-others), X10 = Job status (1-Pensioner, 0-others) , X11 = Job status
(1-Part time or contract, 0-others), X12 = Education level (1- UPSR, 0-no formal education),
X13 = Education level, (1- PMR, 0- no formal education), X14 = Education level (1- SPM, 0-
no formal education), X15= Education level (1- STPM, 0- no formal education), X16 =
Education level (1- Cert, 0- no formal education), X17 = Education level (1- Degree and
above, 0- no formal education), X18 =Household size, X19 = Duration of aid, X20 = Number
of children, X21 = Not working adult, and ε is the model error estimated to be normally
distributed with constant variance.
4. Empirical Results
4.1 Dimensions, Indictors and Cutoff of IPI
The non-monetary measurement, IPI is shown by the following equation, with the weightage
of each dimension derived from the rankings determined by expert review:
IPI =(0.252PS + 0.129WE +0.138OS+0.186KN + 0.295RE) X 100%---- (4)
The equation (4) shows that 29.5% of poverty is contributed by spiritual factors, followed by
25.2% physical self, 12.9% wealth, 18.6% knowledge and 13.8% offspring. Thus, the
spiritual dimension is with the highest weightage, about 30%. On the other hand, wealth is
the lowest weightage dimension contributing almost 13% to the incidence of poverty. This
result shows that experts have identified that all the dimensions mentioned by Shatibi as
relevant and significant in the context of the study ranging from 12.9% to 29.5%. The
variables in the study were derived through expert review where thriteen indicators from five
dimensions were identified as shown by Table 1. Firstly, religiosity is considered as an
important dimension of human needs. It is inclusive of religious knowledge, religious
obligation, contribution and mosque activities. Secondly, physical self are physical needs in
daily life such as healthcare and quality of dwelling or living place. Thirdly, knowledge or

POSTGRADUATE CONFERENCE ON ECONOMICS, PUBLIC ADMINISTRATION AND
BUSINESS (PCEPAB)-5TH SEPTEMBER, 2015
PROMOTING GOWTH, EXCELENT AND SUSTAINABILITY - 5
mind development is essential in developing the intellectual level and skills of individuals. It
is inclusive of education level and skills. Fourthly, family or offspring are an important
element of human needs. Finally, wealth accumulation such as savings or investments and
ability to generate income or revenue from economic activities complete the formulation of
the IPI.
The next step is to decide the cutoff point or the threshold. From an Islamic point of view, a
individual or household is defined as poor if the household needs acquired is less than the
total need whereas destitute is a situation where the household is unable to sustain even 50%
or half of the needs. From a monetary point of view, this cutoff point is easily identified
based on the poverty line income. However from the non-monetary perspective, it is difficult
to quantify the 50% or 100% level of needs. Alkire (2010) used k=30 in her study with the
assumptions that a deprivation of 30% is sufficient to classify the household as poor.
However, this study chooses k = 40 or the deprivation of at least two dimensions or 6
indicators and for destitute, the value of at least 70 or at least 3 dimensions or 8 indicators.
Since the cutoff or threshold is decided based on K1 (total weightage of indicators) = 40%
where the household must be deprived by at least two dimensions or six indicators to be
categorized as poor. This is explained by Table 2. From the threshold of both the methods
discussed above, the poor group of each measurement could be identified and the number or
rate of poor could be calculated (Table 3). It is obvious that the PLI method showed the
lower number of poor and destitute with 13.2% of respondents as poor (including destitute)
wheras 71.4% according to the IPI method. As the IPI is multidimensional in nature as it
takes into account various dimensions, it is logical that the IPI has a bigger group of
identified poor.
Table 1: Indicators and Weightage
Variables Relative
Weight
(%)
Deprived if …..
Physical Self
Dwelling 12.6 Dwelling is deteriorating
Health & not disabled
Wealth
12.6 Any household member with serious disease
and disabled
Employment type 4.3 Household head without permanent job
House ownership 4.3 Household own house (land)
Savings & investment 4.3 Household head or members without savings
and investment
Offspring
No of children 6.9 Household without children
Attend schooling 6.9 Any children did not attend school

POSTGRADUATE CONFERENCE ON ECONOMICS, PUBLIC ADMINISTRATION AND
BUSINESS (PCEPAB)-5TH SEPTEMBER, 2015
PROMOTING GOWTH, EXCELENT AND SUSTAINABILITY - 6
Knowledge
Education level 9.3 Household head did not attend secondary
school
Skills 9.3 Household head without any skills
Religiosity
Religious knowledge 7.4 Household head has basic religious
knowledge
Religious obligations 7.4 Performing of religious obligation
Contribution 7.4 Contribution to close family members
Mosque activities 7.4 Attendance at mosque programmes
Table 2 : Threshold Value
Category PLI Suff.
(Poverty Gap)
IPI
(K)
Poor < 100% 40%
Destitute < 50% 70%
Table 3 : Poverty Rate
Category PLI
Sufficiency IPI(%)
Destitute 0.4 10.5
Poor 12.8 60.9
Non-poor 86.8 28.9
4.2 Determinants of Poverty
Equation (5) and (6) summarizes the relationship between the dependent variables, namely
PLI Sufficiency and IPI and the dependent variables. This is further exemplified by Table 4.
The R - square in equation (6) is higher with a value of 0.29. This explains that the five
significant independent variables are able to explain 29% variation of the IPI. In brief, IPI is
explained by two types of employment indicators, namely Self-employed and Unemployed
and three education attainment indicators, namely PMR, SPM and STPM. All these variables
are negatively correlated to IPI except for Unemployed. Thus, a household with a household
head who is self-employed or who possesses a PMR qualification, a SPM qualification or a
STPM qualification are less deprived in terms of the IPI. Thus, they tend to be not poor as
they able to be independent in fulfilling their daily needs. This could be explained by the fact

POSTGRADUATE CONFERENCE ON ECONOMICS, PUBLIC ADMINISTRATION AND
BUSINESS (PCEPAB)-5TH SEPTEMBER, 2015
PROMOTING GOWTH, EXCELENT AND SUSTAINABILITY - 7
that they have the means to fulfill their needs in terms of the five dimensions of maqasid al-
shariah. This result is similar to earlier studies conducted by Shirazi (1994), Amis (1995),
Rodriguez (2010) and Dartanto & Otsubo (2013) that emphasized the role of educational
attainment on poverty. In contrast, households with a household head who is unemployed or
who has low educational attainment tend to be poor as they do not have the means to fulfill
their daily needs.
On the other hand, the R – square value in equation (5) is lower, able to explain 7.5%
variation of PLI Sufficiency with Household Size and No of Working Adult are significant
independent variables. This result supports the findings of various studies such as Shirazi
(1996) and Mohd & Riaz (2012) that revealed that household size or the dependency ratio do
influence poverty. However, the findings of the present study further explain the role of non-
working adults. Both are negatively related to the dependent variable. The coefficient for
household size is -4.948, meaning that a one unit increase in household size is followed by a
decrease of RM4.940 in the PLI Sufficiency. This is because when the household size
increases, the needs of the household also increase. Thus, the PLI Sufficency or the poverty
gap decreases. On the other hand, a decrease in the household size would increase the poverty
gap or PLI Sufficiency as the needs of the household are reduced. Similarly, a one unit
increase in non-working adults is followed by a decrease of the PLI Sufficiency, but the
magnitude is bigger (RM20.014). This proves that the needs of the adults in terms of
monetary value are much higher compared to the average household in the PLI Sufficiency. It
is obvious that the magnitude change in the overall poverty gap or PLI Suffiicency due to the
change in the household size depends on the category of household, especially if it is a non-
working adult one.
PLI Suff.=17.92 – 4.948*household size – 20.014*non-working adults--- (5)
IPI= 0.545 – 0.09*self-employed – 0.139*education level (PMR) – 0.105*education level
(SPM) – 0.133*education level (STPM) + 0.042*unemployed----- (6)
Table 4: Summary of Regression Analysis
Independent
Variables
PLI Sufficiency
IPI
Self-employed -0.090**
Permanent job
Unemployed 0.042*
PMR -0.139**
SPM -0.105**

POSTGRADUATE CONFERENCE ON ECONOMICS, PUBLIC ADMINISTRATION AND
BUSINESS (PCEPAB)-5TH SEPTEMBER, 2015
PROMOTING GOWTH, EXCELENT AND SUSTAINABILITY - 8
**p-value<0.01, *p-value<0.05
The regression analysis in the present study shows factors influencing both dependent
variables are different. The IPI is associated with more variables obviously because it is
formulated with five dimensions as compared to the unidimensional PLI Sufficiency Thus,
poverty from these two different method should be addressed differently by the policy
makers and other relevant parties.
5. Conclusion
For Islamic institutions, the need for a holistic poverty measurements are irrefutable. It is
vital for Islamic institutions to device appropriate poverty measurement that are holistic in
nature to identify the targeted poverty group. This is essential to mantain trust between the
society and these institutions as mentioned by Suhaib (2009) who stresses that an ideal
Islamic institutions such as zakat organizations should be able to distribute of zakat funds to
appropriate recipients especially the poverty groups. Shirazi (1996 & 2006) concurs that the
main role of Islamic institutions are to facilitate the Muslims to pay zakat and distribute
efficiently to the appropriate recipient.The present paper proposes a multidimensional
perspective of poverty measurement utilizing index as a tool of measurement. Thus, the
introduction of an Islamic poverty measurement represented by IPI incorporating the various
dimensions as suggested by maqasid al-shariah principles would have an impact on Islamic
institutions as it gives a new perspective of measuring poverty from a micro perspective.
Thus, it is strongly recommended that a comprehensive study to formulate the IPI to be
carried out throughout the zakat organizations in Malaysia and oher Muslim countries. This
would enhance the poverty measurement from an Islamic perspective as it comprises of non-
monetary dimensions that would complement the existing monetary poverty measurements as
explained by Nolan and Whelan (2010, 2012).
References
ALKIRE, S. & SANTOS, E. M. (2010). Acute Multidimensional Poverty: A New Index for
Developing Countries. OPHI Working Paper No. 38. Oxford University Press.
STPM -0.133*
Household size -4.948*
Duration of aid
Children
Not working adult -20.014**
R-square 0.082 0.29
Adj R-square 0.074 0.276
MSE 7134.418 0.019
Multicollinearity No No

POSTGRADUATE CONFERENCE ON ECONOMICS, PUBLIC ADMINISTRATION AND
BUSINESS (PCEPAB)-5TH SEPTEMBER, 2015
PROMOTING GOWTH, EXCELENT AND SUSTAINABILITY - 9
AMIS, P. (1995). Making sense of poverty in IIED. Urban poverty: Characteristics, causes
and consequences. Environment and Urbanization, 7(1), 145-157.
AWAN, M.S., WAQAS, M. & ASLAM, M.A. (2011). Multidimensional Poverty in
Pakistan: Case of Punjab. Journal of Economics and Behavioral Studies. Vol. 2, No.
8, 133-144.
DARTANTO, T. (2013). The Determinants of Poverty Dynamics in Indonesia: Evidence
from Panel Data’. Bulletin of Indonesian Economic Studies 49.1: 61-84.
KAMALI, M. H. (2009). Maqasid Made Simple. The International Institute of Islamic
Institute (IIIT).
KASRI, R. & AHMED, H. (2014). Assessing Socio-economics Development Based on
MaqasidAl-shariah Principles. Normative Framework, Methods and Implementation in
Indonesia. Paper presented at Seminar on Maqasid Al-Shariah Based Socio-eonomic
Index. April 30- May 1. Islamic Research and Training Institute (IRTI), Islamic Dev.
Bank (IDB), Jeddah.
MOHD, SAIDATULAKMAL & MADIHA RIAZ. (2012). Characteristics of Poverty In
Pakistan. Developing Country Studies 2.5 (2012): 67-77.
MONZER, K. (1982). Taxation in an islamic economy in Ziauddin Ahmad et.al. Fiscal
policy and resource allocation in Islam. Jeddah. International Centre for Research in
Islamic Economics. King Abdul Aziz University.
NOLAN, B. AND WHELAN, C.T. (2010). Using non-monetary deprivation indicators to
analyse poverty and social exclusions. Lesson from Europe? Journal of Policy
Analysis and Management Spring .
NOLAN, B. AND WHELAN, C.T. (2012). Using non-monetary deprivation indicators to
Analyze European Poverty and Social Exclusion in Counting the poor: New Thinking
about European Poverty Measures and Lessons for United States. Besharov, J.D.and
Couch, A.K. (ed.). Oxford University Press.
RAFI AMIRUDDIN. (2014). Maqasid Al-Shariah. Are We Measuring the Immeasurable?
Islamic Economic Studies, Vol. 22 No. 2. Nov.
RASOOL, M. S. A., & SALLEH, A. M. (2014). Non-Monetary Poverty Measurement in
Malaysia: A Maqāṣid al-Sharīʿah Approach. Islamic Research & Training Institute
(IRTI), 22(2), 33-46.
RODRIGUEZ J. G., MARTINEZ, M.G., SANTOYO, L.S., LOZANO,M,Q AND WEBER,
G.Y. (2010). Chronic and Transient Poverty in Mexico. Economics Buletin, Vol 30,
No.4.
RUPASINGHA, S.J. GOETZ (2007). Social and political forces as determinants of
poverty:A spatial analysis. The Journal of Socio-Economics 36 (2007) 650–671.
SEMAN, JA AND DZOLKARNAINI, N. (2014). Construction od Maqasid Al- Shariah
Based Index of Socio-Economic Development: Concepts and Issues. Paper presented at
Seminar on Maqasid Al-Shariah Based Socio-eonomic Index. April 30- May 1. Islamic
Research and Training Institute (IRTI), Islamic Dev. Bank (IDB), Jeddah.
SEN, A. K. (1992). Inequality Reaxamined. Harvard University Press, Cambridge, MA.

POSTGRADUATE CONFERENCE ON ECONOMICS, PUBLIC ADMINISTRATION AND
BUSINESS (PCEPAB)-5TH SEPTEMBER, 2015
PROMOTING GOWTH, EXCELENT AND SUSTAINABILITY - 10
SHIRAZI, NASIM SHAH. (1996). Targeting, Coverage and Contribution of Zakat to
Households’ Income: A Case of Pakistan. Journal of Economic Cooperation among
Muslim Countries. 17 3-4 (1996). 165-186.
SHIRAZI, N.S. (2006). Providing for the resource shortfall for poverty elimination through
the instrument of zakat in low income muslim countries. IIUM Journal of Economic
and Management 14 no 1 (2006).
SUHAIB, A. Q. (2009). Contribution of Zakat in the Social Development of
Pakistan. Pakistan Journal of Social Sciences (PJSS), 29(2).

POSTGRADUATE CONFERENCE ON ECONOMICS, PUBLIC ADMINISTRATION AND
BUSINESS (PCEPAB)-5TH SEPTEMBER, 2015
PROMOTING GOWTH, EXCELENT AND SUSTAINABILITY - 11
Financing Higher Education through Waqf Institution: An
Alternative Approach
Muhammad Usman
Department of Shari’ah and Economics,
University of Malaya
Asmak Ab Rahman
Department of Shari’ah and Economics,
University of Malaya
Abstract
The present study critically analyses various alternative options for funding higher education institution and
tries to find out viable option. As a result, it explored waqf a perpetual and sustainable alternative source of
funding. Moreover, the study profiles various fund raising and investment management strategies to produce
perpetual income and use waqf as an instrument in any college and university’s development.
Key words: Funding, Higher Education, Investment, development, Waqf endowment
Introduction
Education is one of the vital elements for the sustainable development of any nation. It is not
only a pivotal element for societal development, but also a key input for economic growth in
the form of human capital. A Number of researchers have considered it as a prerequisite for
economic development. Though education from primary to territory is important for the
development, the role of higher education is more critical (Banya & Elu, 2001, p. 4 &
Oliveria et al., 2009).
Colleges and universities are the main vehicles to impart higher education and cradles for
knowledge acquisition (Jamshidi et al, 2012, p.789). While, the effectiveness of these
institutions heavily depends upon funds they receive, from building labs to award
scholarships. Typically, Government is the main source of this funding for higher education.
However, over the last many decades due to local and global changes, higher education
institutions are facing shortage of funds (Barr, 2004, p. 267). Therefore, literature classifies
factors affecting public funding into two broad categories, i.e. global factors and local factors
Global Factors
Globalization, technological advancement, inflation and global financial crises (2007-08) are
affecting higher education funding (UNESCO, 2012). Likewise, transition towards the
knowledge base economy is also influencing higher education (Jamshidi et al, 2012, p.789).
In addition, every nation knows that higher education is the way to remain in an enviable
place in the world (Lebeau, 2012, p.137).

POSTGRADUATE CONFERENCE ON ECONOMICS, PUBLIC ADMINISTRATION AND
BUSINESS (PCEPAB)-5TH SEPTEMBER, 2015
PROMOTING GOWTH, EXCELENT AND SUSTAINABILITY - 12
Local Factors
Political, social, economic and demographic elements are affecting higher education funding.
After the global financial crisis, many countries are facing huge public debt that increases the
fiscal deficit (Michael, 1996). On the other hand, social development and demographic
changes are increasing demand for higher education. Likewise, fiscal constraint, budgeting
formula, including that higher education funding is politically sensitive, are the main factors
affecting public funding for higher educational institutions (Longden, 2001. p.161;
Wangenge, 2008. p. 215; Barr, 2004, p. 267).
Whereas, having lack of accountability and non-responsiveness, higher educational
institutions are heavily being criticised in various countries (Johnstone, 2004, p. 403).The
growing demand of public funding is also an issue for the governments. Whereas, Barr
(1993, p .720) explores higher education is shifting towards market system.
Objectives of the study
The study is using secondary sources to attenuate following objectives.
• To Critically analyse the different sources of financing higher education Institutions
• To explore the most viable and perpetual sources of financing higher education
Institutions
Alternative sources of funding’s for HEIs
As discussed that due to decreasing government funding, colleges and universities are
searching for alternative sources of funds. However, these alternative options have not
emerged as viable options. In proceeding lines, we take an overview of those alternatives and
their limitations.
Raising Fee and Student Loans
One of the immediate steps, which HEI took to bridge the funding requirement, was a
substantial increase in student fee. Kenton et al. (2005, p.114) have illustrated that a decrease
in public funding was always manifested with increase in tuition and other fees. This action
of HEI started affecting quality and promotion of higher education that forced government to
introduce loans as an alternative (Woodhall, 2007, p.6). In response to it several countries
introduced student loans schemes.
In U.K a committee chaired by Lionel Robbins a renowned economist was farmed in 1961.
The committee proposed future recommendations and suggestions on the development of
higher education sector. The main issues highlighted in this committee were growing demand
for higher education and demographic changes. Several economists, submitted their policy
recommendations and proposed student loans as an alternative. Similarly, various developing
countries including Malaysia also introduced student loan scheme (Ramli at el, 2013, p.6) .
Though, it is another issue that what will be the kind and design of these loans? i.e. mortgage-
loans (MLs) or income-contingent loans (ICLs), MLs repayable in fixed instalments over a
fixed period of time. While, ICLs, is repayable with X per cent of individual borrowing as a
proportion of future income (Rasmussen, 2006). The idea of ICLs introduced by famous
American economists Friedman (1955) and Nerlove (1975). Over the period, numerous

POSTGRADUATE CONFERENCE ON ECONOMICS, PUBLIC ADMINISTRATION AND
BUSINESS (PCEPAB)-5TH SEPTEMBER, 2015
PROMOTING GOWTH, EXCELENT AND SUSTAINABILITY - 13
researchers, i.e. Barr (1993) & Chapman, (1997) discussed the shape and design of student
loans and relationship with market forces.
However, Goodman and Kaplan (2003) denied this argument and proposed free education
should be provided. Loans depend on the students’ future level of income and ability to
repay. There are few issues with an ICLs i.e. it gives borrower insurance beside future lack of
money (Chapman, 2006). On the other hand, the student has to accept a higher fraction of
risk. Thus, it will deter student, especially those who are financially weak (Bennett, 1992). It
is also an inequitable and inefficient way of financing. Furthermore, MLs also generate issues
on the supply side. It creates imperfection in the capital market that leads to deficiency of
capital (Barr, 1993, p. 721). Similarly, the Robbins Committee report also appeared as
conflicting stance regarding student loans (Robbins, 1963, p.212).
Putting together, increase in tuition fee is not a viable option as it is not only affect the pace
of HEI but it is also a short term solution. Further, owing to various draw backs discussed,
student loan scheme is also not effective in this context ( Ahier , J. 2000). Thus HEI needs to
come up with long term and more sustainable alternative (Collins et al, 1994, p.33; Hyde,
1980; Wattenbarger , 1986).
Privatization of HEI
Due to inadequacy of public sector to finance the HEIs private sector appeared to fill this gap.
In developed nations a significant portion of higher education sector belongs to private sector
(Jamshidi et al, 2012, p.789). Many of the developing nations, due to growing population and
vast expansion in demand of higher education are also looking for transferring partial
ownership of public universities to private sector (Oketch, 2004). Moreover, allowing private
sector to build universities, Pakistan is one of the prominent examples from the developing
countries where, government allowed private sector to establish universities. Presently, a
large proportion of student is studying in these private universities (Halai, 2011).
In past, this process was also appreciated by IMF and World Bank. As part of globalization,
structural adjustment programs (SAPs) introduced by these two global institutions
emphasized to reduce the government roles by privatization of public assets including higher
education (Kwiek, 2014 & Varghese, 2004). Supporting this policy Lee (2008) argued that
governments support for growing private higher education sector is due to find alternatives
for fiscal constraint and growing social demand for higher education. Similarly, issues, i.e.
the impact of technological advancement, increasing demand of research and innovation,
higher education reforms, the massive expansion in demand for higher education systems
played an important role in the development of private higher education institutions
(Geethanjali et al. 2008). In various countries, private higher education institutions have
played a significant role in higher education development. In response to, growing gross
enrolment and institutional budgets, the role of the private sector is considerable (Fahmi,
2007). Furthermore, the following studies are showing same findings, i.e. (Levy, 2011; Pey,
2008; Lane, 2011; Arokiasamy, 2011; Tham,2011& Agarwal, 2007).
However, exploring privatization of higher education Subramanian, (2014, p.16) stated that
private sector treated higher education as “product” and their students are as “customers”
thus, it is a “trading of education”. Moreover, privatization, marketization, and
commercialization are worsening the quality of higher education (Ng, 2012, Kaul ,1993).
Additionally, it is also affecting the promotion of higher education. Privatization of higher
education lowers the chances of education for low income students due to high cost. It may
also create risk of conflicts of interest with organizations and other sponsors. Whereas, with
the market pressure private institutions run programs and disciplines that have a definite
market value equal to their cost. The private institutions reduce the less demanded discipline

POSTGRADUATE CONFERENCE ON ECONOMICS, PUBLIC ADMINISTRATION AND
BUSINESS (PCEPAB)-5TH SEPTEMBER, 2015
PROMOTING GOWTH, EXCELENT AND SUSTAINABILITY - 14
in the market. Moreover, it seems like due to privatization higher education institutions
appear more accountable. But to whom? In fact, with privatization universities and colleges
are less accountable to public and elected officials (Lyall, 2006).
In condense form, the privatization of HEIs have also not sustained as a long term alternative
thus requiring to search for some other options.
Cost-sharing
The concept of cost sharing was first introduced by Johnstone, D.B (1986). Studying higher
education mechanism in Europe and U.S.A, he discovered that the demand for higher
education was growing in those countries which had aroused the issue of affordability. To
compete with the issue, he proposed a model for higher education finance by the combination
of four sources of funding. Johnston (p.2) assumed that “cost of higher education in all
countries and in all situations can be viewed as emanating from four principal parties” (1)
the state or taxpayers; (2) Parents; (3) Students; (4) Individuals or Institutional philanthropy.
The similar terms “Cost-sharing” has been appeared before Johnstone’s study such as in
Carnegie Commission report (1973) used “sharing the Cost Burden”, but, after the
Johnston’s study in 1986, the term widely appeared and used in many current studies i.e
World Bank (1986, p.8) used “Cost Recovery”. Moreover, the term has been used in the title
of various present studies, i.e.(Ayalew, 2013; Rasmusen, 2006; Ishengoma, 2004; Owino,
2000; Penrose 1998). In various European countries, the idea of cost-sharing received greater
support than other ideas i.e. cost recovery, user charges and tuition fees.
However, cost sharing mechanism also wants financial assistant for needy students.
Woodhall (2006) stated an adequate financial assistance is essential even in the cost-sharing
to ensure the access of higher education for needy students. In the same way, Ziderman and
Albrecht (1995) explored the various loan schemes have failed due to default rates. Similarly,
administrative cost and interest rate are also creating problems. Therefore, the authors
suggested that for some countries state has to give many as grant or higher education
institutions use alternative source of funding rather than creating burden on the students and
parents.
The advocate this believe higher education should be up to some extent financed by tax
government. Secondly, Parents; may also contribute to the cost of higher education. Thirdly,
students may also share in higher educational costs through their earnings, savings or loans
etc. Finally, the donor and charity institutions those may also contribute in higher education
through gifts, donations or awards to colleges and universities. Numbers of researches have
applauded this concept. For example, Eicher and Thierry (2002, p. 68) claimed that mixed
mode of financing is better than exclusively public funding. Moreover, they proposed public-
private sharing concept with various diversification mechanisms. The authors also claimed
that choice of public-private funding relies on the social and practical constraints of society,
including political process and evaluators and researchers’ rational views etc. (p.75).
Johnstone assumed that cost should be sharing equally in all four participants of the concept.
However, If ignore Johnstone’s assumption and transfer large burden on the philanthropy or
endowment funding. So, it has the more ability to have burden and generate perpetual
funding as alternative sources of funding. It is observed that higher education institution rely
on endowment funds because of other resources diminishing or they may not have ability to
sustain increasing burden. Altbach et al. (1999, p.380) concluded “it is a zero-sum game, in
which a lessening of the burden upon, or revenue from, one party must be compensated either
by a reduction of underlying costs or by a shift of the burden to another party”

POSTGRADUATE CONFERENCE ON ECONOMICS, PUBLIC ADMINISTRATION AND
BUSINESS (PCEPAB)-5TH SEPTEMBER, 2015
PROMOTING GOWTH, EXCELENT AND SUSTAINABILITY - 15
Waqf or philanthropy
Higher Educational Institution
Develooment
Waqf institution
Financing Model Investment Model
Equity
Fixed assets
Real estate
Cash
Hedge funds
Private equity
Venture capital
Natural resources
Other
Deposits
Business(s)
etc.
Charity and Aids
Allumi Association
Gifts
special funds
Various Funrasing activities
Government aids
Individual and institutional grants
Soliciting system
Industrialist and Busniss man
philanthropist
etc
Operation expenses
Developmental expenditure
educational programs
Human capital Development
Scholarships
Professesrships
Financial assistant
Accumudation
Etc
Development Model

POSTGRADUATE CONFERENCE ON ECONOMICS, PUBLIC ADMINISTRATION AND
BUSINESS (PCEPAB)-5TH SEPTEMBER, 2015
PROMOTING GOWTH, EXCELENT AND SUSTAINABILITY - 16
Discussion
Higher educational waqf institution financing may be challenging, it is depending on the
situation that how the income is coming, how expenses is laid out, who decides financial
decisions and what are the sources of finance. Higher education institutions are soliciting
donations from these major sources, i.e. alumni, non-alumni, individuals, business
corporations, foundations, religious donations. Moreover, there are few others techniques to
rise funds i.e direct mail, legacy creation, specific funds, special activities and others.
Universities may further invest in financial assets, primarily in the equities, including public
equity, private equity, international equity, etc. Whereas, some of them also allocated to real
assets, real estate, alternative security, stocks and bonds, etc. There are various business
investment strategies those may propose additional revenue in Higher education from
different areas, i.e. Incubator program, agriculture sector, equity participation and other
projects etc.
Conclusion The present research discussed that government funding deteriorating due to global and local
perspective and higher educational institutions are looking for alternative funding options. it
critically investigates various alternative options and found mostly these options are not
viable. However, Waqf (Endowment) proved itself as sustainable and perpetual sources of
income. The higher education endowment fund is one of the main alternative sources of
funding in academic activities. Every endowment management has certain unique features.
Some endowment manages small amount of assets and some institution manages large
amount of endowment asset.
The study further claimed that an endowment is major source of institutional discretionary
funds that institution may use it for research and development, risk taking activities and for
future investment. Similarly, waqf institution provides the margin of excellence, the element
of vitality that separate one institution from another one and offer financial and fiscal
autonomy. It may also create diversification in management and investment strategies. Waqf
resources are relatively unrestricted spending forms for the HEIs as compared to public
funding’s. It can be expanded and increased without constraint.
On the other hand, The higher educational institution needs substantial amount on a regular
basis for building computer labs to awarding scholarships, from research & innovation to
online databases system and from expansion of educational programs to operating expenses.
An efficient waqf institution may assist higher educational institution in all these mentioned
extents. However, public funding mostly are prescribed and regulated.
Traditionally, waqf is investing generally in real asset. While, at present higher education
waqf institution should invest in financial assets rather than investing exclusively on real
estate.
References
Agarwal, P. (2007). Private Higher Education in India: Status and Prospects. United
Kingdom: The Observatory on Borderless Higher Education Woburn House.

POSTGRADUATE CONFERENCE ON ECONOMICS, PUBLIC ADMINISTRATION AND
BUSINESS (PCEPAB)-5TH SEPTEMBER, 2015
PROMOTING GOWTH, EXCELENT AND SUSTAINABILITY - 17
Ahier, J. (2000). Financing Higher Education by Loans and Fees: Theorizing and Researching
the Private Effects of a Public Policy. Journal of Education Policy, 15(6), 683-700.
doi: Doi 10.1080/02680930010000254
Altbach, P. G., Berdahl, R. O., & Gumport, P. J. (1999). American Higher Education in The
Twenty-First Century: Social, Political, and Economic Challenges (2nd ed.) Baltimore,
MD: Johns Hopkins University Press.
Arokiasamy, A. (2011). An Analysis of Globalization and Higher Education in Malaysia.
International Journal of Contemporary Business Studies, 2(9), 6–17.
Ayalew, S. A. (2013). Financing Higher Education in Ethiopia: Analysis of Cost-Sharing
Policy and its Implementation. Higher Education Policy, 26(1), 108-125. doi: Doi
10.1057/Hep.2012.21
Banya, K., & Elu, J. (2001). The World Bank and Financing Higher Education in Sub-
Saharan Africa. Higher Education, 42(1), 1-34. doi: DOI 10.1023/A:1017584501585
Barr, N. (1993). Alternative Funding Resources for Higher Education. The Economic
Journal, 103(418), 718-728. doi: 10.2307/2234544
Barr, N. (2004). Higher Education Funding. Oxford Review of Economic Policy, 20(2), 264-
283. doi: Doi 10.1093/Oxrep/Grh015, p.267.
Bennett, R. G.H and Nevison, D. (1992) Investing in Skill: To Stay On or Not To Stay
On? Welfare State Programme Discussion Papers, WSP 074. Centre for Analysis of
Social Exclusion, The London School of Economics and Political Science, London,
UK.
Chapman, B. (1997). Conceptual Issues and the Australian Experience with Income
Contingent Charges for Higher Education. The Economic Journal, 107(442), 738– 751.
Chapman, B. (2006). Income Contingent Loans For Higher Education: International Reforms.
Handbook of the Economics of Education, 2, 1435-1503.
Collins, S. E., Leitzel, T. C., Morgan, S. D., & Stalcup, R. J. (1994). Declining Revenues And
Increasing Enrollments: Strategies For Coping. Community College. Journal of
Research and Practice, 18(1), 33-42. doi: 10.1080/1066892940180104
Eicher, J. C., & Thierry, C (2002). Rethinking the Financing of Post-Compulsory Education.
Higher Education in Europe, 27(1-2), 69-88. doi: 10.1080/0379772022000003233
Fahmi, M. (2007). Equity on access of low SES Group in the Massification of Higher
Education in Indonesia. Working Paper in Economics and Development Studies.
Center for Economics and Development Studies, Department of Economics,
Padjadjaran University
Friedman, M. (1955), ‘The role of government in education’ in Capitalism and Freedom,

POSTGRADUATE CONFERENCE ON ECONOMICS, PUBLIC ADMINISTRATION AND
BUSINESS (PCEPAB)-5TH SEPTEMBER, 2015
PROMOTING GOWTH, EXCELENT AND SUSTAINABILITY - 18
Geethanjali, V., Prasad, Ch., & Raja, R. (2008). Privatization of Higher Education: Some
Issues. In N.R. Kishan (Ed.), Privatization of education (pp. 46–57). New York: APH
Publishing Corporation.
Goodman, A., & Kaplan, G. (2003). ‘Study now, pay later’ or ‘HE for free’? An assessment
of alternative proposals for higher education finance, Commentary 94. The Institute
For Fiscal Studies.
Halai, N. (2011). Private higher education in Pakistan. International Higher Education, 64,
21.
Hyde, W. &Augenblick, J. (1980). Community college students, costs and finances: A
in the United Kingdom, the Federal Republic of Germany, France, Sweden and the
United
Ishengoma, J. (2004). Cost Sharing in Higher Education in Tanzania: Fact or Fiction. Journal
of Higher Education in Africa, 2(2), 101-134.
Jamshidi, L., Arasteh, H., NavehEbrahim, A., Zeinabadi, H., & Rasmussen, P. D. (2012).
Developmental patterns of privatization in higher education: a comparative study.
Higher Education, 64(6), 789-803.
Johnstone, D. B. (1986). Sharing the Cost of Higher Education: Student Financial Assistance
Johnstone, D. B. (2004). The economics and politics of cost sharing in higher education:
comparative perspectives. Economics of Education Review, 23(4), 403-410. doi:
10.1016/j.econedurev.2003.09.004
Kaul, R. (1993). Caste and Class and Education: Politics of the Capitation Fee
Phenomenon in Karnataka, New Delhi
Kenton, C., Huba, M., Schuh, J., & Shelley, M. (2005). Financing Community Colleges: A
Longitudinal Study Of 11 States. Community College Journal of Research &
Practice, 29(2), 109–122. doi:10.1080/10668920590524256
Kwiek, M. (2014). Structural Changes in The Polish Higher Education System (1990–2010):
a synthetic view. European Journal of Higher Education, 4(3), 266-280.
doi:10.1080/21568235.2014.905965
Lane, J. (2011). Importing Private Higher Education: International Branch Campuses.
Journal of Comparative Policy Analysis: Research and Practice, 13(4), 367–381.
Lebeau, Y. (2012). Who Shall Pay for the Public Good? Comparative Trends in the Funding
Crisis Of Public Higher Education. Compare-a Journal of Comparative and
International Education, 42(1), 137-139

POSTGRADUATE CONFERENCE ON ECONOMICS, PUBLIC ADMINISTRATION AND
BUSINESS (PCEPAB)-5TH SEPTEMBER, 2015
PROMOTING GOWTH, EXCELENT AND SUSTAINABILITY - 19
Lee, M. N. N. (2008). Restructuring Higher Education: Public–Private Partnership. Journal
of Asian Public Policy, 1(2), 188-198. doi: 10.1080/17516230802094494
Levy, D. (2011). Public Policy For Private Higher Education: A Global Analysis. Journal of
ComparativePolicy Analysis: Research and Practice, 13(4), 383–396
Longden, B. (2001). Funding Policy in Higher Education: Contested Terrain. Research Papers
in Education, 16(2), 161-182. doi: 10.1080/02671520110037429
Lyall, K. C., & Sell, K. R. (2006). The De Facto Privatization of American Public Higher
Education. Change: The Magazine of Higher Learning, 38(1), 6-13. doi:
10.3200/CHNG.38.1.6-13
Michael, S. O. (1996). Financial Constraints In Higher Education: Using A Case-Study
Approach. Studies in Higher Education, 21(2), 233-239. doi:
10.1080/03075079612331381388
Nerlove, M. (1975). Some Problems in the use of Income Contingent Loans for the Finance
of Higher Education. The Journal of Political Economy, 83(1), S200–S218. Part II.
Ng, S. W. (2012). Rethinking the Mission of Internationalization of Higher Education in the
Asia-Pacific Region. Compare: A Journal of Comparative and International
Education, 42(3), 439-459. doi: 10.1080/03057925.2011.652815
Oketch, M. (2004). The Emergence of Private University Education In Kenya: Trends,
Prospects, and Challenges. International Journal of Educational Development, 24,
119–136.
Oliveria, T.,& Pereia,P. (2009). Who Pays the Bill? : Study Cost and Students Income in
Portuguese Higher Education.European Journal of Education, 24(1), 111-121,
DOI: 10.1080/01418219999566
Owino, W., & Abagi, O. (2000). Cost Sharing in Education and Health in Kenya. Draft.
Nairobi: Institute of Policy Analysis and Research.
Penrose, P. (1998). Cost Sharing in Education: Public Finance, School and Household
Perspectives. Education Research Paper: ERIC.
Pey, S. (2008). Research Environment of Malaysian Private Higher Education Institutions:
Features, Funding and Policy Implication. In Presented at Asia-Pacific Sub-regional
preparatory conference for the 2009 world conference on higher education. Facing
global and local challenges: The new dynamics for higher education. 25–26
September, Macau, People’s Republic of China.
Ramli, A. M., & Mohamad, M. O. (2013). An Overview of Public Funding for Higher
Learning Education in Malaysia and the Prospect of Waqf Funding. Paper presented
at the Global Higher Education Forum 2013

POSTGRADUATE CONFERENCE ON ECONOMICS, PUBLIC ADMINISTRATION AND
BUSINESS (PCEPAB)-5TH SEPTEMBER, 2015
PROMOTING GOWTH, EXCELENT AND SUSTAINABILITY - 20
Ramli, A. M and Abdullaah Jalil, A.B (2013). Corporate waqf model and its Distinctive
features: the future of Islamic Philanthropy,' World Universities’ Islamic Conference
2013(WUIPCON 2013), Zakat research Institute of Malaysia, University of
Technology MARA PP.387
Rasmussen, C. J. (2006). Effective Cost-Sharing Models in Higher Education: Insights From
Low-Income Students in Australian Universities. Higher Education, 51(1), 1-25.
Robbins, L. C. (1963). Higher Education. Report of the Committee Appointed by the Prime
Minister Under Chairmanship of Lord Robbins 1961-63.
States. New York: The College Board.
Subramanian, K. (2014). Privatization of Higher Education in India: A Boon or Bane.
International Journal of Research in Economics and Social Sciences, 4(6), 1-4.
Tham, S. (2011). Exploring Access and Equity in Malaysia’s Private Higher Education.
ADBI working paper 280. Tokyo: Asian Development Bank Institute.
UNESCO (2012). The Impact of Economics Crisis on Higher Education” United Nations
Educational, Scientific and cultural Organization published by UNESCO (Bangkok).
p.14
Varghese, N. V. (2004). Private Higher Education. Paris, France: UNESCO. Wei, B. (2009).
Formational mechanism and regional growth patterns of private higher education in
China. Chinese Education & Society, 42(6), 74–90.
Wangenge,O. G. (2008). Globalisation and Higher Education Funding Policy Shifts in Kenya.
Journal of Higher Education Policy and Management, 30(3), 215-229. doi:
10.1080/13600800802155010
Wattenbarger, J. L.& Vader, N. J. (1986). Adjusting To Decreased Revenues At Community
Woodhall, M. (2006). Financing Higher Education: The Role of Tuition Fees and Student
Support. In Global University Network for Innovation (GUNI), World Report on
HigherEducation 2006: The Financing of Universities. Basingstoke (U.K.) and New
York (U.S.): Palgrave Macmillan and GUNI, pp. 122-130.
Woodhall, M. (2007). Funding higher education: The contribution of economic thinking to
debate and policy development: World Bank.
Ziderman, A. and Albrecht, D. (1995). Financing Universities in Developing Countries.
Washington D.C. & London: The Falmer Press

POSTGRADUATE CONFERENCE ON ECONOMICS, PUBLIC ADMINISTRATION AND
BUSINESS (PCEPAB)-5TH SEPTEMBER, 2015
PROMOTING GOWTH, EXCELENT AND SUSTAINABILITY - 21
Theory of Giving from an Islamic Perspective
Foyasal Khan
International Islamic University Malaysia,
53100 Gombak, Kuala Lumpur, Malaysia
E-mail: [email protected]
Abstract
For last few decades, a large number of economists and social scientists have been trying to connect non-
economic factors i.e., culture, religion etc. with economics. In every religion, ‘giving’ (in terms of charity in
cash and in kind) has been given utmost importance. Among religions, Islam has focused more extensively on it.
Islam has different categories of ‘giving’. Western literature has also focused on religious giving and religious
attendance. In most cases, they have tried to link these variables with income and observed that among the high
income group, religious giving is preferred over religious attendance (Iannaccone, 1997; Rosborough, 2009 &
2010). Opposite happens among low income group. Of course, there is a relationship between high income and
religious giving, however, variables like religious giving and religious attendance doesn’t totally depend on
income in Islam. Basically, in Islam, both religious giving and religious attendance depends on the level of
Taqwa (Allah fearing). So there is positive relationship between the level of Taqwa and religious giving and
religious attendance. This Islamic proposition has yet shown through model development using microeconomic
framework. In this backdrop, the author aims to come up with a mathematical microeconomic model on ‘Theory
of Giving from an Islamic Perspective’.
Key words: religious giving; religious attendance; Taqwa (Allah fearing); microeconomic
model
1. Introduction
1.1. Background
In the last two centuries, considering non-economic factors in economic discussion was rare
phenomenon. Recently, a large number of economists and social scientists have understood
that limiting discussion on only economic factors is a drawback for which reaching any
meaningful conclusion is almost impossible. Hence, last few decades the economists have
been trying to connect culture, religion etc with economics. In every religion, ‘giving’ (in
terms of charity in cash and in kind) has been given utmost importance. Among religions,
Islam has focused more extensively on it. Islam has different categories of ‘giving’. Some are
obligatory i.e. zakat, ushr and some are recommended i.e. waqf, qard hasan. Western
literature has also focused on religious giving and religious attendance. In most cases, they
have tried to link these variables with income. One of common phenomenon they observed
that among the high income group, religious giving is preferred over religious attendance
(Iannaccone, 1997; Rosborough, 2009 & 2010). Vice versa happens among low income
group. Of course, there is a relationship between high income and religious giving in Islam as
low income group don’t have income above nisab level so they are not commanded to give
zakat, ushr or any other obligatory charity. Having said that variables like religious giving
and religious attendance doesn’t depend on income in Islam. If we ignore the giving in terms
of absolute value and focus on percentage, then we can see that a poor man can also give
more than rich. Even in the early period of Islam, that was actually happening. Some
companions of the prophet (PBUH) donated all of their income and assets for the cause of

POSTGRADUATE CONFERENCE ON ECONOMICS, PUBLIC ADMINISTRATION AND
BUSINESS (PCEPAB)-5TH SEPTEMBER, 2015
PROMOTING GOWTH, EXCELENT AND SUSTAINABILITY - 22
Allah while some other companions donated half, one-fourth etc. Basically, in Islam, both
religious giving and religious attendance depends on the level of Taqwa (Allah fearing).
Taqwa has different levels in Islam, for example, the holy Qur’an has used words like
muslimun, mu’minun, muttaqun and muhsinun to differentiate the level of Allah fearing
among Muslims. So there is positive relationship between the level of Taqwa and religious
giving and religious attendance. This Islamic proposition has yet shown through model
development using microeconomic framework. In this backdrop, the author aims to fill up the
gap hoping to throw some thoughts which may be refined and furnished in the light of
comments and observations from the conscious economists.
1.2. Motivation of the study
Recently I have reviewed a working paper entitled “A Theory of Congregational Giving” by
Jonathan Rosborough where a model has been proposed to illuminate long established
empirical facts about religious giving and attendance rates congregationally and the author
predicts that over- representation in religious congregations will be seen by lower income
individuals while higher income members concentrated their focus on giving. When I was
going through his paper I also agree that any attempt to establish the relationship between
Income group and their response to the religious giving and attendance empirically may give
the same prediction in Muslim countries. This is due to the fact that Muslims can be counted
as numbers but number of real Muslims who are practicing ideally the way the last prophet
(PBUH) has taught us to behave and lead our lives are hardy found. In this situation,
empirical findings in Muslim countries may not be meaningful predicting the same result as
Rosborough found. Considering the scenario, I motivate to do modeling the ideal Muslim
giving behaviour.
1.3. Research objectives and contributions
The objectives of this paper are as follows-
a) To review critically the neo-classical model of religious giving
b) To justify the predictions and propositions of the conventional model from Islamic
perspective or through Islamic moral filter
c) To develop an alternative model based on Islamic ideal behaviour
d) To motivate people to behave according to Islamic ideology for the welfare of the
society
1.4. Organization of the study
This paper has three sections. First section provide introduction covering the background and
motivation along with the objectives of the study. Then, the second section is completely
devoted to review on the relevant literature and Third section discusses more details on the
theory of religious giving using Iannaccone (1997) framework of rational choice model and
an Islamic perceive is also provided in relevant places. Finally, last section concludes.

POSTGRADUATE CONFERENCE ON ECONOMICS, PUBLIC ADMINISTRATION AND
BUSINESS (PCEPAB)-5TH SEPTEMBER, 2015
PROMOTING GOWTH, EXCELENT AND SUSTAINABILITY - 23
2. A Review of the Relevant Literature
Religious giving as a subject of study has been already caught widely attention in many
academic fields of business and social sciences. Beyond this cross-disciplinary appeal,
scholars all around the world are engaged to discuss the topic globally.
Theories of religious giving are few. (Hoge and Griffin 1992: 4-l in Iannaccone, 1997) state
that most research on giving is “exploratory in nature, not guided by any theoretical models”.
In this backdrop, Iannaccone (1997) shows the advantages of using ‘Rational choice theory’
that seeks to integrate numerous predictions within a single conceptual framework. It is well
suited for modeling the measurable dimensions of religious participation, particularly
contributions. It is easy therefore to sympathize with Hoge’s (1993: 36) claim that the
“rational choice economic model” is a “major theoretical resource” for understanding giving,
one that we would be “unwise” abandon.
Hoge and his associates (1995: 6, 7, 11) admit that “the economic model arouses fervent
opposition on psychological and sociological grounds”. But after weighing each of four
distinct “attacks,” they conclude that “the economic model [is] still the best starting place for
understanding religious giving . . . Religious giving is rational behavior.”
Most formal economic models of religious participation build from Gary Becker’s (1976)
theory of household production. The models of Azzi and Ehrenberg (1975), Sullivan (1985),
Iannaccone (1992), and Montgomery (1995) are all simplified variants of a single, general
model that encompasses church attendance, contributions, religious intermarriage,
denominational mobility, life-cycle patterns, church-sect theory, free-rider problems, the
strength of strict churches, organizational dynamics, and more. Iannaccone (19901 provides a
nontechnical introduction to household production theory and its application to religious
participation.
Lincoln, Morrissey and Mundey (2008) summarize, critique, and assess the existing literature
on religious giving by exploring individual and group level explanations, as well as the socio-
political context in which faith-based generosity occurs. They define ‘religious monetary
giving as financial donations given to religiously affiliated congregations, denominations, and
para-church organizations’ and citing Eckel and Grossman 2004: 272; Queen 1996, the
authors argue that many religions have institutionalized charitable giving, for example the
Christian tithe- that is, giving ten percent of one’s income—and Islam’s zakat, one of the
faith’s five pillars which is an “alms-tax” on roughly 2.5 percent of an individual’s wealth.
In terms of behaviors, beliefs, and demographic considerations, Lincoln, Morrissey and
Mundey (2008) outline the most important instruments that undergird individual religious
giving.
Indicators Variables
Behaviors 1. Attendance:
Relationship between participation and religious giving is positive.
high attendance levels are representative of strong religious commitment,
which typically leads to increased religious giving (Hoge 1995; 1994)

POSTGRADUATE CONFERENCE ON ECONOMICS, PUBLIC ADMINISTRATION AND
BUSINESS (PCEPAB)-5TH SEPTEMBER, 2015
PROMOTING GOWTH, EXCELENT AND SUSTAINABILITY - 24
“the relationship between religious giving and involvement in religious
organizations is unambiguously positive.” Chaves and Miller (1999: 171)
“attendance is a very strong predictor of contributions and tends to ‘knock
out’ the other religion variables. Attendance does more than merely take the
place of the observable beliefs and background; it substantially improves over
them because it also captures unobservable components of underlying
religiosity.” Iannaccone (1997: 153)
2. Pledging: planning one’s donations in advance. Pledging and weekly
tithing precipitate greater religious financial generosity.
Beliefs 1. Theological Conservatism: the effect of religious conservatism on
charitable behavior is positive and strong
2. Reciprocity:
Proponents of these religious economies of approach prefer to frame religious
giving as “rational behavior” in which there is a reciprocal relationship
between the donor and the recipient.
In Hoge’s (1995: 56) opinion, “this model remains the most promising
theoretical starting point for understanding religious giving
Demographic
Factors
1. Income:
In aggregate terms, individuals and families with high income generally give
more to religious organizations, and those with low income typically make
smaller donations (Hoge 1994; Chaves and Miller 1999).
aggregate giving to religious organizations is highly skewed (Iannaccone
1997).
2. Age:
Age is being positively related with religious giving.
3. Marriage:
Marriage is found to be positively related with religious giving, especially
when one’s spouse is religious and attends services.
4. Education:
Hoge (1994: 107) concludes that the relationship between education and
giving as a percentage of income is ambiguous.
3. Theory of Giving from Islamic Perspective
In order to develop a theory of giving from Islamic perspective, this paper will follow
‘rational choice model’ developed by Laurence R. Iannaccone’s paper entitled “Skewness
Explained: A Rational Choice Model of Religious Giving” published in 1997. In his paper, he

POSTGRADUATE CONFERENCE ON ECONOMICS, PUBLIC ADMINISTRATION AND
BUSINESS (PCEPAB)-5TH SEPTEMBER, 2015
PROMOTING GOWTH, EXCELENT AND SUSTAINABILITY - 25
mentions five assumptions proposed by Hoge (1994: 102-103) as starting points for future
research, the assumptions are:
1. Religious giving is rational behavior and can be modeled using existing sociological
and economic methods
2. People strongly committed to God and God's promises will more money to the church
3. Church members who have more discretionary income will, on average, give more to
the church
4. The distribution of the amount of money given by members of any church is greatly
skewed
5. The amount of money potentially available to churches from members is a variable
sum, not a fixed sum.
Among the assumptions, Iannacone gives special attention on assumption 4 and he mentions
three facts that are suffice to generate skewness in practice: (1) percentage rates of giving
vary greatly from one person to the next; (2) income levels also vary greatly; and (3) income
levels and giving rates are not strongly (and negatively) correlated (Iannaccone, 1997,
pp.142). On the basis of three facts, he develops his simulation on contribution rates,
incomes, and correlations between religiosity and income. The following simulation shows
how the explanation works.
1. Contribution rates: All studies of giving find that the share of income given to
religion varies greatly from one person to the next. Actual shares vary widely, that
they depend on a person’s religiosity, and that the tendency to choose a share (rather
than an absolute dollar amount) is widespread.
2. Incomes: Although actual incomes are both widely dispersed and highly skewed in
every country, his simulation employs a distribution that is nearly symmetric. He
does so to prove that a skewed distribution of contributions will arise even when the
underlying incomes are not skewed.
3. Correlations: Decades of survey research prove that the actual relationship between
religiosity and income is weak. Richer folks may attend church a bit more or pray a
bit less, but on the whole the impact of income is not particularly great.
He states that assumptions (1) through (3) enable the researchers to simulate contributions as
the product of income and share. People take their (randomly distributed) income, multiply
by their (randomly distributed) propensity to give, and arrive at an actual dollar amount:
contribution = share * income (Iannaccone, 1997, pp. 146).
3.1 Assumptions of the general model:
The general model rests on the following two important assumptions:
1. Individuals allocate their time and money resources so as to maximize their utility
from the production of abstract “household commodities.”
2. Religious satisfaction constitutes one such commodity, and for the purpose of formal
analysis all other commodities may be viewed as an aggregate “secular” commodity.

POSTGRADUATE CONFERENCE ON ECONOMICS, PUBLIC ADMINISTRATION AND
BUSINESS (PCEPAB)-5TH SEPTEMBER, 2015
PROMOTING GOWTH, EXCELENT AND SUSTAINABILITY - 26
3.2. Details of the model:
To simplify the analysis without altering any key results, assume that each individual
consumes R and S denote the quantities of religious and secular commodities respectively. R
and S are produced with inputs of personal time and purchased goods. 1Hence, R and S are
functions of time and money inputs:
R = R (tR , mR ) (1a)
S = S (tS , mS) (lb)
Where tR and mR denote the amount of time and money devoted to religion, and tS and mS
denote the amount of time and money devoted to all other (secular) activities. The total
amount of available time is of course fixed, since each person has only 24 hours per day.
Hence, letting T denote the total amount of available time and letting H denote hours of work,
each person’s time constraint may be written as:
tR + tS + H T (2)
This simply states that altogether the time devoted to religion plus the time devoted to secular
activities plus the time devoted to work cannot exceed the total time available. In a similar
fashion, the amount of money devoted to religious and secular activities cannot exceed total
income, I.
mR + mS I (3)
Total income equals earnings plus non-earned income. Hence, letting w denote the person’s
wage rate and N his or her non-earned income, we may write total income as
I= wH+ N (4)
Following Becker and others, we can define full income, I*, as the amount of income that
would be generated if the household devoted all its time to market labor.
I*= wT+ N (5)
By definition, a rational consumer seeks to allocate his or her resources so as to maximize the
utility derived from R and S:
U(R, S) (6)
subject to the previously described constraints on time and money income (and subject also to
whatever additional constraints govern the production of household commodities).
Specific Mathematical Form of Functions:
1 “Purchased goods” refers to anything bought with money, including physical items and human services. In the
absence of changing prices, the quantity of such goods can be proxied by the amount of money spent on them.

POSTGRADUATE CONFERENCE ON ECONOMICS, PUBLIC ADMINISTRATION AND
BUSINESS (PCEPAB)-5TH SEPTEMBER, 2015
PROMOTING GOWTH, EXCELENT AND SUSTAINABILITY - 27
To proceed, it is must to specify the mathematical form of functions in equations (1) and (6)
because of its relative simplicity and popularity in traditional economic research. This model
will use the Cobb-Douglas form. The Cobb-Douglas specification for equation (6) is:
U (R, S) = RC S1-C (5*)
The Cobb-Douglas specifications for equations (1) are:
R (tR , mR ) = tRa , mR
1-a (1a*)
S (tS , mS) = tSb , mS
1-b (lb*)
These functions are all multiplicative in their inputs (R, S, t, and m) and exponential in their
parameters (a, b, and c). Despite their apparent complexity, the behavioral interpretation of
the equations is straightforward: each one-percent increase in R yields a c-percent increase in
utility, each one-percent increase in tR yields an a-percent increase in religious output, R, and
each one-percent increase in mR yields a (1-a)-percent increase in religious output, R.
The parameter a has an analogous interpretation, but it reflects the relative value of time (as
opposed to money) devoted to religion. Institutional factors such as congregation size (which
affects the incentive to free ride) and denominational norms (concerning giving practices)
certainly influence this parameter - see Hoge and Griffin (1992, chapters 2 and 5) for details.
In terms of the model, denominations whose members average high rates of church
attendance relative to giving (such as Catholics) have a large a-parameter. Denominations
with high rates of giving relative to attendance (such as Mormons and Jews) have a small a-
parameter.
Drawing on standard mathematical results for Cobb-Douglas functions (Varian 1992: 111),
the explicit solution to the preceding utility maximization problem is
tR*= ac(I*/w) (7a)
mR*= (1-a)cI* (7b)
mR*/ tR*= ((1-a)/a)w (7c)
where w and I* denote the individual’s wage rate and full income, respectively.
3.3. Implications of the model from an Islamic perspective:
Let us assume, there are two persons in an Islamic economy and they are different based on
their level of Taqwa. Person A is more Allah-fearing than person B. Their utility functions as
follows:
UA (R, S) = RC S1-C
UB (R, S) = RC S1-C
Where, for person A: Marginal Utility from Religious activities, MUAR > 0; Marginal Utility
from Secular activities MUAS > 0, and for person B: Marginal Utility from Religious
activities, MUBR > 0; Marginal Utility from Secular activities MUBS > 0. Meaning that

POSTGRADUATE CONFERENCE ON ECONOMICS, PUBLIC ADMINISTRATION AND
BUSINESS (PCEPAB)-5TH SEPTEMBER, 2015
PROMOTING GOWTH, EXCELENT AND SUSTAINABILITY - 28
engaging in one additional both religious and secular activities give positive utility. But in an
Islamic economy, MUAR > MUBR and MUAS < MUBS. This is happen due to their level of
Taqwa. More Allah conscious people give priority to the religious activities than less Allah
conscious people.
Marginal Utility from Religious activities, MUR 0; Marginal Utility from Secular activities
MUAS > 0. This is a case if a person does not like religious activities, for example skeptics
and atheists. MUR becomes negative when a secular person compels to take part in religious
activities without willingness.
The parameter c captures the relative value that the individual assigns to religious (as
opposed to secular) commodities. We may therefore interpret c as the person’s underlying
religiosity. If c equals zero then the person attaches no value to religion, and larger c’s
correspond to greater levels of religiosity. Empirically, c will depend on the person’s
religious upbringing, personal experiences, beliefs, and numerous unobservable, random
factors. The parameter c thus captures the “religious human capital” effects described in
Iannaccone (1990, 1995: 118-19). In Islam, parameter c does not capture the Islamicity of a
person. Yes, relatively an Islamic man prefers religious activities over secular activities and
for this reason, c is nonzero and c is greater than 1-c but becoming c=1 has no meaning in
Islam if someone is engaged full-time in religious activities (Ibadah) , he will not have any
opportunity of working to earn livelihood. Hence, he has to depend fully on others in order to
live and this is highly discouraged in Islam.2 So, an Islamic man will maintain a balance
between religious and secular activities.3
To understand the behavioral implications of equations (7)) consider their final, rightmost
terms. In the time equations, 7a, this term has the form (1*/w), which equals full income
divided by the wage rate. Since most households derive almost all of their income from
wages, this term is approximately equal to the person’s full allotment of time, T. The model
thus predicts little or no relationship between income and church attendance. The intuition
behind this result is straightforward: each day has 24 hours; so the rich have, on average, no
more time to give to any particular activity (including religion) than do the poor.
But richer people do have more money. The final term in the money equations, 7b is full
income, I*. The model thus predicts that as income grows, dollar contributions will rise
proportionately. In other words, the share of full income given to religion will remain nearly
constant. The share, which equals (1-a)c, will depend on individual religiosity, institutional
attributes, and unobservable random factors. In Islam, rich people will give more money and
they have obligations in this regard. Wealth is a test for the rich, Allah will question them on
the Day of Judgment about the source of their wealth and how they spend it.
We have thus derived the very result that the simulations assumed. Total dollar contributions
arise out of the multiplicative interaction between two factors (full income and underlying
2, "And when the prayer is finished, then you may disperse through the land and seek of the bounty of Allah."
surat Al-Jumu’ah, (verse 10) 3 “When they spend, do so not excessively or sparingly but are ever, between that, justly moderate.” (Qur’an,
25:67)

POSTGRADUATE CONFERENCE ON ECONOMICS, PUBLIC ADMINISTRATION AND
BUSINESS (PCEPAB)-5TH SEPTEMBER, 2015
PROMOTING GOWTH, EXCELENT AND SUSTAINABILITY - 29
religiosity) that vary independently of each other. Skewness thus follows as a formal
prediction of a rational choice/household production model of religious participation.
Of course, the model does more than predict skewness. Equations (7) also predict that: church
attendance will be less skewed than giving; church attendance will be virtually unrelated to
earned income; and individual rates of attendance will correlate more strongly with the share
of income contributed than the absolute amount contributed. Finally, the model predicts that,
apart from income, the same set of individual attributes (i.e., the same underlying
determinants of religiosity) will have nearly equal impact upon both contributions and
attendance. Empirically, this means that including attendance in the right hand side of a
contributions regression will tend to wash out the effects of all other individual-level
variables except income. (Alternatively, it means that the ratio of contributions to attendance
should be positively affected by the determinants of full income but relatively unaffected by
the underlying determinants of religiosity. See [7c], and note that the religiosity parameter, c,
has dropped from the equation.)
4. Conclusion
Concept of religiosity as understood by western scholars is different than Islamicity as
understood by Muslims. Hence, using the framework of Iannaccone (1997) cannot express
the ideal mode of Islamic giving behavior. It is, therefore, necessary to work seriously
further to improve the model. Despite the limitations, the model discussed above has also
articulated that religious activities both in terms of attendance and giving depend more on
religiosity (Islamicity) than income and others factors. This model is not empirically tested
yet. This is one of the drawbacks of the paper.
Acknowledgments
This paper was submitted on 31st December, 2013 to Dr. Noorihsan Mohamad for the partial
fulfillment of the requirement in the course ECON 7110: Microeconomic Theory for PhD in
Economics. The author is indebted to Dr. Noorihsan for encouraging me to come up with
mathematical microeconomic model in his course and giving suggestions and comments
during the preparation of this manuscript.
References
DAVIDSON, J. D.; PYLE, R. (1994). “Passing the Plate in Affluent Churches: Why Some
Members Give More than Others." Review of Religious Research, 36 (December,
1994): 181-196.
DONAHUE, M. J. (1994). "Correlates of Religious Giving in Six Protestant Denominations."
Review of Religious Research, 36, no. 2 (December 1994): 149-157.
HOGE, DEAN; YANG, F. (1994), "Determinants of Religious Giving in American
Denominations: Data from Two Nationwide Surveys." Review of Religious Research,
36, no. 2 (December 1994): 123-148.

POSTGRADUATE CONFERENCE ON ECONOMICS, PUBLIC ADMINISTRATION AND
BUSINESS (PCEPAB)-5TH SEPTEMBER, 2015
PROMOTING GOWTH, EXCELENT AND SUSTAINABILITY - 30
HOGE, D.; CHARLES, Z.; PATRICK M.; MICHAEL, D. (1996). Money Matters: Personal
Giving in American Churches. Louisville, KY: Westminster John Knox Press
HOGE, DEAN. (1994) "The Problem of Understanding Church Giving." Review of
Religious Research, 36, no. 2 (December 1994): 101-110
IANNACCONE, L. R. (1997). Skewness explained: A rational choice model of religious
giving. Journal for the Scientific Study of Religion, 141-157.
INSKEEP, K. (1994). "Giving Trends in the Evangelical Lutheran Church in America."
Review of Religious Research, 36, no. 2 (December 1994): 238-244.
LUIDENS, D.; NEMETH, R. (1994). "Social Sources of Family Contributions: Giving
Patterns in the Reformed Church in America." Review of Religious Research, 36, no.
2 (December 1994): 207-217.
NEMETH, R.; LUIDENS, D. (1994). "Congregational vs. Denominational Giving: An
Analysis of Giving Patterns in the Presbyterian Church in the United States and the
Reformed Church in America." Review of Religious Research, 36, no. 2 (December
1994): 111-122.
OLSON, D.; CADDELL, D. (1994). "Generous Congregations, Generous Givers:
Congregational Contexts that Stimulate Individual Giving." Review of Religious
Research, 36, no. 2 (December 1994): 168-180.
REXHAUSEN, J.; CIESLAK, M. (1994). "Relationship of Parish Characteristics to Sunday
Giving Among Catholics in the Archdiocese of Cincinnati." Review of Religious
Research, 36, no. 2 (December 1994): 218-229.
ZALESKI, P.; ZECH, C. (1994). "Economic and Attitudinal Factors in Catholic and
Protestant Religious Giving." Review of Religious Research, 36 (December, 1994):
158-167.

POSTGRADUATE CONFERENCE ON ECONOMICS, PUBLIC ADMINISTRATION AND
BUSINESS (PCEPAB)-5TH SEPTEMBER, 2015
PROMOTING GOWTH, EXCELENT AND SUSTAINABILITY - 31
An analysis of the reasons behind abuse of Murabaha Contracts
in disguised Riba in modern practices
Imene Tabet
Hamad Bin Khalifa University
Qatar Foundation
Al Luqta St, Ar-Rayyan
Qatar
Email: [email protected]
Abstract
Since the evolution of Islamic Economics and Finance in the 1970’s, Murabaha stood among the most
promising contract in the early stage of the industry and as a debt financing instrument that is suitable for
financing short as well as long run trade. Many scholars strongly supported it, however, it soon developed into
a pool of malpractices and doubtful activities that included disguised elements of the prohibited elements that
are against the basic principles of Islamic Finance. This paper aims at analysing disguised Riba in modern
Murabaha arrangements, as well as the reasons behind this ongoing abuse that is left untreated at many times,
furthermore the impacts of such prolonged activities on the economy. The analysis will be done through
comprehensive assessment of Murabaha applied models such as, Murabaha-Sukuk and Commodity Murabaha
each with respect to the disguised riba element related to it according to the categorization that will be
discussed.
Keywords: Murabaha, Murabaha-Sukuk, Commodity Murabaha, Disguised Riba, Tawarruq, Bay al ‘ina,
1. Introduction The first Islamic Economics and Finance Evolution in 1970’s called out for reformation of
contractual arrangements under the Islamic Financial systems, pioneers and scholars of the
field have succeeded to develop various contracts upon which Islamic Financial Institutions
took their first step into being. The contract that gained significant popularity was the
Murabaha contract which had the biggest share in that advancement. The modified Murabaha
arrangement that scholars established; namely Murabaha by the Order of Purchaser among
others, was developed to enable credit provision in the form of debt financing by banks to its
clients. It is important to note that the contractual structure of most murabaha arrangements
practiced are sharia compliant and are clear from any prohibited elements such as riba and
other haram activities, based upon which the fuqahaa allowed it to be practiced. Nevertheless,
the excessive use of murabaha made it occupy not less than 80% of the Islamic Financial
Institutions’ resources. This popularity did not last long, with the excessive use of it, as well
as the loopholes that continued to prevail as a result of the abuse of practice; Murabaha; in its
current context and practices, soon was deemed to be inconsistent with the Shariah rules and
objectives. This has called scholars to shed some light on the other Islamic Financial Contacts
that have been ignored for a very long time. This study contributes in several ways to the
existing literature. Firstly, the findings carry significance to management and higher
authorities as well as the financial institutions for policy making. The study analyses the

POSTGRADUATE CONFERENCE ON ECONOMICS, PUBLIC ADMINISTRATION AND
BUSINESS (PCEPAB)-5TH SEPTEMBER, 2015
PROMOTING GOWTH, EXCELENT AND SUSTAINABILITY - 32
dependence of Islamic Financial Institutions over specific contracts such as Murabaha and to
what level they are depending on it in the light of the ongoing debate of its advantages and
drawbacks,
Secondly, this study conceptualizes the objectives and effects of current implementation of
Islamic Financial Contracts on the financial industry’s development which will further add to
the growing debate of the future capacity and strength of Islamic Finance versus its
conventional counterpart
Thirdly, the highlighted loopholes and recommended solutions may act as a guideline to the
concerned authorities of Islamic financial institutions, specifically those focusing on
providing various Islamic financial products and instruments.
Finally, further policy implications are discussed based on the analysis and discussion.
The organization of this study is as follows. We start the discussion by analysing the recent
literature. This is followed by an analysis of prohibited elements that exist in murabaha
practices in Sect. 3, followed by the reasons behind the untreated deficiencies in Sect. 4, the
economic effects of the untreated loopholes and practices in Sect. 5. And finally, Sect. 6
concludes the discussion by providing some policy recommendation and areas for future
research
2. Literature Review Murabahah is a sale contract in which the seller will informs to the customers all the costs
incurred such as transportation cost and shipping. The value of contract will be added on the
total cost as profit. While, on the other side, and according to Hussin (2010), Murabahah
financing is an asset based financing widely used for house and motor vehicle financing by
Islamic banks.
Numerous researches on Murabaha concept especially after the development of Murabaha by
the Order of the Purchaser and its derivatives have been done by various scholars throughout
the world; one of the most distinguished studies was carries out by shaikh AlQaradawi. He
postulated his theoretical arguments along with various other Fuqahaa’ with respect to
murabaha (Al-Qaradawi, 1995), however, that was when he was a supporter of Murabaha as
it came about, in his paper, he also answers several contemporary fuqahaa critics such as al-
Masi who regarded Murabaha by the Order of Purchaser including elements of gharar and
legal tricks which are prohibited by Islam.
Nevertheless, there are two main scholarly views on Murabaha practices. The first view is
that Murabaha, with all its various applications is vital for Islamic Financial industry’s
growth, either by absolute claim or disapproval of some elements, and the second view is that
Murabaha needs to be eliminated from Islamic Financial practices. First of all, Murabahah is
derived from the word ' ribh ' which means profit. Technically, Murabahah is a price mark-
up that is expressed by seller to buyer for more transparent in the sale and purchase
transaction (Abdul Rahman 2010). Murabahah sales can be made by cash or credit.
According to Institute of Islamic Banking and Insurance (IIBI), (2006), Murabahah is a

POSTGRADUATE CONFERENCE ON ECONOMICS, PUBLIC ADMINISTRATION AND
BUSINESS (PCEPAB)-5TH SEPTEMBER, 2015
PROMOTING GOWTH, EXCELENT AND SUSTAINABILITY - 33
contract of sale between the bank and its client for the sale of goods at a price plus an agreed
profit margin for the bank.
A lot of studies exist that support Murabaha. Zaki (2011) wrote a book about the Islamic
finance as an effective took of risk mitigation. He illustrated that Islamic Finance and rules
are used a Risk mitigate and minimize if applied appropriately. Alsayyed,(2010) studied the
uses of Commodity Murabaha, and found that Murabaha is clearly the Islamic treasurer’s
funding product of choice, as it is flexible enough to facilitate many structures for financing,
hedging, and currency exchanging.
On the other hand, many Scholars were of the opposite opinion, Zuhaili (2006) explains that
the Maliki School of Jurisprudence, Umar bin AbdulAziz, Ibn Taymiyyah, Ibn Alqiyym, the
Hanbalis Mohammed bin Allasan Alshaibani and from the Hanafi Schools dislike any
arrangements that include bay al ‘inah And tawarruq for various reasons such as Murabaha
and bai ‘ina practices are a trick and a backdoor to riba, (Al-Zuhaili, 2006). Imam Hanbal
himself disliked those who transact in deferred terms, Zuhaili further explains; practices such
as Murabaha and Tawarruq is actually like the sale of a forced person, this is due to the
nature of the contractual arrangements which could leave the client feeling insolvent,
moreover, this is again the spirit of Islamic Financial Transactions. In fact, most of scholars
nowadays have been more inclined towards this critic side of Murabaha practices due to the
serious loopholes that have been raised
3. Analysis Of Prohibitted Elements That May Exist In Murabaha
Practices Before getting into the analysis of the doubtful practices and the abuse of murabaha contract;
it is vital to go through the development of these practices, in order to be able to trace it to the
beginning. It all started by the first Conference of Islamic Banks in 1979 that was held in
Dubai, where the Murabaha by the Order of Purachasor was suggested and in fact welcomed
by most scholars, clients were selling certain assets to the bank and repurchasing it back on
bases of murabaha for the sake of obtaining liquid cash, this was untill the early 2000’s where
Tawarruq was adobted by several domestic banks soon it became a common practice among
Islamic Banks, with the 15th meeting of Majma Alfiqh Al-Islami which concluded that
tawarruq is permissible, Tawarruq gained popoularity that made its use spread into liquidity
management, especially in the middle east, soon it, soon it was becoming aparent that it was
manipulated and abused, this is when the organized tawarruq came to practice, which made it
clear for some scholars that it was time to speak out againts this act, in the 17 th meeting of
Majma Alfiqh Al-Islamic, Tawarruq was deemed prohibited, yet, its practice remains
ungoing. Furthermore, The most recent development of abusive forms of Murabaha was with
respect to securities, selling stock in favor to one client and selling it back for his own
interest, this is not only bringing unjustifies and secured gain to banks, but it rather is
considered a straight forward riba.
We could see from all these steady flow of that is refelected in the history of Murabaha,
malpractices and are growing to be very serious, moreover, Islamic Banking practitionors
have been more and more daring, this may be due to the lack of serious actions taken against
such practices, or due to the lack of clear cuts in the Sharia Financial Standards and rules

POSTGRADUATE CONFERENCE ON ECONOMICS, PUBLIC ADMINISTRATION AND
BUSINESS (PCEPAB)-5TH SEPTEMBER, 2015
PROMOTING GOWTH, EXCELENT AND SUSTAINABILITY - 34
which is opening doees for many exceptions. The rest of the paper will look into these
practices and the reason behind their prelonged and rather untreated existence.
Below is the summary of the main points that would be discussed in this section:
Figure 1. Summary of the main points to be discussed by the Author
Since the 1970’s, Murabaha, as a debt financing instrument, evolved into various contractual
arrangements that are used for different objectives. Its excessive use has often led to doubtfull
practices that seem to make murabaha contract in its sense closer to the interest bearing loans,
which caused some scholars change their initial view about it, and calling for reduction of the
Islamic Banking institutions dependence upon this contract. The discussion below will
analyse several elements that are deemed to be disguised riba practice, the analysis will be
done through assessing several models in the light of the contractual arrangement as well as
their practices.
The main models that will be used in the essessment are, Commodity Murabaha and
Murabaha Sukuk.
3.1 Prohibited Elements That May Exist In Murabaha Practices
1. Sale of debt: One of the main practices that raised doubt about the existence of disguised riba in
Murabaha is the element of sale of debt, for clarity, this will be discussed later in the
light of Murabaha-Sukuk.
Murabaha- Sukuk was adopted to reflect one of the main uses of Murabaha as an
asset-based debt financing instruments, which practitioners claim that it is vital ‘to
accelerate development of Islamic Monetary Market’ and without which Islamic
Banks may suffer from liquidity crunch. (Siddiqui), although Murabaha-sukuk is
somehow limited in its practices, yet it has been increasingly used in the Islamic
Stock market and have amounted to 20% of the sukuk in the Malaysian Islamic Stock
market. Nevertheless, keeping in mind that all scholars held the opinion that
murabaha in any way must not be used as a tool for creating negotiable instruments to
be transacted in the secondary market. In murabaha sukuk, the deferred debt by the
Disguised Riba Practice in Murabaha
Prohibited Elements that may exist in Murabaha practices
Sale of Debt
Tawarruq
Bai Al 'ina
Malpractice of operation elements in Murabaha
Customer acting as Agent to himself
Risk, Finance, or delivery borne by customer

POSTGRADUATE CONFERENCE ON ECONOMICS, PUBLIC ADMINISTRATION AND
BUSINESS (PCEPAB)-5TH SEPTEMBER, 2015
PROMOTING GOWTH, EXCELENT AND SUSTAINABILITY - 35
non-debtor is sold for deferred cash (in step number 7, Diagram 1 below), the Islamic
Fiqh Academy counted this as Sale of debt, as Najatulla Siddiqi argued in his paper,
that if we bought and IOU of $90 that is worth $100 after a year; we would be doing
that in order to earn the $10 of interest, thus there is no difference between IOU’s (i.e.
Sukuk) created by murabaha or by lending money. Nevertheless, this view has been
challenged by Chapra and Khan who were of the opinion that, a debt resulting from
murabaha has an element absent from a debt arising from borrowing money; that is,
the mark up on spot price, sale and purchase of murabaha-based Debt would take
place on this extra profit margin. (Khan, 2000)
The key point here is that it has been mentioned explicitly in Islamic Fiqh Academy
(2000, p.234) that there is no difference whether the debt is the result of a loan or
whether it is deferred sale (Academy, 2000), otherwise it would amount to Sale of
Debt, unfortunately, that is what has been practiced as far as Murabaha-sukuk is
concerned.
The problem with this proposition is that what was a profit MARGIN for the seller of
goods and services (on a murabaha basis) may not necessarily remain so when the
same seller ‘sells’ the IOU arising from that transaction. Some of the factors involved
in the determination of the mark up on spot price in murabaha may be different from
those involved in the sale of the resulting IOU at a discount. Furthermore, the extra
profits earned in murabaha sale, over and above those earnable on selling for cash, are
still against sale of goods and services. But the part of it that goes to the buyer of the
murabaha based IOU (according to the above mentioned rationalization) has no goods
and services corresponding to it. It is money for money, with a Contract between
Bank and Customer to decide profit rate on resale and payback period. Customer
purchases shares as bank’s agent, bank pays for the,. Bank sales the shares to the
customer on settlement at profit. Figure 2. describes the basic Murabaha Sukuk
model:
Murabaha has also been applied to generate working capital for business and consumer
credits using Commodity Murabaha as a tool to achieve that. The main difference that needs
to be clarified is that in Murabaha Sukuk, the customer needs a specific commodity for which
the bank provides financing, on the other hand, in Commodity Murabaha, the customer wants
cash. Which brings us to the second and third main elements of disguised riba in Murabaha
Figure 2. Murabaha Sukuk Model, Source: Author’s illustration
1.Sukuk(Trust Certificates) 2.Cash
Sukuk Issuer SPV 3. Spot Payment
4.Spot Delivery 5.Commodity Spot Delivery
6.Deferred Price
7.Return from Deferred Price = x
= x + y
= y

POSTGRADUATE CONFERENCE ON ECONOMICS, PUBLIC ADMINISTRATION AND
BUSINESS (PCEPAB)-5TH SEPTEMBER, 2015
PROMOTING GOWTH, EXCELENT AND SUSTAINABILITY - 36
practices namely, tawarruq and bai al ‘ina, which will be assessed in the light of Commodity
Murabaha contractual arrangement.
2. Tawarruq: (Monetization)
In the light of Commodity Murabaha1 (also known as: double murabaha / reversed
murabaha)
Islamic Institutions adobt Tawarruq arrangement to allow for cash financing as a way
to avoid bay al ‘ina, however, tawarruq in itself has been a doubtful elements in
Murabaha arrangements that scholars have deemed to be a disguised riba practice if
not practiced well.
Figure 3. Below is an illustration of how tawarruq is practiced in the context of
Commodity Murabaha in Bank Islam (Malysia).
Figure 3. Contractual Arrangement of Commodity Murabaha as practicedby Bank
Islam Malaysia
Source: www.bankislam.com.my/en/Pages/ShariahConcept.aspx?mlink=PersonalFinancing
1Commodity Murabaha: The bank buys a certain commodity from a broker and sells it to the client, who does not want
to own the commodity, so he sells it to another broker to get cash.

POSTGRADUATE CONFERENCE ON ECONOMICS, PUBLIC ADMINISTRATION AND
BUSINESS (PCEPAB)-5TH SEPTEMBER, 2015
PROMOTING GOWTH, EXCELENT AND SUSTAINABILITY - 37
The Fiqh Academy of the World League in its seventeenth session held agreed that
organized tawarruq is not allowed. Moreover, as early as 2006, Shaykh Dr. Hussein H
Hassan, a prominent member of many Shariah boards including AAOIFI claimed that
many scholars had reached a consensus that organized tawarruq was indeed haram
(Al-Suwaylim).
The reason of the increasing doubt about the practice of tawarruq in general and in
Murabaha in specific is the fact that the client is not interested in the product per se,
rather the money, and the sale in question is an illusionary sale whereby there is no
actual possission of the item. If we look at Figure 3 above, despite the fact that
arrangements such as making the bank as an agent, and ensuring that the commodity
is not returned to the same party (2 brokers involved), yet the whole issue boils down
to obtaining cash immediately, and paying for it later on with a greater mount, and
this is what majority of fuqaha see as nothing but a disguised riba practice. Islamic
Scholars further dislike such arrangements because they believe that businesses and
consumers should use less contrived methods to obtain financing.
3. Bai Ina(Buy-Sell Back)
Although tawarruq and Bai al ‘ina are both said to be derived from the concept of
Murabaha,. Majority of scholars argue that Bai Ina (Buy-Sell Back) is not but a
replication of the interest-bearing loan in the conventional system. The key difference
between Tawarruq arrangements and Bai al ‘ina is that the latter is done among two
parties, while tawarruq is more than two parties involved. Moreover, in the attempt of
applying Bay al ‘ina in Islamic Financial institutions (i.e. in Malaysia), scholars have
placed certain rules to ensure Shariah complience, such as that there should be no
condition of buy back, and each contract should be done seperately. Nevertheless, if
we look into what has been experienced, everything is done in the same setting.
Figure 3 below clarifies the practice of Bai Ina in the context of Murabaha by
Malaysian Banks.

POSTGRADUATE CONFERENCE ON ECONOMICS, PUBLIC ADMINISTRATION AND
BUSINESS (PCEPAB)-5TH SEPTEMBER, 2015
PROMOTING GOWTH, EXCELENT AND SUSTAINABILITY - 38
Figure 4. Bai Al’ina Practice in Murabaha (Malaysia)
Source: http://islamicbankers.me/2012/12/22/the-death-of-bai-inah/ (Islamic Banking: Resource Centre)
All independent Shariah Councils strongly recommended to avoid these instruments
of legal arbitrage in general whether it is in the form of tawarruq or bay al ‘ina. With
the rise of doubts and issues regarding bay al ‘ina, many practitionners believed that
moving from bai al ‘ina to tawarruq in the right thing to do. While both could be
doubtful; it has been increasingly clear that bay al ‘ina is not any different from
interest bearing loans.
These two forms of credit are more clearly parallel to traditional loans and may be
structured to have“rate” resets, rollovers and to accommodate late payment recoveries
which are even more controversial.
3.2 Malpractice Of Operation Elements In Murabaha
The elements that may be considered as disguised riba practices in the context or Murabaha
contractual arrangements go beyond the general elements that are prohibited in themselves
(i.e.sale of debt, tawarruq, and bay al ‘ina). The reformation of murabaha since the 1970’s has
allowed for many loopholes even in term of the abuse in operation elements in itself. We will
now look at the main elements among these arrangements and analyse their reasons in the
light of current practices.
1. Customer’s agency to himself
This concept was introduced after serious mistakes that practitioners committed in the
early stages of Murabaha arrangements developments, when a manager allowed the
client to withdraw the cash needed for purchase from the bank and do all the job by
himself all after which the final price and terms of payment has been concluded. This
is an absolute Riba and not a murabaha sale. Scholars have strictly criticized this
practice till it was brought to an end. A substituting step was introduced, that is,
giving agency to the client, which was believed to be the suitable solution for that
1.Bank sells Asset to
customer at RM30,000 for 60
monthly installment.
(Murabaha sale)
2.Customer Sells Asset to
Bank at RM 20,000 on spot
bases

POSTGRADUATE CONFERENCE ON ECONOMICS, PUBLIC ADMINISTRATION AND
BUSINESS (PCEPAB)-5TH SEPTEMBER, 2015
PROMOTING GOWTH, EXCELENT AND SUSTAINABILITY - 39
problem. Nevertheless, Murabaha has increasingly been criticized for many other
arrangements that seem to be doubtful.
The main argument here is that once the customer becomes an agent for the bank to
take possession of the commodity on behalf the bank and delivering the commodity to
himself, this transfers part of the risk to the customer, especially if the commodity was
bought at the customer’s name from the beginning, this raises the argument that the
profit that the bank gets is guaranteed and without any risks, which is against the
principles of Islamic transactions.
2. Shipping, Risk, or Financing , borne by customer
During the development of murabaha and its application as a financing instrument, it
has come to scholars realization that there are certain key points that must be cleared
and out as a framework in order to ensure the Sharia compliance of murabaha
applications. All fuqahaa’ agreed that in a murabaha contract, all shipping costs, all
risks involved from the moment the contract is initiated till the delivery of commodity
to customer, as well as financing cost must be borne by the Financing Institution (i.e.
Bank). Failing to which the contract may be void and it will be no different from an
interest bearing loan.
These key points were highlighted after several serious malpractices committed
during the early years of murabaha application as what has been aforementioned.
Another issue that scholars raised with respect to shipping and financing in murabaha
arrangement is that in most cases, especially that of import murabaha, Islamic
Financial Institutions do not consider custom duties, Letter of Credit charges, etc. in
their pricing mechanism and the customer must bear all these charges. This is against
the principles of Murabaha where by all costs and related matters needed to deliver
the commodity to the client must be borne by the financier even if it was reflected in
the price. Failing to which will make the Murabaha arrangement interest bearing.
Most of these issues were looked into since the 1983 when the Fiqh Academy
suggested two main points to comply. Firstly, The Bank must own and possess the
commodity BEFORE signing the Murabaha contract with the client. Secondly, the
Bank must bear the risk of damage that could have to the commodity before it reaches
the client along with other risks which give further justification of the profit the bank
gains.
Another case regarding misuse of murabaha that could amount to disguised riba
practices is the issue of physical verification of the commodity, in practice, the
Financial Institution takes only a constructive possession over the commodity, while
the customer actually receives the delivery of the good, there is, however, the risk that
murabaha transaction be executed prior to the procurement of the commodity, which
will render murabaha transaction as being mere financing rather than trading. In other
words, sometimes clients are obliged to fulfil the contract payments before actually
receiving the merchandise, which is completely against the shariah rules. (Ahmad,
2005)
4 Reason Behind Untreated Deficiencies
Now that we have highlighted the main elements leading to disguised Riba in modern
Murabaha practices, it is pertinent to analyze the reasons behind these loopholes being
untreated, and why is Murabaha and its subsequent tools still being practiced despite the
doubts that has been raised and the arguments from many scholars to limit these activities

POSTGRADUATE CONFERENCE ON ECONOMICS, PUBLIC ADMINISTRATION AND
BUSINESS (PCEPAB)-5TH SEPTEMBER, 2015
PROMOTING GOWTH, EXCELENT AND SUSTAINABILITY - 40
that seem to be bringing the name of Islamic Financial instruments to suspicion. These
reasons will be highlighted in the light of their nature, some of which are problems in the
theoretical approach of developing Islamic Financial instruments, meanwhile other reasons
are due to deficiency in application.
4.1 Theoretical Reasons Behind Untreated Deficiencies:
1- One of the main problems faces in the development of Islamic Financial
instruments and working towards improving it generally is the lack of
cooperation between finance experts and Sharia scholars and Sharia board
members. The Shariah members at many times know what opinion is
demanded and expected from them before they truly analyze the cases from a
proper Sharia perspective. At time Shariah members are bias towards what is
wanted from them rather than what they believe Shariah accepts. Many
scholars have recommended to establish an independent body of Sharia
members that are responsible for solving all doubts and disputes, having an
independent body, preferably under the central bank, will result in an
unbiasedness among Sharia members when calling out for their opinions.
2- Lack of vision of contracts, this is indeed on of the main shortcomings of
Islamic Financial institutions, we are often carried away by various things
from trying to compete with our conventional counterparts or strive to
maximize the Islamic Financial institutions share in the market, this major
shortcoming of the mission of Islamic Banking and Finance in general and the
lack of vision towards the actual responsibility of development that must be
the ultimate idea behind Islamic Banking and Finance industry. The aim for
economic development of our Muslim countries especially must be put into
effect, and that should be the path upon which Islamic Financial Instruments
must be developed.
3- As far as Islamic Financial Instruments are concerned, there is a huge lack of
understanding and differentiating between the Constants and Variables of each
contract, knowing which parts of the contract are constants that must exist in
order for the product to be Shariah compliant, and the other elements that
could be altered and developed in order to invent efficient tools for Islamic
Financial sector. Moreover, this cannot be efficiently implemented without a
proper application of fiqh rules with the consideration of maqasid of shariah as
a comprehensive methodology of developing Islamic Financial Instruments
with considering micro as well as macro approach, lack of which has
contributed immensely to the abuse and misuse of Murabaha, among many
others, Islamic Financial Instruments. In other words, in a certain model, each
individual contract may seem perfectly Shariah compliant, however, once it is
practiced with the rest of the model on a macro level; it raises serious doubt
about it Sharia compliance. This is one of main reasons why many scholars,
including Shaikh AlQaradawi, who was a proponent for Murabaha by Order of
Purchaser when it first evolved in 1970’s, however, after all the doubts that
has been raised about its application he attacked it and strongly held the
opinion of limiting its application as much as possible.
4- One of the most obvious reasons behind the continuous use of Murabaha
based Instruments is the fact that it is deemed to be one of the least risky
financial instruments banks may use in financing various activities, with the
numerous uses of it from liquidity absorption, debt financing, and international

POSTGRADUATE CONFERENCE ON ECONOMICS, PUBLIC ADMINISTRATION AND
BUSINESS (PCEPAB)-5TH SEPTEMBER, 2015
PROMOTING GOWTH, EXCELENT AND SUSTAINABILITY - 41
trade financing, Islamic Financial Institutions prefer Murabaha over other
instruments that has been called for to replace it.
4.2 Practical Reasons Behind Untreated Deficiencies:
1- Lack of proper and sufficient Islamic Banking staffing; there is a huge problem in the
distribution of human capital in Islamic Financial Institutions, those who have best
knowledge and experience in banking have weak Shariah knowledge and have the
dominating decision making positions. This eventually caused those with Shariah
knowledge to be there just for consultation, often deemed to have unsuitable opinions
due to lack of economic and practical knowledge.
2- Competition with conventional counterparts, as far as Islamic Financial Institutions
are concerned, we are overwhelmed by competing with our conventional counterparts,
this have caused the Islamic Banking sector to stick to certain activities for the sake of
competition while overlooking the Shariah aspect that could have been forgone for the
sake of competition or even could have rather brought a bigger gain to the Islamic
Financial Industry.
3- Lack of alternative focuses; as many scholars and Islamic Economists have been
suggesting, we must avoid those doubtful practices, it is time to look into developing
other Islamic Financial instruments that has not been focused on, including
Musharaka, Mudaraba, Salam, and many other contracts that are believed to have
huge capacities and a promising future. There is yet room for further development of
Murabaha application that various scholars have suggested. This could include
establishing independent Financial Institution specializing in Murabaha financing or
debt financing in general, whereby they have complete possession of commodities
and trading facilities that enables them to purchase the subject matters. This new
mechanism will enable the separation of trading and financing activities which is the
key solution for the current malpractices. (Ahmad, 2005).
5. Economic Effect Of Untreated Practices
It is pertinent to look into the effect of these untreated practices and issues raising from
abuse of Murabaha products. This will enable us to have a clear idea of the economic as
well as financial dimention of the current situations. Summarized below are the main
negative effects economists believe that is being caused as a result of abuse of Murabaha.
Effect on Economy:
1- Promoting Consumerism: amounting to more than 80% of Islamic Banks resources,
and being an instrument for debt financing, this huge fraction reflects how much
people are seeking debts for financing for things regardless the level of their need and
affordability. Just like in the conventional system, opening the door and giving easy
access for debt financing proved to promote consumerism among the society.
2- The excessive use of murabaha, just like the interest-bearing loans- has pushed
people to be indebted which may eventually lead to higher levels of bankruptcy and
insolvency. Despite the fact that there are credit assessments that are undertaken, this
is one of the main reasons why scholars such as imam hanbal have criticized those
who depends on defer payment sales.
3- The spread of Murabaha as a way of financing debt have significantly caused the lack
of Benevolent loans, this is because to the rather higher profitability of murabaha.
This is bad because the original concept of debt financing in true Islamic practices is
through benevolent loans.

POSTGRADUATE CONFERENCE ON ECONOMICS, PUBLIC ADMINISTRATION AND
BUSINESS (PCEPAB)-5TH SEPTEMBER, 2015
PROMOTING GOWTH, EXCELENT AND SUSTAINABILITY - 42
4- The strong reliance on Murabaha as a financial instrument has significantly reduced
the amount of Investments that are undertaken through Sharika, which is, despite the
fact that is productive rather than consumptive, bears greater risk, which has caused
investors to stick to murabaha since it is deemed to be more secured and a safer
contractual arrangement.
5- Murabaha, in its contemporary practices is most likely to widen the income gap,
leading the rich people to become richer and poor people will be poorer, this is mainly
due to the nature of facilitating credit by banks, who are more likely to accept
financing people who the bank feels safe about their ability of paying back.
Ironically, the aforementioned reasons are among the main causes that have lead to the
financial crisis in 2008, which Islamic Finance claim to be immune to. This indeed puts
further emphasis on the need to shedding light upon new financial products and new
mechanism to be adopted by Islamic Financial Institutions to fulfil greater economic
development and interests.
6. Conclusion:
Despite the fact that Murabaha through all the ways that is has been practiced have
contributed prominently to the growth of Islamic Finance throughout the past years, it
was built to be a powerful tool that had so many uses ranging from Securitization
(Tawarruq), Liquidity absorption by Central Banks, risk mitigation tools for financial
institutions, debt financing for business, car and house financing for individuals..etc,
however, the current contractual arrangements involving murabaha in practice has
developed many loopholes that very little effort have been done to treat, this have caused
many problems and doubts, furthermore it have developed the practices that is said to be
what have caused the financial crisis of 2008. This have caused prominent scholars to call
for a switch in the products currently used in the industry, or at least treating the existing
doubtful practices through introducing new mechanisms. Nevertheless, it is hoped that
economist will start considering indulging more productive contractual arrangement in
financing activities by means of equity financing.
References
Academy, I. F. (2000). Resoultions and Recommndations of the Council of Islamic Fiqh
Academy 1985-2000. Jeddah: Islamic Research and Training Institute, Islamic Development
Bank.
Ahmad, P. D. (2005). Islamic Banking Modes of Finance: proposals for further Evolution.
Egypt.
Al-Qaradawi, Y. (1995). Murabaha Sale bu the Order of Purchaser and its Application in
Islamic Banks in The Light of Tests and Legal Maxims.
AlSayyed, N. (2010). The Uses and Misuses of Commodity Murabaha: Islamic Economic
Perspective. Retrieved April 2, 2015, from MPRA: http://mpra.ub.uni-
muenchen.de/id/eprint/20262
Al-Suwaylim, S. i. (n.d.). Tawarruq Banking Products. Retrieved March 28, 2015, from
ISRA: http://isra.my/media-
centre/downloads.html?task=finish&cid=88&catid=20&m=0
Al-Zuhaili, W. (2006). Tawarruq, its Essence: Main Stream Tawarruq and Organized
Tawarruq. Retrieved April 2, 2015, from ISRA: http://isra.my/media-
centre/downloads.html?task=finish&cid=79&catid=20&m=0]

POSTGRADUATE CONFERENCE ON ECONOMICS, PUBLIC ADMINISTRATION AND
BUSINESS (PCEPAB)-5TH SEPTEMBER, 2015
PROMOTING GOWTH, EXCELENT AND SUSTAINABILITY - 43
Bank Islam. (n.d.). Retrieved March 29, 2015, from
http://www.bankislam.com.my/en/Pages/ShariahConcept.aspx?mlink=PersonalFinanc
ing
Elasrag, H. (2010). Global Financial Crisis and Islamic Finance. Arab Republic of Egypt -
Ministry of Industry & Foreign TRADE.
Islamic Banking: Resource Centre. (n.d.). Retrieved April 1, 2015, from
http://islamicbankers.me/2012/12/22/the-death-of-bai-inah/
Khan, M. C. (2000). Regulation and Supervision of Islamic Banks. Jeddah: Islamic Research
and Training Institute, Islamic Development Bank.
Rahman, A. R. (2010). An Introduction to Islamic Accounting: Theory and Practice. CERT
publication Sdn Bhd.
Siddiqui, M. N. (n.d.). ISLAMIC FINANCE: CURRENT LEGAL AND REGULATORY
ISSUES. Retrieved April 5, 2015, from Siddiqi :
http://www.siddiqi.com/mns/Islamic_Finance_May2004.htm
Zaki, E. (2011). Assessing probabilities of financial distress of banks in UAE. Emerald Group
Publishing Limited.

POSTGRADUATE CONFERENCE ON ECONOMICS, PUBLIC ADMINISTRATION AND
BUSINESS (PCEPAB)-5TH SEPTEMBER, 2015
PROMOTING GOWTH, EXCELENT AND SUSTAINABILITY - 44
Determinants of board size and independence during the Chinese
state enterprises reform: A comparison between controlling
shareholder categories
Zhang Cheng
(Corresponding author)
Institute of Graduate Studies,
University of Malaya, 50603 Kuala Lumpur, Malaysia
Email: [email protected]
Phone: 006+0108924719
Cheong Kee Cheok
Department of Economics, Faculty of Economics and Administration,
University of Malaya, 50603 Kuala Lumpur, Malaysia
Email: [email protected]
Abstract:
The role a corporate board played in corporate governance is a controversial topic. China’s case is made more
complex by the fact it is undergoing economic transition during the past 3 decades, which created additionally a
situation of tension between government control and private sector preeminence. This study focuses on the
determinants of board size and board independence for firms with different categories of controlling shareholders
and in different stages of state enterprises reform. The study selected 439 firms that are listed in Chinese domestic
stock markets during the periods between 2000 and 2012. The fixed effects regression was applied in this study to
test the relationships between Chinese specific corporate governance mechanisms and corporate board size and
independence. The results show that the determinants of Chinese board size and independence vary across different
controlling shareholder categories. These corporate governance mechanisms can take the place of the corporate
board. Specifically, a supervisory board can substitute board independence in central government controlled firms,
while CEO duality, ownership concentration and state ownership can be substitutes for board size and
independence in local government and state enterprise entity controlled firms. Tradable shares lead to a larger and
independent board in all firms except for central government controlled firms. Taken together, this study does not
support the widespread belief that state ownership or control is detrimental to firm performance. Rather the state
can help in mornitoring managerial behavior and improve corporate governance practice.
Key words: Board composition, Corporate governance, Split share structure reform, Controlling
shareholders
JEL codes: G380, G340

POSTGRADUATE CONFERENCE ON ECONOMICS, PUBLIC ADMINISTRATION AND
BUSINESS (PCEPAB)-5TH SEPTEMBER, 2015
PROMOTING GOWTH, EXCELENT AND SUSTAINABILITY - 45
1. Introduction
Corporate boards are at the center of corporate governance, with board size and composition
figure prominently in governance reform. Yet little conclusive evidence exists as to what
determines board size and independence, and their impact on corporate governance. On the
determinants of board composition, some scholars hold the view that board size and board
independence are primarily determined by the CEO’s bargaining power with the rest of the
directors (Iwasaki, 2008, Arthur, 2001, Hermalin and Weisbach, 1998, Combs et al., 2007).
Others argue that board size and board independence are endogenously determined by firm
specific characteristics and the tradeoff between the cost and benefit of the board’s monitoring
(Boone et al., 2007, Linck et al., 2008, Lehn et al., 2009).
If there is no agreement even in situations in which the private economy is dominant, arriving at
any definitive conclusion is even more difficult in China, where economic transition has created
a situation somewhere between government control and private sector preeminence. This
situation is the product of the state enterprises reform (Chen et al., 2006). Arguably the most
important of these reforms is the so-called “split-share reform” of 2005. This reform was aimed
at revitalizing the depressed Chinese financial market caused by the split-share structure, before
the reform, less than one third of the total number of shares were tradable with the rest non-
tradable. The reform converts non-tradable shares to tradable ones.
Understanding corporate board governance before and after this reform is important in its own
right but also because it speaks to the efficiency of these reforms. Beyond these specific issues,
the importance of China’s enterprise sector derives from its rapidly growing size, exemplified by
it counting some of the largest companies in the world (i.e. China Sinopec, State Grid
Corporation of China etc.).
Within the above framework, the specific objectives of this study are to: (1) examine and
compare the determinants of board size and board independence before and after the reform, and
(2) compare how these determinants vary across different categories of controlling shareholders.
This comparison has hitherto not been made; Chen and Al-Najjar (2012)’s work was based on
1999 to 2003 data, i.e. before the reform took place. This study contributes to existing literature
by analyzing the influence of Chinese specific corporate governance mechanisms on Chinese
board structure in different controlling shareholder categories and in different stages of state
enterprises reform.
The structure of this paper is as follows. Section 2 is a brief literature review. Section 3 is the
review of China’s enterprise system and split-share structure reform. Section 4 is the explanation
about methodology and data. Section 5 is about empirical analysis. Section 6 is the conclusion
part of this study. Section 7 lists the references of this study.

POSTGRADUATE CONFERENCE ON ECONOMICS, PUBLIC ADMINISTRATION AND
BUSINESS (PCEPAB)-5TH SEPTEMBER, 2015
PROMOTING GOWTH, EXCELENT AND SUSTAINABILITY - 46
2. Brief Review of Related Literature
Literature regarding agency theory, resource dependent theory and power circulation theory
constitute the theoretical basis for the determinants of board composition. The agency theory
proposed that the main function of the corporate board is to monitor managers on behalf of
shareholders, so that corporate board size and board independence is determined by the tradeoffs
between the cost and benefit of board monitoring. The cost of monitoring refers to information
transferring and processing cost that directors spend to transfer their expertise to the firm as well
as the direct cost such as director’s compensation. The benefit of monitoring refers to the
manager’s potential private benefit that may be extracted from the firm. The resource dependent
theory argued that the main function of corporate board is to provide resources and advices
needed for the firm’s daily operations. Therefore, board composition is determined by the
resources and advice needed for a firm’s daily operations. Larger firms with wider scope of
operations tend to have more independent directors, since larger firms face more serious agency
problems and needs more information than smaller firms. The power circulation theory
emphasized that CEOs may face power contests with rival executives and outside directors.
Thus, board composition is driven by CEO’s bargaining power with the rest of directors in the
board (Boone et al., 2007, Combs et al., 2007). Arthur (2001) opines that board composition is
actually a bargain between the CEO and the rest directors on the board. Combs et al. (2007)
argue that shareholders are concerned about board composition when the CEO is powerful
because the CEO might use that power to pursue his own interests at the expense of
shareholders’ interests. Finkelstein and D'Aveni (1994) propose that CEO duality promotes CEO
expropriation activities by reducing the effectiveness of board monitoring.
As for empirical studies across different regions, the UK’s board composition is found to be less
determined by the monitoring related factors (Guest, 2008). Russia’s board composition is high
related to the bargaining variables (Iwasaki, 2008). Malaysia’s board composition is driven by
the scope of operations and monitoring factors (Germain et al., 2014). Board composition in
Taiwan is highly influenced by CEO characteristics and government regulations (Chen, 2014).
3. China’s enterprise system and split share structure reform
China’s enterprise system is different from that in other countries in that it started from a
situation in which all enterprises were state-owned. A series of enterprise reforms then relaxed
state ownership while retaining a degree of control. Under the strategy of “retaining the large and
releasing the small”, the Chinese government identified about 100 strategic enterprises for full
government ownership but allowed varying degrees of privatization for other state enterprises
not so classified (Jefferson and Su, 2006). These reforms have produced enterprises with links to
the state that defy easy identification (Liao et al., 2014). Nevertheless, according to the China
Securities Regulatory Commission (CSRC), the ultimate controlling shareholders are the
investors who, i) hold directly or indirectly 50% of the total outstanding shares, ii) control

POSTGRADUATE CONFERENCE ON ECONOMICS, PUBLIC ADMINISTRATION AND
BUSINESS (PCEPAB)-5TH SEPTEMBER, 2015
PROMOTING GOWTH, EXCELENT AND SUSTAINABILITY - 47
directly or indirectly 30% of total voting rights, iii) can use the voting rights to select more than
50% of board directors, iv) have significant influence over the decision making in shareholder’s
meeting, v) other situations recognized by CSRC.
3.1 Ultimate controlling shareholders in China
Based on the above definition, four types of enterprises can be distinguished: i) Marketized state-
owned enterprises (SOEs) owned by SOE entities (SOCF), Such as China National Petroleum
Corporation, China Power Investment Corporation and Sinosteel Corporation. ii) SOEs affiliated
to the central government agencies (CGCF), central state assets management bureaus and state
council, such as China Great Wall Computer Shenzhen Company Limited, China Merchants
Property Development Company Limited. iii) SOEs affiliated to local government agencies
(LGCF), local state assets management bureaus and local government, such as Guangzhou
Automobile Group Company Limited, Shanghai Pharmaceuticals Holding Company Limited. iv)
Firms controlled by individuals (PCF), such as Suning Commerce Group Company Limited,
Zhejiang Busen Garments Company Limited.
CGCFs are the focus of Chinese economic reform and are strictly monitored by central
government (Xu et al., 2006). Their CEOs and chairmen are usually carefully selected by the
central government and must have the motivation to perform well since most of them are in line
to be promoted to the rank of Minister (Chen et al., 2009). LGCFs are less monitored by central
government, since the further away the region is from the Chinese Communist Party’s power
center (Beijing), the harder it is for the central government to enforce its regulations (Chen et al.,
2009). Local governments do have the right to set their own regulations in order to manage local
state assets (Lipinga et al., 2006).
Both CGCFs and LGCFs are less likely to be totally profit oriented, since the officials of Chinese
government agencies are public servants, their promotion depends on how well they implement
government instructions and receive fixed salaries. Even though they have the right to select
managers, directors and approve the investment plans proposed by the management, as
government officials, they are prohibited from involving in firm management directly. They also
have no residual cash flow rights, with all the dividend revenues submitted to the Minister of
Finance. Therefore, the main agency problems of government controlled firms are between
controlling shareholders and minority shareholders (Berkman et al., 2012).
In contrast, SOCFs are more likely to pursue profitability and enjoy a degree of autonomy. They
can retain their after-tax profits. Managers typically receive explicit monetary rewards based on
firm performance, hence the incentive compensation mitigated the agency problems between
controlling shareholders and minority shareholders (Berkman et al., 2012).
PCFs are firms controlled directly by individuals and only existed after the “opening-up”
launched in1978. They resemble their counterparts in developed countries in many ways and are
more likely to be market oriented and commercially motivated (Wei et al., 2014). The

POSTGRADUATE CONFERENCE ON ECONOMICS, PUBLIC ADMINISTRATION AND
BUSINESS (PCEPAB)-5TH SEPTEMBER, 2015
PROMOTING GOWTH, EXCELENT AND SUSTAINABILITY - 48
government has limited supervisory power over PCFs. PCFs are more likely to maximize
shareholder wealth since they would select a management team mainly based on its ability to
maximize shareholder’s wealth (Berkman et al., 2012).
3.2 Split share structure reform
The split-share structure reform in 2005 is an important milestone of Chinese state enterprise
reform since it converted non-tradable shares, which accounted for more than two thirds of the
total shares, into tradable shares that permitted more private ownership of Chinese state
enterprises. Before the reform, the main agency problem was between the controlling (state)
shareholders and minority (non-state) shareholders, who had limited power to influence the
management of firms (Yeh et al., 2009). Managers had little incentive to work hard because the
government paid their fixed salaries. Further, the state had motives like political stability,
regional and macroeconomic advancement rather than to protect the interests of tradable
shareholders whose only objective was wealth creation (Hou and Lee, 2012, Jiang et al., 2008).
Third, Chinese laws and regulations protecting the interests of shareholders were only upgraded
gradually. For example, The Guidelines for Introducing Independent Directors to the Board of
Directors of Listed Companies (The guidelines for independent directors) was issued by CSRC
in August 2001 and stipulated that listed firms must have at least one third of board members
who are independent directors by the end of June 2003 (Shan and Round, 2012). The Code of
Corporate Governance for Listed Companies in China was established in January 2002 with the
aim to protect the interests of minority shareholders. The result has been considerable
unhappiness among private investors in listed firms. However, on 29 April 2005, CSRC made
the decision to convert non-tradable shares into tradable shares. As a result, the conflicting
interests between tradable shareholders and non-tradable shareholders were minimized (Guo and
Keown, 2009). Chinese listed firms face more monitoring from outside tradable shareholders
than before.
4. Methodology and Data
4.1 Variables and models
The determinants of board size and board independence investigated in this study are important
corporate governance variables and firm specific character variables that are frequently
examined in the determinants of board composition studies conducted both in other countries and
in China (Boone et al., 2007, Chen and Al-Najjar, 2012). While different from studies in other
countries, this study tested some corporate governance variables that are specific to China,
namely high state ownership, high ownership concentration, use of a two-tier board structure, the
existence of a split-share structure including both tradable shares and non-tradable shares, as well
as having CEOs with dual positions in the firm (Oliver et al., 2014).

POSTGRADUATE CONFERENCE ON ECONOMICS, PUBLIC ADMINISTRATION AND
BUSINESS (PCEPAB)-5TH SEPTEMBER, 2015
PROMOTING GOWTH, EXCELENT AND SUSTAINABILITY - 49
In this study, Board size refers to the total number of directors nominated to the corporate board
including both executive directors and non-executive directors. Board independence is the
percentage of independent directors on the corporate board. While, according to the Guidelines
for establishing independent directors of listed companies, independent directors are those who
hold no other positions in the company and have no relationships with its major shareholders that
may affect its independent judgment. Independent director is an important monitoring
mechanism to guard against a manager’s self-serving behaviors.
Supervisory board size (Supervisory Size) refers to the number of directors in the supervisory
board. China adopted a two-tier board structure that includes a main board of directors and a
supervisory board. The main function of the supervisory board is to monitor the main board and
give advice on the board’s operations (Xiao et al., 2004). The supervisory board has the right to
propose the dismissal of board directors and top managers, as well as to curb directors’ and top
managers’ compensation (Ding et al., 2007). The supervisory board should consist of at least
three persons including representatives of employees and shareholders, but managers, directors
and financial controllers are not qualified (Oliver et al., 2014). Besides, supervisory board was
set up to make up for the deficiencies of board of directors due to its lack of independence since
the CEO may be the chairman of the board as well. As a result, this study predicts that a large
board size will need a large supervisory board size to monitor it. Given that the monitoring role
played by the supervisory board is similar to the monitoring role played by independent
directors, firms with a larger supervisory board do not need to rely on independent directors.
CEO duality (Duality) represents a CEO’s bargaining power over board composition. It is
measured by a dummy variable equal to 1 if CEO and chairman of the board are assumed by the
same person (Finkelstein and D'Aveni, 1994). Eventhough CEO duality may lead to a strong
leadership and fast decision making, there is a trend in which the positions of CEO and board
chairman are being seperated gradually in China, since it can provide for more effective
monitoring and constrains on CEO’s self-serving behaviors (Yang et al., 2011). According to the
power circulation theory, top management keeps shifting the coalition and power struggle, CEO
tends to use his power to form a dominant board composition with loyal inside directors rather
than outside independent directors to avoid power contest with their rivals (Combs et al., 2007).
This study predicts that when the CEO is also the chairman of the board, he or she has more
bargaining power over board composition in the firm to safeguard his own interests (Iwasaki,
2008). As a result, board size tends to be smaller and the number of independent directors tends
to be less.
Percentage of tradable shares (Tradable) is an indicator of the degree of a firm’s privatization
measured by percentage of total shares that allowed to be traded freely. Tradable shares represent
the interests of Chinese domestic investors. In contrast, non-tradable shares represent the
interests of government. Yeh et al. (2009) opined that the split share structure reform in 2005 had
alleviated the horizontal agency problem between non-tradable shareholders and tradable
shareholders because tradable shareholders were given the opportunity to have a voice in
corporate decision-making. Due to the alleviation of the agency problems with the increase in
tradable shares, this study predicts that an increase in tradable shares may lead to a decrease in

POSTGRADUATE CONFERENCE ON ECONOMICS, PUBLIC ADMINISTRATION AND
BUSINESS (PCEPAB)-5TH SEPTEMBER, 2015
PROMOTING GOWTH, EXCELENT AND SUSTAINABILITY - 50
board size and board independence, because board monitoring is less important when there is no
serious agency problem.
Ownership concentration (Concentration) is an important Chinese corporate governance
mechanism measured by the sum of the percentage of shares owned by top 10 largest
shareholders. When ownership is highly concentrated in the hands of a few large shareholders,
minority shareholders find it costly to monitor the behavior of management. As a result, large
shareholders who have more interests in the corporation, will assume more responsibilities in
monitoring its management (Shleifer and Vishny, 1997). In addition, ownership concentration
would put constraints on CEO’s self-serving behaviors. In China, large shareholders have always
involved themselves in major corporate decision-making and managerial processes (Gul et al.,
2010). Thus, the main agency problem under concentrated ownership structure is between large
shareholders and minority shareholders (Yang et al., 2011). Hence, this study predicts that
ownership concentration is a substitute monitoring mechanism for board of directors, thus, board
size and board independence would be reduced with an increase in the degree of ownership
concentration.
State Ownership (State Ownership) is another Chinese corporate governance characteristic.
Since China followed the path of partial privatization, state ownership was retained in the firms
to allow the government to intervene when there is a need to do so. State ownership represents
the overall property of Chinese citizens; therefore, the purpose of state ownership is not solely
related to profit maximization as pursued by other shareholders. The dominance of state
ownership may lead to the divergence of capital resources for non-profit uses, causing insider
control problems since it lacks effective external monitoring over management. While the
controlling power would ultimate fall into the hands of directors and managers who bear minimal
risk of their decisions and free from market disciplines (Oliver et al., 2014, Tian and Estrin,
2008). Due to the inefficiency of state ownership, CEOs in firms with high state ownership are
easy to add inside directors and keep the board smaller and less independence to facilitate them
in their pursuit of self-interests.
A number of other variables help explain board size and independence. Thus
ROA and Tobin Q (Tobinq) are measures of a firm’s accounting and market performance
representing the resources and advice needed from corporate board, since better firm
performance tends to have a larger and more independent board (Jackling and Johl, 2009). Firm
size (Logassets) and firm age (firmage) are firm characteristic variables measured by natural
logarithm of total assets and number of years since the firm was established.

POSTGRADUATE CONFERENCE ON ECONOMICS, PUBLIC ADMINISTRATION AND
BUSINESS (PCEPAB)-5TH SEPTEMBER, 2015
PROMOTING GOWTH, EXCELENT AND SUSTAINABILITY - 51
The equation can be elaborated below:
(1)
it 1 it 2 it 3 it 4 it 5
6 it 7 it 8 it 9 it i it
Board Size = + upervisory Size + + + 10 + State Ownership
+ + + +
itS Duality Tradable Concen
FirmSize FirmAge ROA Tobinq
(2)
it 1 it 2 it 3 it 4 it 5
6 it 7 it 8 it 9 it i it
Board Independence = + upervisory Size + + + 10 + State Ownership
+ + + +
itS Duality Tradable Concen
FirmSize FirmAge ROA Tobinq
4.2 Data and Model Robustness
Data pertinent to this study were collected from a sample of firms listed on the Shanghai and
Shenzhen Stock Exchanges. There were 439 non-financial firms selected during the period
between 2000 and 2012. Firms not continuously listed during this period were excluded from the
sample. Based on the ultimate controlling shareholder, the sample was also divided into several
subsamples made up of firms controlled by SOE entities (SOCF), by private investors (PCF), by
local government (LGCF) and by central government (CGCF). In addition, since the split share
structure reform took place in 2005, the subsamples used in this study were further divided into a
‘before reform’ subsample (from year 2000 to 2004) and a ‘after reform’ subsample (from year
2005 to 2012). All of the financial data and corporate governance data used in this study are
available in the companies’ annual reports collected by the China Stock Market and Accounting
Research Database and CCER database developed by GTA Information Technology Company
Limited and SinoFin Financial Information Company Limited. The descriptive statistics for the
data during these periods are shown in Table 2 in the appendix.
The models above can be estimated by both fixed effects and random effects. Fixed effects
assumed that each firm’s individual effects are correlated with the independent variables, while,
random effects assumes that the individual effects are not correlated with the independent
variables. According to the Hausman test, the difference of the regression coefficients between
fixed effects and random effects is systematic, suggesting that fixed effects is more useful than
random effects (Baltagi et al., 2003) Thus, the models are estimated by fixed effects in this study
and shown in Table (1a) and Table (1b).
To check the robustness of the models, this study conducted a bivariate correlation analysis and
found that the variables in the model are independent of each other, the highest correlation being
0.549 between state ownership and tradable shares, suggesting that there are no strong
relationships among independent variables in the model. This study also checked the variance
inflation factor (VIF) to make sure that there was no multicolinearity problem. Besides, the
Chow test for structure break suggested that there is a structure break between each subsample.

POSTGRADUATE CONFERENCE ON ECONOMICS, PUBLIC ADMINISTRATION AND
BUSINESS (PCEPAB)-5TH SEPTEMBER, 2015
PROMOTING GOWTH, EXCELENT AND SUSTAINABILITY - 52
Table (1a) Determinants of Board Size
SOCF PCF LGCF CGCF Full Before After
Supervisory
Size 0.373*** 0.604*** 0.444*** 0.901*** 0.469*** 0.551*** 0.394***
(5.33) (10.56) (9.71) (10.48) (15.53) (14.86) (7.75)
Duality -0.235 -0.532*** -0.408** -0.0439 -0.292*** -0.202* -0.375**
(-1.29) (-4.76) (-2.76) (-0.17) (-3.70) (-2.37) (-2.70)
Tradable 0.463 0.668*** 0.901*** 0.427 0.566*** -0.0819 0.530*
(1.95) (3.51) (3.61) (0.72) (5.01) (-0.50) (2.32)
Concentration -1.929** -0.683 0.861* 0.0810 -0.165 0.182 -2.168*
(-2.74) (-1.90) (2.27) (0.12) (-0.69) (0.78) (-2.40)
State
Ownership -0.433 1.441*** -0.810** -0.359 -0.208 -0.105 -0.360
(-1.52) (4.00) (-2.94) (-0.73) (-1.60) (-0.64) (-1.18)
Firm_age -0.0392* -0.0167 0.00456 -0.0286 -0.0264*** -0.0431** -0.0183
(-2.39) (-1.16) (0.31) (-0.90) (-3.58) (-2.98) (-0.79)
Firm_size 0.0820 0.652*** 0.324** -0.735*** 0.226*** 0.134 0.137
(0.74) (6.10) (3.05) (-4.67) (3.91) (1.22) (1.59)
ROA -0.108 -0.0680 0.0398 0.757* -0.0295 0.0544 0.000423
(-1.07) (-0.60) (0.29) (2.15) (-0.45) (0.54) (0.01)
Tobinq -0.129* 0.0166 -0.0606 0.0830 0.000185 0.00225 -0.107*
(-2.30) (0.79) (-1.71) (1.25) (0.01) (0.16) (-2.03)
_cons 9.123*** 0.756 4.046*** 13.12*** 5.607*** 6.339*** 8.152***
(7.96) (0.82) (4.03) (8.61) (10.42) (6.85) (7.78)
N 1720 1444 1993 500 5657 3054 2603
R2 within 0.0292 0.1729 0.085 0.3114 0.0766 0.0962 0.0355
R2 between 0.059 0.1401 0.1791 0.0075 0.1897 0.1952 0.1192
R2 overall 0.0635 0.1456 0.1726 0.0325 0.1435 0.1774 0.0887
t statistics in parentheses
* p < 0.05, ** p < 0.01, *** p < 0.001
Table (1b) Determinants of Board Independence
SOCF PCF LGCF CGCF Full Before After
Supervisory
Size
0.00325 -0.00180 -0.00352 -0.0120*** -0.000945 -0.00594*** -0.00167

POSTGRADUATE CONFERENCE ON ECONOMICS, PUBLIC ADMINISTRATION AND
BUSINESS (PCEPAB)-5TH SEPTEMBER, 2015
PROMOTING GOWTH, EXCELENT AND SUSTAINABILITY - 53
(0.72) (-0.52) (-1.31) (-3.69) (-0.54) (-4.08) (-0.60)
Duality 0.00342 -0.00607 -0.0220* 0.0201* -0.00447 0.00655 0.000454
(0.29) (-0.89) (-2.53) (2.05) (-0.98) (1.96) (0.06)
Tradable 0.286*** 0.142*** 0.213*** -0.0334 0.233*** -0.00771 0.0417***
(18.62) (12.29) (14.52) (-1.49) (35.68) (-1.20) (3.32)
Concentration -0.0651 -0.0917*** -0.104*** -0.00618 -0.0978*** -0.00175 -0.192***
(-1.43) (-4.19) (-4.64) (-0.25) (-7.10) (-0.19) (-3.89)
State
Ownership
-0.00522 0.0384 -0.0436** 0.0449* -0.0280*** 0.00988 -0.00884
(-0.28) (1.75) (-2.69) (2.41) (-3.72) (1.53) (-0.53)
Firm_age 0.0337*** 0.0223*** 0.0257*** 0.00293* 0.0300*** 0.00180** 0.0670***
(31.79) (25.49) (30.09) (2.43) (70.37) (3.17) (52.87)
Firm_size -0.00760 -0.00145 -0.0260*** 0.00620 -0.0143*** 0.0146*** -0.0000985
(-1.07) (-0.22) (-4.16) (1.04) (-4.27) (3.37) (-0.02)
ROA -0.0223*** 0.00433 -0.0230** -0.0104 -0.00896* 0.00134 -0.0103*
(-3.41) (0.63) (-2.88) (-0.78) (-2.38) (0.34) (-2.23)
Tobinq -0.0301*** -0.00200 -0.0107*** -0.00309 -0.00727*** 0.000642 -0.0161***
(-8.26) (-1.56) (-5.14) (-1.23) (-7.31) (1.15) (-5.56)
_cons -0.0735 0.0417 0.259*** 0.311*** 0.0531 0.216*** -0.234***
(-0.99) (0.74) (4.39) (5.41) (1.71) (5.94) (-4.08)
N 1720 1444 1993 500 5657 3054 2603
R2 within 0.546 0.3623 0.3422 0.1262 0.526 0.0468 0.6742
R2 between 0.1396 0.0274 0.1135 0.0008 0.0025 0.0084 0.0011
R2 overall 0.2964 0.1191 0.1211 0.0217 0.2213 0.019 0.1307
t statistics in parentheses
* p < 0.05, ** p < 0.01, *** p < 0.001
5. Empirical findings
Summary of Empirical Findings of Table (1a) and Table (1b)
SOCF PCF LGCF CGCF Full Before After
BS BI BS BI BS BI BS BI BS BI BS BI BS BI
Supervisory
Size P P P P N P P N P
CEO duality N N N
Tradable P P P P P P P P

POSTGRADUATE CONFERENCE ON ECONOMICS, PUBLIC ADMINISTRATION AND
BUSINESS (PCEPAB)-5TH SEPTEMBER, 2015
PROMOTING GOWTH, EXCELENT AND SUSTAINABILITY - 54
Concentration N N N N
State Ownership P N N
P represents positive relationship.
N represents negative relationship.
BS represents board size.
BI represents board independence.
5.1 Supervisory board
The results suggest that a larger board size needs a lager supervisory board to monitor its
behaviors. It can be a substitute for the monitoring role played by independent directors only
when the government supervision is strong or when the importance of independent directors has
not been emphasized by CSRC. This study found that supervisory board size is a positive
determinant of board size in all firms since the main function of supervisory board is to monitor
the main board and the management (Oliver et al., 2014). As for its relationships with board
independence, even though the functions of supervisory board and independent directors are
similar, the supervisory board cannot be a substitute for the function played by independent
directors completely with respect to different controlling shareholders. A supervisory board can
be a substitute for independent directors in CGCFs, where government supervision is strong. In
addition, it can also be a substitute for independent directors before the split-share structure
reform when CSRC regulations towards hiring independent directors have not been strengthened.
5.2 CEO duality
A CEO who is also the chairman of the board finds it easier to reduce the number of rivals
among inside directors who can challenge his power and question his interests. He can hardly
reduce the number of independent directors since their percentage on the board is a requirement
decided by CSRC. This study found that CEO duality could influence board size significantly
rather than board independence. Besides, CEO’s bargaining power over smaller board size is
only significant in LGCFs and PCFs where government supervision is weak. This is because
local government is geographically far from the Chinese central government power center
(Beijing) (Cheng et al., 2009). CEOs find it easier to bargain for a smaller board size to seek
their own benefit. Besides, CEOs in PCFs usually have close relationships with large
shareholders, or even appoint themselves the chairman of the board, thus giving themselves more
bargaining power over a firm’s corporate board composition.
5.3 Tradable shares
The influence of tradable shares over board size and board independence tends to be positive in
all firms except for CGCFs, where government supervision is strong. This suggest that a larger

POSTGRADUATE CONFERENCE ON ECONOMICS, PUBLIC ADMINISTRATION AND
BUSINESS (PCEPAB)-5TH SEPTEMBER, 2015
PROMOTING GOWTH, EXCELENT AND SUSTAINABILITY - 55
and more independent board is needed to represent and protect tradable shareholder’s interests,
since a larger and more independent board can provide more resources and advice needed for a
firm’s daily operations and can monitoring the management behaviors well (Boone et al., 2007).
However, CGCFs are less likely to be totally market oriented and the agency problems between
the controlling shareholders and minority shareholders are serious (Berkman et al., 2012),
therefore, tradable shareholders have limited influence over corporate board composition. In
addition, tradable shareholders’ influence over board independence is more pronounced after the
split-share structure reform, since they have been given an opportunity to have a voice for their
own benefit (Yeh et al., 2009).
5.4 Ownership Concentration
Ownership concentration is another important corporate governance mechanism that tends to
serve as a substitute for the monitoring role played by independent directors. The reason is that
when ownership is highly concentrated in the hands of a few large shareholders, minority
shareholders would find it costly to monitor managerial behavior and large shareholders
undertake most of the monitoring activities. However, the independent director’s monitoring role
can only be a substitute for ownership concentration in PCFs and LGCFs, where government
supervision is weak. Since under concentrated ownership structure, large shareholders usually
involve themselves in corporate decision-making and managerial process, and minority
shareholder’s interests could be expropriated easily without government supervision (Gul et al.,
2010).
5.5 State Ownership
The influence of retained state ownership on board composition largely depends on whether the
influence of ownership rights can be subsumed under control rights. State ownership has more
influence over PCFs and LGCFs where government’s supervision is weak. It is less influential
over CGCFs and SOCFs since state interests can be protected through the controlling rights and
not just through the ownership rights. Specifically, it leads to a larger board size in PCFs but a
smaller board size in LGCFs. This is because a smaller and less independent board is easier for
the state to extract benefits from LGCFs. When it comes to the PCFs, state ownership tends to
lead to a larger board size, because PCFs are less concerned about the state interests compared
with LGCFs, and therefore a larger board is easier for state to protect their benefits.
6. Conclusion
Chinese corporate governance has its own characteristics that differ from other contries. The
variables tested in this study represent these specific characteristics, they are state ownership,
ownership concentration, a two-tier board structure, a split-share structure and CEO with dual

POSTGRADUATE CONFERENCE ON ECONOMICS, PUBLIC ADMINISTRATION AND
BUSINESS (PCEPAB)-5TH SEPTEMBER, 2015
PROMOTING GOWTH, EXCELENT AND SUSTAINABILITY - 56
positions. These characteristics are found to be significant determinants of Chinese board size
and independence. At the same time, China was undergoing economic transition, with reforms
leading to the establishment of listed firms being contolled by different shareholder categories.
This study finds that the influence of these specific corproate governance mechanisms on
corporate board composition varies accross different controlling shareholders. Supervisory board
plays a monitoring role as substitutes for independent directors (Chen and Al-Najjar, 2012), only
when government’s supervision power is strong. As for Ownership Concentration, CEO duality
and state ownership, which represents the interests of large shareholders, CEO’s bargianing
power and the state tend to substitute the governance role played by corporate board only when
government supervison power is weak. In contrast, tradable shares that represent the interests of
Chinese domestic investors can only extert their influence on corporate board composition when
government supervision is weak.
What do the above results reveal about China’s corporate governance, more specifically the role
of state played in corporate governance? First, in the absence of a full market economy,
alternative corporate governance mechanisms for monitoring a firm’s management and
performance has a place and can take the place of corporate board. Second, the closer the
government supervises, the less likely these alternative mechanisms substitute corporate board.
Third, these results obtained based on data colledted from publicly listed firms, suggesting that
the government strategy of listing is an effective means to achieve solid corporate governance.
Finally, the split share structure reform has a positive impact on corporate governance and
represents an important step in China’s reform of its corporate sector.
Taken together, these findings do not support the widespread belief that state ownership or
control is necessarily detrimental to firm performance (Tian and Estrin, 2008, Yang et al., 2011).
However, it is accepted that the retained state ownership send a signal to the public that the state
will not expropriate shareholder’s wealth, it plays an active role in supervising management
behaviors and improving corporate governance (Sun and Tong, 2003). In addition, future studies
can explore in detail other controlling shareholders, such as foreign and institutional
shareholders. Since with the continuing reformation of Chinese state enterprises, diversified
ownership structure will be introduced to financially support firm’s development.
7. References
ARTHUR, N. 2001. Board composition as the outcome of an internal bargaining process:
empirical evidence. Journal of Corporate Finance.
BALTAGI, B. H., BRESSON, G. & PIROTTE, A. 2003. Fixed effects, random effects or
Hausman–Taylor? Economics Letters, 79, 361-369.
BERKMAN, H., COLE, R. A. & FU, L. J. 2012. Improving corporate governance where the
State is the controlling block holder: evidence from China. The European Journal of
Finance, 20, 752-777.

POSTGRADUATE CONFERENCE ON ECONOMICS, PUBLIC ADMINISTRATION AND
BUSINESS (PCEPAB)-5TH SEPTEMBER, 2015
PROMOTING GOWTH, EXCELENT AND SUSTAINABILITY - 57
BOONE, A. L., CASARES FIELD, L., KARPOFF, J. M. & RAHEJA, C. G. 2007. The
determinants of corporate board size and composition: An empirical analysis. Journal of
Financial Economics, 85, 66-101.
CHEN, C. H. & AL-NAJJAR, B. 2012. The determinants of board size and independence:
Evidence from China. International Business Review, 21, 831-846.
CHEN, G., FIRTH, M., GAO, D. N. & RUI, O. M. 2006. Ownership structure, corporate
governance, and fraud: Evidence from China. Journal of Corporate Finance, 12, 424-
448.
CHEN, G., FIRTH, M. & XU, L. 2009. Does the type of ownership control matter? Evidence
from China’s listed companies. Journal of Banking & Finance, 33, 171-181.
CHEN, M.-Y. 2014. Determinants of corporate board structure in Taiwan. International Review
of Economics & Finance, 32, 62-78.
COMBS, J. G., KETCHEN, D. J., PERRYMAN, A. A. & DONAHUE, M. S. 2007. The
Moderating Effect of CEO Power on the Board Composition?Firm Performance
Relationship. Journal of Management Studies, 0, 070605080020003-???
DING, Y., ZHANG, H. & ZHANG, J. 2007. Private vs State Ownership and Earnings
Management: evidence from Chinese listed companies. Corporate Governance: An
International Review, 15.
FINKELSTEIN, S. & D'AVENI, R. A. 1994. CEO Duality as a Double-Edged Sword: How
Boards of Directors Balance Entrenchment. Academy of Management Jouarnal, 37.
GERMAIN, L., GALY, N. & LEE, W. 2014. Corporate governance reform in Malaysia: Board
size, independence and monitoring. Journal of Economics and Business, 75, 126-162.
GUEST, P. M. 2008. The determinants of board size and composition: Evidence from the UK.
Journal of Corporate Finance, 14, 51-72.
GUL, F. A., KIM, J.-B. & QIU, A. A. 2010. Ownership concentration, foreign shareholding,
audit quality, and stock price synchronicity: Evidence from China. Journal of Financial
Economics, 95, 425-442.
GUO, E. & KEOWN, A. J. 2009. Privatization and non-tradable stock reform in China. Global
Finance Journal, 20, 191-208.
HERMALIN, B. E. & WEISBACH, M. S. 1998. Endogenously chosen boards of directors and
their monitoring of the CEO. American Economic Review, 96-118.
HOU, W. & LEE, E. 2012. Split Share Structure Reform, corporate governance, and the foreign
share discount puzzle in China. The European Journal of Finance, 1-25.
IWASAKI, I. 2008. The determinants of board composition in a transforming economy:
Evidence from Russia. Journal of Corporate Finance, 14, 532-549.

POSTGRADUATE CONFERENCE ON ECONOMICS, PUBLIC ADMINISTRATION AND
BUSINESS (PCEPAB)-5TH SEPTEMBER, 2015
PROMOTING GOWTH, EXCELENT AND SUSTAINABILITY - 58
JACKLING, B. & JOHL, S. 2009. Board Structure and Firm Performance: Evidence from
India's Top Companies. Corporate Governance: An International Review, 17, 492-509.
JEFFERSON, G. H. & SU, J. 2006. Privatization and restructuring in China: Evidence from
shareholding ownership, 1995–2001. Journal of Comparative Economics, 34, 146-166.
JIANG, B.-B., LAURENCESON, J. & TANG, K. K. 2008. Share reform and the performance of
China's listed companies. China Economic Review, 19, 489-501.
LEHN, K. M., PATRO, S. & ZHAO, M. 2009. Determinants of the Size and Composition of US
Corporate Boards: 1935‐2000. Financial Management, 38, 747-780.
LIAO, L., LIU, B. & WANG, H. 2014. China׳s secondary privatization: Perspectives from the
Split-Share Structure Reform. Journal of Financial Economics, 113, 500-518.
LINCK, J., NETTER, J. & YANG, T. 2008. The determinants of board structure. Journal of
Financial Economics, 87, 308-328.
LIPINGA, X., YUB, X. & GONGMENGC, C. 2006. Ownership Concentration, Outside
Blockholders, and Operating Performance: Evidence from China's Listed Companies
Economic Research Journal, 1, 90-100.
OLIVER, J., QU, W. & WISE, V. 2014. Corporate Governance: A Discussion on Minority
Shareholder Protection in China. International Journal of Economics and Finance, 6.
SHAN, Y. G. & ROUND, D. K. 2012. China's Corporate Governance: Emerging Issues and
Problems. Modern Asian Studies, 46, 1316-1344.
SHLEIFER, A. & VISHNY, R. W. 1997. A survey of corporate governance. THE JOURNAL OF
FINANCE.
SUN, Q. & TONG, W. H. S. 2003. China share issue privatization: the extent of its success.
Journal of Financial Economics, 70, 183-222.
TIAN, L. & ESTRIN, S. 2008. Retained state shareholding in Chinese PLCs: Does government
ownership always reduce corporate value? Journal of Comparative Economics, 36, 74-
89.
WEI, Y., ZHENG, N., LIU, X. & LU, J. 2014. Expanding to outward foreign direct investment
or not? A multi-dimensional analysis of entry mode transformation of Chinese private
exporting firms. International Business Review, 23, 356-370.
XIAO, J. Z., DAHYA, J. & LIN, Z. 2004. A Grounded Theory Exposition of the Role of the
Supervisory Board in China*. British Journal of Management, 15, 39-55.
XU, L., XIN, Y. & CHEN, G. 2006. Ultimate Ownership, the Type of Controlling Shareholders,
and the Comparison of Operating Performance for China's Listed Companies.
YANG, J., CHI, J. & YOUNG, M. 2011. A review of corporate governance in China. Asian-
Pacific Economic Literature, 25, 15-28.

POSTGRADUATE CONFERENCE ON ECONOMICS, PUBLIC ADMINISTRATION AND
BUSINESS (PCEPAB)-5TH SEPTEMBER, 2015
PROMOTING GOWTH, EXCELENT AND SUSTAINABILITY - 59
YEH, Y.-H., SHU, P.-G., LEE, T.-S. & SU, Y.-H. 2009. Non-Tradable Share Reform and
Corporate Governance in the Chinese Stock Market. Corporate Governance: An
International Review, 17, 457-475.
Appendix:
Table2: Descriptive Analysis
Full (Year 2000 to 2012 )
Variable Obs Mean Std. Dev. Min Max
Board Size 5685 9.327 2.185 3.000 19.000
Board Independence 5685 0.294 0.130 0.000 0.730
Supervisory Size 5685 4.070 1.303 0.000 11.000
Duality 5687 0.113 0.317 0.000 1.000
Concentration 5701 0.568 0.146 0.103 1.000
Tradable 5707 0.372 0.233 0.000 1.000
State ownership 5707 0.264 0.257 0.000 0.886
Firm_age 5707 12.217 4.961 1.044 28.608
Firm_size 5707 9.344 0.518 7.562 11.702
ROA 5706 0.018 0.296 -16.112 8.183
Tobinq 5707 1.636 1.342 0.000 44.530
SOCF
Board Size 1731 9.73 2.34 4.00 19.00
Board Independence 1731 0.218 0.153 0.000 0.730
Supervisory Size 1732 4.290 1.341 1.000 11.000
Duality 1736 0.101 0.302 0.000 1.000
Concentration 1741 0.422 0.187 0.000 0.886
Tradable 1735 0.614 0.131 0.208 1.000
State ownership 1741 0.394 0.250 0.000 0.886
Firm_age 1741 9.335 4.568 1.044 26.145
Firm_size 1741 9.281 0.475 7.640 11.702
ROA 1741 0.014 0.400 -16.112 0.634
Tobinq 1741 1.510 0.767 0.000 9.361
PCF

POSTGRADUATE CONFERENCE ON ECONOMICS, PUBLIC ADMINISTRATION AND
BUSINESS (PCEPAB)-5TH SEPTEMBER, 2015
PROMOTING GOWTH, EXCELENT AND SUSTAINABILITY - 60
Board Size 1446 8.57 1.99 3.00 17.00
Board Independence 1446 0.334 0.098 0.000 0.670
Supervisory Size 1446 3.593 1.041 0.000 9.000
Duality 1449 0.154 0.361 0.000 1.000
Concentration 1450 0.350 0.242 0.000 1.000
Tradable 1450 0.521 0.148 0.103 1.000
State ownership 1450 0.048 0.116 0.000 0.740
Firm_age 1450 14.027 4.845 1.214 28.416
Firm_size 1450 9.176 0.489 7.578 11.558
ROA 1449 0.026 0.295 -6.069 8.183
Tobinq 1450 1.970 2.150 0.000 44.530
LGCF
Board Size 2006 9.44 2.08 5.00 18.00
Board Independence 2006 0.316 0.111 0.000 0.570
Supervisory Size 2005 4.184 1.380 1.000 10.000
Duality 2002 0.109 0.312 0.000 1.000
Concentration 2014 0.353 0.247 0.000 0.886
Tradable 2014 0.561 0.141 0.135 1.000
State ownership 2014 0.301 0.242 0.000 0.850
Firm_age 2014 12.942 4.447 1.510 26.030
Firm_size 2014 9.441 0.488 7.562 11.649
ROA 2014 0.015 0.210 -6.338 0.514
Tobinq 2014 1.502 0.946 0.000 15.656
CGCF
Board Size 502 9.66 2.05 5.00 15.00
Board Independence 502 0.356 0.052 0.220 0.560
Supervisory Size 502 4.233 1.185 2.000 8.000
Duality 500 0.054 0.226 0.000 1.000
Concentration 502 0.336 0.262 0.000 0.850
Tradable 502 0.578 0.158 0.219 1.000
State ownership 502 0.291 0.250 0.000 0.850
Firm_age 502 14.074 4.076 4.589 28.608
Firm_size 502 9.664 0.623 7.599 11.659

POSTGRADUATE CONFERENCE ON ECONOMICS, PUBLIC ADMINISTRATION AND
BUSINESS (PCEPAB)-5TH SEPTEMBER, 2015
PROMOTING GOWTH, EXCELENT AND SUSTAINABILITY - 61
ROA 502 0.020 0.121 -2.380 0.208
Tobinq 502 1.642 1.025 0.585 9.371
After
(Year 2005 to 2012)
Board Size 3061 9.168 1.980 4.000 18.000
Board Independence 3061 0.359 0.051 0.090 0.670
Supervisory Size 3060 3.952 1.227 1.000 10.000
Duality 3067 0.112 0.315 0.000 1.000
Concentration 3073 0.533 0.149 0.120 1.000
Tradable 3073 0.272 0.241 0.000 0.903
State_hold 3073 0.168 0.218 0.000 0.812
Firm_age 3073 15.219 3.821 7.047 28.608
Firm_size 3073 9.471 0.540 7.578 11.514
ROA 3073 0.031 0.170 -2.746 8.183
Tobinq 3073 1.811 1.692 0.477 44.530
Before
(Year 2000 to 2004)
Board Size 2624 9.512 2.390 3.000 19.000
Board Independence 2624 0.218 0.151 0.000 0.730
Supervisory Size 2625 4.208 1.374 0.000 11.000
Duality 2620 0.115 0.319 0.000 1.000
Concentration 2628 0.610 0.131 0.103 0.950
Tradable 2634 0.488 0.156 0.000 1.000
State ownership 2634 0.377 0.254 0.000 0.886
Firm_age 2634 8.715 3.676 1.044 21.603
Firm_size 2634 9.197 0.449 7.562 11.702
ROA 2633 0.002 0.394 -16.112 0.514
Tobinq 2634 1.431 0.698 0.000 10.172
Table 3: Correlation Metrix
Board Size
Board
Independence
Supervisory
Size Duality Concentration Tradable
State
Ownership Firm_age Firm_size ROA
Board Size 1

POSTGRADUATE CONFERENCE ON ECONOMICS, PUBLIC ADMINISTRATION AND
BUSINESS (PCEPAB)-5TH SEPTEMBER, 2015
PROMOTING GOWTH, EXCELENT AND SUSTAINABILITY - 62
Board
Independence -0.132 1
Supervisory
Size 0.336 -0.099 1
Duality -0.077 -0.005 -0.063 1
Concentration 0.103 -0.163 0.094 -0.104 1
Tradable 0.095 -0.112 0.054 -0.030 0.376 1
State
Ownership 0.138 -0.244 0.178 -0.072 0.406 0.549 1
Firm_age -0.102 0.457 -0.060 0.055 -0.412 -0.459 -0.497 1
Firm_size 0.220 0.186 0.129 -0.075 0.094 -0.147 -0.007 0.167 1
ROA 0.002 0.010 0.003 0.001 0.012 -0.022 -0.024 0.023 0.082 1
Tobinq -0.105 0.003 -0.076 0.065 -0.122 -0.192 -0.164 0.125 -0.262 -0.034
Table (4a). Chow Test for structure break of board size in different subsamples
Coef. Coef. Coef. Coef. Coef.
Supervisory
Size 0.50318***
Supervisory
Size 0.51465***
Supervisory
Size 0.55603***
Supervisory
Size 0.49955***
Supervisory
Size 0.5241***
Duality -0.2598*** Duality -0.201*** Duality -0.4198*** Duality -0.1645 Duality 0.01602
Concentration 0.1971 Concentration 0.31374 Concentration 0.12641 Concentration 0.81931*** Concentration 0.19882
Tradable 0.65162*** Tradable 0.52166*** Tradable 0.13747 Tradable 1.20959*** Tradable 1.01779***
State_hold 0.64178*** State_hold 0.22968*** State_hold 0.54703*** State_hold -0.9452*** State_hold 0.05809
LGCF*
Supervisory
Size 0.04905
CGCF*
Supervisory
Size 0.03264***
SOCF *
Supervisory
Size -0.0977***
PCF *
Supervisory
Size 0.01826
dumASP*
Supervisory
Size 0.00699
LGCF*
duality 0.02617
CGCF*
duality -0.9847***
SOCF*
duality 0.52949***
PCF*
duality -0.2287
dumASP*
duality -0.4907***
LGCF*
tradable 0.59111***
CGCF*
tradable 1.60063***
SOCF*
tradable 1.24805***
PCF*
tradable -0.6818***
dumASP*
tradable -1.3074***
LGCF*
Concentration 0.44575
CGCF*
Concentration 0.58515***
SOCF*
Concentration 0.95942***
PCF*
Concentration -1.4281***
dumASP*
Concentration 0.50568
LGCF*
state_hold -1.963***
CGCF*
state_hold -1.7774***
SOCF*
state_hold -1.2871***
PCF*
state_hold 2.15096***
dumASP*
state_hold 0.96765***
_cons 6.76162*** _cons 6.75107*** _cons 6.77457*** _cons 6.86722*** _cons 6.66257***
F(5,5647) =
F(5,5647) =
F(5,5647) =
F(5,5647)=124
F(5,5647)=

POSTGRADUATE CONFERENCE ON ECONOMICS, PUBLIC ADMINISTRATION AND
BUSINESS (PCEPAB)-5TH SEPTEMBER, 2015
PROMOTING GOWTH, EXCELENT AND SUSTAINABILITY - 63
121.54 126.43 125.02 .71 114.69
Prob>F=
0.0000
Prob>F=
0.0000
Prob>F=
0.0000
Prob>F=
0.0000
Prob>F=
0.0000
dumASP is the dummy variable equal to1 if the firm year is between 2005 and 2012.
Table (4b). Chow Test for structure break of board independence in different subsamples
Coef. Coef. Coef. Coef. Coef.
Supervisory
Size
-0.0053***
Supervisory
Size
-0.0113***
Supervisory Size
-0.0018 Supervisory
Size
-0.004***
Supervisory
Size
-0.0154***
Duality -0.0143*** Duality -0.0199*** Duality -0.0154*** Duality -0.0367*** Duality -0.0406***
Concentration -0.105*** Concentration -0.0896*** Concentration 0.0103 Concentration -0.0935*** Concentration -0.2281***
Tradable 0.06232*** Tradable 0.05944*** Tradable -0.0361*** Tradable 0.07145*** Tradable 0.35488***
State_hold -0.1548*** State_hold -0.1573*** State_hold -0.0422*** State_hold -0.14*** State_hold -0.0114
LGCF*
Supervisory
Size
0.00089
CGCF*
Supervisory
Size
0.01303***
SOCF *
Supervisory
Size
-0.0059***
PCF *
Supervisory
Size
-0.0003
dumASP*
Supervisory
Size
0.0248***
LGCF*
duality
-0.0216***
CGCF*
duality
0.01703
SOCF*
duality
-0.0211***
PCF*
duality
0.0383***
dumASP*
duality
0.05854***
LGCF*
tradable
-0.0741***
CGCF*
tradable
-0.1153***
SOCF*
tradable
0.19661***
PCF*
tradable
-0.1147***
dumASP*
tradable
-0.3664***
LGCF*
Concentration
0.07962***
CGCF*
Concentration
0.13333***
SOCF*
Concentration
-0.2041***
PCF*
Concentration
0.07276***
dumASP*
Concentration
0.33935***
LGCF*
state_hold
0.08***
CGCF*
state_hold
0.19893***
SOCF*
state_hold
-0.0637***
PCF*
state_hold
0.07412***
dumASP*
state_hold
-0.0137
_cons 0.37924*** _cons 0.38494*** _cons 0.35105*** _cons 0.37668*** _cons 0.26316***
F(5,5647)=
117.90
F(5,5647)=
156.08
F(5,5647)
= 17.65
F(5,5647)=
79.76
F(5,5647)=
254.11
Prob>F=
0.000
Prob>F=
0.000
Prob>F=
0.000
Prob>F=
0.0000
Prob>F=
0.0000

POSTGRADUATE CONFERENCE ON ECONOMICS, PUBLIC ADMINISTRATION AND
BUSINESS (PCEPAB)-5TH SEPTEMBER, 2015
PROMOTING GOWTH, EXCELENT AND SUSTAINABILITY - 64
dumASP is the dummy variable equal to1 if the firm year is between 2005 and 2012

POSTGRADUATE CONFERENCE ON ECONOMICS, PUBLIC ADMINISTRATION AND
BUSINESS (PCEPAB)-5TH SEPTEMBER, 2015
PROMOTING GOWTH, EXCELENT AND SUSTAINABILITY - 65
Knowledge Creation: The Mediator Effect Between Customer
Knowledge Exploration and Firm Knowledge Exploitation in
Product-Service Design
Anisa Mohd Yusoff
Faculty of Industrial Management
Noor Azlinna Azizan (Phd)
Director of Entrepreneurship Centre/ Professor of Finance and Entrepreneurship
University Malaysia Pahang
Abstract
The paper is about the investigation of how customer knowledge captured during use-phase and retirement stage
in the product development cycle. Customer knowledge is integrated with firm-owned knowledge and converted
into new ideas or solutions through knowledge conversion process. As such, enhance the customer value
proposition in terms of product and service function. In addition to that, the research also examined the role of
knowledge creation process during PSS design as a mediator between the knowledge exploration-exploitation
and customer value proposition. Although, literatures related to these three elements (customer knowledge,
knowledge creation and product design) are discussed quite often. However, little discussion found in the context
of integrated product-service and none integrate the three elements in a single research. Our intended
contributions in this article are twofold. First, to empirically examine the effect of customer knowledge captured
from other product life cycle and firm-owned knowledge towards new knowledge creation in Product-Service
System design. Second, to empirically prove knowledge creation in PSS design is crucial to enhancing customer value proposition in terms of product and service function.
The research focused on the organization as the unit of analysis. The Multimedia Super Corridor (MSC) of IT
and Multimedia cluster was chosen as the study group. One thousand questionnaires were sent out, and there
were 156 responses collected. The distribution of respondents is summarized according to MSC cluster, size, and
year of operation. The research utilized four main constructs, (a) knowledge exploration (capturing knowledge
from customers during use phase and retirement stage), (b) knowledge exploitation (deployment of firm existing
knowledge stored in knowledge-based, manuals and documentation and expert knowledge), (c) KCP in PSS
design (the SECI mode) and (d) customer value proposition (product and service function). The relationships
among those constructs were structured in four main hypotheses. Partial least squares structural equation
modeling was employed to assess the model.
Keywords: Knowledge, knowledge creation, Product-Service System, value proposition,
SECI
I. Introduction
In functional economy, functional sales is addressed rather than the physical product (Park,
Geum, & Lee, 2012), which getting much attention, particularly in developed countries
(Akasaka, Nemoto, Kimita, & Shimomura, 2012). The terms such as Product-Service System
(PSS), product-related services or full-services are interchangeably used to designate the
integrated of product-service offerings (Velamuri, Neyer, & Möslein, 2011) for selling
functions. Functionality describes the ability of integrated product-services (Durugbo &

POSTGRADUATE CONFERENCE ON ECONOMICS, PUBLIC ADMINISTRATION AND
BUSINESS (PCEPAB)-5TH SEPTEMBER, 2015
PROMOTING GOWTH, EXCELENT AND SUSTAINABILITY - 66
Riedel, 2013) to provide the function, usability, or purpose of it, rather than the physical
artifact.
PSS firms move from traditional selling artifact manufactured to combination of services and
products to enhance customer loyalty by having long-term business relationship with
customers (Alonso-Rasgado, Thompson, & Elfström, 2004) and offer sustainable solutions
(Nguyen, Schnürmacher, & Stark, 2014). Subsequently, PSS enhance existing customer
value (Kang & Snell, 2007), generate more profit (Husted & Allen, 2009; Dingzu Zhang &
Wang, 2010) and reduce environmental effect (Goedkoop et al., 1999; Shimomura, Nemoto,
& Kimita, 2014).
In earlier product oriented, firm technical product knowledge is required, however, designing
and developing a PSS is not an easy task due its systemic characteristics, actors involved and
its related components (Kimita, Shimomura, & Arai, 2009; Pezzotta, Cavalieri, & Gaiardelli,
2012). Therefore, systematic planning is required to improve continually and enhance
customer demand. Innovation in PSS can be done in two ways, include employee ideas or
customer feedbacks (Schenkl, Schmidt, Schockenhoff, & Maurer, 2014) from the use-phase
(Beuren, Gomes Ferreira, & Cauchick Miguel, 2013). Offering PSS requires firm (product
designer) and customer interaction and produce in depth and wider scope of knowledge
(Schenkl et al., 2014) could enhance the quality of its design solutions (Akasaka et al., 2012).
Flexibility becomes crucial issue as any specific product can be combined with services to
meet customer requirement through distinct operational processes (Reim, Parida, & Örtqvist,
2014; Ueda, Takenaka, Váncza, & Monostori, 2009). Customer's experience are explored to
improve existing firm core product concept and manufacturing capabilities (Goedkoop,
Halen, Riele, & Rommens, 1999), reduce the needs for service throughout the product usage
phase. Hence, PSS focus on lengthening the durability of a product-service which in turn
reduce material/resource usage but at the same time retain the quality (Mont, 2002).
Exploring customer’s experience and exploiting firm internal knowledge gathered from each
phase of new PSS development are crucial to integrate product functionality and its related
services into one solution. The firm that continues searches (CKE) for new knowledge from
customers' experiences and use internal knowledge (FIKE) for upgrading an existing system
may have opportunities to succeed (Prahalad & Ramaswamy, 2004). A firm may choose to
maintain internal knowledge if the firm is very competitive and at strong position in the
industry which that knowledge is sufficient (Denford, 2013). Explorative and exploitative
learning are a complementary concept for optimizing resources and makes the essential
processes efficient and effective (Guidice, Heames, & Wang, 2009). Both approaches offer
renewed in knowledge, but both differ in cost, learning ability and duration (Denford, 2013;
Kang & Snell, 2007).
Designing PSS requires multiple discipline perspective (Morelli, 2003) such as different
background that contribute to new insights and innovative ideas gained from experiential
learning (Nonaka & von Krogh, 2009) to reduce service requirements during use-phase
(Dongmin Zhang, Hu, Xu, & Zhang, 2012). Earlier finding have shown the importance of
customer integration in the concept and design process of new product development (W.
Song, Ming, & Xu, 2013; Dongmin Zhang et al., 2012), innovation (Schaarschmidt & Kilian,
2014; C. W. Y. Wong, Wong, & Boon-itt, 2013) (J. Wu, Guo, and Shi, 2013), product quality
(Su, Chen, & Sha, 2006; Weng & Huang, 2010), service quality (Tseng, 2012) and
operational performance (He, Keung Lai, Sun, & Chen, 2014; Menguc, Auh, & Uslu, 2013;
Yeung, Lo, Yeung, & Cheng, 2008; Ying & Wu, 2012). On the other hand, previous research
on exploitation of firm internal knowledge (see e.g. Ahmed-Kristensen & Vianello, (2014);
Baxter, Roy, Doultsinou, Gao, & Kalta, (2009); Leary (2001); Roy et al. (2014); Dongmin

POSTGRADUATE CONFERENCE ON ECONOMICS, PUBLIC ADMINISTRATION AND
BUSINESS (PCEPAB)-5TH SEPTEMBER, 2015
PROMOTING GOWTH, EXCELENT AND SUSTAINABILITY - 67
Zhang et al. (2012)). Issues from a different stage of product development are crucial input
for PSS design, as customers or the designers’ past experiences can be transferred to facilitate
future product improvements (Ahmed-Kristensen & Vianello, 2014). This study highlights
two issues regarding customer knowledge and firm internal knowledge. First, although
customer knowledge from use-phase and retirement stage are relevant for design phase,
product designer seldom acquires adequate knowledge from service engineer, which result to
inadequate of knowledge transfer between the two teams (Ahmed-Kristensen & Vianello,
2014).
Second, although crucial ideas from the customer are captured, and firm skills and
experiences are enormous, that knowledge has less impact if they cannot be converted,
integrated, applied and shared. New knowledge captured with highly tacit knowledge will
lead to knowledge conversion process. Since new knowledge is the source of innovation, it is
crucial to interpreting knowledge obtained and integrate with firm’s owned knowledge to
improve current product design and its capabilities. The previous research has proven
knowledge creation process affect new product development (Jing & Yang, 2010; Richtnér &
Åhlström, 2010; Wan Zaaimuddin, Goh, & Eze, 2009; Winegard, 2010) product success
(Schulze & Hoegl, 2005), service quality (Tseng, 2012) and co-creation for new product
development (Kohlbacher, 2008). However, those study related knowledge creation and
product development focus on the development of traditional product or service instead of the
integration of both into one final solution.
In summary, this article investigates how customer knowledge exploration (CKE) and firm
internal knowledge exploitation (FIKE) from the entire product development cycle, facilitate
knowledge creation process (KCP) during PSS design. In addition, the study discusses how
the KCP in the product design enhance product-service performance (PSP). The paper has
two contributions: first it offers novel views of how CKE and FIKE enhance new knowledge
creation for product design and PSP. Second, it also demonstrates the three factors CKE,
FIKE and KCP are equally important and well predict the performance of integrated product-
service performance offer to the customer.
II. Theoretical Development and Hypothesess
A. Knowledge
Nonaka and Takeuchi (1995) define knowledge as "beliefs and commitment, action and
meaning". Whereas, Davenport and Probst (2000) have stated knowledge is always bound
within persons not organization, which reflect as the whole body of cognition's and skills
individual use to resolve problems. It is commonly agreed that knowledge is an organized
mixture of thoughts, set of laws, actions, and information (Bhatt, 2000). Nonaka and
Takeuchi (1995) categorized knowledge into tacit and explicit knowledge. They define tacit
knowledge as instance belief, point of view, technical skill and know-how which is created by
individuals through direct experience handling a situation or use of technology. External
knowledge (tacit) from customers, suppliers, partners, and industries who poses know-what
are demanded by customers and what are the requirement that fulfill the needs and know-why
the reasons customer demand. An internalized (tacit) knowledge that has the know what,
why and how characteristic which resides in an individual or employee. In contrast, explicit
knowledge is codified knowledge, stored, articulated and communicated which can be
transmitted in a formal language, for instance databases, handbooks, maps, manual, text,
formulas, guideline, procedures, reports and could be documented and distributed to others.
Explicit knowledge embedded in trademarks, inventions, patents, knowledge recipes, etc. and
a portion of the core know-how of a design.

POSTGRADUATE CONFERENCE ON ECONOMICS, PUBLIC ADMINISTRATION AND
BUSINESS (PCEPAB)-5TH SEPTEMBER, 2015
PROMOTING GOWTH, EXCELENT AND SUSTAINABILITY - 68
B. PSS development phase
With adequate resources and supported, PSS will be success, if the product critical success
factor such as distinctive paybacks to customers, high quality, innovative design, and
reasonable price are well planned, designed and implemented (Brown & Eisenhardt, 1995). In
new product development, the product is created based on market needs that determine the
firm success and competitiveness. Furthermore, the information can be collected by
understanding the market needs through having communication with them. PSS development
integrate alignment of existing design and its realization processes of both product and
services (Aurich, Wolf, Siener, & Schweitzer, 2009) which apparently becomes a challenge to
manufacturing firm, when the firm processes and approaches have to match with the new
system (Marques, Cunha, Valente, & Leitão, 2013). In addition, the provider core
capabilities in manufacturing physical products and its corporate culture may lead to
anticipated solutions related to the product but in restrict manner (Aurich et al., 2009). The
product development process must ensure the functionality and services are offered to
customers, as such integrated product-service development integrate tangible product and
intangible service to provide solution to customers (Exner, Lindow, Buchholz, & Stark, 2014)
instead of pure product ownership (Baines et al., 2007).
Previous research on new product development can be found in prior studies (e.g. Durugbo &
Riedel (2013); Y.-J. Chen, Chen, & Wu (2009); Isaksson et al., (2009); Ismail & Monsef
(2012); Dongmin Zhang et al.(2012); Pezzotta et al. (2012); Aurich, Fuchs, & Wagenknecht
(2006); Schaarschmidt & Kilian (2014); (Hadaya & Marchildon, 2012)). For instance Hadaya
& Marchildon, (2012) state several phases in product development include (a) Beginning of
life (BOL) which refer to the starting point new product concept is developed, clearly
defined, manufactured and delivered to customers; (b) Middle of life (MOL) is the utilization
of product, services delivered and maintenance for the product; (c) End of life (EOL) product
refers to the stage that product is recycled, remanufactured, reused or disposed. Durugbo &
Riedel (2013) suggested four product development stages for integrated product and service:
design, development, delivery, and disposal. Having the similar layout of product
development, Zhang et al., (2012), the modified version using new knowledge exploration
and existing exploitation is shown in Figure 1.

POSTGRADUATE CONFERENCE ON ECONOMICS, PUBLIC ADMINISTRATION AND
BUSINESS (PCEPAB)-5TH SEPTEMBER, 2015
PROMOTING GOWTH, EXCELENT AND SUSTAINABILITY - 69
Figure 1: PSS product life cycle for knowledge exploration and exploitation (Modified
version from Zhang et al., (2012) )
The life cycle includes exploration of the market and customer need by identifying the
requirement of new product and the potential of the provider own capabilities through their
existing knowledge. The product life cycle is divided into three main cycles, beginning of life
cycle (BOL) which includes planning product concept, and design the concept. The BOL
cycle is followed by the Production activities where the detailed design for manufacturing and
production takes place. The Middle of Life cycle (MOL) focuses on utilization of product,
services and maintenance. Whereas end-of life cycle (EOL) includes reuse, remanufacturing,
recycle and disposal or take-back policy.
C. How CKE and internal knowledge exploitation is transferred from one process to
another and create new knowledge during PSS design
There are many models related to managing knowledge, among them are von Krogh and
Roos, Nonaka/Takeuchi, Choo, Wiig, Boisot and Bennet (Cristea & Ă, 2009). These models
help firms to appreciate what they have gone through and forecast what will happen in the
future. However, in this research, only Nonaka and Takeuchi model is discussed in detailed,
as it is seen relevant in the context of the KCP.. Nonaka & Takeuchi’s knowledge creation
model is a dynamic model by assuming human knowledge interplay between tacit knowledge
and explicit knowledge through human interaction between persons (i.e., dialogue) known as
SECI (Socialization, Externalization, Combination and Externalization) (Nonaka & Konno,
1998). During the development of integrated product and service, several types of knowledge
are required, they are explicit knowledge (strategies and rationale for products and processes),
and tacit knowledge (awareness or insight about processes) (Schenkl, Schmidt, Schockenhoff,
& Maurer, 2014).
Another element of knowledge filtration is added to Nonaka’s model to purify the quality of
knowledge captured and prior knowledge owned by employees. Those organizations who fail

POSTGRADUATE CONFERENCE ON ECONOMICS, PUBLIC ADMINISTRATION AND
BUSINESS (PCEPAB)-5TH SEPTEMBER, 2015
PROMOTING GOWTH, EXCELENT AND SUSTAINABILITY - 70
to leverage firm knowledge effectively will suffer various information related anxiety and
face challenge of keeping up with organizing information overload which refers to the high
volume of information that poorly organized and difficult to access and summarize
(MacDonald et al., 2011). It also affects stress on individuals in terms of mental overload
(Strother & Ulij, 2012), productivity and financial losses (Cloete & Snyman, 2003) to
organizations. Several criteria used to filter the knowledge captured: safety, newness, and
relevance. The first criteria is to filter for safety, which ensure information gathered is not
harmful to the firm, thus by filtering process will reduce the consequences. Second, filter for
the relevance of the knowledge captured. As Hanka & Fuka (2005) claim "just-in-time"
knowledge inventories concept access relevant knowledge at the right time when and place
where it is needed becomes crucial. Also highlighted by (Bray & Prietula, 2007), important
knowledge today may not be important for future changes in surrounding, thus filtering
process may avoid overloaded irrelevance knowledge. Third, filter for newness of
knowledge. Knowledge captured must be new to the firm which may provide potential
innovation either incremental or radical (Garcia & Calantone, 2002).
This study research model comprises of four main constructs, customer knowledge
exploration, firm internal knowledge exploitation, knowledge creation in PSS design and
product-service performance. The research model of the study is as shown in Figure 2.
Figure 2
Research model
Socialization. In order to make the socialization process works, employees must show some
sort of they have expertise about the product knowledge. Employees gather knowledge by
learning from past experience, developing and extending the firm internal knowledge
(Alonso-Rasgado et al., 2004; Atuahene-Gima, 2005) such as expert knowledge, diagnosis
skills, facilities and professional equipment, experience, objectivity and integrity, ethical
codes; and relational capital (Aarikka-Stenroos & Jaakkola, 2012). This knowledge can be
gathered from different employees at different stages of PSS development phase: product
design, manufacturing, use-phase and retirement phase. In addition, new knowledge can be
obtained from external sources through socializing with customers (Andreeva & Kianto,
2011). During idea generation, provider starts identifying customer demands through
customer suggestion and complaint (Homburg & Kuehnl, 2014) based on product-service
operation, direct experience, outcome and value received (Johnston & Clark, 2001). In order
to solve the current problem, it requires defining problems appropriately, which lead to
specifying the requirement that meets product-services characteristics. This can be done by
focusing on lead users of a product or processes (Hippel, 1986). The lead user’s knowledge
can be captured in various ways, either virtual channel or face to face. Different providers
may have different approaches how the new knowledge is acquired, such as customer visits
(Schaarschmidt & Kilian, 2014), brainstorming with customer (Alam, 2013), dialogues
(Pezzotta et al., 2012), in-depth interviews (Baxter et al., 2009; Kindström & Kowalkowski,

POSTGRADUATE CONFERENCE ON ECONOMICS, PUBLIC ADMINISTRATION AND
BUSINESS (PCEPAB)-5TH SEPTEMBER, 2015
PROMOTING GOWTH, EXCELENT AND SUSTAINABILITY - 71
2009), observations of social networking sites, blog, online communities, and forum. This
process is called “experiential sharing” or defined as social interactions between two entities
such as the exchange of the specialized skills of firm internal knowledge with customer
experience (Argote & Ingram, 2000) Other approaches for socialization is face-to-face
discussion, knowledge repository / firm databases, customer management systems, and
decision support tools (Chong, Chong, & Gan, 2011). In short the more customer knowledge
is explored, and internal firm knowledge is exploited the more new knowledge will be
created. Thus we hypothesized:
Filtration. Filtration is a process where knowledge gathered or created is filtered to ensure
knowledge obtained conform to the firm predefined goals and objectives (Jamal El-Den,
2006) and potential harmful knowledge will be eliminated from the database (Markovitch &
Paul, 1993). This step requires careful discussion among team members to decide which
knowledge will stay or face out. Unnecessary, spillover or redundant knowledge are discarded
to improve the quality of knowledge asset using the filtering system (Yingnan, Yuduo, &
Xiongfei, 2012). Only unique, relevant, and potential knowledge will be selected for creation
of new knowledge. The more customer knowledge captured, the more filtration process has
to take place, to purify new knowledge obtained. As for FIK, the filtration process is as
equally required for CKE. The reason is knowledge can decline in value based on several
factors, such as time, environment, different sectors / target customers, and technology
changes. Thus, filtration process applies to newly captured knowledge or prior knowledge
owned by employees. Thus the following hypotheses are formulated:
Externalization. In the externalization stage, customer knowledge is articulated in common
terms and explicit concepts such as metaphors, analogies, hypotheses and models (Nonaka
and Takeuchi, 1995), images, symbols, and language including design and product concepts
(Schulte, 2008). Nonaka & Takeuchi also refer this activity as “creating new concept’. For
example in PSS modelling, both product and service are equally important, thus the designing
of both aspects must take place concurrently at the beginning of the new PSS development
(Geng et al., 2011). Customer support during after-sales service is crucial for customer
satisfaction, organization competitiveness, increase product success (Goffin & New, 2001).
As such the authors suggest, the concept of service should be designed in the product for cost
efficiency and effectiveness. Furthermore, the decision making during designing new product
concept will affect product reliability, maintenance and repair (Goffin & New, 2001).
Because of that, customers’ feedback from the use-phase and retirement stage must be
analyzed carefully and need to be translated into understandable meaning. Therefore, a new
concept of the new solution can be determined. At this stage, not only CKE is important, but
FIKE such as experiences gathered through all stages in PSS development. This knowledge
can be captured by utilizing IT application system (Varra et al., 2012). The interaction of
both knowledge, lead to simplification of knowledge conversion from tacit to explicit
knowledge.
Combination. Firm internal knowledge such as experience, mental models, and thoughts and
the new explicit knowledge articulated by individual employees are combined with other
employees (collectively) knowledge and later processed into more complex and systematic,
explicit knowledge (Nonaka & Toyama, 2003; Song, 2008). For example in PSS design,
once, new unique ideas either related to product or its services functions are collected,
customers’ need can be developed by combining with FIKE (Marques et al.,2013) such as

POSTGRADUATE CONFERENCE ON ECONOMICS, PUBLIC ADMINISTRATION AND
BUSINESS (PCEPAB)-5TH SEPTEMBER, 2015
PROMOTING GOWTH, EXCELENT AND SUSTAINABILITY - 72
skills, strategy, and previous experiences gathered during PSS developments. The
combination process involves reconfigure current explicit knowledge through sorting, adding,
reorganizing, and combining processes which yield to new explicit knowledge (encoded
knowledge) (Chatti, 2012) using IT system such as electronic communication, formal
documents, database, and shared management (Hosseini, 2011). With the advance of IT,
creative use of computerized communication networks and large repositories can assist this
knowledge conversion (Nonaka & Toyama, 2003).The providers and customers interaction
co-create insight, skills and relationship through a combination of the customer’s and firm
internal unique knowledge, hence new product and service concept are developed. The
service concept is a solution to a customer problem through activities and interaction.
However, unique value and experienced are created based on the knowledge and skills apply
during consumption, subject to user requirements (Edvardsson, Kristensson, Magnusson, &
Sundström, 2012) Seven examples of service elements suggested by Goffin & New (2001):
installation, user training, documentation, maintenance and repair, on-line support, warranty,
and upgrades. The product concept in PSS present the similarity with the service design
concept, which again include customers’ requirements (Kimita & Shimomura, 2014) such as
functionality, cost, durability, and environmental safety (Schulze & Hoegl, 2005). Another
product concept that need to be incorporated during product design is sustainability issue, in
terms of reduce waste, reduce the usage of material, recyclable and re-use material and easy to
disassemble for disposal (Khor & Udin, 2013). Later, new concept must be analyzed in
terms of its feasibility such as technical availability, adaptability, viability, and cost-benefit
before it is executed.. Once the detail design is defined, a model or a prototype is built to
validate and verify the product design appear as what it is planned. In this case, the prototype
built is tested and must satisfy both product and service elements (Exner et al., 2014). In
summary, during the combination of KCP both CKE and FIKE are crucial sources. Thus we
hypothesize:
Internalization. During internalization process, embedded knowledge such as shared norm
and firm routines are formed once explicit encoded knowledge is transformed into new tacit
knowledge by embodying explicit knowledge through learning by doing, training,
documentation or simulations (Nonaka, Toyama, & Konno, 2000). During training, new
product and service concept are applied so they become individual’s knowledge (Nonaka &
Toyama, 2003). Later, this trigger a new cycle of knowledge creation when team members
socialize and share the new ideas (Nonaka et al., 2000). Knowledge sharing, transfer existing
knowledge from one individual to another, regardless among colleagues within the
department or across departments (Andreeva & Kianto, 2011). This phase is crucial
(Oyefolahan & Dominic, 2011) as it affects knowledge creation and respond to changes,
innovate and achieve organizational competitive advantage. It also contributes to the
development of competency among employees and innovative capability of the organization.
It can be implemented with the support of IT resources such as email, intranet /extranet,
portal, video conferencing, teleconferencing and forums such as communities of practice and
training (Sandhawalia & Dalcher, 2011). In order to allow knowledge can be reused for
future use, knowledge should be recycled and upgraded whenever necessary. Knowledge
storage support organization memory and individuals to access and FIKE and provide coding
and indexing of knowledge for future retrieval. Finally this collective new concept and design
knowledge is transformed into new tacit when it is embodied in shared norm and firm
routines through learning by doing, training and simulation (Nonaka et al., 2000). At this
phase, new knowledge created is applied in real business. At this stage, an increase in

POSTGRADUATE CONFERENCE ON ECONOMICS, PUBLIC ADMINISTRATION AND
BUSINESS (PCEPAB)-5TH SEPTEMBER, 2015
PROMOTING GOWTH, EXCELENT AND SUSTAINABILITY - 73
capturing customer knowledge will increase the ability of employees to embodying explicit
knowledge, similarly firm past experiences are crucial input for new knowledge creation.
Thus, the following are hypothesized:
Hypothesis 1a/b/c/d/e: Customer knowledge exploration (CKE) is positively related to
knowledge creation process (KCP) during new PSS design.
Hypothesis 2a/b/c/d/e: Firm internal knowledge exploitation (FIKE) is positively related to
knowledge creation process (KCP) during new PSS design.
D. Customer knowledge exploration (CKE), firm internal knowledge exploitation
(FIKE) and customer value proposition in terms of product-service performance
(PSP)
A customer value proposition is the basis understanding how the products or services are
experienced by the target user and gain the benefits of consuming the products. It is the core
element of business model and the first step in developing a business model that describes the
logic connection of products and services offer to the customer (Petrovic & Kittl, 2003) and
solve customers’ needs or their problems (OECD, 2012). The value proposition of a product,
adds value in total that can be quantified and measured. The higher value proposition can be
defined the more chance of the product will be accepted by customers (Ott, 2000). Boons and
Leudeke-Freund (2013) state that the relationship between organizations and their customers
is clearly defined by value proposition, which develop not because of specific products or
services but relatively by the value exchange between provider and intended users whom the
products are designed for. Without customer value proposition, it is similar to business
without the target in the marketplace (Morris et al., 2005). Hence, new product development
is considered success when it can contribute to earning revenue and meeting firm objectives
by fulfilling customer needs and satisfaction. Product and service performance is measured
based on product functionality and service quality. Product functionality is defined as the
incorporation of service offers into the traditional product offer, together with extending
product lifecycle (Lindström, Dagman, & Karlberg, 2014). Obviously, there are other
strategies to achieve product success, but one example is product quality such as product
functionality, durability, compatibility, its design (Schulze & Hoegl, 2005) and price
(Morschett, 2006). Also, the characteristic such as the level of product quality, performance,
mechanical and technical features and reliability (Antioco, Moenaert, Feinberg, & Wetzels,
2008) are examples of product functionalities. The service quality measures the effective and
efficient transformation of resources in the form of services that satisfy customer’s need
(Yoon, Kim, & Rhee, 2012).
One approach to offer value to customers is through capturing service feedbacks from
customers. The feedbacks can be crucial sources to enhance PSP. Besides the ability of the
firm to provide solutions to the current problem, it also can deliver supplementary services to
customers (Morschett, 2006). Customer knowledge in terms of sustainability, is another
potential criteria that may affect product-service performance in order to reduce the usage or
replacement of material that can contribute to environmental safety. As a result, less number
of production, cause a reduction in waste generated; increase in dematerialization product in
proper such as re-use, recycling and take back (Maxwell & van der Vorst, 2003). Similarly
production can be reduced through services delivery such as user training, maintenance,
repairs and warranty services, which enhance the efficiency of the product being sold
(Morschett, 2006) thus reduce number of production.

POSTGRADUATE CONFERENCE ON ECONOMICS, PUBLIC ADMINISTRATION AND
BUSINESS (PCEPAB)-5TH SEPTEMBER, 2015
PROMOTING GOWTH, EXCELENT AND SUSTAINABILITY - 74
CKE. The objectives of CKE are to enhance customer satisfaction through value proposed to
them besides gaining other benefits such as innovativeness (Yli-Renko, Autio, & Sapienza,
2001) flexibility, timely response to customer demands, long term relationship and increase in
revenue (Claycomb, Dröge, & Germain, 2005). In this research, the product-service
performance is the final research output. It is chosen due to the value proposed to customers,
in line with the sources of input discussed earlier, for example customer knowledge and firm
internal knowledge. Furthermore, the process of knowledge creation discussed earlier is in
the product-design context. Thus, product-service performance as an output of product design
seems fit. Furthermore, previous study already proved customer knowledge provides some
sort of benefits such as product-service offering (Abebe & Angriawan, 2014), service quality
(Tseng, 2012), and firm’s sustainable innovation (Ayuso, Rodríguez, García-Castro, & Ariño,
2011). Since both CKE and FIKE activities are implemented in this study, the result may
involve with incremental and radical innovation in product, or process (Abebe & Angriawan,
2014).
FIKE. Similarly, deploying firm internal knowledge is also an important enabler for PSS
design, quality, and its development speed (Dongmin Zhang et al., 2012). The provider may
customize product offering by utilizing its resources to identify specific patterns and rules
regarding domain-specific knowledge about customer needs through relationship invested for
their knowledge exchange Sun (2007). The capabilities of the provider to create new and
utilize previous knowledge is depending on how the provider interprets and integrate them
(Hadaya & Marchildon, 2012; Isaksson et al., 2009). Previous research has clearly stated that
exploitation and exploration activities have a different effect on firm performance (Bocanet &
Ponsiglione, 2012). It seems that exploitation of existing knowledge improves current
performance in the existing environment in terms of its efficiency and effectiveness of the
existing system. On the other hand, knowledge exploration provides long-term benefit
(Bocanet & Ponsiglione, 2012). This can be done when employees’ abilities, experience,
training and skills are enhanced internally from time to time perform the assigned task
(Bocanet & Ponsiglione, 2012). This may affect the efficiency and effectiveness of product
offering while at the same time innovate the approach used to deliver customer service. Hence
the following hypotheses are formulated:
H3a/3b: Customer knowledge exploration and firm internal knowledge exploitation are
positively related to product-service performance.
E. Knowledge creation process (KCP) and Product-service performance(PSP)
Many firms have implemented management initiatives after realized that knowledge resources
such as CKE and FIKE are the basic capabilities for value proposition and source of
competitive advantage (Schiuma, Carlucci, & Lerro, 2012). Through management initiatives,
knowledge resources are linked to organizational capabilities, processes and performance
(Schiuma et al., 2012). In addition, by managing knowledge, firms can enhance business
processes and maximize opportunities. Hence, PSS depends on how well the knowledge
management initiatives are implemented. In order to extract knowledge from its external
sources, it requires organizational capabilities to integrate them in the organization,
knowledge processes, and managerial activities such as teamwork, community of practice,
adoption and the use of advanced ICT (Chung & Chen, 2012). However, the knowledge
acquired from external sources alone could not provide impact on organizational
performance, except if the knowledge is integrated with internal firm resources (Chung &
Chen, 2012). Tseng (2012) has proved KCP (knowledge chain) is one of the primary
activities that could affect the service quality.

POSTGRADUATE CONFERENCE ON ECONOMICS, PUBLIC ADMINISTRATION AND
BUSINESS (PCEPAB)-5TH SEPTEMBER, 2015
PROMOTING GOWTH, EXCELENT AND SUSTAINABILITY - 75
Socialization: The socialization between customers and employees during the planning phase
create opportunity to capture customer embodied knowledge such as customer ideas,
suggestions or complaint (Aarikka-Stenroos & Jaakkola, 2012) from any phase of PSS
development and that knowledge are shared through face-to-face or virtual meeting (Varra et
al., 2012). However, knowledge captured from service delivery during use-phase and
retirement stage is crucial for product design phase to enhance existing and future product
design. The customer may share their personalized experience (Hosseini, 2011) with the
team members for example personal expertise, value that they search (Paswan, D’Souza, &
Rajamma, 2014), feeling, emotion, experience and mental model (Hosseini, 2011) through
creative dialogue (Song, 2008). This knowledge provides idea generation to solve the current
problem by focusing on lead users as they represent strong influences of a future product or
process (Schulze & Hoegl, 2005). Socialization during concept development with customers
enable customer experiential learning using product offering in terms of product quality
standards, design of products, production plans, and costs are shared (Claycomb, Dröge, &
Germain, 2005); allow PSS provider to be in a better position to integrate their knowledge for
innovative product concept (Schulze & Hoegl, 2005); and ensure the concept for the new
functionality meets its requirements (Kimita & Shimomura, 2014).
Filtration. Through socialization process, however, ideas or suggestions captured can be
enormous that lead to knowledge spillover. In addition, the high volume of knowledge may
not guarantee they meet the pre-specified quality and conform to the firm predefined goals
and objectives (Jamal El-Den, 2006). Harmful knowledge should be discarded from the firm
database (Markovitch & Paul, 1993) as they cause firm to have difficulties in searching,
handling, evaluating knowledge, and making right decision, besides facing disappointment
and personal stress (MacDonald et al., 2011). Only, unique, relevant, and potential knowledge
will be considered for the creation of new knowledge. The more customer knowledge
captured, the more prior knowledge of FIKE, hence the more filtration process has to take
place to purify new or existing knowledge according to specified targets in designing new
integrated product-service. Quality knowledge will enhance the output, such as product
functions, services or maintenance. With that, the following is hypothesized:
Externalization: During the planning stage the focus is on generating new knowledge, new
solution for both types of product-service developments by identifying customer suggestions
and complaints (Homburg & Kuehnl, 2014). The key ideas are to define problems
appropriately which lead to specifying the requirement that meet product-services
performance. One way is to focusing on lead users of a product or processes as they represent
strong influence of a future product or process (Von Hippel, 1986). After distinguished ideas
captured from customers, employee generates understanding of what is going to be developed
by externalizing the understanding into metaphors or concept creation. By identifying the
customers’ need, customer satisfaction is enhanced through new PSS requirement developed
based on external and internal resources. During this phase, the team able to use this metaphor
to think about how to replicate the motion in future product that enabled them to produce the
desired effects and new concepts are formed (Gourlay & Hill, 2003). In addition, this phase is
crucial during product design for both product and service modeling. Besides that, PSS
design focus on the durability of a product by reducing resources usage without jeopadising
the quality (Mont, 2002), enhance existing customers’ value (Kang & Snell, 2007) generate
more profit (Husted & Allen, 2009; Dingzu Zhang & Wang, 2010) and reduce environmental

POSTGRADUATE CONFERENCE ON ECONOMICS, PUBLIC ADMINISTRATION AND
BUSINESS (PCEPAB)-5TH SEPTEMBER, 2015
PROMOTING GOWTH, EXCELENT AND SUSTAINABILITY - 76
effect (Goedkoop et al., 1999; Shimomura, Nemoto, & Kimita, 2014). Thus externalization
meets the requirement for product design. Thus, we hypothesize:
Combination: During combination in PSS design, managers are engaged in planning
strategies and operational organizing internal and external firm knowledge using advance IS
(Nonaka, Byosiere, Borucki, & Konno, 1994) such as Computer Aided Design and Product
Data Management (Dongmin Zhang et al., 2012). Internal and external knowledge design are
combined, expecially knowledge from service designers or customers feedbacks on service,
maintenance and product retirement. These feedbacks are required to create new complicated
and systematic concepts: diagrams, flowcharts, graphs, and models, which will enhance
previous design in terms of product functions or service quality. Hence, we proposed:
Internalization: In planning for concept design, PSS focus to generate as many ideas that
might be feasible for developing PSS. Internalization of explicit knowledge to tacit
knowledge (embodying explicit knowledge into tacit knowledge) stimulates the realization of
new product innovation in the organization (Li, Huang, & Tsai, 2009). New knowledge in
terms of technical know-how or mental model (Chatti, 2012) improve service processes and
performances and may distinguish from competitor’s product (Hara, Shimada, & Arai, 2013)
are internalized via application or participation (Kenney & Gudergan, 2006), simulation or
experiment (Nonaka and Toyama, 2003). Virtual world of knowledge acquisition through
application in engaging prototyping, testing and benchmarking is disseminated to other
functional units (Nonaka et al., 1994). Furthermore, many studies have proven
internalization lead to greater flexibility in distributing information (Kenney & Gudergan,
2006) that leads to better idea generation in planning and designing PSS, reduce response
time and obtaining better adaptation of environmental change. Finally, the newly created
concept is disseminated to other unit during planning and implementation of product design.
Combination assists the new product based on the firm’s existing capabilities, technically and
economically thus project team has a better understanding of the new product concept created
objectives and requirement (Schulze, 2005). Hence, it is argued that combination mode in
knowledge creation positively affect PSP. Thus, we contend that internalization during the
design phase is positively related to product and service performance.
H4a/b/c/d/e: Knowledge creation process (KCP) during PSS design is positively related to
product-service performance(PSP).
F. The mediating effect of knowledge creation process (KCP) in PSS design on
knowledge exploration-exploitation and product-service performance(PSP)
The PSS performance is closely related to the activities in the KCP. PSS delivery, offer
several benefits to the provider: such as reduced costs, extended product life and use,
efficient use of resources, reduced life-cycle environmental impact (Durugbo et al., 2010). At
the same time, customer gain benefits in terms of accessibility, evolvability, interoperability,
maintainability, modularity, portability and scalability (Durugbo et al., 2010). In other words,
customers may enjoy new functionalities and value delivered to them through service
enhancement (Barquet et al, 2013) In product development, customer knowledge and firm
experience provide valuable knowledge to design new product concept. New knowledge
created through KCP: sharing, filtering, creating concepts, justifying new concept, and
application of new concepts. Without KCP, the interaction between new knowledge captured

POSTGRADUATE CONFERENCE ON ECONOMICS, PUBLIC ADMINISTRATION AND
BUSINESS (PCEPAB)-5TH SEPTEMBER, 2015
PROMOTING GOWTH, EXCELENT AND SUSTAINABILITY - 77
from external sources and previously acquired knowledge may have little impact on new
knowledge creation thus performance of an integrated product-service becomes stagnant.
Previous finding by Tseng (2012) shows knowledge chain play full mediated role between
external knowledge and service quality. The mediator, at this point provides a process
where internal and external knowledge can be interpreted, upgraded, applied and shared in
the new project development. Thus, the following hypotheses are formulated:
H5a/b/c/d/e: Knowledge creation process (socialization / filtration/ externalization/
combination/ internalization) mediates the relationship between customer knowledge
explration (CKE) and product-service performance(PSP)
H6a/b/c/d/e: Knowledge creation process (socialization / filtration/ externalization/
combination/ internalization) mediates the relationship between firm internal knowledge
exploitation and product-service performance(PSP)
III. RESEARCH METHODOLOGY
A. Sample and data collection Unit of analysis in this research was an organization rather than personal or employee
performance. The Multimedia Super Corridor (MSC) of IT and Multimedia cluster was
chosen as the study group. There were 1871 organizations of IT cluster and 331 firms of
Multimedia cluster (www.msc.com). For pilot testing, 300 questionnaires were sent out to the
same group. The respondents were identified based on certain criteria which who hold a
position as a manager in IT/ Production/ Service/ Quality/ Marketing/ Customer Department.
The managers were also required to have at least one year experience. Their responses were
based on voluntary, they may answers question namelessly. All items were measured using
6-point Likert scale ranging from “strongly disagree” to “strongly agree”. The instrument
was pilot tested with 50 managers from the same group. Certain questions were removed and
upgraded based on suggestions from respondents. In the actual survey, one thousand
questionnaires were sent out and156 (15.6%) were collected but three responses were
discarded due to missing data. The distribution of respondents is according to MSC cluster,
size, and year of operation. There were 41 (26%) respondents from Creative Multimedia
cluster and IT related firms 115(74%). With regards to firm size, the majority of respondents
worked in small firms with less than 35 employees (55%), and only 12% of the respondents
were from large size firms with more than 200 employees. Most firms involved in the
research have been operating for more than five years (41%), followed by three to four years
of operation (23%), one to two years of operation (13%), two to three years of operation
(12%) and less than a year of operation (11%).
B. Construct and their questions
There were eight constructs and thirty-eight items. Exploration and exploitation were
independent constructs.. Knowledge creation processes had five sub-constructs: social, filter,
external, combine and internal. Product-service performance (PSP) was a dependent
construct. All eight constructs had reflective measures. Table 1 shows the detail of construct
instruments.

POSTGRADUATE CONFERENCE ON ECONOMICS, PUBLIC ADMINISTRATION AND
BUSINESS (PCEPAB)-5TH SEPTEMBER, 2015
PROMOTING GOWTH, EXCELENT AND SUSTAINABILITY - 78
Table 1 Detail constructs Code Construct Item Author
CKE Knowledge Exploration 4 Prieto et al., (2009)
FIKE Knowledge Exploitation 4 Prieto et al., (2009)
SOCIAL Socialization 4 J. H. Song et al. (2011)
FILTER Filtration 4 Author
EXTERNAL Externalization 4 J. H. Song et al. (2011)
COMBINE Combination 4 J. H. Song et al. (2011)
INTERNAL Internalization 4 J. H. Song et al. (2011)
PSP Product –service
performance
10 He et al., (2014); Swink, Narasimhan, & Wang (2007)
C. Data analysis
Two statistical tools were used to analyze the data SPSS (ver 22.0) and SmartPLS (3.0).
Structural equation modeling (SEM) using SmartPLS was adopted to examine the causal
relationships between the dependent and independent variables in the actual survey. It was
chosen due to several reasons: consistency, flexibility and robustness (Chin & Newsted,
1999). Other reasons for using PLS is due to little theory available, the need of predictive
accuracy, and uncertain model specification (K. K. Wong, 2013). In addition SmartPLS is
used because of the ability to interpret the interaction between latent variables besides the
direct effect (Henseler & Chin, 2010).
a) Validity and Reliability analysis
For common method bias (CMB), the SPSS was used to examine factor analysis. The
analysis extracted ten components for all items which accounted for70% cumulative loadings,
while the first factor loaded to 19% of the total variance which is less than 50%. Thus, it is
concluded there is no significant method bias in the examined data. The analysis by Kaiser-
Meyer-Olkin (KMO) measure sampling adequacy was 0.761, which was larger than 0.5 as
recommended by Kaiser (1974). The Bartlett Test of Sphericity lead to significance level
0.00 (p < 0.01) indicating the investigation of the population correlation was not on identity
matrix. Using an extraction method of Principal Component Analysis, for item reduction, the
factor was extracted to fix number of factors (8 factors) as mentioned in the literature. It was
followed by the rotation method of Promax with Kaiser, the factor loadings. All items were
accounted for 70% cumulative loadings and one item was removed due to higher cross
loadings. The scale reliabilities using Cronbach's alpha for all items were above 0.7 (Hair,
2010). Thus it was concluded that the measurement had an acceptable level of reliability.
b) Measurement model The measurement model was determined by investigating the relationship between the
constructs and their indicators as shown in Table 2. The internal consistency reliability,
convergent validity, and discriminant validity were examined for the reflective constructs.
Internal consistency reliability was evaluated through an examination of composite reliability.
For each of eight reflective constructs (CKE, FIKE, Social, Filter, External, Combine,
Internal, PSP), the composite reliability exceeded the minimum requirement of 0.80. All
constructs had less than 0.95 for composite reliability, which may lead to the measurements
used were semantically non-redundant items (Hair et al., 2014). Convergent validity was
initially examined through indicator reliability. The standardized indicator outer loadings
must be 0.6 or higher (Hair et al., 2014). Thus, another seven indicators were removed. The

POSTGRADUATE CONFERENCE ON ECONOMICS, PUBLIC ADMINISTRATION AND
BUSINESS (PCEPAB)-5TH SEPTEMBER, 2015
PROMOTING GOWTH, EXCELENT AND SUSTAINABILITY - 79
average variance extracted (AVE) is also a measure of convergent validity. The analysis of
AVEs exceeded the cutoff point 0.50 for all the reflective constructs in the model (Hair et al.,
2014). To end, the (Fornell & Larcker., 1981) criterion for assessing discriminant validity was
applied. As shown in Table 3, the square root of inter construct correlations were below the
construct AVEs, thus demonstrating discriminant validity. Finally, all indicator loadings were
higher than their cross loadings, providing further evidence that all the criteria for
discriminant validity were met.
Table 2
Factor loadings, composite reliability, and average variance extracted
Construct Indicators
. . Item
Loadin
g
IR CR AVE
Customer
knowledge
exploration
During product development, to what extent does your firm
explore. . .
Explore problem areas with regards to product and service delivery
with which customer is dissatisfied during customer use-phase. 0.669 0.448 0.809 0.588
Explore problem areas during maintenance which customer is
dissatisfied. 0.778 0.605
Explore numerous novel and useful ideas with regards to product
recycle, reuse or disposal?. 0.844 0.712
Firm
internal
knowledge
exploitation
During product development, to what extent does your firm exploit . . .
Existing knowledge elements are identified, connected and
combined 0.668 0.446
Existing competencies related to products/services design that are
currently being offered? 0.85 0.723 0.848 0.653
Lessons learned in other areas of the organization in operation?
(E.g. manufacturing, marketing, service department) 0.889 0.790
Socializatio
n
Share experiences between employees and customers. 0.725 0.526
Collect work-related information and ideas from employees and
customers 0.826 0.682 0.864 0.614
Capture customer feeling or emotions 0.734 0.539
Fitration Capture customer or employee ideas, suggestions which are new to
the firm 0.843 0.711
Capture customer or employee ideas, suggestions which are
relevant to the firm. 0.842 0.709
Discard ideas or suggestions that may harm organization 0.648 0.420 0.867 0.623
Notify all employees with regard to obsolete or failure in a
previous procedure, methods or techniques. 0.798 0.637
Externa-
lization
Develop new ideas through constructive dialogue by using figures
and diagram 0.852 0.726 Develop general rules and concepts based on several possible
examples 0.672 0.452
Facilitate creative and constructive conversation among the
members 0.846 0.716 0.839 0.638
Combi-
nation
Engage in continued dialogue through reflection among the
members 0.863 0.745
Evaluate the newly developed concepts by a reasonable evaluation
system and organizational vision / mission 0.817 0.667
Conduct experiments and share knowledge with the entire
organization to evaluate the value of the concepts 0.84 0.706 0.895 0.682
Test theoretical knowledge about customer needs 0.765 0.585
Interna-
lization
Combine existing and new concepts in meaningful ways 0.877 0.769
Collaborate with various departments 0.876 0.767

POSTGRADUATE CONFERENCE ON ECONOMICS, PUBLIC ADMINISTRATION AND
BUSINESS (PCEPAB)-5TH SEPTEMBER, 2015
PROMOTING GOWTH, EXCELENT AND SUSTAINABILITY - 80
Use newly learned knowledge as the sources for the future
applications 0.795 0.632 0.870 0.690
Product-
Service perfor-
mance
Product reliability 0.82 0.672
Product functionality 0.761 0.579
Product durability 0.64 0.410 0.921 0.596
Product maintenance 0.899 0.808
Product upgrades 0.837 0.701
Product trainings 0.687 0.472
Product spare part 0.803 0.645
Table 3
Construct correlations, mean and standard deviation
Construct 1 2 3 4 5 6 7 8
1. COMBINE 0.826
2. FIKE 0.18 0.808
3. CKE 0.177 0.092 0.767
4.
EXTERNAL
0.247 0.201 0.326 0.798
5. FILTER 0.209 0.152 0.203 0.335 0.789
6.
INTERNAL
0.153 0.322 0.118 0.354 0.068 0.831
7. PSP 0.368 0.361 0.433 0.46 0.349 0.346 0.772
8. SOCIAL 0.209 0.411 0.176 0.252 0.341 0.194 0.362 0.784
Note: The square root of AVE is shown on the diagonal of the construct correlations and
inter-construct correlations are shown off the diagonal.
c) Structural model
The structural model was assessed to examine the relationship between constructs and the
model’s predictive capabilities (Hair et al., 2014). First, a model that was free from any
collinearity issues was established by performing VIF analysis using linear regression in
SPSS for each independent variable. All VIFs were above 1.00 and well below 4.0, which
indicates that the model was not having collinearity problems (Hair et al., 2014). Second, the
basic theory of the model was tested using SmartPLS and the path analysis results are shown
in Table 4. The structural model was resampling for 1000 times to achieve consistent
magnitude and significance. As indicated in Table 5, using PLS, Beta coefficients, t-statistics,
lower and an upper limit of confidence intervals are presented. Another approach used was
Ordinary Least Squares (OLS) regression. By averaging the items within each construct, the t-
statistic and Beta coefficient were calculated. However, the results of OLS were not
consistent with the PLS. The result of PLS will be used for further analysis and discussion.
Fourteen hypotheses were accepted, and three were rejected. Hypotheses 1 a/b/c/d/e/f were
predicted a positive relationship between CKE and KCP (Social, Filter, External, Combine,
Internal). Four modes of KCP were positively affected by CKE: Social (p < 0.05), Filter (p <
0.01), External (p< 0.01) and Combine (p < 0.05) except Internal. Hypotheses 2 a/b/c/d/e
predicted a positive relationship between FIKE and KCP, and all were supported except
Filter: Social (p<0.01), External (p<0.05), Combine (p < 0.05) and Internal (p<0.01).
Hypotheses 3 predicted both CKE and FIKE had a positive relationship with PSP, both were

POSTGRADUATE CONFERENCE ON ECONOMICS, PUBLIC ADMINISTRATION AND
BUSINESS (PCEPAB)-5TH SEPTEMBER, 2015
PROMOTING GOWTH, EXCELENT AND SUSTAINABILITY - 81
supported ( p < 0 .01 and p < 0.1). Hypotheses 4 expected that all knowledge creation
process had a positive effect on PSP. However only three hypotheses were accepted: Filter
(at p < 0.05), External (at p < 0 .01) and Combine (at p < 0.01). Both Social and Internal
had a positive relationship with PSP but not significant.
Table 4
Path coefficients and results of hypotheses tests
Path PLS result OLS result
Co-
efficient
T- Stat. Confidence
interval
Co-
efficient
T-Stat.
H1a: CKE -> SOCIAL 0.139 2.042** (0.008, 0.275) 0.169 2.127
H2a: FIKE -> SOCIAL 0.398 5.983*** (0.271, 0.53) 0.385 5.171
H1b: CKE -> FILTER 0.191 3.021*** (0.072, 0.308) 0.175 2.203
H2b: FIKE -> FILTER 0.135 1.941 (-0.012, 0.277) 0.094 1.166
H1c: CKE -> EXTERNAL 0.31 4.583*** (0.178, 0.449) 0.319 4.180
H2c: FIKE -> EXTERNAL 0.172 2.249** (0.028, 0.33) 0.181 2.278
H1d: CKE -> COMBINE 0.162 2.046** (0.008, 0.326) 0.179 2.258
H2d: FIKE -> COMBINE 0.165 2.054** (0.008, 0.327) 0.155 1.953
H1e: CKE -> INTERNAL 0.089 1.096 (-0.061, 0.263) 0.134 1.683
H2e: FIKE -> INTERNAL 0.313 4.098*** (0.156, 0.45) 0.334 4.403
H3a: CKE -> PSP 0.268 4.323*** (0.147, 0.382) 0.421 5.768
H3b: FIKE -> PSP 0.164 2.322** (0.035, 0.29) 0.342 4.523
H4a: SOCIAL -> PSP 0.093 1.267 (-0.063, 0.237) 0.361 4.799
H4b: FILTER -> PSP 0.131 2.13** (0.013, 0.256) 0.283 3.659
H4c: EXTERNAL -> PSP 0.177 2.67*** (0.042, 0.311) 0.443 6.135
H4d: COMBINE -> PSP 0.178 2.724*** (0.002, 0.274) 0.369 4.931
H4e: INTERNAL -> PSP 0.145 1.9 (0.048, 0.31) 0.334 4.396
Note: ** p < 0.05, ***p < 0.01
In Table 5, shows R2, communality and redundancy. The prediction value of R2 was tested
according to three categories: weak (0.25), moderate (0.50) or substantial (0.75) (Hair et al.,
2011, 2014). The prediction of PSP was slightly below moderate (R2=0.451), prediction for
KCP of the five modes were below weak standard: Social (R2=0.188), Filter (R2=0.059),
External (R2=0.135), Combine (R2=0.058) and Internal (R2=0.111). Although PSP had below
moderate relationship value (R2=0.451), considering KCP, CKE and FIKE were about
knowledge in different context as the only antecedent for the PSP, 45.1 percent of the
variance explained seem to be adequate and meaningful. In order to evaluate the predictive
relevance of the endogenous latent variables such as Social, Filter, External, Combine,
Internal, and PSP, a blindfolding omission at distance of D = 7 was used. The Q2 for Combine
(0.079), External (0.121) Internal (0.009), Social (0.137) and PSP (0.29) were above 0.15,
which indicated medium predictive relevance. Based on the effect size of (f2) measures the
influence of a specific predictor on an endogenous variable by calculating the change in the
R2 if the predictor is excluded from the model (Cohen, 1988). The change in the R2 indicates
the substantive effect on the R2 values of the endogenous variable. The standard measures to
assess f2 value of endogenous variables are small (0.02), medium (0.15) and large (0.35)
effect size. The results show the effect size f2 values of endogenous variables (PSP) ranged
from small effect size to slightly below medium effect size (0.115) indicating acceptable

POSTGRADUATE CONFERENCE ON ECONOMICS, PUBLIC ADMINISTRATION AND
BUSINESS (PCEPAB)-5TH SEPTEMBER, 2015
PROMOTING GOWTH, EXCELENT AND SUSTAINABILITY - 82
predictive relevance. The overall quality of the research model was computed using the
Goodness of Fit (GoF) formula: GoF= √ Average R2 x Average Communality = 0.3270
(Tenenhaus et al., 2005)
Table 5
R2, communality and redundancy
Construct R2 Communality Redundancy Q2 PSP
CKE - 0.588 0.182 0.115
FIKE - 0.653 0.323 0.037
SOCIAL 0.188 0.614 0.345 0.101 0.011
FILTER 0.059 0.623 0.375 0.027 0.025
EXTERNAL 0.135 0.638 0.286 0.070 0.041
COMBINE 0.058 0.682 0.454 0.037 0.051
INTERNAL 0.111 0.690 0.366 0.066 0.031
PSP 0.451 0.596 0.475 0.260 -
Average 0.167 0.641 0.351 0.116
d) Mediation effect
Later, the mediation effect of KCP between CKE / FIKE and PSP were tested. Table 6
represent the matrix correlation between the three constructs were tested individually.
According to (Baron & Kenny, 1986), to test mediation there are three important steps need
to follow: Firstly, the independent variable (CKE and FIKE) must affect the mediator (KCP);
secondly, the independent variable must significantly affect the dependent variable; and
thirdly, the mediator must significantly affect the dependent variable. If these conditions are
met, the effect of the dependent variable will reduce when the mediator variable is included in
the model.
Thus, the first step was to test the mediation effect of two independent variables: CKE and
FIKE on each process of knowledge creation during product design. Separate coefficients for
each step were tested. As revealed in Table 6, the first column highlight the correlation matrix
between CKE and KCP, which were significant at all knowledge creation mode (except in the
Internal mode). On the other hand correlation matrix between FIKE and KCP show all
matrix correlations of knowledge creation mode were significant except in the Filter mode.
Hence, CKE for Internal mode and FIKE for filter mode are not qualified for further
mediation effect. Second, the examination continued with testing the effect of the
independent variable (CKE and FIKE) and dependent variable of PSP without the effect of
KCP. In the second column of Table 6, shows the effect of CKE and PSP; and FIKE and
PSP, which both were significant at p< 0.01. Because the second step met the requirements,
the following step was implemented.
The third step was to regress the dependent variable of PSP on both independent variable
(CKE and FIKE) and on the mediator KCP (except in the Internal mode for CKE and the
filter mode for FIKE). In the second column of Table 6, shows the intervening variable of
KCP affects the dependent variable in regressing both the independent variable (CKE and
FIKE) and the mediator (KCP) on the dependent variable (PSP). In the third column of Beta
difference, the effect of CKE and FIKE on PSP were higher when excluded the intervening
KCP variables. This condition met the third rule of examining mediation effect as highlighted
by Baron & Kenny (1986).
The fourth step, was to examine whether some form of mediation exist by checking the
significant effect of intervening variable to dependent variable after the independent variable
were controlled. Table 6 shows the effect of KCP to PSP are remained significant after CKE
and FIKE were controlled. Thus, the finding supports of KCP has a partial mediating effect,

POSTGRADUATE CONFERENCE ON ECONOMICS, PUBLIC ADMINISTRATION AND
BUSINESS (PCEPAB)-5TH SEPTEMBER, 2015
PROMOTING GOWTH, EXCELENT AND SUSTAINABILITY - 83
meaning that the three constructs CKE/FIKE, and KCP are significant predictors of PSP. The
finding demonstrates the relationship between CKE/FIKE and PSP, mediated by KCP.
However, Internal mode of knowledge creation processes does not mediate the effect between
CKE and PSP. Similarly, Filter of the KCP is not a mediator between FIKE and PSP.
Table 6
Evaluation of the mediating effects of KCP between CKE and PSP
Model 1
KCP (KCP)
Model 2
PSP without KCP
S F E C 1 PSP
CKE 0.212*** 0.208*** 0.323*** 0.182** 0.148 0.439***
FIKE 0.421*** 0.174 0.216** 0.187* 0.324*** 0.371***
Model 3
PSP with KCP
Beta difference (Model 2 and Model 3)
S F E C I S F E C I
CKE 0.383*** 0.384**
*
0.319*** 0.383*** Nil
-0.056 -0.055 -0.12 -0.056
Nil
S/F/E/C/I 0.298*** 0.282**
*
0.357*** 0.312***
FIKE 0.265*** Nil 0.286*** 0.311** 0.281*** -0.107 Nil -0.084 -0.063 -0.064
S/F/E/C/I 0.260*** Nil 0.402*** 0.324*** 0.278***
Note: S: Social, F: Filter, E:External. C:Combine, I:Internal
V. DISCUSSIONS AND SUMMARY
The test results show that CKE is positively and significantly related with KCP during PSS
design except with Internalization modes. Although the relationship between the two
constructs is positive, the relationship is not significant. Whereas FIKE is positively and
significantly related with KCP during PSS design. Both CKE and FIKE are positively and
significantly related to PSP. This means CKE and FIKE are contributors for product and
service performance.
Finally, PSP is influenced by how well new knowledge is created using SfECI modes during
PSS design. Only three modes of KCP (Filtration, Externalization and Combination) proved
to be predictors of PSP. Socialization and Internalization modes show a positive relationship
towards KCP but not significant. It is because, the two important modes of KCP are
Externalization and Combination, which are both contributing factors to new knowledge
creation, whereas Socialization is treated as capturing input process thus it has less impact
towards PSP. Similarly, Internalization involves with internalizing and distributing output of
KCP and becomes an input for future use. However, it seems that Filtration process is equally
important as externalization and combination modes that have significant positive
relationships towards PSP. The filtration process could enhance the quality of knowledge
created and improve the product functionality and service quality.
The mediating effect demonstrates the relationship between CKE, FIKE, and PSP is
mediated by KCP. KCP has a partial mediating effect, meaning that the three constructs
CKE, FIKE, and KCP are significantly predicting PSP. However, an Internalization of
knowledge creation mode does not mediate the effect between CKE and PSP. Similarly,
Filtration mode of the KCP failed to mediate the relationship between FIKE and PSP.
The study has implication on theoretical and practical. First, in terms of theoretical the paper
offers novel views of how the KCP using SfECI approach during an integrated product-
service design to mediate the effect between the PSS performance and CKE and FIKE.
Second, additional process during knowledge creation, Filtration is added to the original SECI

POSTGRADUATE CONFERENCE ON ECONOMICS, PUBLIC ADMINISTRATION AND
BUSINESS (PCEPAB)-5TH SEPTEMBER, 2015
PROMOTING GOWTH, EXCELENT AND SUSTAINABILITY - 84
process to ensure the information gathered during socialization is filtered according to the
firm's objective and requirement. Third, the research also demonstrates the importance of
new search especially customer knowledge from the user-pays and retirement stage during the
PSS product design, while at the same time maintain the exploitation of existing capabilities
to enhance new concept creation that has the ability to embed the service and end-of-life
options in the product design.
VI. REFERENCES Aarikka-Stenroos, L., & Jaakkola, E. (2012). Value co-creation in knowledge intensive business
services: A dyadic perspective on the joint problem solving process. Industrial Marketing
Management, 41(1), 15–26. Abebe, M. a., & Angriawan, A. (2014). Organizational and competitive influences of exploration and
exploitation activities in small firms. Journal of Business Research, 67(3), 339–345. Ahmed-Kristensen, S., & Vianello, G. (2014). A model for reusing service knowledge based on an
empirical case. Research in Engineering Design, 26(1), 57–76. Akasaka, F., Nemoto, Y., Kimita, K., & Shimomura, Y. (2012). Development of a knowledge-based
design support system for Product-Service Systems. Computers in Industry, 63(4), 309–318.
Alam, I. (2013). Customer interaction in service innovation: evidence from India. International Journal of Emerging Markets, 8(1), 41–64.
Alonso-Rasgado, T., Thompson, G., & Elfström, B.-O. (2004). The design of functional (total care) products. Journal of Engineering Design, 15(6), 515–540.
Antioco, M., Moenaert, R. K., Feinberg, R. a., & Wetzels, M. G. M. (2008). Integrating service and design: the influences of organizational and communication factors on relative product and service characteristics. Journal of the Academy of Marketing Science, 36(4), 501–521.
Argote, L., & Ingram, P. (2000). Knowledge Transfer: A Basis for Competitive Advantage in Firms. Organizational Behavior and Human Decision Processes, 82(1), 150–169.
Atuahene-Gima, K. (2005). Resolving the capability—rigidity paradox in new product innovation. Journal of Marketing, 69(4), 61–83.
Aurich, J. C., Fuchs, C., & Wagenknecht, C. (2006). Life cycle oriented design of technical Product-Service Systems. Journal of Cleaner Production, 14(17), 1480–1494.
Aurich, J. C., Wolf, N., Siener, M., & Schweitzer, E. (2009). Configuration of product-service systems. Journal of Manufacturing Technology Management, 20(5), 591–605.
Ayuso, S., Rodríguez, M. Á., García-Castro, R., & Ariño, M. Á. (2011). Does stakeholder engagement promote sustainable innovation orientation? Industrial Management & Data Systems, 111(9), 1399–1417.
Baines, T. S., Lightfoot, H. W., Evans, S., Neely, a, Greenough, R., Peppard, J., … Wilson, H. (2007). State-of-the-art in product-service systems. Proceedings of the Institution of Mechanical Engineers, Part B: Journal of Engineering Manufacture, 221(10), 1543–1552.
Baron, R. M., & Kenny, D. a. (1986). The moderator-mediator variable distinction in social
psychological research: conceptual, strategic, and statistical considerations. Journal of Personality and Social Psychology, 51(6), 1173–82. Retrieved from http://www.ncbi.nlm.nih.gov/pubmed/3806354
Barquet, A. P. B., de Oliveira, M. G., Amigo, C. R., Cunha, V. P., & Rozenfeld, H. (2013). Employing the business model concept to support the adoption of product–service systems (PSS). Industrial Marketing Management, 42(5), 693–704.
Baxter, D., Roy, R., Doultsinou, A., Gao, J., & Kalta, M. (2009). A knowledge management framework to support product-service systems design. International Journal of Computer
Integrated Manufacturing, 22(12), 1073–1088. Bocanet, A., & Ponsiglione, C. (2012). Balancing exploration and exploitation in complex
environments. VINE: The Journal of Information and Knowledge Management Systems, 42(1), 15–35.

POSTGRADUATE CONFERENCE ON ECONOMICS, PUBLIC ADMINISTRATION AND
BUSINESS (PCEPAB)-5TH SEPTEMBER, 2015
PROMOTING GOWTH, EXCELENT AND SUSTAINABILITY - 85
Bray, D. A., & Prietula, M. J. (2007). Extending March ’ s Exploration and Exploitation : Managing Knowledge in Turbulent Environments. In Twenty Eight International Conference on Information Systems, Montreal 2007 (pp. 1–17). Montreal.
Brown, S. L., & Eisenhardt, K. M. (1995). Product Development: Past Research, Present Findings, and Future Directions. The Academy of Management Review, 20(2), 343–378.
C. Durugbo, A. Tiwari, J. R. A. (2010). Managing Information Flows for Product-Service Systems
Delivery, 2010. Chatti, M. A. (2012). Knowledge management: a personal knowledge network perspective. Journal of
Knowledge Management, 16(5), 829–844. Chen, Y.-J., Chen, Y.-M., & Wu, M.-S. (2009). Development of a Distributed Product Knowledge
Service System. 2009 International Conference on Complex, Intelligent and Software Intensive Systems, 136–143.
Chong, C. W., Chong, S. C., & Gan, G. C. (2011). Inter-organizational knowledge transfer needs among small and medium enterprises. Library Review, 60(1), 37–52.
Claycomb, C., Dröge, C., & Germain, R. (2005). Applied customer knowledge in a manufacturing environment: Flexibility for industrial firms. Industrial Marketing Management, 34(6), 629–640.
Cloete, M., & Snyman, R. (2003). The enterprise portal – is it knowledge management? Aslib Proceedings, 55(4), 234–242.
Cristea, S., & Ă, A. C. Ă. P. A. Ţ. Î. N. (2009). Perspectives on knowledge management models. The Annals of “Dunarea de Jos” University of Galati. Economics and Applied Informatics. , 2, 355–366.
Denford, J. S. (2013). Building knowledge : developing a knowledge-based dynamic capabilities typology. Journal of Knowledge Management, 17(2), 175–194.
Durugbo, C., & Riedel, J. C. K. H. (2013). Readiness assessment of collaborative networked organisations for integrated product and service delivery. International Journal of Production Research, 51(2), 598–613.
Edvardsson, B., Kristensson, P., Magnusson, P., & Sundström, E. (2012). Customer integration within service development—A review of methods and an analysis of insitu and exsitu contributions. Technovation, 32(7-8), 419–429.
Exner, K., Lindow, K., Buchholz, C., & Stark, R. (2014). Validation of Product-Service Systems – A Prototyping Approach. Procedia CIRP, 16, 68–73.
Fornell, C., & Larcker., D. F. (1981). Structural equation models with unobservable variables and measurement error: Algebra and statistics. Journal of Marketing Research, 382–388.
Garcia, R., & Calantone, R. (2002). A critical look at technological innovation typology and innovativeness terminology : a literature review, 19.
Geng, X., Chu, X., & Zhang, Z. (2011). An association rule mining and maintaining approach in
dynamic database for aiding product–service system conceptual design. The International Journal of Advanced Manufacturing Technology, 62(1-4), 1–13.
Goedkoop, M. J., Halen, C. J. G. van, Riele, H. R. M. te, & Rommens, P. J. M. (1999). Product Service systems , Ecological and Economic Basics.
Goffin, K., & New, C. (2001). Customer support and new product development An exploratory study. Journal of Operations & Production Management, 21(3), 275–301.
Gourlay, S., & Hill, K. (2003). The SECI model of knowledge creation: some empirical shortcomings,
377–385. Hadaya, P., & Marchildon, P. (2012). Understanding product lifecycle management and supporting
systems. Industrial Management & Data Systems, 112(4), 559–583. Hair. Joseph.F. (2010). Multivariate data analysis. Hanka, R., & Fuka, K. (2005). The Electronic Library Emerald Article : Information overload and “
just-in-time ” knowledge Information overload knowledge. The Electronic Library,, 18(2000), 279–285.
Hara, T., Shimada, S., & Arai, T. (2013). Design-of-use and design-in-use by customers in
differentiating value creation. CIRP Annals - Manufacturing Technology, 62(1), 103–106.

POSTGRADUATE CONFERENCE ON ECONOMICS, PUBLIC ADMINISTRATION AND
BUSINESS (PCEPAB)-5TH SEPTEMBER, 2015
PROMOTING GOWTH, EXCELENT AND SUSTAINABILITY - 86
He, Y., Keung Lai, K., Sun, H., & Chen, Y. (2014). The impact of supplier integration on customer integration and new product performance: The mediating role of manufacturing flexibility under trust theory. International Journal of Production Economics, 147, 260–270.
Henseler, J., & Chin, W. W. (2010). A Comparison of Approaches for the Analysis of Interaction Effects Between Latent Variables Using Partial Least Squares Path Modeling. Structural Equation Modeling: A Multidisciplinary Journal, 17(1), 82–109.
Hippel, V. (1986). Lead users: a source of novel product concepts. Management Science, 32(7), 791–805.
Homburg, C., & Kuehnl, C. (2014). Is the more always better? A comparative study of internal and external integration practices in new product and new service development. Journal of Business Research, 67(7), 1360–1367.
Hosseini, S. M. (2011). The application of SECI model as a framework of knowledge creation in virtual learning. Asia Pacific Educ. Rev, 12, 263–270.
Husted, B. W., & Allen, D. B. (2009). Strategic Corporate Social Responsibility and Value Creation.
Management International Review, 49(6), 781–799. Isaksson, O., Larsson, T. C., & Rönnbäck, A. Ö. (2009). Development of product-service systems:
challenges and opportunities for the manufacturing firm. Journal of Engineering Design, 20(4), 329–348.
Ismail, W. K. W., & Monsef, S. (2012). New Product Development Through Open Innovation : Role of organization structure and contextual factors. In International Conference on Innovation, Management and Technology Research (ICIMTR2012) (pp. 21–22). Malacca, Malaysia.
J, C. (1988). Statistical Power Analysis for the Behavioral Sciences, 2. Jamal El-Den. (2006). Knowledge Transfer in Virtual Groups. In Proceedings of the 3rd International
Conference on Intellectual Capital and Knowledge Management (pp. 157–166). Jing, N., & Yang, C. (2010). The interrelationship among learning environment, knowledge process
and new product development performance. 2010 IEEE International Conference on Industrial Engineering and Engineering Management, 144–148.
Kaiser, Henry F. (1974). An index of factorial simplicity. Psychometrika, 39(1), 31–36.
Kang, S., & Snell, S. A. (2007). Relational arhetypes, organizational learning, and value creation:
Extending the human resource architecture. Academy of Management Review, 32(1), 236–256. Khor, K. S., & Udin, Z. M. (2013). Reverse logistics in Malaysia: Investigating the effect of green
product design and resource commitment. Resources, Conservation and Recycling, 81, 71–80. doi:10.1016/j.resconrec.2013.08.005
Kimita, K., & Shimomura, Y. (2014). Development of the Design Guideline for Product-service
Systems. Procedia CIRP, 16, 344–349. doi:10.1016/j.procir.2014.02.021 Kimita, K., Shimomura, Y., & Arai, T. (2009). Evaluation of customer satisfaction for PSS design.
Journal of Manufacturing Technology Management, 20(5), 654–673. doi:10.1108/17410380910961046
Kindström, D., & Kowalkowski, C. (2009). Development of industrial service offerings : a process framework. Journal of Service Management, 2(20), 156–172.
Kohlbacher, F. (2008). Knowledge-based New Product Development: fostering innovation through
knowledge co-creation. International Journal of Technology Intelligence and Planning, 4(3), 326.
L., K. J., & Gudergan, S. P. (2006). Knowledge integration in organizations: an empirical assessment. Journal of Knowledge Management10.4, 10(4), 43–58.
Leary, D. E. O. (2001). How Knowledge Reuse Informs Effective System Design and Implementation. IEEE Intelligent System, (January/February), 44–49.
Li, Y.-H., Huang, J.-W., & Tsai, M.-T. (2009). Entrepreneurial orientation and firm performance: The role of knowledge creation process. Industrial Marketing Management, 38(4), 440–449.
Lindström, J., Dagman, A., & Karlberg, M. (2014). Functional Products Lifecycle: Governed by sustainable Win-Win Situations. Procedia CIRP, 22, 163–168.

POSTGRADUATE CONFERENCE ON ECONOMICS, PUBLIC ADMINISTRATION AND
BUSINESS (PCEPAB)-5TH SEPTEMBER, 2015
PROMOTING GOWTH, EXCELENT AND SUSTAINABILITY - 87
MacDonald, J., Bath, P., & Booth, A. (2011). Information overload and information poverty: challenges for healthcare services managers? Journal of Documentation, 67(2), 238–263.
Markovitch, S., & Paul, D. (1993). Information Filtering : Selection Mechanisms in Learning Systems. Marques, P., Cunha, P. F., Valente, F., & Leitão, A. (2013). A Methodology for Product-service
Systems Development. Procedia CIRP, 7, 371–376. Maxwell, D., & van der Vorst, R. (2003). Developing sustainable products and services. Journal of
Cleaner Production, 11(8), 883–895. Menguc, B., Auh, S., & Uslu, A. (2013). Customer knowledge creation capability and performance in
sales teams. J.of the Acad. Mark. Sci., 41, 19–39. Mont, O. K. (2002). Clarifying the concept of product – service system. Journal of Cleaner
Production, 10, 237–245. Morelli, N. (2003). Product-service systems, a perspective shift for designers: A case study: the design
of a telecentre. Design Studies, 24, 73–99. Morschett, D. (2006). Firm-specific influences on the internalization of after-sales service activities in
foreign markets. Journal of Services Marketing, 20(5), 309–323. Nguyen, H. N., Schnürmacher, C., & Stark, R. (2014). Research on How to Introduce the PSS
Engineering into Industry. Procedia CIRP, 16, 74–79. Nonaka, I., Byosiere, P., Borucki, C. C., & Konno, N. (1994). Organizational Knowledge Creation
Theory : A First Comprehensive Test. International Business Review, 3(4), 337–351. Nonaka, I., & Konno, N. (1998). The Concept of “Ba”: Building a Foundation for Knowledge
Creation. California Management Review, 40(30), 40–15.
Nonaka, I., & Toyama, R. (2003). The knowledge-creating theory revisited : knowledge creation as a synthesizing process. Knowledge Management Research & Practice, 1, 2–10.
Nonaka, I., Toyama, R., & Konno, N. (2000). SECI , Ba and Leadership : a Uni ® ed Model of Dynamic Knowledge Creation. Long Range Planning, 33, 5–34.
Nonaka, I., & von Krogh, G. (2009). Perspective—Tacit Knowledge and Knowledge Conversion: Controversy and Advancement in Organizational Knowledge Creation Theory. Organization Science, 20(3), 635–652.
OECD. (2012). The future of eco-innovation: The Role of Business Models in Green Transformation
(pp. 1–27). Copenhagen Denmark. Ott, J. L. (2000). Defining a Value Proposition for Information Security. Information Systems Security,
9(2), 1–3. Park, Y., Geum, Y., & Lee, H. (2012). Toward integration of products and services: Taxonomy and
typology. Journal of Engineering and Technology Management, 29(4), 528–545. Paswan, A. K., D’Souza, D., & Rajamma, R. K. (2014). Value co-creation through knowledge
exchange in franchising. Journal of Services Marketing, 28(2), 116–125.
Petrovic, O., & Kittl, C. (2003). Capturing the value proposition of a product or service Position paper for the international workshop on business models Lausanne, Switzerland, 4.10.2003.
Pezzotta, G., Cavalieri, S., & Gaiardelli, P. (2012). A spiral process model to engineer a product service system: An explorative analysis through case studies. CIRP Journal of Manufacturing Science and Technology, 5(3), 214–225.
Prahalad, C. K., & Ramaswamy, V. (2004). Co-creation experiences: The next practice in value creation. Journal of Interactive Marketing, 18(3), 5–14.
Prieto, I. M., Revilla, E., & Rodríguez-Prado, B. (2009). Managing the knowledge paradox in product development. Journal of Knowledge Management, 13(3), 157–170.
Reim, W., Parida, V., & Örtqvist, D. (2014). Product-Service Systems (PSS) Business Models and Tactics – A Systematic Literature Review. Journal of Cleaner Production.
Richtnér, A., & Åhlström, P. (2010). Top management control and knowledge creation in new product development. International Journal of Operations & Production Management, 30(10), 1006–1031.
Roy, R., Mehnen, J., Addepalli, S., Redding, L., Tinsley, L., & Okoh, C. (2014). Service Knowledge
Capture and Reuse. Procedia CIRP, 16, 9–14.

POSTGRADUATE CONFERENCE ON ECONOMICS, PUBLIC ADMINISTRATION AND
BUSINESS (PCEPAB)-5TH SEPTEMBER, 2015
PROMOTING GOWTH, EXCELENT AND SUSTAINABILITY - 88
Sandhawalia, B. S., & Dalcher, D. (2011). Developing knowledge management capabilities: a structured approach. Journal of Knowledge Management, 15(2), 313–328.
Schaarschmidt, M., & Kilian, T. (2014). Impediments to customer integration into the innovation process: A case study in the telecommunications industry. European Management Journal, 32(2), 350–361.
Schenkl, S. a., Schmidt, D. M., Schockenhoff, D., & Maurer, M. (2014). Knowledge Evaluation for
PSS Providers. Procedia CIRP, 16, 86–91. Schulte, W. D. (2008). Exploring the role of Ba in family business context. VINE: The Journal of
Information and Knowledge Management Systems, 38(1), 104–117. Schulze, A., & Hoegl, M. (2005). Knowledge creation in a new product development projects. Journal
of Management, (April), 1–45. Shimomura, Y., Nemoto, Y., & Kimita, K. (2014). State-of-Art Product-Service Systems in Japan –
The Latest Japanese Product-service Systems Developments. Procedia CIRP, 16, 15–20. Song, J. H., Uhm, D., & Yoon, S. W. (2011). Organizational knowledge creation practice. Leadership
& Organization Development Journal, 32(3), 243–259. Song, W., Ming, X., & Xu, Z. (2013). Risk evaluation of customer integration in new product
development under uncertainty. Computers & Industrial Engineering, 65(3), 402–412. Strother, J. B., & Ulij, J. M. (2012). The challenge of information overload. Professional
Communication Conference (IPCC), IEEE International. IEEE,. Su, C.-T., Chen, Y.-H., & Sha, D. Y. (2006). Linking innovative product development with customer
knowledge: a data-mining approach. Technovation, 26(7), 784–795.
Sun, P.-C. (2007). The correlations among domain knowledge specificity, joint new product development and relationship performance. International Journal of Commerce and Management, 17(1/2), 44–55
Swink, M., Narasimhan, R., & Wang, C. (2007). Managing beyond the factory walls: Effects of four types of strategic integration on manufacturing plant performance. Journal of Operations Management, 25(1), 148–164.
Tenenhaus, M., Vinzi, V. E., Chatelin, Y. M., & Lauro. (2005). PLS path modeling. Computational Statistics & Data Analysis,, 48(1), 159–205.
Tseng, S.-M. (2012). Correlations between external knowledge and the knowledge chain as impacting service quality. Journal of Retailing and Consumer Services, 19(4), 429–437.
Ueda, K., Takenaka, T., Váncza, J., & Monostori, L. (2009). Value creation and decision-making in sustainable society. CIRP Annals - Manufacturing Technology, 58(2), 681–700.
Varra, L., Buzzigoli, C., & Loro, R. (2012). Innovation in Destination Management: social dialogue, Knowledge Management processes and Servant leadership in the Tourism Destination Observatories. Procedia - Social and Behavioral Sciences, 41, 375–385.
Velamuri, V. K., Neyer, A.-K., & Möslein, K. M. (2011). Hybrid value creation: a systematic review of an evolving research area. Journal Für Betriebswirtschaft, 61(1), 3–35.
W, C. W., & Newsted, P. R. (1999). Structural equation modeling analysis with small samples using partial least squares.
Wan Zaaimuddin, W. A., Goh, G. G. G., & Eze, U. C. (2009). Knowledge management process and new product development performance in a Malaysian research and development organisation. 2009 IEEE International Conference on Industrial Engineering and Engineering Management,
997–1001. Weng, R.-H., & Huang, C.-Y. (2010). The impact of customer knowledge capability and relational
capability on new product development performance in Taiwan’s hospitals. In 2010 7th International Conference on Service Systems and Service Management (pp. 1–6). Ieee.
Winegard, B. L. (2010). Knowledge creation in new product development teams: A contingency theory of the effectiveness of knowledge integration mechanism. York University Toronto, Ontario.
Wong, C. W. Y., Wong, C. Y., & Boon-itt, S. (2013). The combined effects of internal and external supply chain integration on product innovation. International Journal of Production Economics,
146(2), 566–574.

POSTGRADUATE CONFERENCE ON ECONOMICS, PUBLIC ADMINISTRATION AND
BUSINESS (PCEPAB)-5TH SEPTEMBER, 2015
PROMOTING GOWTH, EXCELENT AND SUSTAINABILITY - 89
Wong, K. K. (2013). Partial Least Squares Structural Equation Modeling ( PLS-SEM ) Techniques Using SmartPLS. Marketing Bulletin.
Wu, J., Guo, B., & Shi, Y. (2013). Customer knowledge management and IT-enabled business model innovation: A conceptual framework and a case study from China. European Management Journal, 31(4), 359–372.
Yeung, A. H. W., Lo, V. H. Y., Yeung, A. C. L., & Cheng, T. C. E. (2008). Specific customer
knowledge and operational performance in apparel manufacturing. International Journal of Production Economics, 114(2), 520–533.
Ying, Y., & Wu, J. (2012). Customer knowledge management and business model innovation : A
case study on applications of mobile information system in rural China. In Service Systems and
Service Management (ICSSSM), 2012 9th International Conference on. IEEE. Yingnan, D., Yuduo, L., & Xiongfei, Q. (2012). Spatial Knowledge Spillovers: “New 3-Zone
Interaction Engineering.” Systems Engineering Procedia, 3, 307–311. Yli-Renko, H., Autio, E., & Sapienza, H. J. (2001). Social capital, knowledge acquisition, and
knowledge exploitation in young technology-based firms. Strategic Management Journal, 22(6-7), 587–613.
Yoon, B., Kim, S., & Rhee, J. (2012). An evaluation method for designing a new product-service system. Expert Systems with Applications, 39(3), 3100–3108.
Zhang, D., Hu, D., Xu, Y., & Zhang, H. (2012). A framework for design knowledge management and reuse for Product-Service Systems in construction machinery industry. Computers in Industry, 63(4), 328–337.
Zhang, D., & Wang, D. (2010). A Research on Enterprise Value Creation Mechanism. In 2010 International Conference on Computer Application and System Modeling (ICCASM 2010) (Vol. 1, pp. 531–534).

POSTGRADUATE CONFERENCE ON ECONOMICS, PUBLIC ADMINISTRATION AND
BUSINESS (PCEPAB)-5TH SEPTEMBER, 2015
PROMOTING GOWTH, EXCELENT AND SUSTAINABILITY - 90
Risk Management Committee’s Characteristics, its Prestige and
Efficiency Performance
Qian Long Kweh
Universiti Tenaga Nasional
Sultan Haji Ahmad Shah Campus, 26700 Muadzam Shah, Pahang
Malaysia
Wen-Min Lu
National Defense University
No. 70, Sec. 2, Zhongyang North Rd., Beitou, Taipei 112
Taiwan
Noor Azlinna Azizan
Universiti Malaysia Pahang
Lebuhraya Tun Razak, 26600 Gambang Kuantan, Pahang
Malaysia
Abstract
We examine the effects of risk management committee’s characteristics and prestige on efficiency performance,
and the moderating effect of risk management committee’s prestige on the association between risk management
committee’s characteristics and the efficiency performance of Malaysian insurance companies across 2008-
2013. We apply the dynamic network slacks-based measure (DNSBM) model to estimate efficiency performance
and the truncated regression with a bootstrapping procedure shows that risk management committee’s
characteristics and prestige have significantly positive impacts on efficiency performance. However, risk
management committee’s prestige could minify the positive effect of risk management committee’s
characteristics on efficiency performance.
Key words: risk management committee; director’s prestige; efficiency; dynamic network data envelopment
analysis; truncated regression

POSTGRADUATE CONFERENCE ON ECONOMICS, PUBLIC ADMINISTRATION AND
BUSINESS (PCEPAB)-5TH SEPTEMBER, 2015
PROMOTING GOWTH, EXCELENT AND SUSTAINABILITY - 91
1. Introduction
In Asia, it has been argued that Malaysian financial system was not affected by the global
financial crisis in the late 2000s. However, Malaysia indeed felt the spill-over effect as
evidenced by the large drop in exports alongside domestic demand (Asian Development
Bank, 2009). The relatively small effect of the global financial crisis could be because most
Asian countries including Malaysia have introduced much better financial regulatory regimes
since the Asian financial crisis of the late 1990s. That is, financial institutions in the Asian
countries have improved their corporate governance (CG) and internal risk management.
Learning from the lesson, the bad impacts of the financial crises on corporate performance
would be less eminent if risk management was properly regulated. In other words, there is a
serious lack of risk management in financial institutions.
It is surprising to see the relatively few research conducted on corporate risk management in
Malaysia as compared to other emerging economies seeing the growing importance of risk
management around the world. Since risk management has cost control implications, an
analysis of the impact of risk management on corporate performance is necessary to
substantiate findings of previous studies, which generally argues that the implementation of
risk management will improve corporate performance. That is, prior studies suggest that risk
management has a positive relationship with corporate performance. For example, Aebi,
Sabato, and Schmid (2012) find that the presence of a chief risk officer (CRO) in a bank’s
executive board and the situation in which the CRO reports directly to the board of directors
are positively related to corporate performance. Furthermore, risk management not only
contribute to corporate performance, but also positively affect the performance of new
product development as documented by Mu, Peng, and MacLachlan (2009).
Data envelopment analysis (DEA), a non-parametric method that utilizes mathematical
programming to handle multiple variables and relationships simultaneously (Cooper, Seiford,
& Tone, 2006), provides us with an opportunity to view corporate performance from resource
dependence view. In the DEA literature, a growing body of studies also documents the
impact of risk management on efficiency. Using traditional DEA, Kao, Lin, Hsu, and Chen
(2011) prove that risk factors contribute to the performance of financial holding companies
(FHCs), especially in managing credit risk after the 2008 financial crisis. Hadad, Hall,
Kenjegalieva, Santoso, and Simper (2011) indicate that enhancing internal risk management
could improve the productivity of the Indonesian banks, which is measured through the
Malmquist productivity indices of DEA. In a more related study, Cummins, Dionne, Gagné,
and Nouira (2009) show that risk management significantly increases the efficiency of
companies in the U.S. property-liability insurance industry.
Taken together, anecdotal evidence suggests that risk management increases corporate
performance, whereby if a financial institution has a well-established risk management
system, it would have lower costs and ultimately higher efficiency performance. In this
regards, risk management committee plays an important role in ensuring the risk management
system in a financial institution. Therefore, we expect that if a financial institution has an
efficient risk management committee, it would have lower costs and ultimately higher
efficiency performance. To comprehensively measure efficiency performance, we apply a
dynamic network DEA model that takes intermediate measures or linking activities into
consideration over long-term periods (Kaoru Tone & Tsutsui, 2014).

POSTGRADUATE CONFERENCE ON ECONOMICS, PUBLIC ADMINISTRATION AND
BUSINESS (PCEPAB)-5TH SEPTEMBER, 2015
PROMOTING GOWTH, EXCELENT AND SUSTAINABILITY - 92
While the resource-dependence perspective (Pfeffer & Salancik, 1978) is able to describe the
benefits of having an efficient risk management committee and efficiency performance
measurement, several studies (Certo, 2003; Kirchmaier & Kollo, 2006) have revealed that
board prestige has effects on corporate performance based on sociological research on
prestige (for example, MacKinnon & Langford, 1994; Wegener, 1992). Note that prestige is a
commonly-used notion in social network theory and yet it is a construct difficult to define
precisely. The empirical research to date provides mixed evidence in regards of the impacts
of board prestige on corporate performance. The precise cause was open to debate.
Furthermore, a prestigious board structure does not necessarily implicate a prestigious risk
management committee. Consequently, it is an empirical question whether risk management
committee’s prestige has any impacts on corporate performance and what its moderating
effect on the association between risk management committee’s characteristics and corporate
performance would be.
This study is significant in that risk management ought to be integrated into the business, as a
matter of highest priority, before another economic catastrophe happens. Moreover, this study
provides a good explanation as to why risk management committee’s prestige is a key issue
in risk management committee structure and why having prestigious risk management
committee has many benefits to corporate performance.
The continuing divisions of this study proceed as follows. Section 2 develops the main
hypotheses. Section 3 discusses research design. While Section 4 presents the findings,
Section 5 concludes this study.
2. Hypotheses Development Concerned with reducing the cost or the cost of risk, risk management, which is generally
understood to mean methods used to reduce risk and control loss, comes into place. The
leading study, Froot, Scharfstein, and Stein (1993), has provided theoretical insights on
corporate risk management policies, which have then served as guidance for much of the
extant empirical studies relating to risk management. Stulz (1996) presents a theory of
corporate risk management and argues that the main goal of risk management is to shield a
company from the possibility of costly situations, whereby such situations would ultimately
cause financial distress. In other words, risk management is designed to reduce the expected
costs of facing financial problem while ensuring exploitation of comparative advantage.
With respect to the relationship between risk management and corporate performance, Mu et
al. (2009) find that risk management not only contributes to corporate performance, it could
also positively affect the performance of new product development. In a recent study,
Matthews (2013) argues that Chinese banks have in recent years developed modern risk
management methods. Using a network DEA framework, the author finds that there is no
significant direct relationship between the two self-constructed risk metrics and objective
measure of performance such as return on assets. Over the 18-month period from July 2007
to December 2008, Aebi et al. (2012) find that the presence of a chief risk officer (CRO) in a
bank’s executive board and the situation in which the CRO reports directly to the board of
directors are related to a better stock returns and return on equity. Using 14 Taiwanese FHCs
for the period 2001-2009, Kao et al. (2011) prove that risk management contributes to the
operating efficiency of FHCs, especially in managing credit risk after the 2008 financial

POSTGRADUATE CONFERENCE ON ECONOMICS, PUBLIC ADMINISTRATION AND
BUSINESS (PCEPAB)-5TH SEPTEMBER, 2015
PROMOTING GOWTH, EXCELENT AND SUSTAINABILITY - 93
crisis. Using Indonesian banks over the period Q1 2003 to Q2 2007, Hadad et al. (2011)
indicate that enhancing internal risk management could improve the productivity of the
Indonesian banks. In a more related study, Cummins et al. (2009) show that risk management
significantly increases the efficiency of the U.S. property-liability insurance industry for the
period 1995 through 2003. Overall, these results suggest that risk management contributes to
firm performance.
In light of the empirical evidence described in the preceding paragraph, which mostly show
that risk management is positively associated with corporate performance, we predict that
risk management increases efficiency performance. Therefore, we present a directional
hypothesis in alternate form for the three attributes of risk management, in line with Ng,
Chong, and Ismail (2013):
Hypothesis 1: Other things being equal, the number of directors on the risk management
committee including executive and non-executive directors, the number of risk management
committee meetings, and the proportion of independent directors in the risk management
committee are significantly and positively associated with efficiency performance.
A typical characteristic of an individual is prestige, which is defined by D'Aveni (1990) as
“the property of having status”. The term prestige embodies a multitude of concepts like
esteemed educational qualification, prior experience serving military, government, or
business, and social connections (see also D'Aveni & Kesner, 1993; Daily & Johnson, 1997).
In the context of risk management committee (or board of directors at a wider perspective),
the term can be generally understood to mean the committee members’ credibility,
trustworthiness, and competency. As D'Aveni (1990) point out, however, prestige might
reflect an illusion of competence on the individual level. Specifically, prior studies
predominantly rely on objective indicators to proxy for prestige, which renders possibility
that the social network theory is associated with good name alone rather than hard attributes
like elite educational affiliations (Kirchmaier & Kollo, 2006).
In a seminal contribution to the importance of directors’ prestige, May (1939) contend that
prestigious directors on British boards are expert in nothing but someone with high-status
name on the prospectus. The existence of prestigious directors in a company might therefore
cause agency problems whereby the shareholders’ goal is not fulfilled, and affect corporate
performance in the long run. Therefore, linking social networks to prestige would be able to
highlight the feature of high-status name, isolating it from ability. To measure prestige,
Kirchmaier and Kollo (2006) have applied titles carried by directors in their name such as
‘Lord’ and ‘Sir’ and yet found that prestige in terms of title does not significantly affect firm
value.
The Malaysian also use many honorifics, whereby heredity royal titles are reserved for royal
families of Malaysia while titles of honour, both federal and state, are regularly granted to
both men and women who have made significant contributions to the society with respect to

POSTGRADUATE CONFERENCE ON ECONOMICS, PUBLIC ADMINISTRATION AND
BUSINESS (PCEPAB)-5TH SEPTEMBER, 2015
PROMOTING GOWTH, EXCELENT AND SUSTAINABILITY - 94
fields such as politics and business. Since the past few decades, the title glut1 in Malaysia has
created a phenomenon of relationship-based connection, which is particularly prevalent in the
relationship between politics and business. Such connection is linked with social networks
(synonymous with “political connections”)2, a unique scenario in the Malaysian corporate
world. To be specific, titles granted to individual in recognition of his or her various services
to the government may act as public signal of the individual’s prestige. In the literature,
scholars have also documented the prevailing phenomenon of social networks or political
connections in Malaysia, implying the existence of relationship-based capitalism (for
example, Bliss & Gul, 2012a, 2012b; Bliss, Gul, & Majid, 2011; Gomez & Jomo, 1997;
Johnson & Mitton, 2003).
In other words, as prestige is in itself a highly-regarded status, risk management committee
directors of a company who carry titles in their name may have more advantages in managing
risks as compared to those who do not have any social connections. From the resource-based
perspective, prestigious directors should be able to draw more resources and benefits from
their social connections. Before employing these theories – the resource-based view theory
and the social networks theory – to examine risk management committee’s prestige, it is
necessary to discuss some relevant studies. So far this chapter has focused on directors’
prestige or social connections through titles of honour. To the best of our knowledge, using
titles and honorifics granted by government to measure prestige provides us a distinctive
opportunity to examine the relationship-based scenario in Malaysia, which is principally
unobservable in the insurance industry.
Serious discussions on this topic document that social networks at the firm level as a whole
allow companies to benefit from various aspects: capital controls (Johnson & Mitton, 2003;
Mitchell & Joseph, 2010), financial bailout (Faccio, Masulis, & McConnell, 2006), retarding
financial development (Rajan & Zingales, 2003), tax benefits (Adhikari, Derashid, & Zhang,
2006; Wu, Wu, Zhou, & Wu, 2012), and preferential access to debt financing (Chan, Dang, &
Yan, 2012; Claessens, Feijen, & Laeven, 2008; Khwaja & Mian, 2005; Yeh, Shu, & Chiu,
2013). However, all the previously mentioned studies do not take into consideration social
connections on account of title’s prestige. Moreover, it is important to bear in mind the
possible bias in the classification of politically connected companies, which is achieved by
referring to the list of companies identified by prior studies for the out-of-date sample period.
In addition, while social networks may provide companies with various benefits, empirical
evidence on Malaysian sample to date strongly suggests that connected companies are more
risky than non-connected companies based on the perspective of performance. Using 424
Malaysian firms, Johnson and Mitton (2003) show that connected companies were hit harder
during the 1997 Asian financial crisis. Their regression analysis shows that connections result
in a greater stock price decline, which is an average of 7.5 percentage points during the crisis
period. Connected firms experienced drops in share prices to a greater extent than non-
connected firms because it is accepted that the social network ability to provide privileges
was reduced by the crisis. Consistent with the market perception, they prove empirically that
the imposition of capital controls in September 1998 affects positively the performance of
connected firms.
1 In Malaysia, the ratio of titled individuals to the country’s population is higher than that of the United
Kingdom and both systems are vastly different. 2 Malay cultural expert Eddin Khoo claimed that titles are widely abused for their advantages and connections.

POSTGRADUATE CONFERENCE ON ECONOMICS, PUBLIC ADMINISTRATION AND
BUSINESS (PCEPAB)-5TH SEPTEMBER, 2015
PROMOTING GOWTH, EXCELENT AND SUSTAINABILITY - 95
The preceding studies imply that many parties consider connected firms as risky, especially
during financial crisis. Specifically, while companies with prestigious directors on board have
some benefits, they do not seem to benefit fully from resources provided by the social
network such as the lower effective tax rate and preferential access to financing. However,
Poon, Yap, and Lee (2013) find that potential agency problems could be minimized through
socially-connected board members. This notion is consistent with the argument by Johnson
and Mitton (2003) and Gul (2006), which states that controlling function of the ruling
political party helps politically connected companies recovered faster after the financial
crisis.
To elaborate on the main idea, political theorists like North (1990) and Olson (1993) explain
why social connections with political parties come into existence. The reason politicians or
government people get connected with companies is to control the companies. By controlling
the companies, those with political power would be able to create personal wealth in private
institutions. Apart from personal wealth, they also pursue goals that are beneficial to the
government’s agenda, in which Chang and Wong (2004) describe it as to pursue the
communal interests and social objectives. Both of the politicians’ acts are to reward their
supporters for their political votes. In return, the socially-connected individuals receive
benefits from various governmental interventions such as profitable contracts for their
attached companies.
While abovementioned theoretical and empirical studies refer to organizational connections
in which political parties or government transfer resources to connected firms, it is reasonable
to apply the same reasoning to explain social networks in terms of prestigious directors on
boards, particularly risk management committee. In particular, we integrate the social-
network notion of prestige through titled directors by Kirchmaier and Kollo (2006) and the
theories of North (1990) and Olson (1993) and contend that titles of honour carried by
directors bring about benefits to companies. In other words, social networks might improve
corporate performance if directors on risk management committee carry titles in their name
or commonly known as socially connected.
In view of the different expectations regarding the effect of social connections on corporate
performance, it is also an empirical issue whether social networks moderate the monitoring
effectiveness of risk management committee in managing corporate risks. Based on the
resource-dependence perspective (Pfeffer & Salancik, 1978) and the social network theory,
we develop the following hypothesis to test the main effect of prestige on corporate
performance.
Hypothesis 2: Other things being equal, the number of titles of honour carried by directors on
risk management committee is significantly and positively associated with efficiency
performance.
However, other things being equal and echoing the theories of North (1990), Olson (1993),
and Chang and Wong (2004), we predict that the positive effect of risk management on
efficiency performance might be moderated by prestige. This competing argument leads to
the following hypothesis, in alternate form:

POSTGRADUATE CONFERENCE ON ECONOMICS, PUBLIC ADMINISTRATION AND
BUSINESS (PCEPAB)-5TH SEPTEMBER, 2015
PROMOTING GOWTH, EXCELENT AND SUSTAINABILITY - 96
Hypothesis 3: Other things being equal, the number of titles of honour carried by directors on
risk management committee significantly and negatively moderates the relationship between
risk management and efficiency performance.
3. Research Design
3.1 Dynamic network operating process for insurance companies
In this study, we employ a dynamic DEA model with network structure (Kaoru Tone &
Tsutsui, 2014) to assess the corporate performance of insurance companies in Malaysia from
an operational view over long-term periods. It is worth noting that insurance companies
should efficiently manage their resources to be profitable and ultimately sustainable,
especially in the aftermath of the global financial crises that affected the worldwide financial
markets. Since insurance companies might have difficulty in controlling carry-overs in an
instant manner due to the highly volatile market, they should thus assess and improve their
corporate performance on a long-term basis, considering intermediate measures at the same
time, all of which would enable them to assess their dynamic performance at a clearer
picture.
Figure 1: The Dynamic Network Operating Processes for Insurance Companies
To further illustrate the discussion, we present a diagram on the dynamic network operating
processes for insurance companies. As shown schematically in Figure 1, the two-stage DEA
analysis is divided into two main components, namely the resource-management efficiency
and the profitability efficiency. The resource-management efficiency is proposed to assess
how efficient an insurance company manage their inputted resources in relation to other
insurers, while the profitability efficiency is designed to evaluate how efficient an insurance
company generate profits relative to other insurers in the dynamic and challenging market.
Table 1 Definitions of the Input, Carry-over, Intermediate, and Output Variables
Variable Definition
Stage 2
Profitability
Efficiency t
Stage 1
Resource-
Management
Efficiency t
Carry-over
Property, plant,
and Equipment t-1
Intermediate
Incurred claims plus
additions to reserves t
Investment assets t
Period t Period t+1
Input
Labor and business
service expenses t
Output
Operating income t
Operating cash flow t
Stage 2
Profitability
Efficiency t+1
Stage 1
Resource-
Management
Efficiency t+1
Input
Labor and business
service expenses t+1
Output
Operating income t+1
Operating cash flow t+1
Carry-over
Property, plant,
and Equipment t
Carry-over
Property, plant,
and Equipment t+1
Intermediate
Incurred claims plus
additions to reserves t+1
Investment assets t+1
Carry-over
Debt capital t-1
Equity capital t-1
Carry-over
Debt capital t
Equity capital t
Carry-over
Debt capital t+1
Equity capital t+1

POSTGRADUATE CONFERENCE ON ECONOMICS, PUBLIC ADMINISTRATION AND
BUSINESS (PCEPAB)-5TH SEPTEMBER, 2015
PROMOTING GOWTH, EXCELENT AND SUSTAINABILITY - 97
Input
Labor and business
service expenses (x1)
The total amount of operating expenses including staff expenses for the year, which is available in the income
statement (Chen, Liu, & Kweh, 2014; Eling & Luhnen, 2010a; Lu, Wang, & Kweh, 2014).
Carry-over
Debt capital (c1) The total amount of liabilities at the beginning of the year, which is available in the balance sheet (Chen et al.,
2014; Cummins, Weiss, Xie, & Zi, 2010; Lu et al., 2014).
Equity capital (c2) The total amount of shareholders’ equities at the beginning of the year, which is available in the balance sheet
(Eling & Luhnen, 2010a; Greene & Segal, 2004; Kaoru Tone & Sahoo, 2005).
Property, plant, and
equipment (c3)
The total amount of property, plant, and equipment at the beginning of the year, which is available in the
balance sheet.
Intermediate
Incurred benefits plus
additions to reserves
(z1)
While incurred benefits are claims paid for the year, additions to reserves are the funds received by insurers
not needed for benefit payments and expenses that are added to policy reserves at the end of the year (Chen et
al., 2014; Eling & Luhnen, 2010a; Lu et al., 2014).
Investment assets (z2) The total amount of investment assets at the end of the year, which is available in the balance sheet (Chen et
al., 2014; Eling & Luhnen, 2010a)
Output
Operating income (y1) The total amount of operating income for the year, which is available in the income statement.
Operating cash flow
(y2)
The total amount of cash flow generated from operations for the year, which is available in the statement of
cash flow.
Note:
1. All variables are denoted in RM million.
2. The value-added approach or called the production approach is used in this study.
In the selection of inputs, intermediates, carry-overs, and outputs, two factors need to be
considered (Bowlin, 1995). The first consideration is the production function nature of the
DEA model used, in which this study applies the dynamic DEA with network structure
through a slacks-based measure (SBM) approach (Kaoru Tone & Tsutsui, 2014). The second
thought should be related to the financial analysis nature of the research, where by this study
focuses on the insurance industry. Therefore, as can be seen in Figure 1 above, insurers
consume labor and business service expenses along with debt capital and equity capital as
inputted carry-overs to produce incurred claims plus additions to reserve and investment
assets.3 These two intermediates, together with property, plant, and equipment as inputted
carry-overs, are next utilized to generate operating income and operating cash flow. In Table
1, we summarize the variables used by citing relevant studies. Table 2 provides the summary
statistics of the inputs, intermediates, and outputs of our sample over the sample period 2008-
2013. Consistent with prior studies (Chen et al., 2014; Lu et al., 2014), we deflate the
variables to 2007 by dividing them by the 2007 Malaysia's Consumer Price Index (CPI) at
105.7.
Table 2 Summary Statistics of the Input, Carry-over, Intermediate, and Output Variables
Mean Std. Dev. Minimum Maximum
3 Eling and Luhnen (2010b) point out that labor, business services and materials, and capital are the three main
resources used by insurance companies.

POSTGRADUATE CONFERENCE ON ECONOMICS, PUBLIC ADMINISTRATION AND
BUSINESS (PCEPAB)-5TH SEPTEMBER, 2015
PROMOTING GOWTH, EXCELENT AND SUSTAINABILITY - 98
Panel A: Year 2008
Operating expenses (x1) 76.76 64.65 8.53 292.05
Total liabilitiest-1 (c1) 2,277.23 7,167.53 126.59 39,757.26
Total shareholders’ equitiest-1 (c2) 351.69 357.01 99.59 1,668.22
Property, plant and equipmentt-1 (c3) 75.22 134.19 1.72 591.38
Incurred benefits plus additions to reserves (z1) 8,602.06 1,144.49 8,012.00 13,481.27
Investment assets (z2) 2,857.63 6,328.23 90.47 33,811.04
Operating income (y1) 858.59 1,170.97 54.45 6,135.83
Operating cash flow (y2) 2,020.03 109.18 1,792.97 2,489.48
Panel B: Year 2009
Operating expenses (x1) 90.76 75.54 22.89 290.85
Total liabilitiest-1 (c1) 2,297.92 6,870.84 157.44 38,119.19
Total shareholders’ equitiest-1 (c2) 293.65 235.35 72.09 1,002.07
Property, plant and equipmentt-1 (c3) 62.25 116.18 1.49 569.26
Incurred benefits plus additions to reserves (z1) 8,934.22 3,130.89 983.36 22,278.22
Investment assets (z2) 3,469.06 7,909.76 118.01 41,982.18
Operating income (y1) 988.54 1,295.74 117.82 6,229.05
Operating cash flow (y2) 1,982.88 113.10 1,617.08 2,156.00
Panel C: Year 2010
Operating expenses (x1) 101.57 83.64 23.23 313.30
Total liabilitiest-1 (c1) 3,184.95 7,860.70 183.25 42,758.78
Total shareholders’ equitiest-1 (c2) 381.75 308.47 101.12 1,081.52
Property, plant and equipmentt-1 (c3) 62.87 111.62 1.15 550.82
Incurred benefits plus additions to reserves (z1) 9,505.98 2,745.58 7,969.30 20,106.09
Investment assets (z2) 4,347.90 9,165.87 100.72 47,378.46
Operating income (y1) 1,176.02 1,480.65 131.39 7,217.12
Operating cash flow (y2) 2,085.16 195.53 1,786.28 2,748.58
Panel D: Year 2011
Operating expenses (x1) 109.87 89.38 1.40 360.77
Total liabilitiest-1 (c1) 4,794.13 9,476.48 215.04 48,459.64
Total shareholders’ equitiest-1 (c2) 479.94 423.36 126.48 1,862.57
Property, plant and equipmentt-1 (c3) 67.09 109.24 0.90 530.96
Incurred benefits plus additions to reserves (z1) 9,013.64 2,000.09 7,932.97 18,641.03
Investment assets (z2) 4,726.60 9,928.65 24.72 51,785.86

POSTGRADUATE CONFERENCE ON ECONOMICS, PUBLIC ADMINISTRATION AND
BUSINESS (PCEPAB)-5TH SEPTEMBER, 2015
PROMOTING GOWTH, EXCELENT AND SUSTAINABILITY - 99
Operating income (y1) 1,232.24 1,606.11 55.87 7,861.97
Operating cash flow (y2) 2,067.59 164.89 1,847.45 2,601.68
Panel E: Year 2012
Operating expenses (x1) 132.05 101.63 28.89 399.30
Total liabilitiest-1 (c1) 5,064.34 10,091.47 28.60 52,442.11
Total shareholders’ equitiest-1 (c2) 622.19 568.98 21.73 2,543.61
Property, plant and equipmentt-1 (c3) 72.71 107.83 0.00 499.72
Incurred benefits plus additions to reserves (z1) 9,265.22 2,748.53 8,040.93 22,103.46
Investment assets (z2) 5,330.83 11,086.45 239.06 57,728.92
Operating income (y1) 1,345.77 1,681.08 132.81 7,539.55
Operating cash flow (y2) 2,034.27 278.90 949.64 2,805.66
Panel E: Year 2013
Operating expenses (x1) 140.35 131.65 25.29 546.32
Total liabilitiest-1 (c1) 5,542.39 11,155.43 259.00 58,319.91
Total shareholders’ equitiest-1 (c2) 760.88 618.04 140.51 2,594.60
Property, plant and equipmentt-1 (c3) 71.46 97.83 1.04 470.40
Incurred benefits plus additions to reserves (z1) 9,775.57 3,957.83 8,033.87 27,641.31
Investment assets (z2) 6,310.66 12,784.03 203.47 61,525.57
Operating income (y1) 1,399.66 1,907.69 138.22 7,700.76
Operating cash flow (y2) 2,076.74 208.49 1,525.55 2,580.95
3.2 The dynamic slack-based measure model with network structure
As for the DEA formulation, consider the dynamic network operating processes in Figure 1
that deals with n insurers (j = 1,…,n), k stages ( 1,..., )k K over T periods ( 1, ,t T ). At
each period, insurers utilize common k
tm inputs (i = 1,b…, k
tm ) consisting of k stages to
produce k
tr outputs (i = 1,…, k
tr ) consisting of k stages. Let k
iotx(i = 1,…,
k
tm) and
k
roty(i =
1,…, k
tr ) represent the observed input and output values of insurer j consisting of k stages at
period t, respectively,
( , )k h
jtz denote carry-overs values between periods t and t+1. In this
study, the category link is symbolized as badC
. To identify them by period (t), insurer (j),
stages ( k ), and item (i), this study utilizes a notion
,k bad
potC
,( 1, , ; 1, , ; 1,..., )k bad
tp m t T k K for representing bad link values where nbad refers to

POSTGRADUATE CONFERENCE ON ECONOMICS, PUBLIC ADMINISTRATION AND
BUSINESS (PCEPAB)-5TH SEPTEMBER, 2015
PROMOTING GOWTH, EXCELENT AND SUSTAINABILITY - 100
the number of bad links. These are all observed values up to the period T. Let ,k bad
tm denote
the observed inputted carry-over values of insurer j consisting of k stages at period t. Using
these expressions for the operating production processes, this study expresses the target
oinsurer (o = 1,…,n). This study thus defines the non-oriented efficiency by solving the
following programs:
,,
1 , ,1 1 1
*
1 1 1
1 11
1 11
k k badtt
kt
k badkK m m ptT k it
t t k k bad k k badk i pt t iot pot
ok
K rT k rtt t k kk r
t rot
ssw
T m m x CMin
sw
T r y
(1)
1
1
1
( , ) ( , )
1 1
. .
( 1,..., ; 1, , ; 1,..., )
( 1,..., ; 1, , ; 1,..., )
1( 1, , )
, ( , )( 1, , )
nk k k k k
iot ijt jt it tj
nk k k k k
rot rjt jt rt tj
n k
jtj
n nk h h k h k
jt jt jt jtj j
k
pot
s t
x x s i m t T k K
y y s r r t T k K
t T
z z k h t T
C
, , , ,
1
, , ,
11 1
,
( 1, , ; 1, , ; 1,..., )
( 1, , ; 1, , 1; 1,..., )
0, 0, 0, 0
nbad k bad k k bad k bad
pjt jt pt tj
n nk bad k bad k bad
ijt jt ijt jt tj j
k k k k bad
jt it rt pt
C s p m t T k K
C C p m t T k K
s s s
(2)
where o denotes the overall efficiency during the period T, while
k
its
, k
rts
and ,k bad
pts
are
slack variables denoting, input excess, outputs shortfall, link excess, and link deviation,
respectively. The above-stated objective function, an extension of the non-oriented SBM
model (K. Tone, 2001), deals with excesses in both inputs and undesirable (bad) links. The
numerator is the average input efficiency and the denominator is the inverse of the average
output efficiency. The objective function value is also units-invariant. Note that the non-
oriented overall efficiency is a ratio that ranges between zero and unity; when all slacks are
nil, a DMU will be given an efficiency score of 1.4 Put differently, oinsurer is called non-
oriented overall efficient or briefly overall efficient if the optimal solution for Equation (1)
satisfies 1o .
,,
, ,1 1 1
1 1
11
11
k k badtt
kt
k badkK m m ptk it
t k k bad k k badk i pt t iot pot
tk
K rk rtt k kk r
t rot
ssw
m m x C
sw
r y
(3)
4 The DEA score measuring relative efficiency ranges from 0 to 1, in which an insurer with the score of one is
relatively efficient, while one with a score of less than 1 is relatively inefficient.

POSTGRADUATE CONFERENCE ON ECONOMICS, PUBLIC ADMINISTRATION AND
BUSINESS (PCEPAB)-5TH SEPTEMBER, 2015
PROMOTING GOWTH, EXCELENT AND SUSTAINABILITY - 101
where 1
1 T
o t tT
in Equation (3). If all optimal solutions satisfy 1t , oinsurer is
called non-oriented period efficient or briefly period efficient for period T. Again, this is true
under the condition that the optimal slacks for period t in Equation (3) are all zero.
,,
, ,1 1
1
11
11
k k badtt
kt
k badkm m ptit
k k bad k k badi pt t iot pot
k
tk
r rt
k krt rot
ss
m m x C
s
r y
(4)
In Equation (4), 1
kK k
t k t tw . If all optimal solutions satisfy 1k
t , oinsurer is called
non-oriented period efficient or briefly period efficient with the stage k at the period T,
provided that the optimal slacks with the stages k at period t in Equation (4) are all zero.
3.3 Empirical Models
Truncated regression is an appropriate method in the regression analysis involving efficiency
scores as the dependent variable (Simar & Wilson, 2007). Simar and Wilson (2007)
document that OLS or Tobit regression is a relatively inefficient tool for this kind of study.
Simar and Wilson (2011) argue that truncated regression with bootstrapping approach could
best overcome the unknown serial correlation complicating the two-phase analysis.
Therefore, we apply the truncated regression model recommended by Simar and Wilson
(2011) to evaluate the relationship between exogenous factors and the efficiency performance
of insurance companies in Malaysia. Specifically, this study tests the following specification:
, 1,...,j j jX j n (5)
where α is the intercept and εj is the error term. Xj represents a 1 d vector of observation-
specific variables for insurer j, which is expected to be associated with the insurer’s
efficiency score, viz. j . That is, the scalar and the vector in Equation (5) are unknown
parameters to be estimated.
Instead of using Tobit estimation, Simar and Wilson propose an approach based on a
truncated regression with a bootstrapping procedure for estimating Equation (5). The
performance of their Monte Carlo experiments is satisfactory. To obtain an assumption that
the distribution of j , which is restricted by the condition 1j jZ , before truncation
is truncated with zero mean, unknown variance and a truncation point that are determined by
different conditions, Equation (5) is modified and we thus estimate the following equation:
2
ˆ , 1,...,
: (0, ) , 1 , 1,..., .
j j j
j j j
Z j n
where
N such that Z j n
(6)
Note that the true but unobserved efficiency j is replaced by its estimate, viz. ˆj . We use
the parametric bootstrapping technique for regression process to derive more accurate

POSTGRADUATE CONFERENCE ON ECONOMICS, PUBLIC ADMINISTRATION AND
BUSINESS (PCEPAB)-5TH SEPTEMBER, 2015
PROMOTING GOWTH, EXCELENT AND SUSTAINABILITY - 102
bootstrap confidence intervals for the estimates of parameters 2, , and to estimate
Equation (6) by maximizing the corresponding likelihood function, and give heed to the
2, .
In this study, we construct the two main truncated regression models, Equations 7 and 8, to
test our hypotheses. To confirm the fitness of the models, we conduct a simulation test with a
total of 3,000 experimental observations.
0 1 2 3
4
it it it it
it it
PERF RMGT PRES CG control variables
Other control variables
(7)
0 1 2 3
4 5
*
it it it it
it it it
PERF RMGT PRES RMGT PRES
CG control variables Other control variables
(8)
where:
PERFit = Insurer i’s efficiency scores in terms of non-oriented overall efficiency in
year t.
RMGTit
= Insurer i’s risk management as proxied by RMSIZE, RMMEET, and RMIND
in year t. Specifically, (a) RMSIZEit refers to the natural logarithm of the
number of directors on the risk management committee including executive
and non-executive directors, while (b) RMINDit means the proportion of
independent directors in the risk management committee. (c) RMMEETit is
the natural logarithm of the number of risk management committee meeting,
following Ng et al. (2013).
PRESit
= The natural logarithm of insurer i’s number of directors carrying titles of
honour in their name in year t.
CG control variablesit
BSIZEit = The natural logarithm of insurer i’s number of directors on the board in year
t.
BINDit = Insurer i’s proportion of independent directors to total directors in year t.
BMEETit = The natural logarithm of insurer i’s number board meeting in year t.
Other control variablesit
FSIZEit = The natural logarithm of insurer i’s total assets in year t.
LEVit = Insurer i’s ratio of total liabilities to total assets in year t.
LIQit = Insurer i’s ratio of insurance receivable to insurance payable in year t.
PGit = Insurer i’s growth in total premiums received in year t.
TYPEit = A categorical variable, in which insurer i is assigned a value of one, two, or
three if insurer i is a general insurer, life and general insurer, or life insurer in
year t, respectively.
LOCALit = A dummy variable that takes a value of one if insurer i is a locally-bred
company, and zero otherwise.
We expect to have significantly positive coefficients on 1 and 2 , and significantly
negative coefficient on 3 for Equations (7) and (8), respectively.
3.4 Data Collection

POSTGRADUATE CONFERENCE ON ECONOMICS, PUBLIC ADMINISTRATION AND
BUSINESS (PCEPAB)-5TH SEPTEMBER, 2015
PROMOTING GOWTH, EXCELENT AND SUSTAINABILITY - 103
In this study, we first identify all licensed insurance companies in Malaysia that are available
on the website of Central Bank of Malaysia
(http://www.bnm.gov.my/index.php?ch=13&cat=insurance). Subject to the availability of
annual reports, we are able to have an initial dataset for the period from 2007 to 2013. In
other words, restricting our data to the stated sample period maximizes our sample size. To
ensure that we have a balanced panel dataset for analysis, we exclude insurance companies
for which we could not obtain complete required information. With that, our final sample
dataset consists of 30 insurance companies in Malaysia. These insurers’ total assets account
for approximately 98.5 per cent of the total assets of all insurers in Malaysia. That is, our
sample of insurance companies is representative of the insurance industry in Malaysia.
Overall we have 30 insurance companies in Malaysia for the DEA analysis and 180 firm-year
observations for the regression analysis.
As far as the sample size is concerned, we find that the sample size of this study is not
a problem for at least two reasons. First, the sample size meets the requirement of the DEA
approach, which requires that the number of decision-making units (DMUs)5 should be at
least twice the sum of the variables used for the DEA analysis (Golany & Roll, 1989). In this
study, the 30 insurance companies are 3.75 times more than the total number of variables
(1+2+2+1+2). Second, in the regression analysis, we apply truncated regression with a
bootstrapping approach (Simar & Wilson, 2011; Simar & Wilson, 2007), which is able to
mitigate the susceptibility of small sample size. As discussed earlier, the sample insurers are
approximately 98.5 per cent of the insurance industry in Malaysia, indicating that the final
sample used in this study is adequate.
In addition, the final sample dataset fulfils the assumption of ‘isotonicity’, which is another
requirement of a DEA-application study. The term ‘isotonicity’ can be described as the
existence of correlations that are positive among variables used in the DEA analysis, meaning
a proportional increase in an input variable would result in a proportional increase in an
output variable. The untabulated Pearson and Spearman correlation coefficients between
inputs and intermediates (the first-stage output), and between intermediates and outputs
reveal significantly positive correlations between inputs and outputs in the two stages of the
DEA analysis, respectively; thereby satisfying the condition. Particularly, the estimated DEA
efficiency results are meaningful when the DMUs are assumed to be “similar” and
“calculable” units. Taken together, the two-stage DEA model of this study is deemed valid,
and therefore the efficiency performance estimates are meaningful.
4. Results and Analysis
4.1 Efficiency Performance Analysis
On the question of overall efficiency, the general insurers achieve an average score of 0.718
over the sample period 2008-2013. The results indicate that the companies still have some
rooms to improve their overall performance in this dynamic business world. In regards of
period efficiency, it is somewhat surprising that the period efficiency estimates are found to
increase in 2009. This finding confirms an earlier statement that “it has been argued that
Malaysian financial system was not affected by the global financial crisis in the late 2000s.”
However, the performance fluctuated thereafter in the following years. Among the 30
insurers, The Pacific Insurance Berhad, Prudential Assurance Malaysia Berhad, and Manulife
Insurance Berhad appear to set the benchmark of efficiency for their peers as evident by the
5 In this study, the DMUs refer to the sample insurance companies in Malaysia.

POSTGRADUATE CONFERENCE ON ECONOMICS, PUBLIC ADMINISTRATION AND
BUSINESS (PCEPAB)-5TH SEPTEMBER, 2015
PROMOTING GOWTH, EXCELENT AND SUSTAINABILITY - 104
ranking information. That is, the inefficient insurers could take the aforementioned
companies as role models in improving their performance.
Table 3 Overall and Period Efficiency Analysis (EFF1)
Mean efficiency score
Rank
Insurer 2008 2009 2010 2011 2012 2013 Overall
AmG Insurance Berhad 0.484 0.372 0.638 0.840 0.376 0.342 0.494 23
Berjaya Sompo Insurance Berhad 0.385 0.360 0.449 0.448 0.321 0.313 0.378 26
Kurnia Insurans (Malaysia) Berhad 0.416 0.528 0.560 0.463 0.347 0.319 0.435 25
Lonpac Insurance Berhad 0.732 0.454 0.668 0.747 0.735 0.734 0.659 17
Multi-Purpose Insurans Berhad 0.914 1.000 0.639 0.699 0.663 0.638 0.759 14
Pacific & Orient Insurance Co. Berhad 0.494 0.539 0.534 0.623 0.593 0.501 0.547 22
RHB Insurance Berhad 0.855 0.865 0.868 0.897 0.871 0.781 0.856 12
Tune Insurance Malaysia Berhad 0.991 0.997 0.963 1.000 1.000 1.000 0.992 7
Uni.Asia General Insurance Berhad 0.307 0.309 0.323 0.342 0.317 0.323 0.320 30
Etiqa Insurance Berhad 1.000 1.000 1.000 1.000 1.000 0.999 1.000 5
MCIS Zurich Insurance Berhad 0.422 0.399 0.383 0.375 0.246 0.247 0.344 28
AXA Affin Life Insurance Berhad 0.412 0.735 0.653 0.565 0.718 0.664 0.600 19
AmLife Insurance Berhad 0.624 0.998 0.998 1.000 0.465 0.485 0.712 16
Hong Leong Assurance Berhad 0.309 0.676 0.495 0.546 0.492 0.418 0.489 24
CIMB Aviva Assurance Berhad 0.419 0.354 0.306 0.359 0.289 0.326 0.338 29
Uni.Asia Life Assurance Berhad 0.666 0.605 0.625 0.787 1.000 0.707 0.723 15
Average for local insurers 0.589 0.637 0.631 0.668 0.590 0.550 0.603
AIG Malaysia Insurance Berhad 0.465 0.470 0.679 0.777 0.631 0.739 0.624 18
Allianz General Insurance Company (M) Berhad 0.655 0.604 0.529 0.601 0.516 0.468 0.562 21
MSIG Insurance (M) Berhad 0.921 0.995 0.998 0.999 0.999 0.999 0.985 9
Overseas Assurance Corporation (M) Berhad 0.902 0.986 1.000 1.000 0.434 0.381 0.779 13
The Pacific Insurance Berhad 1.000 1.000 1.000 1.000 1.000 1.000 1.000 1
QBE Insurance (M) Berhad 1.000 0.991 1.000 0.872 1.000 1.000 0.975 10
Tokio Marine Insurans (M) Berhad 0.735 0.684 0.454 0.583 0.531 0.492 0.578 20
AIA Berhad 0.666 0.856 0.923 1.000 1.000 1.000 0.899 11
Prudential Assurance Malaysia Berhad 1.000 1.000 1.000 1.000 1.000 1.000 1.000 1
Zurich Insurance Malaysia Berhad 0.981 0.998 0.997 0.997 0.992 0.995 0.994 6
Allianz Life Insurance Malaysia Berhad 0.916 1.000 1.000 1.000 1.000 0.998 0.986 8
Great Eastern Life Assurance (M) Berhad 1.000 1.000 1.000 1.000 1.000 1.000 1.000 4
Manulife Insurance Berhad 1.000 1.000 1.000 1.000 1.000 1.000 1.000 1
Tokio Marine Life Insurance Malaysia Berhad 0.464 0.416 0.417 0.401 0.226 0.225 0.356 27
Average for foreign insurers 0.836 0.857 0.857 0.874 0.809 0.807 0.838

POSTGRADUATE CONFERENCE ON ECONOMICS, PUBLIC ADMINISTRATION AND
BUSINESS (PCEPAB)-5TH SEPTEMBER, 2015
PROMOTING GOWTH, EXCELENT AND SUSTAINABILITY - 105
Total average efficiency score 0.705 0.740 0.737 0.764 0.692 0.670 0.718
Standard deviation 0.253 0.263 0.251 0.241 0.292 0.292 0.248
Minimum efficiency score 0.307 0.309 0.306 0.342 0.226 0.225 0.320
Maximum efficiency score 1.000 1.000 1.000 1.000 1.000 1.000 1.000
In addition, the results in Table 3 also show that foreign insurers are more efficient than local
insurers across the sample period 2008-2013. On the whole, foreign insurers are on average
23.5 per cent more efficient than local insurers. The trend of performance for local insurers
mirrors that of the overall efficiency, fluctuating over the years. As for foreign insurers, their
efficiency scores increase almost monotically from 2008 to 2011 before running into a sharp
decrease in 2012. Turning now to the driver of the overall efficiency, we would compare the
results of resource-management efficiency and profitability efficiency that are reported in
Tables 4 and 5, respectively. It is interesting to note that the average efficiency scores of
resource-management efficiency in all years are higher than those of profitability efficiency.
The findings on the total average show that insurers obtain an average resource-management
efficiency score of 0.774 but only 0.675 in terms of profitability efficiency.
Table 4 Average and Period Efficiency Analysis for Stage 1 – Resource-Management Efficiency (EFF2)
Mean efficiency score
Rank
Insurer 2008 2009 2010 2011 2012 2013 Average
AmG Insurance Berhad 0.359 0.614 0.749 0.864 0.811 0.749 0.691 19
Berjaya Sompo Insurance Berhad 0.549 0.511 0.578 0.641 0.506 0.584 0.561 24
Kurnia Insurans (Malaysia) Berhad 0.708 1.000 1.000 0.806 0.615 0.687 0.803 15
Lonpac Insurance Berhad 0.467 0.424 0.336 0.495 0.470 0.469 0.443 29
Multi-Purpose Insurans Berhad 0.869 1.000 0.726 0.767 0.499 0.717 0.763 18
Pacific & Orient Insurance Co. Berhad 0.651 0.720 0.767 0.936 0.845 0.752 0.778 17
RHB Insurance Berhad 0.873 0.778 0.778 0.795 0.743 0.712 0.780 16
Tune Insurance Malaysia Berhad 1.000 1.000 1.000 1.000 1.000 1.000 1.000 1
Uni.Asia General Insurance Berhad 0.502 0.518 0.558 0.627 0.549 0.558 0.552 25
Etiqa Insurance Berhad 1.000 1.000 1.000 1.000 1.000 1.000 1.000 8
MCIS Zurich Insurance Berhad 0.637 0.630 0.606 0.578 0.340 0.436 0.538 26
AXA Affin Life Insurance Berhad 0.653 0.690 0.608 0.589 0.583 0.399 0.587 22
AmLife Insurance Berhad 1.000 1.000 1.000 1.000 0.535 0.781 0.886 13
Hong Leong Assurance Berhad 0.512 0.654 0.667 0.615 0.582 0.481 0.585 23
CIMB Aviva Assurance Berhad 0.645 0.599 0.635 0.544 0.499 0.627 0.592 21
Uni.Asia Life Assurance Berhad 1.000 1.000 1.000 1.000 1.000 1.000 1.000 1
Average for local insurers 0.714 0.759 0.750 0.766 0.661 0.684 0.722
AIG Malaysia Insurance Berhad 0.405 0.388 0.387 0.555 0.440 0.563 0.456 28
Allianz General Insurance Company (M) Berhad 0.788 0.705 0.556 0.596 0.489 0.458 0.599 20
MSIG Insurance (M) Berhad 0.843 0.997 0.998 0.998 0.998 0.998 0.972 10

POSTGRADUATE CONFERENCE ON ECONOMICS, PUBLIC ADMINISTRATION AND
BUSINESS (PCEPAB)-5TH SEPTEMBER, 2015
PROMOTING GOWTH, EXCELENT AND SUSTAINABILITY - 106
Overseas Assurance Corporation (M) Berhad 0.805 0.973 1.000 1.000 0.708 0.677 0.860 14
The Pacific Insurance Berhad 1.000 1.000 1.000 1.000 1.000 1.000 1.000 1
QBE Insurance (M) Berhad 1.000 1.000 1.000 1.000 1.000 1.000 1.000 1
Tokio Marine Insurans (M) Berhad 0.470 0.369 0.404 0.564 0.380 0.319 0.418 30
AIA Berhad 0.705 0.837 0.946 1.000 1.000 1.000 0.915 12
Prudential Assurance Malaysia Berhad 1.000 1.000 1.000 1.000 1.000 1.000 1.000 1
Zurich Insurance Malaysia Berhad 0.969 1.000 0.998 0.998 0.996 0.999 0.993 9
Allianz Life Insurance Malaysia Berhad 0.832 1.000 1.000 1.000 1.000 0.995 0.971 11
Great Eastern Life Assurance (M) Berhad 1.000 1.000 1.000 1.000 1.000 1.000 1.000 1
Manulife Insurance Berhad 1.000 1.000 1.000 1.000 1.000 1.000 1.000 1
Tokio Marine Life Insurance Malaysia Berhad 0.561 0.518 0.519 0.527 0.237 0.423 0.464 27
Average for foreign insurers 0.813 0.842 0.843 0.874 0.803 0.816 0.832
Total average efficiency score 0.760 0.797 0.794 0.817 0.727 0.746 0.774
Standard deviation 0.214 0.226 0.227 0.199 0.256 0.237 0.212
Minimum efficiency score 0.359 0.369 0.336 0.495 0.237 0.319 0.418
Maximum efficiency score 1.000 1.000 1.000 1.000 1.000 1.000 1.000
The observation that resource-management efficiency is the main driver that contributes to
overall efficiency, however, is only found in local insurers. Interestingly, the efficiency
scores of profitability efficiency (periodic average = 0.522) for local insurers are obviously
much lower than those of their resource-management efficiency (periodic average = 0.722),
both across 2008-2013 and on the average basis. In contrast to local insurers, foreign insurers
appear to achieve better profitability efficiency (periodic average = 0.849) instead of
resource-management efficiency (periodic average = 0.832). These differences could be
explained in part by the fact that local and foreign insurers possess different strengths. It is
intuitive that local insurers rely more on resource-management efficiency in driving their
overall performance due to locality. However, another question arises on whether differences
truly exist between them, who probably have their exclusive characteristics.
Table 5 Average and Period Efficiency Analysis for Stage 2 – Profitability Efficiency (EFF3)
Mean efficiency score
Rank Insurer 2008 2009 2010 2011 2012 2013 Average
AmG Insurance Berhad 0.610 0.272 0.544 0.819 0.048 0.065 0.393 23
Berjaya Sompo Insurance Berhad 0.220 0.211 0.330 0.256 0.140 0.109 0.211 26
Kurnia Insurans (Malaysia) Berhad 0.131 0.106 0.127 0.119 0.079 0.082 0.107 29
Lonpac Insurance Berhad 0.998 0.468 1.000 1.000 1.000 1.000 0.911 12
Multi-Purpose Insurans Berhad 0.957 1.000 0.552 0.632 0.823 0.560 0.754 15
Pacific & Orient Insurance Co. Berhad 0.337 0.359 0.310 0.314 0.346 0.257 0.320 24
RHB Insurance Berhad 0.837 0.952 0.954 1.000 1.000 0.848 0.932 11
Tune Insurance Malaysia Berhad 0.981 0.994 0.928 1.000 1.000 1.000 0.984 9

POSTGRADUATE CONFERENCE ON ECONOMICS, PUBLIC ADMINISTRATION AND
BUSINESS (PCEPAB)-5TH SEPTEMBER, 2015
PROMOTING GOWTH, EXCELENT AND SUSTAINABILITY - 107
Uni.Asia General Insurance Berhad 0.112 0.101 0.095 0.062 0.090 0.093 0.092 30
Etiqa Insurance Berhad 1.000 1.000 1.000 1.000 1.000 0.998 1.000 6
MCIS Zurich Insurance Berhad 0.206 0.168 0.169 0.172 0.154 0.093 0.161 27
AXA Affin Life Insurance Berhad 0.325 0.771 0.697 0.543 0.842 0.926 0.684 19
AmLife Insurance Berhad 0.453 0.996 0.995 1.000 0.426 0.355 0.704 18
Hong Leong Assurance Berhad 0.109 0.698 0.329 0.482 0.408 0.361 0.398 22
CIMB Aviva Assurance Berhad 0.201 0.137 0.102 0.174 0.162 0.154 0.155 28
Uni.Asia Life Assurance Berhad 0.400 0.352 0.372 0.649 1.000 0.506 0.546 20
Average for local insurers 0.492 0.537 0.531 0.576 0.532 0.463 0.522
AIG Malaysia Insurance Berhad 0.514 0.551 0.959 0.999 0.820 0.915 0.793 14
Allianz General Insurance Company (M) Berhad 0.534 0.506 0.503 0.605 0.541 0.477 0.528 21
MSIG Insurance (M) Berhad 1.000 0.993 0.998 1.000 1.000 1.000 0.998 7
Overseas Assurance Corporation (M) Berhad 1.000 1.000 1.000 1.000 0.161 0.124 0.714 17
The Pacific Insurance Berhad 1.000 1.000 1.000 1.000 1.000 1.000 1.000 1
QBE Insurance (M) Berhad 1.000 0.982 1.000 0.774 1.000 1.000 0.959 10
Tokio Marine Insurans (M) Berhad 1.000 0.999 0.500 0.601 0.667 0.658 0.738 16
AIA Berhad 0.639 0.875 0.902 1.000 1.000 1.000 0.903 13
Prudential Assurance Malaysia Berhad 1.000 1.000 1.000 1.000 1.000 1.000 1.000 1
Zurich Insurance Malaysia Berhad 0.994 0.996 0.997 0.996 0.989 0.992 0.994 8
Allianz Life Insurance Malaysia Berhad 1.000 1.000 1.000 1.000 1.000 1.000 1.000 1
Great Eastern Life Assurance (M) Berhad 1.000 1.000 1.000 1.000 1.000 1.000 1.000 5
Manulife Insurance Berhad 1.000 1.000 1.000 1.000 1.000 1.000 1.000 1
Tokio Marine Life Insurance Malaysia Berhad 0.366 0.314 0.318 0.276 0.216 0.059 0.258 25
Average for foreign insurers 0.860 0.873 0.870 0.875 0.814 0.802 0.849
Total average efficiency score 0.664 0.693 0.689 0.716 0.664 0.621 0.675
Standard deviation 0.350 0.351 0.344 0.337 0.380 0.392 0.328
Minimum efficiency score 0.109 0.101 0.095 0.062 0.048 0.059 0.092
Maximum efficiency score 1.000 1.000 1.000 1.000 1.000 1.000 1.000
To address the question raised earlier, we present Table 6, documenting test of difference on
the efficiency scores across 2008-2013. Both non-parametric Mann-Whitney U test and
parametric t-test reveal that the significant differences exist between local insurers and
foreign insurers on the three categories of efficiencies. Specifically, foreign insurers are
statistically shown to have significantly higher overall efficiency, resource-management
efficiency, and profitability efficiency as compared to local insurers. As an additional
analysis, we also compare among the type of services provided by the insurers. The
insignificant results obtained in Table 6 suggest that they could be homogenous in providing
insurance services. In summary, we find that foreign insurers are the constant good
performers in relation to local insurers and the main driver of their respectable overall

POSTGRADUATE CONFERENCE ON ECONOMICS, PUBLIC ADMINISTRATION AND
BUSINESS (PCEPAB)-5TH SEPTEMBER, 2015
PROMOTING GOWTH, EXCELENT AND SUSTAINABILITY - 108
performance is their capability in transforming intermediates like investment assets into
operating cash flow.
Table 6 Test of Difference on the Efficiency Scores over the Sample Period 2008-2013
Features Classification
Overall
period
efficiency
Resource-
management
efficiency
Profitability efficiency
Mean Median Mean Median Mean Median
By capital
source
Local insurers (N = 96) 0.611 0.579 0.722 0.689 0.536 0.482
Foreign insurers (N = 84) 0.840 0.998 0.832 0.998 0.851 0.999
Test of difference (p-value) 0.000 0.000 0.001 0.005 0.000 0.000
By type of
services
General (N = 96) 0.711 0.681 0.744 0.716 0.689 0.927
Life & General (N = 30) 0.691 0.739 0.795 0.838 0.614 0.796
Life (N = 54) 0.744 0.855 0.814 0.855 0.711 0.849
Test of difference (p-value) 0.635 0.594 0.159 0.480 0.475 0.7047
4.2 Descriptive Statistics
Table 7 compares the descriptive statistics between local insurers and foreign insurers on
independent variables included in the empirical model. It is apparent that local insurers have
more directors serving as risk management committees (RMSIZE) and they hold more
meetings annually (RMMEET) (mean = 5 times) as compared to foreign insurers. While local
insurers hire about 4 persons on average as risk management committee, foreign insurers
generally have less than their counterparts. Risk management committee members of foreign
insurance companies meet for approximately 4 times on average yearly. However, the
number of independent directors in the risk management committee (RMIND) of foreign
insurance companies is larger than that of local insurers. In regards of another main variable,
viz. PRES, we find that local insurers have more directors on risk management committee
who carry titles in their name relative to foreign insurers. Overall, the difference-in-means
results indicate that statistically significant differences exist between local insurers and
foreign insurers with respect to risk management committee’s characteristics, board of
directors’ characteristics with the exception of board independence, and firm size.
Table 7 Test of Difference on the Independent Variables between Local and Foreign Insurers
Variable
Local insurer (N = 96) Foreign insurer (N = 84) Test of difference
(p-value) Mean Std. Dev. Mean Std. Dev.
RMSIZE 1.383 0.315 1.309 0.251 0.043
RMIND 0.612 0.274 0.726 0.176 0.002
RMMEET 1.601 0.513 1.447 0.229 0.006
PRES 1.103 0.391 0.593 0.441 0.001

POSTGRADUATE CONFERENCE ON ECONOMICS, PUBLIC ADMINISTRATION AND
BUSINESS (PCEPAB)-5TH SEPTEMBER, 2015
PROMOTING GOWTH, EXCELENT AND SUSTAINABILITY - 109
BSIZE 1.942 0.216 1.801 0.194 0.001
BIND 0.543 0.149 0.550 0.156 0.386
BMEET 2.060 0.319 1.884 0.191 0.001
FSIZE 21.222 0.967 21.883 1.446 0.001
LEV 0.704 0.192 0.742 0.216 0.102
LIQ 2.061 0.898 0.797 0.715 0.218
PG 0.227 0.599 0.172 0.374 0.232
4.3 Regression Analysis
In this study, small sample size could have dishonoured the assumption that error terms are
independent of exogenous variables in a regression analysis. However, it is worth noting that
the truncated regression with bootstrapping approach used in this study could overcome the
small-sample problem. Besides, one researcher would expect strong correlations between the
efficiency scores and exogenous variables. Therefore, we test for the possibility of
multicollinearity. The untabulated correlation coefficients are generally lower than 0.6. Apart
from the correlation analysis, we also conduct the diagnostics of variance inflation factors
(VIF) whose values are all less than 2.2. These surfaced outcomes provide supports that there
is no potential multicollinearity problem in our regression analysis.
Before proceeding to discuss the regression results, it will be necessary to justify the use of
ordinary least square (OLS) in this study alongside the truncated regression technique. In a
DEA-application study that involves regression analysis in the second phase, Banker and
Natarajan (2008) have demonstrated that OLS regression analysis yields consistent estimators
of the regression coefficients. Therefore, in line with prior studies (for example, Chen et al.,
2014; Hsiao, Chang, Cianci, & Huang, 2010; Kweh, Lu, & Wang, 2014) and for sensitivity
analysis, we also present OLS results in Table 8.
Table 8 Regression Results – Overall Efficiency
Variable
Truncated regression
Ordinary least square
Coefficient p-value Coefficient p-value Coefficient p-value Coefficient p-value
Constant 1.437 0.047 0.492 0.166 0.665 0.090 1.346 0.016
RMSIZE 0.456 0.007 0.291 0.098 -0.008 0.924 -0.376 0.035
RMIND 0.234 0.077 0.736 0.041 0.004 0.961 -0.421 0.124
RMMEET 0.100 0.110 0.177 0.135
0.130 0.006 0.223 0.034
PRES 0.193 0.035 1.013 0.040 0.096 0.042 -0.640 0.051
RMSIZE* PRES -0.188 0.148 0.438 0.011
RMIND* PRES -0.417 0.087 0.347 0.127
RMMEET* PRES -0.262 0.074 -0.072 0.405
BSIZE –0.726 0.004 -0.274 0.073 -0.201 0.066 -0.198 0.087
BIND –0.692 0.018 -0.424 0.049 -0.100 0.467 0.000 0.998
BMEET –0.040 0.212 -0.205 0.064 -0.033 0.706 -0.108 0.232
FSIZE 0.042 0.098 0.053 0.046 0.021 0.251 0.023 0.238

POSTGRADUATE CONFERENCE ON ECONOMICS, PUBLIC ADMINISTRATION AND
BUSINESS (PCEPAB)-5TH SEPTEMBER, 2015
PROMOTING GOWTH, EXCELENT AND SUSTAINABILITY - 110
LEV 0.308 0.059 -0.036 0.217 -0.138 0.116 -0.076 0.403
LIQ 0.003 0.168 0.010 0.011 0.006 0.000 0.006 0.000
PG 0.095 0.079 0.143 0.017 0.109 0.002 0.114 0.001
TYPE –0.012 0.215 0.030 0.145 0.021 0.400 0.015 0.525
LOCAL –0.138 0.066 -0.110 0.068 -0.268 0.000 -0.268 0.000
YEAR Dummies Yes Yes
YES YES
N 180 180
Log likelihood 18.799 23.419
Adj. R2
0.258 0.283
F-value 5.788*** 5.406***
On the one hand, as shown in Table 8, risk management committee’s characteristics are
found to have significantly positive impact on the overall efficiency of insurance companies
in Malaysia, with the exception of RMMEET. The coefficients on RMSIZE and RMIND are
0.456 and 0.234 with p-values of 0.007 and 0.077, respectively. However, these two variables
do not reach the conventional significance level under OLS. On the other hand, both
truncated regression and OLS results show that PRES is significantly and positively related to
overall efficiency. These findings, particularly those of truncated regression, support
hypothesis 1 and hypothesis 2 of this study.
If we now turn to the columns comprising interaction terms, it can be observed that the
results of truncated regression again corroborate our hypothesis. The interaction terms on
RMSIZE* PRES, RMIND* PRES and RMMEET* PRES are all negative, suggesting that the
number of titles of honour carried by directors on risk management committee (PRES)
significantly and negatively moderate the relationship between risk management and
efficiency performance, after controlling for board characteristics and firm’s characteristics.
In summary, it is therefore likely that direct regression analysis is invalid for the second-
phase regression estimation involving DEA scores as the dependent variable.
4.4 Discussion – Decision-making Matrix
In Malaysia, the insurance industry has potential market growth and its attractiveness has
drawn in foreign insurance companies to the country. Another interesting feature is the strong
financial system of Malaysia. In spite of the disastrous global financial crisis in the late
2000s, financial institutions like insurance companies in Malaysia felt only a relatively small
spill-over effect. A possible explanation for this might be that insurers in Malaysia have been
managing well their efficiency performance, which implies that performance evaluation is a
key tool for their sustainability. There are, however, other explanations. First, financial
institutions in Malaysia have strengthened their corporate governance and risk management
system since the 1997 Asian financial crisis. Second, insurance companies in Malaysia have
been mandated to have separate risk management committee at board level since 2003. It can

POSTGRADUATE CONFERENCE ON ECONOMICS, PUBLIC ADMINISTRATION AND
BUSINESS (PCEPAB)-5TH SEPTEMBER, 2015
PROMOTING GOWTH, EXCELENT AND SUSTAINABILITY - 111
therefore be assumed that performance evaluation and risk management are particularly
important concerns for companies in the Malaysian insurance industry.
In addition to the univariate and multivariate analyses, utilizing the Stage-1 and Stage-2
efficiency scores, this study constructs a decision-making matrix for managers in insurance
companies. Note that in the Pearson correlation coefficients of variables used in regression
analysis, the correlation between EFF2 and EFF3 is 0.567, which is significant at the 1 per
cent level. The decision-making matrix is shown in Figure 2, whereby the X-axis represents
the resource-management efficiency and the Y-axis represents the profitability efficiency. By
setting reference lines at the median values of the respective sets of efficiency scores, this
study is able to assign each insurer a zone in the decision-making matrix. Through
discussions for each of the zone, this thesis provides some strategic measures for managers in
insurance companies for improving their overall efficiency performance. This study names
each zone based on the business strategy of Boston Consulting Group (BCG) matrix, in
which the upper-right quadrant (Zone A) – the “stars”, the upper-left quadrant (Zone B) – the
“question marks”, the lower-right quadrant (Zone C) – the “cash cows”, and the lower-left
quadrant (Zone D) – the “problem child” are considered.
Figure 2: Stage 1/Stage 2 Efficiency Matrix
The “stars” (Zone A): Insurance companies included in this zone are found to have higher
resource-management efficiency and profitability efficiency. 11 “stars” are identified: AIA
Berhad (C1), Allianz Life Insurance Malaysia Berhad (C4), MSIG Insurance (M) Berhad
(C6), Prudential Assurance Malaysia Berhad (C9), QBE Insurance (M) Berhad (C10), The
Pacific Insurance Berhad (C12), Tune Insurance Malaysia Berhad (C15), Zurich Insurance
Malaysia Berhad (C16), Etiqa Insurance Berhad (C24), Great Eastern Life Assurance (M)
Berhad (C25), and Manulife Insurance Berhad (C27). During the period 2008-2013, these

POSTGRADUATE CONFERENCE ON ECONOMICS, PUBLIC ADMINISTRATION AND
BUSINESS (PCEPAB)-5TH SEPTEMBER, 2015
PROMOTING GOWTH, EXCELENT AND SUSTAINABILITY - 112
insurers are considered to have relatively better operating condition. These exemplary
insurers should maintain their competitive advantages and capabilities in transforming inputs
into value-added outputs. Particularly, they should continue keeping and improving their
well-established risk management system as that would result in lower costs and ultimately
higher efficiency performance.
This study could conclude that Prudential Assurance Malaysia Berhad and The Pacific
Insurance Berhad outshine the other insurers. It is interesting to note that these two insurers
are foreign insurance companies incorporated in Malaysia, consistent with the tests of
differences. Taken together, other insurers could deem these two flagships as the role model
in improving their efficiency performance from the risk management perspective.
The “question marks” (Zone B): Four insurers are included in this zone, namely AIG
Malaysia Insurance Berhad (C2), Multi-Purpose Insurans Berhad (C7), RHB Insurance
Berhad (C11), and Lonpac Insurance Berhad (C26). Although these insurers have relatively
better profitability efficiency, their resource-management efficiency is considered as below
par. To sustain their profitability efficiency, this thesis suggests that these four insurers
should focus on improving their capabilities in transforming inputs into value-added outputs.
If this situation persists in a longer term, this thesis would expect that profitability
efficiencies of these insurers suffer. More explicitly, only by managing well their resources,
they would be able to continue generating high profitability efficiency. Therefore, it is
suggested that managers of these insurers should reduce a great waste of resources. To
achieve this aim, they are advised to hire more directors, preferably sufficiently independent
professionals on risk management committee to first improve their resource-management
efficiency. Moreover, they should have an appropriate number of prestigious directors who
can bring about resources. Overall, these “question marks” may learn from the benchmarks in
Zone A, from which they could learn new breakthrough in managing efficiently resources.
The “cash cows” (Zone C): This zone comprises insurers that have relatively higher
resource-management efficiency but lower profitability efficiency as compared to their
counterparts. The list of insurers includes Overseas Assurance Corporation (M) Berhad (C8),
AmLife Insurance Berhad (C18), Kurnia Insurans (Malaysia) Berhad (C19), and Uni.Asia
Life Assurance Berhad (C30). It is expected that these insurers are gradually gaining
competitive advantages. That is, their efficiency in allocating resources is an accomplishment
that is hard to be imitated, and which should turn out to be a fast growth in their profitability
efficiency. Therefore, this thesis recommends these insurers to recruit more qualified and
independent professionals for reviewing the adequacy of resources for not only the
performance of risk management system, but also investment management activities. In any
case, these insurers should continue learning from the benchmarks in Zone A such as more
investment should be put in marketing activities to increase the amount of premiums earned.
The “problem child” (Zone D): Insurance companies that fall in Zone D are characterized
by lower Stage-1 and Stage-2 efficiency performance. These insurers, with low
competitiveness in both resource allocation and profitability, are Allianz General Insurance
Company (M) Berhad (C3), Hong Leong Assurance Berhad (C5), Tokio Marine Insurans (M)
Berhad (C13), Tokio Marine Life Insurance Malaysia Berhad (C14), AmG Insurance Berhad
(C17), Kurnia Insurans (Malaysia) Berhad (C19), Pacific & Orient Insurance Co. Berhad
(C20), AXA Affin Life Insurance Berhad (C21), Berjaya Sompo Insurance Berhad (C22),

POSTGRADUATE CONFERENCE ON ECONOMICS, PUBLIC ADMINISTRATION AND
BUSINESS (PCEPAB)-5TH SEPTEMBER, 2015
PROMOTING GOWTH, EXCELENT AND SUSTAINABILITY - 113
CIMB Aviva Assurance Berhad (C23), MCIS Zurich Insurance Berhad (C28), and Uni.Asia
General Insurance Berhad (C29). To improve their efficiency performance, this thesis
suggests that they should strictly follow the reference sets in the other zones. For example,
they might consider having industry cooperation to strengthen their competitiveness.
Insurers of particularly concerns, which also appear in the Group C for poor insurers earlier,
are AXA Affin Life Insurance Berhad, Berjaya Sompo Insurance Berhad, CIMB Aviva
Assurance Berhad, MCIS Zurich Insurance Berhad, and Uni.Asia General Insurance Berhad,
three of which are locally-bred insurance companies. They should learn from the benchmarks
in Zone A, wherein the first step is to improve their internal resource allocation, and then is to
study market demands before mapping out guidelines on operating processes for their future.
5. Conclusion
This study has found that risk management committee’s characteristics including the number
of directors on risk management committee, the proportion of independent directors on risk
management committee, and the number of meetings held annually by risk management
committee are significantly and positively related to the efficiency performance of Malaysian
insurers over the sample period 2008-2013. As predicted, risk management committee’s
prestige has a significantly positive effect on efficiency performance. However, this variable
significantly and negatively moderates the relationship between risk management
committee’s characteristics and efficiency performance. These findings support not only
resource-dependence theory and social network theory, but also the political theory.
Furthermore, the effort undertaken here has extended our knowledge in a DEA-application
study that involves a second-phase regression analysis, in which truncated regression is found
to have provided more consistent results as compared to OLS.
Taken together, this study has successfully demonstrated the application of the dynamic DEA
with a network structure and truncated regression in examining the effect of exogenous
factors on efficiency scores. It would be interesting to expand this study to a wider coverage
of insurance companies. For example, further research might explore the performance of
insurance companies in Asian countries using a metafrontier dynamic DEA with a network
structure to cater the different frontier technology of each country.
References
ADHIKARI, A., DERASHID, C., ZHANG, H. (2006). Public Policy, Political Connections,
and Effective Tax Rates: Longitudinal Evidence from Malaysia. Journal of
Accounting and Public Policy. 25(5), 574-595.
AEBI, V., SABATO, G., SCHMID, M. (2012). Risk Management, Corporate Governance,
and Bank Performance in the Financial Crisis. Journal of Banking & Finance. 36(12),
3213-3226.
ASIAN DEVELOPMENT BANK. (2009). The Financial Crisis and Money Markets in
Emerging Asia. In R. Rigg & L. Schou-Zibell (Eds.), ADB Working Paper Series on
Regional Economic Integration.
BANKER, R. D., NATARAJAN, R. (2008). Evaluating Contextual Variables Affecting
Productivity Using Data Envelopment Analysis. Operations Research. 56(1), 48-58.
BLISS, M. A., GUL, F. A. (2012a). Political Connection and Cost of Debt: Some Malaysian
Evidence. Journal of Banking & Finance. 36(5), 1520-1527.

POSTGRADUATE CONFERENCE ON ECONOMICS, PUBLIC ADMINISTRATION AND
BUSINESS (PCEPAB)-5TH SEPTEMBER, 2015
PROMOTING GOWTH, EXCELENT AND SUSTAINABILITY - 114
BLISS, M. A., GUL, F. A. (2012b). Political Connection and Leverage: Some Malaysian
Evidence. Journal of Banking & Finance. 36(8), 2344-2350.
BLISS, M. A., GUL, F. A., MAJID, A. (2011). Do Political Connections Affect the Role of
Independent Audit Committees and Ceo Duality? Some Evidence from Malaysian
Audit Pricing. Journal of Contemporary Accounting & Economics. 7(2), 82-98.
BOWLIN, W. F. (1995). A Characterization of the Financial Condition of the United States'
Aerospace-Defense Industrial Base. OMEGA - The International Journal of
Management Science. 23(5), 539-555.
CERTO, S. T. (2003). Influencing Initial Public Offering Investors with Prestige: Signaling
with Board Structures. Academy of Management Review. 28(3), 432-446.
CHAN, K. S., DANG, V. Q. T., YAN, I. K. M. (2012). Chinese Firms’ Political Connection,
Ownership, and Financing Constraints. Economics Letters. 115(2), 164-167.
CHANG, E. C., WONG, S. M. (2004). Political Control and Performance in China's Listed
Firms. Journal of Comparative Economics. 32(4), 617-636.
CHEN, F.-C., LIU, Z. J., KWEH, Q. L. (2014). Intellectual Capital and Productivity of
Malaysian General Insurers. Economic Modelling. 36(0), 413-420.
CLAESSENS, S., FEIJEN, E., LAEVEN, L. (2008). Political Connections and Preferential
Access to Finance: The Role of Campaign Contributions. Journal of Financial
Economics. 88(3), 554-580.
COOPER, W. W., SEIFORD, L. M., TONE, K. (2006). Introduction to Data Envelopment
Analysis and Its Uses: With Dea-Solver Software and References. USA: Springer
Science.
CUMMINS, J. D., DIONNE, G., GAGNÉ, R., NOUIRA, A. H. (2009). Efficiency of
Insurance Firms with Endogenous Risk Management and Financial Intermediation
Activities. Journal of Productivity Analysis. 32(2), 145-159.
CUMMINS, J. D., WEISS, M. A., XIE, X., ZI, H. (2010). Economies of Scope in Financial
Services: A Dea Efficiency Analysis of the Us Insurance Industry. Journal of Banking
and Finance. 34(7), 1525-1539.
D'AVENI, R. A. (1990). Top Managerial Prestige and Organizational Bankruptcy.
Organization Science. 1(2), 121-142.
D'AVENI, R. A., KESNER, I. F. (1993). Top Managerial Prestige, Power and Tender Offer
Response: A Study of Elite Social Networks and Target Firm Cooperation During
Takeovers. Organization Science. 4(2), 123-151.
DAILY, C. M., JOHNSON, J. L. (1997). Sources of Ceo Power and Firm Financial
Performance: A Longitudinal Assessment. Journal of management. 23(2), 97-117.
ELING, M., LUHNEN, M. (2010a). Efficiency in the International Insurance Industry: A
Cross-Country Comparison. Journal of Banking and Finance. 34(7), 1497-1509.
ELING, M., LUHNEN, M. (2010b). Frontier Efficiency Methodologies to Measure
Performance in the Insurance Industry: Overview, Systematization, and Recent
Developments. Geneva Papers on Risk & Insurance - Issues & Practice. 35(2), 217-
265.
FACCIO, M., MASULIS, R. W., MCCONNELL, J. J. (2006). Political Connections and
Corporate Bailouts. The Journal of Finance. 61(6), 2597-2635.
FROOT, K. A., SCHARFSTEIN, D. S., STEIN, J. C. (1993). Risk Management:
Coordinating Corporate Investment and Financing Policies. Journal of Finance.
48(5), 1629-1658.
GOLANY, B., ROLL, Y. (1989). An Application Procedure for Dea. OMEGA - The
International Journal of Management Science. 17(3), 237-250.
GOMEZ, E. T., JOMO, K. S. (1997). Malaysia's Political Economy: Politics, Patronage and
Profits (2nd ed.). Cambridge: Cambridge University Press.

POSTGRADUATE CONFERENCE ON ECONOMICS, PUBLIC ADMINISTRATION AND
BUSINESS (PCEPAB)-5TH SEPTEMBER, 2015
PROMOTING GOWTH, EXCELENT AND SUSTAINABILITY - 115
GREENE, W. H., SEGAL, D. (2004). Profitability and Efficiency in the U.S. Life Insurance
Industry. Journal of Productivity Analysis. 21(3), 229-247.
GUL, F. A. (2006). Auditors' Response to Political Connections and Cronyism in Malaysia.
Journal of Accounting Research. 44(5), 931-963.
HADAD, M. D., HALL, M. J. B., KENJEGALIEVA, K. A., SANTOSO, W., SIMPER, R.
(2011). Productivity Changes and Risk Management in Indonesian Banking: A
Malmquist Analysis. Applied Financial Economics. 21(12), 847-861.
HSIAO, H.-C., CHANG, H., CIANCI, A. M., HUANG, L.-H. (2010). First Financial
Restructuring and Operating Efficiency: Evidence from Taiwanese Commercial
Banks. Journal of Banking & Finance. 34(7), 1461-1471.
JOHNSON, S., MITTON, T. (2003). Cronyism and Capital Controls: Evidence from
Malaysia. Journal of Financial Economics. 67(2), 351-382.
KAO, M.-C., LIN, C.-Y., HSU, P.-P., CHEN, Y.-H. (2011). Impact of the Financial Crisis
and Risk Management on Performance of Financial Holding Companies in Taiwan.
World Academy of Science, Engineering & Technology. 74, 466-470.
KHWAJA, A. I., MIAN, A. (2005). Do Lenders Favor Politically Connected Firms? Rent
Provision in an Emerging Financial Market. The Quarterly Journal of Economics.
120(4), 1371-1411.
KIRCHMAIER, T., KOLLO, M. G. (2006). The Role of Prestige and Networks in Outside
Director Appointment. Financial Markets Group, London School of Economics and
Political Science. London.
KWEH, Q. L., LU, W.-M., WANG, W.-K. (2014). Dynamic Efficiency: Intellectual Capital
in the Chinese Non-Life Insurance Firms. Journal of Knowledge Management. 18(5),
937-951.
LU, W.-M., WANG, W.-K., KWEH, Q. L. (2014). Intellectual Capital and Performance in
the Chinese Life Insurance Industry. OMEGA - The International Journal of
Management Science. 42(1), 65-74.
MACKINNON, N. J., LANGFORD, T. (1994). The Meaning of Occupational Prestige
Scores. The Sociological Quarterly. 35(2), 215-245.
MATTHEWS, K. (2013). Risk Management and Managerial Efficiency in Chinese Banks: A
Network Dea Framework. OMEGA - The International Journal of Management
Science. 41(2), 207-215.
MAY, A. W. (1939). Financial Regulation Abroad: The Contrasts with American Technique.
Journal of Political Economy. 47(4), 457-496.
MITCHELL, H., JOSEPH, S. (2010). Changes in Malaysia: Capital Controls, Prime
Ministers and Political Connections. Pacific-Basin Finance Journal. 18(5), 460-476.
MU, J., PENG, G., MACLACHLAN, D. L. (2009). Effect of Risk Management Strategy on
Npd Performance. Technovation. 29(3), 170-180.
NG, T.-H., CHONG, L.-L., ISMAIL, H. (2013). Is the Risk Management Committee Only a
Procedural Compliance?: An Insight into Managing Risk Taking among Insurance
Companies in Malaysia. Journal of Risk Finance. 14(1), 71-86.
NORTH, D. C. (1990). Institutions, Institutional Change and Economic Performance. UK:
Cambridge University Press.
OLSON, M. (1993). Dictatorship, Democracy, and Development. American Political Science
Review. 87(3), 567-576.
PFEFFER, J., SALANCIK, G. R. (1978). The External Control of Organizations: A
Resource Dependence Perspective. New York: Harper and Row.
POON, W.-C., YAP, A. K.-H., LEE, T.-H. (2013). The Outcome of Politically Connected
Boards on Commercial Bank Performance in Malaysia. Modern Applied Science.
7(1), 35-50.

POSTGRADUATE CONFERENCE ON ECONOMICS, PUBLIC ADMINISTRATION AND
BUSINESS (PCEPAB)-5TH SEPTEMBER, 2015
PROMOTING GOWTH, EXCELENT AND SUSTAINABILITY - 116
RAJAN, R. G., ZINGALES, L. (2003). The Great Reversals: The Politics of Financial
Development in the Twentieth Century. Journal of Financial Economics. 69(1), 5-50.
SIMAR, L., WILSON, P. (2011). Two-Stage Dea: Caveat Emptor. Journal of Productivity
Analysis. 36(2), 205-218.
SIMAR, L., WILSON, P. W. (2007). Estimation and Inference in Two-Stage, Semi-
Parametric Models of Production Processes. Journal of Econometrics. 136(1), 31-64.
STULZ, R. M. (1996). Rethinking Risk Management. Journal of Applied Corporate Finance.
9(3), 8-25.
TONE, K. (2001). A Slacks-Based Measure of Efficiency in Data Envelopment Analysis.
European Journal of Operational Research. 130(3), 498-509.
TONE, K., SAHOO, B. K. (2005). Evaluating Cost Efficiency and Returns to Scale in the
Life Insurance Corporation of India Using Data Envelopment Analysis. Socio-
Economic Planning Sciences. 39(4), 261-285.
TONE, K., TSUTSUI, M. (2014). Dynamic Dea with Network Structure: A Slacks-Based
Measure Approach. OMEGA - The International Journal of Management Science.
42(1), 124-131.
WEGENER, B. (1992). Concepts and Measurement of Prestige. Annual review of sociology,
253-280.
WU, W., WU, C., ZHOU, C., WU, J. (2012). Political Connections, Tax Benefits and Firm
Performance: Evidence from China. Journal of Accounting and Public Policy. 31(3),
277-300.
YEH, Y.-H., SHU, P.-G., CHIU, S.-B. (2013). Political Connections, Corporate Governance
and Preferential Bank Loans. Pacific-Basin Finance Journal. 21(1), 1079-1101.

POSTGRADUATE CONFERENCE ON ECONOMICS, PUBLIC ADMINISTRATION AND
BUSINESS (PCEPAB)-5TH SEPTEMBER, 2015
PROMOTING GOWTH, EXCELENT AND SUSTAINABILITY - 117
The Performance and Earnings Management of ASEAN Banks in
the Liberalization Era
Mohammad Nourani
Faculty of Economics and Administration
University of Malaya
Jalan Universiti, 50603 Kuala Lumpur, Malaysia
E-mail: [email protected]
Qian Long Kweh
Department of Accounting
College of Business Management and Accounting
Universiti Tenaga Nasional
Sultan Haji Ahmad Shah Campus, 26700 Muadzam Shah, Pahang, Malaysia
E-mail: [email protected]
Wen-Min Lu
Department of Financial Management
National Defense University
No. 70, Sec. 2, Zhongyang North Rd., Beitou, Taipei 112, Taiwan
E-mail: [email protected]
Abstract
After the 1997 Asian financial crisis, Southeast Asian nations have implemented financial liberalization policies
with the purpose of boosting their economies. This scenario has enthused both performance evaluation (a pro)
and earnings management (a con). In this study, we first build on a dynamic network DEA (DN-DEA) approach,
called dynamic network slacks-based measure (DNSBM), to estimate the managerial and profitability
efficiencies of ASEAN commercial banks for the period from 2007 to 2013. On the overall basis, Singaporean banks appear to be the most efficient among all with an average score of 0.622 over the sample period.
Interestingly, the sample banks are found to have about 62.8 per cent of room for improvement. Second, through
panel data model and truncated regression, we find that the negative impacts of earnings management practices
on efficiency are found in loan loss provisions. Overall, it is advisable that policy makers with oversight function
should promote performance evaluation from a multidimensional perspective and keep an eye on earnings
management practices in terms of loan loss provisions.
Keywords: performance evaluation; dynamic network DEA; earnings management;
liberalization; ASEAN
Introduction
According to a report by ADB (2011), Asian emerging economies hold approximately half of
the world’s total exchange reserves and the whole region is also the major exporter and
importer of capitals. This phenomenon attests the underdeveloped intra-regional financial
system to efficiently channel surplus funds. Consequently, effective regional coalition and
Corresponding author

POSTGRADUATE CONFERENCE ON ECONOMICS, PUBLIC ADMINISTRATION AND
BUSINESS (PCEPAB)-5TH SEPTEMBER, 2015
PROMOTING GOWTH, EXCELENT AND SUSTAINABILITY - 118
cooperation is needful in dealing with this immaturity. Among all, the Association of
Southeast Asian Nations (ASEAN)1 has succeeded to create a strong integration among its
members of Southeast Asian nations. Followed by the Asian financial crisis that erupted in
mid-1997, many emerging countries in Asia have experienced substantial rectifications in
their financial liberalization policies with the purpose of boosting their economies.
Specifically, developing countries in South East Asia have experienced various forms of
financial liberalizations in promoting efficient allocation of resources to achieve greater
economic growth during the last few decades. As a result of financial liberalization policies,
the international capital mobility has increased between partner countries through different
international agreements such as ASEAN (Lim, 2005). However, it might be a blessing in
disguise or a curse.
On the one hand, there exists substantial capital inflows into the host countries (Chan and
Karim, 2011). In addition, the increased competition as the consequence of liberalization
policies stimulates firms to put more cautions on their activities such cost management, risk
monitoring, and resource allocation (Gardener et al., 2011). That is, opening up the economy
to international investors leads to higher efficiency of firms by means of intensifying the
competition within a domestic market. According to the seminal works of McKinnon (1973)
and Shaw (1973), financial liberalization yields higher economic growth through increasing
interest rate level which enhances the competition among the market players, while the
allocation of resources are well realized. Therefore, financial liberalization is likely to
increase higher savings which eventually nurtures economic growth by ameliorating the
investment quantity and quality, i.e. efficient allocation of resources (Reinhart and Tokatlidis,
2003). This is the reason why evaluating the efficiency becomes very important in the recent
years where many of the emerging countries have undergone full liberalization policies or
under the process of being liberalized, i.e. partial liberalization.
On the other hand, liberalization enhances competition, which dampens firms’ profitability.
Therefore, underperforming firms will be expelled from the marketplace because lower
profitability increases the risk of bankruptcy (Baik et al., 2011, Becchetti and Sierra, 2003,
Bolt et al., 2012). Put differently, this will create an incentive for managers to sham their
corporate performance in order to attract investors. In fact, past studies prove that pressurized
firms with high chance of bankruptcy are more inclined towards engaging “earnings
management2 (EM)” practices (García Lara et al., 2009, Beneish et al., 2012). Therefore, the
dramatic shift in liberalization policies in emerging countries has predisposed market players
to manipulate the information about financial reporting. It has been repeatedly reported that
the intensified competition as the results of liberalization and government deregulation brings
new opportunities for economic prosperity.
However, the flip side of the coin tells different story. Internal managers are more prone
towards hyperbolizing the firm’s performance to market participants within a competitive
environment (Tinaikar and Xue, 2009). Therefore, firms may report higher earnings compared
1 ASEAN was established on August 1967 by the signing agreement of five countries namely, Indonesia,
Malaysia, Philippines, Singapore and Thailand. Since then, membership has expanded to include Brunei,
Cambodia, Laos, Myanmar, and Vietnam, constituting the ten Member States of ASEAN. 2 Earnings management is defined as the use of managerial judgment to manipulate the financial reporting with
the purpose of either influencing contractual outcomes which depend on the financial reports or misleading the
stakeholders (and investors) about the company’s performance HEALY, P. M. & WAHLEN, J. M. (1999). A
Review of the Earnings Management Literature and Its Implications for Standard Setting. Accounting Horizons,
13, 365-383..

POSTGRADUATE CONFERENCE ON ECONOMICS, PUBLIC ADMINISTRATION AND
BUSINESS (PCEPAB)-5TH SEPTEMBER, 2015
PROMOTING GOWTH, EXCELENT AND SUSTAINABILITY - 119
to other rivals to attract investors. In a comprehensive review of the EM literature, Healy and
Wahlen (1999) conclude that “ the evidence is consistent with firms managing earnings to
window-dress financial statements prior to public securities’ offerings, to increase corporate
managers’ compensation and job security, to avoid violating lending contracts, or to reduce
regulatory costs or to increase regulatory benefits” (p.368). In his review, Healy and Wahlen
(1999) emphasizes that the past studies have focused on whether EM exists and why, yet the
empirical issue on the effect of any earnings management practices on efficiency?” (Healy
and Wahlen, 1999, p.380) has not been well explored.
As banking sector has been the centerpiece in the eyes of policy makers due to its invaluable
importance to the economic development, the sound and well-functioning banking sector is a
potent engine of economic growth. In this vein, banking institutions are not exempted from
this upshot, rather they are also more susceptible to EM practices compared to non-financial
organizations (Grougiou et al., 2014) due to their wide-ranging financial products and
complicated operation which lead to information opacity (Levine, 2004) and asymmetry
(Mülbert, 2009). Moreover, as highlighted by Greenawalt and Sinkey Jr (1988), the higher
chance of earnings manipulation in banking institutions might be attributed to the subjective
judgment that managers has to make in regards to expected reserves for losses. Specifically,
during the period of high profit, banks’ managers incline to smooth the earnings by recording
more loan losses and vice versa (Cornett et al., 2009). While the theoretical and empirical
literature support the amplification in both firm efficiency and EM practices followed by
liberalization, the question remains that how EM could be observed from testing its relation to
efficiency of banks.
To measure banking performance, we adopt dynamic network DEA (DN-DEA) to deal with
inefficiencies of interacting divisions that are embedded inside the banks’ production process.
Frontier efficiency analysis, which has received a considerable attention by researchers, is
more appropriate than a single-dimensional ratio analysis. Data envelopment analysis (DEA),
introduced by the influential work of Charnes et al. (1978), has been coined as the most
frequent frontier efficiency approach used by researchers, particularly among banking studies
(Liu et al., 2013). The value of DEA lies in its ability to transform various performance
aspects into a single efficiency score (Yeh, 1996) through evaluating the relative performance
of a decision-making unit (DMU) compared to its peers or competitors operating within a
same group (Liu et al., 2013). However, the traditional DEA models are not sufficient to
measure the banks’ complex production process because these models assume the system as a
single black box that converts inputs to outputs (Wang et al., 2014). Accordingly, the detailed
sources of inefficiency could not be identified when applying the traditional DEA models.
Given the above discussion, this study aims to estimate the dynamic network efficiency and
address the relationship between EM practices and efficiency of ASEAN banking institutions.
Therefore, the purpose of this study is two-fold. First, we apply the newly developed DN-
DEA model called dynamic network slacks-based measure (DNSBM), formulated by Tone
and Tsutsui (2014), which deals with multiple divisions connected by links of network
structure within each period vertically and also combines the network structure by means of
carry-over activities between two succeeding periods horizontally. The second important
objective of the study is to investigate the influence of controversial EM practices on the
divisional efficiency scores of ASEAN banking institutions. To measure EM practices, we
follow Adams et al. (2009) to use the ratio of loan loss provisions to loans. As a robustness
check, we also include the ratio of loan loss reserves to loans as another measure of EM

POSTGRADUATE CONFERENCE ON ECONOMICS, PUBLIC ADMINISTRATION AND
BUSINESS (PCEPAB)-5TH SEPTEMBER, 2015
PROMOTING GOWTH, EXCELENT AND SUSTAINABILITY - 120
practices. To the best of authors’ knowledge, this study is the first of its kind to examine the
effect of EM on the efficiency of ASEAN banking institutions.
The remainder of this paper unfolds as follows: Section 2 reviews the extant literature on
banking efficiency studies. Section 3 describes the data collection and the methodology used.
Section 4 presents the empirical findings and the discussion, and section 5 concludes the
paper.
Efficiency Studies in ASEAN Banking Sector
In this section, we try to map out the studies addressing the efficiency analysis of banking
institutions in ASEAN alliance. We note that the application of efficiency evaluation in
ASEAN economies is very scant at the moment. Hence, we also focus our attention to East
Asian studies of banking efficiency, where necessary, in order to provide a befitting
background of the subject matter.
Laeven (1999) estimates the technical efficiency of East Asian banks during 1992 to
1996. The input variables include interest expense, labor expense, other operating expense
and the output variables include loans and securities. The efficiency results were surprising
since the scores were increasing or constant during the pre-crisis period in which one might
expect a declining efficiency trend. The author, therefore, tries to shed some lights on the risk -
taking behavior of commercial banks. The findings assert that the banks with low efficiency
scores have endured the crisis due to taking fewer loans and thus less risk.
The first ASEAN banking efficiency paper appearing in the literature, authored by Karim
(2001), is the analysis of scale and cost efficiencies using the stochastic cost frontier
approach. The author uses the banking data of four countries during 1989 to 1996, including
Indonesia, Malaysia, the Philippines, and Thailand, out of ten members due to data
unavailability for the remaining countries. Using the intermediation approach, three inputs
(wages and salaries, land, buildings, and equipment and interest on deposits) and five outputs
(commercial and industrial loans, other loans, time deposits, demand deposits, and securities
and investments) are selected for the efficiency analysis. His findings on profit and cost
efficiency suggest that Thai banks are the least inefficient followed by Indonesian and
Pilipino banks while Malaysian banks perform the best. The author binds the inefficiency of
Indonesian and Pilipino banks to their restrictive regulatory systems. His results also support
the consolidation policy where the larger banks incline towards higher cost efficiency.
Williams and Nguyen (2005) examine the profit efficiency using stochastic frontier approach
for the South East Asian commercial banks in the period of 1990 to 2003. The authors utilize
the unbalanced dataset of 231 commercial banks from five countries (Indonesia, Korea,
Malaysia, the Philippines, and Thailand) to create a common frontier. This is disputatious,
however, the efficiency results can be controlled for significant cross-country differences
(Berger et al., 2000). Williams and Nguyen apply different country economic indicators to
control for cross-border differences. Their key findings support the policy of bank
privatization which leads to higher profit efficiency.
Gardener et al. (2011) provide an empirical efficiency analysis of selected five
ASEAN banking institutions, including Indonesia, Malaysia, the Philippines, Thailand, and
Vietnam for the period of 1998 to 2004. The authors estimate the technical and cost
efficiencies using DEA with two outputs (net loans and other earning assets) and three inputs

POSTGRADUATE CONFERENCE ON ECONOMICS, PUBLIC ADMINISTRATION AND
BUSINESS (PCEPAB)-5TH SEPTEMBER, 2015
PROMOTING GOWTH, EXCELENT AND SUSTAINABILITY - 121
(fixed assets, deposits and personnel costs). Their key findings show that the efficiency of
banks over the sample period has reduced interpreting the weak restructuring of post-1997
crisis. Malaysian and Vietnamese banks perform better in terms of technical and cost
efficiency while Indonesia and Thailand possess the least technical and cost efficient banks in
the post crisis era. Furthermore, countries with higher economic growth rates tend to be more
efficient.
In summary, the above literature of efficiency studies in East Asian banking sector put
forward the importance of cross-country comparison in which the efficiency scores differ
between countries and also before and after the crisis event. The restructuring of financial
institutions takes some time to be effectively implemented and an immediate analysis might
not be appropriate to judge the true influence of restructuring policies. In addition, due to
limitation in data, the above studies fail to consider more countries into analysis in order to
provide a more inclusive picture of ASEAN alliance. Therefore, our study aims to fill the gap
by addressing a more recent period in efficiency analysis as well as a broader group of
ASEAN commercial banks.
Data Envelopment Analysis in Banking Sector
The literature on frontier efficiency methodology, in particular DEA3, is fruitful with
numerous research works focusing on methodological development, application-centered and
both theory and application studies (see Cook and Seiford (2009) and Emrouznejad et al.
(2008) for methodological and theoretical developments and see Liu et al. (2013) for a survey
of application-embedded studies). Liu et al. (2013), who review high-ranked DEA papers
published during 1978 through 2010, indicate that application-embedded papers account for
nearly two-thirds of all published papers and banking studies cover 10.3% of this category
(most popular field). Since the invention of novel DEA by Charnes et al. (1978), the
groundbreaking work of Sherman and Gold (1985), where the authors examine the operating
efficiency of bank branches, paves the way for the application of DEA in banking sector.
Sherman and Gold’s argument about the uniqueness of DEA technique embraced by a number
of banking researchers (Parkan, 1987, Rangan et al., 1988, Elyasiani and Mehdian, 1990,
Berg et al., 1993). Berger and Humphrey (1997), a survey-based study, and Thanassoulis
(1999), an informative study, motivate the researchers by providing the potential areas that
need to be addressed in the domain of banking efficiency and the scope for enhancing the role
of DEA in banking, respectively.
However, as mentioned before, the banks’ complex production process requires more
sophisticated techniques to account for internal structures within the black box. Fortunately,
Following the pioneer work of Färe and Grosskopf (1996), who were the initiators to
investigate the “black box”, many researchers developed new methodologies to overcome the
shortcomings (see Halkos et al. (2014) for a survey of two-stage DEA models). While a rising
number of studies pointing to the meaningfulness of decomposing the banks’ performance
into sub-divisions (Seiford and Zhu, 1999, Luo, 2003, Lo and Lu, 2006, Avkiran, 2009, Lin
and Chiu, 2013), the application of DN-DEA in banking is still in its embryonic stage
(Avkiran, 2014a, Fukuyama and Weber, 2013, Kao and Liu, 2014, Wanke et al., 2014). For
example, Avkiran (2014a) assesses the dynamic efficiency of Chinese commercial banks
3 According to a comprehensive survery of frontier efficiency analysis in financial institutions, mostly banking,
by BERGER, A. N. & HUMPHREY, D. B. (1997). Efficiency of financial institutions: International survey and
directions for future research. European Journal of Operational Research, 98, 175-212., DEA is the most
frequently used approach for efficiency evaluation.

POSTGRADUATE CONFERENCE ON ECONOMICS, PUBLIC ADMINISTRATION AND
BUSINESS (PCEPAB)-5TH SEPTEMBER, 2015
PROMOTING GOWTH, EXCELENT AND SUSTAINABILITY - 122
combined with network structure; Wanke et al. (2014) measure the efficiency of Brazilian
banks using dynamic SBM; Kao and Liu (2014) propose a relational network model applied
to a set of Taiwanese commercial banks; and Fukuyama and Weber (2013) provide an
example of dynamic network DEA using a large sample of Japanese banks. Hence, our study
contributes to the scarce literature of DN-DEA in banking and it is the first study to apply this
technique in a cross-country sample.
Research Design
Data Collection
The efforts to test the hypothesis of this study focus on nine emerging economies: Brunei
Darussalam, Cambodia, Indonesia, Lao People’s Democratic Republic, Malaysia, Philippines,
Singapore, Thailand, and Vietnam. These countries share a main trait, in which they are
members of the ASEAN. Therefore, we argue that the sample banks in this study are by no
means more influential in countries with larger bank populations. Note also that our data
screening process leaves us with no banks from Myanmar, which is also one of the ASEAN
members. This is not surprising because information is sometimes lacking in emerging
economies.
All data are extracted from the Bankscope database for the period from 2007 to 2013. We
collect financial data for as many commercial banks as possible for each country and screen
the initial dataset in the following ways. Firstly, we focus only on commercial banks which
have similar products and services, whereby each of the banks are treated as a DMU for the
DEA analysis. Secondly, we eliminate banks with no complete financial data for the DEA
analysis over the sample period. Finally, we remove banks with missing data for measuring
the testing variable, viz. earnings management. As such, we have a balanced panel dataset that
is made up of 138 commercial banks in each year, in particular: Brunei Darussalam 1,
Cambodia 9, Indonesia 55, Lao People’s Democratic Republic 4, Malaysia 1, Philippines 20,
Singapore 8, Thailand 20, and Vietnam 20. It should be noted that we examine the operating
processes of banks using intermediation approach in line with prior studies4 (Avkiran, 2014a,
Miller and Noulas, 1996, Bhattacharyya et al., 1997, Sturm and Williams, 2004, Avkiran and
Thoraneenitiyan, 2010).
Table 1 Summary statistics of inputs, intermediates, and outputs
Mean Standard Deviation 1st Quartile 3rd Quartile
Input
Personnel expenses (X2) 75.865 140.196 7.000 66.750
Other operating expenses
(X3)
90.096 159.157 8.000 82.750
Input (carry-over)
Fixed assets (X1) 89.986 189.728 6.000 67.750
Liquid assets (X4) 7,422.737 18,799.629 398.000 5,060.750
Intermediate
Loans (Z1) 5,516.260 14,150.085 296.550 3,591.500
Other earning assets (Z2) 5,347.262 9,516.799 2,556.250 4,101.750
4 In an investigation of major DEA applications in banking literature in top journals across 2004 – 2009,
AVKIRAN, N. K. (2011). Association of DEA super-efficiency estimates with financial ratios: Investigating the
case for Chinese banks. Omega, 39, 323-334. reaches the conclusion that “there is no clear agreement amongst
the selection of inputs and outputs beyond the general observance of the intermediation approach to bank
behavior” (Avkiran, 2011, p.326).

POSTGRADUATE CONFERENCE ON ECONOMICS, PUBLIC ADMINISTRATION AND
BUSINESS (PCEPAB)-5TH SEPTEMBER, 2015
PROMOTING GOWTH, EXCELENT AND SUSTAINABILITY - 123
Deposits (Z3) 7,424.737 18,799.629 400.000 5,062.750
Output
Net interest income (Y1) 277.247 535.101 31.700 227.000
Note:
1. All variables are denoted in USD million.
2. Definitions of the variables are as follows. Personnel expenses are total staff costs in year t. Other operating
expenses are total operating costs other than staff costs in year t. Fixed assets are total tangible property, plant,
and equipment in year t-1. Liquid assets are resources that could be converted into cash quickly in year t-1.
Loans are temporary funds provided to customers at interest in year t. Other earning assets include financial
investments in stocks and bonds in year t. Deposits are monies kept by customers at banks in year t. Net interest
income refers to the excess income generated from loans and other earnings assets over expenses associated with
interests on deposits in year t.
In regards of the DEA analysis, we present Table 1 to summarize the descriptive statistics of
variables used. Furthermore, we also perform correlation analysis for the variables. Table 2
shows that all correlation coefficients are significantly positive, indicating that the inputs,
carry-overs, intermediates, and outputs are isotonically related. In other words, the selected
variables are appropriate for further analysis using the stipulated dynamic network DEA
model. Finally, as the number of banks meets the requirement that the number of DMUs
should be larger than double or triple the number of variables used for the DEA analysis, we
conclude that the developed DEA model has high construct validity.
Table 2 Spearman correlation coefficients
X2 X3 X1 X4 Z1 Z2 Z3 Y1
Personnel expenses (X2)
1.000
Other operating
expenses (X3)
0.959 1.000
Fixed assets (X1) 0.875 0.881 1.000
Liquid assets (X4) 0.944 0.946 0.859 1.000
Loans (Z1) 0.938 0.926 0.845 0.975 1.000
Other earning assets
(Z2)
0.692 0.738 0.628 0.767 0.707 1.000
Deposits (Z3) 0.944 0.946 0.859 1.000 0.975 0.767 1.000
Net interest income
(Y1)
0.951 0.937 0.877 0.941 0.949 0.691 0.941 1.000
Note:
1. All of the coefficients are significant at the 1% significance level.
2. See Table 1 for the definitions of the variables.
The traditional DEA models assume a production process as a single ‘black box’ that
transform inputs to outputs. Therefore, every activity has to be categorized as ‘input’ or
‘output’. This would create a problem when there is a complex production process that
requires multiple inputs and outputs. Accordingly, the network DEA models overcome the
abovementioned shortcoming by considering multiple divisions of production within the
black box while evaluating the overall efficiency as well. The network structure allows the
evaluation of the connectivity between inner linking activities (Kao, 2009, Tone and Tsutsui,
2009), hence, it will enable us to build processes of banks’ inner business activities.
This study also considers the linking activities between two succeeding periods which allows
us to take the effect of time on performance measure into account. More specifically, we
incorporate the time effect by means of carry-over activities between the subsequent periods.

POSTGRADUATE CONFERENCE ON ECONOMICS, PUBLIC ADMINISTRATION AND
BUSINESS (PCEPAB)-5TH SEPTEMBER, 2015
PROMOTING GOWTH, EXCELENT AND SUSTAINABILITY - 124
As such, the idea of dynamic DEA (Tone and Tsutsui, 2010) observe the long term fluctuated
trends of banks through the years.
In addition to the above, in traditional DEA models, the relative efficiency for each DMU is
measured under the assumption of the proportional changes of input and output variables,
meaning the models are radial. In fact, radial models may lack objectivity in terms of
reflecting the real input/output conditions for each organization. Furthermore, these models
assume that inputs and outputs can be adjusted according to their ratios, which cannot be
adopted under certain circumstances. As a solution, DNSBM, a proposed model by Tone and
Tsutsui (2014), is a non-radial model which takes the possibility of non-proportional changes
of inputs and outputs into account. This model deals with slacks when estimating the
divisional and overall efficiencies. Considering differences of input and output slacks
concurrently, this study uses non-oriented efficiency to estimate banks’ performance. The
dynamic network processes is shown in Figure 1.
Figure 1 The conceptual framework of the dynamic network production processes for
banks
Modelling the Dynamic Network SBM
Consider the dynamic network processes presented in Figure 1 that deals with n banks (j =
1,…,n) consisting of k divisions ( 1,..., )k K over T terms ( 1, ,t T ). At each term, banks
have common k
tm inputs (i = 1,b…, k
tm ) consisting of k divisions and k
tr outputs (i = 1,…, k
tr ) consisting of k divisions. Let k
iotx (i = 1,…,k
tm ) and k
roty (i = 1,…, k
tr ) denote the
observed input and output values of bank j consisting of k divisions at term t, respectively. ( , )k h
jtz denote the continuity of link flows (carry-overs) between terms t and t+1. This study
symbolizes the category link as badC . In order to identify them by term (t), bank (j) , divisions
( k ) and item (i), this study employs the notion ,k bad
potC ,( 1, , ; 1, , ; 1,..., )k bad
tp m t T k K
for denoting bad link values where nbad is the number of bad links. These are all observed

POSTGRADUATE CONFERENCE ON ECONOMICS, PUBLIC ADMINISTRATION AND
BUSINESS (PCEPAB)-5TH SEPTEMBER, 2015
PROMOTING GOWTH, EXCELENT AND SUSTAINABILITY - 125
values up to the term T. Let ,k bad
tm denote the observed carry-over input values of DMU j
consisting of k divisions at term t. Using these expressions for production, this study
expresses the target obank (o = 1,…,n). Therefore, this study defines the non-oriented
efficiency by solving program as follows:
Let o denote the overall efficiency during the term T. Where
k
its
, k
rts
and ,k bad
pts
are slack
variables denoting, respectively, input excess, outputs shortfall, link excess, and link
deviation.
This objective function is an extension of the non-oriented SBM model (Tone, 2001) and
deals with excesses in both input resources and undesirable (bad) links. The numerator is the
average input efficiency and the denominator is the inverse of the average output efficiency.
This study defines the non-oriented overall efficiency as a ratio that ranges between 0 and 1,
and attains 1 when all slacks are zero. This objective function value is also units-invariant.
,,
1 , ,1 1 1
*
1 1 1
1 11
1 11
k k badtt
kt
k badkK m m ptT k it
t t k k bad k k badk i pt t iot pot
ok
K rT k rtt t k kk r
t rot
ssw
T m m x CMin
sw
T r y
(1)
1
1
1
( , ) ( , )
1 1
. .
( 1,..., ; 1, , ; 1,..., )
( 1,..., ; 1, , ; 1,..., )
1( 1, , )
, ( , )( 1, , )
nk k k k k
iot ijt jt it tj
nk k k k k
rot rjt jt rt tj
n k
jtj
n nk h h k h k
jt jt jt jtj j
k
pot
s t
x x s i m t T k K
y y s r r t T k K
t T
z z k h t T
C
, , , ,
1
, , ,
11 1
,
( 1, , ; 1, , ; 1,..., )
( 1, , ; 1, , 1; 1,..., )
0, 0, 0, 0
nbad k bad k k bad k bad
pjt jt pt tj
n nk bad k bad k bad
ijt jt ijt jt tj j
k k k k bad
jt it rt pt
C s p m t T k K
C C p m t T k K
s s s
(2)
If the optimal solution for (1) satisfies 1o , obank is called non-oriented overall efficient or
briefly overall efficient.

POSTGRADUATE CONFERENCE ON ECONOMICS, PUBLIC ADMINISTRATION AND
BUSINESS (PCEPAB)-5TH SEPTEMBER, 2015
PROMOTING GOWTH, EXCELENT AND SUSTAINABILITY - 126
,,
, ,1 1 1
1 1
11
11
k k badtt
kt
k badkK m m ptk it
t k k bad k k badk i pt t iot pot
tk
K rk rtt k kk r
t rot
ssw
m m x C
sw
r y
(3)
In (3), 1
1 T
o t tT
.If all optimal solutions of satisfy 1t , obank is called non-oriented
term efficient or briefly term efficient for term T. This implies that the optimal slacks for term
t in (3) are all zero.
,,
, ,1 1
1
11
11
k k badtt
kt
k badkm m ptit
k k bad k k badi pt t iot pot
k
tk
r rt
k krt rot
ss
m m x C
s
r y
(4)
In (4), 1
kK k
t k t tw .If all optimal solutions of satisfy 1k
t , obank is called non-oriented
term efficient or briefly term efficient with the divisions k at the term T. This implies that the
optimal slacks with the divisions k at term t in (4) are all zero.
Empirical Findings and Discussion
Dynamic Network Performance Analysis
Table 3 shows the results of the dynamic network DEA model for banking institutions in
ASEAN region. Specifically, the table presents both yearly and average of overall, managerial
and profitability efficiency scores. While the overall efficiency of ASEAN member countries
seems to drop during 2008 to 2012 and then increases in 2013, Singapore banking sector
tends to swim against the tide. Also, Singaporean banks appear to be more efficient in terms
of overall efficiency followed by Cambodia and Malaysia with average scores of 0.622, 0.511
and 0.421 respectively. The overall efficiency of total sample shows a monotonic decrease
over the period with 62.8 per cent room for improvement on average.
In addition, Table 3 also provides the breakdown of overall efficiency into managerial and
profitability efficiencies. In the first division, i.e. managerial efficiency, we can see
fluctuating trends in countries’ banking performance; however, the total sample average is
again at declining trend. Although the managerial efficiency of ASEAN banking institutions
suggests the poor performance of banking sectors in the region, it happens to be more
efficient when compared to profitability efficiency. The results indicate the slightly better
performance of managerial division, in particular in the last three years, pointing that most
countries have enhanced their capabilities to manage the human resources but have failed to
create salient profit-making capacities using their managerial abilities. Nonetheless, there
exists large room for improvement in both managerial and profitability efficiencies. For
instance, bank institutions in ASEAN region can improve their managerial and profitability
efficiencies by 59.7 per cent and 62.8 per cent respectively in order to be fully efficient.

POSTGRADUATE CONFERENCE ON ECONOMICS, PUBLIC ADMINISTRATION AND
BUSINESS (PCEPAB)-5TH SEPTEMBER, 2015
PROMOTING GOWTH, EXCELENT AND SUSTAINABILITY - 127
Table 3 Overall, managerial and profitability efficiencies of banks in ASEAN countries
for the period of 2008-13
Country 2008 2009 2010 2011 2012 2013 Average
Overall efficiency
Brunei 0.295 0.210 0.215 0.201 0.132 0.160 0.202
Cambodia 0.693 0.559 0.553 0.511 0.353 0.398 0.511
Indonesia 0.484 0.466 0.451 0.409 0.324 0.311 0.408
Laos 0.587 0.407 0.465 0.342 0.227 0.282 0.385
Malaysia 0.620 0.519 0.375 0.337 0.259 0.417 0.421
Philippines 0.319 0.289 0.284 0.249 0.217 0.240 0.266
Singapore 0.585 0.630 0.609 0.603 0.690 0.614 0.622
Thailand 0.357 0.311 0.322 0.318 0.296 0.288 0.315
Vietnam 0.387 0.372 0.369 0.312 0.242 0.245 0.321
Total sample 0.450 0.417 0.410 0.373 0.311 0.310 0.378
Managerial efficiency
Brunei 0.239 0.234 0.239 0.267 0.273 0.254 0.251
Cambodia 0.751 0.638 0.639 0.696 0.726 0.639 0.681
Indonesia 0.425 0.448 0.426 0.429 0.398 0.328 0.409
Laos 0.654 0.561 0.473 0.509 0.527 0.502 0.538
Malaysia 0.881 0.833 0.648 0.602 0.765 0.772 0.750
Philippines 0.229 0.246 0.236 0.233 0.212 0.191 0.225
Singapore 0.694 0.724 0.742 0.756 0.739 0.694 0.725
Thailand 0.287 0.296 0.306 0.305 0.266 0.263 0.287
Vietnam 0.482 0.452 0.416 0.359 0.315 0.318 0.390
Total sample 0.430 0.430 0.414 0.411 0.387 0.346 0.403
Profitability efficiency
Brunei 0.350 0.186 0.190 0.141 0.030 0.067 0.161
Cambodia 0.642 0.479 0.473 0.330 0.161 0.202 0.381
Indonesia 0.549 0.486 0.476 0.392 0.312 0.314 0.421
Laos 0.524 0.293 0.459 0.189 0.087 0.134 0.281
Malaysia 0.390 0.308 0.190 0.133 0.120 0.087 0.205
Philippines 0.408 0.331 0.331 0.263 0.232 0.288 0.309
Singapore 0.529 0.580 0.572 0.572 0.680 0.596 0.588
Thailand 0.426 0.326 0.341 0.334 0.327 0.316 0.345
Vietnam 0.310 0.312 0.331 0.268 0.211 0.187 0.270
Total sample 0.478 0.411 0.415 0.344 0.289 0.293 0.372
This study applies Kruskal–Wallis test, a non-parametric statistical analysis, to examine
whether differences exist among efficiency performance of countries in the region (Brockett
& Golany, 1996). As the significance level of 1%, as shown in Table 4, we prove that there is
a significant difference among ASEAN countries in terms of efficiency scores. The statistical
findings indicate the superiority of Singaporean banks in overall efficiency and profitability
efficiency while Malaysia outperforms in managerial efficiency division. It should be noted
that Bruneian banking sector is ranked as the least efficient member of ASEAN coalition in
both overall and divisional efficiencies.
Table 4 Non-parametric statistical test of difference
Country No. of
banks
Overall
efficiency
average
Kruskal–
wallis test
(p-Value)
Managerial
efficiency
average
Kruskal–
wallis test
(p-Value)
Profitability
efficiency
average
Kruskal–
wallis test
(p-Value)

POSTGRADUATE CONFERENCE ON ECONOMICS, PUBLIC ADMINISTRATION AND
BUSINESS (PCEPAB)-5TH SEPTEMBER, 2015
PROMOTING GOWTH, EXCELENT AND SUSTAINABILITY - 128
Brunei 1 0.202 0.000*** 0.251 0.000*** 0.161 0.000***
Cambodia 9 0.511 0.681 0.381
Indonesia 55 0.408 0.409 0.421
Laos 4 0.385 0.538 0.281
Malaysia 1 0.421 0.750 0.205
Philippines 20 0.266 0.225 0.309
Singapore 8 0.622 0.725 0.588
Thailand 20 0.315 0.287 0.345
Vietnam 20 0.321 0.390 0.270
Total Sample 138 0.378 0.403 0.372
Note:
*, **, and *** denote the statistical significance at the 10%, 5%, and 1% level, respectively.
The untabulated results show that only one bank is found to be non-oriented efficient. This
high level of inefficiency encourages us to report the frontier projections. These potential
improvements for inefficient DMUs are determined based on those on the efficient frontier,
i.e. benchmark units (Avkiran, 2014b). Table 5 provides the average excess and shortage of
each variable for all member countries. A positive percentage implies the shortage of
resources (inputs) and a negative percentage implies the excess of resources (outputs).
The findings in Table 5 suggest that the ASEAN members on average have to cut their
personnel expenses and other operating expenses by 59.4 per cent and 59 per cent
respectively. The carry-overs are approximately same as the primary inputs for banks in
which these two input quantities have to be reduced by 60.7 per cent (fixed assets) and 59.9
per cent (liquid assets). The three intermediates act as dual-role variables in production
process meaning that they are outputs for the first division and inputs for the second division.
Consequently, the suggestions on potential improvements are mixed for these variables. For
instance, other earning assets have to be increased for Brunei, Cambodia, Indonesia, Laos and
Malaysia while it has to be decreased for Philippines, Singapore, Thailand and Vietnam. In
summary, ASEAN banks could be efficient if they can increase their net interest income on
average, as the only output, by 21.1 per cent while performing the required changes in inputs,
carry-overs and intermediate variables.
Table 5 Frontier projections for banks in ASEAN countries (%)
Input Carry-over Intermediate Output
Country X2 X3 X1 X4 Z1 Z2 Z3 Y1
Brunei -75.2 -73.7 -75.8 -83.4 -60.9 11.2 -72.0 8.8
Cambodia -25.5 -29.8 -40.3 -56.8 -27.7 6.6 -23.2 21.3
Indonesia -60.5 -56.6 -60.2 -55.6 -37.1 10.3 -37.3 19.3

POSTGRADUATE CONFERENCE ON ECONOMICS, PUBLIC ADMINISTRATION AND
BUSINESS (PCEPAB)-5TH SEPTEMBER, 2015
PROMOTING GOWTH, EXCELENT AND SUSTAINABILITY - 129
Laos -39.9 -44.1 -54.8 -65.7 -26.6 7.2 -25.5 32.0
Malaysia -39.6 -12.4 -22.9 -68.5 -30.7 5.1 -41.0 69.1
Philippines -75.0 -79.8 -77.8 -68.1 -49.4 -25.7 -61.0 7.1
Singapore -31.6 -32.7 -18.2 -30.5 -9.6 -15.5 -30.4 101.3
Thailand -69.8 -71.8 -72.2 -63.9 -59.2 -29.3 -54.7 6.9
Vietnam -60.9 -60.3 -61.6 -69.5 -48.2 -11.1 -54.5 18.5
Total sample -59.4 -59.0 -60.7 -59.9 -41.3 -5.6 -44.4 21.1
Note:
Personnel expenses (X2); Other operating expenses (X3); Fixed assets (X1); Liquid assets (X4); Loans (Z1);
Other earning assets (Z2); Deposits (Z3); Net interest income (Y1).
Negative: Excess of resources.
Positive: Shortage of resources.
The Relationship between Earnings Management and Efficiency
In a DEA-application involving multivariate analysis, a researcher may employ ordinary least
squares (OLS) for the regression analysis. Through OLS, Banker and Natarajan (2008) show
that consistent estimators of the regression coefficients could be obtained despite the fact that
efficiency scores range between zero and one. In this study, the regression results are adjusted
for year-specific and country-specific effects. Specifically, we employ panel data estimation
procedures, which adjust for the time-series and cross-sectional effects. Note that the
Breusch-Godfrey Serial Correlation Lagrange Multiplier (LM) test suggests that panel data
regression is a better estimation technique as compared to pooled regression in this study,
while the Hausman test indicates that fixed-effects model (FEM), instead of random-effects
model (REM), should be applied.
Therefore, we employ the fixed-effects panel data regression model to examine the
relationship between earnings management and overall efficiency. In this study, the following
regression models are run to test the hypotheses:
0 1 2 3 4 5
it it it it it it i
i it
OE LLPL LLRL LNASSETS GROW LIAB Yr
Country
(1)
where:
itOE = The non-oriented DNSBM overall efficiency score based on variable
returns to scale in year t.
itLLPL = Loan loss provisions scaled by loans in year t.
itLLRP
= Loan loss reserves scaled by loans in year t.
itLNASSETS
= The natural logarithm of total assets in year t.
itGROW
= The growth rate of net income in year t.
itLIAB
= Total liabilities scaled by total assets in year t.

POSTGRADUATE CONFERENCE ON ECONOMICS, PUBLIC ADMINISTRATION AND
BUSINESS (PCEPAB)-5TH SEPTEMBER, 2015
PROMOTING GOWTH, EXCELENT AND SUSTAINABILITY - 130
iYr = Year-specific effect dummy variables.
iCountry = Country-specific effect dummy variables.
Based on Adams et al. (2009), we argue that earnings management in banks commonly
happens through loan loss provisions and loan loss reserves due to the nature of their
discretionary choices. If bank managers engage in earning management, we would expect to
have significantly negative coefficients on 1 and 2 because the good-looking earnings
today have to be paid off in the future, in which case it would be shown up in this study
through the dynamic performance measure that is measured over a long-term period.
In addition, we also test the potential problem caused by multicollinearity. The diagnostic test
of variance inflation factors (VIF), which is untabulated, suggest multicolliearity problem
does not exist in this study, whereby the centered VIF values are all less than 1.5 (Kennedy,
1998). We also perform diagnostic test of potential heteroskedasticity for the regression
residuals and we find evidence of heteroskedasticity. Therefore, p-values in Table 6 are
corrected using White cross-section standard errors. The F-statistics indicates that Equation
(1) is statistically significant.
Table 6 Regression results
FEM Truncated Regression
Variable Coefficient Standard
Error
P-value Coefficient Standard
Error
P-value
Intercept 1.402*** 0.131 0.000 0.804*** 0.063 0.000
LLPL -0.200*** 0.031 0.000 -0.682* 0.378 0.071
LLRP 0.243 0.152 0.110 0.493*** 0.100 0.000
LNASSETS -0.144*** 0.014 0.000 -0.028*** 0.006 0.000
GROW 0.011*** 0.002 0.000 0.011*** 0.003 0.000
LIAB 0.058 0.056 0.308 -0.284*** 0.057 0.000
Year dummies Yes Yes
Country
dummies
Yes Yes
Adjusted R-
squared
0.838
F-statistic 31.229***
Log-likelihood 193.026
Note:
*, **, and *** denote the statistical significance at the 10%, 5%, and 1% level, respectively.
The results in Table 6 indicate that loan loss provisions (LLPL) are significantly and
negatively related to the dynamic overall efficiency of banks in the ASEAN countries,
suggesting that earnings management today will be paid off in dynamic performance in the
long term, consistent with our prediction. However, the positive coefficient on loan loss
reserves (LLRP) does not reach the conventional significance level. For another sensitivity
analysis, we estimate Equations (1) using truncated regression, following Lu et al. (2014).
The truncated regression results remain almost qualitatively the same as those of the FEM. In
summary, we find that earnings management engaged by bank managers could be observed
from loan loss provisions rather than loan loss reserves from the perspective of dynamic
performance.

POSTGRADUATE CONFERENCE ON ECONOMICS, PUBLIC ADMINISTRATION AND
BUSINESS (PCEPAB)-5TH SEPTEMBER, 2015
PROMOTING GOWTH, EXCELENT AND SUSTAINABILITY - 131
Conclusions
This study aims to address two key questions in the literature of bank efficiency. Firstly, we
provide a unique example of the application of DN-DEA model in banking that is still in its
embryonic stage. More specifically, we decompose the efficiency of ASEAN banking
institutions into managerial efficiency and profitability efficiency using the newly developed
DN-DEA model, viz. DNSBM. Secondly, we provide an empirical answer to the important
question that what the effect of any EM practices is on the efficiency of firms.
For the first objective, the findings reveal that there exists large room for improvement in
efficiency domain of ASEAN banks. This will accentuate the need for a better policy
formulation in the region to boost the banking sectors upwards. Indeed, the role of ASEAN
alliance could be very influential to achieve this goal. Likewise, the monotonic decrease in the
overall and divisional efficiencies of the total sample is alarming. Among all, the overall
performance of Singaporean banking sector outstrips that of any other banking sectors in
ASEAN region. In detail, Singapore is ranked first in profitability division and second in
managerial division. Meanwhile, the poor performance of Malaysian banking sector on
profitability efficiency drags down its overall efficiency despite its spectacular managerial
efficiency scores. In order to determine the reasons behind the inefficiencies of ASEAN
banks, we investigate the potential areas of improvement relevant to input and output
variables. The results suggest the equal attention should be given to carry-overs as well as
inputs where the ASEAN banks have to reduce the input and carry-over variables by
approximately 60 per cent.
For the second objective, we find a significant negative relationship between loan loss
provisions and dynamic performance of ASEAN banks. However, the loan loss reserves could
not satisfy our proposed hypothesis in determining the EM practices of banking institutions.
Therefore, we argue that loan loss provisions is an appropriate proxy for banks’ EM practices
which significantly dampen the dynamic efficiency of ASEAN banks.
All in all, more researches need to be done to confirm the generalizability of our results.
Indeed, the new approach developed in this study on the relationship between EM practices
and performance demands global appeal. It can be applied to those banking sectors where the
sources of inefficiencies are unknown. Another important area for future research would be to
compare various methodologies developed in the domain of DN-DEA among banking
institutions.
References
ADAMS, B., CAROW, K. A. & PERRY, T. (2009). Earnings management and initial public
offerings: The case of the depository industry. Journal of Banking & Finance, 33,
2363-2372.
ADB (2011). Financial Sector Operational Plan. ADB administration and governance;
Finance. Asian Development Bank.
AVKIRAN, N. K. (2009). Opening the black box of efficiency analysis: an illustration with
UAE banks. Omega, 37, 930-941.
AVKIRAN, N. K. (2011). Association of DEA super-efficiency estimates with financial
ratios: Investigating the case for Chinese banks. Omega, 39, 323-334.

POSTGRADUATE CONFERENCE ON ECONOMICS, PUBLIC ADMINISTRATION AND
BUSINESS (PCEPAB)-5TH SEPTEMBER, 2015
PROMOTING GOWTH, EXCELENT AND SUSTAINABILITY - 132
AVKIRAN, N. K. (2014a). An illustration of dynamic network DEA in commercial banking
including robustness tests. Omega.
AVKIRAN, N. K. (2014b). Probing organizational efficiency. International Journal of
Organizational Analysis, 22, 149-160.
AVKIRAN, N. K. & THORANEENITIYAN, N. (2010). Purging data before productivity
analysis. Journal of Business Research, 63, 294-302.
BAIK, Y.-S., KWAK, B. & LEE, J. (2011). Deregulation and earnings management: The case
of the U.S. airline industry. Journal of Accounting and Public Policy, 30, 589-606.
BANKER, R. D. & NATARAJAN, R. (2008). Evaluating Contextual Variables Affecting
Productivity Using Data Envelopment Analysis. Operations Research, 56, 48-58.
BECCHETTI, L. & SIERRA, J. (2003). Bankruptcy risk and productive efficiency in
manufacturing firms. Journal of Banking & Finance, 27, 2099-2120.
BENEISH, M. D., PRESS, E. & VARGUS, M. E. (2012). Insider Trading and Earnings
Management in Distressed Firms. Contemporary Accounting Research, 29, 191-220.
BERG, S. A., FØRSUND, F. R., HJALMARSSON, L. & SUOMINEN, M. (1993). Banking
efficiency in the Nordic countries. Journal of Banking & Finance, 17, 371-388.
BERGER, A. N., DEYOUNG, R., GENAY, H. & UDELL, G. F. (2000). Globalization of
financial institutions: Evidence from cross-border banking performance. Brookings-
Wharton papers on financial services, 2000, 23-120.
BERGER, A. N. & HUMPHREY, D. B. (1997). Efficiency of financial institutions:
International survey and directions for future research. European Journal of
Operational Research, 98, 175-212.
BHATTACHARYYA, A., LOVELL, C. A. K. & SAHAY, P. (1997). The impact of
liberalization on the productive efficiency of Indian commercial banks. European
Journal of operational research, 98, 332-345.
BOLT, W., DE HAAN, L., HOEBERICHTS, M., VAN OORDT, M. R. & SWANK, J.
(2012). Bank profitability during recessions. Journal of Banking & Finance, 36, 2552-
2564.
CHAN, S.-G. & KARIM, M. Z. A. (2011). Efficiency of foreign banks: Evidence from
selected (Association of Southeast Asian Nations) ASEAN countries. African Journal
of Business Management, 5, 5617-5626
CHARNES, A., COOPER, W. W. & RHODES, E. (1978). Measuring the efficiency of
decision making units. European Journal of Operational Research, 2, 429-444.
COOK, W. D. & SEIFORD, L. M. (2009). Data envelopment analysis (DEA)–Thirty years
on. European Journal of Operational Research, 192, 1-17.
CORNETT, M. M., MCNUTT, J. J. & TEHRANIAN, H. (2009). Corporate governance and
earnings management at large U.S. bank holding companies. Journal of Corporate
Finance, 15, 412-430.
ELYASIANI, E. & MEHDIAN, S. M. (1990). A nonparametric approach to measurement of
efficiency and technological change: The case of large US commercial banks. Journal
of Financial Services Research, 4, 157-168.
EMROUZNEJAD, A., PARKER, B. R. & TAVARES, G. (2008). Evaluation of research in
efficiency and productivity: A survey and analysis of the first 30 years of scholarly
literature in DEA. Socio-Economic Planning Sciences, 42, 151-157.
FÄRE, R. & GROSSKOPF, S. (1996). Intertemporal production frontiers: with dynamic
DEA, Kluwer Academic Publishers, Boston.

POSTGRADUATE CONFERENCE ON ECONOMICS, PUBLIC ADMINISTRATION AND
BUSINESS (PCEPAB)-5TH SEPTEMBER, 2015
PROMOTING GOWTH, EXCELENT AND SUSTAINABILITY - 133
FUKUYAMA, H. & WEBER, W. L. (2013). A dynamic network DEA model with an
application to Japanese Shinkin banks. Efficiency and Productivity Growth. John
Wiley & Sons, Ltd.
GARCÍA LARA, J. M., OSMA, B. G. & NEOPHYTOU, E. (2009). Earnings quality in ex‐post failed firms. Accounting and business research, 39, 119-138.
GARDENER, E., MOLYNEUX, P. & NGUYEN-LINH, H. (2011). Determinants of
efficiency in South East Asian banking. The Service Industries Journal, 31, 2693-
2719.
GREENAWALT, M. B. & SINKEY JR, J. F. (1988). Bank Loan-Loss Provisions and the
Income-Smoothing Hypothesis: An Empirical Analysis, 1976-1984. Journal of
Financial Services Research, 1, 301-318.
GROUGIOU, V., LEVENTIS, S., DEDOULIS, E. & OWUSU-ANSAH, S. (2014). Corporate
social responsibility and earnings management in U.S. banks. Accounting Forum, 38,
155-169.
HALKOS, G. E., TZEREMES, N. G. & KOURTZIDIS, S. A. (2014). A unified classification
of two-stage DEA models. Surveys in operations research and management science,
19, 1-16.
HEALY, P. M. & WAHLEN, J. M. (1999). A Review of the Earnings Management Literature
and Its Implications for Standard Setting. Accounting Horizons, 13, 365-383.
KAO, C. (2009). Efficiency decomposition in network data envelopment analysis: A
relational model. European Journal of Operational Research, 192, 949-962.
KAO, C. & LIU, S.-T. (2014). Multi-period efficiency measurement in data envelopment
analysis: The case of Taiwanese commercial banks. Omega, 47, 90-98.
KARIM, M. Z. A. (2001). Comparative bank efficiency across select ASEAN countries.
ASEAN Economic Bulletin, 289-304.
KENNEDY, P. (1998). A Guide to Econometrics, Cambridge, MIT Press.
LAEVEN, L. (1999). Risk and efficiency in East Asian banks, World Bank Policy Research
Working Paper No. 2255, Washington, DC: World Bank.
LEVINE, R. (2004). The corporate governance of banks: a concise discussion of concepts
and evidence, World Bank Publications.
LIM, S. (2005). Foreign Capital Entry in the Domestic Banking Market of Korea. Korean
Political Science Review, 39, 189-209.
LIN, T.-Y. & CHIU, S.-H. (2013). Using independent component analysis and network DEA
to improve bank performance evaluation. Economic Modelling, 32, 608-616.
LIU, J. S., LU, L. Y., LU, W.-M. & LIN, B. J. (2013). A survey of DEA applications. Omega,
41, 893-902.
LO, S.-F. & LU, W.-M. (2006). Does size matter? Finding the profitability and marketability
benchmark of financial holding companies. Asia-Pacific Journal of Operational
Research, 23, 229-246.
LU, W.-M., WANG, W.-K. & KWEH, Q. L. (2014). Intellectual capital and performance in
the Chinese life insurance industry. Omega, 42, 65-74.
LUO, X. (2003). Evaluating the profitability and marketability efficiency of large banks: An
application of data envelopment analysis. Journal of Business Research, 56, 627-635.
MCKINNON, R. I. (1973). Money and Capital in Economic Development, Washington DC,
Brookings Institution.
MILLER, S. M. & NOULAS, A. G. (1996). The technical efficiency of large bank
production. Journal of Banking & Finance, 20, 495-509.

POSTGRADUATE CONFERENCE ON ECONOMICS, PUBLIC ADMINISTRATION AND
BUSINESS (PCEPAB)-5TH SEPTEMBER, 2015
PROMOTING GOWTH, EXCELENT AND SUSTAINABILITY - 134
MÜLBERT, P. O. (2009). Corporate Governance of Banks. European Business Organization
Law Review, 10, 411-436.
PARKAN, C. (1987). Measuring the efficiency of service operations: an application to bank
branches. Engineering Costs and Production Economics, 12, 237-242.
RANGAN, N., GRABOWSKI, R., ALY, H. Y. & PASURKA, C. (1988). The technical
efficiency of US banks. Economics Letters, 28, 169-175.
REINHART, C. M. & TOKATLIDIS, I. (2003). Financial liberalisation: the African
experience. Journal of African Economies, 12, ii53-ii88.
SEIFORD, L. M. & ZHU, J. (1999). Profitability and marketability of the top 55 US
commercial banks. Management Science, 45, 1270-1288.
SHAW, E. (1973). Financial Deepening in Economic Development, New York, Oxford
University Press.
SHERMAN, H. D. & GOLD, F. (1985). Bank branch operating efficiency: evaluation with
data envelopment analysis. Journal of Banking & Finance, 9, 297-315.
STURM, J.-E. & WILLIAMS, B. (2004). Foreign bank entry, deregulation and bank
efficiency: Lessons from the Australian experience. Journal of Banking & Finance,
28, 1775-1799.
THANASSOULIS, E. (1999). Data Envelopment Analysis and Its Use in Banking. Interfaces,
29, 1-13.
TINAIKAR, S. & XUE, S. Product market competition and earnings management: some
international evidence. Rutgers Business School 20th Anniversary Conference on
Financial Economics and Accounting. November, 2009. 13-14.
TONE, K. & TSUTSUI, M. (2009). Network DEA: a slacks-based measure approach.
European Journal of Operational Research, 197, 243-252.
TONE, K. & TSUTSUI, M. (2010). Dynamic DEA: a slacks-based measure approach.
Omega, 38, 145-156.
TONE, K. & TSUTSUI, M. (2014). Dynamic DEA with network structure: A slacks-based
measure approach. Omega, 42, 124-131.
WANG, W.-K., LU, W.-M. & LIU, P.-Y. (2014). A fuzzy multi-objective two-stage DEA
model for evaluating the performance of US bank holding companies. Expert Systems
with Applications, 41, 4290-4297.
WANKE, P., BARROS, C. P. & FARIA, J. R. (2014). Financial distress drivers in Brazilian
banks: A dynamic slacks approach. European Journal of Operational Research.
WILLIAMS, J. & NGUYEN, N. (2005). Financial liberalisation, crisis, and restructuring: A
comparative study of bank performance and bank governance in South East Asia.
Journal of Banking & Finance, 29, 2119-2154.
YEH, Q.-J. (1996). The application of data envelopment analysis in conjunction with
financial ratios for bank performance evaluation. Journal of the Operational Research
Society, 980-988.

POSTGRADUATE CONFERENCE ON ECONOMICS, PUBLIC ADMINISTRATION AND
BUSINESS (PCEPAB)-5TH SEPTEMBER, 2015
PROMOTING GOWTH, EXCELENT AND SUSTAINABILITY - 135
A Review of Information System-based Decision Making on
Prosperous Relationship Marketing
Morteza Jamalzadeh
Faculty of Business and Accountancy, University of Malaya
50603 Kuala Lumpur, Malaysia
Nasrin Azar
Faculty of Business and Accountancy, University of Malaya
50603 Kuala Lumpur, Malaysia
Quah Chee Heong
Faculty of Business and Accountancy, University of Malaya
50603 Kuala Lumpur, Malaysia
Abstract
Information Systems (IS) is widely addressed amongst marketing literature in recent years. However, a working
definition and implementation of Information Systems is hard to come by among marketers and managers. This
study aim to review the role of Information System in decision making process and understand the extent to
which relationship marketing can be successful in firms. The study further extends knowledge on the conceptual
frameworks of decision making and effect of information system throughout the processes.
Keywords: Decision Making; Information Systems; Relationship Marketing; Success.
1 Introduction Old-fashioned marketing concentrated on trade of low-value products to high numbers of
consumers (Hau & Ngo, 2012). The idea of marketing grew out of economics with an early
bias toward distribution activities and efficiency of marketing channels. There are limited
practical outlines for a mutual relationship with customers have been proposed (Nijssen &
Frambach, 2001). However, a customer-based principle began to take shape as relationship
marketing thinking emerged. It is observed that firm-to-firm relationships were not the
traditional marketer-marketing relationship, but a cooperative existence between firms,
known as symbiotic relationships.
It is noted that the tendency of firms to improve longer interactions with main clients and key
suppliers, outweighing the focus on isolated contacts and providing impetus to relationship
marketing thinking. In this marketing model customer based approach and relationship
importance was replaced with traditional market-based or product-based models (Sarshar, et
al., 2010). Relationship marketing and information systems has been adopted enthusiastically

POSTGRADUATE CONFERENCE ON ECONOMICS, PUBLIC ADMINISTRATION AND
BUSINESS (PCEPAB)-5TH SEPTEMBER, 2015
PROMOTING GOWTH, EXCELENT AND SUSTAINABILITY - 136
in many businesses since it was proven to provide a competitive advantage in the business
and decision making process.
Many association in major industries implemented such system with the same objective in
mind, to increase their revenue stream and to provide better customer service. The promise of
relationship marketing and information systems in businesses proved so alluring that many
adopted such marketing programs has little or no consideration of the feasibility of the
relationship marketing and information systems with the nature of their businesses (Sarshar,
et al., 2010). In this sense, companies might find the marketing information systems useful to
provide affiliate programs that adopted and the contents are viable and do interest of
consumers and effect positively on their decisions towards the products and services.
Therefore, information systems in decision making process become very important and firms
cannot neglect the issue if proper consideration on the feasibility and practicality of the
knowledge and information system was not taken into consideration.
2 Literature review 2.1 Information System in Firms
Formerly, large businesses were successful to resolve the issues of computer systems, which
have been adapted in their organizations. Typically, the problems occur in collecting, saving
and spreading the available data or the scattered data in their organizations. Besides, the
management has practiced hand-off attitude on this matter. Therefore, all the staff was
responsible in data processing, to prepare the information that they need in any particular of
time.
There are changes in computer architecture system and computerization approach parallel to
the technology improvement. Thus, the management starts aware on the important of
information system in their organizations. Therefore, these companies and firms try to apply
information system in their organizations (Yeh, et al., 2012). At the beginning, most of them
have facing computer literacy problem. This problem especially affected on those managers
in the operation and middle level. It is because most of them had never been exposed to the
computer usage and the role of information.
On the contrary, they have been exposed on the management theories as the problems-solving
tools. As the result, they cannot identify the importance of information system. At that time,
most of the data processing staffs were so disappointed with this scenario. This is because
most of them were poor in management theories. Therefore, they have creating and
developing information system, where they think it is the most suitable and accurate system
for these managers usage (Sääksjärvi & Talvinen, 1993). However, there is lots of situation
where the system was ignored, as it is not reach these managers’ requirement.
Nevertheless, later, the managers in operation and middle level have prepared themselves in
computer knowledge and information system. Then, they are starting to understand the
problem solving and decision making process logic, thus they can identify the information
that they need. In the meantime, the data processing staffs also preparing themselves in
management theories, thus they can co-operate with these managers in creating information
system. As the result, information system was created and developed in favorable to the
managers. Finally, it is necessary to develop information system for all companies and firms
throughout the world (Yeh, et al., 2012; Oakford & Williams, 2011).

POSTGRADUATE CONFERENCE ON ECONOMICS, PUBLIC ADMINISTRATION AND
BUSINESS (PCEPAB)-5TH SEPTEMBER, 2015
PROMOTING GOWTH, EXCELENT AND SUSTAINABILITY - 137
Information Systems has meant deploying new technology solutions, such as content or
document management systems, data warehousing or portal applications. Overall, it would
not be easy to have an effective information management. There are many organizations
having issues in the integration of an information management environment. The reasons are
because of too many systems for integration, unlimited requests and demands from end users,
and complexity in organization management and the nature of business (Yeh, et al., 2012).
Marketing information system is not confined to just technology but is also involved in the
business process where it underpins the creation and use of information.
2.2 Concept of Relationship Marketing
There is a constant paradigm shift in marketing in the past few decades (Hau & Ngo, 2012).
The relationship marketing is a relatively new area that gained popularity in most industries
and field research. Many scholars have indicated that merely depending on marketing mix
variables will not be sufficient to attract or to retain customers in the industries. Commercial
companies lack differentiation in their product and services.
Competitive pricing and attractive promotions by the firms have tremendously increased the
customer loyalty. Thus, the traditional approach of marketing mix variables is not adequate to
serve the current market needs (Hau & Ngo, 2012). Many scholars have agreed that
relationship marketing strategies is an important tool for many companies to improve
customer retention and profitability. The study further elaborates that relationship marketing
is aimed at delivering long-term value and satisfaction to customers (Hau & Ngo, 2012).
Relationship marketing requires all the departments in a company to work together as a team
to serve the customers and subsequently to retain them with the organization. The study view
relationship marketing as maintaining continuous relationship and creating potential
customers. According to one study, relationship marketing is also known as real customer
understanding which is about how companies retain existing customers and establish long -
term relationship (Kaur, et al., 2012).
Therefore, relationship marketing can be summarized as establishing and developing strong
and lasting relationship with customers (Cravens, 1998). Having defined on interpretation of
relationship marketing, the next obvious question is why an organization needs relationship
when it can market its products on its own. While an organization might have a huge
infrastructure or has a really successful product, it definitely cannot bank on its own strength
by its own.
Hence, relationship marketing would come into the picture. The needs for relationship plays
an essential part as the affiliate web site does not only customize the look and feel of the web
site to cater with the taste of the various local markets but it also helps to solve the
complexity in terms of technical and marketing demands. Further to this, each website does
enjoy a certain niche market (Kaur, et al., 2012). Hence, by engaging in an affiliate, it helps
to facilitate direct communication between the sellers and the niche market of the site.
These helps to boost profit and enhance online brand awareness. Relationship marketing is an
essential part of marketing in any e-commerce website and in fact most non e-commerce sites
could utilize this technology to implement performance marketing campaigns. Furthermore,
when the researcher compared relationship marketing to a brick and mortar business,
relationship marketing has a prior advantage as there is no heavy investment cost incurred

POSTGRADUATE CONFERENCE ON ECONOMICS, PUBLIC ADMINISTRATION AND
BUSINESS (PCEPAB)-5TH SEPTEMBER, 2015
PROMOTING GOWTH, EXCELENT AND SUSTAINABILITY - 138
and it is negligible with most programs being free to join (Hau & Ngo, 2012). In addition,
there is no need to maintain an inventory since the hassle of purchasing, stocking of items
and storing of finished items and dispatching the items are handled by the merchant.
Necessity for customer service does not arise if using a relationship marketing methodology
(e.g. Information Systems) for online business. This is due to that customer services that
plays a major role in the success or failure of a business does not pose any threat as there is
no direct dealing with the customers. The affiliate’s site will automatically direct the traffic,
or rather the customers to the merchant. Though it is not every marketers who earns a big
income, the fact remains that the attractive feature of relationship marketing is that there is no
restriction of the market. This improves the market data collection for future use using
knowledge management system and effect the decision making process in the organization.
2.3 IS-based Decision Making
Organizations should manage marketing information in an organized form to ensure better
decision making process. It can be possible through managing their information system
within the firm. The researchers have clearly identified two types of decision making:
programmed and unprogrammed. The programmed type which is leading to a long term
objectives and it has been followed with well planning and strategic analysis.
On the other hand, the unprogrammed type consists of those decisions accrue in the
operational environment without any planning. The decision making processes has been
divided to two basic types: Classic and Administrative (George & Jones, 2005). The classic is
being practiced everyday through our routine; starting by using alternative solutions then
select the best solution. But by looking at the other side which is the administrative view,
managers will look at the previous experiences to take an advantage in processing the
decision.
The most important stage in decision making process is a decision itself; usually the leader or
the manager has the authority to making the decision. But before making the decision, the
manger will have to test this decision, which means the manager will make sure that decision
is following the correct structure. The manager should also determine any common decisions
to avoid any past mistakes and weaknesses. A manager will be making the decision surely
within the discussion, but obviously he/she will have his/her own decision.
Here it shows us how the manager will deal with the decision. Because actually no manager
makes a decision individually, it involves the team as well but it depends how the manager is
interacting with their ideas and suggestions. The team members should be involving in the
discussion, but unfortunately not all the members are participating which makes the decision
harder for the manager. And sometimes the leader himself/herself is not interacting with the
members, because the manager will be satisfied with his/her own decision.
Yet communication is always taking a place while making a decision even though is
dependent issue (Mind.Tools.Community, 2010). In addition, in situation where it needs a
quick decision, marketing information system can help to decide fast and accurate at the same
time. This is all done by implementing knowledge environment so employees will be
expected such a similar decision to be made immediately.
Decision support system (DSS) is also an option in this issue since it is a computer-based
decision. Organizations can practice their employees with this type of decision by learning

POSTGRADUATE CONFERENCE ON ECONOMICS, PUBLIC ADMINISTRATION AND
BUSINESS (PCEPAB)-5TH SEPTEMBER, 2015
PROMOTING GOWTH, EXCELENT AND SUSTAINABILITY - 139
lessons from the previous experiences or similar situations by using information systems
(Bakhrankova, 2010). The organization can also train their employees into scenario training
so they will be qualified to deal with emergency cases. Group meetings will be a good idea to
evaluate the results behind that decision, so the employees can have it as references for
further or similar situations.
2.4 Decision Making Constituents
A study has managed to do some connectivity between explicit knowledge in information
system and decision making process (Nicolas, 2004). He has categorized decision making
into 3 phases Intelligence, conception and selection processes. “The intelligence phase
represents the phase of problem definition. Individuals involved in the decision making
process have to find reflective elements and to manage ignorance”.
It is basically the process of intelligence of having an ability to define the problem into
explicit knowledge. Managers will have a good idea about the problem, but they will need to
demonstrate their knowledge about the problem to the members in order to serve each
element of the problem.
At this phase, knowledge will be transferring from individual to other till all the members get
a very deep idea about the problem overview.
After determining the problem, the process will reach to have a decision making action.
Managers will offer their solutions, and there will practice knowledge sharing, ideas
analyzing, discussions and brainstorming processes. Every individual will have his own
concept towards the problem, and the tacit knowledge will be demonstrated here since each
individual is willing to share his/her solution.
This phase (conception) will have a creativity element of establishing solutions, all the
members will be involving in the brainstorming process in order to have a very complex
collection of solution, and that’s what the mangers want (Nicolas, 2004). After reaching to
the confliction point, which is the complexity of solutions; then they will need to move to the
selection phase. The selection phase will include all the possible solutions, the members will
need to analyze all the alternatives and then generate the decision by choosing the best
solution.
Tacit knowledge from information system is very important here, because in order to support
the suggested solution; members will need to demonstrate their tacit knowledge into explicit
view to explain the reasons and analysis. Most of the employees will have great suggestions,
but they will face the problem of ingoing transferring the tacit knowledge (Nicolas, 2004).
That’s why it’d advisable to have a variety of communication and presentation skills in order
to demonstrate the views, ideas and suggestion in very profession method.
This research focused on decision making process into the knowledge environment, which
means it relies on the managerial decision making. Ahmed (2008) has defined the identified
the decision making as follow “the process of selecting from several choices, products or
ideas, and taking action”. This definition is considered as the globalization concept of
decision making process, and under any situation. The definition cover the overall steps to
make a decision from defining objectives, generating ideas then making a decision.

POSTGRADUATE CONFERENCE ON ECONOMICS, PUBLIC ADMINISTRATION AND
BUSINESS (PCEPAB)-5TH SEPTEMBER, 2015
PROMOTING GOWTH, EXCELENT AND SUSTAINABILITY - 140
Ahmed (2008) has redefined the steps into his research about managerial decision making.
The steps as follows: Identify the problem; Generate alternative solutions; choose the best
alternative and lastly implement and monitor the chosen solution. After that Ahmed (2008)
has mapped the four steps to the four functions of management Planning, Organizing,
Leading and Controlling. It might look simple to have the four functions implemented, but
apparently the four functions need a lot of effort and hard work. The planning phase is
determined and done by the top and middle managers since it requires determining the
strategic goals behind the problem.
Organizing is the first important function into decision making process. The managers or
leaders will have to ensure the sharing knowledge activity between employees and in the
organization as a whole. If the organization follows the thinking environment tools and
features; they will successfully implement the organizing function. Organizations are advised
to implement information and knowledge environment to encourage all the employees work
together, support them to share the valuable knowledge (Ahmed, 2008). The leading function
is done after the decision has made, managers have to coordinate all the activities regarding
that decision to have an overall idea about it.
Managers will have to spend more effort to coordinate the action in a way to prove the
decision was made is working properly. The controlling function is the second important
function, managers will need to monitor and evaluate the results of that decision. As
mentioned before, organization will have a great repository of all the decisions and its results.
The evaluation reports will bring a lot of benefits to the organization since it will make the
database full of decision making experiences (Ahmed, 2008).
Overall, the abovementioned steps need delicate information system facilitating decision
making process. With higher level of experience, the companies and firms are getting more
interested in implementation of IS in their organization. In the meantime, the operation and
middle level managers are adjusting with the existing system. All operation and middle level
managers can accept the IS concept, where they can combine the data and the software that
fulfil their need and requirements for decision making (Wright & Ashill, 1998).
Further, the objectives of information systems in today world of businesses can be different
based on the nature of the business. The purpose of information system is to minimize the
management needs in understanding the computer techniques and help them with better and
faster decisions. Therefore, improving its capacity and capability in order to adapt it with the
management-working environment has restructured the marketing information system and
decision making process in general.
Information system did contribute to the problem solving and decision making where it
prepares the organization wide information resources. Therefore, the top management should
give their official commitment on its operation and try to provide the computer tools to the
operation and middle level managers. The existence of marketing information system gives
benefits to these managers, as the essential information is supplied to them unceasingly.
3 Conclusion This endeavor shed light on the key role of information systems in decision making process
for successful relationship marketing in firms. The paper has reviewed several methods and
constructs related to decision making processes and explained the role of information system

POSTGRADUATE CONFERENCE ON ECONOMICS, PUBLIC ADMINISTRATION AND
BUSINESS (PCEPAB)-5TH SEPTEMBER, 2015
PROMOTING GOWTH, EXCELENT AND SUSTAINABILITY - 141
on these processes. It also enhanced the idea about how knowledge within information
system can improve the process of decision making. This paper also presented the importance
of relationship marketing context and decision making components. According to the
reviews, using information system to learn basic knowledge on the problems, managers in
organization can make fast and agile decisions that would not be possible without. Further
investigation is suggested to clear out the role of information systems in decision making
process and the link to successful relationship marketing.
References
Ahmed, Q., 2008. Managerial Decision Making. [Online] Available at:
http://www.slideshare.net/greatqadirgee4u/managerial-decision-making [Accessed July
2013].
Bakhrankova, K., 2010. Decision support system for continuous production. Industrial
Management & Data Systems, 110(4), pp. 591 - 610.
Cravens, D. W., 1998. Examining the impact of market-based strategy paradigms on
marketing strategy. Journal of Strategic Marketing, 6(3), pp. 197-208.
George, J. & Jones, G., 2005. Understanding and managing organizational behavior. Ohio:
Prentice Hall.
Hau, L. N. & Ngo, L. V., 2012. Relationship marketing in Vietnam: an empirical study. Asia
Pacific Journal of Marketing and Logistics, 24(2), pp. 222-235.
Hau, L. N. & Ngo, L. V., 2012. Relationship marketing in Vietnam: an empirical study. Asia
Pacific Journal of Marketing and Logistics, 24(2), pp. 222 - 235.
Kaur, u., Sharma, R. & Mahajan, N., 2012. Exploring customer switching intentions through
relationship marketing paradigm. International Journal of Bank Marketing, 30(4), pp. 280 -
302.
Mind.Tools.Community, 2010. Introduction to decision making techniques: A systematic
Approach to decision making.[Online] Available
at:http://www.mindtools.com/pages/article/new TED_00.html[Accessed July 2013].
Nicolas, R., 2004. Knowledge management impacts on decision making process. Journal of
Knowledge Management, 8(1), pp. 20 - 31.
Nijssen, E. J. & Frambach, R. T., 2001. Creating customer value through strategic marketing
planning: A management approach. Boston: Kluwer Academic Publishers.
Oakford, A. & Williams, P., 2011. The use and value of local information systems: A case
study of the Milton Keynes intelligence (MKi) Observatory. Aslib Proceedings, 63(5), pp.
533 - 548.

POSTGRADUATE CONFERENCE ON ECONOMICS, PUBLIC ADMINISTRATION AND
BUSINESS (PCEPAB)-5TH SEPTEMBER, 2015
PROMOTING GOWTH, EXCELENT AND SUSTAINABILITY - 142
Sääksjärvi, M. V. & Talvinen, J. M., 1993. Integration and Effectiveness of Marketing
Information Systems. European Journal of Marketing, 27(1), pp. 64 - 80.
Sarshar, M., Sertyesilisik, B. & Parry, P., 2010. The extent of use of relationship marketing in
the UK FM sector. Facilities, 28(1/2), pp. 64 - 87.
Wright, M. & Ashill, N., 1998. A contingency model of marketing information. European
Journal of Marketing, 32(1/2), pp. 125 - 144.
Yeh, C.-H., Lee, G.-G. & Pai, J.-C., 2012. How information system capability affects e-
business information technology strategy implementation: An empirical study in Taiwan.
Business Process Management Journal, 18(2), pp. 197 - 218.

POSTGRADUATE CONFERENCE ON ECONOMICS, PUBLIC ADMINISTRATION AND
BUSINESS (PCEPAB)-5TH SEPTEMBER, 2015
PROMOTING GOWTH, EXCELENT AND SUSTAINABILITY - 143
Investors’ vulnerability to anchoring and adjustment,
representativeness and availability heuristics: A comparative
analysis of Malaysian and Pakistani Stock Markets
Habib Hussain Khan
Department of Finance and Banking, University of Malaya
Iram Naz
Muhammad Ali Jinnah University, Islamabad, Pakistan
Fiza Qureshi
University of Sindh, Jamshoro, Pakistan
Abdul Ghafoor
Department of Finance and Banking, University of Malaya
Abstract
Applying both quantitative and qualitative approaches, we study (i) the influence of heuristics (anchoring and
adjustment, representativeness and availability) on investors’ stock buying behavior, (ii) influence of
demographic factors (age, gender, education, experience and income) on level of heuristics, (iii) comparison
between Malaysian and Pakistani investors in their susceptibility to these biases, and (iv) whether heuristics
influence the investors differently when they make buy decisions for themselves and/or for clients. Self-
constructed questionnaires were administered to investors in stock exchanges in Pakistan and Malaysia to
secure data using convenient sampling. Data has been analyzed through items’ description, ANOVA, t-test, correlation and quantile regression. Results from descriptive analysis indicate presence of all three heuristics
among investor in course of their stock buying decision. These findings are also supported by results from
regression and correlation analyses. Demographic factors have significant correlation with level of heuristics
indicating that investors in high age, education and experience groups have lower level of heuristics. Level of
heuristics is significantly different for both countries with Malaysia having slightly lower averages however
impact of heuristics is not different across Malaysia and Pakistan. Across types of investors, the impact of
heuristics is higher when purchase decisions are made on behalf of their clients.
Key Words: Heuristics, Anchoring and adjustment, Availability, Representativeness, Stock
Buying Behavior
1. Introduction
Mental shortcuts (as opposed to thorough information gathering and analysis) in decision
making process are referred to as “heuristics”. Although heuristics can be helpful in many
situations; they often lead to biased decisions (Tversky & Kahneman, 1974). Use of
heuristics in financial decision making is well-established phenomenon in behavioral
economics/finance literature [see for example (De Bondt & Thaler, 1985; Bernard & Thomas,
1989; De Bondt & Thaler, 1990)]. Literature provides many examples of poor decision
making such as selling winners too early and holding losers too long, and excessive trading
(Odean, 1998), under-diversification (Goetzmann & Kumar, 2008). Such behaviors
(anomalies) are observed in stock markets as against the assumptions of traditional finance

POSTGRADUATE CONFERENCE ON ECONOMICS, PUBLIC ADMINISTRATION AND
BUSINESS (PCEPAB)-5TH SEPTEMBER, 2015
PROMOTING GOWTH, EXCELENT AND SUSTAINABILITY - 144
theory but no satisfactory explanation of such behaviors exists in traditional finance theory.
However, behavioral finance tries to understand the underlying motivations behind such
irregular patterns (Subrahmanyam, 2008).
Some of the studies which have been carried out in context of stock market and behavioral
biases show that investors are greatly influenced by their behavioral characteristics. For
example Ariely, Loewenstein, and Prelec (2006) argue that judging the fundamental value of
the assets is a tough task so investors are likely to value their assets in relative terms, mostly
they become anchored to previous buy prices. Similarly, Barber, Odean, and Zhu (2009) find
that investors are likely to buy “attention grabbing” or “in news” stocks because these are
easy to recall. Moreover, investors tend to buy previously owned stocks because they can
easily recall them and also have some information about them.
Although literature recognizes the role of heuristics and biases in investors’ decisions to buy
or sell the stock, focus has mostly been on developed markets. A direct linkage between
heuristics and stock buying decision has not been established so distinctively in developing
countries. Economies in developing countries differ from those in developed countries in
term of political stability, law and order situations, technological development, use of
information technology, financial structure, income level and education etc. Similarly stock
markets and investors across developing and developed countries may also differ. Investors’
attitudes and behaviors are shaped by environmental factors and it is likely that such
behaviors are reflected in their decision making for example Pompian (2006) considers
education is an important tool to overcome heuristics and biases. Therefore behavioral biases
may work differently due to differences in education levels between developed and
developing countries. Moreover, early research in behavioral finance has mostly focused a
single heuristic and considered it to be operating independently. Nevertheless, the
developments in behavioral decision theory specify that different heuristics often operate
collectively and influence the decisions and predictions (Ganzach & Krantz, 1990, 1991;
Czaczkes & Ganzach, 1996). In this study we consider three heuristics namely anchoring and
adjustment, representativeness and availability in context of Malaysian and Pakistani stock
markets.
The methodology applied in behavioral studies differs in that they use qualitative approaches
to examine whether or not behavioral biases influence particular decisions however such
findings have not been tested using statistical methods. We use both qualitative and
quantitative approaches to study (i) the influence of heuristics (anchoring and adjustment,
representativeness and availability) on investors’ stock buying behavior, (ii) influence of
demographic factors (age, gender, education, experience and income level) on heuristics, (iii)
comparison between Malaysian and Pakistani investors in their susceptibility to these biases,
and (iv) whether heuristics influence the investors differently when they make buy decisions
for themselves and/or for clients.
Based on mixed approach (qualitative and quantitative), this study contributes towards
literature on behavioral finance in terms of its context (developing countries) and
methodological approach. The study has implications for financial decision makers in
Malaysia and Pakistan (such as private investors, financial brokers, fund managers, and
financial consultants) because the knowledge of relevant biases can prevent decision makers
from falling prey to these biases and hence irrational decisions. Self-constructed

POSTGRADUATE CONFERENCE ON ECONOMICS, PUBLIC ADMINISTRATION AND
BUSINESS (PCEPAB)-5TH SEPTEMBER, 2015
PROMOTING GOWTH, EXCELENT AND SUSTAINABILITY - 145
questionnaire is administered to investors in stock exchanges in Pakistan and Malaysia to
secure data using convenient sampling. Results from descriptive analysis show that all three
heuristics (Anchoring and Adjustment, Representativeness, and Availability) are likely to
influence investors’ stock buying. These findings are also supported by regression and
correlation analyses. Demographic factors have significant correlation with level of
heuristics. Level of heuristics is significantly different for both countries with Malaysia
having slightly lower averages however impact of heuristics is not different across Malaysia
and Pakistan. Across types of investors, the impact of heuristics is higher when purchase
decisions are made on behalf of their clients.
The study is organized as follows. Chapter 2 discusses the previous literature on our intended
variables. Chapter 3 represents the discussion on methodology and construction of
instrument. In Chapter 4, we report the results and discussion. Chapter 5 contains conclusion,
limitations and future direction of research.
2. Literature Review
The concept of heuristics was first introduced by Tversky and Kahneman (1974) who suggest
that under the situations of uncertainty, individuals use mental shortcuts or rule of thumb
strategies in decision making called “heuristics”. These heuristics turn complex situations
into simple cognitive operations. In many cases such “mental short-cuts” may prove to be
helpful in dealing with complex and uncertain situations; however there are greater chances
that they lead to biased decisions. In the following section we consider literature on three
heuristics; anchoring and adjustment, representativeness and availability one by one.
Although literature on anchoring and adjustment in context of capital market is not matured,
there are certain areas where anchoring is found to have significant role on financial
decisions. For example Degeorge, Patel, and Zeckhauser (1999) find that executives aim to
exceed salient EPS thresholds thus a specific level of ESP serves as anchor for executives
which influences their decision. Similarly investors are not ready to bid the stock prices high
enough when stocks are at or near their peak historical prices because they are anchored to
historical highest (George & Hwang, 2004).
Cen, Hilary, Wei, and Zhang (2010) and Cen, Hilary, and Wei (2013) observe that while
estimating the future success of firm, investors are anchored to historical averages. They also
find that for the firms with high industry median-adjusted forecasted earnings per share, stock
returns happen to be higher than for firms with low industry median-adjusted forecasted
earnings per share. They term this phenomenon as the cross-sectional anchoring of forecasted
earnings per share effect. Johnson, Schnytzer, and Liu (2009) find anchoring and adjustment
in financial market; in comparison to the horserace. They explain that the advantage given by
horse barrier position serves as anchor for horse betters’ probability judgment. Kaustia,
Alho, and Puttonen (2008) find significant anchoring effects in long-term future stock return
estimates in Scandinavian stock market. Williams (2010) finds that stock prices depend on
four things one being anchoring level. Campbell and Sharpe (2009) identify anchoring effect
of historical values in predictions of macroeconomic data such as the consumer price index or
non-farm payroll employment by professionals, resulting in significant forecast errors.
Corporate acquisitions are also found to be affected by anchoring bias (Baker, Pan, &
Wurgler, 2009). Anchoring and adjustment affects the extremity of earning forecasts (Amir &
Ganzach, 1998).

POSTGRADUATE CONFERENCE ON ECONOMICS, PUBLIC ADMINISTRATION AND
BUSINESS (PCEPAB)-5TH SEPTEMBER, 2015
PROMOTING GOWTH, EXCELENT AND SUSTAINABILITY - 146
Anchoring has also been reported to influence various types of decisions in many different
contexts. These include judicial sentencing decisions (Englich, Mussweiler, & Strack, 2006),
personal injury verdicts (Chapman & Bornstein, 1996), estimation of the likelihood of
diseases (Brewer, Chapman, Schwartz, & Bergus, 2007), job performance evaluation
(Latham, Budworth, Yanar, & Whyte, 2008), judges’ rankings in competitions (Ginsburgh &
Van Ours, 2003), and real estate acquisitions (Northcraft & Neale, 1987). In addition,
anchoring has been shown to influence intuitive numerical estimations (Wilson, Houston,
Etling, & Brekke, 1996), probability estimates (Plous, 1989), estimations of sample means
and standard deviations (Lovie, 1985) and estimates of confidence intervals (Block & Harper,
1991), sales predictions (Hogarth, 1981), Bayesian updating tasks (Lopes, 1991), utility
assessments (Schkade & Johnson, 1989), risk assessments (Lichtenstein, Slovic, Fischhoff,
Layman, & Combs, 1978), preferences of gambles (Lichtenstein & Slovic, 1971), perception
of deception and information leakage (Zuckerman, Koestner, Colella, & Alton, 1984),
negotiation outcomes (Ritov, 1996), and choices between product categories (Davis, Hoch, &
Ragsdale, 1986). Although we did not find a study that directly linked anchoring bias to
investors’ decision to invest in stocks but studies on anchoring and stock market do suggest
that it can influence such decision.
Literature on representativeness bias is however very limited as compared to anchoring and
adjustment bias. Yet there are studies which clearly indicate the role of representativeness in
financial decisions. For example Johnson (1983) studies the use of representativeness
heuristic in judgmental predictions of corporate bankruptcy and found that bankruptcy
probability judgments are governed by the assessed similarity of the corporate financial data.
Further forms of representativeness like base rate neglect and sample size neglect are tested
by Jacobs and Potenza (1991). They find that the judgment heuristic biases displayed by
adults are specific to the social domain and that they develop over time. However, greater use
of base rates develops at the same time in the object domain. Cox and Mouw (1992) find that
representativeness leads to misunderstanding of statistical concepts even when participants
can witness their unreasonable approach towards situation. Even after changing answers to
incorporate appropriate information related to situation, the post-test responses revealed the
presence of representativeness. Pham (1998) discovers that “how do I feel about it heuristics”
to be present in decision making. This heuristic arises when a representative of the target
exists in mind and it generates feelings.
Kahneman, Slovic, and Tversky (1982) apply representativeness bias to the world of sports
and find its role in different forms, such concepts can also be translated to financial decision
making (Pompian, 2006). For instance the concept of permitting the game “to go longer” in
order to increase the probability that the stronger player wins can also apply to investing,
where it is called time diversification, which refers to the idea that investors should spread
their assets across ventures operating according to a variety of market cycles, giving their
allocations plenty of time to work properly. Time diversification helps reduce the risk that an
investor will be caught entering or abandoning a particular investment or category at a
disadvantageous point in the economic cycle. It is particularly relevant with regard to highly
volatile investments, such as stocks and long-term bonds, whose prices can fluctuate in the
short term. Holding onto these assets for longer periods of time can soften the effects of such
fluctuations.

POSTGRADUATE CONFERENCE ON ECONOMICS, PUBLIC ADMINISTRATION AND
BUSINESS (PCEPAB)-5TH SEPTEMBER, 2015
PROMOTING GOWTH, EXCELENT AND SUSTAINABILITY - 147
The availability heuristic (a common cognitive strategy in human decision making) provides
an example of how the process of making a judgment influences the evaluation of relevant
events. People's judgments of probability and frequency of events are based on the ease with
which examples of those events come to mind (Tversky & Kahneman, 1973). Availability is
reported to affect decision making in different spheres of lives for example Folkes (1988)
finds that availability influences the judgments about product performance. Similarly Barber
and Odean (2002) discover that investors tend to invest in attention grabbing stocks because
choosing a suitable stock or group of stocks need considerable effort and time because there
are thousands of stocks available in the market. Investors however tend to limit their search to
only attention grabbing stocks. They also found that during high trading days the purchase of
stocks was nearly twice as compared to normal trading days also they tend to buy more
stocks of companies that are in the news. Investors behave like this because they tend to buy
more on high attention days. Their most relevant finding was that, attention grabbing stock
which investors buy due to the availability bias did not beat the market and they never earn
abnormal profits. Barber and Odean (2002) illustrate a direct practical application of
availability bias in individual finance: investors tend to deviate from rationality because they
lack time, resources and skills to process huge volume of data that ought to contextualize a
truly “rational” stock purchase. Information that is literally available to investors simply isn’t
always cognitively available. When pertinent information isn’t available in this latter,
practical sense, decisions are ultimately flawed.
3. Methodology
3.1 Population, Sample, Analysis Technique
Active investors and brokers in Pakistani and Malaysian stock markets constitute population
of this study. Considering the typical nature of population, convenient sampling has been
used and a total of 1000 questionnaires are served to investors at Pakistani and Malaysian1
Stock Exchanges for data collection. We received approximately 300 responses (160 from
Pakistan and 140 from Malaysia), however; we dropped some questionnaires for
incompleteness. A total of 240 usable questionnaires were used in data analysis (144 from
Pakistan and 96 from Malaysia). Following conventions in behavioral studies, items
descriptive analysis has been used as main approach to analyze data whereas t-test, ANOVA,
correlation and quintile regression analyses have been used as supplementary approach for
robustness check.
3.2 Instrument for Data Collection
To capture the presence/absence of heuristics under study, we develop a questionnaire with
the help of and inspiration from Pompian (2006). In addition to three heuristics (anchoring
and adjustment, representativeness, and availability) we also construct a variable for stock
buying behavior which measures investors’ inclination to invest in stocks as compared to
other investment opportunities i. e. bonds etc. The questionnaire was pilot tested in two
stages and checked for validity and reliability so that it can be used for statistical analysis
1In case of Malaysia, some questions were slightly changed to incorporate local currency in numerical examples

POSTGRADUATE CONFERENCE ON ECONOMICS, PUBLIC ADMINISTRATION AND
BUSINESS (PCEPAB)-5TH SEPTEMBER, 2015
PROMOTING GOWTH, EXCELENT AND SUSTAINABILITY - 148
such as regression and correlation2. Generalizability of this questionnaire may however be
limited because of specific characteristics of population.3 The questionnaire consists of 28
questions (excluding demographic factors such age, gender, education, experience and
income), each item captures the response on 5 point likert scale (from strongly disagree to
strongly agree). (Questionnaire can be obtained from author if required)
4. Results and Discussion
Items descriptive analysis is conducted as primary analysis technique to explain most
frequent response of investors to different aspects of heuristics under study. As additional
techniques, data has been analyzed through t-test, ANOVA correlation, and quintile
regression. Descriptive analysis of items shows the frequency of investors’ responses to a
particular question, which can be interpreted in term of presence or absence of particular bias.
For example if more frequent responses on a five point likert scale (from strongly disagree to
strongly agree) are 4 or 5, this would mean an “agree” for 4 and “Strongly agree” for 5,
responses to the question. This can be interpreted as the presence of a particular aspect of
bias. Following section presents the descriptive analysis of each item in questionnaire aimed
at capturing the particular aspect of intended bias.
4.1 Items’ Descriptive Analysis
Table 1 presents the percentage responses to each question for anchoring and adjustment
from both Malaysia and Pakistan. A particular heuristic is said to be “present among
investors” if sum of responses for both strongly agree and agree dominates sum of responses
for strongly disagree and disagree.
Question 1 is posed to check the tendency of the investors to make general market forecasts
that are too close to current levels. Agree versus disagree numbers (%) are 56.2 and 6.2
respectively for Malaysia whereas for Pakistan they are 52.8 and 9 respectively. Second
question measures the investors’ tendency to anchor their forecasts on historical minimum or
maximum prices. Responses for this question are 96.9% (agree) versus 3.1% (disagree) for
Malaysia and 91% and 9% for Pakistan. Third question gauges the tendency of investors to
make a forecast of the percentage that a particular asset class might rise or fall based on the
current level of returns, and to capture the investors’ tendency to anchor their forecasts for
prices on most recent historical percentage increase or decrease. For Malaysia, the responses
are 76.1 (agree) versus 14.5 (disagree), while for Pakistan these are 80.5 versus 13.4.
Investors are likely to anchor on the current economic conditions of a particular country; to
measure this tendency question 4 is asked. Responses for Malaysia are 51 versus 9.3 and 49.3
versus 9.8 for Pakistan. Investors, who are biased with anchoring and adjustment, tend to
anchor on historical maximum or minimum stock prices; question five measures this
phenomenon. Responses to this question are 13.5 versus 46.8 for Malaysia and 47.3 versus
13.2 for Pakistan. In question six, five point measurement scale includes two options (4 and
5) very close to the given value of 900,000 representing high level of anchoring, while other
options were fairly away from this value with option 1 exactly 10% less of this value. In case
of Malaysia the responses for option “4” and “5” are 73.9 versus 21.9 for option 1 and 2; for
2 Factor analysis is used to for validity, whereas Cronbach's alpha for reliability. Cronbach's alpha in case of
each group of questions is more than 0.6. 3 For example it may only be used to analyze the buying behavior of investors in stock market.

POSTGRADUATE CONFERENCE ON ECONOMICS, PUBLIC ADMINISTRATION AND
BUSINESS (PCEPAB)-5TH SEPTEMBER, 2015
PROMOTING GOWTH, EXCELENT AND SUSTAINABILITY - 149
Pakistan, these responses are 75.7 versus 20.2 respectively. Question seven measures the
phenomena that investors, who are exposed to anchoring and adjustment, tend to anchor to
current economic conditions of a particular company.

POSTGRADUATE CONFERENCE ON ECONOMICS, PUBLIC ADMINISTRATION AND
BUSINESS (PCEPAB)-5TH SEPTEMBER, 2015
PROMOTING GOWTH, EXCELENT AND SUSTAINABILITY - 150
Table 1: Percentage Responses to questions on Anchoring and Adjustment
Questions for Anchoring and Adjustment Responses in %
Malaysia Pakistan
1 Suppose that KSE-100 Index is currently at 13500, in your opinion, KSE-100 index at
the end of year 2012 would be somewhat closer to the current level.
SDA DA N A SA
1.0 5.2 37.5 47.9 8.3
SDA DA N A SA
1.4 7.6 38.2 49.3 3.5
2 Suppose you own a stock that is now at 52 weeks highest price level, you are likely to
sell the security at this price level because in your opinion, it has achieved the maximum
price level.
SDA DA N A SA
0.0 3.1 0.0 55.2 41.7
SDA DA N A SA
1.4 4.9 2.8 52.1 38.9
3 Suppose price of a stock increased by 17% during the last year. Then the expected
increase in this stock till the end of current year would be somewhat closer to 17%.
SDA DA N A SA
1.0 13.5 9.4 41.7 34.4
SDA DA N A SA
3.5 9.7 6.3 45.8 34.7
4 Overall economic growth of Pakistan has been declining for the past many years. You
foresee a similar trend of growth in coming years.
SDA DA N A SA
1.0 8.3 39.6 45.8 5.2
SDA DA N A SA
3.5 6.3 41.0 44.4 4.9
5 Suppose you bought the stock of ABC Corporation at RS 12. Couple of months ago, the
stock reached at RS 20. You thought to sell it then but somehow you could not.
Unfortunately the stock dropped to RS 15 and currently trading at 15. Now to sell this
stock, you are likely to wait until it returns to RS 20.
SDA DA N A SA
3.1 43.8 39.6 12.5 1.0
SDA DA N A SA
0.7 46.5 39.6 8.3 4.9
6 Suppose you want to sell your house. Your real estate agent prices your home at
900,000. You did not receive any bids for some days. One day your agent tells you that
local real estate prices are down by 10% on average and that you must also revise your
ask price. Your new price is most likely to be closer to:
SDA DA N A SA
16.7 5.2 4.2 65.6 8.3
SDA DA N A SA
16.0 4.2 4.2 69.4 6.3
7 Suppose that stock of ABC Corporation has outperformed the market for past several
years, considering its past, this stock is expected to show similar performance in future.
SDA DA N A SA
0.0 7.3 4.2 83.3 5.2
SDA DA N A SA
1.4 5.6 3.5 84.0 5.6
***SDA=Strongly Disagree, DA= Disagree, N=Neutral, A=Agree, SA=Strongly Agree

POSTGRADUATE CONFERENCE ON ECONOMICS, PUBLIC ADMINISTRATION AND
BUSINESS (PCEPAB)-5TH SEPTEMBER, 2015
151
Responses for this question are 88.5 versus 7.3 in case of Malaysia and 89.6 versus 7 in case of
Pakistan.
Collectively sum of “agree” and “strongly agree” responses dominates the sum of “disagree” and
“strongly disagree “options in nearly all of the questions except for question 5 where opposite is
true. Respondents’ agreement in general to all questions (except one) supports the presence of
anchoring and adjustment. The questions are posed to gauge whether or not the investors behave
in predicted ways under anchoring and adjustment. Their agreement to such actions confirms that
they are likely to make decisions which are under the influence of anchoring and adjustment.
Moreover, the responses from investors in Malaysia and Pakistan are on average similar
therefore we conclude that vulnerability of investors to anchoring and adjustment is same across
these two countries.
Table 2 shows investors’ responses to each question for representativeness from Malaysia and
Pakistan. Interpretation of responses is same as in case of anchoring and adjustment. Question 8
measures the phenomena that while judging the likelihood of a particular investment outcome,
investors often fail to accurately consider the sample size of the data on which they base their
judgments. The responses are 84.4 versus 9.4 and 84 versus 8.3 for Malaysia and Pakistan
respectively. Similarly the investors, who are biased with representativeness, tend to neglect the
sample size while analyzing the performance of stocks, questions 9 measures this phenomenon.
Responses are 83.4 versus 5.2 and 87.5 versus 6.9 for Malaysia and Pakistan respectively.
Question 10 measures the fact that representativeness heuristic can lead investors to ignore the
base reality and consider a given characteristic as representativeness of whole the scenario.
Responses to this question are 87.5 versus 7.3 for Malaysia and 84 versus 6.3 for Pakistan.
Question 11 gauges the investors’ tendency to determine the potential success of an investment
in a company by contextualizing the venture in a familiar, easy-to-understand classification
scheme is known as base rate neglect. For Malaysia, the responses are 57.2 versus 6.3 whereas
for Pakistan these are 61.9 versus 3.5. Question 12 measures the investors’ tendency to ignore
the base reality. Responses for Malaysia are 86.5 versus 7.3 while for Pakistan, responses are
86.1 and 9.6. Investors’ tendency to show base rate neglect was further confirmed by asking the
question 13. Responses are 81.3 versus 13.5 and 80.6 versus 14.6 for Malaysia and Pakistan
respectively.

POSTGRADUATE CONFERENCE ON ECONOMICS, PUBLIC ADMINISTRATION AND
BUSINESS (PCEPAB)-5TH SEPTEMBER, 2015
152
Table 2: Percentage Responses to questions on Representativeness
Questions for Representativeness Responses in %
Malaysia Pakistan
8 Suppose you are not satisfied with your analyst’s tips about stock purchase. Your friend
tells you about his own analyst that he gave him three great stock picks over the past
month. You are likely to consider your friend’s analyst as “successful” and decide to
switch to this analyst.
SDA DA N A SA
4.2 5.2 6.3 17.7 66.7
SDA DA N A SA
1.4 6.9 7.6 13.2 70.8
9 Suppose you analyzed the performance of a stock for last 10 quarters. You found that its
performance during the initial 4 or 5 quarters has been poor but for last four quarters it
has been excellent so you expect the same excellent performance from the stock in
future.
SDA DA N A SA
2.1 3.1 11.5 81.3 2.1
SDA DA N A SA
0.0 6.9 5.6 85.4 2.1
10 Troubled steel companies can either be (A) The companies that will go out of business;
or (B) The companies that are likely to recover. In your opinion, a 75 year old steel
manufacturing company, which is currently facing some business difficulties, belongs to
category (A) because recently there have been many bankruptcies in steel industry.
SDA DA N A SA
2.1 5.2 5.2 53.1 34.4
SDA DA N A SA
0.0 6.3 9.7 46.5 37.5
11 Suppose you are looking for a long term investment stock. You are told by your friend
about a new IPO Company ABC and that most firms have placed a buy rating on this
stock. You are likely to buy this stock.
SDA DA N A SA
0.0 6.3 37.5 51.0 5.2
SDA DA N A SA
1.4 2.1 34.7 55.6 6.3
12 New IPOs can either be (A) the stocks constituting successful long term investment or
(B) the stocks that will fail as long term investment. In your opinion, ABC Company (the
new IPO) belongs to category (A) because IPOs are good long term investments.
SDA DA N A SA
0.0 7.3 6.3 49.0 37.5
SDA DA N A SA
2.1 7.6 4.2 46.5 39.6
13 AAA rated municipal bonds can either be (A) safe municipal bonds or (B) risky
municipal bonds. In your opinion, AAA rated bond issued by inner city of a racially
divided country belongs to (B) because of potential riskiness of the country (racial
disputes).
SDA DA N A SA
1.0 12.5 5.2 79.2 2.1
SDA DA N A SA
4.9 9.7 4.9 76.4 4.2
14 Analysis of track record of a money manager for past six months suggests that on
average money manager has performed better. Thus you are likely to conclude that his
performance is result of skilled allocation and security selection.
SDA DA N A SA
1.0 6.3 69.8 14.6 8.3
SDA DA N A SA
0.7 5.6 67.4 22.9 3.5
***SDA=Strongly Disagree, DA= Disagree, N=Neutral, A=Agree, SA=Strongly Agree

POSTGRADUATE CONFERENCE ON ECONOMICS, PUBLIC ADMINISTRATION AND
BUSINESS (PCEPAB)-5TH SEPTEMBER, 2015
153
Sample size neglect can lead the investors to wrong conclusion about the performance of
analysts or money managers by taking too narrow sample period of their performance record;
question 14 verifies this aspect. For Malaysia and Pakistan 22.9 versus 7.3 and 26.4 versus 6.3
responses are received respectively.
Results are similar to that of anchoring and adjustment. Again on average, the sum of “agree”
and “strongly agree” responses dominates the sum of “disagree” and “strongly disagree” options
in all cases. Respondents’ agreement in general to all questions not only supports the presence of
representativeness bias but also confirms that it can lead them to sample size neglect and base
rate neglect. Moreover, the responses from investors in Malaysia and Pakistan are on average
similar therefore like anchoring and adjustment, we conclude that vulnerability of investors to
representativeness is same across these two countries.
Investors’ responses to each question for availability from Malaysia and Pakistan are shown in
table 3. Investors’ tendency to rely on readily available knowledge rather than examine other
alternatives or procedures is known as availability bias. Four types of availability biases apply
most to investors: retrievability, narrow range of experience, categorization and resonance.
Retrievability refers to the ease with which the information can be recalled; question 15
measures retrievability. Responses are 91.7 versus 4.1 and 90.3 versus 6.3 for Malaysia and
Pakistan respectively. Investors’ tendency to categorize or call for information that matches a
certain reference is known as categorization and this is measured through question 16. Responses
for this question are 89.6 versus 9.3 for Malaysia and 82.4 versus 4 for Pakistan. Question 17
measures the extent to which certain, given situations matches with individuals’ own, personal
situations can also influence judgment and this is known as resonance. For Malaysia, the
responses are 84.4 versus 6.2 while for Pakistan these are 81.3 versus 12.5. When a person
possesses a too restrictive frame of reference from which to formulate an objective estimate, then
narrow range of experience bias often results; question 18 gauges the narrow range of
experience. 81.3 versus 11.5 are the responses for Malaysia and 84.1 versus 7.6 are ones for
Pakistan. Presence of narrow range of experience among investors is further confirmed by asking
question 19. Responses from Malaysia and Pakistan are 11.4 versus 19.8 and 17.4 versus 13.2
respectively. Finally, question 20 confirms the presence of narrow range of experience among
investors for which responses are 89.7 versus 8.3 and 86.8 versus 6.9 for Malaysia and Pakistan.

POSTGRADUATE CONFERENCE ON ECONOMICS, PUBLIC ADMINISTRATION AND
BUSINESS (PCEPAB)-5TH SEPTEMBER, 2015
154
Table 3: Percentage Responses to questions on Availability
Questions for Availability Responses in %
Malaysia Pakistan
15 Suppose you hear about a great stock tip from your friend who has a good stock market
sense, he recommends you to purchase the stock of ABC Company. You are likely to
buy some shares because your friend is usually right about these things.
SDA DA N A SA
1.0 3.1 4.2 54.2 37.5
SDA DA N A SA
2.1 4.2 3.5 49.3 41.0
16 Suppose you recently studied a success report about a generic drug maker company and
you plan to purchase 100 shares of it. Right before you do, you hear on popular financial
news that another drug maker company just reported great earnings and its stock is up by
10%. You are likely to take this information as confirmation that generics are a good
area for investment and proceed with the purchase.
SDA DA N A SA
1.0 8.3 1.0 47.9 41.7
SDA DA N A SA
1.4 3.5 2.8 54.9 37.5
17 What type of music do you like? In your opinion, the percentage of people who have
similar taste in music as yours is more than the percentage of people who like the other
types.
SDA DA N A SA
3.1 3.1 9.4 79.2 5.2
SDA DA N A SA
4.9 7.6 5.6 77.8 3.5
18 In your opinion, USA provides the best investment opportunities.
SDA DA N A SA
4.2 7.3 7.3 75.0 6.3
SDA DA N A SA
2.1 5.6 8.3 78.5 5.6
19 Suppose during a visit to a Hi Tech Company, you meet many of your college fellows
who studied mathematics at college and were very good at it. You can conclude from
this experience that good mathematics students tend to join the Hi Tech companies.
SDA DA N A SA
2.1 17.7 68.8 8.3 3.1
SDA DA N A SA
4.2 9.0 69.4 15.3 2.1
20 Suppose you are working in a fast growing Hi Tech company and you are asked which
industry generates most successful investments? You are likely to refer to Hi Tech
industry because you have witnessed this industry generating very good investments in
the past.
SDA DA N A SA
0.0 8.3 2.1 87.5 2.1
SDA DA N A SA
0.0 6.9 6.3 84.7 2.1
***SDA=Strongly Disagree, DA= Disagree, N=Neutral, A=Agree, SA=Strongly Agree

POSTGRADUATE CONFERENCE ON ECONOMICS, PUBLIC ADMINISTRATION AND
BUSINESS (PCEPAB)-5TH SEPTEMBER, 2015
PROMOTING GROWTH, EXCELENCE AND SUSTAINABILITY- 155
Similar to anchoring and adjustment and representativeness responses favoring the presence
of availability of dominate in almost all cases. Their consent to the questions supports the
presence of availability because questions are designed such that they show the behaviors of
investors who are likely to fall prey to availability bias. Moreover, the responses from
investors in Malaysia and Pakistan are on average similar therefore like anchoring and
adjustment, we conclude that vulnerability of investors to representativeness is same across
these two countries.
4.2 Correlation and Regression Analysis
In order to support our results from descriptive analysis, we also perform correlation and
regression analyses which are not the conventional approaches in behavioral finance
however; we do so as robustness check. It is interesting to note that results of descriptive
analysis are supported by both correlation and regression analyses. Table 5 displays the
results or correlation analysis. Investors’ buying behavior (last column and last row) is
significantly related to all three biases.41 All three heuristics are significantly related to stock
buying decision. Three demographic factors (age, education and experience) are significant
with negative signs. This finding reveals that level of heuristics is lower for investors in
higher age groups, with more experience and more education. Income level is however
positively related to level of heuristics indicating that investors in lower income groups are
more careful in their analysis and have lower level of biases as compared to their counterparts
in high income groups.
Table 4: Correlation Analysis
ANCH REP AVA DEC AGE GENDER EDUCATION EXPERIENCE
REP .734** 1
AVA .666** .638** 1
DEC .316** .471** .516** 1
AGE -.877** -.865** -.843** -.498** 1
GENDER -.031 -.009 .049 .040 .024 1
EDUCATION -.862** -.852** -.767** -.422** .941** .029 1
EXPERIENCE
-.887** -.851** -.804** -.368** .947** .026 .973** 1
INCOM .880** .867** .807** .478** -.969** -.003 -.958** -.940**
Very important statistics when we apply regression analysis is “F” value which shows the
goodness of fit for the model. F value for our model is 38.63252 which is significant at
p<0.05. Therefore our model is good fit for these variables. Table 5 shows the coefficients
and significance levels for dependent variables (heuristics). Last column reveals that all of the
independent variables (heuristics) are significant predictors of dependent variable (stock
buying behavior). However, significant intercept shows that there are other important
predictors of buying behavior which have not been considered in this model. Although it is
41 ** show the significance level for correlation at 0.01 52 From model summary table in appendix A

POSTGRADUATE CONFERENCE ON ECONOMICS, PUBLIC ADMINISTRATION AND
BUSINESS (PCEPAB)-5TH SEPTEMBER, 2015
PROMOTING GROWTH, EXCELENCE AND SUSTAINABILITY- 156
difficult to interpret the magnitude and direction of coefficients for heuristics, the
significance of these coefficients can be interpreted in term of likelihood of investors to be
influenced by heuristics under study while making stock buy decision.
Table 5: Regression Analysis
Variables Coefficients Std. Error t Sig.
1 (Constant) 1.454 .261 5.561 .000
Anchoring -.274 .088 -3.096 .002
Representativeness .405 .096 4.219 .000
Availability .548 .088 6.232 .000
Two more regressions are run in order to test that a) heuristics impact investors’ stock buying
decision differently in sample countries and b) the impact of heuristics is different for
investors when they make purchase decisions for themselves and/or for their clients. In order
to test cross country difference, we use a dummy variable which equals 1 if the respondent is
from Pakistan and 0 otherwise. Then we multiply this variable with each heuristic, making an
interactive term for each heuristic. These interaction terms are then used as independent
variables along with heuristics in a regression equation with stock buying decision as
dependent variable. Table 7 in appendix “A” shows the results of regression with interactive
dummy for country. However, coefficients on all interactive terms are non-significant
therefore we conclude that impact of heuristics on investors’ buying behavior is similar
across both countries.
To check for differences in impact of heuristics across investors’ type (brokers and individual
investors) we construct a dummy variable which equals 1 if respondent is an individual
investor (uses his own money) and 0 otherwise. We then multiply this dummy variable with
all three heuristics to get interaction terms. Stock buying behavior is then regress on
heuristics along with interaction terms of investors’ type dummy. Results of this analysis are
given in table 8 in appendix “A”. Coefficients on all interactive terms are significant
therefore we interpret that the impact of heuristics different for investors when they make
purchase decisions for themselves and/or for their clients. A negative coefficient on
interaction term shows that of impact of heuristics is higher for investors who make stock
buying decision on behalf of others.
4.3 ANOVA and T-test
In order to test whether level of heuristics differs across two countries we compare three
heuristics using t-test. Results reveal that averages across all three heuristics differ
significantly with lower averages for Malaysia across Pakistan. Results of t-test are not
reported for sake of brevity. Although correlation among demographic variable (Age, gender,
education, experience and income) and heuristics indicates significant relationship, we use
ANOVA to test whether level of heuristics significantly differ based on demographic factors.
Results reveal that level of heuristics differs significantly for all demographic groups except
gender. Results for ANOVA are reported in Appendix A: table 9 through table 12.

POSTGRADUATE CONFERENCE ON ECONOMICS, PUBLIC ADMINISTRATION AND
BUSINESS (PCEPAB)-5TH SEPTEMBER, 2015
PROMOTING GROWTH, EXCELENCE AND SUSTAINABILITY- 157
5. Conclusion
Although literature recognizes the role of heuristics and biases in investors’ decisions to buy
or sell the stock, focus has mostly been on developed markets. A direct linkage between
heuristics and stock buying decision has not been established so distinctively in developing
countries. Economies in developing countries differ from those in developed countries in
term of political stability, law and order situations, technological development, use of
information technology, financial structure, income level and education etc. Similarly stock
markets and investors across developing and developed countries may also differ. Investors’
attitudes and behaviors are shaped by environmental factors and it is likely that such
behaviors are reflected in their decision making for example Pompian (2006) considers
education is an important tool to overcome heuristics and biases. Therefore behavioral biases
may work differently due to differences in education levels between developed and
developing countries. Moreover, early research in behavioral finance has mostly focused a
single heuristic and considered it to be operating independently. Nevertheless, the
developments in behavioral decision theory specify that different heuristics often operate
collectively and influence the decisions and predictions (Ganzach & Krantz, 1990, 1991;
Czaczkes & Ganzach, 1996). In this study we consider three heuristics namely anchoring and
adjustment, representativeness and availability in context of Malaysian and Pakistani stock
markets.
The methodology applied in behavioral studies differs in that they use qualitative approaches
to examine whether or not behavioral biases influence particular decisions however such
findings have not been tested using statistical methods. We use both qualitative and
quantitative approaches to study (i) the influence of heuristics (anchoring and adjustment,
representativeness and availability) on investors’ stock buying behavior, (ii) influence of
demographic factors (age, gender, education, experience and income level) on heuristics, (iii)
comparison between Malaysian and Pakistani investors in their susceptibility to these biases,
and (iv) whether heuristics influence the investors differently when they make buy decisions
for themselves and/or for clients.
In order to collect data on heuristics, a questionnaire is developed with the help of and
inspiration from Pompian (2006). In addition to three heuristics, we also construct a variable
for stock buying behavior which measures investors’ inclination to invest in stocks as
compared to other investment opportunities i. e. bonds etc. Considering the typical nature of
population, convenient sampling has been used and a total of 1000 questionnaires are served
to investors at stock exchanges in Malaysia and Pakistan. A total of 240 usable questionnaires
were used in data analysis (144 from Pakistan and 96 from Malaysia). Items descriptive
analysis has been used as main approach to analyze data whereas ANOVA, t-test, correlation
and Regression analyses have been used as supplementary approach to support findings from
descriptive analysis.
Results from descriptive analysis show that all three heuristics (Anchoring and Adjustment,
Representativeness, and Availability) are likely to influence investors’ stock buying decision.
These findings are also supported by results from regression and correlation analyses.
Demographic factors have significant correlation with level of heuristics; the level of
heuristics is lower for investors in higher age groups, with more experience and more

POSTGRADUATE CONFERENCE ON ECONOMICS, PUBLIC ADMINISTRATION AND
BUSINESS (PCEPAB)-5TH SEPTEMBER, 2015
PROMOTING GROWTH, EXCELENCE AND SUSTAINABILITY- 158
education. Income level is however positively related to level of heuristics indicating that
investors in lower income groups are more careful in their analysis and have lower level of
biases as compared to their counterparts in high income groups. Level of heuristics is
significantly different for both countries with Malaysia having slightly lower averages
however impact of heuristics is not different across Malaysia and Pakistan. Across types of
investors, the impact of heuristics is higher when purchase decisions are made on behalf of
their clients.
Implications of heuristics can be far reaching for investors. First, the investors who are biased
with anchoring and adjustment are more likely purchase a stock that may behave against their
expectations. For example if investors are anchored to historical high stock prices and expect
the stock to recover, they may keep on holding their losing stocks for too long (Odean, 1998).
Similarly they may get anchored to historical percentage increase in prices and expect the
similar trend in future; this leads them to buying the overvalued stock. Investors can also
become anchored to historical performance of companies which may actually deviate from
their trends of past performance because of certain uncontrollable economic factors. Second,
the investors who are exposed to representativeness bias are more likely to buy a wrong stock
for their portfolio. For example they may base their buying decision on insufficient past data,
this may lead them to buy a stock that may not have the potential meet their expectation in
future (sample size neglect). Investor may also fall prey to another type of representativeness
bias (base rate neglect) for example looking for a long-term investment stock they may end
up with stock that is not in fact a long-term investment (i.e. New IPO companies). Third
most investors, if asked to identify the “best” mutual fund company, are likely to select a firm
that engages in heavy advertising. In addition to maintaining a high public relations profile,
these firms also “cherry pick” the funds with the best results in their fund lineups, which
makes this belief more “available” to be recalled. In reality, the companies that manage some
of today’s highest-performing mutual funds undertake little to no advertising. Consumers
who overlook these funds in favor of more widely publicized alternatives may exemplify
retrievability/availability bias. Investors will choose investments based on information that is
available to them (advertising, suggestions from advisors, friends, etc.) and will not engage in
disciplined research or due diligence to verify that the investment selected is a good one.
Our study is limited to only three heuristics (Anchoring and Adjustment, Representativeness,
and Availability) whereas behavioral finance literature has identified more than 50 biases that
can influence the investors’ stock purchase decision. Moreover, we explore the influence of
heuristics only on investors’ stock purchase decision, other financial decisions such as stock
sell decision from investors’ perspective, investing, financing, asset management, dividend
policy and mergers and acquisition decisions from corporate perspective are also exposed to
influence of heuristics. This study can be enhanced to these areas as well. We do not address
the details of what sort of problems these heuristics can create for investors. Further research
on consequences of different biases can be a good contribution to the literature. Moreover,
given that there are just enough observations to analyze the impact, it could also be rewarding
to examine an alternative measure (Investors’ trading data, if available) for capturing the
heuristics.

POSTGRADUATE CONFERENCE ON ECONOMICS, PUBLIC ADMINISTRATION AND
BUSINESS (PCEPAB)-5TH SEPTEMBER, 2015
PROMOTING GROWTH, EXCELENCE AND SUSTAINABILITY- 159
References
Amir, E., & Ganzach, Y. (1998). Overreaction and underreaction in analysts' forecasts.
Journal of Economic Behavior & Organization, 37(3), 333-347.
Ariely, D., Loewenstein, G., & Prelec, D. (2006). Tom Sawyer and the construction of value.
Journal of Economic Behavior & Organization, 60(1), 1-10.
Baker, M., Pan, X., & Wurgler, J. (2009). A reference point theory of mergers and
acquisitions: National Bureau of Economic Research.
Barber, B. M., & Odean, T. (2002). Online investors: do the slow die first? Review of
Financial Studies, 15(2), 455-488.
Barber, B. M., Odean, T., & Zhu, N. (2009). Systematic noise. Journal of Financial Markets,
12(4), 547-569.
Bernard, V. L., & Thomas, J. K. (1989). Post-earnings-announcement drift: delayed price
response or risk premium? Journal of Accounting research, 1-36.
Block, R. A., & Harper, D. R. (1991). Overconfidence in estimation: Testing the anchoring-
and-adjustment hypothesis. Organizational Behavior and Human Decision Processes,
49(2), 188-207.
Brewer, N. T., Chapman, G. B., Schwartz, J. A., & Bergus, G. R. (2007). The influence of
irrelevant anchors on the judgments and choices of doctors and patients. Medical
Decision Making, 27(2), 203-211.
Campbell, S. D., & Sharpe, S. A. (2009). Anchoring bias in consensus forecasts and its effect
on market prices. Journal of Financial and Quantitative Analysis, 44(02), 369-390.
Cen, L., Hilary, G., & Wei, K.-C. (2013). The role of anchoring bias in the equity market:
Evidence from analysts’ earnings forecasts and stock returns. Journal of Financial
and Quantitative Analysis, 48(01), 47-76.
Cen, L., Hilary, G., Wei, K., & Zhang, J. (2010). The Role of Anchoring Bias in the Equity
Market. Jie, The Role of Anchoring Bias in the Equity Market (March 16, 2010).
Chapman, G. B., & Bornstein, B. H. (1996). The more you ask for, the more you get:
Anchoring in personal injury verdicts. Applied Cognitive Psychology, 10(6), 519-540.
Cox, C., & Mouw, J. T. (1992). Disruption of the representativeness heuristic: Can we be
perturbed into using correct probabilistic reasoning? Educational Studies in
Mathematics, 23(2), 163-178.
Czaczkes, B., & Ganzach, Y. (1996). The natural selection of prediction heuristics:
Anchoring and adjustment versus representativeness. Journal of Behavioral Decision
Making, 9(2), 125-139.
Davis, H. L., Hoch, S. J., & Ragsdale, E. E. (1986). An anchoring and adjustment model of
spousal predictions. Journal of Consumer Research, 25-37.
De Bondt, W. F., & Thaler, R. (1985). Does the stock market overreact? The Journal of
finance, 40(3), 793-805.
De Bondt, W. F., & Thaler, R. H. (1990). Do security analysts overreact? The American
Economic Review, 52-57.
Degeorge, F., Patel, J., & Zeckhauser, R. (1999). Earnings Management to Exceed
Thresholds*. The Journal of Business, 72(1), 1-33.
Englich, B., Mussweiler, T., & Strack, F. (2006). Playing dice with criminal sentences: The
influence of irrelevant anchors on experts’ judicial decision making. Personality and
Social Psychology Bulletin, 32(2), 188-200.
Folkes, V. S. (1988). Recent attribution research in consumer behavior: A review and new
directions. Journal of Consumer Research, 548-565.

POSTGRADUATE CONFERENCE ON ECONOMICS, PUBLIC ADMINISTRATION AND
BUSINESS (PCEPAB)-5TH SEPTEMBER, 2015
PROMOTING GROWTH, EXCELENCE AND SUSTAINABILITY- 160
Ganzach, Y., & Krantz, D. H. (1990). The psychology of moderate prediction: I. Experience
with multiple determination. Organizational Behavior and Human Decision
Processes, 47(2), 177-204.
Ganzach, Y., & Krantz, D. H. (1991). The psychology of moderate prediction: II. Leniency
and uncertainty. Organizational Behavior and Human Decision Processes, 48(2),
169-192.
George, T. J., & Hwang, C.-Y. (2004). The 52‐ week high and momentum investing. The
Journal of finance, 59(5), 2145-2176.
Ginsburgh, V. A., & Van Ours, J. C. (2003). Expert opinion and compensation: Evidence
from a musical competition. American Economic Review, 289-296.
Goetzmann, W. N., & Kumar, A. (2008). Equity portfolio diversification*. Review of
Finance, 12(3), 433-463.
Hogarth, R. M. (1981). Beyond discrete biases: Functional and dysfunctional aspects of
judgmental heuristics. Psychological Bulletin, 90(2), 197.
Jacobs, J. E., & Potenza, M. (1991). The use of judgement heuristics to make social and
object decisions: A developmental perspective. Child Development, 62(1), 166-178.
Johnson, J. E. V., Schnytzer, A., & Liu, S. (2009). To what extent do investors in a financial
market anchor their judgments excessively? Evidence from the Hong Kong horserace
betting market. Journal of Behavioral Decision Making, 22(4), 410-434.
Johnson, W. B. (1983). " Representativeness" in Judgmental Predictions of Corporate
Bankruptcy. Accounting Review, 78-97.
Kahneman, D., Slovic, P., & Tversky, A. (1982). Judgement under Uncertainty: Heuristics
and Biases: Cambridge, UK, Cambridge University Press.
Kaustia, M., Alho, E., & Puttonen, V. (2008). How much does expertise reduce behavioral
biases? The case of anchoring effects in stock return estimates. Financial
Management, 37(3), 391-412.
Latham, G. P., Budworth, M. H., Yanar, B., & Whyte, G. (2008). The influence of a
manager's own performance appraisal on the evaluation of others. International
Journal of Selection and Assessment, 16(3), 220-228.
Lichtenstein, S., & Slovic, P. (1971). Reversals of preference between bids and choices in
gambling decisions. Journal of experimental psychology, 89(1), 46.
Lichtenstein, S., Slovic, P., Fischhoff, B., Layman, M., & Combs, B. (1978). Judged
frequency of lethal events. Journal of experimental psychology: Human learning and
memory, 4(6), 551.
Lopes, L. L. (1991). The rhetoric of irrationality. Theory & Psychology, 1(1), 65-82.
Lovie, P. (1985). A note on an unexpected anchoring bias in intuitive statistical inference.
Cognition, 21(1), 69-72.
Northcraft, G. B., & Neale, M. A. (1987). Experts, amateurs, and real estate: An anchoring-
and-adjustment perspective on property pricing decisions. Organizational Behavior
and Human Decision Processes, 39(1), 84-97.
Odean, T. (1998). Do investors trade too much? Available at SSRN 94143.
Pham, M. T. (1998). Representativeness, relevance, and the use of feelings in decision
making. Journal of Consumer Research, 25(2), 144-159.
Plous, S. (1989). Thinking the Unthinkable: The Effects of Anchoring on Likelihood
Estimates of Nuclear War1. Journal of Applied Social Psychology, 19(1), 67-91.
Pompian, M. M. (2006). Behavioral finance and wealth management. How to Build Optimal
Portfolios That Account for Investor Biases, New Jersey.
Ritov, I. (1996). Anchoring in simulated competitive market negotiation. Organizational
Behavior and Human Decision Processes, 67(1), 16-25.

POSTGRADUATE CONFERENCE ON ECONOMICS, PUBLIC ADMINISTRATION AND
BUSINESS (PCEPAB)-5TH SEPTEMBER, 2015
PROMOTING GROWTH, EXCELENCE AND SUSTAINABILITY- 161
Schkade, D. A., & Johnson, E. J. (1989). Cognitive processes in preference reversals.
Organizational Behavior and Human Decision Processes, 44(2), 203-231.
Subrahmanyam, A. (2008). Behavioural finance: A review and synthesis. European
Financial Management, 14(1), 12-29.
Tversky, A., & Kahneman, D. (1973). Availability: A heuristic for judging frequency and
probability. Cognitive psychology, 5(2), 207-232.
Tversky, A., & Kahneman, D. (1974). Judgment under uncertainty: Heuristics and biases.
science, 185(4157), 1124-1131.
Williams, B. (2010). Speculative Bubbles Dynamics and the Role of Anchoring. Paper
presented at the European Financial Management Association Conference. Retrieved
January.
Wilson, T. D., Houston, C. E., Etling, K. M., & Brekke, N. (1996). A new look at anchoring
effects: basic anchoring and its antecedents. Journal of Experimental Psychology:
General, 125(4), 387.
Zuckerman, M., Koestner, R., Colella, M. J., & Alton, A. O. (1984). Anchoring in the
detection of deception and leakage. Journal of Personality and Social Psychology,
47(2), 301.
Appendix A
Table 6: Model Summary
Model Sum of
Squares
df Mean
Square
F Sig.
1 Regression 19.432 3 6.477 38.632 .000b
Residual 39.402 235 .168
Total 58.834 238
Table 7: Regression with Country Dummy
Variables Coefficients Std. Error t
1 (Constant) 1.443 .270 5.343
Anchoring -.268 .125 -
2.134
Representativeness .359 .149 2.406
Availability .588 .159 3.700
Anch X Pak -.017 .185 -.091
Rep X Pak .071 .193 .366
Ava X Pak -.050 .184 -.271
Table 8: Regression with type of investor's Dummy
Variables Coefficients Std. Error t
1 (Constant) 1.442 .267 5.396
Anchoring -.131 .157 -.834
Representativeness .349 .147 2.365
Availability .459 .140 3.280

POSTGRADUATE CONFERENCE ON ECONOMICS, PUBLIC ADMINISTRATION AND
BUSINESS (PCEPAB)-5TH SEPTEMBER, 2015
PROMOTING GROWTH, EXCELENCE AND SUSTAINABILITY- 162
Anch X Inv -.197 .084 -2.321
Rep X Inv -.090 .027 -3.272
Ava X Inv -.112 .042 -2.626
Table 9: ANOVA based on AGE
Sum of Squares df Mean Square F Sig.
Anchoring Between Groups 43.968 3 14.656 331.774 .000
Within Groups 10.425 236 .044
Total 54.394 239
Representativeness Between Groups 33.292 3 11.097 239.643 .000
Within Groups 10.929 236 .046
Total 44.220 239
Availability Between Groups 32.890 3 10.963 225.381 .000
Within Groups 11.480 236 .049
Total 44.370 239
Table 10: ANOVA based on Education
Sum of Squares df Mean Square F Sig.
Anchoring Between Groups 41.054 2 20.527 364.699 .000
Within Groups 13.340 237 .056
Total 54.394 239
Representativeness Between Groups 32.266 2 16.133 319.858 .000
Within Groups 11.954 237 .050
Total 44.220 239
Availability Between Groups 26.424 2 13.212 174.482 .000
Within Groups 17.946 237 .076
Total 44.370 239
Table 11: ANOVA based on Experience
Sum of Squares df Mean Square F Sig.
Anchoring Between Groups 42.908 3 14.303 293.892 .000
Within Groups 11.485 236 .049
Total 54.394 239
Representativeness Between Groups 33.227 3 11.076 237.759 .000
Within Groups 10.994 236 .047
Total 44.220 239
Availability Between Groups 32.868 3 10.956 224.781 .000
Within Groups 11.503 236 .049
Total 44.370 239

POSTGRADUATE CONFERENCE ON ECONOMICS, PUBLIC ADMINISTRATION AND
BUSINESS (PCEPAB)-5TH SEPTEMBER, 2015
PROMOTING GROWTH, EXCELENCE AND SUSTAINABILITY- 163

POSTGRADUATE CONFERENCE ON ECONOMICS, PUBLIC ADMINISTRATION AND
BUSINESS (PCEPAB)-5TH SEPTEMBER, 2015
PROMOTING GROWTH, EXCELENCE AND SUSTAINABILITY- 164
Government Expenditure Policy Analysis in Malaysia: A Social
Accounting Matrix Approach
Mohammad Mahdi Kiaeeha
National University of Malaysia (UKM)
43600 Bangi, Selangor Darul Ehsan, Malaysia
Email: [email protected]
Abstract
In developing countries, government spending has a critical function to play in alleviating aggregate
demand (AD). Also, in macroeconomics, rising government expenditure could have multiplier effects in the final
stage of national income equilibrium. This research compares “Demand-Side” and “Supply-Side” analysis in
the framework of the Malaysia Social Accounting Matrix (SAM) 2005 to assess the economic effects of
government expenditure and evaluate its economic effect. The comparative analysis of these multipliers by using
the Malaysian data is presented. The result demonstrates that the Supply-Side multipliers would be a preferable
tool in allocating government expenditure. It concludes that providing infrastructure in “Service” sector should
be prioritized rather than all other choices, when the economic growth is the most urgent goal of the
government. Hence, the result could be generalized to other developing countries, such as the ASEAN countries.
Key words: Social Accounting Matrix (SAM), Supply-side Multipliers, Demand-side
Multipliers, Government expenditure.
1. Introduction
Currently, Malaysia confronts challenges in moving towards becoming a high-income
economy. The Malaysian government is deeply aware of the challenges and has set itself a
forceful goal of becoming a high-income economy by 2020, which will need a doubling of
private investment as a share of GDP between 2010 and 2020. Initiatives have been
proliferated to reach these objectives, most remarkably the New Economic Model (NEM),
which was developed by the National Economic Advisory Council (NEAC) and inaugurated
by the prime minister in 2009. Additionally, Strategic initiatives involve the Economic
Transformation Program to motivate private investment and the Government Transformation
Program to make a leaner and more consultative government, with measurable goals in the
form of Strategic Reform Initiatives and National Key Result Areas. There are well over 100
different recommendations summarized in the NEM, with a new Delivery Unit and
Performance Management created to guarantee that reforms are fulfilled (OECD, 2013).
Practically, in most of the economic areas, the government has undertaken policy reforms and
shaped or revamped institutions to ensure that the reforms bring results. A Special Task Force
to Facilitate Business (PEMUDAH) was formed in 2007, comprising of corporate leaders and

POSTGRADUATE CONFERENCE ON ECONOMICS, PUBLIC ADMINISTRATION AND
BUSINESS (PCEPAB)-5TH SEPTEMBER, 2015
PROMOTING GROWTH, EXCELENCE AND SUSTAINABILITY- 165
public officials to simplify business operations and thus successfully ameliorate Malaysia’s
ranking in the World Bank’s Doing Business report. The Malaysia Productivity Corporation
is spearheading a wide-ranging review of business regulations to ameliorate processes and
procedures. The investment promotion agency renamed the Malaysian Investment
(previously Industrial) Development Authority (MIDA) to mirror its broader remit in order to
promote services as well as manufacturing. Furthermore, the Putrajaya Committee on GLCs
(Government-Linked Companies) High Performance was formed to lead the GLC
Transformation Program. A new Malaysian Code of Corporate Governance and a
Competition Act were promulgated in 2012 and 2010, respectively. In the financial segment,
the government has a Capital Market Master Plan 2 and a Financial Sector Blueprint for
2011-20, following the earlier Capital Market Master Plan and Financial Sector (OECD,
2013).
It is obvious that the Malaysian government is currently looking for ways to stimulate
investing or provide better infrastructure for investing. The Input-Output economic approach
provides suitable tools for this purpose.
In the Input-output approach, the identification of the foremost sectors is considered to be
helpful for economic planning, especially in developing countries since it aims to generate
above average rises in economic activity and therefore, stimulate whole economic growth.
Based on this view, the government expenditure policy concentrates on special key sectors to
motivate overall economic output and growth (Lenzen, 2013). Hence, this research plans to
assess the efficiency of government intervention in the Malaysian economy by expending in
specific sectors and improving its infrastructure.
The rest of this research is organized as follows: Section 2 provides the background for
government expenditure in the Malaysian economy; Section 3 includes the review of
literature in this field; Section 4 explains the economic construction procedures in forming
the SAM and the method used in this paper; the data, findings and discussions are provided in
Section 5; Section 6 presents the conclusion and policy recommendations. The study also
contains a brief technical appendix in which the detailed tables are organized.
2. Analyzing Government policy in Malaysia
From the economic perspective, when we have a positive shock in government expenditure
for one economic sector, the macro-effects on other product accounts, production factor
accounts and institutional income distributions are generally positive. These comments must
not however take away the attention from the ultimate results of the analyses. While the
enlargement of the macro-effects may be altered by a clearer analysis, the path of the effects
is unlikely to be different.
It is believed that development policies should emphasis on production sectors that have the
largest combined backward and forward linkages (Hirschman, 1985). However, subsequent
studies have found out that the concentration on production linkages in an input-output model
may provide misleading policy prescriptions (Vogel, 1994). Hence, it would be much better
to observe the policy effects in more detailed models such as the Social Accounting Matrix

POSTGRADUATE CONFERENCE ON ECONOMICS, PUBLIC ADMINISTRATION AND
BUSINESS (PCEPAB)-5TH SEPTEMBER, 2015
PROMOTING GROWTH, EXCELENCE AND SUSTAINABILITY- 166
(SAM). However, prior to that, it is important to get a more detailed literature review of the
Malaysian economy in this field.
The Department of Statistics (DOS) of Malaysia has shown that Malaysia’s Government
Spending was boosted from 59,635 Million Malaysian Ringgit (MYR) in 2004 to 64,516
Million MYR in 2005. In fact, from 1975 until 2005, Government Spending in Malaysia
averaged 22,498 Million MYR, with an all-time high of 64,516 Million MYR in 2005 and a
record low of 3,924 Million MYR in 1975 (Trading Economics, 2012) (Department of
Statistics Malaysia, 2012).
0.000
0.020
0.040
0.060
0.080
0.100
0.120
0.140
0.160
1990
1991
1992
1993
1994
1995
1996
1997
1998
1999
2000
2001
2002
2003
2004
2005
2006
2007
2008
2009
2010
2011
2012
2013
Malaysia General Government Expenditure
to GDP
Figure 1. Malaysia General Government Expenditure to GDP

POSTGRADUATE CONFERENCE ON ECONOMICS, PUBLIC ADMINISTRATION AND
BUSINESS (PCEPAB)-5TH SEPTEMBER, 2015
PROMOTING GROWTH, EXCELENCE AND SUSTAINABILITY- 167
Furthermore, the government of Malaysia has recently initiated the Government
Transformation Plan (GTP) in its bid to escalate the public service delivery efficiency, which
is intended to cut public deficit through minimizing wastage and rationalizing subsidies.
In the case of Malaysia, numerous studies have been carried out on the relationship between
the Malaysian government expenditure and revenue. Nonetheless, most of these studies were
performed at the Malaysian federal level. For instance, the analysis tax spend hypothesis for
Malaysia was proven by Ram (1988). Parallel outcomes were gained by Mithani and Khoon
(1999). Another report by A. Aziz et al (2000) uncovered that there would be a bi-directional
causality on tax revenue and government spending nexus inferring a Malaysian fiscal
synchronization. Conversely, Narayan (2005) achieved co-integration and causality between
government revenue and government expenditure in Malaysia. In addition, fiscal relationship
at the state level has been examined by Zulkefly (2003).
3. Literature Review
The theoretical relationship of economic growth and government expenditure is well
documented in the literature. There are two main divergent economic theories concerning the
relationship between economic growth and government expenditure. Keynesian macro-
economic theory has commonly presumed that boosted government expenditure leads to high
summative demand and speedy economic growth, while the Wagnerian theory tends to
provide the opposite interpretation. The latter argues that a rise in national income creates
more government expenditure (Dandan, M. M. 2011).
A number of researchers had focused on the relationship between economic output (and also
economic growth) and government expenditure. In a specific way, we only concentrate on the
literature that investigates this relationship by IO and SAM methods. However, the outcomes
varied from one paper to another.
Specifically, in terms of government spending, Keuning and Thorbecke (1989) analyzed the
effect of Indonesia’s public expenditure on its income distribution for the World Bank. They
found out that a decline of government expenditure affect sectorial output and income
growth; and moreover the average income of each household group varies based on the
government budget options. Dorosh and Sahn (1997) investigated a fall in government
spending in the SAM models for four African countries, namely Cameroon, Gambia,
Madagascar and Nigeria in order to investigate the impact of policy reforms on real incomes
of various household groups. They successfully evidenced the relevance of the SAM model
for emphasizing and focusing issues related to government expenditure, income distribution
and poverty.
The SAM method has a relatively short history in Malaysia. Among the pioneers of SAM in
Malaysia, are Ahluwia and Lysy (1979), (Pyatt and Round, 1979), Ramesh et al. (1980), and
Pyatt et al., (1984). Subsequently, Harun et al. (2012) developed the Malaysian SAM
thoroughly by the incorporation of the disaggregating private capital investments and public

POSTGRADUATE CONFERENCE ON ECONOMICS, PUBLIC ADMINISTRATION AND
BUSINESS (PCEPAB)-5TH SEPTEMBER, 2015
PROMOTING GROWTH, EXCELENCE AND SUSTAINABILITY- 168
sector capital investments according to different production segments. It was obvious that
there were only a few studies regarding the above-mentioned items in Malaysia. Hence, the
present study intends to fill this gap.
4. Methods
4.1 SAM and the Malaysian Economy
Different types of analytical tools can be adopted to evaluate the impact of government
spending on economic variables (such as output). However, in this case, government
expenditure is a component of the national accounts, and hence there is a need to briefly
clarify this method.
The Social Accounting Matrix (SAM) performs as an accounting platform that offers such an
approach (Jorge Alarcón et al, 2011). The SAM, as the literature shows, can be used for the
investigation of public infrastructure investments, public spending in general, and
furthermore on other sectorial policies and trade policies. This matrix allows the analysis of
the effectiveness of past economic programs and the simulation and comparison of possible
consequences of future policies or mixed policy, and also permits the evaluation of external
shocks (Jorge Alarcón et al, 2011).
As expected, SAM fortunately brings together the contemporaneous and unified information
in an extensive economy-wide manner: (i) National income and production accounts; (ii)
Detailed I/O information and section accounts; (iii) Employment of production factors and
earnings data; (iv) Multi lateral partner-trade data; and (v) Nationally sampled and directly
representative household survey data (Tarp, 2003). In this way, the data sources in Malaysia
reveal their strong reliability.
Before pursuing into detailed SAM accounts, we depict a table, which demonstrates how
macro-data could be systematized in a SAM format (Table 1). Table 1 is necessarily a double
entry representation of the dominant macro-economic accounting identities. This table
describes an open-economy Macro-SAM with the consideration of the government sector in
terms of the macro-accounting identities. It must be pointed out that in this case, intermediate
goods are netted out.
Table 12. An Open-economy Macro-SAM with a government sector
Receipts Expenditures Total
1 2 3 4 5
1. Suppliers - C G I E Demand
2. Households Y - - - - Income
3. Government - T - - - Receipts
4. Capital Account - Sh Sg - St Savings
5. Rest of World M - - - - Imports

POSTGRADUATE CONFERENCE ON ECONOMICS, PUBLIC ADMINISTRATION AND
BUSINESS (PCEPAB)-5TH SEPTEMBER, 2015
PROMOTING GROWTH, EXCELENCE AND SUSTAINABILITY- 169
Total Supply Expenditure Expenditure Investment ROW
Additional variables: t42=Sh=private saving, t32=T=tax payments, t43=Sg=government saving,
t15=E=export, t45=St=foreign savings, t51=M=import, t13=G=government spending.
Accounting identities: 1. Y+M=C+G+I+E (GNP), 2. C+T+Sh=Y (Income), 3. G+Sg=T (Government
budget), 4. I=Sh+Sg+St (Saving-Investment), 5. E+St=M (Trade balance).
(Tarp, 2003)
Factors of production of this economy are generally of two types: labor and capital.
Moreover, the labor is disaggregated into three dimensions: rural citizens, urban citizens, and
non-citizens. This macro-table is elaborated in accordance with international input-output
standards and it reveals the most exhaustive and meticulous picture of the I/O production
structure of the Malaysian economy in the current situation.
As a general idea, economic sections targeted for expansion, whether to serve domestic or
external markets, may have totally different effects on domestic sectors, production factor
usage and relative incomes, and these impressions will fundamentally have political as well
as economic outcomes (Tarp, 2003). Accordingly, the Malaysian SAM normally exhibits
precise information on its macroeconomic functions and effects, which should surely
facilitate its role in macroeconomic analysis and policy-making formulation.
4.2 Structures and Schematic of the Malaysian SAM for the Year 2005
Generally, in a SAM we have different types of accounts and sub-accounts. The degree of
disaggregation and classification of SAM could vary from one SAM to another because they
are designed based on the interests of the economy and data existence. However, most of the
time, countries compile SAM by highlighting income distribution as compared to the other
aims. The Malaysian economy has carried out a similar practice where SAM for years 1970,
1978, 2000 and 2005 were totally compiled for the purpose of distribution of income, while
the SAM for 1983 was made for the purpose of flow of funds. The flow theme of funds was
chosen in order to develop deeper into the transactors of income and expenses. As the
problem of income inequality is still vital in Malaysia, the selected theme for SAM 2005 was
distribution of income, where it gives the framework of income distribution in a socio-
economic model. Besides, this theme supports the third thrust of the Ninth Malaysia Plan to
address continuing socio-economic inequalities fundamentally and productively (Jamal and
Raham, 2009).
A simple structure of Malaysia SAM 2005 is presented in Table 2. It describes the
interdependencies between sectors in the economy within a single-accounting framework for
the year 2005. The SAM is indicated by a square matrix in which each transaction or account
has got its own row and column. The incomings are represented as incomes for the row (i)
and outgoings are represented as expenditures for the column (j). The corresponding row and
column totals of the matrix must be equal, consistent with the major fundamental law of
economics, which for every income there is a corresponding outlay or expenditure
(Thorbecke, 2001).

POSTGRADUATE CONFERENCE ON ECONOMICS, PUBLIC ADMINISTRATION AND
BUSINESS (PCEPAB)-5TH SEPTEMBER, 2015
PROMOTING GROWTH, EXCELENCE AND SUSTAINABILITY- 170
Table 13. Schematic of Social Accounting Matrix for Malaysia, 2005
Receipts Activities Commodities Factors Households Government Saving/
investment
Rest of
World
(ROW)
Total
Activities Gross output Gross
output
Commodities Intermediate
inputs
Household
consumption
Government
consumption Investment Export Demands
Factors Capital and
labor
Factor
income
from ROW
Factor
income
Households
Household
income from
factor
ownership
Government
transfer to
households
Household
transfer to
ROW
Household
income
Government
Output
taxes, factor
taxes
Sales taxes,
export taxes
Government
income from
factor
ownership/taxes
Household
transfer to
government
(direct)
ROW
transfers to
government
Government
income
Saving/
Investment
Household
savings
Government
savings
Foreign
savings savings
Rest of
World
(ROW)
Imports
ROW income
from factor
ownership
Government
transfer to
ROW
Capital
outflows to
ROW
Total Activities Supply
expenditures
Factor
expenditures
Household
expenditures
Government
expenditures Investment
Capital
inflows
from ROW
(Jamal and Raham, 2009)
The selected theme and the degree of disaggregation of the individual accounts depend
fundamentally on the questions to be answered using SAM.
4.3 SAM Technical Structure
The following flowchart illustrates the main interrelationship among SAM accounts.

POSTGRADUATE CONFERENCE ON ECONOMICS, PUBLIC ADMINISTRATION AND
BUSINESS (PCEPAB)-5TH SEPTEMBER, 2015
PROMOTING GROWTH, EXCELENCE AND SUSTAINABILITY- 171
Figure 2. Simplified interrelationship among principal SAM accounts (production activities,
factors and institutions) (Thorbecke and Hong-Sang, 1996)
From the methodological point of view, we have supply-based and demand-based methods
for analyzing SAM. The demand base itself has four approaches: 1. Accounting multiplier, 2.
Fixed-price multiplier, 3. SPA (Structural Path Analysis), and 4. Mixed approach or Supply
limited approach. Furthermore, as an economic tool, the effects of three kinds of economic
policies would be analyzed by means of SAM on the endogenous accounts (Kiaeeha, 2010).
The present study will analyze and compare the “Demand-Side” and “Supply-Side”
multipliers of “Social Accounting Matrix” for Malaysia.
In this method, the SAM structure presents flows and relationships between output, demands
and income of factors of production, and also the decomposition of these interactions into
separate effects. Going from SAM to a model structure requires the designation of each
account as endogenous or exogenous. This can be viewed schematically from the table
below:
Table 3. Simplified schematic social accounting matrix
Expenditures
Endogenous accounts Exogenous. Totals
Factors Institutions
(Households and
companies)
Production
activities
Sums of other
accounts
Receipts 1 2 3 4 5
Endogenous accounts
Factors 1 0 0 T13 x1 y1
Productions activities
Factors Factorial Income
distributions
Institutions Including
Household Income
Distribution

POSTGRADUATE CONFERENCE ON ECONOMICS, PUBLIC ADMINISTRATION AND
BUSINESS (PCEPAB)-5TH SEPTEMBER, 2015
PROMOTING GROWTH, EXCELENCE AND SUSTAINABILITY- 172
Institutions, i.e. households and
companies 2 T21 T22 0 x2 y2
production activities 3 0 T32 T33 x3 y3
Exogenous accounts
Sum of other accounts 4 l'1 l'2 l'3 t yx
Totals 5 y'1 y'2 y'3 y'x
(Thorbecke and Hong-Sang, 1996)
For analytical purposes, the endogenous section of the transaction matrix would be converted
into the corresponding matrix of average expenditure propensities. Hence, the demand- and
supply- side models are written in matrix notation as follows:
Xd = AXd + Y
And
Xs = V + XsB
Where
Xd is the column vector of sectoral outputs, xi; Xs is the row vector of sectoral inputs, xj; A is
a matrix of direct-input technical coefficients, aij; B is a matrix of direct-output allocation
coefficients, bij; Y is a column vector of sectoral final demands, yi; and V is a row vector of
sectoral value added, vj.
The respective solutions of the two models are written as follows:
Xd = LY
And
Xs = VG
Where L = (I − A)−1 and G = (I − B)−1 exist and are non-negative, and where Y and V are
known (exogenously determined). The basic assumption of the demand-side (supply-side)
model is that demand (supply) patterns are stable over time. The matrix A (B) can be used for
forecasting of vector Xd (Xs) with exogenously given vector Y (V) for a future year. Note that
Xd and Xs for a future year will not be equal, as the two models are independent (Bon and
Yashoro, 1996).
Now the “Demand-Side” and “Supply-Side” multipliers can be calculated and their results
will be compared in the case of increasing “government expenditure” policy. The results of
employing these methods are explained in the next segment.

POSTGRADUATE CONFERENCE ON ECONOMICS, PUBLIC ADMINISTRATION AND
BUSINESS (PCEPAB)-5TH SEPTEMBER, 2015
PROMOTING GROWTH, EXCELENCE AND SUSTAINABILITY- 173
5. Results and Discussion
5.1 Data and aggregation
In this study, in order to investigate the effect of government expenditure on the Malaysian
Economy, 120 production accounts were aggregated into 9 sectors: 1. Primary Agriculture, 2.
Vegetable oil products, 3. Animal products, 4. Forest and fisheries product, 5. Natural
resources, extractive and related industries, 6. Processed food, 7. Textile and wearing apparel,
8. Manufacturing products, 9. Services.
5.2 Scenario and estimated results
The Malaysian SAM was used to investigate the effect of 1,000 RM rise in government
expenditure (for each economic sector) on the overall economy and also on each sector
separately. Subsequently, the results of this policy were compared for the two models.
The analysis begins with the Demand-Side output Multiplier. Technically, this Multiplier
illustrates the total amount of output induced by the requirement from all economic sectors to
produce output for satisfying the demand of the specific sector for an extra Ringgit Malaysia
(RM) (Currency) of output. In this study, for simulating the Multiplier, it was assumed that
the government tends to spend 1,000 RM (Based on the unit base of the Malaysia SAM 2005)
on the economic sector that has the highest effect in the whole economy.
Hence, for instance, in order to satisfy the demand for an extra Ringgit of “Vegetable oil
products” output, the production induces output of all industries in the economy to a total of
2,835 RM output ultimately. Finally, when comparing all of these output Multipliers of
different industries in Malaysia, it was observed that the “Vegetable oil products” had the
highest effect in this multiplier.
In terms of the Supply-Side output Multiplier model, the process of affecting sectors was
similar to the Demand-Side output Multiplier, but the difference was in the beginning point
of the shock, which starts from the supply side of the economy. Here, the results showed that
the highest effect belongs to the “Service sector” with a total effect of 5.388 RM on the
economy.
Previous studies by Bon and Bing (1993), and Bon and Yashoro (1996) illustrated that the
demand-side model performs somewhat better in terms of total output forecasts, while the
supply-side model performs somewhat better for a larger number of sectors.
Furthermore, Bong and Bing (1993) suggested that further research should concentrate on
combining the two models for direct measurement of the relative importance of demand and
supply forces. However, Mizrahi (1989) showed that these two models can be understood as
special cases of a generalized input-output and SAM model that combines the above two
principles.
All in all, when employing these multipliers to analyze the effect of Government Expenditure
policy (1st type of economic policy), based on the Demand-Side multiplier the most effective

POSTGRADUATE CONFERENCE ON ECONOMICS, PUBLIC ADMINISTRATION AND
BUSINESS (PCEPAB)-5TH SEPTEMBER, 2015
PROMOTING GROWTH, EXCELENCE AND SUSTAINABILITY- 174
sector in improving the production of the Malaysian economy is “Vegetable oil products”,
but on the contrary, for the Supply-Side multiplier the most considerable sector is “Service”.
In general, the Supply-Side multiplier of sectors is higher than their peers’ sectors on the
Demand-Side multiplier.
6. Conclusion and Policy Recommendations
Accordingly, this paper attempts to assess the effect of Malaysian government spending on
the economy. As indicated earlier, the SAM framework provides detailed and valuable
information on the economic and social structures of a country. Its main advantage in
incorporating the economic production and social structures into a single-unit framework
makes it a great tool for improving the socio-macroeconomic database of a nation. Thus, as
the Malaysian economy develops to become more complex, the required statistics and
information required for tracking the distribution of income have to be enhanced so that it is
in line with the aspirations of central planners in addressing current and future scenarios. The
Malaysia SAM serves as one of the tools in assisting a better-formulated policy and well-
designed planning.
Generally, most policymakers view public expenditures as a fiscal tool to affect
macroeconomic variables such as output and employment. In this regard, as we have a few
economic sectors in the aggregated SAM, it seems that it is better to consider the Supply-Side
Model Multiplier as a preferable tool, and hence “Government expenditures” particularly in
the “Service” sector should be prioritized compared to all other choices of spending, when
economic growth is the most urgent goal of the government. These results may be
generalized and applied to other developing countries that have the similar economic
structures as Malaysia.
Appendix
Table 4. Aggregating Sectors
1 RAWAG Primary agriculture
2 VEGOIL Vegetable oil products
3 ANIMAL Animal Product
4 F&FISH Forest and fisheries product
5 MINERAL
Natural resources, extractive and related
industries
6 FOOD Processed food
7 TEXT Textile and wearing apparel
8 MANU Manufacturing products

POSTGRADUATE CONFERENCE ON ECONOMICS, PUBLIC ADMINISTRATION AND
BUSINESS (PCEPAB)-5TH SEPTEMBER, 2015
PROMOTING GROWTH, EXCELENCE AND SUSTAINABILITY- 175
9 SVCS Services
Table 5. Demand-Side Output Multiplier (Calculated in this article)
Demand-Side
Output
Multiplier
RAWAG VEGOIL ANIMAL F&FISH MINERAL FOOD TEXT MANU SVCS
1 2 3 4 5 6 7 8 9
RAWAG 1 1.233 0.060 0.404 0.013 0.011 0.117 0.019 0.009 0.019
VEGOIL 2 0.113 2.013 0.055 0.027 0.022 0.058 0.037 0.033 0.040
ANIMAL 3 0.027 0.010 1.159 0.007 0.006 0.023 0.022 0.004 0.009
F&FISH 4 0.013 0.016 0.015 1.039 0.009 0.048 0.016 0.023 0.019
MINERAL 5 0.019 0.018 0.020 0.021 1.038 0.015 0.029 0.083 0.027
FOOD 6 0.062 0.034 0.050 0.034 0.022 1.180 0.028 0.017 0.037
TEXT 7 0.010 0.015 0.010 0.031 0.010 0.010 1.440 0.010 0.017
MANU 8 0.246 0.252 0.277 0.259 0.111 0.207 0.408 1.276 0.294
SVCS 9 0.295 0.418 0.334 0.328 0.266 0.325 0.521 0.258 1.692
Total 2.018 2.835 2.323 1.758 1.495 1.984 2.520 1.712 2.154
Table 6. Supply-Side Output Multiplier (Calculated in this article)
Supply-Side
Output
Multiplier
RAWAG VEGOIL ANIMAL F&FISH MINERAL FOOD TEXT MANU SVCS
1 2 3 4 5 6 7 8 9
RAWAG 1 1.233 0.278 0.278 0.016 0.061 0.212 0.017 0.348 0.653
VEGOIL 2 0.024 2.013 0.008 0.007 0.026 0.022 0.007 0.274 0.296
ANIMAL 3 0.040 0.064 1.159 0.012 0.046 0.060 0.029 0.250 0.444
F&FISH 4 0.011 0.059 0.008 1.039 0.043 0.071 0.012 0.726 0.525
MINERAL 5 0.003 0.015 0.002 0.005 1.038 0.005 0.005 0.582 0.167
FOOD 6 0.034 0.087 0.019 0.023 0.068 1.180 0.014 0.364 0.699
TEXT 7 0.010 0.075 0.008 0.041 0.061 0.021 1.440 0.421 0.651
MANU 8 0.006 0.030 0.005 0.008 0.016 0.010 0.010 1.276 0.260
SVCS 9 0.009 0.057 0.007 0.012 0.043 0.017 0.014 0.293 1.692
Total 1.371 2.678 1.494 1.163 1.402 1.597 1.548 4.533 5.388
References
Abdullah, A. Z. and et. al. (2009). Current status and policies on biodiesel industry in
Malaysia as the world’s leading producer of palm oil, Energy Policy, No. 37, pp. 5440–5448.

POSTGRADUATE CONFERENCE ON ECONOMICS, PUBLIC ADMINISTRATION AND
BUSINESS (PCEPAB)-5TH SEPTEMBER, 2015
PROMOTING GROWTH, EXCELENCE AND SUSTAINABILITY- 176
Ahluwia, M.S., & Lysy, J. (1979). A general equilibrium model of Malaysia. Developing
Research Center, World Bank, Mimeo.
Allen, H.H. (1998). Social Accounting Matrix, Paper of the Course on National Accounts.
Ansari, M.I. (1996). Monetary vs. Fiscal policy: Some Evidence from Vector
Autoregressiong for India, Journal of Asian Economics, Vol. 7, No. 4. Pp. 677-698.
Aschauer, D.A. (1989a). “Public Investment and Productivity Growth in the Group of
Seven,” Federal Reserve Bank of Chicago, Economic Perspectives, Vol. 13, pp. 17-25.
Aschauer, D.A. (1989b). “Does Public Capital Crowd Out Private Capital?,” Journal of
Monetary Economics, Vol. 24, pp. 171-188.
Aschauer, D.A. (1990). “Is Government Spending Stimulative?,” Contemporary Policy
Issues, Vol. 8, pp. 30-46.
Aziz., A. M., H. Muzafar Shah., W.N.W., Azman Saini & M.Azali. (2000). Testing for
Causality Between Taxation and Government Spending: An Application of Toda- Yamamoto
Approach. Pertanika J. Soc. Sci. & Hum., Vol. 1, no. 8, pp. 45-50.
Benjamine S. Cheng and Tin Wei Lai, (1997). Government Expenditures and Economic
Growth in South Korea: A VAR Approach. Journal of Economic Development, Volume 22,
number 1.
Bon, R and Bing, X. (1993). Comparative stability analysis of demand-side and supply-side
input-output models in the UK, Applied Economics, 25, 75-79.
Bon, R and Yashoro, T. (1996). Comparative stability analysis of demand-side and supply-
side input-output models: the case of Japan, 1960-90, Applied Economics Letters, 3, 349-
354.
Chandra, V. (2006). Technology, Adaptation, and Exports: How Some Developing Countries
Got it Right. World Bank, Washington, DC.
Craven, C. (2011). The Honduran palm oil industry: Employing lessons from Malaysia in the
search for economically and environmentally sustainable energy solutions, Energy Policy,
No. 39, pp. 6943–6950.
Dandan, M. M. (2011). Government expenditures and economic growth in Jordan,
International Conference on Economics and Finance Research, IPEDR vol. 4, IACSIT Press,
Singapore.
Demery, D. and Harrigan, F. (1985). A Social Accounting Matrix of 1978 for Malaysia, For
internal circulation.
Demery, D. and Harrigan, F. (1990). The Construction of the 1983 Malaysian Social
Accounting Matrix, For internal circulation.

POSTGRADUATE CONFERENCE ON ECONOMICS, PUBLIC ADMINISTRATION AND
BUSINESS (PCEPAB)-5TH SEPTEMBER, 2015
PROMOTING GROWTH, EXCELENCE AND SUSTAINABILITY- 177
Dorosh, P., Sahn, D., & Younger, S. (1997). Structural adjustment reconsidered: Economic
policy and poverty in Africa. New York: Cambridge University Press.
Harun, M. and et. al. (2012). Public expenditure expansion and inter-ethnic and rural-urban
income disparity, Procedia Economics and Finance, No. 1, pp 296 – 303.
Hezri, A. A. Hezri and Hasan M. N. (2006). Towards sustainable development? The
evolution of environmental policy in Malaysia, Journal compilation.
Hirschman, A.O., (1958). The Strategy of Economic Development. Yale University Press,
New Haven, CT, USA.
Hirschheim, R. (1985). Information Systems Epistemology: A Historical Perspective. In
Research Methods in Information Systems, proceedings of the IFIP (International Federation
for Information Processing) WG 8.2 Colloquium, Manchester Business School, 1-3rd
September 1984 (E. Mumford, G. Fitzgerald, R. Hirsch-heim and A. T. Wood-Harper Ed.),
13-35, Amsterdam.
Jalil, A. Z. and Harun, H. (2012). fiscal decision and fiscal performance: the case of Kelantan
and Penang, International Conference On Applied Economics (ICOAE) 2012, Proceeding
Economics and Finance, pp. 193-202.
Jamal, J.A and Raham (2009). Achieving Social Accounting Matrix for Malaysia thorough
Distribution of Income, Journal of The Department of Statistics, Malaysia, Vol. 1, pp. 21-34.
Jorge Alarcón and et al, (2011). Dynamic social accounting matrix (DySAM): concept,
methodology and simulation outcomes: the case of Indonesia and Mozambique, International
Labour Office, Employment Sector, Employment Intensive Investment Program. Geneva:
ILO.
Keuning, S. & Thorbecke, E. (1989). The impact of budget retrenchment on income
distribution in Indonesia: A social Accounting Matrix application. Working Paper No.3,
OECD Development Centre.
Kiaeeha, M. M. (2010). Income Distribution in Iran with Fixed-Priced Multiplier Approach
(Based on SAM 2007), Master thesis, Allameh Tabatabaei University.
Lenzen, M. (2013). Environmentally important paths, linkages and key sectors in the
Australian economy, Structural Change and Economic Dynamics 14, pp. 1-34.
Leontief, W. (1936). Quantitative Input and Output Relations in the Economic System of the
United States, The Review of Economic Statistics, 18, pp.105-125.
Loizides J. and Vamvoukeas G. (2005). Government Expenditures and Economic Growth:
Evidence from Trivariate Causality Testing. Journal of Applied Economics, Vol. VIII, NO.1,
pp. 125-152.

POSTGRADUATE CONFERENCE ON ECONOMICS, PUBLIC ADMINISTRATION AND
BUSINESS (PCEPAB)-5TH SEPTEMBER, 2015
PROMOTING GROWTH, EXCELENCE AND SUSTAINABILITY- 178
Louise Chih-hung Lio, Chiehwen Ed Hsu, and Mustafa Z. Younis (2008). The Association
Between Government Expenditures and Economic Growth: Granger Causality Test of US
Data, 1947-2002.
Mitchell, J. D. (2005) The Impact of Government Spending on Economic Growth: executive
summary; backgrounder, Heritage Fundation, No. 1831.
Narayan, Paresh K., (2005). The Government Revenue and Government Expenditure Nexus:
Empirical Evidence from Nine Asian Countries. Journal of Asian Economics, Vol. 15, pp.
1203-1216, 2005. Available at SSRN: http://ssrn.com/abstract=2079383
OECD (2013). OECD INVESTMENT POLICY REVIEWS: MALAYSIA 2013, OECD
Publishing. http://dx.doi.org/10.1787/9789264194588-en
Pyatt, G. and Round, J.I. (1979). Accounting and Fixed Price Multiplier in Social Accounting
Matrix, Economic Journal, Vol. 89, No. 356.
Pyatt, G. and Round, J.I. (1984). Improving the Macroeconomic Data Base: A SAM for
Malaysia, 1970. The World Bank, USA.
Pyatt, G. and Thorbecke, E. (1976). Planning Techniques for a Better Future. International
Labour Office: Geneva.
Ram, R. (1988). Additional Evidence on Causality between Government Revenue and
Government Expenditure. Southern Economic Journal, No. 54 (January), pp.763-769.
Ramesh, C., Gnasegarah, S., Pyatt, G. & Round, J.I. (1980). Social accounts and distribution
of income. The Malaysian economy in 1970. Review of Income and Wealth, 26 (1).
Rasiah, R., (2006). Explaining Malaysia’s export expansion in palm oil and related products.
In: Chandra, V. (Ed.), Technology, Adaptation, and Exports: How Some Developing
Countries Got It Right. World Bank, Washington, DC, pp. 163–192.
Rasmussen, P. N. (1956). Studies in Intersectoral Relations. North-Holland, Amsterdam,
Netherlands.
Rivas, Luis A. (2003). Income taxes, spending composition and long-run growth, European
Economic Review, Vol. 47, pp. 477-503.
Sani, A.R., (2009). Sektor pengangkutan Jepun digesa guna biodiesel sawit. Available at
http://www.bharian.com.my/Current_News/BH/Saturday/Berita Sawit/S
Sinha, Dipendra (1998). Government Expenditure and Economic Growth in Malaysia,
Journal of Economic Development, Vol. 23, No. 2, pp. 71-80.
Tarp et al. (2003). Economic structure and development in an emergent Asian economy:
evidence from a social accounting matrix for Vietnam, Journal of Asian Economics, Vol. 13,

POSTGRADUATE CONFERENCE ON ECONOMICS, PUBLIC ADMINISTRATION AND
BUSINESS (PCEPAB)-5TH SEPTEMBER, 2015
PROMOTING GROWTH, EXCELENCE AND SUSTAINABILITY- 179
pp. 847-871.
Thorbecke, E. and Hong-Sang, J. (1996). Multiplier Decomposition Method to Analysis
Poverty Alleviation, Journal of Development Economics, Vol. 48, No. 2.
Thorbecke, E. (2001). The Social Accounting Matrix: Deterministic or Stochastic Concept,
Paper of Conference at Institute of Social Studies, The Hague, Netherlands.
Townsend, R. F. and McDonald S. (1997). Biased Policies, Agriculture and Income
Distribution in South Africa: A Social Accounting Matrix Approach, Paper prepared for the
ESRC Development Economics Study Group Conference on the ‘Role of the Public Sector’,
University of Reading, 11th - 12th July 1997.
Trading Economics, (2012). http://www.tradingeconomics.com/malaysia/government-
spending
United Nations (1993). System of National Accounts.
Ursuala, (2002). Towards a Definition of Socio-Economic Research for the RESPECT
project, RESPECT discussion.
Wagner, A. (1890). Finanzwissenschaft, Leipzig.
Zulkefli Abdul Karim, Aminuddin Mokhtar, Mohd Azlan Shah Zaidi dan Mustazar Mansur.
(2003). Hubungan Antara Hasil Dengan Perbelanjaan: Bukti Empirikal Kerajaan Persekutuan
dan Kerajaan Negeri di Malaysia. Pascasidang Seminar Kebangsaan Fakulti Ekonomi 2003
yang berjudul "Dasar Awam Dalam Era Globalisasi: Penilaian Semula Ke Arah
Pemantapan Strategi". Fakulti Ekonomi, Universiti Kebangsaan Malaysia. 16 -17 September
2003; 219 - 236.

POSTGRADUATE CONFERENCE ON ECONOMICS, PUBLIC ADMINISTRATION AND
BUSINESS (PCEPAB)-5TH SEPTEMBER, 2015
PROMOTING GROWTH, EXCELENCE AND SUSTAINABILITY- 180
Impact of Information and Communication Technology on
Remittance Flow: A Developing Countries’ Perspective
Md Aslam Mia
Faculty of Economics and Administration, University of Malaya
50603 Kuala-Lumpur, Malaysia
Phone: +60133417794
Shamima Nasrin
Faculty of Economics and Administration, University of Malaya
50603 Kuala-Lumpur, Malaysia
Phone: +60133417794
Mohammad Nourani
Faculty of Economics and Administration, University of Malaya
50603 Kuala-Lumpur, Malaysia
Phone: +60173251926
Navaz Naghavi
Faculty of Economics and Administration, University of Malaya
50603 Kuala-Lumpur, Malaysia
Phone: +60178700942
Angathevar Baskaran
Faculty of Economics and Administration, University of Malaya
50603 Kuala-Lumpur, Malaysia
Phone: +60172414050
Abstract This study investigated the impact of information and communication technology (ICT), as well as macroeconomic
factors on remittance inflow and outflow, with particular focus on developing countries in Asia, Africa and Latin
America. It employed longitudinal datasets for the period 2005 to 2012, and generalized method of moments
(GMM) technique. The findings reveal that most of the ICT and macroeconomic factors have a positive impact on
remittance inflow and outflow. The mobile and internet (fixed broadband internet) subscribers; online banking and
automated teller machine (ATM), exchange rates, inflation, gross domestic product (GDP) and availability of
deposit accounts were found to have significant positive effects on remittance flow. The results suggest that not
only is ICT necessary for a healthy flow of remittance but also economic factors and good governance play an
important role. Drawing from the results, some policy implications are discussed.
Keywords: mobile, internet, ATM, remittance, developing country

POSTGRADUATE CONFERENCE ON ECONOMICS, PUBLIC ADMINISTRATION AND
BUSINESS (PCEPAB)-5TH SEPTEMBER, 2015
PROMOTING GROWTH, EXCELENCE AND SUSTAINABILITY- 181
1. Introduction
The importance of remittance in development has been highly acknowledged by researchers in
recent years (Córdova and Olmedo 2006; Guha 2013; Beine et al. 2012). A number of empirical
studies showed that remittances have a positive impact on poverty alleviation, inequality,
growth, education and household’s welfare (Cooray 2012; Nyamongo et al. 2012; Gupta et al.
2007; Anzoategui et al. 2014; Adams Jr and Page 2005). In contrast, some researchers have also
found mixed impact of remittance on growth, financial development and poverty nexus (Bettin
and Zazzaro 2012; Rapoport and Docquier 2006; Chami et al. 2006). The importance of
remittance is highly significant to the low income families and livelihood sustainability.
Theoretically, that is the central reason that family members move abroad.
The estimated remittance flow to developing countries has been increasing steadily despite the
global recession and large deportation of migrants from some host countries. It soared to
US$404 billion in 2013 and is expected to reach US$436 and US$516 in 2014 and 2016
respectively (World Bank 2014). Apart from official remittance flow, large number of
remittance are transferred by informal channels such as money laundering, hundi, carried cash
and many more that are unreported in the official account of a country. For example, during
1981 to 2000, it was reported that there was a huge flow of remittance through unofficial
channels which amounted to more than 54% of total remittance flow (Ratha 2006)1. There are
several factors behind this huge flow of remittance through unofficial channels including high
service charge, exchange rate volatility, poor banking sector, transaction period, and privacy of
senders (Watterson 2013; Freund and Spatafora 2008; Ratha 2006). However, transaction costs
have slowly reduced since the early 1990’s because of high competition in the remittance
market (Orozco and Center 2004).
Nowadays, the medium of remittance flow adds a different dimension to various commercial
services offered by formal and semi-formal banking institutions. New types of services
emerged, mainly driven by information and communication technology (ICT), which are
largely accepted as easy, reliable and fast in satisfying the demands of clients. Huge expansion
of internet2, mobile subscriptions, and substantial use of ICT in commercial banks, remittance
industry and exchange houses have led to faster processing of remittance flow that is several
times higher compared to the conventional method3. Watterson (2013) emphasized the
significant role of technology-based service such as usage of internet and mobile phone for
remittance transaction in order to compete with the informal channel. Similarly, Amy (2010)
documented that use of Information Technology has restructured the banking sector
significantly. Hence, ICT is playing a vital role to ease all kinds of transaction process.
Although there are many research studies examining the importance of remittance in economic
development, there are not many studies that focus on the impact of information and
communication technology (such as mobile phones, internet and automated teller machine),
combined with macroeconomic factors (exchange rate, inflation, bank branch, deposit accounts,
1 According to Bahar et al. (2006), the amount of unofficial remittance flow accounted for more than 59% during that period
which has been cited from an IMF report. 2 From here onwards, internet means fixed broadband internet subscribers. 3 Conventional approach refers to manual process of sending remittance by bank draft or telegraphic transfer process which
usually requires longer transaction period

POSTGRADUATE CONFERENCE ON ECONOMICS, PUBLIC ADMINISTRATION AND
BUSINESS (PCEPAB)-5TH SEPTEMBER, 2015
PROMOTING GROWTH, EXCELENCE AND SUSTAINABILITY- 182
world governance indicators, GDP and so on), on remittance flow. This study aims to fill this
gap in the literature by contributing in two ways. First, it examines the flow of remittance, both
inflow and outflow, in relation to ICT and macroeconomic factors. Secondly, it employs latest
dataset (2005-2012) with the specific focus on developing countries from Asia, Africa and
Latin America. Drawing from the empirical results, the study presents some major policy
implications that will aid policy formulation and decision making for healthy flow of
remittance.
The paper is organized as follows. Section 2 presents the review of literature in this area.
Section 3 discusses the research design. The empirical findings are presented and discussed in
section 4. Lastly, section 5 concludes the study and proposes some policy suggestions.
2. Literature Review
As a result of globalization, the boundaries, customs, conversations and dealers have been
greatly reduced which has increased the speed and cost efficiency in different arenas (Bonyani
and Zarei 2013). In this context, remittance flow is one of the results of globalization.
Information and communication technology has substantially reduced the transaction cost for
both the remitters and intermediaries (up to 30% to 40% in some cases) (Litan and Rivlin
2001). Expatriates opt to use informal channels for transactions as a result of cumbersome
formal channels and relative ease of informal channels.
Inflow of remittance to the developing countries is drawing considerable attention from the
researchers because of its impact on the domestic economy. Remittance constitutes a large
source of foreign income for many developing countries compared to other financial flows and
in some cases exceeds export revenue, foreign direct investment and aid (Bettin and Zazzaro
2012; Ruiz-Arranz and Giuliano 2005).
One of the important factors influencing remittance is the transaction cost. The highest
(US$21.51) and lowest (US$1.35) average costs are recorded for sending US$200 in South
Africa and Asia respectively (World Bank 2014). Ratha (2005) noted that transaction costs of
remittance could be reduced further by promoting mobile banking technology as a reliable
financial service of commercial banks. Angelakopoulos and Mihiotis (2011) stated that internet
technologies have a great influence on the banking sector and inclusion of Automated Teller
Machines, mobile banking, use of internet and land lines for transaction constitutes the
technological framework of e-banking. David et al. (2013) found that the mobile banking
system has positively influenced migrants’ remittance flow due to its simplicity, reliability and
affordability. Similarly, Siegel and Fransen (2013) documented that mobile banking could be a
revolutionary tool to pushdown remittance transaction cost in Africa. However, the financial
infrastructure has to be elevated substantially in order to realize the economic values of this new
technology. Emergence of information and communication technology, including mobile and
internet banking in developing countries, have become an ideal choice for financial transactions
in recent years.
Demirgüç-Kunt et al. (2011) empirically found that remittances are significantly associated
with number of bank branches, accounts per capita, and ratio of deposits to GDP while
examining the importance of macroeconomic factors in remittance flow. Another study focused
on migrants’ choice of remittance channel and it revealed that financial education of the

POSTGRADUATE CONFERENCE ON ECONOMICS, PUBLIC ADMINISTRATION AND
BUSINESS (PCEPAB)-5TH SEPTEMBER, 2015
PROMOTING GROWTH, EXCELENCE AND SUSTAINABILITY- 183
immigrants, cost reduction and financial inclusion appear to be important determinants behind
use of formal channels of remittance flow (Kosse and Vermeulen 2014). They also showed that
availability of automated teller machine (ATM) terminals, level of GDP in the home country
and people’s preference to use internet banking, play pivotal roles in remittance flow. Ratha
(2006) has emphasized improving access to banking services to facilitate the remittance inflow
to the recipient countries. Studies also focused on the relationship between financial openness,
financial development and remittance inflow. Mookerjee and Roberts (2011) showed that
greater financial sector development contributes to a greater remittance inflow in a country.
They used the number of bank branches per 1000 km2 as the proxy for financial development.
However, the review of literature reveals that little attempt has been made to investigate the role
of information and communication technology (ICT) on remittance flow (inflow and outflow).
Therefore, this study aims to focus on this aspect and address this gap in the existing literature.
Furthermore, most of the previous studies focused on specific factors separately, whereas this
study combines both information technology and macroeconomic factors to assess the
remittance flow in developing countries.
3. Research Design
3.1 Variables Selection
In this study, remittance inflow and outflow are dependent variables. Exchange rate (Exrate) is
one of the important factors in international transactions, thus for remittance flows as well.
Faini (1994) argued that real exchange rate depreciation could possibly have a negative impact
on remittance value. Furthermore, policy makers prefer to use fixed exchange rate regime to
maintain the flow of remittance (Singer 2010). On the other hand, large flows of remittance
substantially appreciates the real exchange rate in Latin American and Caribbean countries
(Ratha and Mohapatra 2007).
Most of the previous studies have investigated the impact of remittance on a recipient country’s
inflation rather than focusing on how inflation affects remittance inflow (Ball et al. 2013; Khan
and Islam 2013). Theoretically, if inflation increases domestically, the cost of living also rises
proportionately. This could be a driving force for immigrants to send more money to maintain
their households’ expenditure in the home country. Thus, we would expect that inflation has a
positive effect on remittance flow.
Banks represent the availability of banking services that disburse the remittance through their
branches and commercial wings. Although the formal banking sector in most developing
countries is not well established, it has outperformed in recent years in terms of providing
services and outreaching to the community. For instance, ATM is one of the latest innovations
for banking services with widespread use in developing countries. The ATM system has
benefited both parties, remitters and beneficiaries, in that the former is allowed to do the
transaction easily while the latter could withdraw the money worldwide (Kosse and Vermeulen
2014).
In the era of globalization ICT has shaped international transactions in different ways.
Electronic-commerce is one of the finest products of ICT that helps to expand commercial
activities as well as non-profit businesses or services through the platform of computer network

POSTGRADUATE CONFERENCE ON ECONOMICS, PUBLIC ADMINISTRATION AND
BUSINESS (PCEPAB)-5TH SEPTEMBER, 2015
PROMOTING GROWTH, EXCELENCE AND SUSTAINABILITY- 184
(Liu 2013). Internet and mobile phones brought about a ‘leapfrogging’ over traditional methods
and massive improvement to remittance flow. Therefore significant improvements have taken
place to increase the remittance flow.
Mobile banking allows a customer to do online transactions from anywhere around the world.
David et al. (2013) found that mobile technology has significantly enhanced remittance flow.
Data on the number of mobile banking users is not available in developing countries, thus this
study uses mobile and fixed broadband internet subscribers as a proxy. It uses fixed broadband
internet subscription rather than normal internet subscription because it is reliable. Although
there are other electronic payment systems such as Paypal, Ikobo, Zoom, Dwolla,
TransferWise, Moneygrams, and Western Union, lack of available data and a lack of aggregate
database did not allow us to include them in this study.
World governance indicator (WGI) of a country comprises six different categories including,
voice and accountability, political stability and absence of violence/terrorism, government
effectiveness, regulatory quality, rule of law, and control of corruption. This study took the
average of all six indicators to estimate aggregate governance indicators for each year (Govt.
Ind.). The lower score of WGI shows the weak government structure while higher average
score means the strong governance framework. The WGI ultimately reflects immigrants trust
and reliability about the ruling government in the home country. Furthermore, a good
government structure, represented by positive WGI values, could be a positive indicator for
remitters to send money home and invest it domestically rather than keeping it or investing
abroad. From a remittance outflow perspective, if the home country WGI is lower, expatriates,
as well as nationals of the country, will have a lack of trust on the home country. They may be
motivated to transfer money abroad rather than injecting into the local economy due to fear of
losing their investment. Weak governance structure of the residing country also influences them
to avoid unexpected risks and uncertain return. Thus, we can hypothesize a direct relationship
of WGI with remittance inflow and inverse relationship with outflow. Figure 1 illustrates the
theoretical framework which incorporates the variables used in this study. Moreover, the
descriptions of variables are provided in Table 1.

POSTGRADUATE CONFERENCE ON ECONOMICS, PUBLIC ADMINISTRATION AND
BUSINESS (PCEPAB)-5TH SEPTEMBER, 2015
PROMOTING GROWTH, EXCELENCE AND SUSTAINABILITY- 185
Figure 2: Theoretical framework
Table 14: Measurements of Variables
Variable Description
Remittance Inflow (RemIn) Measured in millions of US$ per year.
Remittance Outflow
(RemOut)
Measured in Millions of US$ per year.
Exchange Rate (Exrate) Local currency unit against US$, period average per year.
Inflation (Inf) Consumer prices measured in % per annum.
Bank Branch (Banbr) Commercial bank branches per 100,000 adults per year.
Automated Teller Machine
(ATM)
Automated Teller Machines per 100,000 adults per year.
Mobile (Mob) Mobile subscribers per 100 people per year.
Fixed Broadband Internet
(Int)
Internet Subscribers per 100 people per year with a digital
subscriber line, cable modem or other high speed technology.
Deposit Accounts (DepAcc) Depositors with commercial banks per 100,000 per year
Worldwide Governance
Indicator (WGI)
Aggregate average of 6 variables. The values ranging from -2.5
to 2.5.
Gross Domestic Product
(GDP)
GDP per capita based on purchasing power parity (PPP)
measured in current international $
3.2 Model Specification
The study applied dynamic generalized method of moments (GMM), which has not been
previously used by other authors in this context. In this model specification, economic variables

POSTGRADUATE CONFERENCE ON ECONOMICS, PUBLIC ADMINISTRATION AND
BUSINESS (PCEPAB)-5TH SEPTEMBER, 2015
PROMOTING GROWTH, EXCELENCE AND SUSTAINABILITY- 186
are treated as endogenous. The reason is that these variables do not display significant times
series variations, implying that lagged values are very similar to current values (see Baltagi et
al. (2009) and Honig (2008) who discuss about the exogenous and endogenous variables).
However, due to rapid technological change over the last decade, ICT indicators reveal
significant variation annually. These are considered as exogenous variables in the models. It is
worth emphasizing that the moment condition utilizes lag-dependent variable. The dynamic
GMM estimator proposed by Arellano and Bond (1991) eliminates any endogeneity that may be
due to the correlation of country specific, time-invariant factors and the right hand side
repressors. Lagged levels of the dependent variable, predetermined variables and endogenous
variables are used to form GMM-type instruments. First differences of the strictly exogenous
variables are used as standard instruments (Roodman 2006).
As for the diagnostics tests, Sargen’s test of over-identification examines the appropriateness of
the instruments used, while Arellano-Bond AR (2) tests the existence of the second-order serial
correlation in the first-differenced residuals. The model specification is as the following:
Log Rem𝑗𝑖𝑡 = 𝛽0 + 𝛽1𝐿𝑜𝑔 𝑅𝑒𝑚𝑖𝑡−1 + 𝛽2𝐸𝑥𝑟𝑎𝑡𝑒𝑖𝑡 + 𝛽3𝐼𝑛𝑓𝑖𝑡 + 𝛽4𝐿𝑜𝑔𝐺𝐷𝑃𝑖𝑡 + 𝛽5𝑊𝐺𝐼𝑖𝑡 +
𝛽6𝐵𝑎𝑛𝑏𝑟𝑖𝑡 + 𝛽7𝐴𝑇𝑀𝑖𝑡 + 𝛽8𝑀𝑜𝑏𝑖𝑡 + 𝛽9𝐼𝑛𝑡 𝐵𝑟.𝑖𝑡+ 𝛽10𝐷𝑒𝑝𝐴𝑐𝑐𝑖𝑡 + 𝜇𝑖 +휀𝑖𝑡
Rem𝑗𝑖𝑡 , where j=1, 2 means remittance inflow and outflow respectively with a time period of t
from 2005 to 2012. Additionally, i represent country ranging values from 1 to 41 while 𝛽1 to
𝛽10 are the coefficients of respective variables. Likewise, 𝜇𝑖 and 휀𝑖𝑡 represents the country fixed
effect used to control for time-invariant country-specific factors and error term in the model.
3.3 Data
The study collected data from the World Bank database for 41 developing countries from Asia,
Africa and North America4. The longitudinal data ranges from 2005 to 2012 with total
observation of 3266. Among all variables inflation, and world governance indicators have
negative values. Negative inflation means the prices of goods and services have decreased
which led to deflation in the economy. Positive WGI means the governance in the country is
well functioning while negative value shows the weak governance structure of the country.
Since the mean WGI is negative, we can simply say that the governance of the developing
countries chosen in the sample are not well performed. However, the highest WGI score
4 The sample includes the following countries: Afghanistan, Bangladesh, China, India, Indonesia, Iran, Iraq,
Kazakhstan, Kenya, Jordan, Latvia, Lebanon, Lesotho, Maldives, Malaysia, Sri Lanka, Tajikistan, Tanzania,
Thailand, Timor-Leste, Togo, Uganda, Nepal, Namibia, Myanmar, Pakistan, Papua New Guinea, Philippines,
Turkey, Azerbaijan, Benin, Bhutan, Ukraine, Ghana, Guyana, Guinea, Haiti, Trinidad and Tobago, Samoa, St.
Lucia and St. Kitts and Nevis.

POSTGRADUATE CONFERENCE ON ECONOMICS, PUBLIC ADMINISTRATION AND
BUSINESS (PCEPAB)-5TH SEPTEMBER, 2015
PROMOTING GROWTH, EXCELENCE AND SUSTAINABILITY- 187
recorded at 1.06 also shows that countries with good governance are also present within the
sample size. In terms of GDP, the sample also includes the least developed country
(US$920.66) and a relatively well developing country (US$29689.56) with a mean average
GDP of US$7641.31. Although none of the variables was observed to have the full panel data
(328 total observations), highest number of observation (326) was recorded for internet
followed by mobile (322), exchange rate (320), and GDP (320). The lowest number of
observations accounted for deposit accounts (196). Tables 2 illustrates the descriptive statistics
of variables.
Table 15: Descriptive statistics of variables (N= 41)
Variables Mean SD Min Max Obs.
RemIna 3686.93 8961.25 2.24 68820.52 314
RemOut 569.82 1246.45 0.52 6785.53 268
Exrate 783.41 2195.95 0.48 12175.54 320
Inf 8.05 6.75 -10.07 53.23 312
Banbr 10.52 11.69 0.62 66.91 308
ATM 17.25 21.45 0.06 92.39 260
Mob 59.83 40.47 0.26 185.82 322
Int Br 16.08 18.27 0.07 79.35 326
DepAcc 338.59 571.37 6.52 3368.39 196
WGI -0.46 0.63 -1.79 1.06 320
GDP 7641.31 6683.65 920.66 29689.56 320
a. Please refer to Table 1 for variable description.
4. Discussion on Empirical Findings
Multicollinearity is one of the severe problems in multiple regression analysis that produces
unexpected results in estimation process. Thus, pairwise correlation among the main
information and communication technology variables are estimated (see Table 3). The findings
reveal that there is relatively strong correlation among some of the telecommunication
indicators which might increase the potential problem of multicollinearity. The correlation
coefficient ranges from 0.28 to 0.77. The lowest correlation is recorded between Dep.Acc and
Banbr, which makes sense to keep them in a same regression. The highest multicollinearity was
recorded between mobile and internet subscribers. This is due to the fact that, in the era of
telecommunication and smart technology revolution, people also use high speed internet (e.g.
3G, 4G and etc.) in their mobile (smart phone). Therefore, to reduce the probability of
multicollinearity, the rest of the technological variables are introduced separately in the base
regression models similar to Naghavi and Lau (2014).
Table 16: Pairwise correlation between variables (2005-2012)
Dep.Acc Mob Int Br Banbr ATM
DepAcca 1
Mob 0.62 1
Int.Br 0.39 0.77 1

POSTGRADUATE CONFERENCE ON ECONOMICS, PUBLIC ADMINISTRATION AND
BUSINESS (PCEPAB)-5TH SEPTEMBER, 2015
PROMOTING GROWTH, EXCELENCE AND SUSTAINABILITY- 188
Banbr 0.28 0.49 0.67 1
ATM 0.72 0.73 0.73 0.53 1
a. Please refer to Table 1 for variable description.
Since the study used GMM method to estimate the parameters of β1 to β9, the coefficients are
easily interpretable (see Table 4 and 5). The base models include most of the macroeconomic
variables such as exchange rate, inflation, WGI and GDP in both remittance inflow (model 1 to
4 in Table 4) and outflow (model 5 to 8 in Table 5). All the macroeconomic variables remained
significant in both the remittance inflow and outflow models (1-8), although the significance
level has changed despite introducing the technological variables separately. This outcome
shows the significance of the models and robustness of the results. However, when broadband
internet subscription was introduced in model 2 and 6, WGI was not significant even at a 10%
significance level.
Table 17: Factors affecting remittance inflow in Developing countries
Variable Expected Model Model Model Model
Sign 1 2 3 4
Lag Remittance Inflow 0.003***a 0.398*** 0.576*** 0.003***
(0.0001)b (0.05) (0.02) (0.0001)
Exrate + 0.0001 0.0009* 0.001** 0.0008***
(0.0004) (0.0005) (0.0003) (0.0002)
Inf + 0.036** 0.027*** 0.009*** 0.054***
(0.008) (0.004) (0.001) (0.016)
LogGDP + 0.36*** 0.828*** 0.507** 0.37***
(0.012) (0.015) (0.018) (0.012)
Govt.Ind + 1.174*** 0.0082 0.678*** 1.063***
(0.006) (0.001) (0.001) (0.006)
Banbr + 0.063***
(0.0007)
DepAcc + 0.0007*
(0.0003)
Int Br + 0.027***
(0.004)
Mob + 0.007***
(0.001)
ATM + 0.019*** 0.019***
(0.003) (0.003)
Number of Instruments 44 32 29 44
Sargan test c 0.12 0.215 0.102 0.381
Arellano-Bond test d 0.33 0.385 0.586 0.385
a. *, **, *** indicates statistical significance at 10%, 5% and 1% respectively.
b. Values in parenthesis show the standard error.
c. The Sargan test is a test of over identifying restrictions. The null hypothesis is that the
instruments are valid instruments.

POSTGRADUATE CONFERENCE ON ECONOMICS, PUBLIC ADMINISTRATION AND
BUSINESS (PCEPAB)-5TH SEPTEMBER, 2015
PROMOTING GROWTH, EXCELENCE AND SUSTAINABILITY- 189
d. Null hypothesis of Arellano-Bond test for AR (2) is for no autocorrelation in the second
order of residuals.
As macroeconomic factors play an important role, this study also found analogous effects of
these factors on remittance flow, which is in line with other studies. The coefficients of
exchange rate varied from 0.01% to 0.1% (from model 1 to model 4) in remittances inflow with
one additional unit increase in exchange rate against US$. On the other hand, the remittance
outflow coefficients value ranges from 0.01% to 0.2% with additional unit increase in exchange
rate. Slightly higher coefficient of remittance outflow against exchange rate increase revealed
that, due to the price increase, goods and commodities become expensive and can motivate
immigrants to send more remittances for adjusting the net effects in the domestic country. On
the other hand, significant flow of remittance towards a country can appreciate real exchange
rate which might have a negative impact such as Dutch-Disease-like phenomenon (Castañeda
and Catalán 2007; Ratha and Mohapatra 2007). Inflation has a similar effect on remittance
inflow and outflow. As inflation increases the prices of goods and commodities domestically,
more remittance is needed to maintain the same level of households’ expenditures. As such,
remittance flow proportionately changes in relation with the inflation rate. However, the
magnitude of remittance flow changes were large (coefficients varies from 0.9% to 5.4%) for
inflation than exchange rate for additional unit increase in inflation and exchange rate
respectively. Inflation increase is directly related to price increase while exchange rate change
is indirectly related towards the prices of the goods and commodities. So the impact was higher
for inflation changes while both these variables met the expected sign.
GDP is one of the primary and most widely-used indicators to gauge the health of a country’s
economy. This study found that GDP has a positive significant impact on remittance flow (both
inflow and outflow). The empirical findings suggest that the impact of GDP in remittance flow
is robust and remained significant in all the models except when mobile subscriptions is added
in outflow (model 7). Obviously, increasing GDP is a good thing, which indicates the prosperity
of a country, however higher GDP also promotes remittance outflow. When per capita GDP is
high for a country, it shows the development of the country and attracts more immigrants which
substantially increased the remittance outflow. Furthermore, the remittance inflow coefficients
are higher compared to outflow and the estimated net remittance flow is positive based on
estimated model.
The study used world governance indicator (WGI) as a proxy to gauge the overall situation of a
country, particularly governance structure, to see the impact in remittance flow. It found a
significant and dualistic results which have very important implications for policy makers. In
the context of remittance inflow, WGI is positively associated with remittance and observed the
highest coefficients (1.174 in model 1) among all other variables included in the model. On the
other hand, remittance outflow is adversely related with WGI. This suggests that good
governance of a country (considering all those six factors) attracts remittances because
immigrants feel safe and secure to invest domestically rather than holding cash or investing
abroad. However, additional unit increase in WGI will lead to a significant amount of
remittance outflow from the country. This finding is quite exceptional from the existing
literature. Two conclusions can be drawn from this finding. Firstly, improvement in WGI might
be good for the country in general, but greater financial openness allows easy remittance

POSTGRADUATE CONFERENCE ON ECONOMICS, PUBLIC ADMINISTRATION AND
BUSINESS (PCEPAB)-5TH SEPTEMBER, 2015
PROMOTING GROWTH, EXCELENCE AND SUSTAINABILITY- 190
outflow, when there is no outflow restriction. Secondly, in micro level, we can assume that
regardless of the governance structure of a country (whether it is good or bad), immigrants are
honor-bound to send their hard-core earnings to their beloved family due to the maternal
relationship. However, the estimated net effect of WGI (if we take remittance inflow and
outflow together with WGI) is still associated positively with remittance.
In terms of impact of ICT on remittance flow, the three main components, namely broadband
internet, mobile and ATM, showed significantly positive as hypothesized. The coefficients are
higher for broadband internet compared to mobile subscribers. As broadband internet is
required for international transactions, particularly for internet banking (for online transactions),
the impact is somewhat larger than mobile subscriptions. In aggregate, broadband internet can
be used not only in fixed line broadband but also in several high speed digital devices (e.g.
smart phone). Thus, it is estimated to have a better significant impact of per unit increase in
broadband internet subscriptions. Kosse and Vermeulen (2014) have found that those who are
familiar with internet banking are likely to use banking service for channelling the remittance.
Furthermore, researchers also found that the number of internet users has substantially
increased in the last few years and this technology allows clients to do online transactions from
any part of the world and that has significantly affected the remittance flow (David et al. 2013).
Mihalciuc et al. (2008) argued that extensive use of mobile phones increased the interaction
between financial institutions and customers. That is, easy access of information increased the
efficiency of both parties. For example, electronic payment is becoming increasingly popular in
the Middle East countries which enables remitters to use e-banking (O'Flynn 2009).
Table 18: Factors affecting remittance outflow in developing countries.
Variable Expected Model Model Model Model
Sign 5 6 7 8
Lag Remittance
Outflow
0.088*a 0.534*** 0.963*** 0.375***
(0.083)b (0.0007) (0.000) (0.07)
Exrate + 0.0001 0.001 0.0001*** 0.002**
(0.536) (0.07) (0.000) (0.0008)
Inf + 0.011*** 0.045*** 0.022*** 0.019**
(0.004) (0.012) (0.000) (0.008)
LogGDP + 1.07** 1.055* 0.053 0.608***
(0.026) (0.053) (0.345) (0.05)
Govt.Ind - -1.02** -0.652 -0.403*** -0.908***
(0.048) (0.401) (0.001) (0.08)
Banbr + 0.050**
(0.0003)
DepAcc + 0.0003**
(0.02)
Int br + 0.026**
(0.01)
Mob + 0.001**
(0.01)

POSTGRADUATE CONFERENCE ON ECONOMICS, PUBLIC ADMINISTRATION AND
BUSINESS (PCEPAB)-5TH SEPTEMBER, 2015
PROMOTING GROWTH, EXCELENCE AND SUSTAINABILITY- 191
ATM + 0.019*** 0.012**
(0.003) (0.01)
Number of Instruments 44 26 29 25
Sargan test c 0.12 0.486 0.8 0.45
Arellano-Bond test d 0.33 0.69 0.312 0.766
a. *, **, *** indicates statistical significance at 10%, 5% and 1% respectively.
b. Values in parenthesis show the standard error.
c. The Sargan test is a test of over identifying restrictions. The null hypothesis is that the
instruments are valid instruments.
d. Null hypothesis of Arellano-Bond test for AR (2) is for no autocorrelation in the second
order of residuals.
Automated Teller Machine (ATM), which is one of the extended financial services by formal
banking institutions, promotes remittance flow. Our findings suggest that for each additional
unit increase in ATM it will increase both the remittance inflow and outflow. This finding is
similar to the results of Kosse and Vermeulen (2014) that ATM makes a positive impact on
remittance flow. Online transaction becomes easier through ATM and immigrants can transfer
money to third party within seconds. This kind of transfer requires less transaction cost and
thereby motivates immigrants to use such services. Freund and Spatafora (2008) found that
transaction cost was adversely related with remittance flow. Furthermore, Orozco and Center
(2004) found that 1% of total remittance flow from US to Latin America and the Caribbean was
done through ATM and credit or smart card.
Overall, the usage of ICT in remittance flow has had substantial negative impacts on informal
channelling of remittance, as argued by Watterson (2013). Thus, it is helping not only to
increase the official remittance flow, but also helps to reduce the illegal informal channelling of
remittance.
Importance of financial developments largely contributed to remittance flow. The study
examined the availability of commercial banks branches and the number of deposit accounts
holders as a measure of financial depth and openness. Bank branches, which are used to
withdraw remittance that has been sent by expatriates abroad, made a significant positive
impact in remittance flow. This finding is similar to Mookerjee and Roberts (2011) that greater
financial development or greater bank branch showed significant remittance inflow. Demirgüç-
Kunt et al. (2011) also found that remittance flow are strongly related with bank branch as well
as accounts per capita. Remittance outflow is also positively associated with larger bank
branches. However, remittance outflow could be restricted due to several reasons including the
protection of the domestic country’s interest. Some countries might have imposed limitation on
outward remittance flow in fear of financial downturn or immersive impact in the local
currency and domestic economy (Mohapatra and Ratha 2010).
Lastly, similar effects have been observed for the number of deposit accounts on remittance
inflow and outflow. The underlying reason behind these positive relations postulate that, in case
of remittance inflow, deposit accounts are used for keeping the remittance in the bank account
and withdrawals are based on the beneficiary’s preference. On the other hand, formal banking
institutions also require (most often) bank account in their respective banks for channelling
remittance outflow. As such, an account holder can easily transfer the expected amount of

POSTGRADUATE CONFERENCE ON ECONOMICS, PUBLIC ADMINISTRATION AND
BUSINESS (PCEPAB)-5TH SEPTEMBER, 2015
PROMOTING GROWTH, EXCELENCE AND SUSTAINABILITY- 192
remittance to their destination. Online transaction becomes easier and more convenient when an
immigrant has a deposit account and uses the same account number for online transactions such
as transferring remittance. Demirgüç-Kunt et al. (2011) also showed a positive relationship
between bank account and remittance. Furthermore, some commercial banks have offered
attractive remittance deposit account for the healthy flow of the remittance worldwide.
To sum up, the results showed that ICT and macroeconomic factors played an important role in
remittance flow. Particularly, mobile subscriptions, internet users, ATM, exchange rate,
inflation, bank branch, GDP, WGI and deposit accounts have had a significant impact on
remittance flow.
5. Conclusion and Policy Recommendation
Remittance is an external source of financing for most developing countries and contributes
positively to their economic development path. This study examined the impact of ICT and
macroeconomic factors on remittance flow using a dataset of 41 developing countries covering
the period from 2005 to 2012. The results showed that substantial usage of ICT (ATM, mobile
and internet subscriptions) and banking services by financial institutions play a pivotal role in
remittance inflow and outflow. On the other hand, macroeconomic factors such as exchange
rate, inflation, bank branch, deposits account, GDP and WGI also contribute significantly to
remittance flow. The findings of this study have important implications for policy makers trying
to stimulate the remittance flow.
We should note that further innovative ICT initiatives have to be taken in the financial domain
by government or private industries or by both to retain and increase the flow of remittance that
significantly contributes to the national economies, particularly in developing countries.
Furthermore, exchange rate and inflation factors need to be more carefully looked into by
monetary authorities and perhaps there is a need for cost-benefit analysis for choosing a suitable
policy formulation. Government, the key player, should promote expansion of banking sectors
and make sure the financial inclusion of all sections of the society through different ICT
innovations and incentives. Governance structures should be promoted for a healthy remittance
flow by taking consideration of several dimensions. For example, in terms of banking industry,
they should provide hassle-free, secured and reliable banking service to the migrants by
providing a range of financial products and services. Simple but secured online banking
systems (user-friendly) should be developed to help less educated immigrants and promote
remittance flow through official channels and to help reduce illegal money transfers. Finally,
ICT sector actors should provide cost efficient access to everyone which will, in turn, motivate
people to use legal means of remittance flow and shy away from illegal money transfer
network.
Acknowledgement
Authors would like to thanks Howard (Rick) Steel for his English editing support.

POSTGRADUATE CONFERENCE ON ECONOMICS, PUBLIC ADMINISTRATION AND
BUSINESS (PCEPAB)-5TH SEPTEMBER, 2015
PROMOTING GROWTH, EXCELENCE AND SUSTAINABILITY- 193
References
Adams Jr, R. H., & Page, J. (2005). Do international migration and remittances reduce poverty
in developing countries? World Development, 33(10), 1645-1669.
Amy, K. (2010). Bangladesh caps microfinance rates at 27%. Financial times.
Angelakopoulos, G., & Mihiotis, A. (2011). E-banking: challenges and opportunities in the
Greek banking sector. Electronic Commerce Research, 11(3), 297-319.
Anzoategui, D., Demirgüç-Kunt, A., & Martínez Pería, M. S. (2014). Remittances and financial
inclusion: evidence from El Salvador. World Development, 54, 338-349.
Arellano, M., & Bond, S. (1991). Some tests of specification for panel data: Monte Carlo
evidence and an application to employment equations. The review of economic studies,
58(2), 277-297.
Bahar, H., Sarker, A. A., & Hossain, B. (2006). The Flow of Workers’ Remittances in
Bangladesh: Performance, Challenges and Policy Options. Draft Working Paper,
Bangladesh Bank, Dhaka.
Ball, C. P., Lopez, C., & Reyes, J. (2013). Remittances, Inflation and Exchange Rate Regimes
in Small Open Economies. The World Economy, 36(4), 487-507.
Baltagi, B. H., Demetriades, P. O., & Law, S. H. (2009). Financial development and openness:
Evidence from panel data. Journal of Development Economics, 89(2), 285-296.
Beine, M., Lodigiani, E., & Vermeulen, R. (2012). Remittances and financial openness.
Regional Science and Urban Economics, 42(5), 844-857.
Bettin, G., & Zazzaro, A. (2012). Remittances and financial development: substitutes or
complements in economic growth? Bulletin of Economic Research, 64(4), 509-536.
Bonyani, N., & Zarei, M. S. (2013). Challenges and solutions facing electronic commerce law
in Iranian and convention of the international sale of goods and the future outlook.
International Research Journal of Applied and Basic Sciences, 5(10).
Castañeda, J., & Catalán, J. (2007). Emigrant Remittances and the Real Exchange Rate in
Guatemala: An Adjustment-Costs Story. Documento presentado en II Foro de
Investigadores de Bancos Centrales de los Países Miembros del CMCA en Guatemala,
7(8).
Chami, R., Cosimano, T. F., & Gapen, M. (2006). Beware of emigrants bearing gifts: optimal
fiscal and monetary policy in the presence of remittances. Available at SSRN:
http://ssrn.com/abstract=898722.
Cooray, A. (2012). Migrant remittances, financial sector development and the government
ownership of banks: Evidence from a group of non-OECD economies. Journal of
International Financial Markets, Institutions and Money, 22(4), 936-957.
Córdova, J. E. L., & Olmedo, A. (2006). International remittances and development: existing
evidence, policies and recommendations (Occasional Paper ITD= Documento de
Divulgación ITD; n. 41) (Vol. 41): BID-INTAL.
David, B., Dana, D., & Abel, F. (2013). On the effect of mobile phone on migrant remittances:
A closer look at international transfers. Electronic Commerce Research and
Applications, 12(4), 280-288.
Demirgüç-Kunt, A., Córdova, E. L., Pería, M. S. M., & Woodruff, C. (2011). Remittances and
banking sector breadth and depth: Evidence from Mexico. Journal of Development
Economics, 95(2), 229-241.
Faini, R. (1994). Workers remittances and the real exchange rate. Journal of Population
Economics, 7(2), 235-245.
Freund, C., & Spatafora, N. (2008). Remittances, transaction costs, and informality. Journal of
Development Economics, 86(2), 356-366.

POSTGRADUATE CONFERENCE ON ECONOMICS, PUBLIC ADMINISTRATION AND
BUSINESS (PCEPAB)-5TH SEPTEMBER, 2015
PROMOTING GROWTH, EXCELENCE AND SUSTAINABILITY- 194
Guha, P. (2013). Macroeconomic effects of international remittances: The case of developing
economies. Economic Modelling, 33, 292-305.
Gupta, S., Pattillo, C. A., & Wagh, S. (2007). Impact of remittances on poverty and financial
development in Sub-Saharan Africa (Vol. 7): International Monetary Fund.
Honig, A. (2008). Addressing causality in the effect of capital account liberalization on growth.
Journal of Macroeconomics, 30(4), 1602-1616.
Khan, Z. S., & Islam, S. (2013). The Effects of Remittances on Inflation: Evidence from
Bangladesh. Journal of Economics and Business Research, 19(2), 198-208.
Kosse, A., & Vermeulen, R. (2014). Migrants’ Choice of Remittance Channel: Do General
Payment Habits Play a Role? World Development, 62(0), 213-227,
doi:http://dx.doi.org/10.1016/j.worlddev.2014.05.002.
Litan, R. E., & Rivlin, A. M. (2001). Projecting the economic impact of the Internet. American
Economic Review, 313-317.
Liu, S. An Empirical Study on Ecommerce’s effects on economic growth. In International
Conference on Education Technology and Management Sciences (ICETMS), Hong
Kong, China, 2013
Mihalciuc, C. C., Apetri, A. N., & Bonaventure, M. (2008). The importance of modern e-banks
for development of new economy. The USV Annals of Economics and Public
Administration, 8(1), 147-151.
Mohapatra, S., & Ratha, D. (2010). Forecasting migrant remittances during the global financial
crisis. Migration Letters, 7(2), 203-213.
Mookerjee, R., & Roberts, J. (2011). Banking services, transaction costs and international
remittance flows. Applied Economics Letters, 18(3), 199-205.
Naghavi, N., & Lau, W.-Y. (2014). Exploring the nexus between financial openness and
informational efficiency–does the quality of institution matter? Applied Economics,
46(7), 674-685.
Nyamongo, E. M., Misati, R. N., Kipyegon, L., & Ndirangu, L. (2012). Remittances, financial
development and economic growth in Africa. Journal of Economics and Business,
64(3), 240-260.
O'Flynn, M. (2009). Electronic payment is booming in the Middle East. Card Technology
Today, 21(4), 12-13.
Orozco, M., & Center, P. H. (2004). The remittance marketplace: Prices, policy and financial
institutions (Vol. 2, Vol. 8): Pew Hispanic Center Washington, DC.
Rapoport, H., & Docquier, F. (2006). The economics of migrants' remittances. Handbook of the
economics of giving, altruism and reciprocity, 2, 1135-1198.
Ratha, D. (2005). Workers’ remittances: an important and stable source of external
development finance. Economics Seminar Series, Paper 9,
Ratha, D. (2006). Economic Implications of Remittances and Migration: World Bank.
Ratha, D., & Mohapatra, S. (2007). Increasing the macroeconomic impact of remittances on
development. World Bank.
Roodman, D. (2006). An introduction to difference and system gmm in stata. Center for Global
Development Working Paper Series.
Ruiz-Arranz, M., & Giuliano, P. (2005). Remittances, financial development, and growth:
International Monetary Fund.
Siegel, M., & Fransen, S. (2013). New Technologies in Remittance Sending: Opportunities for
mobile remittances in Africa. African Journal of Science, Technology, Innovation and
Development, 5(5), 423-438.
Singer, D. A. (2010). Migrant remittances and exchange rate regimes in the developing world.
American Political Science Review, 104(02), 307-323.

POSTGRADUATE CONFERENCE ON ECONOMICS, PUBLIC ADMINISTRATION AND
BUSINESS (PCEPAB)-5TH SEPTEMBER, 2015
PROMOTING GROWTH, EXCELENCE AND SUSTAINABILITY- 195
Watterson, C. (2013). More Flies with Honey: Encouraging Formal Channel Remittances to
Combat Money Laundering. Texas Law Review(3), 711.
World Bank (2014). Migration and Remittance.
http://web.worldbank.org/WBSITE/EXTERNAL/NEWS/0,,contentMDK:20648762~pa
gePK:64257043~piPK:437376~theSitePK:4607,00.html. Accessed September 2014.

POSTGRADUATE CONFERENCE ON ECONOMICS, PUBLIC ADMINISTRATION AND
BUSINESS (PCEPAB)-5TH SEPTEMBER, 2015
PROMOTING GROWTH, EXCELENCE AND SUSTAINABILITY- 196
Deconstructing the Narratives of Security State and the Role of
Power Elite
Ayesha Shoukat
Faculty of Economics and Administration
University of Malaya
Abstract
This paper attempts to clarify the roles of the power elite in the profound political transformation of Pakistan from
an ideological to a security state. The exercise and maintenance of power is framed by a theoretical
interdisciplinary framework that encompasses political as well as socio-economic dimensions. This framework is
set against the interplay of ethnic and geographic factionalism, with the exercise of military power explained by
extant theories. Understanding the complex concept of power requires deconstructing key elements of the past to
understand the ways power is enacted, expressed, described, concealed, or legitimized. This is accomplished by
reference to documents and interviews that speak to the social and historical context.
Keywords: Ideological state, security state, power elites, collusions and contestations, two
nation theory, military elite, separation of West Pakistan.
Introduction:
The notion of Pakistan as an “Ideological State1” was based on the two nation doctrine in which
populace heterogeneity should be followed by political and geographical autonomy. Although
Pakistan self-determination was based on ideological grounds, it turned out to be a “Garrison
State2” (Lasswell, 1941) or “Security state3” (LaPorte, 1969). Pakistan retained many of the
external forms of democracy, while the effective power was gradually concentrated in the
military elite in the name of security and sovereignty. The given socioeconomic, historical and
cultural conditions favored certain groups, classes and other social formations to support power
shift for their own vested interests. The role of power elites have been extensively discussed in
sociology and political science. The role of the different interest groups in the process of the
1 ideological state apparatus A term developed by the Marxist theorist, Louis Althusser to denote institutions such
as education, the churches, family, media, trade unions, and law, which were formally outside state control but
which served to transmit the values of the state, to interpellate those individuals affected by them, and to maintain
order in a society, above all to reproduce capitalist relations of production.(The Dictionary of Sociology, 1998) 2 The dominant group is constituted by the specialists on violence, since force is the distinctive skill of soldiers and
police. The specialist on violence rises in power as other skill groups subside, such as the specialists on civil
administration, party and pressure-group administration, and specialists on propaganda or persuasion. (Harold D.
Lasswell, 1948)
3 A post- World War II state in which nearly all aspects of political, economic, intellectual, and social life are
dominated by considerations of national defense and the drive to maintain a defense establishment capable of
protecting the state against all comers. (US Military Dictionary)

POSTGRADUATE CONFERENCE ON ECONOMICS, PUBLIC ADMINISTRATION AND
BUSINESS (PCEPAB)-5TH SEPTEMBER, 2015
PROMOTING GROWTH, EXCELENCE AND SUSTAINABILITY- 197
government is a well discussed topic in literature. The early 1900 scholars like David Truman4
and Earl latham5 have wrote about government process as a result of interaction of these interest
groups (elites)(Maniruzzaman, 1966).
In the story of creation of security state, the question of defining a narrative of events
inevitably lead back to the central question about the role of narrative in history more generally.
Even postmodernism, which is supposed to playfully deconstruct or reassemble the elements of
the past, has frequently been reduced to a method. As Hayden whites has suggested, the
construction of historical narratives almost inevitably implies the “emplotment” of events to
convey moral meaning(White, 2009). When we study the history of Pakistan with power elite
philosophy then one came to realize that the fundamental ground theories on which all political
and social building of country’s existence is standing can be divided in three junctures. The
objective of this article is to deconstruct, to uncover the hidden, multi-faceted meanings and
thereby to reveal the codes of power in the narrative of Pakistan’s ideology and existence.
First is Two Nation Theory, the one on basis of which country was separated from united India.
It is considered to be the reason and base of demanding a separate home land for the Muslims
of United India who from centuries were living together(Cohen, 2002).
Second is the East Pakistan separation tragedy, it is also been acclaimed that at the time of
partition it was a deliberate act by the British and Hindus to create such a boundary line which
makes a very narrow link between two Muslim majority areas of united India and later they
keep conspiring the locals of east Pakistan against West Pakistan and created a rift between
them which ultimately ended up by civil disobedience and separation of East Pakistan after a
war with India. Though there were internal problems of East Pakistan with Military but India
jumped in and ended up in having a war which results to Pakistan in shape of losing its East
wing.
Third is the belief that Military is the last savior for the country in all political and economic
crises. And whenever a country reaches to any political or economic brink, it’s always is
Military which comes as a savior and takes country out of such chaos and disaster(Cohen,
2002).
The article is presented in six parts, first the introduction in which I gave a brief explanation of
the purpose of writing this paper along with the three fundamental theories which will be
discussed in different perspective ahead. In second part, the methodology is explained and after
that part 3 to 5 are presenting the debate on the three narratives of the theories discussed above.
Lastly I have concluded the discussion with the concept of role of power elites and their own
vested interest behind all those events and incidences.
4 D. B. Truman, The Governmental Process. New York: Alfred A. Knopf, i95i; E. Latham, "The Group Basis of
Politics, Notes for a Theory," American Political Science Review, Vol. 46, I952, pp. 376-397; G. A. Almond,
Rapporteur, "Research Note, A Comparative Study of Interest Groups and the Political Process," American
Political Science Review, Vol. 52, 1958, pp. 270-282. 5 Latham, op. cit., p. 390.

POSTGRADUATE CONFERENCE ON ECONOMICS, PUBLIC ADMINISTRATION AND
BUSINESS (PCEPAB)-5TH SEPTEMBER, 2015
PROMOTING GROWTH, EXCELENCE AND SUSTAINABILITY- 198
Methodology:
This article is polemic in nature in which Meta –Analysis6 technique is used to deconstruct the
events which leads to certain drawing of history. For it, the procedure followed is to analyze the
results of the researches and studies of other scholars who narrated those incidences in their
own specific explanation and later question them with a new perspective which is based on the
data and other studies results.
The research question answered in this study is that how a state which is considered to be an
ideological state turn out to be a security state in a time due to multiple incidences and events.
And what role power elites played in this transformation.
First Narrative:
Few events have been more imperative to the history of contemporary South Asia than the
partition of the subcontinent into India and Pakistan in 1947. The coming of partition has troupe
a powerful shadow on historical reconstructions of the decades before 1947, while the
complications of partition have persistent to leave their mark on sub continental politics even
till date. Yet, neither scholars of British India nor scholars of Pakistan and Indian nationalism
tried to find a persuasive place for partition within their larger historical narratives (Pandey
1994, 204-5). For British Empire historian, Partition is the result of the failure of the British rule
of transition from colonial to post-colonial rule. For Indian it is “the unfortunate outcome of
sectarian and separatist politics," and "a tragic accompaniment to the exhilaration and promise
of a freedom fought for with courage and velour" (Menon and Bhasin 1998, 3). And for
Pakistani Nationalist it is a triumph of success of having a homeland based on a Muslim
ideology. But the issue which comes here in Pakistan’s history narration is that the partition is
not of a subcontinent, but of the Indian Muslim community itself, and it had made the fitting of
the creation of Pakistan into any simple narrative of Muslim community extremely problematic
(Hardy 1972). Later the emergence of Bangladesh in 1971 made this all the more grim.
Every child in Pakistan is brought up being taught three fundamental theories7. Due to it, there
visions are planned as per so and inborn fear and aggression towards India starts building up
from day one which ask for the need of Military to protect them from their giant enemy which
not only suppress them before the independence but afterwards also, Military’s continuous
conspiracies take away from them, the left wing though initially Bengali’s don’t want to be
separated by us.
The search for a narrative structure to contain the history of partition must begin with the search
for a narrative of the high politics of Pakistan's creation that at least delivers room for an
understanding of the issues that everyday lives influenced the decisions made in Delhi and
6 A meta-analysis refers to methods that focus on contrasting and combining results from different studies, in the
hope of identifying patterns among study results, sources of disagreement among those results, or other interesting
relationships that may come to light in the context of multiple studies 7 The task of rewriting history books started in earnest in 1981, when General Zia ul Haq declared compulsory the
teaching of Pakistan studies to all degree students, including those at engineering and medical colleges. The
University Grants Commission issued a directive to prospective textbook authors specifying that the objective of
the new course is to 'induce pride for the nation’s past, enthusiasm for the present, and unshakeable faith in the
stability and longevity of Pakistan. (University Grants Commission directive, quoted in Azhar Hamid, et al.
Mutalliyah-i-Pakistan (Islamabad: Allama Iqbal Open University, 1983), p. xi.)

POSTGRADUATE CONFERENCE ON ECONOMICS, PUBLIC ADMINISTRATION AND
BUSINESS (PCEPAB)-5TH SEPTEMBER, 2015
PROMOTING GROWTH, EXCELENCE AND SUSTAINABILITY- 199
London. But when we see the historical epochal events in more detail and unbiasedly, we see
that the reality is something else. There is an ample amount of literature which argued that the
concept of two nation theory was very new for the Muslims of India as it was introduced in
early 1900. When British internally have decided to roll back to their country and leave this
colony due to multiple factors of facing continuous aggression by Indian for their independence
started from the independence war of India in 1857 and the pressure they have after First World
War. But they don’t want to leave India being strong enough to be a future political and
economic opponent. United India was the biggest colony of British Empire which after
independence can become there biggest rival economically and politically. So it was well
planned to divide them before handing them back there independence(Ganguly, 2013). Having
said that, no doubt the rifts and the issues among Muslims and Hindus of that area were there
and naturally since the problem was there so it was escalated and magnified but point to ponder
is that was the area given to Pakistan geographically was this much developed to inhibit as a
separate independent state? Were the problems really this much serious that after the major
player “British” who created all these disparities, the two other victims, “Muslims and Hindus”
could not find a way to manage their grievances together? Was the Division done solely on the
demand of Muslims of having separate homeland or was the seed implanted by the British
intentionally to divide the state before leaving? Were they really in such a soft heart towards the
Muslims of United India that they don’t want them to be suppressed by Hindus after they leave?
And if so then why they kept suppressing them by joining hands with Hindus at the time of
British rule though before their invasion, India was governed by Muslim Mughal Empire and
such Muslim Hindu issues were never recorded in history(Ganguly, 2013; Hasan, 1997). There
are writers like (Hardy, 1972) who mentioned that the Partition of Pakistan was not only
partition of Muslims from Hindus but is been observed as a Partition of Indian Muslim
Community itself. But at the same times there is an ample amount of literature supporting Two
Nation theory also like (Sayeed, 1998) “Pakistan: The Formative Phase 1857-1948” deals with
the differences in the political attitudes of the Hindu and Muslim communities in British India
from the war of independence in 1857 until the independence of India and Pakistan in 1947.
The author highlights the anti-western as well as pro-monarchial tendencies of the Muslims of
India. Ayesha Jalal and Sujata Bose’s Modern South Asia: History, Culture, Political Economy
paints a similar picture when the authors emphasize the divergent political attitudes of the two
communities (Hindus and Muslims) inhabiting United India.(Bose & Jalal, 1998)
This gives any rational person a thought to think that who then internally be beneficiary of this
division actually. Who among the Muslims played the role of creating this sense among
Muslims of United India? If they were the real representative of the suppressed class then it
makes a strong lucidity that yes the problem was there and the solution was a separate home
land. But we see that the leaders of Muslim league who actually introduced Pakistan
Movements were the rich Muslim landlords, Modern educated secular urbanities and the
commercial minorities of Western India (W. Wilcox, 1968). Who truly have never been the
victim of the suppression and disparity of Hindus or British? Then what could be there purpose
to fight for separate homeland and independence? One good faith thought could be the pain
they feel for their fellow Muslims and the other more convincing thought could be there
personal benefit out of this separation. Primarily, Muslim league never demanded a separate
homeland, it wanted a loose federation with maximum powers to Muslim majority units but
when congress did not agree, the demand become of a separate state, which was surprisingly

POSTGRADUATE CONFERENCE ON ECONOMICS, PUBLIC ADMINISTRATION AND
BUSINESS (PCEPAB)-5TH SEPTEMBER, 2015
PROMOTING GROWTH, EXCELENCE AND SUSTAINABILITY- 200
backed by British. (Gilmartin, 1998) in his work attempted to do the narration of partition of
Pakistan in context of its impact on South Asia history and concluded it as a result of an events
which relate ‘High Politics’ with the everyday life in India. He said that Pakistan which was
demanded as a symbol of moral order, surpassing the divisions among Muslims was dominated
by elites who came quickly to mistrust the particularism of Pakistani society as a threat to
state’s own moral sovereignty.
Prof. Khalid Bin Sayeed in late 1990’s asked a question that “Pakistan, with all its weaknesses,
has a state, but does it have a nation?’. The two Nation theory is based on the philosophy that
Muslims around the world are one nation and hence cannot live under one state with Hindus of
United India but we see that in Pakistan there is a number of ethnic factionalism which had
developed right from the beginning till today and doesn’t allow a country to emerge up as a
nation. Ayesha Jalal said that Jinnah was the “sole-nationalist” in quest on its Nation(Jalal,
1985) but at the same time in her work she was questioning this also that weather Jinnah ever
really wanted the creation of separate homeland for Muslims of United India or weather the
actual partition was forced by the leaders of Congress who found it more convenient to give
Jinnah a "truncated, moth-eaten" Pakistan rather than to give him the political position he
wanted in a united India. But it is also reality that when in 1937 Jinnah’s Muslim league could
only win 55 vote he coined the formula of “Two Nation Theory”.
“Islam and Hindus mare not religions in the strict sense of the word, but are, in fact different
and distinct social order (…). The Hindus and the Muslims belong to two different religious
philosophies, social customs, and literatures (…). To yoke together such nations under a single
State, one as a numerical minority and the other as a majority, must lead to growing discontent
and the final destruction of any fabric that may be so built up for the government of such a
state”8.
Initially the Muslim separatism developed primarily among the British provinces where
Muslims were in minority, Muslim majority provinces accepted Pakistan movement in 19409.
“The intellect of these regions evolved a nationalist ideology that was over-determined by its
socio-economic and political interest… From Syed Ahmad Khan to Jinnah, this elite shaped an
ethnic variety of nationalism based on Islam”(Jaffrelot, 2002).
(Shaikh, 1989) In her work links this movement with the result of the attempts of literate elites
of Muslim community. Which she called as Ashraf ‘elites’. When we see Pakistan after the
independence, we see the three major elite groups controlling the state and major decisions of
the country. Who saved there entity and their existence. Those were the big landlords of
western India who after the creation of Pakistan saved their land by any further division or any
kind of reforms. Other were the Modern educated urbanities who took charge of all state
departments as Bureaucrats and the last were those commercial minorities who were working as
a traders in the western India and were having little profit, but after independence when Hindu
entrepreneur migrated from western India, they got an opportunity to avail those units in
cheaper prices and allotments and develop themselves as a Business men. (Gustav F Papanek,
1962) has done a detailed survey on the nature of the entrepreneurs in Pakistan in early decade
and was of the view that most of them were the traders who migrated from western India but in
8 Speech of Jinnah in Lahore session of Muslim League in 1940. 9 C. jaffrelot. (2002 ), Pakistan: Nationalism without A Nation

POSTGRADUATE CONFERENCE ON ECONOMICS, PUBLIC ADMINISTRATION AND
BUSINESS (PCEPAB)-5TH SEPTEMBER, 2015
PROMOTING GROWTH, EXCELENCE AND SUSTAINABILITY- 201
his work he mentioned about the growing disparities among East Pakistan due to this west
Pakistan oriented entrepreneurial development. Pakistan’s industrial sector started expanding
due to two major reasons, one the endless support by government and the other was the
international changing scene after world war 11 which brings lot of export options to Pakistan’s
investors10. Which later was expanded under first military regime, (1958 -1968) in shape of
giving maximum import licenses11 to newly developed corporate elite of specifically west
Pakistan and subsidizing private industrial sector(LaPorte, 1969; Naqvi, 1964; Gustav Fritz
Papanek, 1967; Gustav F Papanek, Lewis, & Soligo, 1965; Richard, 1965). So it becomes quite
evident when we join the bits and pieces of all this history the creation of the major elite players
in Pakistan. Landlord elite, bureaucratic elite and corporate elite.
Second Narrative:
Coming to the other irrefutable episode of Pakistan after creation. The separation of east wing
of Pakistan. The average Pakistani thinks that the reason of losing this east wing is actually
conspiracy of India. Which started from the time of independence in 1947. But not much is
known about it that when Military had started having problems in East Pakistan, most of the
Bengali’s did migrated to India from their borders attached with it and India was not ready to
accept them for a long time, for this reason later India jumped in the war against Pakistan and
helped in availing separate homeland for Bengalis so it can revert back the migrants who
entered in its borders. Though the India’s Military were entering East Pakistan from those
borders continuously to fight with Pakistan’s military(Marwah, 1979).
Our focus is to raise the issues which created problems between military and Bengalis. Events
show that how the East Pakistan’s rights at economic and political grounds were sabotaged by
the bureaucrats and corporate elite of West Pakistan. “Wealth appeared to be increasingly
concentrated within a business oligarchy, the so-called twenty-two families belonging to West
Pakistan, while real wages of workers stagnated. East Pakistan, later independent Bangladesh,
became increasingly resentful over political under-representation and resource transfers from
its agricultural exports for industrial investment in West Pakistan”(Ali, 2004) . It is in record
that in the meeting of the chamber of commerce of Pakistan the representative of east Pakistan
wing quoted themselves as been felt as a became a colony of “Brown Englishmen” now after
separation.
(Sisson & Rose, 1991) in his Book, “War and Secession: Pakistan, India, and the Creation of
Bangladesh’ discussed in detail the political and economic reasons of the war of 1971, the
distrust of Bengali’s towards West Pakistan (particularly Punjabi elites) and the resultant
creation of Bangladesh. Though it is recorded that the Bengali’s issues of national identity
along with West Pakistan have started from the day one in shape of language riots12 which keep
excelling in shape of demands like not appropriate representation in national assembly as per
10 Industry contribution expanded from 1% of 1947 to 6 % by 1959. Industrial assets increased ninefold and private
muslims owned firms control two third of these new assets who were not in the scene before 1947. (Gustav F
Papanek, 1962)
11 See (Naqvi, 1964) 12 When Jinnah in his Dhaka declaration in 1948, announced “Urdu” as a national language was not accepted by
East Bengal with full heart. And later when in 1952 the second Prime Minister Khawaja Nizam ud Din, Himself a
Bengali, reaffirm Urdu as national language resulted in language riots.

POSTGRADUATE CONFERENCE ON ECONOMICS, PUBLIC ADMINISTRATION AND
BUSINESS (PCEPAB)-5TH SEPTEMBER, 2015
PROMOTING GROWTH, EXCELENCE AND SUSTAINABILITY- 202
population and not given proper share in government expenditure as compare to West
Pakistan(Oldenburg, 1985).
The number of Bengalis on top bureaucratic positions were far less than West Pakistan13.
Certainly as west Pakistan’s urbanities strive at that time for separate homeland for their own
interest so does the urbanities of east Pakistan but when they don’t find them given there due
share so the confrontation occurred among the elites. On the other hand, the economic boost
Pakistan enjoyed in 1960’s was not seen again by corporate elite of East Pakistan been
transferred them on fair grounds. What corporate elite of West Pakistan did was to win most of
the export contracts on the basis of their personal contacts with the bureaucrats at top policy
making posts belonging to West Pakistan.
Table 1: Capital formation in East and West Pakistan from 1960-70
This table shows clearly the capital formation at private and public level in East and West
Pakistan throughout 1960’s. Same as the Government consumption on expenditure in both
wings which is almost double in West Pakistan as compare to East Pakistan, though
demographically East Pakistan was bigger than West Pakistan. With the emergence of
Bangladesh, Pakistan was the first nation to have suffered division in the post-world war period
(Jahan 1972; Choudhury 1974).
This shows the contestations among the elites who at time of independence joined together for
their vested interest but how later they further get divided to save their own benefits. And how
internal rifts and elite wars created this event of separation of East Wing of Pakistan. (Sayeed,
1972) strong words explains clearly the role and influence of power elites in this separation. He
said “I would support the view that this dissension arose largely because the power elites of
West Pakistan formulated certain policies which provoked so much opposition and Bitterness
from the East that the system was brought to the verge of collapse. It might have been saved in
March 1971, but the power elites were not prepared to let the system be transformed into one
more acceptable to the East”.
13 By Mid 1950’s, 0f 741 top civil servants, only 51 were Bengali, none of whom have a rank of secretary. Of 41
Joint secretaries, only 3 were bengali’s, of 133 deputy secretaries 10 were Bengalis. (Sisson & Rose, 1991)

POSTGRADUATE CONFERENCE ON ECONOMICS, PUBLIC ADMINISTRATION AND
BUSINESS (PCEPAB)-5TH SEPTEMBER, 2015
PROMOTING GROWTH, EXCELENCE AND SUSTAINABILITY- 203
We have discussed the vested interests of power elites of Pakistan in creating a rift between
India and Pakistan at such gigantic level that it turns country towards a security state. But what
could be the reason of India to give a country which is five times smaller than it in size and
population that much importance? Why there defense, foreign and strategic policies revolve
around Pakistan? India has always been concerned about its autonomous status in South Asia
and always is in aspiration to shape the regional security environment (Dash, 1996; Rais, 1991).
(Mohan, 2006) explained in detail the role of India in balancing the power in this South Asia
region. There are factors like Kashmir issue, resource share14 and support to international allies
to enter in this area which always makes both the country very sensitive towards each other’s
policies and actions(Mukherjee, 1983). There are studies like (Verma, 2008) which argues that
stable Pakistan is certainly not in the interest of India. China has also been the vital factor of
discourse among the two countries since the equivalent size neighbor ad competitor in next
world giant for India is always been China. And Pakistan always had a strong alliance with
it(W. A. Wilcox, 1964). As the power elites of Pakistan are using the name of security threat
from India and same as it is India’s interest too to sustain this rift between two countries(Jalal,
1987).
Third Narrative:
Finally, the third core theory of Military as a last savior and true and loyal institution of a
country. This certainly has a role with the second theory also. (Schanberg, 1971) in his article
emphasized on the role of military in the separation of Pakistan. He blamed the military troops
of West Pakistan (majorly Punjab) to brutally demonstrate the military regime's irrational
determination of holding on to East Pakistan at whatever cost and by whatever tactics
necessary15.
After Independence, the only institute which was developed and trained with Pakistan was of
military, rest all were in their primitive stages of development. When after the creation, the
resources and decisive positions were divided among the bureaucrats and the landlords who
played active role in political arenas also, Military found themselves been dictated by the
primitive less developed elite groups which was not acceptable by them. The only way to make
them realize was by showing them that the Military is well developed institute of all arena from
security to political handlings. This can be done by first catering the need of providing the
security to the people which is the fundamental need of a Human. For it they have to be
psychologically been dictated the fear of any Giant who can sabotage all their resources and
future plans. Since other elite groups have win this land to save their own resources but what if
it can again been sabotaged.
So the political, bureaucratic elites have looked towards Military as a savior for their own
vested interest.in return of it Military gets what it wants , which was the never ending relaying
and power of influencing all political and economic decisions of a country. (Mani, 2007) had
considered Pakistan as a weak state and a professional military domain. She in her work argued
that Pakistan’s state institutes had failed to work effectively from the first decade due to
inherent weakness and “Pakistani elites fiercely competed for control of the state”. She gave
14 (Pandian, 2005) 15 It was recorded by foreign diplomat’s estimates that the army has killed at least 200,000 Bengalis.(Schanberg,
1971)

POSTGRADUATE CONFERENCE ON ECONOMICS, PUBLIC ADMINISTRATION AND
BUSINESS (PCEPAB)-5TH SEPTEMBER, 2015
PROMOTING GROWTH, EXCELENCE AND SUSTAINABILITY- 204
credit to the British trained Military of Pakistan of that time to always take charge of political
problems and amongst it been able to establish their own entrepreneurship. Which primarily
had started as a charitable foundation but with time expands and today despite evidence that
military-owned enterprises frequently function through privileges (subsidies, preferred
government contracts),mainstream analysts of Pakistan’s economy judge that these corporations
play an important national development role16. The other contribution first military coup did is
the creation of the industrial elite who grow at the cost of majority of people(Rashid, 1978)
which sustain till date. Pakistan is considered as ‘over developed’ state with under developed
polity by scholars like (Alavi, 1972) and the reason has been given by him and scholars like
(Jalal, 1995) as the consequence of the persisting disjunction between “(the processes of) state
construction and political processes”. Which could be the result of skewed relationship between
a relatively stable state apparatus, which Pakistan inherited from its colonial past, and an
unstable political system. The power elite presiding over the operation of the state machinery
has sought to perpetuate the in egalitarian class structures in the society and played upon the
intra-societal divides, to retain its hold over power(Behuria, 2009).
In 1950’s it was recorded that the country which was in early development stages and need to
spend on great percentage their budget on education, health and infrastructure development,
spends 70% of GDP on defense expenditure. But this cannot be prevailed by one time
investment, it is an institute which can restrain its power by building this savior image all the
time17. Which perhaps gives a reason of having four wars with India in 67 years and having
four Military Coups of 31 years. This gives us the fourth Power Elite of Pakistan, i-e Military
Elite and perhaps the strongest one. it is evident during all coup’s that the military ruler divided
his political opponents and keep them eternally divided in the interest of survival of his regime
and it allows us to apply Samuel P. Huntington’s famous metaphorical assertion, Pakistan is yet
to evolve a “liberal, antimilitaristic consensus” to brush military aside “into a discredited cranny
of history”(Behuria, 2009).
Conclusion:
16 “Fauji Group Targets Companies for Sale,” Daily Times (Pakistan), August 10, 2004 17 The defense expenditure of Pakistan:

POSTGRADUATE CONFERENCE ON ECONOMICS, PUBLIC ADMINISTRATION AND
BUSINESS (PCEPAB)-5TH SEPTEMBER, 2015
PROMOTING GROWTH, EXCELENCE AND SUSTAINABILITY- 205
So if I conclude my discussion, it seems that the transformation of a country to security state is
actually the result of the vested interest of the power elites of that area. Who at times keep
colluding with each other to avail a collective benefits and same as on other times come under
contestation to save their own benefits when see other power elite becoming more stronger.
This also show the creation of many other elites as a result of the bigger plans of the existing
elites. Like the creation of Military elite by the Political, Bureaucrat and landlord elites of early
days. And later the creation of Religious elite by Military in 1980’s and after 9/11 to extend
their coup years and control on country. Undoubtedly, we cannot underestimate the role of
international society in all this power game and their influence on the economic policy of a
country(Fatima, 1997) . Though, military regimes are always been considered as partner of
choice by many states as it helps them achieve there international objectives but is always been
observed that each military regime ended creating more disaster for a country as it is not
representing the democratic voice of a country (Behuria, 2009; Chengappa, 1999; Gregory &
Revill, 2008; Nelson, 2009; Rizvi, 2000).
So if we conclude that the Governance in Pakistan is an elusive harmonizing act between the
military elite and the elected civilian government. It is a right time to understand the delicacy of
this power-sharing arrangement between military who have a vital influence over foreign,
security and key domestic issues, and have an ability to mediate confrontations among feuding
political leaders, parties or state institutions whenever such confrontation deemed threatening to
political stability. On the other hand, civilian government enjoys substantial autonomy for
political and economic management and exercise of state authority, it is expected always to
consider the military’s sensibilities. The military has repeatedly demonstrated that it can and
will influence the nature and direction of political change without necessarily assuming power
(Rizvi, 1998).
References:
Alavi, H. (1972). The state in post-colonial societies: Pakistan and Bangladesh. New Left
Review, 74(1), 59-81.
Ali, I. (2004). Historical Impacts on Political Economy in Pakistan. Asian Journal of
Management Cases, 1(2), 129-146.
Behuria, A. K. (2009). How military dominates the political space in Pakistan: A study of
Musharraf’s rule (1999-2008). Journal of Peace Studies, 16(1-2), 76-102.
Bose, S., & Jalal, A. (1998). Modern South Asia: History, Culture. Political Economy, 2.
Chengappa, B. M. (1999). Pakistan: Military role in civil administration. Strategic Analysis,
23(2), 299-312.
Cohen, S. P. (2002). The nation and the state of Pakistan. Washington Quarterly, 25(3), 109-
122.
Dash, K. C. (1996). The political economy of regional cooperation in South Asia. Pacific
Affairs, 185-209.
Fatima, M. (1997). Foreign influence on Pakistan's economic policy. Pakistan Horizon, 39-49.
Ganguly, S. (2013). Conflict unending: India-Pakistan tensions since 1947: Columbia
University Press.
Gilmartin, D. (1998). Partition, Pakistan, and South Asian history: in search of a narrative. The
Journal of Asian Studies, 57(04), 1068-1095.
Gregory, S., & Revill, J. (2008). The role of the military in the cohesion and stability of
Pakistan. Contemporary South Asia, 16(1), 39-61.

POSTGRADUATE CONFERENCE ON ECONOMICS, PUBLIC ADMINISTRATION AND
BUSINESS (PCEPAB)-5TH SEPTEMBER, 2015
PROMOTING GROWTH, EXCELENCE AND SUSTAINABILITY- 206
Hasan, M. (1997). Legacy of a divided nation: India's Muslims since independence: Hurst.
Jaffrelot, C. (2002). Pakistan: nationalism without a nation: Zed Books.
Jalal, A. (1985). The Sole Spokesman. Jinnah, the Muslim League and the Demand for
Pakistan, 13-44.
Jalal, A. (1987). India's partition and the defence of Pakistan: An historical perspective. The
Journal of Imperial and Commonwealth History, 15(3), 289-310.
Jalal, A. (1995). Democracy and authoritarianism in South Asia: A comparative and historical
perspective (Vol. 1): Cambridge University Press.
LaPorte, R. (1969). Succession in Pakistan: Continuity and change in a Garrison State. Asian
Survey, 9(11), 842-861.
Mani, K. (2007). Militaries in Business State-Making and Entrepreneurship in the Developing
World. Armed Forces & Society, 33(4), 591-611.
Maniruzzaman, T. (1966). Group interests in Pakistan politics, 1947-1958. Pacific Affairs, 83-
98.
Marwah, O. (1979). India's Military Intervention in East Pakistan, 1971–1972. Modern Asian
Studies, 13(04), 549-580.
Mohan, C. R. (2006). India and the Balance of Power. Foreign Aff., 85, 17.
Mukherjee, A. (1983). India's policy towards Pakistan: Associated Book Centre.
Naqvi, S. N. H. (1964). Import licensing in Pakistan. The Pakistan Development Review, 51-68.
Nelson, M. J. (2009). Pakistan in 2008: Moving Beyond Musharraf.
Oldenburg, P. (1985). “A place insufficiently imagined”: language, belief, and the Pakistan
crisis of 1971. The Journal of Asian Studies, 44(04), 711-733.
Pandian, S. (2005). The political economy of trans-Pakistan gas pipeline project: assessing the
political and economic risks for India. Energy Policy, 33(5), 659-670.
Papanek, G. F. (1962). The development of entrepreneurship. The American economic review,
52(2), 46-58.
Papanek, G. F. (1967). Pakistan's development, social goals and private incentives: Harvard
University Press.
Papanek, G. F., Lewis, S. R., & Soligo, R. (1965). Growth and Structural Change in Pakistan's
Manufacturing Industry [with Comment]. The Pakistan Development Review, 5(4), 659-
665.
Rais, R. B. (1991). Pakistan in the regional and global power structure. Asian Survey, 378-392.
Rashid, J. (1978). Economic causes of political crisis in Pakistan: The landlords vs. the
industrialists. The Developing Economies, 16(2), 169-181.
Richard, S. (1965). A View of Pakistan's Industrial Development. Asian Survey, 590-595.
Rizvi, H.-A. (2000). Military, state and society in Pakistan: Macmillan Basingstoke.
Sayeed, K. B. (1972). The breakdown of Pakistan's political system. International Journal,
27(3), 381-404.
Sayeed, K. B. (1998). Pakistan, the formative phase, 1857-1948/[by] Khalid B. Sayeed; with a
foreword by George Cunningham: Oxford University Press.
Schanberg, S. H. (1971). Pakistan divided. Foreign Aff., 50, 125.
Shaikh, F. (1989). Community and Consensus in Islam: Muslim Representation in Colonial
India, 1860-1947: Cambridge University Press Cambridge.
Sisson, R., & Rose, L. E. (1991). War and secession: Pakistan, India, and the creation of
Bangladesh: Univ of California Press.
Verma, B. (2008). Stable Pakistan not in India’s interest. Indian Defence Review: September,
11.
White, H. (2009). The content of the form: Narrative discourse and historical representation :
JHU Press.

POSTGRADUATE CONFERENCE ON ECONOMICS, PUBLIC ADMINISTRATION AND
BUSINESS (PCEPAB)-5TH SEPTEMBER, 2015
PROMOTING GROWTH, EXCELENCE AND SUSTAINABILITY- 207
Wilcox, W. (1968). Political Change in Pakistan: Structures, Functions, Constraints and Goals.
Pacific Affairs, 341-354.
Wilcox, W. A. (1964). India, Pakistan: And the Rise of China: New York: Walker.

POSTGRADUATE CONFERENCE ON ECONOMICS, PUBLIC ADMINISTRATION AND
BUSINESS (PCEPAB)-5TH SEPTEMBER, 2015
PROMOTING GROWTH, EXCELENCE AND SUSTAINABILITY- 208
Market Dynamics and Multiple Borrowing in Microfinance: The
Case of Bangladesh
Md Aslam Mia
Department of Development Studies
Faculty of Economics and Administration
University of Malaya, 50603 Kuala Lumpur, Malaysia
Email: [email protected]
Abstract
There are several factors that have derided the fame of microfinance from ‘hero to zero’ within a very short period
of time and multiple borrowing is one of them. Looking into the market dynamics, particularly the supply and
demand, this study outlines important factors that results multiple borrowing paradox. A multitude of microfinance
operations, aggressive expansion, high penetration rate and institutional leakages are main supply side factors
while consumption demand of hardcore poor, new or expanding micro-enterprise, and household characteristics
are the demand side factors. Impact of multiple borrowing further discussed from the view of borrower, supplier
and academic community.
Keywords: microfinance institutions, multiple borrowing, demand, supply, Bangladesh
JEL: D11, D21, G23, H31
1. Introduction
Microfinance has been severely affected by multiple borrowing and other associated problems
(Dichter et al., 2007, Faruqee and Khalily, 2011, Mpogole et al., 2012). This is further
compounded by exogenous and endogenous shocks in the sector worldwide (Lutzenkirchen and
Weistroffer, 2012). However, the positive impacts of microfinance especially in poverty
reduction has been well documented (Mazumder and Lu, 2015, Imai and Azam, 2012, Swain
and Floro, 2012, Khandker, 2005, Imai et al., 2012). Nevertheless, the problem of multiple
borrowing with its attendant consequence of ‘microfinance-bubble’ has continued to bedevil the
concept. Hence, granting access to finance has turned to be a torn in the flesh of both private
and institutional lenders.
Multiple borrowing is synonymous with over-indebtedness when monthly loan repayment
exceeds 50 per cent of the income (Maurer and Pytkowska, 2010). Over-indebtedness has been
defined as a situation whereby a borrower fails to keep to the repayment schedule which in the
long run increases borrowers’ financial vulnerabilities (Schicks, 2014). Over-indebtedness has
negative impact on the livelihood and wellbeing of borrowers in the society which is in sharp
contrast to the promise of microfinance. As a result of over-indebtedness some borrowers
engage in multiple borrowing which creates more problems such as hunger in families
(Chaudhury and Matin, 2002). As a result, instead of borrowers gaining financial freedom they

POSTGRADUATE CONFERENCE ON ECONOMICS, PUBLIC ADMINISTRATION AND
BUSINESS (PCEPAB)-5TH SEPTEMBER, 2015
PROMOTING GROWTH, EXCELENCE AND SUSTAINABILITY- 209
forced into ‘debt trap’ or ‘debt peonage’ (Faruqee and Khalily, 2011, Fafchamps and Gubert,
2007).
Furthermore, the news that has sparked the global interest concerns the suicide epidemic and
microfinance in India. A number of Indian farmers, particularly from Andhra Pradesh (one of
the mostly microfinance penetrated area) committed suicide because they were unable to repay
their loans (Levin, 2012). The multiple borrowing issues is believed to be the reason behind
such chaos in the sector as researchers pointed out the causality between multiple borrowing
and suicide epidemic (Biswas, 2010, Levin, 2012, Ashta et al., 2011). However, comprehensive
discussions on both demand and supply side factors and the impact of multiple borrowing have
not been fully explored. Hence, this study attempts to examine the market dynamism behind
multiple borrowing and their impact on suppliers, borrowers and the academic community. This
study also highlights that taking necessary steps in microfinance operation is vital before the
impact of multiple borrowing become outrageous. Furthermore, this study underscores some
policy guidelines that are significant to the management of the microfinance institutions (MFIs)
in Bangladesh, and can be extended to the countries facing similar problems.
This study contributes to the existing literature in several ways. Firstly, factors of multiple
borrowing are discussed in the context of Bangladesh microfinance sector, which is one of the
largest (in terms of number of clients) sector in the world (Micro-Credit Regulatory Authority,
2015). Secondly, the impact of multiple borrowing is examined based on existing literature and
the discussion further extended in the perspectives of borrowers, suppliers and the academic
community. The study highlights policy measures that could be used to mitigate the problems
of multiple borrowing. Lastly, this study do not oppose the view of micro financing rather it
raises concern among the respective authorities to reassess their expectation and re-think
ongoing policies.
The rest of the paper is organized as follows. Section 2 discusses multiple borrowing and
market dynamics. The supply side and demand side factors in relation to multiple borrowing are
discussed separately in sections 3 and 4 respectively. Section 5 discusses the impact of multiple
borrowing. Lastly, this study concludes with some policy implications, limitations of the study
and suggestions for possible future studies.
2. Multiple Borrowing and Market Dynamics
Multiple borrowing simply refers to the multiple microfinance membership for an individual or
household (Faruqee and Khalily, 2011, Lutzenkirchen and Weistroffer, 2012, Lahkar and
Pingali, 2014). When an individual borrows from more than one MFIs, it is called ‘individual
multiple borrowing’, while if more than one person from the same household (normal
household unit) borrow from same or different MFIs it is known as ‘households multiple
borrowing’(Faruqee and Khalily, 2011). Generally, borrowing from different MFIs and
investing them together in a productive business enhances the social wellbeing of borrowers.
However, it may have disastrous effect if borrowers keep accumulating debt with little ability
for repayment.

POSTGRADUATE CONFERENCE ON ECONOMICS, PUBLIC ADMINISTRATION AND
BUSINESS (PCEPAB)-5TH SEPTEMBER, 2015
PROMOTING GROWTH, EXCELENCE AND SUSTAINABILITY- 210
Market dynamics plays very significant role in multiple borrowing. Generally, if someone
needs urgent cash, for consumption purposes, to repay preceding loans, expanding their
business, or some other obligations, such individual might borrow from different microfinance
institutions or other alternative sources. Literally, the necessity compels the borrowers to take
loans from other MFIs operating in nearby areas. MFIs are largely considered as loan sources
given their friendly loan procurement with little or no punishment for defaults in repayment.
This however, encourages multiple borrowing.
Guha and Chowdhury (2013) argue that the structure of the sector encourages multiple
borrowing. For example, competition in micro-credit markets complements consumer’s
sovereignty, allowing them to get services from different institutions simultaneously (Casini,
2010, Guha and Chowdhury, 2013, Faruqee and Khalily, 2011). Furthermore, lack of
comprehensive financial facilities also motivate borrowers to enjoy the services of other MFIs,
when the current MFIs fail to provide such services (Krishnaswamy, 2007). Figure 1 below
describes relationship between multiple borrowing and market dynamics.
Figure 1 multiple borrowing and market dynamics
Source: Authors proposed framework.
2. Supply Side Factors
‘Supply creates its own demand’ is the classical doctrine of economics, known as ‘Say’s Law’
and it gives insight to market dynamics, regardless of its poor acceptance among Keynesian
economists (Kates, 2005). Microfinance operations are most likely related to supply-led
initiatives that deliberately provide financial services to their clients including credit, savings,
micro-insurance, international money transfer (remittance) etc.
According to Shaffer (1998), if there are more banks for a given pool of fixed borrowers, it is
highly unlikely to assume that there will be no bad loans given, although the borrowers might

POSTGRADUATE CONFERENCE ON ECONOMICS, PUBLIC ADMINISTRATION AND
BUSINESS (PCEPAB)-5TH SEPTEMBER, 2015
PROMOTING GROWTH, EXCELENCE AND SUSTAINABILITY- 211
be rejected from some other banks or financial institutions. When a borrower is rejected by one
financial institution, the other institutions might not get the exact information due to the
information asymmetry as to investigate reasons for earlier rejections. Furthermore, banks and
other financial institutions compete to provide first credit to the borrowers, although it might
result to loaning in a bad project (Northcott, 2004). Shaffer (1998) termed it as ‘winner’s curse’
that exists when a borrower can reapply to other institutions after being rejected by formal or
informal financial institutions. Due to the informality of the microfinance sector and lack of
comprehensive technology and capital equipment, identifying bad or risky borrowers is costly.
Recent phenomena of commercialization of this industry triggered by high competition and
movement of formal lending institutions to offer credit to the borrowers, aggravate the situation
(Krishnaswamy, 2007).
2.1 More MFIs in operation
Although the first microfinance institution in Bangladesh ‘Grameen Bank’ was created by
Professor Muhammad Yunus in 1976, hundreds of registered and non-registered MFIs are
currently operating in the sector (table 1). The rapid growth of microfinance in the last decade is
believed to be one of the most prominent reasons behind multiple borrowing or overlapping
(McIntosh et al., 2005, Roberts, 2013). The sector has grown intensely in the last decade and
commercialization in their operation has also increased (Kates, 2005, Charitonenko et al., 2004,
Christen and Drake, 2002). It has been observed that incumbent MFIs were more aggressive in
expanding their business for capturing the niche market and increase their market share (Micro-
Credit Regulatory Authority, 2015). The branch expansion has experienced average 15 per cent
growth while the growth rate was 9 per cent for new MFIs creation during 2005 to 2012.
However, the actual number of total clients has not grown at the same rate with branch
expansion or new MFIs creation. Clients grew by only 6 per cent per annum although the
average loan outstanding and average savings have increased by 21 per cent respectively. This
comparatively wide gap between loan outstanding and clients’ growth basically shows an
indication of multiple borrowing. Assuming that average loan size remains relatively stable,
only multiple borrowing can push up the average loan to grow by 21 per cent per annum in this
context. Thus, more MFIs, and their aggressive expansion is most likely to result in multiple
borrowing.
Table 1: Basic Statistics of registered Microfinance Institutions in Bangladesh (in Taka), 2005-
20121.
Indicator 2005 2006 2007 2008 2009 2010 2011 2012* Average
Growth**
MFI 469 641 344 453 420 517 580 643 9per cent
Branches 7,733 12,156 11,112 13,636 16,851 17,252 18,066 17,977 15per cent
Number of clients
(million) 18.82 22.89 20.83 25.13 24.77 25.28 26.08 24.64 5per cent
Loan Outstanding
(Billion)a
56.06
(0.72)
75.2
(0.96)
85.87
(1.10)
85.87
(1.10)
143.13
(1.84)
145.02
(1.86)
173
(2.22)
211.2
(2.70) 21per cent
Savings
(Billion)a
21.01
(0.27)
27.64
(0.35)
37.76
(0.48)
47.39
(0.61)
50.61
(0.65)
51.36
(0.66)
63.27
(0.81)
75.21
(0.96) 21per cent
1 The table values are excluding Grameen Bank.

POSTGRADUATE CONFERENCE ON ECONOMICS, PUBLIC ADMINISTRATION AND
BUSINESS (PCEPAB)-5TH SEPTEMBER, 2015
PROMOTING GROWTH, EXCELENCE AND SUSTAINABILITY- 212
Source: Author’s own compilation from various MRA annual reports.
Note: * as of 30th June 2012 **Average arithmetic growth a Values in the parenthesis are in
US$ at an average rate of US$ 1=Taka 78.10 in 2013 as per World Bank (2015).
2.2 High competition and expansion in the sector
Expanding credit services through expansion of branches to capture the niche market is quite a
common practice among the institutions particularly for the big MFIs due to their high growth
strategy. The competition in Bangladesh is most likely to be ‘localized competition’ among
MFIs. We have observed that, many firms are competing in some areas (like Dhaka, Chittagong
and Rangpur districts of Bangladesh), while there are several places only few MFIs are
established (Figure 3). Hence, it is most likely that the high market penetration rate in those
districts very much coincides with geographical concentration (Figure 3 and Figure 4).
Additionally, only few MFIs (example Top 10 or Top 20) operate across the country where
most of them are localized or regionally oriented. This has an impact on pricing of the MFIs
products: only nearby firms are affected because of localize competition. It is most likely that
the benefit of true competition (particularly in price) is not realized as it should be under the
definition of competitive market when the market structure is evenly distributed across the
country.
Guha and Chowdhury (2013) attempt to establish the relationship between competition and
multiple borrowing. They found that competition between socially motivated MFIs may
enhance multiple borrowing, which also increases the risk of loan default. This has been
corroborated by others (e.g. Krishnaswamy (2007). Figure 2 below shows the time series
relationship between microfinance institutions branch expansion in relation to individual and
households multiple borrowing. Faruqee and Khalily (2011) empirically showed that average
individual and household overlapping or multiple borrowing growth rate were on average,
15.35 per cent and 13.81 per cent per annum respectively between the periods of 2002 to 2009.
The trend of individual and household overlapping rates have gradually increased over the
period. Household multiple borrowing was slightly higher since the beginning of the study
period 2002 and a wider gap was observed between household and individual multiple
borrowing rate in the later period of the study. This phenomenon depict borrowers are rational
and to avoid unnecessary problems, they also motivate their family members to obtain loan
from different MFIs apart from self-borrowing. This is comparatively easy from the borrowing
side and MFIs are less likely to deny the loans as they will consider it as a fresh loan despite the
borrowers coming from same households.

POSTGRADUATE CONFERENCE ON ECONOMICS, PUBLIC ADMINISTRATION AND
BUSINESS (PCEPAB)-5TH SEPTEMBER, 2015
PROMOTING GROWTH, EXCELENCE AND SUSTAINABILITY- 213
Figure-2: Multiple membership and MFI’s branch expansion
Source: The first part of the graph is adapted from Faruqee and Khalily (2011) and the second
graph is estimated by Author with the data collected from various annual reports of the Micro-
Credit Regulatory Authority
2.4. Operational leakages
Operational leakages of microfinance may have contributed to the multiple borrowing
phenomenon. Lack of intra-record systems and labor-intensive operations deteriorate the
performance of microfinance institutions. Furthermore, MFI’s are considered as small and non-
specialized human resource pool where the staff do not possess sufficient operational and
computer skills, lack of training opportunities etc. (Kulik and Molinari, 2004). Thus, the loan
screening process is not up to the standard as practiced in the formal financial sector before the
loan disbursement (Lutzenkirchen and Weistroffer, 2012). According to Frankiewicz (2004),
almost 46 per cent of the MFI’s worldwide have very low usage of technology in providing
financial services to poor communities. Additionally, rarely MFIs have centralized borrowers
profile within their institutions and they do not have intra record system among their
counterparts. Hence, it is difficult to figure out ‘fresh’ and ‘multiple borrowers’ from the pool
of borrowers. All these factors collectively accelerate multiple borrowing.
To mitigate the issue, Figure 3 proposes a comprehensive operational outline that may set up
with the help of information and communication technology. The dash rectangle is the proposed
idea which is currently missing from the microfinance operation. Based on the proposed
framework, once the loan application is delivered to the branch or regional office, profiles of
the borrowers are forwarded to the regional hub database and onto the Micro-credit Regulatory
Authority for their record. The accessibility to the regional database system will provide
adequate information to the branch office whether to disburse the loan or not by looking into
the key information of the applicants once they receive loan request from borrowers. By doing
so, MFIs can trace the borrowers status and share the relevant information among them.
Lutzenkirchen and Weistroffer (2012) also proposed to have credit bureau or regional databases
to mitigate the lending hazards and over borrowing issues.
0
10
20
30
40
50
2002
2003
2004
2005
2006
2007
2008
2009
Per
cen
tag
e
Individual and Households
Overlapping Rate(2002-2009)
Individual
overlapping
Households
overlapping0
5000
10000
15000
20000
Number of MFI's Branches
(2002-2009)
Branch

POSTGRADUATE CONFERENCE ON ECONOMICS, PUBLIC ADMINISTRATION AND
BUSINESS (PCEPAB)-5TH SEPTEMBER, 2015
PROMOTING GROWTH, EXCELENCE AND SUSTAINABILITY- 214
Figure 1: Operational framework of microfinance institutions (MFIs).
Source: Authors’ proposed framework.
2.5. High penetration rate
Market penetration rate in the microfinance context may refer to the ratio of actual number of
borrowers over the total number of targeted borrowers. In the case of Bangladesh microfinance,
this penetration rate is quite similar to the percentage of borrowers to poor people estimated by
the Micro-credit Regulatory Authority. Based on the empirical figure, it could be said that the
sector is experiencing medium growth (above 20%) but with higher penetration rate (between
25% to 30%) in the sector (Gonzalez and Javoy, 2011). Lutzenkirchen and Weistroffer (2012)
showed that, the Bangladesh microfinance sector observed a higher market penetration rate
among all other countries that use microfinance as poverty alleviation tool, where low
penetration was more worrisome for countries like Peru (only 5 %) (Pearlman, 2012).
Figure 3 shows the percentage of borrowers to poor people in the 64 districts of Bangladesh.
There are some districts that recorded well above of 100 per cent market penetration rate. These

POSTGRADUATE CONFERENCE ON ECONOMICS, PUBLIC ADMINISTRATION AND
BUSINESS (PCEPAB)-5TH SEPTEMBER, 2015
PROMOTING GROWTH, EXCELENCE AND SUSTAINABILITY- 215
include, Sylhet, Feni, Meherpur, Dhaka, Narayanganj, Narsingdi and Chittagong. The highest
penetration rate was recorded above 150 per cent in Feni and Meherpur districts that generally
indicates austere multiple borrowing. The total number of actual borrowers outnumbers poor
people in the districts that coincided with multiple borrowers. The strategic locations of these
areas are also significant due to the importance of their economic activities that may have an
impact on multiple borrowing.
Dhaka is the capital city and accommodates the largest number of MFIs while Chittagong and
Sylhet are the divisional capital of the South-East and North-East regions of Bangladesh.
Additionally, Narayanganj and Narsingdi districts are in close proximity to the capital city of
Dhaka. Meherpur is the smallest district in Bangladesh and Feni district is predominantly
agricultural that favorably recounts high market penetration rate (Bangladesh Bureau of
Statistics, 2013). For the agricultural business (those who grow agricultural products) there is a
lag period of investment and return. For example, in the case of rice production, it takes almost
4 to 5 months to harvest the final products and usually twice in a year. Thus, a farmer (who is
also a borrower) needs cash on hand to meet the consumption expenditures during this interval
period. To support the microenterprise and satisfy their consumption demand, entrepreneurs
tend to borrow from multiple microfinance institutions. Hence, it is quite reasonable to believe
that, in a saturated market of microfinance, high market penetration rates and socio-economic
diversifications re-enforced and exacerbated multiple borrowing (Lutzenkirchen and
Weistroffer, 2012).

POSTGRADUATE CONFERENCE ON ECONOMICS, PUBLIC ADMINISTRATION AND
BUSINESS (PCEPAB)-5TH SEPTEMBER, 2015
PROMOTING GROWTH, EXCELENCE AND SUSTAINABILITY- 216
Figure 3: Market penetration of MFIs in Bangladesh (2010)
Source: Adapted from MRA (2010)
2.6. Uneven distribution
The location of MFIs across the country is not evenly distributed. Figure 4 below shows that
most of the MFIs are highly concentrated in the capital of regional division such as, Chittagong
(the birth place of microfinance), Rajshahi and Rangpur. Economically these areas are better
than other divisional districts due to their diverse economic activities and being the main city of
the respective divisions (Bangladesh Bureau of Statistics, 2011). Although the southern part of
Bangladesh is mostly vulnerable to natural disasters and severely poor, the concentration of
MFIs are very less in comparison to other parts of the country. This is very similar with the
findings of Sharma and Zeller (1999) that most of the MFIs or their branches are located in
well-established developed areas compared to very remote and poor region. However, the
institutions may also find it easy for setting their businesses in those areas for greater
connectivity, easy accessibility to the resources and other economic synergies.

POSTGRADUATE CONFERENCE ON ECONOMICS, PUBLIC ADMINISTRATION AND
BUSINESS (PCEPAB)-5TH SEPTEMBER, 2015
PROMOTING GROWTH, EXCELENCE AND SUSTAINABILITY- 217
Figure 4: Geographical Concentration of NGO-MFIs in Bangladesh (2010)
Source: Adapted from MRA (2010)
The policy of setting more MFIs into these specific areas exposed the tendency of targeting
good pockets by MFIs than providing financial services to the hardcore poor. However, the
concept of ‘Location Economics’ is very significant in this context and the sector most likely to
follow the macro models of land use patterns. In general, production activity in space is mostly
correlated with the concentration of population and there is positive feedback between
consumers location and firms (Kilkenny and Thisse, 1999). Yet, MFIs should locate themselves
in close proximity to the poorest of the poor and provide financial services to them as it is the
original aim of such informal banking creation. Hence, reallocation of MFIs from mostly

POSTGRADUATE CONFERENCE ON ECONOMICS, PUBLIC ADMINISTRATION AND
BUSINESS (PCEPAB)-5TH SEPTEMBER, 2015
PROMOTING GROWTH, EXCELENCE AND SUSTAINABILITY- 218
concentrated areas to less concentrated areas will ensure better financial services to the poor
community.
3. Demand Side Factors
‘Necessity knows no laws’ is most relevant concerning the poor community. Although the
creation of microfinance institutions were basically aimed to provide credit for establishing
micro enterprise, borrowers are sometimes forced to borrow from multiple sources due to an
urgent necessity to gratify their demand. Behavioral economics has significant impact in the
decision making of an individual in this regard (Kahneman and Tversky, 1979). Although
classical economics assume that, humans are rational in all the decision making, however, the
concept of ‘Homo-Economics’ is not always true (Rosenberg, 2009). In the case of ‘over-
confidentiality bias’ and ‘hyperbolic discounting’ a borrower may overestimate the present
necessity and make decision that may mislead them (Kahneman and Tversky, 1979).
Similarly, the literature discusses that borrowers prefer to borrow from different MFIs for
smoothening their consumption, timing repayment and maintain their cash flows (Srinivasan
and Kamath, 2009). Furthermore, there are no sanctions by existing MFIs against such actions
(Coleman, 1999, Fernando, 1997) given their incapability to trace out who borrowed from
which institutions and through falsification of the borrowers identity (Krishnaswamy, 2007). In
the competitive market, easy screening process and the relaxation of MFIs loan standards
directly motivate the borrowers to have loans from various MFIs. However, if the loan amounts
are not used for the actual purpose and not invested into the productive assets ventures,
microfinance program may fail to bring expected outcomes and could create disastrous effect to
the borrowers. Several factors that may promote multiple borrowing from demand cum
borrower’s side have been identified.
3.1. To meet the consumption demand
The target group of MFI’s are poor people and in Bangladesh more than 76 per cent of the
people live below US$2 per day (Management Association, 2013) and these group of people are
believed to be the major clients of MFI’s. Reasonably, these high percentages of people do not
have sufficient income for their daily consumption needs. Although MFI’s loans are initially for
forming new or expanding old micro-enterprises, not all loans are injected into micro-
enterprise. Part of the loan, most likely a major portion of it, will be spent for consumption and
only a small percentage will be invested in micro-enterprise (if there is any remaining
afterwards).
The lion-share of loans from MFI’s are being spent on consumption (Mallick, 2012, Sinha and
Matin, 1998, Rahman, 1999). Similarly, Pearlman (2012) pointed out that in some cases,
entrepreneurs use credit as the consumption purpose and left insufficient working capital for
running their micro-enterprise operation. The propensity to consume is high and the maximum
utility is attained through current consumption rather than in future through investment,
particularly for the very hardcore poor. Reciprocally, the marginal propensity to saving is

POSTGRADUATE CONFERENCE ON ECONOMICS, PUBLIC ADMINISTRATION AND
BUSINESS (PCEPAB)-5TH SEPTEMBER, 2015
PROMOTING GROWTH, EXCELENCE AND SUSTAINABILITY- 219
expected to be low and this result in a poor investment record. Additionally, since consumption
is autonomous expenditure, people are more prone to borrow from any available sources to
fulfill their consumption demand.
We consider the nature of consumption of hardcore group of poor borrowers with the Zakat
receiver2. Following Yusoff (2010), the consumption function of poor people is estimated as
follows:
𝐶𝑝 = 𝐶𝑎 + 𝐶𝑏(𝑌) + 𝐶𝑐( 𝐿) 0 Cb 1 0 Cc 1
𝐶𝑝 = 𝐶𝑎 + 𝐶𝑑(𝐿 + 𝑌)…………. (1)
Overall MFI’s borrower’s consumption is assumed to be Cp, while Ca is the autonomous
consumption, even though income is zero. Cb and Cc is marginal propensity to consume (MPC)
in relation with income (Y) and loan amount borrowed (L) respectively. Both of the MPC’s are
positive and less than one which implies that, something will be remaining for savings cum
investment. But, most likely, Cb and Cc are very close to 1 for the low income groups.
Furthermore, we expect Cb and Cc is almost similar, thus it leads to a new MPC of Cd (in
equation 1). As the extreme hardcore poor people have insufficient earnings, they even borrow
money from individuals as well as money lenders to satisfy their consumptions and repay back
when they received loan. Therefore, it assumed that, consumption expenses will not be financed
from loan borrowing, if the income is sufficient. Theoretically, consumption expenditure is not
expected to increase after a certain level of income, and surplus of more than the break-even
level is invested into productive resources. Khan (2005) found that, in rural Bangladesh,
demand for cereal consumption reduces as income increases gradually. So it is most likely to
expect that a portion of the loan amount will be spent for consumption, particularly for the very
poor community after satisfying their consumption demand. Yunus (2006) also mentioned why
the formal lending institutions are reluctant to provide financial services to the poor by saying:
‘Poor people are not credit worthy […] they will not be able to pay back […] no matter
how much money you give, they will eat and the money will be over, they can’t pay you
back’.
However, to have better impact of micro-enterprise loans, a complementary consumption credit
may be designed for the hardcore poor that can satisfy their consumption demand. Furthermore,
since most of the loan repayments are on weekly basis, MFIs may categorically restructure their
loan repayment schedule. For agricultural business, since there is a lag period of initial
investment and return, loan repayment should be quarterly or semiannually that will not put
extra pressure to the borrowers. They can simply get the cash by selling their agricultural
products and settle the loan installment. Hence, borrower will not be motivated to over-borrow
from other MFIs to repay their existing loans (Fischer and Ghatak, 2010).
2 Zakat is one of the five pillars of Islam, and according to Shariah law, every year the eligible people need to make a payment of certain amount of their wealth, typically 2.5 percent, as a charitable and religious purpose. The
receivers of this Zakat must be a poor person who has insufficient income to sustain his or her livelihood.

POSTGRADUATE CONFERENCE ON ECONOMICS, PUBLIC ADMINISTRATION AND
BUSINESS (PCEPAB)-5TH SEPTEMBER, 2015
PROMOTING GROWTH, EXCELENCE AND SUSTAINABILITY- 220
3.2. Necessity for business creation or expansion and insufficient loans
Setting up a new, or expansion of existing, micro-enterprise require significant amount of
financing, and micro-finance institutions loans are small in size that motivate borrowers to take
multiple loans (Srinivasan and Kamath, 2009). A recent investigation on multiple borrowing by
Mpogole et al. (2012) in Iringa, Tanzania found that prevalence of multiple borrowing is very
severe . They argue that the amounts of loan disbursed by MFIs were insufficient and clients
were allegedly borrowing from other MFIs and money lenders to meet the family and business
obligations. The above finding is consistent with the study by Krishnaswamy (2007) in Indian
microfinance sector. He argued that large investment in micro-enterprise motivate the
borrowers to borrow from various MFIs and stretch them together. He termed this as
‘opportunity borrower’ because of the nature of the borrowing. Furthermore, he also classified
‘distress-borrowing’ as those who borrow to meet the lumpy expenditure, consumption or repay
previous loans (for example, borrowing from MFIs to repay money lenders or other MFIs). The
author states that lack of product diversification of the institutions are among factors
contributing to multiple borrowing because some MFIs only provide credit while clients may
need extended financial services such as saving, micro-insurance and etc.
3.3. Households characteristics
In the context of saturated microfinance sector in Bangladesh, Chaudhury and Matin (2002)
have looked into the dimensions and dynamics of multiple borrowing by Bangladesh Rural
Advancement Committee (BRAC) borrowers with a sample size of 240 respondents. Although
they have not clearly examined the main factors involved, their findings led to a fruitful
conclusion. They have claimed that female-owned and resourceful households tend to borrow
from multiple sources because females are the main targets of NGO-MFIs. Furthermore, they
classified all the borrowers into three main categories, namely surplus, occasionally deficit and
chronically deficit households, as a proxy measure of poverty groups and found no statistically
significant relationship in multiple borrowing. They observed that chronically deficit
households borrowed on average from two MFIs, which is similar to other groups but the
average loan taken within last three years varied according to the different poverty group.
Mpogole et al. (2012) discovered that, education level and number of dependents of the
respondent played an important role in multiple borrowing. Highly educated clients borrowed
from more than one MFIs and more dependents in the family substantially increase the loan
contracts. It is most likely that, highly educated respondents are optimistic in their business and
most favorable in creating loan portfolios comprising different MFIs to capture various benefits
provided by them (for example training, technical and non- technical assistances in their
business etc.). Krishnaswamy (2007) further argued that the importance of collective behaviors
placed an important role in multiple borrowing particularly for group or partnership loan
contract. It may be helpful to have workshop, seminars and training with borrowers to enhance
their financial literacy. Once they know the pros and cons of multiple borrowing, their decision
in taking multiple loans may be revisited.

POSTGRADUATE CONFERENCE ON ECONOMICS, PUBLIC ADMINISTRATION AND
BUSINESS (PCEPAB)-5TH SEPTEMBER, 2015
PROMOTING GROWTH, EXCELENCE AND SUSTAINABILITY- 221
4. Impact of Multiple Borrowing
4.1. The borrower’s perspective
There are two general thoughts that have been incited by the researchers. Firstly, the protagonist
argues that when people borrow from different sources, particularly from various MFIs, they
have the ability to repay the loan and the least chance to fall in the debt trap, assuming
entrepreneurs are rational (Armendáriz and Morduch, 2010, Burki and Shah, 2007, Lahkar and
Pingali, 2014). While the antagonists argue that borrowing from multiple sources results in the
cycle of debt and delinquency, as well as overall negative impacts on poverty alleviation and
employment generation (Faruqee and Khalily, 2011, Chaudhury and Matin, 2002, Mpogole et
al., 2012).
Impact of multiple borrowing could be very severe for poorest community of the society while
some borrowers could properly manage the funds and prosper in their business and enhance
their socio-economic livelihood. Investigating the impact of multiple borrowing has multi-
dimensional aspects and the results vary based on the methods/estimation chosen. Schicks and
Rosenberg (2011) argue that multiple borrowing, or cross borrowing, is one of the
measurements of over-indebtedness and could be used as a proxy of early warnings. They stated
that, multiple borrowing represents a person’s cycle of debt and largely attributed to higher risk
of default. The problem happens in the absence of credit bureau when borrowers do not know
how much they are capable to repay and they keep accumulating more debt. Secondly, the
scenario becomes worse when borrowers take a fresh loan to repay existing debt and it creates
uncertainty about when they will be retiring from all debt services. However, further empirical
study by Schicks (2013) in the context of Ghanaian microfinance also revealed that, multiple
borrowing or cross-borrowing, is not significant in over indebtedness, and statistically failed to
prove delinquency too (Schicks, 2014). The result may vary for extreme levels of multiple
borrowing, given the context of borrower’s socio-economic condition (Maurer and Pytkowska,
2010).
Boiwa and Bwisa (2014) investigated the impact of multiple borrowing on the living standard
of borrowers with a sample size of 47 including 8 groups in Kenya. Their studies differ from
other multiple borrowing investigations in that they have extended the inquiry into investment,
health and safety of the clients. They conclude that multiple borrowing increases the income
and savings of the households when they manage the funds appropriately and establish
economic empowerment since income, savings and employment opportunities are interrelated.
Furthermore, they found that, engaging with different MFIs enhance the nutrition, living
condition and preventive healthcare because some MFIs also provide those services apart from
their original product of loan. However, this study has inadequate analysis for robustness of
their results.
Krishnaswamy (2007) concluded that multiple borrowers are purely business-oriented and
manage their loan portfolio by investing into productive assets that generated enough revenue to
cover the repayments in the context of Indian microfinance sector. Borrowing from various
MFIs, stretching them together and putting it into the micro-enterprise business may give them
the synergies of large capital investment despite the high risk. However, Zeballos et al. (2014)

POSTGRADUATE CONFERENCE ON ECONOMICS, PUBLIC ADMINISTRATION AND
BUSINESS (PCEPAB)-5TH SEPTEMBER, 2015
PROMOTING GROWTH, EXCELENCE AND SUSTAINABILITY- 222
argued that, those who take such risks in investment are less likely be defaulted than those who
take less risks among the microfinance borrowers.
Researcher also found the convincing relationship between multiple borrowing and suicide
incidents. This put the policy makers and practitioner under heavier pressure to rethink the
success of microfinance. These suicide cases are the result of multiple borrowing, over-
indebtedness, and coercive recovery practice of the sector (Biswas, 2010). Ashta et al. (2011)
found that high growth and high market penetration rate in the sector is quite likely related to
male suicide. When a person is severely indebted and unable to service his or her debt, it
enhances his fragility and limits his self-confidence, increasing the probability of suicide. There
is a causal relationship between bankruptcy and suicide (Watanabe et al., 2006). Borrowers
think the ultimate way of coping with over indebtedness and multiple borrowing is to commit
suicide which opposes the original promise of microfinance. Nonetheless, borrowers also incur
high transaction costs when they loan from different MFIs (than a single loan) (Srinivasan and
Kamath, 2009).
4.2 The supplier’s perspective
4.2.1. Declining in repayment performance
In the case of multiple borrowing, it is most unlikely that multiple borrowers will be able to
repay back all the loan installments for borrowed amounts due to the constraints on income.
Hence, it effect loan repayment performance of the borrowers that directly deteriorate the
financial performance of MFIs (Northcott, 2004, Srinivasan and Kamath, 2009). Chaudhury
and Matin (2002) empirically related multiple borrowing in loan performance of households
and have drawn a distinctive conclusion that on average when households borrow from more
than one NGO-MFIs, their repayment performance declines. They have argued that, poorer
households face more irregularity and observed an upward trend in loan repayment as move up
the poverty self-assessment status from chronically deficit to surplus unit of households.
Additionally, in terms of land ownership status, it is observed that households with 50 to 99
decimal of land recorded the highest loan repayment over 95 per cent while the rate was below
70 per cent for the landless category. In general, when money is fungible and a borrower
obtains loans from two different MFIs or more, it is very unlikely that they will be able to repay
the loan installments from same business project and exceeding their loan repayment capacity.
However, the generated income will be shared for both loans assuming multiple loans were
invested into only one project.
Mpogole et al. (2012) found that, in Tanzania, about 70 per cent of the respondent said that they
have faced problem in repayment due to multiple borrowing and multiple loans pending. This
corroborates an earlier study which conclude that multiple borrowing has a negative impact on
loan repayment Chaudhury and Matin (2002). Borrowing from different MFIs increases their
liability and threatens to be loan defaulted (Mpogole et al., 2012). To incorporate the other
households attributes in loan repayment performance, Brehanu and Fufa (2008) pointed out the
importance of types of loan, land and livestock holding, experience in doing business,
additional income apart from the original business to be significantly important.

POSTGRADUATE CONFERENCE ON ECONOMICS, PUBLIC ADMINISTRATION AND
BUSINESS (PCEPAB)-5TH SEPTEMBER, 2015
PROMOTING GROWTH, EXCELENCE AND SUSTAINABILITY- 223
In examining the impact of multiple borrowing in Indian microfinance, Krishnaswamy (2007),
estimated that multiple borrowers and single borrowers have the same level of repayment rate
which is similar with other studies (Schicks, 2014, Schicks, 2013, Schicks and Rosenberg,
2011). However, these results are in contrast with the findings of Chaudhury and Matin (2002),
Mpogole et al. (2012). Nevertheless, it does not guarantee the improvement in loan repayment,
since there might be some other factors involved. Krishnaswamy (2007) also estimated a
‘magic’ amount of repayment threshold that if a borrower loans up to Rs. 25000, or up to 30 per
cent of their annual income, the repayment is supposed to be stable. However, beyond this rule
of thumb threshold, repayment irregularities may occur in general. Giving multiple loans to the
same person and experiencing irregularities in loans installments, over indebtedness and
possibly suicide does not move hand in hand with the objectives of microfinance. Hence, it
could be argued that the amount of loan disbursed to multiple borrowers can be channeled into
new borrowers that will enhance the depth of outreach of MFIs (Bos and Millone, 2015).
4.2.2. Quality of the loan portfolio
In a saturated market, expanding credit to the pool of borrowers also deteriorates the portfolio
quality, hence more exposure to risky loans by MFIs (Lutzenkirchen and Weistroffer, 2012,
Gonzalez, 2010). Using empirical evidence, Gonzalez (2010) demonstrate that, when market
penetration rates exceed 8 percent in relation to total population, portfolio quality is adversely
affected. In the case of Bangladesh microfinance, on average the market penetration rate is
above 25 per cent, three times higher than the threshold estimated by Gonzalez (2010).
Lutzenkirchen and Weistroffer (2012) explained this outcome by integrating both clients and
internal human resource management. Firstly, in a fast growing market, finding the low risk
borrowers from a pool of poor borrowers are costly and difficult. Thus, loans are disbursed to
high risk borrowers, focusing more on wealthy and urban entrepreneurs deliberately. Secondly,
to cope with such growth of the institutions, management are reluctant to hire new staff, hence
it increases the workload of existing employees and substantially diminishes the quality of
monitoring of the clients. Thus, not only that the untrained and inexperienced staffs are less
efficient in monitoring the loans, but also they find it difficult to select low risk borrowers in a
highly penetrated market.
4.3. The academic perspective
Majority of the performance evaluation of microfinance institutions studies used secondary
data, self-reported by the MFIs into a database such as Mixmarket and widely used in the recent
literature (Hermes et al., 2011, Ben Soltane, 2014, Roberts, 2013, Ahlin et al., 2011, Cull and
Morduch, 2007). Although the large set of data are available, researchers mostly used several
indicators such as, average loan size, number of borrowers, number of savers, number of
women, active clients, gross loan portfolio, etc. that basically capture their intended research
objective(s) (Twaha and Rashid, 2012, Hisako, 2009, Quayes, 2012, Bos and Millone, 2015,
Serrano-Cinca and Gutiérrez-Nieto, 2014, Mia, 2014).
Previous studies used certain indicators which were either under or over-estimated due to the
multiple borrowing issues. For example, average loan size (sometimes defined as average loan
size/GNI per capita) which is basically the ratio of total loan outstanding divided by the total
number of borrowers as a proxy measure to capture the outreach (providing financial services to

POSTGRADUATE CONFERENCE ON ECONOMICS, PUBLIC ADMINISTRATION AND
BUSINESS (PCEPAB)-5TH SEPTEMBER, 2015
PROMOTING GROWTH, EXCELENCE AND SUSTAINABILITY- 224
the poorest of the poor) of MFIs (Quayes, 2012, Hisako, 2009, Bos and Millone, 2015, Hermes
et al., 2011, Conning, 1999, Servin et al., 2012). It is largely accepted that, smaller average loan
size associated with higher outreach (Louis et al., 2013). This implies that, although MFIs are
making small loans, they are catering to large number of borrowers and deepening their social
objectives with given level of resources. However, in the presence of multiple borrowing, the
numbers of total borrowers are actually overestimated. Particularly, the multiple borrowers are
over counted by respective MFIs, hence, the average loan size is underestimated. Thus, it raises
the question of reliability and robustness of using such variables in the estimation considering
the percentage of multiple borrowing is quite large (in Bangladesh, it was over 30% in 2009).
Thus, we argue that when there is a possibility that the indicator can be affected by the multiple
counting in MFIs, multiple borrowing issues should be analyzed considering appropriate
measurements.
Therefore, in this study, we propose to adjust the actual figure by discounting the rate of
multiple borrowers. The estimation process can be similar like the way real Gross Domestic
Product (GDP) is estimated from the nominal GDP with consideration of inflation. In this case,
rate of multiple borrowing, more concisely individual multiple borrowing should be treated as a
deflator. However, the actual individual multiple borrowing rate should be reliable and
concrete, otherwise it will result in under or overestimate of the adjustment again.
5. Conclusion
After examining the market dynamics, it is mostly likely that more MFIs in operation,
aggressive business expansion, high penetration rates and uneven distribution of MFIs across
the country are the main supply side factors behind multiple borrowing. Furthermore, borrowers
use multiple loans for consumption purpose (Krishnaswamy, 2007), large investment
(Krishnaswamy, 2007, Mpogole et al., 2012, Boiwa and Bwisa, 2014, Fernando, 1997) and
repayment of previous loans (Duvendack and Palmer-Jones, 2012, Venkata and Yamini, 2010,
Boiwa and Bwisa, 2014, Coleman, 1999) and these are the main demand side factors. Also,
households and individual characteristics are relevant in multiple borrowing (Mpogole et al.,
2012, Chaudhury and Matin, 2002, Krishnaswamy, 2007).
Examining the impact of multiple borrowing, this study would like to acknowledge that,
multiple borrowing has resulted in irregularities of repayment/over indebtedness (Boiwa and
Bwisa, 2014, Venkata and Yamini, 2010, Mpogole et al., 2012) while researchers also found no
or less impact (Schicks, 2013, Schicks and Rosenberg, 2011, Krishnaswamy, 2007). The severe
case of multiple borrowing and over indebtedness in India resulted in several suicide cases that
created chaos in the industry. However, the dispute raises concern about the effectiveness of
microfinance not only among the practitioners, but also among policy makers as a way of
alleviating poverty. However, it is most likely that the negative impact of multiple borrowing
outpaced the benefits; hence policy intervention is necessary to correct such inherent market
failures. To deal with this, necessary steps should be taken for a healthy credit flow in the
sector. Below are some policy guidelines that can cure or perhaps mitigate the multiple
borrowing phenomenon in a greater extent,

POSTGRADUATE CONFERENCE ON ECONOMICS, PUBLIC ADMINISTRATION AND
BUSINESS (PCEPAB)-5TH SEPTEMBER, 2015
PROMOTING GROWTH, EXCELENCE AND SUSTAINABILITY- 225
a) Creation of credit bureau or regional hub databases and sharing the basic information
about borrowers before loan disbursement among MFIs. Information and
communication technology can play a significant role in this context.
b) The aggressive expansion of MFIs branch and creation of new MFIs in the saturated
market should be limited and reallocation of branches to the less penetrated area will
ensure the financial services to the poor community in a greater extent.
c) Incumbent MFIs should develop borrower’s oriented products, such as consumer credit
and other necessary financial services (example, insurance, savings, money transfer and
etc.) that can gratify the demand of their clients in a greater extent.
d) The loan size should not be ‘same for all’ rather than it should vary based on the nature
of enterprise and demand from the borrowers.
e) The loan repayment schedule should be restructured based on types of business rather
than general weekly installment.
f) Workshop, seminar and training program should be arranged to enhance the financial
literacy of the borrowers.
g) Academic community should take necessary adjustments while taking some indicators
that may be under or over-estimated due to the influence of the multiple borrowing.
h) Lastly, monitoring and supervising the microfinance activities urged the authorities to
take necessary steps before this crisis become widespread.
The original aim of this study is not to stop the microfinance program rather raising concern
among the respective authorities about the challenges that the sector is experiencing. We
discussed the causes behind multiple borrowing and their impact based on general figures and
facts. However, rigorous empirical estimation is required to understand the dynamics of
multiple borrowing in a greater extent. Proper investigation of cross country context should be
carried out to see the impact of multiple borrowing. Though, empirical analysis may not truly
reflect the factors of multiple borrowing and their impact, in depth case studies will enhance the
understanding of such phenomenon to a greater magnitude.
Acknowledgement
I would like to thank Dr. VGR Chandran and Mr. Vita for their constructive comments and
suggestions.
References
AHLIN, C., LIN, J. & MAIO, M. 2011. Where does microfinance flourish? Microfinance
institution performance in macroeconomic context. Journal of Development Economics,
95, 105-120.
ARMENDÁRIZ, B. & MORDUCH, J. 2010. The economics of microfinance, MIT press.
ASHTA, A., KHAN, S. & OTTO, P. 2011. Does Microfinance Cause or Reduce Suicides?
Personnel, 104, 287.
BANGLADESH BUREAU OF STATISTICS. 2011. Preliminary Report on Household Income
& Expenditure Survey, 2010. [Online]. Dhaka, Bangladesh. Available:
http://www.bbs.gov.bd/PageReportLists.aspx?PARENTKEY=66 [Accessed 20.02.2015.

POSTGRADUATE CONFERENCE ON ECONOMICS, PUBLIC ADMINISTRATION AND
BUSINESS (PCEPAB)-5TH SEPTEMBER, 2015
PROMOTING GROWTH, EXCELENCE AND SUSTAINABILITY- 226
BANGLADESH BUREAU OF STATISTICS 2013. District Statistics 2011: Feni. In:
PLANNING, M. O. (ed.). Dhaka: Bangladesh Bureau of Statistics.
BEN SOLTANE, B. 2014. Total factor productivity change of MENA microfinance
institutions: A Malmquist productivity index approach. Economic Modelling, 39, 182-
189.
BISWAS, S. 2010. India's micro-finance suicide epidemic [Online]. UK: British Broadcasting
Corporation. Available: http://www.bbc.com/news/world-south-asia-11997571
[Accessed 5.04.2015.
BOIWA, W. C. & BWISA, H. 2014. Effects of Multiple Borrowing on the Living Standards of
Microfinance Clients at Kenya Women Finance Trust, Trans Nzoia Region. Developing
Country Studies, 4, 77-85.
BOS, J. W. & MILLONE, M. 2015. Practice what you preach: Microfinance business models
and operational efficiency. World Development, 70, 28-42.
BREHANU, A. & FUFA, B. 2008. Repayment rate of loans from semi-formal financial
institutions among small-scale farmers in Ethiopia: Two-limit Tobit analysis. The
Journal of Socio-Economics, 37, 2221-2230.
BURKI, H. B. & SHAH, M. 2007. The dynamics of microfinance expansion in Lahore.
Islamabad: Pakistan Microfinance Network, June.
CASINI, P. 2010. Competitive Microcredit Markets: Differentiation and ex-ante Incentives for
Multiple Borrowing. LICOS Discussion Paper.
CHARITONENKO, S., RAHMAN, S., AFWAN, I., DE SILVA, D., CAMPION, A. &
FERNANDO, N. A. 2004. Commercialization of microfinance, Asian Development
Bank (ADB).
CHAUDHURY, I. A. & MATIN, I. 2002. Dimensions and dynamics of microfinance
membership overlap–a micro study from Bangladesh. Small Enterprise Development,
13, 46-55.
CHRISTEN, R. P. & DRAKE, D. 2002. Commercialization. The new reality of microfinance.
The commercialization of microfinance: Balancing business and development, 2-20.
COLEMAN, B. E. 1999. The impact of group lending in Northeast Thailand. Journal of
Development Economics, 60, 105-141.
CONNING, J. 1999. Outreach, sustainability and leverage in monitored and peer-monitored
lending. Journal of Development Economics, 60, 51-77.
CULL, R. & MORDUCH, J. 2007. Financial performance and outreach: a global analysis of
leading microbanks*. The Economic Journal, 117, F107-F133.
DICHTER, T. W., HARPER, M. & ACTION, P. 2007. What's wrong with microfinance?,
Practical Action Publishing Rugby.
DUVENDACK, M. & PALMER-JONES, R. 2012. High noon for microfinance impact
evaluations: re-investigating the evidence from Bangladesh. The Journal of
Development Studies, 48, 1864-1880.
FAFCHAMPS, M. & GUBERT, F. 2007. Contingent loan repayment in the Philippines.
Economic Development and Cultural Change, 55, 633-667.
FARUQEE, R. & KHALILY, M. 2011. Multiple borrowing by MFI clients: Current status and
implications for future of microfinance. Dhaka, Bangladesh:: Institute of Microfinance
(InM).
FERNANDO, J. L. 1997. Nongovernmental organizations, micro-credit, and empowerment of
women. The ANNALS of the American Academy of Political and Social Science, 554,
150-177.
FISCHER, G. & GHATAK, M. 2010. Repayment frequency in microfinance contracts with
present-biased borrowers. London School of Economics, Working paper.

POSTGRADUATE CONFERENCE ON ECONOMICS, PUBLIC ADMINISTRATION AND
BUSINESS (PCEPAB)-5TH SEPTEMBER, 2015
PROMOTING GROWTH, EXCELENCE AND SUSTAINABILITY- 227
FRANKIEWICZ, C. Information Technology as a strategic tool for Microfinance in Africa. A
seminar Report, April, 2004. 26-27.
GONZALEZ, A. 2010. Is Microfinance Growing Too Fast? MIX Data Brief [Online].
GONZALEZ, A. & JAVOY, E. 2011. Microfinance and the role of policies and procedures in
saturated markets and during periods of fast growth. MicroBanking Bulletin, September.
GUHA, B. & CHOWDHURY, P. R. 2013. Micro-finance competition: Motivated micro-
lenders, double-dipping and default. Journal of Development Economics, 105, 86-102.
HERMES, N., LENSINK, R. & MEESTERS, A. 2011. Outreach and efficiency of
microfinance institutions. World Development, 39, 938-948.
HISAKO, K. 2009. Competition and wide outreach of microfinance institutions. Economics
Bulletin, 29, 2628-39.
IMAI, K. S. & AZAM, M. S. 2012. Does microfinance reduce poverty in Bangladesh? New
evidence from household panel data. Journal of Development Studies, 48, 633-653.
IMAI, K. S., GAIHA, R., THAPA, G. & ANNIM, S. K. 2012. Microfinance and poverty—a
macro perspective. World Development, 40, 1675-1689.
KAHNEMAN, D. & TVERSKY, A. 1979. Prospect theory: An analysis of decision under risk.
Econometrica: Journal of the Econometric Society, 263-291.
KATES, S. 2005. Supply Creates its Own Demand: A Discussion of the Origins of the Phrase
and of its Adequacy as an Interpretation of Say’s Law of Markets. History of Economics
Review, 41, 49-60.
KHAN, A. R. 2005. Measuring inequality and poverty in Bangladesh: an assessment of the
survey data. The Bangladesh Development Studies, 1-34.
KHANDKER, S. R. 2005. Microfinance and poverty: Evidence using panel data from
Bangladesh. The World Bank Economic Review, 19, 263-286.
KILKENNY, M. & THISSE, J.-F. 1999. Economics of location: a selective survey. Computers
& Operations Research, 26, 1369-1394.
KRISHNASWAMY, K. 2007. Competition and multiple borrowing in the Indian microfinance
sector. India: Institute for Financial Management and Research :Centre for
Microfinance.
KULIK, N. & MOLINARI, P. 2004. Sustainable microfinance and technology. Ford Motor
Company Fellowship. Retrieved May, 7, 2009.
LAHKAR, R. & PINGALI, V. 2014. Risk diversification through multiple group membership
in microfinance. Applied Economics Letters, 21, 622-625.
LEVIN, G. 2012. Critique of microcredit as a development model. Pursuit-The Journal of
Undergraduate Research at the University of Tennessee, 4, 9.
LOUIS, P., SERET, A. & BAESENS, B. 2013. Financial efficiency and social impact of
microfinance institutions using self-organizing maps. World Development, 46, 197-210.
LUTZENKIRCHEN, C. & WEISTROFFER, C. 2012. Microfinance in evolution: An industry
between crisis and advancement. Deutsche Bank Research.
MALLICK, D. 2012. Microfinance and moneylender interest rate: evidence from Bangladesh.
World development, 40, 1181-1189.
MANAGEMENT ASSOCIATION, I. R. 2013. Sustainable Practices: Concepts,
Methodologies, Tools, and Applications: Concepts, Methodologies, Tools, and
Applications, IGI Global.
MAURER, K. & PYTKOWSKA, J. 2010. Indebtedness of Microcredit Clients in Bosnia and
Herzegovina, Results from a comprehensive field study. European Fund for Southeast
Europe (EFSE).

POSTGRADUATE CONFERENCE ON ECONOMICS, PUBLIC ADMINISTRATION AND
BUSINESS (PCEPAB)-5TH SEPTEMBER, 2015
PROMOTING GROWTH, EXCELENCE AND SUSTAINABILITY- 228
MAZUMDER, M. S. U. & LU, W. 2015. What Impact Does Microfinance Have on Rural
Livelihood? A Comparison of Governmental and Non-Governmental Microfinance
Programs in Bangladesh. World Development, 68, 336-354.
MCINTOSH, C., JANVRY, A. & SADOULET, E. 2005. How Rising Competition Among
Microfinance Institutions Affects Incumbent Lenders*. The Economic Journal, 115,
987-1004.
MIA, M. A. 2014. Does lending to women affect revenue generation of microfinance
institutions? The Empirical Econometrics and Quantitative Economics Letters, 3, 59-65.
MICRO-CREDIT REGULATORY AUTHORITY. 2015. An Overview of Microcredit in
Bangladesh [Online]. Dhaka, Bangladesh. Available:
http://www.mra.gov.bd/index.php?option=com_content&view=article&id=104&Itemid
=80 [Accessed 12.02.2015.
MPOGOLE, H., MWAUNGULU, I., MLASU, S. & LUBAWA, G. 2012. Multiple Borrowing
and Loan Repayment: A Study of Microfinance Clients at Iringa, Tanzania. Global
Journal of Management & Business Research, 12.
MRA 2010. NGO-MFIs in Bangladesh : A statistical publication. Dhaka, Bangladesh: Micro-
credit Regulatory Authority.
NORTHCOTT, C. A. 2004. Competition in banking: A review of the literature. Canada: Bank
of Canada Working paper.
PEARLMAN, S. 2012. Too Vulnerable for Microfinance? Risk and Vulnerability as
Determinants of Microfinance Selection in Lima. Journal of Development Studies, 48,
1342-1359.
QUAYES, S. 2012. Depth of outreach and financial sustainability of microfinance institutions.
Applied Economics, 44, 3421-3433.
RAHMAN, A. 1999. Micro-credit initiatives for equitable and sustainable development: Who
pays? World Development, 27, 67-82.
ROBERTS, P. W. 2013. The profit orientation of microfinance institutions and effective
interest rates. World Development, 41, 120-131.
ROSENBERG, R. 2009. Measuring results of microfinance institutions: Minimum indicators
that donors and investors should track-A technical guide.
SCHICKS, J. 2013. The Sacrifices of Micro-Borrowers in Ghana–A Customer-Protection
Perspective on Measuring Over-Indebtedness. The Journal of Development Studies, 49,
1238-1255.
SCHICKS, J. 2014. Over-indebtedness in Microfinance–an empirical analysis of related factors
on the borrower level. World development, 54, 301-324.
SCHICKS, J. & ROSENBERG, R. 2011. Too Much Microcredit?: A Survey of Issues and
Evidence on Over-Indebtedness among Micro-Borrowers. CGAP Occasional Paper.
SERRANO-CINCA, C. & GUTIÉRREZ-NIETO, B. 2014. Microfinance, the long tail and
mission drift. International Business Review, 23, 181-194.
SERVIN, R., LENSINK, R. & VAN DEN BERG, M. 2012. Ownership and technical efficiency
of microfinance institutions: Empirical evidence from Latin America. Journal of
Banking & Finance, 36, 2136-2144.
SHAFFER, S. 1998. The winner's curse in banking. Journal of Financial Intermediation, 7,
359-392.
SHARMA, M. & ZELLER, M. 1999. Placement and outreach of group-based credit
organizations: The cases of ASA, BRAC, and PROSHIKA in Bangladesh. World
Development, 27, 2123-2136.
SINHA, S. & MATIN, I. 1998. Informal Credit Transactions of Micro‐Credit Borrowers in
Rural Bangladesh. IDS Bulletin, 29, 66-80.

POSTGRADUATE CONFERENCE ON ECONOMICS, PUBLIC ADMINISTRATION AND
BUSINESS (PCEPAB)-5TH SEPTEMBER, 2015
PROMOTING GROWTH, EXCELENCE AND SUSTAINABILITY- 229
SRINIVASAN, R. & KAMATH, R. 2009. Microfinance in India: Small, Ostensibly Rigid and
Safe. Working paper, Microfinance Group, Indian Institute of Management Bangalore.
SWAIN, R. B. & FLORO, M. 2012. Assessing the effect of microfinance on vulnerability and
poverty among low income households. Journal of Development Studies, 48, 605-618.
TWAHA, K. & RASHID, A. 2012. Exploring the determinants of the productivity of
microfinance institutions in India. Munich Personal RePEc Archive [Online]. Available:
http://mpra.ub.uni-muenchen.de/45715/.
VENKATA, N. & YAMINI, V. 2010. Why do microfinance clients take multiple loans.
MicroSave India Focus Note, 33.
WATANABE, R., FURUKAWA, M., NAKAMURA, R. & OGURA, Y. 2006. Analysis of the
socioeconomic difficulties affecting the suicide rate in Japan. KIER Discussion Paper,
626.
WORLD BANK. 2015. Official Exchange Rate [Online]. World Bank Group. Available:
http://data.worldbank.org/indicator/PA.NUS.FCRF [Accessed 10.02.2015.
YUNUS, M. 2006. Banker to the poor [Online]. New York: Public Affairs Press. Available:
https://www.ashoka.org/video/4112.
YUSOFF, M. B. 2010. An Analysis Of Zakót Expenditure And Real Output: Theory And
Evidence. International Journal of Economics, Management and Accounting, 18.
ZEBALLOS, E., CASSAR, A. & WYDICK, B. 2014. Do Risky Microfinance Borrowers
Really Invest in Risky Projects? Experimental Evidence from Bolivia. Journal of
Development Studies, 50, 276-287.

POSTGRADUATE CONFERENCE ON ECONOMICS, PUBLIC ADMINISTRATION AND
BUSINESS (PCEPAB)-5TH SEPTEMBER, 2015
PROMOTING GROWTH, EXCELENCE AND SUSTAINABILITY- 230
The Role of Professionalism, Leadership, and Trust to Promote
Organizational Justice
Imran Shafique
Faculty of Economics and Administration
University of Malaya
Abstract
The aim of this study is to empirically investigate the relationship among professionalism, leadership, and trust in
organizational justice. Pakistan is selected as a case study. Data was collected by random sampling technique by
using survey questionnaire. The sample size is composed of twenty public sector universities of Pakistan. The
instrument’s reliability is assessed by Cronbach’s alpha. Furthermore, to analyze the hypotheses correlation and
regression techniques are used respectively. The results state that professionalism, leadership, and trust plays
vital role to promote organizational justice.
Keywords: professionalism, leadership, trust, organizational justice
Introduction
In today’s competitive business environment, organizational justice is the essence of keeping
employees effective, loyal, and committed to organization as well as to their colleagues. Justice
in an organization is vital because of its impact on the performance of the organization in terms
of work effectiveness, trustworthiness of the employees and nurturing mutual respect among
employees (Sheppard, et al., 1992). Organizational justice, in its most general sense, is the way
individuals perceive justice regarding practices in their organizations (Bies and Moag, 1986;
Greenberg, 1990).
The study of organizational justice has received great consideration from the researchers and
scholars and it has become frequently researched topics in the field of industrial-organizational
psychology, human resource management and organization behavior (Cropanzano &
Greenberg, 1997). Perceptions of organizational justice establish an important heuristic in
organizational decision-making, as research relates it to job satisfaction, leadership,
organizational citizenship, organizational commitment, trust in colleagues and supervisors,
turnover, mutual respect among colleagues, job performance, customer satisfaction and leader-
member exchange.
1.2 Trust and Organizational Justice
People evaluate the treatment they receive in organizations of which they are employees with
the treatments that other employees in the same organization or employees of the other
organizations receive, and make evaluations about the level of justice in the organization
according to their own perceptions. It is believed that these evaluations play a key role in the
way members perform their organizational duties and responsibilities. Therefore, the concept of
organizational justice is frequently included in studies concerning organizations and

POSTGRADUATE CONFERENCE ON ECONOMICS, PUBLIC ADMINISTRATION AND
BUSINESS (PCEPAB)-5TH SEPTEMBER, 2015
PROMOTING GROWTH, EXCELENCE AND SUSTAINABILITY- 231
management (Cohen-Charash and Spector, 2001; Konovsky, 2000). Greenberg (1990) stated
that organizational justice refers to people's perceptions of the fairness of treatment received
from organizations and it is a basic requirement for the effective functioning of organizations.
Trust and organizational justice are inseparable, if employee perceives fair and just treatment
from the organization as well as from colleagues; she/he feels organization as well as
colleagues trustworthy. Trust has been defined as “an individual’s or group’s willingness to be
vulnerable to another party based on the confidence that the latter party is benevolent, reliable,
competent, honest, and open” (Hoy & Tschannen-Moran, 1999:189).
In the educational setting two different referents of trust are considered; teacher trust in
colleagues and teacher trust in the principal. Hoy and Kupersmith (1985) developed scales to
measure faculty trust in colleagues and in principals which was further improved by Hoy and
Tschannen-Moran (1999), they developed the Omnibus T-Scale, which determined particularly
the willingness to risk vulnerability and reflected five facets of trust that is; benevolence,
reliability, competency, honesty, and openness.
There are two primary emphases in this study. The first emphasis is the relationship of
Teachers’ professionalism and faculty trust in colleagues with organizational justice. Teachers’
professionalism is a constituent of healthy climates and is linked to trust in colleagues (Hoy, et
al., 2002). When teachers trust each other, they are more likely to communicate and impart
ideas about refining curriculum and teaching methodology. The second emphasis of this study
is the relationship of collegial principal leadership and teacher trust in the principal with
organizational justice. Collegial leadership is where principals are helpful and supportive to
teachers and treat them as people and colleagues, however set high standards for them to
follow. Similarly, Corwin and Borman (1988) affirmed that through administrative support and
collegial leadership, principals can influence teaching positively but through administrative
control they can influence negatively. Furthermore, teachers are more likely to experiment and
take risks to improve the quality of instructions when they are supported by their superiors
(Hoffman, et al., 1994).
Collegial leadership is principal behavior that is concerned with meeting both the social needs
of the faculty and achieving the goals of the school. The principal treats teachers as colleagues,
is open, egalitarian, and friendly, but at the same time sets clear expectations and standards of
performance (Hoy, et al., 2002). Teachers’ professionalism is described as teacher’s
commitment to students and engagement in the teaching task, while respecting the professional
expertise of colleagues. Professional interactions among teachers are open and cooperative.
Teachers are supportive of one another and help each another. Teachers display warmth and
kindliness. Teachers’ professionalism is a respect for colleagues’ competence, commitment to
students, autonomous judgment, mutual cooperation, and support for colleagues (Hoy, et al.,
2002).
The collegial leadership of the principal is critical in nurturing a trusting relationship with the
faculty, and such trust is pivotal in developing a sense of organizational justice. Professional
teacher relationships are significant in facilitating trust among teachers, which in turn enhances
a sense of fairness in the school.

POSTGRADUATE CONFERENCE ON ECONOMICS, PUBLIC ADMINISTRATION AND
BUSINESS (PCEPAB)-5TH SEPTEMBER, 2015
PROMOTING GROWTH, EXCELENCE AND SUSTAINABILITY- 232
The topic of organizational justice and trust is not new in administrative literature but it’s a
negligent issue in education sector (Hoy & Tarter, 2004). In the context of Pakistan, few studies
have been carried out on organizational justice. Salfi (2011) revealed that the heads of
successful schools develop a common and shared school vision to promote a culture of
collaboration, support and trust. They empower others to lead and distribute leadership
responsibilities throughout the school. If a school wants to improve and be successful, trust
plays a significant role (Hoy & Tarter, 2004). So trust must be always nurtured and preserved in
an organization to ensure its existence. Murtaza, et al. (2011) conducted a study in public sector
of Pakistan and revealed that organizational justice is positively related with job satisfaction.
Hoy and Tater (2004) identified a new construct including collegial leadership and Teachers’
professionalism; that has potential impacts on organizational justice. This research on collegial
principal leadership, Teachers’ professionalism, trust in principal and colleagues and
organizational justice has been done specifically in an elementary schools settings hence results
of this study may fill gaps in the research in these settings and further confirm the new concept
of organizational justice in schools.
1.3 Statement of the Problem
Organizational justice is essential for maintaining employee loyalty, commitment, job
satisfaction and effectiveness. In the context of schools, organizational justice is – what is just
and fair treatment for faculty. There are two major participants of organizational justice in the
context of schools, i.e. faculty and principal. There is a need to look at these participants’
behavior (Teachers’ professionalism and collegial principal leadership) to foster faculty trust in
colleagues and principal, which is pivotal to promote organizational justice. Furthermore,
studies are being carried out on organizational justice in schools; in different environments and
cultures all over the world. In Pakistan, researchers are concerned about studying organizational
justice in the context of organizational management, but it’s a neglected concern in the
educational administration and management
1.4 Objectives
To assess the relationship between Teachers’ professionalism and faculty trust in
colleagues.
To assess the relationship between collegial principal leadership and faculty trust in
principal.
To assess the relationship between faculty trust in colleagues and principal, and
organizational justice.
To assess the mediating behavior of trust in principal and trust in colleagues.
To assess the relationship and extent with which Teachers’ professionalism, collegial
principal leadership and faculty trust in colleagues and principal are related to
organizational justice.

POSTGRADUATE CONFERENCE ON ECONOMICS, PUBLIC ADMINISTRATION AND
BUSINESS (PCEPAB)-5TH SEPTEMBER, 2015
PROMOTING GROWTH, EXCELENCE AND SUSTAINABILITY- 233
2.1 Literature Review
2.2 Organizational Justice
Justice in organizations is not a new concept in literature but it has been a negligent issue in the
field of education (Hoy & Tarter, 2004). It has been argued that organizational justice plays an
important role in the development of teachers’ attitudes towards the school which is highly
associated with their job satisfaction (Colquitt et al., 2001). Moreover, the health of an
individual is greatly affected by organizational justice (Kivimaki, et al., 2003). Thus, justice is
not only important for an organization but also important for the well-being of the workers in an
organization because justice has a vital role on enhancing individuals’ satisfaction (Poole,
2008).
According to Poulus (2004), justice should be made as a main agenda in schools because
teachers want justice in work place. Annamalai (2010) also found that in school setup,
organizational justice has important influence towards satisfaction in performance appraisal at
individual (teacher) level and also trust at organizational level. It is also believed that taking
measures that will increase teachers’ organizational commitment, especially reinforcing
organizational justice in schools, will be useful.
According to Singer (1993), justice should be given priority in all organization affairs;
otherwise there will be some negative impact on the organization performance. Justice in the
workplace has a significant relationship with employee’s satisfaction (Poulus, 2004) and the
effectiveness of an organization (Colquitt, et al., 2001). An organizational justice perception
plays an important role in the development of organizational commitment and job satisfaction.
Perceived organizational justice significantly correlates with both job satisfaction and
organization commitment. Those who perceive justice in their organization are more likely to
feel satisfied with their job and feel less likely to leave and feel more committed to their job
(Bakhshi, et al., 2009).
Organizational justice in literature is divided into four dimensions: distributive justice,
procedural justice, interpersonal justice and informational justice (Colquitt et al., 2001).
Distributive justice refers to the employees’ perception towards fairness of the outcomes
received as a result of an allocation decision while procedural justice refers to the employees’
perception towards fairness of the procedures used to make allocation decisions (Cropanzano &
Greenberg, 1997). Other researchers explains that distributive justice refers to employees
perception towards the rewards that he /she receives includes promotion and incentives
whereas, procedural justice refers to the perceptions of the employees’ regarding the procedures
and process of acquiring rewards (Thibaut & Walker, 1975). Interpersonal justice refers to
employees’ perceptions towards the interpersonal treatment that he/she gets during the process
of garnering incentives (Bies & Moag, 1986). Finally, informational justice refers to the
perceptions of employees’ about getting clear information regarding decisions made by the
organization (Bies, Shapiro, & Cummings, 1988). These complete four dimensions are the
processes that are involved in rewarding employees.
Hoy and Tarter’s (2004) study of organizational justice and trust is also important in the context
of this study. Their model predicted that Teachers’ professionalism is directly related to faculty
trust in colleagues, which in turn promotes organizational justice in the workplace and

POSTGRADUATE CONFERENCE ON ECONOMICS, PUBLIC ADMINISTRATION AND
BUSINESS (PCEPAB)-5TH SEPTEMBER, 2015
PROMOTING GROWTH, EXCELENCE AND SUSTAINABILITY- 234
reinforces trust. Similarly, the collegial principal leadership generates faculty trust in the
principal, which independently enhances organizational justice in the school and reinforces
trust. They suggest ten principles of justice for schools setting, which describe the crux of
literature on organizational justice in schools.
i) Equity principle states that outputs acquired by the individuals from the organization
should be proportionate to their inputs. The compensations that teachers receive for
their contributions to the school should reflect balance; teachers should not take an
impression that their contributions are underrated or unrewarded.
ii) Perception principle states that justice is all about an individual’s perception about
fairness. Teachers must perceive that their principal is “following the rules” fairly, for
this principal let them know by word and deed that fair and just procedures will be
followed. Kumar, et al. (2009) revealed in their study that the perception of
organizational justice enhances the positive commitment that employees feel towards
the organization. Perception of organizational justice seems to be one of the most
important reasons for creating a sense in employee that he is a part of the organization.
According to Folger and Konovsky (1989), individuals with a high-level of perceived
organizational justice also express a high level of commitment to the organization.
iii) Voice principal states that principals should involve teachers in decision making when
they have a personal stake in the outcome and when they have the expertise to
contribute to the decisions (Hoy and Tarter, 2003). Principals need to promote both
informal and formal procedures to provoke teacher voice. A cup of coffee with teachers
in the staff room or “walking around” gives opportunities for informal voice. Formal
voice can be raised at faculty meetings, department meetings, in written
communication, and in a reliable “open door” policy.
iv) Interpersonal justice principle states treating employees with sensitivity, dignity and
respect promotes the feeling of fairness. If a bad news is given with respect and with
adequate information, it builds a feel of fair treatment. Sometimes principals have to
communicate adverse information to teachers about their performance or any other
assignment, at that time if they take into account timing, background, and delivery of
such information it will be more likely to create a sense of trust in the principal by
teachers which in turn promote a sense of organizational justice.
v) Consistency principle suggests the fair, evident and consistent application of rules,
regulations, and policies which at the same time gives flexibility to consider individual
needs and unusual circumstances. Consistent behavior is not essentially identical
behavior in all situations, but somewhat it is action that consistently suits the situation.
Therefore, in one situation the behavior may call for direct action whereas another
situation may require a soft touch or a more democratic approach. Effective leadership
is synchronizing appropriate leader behavior with the aspects of the situation (Yukl,
1998).
vi) Egalitarian principle describes that decision making should be free of self-centeredness
and self-interest and formed by the shared mission of the organization. The mission and
aim of the organization must take priority over individual benefits; no one’s interests
take preference over the needs of the collective. Like, assigning new faculty members
to the senior classes appears to violate the egalitarian principle. Such practices are not
in the interest of the school or teachers. The steering mission of public schools should
provide a comprehensive, efficient and effective education to all students, which also
comprises quality of instructions. Self-interest and in-house politics are components
that can erode egalitarianism.

POSTGRADUATE CONFERENCE ON ECONOMICS, PUBLIC ADMINISTRATION AND
BUSINESS (PCEPAB)-5TH SEPTEMBER, 2015
PROMOTING GROWTH, EXCELENCE AND SUSTAINABILITY- 235
vii) Correction principle explains that faulty or inadequate decisions should be corrected,
which depends on feedback, response and willingness to back a bad decision. Usually
supervisors and managers suppose that to admit a mistake is to someway weaken or
challenge their authority. But on the contrary, readiness to appraise a poor decision and
correcting it in all prospects builds in teachers a feeling of trust regarding fairness and
impartiality of the principal. The correction principle emphasizes the necessity for
feedback and precise information. For instance, if teachers conflict with an evaluation,
they must be given provisions for challenge. New indication may guide the principal’s
reappraisal in a just and balanced way. Correction principle suggests that two-way
communication is vital in appraising and reversing the poor decisions. Flexibility in the
organization of the school should openly promote feedback and reviewing of critical
decisions.
viii) Accuracy principle says that decisions must be established on accurate information.
Correction is indivisibly tangled with accuracy. The accuracy principle endorses a sense
of justice by exhibiting that decisions are supported by sound indications and
evidences. Principals who center their judgments on logical evidence rather than
narratives or rumors are expected to underline the confidence that the principal is
probing for the truth and is candidly welcomes new information. Accuracy stimulates
fairness similar to that correction assures; that the organization will treat employees
justly keeping in view the new information.
ix) Representative principle states interests representing the issues of concerned parties
should be taken into account while making decisions. Organizational decisions affect
many of its stakeholders. Decision making that provokes the views and sentiments of
those affected constituencies, justifies the representative principle. For instance, if
school is going to change its curriculum it will effect what teachers teach. In this
scenario, teachers should be represented in the decision-making process because they
not only have a personal concern in the decision outcome but they have also the
expertise, knowledge and wisdom to contribute to a good decision. Representation
principle is addressed, when teachers trust and consider their ideas and opinions are
being represented and have impact on results.
x) Ethical justice principle suggests following established moral and ethical standards.
Justice is primarily an ethical standard. “Honesty, integrity, authenticity, sincerity,
equality, impartiality, trustworthiness, and honor are contemporary ethical and moral
standards that should guide behavior in decision making in school organizations” (Hoy
and Tarter 2004:252). Researchers have been debating on what ethical standards should
be included or excluded, but if school administrators have the courage to obey to only
above mentioned ethical standards they will not have to go far in the subject to create a
fair and just school environment.
2.3 Trust
“Trust is one party’s willingness to be vulnerable to another party based on the confidence that
the latter party is benevolent, reliable, competent, honest, and open” (Hoy and Tschannen-
Moran, 1999:189). Trust is confidence that trusted party is bothered with safeguarding the well-
being of the trusting party while being reliable and competent in fulfilling one’s expectations
(Mishra, 1996).
Golumbiewski and McConkie, (1975:2) defined trust as; “A generalized expectancy held by the
work group that the word, promise, and written or oral statement of another individual, group,
or organization can be relied upon”. Hoy and his colleagues from Ohio State University have

POSTGRADUATE CONFERENCE ON ECONOMICS, PUBLIC ADMINISTRATION AND
BUSINESS (PCEPAB)-5TH SEPTEMBER, 2015
PROMOTING GROWTH, EXCELENCE AND SUSTAINABILITY- 236
been studying trust in school environment from a perspective made up of specific aspects that
can be measured empirically for more than two decades. In 1985 Hoy and Kupersmith
developed an instrument called the Trust Scales (T-Scales) on theoretical footings of Rotter
(1967). The instrument was developed to measure two aspects: faculty trust in the principal and
faculty trust in colleagues. Their initial research also involved linking trust with principal
authenticity. Authenticity describes behaviors through which the principal shows willingness to
admit mistakes, avoid manipulating others, and behaving like real people instead of a
bureaucrat. Their conclusions were that all three dimensions of trust were related to each other
and authentic behavior leads to teacher trust in the principal. Principal authenticity was also
related to teacher trust in the organization. There was only a slight correlation between principal
authentic behaviors and teacher trust in colleagues.
Hoy and Tschannen-Moran (1999) further used the bases of Hoy and Kupersmith’s (1985) T-
Scale and developed Omnibus T-Scale. The Omnibus T-Scale was first tested in elementary
schools and then retested at the high school level. The final version was comprised of 26 items
that detailed into three referents of trust: faculty trust in the principal, faculty trust in colleagues,
and faculty trust in clients. As anticipated, faculty trust in each of these three groups was fairly
related to each other, which inferred that faculty trust in schools is prevalent. When teachers
trust their principal, they tend more to trust each other and their clients.
Faculty trust is a shared property to the extent with which the faculty as a community is eager to
risk vulnerability (Hoy & Tschannen-Moran, 1998; Tschannen-Moran & Hoy, 2001). From the
literature review, we get to know that faculty trust is an accumulation of the following five
facets: benevolence, reliability, competence, honesty, and openness.
Benevolence is confidence that one’s safety or something one concern about will be
safeguarded and not be exploited by the trusted party (Cummings and Bromily, 1996; Hosmer,
1995. Benevolence is made upon expectations. Parents expect teachers to act in the best
interests of their child while treating them with fairness and compassion. Similarly, teachers
trust their students and parents believe that neither will challenge their teaching. Benevolence is
the “accepted vulnerability to another’s possible but not expected ill will” (Baier, 1986:236).
Benevolence is the foremost element of trust relationships as it is based on mutual
understandings of each other’s well-being.
Reliability is the predictability; that is, consistency of behavior and knowing what to expect
from others (Hosmer, 1995). Predictability alone does not build trust because people can do
predictable behaviors which might be against the well-being of others, like being dishonest or
self-centered. Reliability contains a sense of confidence that one’s need may be met in positive
ways and the trusted person will come through or find alternatives to get the best possible
solution in the collective interest of all parties. “Reliability is the confidence that others will
consistently act in ways that are beneficial to the trustee” (Hoy and Tarter, 2004:254).
Competence is the ability to accomplish a task up to the expected standards (Mishra, 1996). In
organizations, most of the tasks are interdependent, teachers must have confidence that
deadlines will be met, tasks will be completed efficiently and the quality of the results will be
adequate. Reliability and benevolence are not enough to build trust if there is lack of
competence to accomplish the task. Once someone disappoints to do a job appropriately or

POSTGRADUATE CONFERENCE ON ECONOMICS, PUBLIC ADMINISTRATION AND
BUSINESS (PCEPAB)-5TH SEPTEMBER, 2015
PROMOTING GROWTH, EXCELENCE AND SUSTAINABILITY- 237
demonstrates a lack of expertise, knowledge and skill, it is hard for others to trust him despite
his good intentions.
Honesty refers to a person’s truthfulness, integrity, and authenticity. Rotter (1967) defined trust
as being able to rely on the word, promise, verbal or written statement of another individual or
group. Honesty is developed on the consistency between truthful statements and actions.
Honesty denotes integrity or a connection between words and deeds. Being responsible for your
actions and not falsifying the truth in order to shift blame is the core of honesty (Tschannen-
Moran and Hoy, 1998).
Openness is a willingness to share relevant information that makes one vulnerable to others.
Openness indicates reciprocity of trust, which explains that having a confidence that all parties
involved will not exploit or harm the other parties. People who hide information aggravate
distrust and end up being isolated (Kramer, Brewer, & Hanna, 1996). Trust begets trust whereas
distrust begets distrust.
2.4 Trust in Principal
From most of the studies on trust in principal it is deduced that trust arises from principal’s
behavior that is caring, collegial, supportive, egalitarian and protective (Tarter & Hoy, 1988;
Tarter, et al., 1989). Faculty trust in principal is defined in literature as: “The faculty has
confidence that the principal will keep his or her word and act in the best interest of the
teachers” (Tschannen-Moran and Hoy, 1998: 342)
Hoffman et al. (1994) found that faculty trust in the principal is highly related to the openness
of the principal, but trust in the principal is only weakly related to openness in teacher behavior.
Trust in principal is mainly a consequence of supportive and collegial principal behavior. “The
successful principal is one who integrates a press for the task and a consideration for teacher
colleagues, who influences superiors without selling-out the teachers, and who protects teachers
from unwarranted outside interference. Effective principals are not only intellectual leaders in
their schools, but are also colleagues who serve and support and also build confidence” (Tarter
& Hoy, 1988:23).
Blumberg, et al., (1978) carried out a study to refine the meaning of the word “trust” and to
define more precisely what teachers need when they think about trusting principals. They were
among the first researchers of trust in schools. In their exploratory research, they found that
teachers’ trust in the principal was more associated to their relationships with the principal as
compared to the organizational responsibilities of the principal. That is, it seemed more
important to teachers how the principal consider them professionally than how the principal ran
the school.
In the study, 85 teachers registered in a graduate program were asked to answer to the
statement, “I trust my principal.” As a result, 179 statements developed, from which the
researchers made 10 categories and developed a questionnaire to rank them. From this study,
five expectations from principal, believed by teachers are raised, which are credibility, support,
fairness, professional openness, and participative decision-making.
(Hoy, et al., 1992; Tarter, et al., 1989; Tarter, et al., 1995) demonstrated that different behaviors
of principal and colleagues made different impact on faculty trust in colleagues and principal.

POSTGRADUATE CONFERENCE ON ECONOMICS, PUBLIC ADMINISTRATION AND
BUSINESS (PCEPAB)-5TH SEPTEMBER, 2015
PROMOTING GROWTH, EXCELENCE AND SUSTAINABILITY- 238
Supportive leadership of the principal propagate the degree of trust teachers felt for the
principal but did not produced trust among the faculty for each other. At the same time, both
collegial and promised behavior of teachers aided create trust in colleagues, but did not make a
significant contribution to trust in the principal. The authenticity of the principal’s behavior is
positively correlated with both aspects of faculty trust (Hoy and Kupersmith, 1986).
The relationship of employees' trust in organizations and its members with the organizations,
leaders plays an important role in the generation of organizational justice. Trust can be studied
on the basis of Blau’s (1964) Social Exchange Theory. This theory explains how individuals
feel about a relationship and the expected results of that relationship (Blau, 1964). If a person
trusts another person he/she will expect some benefits from the relationship. Frazier (2010)
found differential effects of procedural, interpersonal and informational justice on perceived
trustworthiness. He also says that consistent with multifoci organizational justice and social
exchange theory, the effects are dependent on the authority figure being referenced and the
nature of the exchange relationship between authority and subordinate.
Faculty trust in the principal appears crucial to the development of a sense of justice in the
school. As teachers trusting each another is vital in creating fairness in the workplace, so is the
faculty trust in principal and both predicts a close connection between faculty trust and
organizational justice (Hoy and Tarter, 2004). When teachers trust the principal as reliable,
authentic and egalitarian, it encourages open interactions between teachers and principal
(Hoffman, et al., 1994) and implies that principal is competent, and concerned about teachers
(Geist and Hoy, 2003). When principals earn the trust of the faculty, they strengthen a sense of
esteem and respect at the workplace (Hodson, 2001).
2.5 Trust in Colleagues
Faculty trust in colleagues is an important issue in the development and progress of effective
schools. Uline, et al., (1998) argued that effective schools consider both instrumental and
expressive components. Instrumental components of a school refer to students’ achievement
while expressive components of a school include trust in the principal, trust in colleagues, and
school health. They deduced that faculty trust in the principal, teacher trust in colleagues,
organizational health, and student achievement all have significant relationships with teachers’
perception of school effectiveness. Though, teachers’ trust in colleagues is more significantly
linked with perceptions of effectiveness than teachers’ trust in principal.
Tarter, et al., (1989) researched the impact of school climate on faculty trust and found several
significant relationships. They studied 72 secondary schools in New Jersey using trust scales
designed by Hoy and Kupersmith (1985) to measure the faculty trust in the principal and faculty
trust in colleagues. According to the expectations, open school climates were positively
correlated with teachers’ trust in the principal and colleagues. Positive relationships were
obtained between teachers’ trust in principal and principal supportive behavior as well as it was
found that engaged teacher behavior is positively related to teachers’ trust in colleagues.
Negative relationships were discovered between teachers’ trust in principal and directive
principal behavior and at the same time, negative relationships appeared between teachers’ trust
in colleagues and teacher frustration from interference from supervisors and colleagues. Their
research further highlighted the importance of leadership in establishing and maintaining
climates that are empowering because engaged and frustrated teacher behaviors were both

POSTGRADUATE CONFERENCE ON ECONOMICS, PUBLIC ADMINISTRATION AND
BUSINESS (PCEPAB)-5TH SEPTEMBER, 2015
PROMOTING GROWTH, EXCELENCE AND SUSTAINABILITY- 239
related to their trust in the principal. Noticeably, faculty trust in the principal had no effect on
faculty trust in colleagues, and vice versa. The final conclusion was “the principal remains the
single most important individual in the development of organizational climate, but not the
development of trust in colleagues” (Hoy & Kupersmith, 1985:306).
Higher levels of teachers’ professionalism are linked with a faculty that trusts in colleagues
(Hoy, Hannum & Tschannen-Moran 1998; Smith, Hoy & Sweetland, 2001; Sweetland & Hoy,
2000). Open and collegial interactions between teachers convince teachers to trust each other
(Hoffman, Sabo, & Hoy, 1994). “It is an atmosphere of openness and professionalism that leads
to a trust and cooperation among colleagues and the principal, which ultimately promotes
effective schools. Supportive leaders and colleagues build self-confidence in individual teachers
to take risks and try new approaches” (Tarter, Sabo, & Hoy, 1995:84).
Faculty trust in colleagues is crucial and essential condition for organizational justice. Trust is
an important constituent of interpersonal relationships; in fact, the right endurance of a social
group may depend on its members’ willingness to exercise trust with each other (Rotter, 1967).
When colleagues trust one another, it promotes the openness and authenticity of interpersonal
relations (Hoffman et al., 1994), and establishes a climate where members will likely to treat
one another with esteem, honesty, and altruism – all features of a just, fair and caring
workplace. Trust in colleagues develops the ability to establish a sense of self-esteem and
dignity, to enjoy healthy social relations (Hodson, 2001). Therefore, it can be expected that
faculty trust in colleagues enhances a fair and just workplace which in turn reinforces a feeling
of trust among teachers.
2.6 Collegial Principal Leadership
Collegial leadership is described by supportive and egalitarian behavior. A principal can lead
his team in a way that directly effects faculty trust in the principal and indirectly promotes a
sense of organizational justice. Through concepts of collegial leadership, we can say that
collegial principal leadership seizes three important concerns of leadership which are: concern
for people, concern for the task, and concern for change. The principal whose behavior is
expressive, instrumental, and change-oriented, that is, who leads with friendly, supportive
behavior, sets clear expectations and standards of performance, and is open to change, is likely
to be successful (Yukl, 1998). Moreover, such collegial principal behavior fosters a culture of
trust and justice. . Collegial principals build faculty trust in the principal and inspire Teachers’
professionalisms that lead to trust in colleagues (Dean, 2011).
The principal is not only dedicated to task achievement, but is sympathetic, helpful, and
honestly concerned about the well-being of teachers. The principal also lets faculty know what
is expected of them while upholding certain standards of performance (Tschannen-Moran,
1997). Characteristics of collegial leadership of the principal measured on the Organizational
Climate Index comprise the following: “The principal treats all faculty members as his or her
equal. The principal maintains definite standards of performance. The principal is friendly and
approachable. The principal explores all sides of topics and admits that other opinions exist”
(Hoy, et al., 2002:42).
Titrek and Osman (2009) carried out a study to determine the levels of organizational justice in
Turkish schools, according to managers' and employees' perceptions. There were 104 school
managers, 834 teachers and 78 other employees (1,016) took part in the study, which were

POSTGRADUATE CONFERENCE ON ECONOMICS, PUBLIC ADMINISTRATION AND
BUSINESS (PCEPAB)-5TH SEPTEMBER, 2015
PROMOTING GROWTH, EXCELENCE AND SUSTAINABILITY- 240
selected from 7 cities’ schools. Results of the study expressed that most deficiencies in
organizational justice behaviors in Turkish schools are due to managers' behavior towards
employees. This revealed that dishonest, unauthentic, non-collegial behavior of the principal
may lead to a feeling of unjust and unfair organization among teachers.
Collegial leadership affords more decision-making opportunities to teachers. Sweetland and
Hoy (2000) concluded that the one of the strongest climate predictors of teacher empowerment
were collegial leadership. They stated, “Schools in which the principal’s leadership is collegial,
teachers demonstrate a high degree of professionalism.” (Sweetland & Hoy, 2000:720).
Teachers are not impressed by principals who share decision-making only because it is
instructed by superiors (Malen & Ogawa, 1988; Malen et al., 1990). Teachers must feel like
they are trusted by their administrators as professionals who are capable of making choices to
help the organization. Collegial leadership is the key component that allows principals to
release power to teachers whom they trust.
Finally, other researchers conclude that transformational, collegial, and supportive leadership
styles intertwine with trust to help produce the most effective work environments (Hoy &
Miskel, 2005; Hoy, Sabo, & Barnes, 1996). Supportive or collegial leadership is essential
because teachers who feel supported by their administrators are more likely to experiment or
take risks to improve institution (Hoffman et al., 1994).
2.7 Teachers’ Professionalism
Teachers’ professionalism describes teacher behavior characterized by commitment to students
and engagement in the teaching task while admiring the professional expertise of colleagues.
Professional interactions among teachers should be open, cooperative and supportive of one
another and also exhibit warmth and friendliness.
Teachers’ professionalism is another aspect that comes from the development of the
Organizational Climate Index (OCI) developed by Hoy, et al., (2002). “Collegial leadership
refers to the openness of teacher and principal relations, whereas openness of teacher
interactions is encapsulated in teachers’ professionalism” (Sweetland & Hoy, 2000:709).
Teachers’ professionalism is “marked by respect for colleague competence, commitment to
students, autonomous judgment, and mutual cooperation and support of colleagues” (Hoy, et
al., 2002:42).
While developing Organizational Climate Index (OCI), Hoy and Sabo (1998) used teachers’
professionalism to mention four distinct features: teacher commitment, teacher collegiality,
teacher affiliation, and teacher disengagement. Teacher commitment indicates teachers’
dedication to students and their learning. Teacher collegiality is the kindness, sincerity and
friendliness that exist among colleagues. Teacher affiliation refers to their strong association to
the school, colleagues, and students. Teacher disengagement means deficiency of time spent in
the teaching task. Hoy and Sabo (1998) discovered that teacher commitment, teacher
collegiality, and teacher affiliation subject in a positive direction, while teacher disengagement
subjects negatively.
Hoy, et al., (2002) discovered that teachers’ professionalism was the strongest predictor of
faculty trust in colleagues and that it was the only climate variable that has an independent
relationship with trust in colleagues. When teachers see their colleagues working hard and

POSTGRADUATE CONFERENCE ON ECONOMICS, PUBLIC ADMINISTRATION AND
BUSINESS (PCEPAB)-5TH SEPTEMBER, 2015
PROMOTING GROWTH, EXCELENCE AND SUSTAINABILITY- 241
handling situations professionally, they develop trust and respect for the capability and
competence of those colleagues.
Geist and Hoy (2004) also found teachers’ professionalism to be the strongest interpreter of
teacher trust in colleagues. Geist and Hoy (2004) also exposed a positive relationship between
teachers’ professionalism and empowering school structure. When principals design rules and
regulations that help teachers rather than hinder, then a culture of trust develops causing
teachers to become more professional in their relationships with superiors and colleagues. Other
climate studies also suggest that higher the levels of teacher professional behavior, greater
would be the faculty trust in colleagues (Hoy, et al., 1998; Smith, et al., 2001; Sweetland &
Hoy, 2000).
2.8 Collegial Principal Leadership, Teachers’ Professionalism and Trust
An assessment of climate studies is important when debating collegial leadership. A cautious
view of school climate discusses in this debate; both metaphors of health and openness. Hoy
and Sabo (1998) seen collegial leadership as the openness of teacher-principal relations while
teachers’ professionalism as the openness of teacher interactions which develop healthy
organization. Hoy, et al., (2002) further explored this parsimonious view of climate creating a
new instrument called the Organizational Climate Index (OCI). The OCI had strong validity
and demonstrated that collegial principal leadership is crucial in developing faculty trust in
principals. Leaders who were open with teachers, treating them as colleagues while setting
reasonable standards were not only respected by teachers but were rewarded with their trust.
Faculty trust was also a prominent component of healthy and open school climates. The most
important outcome of these studies was that different dimensions of school climate are
responsible for different trust relationships.
Another study linking collegial leadership, teachers’ professionalism, and trust was conducted
by Goddard, et al. in 2004. They examined the dimensions of trust, climate, and principal and
teacher authenticity, they discovered that authentic behaviors lead to trust in both teachers and
principals. Teacher trust in colleagues was explained by the four climate measures, but only
teachers’ professionalism caused a significant independent contribution. Similarly, faculty trust
in the principal was defined by the four climate measures with collegial leadership cause a
strong and significant contribution. Teachers’ professionalism also caused a small but
significant contribution to faculty trust in the principal. Concluding their study, Goddard et al.,
(2004) observed that trust in the principal is defined by the principal’s behavior, and trust in
colleagues in defined by interactions with colleagues. Teachers’ professionalism combined with
collegial leadership engenders a strong trust in the leader.
In a study of 75 middle schools, Hoy and Tarter (2004) measured collegial leadership, teachers’
professionalism, trust and organizational justice. Teacher trust in the principal and teacher trust
in colleagues were measured using Omnibus T-Scale. Collegial leadership and teachers’
professionalism were measured using Organizational Climate index, and organizational justice
was measured using the Organizational Justice Index. It was found that collegial leadership of
the principal is critical in nurturing a trusting relationship with the faculty and such trust is a
key to organizational justice. Professional teacher relationships are significant in accelerating
trust among teachers, which in turn promotes a feel of fairness in the school. Another finding of

POSTGRADUATE CONFERENCE ON ECONOMICS, PUBLIC ADMINISTRATION AND
BUSINESS (PCEPAB)-5TH SEPTEMBER, 2015
PROMOTING GROWTH, EXCELENCE AND SUSTAINABILITY- 242
the study was the strong trust justice relationship for faculty trust in colleagues, but faculty trust
in principal didn’t make significant contribution in the explanation of organizational justice.
2.9 Conclusion
A review of the literature indicates relationships between collegial leadership and teacher trust
in the principal and a link between teachers’ professionalism and teacher trust in colleagues.
Earlier researches suggest that a sense of justice in the school workplace is dependent on leader
behavior that is equitable, considerate, respectful, consistent, free of self-interest, honest, and
ethical. Such kind of principal leadership behavior is more likely to create a perception of fair,
equal, balanced and just treatment among teachers. Furthermore teachers want to participate in
decisions that affect them, but they must be willing to put the interests of the school ahead of
their own and have the feeling that their views are being truly represented in the process of
deciding, it promotes a sense of fairness among teachers. Moreover, leaders must have the
sense, wisdom and confidence to converse and rectify poor decisions as they get feedback and
more precise information. Teacher’s trust towards colleagues and principal is very significant
because when teachers’ trust their colleagues and principal, they will show commitment in their
work and a sense of organizational justice will be developed. Open and healthy climates also
have been linked to organizational justice. Because collegial leadership and teachers’
professionalism are components of open and healthy climates, then there are implications of
links between these factors and organizational justice. Trust is the variable along the pathway to
organizational justice and is developed through the relationships that collegial principals and
professional teachers have with each other.
Research Design
3.1 Introduction
This chapter outlines the research methodology including the research sample, data collection
procedures, conceptual framework, hypotheses and data analysis procedures.
3.2 Data Sample
The study is based on primary data. The universe for this research is 94 Fauji Foundation Model
Schools from all over Pakistan. A sample of 16 schools among these 94 Fauji Foundation
Model Schools with an average of 16 teachers each was selected. Sample contained schools
from Punjab and Khyber Pakhtun Khuwah provinces as majority of the schools are situated in
these two provinces. Balochistan province has only two campuses of Fauji Foundation Model
School, while Sindh has only six campuses of this school. The sample included rural, urban,
and suburban areas of diverse socioeconomic compositions.
3.3 Respondents
Data was collected from permanent class teachers or faculty members who make decisions
about curriculum and develop lesson plans. A total of 256 questionnaires were distributed,
while 176 returned, but 157 were considered. No principals, teacher assistants, substitute
teachers, or administration staff was surveyed. The participants were of diverse academic

POSTGRADUATE CONFERENCE ON ECONOMICS, PUBLIC ADMINISTRATION AND
BUSINESS (PCEPAB)-5TH SEPTEMBER, 2015
PROMOTING GROWTH, EXCELENCE AND SUSTAINABILITY- 243
qualification, experience and age. Mostly participants were female, because study was
conducted in the elementary setting.
3.4 Data Collection Procedures
After acquiring permission from the principals on telephone; questionnaires were sent to the
schools via post. The questionnaire was containing a brief explanation about the purpose of the
study, instructions to fill the questionnaire and assurance to the faculty that all responses would
be treated confidentially. Teachers were also informed that they may refuse to respond to any
items that made them feel uncomfortable and they could choose not to participate or to cease
their participation at any time.
To collect the data for this study; items from three instruments were combined to develop a
questionnaire using seven point likert scale. The instruments from which items were collected
included the following: (a) the Organizational Climate Index (Hoy, et al., 2002), (b) the
Organizational Justice Index (Hoy & Tarter, 2004) and (c) the Omnibus Trust Scale (Hoy &
Tschannen-Moran, 1999). The instruments are listed in the first column of Table 3.1. The
second column lists the Variables used in the study.
Table 3.1: Variables of the study with their instruments
Instrument Variables used in the study
Organizational Climate Index
Collegial Leadership.
Teachers’ professionalism.
Omnibus Trust Scale
Faculty Trust in the Principal.
Faculty Trust in Colleagues.
Organizational Justice index
Organizational justice.
The independent variables were collegial leadership, teacher professional behavior, faculty trust
in principal, faculty trust in colleagues, while there was only one dependent variable that is
organizational justice.

POSTGRADUATE CONFERENCE ON ECONOMICS, PUBLIC ADMINISTRATION AND
BUSINESS (PCEPAB)-5TH SEPTEMBER, 2015
PROMOTING GROWTH, EXCELENCE AND SUSTAINABILITY- 244
3.5 Conceptual Framework
Fig 3.1: Based on Hoy and Tarter, (2004)
3.6 Hypotheses
Based on the literature and above conceptual model, following hypotheses are formulated for
empirical testing:
H1: Collegial principal leadership has a positive relationship with faculty trust in principal.
H2: Teachers’ professionalism has a positive relationship with faculty trust in colleagues.
H3: Faculty trust in colleagues contributes in the explanation of relationship between
teachers’ professionalism and organizational justice.
H4: Faculty trust in principal contributes in the explanation of the relationship between
collegial principal leadership and organizational justice.
H5a: Collegial principal leadership has a positive relationship with organizational justice.
H5b: Teachers’ professionalism has a positive relationship with organizational justice.
H5c: Trust in principal has a positive relationship with organizational justice.
H5d: Trust in colleagues has a positive relationship with organizational justice.
3.7 Data Analysis Techniques
The following data analysis techniques have been used in this research to meet the objectives of
the study and to test the hypotheses.
Frequency tables have been used to express the demographics (gender, age, experience and
academic qualification) of the respondents. Descriptive statistics of variables study the
descriptive of responses of the respondents and the measures of dispersion in their responses.
The statistic table indicates minimum and maximum values, mean and standard deviation of the
data. Mean scores show that where the average response of the respondents for organizational
Teachers’
professionalism
Collegial Principal
Leadership
Faculty Trust in
Principal
Faculty Trust in
Colleagues
Organizational
Justice

POSTGRADUATE CONFERENCE ON ECONOMICS, PUBLIC ADMINISTRATION AND
BUSINESS (PCEPAB)-5TH SEPTEMBER, 2015
PROMOTING GROWTH, EXCELENCE AND SUSTAINABILITY- 245
justice, collegial principal leadership, Teachers’ professionalism, trust in principal and trust in
colleagues lie.
Reliability of the instrument used was measured through Cronbach’s alpha. Consistency of a
measure is called its reliability. A measure is said to have a high reliability if it produces
consistent results under consistent conditions. The value of the cronbach’s alpha ranges from 0
to 1, if value is closer to one instrument will be more reliable.
The correlation analysis has been used in the study to know the strength and direction of the
relationship among all the variables.
The regression analysis is a statistical tool that is used for investigating the relationships
between variables. It is usually used to study the causal effect of one variable on other. In this
study, the effect of independent variables (trust in principal, trust in colleagues, collegial
principal leadership and Teachers’ professionalism) is examined on dependent variable
(organizational justice). Regression analysis also shows that how much of the variations in the
model are caused by independent variable.
3.8 Conclusion
The purpose of this study was to determine the effects of collegial leadership, teachers’
professionalism and teacher trust in the principal and colleagues on organizational justice. The
target population of the study was teachers and faculty members who are directly involve in
making curriculum decisions and developing lesson plans at Fauji Foundation Model Schools
throughout Pakistan. Primary data was gathered through questionnaire. The techniques used in
this study to analyse the data are descriptive statistics, correlation analysis, cronbach’s alpha
and regression analysis.
Results and Discussions
4.1 Introduction
This chapter provides the analysis of data collected using research design and methodology
already explained in preceding chapter and then interpretation of results describing the
acceptance or rejection of hypotheses. At the beginning of the chapter descriptive analysis of all
variables used in the study is discussed. To check the reliability of the questionnaire Cronbach’s
alpha is used. To study the relation between independent, dependent and mediating variables
the correlation analysis is used and at the end to check the impact of independent variables
(Teachers’ professionalism and collegial principal leadership) and mediating variables (trust in
colleagues and trust in principal) on dependent variable (organizational justice) multiple
regression is used.
4.2 Demographic information of the Respondents
Table 4.1 shows the age of the respondents. The frequency distribution of the age shows that
the highest percentage i-e 51.0 percent lies in the age group between 21 to 30 years, while the
second large age group is between 31 to 40 years with a percentage of 33.8 percent. 11.5
percent respondents lie in the age group between 41 to 50 years, and only 3.8 percent of the
respondents are of 50 years or plus.

POSTGRADUATE CONFERENCE ON ECONOMICS, PUBLIC ADMINISTRATION AND
BUSINESS (PCEPAB)-5TH SEPTEMBER, 2015
PROMOTING GROWTH, EXCELENCE AND SUSTAINABILITY- 246
Table 4.1: Age of the Respondents
Frequency Percent Valid Percent Cumulative
Percent
Valid
21-30 80 51.0 51.0 51.0
31-40 53 33.8 33.8 84.7
41-50 18 11.5 11.5 96.2
50 plus 6 3.8 3.8 100.0
Total 157 100.0 100.0
Table 4.2 shows the gender of the respondents. The frequency distribution of the gender shows
that there are more female teachers with a percentage of 95.5 percent, while percentage for male
teachers is 4.5 percent. Sample is having more female respondents as study has been conducted
in an elementary schools setting.
Table 4.2: Gender of the Respondents
Frequency Percent Valid Percent Cumulative
Percent
Valid
Male 7 4.5 4.5 4.5
Female 150 95.5 95.5 100.0
Total 157 100.0 100.0
Table 4.3 shows the academic qualification of the respondents. The frequency distribution
shows that the majority of the teachers are having Masters degree with a percentage of 79
percent, then there are 16 percent of the respondents with Bachlors degree and only 4.5 percent
respondents have M. phil. degree.
Table 4.3: Academic Qualification of the Respondents
Frequency Percent Valid Percent Cumulative
Percent
Valid
Bachelors 26 16.6 16.6 16.6
Masters 124 79.0 79.0 95.5
M.Phil. 7 4.5 4.5 100.0
Total 157 100.0 100.0
Table 4.4 shows the experience of the respondents. The frequency table shows that 50.3
percent of the respondents have 1 – 5 years of teaching experience. 29.3 percent of the
respondents lie in the group having 6 – 10 years of experience. 14 percent of the respondents

POSTGRADUATE CONFERENCE ON ECONOMICS, PUBLIC ADMINISTRATION AND
BUSINESS (PCEPAB)-5TH SEPTEMBER, 2015
PROMOTING GROWTH, EXCELENCE AND SUSTAINABILITY- 247
have 11 – 15 years’ experience, while 4.5 percent are with 16 – 20 years’ experience. And only
1.9 percent of the respondents are having 20 or plus years’ teaching experience.
Table 4.4: Experience of the Respondents
Frequency Percent Valid Percent Cumulative
Percent
Valid
1-5 79 50.3 50.3 50.3
6-10 46 29.3 29.3 79.6
11-15 22 14.0 14.0 93.6
16-20 7 4.5 4.5 98.1
20 plus 3 1.9 1.9 100.0
Total 157 100.0 100.0
4.3 Descriptive Statistics
The data was collected through questionnaires based on a seven point likert scale ranging from
1 (Strongly disagree) to 7 (Strongly agree). The data was collected from the teachers of Fauji
Foundation model Schools. Descriptive statistics gives an idea about the inclination of the
responses against each variable.
Table 4.5: Descriptive Statistics - Trust in Principal
Sr. No. Statement Mean Std. Deviation
1 Teachers in this school trust the principal. 6.2994 .81229
2 The teachers in this school are suspicious of most
of the principal’s actions. 6.4968 .82138
3 The teachers in this school have faith in the
integrity of the principal. 6.4140 .84766
4 The principal in this school typically acts in the
best interests of teachers. 6.1911 1.09856
5 The principal of this school doesn’t show concern
for the teachers. 6.1975 1.35609

POSTGRADUATE CONFERENCE ON ECONOMICS, PUBLIC ADMINISTRATION AND
BUSINESS (PCEPAB)-5TH SEPTEMBER, 2015
PROMOTING GROWTH, EXCELENCE AND SUSTAINABILITY- 248
6 Teachers in this school can rely on the principal. 6.0255 1.21396
7 The principal in this school is competent in doing
his/her job. 6.4713 .62594
8 The principal doesn’t tell teachers what is really
going on. 5.2930 1.90230
Trust in principal 6.1736 .65208
4.3.1 Trust in Principal
The analysis of the variable “trust in principal” depicts the statistics that responses against all
items for this variable are inclined towards “agree” option. Overall mean value for trust in
principal is 6.1, which explains that respondents are more inclined towards the option “agree”.
The standard deviation for trust in principal shows that 0.65 deviations from the mean exist
among responses of the respondents.
Table 4.6: Descriptive Statistics - Trust in Colleagues
Sr. No. Statement Mean Std. Deviation
1 Teachers in this school trust each other. 5.7070 1.61428
2 Teachers in this school typically look out for each
other. 3.6688 2.12551
3 Teachers in this school are suspicious of each
other. 5.6306 1.62625
4 Even in difficult situations, teachers in this school
can depend on each other. 5.8344 1.21342
5 Teachers in this school do their jobs well. 6.5987 .57579
6 Teachers in this school have faith in the integrity of
their colleagues. 6.2866 .93405

POSTGRADUATE CONFERENCE ON ECONOMICS, PUBLIC ADMINISTRATION AND
BUSINESS (PCEPAB)-5TH SEPTEMBER, 2015
PROMOTING GROWTH, EXCELENCE AND SUSTAINABILITY- 249
7 Teachers in this school are open with each other. 5.3057 1.84552
8 When other teachers in this school tell you
something, you can believe it. 5.3248 1.57796
Trust in Colleagues 5.5446 .84720
4.3.2 Trust in Colleagues
The results of the descriptive analysis for the variable “trust in colleagues” depicts that majority
respondents have selected the option “agree. Overall mean value for trust in colleagues is 5.5,
which explains that respondents are more leaning towards the option “agree”. Standard
deviation for trust in colleagues is 0.84, which describes that there are somewhat more
variations among respondents’ responses, may be due to different perceptions of respondents
regarding colleagues behavior.
Table 4.7: Descriptive Statistics - Collegial Principal Leadership
Sr. No. Statement Mean Std. Deviation
1 The principal explores all sides of topics and admits
that the other opinions exist. 6.4395 .87220
2 The principal treats all faculty members as his/her
equal. 6.5541 .63443
3 The principal is friendly and approachable. 6.2739 1.08375
4 The principal lets faculty know what is expected of
them. 6.1783 1.18486
5 The principal maintains definite standards of
performance. 6.1401 .82787
6 The principal puts suggestions made by the faculty
into operations. 6.3567 .86241
7 The principal is willing to make changes. 6.3567 .63055
Collegial Principal Leadership 6.4040 .51053

POSTGRADUATE CONFERENCE ON ECONOMICS, PUBLIC ADMINISTRATION AND
BUSINESS (PCEPAB)-5TH SEPTEMBER, 2015
PROMOTING GROWTH, EXCELENCE AND SUSTAINABILITY- 250
4.3.3 Collegial Principal Leadership
The descriptive statistics of the factors of the variable “collegial principal leadership” shows
more tendencies towards the option “agree”. Overall mean value for collegial principal
leadership is 6.4, which describes that respondents are more inclined towards the option
“agree”. Standard deviation for collegial principal leadership is 0.51, which explains that there
are somewhat more variations among responses of the respondents.
Table 4.8: Descriptive Statistics - Teacher’ Professionalism
Sr. No. Statement Mean Std. Deviation
1 Teachers help and support each other. 6.4395 .87220
2 Teachers accomplish their jobs with enthusiasm. 6.5541 .63443
3 Teachers respect the professional competence of
their colleagues. 6.2739 1.08375
4 The interactions between faculty members are
cooperative. 6.1783 1.18486
5 Teachers in this school exercise professional
judgment. 6.1401 .82787
6 Teachers “go the extra mile” with their students. 6.3567 .86241
7 Teachers provide strong social support for
colleagues. 6.3567 .63055
Teachers’ Professionalism 6.3285 .56947
4.3.4 Teachers’ professionalism
The descriptive statistics for the factors of the variable “Teachers’ professionalism” shows that
maximum responses are inclined towards “agree” option. Overall mean value for Teachers’
professionalism is 6.3, which explains that respondents have more tendency towards the option
“agree”. Overall standard deviation for Teachers’ professionalism is 0.56, which illustrates that
there are somewhat more variations among responses of the respondents from the mean value.

POSTGRADUATE CONFERENCE ON ECONOMICS, PUBLIC ADMINISTRATION AND
BUSINESS (PCEPAB)-5TH SEPTEMBER, 2015
PROMOTING GROWTH, EXCELENCE AND SUSTAINABILITY- 251
Table 4.9: Descriptive Statistics – Organizational Justice
Sr. No. Statement Mean Std. Deviation
1 The principal behavior is consistent. 6.0064 1.25829
2 The principal doesn’t play favorites. 5.8408 1.65448
3 The principal treats everyone with respect and
dignity. 6.8471 .36101
4 There is no preferential treatment in this school. 5.0955 2.22683
5 The principal in this school is fair to everyone. 6.4713 .97770
6 The principal adheres to high ethical standards. 6.7707 .42173
7 Teachers are involved in decisions that affect them. 5.3822 1.93991
8 Teachers are treated fairly in this school. 6.0701 1.27659
Organizational Justice 6.0605 .70093
4.3.5 Organizational Justice
The descriptive analysis of the factors for the dependent variable “organizational justice” shows
that most of the responses are inclined towards “agree” option. Overall mean value for
organizational justice is 6.0 approximately, which defines that respondents are more inclined
towards the option “agree”. Overall standard deviation for organizational justice is 0.70, which
describes that there are somewhat high variations among responses of the respondents.
4.4 Reliability Analysis
To verify the reliability of the variables as well as of the questionnaire as a whole, Cronbach’s
Alpha has been used, which shows to what extent items of the instruments are internally
consistent or reliable for getting a true response from a respondent.
Overall reliability of the measurement scale shows cronbach’s alpha coefficient value equals to
0.868 which describes that the scale is reliable, while the total number of items is 38. This value
of cronbach’s alpha surpasses the recommended value of 0.7 (Nunnally, 1978; Kline, 1999),
illustrating sufficient internal consistency in the measurement scale used in the study.

POSTGRADUATE CONFERENCE ON ECONOMICS, PUBLIC ADMINISTRATION AND
BUSINESS (PCEPAB)-5TH SEPTEMBER, 2015
PROMOTING GROWTH, EXCELENCE AND SUSTAINABILITY- 252
Table 4.10: Reliability Statistics
Cronbach's Alpha N of items
Trust in principal .716 08
Trust in Colleagues .764 08
Collegial Principal Leadership .729 07
Teachers’ Professionalism .758 07
Organizational Justice .643 08
Overall Reliability of the Scale .868 38
Table 4.7 shows the reliability statistics of the variables, which describes that scale is
sufficiently reliable. Trust in colleagues and Teachers’ professionalism, have greater reliability
whereas trust in principal and organizational justice have lesser reliability.
To test the hypotheses derived for the study in preceding chapters, correlation and regression
analysis have been used. First correlation among the variables including demographic has been
discussed to know the direction and strength of the relation among those variables. Further
significance of the relationships is also taken into account.
4.5 Correlation Analysis
Table 4.11: Correlations
TP TC CPL TPro OJ Quali Exp
Trust in
Principal
1
Trust in
Colleagues
.510** 1
Collegial
Principal
.654** .395** 1

POSTGRADUATE CONFERENCE ON ECONOMICS, PUBLIC ADMINISTRATION AND
BUSINESS (PCEPAB)-5TH SEPTEMBER, 2015
PROMOTING GROWTH, EXCELENCE AND SUSTAINABILITY- 253
Leadership
Teachers’
Professionalism
.373** .758** .373** 1
Organizational
Justice
.601** .413** .500** .185* 1
Qualification
.112 .100 -.074 .093 -.144 1
Experience
.228** .401** .141 .144 .285** -.042 1
**. Correlation is significant at the 0.01 level (2-tailed).
*. Correlation is significant at the 0.05 level (2-tailed).
Table 4.11 shows the correlation among the variables of the study, while correlation with
demographics is also given in the table.
Trust in principal has a significant relationship with all the four other variables of the study.
Trust in principal has a positive and strongest correlation (i.e. 0.654) with collegial principal
leadership, and it is significant at 99% level. This shows that if collegial principal leadership
exists, there would be trust in principal. With organization justice and trust in colleagues; it has
positive as well as high correlation (i.e. 0.601 and 0.510 respectively), furthermore both are
significant at 99% level. Teachers’ professionalism has a medium but positive correlation with
trust in principal (i.e. 0.373), which is significant at 99% level.
Trust in colleagues has a significant relationship with all other four variables under study. With
Teachers’ professionalism, trust in colleagues has the positive and highest correlation (i.e.
0.758) among all variables, and it is significant at 99% level. This explains that trust in
colleagues and teachers’ professionalism compliments each other. Trust in principal and trust in
colleagues has a positive, strong and significant at 99% level correlation (i.e. 0.510). With
collegial principal leadership and organizational justice it has medium yet positive correlation
(i.e. 0.413 and 0.395 respectively), and both are significant at 99% level.
There exists a significant correlation among collegial principal leadership and remaining four
variables. Collegial principal leadership has a positive and highest correlation (i.e.0.654) with
trust in principal, among all variables, and it is also significant at 99% level. There exists a
strong and positive correlation (i.e. 0.500) between collegial principal leadership and
organizational justice, which is also significant at 99% level, whereas with teachers’
professionalism and trust in colleagues, collegial principal leadership has medium but positive
and significant at 99% level relationship (i.e. 0.373 and 0.395 respectively).

POSTGRADUATE CONFERENCE ON ECONOMICS, PUBLIC ADMINISTRATION AND
BUSINESS (PCEPAB)-5TH SEPTEMBER, 2015
PROMOTING GROWTH, EXCELENCE AND SUSTAINABILITY- 254
Teachers’ professionalism has a significant correlation with all other variables of the study. It
has positive and highest correlation (i.e. 0.758) among all variables with trust in colleagues,
which is also significant at 99% level. Trust in principal and collegial principal leadership has a
positive and medium correlation with teachers’ professionalism with 99% level of significance.
But between organizational justice and teachers’ professionalism, there exists a weak yet
positive correlation (i.e. 0.185), which is significant at 95% level.
Organizational justice is significantly correlated with all other variables of the study. It has
positive and highest correlation (i.e. 0.601) with trust in principal, which is also significant at
99% level. With collegial principal leadership it has positive and high correlation (0.500), with
99% level of significance. Trust in colleagues and organizational justice have positive and
medium correlation (i.e. 0.413), but significant at 99% level. Between teachers’ professionalism
and organizational justice, there exists a positive and weak correlation (0.185), which is
significant at 95% level.
Two of the controlled variables; qualification of the teachers and their experience are also
considered in correlation analysis. Table shows that qualification has a positive but weak
correlation with trust in principal, trust in colleagues and Teachers’ professionalism, but these
correlations are insignificant. With collegial principal leadership and organizational justice,
qualification has a negative as well as weak correlation, but insignificant.
Experience of the teachers has significant at 99% level correlation with trust in colleagues, trust
in principal and organizational justice. Trust in principal has positive and weak correlation with
experience while trust in colleagues has a positive and medium correlation with experience.
This depicts that experience matters in building trust. With organizational justice, it has positive
and weak but 99% significant correlation. Qualification and experience of the teachers have
insignificant, weak and negative correlation between them.
4.6 Regression Analysis
In order to know the relationship between independent and dependent variables of the study,
multiple linear regression analysis has been used. Stepwise method is used where intentions
were to study the effect of mediators between independent and dependent variables.
4.6.1 Collegial Principal Leadership and Trust in principal
Table 4.12: Model Summaryb
Model R R
Square
Adjusted R
Square
Std. Error of the
Estimate
Change Statistics
F
Change
Sig. F
Change
1 .654a .427 .424 .49499 115.732 .000
a. Predictors: (Constant), CPL
b. Dependent Variable: TP

POSTGRADUATE CONFERENCE ON ECONOMICS, PUBLIC ADMINISTRATION AND
BUSINESS (PCEPAB)-5TH SEPTEMBER, 2015
PROMOTING GROWTH, EXCELENCE AND SUSTAINABILITY- 255
Table 4.13: Coefficientsa
Model Unstandardized Coefficients Standardized Coefficients T Sig.
B Std. Error Beta
(Constant) .826 .499 1.656 .100
CPL .835 .078 .654 10.758 .000
a. Dependent Variable: TP
Table 4.12 shows the model summary. The value of R square is 0.427, which shows that 42.7%
variations of the model are explained due to independent variable. Table 4.13 describes the beta
coefficients of independent variable, which depicts that there will be 83.5% increase in trust in
principal due to unit increase in collegial principal leadership; furthermore values are
significant at 99% level.
Table 4.14: Model Summary
Model R R
Square
Adjusted R
Square
Std. Error of the
Estimate
Change Statistics
R Square
Change
F
Change
Sig. F
Change
1 .500a .250 .245 .60885 - 51.754 .000
2 .618b .381 .373 .55490 .131 32.608 .000
a. Predictors: (Constant), CPL
b. Predictors: (Constant), CPL, TP
Table 4.15: Coefficientsa
Model Unstandardized Coefficients Standardized Coefficients T Sig.
B Std. Error Beta
1 (Constant) 1.662 .613 2.709 .008
CPL .687 .095 .500 7.194 .000
2
(Constant) 1.237 .564 2.193 .030
CPL .258 .115 .188 2.239 .027
TP .514 .090 .478 5.710 .000
a. Dependent Variable: OJ
Table 4.14 illustrates the change in R square of the model when mediating variable is added to
the model. When trust is added to the model its fitness has increased yet significant. Table 4.15
shows that collegial principal leadership (independent variable) has a positive relationship with
organizational justice (dependent variable), which is significant at 99% level. But when trust in
principal (mediating variable) is added, it has become significant at 95% level yet positively
related.
4.6.2 Teachers’ professionalism and Trust in Colleagues
Table 4.16: Model Summaryb
Model R R Square Adjusted R Square Std. Error of the Estimate

POSTGRADUATE CONFERENCE ON ECONOMICS, PUBLIC ADMINISTRATION AND
BUSINESS (PCEPAB)-5TH SEPTEMBER, 2015
PROMOTING GROWTH, EXCELENCE AND SUSTAINABILITY- 256
1 .758a .574 .571 .55473
a. Predictors: (Constant), PTB
b. Dependent Variable: TC
Table 4.17: Coefficientsa
Model Unstandardized Coefficients Standardized Coefficients T Sig.
B Std. Error Beta
(Constant) -1.588 .496 -3.205 .002
PTB 1.127 .078 .758 14.452 .000
a. Dependent Variable: TC
Table 4.16 shows the model summary, where value of R square is 0.574, which shows that
57.4% variations in the model are explained due to independent variable. Table 4.17 describes
the beta coefficients of independent variable, which depicts that there will be 112% increase in
trust in colleagues due to unit increase in Teachers’ professionalism; furthermore values are
significant at 99% level.
Table 4.18: Model Summary
Model R R
Square
Adjusted R
Square
Std. Error of the
Estimate
Change Statistics
R Square
Change
F
Change
Sig. F
Change
1 .185a .034 .028 .69101 - 5.513 .020
2 .457b .209 .199 .62750 .174 33.965 .000
a. Predictors: (Constant), PTB
b. Predictors: (Constant), PTB, TC
Table 4.19: Coefficientsa
Model Unstandardized Coefficients Standardized Coefficients T Sig.
B Std. Error Beta
1 (Constant) 4.617 .617 7.479 .000
PTB .228 .097 .185 2.348 .020
2
(Constant) 5.458 .579 9.429 .000
PTB -.369 .135 -.300 -2.728 .007
TC .530 .091 .640 5.828 .000
a. Dependent Variable: OJ
Table 4.18 illustrates the change in R square of the model when mediating variable is added to
the model. When trust is added to the model fitness has increased and became more significant.
Table 4.19 shows that Teachers’ professionalism (independent variable) has a positive
relationship with organizational justice (dependent variable), which is 95% significant. But
when trust in colleagues (mediating variable) is added, it has become 99% significant but
negatively related.

POSTGRADUATE CONFERENCE ON ECONOMICS, PUBLIC ADMINISTRATION AND
BUSINESS (PCEPAB)-5TH SEPTEMBER, 2015
PROMOTING GROWTH, EXCELENCE AND SUSTAINABILITY- 257
4.7 Incremental Regression
The incremental regression is performed to check the significance of each variable in model and
to assess the extent of their significance in the model. It is performed by removing individual
independent variables from the model to check the change in the significance of model due to
removal of any variable, and by checking the effect on the value of R-square.
Table 4.20: Incremental Regression
Variables OLS1 OLS2 OLS3 OLS4 OLS5
Trust in Principal .416*** - .533*** .562*** .453***
Trust in Colleagues .311*** .435*** - .299*** .107*
Collegial Principal
Leadership
.302*** .593*** .281** - .238**
Teachers’
professionalism
-.401*** -.461 -.094 -.349*** -
R square .438 .364 .386 .411 .394
R square change - .074 .051 .027 .044
F change 29.56*** 29.18*** 32.07*** 35.56*** 33.10***
Significance level: p < 0.01 (***), 0.05 (**), 0.1 (*)
Column 2 of Table 4.20 illustrates that R square of the model including all independent
variables is 0.438, which shows 44% variations of the total variations are explained due to
independent variables.
Furthermore it shows that all independent variables are significant at 99% level. Trust in
principal, trust in colleagues and collegial principal leadership is positively related with
organizational justice while teachers’ professionalism is negatively related with organizational
justice.

POSTGRADUATE CONFERENCE ON ECONOMICS, PUBLIC ADMINISTRATION AND
BUSINESS (PCEPAB)-5TH SEPTEMBER, 2015
PROMOTING GROWTH, EXCELENCE AND SUSTAINABILITY- 258
Column 3 of the table above shows that when trust in principal is removed from the model, it
has altered the value of R-square to a highest degree (0.074 decreases) as the value for the R-
square changes from 0.438 to 0.364, as shown in the table below. This decrease in the value of
the R-square shows that trust in principal is the most significant variable in the model. Next
significant variable among all variables is trust in colleagues, then comes teachers’
professionalism and collegial principal leadership is the least significant variable in the model.
Table 4.21: Results of incremental regression after removing individual independent
variable
R square (original) 0.438
R square after removing trust in principal 0.364
R square after removing trust in colleagues 0.386
R square after removing teachers’ professionalism 0.394
R square after removing collegial leadership 0.411
4.8 Regression Analysis including Demographics
Table 4.22: Model Summaryb
Model R R Square Adjusted R Square Std. Error of the
Estimate
Change Statistics
F
Change
Sig. F Change
1 .688a .474 .453 .51844 22.525 .000
a. Predictors: (Constant), Exp, Qualif, CPL, PTB, TP, TC
b. Dependent Variable: OJ
Table 4.22 shows the model summary which tells that 47.4% of the total variations are
explained due to independent variables, which is also significant at 99% level.
Table 4.23: Coefficientsa
Model Unstandardized
Coefficients
Standardized
Coefficients
t Sig. Collinearity
Statistics
B Std. Error Beta Tolerance VIF
(Constant) 2.674 .640 4.177 .000
TP .464 .092 .431 5.012 .000 .474 2.111
TC .336 .085 .406 3.925 .000 .329 3.044
CPL .234 .112 .170 2.087 .039 .527 1.898
PTB -.395 .115 -.321 -3.431 .001 .402 2.488
Qualification -.302 .097 -.191 -3.126 .002 .940 1.064

POSTGRADUATE CONFERENCE ON ECONOMICS, PUBLIC ADMINISTRATION AND
BUSINESS (PCEPAB)-5TH SEPTEMBER, 2015
PROMOTING GROWTH, EXCELENCE AND SUSTAINABILITY- 259
Experience -.040 .046 -.056 -.878 .381 .873 1.146
a. Dependent Variable: OJ
Table 4.23 depicts that adding demographics makes; trust in principal, trust in colleagues,
teachers’ professionalism and qualification significant at 99% level, while collegial principal
leadership 95% significant. Experience of the teachers is insignificant. Trust in principal, trust
in colleagues and collegial principal leadership is positively related with organizational justice,
while teachers’ professionalism, qualification and experience of the teachers are negatively
related with organizational justice.
4.9 Hypotheses Testing
H1. Collegial principal leadership has a positive relationship with faculty trust in
principal.
From correlation analysis we get to know that collegial principal leadership has a positive and
highest correlation (i.e.0.654) with trust in principal, among all variables, and it is also
significant at 99% level. From regression run between collegial principal leadership and trust in
principal we get to know that these are positively related and there will be 83.5% increase in
trust in principal due to unit increase in collegial principal leadership; furthermore values are
significant at 99% level. These findings are also supported by the findings of Titrek and Osman
(2009), Hoy and Tarter (2004) and Godderd et al. (1998).
H2: Teachers’ professionalism has a positive relationship with faculty trust in colleagues.
Correlation analysis tells us that teachers’ professionalism has positive and highest correlation
(i.e. 0.758) among all variables with trust in colleagues, which is also significant at 99% level.
In regression analysis (table 4.14) it is shown that teachers’ professionalism is positively related
with trust in colleagues and there will be 112% increase in trust in colleagues due to unit
increase in teachers’ professionalism, furthermore values are significant at 99% level. These
results are also backed with the conclusions given by Hoy and Tarter (2004), Hoy, et al. (2002),
Smith et al. (2001), and Geist & Hoy (2004) in their studies.
H3: Faculty trust in colleagues contributes in the explanation of relationship between
Teachers’ professionalism and organizational justice.
Table 4.15 illustrates that when trust in colleagues was added to the model its fitness increased
from 0.034 to 0.209 and became more significant. Table 4.16 shows that teachers’
professionalism (independent variable) has a positive relationship with organizational justice
(dependent variable), which is significant at 95% level. But when trust in colleagues (mediating
variable) is added, it has become significant at 99% level and relation between teachers’
professionalism and organizational justice became negative.
H4: Faculty trust in principal contributes in the explanation of relationship between
collegial principal leadership and organizational justice.
From table 4.11 illustrates that when trust in principal was added to the model its fitness
increased from 0.250 to 0.381, which is significant at 99% level. Table 4.12 shows that
collegial principal leadership (independent variable) has a positive relationship with

POSTGRADUATE CONFERENCE ON ECONOMICS, PUBLIC ADMINISTRATION AND
BUSINESS (PCEPAB)-5TH SEPTEMBER, 2015
PROMOTING GROWTH, EXCELENCE AND SUSTAINABILITY- 260
organizational justice (dependent variable), which is significant at 99% level. But when trust in
principal (mediating variable) is added, it has become significant at 95% level yet positively
related.
H5a: Collegial principal leadership has a positive relationship with organizational justice.
There exists a strong and positive correlation (i.e. 0.500) between collegial principal leadership
and organizational justice, which is also significant at 99% level. As well as from incremental
regression, we come to know that there exist a positive and significant relationship between
collegial principal leadership and organizational justice. And removal of collegial principal
leadership from the model results in a decrease in R square.
H5b: Teachers’ professionalism has a positive relationship with organizational justice.
Between teachers’ professionalism and organizational justice, there exists a positive but weak
correlation (0.185), which is significant at 95% level. Regression analysis tells us that there
exists a negative and significant relationship between these two variables, which rejects the
hypotheses. Incremental regression shows that removal of teachers’ professionalism from the
model results in a decrease in R square.
H5c: Trust in principal has a positive relationship with organizational justice.
Correlation analysis shows a positive and highest correlation (i.e. 0.601) between trust in
principal organizational justice among all variables, which is also significant at 99% level.
Regression analysis shows that trust in principal is positively and significantly related with
organizational justice. Incremental regression shows the highest decrease in the value of the R-
square with the removal of trust in principal from the model which depicts that trust in principal
is the most significant variable in the model.
H5d: Trust in colleagues has a positive relationship with organizational justice.
Correlation analysis illustrates that trust in colleagues and organizational justice has positive
and medium correlation (i.e. 0.413), but significant at 99% level. Regression analysis describes
that trust in colleagues is positively and significantly related with organizational justice, but
incremental regression depicts that its removal from the model decreases the value of R square,
and also makes teachers’ professionalism insignificant.
4.10 Findings about Demographic Variables
Two of the controlled variables; qualification of the teachers and their experience are also
considered in correlation analysis. Correlation table shows that qualification has a positive but
weak correlation with trust in principal, trust in colleagues and teachers’ professionalism, but
these correlations are insignificant. With collegial principal leadership and organizational
justice, qualification has a negative as well as weak correlation, which is also insignificant.
Experience of the teachers has significant at 99% level correlation with trust in colleagues, trust
in principal and organizational justice. Trust in principal has positive and weak correlation with
experience while trust in colleagues has a positive and medium correlation with experience.
This depicts that experience matters in building trust. With organizational justice, it has positive
and weak but significant at 99% level correlation.

POSTGRADUATE CONFERENCE ON ECONOMICS, PUBLIC ADMINISTRATION AND
BUSINESS (PCEPAB)-5TH SEPTEMBER, 2015
PROMOTING GROWTH, EXCELENCE AND SUSTAINABILITY- 261
Regression analysis depicts that adding demographics makes; trust in principal, trust in
colleagues, Teachers’ professionalism and qualification significant at 99%, while collegial
principal leadership 95% significant. Experience of the teachers is insignificant. Trust in
principal, trust in colleagues and collegial principal leadership is positively related with
organizational justice, while Teachers’ professionalism, qualification and experience of the
teachers are negatively related with organizational justice.
4.11 Conclusion
In this chapter, results of the study have been presented along with their interpretations. First of
all descriptive statistics of all the variables is discussed. Descriptive analysis of demographics
shows that there are more female teachers than male in the sample. Majority of the sample lies
between age group 21 – 40 years. Majority of the teachers have Masters degree and lies in the
experience group 1 – 10 years. Correlation shows that all variables are positively and
significantly related with each other, while regression shows that all independent variables are
significant at 99% level. Trust in principal, trust in colleagues and collegial principal leadership
is positively related with organizational justice while Teachers’ professionalism is negatively
related with organizational justice. Reliability of all the variables has been checked using
Cronbach’s Alpha coefficient and found reliable.
Conclusions and Recommendations
5.1 Introduction
This chapter provides an overview of the findings and conclusions of the results,
recommendations suggested on the basis of the findings, future research directions and
limitations of the study.
5.2 Findings and Conclusion of the study
Collegial principal leadership and trust in principal jointly as well as individually
contribute to explain organizational justice.
Teachers’ professionalism and trust in colleagues jointly as well as individually
contribute to explain organizational justice, but Teachers’ professionalism has a
negative relationship with organizational justice.
Collegial leadership, trust in principal, Teachers’ professionalism, and trust in
colleagues jointly contribute to predict organizational justice.
Experience of the teachers correlates positively as well as significantly with
organizational justice.
Qualification of the teachers correlates negatively with organizational justice.
Collegial principal leadership also contributes to explain trust in principal.
Teachers’ professionalism also contributes to explain trust in colleagues.
The results show that there exists a strong relationship between trust in principal and
organizational justice. The strong impact of principal trust on organizational justice is obvious
as the principal is the single and the most dominant person in emerging a sense of
organizational justice in school. The principal of the school is far more significant than the
faculty in generating a just and fair school environment at least with respect to his professional
interactions.

POSTGRADUATE CONFERENCE ON ECONOMICS, PUBLIC ADMINISTRATION AND
BUSINESS (PCEPAB)-5TH SEPTEMBER, 2015
PROMOTING GROWTH, EXCELENCE AND SUSTAINABILITY- 262
Trust of teachers in their colleagues is not a negligible factor. Faculty trust in colleagues makes
an extensive independent impact on the school’s justice system. Nevertheless, it is within the
principal’s power to build a climate of justice by exhibiting in word and deed a commitment to
the justice. The leader leads by example, and there may be no further important character than
fair and just interactions with subordinates, to be an ethical leader.
Results of the study also advocate that the principal can lead in a manner that directly stimulates
faculty trust in the principal and indirectly generate a sense of organizational justice through
such trust. Collegial principal leadership seizes three significant concerns of leadership; concern
for people, concern for the job, and concern for change. If principal’s behavior is expressive,
helpful, and change-oriented and has friendly and supportive behavior, sets clear expectations
and standards of performance for teachers and is open to change, he will likely to be successful
(Yukl, 1998). Moreover, such collegial principal behavior cultivates a culture of trust and
justice.
Teachers’ professionalism also has an independent role in creating a culture of trust and justice
in school. The principal acquires the starring role, but the faculty secures a sound supporting
role. If teachers treat one another as competent professionals, make autonomous judgments,
show a commitment to students, and engage in cooperation and support, they will learn to rely
and trust one another, which also indirectly stimulate a feel of organizational justice in the
school.
As Teachers’ professionalism involves autonomous judgments, cooperation, support and
commitment to all stakeholders of the schools including students, parents, principal and
undoubtedly colleagues, so sometimes teacher consideration for other stakeholders give a
negative feel to trust in colleagues, which eventually has a negative impact on his sense about
organizational justice. Moreover, sometimes unfair rewarding of professional behavior also
leads to a negative feel about organizational justice.
Summing up we can say that, the collegial leadership of the principal is critical in promoting a
trusting relationship with the faculty and such trust is pivotal in nurturing a sense of
organizational justice. Professional teacher relationships are noteworthy in facilitating trust
among teachers, which in turn strengthens a sense of fairness in the school. However, the trust-
justice relationship for faculty is not as strong as for the principal; faculty trust in colleagues
does make a substantial independent contribution in the explanation of organizational justice.
Furthermore, findings of the study revealed the strength of the trust-justice relationship; both
aspects of trust are the most significant variables of the model and show the variations in model
higher than two other independent variables in organizational justice. Faculty trust in principal
and colleagues are; while acting as mediators better explaining the organizational justice than
the two other variables; collegial principal leadership and Teachers’ professionalism.
5.3 Recommendations
A few recommendations based on this analysis of organizational justice, trust, teachers’
professionalism and leader behavior, are:
As trust in principal is strongly related with collegial principal behavior, principal is
required to be equitable, sympathetic, respectful, unbiased, honest, and ethical in his
relationships with teachers.

POSTGRADUATE CONFERENCE ON ECONOMICS, PUBLIC ADMINISTRATION AND
BUSINESS (PCEPAB)-5TH SEPTEMBER, 2015
PROMOTING GROWTH, EXCELENCE AND SUSTAINABILITY- 263
Being a leader, principal can be open with teachers, treat them as colleagues while
setting reasonable standards for performance and clear performance expectations.
Teachers can be involved in decisions that affect them as they do not have only a
personal concern in the decision outcome but they have also the expertise, knowledge
and wisdom to contribute to a good decision.
In order to develop a sense of just and fair organization, teachers’ professionalism can
be rewarded and admired by the principal as well as the colleagues.
Teachers are required to respect other teachers’ competence and their professional
expertise, and promote mutual cooperation; this professional behavior will build trust
among them.
Professional interactions among teachers can be open, cooperative and supportive of one
another and also exhibit warmth and friendliness.
Principal can help teachers cultivate a sense of trust among them by trusting them to
make autonomous decisions in the best interests of all the stakeholders of the school.
Principal can remember that justice and trust are inseparable; one cannot have one
without the other.
5.4 Limitations and Future Research Directions
This study did not deal with the generation of faculty trust in parents and students
because attention was on fair and just relations between the principal and teachers and
among teachers themselves. The concept of organizational justice should be expanded to
relationships between teachers and students.
This study only involved elementary schools or schools that were similar to the
elementary setting. The sample consisted primarily of female teachers. More research
needs to be conducted to see if the results would be the same in the secondary setting as
well as in high schools settings.
In this study, only Fauji Foundation Model Schools have been considered, the research
can be expanded to government as well as private schools.
References
Annamalai, T., et al. (2010). The Mediating Effects of Perceived Organizational Support on the
Relationships between Organizational Justice, Trust and Performance Appraisal in
Malaysian Secondary Schools. European Journal of Social Sciences. 13(4), 623-632.
Baier, A. C. (1986). Trust and antitrust. Ethics. 96, 231-60.
Bakhshi, A., et al. (2009). Organizational Justice Perceptions as Predictor of Job Satisfaction
and Organization Commitment, International journal of business and management.
4(9), 145–154.
Blau, P. M. (1964). Exchange and Power in Social Life. New York: Wiley.
Bies, R. J., & Moag, J. (1986). Interactional justice: Communication criteria of fairness, In R.
J. Lewicki, B. H. Sheppard, & M. Bazerman (Eds.), Research on negotiation in
organizations. 1, 43–55, Greenwich, CT: JAI Press.

POSTGRADUATE CONFERENCE ON ECONOMICS, PUBLIC ADMINISTRATION AND
BUSINESS (PCEPAB)-5TH SEPTEMBER, 2015
PROMOTING GROWTH, EXCELENCE AND SUSTAINABILITY- 264
Bies, R. J., Shapiro, D. L., & Cummings, L. L. (1988). Causal accounts and managing
organizational conflict: Is it enough to say it's not my fault?, Communication Research.
15, 381-399.
Blumberg, A., Greenfield, W. D., & Nason, D. (1978). The substance of trust between teachers
and principals. NAASP Bulletin, 62(9), 76-88.
Bryk, A. S., & Schneider, B. (2002). Trust in schools: A core resource for improvement. New
York: Russell Sage Foundation.
Cohen-Charash, Y., Spector, P.E. (2001). The role of justice in organizations: A meta-analysis,
Organizational Behavior and Human Decision Processes, 86(2), 278–321.
Colquitt, J.A. et al. (2001). Justice at the millennium: A meta-analysis of 25 years
organizational justice research, Journal of Applied Psychology. 86, 425-445.
Corwin, R. G., & Borman, K. M. (1988). School as workplace: Structural constraints on
administration. In N. J. Boyan (Ed.), Handbook of research on educational
administration. 209-238. New York: Longman.
Cropanzano, R., Greenberg, J. (1997). Progress in organizational justice: Tunneling through the
maze” In C. Cooper & I. Robertson (Eds.), International review of industrial and
organizational psychology. 12, 317-372, New York: Wiley.
Cummings, L. L. and Bromily, P. (1996). The Organizational Trust Inventory (OTI):
development and validation, in Kramer, R. and Tyler, T. (Eds). Trust in Organizations.
Sage, Thousand Oaks, CA.
Deutsch, M. (1958). Trust and suspicion. Journal of Conflict Resolution. 2, 265-279.
DiPaola, M., & Hoy, W. K. (2005b). Organizational properties that foster organizational
citizenship. Journal of School Leadership. 15, 391-410.
DiPaola, M. F., & Tschannen-Moran, M. (2001). Organizational citizenship behavior in schools
and its relationship to school climate. Journal of School Leadership. 11, 424-447.
Dean, S.D. et al. (2011). Collegial leadership, teachers’ professionalism, faculty trust:
Predicting teacher academic optimism in elementary schools, Ph. D dissertation,
Graduate School of The University of Alabama, Alabama. Available online
at:http://acumen.lib.ua.edu/content/u0015/0000001/0000619/u0015_0000001_0000619.
pdf.
Frazier, M.L. et al. (2010), Organizational Justice, Trustworthiness, and Trust: A Multifoci
Examination, Group Organization Management, 35(1), 39-76.
Folger, R., & Konovsky, M. A. 1989. Effects of procedural and distributive justice on reactions
to pay raise decisions. Academy of Management Journal. 32, 115-130.
Geist, J. and Hoy, W.K. (2003). Cultivating a culture of trust: enabling school structure,
teachers’ professionalism, and academic press, unpublished working paper, Ohio State
University, Columbus, OH.
Geist, J., & Hoy, W. K. (2004). Cultivating a culture of trust: Enabling school structure,
teachers’ professionalism, and academic press. Leading and Managing. 10, 1-18.

POSTGRADUATE CONFERENCE ON ECONOMICS, PUBLIC ADMINISTRATION AND
BUSINESS (PCEPAB)-5TH SEPTEMBER, 2015
PROMOTING GROWTH, EXCELENCE AND SUSTAINABILITY- 265
Greenberg, J. (1990). Organizational justice: Yesterday, today, and tomorrow. Journal of
Management. 16, 399–432.
Goddard, R. D., Tschannen-Moran, M., & Hoy, W. K. (2001). Teacher trust in students and
parents: A multilevel examination of the distribution and effects of teacher trust in urban
elementary schools. Elementary School Journal. 102, 3-17.
Goddard, R. G., LoGerfo, L., & Hoy, W. K. (2004). High school accountability: The role of
collective efficacy. Educational Policy. 18(30), 403-425.
Golumbiewski, T. T., & McConkie, M. (1975). The centrality of interpersonal trust in group
processes. In C. L. Cooper (Ed.), Theories of group processes. 131-185. New York:
John W. Wiley.
Hallinger, P., & Heck, R. (1996). Reassessing the principal’s role in school effectiveness: A
review of empirical research, 1980-1995. Educational Administration Quarterly. 32, 5-
44.
Hodson, R. (2001), Dignity at Work. Cambridge University Press, Cambridge.
Hoffman, J. D., Sabo, D., Bliss, J., & Hoy, W. K. (1994). Building a culture of trust. Journal of
School Leadership, 3, 484-501.
Hosmer, L. T. (1995). The connecting link between organizational theory and philosophical
ethics. Academy of Management Review, 20(2), 379-403.
Hoy, W. K., & Kupersmith, W. J. (1985). The meaning and measure of faulty trust. Educational
and Psychological Research, 5, 1-10.
Hoy, W. K., Tarter, C. J., & Witkoskie, L. (1992). Faculty trust in colleagues: Linking the
principal with school effectiveness. Journal of Research and Development in Education,
26(1), 40-47.
Hoy, W. K., & Tschannen-Moran, M. (1999). The five faces of trust: An empirical confirmation
in urban elementary schools. Journal of School Leadership, 9, 184-208.
Hoy, W. K. (2002). Faculty trust: A key to student achievement. Journal of School Public
Relations, 23(2), 88-103.
Hoy, W.K., Smith, P.A., & Sweetland, S.R. (2002). “The development of the organizational
climate index for high schools: Its measure and relationship to faculty trust”, The High
School Journal. 86(2), 38-49.
Hoy, W.K. and Tarter, C.J. (2003), Administrators Solving the Problems of Practice: Concepts,
Cases, and Consequences, 2nd ed., Allyn and Bacon, Boston, MA.
Hoy, W. K., & Tschannen-Moran, M. (2003). The conceptualization and measurement of
faculty trust in schools: The Omnibus T-scale, In W. K. Hoy & C. Miskel (Eds.), Studies
in leading and organizing schools. 181-208. Greenwich, CT: Information Age
Publishing.
Hoy, W.K & Tarter, C.J (2004). Organizational justice in schools: no justice without trust.
International Journal of Educational Management, 18(14), 250-259.
Hoy, W. K., & Miskel, C. G. (2005). Educational administration: Theory, research, and
practice (7th ed.). New York: McGraw-Hill.

POSTGRADUATE CONFERENCE ON ECONOMICS, PUBLIC ADMINISTRATION AND
BUSINESS (PCEPAB)-5TH SEPTEMBER, 2015
PROMOTING GROWTH, EXCELENCE AND SUSTAINABILITY- 266
Hoy, W. K., Tarter, C. J., & Woolfolk Hoy, A. (2006). Academic optimism of schools: A force
for student achievement. American Educational Research Journal, 43, 425-446.
Hoy, W. K., Hannum, J., & Tschannen-Moran, M. (1998). Organizational climate and student
achievement: A parsimonious view. Journal of School Leadership, 8, 336-359.
Hoy, W. K., Sabo, D., & Barnes, K. (1996). Organizational health and faculty trust: A view
from the middle level. Research in Middle Level Education Quarterly, 21-39.
Johnson-George, C. E., & Swap, W. C. (1982). Measurement of specific interpersonal trust:
Construction and validation of a scale to assess trust in a specific other. Journal of
Personality and Social Psychology, 43, 1306-1317.
Konovsky M.A (2000). Understanding procedural justice and its impact on business
organizations. Journal of Management. 26, 489-511.
Kline, P. (1999). The handbook of psychological testing. (2nd ed.). London: Routledge
Kramer, R. M., Brewer, M. B., & Hanna, B.A. (1996). Collective trust and collective action:
The decision to trust as a social decision. In R. Kramer & T. Tyler (Eds.), Trust in
organizations (pp.331-56). Thousand Oaks, CA: Sage.
Kumar, K., Bakhshi, A.& Rani, E. (2009). Organizational Justice Perceptions as Predictor of
Job Satisfaction and Organizational Commitment. The IUP Journal of Management
Research. 8(10), 24-37.
Loomis, J. L. (1959). Communication and the development of trust. Human Relations, 12, 305-
315.
Louis, K. (2007). Trust and improvement in schools. Journal of Educational Change, 8(1), 1-
24.
Malen, B. & Ogawa, R. T. (1988a). Professional-patron influence on site-based governance
councils: A confounding case study. Educational Evaluation and Policy Analysis, 10(4),
251-270.
Malen, B. & Ogawa, R. T. (1988b). Site-based management: Disconcerting policy issues,
critical policy, and choices. In J. J. Lane & E. G. Epps (Eds.). Restructuring the schools:
Problems and prospect. 185-206. Berkeley, CA: McCutchan.
Malen, B., Ogawa, R., & Kranz, J. (1990a). Unfulfilled promises. School Administrator. 47(2),
30-59.
Malen, B., Ogawa, R. T., & Kranz, J. (1990b). What do we know about school-based
management? A case study of the literature--A call for research. In W. H. Clune & J. F.
White (Eds.), Choice and control in American education, Volume 2: The practice of
choice, decentralization and school restructuring. New York: Falmer.
Mishra, A.K. (1996), Organizational responses to crisis: the centrality of trust, in Kramer, R.
and Tyler, T. (Eds), Trust in Organizations, Sage, Thousand Oaks, CA.
Murtaza, G., et al. (2011), Impact of organizational justice on employees’ job satisfaction:
Evidence from Pakistan, International conference on management (ICM 2011)
proceeding, 1123-1135.
Nunnally, J. C. (1978). Psychometric theory (2nd ed.). New York: McGraw-Hill.

POSTGRADUATE CONFERENCE ON ECONOMICS, PUBLIC ADMINISTRATION AND
BUSINESS (PCEPAB)-5TH SEPTEMBER, 2015
PROMOTING GROWTH, EXCELENCE AND SUSTAINABILITY- 267
Poole, W.L. (2008). Intersections of organizational justice and identity under the new policy
direction: important understandings for educational leaders. International Journal of
Leadership in Education, 11(1), 23-42.
Poulus, F. (2004). Teachers' perceptions or procedural fairness: Their impact on teacher's
efficacy and commitment, Unpublished PhD Thesis. University of Connecticut,
Connecticut.
Rotter, J. B. (1967). A new scale for the measurement of interpersonal trust, Journal of
Personality, 35, 651-65.
Salfi, N.A. (2011) Successful leadership practices of head teachers for school improvement:
Some evidence from Pakistan. Journal of Educational Administration. 49(4), 414 – 432.
Sheppard, B.H., Lewicki, R.J., & Minton, J.W. (1992). Organizational justice: The search of
fairness in the workplace. New York: Lexington Books.
Singer, M. (1993). Fairness in personnel selection: an organizational justice perspective.
Avebury: Aldershot.
Smith, P. A., Hoy, W. K. and Sweetland, S. R. (2001), Organizational health of high schools
and dimensions of faculty trust. Journal of School Leadership. 11, 135-51.
Sweetland, S. R., & Hoy, W. K. (2000). School characteristics and educational outcomes:
Toward an organizational model of student achievement in middle schools. Educational
Administration Quarterly. 36, 703-729.
Tarter, C. J., & Hoy, W. K. (1988). The context of trust: Teachers and the principal. High
School Journal, 72, 17-24.
Tarter, C. J., Bliss, J. R., & Hoy, W. K. (1989). School characteristics and faculty trust in
secondary schools. Educational Administration Quarterly, 25(3), 294-308.
Tarter, C. J., Sabo, D., & Hoy, W.K. (1995). Middle school climate, faculty trust and
effectiveness: a path analysis. Journal of Research and Development in Education, 29,
41-49.
Thibaut, J., & Walker, L. (1975). Procedural justice: A psychological analysis. Hillsdale, NJ:
Erlbaum.
Titrek & Osman (2009). Employees' Organizational Justice Perceptions in Turkish Schools,
Social Behavior and Personality: an international journal. 37(5), 605-620.
Tschannen-Moran, M. and Hoy, W.K. (1998), Trust in schools: a conceptual analysis, Journal
of Educational Administration. 36, 334-5.
Tschannen-Moran, M. and Hoy, W.K. (2000). A multidisciplinary analysis of the nature,
meaning, and measurement of trust. Review of Educational Research. 70, 547-93.
Tschannen-Moran, M., & Hoy, A.W. (2001). Teacher efficacy: capturing an elusive construct.
Teaching and Teacher Education, 17, 783-80.
Tschannen-Moran, M. and Hoy, W.K. (2002), Trust: a key to quality schools. Unpublished
working paper, Ohio State University, Columbus, OH.

POSTGRADUATE CONFERENCE ON ECONOMICS, PUBLIC ADMINISTRATION AND
BUSINESS (PCEPAB)-5TH SEPTEMBER, 2015
PROMOTING GROWTH, EXCELENCE AND SUSTAINABILITY- 268
Tschannen-Moran, M. and Hoy, W.K. (2003), The conceptualization and measurement of
faculty trust in schools: the Omnibus-T-Scale, in Hoy, W.K. and Miskel, C.G. (Eds),
Studies in Leading and Organizing Schools, Information Age Press, Greenwich, CT.
Uline, C. L., Miller, D. M., & Tschannen-Moran, M. (1998). School effectiveness: The
underlying dimension. Educational Administration Quarterly. 34(4), 462-483.
Yavuz, M. (2010). The effects of teachers’ perception of organizational justice and culture on
organizational commitment. African Journal of Business Management. 4(5), 695-701.
Available online at http://www.academicjournals.org/AJBM.
Yukl, G.A. (1998), Leadership in Organizations, 4th ed. Prentice-Hall, Englewood Cliffs, NJ.
Questionnaire
Name (optional): _______________________________ Gender: _______________
Age (In years): _____________ Academic Qualification: _______________________
Experience (In years): ___________________
Directions: Following are the statements about your school. Kindly indicate your level of
agreement with the statement from strongly disagree to strongly agree. Your answers will be
kept confidential.
Str
on
gly
Dis
ag
ree
Dis
ag
ree
So
mew
ha
t D
isa
gree
Neu
tra
l
So
mew
ha
t A
gree
Ag
ree
Str
on
gly
Ag
ree
1 Teachers in this school trust the principal. 1 2 3 4 5 6 7
2 The teachers in this school are suspicious of most of the
principal’s actions.
1 2 3 4 5 6 7
3 The teachers in this school have faith in the integrity of the
principal.
1 2 3 4 5 6 7
4 The principal in this school typically acts in the best interests 1 2 3 4 5 6 7

POSTGRADUATE CONFERENCE ON ECONOMICS, PUBLIC ADMINISTRATION AND
BUSINESS (PCEPAB)-5TH SEPTEMBER, 2015
PROMOTING GROWTH, EXCELENCE AND SUSTAINABILITY- 269
of teachers.
5 The principal of this school doesn’t show concern for the
teachers.
1 2 3 4 5 6 7
6 Teachers in this school can rely on the principal. 1 2 3 4 5 6 7
7 The principal in this school is competent in doing his/her job. 1 2 3 4 5 6 7
8 The principal doesn’t tell teachers what is really going on. 1 2 3 4 5 6 7
9 Teachers in this school trust each other. 1 2 3 4 5 6 7
10 Teachers in this school typically look out for each other. 1 2 3 4 5 6 7
11 Teachers in this school are suspicious of each other. 1 2 3 4 5 6 7
12 Even in difficult situations, teachers in this school can depend
on each other.
1 2 3 4 5 6 7
13 Teachers in this school do their jobs well. 1 2 3 4 5 6 7
14 Teachers in this school have faith in the integrity of their
colleagues.
1 2 3 4 5 6 7
15 Teachers in this school are open with each other. 1 2 3 4 5 6 7
16 When other teachers in this school tell you something, you can
believe it.
1 2 3 4 5 6 7
17 The principal explores all sides of topics and admits that the
other opinions exist.
1 2 3 4 5 6 7
18 The principal treats all faculty members as his/her equal. 1 2 3 4 5 6 7
19 The principal is friendly and approachable. 1 2 3 4 5 6 7
20 The principal lets faculty know what is expected of them. 1 2 3 4 5 6 7
21 The principal maintains definite standards of performance. 1 2 3 4 5 6 7
22 The principal puts suggestions made by the faculty into
operations.
1 2 3 4 5 6 7
23 The principal is willing to make changes. 1 2 3 4 5 6 7
24 Teachers help and support each other. 1 2 3 4 5 6 7
25 Teachers accomplish their jobs with enthusiasm. 1 2 3 4 5 6 7
26 Teachers respect the professional competence of their
colleagues.
1 2 3 4 5 6 7
27 The interactions between faculty members are cooperative. 1 2 3 4 5 6 7
28 Teachers in this school exercise professional judgment. 1 2 3 4 5 6 7

POSTGRADUATE CONFERENCE ON ECONOMICS, PUBLIC ADMINISTRATION AND
BUSINESS (PCEPAB)-5TH SEPTEMBER, 2015
PROMOTING GROWTH, EXCELENCE AND SUSTAINABILITY- 270
29 Teachers “go the extra mile” with their students. 1 2 3 4 5 6 7
30 Teachers provide strong social support for colleagues. 1 2 3 4 5 6 7
31 The principal behavior is consistent. 1 2 3 4 5 6 7
32 The principal doesn’t play favorites. 1 2 3 4 5 6 7
33 The principal treats everyone with respect and dignity. 1 2 3 4 5 6 7
34 There is no preferential treatment in this school. 1 2 3 4 5 6 7
35 The principal in this school is fair to everyone. 1 2 3 4 5 6 7
36 The principal adheres to high ethical standards. 1 2 3 4 5 6 7
37 Teachers are involved in decisions that affect them. 1 2 3 4 5 6 7
38 Teachers are treated fairly in this school. 1 2 3 4 5 6 7

POSTGRADUATE CONFERENCE ON ECONOMICS, PUBLIC ADMINISTRATION AND
BUSINESS (PCEPAB)-5TH SEPTEMBER, 2015
PROMOTING GROWTH, EXCELENCE AND SUSTAINABILITY- 271
The Impact of Human Values and Organizational Citizenship
Behaviors on Service Quality
Zahra Kamiab Ph.D Student Faculty of Economic and Public Administration
University of Malaya
Abstract The examination of organizational citizenship behaviors as the mediating variable through which human values
affect service quality is still scarce. Approach: This study examined the mediation effects of organizational
citizenship behaviors on the relationships between human values and service quality. The human values studied
were the existence of a structure with ten motivational types of value by Schwartz (1992, 2005) and service quality
was studied in terms of five dimensions from Parasuraman (1988) instrument. Data were collected from a sample
of 117 branches of two governmental commercial banks in Kuala Lumpur, Malaysia. The participants in this study
included 351 employees and 585 customers. To achieve these objectives a mediation model was tested using
structural equation modeling procedure to examine if the hypothesized model fit the data. Results: The results
showed that organizational citizenship behaviors fully mediated the relationships between human values and bank
service quality. Conclusion/Recommendations: The findings of this study suggest that human values play a critical
role in enhancing employee’s organizational citizenship behaviors and service quality. Organizational citizenship
behaviors mediate the effects of human values on service quality. To improve service quality, employers should
improve values and managers try to know employee’s values since these practices have an impact on employee’s
organizational citizenship behaviors which in turn would affect service quality.
Key words: Human values, organizational citizenship behaviors, service quality

POSTGRADUATE CONFERENCE ON ECONOMICS, PUBLIC ADMINISTRATION AND
BUSINESS (PCEPAB)-5TH SEPTEMBER, 2015
PROMOTING GROWTH, EXCELENCE AND SUSTAINABILITY- 272
System Dynamics Analysis of the Biodiesel and CPO Productions
in Malaysia
Sahra Mohammadi, Fatimah Mohamed Arshad, Abdulla Ibragimov
Universiti Putra Malaysia 43400 Serdang Selangor Malaysia
Email: [email protected]
Email:[email protected]
Email:[email protected]
Abstract
This paper examines the biodiesel and crude palm oil productions in Malaysia using a system dynamics
approach. There is an increasing demand for biodiesel in the world. The Biofuels Directive has set targets
rising biodiesel production from 2% in 2005 to 20% by 2020 with Malaysia and Indonesia having the
potential to capture 20% share of the biofuels market in Europe. The Malaysian government also expects that
the blend 10 program of biodiesel will significantly increase demand for the feedstock including crude palm
oil. This paper utilizes system dynamics approach as it enables one to capture the feedback
relationships, non- linearity, and delay exist in commodity markets including palm oil. The model is simulated
for 44 years starting from 1982 to 2025. The simulation results indicate that the CPO demand for biodiesel will
increase in double which requires better concerns in production and stock of palm oil.
Key words: crude palm oil; biodiesel; system
dynamics
1 Introduction
Energy consumption in Malaysia has been growing at a fast rate. Oil, which is mainly utilized
in the transportation and industrial sectors, accounts for a big portion of total energy
consumption in Malaysia. Since the supply of fossil fuel is depleting rapidly, renewable
energy resources have been emerging to fulfill the world demand. Malaysia recognizes the
renewable energy resources as the fifth fuel after oil, coal, natural gas and hydro. It
emphasizes on reliability and cost-effectiveness of energy supply and sustainability (Basiron,
2008).
The demand for biodiesel was triggered by the increase in crude oil price between 2004 and
2005. As shown in Figure 1, in 2005, the crude oil price dramatically increased by about 30%
from USD 37.8/barrel in 2004 to USD 53.4/barrel in 2005 and continued to increases in the
following years. Meanwhile, the price of crude pam oil (CPO) decreased by 15.5% from RM
1,610/mt to RM 1,349/mt during the same period. The sharp decrease in crude oil price
triggered the production of biodiesel. However, the advent of this new product coupled with
other traditional economic factors pushed the price of CPO up again by 40%, increasing
sharply from RM 1,511/mt in 2006 to RM 2,531/mt in 2007.

POSTGRADUATE CONFERENCE ON ECONOMICS, PUBLIC ADMINISTRATION AND
BUSINESS (PCEPAB)-5TH SEPTEMBER, 2015
PROMOTING GROWTH, EXCELENCE AND SUSTAINABILITY- 273
Figure 1. Biodiesel Production (Metric Ton), CPO and Crude Oil Prices (RM per
Metric Ton), 2006-2014
Source: MPOB, 2015; Malaysia Biofuels Annual, 2013
The palm oil industry has significant economic advantages and it requires a careful
understanding of the behavior of key variables in the market. This paper investigates the
possible future behaviors of biodiesel and CPO productions in Malaysia for the next ten years
using a system dynamics approach. More specifically, this paper simulates the future
behavior of CPO demand for biodiesel productions with regards to changes in CPO and crude
oil prices. It also examines the impact of higher efficiency in fresh fruit bunch (FFB)
harvesting mechanism in the volume of CPO production (Figure 2-3).
Figure 2. Scenarios of Possible future behaviors
of CPO and Crude Oil prices
Figure 3. Scenarios of Possible Future Behavior
of CPO and Biodiesel Productions
0
100,000
200,000
300,000
400,000
500,000
600,000
700,000
-
500
1,000
1,500
2,000
2,500
3,000
3,500
2006 2007 2008 2009 2010 2011 2012 2013 2014
MT
RM
/MT
BD Production Crude Oil Price CPO Price

POSTGRADUATE CONFERENCE ON ECONOMICS, PUBLIC ADMINISTRATION AND
BUSINESS (PCEPAB)-5TH SEPTEMBER, 2015
PROMOTING GROWTH, EXCELENCE AND SUSTAINABILITY- 274
1.1 CPO Production
Table 1 shows the oil palm planted area and production of CPO in Sabah, Sarawak, and Peninsular
Malaysia. As shown, planted area and CPO production in Sabah has increased by 93.4% and 97%
from 93,967 ha and 156,471 mt in 1980 to 1.4 mn ha and 5.5 mn mt in 2012, respectively.
Similarly, plantation and production in Sarawak show significant increase of 97% and 99% during
the same period, respectively. In Peninsular Malaysia, planted area and CPO production has
increased from 906,590 ha and 2.4 mn mt in 1980 to 2.5 mn ha and 10.3 mn mt in 2012,
suggesting an increase of 64% and 76% respectively. The total production of CPO in Malaysia has
increased by 86% from 2.5 mn mt in 1980 to about 18.8 mn mt in 2012. The annual growth of
CPO production has changed over the last three decades indicating an average growth of 7.7% in
1980s, 5.2% in 1990s, and 4.2% in 2000s.
Table 1. The Palm Planted Area (‘000 ha) and Production of CPO (‘000 mt) in Sabah,
Sarawak, and Peninsular Malaysia, 1980-2012
Year
Sabah Sarawak Peninsular Malaysia
Plante
d Area
CPO
Production
Planted
Area
CPO
Production
Plante
d
Area
CPO
Production
1980 94 156 23 22 907 2,394
1985 162 285 29 49 1,292 3,801
1990 276 679 55 108 1,698 5,308
1995 518 1,494 119 222 1,903 6,095
2000 1,001 3,110 330 520 2,046 7,212
2005 1,209 5,334 543 1,337 2,299 8,291
2010 1,410 5,316 919 2,180 2,525 9,498
2011 1,432 5,843 1,022 2,696 2,547 10,373
2012 1,443 5,543 1,076 2,923 2,558 10,320
Source: MPIC, 1990 & 2005; MPOB, 2012
1.2 CPO and Crude Oil prices
The price of crude palm oil has appeared with significant fluctuations during the last decades. The
CPO price has increased from RM 701/mt in 1990 to RM 2,384/mt in 2014, suggesting an increase
of 70% (MPOB 2015). The price increase attributes to changes in the world palm oil and soybean
oil prices as well as an increase in the demand for palm oil products. The price of crude oil has also
raised sharply from USD 23/barrel in 1990 to USD 90.9/barrel in 2014, indicating an increase of
74%. As forecasted by the World Bank (2015), the price of crude oil is expected to decrease by
about 28% from USD 90.9/barrel in 2014 to 64.6/barrel in 2020 following by an increase of 22%
and reaching USD 82.9/barrel in 2025.
1.3 Biodiesel Production
The rapid increase in crude oil price above the price levels of vegetable oils, beginning in 2004,
provided the impetus for turning vegetable oils into biodiesel for transportation fuel. Accordingly,

POSTGRADUATE CONFERENCE ON ECONOMICS, PUBLIC ADMINISTRATION AND
BUSINESS (PCEPAB)-5TH SEPTEMBER, 2015
PROMOTING GROWTH, EXCELENCE AND SUSTAINABILITY- 275
palm oil feed stocks are considered as an alternative source of energy to eliminate the use of fossil
fuel, with Malaysia and Indonesia having the potential to capture the biggest market shares. As
stated by Fatimah Mohamed Arshad (2008), Malaysia and Indonesia have the potential to capture
20% share of the world’s biofuel product, if the price of CPO remains attractive compared to that
of crude oil.
Biodiesel in Malaysia was commercially introduced by the end of 2005 when the price of CPO
decreased by 15.5% compared to its previous year. Malaysia’s National Biofuel Policy introduced
on August 2005 aims to position Malaysia as a global biodiesel producer. The primary goals of the
policy are to expand and diversify the market for crude palm oil, to increase the export of biodiesel
and biofuel feed stocks, to help alleviate rural poverty, and help addressing long-term domestic
energy needs (Amna and Fatimah, 2010). The mandatory biodiesel blending was launched on June
2011 which requires diesel to contain 5 percent of biodiesel. It is expected that the share of
biodiesel will increases from 5% to 10% in the future (Applanaidu, 2013).
However, the biodiesel production in Malaysia is significantly under its potential level. The
attempts of Malaysian government to increase its use of biofuels and to expand the market both
domestically and internationally have not been successful due to the unfavorable market conditions
including high crude palm oil prices and the delay in implementing biodiesel blend from 2008 to
June 2011. As presented in Table 2, there are 29 biorefineries in Malaysia with an estimated
capacity to produce 2.74 mn liters of biodiesel. However, the quantity of biodiesel produced is less
than 25% of the maximum capacity. The CPO quantity used in biodiesel production is estimated
591,000 mt in 2014 which is about 2% of total CPO production in Malaysia.
Table 2. Biodiesel Production Capacity and CPO Used Year No. of Bio-
refineries
Nameplate
Capacity
(‘000 Liters)
Capacity
Use (%)
BD
Production
('000 Liters)
CPO Use
in BD
('000 MT)
CPO
Price
(RM/MT)
Crude oil
Price
(RM/Barrel)
2006 8 530 66.60% 353,275 325 1,511 1,760
2007 15 1,121 38.80% 434,800 400 2,531 1,824
2008 23 2,019 25.80% 521,760 480 2,778 2,416
2009 27 2,610 9.20% 241,314 222 2,245 1,622
2010 28 2,746 3.20% 86,960 80 2,705 1,898
2011 28 2,746 2.00% 55,437 51 3,219 2,373
2012 29 2,746 5.50% 152,180 140 2,764 2,447
2013 29 2,746 13.80% 379,363 349 2,371 2,268
2014 29 2,746 23.40% 642,417 591 2,384 2,101
Source: Malaysia Biofuels Annual, 2013
2 Methodology
This paper utilizes system dynamics approach to study the possible future behaviors of CPO and
biodiesel productions in Malaysia. System dynamics is a method to describe, model, simulate and
analyze dynamically complex systems in terms of the processes, information, organizational
boundaries and strategies (Pruyt, 2013). It is used to examine the feedback relationship between
variables, non-linearity, and delay that exist in systems (Richardson and Pugh, 1985). As stated by
Sterman (2000), system dynamics helps to learn about dynamic complexity, understand the sources
of policy resistance and design more effective policies.

POSTGRADUATE CONFERENCE ON ECONOMICS, PUBLIC ADMINISTRATION AND
BUSINESS (PCEPAB)-5TH SEPTEMBER, 2015
PROMOTING GROWTH, EXCELENCE AND SUSTAINABILITY- 276
Casual loop diagrams (CLD) and stock and flow (S&F) diagrams are two commonly used
diagrams in system dynamics modeling. Basically, CLD is the qualitative presentation of a system
behavior. It portraits the feedback structure of a system and shows the relationship between
selected variables. As the modelling process progresses, the CLD model is converted into a
physical structure known as stock and flow diagram. S&F diagram is the quantitative presentation
of the system behavior defined by equations, parameters, and initial conditions.
Figure 3 presents the CLD for oil palm plantation sector and biodiesel production sector in
Malaysia. It consist of three balancing (negative) feedback loops and one reinforcing (positive)
feedback loop which are illustrated as follows.
Figure 3. CLD for Oil Palm Plantation and Biodiesel Sectors
CPO Production Loop (B1): as CPO price increases, the expected CPO price and profitability
increase which lead to an increase in new planting. As new planting increases, planting rate, total
crop and total mature crop increase which lead to higher gain in total FFB harvested and CPO
production. Increase in CPO production cause CPO inventory to go up which leads to lower CPO
prices.
Land Availability Loop (B2): increases in new planting and plantation rate cause total planted area
to increase which leads to a decline in available area. As available area declines, there will be less
area available for new planting. It is estimated that Malaysia has a maximum land capacity of 5.6
Total MatureCrop
Total PlantedArea
CPO TotalDemand
Max LandCapacity
Available Area
ExpectedProduction Cost
ExpectedProfitability
New Planting
FFB per CropArea
Total FFB
Total Crop
Planting Rate
Decay Rate
CPOProduction
CPOImport
CPO Inventory
CPOExport
BiodieselProduction
PPODemand
CPO InventoryCoverage
CPO Price
Expected CPOPrice
R1
Replanting
B1
B2
B3
Biodiesel Price
BiodieselCost
Crude OilPrice
+
+
+
+-
++
+
+
+
+
+
+
-
+
+
+
+
+
-
+
- +
-
+ +
-
+
+
+

POSTGRADUATE CONFERENCE ON ECONOMICS, PUBLIC ADMINISTRATION AND
BUSINESS (PCEPAB)-5TH SEPTEMBER, 2015
PROMOTING GROWTH, EXCELENCE AND SUSTAINABILITY- 277
mn hectares. To date, the oil palm plantation has grown to 5 mn hectares indicating that only 600
thousand hectares are left for oil palm future plantation (Henriksson, 2012).
Palm Age Profile Loop (R1): as new planting, planting rate and total mature crop increase, decay
rate goes up which leads to an increase in replanting activities and new planting.
Biodiesel Production Loop (B3): if the CPO price goes up, the biodiesel price increases which
reduces the biodiesel production and total demand for CPO. As demand for CPO declines, CPO
inventory goes up which leads to lower CPO prices.
Figure 4 presents the S&F diagram associated with CPO and biodiesel productions, using Vensim
modeling software. There are four stocks (levels) constituting the palm oil plantation sector
including immature crops, young crops, mature crops and old crops. The lifespan of oil palm is
between 24-32 years. The peak yield of FFB of oil palm is during mature age and it gradually
declines thereafter. To formulate the CPO production, FFB/ha/year is multiplied by the oil
extraction rate (OER).
The biodiesel production is determined by the margin between CPO and crude oil prices. That is,
as the price ratio increases, production of biodiesel become more attractive. The current mandatary
share of biodiesel is 5% which refers to a blend of 5% palm methyl ester and 95% petroleum based
diesel. The conversion rate of CPO to biodiesel is estimated 0.88 (dimensionless) with a blending
cost of about RM80 per ton or 0.80 cents per liter (Malaysia Biofuels Annual, 2013).
Figure 4. S&F diagram for CPO and Biodiesel Production Sectors

POSTGRADUATE CONFERENCE ON ECONOMICS, PUBLIC ADMINISTRATION AND
BUSINESS (PCEPAB)-5TH SEPTEMBER, 2015
PROMOTING GROWTH, EXCELENCE AND SUSTAINABILITY- 278
3 Model Validation
Model validation is important in detecting the flaws in the system structure. For start, it is always
helpful to compare simulation results with observed historical behaviors. A sound model should
replicate the plausible behaviors to the observed patterns. As shown in figure 4 and 5, simulation
results of CPO and biodiesel productions produce similar behaviors to the historical data.
Moreover, statistical tests including RMSPE and inequality statistics were used to build confidence
in the model. The test’s results show that there is no systematic error in the model and the model
captures right behaviors. It is necessary to note that the model is not developed for point-by-point
prediction, rather the aim is to study the system behaviors and to obtain some understanding about
the market structure.
Figure 4. Simulation of CPO Used in Biodiesel Production, 1982-2014
Figure 5. Simulation of CPO Production, 1982-2014
4 Scenario Analysis
The purpose of the model is to examine the possible future behavior of CPO production and CPO
demand for biodiesel production in Malaysia. In first scenario, we introduce blends 10 and 15 of
biodiesel into the system. In second scenario, we increase FFB yield which can be obtain by
improving harvesting mechanism.
CPO Used in BD
600,000
450,000
300,000
150,000
0
1982 1986 1990 1994 1998 2002 2006 2010 2014
Time (Year)
ton
/Yea
r
CPO Used in BD : Actual
CPO Used in BD : Simulation
CPO Production
20 M
15 M
10 M
5 M
0
1982 1986 1990 1994 1998 2002 2006 2010 2014
Time (Year)
ton
/Yea
r
CPO Production : Actual
CPO Production : Simulation

POSTGRADUATE CONFERENCE ON ECONOMICS, PUBLIC ADMINISTRATION AND
BUSINESS (PCEPAB)-5TH SEPTEMBER, 2015
PROMOTING GROWTH, EXCELENCE AND SUSTAINABILITY- 279
4.1 Scenario I
Simulation results show that the CPO price is expected to increase from RM 2,384/mt in 2014 to
RM 3,671/mt in 2025, suggesting an increase of 35%. Using this result and the forecasted crude oil
prices by the World Bank, we examine the likely behavior of CPO demand in biodiesel production.
The simulation results show that, under the business as usual scenario, CPO demand for biodiesel
production exhibits decline from 591,000 mt in 2014 to 494,618 mt in 2025 due to increases in
CPO prices relative to that of crude oil. Under scenario I, we introduce blend 10 and 15 of
biodiesel into the model, which refers to a blend of 10% and 15% of palm methyl ester and 90%
and 85% petroleum based diesel, respectively. The simulation results show that CPO demand for
biodiesel production increases to about 1.0 and 1.45 mn mt in 2015, suggesting 49% and 66%
increases in CPO demand for biodiesel production, respectively (Figure 6).
4.2 Scenario II
As the demand for palm oil is raising, an increase in productivity gain can help improving the
stability of CPO price. There is a potential increase in the FFB yield. Currently, there is a
significant yield variation between plantations, smallholders as well as mills in Malaysia. Over the
last decades, the average FFB yield is estimated between 19 and 21 mt/ha/year. Lack of exposure
to best practices and the insufficient economies of scale are the main factors resulting in inefficient
crop yield across the nation (ETP, 2014). The simulation results show that, under the business as
usual, the CPO production is expected to increase from 19.56 mn mt in 2014 to 25.33 mn mt in
2025. Under scenario II, we assume an increase in FFB yield by an average of 22 and 23
mt/ha/year. The simulation results show that the CPO production raises to 26.68 and 27.8 mn mt,
suggesting 4% and 8% productivity increases, respectively (Figure 7).
Figure 6. Simulation result for Scenario I (‘000 MT), 1982-2025
Figure 7. Simulation result for Scenario II (‘000 MT), 1982-2025
2
50% 75% 95% 100%
CPO Used in BD
2 M
1.5 M
1 M
500,000
01982 1993 2004 2014 2025
Time (Year)3
50% 75% 95% 100%
CPO Production
40 M
30 M
20 M
10 M
01982 1993 2004 2014 2025
Time (Year)

POSTGRADUATE CONFERENCE ON ECONOMICS, PUBLIC ADMINISTRATION AND
BUSINESS (PCEPAB)-5TH SEPTEMBER, 2015
PROMOTING GROWTH, EXCELENCE AND SUSTAINABILITY- 280
5 Discussion
Palm oil is a major source of sustainable and renewable raw material for the biofuel industry in the
world, with Malaysia and Indonesia having the potential to capture the biggest market shares.
However, the biodiesel production in Malaysia is significantly under its potential level. For
biodiesel production to remain viable, CPO price must decline further. The competitiveness of
palm oil implies that it will remain as an important source of renewable raw material for biofuel
industries in the future. Moreover, productivity gains in the palm oil industry have a significant
impact on economic growth. Hence, it is important to enhance higher efficiency in CPO
production. The FFB yield can be improved through initiatives that increase productivity of labors
in plantations. For instance, the harvesting process should rely more on motorized equipment
rather than labors who are currently the main source in harvesting. The government should enforce
policies to monitor the FFB acceptance process by mills to make sure that only good quality crops
are processed. Technological advances will help to raise yields and maximizing oil production.
6 Conclusion
This study investigates in likely behavior of CPO production as well as CPO demand for biodiesel
production in Malaysia by developing a simulation model. The model is simulated for 44 years
starting from 1982 to 2025. The simulation outputs indicate that the advent of B10 and B15 of
biodiesel production will increase the CPO demand for biodiesel by 49% and 66%, respectively.
The results also indicate that there is a potential increase in the FFB yield and CPO production in
Malaysia. One possible solution to improve the harvesting performance would be to utilize
motorized equipment and technological advances.
Reference
AMNA AWAD ABDEL HAMEED, & FATIMAH MOHAMED ARSHAD. (2010). Inroads of
Palm Oil into the Middle East and North Africa Region. Selongor Malaysia: University Putra
Malaysia Press.
APPLANAIDU, S. D., FATIMAH MOHAMED ARSHAD, MAD NASIR SHAMSUDIN, &
YUSOP Z. (2010). The Impact of Biodiesel Demand on the Malaysian Palm Oil Market: A
Combination of Econometric and System Dynamics Approach. Paper presented at the
International Conference on Business and Economic Research (ICBER), Sarawak. March
2010.
BASIRON, Y. (2008). Palm Oil Production through Sustainable Plantations. European Journal of
Lipid Science and Technology. 109: 289-295.
FATIMAH MOHAMED ARSHAD. (2008). Palm Oil Based Diesel: An Inconvenient Opportune?
IMPAK, Issue 4, 2008.
MALAYSIA BIOFUELS ANNUAL. (2013). The Malaysian Palm Oil Sector- Overview.
Retrieved from
MPIC (Ministry of Plantation Industries and Commodities). (1990). Statistics on Commodities
1990, 2nd Edition.
MPIC (Ministry of Plantation Industries and Commodities). (2005). Statistics on Commodities
2005, 19th edition.
MPOB (Malaysian Palm Oil Board). (2012). Malaysian Palm Oil Statistics. 32th edition.
POSTGRADUATE CONFERENCE ON ECONOMICS, PUBLIC ADMINISTRATION AND
BUSINESS (PCEPAB)-5TH SEPTEMBER, 2015
PROMOTING GROWTH, EXCELENCE AND SUSTAINABILITY- 281
MPOB (Malaysian Palm Oil Board). (2015). Statistics. Retrieved from
PRUYT, E. (2013). Small System Dynamics Models for Big Issues. TU Delft Library, Delft, The
Netherlands.
RICHARDSON, G. P. PUGH, A. L. (1985). Introduction to System Dynamics Modeling with
Dynamo. The MIT Press, England.
STERMAN, J. D. (2000). Business dynamics: Systems Thinking and Modeling for a Complex
World. New York: McGraw-Hill.

POSTGRADUATE CONFERENCE ON ECONOMICS, PUBLIC ADMINISTRATION AND
BUSINESS (PCEPAB)-5TH SEPTEMBER, 2015
PROMOTING GROWTH, EXCELENCE AND SUSTAINABILITY- 282
Dynamic links between financial development and 𝑪𝑶𝟐
emissions in Nigeria: evidence from ARDL bound test
framework
Hamisu Sadi Ali, Law Siong Hook, Zulkornain Bin Yusop & Lee Chin
Department of Economics, Faculty of Economics and Management Universiti Putra
Malaysia, 43400 Serdang, Selangor-Malaysia
Abstract
Using ARDL bound test approach for the period of 1971-2010 the present article examined the links
between financial development, energy consumption, trade openness, economic growth and 𝐶𝑂2
emissions in Nigeria. The result reveals that variables were cointegrated as null hypothesis was rejected
at 5% level of significance. Furthermore based on short run dynamics, financial development, economic
growth and energy consumption have positive significant impact on 𝐶𝑂2 emissions, while trade openness
have negative insignificant impact on 𝐶𝑂2 emissions. In the long-run however, the finding proved that
financial development, economic growth and energy consumption have positive and significant influence
on 𝐶𝑂2 emissions, while trade openness has negative significant impact on 𝐶𝑂2 emissions in Nigeria. The
policy implication is that Nigerian public authority should focus more on initiating environmentally
friendly policies that can reduce carbon emissions and explore other alternative sources of energy
considering its movement with the financial sector performance. Proper trade liberalization policies
should be put in place considering its roles in reducing carbon emission that will improve environmental
quality in the country.
Keywords: 𝐶𝑂2 emissions; Energy consumption; Financial development; Economic
growth; Trade openness; Nigeria.
Introduction
Environmental quality and sustainability is one of the aims that each country is trying to
preserve considering its importance to the inhabitants and their socio-economic dealings
which if not properly checked could even affect their health conditions. The issue of
global warming is one of the serious problems that is facing both industrialized,
emerging and developing countries in the world because of its negative effect of
degrading environmental quality that have serious negative consequences, for example
depletion of the ozone layer that is highly related to 𝐶𝑂2 emissions which is the main
cause of global warming (Alam, et al. 2012). One of the key areas the recent G7 summit
focus is de-carbonation of the globe that is to reduce the level of carbon emissions so as
to safeguard the environment from degradation. The performance of financial sector
could be attributed to other key economic sectors, for example industrial sector that uses
substantial amount of energy which affect the environmental quality despite the growth
of the financial sector as well as overall economic performance. High energy
consumptions could lead to higher 𝐶𝑂2 emissions in Nigeria because fossil fuel
consumption contributed to about 75% of energy consumption in Nigeria (Yusuf, 2014).

POSTGRADUATE CONFERENCE ON ECONOMICS, PUBLIC ADMINISTRATION AND
BUSINESS (PCEPAB)-5TH SEPTEMBER, 2015
PROMOTING GROWTH, EXCELENCE AND SUSTAINABILITY- 283
Literature on financial development and other environmental variables is still meagre
because the area is not largely explored. Therefore the nexus between financial
development and 𝐶𝑂2 emissions is interesting considering the relevance of financial
sector in determining the performances of other economic sectors, for example industrial
sector. The connection is that firms requires finances in order to initiate businesses or
expand their operations, and by doing that the level of 𝐶𝑂2 emissions is increasing daily
which have negative repercussions on the environmental quality. Despite numerous
empirical studies that discussed about the nexus of financial development and other
environmental variables, still no single study that explore the relationship between
financial development and key environmental variables of 𝐶𝑂2 emissions and energy
consumption in Nigeria.
Review of related literature
Various empirical studies examines the links between the variable of interest as well as
other control variables in different countries, but based on our search no single study
that investigated this nexus in Nigeria despite its major roles in both productions and
consumptions of high volume of energy in Africa, as well as it also contribute on
increasing 𝐶𝑂2 emissions in the world. The relationship between energy consumption
and economic growth is investigated by Oh and Lee (2005) using VECM approach for
the period of 1981Q1-2000Q4. The outcome reveals that in the short-run no causal
nexus exist, in the long-run however there is unidirectional causality running from
economic performance to the consumption of energy. The relationship between energy
use and economic growth is examined by Hye and Riaz (2008) in Pakistan for the time
period of 1971-2007 based on ARDL form of Granger-causality. In the short-run the
result of the causality indicated bi-directional causality among the variables, whereas
unidirectional causality exists from economic growth to energy use in the long-run. the
consumption of energy do not affect growth in the long-run because as energy prices
increases it will influence other prices to rises and this leads to the increase in the cost of
doing business hence adversely affected the economy. Tamazian, et al. (2009) in their
panel study on the nexus between economic and financial market development on
environmental degradation for the period of 1992-2004 using standard reduced form
modelling technique across BRIC countries. The result indicated that financial and
economic developments determine the quality of environment in the study sample
countries. The result also shows that higher level of economic and financial advances
reduces the deprivation of the environment. It also highlight based on the finding that
financial liberalization and openness contributes massively to the reduction of 𝐶𝑂2
emissions. Applying ARDL bound testing approach in Tanzania for the period of 1971-
2006 Odhiambo (2009) investigated the relationship between energy consumption and
economic performance and concluded that there is unidirectional causality running from
overall energy uses to economic growth.
The impact of C𝑂2 emissions on economic growth and financial development for the
period of 1980-2008 is examined by Al-mulali and Sab (2012a) for thirty Sub-Saharan
African countries. The result shows that despite high rate of environment pollution

POSTGRADUATE CONFERENCE ON ECONOMICS, PUBLIC ADMINISTRATION AND
BUSINESS (PCEPAB)-5TH SEPTEMBER, 2015
PROMOTING GROWTH, EXCELENCE AND SUSTAINABILITY- 284
energy uses has essential impact on financial development and economic growth in the
countries investigated. The relationship between energy consumption and economic
growth financial market development is also examined by Al-mulali and Sab (2012b)
across 19 countries for the period of 1980-2008 and the results claimed that energy
consumption affect financial development and economic growth significantly. Though,
the development is attached with adverse effect considering its influence on increasing
the rate of C𝑂2 emissions in the countries under investigation. Chaudhry, et al. (2012)
investigated the nexus between energy uses and economic performance for the period of
1972-2012 in Pakistan using ARDL framework. The result shows that when oil is used a
proxy for energy consumption the effect is negative to economic growth. Applied
VECM technique in Tunisia for the period of 1980-2007 Abid and Sebri (2012) study
the links between energy consumption and economic growth. The result shows that in
general economic perspective energy uses enhance economic growth, whereas if sectoral
level is considered energy consumption affected economic growth negatively. Islam, et
al. (2013) investigated the impact of financial market performance, economic growth
and population growth on energy uses in Malaysia. The outcome suggests that energy
uses influence financial development and economic growth in short-run and long-run.
However, energy consumption nexus with population growth is only sustainable in the
short-run.
Shahbaz, et al. (2013a) applied ARDL bound testing approach to study the connection
between energy uses and economic growth by including the financial development and
trade variables in China for the period of 1971-2011. The empirical result reveals that
energy uses, financial development and trade have positive significant impact on
economic growth. Shahbaz et al., (2013b) used ARDL approach and investigated the
links between economic growth, energy consumption, financial development, trade
openness and 𝐶𝑂2 emissions in Indonesia for the time frame of 1975Q1-2011Q2. The
finding shows that when economy grows and energy consumption increases 𝐶𝑂2
emissions also increases, while financial development and financial trade liberalization
reduces it. Conversely, the causality VECM analysis reveals feedback hypothesis
between consumption of energy and 𝐶𝑂2 emissions, two ways causality among
economic growth and C𝑂2 emissions and one way causality running from financial
development to C𝑂2 emissions. The impact financial development on energy uses is
investigated using system-GMM method across EU member countries for the period of
1990-2011 by Mert Topcu (2013). The result reveals that financial development has
important impact on energy uses in old EU member countries despite the indicator of
financial development used. On the new member countries however, it depends on the
type of financial development indicator used. When bank indicator is use the effect
shows an inverted U-shaped while it indicated no substantial connection exist when
stock market indicator is use. The relationship between energy consumption, economic
growth and financial development is investigated in India for the period of 1971-2009
using ARDL framework by Mahalik and Mallick (2014). The result indicated that
energy consumption affected ratio of urban population positively, while its effect on
economic growth and financial development is negative. The finding also reveals that

POSTGRADUATE CONFERENCE ON ECONOMICS, PUBLIC ADMINISTRATION AND
BUSINESS (PCEPAB)-5TH SEPTEMBER, 2015
PROMOTING GROWTH, EXCELENCE AND SUSTAINABILITY- 285
urban population growth adversely influence economic growth, whereas energy
consumption positively affected it.
Uçan, et al. (2014) investigated the impact of renewable and non-renewable energy on
economic growth for 15 EU member countries for the period of 1990-2011 using panel
cointegration analysis. The result established long-run relationship between the
variables. The Granger-causality test result shows unidirectional causal relationship
running from non-renewable energy consumption to economic growth. The causal nexus
among consumption of energy, oil price and economic performance is studied by
Osigwe and Aramowo (2015) in Nigeria based on Granger-causality test analysis. The
outcome shows that the causality between energy uses and economic growth is two
ways. When electricity is used as a measure of energy consumption however,
bidirectional causality exists among energy consumption and economic growth and
price of electricity and its uses as well. While no causal relationship that exists between
kerosene consumption, kerosene prices and economic performance in Nigeria. Ali, et al.
(2015) applied autoregressive distributed lag framework and examine the impact of
financial development on energy consumption in Nigeria using a quarterly data of
1972Q1-2011Q4. The result suggests that variables were cointegrated as null hypothesis
is rejected at 1% significance level. Based on the short-run dynamics financial
development significantly affects consumption of energy and economic growth
adversely, while energy prices positively affect energy consumption significantly. In the
long-run however, the impact of financial development on energy consumption is
negative and insignificant, while the impact on economic growth is negative but
significant and that of energy prices still maintain its positive and significant impact on
energy consumption. Applying Sadorsky (2010) to investigate the marginal impact of
financial development on the energy uses and income across 53 economies for the
period of 1999-2008, Chang (2015) applied different indicators of financial development
and found that energy consumption increase when income rises in both developing and
emerging market countries, while in developed nations it increase with income
transitory up to certain level of income. In low income economies however,
consumption of energy increase with level of financial development when the proxy is
private and domestic credits. However, when stock market indicators are used to
measures financial development, energy consumption marginally reduces with the
financial market development in developed countries while it rises with in higher
income countries of emerging and developing economies.
Data, source and measurements
This study derived its data from world development indicators (WDI CD ROM, 2015)
via World Bank data base for the period of 1971-2010. Financial development is
measured by the domestic credit to private sector as a ratio of GDP, we used 𝐶𝑂2
emissions in kilo terms to represent 𝐶𝑂2 emissions, energy consumption is proxied by
fossil fuel consumption which comprised of coal, oil, petroleum, and natural gas
products, economic growth is measured by real GDP per-capita and trade openness is
measured by sum of export and import as a ratio of GDP.

POSTGRADUATE CONFERENCE ON ECONOMICS, PUBLIC ADMINISTRATION AND
BUSINESS (PCEPAB)-5TH SEPTEMBER, 2015
PROMOTING GROWTH, EXCELENCE AND SUSTAINABILITY- 286
Econometric model specification
In order to specify the ARDL form of vector error correction model we followed Khan
et al., (2005), Fosu and Magnus (2006) and specify our model our model as follows;
∆ln𝐶𝑂2𝑡 = 𝛽0 + 𝛽1ln𝐶𝑂2𝑡−1 + 𝛽2𝐹𝐷𝑡−1 + 𝛽3ln𝐸𝐶𝑡−1 + 𝛽4𝑙𝑛𝐸𝐺𝑡−1 + 𝛽5ln𝑇𝑂𝑡−1 +
∑ 𝛾𝑖𝑝𝑖 ∆ln𝐶𝑂2𝑡−1 + ∑ 𝛿𝑗
𝑞𝑗 ∆ln𝐹𝐷𝑡−𝑗 + ∑ 𝜑𝑙
𝑝𝑙 ∆ln𝐸𝐶𝑡−𝑙 + ∑ 𝜔𝑘
𝑝𝑙 ∆ln𝐸𝐺𝑡−𝑚 +
∑ 𝜂𝑚𝛥𝑞𝑚 𝑙𝑛𝑇𝑂𝑡−𝑛 + 휀𝑡
(1)
Where; 𝑙𝑛𝐶𝑂2 is the log of 𝐶𝑂2 emissions, 𝑙𝑛𝐹𝐷 is the log of financial development,
𝑙𝑛𝐸𝐶 is the log of energy consumption, 𝑙𝑛𝐸𝐺 is the log of economic growth, 𝑙𝑛𝑇𝑂 is the
log of trade openness and subscript t denote time period. The first stage is to estimate
equation (1) using OLS and then move on to test Wald test of F-test with the intention of
testing joint significance of the coefficients of lagged variables in order to observe if
there is long-run relationship among the variables.
The next step is to test the null hypothesis 𝐻0 = 𝛽1 = 𝛽2 = 𝛽3 = 𝛽4 = 𝛽5 = 0 which stated
that there is no cointegration against alternate 𝐻𝑎 ≠ 𝛽1 ≠ 𝛽2 ≠ 𝛽3 ≠ 𝛽4 ≠ 𝛽5 ≠ 0
which stated there is cointegration among the variables. As suggested by Pesaran, et al.
(2001) if the value of the calculated F-test is greater than the upper bound critical value
we reject the null hypothesis of no cointegration which implies the existence of long-run
relationship. However, if the value of estimated F-test is less than lower critical value
null hypothesis cannot be rejected which implies there is no long-run relationship,
whereas if the value of the estimated F-test lies within lower and upper critical value the
result remains indecisive (Pesaran & Pesaran, 1997). We move on to test the long-run
coefficients of ARDL based on the equation (2) below;
ln𝐶𝑂2𝑡 = 𝛽0 + ∑ 𝛾𝑖𝑝𝑖=1 ln𝐶𝑂2𝑡−1 +
∑ 𝛿𝑗𝑞1𝑗=0 lnFD𝑡−𝑗+ ∑ 𝜑𝑙
𝑞2𝑖=0 ln𝐸𝐶𝑡−𝑙+ ∑ 𝜂𝑚
𝑞3𝑚=1 𝑙𝑛𝐸𝐺𝑡−𝑚+ ∑ ∪𝑛
𝑞4𝑚=0 𝑙𝑛𝑇𝑂𝑡−𝑚 + 휀𝑡 (2)
We choose SBC to select lag length of the model and applied error correction model
with a view to determine short-run dynamics of the variables;
∆ln𝐶𝑂2𝑡= 𝛽0 + ∑ 𝛾𝑖𝑝𝑖 ∆ln𝐶𝑂2𝑡−1 +
∑ 𝛿𝑗∆𝑞𝑗 ln𝐹𝐷𝑡−𝑗+ ∑ 𝜑𝑙
𝑞𝑖 ∆ln𝐸𝐶𝑡−𝑙 + ∑ 𝜂𝑚∆
𝑞𝑚 𝑙𝑛𝐸𝐺𝑡−𝑚+ ∑ ∪𝑛 ∆
𝑞𝑚 𝑙𝑛𝑇𝑂𝑡−𝑚 + 𝜗𝑒𝑐𝑚𝑡−1 +
휀𝑡 (3)

POSTGRADUATE CONFERENCE ON ECONOMICS, PUBLIC ADMINISTRATION AND
BUSINESS (PCEPAB)-5TH SEPTEMBER, 2015
PROMOTING GROWTH, EXCELENCE AND SUSTAINABILITY- 287
We Followed Pesaran (1997) in order to test the stability of the long-run coefficient as
well as the short-run dynamics by applying cumulative sum of recursive residuals
(CUSUM) and the cumulative sum of squares of recursive residuals (CUSUMSQ).
Results and discussions
Table 1: Results of the ADF and PP unit root tests from 1971-2010
ADF PP
Level
Variables Constant Without
Trend
Constant With
Trend
Constant Without
Trend
Constant With
Trend
𝐥𝐧𝐅𝐃𝒕 -2.423 -2.616 -2.192 -2.418
𝐥𝐧𝑪𝑶𝟐𝒕 -2.512 -2.552 -2.512 -2.552
𝐥𝐧𝐄𝐂𝒕 -4.918* -3.299*** -4.878* -3.495***
𝐥𝐧𝐄𝐆𝒕 1.649 0.025 1.265 0.006
𝐥𝐧𝐓𝐎𝒕 -2.565 -2.641 -2.565 -2.641
First Difference
𝐥𝐧𝑭𝑫𝒕 -4.930* -4.815* -4.320* -4.238*
𝐥𝐧𝑪𝑶𝟐𝒕 -6.786* -6.691* -6.896* -6.743*
𝐥𝐧𝐄𝐂𝒕
-4.509* -5.258* -4.467* 5.241*
𝐥𝐧𝐄𝐆𝒕 -5.139* -5.673* -5.204* -5.659*
𝐥𝐧𝐓𝐎𝒕 -7.490* -7.616* -7.457* -7.573*
NB: The ADF and PP test equations include both constant and trend terms. The Schwarz information
criterion (SIC) is used to select the optimal lag order in the ADF test equation. The values in brackets are
corresponding p-values *denote significance level at 1%, **5%, and ***10% respectively
The stationarity of the variables is very essential in any time series analysis, the result of
ADF and PP test in table 1 above shows that only energy consumption is integrated at
level means is I(0) variable, while both financial development, 𝐶𝑂2 emissions,
economic growth and trade openness are non-stationary at level but are stationary at first
difference which means the four (4) variables are I(1). Considering the combination of
I(0) and I(1) variable, ARDL is appropriate method to apply (Pesaran, et al. 2001) so as
to test and see whether variables have long-run relationship or not.

POSTGRADUATE CONFERENCE ON ECONOMICS, PUBLIC ADMINISTRATION AND
BUSINESS (PCEPAB)-5TH SEPTEMBER, 2015
PROMOTING GROWTH, EXCELENCE AND SUSTAINABILITY- 288
Cointegration test
Table 2: ARDL bound test estimation result
Model for estimation Lag length
F-statistics
Significance level
Critical bound ______________________
F-statistics
__________________
I(0) I(1)
𝑭𝑪𝒐𝟐(𝑭𝑫|EG|EC|TO) 4 5.92 1% 4.42 6.25
5% 3.20 4.54
10% 2.66 3.83
N.B: *, ** and *** denote significant at 1%, 5% and 10% levels, respectively. Critical values are obtained
from Narayan (2005) (Table Case III: Unrestricted intercept and no trend; pg. 1988)
The ARDL cointegration test reported shows that the calculated F-statistics (5.92) is
greater than upper bound critical values as shown in the Narayan table. The
interpretation remains variables were cointegrated as we reject null hypothesis at 5%
level of significance. Since the long-run relationship is confirmed we then move to
estimate our equation (2) in order to obtain long-run coefficients, the outcome is shown
in table 3 below;
Table 3: Estimated long-run coefficients based on SBC Dependent variable (∆𝑙𝑛𝐶𝑂2𝑡)
Regressors Coefficients T-ratio (p-values)
Constant -11.075 -5.106 (0.000)*
𝐥𝐧𝑭𝑫𝒕 0.133 1.826 (0.082)***
𝐥𝐧𝑬𝑮𝒕 0.687 8.784 (0.000)*
𝐥𝐧𝑬𝑪𝒕 0.915 8.214 (0.000)**
𝐥𝐧𝑻𝑶𝒕 -0.530 -8.452 (0.030)**
NB: *denote significance level at 1%, **5%, and ***10% respectively
The result shows that financial development has positive significant impact on 𝐶𝑂2
emissions, impliedly it means that when financial development increases by 1% in
Nigeria, it stimulates 𝐶𝑂2 emissions to increases by 0.1%, which means financial
development is attached with negative environmental consequences as it creates more
carbon emissions. This finding substantiated the outcome of Al-mulali and Sab (2012b)
for a sample of 19 countries. Economic growth has positive and significant impact on
𝐶𝑂2 emissions as 1% increase in economic performance leads to 0.6% increase in 𝐶𝑂2
emissions, Energy consumption is also positive and significant on 𝐶𝑂2 emissions as 1%
increase in energy consumption could leads to 0.9% increase in 𝐶𝑂2 emissions. The
finding reconfirmed the outcome of a study by Al-mulali and Sab (2012a) across 30
African countries, while trade openness has negative but significant impact on 𝐶𝑂2

POSTGRADUATE CONFERENCE ON ECONOMICS, PUBLIC ADMINISTRATION AND
BUSINESS (PCEPAB)-5TH SEPTEMBER, 2015
PROMOTING GROWTH, EXCELENCE AND SUSTAINABILITY- 289
emissions, this reveals that when trade openness increases by 1% in Nigeria, it leads to
0.5% decline of 𝐶𝑂2 emissions, thus trade openness does not increase 𝐶𝑂2 emissions but
rather reduces it in case of Nigeria.
Conclusion and policy recommendations
We applied ARDL bound test approach and analysed annual data for the period of 1971-
2010 in order to ascertain the dynamic links between 𝐶𝑂2 emissions, energy
consumption, trade openness, economic growth and financial development in Nigeria .
Based on F-test the variables were cointegrated and null hypothesis was rejected at 5%
significance level. The short-run dynamics reveals that 𝐶𝑂2 emissions positively affect
financial development significantly, while economic growth, energy consumptions and
trade openness significantly affect financial development albeit negatively. The long-run
result however reveals that 𝐶𝑂2 emissions, economic growth and energy consumption
have significant positive impact on financial development, whereas trade openness
maintains its negative impact on financial development as in the short-run. The policy
implication suggested based on the research outcome is that policy makers in this
country are faced with two challenges of balancing between achieving high level of
financial development and improve environmental quality simultaneously without which
financial sector development could lead to massive environmental degradation
considering its influence on triggering 𝐶𝑂2 emissions as well as higher consumptions of
energy. The alternative mode of energy consumptions (e.g. green energy) is among the
prerequisite conditions that the authority needs to explore in order to reduce continuous
environmental degradation in the country that is caused by excessive fossil fuel
consumptions which leads to higher 𝐶𝑂2 emissions and caused depletion of the ozone
layer, and hence increase global warming. The next policy alternative is to adopt
suitable trade openness policies that will help in reducing the level of carbon emission
and hence improve environmental quality.
References
Abid, M., & Sebri, M. (2011). Energy consumption-economic growth nexus: does the
level of aggregation matter? International Journal of Energy Economics and Policy,
2(2), 55-62.
Ali, H. S., Yusop, Z. B., & Hook, L. S. (2015). Financial Development and Energy
Consumption Nexus in Nigeria: An Application of ARDL Bound Testing Approach.
International Journal of Energy Economics and Policy, 5(3), 816-821.
Al-Mulali, U., & Sab, C. N. B. C. (2012). The impact of energy consumption and CO 2
emission on the economic growth and financial development in the Sub Saharan African
countries. Energy, 39(1), 180-186.

POSTGRADUATE CONFERENCE ON ECONOMICS, PUBLIC ADMINISTRATION AND
BUSINESS (PCEPAB)-5TH SEPTEMBER, 2015
PROMOTING GROWTH, EXCELENCE AND SUSTAINABILITY- 290
Al-mulali, U., & Sab, C. N. B. C. (2012). The impact of energy consumption and CO2
emission on the economic and financial development in 19 selected countries.
Renewable and Sustainable Energy Reviews, 16(7), 4365-4369.
Banerjee, A., Dolado, J., & Mestre, R. (1998). Error‐correction mechanism tests for
cointegration in a single‐equation framework. Journal of time series analysis, 19(3),
267-283.
Chang, S. C. (2015). Effects of financial developments and income on energy
consumption. International Review of Economics & Finance, 35, 28-44.
Chaudhry, I. S., Safdar, N., & Farooq, F. (2012). Energy consumption and economic
growth: Empirical evidence from Pakistan. Pakistan Journal of Social Sciences, 32(2),
371-382.
Çoban, S., & Topcu, M. (2013). The nexus between financial development and energy
consumption in the EU: A dynamic panel data analysis. Energy economics, 39, 81-88.
Fosu, O.A., Magnus, F.J., 2006. Bounds testing approach to cointegration: an
examination of foreign direct investment trade and growth relationships. Am. J. Appl.
Sci. 3 (11), 2079.
Islam, F., Shahbaz, M., Ahmed, A. U., & Alam, M. M. (2013). Financial development
and energy consumption nexus in Malaysia: a multivariate time series analysis.
Economic Modelling, 30, 435-441.
Khan, M.A., Qayyum, A., Saeed, A.S., 2005. Financial Development and Economic
Growth: The Case of Pakistan. Pak. Dev. Rev 4 (44), 819–837.
Kim, D. H., Lin, S. C., & Suen, Y. B. (2010). Dynamic effects of trade openness on
financial development. Economic Modelling, 27(1), 254-261.
Mahalik, M. K., & Mallick, H. (2014). Energy consumption, economic growth and
financial development: exploring the empirical linkages for India. The Journal of
Developing Areas, 48(4), 139-159.
Odhiambo, N. M. (2009). Energy consumption and economic growth nexus in Tanzania:
an ARDL bounds testing approach. Energy Policy, 37(2), 617-622.
Odhiambo, N. M. (2009). Energy consumption and economic growth nexus in Tanzania:
an ARDL bounds testing approach. Energy Policy, 37(2), 617-622.
Oh, W., & Lee, K. (2004). Energy consumption and economic growth in Korea: testing
the causality relation. Journal of Policy Modeling, 26(8), 973-981.
Osigwe, A. C., & Arawomo, D. F. (2015). Energy Consumption, Energy Prices and
Economic Growth: Causal Relationships Based on Error Correction Model.
International Journal of Energy Economics and Policy, 5(2), 408-41.

POSTGRADUATE CONFERENCE ON ECONOMICS, PUBLIC ADMINISTRATION AND
BUSINESS (PCEPAB)-5TH SEPTEMBER, 2015
PROMOTING GROWTH, EXCELENCE AND SUSTAINABILITY- 291
Pesaran, M. H., & Pesaran, B. (1997). Working with Microfit 4.0: Interactive
econometric analysis;[Windows version]. Oxford University Press.
Pesaran, M.H., Shin, Y., Smith, R.J., 2001. Bounds testing approaches to the analysis of
level relationships. J. Appl. Econ. 16, 289–326.
Salman, D. M., & Atya, E. M. (2014). What is the role of Financial Development and
Energy Consumption on Economic Growth? New Evidence from North African
Countries. International Journal of Finance & Banking Studies (ISSN: 2147-4486), 3(1),
137-149.
Sambo AS (2008) Matching Electricity Supply with Demand in Nigeria. International
Association of Energy Economics 4:32–36.
Shahbaz, M., Hye, Q. M. A., Tiwari, A. K., & Leitão, N. C. (2013). Economic growth,
energy consumption, financial development, international trade and CO 2 emissions in
Indonesia. Renewable and Sustainable Energy Reviews, 25, 109-121.
Shahbaz, M., Khan, S., & Tahir, M. I. (2013). The dynamic links between energy
consumption, economic growth, financial development and trade in China: fresh
evidence from multivariate framework analysis. Energy economics, 40, 8-21.
Tamazian, A., Chousa, J. P., & Vadlamannati, K. C. (2009). Does higher economic and
financial development lead to environmental degradation: evidence from BRIC
countries. Energy policy, 37(1), 246-253.
Uçan, O., ARICIOGLU, E., & YUCEL, F. (2014). Energy Consumption and Economic
Growth Nexus: Evidence from Developed Countries in Europe. International Journal of
Energy Economics and Policy, 4(3), 411-419.
Zeren, F., & Koc, M. (2013). The nexus between energy consumption and financial
development with asymmetric causality test: new evidence from newly industrialized
countries. International Journal of Energy Economics and Policy, 4(1), 83-91.

POSTGRADUATE CONFERENCE ON ECONOMICS, PUBLIC ADMINISTRATION AND
BUSINESS (PCEPAB)-5TH SEPTEMBER, 2015
PROMOTING GROWTH, EXCELENCE AND SUSTAINABILITY- 292
Bell-Metal Industry of Assam: Some Problems and an Alternative
Operating Framework
Chayasmita Deka,
Department of Economics, Christ University
Hosur Road, Bangalore- 560029,
India
Email: [email protected]
Abstract
The bell-metal industry of Sarthebari in Assam is one of the oldest industrial clusters of India. Bell-metal craft is the
identity of the village. It was a legacy and it still is today. However this industry is currently facing a lot of problems.
Though the profitability of the industry is increasing, but this is not reflected in the lives of the artisans who are the
main bearers of skill. The industry is operating in a faulty operating framework wherein some traders are externally
controlling the industry by obliging the artisans to sell back most part of their finished products to them. The artisans
are just paid the making charge with no extra profits or benefits. A declining productivity of artisans, increasing
indebtness, disorientation among local educated youths to join in the trade is slowly pushing the craft to a gloomy path
of extinction. Through a rigorous field survey and statistical analysis the research identifies some demand and supply
side determinants which can be strategically used to enhance the profitability of the industry. This research also
designs an alternative operating framework which takes into account all the problems inherent in the industry and
suggests a highly promising future by enhancing the socio-economic value of the industry.
Keywords: Bell-metal, supply volume, demand frequency, RCFS operating framework, socio-
economic value
Introduction
Even in the era of MNCs and FDIs, the potential of small and medium scale enterprises (SME) in
boosting the economy of local residents of a region and consequently of the state can-not be
undermined. SMEs can make every village self-sufficient without having to migrate to the urban
areas for a livelihood as those are the regions where employment is mostly generated. The SMEs
bear a cultural identity of the villages as the skills of the trade are passed down from one
generation to the next. The bell-metal industry is one of the oldest SME in India which emerged
mainly due to the skills of the artisans. It was a legacy and even today it is; with the entire
manufacturing process being hand-made without even the use of electricity. Unfortunately, the
industry today is facing various socio economic problems. The educated youths of the village are
dis incentivised to join in the trade due to lack of socio economic security and other health
concerns. In such a gloomy backdrop, the future of the industry is at stake.
There has not been much literature specific to this bell-metal industry of Assam. Quite a few
researchers have worked in this area. Much of their study was based on the brass metal industry of
Hajo, another region in the proximity of Sarthebari. Related studies have focussed on finding out
the production process of the industry. The performance of the industry and its socio-economic
impact in the lives of the people were mainly researched upon. Studies have analysed the past and
present status of brass-metal industry. Problems pertaining to the brass metal industry have also
been identified. However identification of a problem is not an end in itself. Suitable solutions have

POSTGRADUATE CONFERENCE ON ECONOMICS, PUBLIC ADMINISTRATION AND
BUSINESS (PCEPAB)-5TH SEPTEMBER, 2015
PROMOTING GROWTH, EXCELENCE AND SUSTAINABILITY- 293
to be devised which can address all the problems. Also no work has been done to identify
strategies to enhance the profitability of the industry.
This research shall explore the bell-metal industry of Assam from a social and marketing
perspective to identify the demand and supply side problems inherent in the industry and to devise
strategies/framework (which shall take account of all currently identified problems) to increase the
profitability of the industry and especially of the artisans who are the main bearers of the skill.
Sarthebari Bell-metal Cluster
Sarthebari is a quaint sleepy town in Barpeta district of western Assam. With The rhythmic clutters
of the metals, the beat of the heavy hammers are the first sounds one can hear even before the sun
rises. Bell-metal is not just a trade of the town; it has been its identity since ages, a skilled passion
being passed on from generations back without fail. There are different views regarding the origin
of the bell-metal industry in Sarthebari. Even today bell-metal continues to be the major source of
livelihood.
The bell-metal production units are operational in different districts of Assam. During the time of
Ahom and Koch kings, bell metal production centres existed at Dhekiajuli, Raha and Titabar in
Central and Eastern Assam respectively. However production today is confined mainly in
Sarthebari after the disintegration of the other centres. The bell-metal production units of
Sarthebari are clustered in the Sarthebari Revenue Circle within the Barpeta district of Assam. The
production units within the cluster are scattered in Sarthebari, Palla, Gomura, Namsala, Karakuchi,
Bamunpara, Botia, Kalatoli, Lochima, Amrikhowa, Singra and Kamarpara villages. There are a
total of 284 bell-metal production units currently in operation employing about 1260 artisans. The
number of employees per unit on an average is thus about 4-5 workers. There are about 4385
households in the 12 villages of the cluster with a population of 28,038 persons according to the
2001 Census of India.
The Core Production Process
An alloy of copper and tin mixed in ratio 78:22 makes bell-metal. . However the production of
bell-metals using the virgin metals is not feasible both in terms of cost and time consumed. The
alternative is the use of old, decrepit bell (bhanga kanh) which is widely pursued by the artisans to
produce new metal. The production of bell-metal in the manufacturing units still follows the
traditional mode of production. It’s a use and reuse method which is popularly being followed. The
main disadvantage here is that some amount of metal gets lost every time in the production
process. Coke and charcoal are the fuels used in the bell-metal industry. The old, decrepit pieces of
bell-metal are further grinded to tinier pieces, which are then melted by putting them in an earthen
pot called ‘mohi’. Then using charcoal, fire is lighted in the aafar (the furnace where the crucibles
can be placed), where the mohi is placed in order to melt the scrap metal. After the scrap metal
turns to liquid, it is poured in the aakar (a circular shaped dice made of clay and used to pour out
the melted bell-metal for cooling to take a solid form). The molten metal cools down there and
takes the shape of a solid form, locally popular as aautakanha. The bell-metal lump is heated in
aafar. After it is heated, the red lump is put out of the aafar. Then by holding the hot bell-metal
piece in a niyeri (an anvil made of iron and circular in shape), the Ojha-kanhar (head artisan) holds
the cake with a sarah (tongs made of iron) so as to rotate the lump in the required direction and the
bhaigas (assistant artisans) sit around the niyeri. Then in order to expand the lump, it is hammered

POSTGRADUATE CONFERENCE ON ECONOMICS, PUBLIC ADMINISTRATION AND
BUSINESS (PCEPAB)-5TH SEPTEMBER, 2015
PROMOTING GROWTH, EXCELENCE AND SUSTAINABILITY- 294
in a rhythmic manner till it gets a desired shape and size. Currently however some of the
production units have started using flat sheet produced by rolling the metal lump in a rolling
machine. This reduces the physical labour of the kanhars (artisans) greatly. The cost of making
such flat sheets from the lump is Rs.8 per kilogram metal. Once the product attains shape, it is
again placed in the aafar to make it hot and red. Then it is immersed in water of PaniDhol (a water
container made of wood and used to submerge the products for cooling) so that it becomes hard
and cold. Whatever defects remain in the shape of the product, it is hammered with small hammers
to bring it to a proper shape. During this process, certain cracks may develop in the outer edge of
the product. An artisan specialised to deal with such refinement called kaitnar cuts the cracked
edge with the help of a kati (a pair of scissors used to cut the thin sheets of bell-metal to give
proper shape after hammering). He also cleans product’s black layer with a khanta (an iron
instrument used for polishing bell-metal products). Product is then heated again in fire, after which
it is polished in a wooden unit called kund by two artisans. Lac is required to fix the product during
polishing. Then the product goes through the last stage, which is polishing, designing and
finishing. Following this method of production different kinds of products are being used again
with diverse range of sizes, shape and design.
Types of Bell-Metal Product
The products are classified into four different classes based on its quality. They are: bazaruwa (low
quality products), aachli (good quality products), charach (better quality products) and aachli
charach (best quality products). The bazaruwa and aachli range of products are in general available
in market and are sold at lower prices. The charach and aachli charach range of products fetch very
good prices but these are beyond the reach of the average buyers. Again there are a diverse range
of products mainly utensils that are being produced with a variety of sizes among each type. Apart
from utensils, a limited number of articles which are a symbol of Assam’s culture like a ‘Sarai’ and
‘Bata’ are produced. One form of Assamese musical instrument called ‘Taal’ which is used in the
religious and cultural performances is also made out of bell-metal. Some of the products currently
produced and the various sizes in which they are produced are listed below:
PRODUCT NAME SIZES
Jail Baati 100-1300
Charach Jail Baati 200-900
Bahir Kanor Baati 200-900
Charach Bahir Kanor Baati 200-900
Aachli Bahir Kanor Baati 200-1300
Jul Khonda Soriya 1100-3000
Bhor Taal 200-5000
Saadha Jail Kahi 200-3000
Charach Jail Kahi 900-2500
Aachli Charach Jail Kahi 500-2500
Jail Ban Kahi 700-2500
Charach Jail Ban Kahi 700-2500
Aachli Charach Jail Ban Kahi 900-3000
Sanda Pehi Lota 500-700
Plate Bata 200-600
Pasang Taal 1000-3250
Table:1 Present product variants and their size ranges
Source: Records of Assam Bell-metal Cooperative Society Limited
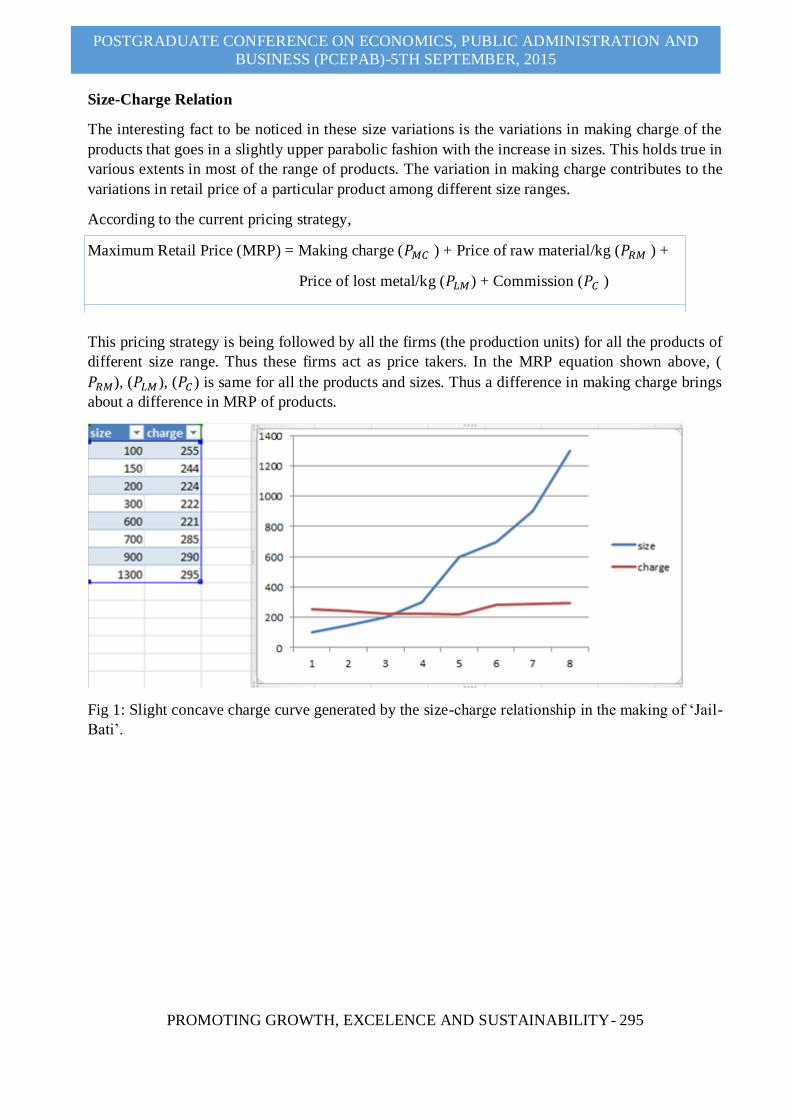
POSTGRADUATE CONFERENCE ON ECONOMICS, PUBLIC ADMINISTRATION AND
BUSINESS (PCEPAB)-5TH SEPTEMBER, 2015
PROMOTING GROWTH, EXCELENCE AND SUSTAINABILITY- 295
Size-Charge Relation
The interesting fact to be noticed in these size variations is the variations in making charge of the
products that goes in a slightly upper parabolic fashion with the increase in sizes. This holds true in
various extents in most of the range of products. The variation in making charge contributes to the
variations in retail price of a particular product among different size ranges.
According to the current pricing strategy,
Maximum Retail Price (MRP) = Making charge (𝑃𝑀𝐶 ) + Price of raw material/kg (𝑃𝑅𝑀 ) +
Price of lost metal/kg (𝑃𝐿𝑀) + Commission (𝑃𝐶 )
This pricing strategy is being followed by all the firms (the production units) for all the products of
different size range. Thus these firms act as price takers. In the MRP equation shown above, (
𝑃𝑅𝑀), (𝑃𝐿𝑀), (𝑃𝐶 ) is same for all the products and sizes. Thus a difference in making charge brings
about a difference in MRP of products.
Fig 1: Slight concave charge curve generated by the size-charge relationship in the making of ‘Jail-
Bati’.

POSTGRADUATE CONFERENCE ON ECONOMICS, PUBLIC ADMINISTRATION AND
BUSINESS (PCEPAB)-5TH SEPTEMBER, 2015
PROMOTING GROWTH, EXCELENCE AND SUSTAINABILITY- 296
Fig 2: Size-charge relationship in making of ‘Bhor Taal’.
From the analysis of size-charge relationships, two significant trends have been noticed. In
products like ‘Jail Bati’, ‘Bhor-Taal’, and ‘Aachli-Bata’ the charge curve takes a slightly concave
shape in its middle size range portions. This indicates that the making charge of smaller sized
products are high and as the size range increases the making charge decreases for a while and after
a point, the making charge further increases. In the shaping of the middle size ranged products the
processes can be carried out in bulk. Hence the making charge is less. But the large sized products
cannot be shaped in bulk and has to be processed one at a time. Thus more human effort goes into
the making of large sized products and so their making charge is also high. As for the small sized
products, a lot of time and effort goes in the intricate designing process.
Fig 3: Size-Charge relationship in making of ‘Jail Ban Kahi’

POSTGRADUATE CONFERENCE ON ECONOMICS, PUBLIC ADMINISTRATION AND
BUSINESS (PCEPAB)-5TH SEPTEMBER, 2015
PROMOTING GROWTH, EXCELENCE AND SUSTAINABILITY- 297
Fig 4: Size-Charge relationship in making of ‘Charach Jail Kahi’
The second trend has been noticed in the making of ‘Jail Ban Kahi’ and ‘Aachli Charach Jail
Kahi’. The former is a specially designed dish with three stands. The latter is a supreme quality
dish. Both of these are big sized products with even size variations ranging from 700-3000 for the
former and 500-2500 for the latter. Thus these can also not be prepared in bulk. Manufacturing
such items consumes a lot of time and effort. Hence from the flat shaped charge curve it can be
seen that irrespective of the size of the product, the making charge is same for all the products.
Field Survey and Data Collection
In order to have a deeper insight into the demand for these products and their supply status two
detailed survey was conducted. The first survey was the supply side survey and the second was the
demand side survey. The intention was to search for solutions to enhance the profitability of the
industry. So efforts were made to find out whether there are some demand and supply side factors
which are accountable for the invisible profits. Data collection was both primary and secondary.
For the primary data collection, structured interviews with the respondents were carried out.
Respondents were selected through a purposive sampling method (for the demand side survey) and
proportional sampling method (for supply side survey). In the supply side survey, addresses of the
factory units were collected from the Assam Bell-metal Cooperative Society Limited Head office,
Sarthebari. The factory units were separately listed based on the commodity produced. The sample
factory units were randomly picked from the list of units manufacturing various commodities in a
proportional manner. Secondary data was collected for the records of the Assam Bell-metal
Cooperative Society Limited. Reports of net profits, no. of operating units, amount of raw
materials used, the value addition in each stage of production, cost of raw materials, commission to
be paid, etc. were collected. The above details were collected for the last ten years. The primary
data was collected from 112 respondents; 40 for the demand side survey (in Sarthebari, Guwahati,
Tezpur and Dibrugarh towns of Assam) and 72 for the supply side survey (from Sarthebari town).

POSTGRADUATE CONFERENCE ON ECONOMICS, PUBLIC ADMINISTRATION AND
BUSINESS (PCEPAB)-5TH SEPTEMBER, 2015
PROMOTING GROWTH, EXCELENCE AND SUSTAINABILITY- 298
Analysis of the Data
The survey conducted for demand side analysis and supply side analysis was mostly a market
survey with nominal inputs. Both the dependent and independent variables were nominal in nature
with more than two categories. So for the analysis, the data was grouped by categorising
respondents into some characteristic nominal categories. The cross sectional, qualitative data was
then tabulated and entered in IBM SPSS Statistics 21. In the demand side analysis, the dependent
variable is product demand frequency, which had three categories namely high demand, occasional
demand and rare demand. The response variables in the demand side are purchase purpose, price
response, product preference, quality awareness and willingness, diversification response, purchase
source and sales strategy. In the supply side, the dependent variable is supply volume and the
response variables are producer’s problems, threat due to machine made products, source of raw
materials, sites of distribution of finished products, supply of fuel, employment duration, seasonal
unemployment, desire to join other means of livelihood, education level and land ownership. The
dependent variable supply volume has three categories namely high supply, occasional supply and
rare supply. Cross tabulation analysis was carried out to analyse the data.
Supply side Analysis
Table 2: Cross Tabulation analysis between producers’ problem and supply volume
The supply analysis reveals that out of 72 respondents questioned, 50% are high suppliers, 30.6%
are occasional suppliers and 19.4% are negligible suppliers. For 54.2% respondents, lack of raw
materials is one of the main problems of the industry, 25% says lack of working capital is one of
the main issues while the remaining 20.8% pointed the lack of financial assistance as the pressing
problem faced by the industry. Lack of working capital is the main cause behind the negligible
supply as reported by 57.1% of the negligible suppliers. Any situation which can eliminate this
worry of the problem of working capital among the artisans can help in boosting the supply
volume by this group of negligible suppliers. With a significance value of 0.021 which is less than
0.05 (from Pearson chi-square test), there appears to be a significant association between the
problems associated with the industry and the supply volume of bell-metal products.
Though the volume of bell-metal products supplied by the local suppliers of the industry is quite
sufficient, yet the market is flooded with cheap machine made products from Moradabad, Uttar
Pradesh. These products are machine made at lower cost and hence their MRP is also low. They

POSTGRADUATE CONFERENCE ON ECONOMICS, PUBLIC ADMINISTRATION AND
BUSINESS (PCEPAB)-5TH SEPTEMBER, 2015
PROMOTING GROWTH, EXCELENCE AND SUSTAINABILITY- 299
are lighter and more lustrous than the traditionally produced articles as they are polished using
sophisticated machineries. However the durability of this machine- made products is low when
compared to the traditionally made bell-metal products. The traditionally made products fetch
good value even when they are broken as the decrepit broken pieces of bell metal serve as a
valuable raw material for further manufacturing of new products. The machine made products
loses their value once they are broken. Most of the consumers do not know how to differentiate
between these two differently made products and the machine made products being cheap sale
more.
Table 3: Cross Tabulation analysis between supply volume and threat due to intrusion of machine
made product
As shown by the table above, 76.4% of the artisans feel a threat due to the flooding of the market
by the machine-made product and 23.6% still believe that the machine-made products cannot
outsmart the original traditional manufactured products. All the negligible suppliers reported a
feeling of threat from the machine made products. The feeling of threat from the flooding of the
market by the machine made products also seems to be associated with the volume of bell-metal
supply. Thus new provisions are required which would ensure the trademarking of the traditional
products. This would bring a brand value and hence would serve as a shield against the threats
from machine made products.
For the provision of raw materials, about 62.5% of suppliers are still heavily dependent on the
traders, 22.2% depend on the Assam Bell-metal Cooperative Limited while a small fraction 15.3%
purchase raw materials themselves against loans. While 78.6% of the negligible suppliers purchase
raw materials annually against loans from private money lenders at high rate of interest, the rest of
the high and occasional suppliers are heavily dependent on the traders for their supply of raw
materials. Though there are banking services in rural areas of Sarthebari and adjoining areas,
however the artisans find taking loans from the private village money lenders an easier option. If
however they are not able to repay their loan amounts in time, they cannot purchase any raw
material for the next year. As a result, such production units are forced to remain closed till they
are able to repay all the multiplying loan amounts. Closure of the units again leads to seasonal
unemployment. The statistics are displayed in the cross tab below.

POSTGRADUATE CONFERENCE ON ECONOMICS, PUBLIC ADMINISTRATION AND
BUSINESS (PCEPAB)-5TH SEPTEMBER, 2015
PROMOTING GROWTH, EXCELENCE AND SUSTAINABILITY- 300
Table 4: Cross tabulation analysis between supply volume and source of procuring raw inputs
The analysis of the sources of supply of finished products reveals that 55.6% of suppliers supply
their finished products to the traders while 31.9% supply it to the Assam Bell-metal Cooperative
and the remaining 12.5% of the artisans sell their finished products themselves. According to
previous study conducted on the bell-metal industry, most of the artisans who procure their raw
materials from the traders are obliged to sell back the finished products to the traders. In the
process, the artisans just receive the making charge while the major share of profit is reaped by the
traders. This obligation leaves the artisans with no incentives to produce more and improve the
existing products in terms of design and diversity. Also 77.8% respondents reported irregular and
insufficient supply of fuels which also results in seasonal closure of the production units.
While 66.7% are employed throughout the year, the remaining 33.3% are not employed
throughout. These seasonal unemployment again arises not due to a lack of demand for labour, but
because the firms are not able to continue production. The survey conducted reveals that 73.6%
were not able to continue production due to shortage of raw materials, 23.6% were in debt and had
to shut down the production units and a negligible fraction (only 2%) had some demand issues.
Thus there is a need for some association or some common centres that takes care of the supply of
raw materials and fuel. Any effort in this direction shall help artisans to deviate their effort and
concentration in the upgradation of production techniques, diversifying the range of products and
evolution of new designs within each product.
Education level doesn’t directly impact the supply volume; but results from the cross tab reveals
that a majority of the artisans (40.3%) are 10th pass while 36.1% have an education qualification of
senior secondary education or above (12th) and only 23.6% of the artisans are school dropouts. On
the land ownership front, 38.9% has some other forms of property ownership; the remaining 61.1%
has no other property ownership.

POSTGRADUATE CONFERENCE ON ECONOMICS, PUBLIC ADMINISTRATION AND
BUSINESS (PCEPAB)-5TH SEPTEMBER, 2015
PROMOTING GROWTH, EXCELENCE AND SUSTAINABILITY- 301
Demand side Analysis
Table 5: Cross Tabulation between demand frequency and purchase purpose
Table 6: Cross Tabulation between demand frequency and price response
The demand side analysis reveals that 45% customers purchase bell-metal products for daily use,
40% for cultural use and 15% for aesthetic purpose. The rare demanders demand mainly for
cultural purpose (85.7%), followed by aesthetic purpose (14.3%) and none for daily purpose.
Among the occasional demanders, 53.3% purchase for cultural purpose, 26.7% for daily purpose
and 20% for aesthetic purpose. Among the high demanders, 77.8% purchase for daily purpose.
With a Pearson Chi square value of 0.002, there is a significant association between the purchase
purpose and product demand. One main point that can be taken to the advantage of the bell -metal
industry is that since 55% customers purchase bell-metal products for purposes other than daily
use, therefore its demand is mainly price inelastic. Thus a price increase to some extent will not
significantly reduce demand. This is supported by the analysis of price response with product
demand. 55% respondents reported that they would be unaffected by a price change and 12.5%

POSTGRADUATE CONFERENCE ON ECONOMICS, PUBLIC ADMINISTRATION AND
BUSINESS (PCEPAB)-5TH SEPTEMBER, 2015
PROMOTING GROWTH, EXCELENCE AND SUSTAINABILITY- 302
said their purchase would increase with an increase in price of the products. Although 32.5% said
that their purchase of the product would decrease with an increase in price, but 85.7% of such
respondents are rare demanders. So a price increase of product would not reduce their demand for
the same.
Similarly, cross tabulation of customer preferences with product demand reveals that 82.5%
customers prefer quality products, 10% prefer good looking products while 7.5% considers price
of the products as their preferences. 42.9% of those whose preference lies on the price of products
are again rare demanders. There is a significant influence of customer preferences with product
demand. 87.5% of the customers also indicated a willingness to learn how to identify between
traditionally made durable products and machine made non-durable products. While 72.5%
supported product diversification, 27.5% said they were satisfied with the currently available range
of products. However, diversification response of customers simply reflected their opinion and
eagerness to purchase different product variants. It in no way directly affects their product demand.
Among 40 customers who were interviewed, 60% advocates popularisation as the strategy that
should be used to increase sales of bell-metal products, 22.5% suggests using price strategy to
increase sales and 17.5% suggest that diversification of bell-metal products should be used as a
strategy to increase sales. Among the respondents who support price strategy, 57.1% are rare
demanders, 20% are occasional demanders and 11.1% are high demanders. However, customers’
view on strategies to increase sales of bell-metal products is also not directly associated with their
demands for the bell-metal products.
A faulty operating system & Design of an alternative
Based on the findings of the cross tabulation analysis, the loopholes of the bell-metal industrial
framework have been identified. The core problem found to be interrelated in the demand and
supply situations of the entire industry lies in the framework in which the bell-metal industry is
currently functioning. There are three formal parties: the traders, the artisans and the Assam Bell -
metal Cooperative Society Limited. While the former two act as dominant players the last is only
an authority for the sake of name as it functions very passively. The traders’ sources the raw
materials (broken metals) and the artisans purchase raw materials from these traders under the
obligation to sell back most of the finished products back to them. In the current framework, there
appears to be an absence of a regulatory body or an association which could look into matters
pertaining to finances and working capital; procuring raw materials and selling of finished
products, etc. which is under the present system a responsibility of the production units
themselves. Overburdening artisans with irrelevant duties lowers their productivity. Secondly, the
bell-metal industry does not have any proper records of their expenses incurred. As stated by the
President of Assam Bell-metal Cooperative Society Limited, they do not receive any invoice of all
the major financial dealings carried out with the Marwari traders of Guwahati as the bell-metal
industry is exempted from the tax system. Thus the industry does not have details of how a sum of
Rs 2 crores granted by the Government of India has been utilised. There is another sum of Rs 3
crores allocated in the name of Assam Bell-metal Cooperative Society Limited granted during the
same time. But the Society is not able to withdraw the same amount due to their inability to
produce the invoices of the past expenses incurred. The third and the most important problem lies
with the overdependence of the manufacturing units with the traders who as a consequence has

POSTGRADUATE CONFERENCE ON ECONOMICS, PUBLIC ADMINISTRATION AND
BUSINESS (PCEPAB)-5TH SEPTEMBER, 2015
PROMOTING GROWTH, EXCELENCE AND SUSTAINABILITY- 303
started controlling the profits of the industry, leaving very little incentives with the artisans
themselves.
Currently, the bell-metal industry is almost a perfectly competitive market, where there are many
production units, each functioning like an independent firm. Each of these firms produces exactly
the similar products and takes the price determined by the market. There is a very low entry barrier
in the present industrial framework. New firms can start with an investment as less as Rs.30, 000-
40,000. The demands for the products are more or less the same irrespective of the prices.
Fig 5: The present operating framework of the Bell-metal Industry
An Alternative Operating Framework
The perfectly competitive industry can be converted into a monopoly industry under the name of
bell-metal industrial village. The RCFS (Reorganised Common Facilities Services Unit) will serve
as the head centre, controlling all the core functions of the reorganised cluster. The other
production units will be brought under one common umbrella of the production wing of the RCFS.
There would be 8 different sub units: the grinding unit, the melting furnace, the moulding unit, the
rolling unit, the shaping unit, the annealing and fixing unit, the designing unit and the polishing
unit. These sub divisions are based completely on the specialised divisions of manufacturing
process. All the artisans formerly associated with the task of grinding in the family product ion
units would be pooled together in the grinding unit. The same would hold for all the other units.
The raw materials would be procured by the RCFS ant the artisans would no longer need to worry
about the issues related to procuring raw materials like taking loans, shutting down units if unable
to repay the loans, laying off of artisans in order to downsize the production units due to lack of
fund, etc. The artisans in the grinding unit would work together for grinding the broken decrepit

POSTGRADUATE CONFERENCE ON ECONOMICS, PUBLIC ADMINISTRATION AND
BUSINESS (PCEPAB)-5TH SEPTEMBER, 2015
PROMOTING GROWTH, EXCELENCE AND SUSTAINABILITY- 304
metal. Then those would be sent to the melting unit where melting can be done faster and easily in
large melting furnace. The molten metal would then be sent to the moulding unit where the hot
molten metal would be placed in different sized aafars to take the desired shape and size. After
they are cooled into lumps, these would be sent to the rolling unit where all the lumps can be rolled
into sheets using the rolling machine which is currently done either by hand or are taken to some
far village for rolling, a very time consuming affair. The rolled sheets would then be sent to the
shaping unit where they would be given the desired shape and form. The next unit in the octane is
the annealing and fixing unit. This is required for some products like the ‘ban bati’, ‘bata’, ‘jail ban
kahi’ etc. which are made in two separate parts and are subsequently joined together. The next unit
of the octane is the designing unit, where the intricate designs would be engraved on the products.
These would then finally be sent to the polishing unit, where the product will take the final shape.
The finished goods would be sent back to the production unit which will subsequently be
transferred to the marketing unit through the RCFS. The marketing unit would take the
responsibility of selling the products, popularising the products through advertising, expansion of
the market, etc. The marketing unit would also be responsible to collect the broken metal from the
customers and other sources. The income earned by selling the finished products would be spent
again for the further function of the units. The marketing units would also take responsibility of
appointing specialised designers in order to brainstorm into possible ways of product
diversification. Training facilities would be organised by the RCFS in which artisans from one unit
would be sent to the subsequent units for training and skill enhancement.
The artisans would receive a fixed salary for their service which would be taxable minimally. But
for every additional piece of product produced they would be paid additional payment as bonus.
The bonus would not be taxed and this would be an incentive for the artisans to produce more. All
the collected taxes would be collected in one common fund in the name of RCFS. Presently, there
are no provisions of artisan pensions after they leave the units due to their inability to work during
old age. Also many artisans suffer from numerous health problems like asthma, other breathing
difficulties due to constant exposure to fire and smoke; eye disorder, muscle pain and join pain,
etc. The collected tax would provide pension schemes to artisans who would work for a minimum
of 15 years. The main wealth of the industry is the skills of the artisans. So the wealth of the
industry would be insured by giving health cover to all the artisans working in any of the units.
Also other youth from the village currently involved in agriculture, and other small jobs can work
in this unit as part time depending on the availability of slots. They would be paid based on per
unit of article produced. This system would wipe out the problem of seasonal unemployment
among youths when their crop fails due to irregular monsoon or when their business shuts down.

POSTGRADUATE CONFERENCE ON ECONOMICS, PUBLIC ADMINISTRATION AND
BUSINESS (PCEPAB)-5TH SEPTEMBER, 2015
PROMOTING GROWTH, EXCELENCE AND SUSTAINABILITY- 305
Fig 6: The proposed RCFS centered Bell-metal industrial Octane
The profits generated by selling bell-metal products, the tax collected and other grants received
would be the fund of the RCFS and its wings. This framework under which the industry would be
transformed into a monopoly industry framework, all benefits of a monopoly industry can be taken
to raise the profits margin. The demand for bell metal products being price inelastic, the prices can
be increased for all the products without losing demand for it. Again prices can be increased
specifically on the smaller and the larger sized products as described by the charge curve through
the size-charge relationship. This new framework would increase the productivity of the artisans be
shifting their focus only into the making of bell-metal products. By increasing the size of the
industry, it can also reach internal economies of scale and benefit henceforth. The RCFS is thus a
win-win situation for all.
Conclusion
This paper explores the bell-metal industry of Assam in an indepth manner. All aspects of the
industry and also the artisans and their socio-economic lives were explored. The artisans were
found to be unconditionally passionate about their work in the industry. Their passion towards the
craft even supersedes their expectations of profit from the trade. Most of the factory units seemed
to care less about the payments that accrued to them. They seemed to fail to realize the value of
their skills. When interviewed about their efforts to move towards the machine based production
process, a reluctant effort was found to prevail among the artisans. Apart from the lack of working
capital to move towards such process, doubts about the durability of machine made bell metal

POSTGRADUATE CONFERENCE ON ECONOMICS, PUBLIC ADMINISTRATION AND
BUSINESS (PCEPAB)-5TH SEPTEMBER, 2015
PROMOTING GROWTH, EXCELENCE AND SUSTAINABILITY- 306
products is the rationale behind their reluctance. The machine made products would bring more
profits to the artisans, but they prefer losing increments in profit to maintaining the quality and
originality of products. This is something to be appreciated of course, but what is wrong about this
attitude is that the increasing threat from similar looking machine made products from some other
states of India might wipe out the very roots of the bell-metal industry; the bell-metal industry of
Sarthebari in Assam. The alternative operating framework controlled through RCFS with a
somewhat monopoly structure can bring solutions to this problem apart from solving other socio-
economic concerns of the lives of the artisans. However reorganising such a scattered industry into
a systematic monopoly industry will need some time and government initiative. This framework
cannot be put into operation without State’s initiative, which is its limitation. This paper answers
the question as to how the bell-metal industry of Sarthebari can be retained; use of diversity in
product variants to suit the tastes of existing customers and at the same time how negligible
demanders can be brought into the category of occasional or high demanders. It looks into how the
business operations be flourished in the state. It has not explored on possibilities and means to
expand the bell-metal industry in a national level and among neighbouring nations. This was a
limitation of the present paper which subsequent researches in this area can explore. Nevertheless,
this research suggests a highly promising operating framework based on consumer preferences and
keeping in view producers’ problems, which has the potential to bring back the ‘invisible profits’
back to the artisans. All that is required is- ‘reorganisation, commitment and diversification’.
Success and prosperity of the SME will automatically follow.
References
Das, M., Bayan, B., & Choudhury, B. (2011). Socio-Economic Aspects of Bell Metal Industry
Workers of Sarukhetri Block of Barpeta District, Assam. Economic Affairs, 56(2), 147-151.
Das, R., & Das, A. K. (2012). Industrial cluster: an approach for rural development in North East
India, International Journal of Trade, Economics and Finance, 2(2)
Deka A. (2014), Bell and brass metal in Assam present status and prospects for development in the
changing market environment, PhD Thesis Gauhati University, Indian ETD
Repository@INFLIBNET7
Hadjimanolis, A. (1999). Barriers to innovation for SMEs in a small less developed country
(Cyprus). Technovation, 19(9), 561-570
Huggins, R., & Thompson, P. (2015). Entrepreneurship, innovation and regional growth: a
network theory. Small Business Economics, 45(1), 103-128
Hussain, S. (2015). Socio-Economic and Structural Analysis of Cottage Industries In Assam And
Comparison With Other North-Eastern States Of India. Asian Journal of Multidisciplinary
Studies, 3(2)
Kaufmann, A., & Tödtling, F. (2002). How effective is innovation support for SMEs? An analysis
of the region of Upper Austria. Technovation, 22(3), 147-159

POSTGRADUATE CONFERENCE ON ECONOMICS, PUBLIC ADMINISTRATION AND
BUSINESS (PCEPAB)-5TH SEPTEMBER, 2015
PROMOTING GROWTH, EXCELENCE AND SUSTAINABILITY- 307
Keeble, D., & Wilkinson, F. (1999). Collective learning and knowledge development in the
evolution of regional clusters of high technology SMEs in Europe. Regional studies, 33(4), 295-
303
Khadria, N. (1990). Traditional Crafts and Occupational Structure of the Assamese Rural Society
in the 19th Century. Social Scientist, 36-63
Pietrobelli, C., & Rabellotti, R. (2006). Upgrading to Compete Global Value Chains, Clusters, and
SMEs in Latin America, David Rockefeller Center for Latin American Studies Harvard University
Roy, R. (2014). “Entrepreneurship Evolution of Cluster Industry in Assam” with special emphasis
to Bell metal Industry of Sarthebari, International Journal of Research in Management &Business
Studies, 1(3)
Sarma J.K (1978), Bell Metal Workers of Assam, Economic and Political Weekly, Vol 13(42), pp
1764-1765
Sato, Y. (2000). Linkage formation by small firms: the case of a rural cluster in Indonesia. Bulletin
of Indonesian Economic Studies, 36(1), 137-166.
Slade, M. E. (1991). Strategic pricing with customer rationing: the case of primary
metals. Canadian Journal of Economics, 70-100

POSTGRADUATE CONFERENCE ON ECONOMICS, PUBLIC ADMINISTRATION AND
BUSINESS (PCEPAB)-5TH SEPTEMBER, 2015
PROMOTING GROWTH, EXCELENCE AND SUSTAINABILITY- 308
The Mechanics Behind Environmental Strategies in Chemical
Manufacturing Firms
Keshminder Singh1, 2
1Centre for Economics and Finance Studies (CfEFS), Faculty of Business and Management
University Teknologi MARA
40450, Selangor, Malaysia
Email: [email protected]
VGR Chandran
Department of Development Studies, Faculty of Economics and Administration
University of Malaya
50603, Kuala Lumpur, Malaysia
Email: [email protected]
Santha Chenayah@Ramu 2Department of Economics, Faculty of Economics and Administration
University of Malaya
50603, Kuala Lumpur, Malaysia
Email: [email protected]
Abstract
The evaluation of an effective environmental strategy goes beyond understanding its antecedence and benefits. In
this aspect, identifying and understanding the multiple mechanics behind the formulation, design and
implementation of environmental strategies serve as an important avenue and so far, there is no clear evidence
in past studies indicating these mechanics. We, in this paper, explored the environmental management strands of
literatures regarding corporate environmentalism to expand and identify the internal mechanics behind the
environmental strategies in large Malaysian chemical manufacturing firms. Given the exploratory nature of the
study, a case study method using a semi-structured interview is used to ascertain these mechanics. Interestingly,
the results revealed seven important mechanics of the environmental strategies in large chemical firms. Among
them include a central system, internal system, quantifiable measurement, specific environmental management
unit, strategy alignment, collaboration and collective involvement. These mechanics are later clustered into two
categories, system and commitment, with regard to the role that they play in the environmental strategy of firms.
Additionally, powerful and influential top management commitments were found to contribute towards the
initiation of these mechanics. The findings also validate the past evidences in the context of a developing country, specifically for the chemical industry.
Keywords: mechanics of environmental strategy, chemical industry, environmental
orientation.

POSTGRADUATE CONFERENCE ON ECONOMICS, PUBLIC ADMINISTRATION AND
BUSINESS (PCEPAB)-5TH SEPTEMBER, 2015
PROMOTING GROWTH, EXCELENCE AND SUSTAINABILITY- 309
Exploring Motivational Factors towards Sustainable
Consumption: An empirical study in Malaysia
Leila Baktash
Department of Applied Statistics, Faculty of Economic & Administration,
University of Malaya
50603, Kuala Lumpur, Malaysia
Email: [email protected]
Muzalwana Abdul Talib
Department of Applied Statistics, Faculty of Economic & Administration,
University of Malaya
50603, Kuala Lumpur, Malaysia
Email: [email protected]
Abstract
Changing consumption and production pattern owing to rapid urbanization, economic and social dynamics,
have become great challenges to movements towards sustainable development in many developed and
developing nations. Unsustainable consumption gives rise to huge negative externalities of greenhouse gas
emission which lead to environmental degradation. Transformation in consumption pattern requires substantial
reorganization of the society and changes in lifestyles to encourage the preservation of natural environmental
endowment. Part of consumption transformation is by promoting ‘green’ household consumption specifically the
green products. In the case of Malaysia, speedy urbanization, consumption and lifestyles step up the resource-
waste problems. The major aim of this study is to determine the influent factors of Malaysian customers green
perception on loyalty towards green purchase. The factors include several marketing mix elements, namely,
price, promotion and place; and two intrinsic motivational factors: trust and quality. The key findings indicate
three factors: trust, quality and place have significant impact on customer loyalty towards green products. The
result can shed light on the development of new strategies in promoting green products and technological
advancement in green product innovation. Green product enhancement would further accelerate customer
loyalty and, in consequence, transforming consumers to embark on sustainable consumption.
Keywords: Customer loyalty, Green product, Promotion, Quality, Trust, Price, Place,
Malaysia
1.0 Introduction
Within the last decades, the consumption and production pattern have severely impacted the
environmental sustainability. Speedy economic growth and increasing population number
over the years would largely contribute to unsustainable consumption if the public are not
well-informed on which ones are the best-performing products and how to make the most
efficient use of the products. Malaysia, for example, is a country with impressive
developmental progress for years, however, there are clear evidences of negative externalities
on the environment. For example, most of the clean rivers are polluted because of unsuitable
emissions by sewage treatment plants, factories, farm animal, land destruction by cutting trees
and domestic solid waste disposal (Adham et al, 2013).

POSTGRADUATE CONFERENCE ON ECONOMICS, PUBLIC ADMINISTRATION AND
BUSINESS (PCEPAB)-5TH SEPTEMBER, 2015
PROMOTING GROWTH, EXCELENCE AND SUSTAINABILITY- 310
There are numerous environmental issues need to be properly addressed. Although Malaysia
was ranked as a 25th in terms of Environmental Performance Index (EPI) in 2011 in the
world, there is still a need to speed up the rate of the environment upkeep so as to reduce
environmental degradation. With the escalating needs for socio-economic advancement, due
to increase in people’s living standard and quality of life, it is necessary to ensure that
Malaysia’s economic growth is, at least, at par with the efforts which foster environmental
sustainability. Different policies need to be mainstreamed to promote sustainable consumption
and production practices for a balanced country’s future development. In the case of Malaysia,
the government SCP-related instruments include regulatory, economic and education, to name
a few (Adham et al., 2013). From the business perspective, the role can be made realized
through current business process such as innovation, marketing and communications and by
working in partnership with consumers (WBCSD, 2008).
The dawn of green concepts has carved the footprints towards environmental protection,
sustainable life style and sustainable development. The green culture need to be instilled and
the customers’ current habitual consumption behavior that are unsustainable need to be
changed (WBCSD, 2008). Nevertheless, consumer willingness to act on environmental
concerns would not be translated into sustainable behavior without factors like availability,
convenience, performance or any related information on the green products. Green marketing
is one of the strategic marketing plan aims to reduce the effects on the environment by design,
produce packaging, labeling and consumption (Delafrooz et al. 2013) It focuses on the ideal
marketing mix to achieve maximum profit potential while adhering to sustainability
principles. (Gittell et al, 2015). One of the effective green marketing strategies is understand
the market and the underlying values and beliefs of the consumers and develop a marketing
plan that aligns well with the values, beliefs, desires for qualities and affordability. Generally,
marketers would develop their strategies around these areas in marketing to enhance branding,
sales and profitability, hence creating a sustainable marketing strategy (Gittell et al, 2015)
Through green marketing, organizations use their environmental consciousness as a marketing
tool which act as a competitive advantage (Kontic & Biljeskovic, 2010). With the need to go
‘green’, it is now a high time for business organizations to opt for green marketing globally
(Bhalerao, 2014). Studies have shown that green marketing activities based on the marketing
mix elements, have had an important influence on increasing consumer knowledge and thus,
shifting consumers into purchasing green products (Delafrooz et al., 2013; Juwaher et al.,
2012; Cohen, 1973). Essentially, the intrinsic influent factors to purchase intention, and
insofar as customer`s loyalty to repurchase the green products are concerned, quality and trust
need to be taken into account. As also been discussed, green marketing strategies could be
fostered to earn consumer trust (Ottman & Mallen, 2014) and in another media form, it was
reported that trust, is actually the key to sustainable consumption (Upchurch, 2013).
The primary objective of this study is to identify the relationship between green perceived of
three marketing mix variables and two intrinsic factors on customer’s loyalty towards green
purchase. This study should shed a light on the business marketing strategy development so as
to increase customer perceived quality and trust and further promote customer`s green

POSTGRADUATE CONFERENCE ON ECONOMICS, PUBLIC ADMINISTRATION AND
BUSINESS (PCEPAB)-5TH SEPTEMBER, 2015
PROMOTING GROWTH, EXCELENCE AND SUSTAINABILITY- 311
purchase loyalty. The next section of this study focuses on review of previous studies,
followed by the conceptual framework. The section on Methodology explains the
Confirmatory factor analysis (CFA) and Structural Equation Model (SEM) to test the
reliability of the determinants and hypotheses of the study and data collection method. In
addition five related hypotheses on the key expected relationships were explained. In the
section ‘Results and discussion’ the finding of the CFA and SEM analysis were presented.
The last section includes the concluding part on the analysis for researchers in making new
strategies and policies.
2.0 Literature review and conceptual framework
Numerous research studies have indicated that today’s consumers are more concerned and
conscious about the environmental impact due to their daily consumption. For instance, the
study by Dagnoli(1990,1991) and Klein (1990) showed that 60 to 90 percent of consumers
would relate their purchasing habit to its environmental impact. There are several factors
which have shown significant effect on green purchase intention based on previous research
work. Some of these factors are similar in a number of studies, like consumer confidence and
satisfaction derived from the products. Based a study by Lassoued (2015) on food products,
consumers put more confidence on the credence attributes of the products i.e. brand quality
and safety, which are basically, intrinsic nature of the product. Likewise, trust is the other
intrinsic factor contributing consumer confidence, which is the key driver to brand loyalty and
hence purchase intention. A study by Aktepe and Toklu (2014) has shown the impact of
customer satisfaction on product loyalty. Their study was on loyalty towards organic products
in Indonesia by utilizing classification algorithms and Structural Equation Modeling. In
another study, positive effect of customer satisfaction and green purchase intention also has
been revealed (Morel, 2012). This study also explored the effect of four traditional marketing-
mix elements (price, promotion, products and place), as well as word of mouth (WOM) on
consumer`s attitude towards purchasing eco-friendly products specifically fasting moving
consumer goods or non-durable ones. The study concludes the important factors affecting
customer`s intention towards purchasing eco-friendly products are word of mouth and
advertising on green product itself. Word of mouth is a form of communication that is
happening between individuals and the people they trust: friends, family other users and
consumer organizations. To a certain extent, this word of mouth form pillars of trust which
could influence on the purchase intention of green products (Upchurch, 2013). Of the same,
overall positive correlation between effective green marketing strategies and customers’
purchase pattern for green products has been proved in a study on the impact of green
marketing on customers’ perception on environmental concerns and green products in
Mauritius (Juwaheer et al., 2010). Based on a study by Qinqin Liang (2014) on green
electronic products in China, all factors under study; attitude toward green purchase, green
perceived value, subjective norm and green trust show significant positive effect on purchase
intention. The study on green purchase has been extended to exploring leveraging factors for
sustained green consumption behavior based on consumption value perceptions. Two factors

POSTGRADUATE CONFERENCE ON ECONOMICS, PUBLIC ADMINISTRATION AND
BUSINESS (PCEPAB)-5TH SEPTEMBER, 2015
PROMOTING GROWTH, EXCELENCE AND SUSTAINABILITY- 312
found to be the most effective are customer`s price and knowledge perception that the
outcome of sustained green consumption is to pay the green price premium (Biswas et al,
2015).
One of the studies conducted in Malaysia by Wong et al (2012) on factors affecting youth
attitude in purchasing green products conducted in Malaysia and Singapore, four significant
factors which are perceived consumer effectiveness, health consciousness, attitudes toward
the environment, and social influence. Another study by Rizwan, et al (2013) explore the
influence of three intrinsic factors, namely, green perceived value, green perceived risk, and
trust on purchase intention based green marketing. The results show perceived value and risk
significantly related to trust and in consequence, towards purchase intention. The study,
however, does not discover any correlational relationship between value and risk. Jen Mei et
al (2012) reported findings from their study on antecedents of green purchase intention among
Malaysian consumers to determine the factors influence the green purchase intention. Some of
factors identified to have substantial influence on green purchase intention are environmental
knowledge; environmental attitude, governmental initiative and peer pressure.
Lee (2008) stated there is vast research work on green marketing in the Western countries
while this is not the case for the countries in Asia as such more of similar studies should be
done in the countries in these regions. Although many scholars in Malaysia agree on the
tremendous growth of green consciousness among the Malaysian consumers, the aspects of
purchase behavior are largely unobserved (Goh & Nabsiah, 2015; Kong et al. 2014). For this
study, a theoretical framework is adopted to explore the effect of green perception towards
green loyalty for several marketing mix elements, namely, price, place and promotion; and
two intrinsic motivational factors that are quality and trust. On realizing the strategic
importance of marketing mix and intrinsic factors on enhancing green product loyalty, the
conceptual model is proposed as shown in Figure 1. The conceptual framework for this study
exemplifies a number of relationships between green perceived marketing mix; promotion,
price, place;, and intrinsic factors i.e. quality and trust onto customer`s loyalty towards green
purchase. Figure 1 illustrates the hypothesized factors and outcomes of consumer loyalty
towards green purchase.
Figure 3: Proposed Research Model

POSTGRADUATE CONFERENCE ON ECONOMICS, PUBLIC ADMINISTRATION AND
BUSINESS (PCEPAB)-5TH SEPTEMBER, 2015
PROMOTING GROWTH, EXCELENCE AND SUSTAINABILITY- 313
The proposed conceptual framework considers three marketing mix elements; price,
promotion and place as the green marketing factors influencing the purchase intention, that
has attracted a large body of research. The framework also incorporates the imperative
intrinsic factors such as trust and quality which proven to have profound impact on green
purchase decision. It is important to highlight that the dependent construct of the model is
green product loyalty, a construct which is under-researched within the context of Malaysian
consumers.
3.0 Methodology
3.1 Hypotheses
The primary objective of identifying the association between green perceptions on several
marketing mix variables: price, place, promotion; and intrinsic factors of quality and trust
towards customer’s loyalty on green purchase, the following five research hypotheses were
tested:
H1: Green perceived promotion positively affect customer`s loyalty towards green purchase.
H2: Green perceived price positively affect customer`s loyalty towards green purchase.
H3: Green perceived quality positively affect customer`s loyalty towards green purchase.
H4: Green perceived trust positively affect customer`s loyalty towards green purchase.
H5: Green perceived place positively affect customer`s loyalty towards green purchase.
3.2 Research design
This study utilized an online survey to collect data from Malaysian residents’ perception on
purchasing green products in Malaysia. The data was collected within two-month period i.e.
during February and March 2015, 244 of the returned questionnaires are usable. The survey
was designed to elicit items for the six constructs in the conceptual model; three constructs for
perception on green marketing mix elements and two constructs of intrinsic factors and a
construct for loyalty towards green purchase intentions. A structured online questionnaire was
developed for this study. The questionnaire includes firstly, a section on respondents’
background such as gender, age, place of residence, monthly income. The second section
included the items or statements measuring on customer`s green perceptions on loyalty
towards green purchase. The perception measured statements represent one endogenous
construct: Loyalty and five exogenous constructs: Promotion, Quality, Trust, Place and Price.
Table 1 lists down the measured statements for each constructs. The perceptions were
assessed through a series of statements and rate on a 5 point Likert-type scale from “strongly
agree” (5) to strongly disagree (1). Data from respondents were tested for reliability, internal
consistency of measures using Cronbach’s alpha (Churchill, 1979).The data obtained from
respondents were cleaned and prepared for analysis stage. To identify the factors influencing
customer`s loyalty towards green purchase among Malaysian customers, this study utilizes the
confirmatory factor analysis (CFA) on structure equation modeling (SEM). Confirmatory
factor analysis (CFA) is used to evaluate the reliability or accuracy of the measurement
procedure. It also enable us to examine the research hypotheses if there are associations

POSTGRADUATE CONFERENCE ON ECONOMICS, PUBLIC ADMINISTRATION AND
BUSINESS (PCEPAB)-5TH SEPTEMBER, 2015
PROMOTING GROWTH, EXCELENCE AND SUSTAINABILITY- 314
between observed indicators (e.g., measured items of factors) and latent factors i.e. influence
on purchase intention on green products . Structure equation modeling (SEM) is a best way to
explore multiple relationships between factors and to estimate measurement properties and
theoretical relationships of the research framework (Hair, 2010) on factors influencing on
customer`s loyalty towards green purchase in Malaysia. To assess the validity of model the
other fit indices are also observed from the estimation of model fit. Chi-square, Goodness-of-
fit index (GFI), Adjusted goodness-of-fit index (AGFI), Comparative fit index (CFI), Normed
fit index (NFI) and root mean square error of approximation (RMSEA).
Table 2: Statements of measured items for each construct
Constructs Code Measured items/ Statements Loyalty Loy1 Over the past year, my loyalty to green product has grown stronger
Loy2 I have been a consumer of green products for sometimes
Loy3 I recommend Green products to my friends
Loy4 I pay attention to Green advertising
Loy5 The green products represent with high quality that I would like to repurchase green
products.
Loy6 I pay attention to my friends/family opinion concerning Green product
Loy7 I understand the information on Green packaging
Loy8 I am willing to pay a premium price for a Green product
Loy9 I would like to repurchase green products.
Loy10 Green product environmental functions provide very good value
Promotion Pro1 It is essential to promote green living in Malaysia
Pro2 The price of green products is lower than the average market price for similar
products
Pro3 I buy green products because they are cheaper options.
Pro4 I think the price of green products is reasonable
Pro5 Green products are well promoted
Pro6 Green products are reasonably priced
Quality Qua1 I think quality is an important criterion when I buy products
Qua2 It is important for me to buy high-quality products
Qua3 I think green products supposed to be good in quality
Qua4 I think green products are fresher than other products
Trust Tr1 Green product’s environmental reputation is reliable.
Tr2 Green product’s environmental performance is dependable.
Tr3 Green product’s environmental claims is trustworthy.
Tr4 Green product’s environmental concern meets my expectations.
Tr5 Green products protect the environment.
Tr6 Green product’s environmental reputation is reliable.
Place Pla1 I easily find Green products in a supermarket
Pla2 I know where the Green displays are located in my supermarket
Price Pr1 I compare prices of the other products with green product
Pr2 I always check prices at the supermarket among brands to ensure I acquire the best
value for money product

POSTGRADUATE CONFERENCE ON ECONOMICS, PUBLIC ADMINISTRATION AND
BUSINESS (PCEPAB)-5TH SEPTEMBER, 2015
PROMOTING GROWTH, EXCELENCE AND SUSTAINABILITY- 315
Pr3 I think price is important when I buy products
Pr4 When I buy the green products, I would ensure that I am getting its value for money
4.0 Results and Discussion
4.1 Characteristics of respondents
The sample observations totaled to 244 respondents who lives in different parts of Malaysia.
Of the total sample, 63.5% (155/244) were female and 36.5% (89/244) were male. Most of
respondents were Malay (46.7%, 114/244), Chinese (20%, 49/244), Indian (12%, 29/244) and
(21.3%, 52/244) international. Largely, the respondents’ age are in the range of 26-35 years
old (48.8%, 119/244) and 36.5%, 89/244 is in the 18-25 years category. (41%, 100/244) of
respondents have bachelor degree and 43%, 105/244 are either master or PhD holder. From
the employment status, 24.6%, 60/244: students, 21.7%, 53/244: not employed, 20.5%,
50/244: in the government sector and 25.8%, 63/244 in private sector. Majority of respondents
32%, 78/244 earn RM 2001 to RM4000 of monthly income. The largest percentage of
respondent live in Kuala Lumpur (40%, 97/244) and the second largest is in Petaling Jaya
(32%, 77/244). More than 40%, 104/244 of the respondents purchase green products at least
once a month and 29%, 71/244 purchase once a week.
4.2 Descriptive and Confirmatory factor analysis (CFA)
Table 2 depicts the several statistical results: descriptive statistics, CFA item loadings,
Cronbach’s Alpha coefficients for each measured items. The application of CFA during the
early stage of analysis is a way to estimate the significant constraints in the research model
and identify the number of factors on observed variables with specific values. CFA is an
example of the structural equation model (SEM), which known as the linear structural
relationship model (Jöreskog & Sörbom, 2004). The results presented in Table 2 show strong
factor loadings i.e., ≥ 0.4 (Cua et al., 2001) in all factors, except one measured item under
promotion, with significant p-values <0.001. Thus, all the items for each factor should be
included in the model but not promotion measured item number 6 with factor loading =0.076
< 0.4 and p-value= 0.273 > 0.001. The Cronbach’s alpha coefficients for all factors range
from 0.582 to 0.858, indicating the constructs are reliable measures.

POSTGRADUATE CONFERENCE ON ECONOMICS, PUBLIC ADMINISTRATION AND
BUSINESS (PCEPAB)-5TH SEPTEMBER, 2015
PROMOTING GROWTH, EXCELENCE AND SUSTAINABILITY- 316
Table 2: Summary results of measured items for each construct
CONSTRUCTS CODE/
ITEMS
MEAN SD ITEMS
LOADING
CRONBACH’S
ALPHA
ITEMS
ERROR
RESULT
LOYALTY Loy1 3.97 .678 .578 0.842
Loy2 3.42 .937 .555 0.847 .187 Supported
Loy3 3.66 .818 .527 0.843 .161 Supported
Loy4 3.59 .962 .564 0.856 .193 Supported
Loy5 3.64 .930 .698 0.846 .199 Supported
Loy6 3.93 .814 .696 0.855 .181 Supported
Loy7 3.77 .860 .667 0.852 .162 Supported
Loy8 3.79 .755 .712 0.857 .187 Supported
Loy9 3.72 .864 .724 0.845 .146 Supported
Loy10 3.99 .740 .535 0.858 .174 Supported
PROMOTION Pro1 3.16 1.009 .888 0.788
Pro2 2.57 1.006 .546 0.623 .075 Supported
Pro3 2.37 1.067 .422 0.658 .081 Supported
Pro4 2.99 1.144 .734 0.594 .086 Supported
Pro5 2.95 1.059 .496 0.678 .079 Supported
Pro6 4.16 .881
.076 0.619 .068 Not
Supported
QUALITY Qua1 4.30 .728 .635 0.701
Qua2 4.05 .892 .770 0.68 .189 Supported
Qua3 4.16 .808 .761 0.699 .171 Supported
Qua4 3.97 .824 .601 0.672 .132 Supported
Tr1 3.81 .726 .598 0.829
Tr2 3.76 .750 .723 0.788 .144 Supported
Tr3 3.65 .724 .686 0.811 .137 Supported
Tr4 3.66 .751 .798 0.804 .150 Supported
Tr5 3.69 .754 .674 0.823 .142 Supported
Tr6 4.10 .730 .608 0.799 .134 Supported
PLACE Pla1 3.51 .941 .822 0.799
Pla2 3.41 1.056 .815 0.582 .105 Supported
PRICE Pr1 4.07 .872 .678 0.582
Pr2 3.90 .906 .691 0.59 .158 Supported
Pr3 3.95 .795 .405 0.583 .111 Supported
Pr4 4.05 .823 .578 0.684 .125 Supported
*** Significant at < 0.001
4.2 Structural Equation Modeling (SEM)
To determine the factors influencing customer`s loyalty on green purchase, this study
employed structural equation modeling (SEM) by using Amos 20. SEM is among the best
methods to explore multiple relationships and measurement properties (Hair,2010). While
Table 3 depicts the hypothesis test results of each influent factor with the path coefficients,
Figure 2 illustrates the resulting structured model with the estimation of factors. Findings of
this study indicate that both green perceived intrinsic factors show positive associations to
customer`s loyalty towards green purchase (quality with β=0.232 and p-value<0.001, trust

POSTGRADUATE CONFERENCE ON ECONOMICS, PUBLIC ADMINISTRATION AND
BUSINESS (PCEPAB)-5TH SEPTEMBER, 2015
PROMOTING GROWTH, EXCELENCE AND SUSTAINABILITY- 317
with β=0.401 and p-value<0.001) Only one green perceived marketing mix element that have
positive effect on customer`s loyalty towards green purchase is place with β=0.232 and p-
value<0.001 However green perceived promotion (β=0.074; p-value>0.001) and green
perceived price (β= - 0.014;p-value>0.001) do not have significant effect on customer`s
loyalty towards green purchase. The squared multiple correlations result showed that 47% of
variation in the customer`s loyalty were explained by quality, trust and place which it is
exceed from 40%. Measure of model fit using five indices all indicate that the model is fit.
(Goodness-of-fit index (GFI =1 > 0.8, Adjusted goodness-of-fit index (AGFI) =0.994>0.8,
Comparative fit index (CFI) =1 > 0.9, Normed fit index (NFI) =0.999>0.9 and root mean
square error of approximation (RMSEA) =0.000 < 0.10, and the chi-square value estimated as
0.199 with p-value=0.656 > 0.05.
Table 3: Path Coefficient
Hypothesis Estimate S.E. C.R. P Results
H1 Loyalty <--- Promotion .074 .037 1.447 .148 Not Supported
H2 Loyalty <--- Price -.014 .044 -.303 .762 Not Supported
H3 Loyalty <--- Quality .232 .047 4.534 *** Supported
H4 Loyalty <--- Trust .401 .057 7.223 *** Supported
H5 Loyalty <--- Place .232 .032 4.456 *** Supported
*** Significant at p <0.001
Figure 4: Research structural model
5.0 Conclusion
This study identified the relationship between green perceived of three marketing mix
elements: place, price and promotion; and two intrinsic factors: quality and trust on
customer’s loyalty towards green purchase. The findings indicate that green trust is the most

POSTGRADUATE CONFERENCE ON ECONOMICS, PUBLIC ADMINISTRATION AND
BUSINESS (PCEPAB)-5TH SEPTEMBER, 2015
PROMOTING GROWTH, EXCELENCE AND SUSTAINABILITY- 318
important criteria in influencing customer`s loyalty towards green purchase, followed by
perceived quality and place. However, the association between promotion and price to
customer`s loyalty towards green purchase is not supported. Trust and quality are similarly the
influent factors affecting green purchase as revealed by the findings of previous studies by
Lassoued (2015) and Rizwan, et al (2013). This finding implies the customers concern about
environmental, social and economic issues are apparent and that they are increasingly willing
to act on those concerns. For business organizations, green trust among their customers and
potential customers can be fostered by contributing more efforts towards environmental
related activities. This can establish an environmentally friendly image to the public that they
are truly committed to the environmental issues. Increased green product positive public
image that further lead trust to purchase intention and thus, add growth to loyalty. From the
marketing mix perspectives, only place was found to have significant positive influence on
loyalty. Price and promotion do not support customers’ loyalty towards loyalty. It could
possibly be that the current practices of green marketing activities are not effective in
attracting the customers. Through strategic and innovative marketing mix elements, business
organizations could actually influence their customers’ choice and use of products that foster
sustainable consumption.
Findings of this study would provide several managerial implications for green marketing
strategy in different industry. First and foremost, it would help to better understand the factors
influencing consumers’ loyalty toward green product through improving the standard of green
product and indirectly improve the green product in the local market. Business organizations
should increase the customer`s loyalty by improving the quality of their products. The
importance of product`s quality is ability to create positive experiences to the consumers,
which has a critical role in developing customer`s loyalty. Through green marketing, customer
awareness, knowledge and understanding on the green products would be increased and more
importantly, it would help to change the way they consume and how to live more sustainable
lifestyles. Business organizations also can start becoming customer mentors on environmental
issues which help to build trust and loyalty on green products, and in turn, fostering
sustainable consumption.
This study was conducted based on a sample of respondents who lives in different part of
Malaysia with different cultural background, lifestyles and socio-economics with experiences
of purchasing green products. Therefore, there is a possibility of a cultural bias playing a role
in the outcome of the study. The results of this study are only supported by the sample of this
study. To further validate of the research model, the next step is to fit the model to different
target sample. Further study could be conducted to a different segment of consumers to a
larger sampling size or different geographical area. In this case the result may be reflective of
the actual purchase behavior of consumers in Malaysia. Continuous investigations using other
measures of the constructs may be necessary in order to increase the awareness of the green
products. Finally this study only focused on general multiple product categories, such as
organic food, cleaning products and therefore there is no sufficient evidence to support the

POSTGRADUATE CONFERENCE ON ECONOMICS, PUBLIC ADMINISTRATION AND
BUSINESS (PCEPAB)-5TH SEPTEMBER, 2015
PROMOTING GROWTH, EXCELENCE AND SUSTAINABILITY- 319
effect of price and promotion, however with focusing on specific products may produce
different findings.
6.0 References
Adnan Aktepe A, S. E. A., Bilal Toklu B. (2014). Customer Satisfaction And Loyalty Analysis With
Classification Algorithms And Structural Equation Modeling. Computers & Industrial Engineering, 1-12.
Aindrila Biswas, M. R. (2015). Green Products: An Exploratory Study On The Consumer Behaviour In
Emerging Economies Of The East. Journal Of Cleaner Production, 87, 463-468.
Aindrila Biswas, M. R. (2015). Green Products: An Exploratory Study On The Consumer Behaviour In
Emerging Economies Of The East. Journal Of Cleaner Production, 87, 463-468.
Aindrila Biswas, R. S., Mousumi Roy, Professor. (2015). Leveraging Factors For Sustained Green Consumption
Behavior Based On Consumption Value Perceptions: Testing The Structural Model. Journal Of Cleaner
Production, 15, 55-159.
Bhalerao, S. A. (2014). Green Marketing: A New Marketing Strategy For Environmentally Compatible Products
, International Journal Of Development Research (Ijdr), 4(8), 1531-1538.
Chan, R.Y.K. (2001). Determinants Of Chinese Consumers‟ Green Purchase Behaviour. Psychology &
Marketing,18 (4), 389-413 Dagnoli, J. (1990). Green Buying Takes Root. Advertising Age, 61, 27.
Dagnoli, J. (1991). Consciously Green. Advertising Age, 62, 14.
Francis Wong V.N, L. M. Y., Lin Xin Ru, Low Siok Yin. (2012). A Study On The Youth Attitudes Toward
Purchase Green Products In Malaysia And Singapore. (Bachelor), Universiti Tunku Abdul Rahman.
Khairul Naim Adham, Karin Merle And Gerhard Weihs, 2013, Sustainable Consumption & Production In
Malaysia: A Baseline Study On Government Policies, Institutions And Practices, Published By Economic
Planning Unit, Prime Minister’s Department With Financial Support From The European Union’s Programme.
Klien, E. (1990). The Selling Of Green. D&B Reports, 38, 30-31.
Lee, K., 2008. Opportunities For Green Marketing: Young Consumers. Market. Intell. Plann., 26: 573-586.
Magali Morel, F. K. (2012). Green Marketing: Consumers’ Attitudes Towards Eco-Friendly Products And
Purchase Intention In The Fast Moving Consumer Goods (Fmcg) Sector. (Master), Umeå School Of Business.
Mainieri, T., Barnett, E., Valdero, T., Unipan, J., And Oskamp, S. (1997). Green Buying: The Influence Of
Environmental Concern On Consumer Behavior.Journal Of Social Psychology, 137, 189-204
Nimse, P., Vijayan, A.,Kumar, A. And Varadarajan, C., (2007). A Review Of Green Product Database.
Environmental Progress. Vol. 26. Iss. 2.
Qinqin Liang, A. S. C. (2014). A Study Of Factors Affecting Customer‘S Attitude Toward Intention To Purchase
Green Electronic Products At An It Mall In Beijing, China. International Conference On Business, Law And Corporate Social Responsibility (Icblcsr'14) Thailand, 1(2).
R. Lassoued, J. E. H. (2015). Consumer Confidence In Credence Attributes: The Role Of Brand Trust. Food
Policy, 1-9.
Ratni Prima Litaa, S. S., M. Ma’rufb , Laura Syahrula. (2014). Green Attitude And Behavior Of Local Tourists
Towards Hotels And Restaurants In West Sumatra, Indonesia. Procedia Environmental Sciences, 20, 261 – 270.
Sachin Kumar Manglaa, P. K., Mukesh Kumar Baruaba. (2015). Risk Analysis In Green Supply Chain Using
Fuzzy Ahp Approach:A Case Study Resources, Conservation And Recycling, 1-16.
Siti Nurafifah Jaafar, P. E. L., Mohaini Mohamed@Naba. Consumers’ Perceptions, Attitudes And Purchase
Intention Towards Private Label Food Products In Malaysia. Asian Journal Of Business And Management
Sciences 2(8), 73-90.
Ulf J.J. Hahnel, C. E. O., Liridon Korcaj, Hans Spada. (2014). What Is Green Worth To You? Activating
Environmental Values Lowers Price Sensitivity Towards Electric Vehicles. Journal Of Environmental
Psychology, 40, 306-319.
Upchurch, L (2013.Trust, Not Green Marketing, Is Key To Driving Sustainable Consumption, The Guardian,
Http://Www.Theguardian.Com/Sustainable-Business/Trust-Marketing-Mainstream-Sustainable-Consumption
Accessed Date: 13 May 2015
World Business Council For Sustainable Development (Wbcsd), (2008) Sustainable Consumption Facts And Trends – From A Business Perspective Business Role Focus Area, Www.Wbcsd.Org : Accessed Date: 14 May
2015

POSTGRADUATE CONFERENCE ON ECONOMICS, PUBLIC ADMINISTRATION AND
BUSINESS (PCEPAB)-5TH SEPTEMBER, 2015
PROMOTING GROWTH, EXCELENCE AND SUSTAINABILITY- 320
The Economic Impact of Terrorism: A new Model and is
Application
Alam Khan
Faculty of Economic and Public Administration
University of Malaya
Abstract
This paper introduces a new economic model the terrorist attack vulnerability evaluation model (TAVE-Model)
to analyze the effects of a possible terrorist attack and its application to Pakistan economy. The TAVE-Model
relies on indicators such as economic desgrowth (-δ), intensity of terrorist attack (αi), terrorist attack losses (-π),
economic wear (Π) due to an attack, level of terrorist attack tension (ζ), level of negotiation (η) and total
economic leaking (Ωt) due to an attack. The underlying intuition is that the economic impact of a terrorist attack
depends on a country’s vulnerability to attacks from domestic and international terrorist groups, which jointly
determines the leakage from economic growth (-δ) and hence the impact on growth. The TAVE-Model shows that
if the real GDP growth rate (∆Оr) is small, then the total economic leaking (Ωt) due to an attack will always
affect economic performance. At the same time, this economy will experience permanent economic desgrowth (-
δ). On the other hand, if the real GDP growth rate (∆Оr) is high, then total economic leaking (Ωt) due to a
terrorist attack will have a more limited impact in the beginning stage. Total economic leaking (Ω t) will cause
economic desgrowth (-δ) only at a later stage. The quantitative estimates of the economic cost of terrorism
generated by TAVE- model should give policymakers at least some rough clues about what is at stake economically in the event of a terrorist attack.
Key Words: Desgrowth; Terrorism; GDP; TAVEmodel

POSTGRADUATE CONFERENCE ON ECONOMICS, PUBLIC ADMINISTRATION AND
BUSINESS (PCEPAB)-5TH SEPTEMBER, 2015
PROMOTING GROWTH, EXCELENCE AND SUSTAINABILITY- 321
Linear and Nonlinear Causal Relationship Between Energy
Consumption and Economic Growth in China: New Evidence Based
on Wavelet Analysis
Ha Junsheng, Tan Pei Pei, Goh Kim Leng
Faculty of Economics & Administration
University Of Malaya
50603 Kuala Lumpur, Malaysia
Email Address: [email protected]
Abstract
This paper attempts to re-assess the nexus between energy consumption and economic growth in China with linear
and nonlinear tests based on wavelet multiscale analysis. Autoregressive distributed lag (ARDL) model is adopted to
test the long run relationship on the original annual data from 1953 to 2011. The results supports neutrality
hypothesis. In addition, the new nonlinear causality test proposed by Nishiyama et al (2011) also failed to detect
energy-growth nexus in any direction. Thus the data are then decomposed by Maximal Overlap Discrete Wavelet
Transform into time series at different time scales that correspond to short, medium and long term time horizons.
The standard linear causality test identifies feedback relationship between economic growth and energy
consumption at all the time scale (short, medium and long run). Moreover, the nonlinear causality test reveals
evidence of nonlinear causality relationship only in the long run, which further supports the feedback hypothesis on
energy-growth nexus. The estimated results imply that Chinese economic development is strongly energy dependent.
Therefore, delicately designed energy policy aiming at sustaining economic growth and tackling environmental
issues simultaneously should be implemented in China.
Key words: Wavelet transforms, Granger causality, ARDL, Energy consumption, Economic
growth.
1 Background and motivation of study
Over the past few decades, the relationship between energy consumption and economic growth
still appear controversial despite the numerous studies that have been conducted. Yet, more
attention has been drawn to this field due to its importance in providing policy implications. If
unidirectional causality relationship is found from economic growth to energy consumption as
found by Kraft and Kraft (1978) and Abosedra and Baghestani (1991), i.e. the conservation
hypothesis, then energy conservation policy can be implemented since it will have little or no
negative impact on the economic growth; if the causality relationship is found to run in the

POSTGRADUATE CONFERENCE ON ECONOMICS, PUBLIC ADMINISTRATION AND
BUSINESS (PCEPAB)-5TH SEPTEMBER, 2015
PROMOTING GROWTH, EXCELENCE AND SUSTAINABILITY- 322
opposite direction as found by Stern (1993) and Zarnikau (1996), i.e. the growth hypothesis, then
energy conservation policy is expected to hamper the economic growth. Hence alternative energy
policy needs to be designed. These policy insights are especially needed in countries that aim at
sustaining fast economic growth.
China is one of the countries with impressive economic growth performance. In the past decades,
its growth rates has maintained at highest rates ever. In order to sustain its fast economic
development, the government has been spending great amount of capital, especially in energy-
intensive sectors. As a result, energy consumption has kept increasing. China has already
surpassed U.S. to become the largest energy consumer in the world as reported by the U.S.
Energy Information Administration (2013); while at the same time, China is also the world’s
second largest economy(World bank 2013), of which 2012 GDP reached US. $ 8.358
trillion(World bank 2013). However, from 1953 to 1980, the real GDP per capita (GPC) of China
has grown at a rather slow rate; only since the late 1980s, the GPC has been growing sharply as
indicated in Figure 1. This trend can be addressed to the implementation of the economic reform,
more specifically the so-called “Open Door policy”, which was initiated in around 1980. Before
the economic reform, due to problems relating to its closed economic system and poor
infrastructures, the economy was rather stagnant. After the reform, the economic policies were
aiming mainly at stimulating economic growth therefore the GDP per capita started to grow
faster than ever. Yet, due to its large population, in 2012, the GPC of China is reported to rank
77th in the world as compared to that of USA rank 11th (Schwab 2013). As the GPC of China is
still low while the population is still large and increasing, China government will certainly have
to take a much longer time than others to meet its economic target, which gives it little room to
slow down the economic development. On the other hand, although Energy consumption per
capita of China has been increasing at a very slow rate throughout the past decades as indicated
by the flat line in Figure 1, due to the tremendous amount of total energy consumption and its fast
growing rate, China is the world’s biggest emitter of greenhouse gases (GHGs)1, which has put it
under international pressure to be more responsible towards the environment, i.e. to reduce GHGs
emission. The direct solution seems to be reduction in energy consumption. This puts China into
dilemma: if the energy consumption has positive influence on economic growth (growth
hypothesis) then adopting energy conservation policies will definitely hamper the sustainable
growth, although it may cause reduction in GHGs emission. If this were true, then the
Government would have to make alternative policies, for example, focusing more on the clean
energy development. Therefore, there is dire need to identify the accurate interactive nexus
1 The international organizations have reported this fact since the year 2007(The New York Times. (2007). "China
overtakes U.S. in greenhouse gas emissions." Retrieved 07/12/2013, from
http://www.nytimes.com/2007/06/20/business/worldbusiness/20iht-emit.1.6227564.html?_r=0.); however, Chinese
government did not acknowledge it until recent years ( Buckley, C. (2010). "China says it is world's top greenhouse
gas emitter." Retrieved 7/12/2013, from http://www.reuters.com/article/2010/11/23/us-climate-cancun-china-
idUSTRE6AM1NG20101123.)

POSTGRADUATE CONFERENCE ON ECONOMICS, PUBLIC ADMINISTRATION AND
BUSINESS (PCEPAB)-5TH SEPTEMBER, 2015
PROMOTING GROWTH, EXCELENCE AND SUSTAINABILITY- 323
between economicgrowth and energy consumption in order to help Chinese Government design
proper and prudent energy policies that can help the country meet its own expected targets while
solving problems such as environmental issues.
Fig.1. Energy consumption per capita and real GDP per capita (1953-2011),
SCE indicates standard coal equivalent
Source: Calculations based on the data of the National Bureau of Statistics of China
However, the existing energy economy literature has produced rather contradicting results on
energy-growth nexus in China. By conducting a thorough literature review on the studies of
Chinese energy economy, Ma, Oxley et al. (2010) conclude that the possible reasons of the mixed
findings include the differences in the methods used, study periods, data sources and coverage of
independent variables. Table 1 summarizes the existing literatures and their findings in China.
Table 1 Selected literatures and their findings on energy-growth nexus in China
Authors Period Methodology Causality relationship
Shiu and Lam (2004) 1971-2000 Bivariate model (ECM) Energy(electricity)→GDP in
both short and long run
Soytas and Sari (2006) 1971-2002 Multivariate model (T-Y) Energy---GDP (no cointegration) Zou and Chau (2006) 1953-2002 Bivariate model (ECM) Energy (oil)→GDP in short run
Energy (oil) ↔GDP in long run
Chen, Kuo et al. (2007) 1971-2001 Bivariate model (ECM) GDP---Energy (electricity)
Yuan, Zhao et al. (2007) 1978-2004 Bivariate model (ECM) Energy (electricity) →GDP in
both Short and long run
Zhang and Cheng (2009) 1960-2007 Multivariate Model (T-Y) GDP→Energy in the long run
Wang, Wang et al. (2011) 1972-2006 Multivariate (ARDL) Energy→GDP in both long and
short run

POSTGRADUATE CONFERENCE ON ECONOMICS, PUBLIC ADMINISTRATION AND
BUSINESS (PCEPAB)-5TH SEPTEMBER, 2015
PROMOTING GROWTH, EXCELENCE AND SUSTAINABILITY- 324
Talha Yalta and Cakar (2012) 1971-2007 meboot with bootstrap Engery---GDP
Zhang and Yang (2013) 1978-2009 Multivariate (T-Y) Energy↔GDP in the long run
Note: “→” stands for “unidirectional Granger cause” , “---“ stands for “does not Granger cause” and “↔” stands for “bidirectional Granger cause”.
Shiu and Lam (2004) found unidirectional causality from electricity consumption to GDP during
1971 to 2000 in both short and long run using error correction model (ECM). Then Soytas and
Sari (2006) applied Toda-Yamamoto (T-Y) test (1995) and found no causality relationship
between energy consumption and GDP from 1971 to 2002. Zou and Chau (2006) again adopted
the ECM model and reported unidirectional causality from oil consumption to GDP in the short
run and bidirectional causality between oil consumption and GDP in the long run during 1953 to
2002. However, applying same method, Chen, Kuo et al. (2007) fail to capture any causality
between GDP and electricity consumption from 1971 to 2001. One the other hand, Yuan, Zhao et
al. (2007) reported unidirectional causality from electricity consumption to GDP in both long and
short run during 1978 to 2004 using Bivariate ECM. Zhang and Cheng (2009) adopted
Multivariate model using T-Y test procedure and found unidirectional causality from GDP to
Energy in the long run on the period of 1960 to 2007. Wang, Wang et al. (2011) also adopted
Multivariate model but using Autoregressive Distributed Lag (ARDL) test approach and reported
unidirectional causality from energy consumption to GDP in both short and long run. Talha Yalta
and Cakar (2012) applied meboot technique with bootstrapping and reported findings that
supports neutrality hypothesis in China. Zhang and Yang (2013) adopted Multivariate model with
T-Y test procedure and found bidirectional causality between energy consumption and GDP.
From these studies above, we can see that analysis based on different methods and data sample or
even same methods do not provide consistent findings on energy-growth nexus.
In order to have more reliable and conclusive findings, Karanfil (2009) advises to look for new
research direction, new perspective and adopt new techniques. He suggests that applying the
same traditional techniques on different data sets or time periods will only add more confusing
results to the literature. This was supported by Payne (2010) and Ozturk (2010), who have
conducted comprehensive literature reviews on the empirical studies conducted in the past three
decades. They have come to the similar conclusion that we should adopt new approach and
methods. In addition, Talha Yalta and Cakar (2012) suggest that the future studies should adopt
the “state of art econometric methods” and be “more focused and detailed” in identifying reliable
information on the energy-growth nexus with robust test results.
In line with these suggestions, this study differs from the existing literature in at least two ways.
First, this study adopts wavelet analysis to examine the potential multi-scale causality
relationship between energy consumption and economic growth in China, which is neglected in
the literature. Granger (1969, 1980) suggested that rather than testing the causality over a single
period a more meaningful causality test should be conducted across different periods using a
spectral-density approach. In line of this, as a preliminary effort to capture the relationship

POSTGRADUATE CONFERENCE ON ECONOMICS, PUBLIC ADMINISTRATION AND
BUSINESS (PCEPAB)-5TH SEPTEMBER, 2015
PROMOTING GROWTH, EXCELENCE AND SUSTAINABILITY- 325
between the cyclical components of electricity consumption and economic growth, Yuan, Zhao et
al. (2007) used Hodrick-Prescott approach to decompose the series. They found that
conintegration relationship exist between both the trend components and the cyclical
components. However, the HP filtering method has been criticized by Harvey and Jaeger (1993),
Cogley and Nason (1995), Baxter and King (1999) and McCallum (2000) among others. The
main drawback is that if the original series is stationary at difference, the HP filtering causes
distortion to its dynamics by inducing spurious information in the cyclical components. In
contrary, wavelet decomposition is considered to be the method that formalizes the concept of
decomposition (Ramsey 1999) and it is proved to preserve the information before and after the
filtering. Ozun and Cifter (2007) conducted the first study to examine energy-growth nexus using
wavelet multi-scale analysis in Turkey. With the same data of Soytas and Sari (2007), they
managed to identify the causality relationships at different time scales which were not revealed
by the former study. Likewise, Aslan, Apergis et al. (2013) applied the wavelet decomposition
method to the US energy market and they found that at the high frequency (short term), energy
consumption is influenced by GDP, which is consistent with the results of the causality
relationship of the original time series. Furthermore, at the lower frequency (medium and long
term), the bidirectional relationship is found. Therefore, it concludes that the short term dynamic
dominates the longer term relationship. Inspired by these studies, we decompose the data series
of energy consumption and economic growth to study the causality relationship on a scale by
scale basis in China. Second, this study aims to capture the information on the nonlinear causality
relationship. Payne (2010) suggests that the information captured by linear causality test may not
be adequate to reveal the energy-growth nexus therefore research adopting nonlinear causality is
worthwhile. Few studies have been done in order to detect the nonlinear causality in the
international market, e.g. Lee and Chang (2007), Chiou-Wei, Chen et al. (2008) and Dergiades,
Martinopoulos et al. (2013). However, the techniques adopted in these studies seem not be able to
draw reliable conclusions. For example, Chiou-Wei, Chen et al. (2008) admit the drawback of the
technique used that may have caused over-rejection problem despite the promising results found
in their study. In our study we adopt the newly proposed consistent technique by Nishiyama,
Hitomi et al. (2011) that will help provide accurate information to the policy makers. Overall, the
novelty of combining the wavelet analysis with both linear and nonlinear causality test helps
reveal the hidden information on the energy-growth nexus in China.
The rest of this article is organized as follows. Empirical methods, data source will be explained
in section 2; Section 3 reports and analyzes the results and section 4 offers concluding remarks.

POSTGRADUATE CONFERENCE ON ECONOMICS, PUBLIC ADMINISTRATION AND
BUSINESS (PCEPAB)-5TH SEPTEMBER, 2015
PROMOTING GROWTH, EXCELENCE AND SUSTAINABILITY- 326
2 Methodology and Data
2.1 Time-frequency Wavelet Decomposition
In order to overcome the limitations of the traditional Fourier transform, which assumes the time
series to be stationary2, or in another sense with constant frequencies over time, wavelet
transform was introduced so that time-varying characteristics of the time series could be studied.
This improvement is possible due to the deliberately chosen or designed wavelets. A wavelet is a
mathematical function, 𝑥(𝑡) , that fulfills the following two conditions(Gençay, Selçuk et al.
2001):
∫ 𝒙(𝑡)𝑑𝑡 = 0∞
−∞ (1), ∫ |𝒙(𝑡)|2 𝑑𝑡 = 1
∞
−∞ (2)
These conditions ensure that the wavelet function must go up and down in waveform along the x-
axis and the energy of the wavelet is unity. There are different types of wavelets available that
suits the needs of studying variety of time series. In this study, we choose the Daubechies Least
Asymmetric wavelet with length of 8(LA8) since it “is orthogonal, near symmetric and have a
compact support and good smoothness properties”(Benhmad 2011).
Having selected the wavelet filter, we need to choose the suitable type of wavelet
transform. There are two types of wavelet transforms. One is Continuous wavelet transform
(CWT), which is to project the original time series onto the wavelets,ψ𝑢,𝑠(𝑡), in order to obtain
the wavelet coefficients. ψ𝑢,𝑠(𝑡) are generated by scaling (s) and translation (u) of a basis or
mother wavelet, ψ(t) (Aguiar-Conraria, Azevedo et al. 2008):
ψ𝑢,𝑠(𝑡) =1
√|𝑠| ψ(
𝑡−𝑢
𝑠), s, u ∈ 𝑅, 𝑆 ≠ 0 (3)
Where “s” and “u” are the scaling and translation parameter; “s” determines the wavelet length
while “u” indicates the wavelet location and 1
√|𝑠| is used to ensure the norm of the daughter
wavelets to be unity.
CWT is presented as (Benhmad 2012):
W(u, s) = ∫ 𝑓(𝑡)∞
−∞ψ𝑢,𝑠(𝑡)𝑑𝑡 (4)
2 Therefore it has minimum applicability in economic time series study as it has been found that most of
macroeconomic time series are nonstationary at level, Nelson, C. R. and C. R. Plosser (1982). "Trends and random
walks in macroeconmic time series: some evidence and implications." Journal of monetary economics 10(2): 139-
162..

POSTGRADUATE CONFERENCE ON ECONOMICS, PUBLIC ADMINISTRATION AND
BUSINESS (PCEPAB)-5TH SEPTEMBER, 2015
PROMOTING GROWTH, EXCELENCE AND SUSTAINABILITY- 327
However, CWT has its draw back as it utilizes all possible integers for “s” and “u” in equation 3
and 4. Therefore, it has the problem of generating redundant amount of information from the
original time series (Gençay, Selçuk et al. 2001). Discrete wavelet transform (DWT) is developed
to overcome this drawback by keeping the minimum but sufficient number of coefficients that are
able to preserve the complete information from the original time series by removing some
unnecessary coefficients in CWT. The DWT is conducted by a critical sampling of the CWT
coefficients by setting conditions for the parameter “s” and “u” in equation 1 as follows(Gençay,
Selçuk et al. 2001):
𝑠 = 2−𝑗 and 𝑢 = 𝑘2−𝑗, 𝑗, 𝑘 ∈ 𝑍 (5)
It is clear from equation 5 that this sampling is dyadic. With these conditions, minimum basis
functions for DWT is produced via(Gençay, Selçuk et al. 2001):
ψ𝑗,𝑘(𝑡) = 2𝑗
2ψ(2𝑗𝑡 − 𝑘) 𝑗, 𝑘 ∈ 𝑍 (6)
Equation 6 creates an orthogonal basis for DWT based on which, a time series with length N can
be analyzed by DWT at dyadic scales and the largest number of scales or decomposition level,
“j”, in equation 5 and 6 is given by the formula (Gençay, Selçuk et al. 2001):
𝑗 = log2(𝑁) (7) Where N is the sample size.
To implement DWT, two filters are needed. A wavelet filter ψ𝑙 = (ψ1 … + ψ𝐿−1) and a scaling
filter φ𝑙 = (φ1 … + φ𝐿−1). The wavelet filter is obtained by equation 6 and has the following
properties:
∑ ψ𝑙 = 0𝐿−1𝑙=0 (8), ∑ ψ𝑙
2 = 1𝐿−1𝑙=0 (9), and ∑ ψ𝑙
𝑙−1𝑙=0 ψ𝑙+2𝑛 = 0 (10)
Where L stands for the even integer width of the filters.
These properties ensure that: (1) the wavelet filter must integrate to zero; (2) it must have unit
energy; (3) it is orthogonal to its even shifts. The scaling filter is related to wavelet filter by a
quadrature mirror filter relationship: φ𝑙 = (−1)𝑙+1ψ𝐿−1−𝑙 for 𝑙 = 0, … , 𝐿 − 1.
By using these filters, the original time series,𝑥(𝑡), is decomposed into subseries that contain
different information at different time scales. Practically, the DWT is implemented by using a
pyramid algorithm introduced by Mallat (1989). At the first decomposition level, 𝑥(𝑡) is filtered
by wavelet filter ψ1,𝑙(high-pass) and scaling filter φ1,𝑙 (low-pass) to obtain the wavelet and
scaling coefficients 𝑑1,𝑡(high frequency) and 𝑠1,𝑡(low frequency). These coefficients are
downsampled to be at half length of 𝑥(𝑡) by removing every 2𝑗 coefficients. 𝑑1,𝑡provide the
details information or the short-term components that indicate the fluctuations or noise of the

POSTGRADUATE CONFERENCE ON ECONOMICS, PUBLIC ADMINISTRATION AND
BUSINESS (PCEPAB)-5TH SEPTEMBER, 2015
PROMOTING GROWTH, EXCELENCE AND SUSTAINABILITY- 328
original series while 𝑠1,𝑡 contain the approximation information or the long-term component that
represents the trend of the original series. In the next level, the scaling coefficients 𝑠1,𝑡 is further
filtered or decomposed into high and low frequency components 𝑑2,𝑡 and 𝑠2,𝑡. This process is
then repeated until the highest decomposition level j, which is determined by equation 7. A DWT
with j decomposition level decompose the original time series into high frequency wavelet
coefficients, 𝑑1,𝑡 , 𝑑2,𝑡 , … 𝑑𝑗,𝑡 and low frequency scaling coefficients 𝑠𝑗,𝑡.
The DWT representation of the original time series is presented below(Tiwari, Dar et al. 2013):
𝑥(𝑡) = ∑ 𝑠𝑗,𝑘φ𝑗,𝑘(𝑡)𝑘 + ∑ 𝑑𝑗,𝑘𝑘 ψ𝑗,𝑘(𝑡) + ∑ 𝑑𝑗−1,𝑘𝑘 ψ𝑗−1,𝑘(𝑡) + ⋯ + ∑ 𝑑1,𝑘𝑘 ψ1,𝑘(𝑡) (11)
Where 𝑠𝑗,𝑘 is the smooth/approximation coefficients that capture the trend of the original time
series 𝑥(𝑡) while 𝑑𝑗,𝑘 to 𝑑1,𝑘 represent the detail coefficients that contain the information on the
short-term deviation from the trend.
Equation 11 also shows that the original time series can be reconstructed by adding up the short-
term and trend components. This reconstruction process is regarded as the multiresolution
analysis (MRA) (Mallat 1989).
In practice, Maximal Overlap DWT(MODWT), an alternative version of DWT, is usually
preferred for the following reasons: 1) MODWT is able to handle data with any sample size,i.e.
not only power of 2, 2) the transform is invariant to shift, i.e. a shift in the time series will not
cause alterations in the transform coefficients(Tiwari, Dar et al. 2013). Moreover, it is not very
crucial in choosing specific wavelet filter when MODWT is implemented(Percival and Walden
2000). As compared to DWT, there is no downsampling of coefficients in MODWT. The
MODWT Scaling coefficients 𝑣𝑗,𝑡 and wavelet coefficients 𝑤𝑗,𝑡 are obtained as:
𝑤𝑗,𝑡 = ∑ 𝜔𝑗,𝑙𝑋𝑡−𝑙 𝑚𝑜𝑑 𝑁𝐿−1𝑙=0 (12) and 𝑣𝑗,𝑡 = ∑ δ𝑗,𝑙𝑋𝑡−𝑙 𝑚𝑜𝑑 𝑁
𝐿−1𝑙=0 (13)
Where the wavelet filters 𝜔𝑙 and scaling filters δ𝑙 for MODWT are obtained by rescaling their
counterparts of DWT as:
𝜔𝑗,𝑙 =ψ𝑗,𝑙
2𝑗
2⁄ (14) and δ𝑗,𝑙 =
φ𝑗,𝑙
2𝑗
2⁄ (15)
Equation 14 and 15 indicate that, in contrary to DWT filters, the filters of MODWT have half
energy.
When applying MODWT, a practical issue facing the researcher is called boundary condition.
Nason (2008) explains the problem in details that when calculating the wavelet coefficients,
especially using long filters such as Daubechies’, some sample values at the length boundary will
be missing due to the calculation method. Gençay, Selçuk et al. (2001) state the similar cause that

POSTGRADUATE CONFERENCE ON ECONOMICS, PUBLIC ADMINISTRATION AND
BUSINESS (PCEPAB)-5TH SEPTEMBER, 2015
PROMOTING GROWTH, EXCELENCE AND SUSTAINABILITY- 329
when one end of the data series is encountered during filtering, an established method is needed
to calculate the remaining coefficients. In this study we use a common method, which is to
assume that the original time series x(t) is with symmetric end reflection, i.e. x(-t)=x(t) and
x(1+t)=x(1-t), e.g. x(-1)=x(1).
2.2 Bounds Testing Procedure for Cointegration
This study adopted the ARDL bounds testing procedure, which was initially proposed by Pesaran
and Shin (1998) and then extended by Pesaran, Shin et al. (2001), to examine the long-run
cointegration relationship between energy consumption and economic growth. The cointegration
test is conducted to avoid spurious regression problem using the data series with long-run
equilibrium relationship. The ARDL approach is selected based on its advantages over other
methods. First, the series under study need not to be integrated of the same order. They can be a
mixture of I(0) and I(1). Second, it can be applied on the data with small sample size. Third, it
provides relatively reliable results even if some of series is endogenous (Harris and Sollis 2003)
and it does not have the problem of pushing the short-term dynamic into the residuals since it is
not residual-based test (Banerjee, Dolado et al. 1993, Banerjee, Dolado et al. 1998, Pattichis
1999). The ARDL model is presented below:
∆𝑙𝑛𝑒𝑐𝑡 = 𝑎0 + ∑ 𝑎1𝑖∆𝑙𝑛𝑒𝑐𝑡−𝑖 + ∑ 𝑎2𝑖∆𝑙𝑛𝑔𝑝𝑐𝑡−𝑖 + 𝑎3𝑙𝑛𝑒𝑐𝑡−1 + 𝑎4𝑙𝑛𝑔𝑝𝑐𝑡−1 + 𝜇𝑡𝑛𝑖=0
𝑛𝑖=1 (16)
∆𝑙𝑛𝑔𝑝𝑐𝑡 = 𝑏0 + ∑ 𝑏1𝑖∆𝑙𝑛𝑔𝑝𝑐𝑡−𝑖 + ∑ 𝑏2𝑖∆𝑙𝑛𝑒𝑐𝑡−𝑖 + 𝑏3𝑙𝑛𝑔𝑝𝑐𝑡−1 + 𝑏4𝑙𝑛𝑒𝑐𝑡−1 + 𝜇𝑡𝑛𝑖=0
𝑛𝑖=1 (17)
Where ln denotes the natural log, ec is energy consumption per capita, and gpc is real GDP per
capita. ∆ is the first difference operator and 𝜇𝑡 is the white noise error term. n is the maximum
lag length.
The bounds testing procedure examines the long-run relationship by restricting the lagged level
variables 𝑙𝑛𝑒𝑐𝑡−1 𝑎𝑛𝑑 𝑙𝑛𝑔𝑝𝑐𝑡−1. A joint significance F-statistic is used to test the null hypothesis
of no cointegration as H0:a3=a4=0 and H0:b3=b4=0 against the alternative hypothesis of
cointegration as Ha:a3≠a4≠0 and Ha:b3≠b4≠0 in equation 11 and 12 respectively. Two sets of
critical values for the large sample size (500 to 1000 observations) are reported by Pesaran, Shin
et al. (2001). Narayan (2005) calculated critical values for sample size (30 to 80 observations),
which is more suitable and therefore used in this study. The set of upper bound assumes that all
the variables are I(1) while the set of lower bound assumes them to be I(1). If the F-statistic is
greater than the upper bound critical value, the null hypothesis of no cointegration is rejected. If it
is smaller than the lower bound critical value, the null hypothesis cannot be rejected. But if it
falls in between the two bounds, the cointegration test becomes inconclusive.

POSTGRADUATE CONFERENCE ON ECONOMICS, PUBLIC ADMINISTRATION AND
BUSINESS (PCEPAB)-5TH SEPTEMBER, 2015
PROMOTING GROWTH, EXCELENCE AND SUSTAINABILITY- 330
2.3 Nonlinear Causality Method
In order to capture the nonlinear causality relationship between energy consumption and
economic growth in China, we adopt a recently proposed powerful test by Nishiyama, Hitomi et
al. (2011). Using Monte Carlo simulation, the test is proved to have nontrivial power against √𝑇
local alternatives, where T is the sample size. The simulation also shows that the test has good
size and power properties. We briefly describe the test in this section following Nishiyama,
Hitomi et al. (2011).
The standard Granger causality is defined based on the concept of optimum linear predictor.
Hence the causality from economic growth (Y) to energy consumption(C) is defined when the
linear prediction of energy consumption can be improved by the current and the past information
of economic growth as shown in equation 18.
E[Ct−P(Ct|Ct-1,…,C1)]2˃ E[Ct−P(Ct|Ct-1,…,C1, Yt-1,…,Y1)]2 (18)
Where P is the optimum linear predictor.
Nishiyama et al(2011) try to not only capture the linear but also nonlinear dependency between
the two time series by replacing the linear predictor by conditional expectation. They define
possible nonlinear causality as:
E[Ct−E(Ct|Ct-1,…,C1)]2˃ E[Ct−E(Ct|Ct-1,…,C1, Yt-1,…,Y1)]2 (19)
Where E is the conditional expectation.
By rearrangement, the null hypothesis is:
E(Ct|Ct-1,…,C1, Yt-1,…,Y1)− E(Ct|Ct-1,…,C1)=0 with probability one (20)
While the alternative hypothesis is:
E[E(Ct|Ct-1,…,C1, Yt-1,…,Y1)]− E(Ct|Ct-1,…,C1)2>0 (21)
The authors managed to construct the test statistic S based on moment conditions. Therefore, the
test is considered as one of the tests for omitted variables, which has been discussed extensively
in the literature by Bierens(1982, 1984), Robinson (1989), Bierens and Ploberger (1997), Chen
and Fan (1999) among others. Interested readers are referred to Nishiyama, Hitomi et al.
(2011)for detailed construction of the test statistics. In addition, the critical value is calculated
using simulation. As Gonzalo and Taamouti (2011) pointed out, this test has the advantage with
simple simulation process and in the sense that its critical values are independent from the data.

POSTGRADUATE CONFERENCE ON ECONOMICS, PUBLIC ADMINISTRATION AND
BUSINESS (PCEPAB)-5TH SEPTEMBER, 2015
PROMOTING GROWTH, EXCELENCE AND SUSTAINABILITY- 331
The test statistics and the critical values are calculated by using the Gauss code developed by
Nishiyama, Hitomi et al. (2011)3.
2.4 Data Description
The sample data used in this study are annual time series for China during the period of
1953 to 2011. The data of real GDP per capita (gpc) is obtained by adjusting the nominal GDP
per capita with the GDP deflator (GDP index) (base 1952=100). The data of energy consumption
per capita (ec) is obtained by dividing total energy consumption by the average total population.
All these data are collected from the National Bureau of statistics of China. The variables are
transformed into natural logarithm (lnec and lngpc respectively) therefore their first differences
represent their growth rates.
3 Empirical Evidence
3.1 Wavelet Decomposition
We first We carried out wavelet decomposition on the real GDP per capita (lngpc) and energy
consumption per capita (lnec) time series into 6 decomposed time series d1, d2, d3, d4, d5 at
different time scales corresponding to different frequency components of the original series and a
smoothed series of s5 which respresents the long run trend of the original series. The original
series is then represented in the time-frequency domain. The d1 represents the lowest time scale
(highest frequency) that occurs at a time horizon of 2 to 4 years while d5 represents the highest
time scale (lowest frequency) of 32 to 64 years. S5 represents the trend of the original series that
occur at a time horizon longer than 64 years. The decomposed d1 to d5 and the s5 of lnec and
lngpc are shown in Figure 2 and Figure 3 respectively.
3 We thank Prof. Nishiyama for sharing the code.

POSTGRADUATE CONFERENCE ON ECONOMICS, PUBLIC ADMINISTRATION AND
BUSINESS (PCEPAB)-5TH SEPTEMBER, 2015
PROMOTING GROWTH, EXCELENCE AND SUSTAINABILITY- 332
Figure. 2. The decomposed time series of energy consumption per capita (lnec), 1953-2011

POSTGRADUATE CONFERENCE ON ECONOMICS, PUBLIC ADMINISTRATION AND
BUSINESS (PCEPAB)-5TH SEPTEMBER, 2015
PROMOTING GROWTH, EXCELENCE AND SUSTAINABILITY- 333
Figure. 3. The decomposed time series of real GDP per capita (lngpc), 1953-2011
3.2 Unit Root Results
Both linear and nonlinear causality tests require the knowledge order of integration about the
time series under study. Hence, we carried out the standard unit root tests: Augmented Dickey-
Fuller (ADF), Phillips-Perron (PP) and Kwiatkowski-Phillips-Schmidt-Shin (KPSS) tests. The
Results of these unit root tests are presented in Table 2. For the original time series lnec and
lngpc, although KPSS test show some conflicting results, ADF and PP tests strongly indicate the

POSTGRADUATE CONFERENCE ON ECONOMICS, PUBLIC ADMINISTRATION AND
BUSINESS (PCEPAB)-5TH SEPTEMBER, 2015
PROMOTING GROWTH, EXCELENCE AND SUSTAINABILITY- 334
series to be I (1). For the decomposed time series d1 to d5 of lnec and lngpc, although there are
some conflicting results, overall these series are confirmed to be I (0).
Table 2 Unit root test
ADF PP KPSS
Level lnec -2.93 -3.27 0.07
Lngpc -1.35 -0.91 0.24***
ec_d1 -8.19*** -57.26** 0.11
ec_d2 -2.97** -4.16*** 0.19
ec_d3 -4.99*** -3.56*** 0.03
ec_d4 -3.03** -2.86* 0.06
ec_d5 -4.82*** -1.67 0.14
gpc_d1 -8.05*** --44.46*** 0.16
gpc_d2 -2.52 -3.93*** 0.20
gpc_d3 -3.49** -3.70*** 0.03
gpc_d4 -2.98** -1.11 0.07
gpc_d5 -7.06*** -0.05 0.24
First differences Lnec -4.33*** -4.47*** 0.10
Lngpc -5.43*** -4.80*** 0.57**
Notes: The optimal numbers of lags for ADF tests were selected based on SIC; the bandwidth for KPSS and
PP tests were chosen based on Newey-West selection procedure using Bartlett kernel. *, ** denote significance
at 5% and 1% respectively. The model of trend with intercept is chosen for the two original series while the
model with intercept only is chosen for all the wavelet reconstructed series.
3.3 ARDL Test Results
Although ARDL test does not require the information on the exact order of integration for the
data series, none of the series should be integrated of the order greater than 1. According to the
unit root test in the previous section, it is confirmed that both of the original series are I (1).
Therefore, we may safely proceed to test the long run relationship between energy consumption
and economic growth using ARDL test.
The initial step in applying ARDL test is to determine the optimal lag order for each variable in
the testing equation. We choose the maximum lag order as 3 years for our annual data as
suggested by Enders (2004) to be relatively long in order to capture the dynamic relationship
between the series. Based on Akaike’s Information Criterion (AIC), the optimal combination lag
order is selected as ARDL (3, 1), when lnec is the dependent variable and ARDL (2, 3) when
lngpc is the dependent variable. A general-to-specific approach with consideration of removing
serial correlation is adopted to find the parsimonious equation for the two models. Finally, the
final equations are selected as:

POSTGRADUATE CONFERENCE ON ECONOMICS, PUBLIC ADMINISTRATION AND
BUSINESS (PCEPAB)-5TH SEPTEMBER, 2015
PROMOTING GROWTH, EXCELENCE AND SUSTAINABILITY- 335
∆𝑙𝑛𝑒𝑐𝑡 = 𝑎0 + 𝑎1 ∆𝑙𝑛𝑒𝑐𝑡−1 + 𝑎2∆𝑙𝑛𝑒𝑐𝑡−3 + 𝑎3𝑙𝑛𝑔𝑝𝑐𝑡−1 + 𝑎4𝑙𝑛𝑒𝑐𝑡−1 + 𝜇𝑡 (19)
∆𝑙𝑛𝑔𝑝𝑐𝑡 = 𝑏0 + 𝑏1∆𝑙𝑛𝑔𝑝𝑐𝑡−1 + 𝑏2∆𝑙𝑛𝑔𝑝𝑐𝑡−2 + 𝑏3∆𝑙𝑛𝑒𝑐𝑡−1 + 𝑏4𝑙𝑛𝑔𝑝𝑐𝑡−1
+𝑏5𝑙𝑛𝑒𝑐𝑡−1 + 𝜇𝑡 (20)
We conducted diagnostic tests on the residuals (not reported here, available upon request). Both
models pass serial correlation test, ARCH test. However, both of the models have the problem of
non-normal errors. Yet, this will not affect the coefficient estimates as the non-normality problem
is mainly caused by excess kurtosis according to Paruolo (1997) as cited by MacDonald and
Ricci (2004), Hanif, Alavi et al. (2011) and Nordin, Nordin et al. (2014). Functional form test
shows that Equation 2 has some problem of misspecification but equation 1 is free from such
problem. This kind of problem is quite common. In fact Pesaran, Shin et al. (2001) also identified
some functional form problem and they addressed the cause to “some non-linear effects or
asymmetries in the adjustment”. Overall, these two equations should provide a sound basis for
cointegration test. The calculated F-statistics for cointegration and the results of the diagnostic
tests on the ARDL model are reported in Table 3. In both models, the Null of no cointegration
relationship between energy consumption and economic growth cannot be rejected at 5% level,
which supports the neutrality hypothesis.
Table 3 The results of ARDL test
Dependent variable Calculated F-statistic
Lnec 4.587
Lngpc 2.746
Critical value (F-test)
Significance level lower bounds I(0) Upper bounds I(1)
1% 7.400 8.510
5% 5.125 6.000
Note: the critical values for lower and upper bounds are obtained from Case III as in Narayan (2005):
Unrestricted intercept and no trend (k=1)
These findings are consistent with the studies of Soytas and Sari (2006), Chen, Kuo et al.
(2007) and Talha Yalta and Cakar (2012) but contradictory with other studies. The usual practice
when the method fails to capture long run relationship among nonstationary data is to difference
them and apply standard Granger causality test on the first differences. However, in this study,
we will try to explore the Granger causality relationship between economic growth and energy
consumption in China by using wavelet-multiscale analysis. The details are presented in the next
section.

POSTGRADUATE CONFERENCE ON ECONOMICS, PUBLIC ADMINISTRATION AND
BUSINESS (PCEPAB)-5TH SEPTEMBER, 2015
PROMOTING GROWTH, EXCELENCE AND SUSTAINABILITY- 336
3.4 Linear and Nonlinear Granger Causality Test on the Decomposed Time Series
Since using ARDL technique failed to capture any cointegration relationship between energy
consumption and economic growth, we conduct both linear and nonlinear(Nishiyama, Hitomi et
al. 2011) causality tests using the first difference of the original time series(lnec and lngpc). As
shown in Table 4, a unidirectional linear causal relationship running from energy consumption to
economic growth is found while no nonlinear causal relationship is captured between the two
variables. This result is partially consistent with Shiu and Lam (2004), Zou and Chau (2006),
Yuan, Zhao et al. (2007) and Wang, Wang et al. (2011) in the sense that growth hypothesis is
supported in the short run.
However, in order to draw more reliable policy implications, we combine linear and nonlinear
causality tests with wavelet multiscale analysis, as an alternative way to cointegration test and
error correction model, to reassess the causal relationship between energy consumption and
economic growth at different time scale, i.e. short, medium and long run. To be more specific, we
apply both linear and nonlinear causality test on the decomposed time series of d1 to d5, which
are all stationary at level based on unit root test results. The results are presented in Table 4. For
the linear causality tests, it is found that there is bidirectional causal relationship at each time
scale between economic growth and energy consumption, which supports feedback hypothesis.
Therefore, with the help of wavelet analysis, it is found that not only energy consumption
contributes economic growth but economic growth also causes energy consumption. On the other
hand, for the nonlinear causality tests, although no causal relationship was found between energy
consumption and economic growth at d1, d2 and d3 which correspond short and medium runs,
bidirectional causal relationship was found between the two variables at d4 and d5, which
corresponds the long run. The nonlinear causality relationship found in the long run should not be
surprising as we found that the misspecification in the ARDL model in the previous section
already exhibit some nonlinearity between economic growth and energy consumption. Such
nonlinear causal relationship reveals the fact that in the past half century over, energy
consumption and economic growth in China have been affected by structural changes that are
usually caused by economic events or changes in energy policy.
On the whole, based on the empirical results provided by the linear and nonlinear causality tests
with wavelet multiscale analysis, it can be more safely argued that in the case of China, feedback
hypothesis is supported with reasonable statistical evidences. Therefore, policies aiming at saving
energy alone will definitely hamper the economic growth. In order to sustain economic growth
while solving the environmental issues, green technology such as clean energy must be
developed. Realizing this, Chinese Government has set the target in the 12 th five-year plan to
make major investments in the two areas: clean energy and clean energy cars besides energy
conservation(KPMG China 2011). However, the government must bear in mind about two
important points. Firstly, clean energy is a must not an alternative. This means that the
government must ensure that the target that it sets for the coming years to be achieved or the

POSTGRADUATE CONFERENCE ON ECONOMICS, PUBLIC ADMINISTRATION AND
BUSINESS (PCEPAB)-5TH SEPTEMBER, 2015
PROMOTING GROWTH, EXCELENCE AND SUSTAINABILITY- 337
economic growth will hardly be sustained. Some studies have been done to evaluate the policy
impact of China’s renewable energy plan. Some achievements have been made(Hong, Zhou et al.
2013, Zhang, Andrews-Speed et al. 2013) while problems and challenges still exist. Zhang,
Andrews-Speed et al. (2013) found that China’s renewable energy plan has put the development
of renewable energy manufacturing industry as the priority over the generation of the renewable
energy. Such approach has caused overcapacity of renewable energy industry and may
compromise the effectiveness and contributions of renewable for the economy. In addition, Hong,
Zhou et al. (2013) analyzed the possible outcome of the impact of energy policy of the
government in the 12th five year plan under different scenarios by simulations. Challenges and
constraints were identified that may reduce the renewable energy contribution in the coming
years include: grid bottleneck, weak technical performance and low energy efficiency of the
related technologies. Therefore, the government should ensure that the energy policy targets on
renewable energy can be met by identifying and tackling such kind of problems and challenges.
A more comprehensive plan on the renewable energy production and technology should be
designed. Secondly, as our results suggest that there exists bidirectional nonlinear causal
relationship between energy consumption and economic growth in China. So it is advised that the
government must consider the impact of structural changes, such as policy changes, on the causal
relationship between energy consumption and economic growth. The ambitious plan of
developing renewable energy is relatively new in China and should be considered a drastically
structural change. The process of increasing the share of renewable energy, which is expected to
replace some traditional energy, will not be easy and smooth. However, in order to sustain its
economic growth with no abrupt shock, the government must take such nonlinear causal
relationship into consideration and design and implement appropriate energy policy with extra
caution.
Table 4 Linear and Nonlinear causality test
Test Test statistics Test Test statistics
Linear Nonlinear linear Nonlinear
lnec → lngpc lngpc → lnec
Original 8.14** 7.01 Original 1.39 8.63
d1 5.91** 7.06 d1 3.13* 7.62
d2 5.56** 6.99 d2 3.38* 7.43
d3 10.06** 11.05 d3 9.90** 8.94
d4 11.87** 18.38* d4 75.62** 15.67*
d5 143.68** 25.13* d5 57.2** 23.86*
Note: *, **denote significance level at 5% and 1% respectively. “ln” stands for natural logarithm, “ec” stands for
energy consumption and “gpc” stands for GDP per capita. “→” stands for Granger cause.

POSTGRADUATE CONFERENCE ON ECONOMICS, PUBLIC ADMINISTRATION AND
BUSINESS (PCEPAB)-5TH SEPTEMBER, 2015
PROMOTING GROWTH, EXCELENCE AND SUSTAINABILITY- 338
4 Conclusions
This paper applied the wavelet multi-scale analysis with linear and nonlinear causality tests to
investigate the causal relationship between energy consumption and economic growth in China in
the period of 1953 to 2011.
For the original time series, the ARDL model fails to detect any long run relationship between
economic growth and energy consumption. However, with the wavelet multi-scale analysis,
bidirectional linear causality relationship is found at all the time scale. On the other hand, the
nonlinear causality test also fails to detect any causality relationship between economic growth
and energy consumption. Again, with the wavelet multi-scale analysis, bidirectional nonlinear
causality relationship is found in the long run. Overall, the energy-growth nexus is found to be
very complex in China. The results imply that the feedback hypothesis is supported with
reasonable statistical evidence of both linear and nonlinear causality tests.
With respect to policy implications, the result of linear bidirectional causality relationship
between economic growth and energy consumption suggest that the government of China should
consider the impact of energy conservation policy on its economic development. In addition, the
result of nonlinear bidirectional causality relationship in the long run imply that the energy
consumption and economic growth are inextricably connected to each other, which urge the
Chinese government to be more cautious in reducing energy consumption in order to solve the
environmental problems. The dependence of economic growth on energy consumption imply that
any energy shocks such as the ones resulted from energy conservation policies with poor
structure and inappropriate approach may hamper the economic growth, especially in the long
run.
Therefore, in order to sustain the economic growth, policies that aim at reducing energy
consumption should be reevaluated. The fact is that on one hand the demand of energy
consumption keeps increasing and the country’s economy is energy-dependent in China as shown
in this and previous studies; on the other hand, the issue of energy security and environmental
concerns bring overwhelming pressure both domestically and internationally that urge the
Chinese government to delicately design effective policies. Nevertheless, it is possible to achieve
the targets of economic growth and environment protection simultaneously to tackle all these
issues. Policies should aim more on the development of energy efficiency technologies and the
green technology such as wind and solar energy, rather than reducing the total energy
consumption directly. Given that the main source of energy is still coal, oil and gas, direct
energy conservation policy alone will not reasonably be able to benefit the country in the long
run.
POSTGRADUATE CONFERENCE ON ECONOMICS, PUBLIC ADMINISTRATION AND
BUSINESS (PCEPAB)-5TH SEPTEMBER, 2015
PROMOTING GROWTH, EXCELENCE AND SUSTAINABILITY- 339
References
Abosedra, S. and H. Baghestani (1991). "New evidence on the causal relationship between
United States energy consumption and gross national product." Journal of Energy and
Development 14(2): 285-292.
Aguiar-Conraria, L., N. Azevedo and M. J. Soares (2008). "Using wavelets to decompose the
time–frequency effects of monetary policy." Physica A: Statistical mechanics and its
Applications 387(12): 2863-2878.
Aslan, A., N. Apergis and S. Yildirim (2013). "Causality between energy consumption and GDP
in the US: evidence from wavelet analysis." Frontiers in Energy: 1-8.
Banerjee, A., J. Dolado and R. Mestre (1998). "Error‐correction mechanism tests for
cointegration in a single‐equation framework." Journal of time series analysis 19(3): 267-283.
Banerjee, A., J. J. Dolado, J. W. Galbraith and D. Hendry (1993). "Co-integration, error
correction, and the econometric analysis of non-stationary data." OUP Catalogue.
Baxter, M. and R. G. King (1999). "Measuring business cycles: approximate band-pass filters for
economic time series." Review of economics and statistics 81(4): 575-593.
Benhmad, F. (2011). "A wavelet analysis of oil price volatility dynamics." Economics bulletin
31(1): 792-806.
Benhmad, F. (2012). "Modeling nonlinear Granger causality between the oil price and US dollar:
A wavelet based approach." Economic Modelling 29(4): 1505-1514.
Bierens, H. J. (1982). "Consistent model specification tests." Journal of Econometrics 20(1): 105-
134.
Bierens, H. J. (1984). "Model specification testing of time series regressions." Journal of
Econometrics 26(3): 323-353.
Bierens, H. J. and W. Ploberger (1997). "Asymptotic theory of integrated conditional moment
tests." Econometrica: Journal of the Econometric Society: 1129-1151.
Buckley, C. (2010). "China says it is world's top greenhouse gas emitter." Retrieved 7/12/2013,
from http://www.reuters.com/article/2010/11/23/us-climate-cancun-china-
idUSTRE6AM1NG20101123.
Chen, S.-T., H.-I. Kuo and C.-C. Chen (2007). "The relationship between GDP and electricity
consumption in 10 Asian countries." Energy Policy 35(4): 2611-2621.
Chen, X. and Y. Fan (1999). "Consistent hypothesis testing in semiparametric and nonparametric
models for econometric time series." Journal of Econometrics 91(2): 373-401.
Chiou-Wei, S. Z., C.-F. Chen and Z. Zhu (2008). "Economic growth and energy consumption
revisited — Evidence from linear and nonlinear Granger causality." Energy Economics 30(6):
3063-3076.
Cogley, T. and J. M. Nason (1995). "Effects of the Hodrick-Prescott filter on trend and difference
stationary time series Implications for business cycle research." Journal of Economic Dynamics
and control 19(1): 253-278.
Dergiades, T., G. Martinopoulos and L. Tsoulfidis (2013). "Energy consumption and economic
growth: Parametric and non-parametric causality testing for the case of Greece." Energy
Economics 36(0): 686-697.

POSTGRADUATE CONFERENCE ON ECONOMICS, PUBLIC ADMINISTRATION AND
BUSINESS (PCEPAB)-5TH SEPTEMBER, 2015
PROMOTING GROWTH, EXCELENCE AND SUSTAINABILITY- 340
Gençay, R., F. Selçuk and B. J. Whitcher (2001). An introduction to wavelets and other filtering
methods in finance and economics, Access Online via Elsevier.
Gonzalo, J. and A. Taamouti (2011). "The reaction of stock market returns to anticipated
unemployment."
Granger, C. W. (1969). "Investigating causal relations by econometric models and cross-spectral
methods." Econometrica: Journal of the Econometric Society: 424-438.
Granger, C. W. (1980). "Testing for causality: a personal viewpoint." Journal of Economic
Dynamics and control 2: 329-352.
Hanif, A., R. Alavi, J. Duasa and G. Mat Ghani (2011). "The determinants of non-tariff barriers
in Malaysia’s agricultural sector." Terengganu International Finance and Economics Journal
(TIFEJ) 1(2): 15-25.
Harris, R. and R. Sollis (2003). Applied time series modelling and forecasting, Wiley.
Harvey, A. C. and A. Jaeger (1993). "Detrending, stylized facts and the business cycle." Journal
of applied econometrics 8(3): 231-247.
Hong, L., N. Zhou, D. Fridley and C. Raczkowski (2013). "Assessment of China's renewable
energy contribution during the 12th Five Year Plan." Energy Policy 62: 1533-1543.
Karanfil, F. (2009). "How many times again will we examine the energy-income nexus using a
limited range of traditional econometric tools?" Energy Policy 37(4): 1191-1194.
KPMG China (2011). China's 12th Five-Year Plan: Energy.
Kraft, J. and A. Kraft (1978). "Relationship between energy and GNP." J. Energy Dev.;(United
States) 3(2).
Lee, C.-C. and C.-P. Chang (2007). "The impact of energy consumption on economic growth:
evidence from linear and nonlinear models in Taiwan." Energy 32(12): 2282-2294.
Ma, H., L. Oxley and J. Gibson (2010). "China's energy economy: A survey of the literature."
Economic systems 34(2): 105-132.
MacDonald, R. and L. A. Ricci (2004). "ESTIMATION OF THE EQUILIBRIUM REAL
EXCHANGE RATE FOR SOUTH AFRICA1." South African Journal of Economics 72(2): 282-
304.
Mallat, S. G. (1989). "Multiresolution approximations and wavelet orthonormal bases of "
Transactions of the American Mathematical Society 315(1): 69-87.
Mallat, S. G. (1989). "A theory for multiresolution signal decomposition: the wavelet
representation." Pattern Analysis and Machine Intelligence, IEEE Transactions on 11(7): 674-
693.
McCallum, B. T. (2000). Alternative monetary policy rules: a comparison with historical settings
for the United States, the United Kingdom, and Japan, National Bureau of Economic Research.
Narayan, P. K. (2005). "The saving and investment nexus for China: evidence from cointegration
tests." Applied economics 37(17): 1979-1990.
Nason, G. P. (2008). Wavelet methods in statistics with R, Springer.
Nelson, C. R. and C. R. Plosser (1982). "Trends and random walks in macroeconmic time series:
some evidence and implications." Journal of monetary economics 10(2): 139-162.

POSTGRADUATE CONFERENCE ON ECONOMICS, PUBLIC ADMINISTRATION AND
BUSINESS (PCEPAB)-5TH SEPTEMBER, 2015
PROMOTING GROWTH, EXCELENCE AND SUSTAINABILITY- 341
Nishiyama, Y., K. Hitomi, Y. Kawasaki and K. Jeong (2011). "A consistent nonparametric test
for nonlinear causality—Specification in time series regression." Journal of Econometrics 165(1):
112-127.
Nordin, S., N. Nordin and R. Ismail (2014). "The Impact of Palm Oil Price on the Malaysian
Stock Market Performance." Journal of Economics & Behavioral Studies 6(1).
Ozturk, I. (2010). "A literature survey on energy–growth nexus." Energy policy 38(1): 340-349.
Ozun, A. and A. Cifter (2007). "Multi-scale causality between energy consumption and GNP in
emerging markets: evidence from Turkey." Investment Management and Financial Innovations
4(2): 61-70.
Paruolo, P. (1997). "Asymptotic inference on the moving average impact matrix in cointegrated 1
(1) VAR systems." Econometric Theory 13(01): 79-118.
Pattichis, C. A. (1999). "Price and income elasticities of disaggregated import demand: results
from UECMs and an application." Applied Economics 31(9): 1061-1071.
Payne, J. E. (2010). "Survey of the international evidence on the causal relationship between
energy consumption and growth." Journal of Economic Studies 37(1): 53-95.
Percival, D. B. and A. T. Walden (2000). "Wavelet Methods for Time Series Analysis
(Cambridge Series in Statistical and Probabilistic Mathematics)."
Pesaran, M. H. and Y. Shin (1998). "An autoregressive distributed-lag modelling approach to
cointegration analysis." Econometric Society Monographs 31: 371-413.
Pesaran, M. H., Y. Shin and R. J. Smith (2001). "Bounds testing approaches to the analysis of
level relationships." Journal of applied econometrics 16(3): 289-326.
Ramsey, J. B. (1999). "The contribution of wavelets to the analysis of economic and financial
data." Philosophical Transactions of the Royal Society of London. Series A: Mathematical,
Physical and Engineering Sciences 357(1760): 2593-2606.
Robinson, P. M. (1989). "Hypothesis testing in semiparametric and nonparametric models for
econometric time series." The Review of Economic Studies 56(4): 511-534.
Schwab, K. (2013). The Global Competitiveness Report 2013–2014.
Shiu, A. and P.-L. Lam (2004). "Electricity consumption and economic growth in China." Energy
policy 32(1): 47-54.
Soytas, U. and R. Sari (2006). "Can China contribute more to the fight against global warming?"
Journal of Policy Modeling 28(8): 837-846.
Soytas, U. and R. Sari (2007). "The relationship between energy and production: evidence from
Turkish manufacturing industry." Energy Economics 29(6): 1151-1165.
Stern, D. I. (1993). "Energy and economic growth in the USA: a multivariate approach." Energy
Economics 15(2): 137-150.
Talha Yalta, A. and H. Cakar (2012). "Energy consumption and economic growth in China: A
reconciliation." Energy Policy 41: 666-675.
The New York Times. (2007). "China overtakes U.S. in greenhouse gas emissions." Retrieved
07/12/2013, from http://www.nytimes.com/2007/06/20/business/worldbusiness/20iht-
emit.1.6227564.html?_r=0.
Tiwari, A. K., A. B. Dar and N. Bhanja (2013). "Oil price and exchange rates: A wavelet based
analysis for India." Economic Modelling 31: 414-422.

POSTGRADUATE CONFERENCE ON ECONOMICS, PUBLIC ADMINISTRATION AND
BUSINESS (PCEPAB)-5TH SEPTEMBER, 2015
PROMOTING GROWTH, EXCELENCE AND SUSTAINABILITY- 342
U.S. Energy Information Administration (2013). Country analysis brief, China.
Wang, Y., Y. Wang, J. Zhou, X. Zhu and G. Lu (2011). "Energy consumption and economic
growth in China: A multivariate causality test." Energy Policy 39(7): 4399-4406.
World bank. (2013). "Country data, China " Retrieved 6/12/2013, from
http://data.worldbank.org/country/china.
World bank. (2013). "Country overview, China." Retrieved 6/12/2013, from
http://www.worldbank.org/en/country/china/overview.
Yuan, J., C. Zhao, S. Yu and Z. Hu (2007). "Electricity consumption and economic growth in
China: cointegration and co-feature analysis." Energy Economics 29(6): 1179-1191.
Zarnikau, J. (1996). "Reexamination of the causal relationship between energy consumption and
gross national product." Journal of Energy and Development 21(2).
Zhang, S., P. Andrews-Speed, X. Zhao and Y. He (2013). "Interactions between renewable
energy policy and renewable energy industrial policy: A critical analysis of China's policy
approach to renewable energies." Energy Policy 62: 342-353.
Zhang, W. and S. Yang (2013). "The influence of energy consumption of China on its real GDP
from aggregated and disaggregated viewpoints." Energy Policy 57: 76-81.
Zhang, X.-P. and X.-M. Cheng (2009). "Energy consumption, carbon emissions, and economic
growth in China." Ecological Economics 68(10): 2706-2712.
Zou, G. and K. Chau (2006). "Short-and long-run effects between oil consumption and economic
growth in China." Energy Policy 34(18): 3644-3655.

POSTGRADUATE CONFERENCE ON ECONOMICS, PUBLIC ADMINISTRATION AND
BUSINESS (PCEPAB)-5TH SEPTEMBER, 2015
PROMOTING GROWTH, EXCELENCE AND SUSTAINABILITY- 343
Steering and Coordinating Society in Urban Governance
Nurussaadah Mokhtar
Department of Urban and Regional Planning
Faculty of Built Environment, University of Malaya, Kuala Lumpur
Malaysia
Email: [email protected]
Abstract
This paper describes the roles of government in steering and coordinating society in the view of modern
governance where participation of non-governmental actors is active. In this perspective, government interacts
with its environment- where society provides inputs to the government that will be converted into policies. In
this interaction, conflicts will occur as a result of diversity in participation in public policy making. Through
examples of urban governance processes carried out by governments at different places around the world, the
complex relationships that strike the balance between state-centric and society-centric is explored. Based on
significant challenges faced in the complexity of steering and coordinating society to achieve sustainable
development policies, this paper, consequently, holds firmly to the principle that government remains a
dominant role in modern governance due to its supremacy as a leader of the state.
Keywords: steering and coordinating, governance, sustainable development policies,
government, urban governance
1 Background of the term ‘governance’
It is a real challenge to write on ‘governance’, particularly in the realms of public
administration theory. This challenge is due to a couple of reasons. When the New Public
Management (NPM) was introduced, that new idea was responding to the ‘old public
administration’ that was generally viewed as in bad shape-governments that were always
associated with inefficiency and ineffectiveness. The aims and goals of the NPM movement
are noble, in theory. However, once implemented over a period of time, several flaws began
to show-disregarding society as citizens and failure of many privatization policies. People
began considering that the NPM is not all good. As that happen, a new idea emerged.
‘Governance’, although not a new term, is a new idea in public administration that is
commonly seen to offer what both ‘old public administration’ and NPM generally failed to
implement in reality. At this moment of time, it is a challenge to write on ‘governance’ since
it is a new concept in comparison to the previous two concepts where actual implementation
on ground is still under experimentation. Most governments in the world, particularly the less
developed countries are in the stage of moving towards ‘governance’ and therefore most
literature is still at theoretical stage. Not many references can be found on the performance of
‘governance’ implementation as compared to those under NPM and the ‘old public
administration’.
Another challenge is due to the fact that the most prominent authors of this subject admit that
the notion ‘governance’ can lead to confusion if not examined correctly. As Pierre (2000)
puts forward, “The governance literature is slightly confusing in its conceptualization of
governance”. In addition, Kooiman (2003) argues that the scholars in the discourse of

POSTGRADUATE CONFERENCE ON ECONOMICS, PUBLIC ADMINISTRATION AND
BUSINESS (PCEPAB)-5TH SEPTEMBER, 2015
PROMOTING GROWTH, EXCELENCE AND SUSTAINABILITY- 344
governance are still at the stage of ‘creative disorder’ due to a great scope of governance
paradigm. The term ‘governance’ can be universal in many different contexts. However, the
focus of this paper is merely at ‘political governance’. Even so, ‘governance’ being an old
term, then reinforced in new setting in different period of time to tackle different set of
societal complexities could still lead to confusion if the root of the term is not explained.
To avoid such confusion and to stay focused, this paper begins by defining the different
concepts of ‘steering’ and ‘coordinating’ in governance process from different perspectives.
Definitions by scholars such as Jon Pierre, Jan Kooiman, B.Guy Peters and Gerry Stoker are
compared against the definition by the authors of the best-seller Reinventing Government and
the widely read book The New Public Service: Serving, not Steering. This analysis of
definitions is provided in the second section: Understanding the Two Governing Approaches:
‘Steering’ and ‘Coordinating.’ The third section: Steering and Coordinating the Society
continues with the process of governance. It discusses the role of steering and coordinating
by the government in governing the society towards sustainable development. With the aid of
David Easton’s systems theory, the process where government interacts with its environment
to get inputs is illustrated. In the fourth section: Urban Governance: Challenges in Steering
and Coordinating Society, the complexity in the processes of governance is elaborated
through discussions of examples of challenges experienced around the world.
2 The Two Governing Approaches: ‘Steering’ and ‘Coordinating’
By looking from comparative politics perspective where governance can be studied from two
different approaches, which are ‘old governance’ and ‘new governance’, the concepts of
‘steering’ and ‘coordinating’ are clearly defined. The ‘old governance’ perspective, that is
perceived as state-centric highlights a theoretical view on governance in the role of
government as to steer the society and the economy (Peters, 2003). According to Kooiman
(2003), “steering is a powerful metaphor for governing in the traditional sense”. The latter
perspective focuses on coordination and self-governance within different types of networks
and public-private interactions, and therefore labeled as society-centric.
In the literature of ‘modern governance’ or ‘new governance’, Pierre (2000), a well-known
scholar in the discourse of political governance, defines governance as “sustaining
coordination and coherence among a wide variety of actors with different purposes and
objectives such as political actors and institutions, corporate interests, civil society and
transnational organizations”. He extended “governance is about how to maintain the
‘steering’ role of political institutions despite the internal and external challenges to the state”.
There are however a variety of perceptions and understandings on the concept of ‘steering’.
The famous Osbourne and Gaebler’s Reinventing Government advises government to steer
instead of rowing. They wrote, “Those who steer the boat have far more power over its
destination than those who row it”. In advocating entrepreneurial spirit in government tasks
as a response to the common view that the government in that period of time was merely a
large, inappropriate bureaucracy, Osbourne and Gaebler suggested ‘privatization’ as a

POSTGRADUATE CONFERENCE ON ECONOMICS, PUBLIC ADMINISTRATION AND
BUSINESS (PCEPAB)-5TH SEPTEMBER, 2015
PROMOTING GROWTH, EXCELENCE AND SUSTAINABILITY- 345
solution. They defined ‘steering’ as government’s responsibility to set up policies and leave
the implementation process to other actors, which is done through privatization process.
The Denhardts’ well-read book, The New Public Service: Serving, not Steering provides a
different view on ‘steering’, responding to the loosely defined ‘steering’ by the authors of
Reinventing Government. According to the Denhardts, ‘steering’ role of government is not
only appropriate but also impossible. They argue so as they view ‘steering’ as ‘controlling’
where government is the only player in policy-making and no negotiation or collaboration
exists with the society. Instead of ‘steering’ they urge government to serve, and in their point
of view, ‘serving’ is defined similarly to the way several scholars define ‘steering’. Their
proposed ‘serving’ role includes the tasks of mediation, reconciliation and adjudication. All
these require among others, the skills of conflict resolution and negotiation as interaction with
various parties take place.
Apart from Pierre’s, this article also adopts the definition of ‘steering’ as a process whereby
governments conduct negotiation of policies and implementation with different actors of
different objectives and purposes (Stoker, 2003). As Stoker (2003) elaborates, “Steering
involves government learning a different ‘operating code’ which rests less on its authority to
make decisions and instead builds on its capacity to create the conditions for positive-sum
partnerships and setting or changing the rules of the game to encourage what are perceived as
beneficial outcomes”. This ‘down to earth’ inclination is in line with the idea of governance
as involving interactions between the government, market and society where collective action
is needed to ensure effectiveness of policy-making process. This definition of ‘steering’
seems to strike the balance between the state-centric and the society-centric approaches in the
discourse of political governance.
Although there are many versions of the concept of ‘steering’, there is a common key element
of it, which is ‘direction’ (Kooiman, 2003). Kooiman elaborates that by steering, a
government, as a governor, will lead its people in a direction which will take them to their
goal. Steering, in spite of being uni-directional and top-down in its character, is yet an
interactive relationship since some form of ‘collaboration’ does exist in the process of
governance.
3 Steering and Coordinating Society
To understand the process of governance, one needs to study the political system as explained
by David Easton through his ‘systems theory’. Easton argues that political sphere interacts
with its environment (refer to Figure 1). This environment comprises of different actors that
provide inputs to the government. In what Easton calls the ‘Black Box’, the political and
bureaucratic institutions will convert these inputs into outputs, in form of policies. These
outputs will be tested in implementation where the new policies interact with the environment
to produce ‘outcomes’ and through what he calls the ‘feedback loop’, those ‘outcomes’ will
generate new inputs to the government. Naturally, it is a cyclical process, thus a never-ending
story.

POSTGRADUATE CONFERENCE ON ECONOMICS, PUBLIC ADMINISTRATION AND
BUSINESS (PCEPAB)-5TH SEPTEMBER, 2015
PROMOTING GROWTH, EXCELENCE AND SUSTAINABILITY- 346
Figure 1: David Easton’s systems theory in studying interaction between government and its environment.
Source: Easton, D., (1979). A Systems Analysis of Political Life, Chicago and London: The University of Chicago Press.
According to Pierre and Peters (2000), “Society performs complementary and occasionally
competitive functions in the process of governance.” It simply means that the society plays
role in presenting their ‘wants’ and ‘demands’ to the government. Although the society’s
‘wants’ and ‘demands’ are not the sole inputs, they shape much of the inputs in addition to
those aspired by the politicians. In the context of political governance, the interactions of
government with the societies, in theory, takes place in different forms. In more traditional
models, the cooperation between state and society takes place in namely ‘pluralist’,
‘corporatist’ and ‘corporatist-pluralist’ models (Pierre and Peters, 2000). While both
‘pluralist’ and ‘corporatist’ models are seen compatible with the ‘old governance’,
‘corporatist-pluralist’ model on the other hand carries very much the idea of ‘modern’ or ‘new
governance’’ as the system recognized the legitimate role of society in participating in policy
making. In this model, in giving inputs to the government, negotiation and coordination will
take place to deal with conflicting wants and demands among the society that comprise of
different actors.
In a more modified form of ‘corporatist-pluralist’ model takes place in the direct partnership
and cooperation between public authorities and private corporate actors in policy
development (Mayntz, 2003). In ‘new governance’, the recognition of the importance of
collaboration between the state and society in policy making has lead to the emergence of the
idea and practice of ‘policy networks’. In several countries with strong civil society,
collaboration occurs between the state and representatives of major stakeholders within a
society, such as business and labour. Although the government of Singapore is known to be
highly authoritarian, it practices this collaboration process in order to achieve successful
policy making and implementation.
In this stage, one will notice several challenges that require attention. In interaction with
citizens, a government deals with diversity and thus complexity. Another challenge is the
issue of governability. In order to achieve good governance, and since society plays partial
responsibility in the process of governance, one might ask if a particular society is ready to
play that role. If society is equipped, another question that arises is whether the government
is fully capable to conduct good governance. As Mayntz (2003) stresses, “Modern

POSTGRADUATE CONFERENCE ON ECONOMICS, PUBLIC ADMINISTRATION AND
BUSINESS (PCEPAB)-5TH SEPTEMBER, 2015
PROMOTING GROWTH, EXCELENCE AND SUSTAINABILITY- 347
governance can only emerge in societies that meet certain institutional and structural
preconditions, both on the side of the political regime and on the side of civil society.
Political authorities must be in a general way acceptable as guardians of public welfare. The
second essential precondition is the existence of a strong, functionally differentiated, and
well-organized civil society”.
In the following stage where government takes action is mainly dealing with policies
implementation process. This is where the roles of steering and coordinating are clearly
demonstrated. In the implementation of Local Agenda 21 for example, the leader of a local
neighborhood who has a general idea of what is needed by his people participates in the
implementation of the policies. What he demands will usually be in conflict with what other
stakeholders push for. Whatever sorts of conflicts have to be negotiated and certain priorities
will have to be compromised, and none of these can come about without the leadership of the
government through its steering and coordinating roles.
4 Urban Governance: Challenges in steering and coordinating society
‘Governance’ takes a partnership approach that maintains the leadership roles of the
government and acknowledges the rights of the people and the resources by other
stakeholders in decision making processes. This is particularly relevant in the context of
urban governance where partnerships between different stakeholders are considered as
fundamental in the legitimacy of policies and decisions made under urban governance
processes. UN-HABITAT (2005) defines urban governance as the sum of the many ways
individuals and institutions, public and private, plan and manage the common affairs of the
city. It is a continuing process through which conflicting or diverse interests may be
accommodated and cooperative action can be taken. It includes formal institutions as well as
informal arrangements and the social capital of citizens. The idea of urban governance has
been promoted widely but not without critics. The practices of urban governance have
recorded several obstacles and challenges. Several challenges that require more
comprehension and analysis are highlighted and discussed below:
a. Eligibility of participants among citizens
Fung (2007) is among several scholars that questions the eligibility of participants among
citizens in the process of urban decision making. In the name of democracy where citizens’
voices must be heard, would quality of the decisions made be affected if one considers that
there exist citizens who do not possess the knowledge, competence and such skills to
command compliance and cooperation in the urban partnerships? It should be considered that
they might not have the information and knowledge to make good judgments and decisions as
public administrators have been trained to do. The revitalization project of Pólwiejska Street
in Poznań, Poland demonstrates an example of uneven partnership as local community actors
were too weak to become equal partners with the city government. They were too weak to
exercise a significant and positive impact on project implementation (Swianiewicz et al.,
2006). In fact, many public policies and decisions are determined not through deliberation
but rather through the technical expertise of officials whose training and professional

POSTGRADUATE CONFERENCE ON ECONOMICS, PUBLIC ADMINISTRATION AND
BUSINESS (PCEPAB)-5TH SEPTEMBER, 2015
PROMOTING GROWTH, EXCELENCE AND SUSTAINABILITY- 348
specialization suits them to solving particular problems and this mode usually does not
involve citizens (Fung, 2007).
b. Less relevant representation among stakeholders
In our eagerness for greater public representation, we must not forget that citizen participants
comprise tiny portion of the population, and unless they are known to represent a
constituency, there are no guarantees that each citizen participant is influential in his or her
community (Irvin and Stansbury, 2004). The relevance of representation among stakeholders
in an urban decision making process is among others, due to the fact that the decisions will
affect numerous aspects of their lives. However, there exist problems of less relevant
representation by group of communities that will be affected the most as compared to other
groups of stakeholders. Therefore, the decisions made with inputs from the less affected
communities and stakeholders may not be the best decisions that will minimize negative
impacts of policies or decisions made.
An example to illustrate this problem is the case of aboriginal communities on Cape York
peninsular in north Queensland. The major development projects carried out in that area were
unusually severe and in some cases were completely destructive of indigenous society and
culture (O’Faircheallaigh, 2002). However, they have been excluded from the public
appraisal process particularly the statutory social impact assessment (SIA) carried out as part
of the governance process. O’Faircheallaigh (2002) added that their exclusion is not new as it
had been so for about 200 years, not unintentionally, but deliberately and systematically.
Other than the case of minority as explained above, less relevant representation among
citizens may as well be in regards to their socio-economic and educational background.
Individuals who are wealthier and better educated tend to participate more than those who
lack these advantages, as do those who have special interests or stronger views (Fiorina, 1999
in Fung, 2006). The factors of age and gender play roles too. Midden’s research in Europe
identified more men participate as opposed to women and the very young and the very old
among the communities recorded less involvement as compared to other range of ages (Baker
et al. 2005). These findings suggest inappropriate representation of the relevant population of
the public.
c. Facilitation of discussions and activities
Partnership meetings of multi-stakeholders often lead to ‘talkfest’ where dialogues are
emphasized rather than concrete action or policy action (Potts et al., 2007). As a result,
objectives of the meetings cannot be achieved. This explains the importance of meeting
facilitation. In fact, facilitation is the most frequently mentioned factor contributing to the
success or failure of public hearings (Baker et al., 2005).
Facilitation of multi-stakeholder meetings is undoubtedly the responsibility of the local
government. To build partnership, local government must adopt the roles of facilitator and
enabler (Phang, 2000). It is highly crucial that local governments invest on training their
officers that will be responsible to carry out meetings that deal with various stakeholders.
Baker et al. (2005) have specified that a facilitator requires a highly polished human and
communication skills. The facilitator’s scope of duty does not centre on technicalities of the

POSTGRADUATE CONFERENCE ON ECONOMICS, PUBLIC ADMINISTRATION AND
BUSINESS (PCEPAB)-5TH SEPTEMBER, 2015
PROMOTING GROWTH, EXCELENCE AND SUSTAINABILITY- 349
meetings merely but it is extended to sensitively managing the audience or the participants
emotion. Moreover, in the context of urban governance where meetings do not only involve
the citizens representatives but also other stakeholders of diverse interest, the leadership in
running the meetings, to listen to all voices and to ensure participants remain calm and
objective throughout the processes is indeed a highly difficult task.
d. Continuous and sustained commitment by stakeholders
In assessing the on-going ecologically sustainable urban development project in an industrial
estate called Lawson, an area in Greater Blue Mountains, New South Wales, Potts et al.
(2007) concluded that such collaborative project is evolving in nature. It is a partnership
between the Blue Mountain City Council, the New South Wales Department of Environment
and Conservation, Sydney Catchment Authority, Australian Museum and Botanical Garden
Trust, three universities (Sydney, New South Wales and West Sydney), the community and
the business companies. Their challenge is huge: deciding on sustainable approaches to land
zoning that ensures harmony between business and industrial activities surrounding the
catchment and ‘lungs’ of the basin of Sydney that is listed as a World Heritage Area. Such
ambitious development is indeed a long term process that demand a continuous and sustained
commitment by all the stakeholders mentioned. Despite experiencing short-term failures and
personality conflicts within and between partners, their high degree of enthusiasm to
transform Lawson into a model of sustainable urban development is more important and in
fact, a factor that will contribute to positive outcomes in the long run.
Figure 2: The general process of urban governance is long and demands a continuous and sustained commitment by
various stakeholders.
Source: UG Toolkit Series, UN-HABITAT, 2003.
e. Distrust and pessimism
It is said that the nature of bureaucracy appreciates not the value of trust. Like other secular
worldviews developed by the westerners that acknowledge nothing but materialism, this
Weberian system of government disregard the worth and the power of trust particularly in the
relationship between the government or the public administrators and the citizens. An
important but unattended consideration in citizen participation efforts is whether public
officials trust citizens… (Yang, 2005). This phenomenon of distrust is possibly due to the
public administrators’ view that the citizens are incapable of participating in decision making
process. In fact, they believe that their participation may prolong or worse, complicate the
process altogether. Many administrators are ambivalent or feel problematic about public
involvement. Some even hold resentment toward citizens (Yang, 2005). Likewise, citizens
have had the same attitude towards public administrators. Praises and positive feedbacks do

POSTGRADUATE CONFERENCE ON ECONOMICS, PUBLIC ADMINISTRATION AND
BUSINESS (PCEPAB)-5TH SEPTEMBER, 2015
PROMOTING GROWTH, EXCELENCE AND SUSTAINABILITY- 350
not usually make headlines but even minor cases of public administrators’ inefficiency would
tarnish their reputation to a severe extent. As a consequence, there exist tensions when both
parties have to cooperate in activities such as urban governance processes.
A similar dimension of distrust can be exemplified by the case of West Bengal government in
India where NGOs attempts to raise political consciousness and organize low income
communities around local issues have been prohibited (Vendana, 1999). This is a paradox to
urban governance principles that acknowledge the roles of different stakeholders including
that of NGOs or other civic institutions in the process of urban governance. This occurrence
of distrust may have lead to the attitude of pessimism towards the significance of urban
governance. Vendana (1999) also finds that very few NGOs take up high conflictive projects
or programmes that deal with issues of access to land, security of tenure, low-income housing
etc. Although their roles can significantly affect the urban decision making process and
therefore benefit the citizens, they would not be without the recognition and support of the
local government as a leader in the process of urban governance.
f. Funding issues
In studying the relationship between the government and urban NGOs in Bombay, Vendana
(1999) finds that most of the large NGOs or internationally reputed NGOs get called for
government funding while the small and medium size NGOs get excluded. Instead of
practicing the known good values of an NGO, their modus operandi in dealing with
government is by using personal contacts and influence, favoritism and nepotism (Vendana,
1999). Hamish (1999), in his research on NGOs and community-based organizations (CBOs)
working on environmental improvement in Calcutta discovers that CBOs often operate within
networks of political patronage where some receive small, regular funding from political
parties. Such phenomenon is a challenge in urban governance as it contradicts the principles
of urban governance especially the principle of transparency.
The other aspect of funding problem is regarding the financial resource bases of local
authorities which are limited. Few are able to generate enough resources for meeting their
expenditure (Phang, 2000). In the sphere of urban governance where local governments work
horizontally with other higher levels of government as equal partners, they still have to
depend on the funding or subsidies allocated by them. Usually the fund may not be
transferred promptly and consequently may halt or delay the processes in urban governance.
g. Costly participatory urban decision making
Partnership between multi stakeholders is indeed a powerful tool in the process of urban
governance. Even so, however powerful it is, it possesses a large barrier, which is the cost-
both money and time. Irvin and Stansbury (2004) point out that the cost of a decision made
by citizen participation groups is arguably more expensive than that of a single agency
administrator, even if the citizen participants' time costs are ignored. They suggest that it is
impractical to spend so much on citizen participation if the decision made collaboratively is
the same with decision made by a trained or experienced public administrator, due to the fact

POSTGRADUATE CONFERENCE ON ECONOMICS, PUBLIC ADMINISTRATION AND
BUSINESS (PCEPAB)-5TH SEPTEMBER, 2015
PROMOTING GROWTH, EXCELENCE AND SUSTAINABILITY- 351
that the decision may only cost the public administrator’s one day as compared to months or
years that may be required by the groups of citizens. Observations made at community
governance workshops as part of the South African West Coast development planning process
recorded that participants indicated that the process was time consuming and questioned its
cost effectiveness and its potential to deliver (Groenewald and Smith, 2002). Clearly the
feasibility of an urban governance process need to be aligned with the budget allocated for
such process, and this is without a doubt a very difficult task to be delivered by the local
government as a facilitator of the process.
h. Problem of quality data and information
The quality of decision making depends heavily upon the quality of information. Problems
with information (outdated, incomplete, unreliable, scattered amongst different stakeholders,
not helpfully focused) are the most commonly cited constraint in urban development decision
making (UN-HABITAT, 2004). The availability of relevant and reliable data and information
remain obstacles in achieving partnerships objectives. The Lawson project facilitated by the
Blue Mountain City Council, New South Wales demonstrated that micro-scale data about
business waste and resource use is often absent (Potts et al., 2007). Potts et al. added that
their partnership also lack integrated regional data and publicly available indicators on
sustainability and innovation.
i. Challenges in negotiation
Complexity in agreeing on strategies and translating them into implementable actions is a
common issue in urban governance partnership. This complexity, which is due to difficulty in
achieving shared view among stakeholders may be argued as the most critical challenge in
urban governance. Action planning process, viewed as the most important tool in the process
requires detailed and continuous negotiation among stakeholders. The case of collaborative
public open space design in self-help housing in Minas-Polvorilla, Mexico City is an example
of this challenge. However, how much complex it was, due to sustained commitment by the
stakeholders involved, despite various problems of reaching agreement between the different
groups, the workshops proceeded (Juarez-Galeana, 2006).
5 Conclusions Although the academic discourse in governance is very vast, this paper has attempted to focus
on the political governance along the line of modern governance. The theme of modern
governance centres on the transformation of the dynamic roles of government as well as
active and legitimate participation of non-governmental actors in policy development and
implementation. These two major qualities of modern governance have been described in this
paper through the roles of government in steering and coordinating the society.
In the process of governing society where government interacts with multiple level of
community, dual responsibilities by each party take place. In taking part by providing inputs
to the government, the society carries a responsibility. On the other end, the government’s

POSTGRADUATE CONFERENCE ON ECONOMICS, PUBLIC ADMINISTRATION AND
BUSINESS (PCEPAB)-5TH SEPTEMBER, 2015
PROMOTING GROWTH, EXCELENCE AND SUSTAINABILITY- 352
responsibility is to coordinate the different inputs by different actors through reconciliation
and negotiation. Both responsibilities are carried on to the stage of policies implementation
where it is lead and monitored by the government. This balance relationship position the state
in the centre of a continuum of state-centric and society-centric.
It is also important to acknowledge the complexity of the process of governance as well as the
diversity of the stakeholders involved, and the paper has embarked on highlighting the
challenges faced through experiences of different stakeholders in selected examples of urban
governance processes. Although urban governance offers sustainable partnerships tools that
can implement sustainable development objectives, is not an easy task as it is a dynamic
process. It involves different groups of people with different interests and it is characterized
by conflicts and long negotiations. Consequently, as opposed to perceptions that
governments’ roles should be minimized in governance process, the paper contends that the
leadership roles of government in governance are very crucial. In the government’s role in
steering and coordinating, its character as a leader and facilitator is clearly manifested.
References
BAKER, WILLIAM H. ET AL. (2005). Critical Factors for Enhancing Municipal Public
Hearings. Public Administration Review, Vol. 65, No. 4 (Jul. - Aug., 2005), pp. 490-
499.
DENHARDT, JANET VINZANT AND DENHARDT, ROBERT B. (2007) The New Public
Service: Serving, not Steering. United States of America: M.E. Sharpe Publisher.
DERAI, VENDANA. (1999). Urban NGO-Government Relationship Experiences from
Bombay in Urban Growth and Development in Asia. Volume II: Living in the Cities.
Chapman, Graham P., et al. (eds.) Ashgate Publishing Limited. England.
FUNG, ARCHON. (2007). Varieties of Participation in Complex Governance. Public
Administration Review; Dec 2006; 66, ABI/INFORM Global. pg. 66.
GAMBLE, A. (2000) Economic Governance in Pierre, J. ed. (2000). Debating Governance:
Authority, Steering and Democracy. New York: Oxford University Press.
GROENEWALD, CORNIE AND SMITH, ANTOINETTE. (2002). Public Participation and
Integrated Development Planning in Decentralized Local Government: A Case Study
of Democratic Transition in South Africa in McLaverty, Peter. 2002. Public
Participation and Innovations in Community Governance. England: Ashgate
Publishing Limited.
IRVIN, RENÉE A. AND STANSBURY, JOHN. (2004). Citizen Participation in Decision
Making: Is It Worth the Effort? Public Administration Review, Vol. 64, No. 1 (Jan. -
Feb., 2004), pp. 55-65.
JUAREZ-GALEANA, LUIS GABRIEL. (2006). Collaborative Public Open Space Design in
Self-help Housing: Minas-Polvorilla, Mexico City in Zetter and Watson (eds).
Designing Sustainable Cities in the Developing World. England: Ashgate Publishing
Limited.
KOOIMAN, J. (2003). Governing as Governance. New Delhi: SAGE Publications.
LOVAN, W. ROBERT, ET AL., ED., (2004). Participatory Governance: Planning, Conflict
Mediation and Public Decision Making in Civil Society. England: Ashgate Publishing
Limited.

POSTGRADUATE CONFERENCE ON ECONOMICS, PUBLIC ADMINISTRATION AND
BUSINESS (PCEPAB)-5TH SEPTEMBER, 2015
PROMOTING GROWTH, EXCELENCE AND SUSTAINABILITY- 353
MAIN, HAMISH. (1999). Environmental Improvement in Calcutta: NGOs and Community
Based Organizations in Urban Growth and Development in Asia. Volume II: Living in
the Cities. Chapman, Graham P., et al. (eds.) Ashgate Publishing Limited. England.
MAYNTZ, R.(2003). From Government to Governance: Political Steering in Modern
Societies. International Summer Academy: From Government to Governance: The
Case of Integrated Product Policy”, Wuerzburg, Germany. Organised by the Institute
for Ecological Economy Research (IOEW), Akademie Frankenwarte and the Federal
Ministry for the Environment, Nature Conservation and Nuclear Safety. September 7-
11, 2003.
O’FAIRCHEALLAIGH, CIARAN. (2002). Overcoming Severe Obstacles to Public
Participation: Indigenous People and Impact Assessment Procedures in Australia in
McLaverty, Peter. 2002. Public Participation and Innovations in Community
Governance. England: Ashgate Publishing Limited.
OSBORNE, DAVID AND GAEBLER, TED (1993). Reinventing Government: How the
Entrepreneurial Spirit is Transforming the Government. United States of America:
Penguin Publisher.
PHANG SIEW NOOI. (2000). Financial Challenges for Local Government in the New
Millennium and the Way Forward. in Habitat Malaysia: Human Settlements Journal
of Malaysia. Federal Department of Town and Country Planning, Ministry of
Housing and Local Government Malaysia.
PIERRE, J. ED. (2000). Debating Governance: Authority, Steering and Democracy. New
York: Oxford University Press.
PIERRE, J. AND B. GUY PETERS (2000). Governance, Politics and the State. Houndmills
and London, U.K: Macmillan.
POTTS, TAVIS, ET AL. (2007). Local Multi-Stakeholder Partnership for Sustainability in
Steering Sustainability in an Urbanizing World: Policy, Practice and Performance .
Anetra Nelson. Ashgate Publishing Limited. England.
STOKER, G. (2000). Urban Political Science and the Challenge of Urban Governance in
Pierre, J. ed. (2000). Debating Governance: Authority, Steering and Democracy. New
York: Oxford University Press.
SWIANIEWICZ, PAWEŁ ET AL. (2006). Uneven Partnerships: Polish City Leaders in
Search of Local Governance in Heinelt, Hubert et al. 2006. Legitimacy and Urban
Governance: A Cross-national Comparative Study. England: Ashgate Publishing
Limited.
UNITED NATIONS HUMAN SETTLEMENTS PROGRAMME (UN-HABITAT). (2010).
The State of Asian Cities 2010/11.
UN-HABITAT. (2004). Urban Governance Toolkit Series. Nairobi: UN-HABITAT.
YANG, KAIFENG. (2005). Public Administrators' Trust in Citizens: A Missing Link in
Citizen Involvement. Public Administration Review, Vol. 65, No. 3 (May - Jun.,
2005), pp. 273-285.

POSTGRADUATE CONFERENCE ON ECONOMICS, PUBLIC ADMINISTRATION AND
BUSINESS (PCEPAB)-5TH SEPTEMBER, 2015
PROMOTING GROWTH, EXCELENCE AND SUSTAINABILITY- 354
Clustering, Cooperation and Innovation in Developing Countries:
Evidence from a Large Footwear Cluster in Nigeria
Isola Oluseyi
Department of Development Studies
Faculty of Economics and Administration,University of Malaya
50603 Kuala Lumpur, Malaysia.
E-mail: [email protected]; [email protected]
Tel: +6014650053
Abstract
Despite the important role of innovation in a market-driven economy, little evidence exist on innovation activities of
SMEs located within industrial clusters in many developing countries. This paper describes the nature and
characteristics of innovation and cooperative activities among informal manufacturers in developing country
contexts. The evidence is based on a very large cluster of footwear manufacturing firms in Nigeria. The evidence
shows that innovation is prevalent among the firms but these are mostly incremental. This indicates that capabilities
for radical innovation, which is necessary for catching-up, is lacking among the firms. But in the face of adequate
resources and policy support, the firms could potentially accumulate such capabilities because most of them already
develop their existing innovations on their own. Interaction within the domestic innovation system is prevalent but
mostly market-based. Hence, innovation policies should seek to foster firms’ interactions beyond simple buy-sell
relationships with such sources.
Keywords: Clustering, footwear, innovation, cooperation, Nigeria
1. Introduction
Economic growth and development are intricately linked with innovative activities and at the
same time, the ability of firms to create knowledge and innovate is crucial for increased
productivity and global competitiveness. By extension, the knowledge, skills, experience,
relationships and motivation necessary for technical change in clusters are very important to the
competitiveness and growth of firms in the clusters. In other words, firms that operate within the
clusters usually experience more growth and are more likely to introduce more innovations than
isolated firms (Beaudry and Breschi, 2000). This is connected with the fact that innovation is a
dynamic process of creating new goods and services as well as all other aspects related with it.
However, despite the important role of innovation in a market-driven economy, little evidence
exist on innovation activities of SMEs located within industrial clusters in many developing
countries such as Nigeria (Bala-Subrahmanya, 2005).

POSTGRADUATE CONFERENCE ON ECONOMICS, PUBLIC ADMINISTRATION AND
BUSINESS (PCEPAB)-5TH SEPTEMBER, 2015
PROMOTING GROWTH, EXCELENCE AND SUSTAINABILITY- 355
This paper responds to this gap in the literature. The paper analyses and discusses the innovation
and cooperation activities of the footwear firms in the Aba cluster. Innovation is broadly defined
to include the application of knowledge in production in a sense that is primarily new to the firm
but not necessarily to the industry, the market or the world. With reference to cooperation,
attention is paid to firms’ interactions with economic actors within the domestic innovation
system.
There are several reasons why a focus on clusters is useful. Geographic and sectoral clustering of
enterprises, most especially in developing countries, has been recognised as a veritable approach
to overcoming constraints to economic growth and development (McCormick, 1999). Lundvall
(1988) earlier opined that geographic agglomeration promotes innovative activities. This opinion
is based on the notion that firms do not innovate nor grow in isolation (Pyke, 1992:1; Edquist,
1997:1). Geographic proximity of firms is particularly important in developing countries, like
Nigeria, where poor infrastructure, weak information systems, and culture that place high value
on oral tradition and face-to-face communication are the norms (McCormick, 1999). Clusters
appear to be a useful instrument for addressing some of the industrial challenges of the
economically marginalised in developing countries (Albu, 1997). Consequently, firms in dense
geographic proximity tend to benefit from the agglomeration relative to isolated enterprises
(Oyelaran-Oyeyinka, 2005). Clustering at its most basic level encourages information sharing
and opportunities for learning new techniques and designs. Moreover, clustering appears to have
the ability to make African countries overcome some of the challenges to industrialisation. This
could be accomplished inter alia through increasing market access, fostering communication and
information sharing, facilitating technological upgrading, increasing efficiency, and contributing
to the development of supportive institutions (McCormick, 1999).
2. Study context, data and method
2.1 The empirical context
The footwear industry in Nigeria comprises a few formal firms and a large number of artisanal
entrepreneurs. They are concentrated in several industrial clusters, most notably in Onitsha and
Aba, respectively in Anambra and Abia states in South-Eastern Nigeria. These clusters in Nigeria
are dominated by entrepreneurs of Igbo origin from the Southeastern part of the country. The
Igbo people are presumably highly entrepreneurial (Brautigam, 1997). In terms of number of
firms and geographical space, the Aba cluster is the largest in the country, and presumably in
West Africa outside the organized formal sector. It is widely acknowledged as the footwear
capital of West Africa; consequently, it commands a significant market share. Wholesalers from
across the sub-continent are among the major distributors of the products from the cluster. From
a statistical perspective, data, trends, patterns and lessons from this cluster could well represent
all the footwear clusters in Nigeria. Given these characteristics, this study focuses on the Aba
cluster. Among the locals, and for trading purposes, the Aba cluster is located in a space known
as the Ariara market. This was the location where the data for this study was collected.

POSTGRADUATE CONFERENCE ON ECONOMICS, PUBLIC ADMINISTRATION AND
BUSINESS (PCEPAB)-5TH SEPTEMBER, 2015
PROMOTING GROWTH, EXCELENCE AND SUSTAINABILITY- 356
2.2 Sampling and data collection
Data collection spanned the period August 5th – 31st, 2013. Primary data was collected from a
random sample of 400 informal enterprises. Ten field assistants, all university graduates, were
employed and trained to join the researcher for the purpose of data collection. Using a structured
questionnaire, the field assistants held oral interviews with the respondents while they worked.
This was necessary not only as a way to control the integrity of information collected but also
because the shoemakers were mostly too busy or poorly educated to self-administer the survey.
The questionnaire elicited information on the characteristics of the firms, knowledge acquisition
methodology of firms, inter- and intra-firm collaborations, funding and innovations activities. In
all, 370 respondents, that is, 92.5% of the sample, completed the questionnaire. Of these, only
291 (72.8% of the sample) were usable in the analyses after removing outliers and missing
responses in all the relevant variables. The response rate compares with previous studies in the
same context (Siyanbola et al. 2011; 2012).
2.3 Data analysis
Missing values in the data were taken into account by using available case analysis (Osborne,
2013: p. 118). In other words, only those cases with complete data on the relevant variables were
analysed (Pallant, 2007: p.57). This approach is suitable because the number of cases with
missing values is a small proportion of the overall sample and the values are demonstrably
missing at random (MAR). Extreme outliers were removed from the data file to avoid bias.
3. Results
3.1 Sample characteristics
Most of the firms in the Aba cluster are micro enterprises according to the definition of the
Nigeria Vision 2020 Program (2009).1 About 97% of them employed ten or fewer employees.
Average age of firms in the sample is 14 years and only about 13% had been in existence for up
to 25 years. Formal capital is negligible, hinting at a huge gap for public policy in relation to the
provision of funding to stimulate the establishment and growth of enterprises. About 50% of the
firms sourced their initial capital from friends and family while about 47% obtained their start-up
capital from personal savings. Consistent with Forrest’s (1994) observation, it is clear that the
cluster is predominantly artisanal. Most of the entrepreneurs had only secondary school education
and acquired their skill by apprenticeship. Documentation hardly occurs but learning by doing
and observation as well as oral instruction is predominant.
3.2 Innovation in the Aba footwear cluster
For the purpose of this study, innovative firms are those that have mastered and implemented the
design and production of goods and services that are new to them, irrespective of whether they
1 The Vision 2020 Program was the flagship of the Obasanjo administration. The main aim of the program, following
a Glodman Sachs report, was to set Nigeria up to be one of the largest economies in the world by the year 2020.

POSTGRADUATE CONFERENCE ON ECONOMICS, PUBLIC ADMINISTRATION AND
BUSINESS (PCEPAB)-5TH SEPTEMBER, 2015
PROMOTING GROWTH, EXCELENCE AND SUSTAINABILITY- 357
are new to their competitors, their countries or the world. Information on innovative firms that
have introduced some sort of innovations between 2011 and 2013 is shown in Table 1. The table
reveals that a total of 90.1% of the firms engaged in innovation activities, while 9.9% of them
reported no innovation activities. In other words, majority of the firms have designed and
produced footwear that are either new to them, their competitors or to the world.
Table 1: Innovative firms
Firm’s Response (n=273) Percentage
Yes 90.1
No 9.9
Total 100
While some innovations are associated with R&D outputs, much of the innovation by SMEs in
the developing countries such as Nigeria are gotten from non-R&D activities. Some of these non-
R&D activities include the acquisition of external knowledge or new equipment and machinery,
new market activities and design. As such many of the innovations reported in the developing
countries are new design, and improvement in quality of products, installation of new equipment,
changed sales and marketing methods and improved new products/services (Gebreeyesus and
Mohnen, 2012). Analysis of the survey of the firms shows that over 50% of the footwear SMEs
frequently change the design of their products while very few (2.1%) reported no changes to
products (Table 2).
Table 2: Rate of change of product designs
Rate of change (n= 288) Percentage
Very frequently 39.9
Frequently 26.7
Occasionally 31.3
Not at all 2.1
Total 100.0
Many scholars have asserted that clustering increases the level of information sharing and
opportunities for learning new techniques and designs (McCormick, 1999). Analysis of the mode
of development of new products by the innovating firms is shown in Table 3. Information in the
table showed that almost all the firms surveyed (97.4%) produced their own designs by
themselves. Very few firms used the support of foreign technical actors (1.3%) while a negligible
number of enterprises used a licensed product (0.4%).

POSTGRADUATE CONFERENCE ON ECONOMICS, PUBLIC ADMINISTRATION AND
BUSINESS (PCEPAB)-5TH SEPTEMBER, 2015
PROMOTING GROWTH, EXCELENCE AND SUSTAINABILITY- 358
Table 3: Mode of development of new products
Mode (n = 234) Percentage
Licensing 0.4
Own development 97.9
Foreign Technical support 1.3
Others (Please specify) 0.4
Total 100.0
According to the mainstream literature on innovation, four categories of novelty of innovations
can be recognised in relation to the firm and the market. Based on level of increasing novelty,
these categories include, (1) innovations that are new only to the firm, (2) innovations that are
new to the market of the firm (and its competitors), (3) innovations that are new to the country
and (4) innovations that are a world first (Sithole et al., 2012). Close to half of the firms in the
footwear sector developed product innovation that are new to the market while a little over one
third developed products that are solely new to the their businesses. A little over 20.0% of the
enterprise had innovations that are new to the world (Table 4). This suggests that most product
innovations undertaken by the firms are incremental. In other words, firms mostly modify
existing products rather than develop completely new ones.
Table 4 Novelty of the products
In discussions on innovation, patents and intellectual property are an important topic. The
protection of intellectual property is thought to be beneficial to innovation. However, its
relevance especially in the informal sector and in developing countries is arguable. In general,
innovation in the informal sector and in latecomer countries’ contexts does not fulfil the novelty
requirements for patenting. As the results in Table 4 suggest, innovation in the study context is
mostly incremental and are not ideal for formal intellectual property protection. Yet, the
knowledge embodied within each new product requires some form of protection otherwise the
Newness (n=242) Percentage
Your business 31.0
Local market 45.9
Global market 23.1
Total 100.0

POSTGRADUATE CONFERENCE ON ECONOMICS, PUBLIC ADMINISTRATION AND
BUSINESS (PCEPAB)-5TH SEPTEMBER, 2015
PROMOTING GROWTH, EXCELENCE AND SUSTAINABILITY- 359
pace of innovation may decline. How then do firms in the Aba footwear cluster surmount this
challenge?
To start with, the survey evidence suggests that almost none of the firms have a formal
intellectual property right (Table 5). The arrangement in the cluster, as discovered during the
course of this study, is nonetheless striking. It bears some semblance with the formal patent
assessment procedure but also has unique informal elements. The local industry association
functions as the institutional authority that offers and enforces intellectual property protection in
the cluster. By definition, every firm in the cluster belongs to the association. Whenever any firm
claims to have come up with a new design, it submits a sample of the relevant footwear to the
association that then verifies the veracity of the claim by checking with its members. If genuine,
the association makes an open announcement of the design throughout the market and bars any
member except the original designer from reproducing the design for a period of 3 -6 months on
average. This mechanism has limitations as it is highly sensitive to personal whims and caprices,
yet it has proven quite effective by being less expensive and more rapid than formal procedures.
Table 5: Formal intellectual property rights
Firm’s Response (n=216) Percentage
Yes 6.9
No 93.1
Total 100.0
3.3 Assessment of the domestic environment for innovation
Conducive policy and regulatory environment are prerequisites for carrying out successful
innovations. There are several ways by which businesses can be motivated to introduce
innovative products to the market. Some of these include: establishment of national funding
agencies, tax incentives for R&D and innovations, direct funding of R&D and innovation through
grants and subsidies. Supportive measures such as these provide enabling domestic environment
for innovation. It could also lead to the development of a strong collaboration among the key
elements of national innovation system. While assessing the local environment for the
introduction of innovative footwear products, the result of the analysis suggests that the domestic
environment for innovation in the footwear sector is poor. For instance, virtually all the firms
surveyed reported that there are very few government incentives for innovation. Majority of the
enterprises also stated that motivations for innovation such as technical support from local
universities and research institutes, efficient standard organisations, quality infrastructure,
venture capital, appropriate modern equipment, skilled manpower are either non-existent or
grossly inadequate (see Table 6).

POSTGRADUATE CONFERENCE ON ECONOMICS, PUBLIC ADMINISTRATION AND
BUSINESS (PCEPAB)-5TH SEPTEMBER, 2015
PROMOTING GROWTH, EXCELENCE AND SUSTAINABILITY- 360
Table 6 Assessment of the domestic environment for innovation
Assessment Indicators (n=268) Very
poor
Poor Fair Good Excellent
Government incentives for
innovation
99.6 0.4
Scientific/skilled manpower (n=267)
96.3 3.0 0.7
Local universities and research institutes for technical support
97.0 1.1 1.9
Standards organisation for
regulatory work
96.2 2.3 1.5
Acquisition of modern equipment 88.3 7.2 4.2 0.4
Quality of ICT services (e.g. internet)
90.5 3.4 2.7 2.7 0.8
Good Infrastructure 94.8 4.2 0.5 0.5
Availability of venture capital 83.7 8.2 4.3 3.8
3.4 Firms’ cooperation activities
Innovation process involves a diverse of cooperative activities in the conceptualisation and
development of new products and processes. As a dynamic process, it also involves a multitude
of diversified group of actors associated by linkages with varied degrees of intensity (Fløysand
and Jakobsen, 2010). These multifaceted and multi-stakeholder process are evolving and
represented in different types of relationships at various levels (Nelson and Winter, 1982).
Cooperative alliances such as these are needed for firms to survive and thrive in a highly
competitive environment. Some of the partners involved in such collaborations range from
universities (George et al, 2002; Wu, 2011), suppliers (Nieto & Santamaría, 2007), customers
(e.g., Belderbos et al, 2004), service intermediaries (Pangarkar & Wu, 2012) and government
officials (Wu & Chen, 2012) to competitors (Luoet al, 2007).
One of the most crucial elements of the concept of innovation is that the product, processes,
organizational structure or marketing strategies implemented by the firm must be new. More
importantly, the implemented idea should add value to all the stakeholders involved. Enterprises
approach innovation from different perspectives. Some firms use a centralist method while some
others adopt the broad approach to innovation (Danish Confederation of Trade Unions, 2007).
The assumption of the centralist method is that only the key members of staff are involved in the
innovation process and as such the development and implementation of innovation activities are

POSTGRADUATE CONFERENCE ON ECONOMICS, PUBLIC ADMINISTRATION AND
BUSINESS (PCEPAB)-5TH SEPTEMBER, 2015
PROMOTING GROWTH, EXCELENCE AND SUSTAINABILITY- 361
carried out in collaboration with the top management. Meanwhile, in the case of the broad
approach, employees in general make significant contribution to innovation process. The
assumption is that employees at the bottom of the ladder are closer to the consumers than the top
management staff and as such they are usually aware of the customer needs. This has been
defined as bottom-up employee-driven innovation. In other words, this idea is entrenched in the
fact that conceiving ideas, implementing ideas and value creation are not only the concern of the
few employees such as engineers and other highly educated people, but are based on systematic
cooperation of all employee groups (Danish Confederation of Trade Unions, 2007).
The result of the analysis in Table 7 listed various ways by which workers such as apprentice and
employees could collaborate on innovation process. With regards to the exchange of information
and experience, over 50% of the respondents are of the opinion that there has been increasing
cooperation among the apprentices and employees in innovation process. However, 55.1% of the
enterprises reported that cooperation on innovation has either been decreasing or remained the
same with regard to labour training. On product development, close to half of the surveyed
enterprises stated that cooperation on innovation process on new product development has either
been decreasing or remained the same. Meanwhile, quite a number of them (51.1%) attested to
the fact that there is a strong cooperation with apprentice and employees on new product
development.
Table 7: Cooperation among workers (apprentice & employees)
Strongly decreased
Decreased Unchanged Increased Strongly increased
Exchange of
information &
experiences
11.90 7.14 27.38 16.67 36.90
Labour Training
27.5
9.6
18.0
14.4
30.5
New product
development
19.6
8.2
21.1
11.9
39.2
Literature on cooperation with competitors reflects both positive and negative impacts on firm’s
strategic behaviour and performance. For instance, many scholars are of the opinion that
cooperation with competitors reduces the inefficiencies of competition, increases information
flow, improves economies of scale, decreases risks and increases the rate of development of new
product and processes (Gnyawali & Park, 2011; Ritala & Hurmelinna‐Laukkanen, 2012).
Meanwhile, other contrasting literature assert that cooperation with competitors could bring about
knowledge leakage, management inefficiencies, unethical business practices and unhealthy

POSTGRADUATE CONFERENCE ON ECONOMICS, PUBLIC ADMINISTRATION AND
BUSINESS (PCEPAB)-5TH SEPTEMBER, 2015
PROMOTING GROWTH, EXCELENCE AND SUSTAINABILITY- 362
competition (Luo et al., 2007; Nieto & Santamaría, 2007). This study examines the existence of
innovation activities and processes that an enterprise in the shoe manufacturing sector might have
with its competitors. Such activities include exchange of information and experience, quality
improvement, labour training, marketing of products, sourcing of raw materials and sharing of
equipment. According to the result of the analysis, many of the enterprises (51.4%) reported that
they collaborated with other shoe manufacturers in the area of exchange of information and
experience. With regard to quality improvement, less than half of the enterprise surveyed has
cooperated with their competitors. There seems to be less cooperation on labour training among
the shoe manufacturers as many of them reported that cooperation has either been decreasing
(49.1%) or remained the same (24.0%) in recent years. Many of the firms also reported that there
is little collaboration on marketing of products among the shoe manufacturers as over half of the
enterprise do not cooperate on marketing. Same trend could also be noticed on sourcing of raw
materials where 70.7% of the firms said that they do not engage with other competitors in
sourcing of raw materials. The case is however different on the issue of sharing of equipment
among the shoe manufacturers. Close to 70% of the shoe manufacturing firms said that they
usually share equipment with other shoe manufacturing firms.
Table 8: Cooperation with competitors
Strongly
decreased
Decreased Unchanged Increased Strongly
increased
Exchange of
information & experiences
13.8 8.3 26.6 28.3 23.1
Quality improvement
19.0 8.7 24.9 28.0 19.4
Labour Training 35.0 14.1 24.0 17.0 9.9
Marketing of
products
49.0 5.5 22.4 9.7 13.4
Sourcing of raw materials
68.3 12.4 11.0 5.5 2.8
Sharing of equipment
14.2 3.1 13.1 32.5 37.0
In recent times, it has become increasingly important for firm to seek for external sources of
knowledge in order to be able to innovate sustainably. This line of thought argues that the ability
of an enterprise to source, utilise and manage external knowledge is a key component in firm’s
competitive advantage most especially the role of the suppliers (Schiele, 2006). Alliances with
suppliers are of different types. For instance, it could be in form of partnership where suppliers

POSTGRADUATE CONFERENCE ON ECONOMICS, PUBLIC ADMINISTRATION AND
BUSINESS (PCEPAB)-5TH SEPTEMBER, 2015
PROMOTING GROWTH, EXCELENCE AND SUSTAINABILITY- 363
are involved in the development of new products (Cantista and Tylecote, 2008; Valle and
Vazquez-Bustelo, 2009). Strategic alliance with the suppliers are usually associated with
activities such as relating with customers with regard to their preferences or reducing product
lifestyles (Fossas-Olalla et al., 2010). This section deals with the role of the raw materials
suppliers as sources of knowledge for innovation in the shoe manufacturing sector. Some of the
issues examined include exchange of information and experience, quality improvement, speeding
up delivery, joint labour training and joint marketing. Results of the analysis show that about one
third of the enterprises (34.5%) reported that they collaborated with their raw material suppliers
in the area of exchange of information and experience. With regard to quality improvement,
36.8% of the firms reported that they cooperate with the raw suppliers on quality improvements.
In the same light, about 40% of the shoe makers reported that they often discuss with the raw
materials suppliers on issues related with delivery of the primary raw materials for the shoe
making. On joint labour training and marketing, the shoe makers seem to have weak
collaborations. For instance, 3.3% and 4.8% of the enterprises in the clusters cooperated with
their raw materials suppliers in the area of joint labour and marketing respectively.
Table 9: Cooperation with raw material suppliers
Strongly
decreased
Decreased Unchanged Increased Strongly
increased
Exchange of
information &
experiences
37.6 11.5 16.4 22.0 12.5
Quality improvement
37.2 9.7 16.3 22.6 14.2
Speeding up delivery
34.5 10.5 15.3 21.3 18.5
Joint labour
training
79.3 11.1 6.3 2.6 0.7
Joint marketing 82.3 8.5 4.4 3.7 1.1
As mentioned earlier, the kind of association developed with suppliers is one of the key factors in
firm’s innovation process. This association often produces linkage between purchasing of goods
and innovation as a result of networks of firms (Hakkanson and Eriksson, 1993). Suppliers
become useful when an enterprise is in need of a particular knowledge beyond its competence
and as such looks out for external sources of information from partners such as the suppliers of
machinery. Based on this fact, some authors have attributed the benefits of collaboration between
a firm and suppliers to improvement in operation and innovation performance (Liu et al., 2000).
This study also examined the influence of the suppliers of machinery on the innovation process

POSTGRADUATE CONFERENCE ON ECONOMICS, PUBLIC ADMINISTRATION AND
BUSINESS (PCEPAB)-5TH SEPTEMBER, 2015
PROMOTING GROWTH, EXCELENCE AND SUSTAINABILITY- 364
of the shoe manufacturers in the clusters. Some of the issues considered along this line include
exchange of information and experience, quality improvement, speeding up delivery, joint labour
training and joint marketing. In comparison to the results of the analysis of the relationship of the
shoe makers with their raw material suppliers, the enterprises has weaker relationship with the
machinery suppliers. For instance, about 14% of the enterprises reported that they collaborated
with their machinery suppliers in the area of exchange of information and experience. With
regard to quality improvement, 13% of the firms reported that they did cooperate with the
suppliers of machinery. Similarly, 13% of the enterprises collaborated with the suppliers of
machinery on how to speed up the delivery of products. In the same light, virtually all the shoe
makers reported that they do not discuss with the suppliers of the machinery on issues related
joint labour training and marketing.
Table 10: Cooperation with machinery suppliers
Strongly
decreased
Decreased Unchanged Increased Strongly
increased
Exchange of
information & experiences
64.2 14.8 8.6 6.8 5.6
Quality
improvement
64.4 11.9 10.6 7.5 5.6
Speeding up delivery
64.6 6.8 15.5 8.7 4.3
Joint labour training
82.8 12.1 1.0 3.0 1.0
Joint
marketing
90.9 5.1 3.0 1.0
The strand of cooperative literature that are grounded in network and game theories have asserted
that cooperation often with specific stakeholders or partners add value to customers (Ingram &
Roberts, 2000). Form of innovation cooperation with the customer is usually recognised within
the context of the introduction of new products. This is coming with the fact that the customer’s
experience in the use of products is valuable in improving existing designs (Tether, 2002; Shaw,
1994) as well as the development of new ones. Scholars have also found out that development of
an innovative products with customers could help to increase market share and support the
integrity of a firm’s products (Tether, 2002). In the same vein, cooperation between firms and
customers has also been found out to reduce risks related to introduction of new products to the
markets (von Hippel, 1976; Ragatz et al., 1997; Tether, 2002). While trying to study the influence
of customers on innovation process in the shoe manufacturing cluster, the study considered issues

POSTGRADUATE CONFERENCE ON ECONOMICS, PUBLIC ADMINISTRATION AND
BUSINESS (PCEPAB)-5TH SEPTEMBER, 2015
PROMOTING GROWTH, EXCELENCE AND SUSTAINABILITY- 365
such as exchange of information and experience, quality improvement, setting up of production
specification and organisation of production. Analysis of results showed that most of the shoe
manufacturers have strong collaboration with the customers on these issues. For instance, 58.5%
of the enterprise surveyed reported that they cooperate with the customers on the issue of
exchange of information and experience. At the same time, over 66.3% of the shoe makers
collaborate with the customers on issue of quality improvement. Same could also be said about
the setting up of production specification where over half of the firms collaborate with the
customers. However, the case is a little bit different with regard to organisation of production.
For instance, 43.7% of the enterprises worked with the customers in the organisation of
production.
Table 11: Cooperation with customers
Strongly
decreased
Decreased Unchanged Increased Strongly
increased
Exchange of
information
& experiences
9.8 4.4 27.3 22.4 36.1
Quality
improvement
8.3 2.4 22.9 30.7 35.6
Setting of
production specification
10.8 12.3 20.6 11.8 44.6
Organisation
of production
43.2 7.4 5.8 6.3 37.4
The innovation literature has established that innovation is highly related to the ability of firm to
absorb and utilise external knowledge. Based on this fact, it has become important for firms to
cooperate with knowledge institutions such as the universities and research institutes for
competitive advantage (Wu, 2011; Tether, 2002). Such formal cooperation include R&D
conglomerates, joint research ventures or information exchange agreements. Three categories of
such R&D cooperation can be recognised. There is the transaction cost approach which involves
sharing of the R&D projects costs, risks and the protection of the dissemination of the outcome of
the research activities (Williamson, 1985). The strategic management method looks at the
cooperation in order to access additional resources for competitive advantages (Teece, 1986).
There is also the industrial organisation method that is based on knowledge spillovers among
major stakeholders. (Petit and Tolwinski, 1999). This section examined the role of the knowledge
institutions such as the universities and the research institutes in the innovation process of the

POSTGRADUATE CONFERENCE ON ECONOMICS, PUBLIC ADMINISTRATION AND
BUSINESS (PCEPAB)-5TH SEPTEMBER, 2015
PROMOTING GROWTH, EXCELENCE AND SUSTAINABILITY- 366
shoe makers in the clusters. The study looked at issues such as exchange of information and
experience, quality improvement, setting up of production specification and organisation of
production. According to the result of the analysis, majority of the firms do not have
collaborations with the knowledge institutions. For instance, virtually all (97.3%) the enterprise
surveyed reported that they do not cooperate with either the universities or research institutes
during the innovation process most especially with regard to the issue of exchange of information
and experience. Similarly, over 99.2% of the shoe makers do not collaborate with the knowledge
institutions on issue of labour training. Same could also be said about the new product
development where 98.5% of the firms do not collaborate with the knowledge institutions. On the
issue of quality improvement, 98.1% of the shoe makers do not collaborate with the universities
and research institutes around the clusters. With regard to organisation of production, 98.9% of
the enterprises do not work with the knowledge institutions.
Table 12: Cooperation with universities and research institutes
Strongly
decreased
Decreased Unchanged Increased Strongly
increased
Exchange of
information &
experiences
96.2 1.1 1.6 1.1
Labour Training
98.4 0.8 0.4 0.4
New product development
96.2 2.3 1.1 0.4
Quality
improvement
95.5 2.6 1.1 0.4 0.4
Organisation of production
97.7 1.2 1.2
4. Conclusions and Implications for Policy
This paper has focused on how firms in a developing country cluster innovate and interact with
economic actors within the domestic innovation system. The evidence presented herein suggests
that innovation is prevalent among the SMEs in the footwear industry in Nigeria but these are
mostly incremental. For policy, the indication is that capabilities for radical innovations which
are necessary for catching-up is lacking among the firms. Notwithstanding, in the face of
adequate resources and policy support, the firms could potentially accumulate such capabilities.
This is because most of them already develop their existing innovations on their own. Interaction
within the domestic innovation system is prevalent as well but not uniform across different types

POSTGRADUATE CONFERENCE ON ECONOMICS, PUBLIC ADMINISTRATION AND
BUSINESS (PCEPAB)-5TH SEPTEMBER, 2015
PROMOTING GROWTH, EXCELENCE AND SUSTAINABILITY- 367
of economic actors. Importantly, universities and other knowledge sources became less relevant
in the firms’ portfolio of cooperation partners while customers became more important. This
suggests two things for policy. First, university-industry interactions need to be strengthened at
least in the sector studied here. Second, market-based sources such as customers are an important
source of innovation-related knowledge. As a result, innovation policies should seek to foster
firms’ interactions beyond simply buy-sell relationships with such sources.
References
Albu M. (1997) Technological Learning and Innovation in Industrial Clusters in the South.
Science Policy Research Unit (SPRU) electronic working papers series No.7.
http://www.sussex.ac.uk
Bala-Subrahmanya M.H. (2005). Technological innovations in Indian engineering industry:
industry and firm level case studies. International Journal of Entrepreneurship and
Innovation Management, 5 (5-6), 401-420.
Beaudry, C., and Breschi, S. (2000). Does Clustering Really Help Firms' Innovative Activities?
Working paper-Manchester business school.
Belderbos, R., Carree, M., & Lokshin, B. (2004). Cooperative R&D and firm performance.
Research Policy, 33(10), 1477–1492
Brautigam, D. (1997). "Substituting for the state: Institutions and industrial development in
Eastern Nigeria." World Development 25(7): 1063-1080.
Brautigam, D. (1997). "Substituting for the state: Institutions and industrial development in
eastern Nigeria." World Development 25(7): 1063-1080.
Cantista I, Tylecote A (2008). Industrial Innovation, Corporate Governance and Supplier-
Customer Relationships. J. Manuf. Technol. Manage. 19(5): 516-590.
Danish Confederation of Trade Unions (2007): Employee-driven innovation: a trade union
priority for growth and job creation in a globalised economy. The Danish Confederation
of Trade Unions, Copenhagen.
Edquist, C. (1997) (ed) Systems of Innovation Technologies, Institutions and Organisations,
PINTER, London and Washington.
Fløysand A and Jakobsen S (2010) The complexity of innovation: A relational turn. Prog. Hum.
Geography 35: 328-344. Doi: 10.1177/0309132510376257
Forrest, T. (1994) The makers and making of Nigerian private enterprise. Spectrum Books
Limited, Nigeria.

POSTGRADUATE CONFERENCE ON ECONOMICS, PUBLIC ADMINISTRATION AND
BUSINESS (PCEPAB)-5TH SEPTEMBER, 2015
PROMOTING GROWTH, EXCELENCE AND SUSTAINABILITY- 368
Fossas-Olalla, M., Lopez-Sanchez, J. I. and Minguela-Rata, B. (2010) Cooperation with suppliers
as a source of innovation. African Journal of Business Management Vol. 4(16), pp. 3491-
3499
Gebreeyesus, M. and Mohnen, P. (2012) Innovation performance and embeddedness in networks:
evidence from the Ethiopian footwear cluster. Elsevier Science Ltd. World Development
vol. 41 pp. 302-316.
George, G., Zahra, S. A., & Wood, D. R. (2002). The effects of business–university alliances on
innovative output and financial performance: A study of publicly traded biotechnology
companies. Journal of Business Venturing, 17(6), 577–609.
Gnyawali, D. R., & Park, B. J. R. (2011). Co-opetition between giants: Collaboration with
competitors for technological innovation. Research Policy, 40(5), 650–663.
Hakkanson H, Eriksson A (1993). Getting Innovations Out of Supplier Networks. J. Bus. Mark.,
1(3): 3-34.
Ingram, P., & Roberts, P. W. (2000). Friendships among competitors in the Sydney hotel
industry. American Journal of Sociology, 106(2), 387–423.
Journal of Economics, 19(1), 5-24.
Liu XP, Siler C, Wang C, Wei Y (2000). Productivity Spillovers From Foreign Direct
Investment: Evidence from UK Industry Level Panel Data. J. Int. Bus. Stud., 31(3): 407-
425.
Lundvall, B-A. (Ed.) (1988) ‘Innovation as an interactive process: from user-producer interaction
to the national system of innovation’, in Oyelaran-Oyeyinka, B.(2005) Inter-firm
collaboration and competitive pressures: SME footwear clusters in Nigeria. International
Journal of Technology and Globalisation 1(3/4) 343-360.
Luo, X., Rindfleisch, A., & Tse, D. K. (2007).Working with rivals: The impact of competitor
alliances on financial performance. Journal of Marketing Research, 44(1), 73–83.
McCormick (1999) “African Enterprise Clusters and Industrialisation: Theory and Reality”
World Development 27(9) 1531 – 1551.
Nelson R and Winter S (1982) An Evolutionary Theory of Economic Change. Press of Harvard
University, Cambridge Massachusetts.
Oyelaran-Oyeyinka, B.(2005) “Inter-firm collaboration and competitive pressures: SME footwear
clusters in Nigeria” International Journal of Technology and Globalisation, 1(3/4) 343-
360.
Pallant, J. (2007) SPSS Survival Manual: A step by Step Guide to Data Analysis using SPSS for
Windows 3rd Edition. Open University Press Mc Graw-Hill Education England.
Pallant, J. (2007) SPSS Survival Manual: A step by Step Guide to Data Analysis using SPSS for
Windows 3rd Edition. Open University Press Mc Graw-Hill Education England.

POSTGRADUATE CONFERENCE ON ECONOMICS, PUBLIC ADMINISTRATION AND
BUSINESS (PCEPAB)-5TH SEPTEMBER, 2015
PROMOTING GROWTH, EXCELENCE AND SUSTAINABILITY- 369
Petit, M., Tolwinski, B., (1999). R&D cooperation or competition? European Economic Review
43, 185–208.
Pyke, F. (1992). ‘Industrial development through small-firm cooperation: Theory and practice’
Geneva, International Labour Office.
Ritala, P., & Hurmelinna‐Laukkanen, P. (2012). Incremental and radical innovation in
coopetition: The role of absorptive capacity and appropriability. Journal of Product
Innovation Management. http://dx.doi.org/10.1111/j.1540-5885.2012.00956.x.
Schiele H (2006). How to Distinguish Innovative Suppliers? Identifying Innovative Suppliers as
New Task for Purchasing. Ind. Mark. Manage. 35(2): 925-935.
Shaw, B. (1994): “User–supplier links and innovation”. In: Dodgson, M., Rothwell, R. (Eds.),
Sithole MM, Blankley W, Labadarios D, Makelane H, Nkobole N. The State of innovation in
South Africa: Findings from the South African National Innovation Survey. S Afr J Sci.
2012;108(7/8), Art. #1320, 5 pages. http:// dx.doi.org/10.4102/sajs. v108i7/8.1320
Siyanbola, W. O., Egbetokun, A. A., Oluseyi, I., Olamade, O. O., Aderemi, H. O., & Sanni, M.
(2012). Indigenous Technologies and Innovation in Nigeria: Opportunities for SMEs.
American Journal of Industrial and Business Management, 2, 64.
Siyanbola, W., Olamade, O., & Isola, O. (2011). Assessing technological innovation in SME
footwear clusters in Nigeria. Paper presented at the Technology Management in the
Energy Smart World (PICMET), 2011 Proceedings of PICMET'11.
Teece, D.J., 1986. Profiting from technological innovation: implications for integration,
collaboration, licensing and public policy. Research Policy 15, 285–305.
Tether, B. (2002): “Who cooperates for innovation and why. An empirical analysis”, Research
Policy, 31, pp. 947-967.
Valle S, Vázquez-Bustelo D (2009). Involving Suppliers in New Product Development: An
Analysis of Spanish Firms. Universia Bus. Rev., 24: 62-75.
von Hippel, E. (1976): “The Dominant Role of Users in the Scientific Instrument Innovation
Process”, Research Policy, 5:2, pp. 212-239.
Williamson, O., 1985. The Economic Institutions of Capitalism, Firms, Markets, Relational
Contracting. The Free Press, New York.
Wu, J. (2011). The asymmetric roles of business ties and political ties in product innovation.
Journal of Business Research, 64(11), 1151–1156.
Wu, J., & Chen, X. Y. (2012). Leaders' social ties, knowledge acquisition capability and firm
competitive advantage. Asia Pacific Journal of Management, 29(2), 331–350.

POSTGRADUATE CONFERENCE ON ECONOMICS, PUBLIC ADMINISTRATION AND
BUSINESS (PCEPAB)-5TH SEPTEMBER, 2015
PROMOTING GROWTH, EXCELENCE AND SUSTAINABILITY - 370
Does Terrorism Affect The Economic Performance? The
Empirical Analysis Of Islamic States In Iraq And Syria (ISIS)
And Pakistan
Alam Khan
Faculty of Economic and Public Administration
University of Malaya
Abstract
This study evaluates the impact of terrorism on economic performance of the three most affect economies of
world due to terrorism. This study concentrates on the economies of Iraq, Syria and Pakistan. This research
Study has applied the economics of Crime Monitoring Model (ECM) of Ruiz Estrada and Ndoma (2014) for
analysis. The results of study explain that terrorism has badly affected the economic performance of the
economies of Iraq, Syria and Pakistan. Instead of direct fighting against the terrorist group in the said
economies, the developed world especially the Europe and United States of America may review the terrorism
policy about these economies and may eradicates the terrorism by reducing poverty, religious discrimination
and inequality to increase the opportunity cost of terrorism.

POSTGRADUATE CONFERENCE ON ECONOMICS, PUBLIC ADMINISTRATION AND
BUSINESS (PCEPAB)-5TH SEPTEMBER, 2015
PROMOTING GROWTH, EXCELENCE AND SUSTAINABILITY - 371
Aquaculture: A Source of Health and Wealth of Bangladesh
Md. Sohel Rana
Department of Economics
Faculty of Economics and Administration, University of Malaya
50603 Kuala Lumpur, Malaysia
Abstract:
The population of the earth is increasing rapidly and creating concerns of many things. One of the concerns of
the increasing number of people is the food. According to FAO, It is predicted that the global population will
increase by another 2 billion and reached to a mark of 9.6 billion by 2050, Simultaneously at the present point of
time, the world contains more than 800 million of the total population who have been continuously suffering
from chronic malnourishment, therefore the food security and health of the population are at big concerns.
Besides fish consumptions has increased from 18.4 kg in 2009 to 19.2 Kg in 2012 (FAO, 2014). Which may put
pressure on fisheries industry immensely.
Aquaculture of fisheries plays a significant role in eliminating hunger, promoting health and reducing poverty.
This particular sector employs huge number of people and supports millions of people in Bangladesh. In context
of Bangladesh aquaculture can be a key sector since fish food is the most traded food all over the world. Since FAO is promoting Blue Growth utilizing socio-economic management of aquatic resources therefore people of
the world must take initiatives to ensure the health of the world, health of themselves and future food security to
ensure Blue World. The aim of the paper is to estimate contribution of Aquaculture in promoting fisheries
production and export growth, meeting domestic fish food supply and employing poor people. This paper will
also point out the safety issues that the small and medium aquaculture producers encounter.
Keywords: Aquaculture, Food Security, Blue World, Aquaculture Production and Export,
Food Safety Issues, Bangladesh

POSTGRADUATE CONFERENCE ON ECONOMICS, PUBLIC ADMINISTRATION AND
BUSINESS (PCEPAB)-5TH SEPTEMBER, 2015
PROMOTING GROWTH, EXCELENCE AND SUSTAINABILITY - 372
Women Empowerment through Entrepreneurship: a Case Study
of Hulu Terengganu, Malaysia
Anjali Dewi Krishnan
Binary University
No.20 Jalan Hormat 25/49, Taman Sri Muda, 40400, Malaysia
Abstract:
This paper attempts to explore the perceived entrepreneurial characteristics of women entrepreneurs in Hulu
Terengganu besides identifying the influences of perceived entrepreneurial characteristics on the business
performance. It starts by reviewing the basic of entrepreneurship and women’s participation in entrepreneurial
venture besides exploring the entrepreneurial traits of women entrepreneurs at Hulu Terengganu. The results
gathered from the research used to investigate the relationship between women entrepreneurs’ characteristics
and business performance. Self-efficacy, entrepreneurial alertness, tolerance of ambiguity, attitude towards
entrepreneurship and some other cognitive style that portraying entrepreneurial characteristics were discovered
through this research. This research finishes by presenting that entrepreneurial characteristics of women
entrepreneurs do carry an impact on business performance.
Keywords: Entrepreneur, Entrepreneurial characeristics, Business Performance
1.0 Introduction
Women are recognized as successful entrepreneurs globally (Heilbrunn 2004). This is also
evident in Malaysia; statistics show that Malaysian entrepreneur’s population grew from 1.2
million in 1982 to 2.2 in 2008 with a significant proportion of women (Department of
Statistic, 2009). The government has given emphasis, supported and initiated various
activities to increase the number of women participants (Ming-Yen & Siong-Choy, 2008)
across broad spectrum of business activities (Abdul Razak Omar, 1998).
It is also said that women are more active in entrepreneurship compared to male counterparts
(Deakins & Freel, 2003). This is very true of the womenfolk of Ulu Trengganu, they are
ubiquitous in all activities of business. This difference as compared to other regions in the
country gives reason to study women entrepreneurship in Ulu Trengganu; especially into their
characteristics which makes them different.
1.1 Statement of the problem
Entrepreneurship contributes significantly to a healthy economy (Kjeldsen & Nielsen, 2006)
and is a push factor for economic and social development throughout the world (Audretsch,
2003). Minniti (2009) study proves that there is a positive correlation between economic
growth and female entrepreneurship. In Malaysia, entrepreneurs through SMEs, with

POSTGRADUATE CONFERENCE ON ECONOMICS, PUBLIC ADMINISTRATION AND
BUSINESS (PCEPAB)-5TH SEPTEMBER, 2015
PROMOTING GROWTH, EXCELENCE AND SUSTAINABILITY - 373
significant government support, account for 97.3% of the total businesses and contributed
32.5% to the GDP of the country in 2011 (Department of Statistics Malaysia, 2012) with a
sizable role played by women (Ahmad, 2009). The Malaysian Business Commission (2010)
shows that food and beverage were among the top business venture in Malaysia and 49,554
business units of it are owned by women in the 2010 and increased to 54,626 units in the year
2011.
However, with least support from outside including government, womenfolk in Ulu
Trengganu, are empowering through entrepreneurship as ducks to water. There are many
studies that principally focus on problems, hindrance and government support (Center for
Women’s Business Research: Key Facts 2006), but not on identification of traits that
successful entrepreneurs’ posses in a community know for such activities since decades.
Hence, a research problem emerges from the lack of understanding of such successful women
entrepreneurs and entrepreneurial characteristics possessed by them. This research aims to
explore these traits to fill the gap in the current literature, through a case study of a successful
community in Hulu Terengganu that can be a role model across the nation.
1.2 Significance of the problem
Entrepreneurship contributes significantly to a healthy economy (Kjeldsen & Nielsen, 2006)
and is a push factor for economic and social development throughout the world (Audretsch,
2003). Minniti (2009) study proves that there is a positive correlation between economic
growth and female entrepreneurship. In Malaysia, entrepreneurs through SMEs, with
significant government support, account for 97.3% of the total businesses and contributed
32.5% to the GDP of the country in 2011 (Department of Statistics Malaysia, 2012) with a
sizable role played by women (Ahmad, 2009). The Malaysian Business Commission (2010)
shows that food and beverage were among the top business venture in Malaysia and 49,554
business units of it are owned by women in the 2010 and increased to 54,626 units in the year
2011.
However, with least support from outside including government, womenfolk in Ulu
Terengganu, are empowering through entrepreneurship as ducks to water. There are many
studies that principally focus on problems, hindrance and government support (Center for
Women’s Business Research: Key Facts 2006), but not on identification of traits that
successful entrepreneurs’ posses in a community know for such activities since decades.
Hence, a research problem emerges from the lack of understanding of such successful women
entrepreneurs and entrepreneurial characteristics possessed by them. This research aims to
explore these traits to fill the gap in the current literature, through a case study of a successful
community in Hulu Terengganu that can be a role model across the nation.
1.3 Purpose of the Research
This study may provide an opportunity to find out the characteristics associated with
entrepreneurship and exploring the relationship it carries on business performance.

POSTGRADUATE CONFERENCE ON ECONOMICS, PUBLIC ADMINISTRATION AND
BUSINESS (PCEPAB)-5TH SEPTEMBER, 2015
PROMOTING GROWTH, EXCELENCE AND SUSTAINABILITY - 374
1.4 Hypothesis/ Research question
Specific objectives
To answer the main objectives, a couple of specific independent objectives are formulated to
understand the issue better. The followings are the specific objectives formulated:
(1) To explore the entrepreneurial characteristics of women entrepreneur at Hulu Terengganu
(2) To examine the relationship between entrepreneurial characteristics of women
entrepreneur at Hulu Terengganu and their business performance
Research Questions
1) What are the perceived entrepreneurial characteristics of women entrepreneurs in Hulu
Terengganu, Malaysia?
2) What are the influences of perceived entrepreneurial characteristics on the business
performance of women entrepreneurs in Hulu Terengganu, Malaysia
Hypotheses
Hypothesis 1
H0: There is no any significant relationship between personality traits and business
performance
H1: There is a significant relationship between personality traits and business performance
Hypothesis 2
H0: There is no any significant relationship between need for achievement and business
performance
H1: There is a significant relationship between need for achievement and business
performance
Hypothesis 3
H0: There is no any significant relationship between risk taking propensity and business
performance
H1: There is a significant relationship between risk taking propensity and business
performance
Hypothesis 4

POSTGRADUATE CONFERENCE ON ECONOMICS, PUBLIC ADMINISTRATION AND
BUSINESS (PCEPAB)-5TH SEPTEMBER, 2015
PROMOTING GROWTH, EXCELENCE AND SUSTAINABILITY - 375
H0: There is no any significant relationship between tolerance for an ambiguity and business
performance
H1: There is a significant relationship between tolerance for an ambiguity and business
performance
Hypothesis 5
H0: There is no any significant relationship between self-efficacy and business performance
H1: There is a significant relationship between self-efficacy and business performance
Hypothesis 6
H0: There is no any significant relationship between cognitive characteristic and business
performance
H1: There is a significant relationship between cognitive characteristic and business
performance
Hypothesis 7
H0: There is no any significant relationship between entrepreneurial alertness and business
performance
H1: There is a significant relationship between entrepreneurial alertness and business
performance
Hypothesis 8
H0: There is no any significant relationship between entrepreneurial attitude and business
performance
H1: There is a significant relationship between entrepreneurial attitude and business
performance
Hypothesis 9
H0: There is no any significant relationship between cognitive style and business performance
H1: There is a significant relationship between cognitive style and business performance
1.5 Assumption
There are some facts that should be stated.

POSTGRADUATE CONFERENCE ON ECONOMICS, PUBLIC ADMINISTRATION AND
BUSINESS (PCEPAB)-5TH SEPTEMBER, 2015
PROMOTING GROWTH, EXCELENCE AND SUSTAINABILITY - 376
(1) The women entrepreneurs from Hulu Terengganu selected as the sampling unit assuming
that there are the group of women entrepreneurs who are making significant contribution to
the growth of nation to an extent.
(2) It is also assumed that all the respondents are homogenous.
(3) Also assumed that all the respondents are willing to make repayment.
1.6 Limitations
There are few limitations has been addressed by the researches. The first and foremost is the
researcher could not happen to conduct a nationwide survey in obtaining the expected data.
Thus, it is quite difficult in making a significant conclusion that can be generalized to the
entire women entrepreneurs. The respondents who were from Hulu Terengganu have been
chosen for this study. This sampling frame had limited the generalizability of the findings.
Consequently, the results of this study cannot represent the entire women entrepreneurs’
community but only a segment of the women entrepreneurs. The respondents of this study
were limited to only women entrepreneurs in the rural community. Therefore, the
entrepreneurial characteristics and business performance of the suburban and urban women
entrepreneurs is not covered in this research. There is no denying that the findings may
change if a larger sample covering both urban and rural areas were used. Also, this study is
subject to time and cost constraints. With a longer time period and availability of bigger fund
will give a better chance to cover more area to give better wider findings. Notwithstanding the
shortcomings, findings of this study have provided insights into women entrepreneurs,
entrepreneurial characteristics and business performance.
1.7 Definition
Definition Concepts
Entrepreneurship Entrepreneurship is seen as making new combinations which include the
introduction of new goods, new methods of production, opening of new markets,
new sources of supply and new organisations (Schumpeter, 1934)
Entrepreneurial
characteristics
Refer to the desired traits, which enable an entrepreneur to do what is expected of
him/her and succeed in business. It is the combination of these characteristics that is
required to enable any one to perform effectively as an entrepreneur. It is possible
for people to develop these characteristics and succeed in their careers as
entrepreneurs. Successful entrepreneurs have common characteristics.
Business
Performance
The accomplishment of a given task measured against preset known standards of
accuracy, completeness, cost, and speed in an organization.

POSTGRADUATE CONFERENCE ON ECONOMICS, PUBLIC ADMINISTRATION AND
BUSINESS (PCEPAB)-5TH SEPTEMBER, 2015
PROMOTING GROWTH, EXCELENCE AND SUSTAINABILITY - 377
2.0 Literature Review
An overview of previous researches related to the research topic is discussed here followed by
a framework to show the relationships between the variables.
2.2 Entrepreneurship
Entrepreneurship definition is dynamic and has evolved over time, Richard Cantillon (1775)
first defined entrepreneurs as individual who are expert in taking risk which translate
entrepreneurship as an art of risk taking, with the most recent by Hitt et al. (2011) which
argues that, entrepreneurship is a process where an individual engages in discovery,
evaluation and exploitation of opportunities. Others (Schumpeter (1934), Drucker, (1985),
Gartner (1988)) have also defined entrepreneurship, with all having a common theme,
business for the first time and its successful management.
2.3 Women Entrepreneurship
There is a significant increase in the numbers of women entrepreneurs throughout the world
(Heilbrunn, 2004). This phenomenon is backed up by behaviour of individual, social and
economic factors (Kavitha, Anantharaman & Sharmila, 2008). The evident social factor
which includes early life experience, stage of career, personal background, family background
and growth environment ( Gibb, 1993) and social pressures (Hebert et al, 1997) strongly
motivate women to become entrepreneurs. In essence, women become entrepreneurs in order
to balance work and family (Kirk & Belovics, 2006).
Among other motivating factors, social networks are also a major factor that motivates
women entrepreneurs (Gadar & Yunus, 2009). Besides these factors, self confidence of
having adequate skills and knowledge together with the knowledge of existing opportunities
gives women a positive attitude to venture in to business (Langowitz & Minniti, 2007).
Although there is many factors motivate women entrepreneurs, money was never a part of it
and it is a result of career dissatisfaction (Cromie, 1987). Not only giving greater flexibility
and coming out of traditional office bureaucracy, but being an entrepreneur means satisfying
their needs and also of their family and children (Lee & Rogoff, 1997).
Malaysia’s development is strongly supported by the women participation in economic
activity which is becoming a growing importance to the country (Ahmad, 2009). Their huge
success in contributing to the nation’s success is backed up by their courage and high level of
commitment in business (Mansor, Suzanna & Siti, 2008). Women entrepreneurs are becoming
more evidently important to the staggering rate in growth of the SMEs and their indirect
contribution to the Malaysian economy. The number of women in Malaysian SMEs in the
year 2003 was 1,122,000 or 36.8 percent of the total employment in SMEs and the number is
going up each year (Ming-Yen & Siong-Choy, 2008) and across diverse business activities.
This advancement is supported by the establishment of Federation Council’s organizations
Women’s Entrepreneurship and also by other women entrepreneurs association such as
Peniagawati, Usahanita, Wawasanita and Sarawak Usahanita and has helped women
entrepreneurs achieve global position (Abdul Razak Omar, 1998).

POSTGRADUATE CONFERENCE ON ECONOMICS, PUBLIC ADMINISTRATION AND
BUSINESS (PCEPAB)-5TH SEPTEMBER, 2015
PROMOTING GROWTH, EXCELENCE AND SUSTAINABILITY - 378
According to the Malaysian Business Commission 2010 food and beverage were among the
top business venture in Malaysia. There are 49,554 business units which are owned by women
in the 2010 and 54,626 units in the year 2011. This increasing figure clearly shows that
Malaysian women are strongly committed to perform in commercial and economic activities.
Norman and McDonald (2004) study found a sizable women entrepreneurs involved in the
home stay business which has a positive effect of the country’s economy, environment and
social aspects (Intan Osman et. al, 2008).
This clearly shows that many women are involved and show keen interest in self-employment
(O’Brien, 1983) besides maintaining a balance between their personal life and career
(Md.zabid & Fariza, 1992).
2.4 Role of Entrepreneurial Development
Entrepreneurs play a major role in contributing and developing the economy of a country.
Many economist and politicians believe that entrepreneurs are the notable contributors of
economic growth and job creation and this is why many countries promote entrepreneurial
activity (Audretsch & Thurik, 2001; Holcombe, 1998; Reynolds et al., 2000, 2001, 2002;
Wennekers, Thurik & Buis, 1997).
Entrepreneurs are not only linked with economic growth through the new firm creation which
creates new economic opportunities (Wennekers, Thurik & Buis, 1997) but also linked to
wealth distribution (Saemundsson & Kirchhoff, 2002; Schumpeter, 1993; Schumpeter, 1996)
and in reducing poverty (Bridges.org, 2002; Christy & Dassie, 2000; Saini, 2001; UNDP,
2001). On top of all this, entrepreneurs create social wealth out of total economic value
created. This happens where markets are not being able to cater specific social needs, where
the government agencies fail to provide services such as welfare and basic education in many
poor countries (Venkataraman, 1997).
In recognizing the role of entrepreneurship, in the year 1993, the General Assembly of the
United Nations Organisation approved a resolution recognizing entrepreneurship as economic
and social force that increases the living standards throughout the world. It also urged their
member countries to build and implement policies to encourage entrepreneurship in the
society (Slaughter, 1996).
2.5 Entrepreneurial Traits
2.5.1 Need for Achievement and Enterprise Performance
In 1965, McClelland studied the relationship among characteristics of entrepreneurs, strategy
and growth of SMEs. The findings revealed that higher achievers spend time thinking on how
to do things better, tend to take immediate responsibility for tasks, display initiatives and
always want feedback on their level of performance (McClelland 1965; McClelland 1987),
which is supported by similar findings by Rotter in 1966. On top of that, Johnson (1990)
revealed a positive relationship between need for achievement and entrepreneurial
performance. This is further supported by a meta-analysis conducted by Collins, Hanges and
Locke (2004) who found that both measures of need for achievement are valid. A more recent

POSTGRADUATE CONFERENCE ON ECONOMICS, PUBLIC ADMINISTRATION AND
BUSINESS (PCEPAB)-5TH SEPTEMBER, 2015
PROMOTING GROWTH, EXCELENCE AND SUSTAINABILITY - 379
study in 2007 found need for achievement is significantly correlated with both the choice of
an entrepreneurial career and with entrepreneurial performance (Rauch & Frese, 2007b).
2.5.2 Risk Taking Propensity and Enterprise Performance
In entrepreneurship studies, the idea regarding risks and uncertainty emerged in the 18th
century through economic theory developed by Cantillon in 1931 (Kirby 2003). The results
are mixed, some have positive relationship, but others are negative. Meta-analysis
investigating this relationship found positive correlation between these two elements (Rauch
et. al., 2007b, Davidsson, 2007). Similarly study investigating this dimension, found that risk-
taking and organizational performance produced a curvilinear relationship. The clarification
for this phenomenon is found in another study in Australia which found that risk-taking which
involved taking calculated risk had positive impact on firm performance, but taking risk
which were considered as daring actions were considered as detrimental for firm performance
(Coulthard, 2007). However, a meta-analysis confirms the positive effect of risk-taking on
entrepreneurship and business success (Rauch and Frese 2007b). The overall relationship
between risk-taking, entrepreneurship, and business success was minimal, indicating the
presence of moderators. This leads to the conclusion that the effect of risk-taking on
entrepreneurship and business success is positive and significant, but weak (Isaga, 2007).
2.5.3 Tolerance for Ambiguity and Enterprise Performance
An entrepreneur with a high tolerance level for ambiguity is one who finds an unclear
situation challenging and struggles to overcome such situations in order to perform better
(Teoh & Foo 1997). With regard to this phenomenon, several researchers have concluded that
entrepreneurs have a significantly higher capacity to tolerate ambiguity than is the case with
managers (Koh 1996; Teoh & Foo 1997). This is because the challenges and potential
associated with business growth are, by their very nature, unpredictable (Schere 1982). As a
result of this, entrepreneurs are required to have considerable tolerance and view uncertainty
as an exciting stimulus rather than a severe threat (Gasse 1982). In fact, if ambiguity tolerance
serves as an exciting stimulus it may foster entrepreneurial success (Begley & Boyd 1987b).
This concept falls in line with the previous notion that entrepreneurs with a higher tolerance
for ambiguity are those who obtain superior results if their mission is in line with company
growth (Gupta & Govindarajan, 1984). Further evidence for the validity of this notion comes
from a recent study carried out by Walley (2007). The author found that successful
entrepreneurs have a greater tolerance for ambiguity than failed entrepreneurs.
2.5.4 Self-Efficacy and Enterprise Performance
Much work has been focused on this theme since it is believed that people who have higher
self-efficacy are most probably to start a venture and lead their venture to growth than people
who have lower self-efficacy (Judge and Bono 2001; Kirby 2003 and Rauch and Frese
2007b). Furthermore, it is argued that people with a high level of self-efficacy tend to set
higher goals, persist even in the face of failure, and sees difficult tasks as challenges to be
conquered rather than issues to be avoided (Kuratko & Hodgetts, 2001). Due to the important
role of self-efficacy, many research works has been done to investigate the effect of self-

POSTGRADUATE CONFERENCE ON ECONOMICS, PUBLIC ADMINISTRATION AND
BUSINESS (PCEPAB)-5TH SEPTEMBER, 2015
PROMOTING GROWTH, EXCELENCE AND SUSTAINABILITY - 380
efficacy on business performance (Baum and Locke 2004). For instance, a meta-analysis
carried out by Judge and Bono (2001) showed a robust, positive link between self-efficacy
and work related performance, proving that self-efficacy is an entrepreneurial feature that
might determine performance. In his studies, Forbes (2005b) measured the link between self-
efficacy and enterprise performance and his findings confirm that self-efficacy and enterprise
performance are positively linked. Likewise, Anna et al. (2000), Baum, Locke and Smith
(2001), Baum and Locke (2004) identified a positive relationship between the self-efficacy of
entrepreneurs and the growth of ventures.
2.6 Cognitive
2.6.1 Entrepreneurial Alertness and Enterprise Performance
Researchers have attempted to understand the role of alertness in venture activities. For
example, Tang (2008) studies the effects of alertness on entrepreneurs' commitment to their
new ventures. The researcher found that highly alert entrepreneurs showed greater
commitment to their firm than less alert entrepreneurs. Following this, Hsieh, Kelley and Liu
(2009) examined the role of alertness in the opportunity recognition process. Their study
confirms a positive relationship between opportunity recognition and alertness, indicating that
entrepreneurial alertness may provide valuable conceptual tools for understanding the process
of opportunity identification and venture performance. Given the importance of alertness in
opportunity identification, linking alertness to firm growth seems highly valuable. This
argument also applies to Ardichvili, Cardozo and Ray (2003) who asserted that successful
entrepreneurs are more likely to have an approach that assists them in recognising
opportunities, which will lead to profits in the future. Thus, it seems clear that entrepreneurial
alertness poses a useful dimension for understanding various aspects of entrepreneurship.
However, a limited number of empirical studies exist in this area (Tang 2008).
2.6.1 Attitude toward Entrepreneurship and Enterprise Performance
A number of studies have tried to understand individual’s attitudes towards entrepreneurship
(Wiklund and Shepherd 2003a; Torimiro and Onco-Adetayo 2005; Kolvereid & Isaksen
2006; Caliendo, Fossen & Kritikos 2009). Studies indicate that attitude is an important
determinant of an individual’s success in entrepreneurship, because a favourable attitude
towards entrepreneurship increases entrepreneurial activity and aspiration, which in turn
positively affect the performance of the enterprise (Kirby 2003). For example, Turan and Kara
(2007) revealed that Turkish entrepreneurs exhibit positive attitudes and a steady
determination with regard to entrepreneurial activities. In line with these findings, a study by
Nybakk and Hansen (2008) revealed that entrepreneurs who exhibit a stronger entrepreneurial
attitude appear to be more likely to change the way they organise their enterprise and tend to
have higher income growth. Subsequently, studies of growth have also found that positive
attitude toward entrepreneurship having a positive effect on the growth of SMEs (Miner et al.
1994; Kolvereid & Bullvag 1996; Wiklund & Shepherd 2003).
2.6.2 Cognitive Style Indicators and Enterprise Performance

POSTGRADUATE CONFERENCE ON ECONOMICS, PUBLIC ADMINISTRATION AND
BUSINESS (PCEPAB)-5TH SEPTEMBER, 2015
PROMOTING GROWTH, EXCELENCE AND SUSTAINABILITY - 381
Allinson, Chell, and Hayes (2000) and Kickul and Krueger (2004) differentiated between
entrepreneurs and non-entrepreneurs using cognitive style as the distinguishing factor. In
support of the argument, both studies found that entrepreneurs were more intuitive than the
general population of managers. Given the promise of the cognitive approach as a field of
study, linking cognitive styles to firm growth seems highly valuable. For example, Allinson,
Chell and Hayes (2000) and Hough and Ogilvie (2005) suggest that different cognitive styles
among individuals can explain variations in information-processing, decision-making and
outcomes (e.g., business outcomes). Empirically, studies are available regarding the
relationship between cognitive styles and enterprise growth. Among the studies which link
cognitive styles and performance, the one by Allinson, Chell and Hayes (2000) reveals that
entrepreneurs of successful firms are more intuitive in their cognitive styles than the general
population. Similarly, Sadler-Smith (2004) found a positive relationship between intuitive
decision style and subsequent financial performance. In addition, Armstrong and Hird (2009)
investigated whether or not cognitive style is an important factor in identifying individuals
with the potential to become successful entrepreneurs. Their findings indicate that successful
entrepreneurs exhibited higher levels of creating style than non-successful entrepreneurs.
Conceptual Framework
Employee Motivation
Business Performance
Entrepreneurial Characteristics
Personality traits
Need for achievement
Risk taking propensity
Tolerance for an ambiguity
Self-efficacy
Cognitive Characteristics
Entrepreneurial alertness
Entrepreneurial attitude
Cognitive style
Dependent Variables

POSTGRADUATE CONFERENCE ON ECONOMICS, PUBLIC ADMINISTRATION AND
BUSINESS (PCEPAB)-5TH SEPTEMBER, 2015
PROMOTING GROWTH, EXCELENCE AND SUSTAINABILITY - 382
3.0 Introduction
This chapter will describe the tools, techniques and data analysis methods developed for the
use in the subsequent chapter. Thus, this chapter illustrates the collaborating establishments,
procedures and methods used to conduct this research to investigate entrepreneurial
characteristics of women entrepreneurs and the relationship it carries towards business
performance. The objectives are repeated here to reiterate how the objectives match the data
collection.
3.1 Justification
This study is quantitative in nature. Quantitative data usually employed to determine
relationships between the variables. This research is based on exploratory research design.
According to Babbie, an exploratory research is essential whenever a researcher is breaking
new ground, and these studies almost always yield new insight into the topic. As there are
little or no studies that have explored the women entrepreneurs’ entrepreneurial characteristics
in Malaysia’s context, thus, this research will give insight to the women entrepreneurs’
entrepreneurial characteristics and the relationship it carries towards business performance.
This fact makes this study exploratory in nature.
3.2 Research Design
For this study we have identified the quantitative methodology to describe and measure the
data. This method is ideal in understanding the specific objectives of this study and helps the
researcher to make specific prediction and gives ideas for future studies. A questionnaire
design was used in this research to gather data from the women entrepreneurs from Hulu
Terengganu. This approach was chosen because easy to assess the entrepreneurial
characteristics of women entrepreneurs. Based on the research objectives statement where a
couple of hypotheses will be tested, we have identified the independent and dependent
variables as follows; the independent variables are entrepreneurial and cognitive
characteristics of women entrepreneurs (personality traits, need for achievement, risk taking
propensity, tolerance for an ambiguity, self-efficacy, entrepreneurial alertness, entrepreneurial
attitude and cognitive style). The dependent variable is business performance.
3.3Sampling Technique
Convenience sampling method was employed in this study. Generally, the questionnaires
were distributed among women entrepreneurs in Hulu Terengganu. The specific area of focus
for this research is the town of Kuala Berang. The samples from this particular town is
deemed as representative of the whole district of Hulu Terengganu as Kuala Berang is the
administrative capital of the district and most of the businesses operate here.
3.3 Research Instrument
The research instrument was a self-administered questionnaire. This questionnaire was
developed through adaptation from various researchers. The personality traits section
examines the women entrepreneurs' psychological profile and includes indicators such as; the

POSTGRADUATE CONFERENCE ON ECONOMICS, PUBLIC ADMINISTRATION AND
BUSINESS (PCEPAB)-5TH SEPTEMBER, 2015
PROMOTING GROWTH, EXCELENCE AND SUSTAINABILITY - 383
need for achievement, locus of control, innovativeness, risk-taking propensity, self-efficacy
and tolerance for ambiguity. Several items were developed for each individual variable and
women entrepreneurs were required to indicate their level of agreement with these items by
using a 5 point Likert scale. Accordingly, need for achievement was measured by the scale
adapted from Steers and Braunstein (1976), which was also used in other research
(Hansemark 1998; Entrialgo, Vazquez and Fernandez 2000; Stewart et al. 2003). The
entrepreneur’s locus of control was measured by three different dimensions, namely: internal
attributing, chance attributing and powerful others (Levenson 1981). These were also
observed in other works (e.g., Koh 1996; Hansemark 1998; Littunen and Virtanen 2006).
Items taken from the Jackson Personality Inventory (Jackson 1984), which was used in other
works (Cromie 2000; Nchimbi 2002; Gurol and Atsan 2006), were used to measure an
entrepreneur’s innovativeness and risk-taking propensity. The scale developed by Sherer et al.
(1982) was used to measure the entrepreneur’s self-efficacy. This scale was chosen because it
is frequently reported to have high reliability (Chen, Gully, and Eden 2001). Lastly, the items
used to measure tolerance of ambiguity were taken from MacDonald (1970). This scale
consists of 20 items and was reported to have high reliability and validity (Gurol and Atsan
2006).
The items used to measure cognitive characteristics are based on a 5-point Likert scale
ranging from 1 (strongly disagree) to 5 (strongly agree). Attitude towards entrepreneurship
was measured using a scale adopted from Turan and Kara (2007). This scale measures the
extent to which the entrepreneur has a positive attitude towards entrepreneurship. We assess
cognitive style with the 18-item Cognitive Style Indicator (CoSI) developed by Cools and
Van Den Broeck (2007). This scale distinguishes a knowing style, a planning style and a
creating style. This scale has been used often as it has shown itself to be reliable and valid
across different countries (Cools and van den Broeck 2007; Marcati, Guido and Peluso 2008).
Eight items adapted from Tang, Tang and Lohrke (2008) were used to measure entrepreneur’s
alertness. These items were developed on the basis of the Kirzner (1979) definition. This scale
has been found to have strong reliability and validity (Tang 2008). The scale incorporates
eight items, four of which represent low alertness while the other four represent high
alertness. The items adapted from Davidson (1989) which were also used by Kolvereid
(1992), Olomi (2001) and Nchimbi (2002) were used to gather information about the
motivation of individuals for starting their businesses. The items comprise both pull factors
and push factors. The respondents were first required to rate the extent to which different
factors were important to them when they started their businesses on a 5-point Likert scale.
Furthermore, the respondents were also required to indicate a degree to which reasons for
starting their businesses are still important to them. The scale ranged from 1 (not important at
all) to 5 (very important).
3.5 Statistical Treatment
The data that were gathered from the questionnaires were coded, edited and then entered into
personal computer using SPSS version 20 for window 2010. Further editing and clearing were
done prior to the analysis.

POSTGRADUATE CONFERENCE ON ECONOMICS, PUBLIC ADMINISTRATION AND
BUSINESS (PCEPAB)-5TH SEPTEMBER, 2015
PROMOTING GROWTH, EXCELENCE AND SUSTAINABILITY - 384
4.0 Finding and Analysis
This chapter reports the findings and results of the analysis derived from the survey data. It
begins with a descriptive analysis on the respondents’ demographic data and their firm’s
performance. It is followed by reliability analysis, description of their entrepreneurial
characteristics, correlation analysis, multiple regression analysis and hypothesis testing
4.1 Summary Result
4.1.1 Demographics Characteristics of Respondents
A total of 313 survey questionnaire were distributed and collected from women entrepreneurs
from Hulu Terengganu. The response rate is 100%.
Table 4.1 presents the summary of the demographic details.
Demographic
Factors % N
Age Group
20-30 30.0 94
31-40 30.7 96
41-50 39.3 123
Total 100.0 313
Marriage Status
Married 59.7 187
Single 30.0 94
Widowed 10.2 32
Total 100.0 313
Highest Education Level % N
Never Attended School 10.2 32
Primary School 30.0 94
STPM / Diploma 40.3 126
Degree 10.2 32
Others 9.3 23
Total 100.0 313
Table 4.1 Respondent Demographic
In this survey, most of the respondents are in the age group of 41-50 and amounted to 39.3 %
of the total number of respondents. It is followed by the age group of 31-40 and 20-30, at 30.7
% and 30.0 % respectively. 187 or 59.7 % of the respondents are married and 30 % remain
single while 10.2 % are widowed. Looking in the highest level of education of the
respondents, STPM / Diploma holders top the table with 126 (40.3%), followed by Primary
School leavers at 30.0% of the total respondent.

POSTGRADUATE CONFERENCE ON ECONOMICS, PUBLIC ADMINISTRATION AND
BUSINESS (PCEPAB)-5TH SEPTEMBER, 2015
PROMOTING GROWTH, EXCELENCE AND SUSTAINABILITY - 385
4.2 Firm Performance
Total number of workers
Frequency Percent Valid Percent Cumulative Percent
Valid No changes 96 30.7 30.7 30.7
Increase 155 49.5 49.5 80.2
Decrease 30 9.6 9.6 89.8
No workers 32 10.2 10.2 100.0
Total 313 100.0 100.0
Table 4.2 Number of Workers
Table 4.2 explains the total number of workers a firm has. It tends to explain the pattern in the
terms of increase and decrease of workers for the last three years. From the table, it is
reasonable to say that 49.5% of the total firms experienced increase in the total number of
workers while 9.6% experienced decrease, 30.7% had no changes in number of workers and
10.2 % firms did not employ any workers.
Total number of relatives working for the firm
Frequency Percent Valid Percent Cumulative Percent
Valid Increase 96 30.7 30.7 30.7
No
relatives 217 69.3 69.3 100.0
Total 313 100.0 100.0
Table 4.3 Number of Relatives Working at Firm
Table 4.3 explains the number of relatives working for a firm in the last three years. It tends to
look at the increase and decrease of number of relatives working in a firm. Based on the table,
it is safe to say that 30.7 % of the total number of firms had experienced increase in number
of relatives working for them. The remaining 69.3% of the firms have no relatives attached
with them.
Firm Sales
Frequency Percent Valid Percent Cumulative Percent
Valid Increase 219 70.0 70.0 70.0
Decrease 32 10.2 10.2 80.2
No changes 62 19.8 19.8 100.0
Total 313 100.0 100.0
Table 4.4 Firm’s Sales

POSTGRADUATE CONFERENCE ON ECONOMICS, PUBLIC ADMINISTRATION AND
BUSINESS (PCEPAB)-5TH SEPTEMBER, 2015
PROMOTING GROWTH, EXCELENCE AND SUSTAINABILITY - 386
Table 4.4 explains the firms’ sales in the last three years. A total of 70.0% firms experienced
increase in their sales compared to 10.2% of decrease in total sales. A total of 62 firms or 19.8
firms reported that their sales remained unchanged.
Firm profit
Frequency Percent Valid Percent Cumulative Percent
Valid Increase 219 70.0 70.0 70.0
Decrease 32 10.2 10.2 80.2
No changes 62 19.8 19.8 100.0
Total 313 100.0 100.0
Table 4.5 Firm’s Profit
Table 4.5 explains the level of profit a firm experienced in the last three years. It is evident
that 219 respondent covering 70.0 of the total respondent had increased profit in their
business. 10.2% seems to have a reduced profit level in the last there years and 19.8% had
their profit unchanged.
Asset development for the last 3 years
Frequency Percent Valid Percent Cumulative Percent
Valid Increase 187 59.7 59.7 59.7
Decrease 96 30.7 30.7 90.4
No changes 30 9.6 9.6 100.0
Total 313 100.0 100.0
Table 4.6 Firms Asset
In the table 4.6 is the response to the question of assets accumulation in the last three years.
59.7% of the total respondent agreed that their assets are increased while 30.7% reported
decrease in the assets. A total 9.6% of respondent had no changes in their assets.
4.3 Reliability Analysis
Cronbach’s alpha is computed for internal validity and is discussed below.
Reliability Statistics
Variables Cronbach’s Alpha N of items Interpretation
Self-efficacy 0.706 14 Good
Tolerance for
Ambiguity
0.761 12 Good
Risk Taking
Propensity
0.236 3 Poor
Need for
Achievement
0.498 5 Poor
Entrepreneurial 0.651 7 Moderate

POSTGRADUATE CONFERENCE ON ECONOMICS, PUBLIC ADMINISTRATION AND
BUSINESS (PCEPAB)-5TH SEPTEMBER, 2015
PROMOTING GROWTH, EXCELENCE AND SUSTAINABILITY - 387
Alertness
Attitude towards
Entrepreneurship
0.720 16 Good
Cognitive Style
Indicators
0.832 18 Very Good
Table 4.7 Reliability Analysis Summary
The results indicate that the Cronbach’s Alpha for 14 items in Self-efficacy is 0.706. The
result shows that this independent variable is ranged as good. The questions about Self-
efficacy have good reliability. The reliability result of Tolerance for Ambiguity measures at
0.761 for 12 items. The result shows that this independent variable is ranged as good. The
questions about Tolerance for Ambiguity have good reliability. The reliability result of Risk
Taking Propensity measures at 0.236 for 3 items. The results shows that this independent
variable is ranged as poor. The questions about Risk Taking Propensity are not reliable for
this research and will not be used for further analysis. The reliability result of Need for
Achievement measures at 0.498 for 5 items. The results shows that this independent variable
is ranged as poor. The questions about Need for Achievement are not reliable for this research
and will not be used for further analysis. The reliability result of Entrepreneurial Alertness
measures at 0.651 for 7 items. The result shows that this independent variable is ranged as
moderate. The questions about Entrepreneurial Alertness have moderate reliability. The
results indicate that the Cronbach’s Alpha for 16 items in Attitude towards Entrepreneurship
is 0.720. The result shows that this independent variable is ranged as good. The questions
about Attitude towards Entrepreneurship have good reliability. The reliability result of
Cognitive Style Indicators measures at 0.832 for 18 items. The result shows that this
independent variable is ranged as very good. The questions about Cognitive Style Indicators
have a very good reliability.
4.4 Entrepreneurial Characteristics
IVs N Mean
Self-efficacy 313 2.94
Tolerance for Ambiguity 313 3.66
Entrepreneurial Alertness 313 3.53
Attitude towards Entrepreneurship 313 3.57
Cognitive Style indicator 313 3.91
Table 4.8 Entrepreneurial Characteristics
Table 4.8 explains the level of each variable that makes up entrepreneurial characteristics
among the respondent. The table shows the mean value for each variable. The figures range
from 1 to 5, where 1 being lowest and 5 being the highest. The higher the mean value gets,
higher the level of association of an individual with the said variable. Based on that,

POSTGRADUATE CONFERENCE ON ECONOMICS, PUBLIC ADMINISTRATION AND
BUSINESS (PCEPAB)-5TH SEPTEMBER, 2015
PROMOTING GROWTH, EXCELENCE AND SUSTAINABILITY - 388
Cognitive Style Indicator is the highest entrepreneurial character among the women
entrepreneurs in Hulu Terengganu. Self-efficacy scored the lowest at 2.94.
4.6 Correlations Analysis
In this section, Pearson Correlation Coefficient test results are displayed and will form the
basis to analyse the hypothesis.
Business Performance
Self-efficacy Pearson Correlation .179
Sig. (2-tailed) .001
N 313
Tolerance for Ambiguity Pearson Correlation .085
Sig. (2-tailed) .133
N 313
Entrepreneurial Alertness Pearson Correlation -.285
Sig. (2-tailed) .000
N 313
Attitude towards
Entrepreneurship
Pearson Correlation -.369
Sig. (2-tailed) .000
N 313
Cognitive Style Indicators Pearson Correlation .043
Sig. (2-tailed) .446
N 313
Table 4.9 Summary of Correlation Analysis
4.7 Multiple Regression Analysis
Model Summary
Model R R Square
Adjusted R
Square Std. Error of the Estimate
1 .657a .432 .419 .44753
Table 4.7.1 Model Summary

POSTGRADUATE CONFERENCE ON ECONOMICS, PUBLIC ADMINISTRATION AND
BUSINESS (PCEPAB)-5TH SEPTEMBER, 2015
PROMOTING GROWTH, EXCELENCE AND SUSTAINABILITY - 389
ANOVAb
Model
Sum of
Squares df Mean Square F Sig.
1 Regression 46.424 7 6.632 33.113 .000a
Residual 61.086 305 .200
Total 107.511 312
Table 4.7.2 Anova Table
Model Unstandardized Coefficients Standardized
Coefficients
T Sig.
B Std. Error Beta
1 (Constant)
Tolerance for
Ambiguity
Self-efficacy
Entrepreneurial
Alertness
Attitude
Towards
Entrepreneurship
Cognitive Style
Indicator
3.227
.573
-.619
-.208
-.789
.570
.628
.086
.117
.071
.100
.101
.411
-.431
-.196
-.499
.344
5.141
6.661
-5.310
-2.948
-7.883
5.651
.000
.000
.000
.003
.000
.000
Table 4.7.3 Coefficients Table
It is noted from Table 4.7.1 as shown above, that the correlation coefficient (R) is 0.657
which indicates a positive linear relationship between ‘Business Performance’, the dependent
variable and the five independent variables. Thus, the results indicate that ‘Business
Performance’ is significantly affected by all the five types of independent variables, discussed
in this study.
Table 4.7.2 also shows that the multiple coefficient of determination (R²) is 0.432,
indicating that about 43.2% of the variation in ‘Business Performance’ could be jointly
explained by the given five independent variables which are Tolerance for Ambiguity, Self-
efficacy, Entrepreneurial Alertness, Attitude towards Entrepreneurship and Cognitive Style
Indicator

POSTGRADUATE CONFERENCE ON ECONOMICS, PUBLIC ADMINISTRATION AND
BUSINESS (PCEPAB)-5TH SEPTEMBER, 2015
PROMOTING GROWTH, EXCELENCE AND SUSTAINABILITY - 390
As per the ANOVA table above, the F-value of the model used for this research is 33.113
(Sig. = 0.000), indicating significance of model at 0.05, the chosen level of significance.
Thus, confirming the fitness of the model which indicates that there is statistically significant
relationship between ‘Business Performance’ and each of the independent variables.
From the Coefficients table 4.7.3, it shows that all the variables have a significant effect on
the ‘Business Performance’, the dependent variable. The P-value for all the independent
variable are less than 5% (0.05), which is the chosen level of significance, indicating that all
five independent variables had significant relationship with ‘Business Performance’.
4.8 Hypothesis Testing based on Correlations Analysis
IVs r value Relationship Hypothesis
Self-efficacy .179 Low relationship H1 Accepted
Entrepreneurial Alertness -.285 Low relationship H1 Accepted
Tolerance for Ambiguity .085 Very low relationship H1 Accepted
Attitude Towards Entrepreneurship -.369 Moderate relationship H1 Accepted
Cognitive Style Indicator .043 Very low relationship H1 Accepted
From the results of the correlation analysis, it shows that the hypothesis (H1) is accepted for
all the independent variable tested. This is because each of the independent variables has
some values no matter positive or negative. For Entrepreneurial Alertness and Attitude
towards Entrepreneurship, there is a negative correlation or negative relationship with the
dependent variable. As in this research we are trying to test whether each independent
variable has relationship with the independent variable or not, that being the case, all the
alternative hypothesis (H1) in this research are accepted.
5.0 Conclusion
This section primarily focused on discussing the finding and recommendations of this
research. The first section will begin with discussion of the research question based on the
finding on section 4. This will be followed by recommendation for further research in this
area, limitations of this research and conclusion.
5.2 Findings Related to Research Question 1:
What are the perceived entrepreneurial characteristics of women entrepreneurs in Hulu
Terengganu, Malaysia?
IVs N Mean
Self-efficacy 313 2.94
Tolerance for Ambiguity 313 3.66
Entrepreneurial Alertness 313 3.53
Attitude towards Entrepreneurship 313 3.57
Cognitive Style indicator 313 3.91

POSTGRADUATE CONFERENCE ON ECONOMICS, PUBLIC ADMINISTRATION AND
BUSINESS (PCEPAB)-5TH SEPTEMBER, 2015
PROMOTING GROWTH, EXCELENCE AND SUSTAINABILITY - 391
Based on the results of the research, women entrepreneurs of Hulu Terengganu seems to have
all the entrepreneurial characteristics tested in this research which are; self-efficacy, tolerance
for ambiguity, entrepreneurial alertness, attitude towards entrepreneurship and cognitive style
indicators. All this variables have a mean value between 2.94 and 3.91 out of a perfect 5.
Cognitive Style Indicator is the highest entrepreneurial character among the women
entrepreneurs in Hulu Terengganu at 3.91 and self-efficacy scored the lowest at 2.94.
5.3 Findings related to Research Question 2:
What are the influences of perceived entrepreneurial characteristics on the business
performance of women entrepreneurs in Hulu Terengganu, Malaysia?
IVs r value Influence on Business Performance
Self-efficacy .179 Low positive
Entrepreneurial Alertness -.285 Low negative
Tolerance for Ambiguity .085 Very low positive
Attitude Towards Entrepreneurship -.369 Moderate negative
Cognitive Style Indicator .043 Very low positive
From the results of the analysis, different entrepreneurial characteristics have different
influences on the business performance of women entrepreneurs in Hulu Terengganu,
Malaysia. Tolerance for Ambiguity and Cognitive style indicator tend to have a very low
positive relationship with business performance. Self-efficacy have a low positive influence
on business performance while Entrepreneurial Alertness and Attitude towards
Entrepreneurship have low negative influence and moderate negative influence on business
performance respectively.
5.4 Recommendations for the Future Research
This study is basically exploratory and cross-sectional in nature and is by no means an
exhaustive study on the students’ market. Additionally the results only reflect on the response
from limited women entrepreneurs in the rural, such as the women entrepreneurs in Hulu
Terengganu. Further measures for this study to be conducted on national basis would be
beneficial, research to include rural areas and smaller towns and with bigger sample size to
reflect the demographic composition of Malaysia.
Apart from entrepreneurial characteristics, there are other factors such as motivational factors,
start-up factors and supportive environmental factors to be considered in determining what
affect business performance.
Conclusion of the Research
This research has been conducted to identify the entrepreneurial characteristics of women
entrepreneurs and the relationship it carries towards business performance. At the end, this
research has met its objectives and successfully answered the research’s questions. Moreover,
this research will provide some ground work or became a benchmark for upcoming researches
on entrepreneurial characteristics. The findings have successfully able to provide certain

POSTGRADUATE CONFERENCE ON ECONOMICS, PUBLIC ADMINISTRATION AND
BUSINESS (PCEPAB)-5TH SEPTEMBER, 2015
PROMOTING GROWTH, EXCELENCE AND SUSTAINABILITY - 392
significant methods regarding the relationship exists between entrepreneurial characteristics
of women entrepreneurs and business performance. Thus, this research can be a guideline for
other researchers who intended to research in the same field to a certain extend.
Reference
Afrane, S 2002, ‘Impact assessment of microfinance intervention in Ghana and South
Africa’, Journal of Microfinance, vol.4, no.1.
Akanji, O. O 2006, ‘Microfinance as a strategy for poverty reduction’, Central Bank of
Nigeria Economic and Financial Review, vol. 39, no. 4.
Allinson, C.W., Chell, E., and Hayes, J 2000, ‘Intuition and entrepreneurial behaviour’,
European Journal of Work and Organizational Psychology, vol. 9, no. 1, pp. 31-43.
Anna, A. L., Chandler, G. N., Jansen, E., and Mero, N. P 2000, ‘Women business owners in
traditional and non-traditional industries’, Journal of Business Venturing, vol. 15, no. 3,
pp.279-303.
Ardichvili, A., Cardozo, R., and Ray, S 2003, ‘A theory of entrepreneurial opportunity
identification and development’, Journal of Business Venturing, vol. 18, no.1, pp. 105-23.
Armstrong, S.J., and Hird, A 2009, ‘Cognitive Style and Entrepreneurial Drive of New and
Mature Business Owner-Managers’, Journal of Business and Psychology, Online first.
Baum, J.R., and Locke, E.A 2004, ‘The relationship of entrepreneurial traits, skill, and
motivation to subsequent venture growth’, Journal of Applied Psychology, vol. 89, no. 4, pp.
587-98.
Baum, J.R., Locke, E.A., and Smith, K.G 2001, ‘A multidimensional model of venture
growth’, Academy of Management Journal, vol. 44, no. 2, pp. 292-303.

POSTGRADUATE CONFERENCE ON ECONOMICS, PUBLIC ADMINISTRATION AND
BUSINESS (PCEPAB)-5TH SEPTEMBER, 2015
PROMOTING GROWTH, EXCELENCE AND SUSTAINABILITY - 393
Begley, T.M., and Boyd, D.P 1987b, ‘Psychological Characteristics Associated with
Performance in Entrepreneurial Firms and Smaller Businesses’, Journal of Business
Venturing, vol. 2, no. 1, pp. 79-93.
Bhatt J. and Tang B 2001, Self Sustainability of Micro-finance Institutions, A critical
Evaluation of Performance of Grameen Bank of the Bangladesh.
Brana, S 2008, ‘Microcredit in France: Does gender matter?’, 5th Annual Conference,
European Microfinance Network, Nice.
Brockhaus, R. H 1982, ‘The psychology of the entrepreneur’, in Kent, C. A.., Sexton, D. L.,
and Vesper K.H, (eds.), Encyclopedia of entrepreneurship, Prentice Hall, Englewood Cliffs,
NJ, pp. 39-71.
Caliendo, M., Fossen, F.M., and Kritikos, A.S 2009, ‘Risk attitudes of nascent entrepreneurs-
new evidence from an experimentally validated survey’, Small Business Economics, vol. 32,
no. 2, pp. 153-67.
Carter, S. & Shaw, E 2006. Women's business ownership: Recent research and policy
developments. Small Business Service, UK
Chell, E 2008, The Entrepreneurial Personality A social Construction. Routledge, East
Sussex.
Chell, E., Haworth, J., and Brearley, S 1991, The entrepreneurial personality: Concepts,
cases, and categories, Routledge, London:
Cheston, S. & Kuhn, L 2002. Empowering women through microfinance. A case study of
Sinapi Aba Trust, Ghana. Opportunity International, USA.

POSTGRADUATE CONFERENCE ON ECONOMICS, PUBLIC ADMINISTRATION AND
BUSINESS (PCEPAB)-5TH SEPTEMBER, 2015
PROMOTING GROWTH, EXCELENCE AND SUSTAINABILITY - 394
Collins, C.J., Hanges, P.J., and Locke, E.A 2004, ‘The relationship of achievement motivation
to entrepreneurial behavior: A meta-analysis’, Human Performance, vol. 17, no. 1, pp. 95-
117.
Cunningham, J.B., and Lischeron, J 1991, ‘Defining entrepreneurship’, Journal of Small
Business Management, vol. 29, no. 1, pp. 45-61.
Davidsson, P., Achtenhagen, L., and Naldi, L 2007, ‘What Do We Know About Small Firm
Growth?’, in Simon Parker, (ed.), The Life Cycle of Entrepreneurial Ventures, Springer, US,
361-98.
Dunn E. and Arbuckle J. Jr 2001, ‘The Impacts of Microcredit: A Case Study from Peru’,
United States Agency for International Development.
Edgcomb, E.L 2002, ‘What makes for effective microenterprise training?’, J. Microfinance,
vol. 4, pp. 99-114.
Entrialgo, M., Vazquez, C., and Fernandez, E 2000, ‘Characteristics of managers as
determinants of entrepreneurial orientation: some Spanish evidence’, Enterprise and
Innovation Management Studies, vol. 1, no. 2, pp. 187-205.
Forbes, D.P 2005b, ‘The effects of strategic decision making on entrepreneurial self efficacy’,
Entrepreneurship-Theory and Practice, vol. 29, no. 5, pp. 599-626.
Fukuyama, F 1995, Trust: Social Virtues and the Creation of Prosperity. Free Press, NY.
Gasse, Y 1982, ‘Elaborations on the psychology of the entrepreneur.’, in Kent, C. A., Sexton,
D. L.., and Vesper, K. H. (eds.) Encyclopedia of Entrepreneurship, Prentice-Hall Englewood
Cliffs, NJ, pp. 57-66.

POSTGRADUATE CONFERENCE ON ECONOMICS, PUBLIC ADMINISTRATION AND
BUSINESS (PCEPAB)-5TH SEPTEMBER, 2015
PROMOTING GROWTH, EXCELENCE AND SUSTAINABILITY - 395
Gupta, A., and Govindarajan, V 1984, ‘Business unit strategy, managerial characteristics, and
business unit effectiveness at Strategy implementation’, Academy of Management Journal,
vol. 27, no, 1, pp. 25-41.
Hartmann, F 2005, ‘The effects of tolerance for ambiguity and uncertainty on the
appropriateness of accounting performance measures’, Abacus, vol. 41, no. 3, pp. 241-64.
Hough, J.R., and ogilvie, D.T 2005, ‘An empirical test of cognitive style and strategic
decision outcomes’, Journal of Management Studies, vol. 42, no. 2, pp. 417-48.
Hsieh, R., Kelley, D.J., and Liu, C 2009, ‘The Roles Of Entrepreneurial Alertness, Prior
Knowledge And Social Networks In The Process Of Opportunity Recognition (Summary)’,
Frontiers of Entrepreneurship Research, vol. 29, Iss. 6, Article 12. Available at:
http://digitalknowledge.babson.edu/fer/vol29/iss6/12
Ibru, C 2009, Growing microfinance through new technologies. Federal University of
Technology, Akure, Nigeria.
Isaga N 2007, ‘Entrepreneurship and the Growth of SMEs in The Furniture Industry in Tanzania’
PhD thesis, Mzumbe University, Tanzania.
Jill, K. R., Thomas, P. C., Lisa, G. K. & Susan, S. D 2007, ‘Women entrepreneurs preparing
for growth: The influence of social capital and training on resource acquisition’, Journal of
Small Business and Entrepreneurship , vol. 20, no. 1, pp. 169-181.
Johnson, B.R 1990, ‘Toward a Multidimensional Model of Entrepreneurship: The Case of
Achievement Motivation and the Entrepreneur’, Entrepreneurship Theory and Practice, vol.
14, no. 3, pp. 39-54.

POSTGRADUATE CONFERENCE ON ECONOMICS, PUBLIC ADMINISTRATION AND
BUSINESS (PCEPAB)-5TH SEPTEMBER, 2015
PROMOTING GROWTH, EXCELENCE AND SUSTAINABILITY - 396
Judge, T.A., and Bono, J.E 2001, ‘Relationship of core self-evaluations traits-self-esteem,
generalized self-efficacy, locus of control, and emotional stability-with job satisfaction and
job performance: A meta-analysis’, Journal of Applied Psychology, vol. 86, no. 1, pp. 80-92.
K'Aol GO 2008, The Role of Microfinance in Fostering Women Entrepreneurship in Kenya.
Nairobi. Kenya Rural Enterprise Program (K-REP). Nairobi.
Khandker, S. R 1998a, Fighting poverty with microcredit: experience in Bangladesh, Oxford
University Press, Washington, D.C:
Kickul, J., and N Krueger 2004, ‘A cognitive process model of entrepreneurial self-efficacy
and intentionality’, in S. A. Zahra, (ed.) Frontiers of Entrepreneurship Research, Babson
College, Wellesley, MA.
Kirby, A. D 2003, Entrepreneurship, MCGraw-Hill Education, Maidenhead.
Kirzner, I. M 1979, Perception, opportunity and profit. University of Chicago Press, Chicago
Knack and Keefer 1997, ‘Does Social Capital Have anEconomic Payoff’, Quarterly Journal
of Economics, Nov. 1997.
Koh, C.H 1996, ‘Testing hypotheses of entrepreneurial characteristics: A study of Hong
Kong MBA students’, Journal of Managerial Psychology, vol. 11, no. 3, pp. 12-25.
Kolvereid, L., and Bullvag, E 1996, ‘Growth intentions and actual growth: The impact of
entrepreneurial choice’, Journal of Enterprising Culture, vol. 4, no. 1, pp.1–17.
Kolvereid, L., and Isaksen, E 2006, ‘New business start-up and subsequent entry into self-
employment’, Journal of Business Venturing, vol. 21, no. 6, pp. 866-85.

POSTGRADUATE CONFERENCE ON ECONOMICS, PUBLIC ADMINISTRATION AND
BUSINESS (PCEPAB)-5TH SEPTEMBER, 2015
PROMOTING GROWTH, EXCELENCE AND SUSTAINABILITY - 397
Krauss, S.I., Frese, M., Friedrich, C., and Unger, J.M 2005, ‘Entrepreneurial orientation: A
psychological model of success among southern African small business owners’, European
Journal of Work and Organizational Psychology, vol. 14, no. 3, pp. 315-44.
Kuratko, D. F., and Hodgetts, R. M 2001, Entrepreneurship: A contemporary Approach,
The Dryden Press, Harcourt Brace College Publishers, Orlando FL:
Kuzilwa, J 2005, ‘The role of credit for small business success: A study of the National
Entrepreneurship Development Fund in Tanzania’, The Journal of Entrepreneurship , vol. 14,
no. 2, pp. 131-161.
Lakwo, A 2007, Microfinance, rural livelihood, and women's empowerment in Uganda,
African Studies Center Research Report 2006.
Ledgerwood J 1999, Microfinance Handbook: An Institutional and Financial Perspective,
Sustainable Banking with the Poor, World Bank, Washington DC.
Lee, C., Lee, K., & Pennings, J. M 2001. ‘Internal capabilities, external networks, and
performance: a study on technology-based ventures’, Strategic Management Journal, vol. 22,
no. 6-7, pp. 615-640.
Lee, D.Y., and Tsang, E.W.K 2001, ‘The effects of entrepreneurial personality, background
and network activities on venture growth’, Journal of Management Studies, vol. 38, no. 4, pp.
583-602.
Martin, T. G 1999, Socio-economic impact of microenterprise credit in the informal sector of
Managua, Nicaragua, viewed 21 January 2009, < http://scholar.lib.vt.edu/thesis/>.
McClelland, D.C 1961, ‘Encouraging Excellence’, Daedalus, vol. 90, no. 4, pp. 711-24.

POSTGRADUATE CONFERENCE ON ECONOMICS, PUBLIC ADMINISTRATION AND
BUSINESS (PCEPAB)-5TH SEPTEMBER, 2015
PROMOTING GROWTH, EXCELENCE AND SUSTAINABILITY - 398
McClelland, D.C 1965,’Toward A Theory of Motive Acquisition’, American Psychologist,
vol. 20, no. 5, pp. 321-33.
McClelland, D.C 1987, ‘Characteristics of Successful Entrepreneurs’, Journal of Creative
Behaviour, vol. 21, no. 3, pp. 219-33.
Miner, J.B., Smith, N.R., and Bracker, J.S 1994, ‘Role of Entrepreneurial Task Motivation in
the Growth of Technologically Innovative Firms - Interpretations from Follow-Up Data’,
Journal of Applied Psychology, vol. 79, no. 4, pp. 627-30.
Mokhtar S.H 2011, ‘Microfinance Performance in Malaysia’ PhD thesis, Lincoln University,
Christchurch.
Narayan, D. and Pritchett, L 2000, ‘Social capital: evidence and implications’, in P. Dasgupta
and I. Serageldin (eds) Social Capital: A Multifaceted Perspective, World Bank, Washington,
DC.
Nybakk, E., and Hansen, E 2008, ‘Entrepreneurial attitude, innovation and performance
among Norwegian nature-based tourism enterprises’, Forest Policy and Economics, vol. 10,
no. 7-8, pp. 473-9.
Ojo O 2009, The role of micro finance in entrepreneurship development. Enugu, Nigeria.
Perry, C., Meredith, G., and Cunnington, H 1988, ‘Relationship between small business
growth and personal characteristics of owner-managers in Australia’, Journal of Small
Business Management, vol. 26, no. 2, pp. 76-9.
Poon, J.M.L., Ainuddin, R., and Junit, S 2006, ‘Effects of Self-concept Traits and
Entrepreneurial Orientation on Firm Performance’, International Small Business Journal, vol.
24, no. 1, pp. 61-82.

POSTGRADUATE CONFERENCE ON ECONOMICS, PUBLIC ADMINISTRATION AND
BUSINESS (PCEPAB)-5TH SEPTEMBER, 2015
PROMOTING GROWTH, EXCELENCE AND SUSTAINABILITY - 399
Rauch, A., and Frese, M 2007b, ‘Let's put the person back into entrepreneurship research: A
meta-analysis on the relationship between business owners' personality traits, business
creation, and success’, European Journal of Work and Organizational Psychology, vol. 16,
no. 4, pp. 353-85.
Reavley, M. A. & Lituchy, T. R 2008. ‘Successful women entrepreneurs: A six-country
analysis of selfreported determinants of success-more than just dollars and cents’,
International Journal of Entrepreneurship and Small Business , vol. 5, no. 3-4, pp. 272-296.
Report on CIDA’s Programming in Microfinance and Microenterprise Development 1998-
1999, Canadian International Development Agency, Gatineau, Canadian.
Roomi, M.A., P.Harrison and J. Beaumont-Krridge 2009. Women-owned small and medium
enterprise in England: Analysis of factors influencing the frowth process. JSEBD, 16: 270-
288.
Rotter, J.B 1966, ‘Generalised Expectancies for internal Versus External Control of
Reinforcement’, Psychological monographs, vol. 80, no. 609.
Rotter, J.B 1996, ‘Generalized expectations for internal versus external control of
reinforcement, Psychological Monographs’, General and Applied, vol. 80, pp. 1-28.
Sadler-Smith, E 2004, ‘Cognitive Style and the Management of Small and Medium-Sized
Enterprises’, Organization Studies, vol. 25, no. 155, pp. 181.
Schere, J 1982, ‘Tolerance of ambiguity as discriminating variable between entrepreneurs and
managers’, Academy of Management Best paper proceedings, vol. 42, pp. 404-38.
Schumpeter, J. A 1934, The theory of economic development, Harvard University Press,
Cambridge, Mass.

POSTGRADUATE CONFERENCE ON ECONOMICS, PUBLIC ADMINISTRATION AND
BUSINESS (PCEPAB)-5TH SEPTEMBER, 2015
PROMOTING GROWTH, EXCELENCE AND SUSTAINABILITY - 400
Shane, S 2003, A general theory of entrepreneurship: The individual-opportunity nexus,
Edward Elgar, UK.
Stewart, W.H., Carland, J.C., Carland, J.W., Watson, W.E., and Sweo, R 2003,
‘Entrepreneurial dispositions and goal orientations: A comparative exploration of United
States and Russian entrepreneurs’, Journal of Small Business Management, vol. 41, no.1,
pp.27-46.
Tajeddini, K 2008, ‘Effect of innovativeness, risk taking, self confidence and the need for
achievement on venture performance: evidence from Switzerland’, European Journal of
International Management, vol. 2, no. 4, pp. 437-53.
Tang, J 2008, ‘Environmental munificence for entrepreneurs: entrepreneurial alertness and
commitment’, International Journal of Entrepreneurial Behaviour and research, vol. 14, no.
3, pp. 128-51.
Teoh, H.Y., and Foo, S.L 1997, ‘Moderating effects of tolerance for ambiguity and risk -
taking propensity on the role conflict-perceived performance relationship: Evidence from
Singaporean entrepreneurs’, Journal of Business Venturing, vol. 12, no. 1, pp. 67-81.
Torimiro, D.O., and Dionco-Adetayo, E.A 2005, ‘Children involvement in entrepreneurship
in rural communities: an attitudinal analysis’, Technovation, vol. 25, no. 6, pp. 683-9.
Turan, M., and Kara, A 2007, ‘An exploratory study of characteristics and attributes of
Turkish entrepreneurs. A cross-country comparison to Irish entrepreneurs’, The International
Entrepreneurship and Management Journal, vol. 5, no 1-2, pp. 25-46.
Versluysen, E 1999, Defying the odds-Banking for the poor. Kumerian Press, USA.

POSTGRADUATE CONFERENCE ON ECONOMICS, PUBLIC ADMINISTRATION AND
BUSINESS (PCEPAB)-5TH SEPTEMBER, 2015
PROMOTING GROWTH, EXCELENCE AND SUSTAINABILITY - 401
Walley, M. J. C 2007, ‘The association between psychological attributes and organisational
performance in New Zealand Small to Medium sized enterprises’, PhD thesis, University of
Canterbury, New Zealand.
Wiklund, J., and Shepherd, D 2003a, ‘Aspiring for, and achieving growth: The moderating
role of resources and opportunities’, Journal of Management Studies, vol. 40, no. 8, pp.1919-
41.
Zhao, H., Seibert, S.E., and Lumpkin, G.T 2010, ‘The Relationship of Personality to
Entrepreneurial Intentions and Performance: A Meta-Analytic Review’, Journal of
Management, vol. 36, no. 2, pp. 381-404.

POSTGRADUATE CONFERENCE ON ECONOMICS, PUBLIC ADMINISTRATION AND
BUSINESS (PCEPAB)-5TH SEPTEMBER, 2015
PROMOTING GROWTH, EXCELENCE AND SUSTAINABILITY - 402
Impact of Increasing Marginal Cost on Recreational Visits: Case
of Lake View Park in Pakistan
Wajiha Haq
University of Malaya
Jalan Universiti, Kuala Lumpur
Malaysia
AND
National University of Science and Technology
H-12, Islamabad
Pakistan
Abstract
Parks and picnic resorts have played an important role in creating amenity value and positive externality.
Pakistan is very rich country in terms of natural landscapes and picnic points. Lake View Park is situated in
Islamabad which is capital city of Pakistan. The immediate community being benefited by this park is of twin
cities which are Rawalpindi and Islamabad. People from far places also come to visit this park. This park is situated near Rawal Lake and provides recreational area along with scenic beauty of wildlife. This research
paper focuses on finding the benefits of parks and to see whether it was beneficial to invest in improving quality
of such public place for which imposition of entry fees was required. In December 2010, there was public
resistance about imposing entry ticket (fees) in Lake View Park which was charged to collect Rs. 30 million to be
invested on park. Questionnaire based primary data has been collected. Results showed that the investment of
Rs. 30 million in Lake View Park financed through Rs. 10 entry ticket was beneficial and didn’t reduced the
demand of visitors for visit by increasing price. Other factors also showed that marginal benefit was greater
than the increase in marginal cost.
Key words: Marginal cost, Lake View Park, marginal benefit, travel cost
Introduction
Parks and picnic resorts have played an important role in creating amenity value. Their role
has remained very important in creating positive externality. Pakistan is very rich country in
terms of natural landscapes and picnic points. It faces four seasons and provides a chance to
enjoy the beauty of four seasons. Pakistan’s tourism industry has remained under developed.
Pakistan has a lot of security concerns and people face a lot emotionally disturbing factors
like terrorist attacks etc. In such situation, an excursion place has a lot of value as people can
relax in peaceful place and beautiful environment. Literature has also provided evidence that
improving quality of environment imposes positive impact on public health. Improving water
and air quality exerts significant positive impact on people that they also value.
Lake View Park is situated in Islamabad, capital of Pakistan. The immediate community
being benefited by this park is of twin cities which are Rawalpindi and Islamabad. People
from far places also come to visit this park. This park is situated near Rawal Lake and

POSTGRADUATE CONFERENCE ON ECONOMICS, PUBLIC ADMINISTRATION AND
BUSINESS (PCEPAB)-5TH SEPTEMBER, 2015
PROMOTING GROWTH, EXCELENCE AND SUSTAINABILITY - 403
provides recreational area along with scenic beauty of wildlife. This research paper focuses on
finding the benefits of parks and to see whether it is beneficial to invest in improving quality
of such public places. In this study, Lake View Park has been taken to analyze the costs and
benefits. In December 2010, there was public resistance about imposing entry ticket in Lake
View Park which was charged in compensation for Rs. 30 million to be invested on park. This
paper analyses whether the benefits of investment were more than its cost or not. We have
used travel cost method to do cost benefit analysis of investment in Lake View for which
people showed resistance.
Literature on finding positive impacts of externality is very few. People find it very difficult
to measure costs and benefits and usually the administration do not bother to find costs and
benefits of any investment in a park as they find it cumbersome. This research paper will not
only add to literature by providing evidences but will also provide new insight about how
people in Pakistan value such amenities. This research will also open discussion on whether
imposing entry fees on parks is beneficial or not.
Literature Review
Recreational sites have significantly positive impact that people value. Instead of just
focusing on how frequently people visit a site as an indicator of their value to such places,
non-market goods indicators have also been taken. Non-monetary benefits of recreational
sites have also been taken but their estimate is difficult. Contingent value just provides
preferences which does not provide accurate estimate of costs and benefits. (Adamowicz
et.al., 1997). It was found that the attitudes of people is towards frequently visiting parks.
Such sites in focus have significant impact on development and improvement of relaxed
environments. (Manfredo, Yuan & Mcquire, 1992). Many studies have found that those who
are environmentally conscious value the environment more. For them the marginal benefit for
environmental quality improvement will be high. This was indicated by Granzen and Olsen in
1991 and Hines, Hungerford and Tomera in 1987. The importance of environmental quality
and its value has been indicated by demand curve which shows the marginal willingness and
benefits that people derive from such resorts. Loomis and Walsh in 1997 estimated demand
curve for recreational sites. Mihalic in 2000 found that people’s decisions to visit any resort is
affected by the value they perceive thus the scenic beauty plays an important role in rendering
the decisions of tourists whether to visit the site or not. It was further found that the value
people attach to recreational sites also help them to choose between where to visit and where
to not. This mechanism works like market demand of products and their choice mechanism
between different products. (Jurowski et. al., 1995). Hightower, Brady and Baker in 2002
inferred in their research that consumers act upon their perceptions and make future decisions
but these perceptions are formed by physical environment. Thus people value the importance
of their environmental surroundings as a valuable environment allows them to make quality
decisions. Clark and Kahn in 1989 found that there are objective measures present in
measuring environmental quality like we see that air quality is measured by the percentage of
oxygen, nitrogen and carbon dioxide. Such a research on measuring on environmental quality
through these objective measures was also conducted by Smith and Desvouges in 1985.
Whitehead, Haab and Huang in 2000 found that objective measures play an important role in

POSTGRADUATE CONFERENCE ON ECONOMICS, PUBLIC ADMINISTRATION AND
BUSINESS (PCEPAB)-5TH SEPTEMBER, 2015
PROMOTING GROWTH, EXCELENCE AND SUSTAINABILITY - 404
finding the value of natural amenities and public parks but non-monetary factors also are very
important in affecting the people’s decision to visit some place or not. This objective method
is difficult to use for a particular site. Eom and Larson used travel cost method to measure the
environmental quality benefits. It is by far most popular method for non-market way of
valuation of environmental amenities. It is better than contingent method. Freeman in 1993
derived a demand curve and calculated consumer benefits. He also derived explicit value of
price of recreational site. In 1989, Bocksteal and McConnell explained that the revealed
preference method has problems of subjectivity by incorporating individual preferences if we
are also incorporating in travel cost method other factors focusing on revealed preferences.
Different factors affect the value of environment perceived by individuals. Pollution of
different kinds affects the environment as well as people’s demand for such places. Water
quality has been largely affected by crops production through use of pesticides, insecticides
and other chemicals. Such chemicals not only affect the chemistry of soil but also affect under
soil water. The water reservoirs under water are also affected and hence affect drinking water
and water used for other work. Many policies have been made seeing cost and benefit of
improving water quality of surface water and underground water. However the benefits of
improving water quality or the direct effect of controlling pollution of water through soil
cannot be directly observed so technique of valuation based on price cannot be used.
Fertilizers used for improving crop production also become a source of surface water
pollution. They get dissolved in water and eventually make drinking water injurious to health.
(Crutchfield, Hansen, and Ribaudo, 1993). Improved environmental quality benefits are
defined as increase in utility due to improvement in quality and given by difference of utility
before and after environmental quality improvement. In case of water quality improvement,
demand and cost curves cannot be directly observed so estimate of marginal benefit due to
improved quality of environment can easily be observed. Different approaches are used to
quantify the change in quality. There are two approaches. Direct approach involves
individual’s choices which they actually among sources of water. Indirect approach involves
asking individuals about their preferences about the choices of water source. (Smith, 1993).
There are benefits of improved water quality to nation in a way that in increase fisheries
industries and tourist industry by providing good places for those who are interested in
fisheries sports. Russell and Vaughan in 1982 used travel cost model to estimate the benefits
of improved water quality. Travel cost method focuses on calculation of time and cost
incurred in visiting the site. On different travel cost people’s willingness to visit the site is
checked. Improved water quality will not only improve fisheries but will also attract new
participants. Existing fisherman will increase their catch by increasing number of days of
catching. Travel cost model actually measured per fisherman benefits through improved water
quality. The estimated benefits were between $300-966 depending on pollution eradication.
Data Description
Survey method has been used to analyze the relationship. 100 respondents filled the
questionnaire and out of which 95 were selected. 5 questionnaire responses were discarded as
they contained a lot of missing values. Questionnaire has been attached in the appendix. Same

POSTGRADUATE CONFERENCE ON ECONOMICS, PUBLIC ADMINISTRATION AND
BUSINESS (PCEPAB)-5TH SEPTEMBER, 2015
PROMOTING GROWTH, EXCELENCE AND SUSTAINABILITY - 405
questionnaire was used by Chin Huang, Huang and Lee in 2011. First seven questions were
used as measurement of “environmental service quality” variable. Questions from 8-11 were
used as measuring instrument for “congestion” variable. Questions from 12-15 were used as
of measure “facility/transportation” variable. Random sampling technique was used. 60 were
female respondents whereas 35 were female respondents. Table 1 shows descriptive statistics.
It shows that the average numbers of trips that people make to Lake View Park in a year are
approximately 2 with standard deviation of around 1. Average travel is approximately 3 (data
was in log form) which means Rs. 932.180 is the average travel cost with small standard
deviation. Average statistics of other variables are also given in table 1 which is computed
from the responses of questions asked in questionnaire for respective variables. Average age
is 22 and average gender is female.
Methodology
In this research paper, travel cost method has been used for the valuation of Lake View Park
and to see per person costs and benefits. How should the travel cost be estimated has been
cited by different authors. Some say that actual method of travel cost estimation for zonal
areas is to calculate number of trips to that particular area from different zones. Average
travel cost per mile is calculated and average travel cost per time is represented by a proxy of
per hour wage. Then distance and time to destination is asked by questionnaire which gives
estimate of total travel cost per mile and time. Freeman in 1993 in his research paper used
substitute price as an estimate of travel cost. If average travel cost is not estimated correctly
then it can lead to underestimation of demand. Also if again the substitute price is not a good
estimate of travel cost then it can lead to underestimation of demand for public resort (whose
costs and benefits are being calculated). We have also asked people about their travel cost for
round trip to Lake View Park as estimation of average cost/ mile estimate was difficult.
Random selection was used for sampling. Ordinary least square method has been used to
analyze the data and infer the results. The econometric model tested through ordinary least
square is as follows:
Y = α + β logX1 + θ X2 + γ X3 + δ X4 + ψ X5 + λ X6
Results
Data was collected from questionnaire method. The reliability of questions to measure the
required variables was checked. Cumulative Chronbach alpha for questions addressing the
variable of environmental quality was 0.72. Cumulative Chronbach alpha for questions
addressing the questions of congestion was 0.71 and 0.69 for facility transportation. 0.7 and
above level of Chronbach alpha is considered satisfactory for considering questions reliable
for the estimation of particular variable.
The model described above was estimated where we were going to see the travel cost effects
on number of trips taken to Lake View Park. Other factors were also considered to affect the
number of trips including environmental quality, congestion, transport quality, gender and
age. Table 2 shows correlation matrix. Correlations between the variables were first
considered before regressing the variables on number of trips. Numbers of trips are found to

POSTGRADUATE CONFERENCE ON ECONOMICS, PUBLIC ADMINISTRATION AND
BUSINESS (PCEPAB)-5TH SEPTEMBER, 2015
PROMOTING GROWTH, EXCELENCE AND SUSTAINABILITY - 406
be negatively correlated with cost i-e as the travel cost increases, number of trips decreases.
Correlation between two variables is significant. Environmental quality is considered
positively and significantly correlated with number of trips. Environmental quality includes
cleanliness of streets and roads, low levels of noise pollution, good vendors, clean and good
communication and transportation system. Trips to Lake View Park will increase with
increase in environmental quality. Congestion is negatively related with number of trips but
the relationship is not significant. Congestion is operationally defined as the how much
parking areas are crowded by people and how much other areas are crowded by tourists.
Transport facility and other facility are positively and significantly correlated with number of
trips. These facilities include clean public toilets, better parking areas and transportation
system allowing people to go easily to Lake View Park. Better transport/facility will increase
number of visits to Lake View Park. Gender and age have insignificant correlation with
number of trips.
Table 3 shows regression analysis. Number of trips to Lake View Park is significantly
affected by the number of travel cost. One percent increase in travel cost decreases number of
trips by 0.0012 percent whereas average number of trips in a year is 4. Thus magnitude of
effect of travel cost on number of trips is very small. One unit increase in environmental
quality significantly increases the number of trips by 0.068. Gender, age and congestion do
not significantly affect the number of trips. Facility/transportation significantly and positively
affects the number of trips. One unit increase in facility/transportation increases number of
trips by 0.148. These results show that number of trips is significantly affected by travel cost
but the magnitude of effect is smaller whereas other factors significantly affecting number of
trips to Lake View Park are environmental quality and facility/transportation. Model is
significant as evident by F-statistics shown in table 5 and the variables explain 42% variation
in number of trips shown in table 4. Durbin Watson is around 2 showing no autocorrelation as
well as VIF (vector inflation factor) is low showing that data also do not suffer from the
problem of multicollinearity.
Conclusion
This research was supposed to address the issue that whether putting Rs. 10 as entry ticket to
Lake View Park against which people resisted is beneficial or not in order to cover
development expenditures of Rs. 30 million. Lake View Park has a lot of existence. Lake
View Park is Wildlife Park with exciting games and scenic beauty of lake situated in capital
of Pakistan. People averagely visit the park twice a year. It is important to see that how
demand for the visits of park are affected by price. In this research paper it was found that the
travel cost affects number of visits but the magnitude is very small. Average travel cost is
around Rs. 900 and one percent (Rs. 9) travel cost decreases trip by 0.0012% which means
that the number of trip s taken per year by visitors will remain same even with the implication
of entry fees Rs. 10. Through this estimation, we see that there is less cost than benefits hence
measures have to be taken to improve Lake View Park. Investment of Rs. 30 million will not
affect the demand curve of visitors and will not curtail the existent customer base whereas
improving the quality will attract more visitors as environmental quality also positively
affects the number of visitors. Better air, clean roads, neat streets and lower level of noise

POSTGRADUATE CONFERENCE ON ECONOMICS, PUBLIC ADMINISTRATION AND
BUSINESS (PCEPAB)-5TH SEPTEMBER, 2015
PROMOTING GROWTH, EXCELENCE AND SUSTAINABILITY - 407
pollution contribute to betterment of environmental quality. We can also see that investment
undertaken after the decision of 2010; visitors to Lake View Parks have been increased. Thus
we can say that by using travel cost method. We have estimated that the travel cost and
approximated that benefits of investment will exceed the cost. Although the estimate is not as
accurate as when travel cost is calculated by using average travel cost per mile/time or
substitutes price. Even in their case the wrong estimate of average travel cost may lead
underestimation or overestimation of costs and benefits.
Thus the investment of Rs. 30 million in Lake View Park financed through Rs. 10 entry ticket
was beneficial and didn’t reduced the demand of visitors for visit by increasing price. Other
factors also showed that marginal benefit were greater.
References
Freeman, A. M. (2003). The measurement of environmental and resource values: theory and
methods. RFF press
Adamowicz, V., Swait, J., Boxall, P., Louviere, J., & Williams, M. (1997). Perceptions versus
objective measures of environmental quality in combined revealed and stated
preference models of environmental valuation, Journal of Environmental Economics
and Management, 32, 65-84.
Bockstael, M., McConnell, K., & I. E.(1989). Strand, Measuring the Benefits of
Improvements in Water Quality: the Chesapeake Bay. Marine Resource Economics, 6,
1-18.
Clark, D. E., & Kahn. J. R. (1989). The two-stage hedonic wage approach: a methodology for
the evaluation of environmental amenities, Journal of Environmental Economics and
Management, 16, pp. 106-120.
Crutchfield, S., Hansen, L., & Ribaudo, M. (1993). Agricultural and water-quality conflicts.
Economic dimensions of the problem. Agriculture information bulletin (No. PB-94-
103348/XAB; USDA/AIB--676). Economic Research Service, Washington, DC
(United States). Resources and Technology Div..
Eom, Y. S., & Larson, D. M. (2006). Improving environmental valuation estimates through
consistent use of revealed and stated preference information. Journal of
Environmental Economics and Management, 52(1), 501-516.
Granzin, K. L., & Olsen, J. E. (1991). Characterizing participants in activities protecting the
environment: A focus on donating, recycling, and conservation behaviors. Journal of
Public Policy & Marketing, 1-27.
Hightower Jr, R., Brady, M. K., & Baker, T. L. (2002). Investigating the role of the physical
environment in hedonic service consumption: an exploratory study of sporting events.
Journal of Business Research, 55(9), 697-707.
Hines, J. M., Hungerford, H. R., & Tomera, A. N. (1987). Analysis and synthesis of research
on responsible environmental behavior: A meta-analysis. The Journal of
environmental education, 18(2), 1-8.
Huang, C. H., & Lee, C. H. (2011). Evaluating recreational benefits of environmental quality
improvement. In International conference on humanities, geography and economics
(ICHGE’2011), Pattaya, December (pp. 308-312).

POSTGRADUATE CONFERENCE ON ECONOMICS, PUBLIC ADMINISTRATION AND
BUSINESS (PCEPAB)-5TH SEPTEMBER, 2015
PROMOTING GROWTH, EXCELENCE AND SUSTAINABILITY - 408
Jurowski, C., Uysal, M., Williams, D. R., & Nog, F. P. (1995). An examination of preferences
and evaluations of visitors based on environmental attitudes: Biscayne Bay National
Park. Journal of Sustainable Tourism, 3(2), 73-86.
Loomis, J. B., & Walsh, R. G. (1997). Recreation economic decisions; comparing benefits
and costs (No. Ed. 2). Venture Publishing Inc..
Manfredo. M., Yuan, S., & McGuire, F.(1992). The influence of attitude accessibility on
attitude-behavior relationships: implications for recreation research. Journal of
Leisure Research, 24, 157-170.
Mihalic, T. (2000). Environmental management of a tourist destination: A factor of tourism
competitiveness. Tourism Management, 21(1), 65-78.
Smith, V. K. (1993). Nonmarket valuation of environmental resources: an interpretive
appraisal. Land Economics, 1-26.
Smith, V. K., & Desvousges. W.H. (1985). The generalized travel cost model and quality
benefits: A consideration. Southern Economic Journal, 52, 371-381.
Vaughan, W. J., & Russell, C. S. (1982). Freshwater recreational fishing: The national
benefits of water pollution control. Washington, DC: Resources for the Future.
Whitehead, J. C., Haab, T. C., & Huang, J. C. (2000). Measuring recreation benefits of quality
improvements with revealed and stated behavior data. Resource and energy
economics, 22(4), 339-354.
Appendix
Figure 1: Genderwise frequency distribution
Male=1
Female=0
Table 1: Descriptive statistics
Mean
Std.
Deviation N
No of trips 2.2660 1.23720 94

POSTGRADUATE CONFERENCE ON ECONOMICS, PUBLIC ADMINISTRATION AND
BUSINESS (PCEPAB)-5TH SEPTEMBER, 2015
PROMOTING GROWTH, EXCELENCE AND SUSTAINABILITY - 409
Travel cost 2.9695 .20052 94
Env quality 17.2234 3.21674 94
Congestion 10.2021 2.89449 94
Transport
facility 12.5638 2.76910 94
Gender .3723 .48602 94
Age 22.0319 1.45508 94
Table 2: Correaltions
No of trips
Travelc
ost
Env
quality
Congestio
n
Transport
facility Gender Age
Pearson
Correlation
No. of trips 1.000 -.103* .072* -.027* .135* .112* .037
LCOST -.103* 1.000 .092 .287 .103 -.022 -.224
Env quality .072* .092 1.000 .350* .267 -.088 -.013
Congestion -.027 .287 .350 1.000 .322* -.062 .090
Transport
facility .122* -.088 -.062 -.086 1.000 -.086 -.095
Gender .012 -.022 -.088 -.062 -.086 1.000 .196
Age .037 -.224 -.013 .090 -.095 .196 1.000
Table 3: Regression analysis
Model
Unstandardized
Coefficients
Standardized
Coefficients
t Sig.
Collinearity Statistics
B Std. Error Beta Tolerance VIF
1 No. of trips 5.158 2.026 2.546 .013
Travel cost -.738 -.041 -.120 2.861 .023 .917 1.090
Env quality .026 .029 .068 2.342 .008 .851 1.175
Congestion .057 .051 .133 1.116 .267 .765 1.308
Transport
facility .066 .0386 .148 3.627 .059 .869 1.151
Gender .008 .274 .003 .027 .978 .948 1.055
Age -.016 .096 -.019 -.168 .867 .870 1.149
Dependent Variable: No of trips
Table 4: Model summary
Model R R Square
Adjusted R
Square
Std. Error of
the Estimate
Durbin-
Watson

POSTGRADUATE CONFERENCE ON ECONOMICS, PUBLIC ADMINISTRATION AND
BUSINESS (PCEPAB)-5TH SEPTEMBER, 2015
PROMOTING GROWTH, EXCELENCE AND SUSTAINABILITY - 410
1 .648a .42 .38 1.23868 1.888
a. Predictors: (Constant), Transport facility, Travel cost, Env quality,
Congestion, Gender, Age
b. Dependent Variable: No of trips
Table 5: Anova
Model
Sum of
Squares df Mean Square F Sig.
1 Regression 5.795 4 1.449 2.944 .032
Residual 136.556 89 1.534
Total 142.351 93
a. Predictors: (Constant), Transport facility, Travel cost, Environmental quality,
Congestion, Gender, Age
b. Dependent Variable: No of trips
Questionnaire
GENDER____________________AGE________________
This questionnaire is about your satisfaction level achieved by going to Lake View Park. Give
the rank according to your satisfaction levels highly satisfactory (1), satisfactory (2), neutral
(3), not satisfactory (4) and very bad (5).
1. I think the transport system is conveniently well.
2. I think the streets are clean.
3. I think the roads connecting from various areas to destination are well.
4. I think there is no noise pollution.
5. I think venders have neat.
6. I think the traveler service center can provide complete travel information.
7. I think the air quality is good.
8. I think there are too many vehicles.
9. I think the parking lot is too crowded.
10. I think the biking path is too crowded.

POSTGRADUATE CONFERENCE ON ECONOMICS, PUBLIC ADMINISTRATION AND
BUSINESS (PCEPAB)-5TH SEPTEMBER, 2015
PROMOTING GROWTH, EXCELENCE AND SUSTAINABILITY - 411
11. I think the number of tourists is huge.
12. I think public toilets are sufficient.
13. I think public toilets are clean.
14. I think the parking places are adequate.
15. I consider the transportation system, including taxi and other public transport, as
convenient.
How many times you visited Lake View Park last year?
___________________________________________________________________________
___
What was the cost of your round trip to Lake View Park?
___________________________________________________________________________
___
Source: Huang & Lee (2011)

POSTGRADUATE CONFERENCE ON ECONOMICS, PUBLIC ADMINISTRATION AND
BUSINESS (PCEPAB)-5TH SEPTEMBER, 2015
PROMOTING GROWTH, EXCELENCE AND SUSTAINABILITY - 412
Impacts of Goods and Services Tax on the Income Distribution
Juliana Abdul Kadir
Zarinah Yusof
Mohamed Aslam Gulam Hassan
Faculty of Econmics and Administration, University of Malaya
Abstract
This study evaluates the impact of Malaysia’s Goods and Services Tax (GST) on income distribution. The
computable general equilibrium model is applied to simulate the different rates of GST on different income groups.
Results indicate that the most influential income group from GST implementation is low-income. This income group get affected more due to their high sensitivity towards consumption patterns particularly on basic goods. It reveals
that the low-income group is burdened with more tax than middle and higher income groups. The Malaysian
government needs to revise the items under zero rated and exempt supplies for certain necessities goods.
Keywords: Goods and services tax, Income distribution, Malaysia, Computable General
Equilibrium
JEL Classifications: H2, E6.
1.0 Introduction
Malaysia is among the most growing countries of the Asian region with characterized as a fast
development for the last three decades. The GDP grew at an average of 6.7% from 1971 to 1990
(Fanara, 2005) and the rate is around 5.7% between 2010 and 2013 (World Bank, 2013).
Malaysia is similar with other developing nations which dependent on indirect taxes (76.7%)
during the initial phases of development in 1960 (Kasipillai, 2006). After 1981, direct taxes took
over with given higher contribution to the country than indirect taxes.
During the last few years, the Malaysian government has been planning the introduction of goods
and services tax (GST) in the country. The advantages for considering the GST are to overcome
the inherent weaknesses in the sales tax system and to broaden the revenue base (ETP Annual
Report, 2012; Lau, 2013; Saira, 2010; Singh, 2014; Tan, 2012). However, it is generally
perceived that the introduction of the GST at 6 per cent would result in price increases for certain
products and decreases in other cases (Ismail, 2014; Whatt, 2013). The price impact from the
introduction of the GST is a major concern, particularly for consumers from the lower income
bracket since they will be worse affected than the other income groups. The lower income group
is more sensitive to price shocks in the market since they spend most of their income on
consumption and have very little savings.
In 2012, more than 50% of the labor force in Malaysia earn a monthly income below RM3,000
(Department of Statistics, 2012a). This income is considered to be in the lower income bracket

POSTGRADUATE CONFERENCE ON ECONOMICS, PUBLIC ADMINISTRATION AND
BUSINESS (PCEPAB)-5TH SEPTEMBER, 2015
PROMOTING GROWTH, EXCELENCE AND SUSTAINABILITY - 413
for households in Malaysia. Middle income starts from RM3000 up to RM70001. The average
monthly income for a household in Malaysia increased by 24.22% from RM4,025 (2009) to
RM5,000 (2012), as reported in the 2012 household income survey (Department of Statistics,
2012b).
The Malaysian Gini coefficient in 2012 was 0.431, which is still high compared to other ASEAN
countries, such as Thailand (0.4) and Indonesia (0.37); and India (0.33) in the Asian region
(Mohamad Hanadzlah, 2013). The Gini Index is a measurement of income distribution, as the
value becomes closer to 1, it possesses an inequality level. The Malaysian Index remained
constant at 0.4 since the late 1980s, but showed an improvement in 2004 (0.462), and 2009
(0.441) to 2012 (0.431) (Economic Planning Unit, 2013).
In addition, only 1.7 and 1.8 million people could afford to pay income tax in 2012 and 2013
respectively, as compared to the 11.4 million of total labor force in Malaysia (Lee, 2012). From
this number, only 15.8% qualified as taxpayers. This shows that people do not earn enough to
qualify as a taxpayer (Mun, 2013). On the one hand, Malaysia is heavily reliant on direct taxes
since 1981, of which a large portion is contributed by corporate and petroleum revenue – in 2013,
corporate tax was 48%, and petroleum tax was 25% - while income tax was only 19% out of the
total direct taxes (Bank Negara Malaysia, 2014). This shows that most of the individuals are not
able to pay income tax in Malaysia since the proportion of taxpayers was only 19% in 2012-2013.
In addition, based on the study by the Royal Malaysian Customs Department, people who earn an
income of less than RM3000 do not qualify to pay income tax. However, these individuals do not
realize that they have been contributing to the revenue from the sales and services taxes estimated
at RM71 per month (Faizulnudin, 2012; Tholasy, 2012). However, after the government
establishes and implements the GST at 6%, it is possible that those people who earn less than
RM3000 will be able to pay this tax.
For 2013, sales and services taxes contributed 28% and 17% to the total indirect taxes,
respectively, which was led by excise duties at 34% (Bank Negara Malaysia, 2014). When both
sales and services taxes were combined, it showed that consumption taxes contributed around
45% to the total indirect taxes. The important thing to mention here is that this tax is not paid by
the consumer directly to the government but that the taxes are included in the prices of the goods
and services. The case is similar is goods and services tax is implemented, no one is excluded
from payment. The concern here is that, the implementation of the GST will have an impact on
the macroeconomic level and income distribution because these two factors describe the overall
economic situation. Income distribution in Malaysia would be less equal as GST will be
implemented (Palil & Ibrahim, 2011).
The most of the income distribution studies in Malaysia concentrated on aspects pertaining to
poverty (Anand, 1977), income distribution in the rural sector (Shand, 1987), economic growth
and income inequality (Shari, 2000), and income distribution across ethnic groups (Saari,
Dietzenbacher, & Los, 2010). These studies mostly evaluate the welfare of people and determine
the Gini coefficient in Malaysia based on the findings.
1 Author justification based on households per capita income in Malaysia (Department of Statistics, 2012b).

POSTGRADUATE CONFERENCE ON ECONOMICS, PUBLIC ADMINISTRATION AND
BUSINESS (PCEPAB)-5TH SEPTEMBER, 2015
PROMOTING GROWTH, EXCELENCE AND SUSTAINABILITY - 414
Accordingly, this study tries to fill the gap in the research on GST in Malaysia to identify the
possible impacts on the income distribution among people reflected by GST implementation. It is
felt that there is a high requirement to fill the gap created in the literature. Therefore, this study is
important to determine and to analyze the impact of the GST as a new tax reform on the
distributional income in Malaysia.
2.0 Tax Reformation in Malaysia
Malaysia has practiced many tax system adjustments since more than last 50 years. Tax reform
called incremental approach2 has taken several slight steps of tax modifications by affecting a
single tax. The public sector in Malaysia is huge since 1970s before privatization policy
implemented in 1983 under tax reform strategy. This policy has downsized tax revenue due to
certain factors: (1) government has given tax incentives for investment, reinvestment, export,
research and development, labor utilization, manpower training and others purposes to make
corporate investment attractive; (2) export duties and customs duties to GDP have dropped 3%
and 1% respectively between 1978-1988; (3) sales tax has improved from 5% to 10% in 1983; (4)
development taxes on professional, business and rental income have levied at 5% and additional
5% has been imposed on profit tax; and numerous individual income surtaxes has been applied
(Jomo, 2000; Wan Abdullah, 2010; Wee, 2006).
Malaysia also same with other countries affected from financial crisis in 1997 and experienced
with tax reformation. Reduction in the number of excise duties in 1982 compliment with an
application of specific rather than ad valorem levies has led to yields deteriorating during the
period of inflation coupled with minimal revenue buoyancy of excise taxes. Therefore, another
smaller tax sources and petroleum revenues have risen to compensate with the diminishing in tax
revenue sources. Daim Zainuddin, the former minister of finance, started in 1984, recommended
for cutting down both individual income tax rates for all kinds of taxpayers and taxable income
brackets from 12 to 9 in 1985 (Narayanan, 1996). The new marginal tax rates have been dropped
into the new range of 5%-40% substituted the standard array of 6%-55%. In addition, in the 1991
budget, the range of marginal tax rates was reduced into 4%-35% and corporate tax rate from
40%-35%, effective from the 1989 review year.
In 1986, new corporate tax has been released for new investors and existing businesses which
consistently meet the current needs to encourage investment as well as to promote economic
growth. This incentive was under the Promotion of Investment Act (1986) which provided a
number of schemes for tax relief including exemption from taxes on imported raw materials and
machinery and tax breaks for bigger companies that purchase inputs from small firms
(Narayanan, 1996). Those adjustments have been affected direct tax revenue and government
revenues as well. In particular, government revenue expanded at 7.07% annually between 1984
and 1991 which largely contributed by petroleum sector. In 1990, development tax on companies
was abolished beginning with a one percent reduction (Narayanan, 1996). Economic condition in
1987-1990 indicated that there was a growth in GDP, recovered to 5.2% in 1987 and climbed to
2 mostly focused on predetermined target

POSTGRADUATE CONFERENCE ON ECONOMICS, PUBLIC ADMINISTRATION AND
BUSINESS (PCEPAB)-5TH SEPTEMBER, 2015
PROMOTING GROWTH, EXCELENCE AND SUSTAINABILITY - 415
9.7% in 1990 after grew from 1985 which worth negative amount. In 1990, there were two
deficits, budget deficit and current account deficit, rose at 5% and 4.1% respectively (Narayanan,
1996).
In fact, the revenue declined for the first time in 30 years in 1986-19873, arising from a
tremendously reduce in petroleum prices. This encourages raises in budget deficit which had been
reduced in 1984-1985 (Narayanan, 1996). The over-reliance on petroleum led taxes is applied in
a narrow base (Narayanan, 1996) and based on the increasing in tax exemption and tax incentives
to the private sector and industry (Singh, 2002). Particularly, these are generally as an
encouragement for the company to increase their investment amount since uncertainty in
petroleum price (Singh, 2002). Therefore, afford to reduce the dependency on direct taxes and
non-oil commodity taxes have been taken. In addition, by 1987, Malaysia has been successfully
reformed its fiscal policies consequent to the mention issues and the global recession.
Other action was concentrated on consumption taxes in the early of 1988, when Daim highlighted
value added tax (VAT) to be further considered (Narayanan, 1996). The recommendation of a
broad-based VAT was designed, however was put on hold, probably until the Treasury obtained
the expertise to observe it throughout. The VAT, with a well-publicized reputation for
regressively, was not for a beginner finance minister with an eye for the highest office. Instead,
the proposal to implement the sales tax and services tax into a single broad-based tax on
consumption was also declared in the 1993 budget speech, but yet stayed conspicuously
soundless on the issue.
On the other hand, the 1993 budget lowered the top rates for both types of taxes from 35% to
34% (1994) and 30% (1995) to maintain income and corporate taxes competitive between
Malaysia's ASEAN neighbors. The same budget also absolutely abolished or lowered import
duties for more than 600 products, which particularly consumption goods, and for additional
2,600 products in the 1995 budget (Narayanan, 1996). However, no major tax effort has been
implemented apart from improved import and excise duties on tobacco and alcoholic products
and the widening of the service tax base in the 1992 and 1993 budgets (Narayanan, 1996).
Direct tax collection has been dropped might because of waived from tax imposing (1999) and
restructured in the tax system (2000). Tax reform in 1999 made government less dependence on
indirect tax. Furthermore, in assessment year 2000, the collection of tax has been reducing
influenced by the restructuring of the tax system and waive in income tax in 1999. But federal
government tax revenue in 2001-20054 was registered a faster growth with the major contribution
is from direct tax. In this plan, direct tax became a big contributor since there was increased in a
number of taxpayer’s in line with the introduction of Self-Assessment System (SAS)5 and the
higher oil price (ADB, 2006; Loganathan & Taha, 2007). Whilst there was a bit decrease in
export duties revenue preceding a minimal decline in exports make growth of indirect tax was
slowed.
3 5th Malaysian Plan 4 8th Malaysian Plan 5 Is introduced to upgrade the tax administration and to enhance voluntary compliance.

POSTGRADUATE CONFERENCE ON ECONOMICS, PUBLIC ADMINISTRATION AND
BUSINESS (PCEPAB)-5TH SEPTEMBER, 2015
PROMOTING GROWTH, EXCELENCE AND SUSTAINABILITY - 416
In 2002, the government has designed and implemented several policies and strategies through
the Pre-emptive Stimulus Package6 to minimize the negative impact of the external recession. The
policies include alteration of corporate tax with (1) 70% exemption for pioneer status; (2)
exemption increased from 10% to 20% for promoting export locally-product (Bernardi, Fraschini,
& Shome, 2007). As compared to 2002, direct tax collection dropped by 3.39% (2003) for all
types of direct taxes except for petroleum revenue. Among the factors which influenced to this
trend was the reduction of the corporate tax rate from 28% (1999)7 to 20% (2002). Indeed this
reduction also influenced by the effect of the war in Iraq and Severe Acute Respiratory Syndrome
(SARS) in 2003 towards the country economy (Bernardi et al., 2007; Taha & Loganathan, 2008).
In 2004, Self-Assessment System has been implemented towards personal tax payer where this
reformation has raised individual income tax and increase collection of direct tax revenue
(Choong & Edward, 2011; Loganathan & Taha, 2007). In 2005, with higher revenue from
petroleum taxes and dividend payments from the state-run oil company, it was helped
government to increase development spending and reduce taxes imposed. It can be proved that
when Malaysian government also relies heavily on revenue from oil and gas industries where the
amount of collection reached RM14, 566 million (Bloomberg News, 2006). Besides that, several
tax modifications have been done towards: (1) individual income tax in 2004; (2) import and
excise duties in 2000; (3) sales tax in 2002; and again (4) import duties in 2012.
In 2010, under the New Economic Model under 6th Prime Minister recommends some reforms to
enhance revenue for Malaysia. The key component of the reforms is to wider tax base; therefore
GST was introduced as a new tax system for Malaysia8. The twofold reasons for a more
diversified tax base were to reduce reliance (1) on income tax (2012:56.4%, 2013:58%), and (2)
petroleum revenue (2012:32.6%, 2013:30.6%) in order to encourage and stimulate individuals’
income and firms’ profit by lowering both rates (Ismail, 2014; Tan, 2012; Whatt, 2013).
Therefore, the plan was announced to make the GST implementation become reality which will
be completely implemented on 1 April 2015 (GST Malaysia, 2014; The Malaysian Insider, 2013;
The Star, 2013).
3.0 Specification of the Model
The CGE model of this study is to estimate the changes in the direction of the effect of the GST
on income distribution in Malaysia. The model has been applied after made some modifications
from Robinson model to capture the institutional arrangements in the Malaysian economy. To
meet the research objective, model is aggregated into 15 sectors: agriculture and mining (2
sectors), industrial and manufacturing (7 sectors) and services (6 sectors). Table 1 represent the
sectors classification used.
Table 1: Aggregated sectors in the model
6 Contain some relevant fiscal measures to improve investment as well 7 It should be noted that the government has kept the corporate tax rate unchanged since 1998 as 28%. In the Budget 2007, it has
reduced from 28% to 26% and 2009 was 25% up till now.
8 Before is referred as Value Added Tax (VAT)

POSTGRADUATE CONFERENCE ON ECONOMICS, PUBLIC ADMINISTRATION AND
BUSINESS (PCEPAB)-5TH SEPTEMBER, 2015
PROMOTING GROWTH, EXCELENCE AND SUSTAINABILITY - 417
No
Aggregated Sectors
Sectors in
2005 Input-Output
1 Agricultural, Forestry and Logging 1-12
2 Crude Oil, Natural Gas and Mining 13-16
3 Food Processing 17-29
4 Textiles and Leather Industries 30-35
5 Petroleum Refinery 44
6 Chemicals and Rubber Processing 45-55
7 Cement, Lime and Plaster, Clay and Ceramic 56-59
8 Iron and Steel Products 60-64
9 Manufacturing 36-43 & 65-85
10 Electricity and Gas 86
11 Wholesale and Retail Trade 87-94
12 Land, Water, Air and Other Transport Services 95-100
13 Communication 101-101
14 Financial Institution and Insurance 102-105
15 Other Services 106-120
The model used 2 factors input; labor and capital which is mobile across sectors, and four agents
in the economy; households, firms, governments and the rest of the world. The model is dynamic,
applied to a small open economy following theoretical structure of Robinson, Kilkenny &
Hanson (1990) model. We begin with reviewing the basic characteristics of AGE model,
explaining household comprehensively, discussing data, calibration process and algebraic model
summary.
Economic agents. Our model includes four types of economic agents; households, firms,
government and rest of the world. We simulates the consumers and producers optimization
behavior, as well as the government and captures all transactions in the circular flow of income.
Private households. The model includes 3 types of household, classified according to their
income level, higher income, middle income and lower income groups. Each household has a
choice for different consumption goods. The characteristics and disaggregation of them are
provided in the ‘data’ section.

POSTGRADUATE CONFERENCE ON ECONOMICS, PUBLIC ADMINISTRATION AND
BUSINESS (PCEPAB)-5TH SEPTEMBER, 2015
PROMOTING GROWTH, EXCELENCE AND SUSTAINABILITY - 418
Production. The production activities in the various sub-sectors chosen are important in this
model to examine the objective of this study. A composite goods are produced in each sectors can
be transform into exported goods or commodity sold in a domestic market. Each production
activities is assumed to combine primary inputs; labor and capital, in a constant return to scale
using the Cobb-Douglas production function to produce final product. Total production of
domestic output, Xi, is given as follows:
𝑋𝑖 = 𝐴𝐾𝑖𝛽
𝐿𝑖1−𝛽
The nested structure of the production in the CGE model is presented in Figure 1. The industries
in the model using domestic and foreign commodities and factor inputs.
Figure 1: Nested Production Structure in the economy
Prices. As a price taker, small country as Malaysia has no power to effect the world import price,
therefore import price is an exogenously taken in the model. The domestic prices of imports
(𝑃𝑀𝑖 ) and exports (𝑃𝑋𝑖) are determined by world prices (pwm and pwe, respectively), exchange
rate (EXR) and import tariff (tm) or export subsidy (te).
𝑃𝑀𝑖 = 𝑝𝑤𝑚𝑖 (1 + 𝑡𝑖𝑚)𝐸𝑋𝑅
𝑃𝑋𝑖 = 𝑝𝑤𝑒𝑖 (1 − 𝑡𝑖𝑒)𝐸𝑋𝑅
International trade. The model is designed to capture the imperfect substitution using Armington
assumption. The domestic and exported goods are combine into composite goods according to
constant elasticity of substitution (CET) function while the combination between domestic and
imported goods is using constant elasticity of transformation (CES) function. The producer price
of the composite goods can be derived as below.
Final Product
Value added Intermediate
Labor Capital Composite
Commodities
Domesti
c
Importe
d
Leontief
Cobb- Douglas
CES

POSTGRADUATE CONFERENCE ON ECONOMICS, PUBLIC ADMINISTRATION AND
BUSINESS (PCEPAB)-5TH SEPTEMBER, 2015
PROMOTING GROWTH, EXCELENCE AND SUSTAINABILITY - 419
𝑃𝑄𝑖 =𝑃𝐷𝑖 . 𝐷𝑖 + 𝑃𝑀𝑖 . 𝑀𝑖
𝑄𝑖
where, 𝑃𝑄𝑖, 𝑃𝐷𝑖 , 𝑃𝑀𝑖 denotes price of composite commodities, price of domestic output and price
of imported product for sector i, while 𝑄𝑖, 𝐷𝑖, 𝑀𝑖 , are the quantity produced by them.
Domestic demand. Total domestic demand consists of four components; household expenditure,
investment demand, government spending and intermediate demand. All the components yield a
fixed nominal expenditure shares. For instance, household spends for paying income tax, and
saves a fixed shares of disposable income. Household expenditure functions are derived from a
Cobb-Douglas utility function. They try to maximize the utility through consumption
expenditure.
Private consumption is a household demands determined using fixed expenditure shares.
𝑄𝐻𝑐ℎ = 𝛽𝑐ℎ ∙ (1 − 𝑚𝑝𝑠ℎ ) ∙ (1 − 𝑡𝑦ℎ) ∙ 𝑌𝐻ℎ
𝑃𝑄𝑐
where 𝑄𝐻𝑐ℎ is a private consumption, 𝑃𝑄𝑐 is a price of composite goods, 𝑚𝑝𝑠ℎ , 𝑌𝐻ℎ , 𝑡𝑦ℎ , 𝛽𝑐ℎ are
household savings rate, income, income tax rate and expenditure shares.
The investment demands are derived from capital composition matrix with fixed proportion of
domestic output. Fixed investment demand (𝐹𝐼𝑁𝑉) is quantity of fixed investment demand
(𝑓𝑖𝑛𝑣̅̅ ̅̅ ̅̅ ) for commodity in the base-year measurement, multiplied by an investment adjustment
factor (𝐼𝐴𝐷𝐽), that considered as exogenous variable.
𝐹𝐼𝑁𝑉𝑐 = 𝑓𝑖𝑛𝑣̅̅ ̅̅ ̅̅ 𝑐 ∙ 𝐼𝐴𝐷𝐽
For the government, total spending on goods and services is exogenously fixed because
government decides how much to purchase the commodities in particular. Government
expenditure (EG) consists of expenditure on goods and services (𝑃𝑐𝑄𝑐) and transfer payments
(𝑡𝑟).
𝐸𝐺 = ∑ 𝑡𝑟 + ∑ 𝑃𝑐 𝑄𝑐
Intermediate demand is calculated from sectoral output subject to fixed input-output coefficients.
Total composite demand broadly grouped into total domestic demand and total import demand.
Figure 2 shows the nested structure of demand in the economy.

POSTGRADUATE CONFERENCE ON ECONOMICS, PUBLIC ADMINISTRATION AND
BUSINESS (PCEPAB)-5TH SEPTEMBER, 2015
PROMOTING GROWTH, EXCELENCE AND SUSTAINABILITY - 420
Figure 2: Nested Demand Structure in the economy
Income. Total government revenue (𝐺𝑅) consists of direct taxes and indirect taxes. Direct taxes
consists of three types of taxes collected by the government which are household income
tax (ℎℎ𝑡𝑎𝑥), corporate tax (𝑐𝑜𝑟𝑡𝑎𝑥), petroleum tax (𝑝𝑒𝑡𝑡𝑎𝑥) while indirect taxes includes tariff
(𝑡𝑎𝑟𝑖𝑓𝑓) and goods and services taxes (𝑔𝑠𝑡).
𝐺𝑅 = ℎℎ𝑡𝑎𝑥 + 𝑐𝑜𝑟𝑡𝑎𝑥 + 𝑝𝑒𝑡𝑡𝑎𝑥 + 𝑡𝑎𝑟𝑖𝑓𝑓 + 𝑔𝑠𝑡
We assume export and excise duties are not significantly contribute to the government revenue.
For income distribution (𝑌𝑑𝑖𝑠𝑡), function is depends on household consumption (ℎℎ𝑐𝑙𝑒𝑠),
marginal propensity to consume (1 − 𝑚𝑝𝑠), tax rate (1 − 𝑡ℎ) and household income (𝑌ℎ). 𝑥 is
referred to high, middle and low income groups.
𝑌𝑑𝑖𝑠𝑡(𝑥) = ∑ ∑ ℎℎ𝑐𝑙𝑒𝑠𝑖 (𝑥)(1 − 𝑚𝑝𝑠(𝑥))(1 − 𝑡ℎ(𝑥))𝑌ℎ𝑡(𝑥)
𝑖𝑡
The group would affected more is depend on high sensitivity they are towards this function.
Welfare measurement. For measuring the people welfare, we use equivalent variation. The
change in the total household consumption equates to a welfare change as measured by the
Hicksian equivalent variation. The function is related to utility level of household (𝑈) before and
after shock and income level of household (𝐼).
Household
Expenditure
Government
Spending Investment
Demand
Intermediate
Demand
Total Composite Demand
Domestic Demand Imported Demand

POSTGRADUATE CONFERENCE ON ECONOMICS, PUBLIC ADMINISTRATION AND
BUSINESS (PCEPAB)-5TH SEPTEMBER, 2015
PROMOTING GROWTH, EXCELENCE AND SUSTAINABILITY - 421
𝐸𝑉ℎ = ( 𝑈ℎ
1 − 𝑈ℎ0)
𝑈ℎ0 𝐼ℎ − ℎℎ𝑠𝑎𝑣
Macro closure. The general price index is fixed exogenously in the model and all prices are fixed
at unity. The supplies of labor and capital are fixed. In the short run, only labor is sectorally
mobile but capital is fixed, but in long run, both the labor and the capital are mobile.
Foreign closure of the model is warranted through the balance-of-payment (BOP) constraint. The
total value of exports equals the total value of imports accounting for an initial BOP deficit or
surplus given by the base year statistics. The BOP constraint thereby determines the real
exchange rate which indicates the (endogenous) value of the domestic currency vis-a` vis the
foreign currency (the latter being exogenous in a small-open-economy setting).
4.0 Data
Data is obtained from various sources, primary data is applied from Malaysian Input-Output
Table for 2005, the Malaysian Household Income Survey for 2012 and Household Expenditure
Survey for 2009. The data has been combined to form a consistent benchmark dataset.
For the empirical parameterization of the model and to provide estimation of the distributional
impacts towards households income, households are disaggregated into 3 categorizes and are
classified according to their income level; higher income, middle income and lower income
groups. Based on HIES, we applied data on household, but not considered data on individual
income and expenditure. The variable location is consider the same, no difference between rural
and urban areas. We also used one indicator to cross-check this dataset, which is through
educational level. The income is measured based on gross monthly income including allowance.
We follow the definition of household income groups of top 20%, middle 40% and bottom 40%
of total households in Malaysia in 2012. Based on this proportion, we decided the range of
incomes among them. The details of the three income groups are explained in Table 2.
Table 2: The Range of the Three Income Groups
Income Group Range of Income
(RM)
Income Share Consumption Share
Higher Above 7000 65% 48%
Middle 3000 - 7000 25% 36%
Lower Below 3000 10% 16%
Lower income group is composed of people who has a secondary education or less, holding of at
least certificate or diploma and has an undergraduate university degree certificate with no
working experiences. They are consider as a lower skill labor. Their monthly income is below
RM3000. We determine this range of income as referred to the one-off fund given by a

POSTGRADUATE CONFERENCE ON ECONOMICS, PUBLIC ADMINISTRATION AND
BUSINESS (PCEPAB)-5TH SEPTEMBER, 2015
PROMOTING GROWTH, EXCELENCE AND SUSTAINABILITY - 422
government to some of the Malaysian resident. The selected people has qualified to receive this
payment as subject to the certain monthly income level. Bantuan Rakyat 1 Malaysia (BRIM)
scheme has been introduced in year 2012 to help Malaysian people which income is less than
RM3000. By 2014, government has considered to widen the coverage up to the people whose
income is less than RM4000.
Middle income group is composed of people who holding a certificate or diploma and has an
undergraduate university degree certificate with less working years experiences. Their monthly
income is between RM3000-RM7000. Higher income group is consider people holding
undergraduate university degree with more working experiences as well as has a postgraduate
university degree certificate such as PhD level. Their monthly income is RM7000 and above.
5.0 Policy Simulation Experiments
The model is a dynamic. This study examine the GST impacts towards income distribution in
Malaysia over a period of 55 years. We divided these years into 12 different periods, each having
5 years and each duration are independent of each other. This gap is chosen based on the 5 years
Malaysian Plan. The benchmark year is 2005 with considering 6% GST rate. For every 5 years,
the rate will be increased for 1 to 2 per cent. All the simulations will be started from 2015 and end
on 2070 and the maximum GST rate is 25% that is in 2070 as shown in Table 3.
Table 3: Years and rates of GST for Policy Experiment
Year Rate Year Rate Year Rate
2015 6% 2035 10% 2055 18%
2020 7% 2040 11% 2060 20%
2025 8% 2045 13% 2065 23%
2030 9% 2050 15% 2070 25%
6.0 Results
This section presents the results from the policy simulation experiments describe above, focusing
in the dynamic effect of GST on income distribution. The experiments perform a simple
comparative dynamic model.
In this experiment, the model is used to determine the effects of the GST implementation. This
policy set up a beginning GST rate as 6 per cent. GST would affected either lower, middle or
higher income earners. The analysis is based on equivalent variation.
Table 4: GST Impact on Each Income Group from 2015-2070
2005 2015 2020 2025 2030 2035
Higher 0.021 0.021 0.023 0.023 0.024 0.024

POSTGRADUATE CONFERENCE ON ECONOMICS, PUBLIC ADMINISTRATION AND
BUSINESS (PCEPAB)-5TH SEPTEMBER, 2015
PROMOTING GROWTH, EXCELENCE AND SUSTAINABILITY - 423
Middle 0.308 0.319 0.335 0.344 0.353 0.361
Lower 4.988 5.181 5.439 5.593 5.741 5.883
2040 2045 2050 2055 2060 2065 2070
Higher 0.025 0.025 0.026 0.026 0.026 0.026 0.026
Middle 0.360 0.376 0.383 0.387 0.391 0.395 0.396
Lower 6.017 6.140 6.251 6.331 6.410 6.484 6.522
Table 4 presents the GST impact on income distribution. The table shows the levels of these
indicators in years 2015 to 2070. Increases in GST rate leads to increase the impact on income
distribution for the stipulated periods. It can be noted that the magnitudes of the impact of GST
rate changes are increased gradually for these three income groups. GST give more influenced on
lower income compared to middle and higher income. The changes is about 30% in the lower
income group when GST rate increased from 6% in 2005 to 25% in 2070.
7.0 Conclusion
Low-income group would affected more due to high sensitivity they have towards consumption
patterns. Study conducted by HIES found that, in 2012 lower-income group spent 38.8 per cent
on food and 27.5 per cent on utilities of their monthly income. This indicated that this group
expenses more on basic goods compared to the middle and high incomes. In fact, regarding Lau
et al. (2013), they averaged that 30 per cent of income was spent on food for those earning less
than RM1, 000 compared to 5 per cent for people with an income above RM10, 000. In this case,
this study try to examine which group would be affected more from GST implementation.
In general, consumption tax are naturally regressive, which implies that the poor are burdened
with more tax than the rich (Lim, 2014; Rasiah, 2014; Tholasy, 2014). Hence, this will worsen
the income distribution. Nevertheless, this concern, might be addressed if the revenue of indirect
taxes is redistributed in terms of free education or free health care for the lower income group.
Furthermore, the government should consider waiving indirect taxes on necessity goods and basic
items (Bond & Hughes, 2013). The Malaysian government should consider setting up items under
zero rated and exempt supplies for certain necessities to minimize the tax burden on the poor and
to ensure that income is equally distributed (GST Malaysia, 2014, Whatt, 2013).
References
ADB. (2006). Tax Reform and The Self Assessment.
http://www.adbi.org/files/2006.07.malaysia.tax.reform.self.assessment.paper.pdf.
Anand, S. (1977). Aspects of poverty in Malaysia. Review of Income and Wealth, 23(1), 1-16.
Bank Negara Malaysia. (2014). Federal Government Revenue. Retrieved 1st Sept, 2014, from
http://www.bnm.gov.my/
Bernardi, L., Fraschini, A., & Shome, P. (2007). Tax Systems and Tax Reforms in South and East
Asia Retrieved from books.google.com.my/books?isbn=1134168322

POSTGRADUATE CONFERENCE ON ECONOMICS, PUBLIC ADMINISTRATION AND
BUSINESS (PCEPAB)-5TH SEPTEMBER, 2015
PROMOTING GROWTH, EXCELENCE AND SUSTAINABILITY - 424
Bloomberg News. (2006). Oil income lets Malaysia spend and cut taxes. Retrieved June 3, 2007
from
http://www.iht.com/articles/2006/09/01/business/tk.php
Choong, K. F., & Edward, W. S. K. (2011). A Study on Self-Assessment Tax System Awareness
in Malaysia. Australian Journal of Basic and Applied Sciences, 5(7), 881-888.
Department of Statistics. (2012a). Findings of The Household Income Survey (HIS) 2012 (pp.
10). Kuala Lumpur: Department of Statistics Malaysia.
Department of Statistics. (2012b). Mean Monthly Household Income by Strata, Malaysia, 2009 &
2012 Findings of the Household Income Survey (HIS) 2012 (pp. 10). Kuala Lumpur:
Jabatan Perangkaan Malaysia.
Economic Planning Unit. (2013). Gini Coefficient by Ethnicity, Strata and State, Malaysia, 1970-
2012. Retrieved 1st Sept, 2014, from http://www.epu.gov.my/en/household-income-
poverty
ETP Annual Report. (2012). Economic Transformation Programme (pp. 1-330). Kuala Lumpur:
Jabatan Perdana Menteri.
Faizulnudin, H. (2012). Implikasi GST Kepada Pengguna. Paper presented at the Persidangan
GST 2012 'Cukai Barang & Perkhidmatan' Reformasi & Transformasi Cukai, Johor
Bahru.
Fanara, G. (2005). Tax Systems and Tax Reforms In South and East Asia: Malaysia. Societa
Italiana di Economia Pubblica 398.
GST Malaysia. (2014). GST Zero Rated Exemption Supply List.
Ismail, S. H. (2014). The Malaysian GST Model. Paper presented at the International Seminar on
GST Sasana Kijang, Kuala Lumpur.
Jomo, K. S. (2000). Malaysia's Privatisation Experience. In R. A. A. Booth (Ed.), The Economies
of Asia 1950-1998. London: Routledge
Kasipillai, J. (2006). A Comprehensive Guide to Malaysian Taxation-Under Self Assessment.
Kuala Lumpur: McGraw-Hill.
Lau, Z. Z. (2013). Fiscal Consolidation: Cutting Waste as Key to Accelerating Growth CPPS
Perspective Series (pp. 7): Centre for Public Policy Studies, Asian Strategy & Leadership
Institute.
Lee, W. L. (2012). Income Tax Cut Expected to Pave Way for GST. Retrieved from
http://www.themalaysianinsider.com/malaysia/article/income-tax-cut-expected-to-pave-
way-for-gst- say-experts. Last accessed 30th Sep 2013.
Lim, K.-H. (2014). Are Consumption Taxes Really More Efficient and Resilient? In S. Wong, S.
Teoh & T. K. Ramnath (Eds.), The ISIS National Forum on Malaysia’s Goods and
Services Tax (GST): Possible Lessons from the United Kingdom and Singapore (Vol. PP
5054/11/2012 (031098)). Kuala Lumpur: Institute of Strategic and International Studies,
Malaysia.
Loganathan, N., & Taha, R. (2007). Have Taxes Led Government Expenditure in Malaysia?
Journal of International Management Studies, 2(2), 99-113.
Mohamad Hanadzlah, A. H. (2013). Malaysia's Income Distribution Inequality 'Still High' 3
August 2013. http://www.thestar.com.my/Business/Business-News/
Mun, F. K. (2013, January). Malaysia GST - How to Face the Inevitable?, BDO International.
Narayanan, S. (1996). Fiscal reform in Malaysia: Behind a successful experience. Asian Survey,
869-881.
Palil, M. R., & Ibrahim, M. A. (2011). The Impact of Goods and Services Tax (GST) on Middle
Income Earners in Malaysia. World Review of Business Research, 1(3), 192-206.

POSTGRADUATE CONFERENCE ON ECONOMICS, PUBLIC ADMINISTRATION AND
BUSINESS (PCEPAB)-5TH SEPTEMBER, 2015
PROMOTING GROWTH, EXCELENCE AND SUSTAINABILITY - 425
Rasiah, R. (2014). Impact of GST on the Poor and Underprivileged. In S. Wong, S. Teoh & T. K.
Ramnath (Eds.), The ISIS National Forum on Malaysia’s Goods and Services Tax (GST):
Possible Lessons from the United Kingdom and Singapore (Vol. PP 5054/11/2012
(031098), pp. 16). Kuala Lumpur: Institute of Strategic and International Studies (ISIS)
Malaysia.
Saari, Y. M., Dietzenbacher, E., & Los, B. (2010). An Analysis of Income Distribution across
Ethnic Groups in Malaysia: Results for
a New Social Accounting Matrix. University of Groningen, European Network for Input-Output
Studies.
Saira, K., M.A., Zariyawati, M.Am & Yoke-May, L. (2010). An Exploratory Study of Goods and
Services Tax Awareness in Malaysia. Political Managements and Policies in Malaysia,
265-276.
Shand, R. T. (1987). Income distribution in a dynamic rural sector: Some evidence from
Malaysia. Economic Development and Cultural Change, 35-50.
Shari, I. (2000). Economic growth and income inequality in Malaysia, 1971–95. Journal of the
Asia Pacific Economy, 5(1-2), 112-124.
Singh, V. (2002). Malaysian Taxation: Administrative and Technical Aspects. Kuala Lumpur
Longman.
Singh, V. (2014). Are Consumption Taxes Really More Efficient and Resilient? In S. Wong, S.
Teoh & T. K. Ramnath (Eds.), The ISIS National Forum on Malaysia’s Goods and
Services Tax (GST): Possible Lessons from the United Kingdom and Singapore (Vol. PP
5054/11/2012 (031098), pp. 16). Kuala Lumpur: Institute of Strategic and International
Studies, Malaysia.
Taha, R., & Loganathan, N. (2008). Causality between tax revenue and government spending in
Malaysia. The International Journal of Business and Finance Research, 2(2), 63-73.
Tan, S. K. (2012). Rasional Pelaksanaan GST. Paper presented at the Persidangan GST 2012
'Cukai Barang & Perkhidmatan' Reformasi & Transformasi Cukai, Johor Bahru.
The Malaysian Insider. (2013). Budget 2014 announced, 6% GST from April 1, 2015.
The Star. (2013). Budget 2014: GST at 6% on April 1, 2015
Tholasy, S. (2012). Masalah & Kesan GST Ke Atas Ekonomi Negara. Paper presented at the
Persidangan GST 2012 'Cukai Barang & Perkhidmatan' Reformasi & Transformasi Cukai,
Johor Bahru.
Tholasy, S. (2014). Are Consumption Taxes Really More Efficient and Resilient? In S. Wong, S.
Teoh & T. K. Ramnath (Eds.), The ISIS National Forum on Malaysia’s Goods and
Services Tax (GST): Possible Lessons from the United Kingdom and Singapore (Vol. PP
5054/11/2012 (031098), pp. 16). Kuala Lumpur: Institute of Strategic and International
Studies, Malaysia.
Wan Abdullah, N. (2010). Public sector reform in Malaysia–addressing the inequalities? :
http://eprints.um.edu.my/11315/1/Rosnah_Wan_Abdullah-WGIII.pdf.
Wee, C. H. (2006). Fiscal Policy and Inequality in Malaysia. Kuala Lumpur: University of
Malaya Press.
Whatt, W. L. (2013). Mekanisme Pelaksanaan GST. Paper presented at Pasca Bajet Negara,
INTAN Kampus Utama Bukit Kiara. .
World Bank. (2013). GDP Growth (annual %).

POSTGRADUATE CONFERENCE ON ECONOMICS, PUBLIC ADMINISTRATION AND
BUSINESS (PCEPAB)-5TH SEPTEMBER, 2015
PROMOTING GROWTH, EXCELENCE AND SUSTAINABILITY - 426
The Influence of Host Country National Support on Expatriate
Success in Malaysia
Hak Liong Chan
Putra Business School, Universiti Putra Malaysia
43400, Serdang, Selangor Darul Ehsan, Malaysia
E-mail: [email protected]
Dahlia Zawawi ,ͣ Siew Imm Ngᵇ
Faculty of Economics and Management, Universiti Putra Malaysia
43400, Serdang, Selangor Darul Ehsan, Malaysia
E-mail: [email protected] ͣ, [email protected]ᵇ
Abstract
This study examines the effects of host country national (HCN) support on expatriate adjustment and withdrawal
intentions, and in turn expatriate performance. This study aims to improve the problems of cross-cultural
adjustment concerning general living, work and interaction faced by expatriates in shared services and outsourcing
(SSO) industry in Malaysia.
In order to provide a broader view of expatriate success, it is critical to study cross-cultural adjustment, job
performance and withdrawal intentions concurrently in this research. Stakeholders are groups of entities or
individuals that are important to expatriates where HCNs are parts of them. Therefore, this study intends to explore
the support HCNs in influencing expatriate success, particularly withdrawal intentions as the ultimate success
criterion. In addition, this research is corroborated by job demands and resources (JD-R) model.
Key words: support, host country nationals, expatriate success, Malaysia
1.0 Introduction
Globalisation has become a universal phenomenon that allows multinationals companies
(MNCs) to show their interest in the growth of international job mobility and relocations in order
to meet global workforce needs (Mercer, 2013). Many MNCs are highly reliant on expatriates to

POSTGRADUATE CONFERENCE ON ECONOMICS, PUBLIC ADMINISTRATION AND
BUSINESS (PCEPAB)-5TH SEPTEMBER, 2015
PROMOTING GROWTH, EXCELENCE AND SUSTAINABILITY - 427
manage their business operations abroad (Selmer, 2001; Huff, Song and B.Gresh, 2014).
Generally, expatriates are employees who work abroad within a specified time frame (Woods,
2003; Mayerhofer, Hartmann, Michelitsch-Riedl and Kollinger, 2004). Expatriates require
international assignment as an effective tool to help them develop their cross-national and cross-
cultural competencies (Yao, 2013) in terms of their ability to adapt, to understand different
cultures and to develop a global mindset (Lee and Kartika, 2014). It has been suggested that
including the three components which are cross-cultural adjustment, job performance and
withdrawal intentions will draw a more sophisticated and wider view of expatriate success
(Bhaskar-Shrinivas, Harrison, Shaffer and Luk, 2005; Shaffer, Ferzandi, Harrison, Gregersen and
Black; Benson and Pattie, 2009). Expatriate success is strongly connected to their ability to
adjust to different conditions of work and non-work domains in the host country (Farh, Bartol,
Shapiro and Shin, 2010). Expatriates show greater intentions to remain until the end of the
assignment when they are able to overcome adjustment difficulties (Pinto, Cabral-Cardoso and
Werther, 2012b).
This study will be conducted in Malaysia and focus on shared services and outsourcing (SSO)
industry. MNCs start to set up their shared services centres and increase the need for information
technology (IT), operations and accounting experts to fill in the positions in Malaysia (The Star
Online, 2013b). Thus, skilled expatriates are required to support and enhance the SSO business
operations in Malaysia. Malaysia is being recognised by MNCs worldwide as one of the best
places to run SSO businesses (Tey, 2014). SSO is a combination of services that is made up with
the best competitive strategy that uses information and communication technology, finance and
accounting, human resources, and engineering design and services (Multimedia Development
Corporation, 2015). Malaysia is the world’s leader in SSO industry particularly in IT, which is
expected to increase its investment from US$800 million in 2010 to over US$2 billion in 2015
(PricewaterhouseCoopers, 2012). Around 300 foreign and multinational companies established
their regional and global SSO centres in Malaysia, contributing billion of investments and
thousands of career opportunities (The Star Online, 2013a).
Many studies (Kraimer, Wayne and Jaworski, 2001; Lee and Vorst, 2010; Mahajan and De Silva,
2012) have been done to examine the role of support on expatriate adjustment and job
performance. Social support is a major contributor to poor cross-cultural adjustment to improve
job performance and early return of expatriates (Beehr and Glazer, 2001; Glazer, 2006).
Takeuchi (2010) emphasises that primary stakeholders are those who can influence expatriates or
are influenced by them including host country nationals (HCNs). Expatriate experience is
embedded in an expatriate’s day-to-day navigation with his or her stakeholders (Miao, Adler and
Xu, 2011). It can be understood through the observation of dynamics between expatriates and
their stakeholders. Again, researchers highlight that expatriates desire support from different
stakeholders especially at the beginning of the relocations (Kraimer and Wayne, 2004; Toh and
Denisi, 2007). Stakeholders can help expatriates achieve their main objectives by providing
whatever they need to succeed in international assignment. This research aims to find out

POSTGRADUATE CONFERENCE ON ECONOMICS, PUBLIC ADMINISTRATION AND
BUSINESS (PCEPAB)-5TH SEPTEMBER, 2015
PROMOTING GROWTH, EXCELENCE AND SUSTAINABILITY - 428
whether HCN support has a considerable implication on expatriate success, is still an under-
researched area in Malaysia.
1.1 Problem Statement
Research on international assignment emphasises on the importance of cross-cultural adjustment
to expatriate experience. However, with every 5 to 12 assignment given to the expatriates, one of
them will fail (Marston, 2011). This is because companies mistakenly assume that expatriates
who have successfully completed an assignment in one country will be able to do the same
elsewhere. It was proven that 52% of the expatriates consider the inability to adapt to host
culture is the greatest difficulty for them (Tower Watson, 2012). According to Brookfield Global
Relocation Services (2014), 15% of the expatriates indicate that cultural adjustment is one of the
main reasons of assignment failure. These issues show that cultural challenges can make
expatriates feel uncomfortable that prevent them from performing better and completing
assignment.
Besides poor cross-cultural adjustment, expatriates’ family-related problems have become a
leading reason for assignment failure (Ernst and Young, 2013). A survey conducted by Cartus
(2014), a global relocation company, reported that 76% of the expatriates agree that the family or
personal situations are the top reason why expatriates withdrew from their assignments. In
addition, 61% of them rated the inability of the family to adjust to the host location as a second
reason of failure. In particular, spouse dissatisfaction is the most influential factor of expatriate
failure (Mohn, 2011). It is identified by 13% of the expatriates who find that dissatisfied spouse
is a cause for them to fail the assignments (Brookfield Global Relocation Services, 2014). An
overseas assignment is not cheap. It basically costs between two to four times of the expatriate’s
base salary, depending on its locations (Alsop, 2014). When an expatriate fails an assignment, it
can cost an organisation approximately $1million for each failure whereby this figure is
multiplied with the increase of group moves (Mohn, 2011). With all these reasons identified,
these evidence prove that expatriate personal and family issues have become the main hurdles for
successful overseas assignments that bring financial loss to the company.
Based on the problems highlighted above, this study attempts to identify the effect of HCN
support on expatriate adjustment and withdrawal intentions, and in turn expatriate performance
which are considered the main criteria of expatraite success (Caligiuri, Joshi and Lazarova; 1999;
Shaffer, et al, 2006). Researchers have suggested that HCNs (e.g, Lee and Vorst, 2010; Mahajan
and De Silva, 2012) are sources of interaction that can provide psychological resources that give
recognition and to facilitate expatriate adjustment. It is confirmed that social support can help
eliminate the risk of assignment failure (Stroppa and Spieß, 2011). Hence, this study will focus
on HCN support that is expected to minimise the aforementioned problems encountered by
expatriates in Malaysia.

POSTGRADUATE CONFERENCE ON ECONOMICS, PUBLIC ADMINISTRATION AND
BUSINESS (PCEPAB)-5TH SEPTEMBER, 2015
PROMOTING GROWTH, EXCELENCE AND SUSTAINABILITY - 429
Previous studies discuss specifically about the willingness of HCNs to provide support and the
interaction with HCNs on expatriate adjustment and performance (e.g., Varma, et al., 2011;
Bakel, et al., 2011; Varma, et al., 2012). HCNs are believed to provide the best source of support
and role information for expatriates to deal with the uncertainty and anxiety. It has been
advocated that HCN support can help expatriates complete their assignments successfully (e.g.,
Toh and Denisi, 2005; Toh and Denisi, 2007). Mahajan and De Silva (2012) suggest that there
will a possible effect of HCNs on expatriates’ withdrawal cognitions. In fact, whether HCN
support can influence withdrawal intentions has yet to be validated. This study would like to
make a contribution to investigate the possible relationship between HCN support and
withdrawal intentions.
2.0 Jobs Demands and Resources Model
The JD-R model assumes that every occupation bears its own risk factors in terms of job stress
or burnout (Demerouti, Bakker, Nachreiner and Schaufeli, 2001). The model can be classified
into two categories, chiefly job demands and job resources which are applicable to various
occupational contexts, regardless of the demands and resources (Demerouti, Bakker, Nachreiner
and Schaufeli, 2001). Job demands refer to those physical, social or organisational aspects of the
job that need an employee’s continuous physical or mental effort that cost physiologically and
psychologically (Bakker, Demerouti and Euwema, 2005). For example, work pressure,
demanding interaction effort and uncomfortable physical environment. Job resources, on the
other hand, refer to those physical, social or organisational aspects of the job that help an
employee achieve work goals, reduce physiological and psychological job demands or improve
personal growth and development (Bakker, Demerouti and Euwema, 2005; Demerouti and
Bakker, 2011). For example, social support, autonomy and career opportunities.
In international environment, MNCs have started paying closer attention to expatriates’ work-
related outcomes such as job engagement and burnout to ensure successful business operation
abroad (Rattrie and Kittler, 2014). JD-R model can act as an invaluable tool for explaining
burnout and engagement across national contexts (Rattrie and Kittler, 2014). A number of
expatriate-related studies have applied JD-R model as the main theory to identify key
contributions (e.g., Lazarova, Westman and Shaffer, 2010; Mahajan and De Silva, 2012; Cole
and Nesbeth, 2014; Ren, Shaffer, Harrison, Fu and Fodchuk, 2014). At first, Lazarova, Westman
and Shaffer (2010) note that expatriate and spouse adjustment can be predicted by both demands
and resources. From a JD-R point of view, resources can directly and indirectly buffer the
negative effects of demands from expatriate adjustment. The model also implies that engagement
can be linked to demands through adjustment where expatriates can easily become engaged in
their roles that contribute to effective job performance. Besides, Mahajan and De Silva (2012)
postulate that JD-R model is a useful theory to investigate the relationship between HCN support
and expatriate adjustment. They highlight that HCN support is a job resource that can reduce

POSTGRADUATE CONFERENCE ON ECONOMICS, PUBLIC ADMINISTRATION AND
BUSINESS (PCEPAB)-5TH SEPTEMBER, 2015
PROMOTING GROWTH, EXCELENCE AND SUSTAINABILITY - 430
expatriate maladjustment resulting from the influence of unmet role expectations. Cole and
Nesbeth (2014) also posits that the model can better the understanding about expatriate
performance within the work-family interface to ensure that the demands exposed and the
resources available to expatriates are balanced. To provide new insights, Ren, et al. (2014)
integrate both reactive factors (cultural novelty, cultural values distance and host country
language deficiency) and proactive factors (information seeking, relationship building and
positive framing) in this area of study, the JD-R model contends that these factors contribute to
both adjustment and embeddedness of expatriates, which are expected to influence the
subsequent outcomes in terms of retention cognitions, and in turn actual turnover.
Social support is a prominent situational variable to buffer against job strain at workplace
(Kaplan, Cassel and Gore, 1977; Sarason, Levine, Basham and Sarason, 1983; Gottlieb and
Bergen, 2010). According to Bakker and Demerouti (2007), social support plays a moderating
role in different work situations when (1) the beginning of a stressor is predictable to certain
extent (e.g., role clarity, performance feedback) (2) the reasons are understandable why a stressor
exists to certain extent (e.g., role information by colleagues or supervisors) (3) the aspects of the
stressor are controlled by the person who experiences it to certain extent (e.g., job decision-
making. Social support is a straightforward job resource to mitigate the negative effects of job
demands (e.g., heavy workload, emotional and physical demands) and protect employees from
significant stressful experience at workplace.
Primarily based on the notion of JD-R model in this present study, job demands are those job
aspects that require employees to devote mental and physical efforts to overcome (Bakker,
Demerouti and Euwema, 2005), the expatriate success criteria can be considered as job demands
as how they are defined and characterised in the literature. Cross-cultural adjustment is the
process of adaptation to living and working in a host country (Black, 1988; Black and Gregersen,
1991). The adjustment process takes people behavioural, cognitive and emotional efforts in order
to become more adjusted to the novel environment (Haslberger, 2008). Harrison and Shaffer
(2005) define expatriate performance as the form of effort, including time and energy, an
expatriate makes for the purpose of the assignment. Employing the JD-R model, Rattrie and
Kittler (2014) stress that adjustment is one of the critical factors in determining successful
international working context. The authors also claim that the model is promosing in managing
well-being and performance related outcomes of expatriates. Withdrawal intentions, on the other
hand, are defined as the degree to which expatriates plan to return to their home early even
before they have not finished their assignments (Bhaskar-Shrinivas, et al, 2005). As the matter of
fact, Swider and Zimmerman (2014) argue that employees who intend to withdraw spend more
time, energy and effort looking for job alternatives that can negatively influence their job
performance at the current job. All in all, the inception of the JD-R model in international setting
has demonstrated its application where the increase of job resources may reflect the reduction of
job demands among expatriates in return. However, there is a substantial gap impeding a

POSTGRADUATE CONFERENCE ON ECONOMICS, PUBLIC ADMINISTRATION AND
BUSINESS (PCEPAB)-5TH SEPTEMBER, 2015
PROMOTING GROWTH, EXCELENCE AND SUSTAINABILITY - 431
comprehensive understanding of the JD-R model about the management of burnout and
engagement in different contexts in particular (Rattrie and Kittler, 2014).
To contribute to the JD-R model, HCN support is expected to minimise the aforementioned job
demands of expatriates. It has been corroborated by Montgomery, Peeters, Schaufeli and Ouden
(2003) that the resources in terms of support can be classified into work and family domain to
predict organisational outcomes. Ren et al. (2014) assert that expatriates who possess more
resources may feel more energetic and motivated to continue staying on their assignment.
Concurrently, the model is also applicable in supporting the interrelationship between the three
criteria of expatriate success simultaneously. As expatriate adjustment is part of the job demand
(Rattrie and Kittler, 2014), there is a strong connection with expatriates’ withdrawal intentions
and job performance (Ren, et al., 2014). When expatriates’ adjustment is poor, their withdrawal
intentions are higher and job performance to be lower. It is followed by the diminished level of
emotional resources can reduce employee’s efforts to complete the tasks that result declining job
performance (Swider and Zimmerman, 2014). This describes the situation where expatriates with
withdrawal intentions may not be able to perform well. Given that POS, HCN support and
spousal support are classified as resources in the JD-R model, they are able to explain the
interaction with expatriate adjustment and its consequential outcomes related to withdrawal
intentions and job performance.
3.0 Literature Review
3.1 Adjustment and Cross-Cultural Adjustment
Adjustment is defined as the degree of psychology comfort an individual feels in a new situation
(Black, 1988). Adjustment and adaptation are used interchangeably in cultural context to explain
acceptance, satisfaction, skills, behaviour and interaction within local community (Shi and
Franklin, 2013). From expatriate perspective, adjustment means the degree of comfort without
the presence of stress, which is strongly related to cross-cultural environment (Black, 1988;
Selmer and Fenner, 2009). Adjustment engages the learning of new culture which consists of
three components: behaviours, cognitions and emotions so that they can be more effective and
content in new environment (Haslberger, 2008). Expatriate can imitate and/or learn suitable
behaviours that are well accepted by the host culture to reduce anxiety and uncertainty.
Therefore, those culturally adjusted expatriates are able to absorb new behaviours, norms and
rules that become the foundation of the host cultures (Church, 1982).
In cross-cultural context, there is a difference between psychological adjustment and socio-
cultural adjustment (Ward and Kennedy, 1993). Psychological adjustment focuses on
individual’s well being and level of satisfaction whereas socio-cultural adjustment focuses on
individual’s social skills, especially the expatriates’ ability to communicate with host nationals.
Expatriates may face numerous challenges during the process of cultural adjustment because

POSTGRADUATE CONFERENCE ON ECONOMICS, PUBLIC ADMINISTRATION AND
BUSINESS (PCEPAB)-5TH SEPTEMBER, 2015
PROMOTING GROWTH, EXCELENCE AND SUSTAINABILITY - 432
culture shock, uncertainty and differences can exist at the same time in a different setting (Wang
and Nayir, 2006). Consequently, expatriates who fail to overcome cultural uncertainties are
likely to suffer from stress that leads to maladjustment. Those with poor experience in the host
culture may perceive that their own culture is inferior (Church, 1982).
Cross-cultural adjustment, on the other hand, is the process of adaptation to living and working
in a culturally different environment (Black, 1988; Black and Gregersen, 1991). The concept of
cross-cultural adjustment is built due to the earlier research on culture shock (Oberg, 1960).
Culture shock is a phenomenon where a foreigner is anxious, confused and apathetic until a new
set of behavioural assumption is developed to facilitate his or her understanding of the social
behaviour of local natives (Wang and Nayir, 2006). Cross-cultural adjustment consists of three
facets of cross-cultural adjustment to assess expatriate ability to adjust in a foreign culture
(Black, Mendenhall and Oddou, 1991). General adjustment refers to life condition in host
country such as housing, shopping, food, weather, entertainmet, transportation and health care
facilities. Interaction adjustment mainly deals with interaction between expatriates and host
nationals. Work adjustment includes responsibilities, supervisions and performance during the
assignment. This model has been very successful in supporting theoretical framework of
numerous expatriate studies (Haslberger, 2008).
3.2 Host Country National Support and Expatriate Adjustment
Host country nationals (HCNs) are individuals or local employees working within the host unit
(Toh and Denisi, 2007). A growing amount of studies emphasise on the factors influencing
HCNs’ perspective and the effects of their attitudes towards expatriates. Research suggests that
attention should be paid to this group of important ‘stakeholder’ in expatriate management
(Takeuchi, 2010). This is because HCNs provide expatriates with the best sources of information
on local culture and customs, role information and social support (Johnson, Kristof-Brown,
Vianen, Pater and Klein, 2003; Varma, Toh and Budhwar, 2006; Toh and Denisi, 2007). Prior
studies have highlighted that HCN support can facilitate expatriate success in particular (e.g.,
Caligiuri and Lazarona, 2002; Toh and Denisi, 2005; Toh and Denisi, 2007; Mahajan and De
Silva, 2012). Although HCNs are important to expatriates, there is no claim that HCNs are
always motivated to give them support. HCNs’ helping behaviours are a matter of personal
option and are not compulsory in job description (Wang and Fang, 2014). These behaviours
come from personal initiative and motivation in nature.
Several researches highlight that HCN support is important to expatriate adjustment (Black,
1990; Lee and Vorst, 2010; Mahajan and De Silva, 2012; Abdul Malek, Budhwar and Reiche,
2014). At first Black (1990) draws a sample of 220 American expatriates working in Japan,
Korea, Taiwan and Hong Kong. Zero-order correlation analysis shows that expatriates who
receive more HCN emotional support have greater general and interaction adjustment but not

POSTGRADUATE CONFERENCE ON ECONOMICS, PUBLIC ADMINISTRATION AND
BUSINESS (PCEPAB)-5TH SEPTEMBER, 2015
PROMOTING GROWTH, EXCELENCE AND SUSTAINABILITY - 433
work adjustment. It is found that HCN support can facilitate expatriates to learn the propoer
ways of interacting with HCNs. The finding is backed by eleven interviews with expatriate
respondents, who comment those HCNs are helpful in facilitating their cross-cultural adjustment
in the host countries. Furthermore, Lee and Vorst (2010) use 74 English teacher expatriates in
Taiwan as a sample to examine the influence of Taiwanese co-worker support on expatriate
adjustment. Regression indicates that Taiwanese co-worker support has a positive impact on
expatriates’ work and interaction adjustment but not on general adjustment. In fact, the main
point is the relationship between Taiwanese HCNs and interaction adjustment is much stronger.
The overall result can be explained by 51% of the expatriates have stayed in Taiwan for more
than 3 years, while 58% of expatriates are not beginners of Chinese language learners.
According to Mahajan and De Silva (2012), JD-R theory is applied to explain HCN support is
crucial to reduce the adverse effect of expatriate maladjustment, the researchers contend that
informational and social support from HCNs are useful for facilitating expatriate adjustment.
Unquestionably, getting support from HCNs can help expatriates to better understand the host
culture in order to get rid of those uncertainties in the host country. A similar study by Abdul
Malek et al. (2014) in Malaysia, investigating two forms of HCN support concerning emotional
and informational support as highlighted earlier by Mahajan and De Silva (2012). Surprisingly,
adopting path analysis, the findings are inconsistent with several past studies (e.g., Black, 1990;
Lee and Vorst, 2010) as HCN support is not significantly related to expatriate adjustment. One of
the main reasons is possibly due to the high power distance culture in Malaysia which creates a
glass ceiling between HCNs and expatriates, who are always perceived to hold higher positions
in a company. Another reason is Malaysians are collectivist, who are cautious about ‘outsiders’,
so this group of people is normally accepted by invitation or permission only.
Based on the literature discussed above, it gives an indication of HCN support is absolutely
imperative to assist expatriates in overcoming cultural adjustment difficulties, but a few do not
substantiate this fact due to certain host cultural factors are difficult for expatriates to deal with
them effectively. For sure, HCNs might not have the ability and resource to provide those kinds
of necessary support that help ease expatriate adjustment related to both work and nonwork
domains. In the nutshell, whether HCN support can be an important factor of expatriate success,
exclusively for the three criteria has not been lacking empirically.
3.3 Expatriate Adjustment and Withdrawal Intentions
Organisational withdrawal is defined as a set of underlying behaviours and intentions that
contribute to the outcomes of negative job attitudes and other factors (Hanisch and Hulin, 1991).
Withdrawal intentions are not actual turnover, instead withdrawal intentions are better predictors
of actual turnover (Cohen and Freund, 2005). This actual turnover can be determined by an
individual’s self-expressed actions or intentions.Withdrawal intentions comprise three different

POSTGRADUATE CONFERENCE ON ECONOMICS, PUBLIC ADMINISTRATION AND
BUSINESS (PCEPAB)-5TH SEPTEMBER, 2015
PROMOTING GROWTH, EXCELENCE AND SUSTAINABILITY - 434
forms: (1) plans to search for another job (2) general thoughts of quitting the currrent job and (3)
intentions to quit the current job (Jaros, Jermier, Koehler and Sincich, 1993). On top of this, Blau
(2000) and Carmeli (2005) argue that withdrawal intentions are a multidimensiocal concept
because the employees can withdraw themselves either from their job, organisation or
occupation. Intentions to withdraw from the job are defined employees leave their current job,
but they might retain in the same organisation. Employees who intend to withdraw from the
organisation are likely to leave their companies in the future. However, employees who plan to
withdraw from their occupation may encounter decision-making dilemma, since the new
occupation would be totally different than the former ones (Blau, 2000; Carmeli, 2005).
The basic theoretical argument suggests that adjustment is a multifaceted approach to predict a
positive relationship with intent to stay in a new environment. Black and colleagues (Black and
Stephens, 1989; Gregersen and Black, 1990) are the first researchers to investigate how job and
nonjob adjustment influence intent to stay of expatriates. Regression finds out that general and
interaction adjustment are positively correlated with intent to stay, but not work adjustment. This
is because most well-adjusted expatriates can focus on the similiarities of their job despite the
cultural differences at the workplace. The scholars also highlight that general environment and
interaction with HCNs make adjustment more crucial to affect expatriates’ withdrawal
intentions. Contrary to these findings, Gabel, Dolan and Cerdin (2005) ascertain that expatriates
who are unadjusted to work show greater interest in leaving their assignment. Caligiuri (1997)
explains that both variables are related to each other and causal at one time, whereby this
argument supports a negative linear relationship between expatriate adjustment and desire to
terminate in her study.
Intent to return early of expatrates is a central consequence for MCNs due to its theoretical and
practical contributions for international assignments. Takeuchi, Yun and Tesluk (2002) base on a
sample of 243 Japanese expatriates in the United States working for various industries, the three
facets of adjustment are rated by three sources (spouse, superiors and expatriates) as predictors
of intent to return early in order to reduce the common method variance. Structural equation
modelling (SEM) analysis indicates that both general and work adjustment are negatively related
to intent to return early, but not interaction adjustment. The results of this study are consistent
with previous findings that support a negative relationship between general and work adjustment,
and expatriates’ withdrawal cognitions (Harrison and Shaffer, 2005; Wu and Ang, 2011).
However, interaction adjustment does not work in their cases. In particular, supporting practises
from organisation can encourage expatriates’ interactions with HCNs at work which motivate
them to succeed in their assignments (Wu and Ang, 2011). Based on the multidimensional
concept of withdrawal intentions by Blau (2000) and Carmeli (2005), only work adjustment is
influential on assignment withdrawal intentions but there are no correlations found between
general and interaction adjustment, and withdrawal intentions in expatriate context (Pinto,
Cabral-Cardosoa and Werther, 2012a).

POSTGRADUATE CONFERENCE ON ECONOMICS, PUBLIC ADMINISTRATION AND
BUSINESS (PCEPAB)-5TH SEPTEMBER, 2015
PROMOTING GROWTH, EXCELENCE AND SUSTAINABILITY - 435
Apart from that, several studies prove that the three facets of adjustment have negative effects on
assignment withdrawal cogitions (Kraimer and Wayne, 2004; Bhaskar-Shrinivas, et al., 2005;
Ren, et al, 2014). Expatriates who receive adjustment support from the company are likely to
complete their assignment, but it does not represent higher level of performance (Kraimer and
Wayne, 2004). Bhaskar-Shrinivas et al. (2005) highlight the fact that many obstacles of
assignment withdrawal take place such as loss of face, negative career implications and uncertain
employment in home country that might reduce different forms of assignment inputs. Although
findings demonstrate that the three facets of adjustment have a negative relationship with
withdrawal cognitions, general or environmental adjustment is the strongest determinant of
withdrawal decisions (Bhaskar-Shrinivas, et al., 2005; Harrison and Shaffer, 2005). This issue is
reiterated by Ren et al. (2014), agree that environment mainly impinges upon expatriates who
experience poor adaptation that leads to assignment withdrawal. Drawing upon JD-R model,
assignment demands require extra effort or resource depletion of expatriates to alleviate
maladjustment. Two different studies are carried out separately by the authors: The first study
consists of 181 expatriate teachers from 30 different countries while the second study consists of
2,207 expatriates from English-speaking countries in Hong Kong. As a result, the findings of
these two studies confirm a positive relationship between expatriate adjustment and retention
cognitions, it indicates that expatriates who are embedded in the host subsidiaries and
community are more likely to retain in their assignments.
The literature has discussed the relationship between expatriate adjustment and withdrawal
intentions in various research settings that provide a broader view of expatriate withdrawal.
Although most studies have agreed that poorer expatriate adjustment causes higher level of
withdrawal intentions in general, it is uncertain to know exactly which dimension of adjustment
has played a leading role in affecting expatriate withdrawal. As noted by Pinto et al. (2012a), the
concept of expatriate withdrawal intentions can be multidimensional as those unadjusted
expatriates may not think to leave their current assignment, occupation or organisation, which
has received less attention since its development in 2012. This is due to the fact that other
possible factors associated with host environment during the expatriation can influence
expatriate withdrawal.
3.4 Expatriate Adjustment and Expatriate Performance
Drawing upon the model of Motowidlo and colleagues., four dimensions of expatriate job
performance are proposed by Caligiuri (1997), mainly technical performance,
contextual/managerial performance, contextual/prosocial performance, and expatriate-specific
performance. Technical performance refers to the expatriate’s ability to apply technical
knowledge and skills in their job. Contextual/managerial performance refers to the expatriate’s
ability to maintain good relationships with coworkers, and provide subordinates training and
development. Contextual/prosocial performance includes organisational commitment,
motivation, effort, team-building, and personal discipline. Finally, expatriate-specific

POSTGRADUATE CONFERENCE ON ECONOMICS, PUBLIC ADMINISTRATION AND
BUSINESS (PCEPAB)-5TH SEPTEMBER, 2015
PROMOTING GROWTH, EXCELENCE AND SUSTAINABILITY - 436
performance includes replacement training, transferring information, cultural adaptation,
language proficiency and developing good relationships with HCNs (Caligiuri, 1997). To
simplify, contextual/managerial performance and expatriate-specific performance are combined
and conceptualised as expatriate contextual performance. Expatriate task performance is the
combination of technical performance and contextual/prosocial performance (Kraimer et al.,
2001).
Parker and McEvoy (1993) are the pioneers who empirically examine the relationship between
expatriate adjustment and expatriate performance of 169 expatriates from 12 countries. The
researchers find that work adjustment has positive effects on self-rated job performance. Job
performance increases when expatriates make better work adjustment rather than general and
interaction adjustment. Shay and Baack (2006) examine the relationship between work
adjustment and self-rated task performance, and HCN subordinate-rated contextual performance
among 153 expatriates from nine international hotels. Findings indicate that work adjustment is
positively related to both task and contextual performance which are rated by the two sources,
respectively. Furthermore, Kawai and Strange (2014) depend upon self-rated job performance
and find out that those 118 Japanese expatriates in Germany have higher levels of task and
contextual performance when their work adjustment increases. It can be argued that
organisation’s dedication to expatriate well-being in terms of career development has contributed
to improved expatriate performance.
It is important to understand that the degree of expatriate performance is established depending
upon how well the expatriates are able to adjust to their work life (work adjustment) and non-
work life (general and interaction adjustment) in the host country. Caligiuri (1997) suggests a
positive linear relationship between adjustment, and self-, peer- and leader-rated performance of
115 expatriates based in an American-based MNC. Results show that expatriate adjustment is
significantly correlated with self-rated performance, but not with both peer and leader ratings
where halo error may be a primary reason to make these relationships non significant. Kraimer
and her colleagues (Kraimer, et al., 2001; Kraimer and Wayne, 2004) rely on supervisor-rated
performance as consequence of adjustment. They apply stress management theory to predict
well-adjusted expatriates will be able to perform well in a different work and general
environment. Therefore, the results show that work adjustment is positively related to task
performance while interaction adjustment is positively related to contextual performance which
provide support for Caligiuri’s (1997) taxanomy of expatriate success. Similarly, Lee et al.
(2013) focus on work and interaction adjustment guided by social exchange theory, there is a
positive relationship found between the two dimensions of adjustment and expatriate
performance. Despite general adjustment, it has been argued that work and interaction
adjustment are the most important determinants in expatriate adjustment and expatriate success,
respectively (Lee and Sukoco, 2010).

POSTGRADUATE CONFERENCE ON ECONOMICS, PUBLIC ADMINISTRATION AND
BUSINESS (PCEPAB)-5TH SEPTEMBER, 2015
PROMOTING GROWTH, EXCELENCE AND SUSTAINABILITY - 437
Based on the three meta-analyses by Hechanova, Beehr, and Christiansen (2003), Bhaskar-
Shrinivas et al. (2005) and Mol, Willemsen and Molen (2005), their findings for the positive
relationships between the three facets of adjustment and expatriate performance are not
supported positively. However, Mol et al. (2005) argue that the findings of Hechanova et al.
(2003) are weaker due to the the correlation does not support the definition of adjustment related
to performance cited in Black (1988). Bhaskar-Shrinivas et al. (2005) assert that adjustment has
substantial impacts on psychological strains and expatriate performance. According to Lee and
Sukoco (2010), a sample of 218 expatriates from Taiwanese MNC firms is validated. Although a
positive and significant relationship between adjustment and performance is confirmed, the
authors argue that expatriate adjustment does not directly influence job performance, so it does
not support the notion of Black (1988), proposing the adjustment level can determine the
performance level. Instead, the psychological comfort is critical to expatriates to develop a set of
operational capabilities for their performance (Lee and Sukoco, 2010). Wu and Ang (2011) stress
that expatriates’ ability to adjust determine the chances of succeeding in an international
assignment. With 169 expatriates working for MNCs in Singapore, the findings demonstrate that
interaction adjustment facilitates expatriates’ relationship building with HCNs that contributes to
their contextual performance. Expatriates with minor difficulties at work are more likely to
perform their duties well that lead to better task performance. Nevertheless, general adjustment
does not influence neither task nor contextual performance.
Expatriates with higher adjustment are more likely to form a kind of psychological comfort
which helps them to stabilise their moods and perform well. With 114 expatriate respondents
from 653 MNCs in Vietnam, Wang and Tran (2012) postulate that only work and interaction
adjustment are positively related to supervisor-rated job performance. General adjustment does
not have any effects on job performance, the authors argue that general living should be referred
to overall adapatation and it is not directly related to operational capabilities at workplace. In
Malaysian context, researchers (Abdul Malek and Budhwar, 2013; Abdul Malek, et al., 2014)
indicate that work adjustment is positively related to task and contextual performance while
interaction adjustment is positively related to contextual performance. General adjustment is not
significantly related to expatriate performance. However, self-rated performance increases the
possibility of common method variance that cannot be completely excluded in their study. In
addition, Lee and Kartika (2014) apply work adjustment theory to explain successful work
adjustment is determined by the individuals and environments, and hence the finding reveals that
expatriate adjustment has positive effects on task, contextual and overall performance. The
theory supports those well-adjusted expatriates will devote more personal resources (e.g., time,
effort, emotion quality) on improving job performance.
A large amount of studies are carried out on expatriate adjustment and expatriate performance
throughout the years, surprisingly, the results of these studies are inconclusive. Some researchers
agree on higher cross-cultural adjustment does not neccessarily determine higher job
performance in international assignment. In fact, the concept and measurement of expatriate

POSTGRADUATE CONFERENCE ON ECONOMICS, PUBLIC ADMINISTRATION AND
BUSINESS (PCEPAB)-5TH SEPTEMBER, 2015
PROMOTING GROWTH, EXCELENCE AND SUSTAINABILITY - 438
performance used in these studies are different from one to another despite the emphasis on task
and contextual performance. Better concept and measures must be developed to accommodate
the essence of cross-cultural adjustment.
3.5 Withdrawal Intentions and Expatriate Performance
It is a severe phenomenon when expatriates who underperform, but they still continue staying in
the assignment. Thomas and Lazarova (2006) stress that intent to remain is inadequate to
determine how successful an expatriate is in regards of his or her job performance during
overseas assignment. Only one study is done so far to investigate the relationship between
withdrawal cognitions and expatriate performance where the sample is selected from 193
expatriates and 108 expatriate-spouse dyad in Hong Kong (Harrison and Shaffer, 2005).
Adopting spouse-reported withdrawal cognitions and self-reported performance of expatriates,
withdrawal cognitions is not significantly related to any components of job performance: task
completion, relationship building and overall performance, and it supports previous argument
(Thomas and Lazarova, 2006). This sole empirical finding, however, is not concrete enough to
produce a strong theory and generalise to other settings as majority of the expatriates of this
study is from Western countries. Another point is different sources of performance rating should
also be applied to predict the true performance of the expatriates, such as supervisory-rating or
peer-rating rather than self-rating which is likely to cause bias result.
Figure 1: Proposed Research Framework
Notes:
indicates the replications
indicates the contributions
4.0 Conclusion
Expatriate
Adjustment
Expatriate
Performance
Host Country
National Support
Withdrawal
Intentions

POSTGRADUATE CONFERENCE ON ECONOMICS, PUBLIC ADMINISTRATION AND
BUSINESS (PCEPAB)-5TH SEPTEMBER, 2015
PROMOTING GROWTH, EXCELENCE AND SUSTAINABILITY - 439
As international assignments become increasingly important to both individuals’ and
organisations’ development, the literature has paid attention to the three overarching criteria for
expatriate success, namely expatriate adjustment, job performance and withdrawal/retention
decisions (Caligiuri, 1997; Kraimer and Wayne, 2004; Shaffer, et al., 2006). It has been
suggested that including the three components will draw a more sophisticated and wider view of
expatriate success (Bhaskar-Shrinivas, et al., 2005; Shaffer, et al., 2006; Benson and Pattie,
2009). Expatriates who are successful in bridging the relation gaps with host community are
likely to be benefitted from receiving role information and social support from HCNs
(e.g.,Varma, Pichler, Budhwar and Biswas, 2009; Varma, Budhwar and Pichler, 2011; Varma,
Pichler, Budhwar and Kupferer, 2012). Therefore, HCN support is incorporated in this study
because it has been suggested an important factor to facilitate successful overseas assignment.
This study is expected to contribute both theoretically and practically. The findings of this study
would like to help expatriates in SSO companies in Malaysia to acquire insights about the
positivity of HCN support on expatriate success. These SSO companies can adopt the proposed
research framework to improve expatriates’ view of relocation.
References
Abdul Malek, M. and Budhwar, P. (2013). Cultural intelligence as a predictor of expatriate
adjustment and performance in Malaysia. Journal of World Business(48), 222-231.
Abdul Malek, M., Budhwar, P. and Reiche, B. S. (2014). Sources of support and expatriation: a
multiple stakeholder perspective of expatriate adjustment and performance in Malaysia.
The International Journal of Human Resource Management, 1-18.
Alsop, R. (2014). When expats return home, what’s next? Retrieved October 24, 2014, from
http://www.bbc.com/capital/story/20140115-returning-expat-discontent
Bakker, A. B. and Demerouti, E. (2007). The Job Demands-Resources model: state of the art.
Journal of Managerial Psychology, 22(3), 309-328.
Bakker, A. B., Demerouti, E. and Euwema, M. C. (2005). Job resources buffer the impact of job
demands on burnout. Journal of Occupational Health Psychology, 10(2), 170-180.
Beehr, T. A. and Glazer, S. (2001). A cultural perspective of social support in relation to
occupational stress. Exploring Theoretical Mechanisms and Perspectives, 1, 97-142.
Benson, G. S. and Pattie, M. (2009). The comparative roles of home and host supervisors in the
expatriate experience. Human Resource Management, 48(1), 49– 68.

POSTGRADUATE CONFERENCE ON ECONOMICS, PUBLIC ADMINISTRATION AND
BUSINESS (PCEPAB)-5TH SEPTEMBER, 2015
PROMOTING GROWTH, EXCELENCE AND SUSTAINABILITY - 440
Bhaskar-Shrinivas, P., Harrison, D. A., Shaffer, M. A. and Luk, D. M. (2005). Input-based
andtime-based models of international adjustment: Meta-analytic evidence ad
theoreticalextensions. Academy of Management Journal, 48(2), 257-281.
Black, J. S. (1988). Work role transitions: A study of American expatriates managers in Japan.
Journal of International Business Studies, 277-294.
Black, J. S. (1990). Locus of control, social support, stress, and adjustment in international
transfers. Asia Pacific Journal of Management, 7(1), 1-29.
Black, J. S. and Gregersen, H. B. (1991). Antecedents to cross-cultural adjustment for expatriates
in Pacific Rim Assignments. Human Relations , 44(5), 497-515.
Black, J. S. and Stephens, G. K. (1989). The influence of the spouse on American expatriate
adjustment and intent to stay in Pacific Rim overseas assignment. Journal of
Management, 15(4), 529-544.
Black, J. S., Mendenhall, M. and Oddou, G. (1991). Toward a comprehensive model of
adjustment: An integration of multiple theoretical perspectives. The Academy of
Management Review, 16(2), 291-317.
Blau, G. (2000). Job, organizational, and professional context antecedents as predictors of intent
for interrole work transitions. Journal of Vocational Behavior, 56, 330–345.
Brookfield Global Relocation Services. (2014). 2014 Global Mobility Trends Survey. Chicago:
Brookfield.
Caligiuri, P. M. (1997). Assessing expatriate success: Beyond just "being there". New
Approaches to Employee Management, 117-140.
Caligiuri, P. M., Joshi, A. and Lazarova, M. (1999). Factors influencing the adjustment of
women on global assignments. The International Journal of Human Resource
Management, 10(2), 163-179.
Carmeli, A. (2005). The relationship between organizational culture and withdrawal intentions
and behavior. International Journal of Manpower, 26(2), 177-195.
Cartus. (2014). Global Mobility Policy and Practices. Cartus Corporation.
Church, A. T. (1982). Sojourner Adjustment. Psychological Bulletin, 91(3), 540-572.

POSTGRADUATE CONFERENCE ON ECONOMICS, PUBLIC ADMINISTRATION AND
BUSINESS (PCEPAB)-5TH SEPTEMBER, 2015
PROMOTING GROWTH, EXCELENCE AND SUSTAINABILITY - 441
Cohen, A. and Freund, A. (2005). A longitudinal analysis of the relationship between multiple
commitments and withdrawal cognitions. Scandinavian Journal of Management, 21,
329–351.
Cole, N., and Nesbeth, K. (2014). Why do international assignments fail? The expatriate families
speak. International Studies of Management and Organization, 44(3), 1-19.
Demerouti, E. and Bakker, A. B. (2011). The Job Demands–Resources model: Challenges for
future research. SA Journal of Industrial Psychology, 37(2), 1-9.
Demerouti, E., Bakker, A. B., Nachreiner, F. and Schaufeli, W. B. (2001). The job demands-
resources model of burnout . Journal of Applied Psychology, 86(3), 499-512.
Dowling, P. J., Festing, M. and Engle, A. D. (2008). International Human Resource
Management. London: Cengage Learning EMEA.
Ernst and Young. (2013). Global Mobility Effectiveness Survey 2013. Retrieved October 24,
2014, from http://www.ey.com/GL/en/Services/Tax/Human-Capital/Global-Mobility-
Effectiveness-Survey-2013---Talent-and-business-strategy
Farh, C. I., Bartol, K. M., Shapiro, D. L. and Shin, J. (2010). Networking abroad: A process
model of how expatriates form support ties to facilitate adjustment. Academy of
Management Review, 35(3), 434–454.
Gabel, R. S., Dolan, S. L. and Cerdin, J. L. (2005). Emotional intelligence as predictor of cultural
adjustment for success in global assignments. Career Development International, 10(5),
375-395.
Glazer, S. (2006). Social support across cultures. International Journal of Intercultural
Relations, 30, 605–622.
Gottlieb, B. H., and Bergen, A. E. (2010). Social support concepts and measures. Journal of
Psychosomatic Research, 69, 511-520.
Gregersen, H. B., and Black, J. S. (1990). A multifaceted approach to expatriate retention in
international assignments. Group and Organisation Studies, 15(4), 461-485.
Gudykunst, W. B. (1994). Bridging differences: Effective intergroup communication (2nd ed.).
Thousand Oaks: SAGE Punlications.

POSTGRADUATE CONFERENCE ON ECONOMICS, PUBLIC ADMINISTRATION AND
BUSINESS (PCEPAB)-5TH SEPTEMBER, 2015
PROMOTING GROWTH, EXCELENCE AND SUSTAINABILITY - 442
Harrison, D. A. and Shaffer, M. A. (2005). Mapping the criterion space for expatriate success:
task- and relationship-based performance, effort and adaptation. The International
Journal of Human Resource Management, 16(8), 1454–1474.
Haslberger, A. (2008). Expatriate adjustment: A more nuanced view. In M. Dickman, C.
Brewster, & P. Sparrow (Eds.), International Human Resource Management: A
European perspective (pp. 130-149). London: Routledge.
Huff, K. C., Song, P. and B.Gresh, E. (2014). Cultural intelligence, personality, and cross-cutural
adjustment: A study of expatriates in Japan. International Journal of Intercultural
Relations, 1-7.
Jaros, S. J., Jermier, J. M., Koehler, J. W. and Sincich, T. (1993). Effects of continuance,
affective, and moral commitment on the withdrawal process: An evaluation of eight
structural equation mdels. The Academy of Management Journal, 36(5), 951-995.
Kawai, N. and Strange, R. (2014). Perceived organizational support and expatriate
performance: understanding a mediated model. The International Journal of Human
Resource Management, pp. 1-24.
Johnson, E. C., Kristof-Brown, A. L., Vianen, A. E., Pater, I. E. and Klein, M. R. (2003).
Expatriate social ties: Personality antecedents and consequences for adjustment.
International Journal of Selection and Assessment, 11(4), 277-288.
Kraimer, M. L. and Wayne, S. J. (2004). An examination of perceived organisational support as
a multidimensional construct in the context of an expatriate assignment. Journal of
Management, 30(2), 209-237.
Kraimer, M. L., Wayne, S. J. and Jaworski, R. A. (2001). Sources of support and expatriate
performance: The mediating role of expatriate adjustment. Personnel Psychology(54),
71-99.
Lazarova, M., Westman, M., and Shaffer, M. A. (2010). Elucidating the positive side of the
work-family interface on international assignments: A model of expatriate work and
family performance. Academy of Management Review, 35(1), 93–117.
Lee, L.-Y. and Kartika, N. (2014). The influence of individual, family, and social capital factors
on expatriate adjustment and performance: The moderating effect of psychology contract
and organizational support. Expert Systems with Applications, 41, 5483–5494.

POSTGRADUATE CONFERENCE ON ECONOMICS, PUBLIC ADMINISTRATION AND
BUSINESS (PCEPAB)-5TH SEPTEMBER, 2015
PROMOTING GROWTH, EXCELENCE AND SUSTAINABILITY - 443
Lee, L.-Y. and Sukoco, B. M. (2010). The effects of cultural intelligence on expatriate
performance: the moderating effects of international experience. The International
Journal of Human Resource Management, 21(7), 963–981.
Lee, L.-Y. and Vorst, D. V. (2010). The influences of social capital and social support on
expatriates’ cultural adjustment: An empirical validation in Taiwan. International
Journal of Management, 27(2), 628-649.
Lee, L.-Y., Veasna, S. and Wu, W.-Y. (2013). The effects of social support and transformational
leadership on expatriate adjustment and performance: The moderating roles of
socialization experience and cultural intelligence. Career Development International,
4(4), 377-415.
Mahajan, A. and De Silva, S. R. (2012). Unmet role expectations of expatriates, host-country
national support, and expatriate adjustment. International Journal of Cross Cultural
Management, 12(3), 349-360.
Marston, R. (2011). Exodus: Movement of rich people - a life at home abroad. Retrieved October
24, 2014, from http://www.bbc.com/news/business-15696714
Mayerhofer, H., Hartmann, L. C., Michelitsch-Riedl, G. and Kollinger, I. (2004). Flexpatriate
assignments: a neglected issue in global staffing. The International Journal of Human
Resource Management, 15(8), 1371–1389.
Multimedia Development Corporation (2015). Shared Services and Outsourcing (SSO).
Retrieved January 24, 2015, from http://www.mscmalaysia.my/sso
Mercer (2013, April 17). Global employees mobility- short and long-term overseas assignment
expected to increase in 2013. Retrieved April 5, 2014, from
http://www.mercer.com/press-releases/1521435
Miao, L., Adler, H. and Xu, X. (2011). A stakeholder approach to expatriate management:
Perceptions of hotel expatriate managers in China. International Journal of Hospitality
Management, 30, 530–541.
Mohn, T. (2011). Plight of the Expat Spouse. Retrieved June 24, 2014, from
http://www.nytimes.com/2011/06/21/business/21expats.html?pagewanted=all&_r=0
Mol, S. T., Willemsen, M. E. and Molen, H. T. V. D. (2005). Predicting expatriate job
performance for selection purposes: A quatitative review. Journal of Cross-
Cultural Psychology, 36(5), pp. 590-620.

POSTGRADUATE CONFERENCE ON ECONOMICS, PUBLIC ADMINISTRATION AND
BUSINESS (PCEPAB)-5TH SEPTEMBER, 2015
PROMOTING GROWTH, EXCELENCE AND SUSTAINABILITY - 444
Montgomery, A. J., Peeters, M. C., Schaufeli, W. B. and Ouden, M. D. (2003). Work‐home
interference among newspaper managers: Its relationship with burnout and engagement.
Anxiety, Stress, & Coping: An International Journal, 16(2), 195-211.
Oberg, K. (1960). Cultural shock: Adjustment to new cultural environment. Practical
Anthropology 7, 177-182.
Parker, B. and McEvoy, G. M. (1993). Initial examination of a model of intercultural
adjustment. International Journal of Intercultural Relations, Volume 17, pp. 355-
379.
Pinto, L. H., Cabral-Cardoso, C. and Werther, W. B. (2012b). Compelled to go abroad? Motives
and outcomes of international assignments. The International Journal of Human
Resource Management, 23(11), 2295–2314.
Pinto, L. H., Cabral-Cardosoa, C. and Werther, J. W. (2012a). Adjustment elusiveness: An
empirical investigation of the effects of cross-cultural adjustment on general assignment
satisfaction and withdrawal intentions. International Journal of Intercultural Relations,
36, 188– 199.
PricewaterhouseCoopers. (2012). Because location matters. Kuala Lumpur:
PricewaterhouseCoopers.
Rattrie, L. T., and Kittler, M. G. (2014). The job demands-resources model and the international
work context – a systematic review. Journal of Global Mobility, 2(3), 260-279.
Ren, H., Shaffer, M. A., Harrison, D. A., Fu, C. and Fodchuk, K. M. (2014). Reactive adjustment
or proactive embedding? Multistudy, multiwave evidence for dual pathways to expatriate
retention. Personnel Psychology, 67, 203-239.
Sarason, I. G., Levine, H. M., Basham, R. B., and Sarason, B. R. (1983). Assessing social
support: The social support questionnaire. Journal of Personality and Social Psychology,
44(1), 127-139. Retrieved 2
Selmer, J. (2001). Coping and adjustment of Western expatriate managers in Hong Kong.
Scandinavian Journal of Management, 167-185.
Selmer, J. and Fenner, C. R. (2009). Spillover effects between work and non-work adjustment
among public sector expatriates. Personel Review, 38(4), 366-379.

POSTGRADUATE CONFERENCE ON ECONOMICS, PUBLIC ADMINISTRATION AND
BUSINESS (PCEPAB)-5TH SEPTEMBER, 2015
PROMOTING GROWTH, EXCELENCE AND SUSTAINABILITY - 445
Shaffer, M. A., Ferzandi, L. A., Harrison, D. A., Gregersen, H. and Black, J. S. (2006). You can
take it with you: Individual differences and expatriate effectiveness. Journal of Applied,
91(1), 109-125
Shay, J. P. and Baack, S. (2006). An empirical investigation of the relationships between modes
and degree of expatriate adjustment and multiple measures of performance. International
Journal of Cross Cultural Management, 6(3), p.275-294.
Shen, J. and Jiang, F. (2011). Factors influencing Chinese female expatriates’ performance in
international assignments. The International Journal of Human Resource Management,
1–17.
Shi, X. and Franklin, P. (2013). Business expatriates' cross-cultural adaptation and their
performance. Asia Pacific Journal of Human Resources, 1-22.
Stroppa, C. and Spieß, E. (2011). International assignments: The role of social support and
personal initiative. International Journal of Intercultural Relations, 35, 234-245.
Swider, B. W., and Zimmerman, R. D. (2014). Prior and future withdrawal and performance:
Ameta-analysis of their relations in panel studies. Journal of Vocational Behavior, 84,
225–236.
Takeuchi, R. (2010). A critical review of expatriate adjustment research through a multiple
stakeholder wiew: Progress, emerging trends, and prospects. Journal of Management,
36(4), 1040-1064.
Takeuchi, R., Yun, S. and Tesluk, P. E. (2002). An examination of crossover and spillover
effects of spousal and expatriate cross-cultural adjustment on expatriate outcomes.
Journal of Applied Psychology, 87(4), pp. 655-666.
Tey, K. (2014). Experts provide insight into opportunities available in industry . Retrieved
March 31, 2015, from
http://m.thestar.com.my/story.aspx?hl=Experts+provide+insight+into+opportunities+avai
lable+in+industry&sec=news&id=%7B6F5BECDB-4762-40E4-8AFB-
0DFCA72278B6%7D
The Star Online. (2013a). Shared services and outsourcing companies to benefit from greater
representation. Retrieved January 25, 2015, from
http://www.thestar.com.my/Business/SME/2014/03/03/A-promise-of-better-backing-
Shared-services-and-outsourcing-companies-to-benefit-from-greater-repres/?style=biz

POSTGRADUATE CONFERENCE ON ECONOMICS, PUBLIC ADMINISTRATION AND
BUSINESS (PCEPAB)-5TH SEPTEMBER, 2015
PROMOTING GROWTH, EXCELENCE AND SUSTAINABILITY - 446
The Star Online. (2013b). Malaysia a top hub option. Retrieved June 8, 2014, from
http://www.thestar.com.my/Business/Business-News/2013/08/15/Malaysia-a-top-hub-
option-Improving-infrastructure-standard-of-living-among-attractions.aspx/
Thomas, D. C., and Lazarova, M. B. (2006). Handbook of research in international human
resource management. In G. K. Stahl, & I. Björkman (Eds.), Expatriate adjustment and
performance: a critical review (pp. 247-264). Cheltenham: Edward Elgar Publishing
Limited.
Toh, S. M. and Denisi, A. S. (2007). Host country nationals as a socialising agents: A social
identity approach. Journal of Organisational Behaviour, 28, 281-301.
Tower Watson. (2012). A Global Talent Mobility Study: Regional Differences in Policy and
Practice. Retrieved November 2, 2014, from
http://www.towerswatson.com/en/Insights/IC-Types/Survey-Research-
Results/2012/07/A-Global-Talent-Mobility-Study-Regional-Differences-in-Policy-and-
Practice
Varma, A., Budhwar, P. and Pichler, S. (2011). Chinese host country nationals’ willingness to
help expatriates: The role of social categorization. Thunderbird International Business
Review, 53(3), 353-364.
Varma, A., Pichler, S., Budhwar, P. and Biswas, S. (2009). Chinese host country nationals'
willingness to support expatriates: The role of collectivism, interpersonal affect and
guanxi. International Journal of Cross Cultural Management, 9(2), 199–216.
Varma, A., Pichler, S., Budhwar, P. and Kupferer, S. (2012). Expatriate-local interactions: An
investigation in China. Journal of Managerial Psychology, 27(7), 753-768.
Varma, A., Toh, S. M. and Budhwar, P. (2006). A new perspective on the female expatriate
experience: The role of host country national categorization. Journal of World Business,
41, 112–120.
Wang, C.-H. and Fang, M. (2014). The effects of personality on host country nationals’ helping
behaviors toward expatriates. International Journal of Intercultural Relations.
Wang, X. and Nayir, D. Z. (2006). How and when is social networking important? Comparing
European expatriate adjustment in China and Turkey. Journal of International
Management, 12, 449-472.

POSTGRADUATE CONFERENCE ON ECONOMICS, PUBLIC ADMINISTRATION AND
BUSINESS (PCEPAB)-5TH SEPTEMBER, 2015
PROMOTING GROWTH, EXCELENCE AND SUSTAINABILITY - 447
Wang, Y.-L. and Tran, E. (2012). Effects of cross-cultural and language training on expatriates'
adjustment and job performance in Vietnam. Asia Pacific Journal of Human Resource,
50, 327-350.
Ward, C. and Kennedy, A. (1993). Where's the "culture" in cross-cultural transition?
Comparative studies od sojourner adjustment. Journal of Cross-Cultural Psychology,
24(2), 221-249.
Woods, P. (2003). Performance management of Australian and Singaporean expatriates.
International Journal of Manpower, 24(5), 517-534.
Wu, P.-C. and Ang, S. H. (2011). The impact of expatriate supporting practices and cultural
intelligence on cross-cultural adjustment and performance of expatriates in Singapore.
The International Journal of Human Resource Management, 22(13), 2683–2702.
Yao, C. D. (2013). Experiencing international assignment: An exploratory study of Chinese
international assignees. Albany: An unpublished PhD thesis: Massey University.

POSTGRADUATE CONFERENCE ON ECONOMICS, PUBLIC ADMINISTRATION AND
BUSINESS (PCEPAB)-5TH SEPTEMBER, 2015
PROMOTING GROWTH, EXCELENCE AND SUSTAINABILITY - 448
Does Government Investment Crowd-in or Crowd-out Private
Investment in Malaysia?
Hoda Hajian Universiti Putra Malaysia Serdang, Selangor, 43400.
Azali Mohamed Universiti Putra Malaysia Serdang, Selangor, 43400.
Abstract
Motivated by the concern of Malaysia’s government to increase private capital formation rate while the country has
witnessed relatively low rate of private capital formation in the post-financial crisis area, this study aims to evaluate
the long run relationship between private investment and government investment that is almost debt financed. Using
a trivariate vector error correction model and time-series data covering last 44 years (from 1970 to 2013) this paper
finds evidence of long-run complementary effect of government investment on private investment in Malaysia.
Key words: Government investment, private investment, crowding-in/out, VECM
Introduction
This study aims to investigate the relationship between private domestic investment and
government (almost debt-financed) investment; motivated by the government concern to revive
private capital formation in Malaysia in order to achieve developed country status by 2020, in one
hand and the increasing level of Malaysia government debt in the other hand -having its potential
side effects. The Tenth Malaysia Plan (TMP) requires a large increase in the private investment
rate growth more than 12% annually over the next 5 years, a significant increase from the 2%
annual growth achieved in the Ninth Malaysia Plan. The debt is used to finance government
investments and development expenditures. However, some economic theory and empirical
evidence refer to negative effects of such government expenditure. In some conditions
government debt-funded investments result in adverse effect in real economy, here specifically
domestic private investment.
Private domestic investment in Malaysia has shifted to a lower rate after the financial crisis and
has never reached back to the prior levels. At the same time, government budget balance has been
facing persistence deficit balances in the aftermath of the AFC. As the figure 1 shows
government investment during 1970s and 1980s is countercyclical. However, in all the years after
the AFC except 2012 and 2013 government policy changes to increase public investment to a
level above the private domestic sector’s. One reason for this is to encourage private domestic
and foreign investment. This implicitly means that Malaysia government believes in the positive

POSTGRADUATE CONFERENCE ON ECONOMICS, PUBLIC ADMINISTRATION AND
BUSINESS (PCEPAB)-5TH SEPTEMBER, 2015
PROMOTING GROWTH, EXCELENCE AND SUSTAINABILITY - 449
effect of increase in government investment or the crowding-in effect. This study reexamines this
assumption to provide further evidence on the issue at hand or put it differently for the crowding-
out vs. crowding in hypothesis.
Crowding out theory is more relevant to the economic condition of advanced economies whereas
in case of emerging and developing countries crowding-in effect is justifiable. The former theory,
argues that debt financed government investment reduces the loanable funds available for private
investment, thus imposing increasing pressure on interest rate and reduce the level of private
investment. The later can be realized through improving the investment environment and
provision of infrastructural support (Greene and Villanueva, 1991).
Empirical evidence is far from conclusive. In one hand, there are several empirical evidence that
support the complementary effect of government investment to private investment including
Aschauer (1989) and Erenburg (1993) for U.S., Greene & Villanueva (1991) for 23 developing
countries, Odedokun (1997) for 48 developing countries, Narayan (2004) for Fiji, Ang (2009) for
Malaysia, Hatano (2010) for Japan. In the other hand negative or replacement effect was found by
Monadjemi (1993), Ghura & Goodwin (2000) for Asia and Latin America, Ramey (2008), De
Castro & Hernandez De Cos (2008), Jorn et al., (2006), Engen & Hubbard (2005), Ardagna, et
al., (2007), Afonso & Sousa (2012), Voss, (2002), Mitra (2006) for India, among others. Against
this backdrop, this article reexamines the effect of government investment on domestic private
sector with the scope of Malaysia over the period of 44 years from1970 to 2013.
This study differs with previous literature in a number of aspects. First, its focus is on the private
domestic capital formation rather than the total private capital formation that has been studied in
most of the previous literature. This is due to avoid aggregation bias in a large foreign direct
investment (FDI) recipient country like Malaysia (Ang, 2009). Second, present study employs
extended and revised time-series data of Malaysia annual capital formation compared to the
similar study by Ang (2009). Third, it extends the model by adding one control variable and
enhances the empirical methodology by checking for the endogenous break point in the co-
integrating relation. Finally, it contributes to the rather scares private investment in Malaysia. We
hope that the result of this study contribute to better understanding of the issue, help policy
makers and inspire further research.
Economic background
This section reviews investment behavior in Malaysia through the period 1970 to 2013. Malaysia
started 1960 with the level of total investment being 10.1% of GDP much lower than average of
lower and middle income countries which was 21.3% at the time. By mid-1960s it increased
rapidly about 17%, before the decay in late 1960s due to the higher economic uncertainty
triggered by the racial riots of 1969. After conducting improvements in the investment incentives
Act of 1968. The 1970s witnessed considerable increase in capital formation, reaching a record
high level in the early 1980s. As the global economic recession hits the country in 1985 total
investment as well as domestic and foreign investment diminished, confronted with large
government deficit and current account deficits following the recession.
Figure 1 depicts the trend of the private domestic, public and total investment rates as percent to
GDP. As it shows the rapid increase in private domestic investment started from 1987 at 12.05%

POSTGRADUATE CONFERENCE ON ECONOMICS, PUBLIC ADMINISTRATION AND
BUSINESS (PCEPAB)-5TH SEPTEMBER, 2015
PROMOTING GROWTH, EXCELENCE AND SUSTAINABILITY - 450
of GDP rate. Total investment was primarily funded by domestic saving, supplemented by
foreign saving. Meanwhile Malaysia financial system contributed to the increasing rate of total
investment over the years to reach a peak of 27% of GDP in 1997. By Asian financial crisis hit
the economy the trend witnessed a sharp fall to the low level of 5.51% in 1999. This notable
reduction resulted in a decline in total investment since then.
Figure 1. Trend of total, private domestic and public investment rate (as percent to GDP)
for 1970 to 2013 in Malaysia.
Notes: `"Private domestic investment is gross private fixed capital formation minus FDI as percent of GDP; Government investment is gross
public fixed capital formation as percent of GDP and total investment refers to sum of private and government investments (as percent of GDP).
Source: Made by author using World Bank Data.
It worth mentioning that total investment is composed of private investment and government
investment, and the private investment itself is comprised of domestic and foreign private
investment with the later known as foreign direct investment (FDI). Inflows of FDI builds an
important part of total private investment given that Malaysia is among the most successful
developing countries in attracting large amount of FDI.
Model and Data
As mentioned before in developing countries complementary effect of government investment to
private investment is widely accepted. Public investment may facilitate and stimulate private
investment through the provision of infrastructural support (Greene and Villanueva, 1991). This
can raise the productivity of capital, and expand the overall resource availability by increasing
output. On the other hand, it is possible that public investment crowd-out private investment in
different ways. In Mundel-Fleming theory under floating exchange rate regime, increase in
government deficit leads to higher interest rate therefore less investment from private sector.
010
2030
40
Per
cent
of G
DP
1970 1980 1990 2000 2010year
Total investment Private Domestic Investment (PDI)
Government Investment (GI)

POSTGRADUATE CONFERENCE ON ECONOMICS, PUBLIC ADMINISTRATION AND
BUSINESS (PCEPAB)-5TH SEPTEMBER, 2015
PROMOTING GROWTH, EXCELENCE AND SUSTAINABILITY - 451
Another crowding-out mechanism is explained by the demand for loanable funds. What happens
is that when the economy is at full capacity the increase in budget deficit –to finance additional
government investment spending- leads to increase in demand for loanable funds. This shifts the
loanable funds demand curve rightwards and upwards, increasing the real interest rate. A higher
real interest rate increases the opportunity cost of borrowing, thus decreases the interest-sensitive
expenditure such as investment. It occurs when increased government borrowing to finance
public investment, a kind of expansionary fiscal policy, reduces private sector investment
spending. To put it differently, crowding out refers to government spending using up financial
and other resources that would otherwise be used by private enterprise. Another interpretation of
this term by some economists is government providing a service or goods that would otherwise
be a business opportunity for private industry (Blejer and Khan, 1984; Aschauer, 1989. Thus
from theoretical view it appears that no prior judgment can be made about the effect of
government investment on private investment.
As the above discussion reveals the effect of government investment on PDI is an empirical
question. Therefore, following model specification is suggested:
𝑃𝐷𝐼𝑡 = 𝑓(𝐺𝐼𝑡 , 𝑦𝑡)
Where 𝑃𝐷𝐼𝑡 is the steady state private domestic investment, 𝐺𝐼𝑡 is public investment and 𝑦𝑡 refers
to economic growth rate that captures the general economic condition and is a control variable
used in related literature.
Two dummy variables would be incorporated into the above specification alternatively. One is to
account for the Asian financial crisis 1997-1998 outlier data. Second is to tack account of any
regime shift after the AFC. The dummy variables are defined as:
𝐷97−98 = {1 𝑖𝑓𝑡 = 1997 − 98
0 𝑜𝑡ℎ𝑒𝑟𝑤𝑖𝑠𝑒 }
𝐷𝑅 = {1 𝑖𝑓𝑡 ≥ 1997
0 𝑜𝑡ℎ𝑒𝑟𝑤𝑖𝑠𝑒 }
Private domestic investment (PDI) is measured by gross fixed private capital formation minus
foreign direct investment (FDI), public investment (PUB) is measured by gross fixed public
capital formation, y is measured by GDP growth rate. Annual data covering the period 1970 to
2013 are employed. The data are obtained from World Bank economic indicator database except
data on private fixed capital formation from 1970 to 1990 that was obtained from Monthly
Statistical Bulletin of Bank Negara Malaysia, Monetary and Banking in Malaysia, (BNM, 1994).
Methodology
A VAR based model is used in order to examine how the variables are related in the long-run.
The use of VAR model as a multiequation model is justifiable due to possible endogeneity and
feedback effect of the model variables. This modeling procedure includes three steps. First step is
checking the level of integration of all the variables including in the model using augmented

POSTGRADUATE CONFERENCE ON ECONOMICS, PUBLIC ADMINISTRATION AND
BUSINESS (PCEPAB)-5TH SEPTEMBER, 2015
PROMOTING GROWTH, EXCELENCE AND SUSTAINABILITY - 452
Dickey-Fuller (ADF) test. In case, the variables are all in the same level of integration so called
I(1), second step would be to check for the existence of cointegration relation using Johansen
cointegration test which allows this test among multivariable group. Finding of any cointegration
relation leads toward third step which is modeling the long run relation using a vector error
correction framework.
The VAR model is in following form:
𝑥𝑡 = 𝜇 + ∑ 𝜑𝑗
𝑝
𝑗=1
𝑥𝑡−𝑗 + 휀𝑡
Where 𝑥𝑡 = [𝑃𝐷𝐼𝑡 , 𝐺𝐼𝑡, 𝑦𝑡]′, 𝜇 is a vector of constant terms where 𝜇 = [𝜇𝑃𝐷𝐼, 𝜇𝐺𝐼, 𝜇𝑦 ]′and 𝜑𝑗 is a
matrix of VAR parameters for lag j. the vector of error terms 휀𝑡 = [ 휀𝑃𝐷𝐼, 휀𝐺𝐼 , 휀𝑦]′~ 𝐼𝑁(0, 𝛺),
where 𝛺 is the variance-covariance matrix of the residuals.
The VAR model in equation 2 can be transformed into a vector error correction model (VECM)
as equation 3 below:
∆𝑥𝑡 = 𝜇 + 𝑥𝑡−1 + 𝜆 ∑ 𝛾𝑗 ∆𝑥𝑡−𝑗
𝑝−1
𝑗=1
+ 휀𝑡
Where ∆= 1 − 𝐿, 𝜆 is the long run multiplier matrix. The important assumption in this
specification is that 휀𝑡 is serially uncorrelated. This highlights the importance of optimal lag
selection in a VAR model. In that lag order should be high enough to prevent residual correlation
in one hand and low enough not to cause overestimation.
Result and discussion
Table 1 reports the result of ADF unit root test which shows all the variables are non-stationary at
level and integrated of level one.
Table 1. Augmented Dickey-Fuller Test.
Level First- difference
PDIt -2.7421 -5.1276***
GIt -2.3692 -5.8889***
yt -0.9212 -10.1372*** Notes: estimating the unit root equations for all the variables separately revealed 1 lag and 0 difference lag, plus intercept and t rend are the
appropriate model specifications, except for growth variable that no intercept and trend is needed.
*** Indicates 1% level of significance.

POSTGRADUATE CONFERENCE ON ECONOMICS, PUBLIC ADMINISTRATION AND
BUSINESS (PCEPAB)-5TH SEPTEMBER, 2015
PROMOTING GROWTH, EXCELENCE AND SUSTAINABILITY - 453
Given that all variables are I(1), cointegration test should be performed. Before cointegration test,
the optimal lag should be chosen. In order to do that VAR level with different lags (p, maximum
4 due to sample size) were estimated. Based on Schwarz criterion 1lag was chosen as the optimal
lag length. Next, from the estimated VAR at level with 1 lags Johansen Cointegration test was
performed to test if there is long-run relation among the variables. The result revealed the
existence of one cointegrating relation among the variables. Table 2 shows the unanimous result
given by Trace statistics as well as Maximum Eigenvalue statistics. It worth mentioning that by
adding more lags (𝜌 ≥ 3) to the VAR system no cointegration relation can be obtained. Thus, in
what follows VECM modeling is proceed up to 2 lags.
Table.2. Johansen cointegration test
Notes: ** indicates significance at 5% level.
Consequently, modeling process can be followed using VECM framework. The results of
cointegrating equations obtained from VECM estimated models are summarized in Table 3
presenting cointegrating vectors and speed of adjustment and diagnostic check statistics for each
model. The first model (Model A) is the VECM with just one lag as suggested by Schwarz
criterion before. The coefficient on ECTt-1 or the speed of adjustment is significant at 1% level
and has the correct sign. That means the existence of long run relationship among the variables.
However, in short run (one year) there is no causality from government investment to private
investment since the relevant short run coefficient is not significant. To improve the model from
the influence of outlier data or regime changes from Asian financial crisis the dummies
introduced earlier are incorporated in the base model and estimated individually. The result of
model B that is the basic VECM with 1 lag plus the dummy variable of D97-98 also shows
significant and negative speed of adjustment which is favorable. Another favorable result is the
coefficient of government investment in short run becomes significant in 5% level. The speed of
adjustment for model A and B are 14% and 16% respectively that means 7 year and 61/4 year take
for the private investment to return to the equilibrium level after a shock to government
investment.
The post-estimation diagnostic checks reveal the existence of some problem in each model A and
B. The residual of the cointegrating equation of Model A is not normally distributed. This
problem is rectified by adding dummy variable in Model B, but then taking account of the outlier
has induced residuals to be serially correlated up to 7 lags. Therefore to rectify the serial
Trace statistics Maximum eigenvalue
Lag 𝑟 = 0 𝑟 ≤ 1 r≤ 2 𝑟 = 0 𝑟 = 1 𝑟 = 2
p=1 40.2140** 11.7630 2.1108 28.4510** 9.6522 2.1108

POSTGRADUATE CONFERENCE ON ECONOMICS, PUBLIC ADMINISTRATION AND
BUSINESS (PCEPAB)-5TH SEPTEMBER, 2015
PROMOTING GROWTH, EXCELENCE AND SUSTAINABILITY - 454
correlation problem in the residuals Model C with 2 lags was estimated. Model D adds D97-98
variable to Model C.
Table 3. Cointegrated Equations
Notes:*** Indicates significance at 1% level.
χ2 Normal, indicates Jarque-Bera normality test of the residuals obtained from the VECM model. F
Serial1and F Serial2 are the Breusch-Godfrey LM test statistics for one and two lag respectively.
Increasing the number of lags of VECM model to two lags did not solve the residual serial
correlation problem. The pattern of residual problems in model C and D is similar to A and B.
That is including dummy variable normalize but serially correlates the residuals at the same time.
Adding more lag increased the relatively low R square and adjusted R square of the model.
However, no short run coefficient becomes significant in model C and D.
In sum, the above analysis showed existence of long run complementary relationship between
government investment and private investment. In other words, although no short run effect could
be detected by this study the positive effect of government investment increase seems to be
persistent for several years on private investment. Ang (2009) found similar complementary
effect but his result were stronger than what was found by present paper. The speed of adjustment
is his models are two times faster than what was obtained here. Moreover, he found significant
short run effect for public investment which this study was not able to discover. However,
Guimaraes & Unteroberdoerster (2006) found no significant effect for government spending to
influence private investment in Malaysia. Against such contradictory findings, the need for
further study remains necessary.
Conclusion
This study reexamined crowd-out vs. crowd-in concept in the long run in the context of a newly
industrialized country of Malaysia for the last 44 years (1970-2013). It contributed to the rather
limited literature on the relationship between government and private investment. The result
supported the complementary or crowd-in effect of government investment on private
investment. However, regarding the contradictory evidence obtained from different researches
Model A
𝜌 = 1
Model B
𝜌 = 1
Model C
𝜌 = 2
Model D
𝜌 = 2
Intercept 6.075 4.246 6.303 5.035
GI 1.171*** 1.108*** 1.162*** 1.120***
y 0.331*** 0.273*** 0.393*** 0.350***
ECTt-1 -0.143*** -0.160*** -0.145*** 0.190***
χ2 Normal 29.286*** 0.738 51.028*** 0.602
F Serial1 0.786 6.939*** 0.619 10.659***
F Serial2 2.441 6.029*** 0.357 5.240***

POSTGRADUATE CONFERENCE ON ECONOMICS, PUBLIC ADMINISTRATION AND
BUSINESS (PCEPAB)-5TH SEPTEMBER, 2015
PROMOTING GROWTH, EXCELENCE AND SUSTAINABILITY - 455
and also the shortcomings of the model in present paper, it is necessary to revisit the issue using a
more consistent model.
References
Afonso, A., & Sousa, R. M. (2012). The macroeconomic effects of fiscal policy. Applied
Economics, 44(34), 4439-4454.
Ang, J. B. (2009). Do public investment and FDI crowd in or crowd out private domestic
investment in Malaysia? Applied Economics, 41(7), 913-919.
Ardagna, S., Caselli, F., & Lane, T. (2007). Fiscal discipline and the cost of public debt service:
some estimates for OECD countries. The BE Journal of Macroeconomics, 7(1).
Aschauer, D. A. (1989). Does public capital crowd out private capital? Journal of monetary
economics, 24(2), 171-188.
De Castro, F., & Hernández de Cos, P. (2008). The economic effects of fiscal policy: the case of
Spain. Journal of Macroeconomics, 30(3), 1005-1028.
Engen, E. M., & Hubbard, R. G. (2005). Federal government debt and interest rates NBER
Macroeconomics Annual 2004, Volume 19 (pp. 83-160): MIT Press.
Erenburg, S. J. (1993). The real effects of public investment on private investment. Applied
Economics, 25(6), 831.
Ghura, D., & Goodwin, B. (2000). Determinants of private investment: a cross-regional empirical
investigation. Applied Economics, 32(14), 1819-1829.
Greene, J., & Villanueva, D. (1991). Private investment in developing countries: an empirical
analysis. Staff Papers-International Monetary Fund, 33-58.
Guimarães, R. P., & Unteroberdoerster, O. (2006). What's Driving Private Investment in
Malaysia? Aggregate Trends and Firm-Level Evidence: International Monetary Fund.
Hatano, T. (2010). Crowding-in effect of public investment on private investment. Public Policy
Review, 6(1), 105-110.
Jorn, T., B., W. G., & Heppke-Falk, K. H. (2010). The Macroeconomic Effects of Exogenous
Fiscal Policy Shocks in Germany: A disaggregated SVAR Analysis. Journal of Economic
and Statistics, 230(3 June), 328-355.
Mitra, P. (2006). Has government investment crowded out private investment in India? The
American Economic Review, 96(2. (May, 2006)), 337-341.
Monadjemi, M. S. (1993). Fiscal policy and private investment expenditure: a study of Australia
and the United States. Applied Economics, 25(2), 143-148. doi:
10.1080/00036849300000018
Narayan, P. K. (2004). Do public investments crowd out private investments? Fresh evidence
from Fiji. Journal of Policy Modeling, 26(6), 747-753. doi:
http://dx.doi.org/10.1016/j.jpolmod.2004.06.002
Odedokun, M. O. (1997). Relative effects of public versus private investment spending on
economic efficiency and growth in developing countries. Applied Economics, 29(10),
1325-1336.
Ramey, V. A. (2008). Identifying government spending shocks: it's all in the timing: (No. w.
15464). National Bureau of Economic Research.
Voss, G. M. (2002). Public and private investment in the United States and Canada. Economic
Modelling, 19(4), 641-664. doi: http://dx.doi.org/10.1016/S0264-9993(00)00074-2

POSTGRADUATE CONFERENCE ON ECONOMICS, PUBLIC ADMINISTRATION AND
BUSINESS (PCEPAB)-5TH SEPTEMBER, 2015
PROMOTING GROWTH, EXCELENCE AND SUSTAINABILITY - 456
External Debt Financing of Public Capital Formation: Empirical
Evidence from Nigeria
Ibrahim Mohammed Adamu
Rajah Rasiah
Faculty of Economics and Administration, University of Malaya, Kuala lumpur, Malaysia
[email protected]; [email protected]
Abstract This paper examines empirically the effect of external debt financing of public capital formation in Nigeria, spanning
between 1970 through 2014. The empirical results are based on autoregressive distributed lag (ARDL) bound testing
to cointegration approach. Following the confirmation of orders of integration and a unique cointegration relation
among the variables, our findings revealed that external debt and foreign direct investment are negatively correlated
with the public capital foration, but openness is positive in both long run and short run. Therefore, the study suggests
that investment in an infrastructure oriented project with a higher rate of return would free Nation from future
indebtednesss. Furthermore, good structural reform such as public-private partnership will enhance foreign direct
investment, and promote public infrastructure efficiency.
Key words: External debt; FDI; Public investment.
1. Introduction
Inadequate public capital investment1 especially in infrastructure development has been a
common problem in Nigeria, despite her position as the largest oil producer and exporter in
Africa and sixth position among the top oil exporters in the World. Added to that, in the last
fourty years the country had borrowed over $35billion as at 2004 (Debt Management Office,
2004), through which to finance her budget deficit and investment in basic infrastructure services.
Unfortunately, numerous infrastructure gaps continue to hamper development in economic and
social sectors. In a nutshell, the priority infrastructure services such as electricity,
telecommunication, water supply, and transport services to mention but a few remained
absolutely inadequate and the existing ones are of poor quality by any standard (USAID, 2007).
Due to increasing external debt stock, Nigeria entered negotiation for debt relief with Paris club
creditors2 in 2003. In 2006, Nigeria benefit from a debt relief amounting to $18billion following
the implementation of the Heavily Indebted Poor Countries (HIPCs) initiative and the
Multilateral Debt Relief Initiative (MDRI) jointly with the Paris club of creditor’s debt relief
intervention (Johansson, 2010). This had drastically reduced the total external debt stock to
$3.5billion as at 2006 (DMO, 2006), this development would provide resources available for
investment in the critical priority sectors of the economy, such as road networks, power, water
and other infrastructure to stimulate productive sectors in the economy. Though, it has been
observed that in the eight year period (i.e. after the debt relief in 2006) additional external debt
1 From now, public capital, public capital formation or investment will be used interchangeably. 2 An informal group of official money lenders established in 1956, maily to coordinate and overcome problems of payment difficulties
encountered by countries that owed its member nations. The member nations include UK, France, Germany, Japan, Italy, Netherlands, USA,
Belgium, Denmark, Austris, Spain, Switzerland, Russia and Finland.

POSTGRADUATE CONFERENCE ON ECONOMICS, PUBLIC ADMINISTRATION AND
BUSINESS (PCEPAB)-5TH SEPTEMBER, 2015
PROMOTING GROWTH, EXCELENCE AND SUSTAINABILITY - 457
has continued to grow amounting to $9.7 billion as at 2014 (Debt Management Office, 2014)
respectively.
Table 1, provides a summary trends of external debt indicators and public investment over the
years. It can be seen clearly that in the 1970s and early 1980s, the debt indicators were very low
and the growth of capital infrastructure was impressive. Though, this could be financed through
revenue from the oil exports. The subsequent collapse in the oil price in 1978 and the sudden
international debt crisis of 1982 reversed the trend where growth in public investment begins to
decline substantially. Indeed, Nigeria’s inability in meeting the debt service requirements had
worsen the debt stock. Despite the increased external borrowing over the period, especially in the
mid-1980s and early 2000, Nigeria’s public investment (measured as a share of GDP) did not
yield any satisfactory improvement to the nation’s infrastructure development objectives because
the external debt had increased without accompanying increase in public investment. Until quite
after the debt relief in 2006, the trends begin to improve (see table 1).
Table 1 External debt and Public investment, 1970-2014 ________________________________________________________________________________________________________
Year 1970 1975 1980 1985 1990 1995 2000 2004 2006 2010 2014
________________________________________________________________________________________________________
External debt ($b) 0.5 1.1 4.3 18.9 33.1 32.6 28.2 35.9 3.5 4.6 9.7
Debt to GDP ratio 3.1 1.6 3.8 23.9 105.2 76.6 62.3 65.1 48.2 6.5 2.4
Debt service ratio 2.3 0.6 1.2 0.7 25.3 15.6 8.7 8.6 8.9 0.3 0.4 Pub. Inv. to GDP 13.1 18.5 35.2 12.0 14.1 7.1 7.0 7.4 8.3 15.0 15.7
________________________________________________________________________________________________________
Source: Debt Management Office, Nigeria (2014) and Central Bank of Nigeria (2014).
However, a number of theories have explored the importance as well as adverse effect of external
borrowing. Kopits and Symansky (1998); Emmerson, Frayne and Love (2003) and Kellerman
(2007) have reported that the “golden rule” of public sector borrowing provides a special
consideration to investment in capital expenditure. Based on the fiscal rule, public deficit is not
harm as long as the government deficit is complemented by an increase in physical assets, and the
expenditures must be covered by revenue while for investment expenditure recourse to debt is
allowed. On the other hand, Krugman (1988) and Sachs (1989) established a case regarding the
adverse effects of high debt using debt overhang hypothesis. They fundamentally argue that
country’s accumulated debt acts as a tax on future output, thus discouraging savings and
investment potentials. They suggested that debt reduction or forgiveness is the best alternative to
enhance investment and growth in developing countries.
Empirically, literature on the external debt financing of public investment has not attracted much
empirical interest and the existing ones have produced inconclusive results. Clements,
Bhattacharya and Nguyen (2003) investigate the determinants of public investment in low income
countries. They found an insignificant effect of external debt as opposed to debt service which
depresses public investment. Lora and Olivera (2007) found higher debt ratios caused a decline in
social expenditure in a study of fifty developing countries. Fosu (2010) and Quattiri and Fosu
(2012) in their studies of Sub-Saharan African countries concluded that the relationship between
external debt and investment in social sector remain negative. Hence, a similar result was found
by Deshpande, (1997) in a study of thirteen severely indebted poor countries. A recent study of
Babu, Gisore and Lawrence (2014) also confirmed that high public debt reduces public capital
investment in the East African Community (EAC). Contrarily, Lora (2007) estimated a model of

POSTGRADUATE CONFERENCE ON ECONOMICS, PUBLIC ADMINISTRATION AND
BUSINESS (PCEPAB)-5TH SEPTEMBER, 2015
PROMOTING GROWTH, EXCELENCE AND SUSTAINABILITY - 458
public investment in Latin America. Findings reveal that increasing debt stock is associated with
improvement in public infrastructure investment. On the other hand, Ndikumana and Verick
(2008) found foreign direct investment crowd in domestic investment in Sub-Saharan African
countries. Unlike Agosin and Machado (2005) for the case of Africa, Asia and Latin America,
Eregha (2012) for ECOWAS countries confirmed a negative effect of FDI on domestic
investment. Equally, with regard to Nigeria, there has not been much effort to examine the impact
of external debt financing on public investment. Though, there are few studies that investigate the
effect of external debt, but focused on either aggregate investment or growth. Edo (2002)
examines the effect of external debt on African countries with emphasis on Nigeria and Morocco.
He found a negative effect of external debt on investment. Adegbite, Ayadi and Ayadi (2008)
found the same results to that of Edo (2002), in which external debt affects investment and
growth negatively. From the empirical literature, the majority of the studies report a negative
correlation apart from Lora (2007).
Nevertheless, the following gaps have been identified. First, some studies ignored the issue of
unit root and cointegration test (e.g. Adegbite, Ayadi and Ayadi, 2008). According to Granger
and Newbold (1974) estimation of nonstationary time series data may render the results
“spurious”. Second, previous studies have either focused on the external debt and private capital
investment, or aggregate investment or growth, but failed to consider the contribution of external
debt on public capital formation, which remain the prime mover of economic activities of any
nation. This is a very serious gap which needs to be addressed. Added to that, a considerable
number of studies are cross country case, which could not address country specific problems with
regard to the external debt finanacing of public capital formation. Thirdly, to the best of our
knowledge no empirical study has attracted interest to address this issue in Nigeria.
Hence, the objective of this paper is to examine empirically the external debt financing of public
capital investment in Nigeria. Specifically, the choice of Nigeria was motivated by the long years
of debt overhang, and suddenly the nation benefited from a debt relief. Thus, a sensitive factor
like debt relief may certainly reduce the level of debt stock (Lora and Olivera, 2007), and would
provide available resources for investment, particularly in infrastructure development to stimulate
private sector participation, and accelerate growth.
This paper contributes to the existing literature in two novel ways: First, we employ a recent
autoregressive distributed lag (ARDL) bound testing to cointegration approach developed by
Pesaran, Shin and Smith (2001), which is more reliable in small samples than Johansen and
Juselius (1990) and Engle and Granger (1974) cointegration test (Pesaran, Shin and Smith, 2001).
Second, we incorporate foreign direct investment into the investment equation since foreign
direct investment can support technology transfer and managerial know how, which in turn
enhances public capital investment. Though, Rasiah, Gammeltoft and Jiang (2010) have
maintained that foreign direct investment may encounter high political risk and macroeconomic
instability if motivated by a particular interest, especially in an oil and gas economies such as
Nigeria, Iran and Venezuela among others. Indeed, to the best of our knowledge, no empirical
research that has explored this important issue of external debt financing and public capital
investment interaction using this approach. Therefore, the combination of these aforementioned
novel thoughts provides the basis for our study and distinguishes our work from others.

POSTGRADUATE CONFERENCE ON ECONOMICS, PUBLIC ADMINISTRATION AND
BUSINESS (PCEPAB)-5TH SEPTEMBER, 2015
PROMOTING GROWTH, EXCELENCE AND SUSTAINABILITY - 459
Following the introductory part, the rest of the paper is structured as follows: Section 2 specifies
the investment model and data sources. Section 3 presents the methodology of the study and
empirical analysis while Section 4 concludes and offers some policy implications.
2. Model specification and Data
This study adopts a modified version of Fosu (2010) and Quattri and Fosu (2012), and specifies a
single country public investment equation as shown below:
),,()()/()(
tttt OPNFDIEDfIG
(1)
Where IG is the public capital investment as a proxy of gross fixed capital formation, ED is the
external debt, FDI is the foreign direct investment inflow, and OPN is the trade openness (The
ratio of trade to GDP). However, we adjust the series closer to stationarity by transforming Eq.(1)
into a log linear form (Lutkepohl, 2004).
t3t2t10 lnlnFDI lnED ln tt OPNIG (2)
All variables are defined earlier. However, subscript t is time span covering annual data between
1970 and 2014 and the symbol µ is the usual stochastic error term which assumed to be normally
distributed. The corresponding coefficients for the parameters (α0–α3) are the unknown
coefficients to be estimated.
Our data consist of 45 annual observations from 1970 to 2014. The public investment is collected
from Central Bank of Nigeria, and the external debt data were taken from the Debt Management
Office, Nigeria. The foreign direct investment inflow and trade openness are available in World
Development Indicators CD-ROM, World Bank. All data are expressed in real terms.
3. Methodology and Empirical analysis
Our empirical analysis begins with the descriptive statistics and correlation matrix of the
candidate variables, but due to economy of space we reserve the result upon request. Prior to
adoption of an econometric methodology, the properties of the data series have to examine to
ascertain their order of integration. Thus, we employ Augmented Dickey Fuller (1981) and
Phillips and Perron (1988) tests. Table 2 presents the results of the unit root test where lnIG, lnED
and lnFDI are intergrated of order one, i.e., I(1) or stationary at first difference whereas lnOPN is
found intergrated of order zero, i.e. I(0). The combination of these orders of integration justifies
the adoption of ARDL bound testing to cointegration approach by Pesaran (Pesaran, Shin and
Smith, 2001).
Table 2 Unit root test
Variable
ADF test
PP test
I(d)
Level
First difference
Level
First difference
lnIG
-0.844(2)
[0.952]
-3.484(3)**
[0.055]
-2.057(1)
[0.553]
-6.252(5)***
[0.000]
I(1)

POSTGRADUATE CONFERENCE ON ECONOMICS, PUBLIC ADMINISTRATION AND
BUSINESS (PCEPAB)-5TH SEPTEMBER, 2015
PROMOTING GROWTH, EXCELENCE AND SUSTAINABILITY - 460
lnED -1.605(1)
[0.773]
-5.060(0)***
[0.005]
-1.074(3)
[0.921]
-4.689(7)***
[0.002]
I(1)
lnFDI
-2.244(0)
[0.453]
-4.429(9)***
[0.006]
-2.241(4)
[0.455]
-9.901(3)***
[0.000]
I(1)
lnOPN
-3.446(2)**
[0.059]
-3.650(6)**
[0.039]
-3.297(0)*
[0.080]
-8.144(2)***
[0.000]
I(0)/I(1)
Note: ***, ** and * denotes 1%, 5% and 10% significance level. Constant and time trend is included in the test. An automatic maximum lag is
used by the Akaike Information Criterion for ADF tests, and Newey-West bandwidth using Bartlett kernel for PP tests respectively. Numbers in
square brackets are the p-values.
Upon the confirmation of the orders of integration, the next is to apply the ARDL bound testing
to cointegration approach for the long run relationship among the variables and the estimation of
short run using unrestricted error correction model corresponding to equation (2) which
interchangeably gives equation (3) to (6) below:
t
p
i
tt
p
i
p
i
p
i
tttttt
ttttt
DOPNFDIEDIG
OPNFDIEDIGIG
,1
1
1,4
1 1 1
1,31,21,1
141312110
2006lnlnlnln
lnlnlnlnln
(3)
t
p
i
tt
p
i
p
i
p
i
tttttt
ttttt
OPNFDIEDIG
OPNFDIEDIGIG
,2
1
1,4
1 1 1
1,31,21,1
141312110
lnlnlnln
lnlnlnlnln
(4)
t
p
i
tt
p
i
p
i
p
i
tttttt
ttttt
OPNEDIGFDI
OPNEDIGFDIFDI
3
1
1,4
1 1 1
1,31,21,1
141312110
lnlnlnln
lnlnlnlnln
(5)
t
p
i
tt
p
i
p
i
p
i
tttttt
ttttt
FDIEDIGOPN
FDIEDIGOPNOPN
,4
1
1,4
1 1 1
1,31,21,1
141312110
lnlnlnln
lnlnlnlnln
(6)
where ∆ is the first difference operator, p is the lag length, and μit are stochastic error terms.
Hence, bearing the structural break in mind following the drastic reduction in the external debt
stock, we incorporated into Eq.(3) a zero-one dummy variable to account for the effects of debt
relief in 2006. It takes the value of 1 from 1970 to 2006 and 0 afterward.
However, Wald test (F-test) is used to examine the long run relationship. The F-statistics also for
the joint hypothesis. The null hypothesis is that the coefficients of the lagged variables are equal
to zero, which entails the absence of long run relationship among the variables, whereas the
alternative hypothesis denotes at least one of these coefficients is not equal to zero. To conduct
the ARDL test, the first step is to estimate Eq.(3) - (6) using ordinary least square method and
apply the F- test for joint significance. Representatively, the null hypothesis for Eq.(3) - (6) is H0:
φ1=φ2=φ3=φ4=0 (No long run relationship) and against the alternative hypotheses H1: φ1 ≠ φ2 ≠
φ3 ≠ φ4 ≠ 0 (existence of Long run relationship). Accordingly, F-test has non-standard distribution
which depends on whether the variables included in the ARDL model are I(0) or I(1), rather the
critical values are provided by Pesaran, Shin and Smith (2001) and Narayan (2005). The

POSTGRADUATE CONFERENCE ON ECONOMICS, PUBLIC ADMINISTRATION AND
BUSINESS (PCEPAB)-5TH SEPTEMBER, 2015
PROMOTING GROWTH, EXCELENCE AND SUSTAINABILITY - 461
calculated F- value of the ARDL models are compared with critical values. If the calculated F-
statistics is greater than the upper bound value, then we concluded that no long run relationship is
rejected against the alternative hypothesis that long run relationship exists. Conversely, if the
calculated F-statistics is less than the lower bound critical values, the null hypothesis is accepted
suggesting that the long run relationship does not exist. Table 3 presents the results of the ARDL
cointegrating tests for the four models. The calculated F-statistics (4.918) of the investment
model is greater than the upper bound critical values provided by Narayan (2005) and Pesaran et
al., (2001) at the 5% level of significance. This validates the rejection of the null hypothesis
against the alternative hypothesis that there exists a long-run cointegrating relationship among the
variables. Thus, the F- statistics of the rest of the models are less than the lower bound critical
values, therefore, we accept the null hypothesis that there is no long run relationship. To provide
further support for the long run relationship, we employ Johansen and Juselius (1990)
multivariate cointegration test. The results are shown in Table 4 supporting the hypothesis of one
cointegrating vector.
Table 3 ARDL cointegration results
Estimated models Optimum Lag Length F-statistics, (k=3); T=45 Structural break Decision
FIG (IG/ED, FDI, OPN) 1, 1, 1, 1 4.918** 1985 Cointegration
FED (ED/IG, FDI, OPN) 1, 1, 0, 0 2.595 2006 No cointegration
FFDI (FDI/IG, FDI, OPN) 1, 0, 0, 0 2.195 1984 No cointegration
FOPN (OPN/IG, ED, FDI) 1, 1, 0, 1 2.769 1983 No cointegration
Significance level
Asymptotic critical values: LBV, I(0); UBV, I(1)
Narayan (2005) Pesaran et al., (2001)
1% 4.983 6.423 4.29 5.61
5% 3.535 4.733 3.23 4.35
10% 2.893 3.983 2.72 3.77
Note: ** indicate 5% level of significance. LBV and UBV denote Lower Bound Value and Upper Bound Value respectively. Critical values are
taken from Narayan (2005), case III, unrestricted intercept and no trend, Pp 1988 and Pesaran et al., (2001) case III, unrestricted intercept and no
trend Pp 300.
Table 4. Johansen and Juselius (1990) Multivariate cointegration test results
Hypothesis Trace statistics At 5% critical value Maximum-eigen statistics At 5% critical value
R = 0 61.259** 47.21 45.419 ** 27.07
R ≤ 1 15.839 29.68 11.071 20.97
R ≤ 2 4.768 15.41 4.606 14.07
R ≤ 3 0.162 3.76 0.162 3.76
Notes: *** and ** indicates 1% and 5% significance level.
Table 5 and 6 presents the long run and short run elasticities. The result provides support for our
a priori expectation. The coefficient of external debt has the correct sign, negative and
statistically significant at the 5% level in the long run, but appear insignificant in the short run.
On average, for every 1% increase in external debt, public investment falls by 29%. Our result is
similar to that of Edo (2002); Fosu (2010); Quattiri and Fosu (2012); Deshpande, (1997); Babu,
Gisore and Lawrence (2014), and disproves the study of Lora (2007). This implies that the
reduction in external debt stock through the debt relief initiative under the Highly Indebted Poor
Countries (HIPC) does not enhance public capital formation.
The coefficient of foreign direct investment is indeterminate, but appear negative and statistically
significant in both long run and short run at the 1% and 10% level. This implies that a 1%
decrease in FDI decreases public investment by 17% in the long and 12% in the short run,
respectively. Our finding is not consistent with Ndikumana and Verick (2008), but proved the

POSTGRADUATE CONFERENCE ON ECONOMICS, PUBLIC ADMINISTRATION AND
BUSINESS (PCEPAB)-5TH SEPTEMBER, 2015
PROMOTING GROWTH, EXCELENCE AND SUSTAINABILITY - 462
results of Agosin and Machado (2005) and Eregha (2012). This may be attributed to poor
macroeconomic policies and fear of political instability that has been a threat to viable business
environment by MNC’s as viewed by Rasiah (Rasiah, Gammeltoft and Jiang (2010). Equally, the
coefficient of trade openness is positive and statistically significant in both long run and short run
at the 10% and 5% level. This implies that a 1% increase in trade openness increases public
investment by 15% in the long run and 39% in the short run. This suggests that the country’s
ability to interact and compete globally has driven public investment.
The coefficient of the shift dummy variable (D2006) capturing the effects of debt relief is positive
and statistically significant. This indicates that the debt relief, which granted to Nigeria has
produced a drastic fall of external debt stock, and freed about 13% of the resources which are
expanded on debt repayment in the past. The one lagged error correction term is negative and
statistically significant as expected, though, is relatively small in magnitude, this reaffirmed the
existence of the long run cointegration relationship among the variables. The results also imply
that the deviation from the long run equilibrium in the previous period is corrected by 13% in the
next period. Furthermore, the short run model passes through appropriate diagnostic tests such as
serial correlation test, Jaque-Bera test for normality of the residuals, ARCH test for
heteroskedasticity, and Ramsey RESET for functional form and confirmed the model was free
from misspecification (see table 7). Similarly, CUSUM and CUSUM SQUARE for stability test
(Brown, Durbin and Evans, 1975), indicates that the test statistics are within the 5% confidence
interval, therefore, the model is stable and reliable over the sample period (see figure 1).
Table 5. Long run elasticities, Dependent variable = lnIG
Variable Coefficient Std. Error t-Statistics P-value
Constant -31.282*** 3.590 -8.712 0.000
lnED -0.293** 0.138 -2.123 0.041
lnFDI -1.657*** 0.228 -7.263 0.000
lnOPN 1.519* 0.810 1.876 0.068
Note: Note: ***, ** and * denotes 1%, 5% and 10% significance level respectively.
Table 6. Short run elasticities, Dependent variable = lnIG
Variable Coefficient Std. Error t-Statistics P-value
Constant 0.180*** 0.046 3.843 0.000
∆lnIG (-1) 0.019 0.143 0.137 0.891
∆lnED -0.058 0.080 -1.722 0.475
∆lnED (-1) -0.083 0.079 -1.050 0.301
∆lnFDI -0.118* 0.063 -1.873 0.070
∆lnFDI (-1) -0.120* 0.069 -1.733 0.093
∆lnOPN 0.386** 0.124 3.093 0.004
∆lnOPN (-1) 0.072 0.134 0.534 0.596
D2006 0.130** 0.062 -2.094 0.044
ECM (-1) -0.133** -0.054 -2.463 0.019
Note: ***, ** and * denotes 1%, 5% and 10% significance level respectively. R-squared [0.617]; Adjusted R-squared [0.506]; F-statistics [5.563
(0.000)]; DW statistics [1.908].
Table 7. Short run Diagnostic test
Test
Null hypothesis
Test statistics
Decision
χ2 serial correlation [2] H0: No autocorrelation 0.6908 [0.5092] Do not reject H0
χ2 Jaque-bera H0: Normality of stochastic term 1.9515 [0.3769] Do not reject H0
χ2ARCH [1] H0: Homoskedasticity 0.7652 [0.3872] Do not reject H0
χ2`Ramsey RESET [1] H0: No mis-specification 0.8742 [0.2778] Do not reject H0

POSTGRADUATE CONFERENCE ON ECONOMICS, PUBLIC ADMINISTRATION AND
BUSINESS (PCEPAB)-5TH SEPTEMBER, 2015
PROMOTING GROWTH, EXCELENCE AND SUSTAINABILITY - 463
Figure 1 Residuals plots for CUSUM and CUSUMSQ
-16
-12
-8
-4
0
4
8
12
16
88 90 92 94 96 98 00 02 04 06 08 10 12
CUSUM 5% Significance
-0.4
-0.2
0.0
0.2
0.4
0.6
0.8
1.0
1.2
1.4
88 90 92 94 96 98 00 02 04 06 08 10 12
CUSUM of Squares 5% Significance
5. Conclusion
In this paper, we examine empirically the external debt financing of public capital investment
in Nigeria from 1970 to 2014 using ARDL bound testing to cointegrating approach. Following
the findings, there are two essential features observed from this paper: (i) it is clearly shown that
external debt affects public capital investment negatively. This implies that the reduction in the
debt stock following the debt relief granted to Nigeria in 2006 under Highly Indebted Poor
Countries initiative (HIPC) did not yield any impressive contribution to public capital formation.
Our findings disregard the Krugman (1988) and Sachs (1989) debt overhang hypothesis that debt
forgiveness or reduction could enhance investment and stimulate growth. (ii) the negative effect
of foreign direct investment also is consistent with view of Rasia, Gammeltoft and Jiang (2010)
that poor macroeconomic instability and political risk, particularly in an oil rich nations like
Nigeria. Conversely, we consider these results as tentative and further empirical investigation has
to be conducted. Finally, the major policy implication of this finding is that loans should be
adequately extended to investment in infrastructure development rather than in consumption
expenditure. This is by investing in development oriented projects with a higher rate of return that
would repay back the loans. In addition, there is the need for attracting foreign direct investment
through structural reforms, such as public-private partnership will encourage foreign investors,
and promote public infrastructure efficiency.
Acknowledgement
My appreciation goes to Dr. T. C. Tang, whose valuable comments and suggestions was my
strength to prepare the manuscript.
Reference
ADEGBITE, E.O; AYADI, F.S, AYADI, O.F. (2008). The impact of Nigerias External Debt on
Economic Development. International Journal of Emerging Markets, 3(3), 285-301.
AGOSIN, M. R., MACHADO, R. (2013). Foreign investment in Developing countries: Does it
crowd in Domestic investment? Oxford Development Studies, 33(2), 149-162.
BABU, J.O; GISORE, N; LAWRENCE, K. (2014). Does Public Debt crowd-out Public
Investment in East Africa Community? Journal of Economics, 2(4), 1-6.
BROWN, R. L., DURBIN, J., EVANS, J. M. (1975). Techniques for testing the consistency of

POSTGRADUATE CONFERENCE ON ECONOMICS, PUBLIC ADMINISTRATION AND
BUSINESS (PCEPAB)-5TH SEPTEMBER, 2015
PROMOTING GROWTH, EXCELENCE AND SUSTAINABILITY - 464
regression relationship over time (with discussion), Journal of the Royal Statistical Society, 37 ,
149-192.
CLEMENTS, B., BHATTARCHARYA, R., NGUYEN, T.Q. (2003). External Debt, Public
investment, and Economic Growth in Low income Countries. IMF Working Paper No. 249.
DESHPANDE, A. (1997). The debt overhang and the disincentive to invest. Journal of
Development Economics, 52, 169-187.
DICKEY, D. A., FULER, W.A. (1981). Likelihood Ratio Statistics for Autoregressive Time
series with a Unit Root. Econometrica, 49(4), 1057-1072.
DMO, Nigeria Annual report and Statement of Account (2004, 2006, 2014)
EDO, S. (2002). The External Debt Problem in Africa: A Comparative Study of Nigeria and
Morocco. African Development Review, 14(2), 221-236.
EMMERSON, C. FRAYNE, C., LOVE, S. (2003). The Government Fiscal Rules Briefing,
Working Paper No. 16, Institute for Fiscal Studies, London.
ENGLE, R., GRANGER, C. (1987). Cointegration and Error correction representation:
estimation and testing. Econometrica, 55, 251-276.
EREGHA, P. B. (2012). The dynamic linkages between Foreign Direct Investment and Domestic
Investment in ECOWAS countries: A Panel cointegration analysis. African Developmwnt
Review, 24(3), 208-220.
FOSU, A. K. (2010). The External Debt-Servicing Constraint and Public Expenditure
Composition in Sub-Sharan Africa. African Development Review, 22(3), 378-393.
JOHANSEN, S., JUSELIUS, K. (1990). Maximum estimation and inference on cointegration
with applications to the demand for Money. Oxford Bulletin of Economics and Statistics, 52,
169-210.
JOHANSSON, P. (2010). Debt Relief, Investment and Growth. World Development, 38(9),
1204-116.
KELLERMAN, K. (2007). Debt Financing of Public Investment: On a popular Misinterpretation
of “The Golden Rule of Public Sector Borrowing”. European Journal of Political Economy,
1088-1104.
KOPITS, G., SYMANSKY, S. (1998). Fiscal Policy Rules. Occasional Paper No. 162, IMF
Washington, D.C.: The World Bank.
KRUGMAN, P. (1988). Financing vs Forgiving a Debt Overhang. Journal of Development
Economics, 29(3), 68-253.
LORA, E. (2007). Public Investment in Infrastructure in Latin America: Is debt the culprit.
Working paper No. 595, Inter-American Development Bank, Research Department,
Washington, D. C.: World Bank.

POSTGRADUATE CONFERENCE ON ECONOMICS, PUBLIC ADMINISTRATION AND
BUSINESS (PCEPAB)-5TH SEPTEMBER, 2015
PROMOTING GROWTH, EXCELENCE AND SUSTAINABILITY - 465
LORA, E., OLIVERA, M. (2007). Public Debt and Social Expenditure. Friends or Foes?
Emerging Market Review, 8, 299-310.
LUTKEPOHL, H. (2004). Univariate Time Series Analysis. In applied Time Series Econometric
in H. Lutkepohl and M. Kratzig (eds). Cambridge University Press. U.S.A, p.17.
NARAYAN, P. K. (2005). The Savings and Investment Nexus for China, Evidence from
Cointegration tests. Applied Economics, 37(17), 1979-1990.
NDIKUMANA, L., VERICK, S. (2008). The Linkages between FDI and Domestic Investment:
Unravelling the Development Impact of Foreign Direct Investment in Sub-Saharan Africa,
IZA Discussion Papers, No. 3296.
PESARAN,M. H., SHIN, Y., SMITH, R. J. (2001). Bounds Testing Approaches to the Analysis
of Level Relationship. Journal of Applied Econometrics, 16, 289-326.
PHILLIPS, P., PERRON, P. (1988). “Testing for a Unit Root in Time Series Regression”.
Biometrica, 75(2), 335-346.
QUATTRI, M., FOSU, A. K. (2012). On the Impact of External Debt and Aid on Public
Expenditure Allocation in Sub-Sharan Africa after the Launch of the HIPC Initiative. UNU-
WIDER, Working Paper No. 42.
RASIAH, R., GAMMELTOFT, P., JIANG, Y. (2010). Home Government Policies for Outward
FDI from Emerging Economies: Lesson from Asia. Journal of Emerging Markets, 5(3/4), 333-
357.
SACHS, J. D. (1989). The Debt Overhang of Developing Countries in G. Calvo (Ed.), Debt,
Stabilization and Development. Oxford, Basil Blackwell.
USAID (2007). Nigerias Economic Performance Assessment, Nathan Associates Inc.