'Under a shower of bird-notes': R. S. Thomas's elegiac poems ...
Upload
independentCategory
view
5download
0
This article appeared in a journal published by Elsevier. The attachedcopy is furnished to the author for internal non-commercial researchand education use, including for instruction at the authors institution
and sharing with colleagues.
Other uses, including reproduction and distribution, or selling orlicensing copies, or posting to personal, institutional or third party
websites are prohibited.
In most cases authors are permitted to post their version of thearticle (e.g. in Word or Tex form) to their personal website orinstitutional repository. Authors requiring further information
regarding Elsevier’s archiving and manuscript policies areencouraged to visit:
http://www.elsevier.com/copyright
Author's personal copy
Low-energy hydrogen ion shower (LEHIS) treatment ofpolytetrafluoroethylene (PTFE) materials
Hernando S. Salapare III*, Gene Q. Blantocas, Virginia R. Noguera, Henry J. Ramos
Plasma Physics Laboratory, National Institute of Physics, University of the Philippines, Diliman, Quezon City 1101, Philippines
1. Introduction
Since way back in the past century, polytetrafluoroethylene(PTFE) or more commonly known as Teflon has graduallydeveloped to become the seminal material in numerous applica-tions. By virtue of its incredibly versatile characteristics, itspotential use in a modern technological society appears limitless—ranging from electrical and electronics, food packaging andprocessing, biomedical, chemical and mechanical to agriculturaland aeronautical applications. Despite its obvious merits, PTFE isnot without problems in certain usage. Nevertheless, the ease withwhich the surface attributes of PTFE can be manipulated withoutaltering its bulk composition suggests that the logical focus shouldbe towards tuning PTFE surface to suit a particular application.Surface modification allows for the change and improvement of
the property of a material, consequently, making the processedmaterial more useful in various aspects [1–3]. There is already anenormous body of work on surface modification methods of PTFE.Some of these techniques utilize flame [4], chemical [5], grafting[6–7], corona discharge [8], low-pressure plasma [9–11], and UVexposure [12]. This work presents the surface treatment of PTFEusing low-energy hydrogen ion shower (LEHIS) irradiation.
PTFE is a pliable material and is resistant to high heat; it hasbeen used as a reflective layer for back-light illumination mountedbehind miniaturized flat panel displays. One problem using PTFE asa reflector is that it permits a small amount of light leakage viaoptical transmittance [13]. It is one of the objects of thiscontribution to establish the viability of LEHIS treatment toaddress such light leakage problem. Reduced optical leakageshould improve the brightness of flat compact video screensemploying PTFE reflective layers. In general, the current studywishes to ascertain the following: (i) viability of LEHIS to surfacemodify PTFE utilizing relatively short treatment times yetproducing significantly high-throughput, (ii) the mechanism of
Applied Surface Science 255 (2008) 2951–2957
A R T I C L E I N F O
Article history:
Received 19 December 2007
Received in revised form 18 August 2008
Accepted 21 August 2008
Available online 3 September 2008
PACS:
81.30.Hd
81.65.�b
68.35.bm
61.80.�x
68.08.Bc
Keywords:
Polytetrafluoroethylene (PTFE)
Low-energy hydrogen ion shower (LEHIS)
Gas discharge ion source (GDIS)
Wettability
Contact angle
Optical transmission
Scanning electron microscopy (SEM)
Fourier transform infrared spectroscopy
(FTIR)
A B S T R A C T
The wettability and optical transmittance properties of hydrogen ion treated polytetrafluoroethylene
(PTFE) materials were evaluated using contact angle, laser irradiation, scanning electron microscopy
(SEM), and Fourier transform infrared spectroscopy (FTIR) tests. The materials were processed using low-
energy hydrogen ion shower (LEHIS) produced by a gas discharge ion source (GDIS). The duration of
treatment and ion shower energy were varied to determine their effects on the PTFE specimens. Mass
spectrometry showed the ion shower constituents to be H+ and H2+ species. Within the bounds of the
discharge conditions, flux density for the Hn+ beam measured a minimum of 0.06 A/m2 and a maximum of
0.25 A/m2. Both one- and two-way analysis of variance were employed to assist in the interpretation of
the empirical data. Results showed that treatment using lower plasma discharge currents (Id) improved
material hydrophobicity with contact angles measuring a high of 1158 while higher Id resulted in
enhanced hydrophilicity reducing contact angles down to 618. Transmittance and wettability were found
to correlate, i.e., a surface made more wettable became optically transmissive allowing as much as 99%
signal transmittance. Conversely, a surface made more hydrophobic reduced light leakage to as low as
60%. As the material showed increased surface striations, its optical transmittance, wettability, and
surface tension also increased. With no observable shifting of the IR-absorption peaks, the surface
modification was essentially morphological in character.
� 2008 Elsevier B.V. All rights reserved.
* Corresponding author. Tel.: +63 2 9204475; fax: +63 2 9280296.
E-mail address: [email protected] (H.S. Salapare III).
Contents lists available at ScienceDirect
Applied Surface Science
journa l homepage: www.e lsev ier .com/ locate /apsusc
0169-4332/$ – see front matter � 2008 Elsevier B.V. All rights reserved.
doi:10.1016/j.apsusc.2008.08.079
Author's personal copy
surface modification as to whether it is physically or chemicallybased, or perhaps a combination of both, and (iii) the associationbetween wettability and light leakage. The effectiveness of LEHISas a surface modifier is assessed through contact angle measure-ments, scanning electron microscopy (SEM), Fourier transforminfrared spectroscopy (FTIR), and optical transmittance.
2. Experimental setup and methodology
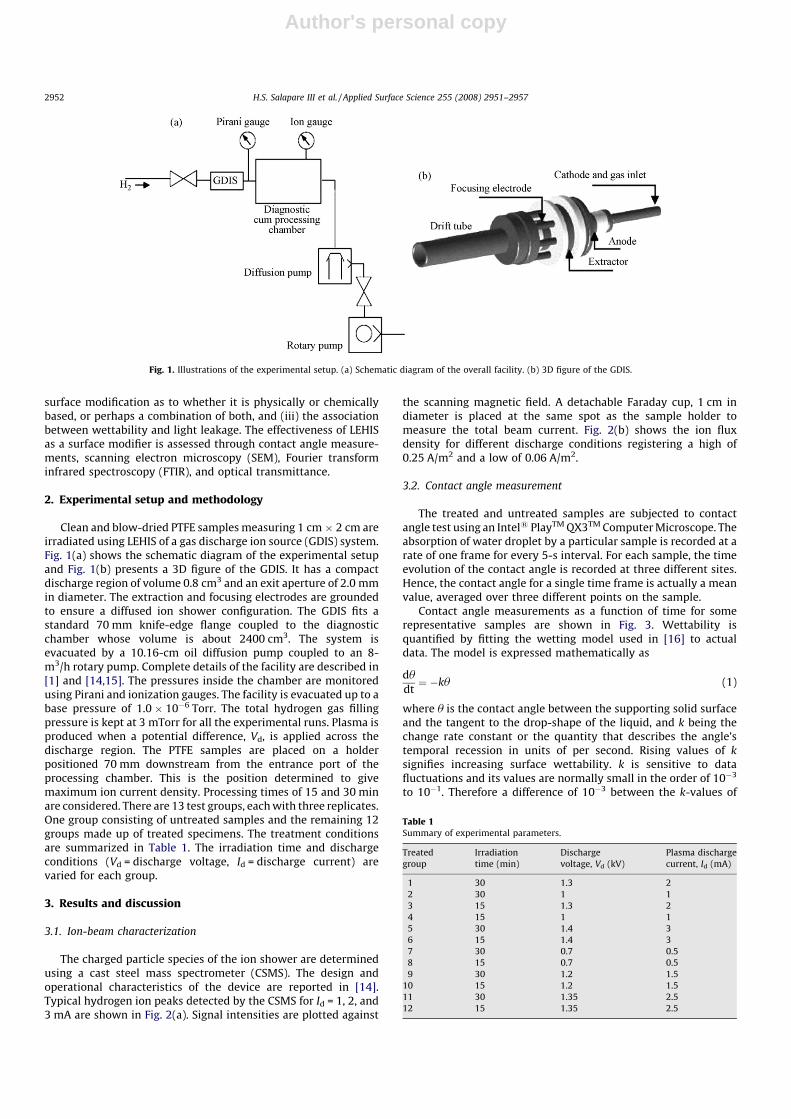
Clean and blow-dried PTFE samples measuring 1 cm � 2 cm areirradiated using LEHIS of a gas discharge ion source (GDIS) system.Fig. 1(a) shows the schematic diagram of the experimental setupand Fig. 1(b) presents a 3D figure of the GDIS. It has a compactdischarge region of volume 0.8 cm3 and an exit aperture of 2.0 mmin diameter. The extraction and focusing electrodes are groundedto ensure a diffused ion shower configuration. The GDIS fits astandard 70 mm knife-edge flange coupled to the diagnosticchamber whose volume is about 2400 cm3. The system isevacuated by a 10.16-cm oil diffusion pump coupled to an 8-m3/h rotary pump. Complete details of the facility are described in[1] and [14,15]. The pressures inside the chamber are monitoredusing Pirani and ionization gauges. The facility is evacuated up to abase pressure of 1.0 � 10�6 Torr. The total hydrogen gas fillingpressure is kept at 3 mTorr for all the experimental runs. Plasma isproduced when a potential difference, Vd, is applied across thedischarge region. The PTFE samples are placed on a holderpositioned 70 mm downstream from the entrance port of theprocessing chamber. This is the position determined to givemaximum ion current density. Processing times of 15 and 30 minare considered. There are 13 test groups, each with three replicates.One group consisting of untreated samples and the remaining 12groups made up of treated specimens. The treatment conditionsare summarized in Table 1. The irradiation time and dischargeconditions (Vd = discharge voltage, Id = discharge current) arevaried for each group.
3. Results and discussion
3.1. Ion-beam characterization
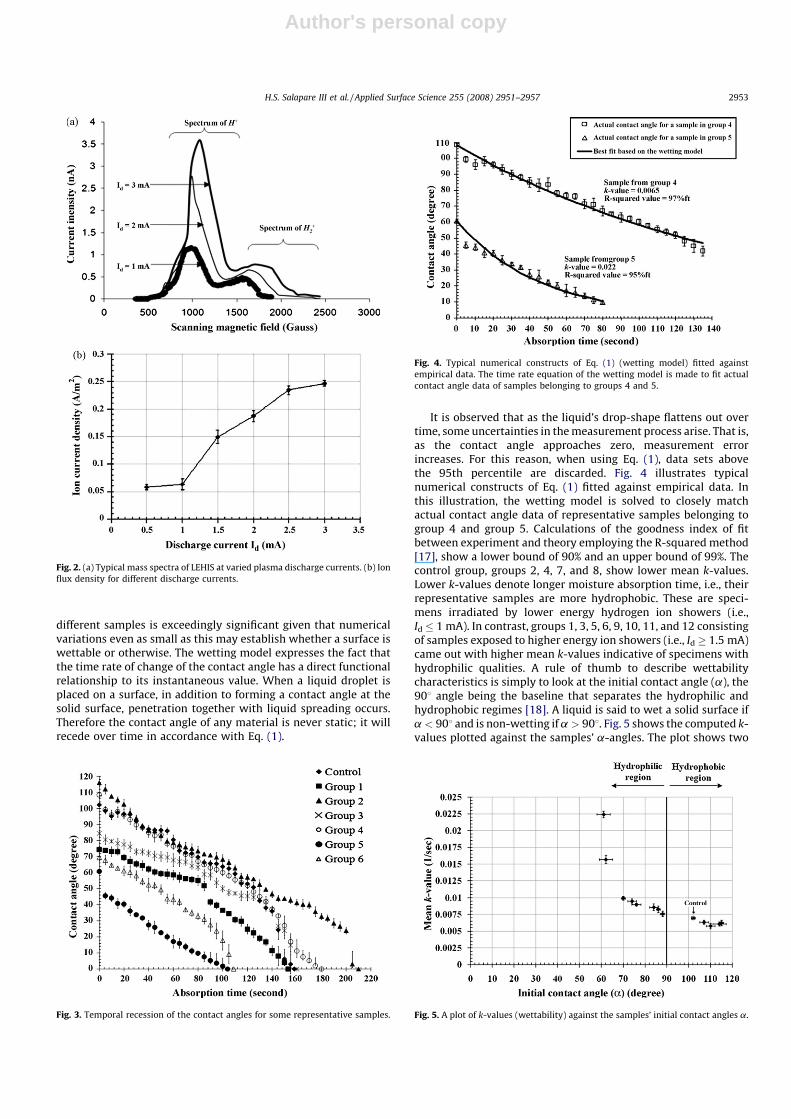
The charged particle species of the ion shower are determinedusing a cast steel mass spectrometer (CSMS). The design andoperational characteristics of the device are reported in [14].Typical hydrogen ion peaks detected by the CSMS for Id = 1, 2, and3 mA are shown in Fig. 2(a). Signal intensities are plotted against
the scanning magnetic field. A detachable Faraday cup, 1 cm indiameter is placed at the same spot as the sample holder tomeasure the total beam current. Fig. 2(b) shows the ion fluxdensity for different discharge conditions registering a high of0.25 A/m2 and a low of 0.06 A/m2.
3.2. Contact angle measurement
The treated and untreated samples are subjected to contactangle test using an Intel1 PlayTM QX3TM Computer Microscope. Theabsorption of water droplet by a particular sample is recorded at arate of one frame for every 5-s interval. For each sample, the timeevolution of the contact angle is recorded at three different sites.Hence, the contact angle for a single time frame is actually a meanvalue, averaged over three different points on the sample.
Contact angle measurements as a function of time for somerepresentative samples are shown in Fig. 3. Wettability isquantified by fitting the wetting model used in [16] to actualdata. The model is expressed mathematically as
dudt¼ �ku (1)
where u is the contact angle between the supporting solid surfaceand the tangent to the drop-shape of the liquid, and k being thechange rate constant or the quantity that describes the angle’stemporal recession in units of per second. Rising values of k
signifies increasing surface wettability. k is sensitive to datafluctuations and its values are normally small in the order of 10�3
to 10�1. Therefore a difference of 10�3 between the k-values of
Fig. 1. Illustrations of the experimental setup. (a) Schematic diagram of the overall facility. (b) 3D figure of the GDIS.
Table 1Summary of experimental parameters.
Treated
group
Irradiation
time (min)
Discharge
voltage, Vd (kV)
Plasma discharge
current, Id (mA)
1 30 1.3 2
2 30 1 1
3 15 1.3 2
4 15 1 1
5 30 1.4 3
6 15 1.4 3
7 30 0.7 0.5
8 15 0.7 0.5
9 30 1.2 1.5
10 15 1.2 1.5
11 30 1.35 2.5
12 15 1.35 2.5
H.S. Salapare III et al. / Applied Surface Science 255 (2008) 2951–29572952
Author's personal copy
different samples is exceedingly significant given that numericalvariations even as small as this may establish whether a surface iswettable or otherwise. The wetting model expresses the fact thatthe time rate of change of the contact angle has a direct functionalrelationship to its instantaneous value. When a liquid droplet isplaced on a surface, in addition to forming a contact angle at thesolid surface, penetration together with liquid spreading occurs.Therefore the contact angle of any material is never static; it willrecede over time in accordance with Eq. (1).
It is observed that as the liquid’s drop-shape flattens out overtime, some uncertainties in the measurement process arise. That is,as the contact angle approaches zero, measurement errorincreases. For this reason, when using Eq. (1), data sets abovethe 95th percentile are discarded. Fig. 4 illustrates typicalnumerical constructs of Eq. (1) fitted against empirical data. Inthis illustration, the wetting model is solved to closely matchactual contact angle data of representative samples belonging togroup 4 and group 5. Calculations of the goodness index of fitbetween experiment and theory employing the R-squared method[17], show a lower bound of 90% and an upper bound of 99%. Thecontrol group, groups 2, 4, 7, and 8, show lower mean k-values.Lower k-values denote longer moisture absorption time, i.e., theirrepresentative samples are more hydrophobic. These are speci-mens irradiated by lower energy hydrogen ion showers (i.e.,Id � 1 mA). In contrast, groups 1, 3, 5, 6, 9, 10, 11, and 12 consistingof samples exposed to higher energy ion showers (i.e., Id � 1.5 mA)came out with higher mean k-values indicative of specimens withhydrophilic qualities. A rule of thumb to describe wettabilitycharacteristics is simply to look at the initial contact angle (a), the908 angle being the baseline that separates the hydrophilic andhydrophobic regimes [18]. A liquid is said to wet a solid surface ifa < 908 and is non-wetting if a > 908. Fig. 5 shows the computed k-values plotted against the samples’ a-angles. The plot shows two
Fig. 2. (a) Typical mass spectra of LEHIS at varied plasma discharge currents. (b) Ion
flux density for different discharge currents.
Fig. 3. Temporal recession of the contact angles for some representative samples.
Fig. 4. Typical numerical constructs of Eq. (1) (wetting model) fitted against
empirical data. The time rate equation of the wetting model is made to fit actual
contact angle data of samples belonging to groups 4 and 5.
Fig. 5. A plot of k-values (wettability) against the samples’ initial contact angles a.
H.S. Salapare III et al. / Applied Surface Science 255 (2008) 2951–2957 2953
Author's personal copy
distinct regions: a hydrophobic region where a > 908 occupied bythe low energy and control groups with lower k-values and ahydrophilic region where a < 908 occupied by the higher energygroups with higher k-values.
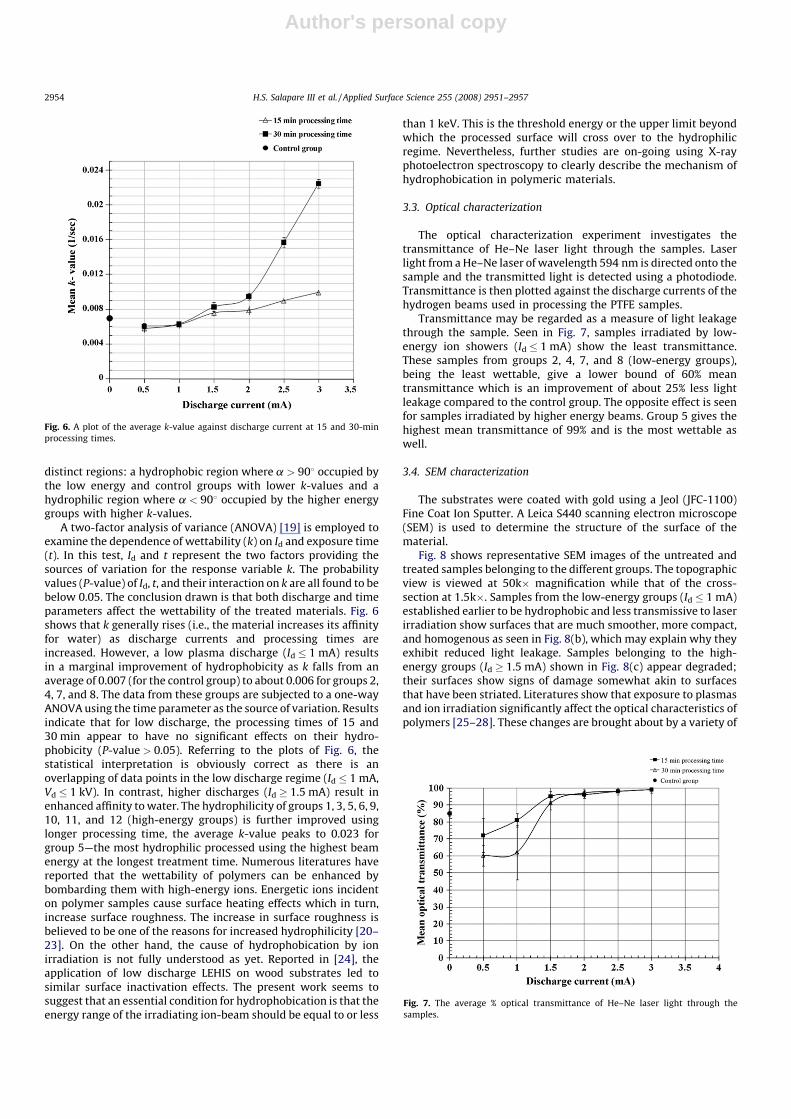
A two-factor analysis of variance (ANOVA) [19] is employed toexamine the dependence of wettability (k) on Id and exposure time(t). In this test, Id and t represent the two factors providing thesources of variation for the response variable k. The probabilityvalues (P-value) of Id, t, and their interaction on k are all found to bebelow 0.05. The conclusion drawn is that both discharge and timeparameters affect the wettability of the treated materials. Fig. 6shows that k generally rises (i.e., the material increases its affinityfor water) as discharge currents and processing times areincreased. However, a low plasma discharge (Id � 1 mA) resultsin a marginal improvement of hydrophobicity as k falls from anaverage of 0.007 (for the control group) to about 0.006 for groups 2,4, 7, and 8. The data from these groups are subjected to a one-wayANOVA using the time parameter as the source of variation. Resultsindicate that for low discharge, the processing times of 15 and30 min appear to have no significant effects on their hydro-phobicity (P-value > 0.05). Referring to the plots of Fig. 6, thestatistical interpretation is obviously correct as there is anoverlapping of data points in the low discharge regime (Id � 1 mA,Vd � 1 kV). In contrast, higher discharges (Id � 1.5 mA) result inenhanced affinity to water. The hydrophilicity of groups 1, 3, 5, 6, 9,10, 11, and 12 (high-energy groups) is further improved usinglonger processing time, the average k-value peaks to 0.023 forgroup 5—the most hydrophilic processed using the highest beamenergy at the longest treatment time. Numerous literatures havereported that the wettability of polymers can be enhanced bybombarding them with high-energy ions. Energetic ions incidenton polymer samples cause surface heating effects which in turn,increase surface roughness. The increase in surface roughness isbelieved to be one of the reasons for increased hydrophilicity [20–23]. On the other hand, the cause of hydrophobication by ionirradiation is not fully understood as yet. Reported in [24], theapplication of low discharge LEHIS on wood substrates led tosimilar surface inactivation effects. The present work seems tosuggest that an essential condition for hydrophobication is that theenergy range of the irradiating ion-beam should be equal to or less
than 1 keV. This is the threshold energy or the upper limit beyondwhich the processed surface will cross over to the hydrophilicregime. Nevertheless, further studies are on-going using X-rayphotoelectron spectroscopy to clearly describe the mechanism ofhydrophobication in polymeric materials.
3.3. Optical characterization
The optical characterization experiment investigates thetransmittance of He–Ne laser light through the samples. Laserlight from a He–Ne laser of wavelength 594 nm is directed onto thesample and the transmitted light is detected using a photodiode.Transmittance is then plotted against the discharge currents of thehydrogen beams used in processing the PTFE samples.
Transmittance may be regarded as a measure of light leakagethrough the sample. Seen in Fig. 7, samples irradiated by low-energy ion showers (Id � 1 mA) show the least transmittance.These samples from groups 2, 4, 7, and 8 (low-energy groups),being the least wettable, give a lower bound of 60% meantransmittance which is an improvement of about 25% less lightleakage compared to the control group. The opposite effect is seenfor samples irradiated by higher energy beams. Group 5 gives thehighest mean transmittance of 99% and is the most wettable aswell.
3.4. SEM characterization
The substrates were coated with gold using a Jeol (JFC-1100)Fine Coat Ion Sputter. A Leica S440 scanning electron microscope(SEM) is used to determine the structure of the surface of thematerial.
Fig. 8 shows representative SEM images of the untreated andtreated samples belonging to the different groups. The topographicview is viewed at 50k� magnification while that of the cross-section at 1.5k�. Samples from the low-energy groups (Id � 1 mA)established earlier to be hydrophobic and less transmissive to laserirradiation show surfaces that are much smoother, more compact,and homogenous as seen in Fig. 8(b), which may explain why theyexhibit reduced light leakage. Samples belonging to the high-energy groups (Id � 1.5 mA) shown in Fig. 8(c) appear degraded;their surfaces show signs of damage somewhat akin to surfacesthat have been striated. Literatures show that exposure to plasmasand ion irradiation significantly affect the optical characteristics ofpolymers [25–28]. These changes are brought about by a variety of
Fig. 6. A plot of the average k-value against discharge current at 15 and 30-min
processing times.
Fig. 7. The average % optical transmittance of He–Ne laser light through the
samples.
H.S. Salapare III et al. / Applied Surface Science 255 (2008) 2951–29572954

Author's personal copy
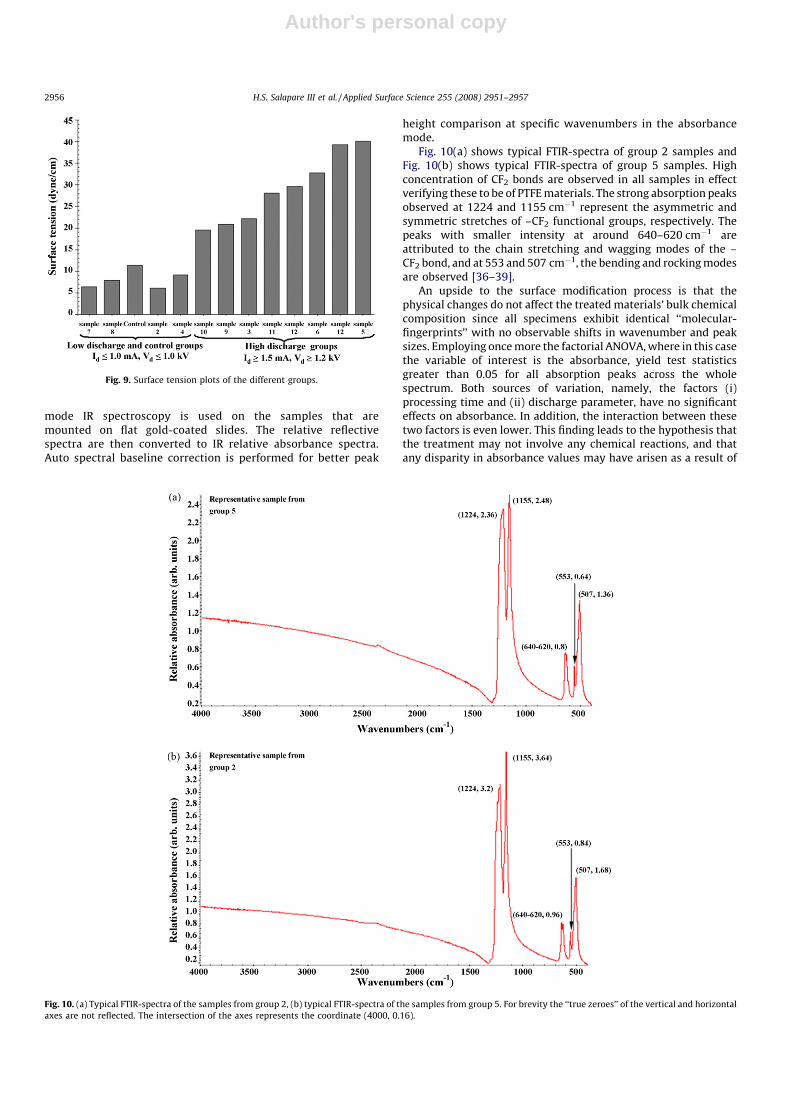
factors such as increased polymeric cross-linking [29], carboniza-tion [30], surface erosion forming spires and needles whosevertical dimensions may range from tenths to hundreds of microns[31] and alterations in refractive index due to structuralmodifications [32]. Optical transmission is a very complex functionand is strongly dependent on the absorption coefficient andrefractive index of the substrate material; as well as the envelopeof the interference maxima and minima of the transmissionspectra [33]. For the samples under study, it is plausible that higherenergy ion bombardment leads to surface structural modificationin the form of increased striations and scissions allowing theinterference envelope function to attain maximum transmission at594-nm wavelength. Surface texturing of this kind wherein up to99% optical transmittance is achieved, occurs at ion flux density of0.25 A/m2 (Id = 3 mA). Fig. 9 presents the surface tension of thesamples calculated using a relation derived from Berthelot’s rule
[34] and Young’s equation of state [35] given by
cos a ¼ �1þ 2
ffiffiffiffiffiffiffigs
gw
r(2)
where a is the initial contact angle, gs is the surface tension of thesample, and gw is the surface tension of water equal to 72.8 dyne/cm. Careful scrutiny of Figs. 8 and 9 reveal that rough surfaces,namely, those coming from the high discharge groups, have highersurface tensions. For samples coming from the low dischargegroups, the surface tensions are lower.
3.5. FTIR characterization
A NEXUS 670 FTIR ESP with Nicolet Continuum Microscopeis used for the chemical analysis of the PTFE samples. Reflective
Fig. 8. (a) SEM image of a representative sample from the control group, (b) typical SEM image from the group processed at low discharge currents, Id � 1.0 mA, beam energy
�1.0 keV, and (c) typical SEM image from the group processed at higher discharge currents, Id � 1.5 mA, beam energy �1.2 keV.
H.S. Salapare III et al. / Applied Surface Science 255 (2008) 2951–2957 2955
Author's personal copy
mode IR spectroscopy is used on the samples that aremounted on flat gold-coated slides. The relative reflectivespectra are then converted to IR relative absorbance spectra.Auto spectral baseline correction is performed for better peak
height comparison at specific wavenumbers in the absorbancemode.
Fig. 10(a) shows typical FTIR-spectra of group 2 samples andFig. 10(b) shows typical FTIR-spectra of group 5 samples. Highconcentration of CF2 bonds are observed in all samples in effectverifying these to be of PTFE materials. The strong absorption peaksobserved at 1224 and 1155 cm�1 represent the asymmetric andsymmetric stretches of –CF2 functional groups, respectively. Thepeaks with smaller intensity at around 640–620 cm�1 areattributed to the chain stretching and wagging modes of the –CF2 bond, and at 553 and 507 cm�1, the bending and rocking modesare observed [36–39].
An upside to the surface modification process is that thephysical changes do not affect the treated materials’ bulk chemicalcomposition since all specimens exhibit identical ‘‘molecular-fingerprints’’ with no observable shifts in wavenumber and peaksizes. Employing once more the factorial ANOVA, where in this casethe variable of interest is the absorbance, yield test statisticsgreater than 0.05 for all absorption peaks across the wholespectrum. Both sources of variation, namely, the factors (i)processing time and (ii) discharge parameter, have no significanteffects on absorbance. In addition, the interaction between thesetwo factors is even lower. This finding leads to the hypothesis thatthe treatment may not involve any chemical reactions, and thatany disparity in absorbance values may have arisen as a result of
Fig. 10. (a) Typical FTIR-spectra of the samples from group 2, (b) typical FTIR-spectra of the samples from group 5. For brevity the ‘‘true zeroes’’ of the vertical and horizontal
axes are not reflected. The intersection of the axes represents the coordinate (4000, 0.16).
Fig. 9. Surface tension plots of the different groups.
H.S. Salapare III et al. / Applied Surface Science 255 (2008) 2951–29572956
Author's personal copy
physical changes. It is also highly unlikely that Hn+ ions at this
energy range (�1 keV) will bond with fluorocarbons. Themodification process may be purely morphological in character.
4. Conclusions
The wettability and optical transmittance properties of hydro-gen ion treated PTFE materials were evaluated using contact anglemeasurements, laser irradiation, SEM, and FTIR tests. Dependingon the kind of LEHIS treatment, two kinds of PTFE surfaces could beproduced. Low discharge LEHIS produced hydrophobic, smooth,and less optically transmissive surfaces while high discharge LEHISproduced hydrophilic, striated, and light transmissive surfaces. Ahighly wettable PTFE would most likely be transmissive to lightand a less wettable substance otherwise. If PTFE were to be used asa barrier to minimize the leakage of light, the material should beprocessed using LEHIS with discharge parameters not exceeding1 kV. This finding agreed with the results of [31] where spectraltransmittance of polyimide decreased for all wavelengths aftertreatment by argon ion beam in this energy range. LEHIS of thisintensity would be sufficient to texture the PTFE surface in areasonably short time but with beam energy low enough to ensurethe material maintained its physical integrity.
Infrared spectroscopy showed no change in peak wavenumbersand sizes; evidence that the surface modification process had noeffect on the treated materials’ chemical properties. Althoughempirical data pointed largely to a morphological modification,one cannot entirely discount chemical reactions on the surfaceinduced by the irradiation process. Using X-ray photoelectronspectroscopy, further investigation to clarify this issue is inprogress.
Acknowledgments
The financial support of the project from the Department ofScience and Technology (DOST)—Philippine Council for AdvancedScience and Technology Research and Development (PCASTRD) isgratefully acknowledged.
References
[1] H.J. Ramos, J.L.C. Monasterial, G.Q. Blantocas, Nucl. Instrum. Methods Phys. Res. B242 (2006) 41–44.
[2] M.S. Sheu, D.M. Hudson, I.H. Loh, The Encyclopedic Handbook of Biomaterials andBio-engineering. Part A, vol. 1, Marcel Dekker, New York, 1995, p. 865.
[3] C.M. Chan, T.M. Ko, Surf. Sci. Rep. 24 (1996) 1.
[4] M. Strobel, N. Sullivan, M.C. Branch, J. Park, M. Ulsh, R.S. Kapaun, B. Leys, J. Adhes.Sci. Technol. 14 (2002) 1243.
[5] E.Y. Kim, J.S. Kong, S.K. An, H.D. Kim, J. Adhes. Sci. Technol. 14 (2000) 1119.[6] F.Z. Sidouni, N. Nurdin, P. Chabrecek, D. Lohmann, J. Vogt, N. Xanthopoulos, H.J.
Mathieu, P. Francois, P. Vaudaux, P. Descouts, Surf. Sci. 491 (2001) 355.[7] C. Mao, C. Zhang, Y. Qiu, A. Zhu, J. Shen, S. Lin, Appl. Surf. Sci. 228 (2006) 26.[8] M.J. Bader, J.J. O’Brien, K.L. Riddle, US Patent 5,725,962 (1998).[9] J.M. Grace, L.J. Gerenser, J. Disp. Sci. Technol. 24 (2003) 305.
[10] E.M. Mount, J.R. Wagner, US Patent 5,981,079 (1999).[11] Q. Toanle, J.J. Pireaux, R. Caudano, P. Lectere, R. Lazzaroni, J. Disp. Sci. Technol. 12
(1998) 999.[12] K. Gotoh, Y. Nakata, M. Tagawa, M. Tagawa, Colloid Surf. A 224 (2003) 163.[13] B. Miller, K. Holcomb, B. Davies, US Patent 6,390,638.[14] G.Q. Blantocas, H.J. Ramos, M. Wada, Rev. Sci. Instrum. 75 (9) (2004) 2848–2853.[15] G.Q. Blantocas, H.J. Ramos, M. Wada, Jpn. J. Appl. Phys. 45 (10B) (2006) 8525–
8530.[16] G.Q. Blantocas, H.J. Ramos, M. Wada, Jpn. J. Appl. Phys. 45 (10B) (2006) 8498–
8501.[17] R.E. Walpole, R.H. Myers, Probability Statistics for Engineers and Scientists, 5th
Ed., Macmillan Publishing Company, 1993.[18] J.M. Goddard, J.H. Hotchkiss, Prog. Polym. Sci. 32 (2007) 698–725.[19] D.C. Montgomery, Design Analysis of Experiments, 5th Ed., John Wiley and Sons,
2001.[20] S. Guruvenket, M. Kumath, S.P. Vijayalakshmi, A.M. Raichur, G.M. Rao, J. Appl.
Polym. Sci. 90 (2003) 1618.[21] G.S. Tzeng, H.J. Chen, Y.Y. Wang, C.C. Wan, Surf. Coat. Technol. 89 (1997) 108–113.[22] D.W. Dwight, W.M. Riggs, J. Colloid Interface Sci. 48 (1974) 650.[23] F. Garbassi, M. Morra, E. Occhiello, Polymer Surfaces: from Physics to Technology,
Wiley, New York, 1994 (Chapter 4).[24] G.Q. Blantocas, P.E.R. Mateum, R.W.M. Orille, R.J.U. Ramos, J.L.C. Monasterial,
H.J. Ramos, L.M.T. Bo-ot, Nucl. Instrum. Methods Phys. Res. B 259 (2) (2007)875–883.
[25] S.P. Tripathy, R. Mishra, D.T. Khathing, A. Kulshrestha, K.K. Dwivedi, A. Srivastava,S. Ghosh, D. Fink, Radiat. Effects Defects Solids 153 (4) (2001) 335–341.
[26] Y. Xin, Z.Y. Ninga, C. Ye, X.H. Lu, S.L. Xiang, W. Du, S. Huang, J. Chen, S.H. Cheng,Surf. Coat. Technol. 173 (2–3) (2003) 172–177.
[27] S.H. Cho, Z.T. Park, J.G. Kim, J.H. Boo, Surf. Coat. Technol. 174–175 (2003) 1111–1115.
[28] P. Sreeramana Aithal, H.S. Nagaraja, P. Mohan Rao, D.K. Avasthi, Sarma Asati, J.Appl. Phys. 81 (1997) 7526.
[29] P.G. Pape, J. Vinyl Addit. Technol. 6 (1) (2004) 49–52.[30] Z.A. Iskanderova, J.I. Kleiman, Y. Gudimenko, G.R. Cool, R.C. Tennyson, US Patent
5,683,757 (1997).[31] J.M. Mirtich, J.S. Sovey, US Patent 4,199,650 (1980).[32] C. Darraud, B. Bennamane, C. Gagnadre, J.L. Decossas, J.C. Vareille, Polymer 35 (11)
(1994) 2447–2451.[33] P. Sharma, S.C. Katyal, Research Letters in Materials Science, 2008, Hindawi
Publishing Corporation, doi:10.1155/2008/826402.[34] D.Y. Kwok, A.W. Neumann, Colloids Surf. A: Physicochem. Eng. Aspects 161 (2000)
31–48.[35] A. Sonin, The Surface Physics of Liquid Crystal, Gordon and Breach Publishers,
Luxemburg, 1995.[36] H.Y. Kwong, M.H. Wong, Y.W. Wong, K.H. Wong, Appl. Surf. Sci. 253 (22) (2007)
8841–8845.[37] R. d’Agostino, Plasma Deposition, Treatment and Etching, Academic Press, New
York, 1990.[38] N.B. Colthup, L.H. Daly, S.E. Wiberley, 3rd Ed., Introduction to Infrared and Raman
Spectroscopy, 380–381, Academic Press, Boston, 1990, pp. 249–252.[39] A. Satyaprasad, V. Jain, S.K. Nema, Appl. Surf. Sci. 253 (2007) 5462–5466.
H.S. Salapare III et al. / Applied Surface Science 255 (2008) 2951–2957 2957
Copyright © 2022 FDOKUMEN