Kinetics of the 20°C phase transformation in polytetrafluoroethylene
14
JOURNAL OF POLYMER SCIENCE: Polymer Physics Edition VOL. 10, 2209-2222 (1972) Kinetics of the 20°C Phase Transformation in Polytetrafluoroethylene RAJ T. NATARAJAN and THEODORE DAVIDSON, Department of Materials Science, Northwestern University, Evanston, Illinois 60201 synopsis The rate at which PTFE transforms from the triclinic to the hexagonal phase has been measured under isothermal conditions. Samples in a series of decreasing density and crystallinity show increased isothermal rates of transformation. Observed kinetic data are int.erpretxl on the basis of a modified Avrami-Johnson-Mehl treatment. A model for the transformation in which planes of helix-hand reversal propagate through the lattice is shown to fit the experimental results. The transformation rate is observed to be pro- portional to the total (001) surface area in the polytetrafluoroethylene specimens, sug- gesting that nucleation of the transformation takes place at grain boundaries. INTRODUCTION Rigby and Bunn' demonstrated the occurrence of a first-order transfor- mation in polytetrafluoroethylene (PTFE) at 20°C by measuring specific volume changes with temperature. The specific volume measurements showed a 1% increase at about 20°C. Later, Quinn et aL2 discovered that the "room-temperature transition" is actually two transitions. By mea- suring specific volume as a function of temperature, they showed that the low-temperature portion, which accounts for 85y0 of the volume change in the transition, is centered around 20"C, while the high-temperature portion is centered around 30°C. Thermal property measurements by several author^^-'^ have confirmed the existence of the 20 and 30°C transitions in PTFE. The x-ray diffraction studies of Bunn and Howells13 and Pierce et al.I4 show that below 20°C the.conformation of the PTFE molecule is a slowly twisting helix with 13 CF2 groups per 180" twist of the molecule. These helical molecules pack on a triclinic lattice with a = 5.59 8, c = 16.85 A, and y = 119.3". Above 20°C the conformation changes t o a helix with 15 CF2 groups per 180" twist of the molecule an! the molecules pack on a hexagonal lattice with a = 5.65 8 and c = 19.5 A. Potential energy calculations by various author^'^-'^ on the basis of the above lattice parameters for an isolated PTFE molecule have shown that the trans stat,e is split into two minima occurring at &+ = +17". The estimates of Bates and Stockmayer'8 give a statistical weight of approxi- 2209 @ 1972 by John Wiley & Sons, Inc.
Transcript of Kinetics of the 20°C phase transformation in polytetrafluoroethylene

JOURNAL OF POLYMER SCIENCE: Polymer Physics Edition VOL. 10, 2209-2222 (1972)
Kinetics of the 20°C Phase Transformation in Polytetrafluoroethylene
RAJ T. NATARAJAN and THEODORE DAVIDSON, Department of Materials Science, Northwestern University, Evanston, Illinois 60201
synopsis
The rate at which PTFE transforms from the triclinic to the hexagonal phase has been measured under isothermal conditions. Samples in a series of decreasing density and crystallinity show increased isothermal rates of transformation. Observed kinetic data are int.erpretxl on the basis of a modified Avrami-Johnson-Mehl treatment. A model for the transformation in which planes of helix-hand reversal propagate through the lattice is shown to fit the experimental results. The transformation rate is observed to be pro- portional to the total (001) surface area in the polytetrafluoroethylene specimens, sug- gesting that nucleation of the transformation takes place a t grain boundaries.
INTRODUCTION
Rigby and Bunn' demonstrated the occurrence of a first-order transfor- mation in polytetrafluoroethylene (PTFE) at 20°C by measuring specific volume changes with temperature. The specific volume measurements showed a 1% increase at about 20°C. Later, Quinn et aL2 discovered that the "room-temperature transition" is actually two transitions. By mea- suring specific volume as a function of temperature, they showed that the low-temperature portion, which accounts for 85y0 of the volume change in the transition, is centered around 20"C, while the high-temperature portion is centered around 30°C. Thermal property measurements by several author^^-'^ have confirmed the existence of the 20 and 30°C transitions in PTFE.
The x-ray diffraction studies of Bunn and Howells13 and Pierce et al.I4 show that below 20°C the.conformation of the PTFE molecule is a slowly twisting helix with 13 CF2 groups per 180" twist of the molecule. These helical molecules pack on a triclinic lattice with a = 5.59 8, c = 16.85 A, and y = 119.3". Above 20°C the conformation changes to a helix with 15 CF2 groups per 180" twist of the molecule an! the molecules pack on a hexagonal lattice with a = 5.65 8 and c = 19.5 A.
Potential energy calculations by various author^'^-'^ on the basis of the above lattice parameters for an isolated PTFE molecule have shown that the trans stat,e is split into two minima occurring at &+ = +17". The estimates of Bates and Stockmayer'8 give a statistical weight of approxi-
2209
@ 1972 by John Wiley & Sons, Inc.

2210 NATARAJAN AND DAVIDSON
mately 0.05 for a conformation involving a change in the handedness of the helix, namely, t * P .
Cochran et aLZo derived expressions for (1) the Fourier transforms of a number of helical structures and (2) the structure factor of a finite crystal made up of a periodic array of such helical chains. Following these au- thors, Clark and MuusZ1 wrote expressions for the structure factor of a finite PTFE crystal. They further added the effects of specific types of disorder in crystals of helical PTFE molecules to the structure factor ex- pressions. For the specific type of disorder involving small angular dis- placements about the chain axis, they computed the Bragg intensities. Their observations of fiber patterns of PTFE between 20 and 30°C cor- responded to the condition for small angular displacements of molecular segments about their long axes with respect to a preferred direction per- pendicular to the chain axis.22
The results of NMR studies on oriented PTFE fibers carried out by Hyndman and OriglioZ3 are in conformity with the suggestion by Clark and MuusZ2 that a rotationdly disordering transition occurs in the crystalline regions of PTFE at 20°C. Kriegsmann et al.24 explained this rotational disorder as an inversion of the helix; the inversion being brought about by the motion of helix reversal points (t*t') present in the molecule.
The detailed mechanism of the 20°C transformation is still unresolved. In the present study certain logical assumptions are made to explain the mechanism of this transformation and, based on the mechanism thus proposed, the rate equations for the phase transition are derived. Kinetic experiments have been carried out to determine the rate of the 20°C transi- tion; the experimental results are compared with the predictions of the theoretical rate equations.
EXPERIMENTAL
Material
The polymer used in these experiments, kindly donated by Allied Chem- ical Corporation, Clifton, New Jersey, is a granular resin, Halon G-80 lot # 11-28-67. This material has a particle size of about 25 p and a molecular weight of 6 to 10 million.25
Details of the polytetrafluoroethylene samples used in the equilibrium and kinetic experiments are given in Table I.
Sintered samples of various crystallinities were obtained by cooling at different rates from the sintering temperature of 380°C. The densities of the samples were measured by means of a bromoform-carbon tetrachloride density-gradient column at 23°C. The per cent crystallinities of the sam- ples were calculated from the specific gravities by using the calibration chart of Thomas et a1.26 The mean lamellar thickness and breadth in the samples were measured on electron micrographs taken from replicas of fractured surfaces and optical micrographs of microtomed sections. Figure 1 shows electron micrographs of various samples used in this study.

PHASE TRANSFORMATION IN PTFE 2211
TABLE I Details of the PTFE Samples Used in the Equilibrium and Kinetic
Experiments
Mean Mean lamellar (001) sur-
Specific gravity, Crystal- lamellar breadth, face area,a Sample g/cc linity, % thickness, A p r/r2
1 2.157 f 0.002 49 1100 10 7 . 6 2 2.211 f 0.001 67 1600 30 4 . 8 3 2.241 f 0.001 76 1800 110 4 . 0 4 2.253 f 0.001 79 2600 130 3 .0
a (001) surface area was measured as total length of (001) intersection lines per unit area of fracture surface.
(C) (d 1 Fig. 1. Electron micrographs of fractured surfaces of slow-cooled PTFE samples,
(a) 2.157 g/cc; (b) 2.211 g/cc; ( c ) 2.241 (bar = 1 p ) for samples of various densities: g/cc; ( d ) 2.253 g/cc.
2212 NATARAJAN AND DAVIDSON
I m V -
( A )
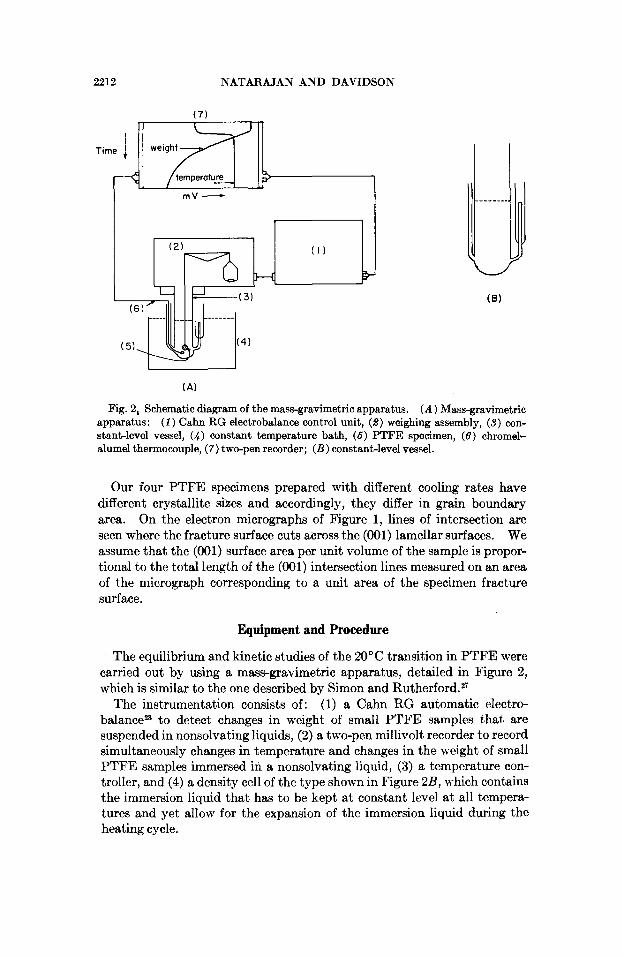
Fig. 2, Schematic diagram of the mass-gravimetric apparatus. (A ) Mass-gravimetric apparatus: ( 1 ) Cahn RG electrobalance control unit, (9) weighing assembly, (3) con- stant-level vessel, (4) constant temperature bath, (6) PTFE specimen, ( 8 ) chromel- alumel thermocouple, (7) two-pen recorder; (B) constant-level vessel.
Our four PTFE specimens prepared with different cooling rates have different crystallite sizes and accordingly, they differ in grain boundary area. On the electron micrographs of Figure 1, lines of intersection are seen where the fracture surface cuts across the (001) lamellar surfaces. We assume that the (001) surface area per unit volume of the sample is propor- tional to the total length of the (001) intersection lines measured on an area of the micrograph corresponding to a unit area of the specimen fracture surface.
Equipment and Procedure
The equilibrium and kinetic studies of the 20°C transition in PTFE were carried out by using a mass-gravimetric apparatus, detailed in Figure 2, which is similar t o the one described by Simon and Rutherford.*
(1) a Cahn RG automatic electro- balanceB to detect changes in weight of small PTFE samples that are suspended in nonsolvating liquids, ( 2 ) a two-pen millivolt recorder to record simultaneously changes in temperature and changes in the weight of small PTFE samples immersed in a nonsolvating liquid, (3) a temperature con- troller, and (4) a density cell of the type shown in Figure 2B, which contains the immersion liquid that has to be kept at constant level a t all tempera- tures and yet allow for the expansion of the immersion liquid during the heating cycle.
The instrumentation consists of:

PHASE TRANSFORMATION IN PTFE 2213
A small PTFE specimen (ca. 100 mg) is cut out, suspended from the weighing assembly of the Cahn balance with a piece of fine platinum wire (British Standard Gauge 45), and immersed in white oil contained in the density cell. The density cell is placed in a waterbath in order to maintain a constant temperature. The electrobalance is standardized so that the recorder reads 1 mg weight change full-scale. Changes of as small as 1 X 10⁻⁶ g can be detected. In the kinetic experiment, the samples were equili- brated at 16.S"C for a sufficient length of time (over 30 min); a step change in temperature to above the transition temperature was made by changing the bath; and the immersion weight was followed as a function of time. The specific gravity of the oil was determined at various temperatures by recording the immersion weight of a quartz specimen as a function of tem- perature. From the density of the oil and the immersion weight of the sample, the specific gravity of the sample was computed as a function of time. In the equilibrium experiments, the immersion weight of the sample was measured at temperature intervals of 0.5"C. At each temperature the sample was equilibrated for 10-30 min until the recorded weight attained a steady value.
RESULTS
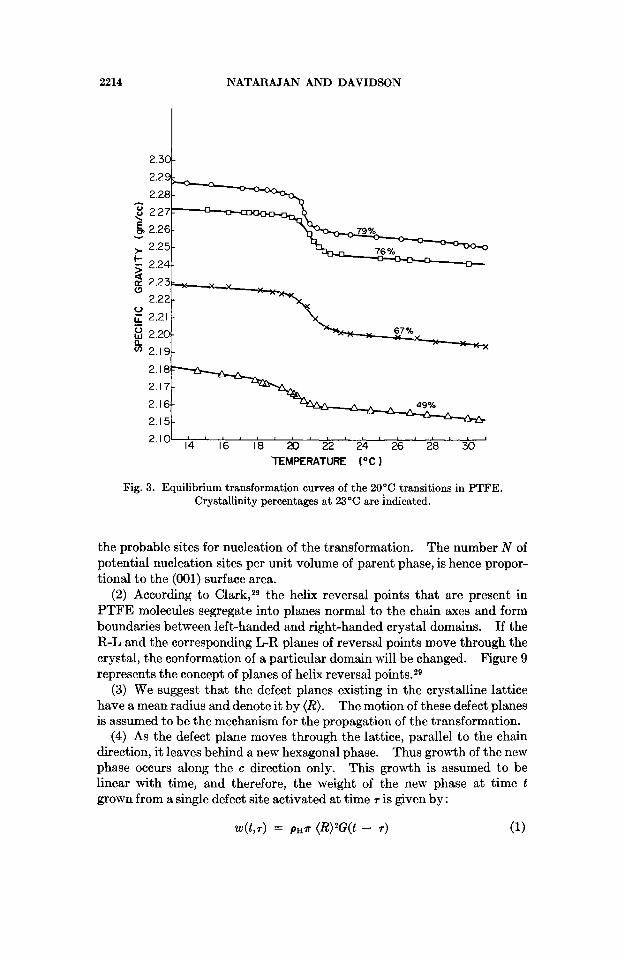
The temperature variation of the specific gravity for samples of different crystalhities is shown in Figure 3. The results of equilibrium studies show increased changes in density with increasing crystallinities at the 20" C transition. Also the transition occurs over a narrower tempersture range for samples of high crystallinity and perfection than for samples of low crystallinity.
In Figure 4 the heating and cooling curves from the equilibrium experi- ments are plotted for the 79% crystalline sample. The plots of heating and cooling experiments show a separation of approximately 1.5"C at their midpoint.
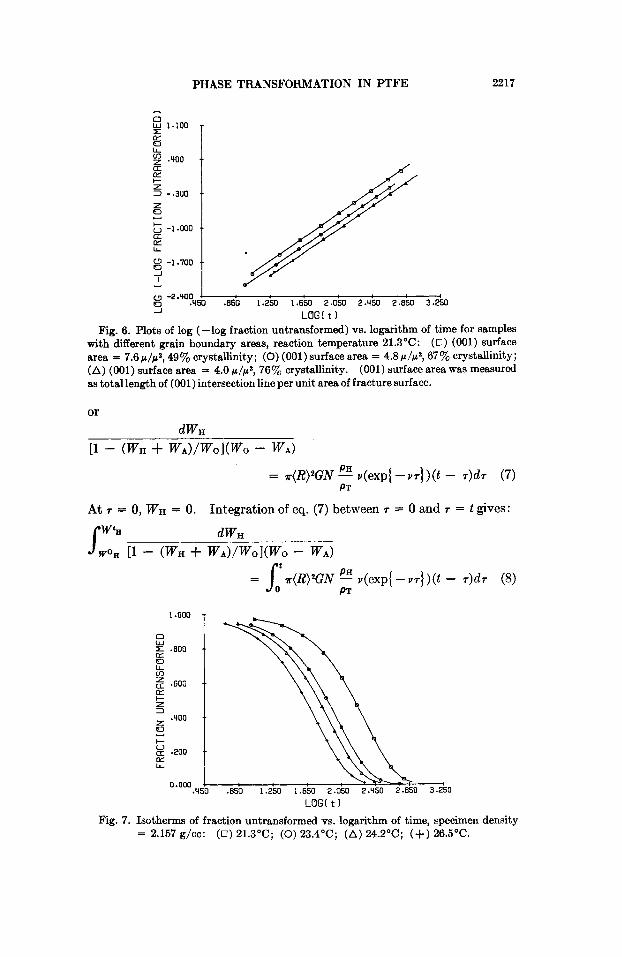
In Figures 5 to S, the points plotted are the results of the kinetic experi- ments. Figure 5 shows the plots of fraction untransformed versus log time for samples with different grain boundary areas. The plots of log (-log fraction untransformed) versus log time for samples with different grain boundary areas are shown in Figure 6. The isotherms of the fraction un- transformed versus logarithm of time are plotted in Figure 7. Figure S shows the isotherms of log (-log fraction untransformed) versus log time.
Time is measured in seconds.
All the logarithms are taken to the base 10.
DISCUSSION A mecha.nism is proposed below to explain the results of our kinetics
(1) The (001) crystal surfaces are the regions of highest energy in the Therefore, it is fea.sible that these grain boundary areas are
experiments.
polymer solid.
2214 NATARAJAN AND DAVIDSON
2.3 d
67% 2.20 2.19
- . .I ,.
2.16 49%
2.15
16 18 20 22 24 26 28 30 2.101 1 4 ' I ' ' ' ' I ' I ' ' " ' ' ' 1
TEMPERATURE ("C 1
Fig. 3. Equilibrium transformation curves of the 20°C transitions in PTFE. Crystallinity percentages at 23'C are indicated.
the probable sites for nucleation of the transformation. The number N of potential nucleation sites per unit volume of parent phase, is hence propor- tional to the (001) surface area.
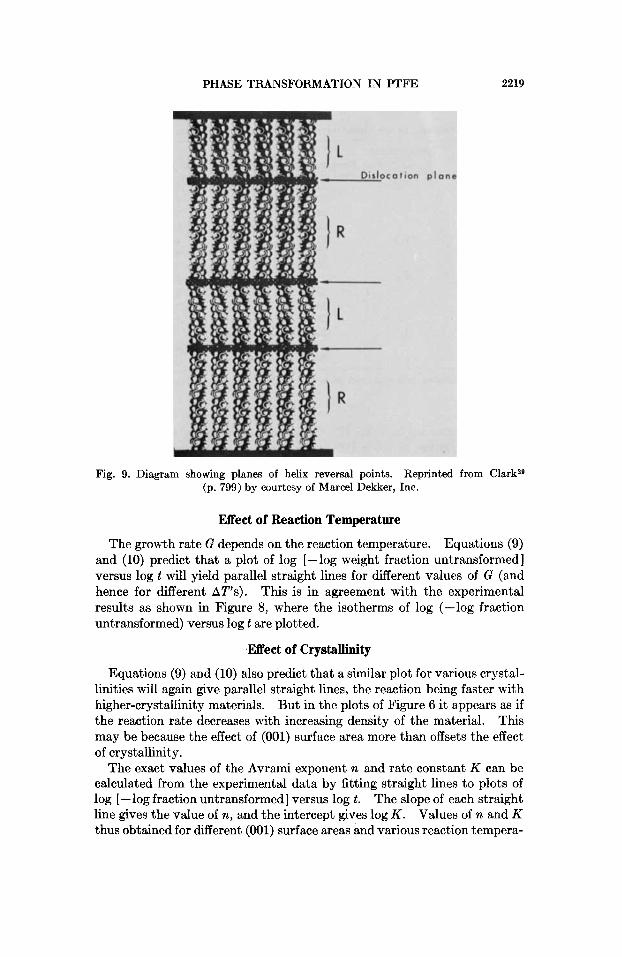
(2) According to Clark,29 the helix reversal points that are present in PTFE molecules segregate into planes normal to the chain axes and form boundaries between left-handed and right-handed crystal domains. If the R-L and the corresponding L-R planes of reversal points move through the crystal, the conformation of a particular domain will be changed. Figure 9 represents the concept of planes of helix reversal points.29
(3) We suggest that the defect planes existing in the crystalline lattice have a mean radius and denote it by (R). The motion of these defect planes is assumed to be the mechanism for the propagation of the transform a t' ion. (4) As the defect plane moves through the lattice, parallel to the chain
direction, it leaves behind a new hexagonal phase. Thus growth of the new phase occurs along the c direction only. This growth is assumed to be linear with time, and therefore, the weight of the new phase at time t grown from a single defect site activated at time T is given by:
~(t , . ) = p H i ~ (R)2G(t - T) (1)

PHASE TRANSFORMATION IN PTFE 2215
SPECIMEN : 79% CRYSTALLINE
0 HEATING X COOLING
TEMPERATURE ( O C
Fig. 4. Heating and cooling curves of 20°C and 30°C transitions. Specimen: 79% crystalline PTFE
where pH is the density of the hexagonal phase and G is the growth rate in the c direction.
(5) Following A ~ r a m i , ~ - a ~ me make the further assumption that there are N potential nucleation sites present per unit volume of parent phase at the start of the phase transition a.nd that they diminish according to the well known first-order decay law :
N , = N exp { - vt) (2)
where N , is the number of sites remaining at time t and v is the nucleation frequency of the sites. Therefore the number of nuclei a t time r is:
N ( T ) = N,v = Nv exp { -VT) (3)
(6) As the growth of the activated nuclei continues, restrictions to growth are met in the form of already transformed material. Johnson and Meh133 treat the effect of impingement with the already transformed material as :
clx,/clx', = 1 - x* (4)

2216 NATARAJAN AND DAVIDSON
l*ooo T
0.000 - ’ I .%O 3 5 0 1.250 1.650 2.050 2.450 2.850 3.250
LOG( t 1
Fig. 5. Plots of fraction untransformed vs. logarithm of time for samples with different grain boundary areas, reaction temperature = 21.3OC: ( 0 ) (001) surface area = 7.6 p/p2,49% crystallinity; (0) (001) surface area = 4.8 p / p 2 , 67% crystallinity; (A) (001) surface area = 4.0 p/p2, 76% crystallinity. (001) surface area was measured as total length of (001) intersection line per unit area of fracture surface.
where dxz is the fraction transformed in the time interval (t - 7 ) after cor- recting for impingement during that interval; & I t is the fraction trans- formed in the time interval (t - .), neglecting impingement effect during that time interval; and x, is the weight fraction transformed a t time t.
(7) The noncrystalline phase may be assumed to prevent the growth of a new phase in a manner similar to that of a region already transformed.
Predictions of the Transformation Kinetics
The 20°C transition in PTFE is represented as: 20oc
(PTFE)T + (PTFE)A (PTFE)H + (PTFE)A
We let WO denote the total weight of polymer, WT the weight of triclinic phase, WH the weight of hexagonal phase, and WA the weight of noncrystal- line phase. The impingements by the noncrystalline and the already- transformed regions can be included as :
where 1 - [(WH + WA)/Wo] is the fraction of triclinic phase remaining.
(t - 7 ) is given by: From eqs. (l), (2), (3), and (5) the mass transformed in the time interval
d w H = ( l - WH wo + WA) (WO ; WA)
X Nv(exp { -v7j)pH?r(R)zG(t - T)dr (6)
PHASE TRANSFORMATION IN PTFE
w 1.100 x CY 0 LL
U w I- z
z
g .YO0
El ::i:::o:: a w LL
-1.700 -J - a -!?.YO0
2217
-
..
/ ..
* I
or d W H
[I - ( W H + w A ) / w O ] ( w O - W A )
PH
PT = T(R)~GN - v(exp{ - v r ) ) ( t - r)dr (7)
At r = 0, W H = 0. Integration of eq. (7) between r = 0 and r = t gives:
dwH J:: [I - (WH + w A ) / w O ] ( w O - W A )
!2 .200 w LL
0.000 1 .450 .850 1.250 1.650 2.050 2.450 2
LOG[ t 1
Fig. 7. Isotherms of fraction untransformed vs. logarithm of time, specimen density = 2.157 g/cc: ( 0 ) 21.3"C; (0) 23.4"C; (A) 24.2"C; (+) 26.5"C.
2218 NATARAJAN AND DAVIDSON
I z
I-
c LT LL
2 = -1.000
f3 -1.700 ' a - _I I 3 f3 - 2 . W O 0 .1150 .850 1.250 1.650 2.050 2.1150 2.850 3.250 J LOG[ t 1
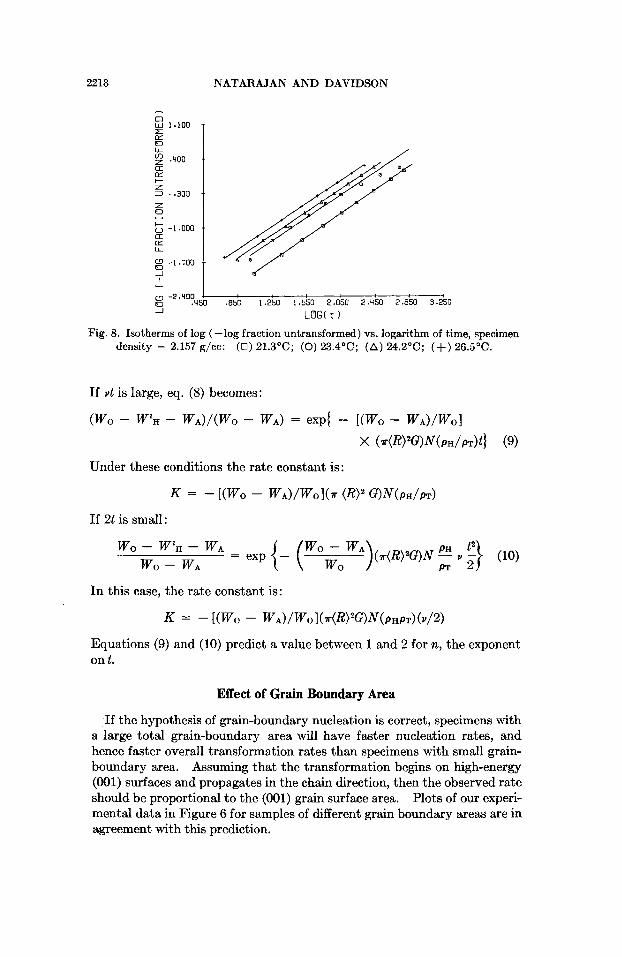
Fig. 8. Isotherms of log (-log fraction untransformed) vs. logarithm of time, specimen density = 2.157 g/cc: ( 0 ) 21.3"C; (0) 23.4OC; (A) 24.2"C; (+) 26.5OC.
If vt is large, eq. (8) becomes:
(Wo - w l H - wA)/(wO - wA) = exp{ - [(wo - w,>/w~I x ( d W 2 G ) N ( ~ H / ~ T ) t ) (9)
Under these conditions the rate constant is:
K = - [(WO - w A ) / w O ] ( r (R)' G)N(PH/PT)
If 2t is small:
In this case, the rate constant is:
K = - [ ( W O - WA)/wO](*(R)*G)N(pHpT)(Y/2)
Equations (9) and (10) predict a value between 1 and 2 for n, the exponent on t.
Effect of Grain Boundary Area
If the hypothesis of grain-boundary nucleation is correct, specimens with a large total grain-boundary area will have faster nucleation rates, and hence faster overall transformation rates than specimens with small grain- boundary area. Assuming that the transformation begins on high-energy (001) surfaces and propagates in the chain direction, then the observed rate should be proportional to the (001) grain surface area. Plots of our experi- mental data in Figure 6 for samples of different grain boundary areas are in agreement with this prediction.
PHASE TRANSFORMATION IN PTFE 2219
Fig. 9. Diagram showing planes of helix reversal points. Reprinted from Clarkzg (p. 799) by courtesy of Marcel Dekker, Inc.
Effect of Reaction Temperature
Equations (9) and (10) predict that a plot of log [-log weight fraction untransformed] versus log t will yield parallel straight lines for different values of G (and hence for different AT’S). This is in agreement with the experimental results as shown in Figure 8, where the isotherms of log (--log fraction untmnsformed) versus log t are plotted.
The growth rate G depends on the reaction temperature.
.Effect of Crystallinity
Equations (9) and (10) also predict that a similar plot for various crystal- linities will again give parallel straight lines, the reaction being faster with higher-crystallinity materials. But in the plots of Figure 6 it appears as if the reaction rate decreases with increasing density of the material. This may be because the effect of (001) surface area more than offsets the effect of crystallinity.
The exact values of the Avrami exponent n and rate constant K can be calculated from the experimental data by fitting straight lines to plots of log [-log fraction untransformed] versus log t. The slope of each straight line gives the value of n, and the intercept gives log K . Values of n and K thus obtained for different (001) surface areas and various reaction tempera-

2220 NATARAJAN AND DAVIDSON
TABLE I1 Summary of the Mass-Gravimetric Experimental Results
Crystallinity, (001) surface' % p/p2 Temperature, "C Intercept K x lo3 n
49 7 . 6 21.3 -3.1744 1.54 1.20 23.4 -2.7227 4.26 1.16 24.2 - 2.6041 5.73 1.16 26.5 - 2.4361 8.44 1.17
67 4 . 8 21.3 - 3.3006 1.15 1.18 23.4 -2.8962 2.92 1.21 26.5 - 2.5184 6.98 1.19
76 4 . 0 21.3 -3.4665 0.79 1.19 23.4 -2.9320 2.69 1.18 24.2 - 2.8302 3.41 1.20 26.5 - 2.6969 4.64 1.17
79 3 . 0 23.4 -3.0661 1.98 1.23 24.2 -2.9452 2.61 1.20 26.5 - 2.7831 3.79 1.16
~
* (001) surface area was measured as total length of line per unit area of fracture surface.
tures are summarized in Table 11. Based on these values of n and K , the theoretical equation, eq. (9) or (10) may be plotted and superimposed on the experimental data. The continuous lines in the plots of fraction untrans- formed versus log 2 (Figs. 5 and 7) are obtained by plotting the theoretical equation eq. (9) or (10).
The 30" Transition
At 30°C a phase transition occurs which converts the ordered hexagonal phase of PTFE to a hexagonal structure disordered in the c direction. Because of the small specific volume change associated with it, we have not made measurements of the kinetics involved. Clarkz9 has suggested that the planes of helix-hand reversal disaggregate above 30°C. Whether this is a result of the 30°C transition or an element of the mechanism cannot be decided on the basis of the data available.
CONCLUSIONS
We have found that the 20°C phase transition in PTFE occurs a t a faster rate for samples of greater (001) surface area. From isothermal transfor- mation experiments we find that the ra,te increases with temperature. Experiments in which the sample is equilibrated at a series of temperatures show that the midpoint of the transformation upon cooling occurs 1.5"C lower than the midpoint upon heating.
The transformation can be described in terms of a model in which defect planes of helix-hand reversal points propaga.te through the 1a.ttice. It is observed that the transformation rate is proportional to the grain boundary

PHASE TRANSFORMATION IN PTFE 2221
area in a series of specimens. This makes plausible the idea that grain boundaries serve as nucleation sites for the transformation.
As in all treatments in which a model is compared to experimental data, a.greement between model and experiment is necessary to substantiate the model but is not sufficient to establish its uniqueness. In the present investigation, calculations based on a model of helix reversal as the mecha- nism of transformation successfully represent the data but do not exclude other mechanisms.
APPENDIX
If the impingement correction is made on a volume-fraction basis rather than on a weight-fraction basis, the results are:
where po is the density of the bulk polymer.
becomes If vt is large, the final kinetic equation for volume fraction untransformed
and the rate constant is:
K = - [(WO - w A ) / w O ] ? r ( R ) 2 G N ( p ~ / p ~ )
If vt is small, the volume-fraction untransformed is:
and the rate constant is:
K = - [(wo - ~A>/WO]?~(R)'GN(PO~/~PT)
fraction basis except for the constant PO/PT in place of PH/PT. These equations are exactly similar to those derived on the weight-
This work was supported in part by the National Science Foundation (Grant GK 5901) and in part by the Advanced Research Projects Agency through the Northwestern University Materials Research Center. R. T. Natarajan has held a Research Assistant- ship from the Center. We appreciate gifts of PTFE samples from the Allied Chemical Corp. and E. I. du Pont de Nemours & Co., Inc.
References 1. H. A. Rigby and C . W. Bunn, Nature, 164,583 (1949). 2. F. A. Quinn, Jr., D. E. Roberts, and R. N. Work, J . Appl. Phys., 22,1085 (1951). 3. G. T. Furukawa, R. E. McCoskey, and G. J. King, J . Res. Nat. Bur. Stand., 49,
4. P. Marx and M. Dole, J . Amer. Chem. SOC., 77,4771 (1955). 5. T. Kuroda and H. Sakami, Nagoya Kogyo Gijutsu Shikkensho Hokoku, 7,1(1958);
273 (1952).
Chem. Abstr., 57,4828h (1962).

2222 NATARAJAN AND DAVIDSON
6. K. Eiermann, K.-H. Hellwege, and W. Knappe, Kolbid-Z., 174,134 (1961). 7. D. A. Vassallo and J. C. Harden, Anal. Chem., 34,132 (1962). 8. B. Ke, J . Polym. Sci. B, 1,167 (1963). 9. Y. Ozawa and Y. Wada, Japan J . Appl. Phys., 3,436 (1964).
10. K.-L. Hsu, D. E. Kline, and J. N. Todinson, J . Appl. Polym. Sci., 9,3567 (1965). 11. M. D. Campbell, J. F. Haskins, G. L. O’Barr, and J. Hertz, J . Spac. Rock., 3 ,
12. R. C. Steere, J . Appl. Polym. Sci., 10,1673 (1966). 13. C. W. Bunn and E. R. Howells, Nature, 174,549 (1954). 14. R. H. H. Pieroe, Jr., E. S. Clark, J. F. Whitney, and W. M. D. Bryant, paper pre-
sented at 130th Meeting ot the American Chemical Society, Atlantic City, September 1956.
596 (1966).
15. T. W. Bates, Trans. Faraday Soc., 63,1825 (1967). 16. T. W. Bates and W. H. Stockmayer, J . Chem. Phys., 45,2321 (1966). 17. T. W. Bates and W. H. Stockmayer, Macromolecules, 1,12 (1968). 18. T. W. Bates and W. H. Stockmayer, Macromolecuks, 1,17 (1968). 19. M. Iwasaki, J. Polym. Sci. A , 1,1099 (1963). 20. W. Cochran, F. H. C. Crick, and V. Vand, Acta Cryst., 5,581 (1952). 21. E. S. Clark and L. T. MUUS, 2. Krist., 117,108 (1962). 22. E. S. ClarkandL. T. MUUS, 2. Krist., 117,119 (1962). 23. D. Hyndman and G. F. Origlio, J . Appl. Phys., 31,1849 (1960). 24. H. Kriegsmann, G. Seifert, K. Frigge, and G. Dube, in Macromokcular Chemistry,
Prague 1966 ( J . Polym. Sci. C, 16), 0. Wichterle and B. SedlhEek, Eds., Interscience, New York, 1967, p. 1843.
25. T. W. Sloan (Allied Chemical Corporation, Clifton, New Jersey), private com- munication, Dec. 26,1967.
26. P. E. Thomas, J. F. Lontz, C. A. Sperati, and J. L. McPherson, SPE J., 12, 89 (1956).
27. F. T. Simon and J. M. Rutherford, Jr., J . Appl. Phys., 35.82 (1964). 28. L. Cahn and H. R. Schulta, Vacuum Microbalance Techniques, Plenum Press,
29. E. S. Clark, J . M a c r m l . Sci. Phys., B1,795 (1967). 30. M. Avrami, J. Chem. Phys., 7,1103 (1939). 31. M. Avrami, J. Chem. Phys., 8,212 (1940). 32. M. Avrami, J. Chem. Phys., 9,177 (1941). 33. W. A. Johnson and R. F. Mehl, Trans. AIME, 135,416 (1939).
New York, 1962, Vol. 2, p. 10.
Received November 29, 1971 Revised June 13, 1972