Low-dose three-dimensional hard x-ray imaging of bacterial ...
7
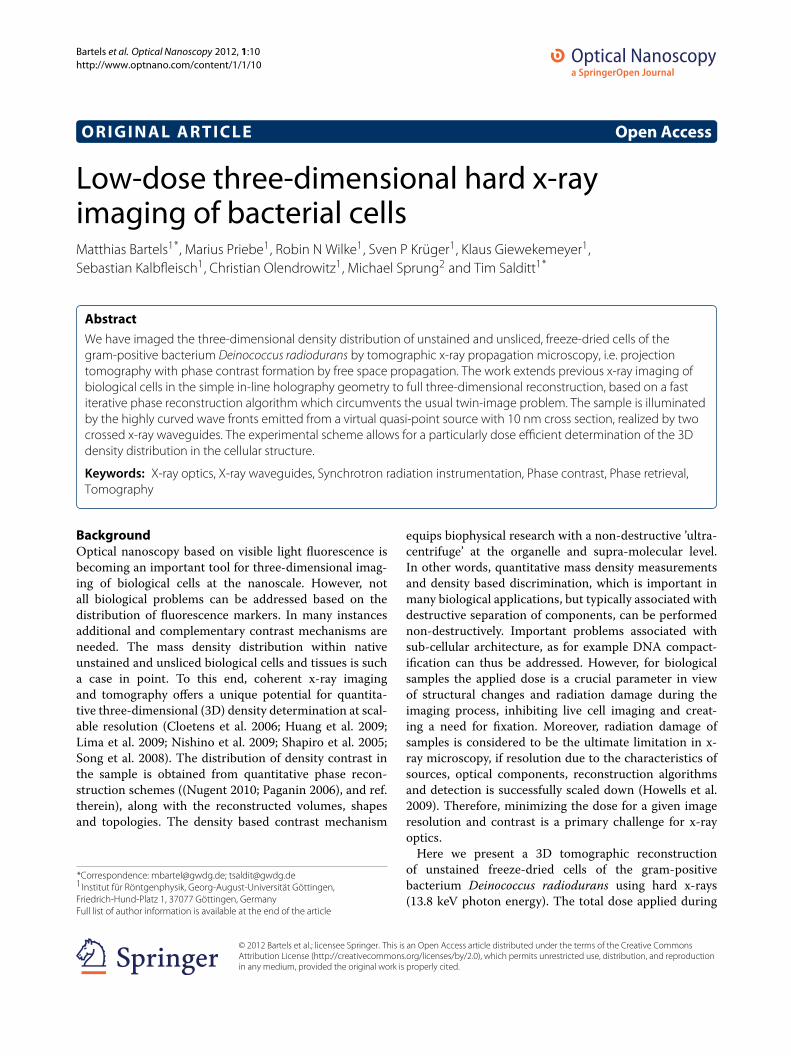
Bartels et al. Optical Nanoscopy 2012, 1:10 http://www.optnano.com/content/1/1/10 ORIGINAL ARTICLE Open Access Low-dose three-dimensional hard x-ray imaging of bacterial cells Matthias Bartels 1* , Marius Priebe 1 , Robin N Wilke 1 , Sven P Kr ¨ uger 1 , Klaus Giewekemeyer 1 , Sebastian Kalbfleisch 1 , Christian Olendrowitz 1 , Michael Sprung 2 and Tim Salditt 1* Abstract We have imaged the three-dimensional density distribution of unstained and unsliced, freeze-dried cells of the gram-positive bacterium Deinococcus radiodurans by tomographic x-ray propagation microscopy, i.e. projection tomography with phase contrast formation by free space propagation. The work extends previous x-ray imaging of biological cells in the simple in-line holography geometry to full three-dimensional reconstruction, based on a fast iterative phase reconstruction algorithm which circumvents the usual twin-image problem. The sample is illuminated by the highly curved wave fronts emitted from a virtual quasi-point source with 10 nm cross section, realized by two crossed x-ray waveguides. The experimental scheme allows for a particularly dose efficient determination of the 3D density distribution in the cellular structure. Keywords: X-ray optics, X-ray waveguides, Synchrotron radiation instrumentation, Phase contrast, Phase retrieval, Tomography Background Optical nanoscopy based on visible light fluorescence is becoming an important tool for three-dimensional imag- ing of biological cells at the nanoscale. However, not all biological problems can be addressed based on the distribution of fluorescence markers. In many instances additional and complementary contrast mechanisms are needed. The mass density distribution within native unstained and unsliced biological cells and tissues is such a case in point. To this end, coherent x-ray imaging and tomography offers a unique potential for quantita- tive three-dimensional (3D) density determination at scal- able resolution (Cloetens et al. 2006; Huang et al. 2009; Lima et al. 2009; Nishino et al. 2009; Shapiro et al. 2005; Song et al. 2008). The distribution of density contrast in the sample is obtained from quantitative phase recon- struction schemes ((Nugent 2010; Paganin 2006), and ref. therein), along with the reconstructed volumes, shapes and topologies. The density based contrast mechanism *Correspondence: [email protected]; [email protected] 1 Institut f ¨ ur R ¨ ontgenphysik, Georg-August-Universit¨ at G ¨ ottingen, Friedrich-Hund-Platz 1, 37077 G ¨ ottingen, Germany Full list of author information is available at the end of the article equips biophysical research with a non-destructive ’ultra- centrifuge’ at the organelle and supra-molecular level. In other words, quantitative mass density measurements and density based discrimination, which is important in many biological applications, but typically associated with destructive separation of components, can be performed non-destructively. Important problems associated with sub-cellular architecture, as for example DNA compact- ification can thus be addressed. However, for biological samples the applied dose is a crucial parameter in view of structural changes and radiation damage during the imaging process, inhibiting live cell imaging and creat- ing a need for fixation. Moreover, radiation damage of samples is considered to be the ultimate limitation in x- ray microscopy, if resolution due to the characteristics of sources, optical components, reconstruction algorithms and detection is successfully scaled down (Howells et al. 2009). Therefore, minimizing the dose for a given image resolution and contrast is a primary challenge for x-ray optics. Here we present a 3D tomographic reconstruction of unstained freeze-dried cells of the gram-positive bacterium Deinococcus radiodurans using hard x-rays (13.8 keV photon energy). The total dose applied during © 2012 Bartels et al.; licensee Springer. This is an Open Access article distributed under the terms of the Creative Commons Attribution License (http://creativecommons.org/licenses/by/2.0), which permits unrestricted use, distribution, and reproduction in any medium, provided the original work is properly cited.
-
Upload
khangminh22 -
Category
Documents
-
view
0 -
download
0
Transcript of Low-dose three-dimensional hard x-ray imaging of bacterial ...
Bartels et al. Optical Nanoscopy 2012, 1:10http://www.optnano.com/content/1/1/10
ORIGINAL ARTICLE Open Access
Low-dose three-dimensional hard x-rayimaging of bacterial cellsMatthias Bartels1*, Marius Priebe1, Robin N Wilke1, Sven P Kruger1, Klaus Giewekemeyer1,Sebastian Kalbfleisch1, Christian Olendrowitz1, Michael Sprung2 and Tim Salditt1*
Abstract
We have imaged the three-dimensional density distribution of unstained and unsliced, freeze-dried cells of thegram-positive bacterium Deinococcus radiodurans by tomographic x-ray propagation microscopy, i.e. projectiontomography with phase contrast formation by free space propagation. The work extends previous x-ray imaging ofbiological cells in the simple in-line holography geometry to full three-dimensional reconstruction, based on a fastiterative phase reconstruction algorithm which circumvents the usual twin-image problem. The sample is illuminatedby the highly curved wave fronts emitted from a virtual quasi-point source with 10 nm cross section, realized by twocrossed x-ray waveguides. The experimental scheme allows for a particularly dose efficient determination of the 3Ddensity distribution in the cellular structure.
Keywords: X-ray optics, X-ray waveguides, Synchrotron radiation instrumentation, Phase contrast, Phase retrieval,Tomography
BackgroundOptical nanoscopy based on visible light fluorescence isbecoming an important tool for three-dimensional imag-ing of biological cells at the nanoscale. However, notall biological problems can be addressed based on thedistribution of fluorescence markers. In many instancesadditional and complementary contrast mechanisms areneeded. The mass density distribution within nativeunstained and unsliced biological cells and tissues is sucha case in point. To this end, coherent x-ray imagingand tomography offers a unique potential for quantita-tive three-dimensional (3D) density determination at scal-able resolution (Cloetens et al. 2006; Huang et al. 2009;Lima et al. 2009; Nishino et al. 2009; Shapiro et al. 2005;Song et al. 2008). The distribution of density contrast inthe sample is obtained from quantitative phase recon-struction schemes ((Nugent 2010; Paganin 2006), and ref.therein), along with the reconstructed volumes, shapesand topologies. The density based contrast mechanism
*Correspondence: [email protected]; [email protected] fur Rontgenphysik, Georg-August-Universitat Gottingen,Friedrich-Hund-Platz 1, 37077 Gottingen, GermanyFull list of author information is available at the end of the article
equips biophysical research with a non-destructive ’ultra-centrifuge’ at the organelle and supra-molecular level.In other words, quantitative mass density measurementsand density based discrimination, which is important inmany biological applications, but typically associated withdestructive separation of components, can be performednon-destructively. Important problems associated withsub-cellular architecture, as for example DNA compact-ification can thus be addressed. However, for biologicalsamples the applied dose is a crucial parameter in viewof structural changes and radiation damage during theimaging process, inhibiting live cell imaging and creat-ing a need for fixation. Moreover, radiation damage ofsamples is considered to be the ultimate limitation in x-ray microscopy, if resolution due to the characteristics ofsources, optical components, reconstruction algorithmsand detection is successfully scaled down (Howells et al.2009). Therefore, minimizing the dose for a given imageresolution and contrast is a primary challenge for x-rayoptics.Here we present a 3D tomographic reconstruction
of unstained freeze-dried cells of the gram-positivebacterium Deinococcus radiodurans using hard x-rays(13.8 keV photon energy). The total dose applied during
© 2012 Bartels et al.; licensee Springer. This is an Open Access article distributed under the terms of the Creative CommonsAttribution License (http://creativecommons.org/licenses/by/2.0), which permits unrestricted use, distribution, and reproductionin any medium, provided the original work is properly cited.
Bartels et al. Optical Nanoscopy 2012, 1:10 Page 2 of 7http://www.optnano.com/content/1/1/10
the tomographic scan was about 1.6·105 Gray ([GY=J/kg]),corresponding to 1.9 · 103 Gy per projection, which isseveral orders of magnitude below the values reported inprevious x-ray coherent diffractive imaging (CDI) stud-ies of D. radiodurans (Lima et al. 2009; Giewekemeyeret al. 2010; Wilke et al. 2012). Despite the low dose, phasereconstruction based on recorded holographic intensitieswas not hampered by noise, primarily due to two reasons:(i) the use of a highly coherent beam with curved wave-fronts (Salditt et al. 2011), emitted by a quasi-point sourcewith 10 nm cross section, realized by a 2D x-ray wave-guide system (Kruger et al. 2010, 2012), and (ii) a robustand quickly converging iterative reconstruction schemewhich takes photon noise effects into account quantita-tively (Giewekemeyer et al. 2011). The electron densitydistribution and an effective mass density distribution ofthe cellular structure was extracted quantitatively fromthe reconstructed 3D phase information. Density contrastmay help to understand the bacterium’s extraordinaryresistance to high doses of ionizing radiation based onthe structural arrangement of its nucleoid (Eltsov andDubochet 2006a, 2006b; Minskey et al. 2006). Coherentx-ray imaging was previously used to derive the pro-jected electron density of D. radiodurans (Giewekemeyeret al. 2010), providing thus a contrast mechanism com-plementary to electron microscopy studies (Eltsov andDubochet 2005; Levin-Zaidman et al. 2003). The datawas recorded by scanning a micron-sized x-ray beamover the sample, followed by reconstruction of the far-field diffraction patterns, yielding the super-resolutionreal space projection image. The reconstruction algo-rithm used was based on the a priori knowledge ofpartial overlap between adjacent images, reducing thenumber of unknown variables, an approach denoted byptychography (Dierolf et al. (2010)). In order to obtainthe locally resolved electron and mass density ratherthan just projected values, we here extend this workfrom 2D to 3D.However, instead of ptychographic tomography which
involves scanning two translations and one rotation withcorrespondingly large overhead time (Dierolf et al. 2010;Wilke et al. 2012), in this work we use x-ray propa-gation microscopy, i.e. projection imaging with contrastformation by free space propagation (Cloetens et al. 1999;Wilkins et al. 1996). In our view, replacing the (Fraun-hofer) far-field recording with a magnified (Fresnel) near-field setting (Giewekemeyer et al. 2011, Mokso et al. 2007)has the following advantages: (i) The near-field patterndirectly represents location and shape of the object, sothat object support and position in the beam can be read-ily located, giving useful a priori knowledge. (ii) Currentdetector technology is better exploited due to homoge-nous signal level. Furthermore, (iii) a high dose efficiencyis gained by interference of the weak diffracted wave with
the much stronger primary wave as demonstrated experi-mentally in this work. Finally, (iv) in view of 3D imaging,a full field approach based on scanning only one degreeof freedom (rotation axis) produces less overhead time indata acquisition and imposes less restrictive requirementson mechanical accuracy and longterm vibrational stabil-ity. However, shaping a highly coherent beam with curvedwavefronts is a major challenge in propagation imaging.By using x-ray waveguides the well-known problems ofempty beam correction and geometrical distortions asso-ciated with hard x-ray focusing optics (Mokso et al. 2007)can be solved (Giewekemeyer et al. 2011).
MethodsFigure 1 shows a schematic of the experiment performedwith the Gottingen Instrument for Nano Imaging withX-rays (GINIX) installed at the coherence beamline P10of the new storage ring PETRA III at Hasylab, DESY(Kalbfleisch et al. 2011; Salditt et al. 2011). The undulatorbeam was monochromatized by a Si(111) double crystalto 13.8 keV and then focused by two Kirkpatrick-Baez(KB) mirrors polished to fixed elliptical shape, yieldinga focus size of Dhorz = 370 nm and Dvert = 200 nmfull width at half maximum (FWHM), as measured byscanning x-ray waveguides horizontally and verticallythrough the beam. The total flux was 2.4 × 10¹¹ countsper second at 70 mA ring current, as measured by apixel detector (Pilatus, Dectris) positioned at 5.29 m inthe widened far-field of the KB beam. The waveguide(WG) system was positioned in the focal plane of the KBmirror, using a miniaturized fully motorized goniome-ter with optical encoders (Attocube). Alignment of thewaveguide as well as the sample mounted on a dedicatedtomography stage was facilitated by use of two on-axisoptical microscopes, one directed downstream and oneupstream with the beam, see Additional file 1 for details.Two different single photon counting pixel detectors,with 172 μm (Pilatus, Dectris) and 55 μm (Maxipix) pixelsize were used. The waveguide system consisted of twocrossed planar waveguide slices, each with a transmissionoptimized sputtered thin film sequenceGe/Mo/C/Mo/Ge,with 35 nm amorphous C as the guiding layer (Krugeret al. 2010, 2012; Salditt et al. 2011). Note that due tograzing angles, the guiding layer width of 35 nm corre-sponds to only two propagating modes in the waveguide.Absorption of radiative modes in the cladding thenresults in a strong damping of all radiation except ofthe two fundamental modes. Finally, the interference ofthe modes can lead to a an effective beam width whichis substantially smaller than the guiding layer thickness(Kruger et al. 2012). The small exit beam width of thewaveguide beam is evidenced by the large divergenceangle of its far-field intensity distribution, measured with
Bartels et al. Optical Nanoscopy 2012, 1:10 Page 3 of 7http://www.optnano.com/content/1/1/10
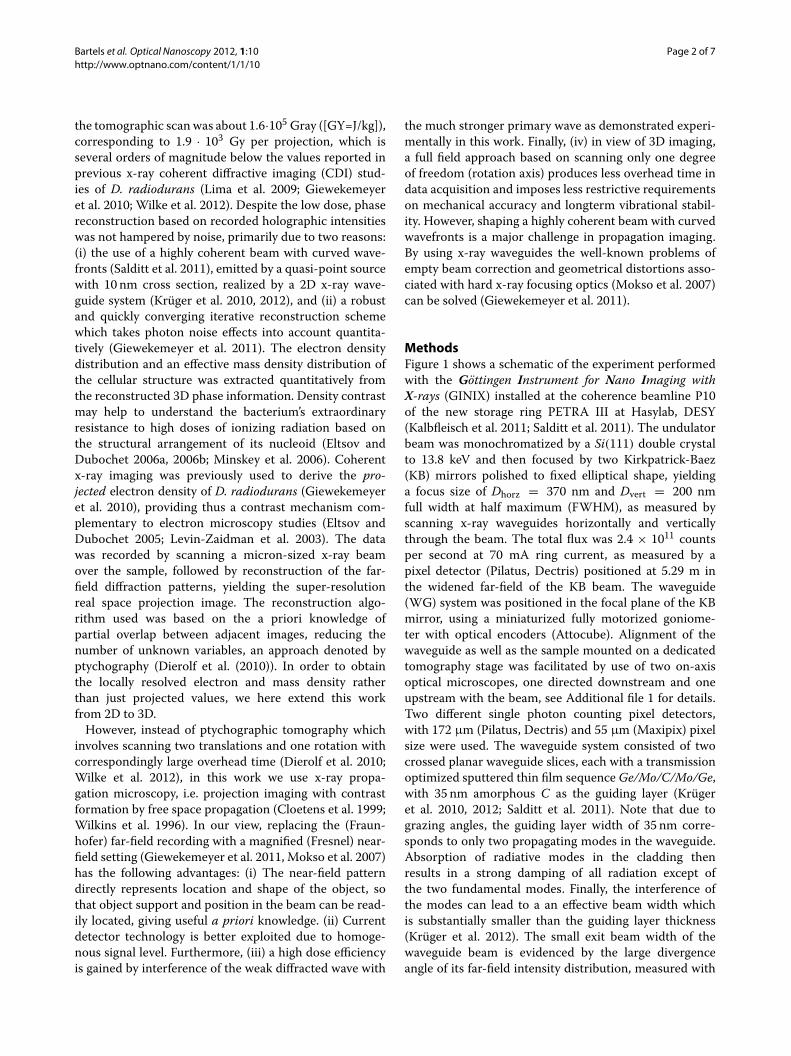
Figure 1 Experimental setup. (a) A monochromatic x-ray beam is focused by two KB mirrors onto the system of two crossed planar waveguides(WG) with a layered guiding core structure for optimized transmission. The sample (for an optical mircograph of the cells, see inset) is placed at adistance z1 behind the WG exit. The area pixel detector is placed at a distance z2 � z1 away from the sample to collect the diffraction pattern. (b)Logarithmic far-field intensity distribution of a 15 keV beam exiting the waveguide (scale bar 0.02 A−1, 100 second dwell time), measured with apixel detector (Pilatus) at a distance of 5.29 m behind the focus. The small focal width of the waveguide beam is evidenced by its large divergenceangle, the relatively homogenous intensity distribution well suited for imaging (dashed rectangle) has a divergence angle of 5 mrad. (c) Thenear-field intensity distribution in the effective focal plane is obtained by inverting the diffraction pattern with the error reduction algorithm, shownin logarithmic scale, scale bar 20 nm. (d) Gaussian fits of the central peak along the horizontal and vertical direction give a width of 10 nm × 9.8 nm(FWHM), respectively.
a pixel detector (Pilatus) at a distance of 5.29 m behindthe WG (data shown in Figure 1(b), recorded at 15 keVphoton energy). The relatively homogenous part of thewaveguide far-field intensity distribution (dashed rect-angle in Figure 1(b)) is well suited for imaging and hasa divergence angle of 5 mrad. The near-field intensitydistribution in the effective focal plane is obtained byinverting the diffraction pattern using the error reduc-tion algorithm (Kruger et al. 2010, 2012 (see Figure 1(c)).Gaussian fits of the central peak along the horizontaland vertical direction give a width of 10 nm × 9.8 nm(FWHM), respectively (see Figure 1(d)). Cells of theDeinococcus radiodurans wild-type strain were cultivatedfrom freeze-dried cultures (DSM No. 20539 by the Ger-man Collection of Microorganisms and Cell Cultures),suspended on Si3N4-foils (Silson) with 1 μm thicknessand 5 × 5 mm2 lateral dimensions, shock frozen bycryogenic fixation in ethane (cryo-plunging), and subse-quently freeze dried, see Additional file 1 for details. Torecord projection propagation images in full field mode
the sample (for an optical micrograph of the cells, seeFigure 1(a)) was placed at a (defocus) distance z1 = 8mm from the WG exit plane, where the divergent WGbeam has broadened to a field of view (FOV) of 40 ×40 μm2, as calculated from the measured far-field diver-gence angle of 5 mrad. As shown previously, the imagingexperiment can then be described in a well-knownequivalent parallel-beam geometry (Mayo et al. 2002;Fuhse et al. 2006) with a demagnified (effective) detectorpixel size of �D/M and a (de)magnification factor ofM = (z1 + z2)/z1 as well as an effective sample-detectordistance zeff = z1z2/(z1 + z2) = z2/M. Note that herez2 � z1, so that zeff � z1 = 8 mm and M � z2/z1 = 660,resulting in an effective detector pixel size of � 83 nm.For 3D imaging, 83 projection images Iφ were collectedover 162 degrees with a total exposure time of 10 min-utes for each angle φ, distributed over N = 15 detectoraccumulations, which were subsequently corrected forlateral drift by cross-correlation methods with sub-pixelaccuracy (Guizar-Sicairos et al. 2008). The total fluence
Bartels et al. Optical Nanoscopy 2012, 1:10 Page 4 of 7http://www.optnano.com/content/1/1/10
for each projection was � 4.38 · 106 photons/μm2, corre-sponding to a dose of � 1.9 ·103 Gy, based on calculationspresented in (Howells et al. 2009). Next, the normalizedintensity distribution was calculated as Iφ(x, y) = Iφ/I0by division with the empty beam intensity distributionI0(x, y), followed by a filtering of residual low frequencyvariations, see Additional file 1 for details on imageprocessing and filtering. Based on the projection approx-imation, the measured signal at the detector normalizedby the empty beam intensity distribution, describedin the equivalent parallel-beam geometry is thengiven as
Iφ(x, y) = |Dzeff [χ(x, y)] |2 , (1)
whereDzeff denotes the two-dimensional Fresnel propaga-tor over the distance zeff along the optical axis and χ(x, y)the sample transmission function (Giewekemeyer et al.2011). Backpropagation of Eq. (1) leads to a single-stepholographic reconstruction of the normalized intensityIφ(x, y), which is however intrinsically spoiled by the so-called twin-image. As presented previously in Gieweke-meyer et al. (2011), a significant improvement of thereconstruction can be achieved by application of a modi-fied version of the Hybrid-Input-Output (HIO) algorithm(Paganin (2006)) well suited for pure phase objects. Notethat the HIO algorithm is a classical iterative algorithm,which cycles between reciprocal space and real space. Inreciprocal space, the measured information is fed in, andin real space, additional ‘real space’ constrains are applied,which in many cases leads to convergence towards thesolution which satisfied both constraints. Most commona priori knowledge in real space is based on supportinformation, i.e. in which region of the illuminated areathe sample is positioned and/or amplitude constraint, i.e.knowledge about the amplitude of the object, for exam-ple when absorption can be neglected. According to the
HIO version published in Giewekemeyer et al. (2011), thereal space upgrade consists of two constraints, one for theamplitude, and one for the phase of the wave, as specifiedby the following two equations. The update of the currentamplitude |χn| is given by
|χn+1| = |χn| − β · (|χ ′n| − 1
), (2)
as proposed in Gurevey (2003). Secondly, a phase con-straint is included in the iteration, namely,
ϕ(χn+1(x, y))
={
ϕ(χn(x, y)) − γ · ϕ(χ ′n(x, y)) ∀(x, y) /∈ S
min{ϕ(χ ′n(x, y)), 0} ∀(x, y) ∈ S.
(3)
|χ ′n| denotes the amplitude of the n-th iterate after appli-cation of the detection plane constraint, i.e. χ ′n :=PM(χn) with PM(χn) = D−zeff [
√I · exp(iϕ(χn))] denoting
the modulus replacement operation in the detection planeand ϕ(z) := arg(z) for any complex number z ∈ C. Theamplitude constraint (2) slowly pushes |χn| towards 1 andthe phase constraint (3) causes a gentle decrease of thephase to a constant C (C = 0 was chosen here) in the area,where no object is located. The phase inside the supportarea S ⊂ R
2, however, is left untouched, as long as it is notlarger than C, allowing for phase changes �ϕ(x, y) in onedirection only, as expected for objects with |�ϕ(x, y)| <
π . The speed of convergence is determined by the feed-back parameters γ ∈[ 0, 1] and β ∈[ 0, 1]. For tomographicdatasets it is crucial to determine the accurate supportarea S automatically for each projection, which is achievedby a thresholding approach, as explained in Additionalfile 1.Before application to a biological sample, suitable test
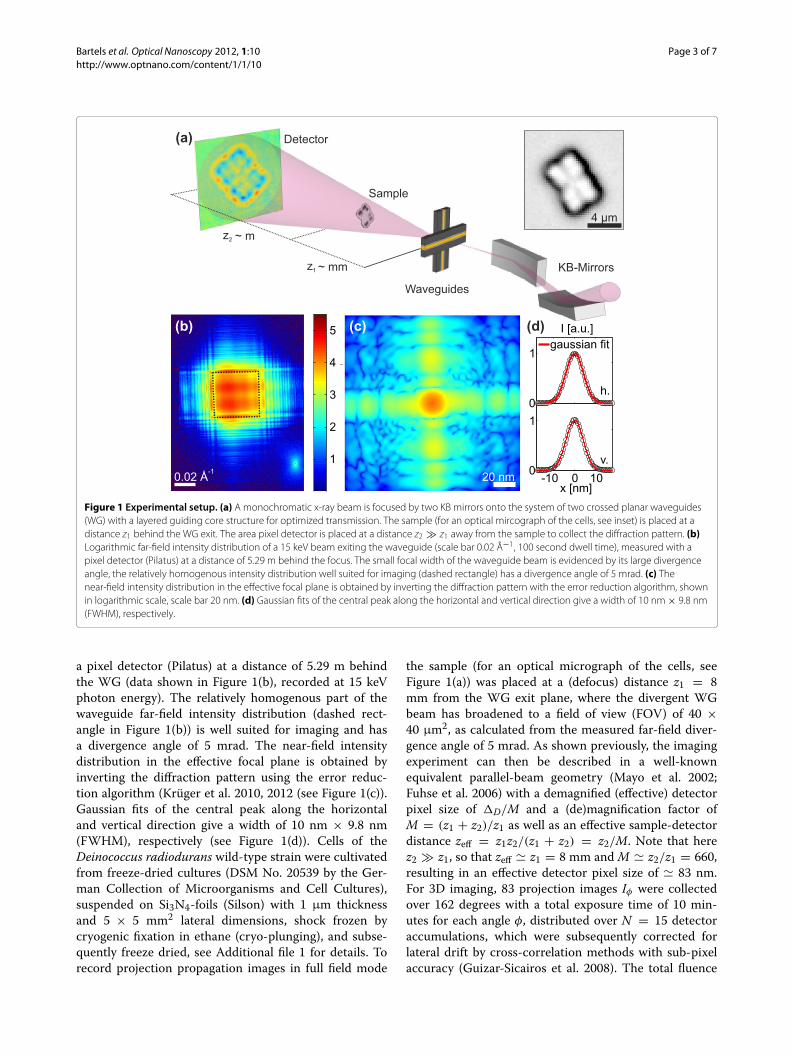
structures can be used to control the contrast transfer ofthe setup at the relevant resolution range. Figure 2 showsthe example of a lithographic pattern consisting of 50 nm
Figure 2 Test structure. (a) Scanning electron micrograph of a 500 nm thick tantalum test structure with 50 nm lines and spaces. (b) Hologram ofthe test structure obtained from the normalized intensity distribution recorded during 1 second total illumination time. Effective pixel sizes are 16nm in horizontal and 11 nm in vertical direction, the field of view is 3.4 μm (h) × 2.2 μm (v). (c) Profile along the black line in (b) together with asinusoidal fit yielding a perdiodicity of 100.7 nm, well in agreement with the 50 nm feature size.
Bartels et al. Optical Nanoscopy 2012, 1:10 Page 5 of 7http://www.optnano.com/content/1/1/10
lines and spaces in a 500 nm thick tantalum layer (NTT-AT, Japan, model # ATN/XRESO-50HC), see (a) for a SEMmicrograph. The measured hologram (b), after correc-tion by the empty beam, corresponds to a total field ofview of 3.4 μm (h.) × 2.2 μm (v.). Analysis of line cuts asshown in (c) shows that sufficient contrast of �I/I � 0.2is achieved. For the data on the test structure, we haveused a waveguide system with 60 nm amorphous C asthe guiding layer resulting in a total flux of 5 × 10⁸ cpsexiting the waveguide system at 80 mA ring current. Thetest structure was positioned at z1 = 1.063 mm. Dueto the sequential arrangement of the crossed waveguidesystem the distances from both individual planar wave-guide slices to the sample differ by 450 μm, which is thethickness of the second waveguide slice. With the detec-tor (Maxipix) placed at z2 = 5.36 m the effective pixel side
lengths are � 16 nm in horizontal and � 11 nm in verticaldirection. Note that the resulting anisotropy of effectivepropagation distance and sampling along the horizontaland vertical direction can easily be implemented in thenumerical Fresnel propagation. The total exposure time ofthe hologram was 1 second, distributed over 200 detectoraccumulations followed by an empty beam recording.
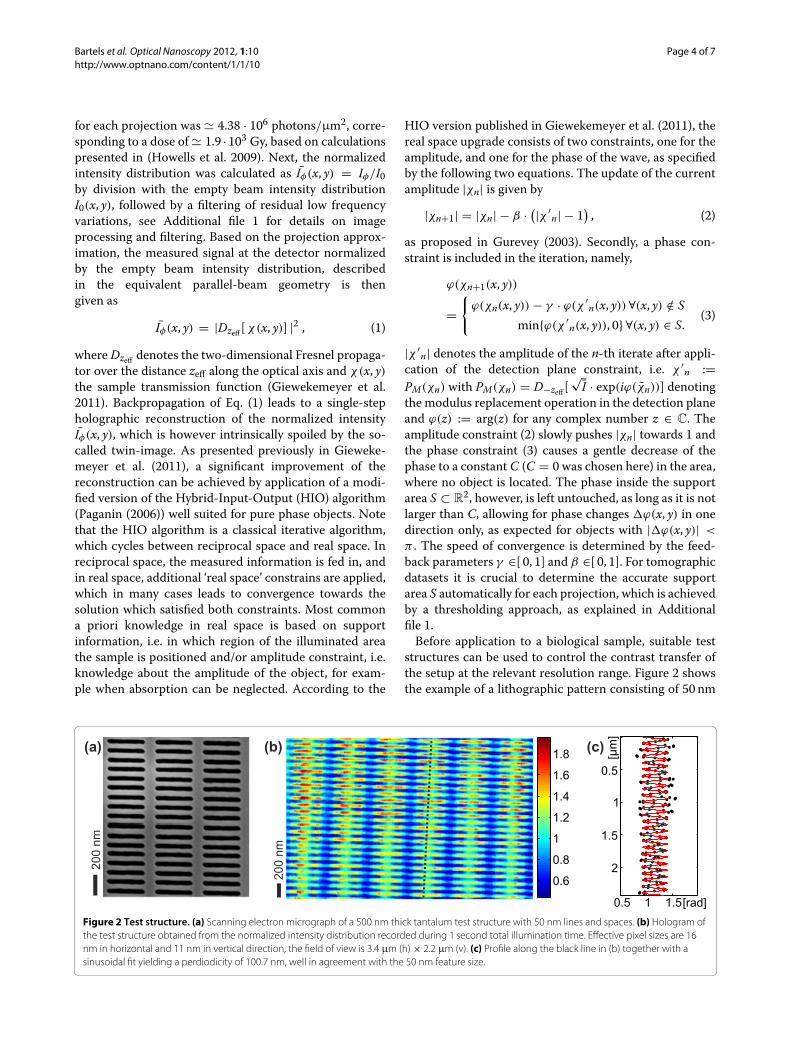
ResultsPhase reconstructions of Deinococcus radiodurans fortwo different rotation angles θ are shown in Figure 3. Theywere obtained by averaging the complex reconstructionsfrom 50 independent runs of the modified HIO algorithm,which stopped at an average iteration number of Nit �2000 and showed a very small distribution of the resultingphase values with a standard deviation below 5 · 10−4 rad
Figure 3 2D projections of D. radiodurans. Holographic intensity diffracted from freeze-dried D. radiodurans cells at rotation angles (a) θ = 80◦and (c) θ = 0◦ , normalized by the empty WG far-field intensity distribution. (b,d) Corresponding phase reconstructions obtained with a modifiedHIO scheme as described in the main text. The coloring is scaled in rad and also mg/cm2. (e) Angular averaged power spectral density (PSD) of thephase reconstruction shown in (d) plotted as a blue line, together with the phase-contrast transfer function (PCTF). In comparison to the PSD of asingle-step holographic reconstruction, shown as a red line, the modified HIO scheme recovers spatial frequencies, where the PCTF is zero. A fit ofan exponential power law to the PSD in the interval [0.1,3]μm−1 is shown as a dashed black line. The transition point to the noise plateau, shown asa solid black line, is at 4μm−1. (f) 2D projection of the tomographic 3D dataset of the cells, obtained by numerical evaluation of line integralscorresponding to a rotation angle θ = 0◦ .
Bartels et al. Optical Nanoscopy 2012, 1:10 Page 6 of 7http://www.optnano.com/content/1/1/10
in each pixel. The algorithmic feedback parameters wereset to β = γ = 0.2 and an initial guess was generated asdetailed in Giewekemeyer et al. 2011. As described earlier((Giewekemeyer et al. 2010, 2011), see also Additionalfile 1) the reconstructed phase distribution can berescaled into a projected electron or, for light biologicalmaterials, mass density map (see additional colorbar scal-ing in Figure 3) with a density range well in agreementto what has been found before for cells of D. radiodurans(Giewekemeyer et al. 2010). Figure 3(e) shows the angu-lar averaged power spectral density (PSD) of the phasereconstruction corresponding to θ = 0◦. Fitting the PSDto an exponential power law in the interval [0.1,3]μm−1,a transition to the noise plateau is found at 4μm−1,indicating an upper limit of the obtained (half-period)spatial resolution at 125 nm. 83 projected effective massdensity maps, reconstructed from data collected at angles
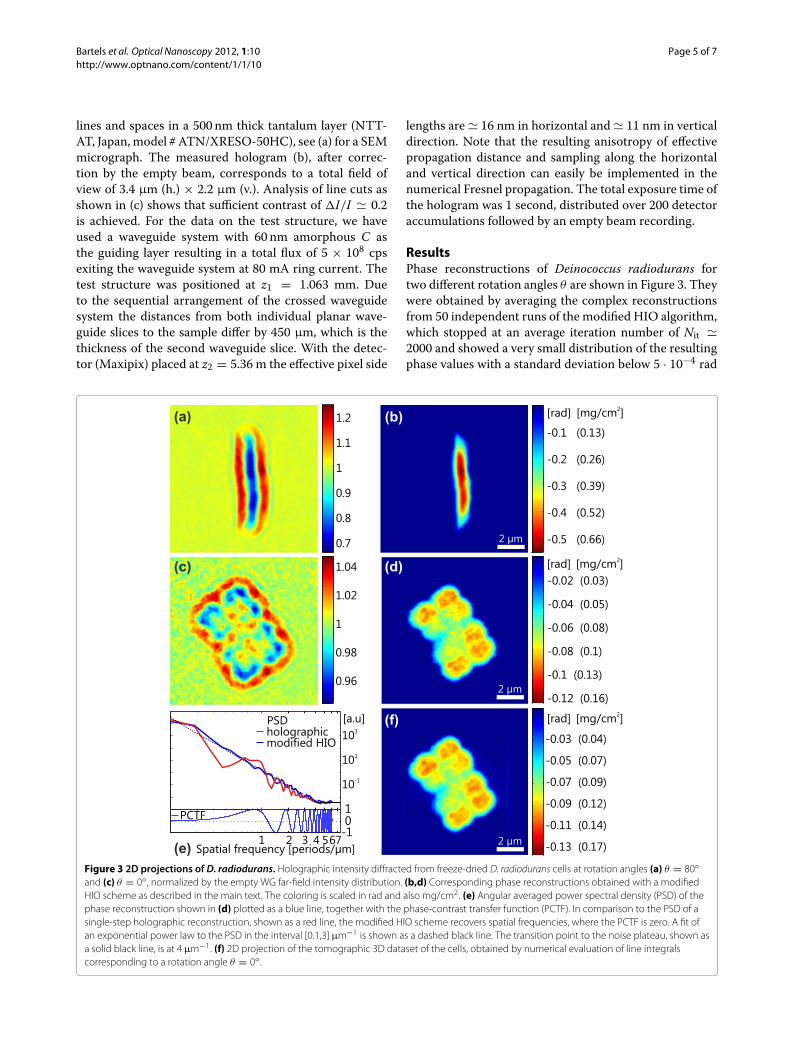
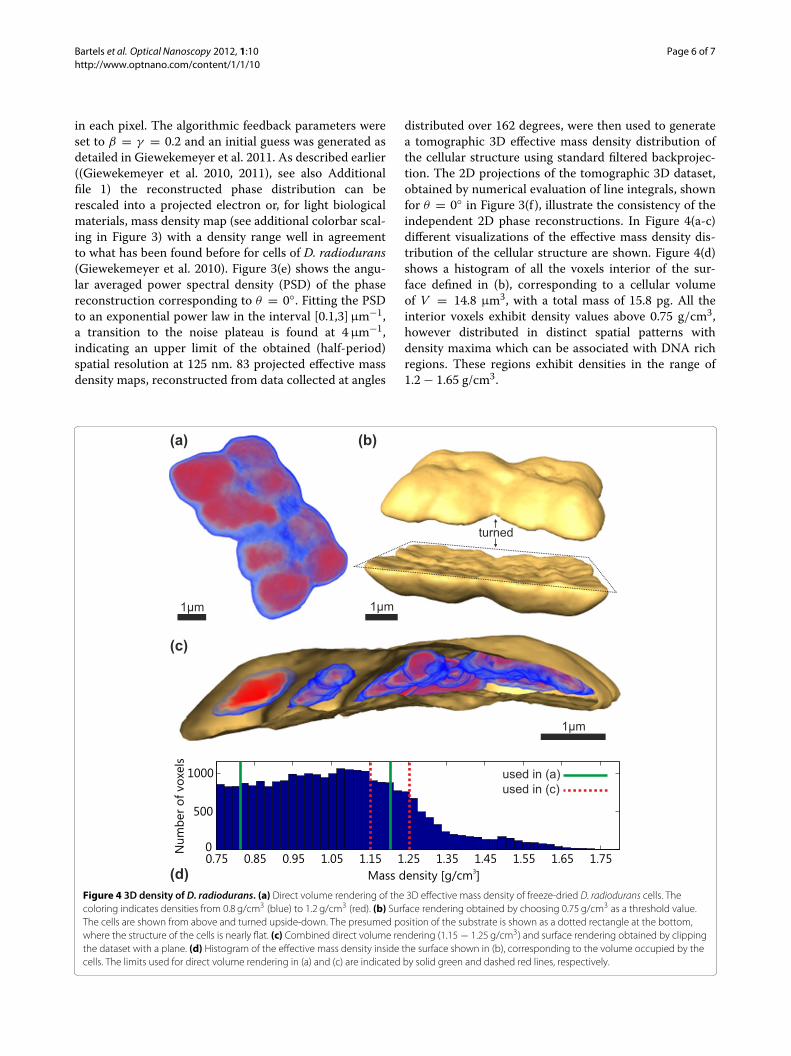
distributed over 162 degrees, were then used to generatea tomographic 3D effective mass density distribution ofthe cellular structure using standard filtered backprojec-tion. The 2D projections of the tomographic 3D dataset,obtained by numerical evaluation of line integrals, shownfor θ = 0◦ in Figure 3(f ), illustrate the consistency of theindependent 2D phase reconstructions. In Figure 4(a-c)different visualizations of the effective mass density dis-tribution of the cellular structure are shown. Figure 4(d)shows a histogram of all the voxels interior of the sur-face defined in (b), corresponding to a cellular volumeof V = 14.8 μm3, with a total mass of 15.8 pg. All theinterior voxels exhibit density values above 0.75 g/cm3,however distributed in distinct spatial patterns withdensity maxima which can be associated with DNA richregions. These regions exhibit densities in the range of1.2 − 1.65 g/cm3.
Figure 4 3D density of D. radiodurans. (a) Direct volume rendering of the 3D effective mass density of freeze-dried D. radiodurans cells. Thecoloring indicates densities from 0.8 g/cm3 (blue) to 1.2 g/cm3 (red). (b) Surface rendering obtained by choosing 0.75 g/cm3 as a threshold value.The cells are shown from above and turned upside-down. The presumed position of the substrate is shown as a dotted rectangle at the bottom,where the structure of the cells is nearly flat. (c) Combined direct volume rendering (1.15 − 1.25 g/cm3) and surface rendering obtained by clippingthe dataset with a plane. (d) Histogram of the effective mass density inside the surface shown in (b), corresponding to the volume occupied by thecells. The limits used for direct volume rendering in (a) and (c) are indicated by solid green and dashed red lines, respectively.
Bartels et al. Optical Nanoscopy 2012, 1:10 Page 7 of 7http://www.optnano.com/content/1/1/10
ConclusionIn summary, we have used phase contrast projectiontomography to compute the 3D density distribution inbacterial cells, showing characteristic density maximawhich we attribute to DNA rich regions. The imagingand reconstruction method based on near-field prop-agation or in-line holographic recording is particularlydose efficient. Application of the method to multi-cellularorganisms and tissues would allow a large field of viewin all spatial dimensions at sub-cellular resolution with-out the need of staining or slicing. The ability to easilyadapt the field of view and resolution by changing thedefocus distance could be used as a zoom and advanta-geously combined with region-of-interest (local) tomog-raphy, which however would imply generalizations of thephase reconstruction algorithms. With further techno-logical progress (waveguide transmission, vibrational sta-bility), resolution can be increased up to the theoreticallimit set by the extension of the quasi-point source usedfor illumination, which was 10 nm in the present case.The result of the 2D test structure, for which a wave-guide with particularly high flux was available, alreadydemonstrates that the waveguide setup is in principle wellsuited for imaging at a resolution below 50 nm, a fieldof view in the range of several microns up to a few hun-dreds of microns, and one second accumulation time,paving the way for relatively fast and dose efficient nano-tomography applications.
Additional file
Additional file 1: Supporting information.
Competing interestsThe authors declare that they have no competing interests.
Authors’ contributionsMB has been the main person carrying out the experiment and has analyzedthe data. MB and TS have designed the experiment and have written thepaper. MP,SK,CO,MS,SPK,RNW and TS have participated in the synchrotronexperiments. SPK has contributed the x-ray waveguide optics, SK hascontributed experimental tools, KG has contributed algorithmic tools. MP hasprepared the cellular sample. All authors read and approved the finalmanuscript.
AcknowledgementsWe thank HASYLAB for beamtime and the PETRA III team for excellent beamconditions. Funding by the DFG collaborative research center SFB 755Nanoscale Photonic Imaging and the German Ministry of Education andResearch (Grant No. 05K10MGA) is gratefully acknowledged.
Author details1Institut fur Rontgenphysik, Georg-August-Universitat Gottingen,Friedrich-Hund-Platz 1, 37077 Gottingen, Germany. 2HASYLAB at DESY,Notkestr. 85, 22607 Hamburg, Germany.
Received: 15 July 2012 Accepted: 2 October 2012Published: 30 November 2012
ReferencesCloetens P, Ludwig W, van Dyck D, et al. (1999) Holotomography: Quantitative
phase tomography with micrometer resolution using hard synchrotronradiation x rays. Appl Phys Lett 75: 2912
Cloetens P, Mache R, Schlenker M, et al. (2006) Quantitative phase tomographyof Arabidopsis seeds reveals intercellular void network. PNAS 103: 14626
Dierolf M, Menzel A, Thibault P, et al. (2010) Ptychographic X-ray computedtomography at the nanoscale. Nature 467: 436
Eltsov E, Dubochet J (2005) Fine Structure of the Deinococcus radioduransNucleoid Revealed by Cryoelectron Microscopy of Vitreous Sections. JBacteriol 187: 8047
Eltsov, E, Dubochet J (2006) Study of the Deinococcus radiodurans Nucleoidby Cryoelectron Microscopy of Vitreous Sections: SupplementaryComments. J Bacteriol 188: 6052
Eltsov, E, Dubochet, J (2006) Rebuttal: Ring-Like Nucleoids and DNA Repair inDeinococcus radiodurans. J Bacteriol 188: 6052
Fuhse C, Ollinger C, Salditt T (2006) Waveguide-Based Off-Axis Holographywith Hard X Rays. Phys Rev Lett 97: 254801
Giewekemeyer K, Thibault P, Kalbfleisch S, et al. (2010) Quantitative biologicalimaging by ptychographic x-ray diffraction microscopy. PNAS 107: 529
Giewekemeyer K, Kruger SP, Kalbfleisch S, et al. (2011) X-ray propagationmicroscopy of biological cells using waveguides as a quasipoint source.Phys Rev A 83: 023804
Guizar-Sicairos M, Thurman ST, Fienup JR (2008) Efficient subpixel imageregistration algorithms. Opt Lett 33: 156–158
Gureyev TE (2003) Composite techniques for phase retrieval in the Fresnelregion. Opt Commun 220: 49
Howells MR, Beetz T, Chapman HN, et al. (2009) An assessment of theresolution limitation due to radiation-damage in X-ray diffractionmicroscopy. J El Spec Rel Phen 170: 4
Huang X, Nelson J, Kirz J, et al. (2009) Soft X-Ray Diffraction Microscopy of aFrozen Hydrated Yeast Cell. Phys Rev Lett 103: 198101
Kalbfleisch S, Neubauer H, Kruger SP, et al. (2011) The Gøttingen HolographyEndstation of Beamline P10 at PETRA III/DESY. AIP Conf Proc 1365: 96
Kruger SP, Giewekemeyer K, Kalbfleisch S, et al. (2010) Sub-15 nm beamconfinement by two crossed x-ray waveguides. Opt Express 18: 13492
Kruger SP, Neubauer H, Bartels M, et al. (2012) Sub-10 nm beam confinementby X-ray waveguides: design, fabrication and characterization of opticalproperties. J Synchrotron Rad 19: 227
Levin-Zaidman S, Englander J, Shimoni E, et al. (2003) Ringlike Structure of theDeinococcus radiodurans Genome: A Key to Radioresistance? Science 299:254
Lima E, Wiegart L, Howells M, et al. (2009) Cryogenic X-Ray DiffractionMicroscopy for Biological Samples. Phys Rev Lett 103: 198102
Mayo SC, Miller PR, Wilkins W, et al. (2002) Quantitative X-ray projectionmicroscopy: phase-contrast and multi-spectral imaging. J Microsc 207: 79
Minsky A, Shimoni E, Englander J (2006) Rebuttal: Study of the Deinococcusradiodurans Nucleoid. J Bacteriol 188: 6059
Mokso R, Cloetens P, Ludwig W, et al. (2007) Nanoscale zoom tomographywith hard x rays using Kirkpatrick-Baez optics. Appl Phys Lett 90: 144104
Nishino Y, Takahashi Y, Imamoto N, et al. (2009) Three-DimensionalVisualization of a Human Chromosome Using Coherent X-Ray Diffraction.Phys Rev Lett 102: 018101
Nugent KA (2010) Coherent methods in the X-ray sciences. Adv Phys 59: 1Paganin D (2006) Coherent X-Ray Optics. Oxford University Press, OxfordSalditt T, Kalbfleisch S, OsterhoffM, et al. (2011) Partially coherent nano-focused
x-ray radiation characterized by Talbot interferometry. Opt Express 19: 9656Shapiro D, Thibault P, Beetz T, et al. (2005) Biological imaging by soft x-ray
diffraction microscopy. PNAS 102: 15343Song C, Jiang H, Mancuso A, et al. (2008) Quantitative Imaging of Single,
Unstained Viruses with Coherent X Rays. Phys Rev Lett 201: 158101Wilke RN, Priebe M, Bartels M, et al. (2012) Hard X-ray imaging of bacterial cells:
nano-diffraction and ptychographic reconstruction. Opt Express 20(17):19232-19254
Wilkins SW, Gureyev TE, Gao D, et al. (1996) Phase-contrast imaging usingpolychromatic hard x-rays. Nature 384: 335
doi:10.1186/2192-2853-1-10Cite this article as: Bartels et al.: Low-dose three-dimensional hard x-rayimaging of bacterial cells. Optical Nanoscopy 2012 1:10.